UNITED STATES
SECURITIES AND EXCHANGE COMMISSION
Washington, D.C. 20549
FORM N-CSRS
CERTIFIED SHAREHOLDER REPORT OF REGISTERED MANAGEMENT
INVESTMENT COMPANIES
Investment Company Act file number 811-07445
SEI Asset Allocation Trust
(Exact name of registrant as specified in charter)
SEI Investments
One Freedom Valley Drive
Oaks, PA 19456
(Address of principal executive offices) (Zip code)
Timothy D. Barto, Esq.
SEI Investments
One Freedom Valley Drive
Oaks, PA 19456
(Name and address of agent for service)
Registrant’s telephone number, including area code: 610-676-1000
Date of fiscal year end: March 31, 2022
Date of reporting period: September 30, 2021
| Item 1. | Reports to Stockholders. |

September 30, 2021
SEMI-ANNUAL REPORT
SEI Asset Allocation Trust
 | Defensive Strategy Fund |
| Defensive Strategy Allocation Fund |
| Conservative Strategy Fund |
| Conservative Strategy Allocation Fund |
| Moderate Strategy Fund |
| Moderate Strategy Allocation Fund |
| Aggressive Strategy Fund |
| Tax-Managed Aggressive Strategy Fund |
| Core Market Strategy Fund |
| Core Market Strategy Allocation Fund |
| Market Growth Strategy Fund |
| Market Growth Strategy Allocation Fund |
Paper copies of the Funds’ shareholder reports are no longer sent by mail, unless you specifically request them from the Funds or from your financial intermediary, such as a broker-dealer or bank. Shareholder reports are available online and you will be notified by mail each time a report is posted on the Funds’ website and provided with a link to access the report online.
You may elect to receive all future reports in paper free of charge. If you invest through a financial intermediary, you can contact your financial intermediary to inform it that you wish to continue receiving paper copies of your shareholder reports. If you invest directly with the Funds, you can inform the Funds that you wish to continue receiving paper copies of your shareholder reports by calling 1-800-DIAL-SEI. Your election to receive reports in paper will apply to all funds held with the SEI Funds or your financial intermediary.

| 1 | ||
| 20 | ||
| 22 | ||
| 24 | ||
| 28 | ||
| 32 | ||
| 43 | ||
The Trust files its complete schedule of portfolio holdings with the Securities and Exchange Commission for the first and third quarters of each fiscal year as an exhibit to its reports on Form N-PORT. The Trust’s Form N-PORT reports are available on the Commission’s website at http://www.sec.gov.
A description of the policies and procedures that the Trust uses to determine how to vote proxies relating to portfolio securities, as well as information relating to how a Fund voted proxies relating to portfolio securities during the most recent 12-month period ended June 30, is available (i) without charge, upon request, by calling 1-800-DIAL-SEI; and (ii) on the Commission’s website at http://www.sec.gov.
SCHEDULE OF INVESTMENTS (Unaudited)
September 30, 2021
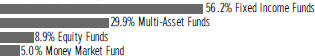
Defensive Strategy Fund
Sector Weightings †:
†Percentages are based on total investments.
| Description | Shares | Market Value ($ Thousands) | ||||||
AFFILIATED INVESTMENT FUNDS — 100.0% |
| |||||||
Fixed Income Funds — 56.2% |
| |||||||
SEI Daily Income Trust Short Duration Government Fund, Cl Y | 479,942 | $ | 5,020 | |||||
SEI Institutional Managed Trust Conservative Income Fund, Cl Y | 250,355 | 2,506 | ||||||
SEI Institutional Managed Trust Core Fixed Income Fund, Cl Y | 86,978 | 1,001 | ||||||
SEI Institutional Managed Trust Real Return Fund, Cl Y | 77,924 | 836 | ||||||
|
| |||||||
Total Fixed Income Funds | 9,363 | |||||||
|
| |||||||
Multi-Asset Funds — 29.9% | ||||||||
SEI Institutional Managed Trust Multi-Asset Capital Stability Fund, Cl Y | 315,757 | 3,328 | ||||||
SEI Institutional Managed Trust Multi-Asset Income Fund, Cl Y | 72,346 | 831 | ||||||
SEI Institutional Managed Trust Multi-Asset Inflation Managed Fund, Cl Y | 93,543 | 834 | ||||||
|
| |||||||
Total Multi-Asset Funds | 4,993 | |||||||
|
| |||||||
Equity Funds — 8.9% | ||||||||
SEI Institutional Managed Trust Global Managed Volatility Fund, Cl Y | 69,724 | 823 | ||||||
SEI Institutional Managed Trust U.S. Managed Volatility Fund, Cl Y | 37,240 | 658 | ||||||
|
| |||||||
Total Equity Funds | 1,481 | |||||||
|
| |||||||
Money Market Fund — 5.0% |
| |||||||
SEI Daily Income Trust Government Fund, Cl F, 0.010%** | 835,352 | 836 | ||||||
|
| |||||||
Total Money Market Fund | 836 | |||||||
|
| |||||||
Total Investments in Securities — 100.0% |
| $ | 16,673 | |||||
|
| |||||||
Percentages are based on Net Assets of $16,671 ($ Thousands).
** Rate shown is the 7-day effective yield as of September 30, 2021.
Cl — Class
As of September 30, 2021, all of the Fund’s investments in securities were considered Level 1 in accordance with the authoritative guidance on fair value measurements and disclosure under U.S. GAAP.
As of September 30, 2021, there were no transfers in or out of Level 3.
For more information on valuation inputs, see Note 2 — Significant Accounting Policies in Notes to Financial Statements.
| SEI Asset Allocation Trust / Semi-Annual Report / September 30, 2021 | 1 |
SCHEDULE OF INVESTMENTS (Unaudited)
September 30, 2021
Defensive Strategy Fund (Concluded)
The following is a summary of the transactions with affiliates for the period ended September 30, 2021 ($ Thousands):
| Security Description | Value 3/31/2021 | Purchases at Cost | Proceeds from Sales | Realized Gain/(Loss) | Change in Unrealized Appreciation/ (Depreciation) | Value 9/30/2021 | Shares | Dividend Income | Capital Gains | |||||||||
| SEI Daily Income Trust Short Duration Government Fund, Cl Y | $ 5,319 | $ 863 | $ (1,128) | $ (5) | $ (29) | $ 5,020 | 479,942 | $ 24 | $ — | |||||||||
| SEI Institutional Managed Trust Conservative Income, Cl Y | 2,657 | 416 | (567) | — | — | 2,506 | 250,355 | — | — | |||||||||
| SEI Institutional Managed Trust Core Fixed Income Fund, Cl Y | 1,064 | 182 | (259) | (1) | 15 | 1,001 | 86,978 | 9 | — | |||||||||
| SEI Institutional Managed Trust Real Return Fund, Cl Y | 885 | 147 | (203) | 2 | 5 | 836 | 77,924 | 19 | — | |||||||||
| SEI Institutional Managed Trust Multi-Asset Capital Stability, Cl Y | 3,546 | 531 | (788) | 7 | 32 | 3,328 | 315,757 | — | — | |||||||||
| SEI Institutional Managed Trust Multi-Asset Income Fund, Cl Y | 886 | 140 | (214) | 3 | 16 | 831 | 72,346 | 16 | — | |||||||||
| SEI Institutional Managed Trust Multi-Asset Inflation Managed Fund, Cl Y | 881 | 116 | (218) | 10 | 45 | 834 | 93,543 | — | — | |||||||||
| SEI Institutional Managed Trust Global Managed Volatility Fund, Cl Y | 876 | 130 | (226) | 23 | 20 | 823 | 69,724 | — | — | |||||||||
| SEI Institutional Managed Trust U.S. Managed Volatility Fund, Cl Y | 700 | 122 | (184) | 11 | 9 | 658 | 37,240 | 7 | — | |||||||||
| SEI Daily Income Trust Government Fund, Cl F | 886 | 139 | (189) | — | — | 836 | 835,352 | — | — | |||||||||
|
|
|
|
|
|
|
| |||||||||||
| Totals | $ 17,700 | $ 2,786 | $ (3,976) | $ 50 | $ 113 | $ 16,673 | $ 75 | $ — | ||||||||||
|
|
|
|
|
|
|
|
Amounts designated as “—“ are $0 or have been rounded to $0.
The accompanying notes are an integral part of the financial statements.
| 2 | SEI Asset Allocation Trust / Semi-Annual Report / September 30, 2021 |
SCHEDULE OF INVESTMENTS (Unaudited)
September 30, 2021
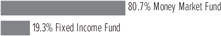
Defensive Strategy Allocation Fund
Sector Weightings †:
†Percentages are based on total investments.
| Description | Shares | Market Value ($ Thousands) | ||||||
AFFILIATED INVESTMENT FUNDS — 100.0% |
| |||||||
Money Market Fund — 80.7% |
| |||||||
SEI Daily Income Trust Government Fund, Cl F, 0.010%*† | 4,573,312 | $ | 4,573 | |||||
|
|
| ||||||
Total Money Market Fund | 4,573 | |||||||
|
|
| ||||||
Fixed Income Fund — 19.3% |
| |||||||
SEI Institutional Managed Trust High Yield Bond Fund, Cl Y | 154,470 | 1,094 | ||||||
|
|
| ||||||
Total Fixed Income Fund | 1,094 | |||||||
|
|
| ||||||
Total Investments in Securities — 100.0% |
| $ | 5,667 | |||||
|
|
| ||||||
Percentages are based on Net Assets of $5,665 ($ Thousands).
Cl — Class
* Represents greater than 50% of the Fund’s total investments. For further financial information, available upon request at no charge, please go to the Securities Exchange Commission’s website at http://www.sec.gov or call 1-800-DIAL-SEI.
† Rate shown is the 7-day effective yield as of September 30, 2021.
As of September 30, 2021, all of the Fund’s investments in securities were considered Level 1, in accordance with the authoritative guidance on fair value measurements and disclosure under U.S. GAAP.
As of September 30, 2021, there were no transfers in or out of Level 3.
For more information on valuation inputs, see Note 2 — Significant Accounting Policies in Notes to Financial Statements.
The following is a summary of the transactions with affiliates for the period ended September 30, 2021 ($ Thousands):
| Security Description | Value 3/31/2021 | Purchases at Cost | Proceeds from Sales | Realized Gain/(Loss) | Change in Unrealized Appreciation/ (Depreciation) | Value 9/30/2021 | Shares | Dividend Income | Capital Gains | |||||||||
| SEI Daily Income Trust Government Fund, Cl F | $ 5,033 | $ 228 | $ (688) | $ — | $ — | $ 4,573 | 4,573,312 | $ — | $ — | |||||||||
| SEI Institutional Managed Trust High Yield Bond Fund, Cl Y | 1,205 | 78 | (218) | 5 | 24 | 1,094 | 154,470 | 32 | — | |||||||||
|
|
|
|
|
|
|
| |||||||||||
| Totals | $ 6,238 | $ 306 | $ (906) | $ 5 | $ 24 | $ 5,667 | $ 32 | $ — | ||||||||||
|
|
|
|
|
|
|
|
Amounts designated as “—” are either $0 or have been rounded to $0.
The accompanying notes are an integral part of the financial statements.
| SEI Asset Allocation Trust / Semi-Annual Report / September 30, 2021 | 3 |
SCHEDULE OF INVESTMENTS (Unaudited)
September 30, 2021
Conservative Strategy Fund
Sector Weightings †:

†Percentages are based on total investments.
| Description | Shares | Market Value ($ Thousands) | ||||||
AFFILIATED INVESTMENT FUNDS — 100.0% |
| |||||||
Fixed Income Funds — 51.2% |
| |||||||
SEI Daily Income Trust Short Duration Government Fund, Cl Y | 899,935 | $ | 9,413 | |||||
SEI Daily Income Trust Ultra Short Duration Bond Fund, Cl Y | 267,894 | 2,507 | ||||||
SEI Institutional International Trust Emerging Markets Debt Fund, Cl Y | 184,321 | 1,849 | ||||||
SEI Institutional Managed Trust Conservative Income Fund, Cl Y | 625,915 | 6,265 | ||||||
SEI Institutional Managed Trust Core Fixed Income Fund, Cl Y | 649,637 | 7,477 | ||||||
SEI Institutional Managed Trust High Yield Bond Fund, Cl Y | 266,633 | 1,888 | ||||||
SEI Institutional Managed Trust Real Return Fund, Cl Y | 233,564 | 2,507 | ||||||
|
| |||||||
Total Fixed Income Funds | 31,906 | |||||||
|
| |||||||
Multi-Asset Funds — 31.1% |
| |||||||
SEI Institutional Managed Trust Multi-Asset Accumulation Fund, Cl Y | 178,111 | 1,854 | ||||||
SEI Institutional Managed Trust Multi-Asset Capital Stability Fund, Cl Y | 1,007,632 | 10,621 | ||||||
SEI Institutional Managed Trust Multi-Asset Income Fund, Cl Y | 325,557 | 3,741 | ||||||
SEI Institutional Managed Trust Multi-Asset Inflation Managed Fund, Cl Y | 351,318 | 3,134 | ||||||
|
| |||||||
Total Multi-Asset Funds | 19,350 | |||||||
|
| |||||||
Equity Funds — 17.7% |
| |||||||
SEI Institutional Managed Trust Global Managed Volatility Fund, Cl Y | 570,139 | 6,733 | ||||||
SEI Institutional Managed Trust U.S. Managed Volatility Fund, Cl Y | 244,874 | 4,322 | ||||||
|
| |||||||
Total Equity Funds | 11,055 | |||||||
|
| |||||||
Total Investments in Securities — 100.0% |
| $ | 62,311 | |||||
|
| |||||||
Percentages are based on Net Assets of $62,296 ($ Thousands).
Cl — Class
As of September 30, 2021, all of the Fund’s investments in securities were considered Level 1, in accordance with the authoritative guidance on fair value measurements and disclosure under U.S. GAAP.
As of September 30, 2021, there were no transfers in or out of Level 3.
For more information on valuation inputs, see Note 2 — Significant Accounting Policies in Notes to Financial Statements
| 4 | SEI Asset Allocation Trust / Semi-Annual Report / September 30, 2021 |
The following is a summary of the transactions with affiliates for the period ended September 30, 2021 ($ Thousands):
| Security Description | Value 3/31/2021 | Purchases at Cost | Proceeds from Sales | Realized Gain/(Loss) | Change in Unrealized Appreciation/ (Depreciation) | Value 9/30/2021 | Shares | Dividend Income | Capital Gains | |||||||||
| SEI Daily Income Trust Short Duration Government Fund, Cl Y | $ 10,449 | $ 119 | $ (1,089) | $ (4) | $ (62) | $ 9,413 | 899,935 | $ 46 | $ — | |||||||||
| SEI Daily Income Trust Ultra Short Duration Bond Fund, Cl Y | 2,787 | 23 | (300) | 1 | (4) | 2,507 | 267,894 | 10 | — | |||||||||
| SEI Institutional International Trust Emerging Markets Debt Fund, Cl Y | 2,083 | 76 | (321) | 5 | 6 | 1,849 | 184,321 | 37 | — | |||||||||
| SEI Institutional Managed Trust Conservative Income Fund, Cl Y | 6,963 | 39 | (737) | 1 | (1) | 6,265 | 625,915 | — | — | |||||||||
| SEI Institutional Managed Trust Core Fixed Income Fund, Cl Y | 8,351 | 155 | (1,142) | (13) | 126 | 7,477 | 649,637 | 73 | — | |||||||||
| SEI Institutional Managed Trust High Yield Bond Fund, Cl Y | 2,103 | 72 | (336) | 4 | 45 | 1,888 | 266,633 | 55 | — | |||||||||
| SEI Institutional Managed Trust Real Return Fund, Cl Y | 2,785 | 74 | (372) | 17 | 3 | 2,507 | 233,564 | 57 | — | |||||||||
| SEI Institutional Managed Trust Multi-Asset Accumulation Fund, Cl Y | 2,077 | 43 | (410) | 8 | 136 | 1,854 | 178,111 | — | — | |||||||||
| SEI Institutional Managed Trust Multi-Asset Capital Stability Fund, Cl Y | 11,838 | 59 | (1,404) | 62 | 66 | 10,621 | 1,007,632 | — | — | |||||||||
| SEI Institutional Managed Trust Multi-Asset Income Fund, Cl Y | 4,183 | 88 | (620) | 48 | 42 | 3,741 | 325,557 | 76 | — | |||||||||
| SEI Institutional Managed Trust Multi-Asset Inflation Managed Fund, Cl Y | 3,466 | 57 | (601) | (91) | 303 | 3,134 | 351,318 | — | — | |||||||||
| SEI Institutional Managed Trust Global Managed Volatility Fund, Cl Y | 7,618 | 216 | (1,475) | 90 | 284 | 6,733 | 570,139 | — | — | |||||||||
| SEI Institutional Managed Trust U.S. Managed Volatility Fund, Cl Y | 4,834 | 262 | (912) | 55 | 83 | 4,322 | 244,874 | 46 | — | |||||||||
|
|
|
|
|
|
|
| |||||||||||
| Totals | $ 69,537 | $ 1,283 | $ (9,719) | $ 183 | $ 1,027 | $ 62,311 | $ 400 | $ — | ||||||||||
|
|
|
|
|
|
|
|
Amounts designated as “—“ are $0 or have been rounded to $0.
The accompanying notes are an integral part of the financial statements.
| SEI Asset Allocation Trust / Semi-Annual Report / September 30, 2021 | 5 |
SCHEDULE OF INVESTMENTS (Unaudited)
September 30, 2021
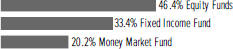
Conservative Strategy Allocation Fund
Sector Weightings †:
†Percentages are based on total investments.
| Description | Shares | Market Value ($ Thousands) | ||||||
AFFILIATED INVESTMENT FUNDS — 100.0% |
| |||||||
Equity Funds — 46.4% |
| |||||||
SEI Institutional Managed Trust Real Estate Fund, Cl Y | 242,886 | $ | 4,282 | |||||
SEI Institutional Managed Trust U.S. Managed Volatility Fund, Cl Y | 495,559 | 8,746 | ||||||
|
|
| ||||||
Total Equity Funds | 13,028 | |||||||
|
|
| ||||||
Fixed Income Fund — 33.4% |
| |||||||
SEI Institutional Managed Trust High Yield Bond Fund, Cl Y | 1,323,402 | 9,370 | ||||||
|
|
| ||||||
| Description | Shares | Market Value ($ Thousands) | ||||||
AFFILIATED INVESTMENT FUNDS (continued) |
| |||||||
Total Fixed Income Fund | $ | 9,370 | ||||||
|
|
| ||||||
Money Market Fund — 20.2% |
| |||||||
SEI Daily Income Trust Government Fund, Cl F, 0.010%* | 5,653,631 | 5,654 | ||||||
|
|
| ||||||
Total Money Market Fund | 5,654 | |||||||
|
|
| ||||||
Total Investments in Securities — 100.0% | $ | 28,052 | ||||||
|
|
| ||||||
Percentages are based on Net Assets of $28,044 ($ Thousands).
*Rate shown is the 7-day effective yield as of September 30, 2021.
Cl — Class
As of September 30, 2021, all of the Fund’s investments in securities were considered Level 1, in accordance with the authoritative guidance on fair value measurements and disclosure under U.S. GAAP.
As of September 30, 2021, there were no transfers in or out of Level 3.
For more information on valuation inputs, see Note 2 — Significant Accounting Policies in Notes to Financial Statements.
The following is a summary of the transactions with affiliates for the period ended September 30, 2021 ($ Thousands):
| Security Description | Value 3/31/2021 | Purchases at Cost | Proceeds from Sales | Realized Gain/(Loss) | Change in Unrealized Appreciation/ (Depreciation) | Value 9/30/2021 | Shares | Dividend Income | Capital Gains | |||||||||
| SEI Institutional Managed Trust Real Estate Fund, Cl Y | $ 4,498 | $ 59 | $ (888) | $ 163 | $ 450 | $ 4,282 | 242,886 | $ 36 | $ — | |||||||||
| SEI Institutional Managed Trust U.S. Managed Volatility Fund, Cl Y | 9,098 | 105 | (708) | 144 | 107 | 8,746 | 495,559 | 89 | — | |||||||||
| SEI Institutional Managed Trust High Yield Bond Fund, Cl Y | 9,715 | 447 | (1,029) | 6 | 231 | 9,370 | 1,323,402 | 270 | — | |||||||||
| SEI Daily Income Trust Government Fund, Cl F | 5,853 | 245 | (444) | — | — | 5,654 | 5,653,631 | — | — | |||||||||
|
|
|
|
|
|
|
| |||||||||||
| Totals | $ 29,164 | $ 856 | $ (3,069) | $313 | $788 | $28,052 | $ 395 | $ — | ||||||||||
|
|
|
|
|
|
|
|
Amounts designated as “—“ are $0 or have been rounded to $0.
The accompanying notes are an integral part of the financial statements.
| 6 | SEI Asset Allocation Trust / Semi-Annual Report / September 30, 2021 |
SCHEDULE OF INVESTMENTS (Unaudited)
September 30, 2021
Moderate Strategy Fund
Sector Weightings †:

†Percentages are based on total investments.
| Description | Shares | Market Value ($ Thousands) | ||||||
AFFILIATED INVESTMENT FUNDS — 100.0% |
| |||||||
Fixed Income Funds — 36.3% |
| |||||||
SEI Daily Income Trust Short Duration Government Fund, Cl Y | 1,008,374 | $ | 10,548 | |||||
SEI Daily Income Trust Ultra Short Duration Bond Fund, Cl Y | 422,119 | 3,951 | ||||||
SEI Institutional International Trust Emerging Markets Debt Fund, Cl Y | 391,692 | 3,929 | ||||||
SEI Institutional Managed Trust Core Fixed Income Fund, Cl Y | 1,832,431 | 21,091 | ||||||
SEI Institutional Managed Trust High Yield Bond Fund, Cl Y | 560,208 | 3,966 | ||||||
SEI Institutional Managed Trust Real Return Fund, Cl Y | 368,023 | 3,949 | ||||||
|
|
| ||||||
Total Fixed Income Funds |
| 47,434 | ||||||
|
|
| ||||||
Multi-Asset Funds — 35.0% |
| |||||||
SEI Institutional Managed Trust Multi-Asset Accumulation Fund, Cl Y | 1,873,732 | 19,505 | ||||||
SEI Institutional Managed Trust Multi-Asset Capital Stability Fund, Cl Y | 1,247,673 | 13,150 | ||||||
SEI Institutional Managed Trust Multi-Asset Income Fund, Cl Y | 571,820 | 6,570 | ||||||
SEI Institutional Managed Trust Multi-Asset Inflation Managed Fund, Cl Y | 737,256 | 6,576 | ||||||
|
|
| ||||||
Total Multi-Asset Funds |
| 45,801 | ||||||
|
|
| ||||||
Equity Funds — 28.7% |
| |||||||
SEI Institutional Managed Trust Global Managed Volatility Fund, Cl Y | 1,639,764 | 19,366 | ||||||
SEI Institutional Managed Trust Large Cap Fund, Cl Y | 292,391 | 5,123 | ||||||
SEI Institutional Managed Trust U.S. Managed Volatility Fund, Cl Y | 734,936 | 12,972 | ||||||
|
|
| ||||||
Total Equity Funds |
| 37,461 | ||||||
|
|
| ||||||
Total Investments in Securities — 100.0% |
| $ | 130,696 | |||||
|
|
| ||||||
Percentages are based on Net Assets of $130,661 ($ Thousands).
Cl — Class
As of September 30, 2021, all of the Fund’s investments in securities were considered Level 1, in accordance with the authoritative guidance on fair value measurements and disclosure under U.S. GAAP.
As of September 30, 2021, there were no transfers in or out of Level 3.
For more information on valuation inputs, see Note 2 — Significant Accounting Policies in Notes to Financial Statements.
| SEI Asset Allocation Trust / Semi-Annual Report / September 30, 2021 | 7 |
SCHEDULE OF INVESTMENTS (Unaudited)
September 30, 2021
Moderate Strategy Fund (Concluded)
The following is a summary of the transactions with affiliates for the period ended September 30, 2021 ($ Thousands):
| Security Description | Value 3/31/2021 | Purchases at Cost | Proceeds from Sales | Realized Gain/(Loss) | Change in Unrealized Appreciation/ (Depreciation) | Value 9/30/2021 | Shares | Dividend Income | Capital Gains | |||||||||
| SEI Daily Income Trust Short Duration Government Fund, Cl Y | $ 11,905 | $ 203 | $ (1,486) | $ (10) | $ (64) | $ 10,548 | 1,008,374 | $ 51 | $ — | |||||||||
| SEI Daily Income Trust Ultra Short Duration Bond Fund, Cl Y | 4,464 | 82 | (591) | 2 | (6) | 3,951 | 422,119 | 15 | — | |||||||||
| SEI Institutional International Trust Emerging Markets Debt Fund, Cl Y | 4,461 | 171 | (729) | (10) | 36 | 3,929 | 391,692 | 79 | — | |||||||||
| SEI Institutional Managed Trust Core Fixed Income Fund, Cl Y | 23,830 | 463 | (3,514) | (54) | 366 | 21,091 | 1,832,431 | 205 | — | |||||||||
| SEI Institutional Managed Trust High Yield Bond Fund, Cl Y | 4,490 | 158 | (787) | 10 | 95 | 3,966 | 560,208 | 116 | — | |||||||||
| SEI Institutional Managed Trust Real Return Fund, Cl Y | 4,460 | 165 | (710) | 33 | 1 | 3,949 | 368,023 | 89 | — | |||||||||
| SEI Institutional Managed Trust Multi-Asset Accumulation Fund, Cl Y | 22,146 | 392 | (4,547) | 60 | 1,454 | 19,505 | 1,873,732 | — | — | |||||||||
| SEI Institutional Managed Trust Multi-Asset Capital Stability Fund, Cl Y | 14,868 | 114 | (1,987) | 81 | 74 | 13,150 | 1,247,673 | — | — | |||||||||
| SEI Institutional Managed Trust Multi-Asset Income Fund, Cl Y | 7,444 | 179 | (1,209) | 77 | 79 | 6,570 | 571,820 | 133 | — | |||||||||
| SEI Institutional Managed Trust Multi-Asset Inflation Managed Fund, Cl Y | 7,405 | 199 | (1,480) | (221) | 673 | 6,576 | 737,256 | — | — | |||||||||
| SEI Institutional Managed Trust Global Managed Volatility Fund, Cl Y | 22,194 | 287 | (4,166) | 315 | 736 | 19,366 | 1,639,764 | — | — | |||||||||
| SEI Institutional Managed Trust Large Cap Fund, Cl Y | 5,938 | 211 | (1,363) | 250 | 87 | 5,123 | 292,391 | 26 | — | |||||||||
| SEI Institutional Managed Trust U.S. Managed Volatility Fund, Cl Y | 14,755 | 609 | (2,798) | 151 | 255 | 12,972 | 734,936 | 139 | — | |||||||||
|
|
|
|
|
|
|
| |||||||||||
| Totals | $ 148,360 | $ 3,233 | $ (25,367) | $ 684 | $ 3,786 | $ 130,696 | $ 853 | $ — | ||||||||||
|
|
|
|
|
|
|
|
Amounts designated as “—“ are $0 or have been rounded to $0.
The accompanying notes are an integral part of the financial statements.
| 8 | SEI Asset Allocation Trust / Semi-Annual Report / September 30, 2021 |
SCHEDULE OF INVESTMENTS (Unaudited)
September 30, 2021
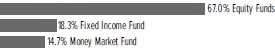
Moderate Strategy Allocation Fund
Sector Weightings †:
†Percentages are based on total investments.
| Description | Shares | Market Value ($ Thousands) | ||||||
AFFILIATED INVESTMENT FUNDS — 100.0% |
| |||||||
Equity Funds — 67.0% |
| |||||||
SEI Institutional International Trust International Equity Fund, Cl Y | 284,496 | $ | 3,861 | |||||
SEI Institutional Managed Trust Real Estate Fund, Cl Y | 218,253 | 3,848 | ||||||
SEI Institutional Managed Trust Tax-Managed Large Cap Fund, Cl Y | 209,795 | 7,372 | ||||||
SEI Institutional Managed Trust U.S. Managed Volatility Fund, Cl Y | 1,851,503 | 32,679 | ||||||
|
| |||||||
Total Equity Funds |
| 47,760 | ||||||
|
| |||||||
Fixed Income Fund — 18.3% |
| |||||||
SEI Institutional Managed Trust High Yield Bond Fund, Cl Y | 1,846,350 | 13,072 | ||||||
|
| |||||||
| Description | Shares | Market Value ($ Thousands) | ||||||
AFFILIATED INVESTMENT FUNDS (continued) |
| |||||||
Total Fixed Income Fund |
| $ | 13,072 | |||||
|
| |||||||
Money Market Fund — 14.7% |
| |||||||
SEI Daily Income Trust Government Fund, Cl F, 0.010%* | 10,484,482 | 10,484 | ||||||
|
| |||||||
Total Money Market Fund |
| 10,484 | ||||||
|
| |||||||
Total Investments in Securities — 100.0% (Cost $50,999) ($ Thousands) |
| $ | 71,316 | |||||
|
| |||||||
Percentages are based on Net Assets of $71,296 ($ Thousands).
*Rate shown is the 7-day effective yield as of September 30, 2021.
Cl — Class
As of September 30, 2021, all of the Fund’s investments in securities were considered Level 1, in accordance with the authoritative guidance on fair value measurements and disclosure under U.S. GAAP.
As of September 30, 2021, there were no transfers in or out of Level 3.
For more information on valuation inputs, see Note 2 — Significant Accounting Policies in Notes to Financial Statements.
The following is a summary of the transactions with affiliates for the period ended September 30, 2021 ($ Thousands):
| Security Description | Value 3/31/2021 | Purchases at Cost | Proceeds from Sales | Realized Gain/(Loss) | Change in Unrealized Appreciation/ (Depreciation) | Value 9/30/2021 | Shares | Dividend Income | Capital Gains | |||||||||
| SEI Institutional International Trust International Equity Fund, Cl Y | $ 3,769 | $ 352 | $ (375) | $ 6 | $ 109 | $ 3,861 | 284,496 | $ — | $ — | |||||||||
| SEI Institutional Managed Trust Real Estate Fund, Cl Y | 3,740 | 241 | (648) | 90 | 425 | 3,848 | 218,253 | 31 | — | |||||||||
| SEI Institutional Managed Trust Tax-Managed Large Cap Fund, Cl Y | 7,208 | 325 | (670) | 216 | 293 | 7,372 | 209,795 | 41 | — | |||||||||
| SEI Institutional Managed Trust U.S. Managed Volatility Fund, Cl Y | 31,435 | 1,745 | (1,313) | 66 | 746 | 32,679 | 1,851,503 | 313 | — | |||||||||
| SEI Institutional Managed Trust High Yield Bond Fund, Cl Y | 12,424 | 1,292 | (954) | (41) | 351 | 13,072 | 1,846,350 | 361 | — | |||||||||
| SEI Daily Income Trust Government Fund, Cl F | 9,944 | 1,290 | (750) | — | — | 10,484 | 10,484,482 | 1 | — | |||||||||
|
|
|
|
|
|
|
| |||||||||||
Totals | $ 68,520 | $ 5,245 | $ (4,710) | $ 337 | $ 1,924 | $ 71,316 | $ 747 | $ — | ||||||||||
|
|
|
|
|
|
|
|
Amount designated as “— “ are $0 or have been rounded to $0.
The accompanying notes are an integral part of the financial statements.
| SEI Asset Allocation Trust / Semi-Annual Report / September 30, 2021 | 9 |
SCHEDULE OF INVESTMENTS (Unaudited)
September 30, 2021
Aggressive Strategy Fund
Sector Weightings †:

†Percentages are based on total investments.
| Description | Shares | Market Value ($ Thousands) | ||||||
AFFILIATED INVESTMENT FUNDS — 100.0% |
| |||||||
Equity Funds — 62.8% |
| |||||||
SEI Institutional International Trust Emerging Markets Equity Fund, Cl Y | 845,057 | $ | 12,042 | |||||
SEI Institutional International Trust International Equity Fund, Cl Y | 2,631,373 | 35,708 | ||||||
SEI Institutional Managed Trust Dynamic Asset Allocation Fund, Cl Y | 734,821 | 13,623 | ||||||
SEI Institutional Managed Trust Large Cap Fund, Cl Y | 2,035,995 | 35,671 | ||||||
SEI Institutional Managed Trust Small Cap Fund, Cl Y | 619,733 | 10,201 | ||||||
|
| |||||||
Total Equity Funds |
| 107,245 | ||||||
|
| |||||||
Multi-Asset Fund — 20.1% |
| |||||||
SEI Institutional Managed Trust Multi-Asset Accumulation Fund, Cl Y | 3,298,275 | 34,335 | ||||||
|
| |||||||
Total Multi-Asset Fund |
| 34,335 | ||||||
|
| |||||||
Fixed Income Funds — 17.1% |
| |||||||
SEI Institutional International Trust Emerging Markets Debt Fund, Cl Y | 1,029,017 | 10,321 | ||||||
SEI Institutional Managed Trust Core Fixed Income Fund, Cl Y | 749,092 | 8,622 | ||||||
SEI Institutional Managed Trust High Yield Bond Fund, Cl Y | 1,465,731 | 10,377 | ||||||
|
| |||||||
Total Fixed Income Funds |
| 29,320 | ||||||
|
| |||||||
Total Investments in Securities — 100.0% |
| $ | 170,900 | |||||
|
| |||||||
Percentages are based on Net Assets of $170,839 ($ Thousands).
Cl — Class
As of September 30, 2021, all of the Fund’s investments were considered Level 1, in accordance with the authoritative guidance on fair value measurements and disclosure under U.S. GAAP.
As of September 30, 2021, there were no transfers in or out of Level 3.
For more information on valuation inputs, see Note 2 — Significant Accounting Policies in Notes to Financial Statements.
| 10 | SEI Asset Allocation Trust / Annual Report / September 30, 2021 |
The following is a summary of the transactions with affiliates for the period ended September 30, 2021 ($ Thousands):
| Security Description | Value 3/31/2021 | Purchases at Cost | Proceeds from Sales | Realized Gain/(Loss) | Change in Unrealized Appreciation/ (Depreciation) | Value 9/30/2021 | Shares | Dividend Income | Capital Gains | |||||||||
SEI Institutional International Trust Emerging Markets Equity Fund, Cl Y | $ 12,583 | $ 658 | $ (656) | $ 2 | $ (545) | $ 12,042 | 845,057 | $ — | $ — | |||||||||
SEI Institutional International Trust International Equity Fund, Cl Y | 38,730 | 1,426 | (5,713) | 1,108 | 157 | 35,708 | 2,631,373 | — | — | |||||||||
SEI Institutional Managed Trust Dynamic Asset Allocation Fund, Cl Y | 14,879 | 288 | (3,012) | 982 | 486 | 13,623 | 734,821 | — | — | |||||||||
SEI Institutional Managed Trust Large Cap Fund, Cl Y | 39,083 | 986 | (6,652) | 1,528 | 726 | 35,671 | 2,035,995 | 176 | — | |||||||||
SEI Institutional Managed Trust Small Cap Fund, Cl Y | 10,797 | 859 | (1,760) | 317 | (12) | 10,201 | 619,733 | 7 | — | |||||||||
SEI Institutional Managed Trust Multi-Asset Accumulation Fund, Cl Y | 36,685 | 826 | (5,810) | 233 | 2,401 | 34,335 | 3,298,275 | — | — | |||||||||
SEI Institutional International Trust Emerging Markets Debt Fund, Cl Y | 10,713 | 433 | (873) | (10) | 58 | 10,321 | 1,029,017 | 201 | — | |||||||||
SEI Institutional Managed Trust Core Fixed Income Fund, Cl Y | 9,059 | 412 | (975) | (27) | 153 | 8,622 | 749,092 | 84 | — | |||||||||
SEI Institutional Managed Trust High Yield Bond Fund, Cl Y | 10,978 | 527 | (1,398) | (93) | 363 | 10,377 | 1,465,731 | 305 | — | |||||||||
|
|
|
|
|
|
|
| |||||||||||
Totals | $183,507 | $6,415 | $(26,849) | $4,040 | $3,787 | $170,900 | $773 | $— | ||||||||||
|
|
|
|
|
|
|
|
Amounts designated as “—“ are $0 or have been rounded to $0.
The accompanying notes are an integral part of the financial statements.
| SEI Asset Allocation Trust / Annual Report / September 30, 2021 | 11 |
SCHEDULE OF INVESTMENTS (Unaudited)
September 30, 2021
Tax-Managed Aggressive Strategy Fund
Sector Weightings †:
†Percentages are based on total investments.
| Description | Shares | Market Value ($ Thousands) | ||||||
AFFILIATED INVESTMENT FUNDS — 100.0% |
| |||||||
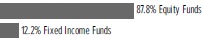
Equity Funds — 87.8% |
| |||||||
SEI Institutional International Trust Emerging | 125,444 | $ | 1,787 | |||||
SEI Institutional International Trust International Equity Fund, Cl Y | 1,041,153 | 14,128 | ||||||
SEI Institutional Managed Trust Tax-Managed Large Cap Fund, Cl Y* | 1,423,160 | 50,010 | ||||||
SEI Institutional Managed Trust Tax-Managed Small/Mid Cap Fund, Cl Y | 448,128 | 12,579 | ||||||
|
| |||||||
Total Equity Funds (Cost $33,527) ($ Thousands) | 78,504 | |||||||
|
| |||||||
Fixed Income Funds — 12.2% |
| |||||||
SEI Institutional International Trust Emerging Markets Debt Fund, Cl Y | 356,797 | 3,579 | ||||||
| Description | Shares | Market Value ($ Thousands) | ||||||
AFFILIATED INVESTMENT FUNDS (continued) |
| |||||||
SEI Institutional Managed Trust High Yield Bond Fund, Cl Y | 1,033,462 | $ | 7,317 | |||||
|
| |||||||
Total Fixed Income Funds |
| 10,896 | ||||||
|
| |||||||
Total Investments in Securities — 100.0% |
| $ | 89,400 | |||||
|
| |||||||
Percentages are based on Net Assets of $89,374 ($ Thousands).
Cl — Class
*Represents greater than 50% of the Fund’s total investments. For further financial information, available upon request at no charge, please go to the Securities Exchange Commission’s website at http://www.sec.gov or call 1-800-DIAL-SEI.
As of September 30, 2021, all of the Fund’s investments in securities were considered Level 1, in accordance with the authoritative guidance on fair value measurement and disclosure under U.S. GAAP.
As of September 30, 2021, there were no transfers in or out of Level 3.
For more information on valuation inputs, see Note 2 — Significant Accounting Policies in Notes to Financial Statements.
The following is a summary of the transactions with affiliates for the period ended September 30, 2021 ($ Thousands):
| Security Description | Value 3/31/2021 | Purchases at Cost | Proceeds from Sales | Realized Gain/(Loss) | Change in Unrealized Appreciation/ (Depreciation) | Value 9/30/2021 | Shares | Dividend Income | Capital Gains | |||||||||
SEI Institutional International Trust Emerging Markets Equity Fund, Cl Y | $ 1,725 | $ 182 | $ (39) | $ — | $ (81) | $ 1,787 | 125,444 | $ — | $ — | |||||||||
SEI Institutional International Trust International Equity Fund, Cl Y | 13,655 | 170 | (102) | 2 | 403 | 14,128 | 1,041,153 | — | — | |||||||||
SEI Institutional Managed Trust Tax-Managed Large Cap Fund, Cl Y | 49,144 | 276 | (2,846) | 720 | 2,716 | 50,010 | 1,423,160 | 276 | — | |||||||||
SEI Institutional Managed Trust Tax-Managed Small/Mid Cap Fund, Cl Y | 12,270 | 278 | (309) | 58 | 282 | 12,579 | 448,128 | 8 | — | |||||||||
SEI Institutional International Trust Emerging Markets Debt Fund, Cl Y | 3,376 | 277 | (83) | (2) | 11 | 3,579 | 356,797 | 64 | — | |||||||||
SEI Institutional Managed Trust High Yield Bond Fund, Cl Y | 6,807 | 613 | (275) | (23) | 195 | 7,317 | 1,033,462 | 200 | — | |||||||||
|
|
|
|
|
|
|
| |||||||||||
Totals | $86,977 | $1,796 | $(3,654) | $755 | $3,526 | $89,400 | $548 | $— | ||||||||||
|
|
|
|
|
|
|
|
Amounts designated as “—” are $0 or have been rounded to $0.
The accompanying notes are an integral part of the financial statements.
| 12 | SEI Asset Allocation Trust / Semi-Annual Report / September 30, 2021 |
SCHEDULE OF INVESTMENTS (Unaudited)
September 30, 2021
Core Market Strategy Fund
Sector Weightings †:
†Percentages are based on total investments.
| Description | Shares | Market Value ($ Thousands) | ||||||
AFFILIATED INVESTMENT FUNDS — 100.0% |
| |||||||
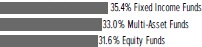
Fixed Income Funds — 35.4% | ||||||||
SEI Institutional International Trust Emerging Markets Debt Fund, Cl Y | 367,103 | $ | 3,682 | |||||
SEI Institutional Managed Trust Core Fixed Income Fund, Cl Y | 1,617,313 | 18,615 | ||||||
SEI Institutional Managed Trust High Yield Bond Fund, Cl Y | 529,138 | 3,746 | ||||||
|
| |||||||
Total Fixed Income Funds | 26,043 | |||||||
|
| |||||||
Multi-Asset Funds — 33.0% |
| |||||||
SEI Institutional Managed Trust Multi-Asset Accumulation Fund, Cl Y | 1,403,176 | 14,607 | ||||||
SEI Institutional Managed Trust Multi-Asset Income Fund, Cl Y | 322,531 | 3,706 | ||||||
SEI Institutional Managed Trust Multi-Asset Inflation Managed Fund, Cl Y | 669,800 | 5,975 | ||||||
|
| |||||||
Total Multi-Asset Funds | 24,288 | |||||||
|
| |||||||
Equity Funds — 31.6% | ||||||||
SEI Institutional International Trust Emerging Markets Equity Fund, Cl Y | 154,000 | 2,194 | ||||||
SEI Institutional International Trust International Equity Fund, Cl Y | 532,560 | 7,227 | ||||||
SEI Institutional Managed Trust Dynamic Asset Allocation Fund, Cl Y | 195,216 | 3,619 | ||||||
SEI Institutional Managed Trust Large Cap Fund, Cl Y | 454,197 | 7,958 | ||||||
SEI Institutional Managed Trust Small Cap Fund, Cl Y | 133,812 | 2,203 | ||||||
|
| |||||||
Total Equity Funds | 23,201 | |||||||
|
| |||||||
Total Investments in Securities — 100.0% |
| $ | 73,532 | |||||
|
| |||||||
Percentages are based on Net Assets of $73,510 ($ Thousands).
Cl — Class
As of September 30, 2021, all of the Fund’s investments were considered Level 1, in accordance with the authoritative guidance on fair value measurements and disclosure under U.S. GAAP.
As of September 30, 2021, there were no transfers in or out of Level 3.
For more information on valuation inputs, see Note 2 — Significant Accounting Policies in Notes to Financial Statements.
| SEI Asset Allocation Trust / Semi-Annual Report / September 30, 2021 | 13 |
SCHEDULE OF INVESTMENTS (Unaudited)
September 30, 2021
Core Market Strategy Fund (Concluded)
The following is a summary of the transactions with affiliates for the period ended September 30, 2021 ($ Thousands):
| Security Description | Value 3/31/2021 | Purchases at Cost | Proceeds from Sales | Realized Gain/(Loss) | Change in Unrealized Appreciation/ (Depreciation) | Value 9/30/2021 | Shares | Dividend Income | Capital Gains | |||||||||
| SEI Institutional International Trust Emerging Markets Debt Fund, Cl Y | $3,932 | $ 120 | $(390) | $ 2 | $ 18 | $3,682 | 367,103 | $73 | $— | |||||||||
| SEI Institutional Managed Trust Core Fixed Income Fund, Cl Y | 19,704 | 304 | (1,669) | (32) | 308 | 18,615 | 1,617,313 | 181 | — | |||||||||
| SEI Institutional Managed Trust High Yield Bond Fund, Cl Y | 3,981 | 125 | (457) | 3 | 94 | 3,746 | 529,138 | 110 | — | |||||||||
| SEI Institutional Managed Trust Multi-Asset Accumulation Fund, Cl Y | 15,793 | 86 | (2,425) | 128 | 1,025 | 14,607 | 1,403,176 | — | — | |||||||||
| SEI Institutional Managed Trust Multi-Asset Income Fund, Cl Y | 3,960 | 91 | (433) | 28 | 60 | 3,706 | 322,531 | 76 | — | |||||||||
| SEI Institutional Managed Trust Multi-Asset Inflation Managed Fund, Cl Y | 6,335 | 89 | (855) | (59) | 465 | 5,975 | 669,800 | — | — | |||||||||
| SEI Institutional International Trust Emerging Markets Equity Fund, Cl Y | 2,367 | 141 | (214) | 1 | (101) | 2,194 | 154,000 | — | — | |||||||||
| SEI Institutional International Trust International Equity Fund, Cl Y | 7,874 | 9 | (913) | 342 | (85) | 7,227 | 532,560 | — | — | |||||||||
| SEI Institutional Managed Trust Dynamic Asset Allocation Fund, Cl Y | 3,974 | 40 | (794) | 348 | 51 | 3,619 | 195,216 | — | — | |||||||||
| SEI Institutional Managed Trust Large Cap Fund, Cl Y | 8,711 | 102 | (1,367) | 448 | 64 | 7,958 | 454,197 | 40 | — | |||||||||
| SEI Institutional Managed Trust Small Cap Fund, Cl Y | 2,383 | 90 | (333) | 94 | (31) | 2,203 | 133,812 | 2 | — | |||||||||
|
|
|
|
|
|
|
| |||||||||||
Totals | $79,014 | $1,197 | $(9,850) | $1,303 | $1,868 | $73,532 | $482 | $— | ||||||||||
|
|
|
|
|
|
|
|
Amounts designated as “— “ are $0 or have been rounded to $0.
The accompanying notes are an integral part of the financial statements.
| 14 | SEI Asset Allocation Trust / Semi-Annual Report / September 30, 2021 |
SCHEDULE OF INVESTMENTS (Unaudited)
September 30, 2021
Core Market Strategy Allocation Fund
Sector Weightings †:
†Percentages are based on total investments.
| Description | Shares | Market Value ($ Thousands) | ||||||
AFFILIATED INVESTMENT FUNDS — 100.0% |
| |||||||
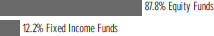
Equity Funds — 87.8% |
| |||||||
SEI Institutional International Trust | 36,985 | $ | 527 | |||||
SEI Institutional International Trust | 308,463 | 4,186 | ||||||
SEI Institutional Managed Trust Tax-Managed Large Cap Fund, Cl Y * | 417,026 | 14,654 | ||||||
SEI Institutional Managed Trust Tax-Managed Small/Mid Cap Fund, Cl Y | 131,769 | 3,699 | ||||||
|
| |||||||
Total Equity Funds | 23,066 | |||||||
|
| |||||||
Fixed Income Funds — 12.2% |
| |||||||
SEI Institutional International Trust | 106,395 | 1,067 | ||||||
| Description | Shares | Market Value ($ Thousands) | ||||||
AFFILIATED INVESTMENT FUNDS (continued) |
| |||||||
SEI Institutional Managed Trust High Yield Bond Fund, Cl Y | 303,899 | $ | 2,152 | |||||
|
| |||||||
Total Fixed Income Funds | 3,219 | |||||||
|
| |||||||
Total Investments in Securities — 100.0% |
| $ | 26,285 | |||||
|
| |||||||
Percentages are based on Net Assets of $26,277 ($ Thousands).
Cl — Class
* Represents greater than 50% of the Fund’s total investments. For further financial information, available upon request at no charge, please go to the Securities Exchange Commission’s website at http://www.sec.gov or call 1-800-DIAL-SEI.
As of September 30, 2021, all of the Fund’s investments in securities were considered Level 1, in accordance with the authoritative guidance on fair value measurements and disclosure under U.S. GAAP.
As of September 30, 2021, there were no transfers in or out of Level 3.
For more information on valuation inputs, see Note 2 — Significant Accounting Policies in Notes to Financial Statements.
The following is a summary of the transactions with affiliates for the period ended September 30, 2021 ($ Thousands):
| Security Description | Value 3/31/2021 | Purchases at Cost | Proceeds from Sales | Realized Gain/(Loss) | Change in Unrealized Appreciation/ (Depreciation) | Value 9/30/2021 | Shares | Dividend Income | Capital Gains | |||||||||
| SEI Institutional International Trust Emerging Markets Equity Fund, Class Y | $ 511 | $78 | $(38) | $— | $(24) | $ 527 | 36,985 | $— | $— | |||||||||
| SEI Institutional International Trust International Equity Fund, Class Y | 4,132 | 83 | (154) | 29 | 96 | 4,186 | 308,463 | — | — | |||||||||
| SEI Institutional Managed Trust Tax Managed Large Cap Fund, Class Y | 14,512 | 90 | (968) | 407 | 613 | 14,654 | 417,026 | 82 | — | |||||||||
| SEI Institutional Managed Trust Tax-Managed Small/Mid Cap Fund, Class Y | 3,621 | 60 | (84) | 11 | 91 | 3,699 | 131,769 | 2 | — | |||||||||
| SEI Institutional International Trust Emerging Markets Debt Fund, Class Y | 1,018 | 86 | (41) | (1) | 5 | 1,067 | 106,395 | 19 | — | |||||||||
SEI Institutional Managed Trust High Yield Bond Fund, Class Y | 2,090 | 128 | (117) | (4) | 55 | 2,152 | 303,899 | 60 | — | |||||||||
|
|
|
|
|
|
|
| |||||||||||
Totals | $25,884 | $525 | $(1,402) | $442 | $836 | $26,285 | $163 | $— | ||||||||||
|
|
|
|
|
|
|
|
Amounts designated as “— “ are $0 or have been rounded to $0.
The accompanying notes are an integral part of the financial statements.
| SEI Asset Allocation Trust / Semi-Annual Report / September 30, 2021 | 15 |
SCHEDULE OF INVESTMENTS (Unaudited)
September 30, 2021
Market Growth Strategy Fund
Sector Weightings †:

†Percentages are based on total investments.
| Description | Shares | Market Value ($ Thousands) | ||||||
AFFILIATED INVESTMENT FUNDS — 100.0% |
| |||||||
Equity Funds — 43.7% |
| |||||||
SEI Institutional International Trust Emerging Markets Equity Fund, Cl Y | 526,598 | $ 7,504 | ||||||
SEI Institutional International Trust International Equity Fund, Cl Y | 2,064,646 | 28,017 | ||||||
SEI Institutional Managed Trust Dynamic Asset Allocation Fund, Cl Y | 606,745 | 11,249 | ||||||
SEI Institutional Managed Trust Large Cap Fund, Cl Y | 1,710,488 | 29,968 | ||||||
SEI Institutional Managed Trust Small Cap Fund, Cl Y | 341,674 | 5,624 | ||||||
|
| |||||||
Total Equity Funds | 82,362 | |||||||
|
| |||||||
Multi-Asset Funds — 32.1% |
| |||||||
SEI Institutional Managed Trust Multi-Asset Accumulation Fund, Cl Y | 3,635,102 | 37,841 | ||||||
SEI Institutional Managed Trust Multi-Asset Income Fund, Cl Y | 660,010 | 7,584 | ||||||
SEI Institutional Managed Trust Multi-Asset Inflation Managed Fund, Cl Y | 1,704,619 | 15,205 | ||||||
|
| |||||||
Total Multi-Asset Funds | 60,630 | |||||||
|
| |||||||
Fixed Income Funds — 24.2% |
| |||||||
SEI Institutional International Trust Emerging Markets Debt Fund, Cl Y | 945,542 | 9,484 | ||||||
SEI Institutional Managed Trust Core Fixed Income Fund, Cl Y | 2,312,752 | 26,620 | ||||||
SEI Institutional Managed Trust High Yield Bond Fund, Cl Y | 1,346,793 | 9,535 | ||||||
|
| |||||||
Total Fixed Income Funds | 45,639 | |||||||
|
| |||||||
Total Investments in Securities — 100.0% | $ 188,631 | |||||||
|
| |||||||
Percentages are based on Net Assets of $188,568 ($ Thousands).
Cl — Class
As of September 30, 2021, all of the Fund’s investments in securities were considered Level 1, in accordance with the authoritative guidance on fair value measurement and disclosure under U.S. GAAP.
As of September 30, 2021, there were no transfers in our out of Level 3.
For more information on valuation inputs, see Note 2 — Significant Accounting Policies in Notes to Financial Statements
| 16 | SEI Asset Allocation Trust / Semi-Annual Report / September 30, 2021 |
The following is a summary of the transactions with affiliates for the period ended September 30, 2021 ($ Thousands):
| Security Description | Value 3/31/2021 | Purchases at Cost | Proceeds from Sales | Realized Gain/(Loss) | Change in Unrealized Appreciation/ (Depreciation) | Value 9/30/2021 | Shares | Dividend Income | Capital Gains | |||||||||
| SEI Institutional International Trust Emerging Markets Equity Fund, Cl Y | $ 7,681 | $ 245 | $ (76) | $ 2 | $ (348) | $ 7,504 | 526,598 | $ — | $ — | |||||||||
| SEI Institutional International Trust International Equity Fund, Cl Y | 29,468 | 45 | (2,426) | 785 | 145 | 28,017 | 2,064,646 | — | — | |||||||||
| SEI Institutional Managed Trust Dynamic Asset Allocation Fund, Cl Y | 11,897 | — | (1,812) | 819 | 345 | 11,249 | 606,745 | — | — | |||||||||
| SEI Institutional Managed Trust Large Cap Fund, Cl Y | 31,603 | 143 | (3,569) | 973 | 818 | 29,968 | 1,710,488 | 143 | — | |||||||||
| SEI Institutional Managed Trust Small Cap Fund, Cl Y | 5,839 | 85 | (450) | 126 | 24 | 5,624 | 341,674 | 4 | — | |||||||||
| SEI Institutional Managed Trust Multi-Asset Accumulation Fund, Cl Y | 38,764 | — | (3,690) | 160 | 2,607 | 37,841 | 3,635,102 | — | — | |||||||||
| SEI Institutional Managed Trust Multi-Asset Income Fund, Cl Y | 7,718 | 152 | (453) | 23 | 144 | 7,584 | 660,010 | 152 | — | |||||||||
| SEI Institutional Managed Trust Multi-Asset Inflation Managed Fund, Cl Y | 15,540 | 57 | (1,394) | (189) | 1,191 | 15,205 | 1,704,619 | — | — | |||||||||
| SEI Institutional International Trust Emerging Markets Debt Fund, Cl Y | 9,566 | 254 | (372) | (3) | 39 | 9,484 | 945,542 | 180 | — | |||||||||
| SEI Institutional Managed Trust Core Fixed Income Fund, Cl Y | 26,873 | 764 | (1,382) | (67) | 432 | 26,620 | 2,312,752 | 251 | — | |||||||||
| SEI Institutional Managed Trust High Yield Bond Fund, Cl Y | 9,747 | 273 | (724) | (47) | 286 | 9,535 | 1,346,793 | 273 | — | |||||||||
|
|
|
|
|
|
|
| |||||||||||
| Totals | $194,696 | $2,018 | $(16,348) | $2,582 | $5,683 | $188,631 | $1,003 | $- | ||||||||||
|
|
|
|
|
|
|
|
Amounts designated as “ – “ are $0 or have been rounded to $0.
The accompanying notes are an integral part of the financial statements.
| SEI Asset Allocation Trust / Semi-Annual Report / September 30, 2021 | 17 |
SCHEDULE OF INVESTMENTS (Unaudited)
September 30, 2021
Market Growth Strategy Allocation Fund
Sector Weightings †:
† Percentages are based on total investments.
| Description | Shares | Market Value ($ Thousands) | ||||||
AFFILIATED INVESTMENT FUNDS — 100.0% |
| |||||||
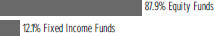
Equity Funds — 87.9% |
| |||||||
SEI Institutional International Trust Emerging Markets Equity Fund, Cl Y | 187,369 | $ | 2,670 | |||||
SEI Institutional International Trust International Equity Fund, Cl Y | 1,626,496 | 22,071 | ||||||
SEI Institutional Managed Trust Tax-Managed Large Cap Fund, Cl Y * | 2,238,750 | 78,670 | ||||||
SEI Institutional Managed Trust Tax-Managed Small/Mid Cap Fund, Cl Y | 692,759 | 19,446 | ||||||
|
| |||||||
Total Equity Funds | 122,857 | |||||||
|
| |||||||
Fixed Income Funds — 12.1% |
| |||||||
SEI Institutional International Trust Emerging Markets Debt Fund, Cl Y | 548,521 | 5,502 | ||||||
| Description | Shares | Market Value ($ Thousands) | ||||||
AFFILIATED INVESTMENT FUNDS (continued) |
| |||||||
SEI Institutional Managed Trust High Yield Bond Fund, Cl Y | 1,618,341 | $ 11,458 | ||||||
|
| |||||||
Total Fixed Income Funds |
| 16,960 | ||||||
|
| |||||||
Total Investments in Securities — 100.0% |
| $ 139,817 | ||||||
|
| |||||||
Percentages are based on Net Assets of $139,776 ($ Thousands).
Cl — Class
* Represents greater than 50% of the Fund’s total investments. For further financial information, available upon request at no charge, please go to the Securities Exchange Commission’s website at http://www.sec.gov or call 1-800-DIAL-SEI.
As of September 30, 2021, all of the Fund’s investments in securities were considered Level 1, in accordance with the authoritative guidance on fair value measurements and disclosure under U.S. GAAP.
As of September 30, 2021, there were no transfers in or out of Level 3.
For more information on valuation inputs, see Note 2 — Significant Accounting Policies in Notes to Financial Statements.
The following is a summary of the transactions with affiliates for the period ended September 30, 2021 ($ Thousands):
| Security Description | Value 3/31/2021 | Purchases at Cost | Proceeds from Sales | Realized Gain/(Loss) | Change in Unrealized Appreciation/ (Depreciation) | Value 9/30/2021 | Shares | Dividend Income | Capital Gains | |||||||||
| SEI Institutional International Trust Emerging Markets Equity Fund, Class Y | $ 2,596 | $ 215 | $ (16) | $ — | $(125) | $ 2,670 | 187,369 | $— | $— | |||||||||
| SEI Institutional International Trust International Equity Fund, Class Y | 21,669 | — | (245) | 71 | 576 | 22,071 | 1,626,496 | — | — | |||||||||
| SEI Institutional Managed Trust Tax-Managed Large Cap Fund, Class Y | 76,136 | 430 | (3,258) | 1,275 | 4,087 | 78,670 | 2,238,750 | 430 | — | |||||||||
| SEI Institutional Managed Trust Tax-Managed Small/Mid Cap Fund, Class Y | 19,016 | 38 | (135) | 50 | 477 | 19,446 | 692,759 | 12 | — | |||||||||
| SEI Institutional International Trust Emerging Markets Debt Fund, Class Y | 5,122 | 369 | 1 | — | 10 | 5,502 | 548,521 | 100 | — | |||||||||
| SEI Institutional Managed Trust High Yield Bond Fund, Class Y | 10,760 | 502 | (72) | (6) | 274 | 11,458 | 1,618,341 | 310 | — | |||||||||
|
|
|
|
|
|
|
| |||||||||||
| Totals | $135,299 | $1,554 | $(3,725) | $1,390 | $5,299 | $139,817 | $852 | $- | ||||||||||
|
|
|
|
|
|
|
|
Amounts designated as “— “ are $0 or have been rounded to $0.
The accompanying notes are an integral part of the financial statements.
| 18 | SEI Asset Allocation Trust / Semi-Annual Report / September 30, 2021 |
(This page intentionally left blank)
STATEMENTS OF ASSETS AND LIABILITIES (Unaudited) ($ Thousands)
September 30, 2021
| ||||||||||||||||
| Defensive Strategy Fund | Defensive Strategy Allocation Fund | Conservative Strategy Fund | Conservative Strategy Allocation Fund | |||||||||||||
| ||||||||||||||||
Assets: | ||||||||||||||||
Investments in affiliated funds, at market value † | $ | 16,673 | $ | 5,667 | $ | 62,311 | $ | 28,052 | ||||||||
Receivable for fund shares sold | 10 | — | 6 | — | ||||||||||||
Income distribution receivable from affiliated funds | 8 | 5 | 37 | 41 | ||||||||||||
Receivable for investment securities sold | — | 7 | 34 | 206 | ||||||||||||
Prepaid expenses | — | 1 | 10 | 4 | ||||||||||||
| ||||||||||||||||
Total Assets | 16,691 | 5,680 | 62,398 | 28,303 | ||||||||||||
| ||||||||||||||||
Liabilities: | ||||||||||||||||
Payable for investment securities purchased | 10 | 5 | 37 | 41 | ||||||||||||
Payable for fund shares redeemed | 5 | 6 | 29 | 201 | ||||||||||||
Shareholder servicing fees payable | 1 | 1 | 8 | 6 | ||||||||||||
Distribution fees payable | — | — | 1 | — | ||||||||||||
Investment advisory fees payable | — | — | — | — | ||||||||||||
Administrative servicing fees payable | — | — | — | — | ||||||||||||
Trustees’ fees payable | — | — | — | — | ||||||||||||
Accrued expenses | 4 | 3 | 27 | 11 | ||||||||||||
| ||||||||||||||||
Total Liabilities | 20 | 15 | 102 | 259 | ||||||||||||
| ||||||||||||||||
Net Assets | $ | 16,671 | $ | 5,665 | $ | 62,296 | $ | 28,044 | ||||||||
| ||||||||||||||||
† Cost of investments in affiliated funds | $ | 15,997 | $ | 5,570 | $ | 59,147 | $ | 22,637 | ||||||||
| ||||||||||||||||
Net Assets: | ||||||||||||||||
Paid in Capital (unlimited authorization - no par value) | $ | 15,907 | $ | 7,257 | $ | 60,172 | $ | 25,044 | ||||||||
Total distributable earnings/(loss) | 764 | (1,592 | ) | 2,124 | 3,000 | |||||||||||
Net Assets | $ | 16,671 | $ | 5,665 | $ | 62,296 | $ | 28,044 | ||||||||
| Net Asset Value, Offering and Redemption Price Per Share — Class F | $10.20 | $11.76 | $11.17 | $13.19 | ||||||||||||
| ($15,979,265 ÷ | ($5,665,303 ÷ | ($61,720,746 ÷ | ($28,043,861 ÷ | |||||||||||||
| 1,567,105 shares) | 481,796 shares) | 5,527,557 shares) | 2,126,150 shares) | |||||||||||||
| ||||||||||||||||
| Net Asset Value, Offering and Redemption Price Per Share — Class D | N/A | N/A | $11.14 | N/A | ||||||||||||
| ($269,466 ÷ | ||||||||||||||||
| 24,192 shares) | ||||||||||||||||
| ||||||||||||||||
| Net Asset Value, Offering and Redemption Price Per Share — Class I | $10.02 | N/A | $11.39 | N/A | ||||||||||||
| ($692,169 ÷ | ($305,791 ÷ | |||||||||||||||
| 69,108 shares) | 26,857 shares) | |||||||||||||||
| ||||||||||||||||
(1) Net assets divided by shares does not calculate to the stated NAV because net assets and shares are shown rounded.
Amounts designated as “—” are $0 or have been rounded to $0.
N/A - Not applicable. Class D and/or Class I shares currently not offered.
The accompanying notes are an integral part of the financial statements.
| 20 | SEI Asset Allocation Trust / Semi-Annual Report / September 30, 2021 |
|
| |||||||||||||||||||||||||||||
Moderate Strategy Fund | Moderate Strategy Allocation Fund | Aggressive Strategy Fund | Tax-Managed Strategy Fund | Core Market Strategy Fund | Core Market Strategy Allocation Fund | Market Growth Strategy Fund | Market Growth Strategy Allocation Fund | |||||||||||||||||||||||
|
| |||||||||||||||||||||||||||||
| $ | 130,696 | $ | 71,316 | $ | 170,900 | $ | 89,400 | $ | 73,532 | $ | 26,285 | $ | 188,631 | $ | 139,817 | |||||||||||||||
| 4 | — | 14 | — | 7 | — | 13 | 55 | |||||||||||||||||||||||
| 76 | 57 | 59 | 31 | 54 | 9 | 103 | 49 | |||||||||||||||||||||||
| 54 | 43 | 175 | 16 | 22 | 11 | 183 | 5 | |||||||||||||||||||||||
| 22 | 10 | 26 | 12 | 12 | 4 | 28 | 20 | |||||||||||||||||||||||
|
| |||||||||||||||||||||||||||||
| 130,852 | 71,426 | 171,174 | 89,459 | 73,627 | 26,309 | 188,958 | 139,946 | |||||||||||||||||||||||
|
| |||||||||||||||||||||||||||||
| 76 | 57 | 59 | 32 | 54 | 9 | 103 | 49 | |||||||||||||||||||||||
| 35 | 31 | 158 | — | 15 | 6 | 163 | 35 | |||||||||||||||||||||||
| 23 | 15 | 37 | 19 | 16 | 6 | 40 | 30 | |||||||||||||||||||||||
| 1 | — | 7 | — | — | — | 6 | — | |||||||||||||||||||||||
| — | — | 1 | 1 | — | — | 1 | 1 | |||||||||||||||||||||||
| 1 | — | 3 | — | — | — | 2 | — | |||||||||||||||||||||||
| 1 | — | 1 | 1 | 1 | — | 1 | 1 | |||||||||||||||||||||||
| 54 | 27 | 69 | 32 | 31 | 11 | 74 | 54 | |||||||||||||||||||||||
|
| |||||||||||||||||||||||||||||
| 191 | 130 | 335 | 85 | 117 | 32 | 390 | 170 | |||||||||||||||||||||||
|
| |||||||||||||||||||||||||||||
| $ | 130,661 | $ | 71,296 | $ | 170,839 | $ | 89,374 | $ | 73,510 | $ | 26,277 | $ | 188,568 | $ | 139,776 | |||||||||||||||
|
| |||||||||||||||||||||||||||||
| $ | 121,318 | $ | 50,999 | $ | 129,256 | $ | 44,244 | $ | 61,211 | $ | 12,164 | $ | 155,141 | $ | 66,462 | |||||||||||||||
|
| |||||||||||||||||||||||||||||
| $ | 122,148 | $ | 51,900 | $ | 129,807 | $ | 44,667 | $ | 62,324 | $ | 10,915 | $ | 155,762 | $ | 63,676 | |||||||||||||||
| 8,513 | 19,396 | 41,032 | 44,707 | 11,186 | 15,362 | 32,806 | 76,100 | |||||||||||||||||||||||
|
| |||||||||||||||||||||||||||||
| $ | 130,661 | $ | 71,296 | $ | 170,839 | $ | 89,374 | $ | 73,510 | $ | 26,277 | $ | 188,568 | $ | 139,776 | |||||||||||||||
|
| |||||||||||||||||||||||||||||
| $13.24 | $20.24 | $17.80 | $27.31 | $13.00 | $23.45 | $15.22 | $30.06 | |||||||||||||||||||||||
| ($127,782,233 ÷ | ($71,295,904 ÷ | ($159,179,139 ÷ | ($89,374,408 ÷ | ($73,505,705 ÷ | ($26,276,963 ÷ | ($181,638,987 ÷ | ($139,776,006 ÷ | |||||||||||||||||||||||
| 9,651,463 shares) | 3,522,321 shares) | 8,943,929 shares) | 3,272,563 shares) | 5,652,798 shares) | 1,120,468 shares) | 11,937,067 shares) | 4,649,526 shares) | |||||||||||||||||||||||
|
| |||||||||||||||||||||||||||||
| $13.21 | N/A | $17.50 | N/A | N/A | N/A | $15.11 | N/A | |||||||||||||||||||||||
| ($286,178 ÷ | ($1,617,644 ÷ | ($2,263,360 ÷ | ||||||||||||||||||||||||||||
| 21,658 shares) | 92,463 shares) | 149,748 shares) | ||||||||||||||||||||||||||||
|
| |||||||||||||||||||||||||||||
| $13.63 | N/A | $17.26 | N/A | $14.58 | N/A | $14.96 | N/A | |||||||||||||||||||||||
| ($2,592,563 ÷ | ($10,042,005 ÷ | ($4,632 ÷ | ($4,665,818 ÷ | |||||||||||||||||||||||||||
| 190,203 shares) | 581,682 shares) | 318 shares)(1) | 311,854 shares) | |||||||||||||||||||||||||||
|
| |||||||||||||||||||||||||||||
| SEI Asset Allocation Trust / Semi-Annual Report / September 30, 2021 | 21 |
STATEMENTS OF OPERATIONS ($ Thousands)
For the six months ended September 30, 2021 (Unaudited)
| Defensive Strategy Fund | Defensive Strategy Allocation Fund | Conservative Strategy Fund | Conservative Strategy Allocation Fund | |||||||||||||
Investment Income: | ||||||||||||||||
Income distributions from affiliated funds | $ | 75 | $ | 32 | $ | 400 | $ | 395 | ||||||||
Expenses | ||||||||||||||||
Administration fees | 13 | 4 | 50 | 22 | ||||||||||||
Investment advisory fees | 9 | 3 | 33 | 15 | ||||||||||||
Shareholder servicing fees —Class F | 21 | 7 | 80 | 37 | ||||||||||||
Shareholder servicing fees —Class D | — | — | 3 | — | ||||||||||||
Shareholder servicing fees —Class I | — | — | — | — | ||||||||||||
Trustees’ fees | — | — | 1 | — | ||||||||||||
Distribution fees — Class D | — | — | 9 | — | ||||||||||||
Administrative servicing fees — Class I | — | — | — | — | ||||||||||||
Registration fees | 6 | 2 | 13 | 5 | ||||||||||||
Printing fees | 3 | 1 | 10 | 5 | ||||||||||||
Professional fees | 2 | 1 | 7 | 3 | ||||||||||||
Custodian/wire agent fees | 1 | — | 2 | 1 | ||||||||||||
Chief compliance officer fees | — | — | — | — | ||||||||||||
Other expenses | — | — | 1 | 1 | ||||||||||||
Total expenses | 55 | 18 | 209 | 89 | ||||||||||||
Less: | ||||||||||||||||
Administration fees waived | (13 | ) | (4 | ) | (50 | ) | (22 | ) | ||||||||
Investment advisory fees waived | (9 | ) | (3 | ) | (33 | ) | (15 | ) | ||||||||
Reimbursement from advisor | (2 | ) | — | (1 | ) | — | ||||||||||
Waiver of shareholder servicing fees — Class F | (12 | ) | — | (29 | ) | — | ||||||||||
Waiver of shareholder servicing fees — Class D | �� | — | — | (1 | ) | — | ||||||||||
Waiver of shareholder servicing fees — Class I | — | — | — | — | ||||||||||||
Net Expenses | 19 | 11 | 95 | 52 | ||||||||||||
Net Investment Income | 56 | 21 | 305 | 343 | ||||||||||||
Net Realized and Unrealized Gain (Loss) from Affiliated Funds: | ||||||||||||||||
Net realized gain from sales of affiliated funds | 50 | 5 | 183 | 313 | ||||||||||||
Net change in unrealized appreciation from affiliated funds | 113 | 24 | 1,027 | 788 | ||||||||||||
Net Realized and Unrealized gain from Affiliated Funds | 163 | 29 | 1,210 | 1,101 | ||||||||||||
Net Increase in Net Assets Resulting from Operations | $ | 219 | $ | 50 | $ | 1,515 | $ | 1,444 | ||||||||
Amounts designated as “—” are $0 or have been rounded to $0.
The accompanying notes are an integral part of the financial statements.
| 22 | SEI Asset Allocation Trust / Semi-Annual Report / September 30, 2021 |
| Moderate Strategy Fund | Moderate Strategy Allocation Fund | Aggressive Strategy Fund | Tax-Managed Aggressive Strategy Fund | Core Market Strategy Fund | Core Market Strategy Allocation Fund | Market Growth Strategy Fund | Market Growth Strategy Allocation Fund | |||||||||||||||||||||||
| $ | 853 | $ | 747 | $ | 773 | $ | 548 | $ | 482 | $ | 163 | $ | 1,003 | $ | 852 | |||||||||||||||
| 105 | 54 | 138 | 68 | 60 | 20 | 149 | 107 | |||||||||||||||||||||||
| 70 | 36 | 92 | 46 | 40 | 14 | 99 | 71 | |||||||||||||||||||||||
| 170 | 91 | 200 | 114 | 100 | 34 | 236 | 179 | |||||||||||||||||||||||
| 2 | — | 18 | — | — | — | 6 | — | |||||||||||||||||||||||
| 3 | — | 13 | — | — | — | 6 | — | |||||||||||||||||||||||
| 1 | 1 | 2 | 1 | 1 | — | 2 | 1 | |||||||||||||||||||||||
| 5 | — | 53 | — | — | — | 17 | — | |||||||||||||||||||||||
| 3 | — | 13 | — | — | — | 6 | — | |||||||||||||||||||||||
| 29 | 12 | 30 | 14 | 14 | 5 | 34 | 23 | |||||||||||||||||||||||
| 21 | 12 | 29 | 15 | 13 | 4 | 31 | 23 | |||||||||||||||||||||||
| 15 | 7 | 19 | 9 | 8 | 3 | 21 | 15 | |||||||||||||||||||||||
| 5 | 3 | 7 | 3 | 3 | 1 | 7 | 5 | |||||||||||||||||||||||
| — | — | — | — | — | — | 1 | — | |||||||||||||||||||||||
| 3 | 1 | 3 | 2 | 1 | 1 | 3 | 3 | |||||||||||||||||||||||
| 432 | 217 | 617 | 272 | 240 | 82 | 618 | 427 | |||||||||||||||||||||||
| (105) | (54 | ) | (138 | ) | (68 | ) | (60 | ) | (20 | ) | (149 | ) | (107 | ) | ||||||||||||||||
| (70) | (35 | ) | (89 | ) | (43 | ) | (40 | ) | (13 | ) | (97 | ) | (68 | ) | ||||||||||||||||
| (3) | — | — | — | — | — | — | — | |||||||||||||||||||||||
| (27) | — | — | — | — | — | — | — | |||||||||||||||||||||||
| — | — | — | — | — | — | — | — | |||||||||||||||||||||||
| (1) | — | — | — | — | — | — | — | |||||||||||||||||||||||
| 226 | 128 | 390 | 161 | 140 | 49 | 372 | 252 | |||||||||||||||||||||||
| 627 | 619 | 383 | 387 | 342 | 114 | 631 | 600 | |||||||||||||||||||||||
| 684 | 337 | 4,040 | 755 | 1,303 | 442 | 2,582 | 1,390 | |||||||||||||||||||||||
| 3,786 | 1,924 | 3,787 | 3,526 | 1,868 | 836 | 5,683 | 5,299 | |||||||||||||||||||||||
| 4,470 | 2,261 | 7,827 | 4,281 | 3,171 | 1,278 | 8,265 | 6,689 | |||||||||||||||||||||||
| $ | 5,097 | $ | 2,880 | $ | 8,210 | $ | 4,668 | $ | 3,513 | $ | 1,392 | $ | 8,896 | $ | 7,289 | |||||||||||||||
| SEI Asset Allocation Trust / Semi-Annual Report / September 30, 2021 | 23 |
STATEMENTS OF CHANGES IN NET ASSETS ($ Thousands)
For the six months ended September 30, 2021 (Unaudited) and the year ended March 31, 2021
| Defensive Strategy Fund | Defensive Strategy Allocation Fund | |||||||
| 4/01/21 - 9/30/21 | 4/01/20 - 3/31/21 | 4/01/21 - 9/30/21 | 4/01/20 - 3/31/21 | |||||
Operations: | ||||||||
Net investment income | $ 56 | $ 214 | $ 21 | $ 58 | ||||
Net realized gain (loss) from sales of affiliated funds | 50 | 235 | 5 | (89) | ||||
Capital gain distributions received from affiliated funds | — | 261 | — | 23 | ||||
Net change in unrealized appreciation from affiliated funds | 113 | 1,025 | 24 | 325 | ||||
Net Increase in Net Assets Resulting from Operations | 219 | 1,735 | 50 | 317 | ||||
Distributions: | ||||||||
Class F | (68) | (365) | (23) | (118) | ||||
Class D | N/A | N/A | N/A | N/A | ||||
Class I | (1) | (6) | N/A | N/A | ||||
Return of Capital: | ||||||||
Class F | — | — | — | (1) | ||||
Class D | N/A | N/A | N/A | N/A | ||||
Class I | — | — | N/A | N/A | ||||
Total Distributions | (69) | (371) | (23) | (119) | ||||
Capital Share Transactions:(1) | ||||||||
Class F | ||||||||
Proceeds from shares issued | 2,762 | 44,930 | 333 | 1,645 | ||||
Reinvestment of dividends & distributions | 66 | 360 | 22 | 112 | ||||
Cost of shares redeemed | (4,326) | (45,341) | (953) | (3,291) | ||||
Increase (Decrease) in Net Assets Derived from Class F Transactions | (1,498) | (51) | (598) | (1,534) | ||||
Class D | ||||||||
Proceeds from shares issued | N/A | N/A | N/A | N/A | ||||
Reinvestment of dividends & distributions | N/A | N/A | N/A | N/A | ||||
Cost of shares redeemed | N/A | N/A | N/A | N/A | ||||
Increase (Decrease) in Net Assets Derived from Class D Transactions | N/A | N/A | N/A | N/A | ||||
Class I | ||||||||
Proceeds from shares issued | 381 | 101 | N/A | N/A | ||||
Reinvestment of dividends & distributions | 1 | 6 | N/A | N/A | ||||
Cost of shares redeemed | (63) | (180) | N/A | N/A | ||||
Increase (Decrease) in Net Assets Derived from Class I Transactions | 319 | (73) | N/A | N/A | ||||
Increase (Decrease) in Net Assets Derived From Capital Share Transactions | (1,179) | (124) | (598) | (1,534) | ||||
Net Increase (Decrease) in Net Assets | (1,029) | 1,240 | (571) | (1,336) | ||||
Net Assets: | ||||||||
Beginning of Period | 17,700 | 16,460 | 6,236 | 7,572 | ||||
End of Period | $ 16,671 | $ 17,700 | $ 5,665 | $ 6,236 | ||||
(1) For Capital Share Transactions see footnote 4 in the notes to financial statements.
Amounts designated as “—” are $0 or have been rounded to $0.
N/A — Not applicable. Class D and Class I shares currently not offered.
The accompanying notes are an integral part of the financial statements.
| 24 | SEI Asset Allocation Trust / Semi-Annual Report / September 30, 2021 |
| Conservative Strategy Fund | Conservative Strategy Allocation Fund | Moderate Strategy Fund | Moderate Strategy Allocation Fund | |||||||||||||||||||||||||||
| 4/01/21 - 9/30/21 | 4/01/20 - 3/31/21 | 4/01/21 - 9/30/21 | 4/01/20 - 3/31/21 | 4/01/21 - 9/30/21 | 4/01/20 - 3/31/21 | 4/01/21 - 9/30/21 | 4/01/20 - 3/31/21 | |||||||||||||||||||||||
| $ | 305 | $ | 734 | $ | 343 | $ | 796 | $ | 627 | $ | 1,703 | $ | 619 | $ | 1,241 | |||||||||||||||
| 183 | (580 | ) | 313 | (845 | ) | 684 | (2,306 | ) | 337 | 918 | ||||||||||||||||||||
| — | 1,013 | — | 1,157 | — | 3,873 | — | 2,852 | |||||||||||||||||||||||
| 1,027 | 6,095 | 788 | 6,259 | 3,786 | 20,584 | 1,924 | 13,034 | |||||||||||||||||||||||
| 1,515 | 7,262 | 1,444 | 7,367 | 5,097 | 23,854 | 2,880 | 18,045 | |||||||||||||||||||||||
| (374 | ) | (1,531 | ) | (481 | ) | (1,074 | ) | (859 | ) | (4,208 | ) | (1,028 | ) | (4,314 | ) | |||||||||||||||
| (7 | ) | (60 | ) | N/A | N/A | (7 | ) | (79 | ) | N/A | N/A | |||||||||||||||||||
| (2 | ) | (9 | ) | N/A | N/A | (12 | ) | (57 | ) | N/A | N/A | |||||||||||||||||||
| — | — | — | — | — | — | — | — | |||||||||||||||||||||||
| — | — | N/A | N/A | — | — | N/A | N/A | |||||||||||||||||||||||
| — | — | N/A | N/A | — | — | N/A | N/A | |||||||||||||||||||||||
| (383 | ) | (1,600 | ) | (481 | ) | (1,074 | ) | (878 | ) | (4,344 | ) | (1,028 | ) | (4,314 | ) | |||||||||||||||
| 4,175 | 14,203 | 326 | 1,837 | 5,742 | 53,266 | 5,767 | 6,176 | |||||||||||||||||||||||
| 353 | 1,445 | 427 | 962 | 823 | 4,017 | 956 | 3,991 | |||||||||||||||||||||||
| (8,521 | ) | (19,024 | ) | (2,828 | ) | (11,238 | ) | (24,841 | ) | (75,268 | ) | (5,781 | ) | (15,893 | ) | |||||||||||||||
| (3,993 | ) | (3,376 | ) | (2,075 | ) | (8,439 | ) | (18,276 | ) | (17,985 | ) | 942 | (5,726 | ) | ||||||||||||||||
| 169 | 1,647 | N/A | N/A | 196 | 462 | N/A | N/A | |||||||||||||||||||||||
| 7 | 57 | N/A | N/A | 6 | 74 | N/A | N/A | |||||||||||||||||||||||
| (4,495 | ) | (1,059 | ) | N/A | N/A | (3,916 | ) | (500 | ) | N/A | N/A | |||||||||||||||||||
| (4,319 | ) | 645 | N/A | N/A | (3,714 | ) | 36 | N/A | N/A | |||||||||||||||||||||
| 44 | 81 | N/A | N/A | 432 | 335 | N/A | N/A | |||||||||||||||||||||||
| 2 | 9 | N/A | N/A | 12 | 57 | N/A | N/A | |||||||||||||||||||||||
| (89 | ) | (608 | ) | N/A | N/A | (331 | ) | (392 | ) | N/A | N/A | |||||||||||||||||||
| (43 | ) | (518 | ) | N/A | N/A | 113 | — | N/A | N/A | |||||||||||||||||||||
| (8,355 | ) | (3,249 | ) | (2,075 | ) | (8,439 | ) | (21,877 | ) | (17,949 | ) | 942 | (5,726 | ) | ||||||||||||||||
| (7,223 | ) | 2,413 | (1,112 | ) | (2,146 | ) | (17,658 | ) | 1,561 | 2,794 | 8,005 | |||||||||||||||||||
| 69,519 | 67,106 | 29,156 | 31,302 | 148,319 | 146,758 | 68,502 | 60,497 | |||||||||||||||||||||||
| $ | 62,296 | $ | 69,519 | $ | 28,044 | $ | 29,156 | $ | 130,661 | $ | 148,319 | $ | 71,296 | $ | 68,502 | |||||||||||||||
| SEI Asset Allocation Trust / Semi-Annual Report / September 30, 2021 | 25 |
STATEMENTS OF CHANGES IN NET ASSETS ($ Thousands) (Concluded)
For the six months ended September 30, 2021 (Unaudited) and the year ended March 31, 2021
| Aggressive Strategy Fund | Tax-Managed Aggressive Strategy Fund | |||||||||||||||
| 4/01/21 - 9/30/21 | 4/01/20 - 3/31/21 | 4/01/21 - 9/30/21 | 4/01/20 - 3/31/21 | |||||||||||||
Operations: | ||||||||||||||||
Net investment income | $ | 383 | $ | 1,941 | $ | 387 | $ | 898 | ||||||||
Net realized gain from sales of affiliated funds | 4,040 | 910 | 755 | 93 | ||||||||||||
Capital gain distributions received from affiliated funds | — | 3,449 | — | 715 | ||||||||||||
Net change in unrealized appreciation from affiliated funds | 3,787 | 51,989 | 3,526 | 29,343 | ||||||||||||
Net Increase in Net Assets Resulting from Operations | 8,210 | 58,289 | 4,668 | 31,049 | ||||||||||||
Distributions: | ||||||||||||||||
Class F | (355 | ) | (5,821 | ) | (385 | ) | (3,186 | ) | ||||||||
Class D | — | (645 | ) | N/A | N/A | |||||||||||
Class I | (12 | ) | (346 | ) | N/A | N/A | ||||||||||
Total Distributions | (367 | ) | (6,812 | ) | (385 | ) | (3,186 | ) | ||||||||
Capital Share Transactions:(1) | ||||||||||||||||
Class F | ||||||||||||||||
Proceeds from shares issued | 26,571 | 17,233 | 1,347 | 4,565 | ||||||||||||
Reinvestment of dividends & distributions | 339 | 5,623 | 361 | 2,994 | ||||||||||||
Cost of shares redeemed | (28,549 | ) | (35,561 | ) | (3,570 | ) | (7,376 | ) | ||||||||
Increase (Decrease) in Net Assets Derived from Class F Transactions | (1,639 | ) | (12,705 | ) | (1,862 | ) | 183 | |||||||||
Class D | ||||||||||||||||
Proceeds from shares issued | 654 | 1,953 | N/A | N/A | ||||||||||||
Reinvestment of dividends & distributions | — | 637 | N/A | N/A | ||||||||||||
Cost of shares redeemed | (19,229 | ) | (1,417 | ) | N/A | N/A | ||||||||||
Increase (Decrease) in Net Assets Derived from Class D Transactions | (18,575 | ) | 1,173 | N/A | N/A | |||||||||||
Class I | ||||||||||||||||
Proceeds from shares issued | 632 | 1,126 | N/A | N/A | ||||||||||||
Reinvestment of dividends & distributions | 11 | 346 | N/A | N/A | ||||||||||||
Cost of shares redeemed | (869 | ) | (960 | ) | N/A | N/A | ||||||||||
Increase (Decrease) in Net Assets Derived from Class I Transactions | (226 | ) | 512 | N/A | N/A | |||||||||||
Increase (Decrease) in Net Assets Derived From Capital Share Transactions | (20,440 | ) | (11,020 | ) | (1,862 | ) | 183 | |||||||||
Net Increase (Decrease) in Net Assets | (12,597 | ) | 40,457 | 2,421 | 28,046 | |||||||||||
Net Assets: | ||||||||||||||||
Beginning of Period | 183,436 | 142,979 | 86,953 | 58,907 | ||||||||||||
End of Period | $ | 170,839 | $ | 183,436 | $ | 89,374 | $ | 86,953 | ||||||||
(1) For Capital Share Transactions see footnote 4 in the notes to financial statements.
Amounts designated as “—” are $0 or have been rounded to $0.
N/A — Not applicable. Class D and Class I shares currently not offered.
The accompanying notes are an integral part of the financial statements.
| 26 | SEI Asset Allocation Trust / Semi-Annual Report / September 30, 2021 |
| Core Market Strategy Fund | Core Market Strategy Allocation Fund | Market Growth Strategy Fund | Market Growth Strategy Allocation Fund | |||||||||||||||||||||||||||
| 4/01/21 - 9/30/21 | 4/01/20 - 3/31/21 | 4/01/21 - 9/30/21 | 4/01/20 - 3/31/21 | 4/01/21 - 9/30/21 | 4/01/20 - 3/31/21 | 4/01/21 - 9/30/21 | 4/01/20 - 3/31/21 | |||||||||||||||||||||||
| $ | 342 | $ | 1,090 | $ | 114 | $ | 303 | $ | 631 | $ | 2,467 | $ | 600 | $ | 1,507 | |||||||||||||||
| 1,303 | 1,007 | 442 | 1,107 | 2,582 | 1,398 | 1,390 | 3,330 | |||||||||||||||||||||||
| — | 1,919 | — | 235 | — | 4,240 | — | 1,188 | |||||||||||||||||||||||
| 1,868 | 13,939 | 836 | 8,808 | 5,683 | 44,139 | 5,299 | 46,399 | |||||||||||||||||||||||
| 3,513 | 17,955 | 1,392 | 10,453 | 8,896 | 52,244 | 7,289 | 52,424 | |||||||||||||||||||||||
| (342 | ) | (3,499 | ) | (115 | ) | (1,468 | ) | (603 | ) | (7,301 | ) | (599 | ) | (6,671 | ) | |||||||||||||||
| N/A | N/A | N/A | N/A | — | (166 | ) | N/A | N/A | ||||||||||||||||||||||
| — | — | N/A | N/A | (9 | ) | (164 | ) | N/A | N/A | |||||||||||||||||||||
| (342 | ) | (3,499 | ) | (115 | ) | (1,468 | ) | (612 | ) | (7,631 | ) | (599 | ) | (6,671 | ) | |||||||||||||||
| 1,278 | 5,228 | 495 | 930 | 5,861 | 14,177 | 1,075 | 3,393 | |||||||||||||||||||||||
| 334 | 3,413 | 101 | 1,298 | 587 | 7,109 | 556 | 6,208 | |||||||||||||||||||||||
| (10,268 | ) | (17,082 | ) | (1,472 | ) | (5,835 | ) | (17,539 | ) | (40,246 | ) | (3,805 | ) | (20,320 | ) | |||||||||||||||
| (8,656 | ) | (8,441 | ) | (876 | ) | (3,607 | ) | (11,091 | ) | (18,960 | ) | (2,174 | ) | (10,719 | ) | |||||||||||||||
| N/A | N/A | N/A | N/A | 225 | 616 | N/A | N/A | |||||||||||||||||||||||
| N/A | N/A | N/A | N/A | — | 164 | N/A | N/A | |||||||||||||||||||||||
| N/A | N/A | N/A | N/A | (3,539 | ) | (1,408 | ) | N/A | N/A | |||||||||||||||||||||
| N/A | N/A | N/A | N/A | (3,314 | ) | (628 | ) | N/A | N/A | |||||||||||||||||||||
| 3 | 2 | N/A | N/A | 151 | 295 | N/A | N/A | |||||||||||||||||||||||
| — | — | N/A | N/A | 9 | 164 | N/A | N/A | |||||||||||||||||||||||
| — | — | N/A | N/A | (104 | ) | (328 | ) | N/A | N/A | |||||||||||||||||||||
| 3 | 2 | N/A | N/A | 56 | 131 | N/A | N/A | |||||||||||||||||||||||
| (8,653 | ) | (8,439 | ) | (876 | ) | (3,607 | ) | (14,349 | ) | (19,457 | ) | (2,174 | ) | (10,719 | ) | |||||||||||||||
| (5,482 | ) | 6,017 | 401 | 5,378 | (6,065 | ) | 25,156 | 4,516 | 35,034 | |||||||||||||||||||||
| 78,992 | 72,975 | 25,876 | 20,498 | 194,633 | 169,477 | 135,260 | 100,226 | |||||||||||||||||||||||
| $ | 73,510 | $ | 78,992 | $ | 26,277 | $ | 25,876 | $ | 188,568 | $ | 194,633 | $ | 139,776 | $ | 135,260 | |||||||||||||||
| SEI Asset Allocation Trust / Semi-Annual Report / September 30, 2021 | 27 |
For the six months ended September 30, 2021 (Unaudited) and the years ended March 31,
For a Share Outstanding Throughout Each Period
| Net Asset Value, Beginning of Period | Net Investment | Net Realized and Unrealized Gains (Losses) from Funds* | Total from | Dividends from Net Investment Income | Distributions from Realized Capital Gains | Total Dividends and Distributions | Net Asset Value, End of Period | Total Return† | Net Assets End of Period($ Thousands) | Ratio of to Average | Ratio of Expenses to Average Net Assets (Excluding Waivers)** | Ratio of Net Investment to Average | Portfolio Turnover Rate† | |||||||||||||||||||||||||||||||||||||||||||
Defensive Strategy Fund |
| |||||||||||||||||||||||||||||||||||||||||||||||||||||||
Class F | ||||||||||||||||||||||||||||||||||||||||||||||||||||||||
2021@ | $ | 10.11 | $ | 0.03 | $ | 0.10 | $ | 0.13 | $ | (0.04) | $ — | $ | (0.04) | $ | 10.20 | 1.29 | % | $ | 15,979 | 0.21 | % | 0.58 | % | 0.66 | % | 16 | % | |||||||||||||||||||||||||||||
2021 | 9.72 | 0.07 | 0.51 | 0.58 | (0.19) | — | (0.19) | 10.11 | 5.99 | 17,330 | 0.21 | 0.58 | 0.68 | 143 | ||||||||||||||||||||||||||||||||||||||||||
2020 | 9.88 | 0.19 | (0.11) | 0.08 | (0.24) | — | (0.24) | 9.72 | 0.77 | 16,031 | 0.21 | 0.59 | 1.92 | 17 | ||||||||||||||||||||||||||||||||||||||||||
2019 | 9.79 | 0.17 | 0.09 | 0.26 | (0.17) | — | (0.17) | 9.88 | 2.75 | 19,624 | 0.21 | 0.57 | 1.77 | 24 | ||||||||||||||||||||||||||||||||||||||||||
2018 | 9.83 | 0.16 | (0.02) | 0.14 | (0.18) | — | (0.18) | 9.79 | 1.45 | 28,203 | 0.21 | 0.57 | 1.58 | 19 | ||||||||||||||||||||||||||||||||||||||||||
2017 | 9.71 | 0.10 | 0.14 | 0.24 | (0.12) | — | (0.12) | 9.83 | 2.44 | 32,489 | 0.23 | (1) | 0.64 | 1.05 | 69 | |||||||||||||||||||||||||||||||||||||||||
Class I | ||||||||||||||||||||||||||||||||||||||||||||||||||||||||
2021@ | $ | 9.93 | $ | 0.02 | $ | 0.10 | $ | 0.12 | $ | (0.03) | $ — | $ | (0.03) | $ | 10.02 | 1.18 | % | $ | 692 | 0.46 | % | 0.83 | % | 0.43 | % | 16 | % | |||||||||||||||||||||||||||||
2021 | 9.54 | 0.04 | 0.52 | 0.56 | (0.17) | — | (0.17) | 9.93 | 5.84 | 370 | 0.46 | 0.83 | 0.43 | 143 | ||||||||||||||||||||||||||||||||||||||||||
2020 | 9.70 | 0.16 | (0.10) | 0.06 | (0.22) | — | (0.22) | 9.54 | 0.53 | 429 | 0.46 | 0.84 | 1.67 | 17 | ||||||||||||||||||||||||||||||||||||||||||
2019 | 9.62 | 0.16 | 0.07 | 0.23 | (0.15) | — | (0.15) | 9.70 | 2.44 | 328 | 0.46 | 0.82 | 1.67 | 24 | ||||||||||||||||||||||||||||||||||||||||||
2018 | 9.66 | 0.13 | (0.02) | 0.11 | (0.15) | — | (0.15) | 9.62 | 1.18 | 472 | 0.46 | 0.82 | 1.29 | 19 | ||||||||||||||||||||||||||||||||||||||||||
2017 | 9.55 | 0.06 | 0.14 | 0.20 | (0.09) | — | (0.09) | 9.66 | 2.09 | 979 | 0.48 | (1) | 0.90 | 0.61 | 69 | |||||||||||||||||||||||||||||||||||||||||
Defensive Strategy Allocation Fund |
| |||||||||||||||||||||||||||||||||||||||||||||||||||||||
Class F | ||||||||||||||||||||||||||||||||||||||||||||||||||||||||
2021@ | $ | 11.71 | $ | 0.04 | $ | 0.05 | $ | 0.09 | $ | (0.04) | $ — | $ | (0.04) | $ | 11.76 | 0.81 | % | $ | 5,665 | 0.35 | % | 0.61 | % | 0.72 | % | 7 | % | |||||||||||||||||||||||||||||
2021 | 11.36 | �� | 0.10 | 0.45 | 0.55 | (0.20) | —^ | (0.20) | 11.71 | 4.88 | 6,236 | 0.35 | 0.61 | 0.86 | 27 | |||||||||||||||||||||||||||||||||||||||||
2020 | 14.25 | 0.44 | (2.56) | (2.12) | (0.53) | (0.24 | ) | (0.77) | 11.36 | (16.02) | 7,572 | 0.35 | 0.58 | 3.07 | 49 | |||||||||||||||||||||||||||||||||||||||||
2019 | 14.13 | 0.43 | 0.79 | 1.22 | (0.59) | (0.51 | ) | (1.10) | 14.25 | 9.22 | 8,168 | 0.35 | 0.57 | 3.05 | 44 | |||||||||||||||||||||||||||||||||||||||||
2018 | 14.54 | 0.43 | 0.16 | 0.59 | (0.62) | (0.38 | ) | (1.00) | 14.13 | 4.02 | 10,125 | 0.35 | 0.57 | 2.95 | 31 | |||||||||||||||||||||||||||||||||||||||||
2017 | 14.31 | 0.46 | 1.21 | 1.67 | (0.60) | (0.84 | ) | (1.44) | 14.54 | 12.15 | 8,341 | 0.37 | (2) | 0.63 | 3.17 | 30 | ||||||||||||||||||||||||||||||||||||||||
Conservative Strategy Fund |
| |||||||||||||||||||||||||||||||||||||||||||||||||||||||
Class F | ||||||||||||||||||||||||||||||||||||||||||||||||||||||||
2021@ | $ | 10.99 | $ | 0.05 | $ | 0.20 | $ | 0.25 | $ | (0.07) | $ — | $ | (0.07) | $ | 11.17 | 2.24 | % | $ | 61,721 | 0.26 | % | 0.60 | % | 0.94 | % | 2 | % | |||||||||||||||||||||||||||||
2021 | 10.15 | 0.12 | 0.96 | 1.08 | (0.19) | (0.05 | ) | (0.24) | 10.99 | 10.71 | 64,670 | 0.26 | 0.60 | 1.07 | 20 | |||||||||||||||||||||||||||||||||||||||||
2020 | 10.66 | 0.23 | (0.39) | (0.16) | (0.30) | (0.05 | ) | (0.35) | 10.15 | (1.68) | 62,724 | 0.26 | 0.59 | 2.12 | 18 | |||||||||||||||||||||||||||||||||||||||||
2019 | 10.56 | 0.21 | 0.10 | 0.31 | (0.21) | — | (0.21) | 10.66 | 3.04 | 74,320 | 0.26 | 0.57 | 2.00 | 13 | ||||||||||||||||||||||||||||||||||||||||||
2018 | 10.49 | 0.19 | 0.11 | 0.30 | (0.23) | — | (0.23) | 10.56 | 2.85 | 80,886 | 0.26 | 0.57 | 1.78 | 17 | ||||||||||||||||||||||||||||||||||||||||||
2017 | 10.26 | 0.16 | 0.27 | 0.43 | (0.20) | — | (0.20) | 10.49 | 4.22 | 86,219 | 0.28 | (3) | 0.63 | 1.52 | 55 | |||||||||||||||||||||||||||||||||||||||||
Class D | ||||||||||||||||||||||||||||||||||||||||||||||||||||||||
2021@ | $ | 10.97 | $ | 0.02 | $ | 0.17 | $ | 0.19 | $ | (0.02) | $ — | $ | (0.02) | $ | 11.14 | 1.74 | % | $ | 269 | 1.01 | % | 1.35 | % | 0.36 | % | 2 | % | |||||||||||||||||||||||||||||
2021 | 10.13 | 0.04 | 0.96 | 1.00 | (0.11) | (0.05 | ) | (0.16) | 10.97 | 9.91 | 4,507 | 1.01 | 1.35 | 0.34 | 20 | |||||||||||||||||||||||||||||||||||||||||
2020 | 10.64 | 0.15 | (0.39) | (0.24) | (0.22) | (0.05 | ) | (0.27) | 10.13 | (2.43) | 3,580 | 1.01 | 1.34 | 1.39 | 18 | |||||||||||||||||||||||||||||||||||||||||
2019 | 10.54 | 0.13 | 0.11 | 0.24 | (0.14) | — | (0.14) | 10.64 | 2.28 | 3,700 | 1.01 | 1.32 | 1.28 | 13 | ||||||||||||||||||||||||||||||||||||||||||
2018 | 10.48 | 0.11 | 0.10 | 0.21 | (0.15) | — | (0.15) | 10.54 | 1.97 | 3,506 | 1.01 | 1.32 | 1.02 | 17 | ||||||||||||||||||||||||||||||||||||||||||
2017 | 10.24 | 0.08 | 0.28 | 0.36 | (0.12) | — | (0.12) | 10.48 | 3.55 | 3,609 | 1.02 | (3) | 1.38 | 0.79 | 55 | |||||||||||||||||||||||||||||||||||||||||
Class I | ||||||||||||||||||||||||||||||||||||||||||||||||||||||||
2021@ | $ | 11.20 | $ | 0.04 | $ | 0.20 | $ | 0.24 | $ | (0.05) | $ — | $ | (0.05) | $ | 11.39 | 2.15 | % | $ | 306 | 0.51 | % | 0.85 | % | 0.69 | % | 2 | % | |||||||||||||||||||||||||||||
2021 | 10.34 | 0.06 | 1.00 | 1.06 | (0.15) | (0.05 | ) | (0.20) | 11.20 | 10.35 | 342 | 0.51 | 0.85 | 0.58 | 20 | |||||||||||||||||||||||||||||||||||||||||
2020 | 10.85 | 0.20 | (0.38) | (0.18) | (0.28) | (0.05 | ) | (0.33) | 10.34 | (1.89) | 802 | 0.51 | 0.84 | 1.86 | 18 | |||||||||||||||||||||||||||||||||||||||||
2019 | 10.74 | 0.19 | 0.11 | 0.30 | (0.19) | — | (0.19) | 10.85 | 2.83 | 982 | 0.51 | 0.82 | 1.75 | 13 | ||||||||||||||||||||||||||||||||||||||||||
2018 | 10.67 | 0.11 | 0.16 | 0.27 | (0.20) | — | (0.20) | 10.74 | 2.49 | 1,023 | 0.51 | 0.82 | 1.03 | 17 | ||||||||||||||||||||||||||||||||||||||||||
2017 | 10.42 | 0.13 | 0.29 | 0.42 | (0.17) | — | (0.17) | 10.67 | 4.09 | 4,030 | 0.53 | (3) | 0.88 | 1.23 | 55 | |||||||||||||||||||||||||||||||||||||||||
| @ | For the six-month period ended September 30, 2021. All ratios for the period have been annualized. |
| * | Per share calculations were performed using average shares. |
| ** | The expense ratios do not include expenses of the underlying affiliated investment companies. |
| ^ | Includes return of capital less than $0.005. |
| † | Returns and portfolio turnover rate are for the period indicated and have not been annualized. Returns shown do not reflect the deduction of taxes that a shareholder would pay on Fund distributions or the redemption of Fund shares. |
| (1) | The expense ratio includes Trustee and Proxy fees that are not subject to any voluntary expense waiver or reimbursement agreement. Had the fees been excluded the ratios would have been 0.21%, and 0.46% for classes F, and I, respectively. |
| (2) | The expense ratio includes Trustee and Proxy fees that are not subject to any voluntary expense waiver or reimbursement agreement. Had the fees been excluded the ratio would have been 0.35% for class F. |
| (3) | The expense ratio includes Trustee and Proxy fees that are not subject to any voluntary expense waiver or reimbursement agreement. Had the fees been excluded the ratios would have been 0.26%, 1.01%, and 0.51% for classes F, D, and I, respectively. |
Amounts designated as “—” are $0 or have been rounded to $0.
| 28 | SEI Asset Allocation Trust / Semi-Annual Report / September 30, 2021 |
FINANCIAL HIGHLIGHTS
For the six months ended September 30, 2021 (Unaudited) and the years ended March 31,
For a Share Outstanding Throughout Each Period
Net Asset of Period | Net Investment Income* | Net Realized Unrealized (Losses) from | Total from | Dividends from Net Investment Income | Distributions from Realized Capital Gains | Total Dividends and Distributions | Net Asset End of Period | Total Return† | Net Assets End of Period($ Thousands) | Ratio of Expenses to Average Net Assets** | Ratio of Net Assets | Ratio of Net to Average | Portfolio Turnover Rate† | |||||||||||||||||||||||||||||||||||||||||||
Conservative Strategy Allocation Fund |
| |||||||||||||||||||||||||||||||||||||||||||||||||||||||
Class F | ||||||||||||||||||||||||||||||||||||||||||||||||||||||||
2021@ | $ | 12.78 | $ | 0.15 | $ | 0.47 | $ | 0.62 | $ | (0.21) | $ — | $ | (0.21) | $ | 13.19 | 4.91 | % | $ | 28,044 | 0.35 | % | 0.60 | % | 2.32 | % | 3 | % | |||||||||||||||||||||||||||||
2021 | 10.46 | 0.30 | 2.42 | 2.72 | (0.40) | — | (0.40) | 12.78 | 26.55 | 29,156 | 0.35 | 0.60 | 2.57 | 23 | ||||||||||||||||||||||||||||||||||||||||||
2020 | 13.21 | 0.38 | (1.94) | (1.56) | (0.45) | (0.74) | (1.19) | 10.46 | (13.46) | 31,302 | 0.35 | 0.59 | 2.86 | 22 | ||||||||||||||||||||||||||||||||||||||||||
2019 | 13.18 | 0.37 | 0.83 | 1.20 | (0.48) | (0.69) | (1.17) | 13.21 | 9.78 | 39,828 | 0.35 | 0.57 | 2.75 | 15 | ||||||||||||||||||||||||||||||||||||||||||
2018 | 13.59 | 0.38 | 0.17 | 0.55 | (0.54) | (0.42) | (0.96) | 13.18 | 3.98 | 39,443 | 0.35 | 0.57 | 2.79 | 16 | ||||||||||||||||||||||||||||||||||||||||||
2017 | 13.86 | 0.40 | 1.13 | 1.53 | (0.52) | (1.28) | (1.80) | 13.59 | 11.57 | 44,284 | 0.37 | (1) | 0.63 | 2.84 | 23 | |||||||||||||||||||||||||||||||||||||||||
Moderate Strategy Fund |
| |||||||||||||||||||||||||||||||||||||||||||||||||||||||
Class F | ||||||||||||||||||||||||||||||||||||||||||||||||||||||||
2021@ | $ | 12.87 | $ | 0.06 | $ | 0.39 | $ | 0.45 | $ | (0.08) | $ — | $ | (0.08) | $ | 13.24 | 3.51 | % | $ | 127,782 | 0.31 | % | 0.61 | % | 0.91 | % | 2 | % | |||||||||||||||||||||||||||||
2021 | 11.37 | 0.13 | 1.71 | 1.84 | (0.22) | (0.12) | (0.34) | 12.87 | 16.32 | 142,002 | 0.31 | 0.60 | 1.08 | 33 | ||||||||||||||||||||||||||||||||||||||||||
2020 | 12.17 | 0.26 | (0.64) | (0.38) | (0.42) | — | (0.42) | 11.37 | (3.45) | 141,208 | 0.31 | 0.59 | 2.06 | 27 | ||||||||||||||||||||||||||||||||||||||||||
2019 | 12.01 | 0.26 | 0.17 | 0.43 | (0.27) | — | (0.27) | 12.17 | 3.72 | 168,079 | 0.31 | 0.57 | 2.17 | 12 | ||||||||||||||||||||||||||||||||||||||||||
2018 | 11.75 | 0.18 | 0.33 | 0.51 | (0.25) | — | (0.25) | 12.01 | 4.38 | 194,123 | 0.31 | 0.57 | 1.53 | 16 | ||||||||||||||||||||||||||||||||||||||||||
2017 | 11.30 | 0.20 | 0.55 | 0.75 | (0.30) | — | (0.30) | 11.75 | 6.68 | 212,074 | 0.33 | (2) | 0.63 | 1.70 | 30 | |||||||||||||||||||||||||||||||||||||||||
Class D | ||||||||||||||||||||||||||||||||||||||||||||||||||||||||
2021@ | $ | 12.83 | $ | 0.03 | $ | 0.38 | $ | 0.41 | $ | (0.03) | $ — | $ | (0.03) | $ | 13.21 | 3.17 | % | $ | 286 | 1.06 | % | 1.36 | % | 0.51 | % | 2 | % | |||||||||||||||||||||||||||||
2021 | 11.34 | 0.05 | 1.69 | 1.74 | (0.13) | (0.12) | (0.25) | 12.83 | 15.40 | 3,908 | 1.06 | 1.35 | 0.38 | 33 | ||||||||||||||||||||||||||||||||||||||||||
2020 | 12.13 | 0.17 | (0.64) | (0.47) | (0.32) | — | (0.32) | 11.34 | (4.10) | 3,419 | 1.06 | 1.34 | 1.37 | 27 | ||||||||||||||||||||||||||||||||||||||||||
2019 | 11.98 | 0.17 | 0.16 | 0.33 | (0.18) | — | (0.18) | 12.13 | 2.87 | 3,574 | 1.06 | 1.32 | 1.45 | 12 | ||||||||||||||||||||||||||||||||||||||||||
2018 | 11.71 | 0.09 | 0.34 | 0.43 | (0.16) | — | (0.16) | 11.98 | 3.68 | 3,461 | 1.06 | 1.32 | 0.76 | 16 | ||||||||||||||||||||||||||||||||||||||||||
2017 | 11.27 | 0.11 | 0.54 | 0.65 | (0.21) | — | (0.21) | 11.71 | 5.82 | 3,646 | 1.07 | (2) | 1.37 | 0.95 | 30 | |||||||||||||||||||||||||||||||||||||||||
Class I | ||||||||||||||||||||||||||||||||||||||||||||||||||||||||
2021@ | $ | 13.24 | $ | 0.04 | $ | 0.41 | $ | 0.45 | $ | (0.06) | $ — | $ | (0.06) | $ | 13.63 | 3.44 | % | $ | 2,593 | 0.56 | % | 0.86 | % | 0.64 | % | 2 | % | |||||||||||||||||||||||||||||
2021 | 11.70 | 0.11 | 1.74 | 1.85 | (0.19) | (0.12) | (0.31) | 13.24 | 15.91 | 2,409 | 0.56 | 0.85 | 0.87 | 33 | ||||||||||||||||||||||||||||||||||||||||||
2020 | 12.50 | 0.23 | (0.64) | (0.41) | (0.39) | — | (0.39) | 11.70 | (3.60) | 2,131 | 0.56 | 0.84 | 1.82 | 27 | ||||||||||||||||||||||||||||||||||||||||||
2019 | 12.34 | 0.24 | 0.16 | 0.40 | (0.24) | — | (0.24) | 12.50 | 3.35 | 2,302 | 0.56 | 0.82 | 1.97 | 12 | ||||||||||||||||||||||||||||||||||||||||||
2018 | 12.05 | 0.16 | 0.35 | 0.51 | (0.22) | — | (0.22) | 12.34 | 4.25 | 3,598 | 0.56 | 0.82 | 1.28 | 16 | ||||||||||||||||||||||||||||||||||||||||||
2017 | 11.59 | 0.14 | 0.58 | 0.72 | (0.26) | — | (0.26) | 12.05 | 6.32 | 4,284 | 0.58 | (2) | 0.88 | 1.20 | 30 | |||||||||||||||||||||||||||||||||||||||||
Moderate Strategy Allocation Fund |
| |||||||||||||||||||||||||||||||||||||||||||||||||||||||
Class F | ||||||||||||||||||||||||||||||||||||||||||||||||||||||||
2021@ | $ | 19.71 | $ | 0.17 | $ | 0.65 | $ | 0.82 | $ | (0.29) | $ — | $ | (0.29) | $ | 20.24 | 4.20 | % | $ | 71,296 | 0.35 | % | 0.60 | % | 1.70 | % | 6 | % | |||||||||||||||||||||||||||||
2021 | 15.94 | 0.35 | 4.67 | 5.02 | (0.43) | (0.82) | (1.25) | 19.71 | 32.25 | 68,502 | 0.35 | 0.60 | 1.92 | 17 | ||||||||||||||||||||||||||||||||||||||||||
2020 | 20.00 | 0.46 | (2.85) | (2.39) | (0.51) | (1.16) | (1.67) | 15.94 | (13.64) | 60,497 | 0.35 | 0.59 | 2.25 | 11 | ||||||||||||||||||||||||||||||||||||||||||
2019 | 20.35 | 0.42 | 0.95 | 1.37 | (0.56) | (1.16) | (1.72) | 20.00 | 7.32 | 85,313 | 0.35 | 0.57 | 2.08 | 15 | ||||||||||||||||||||||||||||||||||||||||||
2018 | 19.87 | 0.41 | 1.15 | 1.56 | (0.59) | (0.49) | (1.08) | 20.35 | 7.87 | 92,109 | 0.35 | 0.57 | 1.98 | 14 | ||||||||||||||||||||||||||||||||||||||||||
2017 | 19.16 | 0.40 | 1.88 | 2.28 | (0.48) | (1.09) | (1.57) | 19.87 | 12.35 | 93,996 | 0.37 | (1) | 0.63 | 2.03 | 16 | |||||||||||||||||||||||||||||||||||||||||
| @ | For the six-month period ended September 30, 2021. All ratios for the period have been annualized. |
| * | Per share calculations were performed using average shares. |
| ** | The expense ratios do not include expenses of the underlying affiliated investment companies. |
| † | Returns and portfolio turnover rate are for the period indicated and have not been annualized. Returns shown do not reflect the deduction of taxes that a shareholder would pay on Fund distributions or the redemption of Fund shares. |
| (1) | The expense ratio includes Trustee and Proxy fees that are not subject to any voluntary expense waiver or reimbursement agreement. Had the fees been excluded the ratio would have been 0.35% for class F. |
| (2) | The expense ratio includes Trustee and Proxy fees that are not subject to any voluntary expense waiver or reimbursement agreement. Had the fees been excluded the ratios would have been 0.31%, 1.06%, and 0.56%, for classes F, D, and I, respectively. |
Amounts designated as “—” are $0 or have been rounded to $0.
| SEI Asset Allocation Trust / Semi-Annual Report / September 30, 2021 | 29 |
FINANCIAL HIGHLIGHTS
For the six months ended September 30, 2021 (Unaudited) and the years ended March 31,
For a Share Outstanding Throughout Each Period
Net Asset of Period | Net Investment Income* | Net Realized Unrealized (Losses) from | Total from | Dividends from Net | Distributions from Realized Capital Gains | Total Dividends and Distributions | Net Asset End of Period | Total Return† | Net Assets End of Period($ Thousands) | Ratio of Expenses to Average Net Assets** | Ratio of Net Assets | Ratio of Net to Average | Portfolio Turnover Rate† | |||||||||||||||||||||||||||||||||||||||||||
Aggressive Strategy Fund |
| |||||||||||||||||||||||||||||||||||||||||||||||||||||||
Class F | ||||||||||||||||||||||||||||||||||||||||||||||||||||||||
2021@ | $ | 17.09 | $ | 0.04 | $ | 0.71 | $ | 0.75 | $ | (0.04) | $ — | $ | (0.04) | $ | 17.80 | 4.39 | % | $ | 159,179 | 0.35 | % | 0.60 | % | 0.47 | % | 4 | % | |||||||||||||||||||||||||||||
2021 | 12.41 | 0.19 | 5.16 | 5.35 | (0.28) | (0.39) | (0.67) | 17.09 | 43.43 | 154,482 | 0.35 | 0.60 | 1.25 | 19 | ||||||||||||||||||||||||||||||||||||||||||
2020 | 14.76 | 0.25 | (1.73) | (1.48) | (0.44) | (0.43) | (0.87) | 12.41 | (11.14) | 123,231 | 0.35 | 0.59 | 1.63 | 21 | ||||||||||||||||||||||||||||||||||||||||||
2019 | 15.08 | 0.26 | (0.23) | 0.03 | (0.35) | — | (0.35) | 14.76 | 0.42 | 172,138 | 0.35 | 0.57 | 1.73 | 12 | ||||||||||||||||||||||||||||||||||||||||||
2018 | 13.71 | 0.17 | 1.45 | 1.62 | (0.25) | — | (0.25) | 15.08 | 11.86 | 203,817 | 0.35 | 0.57 | 1.18 | 7 | ||||||||||||||||||||||||||||||||||||||||||
2017 | 12.42 | 0.16 | 1.41 | 1.57 | (0.28) | — | (0.28) | 13.71 | 12.75 | 213,248 | 0.37 | (1) | 0.63 | 1.21 | 19 | |||||||||||||||||||||||||||||||||||||||||
Class D | ||||||||||||||||||||||||||||||||||||||||||||||||||||||||
2021@ | $ | 16.83 | $ | (0.01) | $ | 0.68 | $ | 0.67 | $ | — | $ — | $ | — | $ | 17.50 | 3.98 | % | $ | 1,618 | 1.10 | % | 1.35 | % | (0.10) | % | 4 | % | |||||||||||||||||||||||||||||
2021 | 12.25 | 0.09 | 5.07 | 5.16 | (0.19) | (0.39) | (0.58) | 16.83 | 42.37 | 19,093 | 1.10 | 1.35 | 0.57 | 19 | ||||||||||||||||||||||||||||||||||||||||||
2020 | 14.59 | 0.15 | (1.72) | (1.57) | (0.34) | (0.43) | (0.77) | 12.25 | (11.79) | 12,914 | 1.10 | 1.34 | 0.97 | 21 | ||||||||||||||||||||||||||||||||||||||||||
2019 | 14.93 | 0.15 | (0.23) | (0.08) | (0.26) | — | (0.26) | 14.59 | (0.36) | 14,087 | 1.10 | 1.32 | 1.04 | 12 | ||||||||||||||||||||||||||||||||||||||||||
2018 | 13.60 | 0.05 | 1.46 | 1.51 | (0.18) | — | (0.18) | 14.93 | 11.06 | 14,419 | 1.10 | 1.32 | 0.34 | 7 | ||||||||||||||||||||||||||||||||||||||||||
2017 | 12.35 | 0.07 | 1.39 | 1.46 | (0.21) | — | (0.21) | 13.60 | 11.91 | 16,610 | 1.11 | (1) | 1.38 | 0.52 | 19 | |||||||||||||||||||||||||||||||||||||||||
Class I | ||||||||||||||||||||||||||||||||||||||||||||||||||||||||
2021@ | $ | 16.58 | $ | 0.02 | $ | 0.68 | $ | 0.70 | $ | (0.02) | $ — | $ | (0.02) | $ | 17.26 | 4.22 | % | $ | 10,042 | 0.60 | % | 0.85 | % | 0.23 | % | 4 | % | |||||||||||||||||||||||||||||
2021 | 12.05 | 0.15 | 5.01 | 5.16 | (0.24) | (0.39) | (0.63) | 16.58 | 43.13 | 9,861 | 0.60 | 0.85 | 1.04 | 19 | ||||||||||||||||||||||||||||||||||||||||||
2020 | 14.36 | 0.21 | (1.69) | (1.48) | (0.40) | (0.43) | (0.83) | 12.05 | (11.40) | 6,834 | 0.60 | 0.84 | 1.40 | 21 | ||||||||||||||||||||||||||||||||||||||||||
2019 | 14.68 | 0.24 | (0.24) | — | (0.32) | — | (0.32) | 14.36 | 0.18 | 8,650 | 0.60 | 0.82 | 1.65 | 12 | ||||||||||||||||||||||||||||||||||||||||||
2018 | 13.35 | 0.11 | 1.44 | 1.55 | (0.22) | — | (0.22) | 14.68 | 11.60 | 11,405 | 0.60 | 0.82 | 0.77 | 7 | ||||||||||||||||||||||||||||||||||||||||||
2017 | 12.11 | 0.11 | 1.38 | 1.49 | (0.25) | — | (0.25) | 13.35 | 12.38 | 21,720 | 0.62 | (1) | 0.88 | 0.84 | 19 | |||||||||||||||||||||||||||||||||||||||||
Tax-Managed Aggressive Strategy Fund |
| |||||||||||||||||||||||||||||||||||||||||||||||||||||||
Class F | ||||||||||||||||||||||||||||||||||||||||||||||||||||||||
2021@ | $ | 26.03 | $ | 0.12 | $ | 1.28 | $ | 1.40 | $ | (0.12) | $ — | $ | (0.12) | $ | 27.31 | 5.37 | % | $ | 89,374 | 0.35 | % | 0.60 | % | 0.85 | % | 2 | % | |||||||||||||||||||||||||||||
2021 | 17.53 | 0.27 | 9.21 | 9.48 | (0.31) | (0.67) | (0.98) | 26.03 | 54.85 | 86,953 | 0.35 | 0.60 | 1.22 | 8 | ||||||||||||||||||||||||||||||||||||||||||
2020 | 20.91 | 0.32 | (3.08) | (2.76) | (0.33) | (0.29) | (0.62) | 17.53 | (13.77) | 58,907 | 0.35 | 0.59 | 1.51 | 12 | ||||||||||||||||||||||||||||||||||||||||||
2019 | 21.61 | 0.27 | 0.02 | 0.29 | (0.29) | (0.70) | (0.99) | 20.91 | 1.68 | 76,364 | 0.35 | 0.57 | 1.25 | 8 | ||||||||||||||||||||||||||||||||||||||||||
2018 | 19.20 | 0.24 | 2.44 | 2.68 | (0.27) | — | (0.27) | 21.61 | 14.00 | 75,709 | 0.35 | 0.57 | 1.16 | 7 | ||||||||||||||||||||||||||||||||||||||||||
2017 | 16.99 | 0.21 | 2.24 | 2.45 | (0.24) | — | (0.24) | 19.20 | 14.51 | 64,802 | 0.37 | (2) | 0.63 | 1.17 | 11 | |||||||||||||||||||||||||||||||||||||||||
Core Market Strategy Fund |
| |||||||||||||||||||||||||||||||||||||||||||||||||||||||
Class F | ||||||||||||||||||||||||||||||||||||||||||||||||||||||||
2021@ | $ | 12.52 | $ | 0.06 | $ | 0.47 | $ | 0.53 | $ | (0.05) | $ — | $ | (0.05) | $ | 13.00 | 4.28 | % | $ | 73,505 | 0.35 | % | 0.60 | % | 0.86 | % | 2 | % | |||||||||||||||||||||||||||||
2021 | 10.33 | 0.17 | 2.56 | 2.73 | (0.30) | (0.24) | (0.54) | 12.52 | 26.72 | 78,990 | 0.35 | 0.60 | 1.40 | 16 | ||||||||||||||||||||||||||||||||||||||||||
2020 | 11.52 | 0.23 | (0.80) | (0.57) | (0.41) | (0.21) | (0.62) | 10.33 | (5.56) | 72,975 | 0.35 | 0.59 | 1.95 | 27 | ||||||||||||||||||||||||||||||||||||||||||
2019 | 11.76 | 0.26 | (0.05) | 0.21 | (0.29) | (0.16) | (0.45) | 11.52 | 2.08 | 94,760 | 0.35 | 0.57 | 2.22 | 14 | ||||||||||||||||||||||||||||||||||||||||||
2018 | 11.19 | 0.17 | 0.63 | 0.80 | (0.23) | — | (0.23) | 11.76 | 7.17 | 105,341 | 0.35 | 0.57 | 1.42 | 11 | ||||||||||||||||||||||||||||||||||||||||||
2017 | 10.90 | 0.17 | 0.75 | 0.92 | (0.30) | (0.33) | (0.63) | 11.19 | 8.65 | 106,398 | 0.37 | (3) | 0.63 | 1.48 | 23 | |||||||||||||||||||||||||||||||||||||||||
Class I | ||||||||||||||||||||||||||||||||||||||||||||||||||||||||
2021@ | $ | 14.03 | $ | 0.04 | $ | 0.55 | $ | 0.59 | $ | (0.04) | $ — | $ | (0.04) | $ | 14.58 | 4.23 | % | $ | 5 | 0.60 | % | 0.85 | % | 0.58 | % | 2 | % | |||||||||||||||||||||||||||||
2021 | 11.45 | 0.10 | 3.01 | 3.11 | (0.29) | (0.24) | (0.53) | 14.03 | 27.44 | 2 | 0.33 | ‡ | 0.38 | ‡ | 0.70 | 16 | ||||||||||||||||||||||||||||||||||||||||
2020 | 12.63 | 0.35 | (0.92) | (0.57) | (0.40) | (0.21) | (0.61) | 11.45 | (5.04) | — | —^^ | —^^ | 2.68 | 27 | ||||||||||||||||||||||||||||||||||||||||||
2019 | 12.78 | 0.31 | (0.05) | 0.26 | (0.25) | (0.16) | (0.41) | 12.63 | 2.30 | — | —^ | —^ | 2.44 | 14 | ||||||||||||||||||||||||||||||||||||||||||
2018 | 12.13 | 0.19 | 0.66 | 0.85 | (0.20) | — | (0.20) | 12.78 | 7.00 | 1 | 0.60 | 0.82 | 1.49 | 11 | ||||||||||||||||||||||||||||||||||||||||||
2017 | 11.77 | 0.25 | 0.71 | 0.96 | (0.27) | (0.33) | (0.60) | 12.13 | 8.37 | 103 | 0.60 | (3) | 0.86 | 2.05 | 23 | |||||||||||||||||||||||||||||||||||||||||
| @ | For the six-month period ended September 30, 2021. All ratios for the period have been annualized. |
| * | Per share calculations were performed using average shares. |
| ** | The expense ratios do not include expenses of the underlying affiliated investment companies. |
| † | Returns and portfolio turnover rate are for the period indicated and have not been annualized. Returns shown do not reflect the deduction of taxes that a shareholder would pay on Fund distributions or the redemption of Fund shares. |
| ^ | The ratio appears lower due to the relative net asset value of Class I. Prospectively, it is expected the ratio of net expenses to average net assets would approximate 0.60% (0.82% excluding waivers). |
| ^^ | The ratio appears lower due to the relative net asset value of Class I. Prospectively, it is expected the ratio of net expenses to average net assets would approximate 0.60% (0.84% excluding waivers). |
| ‡ | The ratio appears lower due to the relative net asset value of Class I. Prospectively, it is expected the ratio of net expenses to average net assets would approximate 0.60% (0.85% excluding waivers). |
| (1) | The expense ratio includes Trustee and Proxy fees that are not subject to any voluntary expense waiver or reimbursement agreement. Had the fees been excluded the ratios would have been 0.35%, 1.10%, and 0.60%, for classes F, D, and I, respectively. |
| (2) | The expense ratio includes Trustee and Proxy fees that are not subject to any voluntary expense waiver or reimbursement agreement. Had the fees been excluded the ratio would have been 0.35% for class F. |
| (3) | The expense ratio includes Trustee and Proxy fees that are not subject to any voluntary expense waiver or reimbursement agreement. Had the fees been excluded the ratio would have been 0.35% and 0.60% for class F and I, respectively. |
Amounts designated as “—” are $0 or have been rounded to $0.
| 30 | SEI Asset Allocation Trust / Semi-Annual Report / September 30, 2021 |
FINANCIAL HIGHLIGHTS
For the six months ended September 30, 2021 (Unaudited) and the years ended March 31,
For a Share Outstanding Throughout Each Period
| Net Asset Value, Beginning of Period | Net Investment Income* | Net Realized and Unrealized Gains (Losses) from Affiliated Funds* | Total from | Dividends from Net Investment Income | Distributions from Realized Capital Gains | Total Dividends and Distributions | Net Asset of Period | Total Return† | Net Assets End of Period($ Thousands) | Ratio of to Average | Ratio of Expenses to Average Net Assets (Excluding Waivers)** | Ratio of Net Investment to Average | Portfolio Turnover Rate† | |||||||||||||||||||||||||||||||||||||||||||
Core Market Strategy Allocation Fund |
| |||||||||||||||||||||||||||||||||||||||||||||||||||||||
Class F | ||||||||||||||||||||||||||||||||||||||||||||||||||||||||
2021@ | $ | 22.35 | $ | 0.10 | $ | 1.10 | $ | 1.20 | $ | (0.10 | ) | $ — | $ | (0.10 | ) | $ | 23.45 | 5.38 | % | $ | 26,277 | 0.35 | % | 0.60 | % | 0.85 | % | 2 | % | |||||||||||||||||||||||||||
2021 | 15.31 | 0.24 | 8.00 | 8.24 | (0.27 | ) | (0.93 | ) | (1.20 | ) | 22.35 | 54.79 | 25,876 | 0.35 | 0.60 | 1.23 | 5 | |||||||||||||||||||||||||||||||||||||||
2020 | 18.64 | 0.29 | (2.66 | ) | (2.37 | ) | (0.30 | ) | (0.66 | ) | (0.96 | ) | 15.31 | (13.80 | ) | 20,498 | 0.35 | 0.59 | 1.51 | 10 | ||||||||||||||||||||||||||||||||||||
2019 | 18.99 | 0.24 | 0.03 | 0.27 | (0.26 | ) | (0.36 | ) | (0.62 | ) | 18.64 | 1.64 | 27,686 | 0.35 | 0.57 | 1.25 | 17 | |||||||||||||||||||||||||||||||||||||||
2018 | 17.42 | 0.22 | 2.20 | 2.42 | (0.24 | ) | (0.61 | ) | (0.85 | ) | 18.99 | 13.98 | 28,825 | 0.35 | 0.57 | 1.16 | 13 | |||||||||||||||||||||||||||||||||||||||
2017 | 15.41 | 0.19 | 2.03 | 2.22 | (0.21 | ) | — | (0.21 | ) | 17.42 | 14.55 | 26,980 | 0.37 | (1) | 0.63 | 1.18 | 15 | |||||||||||||||||||||||||||||||||||||||
Market Growth Strategy Fund |
| |||||||||||||||||||||||||||||||||||||||||||||||||||||||
Class F | ||||||||||||||||||||||||||||||||||||||||||||||||||||||||
2021@ | $ | 14.60 | $ | 0.05 | $ | 0.62 | $ | 0.67 | $ | (0.05 | ) | $ — | $ | (0.05 | ) | $ | 15.22 | 4.58 | % | $ | 181,639 | 0.35 | % | 0.60 | % | 0.66 | % | 1 | % | |||||||||||||||||||||||||||
2021 | 11.42 | 0.18 | 3.56 | 3.74 | (0.29 | ) | (0.27 | ) | (0.56 | ) | 14.60 | 33.05 | 184,903 | 0.35 | 0.60 | 1.34 | 13 | |||||||||||||||||||||||||||||||||||||||
2020 | 12.96 | 0.24 | (1.19 | ) | (0.95 | ) | (0.43 | ) | (0.16 | ) | (0.59 | ) | 11.42 | (8.00 | ) | 161,376 | 0.35 | 0.59 | 1.83 | 20 | ||||||||||||||||||||||||||||||||||||
2019 | 13.11 | 0.26 | (0.10 | ) | 0.16 | (0.31 | ) | — | (0.31 | ) | 12.96 | 1.42 | 221,526 | 0.35 | 0.57 | 2.01 | 12 | |||||||||||||||||||||||||||||||||||||||
2018 | 12.26 | 0.17 | 0.92 | 1.09 | (0.24 | ) | — | (0.24 | ) | 13.11 | 8.92 | 263,954 | 0.35 | 0.57 | 1.29 | 7 | ||||||||||||||||||||||||||||||||||||||||
2017 | 11.40 | 0.16 | 0.98 | 1.14 | (0.28 | ) | — | (0.28 | ) | 12.26 | 10.15 | 286,089 | 0.37 | (2) | 0.63 | 1.33 | 20 | |||||||||||||||||||||||||||||||||||||||
Class D | ||||||||||||||||||||||||||||||||||||||||||||||||||||||||
2021@ | $ | 14.51 | $ | — | $ | 0.60 | $ | 0.60 | $ | — | $ — | $ | — | $ | 15.11 | 4.14 | % | $ | 2,263 | 1.10 | % | 1.35 | % | (0.03 | )% | 1 | % | |||||||||||||||||||||||||||||
2021 | 11.36 | 0.07 | 3.55 | 3.62 | (0.20 | ) | (0.27 | ) | (0.47 | ) | 14.51 | 32.00 | 5,307 | 1.10 | 1.35 | 0.56 | 13 | |||||||||||||||||||||||||||||||||||||||
2020 | 12.89 | 0.15 | (1.19 | ) | (1.04 | ) | (0.33 | ) | (0.16 | ) | (0.49 | ) | 11.36 | (8.65 | ) | 4,749 | 1.10 | 1.34 | 1.12 | 20 | ||||||||||||||||||||||||||||||||||||
2019 | 13.04 | 0.17 | (0.10 | ) | 0.07 | (0.22 | ) | — | (0.22 | ) | 12.89 | 0.66 | 5,203 | 1.10 | 1.32 | 1.33 | 12 | |||||||||||||||||||||||||||||||||||||||
2018 | 12.20 | 0.06 | 0.93 | 0.99 | (0.15 | ) | — | (0.15 | ) | 13.04 | �� | 8.13 | 5,779 | 1.10 | 1.32 | 0.49 | 7 | |||||||||||||||||||||||||||||||||||||||
2017 | 11.35 | 0.08 | 0.98 | 1.06 | (0.21 | ) | — | (0.21 | ) | 12.20 | 9.37 | 6,496 | 1.11 | (2) | 1.38 | 0.66 | 20 | |||||||||||||||||||||||||||||||||||||||
Class I | ||||||||||||||||||||||||||||||||||||||||||||||||||||||||
2021@ | $ | 14.36 | $ | 0.03 | $ | 0.60 | $ | 0.63 | $ | (0.03 | ) | $ — | $ | (0.03 | ) | $ | 14.96 | 4.39 | % | $ | 4,666 | 0.60 | % | 0.85 | % | 0.40 | % | 1 | % | |||||||||||||||||||||||||||
2021 | 11.24 | 0.15 | 3.50 | 3.65 | (0.26 | ) | (0.27 | ) | (0.53 | ) | 14.36 | 32.71 | 4,423 | 0.60 | 0.85 | 1.14 | 13 | |||||||||||||||||||||||||||||||||||||||
2020 | 12.76 | 0.15 | (1.11 | ) | (0.96 | ) | (0.40 | ) | (0.16 | ) | (0.56 | ) | 11.24 | (8.21 | ) | 3,352 | 0.60 | 0.84 | 1.12 | 20 | ||||||||||||||||||||||||||||||||||||
2019 | 12.91 | 0.22 | (0.09 | ) | 0.13 | (0.28 | ) | — | (0.28 | ) | 12.76 | 1.18 | 6,584 | 0.60 | 0.82 | 1.76 | 12 | |||||||||||||||||||||||||||||||||||||||
2018 | 12.08 | 0.12 | 0.92 | 1.04 | (0.21 | ) | — | (0.21 | ) | 12.91 | 8.61 | 7,527 | 0.60 | 0.82 | 0.97 | 7 | ||||||||||||||||||||||||||||||||||||||||
2017 | 11.23 | 0.11 | 0.99 | 1.10 | (0.25 | ) | — | (0.25 | ) | 12.08 | 9.94 | 8,658 | 0.62 | (2) | 0.88 | 0.98 | 20 | |||||||||||||||||||||||||||||||||||||||
Market Growth Strategy Allocation Fund |
| |||||||||||||||||||||||||||||||||||||||||||||||||||||||
Class F | ||||||||||||||||||||||||||||||||||||||||||||||||||||||||
2021@ | $ | 28.65 | $ | 0.13 | $ | 1.41 | $ | 1.54 | $ | (0.13 | ) | $ — | $ | (0.13 | ) | $ | 30.06 | 5.37 | % | $ | 139,776 | 0.35 | % | 0.60 | % | 0.84 | % | 1 | % | |||||||||||||||||||||||||||
2021 | 19.50 | 0.30 | 10.22 | 10.52 | (0.34 | ) | (1.03 | ) | (1.37 | ) | 28.65 | 54.87 | 135,260 | 0.35 | 0.60 | 1.22 | 4 | |||||||||||||||||||||||||||||||||||||||
2020 | 23.46 | 0.36 | (3.42 | ) | (3.06 | ) | (0.37 | ) | (0.53 | ) | (0.90 | ) | 19.50 | (13.83 | ) | 100,226 | 0.35 | 0.59 | 1.51 | 10 | ||||||||||||||||||||||||||||||||||||
2019 | 23.61 | 0.29 | 0.07 | 0.36 | (0.32 | ) | (0.19 | ) | (0.51 | ) | 23.46 | 1.66 | 133,196 | 0.35 | 0.57 | 1.23 | 9 | |||||||||||||||||||||||||||||||||||||||
2018 | 20.98 | 0.26 | 2.66 | 2.92 | (0.29 | ) | — | (0.29 | ) | 23.61 | 13.99 | 134,878 | 0.35 | 0.57 | 1.17 | 7 | ||||||||||||||||||||||||||||||||||||||||
2017 | 18.56 | 0.23 | 2.45 | 2.68 | (0.26 | ) | — | (0.26 | ) | 20.98 | 14.55 | 128,414 | 0.37 | (1) | 0.63 | 1.17 | 9 | |||||||||||||||||||||||||||||||||||||||
| @ | For the six-month period ended September 30, 2021. All ratios for the period have been annualized. |
| * | Per share calculations were performed using average shares. |
| ** | The expense ratios do not include expenses of the underlying affiliated investment companies. |
| † | Returns and portfolio turnover rate are for the period indicated and have not been annualized. Returns shown do not reflect the deduction of taxes that a shareholder would pay on Fund distributions or the redemption of Fund shares. |
| (1) | The expense ratio includes Trustee and Proxy fees that are not subject to any voluntary expense waiver or reimbursement agreement. Had the fees been excluded the ratio would have been 0.35% for class F. |
| (2) | The expense ratio includes Trustee and Proxy fees that are not subject to any voluntary expense waiver or reimbursement agreement. Had the fees been excluded the ratios would have been 0.35%, 1.10% and 0.60% for classes F, D, and I, respectively. |
Amounts designated as “—” are $0 or have been rounded to $0.
The accompanying notes are an integral part of the financial statements.
| SEI Asset Allocation Trust / Semi-Annual Report / September 30, 2021 | 31 |
NOTES TO FINANCIAL STATEMENTS (Unaudited)
September 30, 2021
1. ORGANIZATION
SEI Asset Allocation Trust (the “Trust”) is organized as a Massachusetts Business Trust under a Declaration of Trust dated November 20, 1995. The Trust is registered under the Investment Company Act of 1940, as amended (“1940 Act”), as an open-end investment company with twelve funds: Defensive Strategy Fund, Defensive Strategy Allocation Fund, Conservative Strategy Fund, Conservative Strategy Allocation Fund, Moderate Strategy Fund, Moderate Strategy Allocation Fund, Aggressive Strategy Fund, Tax- Managed Aggressive Strategy Fund, Core Market Strategy Fund, Core Market Strategy Allocation Fund, Market Growth Strategy Fund and Market Growth Strategy Allocation Fund (each a “Fund,” collectively the “Funds”). Each Fund is a “fund of funds” and offers shareholders the opportunity to invest in certain underlying affiliated investment companies, which are separately managed series of the following investment companies: SEI Daily Income Trust, SEI Institutional Managed Trust, and SEI Institutional International Trust. The Declaration of Trust permits the Trust to offer separate classes of shares in each Fund, as follows: Defensive Strategy Fund, Conservative Strategy Fund, Moderate Strategy Fund, Aggressive Strategy Fund, Core Market Strategy Fund and Market Growth Strategy Fund offer Class F (formerly Class A), Class D and Class I Shares; Defensive Strategy Allocation Fund, Conservative Strategy Allocation Fund, Moderate Strategy Allocation Fund, Tax-Managed Aggressive Strategy Fund, Core Market Strategy Allocation Fund, and Market Growth Strategy Allocation Fund offer Class F Shares. The assets of each Fund are segregated, and a shareholder’s interest is limited to the Fund in which shares are held. The Trust’s prospectuses provide a description of each Fund’s investment objective and strategies.
As of September 30, 2021, the Class D shares of Defensive Strategy Fund and Core Market Strategy Fund had not yet commenced operations.
2. SIGNIFICANT ACCOUNTING POLICIES
The following are significant accounting policies, which are consistently followed in the preparation of its financial statements by the Funds. The Funds are investment companies that apply the accounting and reporting guidance issued in Topic 946 by the U.S. Financial Accounting Standards Board (“FASB”).
Use of Estimates — The preparation of financial statements, in conformity with U.S. generally accepted accounting principles (“U.S. GAAP”), requires management to make estimates and assumptions that affect the reported amount of assets and liabilities and disclosure of contingent assets at the date of
the financial statements, and the reported results of operations during the reporting period. Actual results could differ from those estimates.
Security Valuation — The assets of each Fund consist primarily of the investments in underlying affiliated investment companies, which are valued at their respective daily net asset values in accordance with Board-approved pricing procedures.
In accordance with U.S. GAAP, fair value is defined as the price that a Fund would receive upon selling an investment in an orderly transaction to an independent buyer in the principal or most advantageous market of the investment. A three tier hierarchy has been established to maximize the use of observable and minimize the use of unobservable inputs and to establish classification of fair value measurements for disclosure purposes. Inputs refer broadly to the assumptions that market participants would use in pricing an asset. Inputs may be observable or unobservable. Observable inputs are inputs that reflect the assumptions market participants would use in pricing the asset or liability based on market data obtained from sources independent of the reporting entity. Unobservable inputs are inputs that reflect the reporting entity’s own assumptions about the assumptions market participants would use in pricing the asset or liability based on the best information available in the circumstances.
The three-tier hierarchy of inputs is summarized in the three broad Levels listed below:
Level 1 — quoted prices in active markets for identical investments
Level 2 — other significant observable inputs (including quoted prices for similar investments, interest rates, prepayment speeds, credit risks, etc.)
Level 3 — significant unobservable inputs (including the Fund’s own assumptions in determining the fair value of investments)
The valuation techniques used by the Funds to measure fair value during the six-month period ended September 30, 2021 maximized the use of observable inputs and minimized the use of unobservable inputs.
During the six-month period ended September 30, 2021, there were no significant changes to the Trust’s fair valuation methodologies. For details of the investment classification, reference the Schedules of Investments.
Security Transactions and Related Income — Security transactions are accounted for on trade date. Dividend income received from the affiliated funds is recognized on the ex-dividend date and is recorded as income distributions in the Statement of Operations. Capital gain distributions received from the affiliated funds
| 32 | SEI Asset Allocation Trust / Semi-Annual Report / September 30, 2021 |
are recognized on ex-dividend date and are recorded on the Statement of Operations as such. Costs used in determining realized gains and losses on the sales of investment securities are on the basis of specific identification.
Expenses — Expenses that are directly related to one of the Funds are charged directly to that Fund. Other operating expenses of the Trust are allocated to the Funds on the basis of relative daily net assets.
Expenses included in the accompanying financial statements reflect the expenses of each Fund and do not include any expenses associated with the underlying funds.
Classes — Class-specific expenses are borne by that class of shares. Income, realized and unrealized gains/ losses and non-class-specific expenses are allocated to the respective classes on the basis of relative daily net assets.
Dividends and Distributions to Shareholders — Dividends and distributions to shareholders which are determined in accordance with Federal tax regulations are recorded on the ex-dividend date. Distributions from net investment income are declared and paid to shareholders periodically for each Fund. Any net realized capital gain for each Fund is distributed to shareholders at least annually.
Forward Foreign Currency Contracts — To the extent consistent with its investment objective and strategies, a Fund may enter into forward foreign currency contracts as hedges against either specific transactions, fund positions or anticipated fund positions. A Fund may also engage in currency transactions to enhance that Fund’s returns. All commitments are “marked-to-market” daily at the applicable foreign exchange rate, and any resulting unrealized gains or losses are recorded currently. The Funds realize gains and losses at the time forward contracts are extinguished. Unrealized gains or losses on outstanding positions in forward foreign currency contracts held at the close of the period are recognized as ordinary income or loss for Federal income tax purposes. The Funds could be exposed to risk if the counterparties to the contracts are unable to meet the terms of the contract and from unanticipated movements in the value of a foreign currency relative to the U.S. dollar. Finally, the risk exists that losses could exceed amounts disclosed on the Statements of Assets and Liabilities. It is the Funds’ policy to present the gross unrealized appreciation and gross unrealized depreciation of the forward foreign currency contracts separately on the Statements of Assets and Liabilities, as the Funds do not have a master netting agreement with the counterparty to the forward foreign currency contracts. As of and for the six-month period ended
September 30, 2021 the Funds did not utilize forward foreign currency contracts.
3. INVESTMENT ADVISORY, ADMINISTRATION AND DISTRIBUTION AGREEMENTS AND OTHER TRANSACTIONS WITH AFFILIATES
Investment Advisory, Administration and Distribution Agreements — SEI Investments Management Corporation (“SIMC”) serves as investment adviser (the “Adviser”) to each Fund. In connection with serving as Adviser, SIMC is entitled to a fee, which is calculated daily and paid monthly, based on each Fund’s average daily net assets.
SEI Investments Global Funds Services (the “Administrator”) provides the Trust with administrative and transfer agency services. For its services, the Administrator is entitled to a fee, which is calculated daily and paid monthly, based on the average daily net assets of each Fund.
SEI Investments Distribution Co. (the “Distributor”), a wholly owned subsidiary of SEI Investments Company (“SEI”) and a registered broker-dealer, acts as the Distributor of the shares of the Trust. Pursuant to Rule 12b-1 under the 1940 Act, the Funds have adopted a distribution and shareholder services plan (the Distribution Plan) with respect to Class D Shares that allows Class D Shares to pay fees to service providers, based on average daily net assets of the Class D Shares, to compensate them for distribution services or shareholder services with respect to Class D Shares.
In addition, the Funds have adopted a shareholder services plan (the Service Plan) with respect to Class F, D and I Shares that allows such Shares to pay service providers a fee, based on average daily net assets of each respective Class of Shares, in connection with the ongoing servicing of shareholder accounts owning such Shares. The Funds have also adopted an administrative services plan and agreement (the “Administrative Service Plan”) with respect to Class I Shares that allows such Shares to pay service providers a fee, based on average daily net assets of the Class I Shares, in connection with ongoing administrative services for shareholder accounts owning such Shares.
The Funds’ Distribution, Service and Administrative Service Plans provide that distribution fees, shareholder service fees and administrative service fees, as applicable, will be paid to SEI Investments Distribution Co., which may then be used by SEI Investments Distribution Co. to compensate financial intermediaries for providing distribution, shareholder services or administrative services with respect to the Shares.
| SEI Asset Allocation Trust / Semi-Annual Report / September 30, 2021 | 33 |
NOTES TO FINANCIAL STATEMENTS (Unaudited) (Continued)
September 30, 2021
The Adviser, Administrator and/or Distributor have voluntarily agreed to waive or reimburse the Funds for all or a portion of their fees in order to keep total annual fund operating expenses (exclusive of acquired fund fees and expenses, interest from borrowings, brokerage commissions, taxes, trustees fees, proxy fees and extraordinary expenses not incurred in the ordinary course of the Funds’ business) at a specified
level. These waivers and reimbursements are voluntary and the Funds’ Adviser, Administrator and/or Distributor may discontinue all or part of any of these waivers at any time.
The Administrator, Distributor, and Adviser for the Trust serve in the same capacity for the underlying affiliated investment companies.
The following is a summary of annual fees payable to the Adviser, and Distributor and the voluntary expense limitations for each Fund:
| Advisory Fees | Shareholder Servicing Fees | Administrative Servicing Fees | Distribution Fees* | Voluntary Expense Limitations | ||||||
Defensive Strategy Fund | ||||||||||
Class F | 0.10% | 0.25% | — | — | 0.21% | |||||
Class I | 0.10% | 0.25% | 0.25% | — | 0.46% | |||||
Defensive Strategy Allocation Fund | ||||||||||
Class F | 0.10% | 0.25% | — | — | 0.35% | |||||
Conservative Strategy Fund | ||||||||||
Class F | 0.10% | 0.25% | — | — | 0.26% | |||||
Class D | 0.10% | 0.25% | — | 0.75% | 1.01% | |||||
Class I | 0.10% | 0.25% | 0.25% | — | 0.51% | |||||
Conservative Strategy Allocation Fund | ||||||||||
Class F | 0.10% | 0.25% | — | — | 0.35% | |||||
Moderate Strategy Fund | ||||||||||
Class F | 0.10% | 0.25% | — | — | 0.31% | |||||
Class D | 0.10% | 0.25% | — | 0.75% | 1.06% | |||||
Class I | 0.10% | 0.25% | 0.25% | — | 0.56% | |||||
Moderate Strategy Allocation Fund | ||||||||||
Class F | 0.10% | 0.25% | — | — | 0.35% | |||||
Aggressive Strategy Fund | ||||||||||
Class F | 0.10% | 0.25% | — | — | 0.35% | |||||
Class D | 0.10% | 0.25% | — | 0.75% | 1.10% | |||||
Class I | 0.10% | 0.25% | 0.25% | — | 0.60% | |||||
Tax-Managed Aggressive Strategy Fund | ||||||||||
Class F | 0.10% | 0.25% | — | — | 0.35% | |||||
Core Market Strategy Fund | ||||||||||
Class F | 0.10% | 0.25% | — | — | 0.35% | |||||
Class I | 0.10% | 0.25% | 0.25% | — | 0.60% | |||||
Core Market Strategy Allocation Fund | ||||||||||
Class F | 0.10% | 0.25% | — | — | 0.35% | |||||
Market Growth Strategy Fund | ||||||||||
Class F | 0.10% | 0.25% | — | — | 0.35% | |||||
Class D | 0.10% | 0.25% | — | 0.75% | 1.10% | |||||
Class I | 0.10% | 0.25% | 0.25% | — | 0.60% | |||||
Market Growth Strategy Allocation Fund | ||||||||||
Class F | 0.10% | 0.25% | — | — | 0.35% | |||||
| * | These payments are characterized as “compensation” and are not directly tied to expenses incurred by the Distributor. The payments the Distributor receives during any year may therefore be higher or lower than its actual expenses. |
| 34 | SEI Asset Allocation Trust / Semi-Annual Report / September 30, 2021 |
The Trust will pay the Administrator the following fees at the annual rate set forth below based upon the aggregate average daily net assets of the Trust:
| First $1.5 Billion | Next $500 Million | Next $500 Million | Next $500 Million | Over $3 Billion | ||||||||||||||||
Defensive Strategy Fund | 0.150 | % | 0.1375 | % | 0.1250 | % | 0.1125 | % | 0.10 | % | ||||||||||
Defensive Strategy Allocation Fund | 0.150 | % | 0.1375 | % | 0.1250 | % | 0.1125 | % | 0.10 | % | ||||||||||
Conservative Strategy Fund | 0.150 | % | 0.1375 | % | 0.1250 | % | 0.1125 | % | 0.10 | % | ||||||||||
Conservative Strategy Allocation Fund | 0.150 | % | 0.1375 | % | 0.1250 | % | 0.1125 | % | 0.10 | % | ||||||||||
Moderate Strategy Fund | 0.150 | % | 0.1375 | % | 0.1250 | % | 0.1125 | % | 0.10 | % | ||||||||||
Moderate Strategy Allocation Fund | 0.150 | % | 0.1375 | % | 0.1250 | % | 0.1125 | % | 0.10 | % | ||||||||||
Aggressive Strategy Fund | 0.150 | % | 0.1375 | % | 0.1250 | % | 0.1125 | % | 0.10 | % | ||||||||||
Tax-Managed Aggressive Strategy Fund | 0.150 | % | 0.1375 | % | 0.1250 | % | 0.1125 | % | 0.10 | % | ||||||||||
Core Market Strategy Fund | 0.150 | % | 0.1375 | % | 0.1250 | % | 0.1125 | % | 0.10 | % | ||||||||||
Core Market Strategy Allocation Fund | 0.150 | % | 0.1375 | % | 0.1250 | % | 0.1125 | % | 0.10 | % | ||||||||||
Market Growth Strategy Fund | 0.150 | % | 0.1375 | % | 0.1250 | % | 0.1125 | % | 0.10 | % | ||||||||||
Market Growth Strategy Allocation Fund | 0.150 | % | 0.1375 | % | 0.1250 | % | 0.1125 | % | 0.10 | % | ||||||||||
Interfund Lending — The SEC has granted an exemption that permits the Trust to participate in an interfund lending program (the “Program”) with existing or future investment companies registered under the 1940 Act that are advised by SIMC (the “SEI Funds”). The Program allows the SEI Funds to lend money to and borrow money from each other for temporary or emergency purposes. Participation in the Program is voluntary for both borrowing and lending funds. Interfund loans may be made only when the rate of interest to be charged is more favorable to the lending fund than an investment in overnight repurchase agreements (“Repo Rate”), and more favorable to the borrowing fund than the rate of interest that would be charged by a bank for short-term borrowings (“Bank Loan Rate”). The Bank Loan Rate will be determined using a formula reviewed annually by the SEI Funds’ Board of Trustees. The interest rate imposed on interfund loans is the average of the Repo Rate and the Bank Loan Rate. For the six-month period ended September 30, 2021, the Trust has not participated in the Program.
Other — Certain officers and Trustees of the Trust are also officers and/or Directors of the Administrator, the Adviser and/or the Distributor. The Trust pays each unaffiliated Trustee an annual fee for attendance at quarterly, interim, and committee meetings. The Administrator or the Adviser pays compensation of officers and affiliated Trustees.
A portion of the services provided by the Chief Compliance Officer (“CCO”) and his staff, whom are employees of the Administrator, are paid for by the Trust as incurred. The services include regulatory oversight of the Trust’s Adviser and service providers.
| SEI Asset Allocation Trust / Semi-Annual Report / September 30, 2021 | 35 |
NOTES TO FINANCIAL STATEMENTS (Unaudited) (Continued)
September 30, 2021
4. CAPITAL SHARE TRANSACTIONS
For the six-month period ended September 30, 2021 (Unaudited) and the year ended March 31, 2021, Capital Share transactions for the Funds were as follows (Thousands):
| Defensive Strategy Fund | Defensive Strategy Allocation Fund | Conservative Strategy Fund | Conservative Strategy Allocation Fund | |||||||||||||||||||||||||||||
| 4/01/21 - 9/30/21 | 2021 | 4/01/21 - 9/30/21 | 2021 | 4/01/21 - 9/30/21 | 2021 | 4/01/21 - 9/30/21 | 2021 | |||||||||||||||||||||||||
Shares Issued and Redeemed: | ||||||||||||||||||||||||||||||||
Class F: | ||||||||||||||||||||||||||||||||
Shares Issued | 270 | 4,488 | 28 | 143 | 372 | 1,327 | 25 | 162 | ||||||||||||||||||||||||
Shares Issued in Lieu of Cash Distributions | 7 | 37 | 2 | 10 | 32 | 134 | 33 | 85 | ||||||||||||||||||||||||
Shares Redeemed | (424 | ) | (4,459 | ) | (81 | ) | (286 | ) | (761 | ) | (1,758 | ) | (213 | ) | (958 | ) | ||||||||||||||||
Total Class F Transactions | (147 | ) | 66 | (51 | ) | (133 | ) | (357 | ) | (297 | ) | (155 | ) | (711 | ) | |||||||||||||||||
Shares Issued and Redeemed: | ||||||||||||||||||||||||||||||||
Class D: | ||||||||||||||||||||||||||||||||
Shares Issued | N/A | N/A | N/A | N/A | 15 | 152 | N/A | N/A | ||||||||||||||||||||||||
Shares Issued in Lieu of Cash Distributions | N/A | N/A | N/A | N/A | 1 | 5 | N/A | N/A | ||||||||||||||||||||||||
Shares Redeemed | N/A | N/A | N/A | N/A | (403 | ) | (100 | ) | N/A | N/A | ||||||||||||||||||||||
Total Class D Transactions | N/A | N/A | N/A | N/A | (387 | ) | 57 | N/A | N/A | |||||||||||||||||||||||
Shares Issued and Redeemed: | ||||||||||||||||||||||||||||||||
Class I: | ||||||||||||||||||||||||||||||||
Shares Issued | 38 | 10 | N/A | N/A | 4 | 7 | N/A | N/A | ||||||||||||||||||||||||
Shares Issued in Lieu of Cash Distributions | — | 1 | N/A | N/A | — | 1 | N/A | N/A | ||||||||||||||||||||||||
Shares Redeemed | (6 | ) | (19 | ) | N/A | N/A | (8 | ) | (55 | ) | N/A | N/A | ||||||||||||||||||||
Total Class I Transactions | 32 | (8 | ) | N/A | N/A | (4 | ) | (47 | ) | N/A | N/A | |||||||||||||||||||||
Increase (Decrease) in Capital Shares | (115 | ) | 58 | (51 | ) | (133 | ) | (748 | ) | (287 | ) | (155 | ) | (711 | ) | |||||||||||||||||
| ||||||||||||||||||||||||||||||||
| Moderate Strategy Fund | Moderate Strategy Allocation Fund | Aggressive Strategy Fund | Tax-Managed Aggressive Strategy Fund | |||||||||||||||||||||||||||||
| 4/01/21 - 9/30/21 | 2021 | 4/01/21 - 9/30/21 | 2021 | 4/01/21 - 9/30/21 | 2021 | 4/01/21 - 9/30/21 | 2021 | |||||||||||||||||||||||||
Shares Issued and Redeemed: | ||||||||||||||||||||||||||||||||
Class F: | ||||||||||||||||||||||||||||||||
Shares Issued | 430 | 4,315 | 283 | 329 | 1,474 | 1,059 | 49 | 202 | ||||||||||||||||||||||||
Shares Issued in Lieu of Cash Distributions | 63 | 321 | 48 | 219 | 20 | 349 | 14 | 130 | ||||||||||||||||||||||||
Shares Redeemed | (1,878 | ) | (6,017 | ) | (283 | ) | (868 | ) | (1,587 | ) | (2,301 | ) | (131 | ) | (352 | ) | ||||||||||||||||
Total Class F Transactions | (1,385 | ) | (1,381 | ) | 48 | (320 | ) | (93 | ) | (893 | ) | (68 | ) | (20 | ) | |||||||||||||||||
Shares Issued and Redeemed: | ||||||||||||||||||||||||||||||||
Class D: | ||||||||||||||||||||||||||||||||
Shares Issued | 15 | 37 | N/A | N/A | 37 | 131 | N/A | N/A | ||||||||||||||||||||||||
Shares Issued in Lieu of Cash Distributions | 1 | 6 | N/A | N/A | — | 40 | N/A | N/A | ||||||||||||||||||||||||
Shares Redeemed | (299 | ) | (40 | ) | N/A | N/A | (1,079 | ) | (91 | ) | N/A | N/A | ||||||||||||||||||||
Total Class D Transactions | (283 | ) | 3 | N/A | N/A | (1,042 | ) | 80 | N/A | N/A | ||||||||||||||||||||||
Shares Issued and Redeemed: | ||||||||||||||||||||||||||||||||
Class I: | ||||||||||||||||||||||||||||||||
Shares Issued | 32 | 26 | N/A | N/A | 36 | 74 | N/A | N/A | ||||||||||||||||||||||||
Shares Issued in Lieu of Cash Distributions | 1 | 4 | N/A | N/A | 1 | 22 | N/A | N/A | ||||||||||||||||||||||||
Shares Redeemed | (25 | ) | (30 | ) | N/A | N/A | (50 | ) | (68 | ) | N/A | N/A | ||||||||||||||||||||
Total Class I Transactions | 8 | — | N/A | N/A | (13 | ) | 28 | N/A | N/A | |||||||||||||||||||||||
Increase (Decrease) in Capital Shares | (1,660 | ) | (1,378 | ) | 48 | (320 | ) | (1,148 | ) | (785 | ) | (68 | ) | (20 | ) | |||||||||||||||||
| 36 | SEI Asset Allocation Trust / Semi-Annual Report / September 30, 2021 |
| Core Market Strategy Fund | Core Market Strategy Allocation Fund | Market Growth Strategy Fund | Market Growth Strategy Allocation Fund | |||||||||||||||||||||||||||||
| 4/01/21 - 9/30/21 | 2021 | 4/01/21 - 9/30/21 | 2021 | 4/01/21 - 9/30/21 | 2021 | 4/01/21 - 9/30/21 | 2021 | |||||||||||||||||||||||||
Shares Issued and Redeemed: | ||||||||||||||||||||||||||||||||
Class F: | ||||||||||||||||||||||||||||||||
Shares Issued | 96 | 448 | 21 | 51 | 382 | 1,031 | 35 | 144 | ||||||||||||||||||||||||
Shares Issued in Lieu of Cash Distributions | 26 | 281 | 4 | 65 | 39 | 509 | 20 | 244 | ||||||||||||||||||||||||
Shares Redeemed | (780 | ) | (1,486 | ) | (63 | ) | (298 | ) | (1,150 | ) | (3,002 | ) | (126 | ) | (805) | |||||||||||||||||
Total Class F Transactions | (658 | ) | (757 | ) | (38 | ) | (182 | ) | (729 | ) | (1,462 | ) | (71 | ) | (417) | |||||||||||||||||
Shares Issued and Redeemed: | ||||||||||||||||||||||||||||||||
Class D: | ||||||||||||||||||||||||||||||||
Shares Issued | N/A | N/A | N/A | N/A | 15 | 46 | N/A | N/A | ||||||||||||||||||||||||
Shares Issued in Lieu of Cash Distributions | N/A | N/A | N/A | N/A | — | 12 | N/A | N/A | ||||||||||||||||||||||||
Shares Redeemed | N/A | N/A | N/A | N/A | (231 | ) | (110 | ) | N/A | N/A | ||||||||||||||||||||||
Total Class D Transactions | N/A | N/A | N/A | N/A | (216 | ) | (52 | ) | N/A | N/A | ||||||||||||||||||||||
Shares Issued and Redeemed: | ||||||||||||||||||||||||||||||||
Class I: | ||||||||||||||||||||||||||||||||
Shares Issued | — | — | N/A | N/A | 10 | 22 | N/A | N/A | ||||||||||||||||||||||||
Shares Issued in Lieu of Cash Distributions | — | — | N/A | N/A | 1 | 12 | N/A | N/A | ||||||||||||||||||||||||
Shares Redeemed | — | — | N/A | N/A | (7 | ) | (24 | ) | N/A | N/A | ||||||||||||||||||||||
Total Class I Transactions | — | — | N/A | N/A | 4 | 10 | N/A | N/A | ||||||||||||||||||||||||
Decrease in Capital Shares | (658 | ) | (757 | ) | (38 | ) | (182 | ) | (941 | ) | (1,504 | ) | (71 | ) | (417 | ) | ||||||||||||||||
Amounts designated as “—” are zero or have been rounded to zero.
N/A — Not applicable. Class D and Class I shares currently not offered.
5. INVESTMENT TRANSACTIONS
The cost of security purchases and the proceeds from the sale of securities, other than temporary cash investments and futures, during the six-month period ended September 30, 2021 were as follows ($ Thousands):
| Total | ||||
| Defensive Strategy Fund | ||||
| Purchases | $ | 2,647 | ||
| Sales | 3,787 | |||
| Defensive Strategy Allocation Fund | ||||
| Purchases | 78 | |||
| Sales | 218 | |||
| Conservative Strategy Fund | ||||
| Purchases | 1,283 | |||
| Sales | 9,719 | |||
| Conservative Strategy Allocation Fund | ||||
| Purchases | 611 | |||
| Sales | 2,625 | |||
| Moderate Strategy Fund | ||||
| Purchases | 3,233 | |||
| Sales | 25,367 | |||
| Moderate Strategy Allocation Fund | ||||
| Purchases | 3,955 | |||
| Sales | 3,960 | |||
| Aggressive Strategy Fund | ||||
| Purchases | 6,415 | |||
| Sales | 26,849 | |||
| Total | ||||
| Tax-Managed Aggressive Strategy Fund | ||||
| Purchases | 1,796 | |||
| Sales | 3,654 | |||
| Core Market Strategy Fund | ||||
| Purchases | 1,197 | |||
| Sales | 9,850 | |||
| Core Market Strategy Allocation Fund | ||||
| Purchases | 525 | |||
| Sales | 1,402 | |||
| Market Growth Strategy Fund | ||||
| Purchases | 2,018 | |||
| Sales | 16,348 | |||
| Market Growth Strategy Allocation | ||||
| Fund | ||||
| Purchases | 1,554 | |||
Sales | 3,725 | |||
6. FEDERAL TAX INFORMATION
It is each Fund’s intention to qualify as a regulated investment company for Federal income tax purposes and distribute all of its taxable income (including net capital gains). Accordingly, no provision for Federal income taxes is required.
Management has analyzed the Funds’ tax positions taken on federal income tax returns for all open tax years (current and prior three tax years) and has concluded that as of March 31, 2021, no provision for income tax is required in the Funds’ financial statements. The Funds’ federal and state income and federal excise tax returns for tax years for which the applicable statutes of limitations have not expired are subject to
| SEI Asset Allocation Trust / Semi-Annual Report / September 30, 2021 | 37 |
NOTES TO FINANCIAL STATEMENTS (Unaudited) (Continued)
September 30, 2021
examination by the Internal Revenue Service and state
departments of revenue.
The tax character of dividends and distributions declared during the years ended March 31, 2021 and March 31, 2020 were as follows ($ Thousands):
| Ordinary Income | Long-Term Capital Gains | Return of Capital | Totals | |||||||||||||||||||||||||||||
| 2021 | 2020 | 2021 | 2020 | 2021 | 2020 | 2021 | 2020 | |||||||||||||||||||||||||
| Defensive Strategy Fund | $ | 371 | $ | 455 | $ | — | $ | — | $ | — | $ | — | $ | 371 | $ | 455 | ||||||||||||||||
| Defensive Strategy Allocation Fund | 118 | 368 | — | 161 | 1 | — | 119 | 529 | ||||||||||||||||||||||||
| Conservative Strategy Fund | 1,248 | 2,096 | 352 | 313 | — | — | 1,600 | 2,409 | ||||||||||||||||||||||||
| Conservative Strategy Allocation Fund | 1,074 | 1,373 | — | 2,191 | — | — | 1,074 | 3,564 | ||||||||||||||||||||||||
| Moderate Strategy Fund | 2,942 | 5,488 | 1,402 | — | — | — | 4,344 | 5,488 | ||||||||||||||||||||||||
| Moderate Strategy Allocation Fund | 1,529 | 2,099 | 2,785 | 4,559 | — | — | 4,314 | 6,658 | ||||||||||||||||||||||||
| Aggressive Strategy Fund | 2,816 | 5,357 | 3,996 | 5,143 | — | — | 6,812 | 10,500 | ||||||||||||||||||||||||
| Tax-Managed Aggressive Strategy Fund | 1,043 | 1,211 | 2,143 | 1,047 | — | — | 3,186 | 2,258 | ||||||||||||||||||||||||
| Core Market Strategy Fund | 1,961 | 3,084 | 1,538 | 1,468 | — | — | 3,499 | 4,552 | ||||||||||||||||||||||||
| Core Market Strategy Allocation Fund | 339 | 425 | 1,129 | 895 | — | — | 1,468 | 1,320 | ||||||||||||||||||||||||
| Market Growth Strategy Fund | 3,974 | 6,867 | 3,657 | 2,466 | — | — | 7,631 | 9,333 | ||||||||||||||||||||||||
| Market Growth Strategy Allocation Fund | 1,709 | 2,073 | 4,962 | 2,768 | — | — | 6,671 | 4,841 | ||||||||||||||||||||||||
As of March 31, 2021, the components of Distributable Earnings (Accumulated Losses) on a tax basis were as follows
($ Thousands):
| Undistributed Ordinary Income | Undistributed Long-Term Capital Gain | Capital Loss Carryforwards | Post- October Losses | Other Temporary Differences | Unrealized Appreciation (Depreciation) | Total Distributable Earnings/ (Accumulated Losses) | ||||||||||||||||||||||
| Defensive Strategy Fund | $ | 190 | $ | 65 | $ | — | $ | — | $ | 4 | $ | 355 | $ | 614 | ||||||||||||||
| Defensive Strategy Allocation Fund | — | — | (1,585 | ) | — | 1 | (35 | ) | (1,619 | ) | ||||||||||||||||||
| Conservative Strategy Fund | 150 | 170 | — | — | — | 672 | 992 | |||||||||||||||||||||
| Conservative Strategy Allocation Fund | 238 | — | (1,089 | ) | — | — | 2,888 | 2,037 | ||||||||||||||||||||
| Moderate Strategy Fund | 751 | 1,299 | — | — | (3 | ) | 2,247 | 4,294 | ||||||||||||||||||||
| Moderate Strategy Allocation Fund | 499 | 2,700 | — | — | (3 | ) | 14,348 | 17,544 | ||||||||||||||||||||
| Aggressive Strategy Fund | 56 | 4,145 | — | — | (2 | ) | 28,990 | 33,189 | ||||||||||||||||||||
| Tax-Managed Aggressive Strategy Fund | — | — | — | — | 2 | 40,423 | 40,425 | |||||||||||||||||||||
| Core Market Strategy Fund | 109 | 1,948 | — | — | — | 5,958 | 8,015 | |||||||||||||||||||||
| Core Market Strategy Allocation Fund | — | 1,152 | — | — | 1 | 12,932 | 14,085 | |||||||||||||||||||||
| Market Growth Strategy Fund | 195 | 4,661 | — | — | — | 19,666 | 24,522 | |||||||||||||||||||||
| Market Growth Strategy Allocation Fund | 2 | 4,185 | — | — | (1) | 65,224 | 69,410 | |||||||||||||||||||||
| 38 | SEI Asset Allocation Trust / Semi-Annual Report / September 30, 2021 |
The Funds had capital loss carryforwards at March 31, 2021 as follows ($ Thousands):
| Short-Term Loss | Long-Term Loss | Total | ||||||||||
Defensive Strategy Allocation Fund | $545 | $1,040 | $ | 1,585 | ||||||||
Conservative Strategy Allocation Fund | 290 | 799 | 1,089 | |||||||||
The Defensive Strategy Fund utilized capital loss carryforward to offset capital gains of $73 ($ Thousands).
For Federal income tax purposes, the cost of investments owned at September 30, 2021, and the net realized gains or losses on investments sold for the period were different from amounts reported for financial reporting purposes. These differences are primarily due to wash sales which cannot be used for Federal income tax purposes in the current year and have been deferred for use in future years. The aggregate gross unrealized appreciation and depreciation on total investments held by the Funds at September 30, 2021, was as follows ($ Thousands):
| Federal Tax Cost | Appreciated Securities | Depreciated Securities | Net Unrealized Appreciation | |||||||||||||
Defensive Strategy Fund | $15,997 | $676 | $— | $676 | ||||||||||||
Defensive Strategy Allocation Fund | 5,570 | 97 | — | 97 | ||||||||||||
Conservative Strategy Fund | 59,147 | 3,216 | (52) | 3,164 | ||||||||||||
Conservative Strategy Allocation Fund | 22,637 | 5,415 | — | 5,415 | ||||||||||||
Moderate Strategy Fund | 121,318 | 9,405 | (27) | 9,378 | ||||||||||||
Moderate Strategy Allocation Fund | 50,999 | 20,317 | — | 20,317 | ||||||||||||
Aggressive Strategy Fund | 129,256 | 41,645 | (1) | 41,644 | ||||||||||||
Tax-Managed Aggressive Strategy Fund | 44,244 | 45,156 | — | 45,156 | ||||||||||||
Core Market Strategy Fund | 61,211 | 12,321 | — | 12,321 | ||||||||||||
Core Market Strategy Allocation Fund | 12,164 | 14,121 | — | 14,121 | ||||||||||||
Market Growth Strategy Fund | 155,141 | 33,862 | (372) | 33,490 | ||||||||||||
Market Growth Strategy Allocation Fund | 66,462 | 73,401 | (46) | 73,355 | ||||||||||||
7. INDEMNIFICATIONS
In the normal course of business, a Fund may enter into contracts that provide general indemnifications by a Fund to the counterparty of the contract. A Fund’s maximum exposure under these arrangements is dependent on future claims that may be made against a Fund and, therefore, cannot be established; however, based on experience, management believes the risk of loss from such claims is considered remote.
8. CONCENTRATION RISK
The Underlying SEI Funds and other investment companies and exchange traded products in which the Funds invest may apply any of a variety of investment strategies and may invest in a broad range of asset classes, securities and other investments to attempt to achieve their designated investment goals.
The following descriptions provide additional information about some of the risks of investing in the Funds:
Asset Allocation Risk — The risk that SIMC’s decisions regarding asset classes and Underlying SEI Funds will not anticipate market trends successfully.
Below Investment Grade Securities (Junk Bonds) Risk — Fixed income securities rated below investment grade ( junk bonds) involve greater risk of default or downgrade and are generally more volatile than investment grade securities because the prospect for repayment of principal and interest of many of these securities is speculative. Because these securities typically offer a higher rate of return to compensate for these risks, they are sometimes referred to as “high yield bonds,” but there is no guarantee that an investment in these securities will result in a high rate of return.
Exchange-Traded Products (ETPs) Risk — The risks of owning interests of an ETP, such as an ETF, ETN or exchange-traded commodity pool, generally reflect the same risks as owning the underlying securities or other instruments that the ETP is designed to track. The shares of certain ETPs may trade at a premium or discount to their intrinsic value (i.e., the market value may differ from the net asset value (NAV) of an ETP’s shares). For example, supply and demand for shares of an ETF or market disruptions may cause the market price of the ETF to deviate from the value of the ETF’s investments, which may be emphasized in less liquid markets. The value of an ETN may also differ from the valuation of its reference market or instrument due to changes in the issuer’s credit rating. By investing in an ETP, the Fund or an Underlying SEI Fund indirectly bears the proportionate share of any fees and expenses of the ETP in addition to the fees and expenses that the Fund and its shareholders directly bear in connection with the Fund’s operations. Because certain ETPs may have a significant portion of their assets exposed directly or indirectly to commodities or commodity-linked securities, developments affecting commodities may have a disproportionate impact on such ETPs and may subject the ETPs to greater volatility than investments in traditional securities.
Foreign Investment/Emerging Markets Risk — The risk that non-U.S. securities may be subject to additional risks due to, among other things, political, social and economic developments abroad, currency movements, and different legal, regulatory, tax, accounting and audit environments. These additional risks may be heightened with respect to emerging market countries because political turmoil and rapid changes in economic conditions are more likely to occur in these countries. Investments in emerging markets are subject to the added risk that information in emerging market investments may be unreliable or outdated due to differences in regulatory, accounting or auditing and financial record keeping standards, or because less
| SEI Asset Allocation Trust / Semi-Annual Report / September 30, 2021 | 39 |
NOTES TO FINANCIAL STATEMENTS (Unaudited) (Continued)
September 30, 2021
information about emerging market investments is publicly available. In addition, the rights and remedies associated with emerging market investments may be different than investments in developed markets. A lack of reliable information, rights and remedies increase the risks of investing in emerging markets in comparison to more developed markets. In addition, periodic U.S. Government restrictions on investments in issuers from certain foreign countries may require the Fund or an Underlying SEI Fund to sell such investments at inopportune times, which could result in losses to the Fund or an Underlying SEI Fund.
Investment Company Risk — When the Fund or an Underlying SEI Fund invests in an investment company, in addition to directly bearing the expenses associated with its own operations, it will bear a pro rata portion of the investment company’s expenses. In addition, while the risks of owning shares of an investment company generally reflect the risks of owning the underlying investments of the investment company, the Fund may be subject to additional or different risks than if the Fund or an Underlying SEI Fund had invested directly in the underlying investments.
Portfolio Turnover Risk — Due to its investment strategy, a Fund may buy and sell securities frequently. This may result in higher transaction costs and additional capital gains tax liabilities, which may affect the Fund’s performance.
Real Estate Industry Risk — Securities of companies principally engaged in the real estate industry may be subject to the risks associated with the direct ownership of real estate. Risks commonly associated with the direct ownership of real estate include fluctuations in the value of underlying properties, defaults by borrowers or tenants, changes in interest rates and risks related to general or local economic conditions.
Short Sales Risk — A short sale involves the sale of a security that a fund does not own in the expectation of purchasing the same security (or a security exchangeable therefore) at a later date at a lower price. Short sales entered into by an Underlying SEI Fund expose the Fund to the risk that the Underlying SEI Fund will be required to buy a security sold short (also known as “covering” the short position) at a time when the security has appreciated in value, thus resulting in a loss to the Underlying SEI Fund and, therefore, the Fund, that is potentially unlimited. Reinvesting proceeds received from short selling may create leverage, which can amplify the effects of market volatility on the share price of an Underlying SEI Fund and, therefore, the Fund. Investment in short sales may also cause an Underlying SEI Fund to incur expenses related to borrowing securities. In addition, shorting a future contract may
require posting only a margin that may amount to less than the notional exposure of the contract. Such a practice may exacerbate the loss in a case of adverse price action.
Small and Medium Capitalization Risk — Small and medium capitalization companies may be more vulnerable to adverse business or economic events than larger, more established companies. In particular, small and medium capitalization companies may have limited product lines, markets and financial resources and may depend upon a relatively small management group. Therefore, small and medium capitalization stocks may be more volatile than those of larger companies. Small and medium capitalization stocks may be traded over-the-counter (OTC). OTC stocks may trade less frequently and in smaller volume than exchange listed stocks and may have more price volatility than that of exchange listed stocks.
Large Capitalization Risk — The risk that larger, more established companies may be unable to respond quickly to new competitive challenges such as changes in technology and consumer tastes. Larger companies also may not be able to attain the high growth rates of successful smaller companies.
U.S. Government Securities Risk — Although U.S. Government securities are considered to be among the safest investments, they are still subject to the credit risk of the U.S. Government and are not guaranteed against price movements due to changing interest rates. Obligations issued by some U.S. Government agencies are backed by the U.S. Treasury, while others are backed solely by the ability of the agency to borrow from the U.S. Treasury or by the agency’s own resources. No assurance can be given that the U.S. Government will provide financial support to its agencies and instrumentalities if it is not obligated by law to do so.
Interest Rate Risk — The risk that a rise in interest rates will cause a fall in the value of fixed income securities, including U.S. Government securities, in which the Underlying SEI Funds invest. A low interest rate environment may present greater interest rate risk because there may be a greater likelihood of rates increasing and rates may increase more rapidly.
Commodity Investments Risk — Certain Underlying SEI Funds may invest a portion of their assets in a wholly owned subsidiary that is not registered under the Investment Company Act of 1940, as amended (1940 Act), and invests directly in commodities and commodity-related instruments. Other Underlying SEI Funds may have indirect exposure to commodities by investing in commodity-related instruments. Commodity investments and derivatives may be more volatile and less liquid than direct investments in the underlying
| 40 | SEI Asset Allocation Trust / Semi-Annual Report / September 30, 2021 |
commodities themselves. Commodity-related equity returns can also be affected by the issuer’s financial structure or the performance of unrelated businesses. The value of a commodity investment or a derivative investment in commodities is typically based upon the price movements of a physical commodity, a commodity futures contract or commodity index or some other readily measurable economic variable that is dependent upon changes in the value of commodities or the commodities markets. The value of these securities will rise or fall in response to changes in the underlying commodity or related benchmark or investment, changes in interest rates, or factors affecting a particular industry or commodity, such as natural disasters, weather and U.S. and international economic, political and regulatory developments.
Currency Risk — As a result of the Fund’s and certain Underlying SEI Funds’ investments in securities or other investments denominated in, and/or receiving revenues in, foreign currencies, the Fund will be subject to currency risk. Currency risk is the risk that foreign currencies will decline in value relative to the U.S. dollar or, in the case of hedging positions, that the U.S. dollar will decline in value relative to the currency hedged. In either event, the dollar value of an investment in the Fund or an Underlying SEI Fund would be adversely affected. Currency exchange rates may fluctuate in response to, among other things, changes in interest rates, intervention (or failure to intervene) by U.S. or foreign governments, central banks or supranational entities, or by the imposition of currency controls or other political developments in the United States or abroad.
Equity Market Risk — The risk that the market value of a security may move up and down, sometimes rapidly and unpredictably. Market risk may affect a single issuer, an industry, a sector or the equity or bond market as a whole. Equity markets may decline significantly in response to adverse issuer, political, regulatory, market, economic or other developments that may cause broad changes in market value, public perceptions concerning these developments, and adverse investor sentiment or publicity. Similarly, environmental and public health risks, such as natural disasters or epidemics, or widespread Fear that such events may occur, may impact markets adversely and cause market volatility in both the short-and long-term.
Fixed Income Market Risk — The prices of fixed income securities respond to economic developments, particularly interest rate changes, as well as to perceptions about the creditworthiness of individual issuers, including governments and their agencies. Generally, an Underlying SEI Fund’s fixed income securities will decrease in value if interest rates rise
and vice versa. In a low interest rate environment, risks associated with rising rates are heightened. Declines in dealer market-making capacity as a result of structural or regulatory changes could decrease liquidity and/or increase volatility in the fixed income markets. Markets for fixed income securities may decline significantly in response to adverse issuer, political, regulatory, market, economic or other developments that may cause broad changes in market value, public perceptions concerning these developments, and adverse investor sentiment or publicity. Similarly, environmental and public health risks, such as natural disasters or epidemics, or widespread fear that such events may occur, may impact markets adversely and cause market volatility in both the short- and long-term. In response to these events, the Underlying SEI Fund’s and, in turn, the Fund’s value may fluctuate and/or the Underlying SEI Fund and the Fund may experience increased redemptions from shareholders, which may impact the Underlying SEI Fund’s and the Fund’s liquidity or force the Underlying SEI Fund and the Fund to sell securities into a declining or illiquid market.
Economic Risks of Global Health Events — Global health events and pandemics, such as COVID-19, have the ability to affect—quickly, drastically and substantially the economies of many nations, states, individual companies and the markets in general and can cause disruptions that cannot necessarily be foreseen. The spread of COVID-19 around the world in 2020 resulted in a substantial number of nations implementing social distancing measures, quarantines, and the shutdown of non-essential businesses and governmental services. Further, it has caused significant volatility in U.S. and international markets. The impact of the outbreak may be short term or may last for an extended period of time. The foregoing is not intended to be a complete discussion of all risks associated with the investment strategies of the Funds. Please refer to the current prospectus for a discussion of the risks associated with investing in the Funds.
9. CONCENTRATION OF SHAREHOLDERS
SEI Private Trust Company (“SPTC”) and SIMC are subsidiaries of SEI Investments Company. As of September 30, 2021, SPTC held of record the following:
Defensive Strategy Fund - Class F | 58.27 | % | ||
Defensive Strategy Allocation Fund - Class F | 71.78 | % | ||
Conservative Strategy Fund - Class F | 71.66 | % | ||
Conservative Strategy Fund - Class D | 73.13 | % | ||
Conservative Strategy Allocation Fund - Class F | 88.90 | % | ||
Moderate Strategy Fund - Class F | 86.89 | % | ||
Moderate Strategy Fund - Class D | 77.61 | % | ||
Moderate Strategy Allocation Fund - Class F | 81.08 | % |
| SEI Asset Allocation Trust / Semi-Annual Report / September 30, 2021 | 41 |
NOTES TO FINANCIAL STATEMENTS (Unaudited) (Concluded)
September 30, 2021
Aggressive Strategy Fund - Class F | 63.00 | % | ||||
Tax-Managed Aggressive Strategy Fund - Class F | 94.07 | % | ||||
Core Market Strategy Fund - Class F | 95.69 | % | ||||
Core Market Strategy Allocation Fund - Class F | 94.20 | % | ||||
Market Growth Strategy Fund - Class F | 83.93 | % | ||||
Market Growth Strategy Fund - Class D | 76.82 | % | ||||
Market Growth Strategy Allocation Fund - Class F | 89.11 | % | ||||
SPTC is not a direct service provider to the SEI Funds. However, SPTC performs a role in the comprehensive investment solution that SEI provides to investors. SPTC holds shares in the Funds as custodian for shareholders that are clients of independent registered investment advisers, financial planners, bank trust departments and other financial advisers. SPTC maintains omnibus accounts at the Fund’s transfer agent.
10. SUBSEQUENT EVENTS
The Trust, on behalf of the Funds, has evaluated the need for disclosures and/or adjustments resulting from subsequent events. Based on this evaluation, no disclosures and/or adjustments were required to the financial statements through the date of issuance.
| 42 | SEI Asset Allocation Trust / Semi-Annual Report / September 30, 2021 |
DISCLOSURE OF FUND EXPENSES (Unaudited)
September 30, 2021
All mutual funds have operating expenses. As a shareholder of a fund, your investment is affected by these ongoing costs, which include (among others) costs for portfolio management, administrative services, and shareholder reports like this one. It is important for you to understand the impact of these costs on your investment returns.
Operating expenses such as these are deducted from the fund’s gross income and directly reduce your final investment return. These expenses are expressed as a percentage of the fund’s average net assets; this percentage is known as the fund’s expense ratio.
The following examples use the expense ratio and are intended to help you understand the ongoing costs (in dollars) of investing in your fund and to compare these costs with those of other mutual funds. The examples are based on an investment of $1,000 made at the beginning of the period shown and held for the entire period from April 1, 2021 to September 30, 2021.
The table on this page illustrates your fund’s costs in two ways:
•Actual fund return. This section helps you to estimate the actual expenses after fee waivers that your Fund incurred over the period. The “Expenses Paid During Period” column shows the actual dollar expense cost incurred by a $1,000 investment in the Fund, and the “Ending Account Value” number is derived from deducting that expense cost from the Fund’s gross investment return.
You can use this information, together with the actual amount you invested in the Fund, to estimate the expenses you paid over that period. Simply divide your actual account value by $1,000 to arrive at a ratio (for example, an $8,600 account value divided by $1,000 = 8.6), then multiply that ratio by the number shown for your Fund under “Expenses Paid During Period.”
•Hypothetical 5% return. This section helps you compare your Fund’s costs with those of other mutual funds. It assumes that the fund had an annual 5% return before expenses during the year, but that the expense ratio (Column 3) for the period is unchanged. This example is useful in making comparisons because the Securities and Exchange Commission requires all mutual funds to make this 5% calculation. You can assess your Fund’s comparative cost by comparing the hypothetical result for your Fund in the “Expenses Paid During Period” column with those that appear in the same charts in the shareholder reports for other funds.
NOTE: Because the return is set at 5% for comparison purposes — NOT your Fund’s actual return — the account values shown may not apply to your specific investment.
| Beginning Account Value 4/1/21 | Ending Account Value 9/30/21 | Annualized Expense Ratios | Expenses Paid During Period* | |||||||||||||
Defensive Strategy Fund |
| |||||||||||||||
Actual Fund Return |
| |||||||||||||||
Class F | $1,000.00 | $1,012.90 | 0.21 | % | $1.06 | |||||||||||
Class I | 1,000.00 | 1,011.80 | 0.46 | 2.32 | ||||||||||||
Hypothetical 5% Return |
| |||||||||||||||
Class F | $1,000.00 | $1,024.02 | 0.21 | % | $1.07 | |||||||||||
Class I | 1,000.00 | 1,022.76 | 0.46 | 2.33 | ||||||||||||
Defensive Strategy Allocation Fund |
| |||||||||||||||
Actual Fund Return |
| |||||||||||||||
Class F | $1,000.00 | $1,008.10 | 0.35 | % | $1.76 | |||||||||||
Hypothetical 5% Return |
| |||||||||||||||
Class F | $1,000.00 | $1,023.31 | 0.35 | % | $1.78 | |||||||||||
| Beginning Account Value 4/1/21 | Ending Account Value 9/30/21 | Annualized Expense Ratios | Expenses Paid During Period* | |||||||||||||
Conservative Strategy Fund |
| |||||||||||||||
Actual Fund Return |
| |||||||||||||||
Class F | $1,000.00 | $1,022.40 | 0.26 | % | $1.32 | |||||||||||
Class D | 1,000.00 | 1,017.40 | 1.01 | 5.11 | ||||||||||||
Class I | 1,000.00 | 1,021.50 | 0.51 | 2.58 | ||||||||||||
Hypothetical 5% Return |
| |||||||||||||||
Class F | $1,000.00 | $1,023.77 | 0.26 | % | $1.32 | |||||||||||
Class D | 1,000.00 | 1,020.01 | 1.01 | 5.11 | ||||||||||||
Class I | 1,000.00 | 1,022.51 | 0.51 | 2.59 | ||||||||||||
Conservative Strategy Allocation Fund |
| |||||||||||||||
Actual Fund Return |
| |||||||||||||||
Class F | $1,000.00 | $1,049.10 | 0.35 | % | $1.80 | |||||||||||
Hypothetical 5% Return |
| |||||||||||||||
Class F | $1,000.00 | $1,023.31 | 0.35 | % | $1.78 | |||||||||||
| SEI Asset Allocation Trust / Semi-Annual Report / September 30, 2021 | 43 |
DISCLOSURE OF FUND EXPENSES (Unaudited) (Concluded)
September 30, 2021
| Beginning Account Value 4/1/21 | Ending Account Value 9/30/21 | Annualized Expense Ratios | Expenses Paid During Period* | |||||||||||||
Moderate Strategy Fund |
| |||||||||||||||
Actual Fund Return |
| |||||||||||||||
Class F | $ | 1,000.00 | $ | 1,035.10 | 0.31 | % | $ | 1.58 | ||||||||
Class D | 1,000.00 | 1,031.70 | 1.06 | 5.40 | ||||||||||||
Class I | 1,000.00 | 1,034.40 | 0.56 | 2.86 | ||||||||||||
Hypothetical 5% Return |
| |||||||||||||||
Class F | $ | 1,000.00 | $ | 1,023.51 | 0.31 | % | $ | 1.57 | ||||||||
Class D | 1,000.00 | 1,019.75 | 1.06 | 5.37 | ||||||||||||
Class I | 1,000.00 | 1,022.26 | 0.56 | 2.84 | ||||||||||||
Moderate Strategy Allocation Fund |
| |||||||||||||||
Actual Fund Return |
| |||||||||||||||
Class F | $ | 1,000.00 | $ | 1,042.00 | 0.35 | % | $ | 1.79 | ||||||||
Hypothetical 5% Return |
| |||||||||||||||
Class F | $ | 1,000.00 | $ | 1,023.31 | 0.35 | % | $ | 1.78 | ||||||||
Aggressive Strategy Fund |
| |||||||||||||||
Actual Fund Return |
| |||||||||||||||
Class F | $ | 1,000.00 | $ | 1,043.90 | 0.35 | % | $ | 1.79 | ||||||||
Class D | 1,000.00 | 1,039.80 | 1.10 | 5.62 | ||||||||||||
Class I | 1,000.00 | 1,042.20 | 0.60 | 3.07 | ||||||||||||
Hypothetical 5% Return |
| |||||||||||||||
Class F | $ | 1,000.00 | $ | 1,023.31 | 0.35 | % | $ | 1.78 | ||||||||
Class D | 1,000.00 | 1,019.55 | 1.10 | 5.57 | ||||||||||||
Class I | 1,000.00 | 1,022.06 | 0.60 | 3.04 | ||||||||||||
Tax-Managed Aggressive Strategy Fund |
| |||||||||||||||
Actual Fund Return |
| |||||||||||||||
Class F | $ | 1,000.00 | $ | 1,053.70 | 0.35 | % | $ | 1.80 | ||||||||
Hypothetical 5% Return |
| |||||||||||||||
Class F | $ | 1,000.00 | $ | 1,023.31 | 0.35 | % | $ | 1.78 | ||||||||
Core Market Strategy Fund |
| |||||||||||||||
Actual Fund Return |
| |||||||||||||||
Class F | $ | 1,000.00 | $ | 1,042.80 | 0.35 | % | $ | 1.79 | ||||||||
Class I | 1,000.00 | 1,042.30 | 0.60 | 3.02 | ||||||||||||
Hypothetical 5% Return |
| |||||||||||||||
Class F | $ | 1,000.00 | $ | 1,023.31 | 0.35 | % | $ | 1.78 | ||||||||
Class I | 1,000.00 | 1,022.11 | 0.60 | 2.99 | ||||||||||||
Core Market Strategy Allocation Fund |
| |||||||||||||||
Actual Fund Return |
| |||||||||||||||
Class F | $ | 1,000.00 | $ | 1,053.80 | 0.35 | % | $ | 1.80 | ||||||||
Hypothetical 5% Return |
| |||||||||||||||
Class F | $ | 1,000.00 | $ | 1,023.31 | 0.35 | % | $ | 1.78 | ||||||||
Market Growth Strategy Fund |
| |||||||||||||||
Actual Fund Return |
| |||||||||||||||
Class F | $ | 1,000.00 | $ | 1,045.80 | 0.35 | % | $ | 1.79 | ||||||||
Class D | 1,000.00 | 1,041.40 | 1.10 | 5.63 | ||||||||||||
Class I | 1,000.00 | 1,043.90 | 0.60 | 3.07 | ||||||||||||
Hypothetical 5% Return |
| |||||||||||||||
Class F | $ | 1,000.00 | $ | 1,023.31 | 0.35 | % | $ | 1.78 | ||||||||
Class D | 1,000.00 | 1,019.55 | 1.10 | 5.57 | ||||||||||||
Class I | 1,000.00 | 1,022.06 | 0.60 | 3.04 | ||||||||||||
| Beginning Account Value 4/1/21 | Ending Account Value 9/30/21 | Annualized Expense Ratios | Expenses Paid During Period* | |||||||||||||
Market Growth Strategy Allocation Fund |
| |||||||||||||||
Actual Fund Return |
| |||||||||||||||
Class F | $ | 1,000.00 | $ | 1,053.70 | 0.35 | % | $ | 1.80 | ||||||||
Hypothetical 5% Return |
| |||||||||||||||
Class F | $ | 1,000.00 | $ | 1,023.31 | 0.35 | % | $ | 1.78 | ||||||||
| * | Expenses are equal to the Fund’s annualized expense ratio multiplied by the average account value over the period, multiplied by 183/365 (to reflect the one-half year period shown). |
| 44 | SEI Asset Allocation Trust / Semi-Annual Report / September 30, 2021 |
SEI ASSET ALLOCATION TRUST SEMI ANNUAL REPORT SEPTEMBER 30, 2021
Robert A. Nesher, Chairman
Trustees
William M. Doran
George J. Sullivan, Jr.
Nina Lesavoy
James M. Williams
Mitchell A. Johnson
Hubert L. Harris, Jr.
Susan C. Cote
James B. Taylor
Christine Reynolds
Thomas Melendez
Officers
Robert A. Nesher
President and Chief Executive Officer
Peter A. Rodriguez
Controller and Chief Financial Officer
Glenn R. Kurdziel
Assistant Controller
Russell Emery
Chief Compliance Officer
Timothy D. Barto
Vice President, Secretary
Aaron Buser
Vice President, Assistant Secretary
David F. McCann
Vice President, Assistant Secretary
Stephen G. MacRae
Vice President
Bridget E. Sudall
Anti-Money Laundering Compliance Officer
Privacy Officer
Investment Adviser
SEI Investments Management Corporation
Administrator
SEI Investments Global Funds Services
Distributor
SEI Investments Distribution Co.
Legal Counsel
Morgan, Lewis & Bockius LLP
Independent Registered Public Accounting Firm
KPMG LLP
This report and the financial statements contained herein are submitted for the general information of the shareholders of the Trust and must be preceded or accompanied by a current prospectus. Shares of the Funds are not deposits or obligations of, or guaranteed or endorsed by, any bank. The shares are not federally insured by the Federal Deposit Insurance Corporation (FDIC), the Federal Reserve Board, or any other government agency. Investment in the shares involves risk, including the possible loss of principal.
For more information call
1 800 DIAL SEI
(1 800 342 5734)

SEI-F-118 (9/21)
| Item 2. | Code of Ethics. |
Not applicable for semi-annual report.
| Item 3. | Audit Committee Financial Expert. |
Not applicable for semi-annual report.
| Item 4. | Principal Accountant Fees and Services. |
Not applicable for semi-annual report.
| Item 5. | Audit Committee of Listed Registrants. |
Not applicable.
| Item 6. | Investments. |
Not applicable.
| Item 7. | Disclosure of Proxy Voting Policies and Procedures for Closed-End Management Investment Companies. |
Not applicable.
| Item 8. | Portfolio Managers of Closed-End Management Investment Companies. |
Not applicable.
| Item 9. | Purchases of Equity Securities by Closed-End Management Company and Affiliated Purchasers. |
Not applicable.
| Item 10. | Submission of Matters to a Vote of Security Holders. |
There have been no material changes to the procedures by which shareholders may recommend nominees to the Registrant’s Board of Trustees (the “Board”). The Registrant has a standing Governance Committee (the “Committee”) currently consisting of the Independent Trustees. The Committee is responsible for evaluating and recommending nominees for election to the Board. Pursuant to the Committee’s Charter, adopted on June 18, 2004, as amended, the Committee will review all shareholder recommendations for nominations to fill vacancies on the Board if such recommendations are submitted in writing and addressed to the Committee at the Registrant’s office.
| Item 11. | Controls and Procedures. |
(a) The Registrant’s principal executive and principal financial officers, or persons performing similar functions, have concluded that the Registrant’s disclosure controls and procedures (as defined in Rule 30a-3(c) under the Investment Company Act of 1940 (the “1940 Act”)) are effective, based on the evaluation of these controls and procedures required by Rule 30a-3(b) under the 1940 Act and Rules 13a-15(b) or 15d-15(b) under the Securities Exchange Act of 1934 as of a date within 90 days of the filing date of this report.
(b) There were no changes in the Registrant’s internal control over financial reporting (as defined in Rule 30a-3(d) under the 1940 Act) that occurred during the period covered by this report that have materially affected, or are reasonably likely to materially affect, the Registrant’s internal control over financial reporting.
| Item 12. | Disclosure of Securities Lending Activities for Closed-End Management Investment Companies. |
Not applicable.
| Item 13. | Exhibits. |
(a)(1) Not applicable for semi-annual report.
SIGNATURES
Pursuant to the requirements of the Securities Exchange Act of 1934 and the Investment Company Act of 1940, the Registrant has duly caused this report to be signed on its behalf by the undersigned, thereunto duly authorized.
| SEI Asset Allocation Trust | ||
| By: | /s/ Robert A. Nesher | |
| Robert A. Nesher, President and CEO |
Date: December 6, 2021
Pursuant to the requirements of the Securities Exchange Act of 1934 and the Investment Company Act of 1940, this report has been signed below by the following persons on behalf of the Registrant and in the capacities and on the dates indicated.
| By: | /s/ Robert A. Nesher | |
Robert A. Nesher, President and CEO |
Date: December 6, 2021
| By: | /s/ Peter A. Rodriguez | |
| Peter A. Rodriguez, Controller and CFO |
Date: December 6, 2021