![]()
Depomed Announces Third Quarter 2017 Financial Results
- Third Quarter Net Sales of $95 Million-
- Slán Medicinal Holdings Transaction Creates New Specialty Unit and Diversifies Business -
- Updates Full-Year Guidance -
- Conference Call Scheduled for Today at 4:30 PM EST; Dial In Information Below -
NEWARK, California, November 07, 2017 - Depomed, Inc. (Nasdaq: DEPO) today reported financial results for the quarter ended September 30, 2017 and provided an update to the business.
“During the third quarter, we made progress in stabilizing our business despite the declines in the opioid market. We would have expected to have made further progress in the fourth quarter if not for the negative impact of NUCYNTA supply issues following Hurricanes Irma and Maria,” said Arthur Higgins, President and CEO of Depomed. “With September’s expansion of the neurology salesforce and today’s exciting transaction with Slán Medicinal Holdings, we see our go forward growth based on three pillars comprised of maintaining a strong NUCYNTA franchise, growing our neurology franchise and building a new specialty business. At the core of this strategy is delivering value to our stakeholders while always putting the patient first.”
Business and Financial Highlights
· Third quarter 2017 revenues were $95 million
· Third quarter ending cash and marketable securities was $113 million
· Quarterly GAAP net loss of ($16) million or ($0.25) per share
· Quarterly non-GAAP adjusted earnings of $10 million, or $0.14 per share
· Quarterly non-GAAP adjusted EBITDA of $30 million
· Neurology Salesforce increased to 90 representatives effective September 1
· Acquisition of rights to Cosyntropin (Synthetic ACTH Depot) creates new specialty business
· Lazanda Sale to Slán Medicinal Holdings reduces our concentration in the opioid market
REVENUES (GAAP BASIS)
(in thousands, unaudited)
|
| Three Months Ended |
| Nine Months Ended |
| ||||||||
|
| September 30, |
| September 30, |
| ||||||||
|
| 2017 |
| 2016 |
| 2017 |
| 2016 |
| ||||
|
|
|
|
|
|
|
|
|
| ||||
Product sales, net: |
|
|
|
|
|
|
|
|
| ||||
Nucynta products |
| $ | 58,665 |
| $ | 65,287 |
| $ | 183,299 |
| $ | 206,568 |
|
Gralise |
| 21,103 |
| 20,640 |
| 57,777 |
| 63,451 |
| ||||
Cambia |
| 8,164 |
| 9,110 |
| 23,862 |
| 22,900 |
| ||||
Lazanda |
| 4,040 |
| 8,181 |
| 13,239 |
| 19,093 |
| ||||
Zipsor |
| 3,232 |
| 7,085 |
| 12,286 |
| 19,379 |
| ||||
Pharmacy benefit manager dispute reserve |
| — |
| — |
| (4,742 | ) | — |
| ||||
Total product sales, net |
| 95,204 |
| 110,303 |
| 285,721 |
| 331,391 |
| ||||
|
|
|
|
|
|
|
|
|
| ||||
Royalties |
| 209 |
| 221 |
| 596 |
| 595 |
| ||||
|
|
|
|
|
|
|
|
|
| ||||
Total revenues (GAAP Basis) |
| $ | 95,413 |
| $ | 110,524 |
| $ | 286,317 |
| $ | 331,986 |
|
Transformational Transaction Creates New Specialty Business
This afternoon the Company announced that it has entered into an agreement with Slán Medicinal Holdings. (“Slán”), pursuant to which the Company acquired from Slán the rights to market the specialty drug, Cosyntropin (Synthetic ACTH Depot), in the United States and divested its Lazanda® (nasal fentanyl) to Slán. The Company expects Slán to submit a New Drug Application with the U.S. Food and Drug Administration for the first indication for Cosyntropin (Synthetic ACTH Depot) in late 2018.
Executed Expansion of Neurology Salesforce
As of September 1st, the Company completed the growth of its Neurology salesforce to 90 representatives who are focused on Gralise® and CAMBIA®. The Company believes that the increased salesforce, with smaller and more targeted territories, will benefit these highly promotionally sensitive products. The Company also believes that the increased salesforce provides a platform that allows for the potential addition of neurology-based product acquisitions.
Puerto Rico Product Supply Update
Based on the information available to the Company at this time, the Company will experience temporary outages of certain strengths of NUCYNTA ER in the fourth quarter. The Company expects that based on our current inventory and our manufacturer’s potential ability to produce new drug supply that the magnitude of the outages will be less than $10 million.
NUCYNTA IR recently transitioned to a new third party manufacturer in the United States, and based on currently available information, the Company does not anticipate any material disruption to this supply. In addition, based on the information available at this time, the Company believes it has an adequate inventory of Gralise, which is manufactured in Puerto Rico.
Updated 2017 Financial Outlook
The Company is updating its 2017 financial guidance as a result of third quarter performance, the impact of Hurricanes Irma and Maria to the supply of NUCYNTA®, continuing contraction in the long-acting and short-acting opioid markets and the transfer of Lazanda to Slán Medicinal Holdings.
|
| Updated Guidance |
| Prior Guidance |
|
Total Revenue (GAAP) |
| $375 to $380 million |
| $395 to $410 million |
|
Total Revenue (Non-GAAP) |
| $380 to $385 million |
| $400 to $415 million |
|
Non-GAAP SG&A Expense |
| $190 to $194 million |
| $195 to $201 million |
|
Non-GAAP R&D Expense |
| $14 to $16 million |
| $18 to $23 million |
|
Non-GAAP Adjusted EBITDA |
| $104 to $109 million |
| $107 to $117 million |
|
Non-GAAP Financial Measures
To supplement our financial results presented on a U.S. generally accepted accounting principles, or GAAP, basis, we have included information about non-GAAP adjusted earnings, non-GAAP adjusted earnings per share and non-GAAP adjusted EBITDA, non-GAAP financial measures, as useful operating metrics. We believe that the presentation of these non-GAAP financial measures, when viewed with our results under GAAP and the accompanying reconciliation, provides supplementary information to analysts, investors, lenders, and our management in assessing the Company’s performance and results from period to period. We use these non-GAAP measures internally to understand, manage and evaluate the Company’s performance, and in part, in the determination of bonuses for executive officers and employees. These non-GAAP financial measures should be considered in addition to, and not a substitute for, or superior to, net income or other financial measures calculated in accordance with GAAP. Non-GAAP adjusted earnings and non-GAAP adjusted earnings per share are not based on any standardized methodology prescribed by GAAP and represent GAAP net income (loss) and GAAP earnings (loss) per share adjusted to exclude amortization, IPR&D and non-cash adjustments related to product acquisitions, stock-based compensation expense, non-cash interest expense related to debt, costs associated with the special meeting requests made by an activist investor and CEO transition, costs associated with an attempted debt refinancing, restructuring costs, adjustments associated with non-recurring legal settlements and disputes, and to adjust for the tax effect related to each of the non-GAAP adjustments. Non-GAAP adjusted EBITDA is not based on any standardized methodology prescribed by GAAP and represents GAAP net income (loss) adjusted to exclude interest income, interest expense, amortization, IPR&D and non-cash adjustments related to product acquisitions, stock-based compensation expense, depreciation, taxes, restructuring costs, adjustments related to non-recurring legal settlements and disputes, costs associated with an attempted debt refinancing, the special meeting requests made by an activist investor, and CEO transition. Non-GAAP financial measures used by us may be calculated differently from, and therefore may not be comparable to, non-GAAP measures used by other companies.
Conference Call and Webcast
Depomed will host a conference call today, Tuesday, November 7th beginning at 4:30 p.m. EST (1:30 p.m. PST) to discuss its results. This event can be accessed in three ways:
· From the Depomed website: http://investor.depomedinc.com/ Please access the website 15 minutes prior to the start of the call to download and install any necessary audio software.
· By telephone: Participants can access the call by dialing (866) 643-3010 (United States) or (857) 270-6032 (International) referencing Conference ID 8996849.
· By replay: A replay of the webcast will be located under the Investor Relations section of Depomed’s website approximately two hours after the conclusion of the live call and will be available for three months.
About Depomed
Depomed is a leading specialty pharmaceutical company focused on enhancing the lives of the patients, families, physicians, providers and payors we serve through commercializing innovative products for pain and neurology related disorders. Depomed markets five medicines with areas of focus that include mild to severe acute pain, moderate to severe chronic pain, neuropathic pain and migraine. Depomed is headquartered in Newark, California. To learn more about Depomed, visit www.depomed.com.
“Safe Harbor” Statement under the Private Securities Litigation Reform Act of 1995. The statements that are not historical facts contained in this release are forward-looking statements that involve risks and uncertainties including, but not limited to, those related to the commercialization of NUCYNTA ER, NUCYNTA, Gralise, CAMBIA, Zipsor and Lazanda, Depomed’s financial outlook for 2017 and expectations regarding financial results and potential business opportunities and other risks detailed in the Company’s Securities and Exchange Commission filings, including the Company’s most recent Annual Report on Form 10-K and most recent Quarterly Report on Form 10-Q. The achievement of 2017 financial guidance is significantly dependent upon the success of NUCYNTA ER and NUCYNTA, and the continuing public focus on the opioid markets and the decline in the short-acting and long-acting opioid markets present risk to achievement of financial guidance. The inclusion of forward-looking statements should not be regarded as a representation that any of the Company’s plans or objectives will be achieved. You are cautioned not to place undue reliance on these forward-looking statements, which speak only as of the date hereof. The Company undertakes no obligation to publicly release the result of any revisions to these forward-looking statements that may be made to reflect events or circumstances after the date hereof or to reflect the occurrence of unanticipated events.
INVESTOR AND MEDIA CONTACT:
Christopher Keenan
VP, Investor Relations and Corporate Communications
510-744-8000
ckeenan@depomed.com
CONSOLIDATED STATEMENTS OF OPERATIONS (GAAP BASIS)
(in thousands, except per share amounts)
|
| Three Months Ended |
| Nine Months Ended |
| ||||||||
|
| September 30, |
| September 30, |
| ||||||||
|
| 2017 |
| 2016 |
| 2017 |
| 2016 |
| ||||
|
| (unaudited) |
| (unaudited) |
| ||||||||
Revenues: |
|
|
|
|
|
|
|
|
| ||||
Product sales, net |
| $ | 95,204 |
| $ | 110,303 |
| $ | 285,721 |
| $ | 331,391 |
|
Royalties |
| 209 |
| 221 |
| 596 |
| 595 |
| ||||
Total revenues |
| 95,413 |
| 110,524 |
| 286,317 |
| 331,986 |
| ||||
|
|
|
|
|
|
|
|
|
| ||||
Costs and expenses: |
|
|
|
|
|
|
|
|
| ||||
Cost of sales |
| 17,396 |
| 20,243 |
| 54,895 |
| 64,757 |
| ||||
Research and development expense |
| 1,761 |
| 10,412 |
| 12,459 |
| 23,477 |
| ||||
Selling, general and administrative expense |
| 48,850 |
| 51,574 |
| 147,379 |
| 156,036 |
| ||||
Amortization of intangible assets |
| 25,734 |
| 27,037 |
| 77,204 |
| 81,111 |
| ||||
Restructuring charges |
| 434 |
| — |
| 3,875 |
| — |
| ||||
Total costs and expenses |
| 94,175 |
| 109,266 |
| 295,812 |
| 325,381 |
| ||||
|
|
|
|
|
|
|
|
|
| ||||
Loss from operations |
| 1,238 |
| 1,258 |
| (9,495 | ) | 6,605 |
| ||||
Interest and other income |
| 72 |
| 113 |
| 604 |
| 310 |
| ||||
Loss on prepayment of senior notes |
| — |
| — |
| (5,364 | ) | (5,777 | ) | ||||
Interest expense |
| (17,815 | ) | (20,307 | ) | (55,697 | ) | (63,182 | ) | ||||
(Provision for)/Benefit from income taxes |
| 513 |
| 6,042 |
| 560 |
| 17,692 |
| ||||
Net loss |
| $ | (15,992 | ) | $ | (12,894 | ) | $ | (69,392 | ) | $ | (44,352 | ) |
|
|
|
|
|
|
|
|
|
| ||||
Basic and diluted net loss per share |
| $ | (0.25 | ) | $ | (0.21 | ) | $ | (1.11 | ) | $ | (0.73 | ) |
Shares used in calculating basic and diluted net loss per share |
| 62,997 |
| 61,422 |
| 62,556 |
| 61,163 |
| ||||
CONSOLIDATED CONDENSED BALANCE SHEETS
(in thousands)
(unaudited)
|
| September 30, |
| December 31, |
| ||
|
| 2017 |
| 2016 |
| ||
|
|
|
|
|
| ||
Cash, cash equivalents and marketable securities |
| $ | 113,457 |
| $ | 177,420 |
|
Accounts receivable |
| 77,698 |
| 102,589 |
| ||
Inventories |
| 10,415 |
| 13,033 |
| ||
Property and equipment, net |
| 13,943 |
| 15,526 |
| ||
Intangible assets, net |
| 824,944 |
| 902,149 |
| ||
Prepaid and other assets |
| 19,050 |
| 14,620 |
| ||
Total assets |
| $ | 1,059,507 |
| $ | 1,225,337 |
|
|
|
|
|
|
| ||
Accounts payable |
| 7,033 |
| 14,855 |
| ||
Income tax payable |
| 28 |
| 59 |
| ||
Interest payable |
| 11,308 |
| 15,924 |
| ||
Accrued liabilities |
| 47,599 |
| 59,398 |
| ||
Accrued rebates, returns and discounts |
| 136,998 |
| 131,536 |
| ||
Senior notes |
| 369,226 |
| 466,051 |
| ||
Convertible notes |
| 265,163 |
| 252,725 |
| ||
Contingent consideration liability |
| 5,636 |
| 14,825 |
| ||
Other liabilities |
| 17,869 |
| 19,176 |
| ||
Shareholders’ equity |
| 198,647 |
| 250,788 |
| ||
Total liabilities and shareholders’ equity |
| 1,059,507 |
| $ | 1,225,337 |
| |
RECONCILIATION OF GAAP NET LOSS TO NON-GAAP ADJUSTED EARNINGS
(in thousands, except per share amounts)
|
| Three Months Ended |
| Nine Months Ended |
| ||||||||
|
| September 30, |
| September 30, |
| ||||||||
|
| 2017 |
| 2016 |
| 2017 |
| 2016 |
| ||||
|
| (unaudited) |
| (unaudited) |
| ||||||||
|
|
|
|
|
|
|
|
|
| ||||
GAAP net loss |
| $ | (15,992 | ) | $ | (12,894 | ) | $ | (69,392 | ) | $ | (44,352 | ) |
Non-cash interest expense on debt |
| 4,839 |
| 4,460 |
| 15,613 |
| 13,861 |
| ||||
Managed care dispute reserve |
| — |
| — |
| 4,742 |
| — |
| ||||
Intangible amortization related to product acquisitions |
| 25,734 |
| 27,037 |
| 77,204 |
| 81,111 |
| ||||
Inventory step-up related to product acquisitions |
| — |
| — |
| — |
| 16 |
| ||||
Contingent consideration related to product acquisitions |
| (1,194 | ) | 686 |
| (6,525 | ) | 1,593 |
| ||||
Stock based compensation |
| 2,911 |
| 4,364 |
| 9,870 |
| 12,602 |
| ||||
Other costs (1) |
| 612 |
| 2,015 |
| 3,142 |
| 2,942 |
| ||||
Restructuring charges |
| 434 |
| — |
| 3,875 |
| — |
| ||||
Valuation allowance on deferred tax assets |
| 4,172 |
| — |
| 19,274 |
| — |
| ||||
Income tax effect of non-GAAP adjustments (3) |
| (11,846 | ) | (13,479 | ) | (38,249 | ) | (39,211 | ) | ||||
Non-GAAP adjusted earnings |
| $ | 9,670 |
| $ | 12,189 |
| $ | 19,554 |
| $ | 28,562 |
|
Add interest expense of convertible debt, net of tax (2) |
| 1,348 |
| 1,348 |
| 2,695 |
| 2,695 |
| ||||
Numerator |
| $ | 11,018 |
| $ | 13,537 |
| $ | 22,249 |
| $ | 31,257 |
|
Shares used in calculation (2) |
| 81,376 |
| 81,940 |
| 81,607 |
| 81,370 |
| ||||
Non-GAAP adjusted earnings per share |
| $ | 0.14 |
| $ | 0.17 |
| $ | 0.27 |
| $ | 0.38 |
|
(1) Other costs represents non-recurring costs associated with the special meeting requests of an activist investor, CEO transition and an attempted debt refinancing.
(2) The Company uses the if-converted method to compute diluted earnings per share with respect to its convertible debt.
(3) Calculated by taking the pre-tax non-GAAP adjustments and applying the statutory tax rate. Expected cash taxes were zero for the three months ended September 30, 2017 and $(1,303) for the three months ended September 30, 2016. Expected cash taxes were zero for the nine months ended September 30, 2017 and $1,509 for the nine months ended September 30, 2016.
RECONCILIATION OF GAAP NET LOSS TO NON-GAAP ADJUSTED EBITDA
(in thousands)
|
| Three Months Ended |
| Nine Months Ended |
| ||||||||
|
| September 30, |
| September 30, |
| ||||||||
|
| 2017 |
| 2016 |
| 2017 |
| 2016 |
| ||||
|
| (unaudited) |
| (unaudited) |
| ||||||||
|
|
|
|
|
|
|
|
|
| ||||
GAAP net loss |
| $ | (15,992 | ) | $ | (12,894 | ) | $ | (69,392 | ) | $ | (44,352 | ) |
Pharmacy benefit manager dispute reserve |
| — |
| — |
| 4,742 |
| — |
| ||||
Intangible amortization related to product acquisitions |
| 25,734 |
| 27,037 |
| 77,204 |
| 81,111 |
| ||||
Inventory step-up related to product acquisitions |
| — |
| — |
| — |
| 16 |
| ||||
Contingent consideration related to product acquisitions |
| (1,194 | ) | 686 |
| (6,525 | ) | 1,593 |
| ||||
Stock based compensation |
| 2,911 |
| 4,364 |
| 9,870 |
| 12,602 |
| ||||
Interest income |
| (72 | ) | (113 | ) | (332 | ) | (310 | ) | ||||
Interest expense |
| 17,584 |
| 19,666 |
| 59,829 |
| 67,001 |
| ||||
Depreciation |
| 605 |
| 646 |
| 1,839 |
| 1,908 |
| ||||
Benefit from income taxes |
| (513 | ) | (6,042 | ) | (560 | ) | (17,692 | ) | ||||
Other costs (1) |
| 612 |
| 2,015 |
| 3,142 |
| 2,942 |
| ||||
Restructuring charges |
| 434 |
| — |
| 3,875 |
| — |
| ||||
Transaction costs |
| — |
| — |
| — |
| 45 |
| ||||
Non-GAAP adjusted EBITDA |
| $ | 30,109 |
| $ | 35,365 |
| $ | 83,692 |
| $ | 104,864 |
|
(1) Other costs represents non-recurring costs associated with the special meeting requests of an activist investor, CEO transition and an attempted debt refinancing.
RECONCILATIONS OF GAAP REPORTED TO NON-GAAP ADJUSTED INFORMATION
For the three months ended September 30, 2017
(in thousands)
(unaudited)
|
| Cost of sales |
| Research and |
| Selling, |
| Restructuring |
| Amortization |
| Interest |
| Benefit from |
| |||||||
GAAP as reported |
| $ | 17,396 |
| $ | 1,761 |
| $ | 48,850 |
| $ | 434 |
| $ | 25,734 |
| $ | (17,815 | ) | $ | 513 |
|
Non-cash interest expense on debt |
| — |
| — |
| — |
| — |
| — |
| 4,839 |
| — |
| |||||||
Intangible amortization related to product acquisitions |
| — |
| — |
| — |
| — |
| (25,734 | ) | — |
| — |
| |||||||
Contingent consideration related to product acquisitions |
| — |
| — |
| 1,415 |
| — |
| — |
| 221 |
| — |
| |||||||
Stock based compensation |
| (9 | ) | (45 | ) | (2,857 | ) | — |
| — |
| — |
| — |
| |||||||
Other costs |
| — |
| — |
| (612 | ) | — |
| — |
| — |
| — |
| |||||||
Restructuring charges |
| — |
| — |
| — |
| (434 | ) | — |
| — |
| — |
| |||||||
Valuation allowance on deferred tax assets |
| — |
| — |
| — |
| — |
| — |
| — |
| 4,172 |
| |||||||
Income tax effect of non-GAAP adjustments |
| — |
| — |
| — |
| — |
| — |
| — |
| (11,846 | ) | |||||||
Non-GAAP adjusted |
| $ | 17,387 |
| $ | 1,716 |
| $ | 46,796 |
| $ | — |
| $ | — |
| $ | (12,755 | ) | $ | (7,161 | ) |
RECONCILATIONS OF GAAP REPORTED TO NON-GAAP ADJUSTED INFORMATION
For the three months ended September 30, 2016
(in thousands)
(unaudited)
|
| Cost of |
| Research and |
| Selling, general |
| Amortization of |
| Interest expense |
| Benefit from |
| ||||||
GAAP as reported |
| $ | 20,243 |
| $ | 10,412 |
| $ | 51,574 |
| $ | 27,037 |
| $ | (20,307 | ) | $ | 6,042 |
|
Non-cash interest expense on debt |
| — |
| — |
| — |
| — |
| 4,460 |
| — |
| ||||||
Intangible amortization related to product acquisitions |
| — |
| — |
| — |
| (27,037 | ) | — |
| — |
| ||||||
Contingent consideration related to product acquisitions |
| — |
| — |
| (78 | ) | — |
| 608 |
| — |
| ||||||
Stock based compensation |
| (11 | ) | (121 | ) | (4,232 | ) | — |
| — |
| — |
| ||||||
Other costs |
| — |
| — |
| (2,015 | ) | — |
| — |
| — |
| ||||||
Income tax effect of non-GAAP adjustments |
| — |
| — |
| — |
| — |
| — |
| (13,479 | ) | ||||||
Non-GAAP adjusted |
| $ | 20,232 |
| $ | 10,291 |
| $ | 45,249 |
| $ | — |
| $ | (15,239 | ) | $ | (7,437 | ) |
RECONCILATIONS OF GAAP REPORTED TO NON-GAAP ADJUSTED INFORMATION
For the nine months ended September 30, 2017
(in thousands)
(unaudited)
|
| Product Sales |
| Cost of sales |
| Research and |
| Selling, |
| Restructuring |
| Amortization |
| Interest |
| Benefit from |
| ||||||||
GAAP as reported |
| $ | 286,317 |
| $ | 54,895 |
| $ | 12,459 |
| $ | 147,379 |
| $ | 3,875 |
| $ | 77,204 |
| $ | (55,697 | ) | $ | 560 |
|
Non-cash interest expense on debt |
| — |
| — |
| — |
| — |
| — |
| — |
| 15,613 |
| — |
| ||||||||
Managed care dispute reserve |
| 4,742 |
| — |
| — |
| — |
| — |
| — |
| — |
| — |
| ||||||||
Intangible amortization related to product acquisitions |
| — |
| — |
| — |
| — |
| — |
| (77,204 | ) | — |
| — |
| ||||||||
Contingent consideration related to product acquisitions |
| — |
| — |
| — |
| 7,542 |
| — |
| — |
| 1,017 |
| — |
| ||||||||
Stock based compensation |
| — |
| (84 | ) | (652 | ) | (9,134 | ) | — |
| — |
| — |
| — |
| ||||||||
Other costs |
| — |
| — |
| — |
| (3,142 | ) | — |
| — |
| — |
| — |
| ||||||||
Restructuring charges |
| — |
| — |
| — |
| — |
| (3,875 | ) | — |
| — |
| — |
| ||||||||
Valuation allowance on deferred tax assets |
| — |
| — |
| — |
| — |
| — |
| — |
| — |
| 19,274 |
| ||||||||
Income tax effect of non-GAAP adjustments |
| — |
| — |
| — |
| — |
| — |
| — |
| — |
| (38,249 | ) | ||||||||
Non-GAAP adjusted |
| $ | 291,059 |
| $ | 54,811 |
| $ | 11,807 |
| $ | 142,645 |
| $ | — |
| $ | — |
| $ | (39,067 | ) | $ | (18,415 | ) |
RECONCILATIONS OF GAAP REPORTED TO NON-GAAP ADJUSTED INFORMATION
For the nine months ended September 30, 2016
(in thousands)
(unaudited)
|
| Cost of sales |
| Research and |
| Selling, |
| Amortization |
| Interest |
| Benefit from |
| ||||||
GAAP as reported |
| $ | 64,757 |
| $ | 23,477 |
| $ | 156,036 |
| $ | 81,111 |
| $ | (63,182 | ) | $ | 17,692 |
|
Non-cash interest expense on debt |
| — |
| — |
| — |
| — |
| 13,861 |
| — |
| ||||||
Intangible amortization related to product acquisitions |
| — |
| — |
| — |
| (81,111 | ) | — |
| — |
| ||||||
Inventory step-up related to product acquisitions |
| (16 | ) | — |
| — |
| — |
| — |
| — |
| ||||||
Contingent consideration related to product acquisitions |
| — |
| — |
| 209 |
| — |
| 1,802 |
| — |
| ||||||
Stock based compensation |
| (27 | ) | (329 | ) | (12,246 | ) | — |
| — |
| — |
| ||||||
Other costs |
| — |
| — |
| (2,942 | ) | — |
| — |
| — |
| ||||||
Income tax effect of non-GAAP adjustments |
| — |
| — |
| — |
| — |
| — |
| (39,211 | ) | ||||||
Non-GAAP adjusted |
| $ | 64,714 |
| $ | 23,148 |
| $ | 141,057 |
| $ | — |
| $ | (47,519 | ) | $ | (21,519 | ) |
RECONCILIATION OF GAAP NET LOSS PER SHARE TO NON-GAAP ADJUSTED EARNINGS PER SHARE
|
| Three Months Ended |
| Nine Months Ended |
| ||||||||
|
| September 30, |
| September 30, |
| ||||||||
|
| 2017 |
| 2016 |
| 2017 |
| 2016 |
| ||||
|
| (unaudited) |
| (unaudited) |
| ||||||||
|
|
|
|
|
|
|
|
|
| ||||
GAAP net loss per share |
| $ | (0.25 | ) | $ | (0.21 | ) | $ | (1.11 | ) | $ | (0.73 | ) |
Conversion from basic shares to diluted shares |
| 0.06 |
| 0.05 |
| 0.26 |
| 0.18 |
| ||||
Non-cash interest expense on debt |
| 0.06 |
| 0.05 |
| 0.19 |
| 0.17 |
| ||||
Managed care dispute reserve |
| — |
| — |
| 0.06 |
| — |
| ||||
Intangible amortization related to product acquisitions |
| 0.32 |
| 0.33 |
| 0.95 |
| 1.00 |
| ||||
Inventory step-up related to product acquisitions |
| — |
| — |
| — |
| 0.00 |
| ||||
Contingent consideration related to product acquisitions |
| (0.01 | ) | 0.01 |
| (0.08 | ) | 0.02 |
| ||||
Stock based compensation |
| 0.04 |
| 0.05 |
| 0.12 |
| 0.15 |
| ||||
Other costs |
| 0.01 |
| 0.02 |
| 0.04 |
| 0.04 |
| ||||
Restructuring charges |
| 0.01 |
| — |
| 0.05 |
| — |
| ||||
Valuation allowance on deferred tax assets |
| 0.05 |
| — |
| 0.24 |
| — |
| ||||
Income tax effect of non-GAAP adjustments |
| (0.15 | ) | (0.16 | ) | (0.47 | ) | (0.48 | ) | ||||
Add interest expense of convertible debt, net of tax (2) |
| 0.02 |
| 0.02 |
| 0.03 |
| 0.03 |
| ||||
Non-GAAP adjusted earnings per share |
| $ | 0.14 |
| $ | 0.17 |
| $ | 0.27 |
| $ | 0.38 |
|
Third Quarter 2017 Financial Update November 7, 2017

Forward Looking Statements 2 The statements that are not historical facts contained in this presentation are forward-looking statements that involve risks and uncertainties including, but not limited to, those related to Depomed’s strategy, plans, objectives, expectations (financial or otherwise) and intentions, future financial results and growth potential, including projected revenues and earnings, expectations regarding periods of exclusivity for the Nucynta® franchise, Gralise®, CAMBIA®, Lazanda®, Zipsor®, cebranopadol, as well as any other statements that are not historical facts. These forward-looking statements are based on Depomed’s current expectations and inherently involve significant risks and uncertainties. Actual results and the timing of events could differ materially from those anticipated in such forward-looking statements as a result of these risks and uncertainties, which include, without limitation: risks associated with the commercialization of our products, including competitive risks; risks relating to the pending ANDA litigation for Nucynta and Nucynta ER; pricing and third party payor reimbursement risks for our products; regulatory risks, including FDA regulation of our products and regulation of our promotional practices; risks relating to the successful development of new product candidates; as well as other risks related to Depomed's business detailed from time-to-time under the caption "Risk Factors" and elsewhere in Depomed's SEC filings and reports, including in its Annual Report on Form 10-K for the year ended December 31, 2016 and its most recent Quarterly Report on Form 10-Q. Depomed undertakes no duty or obligation to update any forward-looking statements contained in this presentation as a result of new information, future events or changes in its expectations except as may be required by law. This presentation contains non-GAAP financial measures, including EBITDA, Adjusted EBITDA and other financial measures labeled as “non-GAAP.” Please refer to Depomed’s November 7, 2017 earnings release on the Depomed website (Depomed.com) for an explanation of these non-GAAP financial measures and for tables that reconcile the non-GAAP figures to their GAAP equivalent. “Safe Harbor” Statement Under the Private Securities Litigation Reform Act of 1995
A Clear Strategy for Growth Not One But Three Pillars Form Our Strategy 3 MAINTAIN a Strong NUCYNTA Franchise GROW Neurology and Pain Businesses BUILD a New Specialty Business

Principles Guiding the Way We Do Business PUTTING the Patient First PRODUCTIVITY Aimed at Improving Effectiveness Across the Business PROFITABILITY in Line with Our Peer Group 4
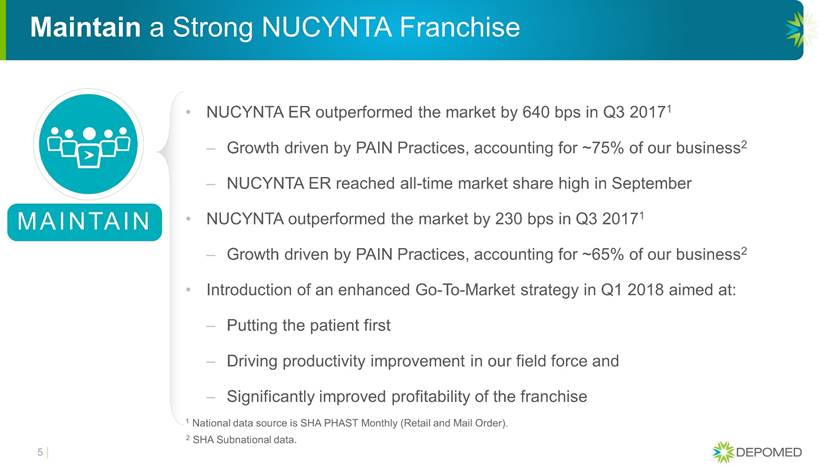
Maintain a Strong NUCYNTA Franchise NUCYNTA ER outperformed the market by 640 bps in Q3 20171 Growth driven by PAIN Practices, accounting for ~75% of our business2 NUCYNTA ER reached all-time market share high in September NUCYNTA outperformed the market by 230 bps in Q3 20171 Growth driven by PAIN Practices, accounting for ~65% of our business2 Introduction of an enhanced Go-To-Market strategy in Q1 2018 aimed at: Putting the patient first Driving productivity improvement in our field force and Significantly improved profitability of the franchise 5 MAINTAIN 1 National data source is SHA PHAST Monthly (Retail and Mail Order). 2 SHA Subnational data.
GROW Grow Our Neurology and Pain Businesses September marked the completed relaunch of our Neurology salesforce with 90 representatives Provides proper support to highly-promotionally sensitive products Gralise® and CAMBIA ® October: Increased levels of Gralise® starter packs seen Creates credible platform to expand with new products Committed to adding at least one new product in 2018 6

Build A New Specialty Business Establishment of a New Specialty Products Business Unit Mark Booth as General Manager brings 30+ years of biopharma experience Objective is to build a portfolio of specialty/orphan drugs addressing the unmet needs of the patient, physician and payors Provides a platform for new growth and diversification First product: Cosyntropin (Synthetic ACTH Depot) July 2017: Mallinckrodt grants license to West Therapeutic Development for Cosyntropin (Synthetic ACTH Depot); Forced FTC Divestiture 7 BUILD
Transformational Transaction Creates New Specialty Business Depomed/ Slán Medicinal Holdings Limited Acquisition of Cosyntropin (Synthetic ACTH Depo) provides a late-stage, high-value product Depomed is the exclusive licensee for United States Current U.S. market is secured by H.P. Acthar® Gel (Natural ACTH Depot) with estimated sales of $1.2B 1st Indication: NDA filing expected in late 2018 Launch expected in 2H 2019 2nd Indication: Investigational New Drug (IND) trial anticipated in Q1 2018 in Infantile Spasms The Pediatric Epilepsy Research Consortium (Kelly Knupp, M.D., Principal Investigator) 15 sites enrolling approximately 400 patients Orphan Drug Status in infantile spasms granted August 2017 8 Next 12-18 Months: Expect to Bring Additional Products into This Business
Established and New Leaders Bringing Valuable Experience at Pivotal Time 9 Established Roles August Moretti SVP Finance and Chief Financial Officer Alexza, Alavita; 30+ Years Experience Matthew Gosling SVP and General Counsel Heller Ehrman; 20 Years Experience New Roles Jeff Carrol Vice President and Chief Compliance Officer NuVasive, Santarus; 17 Years Experience New Hires Mark Booth GM, SVP Specialty Products Business Orexigen, Takeda, Abbott; 30+ Years Experience Sharon Larkin SVP, Human Resources And Administration Abbott; 25+ Years Experience Sean McKercher SVP, Marketing and Operations Ipsen, Abbott; 35+ Years Experience Peter Schineller SVP, Sales and Managed Markets and Trade SkylineDx, Alexza; 25+ Years Experience Santosh Vetticaden, MD SVP, Chief Medical and Scientific Officer J&J, Cubist; 35+ Years Experience Timothy Hermes Vice President, Government Affairs Collegium, Auxilium; 15+ Years Experience Daniel Peisert Vice President, Business Development Concordia International; 15 Years Experience

Strategy: Unveil Enhanced NUCYNTA Go-To-Market Strategy Synthetic Cosyntropin (Synthetic ACTH Depot): Commence Investigational New Drug (IND) Trial in Infantile Spasms Purdue Litigation: Pre-Trial Conference to Set Trial Date Refinancing: Execute Refinancing of Deerfield and Pharmakon Advisors’ Secured Debt Milestones Driving Growth in 2018 and Beyond 10 First Half 2018 Synthetic Cosyntropin (Synthetic ACTH Depot): Submission of NDA by West for First Indication Business Development: Execute 1 to 2 New Opportunities Aimed at Accelerating Growth Second Half 2018 2018: A Year of Growth and Repositioning Setting up for a Breakout 2019/2020

Third Quarter 2017 Financial Results August Moretti, SVP Finance and Chief Financial Officer

12 3Q 2017 total GAAP revenues of $95.4 million Financial 3Q 2017 net sales of $58.7 million versus $63.9 million in 2Q 2017 NUCYNTA® 3Q 2017 net sales of $21.1 million versus $18.1 million in 2Q 2017 Gralise® 3Q 2017 net sales of $8.2 million versus $8.5 million in 2Q 2017 CAMBIA® 3Q 2017 net sales of $4.0 million versus $5.3 million in 2Q 2017 Lazanda® 3Q 2017 net sales of $3.2 million versus $4.4 million in 2Q 2017 Zipsor® Third Quarter 2017 Revenue Overview
13 Approximately 18% of revenue; down slightly from the second quarter COGS $48.9 million GAAP SG&A $46.8 million Non-GAAP SG&A $1.8 million GAAP R&D $1.7 million Non-GAAP R&D $30.1 million versus $28.3 million in Q2 2017 Non-GAAP EBIDTA Third Quarter 2017 Overview Decreased approximately two days from end of Q2 2017 Days on Hand
Third Quarter 2017 Balance Sheet 14 cash equivalents and marketable securities of $114 million versus $117 million in Q2 2017 Cash CONSOLIDATED CONDENSED BALANCE SHEETS (in thousands) (unaudited) September 30, December 31, 2017 2016 Cash, cash equivalents and marketable securities 113,457 $ 177,420 $ Accounts receivable 77,698 102,589 Inventories 10,415 13,033 Property and equipment, net 13,943 15,526 Intangible assets, net 824,944 902,149 Prepaid and other assets 19,050 14,620 Total assets 1,059,507 $ 1,225,337 $ Accounts payable 7,033 14,855 Income tax payable 28 59 Interest payable 11,308 15,924 Accrued liabilities 47,599 59,398 Accrued rebates, returns and discounts 136,998 131,536 Senior notes 369,226 466,051 Convertible notes 265,163 252,725 Contingent consideration liability 5,636 14,825 Other liabilities 17,869 19,176 Shareholders’ equity 198,647 250,788 Total liabilities and shareholders’ equity 1,059,507 1,225,337 $
Updated Full-Year Guidance Updated Guidance Prior Guidance Total Revenue (GAAP) $375 to $380 million $395 to $410 million Total Revenue (Non-GAAP) $380 to $385 million $400 to $415 million Non-GAAP SG&A Expense $190 to $194 million $195 to $201 million Non-GAAP R&D Expense $14 to $16 million $18 to $23 million Non-GAAP Adjusted EBITDA $104 to $109 million $107 to $117 million 15 Updated Guidance Reflects Third Quarter Performance and Impact of Hurricanes Irma and Maria on the NUCYNTA® ER Supply
Questions and Answers

Summary Arthur Higgins, President and Chief Executive Officer

Depomed Committed to Turning Headwinds into Tailwinds 18 Executing on a Clear Strategy of Maintain a Strong NUCYNTA Franchise, Grow Our Neurology and Pain Businesses and Build a New Specialty Business Leveraging Opportunities to Drive Superior Profitability Committed to Putting the Patient First
Appendix

Note Regarding Use of GAAP and Non-GAAP Financial Measures To supplement our financial results presented on a U.S. generally accepted accounting principles, or GAAP, basis, the Company has included information about non-GAAP adjusted earnings, non-GAAP adjusted earnings per share and non-GAAP adjusted EBITDA, non-GAAP financial measures, as useful operating metrics. The Company believes that the presentation of these non-GAAP financial measures, when viewed with our results under GAAP and the accompanying reconciliation, provides supplementary information to analysts, investors, lenders, and our management in assessing the Company’s performance and results from period to period. The Company uses these non-GAAP measures internally to understand, manage and evaluate the Company’s performance, and in part, in the determination of bonuses for executive officers and employees. These non-GAAP financial measures should be considered in addition to, and not a substitute for, or superior to, net income or other financial measures calculated in accordance with GAAP. Non-GAAP adjusted earnings and non-GAAP adjusted earnings per share are not based on any standardized methodology prescribed by GAAP and represent GAAP net income (loss) and GAAP earnings (loss) per share adjusted to exclude amortization, IPR&D and non-cash adjustments related to product acquisitions, stock-based compensation expense, non-cash interest expense related to debt, the special meeting requests made by an activist investor and CEO transition, restructuring costs, adjustments associated with non-recurring legal settlements and disputes, and to adjust for the tax effect related to each of the non-GAAP adjustments. Non-GAAP adjusted EBITDA is not based on any standardized methodology prescribed by GAAP and represents GAAP net income (loss) adjusted to exclude interest income, interest expense, amortization, IPR&D and non-cash adjustments related to product acquisitions, stock-based compensation expense, depreciation, taxes, restructuring costs, adjustments related to non-recurring legal settlements and disputes, the special meeting requests made by an activist investor, and CEO transition. Non-GAAP financial measures used by us may be calculated differently from, and therefore may not be comparable to, non-GAAP measures used by other companies. 20
GAAP to Non-GAAP Reconciliation Adjusted Earnings 21 RECONCILIATION OF GAAP NET LOSS TO NON-GAAP ADJUSTED EARNINGS (in thousands, except per share amounts) Three Months Ended Nine Months Ended September 30, September 30, 2017 2016 2017 2016 (unaudited) (unaudited) GAAP net loss (15,992) $ (12,894) $ (69,392) $ (44,352) $ Non-cash interest expense on debt 4,839 4,460 15,613 13,861 Managed care dispute reserve - - 4,742 - Intangible amortization related to product acquisitions 25,734 27,037 77,204 81,111 Inventory step-up related to product acquisitions - - - 16 Contingent consideration related to product acquisitions (1,194) 686 (6,525) 1,593 Stock based compensation 2,911 4,364 9,870 12,602 Other costs (1) 612 2,015 3,142 2,942 Restructuring charges 434 - 3,875 - Valuation allowance on deferred tax assets 4,172 - 19,274 - Income tax effect of non-GAAP adjustments (3) (11,846) (13,479) (38,249) (39,211) Non-GAAP adjusted earnings 9,670 $ 12,189 $ 19,554 $ 28,562 $ Add interest expense of convertible debt, net of tax (2) 1,348 1,348 2,695 2,695 Numerator 11,018 $ 13,537 $ 22,249 $ 31,257 $ Shares used in calculation (2) 81,376 81,940 81,607 81,370 Non-GAAP adjusted earnings per share 0.14 $ 0.17 $ 0.27 $ 0.38 $ (2) The Company uses the if-converted method to compute diluted earnings per share with respect to its convertible debt. (3) Calculated by taking the pre-tax non-GAAP adjustments and applying the statutory tax rate. Expected cash taxes were zero for the three months ended September 30, 2017 and $(1,303) for the three months ended September 30, 2016. Expected cash taxes were zero for the nine months ended September 30, 2017 and $1,509 for the nine months ended September 30, 2016. (1) Other costs represents non-recurring costs associated with the special meeting requests of an activist investor, CEO transition and an attempted debt refinancing.
GAAP to Non-GAAP Reconciliation EBITDA and Adjusted EBIDTA 22 RECONCILIATION OF GAAP NET LOSS TO NON-GAAP ADJUSTED EBITDA (in thousands) Three Months Ended Nine Months Ended September 30, September 30, 2017 2016 2017 2016 (unaudited) (unaudited) GAAP net loss (15,992) $ (12,894) $ (69,392) $ (44,352) $ Pharmacy benefit manager dispute reserve - - 4,742 - Intangible amortization related to product acquisitions 25,734 27,037 77,204 81,111 Inventory step-up related to product acquisitions - - - 16 Contingent consideration related to product acquisitions (1,194) 686 (6,525) 1,593 Stock based compensation 2,911 4,364 9,870 12,602 Interest income (72) (113) (332) (310) Interest expense 17,584 19,666 59,829 67,001 Depreciation 605 646 1,839 1,908 Benefit from income taxes (513) (6,042) (560) (17,692) Other costs (1) 612 2,015 3,142 2,942 Restructuring charges 434 - 3,875 - Transaction costs - - - 45 Non-GAAP adjusted EBITDA 30,109 $ 35,365 $ 83,692 $ 104,864 $ (1) Other costs represents non-recurring costs associated with the special meeting requests of an activist investor, CEO transition and an attempted debt refinancing.
GAAP to Non-GAAP Reconciliation Adjusted Information (Three Months Ended September 30, 2017) 23 Cost of sales Research and development expense Selling, general and administrative expense Restructuring Charges Amortization of intangible assets Interest expense Benefit from (provision for) income taxes GAAP as reported 17,396 $ 1,761 $ 48,850 $ 434 $ 25,734 $ (17,815) $ 513 $ Non-cash interest expense on debt - - - - - 4,839 - Intangible amortization related to product acquisitions - - - - (25,734) - - Contingent consideration related to product acquisitions - - 1,415 - - 221 - Stock based compensation (9) (45) (2,857) - - - - Other costs - - (612) - - - - Restructuring charges - - - (434) - - - Valuation allowance on deferred tax assets - - - - - - 4,172 Income tax effect of non-GAAP adjustments - - - - - - (11,846) Non-GAAP adjusted 17,387 $ 1,716 $ 46,796 $ - $ - $ (12,755) $ (7,161) $ RECONCILATIONS OF GAAP REPORTED TO NON-GAAP ADJUSTED INFORMATION For the three months ended September 30, 2017 (in thousands) (unaudited)
GAAP to Non-GAAP Reconciliation Adjusted Information (Three Months Ended September 30, 2016) 24 Cost of sales Research and development expense Selling, general and administrative expense Amortization of intangible assets Interest expense Benefit from (provision for) income taxes GAAP as reported 20,243 $ 10,412 $ 51,574 $ 27,037 $ (20,307) $ 6,042 $ Non-cash interest expense on debt - - - - 4,460 - Intangible amortization related to product acquisitions - - - (27,037) - - Contingent consideration related to product acquisitions - - (78) - 608 - Stock based compensation (11) (121) (4,232) - - - Other costs - - (2,015) - - - Income tax effect of non-GAAP adjustments - - - - - (13,479) Non-GAAP adjusted 20,232 $ 10,291 $ 45,249 $ - $ (15,239) $ (7,437) $ (in thousands) (unaudited) RECONCILATIONS OF GAAP REPORTED TO NON-GAAP ADJUSTED INFORMATION For the three months ended September 30, 2016
GAAP to Non-GAAP Reconciliation Adjusted Information (Nine Months Ended September 30, 2017) 25 Product Sales Cost of sales Research and development expense Selling, general and administrative expense Restructuring Charges Amortization of intangible assets Interest expense Benefit from (provision for) income taxes GAAP as reported 286,317 $ 54,895 $ 12,459 $ 147,379 $ 3,875 $ 77,204 $ (55,697) $ 560 $ Non-cash interest expense on debt - - - - - - 15,613 - Managed care dispute reserve 4,742 - - - - - - - Intangible amortization related to product acquisitions - - - - - (77,204) - - Contingent consideration related to product acquisitions - - - 7,542 - - 1,017 - Stock based compensation - (84) (652) (9,134) - - - - Other costs - - - (3,142) - - - - Restructuring charges - - - - (3,875) - - - Valuation allowance on deferred tax assets - - - - - - - 19,274 Income tax effect of non-GAAP adjustments - - - - - - - (38,249) Non-GAAP adjusted 291,059 $ 54,811 $ 11,807 $ 142,645 $ - $ - $ (39,067) $ (18,415) $ RECONCILATIONS OF GAAP REPORTED TO NON-GAAP ADJUSTED INFORMATION For the nine months ended September 30, 2017 (in thousands) (unaudited)
GAAP to Non-GAAP Reconciliation Adjusted Information (Nine Months Ended September 30, 2016) 26 Cost of sales Research and development expense Selling, general and administrative expense Amortization of intangible assets Interest expense Benefit from (provision for) income taxes GAAP as reported 64,757 $ 23,477 $ 156,036 $ 81,111 $ (63,182) $ 17,692 $ Non-cash interest expense on debt - - - - 13,861 - Intangible amortization related to product acquisitions - - - (81,111) - - Inventory step-up related to product acquisitions (16) - - - - - Contingent consideration related to product acquisitions - - 209 - 1,802 - Stock based compensation (27) (329) (12,246) - - - Other costs - - (2,942) - - - Income tax effect of non-GAAP adjustments - - - - - (39,211) Non-GAAP adjusted 64,714 $ 23,148 $ 141,057 $ - $ (47,519) $ (21,519) $ For the nine months ended September 30, 2016 (in thousands) (unaudited) RECONCILATIONS OF GAAP REPORTED TO NON-GAAP ADJUSTED INFORMATION
GAAP to Non-GAAP Reconciliation Earnings Per Share 27 Three Months Ended Nine Months Ended September 30, September 30, 2017 2016 2017 2016 (unaudited) (unaudited) GAAP net loss per share (0.25) $ (0.21) $ (1.11) $ (0.73) $ Conversion from basic shares to diluted shares 0.06 0.05 0.26 0.18 Non-cash interest expense on debt 0.06 0.05 0.19 0.17 Managed care dispute reserve - - 0.06 - Intangible amortization related to product acquisitions 0.32 0.33 0.95 1.00 Inventory step-up related to product acquisitions - - - 0.00 Contingent consideration related to product acquisitions (0.01) 0.01 (0.08) 0.02 Stock based compensation 0.04 0.05 0.12 0.15 Other costs 0.01 0.02 0.04 0.04 Restructuring charges 0.01 - 0.05 - Valuation allowance on deferred tax assets 0.05 - 0.24 - Income tax effect of non-GAAP adjustments (0.15) (0.16) (0.47) (0.48) Add interest expense of convertible debt, net of tax (2) 0.02 0.02 0.03 0.03 Non-GAAP adjusted earnings per share 0.14 $ 0.17 $ 0.27 $ 0.38 $ RECONCILIATION OF GAAP NET LOSS PER SHARE TO NON-GAAP ADJUSTED EARNINGS PER SHARE