| UNITED STATES SECURITIES AND EXCHANGE COMMISSION | ||
| Washington, D.C. 20549 | ||
FORM N-CSR | ||
| CERTIFIED SHAREHOLDER REPORT OF REGISTERED MANAGEMENT INVESTMENT COMPANIES | ||
| Investment Company Act file number: | (811-07513) |
| Exact name of registrant as specified in charter: | Putnam Funds Trust |
| Address of principal executive offices: | 100 Federal Street, Boston, Massachusetts 02110 |
| Name and address of agent for service: | Stephen Tate, Vice President 100 Federal Street Boston, Massachusetts 02110 |
| Copy to: | Bryan Chegwidden, Esq. Ropes & Gray LLP 1211 Avenue of the Americas New York, New York 10036 |
| Registrant’s telephone number, including area code: | (617) 292-1000 |
| Date of fiscal year end: | October 31, 2021 |
| Date of reporting period: | November 1, 2020 – October 31, 2021 |
Item 1. Report to Stockholders: |
| The following is a copy of the report transmitted to stockholders pursuant to Rule 30e-1 under the Investment Company Act of 1940: | |||
Putnam Multi-Asset
Absolute Return
Fund
Annual report
10 | 31 | 21
Message from the Trustees
December 9, 2021
Dear Fellow Shareholder:
In 2021, the stock market had another above-average year. Corporate earnings rose as the economy reopened and stimulus policies helped increase demand. Bonds, on the other hand, had a subpar year amid higher inflation. To respond to inflation risk, in part, the U.S. Federal Reserve has begun to reduce its monthly asset purchases, a program put in place during the Covid-19 pandemic.
Changes and opportunities lie ahead. In November, Congress passed the bipartisan Infrastructure Investment and Jobs Act. It will increase funding for roads, ports, rail, and other projects in the coming decade.
As companies continue to adapt to the pandemic, many of them face new challenges, like rebuilding supply chains, hiring workers, and addressing climate risk. Amid all of it, Putnam’s researchers will be actively looking for potential investments to meet the goals of your fund.
Thank you for investing with Putnam.


Current performance may be lower or higher than the quoted past performance, which cannot guarantee future results. Share price, principal value, and return will fluctuate, and you may have a gain or a loss when you sell your shares. Performance of class A shares assumes reinvestment of distributions and does not account for taxes. Fund returns in the bar chart do not reflect a sales charge of 5.75%; had they, returns would have been lower. See below and pages 9–11 for additional performance information. For a portion of the periods, the fund had expense limitations, without which returns would have been lower. To obtain the most recent month-end performance, visit putnam.com.

This comparison shows your fund’s performance in the context of broad market indexes for the 12 months ended 10/31/21. See above and pages 9–11 for additional fund performance information. Index descriptions can be found on page 16.
All Bloomberg indices are provided by Bloomberg Index Services Limited.
| 2 Multi-Asset Absolute Return Fund |


Jason, how did stocks perform for the reporting period?
Stocks advanced for much of the period. Record monetary and fiscal stimulus, the availability of multiple Covid-19 vaccines, and signs of a global economic recovery were supportive of risk assets. Investors seemed to shake off periodic headwinds, including a resurgence in Covid-19 cases caused by the Delta variant and rising inflation. A $1.9 trillion U.S. relief bill enacted in March 2021, along with strong corporate earnings, helped lift investor sentiment. U.S. stocks, as measured by the S&P 500 Index, posted a remarkable return of 42.91% for the period.
How did bonds perform for the reporting period?
The Federal Reserve purchased billions of dollars’ worth of U.S. Treasuries, mortgage-backed and corporate bonds, and exchange-traded funds, helping to keep interest rates low. By mid-period, stimulus-fueled growth and rising inflation began to caution investors, as they weighed the potential for a shift in central bank policy. Yields on longer-term U.S. Treasuries edged higher, while shorter-term yields remained low.
| Multi-Asset Absolute Return Fund 3 |

Allocations are shown as a percentage of the fund’s net assets. Cash and net other assets, if any, represent the market value weights of cash, derivatives, short-term securities, and other unclassified assets in the portfolio. Summary information may differ from the portfolio schedule included in the financial statements due to the inclusion of derivative securities, any interest accruals, the use of different classifications of securities for presentation purposes, and rounding. Negative weights may result from timing differences between trade and settlement dates of securities, such as to-be-announced (TBA) commitments, or by the use of derivatives. Holdings and allocations may vary over time.

In late September 2021, the Fed indicated it was ready to scale back its monthly asset purchases as soon as November and could increase rates in 2022. Uncertainty in Washington, D.C., over a proposed $1.2 trillion infrastructure package also tempered market sentiment. The interest-rate-sensitive Bloomberg U.S. Aggregate Bond Index, a measure of investment-grade corporate bonds, posted a loss of 0.48% for the period. The yield on the benchmark 10-year U.S. Treasury note fluctuated but ended the period higher at 1.55% compared with 0.87% at the start of the period.
How did the fund perform for the reporting period?
The fund’s class A shares posted a loss of 0.49%, underperforming the fund’s benchmark, the ICE BofA U.S. Treasury Bill Index, which posted a gain of 0.06% for the period.
Can you provide an overview of the fund’s strategies?
The fund pursues risk-and-return characteristics by dynamically allocating assets using a combination of directional [market sensitive] and nondirectional [market neutral] strategies.
| 4 Multi-Asset Absolute Return Fund |
The directional portion of the portfolio consists of two components: a risk-balanced portfolio of stocks and bonds designed to efficiently capture long-term market returns and a dynamic asset allocation overlay to reflect tactical views. The overlay consists of tactical long and short positions to equities, interest rates, credit, and commodities based on the team’s expectations for each of these asset classes. The team manages both the composition and total level of risk, depending on market conditions and the prevailing opportunity set.
The nondirectional portion of the portfolio consists of long/short market neutral strategies intended to provide flexible uncorrelated sources of alpha.

What strategies had the biggest influence on performance for the reporting period?
Directional strategies benefited fund performance over the period. The equity portion of the risk-balanced portfolio finished the period positive. Our tactical position to equity risk also enhanced results. The portfolio’s positioning to equity risk ranged from modestly long to long before we removed the position at the end of August 2021. This positioning lifted performance as stocks soared to new highs due

This table shows the fund’s top 10 individual holdings and the percentage of the fund’s net assets that each represented as of 10/31/21. Short-term investments, TBA commitments, and derivatives, if any, are excluded. Holdings may vary over time.
| Multi-Asset Absolute Return Fund 5 |
to more stimulus, Covid-19 progress, and signs of economic recovery. Overall, the portfolio was net long to equity risk, which resulted in a positive contribution from directional equity exposure.
The fixed income portion of the risk-balanced portfolio finished the period negative. Our tactical positioning to interest-rate risk slightly weakened fund performance. At the start of the period, we had a modest tactical short position to interest-rate risk and then moved to a neutral position at the beginning of December 2020. We returned to a modest short position at the beginning of May 2021. Overall, the portfolio was net long to interest-rate risk, which resulted in a negative contribution from directional interest-rate exposure.
A tactical long position to commodity risk, implemented in January 2021, also lifted performance. A modest tactical long position to credit risk slightly added to results. We removed both positions in August 2021.
Overall, nondirectional strategies detracted from fund results, mostly due to weakness in our equity selection alpha strategies. Most notably, our quantitative emerging market equity long/short, opportunistic reflation, and forensic accounting long/short strategies were negative for the period. Our fixed income sector alpha strategy finished the period negative, due to a strategy that shorts U.S. real yields. Our currency alpha strategy experienced a similar loss for the period. Fixed income selection alpha slightly detracted, driven by a strategy focused on structured mortgage credit.
Our commodity alpha strategy was the largest positive contributor from our nondirectional exposures. Alternative beta was also additive, due to strength from our volatility carry strategy. Our regional fixed income strategy, which takes a long position on high-yield debt and a short position on emerging market debt, finished the period slightly positive.
How were derivatives used during the reporting period?
We used options to hedge duration and convexity, isolate and hedge prepayment risk, gain exposure to interest rates and securities,
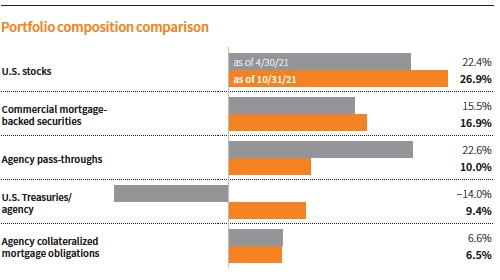
This chart shows how the fund’s top weightings have changed over the past six months. Allocations are shown as a percentage of the fund’s net assets. Cash and net other assets, if any, represent the market value weights of cash, derivatives, short-term securities, and other unclassified assets in the portfolio. Current period summary information may differ from the portfolio schedule included in the financial statements due to the inclusion of derivative securities, any interest accruals, the use of different classifications of securities for presentation purposes, and rounding. Holdings and allocations may vary over time.
| 6 Multi-Asset Absolute Return Fund |
generate additional income for the portfolio, hedge against changes in the values of securities, enhance returns on securities, and manage downside risks. Futures were used to manage exposure to market risk, hedge prepayment and interest-rate risks, gain exposure to interest rates, and equitize cash. Forward currency contracts were used to help hedge foreign exchange risk and gain exposure to currencies. Interest-rate swaps were used to hedge interest-rate risk, gain exposure to interest rates, and hedge prepayment risk. Credit default swaps were used to help hedge credit and market risks, as well as gain exposure to individual names and/or baskets of securities. Lastly, total return swaps were used to hedge sector exposure, manage exposure to specific sectors, securities, or industries, and gain exposure to a basket of securities as well as specific sectors, industries, markets, and countries.
How is the fund positioned for the new fiscal year?
The portfolio is positioned close to a neutral stance. Within our dynamic allocation overlay, we have a modest short position to interest-rate risk. We do not have any tactical exposure to equity risk, credit risk, or commodity risk. Overall, the portfolio’s positioning is net long to equity risk and interest-rate risk. Overall portfolio risk is tilted toward the directional portion of the portfolio. Most of the directional risk continues to be in equity exposures. Nondirectional risk continues to come from our equity selection alpha strategies.
What is your outlook for the economy and the fund?
Despite recent volatility, financial markets have recovered significantly this year. The stimulative monetary and fiscal policy backdrop among the Group of Ten [G10] advanced countries, historically strong earnings, positive economic data, and ample liquidity fueled the performance of financial markets. While we remain optimistic about the recovery, we anticipate more
ABOUT DERIVATIVES
Derivatives are an increasingly common type of investment instrument, the performance of which is derived from an underlying security, index, currency, or other area of the capital markets. Derivatives employed by the fund’s managers generally serve one of two main purposes: to implement a strategy that may be difficult or more expensive to invest in through traditional securities, or to hedge unwanted risk associated with a particular position.
For example, the fund’s managers might use currency forward contracts to capitalize on an anticipated change in exchange rates between two currencies. This approach would require a significantly smaller outlay of capital than purchasing traditional bonds denominated in the underlying currencies. In another example, the managers may identify a bond that they believe is undervalued relative to its risk of default, but may seek to reduce the interest-rate risk of that bond by using interest-rate swaps, a derivative through which two parties “swap” payments based on the movement of certain rates. In other examples, the managers may use options and futures contracts to hedge against a variety of risks by establishing a combination of long and short exposures to specific equity markets or sectors.
Like any other investment, derivatives may not appreciate in value and may lose money. Derivatives may amplify traditional investment risks through the creation of leverage and may be less liquid than traditional securities. And because derivatives typically represent contractual agreements between two financial institutions, derivatives entail “counterparty risk,” which is the risk that the other party is unable or unwilling to pay. Putnam monitors the counterparty risks we assume. For example, Putnam often enters into collateral agreements that require the counterparties to post collateral on a regular basis to cover their obligations to the fund. Counterparty risk for exchange-traded futures and centrally cleared swaps is mitigated by the daily exchange of margin and other safeguards against default through their respective clearinghouses.
| Multi-Asset Absolute Return Fund 7 |
volatility ahead as investors weigh the impact of a shift in central bank policy, the unlikely chance of further stimulus, and slowing global growth. We believe the levels of volatility and sentiment priced into markets currently do not adequately account for the uncertainties present.
Given the current environment, our outlook on equities is neutral. This view is supported by what we believe has been a move past peak earnings growth, narrowing market breadth, and expectations for a shift in central bank policy. While we maintain a positive disposition toward equities, we believe risks have become more balanced.
In fixed income, our outlook on credit is also neutral. Spreads have been hovering at the tight end of their recent range, while volatility and defaults are extremely low. Within this context, we would expect an uptick in volatility and thus a lower risk-adjusted return as opposed to a substantial widening in spreads. Additionally, fund flows into high yield have recently reversed their strong inflow trend from last year. Our outlook on rate-sensitive fixed income is slightly bearish. Real yields are still exceptionally low, and we expect that U.S. monetary policy is likely to only tighten going forward. In addition, global benchmark yields have moved off their recent lows.
Our view on commodities is neutral. Despite OPEC+ continuing to taper cuts, many factors have contributed to a sustained supply deficit, including a lack of progress in Iranian negotiations and U.S. producer constraints. Against this backdrop, we continue to have conviction in our investment strategies.
Thank you, Jason, for your time and insights today.
The views expressed in this report are exclusively those of Putnam Management and are subject to change. They are not meant as investment advice.
Please note that the holdings discussed in this report may not have been held by the fund for the entire period. Portfolio composition is subject to review in accordance with the fund’s investment strategy and may vary in the future. Current and future portfolio holdings are subject to risk.
| 8 Multi-Asset Absolute Return Fund |
Your fund’s performance
This section shows your fund’s performance, price, and distribution information for periods ended October 31, 2021, the end of its most recent fiscal year. In accordance with regulatory requirements for mutual funds, we also include performance information as of the most recent calendar quarter-end and expense information taken from the fund’s current prospectus. Performance should always be considered in light of a fund’s investment strategy. Data represent past performance. Past performance does not guarantee future results. More recent returns may be less or more than those shown. Investment return and principal value will fluctuate, and you may have a gain or a loss when you sell your shares. Performance information does not reflect any deduction for taxes a shareholder may owe on fund distributions or on the redemption of fund shares. For the most recent month-end performance, please visit the Individual Investors section at putnam.com or call Putnam at 1-800-225-1581. Class P, R, R6, and Y shares are not available to all investors.
See the Terms and definitions section in this report for definitions of the share classes offered by your fund.
Fund performance Total return for periods ended 10/31/21
| Annual | ||||||||
| average | Annual | Annual | Annual | |||||
| (life of fund) | 10 years | average | 5 years | average | 3 years | average | 1 year | |
| Class A (12/23/08) | ||||||||
| Before sales charge | 2.58% | 16.02% | 1.50% | –3.72% | –0.76% | –6.94% | –2.37% | –0.49% |
| After sales charge | 2.10 | 9.35 | 0.90 | –9.26 | –1.92 | –12.29 | –4.28 | –6.21 |
| Class B (12/23/08) | ||||||||
| Before CDSC | 2.09 | 9.30 | 0.89 | –7.25 | –1.49 | –8.99 | –3.09 | –1.21 |
| After CDSC | 2.09 | 9.30 | 0.89 | –9.03 | –1.88 | –11.64 | –4.04 | –6.15 |
| Class C (12/23/08) | ||||||||
| Before CDSC | 2.10 | 9.32 | 0.89 | –7.23 | –1.49 | –8.95 | –3.08 | –1.12 |
| After CDSC | 2.10 | 9.32 | 0.89 | –7.23 | –1.49 | –8.95 | –3.08 | –2.10 |
| Class P (8/31/16) | ||||||||
| Net asset value | 2.88 | 19.95 | 1.84 | –1.81 | –0.36 | –5.84 | –1.99 | 0.00 |
| Class R (12/23/08) | ||||||||
| Net asset value | 2.30 | 13.26 | 1.25 | –4.92 | –1.00 | –7.60 | –2.60 | –0.69 |
| Class R6 (7/2/12) | ||||||||
| Net asset value | 2.90 | 20.19 | 1.86 | –1.98 | –0.40 | –5.87 | –2.00 | 0.00 |
| Class Y (12/23/08) | ||||||||
| Net asset value | 2.83 | 19.14 | 1.77 | –2.48 | –0.50 | –6.21 | –2.12 | –0.10 |
Current performance may be lower or higher than the quoted past performance, which cannot guarantee future results. After-sales-charge returns for class A shares reflect the deduction of the maximum 5.75% sales charge, levied at the time of purchase. Class B share returns after contingent deferred sales charge (CDSC) reflect the applicable CDSC, which is 5% in the first year, declining over time to 1% in the sixth year, and is eliminated thereafter. Class C share returns after CDSC reflect a 1% CDSC for the first year that is eliminated thereafter. Class P, R, R6, and Y shares have no initial sales charge or CDSC. Performance for class P and R6 shares prior to their inception is derived from the historical performance of class Y shares and has not been adjusted for the lower investor servicing fees applicable to class P and R6 shares; had it, returns would have been higher.
For a portion of the periods, the fund had expense limitations, without which returns would have been lower.
Class B and C share performance reflects conversion to class A shares after eight years.
| Multi-Asset Absolute Return Fund 9 |
Comparative index returns For periods ended 10/31/21
| Annual | ||||||||
| average | Annual | Annual | Annual | |||||
| (life of fund) | 10 years | average | 5 years | average | 3 years | average | 1 year | |
| ICE BofA U.S. Treasury | ||||||||
| Bill Index | 0.56% | 6.72% | 0.65% | 5.99% | 1.17% | 3.56% | 1.17% | 0.06% |
| Bloomberg U.S. Aggregate | ||||||||
| Bond Index | 3.84 | 34.37 | 3.00 | 16.46 | 3.10 | 17.84 | 5.63 | –0.48 |
| S&P 500 Index | 16.26 | 349.39 | 16.21 | 137.90 | 18.93 | 79.25 | 21.48 | 42.91 |
Index results should be compared with fund performance before sales charge, before CDSC, or at net asset value.
All Bloomberg indices are provided by Bloomberg Index Services Limited.

Past performance does not indicate future results. At the end of the same time period, a $10,000 investment in the fund’s class B and C shares would have been valued at $10,930 and $10,932, respectively, and no contingent deferred sales charges would apply. A $10,000 investment in the fund’s class P, R, R6, and Y shares would have been valued at $11,995, $11,326, $12,019, and $11,914, respectively.
All Bloomberg indices are provided by Bloomberg Index Services Limited.
Fund price and distribution information For the 12-month period ended 10/31/21
| Class A | Class B | Class C | Class P | Class R | Class R6 | Class Y | ||
| Before | After | Net | Net | Net | Net | Net | Net | |
| sales | sales | asset | asset | asset | asset | asset | asset | |
| Share value | charge | charge | value | value | value | value | value | value |
| 10/31/20 | $10.29 | $10.92 | $9.90 | $9.86 | $10.39 | $10.09 | $10.42 | $10.36 |
| 10/31/21 | 10.24 | 10.86 | 9.78 | 9.75 | 10.39 | 10.02 | 10.42 | 10.35 |
The classification of distributions, if any, is an estimate. Before-sales-charge share value and current dividend rate for class A shares, if applicable, do not take into account any sales charge levied at the time of purchase. After-sales-charge share value, current dividend rate, and current 30-day SEC yield, if applicable, are calculated assuming that the maximum sales charge (5.75% for class A shares) was levied at the time of purchase. Final distribution information will appear on your year-end tax forms.
The fund made no distributions during the period.
| 10 Multi-Asset Absolute Return Fund |
Fund performance as of most recent calendar quarter Total return for periods ended 9/30/21
| Annual | ||||||||
| average | Annual | Annual | Annual | |||||
| (life of fund) | 10 years | average | 5 years | average | 3 years | average | 1 year | |
| Class A (12/23/08) | ||||||||
| Before sales charge | 2.59% | 19.38% | 1.79% | –4.07% | –0.83% | –10.11% | –3.49% | –2.57% |
| After sales charge | 2.11 | 12.51 | 1.19 | –9.59 | –2.00 | –15.28 | –5.38 | –8.17 |
| Class B (12/23/08) | ||||||||
| Before CDSC | 2.09 | 12.38 | 1.17 | –7.59 | –1.57 | –12.09 | –4.21 | –3.36 |
| After CDSC | 2.09 | 12.38 | 1.17 | –9.36 | –1.95 | –14.66 | –5.15 | –8.19 |
| Class C (12/23/08) | ||||||||
| Before CDSC | 2.10 | 12.41 | 1.18 | –7.57 | –1.56 | –12.08 | –4.20 | –3.37 |
| After CDSC | 2.10 | 12.41 | 1.18 | –7.57 | –1.56 | –12.08 | –4.20 | –4.34 |
| Class P (8/31/16) | ||||||||
| Net asset value | 2.89 | 23.42 | 2.13 | –2.07 | –0.42 | –8.95 | –3.08 | –2.17 |
| Class R (12/23/08) | ||||||||
| Net asset value | 2.30 | 16.46 | 1.54 | –5.27 | –1.08 | –10.79 | –3.74 | –2.82 |
| Class R6 (7/2/12) | ||||||||
| Net asset value | 2.90 | 23.54 | 2.14 | –2.34 | –0.47 | –9.14 | –3.14 | –2.26 |
| Class Y (12/23/08) | ||||||||
| Net asset value | 2.83 | 22.46 | 2.05 | –2.84 | –0.57 | –9.40 | –3.24 | –2.36 |
See the discussion following the fund performance table on page 9 for information about the calculation of fund performance.
| Multi-Asset Absolute Return Fund 11 |
Your fund’s expenses
As a mutual fund investor, you pay ongoing expenses, such as management fees, distribution fees (12b-1 fees), and other expenses. In the most recent six-month period, your fund’s expenses were limited; had expenses not been limited, they would have been higher. Using the following information, you can estimate how these expenses affect your investment and compare them with the expenses of other funds. You may also pay one-time transaction expenses, including sales charges (loads) and redemption fees, which are not shown in this section and would have resulted in higher total expenses. For more information, see your fund’s prospectus or talk to your financial representative.
Expense ratios
| Class A | Class B | Class C | Class P | Class R | Class R6 | Class Y | |
| Total annual operating expenses for the | |||||||
| fiscal year ended 10/31/20 | 0.94% | 1.69% | 1.69% | 0.54% | 1.19% | 0.58% | 0.69% |
| Annualized expense ratio for the | |||||||
| six-month period ended 10/31/21*† | 0.90% | 1.65% | 1.65% | 0.48% | 1.15% | 0.52% | 0.65% |
Fiscal year expense information in this table is taken from the most recent prospectus, is subject to change, and may differ from that shown for the annualized expense ratio and in the financial highlights of this report.
Prospectus expense information also includes the impact of acquired fund fees and expenses of 0.04%, which is not included in the financial highlights or annualized expense ratios. Expenses are shown as a percentage of average net assets.
* Expense ratios for each class are for the fund’s most recent fiscal half year. As a result of this, ratios may differ from expense ratios based on one-year data in the financial highlights.
† Includes a decrease of 0.31% from annualizing the performance fee adjustment for the six months ended 10/31/21.
Expenses per $1,000
The following table shows the expenses you would have paid on a $1,000 investment in each class of the fund from 5/1/21 to 10/31/21. It also shows how much a $1,000 investment would be worth at the close of the period, assuming actual returns and expenses.
| Class A | Class B | Class C | Class P | Class R | Class R6 | Class Y | |
| Expenses paid per $1,000*† | $4.53 | $8.28 | $8.28 | $2.42 | $5.78 | $2.62 | $3.27 |
| Ending value (after expenses) | $995.10 | $991.90 | $991.90 | $997.10 | $994.00 | $998.10 | $997.10 |
* Expenses for each share class are calculated using the fund’s annualized expense ratio for each class, which represents the ongoing expenses as a percentage of average net assets for the six months ended 10/31/21. The expense ratio may differ for each share class.
† Expenses are calculated by multiplying the expense ratio by the average account value for the period; then multiplying the result by the number of days in the period (184); and then dividing that result by the number of days in the year (365).
| 12 Multi-Asset Absolute Return Fund |
Estimate the expenses you paid
To estimate the ongoing expenses you paid for the six months ended 10/31/21, use the following calculation method. To find the value of your investment on 5/1/21, call Putnam at 1-800-225-1581.

Compare expenses using the SEC’s method
The Securities and Exchange Commission (SEC) has established guidelines to help investors assess fund expenses. Per these guidelines, the following table shows your fund’s expenses based on a $1,000 investment, assuming a hypothetical 5% annualized return. You can use this information to compare the ongoing expenses (but not transaction expenses or total costs) of investing in the fund with those of other funds. All mutual fund shareholder reports will provide this information to help you make this comparison. Please note that you cannot use this information to estimate your actual ending account balance and expenses paid during the period.
| Class A | Class B | Class C | Class P | Class R | Class R6 | Class Y | |
| Expenses paid per $1,000*† | $4.58 | $8.39 | $8.39 | $2.45 | $5.85 | $2.65 | $3.31 |
| Ending value (after expenses) | $1,020.67 | $1,016.89 | $1,016.89 | $1,022.79 | $1,019.41 | $1,022.58 | $1,021.93 |
* Expenses for each share class are calculated using the fund’s annualized expense ratio for each class, which represents the ongoing expenses as a percentage of average net assets for the six months ended 10/31/21. The expense ratio may differ for each share class.
† Expenses are calculated by multiplying the expense ratio by the average account value for the six-month period; then multiplying the result by the number of days in the six-month period (184); and then dividing that result by the number of days in the year (365).
| Multi-Asset Absolute Return Fund 13 |
Consider these risks before investing
Allocation of assets among asset classes may hurt performance. The value of investments in the fund’s portfolio may fall or fail to rise over extended periods of time for a variety of reasons, including general economic, political, or financial market conditions; investor sentiment and market perceptions; government actions; geopolitical events or changes; and factors related to a specific issuer, asset class, geography, industry, or sector. These and other factors may lead to increased volatility and reduced liquidity in the fund’s portfolio holdings.
Growth stocks may be more susceptible to earnings disappointments, and value stocks may fail to rebound. Bond investments are subject to interest-rate risk (the risk of bond prices falling if interest rates rise) and credit risk (the risk of an issuer defaulting on interest or principal payments). Interest-rate risk is generally greater for longer-term bonds, and credit risk is generally greater for below-investment-grade bonds. Unlike bonds, funds that invest in bonds have fees and expenses. Lower-rated bonds may offer higher yields in return for more risk. Funds that invest in government securities are not guaranteed. Mortgage-backed securities are subject to prepayment risk, which means that they may increase in value less than other bonds when interest rates decline and decline in value more than other bonds when interest rates rise. The fund may have to invest the proceeds from prepaid investments, including mortgage- and asset-backed investments, in other investments with less attractive terms and yields. International investing involves currency, economic, and political risks. Emerging market securities have illiquidity and volatility risks. Our alpha strategy may lose money or not earn a return sufficient to cover associated trading and other costs.
Our use of leverage obtained through derivatives increases these risks by increasing investment exposure. Risks associated with derivatives include increased investment exposure (which may be considered leverage) and, in the case of over-the-counter instruments, the potential inability to terminate or sell derivatives positions and the potential failure of the other party to the instrument to meet its obligations. The fund’s efforts to produce lower-volatility returns may not be successful. The fund may not achieve its goal, and it is not intended to be a complete investment program.
Our investment techniques, analyses, and judgments may not produce the outcome we intend. The investments we select for the fund may not perform as well as other securities that we do not select for the fund. We, or the fund’s other service providers, may experience disruptions or operating errors that could negatively impact the fund. The fund is not intended to outperform stocks and bonds during strong market rallies. The fund’s prospectus lists additional risks. You can lose money by investing in the fund.
| 14 Multi-Asset Absolute Return Fund |
Terms and definitions
Important terms
Total return shows how the value of the fund’s shares changed over time, assuming you held the shares through the entire period and reinvested all distributions in the fund.
Before sales charge, or net asset value, is the price, or value, of one share of a mutual fund, without a sales charge. Before-sales-charge figures fluctuate with market conditions. They are calculated by dividing the net assets of each class of shares by the number of outstanding shares in the class.
After sales charge is the price of a mutual fund share plus the maximum sales charge levied at the time of purchase. After-sales-charge performance figures shown here assume the 5.75% maximum sales charge for class A shares.
Contingent deferred sales charge (CDSC) is generally a charge applied at the time of the redemption of class B or C shares and assumes redemption at the end of the period. Your fund’s class B CDSC declines over time from a 5% maximum during the first year to 1% during the sixth year. After the sixth year, the CDSC no longer applies. The CDSC for class C shares is 1% for one year after purchase.
Share classes
Class A shares are generally subject to an initial sales charge and no CDSC (except on certain redemptions of shares bought without an initial sales charge).
Class B shares are closed to new investments and are only available by exchange from another Putnam fund or through dividend and/or capital gains reinvestment. They are not subject to an initial sales charge and may be subject to a CDSC.
Class C shares are not subject to an initial sales charge and are subject to a CDSC only if the shares are redeemed during the first year.
Class P shares require no minimum initial investment amount and no minimum subsequent investment amount. There is no initial or deferred sales charge. They are available only to other Putnam funds and other accounts managed by Putnam Management or its affiliates.
Class R shares are not subject to an initial sales charge or CDSC and are only available to employer-sponsored retirement plans.
Class R6 shares are not subject to an initial sales charge or CDSC and carry no 12b-1 fee. They are generally only available to employer-sponsored retirement plans, corporate and institutional clients, and clients in other approved programs.
Class Y shares are not subject to an initial sales charge or CDSC and carry no 12b-1 fee. They are generally only available to corporate and institutional clients and clients in other approved programs.
Fixed-income terms
Current rate is the annual rate of return earned from dividends or interest of an investment. Current rate is expressed as a percentage of the price of a security, fund share, or principal investment.
Mortgage-backed security (MBS), also known as a mortgage “pass-through,” is a type of asset-backed security that is secured by a mortgage or collection of mortgages. The following are types of MBSs:
• Agency “pass-through” has its principal and interest backed by a U.S. government agency, such as the Federal National Mortgage Association (Fannie Mae), Government National Mortgage Association (Ginnie Mae), and Federal Home Loan Mortgage Corporation (Freddie Mac).
| Multi-Asset Absolute Return Fund 15 |
• Collateralized mortgage obligation (CMO) represents claims to specific cash flows from pools of home mortgages. The streams of principal and interest payments on the mortgages are distributed to the different classes of CMO interests in “tranches.” Each tranche may have different principal balances, coupon rates, prepayment risks, and maturity dates. A CMO is highly sensitive to changes in interest rates and any resulting change in the rate at which homeowners sell their properties, refinance, or otherwise prepay loans. CMOs are subject to prepayment, market, and liquidity risks.
◦ Interest-only (IO) security is a type of CMO in which the underlying asset is the interest portion of mortgage, Treasury, or bond payments.
• Non-agency residential mortgage-backed security (RMBS) is an MBS not backed by Fannie Mae, Ginnie Mae, or Freddie Mac. One type of RMBS is an Alt-A mortgage-backed security.
• Commercial mortgage-backed security (CMBS) is secured by the loan on a commercial property.
Yield curve is a graph that plots the yields of bonds with equal credit quality against their differing maturity dates, ranging from shortest to longest. It is used as a benchmark for other debt, such as mortgage or bank lending rates.
Comparative indexes
Bloomberg U.S. Aggregate Bond Index is an unmanaged index of U.S. investment-grade fixed-income securities.
ICE BofA (Intercontinental Exchange Bank of America) U.S. Treasury Bill Index is an unmanaged index that tracks the performance of U.S. dollar-denominated U.S. Treasury bills publicly issued in the U.S. domestic market. Qualifying securities must have a remaining term of at least one month to final maturity and a minimum amount outstanding of $1 billion.
S&P 500® Index is an unmanaged index of common stock performance.
Indexes assume reinvestment of all distributions and do not account for fees. Securities and performance of a fund and an index will differ. You cannot invest directly in an index.
BLOOMBERG® is a trademark and service mark of Bloomberg Finance L.P. and its affiliates (collectively “Bloomberg”). Bloomberg or Bloomberg’s licensors own all proprietary rights in the Bloomberg Indices. Neither Bloomberg nor Bloomberg’s licensors approve or endorse this material, or guarantee the accuracy or completeness of any information herein, or make any warranty, express or implied, as to the results to be obtained therefrom, and to the maximum extent allowed by law, neither shall have any liability or responsibility for injury or damages arising in connection therewith.
ICE Data Indices, LLC (“ICE BofA”), used with permission. ICE BofA permits use of the ICE BofA indices and related data on an “as is” basis; makes no warranties regarding same; does not guarantee the suitability, quality, accuracy, timeliness, and/or completeness of the ICE BofA indices or any data included in, related to, or derived therefrom; assumes no liability in connection with the use of the foregoing; and does not sponsor, endorse, or recommend Putnam Investments, or any of its products or services.
| 16 Multi-Asset Absolute Return Fund |
Other information for shareholders
Proxy voting
Putnam is committed to managing our mutual funds in the best interests of our shareholders. The Putnam funds’ proxy voting guidelines and procedures, as well as information regarding how your fund voted proxies relating to portfolio securities during the 12-month period ended June 30, 2021, are available in the Individual Investors section of putnam.com and on the Securities and Exchange Commission (SEC) website, www.sec.gov. If you have questions about finding forms on the SEC’s website, you may call the SEC at 1-800-SEC-0330. You may also obtain the Putnam funds’ proxy voting guidelines and procedures at no charge by calling Putnam’s Shareholder Services at 1-800-225-1581.
Fund portfolio holdings
The fund will file a complete schedule of its portfolio holdings with the SEC for the first and third quarters of each fiscal year on Form N-PORT within 60 days of the end of such fiscal quarter. Shareholders may obtain the fund’s Form N-PORT on the SEC’s website at www.sec.gov.
Prior to its use of Form N-PORT, the fund filed its complete schedule of its portfolio holdings with the SEC on Form N-Q, which is available online at www.sec.gov.
Trustee and employee fund ownership
Putnam employees and members of the Board of Trustees place their faith, confidence, and, most importantly, investment dollars in Putnam mutual funds. As of October 31, 2021, Putnam employees had approximately $584,000,000 and the Trustees had approximately $82,000,000 invested in Putnam mutual funds. These amounts include investments by the Trustees’ and employees’ immediate family members as well as investments through retirement and deferred compensation plans.
Liquidity risk management program
Putnam, as the administrator of the fund’s liquidity risk management program (appointed by the Board of Trustees), presented the most recent annual report on the program to the Trustees in April 2021. The report covered the structure of the program, including the program documents and related policies and procedures adopted to comply with Rule 22e-4 under the Investment Company Act of 1940, and reviewed the operation of the program from January 2020 through December 2020. The report included a description of the annual liquidity assessment of the fund that Putnam performed in November 2020. The report noted that there were no material compliance exceptions identified under Rule 22e-4 during the period. The report included a review of the governance of the program and the methodology for classification of the fund’s investments. The report also included a discussion of liquidity monitoring during the period, including during the market liquidity challenges caused by the Covid-19 pandemic, and the impact those challenges had on the liquidity of the fund’s investments. Putnam concluded that the program has been operating effectively and adequately to ensure compliance with Rule 22e-4.
| Multi-Asset Absolute Return Fund 17 |
Important notice regarding Putnam’s privacy policy
In order to conduct business with our shareholders, we must obtain certain personal information such as account holders’ names, addresses, Social Security numbers, and dates of birth. Using this information, we are able to maintain accurate records of accounts and transactions.
It is our policy to protect the confidentiality of our shareholder information, whether or not a shareholder currently owns shares of our funds. In particular, it is our policy not to sell information about you or your accounts to outside marketing firms. We have safeguards in place designed to prevent unauthorized access to our computer systems and procedures to protect personal information from unauthorized use.
Under certain circumstances, we must share account information with outside vendors who provide services to us, such as mailings and proxy solicitations. In these cases, the service providers enter into confidentiality agreements with us, and we provide only the information necessary to process transactions and perform other services related to your account. Finally, it is our policy to share account information with your financial representative, if you’ve listed one on your Putnam account.
| 18 Multi-Asset Absolute Return Fund |
Trustee approval of management contract
General conclusions
The Board of Trustees of The Putnam Funds oversees the management of each fund and, as required by law, determines annually whether to approve the continuance of your fund’s management contract with Putnam Investment Management, LLC (“Putnam Management”), the sub-management contract with respect to your fund between Putnam Management and its affiliate, Putnam Investments Limited (“PIL”), and the sub-advisory contract among Putnam Management, PIL, and another affiliate, The Putnam Advisory Company (“PAC”). The Board, with the assistance of its Contract Committee, requests and evaluates all information it deems reasonably necessary under the circumstances in connection with its annual contract review. The Contract Committee consists solely of Trustees who are not “interested persons” (as this term is defined in the Investment Company Act of 1940, as amended (the “1940 Act”)) of The Putnam Funds (“Independent Trustees”).
At the outset of the review process, members of the Board’s independent staff and independent legal counsel considered any possible changes to the annual contract review materials furnished to the Contract Committee during the course of the previous year’s review and, as applicable, identified those changes to Putnam Management. Following these discussions and in consultation with the Contract Committee, the Independent Trustees’ independent legal counsel requested that Putnam Management and its affiliates furnish specified information, together with any additional information that Putnam Management considered relevant, to the Contract Committee. Over the course of several months ending in June 2021, the Contract Committee met on a number of occasions with representatives of Putnam Management, and separately in executive session, to consider the information that Putnam Management provided. Throughout this process, the Contract Committee was assisted by the members of the Board’s independent staff and by independent legal counsel for The Putnam Funds and the Independent Trustees.
In May 2021, the Contract Committee met in executive session to discuss and consider its recommendations with respect to the continuance of the contracts. At the Trustees’ June 2021 meeting, the Contract Committee met in executive session with the other Independent Trustees to review a summary of the key financial, performance and other data that the Contract Committee considered in the course of its review. The Contract Committee then presented its written report, which summarized the key factors that the Committee had considered and set forth its recommendations. The Contract Committee recommended, and the Independent Trustees approved, the continuance of your fund’s management, sub-management and sub-advisory contracts, effective July 1, 2021. (Because PIL and PAC are affiliates of Putnam Management and Putnam Management remains fully responsible for all services provided by PIL and PAC, the Trustees have not attempted to evaluate PIL or PAC as separate entities, and all subsequent references to Putnam Management below should be deemed to include reference to PIL and PAC as necessary or appropriate in the context.)
The Independent Trustees’ approval was based on the following conclusions:
• That the fee schedule in effect for your fund represented reasonable compensation in light of the nature and quality of the services being provided to the fund, the fees paid by competitive funds, the costs incurred by Putnam Management in providing services to the fund and the application of certain reductions and waivers noted below; and
• That the fee schedule in effect for your fund represented an appropriate sharing between fund shareholders and Putnam Management of any economies of scale as may exist in the management of the fund at current asset levels.
These conclusions were based on a comprehensive consideration of all information provided to the Trustees and were not the result of any single factor. Some of the factors that figured particularly in the Trustees’ deliberations and how the Trustees considered these factors are described below, although individual Trustees may have evaluated the information presented differently, giving different weights to various factors. It is also important to recognize that the management arrangements for your fund and the other Putnam funds are the result of many years of review and discussion between the Independent Trustees and Putnam Management, that some aspects of the arrangements may receive greater scrutiny in some years than others and that the Trustees’ conclusions
| Multi-Asset Absolute Return Fund 19 |
may be based, in part, on their consideration of fee arrangements in previous years. For example, with certain exceptions primarily involving newly launched or repositioned funds, the current fee arrangements under the vast majority of the funds’ management contracts were first implemented at the beginning of 2010 following extensive review by the Contract Committee and discussions with representatives of Putnam Management, as well as approval by shareholders.
Management fee schedules and total expenses
The Trustees reviewed the management fee schedules in effect for all Putnam funds, including fee levels and breakpoints. Under its management contract, your fund has the benefit of breakpoints in its management fee schedule that provide shareholders with reduced fee levels as assets under management in the Putnam family of funds increase. The Trustees also reviewed the total expenses of each Putnam fund, recognizing that in most cases management fees represented the major, but not the sole, determinant of total costs to fund shareholders. (Two funds have implemented so-called “all-in” management fees covering substantially all routine fund operating costs.)
In reviewing fees and expenses, the Trustees generally focus their attention on material changes in circumstances — for example, changes in assets under management, changes in a fund’s investment strategy, changes in Putnam Management’s operating costs or profitability, or changes in competitive practices in the mutual fund industry — that suggest that consideration of fee changes might be warranted. The Trustees concluded that the circumstances did not indicate that changes to the management fee schedule for your fund would be appropriate at this time.
Your fund’s management contract provides that its management fees will be adjusted up or down depending upon whether your fund’s performance is better or worse than the performance of an appropriate index of securities prices specified in the management contract. The management contract also provides for a reduction of the management fee for the fund in any circumstance where the fee payable by the fund under the management contract would be higher than the management fee would have been under the fund’s prior management contract, which was subject to a different performance fee structure. In the course of reviewing investment performance, the Trustees examined the operation of your fund’s performance fees and concluded that these fees were operating effectively to align further Putnam Management’s economic interests with those of the fund’s shareholders.
As in the past, the Trustees also focused on the competitiveness of each fund’s total expense ratio. The Trustees and Putnam Management and the funds’ investor servicing agent, Putnam Investor Services, Inc. (“PSERV”), have implemented expense limitations that were in effect during your fund’s fiscal year ending in 2020. These expense limitations were: (i) a contractual expense limitation applicable to specified open-end funds, including your fund, of 25 basis points on investor servicing fees and expenses and (ii) a contractual expense limitation applicable to specified open-end funds, including your fund, of 20 basis points on so-called “other expenses” (i.e., all expenses exclusive of management fees, distribution fees, investor servicing fees, investment-related expenses, interest, taxes, brokerage commissions, acquired fund fees and expenses and extraordinary expenses). These expense limitations attempt to maintain competitive expense levels for the funds. Most funds, including your fund, had sufficiently low expenses that these expense limitations were not operative during their fiscal years ending in 2020. Putnam Management and PSERV have agreed to maintain these expense limitations until at least February 28, 2023. Putnam Management and PSERV’s commitment to these expense limitation arrangements, which were intended to support an effort to have fund expenses meet competitive standards, was an important factor in the Trustees’ decision to approve the continuance of your fund’s management, sub-management and sub-advisory contracts. In addition, during its fiscal year ending in 2020, your fund’s expenses were reduced as a result of Putnam Management’s contractual agreement to waive fees and/or reimburse expenses of your fund to the extent that expenses of the fund (excluding payments under the fund’s distribution plans, investor servicing fees, any applicable performance-based upward or downward adjustments to the fund’s base management fee, brokerage, interest, taxes, investment-related expenses, extraordinary expenses and acquired fund fees and expenses) exceeded an annual rate of 0.77% of its average net assets. Effective July 1, 2021, this expense limitation is no longer operative.
| 20 Multi-Asset Absolute Return Fund |
The Trustees reviewed comparative fee and expense information for a custom group of competitive funds selected by Broadridge Financial Solutions, Inc. (“Broadridge”). This comparative information included your fund’s percentile ranking for effective management fees and total expenses (excluding any applicable 12b-1 fees), which provides a general indication of your fund’s relative standing. In the custom peer group, your fund ranked in the first quintile in effective management fees (determined for your fund and the other funds in the custom peer group based on fund asset size and the applicable contractual management fee schedule) and in the first quintile in total expenses (excluding any applicable 12b-1 fees) as of December 31, 2020. The first quintile represents the least expensive funds and the fifth quintile the most expensive funds. The fee and expense data reported by Broadridge as of December 31, 2020 reflected the most recent fiscal year-end data available in Broadridge’s database at that time.
In connection with their review of fund management fees and total expenses, the Trustees also reviewed the costs of the services provided and the profits realized by Putnam Management and its affiliates from their contractual relationships with the funds. This information included trends in revenues, expenses and profitability of Putnam Management and its affiliates relating to the investment management, investor servicing and distribution services provided to the funds. In this regard, the Trustees also reviewed an analysis of the revenues, expenses and profitability of Putnam Management and its affiliates, allocated on a fund-by-fund basis, with respect to the funds’ management, distribution and investor servicing contracts. For each fund, the analysis presented information about revenues, expenses and profitability for each of the agreements separately and for the agreements taken together on a combined basis. The Trustees concluded that, at current asset levels, the fee schedules in place for the Putnam funds, including the fee schedule for your fund, represented reasonable compensation for the services being provided and represented an appropriate sharing between fund shareholders and Putnam Management of any economies of scale as may exist in the management of the Putnam funds at that time.
The information examined by the Trustees in connection with their annual contract review for the Putnam funds included information regarding services provided and fees charged by Putnam Management and its affiliates to other clients, including defined benefit pension and profit-sharing plans, sub-advised mutual funds, private funds sponsored by affiliates of Putnam Management, model-only separately managed accounts and Putnam Management’s newly launched exchange-traded funds. This information included, in cases where a product’s investment strategy corresponds with a fund’s strategy, comparisons of those fees with fees charged to the Putnam funds, as well as an assessment of the differences in the services provided to these clients as compared to the services provided to the Putnam funds. The Trustees observed that the differences in fee rates between these clients and the Putnam funds are by no means uniform when examined by individual asset sectors, suggesting that differences in the pricing of investment management services to these types of clients may reflect, among other things, historical competitive forces operating in separate marketplaces. The Trustees considered the fact that in many cases fee rates across different asset classes are higher on average for mutual funds than for other clients, and the Trustees also considered the differences between the services that Putnam Management provides to the Putnam funds and those that it provides to its other clients. The Trustees did not rely on these comparisons to any significant extent in concluding that the management fees paid by your fund are reasonable.
Investment performance
The quality of the investment process provided by Putnam Management represented a major factor in the Trustees’ evaluation of the quality of services provided by Putnam Management under your fund’s management contract. The Trustees were assisted in their review of Putnam Management’s investment process and performance by the work of the investment oversight committees of the Trustees and the full Board of Trustees, which meet on a regular basis with individual portfolio managers and with senior management of Putnam Management’s Investment Division throughout the year. The Trustees concluded that Putnam Management generally provides a high-quality investment process — based on the experience and skills of the individuals assigned to the management of fund portfolios, the resources made available to them and in general Putnam Management’s ability to attract and retain high-quality personnel — but also recognized
| Multi-Asset Absolute Return Fund 21 |
that this does not guarantee favorable investment results for every fund in every time period.
The Trustees considered that, in the aggregate, The Putnam Funds generally performed well in 2020, which Putnam Management characterized as a challenging year with significant volatility and varied market dynamics. On an asset-weighted basis, the Putnam funds ranked in the second quartile of their peers as determined by Lipper Inc. (“Lipper”) for the year ended December 31, 2020 and, on an asset-weighted-basis, delivered a gross return that was 2.3% ahead of their benchmarks in 2020. In addition to the performance of the individual Putnam funds, the Trustees considered, as they had in prior years, the performance of The Putnam Fund complex versus competitor fund complexes. In this regard, the Trustees observed that The Putnam Funds’ relative performance, as reported in the Barron’s/Lipper Fund Families survey, continued to be exceptionally strong over the long term, with The Putnam Funds ranking as the 3rd best performing mutual fund complex out of 44 complexes for the ten-year period, with 2020 marking the fourth consecutive year that The Putnam Funds have ranked in the top ten fund complexes for the ten-year period. The Trustees noted that The Putnam Funds’ performance was solid over the one- and five-year periods, with The Putnam Funds ranking 22nd out of 53 complexes and 14th out of 50 complexes, respectively. In addition to the Barron’s/Lipper Fund Families Survey, the Trustees also considered the funds’ ratings assigned by Morningstar Inc., noting that 26 of the funds were four- or five-star rated at the end of 2020 (representing an increase of four funds year-over-year) and that this included seven funds that had achieved a five-star rating (representing an increase of two funds year-over-year). They also noted, however, the disappointing investment performance of some funds for periods ended December 31, 2020 and considered information provided by Putnam Management regarding the factors contributing to the underperformance and actions being taken to improve the performance of these particular funds. The Trustees indicated their intention to continue to monitor closely the performance of those funds and evaluate whether additional actions to address areas of underperformance may be warranted.
For purposes of the Trustees’ evaluation of the Putnam funds’ investment performance, the Trustees generally focus on a competitive industry ranking of each fund’s total net return over a one-year, three-year and five-year period. For a number of Putnam funds with relatively unique investment mandates for which Putnam Management informed the Trustees that meaningful competitive performance rankings are not considered to be available, the Trustees evaluated performance based on their total gross and net returns and comparisons of those returns to the returns of selected investment benchmarks. In the case of your fund, the Trustees considered information about your fund’s total return and its performance relative to its benchmark over the one-year, three-year and five-year periods ended December 31, 2020. Your fund’s class A shares’ return, net of fees and expenses, was negative and trailed the return of its benchmark over the one-year, three-year and five-year periods ended December 31, 2020. (When considering performance information, shareholders should be mindful that past performance is not a guarantee of future results.) The Trustees expressed concern about your fund’s significant underperformance relative to its benchmark over the one-year and three-year periods ended December 31, 2020 and considered the circumstances that may have contributed to this disappointing performance. The Trustees considered Putnam Management’s observation that the fund’s underperformance over the one-year period was primarily due to poor security selection in several equity and fixed income strategies. The Trustees also noted Putnam Management’s view that the fund’s underperformance over the three-year period was primarily due to poor security selection in several equity strategies. The Trustees considered Putnam Management’s observation that strategic exposure to commodities also detracted from the fund’s performance over the three-year period, noting that commodities exposure had since been removed from the fund’s strategic positioning.
The Trustees considered that the fund’s portfolio managers continued to have confidence in the long-term efficacy of the strategies that had underperformed in recent years and that the fund had reduced its reliance on equity strategies in an effort to improve the fund’s balance of risks. The Trustees noted that Putnam Management remained confident in the fund’s portfolio managers. The Trustees also considered Putnam Management’s continued efforts to support fund performance through certain initiatives, including structuring compensation for portfolio managers to enhance accountability for fund performance, emphasizing accountability in the
| 22 Multi-Asset Absolute Return Fund |
portfolio management process and affirming its commitment to a fundamental-driven approach to investing. The Trustees noted further that Putnam Management had made selective hires and internal promotions in 2020 to strengthen its investment team.
As a general matter, the Trustees believe that cooperative efforts between the Trustees and Putnam Management represent the most effective way to address investment performance concerns that may arise from time to time. The Trustees noted that investors in the Putnam funds have, in effect, placed their trust in the Putnam organization, under the oversight of the funds’ Trustees, to make appropriate decisions regarding the management of the funds. The Trustees also considered that Putnam Management has made changes in light of subpar investment performance when warranted. Based on Putnam Management’s willingness to take appropriate measures to address fund performance issues, the Trustees concluded that it continued to be advisable to seek change within Putnam Management to address performance shortcomings. In the Trustees’ view, the alternative of engaging a new investment adviser for an underperforming fund, with all the attendant risks and disruptions, would not likely provide any greater assurance of improved investment performance.
Brokerage and soft-dollar allocations; investor servicing
The Trustees considered various potential benefits that Putnam Management may receive in connection with the services it provides under the management contract with your fund. These include benefits related to brokerage allocation and the use of soft dollars, whereby a portion of the commissions paid by a fund for brokerage may be used to acquire research services that are expected to be useful to Putnam Management in managing the assets of the fund and of other clients. Subject to policies established by the Trustees, soft dollars generated by these means are used predominantly to acquire brokerage and research services (including third-party research and market data) that enhance Putnam Management’s investment capabilities and supplement Putnam Management’s internal research efforts. The Trustees indicated their continued intent to monitor regulatory and industry developments in this area with the assistance of their Brokerage Committee. In addition, with the assistance of their Brokerage Committee, the Trustees indicated their continued intent to monitor the allocation of the Putnam funds’ brokerage in order to ensure that the principle of seeking best price and execution remains paramount in the portfolio trading process.
Putnam Management may also receive benefits from payments that the funds make to Putnam Management’s affiliates for investor or distribution services. In conjunction with the annual review of your fund’s management, sub-management and sub-advisory contracts, the Trustees reviewed your fund’s investor servicing agreement with PSERV and its distributor’s contract and distribution plans with Putnam Retail Management Limited Partnership (“PRM”), both of which are affiliates of Putnam Management. The Trustees concluded that the fees payable by the funds to PSERV and PRM, as applicable, for such services are fair and reasonable in relation to the nature and quality of such services, the fees paid by competitive funds and the costs incurred by PSERV and PRM, as applicable, in providing such services. Furthermore, the Trustees were of the view that the investor services provided by PSERV were required for the operation of the funds, and that they were of a quality at least equal to those provided by other providers.
| Multi-Asset Absolute Return Fund 23 |
Audited financial statements
These sections of the report, as well as the accompanying Notes, preceded by the Report of Independent Registered Public Accounting Firm, constitute the fund’s audited financial statements.
The fund’s portfolio lists all the fund’s investments and their values as of the last day of the reporting period. Holdings are organized by asset type and industry sector, country, or state to show areas of concentration and diversification.
Statement of assets and liabilities shows how the fund’s net assets and share price are determined. All investment and non-investment assets are added together. Any unpaid expenses and other liabilities are subtracted from this total. The result is divided by the number of shares to determine the net asset value per share, which is calculated separately for each class of shares. (For funds with preferred shares, the amount subtracted from total assets includes the liquidation preference of preferred shares.)
Statement of operations shows the fund’s net investment gain or loss. This is done by first adding up all the fund’s earnings — from dividends and interest income — and subtracting its operating expenses to determine net investment income (or loss). Then, any net gain or loss the fund realized on the sales of its holdings — as well as any unrealized gains or losses over the period — is added to or subtracted from the net investment result to determine the fund’s net gain or loss for the fiscal period.
Statement of changes in net assets shows how the fund’s net assets were affected by the fund’s net investment gain or loss, by distributions to shareholders, and by changes in the number of the fund’s shares. It lists distributions and their sources (net investment income or realized capital gains) over the current reporting period and the most recent fiscal year-end. The distributions listed here may not match the sources listed in the Statement of operations because the distributions are determined on a tax basis and may be paid in a different period from the one in which they were earned.
Financial highlights provide an overview of the fund’s investment results, per-share distributions, expense ratios, net investment income ratios, and portfolio turnover in one summary table, reflecting the five most recent reporting periods. In a semiannual report, the highlights table also includes the current reporting period.
| 24 Multi-Asset Absolute Return Fund |
Report of Independent Registered Public Accounting Firm
To the Board of Trustees of Putnam Funds Trust and Shareholders of
Putnam Multi-Asset Absolute Return Fund:
Opinion on the Financial Statements
We have audited the accompanying statement of assets and liabilities, including the fund’s portfolio, of Putnam Multi-Asset Absolute Return Fund (one of the funds constituting Putnam Funds Trust, referred to hereafter as the “Fund”) as of October 31, 2021, the related statement of operations for the year ended October 31, 2021, the statement of changes in net assets for each of the two years in the period ended October 31, 2021, including the related notes, and the financial highlights for each of the five years in the period ended October 31, 2021 (collectively referred to as the “financial statements”). In our opinion, the financial statements present fairly, in all material respects, the financial position of the Fund as of October 31, 2021, the results of its operations for the year then ended, the changes in its net assets for each of the two years in the period ended October 31, 2021, and the financial highlights for each of the five years in the period ended October 31, 2021, in conformity with accounting principles generally accepted in the United States of America.
Basis for Opinion
These financial statements are the responsibility of the Fund’s management. Our responsibility is to express an opinion on the Fund’s financial statements based on our audits. We are a public accounting firm registered with the Public Company Accounting Oversight Board (United States) (“PCAOB”) and are required to be independent with respect to the Fund in accordance with the U.S. federal securities laws and the applicable rules and regulations of the Securities and Exchange Commission and the PCAOB.
We conducted our audits of these financial statements in accordance with the standards of the PCAOB. Those standards require that we plan and perform the audit to obtain reasonable assurance about whether the financial statements are free of material misstatement, whether due to error or fraud.
Our audits included performing procedures to assess the risks of material misstatement of the financial statements, whether due to error or fraud, and performing procedures that respond to those risks. Such procedures included examining, on a test basis, evidence regarding the amounts and disclosures in the financial statements. Our audits also included evaluating the accounting principles used and significant estimates made by management, as well as evaluating the overall presentation of the financial statements. Our procedures included confirmation of securities owned as of October 31, 2021, by correspondence with the custodian, transfer agent and brokers; when replies were not received from brokers, we performed other auditing procedures. We believe that our audits provide a reasonable basis for our opinion.
PricewaterhouseCoopers LLP
Boston, Massachusetts
December 9, 2021
We have served as the auditor of one or more investment companies in the Putnam Investments family of funds since at least 1957. We have not been able to determine the specific year we began serving as auditor.
| Multi-Asset Absolute Return Fund 25 |
| The fund’s portfolio 10/31/21 | ||
| U.S. GOVERNMENT AND AGENCY MORTGAGE OBLIGATIONS (33.1%)* | Principal amount | Value |
| U.S. Government Guaranteed Mortgage Obligations (—%) | ||
| Government National Mortgage Association Pass-Through Certificates | ||
| 5.50%, 5/20/49 | $53,090 | $60,537 |
| 5.00%, 5/20/49 | 135,245 | 149,789 |
| 3.50%, with due dates from 10/20/49 to 11/20/49 | 78,724 | 84,545 |
| 294,871 | ||
| U.S. Government Agency Mortgage Obligations (33.1%) | ||
| Federal Home Loan Mortgage Corporation Pass-Through Certificates | ||
| 3.50%, 8/1/43 | 306,227 | 332,546 |
| 3.00%, 3/1/43 | 244,670 | 259,785 |
| Federal National Mortgage Association Pass-Through Certificates | ||
| 5.50%, 1/1/38 | 731,598 | 831,095 |
| 5.00%, with due dates from 1/1/49 to 8/1/49 | 69,115 | 76,048 |
| 4.50%, 5/1/49 | 16,517 | 18,025 |
| 3.50%, 6/1/56 | 1,651,539 | 1,797,094 |
| 3.50%, with due dates from 6/1/42 to 7/1/43 | 540,102 | 583,625 |
| 3.00%, with due dates from 2/1/43 to 2/1/43 | 619,240 | 657,497 |
| Uniform Mortgage-Backed Securities | ||
| 5.50%, TBA, 11/1/51 | 3,000,000 | 3,346,962 |
| 4.50%, TBA, 11/1/51 | 2,000,000 | 2,161,250 |
| 4.00%, TBA, 11/1/51 | 54,000,000 | 57,824,253 |
| 3.50%, TBA, 11/1/51 | 56,000,000 | 59,167,517 |
| 3.00%, TBA, 12/1/51 | 1,000,000 | 1,041,914 |
| 3.00%, TBA, 11/1/51 | 6,000,000 | 6,259,746 |
| 2.50%, TBA, 11/1/51 | 17,000,000 | 17,460,855 |
| 2.00%, TBA, 11/1/51 | 54,000,000 | 53,994,503 |
| 205,812,715 | ||
| Total U.S. government and agency mortgage obligations (cost $205,854,357) | $206,107,586 | |
| U.S. TREASURY OBLIGATIONS (0.1%)* | Principal amount | Value |
| U.S. Treasury Notes | ||
| 0.75%, 4/30/26 i | $235,000 | $231,867 |
| 0.375%, 12/31/25 i | 197,000 | 191,577 |
| Total U.S. treasury obligations (cost $423,444) | $423,444 | |
| COMMON STOCKS (14.7%)* | Shares | Value |
| Basic materials (1.7%) | ||
| Anglo American Platinum, Ltd. (South Africa) | 12,919 | $1,307,473 |
| Kossan Rubber Industries (Malaysia) | 322,400 | 183,970 |
| Kumba Iron Ore, Ltd. (South Africa) | 5,621 | 171,799 |
| Kumho Petrochemical Co., Ltd. (South Korea) | 6,332 | 936,415 |
| MMC Norilsk Nickel PJSC ADR (Russia) | 57,947 | 1,816,772 |
| POSCO (South Korea) | 2,093 | 529,116 |
| Southern Copper Corp. (Peru) | 28,114 | 1,686,559 |
| Tata Steel, Ltd. (India) | 55,139 | 975,424 |
| Vale SA ADR (Brazil) S | 145,066 | 1,846,690 |
| Vedanta, Ltd. (India) | 326,894 | 1,317,490 |
| 10,771,708 |
26 Multi-Asset Absolute Return Fund | |
| COMMON STOCKS (14.7%)* cont. | Shares | Value |
| Capital goods (0.4%) | ||
| Haitian International Holdings, Ltd. (China) | 264,000 | $772,891 |
| Hartalega Holdings Bhd (Malaysia) | 158,800 | 225,072 |
| Sri Trang Gloves Thailand PCL (Thailand) | 1,603,900 | 1,474,239 |
| 2,472,202 | ||
| Communication services (0.1%) | ||
| Hellenic Telecommunications Organization SA (Greece) | 30,722 | 543,955 |
| KT Corp. (South Korea) | 7,992 | 209,219 |
| 753,174 | ||
| Consumer cyclicals (1.2%) | ||
| China Yongda Automobiles Services Holdings, Ltd. (China) | 717,500 | 1,145,210 |
| iHeartMedia, Inc. Class A † | 26,640 | 516,283 |
| Kia Corp. (South Korea) | 26,436 | 1,933,496 |
| Lite-On Technology Corp. (Taiwan) | 240,000 | 530,692 |
| OPAP SA (Greece) | 37,206 | 579,876 |
| Xinyi Glass Holdings, Ltd. (China) | 406,000 | 1,149,133 |
| Zhongsheng Group Holdings, Ltd. (China) | 206,000 | 1,860,139 |
| 7,714,829 | ||
| Consumer staples (1.6%) | ||
| Ambev SA (Brazil) | 550,000 | 1,655,711 |
| Arca Continental SAB de CV (Mexico) | 50,558 | 307,724 |
| China Feihe, Ltd. (China) | 529,000 | 884,202 |
| Coca-Cola Icecek AS (Turkey) | 25,672 | 227,386 |
| Grupo Bimbo SAB de CV Class A (Mexico) | 66,455 | 197,544 |
| Indofood Sukses Makmur Tbk PT (Indonesia) | 441,100 | 197,844 |
| JD.com, Inc. ADR (China) † | 29,859 | 2,337,363 |
| Marfrig Global Foods SA (Brazil) | 97,100 | 455,925 |
| Thai Union Group PCL Class F (Thailand) | 1,110,200 | 699,260 |
| Want Want China Holdings, Ltd. (China) | 1,734,000 | 1,344,328 |
| Yum China Holdings, Inc. (China) | 32,004 | 1,826,788 |
| 10,134,075 | ||
| Energy (0.5%) | ||
| China Coal Energy Co., Ltd. Class H (China) | 401,000 | 243,935 |
| China Shenhua Energy Co., Ltd. (China) | 734,000 | 1,579,510 |
| Lukoil PJSC ADR (Russia) | 14,266 | 1,452,596 |
| 3,276,041 | ||
| Financials (2.4%) | ||
| Agile Group Holdings, Ltd. (China) | 646,000 | 506,741 |
| Banco Bradesco SA (Brazil) | 281,600 | 992,920 |
| Banco Macro SA ADR (Argentina) † | 18,456 | 290,313 |
| Banco Santander (Brasil) S.A. (Units) (Brazil) | 207,671 | 1,265,793 |
| Banco Santander Chile (Chile) | 10,340,857 | 452,532 |
| Cathay Financial Holding Co., Ltd. (Taiwan) | 503,000 | 1,056,046 |
| Chailease Holding Co., Ltd. (Taiwan) | 150,654 | 1,449,704 |
| China Merchants Bank Co., Ltd. Class H (China) | 20,500 | 173,119 |
| China Minsheng Banking Corp., Ltd. Class H (China) | 1,476,000 | 585,069 |
| CTBC Financial Holding Co., Ltd. (Taiwan) | 554,000 | 463,476 |
| Fubon Financial Holding Co., Ltd. (Taiwan) | 13,400 | 35,545 |
| Hana Financial Group, Inc. (South Korea) | 45,417 | 1,743,538 |
| Hong Leong Bank Bhd (Malaysia) | 37,300 | 169,620 |
Multi-Asset Absolute Return Fund 27 | |
| COMMON STOCKS (14.7%)* cont. | Shares | Value |
| Financials cont. | ||
| Hopson Development Holdings, Ltd. (China) | 31,350 | $85,278 |
| KB Financial Group, Inc. (South Korea) | 41,709 | 2,009,748 |
| Logan Group Co., Ltd. (China) | 247,000 | 247,294 |
| Ping An Insurance (Group) Co. of China, Ltd. Class H (China) | 265,000 | 1,908,273 |
| Powerlong Real Estate Holdings, Ltd. (China) | 472,000 | 324,410 |
| Qualitas Controladora SAB de CV (Mexico) | 19,898 | 91,777 |
| Sberbank of Russia PJSC ADR (Russia) | 26,647 | 534,408 |
| Shinhan Financial Group Co., Ltd. (South Korea) | 6,568 | 214,187 |
| Tisco Financial Group PCL (Thailand) | 114,400 | 318,041 |
| 14,917,832 | ||
| Health care (0.6%) | ||
| China Medical System Holdings, Ltd. (China) | 444,000 | 756,188 |
| Cipla, Ltd./India (India) † | 22,513 | 272,484 |
| CSPC Pharmaceutical Group, Ltd. (China) | 1,426,000 | 1,494,241 |
| Sun Pharmaceutical Industries, Ltd. (India) | 99,810 | 1,060,847 |
| 3,583,760 | ||
| Technology (5.8%) | ||
| Alibaba Group Holding, Ltd. (China) † | 228,624 | 4,730,066 |
| Infosys, Ltd. (India) | 116,864 | 2,615,246 |
| LG Electronics, Inc. (South Korea) | 13,412 | 1,389,904 |
| Mindtree, Ltd. (India) | 30,523 | 1,836,180 |
| Novatek Microelectronics Corp. (Taiwan) | 110,000 | 1,656,583 |
| Parade Technologies, Ltd. (Taiwan) | 18,000 | 1,164,757 |
| Quanta Computer, Inc. (Taiwan) | 259,000 | 727,572 |
| Realtek Semiconductor Corp. (Taiwan) | 61,000 | 1,102,992 |
| Samsung Electro-Mechanics Co., Ltd. (South Korea) | 781 | 106,674 |
| Samsung Electronics Co., Ltd. (South Korea) | 99,159 | 5,940,800 |
| Taiwan Semiconductor Manufacturing Co., Ltd. ADR (Taiwan) | 47,651 | 5,417,919 |
| Tata Consultancy Services, Ltd. (India) | 23,553 | 1,069,961 |
| Tech Mahindra, Ltd. (India) | 91,222 | 1,804,021 |
| Tencent Holdings, Ltd. (China) | 50,300 | 3,122,938 |
| United Microelectronics Corp. (Taiwan) | 369,000 | 777,102 |
| Wipro, Ltd. (India) | 196,929 | 1,716,391 |
| 35,179,106 | ||
| Transportation (0.4%) | ||
| COSCO SHIPPING Holdings Co., Ltd. Class H (China) | 627,900 | 979,248 |
| Evergreen Marine Corp. Taiwan, Ltd. (Taiwan) | 399,000 | 1,443,960 |
| 2,423,208 | ||
| Utilities and power (—%) | ||
| Glow Energy PCL (Thailand) † F | 35,800 | 11 |
| Texas Competitive Electric Holdings Co., LLC/TCEH Finance, Inc. (Rights) | 25,989 | 34,825 |
| 34,836 | ||
| Total common stocks (cost $71,104,518) | $91,260,771 | |
| INVESTMENT COMPANIES (10.6%)* | Shares | Value |
| Communication Services Select Sector SPDR Fund S | 124,500 | $9,997,350 |
| Energy Select Sector SPDR Fund S | 408,800 | 23,493,736 |
| Financial Select Sector SPDR Fund | 549,400 | 22,118,844 |
| Materials Select Sector SPDR Fund | 118,100 | 10,052,672 |
| Total investment companies (cost $53,453,777) | $65,662,602 | |
28 Multi-Asset Absolute Return Fund | |
| MORTGAGE-BACKED SECURITIES (9.6%)* | Principal amount | Value | |
| Agency collateralized mortgage obligations (6.2%) | |||
| Federal Home Loan Mortgage Corporation | |||
| REMICs IFB Ser. 2990, Class LB, ((-2.556 x 1 Month US LIBOR) + 16.95%), 16.715%, 6/15/34 | $68,266 | $79,871 | |
| REMICs IFB Ser. 4727, Class SA, IO, ((-1 x 1 Month US LIBOR) + 6.20%), 6.11%, 11/15/47 | 2,569,477 | 486,034 | |
| REMICs IFB Ser. 3852, Class NT, ((-1 x 1 Month US LIBOR) + 6.00%), 5.91%, 5/15/41 | 865,420 | 910,553 | |
| REMICs Ser. 5043, IO, 5.00%, 11/25/50 | 3,479,409 | 690,983 | |
| REMICs Ser. 5018, Class QI, IO, 5.00%, 10/25/50 | 3,349,535 | 514,298 | |
| REMICs Ser. 5128, Class IE, IO, 4.50%, 7/25/51 | 3,800,235 | 700,319 | |
| REMICs Ser. 5125, Class MI, IO, 4.50%, 11/25/48 | 4,515,578 | 773,351 | |
| REMICs Ser. 4122, Class TI, IO, 4.50%, 10/15/42 | 595,791 | 80,453 | |
| REMICs Ser. 5010, Class IE, IO, 4.00%, 9/25/50 | 4,915,783 | 702,395 | |
| REMICs Ser. 4355, Class DI, IO, 4.00%, 3/15/44 | 531,934 | 16,199 | |
| REMICs Ser. 4193, Class PI, IO, 4.00%, 3/15/43 | 1,439,615 | 188,728 | |
| REMICs Ser. 4213, Class GI, IO, 4.00%, 11/15/41 | 379,122 | 18,501 | |
| REMICs Ser. 5060, Class EI, IO, 3.50%, 1/25/51 | 2,530,793 | 418,162 | |
| REMICs Ser. 4369, Class IA, IO, 3.50%, 7/15/44 | 304,147 | 40,174 | |
| REMICs Ser. 4136, Class IW, IO, 3.50%, 10/15/42 | 1,377,053 | 146,900 | |
| REMICs Ser. 4097, Class PI, IO, 3.50%, 11/15/40 | 99,008 | 231 | |
| REMICs Ser. 5082, Class IQ, IO, 3.00%, 3/25/51 | 6,813,389 | 799,756 | |
| REMICs Ser. 4150, Class DI, IO, 3.00%, 1/15/43 | 1,494,260 | 149,426 | |
| REMICs Ser. 4158, Class TI, IO, 3.00%, 12/15/42 | 2,635,206 | 204,018 | |
| REMICs Ser. 4183, Class MI, IO, 3.00%, 2/15/42 | 993,788 | 58,832 | |
| REMICs Ser. 4206, Class IP, IO, 3.00%, 12/15/41 | 1,699,130 | 110,556 | |
| Structured Pass-Through Certificates FRB Ser. 8, Class A9, IO, 0.436%, 11/15/28 W | 95,551 | 717 | |
| Structured Pass-Through Certificates FRB Ser. 59, Class 1AX, IO, 0.278%, 10/25/43 W | 457,709 | 4,852 | |
| Structured Pass-Through Certificates Ser. 48, Class A2, IO, 0.212%, 7/25/33 W | 710,829 | 5,331 | |
| REMICs Ser. 3175, Class MO, PO, zero %, 6/15/36 | 6,201 | 5,581 | |
| Strips Ser. 315, PO, zero %, 9/15/43 | 1,169,125 | 1,052,571 | |
| Federal National Mortgage Association | |||
| REMICs IFB Ser. 05-74, Class NK, ((-5 x 1 Month US LIBOR) + 27.50%), 27.054%, 5/25/35 | 37,246 | 50,264 | |
| REMICs IFB Ser. 11-4, Class CS, ((-2 x 1 Month US LIBOR) + 12.90%), 12.722%, 5/25/40 | 342,326 | 431,331 | |
| REMICs IFB Ser. 17-8, Class SB, IO, ((-1 x 1 Month US LIBOR) + 6.10%), 6.011%, 2/25/47 | 5,903,240 | 1,114,000 | |
| REMICs Ser. 16-3, Class NI, IO, 6.00%, 2/25/46 | 2,373,327 | 502,512 | |
| REMICs IFB Ser. 19-49, Class ST, IO, ((-1 x 1 Month US LIBOR) + 6.02%), 5.931%, 9/25/49 | 4,169,342 | 750,753 | |
| REMICs IFB Ser. 17-74, Class SA, IO, ((-1 x 1 Month US LIBOR) + 5.75%), 5.661%, 10/25/47 | 6,262,328 | 998,695 | |
| REMICs Ser. 18-58, Class IO, IO, 5.50%, 8/25/48 | 2,101,553 | 411,591 | |
| REMICs Ser. 15-28, IO, 5.50%, 5/25/45 | 3,158,792 | 595,717 | |
| Interest Strip Ser. 397, Class 2, IO, 5.00%, 9/25/39 | 16,018 | 2,755 | |
| REMICs Ser. 20-93, Class WI, IO, 5.00%, 6/25/50 | 4,368,593 | 769,266 | |
| REMICs Ser. 17-113, IO, 5.00%, 1/25/38 | 600,876 | 69,690 | |
Multi-Asset Absolute Return Fund 29 | |
| MORTGAGE-BACKED SECURITIES (9.6%)* cont. | Principal amount | Value | |
| Agency collateralized mortgage obligations cont. | |||
| Federal National Mortgage Association | |||
| REMICs Ser. 21-15, Class JI, IO, 4.50%, 4/25/51 | $2,739,797 | $468,505 | |
| REMICs Ser. 21-17, Class KI, IO, 4.50%, 4/25/51 | 5,209,948 | 681,357 | |
| REMICs Ser. 14-47, Class IP, IO, 4.00%, 3/25/44 | 1,428,409 | 137,359 | |
| REMICs Ser. 12-124, Class UI, IO, 4.00%, 11/25/42 | 2,175,295 | 316,105 | |
| REMICs Ser. 12-22, Class CI, IO, 4.00%, 3/25/41 | 903,903 | 30,539 | |
| REMICs Ser. 15-10, Class AI, IO, 3.50%, 8/25/43 | 217,128 | 4,195 | |
| REMICs Ser. 12-136, Class PI, IO, 3.50%, 11/25/42 | 594,090 | 31,436 | |
| REMICs Ser. 14-10, IO, 3.50%, 8/25/42 | 566,001 | 57,613 | |
| REMICs Ser. 13-21, Class AI, IO, 3.50%, 3/25/33 | 1,299,798 | 186,859 | |
| REMICs Ser. 21-44, Class NI, IO, 3.00%, 7/25/51 | 2,995,591 | 535,899 | |
| REMICs Ser. 21-56, Class IL, IO, 3.00%, 3/25/51 | 4,427,074 | 673,120 | |
| REMICs Ser. 12-151, Class PI, IO, 3.00%, 1/25/43 | 1,331,494 | 151,113 | |
| REMICs Ser. 6, Class BI, IO, 3.00%, 12/25/42 | 1,044,477 | 58,238 | |
| REMICs Ser. 13-23, Class PI, IO, 3.00%, 10/25/41 | 686,260 | 10,217 | |
| REMICs Ser. 13-31, Class NI, IO, 3.00%, 6/25/41 | 920,316 | 16,806 | |
| REMICs Trust Ser. 98-W5, Class X, IO, 0.719%, 7/25/28 W | 192,069 | 4,072 | |
| REMICs Trust Ser. 98-W2, Class X, IO, 0.507%, 6/25/28 W | 608,765 | 13,697 | |
| REMICs Ser. 08-36, Class OV, PO, zero %, 1/25/36 | 4,017 | 3,727 | |
| Government National Mortgage Association | |||
| FRB Ser. 20-112, Class MS, IO, ((-1 x 1 Month US LIBOR) + 6.30%), 6.214%, 8/20/50 | 3,605,404 | 708,678 | |
| IFB Ser. 18-91, Class SJ, IO, ((-1 x 1 Month US LIBOR) + 6.25%), 6.164%, 7/20/48 | 2,515,470 | 381,747 | |
| IFB Ser. 13-129, Class SN, IO, ((-1 x 1 Month US LIBOR) + 6.15%), 6.064%, 9/20/43 | 364,212 | 63,963 | |
| IFB Ser. 13-99, Class VS, IO, ((-1 x 1 Month US LIBOR) + 6.10%), 6.014%, 7/16/43 | 420,052 | 66,683 | |
| IFB Ser. 20-15, Class CS, IO, ((-1 x 1 Month US LIBOR) + 6.05%), 5.964%, 2/20/50 | 146,520 | 17,464 | |
| IFB Ser. 19-99, Class KS, IO, ((-1 x 1 Month US LIBOR) + 6.05%), 5.964%, 8/20/49 | 126,974 | 16,537 | |
| IFB Ser. 19-78, Class SJ, IO, ((-1 x 1 Month US LIBOR) + 6.05%), 5.964%, 6/20/49 | 159,619 | 19,836 | |
| IFB Ser. 11-17, Class S, IO, ((-1 x 1 Month US LIBOR) + 6.05%), 5.964%, 2/20/41 | 783,070 | 148,346 | |
| Ser. 16-150, Class I, IO, 5.00%, 11/20/46 | 2,579,939 | 463,357 | |
| Ser. 18-127, Class IC, IO, 5.00%, 10/20/44 | 1,282,494 | 236,466 | |
| Ser. 14-76, IO, 5.00%, 5/20/44 | 1,444,768 | 254,663 | |
| Ser. 14-163, Class NI, IO, 5.00%, 2/20/44 | 1,162,618 | 158,816 | |
| Ser. 14-2, Class IC, IO, 5.00%, 1/16/44 | 3,030,178 | 634,110 | |
| Ser. 13-3, Class IT, IO, 5.00%, 1/20/43 | 513,503 | 97,103 | |
| Ser. 11-116, Class IB, IO, 5.00%, 10/20/40 | 5,866 | 450 | |
| Ser. 10-35, Class UI, IO, 5.00%, 3/20/40 | 350,365 | 64,165 | |
| Ser. 10-20, Class UI, IO, 5.00%, 2/20/40 | 551,587 | 101,282 | |
| Ser. 10-9, Class UI, IO, 5.00%, 1/20/40 | 1,798,525 | 340,605 | |
| Ser. 09-121, Class UI, IO, 5.00%, 12/20/39 | 1,395,274 | 261,837 | |
| Ser. 15-80, Class IA, IO, 4.50%, 6/20/45 | 2,432,184 | 416,124 | |
| Ser. 15-167, Class BI, IO, 4.50%, 4/16/45 | 1,169,572 | 221,763 | |
| Ser. 14-108, Class IP, IO, 4.50%, 12/20/42 | 225,916 | 14,764 | |
30 Multi-Asset Absolute Return Fund | |
| MORTGAGE-BACKED SECURITIES (9.6%)* cont. | Principal amount | Value | |
| Agency collateralized mortgage obligations cont. | |||
| Government National Mortgage Association | |||
| Ser. 10-35, Class AI, IO, 4.50%, 3/20/40 | $794,736 | $69,192 | |
| Ser. 10-35, Class QI, IO, 4.50%, 3/20/40 | 388,522 | 64,840 | |
| Ser. 13-151, Class IB, IO, 4.50%, 2/20/40 | 643,495 | 102,646 | |
| Ser. 10-9, Class QI, IO, 4.50%, 1/20/40 | 453,740 | 75,276 | |
| Ser. 09-121, Class BI, IO, 4.50%, 12/16/39 | 275,359 | 51,330 | |
| Ser. 15-99, Class LI, IO, 4.00%, 7/20/45 | 266,461 | 22,248 | |
| Ser. 15-53, Class MI, IO, 4.00%, 4/16/45 | 2,774,440 | 527,144 | |
| Ser. 15-187, Class JI, IO, 4.00%, 3/20/45 | 1,545,299 | 209,427 | |
| Ser. 14-63, Class PI, IO, 4.00%, 7/20/43 | 352,409 | 30,608 | |
| Ser. 13-24, Class PI, IO, 4.00%, 11/20/42 | 560,376 | 58,207 | |
| Ser. 12-106, Class QI, IO, 4.00%, 7/20/42 | 257,854 | 38,162 | |
| Ser. 12-47, Class CI, IO, 4.00%, 3/20/42 | 848,676 | 130,089 | |
| Ser. 14-104, IO, 4.00%, 3/20/42 | 2,651,617 | 331,976 | |
| Ser. 12-50, Class PI, IO, 4.00%, 12/20/41 | 700,610 | 72,746 | |
| Ser. 12-8, Class PI, IO, 4.00%, 5/20/41 | 1,166,116 | 91,710 | |
| Ser. 14-133, Class AI, IO, 4.00%, 10/20/36 | 480,717 | 3,221 | |
| Ser. 20-167, Class PI, IO, 3.50%, 11/20/50 | 3,540,756 | 388,785 | |
| Ser. 15-24, Class IA, IO, 3.50%, 2/20/45 | 807,191 | 81,849 | |
| Ser. 13-102, Class IP, IO, 3.50%, 6/20/43 | 85,102 | 342 | |
| Ser. 13-100, Class MI, IO, 3.50%, 2/20/43 | 606,837 | 27,053 | |
| Ser. 13-37, Class JI, IO, 3.50%, 1/20/43 | 573,075 | 52,224 | |
| Ser. 12-145, IO, 3.50%, 12/20/42 | 954,904 | 165,374 | |
| Ser. 13-27, Class PI, IO, 3.50%, 12/20/42 | 172,215 | 16,576 | |
| Ser. 18-127, Class IA, IO, 3.50%, 4/20/42 | 340,724 | 22,290 | |
| Ser. 13-37, Class LI, IO, 3.50%, 1/20/42 | 471,819 | 25,195 | |
| Ser. 12-141, Class WI, IO, 3.50%, 11/20/41 | 166,732 | 664 | |
| Ser. 15-36, Class GI, IO, 3.50%, 6/16/41 | 788,837 | 32,499 | |
| Ser. 13-157, Class IA, IO, 3.50%, 4/20/40 | 502,091 | 10,159 | |
| Ser. 13-79, Class XI, IO, 3.50%, 11/20/39 | 1,636,314 | 61,923 | |
| Ser. 183, Class AI, IO, 3.50%, 10/20/39 | 424,052 | 5,787 | |
| Ser. 13-6, Class AI, IO, 3.50%, 8/20/39 | 1,353,496 | 93,558 | |
| Ser. 15-124, Class NI, IO, 3.50%, 6/20/39 | 165,536 | 596 | |
| Ser. 15-24, Class IC, IO, 3.50%, 11/20/37 | 786,783 | 20,535 | |
| Ser. 21-78, Class IP, IO, 3.00%, 5/20/51 | 6,805,841 | 578,496 | |
| Ser. 17-H02, Class BI, IO, 2.433%, 1/20/67 W | 5,029,761 | 357,420 | |
| Ser. 16-H04, Class HI, IO, 2.385%, 7/20/65 W | 4,462,569 | 197,692 | |
| FRB Ser. 16-H16, Class DI, IO, 2.242%, 6/20/66 W | 3,768,367 | 274,384 | |
| Ser. 16-H23, Class NI, IO, 2.139%, 10/20/66 W | 6,280,332 | 428,947 | |
| Ser. 16-H11, Class HI, IO, 2.101%, 1/20/66 W | 4,278,547 | 225,292 | |
| Ser. 15-H24, Class HI, IO, 2.057%, 9/20/65 W | 11,469,552 | 389,047 | |
| Ser. 15-H15, Class JI, IO, 1.958%, 6/20/65 W | 8,879,227 | 610,891 | |
| Ser. 15-H19, Class NI, IO, 1.906%, 7/20/65 W | 11,870,514 | 712,231 | |
| FRB Ser. 15-H16, Class XI, IO, 1.882%, 7/20/65 W | 7,612,612 | 569,423 | |
| Ser. 15-H25, Class EI, IO, 1.849%, 10/20/65 W | 7,738,354 | 465,075 | |
| Ser. 15-H26, Class DI, IO, 1.848%, 10/20/65 W | 4,658,316 | 345,498 | |
| Ser. 15-H20, Class CI, IO, 1.834%, 8/20/65 W | 12,069,401 | 882,273 | |
| Ser. 16-H02, Class BI, IO, 1.816%, 11/20/65 W | 11,208,715 | 819,357 | |
| Ser. 15-H10, Class CI, IO, 1.801%, 4/20/65 W | 13,548,226 | 796,636 | |
Multi-Asset Absolute Return Fund 31 | |
| MORTGAGE-BACKED SECURITIES (9.6%)* cont. | Principal amount | Value | |
| Agency collateralized mortgage obligations cont. | |||
| Government National Mortgage Association | |||
| Ser. 16-H03, Class AI, IO, 1.77%, 1/20/66 W | $8,677,325 | $516,572 | |
| Ser. 15-H25, Class BI, IO, 1.753%, 10/20/65 W | 10,759,145 | 738,077 | |
| Ser. 15-H26, Class EI, IO, 1.73%, 10/20/65 W | 8,107,730 | 479,167 | |
| Ser. 15-H09, Class AI, IO, 1.729%, 4/20/65 W | 8,004,362 | 470,673 | |
| Ser. 17-H14, Class DI, IO, 1.703%, 6/20/67 W | 7,959,644 | 362,960 | |
| Ser. 15-H09, Class BI, IO, 1.681%, 3/20/65 W | 11,296,856 | 638,148 | |
| Ser. 15-H25, Class AI, IO, 1.613%, 9/20/65 W | 11,334,612 | 604,135 | |
| Ser. 15-H10, Class EI, IO, 1.603%, 4/20/65 W | 8,015,264 | 292,453 | |
| Ser. 14-H21, Class AI, IO, 1.54%, 10/20/64 W | 9,073,087 | 555,717 | |
| Ser. 11-H15, Class AI, IO, 1.536%, 6/20/61 W | 2,686,447 | 112,075 | |
| Ser. 15-H14, Class BI, IO, 1.533%, 5/20/65 W | 11,952,746 | 372,758 | |
| Ser. 16-H04, Class KI, IO, 1.527%, 2/20/66 W | 7,674,166 | 368,120 | |
| Ser. 16-H07, Class HI, IO, 1.526%, 2/20/66 W | 5,698,676 | 418,283 | |
| Ser. 16-H08, Class GI, IO, 1.432%, 4/20/66 W | 10,765,228 | 463,971 | |
| GSMPS Mortgage Loan Trust 144A FRB Ser. 99-2, IO, 0.431%, 9/19/27 W | 66,405 | 252 | |
| 38,855,236 | |||
| Commercial mortgage-backed securities (1.9%) | |||
| Banc of America Commercial Mortgage Trust FRB Ser. 07-1, Class XW, IO, 0.313%, 1/15/49 W | 87,674 | 2 | |
| Banc of America Commercial Mortgage Trust 144A FRB Ser. 08-1, Class C, 6.567%, 2/10/51 (In default) † W | 1,107,980 | 23,268 | |
| Banc of America Merrill Lynch Commercial Mortgage, Inc. FRB Ser. 05-1, Class C, 5.482%, 11/10/42 (In default) † W | 721,000 | 195,391 | |
| Bear Stearns Commercial Mortgage Securities Trust | |||
| FRB Ser. 07-T26, Class AJ, 5.431%, 1/12/45 W | 884,000 | 698,360 | |
| Ser. 05-PWR7, Class D, 5.262%, 2/11/41 W | 806,000 | 565,006 | |
| Ser. 05-PWR7, Class C, 5.235%, 2/11/41 W | 489,000 | 564,738 | |
| COMM Mortgage Trust 144A | |||
| FRB Ser. 14-CR17, Class D, 4.848%, 5/10/47 W | 315,000 | 295,764 | |
| Ser. 12-CR3, Class F, 4.75%, 10/15/45 W | 725,000 | 205,181 | |
| Ser. 12-LC4, Class E, 4.25%, 12/10/44 | 1,056,000 | 151,853 | |
| GS Mortgage Securities Trust 144A FRB Ser. 14-GC24, Class D, 4.536%, 9/10/47 W | 1,037,000 | 708,831 | |
| JPMBB Commercial Mortgage Securities Trust 144A | |||
| FRB Ser. 14-C18, Class D, 4.796%, 2/15/47 W | 2,751,000 | 1,508,877 | |
| FRB Ser. 13-C14, Class E, 4.548%, 8/15/46 W | 1,491,000 | 1,004,063 | |
| JPMorgan Chase Commercial Mortgage Securities Trust 144A | |||
| FRB Ser. 12-C6, Class F, 5.139%, 5/15/45 W | 766,000 | 495,212 | |
| FRB Ser. 13-LC11, Class E, 3.25%, 4/15/46 W | 370,000 | 253,467 | |
| Ser. 12-C6, Class G, 2.972%, 5/15/45 W | 1,166,000 | 651,554 | |
| LB-UBS Commercial Mortgage Trust FRB Ser. 07-C2, Class XW, IO, 0.056%, 2/15/40 W | 61,928 | 3 | |
| ML-CFC Commercial Mortgage Trust 144A FRB Ser. 06-4, Class XC, IO, 1.156%, 12/12/49 W | 22,314 | 74 | |
| Morgan Stanley Bank of America Merrill Lynch Trust 144A | |||
| FRB Ser. 13-C11, Class E, 4.351%, 8/15/46 W | 1,350,000 | 54,000 | |
| FRB Ser. 13-C11, Class F, 4.351%, 8/15/46 W | 1,720,000 | 18,920 | |
| FRB Ser. 13-C10, Class D, 4.08%, 7/15/46 W | 2,538,000 | 1,363,200 | |
32 Multi-Asset Absolute Return Fund | |
| MORTGAGE-BACKED SECURITIES (9.6%)* cont. | Principal amount | Value | |
| Commercial mortgage-backed securities cont. | |||
| Morgan Stanley Capital I Trust Ser. 06-HQ10, Class B, 5.448%, 11/12/41 W | $722,869 | $711,854 | |
| Morgan Stanley Capital I Trust 144A FRB Ser. 11-C3, Class G, 5.091%, 7/15/49 W | 795,000 | 359,306 | |
| UBS-Barclays Commercial Mortgage Trust 144A Ser. 12-C2, Class F, 5.00%, 5/10/63 W | 853,000 | 20,216 | |
| Wachovia Bank Commercial Mortgage Trust FRB Ser. 06-C29, IO, 0.26%, 11/15/48 W | 766,772 | 18 | |
| Wachovia Bank Commercial Mortgage Trust 144A FRB Ser. 05-C21, Class E, 5.104%, 10/15/44 W | 401,907 | 370,156 | |
| Wells Fargo Commercial Mortgage Trust 144A FRB Ser. 13-LC12, Class D, 4.306%, 7/15/46 W | 823,000 | 371,900 | |
| WF-RBS Commercial Mortgage Trust 144A | |||
| Ser. 11-C3, Class E, 5.00%, 3/15/44 W | 367,000 | 50,756 | |
| Ser. 11-C4, Class E, 4.887%, 6/15/44 W | 87,000 | 63,551 | |
| Ser. 11-C4, Class F, 4.887%, 6/15/44 W | 1,355,000 | 677,500 | |
| FRB Ser. 13-C15, Class D, 4.499%, 8/15/46 W | 673,004 | 387,395 | |
| FRB Ser. 12-C10, Class E, 4.412%, 12/15/45 W | 697,000 | 166,209 | |
| 11,936,625 | |||
| Residential mortgage-backed securities (non-agency) (1.5%) | |||
| American Home Mortgage Investment Trust FRB Ser. 07-1, Class GA1C, (1 Month US LIBOR + 0.19%), 0.279%, 5/25/47 | 345,201 | 199,755 | |
| Citigroup Mortgage Loan Trust, Inc. FRB Ser. 07-AMC3, Class A2D, (1 Month US LIBOR + 0.35%), 0.439%, 3/25/37 | 643,433 | 603,556 | |
| Countrywide Home Loans Mortgage Pass-Through Trust FRB Ser. 05-3, Class 1A1, (1 Month US LIBOR + 0.62%), 0.709%, 4/25/35 | 218,708 | 199,226 | |
| Federal Home Loan Mortgage Corporation Structured Agency Credit Risk Debt FRN Ser. 16-DNA1, Class B, (1 Month US LIBOR + 10.00%), 10.086%, 7/25/28 | 1,225,785 | 1,367,587 | |
| Federal Home Loan Mortgage Corporation 144A | |||
| Structured Agency Credit Risk Trust FRB Ser. 18-HQA2, Class B2, (1 Month US LIBOR + 11.00%), 11.089%, 10/25/48 | 161,000 | 190,472 | |
| Structured Agency Credit Risk Trust FRB Ser. 19-DNA2, Class B2, (1 Month US LIBOR + 10.50%), 10.589%, 3/25/49 | 63,000 | 70,240 | |
| Structured Agency Credit Risk Trust FRB Ser. 19-DNA3, Class B2, (1 Month US LIBOR + 8.15%), 8.239%, 7/25/49 | 92,000 | 98,953 | |
| Structured Agency Credit Risk Trust FRB Ser. 18-DNA2, Class B1, (1 Month US LIBOR + 3.70%), 3.789%, 12/25/30 | 82,000 | 84,987 | |
| Structured Agency Credit Risk Trust FRB Ser. 19-DNA1, Class M2, (1 Month US LIBOR + 2.65%), 2.739%, 1/25/49 | 101,970 | 103,330 | |
| Structured Agency Credit Risk Trust FRB Ser. 19-DNA2, Class M2, (1 Month US LIBOR + 2.45%), 2.539%, 3/25/49 | 11,147 | 11,286 | |
| Federal National Mortgage Association | |||
| Connecticut Avenue Securities FRB Ser. 16-C02, Class 1B, (1 Month US LIBOR + 12.25%), 12.339%, 9/25/28 | 2,214,187 | 2,559,355 | |
| Connecticut Avenue Securities FRB Ser. 15-C04, Class 1M2, (1 Month US LIBOR + 5.70%), 5.789%, 4/25/28 | 863,157 | 913,234 | |
| Connecticut Avenue Securities FRB Ser. 15-C04, Class 2M2, (1 Month US LIBOR + 5.55%), 5.639%, 4/25/28 | 59,532 | 62,391 | |
| Connecticut Avenue Securities FRB Ser. 15-C03, Class 2M2, (1 Month US LIBOR + 5.00%), 5.089%, 7/25/25 | 17,669 | 17,788 | |
Multi-Asset Absolute Return Fund 33 | |
| MORTGAGE-BACKED SECURITIES (9.6%)* cont. | Principal amount | Value | |
| Residential mortgage-backed securities (non-agency) cont. | |||
| Federal National Mortgage Association | |||
| Connecticut Avenue Securities FRB Ser. 17-C03, Class 1B1, (1 Month US LIBOR + 4.85%), 4.939%, 10/25/29 | $265,000 | $286,835 | |
| Connecticut Avenue Securities FRB Ser. 17-C06, Class 2B1, (1 Month US LIBOR + 4.45%), 4.539%, 2/25/30 | 451,000 | 472,423 | |
| Connecticut Avenue Securities FRB Ser. 15-C02, Class 1M2, (1 Month US LIBOR + 4.00%), 4.089%, 5/25/25 | 24,537 | 25,015 | |
| Connecticut Avenue Securities FRB Ser. 15-C02, Class 2M2, (1 Month US LIBOR + 4.00%), 4.089%, 5/25/25 | 14,244 | 14,323 | |
| Connecticut Avenue Securities FRB Ser. 17-C05, Class 1B1, (1 Month US LIBOR + 3.60%), 3.689%, 1/25/30 | 346,000 | 361,619 | |
| Connecticut Avenue Securities FRB Ser. 17-C06, Class 2M2, (1 Month US LIBOR + 2.80%), 2.889%, 2/25/30 | 78,526 | 80,017 | |
| GCAT Trust 144A Ser. 20-NQM2, Class A3, 2.935%, 4/25/65 | 53,010 | 53,531 | |
| GSAA Trust FRB Ser. 07-6, Class 1A1, (1 Month US LIBOR + 0.12%), 0.329%, 5/25/47 | 145,348 | 107,550 | |
| MortgageIT Trust FRB Ser. 04-1, Class M2, (1 Month US LIBOR + 1.01%), 1.094%, 11/25/34 | 133,580 | 130,025 | |
| Residential Accredit Loans, Inc. FRB Ser. 06-QO5, Class 1A1, (1 Month US LIBOR + 0.43%), 0.519%, 5/25/46 | 154,973 | 139,476 | |
| Residential Accredit Loans, Inc. Trust FRB Ser. 06-QO10, Class A1, (1 Month US LIBOR + 0.16%), 0.409%, 1/25/37 | 164,075 | 158,139 | |
| Structured Asset Mortgage Investments II Trust | |||
| FRB Ser. 07-AR7, Class 1A1, (1 Month US LIBOR + 0.85%), 0.939%, 5/25/47 | 128,691 | 114,002 | |
| FRB Ser. 07-AR1, Class 2A1, (1 Month US LIBOR + 0.18%), 0.269%, 1/25/37 | 650,246 | 626,938 | |
| 9,052,053 | |||
| Total mortgage-backed securities (cost $76,793,392) | $59,843,914 | ||
| COMMODITY LINKED NOTES (7.5%)*††† | Principal amount | Value |
| Bank of America Corp. 144A sr. unsec. unsub. notes 1-month LIBOR less 0.11%, 2022 (Indexed to the BofA Merrill Lynch Commodity MLBX4SX6 Excess Return Strategy multiplied by 3) | $11,630,000 | $12,094,641 |
| Citigroup Global Markets Holdings, Inc. sr. notes Ser. N, 1-month USD LIBOR less 0.06%, 2022 (Indexed to the Citi Commodities F3 vs F0 — 4x Leveraged Index multiplied by 3) | 9,775,000 | 10,574,800 |
| Citigroup Global Markets Holdings, Inc. 144A sr. notes, zero %, 2022 (Indexed to the Citi Cross-Asset Trend 10% Vol Index multiplied by 3) | 14,969,000 | 15,379,145 |
| Citigroup Global Markets Holdings, Inc. sr. notes Ser. N, 1-month USD LIBOR less 0.05%, 2022 (Indexed to the S&P GSCI Light Energy Excess Return Index multiplied by 3) | 4,910,000 | 8,535,092 |
| Total commodity Linked Notes (cost $41,284,000) | $46,583,678 | |
| WARRANTS (1.3%)* † | Expiration date | Strike price | Warrants | Value |
| Bank of Jiangsu Co., Ltd. 144A (China) | 9/28/22 | $0.00 | 1,098,000 | $1,078,160 |
| Bank of Shanghai Co., Ltd. (China) | 12/30/21 | 0.00 | 234,800 | 267,212 |
| ENN Natural Gas Co., Ltd. 144A (China) | 9/16/22 | 0.00 | 68,400 | 196,581 |
| Focus Media Information Technology Co., Ltd. (China) | 4/12/23 | 0.00 | 76,100 | 87,437 |
34 Multi-Asset Absolute Return Fund | |
| WARRANTS (1.3%)* † cont. | Expiration date | Strike price | Warrants | Value |
| G-bits Network Technology Xiamen Co., Ltd. 144A (China) | 10/21/22 | $0.00 | 13,000 | $694,958 |
| Guaranteed Rate, Inc. F | 3/1/23 | 0.01 | 337 | 17 |
| Maxscend Microelectronics Co., Ltd. 144A (China) | 7/29/22 | 0.00 | 11,600 | 559,905 |
| Sany Heavy Industry Co., Ltd. 144A Class A (China) | 1/17/22 | 0.00 | 389,800 | 1,397,154 |
| Seazen Holdings Co., Ltd. (China) | 6/3/22 | 0.00 | 57,300 | 306,280 |
| Shaanxi Coal Industry Co., Ltd. 144A (China) | 7/29/22 | 0.00 | 190,700 | 372,425 |
| Shenzhen Mindray Bio-Medical Electronics Co., Ltd. (China) | 12/10/21 | 0.00 | 24,800 | 1,456,043 |
| Youngor Group Co., Ltd. 144A (China) | 7/29/22 | 0.00 | 1,573,600 | 1,579,559 |
| Zhuzhou Kibing Group Co., Ltd. 144A (China) | 7/29/22 | 0.00 | 106,550 | 264,473 |
| Total warrants (cost $9,250,553) | $8,260,204 | |||
| ASSET-BACKED SECURITIES (1.3%)* | Principal amount | Value | |
| 1Sharpe Mortgage Trust 144A FRB Ser. 20-1, Class NOTE, (BBA LIBOR USD 3 Month + 2.90%), 3.025%, 7/25/24 | $1,011,000 | $1,012,314 | |
| Mello Warehouse Securitization Trust 144A | |||
| FRB Ser. 20-1, Class A, (1 Month US LIBOR + 0.90%), 0.989%, 10/25/53 | 455,000 | 455,000 | |
| FRB Ser. 20-2, Class A, (1 Month US LIBOR + 0.80%), 0.889%, 11/25/53 | 274,000 | 274,000 | |
| MRA Issuance Trust 144A | |||
| FRB Ser. 21-EBO1, Class A2X, (1 Month US LIBOR + 1.75%), 1.838%, 4/15/22 | 509,000 | 509,000 | |
| FRB Ser. 21-EBO4, Class A1X, (1 Month US LIBOR + 1.75%), 1.832%, 2/16/22 | 540,000 | 540,219 | |
| FRB Ser. 20-11, Class A1X, (1 Month US LIBOR + 1.70%), 1.784%, 4/22/22 | 512,000 | 512,000 | |
| FRB Ser. 21-NA1, Class A1X, (1 Month US LIBOR + 1.50%), 1.582%, 3/8/22 | 506,000 | 506,484 | |
| FRB Ser. 20-2, Class A2, (1 Month US LIBOR + 1.45%), 1.282%, 8/15/22 | 783,000 | 783,000 | |
| FRB Ser. 21-14, Class A1X, (1 Month US LIBOR + 1.25%), 1.243%, 2/15/22 | 522,000 | 522,176 | |
| FRB Ser. 21-8, Class A2X, (1 Month US LIBOR + 1.15%), 1.238%, 5/15/22 | 500,000 | 500,000 | |
| FRB Ser. 21-11, Class A1X, (1 Month US LIBOR + 1.15%), 1.234%, 1/25/22 | 540,000 | 540,000 | |
| Station Place Securitization Trust 144A | |||
| FRB Ser. 21-6, Class A, (1 Month US LIBOR + 0.80%), 0.889%, 4/25/22 | 568,000 | 568,000 | |
| FRB Ser. 21-10, Class A, (1 Month US LIBOR + 0.75%), 0.854%, 8/8/22 | 568,000 | 568,000 | |
| FRB Ser. 21-14, Class A1, (1 Month US LIBOR + 0.70%), 0.78%, 12/8/22 | 182,000 | 182,000 | |
| FRB Ser. 21-16, Class A1, (1 Month US LIBOR + 0.62%), 0.698%, 11/7/22 | 528,000 | 528,000 | |
| Total asset-backed securities (cost $7,998,000) | $8,000,193 | ||
Multi-Asset Absolute Return Fund 35 | |
| FOREIGN GOVERNMENT AND AGENCY BONDS AND NOTES (1.1%)* | Principal amount | Value | |
| Angola (Republic of) sr. unsec. notes Ser. REGS, 8.25%, 5/9/28 (Angola) | $270,000 | $273,032 | |
| Argentina (Republic of) 144A sr. unsec. notes 5.00%, 2/1/29 (Argentina) | 542,411 | 347,143 | |
| Buenos Aires (Government of) 144A sr. unsec. unsub. bonds 3.90%, 9/1/37 (Argentina) | 276,514 | 122,022 | |
| Dominican (Republic of) sr. unsec. unsub. bonds Ser. REGS, 6.40%, 6/5/49 (Dominican Republic) | 208,000 | 221,000 | |
| Dominican (Republic of) sr. unsec. unsub. notes Ser. REGS, 6.875%, 1/29/26 (Dominican Republic) | 183,000 | 209,535 | |
| Dominican (Republic of) sr. unsec. unsub. notes Ser. REGS, 5.95%, 1/25/27 (Dominican Republic) | 303,000 | 338,603 | |
| Indonesia (Republic of) sr. unsec. unsub. notes Ser. REGS, 5.875%, 1/15/24 (Indonesia) | 1,005,000 | 1,111,787 | |
| Indonesia (Republic of) 144A sr. unsec. notes 4.75%, 1/8/26 (Indonesia) | 300,000 | 337,502 | |
| Ivory Coast (Republic of) sr. unsec. unsub. bonds Ser. REGS, 6.125%, 6/15/33 (Ivory Coast) | 1,310,000 | 1,377,138 | |
| Ivory Coast (Republic of) 144A sr. unsec. unsub. bonds 5.25%, 3/22/30 (Ivory Coast) | EUR | 190,000 | 225,522 |
| Saudi Arabia (Kingdom of) sr. unsec. notes Ser. REGS, 2.90%, 10/22/25 (Saudi Arabia) | $272,000 | 287,686 | |
| Senegal (Republic of) unsec. bonds Ser. REGS, 6.25%, 5/23/33 (Senegal) | 1,260,000 | 1,299,375 | |
| South Africa (Republic of) sr. unsec. unsub. notes 4.85%, 9/27/27 (South Africa) | 247,000 | 259,350 | |
| United Mexican States sr. unsec. bonds 2.659%, 5/24/31 (Mexico) | 383,000 | 369,633 | |
| Venezuela (Republic of) sr. unsec. notes 7.65%, 4/21/25 (Venezuela) (In default) † | 815,000 | 79,463 | |
| Total foreign government and agency bonds and notes (cost $6,657,918) | $6,858,791 | ||
| CORPORATE BONDS AND NOTES (0.2%)* | Principal amount | Value | |
| Itau Unibanco Holding SA/Cayman Islands 144A unsec. sub. FRB 3.875%, 4/15/31 (Brazil) | $220,000 | $211,422 | |
| Petrobras Global Finance BV company guaranty sr. unsec. unsub. bonds 5.50%, 6/10/51 (Brazil) | 114,000 | 100,066 | |
| Petrobras Global Finance BV company guaranty sr. unsec. unsub. notes 6.25%, 3/17/24 (Brazil) | 60,000 | 65,400 | |
| Petrobras Global Finance BV company guaranty sr. unsec. unsub. notes 5.999%, 1/27/28 (Brazil) | 127,000 | 138,113 | |
| Petrobras Global Finance BV company guaranty sr. unsec. unsub. notes 5.60%, 1/3/31 (Brazil) | 118,000 | 123,428 | |
| Petroleos de Venezuela SA company guaranty sr. unsec. unsub. notes 5.375%, 4/12/27 (Venezuela) (In default) † | 1,809,000 | 90,450 | |
| Petroleos Mexicanos company guaranty sr. unsec. unsub. FRB 7.69%, 1/23/50 (Mexico) | 242,000 | 231,110 | |
| Petroleos Mexicanos company guaranty sr. unsec. unsub. FRB 5.95%, 1/28/31 (Mexico) | 130,000 | 127,894 | |
36 Multi-Asset Absolute Return Fund | |
| CORPORATE BONDS AND NOTES (0.2%)* cont. | Principal amount | Value | |
| Petroleos Mexicanos company guaranty sr. unsec. unsub. notes 6.50%, 3/13/27 (Mexico) | $35,000 | $37,288 | |
| VTB Bank OJSC Via VTB Capital SA 144A unsec. sub. bonds 6.95%, 10/17/22 (Russia) | 400,000 | 415,500 | |
| Total corporate bonds and notes (cost $2,154,042) | $1,540,671 | ||
| PURCHASED OPTIONS OUTSTANDING (—%)* Counterparty | Expiration date/strike price | Notional amount | Contract amount | Value | |
| Bank of America N.A. | |||||
| GBP/USD (Put) | Nov-21/$1.33 | $35,727,503 | GBP | 26,106,100 | $11,969 |
| Goldman Sachs International | |||||
| AUD/USD (Put) | Nov-21/0.73 | 26,875,335 | AUD | 35,726,600 | 39,722 |
| EUR/USD (Put) | Nov-21/1.16 | 35,322,274 | EUR | 30,555,600 | 133,059 |
| JPMorgan Chase Bank N.A. | |||||
| EUR/USD (Put) | Nov-21/1.15 | 35,317,303 | EUR | 30,551,300 | 48,561 |
| Toronto-Dominion Bank | |||||
| USD/CAD (Call) | Nov-21/CAD 1.26 | 13,162,000 | $13,162,000 | 33,129 | |
| UBS AG | |||||
| NZD/USD (Put) | Nov-21/$0.68 | 27,314,714 | NZD | 38,117,100 | 1,557 |
| Total purchased options outstanding (cost $1,010,451) | $267,997 | ||||
| UNITS (—%)* | Units | Value |
| Getnet Adquirencia e Servicos para Meios de Pagamento SA (Brazil) † | $51,918 | $40,108 |
| Total units (cost $51,745) | $40,108 | |
| SHORT-TERM INVESTMENTS (61.3%)* | Principal amount/ shares | Value | |
| ABN AMRO Funding USA, LLC commercial paper 0.100%, 11/1/21 | $4,000,000 | $3,999,959 | |
| Atlantic Asset Securitization, LLC asset backed commercial paper 0.110%, 11/18/21 | 3,500,000 | 3,499,820 | |
| Barclays Bank PLC CCP asset backed commercial paper 0.110%, 12/23/21 | 3,500,000 | 3,499,408 | |
| BPCE SA commercial paper 0.100%, 11/24/21 | 3,500,000 | 3,499,826 | |
| Collateralized Commercial Paper FLEX Co., LLC asset backed commercial paper 0.070%, 11/10/21 | 4,000,000 | 3,999,884 | |
| Export Development Canada commercial paper 0.060%, 11/2/21 | 2,250,000 | 2,249,986 | |
| Federal Home Loan Banks discount notes commercial paper 0.040%, 12/8/21 | 4,000,000 | 3,999,835 | |
| ING (U.S.) Funding, LLC commercial paper 0.080%, 12/17/21 | 3,500,000 | 3,499,571 | |
| Interest in $428,102,000 joint tri-party repurchase agreement dated 10/29/2021 with Citigroup Global Markets, Inc. due 11/1/2021 — maturity value of $69,102,346 for an effective yield of 0.060% (collateralized by Agency Mortgage-Backed Securities and U.S. Treasuries (including strips) with coupon rates ranging from 1.694% to 7.250% and due dates ranging from 8/1/2022 to 7/20/2068, valued at $436,664,112) | 69,102,000 | 69,102,000 | |
| MetLife Short Term Funding, LLC asset backed commercial paper 0.060%, 11/3/21 | 3,500,000 | 3,499,970 | |
| Mizuho Bank, Ltd./Singapore commercial paper 0.100%, 11/29/21 | 3,500,000 | 3,499,670 | |
| National Australia Bank, Ltd. commercial paper 0.080%, 12/1/21 | 3,000,000 | 2,999,808 | |
Multi-Asset Absolute Return Fund 37 | |
| SHORT-TERM INVESTMENTS (61.3%)* cont. | Principal amount/ shares | Value | |
| Nordea Bank ABP commercial paper 0.085%, 12/15/21 | $4,000,000 | $3,999,583 | |
| Old Line Funding, LLC asset backed commercial paper 0.090%, 12/17/21 | 4,000,000 | 3,999,494 | |
| Prudential PLC commercial paper 0.070%, 11/4/21 | 3,000,000 | 2,999,964 | |
| Putnam Cash Collateral Pool, LLC 0.08% d | Shares | 11,679,600 | 11,679,600 |
| Putnam Short Term Investment Fund Class P 0.09% L | Shares | 154,801,408 | 154,801,408 |
| Sheffield Receivables Co., LLC asset backed commercial paper 0.100%, 12/13/21 | $3,680,000 | 3,679,540 | |
| Skandinaviska Enskilda Banken AB commercial paper 0.090%, 12/9/21 | 3,500,000 | 3,499,705 | |
| Societe Generale SA commercial paper 0.105%, 12/2/21 | 3,500,000 | 3,499,791 | |
| State Street Institutional U.S. Government Money Market Fund, Premier Class 0.03% P | Shares | 3,086,000 | 3,086,000 |
| Sumitomo Mitsui Trust BankLtd. commercial paper 0.105%, 12/1/21 | $4,000,000 | 3,999,704 | |
| Svenska Handelsbanken commercial paper 0.100%, 12/23/21 | 3,250,000 | 3,249,614 | |
| Swedbank AB commercial paper 0.090%, 11/29/21 | 1,450,000 | 1,449,939 | |
| Toronto-Dominion Bank (The) commercial paper 0.110%, 11/5/21 | 4,000,000 | 3,999,938 | |
| TotalEnergies Capital Canada, Ltd. commercial paper 0.080%, 11/30/21 | 3,500,000 | 3,499,720 | |
| U.S. Treasury Bills 0.054%, 4/7/22 ∆ § | 10,120,000 | 10,117,461 | |
| U.S. Treasury Bills 0.053%, 5/19/22 ∆ § | 12,500,000 | 12,494,991 | |
| U.S. Treasury Bills 0.052%, 3/24/22 # ∆ § | 8,598,000 | 8,595,974 | |
| U.S. Treasury Bills 0.043%, 3/3/22 # ∆ § | 11,900,000 | 11,897,580 | |
| U.S. Treasury Bills 0.046%, 2/17/22 # ∆ § | 6,900,000 | 6,898,887 | |
| U.S. Treasury Bills 0.051%, 4/21/22 ∆ § | 4,000,000 | 3,998,813 | |
| U.S. Treasury Bills 0.034%, 3/10/22 # ∆ § | 6,600,000 | 6,598,581 | |
| U.S. Treasury Bills 0.038%, 2/3/22 # ∆ § | 5,500,000 | 5,499,192 | |
| Total short-term investments (cost $380,899,186) | $380,895,216 | ||
| TOTAL INVESTMENTS | ||
| Total investments (cost $856,935,383) | $875,745,175 | |
| Key to holding’s currency abbreviations | |||
| AUD | Australian Dollar | ||
| CAD | Canadian Dollar | ||
| CHF | Swiss Franc | ||
| EUR | Euro | ||
| GBP | British Pound | ||
| NOK | Norwegian Krone | ||
| NZD | New Zealand Dollar | ||
| SEK | Swedish Krona | ||
| Key to holding’s abbreviations | |||
| ADR | American Depository Receipts: represents ownership of foreign securities on deposit with a custodian bank | ||
| bp | Basis Points | ||
| FRB | Floating Rate Bonds: the rate shown is the current interest rate at the close of the reporting period. Rates may be subject to a cap or floor. For certain securities, the rate may represent a fixed rate currently in place at the close of the reporting period. | ||
38 Multi-Asset Absolute Return Fund | |
| FRN | Floating Rate Notes: the rate shown is the current interest rate or yield at the close of the reporting period. Rates may be subject to a cap or floor. For certain securities, the rate may represent a fixed rate currently in place at the close of the reporting period. | ||
| IFB | Inverse Floating Rate Bonds, which are securities that pay interest rates that vary inversely to changes in the market interest rates. As interest rates rise, inverse floaters produce less current income. The rate shown is the current interest rate at the close of the reporting period. Rates may be subject to a cap or floor. | ||
| IO | Interest Only | ||
| OJSC | Open Joint Stock Company | ||
| OTC | Over-the-counter | ||
| PJSC | Public Joint Stock Company | ||
| PO | Principal Only | ||
| REGS | Securities sold under Regulation S may not be offered, sold or delivered within the United States except pursuant to an exemption from, or in a transaction not subject to, the registration requirements of the Securities Act of 1933. | ||
| SPDR | S&P Depository Receipts | ||
| TBA | To Be Announced Commitments | ||
| Notes to the fund’s portfolio | |||
| Unless noted otherwise, the notes to the fund’s portfolio are for the close of the fund’s reporting period, which ran from November 1, 2020 through October 31, 2021 (the reporting period). Within the following notes to the portfolio, references to “Putnam Management” represent Putnam Investment Management, LLC, the fund’s manager, an indirect wholly-owned subsidiary of Putnam Investments, LLC and references to “ASC 820” represent Accounting Standards Codification 820 Fair Value Measurements and Disclosures. | |||
| * | Percentages indicated are based on net assets of $621,824,868. | ||
| ††† | The value of the commodity linked notes, which are marked to market daily, may be based on a multiple of the performance of the index. The multiple (or leverage) will increase the volatility of the note’s value relative to the change in the underlying index. | ||
| † | This security is non-income-producing. | ||
| # | This security, in part or in entirety, was pledged and segregated with the broker to cover margin requirements for futures contracts at the close of the reporting period. Collateral at period end totaled $6,642,712 and is included in Investments in securities on the Statement of assets and liabilities (Notes 1 and 8). | ||
| ∆ | This security, in part or in entirety, was pledged and segregated with the custodian for collateral on certain derivative contracts at the close of the reporting period. Collateral at period end totaled $48,946,244 and is included in Investments in securities on the Statement of assets and liabilities (Notes 1 and 8). | ||
| § | This security, in part or in entirety, was pledged and segregated with the custodian for collateral on the initial margin on certain centrally cleared derivative contracts at the close of the reporting period. Collateral at period end totaled $9,400,813 and is included in Investments in securities on the Statement of assets and liabilities (Notes 1 and 8). | ||
| d | Affiliated company. See Notes 1 and 5 to the financial statements regarding securities lending. The rate quoted in the security description is the annualized 7-day yield of the fund at the close of the reporting period. | ||
| F | This security is valued by Putnam Management at fair value following procedures approved by the Trustees. Securities are classified as Level 3 for ASC 820 based on the securities’ valuation inputs. At the close of the reporting period, fair value pricing was also used for certain foreign securities in the portfolio (Note 1). | ||
| i | This security was pledged, or purchased with cash that was pledged, to the fund for collateral on certain derivative contracts (Note 1). | ||
| L | Affiliated company (Note 5). The rate quoted in the security description is the annualized 7-day yield of the fund at the close of the reporting period. | ||
| P | This security was pledged, or purchased with cash that was pledged, to the fund for collateral on certain derivative contracts and TBA commitments. The rate quoted in the security description is the annualized 7-day yield of the fund at the close of the reporting period. | ||
| S | Security on loan, in part or in entirety, at the close of the reporting period (Note 1). | ||
| W | The rate shown represents the weighted average coupon associated with the underlying mortgage pools. Rates may be subject to a cap or floor. | ||
Multi-Asset Absolute Return Fund 39 | |
| At the close of the reporting period, the fund maintained liquid assets totaling $386,056,262 to cover certain derivative contracts and delayed delivery securities. | |||
| Unless otherwise noted, the rates quoted in Short-term investments security descriptions represent the weighted average yield to maturity. | |||
| Debt obligations are considered secured unless otherwise indicated. | |||
| 144A after the name of an issuer represents securities exempt from registration under Rule 144A of the Securities Act of 1933, as amended. These securities may be resold in transactions exempt from registration, normally to qualified institutional buyers. | |||
| See Note 1 to the financial statements regarding TBA commitments. | |||
| The dates shown on debt obligations are the original maturity dates. | |||
| FORWARD CURRENCY CONTRACTS at 10/31/21 (aggregate face value $622,238,386) | ||||||
| Counterparty | Currency | Contract type* | Delivery date | Value | Aggregate face value | Unrealized appreciation/ (depreciation) |
| Bank of America N.A. | ||||||
| Australian Dollar | Sell | 1/19/22 | $4,925,557 | $4,769,978 | $(155,579) | |
| British Pound | Buy | 12/15/21 | 1,291,146 | 1,322,912 | (31,766) | |
| Canadian Dollar | Sell | 1/19/22 | 2,560,392 | 2,519,315 | (41,077) | |
| Euro | Buy | 12/15/21 | 8,099,345 | 8,337,811 | (238,466) | |
| Hong Kong Dollar | Buy | 11/17/21 | 1,180,499 | 1,181,552 | (1,053) | |
| Hong Kong Dollar | Sell | 11/17/21 | 1,180,499 | 1,180,389 | (110) | |
| Japanese Yen | Buy | 11/17/21 | 3,398,366 | 3,521,385 | (123,019) | |
| New Zealand Dollar | Sell | 1/19/22 | 6,449,489 | 6,275,483 | (174,006) | |
| Swedish Krona | Buy | 12/15/21 | 828,435 | 838,179 | (9,744) | |
| Swiss Franc | Buy | 12/15/21 | 1,151,420 | 1,131,490 | 19,930 | |
| Barclays Bank PLC | ||||||
| Australian Dollar | Sell | 1/19/22 | 3,512,494 | 3,400,275 | (112,219) | |
| British Pound | Buy | 12/15/21 | 4,131,587 | 4,106,296 | 25,291 | |
| Canadian Dollar | Buy | 1/19/22 | 1,643,005 | 1,620,742 | 22,263 | |
| Euro | Sell | 12/15/21 | 4,110,831 | 4,179,522 | 68,691 | |
| Japanese Yen | Buy | 11/17/21 | 3,477,465 | 3,573,156 | (95,691) | |
| New Zealand Dollar | Sell | 1/19/22 | 2,395,032 | 2,330,558 | (64,474) | |
| Swedish Krona | Buy | 12/15/21 | 2,425,466 | 2,423,264 | 2,202 | |
| Swiss Franc | Sell | 12/15/21 | 6,904,586 | 6,894,109 | (10,477) | |
| Citibank, N.A. | ||||||
| Australian Dollar | Sell | 1/19/22 | 4,601,260 | 4,455,908 | (145,352) | |
| British Pound | Buy | 12/15/21 | 5,460,785 | 5,485,997 | (25,212) | |
| Canadian Dollar | Buy | 1/19/22 | 2,793,052 | 2,747,892 | 45,160 | |
| Euro | Sell | 12/15/21 | 2,599,992 | 2,674,470 | 74,478 | |
| Japanese Yen | Buy | 11/17/21 | 4,910,673 | 5,060,318 | (149,645) | |
| New Zealand Dollar | Sell | 1/19/22 | 4,648,223 | 4,522,024 | (126,199) | |
| Norwegian Krone | Buy | 12/15/21 | 3,403,953 | 3,342,558 | 61,395 | |
| Swedish Krona | Sell | 12/15/21 | 2,818,677 | 2,761,123 | (57,554) | |
| Swiss Franc | Sell | 12/15/21 | 1,691,316 | 1,661,599 | (29,717) | |
| Credit Suisse International | ||||||
| Australian Dollar | Buy | 1/19/22 | 1,191,548 | 1,153,938 | 37,610 | |
| British Pound | Sell | 12/15/21 | 3,270,229 | 3,305,355 | 35,126 | |
| Canadian Dollar | Buy | 1/19/22 | 1,672,098 | 1,661,409 | 10,689 | |
40 Multi-Asset Absolute Return Fund | |
| FORWARD CURRENCY CONTRACTS at 10/31/21 (aggregate face value $622,238,386) cont. | ||||||
| Counterparty | Currency | Contract type* | Delivery date | Value | Aggregate face value | Unrealized appreciation/ (depreciation) |
| Credit Suisse International cont. | ||||||
| Euro | Sell | 12/15/21 | $3,578,403 | $3,673,652 | $95,249 | |
| New Zealand Dollar | Buy | 1/19/22 | 2,355,099 | 2,291,388 | 63,711 | |
| Goldman Sachs International | ||||||
| Australian Dollar | Sell | 1/19/22 | 2,554,425 | 2,413,956 | (140,469) | |
| British Pound | Buy | 12/15/21 | 8,004,752 | 8,363,024 | (358,272) | |
| Canadian Dollar | Buy | 1/19/22 | 13,277,382 | 13,039,787 | 237,595 | |
| Euro | Buy | 12/15/21 | 1,815,181 | 2,163,529 | (348,348) | |
| Hong Kong Dollar | Buy | 11/17/21 | 653,699 | 653,647 | 52 | |
| Hong Kong Dollar | Sell | 11/17/21 | 653,699 | 654,237 | 538 | |
| Japanese Yen | Buy | 11/17/21 | 2,566,637 | 3,049,120 | (482,483) | |
| New Zealand Dollar | Sell | 1/19/22 | 10,614,941 | 10,321,478 | (293,463) | |
| Norwegian Krone | Sell | 12/15/21 | 8,634,104 | 8,418,259 | (215,845) | |
| Swedish Krona | Buy | 12/15/21 | 2,943,448 | 3,104,396 | (160,948) | |
| Swiss Franc | Sell | 12/15/21 | 2,863,624 | 2,879,815 | 16,191 | |
| HSBC Bank USA, National Association | ||||||
| Australian Dollar | Sell | 1/19/22 | 91,496 | 88,578 | (2,918) | |
| British Pound | Buy | 12/15/21 | 1,939,389 | 1,948,646 | (9,257) | |
| Canadian Dollar | Buy | 1/19/22 | 1,376,969 | 1,354,828 | 22,141 | |
| Euro | Buy | 12/15/21 | 13,875,383 | 14,205,328 | (329,945) | |
| Hong Kong Dollar | Buy | 11/17/21 | 1,989,092 | 1,990,270 | (1,178) | |
| Hong Kong Dollar | Sell | 11/17/21 | 1,989,092 | 1,990,397 | 1,305 | |
| Japanese Yen | Buy | 11/17/21 | 1,217,101 | 1,251,621 | (34,520) | |
| New Zealand Dollar | Sell | 1/19/22 | 2,783,266 | 2,707,661 | (75,605) | |
| Swiss Franc | Sell | 12/15/21 | 3,947,243 | 3,954,750 | 7,507 | |
| JPMorgan Chase Bank N.A. | ||||||
| Australian Dollar | Buy | 1/19/22 | 4,489,750 | 4,289,945 | 199,805 | |
| British Pound | Sell | 12/15/21 | 1,424,600 | 1,379,402 | (45,198) | |
| Canadian Dollar | Buy | 1/19/22 | 9,472,473 | 9,416,717 | 55,756 | |
| Euro | Sell | 12/15/21 | 14,698,845 | 15,026,369 | 327,524 | |
| Japanese Yen | Sell | 11/17/21 | 5,981,674 | 6,209,239 | 227,565 | |
| New Zealand Dollar | Buy | 1/19/22 | 21,097,060 | 20,525,155 | 571,905 | |
| Norwegian Krone | Buy | 12/15/21 | 7,964,615 | 7,833,207 | 131,408 | |
| Swedish Krona | Buy | 12/15/21 | 2,456,656 | 2,430,422 | 26,234 | |
| Swiss Franc | Sell | 12/15/21 | 2,710,306 | 2,714,960 | 4,654 | |
| Morgan Stanley & Co. International PLC | ||||||
| Australian Dollar | Buy | 1/19/22 | 13,526,736 | 13,124,451 | 402,285 | |
| British Pound | Buy | 12/15/21 | 13,196,851 | 13,323,073 | (126,222) | |
| Canadian Dollar | Buy | 1/19/22 | 4,604,391 | 4,639,639 | (35,248) | |
| Euro | Buy | 12/15/21 | 8,894,224 | 9,140,769 | (246,545) | |
| Japanese Yen | Buy | 11/17/21 | 7,848,949 | 8,160,321 | (311,372) | |
| New Zealand Dollar | Sell | 1/19/22 | 9,326,503 | 9,073,157 | (253,346) | |
| Norwegian Krone | Buy | 12/15/21 | 8,538,573 | 8,307,698 | 230,875 | |
| Swedish Krona | Buy | 12/15/21 | 12,603,392 | 12,750,079 | (146,687) | |
| Swiss Franc | Sell | 12/15/21 | 1,639,919 | 1,597,909 | (42,010) | |
Multi-Asset Absolute Return Fund 41 | |
| FORWARD CURRENCY CONTRACTS at 10/31/21 (aggregate face value $622,238,386) cont. | ||||||
| Counterparty | Currency | Contract type* | Delivery date | Value | Aggregate face value | Unrealized appreciation/ (depreciation) |
| NatWest Markets PLC | ||||||
| Australian Dollar | Buy | 1/19/22 | $1,868,810 | $1,766,242 | $102,568 | |
| British Pound | Buy | 12/15/21 | 1,656,604 | 1,689,604 | (33,000) | |
| Canadian Dollar | Buy | 1/19/22 | 1,206,131 | 1,186,685 | 19,446 | |
| Euro | Buy | 12/15/21 | 2,505,566 | 2,546,831 | (41,265) | |
| Japanese Yen | Buy | 11/17/21 | 1,310,960 | 1,348,543 | (37,583) | |
| New Zealand Dollar | Sell | 1/19/22 | 10,959,737 | 10,643,490 | (316,247) | |
| Norwegian Krone | Buy | 12/15/21 | 2,568,038 | 2,481,981 | 86,057 | |
| Swedish Krona | Sell | 12/15/21 | 272,215 | 272,011 | (204) | |
| Swiss Franc | Buy | 12/15/21 | 5,202,553 | 5,212,104 | (9,551) | |
| State Street Bank and Trust Co. | ||||||
| Australian Dollar | Sell | 1/19/22 | 15,418,421 | 15,221,742 | (196,679) | |
| British Pound | Sell | 12/15/21 | 3,199,875 | 3,156,067 | (43,808) | |
| Canadian Dollar | Buy | 1/19/22 | 14,010,112 | 13,867,898 | 142,214 | |
| Euro | Sell | 12/15/21 | 9,323,082 | 9,326,494 | 3,412 | |
| Hong Kong Dollar | Buy | 11/17/21 | 9,188,446 | 9,196,326 | (7,880) | |
| Hong Kong Dollar | Sell | 11/17/21 | 9,188,446 | 9,187,246 | (1,200) | |
| Japanese Yen | Sell | 11/17/21 | 32,632,093 | 33,692,378 | 1,060,285 | |
| New Zealand Dollar | Sell | 1/19/22 | 2,786,916 | 2,697,960 | (88,956) | |
| Norwegian Krone | Sell | 12/15/21 | 315,326 | 264,228 | (51,098) | |
| Swedish Krona | Sell | 12/15/21 | 7,830,207 | 7,697,209 | (132,998) | |
| Swiss Franc | Buy | 12/15/21 | 1,909,483 | 1,842,041 | 67,442 | |
| Toronto-Dominion Bank | ||||||
| Australian Dollar | Buy | 1/19/22 | 2,503,937 | 2,424,845 | 79,092 | |
| British Pound | Buy | 12/15/21 | 4,237,118 | 4,203,578 | 33,540 | |
| Canadian Dollar | Buy | 1/19/22 | 476,714 | 484,191 | (7,477) | |
| Euro | Sell | 12/15/21 | 2,086,891 | 2,142,511 | 55,620 | |
| Hong Kong Dollar | Buy | 11/17/21 | 1,507,201 | 1,508,521 | (1,320) | |
| Hong Kong Dollar | Sell | 11/17/21 | 1,507,201 | 1,507,027 | (174) | |
| Japanese Yen | Buy | 11/17/21 | 7,634,044 | 7,884,307 | (250,263) | |
| New Zealand Dollar | Sell | 1/19/22 | 3,934,158 | 3,826,916 | (107,242) | |
| Norwegian Krone | Buy | 12/15/21 | 13,615,659 | 13,376,015 | 239,644 | |
| Swedish Krona | Sell | 12/15/21 | 10,295,101 | 10,048,528 | (246,573) | |
| UBS AG | ||||||
| Australian Dollar | Buy | 1/19/22 | 5,365,955 | 5,195,711 | 170,244 | |
| British Pound | Sell | 12/15/21 | 10,190,381 | 10,252,790 | 62,409 | |
| Canadian Dollar | Buy | 1/19/22 | 6,627,862 | 6,524,933 | 102,929 | |
| Euro | Buy | 12/15/21 | 22,569,643 | 23,146,675 | (577,032) | |
| Hong Kong Dollar | Buy | 11/17/21 | 1,660,089 | 1,659,687 | 402 | |
| Hong Kong Dollar | Sell | 11/17/21 | 1,660,089 | 1,661,468 | 1,379 | |
| Japanese Yen | Buy | 11/17/21 | 24,929,289 | 25,595,635 | (666,346) | |
| New Zealand Dollar | Sell | 1/19/22 | 5,261,312 | 5,098,966 | (162,346) | |
| Norwegian Krone | Sell | 12/15/21 | 4,048,474 | 3,923,610 | (124,864) | |
| Swedish Krona | Sell | 12/15/21 | 6,573,095 | 6,445,666 | (127,429) | |
| Swiss Franc | Sell | 12/15/21 | 10,036,245 | 10,023,034 | (13,211) | |
42 Multi-Asset Absolute Return Fund | |
| FORWARD CURRENCY CONTRACTS at 10/31/21 (aggregate face value $622,238,386) cont. | ||||||
| Counterparty | Currency | Contract type* | Delivery date | Value | Aggregate face value | Unrealized appreciation/ (depreciation) |
| WestPac Banking Corp. | ||||||
| British Pound | Sell | 12/15/21 | $735,432 | $743,298 | $7,866 | |
| Canadian Dollar | Sell | 1/19/22 | 105,380 | 103,675 | (1,705) | |
| Euro | Buy | 12/15/21 | 914,418 | 938,904 | (24,486) | |
| Japanese Yen | Sell | 11/17/21 | 555,808 | 573,984 | 18,176 | |
| New Zealand Dollar | Sell | 1/19/22 | 767,810 | 746,945 | (20,865) | |
| Unrealized appreciation | 5,277,860 | |||||
| Unrealized (depreciation) | (8,543,041) | |||||
| Total | $(3,265,181) | |||||
| * The exchange currency for all contracts listed is the United States Dollar. | ||||||
| FUTURES CONTRACTS OUTSTANDING at 10/31/21 | ||||||
| Number of contracts | Notional amount | Value | Expiration date | Unrealized appreciation/ (depreciation) | ||
| MSCI EAFE Index (Long) | 65 | $7,590,469 | $7,603,700 | Dec-21 | $(90,736) | |
| MSCI Emerging Markets Index (Long) | 55 | 3,478,074 | 3,470,500 | Dec-21 | (99,482) | |
| NASDAQ 100 Index E-Mini (Long) | 23 | 7,285,710 | 7,285,710 | Dec-21 | 104,553 | |
| Russell 2000 Index E-Mini (Long) | 32 | 3,675,506 | 3,672,480 | Dec-21 | 80,186 | |
| S&P 500 Index E-Mini (Long) | 33 | 7,598,877 | 7,585,050 | Dec-21 | 154,537 | |
| S&P 500 Index E-Mini (Short) | 5 | 1,151,345 | 1,149,250 | Dec-21 | (76,326) | |
| U.S. Treasury Note 2 yr (Short) | 1,198 | 262,661,500 | 262,661,500 | Dec-21 | 1,111,068 | |
| U.S. Treasury Note 5 yr (Short) | 1,098 | 133,681,500 | 133,681,500 | Dec-21 | 1,740,701 | |
| U.S. Treasury Note 10 yr (Long) | 3,478 | 454,585,469 | 454,585,469 | Dec-21 | (8,119,388) | |
| Unrealized appreciation | 3,191,045 | |||||
| Unrealized (depreciation) | (8,385,932) | |||||
| Total | $(5,194,887) | |||||
| WRITTEN OPTIONS OUTSTANDING at 10/31/21 (premiums $39,815) | |||||
| Counterparty | Expiration date/strike price | Notional amount | Contract amount | Value | |
| Toronto-Dominion Bank | |||||
| USD/CAD (Put) | Nov-21/CAD 1.23 | $13,162,000 | $13,162,000 | $39,433 | |
| Total | |||||
| FORWARD PREMIUM SWAP OPTION CONTRACTS OUTSTANDING at 10/31/21 | ||||||
| Counterparty Fixed right or obligation % to receive or (pay)/Floating rate index/ Maturity date | Expiration date/strike | Notional/ contract amount | Premium receivable/ (payable) | Unrealized appreciation/ (depreciation) | ||
| Bank of America N.A. | ||||||
| (1.275)/3 month USD-LIBOR-BBA/Mar-50 (Purchased) | Mar-30/1.275 | $479,600 | $(62,468) | $20,206 | ||
| (2.3075)/3 month USD-LIBOR-BBA/Jun-52 (Purchased) | Jun-22/2.3075 | 359,700 | (8,138) | (2,057) | ||
Multi-Asset Absolute Return Fund 43 | |
| FORWARD PREMIUM SWAP OPTION CONTRACTS OUTSTANDING at 10/31/21 cont. | ||||||
| Counterparty Fixed right or obligation % to receive or (pay)/Floating rate index/ Maturity date | Expiration date/strike | Notional/ contract amount | Premium receivable/ (payable) | Unrealized appreciation/ (depreciation) | ||
| Bank of America N.A. cont. | ||||||
| 1.275/3 month USD-LIBOR-BBA/Mar-50 (Purchased) | Mar-30/1.275 | $479,600 | $(62,468) | $(22,162) | ||
| 2.3075/3 month USD-LIBOR-BBA/Jun-52 (Purchased) | Jun-22/2.3075 | 359,700 | (169,122) | (115,630) | ||
| Goldman Sachs International | ||||||
| 2.8175/3 month USD-LIBOR-BBA/Mar-47 (Purchased) | Mar-27/2.8175 | 166,600 | (21,033) | 12,623 | ||
| (2.8175)/3 month USD-LIBOR-BBA/Mar-47 (Purchased) | Mar-27/2.8175 | 166,600 | (21,033) | (12,067) | ||
| JPMorgan Chase Bank N.A. | ||||||
| 2.8325/3 month USD-LIBOR-BBA/Feb-52 (Purchased) | Feb-22/2.8325 | 833,400 | (116,363) | 104,458 | ||
| (2.8325)/3 month USD-LIBOR-BBA/Feb-52 (Purchased) | Feb-22/2.8325 | 833,400 | (116,363) | (115,584) | ||
| Unrealized appreciation | 137,287 | |||||
| Unrealized (depreciation) | (267,500) | |||||
| Total | $(130,213) | |||||
| TBA SALE COMMITMENTS OUTSTANDING at 10/31/21 (proceeds receivable $143,934,492) | |||
| Agency | Principal amount | Settlement date | Value |
| Uniform Mortgage-Backed Securities, 3.00%, 11/1/51 | $1,000,000 | 11/10/21 | $1,043,291 |
| Uniform Mortgage-Backed Securities, 2.50%, 12/1/51 | 17,000,000 | 12/13/21 | 17,419,682 |
| Uniform Mortgage-Backed Securities, 2.50%, 11/1/51 | 17,000,000 | 11/10/21 | 17,460,855 |
| Uniform Mortgage-Backed Securities, 2.00%, 12/1/51 | 54,000,000 | 12/13/21 | 53,886,924 |
| Uniform Mortgage-Backed Securities, 2.00%, 11/1/51 | 54,000,000 | 11/10/21 | 53,994,503 |
| Total | $143,805,255 | ||
| CENTRALLY CLEARED INTEREST RATE SWAP CONTRACTS OUTSTANDING at 10/31/21 | |||||||
| Notional amount | Value | Upfront premium received (paid) | Termination date | Payments made by fund | Payments received by fund | Unrealized appreciation/ (depreciation) | |
| $391,400 | $22,114 | $(6) | 12/7/30 | 2.184% — Semiannually | 3 month USD-LIBOR-BBA — Quarterly | $(25,470) | |
| 470,500 | 10,026 E | (5) | 6/5/29 | 3 month USD-LIBOR-BBA — Quarterly | 2.2225% — Semiannually | 10,021 | |
| 39,300 | 5,162 E | (1) | 6/22/52 | 2.3075% — Semiannually | 3 month USD-LIBOR-BBA — Quarterly | (5,164) | |
| 835,100 | 83,134 E | (28) | 1/27/47 | 3 month USD-LIBOR-BBA — Quarterly | 1.27% — Semiannually | (83,163) | |
| 70,500 | 6,234 E | (2) | 3/7/50 | 1.275% — Semiannually | 3 month USD-LIBOR-BBA — Quarterly | 6,231 | |
44 Multi-Asset Absolute Return Fund | |
| CENTRALLY CLEARED INTEREST RATE SWAP CONTRACTS OUTSTANDING at 10/31/21 cont. | |||||||
| Notional amount | Value | Upfront premium received (paid) | Termination date | Payments made by fund | Payments received by fund | Unrealized appreciation/ (depreciation) | |
| $146,000 | $19,630 | $381 | 10/16/50 | 3 month USD-LIBOR-BBA — Quarterly | 1.16% — Semiannually | $(19,195) | |
| 1,253,000 | 19,359 | (17) | 2/22/31 | 1.3659% — Semiannually | 3 month USD-LIBOR-BBA — Quarterly | 16,428 | |
| 815,000 | 8,313 | (11) | 2/24/31 | 1.4255% — Semiannually | 3 month USD-LIBOR-BBA — Quarterly | 6,341 | |
| 1,110,000 | 2,176 | (15) | 3/2/31 | 1.51882% — Semiannually | 3 month USD-LIBOR-BBA — Quarterly | (381) | |
| 872,600 | 8,883 | (8) | 4/1/26 | 0.94375% — Semiannually | 3 month USD-LIBOR-BBA — Quarterly | 8,287 | |
| 39,210,000 | 85,086 | 46,584 | 4/20/31 | 1.57% — Semiannually | 3 month USD-LIBOR-BBA — Quarterly | (55,593) | |
| 31,343,000 | 510,577 E | (337,949) | 12/15/26 | 0.95% — Semiannually | 3 month USD-LIBOR-BBA — Quarterly | 172,629 | |
| 148,009,000 | 1,118,948 E | 262,967 | 12/15/23 | 3 month USD-LIBOR-BBA — Quarterly | 0.40% — Semiannually | (857,028) | |
| 26,010,000 | 595,889 E | 631,170 | 12/15/31 | 3 month USD-LIBOR-BBA — Quarterly | 1.35% — Semiannually | 35,281 | |
| 6,431,000 | 128,942 E | 285,486 | 12/15/51 | 3 month USD-LIBOR-BBA — Quarterly | 1.65% — Semiannually | 156,545 | |
| 10,035,000 | 210,735 E | (63,626) | 12/15/31 | 1.10% — Annually | Secured Overnight Financing Rate — Annually | 147,109 | |
| 1,941,000 | 1,572 | (16) | 10/20/26 | 1.252% — Semiannually | 3 month USD-LIBOR-BBA — Quarterly | (2,245) | |
| 1,322,000 | 1,296 | (11) | 10/21/26 | 1.2155% — Semiannually | 3 month USD-LIBOR-BBA — Quarterly | 891 | |
| 287,000 | 12,137 | (10) | 10/27/51 | 1.898% — Semiannually | 3 month USD-LIBOR-BBA — Quarterly | (12,202) | |
| 3,882,000 | 6,638 | (51) | 11/1/31 | 1.587% — Semiannually | 3 month USD-LIBOR-BBA — Quarterly | (6,690) | |
| 23,017,000 | 9,437 | (87) | 11/1/23 | 3 month USD-LIBOR-BBA — Quarterly | 0.711% — Semiannually | 9,350 | |
Multi-Asset Absolute Return Fund 45 | |
| CENTRALLY CLEARED INTEREST RATE SWAP CONTRACTS OUTSTANDING at 10/31/21 cont. | |||||||
| Notional amount | Value | Upfront premium received (paid) | Termination date | Payments made by fund | Payments received by fund | Unrealized appreciation/ (depreciation) | |
| AUD | 11,072,000 | $585,189 E | $41,047 | 12/15/31 | 6 month AUD-BBR-BBSW — Semiannually | 1.395% — Semiannually | $(544,142) |
| CAD | 9,375,000 | 378,227 E | 41,796 | 12/15/31 | 3 month CAD-BA-CDOR — Semiannually | 1.70% — Semiannually | (336,431) |
| CHF | 2,947,000 | 87,515 E | 35,806 | 12/15/31 | 0.050% plus Swiss Average Rate Overnight — Annually | — | (51,709) |
| EUR | 12,761,000 | 405,525 E | 157,091 | 12/15/31 | 6 month EUR-EURIBOR-REUTERS — Semiannually | 0.02% — Annually | (248,434) |
| GBP | 4,747,000 | 205,420 E | (201,743) | 12/15/31 | 0.6525% — Annually | Sterling Overnight Index Average — Annually | 3,677 |
| NOK | 25,679,000 | 87,908 E | (8,456) | 12/15/31 | 1.63% — Annually | 6 month NOK-NIBOR-NIBR — Semiannually | 79,452 |
| NZD | 5,833,000 | 273,869 E | 20,610 | 12/15/31 | 3 month NZD-BBR-FRA — Quarterly | 2.03% — Semiannually | (253,259) |
| SEK | 11,498,000 | 49,417 E | (5,766) | 12/15/31 | 0.65% — Annually | 3 month SEK-STIBOR-SIDE — Quarterly | 43,651 |
| Total | $905,130 | $(1,805,213) | |||||
| E Extended effective date. | |||||||
| OTC TOTAL RETURN SWAP CONTRACTS OUTSTANDING at 10/31/21 | |||||||
| Swap counterparty/ Notional amount | Value | Upfront premium received (paid) | Termination date | Payments received (paid) by fund | Total return received by or paid by fund | Unrealized appreciation/ (depreciation) | |
| Bank of America N.A. | |||||||
| $142,022,863 | $149,277,433 | $— | 10/12/22 | (Secured Overnight Financing Rate plus 0.22%) — Quarterly | A basket (MLFCF15) of common stocks — Quarterly* | $7,307,322 | |
| 1,548,289 | 1,519,800 | — | 6/20/23 | (1 month USD-LIBOR-BBA plus 0.10%) — Monthly | Al Rajhi Bank — Monthly | (28,956) | |
| 957,432 | 939,815 | — | 6/20/23 | 1 month USD-LIBOR-BBA plus 1.00% — Monthly | Al Rajhi Bank — Monthly | (17,906) | |
46 Multi-Asset Absolute Return Fund | |
| OTC TOTAL RETURN SWAP CONTRACTS OUTSTANDING at 10/31/21 cont. | |||||||
| Swap counterparty/ Notional amount | Value | Upfront premium received (paid) | Termination date | Payments received (paid) by fund | Total return received by or paid by fund | Unrealized appreciation/ (depreciation) | |
| Bank of America N.A. cont. | |||||||
| $142,015,867 | $150,180,638 | $— | 10/12/22 | Secured Overnight Financing Rate plus 0.05% — Quarterly | Russell 1000 Total Return Index — Quarterly | $(8,139,563) | |
| 610,610 | 602,066 | — | 6/20/23 | (1 month USD-LIBOR-BBA plus 1.00%) — Monthly | United Electronics Co. — Monthly | (8,728) | |
| Barclays Bank PLC | |||||||
| 54,524,007 | 54,660,179 | — | 5/26/22 | (0.10%) — Monthly | Buraschi Barclays Adaptive Trend Strategy EX-Commodities ER — Monthly | 135,566 | |
| Citibank, N.A. | |||||||
| 700,456 | 729,754 | — | 7/5/22 | 1 month USD-LIBOR-BBA minus 0.35% — Monthly | AAR Corp. — Monthly | (29,426) | |
| 460,841 | 460,691 | — | 7/5/22 | 1 month USD-LIBOR-BBA minus 0.35% — Monthly | ACI Worldwide, Inc. — Monthly | 66 | |
| 951,627 | 1,097,412 | — | 7/5/22 | 1 month USD-LIBOR-BBA minus 0.25% — Monthly | Adapt Health Corp. — Monthly | (145,959) | |
| 1,020,125 | 1,080,917 | — | 7/5/22 | 1 month USD-LIBOR-BBA minus 0.35% — Monthly | Advance Auto Parts Inc. — Monthly | (60,931) | |
| 306,403 | 304,233 | — | 7/5/22 | 1 month USD-LIBOR-BBA minus 1.85% — Monthly | B&G Foods, Inc. — Monthly | 2,298 | |
| 2,402,505 | 2,399,941 | — | 7/5/22 | 1 month USD-LIBOR-BBA minus 0.35% — Monthly | Bausch Health Cos, Inc. — Monthly | 2,123 | |
| 856,333 | 786,686 | — | 7/5/22 | 1 month USD-LIBOR-BBA minus 0.35% — Monthly | Century Link, Inc. — Monthly | 76,743 | |
| 801,624 | 889,425 | — | 7/5/22 | 1 month USD-LIBOR-BBA minus 0.35% — Monthly | Dycom Industries, Inc. — Monthly | (87,947) | |
| 94,590 | 114,605 | — | 7/5/22 | 1 month USD-LIBOR-BBA minus 1.25% — Monthly | Ebix, Inc. — Monthly | (20,032) | |
| 2,000,651 | 2,046,714 | — | 7/5/22 | 1 month USD-LIBOR-BBA minus 0.35% — Monthly | Elanco Animal Health, Inc. — Monthly | (46,431) | |
| 965,350 | 1,063,554 | — | 7/5/22 | 1 month USD-LIBOR-BBA minus 0.35% — Monthly | Everbridge, Inc. — Monthly | (98,381) | |
| 1,741,784 | 1,752,478 | — | 7/5/22 | 1 month USD-LIBOR-BBA minus 0.35% — Monthly | Fair Isaac Corp. — Monthly | (11,014) | |
Multi-Asset Absolute Return Fund 47 | |
| OTC TOTAL RETURN SWAP CONTRACTS OUTSTANDING at 10/31/21 cont. | |||||||
| Swap counterparty/ Notional amount | Value | Upfront premium received (paid) | Termination date | Payments received (paid) by fund | Total return received by or paid by fund | Unrealized appreciation/ (depreciation) | |
| Citibank, N.A. cont. | |||||||
| $1,048,340 | $992,144 | $— | 7/5/22 | 1 month USD-LIBOR-BBA minus 0.35% — Monthly | First Citizens Bcshs-Cl A — Monthly | $56,004 | |
| 961,560 | 736,032 | — | 7/5/22 | 1 month USD-LIBOR-BBA — Monthly | Healthcare Services Group — Monthly | 225,351 | |
| 926,667 | 1,046,628 | — | 7/5/22 | 1 month USD-LIBOR-BBA minus 0.35% — Monthly | HP Inc — Monthly | (120,055) | |
| 2,385,823 | 2,473,925 | — | 7/5/22 | 1 month USD-LIBOR-BBA minus 0.35% — Monthly | L3Harris Technologies Inc — Monthly | (88,539) | |
| 572,655 | 493,929 | — | 7/5/22 | 1 month USD-LIBOR-BBA minus 0.35% — Monthly | Liveperson Inc. — Monthly | 78,621 | |
| 2,276,989 | 2,434,193 | — | 7/5/22 | 1 month USD-LIBOR-BBA minus 0.35% — Monthly | Penumbra, Inc. — Monthly | (157,622) | |
| 861,008 | 1,013,392 | — | 7/5/22 | 1 month USD-LIBOR-BBA minus 0.35% — Monthly | Ping Identity Holding Corp. — Monthly | (152,542) | |
| 263,683 | 414,081 | — | 7/5/22 | 1 month USD-LIBOR-BBA minus 0.35% — Monthly | Plug Power, Inc. — Monthly | (150,446) | |
| 1,019,832 | 1,033,317 | — | 7/5/22 | 1 month USD-LIBOR-BBA minus 0.35% — Monthly | Primoris Services Corp. — Monthly | (13,590) | |
| 2,856,408 | 3,041,016 | — | 7/5/22 | 1 month USD-LIBOR-BBA minus 0.35% — Monthly | Ralph Lauren Corp. — Monthly | (201,573) | |
| 1,029,486 | 1,049,049 | — | 7/5/22 | 1 month USD-LIBOR-BBA minus 0.35% — Monthly | Square Inc. — Monthly | (19,563) | |
| 331,144 | 331,641 | — | 7/5/22 | 1 month USD-LIBOR-BBA minus 0.35% — Monthly | Stitch Fix Inc Class A — Monthly | (531) | |
| 2,497,107 | 3,563,686 | — | 7/5/22 | 1 month USD-LIBOR-BBA minus 1.30% — Monthly | Tesla, Inc. — Monthly | (1,067,037) | |
| 1,535,685 | 1,543,431 | — | 7/5/22 | 1 month USD-LIBOR-BBA minus 0.35% — Monthly | The Hershey Co. — Monthly | (8,028) | |
| 1,010,685 | 1,053,583 | — | 7/5/22 | 1 month USD-LIBOR-BBA minus 0.35% — Monthly | Universal Display Corp. — Monthly | (43,002) | |
| 303,127 | 293,057 | — | 7/5/22 | 1 month USD-LIBOR-BBA minus 0.35% — Monthly | WD−40 Co. — Monthly | 9,913 | |
48 Multi-Asset Absolute Return Fund | |
| OTC TOTAL RETURN SWAP CONTRACTS OUTSTANDING at 10/31/21 cont. | |||||||
| Swap counterparty/ Notional amount | Value | Upfront premium received (paid) | Termination date | Payments received (paid) by fund | Total return received by or paid by fund | Unrealized appreciation/ (depreciation) | |
| Citibank, N.A. cont. | |||||||
| $1,990,700 | $1,936,189 | $— | 7/5/22 | 1 month USD-LIBOR-BBA minus 0.35% — Monthly | Woodward, Inc. — Monthly | $54,146 | |
| 139,949 | 158,981 | — | 7/5/22 | 1 month USD-LIBOR-BBA minus 3.25% — Monthly | Zynex, Inc. — Monthly | (19,097) | |
| Credit Suisse International | |||||||
| 2,576,178 | 2,640,425 | — | 11/2/21 | 1 month USD-LIBOR-BBA minus 0.35% — Monthly | MSCI Daily TR Net Emerging Markets USD — Monthly | (64,752) | |
| 51,050,419 | 52,323,542 | — | 11/2/21 | 1 month USD-LIBOR-BBA minus 0.35% — Monthly | MSCI Emerging Markets TR Net USD — Monthly | (1,283,156) | |
| Goldman Sachs International | |||||||
| 230,517,182 | 231,751,573 | — | 12/15/25 | (1 month USD-LIBOR-BBA plus 0.50%) — Monthly | A basket (GSGLPWDL) of common stocks — Monthly* | 1,267,963 | |
| 224,598,910 | 225,962,367 | — | 12/15/25 | 1 month USD-LIBOR-BBA minus 0.15% — Monthly | A basket (GSGLPWDS) of common stocks — Monthly* | (1,444,156) | |
| 424,419 | 445,149 | — | 12/15/25 | (1 month USD-LIBOR-BBA plus 0.35%) — Monthly | Abbvie Inc. — Monthly | 25,711 | |
| 827,351 | 850,131 | — | 12/15/25 | (1 month USD-LIBOR-BBA plus 0.35%) — Monthly | Agilent Technologies, Inc. — Monthly | 23,698 | |
| 223,220 | 222,286 | — | 12/15/25 | (1 month USD-LIBOR-BBA plus 0.35%) — Monthly | Amgen Inc — Monthly | (969) | |
| 105,589 | 101,369 | — | 12/15/25 | (1 month USD-LIBOR-BBA plus 0.40%) — Monthly | Astellas Pharma Inc. — Monthly | (3,024) | |
| 426,358 | 441,650 | — | 12/15/25 | (1 month USD-LIBOR-BBA) — Monthly | AstraZeneca PLC — Monthly | 15,280 | |
| 338,094 | 348,369 | — | 12/15/25 | (1 month USD-LIBOR-BBA plus 0.35%) — Monthly | Astrazeneca Plc — Monthly | 10,222 | |
| 325,490 | 329,549 | — | 12/15/25 | (1 month USD-LIBOR-BBA plus 0.35%) — Monthly | Bayer AG- Reg — Monthly | 4,008 | |
| 791,349 | 741,459 | — | 12/15/25 | 1 month USD-LIBOR-BBA minus 0.50% — Monthly | Beyond Meat, Inc. — Monthly | 49,727 | |
| 332,367 | 315,216 | — | 12/15/25 | (1 month USD-LIBOR-BBA plus 0.35%) — Monthly | Biogen Inc. — Monthly | (17,202) | |
Multi-Asset Absolute Return Fund 49 | |
| OTC TOTAL RETURN SWAP CONTRACTS OUTSTANDING at 10/31/21 cont. | |||||||
| Swap counterparty/ Notional amount | Value | Upfront premium received (paid) | Termination date | Payments received (paid) by fund | Total return received by or paid by fund | Unrealized appreciation/ (depreciation) | |
| Goldman Sachs International cont. | |||||||
| $395,723 | $585,437 | $— | 12/15/25 | 1 month USD-LIBOR-BBA minus 0.35% — Monthly | Bloom Energy Corp. — A — Monthly | $(189,753) | |
| 295,127 | 295,329 | — | 12/15/25 | (1 month USD-LIBOR-BBA plus 0.35%) — Monthly | Bristol-Myers Squibb Co. — Monthly | 2,634 | |
| 300,235 | 308,142 | — | 12/15/25 | (1 month USD-LIBOR-BBA plus 0.30%) — Monthly | CSL Ltd. — Monthly | 7,866 | |
| 32,220 | 31,413 | — | 12/15/25 | (1 month USD-LIBOR-BBA plus 0.40%) — Monthly | Dajichi Sankyo Co Ltd. — Monthly | (677) | |
| 147,917 | 146,182 | — | 12/15/25 | (1 month USD-LIBOR-BBA plus 0.40%) — Monthly | Eisai Co Ltd. — Monthly | (422) | |
| 248,585 | 266,224 | — | 12/15/25 | (1 month USD-LIBOR-BBA plus 0.35%) — Monthly | Eli Lilly & Co. — Monthly | 17,601 | |
| 81,500 | 76,402 | — | 12/15/25 | (1 month USD-LIBOR-BBA plus 0.35%) — Monthly | Eurofins Scientific — Monthly | (5,110) | |
| 983,619 | 1,119,123 | — | 12/15/25 | 1 month USD-LIBOR-BBA minus 0.35% — Monthly | First Solar Inc. — Monthly | (135,600) | |
| 88,568 | 87,566 | — | 12/15/25 | (1 month USD-LIBOR-BBA plus 0.35%) — Monthly | Galapagos NV — Monthly | (1,016) | |
| 251,719 | 241,483 | — | 12/15/25 | (1 month USD-LIBOR-BBA plus 0.35%) — Monthly | Gilead Sciences Inc — Monthly | (10,275) | |
| 442,891 | 477,529 | — | 12/15/25 | (1 month USD-LIBOR-BBA plus 0.35%) — Monthly | Glaxosmithkline Plc — Monthly | 34,569 | |
| 10,046,299 | 9,977,862 | — | 12/15/25 | (0.45%) — Monthly | Goldman Sachs Volatility Carry US Enhanced 3x Excess Return Strategy — Monthly †† | (70,069) | |
| 32,417,497 | 32,255,901 | — | 12/15/25 | (0.45%) — Monthly | Goldman Sachs Volatility Carry US Series 85 Excess Return Strategy — Monthly †† | (161,596) | |
| 7,531,992 | 7,574,596 | — | 12/15/25 | (0.30%) — Monthly | Goldman Sachs Volatility of Volatility Carry Excess Return Strategy — Monthly † | 41,788 | |
50 Multi-Asset Absolute Return Fund | |
| OTC TOTAL RETURN SWAP CONTRACTS OUTSTANDING at 10/31/21 cont. | |||||||
| Swap counterparty/ Notional amount | Value | Upfront premium received (paid) | Termination date | Payments received (paid) by fund | Total return received by or paid by fund | Unrealized appreciation/ (depreciation) | |
| Goldman Sachs International cont. | |||||||
| $19,134,843 | $19,302,579 | $— | 12/15/25 | (0.30%) — Monthly | Goldman Sachs Volatility of Volatility Carry Series 69 Excess Return Strategy — Monthly † | $165,664 | |
| 56,314 | 54,191 | — | 12/15/25 | (1 month USD-LIBOR-BBA plus 0.35%) — Monthly | Grifols Sa — Monthly | (2,132) | |
| 87,350 | 88,953 | — | 12/15/25 | (1 month USD-LIBOR-BBA plus 0.35%) — Monthly | H Lundbeck A/S — Monthly | 1,589 | |
| 121,070 | 123,687 | — | 12/15/25 | (1 month USD-LIBOR-BBA plus 0.35%) — Monthly | Hikma Pharmaceuticals PLC — Monthly | 2,598 | |
| 134,805 | 123,200 | — | 12/15/25 | (1 month USD-LIBOR-BBA plus 0.40%) — Monthly | Hisamitsu Pharmaceutical Co — Monthly | (10,383) | |
| 538,238 | 544,974 | — | 12/15/25 | (1 month USD-LIBOR-BBA plus 0.35%) — Monthly | Illumina Inc — Monthly | 6,652 | |
| 57,037 | 58,273 | — | 12/15/25 | (1 month USD-LIBOR-BBA plus 0.35%) — Monthly | Incyte Corp — Monthly | 1,227 | |
| 577,629 | 596,863 | — | 12/15/25 | (1 month USD-LIBOR-BBA plus 0.35%) — Monthly | Ipsen — Monthly | 19,144 | |
| 855,546 | 898,762 | — | 12/15/25 | (1 month USD-LIBOR-BBA plus 0.35%) — Monthly | IQVIA Holdings, Inc. — Monthly | 43,083 | |
| 465,673 | 470,235 | — | 12/15/25 | (1 month USD-LIBOR-BBA plus 0.35%) — Monthly | Johnson & Johnson — Monthly | 4,489 | |
| 489,484 | 550,224 | — | 12/15/25 | (1 month USD-LIBOR-BBA plus 0.35%) — Monthly | Merck & Co. Inc. — Monthly | 60,664 | |
| 925,743 | 979,192 | — | 12/15/25 | (1 month USD-LIBOR-BBA plus 0.35%) — Monthly | Merck Kgaa — Monthly | 53,306 | |
| 856,321 | 894,452 | — | 12/15/25 | (1 month USD-LIBOR-BBA plus 0.35%) — Monthly | Mettler-Toledo International — Monthly | 37,997 | |
| 843,786 | 911,995 | — | 12/15/25 | 1 month USD-LIBOR-BBA minus 0.35% — Monthly | New Relic Inc. — Monthly | (68,291) | |
| 38,175 | 37,902 | — | 12/15/25 | (1 month USD-LIBOR-BBA plus 0.35%) — Monthly | Novartis Ag-Reg — Monthly | (279) | |
| 873,899 | 879,312 | — | 12/15/25 | 1 month USD-LIBOR-BBA minus 0.35% — Monthly | Open Text Corp. — Monthly | (1,351) | |
Multi-Asset Absolute Return Fund 51 | |
| OTC TOTAL RETURN SWAP CONTRACTS OUTSTANDING at 10/31/21 cont. | |||||||
| Swap counterparty/ Notional amount | Value | Upfront premium received (paid) | Termination date | Payments received (paid) by fund | Total return received by or paid by fund | Unrealized appreciation/ (depreciation) | |
| Goldman Sachs International cont. | |||||||
| $21,806 | $22,969 | $— | 12/15/25 | (1 month USD-LIBOR-BBA plus 0.35%) — Monthly | Organon & Co. — Monthly | $1,159 | |
| 15,502 | 16,153 | — | 12/15/25 | (1 month USD-LIBOR-BBA plus 0.35%) — Monthly | Orion Oyj-Class B — Monthly | 649 | |
| 683,338 | 748,230 | — | 12/15/25 | 1 month USD-LIBOR-BBA minus 0.35% — Monthly | Outset Medical Inc. — Monthly | (64,959) | |
| 824,986 | 859,332 | — | 12/15/25 | (1 month USD-LIBOR-BBA plus 0.35%) — Monthly | Perkinelmer Inc. — Monthly | 34,558 | |
| 380,791 | 384,452 | — | 12/15/25 | (1 month USD-LIBOR-BBA plus 0.35%) — Monthly | Perrigo Co Plc — Monthly | 3,602 | |
| 610,193 | 643,284 | — | 12/15/25 | (1 month USD-LIBOR-BBA plus 0.35%) — Monthly | Pfizer, Inc. — Monthly | 32,996 | |
| 681,566 | 747,787 | — | 12/15/25 | 1 month USD-LIBOR-BBA minus 0.35% — Monthly | Progyny, Inc. — Monthly | (66,287) | |
| 21,341 | 22,527 | — | 12/15/25 | (1 month USD-LIBOR-BBA plus 0.35%) — Monthly | Recordati Industria Chemica — Monthly | 1,182 | |
| 45,919 | 53,115 | — | 12/15/25 | (1 month USD-LIBOR-BBA plus 0.35%) — Monthly | Regeneron Pharmaceuticals — Monthly | 7,189 | |
| 403,603 | 415,216 | — | 12/15/25 | (1 month USD-LIBOR-BBA plus 0.35%) — Monthly | Sanofi — Monthly | 11,551 | |
| 425,638 | 432,875 | — | 12/15/25 | (1 month USD-LIBOR-BBA plus 0.35%) — Monthly | Sartorius Stedim Biotech — Monthly | 7,171 | |
| 166,468 | 160,560 | — | 12/15/25 | (1 month USD-LIBOR-BBA plus 0.40%) — Monthly | Shionogi & Co Ltd — Monthly | (4,842) | |
| 160,460 | 162,362 | — | 12/15/25 | 1 month USD-LIBOR-BBA minus 0.50% — Monthly | Sillajen Inc. — Monthly | (2,941) | |
| 1,686,149 | 1,750,946 | — | 12/15/25 | 1 month USD-LIBOR-BBA minus 0.35% — Monthly | Steris, PLC — Monthly | (64,961) | |
| 381,433 | 314,979 | — | 12/15/25 | (1 month USD-LIBOR-BBA plus 0.40%) — Monthly | Sumitomo Dajnippon Pharma Co. — Monthly | (64,001) | |
| 306,698 | 286,346 | — | 12/15/25 | (1 month USD-LIBOR-BBA plus 0.40%) — Monthly | Taisho Pharmaceutical Holdin — Monthly | (18,250) | |
52 Multi-Asset Absolute Return Fund | |
| OTC TOTAL RETURN SWAP CONTRACTS OUTSTANDING at 10/31/21 cont. | |||||||
| Swap counterparty/ Notional amount | Value | Upfront premium received (paid) | Termination date | Payments received (paid) by fund | Total return received by or paid by fund | Unrealized appreciation/ (depreciation) | |
| Goldman Sachs International cont. | |||||||
| $145,640 | $144,350 | $— | 12/15/25 | (1 month USD-LIBOR-BBA plus 0.40%) — Monthly | Takeda Pharmaceutical Co Ltd — Monthly | $2,419 | |
| 253,935 | 229,276 | — | 12/15/25 | (1 month USD-LIBOR-BBA plus 0.35%) — Monthly | Teva Pharmaceutical-Sp Adr — Monthly | (24,698) | |
| 786,809 | 855,278 | — | 12/15/25 | (1 month USD-LIBOR-BBA plus 0.35%) — Monthly | Thermo Fisher Scientific Inc — Monthly | 68,346 | |
| 92,541 | 96,955 | — | 12/15/25 | (1 month USD-LIBOR-BBA plus 0.35%) — Monthly | Ucb Sa — Monthly | 4,399 | |
| 11,633 | 11,836 | — | 12/15/25 | (1 month USD-LIBOR-BBA plus 0.35%) — Monthly | Vertex Pharmaceuticals Inc — Monthly | 200 | |
| 372,438 | 369,395 | — | 12/15/25 | (1 month USD-LIBOR-BBA plus 0.35%) — Monthly | Viatris, Inc. — Monthly | (3,102) | |
| 203,946 | 196,054 | — | 12/15/25 | (1 month USD-LIBOR-BBA plus 0.35%) — Monthly | Vifor Pharma AG — Monthly | (7,924) | |
| 895,212 | 954,527 | — | 12/15/25 | (1 month USD-LIBOR-BBA plus 0.35%) — Monthly | Waters Corp. — Monthly | 59,176 | |
| 705,748 | 754,538 | — | 12/15/25 | (1 month USD-LIBOR-BBA plus 0.35%) — Monthly | Zoetis, Inc. — Monthly | 49,553 | |
| JPMorgan Chase Bank N.A. | |||||||
| 41,929,958 | 42,509,496 | — | 10/14/22 | (Secured Overnight Financing Rate plus 0.41%) — Monthly | A basket (JPCMPTFL) of common stocks — Monthly* | 582,380 | |
| 19,043,482 | 19,708,469 | — | 2/5/22 | (1 month USD-LIBOR-BBA plus 0.35%) — Monthly | Russell 1000 Value Total Return Index — Monthly | 659,224 | |
| UBS AG | |||||||
| 225,543,154 | 226,696,157 | — | 5/22/23 | (Secured Overnight Financing Rate plus 0.35%) — Monthly | A basket (UBSPUSER) of common stocks — Monthly* | 1,153,003 | |
| 2,793,293 | 2,862,953 | — | 11/2/21 | 1 month USD-LIBOR-BBA minus 0.25% — Monthly | MSCI Daily TR Net Emerging Markets USD — Monthly | (70,008) | |
| 47,929,934 | 49,125,237 | — | 11/2/21 | 1 month USD-LIBOR-BBA minus 0.25% — Monthly | MSCI Emerging Markets TR Net USD — Monthly | (1,201,261) | |
Multi-Asset Absolute Return Fund 53 | |
| OTC TOTAL RETURN SWAP CONTRACTS OUTSTANDING at 10/31/21 cont. | |||||||
| Swap counterparty/ Notional amount | Value | Upfront premium received (paid) | Termination date | Payments received (paid) by fund | Total return received by or paid by fund | Unrealized appreciation/ (depreciation) | |
| UBS AG cont. | |||||||
| $225,667,548 | $226,649,971 | $— | 5/22/23 | Secured Overnight Financing Rate plus 0.20% — Monthly | S&P 500 Total Return 4 Jan 1988 Index — Monthly | $(982,423) | |
| Upfront premium received | — | Unrealized appreciation | 12,524,390 | ||||
| Upfront premium (paid) | — | Unrealized (depreciation) | (16,782,769) | ||||
| Total | $— | Total | $(4,258,379) | ||||
| * The 50 largest components, and any individual component greater than 1% of basket value, are shown below. | |||||||
| † Replicates exposure to the difference between the implied and the realized volatility risk premium in the CBOE Volatility Index option market, with a delta hedge overlay. | |||||||
| †† Replicates exposure to the difference between the implied and the realized volatility risk premium on the S&P 500 Index, with a delta hedge overlay. | |||||||
| A BASKET (MLFCF15) OF COMMON STOCKS | ||||
| Common stocks | Sector | Shares | Value | Percentage value |
| Apple, Inc. | Technology | 61,498 | $9,212,397 | 6.17% |
| Alphabet, Inc. Class A | Technology | 2,757 | 8,161,974 | 5.47% |
| Microsoft Corp. | Technology | 18,528 | 6,144,109 | 4.12% |
| Amazon.com, Inc. | Consumer cyclicals | 1,626 | 5,484,685 | 3.67% |
| NVIDIA Corp. | Technology | 18,080 | 4,622,514 | 3.10% |
| JPMorgan Chase & Co. | Financials | 22,968 | 3,902,110 | 2.61% |
| Accenture PLC Class A | Technology | 8,715 | 3,126,760 | 2.09% |
| Intuit, Inc. | Technology | 4,863 | 3,043,940 | 2.04% |
| Adobe, Inc. | Technology | 4,380 | 2,848,411 | 1.91% |
| Qualcomm, Inc. | Technology | 20,946 | 2,786,689 | 1.87% |
| Goldman Sachs Group, Inc. (The) | Financials | 6,670 | 2,757,241 | 1.85% |
| Bristol-Myers Squibb Co. | Health care | 44,822 | 2,617,629 | 1.75% |
| Abbott Laboratories | Health care | 20,106 | 2,591,460 | 1.74% |
| Citigroup, Inc. | Financials | 36,716 | 2,539,277 | 1.70% |
| Walmart, Inc. | Consumer cyclicals | 16,783 | 2,507,674 | 1.68% |
| Ford Motor Co. | Consumer cyclicals | 136,702 | 2,334,868 | 1.56% |
| Verizon Communications, Inc. | Communication services | 38,800 | 2,056,010 | 1.38% |
| Merck & Co., Inc. | Health care | 22,298 | 1,963,372 | 1.32% |
| Lockheed Martin Corp. | Capital goods | 5,071 | 1,685,278 | 1.13% |
| Fortinet, Inc. | Technology | 4,864 | 1,635,911 | 1.10% |
| Cisco Systems, Inc./California | Technology | 28,688 | 1,605,651 | 1.08% |
| TJX Cos., Inc. (The) | Consumer cyclicals | 24,005 | 1,572,072 | 1.05% |
| Target Corp. | Consumer cyclicals | 5,911 | 1,534,586 | 1.03% |
| MetLife, Inc. | Financials | 24,150 | 1,516,604 | 1.02% |
| PepsiCo, Inc. | Consumer staples | 9,129 | 1,475,227 | 0.99% |
| Align Technology, Inc. | Health care | 2,346 | 1,464,898 | 0.98% |
| Procter & Gamble Co. (The) | Consumer staples | 9,950 | 1,422,695 | 0.95% |
| Edwards Lifesciences Corp. | Health care | 11,093 | 1,329,173 | 0.89% |
54 Multi-Asset Absolute Return Fund | |
| A BASKET (MLFCF15) OF COMMON STOCKS cont. | ||||
| Common stocks | Sector | Shares | Value | Percentage value |
| CSX Corp. | Transportation | 35,540 | $1,285,495 | 0.86% |
| McDonald’s Corp. | Consumer staples | 5,232 | 1,284,716 | 0.86% |
| Colgate-Palmolive Co. | Consumer staples | 16,807 | 1,280,548 | 0.86% |
| DuPont de Nemours, Inc. | Basic materials | 17,677 | 1,230,333 | 0.82% |
| Constellation Brands, Inc. Class A | Consumer staples | 5,620 | 1,218,399 | 0.82% |
| O’Reilly Automotive, Inc. | Consumer cyclicals | 1,955 | 1,216,871 | 0.82% |
| Facebook, Inc. Class A | Technology | 3,744 | 1,211,557 | 0.81% |
| Pinterest, Inc. Class A | Technology | 26,935 | 1,202,364 | 0.81% |
| Veeva Systems, Inc. Class A | Technology | 3,671 | 1,163,614 | 0.78% |
| Vertex Pharmaceuticals, Inc. | Health care | 6,150 | 1,137,399 | 0.76% |
| Roku, Inc. | Technology | 3,686 | 1,123,968 | 0.75% |
| Synopsys, Inc. | Technology | 3,338 | 1,112,285 | 0.75% |
| Moderna, Inc. | Health care | 3,188 | 1,100,437 | 0.74% |
| Parker Hannifin Corp. | Capital goods | 3,655 | 1,083,986 | 0.73% |
| Cadence Design Systems, Inc. | Technology | 6,053 | 1,047,896 | 0.70% |
| McKesson Corp. | Health care | 4,926 | 1,023,942 | 0.69% |
| Medtronic PLC | Health care | 8,275 | 991,886 | 0.66% |
| Southern Co. (The) | Utilities and power | 15,874 | 989,251 | 0.66% |
| Marriott International, Inc./MD Class A | Consumer cyclicals | 6,179 | 988,832 | 0.66% |
| Gartner, Inc. | Consumer cyclicals | 2,898 | 962,007 | 0.64% |
| Ameriprise Financial, Inc. | Financials | 3,107 | 938,732 | 0.63% |
| Synchrony Financial | Financials | 19,046 | 884,673 | 0.59% |
| A BASKET (GSGLPWDL) OF COMMON STOCKS | ||||
| Common stocks | Sector | Shares | Value | Percentage value |
| Athene Holding, Ltd. Class A | Financials | 15,250 | $1,326,859 | 0.57% |
| Take-Two Interactive Software, Inc. | Technology | 6,980 | 1,263,365 | 0.55% |
| Merck & Co., Inc. | Health care | 14,213 | 1,251,469 | 0.54% |
| Moncler SpA (Italy) | Consumer cyclicals | 17,209 | 1,235,797 | 0.53% |
| IAC/InterActiveCorp | Technology | 8,052 | 1,226,851 | 0.53% |
| Newcrest Mining, Ltd. (Australia) | Basic materials | 65,056 | 1,218,068 | 0.53% |
| A.O. Smith Corp. | Capital goods | 16,563 | 1,210,225 | 0.52% |
| Netflix, Inc. | Consumer staples | 1,750 | 1,208,180 | 0.52% |
| Iberdrola SA (Spain) | Utilities and power | 101,976 | 1,204,185 | 0.52% |
| Electricite De France SA (France) | Utilities and power | 81,782 | 1,203,494 | 0.52% |
| Cadence Design Systems, Inc. | Technology | 6,934 | 1,200,365 | 0.52% |
| Pandora A/S (Denmark) | Consumer cyclicals | 8,577 | 1,197,776 | 0.52% |
| FactSet Research Systems, Inc. | Consumer cyclicals | 2,685 | 1,191,692 | 0.51% |
| Bank Leumi Le-Israel BM (Israel) | Financials | 124,787 | 1,189,765 | 0.51% |
| Veeva Systems, Inc. Class A | Technology | 3,730 | 1,182,361 | 0.51% |
| Bank Hapoalim MB (Israel) | Financials | 120,118 | 1,180,553 | 0.51% |
| Aristocrat Leisure, Ltd. (Australia) | Consumer cyclicals | 33,416 | 1,173,399 | 0.51% |
| Chevron Corp. | Energy | 10,194 | 1,167,071 | 0.50% |
| KLA Corp. | Technology | 3,124 | 1,164,617 | 0.50% |
Multi-Asset Absolute Return Fund 55 | |
| A BASKET (GSGLPWDL) OF COMMON STOCKS cont. | ||||
| Common stocks | Sector | Shares | Value | Percentage value |
| VEREIT, Inc. | Financials | 23,128 | $1,163,341 | 0.50% |
| MSCI, Inc. | Technology | 1,748 | 1,162,429 | 0.50% |
| PPG Industries, Inc. | Basic materials | 7,238 | 1,162,242 | 0.50% |
| Synopsys, Inc. | Technology | 3,483 | 1,160,552 | 0.50% |
| GlaxoSmithKline PLC (United Kingdom) | Health care | 56,050 | 1,157,198 | 0.50% |
| eBay, Inc. | Technology | 15,077 | 1,156,675 | 0.50% |
| Recruit Holdings Co., Ltd. (Japan) | Consumer staples | 17,409 | 1,156,566 | 0.50% |
| Segro PLC (United Kingdom) | Financials | 65,299 | 1,155,034 | 0.50% |
| ConocoPhillips | Energy | 15,477 | 1,152,902 | 0.50% |
| Lear Corp. | Consumer cyclicals | 6,655 | 1,143,650 | 0.49% |
| Magna International, Inc. (Canada) | Consumer cyclicals | 13,999 | 1,138,753 | 0.49% |
| Shopify, Inc. Class A (Canada) | Technology | 780 | 1,138,745 | 0.49% |
| Exxon Mobil Corp. | Energy | 17,657 | 1,138,357 | 0.49% |
| Roche Holding AG (Switzerland) | Health care | 2,924 | 1,130,533 | 0.49% |
| Sonic Healthcare, Ltd. (Australia) | Health care | 37,423 | 1,126,898 | 0.49% |
| PepsiCo, Inc. | Consumer staples | 6,936 | 1,120,855 | 0.48% |
| RWE AG (Germany) | Utilities and power | 29,079 | 1,118,386 | 0.48% |
| Sealed Air Corp. | Basic materials | 18,828 | 1,116,865 | 0.48% |
| Canadian Imperial Bank of Commerce (Canada) | Financials | 9,196 | 1,115,871 | 0.48% |
| Owens Corning | Consumer cyclicals | 11,932 | 1,114,569 | 0.48% |
| SEI Investments Co. | Financials | 17,611 | 1,110,180 | 0.48% |
| Mettler-Toledo International, Inc. | Health care | 749 | 1,109,270 | 0.48% |
| Nordson Corp. | Capital goods | 4,353 | 1,106,631 | 0.48% |
| Valeo (France) | Consumer cyclicals | 37,725 | 1,104,637 | 0.48% |
| Fidelity National Financial, Inc. | Financials | 23,032 | 1,103,467 | 0.48% |
| Fortive Corp. | Capital goods | 14,554 | 1,101,863 | 0.48% |
| Dover Corp. | Capital goods | 6,513 | 1,101,139 | 0.48% |
| AMETEK, Inc. | Conglomerates | 8,310 | 1,100,298 | 0.47% |
| Royal Bank of Canada (Canada) | Financials | 10,559 | 1,099,119 | 0.47% |
| Cummins, Inc. | Capital goods | 4,580 | 1,098,555 | 0.47% |
| Royal Dutch Shell PLC Class A (United Kingdom) | Energy | 47,693 | 1,097,182 | 0.47% |
| A BASKET (GSGLPWDS) OF COMMON STOCKS | ||||
| Common stocks | Sector | Shares | Value | Percentage value |
| Sunrun, Inc. | Energy | 24,881 | $1,435,138 | 0.64% |
| CyberArk Software, Ltd. (Israel) | Technology | 6,623 | 1,192,784 | 0.53% |
| Mosaic Co. (The) | Basic materials | 28,690 | 1,192,636 | 0.53% |
| Masco Corp. | Consumer cyclicals | 17,942 | 1,176,126 | 0.52% |
| Devon Energy Corp. | Energy | 29,086 | 1,165,773 | 0.52% |
| Chewy, Inc. Class A | Consumer staples | 15,326 | 1,161,717 | 0.51% |
| Ceridian HCM Holding, Inc. | Technology | 9,251 | 1,158,655 | 0.51% |
| Live Nation Entertainment, Inc. | Consumer cyclicals | 11,412 | 1,154,295 | 0.51% |
56 Multi-Asset Absolute Return Fund | |
| A BASKET (GSGLPWDS) OF COMMON STOCKS cont. | ||||
| Common stocks | Sector | Shares | Value | Percentage value |
| CH Robinson Worldwide, Inc. | Transportation | 11,824 | $1,146,778 | 0.51% |
| Valero Energy Corp. | Energy | 14,827 | 1,146,547 | 0.51% |
| Trade Desk, Inc. (The) Class A | Consumer cyclicals | 15,304 | 1,146,392 | 0.51% |
| Aon PLC | Financials | 3,579 | 1,145,070 | 0.51% |
| Pioneer Natural Resources Co. | Energy | 6,104 | 1,141,398 | 0.51% |
| Royalty Pharma PLC Class A | Health care | 28,745 | 1,136,294 | 0.50% |
| Fastenal Co. | Consumer staples | 19,701 | 1,124,558 | 0.50% |
| Silver Wheaton Corp. (Canada) | Basic materials | 27,852 | 1,124,336 | 0.50% |
| Equifax, Inc. | Consumer cyclicals | 4,041 | 1,121,141 | 0.50% |
| Veolia Environnement SA (France) | Utilities and power | 34,189 | 1,115,727 | 0.49% |
| Nutrien, Ltd. (Canada) | Basic materials | 15,950 | 1,114,806 | 0.49% |
| Cheniere Energy, Inc. | Energy | 10,778 | 1,114,446 | 0.49% |
| Clarivate PLC (United Kingdom) | Technology | 47,494 | 1,113,726 | 0.49% |
| FedEx Corp. | Transportation | 4,713 | 1,109,974 | 0.49% |
| Heineken NV (Netherlands) | Consumer staples | 9,999 | 1,107,611 | 0.49% |
| Markel Corp. | Financials | 843 | 1,106,511 | 0.49% |
| Waste Connections, Inc. | Capital goods | 8,132 | 1,106,075 | 0.49% |
| VF Corp. | Consumer cyclicals | 15,163 | 1,105,083 | 0.49% |
| Broadridge Financial Solutions, Inc. | Financials | 6,181 | 1,102,791 | 0.49% |
| Oak Street Health, Inc. | Health care | 23,269 | 1,099,015 | 0.49% |
| Hess Corp. | Energy | 13,296 | 1,097,848 | 0.49% |
| Realestate.com.au, Ltd. (Australia) | Technology | 9,108 | 1,097,237 | 0.49% |
| AXA SA (France) | Financials | 37,517 | 1,091,173 | 0.48% |
| Seek, Ltd. (Australia) | Technology | 44,334 | 1,090,550 | 0.48% |
| United Rentals, Inc. | Consumer cyclicals | 2,872 | 1,088,737 | 0.48% |
| Equinix, Inc. | Communication services | 1,298 | 1,086,534 | 0.48% |
| Atmos Energy Corp. | Utilities and power | 11,779 | 1,085,111 | 0.48% |
| Essity AB Class B (Sweden) | Consumer staples | 33,545 | 1,085,093 | 0.48% |
| Credit Suisse Group AG (Switzerland) | Financials | 104,223 | 1,085,034 | 0.48% |
| Vestas Wind Systems A/S (Denmark) | Energy | 25,079 | 1,084,615 | 0.48% |
| Check Point Software Technologies, Ltd. (Israel) | Technology | 9,025 | 1,079,382 | 0.48% |
| Naturgy Energy Group SA (Spain) | Utilities and power | 40,993 | 1,077,125 | 0.48% |
| ORIX Corp. (Japan) | Financials | 54,428 | 1,076,851 | 0.48% |
| Lonza Group AG (Switzerland) | Health care | 1,313 | 1,076,651 | 0.48% |
| Westinghouse Air Brake Technologies Corp. | Transportation | 11,811 | 1,071,657 | 0.47% |
| TransCanada Corp. (Canada) | Energy | 19,762 | 1,069,076 | 0.47% |
| Catalent, Inc. | Health care | 7,753 | 1,068,849 | 0.47% |
| Jacobs Engineering Group, Inc. | Capital goods | 7,602 | 1,067,470 | 0.47% |
| Trend Micro, Inc. (Japan) | Technology | 18,891 | 1,065,750 | 0.47% |
| Wynn Resorts, Ltd. | Consumer cyclicals | 11,855 | 1,064,570 | 0.47% |
| Chugai Pharmaceutical Co., Ltd. (Japan) | Health care | 28,426 | 1,059,234 | 0.47% |
| American Express Co. | Financials | 6,083 | 1,057,075 | 0.47% |
Multi-Asset Absolute Return Fund 57 | |
| A BASKET (JPCMPTFL) OF COMMON STOCKS | ||||
| Common stocks | Sector | Shares | Value | Percentage value |
| Change Healthcare, Inc. | Health care | 29,777 | $641,102 | 1.51% |
| Dentsply Sirona, Inc. | Health care | 10,073 | 576,258 | 1.36% |
| Bristol-Myers Squibb Co. | Health care | 9,200 | 537,273 | 1.26% |
| General Motors Co. | Consumer cyclicals | 9,542 | 519,350 | 1.22% |
| Ford Motor Co. | Consumer cyclicals | 29,298 | 500,406 | 1.18% |
| BorgWarner, Inc. | Capital goods | 10,262 | 462,527 | 1.09% |
| Delphi Automotive PLC | Capital goods | 2,627 | 454,179 | 1.07% |
| Zoetis, Inc. | Health care | 2,051 | 443,426 | 1.04% |
| Driven Brands Holdings, Inc. | Consumer cyclicals | 13,564 | 440,408 | 1.04% |
| TransDigm Group, Inc. | Capital goods | 700 | 436,559 | 1.03% |
| Merck & Co., Inc. | Health care | 4,827 | 425,021 | 1.00% |
| lululemon athletica, Inc. (Canada) | Consumer cyclicals | 896 | 417,699 | 0.98% |
| AECOM | Capital goods | 5,650 | 386,297 | 0.91% |
| Catalent, Inc. | Health care | 2,636 | 363,387 | 0.85% |
| Thor Industries, Inc. | Consumer cyclicals | 3,501 | 356,933 | 0.84% |
| Hexcel Corp. | Capital goods | 6,061 | 343,899 | 0.81% |
| Tandem Diabetes Care, Inc. | Health care | 2,518 | 343,341 | 0.81% |
| Datto Holding Corp. | Technology | 14,160 | 338,425 | 0.80% |
| Hanesbrands, Inc. | Consumer cyclicals | 19,783 | 337,100 | 0.79% |
| AZEK Co., Inc. (The) | Basic materials | 9,112 | 334,306 | 0.79% |
| Timken Co. (The) | Basic materials | 4,610 | 327,113 | 0.77% |
| TopBuild Corp. | Basic materials | 1,238 | 318,130 | 0.75% |
| Skechers USA, Inc. Class A | Consumer cyclicals | 6,702 | 309,685 | 0.73% |
| Darling Ingredients, Inc. | Consumer staples | 3,623 | 306,233 | 0.72% |
| T-Mobile US, Inc. | Communication services | 2,623 | 301,728 | 0.71% |
| Perrigo Co. PLC | Health care | 6,590 | 297,540 | 0.70% |
| United Rentals, Inc. | Consumer cyclicals | 776 | 294,278 | 0.69% |
| Dropbox, Inc. Class A | Technology | 9,642 | 293,972 | 0.69% |
| Datadog, Inc. Class A | Technology | 1,753 | 292,785 | 0.69% |
| Boston Scientific Corp. | Health care | 6,786 | 292,682 | 0.69% |
| Spirit AeroSystems Holdings, Inc. Class A | Capital goods | 6,936 | 286,396 | 0.67% |
| Monolithic Power Systems, Inc. | Technology | 544 | 286,103 | 0.67% |
| DexCom, Inc. | Health care | 451 | 281,073 | 0.66% |
| Mercury Systems, Inc. | Technology | 5,424 | 279,546 | 0.66% |
| Deckers Outdoor Corp. | Consumer cyclicals | 694 | 274,324 | 0.65% |
| Quanta Services, Inc. | Capital goods | 2,203 | 267,134 | 0.63% |
| Rocket Cos., Inc. Class A | Financials | 15,997 | 263,636 | 0.62% |
| Vertiv Holdings Co. | Capital goods | 10,234 | 262,802 | 0.62% |
| Advanced Micro Devices, Inc. | Technology | 2,157 | 259,301 | 0.61% |
| Freshpet, Inc. | Consumer cyclicals | 1,644 | 256,291 | 0.60% |
| StoneCo., Ltd. Class A (Brazil) | Consumer cyclicals | 7,284 | 246,638 | 0.58% |
| Zscaler, Inc. | Technology | 761 | 242,554 | 0.57% |
| Harley-Davidson, Inc. | Consumer cyclicals | 6,619 | 241,527 | 0.57% |
| American Airlines Group, Inc. | Transportation | 12,470 | 239,425 | 0.56% |
58 Multi-Asset Absolute Return Fund | |
| A BASKET (JPCMPTFL) OF COMMON STOCKS cont. | ||||
| Common stocks | Sector | Shares | Value | Percentage value |
| Mirati Therapeutics, Inc. | Health care | 1,258 | $237,737 | 0.56% |
| Hill-Rom Holdings, Inc. | Health care | 1,522 | 235,758 | 0.55% |
| AT&T, Inc. | Communication services | 9,176 | 231,783 | 0.55% |
| Crowdstrike Holdings, Inc. Class A | Technology | 818 | 230,631 | 0.54% |
| Brooks Automation, Inc. | Technology | 1,974 | 229,909 | 0.54% |
| HubSpot, Inc. | Technology | 283 | 229,625 | 0.54% |
| A BASKET (UBSPUSER) OF COMMON STOCKS | ||||
| Common stocks | Sector | Shares | Value | Percentage value |
| Microsoft Corp. | Technology | 58,206 | $19,302,179 | 8.51% |
| Apple, Inc. | Technology | 71,761 | 10,749,759 | 4.74% |
| Amazon.com, Inc. | Consumer cyclicals | 2,647 | 8,926,601 | 3.94% |
| Alphabet, Inc. Class C | Technology | 2,516 | 7,460,113 | 3.29% |
| NVIDIA Corp. | Technology | 19,782 | 5,057,714 | 2.23% |
| Tesla, Inc. | Consumer cyclicals | 3,560 | 3,965,955 | 1.75% |
| JPMorgan Chase & Co. | Financials | 23,217 | 3,944,254 | 1.74% |
| Bank of America Corp. | Financials | 82,356 | 3,934,978 | 1.74% |
| Regeneron Pharmaceuticals, Inc. | Health care | 6,077 | 3,888,832 | 1.72% |
| Union Pacific Corp. | Transportation | 15,622 | 3,771,232 | 1.66% |
| Danaher Corp. | Health care | 11,885 | 3,705,316 | 1.63% |
| Johnson Controls International PLC | Capital goods | 49,950 | 3,664,840 | 1.62% |
| Walmart, Inc. | Consumer cyclicals | 23,679 | 3,538,102 | 1.56% |
| Facebook, Inc. Class A | Technology | 10,687 | 3,457,890 | 1.53% |
| PayPal Holdings, Inc. | Consumer cyclicals | 13,725 | 3,192,375 | 1.41% |
| Citigroup, Inc. | Financials | 45,863 | 3,171,887 | 1.40% |
| Charter Communications, Inc. Class A | Communication services | 4,576 | 3,088,125 | 1.36% |
| Adobe, Inc. | Technology | 4,513 | 2,935,125 | 1.29% |
| O’Reilly Automotive, Inc. | Consumer cyclicals | 4,266 | 2,654,637 | 1.17% |
| Visa, Inc. Class A | Financials | 11,934 | 2,527,368 | 1.11% |
| Thermo Fisher Scientific, Inc. | Health care | 3,950 | 2,500,551 | 1.10% |
| Anthem, Inc. | Health care | 5,732 | 2,493,963 | 1.10% |
| American Tower Corp. | Communication services | 8,709 | 2,455,607 | 1.08% |
| Northrop Grumman Corp. | Capital goods | 6,577 | 2,349,408 | 1.04% |
| ConocoPhillips | Energy | 31,290 | 2,330,777 | 1.03% |
| Nike, Inc. Class B | Consumer cyclicals | 13,931 | 2,330,539 | 1.03% |
| Mastercard, Inc. Class A | Consumer cyclicals | 6,870 | 2,305,132 | 1.02% |
| Goldman Sachs Group, Inc. (The) | Financials | 5,558 | 2,297,229 | 1.01% |
| Johnson & Johnson | Health care | 14,086 | 2,294,392 | 1.01% |
| Merck & Co., Inc. | Health care | 25,815 | 2,273,023 | 1.00% |
| AbbVie, Inc. | Health care | 19,005 | 2,179,344 | 0.96% |
| UnitedHealth Group, Inc. | Health care | 4,592 | 2,114,675 | 0.93% |
| Procter & Gamble Co. (The) | Consumer staples | 14,210 | 2,031,877 | 0.90% |
| ServiceNow, Inc. | Technology | 2,830 | 1,974,412 | 0.87% |
| Southwest Airlines Co. | Transportation | 41,353 | 1,955,181 | 0.86% |
Multi-Asset Absolute Return Fund 59 | |
| A BASKET (UBSPUSER) OF COMMON STOCKS cont. | ||||
| Common stocks | Sector | Shares | Value | Percentage value |
| Freeport-McMoRan, Inc. (Indonesia) | Basic materials | 50,839 | $1,917,638 | 0.85% |
| Target Corp. | Consumer cyclicals | 7,245 | 1,880,956 | 0.83% |
| Qualcomm, Inc. | Technology | 13,996 | 1,862,000 | 0.82% |
| United Rentals, Inc. | Consumer cyclicals | 4,832 | 1,832,005 | 0.81% |
| Eli Lilly and Co. | Health care | 6,892 | 1,755,918 | 0.77% |
| TJX Cos., Inc. (The) | Consumer cyclicals | 26,361 | 1,726,404 | 0.76% |
| Intuit, Inc. | Technology | 2,739 | 1,714,721 | 0.76% |
| NRG Energy, Inc. | Utilities and power | 42,491 | 1,694,963 | 0.75% |
| Exxon Mobil Corp. | Energy | 26,189 | 1,688,399 | 0.74% |
| General Motors Co. | Consumer cyclicals | 30,127 | 1,639,830 | 0.72% |
| Valero Energy Corp. | Energy | 21,064 | 1,628,876 | 0.72% |
| American International Group, Inc. | Financials | 27,537 | 1,627,185 | 0.72% |
| Advanced Micro Devices, Inc. | Technology | 13,185 | 1,585,285 | 0.70% |
| HCA Healthcare, Inc. | Health care | 6,297 | 1,577,188 | 0.70% |
| DexCom, Inc. | Health care | 2,446 | 1,524,149 | 0.67% |
| CENTRALLY CLEARED TOTAL RETURN SWAP CONTRACTS OUTSTANDING at 10/31/21 | |||||||
| Notional amount | Value | Upfront premium received (paid) | Termination date | Payments received (paid) by fund | Total return received by or paid by fund | Unrealized appreciation/ (depreciation) | |
| $32,695,000 | $890,285 | $(595) | 1/15/32 | 2.78% — At maturity | USA Non-revised Consumer Price Index-Urban (CPI-U) — At maturity | $(890,880) | |
| 103,112,000 | 2,198,348 | (1,041) | 9/13/26 | 2.7375% — At maturity | USA Non-revised Consumer Price Index-Urban (CPI-U) — At maturity | (2,199,389) | |
| Total | $(1,636) | $(3,090,269) | |||||
| OTC CREDIT DEFAULT CONTRACTS OUTSTANDING — PROTECTION SOLD at 10/31/21 | ||||||||
| Swap counterparty/ Referenced debt* | Rating*** | Upfront premium received (paid)** | Notional amount | Value | Termi- nation date | Payments received by fund | Unrealized appreciation/ (depreciation) | |
| Bank of America N.A. | ||||||||
| CMBX NA BBB−.6 Index | B+/P | $4,580 | $67,000 | $18,626 | 5/11/63 | 300 bp — Monthly | $(14,007) | |
| CMBX NA BBB−.6 Index | B+/P | 6,498 | 114,000 | 31,692 | 5/11/63 | 300 bp — Monthly | (25,128) | |
| CMBX NA BBB−.6 Index | B+/P | 15,001 | 243,000 | 67,554 | 5/11/63 | 300 bp — Monthly | (52,411) | |
| Barclays Bank PLC | ||||||||
| CMBX NA BBB−.6 Index | B+/P | 26,163 | 236,000 | 65,608 | 5/11/63 | 300 bp — Monthly | (39,307) | |
| CMBX NA BBB−.7 Index | BB−/P | 8,583 | 1,527,000 | 289,825 | 1/17/47 | 300 bp — Monthly | (280,350) | |
60 Multi-Asset Absolute Return Fund | |
| OTC CREDIT DEFAULT CONTRACTS OUTSTANDING — PROTECTION SOLD at 10/31/21 cont. | ||||||||
| Swap counterparty/ Referenced debt* | Rating*** | Upfront premium received (paid)** | Notional amount | Value | Termi- nation date | Payments received by fund | Unrealized appreciation/ (depreciation) | |
| Citigroup Global Markets, Inc. | ||||||||
| CMBX NA BB.6 Index | B-/P | $237,268 | $1,591,129 | $698,824 | 5/11/63 | 500 bp — Monthly | $(460,009) | |
| CMBX NA BB.7 Index | B/P | 32,151 | 630,000 | 211,176 | 1/17/47 | 500 bp — Monthly | (178,412) | |
| CMBX NA BBB−.6 Index | B+/P | 886,347 | 13,919,000 | 3,869,482 | 5/11/63 | 300 bp — Monthly | (2,975,016) | |
| Credit Suisse International | ||||||||
| CMBX NA BBB−.6 Index | B+/P | 3,581,285 | 38,114,000 | 10,595,692 | 5/11/63 | 300 bp — Monthly | (6,992,174) | |
| CMBX NA BBB−.7 Index | BB−/P | 41,182 | 521,000 | 98,886 | 1/17/47 | 300 bp — Monthly | (57,400) | |
| CMBX NA BBB−.7 Index | BB−/P | 477,712 | 6,463,000 | 1,226,677 | 1/17/47 | 300 bp — Monthly | (745,196) | |
| Goldman Sachs International | ||||||||
| CMBX NA BBB−.6 Index | B+/P | 12,819 | 162,000 | 45,036 | 5/11/63 | 300 bp — Monthly | (32,123) | |
| CMBX NA BBB−.6 Index | B+/P | 14,345 | 170,000 | 47,260 | 5/11/63 | 300 bp — Monthly | (32,815) | |
| CMBX NA BBB−.6 Index | B+/P | 15,423 | 178,000 | 49,484 | 5/11/63 | 300 bp — Monthly | (33,958) | |
| CMBX NA BBB−.6 Index | B+/P | 21,266 | 252,000 | 70,056 | 5/11/63 | 300 bp — Monthly | (48,644) | |
| CMBX NA BBB−.6 Index | B+/P | 32,134 | 292,000 | 81,176 | 5/11/63 | 300 bp — Monthly | (48,871) | |
| CMBX NA BBB−.6 Index | B+/P | 22,005 | 323,000 | 89,794 | 5/11/63 | 300 bp — Monthly | (67,601) | |
| CMBX NA BBB−.6 Index | B+/P | 43,866 | 508,000 | 141,224 | 5/11/63 | 300 bp — Monthly | (97,061) | |
| CMBX NA BBB−.6 Index | B+/P | 72,333 | 521,000 | 144,838 | 5/11/63 | 300 bp — Monthly | (72,200) | |
| CMBX NA BBB−.6 Index | B+/P | 54,650 | 727,000 | 202,106 | 5/11/63 | 300 bp — Monthly | (147,032) | |
| CMBX NA BBB−.6 Index | B+/P | 43,204 | 871,000 | 242,138 | 5/11/63 | 300 bp — Monthly | (198,426) | |
| CMBX NA BBB−.6 Index | B+/P | 113,818 | 1,020,000 | 283,560 | 5/11/63 | 300 bp — Monthly | (169,147) | |
| CMBX NA BBB−.6 Index | B+/P | 113,818 | 1,020,000 | 283,560 | 5/11/63 | 300 bp — Monthly | (169,147) | |
| CMBX NA BBB−.6 Index | B+/P | 90,667 | 1,094,000 | 304,132 | 5/11/63 | 300 bp — Monthly | (212,827) | |
| CMBX NA BBB−.6 Index | B+/P | 123,458 | 1,108,000 | 308,024 | 5/11/63 | 300 bp — Monthly | (183,920) | |
| CMBX NA BBB−.6 Index | B+/P | 67,079 | 1,286,000 | 357,508 | 5/11/63 | 300 bp — Monthly | (289,679) | |
| CMBX NA BBB−.6 Index | B+/P | 217,829 | 2,012,000 | 559,336 | 5/11/63 | 300 bp — Monthly | (340,333) | |
Multi-Asset Absolute Return Fund 61 | |
| OTC CREDIT DEFAULT CONTRACTS OUTSTANDING — PROTECTION SOLD at 10/31/21 cont. | ||||||||
| Swap counterparty/ Referenced debt* | Rating*** | Upfront premium received (paid)** | Notional amount | Value | Termi- nation date | Payments received by fund | Unrealized appreciation/ (depreciation) | |
| Goldman Sachs International cont. | ||||||||
| CMBX NA BBB−.6 Index | B+/P | $440,741 | $3,998,000 | $1,111,444 | 5/11/63 | 300 bp — Monthly | $(668,371) | |
| CMBX NA BBB−.7 Index | BB−/P | 171,603 | 2,462,000 | 467,288 | 1/17/47 | 300 bp — Monthly | (294,248) | |
| CMBX NA BBB−.7 Index | BB−/P | 587,623 | 7,950,000 | 1,508,910 | 1/17/47 | 300 bp — Monthly | (916,649) | |
| JPMorgan Securities LLC | ||||||||
| CMBX NA BBB−.6 Index | B+/P | 16,227,132 | 50,757,000 | 14,110,446 | 5/11/63 | 300 bp — Monthly | 2,146,295 | |
| Merrill Lynch International | ||||||||
| CMBX NA BB.7 Index | B/P | 23,979 | 210,000 | 70,392 | 1/17/47 | 500 bp — Monthly | (46,209) | |
| CMBX NA BBB−.6 Index | B+/P | 4,041,450 | 14,999,000 | 4,169,722 | 5/11/63 | 300 bp — Monthly | (119,523) | |
| Morgan Stanley & Co. International PLC | ||||||||
| CMBX NA BBB−.6 Index | B+/P | 320,980 | 4,845,000 | 1,346,910 | 5/11/63 | 300 bp — Monthly | (1,023,104) | |
| Upfront premium received | 28,188,992 | Unrealized appreciation | 2,146,295 | |||||
| Upfront premium (paid) | — | Unrealized (depreciation) | (17,031,298) | |||||
| Total | $28,188,992 | Total | $(14,885,003) | |||||
| * Payments related to the referenced debt are made upon a credit default event. | ||||||||
| ** Upfront premium is based on the difference between the original spread on issue and the market spread on day of execution. | ||||||||
| *** Ratings for an underlying index represent the average of the ratings of all the securities included in that index. The Moody’s, Standard & Poor’s or Fitch ratings are believed to be the most recent ratings available at October 31, 2021. Securities rated by Fitch are indicated by “/F.” Securities rated by Putnam are indicated by “/P.” The Putnam rating categories are comparable to the Standard & Poor’s classifications. | ||||||||
| OTC CREDIT DEFAULT CONTRACTS OUTSTANDING — PROTECTION PURCHASED at 10/31/21 | ||||||||
| Swap counterparty/ Referenced debt* | Upfront premium received (paid)** | Notional amount | Value | Termi- nation date | Payments (paid) by fund | Unrealized appreciation/ (depreciation) | ||
| Citigroup Global Markets, Inc. | ||||||||
| CMBX NA A.6 Index | $3,715 | $433,000 | $43,560 | 5/11/63 | (200 bp) — Monthly | $47,106 | ||
| CMBX NA BB.10 Index | (25,000) | 228,000 | 56,156 | 11/17/59 | (500 bp) — Monthly | 30,935 | ||
| CMBX NA BB.10 Index | (21,916) | 210,000 | 51,723 | 11/17/59 | (500 bp) — Monthly | 29,603 | ||
| CMBX NA BB.11 Index | (81,623) | 630,000 | 53,298 | 11/18/54 | (500 bp) — Monthly | (28,937) | ||
62 Multi-Asset Absolute Return Fund | |
| OTC CREDIT DEFAULT CONTRACTS OUTSTANDING — PROTECTION PURCHASED at 10/31/21 cont. | ||||||||
| Swap counterparty/ Referenced debt* | Upfront premium received (paid)** | Notional amount | Value | Termi- nation date | Payments (paid) by fund | Unrealized appreciation/ (depreciation) | ||
| Citigroup Global Markets, Inc. cont. | ||||||||
| CMBX NA BB.11 Index | $(18,193) | $193,000 | $16,328 | 11/18/54 | (500 bp) — Monthly | $(2,052) | ||
| CMBX NA BB.9 Index | (255,056) | 2,471,000 | 523,111 | 9/17/58 | (500 bp) — Monthly | 265,652 | ||
| Credit Suisse International | ||||||||
| CMBX NA BB.10 Index | (51,729) | 435,000 | 107,141 | 11/17/59 | (500 bp) — Monthly | 54,989 | ||
| CMBX NA BB.10 Index | (55,104) | 413,000 | 101,722 | 11/17/59 | (500 bp) — Monthly | 46,216 | ||
| CMBX NA BB.7 Index | (29,194) | 1,591,129 | 698,824 | 5/11/63 | (500 bp) — Monthly | 668,083 | ||
| CMBX NA BB.9 Index | (112,076) | 1,118,000 | 236,681 | 9/17/58 | (500 bp) — Monthly | 123,518 | ||
| Goldman Sachs International | ||||||||
| CMBX NA BB.7 Index | (296,107) | 1,622,000 | 543,694 | 1/17/47 | (500 bp) — Monthly | 246,010 | ||
| CMBX NA BB.7 Index | (43,113) | 255,000 | 85,476 | 1/17/47 | (500 bp) — Monthly | 42,115 | ||
| CMBX NA BB.7 Index | (30,568) | 202,000 | 67,710 | 1/17/47 | (500 bp) — Monthly | 36,946 | ||
| CMBX NA BB.7 Index | (19,899) | 98,000 | 32,850 | 1/17/47 | (500 bp) — Monthly | 12,855 | ||
| CMBX NA BB.9 Index | (21,896) | 184,000 | 38,953 | 9/17/58 | (500 bp) — Monthly | 16,878 | ||
| CMBX NA BB.9 Index | (22,144) | 184,000 | 38,953 | 9/17/58 | (500 bp) — Monthly | 16,629 | ||
| JPMorgan Securities LLC | ||||||||
| CMBX NA BB.17 Index | (1,514,014) | 3,092,000 | 1,036,438 | 1/17/47 | (500 bp) — Monthly | (480,582) | ||
| CMBX NA BBB−.7 Index | (2,665,497) | 11,354,000 | 2,154,989 | 1/17/47 | (300 bp) — Monthly | (517,131) | ||
| Merrill Lynch International | ||||||||
| CMBX NA A.6 Index | 8,647 | 520,000 | 52,312 | 5/11/63 | (200 bp) — Monthly | 60,756 | ||
| CMBX NA BB.10 Index | (23,898) | 420,000 | 103,446 | 11/17/59 | (500 bp) — Monthly | 79,140 | ||
| CMBX NA BB.11 Index | (273,312) | 553,000 | 46,784 | 11/18/54 | (500 bp) — Monthly | (227,066) | ||
| CMBX NA BB.9 Index | (29,958) | 769,000 | 162,797 | 9/17/58 | (500 bp) — Monthly | 132,092 | ||
| Morgan Stanley & Co. International PLC | ||||||||
| CMBX NA BBB−.7 Index | (315,451) | 3,096,000 | 587,621 | 1/17/47 | (300 bp) — Monthly | 270,363 | ||
| CMBX NA BB.10 Index | (22,024) | 210,000 | 51,723 | 11/17/59 | (500 bp) — Monthly | 29,495 | ||
Multi-Asset Absolute Return Fund 63 | |
| OTC CREDIT DEFAULT CONTRACTS OUTSTANDING — PROTECTION PURCHASED at 10/31/21 cont. | ||||||||
| Swap counterparty/ Referenced debt* | Upfront premium received (paid)** | Notional amount | Value | Termi- nation date | Payments (paid) by fund | Unrealized appreciation/ (depreciation) | ||
| Morgan Stanley & Co. International PLC cont. | ||||||||
| CMBX NA BB.9 Index | $(44,620) | $368,000 | $77,906 | 9/17/58 | (500 bp) — Monthly | $32,928 | ||
| CMBX NA BB.9 Index | (22,310) | 184,000 | 38,953 | 9/17/58 | (500 bp) — Monthly | 16,464 | ||
| Upfront premium received | 12,362 | Unrealized appreciation | 2,258,773 | |||||
| Upfront premium (paid) | (5,994,702) | Unrealized (depreciation) | (1,255,768) | |||||
| Total | $(5,982,340) | Total | $1,003,005 | |||||
| * Payments related to the referenced debt are made upon a credit default event. | ||||||||
| ** Upfront premium is based on the difference between the original spread on issue and the market spread on day of execution. | ||||||||
| CENTRALLY CLEARED CREDIT DEFAULT CONTRACTS OUTSTANDING — PROTECTION SOLD at 10/31/21 | ||||||||
| Referenced debt* | Rating*** | Upfront premium received (paid)** | Notional amount | Value | Termi- nation date | Payments received by fund | Unrealized appreciation/ (depreciation) | |
| NA HY Series 37 Index | B+/P | $(3,535,292) | $37,420,000 | $3,317,283 | 12/20/26 | 500 bp — Quarterly | $(51,698) | |
| Total | $(3,535,292) | |||||||
| * Payments related to the referenced debt are made upon a credit default event. | ||||||||
| ** Upfront premium is based on the difference between the original spread on issue and the market spread on day of execution. | ||||||||
| *** Ratings for an underlying index represent the average of the ratings of all the securities included in that index. The Moody’s, Standard & Poor’s or Fitch ratings are believed to be the most recent ratings available at October 31, 2021. Securities rated by Fitch are indicated by “/F.” Securities rated by Putnam are indicated by “/P.” The Putnam rating categories are comparable to the Standard & Poor’s classifications. | ||||||||
| CENTRALLY CLEARED CREDIT DEFAULT CONTRACTS OUTSTANDING — PROTECTION PURCHASED at 10/31/21 | |||||||
| Referenced debt* | Upfront premium received (paid)** | Notional amount | Value | Termi- nation date | Payments (paid) by fund | Unrealized appreciation/ (depreciation) | |
| EM Series 36 Index | $(2,168,864) | $64,692,000 | $2,646,550 | 12/20/26 | (100 bp) — Quarterly | $405,806 | |
| NA HY Series 37 Index | 6,594,526 | 69,858,000 | 6,192,912 | 12/20/26 | (500 bp) — Quarterly | 91,134 | |
| Total | $4,425,662 | $496,940 | |||||
| * Payments related to the referenced debt are made upon a credit default event. | |||||||
| ** Upfront premium is based on the difference between the original spread on issue and the market spread on day of execution. | |||||||
64 Multi-Asset Absolute Return Fund | |
Level 1: Valuations based on quoted prices for identical securities in active markets.
Level 2: Valuations based on quoted prices in markets that are not active or for which all significant inputs are observable, either directly or indirectly.
Level 3: Valuations based on inputs that are unobservable and significant to the fair value measurement.
| Valuation inputs | |||
| Investments in securities: | Level 1 | Level 2 | Level 3 |
| Common stocks*: | |||
| Basic materials | $3,533,249 | $7,238,459 | $— |
| Capital goods | 1,474,239 | 997,963 | — |
| Communication services | — | 753,174 | — |
| Consumer cyclicals | 516,283 | 7,198,546 | — |
| Consumer staples | 7,480,315 | 2,653,760 | — |
| Energy | — | 3,276,041 | — |
| Financials | 3,411,376 | 11,506,456 | — |
| Health care | — | 3,583,760 | — |
| Technology | 5,417,919 | 29,761,187 | — |
| Transportation | — | 2,423,208 | — |
| Utilities and power | — | 34,825 | 11 |
| Total common stocks | 21,833,381 | 69,427,379 | 11 |
| Asset-backed securities | — | 5,692,879 | 2,307,314 |
| Commodity linked notes | — | 46,583,678 | — |
| Corporate bonds and notes | — | 1,540,671 | — |
| Foreign government and agency bonds and notes | — | 6,858,791 | — |
| Investment companies | 65,662,602 | — | — |
| Mortgage-backed securities | — | 59,843,914 | — |
| Purchased options outstanding | — | 267,997 | — |
| U.S. government and agency mortgage obligations | — | 206,107,586 | — |
| U.S. treasury obligations | — | 423,444 | — |
| Units | 40,108 | — | — |
| Warrants | — | 8,260,187 | 17 |
| Short-term investments | 3,086,000 | 377,809,216 | — |
| Totals by level | $90,622,091 | $782,815,742 | $2,307,342 |
Multi-Asset Absolute Return Fund 65 | |
| Valuation inputs | |||
| Other financial instruments: | Level 1 | Level 2 | Level 3 |
| Forward currency contracts | $— | $(3,265,181) | $— |
| Futures contracts | (5,194,887) | — | — |
| Written options outstanding | — | (39,433) | — |
| Forward premium swap option contracts | — | (130,213) | — |
| TBA sale commitments | — | (143,805,255) | — |
| Interest rate swap contracts | — | (2,710,343) | — |
| Total return swap contracts | — | (7,347,012) | — |
| Credit default contracts | — | (36,533,778) | — |
| Totals by level | $(5,194,887) | $(193,831,215) | $— |
| * Common stock classifications are presented at the sector level, which may differ from the fund’s portfolio presentation. | |||
| At the start and close of the reporting period, Level 3 investments in securities represented less than 1% of the fund’s net assets and were not considered a significant portion of the fund’s portfolio. | |||
The accompanying notes are an integral part of these financial statements.
66 Multi-Asset Absolute Return Fund | |
Statement of assets and liabilities 10/31/21
| ASSETS | |
| Investment in securities, at value, including $11,281,664 of securities on loan (Notes 1 and 8): | |
| Unaffiliated issuers (identified cost $690,454,375) | $709,264,167 |
| Affiliated issuers (identified cost $166,481,008) (Note 5) | 166,481,008 |
| Cash | 322,333 |
| Foreign currency (cost $2,254) (Note 1) | 1,204 |
| Dividends, interest and other receivables | 1,365,995 |
| Foreign tax reclaim | 360,304 |
| Receivable for shares of the fund sold | 607,827 |
| Receivable for investments sold | 31,548,398 |
| Receivable for sales of delayed delivery securities (Note 1) | 33,258 |
| Receivable for sales of TBA securities (Note 1) | 127,915,839 |
| Receivable for variation margin on futures contracts (Note 1) | 49,906 |
| Receivable for variation margin on centrally cleared swap contracts (Note 1) | 788,652 |
| Unrealized appreciation on forward premium swap option contracts (Note 1) | 137,287 |
| Unrealized appreciation on forward currency contracts (Note 1) | 5,277,860 |
| Unrealized appreciation on OTC swap contracts (Note 1) | 16,929,458 |
| Premium paid on OTC swap contracts (Note 1) | 5,994,702 |
| Prepaid assets | 21,625 |
| Total assets | 1,067,099,823 |
| LIABILITIES | |
| Payable for investments purchased | 23,619,331 |
| Payable for purchases of delayed delivery securities (Note 1) | 1,744,518 |
| Payable for purchases of TBA securities (Note 1) | 185,274,582 |
| Payable for shares of the fund repurchased | 1,304,127 |
| Payable for compensation of Manager (Note 2) | 219,240 |
| Payable for custodian fees (Note 2) | 38,016 |
| Payable for investor servicing fees (Note 2) | 105,487 |
| Payable for Trustee compensation and expenses (Note 2) | 268,786 |
| Payable for administrative services (Note 2) | 899 |
| Payable for distribution fees (Note 2) | 67,250 |
| Payable for variation margin on futures contracts (Note 1) | 295,511 |
| Payable for variation margin on centrally cleared swap contracts (Note 1) | 386,630 |
| Unrealized depreciation on OTC swap contracts (Note 1) | 35,069,835 |
| Premium received on OTC swap contracts (Note 1) | 28,201,354 |
| Unrealized depreciation on forward currency contracts (Note 1) | 8,543,041 |
| Unrealized depreciation on forward premium swap option contracts (Note 1) | 267,500 |
| Written options outstanding, at value (premiums $39,815) (Note 1) | 39,433 |
| TBA sale commitments, at value (proceeds receivable $143,934,492) (Note 1) | 143,805,255 |
| Collateral on securities loaned, at value (Note 1) | 11,679,600 |
| Collateral on certain derivative contracts and TBA commitments, at value (Notes 1 and 8) | 3,509,444 |
| Other accrued expenses | 835,116 |
| Total liabilities | 445,274,955 |
| Net assets | $621,824,868 |
(Continued on next page)
| Multi-Asset Absolute Return Fund 67 |
Statement of assets and liabilities cont.
| REPRESENTED BY | |
| Paid-in capital (Unlimited shares authorized) (Notes 1 and 4) | $674,902,292 |
| Total distributable earnings (Note 1) | (53,077,424) |
| Total — Representing net assets applicable to capital shares outstanding | $621,824,868 |
| COMPUTATION OF NET ASSET VALUE AND OFFERING PRICE | |
| Net asset value and redemption price per class A share | |
| ($175,325,265 divided by 17,117,511 shares) | $10.24 |
| Offering price per class A share (100/94.25 of $10.24)* | $10.86 |
| Net asset value and offering price per class B share ($4,193,626 divided by 428,583 shares)** | $9.78 |
| Net asset value and offering price per class C share ($28,284,050 divided by 2,901,076 shares)** | $9.75 |
| Net asset value, offering price and redemption price per class P share | |
| ($305,551,007 divided by 29,401,086 shares) | $10.39 |
| Net asset value, offering price and redemption price per class R share | |
| ($2,236,740 divided by 223,213 shares) | $10.02 |
| Net asset value, offering price and redemption price per class R6 share | |
| ($21,626,285 divided by 2,076,259 shares) | $10.42 |
| Net asset value, offering price and redemption price per class Y share | |
| ($84,607,895 divided by 8,177,716 shares) | $10.35 |
*On single retail sales of less than $50,000. On sales of $50,000 or more the offering price is reduced.
**Redemption price per share is equal to net asset value less any applicable contingent deferred sales charge.
The accompanying notes are an integral part of these financial statements.
| 68 Multi-Asset Absolute Return Fund |
Statement of operations Year ended 10/31/21
| INVESTMENT INCOME | |
| Interest (net of foreign tax of $2) (including interest income of $198,501 from investments | |
| in affiliated issuers) (Note 5) | $6,663,153 |
| Dividends (net of foreign tax of $396,285) | 4,618,921 |
| Securities lending (net of expenses) (Notes 1 and 5) | 26,964 |
| Total investment income | 11,309,038 |
| EXPENSES | |
| Compensation of Manager (Note 2) | 2,690,531 |
| Investor servicing fees (Note 2) | 721,232 |
| Custodian fees (Note 2) | 155,559 |
| Trustee compensation and expenses (Note 2) | 29,666 |
| Distribution fees (Note 2) | 1,030,657 |
| Administrative services (Note 2) | 17,821 |
| Other | 383,296 |
| Fees waived and reimbursed by Manager (Note 2) | (133,844) |
| Total expenses | 4,894,918 |
| Expense reduction (Note 2) | (5,210) |
| Net expenses | 4,889,708 |
| Net investment income | 6,419,330 |
| REALIZED AND UNREALIZED GAIN (LOSS) | |
| Net realized gain (loss) on: | |
| Securities from unaffiliated issuers (Notes 1 and 3) | 80,434,519 |
| Foreign currency transactions (Note 1) | (259,165) |
| Forward currency contracts (Note 1) | (1,896,339) |
| Futures contracts (Note 1) | (37,718,827) |
| Swap contracts (Note 1) | (19,021,119) |
| Written options (Note 1) | 607,111 |
| Total net realized gain | 22,146,180 |
| Change in net unrealized appreciation (depreciation) on: | |
| Securities from unaffiliated issuers and TBA sale commitments (net of foreign tax of $658,513) | (27,928,889) |
| Assets and liabilities in foreign currencies | 21,490 |
| Forward currency contracts | (4,015,893) |
| Futures contracts | (3,525,464) |
| Swap contracts | 7,139,483 |
| Written options | (652,841) |
| Total change in net unrealized depreciation | (28,962,114) |
| Net loss on investments | (6,815,934) |
| Net decrease in net assets resulting from operations | $(396,604) |
The accompanying notes are an integral part of these financial statements.
| Multi-Asset Absolute Return Fund 69 |
Statement of changes in net assets
| DECREASE IN NET ASSETS | Year ended 10/31/21 | Year ended 10/31/20 |
| Operations | ||
| Net investment income | $6,419,330 | $16,359,167 |
| Net realized gain (loss) on investments | ||
| and foreign currency transactions | 22,146,180 | (131,191,748) |
| Change in net unrealized appreciation (depreciation) | ||
| of investments and assets and liabilities | ||
| in foreign currencies | (28,962,114) | 9,639,046 |
| Net decrease in net assets resulting from operations | (396,604) | (105,193,535) |
| Decrease from capital share transactions (Note 4) | (173,370,645) | (232,472,827) |
| Total decrease in net assets | (173,767,249) | (337,666,362) |
| NET ASSETS | ||
| Beginning of year | 795,592,117 | 1,133,258,479 |
| End of year | $621,824,868 | $795,592,117 |
The accompanying notes are an integral part of these financial statements.
| 70 Multi-Asset Absolute Return Fund |
| This page left blank intentionally. |
| Multi-Asset Absolute Return Fund 71 |
Financial highlights (For a common share outstanding throughout the period)
| INVESTMENT OPERATIONS | LESS DISTRIBUTIONS | RATIOS AND SUPPLEMENTAL DATA | |||||||||||||
| Ratio of net | |||||||||||||||
| Net asset | Net | Net realized | Ratio of | investment | |||||||||||
| value, | investment | and unrealized | Total from | From net | From net | Non-recurring | Net asset | Total return | Net assets, | expenses | income (loss) | Portfolio | |||
| beginning | income | gain (loss) on | investment | investment | realized gain | From return | Total | reimburse- | value, end | at net asset | end of period | to average | to average | turnover | |
| Period ended | of period | (loss)a | investments | operations | income | on investments | of capital | distributions | ments | of period | value (%)b | (in thousands) | net assets (%)c | net assets (%) | (%)e |
| Class A | |||||||||||||||
| October 31, 2021 | $10.29 | .08 | (.13) | (.05) | — | — | — | — | — | $10.24 | (.49) | $175,325 | .88d | .73d | 1,040 |
| October 31, 2020 | 11.47 | .17 | (1.35) | (1.18) | — | — | — | — | — | 10.29 | (10.29) | 226,129 | .86d | 1.56d | 416 |
| October 31, 2019 | 11.39 | .27 | .18 | .45 | (.37) | — | —h | (.37) | — | 11.47 | 4.24 | 285,722 | .89d | 2.36d | 638 |
| October 31, 2018 | 12.34 | .23 | (.88) | (.65) | (.24) | (.06) | — | (.30) | —f | 11.39 | (5.43) | 357,330 | 1.02d,g | 1.96d | 479 |
| October 31, 2017 | 11.28 | .24 | .82 | 1.06 | — | — | — | — | — | 12.34 | 9.40 | 262,943 | 1.16 | 2.01 | 559 |
| Class B | |||||||||||||||
| October 31, 2021 | $9.90 | (.01) | (.11) | (.12) | — | — | — | — | — | $9.78 | (1.21) | $4,194 | 1.63d | (.06)d | 1,040 |
| October 31, 2020 | 11.12 | .09 | (1.31) | (1.22) | — | — | — | — | — | 9.90 | (10.97) | 9,037 | 1.61d | .85d | 416 |
| October 31, 2019 | 11.04 | .18 | .18 | .36 | (.28) | — | —h | (.28) | — | 11.12 | 3.48 | 16,092 | 1.64d | 1.62d | 638 |
| October 31, 2018 | 11.95 | .14 | (.86) | (.72) | (.13) | (.06) | — | (.19) | —f | 11.04 | (6.11) | 26,759 | 1.77d,g | 1.20d | 479 |
| October 31, 2017 | 11.01 | .15 | .79 | .94 | — | — | — | — | — | 11.95 | 8.54 | 23,289 | 1.91 | 1.30 | 559 |
| Class C | |||||||||||||||
| October 31, 2021 | $9.86 | (.01) | (.10) | (.11) | — | — | — | — | — | $9.75 | (1.12) | $28,284 | 1.63d | (.08)d | 1,040 |
| October 31, 2020 | 11.08 | .09 | (1.31) | (1.22) | — | — | — | — | — | 9.86 | (11.01) | 73,200 | 1.61d | .86d | 416 |
| October 31, 2019 | 11.01 | .18 | .18 | .36 | (.29) | — | —h | (.29) | — | 11.08 | 3.47 | 139,156 | 1.64d | 1.62d | 638 |
| October 31, 2018 | 11.93 | .14 | (.86) | (.72) | (.14) | (.06) | — | (.20) | —f | 11.01 | (6.13) | 201,582 | 1.77d,g | 1.22d | 479 |
| October 31, 2017 | 10.99 | .15 | .79 | .94 | — | — | — | — | — | 11.93 | 8.55 | 151,075 | 1.91 | 1.29 | 559 |
| Class P | |||||||||||||||
| October 31, 2021 | $10.39 | .12 | (.12) | —h | — | — | — | — | — | $10.39 | — | $305,551 | .46d | 1.19d | 1,040 |
| October 31, 2020 | 11.54 | .21 | (1.36) | (1.15) | — | — | — | — | — | 10.39 | (9.97) | 277,872 | .46d | 1.92d | 416 |
| October 31, 2019 | 11.47 | .31 | .18 | .49 | (.42) | — | —h | (.42) | — | 11.54 | 4.58 | 258,501 | .50d | 2.77d | 638 |
| October 31, 2018 | 12.42 | .29 | (.90) | (.61) | (.28) | (.06) | — | (.34) | —f | 11.47 | (5.03) | 220,539 | .63d,g | 2.42d | 479 |
| October 31, 2017 | 11.31 | .29 | .82 | 1.11 | — | — | — | — | — | 12.42 | 9.81 | 89,518 | .78 | 2.41 | 559 |
| Class R | |||||||||||||||
| October 31, 2021 | $10.09 | .05 | (.12) | (.07) | — | — | — | —�� | — | $10.02 | (.69) | $2,237 | 1.13d | .51d | 1,040 |
| October 31, 2020 | 11.27 | .14 | (1.32) | (1.18) | — | — | — | — | — | 10.09 | (10.47) | 2,607 | 1.11d | 1.33d | 416 |
| October 31, 2019 | 11.20 | .24 | .17 | .41 | (.34) | — | —h | (.34) | — | 11.27 | 3.93 | 3,746 | 1.14d | 2.13d | 638 |
| October 31, 2018 | 12.16 | .19 | (.86) | (.67) | (.23) | (.06) | — | (.29) | —f | 11.20 | (5.65) | 4,377 | 1.27d,g | 1.65d | 479 |
| October 31, 2017 | 11.15 | .20 | .81 | 1.01 | — | — | — | — | — | 12.16 | 9.06 | 4,597 | 1.41 | 1.73 | 559 |
| Class R6 | |||||||||||||||
| October 31, 2021 | $10.42 | .12 | (.12) | —h | — | — | — | — | — | $10.42 | — | $21,626 | .50d | 1.13d | 1,040 |
| October 31, 2020 | 11.58 | .21 | (1.37) | (1.16) | — | — | — | — | — | 10.42 | (10.02) | 10,764 | .50d | 1.93d | 416 |
| October 31, 2019 | 11.50 | .31 | .18 | .49 | (.41) | — | —h | (.41) | — | 11.58 | 4.60 | 13,717 | .54d | 2.73d | 638 |
| October 31, 2018 | 12.45 | .27 | (.88) | (.61) | (.28) | (.06) | — | (.34) | —f | 11.50 | (5.06) | 13,971 | .67d,g | 2.29d | 479 |
| October 31, 2017 | 11.35 | .28 | .82 | 1.10 | — | — | — | — | — | 12.45 | 9.69 | 9,071 | .82 | 2.37 | 559 |
See notes to financial highlights at the end of this section.
The accompanying notes are an integral part of these financial statements.
| 72 Multi-Asset Absolute Return Fund | Multi-Asset Absolute Return Fund 73 |
Financial highlights cont.
| INVESTMENT OPERATIONS | LESS DISTRIBUTIONS | RATIOS AND SUPPLEMENTAL DATA | |||||||||||||
| Ratio of net | |||||||||||||||
| Net asset | Net | Net realized | Ratio of | investment | |||||||||||
| value, | investment | and unrealized | Total from | From net | From net | Non-recurring | Net asset | Total return | Net assets, | expenses | income (loss) | Portfolio | |||
| beginning | income | gain (loss) on | investment | investment | realized gain | From return | Total | reimburse- | value, end | at net asset | end of period | to average | to average | turnover | |
| Period ended | of period | (loss)a | investments | operations | income | on investments | of capital | distributions | ments | of period | value (%)b | (in thousands) | net assets (%)c | net assets (%) | (%)e |
| Class Y | |||||||||||||||
| October 31, 2021 | $10.36 | .10 | (.11) | (.01) | — | — | — | — | — | $10.35 | (.10) | $84,608 | .63d | .98d | 1,040 |
| October 31, 2020 | 11.52 | .21 | (1.37) | (1.16) | — | — | — | — | — | 10.36 | (10.07) | 195,984 | .61d | 1.89d | 416 |
| October 31, 2019 | 11.45 | .30 | .17 | .47 | (.40) | — | —h | (.40) | — | 11.52 | 4.39 | 409,994 | .64d | 2.61d | 638 |
| October 31, 2018 | 12.40 | .26 | (.88) | (.62) | (.27) | (.06) | — | (.33) | —f | 11.45 | (5.16) | 679,839 | .77d,g | 2.19d | 479 |
| October 31, 2017 | 11.31 | .27 | .82 | 1.09 | — | — | — | — | — | 12.40 | 9.64 | 622,673 | .91 | 2.29 | 559 |
a Per share net investment income (loss) has been determined on the basis of the weighted average number of shares outstanding during the period.
b Total return assumes dividend reinvestment and does not reflect the effect of sales charges.
c Includes amounts paid through expense offset and/or brokerage service arrangements, if any (Note 2). Also excludes acquired fund fees and expenses, if any.
d Reflects a voluntary waiver of certain fund expenses in effect during the period. As a result of such waivers, the expenses of each class reflect a reduction of the following amounts (Note 2):
| Percentage of average net assets | |||
| October 31, 2021 | 0.02% | ||
| October 31, 2020 | 0.04 | ||
| October 31, 2019 | 0.03 | ||
| October 31, 2018 | 0.02 |
e Portfolio turnover includes TBA purchase and sale commitments.
f Reflects a non-recurring reimbursement pursuant to a settlement between the Securities and Exchange Commission (the SEC) and Barclay’s Capital Inc. which amounted to less than $0.01 per share outstanding on November 20, 2017.
g Includes one-time merger costs of 0.01%.
h Amount represents less than $0.01 per share.
The accompanying notes are an integral part of these financial statements.
| 74 Multi-Asset Absolute Return Fund | Multi-Asset Absolute Return Fund 75 |
Notes to financial statements 10/31/21
Within the following Notes to financial statements, references to “State Street” represent State Street Bank and Trust Company, references to “the SEC” represent the Securities and Exchange Commission, references to “Putnam Management” represent Putnam Investment Management, LLC, the fund’s manager, an indirect wholly-owned subsidiary of Putnam Investments, LLC and references to “OTC”, if any, represent over-the-counter. Unless otherwise noted, the “reporting period” represents the period from November 1, 2020 through October 31, 2021.
Putnam Multi-Asset Absolute Return Fund (the fund) is a diversified series of Putnam Funds Trust (the Trust), a Massachusetts business trust registered under the Investment Company Act of 1940, as amended, as an open-end management investment company. The goal of the fund is to seek positive total return. In pursuing a positive total return, the fund’s strategies are generally intended to produce lower volatility over a reasonable period of time than has been historically associated with traditional asset classes that have earned similar levels of return over long historical periods. The fund aims to accomplish this objective by combining “directional” strategies and “non-directional” strategies. The directional strategies seek efficient, diversified exposure to investment markets. They also seek to balance risk and provide positive total return by investing, without limit, in many different asset classes, including U.S., international, and emerging markets equity securities (growth or value stocks or both) and fixed-income securities; mortgage- and asset-backed securities; below-investment-grade securities (sometimes referred to as “junk bonds”); inflation-protected securities; commodities; and real estate investment trusts (REITs). The non-directional strategies aim to provide positive returns that have minimal correlation with traditional asset classes, such as equities or equity-like investments. The non-directional strategies are generally implemented using paired long and short positions in an effort to capitalize on long-term market inefficiencies and short-term opportunities. The non-directional strategies may involve the use of active trading strategies, currency transactions and options transactions.
Putnam Management may consider, among other factors, a company’s valuation, financial strength, growth potential, competitive position in its industry, projected future earnings, cash flows and dividends when deciding whether to buy or sell equity investments, and, among other factors, credit, interest rate and prepayment risks when deciding whether to buy or sell fixed-income investments. Putnam Management may also take into account general market conditions when making investment decisions. The fund typically uses derivatives, such as futures, options, certain foreign currency transactions, warrants and swap contracts, to a significant extent for hedging purposes and to increase the fund’s exposure to the asset classes and strategies mentioned above, which may create investment leverage.
The fund offers class A, class B, class C, class P, class R, class R6 and class Y shares. Purchases of class B shares are closed to new and existing investors except by exchange from class B shares of another Putnam fund or through dividend and/or capital gains reinvestment. Class A shares are sold with a maximum front-end sales charge of 5.75%. Class A shares generally are not subject to a contingent deferred sales charge, and class P, class R, class R6 and class Y shares are not subject to a contingent deferred sales charge. Class B shares, which convert to class A shares after approximately eight years, are not subject to a front-end sales charge and are subject to a contingent deferred sales charge if those shares are redeemed within six years of purchase. Class C shares are subject to a one-year 1.00% contingent deferred sales charge and generally convert to class A shares after approximately eight years. Prior to March 1, 2021, class C shares generally converted to class A shares after approximately ten years. Class R shares, which are not available to all investors, are sold at net asset value. The expenses for class A, class B, class C and class R shares may differ based on the distribution fee of each class, which is identified in Note 2. Class P, class R6 and class Y shares, which are sold at net asset value, are generally subject to the same expenses as class A, class B, class C and class R shares, but do not bear a distribution fee, and in the case of class P and class R6 shares, bear a lower investor servicing fee, which is identified in Note 2. Class P shares are only available to other Putnam funds and other accounts managed by Putnam Management or its affiliates. Class R6 and class Y shares are not available to all investors.
In the normal course of business, the fund enters into contracts that may include agreements to indemnify another party under given circumstances. The fund’s maximum exposure under these arrangements is unknown as this would involve future claims that may be, but have not yet been, made against the fund. However, the fund’s management team expects the risk of material loss to be remote.
The fund has entered into contractual arrangements with an investment adviser, administrator, distributor, shareholder servicing agent and custodian, who each provide services to the fund. Unless expressly stated otherwise, shareholders are not parties to, or intended beneficiaries of these contractual arrangements, and these contractual arrangements are not intended to create any shareholder right to enforce them against the service providers or to seek any remedy under them against the service providers, either directly or on behalf of the fund.
| 76 Multi-Asset Absolute Return Fund |
Under the fund’s Amended and Restated Agreement and Declaration of Trust, any claims asserted against or on behalf of the Putnam Funds, including claims against Trustees and Officers, must be brought in state and federal courts located within the Commonwealth of Massachusetts.
Note 1: Significant accounting policies
The following is a summary of significant accounting policies consistently followed by the fund in the preparation of its financial statements. The preparation of financial statements is in conformity with accounting principles generally accepted in the United States of America and requires management to make estimates and assumptions that affect the reported amounts of assets and liabilities in the financial statements and the reported amounts of increases and decreases in net assets from operations. Actual results could differ from those estimates. Subsequent events after the Statement of assets and liabilities date through the date that the financial statements were issued have been evaluated in the preparation of the financial statements.
Investment income, realized and unrealized gains and losses and expenses of the fund are borne pro-rata based on the relative net assets of each class to the total net assets of the fund, except that each class bears expenses unique to that class (including the distribution fees applicable to such classes). Each class votes as a class only with respect to its own distribution plan or other matters on which a class vote is required by law or determined by the Trustees. If the fund were liquidated, shares of each class would receive their pro-rata share of the net assets of the fund. In addition, the Trustees declare separate dividends on each class of shares.
Security valuation Portfolio securities and other investments are valued using policies and procedures adopted by the Board of Trustees. The Trustees have formed a Pricing Committee to oversee the implementation of these procedures and have delegated responsibility for valuing the fund’s assets in accordance with these procedures to Putnam Management. Putnam Management has established an internal Valuation Committee that is responsible for making fair value determinations, evaluating the effectiveness of the pricing policies of the fund and reporting to the Pricing Committee.
Investments for which market quotations are readily available are valued at the last reported sales price on their principal exchange, or official closing price for certain markets, and are classified as Level 1 securities under Accounting Standards Codification 820 Fair Value Measurements and Disclosures (ASC 820). If no sales are reported, as in the case of some securities that are traded OTC, a security is valued at its last reported bid price and is generally categorized as a Level 2 security.
Investments in open-end investment companies (excluding exchange-traded funds), if any, which can be classified as Level 1 or Level 2 securities, are valued based on their net asset value. The net asset value of such investment companies equals the total value of their assets less their liabilities and divided by the number of their outstanding shares.
Market quotations are not considered to be readily available for certain debt obligations (including short-term investments with remaining maturities of 60 days or less) and other investments; such investments are valued on the basis of valuations furnished by an independent pricing service approved by the Trustees or dealers selected by Putnam Management. Such services or dealers determine valuations for normal institutional-size trading units of such securities using methods based on market transactions for comparable securities and various relationships, generally recognized by institutional traders, between securities (which consider such factors as security prices, yields, maturities and ratings). These securities will generally be categorized as Level 2.
Many securities markets and exchanges outside the U.S. close prior to the scheduled close of the New York Stock Exchange and therefore the closing prices for securities in such markets or on such exchanges may not fully reflect events that occur after such close but before the scheduled close of the New York Stock Exchange. Accordingly, on certain days, the fund will fair value certain foreign equity securities and total return swaps taking into account multiple factors including movements in the U.S. securities markets, currency valuations and comparisons to the valuation of American Depository Receipts, exchange-traded funds and futures contracts. The foreign equity securities, which would generally be classified as Level 1 securities, will be transferred to Level 2 of the fair value hierarchy when they are valued at fair value. The number of days on which fair value prices will be used will depend on market activity and it is possible that fair value prices will be used by the fund to a significant extent. At the close of the reporting period, fair value pricing was used for certain foreign securities and total return swaps in the portfolio. Securities quoted in foreign currencies, if any, are translated into U.S. dollars at the current exchange rate.
To the extent a pricing service or dealer is unable to value a security or provides a valuation that Putnam Management does not believe accurately reflects the security’s fair value, the security will be valued at fair value by Putnam Management in accordance with policies and procedures approved by the Trustees. Certain investments,
| Multi-Asset Absolute Return Fund 77 |
including certain restricted and illiquid securities and derivatives, are also valued at fair value following procedures approved by the Trustees. These valuations consider such factors as significant market or specific security events such as interest rate or credit quality changes, various relationships with other securities, discount rates, U.S. Treasury, U.S. swap and credit yields, index levels, convexity exposures, recovery rates, sales and other multiples and resale restrictions. These securities are classified as Level 2 or as Level 3 depending on the priority of the significant inputs.
To assess the continuing appropriateness of fair valuations, the Valuation Committee reviews and affirms the reasonableness of such valuations on a regular basis after considering all relevant information that is reasonably available. Such valuations and procedures are reviewed periodically by the Trustees. Certain securities may be valued on the basis of a price provided by a single source. The fair value of securities is generally determined as the amount that the fund could reasonably expect to realize from an orderly disposition of such securities over a reasonable period of time. By its nature, a fair value price is a good faith estimate of the value of a security in a current sale and does not reflect an actual market price, which may be different by a material amount.
Joint trading account Pursuant to an exemptive order from the SEC, the fund may transfer uninvested cash balances into a joint trading account along with the cash of other registered investment companies and certain other accounts managed by Putnam Management. These balances may be invested in issues of short-term investments having maturities of up to 90 days.
Repurchase agreements The fund, or any joint trading account, through its custodian, receives delivery of the underlying securities, the fair value of which at the time of purchase is required to be in an amount at least equal to the resale price, including accrued interest. Collateral for certain tri-party repurchase agreements, which totaled $70,484,052 at the end of the reporting period, is held at the counterparty’s custodian in a segregated account for the benefit of the fund and the counterparty. Putnam Management is responsible for determining that the value of these underlying securities is at all times at least equal to the resale price, including accrued interest. In the event of default or bankruptcy by the other party to the agreement, retention of the collateral may be subject to legal proceedings.
Security transactions and related investment income Security transactions are recorded on the trade date (the date the order to buy or sell is executed). Gains or losses on securities sold are determined on the identified cost basis.
Interest income, net of any applicable withholding taxes, if any, and including amortization and accretion of premiums and discounts on debt securities, is recorded on the accrual basis. Dividend income, net of any applicable withholding taxes, is recognized on the ex-dividend date except that certain dividends from foreign securities, if any, are recognized as soon as the fund is informed of the ex-dividend date. Non-cash dividends, if any, are recorded at the fair value of the securities received. Dividends representing a return of capital or capital gains, if any, are reflected as a reduction of cost and/or as a realized gain.
Securities purchased or sold on a delayed delivery basis may be settled at a future date beyond customary settlement time; interest income is accrued based on the terms of the securities. Losses may arise due to changes in the fair value of the underlying securities or if the counterparty does not perform under the contract.
Stripped securities The fund may invest in stripped securities which represent a participation in securities that may be structured in classes with rights to receive different portions of the interest and principal. Interest-only securities receive all of the interest and principal-only securities receive all of the principal. If the interest-only securities experience greater than anticipated prepayments of principal, the fund may fail to recoup fully its initial investment in these securities. Conversely, principal-only securities increase in value if prepayments are greater than anticipated and decline if prepayments are slower than anticipated. The fair value of these securities is highly sensitive to changes in interest rates.
Foreign currency translation The accounting records of the fund are maintained in U.S. dollars. The fair value of foreign securities, currency holdings, and other assets and liabilities is recorded in the books and records of the fund after translation to U.S. dollars based on the exchange rates on that day. The cost of each security is determined using historical exchange rates. Income and withholding taxes are translated at prevailing exchange rates when earned or incurred. The fund does not isolate that portion of realized or unrealized gains or losses resulting from changes in the foreign exchange rate on investments from fluctuations arising from changes in the market prices of the securities. Such gains and losses are included with the net realized and unrealized gain or loss on investments. Net realized gains and losses on foreign currency transactions represent net realized exchange gains or losses on disposition of foreign currencies, currency gains and losses realized between the trade and settlement dates on securities transactions and the difference between the amount of investment income and
| 78 Multi-Asset Absolute Return Fund |
foreign withholding taxes recorded on the fund’s books and the U.S. dollar equivalent amounts actually received or paid. Net unrealized appreciation and depreciation of assets and liabilities in foreign currencies arise from changes in the value of assets and liabilities other than investments at the period end, resulting from changes in the exchange rate.
Options contracts The fund uses options contracts to hedge duration and convexity, to isolate prepayment risk, to gain exposure to interest rates, to hedge against changes in values of securities it owns, owned or expects to own, to hedge prepayment risk, to generate additional income for the portfolio, to enhance returns on securities owned, to gain exposure to securities and to manage downside risks.
The potential risk to the fund is that the change in value of options contracts may not correspond to the change in value of the hedged instruments. In addition, losses may arise from changes in the value of the underlying instruments if there is an illiquid secondary market for the contracts, if interest or exchange rates move unexpectedly or if the counterparty to the contract is unable to perform. Realized gains and losses on purchased options are included in realized gains and losses on investment securities. If a written call option is exercised, the premium originally received is recorded as an addition to sales proceeds. If a written put option is exercised, the premium originally received is recorded as a reduction to the cost of investments.
Exchange-traded options are valued at the last sale price or, if no sales are reported, the last bid price for purchased options and the last ask price for written options. OTC traded options are valued using prices supplied by dealers.
Options on swaps are similar to options on securities except that the premium paid or received is to buy or grant the right to enter into a previously agreed upon interest rate or credit default contract. Forward premium swap option contracts include premiums that have extended settlement dates. The delayed settlement of the premiums is factored into the daily valuation of the option contracts. In the case of interest rate cap and floor contracts, in return for a premium, ongoing payments between two parties are based on interest rates exceeding a specified rate, in the case of a cap contract, or falling below a specified rate in the case of a floor contract.
Written option contracts outstanding at period end, if any, are listed after the fund’s portfolio.
Futures contracts The fund uses futures contracts to manage exposure to market risk, to hedge prepayment risk, to hedge interest rate risk, to gain exposure to interest rates and to equitize cash.
The potential risk to the fund is that the change in value of futures contracts may not correspond to the change in value of the hedged instruments. In addition, losses may arise from changes in the value of the underlying instruments, if there is an illiquid secondary market for the contracts, if interest or exchange rates move unexpectedly or if the counterparty to the contract is unable to perform. With futures, there is minimal counterparty credit risk to the fund since futures are exchange traded and the exchange’s clearinghouse, as counterparty to all exchange traded futures, guarantees the futures against default. Risks may exceed amounts recognized on the Statement of assets and liabilities. When the contract is closed, the fund records a realized gain or loss equal to the difference between the value of the contract at the time it was opened and the value at the time it was closed.
Futures contracts are valued at the quoted daily settlement prices established by the exchange on which they trade. The fund and the broker agree to exchange an amount of cash equal to the daily fluctuation in the value of the futures contract. Such receipts or payments are known as “variation margin.”
Futures contracts outstanding at period end, if any, are listed after the fund’s portfolio.
Forward currency contracts The fund buys and sells forward currency contracts, which are agreements between two parties to buy and sell currencies at a set price on a future date. These contracts are used to hedge foreign exchange risk and to gain exposure to currencies.
The U.S. dollar value of forward currency contracts is determined using current forward currency exchange rates supplied by a quotation service. The fair value of the contract will fluctuate with changes in currency exchange rates. The contract is marked to market daily and the change in fair value is recorded as an unrealized gain or loss. The fund records a realized gain or loss equal to the difference between the value of the contract at the time it was opened and the value at the time it was closed when the contract matures or by delivery of the currency. The fund could be exposed to risk if the value of the currency changes unfavorably, if the counterparties to the contracts are unable to meet the terms of their contracts or if the fund is unable to enter into a closing position. Risks may exceed amounts recognized on the Statement of assets and liabilities.
Forward currency contracts outstanding at period end, if any, are listed after the fund’s portfolio.
| Multi-Asset Absolute Return Fund 79 |
Interest rate swap contracts The fund entered into OTC and/or centrally cleared interest rate swap contracts, which are arrangements between two parties to exchange cash flows based on a notional principal amount, to hedge interest rate risk, to gain exposure on interest rates and to hedge prepayment risk.
An OTC and centrally cleared interest rate swap can be purchased or sold with an upfront premium. For OTC interest rate swap contracts, an upfront payment received by the fund is recorded as a liability on the fund’s books. An upfront payment made by the fund is recorded as an asset on the fund’s books. OTC and centrally cleared interest rate swap contracts are marked to market daily based upon quotations from an independent pricing service or market makers. Any change is recorded as an unrealized gain or loss on OTC interest rate swaps. Daily fluctuations in the value of centrally cleared interest rate swaps are settled through a central clearing agent and are recorded in variation margin on the Statement of assets and liabilities and recorded as unrealized gain or loss. Payments, including upfront premiums, received or made are recorded as realized gains or losses at the reset date or the closing of the contract. Certain OTC and centrally cleared interest rate swap contracts may include extended effective dates. Payments related to these swap contracts are accrued based on the terms of the contract.
The fund could be exposed to credit or market risk due to unfavorable changes in the fluctuation of interest rates or if the counterparty defaults, in the case of OTC interest rate contracts, or the central clearing agency or a clearing member defaults, in the case of centrally cleared interest rate swap contracts, on its respective obligation to perform under the contract. The fund’s maximum risk of loss from counterparty risk or central clearing risk is the fair value of the contract. This risk may be mitigated for OTC interest rate swap contracts by having a master netting arrangement between the fund and the counterparty and for centrally cleared interest rate swap contracts through the daily exchange of variation margin. There is minimal counterparty risk with respect to centrally cleared interest rate swap contracts due to the clearinghouse guarantee fund and other resources that are available in the event of a clearing member default. Risk of loss may exceed amounts recognized on the Statement of assets and liabilities.
OTC and centrally cleared interest rate swap contracts outstanding, including their respective notional amounts at period end, if any, are listed after the fund’s portfolio.
Total return swap contracts The fund entered into OTC and/or centrally cleared total return swap contracts, which are arrangements to exchange a market-linked return for a periodic payment, both based on a notional principal amount, to hedge sector exposure, to manage exposure to specific sectors or industries, to manage exposure to specific securities, to gain exposure to a basket of securities, to gain exposure to specific markets or countries and to gain exposure to specific sectors or industries.
To the extent that the total return of the security, index or other financial measure underlying the transaction exceeds or falls short of the offsetting interest rate obligation, the fund will receive a payment from or make a payment to the counterparty. OTC and/or centrally cleared total return swap contracts are marked to market daily based upon quotations from an independent pricing service or market maker. Any change is recorded as an unrealized gain or loss on OTC total return swaps. Daily fluctuations in the value of centrally cleared total return swaps are settled through a central clearing agent and are recorded in variation margin on the Statement of assets and liabilities and recorded as unrealized gain or loss. Payments received or made are recorded as realized gains or losses. Certain OTC and/or centrally cleared total return swap contracts may include extended effective dates. Payments related to these swap contracts are accrued based on the terms of the contract. The fund could be exposed to credit or market risk due to unfavorable changes in the fluctuation of interest rates or in the price of the underlying security or index, the possibility that there is no liquid market for these agreements or that the counterparty may default on its obligation to perform. The fund’s maximum risk of loss from counterparty risk or central clearing risk is the fair value of the contract. This risk may be mitigated for OTC total return swap contracts by having a master netting arrangement between the fund and the counterparty and for centrally cleared total return swap contracts through the daily exchange of variation margin. There is minimal counterparty risk with respect to centrally cleared total return swap contracts due to the clearinghouse guarantee fund and other resources that are available in the event of a clearing member default. Risk of loss may exceed amounts recognized on the Statement of assets and liabilities.
OTC and/or centrally cleared total return swap contracts outstanding, including their respective notional amounts at period end, if any, are listed after the fund’s portfolio.
Credit default contracts The fund entered into OTC and/or centrally cleared credit default contracts to hedge credit risk, to hedge market risk and to gain exposure on individual names and/or baskets of securities.
| 80 Multi-Asset Absolute Return Fund |
In OTC and centrally cleared credit default contracts, the protection buyer typically makes a periodic stream of payments to a counterparty, the protection seller, in exchange for the right to receive a contingent payment upon the occurrence of a credit event on the reference obligation or all other equally ranked obligations of the reference entity. Credit events are contract specific but may include bankruptcy, failure to pay, restructuring and obligation acceleration. For OTC credit default contracts, an upfront payment received by the fund is recorded as a liability on the fund’s books. An upfront payment made by the fund is recorded as an asset on the fund’s books. Centrally cleared credit default contracts provide the same rights to the protection buyer and seller except the payments between parties, including upfront premiums, are settled through a central clearing agent through variation margin payments. Upfront and periodic payments received or paid by the fund for OTC and centrally cleared credit default contracts are recorded as realized gains or losses at the reset date or close of the contract. The OTC and centrally cleared credit default contracts are marked to market daily based upon quotations from an independent pricing service or market makers. Any change in value of OTC credit default contracts is recorded as an unrealized gain or loss. Daily fluctuations in the value of centrally cleared credit default contracts are recorded in variation margin on the Statement of assets and liabilities and recorded as unrealized gain or loss. Upon the occurrence of a credit event, the difference between the par value and fair value of the reference obligation, net of any proportional amount of the upfront payment, is recorded as a realized gain or loss.
In addition to bearing the risk that the credit event will occur, the fund could be exposed to market risk due to unfavorable changes in interest rates or in the price of the underlying security or index or the possibility that the fund may be unable to close out its position at the same time or at the same price as if it had purchased the underlying reference obligations. In certain circumstances, the fund may enter into offsetting OTC and centrally cleared credit default contracts which would mitigate its risk of loss. Risks of loss may exceed amounts recognized on the Statement of assets and liabilities. The fund’s maximum risk of loss from counterparty risk, either as the protection seller or as the protection buyer, is the fair value of the contract. This risk may be mitigated for OTC credit default contracts by having a master netting arrangement between the fund and the counterparty and for centrally cleared credit default contracts through the daily exchange of variation margin. Counterparty risk is further mitigated with respect to centrally cleared credit default swap contracts due to the clearinghouse guarantee fund and other resources that are available in the event of a clearing member default. Where the fund is a seller of protection, the maximum potential amount of future payments the fund may be required to make is equal to the notional amount.
OTC and centrally cleared credit default contracts outstanding, including their respective notional amounts at period end, if any, are listed after the fund’s portfolio.
TBA commitments The fund may enter into TBA (to be announced) commitments to purchase securities for a fixed unit price at a future date beyond customary settlement time. Although the unit price and par amount have been established, the actual securities have not been specified. However, it is anticipated that the amount of the commitments will not significantly differ from the principal amount. The fund holds, and maintains until settlement date, cash or high-grade debt obligations in an amount sufficient to meet the purchase price, or the fund may enter into offsetting contracts for the forward sale of other securities it owns. Income on the securities will not be earned until settlement date.
The fund may also enter into TBA sale commitments to hedge its portfolio positions, to sell mortgage-backed securities it owns under delayed delivery arrangements or to take a short position in mortgage-backed securities. Proceeds of TBA sale commitments are not received until the contractual settlement date. During the time a TBA sale commitment is outstanding, either equivalent deliverable securities or an offsetting TBA purchase commitment deliverable on or before the sale commitment date are held as “cover” for the transaction, or other liquid assets in an amount equal to the notional value of the TBA sale commitment are segregated. If the TBA sale commitment is closed through the acquisition of an offsetting TBA purchase commitment, the fund realizes a gain or loss. If the fund delivers securities under the commitment, the fund realizes a gain or a loss from the sale of the securities based upon the unit price established at the date the commitment was entered into.
TBA commitments, which are accounted for as purchase and sale transactions, may be considered securities themselves, and involve a risk of loss due to changes in the value of the security prior to the settlement date as well as the risk that the counterparty to the transaction will not perform its obligations. Counterparty risk is mitigated by having a master agreement between the fund and the counterparty.
Unsettled TBA commitments are valued at their fair value according to the procedures described under “Security valuation” above. The contract is marked to market daily and the change in fair value is recorded by the fund as an unrealized gain or loss. Based on market circumstances, Putnam Management will determine whether to take delivery of the underlying securities or to dispose of the TBA commitments prior to settlement.
| Multi-Asset Absolute Return Fund 81 |
TBA purchase commitments outstanding at period end, if any, are listed within the fund’s portfolio and TBA sale commitments outstanding at period end, if any, are listed after the fund’s portfolio.
Master agreements The fund is a party to ISDA (International Swaps and Derivatives Association, Inc.) Master Agreements that govern OTC derivative and foreign exchange contracts and Master Securities Forward Transaction Agreements that govern transactions involving mortgage-backed and other asset-backed securities that may result in delayed delivery (Master Agreements) with certain counterparties entered into from time to time. The Master Agreements may contain provisions regarding, among other things, the parties’ general obligations, representations, agreements, collateral requirements, events of default and early termination. With respect to certain counterparties, in accordance with the terms of the Master Agreements, collateral pledged to the fund is held in a segregated account by the fund’s custodian and, with respect to those amounts which can be sold or repledged, are presented in the fund’s portfolio.
Collateral pledged by the fund is segregated by the fund’s custodian and identified in the fund’s portfolio. Collateral can be in the form of cash or debt securities issued by the U.S. Government or related agencies or other securities as agreed to by the fund and the applicable counterparty. Collateral requirements are determined based on the fund’s net position with each counterparty.
With respect to ISDA Master Agreements, termination events applicable to the fund may occur upon a decline in the fund’s net assets below a specified threshold over a certain period of time. Termination events applicable to counterparties may occur upon a decline in the counterparty’s long-term or short-term credit ratings below a specified level. In each case, upon occurrence, the other party may elect to terminate early and cause settlement of all derivative and foreign exchange contracts outstanding, including the payment of any losses and costs resulting from such early termination, as reasonably determined by the terminating party. Any decision by one or more of the fund’s counterparties to elect early termination could impact the fund’s future derivative activity.
At the close of the reporting period, the fund had a net liability position of $47,043,285 on open derivative contracts subject to the Master Agreements. Collateral pledged by the fund at period end for these agreements totaled $48,946,244 and may include amounts related to unsettled agreements.
Securities lending The fund may lend securities, through its agent, to qualified borrowers in order to earn additional income. The loans are collateralized by cash in an amount at least equal to the fair value of the securities loaned. The fair value of securities loaned is determined daily and any additional required collateral is allocated to the fund on the next business day. The remaining maturities of the securities lending transactions are considered overnight and continuous. The risk of borrower default will be borne by the fund’s agent; the fund will bear the risk of loss with respect to the investment of the cash collateral. Income from securities lending, net of expenses, is included in investment income on the Statement of operations. Cash collateral is invested in Putnam Cash Collateral Pool, LLC, a limited liability company managed by an affiliate of Putnam Management. Investments in Putnam Cash Collateral Pool, LLC are valued at its closing net asset value each business day. There are no management fees charged to Putnam Cash Collateral Pool, LLC. At the close of the reporting period, the fund received cash collateral of $11,679,600 and the value of securities loaned amounted to $11,281,664.
Interfund lending The fund, along with other Putnam funds, may participate in an interfund lending program pursuant to an exemptive order issued by the SEC. This program allows the fund to borrow from or lend to other Putnam funds that permit such transactions. Interfund lending transactions are subject to each fund’s investment policies and borrowing and lending limits. Interest earned or paid on the interfund lending transaction will be based on the average of certain current market rates. During the reporting period, the fund did not utilize the program.
Lines of credit The fund participates, along with other Putnam funds, in a $317.5 million unsecured committed line of credit and a $235.5 million unsecured uncommitted line of credit, both provided by State Street. Borrowings may be made for temporary or emergency purposes, including the funding of shareholder redemption requests and trade settlements. Interest is charged to the fund based on the fund’s borrowing at a rate equal to 1.25% plus the higher of (1) the Federal Funds rate and (2) the Overnight Bank Funding Rate for the committed line of credit and 1.30% plus the higher of (1) the Federal Funds rate and (2) the Overnight Bank Funding Rate for the uncommitted line of credit. A closing fee equal to 0.04% of the committed line of credit and 0.04% of the uncommitted line of credit has been paid by the participating funds. In addition, a commitment fee of 0.21% per annum on any unutilized portion of the committed line of credit is allocated to the participating funds based on their relative net assets and paid quarterly. During the reporting period, the fund had no borrowings against these arrangements.
| 82 Multi-Asset Absolute Return Fund |
Federal taxes It is the policy of the fund to distribute all of its taxable income within the prescribed time period and otherwise comply with the provisions of the Internal Revenue Code of 1986, as amended (the Code), applicable to regulated investment companies. It is also the intention of the fund to distribute an amount sufficient to avoid imposition of any excise tax under Section 4982 of the Code.
The fund is subject to the provisions of Accounting Standards Codification 740 Income Taxes (ASC 740). ASC 740 sets forth a minimum threshold for financial statement recognition of the benefit of a tax position taken or expected to be taken in a tax return. The fund did not have a liability to record for any unrecognized tax benefits in the accompanying financial statements. No provision has been made for federal taxes on income, capital gains or unrealized appreciation on securities held nor for excise tax on income and capital gains. Each of the fund’s federal tax returns for the prior three fiscal years remains subject to examination by the Internal Revenue Service.
The fund may also be subject to taxes imposed by governments of countries in which it invests. Such taxes are generally based on either income or gains earned or repatriated. The fund accrues and applies such taxes to net investment income, net realized gains and net unrealized gains as income and/or capital gains are earned. In some cases, the fund may be entitled to reclaim all or a portion of such taxes, and such reclaim amounts, if any, are reflected as an asset on the fund’s books. In many cases, however, the fund may not receive such amounts for an extended period of time, depending on the country of investment.
Under the Regulated Investment Company Modernization Act of 2010, the fund will be permitted to carry forward capital losses incurred for an unlimited period and the carry forwards will retain their character as either short-term or long-term capital losses. At October 31, 2021, the fund had the following capital loss carryovers available, to the extent allowed by the Code, to offset future net capital gain, if any:
| Loss carryover | ||
| Short-term | Long-term | Total |
| $45,854,470 | $15,174,909 | $61,029,379 |
Distributions to shareholders Distributions to shareholders from net investment income are recorded by the fund on the ex-dividend date. Distributions from capital gains, if any, are recorded on the ex-dividend date and paid at least annually. The amount and character of income and gains to be distributed are determined in accordance with income tax regulations, which may differ from generally accepted accounting principles. These differences include temporary and/or permanent differences from losses on wash sale transactions, foreign currency gains and losses, foreign taxes paid on capital gains, defaulted bond interest, unrealized gains and losses on certain futures contracts, income on swap contracts and interest-only securities. Reclassifications are made to the fund’s capital accounts to reflect income and gains available for distribution (or available capital loss carryovers) under income tax regulations. At the close of the reporting period, the fund reclassified $9,644,417 to decrease undistributed net investment income and $9,644,417 to decrease accumulated net realized loss.
Tax cost of investments includes adjustments to net unrealized appreciation (depreciation) which may not necessarily be final tax cost basis adjustments, but closely approximate the tax basis unrealized gains and losses that may be realized and distributed to shareholders. The tax basis components of distributable earnings and the federal tax cost as of the close of the reporting period were as follows:
| Unrealized appreciation | $101,796,288 |
| Unrealized depreciation | (104,736,649) |
| Net unrealized depreciation | (2,940,361) |
| Undistributed ordinary income | 5,176,959 |
| Undistributed long-term gains | 7,245,365 |
| Capital Loss Carryforward | (61,029,379) |
| Cost for federal income tax purposes | $679,659,433 |
Expenses of the Trust Expenses directly charged or attributable to any fund will be paid from the assets of that fund. Generally, expenses of the Trust will be allocated among and charged to the assets of each fund on a basis that the Trustees deem fair and equitable, which may be based on the relative assets of each fund or the nature of the services performed and relative applicability to each fund.
| Multi-Asset Absolute Return Fund 83 |
Note 2: Management fee, administrative services and other transactions
The fund pays Putnam Management a management fee (base fee) (based on the fund’s average net assets and computed and paid monthly) at annual rates that may vary based on the average of the aggregate net assets of all open-end mutual funds sponsored by Putnam Management (excluding net assets of funds that are invested in, or that are invested in by, other Putnam funds to the extent necessary to avoid “double counting” of those assets). Such annual rates may vary as follows:
| 0.880% | of the first $5 billion, | 0.680% | of the next $50 billion, | |
| 0.830% | of the next $5 billion, | 0.660% | of the next $50 billion, | |
| 0.780% | of the next $10 billion, | 0.650% | of the next $100 billion and | |
| 0.730% | of the next $10 billion, | 0.645% | of any excess thereafter. |
Prior to April 30, 2018, the annual rates were as follows:
| 1.030% | of the first $5 billion, | 0.830% | of the next $50 billion, | |
| 0.980% | of the next $5 billion, | 0.810% | of the next $50 billion, | |
| 0.930% | of the next $10 billion, | 0.800% | of the next $100 billion and | |
| 0.880% | of the next $10 billion, | 0.795% | of any excess thereafter. |
The applicable base fee is increased or decreased for each month by an amount based on the performance of the fund. The amount of the increase or decrease is calculated monthly based on a performance adjustment rate that is equal to 0.04 multiplied by the difference between the fund’s annualized performance (measured by Putnam Absolute Return 500 Fund’s class A shares for periods prior to April 30, 2018 and by the fund’s class A shares for periods thereafter) and the annualized performance of the ICE BofA U.S. Treasury Bill Index plus 5.00% over the thirty-six month period then ended (the “performance period”). The maximum annualized performance adjustment rate is +/–0.20%. Each month, the performance adjustment rate is multiplied by the fund’s combined average net assets (calculated as the combined average net assets of Putnam Absolute Return 500 Fund and the fund for periods prior to April 30, 2018 and as the fund’s average net assets for periods thereafter) over the performance period and the result is divided by twelve. The resulting dollar amount is added to, or subtracted from, the base fee for that month. The monthly base fee is determined based on the fund’s average net assets for the month, while the performance adjustment is determined based on the fund’s combined average net assets over the performance period of up to thirty-six months. This means it is possible that, if the fund underperforms significantly over the performance period, and the fund’s assets have declined significantly over that period, the negative performance adjustment may exceed the base fee. In this event, Putnam Management would make a payment to the fund.
Prior to April 30, 2018, the applicable base fee was increased or decreased for each month by an amount based on the performance of the fund. The amount of the increase or decrease was calculated monthly based on a performance adjustment rate that was equal to 0.04 multiplied by the difference between the fund’s annualized performance (measured by the fund’s class A shares) and the annualized performance of the ICE BofA U.S. Treasury Bill Index plus 7.00% over the thirty-six month period then ended (the “performance period”). The maximum annualized performance adjustment rate was +/- 0.28%. Each month, the performance adjustment rate was multiplied by the fund’s average net assets over the performance period and the result is divided by twelve. The resulting dollar amount was added to, or subtracted from, the base fee for that month. The monthly base fee was determined based on the fund’s average net assets for the month, while the performance adjustment was determined based on the fund’s average net assets over the performance period of up to thirty-six months.
The management contract also provides for a reduction of the management fee for the fund in any circumstance where the fee payable by the fund is higher than what the management fee would have been under the prior fee schedule in effect for the fund prior to the funds merger with Putnam Absolute Return 500 Fund on April 30, 2018 (the “Prior Management Contract”). Under those circumstances, Putnam Management has agreed to reduce its management fee to reflect the lower amount that would have been payable under the Prior Management Contract.
Because the performance adjustment is based on the fund’s performance relative to its applicable benchmark index, and not its absolute performance, the performance adjustment could increase Putnam Management’s fee even if the fund’s shares lose value during the performance period provided that the fund outperformed
| 84 Multi-Asset Absolute Return Fund |
its benchmark index, and could decrease Putnam Management’s fee even if the fund’s shares increase in value during the performance period provided that the fund underperformed its benchmark index.
For the reporting period, the management fee represented an effective rate (excluding the impact of any expense waiver in effect) of 0.386% of the fund’s average net assets, which included an effective base fee of 0.712% and a decrease of 0.326% ($2,270,228) based on performance.
Putnam Management has contractually agreed, through February 28, 2023, to waive fees and/or reimburse the fund’s expenses to the extent necessary to limit the cumulative expenses of the fund, exclusive of brokerage, interest, taxes, investment-related expenses, extraordinary expenses, acquired fund fees and expenses and payments under the fund’s investor servicing contract, investment management contract and distribution plans, on a fiscal year-to-date basis to an annual rate of 0.20% of the fund’s average net assets over such fiscal year-to-date period. During the reporting period, the fund’s expenses were not reduced as a result of this limit.
Putnam Management has also contractually agreed to waive fees (and, to the extent necessary, bear other expenses) of the fund through July 1, 2021, to the extent that the total expenses of the fund (before any applicable performance-based upward or downward adjustments to the fund’s management fee and excluding payments under the fund’s distribution plans, brokerage, interest, taxes, investor servicing fees, investment-related expenses, extraordinary expenses, and acquired fund fees and expenses) would exceed an annual rate of 0.77% of the fund’s average net assets. During the reporting period, the fund’s expenses were reduced by $133,844 as a result of this limit.
Putnam Investments Limited (PIL), an affiliate of Putnam Management, is authorized by the Trustees to manage a separate portion of the assets of the fund as determined by Putnam Management from time to time. PIL did not manage any portion of the assets of the fund during the reporting period. If Putnam Management were to engage the services of PIL, Putnam Management would pay a quarterly sub-management fee to PIL for its services at an annual rate of 0.35% of the average net assets of the portion of the fund managed by PIL.
The Putnam Advisory Company, LLC (PAC), an affiliate of Putnam Management, is authorized by the Trustees to manage a separate portion of the assets of the fund, as designated from time to time by Putnam Management or PIL. PAC did not manage any portion of the assets of the fund during the reporting period. If Putnam Management or PIL were to engage the services of PAC, Putnam Management or PIL, as applicable, would pay a quarterly sub-advisory fee to PAC for its services at the annual rate of 0.35% of the average net assets of the portion of the fund’s assets for which PAC is engaged as sub-adviser.
The fund reimburses Putnam Management an allocated amount for the compensation and related expenses of certain officers of the fund and their staff who provide administrative services to the fund. The aggregate amount of all such reimbursements is determined annually by the Trustees.
Custodial functions for the fund’s assets are provided by State Street. Custody fees are based on the fund’s asset level, the number of its security holdings and transaction volumes.
Putnam Investor Services, Inc., an affiliate of Putnam Management, provides investor servicing agent functions to the fund. Putnam Investor Services, Inc. received fees for investor servicing for class A, class B, class C, class R and class Y shares that included (1) a per account fee for each direct and underlying non-defined contribution account (retail account) of the fund; (2) a specified rate of the fund’s assets attributable to defined contribution plan accounts; and (3) a specified rate based on the average net assets in retail accounts. Putnam Investor Services, Inc. has agreed that the aggregate investor servicing fees for each fund’s retail and defined contribution accounts for these share classes will not exceed an annual rate of 0.25% of the fund’s average assets attributable to such accounts.
Class P shares paid a monthly fee based on the average net assets of class P shares at an annual rate of 0.01%.
Class R6 shares paid a monthly fee based on the average net assets of class R6 shares at an annual rate of 0.05%.
During the reporting period, the expenses for each class of shares related to investor servicing fees were as follows:
| Class A | $363,298 | Class R | 4,137 | |
| Class B | 11,594 | Class R6 | 12,617 | |
| Class C | 82,025 | Class Y | 217,904 | |
| Class P | 29,657 | Total | $721,232 |
| Multi-Asset Absolute Return Fund 85 |
The fund has entered into expense offset arrangements with Putnam Investor Services, Inc. and State Street whereby Putnam Investor Services, Inc.’s and State Street’s fees are reduced by credits allowed on cash balances. For the reporting period, the fund’s expenses were reduced by $5,210 under the expense offset arrangements.
Each Independent Trustee of the fund receives an annual Trustee fee, of which $414, as a quarterly retainer, has been allocated to the fund, and an additional fee for each Trustees meeting attended. Trustees also are reimbursed for expenses they incur relating to their services as Trustees.
The fund has adopted a Trustee Fee Deferral Plan (the Deferral Plan) which allows the Trustees to defer the receipt of all or a portion of Trustees fees payable on or after July 1, 1995. The deferred fees remain invested in certain Putnam funds until distribution in accordance with the Deferral Plan.
The fund has adopted an unfunded noncontributory defined benefit pension plan (the Pension Plan) covering all Trustees of the fund who have served as a Trustee for at least five years and were first elected prior to 2004. Benefits under the Pension Plan are equal to 50% of the Trustee’s average annual attendance and retainer fees for the three years ended December 31, 2005. The retirement benefit is payable during a Trustee’s lifetime, beginning the year following retirement, for the number of years of service through December 31, 2006. Pension expense for the fund is included in Trustee compensation and expenses in the Statement of operations. Accrued pension liability is included in Payable for Trustee compensation and expenses in the Statement of assets and liabilities. The Trustees have terminated the Pension Plan with respect to any Trustee first elected after 2003.
The fund has adopted distribution plans (the Plans) with respect to the following share classes pursuant to Rule 12b–1 under the Investment Company Act of 1940. The purpose of the Plans is to compensate Putnam Retail Management Limited Partnership, an indirect wholly-owned subsidiary of Putnam Investments, LLC, for services provided and expenses incurred in distributing shares of the fund. The Plans provide payments by the fund to Putnam Retail Management Limited Partnership at an annual rate of up to the following amounts (Maximum %) of the average net assets attributable to each class. The Trustees have approved payment by the fund at the following annual rate (Approved %) of the average net assets attributable to each class. During the reporting period, the class-specific expenses related to distribution fees were as follows:
| Maximum % | Approved % | Amount | |
| Class A | 0.35% | 0.25% | $500,090 |
| Class B | 1.00% | 1.00% | 64,153 |
| Class C | 1.00% | 1.00% | 455,038 |
| Class R | 1.00% | 0.50% | 11,376 |
| Total | $1,030,657 |
For the reporting period, Putnam Retail Management Limited Partnership, acting as underwriter, received net commissions of $12,322 from the sale of class A shares and received $797 and $1,141 in contingent deferred sales charges from redemptions of class B and class C shares, respectively.
A deferred sales charge of up to 1.00% is assessed on certain redemptions of class A shares. For the reporting period, Putnam Retail Management Limited Partnership, acting as underwriter, received $133 on class A redemptions.
Note 3: Purchases and sales of securities
During the reporting period, the cost of purchases and the proceeds from sales, excluding short-term investments, were as follows:
| Cost of purchases | Proceeds from sales | |
| Investments in securities, including TBA commitments (Long-term) | $5,009,641,724 | $5,436,258,489 |
| U.S. government securities (Long-term) | — | — |
| Total | $5,009,641,724 | $5,436,258,489 |
The fund may purchase or sell investments from or to other Putnam funds in the ordinary course of business, which can reduce the fund’s transaction costs, at prices determined in accordance with SEC requirements and policies approved by the Trustees. During the reporting period, purchases or sales of long-term securities from or to other Putnam funds, if any, did not represent more than 5% of the fund’s total cost of purchases and/or total proceeds from sales.
| 86 Multi-Asset Absolute Return Fund |
Note 4: Capital shares
At the close of the reporting period, there were an unlimited number of shares of beneficial interest authorized. Transactions, including, if applicable, direct exchanges pursuant to share conversions, in capital shares were as follows:
| YEAR ENDED 10/31/21 | YEAR ENDED 10/31/20 | |||
| Class A | Shares | Amount | Shares | Amount |
| Shares sold | 3,011,736 | $30,981,100 | 3,781,573 | $41,210,635 |
| Shares issued in connection with | ||||
| reinvestment of distributions | — | — | — | — |
| 3,011,736 | 30,981,100 | 3,781,573 | 41,210,635 | |
| Shares repurchased | (7,878,768) | (81,520,661) | (6,715,405) | (72,525,305) |
| Net decrease | (4,867,032) | $(50,539,561) | (2,933,832) | $(31,314,670) |
| YEAR ENDED 10/31/21 | YEAR ENDED 10/31/20 | |||
| Class B | Shares | Amount | Shares | Amount |
| Shares sold | 1,142 | $11,315 | 1,640 | $17,850 |
| Shares issued in connection with | ||||
| reinvestment of distributions | — | — | — | — |
| 1,142 | 11,315 | 1,640 | 17,850 | |
| Shares repurchased | (485,367) | (4,823,688) | (536,444) | (5,621,200) |
| Net decrease | (484,225) | $(4,812,373) | (534,804) | $(5,603,350) |
| YEAR ENDED 10/31/21 | YEAR ENDED 10/31/20 | |||
| Class C | Shares | Amount | Shares | Amount |
| Shares sold | 79,919 | $790,928 | 209,619 | $2,201,487 |
| Shares issued in connection with | ||||
| reinvestment of distributions | — | — | — | — |
| 79,919 | 790,928 | 209,619 | 2,201,487 | |
| Shares repurchased | (4,599,338) | (45,289,002) | (5,351,053) | (55,880,946) |
| Net decrease | (4,519,419) | $(44,498,074) | (5,141,434) | $(53,679,459) |
| YEAR ENDED 10/31/20* | ||||
| Class M | Shares | Amount | ||
| Shares sold | 166 | $1,834 | ||
| Shares issued in connection with | ||||
| reinvestment of distributions | — | — | ||
| 166 | 1,834 | |||
| Shares repurchased | (566,186) | (6,211,429) | ||
| Net decrease | (566,020) | $(6,209,595) | ||
| Multi-Asset Absolute Return Fund 87 |
| YEAR ENDED 10/31/21 | YEAR ENDED 10/31/20 | |||
| Class P | Shares | Amount | Shares | Amount |
| Shares sold | 20,081,370 | $209,465,132 | 36,369,149 | $389,443,438 |
| Shares issued in connection with | ||||
| reinvestment of distributions | — | — | — | — |
| 20,081,370 | 209,465,132 | 36,369,149 | 389,443,438 | |
| Shares repurchased | (17,416,108) | (181,543,147) | (32,033,437) | (341,892,105) |
| Net increase | 2,665,262 | $27,921,985 | 4,335,712 | $47,551,333 |
| YEAR ENDED 10/31/21 | YEAR ENDED 10/31/20 | |||
| Class R | Shares | Amount | Shares | Amount |
| Shares sold | 34,698 | $351,074 | 12,247 | $131,079 |
| Shares issued in connection with | ||||
| reinvestment of distributions | — | — | — | — |
| 34,698 | 351,074 | 12,247 | 131,079 | |
| Shares repurchased | (69,882) | (706,575) | (86,156) | (896,136) |
| Net decrease | (35,184) | $(355,501) | (73,909) | $(765,057) |
| YEAR ENDED 10/31/21 | YEAR ENDED 10/31/20 | |||
| Class R6 | Shares | Amount | Shares | Amount |
| Shares sold | 2,121,668 | $22,057,975 | 334,908 | $3,737,256 |
| Shares issued in connection with | ||||
| reinvestment of distributions | — | — | — | — |
| 2,121,668 | 22,057,975 | 334,908 | 3,737,256 | |
| Shares repurchased | (1,078,159) | (11,294,831) | (487,051) | (5,310,883) |
| Net increase (decrease) | 1,043,509 | $10,763,144 | (152,143) | $(1,573,627) |
| YEAR ENDED 10/31/21 | YEAR ENDED 10/31/20 | |||
| Class Y | Shares | Amount | Shares | Amount |
| Shares sold | 1,367,432 | $14,256,360 | 6,413,934 | $69,737,986 |
| Shares issued in connection with | ||||
| reinvestment of distributions | — | — | — | — |
| 1,367,432 | 14,256,360 | 6,413,934 | 69,737,986 | |
| Shares repurchased | (12,099,866) | (126,106,625) | (23,084,310) | (250,616,388) |
| Net decrease | (10,732,434) | $(111,850,265) | (16,670,376) | $(180,878,402) |
* Effective November 25, 2019, the fund converted all of its class M shares to class A shares and class M shares were no longer able to be purchased.
At the close of the reporting period, the Putnam RetirementReady Funds owned 48.7% of the outstanding shares of the fund.
| 88 Multi-Asset Absolute Return Fund |
Note 5: Affiliated transactions
Transactions during the reporting period with any company which is under common ownership or control were as follows:
| Shares | |||||
| outstanding | |||||
| and fair | |||||
| Fair value as | Purchase | Sale | Investment | value as | |
| Name of affiliate | of 10/31/20 | cost | proceeds | income | of 10/31/21 |
| Short-term investments | |||||
| Putnam Cash Collateral | |||||
| Pool, LLC* | $54,965,683 | $875,161,022 | $918,447,105 | $41,426 | $11,679,600 |
| Putnam Short Term | |||||
| Investment Fund** | 194,264,638 | 73,477,952 | 112,941,182 | 198,501 | 154,801,408 |
| Total Short-term | |||||
| investments | $249,230,321 | $948,638,974 | $1,031,388,287 | $239,927 | $166,481,008 |
* No management fees are charged to Putnam Cash Collateral Pool, LLC (Note 1).Investment income shown is included in securities lending income on the Statement of operations. There were no realized or unrealized gains or losses during the period.
** Management fees charged to Putnam Short Term Investment Fund have been waived by Putnam Management. There were no realized or unrealized gains or losses during the period.
Note 6: Market, credit and other risks
In the normal course of business, the fund trades financial instruments and enters into financial transactions where risk of potential loss exists due to changes in the market (market risk) or failure of the contracting party to the transaction to perform (credit risk). The fund may be exposed to additional credit risk that an institution or other entity with which the fund has unsettled or open transactions will default. Investments in foreign securities involve certain risks, including those related to economic instability, unfavorable political developments, and currency fluctuations. The fund may invest in higher-yielding, lower-rated bonds that may have a higher rate of default. The fund may invest a significant portion of its assets in securitized debt instruments, including mortgage-backed and asset-backed investments. The yields and values of these investments are sensitive to changes in interest rates, the rate of principal payments on the underlying assets and the market’s perception of the issuers. The market for these investments may be volatile and limited, which may make them difficult to buy or sell.
On July 27, 2017, the United Kingdom’s Financial Conduct Authority (“FCA”), which regulates LIBOR, announced a desire to phase out the use of LIBOR by the end of 2021. On March 5, 2021, the FCA and LIBOR’s administrator, ICE Benchmark Administration, announced that most LIBOR settings will no longer be published after the end of 2021 and a majority of U.S. dollar LIBOR settings will no longer be published after June 30, 2023. LIBOR has historically been a common benchmark interest rate index used to make adjustments to variable-rate loans. It is used throughout global banking and financial industries to determine interest rates for a variety of financial instruments and borrowing arrangements. The transition process might lead to increased volatility and illiquidity in markets that currently rely on LIBOR to determine interest rates. It could also lead to a reduction in the value of some LIBOR-based investments and reduce the effectiveness of new hedges placed against existing LIBOR-based investments. While some LIBOR-based instruments may contemplate a scenario where LIBOR is no longer available by providing for an alternative rate-setting methodology, not all may have such provisions and there may be significant uncertainty regarding the effectiveness of any such alternative methodologies. Since the usefulness of LIBOR as a benchmark could deteriorate during the transition period, these effects could occur prior to the date on which the applicable rate ceases to be published.
Beginning in January 2020, global financial markets have experienced, and may continue to experience, significant volatility resulting from the spread of a virus known as Covid–19. The outbreak of Covid–19 has resulted in travel and border restrictions, quarantines, supply chain disruptions, lower consumer demand, and general market uncertainty. The effects of Covid–19 have adversely affected, and may continue to adversely affect, the global economy, the economies of certain nations, and individual issuers, all of which may negatively impact the fund’s performance.
| Multi-Asset Absolute Return Fund 89 |
Note 7: Summary of derivative activity
The volume of activity for the reporting period for any derivative type that was held during the period is listed below and was based on an average of the holdings at the end of each fiscal quarter:
| Purchased equity option contracts (contract amount) | $33,000 |
| Purchased currency option contracts (contract amount) | $70,800,000 |
| Purchased swap option contracts (contract amount) | $17,600,000 |
| Written currency option contracts (contract amount) | $19,800,000 |
| Written swap option contracts (contract amount) | $13,900,000 |
| Futures contracts (number of contracts) | 6,000 |
| Forward currency contracts (contract amount) | $846,400,000 |
| Centrally cleared interest rate swap contracts (notional) | $301,000,000 |
| OTC total return swap contracts (notional) | $1,697,100,000 |
| Centrally cleared total return swap contracts (notional) | $115,100,000 |
| OTC credit default contracts (notional) | $191,200,000 |
| Centrally cleared credit default contracts (notional) | $189,000,000 |
| Warrants (number of warrants) | 3,700,000 |
The following is a summary of the fair value of derivative instruments as of the close of the reporting period:
| Fair value of derivative instruments as of the close of the reporting period | ||||
| ASSET DERIVATIVES | LIABILITY DERIVATIVES | |||
| Derivatives not | ||||
| accounted for as | Statement of | Statement of | ||
| hedging instruments | assets and | assets and | ||
| under ASC 815 | liabilities location | Fair value | liabilities location | Fair value |
| Receivables, Net | ||||
| assets — Unrealized | Payables, Net assets — | |||
| Credit contracts | appreciation | $13,043,609* | Unrealized depreciation | $49,577,387* |
| Foreign exchange | ||||
| contracts | Investments, Receivables | 5,545,857 | Payables | 8,582,474 |
| Investments, | ||||
| Receivables, Net | ||||
| assets — Unrealized | Payables, Net assets — | |||
| Equity contracts | appreciation | 21,123,870* | Unrealized depreciation | 17,049,313* |
| Investments, | ||||
| Receivables, Net | ||||
| assets — Unrealized | Payables, Net assets — | |||
| Interest rate contracts | appreciation | 4,110,804* | Unrealized depreciation | 15,307,612* |
| Total | $43,824,140 | $90,516,786 | ||
* Includes cumulative appreciation/depreciation of futures contracts and/or centrally cleared swaps as reported in the fund’s portfolio. Only current day’s variation margin is reported within the Statement of assets and liabilities.
| 90 Multi-Asset Absolute Return Fund |
The following is a summary of realized and change in unrealized gains or losses of derivative instruments in the Statement of operations for the reporting period (Note 1):
| Amount of realized gain or (loss) on derivatives recognized in net gain or (loss) on investments | ||||||
| Derivatives not | ||||||
| accounted for as | ||||||
| hedging | Forward | |||||
| instruments under | currency | |||||
| ASC 815 | Warrants | Options | Futures | contracts | Swaps | Total |
| Credit contracts | $— | $— | $— | $— | $(4,043,878) | $(4,043,878) |
| Foreign exchange | ||||||
| contracts | — | 87,967 | — | (1,896,339) | — | $(1,808,372) |
| Equity contracts | 3,615,859 | (4,791,751) | (16,221,599) | — | (9,456,242) | $(26,853,733) |
| Interest rate | ||||||
| contracts | — | 446,577 | (21,497,228) | — | (5,520,999) | $(26,571,650) |
| Total | $3,615,859 | $(4,257,207) | $(37,718,827) | $(1,896,339) | $(19,021,119) | $(59,277,633) |
| Change in unrealized appreciation or (depreciation) on derivatives recognized in net gain or (loss) | ||||||
| on investments | ||||||
| Derivatives not | ||||||
| accounted for as | ||||||
| hedging | Forward | |||||
| instruments under | currency | |||||
| ASC 815 | Warrants | Options | Futures | contracts | Swaps | Total |
| Credit contracts | $— | $— | $— | $— | $8,592,812 | $8,592,812 |
| Foreign exchange | ||||||
| contracts | — | (20,797) | — | (4,015,893) | — | $(4,036,690) |
| Equity contracts | (4,877,750) | 1,432,482 | (1,678,489) | — | 4,088,964 | $(1,034,793) |
| Interest rate | ||||||
| contracts | — | (235,675) | (1,846,975) | — | (5,542,293) | $(7,624,943) |
| Total | $(4,877,750) | $1,176,010 | $(3,525,464) | $(4,015,893) | $7,139,483 | $(4,103,614) |
| Multi-Asset Absolute Return Fund 91 |
Note 8: Offsetting of financial and derivative assets and liabilities
The following table summarizes any derivatives, repurchase agreements and reverse repurchase agreements, at the end of the reporting period, that are subject to an enforceable master netting agreement or similar agreement. For securities lending transactions or borrowing transactions associated with securities sold short, if any, see Note 1. For financial reporting purposes, the fund does not offset financial assets and financial liabilities that are subject to the master netting agreements in the Statement of assets and liabilities.
| Bank of America N.A. | Barclays Bank PLC | Barclays Capital, Inc. (clearing broker) | BofA Securities, Inc. | Citibank, N.A. | Citigroup Global Markets, Inc. | Credit Suisse International | Goldman Sachs International | HSBC Bank USA, National Association | JPMorgan Chase Bank N.A. | JPMorgan Securities LLC | Merrill Lynch International | Morgan Stanley & Co. International PLC | NatWest Markets PLC | State Street Bank and Trust Co. | Toronto- Dominion Bank | UBS AG | WestPac Banking Corp. | Total | |
| Assets: | |||||||||||||||||||
| Centrally cleared interest rate | |||||||||||||||||||
| swap contracts§ | $— | $— | $ 130,316 | $— | $— | $— | $— | $— | $— | $— | $— | $— | $— | $— | $— | $— | $— | $— | $130,316 |
| OTC Total return | |||||||||||||||||||
| swap contracts*# | 7,307,322 | 135,566 | — | — | 505,265 | — | — | 2,181,630 | — | 1,241,604 | — | — | — | — | — | — | 1,153,003 | — | 12,524,390 |
| Centrally cleared total return | |||||||||||||||||||
| swap contracts§ | — | — | 465,539 | — | — | — | — | — | — | — | — | — | — | — | — | — | — | — | 465,539 |
| OTC Credit default contracts — | |||||||||||||||||||
| protection sold*# | — | — | — | — | — | — | — | — | — | — | — | — | — | — | — | — | — | — | — |
| OTC Credit default contracts — | |||||||||||||||||||
| protection purchased*# | — | — | — | — | — | 740,380 | 1,140,909 | 805,160 | — | — | 3,181,798 | 363,443 | 753,655 | — | — | — | — | — | 6,985,345 |
| Centrally cleared credit | |||||||||||||||||||
| default contracts§ | — | — | 192,797 | — | — | — | — | — | — | — | — | — | — | — | — | — | — | — | 192,797 |
| Futures contracts§ | — | — | — | 49,906 | — | — | — | — | — | — | — | — | — | — | — | — | — | — | 49,906 |
| Forward currency contracts# | 19,930 | 118,447 | — | — | 181,033 | — | 242,385 | 254,376 | 30,953 | 1,544,851 | — | — | 633,160 | 208,071 | 1,273,353 | 407,896 | 337,363 | 26,042 | 5,277,860 |
| Forward premium swap | |||||||||||||||||||
| option contracts# | 20,206 | — | — | — | — | — | — | 12,623 | — | 104,458 | — | — | — | — | — | — | — | — | 137,287 |
| Purchased options**# | 11,969 | — | — | — | — | — | — | 172,781 | — | 48,561 | — | — | — | — | — | 33,129 | 1,557 | — | 267,997 |
| Repurchase agreements ** | — | — | — | — | — | 69,102,000 | — | — | — | — | — | — | — | — | — | — | — | — | 69,102,000 |
| Total Assets | $7,359,427 | $254,013 | $788,652 | $49,906 | $686,298 | $69,842,380 | $1,383,294 | $3,426,570 | $30,953 | $2,939,474 | $3,181,798 | $363,443 | $1,386,815 | $208,071 | $1,273,353 | $441,025 | $1,491,923 | $26,042 | $95,133,437 |
| Liabilities: | |||||||||||||||||||
| Centrally cleared interest rate | |||||||||||||||||||
| swap contracts§ | — | — | 386,630 | — | — | — | — | — | — | — | — | — | — | — | — | — | — | — | 386,630 |
| OTC Total return | |||||||||||||||||||
| swap contracts*# | 8,195,153 | — | — | — | 2,541,746 | — | 1,347,908 | 2,444,270 | — | — | — | — | — | — | — | — | 2,253,692 | — | 16,782,769 |
| Centrally cleared total return | |||||||||||||||||||
| swap contracts§ | — | — | — | — | — | — | — | — | — | — | — | — | — | — | — | — | — | — | — |
| OTC Credit default contracts — | |||||||||||||||||||
| protection sold*# | 117,625 | 354,403 | — | — | — | 4,769,203 | 11,894,949 | 6,281,733 | — | — | 14,080,837 | 4,231,161 | 1,344,084 | — | — | — | — | — | 43,073,995 |
| OTC Credit default contracts — | |||||||||||||||||||
| protection purchased*# | — | — | — | — | — | — | — | — | — | — | — | — | — | — | — | — | — | — | — |
| Centrally cleared credit | |||||||||||||||||||
| default contracts§ | — | — | — | — | — | — | — | — | — | — | — | — | — | — | — | — | — | — | — |
| Futures contracts§ | — | — | — | 97,325 | — | — | — | — | — | — | 198,186 | — | — | — | — | — | — | — | 295,511 |
| Forward currency contracts# | 774,820 | 282,861 | — | — | 533,679 | — | — | 1,999,828 | 453,423 | 45,198 | — | — | 1,161,430 | 437,850 | 522,619 | 613,049 | 1,671,228 | 47,056 | 8,543,041 |
| Forward premium swap | |||||||||||||||||||
| option contracts# | 139,849 | — | — | — | — | — | — | 12,067 | — | 115,584 | — | — | — | — | — | — | — | — | 267,500 |
| 92 Multi-Asset Absolute Return Fund | Multi-Asset Absolute Return Fund 93 |
| Bank of America N.A. | Barclays Bank PLC | Barclays Capital, Inc. (clearing broker) | BofA Securities,Inc. | Citibank, N.A. | Citigroup Global Markets, Inc. | Credit Suisse International | Goldman Sachs International | HSBC Bank USA, National Association | JPMorgan Chase Bank N.A. | JPMorgan Securities LLC | Merrill Lynch International | Morgan Stanley & Co. International PLC | NatWest Markets PLC | State Street Bank and Trust Co. | Toronto- Dominion Bank | UBS AG | WestPac Banking Corp. | Total | |
| Written options# | $— | $— | $— | $— | $— | $— | $— | $— | $— | $— | $— | $— | $— | $— | $— | $39,433 | $— | $— | $39,433 |
| Reverse repurchase agreements | — | — | — | — | — | — | — | — | — | — | — | — | — | — | — | — | — | — | — |
| Total Liabilities | $9,227,447 | $637,264 | $386,630 | $97,325 | $3,075,425 | $4,769,203 | $13,242,857 | $10,737,898 | $453,423 | $160,782 | $14,279,023 | $4,231,161 | $2,505,514 | $437,850 | $522,619 | $652,482 | $3,924,920 | $47,056 | $69,388,879 |
| Total Financial and Derivative | |||||||||||||||||||
| Net Assets | $(1,868,020) | $(383,251) | $402,022 | $(47,419) | $(2,389,127) | $65,073,177 | $(11,859,563) | $(7,311,328) | $(422,470) | $2,778,692 | $(11,097,225) | $(3,867,718) | $(1,118,699) | $(229,779) | $750,734 | $(211,457) | $(2,432,997) | $(21,014) | $25,744,558 |
| Total collateral | |||||||||||||||||||
| received (pledged)†## | $(1,708,532) | $(383,251) | $— | $— | $(2,123,150) | $65,073,177 | $(11,859,563) | $(7,311,328) | $(353,931) | $2,690,000 | $(11,032,986) | $(3,867,718) | $(677,822) | $(229,779) | $423,444 | $(151,955) | $(2,432,997) | $— | |
| Net amount | $(159,488) | $— | $402,022 | $(47,419) | $(265,977) | $— | $— | $— | $(68,539) | $88,692 | $(64,239) | $— | $(440,877) | $— | $327,290 | $(59,502) | $— | $(21,014) | |
| Controlled collateral | |||||||||||||||||||
| received (including | |||||||||||||||||||
| TBA commitments)** | $— | $— | $— | $266,000 | $— | $— | $— | $— | $— | $2,690,000 | $130,000 | $— | $— | $— | $423,444 | $— | $— | $— | $3,509,444 |
| Uncontrolled collateral received | $— | $— | $— | $— | $— | $70,484,052 | $— | $— | $— | $— | $— | $— | $— | $— | $— | $— | $— | $— | $70,484,052 |
| Collateral (pledged) (including | |||||||||||||||||||
| TBA commitments)** | $(1,708,532) | $(854,871) | $— | $— | $(2,123,150) | $(4,150,128) | $(12,560,208) | $(7,318,964) | $(353,931) | $— | $(11,032,986) | $(3,972,132) | $(677,822) | $(241,913) | $— | $(151,955) | $(3,799,652) | $— | $(48,946,244) |
* Excludes premiums, if any. Included in unrealized appreciation and depreciation on OTC swap contracts on the Statement of assets and liabilities.
** Included with Investments in securities on the Statement of assets and liabilities.
† Additional collateral may be required from certain brokers based on individual agreements.
# Covered by master netting agreement (Note 1).
##Any over-collateralization of total financial and derivative net assets is not shown. Collateral may include amounts related to unsettled agreements.
§ Includes current day’s variation margin only as reported on the Statement of assets and liabilities, which is not collateralized. Cumulative appreciation/(depreciation) for futures contracts and centrally cleared swap contracts is represented in the tables listed after the fund’s portfolio. Collateral pledged for initial margin on futures contracts and centrally cleared swap contracts, which is not included in the table above, amounted to $6,642,712 and $9,400,813, respectively.
Note 9: New accounting pronouncements
In March 2020, the Financial Accounting Standards Board (FASB) issued Accounting Standards Update (ASU) 2020–04, Reference Rate Reform (Topic 848) — Facilitation of the Effects of Reference Rate Reform on Financial Reporting. The amendments in ASU 2020–04 provide optional temporary financial reporting relief from the effect of certain types of contract modifications due to the planned discontinuation of LIBOR and other interbank-offered based reference rates as of the end of 2021. The discontinuation of LIBOR was subsequently extended to June 30, 2023. ASU 2020–04 is effective for certain reference rate-related contract modifications that occur during the period March 12, 2020 through December 31, 2022. Management is currently evaluating the impact, if any, of applying this provision.
| 94 Multi-Asset Absolute Return Fund | Multi-Asset Absolute Return Fund 95 |
Federal tax information (Unaudited)
Pursuant to §852 of the Internal Revenue Code, as amended, the fund hereby designates $7,969,902 as a capital gain dividend with respect to the taxable year ended October 31, 2021, or, if subsequently determined to be different, the net capital gain of such year.
For the reporting period, the fund hereby designates 42.31%, or the maximum amount allowable, of its taxable ordinary income distributions as qualified dividends taxed at the individual net capital gain rates.
The Form 1099 that will be mailed to you in January 2022 will show the tax status of all distributions paid to your account in calendar 2021.
| 96 Multi-Asset Absolute Return Fund |

| Multi-Asset Absolute Return Fund 97 |

* Mr. Reynolds is an “interested person” (as defined in the Investment Company Act of 1940) of the fund and Putnam Investments. He is President and Chief Executive Officer of Putnam Investments, as well as the President of your fund and each of the other Putnam funds.
The address of each Trustee is 100 Federal Street, Boston, MA 02110.
As of October 31, 2021, there were 100 Putnam funds. All Trustees serve as Trustees of all Putnam funds.
Each Trustee serves for an indefinite term, until his or her resignation, retirement at age 75, removal, or death.
| 98 Multi-Asset Absolute Return Fund |
Officers
In addition to Robert L. Reynolds, the other officers of the fund are shown below:
| James F. Clark (Born 1974) | Susan G. Malloy (Born 1957) |
| Vice President and Chief Compliance Officer | Vice President and Assistant Treasurer |
| Since 2016 | Since 2007 |
| Chief Compliance Officer and Chief Risk Officer, | Head of Accounting and Middle Office Services, |
| Putnam Investments, and Chief Compliance Officer, | Putnam Investments and Putnam Management |
| Putnam Management | |
| Denere P. Poulack (Born 1968) | |
| Nancy E. Florek (Born 1957) | Assistant Vice President, Assistant Clerk, |
| Vice President, Director of Proxy Voting and Corporate | and Assistant Treasurer |
| Governance, Assistant Clerk, and Assistant Treasurer | Since 2004 |
| Since 2000 | |
| Janet C. Smith (Born 1965) | |
| Michael J. Higgins (Born 1976) | Vice President, Principal Financial Officer, Principal |
| Vice President, Treasurer, and Clerk | Accounting Officer, and Assistant Treasurer |
| Since 2010 | Since 2007 |
| Head of Fund Administration Services, | |
| Jonathan S. Horwitz (Born 1955) | Putnam Investments and Putnam Management |
| Executive Vice President, Principal Executive Officer, | |
| and Compliance Liaison | Stephen J. Tate (Born 1974) |
| Since 2004 | Vice President and Chief Legal Officer |
| Since 2021 | |
| Richard T. Kircher (Born 1962) | General Counsel, Putnam Investments, |
| Vice President and BSA Compliance Officer | Putnam Management, and Putnam Retail Management |
| Since 2019 | |
| Assistant Director, Operational Compliance, Putnam | Mark C. Trenchard (Born 1962) |
| Investments and Putnam Retail Management | Vice President |
| Since 2002 | |
| Director of Operational Compliance, Putnam | |
| Investments and Putnam Retail Management | |
The principal occupations of the officers for the past five years have been with the employers as shown above, although in some cases they have held different positions with such employers. The address of each officer is 100 Federal Street, Boston, MA 02110.
| Multi-Asset Absolute Return Fund 99 |
Services for shareholders
Investor services
Systematic investment plan Tell us how much you wish to invest regularly — weekly, semimonthly, or monthly — and the amount you choose will be transferred automatically from your checking or savings account. There’s no additional fee for this service, and you can suspend it at any time. This plan may be a great way to save for college expenses or to plan for your retirement.
Please note that regular investing does not guarantee a profit or protect against loss in a declining market. Before arranging a systematic investment plan, consider your financial ability to continue making purchases in periods when prices are low.
Systematic exchange You can make regular transfers from one Putnam fund to another Putnam fund. There are no additional fees for this service, and you can cancel or change your options at any time.
Dividends PLUS You can choose to have the dividend distributions from one of your Putnam funds automatically reinvested in another Putnam fund at no additional charge.
Free exchange privilege You can exchange money between Putnam funds free of charge, as long as they are the same class of shares. A signature guarantee is required if you are exchanging more than $500,000. The fund reserves the right to revise or terminate the exchange privilege.
Reinstatement privilege If you’ve sold Putnam shares or received a check for a dividend or capital gain, you may reinvest the proceeds with Putnam within 90 days of the transaction and they will be reinvested at the fund’s current net asset value — with no sales charge. However, reinstatement of class B shares may have special tax consequences. Ask your financial or tax representative for details.
Check-writing service You have ready access to many Putnam accounts. It’s as simple as writing a check, and there are no special fees or service charges. For more information about the check-writing service, call Putnam or visit our website.
Dollar cost averaging When you’re investing for long-term goals, it’s time, not timing, that counts. Investing on a systematic basis is a better strategy than trying to figure out when the markets will go up or down. This means investing the same amount of money regularly over a long period. This method of investing is called dollar cost averaging. When a fund’s share price declines, your investment dollars buy more shares at lower prices. When it increases, they buy fewer shares. Over time, you will pay a lower average price per share.
For more information
Visit the Individual Investors section at putnam.com A secure section of our website contains complete information on your account, including balances and transactions, updated daily. You may also conduct transactions, such as exchanges, additional investments, and address changes. Log on today to get your password.
Call us toll free at 1-800-225-1581 Ask a helpful Putnam representative or your financial advisor for details about any of these or other services, or see your prospectus.
| 100 Multi-Asset Absolute Return Fund |
Fund information
Founded over 80 years ago, Putnam Investments was built around the concept that a balance between risk and reward is the hallmark of a well-rounded financial program. We manage funds across income, value, blend, growth, sustainable, asset allocation, absolute return, and global sector categories.
| Investment Manager | Trustees | Jonathan S. Horwitz |
| Putnam Investment | Kenneth R. Leibler, Chair | Executive Vice President, |
| Management, LLC | Liaquat Ahamed | Principal Executive Officer, |
| 100 Federal Street | Ravi Akhoury | and Compliance Liaison |
| Boston, MA 02110 | Barbara M. Baumann | |
| Katinka Domotorffy | Richard T. Kircher | |
| Investment Sub-Advisors | Catharine Bond Hill | Vice President and BSA |
| Putnam Investments Limited | Paul L. Joskow | Compliance Officer |
| 16 St James’s Street | George Putnam, III | |
| London, England SW1A 1ER | Robert L. Reynolds | Susan G. Malloy |
| Manoj P. Singh | Vice President and | |
| The Putnam Advisory Company, LLC | Mona K. Sutphen | Assistant Treasurer |
| 100 Federal Street | ||
| Boston, MA 02110 | Officers | Denere P. Poulack |
| Robert L. Reynolds | Assistant Vice President, | |
| Marketing Services | President | Assistant Clerk, and |
| Putnam Retail Management | Assistant Treasurer | |
| Limited Partnership | James F. Clark | |
| 100 Federal Street | Vice President, Chief Compliance | Janet C. Smith |
| Boston, MA 02110 | Officer, and Chief Risk Officer | Vice President, |
| Principal Financial Officer, | ||
| Custodian | Nancy E. Florek | Principal Accounting Officer, |
| State Street Bank | Vice President, Director of | and Assistant Treasurer |
| and Trust Company | Proxy Voting and Corporate | |
| Governance, Assistant Clerk, | Stephen J. Tate | |
| Legal Counsel | and Assistant Treasurer | Vice President and |
| Ropes & Gray LLP | Chief Legal Officer | |
| Michael J. Higgins | ||
| Independent Registered | Vice President, Treasurer, | Mark C. Trenchard |
| Public Accounting Firm | and Clerk | Vice President |
| PricewaterhouseCoopers LLP |
This report is for the information of shareholders of Putnam Multi-Asset Absolute Return Fund. It may also be used as sales literature when preceded or accompanied by the current prospectus, the most recent copy of Putnam’s Quarterly Performance Summary, and Putnam’s Quarterly Ranking Summary. For more recent performance, please visit putnam.com. Investors should carefully consider the investment objectives, risks, charges, and expenses of a fund, which are described in its prospectus. For this and other information or to request a prospectus or summary prospectus, call 1-800-225-1581 toll free. Please read the prospectus carefully before investing. The fund’s Statement of Additional Information contains additional information about the fund’s Trustees and is available without charge upon request by calling 1-800-225-1581.

| Item 2. Code of Ethics: |
| (a) The fund’s principal executive, financial and accounting officers are employees of Putnam Investment Management, LLC, the Fund’s investment manager. As such they are subject to a comprehensive Code of Ethics adopted and administered by Putnam Investments which is designed to protect the interests of the firm and its clients. The Fund has adopted a Code of Ethics which incorporates the Code of Ethics of Putnam Investments with respect to all of its officers and Trustees who are employees of Putnam Investment Management, LLC. For this reason, the Fund has not adopted a separate code of ethics governing its principal executive, financial and accounting officers. |
| (c) In April 2021, the Code of Ethics of Putnam Investments was amended. The key changes to the Code of Ethics are as follows: (i) Employees may invest in the Putnam Exchange Traded Funds (ETFs) with preclearing requirements for certain individuals (ii) All employees must hold Putnam ETFs in an approved Putnam broker (iii) All access persons must report Putnam ETF trades or holdings in the quarterly transaction report or annual holdings report. |
| Item 3. Audit Committee Financial Expert: |
| The Funds’ Audit, Compliance and Risk Committee is comprised solely of Trustees who are “independent” (as such term has been defined by the Securities and Exchange Commission (“SEC”) in regulations implementing Section 407 of the Sarbanes-Oxley Act (the “Regulations”)). The Trustees believe that each member of the Audit, Compliance and Risk Committee also possesses a combination of knowledge and experience with respect to financial accounting matters, as well as other attributes, that qualifies him or her for service on the Committee. In addition, the Trustees have determined that each of Dr. Hill, Dr. Joskow, and Mr. Singh qualifies as an “audit committee financial expert” (as such term has been defined by the Regulations) based on their review of his or her pertinent experience and education; in the case of Dr. Joskow, including his experience serving on the audit committees of several public companies and institutions and his education and experience as an economist who studies companies and industries, routinely using public company financial statements in his research. The SEC has stated, and the funds’ amended and restated agreement and Declaration of Trust provides, that the designation or identification of a person as an audit committee financial expert pursuant to this Item 3 of Form N-CSR does not impose on such person any duties, obligations or liability that are greater than the duties, obligations and liability imposed on such person as a member of the Audit, Compliance and Risk Committee and the Board of Trustees in the absence of such designation or identification. |
| Item 4. Principal Accountant Fees and Services: |
| The following table presents fees billed in each of the last two fiscal years for services rendered to the fund by the fund’s independent auditor: |
| Fiscal year ended | Audit Fees | Audit-Related Fees | Tax Fees | All Other Fees | |
| October 31, 2021 | $135,406 | $ — | $21,733 | $ — | |
| October 31, 2020 | $152,225 | $ — | $13,642 | $ — | |
| For the fiscal years ended October 31, 2021 and October 31, 2020, the fund’s independent auditor billed aggregate non-audit fees in the amounts of $286,632 and $359,484 respectively, to the fund, Putnam Management and any entity controlling, controlled by or under common control with Putnam Management that provides ongoing services to the fund. |
| Audit Fees represent fees billed for the fund’s last two fiscal years relating to the audit and review of the financial statements included in annual reports and registration statements, and other services that are normally provided in connection with statutory and regulatory filings or engagements. |
| Audit-Related Fees represent fees billed in the fund’s last two fiscal years for services traditionally performed by the fund’s auditor, including accounting consultation for proposed transactions or concerning financial accounting and reporting standards and other audit or attest services not required by statute or regulation. |
| Tax Fees represent fees billed in the fund’s last two fiscal years for tax compliance, tax planning and tax advice services. Tax planning and tax advice services include assistance with tax audits, employee benefit plans and requests for rulings or technical advice from taxing authorities. |
| Pre-Approval Policies of the Audit, Compliance and Risk Committee. The Audit, Compliance and Risk Committee of the Putnam funds has determined that, as a matter of policy, all work performed for the funds by the funds’ independent auditors will be pre-approved by the Committee itself and thus will generally not be subject to pre-approval procedures. |
| The Audit, Compliance and Risk Committee also has adopted a policy to pre-approve the engagement by Putnam Management and certain of its affiliates of the funds’ independent auditors, even in circumstances where pre-approval is not required by applicable law. Any such requests by Putnam Management or certain of its affiliates are typically submitted in writing to the Committee and explain, among other things, the nature of the proposed engagement, the estimated fees, and why this work should be performed by that particular audit firm as opposed to another one. In reviewing such requests, the Committee considers, among other things, whether the provision of such services by the audit firm are compatible with the independence of the audit firm. |
| The following table presents fees billed by the fund’s independent auditor for services required to be approved pursuant to paragraph (c)(7)(ii) of Rule 2–01 of Regulation S-X. |
| Fiscal year ended | Audit-Related Fees | Tax Fees | All Other Fees | Total Non-Audit Fees | |
| October 31, 2021 | $ — | $264,899 | $ — | $ — | |
| October 31, 2020 | $ — | $345,842 | $ — | $ — | |
| Item 5. Audit Committee of Listed Registrants |
| Not applicable |
| Item 6. Schedule of Investments: |
| The registrant’s schedule of investments in unaffiliated issuers is included in the report to shareholders in Item 1 above. |
| Item 7. Disclosure of Proxy Voting Policies and Procedures For Closed-End Management Investment Companies: |
| Not applicable |
| Item 8. Portfolio Managers of Closed-End Investment Companies |
| Not Applicable |
| Item 9. Purchases of Equity Securities by Closed-End Management Investment Companies and Affiliated Purchasers: |
| Not applicable |
| Item 10. Submission of Matters to a Vote of Security Holders: |
| Not applicable |
| Item 11. Controls and Procedures: |
| (a) The registrant’s principal executive officer and principal financial officer have concluded, based on their evaluation of the effectiveness of the design and operation of the registrant’s disclosure controls and procedures as of a date within 180 days of the filing date of this report, that the design and operation of such procedures are generally effective to provide reasonable assurance that information required to be disclosed by the registrant in this report is recorded, processed, summarized and reported within the time periods specified in the Commission’s rules and forms. |
| (b) Changes in internal control over financial reporting: Not applicable |
| Item 12. Disclosures of Securities Lending Activities for Closed-End Management Investment Companies: |
| Not Applicable |
| Item 13. Exhibits: |
| (a)(1) The Code of Ethics of The Putnam Funds, which incorporates the Code of Ethics of Putnam Investments, is filed herewith. |
| (b) The certifications required by Rule 30a-2(b) under the Investment Company Act of 1940, as amended, are filed herewith. |
| SIGNATURES |
| Pursuant to the requirements of the Securities Exchange Act of 1934 and the Investment Company Act of 1940, the registrant has duly caused this report to be signed on its behalf by the undersigned, thereunto duly authorized. |
| Putnam Funds Trust |
| By (Signature and Title): |
| /s/ Janet C. Smith Janet C. Smith Principal Accounting Officer |
| Date: December 28, 2021 |
| Pursuant to the requirements of the Securities Exchange Act of 1934 and the Investment Company Act of 1940, this report has been signed below by the following persons on behalf of the registrant and in the capacities and on the dates indicated. |
| By (Signature and Title): |
| /s/ Jonathan S. Horwitz Jonathan S. Horwitz Principal Executive Officer |
| Date: December 28, 2021 |
| By (Signature and Title): |
| /s/ Janet C. Smith Janet C. Smith Principal Financial Officer |
| Date: December 28, 2021 |