| UNITED STATES SECURITIES AND EXCHANGE COMMISSION | ||
| Washington, D.C. 20549 | ||
FORM N-CSR | ||
| CERTIFIED SHAREHOLDER REPORT OF REGISTERED MANAGEMENT INVESTMENT COMPANIES | ||
| Investment Company Act file number: | (811-07513) |
| Exact name of registrant as specified in charter: | Putnam Funds Trust |
| Address of principal executive offices: | 100 Federal Street, Boston, Massachusetts 02110 |
| Name and address of agent for service: | Stephen Tate, Vice President 100 Federal Street Boston, Massachusetts 02110 |
| Copy to: | Bryan Chegwidden, Esq. Ropes & Gray LLP 1211 Avenue of the Americas New York, New York 10036 |
| James E. Thomas, Esq. Ropes & Gray LLP 800 Boylston Street Boston, Massachusetts 02199 |
| Registrant’s telephone number, including area code: | (617) 292-1000 |
| Date of fiscal year end: | August 31, 2023 |
| Date of reporting period: | September 1, 2022 – February 28, 2023 |
Item 1. Report to Stockholders: |
| The following is a copy of the report transmitted to stockholders pursuant to Rule 30e-1 under the Investment Company Act of 1940: | |||
Putnam
Emerging Markets
Equity Fund
Semiannual report
2 | 28 | 23
Message from the Trustees
April 4, 2023
Dear Fellow Shareholder:
In the first few months of 2023, we have seen continued U.S. economic growth, a strong jobs market, and persistent inflation. Stocks and bonds rallied in January but pulled back when reports of rising prices caused concern that the U.S. Federal Reserve would raise interest rates more than expected. Generally speaking, the Fed wants to slow economic activity to ease price pressures, but without causing a recession.
While Putnam’s investment teams are aware of the Fed’s balancing act, they remain focused on analyzing companies and individual securities. They see the potential risks in today’s economic environment but also monitor how businesses adjust and strive to perform well, even in an uncertain economy. Their insights help them carefully select securities and build portfolios to pursue returns for you.
Thank you for investing with Putnam.

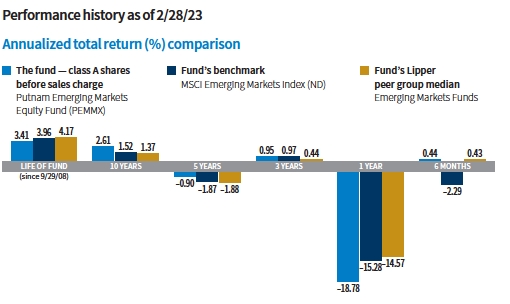
Current performance may be lower or higher than the quoted past performance, which cannot guarantee future results. Share price, principal value, and return will fluctuate, and you may have a gain or a loss when you sell your shares. Performance of class A shares assumes reinvestment of distributions and does not account for taxes. Fund returns in the bar chart do not reflect a sales charge of 5.75%; had they, returns would have been lower. See below and pages 7–8 for additional performance information. For a portion of the periods, the fund had expense limitations, without which returns would have been lower. To obtain the most recent month-end performance, visit putnam.com.
Returns for periods of less than one year are not annualized.
Lipper peer group median is provided by Lipper, a Refinitiv company.

This comparison shows your fund’s performance in the context of broad market indexes for the six months ended 2/28/23. See above and pages 7–8 for additional fund performance information. Index descriptions can be found on pages 12–13.
All Bloomberg indices are provided by Bloomberg Index Services Limited.
| 2 Emerging Markets Equity Fund |

How did emerging market stocks fare for the six-month reporting period?
EM stocks held up well for most of the period, but struggled in the final month, resulting in a decline for the MSCI Emerging Markets Index [ND]. Like stocks in most global markets, EM equities faced ongoing macroeconomic challenges such as rising inflation, an uneven global economic recovery, and the Russia-Ukraine War.
How did the fund perform?
For the six-month reporting period, the fund’s class A shares returned 0.44%, outperforming the fund’s benchmark, the MSCI Emerging Markets Index [ND], which returned –2.29%.
What were some stocks that helped fund performance during the reporting period?
The top contributor for the period was Grupo Financiero Banorte, one of Mexico’s largest banks. Banorte is one of the highest-quality banks in Mexico, in our view, and is recognized for its technology leadership and asset quality. Last year was a strong one for Banorte, which posted a 19% return on equity driven by industry-leading, risk-adjusted net interest
| Emerging Markets Equity Fund 3 |
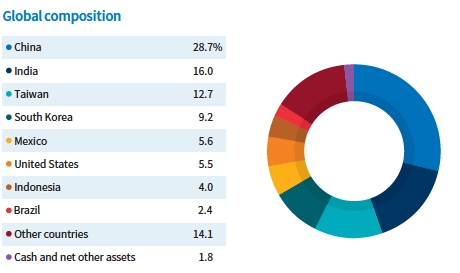
Allocations are shown as a percentage of the fund’s net assets as of 2/28/23. Cash and net other assets, if any, represent the market value weights of cash, derivatives, short-term securities, and other unclassified assets in the portfolio. Summary information may differ from the information in the portfolio schedule notes included in the financial statements due to the inclusion of derivative securities, any interest accruals, the exclusion of as-of trades, if any, and rounding. Holdings and allocations may vary over time.
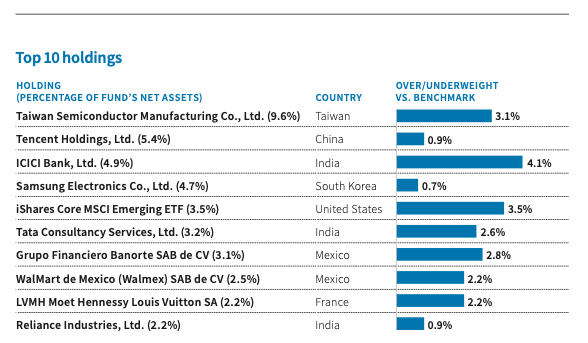
This table shows the fund’s top 10 holdings by percentage of the fund’s net assets as of 2/28/23. Short-term investments and derivatives, if any, are excluded. Holdings may vary over time.
| 4 Emerging Markets Equity Fund |
margins. We expect Banorte will also be a key beneficiary of manufacturing nearshoring to Mexico. Combined with a price-to-book ratio that is still 13% below its long-term average, we believe Banorte continues to offer an attractive long-term risk/reward profile.
Another key contributor for the period was MercadoLibre, one of the largest e-commerce and payment ecosystems in Latin America. The company handled almost $35 billion in merchandise, fulfilled the majority of deliveries through its own logistics network at no cost to customers, and processed more than $120 billion on its payment platform in 2022. Also in 2022, MercadoLibre was able to deliver against intense competition and a tough macroeconomic backdrop, in our view. We continue to believe MercadoLibre offers continued growth potential coupled with what are, in our view, more-than-reasonable valuations.
What were some holdings that detracted from performance during the reporting period?
The top detractor was Alinma Bank, the second-largest Islamic bank and sixth-largest bank by loan book in Saudi Arabia. Alinma benefited from two themes — rising oil prices and higher interest rates — and was the top contributor to performance in the fund’s previous fiscal year. However, during this reporting period, the stock struggled after Alinma reported disappointing fourth-quarter financial results that missed consensus expectations. Despite the recent underperformance, our outlook remains positive and we believe net interest margins can improve and loan growth can continue.

Another detractor was JD.com, the third-largest e-commerce company in China. Our initial thesis was that its core JD Retail business should compound at an above-market growth rate, and we believed that margins could continue their upward trend, driven by operating leverage and cost efficiency. However, a recent slowdown in growth, coupled with its announcement of a subsidy program, resulted in underperformance during the period. Despite China’s increasingly competitive e-commerce landscape, we believe JD.com is uniquely positioned due to its business model,

This table shows the fund’s largest allocation shifts, by percentage, over the past six months. Allocations are shown as a percentage of the fund’s net assets. Current period summary information may differ from the portfolio schedule included in the financial statements due to the inclusion of derivative securities, any interest accruals, the exclusion of as-of trades, if any, the use of different classifications of securities for presentation purposes, and rounding. Holdings and allocations may vary over time.
| Emerging Markets Equity Fund 5 |
strong logistics capabilities, and quality control. It is backed by a solid balance sheet, in our view, and it just started paying an annual dividend. We also believe it offers more-than-reasonable valuations and remains an appealing long-term investment.
What is your outlook for emerging markets?
Despite the macroeconomic challenges, we remain optimistic about EM stocks overall. Their valuations remain compelling, in our view, and we expect the U.S. dollar to weaken, which is often beneficial for EM equity performance. We have overweight positioning in India and Indonesia, as we believe structural drivers will insulate their economies in the event of a global recession. We have also become tactically bullish on China, which faced many headwinds in calendar 2022. China’s economy is rapidly reopening, the government is providing a backstop to the real estate market, and negative regulatory headlines have taken a pause. The outlook for China’s gross domestic product growth and earnings has improved significantly over the past four months. We are focused on areas of growth that we believe are aligned with the Chinese government’s goals, and on businesses that may benefit from increased consumption in China after three years of strict lockdowns.
Thank you, Brian, for your time and insights today.
The views expressed in this report are exclusively those of Putnam Management and are subject to change. They are not meant as investment advice.
Please note that the holdings discussed in this report may not have been held by the fund for the entire period. Portfolio composition is subject to review in accordance with the fund’s investment strategy and may vary in the future. Current and future portfolio holdings are subject to risk.
| 6 Emerging Markets Equity Fund |
Your fund’s performance
This section shows your fund’s performance, price, and distribution information for periods ended February 28, 2023, the end of the first half of its current fiscal year. In accordance with regulatory requirements for mutual funds, we also include performance information as of the most recent calendar quarter-end and expense information taken from the fund’s current prospectus. Performance should always be considered in light of a fund’s investment strategy. Data represent past performance. Past performance does not guarantee future results. More recent returns may be less or more than those shown. Investment return and principal value will fluctuate, and you may have a gain or a loss when you sell your shares. Performance information does not reflect any deduction for taxes a shareholder may owe on fund distributions or on the redemption of fund shares. For the most recent month-end performance, please visit the Individual Investors section at putnam.com or call Putnam at 1-800-225-1581. Class R, R6, and Y shares are not available to all investors. See the Terms and definitions section in this report for definitions of the share classes offered by your fund.
Annualized fund performance Total return for periods ended 2/28/23
| Life of fund | 10 years | 5 years | 3 years | 1 year | 6 months | |
| Class A (9/29/08) | ||||||
| Before sales charge | 3.41% | 2.61% | –0.90% | 0.95% | –18.78% | 0.44% |
| After sales charge | 2.99 | 2.00 | –2.06 | –1.02 | –23.45 | –5.33 |
| Class B (9/29/08) | ||||||
| Before CDSC | 2.98 | 1.98 | –1.63 | 0.20 | –19.36 | 0.09 |
| After CDSC | 2.98 | 1.98 | –1.99 | –0.74 | –23.39 | –4.91 |
| Class C (9/29/08) | ||||||
| Before CDSC | 2.98 | 1.98 | –1.63 | 0.20 | –19.38 | 0.10 |
| After CDSC | 2.98 | 1.98 | –1.63 | 0.20 | –20.19 | –0.90 |
| Class R (9/29/08) | ||||||
| Net asset value | 3.15 | 2.34 | –1.15 | 0.69 | –19.02 | 0.27 |
| Class R6 (5/22/18) | ||||||
| Net asset value | 3.74 | 2.95 | –0.47 | 1.39 | –18.42 | 0.69 |
| Class Y (9/29/08) | ||||||
| Net asset value | 3.68 | 2.87 | –0.64 | 1.21 | –18.62 | 0.52 |
Current performance may be lower or higher than the quoted past performance, which cannot guarantee future results. After-sales-charge returns for class A shares reflect the deduction of the maximum 5.75% sales charge levied at the time of purchase. Class B share returns after contingent deferred sales charge (CDSC) reflect the applicable CDSC, which is 5% in the first year, declining over time to 1% in the sixth year, and is eliminated thereafter. Class C share returns after CDSC reflect a 1% CDSC for the first year that is eliminated thereafter. Class R, R6, and Y shares have no initial sales charge or CDSC. Performance for class R6 shares prior to their inception is derived from the historical performance of class Y shares and has not been adjusted for the lower investor servicing fees applicable to class R6 shares; had it, returns would have been higher.
Returns for periods of less than one year are not annualized.
For a portion of the periods, the fund had expense limitations, without which returns would have been lower.
The fund has had performance fee adjustments that may have had a positive or negative impact on returns.
Class B and C share performance reflects conversion to class A shares after eight years.
| Emerging Markets Equity Fund 7 |
Comparative annualized index returns For periods ended 2/28/23
| Life of fund | 10 years | 5 years | 3 years | 1 year | 6 months | |
| MSCI Emerging Markets | ||||||
| Index (ND) | 3.96% | 1.52% | –1.87% | 0.97% | –15.28% | –2.29% |
| Lipper Emerging Markets | ||||||
| Funds category median* | 4.17 | 1.37 | –1.88 | 0.44 | –14.57 | 0.43 |
Index and Lipper results should be compared with fund performance before sales charge, before CDSC, or at net asset value.
Returns for periods of less than one year are not annualized.
Lipper peer group median is provided by Lipper, a Refinitiv company.
* Over the 6-month, 1-year, 3-year, 5-year, 10-year, and life-of-fund periods ended 2/28/23, there were 814, 789, 705, 618, 369, and 199 funds, respectively, in this Lipper category.
Fund price and distribution information For the six-month period ended 2/28/23
| Class A | Class B | Class C | Class R | Class R6 | Class Y | ||
| Before | After | Net | Net | Net | Net | Net | |
| sales | sales | asset | asset | asset | asset | asset | |
| Share value | charge | charge | value | value | value | value | value |
| 8/31/22 | $11.28 | $11.97 | $10.53 | $10.47 | $11.17 | $11.52 | $11.48 |
| 2/28/23 | 11.33 | 12.02 | 10.54 | 10.48 | 11.20 | 11.60 | 11.54 |
The classification of distributions, if any, is an estimate. Before-sales-charge share value and current dividend rate for class A shares, if applicable, do not take into account any sales charge levied at the time of purchase. After-sales-charge share value, current dividend rate, and current 30-day SEC yield, if applicable, are calculated assuming that the maximum sales charge (5.75% for class A shares) was levied at the time of purchase. Final distribution information will appear on your year-end tax forms.
The fund made no distributions during the period.
Annualized fund performance as of most recent calendar quarter
Total return for periods ended 3/31/23
| Life of fund | 10 years | 5 years | 3 years | 1 year | 6 months | |
| Class A (9/29/08) | ||||||
| Before sales charge | 3.64% | 3.17% | –0.33% | 7.31% | –12.79% | 16.14% |
| After sales charge | 3.22 | 2.56 | –1.50 | 5.21 | –17.80 | 9.46 |
| Class B (9/29/08) | ||||||
| Before CDSC | 3.21 | 2.55 | –1.07 | 6.49 | –13.42 | 15.71 |
| After CDSC | 3.21 | 2.55 | –1.43 | 5.60 | –17.75 | 10.71 |
| Class C (9/29/08) | ||||||
| Before CDSC | 3.21 | 2.55 | –1.07 | 6.53 | –13.42 | 15.69 |
| After CDSC | 3.21 | 2.55 | –1.07 | 6.53 | –14.28 | 14.69 |
| Class R (9/29/08) | ||||||
| Net asset value | 3.38 | 2.91 | –0.58 | 7.06 | –12.98 | 16.00 |
| Class R6 (5/22/18) | ||||||
| Net asset value | 3.96 | 3.51 | 0.09 | 7.74 | –12.40 | 16.38 |
| Class Y (9/29/08) | ||||||
| Net asset value | 3.90 | 3.42 | –0.08 | 7.57 | –12.52 | 16.25 |
See the discussion following the fund performance table on page 7 for information about the calculation of fund performance.
Returns for periods of less than one year are not annualized.
| 8 Emerging Markets Equity Fund |
Your fund’s expenses
As a mutual fund investor, you pay ongoing expenses, such as management fees, distribution fees (12b-1 fees), and other expenses. In the most recent six-month period, your fund’s expenses were limited; had expenses not been limited, they would have been higher. Using the following information, you can estimate how these expenses affect your investment and compare them with the expenses of other funds. You may also pay one-time transaction expenses, including sales charges (loads) and redemption fees, which are not shown in this section and would have resulted in higher total expenses. For more information, see your fund’s prospectus or talk to your financial representative.
Expense ratios
| Class A | Class B | Class C | Class R | Class R6 | Class Y | |
| Net expenses for the fiscal year | ||||||
| ended 8/31/22*† | 1.36% | 2.11% | 2.11% | 1.61% | 0.94% | 1.11% |
| Total annual operating expenses for the | ||||||
| fiscal year ended 8/31/22* | 1.64% | 2.39% | 2.39% | 1.89% | 1.22% | 1.39% |
| Annualized expense ratio for the | ||||||
| six-month period ended 2/28/23‡ | 1.31% | 2.06% | 2.06% | 1.56% | 0.87% | 1.06% |
Fiscal year expense information in this table is taken from the most recent prospectus, is subject to change, and may differ from that shown for the annualized expense ratio and in the financial highlights of this report.
Prospectus expense information also includes the impact of acquired fund fees and expenses of 0.03%, which is not included in the financial highlights or annualized expense ratios. Expenses are shown as a percentage of average net assets.
* Restated to reflect current fees.
† Reflects Putnam Management’s contractual obligation to limit certain fund expenses through 12/30/23.
‡ Includes an increase of 0.04% from annualizing the performance fee adjustment for the six months ended 2/28/23.
Expenses per $1,000
The following table shows the expenses you would have paid on a $1,000 investment in each class of the fund from 9/1/22 to 2/28/23. It also shows how much a $1,000 investment would be worth at the close of the period, assuming actual returns and expenses.
| Class A | Class B | Class C | Class R | Class R6 | Class Y | |
| Expenses paid per $1,000*† | $6.51 | $10.22 | $10.22 | $7.75 | $4.33 | $5.27 |
| Ending value (after expenses) | $1,004.40 | $1,000.90 | $1,001.00 | $1,002.70 | $1,006.90 | $1,005.20 |
* Expenses for each share class are calculated using the fund’s annualized expense ratio for each class, which represents the ongoing expenses as a percentage of average net assets for the six months ended 2/28/23. The expense ratio may differ for each share class.
† Expenses are calculated by multiplying the expense ratio by the average account value for the period; then multiplying the result by the number of days in the period (181); and then dividing that result by the number of days in the year (365).
| Emerging Markets Equity Fund 9 |
Estimate the expenses you paid
To estimate the ongoing expenses you paid for the six months ended 2/28/23, use the following calculation method. To find the value of your investment on 9/1/22, call Putnam at 1-800-225-1581.

Compare expenses using the SEC’s method
The Securities and Exchange Commission (SEC) has established guidelines to help investors assess fund expenses. Per these guidelines, the following table shows your fund’s expenses based on a $1,000 investment, assuming a hypothetical 5% annualized return. You can use this information to compare the ongoing expenses (but not transaction expenses or total costs) of investing in the fund with those of other funds. All mutual fund shareholder reports will provide this information to help you make this comparison. Please note that you cannot use this information to estimate your actual ending account balance and expenses paid during the period.
| Class A | Class B | Class C | Class R | Class R6 | Class Y | |
| Expenses paid per $1,000*† | $6.56 | $10.29 | $10.29 | $7.80 | $4.36 | $5.31 |
| Ending value (after expenses) | $1,018.30 | $1,014.58 | $1,014.58 | $1,017.06 | $1,020.48 | $1,019.54 |
* Expenses for each share class are calculated using the fund’s annualized expense ratio for each class, which represents the ongoing expenses as a percentage of average net assets for the six months ended 2/28/23. The expense ratio may differ for each share class.
† Expenses are calculated by multiplying the expense ratio by the average account value for the six-month period; then multiplying the result by the number of days in the six-month period (181); and then dividing that result by the number of days in the year (365).
| 10 Emerging Markets Equity Fund |
Consider these risks before investing
International investing involves currency, economic, and political risks. Emerging market securities carry illiquidity and volatility risks. Investments in small and/or midsize companies increase the risk of greater price fluctuations. From time to time, the fund may invest a significant portion of its assets in companies in one or more related industries or sectors, which would make the fund more vulnerable to adverse developments affecting those industries or sectors.
Growth stocks may be more susceptible to earnings disappointments, and value stocks may fail to rebound. Risks associated with derivatives include increased investment exposure (which may be considered leverage) and, in the case of over-the-counter instruments, the potential inability to terminate or sell derivatives positions and the potential failure of the other party to the instrument to meet its obligations. The value of investments in the fund’s portfolio may fall or fail to rise over extended periods of time for a variety of reasons, including general economic, political, or financial market conditions; investor sentiment and market perceptions; government actions; geopolitical events or changes; and factors related to a specific issuer, geography, industry, or sector. These and other factors may lead to increased volatility and reduced liquidity in the fund’s portfolio holdings.
Our investment techniques, analyses, and judgments may not produce the outcome we intend. The investments we select for the fund may not perform as well as other securities that we do not select for the fund. We, or the fund’s other service providers, may experience disruptions or operating errors that could have a negative effect on the fund. You can lose money by investing in the fund.
| Emerging Markets Equity Fund 11 |
Terms and definitions
Important terms
Total return shows how the value of the fund’s shares changed over time, assuming you held the shares through the entire period and reinvested all distributions in the fund.
Before sales charge, or net asset value, is the price, or value, of one share of a mutual fund, without a sales charge. Before-sales-charge figures fluctuate with market conditions. They are calculated by dividing the net assets of each class of shares by the number of outstanding shares in the class.
After sales charge is the price of a mutual fund share plus the maximum sales charge levied at the time of purchase. After-sales-charge performance figures shown here assume the 5.75% maximum sales charge for class A shares.
Contingent deferred sales charge (CDSC) is generally a charge applied at the time of the redemption of class B or C shares and assumes redemption at the end of the period. Your fund’s class B CDSC declines over time from a 5% maximum during the first year to 1% during the sixth year. After the sixth year, the CDSC no longer applies. The CDSC for class C shares is 1% for one year after purchase.
Share classes
Class A shares are generally subject to an initial sales charge and no CDSC (except on certain redemptions of shares bought without an initial sales charge).
Class B shares are closed to new investments and are only available by exchange from class B shares of another Putnam fund or through dividend and/or capital gains reinvestment. They are not subject to an initial sales charge and may be subject to a CDSC.
Class C shares are not subject to an initial sales charge and are subject to a CDSC only if the shares are redeemed during the first year.
Class R shares are not subject to an initial sales charge or CDSC and are only available to employer-sponsored retirement plans.
Class R6 shares are not subject to an initial sales charge or CDSC and carry no 12b-1 fee. They are generally only available to employer-sponsored retirement plans, corporate and institutional clients, and clients in other approved programs.
Class Y shares are not subject to an initial sales charge or CDSC and carry no 12b-1 fee. They are generally only available to corporate and institutional clients and clients in other approved programs.
Comparative indexes
Bloomberg U.S. Aggregate Bond Index is an unmanaged index of U.S. investment-grade fixed income securities.
ICE BofA (Intercontinental Exchange Bank of America) U.S. 3-Month Treasury Bill Index is an unmanaged index that seeks to measure the performance of U.S. Treasury bills available in the marketplace.
MSCI Emerging Markets Index (ND) is a free float-adjusted market capitalization index that is designed to measure equity market performance in the global emerging markets. Calculated with net dividends (ND), this total return index reflects the reinvestment of dividends after the deduction of withholding taxes, using a tax rate applicable to non-resident institutional investors who do not benefit from double taxation treaties.
S&P 500® Index is an unmanaged index of common stock performance.
Indexes assume reinvestment of all distributions and do not account for fees. Securities and performance of a fund and an index will differ. You cannot invest directly in an index.
BLOOMBERG® is a trademark and service mark of Bloomberg Finance L.P. and its affiliates (collectively
| 12 Emerging Markets Equity Fund |
“Bloomberg”). Bloomberg or Bloomberg’s licensors own all proprietary rights in the Bloomberg Indices. Neither Bloomberg nor Bloomberg’s licensors approve or endorse this material, or guarantee the accuracy or completeness of any information herein, or make any warranty, express or implied, as to the results to be obtained therefrom, and to the maximum extent allowed by law, neither shall have any liability or responsibility for injury or damages arising in connection therewith.
ICE Data Indices, LLC (“ICE BofA”), used with permission. ICE BofA permits use of the ICE BofA indices and related data on an “as is” basis; makes no warranties regarding same; does not guarantee the suitability, quality, accuracy, timeliness, and/or completeness of the ICE BofA indices or any data included in, related to, or derived therefrom; assumes no liability in connection with the use of the foregoing; and does not sponsor, endorse, or recommend Putnam Investments, or any of its products or services.
Lipper, a Refinitiv company, is a third-party industry-ranking entity that ranks mutual funds. Its rankings do not reflect sales charges. Lipper rankings are based on total return at net asset value relative to other funds that have similar current investment styles or objectives as determined by Lipper. Lipper may change a fund’s category assignment at its discretion. Lipper category medians reflect performance trends for funds within a category.
| Emerging Markets Equity Fund 13 |
Other information for shareholders
Important notice regarding delivery of shareholder documents
In accordance with Securities and Exchange Commission (SEC) regulations, Putnam sends a single notice of internet availability, or a single printed copy, of annual and semiannual shareholder reports, prospectuses, and proxy statements to Putnam shareholders who share the same address, unless a shareholder requests otherwise. If you prefer to receive your own copy of these documents, please call Putnam at 1-800-225-1581, and Putnam will begin sending individual copies within 30 days.
Proxy voting
Putnam is committed to managing our mutual funds in the best interests of our shareholders. The Putnam funds’ proxy voting guidelines and procedures, as well as information regarding how your fund voted proxies relating to portfolio securities during the 12-month period ended June 30, 2022, are available in the Individual Investors section of putnam.com and on the SEC’s website, www.sec.gov. If you have questions about finding forms on the SEC’s website, you may call the SEC at 1-800-SEC-0330. You may also obtain the Putnam funds’ proxy voting guidelines and procedures at no charge by calling Putnam’s Shareholder Services at 1-800-225-1581.
Fund portfolio holdings
The fund will file a complete schedule of its portfolio holdings with the SEC for the first and third quarters of each fiscal year on Form N-PORT within 60 days of the end of such fiscal quarter. Shareholders may obtain the fund’s Form N-PORT on the SEC’s website at www.sec.gov.
Trustee and employee fund ownership
Putnam employees and members of the Board of Trustees place their faith, confidence, and, most importantly, investment dollars in Putnam mutual funds. As of February 28, 2023, Putnam employees had approximately $450,000,000 and the Trustees had approximately $63,000,000 invested in Putnam mutual funds. These amounts include investments by the Trustees’ and employees’ immediate family members as well as investments through retirement and deferred compensation plans.
| 14 Emerging Markets Equity Fund |
Financial statements
These sections of the report, as well as the accompanying Notes, constitute the fund’s financial statements.
The fund’s portfolio lists all the fund’s investments and their values as of the last day of the reporting period. Holdings are organized by asset type and industry sector, country, or state to show areas of concentration and diversification.
Statement of assets and liabilities shows how the fund’s net assets and share price are determined. All investment and non-investment assets are added together. Any unpaid expenses and other liabilities are subtracted from this total. The result is divided by the number of shares to determine the net asset value per share, which is calculated separately for each class of shares. (For funds with preferred shares, the amount subtracted from total assets includes the liquidation preference of preferred shares.)
Statement of operations shows the fund’s net investment gain or loss. This is done by first adding up all the fund’s earnings — from dividends and interest income — and subtracting its operating expenses to determine net investment income (or loss). Then, any net gain or loss the fund realized on the sales of its holdings — as well as any unrealized gains or losses over the period — is added to or subtracted from the net investment result to determine the fund’s net gain or loss for the fiscal period.
Statement of changes in net assets shows how the fund’s net assets were affected by the fund’s net investment gain or loss, by distributions to shareholders, and by changes in the number of the fund’s shares. It lists distributions and their sources (net investment income or realized capital gains) over the current reporting period and the most recent fiscal year-end. The distributions listed here may not match the sources listed in the Statement of operations because the distributions are determined on a tax basis and may be paid in a different period from the one in which they were earned. Dividend sources are estimated at the time of declaration. Actual results may vary. Any non-taxable return of capital cannot be determined until final tax calculations are completed after the end of the fund’s fiscal period.
Financial highlights provide an overview of the fund’s investment results, per-share distributions, expense ratios, net investment income ratios, and portfolio turnover (not required for money market funds) in one summary table, reflecting the five most recent reporting periods. In a semiannual report, the highlights table also includes the current reporting period.
| Emerging Markets Equity Fund 15 |
| The fund’s portfolio 2/28/23 (Unaudited) | ||
| COMMON STOCKS (94.7%)* | Shares | Value |
| Airlines (1.2%) | ||
| Copa Holdings SA Class A (Panama) † S | 49,208 | $4,544,359 |
| 4,544,359 | ||
| Automobiles (2.0%) | ||
| BYD Co., Ltd. Class H (China) | 273,500 | 7,346,642 |
| 7,346,642 | ||
| Banks (15.2%) | ||
| Abu Dhabi Islamic Bank PJSC (United Arab Emirates) | 1,371,902 | 3,898,729 |
| Alinma Bank (Saudi Arabia) | 1,009,481 | 7,912,551 |
| Bank Central Asia Tbk PT (Indonesia) | 6,810,900 | 3,907,303 |
| Bank Mandiri Persero Tbk PT (Indonesia) | 9,635,100 | 6,258,285 |
| Grupo Financiero Banorte SAB de CV Class O (Mexico) | 1,390,000 | 11,766,360 |
| ICICI Bank, Ltd. (India) | 1,789,150 | 18,507,981 |
| KB Financial Group, Inc. (South Korea) | 125,865 | 4,877,103 |
| 57,128,312 | ||
| Chemicals (0.6%) | ||
| Hansol Chemical Co., Ltd. (South Korea) | 14,519 | 2,237,778 |
| 2,237,778 | ||
| Electrical equipment (0.8%) | ||
| KEI Industries, Ltd. (India) | 158,159 | 3,113,477 |
| 3,113,477 | ||
| Electronic equipment, instruments, and components (3.5%) | ||
| E Ink Holdings, Inc. (Taiwan) | 230,000 | 1,456,655 |
| Samsung SDI Co., Ltd. (South Korea) | 13,228 | 6,939,328 |
| Sinbon Electronics Co., Ltd. (Taiwan) | 504,000 | 4,930,297 |
| 13,326,280 | ||
| Food and staples retailing (5.3%) | ||
| Dino Polska SA (Poland) † | 40,778 | 3,405,202 |
| Shoprite Holdings, Ltd. (South Africa) | 309,805 | 3,752,566 |
| Sumber Alfaria Trijaya Tbk PT (Indonesia) | 16,567,900 | 3,150,299 |
| WalMart de Mexico (Walmex) SAB de CV (Mexico) | 2,396,000 | 9,441,784 |
| 19,749,851 | ||
| Food products (1.5%) | ||
| China Mengniu Dairy Co., Ltd. (China) | 1,281,000 | 5,630,382 |
| 5,630,382 | ||
| Gas utilities (1.1%) | ||
| China Resources Gas Group, Ltd. (China) | 955,100 | 4,028,620 |
| 4,028,620 | ||
| Health-care equipment and supplies (1.1%) | ||
| Shenzhen Mindray Bio-Medical Electronics Co., Ltd. Class A (China) | 87,400 | 3,953,737 |
| 3,953,737 | ||
| Health-care providers and services (2.4%) | ||
| Apollo Hospitals Enterprise, Ltd. (India) | 84,744 | 4,509,912 |
| Max Healthcare Institute, Ltd. (India) † | 887,943 | 4,574,199 |
| 9,084,111 | ||
| Hotels, restaurants, and leisure (2.7%) | ||
| H World Group, Ltd. ADR (China) | 126,600 | 5,997,042 |
| Indian Hotels Co., Ltd. (India) | 1,090,432 | 4,096,008 |
| 10,093,050 |
16 Emerging Markets Equity Fund | |
| COMMON STOCKS (94.7%)* cont. | Shares | Value |
| Insurance (3.9%) | ||
| AIA Group, Ltd. (Hong Kong) | 756,800 | $8,018,258 |
| Ping An Insurance Group Co. of China, Ltd. Class H (China) | 981,000 | 6,664,436 |
| 14,682,694 | ||
| Interactive media and services (5.4%) | ||
| Tencent Holdings, Ltd. (China) | 463,000 | 20,344,947 |
| 20,344,947 | ||
| Internet and direct marketing retail (7.4%) | ||
| Alibaba Group Holding, Ltd. (China) † | 643,168 | 7,067,480 |
| JD.com, Inc. Class A (China) | 168,345 | 3,743,209 |
| JD.com, Inc. ADR (China) | 14,000 | 622,160 |
| Meituan Class B (China) † | 427,710 | 7,390,097 |
| MercadoLibre, Inc. (Brazil) † | 4,115 | 5,020,300 |
| Pinduoduo, Inc. ADR (China) † | 47,100 | 4,132,083 |
| 27,975,329 | ||
| IT Services (3.2%) | ||
| Tata Consultancy Services, Ltd. (India) | 299,803 | 12,003,503 |
| 12,003,503 | ||
| Life sciences tools and services (1.2%) | ||
| Hangzhou Tigermed Consulting Co., Ltd. Class H (China) | 395,500 | 4,561,939 |
| 4,561,939 | ||
| Machinery (0.8%) | ||
| Shenzhen Inovance Technology Co., Ltd. Class A (China) | 300,160 | 3,165,974 |
| 3,165,974 | ||
| Metals and mining (1.1%) | ||
| Anglo American PLC (Johannesburg Exchange) (United Kingdom) | 78,942 | 2,739,916 |
| Vale Indonesia Tbk PT (Indonesia) † | 3,406,600 | 1,528,341 |
| 4,268,257 | ||
| Oil, gas, and consumable fuels (3.5%) | ||
| PetroChina Co., Ltd. Class H (China) | 9,502,000 | 4,850,879 |
| Reliance Industries, Ltd. (India) | 294,709 | 8,276,097 |
| 13,126,976 | ||
| Pharmaceuticals (2.2%) | ||
| AstraZeneca PLC (United Kingdom) | 41,275 | 5,392,068 |
| Sun Pharmaceutical Industries, Ltd. (India) | 254,136 | 2,939,513 |
| 8,331,581 | ||
| Professional services (1.0%) | ||
| Centre Testing International Group Co., Ltd. Class A (China) | 1,116,856 | 3,602,481 |
| 3,602,481 | ||
| Real estate management and development (1.1%) | ||
| Country Garden Services Holdings Co., Ltd. (China) | 977,000 | 1,811,151 |
| Phoenix Mills, Ltd. (The) (India) | 130,269 | 2,179,628 |
| 3,990,779 | ||
| Semiconductors and semiconductor equipment (13.8%) | ||
| Advanced Micro Devices, Inc. † | 95,700 | 7,520,106 |
| ASPEED Technology, Inc. (Taiwan) | 16,700 | 1,514,510 |
| Faraday Technology Corp. (Taiwan) | 573,000 | 3,448,251 |
| LEENO Industrial, Inc. (South Korea) | 25,964 | 3,174,138 |
| Taiwan Semiconductor Manufacturing Co., Ltd. (Taiwan) | 2,184,889 | 36,221,209 |
| 51,878,214 |
Emerging Markets Equity Fund 17 | |
| COMMON STOCKS (94.7%)* cont. | Shares | Value |
| Software (1.1%) | ||
| Totvs SA (Brazil) | 779,620 | $4,063,802 |
| 4,063,802 | ||
| Technology hardware, storage, and peripherals (4.7%) | ||
| Samsung Electronics Co., Ltd. (South Korea) | 382,975 | 17,487,989 |
| 17,487,989 | ||
| Textiles, apparel, and luxury goods (5.6%) | ||
| Li Ning Co., Ltd. (China) | 796,500 | 6,845,975 |
| LVMH Moet Hennessy Louis Vuitton SA (France) | 10,033 | 8,352,871 |
| Shenzhou International Group Holdings, Ltd. (China) | 525,100 | 5,762,291 |
| 20,961,137 | ||
| Transportation infrastructure (1.3%) | ||
| International Container Terminal Services, Inc. (Philippines) | 1,367,310 | 4,948,225 |
| 4,948,225 | ||
| Total common stocks (cost $318,957,126) | $355,630,426 | |
| INVESTMENT COMPANIES (3.5%)* | Shares | Value |
| iShares Core MSCI Emerging Markets ETF S | 281,100 | $13,310,085 |
| Total investment companies (cost $14,024,065) | $13,310,085 | |
| SHORT-TERM INVESTMENTS (5.3%)* | Shares | Value | |
| Putnam Cash Collateral Pool, LLC 4.85% d | 12,539,778 | $12,539,778 | |
| Putnam Short Term Investment Fund Class P 4.72% L | 7,214,363 | 7,214,363 | |
| Total short-term investments (cost $19,754,141) | $19,754,141 | ||
| TOTAL INVESTMENTS | ||
| Total investments (cost $352,735,332) | $388,694,652 | |
| Key to holding’s abbreviations | |||
| ADR | American Depository Receipts: Represents ownership of foreign securities on deposit with a custodian bank. | ||
| ETF | Exchange Traded Fund | ||
| PJSC | Public Joint Stock Company | ||
| Notes to the fund’s portfolio | |||
| Unless noted otherwise, the notes to the fund’s portfolio are for the close of the fund’s reporting period, which ran from September 1, 2022 through February 28, 2023 (the reporting period). Within the following notes to the portfolio, references to “Putnam Management” represent Putnam Investment Management, LLC, the fund’s manager, an indirect wholly-owned subsidiary of Putnam Investments, LLC and references to “ASC 820” represent Accounting Standards Codification 820 Fair Value Measurements and Disclosures. | |||
| * | Percentages indicated are based on net assets of $375,629,892. | ||
| † | This security is non-income-producing. | ||
| d | Affiliated company. See Notes 1 and 5 to the financial statements regarding securities lending. The rate quoted in the security description is the annualized 7-day yield of the fund at the close of the reporting period. | ||
| L | Affiliated company (Note 5). The rate quoted in the security description is the annualized 7-day yield of the fund at the close of the reporting period. | ||
| S | Security on loan, in part or in entirety, at the close of the reporting period (Note 1). | ||
| DIVERSIFICATION BY COUNTRY | ||||
| Distribution of investments by country of risk at the close of the reporting period, excluding collateral received, if any (as a percentage of Portfolio Value): | ||||
| China | 28.6% | United Kingdom | 2.2% | |
| India | 16.0 | Hong Kong | 2.1 | |
| Taiwan | 12.7 | Saudi Arabia | 2.1 | |
| South Korea | 9.2 | Philippines | 1.3 | |
| United States | 7.5 | Panama | 1.2 | |
| Mexico | 5.6 | United Arab Emirates | 1.0 | |
| Indonesia | 4.0 | South Africa | 1.0 | |
| Brazil | 2.4 | Poland | 0.9 | |
| France | 2.2 | Total | 100.0% | |
18 Emerging Markets Equity Fund | |
ASC 820 establishes a three-level hierarchy for disclosure of fair value measurements. The valuation hierarchy is based upon the transparency of inputs to the valuation of the fund’s investments. The three levels are defined as follows:
Level 1: Valuations based on quoted prices for identical securities in active markets.
Level 2: Valuations based on quoted prices in markets that are not active or for which all significant inputs are observable, either directly or indirectly.
Level 3: Valuations based on inputs that are unobservable and significant to the fair value measurement.
The following is a summary of the inputs used to value the fund’s net assets as of the close of the reporting period:
| Valuation inputs | |||
| Investments in securities: | Level 1 | Level 2 | Level 3 |
| Common stocks*: | |||
| Communication services | $— | $20,344,947 | $— |
| Consumer discretionary | 15,771,585 | 50,604,573 | — |
| Consumer staples | 9,441,784 | 15,938,449 | — |
| Energy | — | 13,126,976 | — |
| Financials | 11,766,360 | 60,044,646 | — |
| Health care | — | 25,931,368 | — |
| Industrials | 4,544,359 | 14,830,157 | — |
| Information technology | 11,583,908 | 87,175,880 | — |
| Materials | — | 6,506,035 | — |
| Real estate | — | 3,990,779 | — |
| Utilities | — | 4,028,620 | — |
| Total common stocks | 53,107,996 | 302,522,430 | — |
| Investment companies | 13,310,085 | — | — |
| Short-term investments | — | 19,754,141 | — |
| Totals by level | $66,418,081 | $322,276,571 | $— |
| * Common stock classifications are presented at the sector level, which may differ from the fund’s portfolio presentation. | |||
The accompanying notes are an integral part of these financial statements.
Emerging Markets Equity Fund 19 | |
Statement of assets and liabilities 2/28/23 (Unaudited)
| ASSETS | |
| Investment in securities, at value, including $12,282,350 of securities on loan (Note 1): | |
| Unaffiliated issuers (identified cost $332,981,191) | $368,940,511 |
| Affiliated issuers (identified cost $19,754,141) (Notes 1 and 5) | 19,754,141 |
| Foreign currency (cost $2,174) (Note 1) | 1,381 |
| Dividends, interest and other receivables | 1,520,133 |
| Foreign tax reclaim | 232,067 |
| Receivable for shares of the fund sold | 516,237 |
| Prepaid assets | 52,656 |
| Total assets | 391,017,126 |
| LIABILITIES | |
| Payable for investments purchased | 1,024,890 |
| Payable for shares of the fund repurchased | 236,327 |
| Payable for compensation of Manager (Note 2) | 21,564 |
| Payable for custodian fees (Note 2) | 103,426 |
| Payable for investor servicing fees (Note 2) | 139,631 |
| Payable for Trustee compensation and expenses (Note 2) | 159,049 |
| Payable for administrative services (Note 2) | 1,384 |
| Payable for distribution fees (Note 2) | 89,624 |
| Payable for foreign capital gains taxes | 966,160 |
| Collateral on securities loaned, at value (Note 1) | 12,539,778 |
| Other accrued expenses | 105,401 |
| Total liabilities | 15,387,234 |
| Net assets | $375,629,892 |
| REPRESENTED BY | |
| Paid-in capital (Unlimited shares authorized) (Notes 1 and 4) | $452,578,726 |
| Total distributable earnings (Note 1) | (76,948,834) |
| Total — Representing net assets applicable to capital shares outstanding | $375,629,892 |
| COMPUTATION OF NET ASSET VALUE AND OFFERING PRICE | |
| Net asset value and redemption price per class A share | |
| ($188,049,652 divided by 16,595,299 shares) | $11.33 |
| Offering price per class A share (100/94.25 of $11.33)* | $12.02 |
| Net asset value and offering price per class B share ($852,964 divided by 80,944 shares)** | $10.54 |
| Net asset value and offering price per class C share ($6,031,851 divided by 575,791 shares)** | $10.48 |
| Net asset value, offering price and redemption price per class R share | |
| ($4,696,307 divided by 419,173 shares) | $11.20 |
| Net asset value, offering price and redemption price per class R6 share | |
| ($26,943,636 divided by 2,323,370 shares) | $11.60 |
| Net asset value, offering price and redemption price per class Y share | |
| ($149,055,482 divided by 12,917,787 shares) | $11.54 |
* On single retail sales of less than $50,000. On sales of $50,000 or more the offering price is reduced.
** Redemption price per share is equal to net asset value less any applicable contingent deferred sales charge.
The accompanying notes are an integral part of these financial statements.
| 20 Emerging Markets Equity Fund |
Statement of operations Six months ended 2/28/23 (Unaudited)
| INVESTMENT INCOME | |
| Dividends (net of foreign tax of $464,098) | $3,348,749 |
| Interest (including interest income of $69,932 from investments in affiliated issuers) (Note 5) | 69,932 |
| Securities lending (net of expenses) (Notes 1 and 5) | 5,024 |
| Total investment income | 3,423,705 |
| EXPENSES | |
| Compensation of Manager (Note 2) | 1,748,287 |
| Investor servicing fees (Note 2) | 414,918 |
| Custodian fees (Note 2) | 110,571 |
| Trustee compensation and expenses (Note 2) | 8,294 |
| Distribution fees (Note 2) | 282,325 |
| Administrative services (Note 2) | 7,592 |
| Other | 164,218 |
| Fees waived and reimbursed by Manager (Note 2) | (547,729) |
| Total expenses | 2,188,476 |
| Expense reduction (Note 2) | (1,282) |
| Net expenses | 2,187,194 |
| Net investment income | 1,236,511 |
| REALIZED AND UNREALIZED GAIN (LOSS) | |
| Net realized gain (loss) on: | |
| Securities from unaffiliated issuers (net of foreign tax of $29,582) (Notes 1 and 3) | (31,371,903) |
| Foreign currency transactions (Note 1) | (98,618) |
| Total net realized loss | (31,470,521) |
| Change in net unrealized appreciation (depreciation) on: | |
| Securities from unaffiliated issuers (net of decrease in deferred foreign taxes of $145,838) | 31,564,554 |
| Assets and liabilities in foreign currencies | 10,322 |
| Total change in net unrealized appreciation | 31,574,876 |
| Net gain on investments | 104,355 |
| Net increase in net assets resulting from operations | $1,340,866 |
The accompanying notes are an integral part of these financial statements.
| Emerging Markets Equity Fund 21 |
Statement of changes in net assets
| INCREASE (DECREASE) IN NET ASSETS | Six months ended 2/28/23* | Year ended 8/31/22 |
| Operations | ||
| Net investment income | $1,236,511 | $2,353,396 |
| Net realized loss on investments | ||
| and foreign currency transactions | (31,470,521) | (77,029,303) |
| Change in net unrealized appreciation (depreciation) | ||
| of investments and assets and liabilities | ||
| in foreign currencies | 31,574,876 | (108,426,441) |
| Net increase (decrease) in net assets resulting | ||
| from operations | 1,340,866 | (183,102,348) |
| Distributions to shareholders (Note 1): | ||
| From ordinary income | ||
| Net investment income | ||
| Class A | — | (129,587) |
| Class B | — | (1,142) |
| Class C | — | (5,588) |
| Class R | — | (2,730) |
| Class R6 | — | (16,951) |
| Class Y | — | (99,009) |
| Net realized short-term gain on investments | ||
| Class A | — | (7,112,162) |
| Class B | — | (62,676) |
| Class C | — | (306,689) |
| Class R | — | (149,816) |
| Class R6 | — | (930,304) |
| Class Y | — | (5,434,022) |
| From net realized long-term gain on investments | ||
| Class A | — | (7,205,641) |
| Class B | — | (63,499) |
| Class C | — | (310,719) |
| Class R | — | (151,784) |
| Class R6 | — | (942,531) |
| Class Y | — | (5,505,442) |
| Decrease from capital share transactions (Note 4) | (1,218,395) | (46,019,426) |
| Total increase (decrease) in net assets | 122,471 | (257,552,066) |
| NET ASSETS | ||
| Beginning of period | 375,507,421 | 633,059,487 |
| End of period | $375,629,892 | $375,507,421 |
* Unaudited.
The accompanying notes are an integral part of these financial statements.
| 22 Emerging Markets Equity Fund |
| This page left blank intentionally. |
| Emerging Markets Equity Fund 23 |
Financial highlights
(For a common share outstanding throughout the period)
| INVESTMENT OPERATIONS | LESS DISTRIBUTIONS | RATIOS AND SUPPLEMENTAL DATA | |||||||||||
| Ratio | Ratio of net | ||||||||||||
| Net asset | Net realized | of expenses | investment | ||||||||||
| value, | and unrealized | Total from | From net | From net | Net asset | Total return | Net assets, | to average | income (loss) | Portfolio | |||
| beginning | Net investment | gain (loss) | investment | investment | realized gain | Total | value, end | at net asset | end of period | net assets | to average | turnover | |
| Period ended | of period | income (loss)a | on investments | operations | income | on investments | distributions | of period | value (%)b | (in thousands) | (%)c,d | net assets (%)c | (%) |
| Class A | |||||||||||||
| February 28, 2023** | $11.28 | .03e | .02 | .05 | — | — | — | $11.33 | .44* | $188,050 | .65* | .29*e | 38* |
| August 31, 2022 | 17.25 | .05 | (5.20) | (5.15) | (.01) | (.81) | (.82) | 11.28 | (31.05) | 197,474 | 1.33 | .38 | 127 |
| August 31, 2021 | 14.68 | (.01) | 2.86 | 2.85 | (.02) | (.26) | (.28) | 17.25 | 19.50 | 315,105 | 1.29 | (.07) | 124 |
| August 31, 2020 | 11.05 | .08f | 3.69 | 3.77 | (.14) | — | (.14) | 14.68 | 34.30 | 269,748 | 1.31 | .60f | 127 |
| August 31, 2019 | 11.75 | .09 | (.57) | (.48) | (.01) | (.21) | (.22) | 11.05 | (3.96) | 36,325 | 1.26 | .80 | 175 |
| August 31, 2018 | 11.82 | .08 | (.14) | (.06) | (.01) | — | (.01) | 11.75 | (.53) | 41,379 | 1.57 | .67 | 172 |
| Class B | |||||||||||||
| February 28, 2023** | $10.53 | (.01)e | .02 | .01 | — | — | — | $10.54 | .09* | $853 | 1.02* | (.09)*e | 38* |
| August 31, 2022 | 16.28 | (.07)f | (4.86) | (4.93) | (.01) | (.81) | (.82) | 10.53 | (31.57) | 1,227 | 2.08 | (.49)f | 127 |
| August 31, 2021 | 13.95 | (.13) | 2.72 | 2.59 | — | (.26) | (.26) | 16.28 | 18.65 | 2,993 | 2.04 | (.81) | 124 |
| August 31, 2020 | 10.52 | (.05) | 3.54 | 3.49 | (.06) | — | (.06) | 13.95 | 33.26 | 3,493 | 2.06 | (.43) | 127 |
| August 31, 2019 | 11.27 | .02 | (.56) | (.54) | — | (.21) | (.21) | 10.52 | (4.67) | 1,998 | 2.01 | .17 | 175 |
| August 31, 2018 | 11.41 | (.01) | (.13) | (.14) | — | — | — | 11.27 | (1.23) | 2,650 | 2.32 | (.09) | 172 |
| Class C | |||||||||||||
| February 28, 2023** | $10.47 | (.01)e | .02 | .01 | — | — | — | $10.48 | .10* | $6,032 | 1.02* | (.08)*e | 38* |
| August 31, 2022 | 16.19 | (.06) | (4.84) | (4.90) | (.01) | (.81) | (.82) | 10.47 | (31.55) | 7,088 | 2.08 | (.42) | 127 |
| August 31, 2021 | 13.88 | (.13) | 2.70 | 2.57 | — | (.26) | (.26) | 16.19 | 18.60 | 13,498 | 2.04 | (.82) | 124 |
| August 31, 2020 | 10.48 | (.05) | 3.52 | 3.47 | (.07) | — | (.07) | 13.88 | 33.27 | 11,606 | 2.06 | (.47) | 127 |
| August 31, 2019 | 11.23 | .02 | (.56) | (.54) | — | (.21) | (.21) | 10.48 | (4.69) | 6,546 | 2.01 | .19 | 175 |
| August 31, 2018 | 11.37 | (.02) | (.12) | (.14) | — | — | — | 11.23 | (1.23) | 7,163 | 2.32 | (.12) | 172 |
| Class R | |||||||||||||
| February 28, 2023** | $11.17 | .02e | .01 | .03 | — | — | — | $11.20 | .27* | $4,696 | .78* | .17*e | 38* |
| August 31, 2022 | 17.13 | .02 | (5.16) | (5.14) | (.01) | (.81) | (.82) | 11.17 | (31.21) | 4,510 | 1.58 | .17 | 127 |
| August 31, 2021 | 14.62 | (.06) | 2.86 | 2.80 | (.03) | (.26) | (.29) | 17.13 | 19.25 | 6,419 | 1.54 | (.35) | 124 |
| August 31, 2020 | 10.97 | .01 | 3.70 | 3.71 | (.06) | — | (.06) | 14.62 | 33.86 | 1,119 | 1.56 | .11 | 127 |
| August 31, 2019 | 11.68 | .08 | (.58) | (.50) | — | (.21) | (.21) | 10.97 | (4.16) | 1,093 | 1.51 | .74 | 175 |
| August 31, 2018 | 11.77 | .04 | (.13) | (.09) | — | — | — | 11.68 | (.76) | 1,100 | 1.82 | .32 | 172 |
| Class R6 | |||||||||||||
| February 28, 2023** | $11.52 | .06e | .02 | .08 | — | — | — | $11.60 | .69* | $26,944 | .43* | .51*e | 38* |
| August 31, 2022 | 17.53 | .11 | (5.30) | (5.19) | (.01) | (.81) | (.82) | 11.52 | (30.77) | 27,655 | .91 | .81 | 127 |
| August 31, 2021 | 14.88 | .05 | 2.92 | 2.97 | (.06) | (.26) | (.32) | 17.53 | 20.06 | 41,708 | .89 | .31 | 124 |
| August 31, 2020 | 11.22 | .10 | 3.77 | 3.87 | (.21) | — | (.21) | 14.88 | 34.81 | 22,945 | .89 | .76 | 127 |
| August 31, 2019 | 11.89 | .17 | (.61) | (.44) | (.02) | (.21) | (.23) | 11.22 | (3.55) | 10,143 | .82 | 1.47 | 175 |
| August 31, 2018† | 13.13 | .12 | (1.36) | (1.24) | — | — | — | 11.89 | (9.44)* | 7,219 | .32* | .98* | 172 |
See notes to financial highlights at the end of this section.
The accompanying notes are an integral part of these financial statements.
| 24 Emerging Markets Equity Fund | Emerging Markets Equity Fund 25 |
Financial highlights cont.
| INVESTMENT OPERATIONS | LESS DISTRIBUTIONS | RATIOS AND SUPPLEMENTAL DATA | |||||||||||
| Ratio | Ratio of net | ||||||||||||
| Net asset | Net realized | of expenses | investment | ||||||||||
| value, | and unrealized | Total from | From net | From net | Net asset | Total return | Net assets, | to average | income (loss) | Portfolio | |||
| beginning | Net investment | gain (loss) | investment | investment | realized gain | Total | value, end | at net asset | end of period | net assets | to average | turnover | |
| Period ended | of period | income (loss)a | on investments | operations | income | on investments | distributions | of period | value (%)b | (in thousands) | (%)c,d | net assets (%)c | (%) |
| Class Y | |||||||||||||
| February 28, 2023** | $11.48 | .04e | .02 | .06 | — | — | — | $11.54 | .52* | $149,055 | .53* | .39*e | 38* |
| August 31, 2022 | 17.49 | .08 | (5.27) | (5.19) | (.01) | (.81) | (.82) | 11.48 | (30.84) | 137,553 | 1.08 | .60 | 127 |
| August 31, 2021 | 14.86 | .02 | 2.91 | 2.93 | (.04) | (.26) | (.30) | 17.49 | 19.84 | 253,336 | 1.04 | .13 | 124 |
| August 31, 2020 | 11.19 | .06 | 3.79 | 3.85 | (.18) | — | (.18) | 14.86 | 34.66 | 82,640 | 1.06 | .46 | 127 |
| August 31, 2019 | 11.88 | .13 | (.59) | (.46) | (.02) | (.21) | (.23) | 11.19 | (3.74) | 69,989 | 1.01 | 1.17 | 175 |
| August 31, 2018 | 11.94 | .13 | (.16) | (.03) | (.03) | — | (.03) | 11.88 | (.26) | 81,472 | 1.32 | 1.00 | 172 |
* Not annualized.
** Unaudited.
† For the period May 22, 2018 (commencement of operations) to August 31, 2018.
a Per share net investment income (loss) has been determined on the basis of the weighted average number of shares outstanding during the period.
b Total return assumes dividend reinvestment and does not reflect the effect of sales charges.
c Reflects an involuntary contractual expense limitation in effect during the period. As a result of such limitation, the expenses of each class reflect a reduction of the following amounts as a percentage of the average net assets of each class (Note 2):
| 2/28/23 | 8/31/22 | 8/31/21 | 8/31/20 | 8/31/19 | 8/31/18 | |
| Class A | 0.15% | 0.29% | 0.27% | 0.48% | 0.45% | 0.21% |
| Class B | 0.15 | 0.29 | 0.27 | 0.48 | 0.45 | 0.21 |
| Class C | 0.15 | 0.29 | 0.27 | 0.48 | 0.45 | 0.21 |
| Class R | 0.15 | 0.29 | 0.27 | 0.48 | 0.45 | 0.21 |
| Class R6 | 0.15 | 0.29 | 0.27 | 0.48 | 0.45 | 0.06 |
| Class Y | 0.15 | 0.29 | 0.27 | 0.48 | 0.45 | 0.21 |
d Includes amounts paid through expense offset and/or brokerage/service arrangements, if any (Note 2). Also excludes acquired fund fees and expenses, if any.
e Reflects a dividend received by the fund from a single issuer which amounted to the following amounts:
| Per share | Percentage of average net assets | |
| Class A | $0.03 | 0.28% |
| Class B | 0.03 | 0.27 |
| Class C | 0.03 | 0.28 |
| Class R | 0.03 | 0.29 |
| Class R6 | 0.03 | 0.28 |
| Class Y | 0.03 | 0.28 |
f The net investment income ratio and per share amount shown for the period ending may not correspond with the expected class specific differences for the period due to the timing of subscriptions into or redemptions out of the class.
The accompanying notes are an integral part of these financial statements.
| 26 Emerging Markets Equity Fund | Emerging Markets Equity Fund 27 |
Notes to financial statements 2/28/23 (Unaudited)
Within the following Notes to financial statements, references to “State Street” represent State Street Bank and Trust Company, references to “the SEC” represent the Securities and Exchange Commission, references to “Putnam Management” represent Putnam Investment Management, LLC, the fund’s manager, an indirect wholly-owned subsidiary of Putnam Investments, LLC. Additionally, references to “OTC”, if any, represent over-the-counter and references to “ESG”, if any, represent environmental, social and governance. Unless otherwise noted, the “reporting period” represents the period from September 1, 2022 through February 28, 2023.
Putnam Emerging Markets Equity Fund (the fund) is a non-diversified series (prior to September 29, 2022, the fund was a diversified series) of Putnam Funds Trust (the Trust), a Massachusetts business trust registered under the Investment Company Act of 1940, as amended, as an open-end management investment company. The goal of the fund is to seek long-term capital appreciation. The fund invests mainly in common stocks (growth or value stocks or both) of emerging market companies of any size that Putnam Management believes have favorable investment potential. For example, the fund may purchase stocks of companies with stock prices that reflect a value lower than that which Putnam Management places on the company. Putnam Management may also consider other factors that Putnam Management believes will cause the stock price to rise. Under normal circumstances, Putnam Management invests at least 80% of the fund’s net assets in equity securities of emerging market companies. This policy may be changed only after 60 days’ notice to shareholders. Emerging markets include countries in the MSCI Emerging Markets Index or that Putnam Management considers to be emerging markets based on Putnam Management’s evaluation of their level of economic development or the size and nature of their securities markets. Putnam Management may consider, among other factors, a company’s valuation, financial strength, growth potential, competitive position in its industry, projected future earnings, cash flows and dividends when deciding whether to buy or sell investments. The fund may also use derivatives, such as futures, options, certain foreign currency transactions, warrants and swap contracts, for both hedging and non-hedging purposes. The fund is “non-diversified,” which means it may invest a greater percentage of its assets in fewer issuers than a “diversified” fund.
The fund offers the following share classes. The expenses for each class of shares may differ based on the distribution and investor servicing fees of each class, which are identified in Note 2.
| Share class | Sales charge | Contingent deferred sales charge | Conversion feature |
| 1.00% on certain redemptions of shares | |||
| Class A | Up to 5.75% | bought with no initial sales charge | None |
| Converts to class A shares | |||
| Class B* | None | 5.00% phased out over six years | after 8 years |
| Converts to class A shares | |||
| Class C | None | 1.00% eliminated after one year | after 8 years |
| Class R† | None | None | None |
| Class R6† | None | None | None |
| Class Y† | None | None | None |
* Purchases of class B shares are closed to new and existing investors except by exchange from class B shares of another Putnam fund or through dividend and/or capital gains reinvestment.
† Not available to all investors.
In the normal course of business, the fund enters into contracts that may include agreements to indemnify another party under given circumstances. The fund’s maximum exposure under these arrangements is unknown as this would involve future claims that may be, but have not yet been, made against the fund. However, the fund’s management team expects the risk of material loss to be remote.
The fund has entered into contractual arrangements with an investment adviser, administrator, distributor, shareholder servicing agent and custodian, who each provide services to the fund. Unless expressly stated otherwise, shareholders are not parties to, or intended beneficiaries of these contractual arrangements, and these contractual arrangements are not intended to create any shareholder right to enforce them against the service providers or to seek any remedy under them against the service providers, either directly or on behalf of the fund.
| 28 Emerging Markets Equity Fund |
Under the fund’s Amended and Restated Agreement and Declaration of Trust, any claims asserted against or on behalf of the Putnam Funds, including claims against Trustees and Officers, must be brought in state and federal courts located within the Commonwealth of Massachusetts.
Note 1: Significant accounting policies
The following is a summary of significant accounting policies consistently followed by the fund in the preparation of its financial statements. The preparation of financial statements is in conformity with accounting principles generally accepted in the United States of America and requires management to make estimates and assumptions that affect the reported amounts of assets and liabilities in the financial statements and the reported amounts of increases and decreases in net assets from operations. Actual results could differ from those estimates. Subsequent events after the Statement of assets and liabilities date through the date that the financial statements were issued have been evaluated in the preparation of the financial statements.
Investment income, realized and unrealized gains and losses and expenses of the fund are borne pro-rata based on the relative net assets of each class to the total net assets of the fund, except that each class bears expenses unique to that class (including the distribution fees applicable to such classes). Each class votes as a class only with respect to its own distribution plan or other matters on which a class vote is required by law or determined by the Trustees. If the fund were liquidated, shares of each class would receive their pro-rata share of the net assets of the fund. In addition, the Trustees declare separate dividends on each class of shares.
Security valuation Portfolio securities and other investments are valued using policies and procedures adopted by the Board of Trustees. The Trustees have formed a Pricing Committee to oversee the implementation of these procedures and have delegated responsibility for valuing the fund’s assets in accordance with these procedures to Putnam Management. Putnam Management has established an internal Valuation Committee that is responsible for making fair value determinations, evaluating the effectiveness of the pricing policies of the fund and reporting to the Pricing Committee.
Investments for which market quotations are readily available are valued at the last reported sales price on their principal exchange, or official closing price for certain markets, and are classified as Level 1 securities under Accounting Standards Codification 820 Fair Value Measurements and Disclosures (ASC 820). If no sales are reported, as in the case of some securities that are traded OTC, a security is valued at its last reported bid price and is generally categorized as a Level 2 security.
Investments in open-end investment companies (excluding exchange-traded funds), if any, which can be classified as Level 1 or Level 2 securities, are valued based on their net asset value. The net asset value of such investment companies equals the total value of their assets less their liabilities and divided by the number of their outstanding shares.
Many securities markets and exchanges outside the U.S. close prior to the scheduled close of the New York Stock Exchange and therefore the closing prices for securities in such markets or on such exchanges may not fully reflect events that occur after such close but before the scheduled close of the New York Stock Exchange. Accordingly, on certain days, the fund will fair value certain foreign equity securities taking into account multiple factors including movements in the U.S. securities markets, currency valuations and comparisons to the valuation of American Depository Receipts, exchange-traded funds and futures contracts. The foreign equity securities, which would generally be classified as Level 1 securities, will be transferred to Level 2 of the fair value hierarchy when they are valued at fair value. The number of days on which fair value prices will be used will depend on market activity and it is possible that fair value prices will be used by the fund to a significant extent. At the close of the reporting period, fair value pricing was used for certain foreign securities in the portfolio. Securities quoted in foreign currencies, if any, are translated into U.S. dollars at the current exchange rate. Short-term securities with remaining maturities of 60 days or less are valued using an independent pricing service approved by the Trustees, and are classified as Level 2 securities.
To the extent a pricing service or dealer is unable to value a security or provides a valuation that Putnam Management does not believe accurately reflects the security’s fair value, the security will be valued at fair value by Putnam Management in accordance with policies and procedures approved by the Trustees. Certain investments, including certain restricted and illiquid securities and derivatives, are also valued at fair value following procedures approved by the Trustees. These valuations consider such factors as significant market or specific security events such as interest rate or credit quality changes, various relationships with other securities, discount
| Emerging Markets Equity Fund 29 |
rates, U.S. Treasury, U.S. swap and credit yields, index levels, convexity exposures, recovery rates, sales and other multiples and resale restrictions. These securities are classified as Level 2 or as Level 3 depending on the priority of the significant inputs.
To assess the continuing appropriateness of fair valuations, the Valuation Committee reviews and affirms the reasonableness of such valuations on a regular basis after considering all relevant information that is reasonably available. Such valuations and procedures are reviewed periodically by the Trustees. The fair value of securities is generally determined as the amount that the fund could reasonably expect to realize from an orderly disposition of such securities over a reasonable period of time. By its nature, a fair value price is a good faith estimate of the value of a security in a current sale and does not reflect an actual market price, which may be different by a material amount.
Security transactions and related investment income Security transactions are recorded on the trade date (the date the order to buy or sell is executed). Gains or losses on securities sold are determined on the identified cost basis.
Interest income, net of any applicable withholding taxes, if any, is recorded on the accrual basis. Amortization and accretion of premiums and discounts on debt securities, if any, is recorded on the accrual basis.
Dividend income, net of any applicable withholding taxes, is recognized on the ex-dividend date except that certain dividends from foreign securities, if any, are recognized as soon as the fund is informed of the ex-dividend date. Non-cash dividends, if any, are recorded at the fair value of the securities received. Dividends representing a return of capital or capital gains, if any, are reflected as a reduction of cost and/or as a realized gain.
Foreign currency translation The accounting records of the fund are maintained in U.S. dollars. The fair value of foreign securities, currency holdings, and other assets and liabilities is recorded in the books and records of the fund after translation to U.S. dollars based on the exchange rates on that day. The cost of each security is determined using historical exchange rates. Income and withholding taxes are translated at prevailing exchange rates when earned or incurred. The fund does not isolate that portion of realized or unrealized gains or losses resulting from changes in the foreign exchange rate on investments from fluctuations arising from changes in the market prices of the securities. Such gains and losses are included with the net realized and unrealized gain or loss on investments. Net realized gains and losses on foreign currency transactions represent net realized exchange gains or losses on disposition of foreign currencies, currency gains and losses realized between the trade and settlement dates on securities transactions and the difference between the amount of investment income and foreign withholding taxes recorded on the fund’s books and the U.S. dollar equivalent amounts actually received or paid. Net unrealized appreciation and depreciation of assets and liabilities in foreign currencies arise from changes in the value of assets and liabilities other than investments at the period end, resulting from changes in the exchange rate.
Securities lending The fund may lend securities, through its agent, to qualified borrowers in order to earn additional income. The loans are collateralized by cash in an amount at least equal to the fair value of the securities loaned. The fair value of securities loaned is determined daily and any additional required collateral is allocated to the fund on the next business day. The remaining maturities of the securities lending transactions are considered overnight and continuous. The risk of borrower default will be borne by the fund’s agent; the fund will bear the risk of loss with respect to the investment of the cash collateral. Income from securities lending, net of expenses, is included in investment income on the Statement of operations. Cash collateral is invested in Putnam Cash Collateral Pool, LLC, a limited liability company managed by an affiliate of Putnam Management. Investments in Putnam Cash Collateral Pool, LLC are valued at its closing net asset value each business day. There are no management fees charged to Putnam Cash Collateral Pool, LLC. At the close of the reporting period, the fund received cash collateral of $12,539,778 and the value of securities loaned amounted to $12,282,350.
Interfund lending The fund, along with other Putnam funds, may participate in an interfund lending program pursuant to an exemptive order issued by the SEC. This program allows the fund to borrow from or lend to other Putnam funds that permit such transactions. Interfund lending transactions are subject to each fund’s investment policies and borrowing and lending limits. Interest earned or paid on the interfund lending transaction will be based on the average of certain current market rates. During the reporting period, the fund did not utilize the program.
Lines of credit The fund participates, along with other Putnam funds, in a $100 million ($317.5 million prior to October 14, 2022) unsecured committed line of credit and a $235.5 million unsecured uncommitted line of credit, both provided by State Street. Borrowings may be made for temporary or emergency purposes, including the
| 30 Emerging Markets Equity Fund |
funding of shareholder redemption requests and trade settlements. Interest is charged to the fund based on the fund’s borrowing at a rate equal to 1.25% plus the higher of (1) the Federal Funds rate and (2) the Overnight Bank Funding Rate for the committed line of credit and 1.30% plus the higher of (1) the Federal Funds rate and (2) the Overnight Bank Funding Rate for the uncommitted line of credit. A closing fee equal to 0.04% of the committed line of credit and 0.04% of the uncommitted line of credit has been paid by the participating funds. In addition, a commitment fee of 0.21% per annum on any unutilized portion of the committed line of credit is allocated to the participating funds based on their relative net assets and paid quarterly. During the reporting period, the fund had no borrowings against these arrangements.
Federal taxes It is the policy of the fund to distribute all of its taxable income within the prescribed time period and otherwise comply with the provisions of the Internal Revenue Code of 1986, as amended (the Code), applicable to regulated investment companies. It is also the intention of the fund to distribute an amount sufficient to avoid imposition of any excise tax under Section 4982 of the Code.
The fund is subject to the provisions of Accounting Standards Codification 740 Income Taxes (ASC 740). ASC 740 sets forth a minimum threshold for financial statement recognition of the benefit of a tax position taken or expected to be taken in a tax return. The fund did not have a liability to record for any unrecognized tax benefits in the accompanying financial statements. No provision has been made for federal taxes on income, capital gains or unrealized appreciation on securities held nor for excise tax on income and capital gains. Each of the fund’s federal tax returns for the prior three fiscal years remains subject to examination by the Internal Revenue Service.
The fund may also be subject to taxes imposed by governments of countries in which it invests. Such taxes are generally based on either income or gains earned or repatriated. The fund accrues and applies such taxes to net investment income, net realized gains and net unrealized gains as income and/or capital gains are earned. In some cases, the fund may be entitled to reclaim all or a portion of such taxes, and such reclaim amounts, if any, are reflected as an asset on the fund’s books. In many cases, however, the fund may not receive such amounts for an extended period of time, depending on the country of investment.
Under the Regulated Investment Company Modernization Act of 2010, the fund will be permitted to carry forward capital losses incurred for an unlimited period and the carry forwards will retain their character as either short-term or long-term capital losses. At August 31, 2022, the fund had the following capital loss carryovers available, to the extent allowed by the Code, to offset future net capital gain, if any:
| Loss carryover | ||
| Short-term | Long-term | Total |
| $63,400,413 | $5,517,919 | $68,918,332 |
Pursuant to federal income tax regulations applicable to regulated investment companies, the fund has elected to defer $685,407 to its fiscal year ending August 31, 2023 of late year ordinary losses ((i) ordinary losses recognized between January 1, 2022 and August 31, 2022, and (ii) specified ordinary and currency losses recognized between November 1, 2021 and August 31, 2022).
Tax cost of investments includes adjustments to net unrealized appreciation (depreciation) which may not necessarily be final tax cost basis adjustments, but closely approximate the tax basis unrealized gains and losses that may be realized and distributed to shareholders. The aggregate identified cost on a tax basis is $364,817,327, resulting in gross unrealized appreciation and depreciation of $35,858,913 and $11,981,588, respectively, or net unrealized appreciation of $23,877,325.
Distributions to shareholders Distributions to shareholders from net investment income are recorded by the fund on the ex-dividend date. Distributions from capital gains, if any, are recorded on the ex-dividend date and paid at least annually. The amount and character of income and gains to be distributed are determined in accordance with income tax regulations, which may differ from generally accepted accounting principles. Dividend sources are estimated at the time of declaration. Actual results may vary. Any non-taxable return of capital cannot be determined until final tax calculations are completed after the end of the fund’s fiscal year. Reclassifications are made to the fund’s capital accounts to reflect income and gains available for distribution (or available capital loss carryovers) under income tax regulations.
Expenses of the Trust Expenses directly charged or attributable to any fund will be paid from the assets of that fund. Generally, expenses of the Trust will be allocated among and charged to the assets of each fund on a basis that the Trustees deem fair and equitable, which may be based on the relative assets of each fund or the nature of the services performed and relative applicability to each fund.
| Emerging Markets Equity Fund 31 |
Note 2: Management fee, administrative services and other transactions
The fund pays Putnam Management a management fee (base fee) (based on the fund’s average net assets and computed and paid monthly) at annual rates that may vary based on the average of the aggregate net assets of all open-end mutual funds sponsored by Putnam Management (excluding net assets of funds that are invested in, or that are invested in by, other Putnam funds to the extent necessary to avoid “double counting” of those assets). Such annual rates may vary as follows:
| 1.080% | of the first $5 billion, | 0.880% | of the next $50 billion, | |
| 1.030% | of the next $5 billion, | 0.860% | of the next $50 billion, | |
| 0.980% | of the next $10 billion, | 0.850% | of the next $100 billion and | |
| 0.930% | of the next $10 billion, | 0.845% | of any excess thereafter. |
In addition, the monthly management fee consists of the monthly base fee plus or minus a performance adjustment for the month. The performance adjustment is determined based on performance over the thirty-six month period then ended. Each month, the performance adjustment is calculated by multiplying the performance adjustment rate and the fund’s average net assets over the performance period and dividing the result by twelve. The resulting dollar amount is added to, or subtracted from the base fee for that month. The performance adjustment rate is equal to 0.03 multiplied by the difference between the fund’s annualized performance (measured by the fund’s class A shares) and the annualized performance of the MSCI Emerging Markets Index (ND) each measured over the performance period. The maximum annualized performance adjustment rate is +/– 0.21%. The monthly base fee is determined based on the fund’s average net assets for the month, while the performance adjustment is determined based on the fund’s average net assets over the thirty-six month performance period. This means it is possible that, if the fund underperforms significantly over the performance period, and the fund’s assets have declined significantly over that period, the negative performance adjustment may exceed the base fee. In this event, Putnam Management would make a payment to the fund.
In connection with the merger of Putnam International Growth Fund (“acquired fund”) into the fund on May 18, 2020, the management contract was amended such that, after completion of the merger, the combined fund’s performance adjustment will be calculated based on the combined assets of the fund and the acquired fund for any portion of a performance period that is prior to the merger, unless the use of the combined assets results in a fee payable by the fund under the amended management contract that is higher than the management fee that would have been paid under the fund’s current management contract. Under those circumstances, Putnam Management has agreed to reduce its management fee to reflect the lower amount that would have been payable under the fund’s current fee schedule, which would only take into account the assets of the fund for the period prior to the closing of the mergers. As a result of these management contract changes, the fund’s shareholders may pay a lower management fee, but would never pay a higher management fee, under the amended management contract than they would have paid under the fund’s current management contract.
Because the performance adjustment is based on the fund’s performance relative to its applicable benchmark index, and not its absolute performance, the performance adjustment could increase Putnam Management’s fee even if the fund’s shares lose value during the performance period provided that the fund outperformed its benchmark index, and could decrease Putnam Management’s fee even if the fund’s shares increase in value during the performance period provided that the fund underperformed its benchmark index.
For the reporting period, the management fee represented an effective rate (excluding the impact of any expense waiver in effect) of 0.477% of the fund’s average net assets, which included an effective base fee of 0.457% and an increase of 0.020% ($72,424) based on performance.
Putnam Management has contractually agreed, through December 30, 2023, to waive fees and/or reimburse the fund’s expenses to the extent necessary to limit the cumulative expenses of the fund, exclusive of brokerage, interest, taxes, investment-related expenses, extraordinary expenses, acquired fund fees and expenses and payments under the fund’s investor servicing contract, investment management contract and distribution plans, on a fiscal year-to-date basis to an annual rate of 0.20% of the fund’s average net assets over such fiscal year-to-date period. During the reporting period, the fund’s expenses were not reduced as a result of this limit.
Putnam Management has also contractually agreed to waive fees (and, to the extent necessary, bear other expenses) of the fund through December 30, 2023, to the extent that total expenses of the fund (before any applicable performance-based adjustment to the fund’s base management fee and excluding brokerage, interest, taxes, investment-related expenses, payments under distribution plans, extraordinary expenses, payments under the fund’s investor servicing contract and acquired fund fees and expenses, but including payments under the
| 32 Emerging Markets Equity Fund |
fund’s investment management contract) would exceed an annual rate of 0.78% of the fund’s average net assets. During the reporting period, the fund’s expenses were reduced by $547,729 as a result of this limit.
Putnam Investments Limited (PIL), an affiliate of Putnam Management, is authorized by the Trustees to manage a separate portion of the assets of the fund as determined by Putnam Management from time to time. PIL did not manage any portion of the assets of the fund during the reporting period. If Putnam Management were to engage the services of PIL, Putnam Management would pay a quarterly sub-management fee to PIL for its services at an annual rate of 0.25% of the average net assets of the portion of the fund managed by PIL.
The Putnam Advisory Company, LLC (PAC), an affiliate of Putnam Management, is authorized by the Trustees to manage a separate portion of the assets of the fund, as designated from time to time by Putnam Management or PIL. PAC did not manage any portion of the assets of the fund during the reporting period. If Putnam Management or PIL were to engage the services of PAC, Putnam Management or PIL, as applicable, would pay a quarterly sub-advisory fee to PAC for its services at the annual rate of 0.25% of the average net assets of the portion of the fund’s assets for which PAC is engaged as sub-adviser.
The fund reimburses Putnam Management an allocated amount for the compensation and related expenses of certain officers of the fund and their staff who provide administrative services to the fund. The aggregate amount of all such reimbursements is determined annually by the Trustees.
Custodial functions for the fund’s assets are provided by State Street. Custody fees are based on the fund’s asset level, the number of its security holdings and transaction volumes.
Putnam Investor Services, Inc., an affiliate of Putnam Management, provides investor servicing agent functions to the fund. Putnam Investor Services, Inc. received fees for investor servicing for class A, class B, class C, class R and class Y shares that included (1) a per account fee for each direct and underlying non-defined contribution account (retail account) of the fund; (2) a specified rate of the fund’s assets attributable to defined contribution plan accounts; and (3) a specified rate based on the average net assets in retail accounts. Putnam Investor Services, Inc. has agreed that the aggregate investor servicing fees for each fund’s retail and defined contribution accounts for these share classes will not exceed an annual rate of 0.25% of the fund’s average assets attributable to such accounts.
Class R6 shares paid a monthly fee based on the average net assets of class R6 shares at an annual rate of 0.05%.
During the reporting period, the expenses for each class of shares related to investor servicing fees were as follows:
| Class A | $227,142 | Class R | 5,418 | |
| Class B | 1,223 | Class R6 | 6,702 | |
| Class C | 7,666 | Class Y | 166,767 | |
| Total | $414,918 |
The fund has entered into expense offset arrangements with Putnam Investor Services, Inc. and State Street whereby Putnam Investor Services, Inc.’s and State Street’s fees are reduced by credits allowed on cash balances. For the reporting period, the fund’s expenses were reduced by $1,282 under the expense offset arrangements.
Each Independent Trustee of the fund receives an annual Trustee fee, of which $324, as a quarterly retainer, has been allocated to the fund, and an additional fee for each Trustees meeting attended. Trustees also are reimbursed for expenses they incur relating to their services as Trustees.
The fund has adopted a Trustee Fee Deferral Plan (the Deferral Plan) which allows the Trustees to defer the receipt of all or a portion of Trustees fees payable on or after July 1, 1995. The deferred fees remain invested in certain Putnam funds until distribution in accordance with the Deferral Plan.
The fund has adopted an unfunded noncontributory defined benefit pension plan (the Pension Plan) covering all Trustees of the fund who have served as a Trustee for at least five years and were first elected prior to 2004. Benefits under the Pension Plan are equal to 50% of the Trustee’s average annual attendance and retainer fees for the three years ended December 31, 2005. The retirement benefit is payable during a Trustee’s lifetime, beginning the year following retirement, for the number of years of service through December 31, 2006. Pension expense for the fund is included in Trustee compensation and expenses in the Statement of operations. Accrued pension liability is included in Payable for Trustee compensation and expenses in the Statement of assets and liabilities. The Trustees have terminated the Pension Plan with respect to any Trustee first elected after 2003.
| Emerging Markets Equity Fund 33 |
The fund has adopted distribution plans (the Plans) with respect to the following share classes pursuant to Rule 12b–1 under the Investment Company Act of 1940. The purpose of the Plans is to compensate Putnam Retail Management Limited Partnership, an indirect wholly-owned subsidiary of Putnam Investments, LLC, for services provided and expenses incurred in distributing shares of the fund. The Plans provide payments by the fund to Putnam Retail Management Limited Partnership at an annual rate of up to the following amounts (Maximum %) of the average net assets attributable to each class. The Trustees have approved payment by the fund at the following annual rate (Approved %) of the average net assets attributable to each class. During the reporting period, the class-specific expenses related to distribution fees were as follows:
| Maximum % | Approved % | Amount | |
| Class A | 0.35% | 0.25% | $234,466 |
| Class B | 1.00% | 1.00% | 5,040 |
| Class C | 1.00% | 1.00% | 31,625 |
| Class R | 1.00% | 0.50% | 11,194 |
| Total | $282,325 |
For the reporting period, Putnam Retail Management Limited Partnership, acting as underwriter, received net commissions of $7,886 from the sale of class A shares and received $2 and $61 in contingent deferred sales charges from redemptions of class B and class C shares, respectively.
A deferred sales charge of up to 1.00% is assessed on certain redemptions of class A shares. For the reporting period, Putnam Retail Management Limited Partnership, acting as underwriter, received $85 on class A redemptions.
Note 3: Purchases and sales of securities
During the reporting period, the cost of purchases and the proceeds from sales, excluding short-term investments, were as follows:
| Cost of purchases | Proceeds from sales | |
| Investments in securities (Long-term) | $136,341,339 | $139,871,092 |
| U.S. government securities (Long-term) | — | — |
| Total | $136,341,339 | $139,871,092 |
The fund may purchase or sell investments from or to other Putnam funds in the ordinary course of business, which can reduce the fund’s transaction costs, at prices determined in accordance with SEC requirements and policies approved by the Trustees. During the reporting period, purchases or sales of long-term securities from or to other Putnam funds, if any, did not represent more than 5% of the fund’s total cost of purchases and/or total proceeds from sales.
Note 4: Capital shares
At the close of the reporting period, there were an unlimited number of shares of beneficial interest authorized. Transactions, including, if applicable, direct exchanges pursuant to share conversions, in capital shares were as follows:
| SIX MONTHS ENDED 2/28/23 | YEAR ENDED 8/31/22 | |||
| Class A | Shares | Amount | Shares | Amount |
| Shares sold | 453,091 | $4,981,812 | 1,258,435 | $17,433,752 |
| Shares issued in connection with | ||||
| reinvestment of distributions | — | — | 921,455 | 13,821,819 |
| 453,091 | 4,981,812 | 2,179,890 | 31,255,571 | |
| Shares repurchased | (1,360,152) | (14,955,498) | (2,940,252) | (41,411,921) |
| Net decrease | (907,061) | $(9,973,686) | (760,362) | $(10,156,350) |
| 34 Emerging Markets Equity Fund |
| SIX MONTHS ENDED 2/28/23 | YEAR ENDED 8/31/22 | |||
| Class B | Shares | Amount | Shares | Amount |
| Shares sold | — | $— | 120 | $1,822 |
| Shares issued in connection with | ||||
| reinvestment of distributions | — | — | 8,914 | 125,508 |
| — | — | 9,034 | 127,330 | |
| Shares repurchased | (35,539) | (371,322) | (76,387) | (1,033,582) |
| Net decrease | (35,539) | $(371,322) | (67,353) | $(906,252) |
| SIX MONTHS ENDED 2/28/23 | YEAR ENDED 8/31/22 | |||
| Class C | Shares | Amount | Shares | Amount |
| Shares sold | 24,802 | $261,013 | 84,220 | $1,144,148 |
| Shares issued in connection with | ||||
| reinvestment of distributions | — | — | 44,515 | 622,763 |
| 24,802 | 261,013 | 128,735 | 1,766,911 | |
| Shares repurchased | (126,055) | (1,293,009) | (285,337) | (3,806,631) |
| Net decrease | (101,253) | $(1,031,996) | (156,602) | $(2,039,720) |
| SIX MONTHS ENDED 2/28/23 | YEAR ENDED 8/31/22 | |||
| Class R | Shares | Amount | Shares | Amount |
| Shares sold | 63,869 | $714,784 | 84,628 | $1,159,465 |
| Shares issued in connection with | ||||
| reinvestment of distributions | — | — | 20,445 | 304,229 |
| 63,869 | 714,784 | 105,073 | 1,463,694 | |
| Shares repurchased | (48,499) | (535,859) | (75,968) | (1,055,025) |
| Net increase | 15,370 | $178,925 | 29,105 | $408,669 |
| SIX MONTHS ENDED 2/28/23 | YEAR ENDED 8/31/22 | |||
| Class R6 | Shares | Amount | Shares | Amount |
| Shares sold | 275,355 | $3,155,790 | 561,880 | $7,822,008 |
| Shares issued in connection with | ||||
| reinvestment of distributions | — | — | 123,758 | 1,889,786 |
| 275,355 | 3,155,790 | 685,638 | 9,711,794 | |
| Shares repurchased | (352,311) | (4,029,815) | (664,658) | (9,651,094) |
| Net increase (decrease) | (76,956) | $(874,025) | 20,980 | $60,700 |
| SIX MONTHS ENDED 2/28/23 | YEAR ENDED 8/31/22 | |||
| Class Y | Shares | Amount | Shares | Amount |
| Shares sold | 4,692,792 | $52,743,216 | 9,695,017 | $138,513,328 |
| Shares issued in connection with | ||||
| reinvestment of distributions | — | — | 723,385 | 11,017,149 |
| 4,692,792 | 52,743,216 | 10,418,402 | 149,530,477 | |
| Shares repurchased | (3,762,038) | (41,889,507) | (12,915,527) | (182,916,950) |
| Net increase (decrease) | 930,754 | $10,853,709 | (2,497,125) | $(33,386,473) |
| Emerging Markets Equity Fund 35 |
Note 5: Affiliated transactions
Transactions during the reporting period with any company which is under common ownership or control were as follows:
| Shares | |||||
| outstanding | |||||
| and fair | |||||
| Fair value as | Purchase | Sale | Investment | value as | |
| Name of affiliate | of 8/31/22 | cost | proceeds | income | of 2/28/23 |
| Short-term investments | |||||
| Putnam Cash Collateral | |||||
| Pool, LLC* | $5,251,990 | $31,019,262 | $23,731,474 | $80,376 | $12,539,778 |
| Putnam Short Term | |||||
| Investment Fund** | 4,451,141 | 71,292,823 | 68,529,601 | 69,932 | 7,214,363 |
| Total Short-term | |||||
| investments | $9,703,131 | $102,312,085 | $92,261,075 | $150,308 | $19,754,141 |
* No management fees are charged to Putnam Cash Collateral Pool, LLC (Note 1). Investment income shown is included in securities lending income on the Statement of operations. There were no realized or unrealized gains or losses during the period.
** Management fees charged to Putnam Short Term Investment Fund have been waived by Putnam Management. There were no realized or unrealized gains or losses during the period.
Note 6: Market, credit and other risks
In the normal course of business, the fund trades financial instruments and enters into financial transactions where risk of potential loss exists due to changes in the market (market risk) or failure of the contracting party to the transaction to perform (credit risk). The fund may be exposed to additional credit risk that an institution or other entity with which the fund has unsettled or open transactions will default. Investments in foreign securities involve certain risks, including those related to economic instability, unfavorable political developments, and currency fluctuations.
The Covid–19 pandemic and efforts to contain its spread have resulted in, among other effects, significant market volatility, exchange trading suspensions and closures, declines in global financial markets, higher default rates, significant changes in fiscal and monetary policies, and economic downturns and recessions. The effects of the Covid–19 pandemic have negatively affected, and may continue to negatively affect, the global economy, the economies of the United States and other individual countries, the financial performance of individual issuers, sectors, industries, asset classes, and markets, and the value, volatility, and liquidity of particular securities and other assets. The effects of the Covid–19 pandemic also are likely to exacerbate other risks that apply to the fund, which could negatively impact the fund’s performance and lead to losses on your investment in the fund. The duration of the Covid–19 pandemic and its effects cannot be determined with certainty.
| 36 Emerging Markets Equity Fund |
Fund information
Founded over 85 years ago, Putnam Investments was built around the concept that a balance between risk and reward is the hallmark of a well-rounded financial program. We manage funds across income, value, blend, growth, sustainable, and asset allocation categories.
| Investment Manager | Trustees | Richard T. Kircher |
| Putnam Investment | Kenneth R. Leibler, Chair | Vice President and |
| Management, LLC | Barbara M. Baumann, Vice Chair | BSA Compliance Officer |
| 100 Federal Street | Liaquat Ahamed | |
| Boston, MA 02110 | Katinka Domotorffy | Martin Lemaire |
| Catharine Bond Hill | Vice President and | |
| Investment Sub-Advisors | Jennifer Williams Murphy | Derivatives Risk Manager |
| Putnam Investments Limited | Marie Pillai | |
| 16 St James’s Street | George Putnam III | Susan G. Malloy |
| London, England SW1A 1ER | Robert L. Reynolds | Vice President and |
| Manoj P. Singh | Assistant Treasurer | |
| The Putnam Advisory Company, LLC | Mona K. Sutphen | |
| 100 Federal Street | Alan G. McCormack | |
| Boston, MA 02110 | Officers | Vice President and |
| Robert L. Reynolds | Derivatives Risk Manager | |
| Marketing Services | President | |
| Putnam Retail Management | Denere P. Poulack | |
| Limited Partnership | James F. Clark | Assistant Vice President, |
| 100 Federal Street | Vice President, Chief Compliance | Assistant Clerk, and |
| Boston, MA 02110 | Officer, and Chief Risk Officer | Assistant Treasurer |
| Custodian | Michael J. Higgins | Janet C. Smith |
| State Street Bank | Vice President, Treasurer, | Vice President, |
| and Trust Company | and Clerk | Principal Financial Officer, |
| Principal Accounting Officer, | ||
| Legal Counsel | Jonathan S. Horwitz | and Assistant Treasurer |
| Ropes & Gray LLP | Executive Vice President, | |
| Principal Executive Officer, | Stephen J. Tate | |
| and Compliance Liaison | Vice President and | |
| Chief Legal Officer | ||
| Mark C. Trenchard | ||
| Vice President |
This report is for the information of shareholders of Putnam Emerging Markets Equity Fund. It may also be used as sales literature when preceded or accompanied by the current prospectus, the most recent copy of Putnam’s Quarterly Performance Summary, and Putnam’s Quarterly Ranking Summary. For more recent performance, please visit putnam.com. Investors should carefully consider the investment objectives, risks, charges, and expenses of a fund, which are described in its prospectus. For this and other information or to request a prospectus or summary prospectus, call 1-800-225-1581 toll free. Please read the prospectus carefully before investing. The fund’s Statement of Additional Information contains additional information about the fund’s Trustees and is available without charge upon request by calling 1-800-225-1581.

| Item 2. Code of Ethics: |
| Not applicable |
| Item 3. Audit Committee Financial Expert: |
| Not applicable |
| Item 4. Principal Accountant Fees and Services: |
| Not applicable |
| Item 5. Audit Committee of Listed Registrants |
| Not applicable |
| Item 6. Schedule of Investments: |
| The registrant’s schedule of investments in unaffiliated issuers is included in the report to shareholders in Item 1 above. |
| Item 7. Disclosure of Proxy Voting Policies and Procedures For Closed-End Management Investment Companies: |
| Not applicable |
| Item 8. Portfolio Managers of Closed-End Investment Companies |
| Not Applicable |
| Item 9. Purchases of Equity Securities by Closed-End Management Investment Companies and Affiliated Purchasers: |
| Not applicable |
| Item 10. Submission of Matters to a Vote of Security Holders: |
| Not applicable |
| Item 11. Controls and Procedures: |
| (a) The registrant’s principal executive officer and principal financial officer have concluded, based on their evaluation of the effectiveness of the design and operation of the registrant’s disclosure controls and procedures as of a date within 90 days of the filing date of this report, that the design and operation of such procedures are generally effective to provide reasonable assurance that information required to be disclosed by the registrant in this report is recorded, processed, summarized and reported within the time periods specified in the Commission’s rules and forms. |
| (b) Changes in internal control over financial reporting: Not applicable |
| Item 12. Disclosures of Securities Lending Activities for Closed-End Investment Companies: |
| Not Applicable |
| Item 13. Exhibits: |
| (a)(1) Not applicable |
| (b) The certifications required by Rule 30a-2(b) under the Investment Company Act of 1940, as amended, are filed herewith. |
| SIGNATURES |
| Pursuant to the requirements of the Securities Exchange Act of 1934 and the Investment Company Act of 1940, the registrant has duly caused this report to be signed on its behalf by the undersigned, thereunto duly authorized. |
| Putnam Funds Trust |
| By (Signature and Title): |
| /s/ Janet C. Smith Janet C. Smith Principal Accounting Officer |
| Date: April 27, 2023 |
| Pursuant to the requirements of the Securities Exchange Act of 1934 and the Investment Company Act of 1940, this report has been signed below by the following persons on behalf of the registrant and in the capacities and on the dates indicated. |
| By (Signature and Title): |
| /s/ Jonathan S. Horwitz Jonathan S. Horwitz Principal Executive Officer |
| Date: April 27, 2023 |
| By (Signature and Title): |
| /s/ Janet C. Smith Janet C. Smith Principal Financial Officer |
| Date: April 27, 2023 |