EXHIBIT 99.3
Cameco Corporation
2011 Management’s Discussion and Analysis
February 9, 2012

Management’s discussion and analysis
February 9, 2012
2011 Highlights | 4 | |||
The nuclear fuel cycle | 7 | |||
About Cameco | 8 | |||
The nuclear industry today | 11 | |||
The long-term view | 14 | |||
Our strategy | 17 | |||
Financial results | 32 | |||
Our operations and development projects | 61 | |||
Mineral reserves and resources | 96 | |||
Additional information | 101 | |||
Throughout this document, the termswe, us, our andCameco mean Cameco Corporation and its subsidiaries.
Management’s discussion and analysis
This management’s discussion and analysis (MD&A) includes information that will help you understand management’s perspective of our audited consolidated financial statements (financial statements) and notes for the year ended December 31, 2011. This information is based on what we knew on February 8, 2012.
We encourage you to read our financial statements and notes as you review this MD&A. You can find more information about Cameco, including our financial statements and our most recent annual information form, on our website at cameco.com, on SEDAR at sedar.com or on EDGAR at sec.gov. You should also read our annual information form before making an investment decision about our securities.
On January 1, 2011, we adopted International Financial Reporting Standards (IFRS), which have become the generally accepted accounting principles required to be used by most Canadian publicly accountable enterprises. Our financial statements and notes for the year ended December 31, 2011 have been prepared using IFRS. Amounts relating to the year ended December 31, 2010 in this MD&A and our financial statements have been revised to reflect our adoption of IFRS. Amounts for periods prior to January 1, 2010 are presented in accordance with Canadian Generally Accepted Accounting Principles (Canadian GAAP) in effect prior to January 1, 2011. When we refer to Canadian GAAP in this MD&A, we mean Canadian GAAP as in effect before adoption of IFRS.
Presentation and terminology used in our financial statements and this MD&A differ from that used in previous years. Details of the more significant accounting differences can be found in note 3 to our financial statements.
Unless we have specified otherwise, all dollar amounts are in Canadian dollars.
2011 MANAGEMENT’SDISCUSSIONANDANALYSIS 1
Caution about forward-looking information
Our MD&A includes statements and information about our expectations for the future. When we discuss our strategy, plans, future financial and operating performance, or other things that have not yet taken place, we are making statements considered to beforward-looking information orforward-looking statements under Canadian and United States securities laws. We refer to them in this MD&A asforward-looking information.
Key things to understand about the forward-looking information in this MD&A:
| • | It typically includes words and phrases about the future, such as: believe, estimate, anticipate, expect, plan, intend, predict, goal, target, project, potential, strategy and outlook (see examples below). |
| • | It represents our current views, and can change significantly. |
| • | It is based on a number ofmaterial assumptions,including those we have listed on page 3, which may prove to be incorrect. |
| • | Actual results and events may be significantly different from what we currently expect, due to the risks associated with our business. We list a number of thesematerial riskson page 3. We recommend you also review our annual information form, which includes a discussion of other material risks that could cause actual results to differ significantly from our current expectations. |
| • | Forward-looking information is designed to help you understand management’s current views of our near and longer term prospects, and may not be appropriate for other purposes. We will not necessarily update this information unless we are required to by securities laws. |
Examples of forward-looking information in this MD&A
| • | our expectations about 2012 and future global uranium supply, consumption, demand and number of operable reactors, including the discussion on the expected impact resulting from the March 2011 nuclear incident in Japan |
| • | our expectations for spot prices in 2012 |
| • | our strategy for increasing annual production to 40 million pounds by 2018 and our expectation that existing cash balances and operating cash flows will meet anticipated capital requirements without the need for any significant additional financing to reach this goal |
| • | our expectations regarding uranium demand in the near term |
| • | our 2012 objectives |
| • | the outlook for each of our operating segments for 2012, and our consolidated outlook for the year |
| • | our expectation that we will invest significantly in expanding production at our existing mines and advancing projects as we pursue our growth strategy |
| • | our expectation that cash balances will decline as we use the funds in our business and pursue our growth plans |
| • | our expectations for 2012, 2013 and 2014 capital expenditures |
| • | our expectation that our operating and investment activities in 2012 will not be constrained by the financial covenants in our unsecured revolving credit facility |
| • | our uranium price sensitivity analysis |
| • | forecast production at our uranium operations from 2012 to 2016 |
| • | the likely terms and volumes to be covered by long-term delivery contracts that we enter into in 2012 and in future years |
| • | future production at our fuel services operations |
| • | future royalty and tax payments and rates |
| • | our future plans for each of our uranium operating properties, development projects and projects under evaluation, and fuel services operating sites |
| • | our expectations regarding Cigar Lake |
| • | our mineral reserve and resource estimates |
2 CAMECOCORPORATION
Material risks
| • | actual sales volumes or market prices for any of our products or services are lower than we expect for any reason, including changes in market prices or loss of market share to a competitor |
| • | we are adversely affected by changes in foreign currency exchange rates, interest rates or tax rates |
| • | our production costs are higher than planned, or necessary supplies are not available, or not available on commercially reasonable terms |
| • | our estimates of production, purchases, costs, decommissioning or reclamation expenses, or our tax expense estimates, prove to be inaccurate |
| • | we are unable to enforce our legal rights under our existing agreements, permits or licences, or are subject to litigation or arbitration that has an adverse outcome |
| • | there are defects in, or challenges to, title to our properties |
| • | our mineral reserve and resource estimates are not reliable, or we face unexpected or challenging geological, hydrological or mining conditions |
| • | we are affected by environmental, safety and regulatory risks, including increased regulatory burdens or delays |
| • | we cannot obtain or maintain necessary permits or approvals from government authorities |
| • | we are affected by political risks in a developing country where we operate |
| • | we are affected by terrorism, sabotage, blockades, civil unrest, accident or a deterioration in political support for, or demand for, nuclear energy |
| • | we are impacted by changes in the regulation or public perception of the safety of nuclear power plants, which adversely affect the construction of new plants, the relicensing of existing plants and the demand for uranium |
| • | there are changes to government regulations or policies that adversely affect us, including tax and trade laws and policies |
| • | our uranium and conversion suppliers fail to fulfil delivery commitments |
| • | our Cigar Lake development, mining or production plans are delayed or do not succeed, including as a result of any difficulties encountered with the jet boring mining method or our inability to acquire any of the required jet boring equipment |
| • | we are affected by natural phenomena, including inclement weather, fire, flood and earthquakes |
| • | our operations are disrupted due to problems with our own or our customers’ facilities, the unavailability of reagents, equipment, operating parts and supplies critical to production, equipment failure, lack of tailings capacity, labour shortages, labour relations issues, strikes or lockouts, underground floods, cave ins, ground movements, tailings dam failures, transportation disruptions or accidents, or other development and operating risks |
Material assumptions
| • | our expectations regarding sales and purchase volumes and prices for uranium, fuel services and electricity |
| • | our expectations regarding the demand for uranium, the construction of new nuclear power plants and the relicensing of existing nuclear power plants not being adversely affected by changes in regulation or in the public perception of the safety of nuclear power plants |
| • | our expected production level and production costs |
| • | our expectations regarding spot prices and realized prices for uranium, and other factors discussed on page 48,Price sensitivity analysis: uranium |
| • | our expectations regarding tax rates, foreign currency exchange rates and interest rates |
| • | our decommissioning and reclamation expenses |
| • | our mineral reserve and resource estimates, and the assumptions upon which they are based, are reliable |
| • | the geological, hydrological and other conditions at our mines |
| • | our Cigar Lake development, mining and production plans succeed, including the success of the jet boring mining method at Cigar Lake and that we will be able to obtain the additional jet boring system units we require on schedule |
| • | our ability to continue to supply our products and services in the expected quantities and at the expected times |
| • | our ability to comply with current and future environmental, safety and other regulatory requirements, and to obtain and maintain required regulatory approvals |
| • | our operations are not significantly disrupted as a result of political instability, nationalization, terrorism, sabotage, blockades, civil unrest, breakdown, natural disasters, governmental or political actions, litigation or arbitration proceedings, the unavailability of reagents, equipment, operating parts and supplies critical to production, labour shortages, labour relations issues, strikes or lockouts, underground floods, cave ins, ground movements, tailings dam failure, lack of tailings capacity, transportation disruptions or accidents or other development or operating risks |
2011 MANAGEMENT’SDISCUSSIONANDANALYSIS 3
2011 Highlights
After a year of global economic, political and environmental challenges, we reassessed our corporate growth strategy and found it to be as relevant today as it was in 2008 when we set our Double U course. We remain confident in the long-term fundamentals of the nuclear industry. World demand for safe, clean, reliable and affordable energy continues to grow and the need for nuclear energy as part of the world’s energy mix remains compelling.
We are preparing our assets to ensure we can be among the first to respond when the market signals new production is needed and to maintain our position as one of the world’s largest uranium producers.
We demonstrated our financial strength again this year and we continued to make good progress on our pipeline of projects in development and under evaluation, hitting some key milestones along the way.
Strong financial performance
Our financial results were better than expected and we achieved a number of performance records for the year and during the fourth quarter, including:
| • | annual revenue of $2.4 billion and quarterly revenue of $977 million from our nuclear business |
| • | annual gross profit of $776 million and quarterly gross profit of $353 million from our nuclear business |
| • | annual revenue of $1.6 billion and quarterly revenue of $731 million from our uranium segment |
| • | annual average realized price of $49.18 per pound ($49.17 US per pound) in our uranium segment |
Net earnings attributable to our shareholders (net earnings) in 2011 were $450 million. In 2010, net earnings were higher by $66 million, mainly due to higher earnings in both our electricity and fuel services segments.
Highlights December 31 ($ millions except where indicated) | 2011 | 2010 | change | |||||||||||||
Revenue | 2,384 | 2,124 | 12 | % | ||||||||||||
Gross profit | 776 | 771 | 1 | % | ||||||||||||
Net earnings | 450 | 516 | (13 | )% | ||||||||||||
$ per common share (diluted) | 1.14 | 1.31 | (13 | )% | ||||||||||||
Adjusted net earnings (non-IFRS, see page 33 & 34) | 509 | 497 | 2 | % | ||||||||||||
$ per common share (adjusted and diluted) | 1.29 | 1.26 | 2 | % | ||||||||||||
Cash provided by operations (after working capital changes) | 732 | 521 | 40 | % | ||||||||||||
Average realized prices | Uranium | $US/lb $Cdn/lb |
| 49.17 49.18 |
|
| 43.63 45.81 |
|
| 13 7 | % % | |||||
| Fuel services | $Cdn/kgU | 16.71 | 16.86 | (1 | )% | |||||||||||
| Electricity | $Cdn/MWh | 54 | 58 | (7 | )% | |||||||||||
Shares and stock options outstanding
At February 9, 2012, we had:
| • | 394,767,078 common shares and one Class B share outstanding |
| • | 8,442,385 stock options outstanding, with exercise prices ranging from $10.51 to $46.88 |
Dividend policy
Our board of directors has established a policy of paying a quarterly dividend of $0.10 ($0.40 per year) per common share. This policy will be reviewed from time to time based on our cash flow, earnings, financial position, strategy and other relevant factors.
4 CAMECOCORPORATION
Excellent progress in our uranium segment this year
In our uranium segment this year, production was 3% higher than the guidance we provided in our 2011 third quarter MD&A. We had a number of successes at our mining operations, development projects and projects under evaluation. Key highlights:
| • | realized benefits of production flexibility provisions in our McArthur River/Key Lake licences, matching our 2010 production record and exceeding our production target by 5% |
| • | realized benefits of improved efficiency and reliability of equipment at Key Lake |
| • | completed construction of the acid, steam and oxygen plants at Key Lake |
| • | signed a memorandum of agreement (MOA) to increase production at Inkai from 3.9 million pounds (100% basis) to 5.2 million pounds (100% basis). SeeUranium – operating properties – Inkaion page 79 for more information. |
| • | signed an agreement to process all Cigar Lake ore at the McClean Lake mill, which is expected to result in a significant reduction in the operating cost of the project. SeeUranium – development project – Cigar Lakeon page 83 for more information. |
| • | completed remediation of the underground and sinking of shaft 2 to the 480 metre level at Cigar Lake |
| • | received regulatory approval for our Cigar Lake mine plan and to begin work on our project to allow the release of treated water directly to Seru Bay |
| • | completed a memorandum of understanding (MOU) for a mine development agreement with the Martu (the local indigenous people) at our Kintyre project |
We continued to advance our exploration activities, spending $10 million on five brownfield exploration projects, and $38 million for resource delineation at Kintyre and Cigar Lake. We spent about $48 million on regional exploration programs, mostly in Saskatchewan, followed by Australia, northern Canada, Asia and South America.
Updates on our other segments
In our fuel services segment, we decreased production due to unfavourable market conditions for UF6.
In our electricity segment, Bruce Power Limited Partnership (BPLP) generated 24.9 terawatt hours (TWh) of electricity, at a capacity factor of 87%. Our share of earnings before taxes was $92 million.
Our investment in Global Laser Enrichment (GLE) continues to progress. GLE is continuing its testing activities and engineering design work for a commercial facility. The US Nuclear Regulatory Commission is assessing GLE’s application for a commercial facility construction and operating licence.
Highlights | 2011 | 2010 | change | |||||||||||
Uranium | Production volume (million lbs) | 22.4 | 22.8 | (2 | )% | |||||||||
| Sales volume (million lbs) | 32.9 | 29.6 | 11 | % | ||||||||||
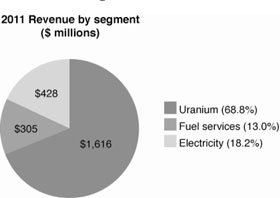
| Revenue ($ millions) | 1,616 | 1,358 | 19 | % | ||||||||||
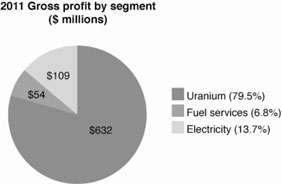
| Gross profit ($ millions) | 632 | 532 | 19 | % | ||||||||||
Fuel services | Production volume (million kgU) | 14.7 | 15.4 | (5 | )% | |||||||||
| Sales volume (million kgU) | 18.3 | 17.0 | 8 | % | ||||||||||
| Revenue ($ millions) | 305 | 287 | 6 | % | ||||||||||
| Gross profit ($ millions) | 54 | 65 | (17 | )% | ||||||||||
Electricity | Output (100%) (TWh) | 24.9 | 25.9 | (4 | )% | |||||||||
| Revenue (100%) | 1,354 | 1,509 | (10 | )% | ||||||||||
| Our share of earnings before taxes ($ millions) | 92 | 172 | (47 | )% | ||||||||||
2011 MANAGEMENT’SDISCUSSIONANDANALYSIS 5
Key market facts
Demand for electricity is expected to nearly double from 2009 to 2035, driven mainly by growth in the developing world as it seeks to diversify sources of energy and provide security of supply.
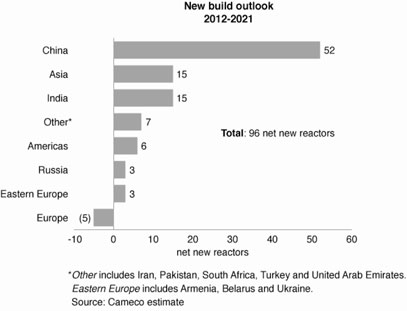
| • | At the start of 2012, there were 431 operable commercial nuclear power reactors in 31 countries, providing about 13% of the world’s electricity. |
| • | At the start of 2012, there were 63 reactors under construction, and by 2021 we expect 96 new reactors (net) to come on line. |
| • | Most of this new build is being driven by rapidly developing countries like China and India, which have severe energy deficits and want clean sources of electricity to improve their environment and sustain economic growth. |
| • | Over the next decade, we expect demand for uranium to grow by an average of 3% per year. |
| • | To meet global demand over the next 10 years, we expect 65% of uranium supply will come from mines that are currently in operation, 15% from finite sources of secondary supply (mainly Russian highly enriched uranium (HEU), government inventories and limited recycling), and 20% will have to come from new sources of supply. |
| • | With uranium assets on three continents, including high-grade reserves and low-cost mining operations in Canada, and investments that cover the nuclear fuel cycle—we are ideally positioned to benefit from the world's growing need for clean, reliable energy. |
6 CAMECOCORPORATION
The nuclear fuel cycle
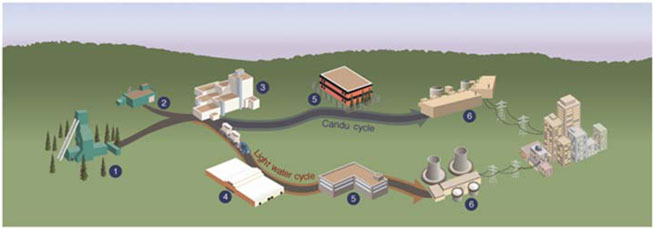
| 1 | Mining |
There are three common ways to mine uranium, depending on the depth of the orebody and the deposit’s geological characteristics:
| • | Open pit mining is used if the ore is near the surface. The ore is usually mined using drilling and blasting. |
| • | Underground mining is used if the ore is too deep to make open pit mining economical. Tunnels and shafts provide access to the ore. |
| • | In situ recovery (ISR) does not require large scale excavation. Instead, holes are drilled into the ore and a solution is used to dissolve the uranium. The solution is pumped to the surface where the uranium is recovered. |
| 1 | Milling |
Ore from open pit and underground mines is processed to extract the uranium and package it as a powder typically referred to asuranium concentrates (U3O8) oryellowcake. The leftover processed rock and other solid waste (tailings) is placed in an engineered tailings facility.
| 2 | Refining |
Refining removes the impurities from the uranium concentrate and changes its chemical form touranium trioxide (UO3).
| 3 | Conversion |
For light water reactors, the UO3 is converted touranium hexafluoride (UF6) gas to prepare it for enrichment. For heavy water reactors like the Candu reactor, the UO3 is converted into powdereduranium dioxide (UO2).
| 4 | Enrichment |
Uranium is made up of two main isotopes: U-238 and U-235. Only U-235 atoms, which make up 0.7% of natural uranium, are involved in the nuclear reaction (fission). Most of the world’s commercial nuclear reactors require uranium that has an enriched level of U-235 atoms.
The enrichment process increases the concentration of U-235 to between 3% and 5% by separating U-235 atoms from the U-238. Enriched UF6 gas is then converted to powdered UO2.
| 5 | Fuel manufacturing |
Natural or enriched UO2 is pressed into pellets, which are baked at a high temperature. These are packed into zircaloy or stainless steel tubes, sealed and then assembled into fuel bundles.
| 6 | Generation |
Nuclear reactors are used to generate electricity.
U-235 atoms in the reactor fuel fission, creating heat that generates steam to drive turbines. The fuel bundles in the reactor need to be replaced as the U-235 atoms are depleted, typically after one or two years depending upon the reactor type. The used–orspent–fuel is stored or reprocessed.
Spent fuel management
The majority of spent fuel is safely stored at the reactor site. A small amount of spent fuel is reprocessed. The reprocessed fuel is used in some European and Japanese reactors.
2011 MANAGEMENT’SDISCUSSIONANDANALYSIS 7
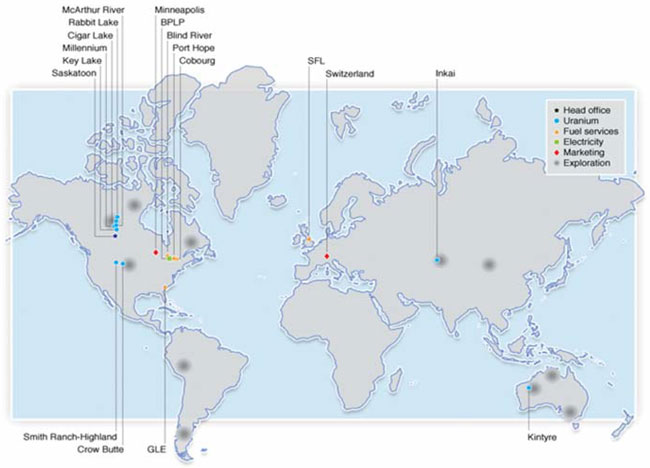
About Cameco
Our head office is in Saskatoon, Saskatchewan. We are one of the world’s largest uranium producers, with uranium assets on three continents. Nuclear energy plants around the world use our uranium products to generate one of the cleanest sources of electricity available today. Our operations and investments span the nuclear fuel cycle, from exploration to electricity generation.
Management update
On July 1, 2011, Tim Gitzel assumed the role of president and chief executive officer (CEO), succeeding Jerry Grandey, who retired after more than eight years as CEO and 18 years with Cameco. Tim has developed extensive experience in Canadian and international uranium mining activities during his 18 years in senior management positions, and his transition to CEO was well planned and seamlessly executed. Tim joined the company in 2007 as senior vice-president and chief operating officer and was promoted to president in May of 2010. Before joining Cameco, he was executive vice-president, mining business unit for AREVA, based in Paris, France, with responsibility for uranium, gold, exploration and decommissioning operations in 11 countries around the world.
On July 15, 2011, Grant Isaac, previously senior vice-president, corporate services, became senior vice-president and chief financial officer (CFO), succeeding Kim Goheen who retired after 14 years with Cameco.
Alice Wong, previously vice-president, safety, health, environment, quality and regulatory relations, was appointed senior vice-president, corporate services.
Under Tim’s direction, the management team remains committed to the strategy, vision and values that have helped us become a global leader in the nuclear industry.
Strengths
We are a pure-play nuclear investment with a proven track record and the strengths to take advantage of the world’s rising demand for safe, clean and reliable energy. Our core strengths make us unique:
| • | a large portfolio of low-cost mining operations and geographically diverse uranium assets |
| • | controlling interests in the world’s largest high-grade uranium reserves |
| • | extensive mineral reserves and resources located near our existing infrastructure |
| • | excellent growth potential from existing assets, combined with an advanced global exploration program |
| • | multiple sources of conversion and the ability to adjust production in response to changing market signals |
| • | a worldwide marketing presence and a strong, creditworthy customer base |
| • | an extensive portfolio of long-term sales contracts supported by long-life assets |
| • | innovative technology and experience operating in technically challenging environments |
| • | a leader in corporate social responsibility—building long-term, trusting relationships with communities impacted by our operations |
| • | an enterprise-wide risk management system tied directly to our strategy and objectives |
| • | balanced financial management focused on adding value for our shareholders while positioning us for growth |
| • | among the first to build relationships in emerging markets |
With our extraordinary assets, contract portfolio, employee expertise, comprehensive industry knowledge and financial strength, we are confident in our ability to continue to grow and increase shareholder value.
8 CAMECOCORPORATION
Business segments
 |  |
Uranium
We are one of the world’s largest uranium producers, and in 2011 accounted for about 16% of the world’s production. We have controlling ownership of the world’s largest high-grade reserves, with ore grades up to 100 times the world average, and low-cost operations.
Product
| • | uranium concentrates (U3O8) |
Mineral reserves and resources
Mineral reserves
| • | approximately 435 million pounds proven and probable |
Mineral resources
| • | approximately 254 million pounds measured and indicated and 318 million pounds inferred |
Global exploration
| • | focused on four continents |
| • | approximately 5 million hectares of land |
Operating properties
| • | McArthur River and Key Lake, Saskatchewan |
| • | Rabbit Lake, Saskatchewan |
| • | Smith Ranch-Highland, Wyoming |
| • | Crow Butte, Nebraska |
| • | Inkai, Kazakhstan |
Development project
| • | Cigar Lake, Saskatchewan |
Projects under evaluation
| • | Inkai blocks 1 and 2 production increase, Kazakhstan |
| • | Inkai block 3, Kazakhstan |
| • | McArthur River extension, Saskatchewan |
| • | Kintyre, Australia |
| • | Millennium, Saskatchewan |
Fuel services
We are an integrated uranium fuel supplier, offering refining, conversion and fuel manufacturing services.
Products
| • | uranium trioxide (UO3) |
| • | uranium hexafluoride (UF6) (control about 25% of world conversion capacity) |
| • | uranium dioxide (UO2) (the world’s only commercial supplier of natural UO2) |
| • | fuel bundles, reactor components and monitoring equipment used by Candu reactors |
Operations
| • | Blind River refinery, Ontario |
(refines uranium concentrates to UO3) |
| • | Port Hope conversion facility, Ontario |
(converts UO3 to UF6 or UO2) |
| • | Cameco Fuel Manufacturing Inc., Ontario |
| (manufactures fuel bundles and reactor components) |
| • | a toll conversion agreement with Springfields Fuels Ltd. |
(SFL), Lancashire, United Kingdom (UK) (to convert UO3 to UF6– expires in 2016) |
We also have a 24% interest in Global Laser Enrichment (GLE) in North Carolina, with General Electric (51%) and Hitachi Ltd. (25%). GLE is testing a third-generation technology that, if successful, will use lasers to commercially enrich uranium.
2011 MANAGEMENT’SDISCUSSIONANDANALYSIS 9
Electricity
We generate clean electricity through our 31.6% interest in the Bruce Power Limited Partnership (BPLP), which operates four nuclear reactors at the Bruce B generating station in southern Ontario.
Capacity
| • | 3,260 megawatts (MW) (100% basis) (about 18% of Ontario’s electricity) |
We also have agreements to manage the procurement of fuel and fuel services for BPLP, including:
| • | uranium concentrates |
| • | conversion services |
| • | fuel fabrication services |
Global presence
10 CAMECOCORPORATION
The nuclear energy industry today
The nuclear energy industry addressed significant challenges in 2011 related to events at the Fukushima-Daiichi nuclear power plant in Japan. As a result, the outlook for the industry remains uncertain for the near to medium term. In the long term, however, we continue to see a very strong and promising growth profile for the nuclear industry.
On March 11, an earthquake and tsunami in Japan caused cooling systems at the Fukushima-Daiichi nuclear power station to fail, and radioactive materials were released. This reduced public confidence in nuclear power in some countries, most notably Germany, which represents 5% of world nuclear generating capacity. It decided to revert to its previous phase-out policy, shutting down eight of its reactors, and plans to shut down the remaining nine reactors by 2022.
It remains unclear what level of nuclear power Japan itself—which represents 12% of global nuclear generating capacity—will depend on in the future. As of February 8, 2012, Japan had three reactors operating. These three reactors are scheduled to enter regular maintenance shutdowns between late February and the end of April, at which time we expect all of Japan’s nuclear reactors will be offline. Many are unaffected by the events in March 2011 but are offline for both planned and unplanned maintenance outages, and diminished public support has prevented utilities from gaining the regulatory and political approvals necessary to restart them. The Japanese government has ordered stress tests to be conducted on all reactors before allowing them to restart, and is implementing reforms to its existing nuclear regulatory framework and energy policy. Stress tests are progressing, but the government has not made any final decisions about restarting the reactors. Local government approval will also likely be required to allow reactors to restart.
The current operating status of reactors in Germany and Japan has caused concern that, in the near to medium term, additional volumes could be introduced to the market from deferrals and/or cancellations of deliveries under sales contracts. This has caused market participants to be discretionary in their purchases. We believe that utilities will continue to work with producers to manage these materials and minimize the impact on the market.
Cameco well positioned
During this period of uncertainty, we are in the enviable position of being heavily committed under long-term sales contracts through 2016. As well, we have commitments to supply a total of about 290 million pounds of uranium under all of our long-term contracts, many of which extend beyond 2016. Therefore, we expect to have a solid revenue stream for years to come, even in the event of declining uranium market prices.
Industry taking action
At the same time, the industry has taken action. Countries with nuclear programs are reviewing regulatory standards, assessing the safety of existing facilities and the design of reactors under construction or in the planning stage. Third party organizations such as the International Atomic Energy Association, Nuclear Energy Institute, World Association of Nuclear Operators, Institute of Nuclear Power Operators, and the World Nuclear Association are lending their support and technical expertise to governments and operators, and providing an accurate source of information for the public.
Preliminary safety reviews are now complete and lessons are being applied that we expect will make the industry even safer. Most countries with nuclear generation capacity have reconfirmed their commitment to the technology and to the future of nuclear energy.
Long-term outlook is positive
Electricity is essential to maintaining and improving the standard of living for people around the world. Demand for safe, clean, reliable, affordable energy continues to grow and the need for nuclear as part of the world’s energy mix remains compelling. We expect demand for uranium to grow, and along with it the need for new supply to meet future customer requirements. You can read more about our outlook on future supply and demand inThe long-term viewon page 14.
2011 MANAGEMENT’SDISCUSSIONANDANALYSIS 11
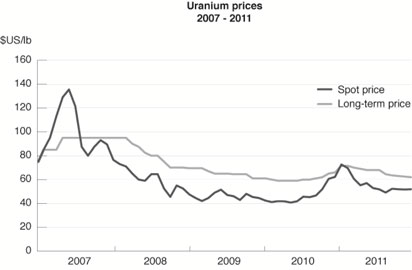
Industry prices
Since March, the spot price has declined from $70 (US) per pound to the low $50 (US) per pound range. Utilities continue to be well covered under existing contracts. Given the current uncertainties in the market, we expect utilities and other market participants will continue to be cautiously opportunistic in their buying. We expect uranium demand in the near to medium term to remain somewhat discretionary, and so we expect prices to be relatively stable in 2012.
| 2011 | 2010 | change | ||||||||||
Uranium($US/lb) 1 | ||||||||||||
Average spot market price | 56.36 | 46.83 | 20 | % | ||||||||
Average long-term price | 66.79 | 60.92 | 10 | % | ||||||||
Fuel services ($US/kgU UF6)1 | ||||||||||||
Average spot market price | ||||||||||||
• North America | 10.61 | 9.11 | 16 | % | ||||||||
• Europe | 10.61 | 9.83 | 8 | % | ||||||||
Average long-term price | ||||||||||||
• North America | 16.09 | 12.21 | 32 | % | ||||||||
• Europe | 16.42 | 13.27 | 24 | % | ||||||||
Note: the industry does not publish UO2prices. | ||||||||||||
Electricity ($/MWh) | ||||||||||||
Average Ontario electricity spot price | 30 | 36 | (17 | )% | ||||||||
| 1 | Average of prices reported by TradeTech and Ux Consulting (Ux) |
12 CAMECOCORPORATION
World consumption and production
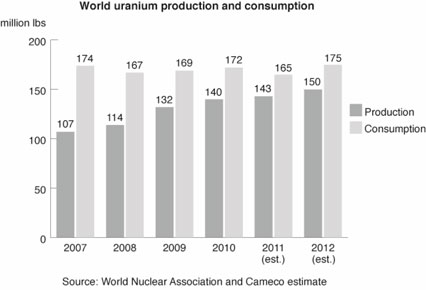
While the events of 2011 reduced our estimate of global consumption in 2011 to 165 million pounds, which is about 15% lower than our original estimate of 195 million pounds, the industry also faced a number of production challenges this year. We estimate 2011 global production was 143 million pounds, about 5% below our original estimate of 150 million pounds.
We expect global uranium consumption to increase to about 175 million pounds in 2012, and global production to be approximately 150 million pounds. Secondary supplies should continue to bridge the gap.
By 2021, we expect world uranium consumption to be about 230 million pounds per year, an average annual growth rate of about 3%.
World consumption for UF6 and natural UO2 conversion services decreased 3% in 2011. After the events in Japan, a number of reactors were taken offline (primarily in Germany and Japan) and a number of new reactor startups were delayed as increased safety checks were required. We expect world consumption to increase by about 6% in 2012 as delayed new reactors come online.
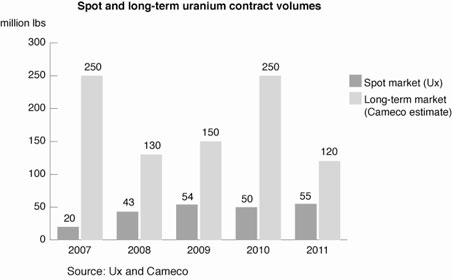
Contract volumes
The Ux estimate for global spot market sales in 2011 is about 55 million pounds, 2% above the previous record high of 54 million pounds in 2009. Utilities were responsible for 34% of the purchases. Traders and financial players were the primary participants, taking advantage of the lower spot prices to make opportunistic purchases.
At the start of 2011, we expected long-term contracting volumes for the year to be between 150 million and 200 million pounds, but they ended the year at about 120 million pounds. We believe the decrease is likely related to utilities’ reluctance to contract during this period of market and price uncertainty. We estimate long-term contracting volumes in 2012 will be between 80 and 100 million pounds, depending on supply, market expectations and market prices.
2011 MANAGEMENT’SDISCUSSIONANDANALYSIS 13
The long-term view
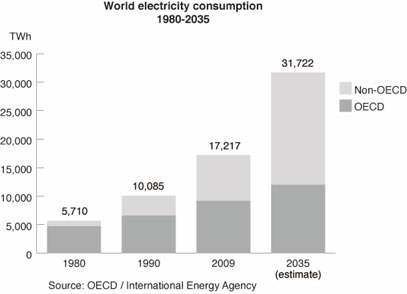
We remain confident in the long-term fundamentals of the nuclear industry, despite the near- to medium-term uncertainty. World population and industrial development continue to grow, and the World Energy Outlook for 2011 predicts a near doubling of electricity consumption between 2009 and 2035. Most of this energy will be used by developing (non-OECD) countries as their populations and standards of living increase.
New reactor outlook
Within this context, most countries are pursuing a diversified approach to energy growth, with an emphasis on energy security and clean energy. Nuclear power can generate baseload electricity with no toxic air pollutants, carbon dioxide (CO2) or other greenhouse gas emissions. It has the capacity to produce enough electricity on a global scale to meet the world’s growing needs, and while it is not the only solution, it is an affordable and sustainable source of safe, clean and reliable energy. As a result, we expect nuclear energy to remain an important part of the energy mix.
This is evident in the growth in reactor construction we expect over the next 10 years. There are 431 reactors operable today. We expect the start up of 96 net new reactors by 2021, increasing the total number of operable reactors to 527.
This is a rate of growth in new reactor construction not seen since the 1970s.
14 CAMECOCORPORATION
Today there are 63 reactors under construction around the world. China continues to lead the growth, with 26 reactors under construction and dozens more planned. India, Russia and South Korea also continue to expand their nuclear generating capacity.
In the UK, government commitment to nuclear energy is strong, driven by concerns about energy security and the need to limit CO2 emissions. The US continues to make progress toward new nuclear development with six units planned, four of which we expect will receive construction licences this year, and one of which is already under construction.
We have long-term supply contracts in many of these countries, including the US and China.
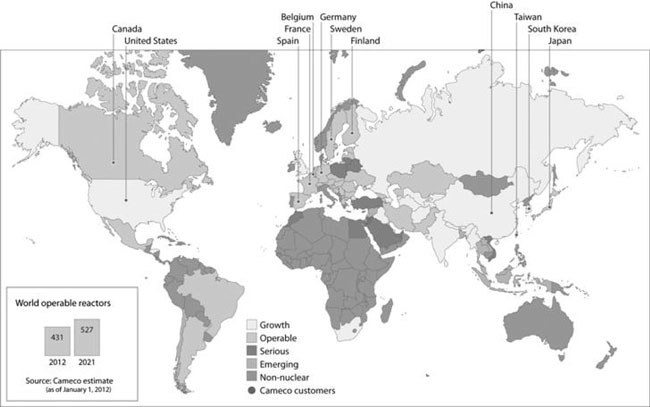
Other previously non-nuclear countries are either moving ahead with their reactor construction programs or considering adding nuclear to their energy programs in the future. For example, the United Arab Emirates is proceeding with its plans to have 5.6 gigawatts of nuclear capacity in place by 2020 and is beginning the process to secure fuel for those reactors. In Saudi Arabia, where power demand has been increasing by 7% to 8% annually, plans to build 16 reactors by 2030 have been announced. Vietnam, Poland, Lithuania, Turkey, Jordan, Egypt and Belarus are also moving forward with plans to proceed with nuclear power development.
2011 MANAGEMENT’SDISCUSSIONANDANALYSIS 15
Demand for uranium is growing
Not surprisingly, as the number of reactors grows, so too does the demand for uranium.
We expect world demand of approximately 2.2 billion pounds over the next 10 years, which includes both world consumption and strategic inventory building. Although our previous forecast has decreased by about 7% due to the events in 2011, it is still significant growth. By 2021, we expect world uranium demand to be about 250 million pounds per year, an average annual growth rate of about 3%.
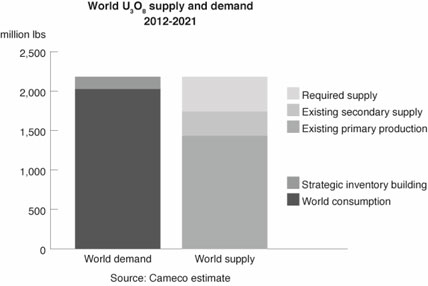
Supply is expected to tighten
While the impact of the March events in Japan on demand was more immediately apparent, the drop in uranium prices and ongoing global economic turmoil are beginning to have an impact on the outlook for supply.
Disruptions in mine production, difficulty raising funds for new mining projects, project delays, the announced cancellations of new mines or mine expansions, and the end of the Russian highly enriched uranium (HEU) commercial agreement, all point to tightening supply.
We expect 65% of global uranium supply over the next 10 years to come from existingprimary production—mines that are currently in commercial operation—while we expect 15% to come from existingsecondary supply sources. However, most secondary sources are finite and will not meet long-term needs. Currently, one of the largest sources of secondary supply is uranium derived from the Russian HEU commercial agreement. We expect all deliveries from this source to be made by the end of 2013, leaving a gap of about 24 million pounds per year. SeeManaging our supply and costsstarting on page 23 for more information about the Russian HEU commercial agreement.
The result is that we expect 20% of supply will need to come fromnew sources at a time when new projects are being delayed or cancelled because of current market conditions.In addition, there are barriers to entry, and the lead time for new uranium production can be as long as 10 years or more, depending on the deposit type and location.
Cameco is well positioned
Given our extensive base of mineral reserves and resources, diversified sources of supply and global exploration program, we are well positioned to meet the growing demand for uranium.
16 CAMECOCORPORATION
Our strategy
Our strategy is to increase annual uranium production to 40 million pounds by 2018 and to invest in opportunities across the nuclear fuel cycle that we expect will complement and enhance our business.
Growth
Our growth strategy continues to focus on our uranium segment. Over the next 10 years, we expect 96 net new reactors to be built. Deliveries under the Russian HEU commercial agreement will end in 2013, and the industry will need new production. Lead-times in our industry are long, so we are preparing our assets today to make sure we can respond quickly to changing market conditions with a continued focus on profitability.
In addition, we have an active exploration program and a disciplined acquisition strategy, which we expect will provide us with opportunities to create synergies and grow.
Exploration
Our program is directed at replacing mineral reserves as they are depleted by our production, and ensuring our growth beyond 2018. We have maintained an active exploration program even during periods of weak uranium prices, which has helped us secure land with exploration and development prospects that are among the best in the world. Many of these prospects are located close to our existing operations where we have established infrastructure and capacity to expand.
Our exploration efforts have increased uranium mineral reserves and resources at our operations. We have direct interests in almost 75 active exploration projects in eight countries, over 110 experienced professionals searching for the next generation of deposits, and ownership interests in approximately 5 million hectares (12.5 million acres) of land mainly in Canada, Australia, Kazakhstan, the US, Mongolia and Peru. In northern Saskatchewan alone, we have direct interests in 1.4 million hectares (3.5 million acres) of land covering many of the most prospective exploration areas of the Athabasca Basin. Many of our projects are advanced through joint ventures with both junior and major uranium companies.
For properties that meet our investment criteria, we will partner with other companies through strategic alliances, equity holdings and traditional joint venture arrangements. Our leadership position and industry expertise in both exploration and corporate social responsibility make us a partner of choice.
Acquisition
We have a dedicated team looking for acquisition opportunities that we expect will further add to our production, support our sales activities, and complement and enhance our business in the nuclear industry. We will invest when an opportunity is available at the right time and the right price.
2011 MANAGEMENT’SDISCUSSIONANDANALYSIS 17
Uranium: growing production
We have a strategy and process in place to increase our annual production to 40 million pounds by 2018, which we expect to come from three sources:
| • | operating properties |
| • | development projects |
| • | projects under evaluation |
We expect about half of the total 2018 annual production will come from mines that are already operating, while the other half is expected to come from projects that are in development or under evaluation.
We advance each project through a stage gate process that includes several defined decision points in the assessment and development stages. At each point, we re-evaluate the project based on current economic, competitive, social, legal, political and environmental considerations. If it continues to meet our criteria, we proceed to the next stage. This process allows us to build a pipeline of projects ready for a production decision.
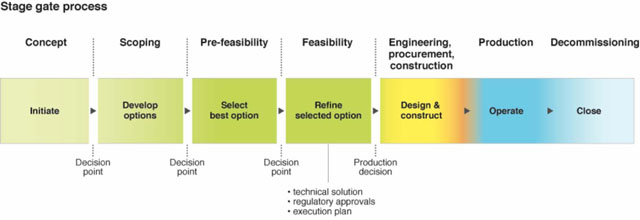
The chart below shows the mix of projects we had when we started our Double U strategy in 2008 and how we expect each of these sources to progress towards achieving our 2018 production goal.
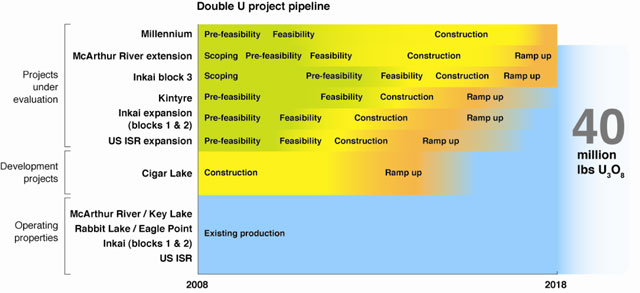
Many of these projects are in the early stage. Depending on the results of our evaluation activities or changing market signals, the mix of projects to reach our 2018 goal may change.
18 CAMECOCORPORATION
To meet our goal, we estimate our capital costs for the development projects and projects under evaluation in the chart will be between $200 and $400 million per year in growth capital for the next three years. SeeCapital spending starting on page 42.
This is a preliminary estimate that we expect to fund using existing cash balances and operating cash flows. Many of these are early stage projects, however, and the mix of projects and their underlying capital estimates could change significantly.

In 2008 Cameco launched a strategy to double our annual uranium production to 40 million pounds by 2018 (Double U).
We have been working toward that goal by focusing on our existing portfolio, monitoring the market and putting resources into the projects that make the most sense. We just completed year four of our 10-year strategy, and we are on track.
Operating properties
Our current sources of production are McArthur River/Key Lake, Rabbit Lake, Smith Ranch-Highland, Crow Butte and Inkai.
We plan to maintain production at these operations, and to expand production where we can by developing new mining zones. We are upgrading the mills at Key Lake and Rabbit Lake to support our plans for production growth.
Inkai blocks 1 and 2, in Kazakhstan, have the potential to significantly increase production. Based on current mineral reserves, we expect Rabbit Lake to produce until 2017, although work is ongoing to extend its mine life even further.
Development project
Cigar Lake is our project in development. It is a superior, world-class deposit that we expect to generate 9 million pounds of uranium per year (our share) after we finish construction and ramp up to full production. We are targeting first commissioning in ore in mid-2013, with the first pounds to be packaged at the McClean Lake mill in the fourth quarter of 2013.
Projects under evaluation
We are evaluating several potential sources of production, including expanding McArthur River, increasing production at Inkai blocks 1 and 2, advancing Inkai block 3, increasing production in the US, and advancing Kintyre and Millennium.
| • | The McArthur River extension is expected to expand our existing mining area, which is part of the most prolific high-grade uranium system in the world. |
| • | Under an MOU with our Inkai partner, National Atomic Company KazAtomProm Joint Stock Company (Kazatomprom), we are in discussions to increase annual production from blocks 1 and 2 to 10.4 million pounds (100% basis). |
| • | Inkai block 3, in Kazakhstan, has the potential to become a significant source of production. |
| • | We are the largest producer in the US and are planning to almost double annual production. |
| • | Our 70% interest in Kintyre, in Australia, adds potential to diversify our production by geography and deposit type. |
| • | Millennium is a uranium deposit in northern Saskatchewan that we expect will take advantage of our excess milling capacity. |
We expect to spend between $20 million and $25 million per year on average for the next three years to assess the feasibility of projects under evaluation. These amounts will be expensed as incurred.
You can read more about each of these projects inOur operations and development projects on page 61.
2011 MANAGEMENT’SDISCUSSIONANDANALYSIS 19
Fuel services: capturing synergies
We control about 25% of world UF6 conversion capacity and are the only commercial supplier of natural UO2. Our focus is on cost-competitiveness and operational efficiency.
Our fuel services segment is strategically important because it helps support the growth of the uranium segment. Offering a range of products and services to customers helps us broaden our business relationships and expand our uranium market share.
We also continue to explore innovative areas like laser enrichment technology to broaden our fuel cycle participation and help us serve our customers more effectively.
Today, uranium enrichment is the second largest value component, after uranium, in a typical light water reactor fuel bundle. The enrichment market has the same customer base as the uranium market, and most of the world’s commercial nuclear reactors need enriched uranium.
Uranium and enrichment can be substituted for each other to some extent to produce a given amount of enriched uranium product. For example, when uranium is relatively more expensive than enrichment, it is more cost effective to reduce the amount of uranium feedstock and use more enrichment capacity. When enrichment is relatively more expensive, it makes sense to use more uranium and less enrichment to produce the same amount of enriched uranium product.
Enrichment has the potential to be a significant growth area for us, and offers operational synergies that could significantly enhance profit margins for both our uranium business and future enrichment operations. As one of the largest uranium suppliers in the world, our investment in this segment of the fuel cycle would help us capture additional value.
Electricity: capturing added value
Our investment in BPLP has been an excellent source of cash flow. Our focus is on maintaining steady cash flow and building synergies with our other segments. BPLP is considering extending the operating life of the four Bruce B units and we will have an opportunity to invest if BPLP decides to proceed. We would base this investment decision on the underlying value proposition and the strategic fit with our other growth objectives.
20 CAMECOCORPORATION
This discussion of our strategy and our process to increase our annual uranium production by 2018 is all forward-looking information. It is based on the assumptions and subject to the material risks discussed on page 3, and specifically on the assumptions and risks listed here.
Assumptions
Our statements about increasing annual production by 2018 to 40 million pounds reflect our current production target for 2018. Although we are confident in our efforts to reach that target, we cannot guarantee that we will. We have made assumptions about 2018 production levels at each of our existing operating mines. We have also made assumptions about the development of mines that are not operating yet and their 2018 production levels. We believe these assumptions are reasonable, individually and together, but if an assumption about one or more mines proves to be incorrect, we will not reach our 2018 target production level unless the shortfall can be made up by additional production at another mine.
Material risks that could prevent us from reaching our target
| • | we cannot locate additional mineral reserves and identify appropriate methods of mining to maintain and increase production levels at McArthur River |
| • | we cannot locate additional mineral reserves to extend Rabbit Lake’s mine life to maintain production |
| • | our partner or the Kazakh government does not support an increase in production to the expected level at Inkai, blocks 1 and 2, or we do not reach the full production level as quickly as we expect |
| • | we cannot bring block 3 into production at Inkai if the feasibility study is not favourable or we cannot secure partner or government approval |
| • | development at Cigar Lake is not completed on schedule, or we do not reach the full production level as quickly as we expect |
| • | development of Kintyre is delayed due to political, regulatory or indigenous people issues |
| • | we cannot obtain a favourable feasibility study for Kintyre or the Millennium project, or we cannot reach agreement with our project partners to move ahead with production at Kintyre or Millennium |
| • | the Key Lake mill does not have enough capacity to handle anticipated production increases, and we are not able to expand its capacity or to identify alternative milling arrangements |
| • | the projects under evaluation do not proceed or, if they do, are not completed on schedule or do not reach full production levels as quickly as we expect |
| • | uranium prices and development and operating costs make it uneconomical to develop projects under consideration |
| • | we cannot obtain or maintain necessary permits or approvals from government authorities |
| • | disruption in production or development due to natural phenomena, labour disputes, political risks, blockades or other acts of social or political activism, lack of tailings capacity, or other development and operation risks |
2011 MANAGEMENT’SDISCUSSIONANDANALYSIS 21
Building on our strengths
World-class assets
We have extensive mineral reserves and resources, a large portfolio of low-cost mining operations, and geographically diverse uranium assets with controlling interests in the world’s largest high-grade uranium reserves.
Employee expertise
Our company is filled with talented and creative people who are committed to achieving our strategy in a manner consistent with our corporate values of protecting people and the environment, excellence and integrity.
Strong customer relationships
We have large, creditworthy customers that continue to need uranium, even during weak economic conditions, and we expect the uranium contract portfolio we have built to provide a solid revenue stream for years to come.
Uranium price leverage
Our plans to increase our production of uranium, combined with our contracting strategy, are designed to give us leverage when uranium prices go up, and to protect us when prices decline.
Financial strength
We are in a strong financial position to proceed with our growth plans. We are working to ensure our capital structure is appropriate and adds value for our shareholders.
Disciplined portfolio management
We have a disciplined portfolio management process that incorporates all capital projects into a single capital plan and uses a stage gate decision process (see page 18). This ensures our capital projects are aligned with our strategic objectives, and that business benefits are measurable and attainable.
Focused risk management
We have a formal enterprise-wide risk management process that we apply consistently and systematically across our organization. Risk management is a core element of our strategy and our objectives, and we use it to continuously improve our organization. It will underpin decisions we make as we move ahead with our growth strategy.
Innovation
We are always looking for ways to improve processes, to increase safety and environmental performance, and reduce costs. We are currently working on projects in all aspects of operations, including upgrading the Key Lake and Rabbit Lake mills.
Reputation
We believe strongly in our values and apply them consistently in our operations and business dealings. We are recognized as a reliable supplier and business partner, strong community supporter and employer of choice.
22 CAMECOCORPORATION
Managing our growth
Our ability to grow is a function of our people, processes, assets and reputation, and the ability to enhance and leverage these strengths to add value and build competitive advantage.
We use four categories to define what we are committed to deliver, and how we will measure our results:
| • | outstanding financial performance |
| • | a safe, healthy and rewarding workplace |
| • | a clean environment |
| • | supportive communities |
We introduced these measures of success to proactively address the financial, social and environmental aspects of our business. We believe that each is integral to our overall success and that, together, they will ensure our long-term sustainability.
Focus on long-term sustainability
Companies are under growing scrutiny for the way they conduct their businesses, and there has been a significant increase in stakeholder expectations for environmentally and socially responsible business practices.
Rather than viewing sustainable development as an ‘add-on’ to traditional business activity, we see it as integral to the way we do business, and have made it a strategic priority, integrating it into our objectives and compensation policies.
You can find out more in our sustainable development report and annual information form, which are on our website (cameco.com).
Outstanding financial performance
The mining industry is becoming increasingly competitive, particularly in two of the jurisdictions where we operate, northern Saskatchewan in Canada and Western Australia. Our financial results depend heavily on our sales and production volumes, on the cost of supply, and on the prices we realize in our uranium and fuel services segments.
Managing our supply and costs
We sell more uranium than we produce every year. We meet our delivery commitments using uranium we obtain:
| • | from our own production |
| • | through long-term purchase agreements and on the spot market |
| • | from our existing inventory—we target inventories of about six months of forward sales of uranium concentrates and UF6 |
Like all mining companies, our uranium segment is affected by the rising cost of inputs like labour and fuel. In 2011, labour, production supplies and contracted services made up 88% of the production costs at our uranium mines. Labour (34%) was the largest component. Production supplies (27%) included fuels, reagents and other items. Contracted services (27%) included mining and maintenance contractors, air charters, security and ground freight.
Operating costs in our fuel services segment are mainly fixed. In 2011, labour accounted for about 49% of the total. The largest variable operating cost is for energy (natural gas and electricity), followed by zirconium and anhydrous hydrogen fluoride.
To help us operate efficiently and cost-effectively as we grow, we manage operating costs and improve plant reliability by prudently investing in production infrastructure, new technology and business process improvements.
Our costs are also affected by the purchases of uranium and conversion services we make under long-term contracts and on the spot market.
Our long-term purchase contracts are at fixed prices that are lower than the current published spot and long-term prices. Our most significant long-term purchase contract is the Russian HEU commercial agreement, which ends in 2013. We expect to purchase about 17 million pounds, our remaining volumes, under this agreement to the end of 2013. The purchase price escalates with inflation and was agreed to in 2001 when uranium prices were much lower than today. In 2008, pricing on approximately 6 million pounds of the remaining volumes available to us in 2012 and
2011 MANAGEMENT’SDISCUSSIONANDANALYSIS 23
2013 was renegotiated. Using a $60 (US) per pound uranium spot price, the average price increase from 2012 to 2013 on these 6 million pounds is expected to be about $18 (US) per pound (including an adjustment for inflation).
After the Russian HEU commercial agreement ends in 2013, we expect to maintain our sales volumes using a combination of sources including:
| • | increased production from various supply sources (including the rampup of Cigar Lake) |
| • | normal-course purchases of uranium under existing and/or new arrangements |
| • | discretionary use of inventories |
We expect our purchases will result in profitable sales; however, the cost of purchased material is likely to be higher than our other sources of supply.
In addition, we will make spot purchases to take advantage of opportunities to place material into higher priced contracts. We make spot purchases prudently, looking at the spot price and other factors relating to our business to decide whether a spot purchase is appropriate. This activity gives us insight into the underlying market fundamentals and is a source of profit.
Managing contracts
We sell uranium and fuel services directly to nuclear utilities around the world, as uranium concentrates, UO2, UF6, conversion services or fuel fabrication.
Uranium is not traded in meaningful quantities on a commodity exchange. Utilities buy the majority of their uranium and fuel services products under long-term contracts with suppliers, and meet the rest of their needs on the spot market.
Our extensive portfolio of long-term sales contracts—and the long-term, trusting relationships we have with our customers—are core strengths for us.
Because we deliver large volumes of uranium every year, our net earnings and operating cash flows are affected by changes in the uranium price. Our contracting strategy is to secure a solid base of earnings and cash flow by maintaining a balanced contract portfolio that maximizes our realized price. Market prices are influenced by the fundamentals of supply and demand, geopolitical events, disruptions in planned supply and other market factors. Contract terms usually reflect market conditions at the time the contract is accepted, with deliveries beginning several years in the future.
Our current uranium contracting strategy is to sign contracts with terms of 10 years or more that include mechanisms to protect us when market prices decline, and allow us to benefit when market prices go up. Our portfolio includes a mix of fixed-price and market-related contracts, which we target at a 40:60 ratio. Fixed-price contracts are typically based on the industry long-term price indicator at the time the contract is accepted, adjusted for inflation to the time of delivery. Market-related contracts may be based on either the spot price or the long-term price as quoted at the time of delivery, and often include floor prices adjusted for inflation and some include ceiling prices also adjusted for inflation.
This is a balanced approach that reduces the volatility of our future earnings and cash flow, and that we believe delivers the best value to shareholders over the long term. It is also consistent with the contracting strategy of our customers. This strategy has allowed us to add increasingly favourable contracts to our portfolio that will enable us to benefit from any increases in market prices in the future.
The majority of our contracts include a supply interruption clause that gives us the right to reduce, on a pro rata basis, defer or cancel deliveries if there is a shortfall in planned production or in deliveries under the Russian HEU commercial agreement.
We are heavily committed under long-term uranium contracts through 2016, so we are being selective when considering new commitments.
The majority of our fuel services contracts are at a fixed price per kgU, adjusted for inflation, and reflect the market at the time the contract is accepted.
24 CAMECOCORPORATION
A safe, healthy and rewarding workplace
We strive to foster a safe, healthy and rewarding workplace at all of our facilities, and measure progress against key indicators, such as conventional and radiation safety statistics, employee sentiment toward the company and employment creation.
To achieve our growth objectives, we continue to build an engaged, qualified and diverse organization capable of leading and implementing our strategies. Our challenge is to retain our current workforce and compete for the limited number of qualified people available, both to replace retiring employees and to support our growth. Our long-term people strategy includes identifying critical workforce segments and planning our workforce to meet this challenge.
Our approach is working. We were recognized in a number of ways for our employee programs in 2011: the Financial Post named Cameco one of the Top 10 Best Companies to Work For in Canada; Mediacorp named us one of Canada’s Top 100 Employers; and The Globe and Mail named us one of Canada’s Top Diversity Employers. You can find out more about our awards on cameco.com.
A clean environment
We are committed to operating our business with respect and care for the local and global environment. We strive to be a leader in environmental practices and performance by complying with and moving beyond legal and other requirements.
We are committed to integrating environmental leadership into everything we do. In 2005, we launched a formal environmental leadership initiative, and set objectives and performance indicators to measure our progress in protecting the air, water and land near our operations, and in reducing the amount of waste we generate and energy we use.
Reducing our impact
We have been working to reduce the impact we have on the environment. This includes monitoring and reducing our effect on air, water and land, reducing the greenhouse gases we produce and the amount of energy we consume, and managing the effects of waste.
We are investing in management systems and safety initiatives to achieve operational excellence, and this continues to improve our safety and environmental performance and operating efficiency.
We have developed new water treatment technologies that have improved the quality of the water released from our Saskatchewan uranium milling operations, and are working on other projects to reduce waste, improve the reclamation process and manage waste rock more effectively.
We have also completed an energy assessment at each of our North American operations, and developed management plans for reducing our energy intensity and greenhouse gas emissions.
We are maximizing the lifespan of our operating sites to limit the environmental impact of operations, and revitalizing the Key Lake mill (in operation for 29 years) and Rabbit Lake mill (in operation for 37 years).
Like other large industrial organizations, we use chemicals in our operations that could be hazardous to our health and the environment if they are not handled correctly. We train our employees in the proper use of hazardous substances and in emergency response techniques.
We work with communities who are affected by our activities to tell them what we are doing and to receive feedback and further input to build and sustain their trust. For example, in Saskatchewan, we participate in the Athabasca Working Group and Northern Saskatchewan Environmental Quality Committee. In Ontario, we liaise with our communities by regularly holding educational and environment-focused activities.
2011 MANAGEMENT’SDISCUSSIONANDANALYSIS 25
Supportive communities
To maintain public support for our operations (our social licence to operate) and our global reputation, we need the respect and support of communities, indigenous people, governments and regulators affected by our operations.
We build and sustain the trust of local communities by being a leader in corporate social responsibility (CSR). Through our CSR initiatives, we educate, engage, employ and invest in the people in the regions where we operate.
For example, in northern Saskatchewan in 2011:
| • | just over 50% of the employees at our northern mines were local residents (more than 760 residents) and were paid over $43 million in wages |
| • | approximately $390 million was paid to northern businesses, who provided 74% of services to our northern minesites. This is the most that we have ever procured from northern vendors in one year. |
| • | we made nearly 90 community visits in northern Saskatchewan to discuss potential projects at our northern operations and to provide career information to high school students and community members |
| • | we donated over $1.3 million to northern and aboriginal initiatives for youth, health and wellness, education and literacy, and culture and recreation |
| • | we provided $100,000 in scholarships to post-secondary students |
Our operations are closely regulated to give the public comfort that we are operating in a safe and environmentally responsible way. Regulators approve the construction, startup, continued operation and any significant changes to our operations. Our operations are also subject to laws and regulations related to safety and the environment, including the management of hazardous wastes and materials.
Our objectives are consistent with those of our regulators—to keep people safe and to protect the environment. We pursue these goals through open and co-operative relationships with all of our regulators. We work to earn their trust and that of other stakeholders by continually striving to protect people and the environment.
26 CAMECOCORPORATION
Measuring our results
We set corporate, business unit and departmental objectives every year under our four measures of success, and these become the foundation for a portion of annual employee compensation.
2011 objectives | Results | 2012 objectives This is forward-looking information. See page 2 for more information. | ||
Outstanding financial performance | ||||
Production
• Produce 21.9 million pounds of U3O8 and between 15 million and 16 million kgU from fuel services. | Achieved
• Our share of U3O8 production was 22.4 million pounds, or 102% of plan, and we produced 14.7 million kgU at fuel services, or 98% of plan.
Exceeded
• Exceeded our production target of 18.7 million lbs U3O8 (100% basis) by 7% at McArthur River/Key Lake through technological advancements and identification of mining opportunities that allowed us to take advantage of production flexibility provisions in our operating licences. | Production
• Achieve budgeted production from our uranium and fuel services segments.
McArthur River
• Implement productivity improvements to maintain planned production during mining zone transitions. | ||
Financial measures
Corporate performance
• Achieve budgeted net earnings and cash flow from operations (before working capital changes). | Exceeded
• Adjusted net earnings1 were $509 million, 32% higher than budget. Cash flow from operations (before working capital changes)1 was $850 million, 41% higher than budget. | Financial measures
Corporate performance • Achieve budgeted adjusted net earnings and cash flow from operations (before working capital changes). | ||
Costs
• Strive for unit costs below budget. | Achieved
• Actual unit operating costs for uranium were 1% better than budgeted costs of $19.19 per lb U3O8 produced and exceeded budgeted unit production costs for fuel services of $15.65 per kgU sold, by 3%. The results were weighted 70/30, reflecting the portion each segment makes up of our business. Our minimum target was to achieve budgeted unit costs on a consolidated basis. Target was achieved in the face of cost escalation fueled by increased resource development activity where we operate. | Costs
• Achieve budgeted unit costs. | ||
| 1 | We use adjusted net earnings and cash flow from operations (before working capital changes) as a more meaningful way to compare our financial performance from period to period. These are not standard measures, and not a substitute for financial information prepared in accordance with IFRS. Other companies may calculate these measures differently. SeeAdjusted net earnings (non-IFRS/GAAP measure)and note 26 to our audited 2011 financial statements for more information. |
2011 MANAGEMENT’SDISCUSSIONANDANALYSIS 27
2011 objectives | Results | 2012 objectives | ||
Outstanding financial performance | ||||
Growth
Cigar Lake
• Advance the project towards mid-2013 startup by completing remediation of all underground workings and advancing shaft 2 sinking.
Inkai
• Advance block 3 mineral resource delineation and the engineering design of a test leach facility. Advance construction of site infrastructure. | Achieved
• Completed remediation of all underground workings and completed sinking of shaft 2 to the 480 metre level. Cigar Lake is a challenging deposit to mine. Completion of these critical milestones required careful planning and deliberate execution.
Partially achieved
• Advanced block 3 mineral resource delineation, completed engineering for a test leach facility and began infrastructure development. We need regulatory approval of the detailed delineation and test leach work programs. The approval process has been challenging because of the complex and developing regulatory environment.
Partially achieved | Growth
• Meet regulatory project milestones and stage gate assessments on projects that support our Double U strategy.
Cigar Lake
• Advance the project towards startup in 2013 by successfully completing critical activities planned for 2012.
Inkai
• Advance block 3 mineral resource delineation drilling and complete the test leach facility.
• Receive approval to increase annual production from blocks 1 and 2 to design capacity of 5.2 million pounds per annum (100% basis). Continue to advance our longer-term objective of receiving approval to double annual production from blocks 1 and 2, extend the lease terms and secure block 3 mining rights. | ||
• Receive approval to increase annual production from blocks 1 and 2 to design capacity of 5.2 million pounds per annum (100% basis). Pursue our longer-term objective of receiving approval to double annual production from blocks 1 and 2 by advancing the conversion joint venture project with Kazatomprom. | • Signed memorandum of agreement with our partner to increase annual production from blocks 1 and 2 to 5.2 million pounds per year (100% basis). Government approval is pending in this complex and developing regulatory environment. To pursue our longer-term objective to double annual production, we continued to explore with Kazatomprom the feasibility of building a uranium conversion facility and other potential collaborations in uranium conversion. | |||
28 CAMECOCORPORATION
2011 objectives | Results | 2012 objectives | ||
Outstanding financial performance | ||||
Growth (continued)
Kintyre
• Continue to advance project evaluation to allow a production decision as soon as possible. | Partially achieved
• Significantly advanced a prefeasibility study and an environmental review and management program in a remote area that is often subject to extreme weather conditions. To support our prefeasibility study, we expanded the scope of our drilling program and delayed these activities to 2012. Gained support in principle from the Martu, the local indigenous people, for development of the project. | Growth (continued)
Kintyre
• Continue to advance project evaluation in 2012 and decide if we will proceed to feasibility.
Exploration and innovation
• Replace mineral reserves and resources at the rate of annual U3O8 production based on a three-year rolling average. | ||
Millennium
• Continue to advance the Millennium project toward a project decision. | Achieved
• Continued to work on the environmental assessment and carried out additional studies and design work. Our 2011 drill program resulted in an increase in inferred resources. As a project under evaluation, it must pass a number of decision points before the project decision is made. | |||
Exploration and innovation
• Replace mineral reserves and resources at the rate of annual U3O8 production based on a three-year rolling average. | Achieved
• Over the last three years, mineral reserves decreased by 60 million pounds compared to production of 66 million pounds, measured and indicated resources increased by 126 million pounds and inferred resources decreased by 18 million pounds. On average, production was replaced and exceeded by 16 million pounds per year in each of the last three years (2009 to 2011). Replacing our reserves and resources is fundamental to our long-term success.
Achieved | |||
• Support production growth and improved operating efficiencies through targeted research, development and technological innovation. | • Advanced numerous ongoing research projects and selected four of these to fast track that are aimed at improving our environmental performance and process efficiencies at our operations. Innovation is critical to achieving continuous improvement in these areas even though it is complex and its outcome is uncertain. | |||
2011 MANAGEMENT’SDISCUSSIONANDANALYSIS 29
2011 objectives | Results | 2012 objectives | ||
Outstanding financial performance | ||||
Growth (continued)
McArthur River extension
• Advance the underground exploration drifts to the north of current mining areas and initiate a feasibility study. | Achieved
• �� Advanced the underground exploration drifts based on our updated mine plan and began feasibility work. Upgraded resources from inferred to indicated based on surface drilling. Achieved these results while managing the operational risks associated with the location and grade of the orebody. | Growth (continued) | ||
Management
• Sustain and grow production in accordance with our strategy to double annual uranium production by 2018 by advancing pipeline uranium projects through the stage gate process. | Achieved
• Successfully implemented the stage gate process and incorporated all of our global development projects into the process. This is a complex scheduling process involving cross-functional teams, communication across different disciplines and several large capital projects in different geographic locations competing for internal resources. | Management
• Deliver capital projects planned for completion in 2012 within budget and on schedule. | ||
• Deliver planned capital projects within 10% of budget. | Achieved
• The 213 capital projects that closed in 2011 were 3.8% below our budget of $150 million. | |||
Safe, healthy and rewarding workplace | ||||
• Strive for no lost-time injuries at all Cameco-operated sites and, at a minimum, maintain a long-term downward trend in combined employee and contractor injury frequency and severity, and radiation doses. | Achieved
• Safety performance in 2011 was strong overall, although performance declined slightly from last year’s record-setting level and there were a few serious near misses. Lost-time incident frequency for employees and contractors was 0.3 per 200,000 hours worked compared to a target of 0.4, severity was 8.9 compared to a target of 25. | • Strive for no lost-time injuries at all Cameco-operated sites and, at a minimum, maintain a long-term downward trend in combined employee and contractor injury frequency and severity, and radiation doses.
• Attract, retain, engage and develop employees in support of current and future operations and establish succession pools for key positions. | ||
• Complete implementation of the risk standard and integrate it into our quality management system. Adopt a risk policy and implement improvements to the risk governance structure at the management and board level. | Achieved
• Completed implementation of the risk standard and integrated it into our quality management system. This involved significant change management across Cameco. Management and the board approved the risk policy, and we made improvements to our risk governance structure. | |||
30 CAMECOCORPORATION
2011 objectives | Results | 2012 objectives | ||
Clean environment | ||||
• Strive for zero reportable environmental incidents, reduce the frequency of incidents and have no significant incidents at Cameco-operated sites. | Partially achieved
• There were 31 reportable environmental incidents, slightly above our three-year average of 29, but within the range of expected statistical variation. There were no significant environmental incidents. | • Strive for zero reportable environmental incidents, reduce the frequency of incidents and have no significant incidents at Cameco-operated sites. | ||
• Improve year-over-year performance in corporate environmental leadership indicators. | Achieved
• Two of eight key performance indicators showed an improvement over 2010, while two were at the same level as 2010. Higher rates in two of the key indicators were largely influenced by the cleanup of historic waste. Higher rates in the remaining two key indicators were tied to increased activity at our operations. We need continuous innovation in our practices and technology to improve year-over-year. | |||
Supportive communities | ||||
• Develop long-term relationships by engaging with stakeholders important to our sustainability. Ensure support from our employees, impacted communities, investors, governments and the general public through communications, community investment and business development. | Achieved
• Established and maintained positive relationships with groups affected by our operating activities. Received a higher management credibility rating of 74% in our investor perception study compared to 64% in 2010. Maintained strong corporate trust ratings in Saskatchewan (7.24/10 compared to 7.62 in 2010), Port Hope (7.98/10 compared to 7.58 in 2010) and the US (7.32/10 compared to 7.74 in 2010). These levels of support for our operations were achieved in the face of inherent challenges for mining companies, complicated by misperceptions of the nuclear industry. Named a Top 100 Employer and among the 10 Best Companies to Work For, and received awards for being one of Saskatchewan’s Top Employers, Canada’s Best Diversity Employers and a Top Employer of Canadians Over 40. | • Develop long-term relationships by engaging with regulators and other stakeholders important to our sustainability. Secure continued support from our employees, impacted communities, investors, governments and the general public through communications, community investment and business development.
• Implement Cameco’s corporate social responsibility policy to advance Cameco projects in all locations and secure support from indigenous communities affected by our operations. | ||
2011 MANAGEMENT’SDISCUSSIONANDANALYSIS 31
Financial results
This section of our MD&A discusses our performance, financial condition and outlook for the future.
2011 consolidated financial results | 33 | |||
Outlook for 2012 | 39 | |||
Liquidity and capital resources | 40 | |||
2011 financial results by segment | 46 | |||
Uranium | 46 | |||
Fuel services | 50 | |||
Electricity | 51 | |||
Fourth quarter results | 53 | |||
Fourth quarter consolidated results | 53 | |||
Quarterly trends | 54 | |||
Fourth quarter results by segment | 55 | |||
32 CAMECOCORPORATION
2011 consolidated financial results
On January 1, 2011, we adopted IFRS for Canadian publicly accountable enterprises. Our financial statements have been prepared using IFRS. Amounts relating to the year ended December 31, 2010 in this MD&A and our related financial statements have been revised using IFRS for comparative purposes. Amounts for periods prior to January 1, 2010 are presented in accordance with Canadian GAAP.
Highlights December 31 ($ millions except per share amounts) | 2011 | 2010 | Canadian GAAP 2009 | change from 2010 to 2011 | ||||||||||||
Revenue | 2,384 | 2,124 | 2,315 | 12 | % | |||||||||||
Gross profit | 776 | 771 | 750 | 1 | % | |||||||||||
Net earnings | 450 | 516 | 1,099 | 1 | (13 | )% | ||||||||||
$ per common share (basic) | 1.14 | 1.31 | 2.83 | 1 | (13 | )% | ||||||||||
$ per common share (diluted) | 1.14 | 1.31 | 2.82 | 1 | (13 | )% | ||||||||||
Adjusted net earnings (non-IFRS/GAAP, see below) | 509 | 497 | 528 | 2 | % | |||||||||||
$ per common share (adjusted and diluted) | 1.29 | 1.26 | 1.35 | 2 | % | |||||||||||
Cash provided by operations (after working capital changes) | 732 | 521 | 690 | 40 | % | |||||||||||
| 1 | Net earnings for 2009 includes an amount of $382 million relating to a discontinued operation. In 2009, we sold our interest in Centerra Gold Inc. For that year, net earnings from continuing operations amounted to $717 million ($1.84 per share basic & diluted). |
Net earnings
Our net earnings were $450 million ($1.14 per share diluted) compared to $516 million ($1.31 per share diluted) in 2010 mainly due to:
| • | lower earnings from our electricity business due to higher costs, lower realized prices and a decline in sales volumes |
| • | higher taxes due to an increase in the provision related to our transfer pricing dispute with the Canadian Revenue Agency (CRA) |
| • | lower earnings from our fuel services business as a result of an increase in the cost of sales, partially offset by an increase in sales volumes |
| • | losses on foreign exchange derivatives, compared to gains in 2010 |
| • | higher earnings from our uranium business due to higher realized prices, and an increase in sales volumes, partially offset by an increase in the cost of sales |
Three-year trend
Our net earnings normally trend with revenue, but in recent years have been significantly influenced by unusual items.
In 2010, our net earnings were $583 million lower than in 2009 primarily due to us selling our interest in Centerra and recording an after tax gain of $374 million in 2009. We also recorded an after tax profit of $189 million on foreign exchange derivatives in 2009 compared to an after tax profit of $19 million in 2010.
Adjusted net earnings (non-IFRS/GAAP measure)
Adjusted net earnings is a measure that does not have a standardized meaning or a consistent basis of calculation under IFRS (non-IFRS measure). We use this measure as a more meaningful way to compare our financial performance from period to period. We believe that, in addition to conventional measures prepared in accordance with IFRS, certain investors use this information to evaluate our performance. Adjusted net earnings is our net earnings attributable to equity holders, adjusted to better reflect the underlying financial performance for the reporting period. The adjusted earnings measure reflects the matching of the net benefits of our hedging program with the inflows of foreign currencies in the applicable reporting period and adjusted for earnings from discontinued operations. We also used this measure prior to adoption of IFRS (non-GAAP measure).
2011 MANAGEMENT’SDISCUSSIONANDANALYSIS 33
Adjusted net earnings is non-standard supplemental information and should not be considered in isolation or as a substitute for financial information prepared according to accounting standards. Other companies may calculate this measure differently so you may not be able to make a direct comparison to similar measures presented by other companies.
To facilitate a better understanding of these measures, the table below reconciles adjusted net earnings with our net earnings for the years ended 2011 and 2010 as reported in our financial statements.
($ millions) | 2011 | 2010 | Canadian GAAP 2009 | |||||||||
Net earnings | 450 | 516 | 1,099 | |||||||||
Adjustments | ||||||||||||
Earnings from discontinued operations (after tax) | — | — | (382 | ) | ||||||||
Adjustments on derivatives1(pre-tax) | 80 | (26 | ) | (257 | ) | |||||||
Income taxes on adjustments to derivatives | (21 | ) | 7 | 68 | ||||||||
|
|
|
|
|
| |||||||
Adjusted net earnings | 509 | 497 | 528 | |||||||||
|
|
|
|
|
| |||||||
| 1 | In 2008, we opted to discontinue hedge accounting for our portfolio of foreign currency forward sales contracts. Since then, we have adjusted our gains or losses on derivatives as reported under IFRS (and previously under Canadian GAAP) to reflect what our earnings would have been had hedge accounting been applied. |
The table below shows what contributed to the change in adjusted net earnings for 2011.
($ millions) | ||||||
Adjusted net earnings – 2010 | 497 | |||||
|
| |||||
Change in gross profit by segment (we calculate gross profit by deducting from revenue the cost of products and services sold, and depreciation and amortization (D&A), net of hedging benefits) | ||||||
Uranium | Higher sales volume | 58 | ||||
| Higher realized prices ($US) | 182 | |||||
| Foreign exchange impact on realized prices | (71 | ) | ||||
| Higher costs | (68 | ) | ||||
| Hedging benefits | 20 | |||||
|
| |||||
| change – uranium | 121 | |||||
|
| |||||
Fuel services | Higher sales volume | 5 | ||||
| Lower realized prices ($Cdn) | (3 | ) | ||||
| Higher costs | (13 | ) | ||||
| Hedging benefits | 3 | |||||
|
| |||||
| change – fuel services | (8 | ) | ||||
|
| |||||
Electricity | Lower sales volume | (8 | ) | |||
| Lower realized prices ($Cdn) | (30 | ) | ||||
| Higher costs | (46 | ) | ||||
|
| |||||
| change – electricity | (84 | ) | ||||
|
| |||||
Other changes | ||||||
Cigar lake remediation | 12 | |||||
Income taxes | (36 | ) | ||||
Other | 7 | |||||
|
| |||||
Adjusted net earnings – 2011 | 509 | |||||
|
| |||||
34 CAMECOCORPORATION
Three-year trend
Our adjusted net earnings have been relatively stable over the past three years.
The 6% decrease from 2009 to 2010 resulted from:
| • | lower profits from our electricity business, relating to a lower realized selling price |
| • | higher exploration expenses |
| • | higher income taxes |
| • | partially offset by improved profits in the uranium business, relating to the lower cost of sales |
The 2% increase from 2010 to 2011 resulted from:
| • | higher earnings from our uranium business due to higher realized prices, and an increase in sales volumes, partially offset by: |
| • | an increase in the cost of sales |
| • | lower earnings from our electricity business due to higher costs, lower realized prices and lower sales volumes |
| • | lower earnings from our fuel services business resulting from higher costs, partially offset by higher sales volumes |
| • | higher income taxes |
Revenue
The table below shows what contributed to the change in revenue this year.
($ millions) | ||||
Revenue – 2010 | 2,124 | |||
Uranium | ||||
Higher sales volume | 147 | |||
Higher realized prices ($Cdn) | 111 | |||
Fuel services | ||||
Higher sales volume | 21 | |||
Lower realized prices ($Cdn) | (3 | ) | ||
Electricity | ||||
Lower output | (19 | ) | ||
Lower realized prices ($Cdn) | (31 | ) | ||
Other | 34 | |||
Revenue – 2011 | 2,384 | |||
SeeFinancial results by segmenton page 46 for more detailed discussion.
Three-year trend
In 2010, revenue declined by 8% to $2.1 billion largely due to reduced sales volumes in the uranium business and a lower realized price in electricity. The decline in sales volumes was matched with an increase in inventories.
In 2011, revenue increased by 12% to a record $2.4 billion, due to higher sales volumes and record realized prices in our uranium business.
Average realized prices
| 2011 | 2010 | 2009 | change from 2010 to 2011 | |||||||||||||||
Uranium1 | $US/lb $Cdn/lb |
| 49.17 49.18 |
|
| 43.63 45.81 |
|
| 38.25 45.12 |
|
| 13 7 | % % | |||||
Fuel services | $Cdn/kgU | 16.71 | 16.86 | 17.84 | (1 | )% | ||||||||||||
Electricity | $Cdn/MWh | 54 | 58 | 64 | (7 | )% | ||||||||||||
| 1 | Average realized foreign exchange rate ($US/$Cdn): 2011 – $1.00, 2010 – $1.05 and 2009 – $1.18. |
2011 MANAGEMENT’SDISCUSSIONANDANALYSIS 35
Outlook for 2012
We expect consolidated revenue to be 0% to 5% lower in 2012 due to:
| • | lower sales volumes in the fuel services business |
| • | decrease in realized prices in the uranium business |
| • | partially offset by higher volumes in the electricity business |
Our customers choose when in the year to receive deliveries of uranium and fuel services products, so our quarterly delivery patterns, and therefore our sales volumes and revenue, can vary significantly. We expect that deliveries this year will be evenly distributed across the quarters. However, not all delivery notices have been received to date, which could alter the delivery pattern.
Corporate expenses
Administration
($ millions) | 2011 | 2010 | change | |||||||||
Direct administration | 147 | 145 | 1 | % | ||||||||
Stock-based compensation | 10 | 10 | — | |||||||||
|
|
|
|
|
| |||||||
Total administration | 157 | 155 | 1 | % | ||||||||
|
|
|
|
|
| |||||||
Direct administration costs in 2011 were $2 million higher than in 2010 as we continued to pursue and evaluate growth opportunities. These costs were lower than we forecast as we narrowed the scope of some business development activities during the year.
We recorded $10 million in stock-based compensation expenses this year under our stock option, deferred share unit, performance share unit and phantom stock option plans, the same as in 2010. See note 27 to the financial statements.
Outlook for 2012
We expect administration costs (not including stock-based compensation) to be about 10% to 15% higher than in 2011 due to planned higher spending in support of our growth strategy.
Exploration
In 2011, uranium exploration expenses were $96 million, the same as in 2010. Our exploration efforts in 2011 focused on Canada, Australia, Kazakhstan and the United States.
Outlook for 2012
We expect exploration expenses to be about 15% to 20% higher than they were in 2011 due to an increase in evaluation activities at Kintyre and Inkai block 3. We will also continue to focus efforts in Canada.
Finance costs
Finance costs were $74 million compared to $86 million in 2010. The decrease from last year largely reflects lower foreign exchange expenses and product loan standby fees. The product loan facility was terminated in 2010. See note 22 to the financial statements.
Finance income
Finance income was $25 million compared to $21 million in 2010 due to higher rates of return on short-term investments.
36 CAMECOCORPORATION
Gains and losses on derivatives
In 2011, we recorded $4 million in losses on our derivatives compared to gains of $75 million in 2010. The losses reflect the weakening of the Canadian dollar in 2011. See note 29 to the financial statements.
Income taxes
We recorded an income tax expense of $12 million in 2011 compared to $3 million in 2010 and higher than the guidance we provided in our third quarter MD&A (0% to 5% recovery). The higher expense was primarily due to an increase in the provision related to the CRA transfer pricing dispute discussed below. The increase in the provision was partially offset by higher losses being incurred in Canada, which was largely attributable to losses we recorded on derivatives in 2011 compared to the gains recorded in 2010. See note 24 to the financial statements.
On an adjusted earnings basis, our tax expense was $33 million in 2011 compared to a recovery of $3 million in 2010. The increase was primarily due to the increase in the provision related to the CRA transfer pricing dispute. Our effective tax rate was 6% in 2011 compared to a recovery of 1% in 2010. The table below presents our adjusted earnings and adjusted income tax expenses attributable to Canadian and foreign jurisdictions.
($ millions) | 2011 | 2010 | ||||||
Pre-tax Adjusted Earnings1 | ||||||||
Canada2 | (297 | ) | (89 | ) | ||||
Foreign | 827 | 573 | ||||||
|
|
|
| |||||
Total pre-tax adjusted earnings | 530 | 484 | ||||||
|
|
|
| |||||
Adjusted Income Taxes1 | ||||||||
Canada2 | (34 | ) | (46 | ) | ||||
Foreign | 67 | 43 | ||||||
Adjusted income tax expense (recovery) | 33 | (3 | ) | |||||
Effective tax rate | 6 | % | (1 | )% | ||||
| 1 | Pre-tax adjusted earnings and adjusted income taxes are non-IFRS measures. |
| 2 | Our IFRS-based measures have been adjusted by the amounts reflected in the table in adjusted net earnings (non-IFRS/GAAP measure on pages 33 & 34). |
Since 2008, CRA has disputed the transfer pricing methodology we used for certain uranium sale and purchase agreements and issued notices of reassessment for our 2003 through 2006 tax returns. We believe it is likely that CRA will reassess our tax returns for 2007 through 2011 on a similar basis. Our view is that CRA is incorrect, and we are contesting its position. As a result we are pursuing our appeal rights under theIncome Tax Act. However, to reflect the uncertainties of CRA’s appeals process and litigation, we have provided a total of $54 million for uncertain tax positions for the years 2003 through 2011. We believe that the ultimate resolution of this matter will not be material to our financial position, results of operations or liquidity over the period. However, an unfavourable outcome for the years 2003 to 2011 could be material to our financial position, results of operations or cash flows in the year(s) of resolution. See note 24 to the financial statements.
Outlook for 2012
On an adjusted net earnings basis, we expect our effective income tax rate will reflect a net recovery of 0% to 5% as taxable income in Canada is expected to decline. For the next few years, we expect our tax rate to continue in accordance with our 2012 outlook.
2011 MANAGEMENT’SDISCUSSIONANDANALYSIS 37
Foreign exchange
The exchange rate between the Canadian dollar and US dollar affects the financial results of our uranium and fuel services segments.
Sales of uranium and fuel services are routinely denominated in US dollars while production costs are largely denominated in Canadian dollars. We use planned hedging to try to protect net inflows (total uranium and fuel services sales less US dollar cash expenses and product purchases) from the uranium and fuel services segments against declines in the US dollar in the shorter term. Our strategy is to hedge net inflows over a rolling 60-month period. Our policy is to hedge 35% to 100% of net inflows in the first 12 months. The range declines every year until it reaches 0% to 10% of our net inflows (from 48 and 60 months).
We also have a natural hedge against US currency fluctuations as a portion of our annual cash outlays, including purchases of uranium and fuel services, are denominated in US dollars. The earnings impact of this natural hedge is more difficult to identify because inventory includes material added over more than one fiscal period.
At December 31, 2011:
| • | The value of the US dollar relative to the Canadian dollar was $1.00 (US) for $1.02(Cdn), up from $1.00 (US) for $0.99 (Cdn) at December 31, 2010. The exchange rate averaged $1.00 (US) for $0.99 (Cdn) over the year. |
| • | Our effective exchange rate for the year was about $1.00 (US) for $1.00 (Cdn), compared to $1.00 (US) for $1.05 (Cdn) in 2010. |
| • | We had foreign currency contracts of $1.4 billion (US) and EUR 31 million at December 31, 2011. The US currency contracts had an average exchange rate of $1.00 (US) for $1.01 (Cdn). |
| • | The mark-to-market loss on all foreign exchange contracts was $18 million compared to a $47 million gain at December 31, 2010. |
We manage counterparty risk associated with hedging by dealing with highly rated counterparties and limiting our exposure. At December 31, 2011, all counterparties to foreign exchange hedging contracts had a Standard & Poor’s (S&P) credit rating of A or better.
Sensitivity analysis
At December 31, 2011, every one-cent change in the value of the Canadian dollar versus the US dollar would change our 2011 net earnings by about $10 million (Cdn). This sensitivity is based on an exchange rate of $1.00 (US) for $1.02 (Cdn).
38 CAMECOCORPORATION
Outlook for 2012
Over the next several years, we expect to invest significantly in expanding production at existing mines and advancing projects as we pursue our growth strategy. The projects are at various stages of development, from exploration and evaluation to construction.
We expect our existing cash balances and operating cash flows will meet our anticipated capital requirements without the need for significant additional funding. Cash balances will decline as we use the funds in our business and pursue our growth plans.
Our outlook for 2012 reflects the growth expenditures necessary to help us achieve our strategy. We do not provide an outlook for the items in the table that are marked with a dash.
SeeFinancial results by segmenton page 46 for details.
2012 Financial outlook
Consolidated | Uranium | Fuel services | Electricity | |||||
Production | — | 21.7 million lbs | 13 to 14 million kgU | — | ||||
Sales volume | — | 31 to 33 million lbs | Decrease 10% to 15% | — | ||||
Capacity factor | — | — | — | 95% | ||||
Revenue compared to 2011 | Decrease 0% to 5% | Decrease 0% to 5%1 | Decrease 10% to 15% | Increase 5% to 10% | ||||
Average unit cost of sales (including D&A) | — | Increase 0% to 5%2 | Increase 10% to 15% | Decrease 5% to 10% | ||||
Direct administration costs compared to 20113 | Increase 10% to 15% | — | — | — | ||||
Exploration costs compared to 2011 | — | Increase 15% to 20% | — | — | ||||
Tax rate | Recovery of 0% to 5% | — | — | — | ||||
Capital expenditures | $620 million4 | — | — | $80 million |
| 1 | Based on a uranium spot price of $52.00 (US) per pound (the Ux spot price as of February 6, 2012), a long-term price indicator of $61.00 (US) per pound (the Ux long-term indicator on January 30, 2012) and an exchange rate of $1.00 (US) for $1.00 (Cdn). |
| 2 | This increase is based on the unit cost of sale for produced material and committed long-term purchases. If we decide to make discretionary purchases in 2012 then we expect the average unit cost of sales to increase further. |
| 3 | Direct administration costs do not include stock-based compensation expenses. See page 36 for more information. |
| 4 | Does not include our share of capital expenditures at BPLP. |
Sensitivity analysis
For 2012:
| • | a change of $5 (US) per pound in each of the Ux spot price ($52.00 (US) per pound on February 6, 2012) and the Ux long-term price indicator ($61.00 (US) per pound on January 30, 2012) would change revenue by $68 million and net earnings by $55 million. |
| • | a change of $5/MWh in the electricity spot price would change our 2012 net earnings by $4 million based on the assumption that the spot price will remain below the floor price of $50.18/MWh provided for under BPLP’s agreement with the Ontario Power Authority (OPA). |
2011 MANAGEMENT’SDISCUSSIONANDANALYSIS 39
Liquidity and capital resources
At the end of 2011, we had cash and short-term investments of $1.2 billion in a mix of short-term deposits and treasury bills, while our total debt amounted to $1.0 billion. We were in a similar position at the end of 2010.
We have large, creditworthy customers that continue to need uranium even during weak economic conditions, and we expect the uranium contract portfolio we have built to provide a solid revenue stream for years to come.
Our financial objective is to make sure we have the cash and debt capacity to fund our operating activities, investments and growth. We have several alternatives to fund future capital needs, including our significant cash position, credit facilities, future operating cash flow and debt or equity financing, and are continually evaluating these options to make sure we have the best mix of capital resources to meet our needs.
Financial condition
| 2011 | 2010 | |||||||
Cash position ($ millions) | 1,203 | 1,260 | ||||||
Cash provided by operations ($ millions) | 732 | 521 | ||||||
Cash provided by operations/net debt | n/a | 1 | n/a | 1 | ||||
Net debt/total capitalization | n/a | 1 | n/a | 1 | ||||
| 1 | Cash and cash equivalents exceeded debt. |
Credit ratings
The credit ratings assigned to our securities by external ratings agencies are important to our ability to raise capital at competitive pricing to support our business operations. Our investment grade credit ratings reflect the current financial strength of our company.
Third-party ratings for our commercial paper and senior debt as of December 31, 2011:
Security | DBRS | S&P | ||||||
Commercial paper | R-1(low) | A-1 (low) | 1 | |||||
Senior unsecured debentures | A (low) | BBB+ | ||||||
| 1 | Canadian National Scale Rating. The Global Scale Rating is A-2. |
The rating agencies may revise or withdraw these ratings if they believe circumstances warrant. A change in our credit ratings could affect our cost of funding and our access to capital through the capital markets.
40 CAMECOCORPORATION
Liquidity
| ($ millions) | 2011 | 2010 | ||||||
Cash and cash equivalents at beginning of year | 1,260 | 1,304 | ||||||
Cash from operations | 732 | 521 | ||||||
Investment activities | ||||||||
Additions to property, plant and equipment | (647 | ) | (431 | ) | ||||
Other investing activities | 40 | 12 | ||||||
Financing activities | ||||||||
Change in debt | (3 | ) | (10 | ) | ||||
Interest paid | (61 | ) | (54 | ) | ||||
Issue of shares | 7 | 18 | ||||||
Dividends | (146 | ) | (106 | ) | ||||
Other financing activities | 13 | 10 | ||||||
Exchange rate on changes on foreign currency cash balances | 8 | (4 | ) | |||||
Cash and short-term investments at end of year | 1,203 | 1,260 | ||||||
On transition to IFRS, we elected to classify interest payments as a financing activity rather than an operating activity in our statement of cash flows. This change will increase our reported cash flows from operating activities with a corresponding decrease in cash flows from financing activities. There is no net impact on consolidated cash flows as a result of this change in presentation. Prior period amounts for 2010 have been revised to reflect this classification.
Cash from operations
Cash from operations was 40% higher than in 2010 mainly due to higher profits in the uranium business and lower working capital requirements relating to decreased inventory levels. Not including working capital requirements, our operating cash flows in the year were up $60 million. See note 26 to the financial statements.
Investing activities
Cash used in investing includes acquisitions and capital spending.
Acquisitions and divestitures
In 2010 and 2011, we concluded no significant acquisitions or divestitures.
Talvivaara Agreement
On February 7, 2011, we signed two agreements with Talvivaara Mining Company Plc (Talvivaara) to buy uranium produced at the Sotkamo nickel-zinc mine in eastern Finland. Under the first agreement with Talvivaara, we will provide an up-front payment, to a maximum of $60 million (US), to cover certain construction costs. 2011 expenditures were $19 million (US) and we expect to fund an additional $41 million (US) in 2012. This amount will be repaid through the initial deliveries of uranium concentrates. Once the full amount has been repaid, we will continue to purchase the uranium concentrates produced at the Sotkamo mine through a second agreement, which provides for the purchase of uranium using a pricing formula that references market prices at the time of delivery. The second agreement expires on December 31, 2027.
2011 MANAGEMENT’SDISCUSSIONANDANALYSIS 41
Capital spending
We classify capital spending as growth or sustaining. Growth capital is money we invest to generate incremental production, and for business development. Sustaining capital is the money we spend to keep our operations at current production levels.
(Cameco’s share in $ millions) | 2011 plan | 2011 actual | 2012 plan | |||||||||
Growth capital | ||||||||||||
Cigar Lake | 176 | 172 | 215 | |||||||||
Inkai | 9 | 1 | 10 | |||||||||
McArthur River | 14 | 24 | 35 | |||||||||
Millennium | 6 | 4 | 5 | |||||||||
US ISR | 13 | 15 | 30 | |||||||||
|
|
|
|
|
| |||||||
Total growth capital | 218 | 216 | 295 | |||||||||
|
|
|
|
|
| |||||||
Sustaining capital | ||||||||||||
McArthur River/Key Lake | 169 | 168 | 145 | |||||||||
US ISR | 38 | 39 | 50 | |||||||||
Rabbit Lake | 85 | 77 | 75 | |||||||||
Inkai | 19 | 15 | 30 | |||||||||
Fuel services | 32 | 18 | 20 | |||||||||
Other | 14 | 20 | 5 | |||||||||
|
|
|
|
|
| |||||||
Total sustaining capital | 357 | 337 | 325 | |||||||||
|
|
|
|
|
| |||||||
Total uranium & fuel services | 575 | 1 | 553 | 620 | ||||||||
|
|
|
|
|
| |||||||
Electricity (our 31.6% share of BPLP) | 80 | 77 | 80 | |||||||||
| 1 | We updated our 2011 capital cost estimate in the Q1 MD&A to $620 million, in the Q2 MD&A to $590 million and in the Q3 MD&A to $575 million. |
Capital expenditures were 4% below the guidance we provided in our third quarter MD&A, mainly due to variances at Inkai and in the fuel services division. We do not expect this reduction in capital expenditures in 2011 will impact our plans to increase annual uranium production by 2018. The variance at fuel services was mainly due to cancellation of certain projects and revisions to project schedules. The variance at Inkai was mainly due to the deferral of upgrades to infrastructure and slower than expected progress on approvals for block 3.
Outlook for investing activities
We expect total capital expenditures for uranium and fuel services to be about 12% higher in 2012 as a result of higher spending for:
| • | growth capital at Cigar Lake |
| • | growth and sustaining capital at US ISR |
| • | sustaining capital at Inkai |
Major sustaining expenditures in 2012 include:
| • | McArthur River/Key Lake – At McArthur River, the largest component is mine development at about $50 million. Other projects include site facility expansion and equipment purchases. At Key Lake, various projects to revitalize the mill will be undertaken at about $35 million, as well as work on the tailings facilities. |
| • | US in situ recovery (ISR) – Wellfield construction and well installation is the largest project at approximately $30 million. We also plan to work on the development of the Gas Hills and North Butte projects as well as revitalization of the Highland processing plant. |
| • | Rabbit Lake – At Eagle Point, the largest project includes mine development at about $15 million. Other projects include work on electrical systems, various mill equipment replacements and continued work on mine dewatering systems and tailings facilities. |
42 CAMECOCORPORATION
In addition, we expect capital expenditures for 2013 and 2014 to be as follows:
($ millions) | 2013 | 2014 | ||||||
Growth capital | 325 – 350 | 250 – 275 | ||||||
Sustaining capital | 325 – 350 | 350 – 375 | ||||||
|
|
|
| |||||
Total uranium & fuel services | 650 – 700 | 600 – 650 | ||||||
|
|
|
| |||||
These growth capital expenditures are related to our Double U strategy. Many of these are early stage projects, however, and the mix of projects and their underlying capital estimates could change significantly. This is a preliminary estimate that we expect to fund using existing cash balances and operating cash flows.
This information regarding currently expected capital expenditures for future periods is forward-looking information, and is based upon the assumptions and subject to the material risks discussed on page 3. Our actual capital expenditures for future periods may be significantly different.
Financing activities
Cash from financing includes borrowing and repaying debt, and other financial transactions including paying dividends and providing financial assurance.
As a result of our significant cash balance, there was little in the way of financing activities in 2011.
Long-term contractual obligations
December 31, 2011 ($ millions) | 2012 | 2013 and 2014 | 2015 and 2016 | 2017 and beyond | Total | |||||||||||||||
Long-term debt | 15 | 41 | 342 | 549 | 947 | |||||||||||||||
Interest on long-term debt | 53 | 102 | 78 | 80 | 313 | |||||||||||||||
Provision for reclamation | 10 | 40 | 47 | 480 | 577 | |||||||||||||||
Provision for waste disposal | 4 | 7 | 11 | — | 22 | |||||||||||||||
Other liabilities | — | — | — | 507 | 507 | |||||||||||||||
|
|
|
|
|
|
|
|
|
| |||||||||||
Total | 82 | 190 | 478 | 1,616 | 2,366 | |||||||||||||||
|
|
|
|
|
|
|
|
|
| |||||||||||
In the fourth quarter, we cancelled our $100 million revolving credit facility that was maturing in February 2012. We also amended and extended our $500 million unsecured revolving credit facility that was maturing in November 2012. We now have unsecured lines of credit of about $1.9 billion, which include the following:
| • | A $1.25 billion unsecured revolving credit facility that matures November 1, 2016. Each year on the anniversary date, and upon mutual agreement, the facility can be extended for an additional year. In addition to borrowing directly from this facility, we can use up to $100 million of it to issue letters of credit and we may use it to provide liquidity for our commercial paper program, as necessary. From time to time we may increase the revolving credit facility above $1.25 billion, by increments of no less than $50 million, up to a total of $1.75 billion. The facility ranks equally with all of our other senior debt. At December 31, 2011, there was nothing outstanding under this facility. |
| • | Approximately $700 million in short-term borrowing and letters of credit provided by various financial institutions. We use these facilities mainly to provide financial assurance for future decommissioning and reclamation of our operating sites, and as overdraft protection. At December 31, 2011, we had approximately $665 million outstanding in letters of credit. |
We have $800 million in senior unsecured debentures:
| • | $300 million bearing interest at 4.7% per year, maturing on September 16, 2015 |
| • | $500 million bearing interest at 5.67% per year, maturing on September 2, 2019 |
2011 MANAGEMENT’SDISCUSSIONANDANALYSIS 43
We have issued a $73 million (US) promissory note to GLE to support future development of its business. In November 2011, GLE requested a drawing of $8 million (US) which included $7 million of accrued interest. The balance remaining on the note is $72 million (US).
Debt covenants
Our revolving credit facility includes the following financial covenants:
| • | our funded debt to tangible net worth ratio must be 1:1 or less |
| • | other customary covenants and events of default |
Funded debt is total consolidated debt less the following: non-recourse debt, $100 million in letters of credit, cash and short-term investments.
Not complying with any of these covenants could result in accelerated payment and termination of our revolving credit facility. At December 31, 2011, we complied with all covenants, and we expect to continue to comply in 2012.
Off-balance sheet arrangements
We had two kinds of off-balance sheet arrangements at the end of 2011:
| • | purchase commitments |
| • | financial assurances |
Purchase commitments
December 31, 2011 ($ millions) | 2012 | 2013 and 2014 | 2015 and 2016 | 2017 and beyond | Total | |||||||||||||||
Purchase commitments1 | 308 | 581 | 128 | 440 | 1,457 | |||||||||||||||
| 1 | Denominated in US dollars, converted to Canadian dollars as of December 31, 2011 at the rate of $1.02. |
Most of these are commitments to buy uranium and fuel services products under long-term, fixed-price arrangements.
At the end of 2011, we had committed to $1.5 billion (Cdn) for the following:
| • | About 35 million pounds of U3O8 equivalent from 2012 to 2027. Of these, about 17 million pounds are from our agreement with Techsnabexport Joint Stock Company (Tenex) to buy uranium from dismantled Russian weapons (the Russian HEU commercial agreement) through 2013. |
| • | Over 30 million kgU as UF6 in conversion services from 2012 to 2016 primarily under our agreements with Springfields Fuels Ltd. (SFL) and Tenex. |
| • | Over 0.9 million Separative Work Units (SWU) of enrichment services to meet existing forward sales commitments under agreements with a non-western supplier. |
Non-delivery by Tenex or SFL under their agreements could have a material adverse effect on our financial condition, liquidity and results of operations.
Tenex, SFL and the SWU supplier do not have the right to terminate their agreements other than pursuant to customary event of default provisions.
44 CAMECOCORPORATION
Financial assurances
December 31 ($ millions) | 2011 | 2010 | change | |||||||||
Standby letters of credit | 670 | 550 | 22 | % | ||||||||
BPLP guarantees | 69 | 82 | (16 | )% | ||||||||
|
|
|
|
|
| |||||||
Total | 739 | 632 | 17 | % | ||||||||
|
|
|
|
|
| |||||||
Standby letters of credit mainly provide financial assurance for the decommissioning and reclamation of our mining and conversion facilities. We are required to provide letters of credit to various regulatory agencies until decommissioning and reclamation activities are complete. Letters of credit are issued by financial institutions for a one-year term.
Our total commitment for financial guarantees on behalf of BPLP was an estimated $77 million at the end of the year. See note 31 to the financial statements.
Balance sheet
December 31 ($ millions except per share amounts) | 2011 | 2010 | Canadian GAAP 2009 | change from 2010 to 2011 | ||||||||||||
Inventory | 494 | 533 | 453 | (7 | )% | |||||||||||
Total assets | 7,802 | 7,203 | 7,394 | 8 | % | |||||||||||
Long-term financial liabilities | 1,743 | 1,530 | 1,437 | 14 | % | |||||||||||
|
|
|
|
|
|
|
| |||||||||
Dividends per common share | 0.40 | 0.28 | 0.24 | 43 | % | |||||||||||
|
|
|
|
|
|
|
| |||||||||
Total product inventories decreased by 7% to $494 million this year due to lower levels of inventory for uranium, where the quantities sold exceeded quantities produced and purchased for the year. The average cost of uranium was higher as a result of the increasing costs of produced and purchased material. At December 31, 2011, our average cost for uranium was $25.11 per pound, up from $24.01 per pound at December 31, 2010. In 2010, total product inventories increased by 18% due to higher levels of uranium, where the quantities produced and purchased exceeded sales for the year. The average cost of uranium was lower as a result of fewer purchases at near-market prices.
At the end of 2011, our total assets amounted to $7.8 billion, an increase of $0.6 billion compared to 2010 due primarily to a higher rate of investment in property, plant and equipment. In 2010, the total asset balance decreased by $0.2 billion; on transition to IFRS, we expensed all borrowing costs that had been previously capitalized under Canadian GAAP.
The major components of long-term financial liabilities are long-term debt, finance lease obligations, the provision for reclamation and financial derivatives. In 2011, our balance increased by $0.2 billion. In 2010, our balance increased by $0.1 billion primarily due to adjustments as a result of the transition to IFRS. See note 3 to the financial statements.
2011 MANAGEMENT’SDISCUSSIONANDANALYSIS 45
2011 financial results by segment
Uranium
Highlights | 2011 | 2010 | change | |||||||||
Production volume (million lbs) | 22.4 | 22.8 | (2 | )% | ||||||||
Sales volume (million lbs) | 32.9 | 29.6 | 11 | % | ||||||||
Average spot price ($US/lb) | 56.36 | 46.83 | 20 | % | ||||||||
Average long-term price ($US/lb) | 66.79 | 60.92 | 10 | % | ||||||||
Average realized price | ||||||||||||
($US/lb) | 49.17 | 43.63 | 13 | % | ||||||||
($Cdn/lb) | 49.18 | 45.81 | 7 | % | ||||||||
Average unit cost of sales ($Cdn/lb) (including D&A) | 29.94 | 27.87 | 7 | % | ||||||||
Revenue ($ millions) | 1,616 | 1,358 | 19 | % | ||||||||
Gross profit ($ millions) | 632 | 532 | 19 | % | ||||||||
Gross profit (%) | 39 | 39 | — | |||||||||
Production volumes in 2011 were 2% lower than 2010 due to lower production from Smith Ranch-Highland and Inkai. SeeOperating propertieson page 61 for more information.
Uranium revenues this year were up 19% compared to 2010, due to an 11% increase in sales volumes and an increase of 7% in the Canadian dollar average realized price. Sales volumes in 2011 were higher than 2010 due to some customers deferring 2010 deliveries under contracts until 2011. The 19% increase was higher than the guidance we provided in the third quarter (increase 10% to 15%) as sales volumes for 2011 were at the top of the range provided (31 million pounds to 33 million pounds) at that time.
Our realized prices this year in US dollars were 13% higher than 2010 mainly due to higher US dollar prices under market-related contracts. Our Canadian dollar selling price, however, was only 7% higher than 2010 as a result of a less favourable exchange rate when compared to 2010. Our exchange rate averaged $1.00 compared to $1.05 in 2010.
Total cost of sales (including D&A) increased by 19% this year ($983 million compared to $826 million in 2010). This was mainly the result of the following:
| • | the 11% increase in sales volumes |
| • | average unit costs for produced uranium were 7% higher, although our average unit cost of sale for produced material was within the guidance we provided |
| • | average unit costs for purchased uranium were 14% higher due to the increase in spot prices |
| • | standby costs paid to AREVA relating to the McClean Lake mill |
| • | higher royalty charges due to higher deliveries of Saskatchewan-produced material and higher realized prices. In 2011, total royalties rose to $124 million from $78 million in 2010. |
The net effect was a $100 million increase in gross profit for the year.
46 CAMECOCORPORATION
The following table shows the costs of produced and purchased uranium incurred in the reporting periods (non-IFRS measures see below). These costs do not include selling costs such as royalties, transportation and commissions, nor do they reflect the impact of opening inventories on our reported cost of sales.
($Cdn/lb) | 2011 | 2010 | change | |||||||||
Produced | ||||||||||||
Cash cost | 18.45 | 16.89 | 9 | % | ||||||||
Non-cash cost | 6.50 | 6.32 | 3 | % | ||||||||
|
|
|
| |||||||||
Total production cost | 24.95 | 23.21 | 7 | % | ||||||||
|
|
|
| |||||||||
Quantity produced (million lbs) | 22.4 | 22.8 | (2 | )% | ||||||||
Purchased | ||||||||||||
Cash cost | 26.08 | 22.85 | 14 | % | ||||||||
Quantity purchased (million lbs) | 9.6 | 10.6 | (9 | )% | ||||||||
Totals | ||||||||||||
Produced and purchased costs | 25.29 | 23.10 | 9 | % | ||||||||
Quantities produced and purchased (million lbs) | 32.0 | 33.4 | (4 | )% | ||||||||
Cash cost per pound, non-cash cost per pound and total cost per pound for produced and purchased uranium presented in the above table are non-IFRS measures. These measures do not have a standardized meaning or a consistent basis of calculation under IFRS. We use these measures in our assessment of the performance of our uranium business. We believe that, in addition to conventional measures prepared in accordance with IFRS, certain investors use this information to evaluate our performance and ability to generate cash flow.
These measures are non-standard supplemental information and should not be considered in isolation or as a substitute for measures of performance prepared according to accounting standards. These measures are not necessarily indicative of operating profit or cash flow from operations as determined under IFRS. Other companies may calculate these measures differently so you may not be able to make a direct comparison to similar measures presented by other companies.
To facilitate a better understanding of these measures, the table below presents a reconciliation of these measures to our unit cost of sales for the years ended 2011 and 2010 as reported in our financial statements.
Cash and total cost per pound reconciliation
($ millions) | 2011 | 2010 | ||||||
Cost of product sold | 824.3 | 691.3 | ||||||
Add / (subtract) | ||||||||
Royalties | (123.6 | ) | (78.2 | ) | ||||
Standby charges | (22.0 | ) | (12.0 | ) | ||||
Other selling costs | (9.4 | ) | (13.4 | ) | ||||
Change in inventories | (5.7 | ) | 39.6 | |||||
|
|
|
| |||||
Cash operating costs(a) | 663.6 | 627.3 | ||||||
Add / (subtract) | ||||||||
Depreciation and amortization | 159.2 | 134.9 | ||||||
Change in inventories | (13.6 | ) | 9.2 | |||||
|
|
|
| |||||
Total operating costs(b) | 809.2 | 771.4 | ||||||
|
|
|
| |||||
Uranium produced and purchased (millions lbs) (c) | 32.0 | 33.4 | ||||||
Cash costs per pound(a ÷ c) | 20.74 | 18.78 | ||||||
Total costs per pound(b ÷ c) | 25.29 | 23.10 | ||||||
2011 MANAGEMENT’SDISCUSSIONANDANALYSIS 47
Outlook for 2012
We expect to produce 21.7 million pounds in 2012. In addition, we have commitments under long-term contracts to purchase about 8 million pounds.
Based on the contracts we have in place, we expect to sell between 31 million and 33 million pounds of U3O8 in 2012. We expect the average unit cost of sales to be 0% to 5% higher than in 2011. The increase is due primarily to higher costs for produced material. If we decide to make additional discretionary purchases in 2012 then we expect the average unit cost of sales to increase further.
Based on current spot prices, revenue should be about 0% to 5% lower than it was in 2011 as a result of an expected decrease in the realized price.
Our customers choose when in the year to receive deliveries of uranium and fuel services products, so our quarterly delivery patterns, and therefore our sales volumes and revenue, can vary significantly. In 2012, we expect that deliveries will be evenly distributed across the quarters. However, not all delivery notices have been received to date, which could alter the delivery pattern.
Price sensitivity analysis: uranium
The table below isnot a forecast of prices we expect to receive. The prices we actually realize will be different from the prices shown in the table.
It is designed to indicate how the portfolio of long-term contracts we had in place on December 31, 2011 would respond to different spot prices. In other words, we would realize these prices only if the contract portfolio remained the same as it was on December 31, 2011, and none of the assumptions we list below change.
We intend to update this table each quarter in our MD&A to reflect deliveries made and changes to our contract portfolio each quarter. As a result we expect the table to change from quarter to quarter.
Expected realized uranium price sensitivity under various spot price assumptions
(rounded to the nearest $1.00)
($US/lb U3O8) | ||||||||||||||||||||||||||||
Spot prices | $ | 20 | $ | 40 | $ | 60 | $ | 80 | $ | 100 | $ | 120 | $ | 140 | ||||||||||||||
2012 | 38 | 42 | 50 | 57 | 66 | 74 | 81 | |||||||||||||||||||||
2013 | 43 | 46 | 54 | 62 | 71 | 80 | 88 | |||||||||||||||||||||
2014 | 45 | 48 | 56 | 65 | 74 | 83 | 91 | |||||||||||||||||||||
2015 | 43 | 47 | 56 | 66 | 77 | 87 | 97 | |||||||||||||||||||||
2016 | 45 | 50 | 58 | 68 | 78 | 88 | 97 | |||||||||||||||||||||
The table illustrates the mix of long-term contracts in our December 31, 2011 portfolio, and is consistent with our contracting strategy. The table has been updated to December 31, 2011 to reflect:
| • | deliveries made and contracts entered into up to December 31, 2011 |
| • | changes to deliveries under some sales contracts to assist our customers who were directly impacted by the March nuclear incident in Japan |
| • | changes to deliveries under some contracts where deliveries are tied to reactor requirements |
Our portfolio includes a mix of fixed-price and market-related contracts, which we target at a 40:60 ratio. We signed many of our current contracts in 2003 to 2005, when market prices were low ($11 to $31 (US)). Those that are fixed at lower prices or have low ceiling prices will yield prices that are lower than current market prices. These older contracts are beginning to expire, and we are starting to deliver into more favourably priced contracts.
48 CAMECOCORPORATION
Our portfolio is affected by more than just the spot price. We made the following assumptions (which are not forecasts) to create the table:
Sales
| • | sales volumes on average of 32 million pounds per year |
Deliveries
| • | customers take the maximum quantity allowed under each contract (unless they have already provided a delivery notice indicating they will take less) |
| • | we defer a portion of deliveries under existing contracts for 2012 |
Prices
| • | the average long-term price indicator is the same as the average spot price for the entire year (a simplified approach for this purpose only). Since 1996, the long-term price indicator has averaged 14% higher than the spot price. This differential has varied significantly. Assuming the long-term price is at a premium to spot, the prices in the table will be higher. |
| • | we deliver all volumes that we do not have contracts for at the spot price for each scenario |
Inflation
| • | is 3% per year |
Tiered royalties
As sales of material we produce at our Saskatchewan properties increase, so do the tiered royalties we pay. The table below indicates what we would pay in tiered royalties at various realized prices. We record tiered royalties as a cost of sales.
This table assumes that we sell 100,000 pounds U3O8 and that there is no capital allowance available to reduce royalties, and is based on 2011 government prescribed rates. The index value to calculate rates for 2012 is not available until April 2012.
Realized price ($Cdn) | Tier 1 royalty 6% x (sales price - $18.05) | Tier 2 royalty 4% x (sales price - $27.07) | Tier 3 royalty 5% x (sales price - $36.09) | Total royalties | ||||||||||||
25 | 41,700 | — | — | 41,700 | ||||||||||||
35 | 101,700 | 31,720 | — | 133,420 | ||||||||||||
45 | 161,700 | 71,720 | 44,550 | 277,970 | ||||||||||||
55 | 221,700 | 111,720 | 94,550 | 427,970 | ||||||||||||
65 | 281,700 | 151,720 | 144,550 | 577,970 | ||||||||||||
75 | 341,700 | 191,720 | 194,550 | 727,970 | ||||||||||||
85 | 401,700 | 231,720 | 244,550 | 877,970 | ||||||||||||
2011 MANAGEMENT’SDISCUSSIONANDANALYSIS 49
Fuel services
(includes results for UF6, UO2 and fuel fabrication)
Highlights | 2011 | 2010 | change | |||||||||
Production volume (million kgU) | 14.7 | 15.4 | (5 | )% | ||||||||
Sales volume (million kgU) | 18.3 | 17.0 | 8 | % | ||||||||
Realized price ($Cdn/kgU) | 16.71 | 16.86 | (1 | )% | ||||||||
Average unit cost of sales ($Cdn/kgU) (including D&A) | 13.75 | 13.05 | 5 | % | ||||||||
Revenue ($ millions) | 305 | 287 | 6 | % | ||||||||
Gross profit ($ millions) | 54 | 65 | (17 | )% | ||||||||
Gross profit (%) | 18 | 23 | (22 | )% | ||||||||
Total revenue increased by 6% due to an 8% increase in sales volumes.
The total cost of sales (including D&A) increased by 13% ($251 million compared to $222 million in 2010) due to the increase in sales volumes. The average unit cost of sales was 5% higher due to higher unit costs for UF6 relating to lower production.
The net effect was a $11 million decrease in gross profit.
Outlook for 2012
Due to current unfavourable market conditions for UF6 conversion, we are decreasing our production in 2012. We plan to produce between 13 million and 14 million kgU, and expect sales volumes in 2012 to be 10% to 15% lower than in 2011.
We are changing our fuel services product mix in 2012, producing and selling less UF6 than in 2011. We will also realize fewer 2012 cost recoveries in UF6 conversion. Therefore, in fuel services we expect:
| • | the average realized price for our fuel services products to increase by 0% to 5% |
| • | revenue to decrease by 10% to 15% |
| • | average unit cost of sales (including D&A) to increase by 10% to 15% |
50 CAMECOCORPORATION
Electricity
BPLP
(100% – not prorated to reflect our 31.6% interest)
Highlights ($ millions except where indicated) | 2011 | 2010 | change | |||||||||
Output - terawatt hours (TWh) | 24.9 | 25.9 | (4 | )% | ||||||||
Capacity factor (the amount of electricity the plants actually produced for sale as a percentage of the amount they were capable of producing) | 87 | % | 91 | % | (4 | )% | ||||||
Realized price ($/MWh) | 54 | 1 | 58 | (7 | )% | |||||||
Average Ontario electricity spot price ($/MWh) | 30 | 36 | (17 | )% | ||||||||
Revenue | 1,354 | 1,509 | (10 | )% | ||||||||
Operating costs (net of cost recoveries) | 1,006 | 910 | 11 | % | ||||||||
Cash costs | 812 | 740 | 10 | % | ||||||||
Non-cash costs | 194 | 170 | 14 | % | ||||||||
Income before interest and finance charges | 348 | 599 | (42 | )% | ||||||||
Interest and finance charges | 37 | 37 | — | |||||||||
Cash from operations | 490 | 669 | (27 | )% | ||||||||
Capital expenditures | 243 | 136 | 79 | % | ||||||||
Distributions | 270 | 525 | (49 | )% | ||||||||
Capital calls | 21 | — | — | |||||||||
Operating costs ($/MWh) | 40 | 1 | 35 | 14 | % | |||||||
| 1 | Based on actual generation of 24.9 TWh plus deemed generation of 0.4 TWh |
Our earnings from BPLP
Highlights ($ millions except where indicated) | 2011 | 2010 | change | |||||||||
BPLP’s earnings before taxes (100%) | 311 | 562 | (45 | )% | ||||||||
Cameco’s share of pretax earnings before adjustments (31.6%) | 98 | 178 | (45 | )% | ||||||||
Proprietary adjustments | (6 | ) | (6 | ) | — | |||||||
Earnings before taxes from BPLP | 92 | 172 | (47 | )% | ||||||||
BPLP’s results in 2011 are largely the result of lower revenues, which were 10% lower than 2010 due to a 7% decrease in realized electricity prices. BPLP’s average realized price reflects spot sales, revenue recognized under BPLP’s agreement with the Ontario Power Authority (OPA) and revenue from financial contracts.
BPLP has an agreement with the OPA under which output from each B reactor is supported by a floor price (currently $50.18/MWh) that is adjusted annually for inflation. The floor price mechanism and any associated payments to BPLP for the output from each individual B reactor will expire on a date specified in the agreement. The expiry dates are December 31, 2015 for unit B6, December 31, 2016 for unit B5, December 31, 2017 for unit B7 and December 31, 2019 for unit B8. Revenue is recognized monthly, based on the positive difference between the floor price and the spot price. BPLP does not have to repay the revenue from the agreement with the OPA to the extent that the floor price for the particular year exceeds the average spot price for that year.
2011 MANAGEMENT’SDISCUSSIONANDANALYSIS 51
The agreement also provides for payment if the Independent Electricity System Operator reduces BPLP’s generation because Ontario baseload generation is higher than required. The amount of the reduction is considered ‘deemed generation’, and BPLP is paid either the spot price or the floor price—whichever is higher. Deemed generation was 0.4 TWh in 2011.
During 2011, BPLP recognized revenue of $498 million under the agreement with the OPA, compared to $339 million in 2010.
BPLP also has financial contracts in place that reflect market conditions at the time they were signed. Contracts signed in 2006 to 2008, when the spot price was higher than the floor price, reflected the strong forward market at the time. BPLP receives or pays the difference between the contract price and the spot price. BPLP sold the equivalent of about 54% of its output under financial contracts in 2011, compared to 42% in 2010. Pricing under these contracts was lower than in 2010. From time to time, BPLP enters the market to lock in gains under these contracts.
BPLP’s operating costs were $1.0 billion this year compared to $910 million in 2010 due to higher maintenance costs incurred during outage periods and increased staff costs.
The net effect was a decrease in our share of earnings before taxes of 47%.
BPLP distributed $270 million to the partners in 2011. Our share was $85 million. BPLP capital calls to the partners in 2011 were $21 million. Our share was $7 million. The partners have agreed that BPLP will distribute excess cash monthly, and will make separate cash calls for major capital projects.
BPLP’s capacity factor was 87% in 2011, down from 91% in 2010 due to a higher volume of outage days during the year’s planned outages compared to last year’s planned outages.
Outlook for 2012
Bruce Power estimates the average capacity factor for the four Bruce B reactors to be 95% in 2012, and actual output to be about 9% higher than it was in 2011 due to fewer planned outage days in 2012. The 2012 realized price for electricity is projected to be about the same as 2011. As a result we expect that revenue will increase by 5% to 10%.
We expect the average unit cost (net of cost recoveries) to be 5% to 10% lower in 2012 and total operating costs to decrease by about 0% to 5%, mainly due to fewer planned outages resulting in lower costs.
52 CAMECOCORPORATION
Fourth quarter results
Fourth quarter consolidated results
| Highlights | Three months ended December 31 | |||||||||||
($ millions except per share amounts) | 2011 | 2010 | change | |||||||||
Revenue | 977 | 673 | 45 | % | ||||||||
Gross profit | 353 | 252 | 40 | % | ||||||||
Net earnings | 265 | 206 | 29 | % | ||||||||
$ per common share (basic) | 0.67 | 0.52 | 29 | % | ||||||||
$ per common share (diluted) | 0.67 | 0.52 | 29 | % | ||||||||
Adjusted net earnings (non-IFRS, see pages 33 & 34) | 249 | 190 | 31 | % | ||||||||
$ per common share (adjusted and diluted) | 0.63 | 0.48 | 31 | % | ||||||||
Cash provided by operations (after working capital changes) | 255 | 109 | 134 | % | ||||||||
In the fourth quarter of 2011, our net earnings were $265 million ($0.67 per share diluted), an increase of $59 million compared to $206 million ($0.52 per share diluted) in 2010. Uranium revenues were up significantly due to an increase in sales volumes, an increase in the average realized selling price and partially offset by lower results in the electricity business due to lower sales volumes and a lower realized price.
The 31% increase in adjusted net earnings in the quarter followed the same trend as our net earnings, due to our positive results in the uranium business partially offset by our results in the electricity business.
We use adjusted net earnings, a non-IFRS measure, as a more meaningful way to compare our financial performance from period to period. See pages 33 & 34 for more information. The table below reconciles adjusted net earnings with our net earnings.
| Three months ended December 31 | ||||||||
($ millions) | 2011 | 2010 | ||||||
Net earnings | 265 | 206 | ||||||
Adjustments | ||||||||
Adjustments on derivatives1(pre-tax) | (22 | ) | (22 | ) | ||||
Income taxes on adjustments to derivatives | 6 | 6 | ||||||
|
|
|
| |||||
Adjusted net earnings | 249 | 190 | ||||||
|
|
|
| |||||
| 1 | In 2008, we opted to discontinue hedge accounting for our portfolio of foreign currency forward sales contracts. Since then, we have adjusted our gains and losses on derivatives as reported under IFRS to reflect what our earnings would have been had hedge accounting been applied. |
We recorded an income tax expense of $25 million this quarter, based on adjusted net earnings, compared to a $1 million expense in 2010.
2011 MANAGEMENT’SDISCUSSIONANDANALYSIS 53
Direct administration costs were $46 million in the quarter, $6 million lower than the same period last year. Stock-based compensation expenses were $2 million higher than the fourth quarter of 2010 at $3 million. See note 27 to the financial statements.
| Three months ended December 31 | ||||||||||||
($ millions) | 2011 | 2010 | change | |||||||||
Direct administration | 46 | 52 | (12 | )% | ||||||||
Stock-based compensation | 5 | 3 | 67 | % | ||||||||
|
|
|
|
|
| |||||||
Total administration | 51 | 55 | (7 | )% | ||||||||
|
|
|
|
|
| |||||||
Quarterly trends
| Highlights | 2011 | 2010 | ||||||||||||||||||||||||||||||
($ millions except per share amounts) | Q4 | Q3 | Q2 | Q1 | Q4 | Q3 | Q2 | Q1 | ||||||||||||||||||||||||
Revenue | 977 | 527 | 426 | 454 | 673 | 419 | 546 | 486 | ||||||||||||||||||||||||
Net earnings | 265 | 39 | 55 | 91 | 206 | 97 | 70 | 143 | ||||||||||||||||||||||||
$ per common share (basic) | 0.67 | 0.10 | 0.14 | 0.23 | 0.52 | 0.25 | 0.18 | 0.36 | ||||||||||||||||||||||||
$ per common share (diluted) | 0.67 | 0.10 | 0.14 | 0.23 | 0.52 | 0.25 | 0.18 | 0.36 | ||||||||||||||||||||||||
Adjusted net earnings (non-IFRS, see page 33 ) | 249 | 104 | 72 | 84 | 190 | 79 | 116 | 112 | ||||||||||||||||||||||||
$ per common share (adjusted and diluted) | 0.63 | 0.26 | 0.18 | 0.22 | 0.48 | 0.21 | 0.29 | 0.28 | ||||||||||||||||||||||||
Cash provided by operations (after working capital changes) | 255 | 190 | 20 | 267 | 109 | (5 | ) | 271 | 146 | |||||||||||||||||||||||
Key things to note:
| • | Our financial results are strongly influenced by the performance of our uranium segment, which accounted for 75% of consolidated revenues in the fourth quarter of 2011. |
| • | The timing of customer requirements, which tend to vary from quarter to quarter, drives revenue in the uranium and fuel services segments. |
| • | Net earnings do not trend directly with revenue due to unusual items and transactions that occur from time to time. We use adjusted net earnings, a non-IFRS measure, as a more meaningful way to compare our results from period to period (see pages 33 & 34 for more information). |
| • | Cash from operations tends to fluctuate as a result of the timing of deliveries and product purchases in our uranium and fuel services segments. |
| • | Quarterly results are not necessarily a good indication of annual results due to the variability in customer requirements noted above. |
54 CAMECOCORPORATION
Fourth quarter results by segment
Uranium
Highlights | Three months ended December 31 | change | ||||||||||
| 2011 | 2010 | |||||||||||
Production volume (million lbs) | 6.6 | 6.4 | 3 | % | ||||||||
Sales volume (million lbs) | 13.8 | 9.1 | 52 | % | ||||||||
Average spot price ($US/lb) | 51.79 | 58.29 | (11 | )% | ||||||||
Average long-term price ($US/lb) | 62.50 | 64.33 | (3 | )% | ||||||||
Average realized price | ||||||||||||
($US/lb) | 52.09 | 48.51 | 7 | % | ||||||||
($Cdn/lb) | 53.08 | 50.10 | 6 | % | ||||||||
Average unit cost of sales ($Cdn/lb) (including D&A) | 30.29 | 29.38 | 3 | % | ||||||||
Revenue ($ millions) | 731 | 457 | 60 | % | ||||||||
Gross profit ($ millions) | 314 | 189 | 66 | % | ||||||||
Gross profit (%) | 43 | 41 | 5 | % | ||||||||
Production volumes were 3% higher due to slightly higher output at Rabbit Lake and Inkai, partially offset by slightly lower output at McArthur River/Key Lake and Smith Ranch-Highland. SeeOperating propertieson page 61 for more information.
Uranium revenues were up 60% due to a 6% increase in the Canadian dollar average realized price, and a 52% increase in sales volumes.
Our realized prices this quarter were higher than the fourth quarter of 2010 mainly due to higher US dollar prices under market related contracts, partially offset by a less favourable exchange rate. In the fourth quarter of 2011, our realized foreign exchange rate was $1.02 compared to $1.03 in the prior year.
Total cost of sales (including D&A) increased by 56% ($417 million compared to $268 million in 2010). This was mainly the result of the following:
| • | the 52% increase in sales volumes |
| • | higher royalty charges due to higher deliveries of Saskatchewan-produced material and higher realized prices |
| • | average unit costs for produced uranium were 2% higher |
| • | partially offset by 33% lower average unit costs for purchased uranium due to fewer purchases at spot prices |
The net effect was a $125 million increase in gross profit for the quarter.
2011 MANAGEMENT’SDISCUSSIONANDANALYSIS 55
The following table shows the costs of produced and purchased uranium incurred in the reporting periods (non-IFRS measures see below). These costs do not include selling costs such as royalties, transportation and commissions, nor do they reflect the impact of opening inventories on our reported cost of sales.
($Cdn/lb) | Three months ended December 31 | change | ||||||||||
| 2011 | 2010 | |||||||||||
Produced | ||||||||||||
Cash cost | 17.44 | 15.94 | 9 | % | ||||||||
Non-cash cost | 5.52 | 6.52 | (15 | )% | ||||||||
|
|
|
| |||||||||
Total production cost | 22.96 | 22.46 | 2 | % | ||||||||
|
|
|
| |||||||||
Quantity produced (million lbs) | 6.6 | 6.4 | 3 | % | ||||||||
Purchased | ||||||||||||
Cash cost | 18.86 | 28.14 | (33 | )% | ||||||||
Quantity purchased (million lbs) | 2.3 | 4.3 | (47 | )% | ||||||||
Totals | ||||||||||||
Produced and purchased costs | 21.90 | 24.74 | (11 | )% | ||||||||
Quantities produced and purchased (million lbs) | 8.9 | 10.7 | (17 | )% | ||||||||
Cash cost per pound, non-cash cost per pound and total cost per pound for produced and purchased uranium presented in the above table are non-IFRS measures. These measures do not have a standardized meaning or a consistent basis of calculation under IFRS. We use these measures in our assessment of the performance of our uranium business. We believe that, in addition to conventional measures prepared in accordance with IFRS, certain investors use this information to evaluate our performance and ability to generate cash flow.
These measures are non-standard supplemental information and should not be considered in isolation or as a substitute for measures of performance prepared according to accounting standards. These measures are not necessarily indicative of operating profit or cash flow from operations as determined under IFRS. Other companies may calculate these measures differently so you may not be able to make a direct comparison to similar measures presented by other companies.
56 CAMECOCORPORATION
To facilitate a better understanding of these measures, the table below presents a reconciliation of these measures to our unit cost of sales for the fourth quarters of 2011 and 2010.
Cash and total cost per pound reconciliation
($ millions) | Three months ended December 31 | |||||||
| 2011 | 2010 | |||||||
Cost of product sold | 336.8 | 230.9 | ||||||
Add / (subtract) | ||||||||
Royalties | (61.3 | ) | (18.2 | ) | ||||
Standby charges | (6.0 | ) | (6.4 | ) | ||||
Other selling costs | (2.8 | ) | (7.9 | ) | ||||
Change in inventories | (108.2 | ) | 24.6 | |||||
|
|
|
| |||||
Cash operating costs(a) | 158.5 | 223.0 | ||||||
Add / (subtract) | ||||||||
Depreciation and amortization | 80.1 | 37.3 | ||||||
Change in inventories | (43.7 | ) | 4.4 | |||||
|
|
|
| |||||
Total operating costs(b) | 194.9 | 264.7 | ||||||
|
|
|
| |||||
Uranium produced & purchased (millions lbs) (c) | 8.9 | 10.7 | ||||||
Cash costs per pound (a ÷ c) | 17.81 | 20.84 | ||||||
Total costs per pound (b ÷ c) | 21.90 | 24.74 | ||||||
2011 MANAGEMENT’SDISCUSSIONANDANALYSIS 57
Fuel services
(includes results for UF6, UO2 and fuel fabrication)
Highlights | Three months ended December 31 | change | ||||||||||
| 2011 | 2010 | |||||||||||
Production volume (million kgU) | 3.1 | 3.9 | (21 | )% | ||||||||
Sales volume (million kgU) | 7.2 | 6.3 | 14 | % | ||||||||
Realized price ($Cdn/kgU) | 14.66 | 14.59 | — | |||||||||
Average unit cost of sales ($Cdn/kgU) (including D&A) | 11.18 | 12.49 | (10 | )% | ||||||||
Revenue ($ millions) | 106 | 91 | 16 | % | ||||||||
Gross profit ($ millions) | 25 | 13 | 92 | % | ||||||||
Gross profit (%) | 24 | 14 | 71 | % | ||||||||
Production volumes were 21% lower than in 2010 due to the decrease in production of UF6. We reduced our production forecast in the third quarter as a result of unfavourable market conditions.
Total revenue increased by 16% due to a 14% increase in sales volumes and a slight increase in realized price.
The total cost of sales (including D&A) increased by 4% ($81 million compared to $78 million in the fourth quarter of 2010) due to the increase in sales volumes. When compared to 2010, the average unit cost of sales was 10% lower primarily due to higher cost recoveries in 2011.
The net effect was a $12 million increase in gross profit.
58 CAMECOCORPORATION
Electricity
BPLP
(100% – not prorated to reflect our 31.6% interest)
Highlights ($ millions except where indicated) | Three months ended December 31 | change | ||||||||||
| 2011 | 2010 | |||||||||||
Output - terawatt hours (TWh) | 6.2 | 6.6 | (6 | )% | ||||||||
Capacity factor (the amount of electricity the plants actually produced for sale as a percentage of the amount they were capable of producing) | 86 | % | 91 | % | (6 | )% | ||||||
Realized price ($/MWh) | 53 | 1 | 60 | (12 | )% | |||||||
Average Ontario electricity spot price ($/MWh) | 27 | 32 | (16 | )% | ||||||||
Revenue | 338 | 393 | (14 | )% | ||||||||
Operating costs (net of cost recoveries) | 271 | 225 | 20 | % | ||||||||
Cash costs | 220 | 183 | 20 | % | ||||||||
Non-cash costs | 51 | 42 | 21 | % | ||||||||
Income before interest and finance charges | 67 | 168 | (60 | )% | ||||||||
Interest and finance charges | 7 | 7 | — | |||||||||
Cash from operations | 114 | 147 | (22 | )% | ||||||||
Capital expenditures | 84 | 38 | 121 | % | ||||||||
Distributions | 65 | 120 | (46 | )% | ||||||||
Capital calls | 10 | — | — | |||||||||
Operating costs ($/MWh) | 42 | 1 | 34 | 24 | % | |||||||
| 1 | Based on actual generation of 6.2 TWh plus deemed generation of 0.2 TWh in the fourth quarter. |
Our earnings from BPLP
Highlights ($ millions except where indicated) | Three months ended December 31 | change | ||||||||||
| 2011 | 2010 | |||||||||||
BPLP’s earnings before taxes (100%) | 60 | 161 | (63 | )% | ||||||||
Cameco’s share of pretax earnings before adjustments (31.6%) | 19 | 51 | (63 | )% | ||||||||
Proprietary adjustments | (2 | ) | (2 | ) | — | |||||||
Earnings before taxes from BPLP | 17 | 49 | (65 | )% | ||||||||
Total electricity revenue decreased 14% due to lower output and a lower realized price. Realized prices reflect spot sales, revenue recognized under BPLP’s agreement with the OPA, and financial contract revenue. BPLP recognized revenue of $147 million this quarter under its agreement with the OPA, compared to $114 million in the fourth quarter of 2010. The equivalent of about 66% of BPLP’s output was sold under financial contracts this quarter, compared to 45% in the fourth quarter of 2010. From time to time BPLP enters the market to lock in gains under these contracts.
The capacity factor was 86% this quarter, down from 91% in the fourth quarter of 2010 due to a higher volume of outage days during the year’s planned outages compared to last year’s planned outages.
Operating costs were $271 million compared to $225 million in 2010 due to higher maintenance costs incurred during outage periods and increased staff costs.
2011 MANAGEMENT’SDISCUSSIONANDANALYSIS 59
The result was a 65% decrease in our share of earnings before taxes.
BPLP distributed $65 million to the partners in the fourth quarter. Our share was $21 million. BPLP capital calls to the partners in the fourth quarter were $10 million. Our share was $3 million. The partners have agreed that BPLP will distribute excess cash monthly, and will make separate cash calls for major capital projects.
60 CAMECOCORPORATION
Our operations and development projects
This section of our MD&A is an overview of each of our operations, what we accomplished this year, our plans for the future and how we manage risk.
Uranium | ||||
Operating properties | ||||
McArthur River and Key Lake | 67 | |||
Rabbit Lake | 73 | |||
Smith Ranch-Highland | 75 | |||
Crow Butte | 77 | |||
Inkai | 79 | |||
Development project | ||||
Cigar Lake | 83 | |||
Projects under evaluation | ||||
Inkai blocks 1 and 2 production increase (see Inkai, above) | 79 | |||
Inkai block 3 (see Inkai, above) | 79 | |||
McArthur River extension | ||||
(see McArthur River, above) | 67 | |||
Kintyre | 89 | |||
Millennium | 90 | |||
Exploration | 91 | |||
Fuel services | ||||
Refining | ||||
Blind River refinery | 92 | |||
Conversion and fuel manufacturing | ||||
Port Hope conversion services | 93 | |||
Fuel Manufacturing | 93 | |||
Springfields Fuels | 93 | |||
Electricity | ||||
Bruce Power Limited Partnership | 95 | |||
2011 MANAGEMENT’SDISCUSSIONANDANALYSIS 61
Managing the risks
The nature of our operations means we face many potential risks and hazards that could have a significant impact on our business. We have comprehensive systems and procedures in place to manage them, but there is no assurance we will be successful in preventing the harm any of these risks and hazards could cause.
Below we list the regulatory, environmental and operational risks that generally apply to all of our operations, development projects and projects under evaluation. We also talk about how we manage specific risks in each operation or project update. These risks could have a material impact on our business in the near term.
We recommend you also review our annual information form, which includes a discussion of other material risks that could have an impact on our business.
Regulatory risks
A significant part of our economic value depends on our ability to:
| • | obtain and renew the licences and other approvals we need to operate, to increase production at our mines and to develop new mines. If we do not receive the regulatory approvals we need, or do not receive them at the right time, then we may have to delay, modify or cancel a project, which could increase our costs and delay or prevent us from generating revenue from the project. Regulatory review, including the review of environmental matters, is a long and complex process. |
| • | comply with the conditions in these licences and approvals. In a number of instances, our right to continue operating facilities, increase production at our mines and develop new mines depends on our compliance with these conditions. |
| • | comply with the extensive and complex laws and regulations that govern our activities, including our growth plans. Environmental legislation imposes very strict standards and controls on almost every aspect of our operations and the mines we plan to develop, and is not only introducing new requirements, but also becoming more stringent. For example: |
| • | we must complete an environmental assessment before we can begin developing a new mine or make any significant change to our operations |
| • | we increasingly need regulatory approval to make changes to our operational processes, which can take a significant amount of time because it may require an environmental assessment or an extensive review of supporting information. The complexity of this process can be further compounded when regulatory approvals are required from multiple agencies. |
We use significant management and financial resources to manage our regulatory risks.
62 CAMECOCORPORATION
Environmental risks
We have the safety, health and environmental risks associated with any mining and chemical processing company. All three of our business segments also face unique risks associated with radiation.
Laws to protect the environment are becoming more stringent for members of the nuclear energy industry and have inter-jurisdictional aspects (both federal and provincial/state regimes are applicable). Once we have permanently stopped mining and processing activities at an operating site, we are required to decommission the site to the satisfaction of the regulator. We have developed conceptual decommissioning plans for our operating sites and use them to estimate our decommissioning costs. As the site approaches or goes into decommissioning, regulators review our detailed decommissioning plan and carry out the required regulatory approval process. This can result in further regulatory process, as well as additional requirements, costs and financial assurances.
At the end of 2011, our estimate of total decommissioning and reclamation costs was $577 million. This is the undiscounted value of the obligation and is based on our current operations. We had accounting provisions of $509 million at the end of 2011 (the present value of the $577 million). Since we expect to incur most of these expenditures at the end of the useful lives of the operations they relate to, our expected costs for decommissioning and reclamation for the next five years are not material.
We provide financial assurances for decommissioning and reclamation such as letters of credit to regulatory authorities, as required. We had a total of $664 million in letters of credit supporting our reclamation liabilities at the end of 2011. Since 2001, all of our North American operations have had letters of credit in place that provide financial assurance in connection with our preliminary plans for decommissioning for the sites.
Some of the sites we own or operate have been under ongoing investigation and/or remediation and planning as a result of historic soil and groundwater conditions. For example, we are addressing issues related to historic soil and groundwater contamination at Port Hope.
We use significant management and financial resources to manage our environmental risks.
We manage environmental risks through our safety, health, environment and quality (SHEQ) management system. Our SHEQ management system is centralized and managed at the corporate level, and we implement it corporately and at our operations. Our chief executive officer is responsible for ensuring that our SHEQ management system is implemented. Our board’s safety, health and environment committee also oversees how we manage our environmental risks.
In 2011, we invested:
| • | $99 million in environmental protection, monitoring and assessment programs, or 30% more than 2010 |
| • | $30 million in health and safety programs, which is 12% less than we spent in 2010 |
In 2012, spending for health and safety programs is expected to be similar to 2011, while spending for environmental programs is expected to increase slightly.
Lessons learned from Japan
In response to the events in Japan this year, the Canadian Nuclear Safety Commission (CNSC) asked us to review the risk management and emergency preparedness processes at all of our Canadian sites, under subsection 12(2) of the General Nuclear Safety and Control Regulations.
Our uranium and fuel services divisions retained third-party experts to carry out the reviews, and these were completed and submitted to the CNSC this year.
The evaluations focused on the potential effects of extreme natural events on human health and the environment, and the risk management and emergency preparedness processes we have in place to prevent, mitigate and respond. The review concluded that the multi-layer system we have in place at all of our operations—our five levels of defence—provides multiple and effective barriers against the potential effects of a natural disaster.
We are considering other recommendations we received as we continue to improve our designs, practices, policies and plans to ensure worker and public safety. We do not expect any of the recommendations to require material expenditures.
2011 MANAGEMENT’SDISCUSSIONANDANALYSIS 63
Operational risks
Other operational risks and hazards include:
| • | environmental damage |
| • | industrial and transportation accidents |
| • | labour shortages, disputes or strikes |
| • | cost increases for contracted or purchased materials, supplies and services |
| • | shortages of required materials, supplies and equipment |
| • | transportation disruptions |
| • | electrical power interruptions |
| • | equipment failures |
| • | non-compliance with laws and licences |
| • | catastrophic accidents |
| • | fires |
| • | blockades or other acts of social or political activism |
| • | natural phenomena, such as inclement weather conditions, floods and earthquakes |
| • | unusual, unexpected or adverse mining or geological conditions |
| • | underground floods |
| • | ground movement or cave ins |
| • | tailings pipeline or dam failures |
| • | technological failure of mining methods |
We have insurance to cover some of these risks and hazards, but not all of them, and not to the full amount of losses or liabilities that could potentially arise.
64 CAMECOCORPORATION
Uranium – production overview
Our production was 2% lower in 2011 than it was in 2010, but 3% higher than the guidance we provided in our third quarter MD&A. We had a number of successes at our mining operations in 2011.
At McArthur River/Key Lake:
| • | realized benefits of production flexibility provisions in our McArthur River/Key Lake licences, matching our 2010 production record and exceeding our production target by 5% |
| • | realized benefits of improved efficiency and reliability of equipment at Key Lake |
At Inkai:
| • | received government approval allowing us to increase production to 3.9 million pounds (100% basis) |
| • | signed an MOA to increase production to 5.2 million pounds (100% basis) |
Uranium production
Cameco’s share (million lbs) | Three months ended December 31 | Year ended December 31 | 2011 plan | |||||||||||||||||
| 2011 | 2010 | 2011 | 2010 | |||||||||||||||||
McArthur River/Key Lake | 3.9 | 4.0 | 13.9 | 13.9 | 13.3 | |||||||||||||||
Rabbit Lake | 1.6 | 1.3 | 3.8 | 3.8 | 3.6 | |||||||||||||||
Smith Ranch-Highland | 0.2 | 0.4 | 1.4 | 1.8 | 1.6 | |||||||||||||||
Crow Butte | 0.2 | 0.2 | 0.8 | 0.7 | 0.7 | |||||||||||||||
Inkai | 0.7 | 0.5 | 2.5 | 2.6 | 2.5 | |||||||||||||||
|
|
|
|
|
|
|
|
|
| |||||||||||
Total | 6.6 | 6.4 | 22.4 | 22.8 | 21.7 | 1 | ||||||||||||||
|
|
|
|
|
|
|
|
|
| |||||||||||
| 1 | We updated our 2011 plan in our Q3 MD&A to 21.7 million pounds from 21.9 million pounds at the beginning of 2011. |
Outlook
We have geographically diverse sources of production. Our strategy is to increase our annual production to 40 million pounds by 2018, which we expect will come from our operating properties, development projects and projects under evaluation.
Cameco’s share of production — annual forecast to 2016
Current forecast (million lbs) | 2012 | 2013 | 2014 | 2015 | 2016 | |||||||||||||||
McArthur River/Key Lake | 13.1 | 13.1 | 13.1 | 13.1 | 13.1 | |||||||||||||||
Rabbit Lake | 3.7 | 3.7 | 3.7 | 3.7 | 3.4 | |||||||||||||||
US ISR | 2.4 | 3.0 | 3.1 | 3.7 | 3.8 | |||||||||||||||
Inkai1 | 2.5 | 2.9 | 2.9 | 2.9 | 2.9 | |||||||||||||||
Cigar Lake | — | 0.3 | 1.9 | 5.5 | 7.9 | |||||||||||||||
|
|
|
|
|
|
|
|
|
| |||||||||||
Total share of production | 21.7 | 23.0 | 24.7 | 28.9 | 31.1 | |||||||||||||||
|
|
|
|
|
|
|
|
|
| |||||||||||
Cameco’s share of Inkai’s production on which profits are generated2 | ||||||||||||||||||||
Inkai1 | 2.6 | 3.0 | 3.0 | 3.0 | 3.0 | |||||||||||||||
|
|
|
|
|
|
|
|
|
| |||||||||||
Total2 | 21.8 | 23.1 | 24.8 | 29.0 | 31.2 | |||||||||||||||
|
|
|
|
|
|
|
|
|
| |||||||||||
| 1 | We have signed an MOA with Kazatomprom to increase annual production to 5.2 million pounds (100% basis). Once implemented, we will receive the right to purchase 2.9 million pounds of Inkai’s annual production and receive profits on 3.0 million pounds. See page 79 for more information. |
| 2 | We have adjusted the production table to reflect the share of Inkai’s production we will use to calculate our profits under the MOA. See page 79 for more information. |
2011 MANAGEMENT’SDISCUSSIONANDANALYSIS 65
In 2013, production at McArthur River may be lower as we transition to mining upper zone 4.
Our 2012 and future annual production targets for Inkai assume, and we expect:
| • | Inkai will obtain the necessary government permits and approvals to produce at an annual rate of 5.2 million pounds (100% basis), including an amendment to the resource use contract |
| • | we reach a binding agreement with Kazatomprom to finalize the terms of the MOA |
| • | Inkai will ramp up production to an annual rate of 5.2 million pounds (100% basis) |
There is no certainty Inkai will receive these permits or approvals or we will reach a binding agreement with Kazatomprom or that Inkai will be able to ramp up production. If Inkai does not, or if the permits and approvals are delayed, Inkai may be unable to achieve its 2012 and future annual production targets and we may have to recatagorize some of Inkai’s mineral reserves as resources.
This forecast is forward-looking information. It is based on the assumptions and subject to the material risks discussed on page 3, and specifically on the assumptions and risks noted above and listed here. Actual production may be significantly different from this forecast.
Assumptions
| • | we achieve our forecast production for each operation, which requires, among other things, that our mining plans succeed, processing plants and equipment are available and function as designed, we have sufficient tailings capacity and our mineral reserve estimates are reliable |
| • | we obtain or maintain the necessary permits and approvals from government authorities |
| • | our production is not disrupted or reduced as a result of natural phenomena, labour disputes, political risks, blockades or other acts of social or political activism, shortage or lack of supplies critical to production, equipment failures or other development and operation risks |
Material risks that could cause actual results to differ materially
| • | we do not achieve forecast production levels for each operation because of a change in our mining plans, processing plants or equipment are not available or do not function as designed, lack of tailings capacity or for other reasons |
| • | we cannot obtain or maintain necessary permits or approvals from government authorities |
| • | natural phenomena, labour disputes, political risks, blockades or other acts of social or political activism, shortage or lack of supplies critical to production, equipment failures or other development and operation risks disrupt or reduce our production |
66 CAMECOCORPORATION
Uranium – operating properties
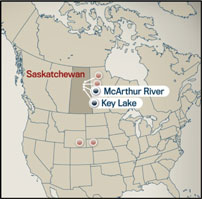 | McArthur River/Key Lake
McArthur River is the world’s largest, high-grade uranium mine, and Key Lake is the largest uranium mill in the world.
Ore grades at the McArthur River mine are 100 times the world average, which means it can produce more than 18 million pounds per year by mining only 150 to 200 tonnes of ore per day. We are the operator.
McArthur River is one of our three material uranium properties. |
| Location | Saskatchewan, Canada | |
| Ownership | 69.805% – McArthur River 83.33% – Key Lake | |
| End product | uranium concentrates | |
| ISO certification | ISO 14001 certified | |
| Mine type | underground | |
Estimated reserves (our share) | 226.2 million pounds (proven and probable) average grade U3O8: 16.89% | |
Estimated resources (our share) | 51.0 million pounds (measured and indicated) average grade U3O8: 17.63% 60.3 million pounds (inferred) average grade U3O8: 9.67% | |
| Mining methods | currently: raiseboring pending regulatory approval: blasthole stoping under development: boxhole boring | |
| Licensed capacity | mine and mill: 18.7 million pounds per year (can be exceeded – seeProduction Flexibility) | |
| Total production 2000 to 2011 | 211 million pounds (McArthur River/Key Lake) (100% basis) | |
1983 to 2002 | 209.8 million pounds (Key Lake) (100% basis) | |
| 2011 production | 13.9 million pounds (our share) | |
| 2012 forecast production | 13.1 million pounds (our share) | |
| Estimated decommissioning cost | $36.1 million – McArthur River | |
| $120.7 million – Key Lake | ||
2011 MANAGEMENT’SDISCUSSIONANDANALYSIS 67
Background
Production flexibility
Our operating licences for Key Lake mill and McArthur River mine were amended in 2009 and 2010, giving us flexibility in our annual licensed production limit. As long as average annual production does not exceed 18.7 million pounds per year, these amendments allow:
| • | Key Lake mill to produce up to 20.4 million pounds (100% basis) per year |
| • | McArthur River to produce up to 21 million pounds (100% basis) per year |
If production is lower than 18.7 million pounds in any year, we can produce more in future years until we recover the shortfall. We still have the opportunity to recover past production shortfalls of about 2.5 million pounds (100% basis) at Key Lake mill and about 3.5 million pounds (100% basis) at McArthur River.
Mining methods and techniques
We use a number of innovative methods and techniques to mine the McArthur River deposit:
Ground freezing
The sandstone that overlays the deposit and basement rocks is water-bearing, with large volumes of water under significant pressure. We use ground freezing to form an impermeable wall around the area being mined. This prevents water from entering the mine, and helps stabilize weak rock formations.
In 2009, we developed an innovative, cathedral-shaped freezewall around zone 2, panel 5, allowing us to develop tunnels above and below the orebody. We expect this innovation will allow us to continue using raisebore mining as the main mining method at McArthur River and improve production efficiencies as we transition to other areas of the mine (seePlanning for the future – New mining zones).
Raisebore mining
Raisebore mining is an innovative non-entry approach that we adapted to meet the unique challenges at McArthur River. It involves:
| • | drilling a series of overlapping holes through the ore zone from a raisebore chamber in waste rock above the ore |
| • | collecting the broken ore at the bottom of the raises using line-of-sight remote-controlled scoop trams, and transporting it to a grinding circuit |
| • | filling each raisebore hole with concrete once mining is complete |
| • | removing the equipment and filling the entire chamber with concrete when all the rows of raises in a chamber are complete |
| • | starting the process again with the next raisebore chamber |
We have used the raisebore mining method to successfully extract about 210 million pounds (100% basis) since we began mining in 1999.
68 CAMECOCORPORATION
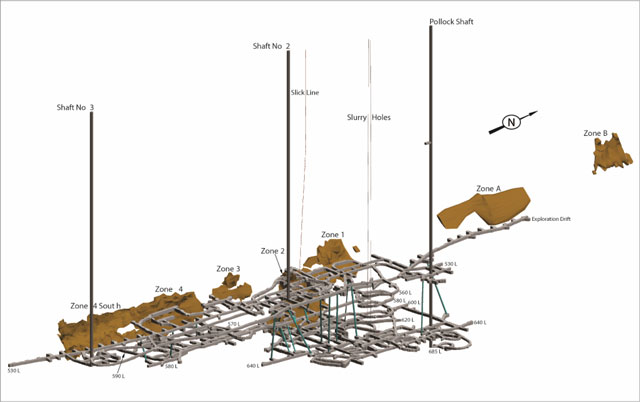
McArthur River currently has four zones with delineated mineral reserves (zones 1 to 4). Parts of zones 1, 2, 3 and 4 also have mineral resources. In addition, zones A and B to the north contain mineral resources.
We have mined from zone 2 since the mine started production. Zone 2 is divided into four panels (panels 1, 2, 3 and 5). Until late 2009, all mine production was from panels 1, 2 and 3, and there are still limited reserves that we will extract from these panels in the next few years. Panel 5 represents the upper portion of zone 2, overlying a portion of the other panels.
We successfully transitioned to panel 5 in 2009, the first time development has been accomplished through the unconformity into the Athabasca sandstone.
In late 2010, we brought the lower mining area of zone 4 into production.
Boxhole boring
Given our success with the cathedral-shaped freezewall around zone 2, panel 5, the use of boxhole boring in our mine plan has been significantly narrowed in scope. We expect to be able to continue using raisebore mining as our main mining method for McArthur River.
Boxhole boring is similar to the raisebore method, but the drilling machine is located below the orebody, so development is not required above the orebody. This method is currently being used at only a few mines around the world, but has not been used for uranium mining.
Boxhole boring poses some technical challenges. We will continue to test this method in 2012; however, we expect it will only be used as a secondary method, in areas where we determine raiseboring is not feasible. Boxhole boring may not be as productive as the raisebore method, but we will be able to determine this more accurately once we have fully developed and tested the method at McArthur River.
Blasthole stoping
Blasthole stoping involves establishing drill access above the ore and extraction access below the ore. The area between the upper and lower access levels (the stope) is then drilled off and blasted. The broken rock and ore are collected on the lower level and removed by line-of-sight remote-controlled scoop trams, then transported to a
2011 MANAGEMENT’SDISCUSSIONANDANALYSIS 69
grinding circuit. Once a stope is mined out, it is backfilled with concrete to maintain ground stability and allow the next stope in sequence to be mined. This mining method has been used extensively in the mining industry, including for mining uranium.
Blasthole stoping is being evaluated for the recovery of small isolated, lower grade ore zones away from the freezewalls and where raisebore or boxhole boring is uneconomic or impractical. We mined our first blasthole stope in the fourth quarter of 2011, in lower zone 4, with good productivity.
2011 update
Production
Our share of production in 2011 was 5% higher than our target of 13.3 million pounds, and the same as 2010.
At McArthur River and Key Lake we matched our production record set in 2010, realizing benefits under the production flexibility amendments to the McArthur River and Key Lake operating licences (seeProduction flexibility). Our revitalization program has improved the efficiency and reliability of equipment at the Key Lake mill, which had record monthly production in the latter part of the year.
New mining areas
Upper zone 4 – we began drilling for the freezewall required to bring the upper mining area of zone 4 into production.
Mill revitalization
The Key Lake mill began operating in 1983. We are revitalizing the mill to ensure sustained reliable production and increase our uranium production capability.
The Key Lake revitalization plan includes upgrading circuits with new technology to simplify operations and improve environmental performance. After the mill is revitalized, annual production will depend mainly on mine production. As part of this plan, we replaced the acid, steam and oxygen plants.
At the end of 2011, construction of all three plants was complete. The steam plant was commissioned at year end and the oxygen plant was commissioned in early 2012. We have started commissioning the acid plant.
Tailings capacity
The regulator approved the guidelines for ourKey Lake extension project,which proposes to:
| • | allow continued processing of ore from the McArthur River mine and other potential mine developments |
| • | increase long-term capacity of the Deilmann tailings management facility by allowing us to deposit tailings to a higher elevation |
| • | increase annual mill production capacity to 25 million pounds (100% basis) |
We are currently drafting the environmental impact study for submission to the regulator as part of the environmental assessment process. This year we:
| • | completed the detailed design for the stabilization of the Deilmann tailings management facility pitwalls |
| • | relocated the infrastructure necessary to allow us to flatten the slope of the pitwalls |
| • | continued our work on the environmental assessment for the Key Lake extension project |
McArthur River extension
In addition to the exploration work discussed below, we advanced feasibility work on theMcArthur River extension project this year. This is a multi-year project to safely expand the underground mine and develop new mining areas.
Our plan is to:
| • | increase average annual production at the mine from 18.7 million pounds (100% basis) to 22 million pounds (100% basis) |
| • | construct the infrastructure necessary to support production at this level |
| • | further delineate mineral resources to the north and south of the current mining operations |
An environmental assessment is required for the potential increase in production. Other work on this project will be approved through regular licensing activities.
70 CAMECOCORPORATION
Exploration
As part of theMcArthur River extension, we advanced the exploration drifts to zones A and B, north of current mining operations, and were successful in upgrading the majority of the zone B inferred mineral resources to the indicated category based on surface drilling. This area continues to show promise.
Planning for the future
Production
We expect our share of production to be 13.1 million pounds in 2012 and we will continue to look for opportunities to take advantage of the production flexibility provision in our licences.
New mining zones
Zone 4 – In 2012, we will continue the drilling to install the freezewall required to bring the upper mining area of zone 4 into production. We expect to start freezing upper zone 4 in 2013 and begin production from this area in 2014.
We expect to use raisebore mining in this area, applying the ground freezing experience we gained in zone 2, panel 5. This should significantly improve production efficiencies compared to boxhole boring.
Mill revitalization
In 2012, we expect to:
| • | complete the commissioning of the new acid plant |
| • | begin work for the construction of a new electrical substation and calciner |
Tailings capacity
In 2012, we expect to:
| • | begin to flatten the slope of the Deilmann tailings management facility pitwalls |
| • | advance the environmental assessment for the Key Lake extension project. We expect to submit the draft environmental impact statement to the regulators by the end of the second quarter. Comments on the draft are expected before year end. |
Exploration
In 2012, we plan to continue advancing the underground exploration drift to the south of the current mining areas. We also plan to test, from surface, along the entire length of the mineralized zone to identify additional mineral resources.
Managing our risks
Production at McArthur River/Key Lake poses many challenges: control of groundwater, weak rock formations, radiation protection, water inflow, mining method uncertainty and changes to productivity, mine transitioning, regulatory approvals, tailings capacity, reliability of facilities at Key Lake, surface and underground fires. Operational experience gained since the start of production has resulted in a significant reduction in risk.
Water inflow risk
The greatest risk is production interruption from water inflows. A 2003 water inflow resulted in a three-month suspension of production. We also had a small water inflow in 2008 that did not impact production.
The consequences of another water inflow at McArthur River would depend on its magnitude, location and timing, but could include a significant interruption or reduction in production, a material increase in costs or a loss of mineral reserves.
We take the following steps to reduce the risk of inflows, but there is no guarantee that these will be successful:
| • | Ground freezing: Before mining, we drill freezeholes and freeze the ground to form an impermeable freezewall around the area being mined. Ground freezing reduces but does not eliminate the risk of water inflows. |
| • | Mine development: We plan for our mine development to take place away from known groundwater sources whenever possible. In addition, we assess all planned mine development for relative risk, and apply extensive additional technical and operating controls for all higher risk development. |
| • | Pumping capacity and treatment limits: Our standard for this project is to secure pumping capacity of at least one and a half times the estimated maximum sustained inflow. We review our dewatering system and requirements at least once a year and before beginning work on any new zone. |
2011 MANAGEMENT’SDISCUSSIONANDANALYSIS 71
We believe we have sufficient pumping, water treatment and surface storage capacity to handle the estimated maximum sustained inflow.
Key Lake tailings capacity risk
Tailings from processing McArthur River ore are deposited in the Deilmann tailings management facility. At current production rates, the licensed capacity of the Deilmann tailings management facility is about six years, assuming we experience only minor losses in storage capacity due to sloughing from the pitwalls. Significant sloughing could constrain McArthur River production.
Sloughing of material from the pitwalls in the past has resulted in the loss of capacity. Technical studies show that stabilizing and reducing water levels in the pit enhances the stability of the pitwalls and reduces the risk of sloughing. We doubled our dewatering treatment capacity, allowing us to stabilize the water level in the pit. The water level has been gradually reduced over the past three and a half years.
In 2009, regulators approved our plan for the long-term stabilization of the Deilmann tailings management facility pitwalls. We are implementing the plan, and expect it will take approximately three years to complete the work.
We have also looked at options for long-term storage of tailings at Key Lake. We are proceeding with the environmental assessment to support an application for regulatory approval to deposit tailings in the Deilmann tailings management facility to a much higher level. This would provide us with enough tailings capacity to potentially mill a volume equal to all the known mineral reserves and resources from McArthur River and additional capacity to toll mill ore from other regional deposits.
We also manage the risks listed on pages 62 to 64.
72 CAMECOCORPORATION
Uranium – operating properties
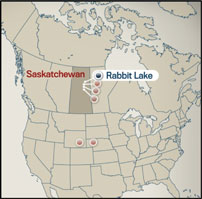 |
Rabbit Lake
The Rabbit Lake operation, which opened in 1975, is the longest operating uranium production facility in North America, and the second largest uranium mill in the world. |
Location | Saskatchewan, Canada | |
Ownership | 100% | |
End product | uranium concentrates | |
ISO certification | ISO 14001 certified | |
Mine type | underground | |
Estimated reserves | 24.0 million pounds (proven and probable) average grade U3O8: 0.73% | |
Estimated resources | 4.3 million pounds (indicated) average grade U3O8: 0.53% 10.4 million pounds (inferred) average grade U3O8: 1.42% | |
Mining method | vertical blasthole stoping | |
Licensed capacity | mill: maximum 16.9 million pounds per year; currently 11 million | |
Total production 1975 to 2011 | 186.3 million pounds | |
2011 production | 3.8 million pounds | |
2012 forecast production | 3.7 million pounds | |
Estimated decommissioning cost | $105.2 million | |
2011 update
Production
Production this year was about 6% higher than our plan and the same as it was in 2010.
Mill upgrades
During our scheduled mill maintenance shutdown in the third quarter, we completed the second phase of upgrades at the acid plant, successfully replacing the acid plant final towers.
We signed an agreement with our joint venture partners which changes the milling arrangements for the ore from Cigar Lake. SeeUranium - development project Cigar Lakeon page 83 for more information.
2011 MANAGEMENT’SDISCUSSIONANDANALYSIS 73
We received regulatory approval to begin exploration-related development and drilling on the Powell Zone, and completed a portion of the development work. We plan to complete the development work in 2012 and carry out drilling to further evaluate this zone.
Planning for the future
Production
We expect to produce 3.7 million pounds in 2012.
Tailings Capacity
We expect to have sufficient tailings capacity to support milling of Eagle Point ore until approximately mid-2016.
We are planning to expand the existing tailings management facility by mid-2016, to increase the tailings capacity so that it can support the extension of Rabbit Lake’s mine life and provide additional tailings capacity to process ore from other potential sources. The regulators will need to approve an environmental assessment before we can proceed.
Exploration
We have extended our underground drilling reserve replacement program into 2012. We plan to test and evaluate areas east and northeast of the mine where we have had good results, and to the north and south. This drilling will largely be from surface.
Reclamation
As part of our multi-year site-wide reclamation plan, we expect to spend over $2 million in 2012 to reclaim facilities that are no longer in use.
Managing our risks
We manage the risks listed on pages 62 to 64.
74 CAMECOCORPORATION
Uranium – operating properties
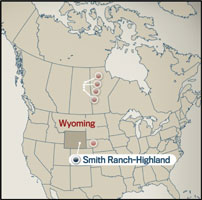 |
Smith Ranch-Highland
We operate Smith Ranch and Highland as a combined operation. Each has its own processing facility, but the Smith Ranch central plant processes all the uranium. The Highland plant is currently idle.
Together, they form the largest uranium production facility in the United States. |
Location | Wyoming, US | |
Ownership | 100% | |
End product | uranium concentrates | |
ISO certification | ISO 14001 certified | |
Estimated reserves | 6.6 million pounds (proven and probable) average grade U3O8: 0.09% | |
Estimated resources | 23.7 million pounds (measured and indicated) average grade U3O8: 0.06% 6.6 million pounds (inferred) average grade U3O8: 0.05% | |
Mining method | in situ recovery (ISR) | |
Licensed capacity | wellfields: 2 million pounds per year processing plants: 5 million pounds per year including Highland mill | |
Total production 2002 to 2011 | 15 million pounds | |
2011 production | 1.4 million pounds | |
2012 forecast production | 1.7 million pounds | |
Estimated decommissioning cost | $168 million (US) | |
2011 update
Production
Production this year was 22% lower than 2010 and 13% lower than our plan. The review process to obtain regulatory approvals has lengthened at Smith Ranch-Highland, which has increased the timeline to bring new wellfields into production.
Licensing
The regulators continue to review our licence renewal application. We are allowed to continue with all previously approved activities during the licence renewal process.
2011 MANAGEMENT’SDISCUSSIONANDANALYSIS 75
Processing
In the fourth quarter, we signed a toll processing agreement with Uranerz Energy Corporation to process up to 800,000 pounds per year at the Smith Ranch-Highland processing plants. The agreement allows us to use excess plant capacity.
Planning for the future
Production
We expect to produce 1.7 million pounds in 2012.
We continue to seek regulatory approvals to proceed with expansions at our various satellite operations; however, we are experiencing some delays in receiving the necessary regulatory approvals. We recognize the regulators have a large volume of permits to process. We are working with them to improve communications and ensure we better understand and meet their needs. We are advancing work on satellite properties where prior approvals are in place.
Exploration
We are continuing our exploration activity with the objective of extending the mine life at Smith Ranch-Highland and satellite properties.
Managing our risks
The operating environment is becoming more complex as public interest and regulatory oversight increase. This may affect our plans to increase production. We also manage the risks listed on pages 62 to 64.
76 CAMECOCORPORATION
Uranium – operating properties
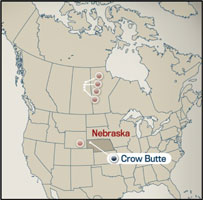 |
Crow Butte
Crow Butte was discovered in 1980 and began production in 1991. It is the first uranium mine in Nebraska, and is a significant contributor to the economy of northwest Nebraska. |
Location | Nebraska, US | |
Ownership | 100% | |
End product | Uranium concentrates | |
ISO certification | ISO 14001 certified | |
Estimated reserves | 3.7 million pounds (proven) average grade U3O8: 0.13% | |
Estimated resources | 11.9 million pounds (indicated) average grade U3O8: 0.12% | |
Mining method | in situ recovery (ISR) | |
Licensed capacity (processing plant and wellfields) | 1 million pounds per year | |
Total production 2002 to 2011 | 7.6 million pounds | |
2011 production | 0.8 million pounds | |
2012 forecast production | 0.7 million pounds | |
Estimated decommissioning cost | $35.6 million (US) | |
2011 update
Production
Production this year was 14% higher than 2010 and our forecast for the year.
Licensing
The regulators continued to review our applications to expand and relicense Crow Butte. They are planning public hearings in 2012 to consider our application. We are allowed to continue with all previously approved activities during the licence renewal process.
2011 MANAGEMENT’SDISCUSSIONANDANALYSIS 77
Planning for the future
Production
In 2012, we expect to produce 0.7 million pounds.
We are seeking regulatory approvals to proceed with expansions at our various satellite operations; however, we are experiencing some delays in receiving the necessary regulatory approvals. We recognize the regulators have a large volume of permits to process. We are working with them to improve communications and ensure we better understand and meet their needs.
Managing our risks
The operating environment is becoming more complex as public interest and regulatory oversight increase. This may affect our plans to increase production. We also manage the risks listed on pages 62 to 64.
78 CAMECOCORPORATION
Uranium – operating properties
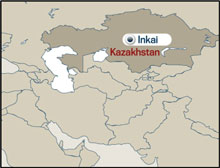 |
Inkai
Inkai is a very significant uranium deposit, located in Kazakhstan. There are two production areas (blocks 1 and 2) and an exploration area (block 3). The operator is Joint Venture Inkai Limited Liability Partnership, which we jointly own (60%) with Kazatomprom (40%).
Inkai is one of our three material uranium properties. |
Location | South Kazakhstan | |
Ownership | 60% | |
End product | uranium concentrates | |
ISO certification | BSI OHSAS 18001 ISO 14001 certified | |
Estimated reserves (our share) | 59.7 million pounds (proven and probable) average grade U3O8: 0.07% | |
Estimated resources (our share) | 28.8 million pounds (indicated) average grade U3O8: 0.08% 153.0 million pounds (inferred) average grade U3O8: 0.05% | |
Mining method | in situ recovery (ISR) | |
Licensed capacity (wellfields) | approved: 3.9 million pounds per year (our share 2.3 million pounds per year)
application: 5.2 million pounds per year (our share 2.9/3.0 million pounds per year – seeLicensing) | |
Total production 2008 to 2011 | 6.5 million pounds (our share) | |
2011 production | 2.5 million pounds (our share) | |
2012 forecast production | 4.3 million pounds (100% basis) (our share of production 2.5 million pounds – seeLicensing) | |
Estimated decommissioning cost | $11 million (US) | |
2011 update
Production
Production this year was in line with the currently approved production level, but about 4% lower than production in 2010. Lower production was a result of in-process uranium inventory changes. Prior to final commissioning of the processing facilities in 2010, the in-process uranium inventory had built up. A significant reduction of this inventory added to production in 2010.
2011 MANAGEMENT’SDISCUSSIONANDANALYSIS 79
In addition, production in 2010, the first full year of operation, benefited from the higher grades associated with new wellfields. Average grades at in situ recovery operations typically stabilize at levels lower than initial years because uranium is recovered from a mix of wellfields of varying maturities and, as wellfields mature, the grades decrease. The processing plant has the capacity to produce at an annual rate of 5.2 million pounds per year (100% basis) depending on the grade of the production solution. Inkai is planning to expand the existing satellite plant capacity in order to support this production rate from lower grade solution. Regulatory approval is required to carry out production at the annual rate of 5.2 million pounds per year (100% basis).
Operations
Inkai experienced brief interruptions to its sulphuric acid supply during the year, which had a small impact on production. The supply of sulphuric acid is tight in Kazakhstan.
Project funding
We have a loan agreement with Inkai. As of December 31, 2011, there was:
| • | $192 million (US) of principal outstanding on the loan (in 2011 Inkai repaid $122 million (US) of principal) |
| • | a nominal amount of accrued interest and financing fees on the loan. In 2011, Inkai paid $6 million (US) in accrued interest and financing fees. |
Inkai uses 100% of the cash available for distribution every year to pay accrued interest and financing fees. After these are paid, Inkai uses 80% of the remaining cash available for distribution to repay principal outstanding on the loan until it is repaid in full. The final 20% is distributed as dividends to the owners.
We have also agreed to advance funds for Inkai’s work on block 3 until the feasibility study is complete.
Licensing
An amendment to Inkai’s resource use contract was signed early in 2011, and Inkai received government approval to:
| • | increase annual production from blocks 1 and 2 to 3.9 million pounds (100% basis) |
| • | carry out a five-year assessment program at block 3 that includes delineation drilling, uranium resource estimation, construction and operation of a test leach facility, and completion of a feasibility study |
We signed an MOA this year with our partner, Kazatomprom, to increase production from blocks 1 and 2 to 5.2 million pounds (100% basis). Under the MOA, our share of Inkai’s annual production will be 2.9 million pounds with the processing plant at full capacity. We will also be entitled to receive profits on 3.0 million pounds.
To implement the increase, we need a binding agreement finalizing the terms of the MOA, government approval and an amendment to the resource use contract.
Block 3 exploration
Inkai continued delineation drilling, began infrastructure development and completed engineering for a test leach facility for the block 3 assessment program. Regulatory approval of the detailed delineation and test leach work programs is required.
Based on earlier agreements, profits from future block 3 production are to be shared on a 50:50 basis with our partner, instead of based on our ownership interests.
Uranium conversion project
Under the guidance of the memorandum of understanding (MOU) signed in 2007 (seeDoubling production), we continued to work with our partner Kazatomprom to evaluate joint UF6 conversion opportunities. This work includes examining the feasibility of a number of options and locations based on strategic and economic considerations.
80 CAMECOCORPORATION
Planning for the future
Production
We expect our share of production to be 2.5 million pounds in 2012.
Block 3 exploration
In 2012 we expect to continue delineation drilling and development of a test leach facility.
Doubling production
As part of our strategy, we are working with our partner, Kazatomprom, to implement our 2007 non-binding MOU. The memorandum:
| • | targets future annual production capacity at 10.4 million pounds (100% basis). Our share of the additional capacity is expected to be 50%. |
| • | contemplates studying the feasibility of constructing a uranium conversion facility as well as other potential collaborations in uranium conversion |
To implement the increase, we need a binding agreement to finalize the terms of the MOU, and various approvals from our partner and the government. We expect our ability to double annual uranium production at Inkai will be closely tied to the success of the uranium conversion project.
Managing our risks
Regulatory approvals
Our 2012 and future annual production targets for Inkai assume, and we expect:
| • | Inkai will obtain the necessary government permits and approvals to produce at an annual rate of 5.2 million pounds (100% basis), including an amendment to the resource use contract |
| • | we reach a binding agreement with Kazatomprom to finalize the terms of the MOA |
| • | Inkai will ramp up production to an annual rate of 5.2 million pounds (100% basis) |
There is no certainty Inkai will receive these permits or approvals or we will reach a binding agreement with Kazatomprom or that Inkai will be able to ramp up production. If Inkai does not, or if the permits and approvals are delayed, Inkai may be unable to achieve its 2012 and future annual production targets and we may have to recatagorize some of Inkai’s mineral reserves as resources.
We also require regulatory approval of our detailed block 3 delineation and test leach work programs.
Supply of sulphuric acid
There were brief interruptions to sulphuric acid supply during the year. Given the importance of sulphuric acid to Inkai’s mining operations, we continue to closely monitor its availability. Our production may be less than forecast if there is a shortage.
Political risk
Kazakhstan declared itself independent in 1991 after the dissolution of the Soviet Union. Our Inkai investment, and our plans to increase production, are subject to the risks associated with doing business in developing countries, which have significant potential for social, economic, political, legal, and fiscal instability. Kazakh laws and regulations are complex and still developing and their application can be difficult to predict. To maintain and increase Inkai production, we need ongoing support, agreement and co-operation from our partner and the government.
The principal legislation governing subsoil exploration and mining activity in Kazakhstan is the Subsoil Use Law dated June 24, 2010. It replaces the Law on the Subsoil and Subsoil Use, dated January 27, 1996.
In general, Inkai’s licences are governed by the version of the subsoil law that was in effect when the licences were issued in April 1999, and new legislation applies to Inkai only if it does not worsen Inkai’s position. Changes to legislation related to national security, among other criteria, however, are exempt from the stabilization clause in the resource use contract. The Kazakh government interprets the national security exemption broadly.
With the new subsoil law, the government continues to weaken its stabilization guarantee. The government is broadly applying the national security exception to encompass security over strategic national resources.
2011 MANAGEMENT’SDISCUSSIONANDANALYSIS 81
The resource use contract contains significantly broader stabilization provisions than the new subsoil law, and these contract provisions currently apply to us.
To date, the new subsoil law has not had a significant impact on Inkai. We continue to assess the impact. See our annual information form for an overview of this change in law.
There has been recent civil unrest in the oil producing region of West Kazakhstan. The government has taken action to resolve the underlying concerns and restore stability. Inkai, which is in South Kazakhstan, has not been impacted by the civil unrest. We are monitoring the situation.
We also manage the risks listed on pages 62 to 64.
82 CAMECOCORPORATION
Uranium – development project
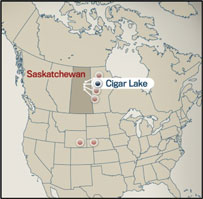 | Cigar Lake
Cigar Lake is the world’s second largest high-grade uranium deposit, with grades that are 100 times the world average. We are a 50% owner and the mine operator.
Cigar Lake, which is being developed, is one of our three material uranium properties. |
| Location | Saskatchewan, Canada | |
| Ownership | 50.025% | |
| End product | uranium concentrates | |
| Mine type | underground | |
Estimated reserves (our share) | 108.4 million pounds (proven and probable) average grade U3O8: 18.30% | |
Estimated resources (our share) | 1.1 million pounds (measured and indicated) average grade U3O8: 2.25% 62.2 million pounds (inferred) average grade U3O8: 12.59% | |
| Mining method | jet boring | |
| Target production date | begin commissioning in ore mid-2013; first packaged pounds in the fourth quarter of 2013 | |
Target annual production (our share) | 9 million pounds at full production | |
| Estimated decommissioning cost | $27.7 million (to the end of construction) | |
Background
Development
We began developing the Cigar Lake underground mine in 2005, but development was delayed due to water inflows (two in 2006 and one in 2008). The first inflow flooded shaft 2 while it was under construction. The second inflow flooded the underground development and we began remediation late in 2006. In 2008, another inflow interrupted the dewatering of the underground development. We sealed the inflows and completed dewatering of shafts 1 and 2. In 2011, we completed remediation of the underground.
2011 MANAGEMENT’SDISCUSSIONANDANALYSIS 83
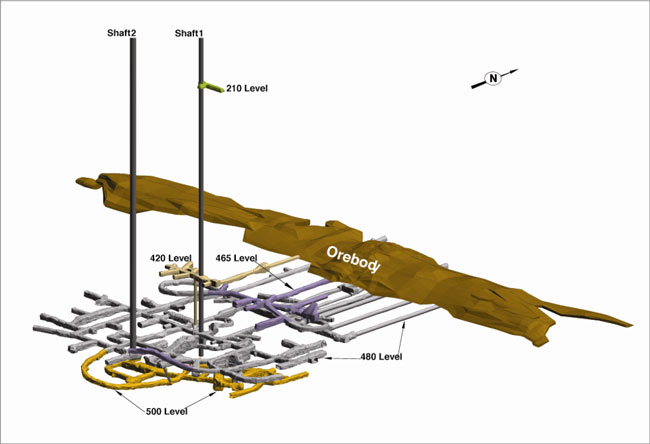
Mining method
We will use a number of innovative methods and techniques to mine the Cigar Lake deposit:
Bulk freezing
The sandstone that overlays the deposit and basement rocks is water-bearing, with large volumes of water under significant pressure. We will freeze the ore zone and surrounding ground in the area to be mined to prevent water from entering the mine and to help stabilize weak rock formations.
To meet our production schedule, the ground has to be fully frozen in the area being mined before we begin jet boring. We have divided the orebody into production panels, and will have one jet boring mining unit operating in a panel. At least four production panels need to be frozen at one time to achieve the full production rate of 18 million pounds per year. Two jet boring machines will be working at a time, while the other two are being moved or set up, or in the backfill cycle.
In the past, bulk freezing has been done from underground. In 2010, however, we tested and began to implement an innovative surface freeze strategy. The strategy reduces the risk to the production schedule for two reasons:
| • | the surface freeze process can start before developing the underground tunnels |
| • | construction activities underground are simplified by moving some of the freezing infrastructure to surface |
Our plan is to use a hybrid freezing approach. We will use surface freezing to support the rampup period and underground freezing for the longer term development of the mine. In 2011, we restarted freezing the ore from underground and used freezing around shaft 2 to support the sinking and subsequent break through on the 480 metre level. We also began to freeze the ground from surface.
Jet boring
After many years of test mining, we selected jet boring, a non-entry mining method, which we have developed and adapted specifically for this deposit. Overall, our initial test program was a success and met all initial objectives. This method is new to the uranium mining industry. It involves:
84 CAMECOCORPORATION
| • | drilling a pilot hole into the frozen orebody, inserting a high pressure water jet and cutting a cavity out of the frozen ore |
| • | collecting the ore and water mixture (slurry) from the cavity and pumping it to storage (sump storage) allowing it to settle |
| • | using a clamshell, transporting the ore from the sump storage to a grinding and processing circuit, eventually loading a tanker truck with ore slurry for transport to the mill |
| • | filling each cavity in the orebody with concrete once mining is complete |
| • | starting the process again with the next cavity |
Milling
We have signed agreements with the owners of the Cigar Lake project and McClean Lake mill to process all Cigar Lake ore at McClean Lake.
Under the previous toll milling agreements, both the McClean Lake mill and the Rabbit Lake mill would process uranium from Cigar Lake. Under the new milling arrangement, the McClean Lake mill will process and package 100% of Cigar Lake uranium. The Rabbit Lake mill will continue to process ore mined on that site and has the flexibility to process ore from other potential sources.
2011 update
During the year, we:
| • | completed remediation of the underground |
| • | resumed underground construction in the south end of the mine |
| • | completed the sinking of shaft 2 to the 480 metre level in early 2012 |
| • | substantially completed the ore loadout facility |
| • | procured additional equipment for the jet boring system |
| • | obtained regulatory approval to change the discharge location for the release of treated water to Seru Bay of Waterbury Lake |
| • | obtained regulatory approval for the Cigar Lake mine plan |
Costs
As of December 31, 2011, we had:
| • | invested about $675 million for our share of the construction costs to develop Cigar Lake |
| • | expensed about $86 million in remediation expenses, including about $4 million in 2011 |
| • | expensed about $35 million in standby costs |
We expect to spend an additional $484 million (our share) to complete this project, which requires us to:
| • | invest about $429 million for our share of the remaining capital costs, bringing our total share to about $1.1 billion |
| • | expense about $55 million for our share of the remaining standby costs, bringing our total share to about $90 million |
This would bring our total share of the cost for this project to about $1.3 billion since we began development in 2005.
Exploration
We completed a surface drilling program this year, which increased the mineral reserves and average ore grade slightly, and extended the orebody further to the west. It also increased our confidence in the geology and the grade we can expect during the rampup period. We also initiated a drilling program to further delineate the west end of the mineralization.
Planning for the future
In 2012, we expect to:
| • | complete the sinking of shaft 2 to its final depth of 500 metres |
| • | begin installing shaft 2 infrastructure, including construction of a concrete ventilation partition, installation of electrical cable, water services, ore slurry pipes and hoist systems |
| • | complete the surface ore loadout facility |
2011 MANAGEMENT’SDISCUSSIONANDANALYSIS 85
| • | resume underground development in the north end of the mine |
| • | move the jet boring system to site and begin testing underground |
| • | develop two mining tunnels using the mine development system |
| • | complete the Seru Bay pipeline |
| • | complete all engineering designs and drawings for the project |
| • | construct the clarifier |
Technical report
Cigar Lake continues to be a key part of our plan to increase our annual production to 40 million pounds by 2018 and we are pleased with the progress we are making to bring this valuable orebody into production. Over the year, we implemented a number of changes to the project, which have enhanced the overall economics of the project. These changes have put Cigar Lake on the path to becoming another high-grade, low-cost source of production, similar to our McArthur River operation.
We are updating the March 2010 Cigar Lake technical report to reflect these changes, including the impact of the new milling arrangement, surface freezing and other developments. We plan to file the updated technical report with our February 2012 annual information form. The highlights of the technical report are:
| • | a decrease in the estimated average cash operating cost to about $18.60 per pound from about $23.10 per pound estimated in 2010. The reduction is primarily due to the new milling arrangement. |
| • | an increase of about $190 million in our share of the total estimated capital cost at completion to $1.1 billion. The increase is mainly due to the implementation of the surface freeze strategy, general cost escalation, costs to upgrade and expand the McClean Lake mill and improvements to the mine plan. |
| • | a change to the production profile, with slightly lower production expected in the first years of the project offset by higher production in the later years. We expect our share of production in 2013 to be about 0.3 million pounds. This compares to our previous estimate of 1 million pounds. This and the other revisions to our production schedule on page 65 represent an 8.7% decrease in our production forecast through 2016 and are a result of the extended period required for remediation and a better understanding of the geology and lower grades in the initial production panels. |
| • | first commissioning in ore expected in mid-2013 and the first pounds expected to be packaged at the McClean Lake mill in the fourth quarter |
| • | rampup to the full production rate expected by the end of 2017 |
| • | a 4% increase in our share of the mineral reserves estimate from 104.7 million pounds to 108.4 million pounds and an 8% increase in the estimated average ore grade |
| • | an upgrade of probable mineral reserves to proven minerals reserves |
Given the scale of this project and the challenging nature of the geology and mining method, we have made significant achievements since 2010. We will continue to develop this asset in a safe and deliberate manner to ensure we realize the economic benefits of this project.
Our expectations and plans regarding Cigar Lake, the expected benefit of milling Cigar Lake ore at the McClean Lake mill, the estimated average cash operating cost, our expected share of the total project and capital cost at completion for Cigar Lake and our mineral reserve estimate, are forward-looking information. They are based on the assumptions and subject to the material risks discussed on page 3, and specifically on the assumptions and risks listed on the following page.
86 CAMECOCORPORATION
Assumptions
| • | our expectation that the new milling arrangement will result in the expected reduction in the operating cost |
| • | there is no material delay or disruption in our plans as a result of a ground movements, cave ins, additional water inflows, a failure of seals or plugs used for previous water inflows, natural phenomena, delay in acquiring critical equipment, equipment failure or other causes |
| • | there are no labour disputes or shortages |
| • | we obtain contractors, equipment, operating parts, supplies, regulatory permits and approvals when we need them |
| • | processing plants are available and function as designed and sufficient tailings facility capacity is available |
| • | our mineral reserves estimate and the assumptions it is based on are reliable |
| • | our Cigar Lake development, mining and production plans succeed |
| • | our expectation that the jet boring mining method will be successful and that we will be able to obtain the additional jet boring system units we require on schedule |
Material risks
| • | the new milling arrangement does not result in the expected cost savings or other benefits |
| • | an unexpected geological, hydrological or underground condition or an additional water inflow, further delays our progress |
| • | ground movements or cave ins |
| • | we cannot obtain or maintain the necessary regulatory permits or approvals |
| • | natural phenomena, labour disputes, equipment failure, delay in obtaining the required contractors, equipment, operating parts and supplies or other reasons cause a material delay or disruption in our plans |
| • | processing plants are not available or do not function as designed and sufficient tailings facility capacity is not available |
| • | our mineral reserves estimate is not reliable |
| • | our development, mining or production plans for Cigar Lake are delayed or do not succeed for any reason, including technical difficulties with the jet boring mining method or our inability to acquire any of the required jet boring equipment |
Managing our risks
Cigar Lake is a challenging deposit to develop and mine. These challenges include control of groundwater, weak rock formations, radiation protection, water inflow, mining method uncertainty, regulatory approvals, tailings capacity, surface and underground fires and other mining-related challenges. To reduce this risk, we are applying our operational experience and the lessons we have learned about water inflows at McArthur River and Cigar Lake.
Water inflow risk
A significant risk to development and production is from water inflows. The 2006 and 2008 water inflows were significant setbacks.
The consequences of another water inflow at Cigar Lake would depend on its magnitude, location and timing, but could include a significant delay in Cigar Lake’s development or production, a material increase in costs or a loss of mineral reserves.
We take the following steps to reduce the risk of inflows, but there is no guarantee that these will be successful:
| • | Bulk freezing: Two of the primary challenges in mining the deposit are control of groundwater and ground support. Bulk freezing reduces but does not eliminate the risk of water inflows. |
| • | Mine development: We plan for our mine development to take place away from known groundwater sources whenever possible. In addition, we assess all planned mine development for relative risk, and apply extensive additional technical and operating controls for all higher risk development. |
| • | Pumping capacity and treatment limits: We have pumping capacity to meet our standard for this project of at least one and a half times the estimated maximum inflow. |
We believe we have sufficient pumping, water treatment and surface storage capacity to handle the estimated maximum inflow.
2011 MANAGEMENT’SDISCUSSIONANDANALYSIS 87
Jet boring mining method and units
We have successfully demonstrated the jet boring mining method in trials. This method, however, has not been proven at full production. We have developed and adapted this method specifically for this deposit. As we ramp up production, there may be some technical challenges, which could affect our production plans. There is a risk the rampup to full production may take longer than planned and that the full production rate may not be achieved on a sustained and consistent basis. A comprehensive testing, pre-commissioning, commissioning and startup plan has been implemented to assure successful startup and on-going operations. We are confident we will be able to solve challenges that may arise, but failure to do so would have a significant impact on our business.
Our mining plan requires four jet boring system units. We currently have one unit and in 2011 agreed to purchase an additional three units. There is a risk that rampup to full production at Cigar Lake may take longer than planned if the manufacture or delivery of these three units does not take place as scheduled. As part of our startup plan noted above, we are working with our supplier to assure timely delivery of these units.
We also manage the risks listed on pages 62 to 64.
88 CAMECOCORPORATION
Uranium – projects under evaluation
Kintyre
Kintyre, which we acquired with a partner in 2008, diversifies our geographic reach and deposit types. We are the operator.
| Location | Western Australia | |
| Ownership | 70% | |
| End product | uranium concentrates | |
| Mine type | open pit | |
Estimated resources (our share) | 38.7 million pounds (indicated) average grade U3O8: 0.58% 6.7 million pounds (inferred) average grade U3O8: 0.46% | |
Background
In August 2008, we paid $346 million (US) to acquire a 70% interest in Kintyre.
2011 update
This year we:
| • | generated a National Instrument 43-101 mineral resource estimate |
| • | completed an MOU for a mine development agreement with the Martu |
| • | significantly advanced a prefeasibility study and an environmental review and management program, the level of environmental assessment required for the Kintyre project |
We had planned to complete the prefeasibility study and submit a draft environmental review and management program. To support the prefeasibility study, we expanded the scope of our drilling program and have delayed these activities to 2012.
Planning for the future
Our plan for 2012 is to keep moving the project towards a production decision. We expect to:
| • | carry out further exploration drilling to test for other potential satellite deposits |
| • | complete the prefeasibility study and decide whether to proceed to the feasibility stage |
| • | submit a draft environmental review and management program |
| • | complete the mine development agreement with the Martu |
Managing the risks
To successfully develop this project, we need a positive feasibility study, regulatory approval and an agreement with the Martu. We also manage the risks listed on pages 62 to 64.
2011 MANAGEMENT’SDISCUSSIONANDANALYSIS 89
Uranium – projects under evaluation
Millennium
Millennium is a uranium deposit in northern Saskatchewan that we expect will use our excess milling capacity. We are the operator.
| Location | Saskatchewan, Canada | |
| Ownership | 42% | |
| End product | uranium concentrates | |
| Mine type | underground | |
Estimated resources (our share) | 21.4 million pounds (indicated) average grade U3O8: 4.55% 7.0 million pounds (inferred) average grade U3O8: 2.54% | |
Background
The Millennium deposit was discovered in 2000. The deposit was delineated through geophysical survey and drilling work between 2000 and 2007.
2011 update
This year we:
| • | continued work on the environmental assessment |
| • | completed a summer drill program, which increased our inferred mineral resource estimate |
| • | carried out additional studies and design work to advance the project |
Planning for the future
Our plan for 2012 is to keep moving the project towards a production decision. We expect to:
| • | complete the environmental assessment and submit the draft environmental impact study to the regulators in early 2012 |
| • | begin engineering for the project |
| • | carry out a drill program to test the upper portion of the ore body |
Managing our risks
The English River First Nation (ERFN) has selected surface lands covering the Millennium deposit in a claim for Treaty Land Entitlement (TLE). The Saskatchewan government has rejected the selection, but the ERFN has challenged the government’s decision in the courts and this litigation continues. The TLE process does not affect our mineral rights, but it could have an impact on the surface rights and benefits we ultimately negotiate as part of the development of this deposit.
Environment Canada has proposed a recovery strategy for woodland caribou in northern Saskatchewan. This strategy has the potential to restrict further economic and social development in northern Saskatchewan and could have an impact on our ability to develop this deposit.
We also manage the risks listed on pages 62 to 64.
90 CAMECOCORPORATION
Uranium – exploration
Exploration is key to ensuring our long-term growth, and since 2007 we have more than doubled our annual investment.
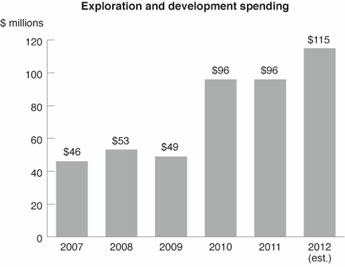
2011 update
Brownfield exploration
Brownfield exploration is uranium exploration near our existing operations, and includes expenses for advanced exploration projects where uranium mineralization is being defined.
This year we spent $10 million on five brownfield exploration projects, and $38 million for resource definition at Kintyre and at Cigar Lake.
Regional exploration
We spent about $48 million on regional exploration programs (including support costs). Saskatchewan was the largest region, followed by Australia, northern Canada, Asia and South America.
Plans for 2012
We plan to spend approximately $115 million on uranium exploration in 2012 as part of our long-term strategy.
Brownfield exploration
We plan to spend approximately $15 million on five brownfield exploration projects in the Athabasca Basin and Australia. Our expenditures on projects under evaluation are expected to total $35 million, with the largest amounts spent on Kintyre and Inkai block 3.
Regional exploration
We plan to spend about $65 million on 49 projects worldwide, the majority of which are at drill target stage. Among the larger expenditures planned are $9 million on two adjacent projects in Nunavut, $9 million to test targets near our US operations and on our satellite properties, $4 million on the Read Lake project, $5 million on targets in South Australia, and $5 million to follow up encouraging results on the Wellington Range project in Australia.
2011 MANAGEMENT’SDISCUSSIONANDANALYSIS 91
Fuel services – refining
Blind River refinery
Blind River is the world’s largest commercial uranium refinery, refining uranium concentrates from mines around the world into UO3.
| Location | Ontario, Canada | |
| Ownership | 100% | |
| End product | UO3 | |
| ISO certification | ISO 14001 certified | |
| Licensed capacity | approved: 18 million kgU as UO3 per year application: 24 million kgU as UO3 per year | |
| Estimated decommissioning cost | $38.6 million (pending regulatory approval) | |
2011 update
Production
Our Blind River refinery produced 13.5 million kgU of UO3 this year. This ensured that SFL maintained its contractual inventories and Port Hope met its production requirements.
Managing our risks
We manage the risks listed on pages 62 to 64.
92 CAMECOCORPORATION
Fuel services – conversion and fuel manufacturing
We control about 25% of world UF6 conversion capacity.
Port Hope conversion services
Port Hope is the only uranium conversion facility in Canada and the only commercial supplier of UO2 for Canadian-made Candu reactors.
Location | Ontario, Canada | |
Ownership | 100% | |
End product | UF6, UO2 | |
ISO certification | ISO 14001 certified | |
Licensed capacity | 12.5 million kgU as UF6 per year | |
| 2.8 million kgU as UO2 per year | ||
Estimated decommissioning cost | $101.7 million (pending regulatory approval) | |
Cameco Fuel Manufacturing Inc. (CFM)
CFM produces fuel bundles and reactor components for Candu reactors.
Location | Ontario, Canada | |
Ownership | 100% | |
End product | Candu fuel bundles and components | |
ISO certification | ISO 9001 certified, ISO 14001 certified | |
Licensed capacity | 1.2 million kgU as UO2as finished bundles | |
Estimated decommissioning cost | $19.5 million (pending regulatory approval) | |
Springfields Fuels Ltd. (SFL)
SFL is the newest conversion facility in the world. We contract almost all of its capacity through a toll-processing agreement to 2016.
Location | Lancashire, UK | |
Toll-processing agreement | annual conversion of 5 million kgU as UO3 to UF6 | |
Licensed capacity | 6.0 million kgU as UF6 per year | |
2011 MANAGEMENT’SDISCUSSIONANDANALYSIS 93
2011 update
Production
Fuel services produced 14.7 million kgU in 2011, slightly lower than our plan at the beginning of the year and 5% lower than 2010. In the third quarter, we reduced our production due to unfavourable market conditions for UF6 conversion.
Port Hope conversion facility cleanup and modernization (Vision 2010)
We submitted the draft environmental impact statement for review by the regulators in December 2010 and have continued work on the environmental assessment.
Community outreach
We continued to strengthen our community outreach program in Port Hope by:
| • | holding a series of community forums |
| • | making presentations to municipal council |
| • | reaching out using community newsletters, newspaper advertising, public displays, open houses and a website dedicated to the Port Hope community |
Public opinion research shows we have strong local support.
Springfields toll milling agreement
Based on the unfavourable market conditions for UF6 conversion, we have discontinued discussions to extend our toll conversion contract with SFL beyond 2016. We remain fully committed to the current contract. If market conditions improve over the next few years, we would consider resuming our discussions to extend the contract.
Planning for the future
Production
We have lowered our production target for 2012 to between 13 million and 14 million kgU due to the unfavourable market conditions for UF6 conversion.
Port Hope conversion facility cleanup and modernization (Vision 2010)
In 2012, we expect to continue with the environmental assessment process for this project.
Managing our risks
We manage the risks listed on pages 62 to 64.
94 CAMECOCORPORATION
Electricity
Bruce Power Limited Partnership (BPLP)
BPLP leases and operates four Candu nuclear reactors that have the capacity to provide about 18% of Ontario’s electricity.
Location | Ontario, Canada | |
Ownership | 31.6% | |
ISO certification | ISO 14001 certified | |
Expected reactor life | 2018 to 2021 | |
Term of lease | 2018 – right to extend for up to 25 years | |
Generation capacity | 3,260 MW | |
Background
We are the fuel procurement manager for BPLP’s four nuclear reactors and for Bruce A Limited Partnership’s (BALP) two operating reactors.
We provide 100% of BPLP’s uranium concentrates and have agreed to supply BALP with the majority of its future uranium concentrates. We also provide 100% of BPLP and BALP’s fuel manufacturing and UO2 requirements.
2011 update
Output
BPLP’s capacity factor was 87%.
Collective agreements
The collective agreements with the Power Workers’ Union and the Society of Energy Professionals expired in December 2010. BPLP reached an agreement with the Power Workers’ Union this year for a new contract that extends to 2013, and with the Society of Energy Professionals for a new contract that extends until 2014.
Planning for the future
Output
We expect the capacity factor to be 95% in 2012 and actual output to be about 9% higher than 2011.
Managing our risks
BPLP manages the unique risks associated with operating Candu reactors. The amount of electricity generated, and the cost of that generation, could vary materially from forecast if planned outages are significantly longer than planned, or there are many unplanned outages, either for maintenance, regulatory requirements, equipment malfunction or due to other causes.
BPLP also manages the risks listed on pages 62 to 64.
2011 MANAGEMENT’SDISCUSSIONANDANALYSIS 95
Mineral reserves and resources
Our mineral reserves and resources are the foundation of our company and fundamental to our success.
We have interests in a number of uranium properties. The tables in this section show our estimates of the proven and probable reserves, measured and indicated resources and inferred resources at those properties. However, only three of the properties listed in those tables are material uranium properties for us: McArthur River and Inkai, which are being mined, and Cigar Lake, which is being developed.
We estimate and disclose mineral reserves and resources in five categories, using the definitions adopted by the Canadian Institute of Mining, Metallurgy and Petroleum, and in accordance with CanadianNational Instrument 43-101 – Standards of Disclosure for Mineral Projects (NI 43-101), developed by the Canadian Securities Administrators. You can find out more about these categories at www.cim.org.
About mineral resources
Mineral resources do not have demonstrated economic viability, but have reasonable prospects for economic extraction. They fall into three categories: measured, indicated and inferred. Our reported mineral resources are exclusive of mineral reserves.
| • | Measured and indicated mineral resources can be estimated with a level of confidence sufficient to allow the appropriate application of technical and economic parameters to support evaluation of the economic viability of the deposit. |
| • | measured resources: we can confirm geological and grade continuity to support production planning. |
| • | indicated resources: we can reasonably assume geological and grade continuity to support mine planning. |
| • | inferred mineral resources are estimated using limited information. We do not have enough confidence to evaluate their economic viability in a meaningful way. You should not assume that all or any part of an inferred mineral resource will be upgraded to an indicated or measured mineral resource as a result of continued exploration. |
About mineral reserves
Mineral reserves are the economically mineable part of measured and indicated mineral resources demonstrated by at least a preliminary feasibility study. They fall into two categories:
| • | proven reserves: the economically mineable part of a measured resource for which a preliminary feasibility study demonstrates that economic extraction is justified |
| • | probable reserves: the economically mineable part of a measured and/or indicated resource for which a preliminary feasibility study demonstrates that economic extraction is justified |
We use current geological models, an average uranium price of $58.00 (US) per pound U3O8unless otherwise noted, and current or projected operating costs and mine plans to estimate our mineral reserves, allowing for dilution and mining losses. We apply our standard data verification process for every estimate.
We report mineral reserves as the quantity of contained ore supporting our mining plans, and include an estimate of the metallurgical recovery for each uranium property. Metallurgical recovery is an estimate of the amount of valuable product that can be physically recovered by the metallurgical extraction process, and is calculated by multiplying the quantity of contained metal (content) by the estimated metallurgical recovery percentage. Our share of uranium in the mineral reserves table on page 99 is before accounting for estimated metallurgical recovery.
Changes this year
Our share of proven and probable mineral reserves went from 476 million pounds U3O8 at the end of 2010 to 435 million pounds at the end of 2011. The change was mostly the result of:
| • | mining and milling activities, which used 23.4 million pounds |
| • | conversion of probable mineral reserves to proven from additional drilling results and/or refinements to the mining and freezing plans at McArthur River and Cigar Lake |
96 CAMECOCORPORATION
| • | conversion of mineral reserves to mineral resources for portions of Gas Hills-Peach and North Butte-Brown Ranch where it was recognized that the project risks and economic assessments could be improved by modelling individual roll-fronts instead of combining them as one mineralized unit |
| • | At Inkai, a requirement to produce equal amounts from blocks 1 and 2 resulted in an update of the life-of-mine production schedule and conversion of pounds from reserves to resources |
Measured and indicated mineral resources increased from 142 million pounds U3O8 at the end of 2010 to 254 million pounds at the end of 2011. The change was mostly the result of:
| • | first time reporting of mineral resources at Kintyre |
| • | conversion of inferred mineral resources to indicated resources at McArthur River |
| • | conversion of mineral reserves to mineral resources at Gas Hills-Peach and Inkai |
At the end of 2011, our share of inferred mineral resources was 318 million pounds U3O8 — a net decrease of 39 million pounds, which were mostly upgraded to the indicated resource category at McArthur River zone B and Cigar Lake.
Qualified persons
The technical and scientific information discussed in this MD&A, including mineral reserve and resource estimates, for our material properties (McArthur River/Key Lake, Inkai and Cigar Lake) were approved by the following individuals who are qualified persons for the purposes of NI 43-101:
McArthur River/Key Lake
| • | Alain G. Mainville, director, mineral resources management, Cameco |
| • | David Bronkhorst, vice-president, Saskatchewan mining south, Cameco |
| • | Greg Murdock, technical superintendent, McArthur River, Cameco |
| • | Les Yesnik, general manager, Key Lake, Cameco |
Cigar Lake
| • | Alain G. Mainville, director, mineral resources management, Cameco |
| • | Eric Paulsen, interim chief metallurgist, technology & innovation, Cameco |
| • | Grant Goddard, vice-president, Saskatchewan mining north, Cameco |
| • | Scott Bishop, principal mine engineer, technology & innovation, Cameco |
Inkai
| • | Alain G. Mainville, director, mineral resources management, Cameco |
| • | Dave Neuburger, vice-president, international mining, Cameco |
| • | Lawrence Reimann, manager, technical services, Cameco Resources |
Important information about mineral reserve and resource estimates
Although we have carefully prepared and verified the mineral reserve and resource figures in this document, the figures are estimates, based in part on forward-looking information.
Estimates are based on our knowledge, mining experience, analysis of drilling results, the quality of available data and management’s best judgment. They are, however, imprecise by nature, may change over time, and include many variables and assumptions including:
| • | geological interpretation |
| • | extraction plans |
| • | commodity prices and currency exchange rates |
| • | recovery rates |
| • | operating and capital costs |
There is no assurance that the indicated levels of uranium will be produced, and we may have to re-estimate our mineral reserves based on actual production experience. Changes in the price of uranium, production costs or recovery rates could make it unprofitable for us to operate or develop a particular site or sites for a period of time. See page 2 for information about forward-looking information.
2011 MANAGEMENT’SDISCUSSIONANDANALYSIS 97
Please see our mineral reserves and resources section of our annual information form for the specific assumptions, parameters and methods used for McArthur River, Inkai and Cigar Lake mineral reserve and resource estimates.
Important information for US investors
While the terms measured, indicated and inferred mineral resources are recognized and required by Canadian securities regulatory authorities, the US Securities and Exchange Commission (SEC) does not recognize them. Under US standards, mineralization may not be classified as a ‘reserve’ unless it has been determined at the time of reporting that the mineralization could be economically and legally produced or extracted. US investors should not assume that:
| • | any or all of a measured or indicated mineral resource will ever be converted into proven or probable mineral reserves |
| • | any or all of an inferred mineral resource exists or is economically or legally mineable, or will ever be upgraded to a higher category. Under Canadian securities regulations, estimates of inferred resources may not form the basis of feasibility or prefeasibility studies. Inferred resources have a great amount of uncertainty as to their existence and economic and legal feasibility. |
The requirements of Canadian securities regulators for identification of ‘reserves’ are also not the same as those of the SEC, and mineral reserves reported by us in accordance with Canadian requirements may not qualify as reserves under SEC standards.
Other information concerning descriptions of mineralization, mineral reserves and resources may not be comparable to information made public by companies that comply with the SEC’s reporting and disclosure requirements for US domestic mining companies, including Industry Guide 7.
98 CAMECOCORPORATION
Mineral reserves
As at December 31, 2011 (100% basis – only the second last column shows Cameco’s share)
Proven and probable (tonnes in thousands; pounds in millions)
| Proven | Probable | Total mineral reserves | ||||||||||||||||||||||||||||||||||||||||||||
Property | Mining method | Tonnes | Grade %U3O8 | Content (lbs U3O8) | Tonnes | Grade %U3O8 | Content (lbs U3O8) | Tonnes | Grade %U3O8 | Content (lbs U3O8) | Cameco’s share of content (lbs U3O8) | Estimated metallurgical recovery (%) | ||||||||||||||||||||||||||||||||||
McArthur River | underground | 457.5 | 22.07 | 222.6 | 412.7 | 11.14 | 101.4 | 870.2 | 16.89 | 324.0 | 226.2 | 98.7 | ||||||||||||||||||||||||||||||||||
Cigar Lake | underground | 233.6 | 22.31 | 114.9 | 303.5 | 15.22 | 101.8 | 537.1 | 18.30 | 216.7 | 108.4 | 98.5 | ||||||||||||||||||||||||||||||||||
Rabbit Lake | underground | 91.0 | 0.52 | 1.0 | 1,399.9 | 0.75 | 23.0 | 1,490.9 | 0.73 | 24.0 | 24.0 | 96.7 | ||||||||||||||||||||||||||||||||||
Key Lake | open pit | 61.9 | 0.52 | 0.7 | 61.9 | 0.52 | 0.7 | 0.6 | 98.7 | |||||||||||||||||||||||||||||||||||||
Inkai | ISR | 3,772.4 | 0.08 | 6.9 | 63,692.4 | 0.07 | 92.6 | 67,464.8 | 0.07 | 99.5 | 59.7 | 85.0 | ||||||||||||||||||||||||||||||||||
Gas Hills-Peach | ISR | 999.2 | 0.11 | 2.4 | 999.2 | 0.11 | 2.4 | 2.4 | 72.0 | |||||||||||||||||||||||||||||||||||||
North Butte-Brown Ranch | ISR | 1,839.3 | 0.09 | 3.7 | 1,839.3 | 0.09 | 3.7 | 3.7 | 80.0 | |||||||||||||||||||||||||||||||||||||
Smith Ranch-Highland | ISR | 1,124.7 | 0.11 | 2.7 | 2,263.4 | 0.08 | 3.9 | 3,388.1 | 0.09 | 6.6 | 6.6 | 80.0 | ||||||||||||||||||||||||||||||||||
Crow Butte | ISR | 1,282.6 | 0.13 | 3.7 | 1,282.6 | 0.13 | 3.7 | 3.7 | 85.0 | |||||||||||||||||||||||||||||||||||||
|
|
|
|
|
|
|
|
|
|
|
|
|
|
|
|
|
|
|
| |||||||||||||||||||||||||||
Total | 7,023.7 | — | 352.5 | 70,910.4 | — | 328.8 | 77,934.1 | — | 681.3 | 435.3 | ||||||||||||||||||||||||||||||||||||
|
|
|
|
|
|
|
|
|
|
|
|
|
|
|
|
|
|
|
| |||||||||||||||||||||||||||
Notes
ISR –in situ recovery
Estimates in the table above:
| • | use an average uranium price of $58.00 (US)/lb U3O8except for Cigar Lake which uses an average uranium price of $61.00 (US)/lb U3O8 |
| • | are based on an average exchange rate of $1.00 US=$1.02 Cdn, except Cigar Lake, which is based on an average exchange rate of $1.00 US=$1.10 Cdn |
Totals may not add up due to rounding.
Except for the possible Inkai permitting issue referred to below, we do not expect these mineral reserve estimates to be materially affected by metallurgical, environmental, permitting, legal, taxation, socio-economic, political, marketing or other relevant issues.
Metallurgical recovery
We report mineral reserves as the quantity of contained ore supporting our mining plans, and include an estimate of the metallurgical recovery for each uranium property. Metallurgical recovery is an estimate of the amount of valuable product that can be physically recovered by the metallurgical extraction process, and is calculated by multiplying the quantity of contained metal (content) by the estimated metallurgical recovery percentage. Our share of uranium in the mineral reserves table above is before accounting for estimated metallurgical recovery.
Estimates for Inkai
Our 2012 and future annual production targets and mineral estimate for Inkai assume, and we expect:
| • | Inkai will obtain the necessary government permits and approvals to produce at an annual rate of 5.2 million pounds (100% basis), including an amendment to the resource use contract |
| • | we reach a binding agreement with Kazatomprom to finalize the terms of the MOA |
| • | Inkai will ramp up production to an annual rate of 5.2 million pounds (100% basis) |
There is no certainty Inkai will receive these permits or approvals or we will reach a binding agreement with Kazatomprom or that Inkai will be able to ramp up production. If Inkai does not, or if the permits and approvals are delayed, Inkai may be unable to achieve its 2012 and future annual production targets and we may have to recatagorize some of Inkai’s reserves as resources.
2011 MANAGEMENT’SDISCUSSIONANDANALYSIS 99
Mineral resources
As at December 31, 2011 (100% – only the last column shows Cameco’s share)
Measured and indicated (tonnes in thousands; pounds in millions)
| Measured | Indicated | Total measured and indicated | ||||||||||||||||||||||||||||||||||||||||
Property | Mining | Tonnes | Grade % U3O8 | Content (lbs U3O8) | Tonnes | Grade % U3O8 | Content (lbs U3O8) | Tonnes | Grade % U3O8 | Content (lbs U3O8) | Cameco’s share (lbs U3O8) | |||||||||||||||||||||||||||||||
McArthur River | underground | 73.7 | 5.58 | 9.1 | 114.4 | 25.40 | 64.0 | 188.1 | 17.63 | 73.1 | 51.0 | |||||||||||||||||||||||||||||||
Cigar Lake | underground | 18.9 | 1.68 | 0.7 | 25.5 | 2.71 | 1.5 | 44.4 | 2.25 | 2.2 | 1.1 | |||||||||||||||||||||||||||||||
Kintyre | open pit | 4,315.4 | 0.58 | 55.2 | 4,315.4 | 0.58 | 55.2 | 38.7 | ||||||||||||||||||||||||||||||||||
Rabbit Lake | underground | 362.4 | 0.53 | 4.3 | 362.4 | 0.53 | 4.3 | 4.3 | ||||||||||||||||||||||||||||||||||
Dawn Lake | open pit, underground | 347.0 | 1.69 | 12.9 | 347.0 | 1.69 | 12.9 | 7.4 | ||||||||||||||||||||||||||||||||||
Millennium | underground | 507.8 | 4.55 | 50.9 | 507.8 | 4.55 | 50.9 | 21.4 | ||||||||||||||||||||||||||||||||||
Phoenix | underground | 89.9 | 17.98 | 35.6 | 89.9 | 17.98 | 35.6 | 10.7 | ||||||||||||||||||||||||||||||||||
Tamarack | underground | 183.8 | 4.42 | 17.9 | 183.8 | 4.42 | 17.9 | 10.3 | ||||||||||||||||||||||||||||||||||
Inkai | ISR | 28,613.1 | 0.08 | 48.0 | 28,613.1 | 0.08 | 48.0 | 28.8 | ||||||||||||||||||||||||||||||||||
Gas Hills-Peach | ISR | 1,964.2 | 0.08 | 3.4 | 7,821.9 | 0.11 | 18.8 | 9,786.1 | 0.10 | 22.2 | 22.2 | |||||||||||||||||||||||||||||||
North Butte-Brown Ranch | ISR | 7,248.9 | 0.08 | 12.3 | 7,248.9 | 0.08 | 12.3 | 12.3 | ||||||||||||||||||||||||||||||||||
Smith Ranch-Highland | ISR | 2,158.3 | 0.11 | 5.1 | 14,778.0 | 0.06 | 18.6 | 16,936.3 | 0.06 | 23.7 | 23.7 | |||||||||||||||||||||||||||||||
Crow Butte | ISR | 2,592.2 | 0.21 | 11.9 | 2,592.2 | 0.21 | 11.9 | 11.9 | ||||||||||||||||||||||||||||||||||
Ruby Ranch | ISR | 2,215.3 | 0.08 | 4.1 | 2,215.3 | 0.08 | 4.1 | 4.1 | ||||||||||||||||||||||||||||||||||
Ruth | ISR | 1,080.5 | 0.09 | 2.1 | 1,080.5 | 0.09 | 2.1 | 2.1 | ||||||||||||||||||||||||||||||||||
Shirley Basin | ISR | 89.2 | 0.16 | 0.3 | 1,638.2 | 0.11 | 4.1 | 1,727.4 | 0.12 | 4.4 | 4.4 | |||||||||||||||||||||||||||||||
|
|
|
|
|
|
|
|
|
|
|
|
|
|
|
|
|
|
|
| |||||||||||||||||||||||
Total | 4,304.3 | — | 18.6 | 71,934.3 | — | 362.2 | 76,238.6 | — | 380.8 | 254.4 | ||||||||||||||||||||||||||||||||
|
|
|
|
|
|
|
|
|
|
|
|
|
|
|
|
|
|
|
| |||||||||||||||||||||||
Inferred (tonnes in thousands; pounds in millions)
Property | Mining method | Tonnes | Grade % U3O8 | Content (lbs U3O8) | Cameco’s share (lbs U3O8) | |||||||||||||
McArthur River | underground | 405.2 | 9.67 | 86.4 | 60.3 | |||||||||||||
Cigar Lake | underground | 448.0 | 12.59 | 124.4 | 62.2 | |||||||||||||
Kintyre | open pit | 950.2 | 0.46 | 9.6 | 6.7 | |||||||||||||
Rabbit Lake | underground | 331.9 | 1.42 | 10.4 | 10.4 | |||||||||||||
Millennium | underground | 297.8 | 2.54 | 16.7 | 7.0 | |||||||||||||
Phoenix | underground | 23.8 | 7.27 | 3.8 | 1.1 | |||||||||||||
Tamarack | underground | 45.6 | 1.02 | 1.0 | 0.6 | |||||||||||||
Inkai | ISR | 254,696.0 | 0.05 | 255.1 | 153.0 | |||||||||||||
Gas Hills-Peach | ISR | 861.5 | 0.07 | 1.3 | 1.3 | |||||||||||||
North Butte-Brown Ranch | ISR | 594.3 | 0.06 | 0.8 | 0.8 | |||||||||||||
Smith Ranch-Highland | ISR | 6,404.0 | 0.05 | 6.6 | 6.6 | |||||||||||||
Crow Butte | ISR | 2,282.2 | 0.12 | 6.0 | 6.0 | |||||||||||||
Ruby Ranch | ISR | 56.2 | 0.14 | 0.2 | 0.2 | |||||||||||||
Ruth | ISR | 210.9 | 0.08 | 0.4 | 0.4 | |||||||||||||
Shirley Basin | ISR | 508.0 | 0.10 | 1.1 | 1.1 | |||||||||||||
|
|
|
|
|
|
|
| |||||||||||
Total | 268,115.6 | — | 523.8 | 317.7 | ||||||||||||||
|
|
|
|
|
|
|
| |||||||||||
Notes
ISR –in situ recovery
Mineral resources do not include amounts that have been identified as mineral reserves.
Mineral resources do not have demonstrated economic viability. Totals may not add up due to rounding.
100 CAMECOCORPORATION
Additional information
Related party transactions
We buy significant amounts of goods and services for our Saskatchewan mining operations from northern Saskatchewan suppliers to support economic development in the region. One of these suppliers is Points Athabasca Contracting Ltd. (PACL). In 2011, we paid PACL $63 million for construction and contracting services (2010 – $38 million). These transactions were carried out in the normal course of business. A member of Cameco’s board of directors is the president of PACL.
Critical accounting estimates
Because of the nature of our business, we are required to make estimates that affect the amount of assets and liabilities, revenues and expenses, commitments and contingencies we report.
We base our estimates on our experience, our best judgment, guidelines established by the Canadian Institute of Mining, Metallurgy and Petroleum and on assumptions we believe are reasonable. We believe the following critical accounting estimates reflect the more significant judgments used in the preparation of our financial statements.
Decommissioning and reclamation
We are required to estimate the cost of decommissioning and reclamation for each operation, but we normally do not incur these costs until an asset is nearing the end of its useful life. Regulatory requirements and decommissioning methods could change during that time, making our actual costs different from our estimates. A significant change in these costs or in our mineral reserves could have a material impact on our net earnings and financial position.
Property, plant and equipment
We depreciate property, plant and equipment primarily using the unit of production method, where the carrying value is reduced as resources are depleted. A change in our mineral reserves would change our depreciation expenses, and such a change could have a material impact on amounts charged to earnings.
We assess the carrying values of property, plant and equipment and goodwill every year, or more often if necessary. If we determine that we cannot recover the carrying value of an asset or goodwill, we write off the unrecoverable amount against current earnings. We base our assessment of recoverability on assumptions and judgments we make about future prices, production costs, our requirements for sustaining capital and our ability to economically recover mineral reserves. A material change in any of these assumptions could have a significant impact on the potential impairment of these assets.
Taxes
When we are preparing our financial statements, we estimate taxes in each jurisdiction we operate in, taking into consideration different tax rates, non-deductible expenses, valuation of deferred tax assets, changes in tax laws and our expectations for future results.
We base our estimates of deferred income taxes on temporary differences between the assets and liabilities we report in our financial statements, and the assets and liabilities determined by the tax laws in the various countries we operate in. We record deferred income taxes in our financial statements based on our estimated future cash flows, which includes estimates of non-deductible expenses. If these estimates are not accurate, there could be a material impact on our net earnings and financial position.
2011 MANAGEMENT’SDISCUSSIONANDANALYSIS 101
Controls and procedures
We have evaluated the effectiveness of our disclosure controls and procedures and internal control over financial reporting as of December 31, 2011, as required by the rules of the US Securities and Exchange Commission and the Canadian Securities Administrators.
Management, including our CEO and our CFO, supervised and participated in the evaluation, and concluded that our disclosure controls and procedures are effective to provide a reasonable level of assurance that the information we are required to disclose in reports we file or submit under securities laws is recorded, processed, summarized and reported accurately, and within the time periods specified. It should be noted that while the CEO and CFO believe that our disclosure controls and procedures provide a reasonable level of assurance that they are effective, they do not expect the disclosure controls and procedures or internal control over financial reporting to be capable of preventing all errors and fraud. A control system, no matter how well conceived or operated, can provide only reasonable, not absolute, assurance that the objectives of the control system are met.
Management, including our CEO and our CFO, is responsible for establishing and maintaining internal control over financial reporting and conducted an evaluation of the effectiveness of our internal control over financial reporting based on theInternal Control — Integrated Framework issued by the Committee of Sponsoring Organizations of the Treadway Commission. Based on this evaluation, management concluded that our internal control over financial reporting was effective as of December 31, 2011. We have not made any change to our internal control over financial reporting during the 2011 fiscal year that has materially affected, or is reasonably likely to materially affect, our internal control over financial reporting.
New accounting pronouncements
Financial instruments
In October 2010, the International Accounting Standards Board (“IASB”) issued IFRS 9,Financial Instruments(“IFRS 9”). This standard is effective for periods beginning on or after January 1, 2015 and is part of a wider project to replace IAS 39,Financial Instruments: Recognition and Measurement. IFRS 9 replaces the current multiple classification and measurement models for financial assets and liabilities with a single model that has only two classification categories: amortized cost and fair value. The basis of classification depends on the entity’s business model and the contractual cash flow characteristics of the financial asset or liability. The guidance in IAS 39 on impairment of financial assets and hedge accounting continues to apply. We are assessing the impact of this new standard on our financial statements.
Consolidated financial statements
In May 2011, the IASB issued IFRS 10,Consolidated Financial Statements(“IFRS 10”). This standard is effective for periods beginning on or after January 1, 2013 and establishes principles for the presentation and preparation of consolidated financial statements when an entity controls one or more other entities. IFRS 10 defines the principle of control and establishes control as the basis for determining which entities are consolidated in the consolidated financial statements. We are assessing the impact of this new standard on our financial statements.
Joint arrangements
In May 2011, the IASB issued IFRS 11,Joint Arrangements (“IFRS 11”). This standard is effective for periods beginning on or after January 1, 2013 and establishes principles for financial reporting by parties to a joint arrangement. IFRS 11 requires a party to assess the rights and obligations arising from an arrangement in determining whether an arrangement is either a joint venture or a joint operation. Joint ventures are to be accounted for using the equity method while joint operations will continue to be accounted for using proportionate consolidation. We are assessing the impact of this new standard on our financial statements.
102 CAMECOCORPORATION
Disclosure of interests in other entities
In May 2011, the IASB issued IFRS 12,Disclosure of Interests in Other Entities (“IFRS 12”). This standard is effective for periods beginning on or after January 1, 2013 and applies to entities that have an interest in a subsidiary, a joint arrangement, an associate or an unconsolidated structured entity. IFRS 12 integrates and makes consistent the disclosure requirements for a reporting entity’s interest in other entities and presents those requirements in a single standard. We are assessing the impact of this new standard on our financial statements.
Fair value measurement
In May 2011, the IASB issued IFRS 13,Fair Value Measurement (“IFRS 13”). This standard is effective for periods beginning on or after January 1, 2013 and provides additional guidance where IFRS requires fair value to be used. IFRS 13 defines fair value, sets out in a single standard a framework for measuring fair value and establishes the required disclosures about fair value measurements. We are assessing the impact of this new standard on our financial statements.
Employee benefits
In June 2011, the IASB issued an amended version of IAS 19,Employee Benefits (“IAS 19”). This amendment is effective for periods beginning on or after January 1, 2013 and eliminates the ‘corridor method’ of accounting for defined benefit plans. Revised IAS 19 also streamlines the presentation of changes in assets and liabilities arising from defined benefit plans, and enhances the disclosure requirements for defined benefit plans. We are assessing the impact of this revised standard on our financial statements.
Presentation of other comprehensive income (OCI)
In June 2011, the IASB issued an amended version of IAS 1,Presentation of Financial Statements (“IAS 1”). This amendment is effective for periods beginning on or after January 1, 2012 and requires companies preparing financial statements in accordance with IFRS to group together items within OCI that may be reclassified to the profit or loss section of the statement of earnings. Revised IAS 1 also reaffirms existing requirements that items in OCI and profit or loss should be presented as either a single statement or two consecutive statements. We are assessing the impact of this revised standard on our financial statements.
2011 MANAGEMENT’SDISCUSSIONANDANALYSIS 103