Exhibit 99.2

Management’s discussion and analysis
for the quarter ended September 30, 2013
| | | | |
THIRD QUARTER UPDATE | | | 4 | |
CONSOLIDATED FINANCIAL RESULTS | | | 8 | |
OUTLOOK FOR 2013 | | | 12 | |
LIQUIDITY AND CAPITAL RESOURCES | | | 13 | |
FINANCIAL RESULTS BY SEGMENT | | | | |
URANIUM | | | 15 | |
FUEL SERVICES | | | 18 | |
NUKEM | | | 19 | |
ELECTRICITY | | | 21 | |
OUR OPERATIONS AND DEVELOPMENT PROJECT | | | 23 | |
URANIUM 2013 Q3 UPDATES | | | 25 | |
FUEL SERVICES 2013 Q3 UPDATES | | | 26 | |
QUALIFIED PERSONS | | | 27 | |
ADDITIONAL INFORMATION | | | 27 | |
This management’s discussion and analysis (MD&A) includes information that will help you understand management’s perspective of our unaudited condensed consolidated interim financial statements and notes for the quarter ended September 30, 2013 (interim financial statements). The information is based on what we knew as of October 29, 2013 and updates our first quarter, second quarter and annual MD&A included in our 2012 annual report.
As you review this MD&A, we encourage you to read our interim financial statements as well as our audited consolidated financial statements and notes for the year ended December 31, 2012 and annual MD&A. You can find more information about Cameco, including our audited consolidated financial statements and our most recent annual information form, on our website at cameco.com, on SEDAR at sedar.com or on EDGAR at sec.gov. You should also read our annual information form before making an investment decision about our securities.
The financial information in this MD&A and in our financial statements and notes are prepared according to International Financial Reporting Standards (IFRS), unless otherwise indicated.
Unless we have specified otherwise, all dollar amounts are in Canadian dollars.
Throughout this document, the terms we, us, our and Cameco mean Cameco Corporation and its subsidiaries, including NUKEM Energy Gmbh (NUKEM), unless otherwise indicated.
Caution about forward-looking information
Our MD&A includes statements and information about our expectations for the future. When we discuss our strategy, plans, future financial and operating performance, or other things that have not yet taken place, we are making statements considered to beforward-looking information orforward-looking statements under Canadian and United States securities laws. We refer to them in this MD&A asforward-looking information.
Key things to understand about the forward-looking information in this MD&A:
| | • | | It typically includes words and phrases about the future, such as: anticipate, believe, estimate, expect, plan, will, intend, goal, target, forecast, project, strategy and outlook (see examples below). |
| | • | | It represents our current views, and can change significantly. |
| | • | | It is based on a number ofmaterial assumptions, including those we have listed on page 3, which may prove to be incorrect. |
| | • | | Actual results and events may be significantly different from what we currently expect, due to the risks associated with our business. We list a number of thesematerial risks on pages 2 and 3. We recommend you also review our annual information form and our annual, first and second quarter MD&A, which include a discussion of othermaterial risks that could cause actual results to differ significantly from our current expectations. |
| | • | | Forward-looking information is designed to help you understand management’s current views of our near and longer term prospects, and it may not be appropriate for other purposes. We will not necessarily update this information unless we are required to by securities laws. |
Examples of forward-looking information in this MD&A
| | • | | the discussion under the headingOur strategy |
| | • | | our expectations about 2013 and future global uranium supply and demand, including the discussion under the headingUranium market update |
| | • | | the outlook for each of our operating segments for 2013 and our consolidated outlook for the year |
| | • | | our expectation that existing cash balances and operating cash flows will meet our anticipated 2013 capital requirements without the need for any significant additional funding |
| | • | | our estimate of the amount and timing of expected cash taxes payable to the Canada Revenue Agency (CRA) |
| | • | | our expectation that our operating and investment activities in 2013 will not be constrained by the financial covenants in our unsecured revolving credit facility |
| | • | | our uranium price sensitivity analysis |
| | • | | forecast production at our uranium operations from 2013 to 2017 and our plan to achieve annual supply of 36 million pounds by 2018 |
| | • | | our future plans for each of our uranium operating properties and development project |
| | • | | our expectation that we will begin mining in the first quarter of 2014 at Cigar Lake with AREVA’s McClean Lake mill processing the first ore at the end of the second quarter of 2014 |
Material risks
| | • | | actual sales volumes or market prices for any of our products or services are lower than we expect for any reason, including changes in market prices or loss of market share to a competitor |
| | • | | we are adversely affected by changes in foreign currency exchange rates, interest rates or tax rates, or we are unsuccessful in our dispute with the CRA |
| | • | | our production costs are higher than planned, or necessary supplies are not available, or not available on commercially reasonable terms |
| | • | | our estimates of production, purchases, costs, decommissioning or reclamation expenses, or our tax expense estimates, prove to be inaccurate |
| | • | | we are unable to enforce our legal rights under our existing agreements, permits or licences, or are subject to litigation or arbitration that has an adverse outcome |
| | • | | there are defects in, or challenges to, title to our properties |
| | • | | our mineral reserve and resource estimates are not reliable, or we face unexpected or challenging geological, hydrological or mining conditions |
| | • | | we are affected by environmental, safety and regulatory risks, including increased regulatory burdens or delays |
| | • | | we cannot obtain or maintain necessary permits or approvals from government authorities |
| | • | | we are affected by political risks in a developing country where we operate |
| | • | | we are affected by terrorism, sabotage, blockades, civil unrest, social or political activism, accident or a deterioration in political support for, or demand for, nuclear energy |
| | • | | we are impacted by changes in the regulation or public perception of the safety of nuclear power plants, which adversely affect the construction of new plants, the relicensing of existing plants and the demand for uranium |
| | • | | there are changes to government regulations or policies that adversely affect us, including tax and trade laws and policies |
| | • | | our uranium and conversion suppliers fail to fulfill delivery commitments |
2 CAMECO CORPORATION
| | • | | our Cigar Lake development, mining or production plans are delayed or do not succeed, including as a result of any difficulties encountered with the jet boring mining method, processing of the ore, or our inability to acquire any of the required jet boring equipment |
| | • | | our McArthur River development, mining or production plans are delayed or do not succeed |
| | • | | we are affected by natural phenomena, including inclement weather, fire, flood and earthquakes |
| | • | | our operations are disrupted due to problems with our own or our customers’ facilities, the unavailability of reagents, equipment, operating parts and supplies critical to production, equipment failure, lack of tailings capacity, |
| | | labour shortages, labour relations issues (including an inability to renew agreements with unionized employees at McArthur River and Key Lake), strikes or lockouts, underground floods, caveins, ground movements, tailings dam failures, transportation disruptions or accidents, or other development and operating risks |
| | • | | NUKEM’s actual uranium sales volume, cash flows and revenue in 2013 are lower than expected due to losses in connection with spot market purchases, counterparty default on payment or other obligations, counterparty insolvency or other risks |
| | • | | departure of key personnel at NUKEM could have an adverse effect on continuing operations |
Material assumptions
| | • | | our expectations regarding sales and purchase volumes and prices for uranium, fuel services and electricity |
| | • | | our expectations regarding the demand for uranium, the construction of new nuclear power plants and the relicensing of existing nuclear power plants not being more adversely affected than expected by changes in regulation or in the public perception of the safety of nuclear power plants |
| | • | | our expected production level and production costs |
| | • | | our expectations regarding spot prices and realized prices for uranium, and other factors discussed on page 17,Price sensitivity analysis: uranium |
| | • | | our expectations regarding tax rates and payments, the outcome of the dispute with the CRA, foreign currency exchange rates and interest rates |
| | • | | our decommissioning and reclamation expenses |
| | • | | our mineral reserve and resource estimates, and the assumptions upon which they are based, are reliable |
| | • | | the geological, hydrological and other conditions at our mines |
| | • | | our Cigar Lake development, mining and production plans are successful, including success with the jet boring mining method and processing of the ore, and that we will be able to obtain the additional jet boring systems we require on schedule |
| | • | | the success of our McArthur River development, mining and production plans |
| | • | | our ability to continue to supply our products and services in the expected quantities and at the expected times |
| | • | | our ability to comply with current and future environmental, safety and other regulatory requirements, and to obtain and maintain required regulatory approvals |
| | • | | our operations are not significantly disrupted as a result of political instability, nationalization, terrorism, sabotage, blockades, civil unrest, breakdown, natural disasters, governmental or political actions, litigation or arbitration proceedings, the unavailability of reagents, equipment, operating parts and supplies critical to production, labour shortages, labour relations issues (including an inability to renew agreements with unionized employees at McArthur River and Key Lake), strikes or lockouts, underground floods, caveins, ground movements, tailings dam failure, lack of tailings capacity, transportation disruptions or accidents or other development or operating risks |
| | • | | NUKEM’s actual uranium sales volume, cash flows and revenue in 2013 will be consistent with our expectations |
| | • | | key personnel will remain with NUKEM |
2013 THIRD QUARTER REPORT 3
Our strategy
Our strategy is to profitably increase annual uranium supply to 36 million pounds by 2018, subject to market conditions, and to invest in opportunities across the nuclear fuel cycle that we expect will complement and enhance our business. Lead-times in our industry are long, so we are preparing our assets today to make sure we can be among the first to respond when the market signals new production is needed.
However, we are also committed to enhancing our near-term financial returns and continuing to create shareholder value. In the context of current market uncertainty, we have made some modifications to our operating and development plans to ensure we remain a low cost producer and profitably grow the company.
You can read more about our strategy in our 2012 annual MD&A.
Third quarter update
Our performance
Effective January 1, 2013, IFRS 11 – Joint Arrangements requires that we account for our interest in Bruce Power Limited Partnership (BPLP) using equity accounting. Our quarterly results for 2012 throughout this MD&A have been restated for comparative purposes. SeeNew standards and interpretations on page 28 for more information.
| | | | | | | | | | | | | | | | | | | | | | | | |
| HIGHLIGHTS | | THREE MONTHS
ENDED
SEPTEMBER 30 | | | | | | NINE MONTHS
ENDED
SEPTEMBER 30 | | | | |
($ MILLIONS EXCEPT WHERE INDICATED) | | 2013 | | | 2012 | | | CHANGE | | | 2013 | | | 2012 | | | CHANGE | |
Revenue | | | 597 | | | | 296 | | | | 102 | % | | | 1,461 | | | | 1,044 | | | | 40 | % |
Gross profit | | | 228 | | | | 85 | | | | 168 | % | | | 422 | | | | 285 | | | | 48 | % |
Net earnings attributable to equity holders | | | 211 | | | | 79 | | | | 167 | % | | | 254 | | | | 212 | | | | 20 | % |
$ per common share (diluted) | | | 0.53 | | | | 0.20 | | | | 165 | % | | | 0.64 | | | | 0.54 | | | | 19 | % |
Adjusted net earnings (non-IFRS, see page 8) | | | 208 | | | | 49 | | | | 324 | % | | | 295 | | | | 200 | | | | 48 | % |
$ per common share (adjusted and diluted) | | | 0.53 | | | | 0.12 | | | | 342 | % | | | 0.75 | | | | 0.51 | | | | 47 | % |
Cash provided by operations
(after working capital changes) | | | 136 | | | | 36 | | | | 278 | % | | | 368 | | | | 293 | | | | 26 | % |
THIRD QUARTER
Net earnings attributable to equity holders (net earnings) this quarter were $211 million ($0.53 per share diluted) compared to $79 million ($0.20 per share diluted) in the third quarter of 2012. Net earnings were affected by the items noted below.
On an adjusted basis, our earnings this quarter were $208 million ($0.53 per share diluted) compared to $49 million ($0.12 per share diluted) (non-IFRS measure, see page 8) in the third quarter of 2012, mainly due to:
| | • | | higher earnings from our uranium business based on increased sales volumes and higher realized prices related to our contract portfolio and a weaker Canadian dollar |
| | • | | lower exploration expenditures |
| | • | | partially offset by a higher income tax expense |
SeeFinancial results by segment on page 15 for more detailed discussion.
FIRST NINE MONTHS
Net earnings in the first nine months of the year were $254 million ($0.64 per share diluted) compared to $212 million ($0.54 per share diluted) in the first nine months of 2012. Net earnings were affected by the items noted below, partially offset by mark-to-market losses on foreign exchange derivatives.
4 CAMECO CORPORATION
On an adjusted basis, our earnings for the first nine months of this year were $295 million ($0.75 per share diluted) compared to $200 million ($0.51 per share diluted) (non-IFRS measure, see page 8) for the first nine months of 2012, mainly due to:
| | • | | higher earnings from our uranium and fuel services segments based on higher realized prices and increased sales volumes |
| | • | | lower exploration expenses |
| | • | | partially offset by lower earnings in the electricity business as a result of lower generation and higher operating costs |
SeeFinancial results by segment on page 15 for more detailed discussion.
Operations update
| | | | | | | | | | | | | | | | | | | | | | | | | | | | |
| | | | | | | THREE MONTHS
ENDED
SEPTEMBER 30 | | | CHANGE | | | NINE MONTHS
ENDED
SEPTEMBER 30 | | | CHANGE | |
HIGHLIGHTS | | | | | | 2013 | | | 2012 | | | | 2013 | | | 2012 | | |
Uranium | | Production volume (million lbs) | | | 5.8 | | | | 5.3 | | | | 9 | % | | | 16.2 | | | | 15.4 | | | | 5 | % |
| | Sales volume (million lbs) | | | 8.5 | | | | 5.2 | | | | 63 | % | | | 20.1 | | | | 18.4 | | | | 9 | % |
| | Average realized price | | ($US/lb) | | | 50.73 | | | | 45.26 | | | | 12 | % | | | 48.72 | | | | 45.95 | | | | 6 | % |
| | | | ($Cdn/lb) | | | 52.59 | | | | 45.77 | | | | 15 | % | | | 49.81 | | | | 46.41 | | | | 7 | % |
| | Revenue ($ millions) | | | 449 | | | | 238 | | | | 89 | % | | | 1,001 | | | | 855 | | | | 17 | % |
| | Gross profit ($ millions) | | | 226 | | | | 88 | | | | 157 | % | | | 400 | | | | 275 | | | | 45 | % |
Fuel services | | Production volume (million kgU) | | | 2.6 | | | | 2.1 | | | | 24 | % | | | 12.2 | | | | 10.9 | | | | 12 | % |
| | Sales volume (million kgU) | | | 3.8 | | | | 3.3 | | | | 15 | % | | | 11.1 | | | | 10.4 | | | | 7 | % |
| | Average realized price ($Cdn/kgU) | | | 20.03 | | | | 17.35 | | | | 15 | % | | | 18.63 | | | | 18.08 | | | | 3 | % |
| | Revenue ($ millions) | | | 77 | | | | 58 | | | | 33 | % | | | 208 | | | | 188 | | | | 11 | % |
| | Gross profit ($ millions) | | | 13 | | | | 2 | | | | 550 | % | | | 34 | | | | 22 | | | | 55 | % |
NUKEM1 | | Sales volume U3O8(million lbs) | | | 2.1 | | | | — | | | | — | | | | 5.6 | | | | — | | | | — | |
| | Average realized price ($Cdn/lb) | | | 40.24 | | | | — | | | | — | | | | 42.50 | | | | — | | | | — | �� |
| | Revenue ($ millions) | | | 93 | | | | — | | | | — | | | | 276 | | | | — | | | | — | |
| | Gross profit (loss) ($ millions) | | | (7 | ) | | | — | | | | — | | | | 1 | | | | — | | | | — | |
Electricity | | Output (100%) (TWh) | | | 6.9 | | | | 7.1 | | | | (3 | )% | | | 17.9 | | | | 19.6 | | | | (9 | )% |
| | Average realized price ($Cdn/MWh) | | | 55.00 | | | | 54.00 | | | | 2 | % | | | 54.00 | | | | 55.00 | | | | (2 | )% |
| | Revenue (100%) | | | 392 | | | | 384 | | | | 2 | % | | | 987 | | | | 1,095 | | | | (10 | )% |
| | Our share of earnings before taxes ($ millions) | | | 63 | | | | 42 | | | | 50 | % | | | 62 | | | | 112 | | | | (45 | )% |
| 1 | SeeNUKEM on page 19 for details of the purchase price allocation. |
Production in our uranium segment this quarter was 9% higher compared to the third quarter of 2012 due to the rampup of the North Butte satellite operation and higher production at Smith Ranch-Highland, Rabbit Lake, and Inkai. For the first nine months, production was 5% higher than for the same period in 2012 due to the rampup of production from the North Butte satellite operation and higher production from Inkai. SeeUranium 2013 Q3 updates starting on page 25 for more information.
Key highlights:
| | • | | At Cigar Lake, the installation of the steel liners in the run-of-mine (ROM) systems is essentially complete and on schedule for production in the first quarter of 2014, and we have begun jet boring in a waste cavity as part of the commissioning process. SeeDevelopment project on page 26 for more information. |
| | • | | At McArthur River, Key Lake and Rabbit Lake, we were granted 10-year operating licences by the Canadian Nuclear Safety Commission (CNSC) |
| | • | | We delivered our first shipments of Canadian uranium to China under the new Canada-China Nuclear Co-operation Agreement |
2013 THIRD QUARTER REPORT 5
Production in our fuel services segment was 24% higher this quarter than in the third quarter of 2012 and 12% higher for the first nine months compared to last year.
In our electricity segment, BPLP’s generation was 3% lower for the quarter and 9% lower for the first nine months of the year compared to the same periods last year, mainly due to an increase in the number of outage days. The capacity factor this quarter was 96% compared to 99% in the third quarter of 2012. For the first nine months of the year the capacity factor was 83%, compared to 92% in 2012.
Uranium market update
The uranium market continues in a state of uncertainty for the present and medium term. Similar to the previous quarter, volumes contracted have remained low as neither buyers nor suppliers are under significant pressure to contract. A general lack of utility demand, combined with inventory overhang from Japan’s idled reactors, as well as operational issues and shutdowns in South Korea and the US, has put further pressure on both spot and long-term uranium prices.
We believe the market will continue in this state until Japanese reactors begin to restart, helping to clear inventories. Progress on this front continues. As of October 29, five utilities had applied to restart 14 reactors, and Japan’s Nuclear Regulatory Authority is currently carrying out evaluations. Over the long term, we believe nuclear will remain an important energy source for the country, both in terms of its economy and meeting its environmental goals.
Adding to the current challenges in the market, production has remained solid, and even increased slightly; however, there have been some deferrals of future projects due to uranium prices insufficient to support new production. The deferrals will not directly impact the near-term market, but could have an effect on the longer term outlook for the uranium industry. Complicating the supply outlook further is the possibility of some projects, primarily driven by sovereign interests, moving forward despite market conditions.
Over the long term, we believe the fundamentals for the industry remain strong. Most notably, China has reaffirmed its substantial growth targets out to 2020, and indicated plans to pursue further growth out to 2030. Their growth is palpable as construction on two more reactors began during the third quarter, bringing the total under construction to 30.
At Cameco, we continue to prepare for the future growth we see for the industry, while also remaining responsive to current market signals and following a strategy that will allow us to remain competitive in challenging environments.
Caution about forward-looking information relating to our uranium market update
This discussion of our expectations for the nuclear industry, including future global uranium supply and demand, is forward-looking information that is based upon the assumptions and subject to the material risks discussed under the headingCaution about forward-looking information beginning on page 2.
Industry prices
| | | | | | | | | | | | | | | | | | | | | | | | |
| | | SEP 30 2013 | | | JUN 30 2013 | | | MAR 31 2013 | | | SEP 30 2012 | | | JUN 30 2012 | | | MAR 31 2012 | |
Uranium ($US/lb U3O8) 1 | | | | | | | | | | | | | | | | | | | | | | | | |
Average spot market price | | | 35.00 | | | | 39.60 | | | | 42.25 | | | | 46.50 | | | | 50.75 | | | | 51.05 | |
Average long-term price | | | 50.50 | | | | 57.00 | | | | 56.50 | | | | 60.50 | | | | 61.25 | | | | 60.00 | |
Fuel services ($US/kgU as UF6)1 | | | | | | | | | | | | | | | | | | | | | | | | |
Average spot market price | | | | | | | | | | | | | | | | | | | | | | | | |
North America | | | 9.00 | | | | 10.00 | | | | 10.50 | | | | 9.25 | | | | 6.63 | | | | 6.63 | |
Europe | | | 9.50 | | | | 10.38 | | | | 11.00 | | | | 9.75 | | | | 7.00 | | | | 7.00 | |
Average long-term price | | | | | | | | | | | | | | | | | | | | | | | | |
North America | | | 16.38 | | | | 16.75 | | | | 16.75 | | | | 16.75 | | | | 16.75 | | | | 16.75 | |
Europe | | | 17.13 | | | | 17.25 | | | | 17.25 | | | | 17.25 | | | | 17.25 | | | | 17.25 | |
Note: the industry does not publish UO2prices. | | | | | | | | | | | | | | | | | | | | | | | | |
Electricity ($/MWh) | | | | | | | | | | | | | | | | | | | | | | | | |
Average Ontario electricity spot price | | | 24.00 | | | | 25.00 | | | | 29.00 | | | | 28.00 | | | | 19.00 | | | | 20.00 | |
| 1 | Average of prices reported by TradeTech and Ux Consulting (Ux) |
6 CAMECO CORPORATION
On the spot market, where purchases call for delivery within one year, the volume reported for the third quarter of 2013 was approximately 12 million pounds. This compares to just over 9 million pounds in the third quarter of 2012.
At the end of the quarter, the average spot price was $35.00 (US) per pound. On October 28, 2013, Ux reported a spot price of $34.75 (US) per pound.
The long-term uranium price declined during the quarter. Long-term contracts usually call for deliveries to begin more than two years after the contract is finalized and use a number of pricing formulas, including fixed prices adjusted by inflation indices, and market referenced prices (spot and long-term indicators quoted near the time of delivery).
Spot and long-term UF6conversion prices declined from the previous quarter.
SHARES AND STOCK OPTIONS OUTSTANDING
At October 28, 2013, we had:
| | • | | 395,466,300 common shares and one Class B share outstanding |
| | • | | 9,902,604 stock options outstanding, with exercise prices ranging from $15.79 to $54.38 |
DIVIDEND POLICY
Our board of directors has established a policy of paying a quarterly dividend of $0.10 ($0.40 per year) per common share. This policy will be reviewed from time to time based on our cash flow, earnings, financial position, strategy and other relevant factors.
2013 THIRD QUARTER REPORT 7
Financial results
This section of our MD&A discusses our performance, financial condition and outlook for the future.
Consolidated financial results
| | | | | | | | | | | | | | | | | | | | | | | | |
| HIGHLIGHTS | | THREE MONTHS
ENDED
SEPTEMBER 30 | | | | | | NINE MONTHS
ENDED
SEPTEMBER 30 | | | | |
($ MILLIONS EXCEPT WHERE INDICATED) | | 2013 | | | 2012 | | | CHANGE | | | 2013 | | | 2012 | | | CHANGE | |
Revenue | | | 597 | | | | 296 | | | | 102 | % | | | 1,461 | | | | 1,044 | | | | 40 | % |
Gross profit | | | 228 | | | | 85 | | | | 168 | % | | | 422 | | | | 285 | | | | 48 | % |
Net earnings attributable to equity holders | | | 211 | | | | 79 | | | | 167 | % | | | 254 | | | | 212 | | | | 20 | % |
$ per common share (basic) | | | 0.53 | | | | 0.20 | | | | 165 | % | | | 0.64 | | | | 0.54 | | | | 19 | % |
$ per common share (diluted) | | | 0.53 | | | | 0.20 | | | | 165 | % | | | 0.64 | | | | 0.54 | | | | 19 | % |
Adjusted net earnings (non-IFRS, see page 8) | | | 208 | | | | 49 | | | | 324 | % | | | 295 | | | | 200 | | | | 48 | % |
$ per common share (adjusted and diluted) | | | 0.53 | | | | 0.12 | | | | 342 | % | | | 0.75 | | | | 0.51 | | | | 47 | % |
Cash provided by operations
(after working capital changes) | | | 136 | | | | 36 | | | | 278 | % | | | 368 | | | | 293 | | | | 26 | % |
Net earnings
In the third quarter of 2013, our net earnings were $211 million ($0.53 per share diluted), an increase of $132 million compared to $79 million ($0.20 per share diluted) in 2012. Net earnings were affected by the items noted below.
On an adjusted basis, our earnings this quarter were $208 million ($0.53 per share diluted) compared to $49 million ($0.12 per share diluted) (non-IFRS measure, see below) in the third quarter of 2012, mainly due to:
| | • | | higher earnings from our uranium business based on increased sales volumes and higher realized prices related to our contract portfolio and a weaker Canadian dollar |
| | • | | lower exploration expenditures |
| | • | | partially offset by higher income tax expenses |
Net earnings in the first nine months of the year were $254 million ($0.64 per share diluted), an increase of $42 million compared to $212 million ($0.54 per share diluted) in 2012. Net earnings were affected by the items noted below, partially offset by mark-to-market losses on foreign exchange derivatives.
On an adjusted basis, our earnings for the first nine months of this year were $295 million ($0.75 per share diluted) compared to $200 million ($0.51 per share diluted) (non-IFRS measure, see below). This increase was largely the result of:
| | • | | higher earnings from our uranium and fuel services segments based on higher realized prices and increased sales volumes |
| | • | | lower exploration expenses |
| | • | | partially offset by lower earnings in the electricity business as a result of lower generation and higher operating costs |
SeeFinancial results by segment on page 15 for more detailed discussion.
Adjusted net earnings (non-IFRS measure)
Adjusted net earnings is a measure that does not have a standardized meaning or a consistent basis of calculation under IFRS (non-IFRS measure). We use this measure as a more meaningful way to compare our financial performance from period to period. We believe that, in addition to conventional measures prepared in accordance with IFRS, certain investors use this information to evaluate our performance. Adjusted net earnings is our net earnings attributable to equity holders, adjusted to better reflect the underlying financial performance for the reporting period. The adjusted earnings measure reflects the matching of the net benefits of our hedging program with the inflows of foreign currencies in the applicable reporting period and has been adjusted for
8 CAMECO CORPORATION
impairment charges on a non-producing property, the NUKEM inventory writedown, as well as losses on our exploration interests.
Adjusted net earnings is non-standard supplemental information and should not be considered in isolation or as a substitute for financial information prepared according to accounting standards. Other companies may calculate this measure differently, so you may not be able to make a direct comparison to similar measures presented by other companies.
The table below reconciles adjusted net earnings with our net earnings.
| | | | | | | | | | | | | | | | |
| | | THREE MONTHS
ENDED
SEPTEMBER 30 | | | NINE MONTHS
ENDED
SEPTEMBER 30 | |
($ MILLIONS) | | 2013 | | | 2012 | | | 2013 | | | 2012 | |
Net earnings attributable to equity holders | | | 211 | | | | 79 | | | | 254 | | | | 212 | |
| | | | | | | | | | | | | | | | |
Adjustments | | | | | | | | | | | | | | | | |
Adjustments on derivatives1(pre-tax) | | | (41 | ) | | | (40 | ) | | | 20 | | | | (16 | ) |
NUKEM inventory writedown | | | 17 | | | | — | | | | 17 | | | | — | |
Loss on exploration interests | | | 15 | | | | — | | | | 15 | | | | — | |
Income taxes on adjustments | | | 6 | | | | 10 | | | | (11 | ) | | | 4 | |
| | | | | | | | | | | | | | | | |
Adjusted net earnings | | | 208 | | | | 49 | | | | 295 | | | | 200 | |
| | | | | | | | | | | | | | | | |
| 1 | We do not apply hedge accounting for our portfolio of foreign currency forward sales contracts. However, we have adjusted our gains or losses on derivatives to reflect what our earnings would have been had hedge accounting been in place. |
The table that follows describes what contributed to the changes in adjusted net earnings this quarter.
| | | | | | | | | | | | |
($ MILLIONS) | | | | | | THREE MONTHS
ENDED
SEPTEMBER 30 | | | NINE MONTHS
ENDED
SEPTEMBER 30 | |
Adjusted net earnings– 2012 | | | | | 49 | | | | 200 | |
| | | | | | | | | | | | |
Change in gross profit by segment | | (we calculate gross profit by deducting from revenue the cost of products and services sold, and depreciation and amortization (D&A), net of hedging benefits) | |
Uranium | | Higher sales volume | | | 57 | | | | 25 | |
| | Higher realized prices ($US) | | | 47 | | | | 56 | |
| | Foreign exchange impact on realized prices | | | 11 | | | | 12 | |
| | Lower costs | | | 23 | | | | 32 | |
| | Hedging benefits | | | (15 | ) | | | (41 | ) |
| | | | | | | | | | | | |
| | change –uranium | | | 123 | | | | 84 | |
| | | | | | | | | | | | |
Fuel services | | Higher sales volume | | | — | | | | 2 | |
| | Higher realized prices ($Cdn) | | | 10 | | | | 6 | |
| | Lower costs | | | 1 | | | | 4 | |
| | Hedging benefits | | | (1 | ) | | | (5 | ) |
| | | | | | | | | | | | |
| | change –fuel services | | | 10 | | | | 7 | |
| | | | | | | | | | | | |
NUKEM | | Gross profit, net of pretax inventory adjustment | | | 10 | | | | 17 | |
| | | | | | | | | | | | |
| | change –NUKEM | | | 10 | | | | 17 | |
| | | | | | | | | | | | |
Other changes | | | | | | | | |
Higher/(lower) earnings from equity investment in BPLP | | | 21 | | | | (50 | ) |
Lower/(higher) administration expenditures | | | 3 | | | | (10 | ) |
Lower exploration expenditures | | | 15 | | | | 19 | |
(Higher) income taxes | | | (27 | ) | | | (2 | ) |
Contract termination fee (Q2, 2012) | | | — | | | | 30 | |
Other | | | 4 | | | | — | |
| | | | | | | | | | | | |
Adjusted net earnings– 2013 | | | 208 | | | | 295 | |
| | | | | | | | | | | | |
SeeFinancial results by segment on page 15 for more detailed discussion.
2013 THIRD QUARTER REPORT 9
Quarterly trends
| | | | | | | | | | | | | | | | | | | | | | | | | | | | | | | | |
| HIGHLIGHTS | | 2013 | | | 2012 | | | 2011 | |
($ MILLIONS EXCEPT PER SHARE AMOUNTS) | | Q3 | | | Q2 | | | Q1 | | | Q41 | | | Q31 | | | Q21 | | | Q11 | | | Q4 | |
Revenue | | | 597 | | | | 421 | | | | 443 | | | | 846 | | | | 296 | | | | 282 | | | | 466 | | | | 971 | |
Net earnings attributable to equity holders | | | 211 | | | | 34 | | | | 9 | | | | 41 | | | | 79 | | | | 5 | | | | 128 | | | | 265 | |
$ per common share (basic) | | | 0.53 | | | | 0.09 | | | | 0.02 | | | | 0.10 | | | | 0.20 | | | | 0.01 | | | | 0.33 | | | | 0.67 | |
$ per common share (diluted) | | | 0.53 | | | | 0.09 | | | | 0.02 | | | | 0.10 | | | | 0.20 | | | | 0.01 | | | | 0.33 | | | | 0.67 | |
Adjusted net earnings (non-IFRS, see page 8) | | | 208 | | | | 61 | | | | 26 | | | | 233 | | | | 49 | | | | 31 | | | | 120 | | | | 249 | |
$ per common share (adjusted and diluted) | | | 0.53 | | | | 0.15 | | | | 0.07 | | | | 0.59 | | | | 0.12 | | | | 0.08 | | | | 0.31 | | | | 0.63 | |
Cash provided by operations (after working capital changes) | | | 136 | | | | (37 | ) | | | 269 | | | | 286 | | | | 36 | | | | (117 | ) | | | 374 | | | | 258 | |
| 1 | Our quarterly results have been restated in accordance withIFRS 11 – Joint Arrangements andIAS 19 – Employee Benefits. Our quarterly results prior to the first quarter of 2012 have not been restated. |
The table that follows presents the differences between net earnings and adjusted net earnings for the previous seven quarters.
| | | | | | | | | | | | | | | | | | | | | | | | | | | | | | | | |
| | | 2013 | | | 2012 | | | | |
($ MILLIONS) | | Q3 | | | Q2 | | | Q1 | | | Q42 | | | Q32 | | | Q22 | | | Q12 | | | Q4 | |
Net earnings attributable to equity holders | | | 211 | | | | 34 | | | | 9 | | | | 41 | | | | 79 | | | | 5 | | | | 128 | | | | 265 | |
Adjustments | | | | | | | | | | | | | | | | | | | | | | | | | | | | | | | | |
Adjustments on derivatives1 (pre-tax) | | | (41 | ) | | | 36 | | | | 25 | | | | 33 | | | | (40 | ) | | | 35 | | | | (11 | ) | | | (22 | ) |
NUKEM inventory writedown | | | 17 | | | | — | | | | — | | | | — | | | | — | | | | — | | | | — | | | | — | |
Losses on exploration interests | | | 15 | | | | — | | | | — | | | | — | | | | — | | | | — | | | | — | | | | — | |
Impairment charge on non-producing property | | | — | | | | — | | | | — | | | | 168 | | | | — | | | | — | | | | — | | | | — | |
Income taxes on adjustments | | | 6 | | | | (9 | ) | | | (8 | ) | | | (9 | ) | | | 10 | | | | (9 | ) | | | 3 | | | | 6 | |
Adjusted net earnings (non-IFRS, see page 8) | | | 208 | | | | 61 | | | | 26 | | | | 233 | | | | 49 | | | | 31 | | | | 120 | | | | 249 | |
| 1 | We do not apply hedge accounting for our portfolio of foreign currency forward sales contracts. However, we have adjusted our gains or losses on derivatives to reflect what our earnings would have been had hedge accounting been in place. |
| 2 | Our quarterly results have been restated in accordance withIAS 19 – Employee Benefits. Our quarterly results prior to the first quarter of 2012 have not been restated. |
Key things to note:
| | • | | Our financial results are strongly influenced by the performance of our uranium segment, which accounted for 75% of consolidated revenues in the third quarter of 2013. |
| | • | | The timing of customer requirements, which tends to vary from quarter to quarter, drives revenue in the uranium and fuel services segments. |
| | • | | Net earnings do not trend directly with revenue due to unusual items and transactions that occur from time to time. We use adjusted net earnings, a non-IFRS measure, as a more meaningful way to compare our results from period to period (see page 8 for more information). |
| | • | | Cash from operations tends to fluctuate as a result of the timing of deliveries and product purchases in our uranium and fuel services segments. |
| | • | | Quarterly results are not necessarily a good indication of annual results due to the variability in customer requirements noted above. |
RESTRUCTURING
As a result of our restructuring activities, we saw improvements in our direct administration, exploration and operating costs during the quarter. However, in 2013, the benefit of these savings will be partially offset by the one-time costs associated with the restructuring. We will continue to focus on being more efficient in all parts of the business, with the intent of remaining a low cost producer and profitably growing the company. SeeAdministrationand Explorationsections on page 11, as well asFinancial results by segmenton page 15 for more information.
10 CAMECO CORPORATION
ADMINISTRATION
| | | | | | | | | | | | | | | | | | | | | | | | |
| | | THREE MONTHS
ENDED
SEPTEMBER 30 | | | | | | NINE MONTHS
ENDED
SEPTEMBER 30 | | | | |
($ MILLIONS) | | 2013 | | | 2012 | | | CHANGE | | | 2013 | | | 2012 | | | CHANGE | |
Direct administration | | | 34 | | | | 37 | | | | (8 | )% | | | 114 | | | | 110 | | | | 4 | % |
Restructuring charges | | | — | | | | — | | | | — | | | | 5 | | | | — | | | | — | |
Stock-based compensation | | | 2 | | | | 2 | | | | — | | | | 15 | | | | 14 | | | | 7 | % |
| | | | | | | | | | | | | | | | | | | | | | | | |
Total administration | | | 36 | | | | 39 | | | | (8 | )% | | | 134 | | | | 124 | | | | 8 | % |
| | | | | | | | | | | | | | | | | | | | | | | | |
As a result of our restructuring activities, direct administration costs were $3 million lower this quarter compared to the same quarter last year. For the first nine months, direct administration costs were $4 million higher than for the same period last year due to the addition of NUKEM’s administration ($11 million in the first nine months) and advisory fee ($3 million), partially offset by savings from our restructuring activities.
EXPLORATION
In the third quarter, uranium exploration expenses were $20 million, a decrease of $14 million compared to the third quarter of 2012. Exploration expenses in the first nine months of the year decreased to $56 million from $76 million in 2012 as a result of decreased activity at our Kintyre property in Australia. We expect exploration expenses to be about 15% to 20% lower than they were in 2012. Our exploration efforts in 2013 are focused on Canada, Australia, Kazakhstan and the United States.
As part of our strategy to focus on projects that provide the most certainty in the near term, we have decided to divest our interests in Argentina and Peru, which required us to record a loss of $15 million.
INCOME TAXES
We recorded an income tax expense of $24 million in third quarter of 2013 compared to an expense of $2 million in the third quarter of 2012.
On an adjusted basis, we recorded an income tax expense of $19 million this quarter compared to a recovery of $9 million in the third quarter of 2012 due to the distribution of earnings between jurisdictions.
In the first nine months of 2013, we recorded an income tax recovery of $49 million compared to a recovery of $36 million in 2012. The change in the net recovery was in part due to a decline in pre-tax earnings in Canada in 2013. The distribution of earnings between jurisdictions was also different compared to 2012. In 2013, we recorded losses of $303 million in Canada compared to losses of $179 million in 2012, whereas earnings in foreign jurisdictions increased to $508 million from $354 million. The tax rate in Canada is higher than the average of the rates in the foreign jurisdictions in which we operate.
On an adjusted basis, we recorded an income tax recovery of $38 million in the first nine months of 2013 compared to a recovery of $40 million in 2012 due in part to lower pre-tax adjusted earnings in 2012.
| | | | | | | | | | | | | | | | |
| | | THREE MONTHS
ENDED
SEPTEMBER 30 | | | NINE MONTHS
ENDED
SEPTEMBER 30 | |
($ MILLIONS) | | 2013 | | | 2012 | | | 2013 | | | 2012 | |
Pre-tax adjusted earnings1 | | | | | | | | | | | | | | | | |
Canada2 | | | (12 | ) | | | (46 | ) | | | (273 | ) | | | (194 | ) |
Foreign | | | 239 | | | | 86 | | | | 530 | | | | 354 | |
| | | | | | | | | | | | | | | | |
Total pre-tax adjusted earnings | | | 227 | | | | 40 | | | | 257 | | | | 160 | |
| | | | | | | | | | | | | | | | |
Adjusted income taxes1 | | | | | | | | | | | | | | | | |
Canada2 | | | (1 | ) | | | (9 | ) | | | (64 | ) | | | (49 | ) |
Foreign | | | 20 | | | | — | | | | 26 | | | | 9 | |
| | | | | | | | | | | | | | | | |
Adjusted income tax expense (recovery) | | | 19 | | | | (9 | ) | | | (38 | ) | | | (40 | ) |
| | | | | | | | | | | | | | | | |
Effective tax rate | | | 8 | % | | | (23 | )% | | | (15 | )% | | | (25 | )% |
| | | | | | | | | | | | | | | | |
| 1 | Pre-tax adjusted earnings and adjusted income taxes are non-IFRS measures. |
| 2 | Our IFRS-based measures have been adjusted by the amounts reflected in the table in adjusted net earnings (non-IFRS measure on page 8). |
2013 THIRD QUARTER REPORT 11
FOREIGN EXCHANGE
At September 30, 2013:
| | • | | The value of the US dollar relative to the Canadian dollar was $1.00 (US) for $1.03 (Cdn), down from $1.00 (US) for $1.05 (Cdn) at June 30, 2013. The exchange rate averaged $1.00 (US) for $1.01 (Cdn) over the quarter. |
| | • | | We had foreign currency contracts of $1.5 billion (US) and €68 million at September 30, 2013. The mark-to-market gain on all foreign exchange contracts was $1.9 million compared to a $53 million loss at June 30, 2013. The average exchange rate for USD currency contracts was $1.00 (US) for $1.03 (Cdn) and €1.00 (EUR) for $1.35 (US) for EUR currency contracts. |
Outlook for 2013
Our outlook reflects our expectations for 2013 and the growth expenditures necessary to help us achieve our strategy. A number of items in our outlook table have changed and we explain each change below. We do not provide an outlook for the items in the table that are marked with a dash.
SeeFinancial results by segment on page 15 for details.
2013 FINANCIAL OUTLOOK
NUKEM is included in the consolidated amounts; BPLP is not included in the consolidated amounts.
| | | | | | | | | | |
| | | CONSOLIDATED | | URANIUM | | FUEL SERVICES | | NUKEM | | ELECTRICITY |
Production | | — | | 23.1 million lbs | | 15 to 16 million kgU | | — | | — |
Sales volume | | — | | 31 to 33 million lbs | | Increase 10% to 15% | | 8 to 10 million lbs U3O8 | | — |
Capacity factor | | — | | — | | — | | — | | 87% |
Revenue compared to 2012 | | Increase30% to 35% | | Increase5% to 10%1 | | Increase 10% to 15% | | $450 to $550 million | | Decrease 5% to 10% |
NUKEM operating cash flows | | — | | — | | — | | $50 to $70 million | | — |
NUKEM gross profit | | — | | — | | — | | 3% to 5% | | — |
Average unit cost of sales (including D&A) | | — | | Increase 0% to 5%2 | | Increase 0% to 5% | | — | | Increase 20% to 25% |
Direct administration costs compared to 20123 | | Increase 0% to 5% | | — | | — | | $10 to $12 million | | — |
Exploration costs compared to 2012 | | — | | Decrease 15% to 20% | | — | | — | | — |
Tax rate | | Recovery of 15% to 20% | | — | | — | | Expense of 30% to 35% | | — |
Capital expenditures | | $685 million4 | | — | | — | | — | | $80 million (our share) |
| 1 | Based on a uranium spot price of $34.75 (US) per pound (the Ux spot price as of October 28, 2013), a long-term price indicator of $50.00 (US) per pound (the Ux long-term indicator on September 30, 2013) and an exchange rate of $1.00 (US) for $1.03 (Cdn). |
| 2 | This increase is based on the unit cost of sale for produced material and committed long-term purchases. If we decide to make discretionary purchases in 2013 then we expect the overall unit cost of product sold to increase further. |
| 3 | Direct administration costs do not include stock-based compensation expenses or restructuring costs. See page 11 for more information. |
| 4 | Does not include our share of capital expenditures at BPLP. |
In our uranium and fuel services segments, our customers choose when in the year to receive deliveries, so our quarterly delivery patterns, sales volumes and revenue, can vary significantly. We are on track to meet our 2013 sales targets, and therefore, expect to deliver between 11 million and 13 million pounds of uranium in the fourth quarter.
We have decreased our production outlook to 23.1 million pounds U3O8 (previously 23.3 million pounds U3O8) to reflect the removal of Cigar Lake production from our 2013 forecast, and lower expected production from our US operations, partially offset by higher expected production from McArthur River/Key Lake.
12 CAMECO CORPORATION
We now expect revenues in the uranium segment to increase 5% to 10% over 2012 (previously an increase of up to 5%) mainly due to changes in our outlook for foreign exchange rates. We now expect the value of the US dollar relative to the Canadian dollar to be $1.00 (US) for $1.03 (Cdn), up from our original expectation of $1.00 (US) for $1.00 (Cdn).
In the fuel services segment, we expect an increase in sales volumes of 10% to 15% compared to 2012 (previously a 5% to 10% increase) and a resulting increase in fuel services revenues by 10% to15% (previously a 5% to 10% increase) compared to 2012. We also expect an increase in unit cost of sales of up to 5% (previously a decrease of up to 5%).
The increase to our outlook for uranium and fuel services revenues has an impact on consolidated revenue, which we now expect to increase by 30% to 35% (previously an increase of 25% to 30%) compared to 2012.
In the NUKEM segment, operating cash flows are expected to be between $50 million to $70 million (previously $60 million to $80 million) as a result of a decision to decrease planned sales activities in the current price environment.
We now expect BPLP’s capacity factor for 2013 to be 87% compared to 88% as previously reported. The change in outlook is largely the result of increased outage days this year.
SENSITIVITY ANALYSIS
For the rest of 2013:
| | • | | a change of $5 (US) per pound in both the Ux spot price ($34.75 (US) per pound on October 28, 2013) and the Ux long-term price indicator ($50.00 (US) per pound on September 30, 2013) would change revenue by $14 million and net earnings by $2 million |
| | • | | a change of $5/MWh in the electricity spot price would change our 2013 net earnings by $2 million based on the assumption that the spot price will remain below the floor price of $52.34/MWh provided under BPLP’s agreement with the Ontario Power Authority (OPA) |
| | • | | a one-cent change in the value of the Canadian dollar versus the US dollar would effectively change revenue by $4 million and adjusted net earnings by $2 million, with a decrease in the value of the Canadian dollar versus the US dollar having a positive impact. This sensitivity is based on an exchange rate of $1.00 (US) for $1.03 (Cdn). |
Liquidity and capital resources
Our financial objective is to make sure we have the cash and debt capacity to fund our operating activities, investments and growth. We expect our existing cash balances and operating cash flows will meet our anticipated 2013 capital requirements without the need for significant additional funding.
We have large, creditworthy customers that continue to need uranium even during weak economic conditions, and we expect the uranium contract portfolio we have built to provide a solid revenue stream for years to come.
We expect to continue investing in expanding our production capacity over the next several years. We have a number of alternatives to fund this continued growth, including using our current cash balances, drawing on our existing credit facilities, entering new credit facilities, using our operating cash flow, and raising additional capital through debt or equity financings. We are always considering our financing options so that we can take advantage of favourable market conditions when they arise.
We have an ongoing dispute with the CRA regarding our offshore marketing company structure and related transfer pricing arrangements. Until this dispute is settled, we expect to make cash payments to the CRA for 50% of the cash taxes payable on income reassessed and the related interest and instalment penalties. We provided an estimate of the amount and timing of the expected cash taxes payable in our first quarter MD&A. There has been no material change to our estimate. See note 12 of our financial statements for more details.
2013 THIRD QUARTER REPORT 13
CASH FROM OPERATIONS
Cash from operations was $100 million higher this quarter than in 2012, due largely to higher uranium deliveries. Working capital requirements were $67 million higher in 2013, largely as a result of an increase in accounts receivable and a decrease in accounts payable. SeeFinancial results by segment on page 15 for details.
Cash from operations was $75 million higher for the first nine months of 2013 than for the same period in 2012 mainly due to higher uranium deliveries. Working capital required $119 million more in 2013, largely as a result of a decrease in accounts payable during the period. Not including working capital requirements, our operating cash flows in the first nine months were higher by $194 million. SeeFinancial results by segment on page 15 for details.
DEBT
We use debt to provide additional liquidity. We have sufficient borrowing capacity with unsecured lines of credit totaling about $2.2 billion at September 30, 2013 unchanged from June 30, 2013. At September 30, 2013, we had approximately $773 million outstanding in letters of credit, $25 million outstanding in commercial paper and $57 million drawn on NUKEM’s revolving credit facility to cover short term working capital requirements that we are required to record as an overdraft.
DEBT COVENANTS
We are bound by certain covenants in our unsecured revolving credit facility. The financially related covenants place restrictions on total debt, including guarantees. As at September 30, 2013, we met these financial covenants and do not expect our operating and investment activities for the remainder of 2013 to be constrained by them.
LONG-TERM CONTRACTUAL OBLIGATIONS AND OFF-BALANCE SHEET ARRANGEMENTS
We had two kinds of off-balance sheet arrangements at September 30, 2013:
There have been no material changes to our long-term contractual obligations or financial assurances since December 31, 2012, or to our purchase commitments since March 31, 2013, including payments due for the next five years and thereafter. Please see our annual and first quarter MD&A for more information.
BALANCE SHEET
| | | | | | | | | | | | |
($ MILLIONS) | | SEPT 30, 2013 | | | DEC 31, 2012 | | | CHANGE | |
Cash, short-term investments and NUKEM’s overdraft | | | 216 | | | | 799 | | | | (73 | )% |
Total debt | | | 1,328 | | | | 1,360 | | | | (2 | )% |
Inventory | | | 976 | | | | 564 | | | | 73 | % |
Total cash and short-term investments, net of the overdraft recorded under NUKEM’s revolving credit facility at September 30, 2013 was $216 million, or 73% lower than at December 31, 2012 due to capital expenditures and completion of the acquisition of NUKEM in January. Net debt September 30, 2013 was $1,112 million.
Total debt decreased by $32 million to $1,328 million at September 30, 2013. Of this total, $35 million was classified as current, down $32 million compared to December 31, 2012. See notes 16 and 17 of our audited annual financial statements for more detail.
Total product inventories increased by $412 million. Uranium and fuel services inventories increased as sales were lower than production and purchases in the first nine months of the year. NUKEM inventories also increased as sales were lower than purchases.
14 CAMECO CORPORATION
Financial results by segment
Uranium
| | | | | | | | | | | | | | | | | | | | | | | | |
| | | THREE MONTHS
ENDED SEPTEMBER 30 | | | | | | NINE MONTHS
ENDED SEPTEMBER 30 | | | | |
HIGHLIGHTS | | 2013 | | | 2012 | | | CHANGE | | | 2013 | | | 2012 | | | CHANGE | |
Production volume (million lbs) | | | 5.8 | | | | 5.3 | | | | 9 | % | | | 16.2 | | | | 15.4 | | | | 5 | % |
Sales volume (million lbs) | | | 8.5 | | | | 5.2 | | | | 63 | % | | | 20.1 | | | | 18.4 | | | | 9 | % |
Average spot price ($US/lb) | | | 34.75 | | | | 48.08 | | | | (28 | )% | | | 39.21 | | | | 50.38 | | | | (22 | )% |
Average long-term price ($US/lb) | | | 53.00 | | | | 60.67 | | | | (13 | )% | | | 55.50 | | | | 60.67 | | | | (9 | )% |
Average realized price | | | | | | | | | | | | | | | | | | | | | | | | |
($US/lb) | | | 50.73 | | | | 45.26 | | | | 12 | % | | | 48.72 | | | | 45.95 | | | | 6 | % |
($Cdn/lb) | | | 52.59 | | | | 45.77 | | | | 15 | % | | | 49.81 | | | | 46.41 | | | | 7 | % |
Average unit cost of sales ($Cdn/lb) (including D&A) | | | 26.19 | | | | 28.85 | | | | (9 | )% | | | 29.91 | | | | 31.50 | | | | (5 | )% |
Revenue ($ millions) | | | 449 | | | | 238 | | | | 89 | % | | | 1,001 | | | | 855 | | | | 17 | % |
Gross profit ($ millions) | | | 226 | | | | 88 | | | | 157 | % | | | 400 | | | | 275 | | | | 45 | % |
Gross profit (%) | | | 50 | | | | 37 | | | | 35 | % | | | 40 | | | | 32 | | | | 25 | % |
THIRD QUARTER
Production volumes this quarter were 9% higher compared to the third quarter of 2012, due to the rampup of the North Butte satellite operation and higher production at Smith Ranch-Highland, Rabbit Lake, and Inkai. SeeUranium 2013 Q3 updates starting on page 25 for more information.
Uranium revenues were up 89% due to a 63% increase in sales volumes and a 15% increase in the Canadian dollar average realized price. The average realized price was higher this quarter than in the third quarter of 2012 due to the mix of contracts and higher US dollar prices under fixed price contracts. In the third quarter of 2013, our realized foreign exchange rate was $1.04 compared to $1.01 in the prior year.
Total cost of sales (including D&A) increased by 49% ($224 million compared to $150 million in 2012). This was mainly the result of a 63% increase in sales volumes, offset by lower unit cost of sales.
Unit cost of produced material sold was lower in the third quarter than the same period in 2012 as a result of increased production, along with a reduction in expenses due to our restructuring activities.
The net effect was a $138 million increase in gross profit for the quarter.
FIRST NINE MONTHS
Production volumes for the first nine months of the year were 5% higher than in the previous year due to the rampup of production from the North Butte satellite operation and higher production from Inkai. SeeUranium 2013 Q3 updates starting on page 25 for more information.
For the first nine months of 2013, uranium revenues were up 17% compared to 2012, due to a 9% increase in sales volumes and a 7% increase in the Canadian dollar average realized price.
Our realized prices for the first nine months of 2013 were higher than 2012, mainly due to the mix of contracts and higher US dollar prices under fixed price contracts.
Total cost of sales (including D&A) increased by 4% ($601 million compared to $580 million in 2012). This was mainly the result of a 9% increase in sales volumes, offset by lower unit cost of sales.
The net effect was a $125 million increase in gross profit for the first nine months.
The table on the following page shows the costs of produced and purchased uranium incurred in the reporting periods (which are non-IFRS measures, see the paragraphs below the table). These costs do not include selling costs such as royalties, transportation and commissions, nor do they reflect the impact of opening inventories on our reported cost of sales.
2013 THIRD QUARTER REPORT 15
| | | | | | | | | | | | | | | | | | | | | | | | |
| | | THREE MONTHS
ENDED SEPTEMBER 30 | | | | | | NINE MONTHS
ENDED SEPTEMBER 30 | | | | |
($/LB) | | 2013 | | | 2012 | | | CHANGE | | | 2013 | | | 2012 | | | CHANGE | |
Produced | | | | | | | | | | | | | | | | | | | | | | | | |
Cash cost | | | 17.68 | | | | 21.11 | | | | (16 | )% | | | 19.66 | | | | 21.18 | | | | (7 | )% |
Non-cash cost | | | 10.63 | | | | 8.62 | | | | 23 | % | | | 9.48 | | | | 8.01 | | | | 18 | % |
| | | | | | | | | | | | | | | | | | | | | | | | |
Total production cost | | | 28.31 | | | | 29.73 | | | | (5 | )% | | | 29.14 | | | | 29.19 | | | | — | |
| | | | | | | | | | | | | | | | | | | | | | | | |
Quantity produced (million lbs) | | | 5.8 | | | | 5.3 | | | | 9 | % | | | 16.2 | | | | 15.4 | | | | 5 | % |
Purchased | | | | | | | | | | | | | | | | | | | | | | | | |
Cash cost | | | 16.57 | | | | 26.08 | | | | (36 | )% | | | 23.25 | | | | 27.04 | | | | (14 | )% |
Quantity purchased (million lbs) | | | 3.8 | | | | 4.6 | | | | (17 | )% | | | 8.7 | | | | 8.4 | | | | 4 | % |
Totals | | | | | | | | | | | | | | | | | | | | | | | | |
Produced and purchased costs | | | 23.66 | | | | 28.03 | | | | (16 | )% | | | 27.08 | | | | 28.43 | | | | (5 | )% |
Quantities produced and purchased (million lbs) | | | 9.6 | | | | 9.9 | | | | (3 | )% | | | 24.9 | | | | 23.8 | | | | 5 | % |
Cash cost per pound, non-cash cost per pound and total cost per pound for produced and purchased uranium presented in the above table are non-IFRS measures. These measures do not have a standardized meaning or a consistent basis of calculation under IFRS. We use these measures in our assessment of the performance of our uranium business. We believe that, in addition to conventional measures prepared in accordance with IFRS, certain investors use this information to evaluate our performance and ability to generate cash flow.
These measures are non-standard supplemental information and should not be considered in isolation or as a substitute for measures of performance prepared according to accounting standards. These measures are not necessarily indicative of operating profit or cash flow from operations as determined under IFRS. Other companies may calculate these measures differently so you may not be able to make a direct comparison to similar measures presented by other companies.
To facilitate a better understanding of these measures, the following table presents a reconciliation of these measures to our unit cost of sales for the third quarters and the first nine months of 2013 and 2012.
CASH AND TOTAL COST PER POUND RECONCILIATION
| | | | | | | | | | | | | | | | | | | | | | | | |
| | | THREE MONTHS
ENDED SEPTEMBER 30 | | | | | | NINE MONTHS
ENDED SEPTEMBER 30 | | | | |
($ MILLIONS) | | 2013 | | | 2012 | | | CHANGE | | | 2013 | | | 2012 | | | CHANGE | |
Cost of product sold | | | 198.2 | | | | 123.7 | | | | 60 | % | | | 509.4 | | | | 489.4 | | | | 4 | % |
Add / (subtract) | | | | | | | | | | | | | | | | | | | | | | | | |
Royalties | | | (6.2 | ) | | | (6.7 | ) | | | (7 | )% | | | (38.3 | ) | | | (64.3 | ) | | | (40 | )% |
Standby charges | | | (9.1 | ) | | | (8.0 | ) | | | 14 | % | | | (26.3 | ) | | | (20.9 | ) | | | 26 | % |
Other selling costs | | | (0.1 | ) | | | (0.6 | ) | | | (83 | )% | | | 3.4 | | | | (2.9 | ) | | | (217 | )% |
Change in inventories | | | (17.3 | ) | | | 123.5 | | | | (114 | )% | | | 72.5 | | | | 152.1 | | | | (52 | )% |
| | | | | | | | | | | | | | | | | | | | | | | | |
Cash operating costs (a) | | | 165.5 | | | | 231.9 | | | | (29 | )% | | | 520.7 | | | | 553.4 | | | | (6 | )% |
Add / (subtract) | | | | | | | | | | | | | | | | | | | | | | | | |
Depreciation and amortization | | | 25.6 | | | | 26.2 | | | | (2 | )% | | | 91.7 | | | | 90.8 | | | | 1 | % |
Change in inventories | | | 36.0 | | | | 19.4 | | | | 86 | % | | | 61.9 | | | | 32.4 | | | | 91 | % |
| | | | | | | | | | | | | | | | | | | | | | | | |
Total operating costs (b) | | | 227.1 | | | | 277.5 | | | | (18 | )% | | | 674.3 | | | | 676.6 | | | | — | |
| | | | | | | | | | | | | | | | | | | | | | | | |
Uranium produced & purchased (millions lbs)(c) | | | 9.6 | | | | 9.9 | | | | (3 | )% | | | 24.9 | | | | 23.8 | | | | 5 | % |
Cash costs ($/lb) (a ÷ c) | | | 17.24 | | | | 23.42 | | | | (26 | )% | | | 20.91 | | | | 23.25 | | | | (10 | )% |
Total costs ($/lb) (b ÷ c) | | | 23.66 | | | | 28.03 | | | | (16 | )% | | | 27.08 | | | | 28.43 | | | | (5 | )% |
16 CAMECO CORPORATION
PRICE SENSITIVITY ANALYSIS: URANIUM
The table and graph below are not forecasts of prices we expect to receive. The prices we actually realize will be different from the prices shown in the table and graph. They are designed to indicate how the portfolio of long-term contracts we had in place in our uranium segment on September 30, 2013 would respond to different spot prices. In other words, we would realize these prices only if the contract portfolio remained the same as it was on September 30, 2013, and none of the assumptions we list below change.
We intend to update this table and graph each quarter in our MD&A to reflect deliveries made and changes to our contract portfolio each quarter. As a result, we expect the table and graph to change from quarter to quarter.
EXPECTED REALIZED URANIUM PRICE SENSITIVITY UNDER VARIOUS SPOT PRICE ASSUMPTIONS
(rounded to the nearest $1.00)
| | | | | | | | | | | | | | | | | | | | | | | | | | | | |
SPOT PRICES ($US/LB U3O8) | | $20 | | | $40 | | | $60 | | | $80 | | | $100 | | | $120 | | | $140 | |
2013 | | | 48 | | | | 48 | | | | 49 | | | | 52 | | | | 54 | | | | 56 | | | | 58 | |
2014 | | | 45 | | | | 48 | | | | 55 | | | | 63 | | | | 71 | | | | 79 | | | | 85 | |
2015 | | | 41 | | | | 46 | | | | 55 | | | | 65 | | | | 75 | | | | 85 | | | | 93 | |
2016 | | | 42 | | | | 47 | | | | 57 | | | | 68 | | | | 79 | | | | 89 | | | | 97 | |
2017 | | | 42 | | | | 47 | | | | 57 | | | | 67 | | | | 77 | | | | 86 | | | | 94 | |
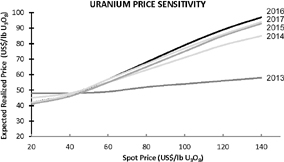
The table and graph illustrate the mix of long-term contracts in our September 30, 2013 portfolio, and are consistent with our contracting strategy. Both have been updated to reflect deliveries made and contracts entered into up to September 30, 2013. In the first three quarters of 2013, we completed deliveries into a number of market-related contracts, and fixed-priced contracts are gradually making up a larger proportion of our remaining 2013 deliveries. Our contract portfolio is, therefore, becoming less sensitive to market prices as the year progresses.
Our portfolio includes a mix of fixed-price and market-related contracts, which we target at a 40:60 ratio. Those that are fixed at lower prices or have low ceiling prices will yield prices that are lower than current market prices. In 2012, a number of older contracts expired and we are starting to deliver into more favourably priced contracts.
Our portfolio is affected by more than just the spot price. We made the following assumptions (which are not forecasts) to create the table:
Sales
| | • | | sales volumes on average of 31 million pounds per year |
Deliveries
| | • | | deliveries include best estimates of requirements contracts and contracts with volume flex provisions |
| | • | | we defer a portion of deliveries under existing contracts for 2013 |
Annual inflation
| | • | | is 1.5% in Canada and 2% in the US |
Prices
| | • | | the average long-term price indicator is the same as the average spot price for the entire year (a simplified approach for this purpose only). Since 1996, the long-term price indicator has averaged 17% higher than the spot price. This differential has varied significantly. Assuming the long-term price is at a premium to spot, the prices in the table and graph will be higher. |
2013 THIRD QUARTER REPORT 17
Fuel services
(includes results for UF6, UO2and fuel fabrication)
| | | | | | | | | | | | | | | | | | | | | | | | |
| | | THREE MONTHS
ENDED SEPTEMBER 30 | | | | | | NINE MONTHS
ENDED SEPTEMBER 30 | | | | |
HIGHLIGHTS | | 2013 | | | 2012 | | | CHANGE | | | 2013 | | | 2012 | | | CHANGE | |
Production volume (million kgU) | | | 2.6 | | | | 2.1 | | | | 24 | % | | | 12.2 | | | | 10.9 | | | | 12 | % |
Sales volume (million kgU) | | | 3.8 | | | | 3.3 | | | | 15 | % | | | 11.1 | | | | 10.4 | | | | 7 | % |
Average realized price ($Cdn/kgU) | | | 20.03 | | | | 17.35 | | | | 15 | % | | | 18.63 | | | | 18.08 | | | | 3 | % |
Average unit cost of sales ($Cdn/kgU) (including D&A) | | | 16.63 | | | | 16.74 | | | | (1 | )% | | | 15.58 | | | | 15.92 | | | | (2 | )% |
Revenue ($ millions) | | | 77 | | | | 58 | | | | 33 | % | | | 208 | | | | 188 | | | | 11 | % |
Gross profit ($ millions) | | | 13 | | | | 2 | | | | 550 | % | | | 34 | | | | 22 | | | | 55 | % |
Gross profit (%) | | | 17 | | | | 3 | | | | 467 | % | | | 16 | | | | 12 | | | | 33 | % |
THIRD QUARTER
Total revenue increased by 33% due to a 15% increase in realized price and a 15% increase in sales volumes.
The total cost of sales (including D&A) increased by 14% ($64 million compared to $56 million in the third quarter of 2012) mainly due to a 15% increase in sales volumes and differences in the mix of fuel services products sold.
The net effect was an $11 million increase in gross profit.
FIRST NINE MONTHS
In the first nine months of the year, total revenue increased by 11% due to a 7% increase in sales volumes and a 3% increase in realized price.
The total cost of sales (including D&A) increased by 5% ($174 million compared to $165 million in the third quarter of 2012), mainly due to a 7% increase in sales volume.
The net effect was a $12 million increase in gross profit.
18 CAMECO CORPORATION
NUKEM
| | | | | | | | | | | | | | | | | | | | | | | | |
| | | THREE MONTHS
ENDED SEPTEMBER 30 | | | | | | NINE MONTHS
ENDED SEPTEMBER 30 | | | | |
($ MILLIONS EXCEPT WHERE INDICATED) | | NUKEM | | | PURCHASE
ACCOUNTING | | | CONSOLIDATED | | | NUKEM | | | PURCHASE
ACCOUNTING | | | CONSOLIDATED | |
Uranium sales (million lbs) | | | 2.1 | | | | — | | | | 2.1 | | | | 5.6 | | | | — | | | | 5.6 | |
Revenue | | | 92 | | | | 1 | | | | 93 | | | | 283 | | | | (7 | ) | | | 276 | |
Cost of product sold (including D&A) | | | 71 | | | | 29 | | | | 100 | | | | 215 | | | | 60 | | | | 275 | |
Gross profit (loss) | | | 21 | | | | (28 | ) | | | (7 | ) | | | 68 | | | | (67 | ) | | | 1 | |
Net earnings | | | 13 | | | | (19 | ) | | | (6 | ) | | | 40 | | | | (46 | ) | | | (6 | ) |
Adjustments on derivatives1 | | | 1 | | | | — | | | | 1 | | | | (2 | ) | | | — | | | | (2 | ) |
NUKEM inventory writedown | | | — | | | | 11 | | | | 11 | | | | — | | | | 11 | | | | 11 | |
Adjusted net earnings1 | | | 14 | | | | (8 | ) | | | 6 | | | | 38 | | | | (35 | ) | | | 3 | |
Cash provided by operations | | | (91 | ) | | | — | | | | (91 | ) | | | (3 | ) | | | — | | | | (3 | ) |
| 1 | Adjustments relate to unrealized gains and losses on foreign currency forward sales contracts (non-IFRS measure, see page 8). |
On January 9, 2013, we acquired NUKEM for cash consideration of €107 million ($140 million (US)). We also assumed NUKEM’s net debt, which amounted to about €79 million ($104 million (US)).
In accordance with the terms of the purchase agreement, Cameco paid Advent additional consideration of €6,075,000 ($7,808,000), representing a share of NUKEM’s 2012 earnings. Following discussions with Advent, the earn-out provision has been terminated and there will be no additional payments related to the transaction.
For accounting purposes, the purchase price is allocated to the assets and liabilities acquired based on their fair values as of the acquisition date. The purchase price allocation is provided in the table below. We believe that these values are representative of the transaction; however, it is possible that the final allocation will differ.
Much of the purchase price was related to nuclear fuel inventories and the portfolio of sales and purchase contracts acquired. The amounts attributed to inventory and contracts were based on market values as at the acquisition date. They will be charged to earnings in the period(s) in which related transactions occur. The amount categorized as goodwill reflects the value assigned to the expected future earnings capabilities of the organization. This is the earnings potential that we anticipate will be realized through new business arrangements. Goodwill is not amortized and is tested for impairment at least annually.
PURCHASE PRICE ALLOCATION
| | | | |
| | | $US MILLIONS | |
Net assets | | | | |
Working capital | | | (22 | ) |
Inventory | | | 165 | |
Sales, purchase contracts and other intangibles | | | 88 | |
Goodwill | | | 88 | |
Debt | | | (117 | ) |
Deferred taxes | | | (54 | ) |
| | | | |
Net assets acquired | | | 148 | |
| | | | |
Financed by | | | | |
Cash | | | 140 | |
Additional consideration (earn-out provision) | | | 8 | |
| | | | |
Liabilities and equity | | | 148 | |
| | | | |
2013 THIRD QUARTER REPORT 19
THIRD QUARTER
During the third quarter of 2013, NUKEM delivered 2.1 million pounds of uranium. On a consolidated basis, NUKEM contributed $93 million in revenues and reduced gross profit by $7 million. Adjusted net earnings were $6 million (non-IFRS measure, see page 8). NUKEM’s contribution to our earnings is significantly impacted by our purchase price accounting. Excluding the impact of the purchase accounting and the inventory writedown, NUKEM’s adjusted net earnings (non-IFRS measure, see page 8) were $14 million for the quarter. During the quarter, NUKEM’s operating activities used $91 million in cash due to higher-than-usual working capital requirements. Approximately $70 million in cash was required for payment of uranium purchases from prior periods. In addition, the accounts receivable balance increased due to timing of deliveries.
During the quarter, we recorded a charge of $17 million ($11 million net of tax) against the carrying value of NUKEM’s uranium inventories. Uranium to be purchased under contractual fixed price arrangements and inventory on hand at the acquisition date were valued using the spot price at that time. The decline in the spot price in recent months has caused the carrying values of certain quantities to exceed their estimated realizable value by $17 million.
FIRST NINE MONTHS
During the first nine months of 2013, NUKEM delivered 5.6 million pounds of uranium. On a consolidated basis, NUKEM contributed $276 million in revenues and $1 million in gross profit. Adjusted net earnings were $3 million (non-IFRS measure, see page 8). NUKEM’s contribution to our earnings is significantly impacted by our purchase price accounting. Excluding the impact of the purchase accounting, NUKEM’s adjusted net earnings (non-IFRS measure, see page 8) were $38 million for the first nine months. NUKEM’s operating activities required the use of $3 million in cash during the first nine months. While adjusted earnings were positive at the NUKEM level, working capital requirements were substantial. Most notably, uranium inventories increased by about 2 million pounds to the end of September. Cash flows for the fourth quarter are projected to be in the range of $50 million to $70 million due to higher uranium deliveries and a drawdown of uranium inventories.
As noted above, much of the NUKEM purchase price was attributable to inventories and the portfolio of contracts. With respect to nuclear fuel inventories, amounts assigned were based on market values as of the date of acquisition. As these quantities are delivered to NUKEM’s customers, we will adjust the cost of product sold to reflect the values at the acquisition date, regardless of NUKEM’s historic costs.
As of the date of the purchase agreement, had NUKEM’s sales and purchase contracts been settled, it would have realized significant financial benefit. As a result, we paid a premium to acquire the portfolio. Accordingly, a portion of the purchase price has been attributed to the various contracts. In our accounting for NUKEM, we will amortize the amounts assigned to the portfolio in the periods in which NUKEM transacts under the relevant contracts. The net effect is a reduction in reported profit margins relative to NUKEM’s results. We expect the majority of the amount allocated to the contract portfolio will be amortized within two years.
20 CAMECO CORPORATION
Electricity
BPLP (100% – not prorated to reflect our 31.6% interest)
| | | | | | | | | | | | | | | | | | | | | | | | |
| HIGHLIGHTS | | THREE MONTHS
ENDED SEPTEMBER 30 | | | | | | NINE MONTHS
ENDED SEPTEMBER 30 | | | | |
($ MILLIONS EXCEPT WHERE INDICATED) | | 2013 | | | 2012 | | | CHANGE | | | 2013 | | | 2012 | | | CHANGE | |
Output - terawatt hours (TWh) | | | 6.9 | | | | 7.1 | | | | (3 | )% | | | 17.9 | | | | 19.6 | | | | (9 | )% |
Capacity factor (the amount of electricity the plants actually produced for sale as a percentage of the amount they were capable of producing) | | | 96 | % | | | 99 | % | | | (3 | )% | | | 83 | % | | | 92 | % | | | (10 | )% |
Realized price ($/MWh) | | | 55 | 1 | | | 54 | | | | 2 | % | | | 54 | 2 | | | 55 | 3 | | | (2 | )% |
Average Ontario electricity spot price ($/MWh) | | | 24 | | | | 28 | | | | (14 | )% | | | 26 | | | | 22 | | | | 18 | % |
Revenue | | | 392 | | | | 384 | | | | 2 | % | | | 987 | | | | 1,095 | | | | (10 | )% |
Operating costs (net of cost recoveries) | | | 187 | | | | 237 | | | | (21 | )% | | | 767 | | | | 709 | | | | 8 | % |
Cash costs | | | 129 | | | | 181 | | | | (29 | )% | | | 604 | | | | 545 | | | | 11 | % |
Non-cash costs | | | 58 | | | | 56 | | | | 4 | % | | | 163 | | | | 164 | | | | (1 | )% |
Income before interest and finance charges | | | 205 | | | | 147 | | | | 39 | % | | | 220 | | | | 386 | | | | (43 | )% |
Interest and finance charges | | | 2 | | | | 10 | | | | (80 | )% | | | 12 | | | | 20 | | | | (40 | )% |
Cash from operations | | | 126 | | | | 93 | | | | 35 | % | | | 467 | | | | 423 | | | | 10 | % |
Capital expenditures | | | 45 | | | | 52 | | | | (13 | )% | | | 180 | | | | 140 | | | | 29 | % |
Distributions | | | 105 | | | | 95 | | | | 11 | % | | | 205 | | | | 285 | | | | (28 | )% |
Capital calls | | | 12 | | | | 17 | | | | (29 | )% | | | 27 | | | | 50 | | | | (46 | )% |
| 1 | Based on actual generation of 6.9 TWh plus deemed generation of 0.2 TWh in the third quarter of 2013. |
| 2 | Based on actual generation of 17.9 TWh plus deemed generation of 0.4 TWh in the first nine months of 2013. |
| 3 | Based on actual generation of 19.6 TWh plus deemed generation of 0.4 TWh in the first nine months of 2012. |
OUR EARNINGS FROM BPLP
| | | | | | | | | | | | | | | | | | | | | | | | |
| HIGHLIGHTS | | THREE MONTHS
ENDED SEPTEMBER 30 | | | | | | NINE MONTHS
ENDED SEPTEMBER 30 | | | | |
($ MILLIONS EXCEPT WHERE INDICATED) | | 2013 | | | 2012 | | | CHANGE | | | 2013 | | | 2012 | | | CHANGE | |
BPLP’s earnings before taxes (100%) | | | 203 | | | | 137 | | | | 48 | % | | | 208 | | | | 366 | | | | (43 | )% |
Cameco’s share of pretax earnings before adjustments (31.6%) | | | 64 | | | | 43 | | | | 49 | % | | | 66 | | | | 116 | | | | (43 | )% |
Proprietary adjustments | | | (1 | ) | | | (1 | ) | | | — | | | | (4 | ) | | | (4 | ) | | | — | |
Earnings before taxes from BPLP | | | 63 | | | | 42 | | | | 50 | % | | | 62 | | | | 112 | | | | (45 | )% |
THIRD QUARTER
Total electricity revenue increased 2% this quarter due to a higher realized price. Realized prices reflect spot sales, revenue recognized under BPLP’s agreement with the OPA, and financial contract revenue. BPLP recognized revenue of $204 million this quarter under its agreement with the OPA, compared to $166 million in the third quarter of 2012. Gains on BPLP’s contract activity in the third quarter of 2013 were $20 million, compared to $21 million in the third quarter of 2012.
The capacity factor was 96% this quarter, down from 99% in the third quarter of 2012. There was one unplanned outage day in the quarter, compared to no outage days in the third quarter of 2012.
Operating costs this quarter were $187 million compared to $237 million in 2012 due to an adjustment to supplemental lease charges made in the third quarter of 2013, which occurred in the second quarter in 2012.
The result was $63 million in earnings before taxes (our share) in the third quarter of 2013 compared to $42 million in earnings before taxes in the third quarter of 2012.
2013 THIRD QUARTER REPORT 21
BPLP distributed $105 million to the partners in the third quarter. Our share was $33 million. BPLP capital calls to the partners in the third quarter were $12 million. Our share was $4 million. The partners have agreed that BPLP will distribute excess cash monthly, and will make separate cash calls for major capital projects.
FIRST NINE MONTHS
Total electricity revenue for the first nine months decreased 10% compared to 2012 due to lower output and a lower realized price. Realized prices reflect spot sales, revenue recognized under BPLP’s agreement with the OPA, and financial contract revenue. BPLP recognized revenue of $486 million in the first nine months of 2013 under its agreement with the OPA, compared to $575 million in the first nine months of 2012. Gains on BPLP’s contract activity in the first nine months of 2013 were $42 million, compared to $80 million in the same period last year.
The capacity factor was 83% for the first nine months of the year, down from 92% for the same period in 2012. There were 140 planned and 13 unplanned outage days in the first nine months of 2013, compared to 46 planned and 25 unplanned outage days in the first nine months of 2012.
Operating costs were $767 million compared to $709 million in 2012 due to higher maintenance costs incurred primarily as a result of more planned outage days than in 2012.
The result was $62 million in earnings before taxes (our share) in the first nine months of 2013 compared to $112 million in earnings before taxes in the first nine months of 2012.
BPLP distributed $205 million to the partners in the first nine months of 2013. Our share was $65 million. BPLP capital calls to the partners in the first nine months of the year were $27 million. Our share was $9 million. The partners have agreed that BPLP will distribute excess cash monthly, and will make separate cash calls for major capital projects.
22 CAMECO CORPORATION
Our operations and development project
Uranium – production overview
Production in our uranium segment this quarter was 0.5 million pounds higher compared to the third quarter of 2012. Production in the first nine months of the year was 0.8 million pounds higher than the same period in 2012. SeeUranium 2013 Q3 updatesstarting on page 25 for more information.
URANIUM PRODUCTION
| | | | | | | | | | | | | | | | | | | | | | | | |
CAMECO’S SHARE | | THREE MONTHS
ENDED
SEPTEMBER 30 | | | | | | NINE MONTHS
ENDED
SEPTEMBER 30 | | | | |
(MILLION LBS) | | 2013 | | | 2012 | | | CHANGE | | | 2013 | | | 2012 | | | CHANGE | |
McArthur River/Key Lake | | | 3.8 | | | | 3.8 | | | | — | | | | 10.1 | | | | 10.1 | | | | — | |
Rabbit Lake | | | 0.4 | | | | 0.3 | | | | 33 | % | | | 2.0 | | | | 2.1 | | | | (5 | )% |
Smith Ranch-Highland | | | 0.5 | | | | 0.3 | | | | 67 | % | | | 1.2 | | | | 0.8 | | | | 50 | % |
Crow Butte | | | 0.2 | | | | 0.2 | | | | — | | | | 0.5 | | | | 0.6 | | | | (17 | )% |
Inkai | | | 0.9 | | | | 0.7 | | | | 29 | % | | | 2.4 | | | | 1.8 | | | | 33 | % |
Total | | | 5.8 | | | | 5.3 | | | | 9 | % | | | 16.2 | | | | 15.4 | | | | 5 | % |
Outlook
In October, Talvivaara announced that its liquidity position had weakened more than anticipated and that it was undertaking an assessment of all available funding options to secure its financial flexibility. This announcement has created some uncertainty for us around the timing of production startup and length of the rampup period. We have invested a total of $70 million (US) in the uranium extraction process and construction is about 98% complete. We will monitor the situation very closely to determine if it will impact production startup in 2014 or our 2018 supply target. Our production decisions continue to be driven by profitability and are subject to market conditions.
CAMECO’S SHARE OF PRODUCTION – ANNUAL FORECAST TO 2017
| | | | | | | | | | | | | | | | | | | | |
CURRENT FORECAST (MILLION LBS) | | 2013 | | | 2014 | | | 2015 | | | 2016 | | | 2017 | |
McArthur River/Key Lake | | | 13.6 | | | | 13.1 | | | | 13.1 | | | | 13.1 | | | | 13.1 | |
Rabbit Lake | | | 4.2 | | | | 4.2 | | | | 4.2 | | | | 4.2 | | | | 4.2 | |
US ISR | | | 2.3 | | | | 2.9 | | | | 2.9 | | | | 3.0 | | | | 3.0 | |
Inkai1 | | | 2.9 | | | | 2.9 | | | | 2.9 | | | | 2.9 | | | | 2.9 | |
Cigar Lake2 | | | 0.0 | | | | 1.8 | | | | 5.5 | | | | 7.9 | | | | 8.2 | |
| | | | | | | | | | | | | | | | | | | | |
Total share of production2 | | | 23.0 | | | | 24.9 | | | | 28.6 | | | | 31.1 | | | | 31.4 | |
| | | | | | | | | | | | | | | | | | | | |
Cameco’s share of Inkai’s production on which profits are generated2,3 | | | | | | | | | | | | | | | | | | | | |
Inkai1 | | | 3.0 | | | | 3.0 | | | | 3.0 | | | | 3.0 | | | | 3.0 | |
| | | | | | | | | | | | | | | | | | | | |
Total2,3 | | | 23.1 | | | | 25.0 | | | | 28.7 | | | | 31.2 | | | | 31.5 | |
| | | | | | | | | | | | | | | | | | | | |
| 1 | In 2011, we signed a memorandum of agreement (2011 MOA) with Kazatomprom to increase annual production to 5.2 million pounds (100% basis). Under the 2011 MOA, we will have the right to purchase 2.9 million pounds of Inkai’s annual production and receive profits on 3.0 million pounds. |
| 2 | We have removed Cigar Lake production from our 2013 forecast; however, revisions to the rest of our five-year production forecast will be made as part of our annual reporting for 2013, when further progress on commissioning of the mine and mill has been made. |
| 3 | We have adjusted the production table to reflect the share of Inkai’s production we will use to calculate our profits under the 2011 MOA, as described in the note 1 above. |
Our 2013 and future annual production targets for Inkai assume, and we expect, that Inkai will obtain the necessary government permits and approvals to produce at an annual rate of 5.2 million pounds (100% basis), including an amendment to the resource use contract.
2013 THIRD QUARTER REPORT 23
There is no certainty Inkai will receive these permits or approvals. If Inkai does not, or if the permits and approvals are delayed, Inkai may be unable to achieve its 2013 and future annual production targets and we may have to re-categorize some of Inkai’s mineral reserves as resources.
This forecast is forward-looking information. It is based on the assumptions and subject to the material risks discussed on pages 2 and 3, and specifically on the assumptions and risks listed here. Actual production may be significantly different from this forecast.
Assumptions
| | • | | we achieve our forecast production for each operation, which requires, among other things, that our mining plans succeed, processing plants and equipment are available and function as expected, we have sufficient tailings capacity and our mineral reserve estimates are reliable |
| | • | | we obtain or maintain the necessary permits and approvals from government authorities |
| | • | | our production is not disrupted or reduced as a result of natural phenomena, labour disputes, political risks, blockades or other acts of social or political activism, shortage or lack of supplies critical to production, equipment failures or other development and operation risks |
Material risks that could cause actual results to differ materially
| | • | | we do not achieve forecast production levels for each operation because of a change in our mining plans, processing plants or equipment are not available or do not function as expected, lack of tailings capacity or for other reasons |
| | • | | we cannot obtain or maintain necessary permits or approvals from government authorities |
| | • | | natural phenomena, labour disputes (including an inability to renew agreements with unionized employees at McArthur River and Key Lake), political risks, blockades or other acts of social or political activism, shortage or lack of supplies critical to production, equipment failures or other development and operation risks disrupt or reduce our production |
24 CAMECO CORPORATION
Uranium 2013 Q3 updates
Operating properties
McArthur River/Key Lake
Production update
Production for the quarter and for the first nine months of 2013 was unchanged compared to the same periods last year. We expect our share of production this year to increase to 13.6 million pounds compared to our previous forecast of 13.2 million pounds U3O8.
Operations update
At McArthur River, we began freezing zone 4 north and plan to begin mining this zone in late 2014.
This quarter, the CNSC granted approval for the use of two secondary extraction methods: blasthole stoping and boxhole boring. Test programs for each method were completed in the first half of the year, and shown to be viable, economic options for mining ore on the periphery of the orebody, as well as in smaller, lower grade areas. As a result, we expect that these extraction methods will only be used in those limited situations to complement our primary extraction method of raiseboring.
On October 29, 2013, the CNSC granted a renewal of our McArthur River and Key Lake operating licences. The licence term is from November 1, 2013 to October 31, 2023.
Labour relations
The current collective agreements with unionized employees at McArthur River and Key Lake will expire on December 31, 2013. Bargaining is expected to begin on November 1, 2013. There is risk to production if we are unable to reach an agreement and a work stoppage occurs.
Rabbit Lake
Production update
Production was 33% higher in the third quarter and 5% lower for the first nine months compared to the same periods last year. This was a result of the timing of a scheduled mill maintenance shutdown and changes to the mill’s operating schedule, which are specifically planned and managed throughout the year to ensure the most efficient operation of the mill. As a result, we regularly experience large variations in mill production from quarter to quarter, but remain on track to achieve our annual production target for 2013.
On October 29, 2013, the CNSC granted a renewal of our Rabbit Lake operating licences. The licence term is from November 1, 2013 to October 31, 2023.
Smith Ranch-Highland and Crow Butte
Production update
At our US operations, production was 40% higher for the quarter and 21% higher for the first nine months of the year compared to the same periods in 2012. Higher production from Smith Ranch-Highland and initial production from the North Butte satellite operation contributed to the increase.
Our ability to bring new wellfields into production in both Wyoming and Nebraska continues to be affected by the lengthened review process to obtain regulatory approvals. The operating environment has become more complex as public interest and regulatory oversight has increased. As a result, we now expect our share of production this year to be 2.3 million pounds compared to our previous forecast of 2.6 million pounds U3O8.
Operations update
In the third quarter, our North Butte satellite continued to ramp up production and is on track to contribute approximately 300,000 pounds this year.
2013 THIRD QUARTER REPORT 25
Inkai
Production update
Production was 29% higher in the third quarter and 33% higher in the first nine months of 2013 compared to the same periods last year. We have continued to bring on new wellfields to maintain a higher head grade in the wellfield production mix, which has resulted in higher production for the third quarter and first nine months. The higher head grade and other improvements to the extraction processes allow the Inkai operation to produce at its design capacity of 5.2 million pounds per year.
Block 3 update
Due to contractor delays, we now expect to complete construction of the test leach facility and test wellfields, and to begin operating the test wellfields in 2014.
Development project
Cigar Lake
Production update
On September 9, 2013, we announced that during the commissioning of the underground ore handling facilities, we identified corrective work that needed to be done to ensure the mine would operate at the high level of safety and efficiency we require. The resulting schedule change delayed our target to bring the mine into production in 2013, which we now expect during the first quarter of 2014. Additionally, AREVA has advised us that the basic engineering to address the hydrogen issue in the leaching circuit of the McClean Lake mill has been completed, and work is in progress to finalize schedule and cost estimates. Detailed engineering has started, as well as the procurement of long lead time items. The mill is expected to begin processing Cigar Lake ore by the end of the second quarter of 2014.
As a result, we have removed Cigar Lake production from our 2013 forecast; however, revisions, if any, to the rest of our five-year production forecast will be made as part of our annual reporting for 2013, when further progress on commissioning of the mine and mill has been made.
Operations update
We continued to make progress at Cigar Lake in the third quarter. Work to install the steel liners and prepare the north and south run-of-mine (ROMs) systems for operation is essentially complete and on schedule for production in the first quarter of 2014. Installation of the remaining underground and surface infrastructure required to begin jet boring in ore is substantially complete. We have begun jet boring in a waste cavity as part of the commissioning process, and commissioning of the underground processing systems is progressing well.
Fuel services 2013 Q3 updates
Port Hope conversion services
Cameco Fuel Manufacturing Inc.
Springfields Fuels Ltd. (SFL)
Production update
Fuel services produced 2.6 million kgU in the third quarter, 24% higher than the same period last year. Production for the first nine months of the year was 12.2 million kgU, 12% higher compared to last year. Production remains on track for the year.
26 CAMECO CORPORATION
Qualified persons
The technical and scientific information discussed in this MD&A for our material properties (McArthur River/Key Lake, Inkai and Cigar Lake) was approved by the following individuals who are qualified persons for the purposes of NI 43-101:
McArthur River/Key Lake
| | • | | David Bronkhorst, vice-president, Saskatchewan mining south, Cameco Les |
Yesnik, general manager, Key Lake, Cameco
Cigar Lake
| • | | Scott Bishop, principal mine engineer, technical services, Cameco |
Inkai
| | • | | Ken Gullen, technical director, international, Cameco |
Additional information
Critical accounting estimates
Due to the nature of our business, we are required to make estimates that affect the amount of assets and liabilities, revenues and expenses, commitments and contingencies we report. We base our estimates on our experience, our best judgment, guidelines established by the Canadian Institute of Mining, Metallurgy and Petroleum and on assumptions we believe are reasonable.
Controls and procedures
As of September 30, 2013, we carried out an evaluation under the supervision and with the participation of our management, including our chief executive officer (CEO) and chief financial officer (CFO), of the effectiveness of our disclosure controls and procedures. There are inherent limitations to the effectiveness of any system of disclosure controls and procedures, including the possibility of human error and the circumvention or overriding of the controls and procedures. Accordingly, even effective disclosure controls and procedures can only provide reasonable assurance of achieving their control objectives.
Based upon that evaluation and as of September 30, 2013, the CEO and CFO concluded that:
| | • | | the disclosure controls and procedures were effective to provide reasonable assurance that information required to be disclosed in the reports we file and submit under applicable securities laws is recorded, processed, summarized and reported as and when required |
| | • | | such information is accumulated and communicated to our management, including our CEO and CFO, as appropriate to allow timely decisions regarding required disclosure |
There has been no change in our internal control over financial reporting during the quarter ended September 30, 2013 that has materially affected, or is reasonably likely to materially affect, our internal control over financial reporting.
Management has excluded NUKEM from its assessment of internal control over financial reporting as of September 30, 2013 because we acquired NUKEM in 2013. The total assets and total revenues of NUKEM represented approximately 7% and 19%, respectively, of our consolidated financial statement amounts as of and for the quarter ended September 30, 2013.
New Bylaws
Our board has approved new bylaws for the corporation, which are now in effect, to replace the 2002 corporate bylaws. Our shareholders will be asked to approve these bylaws at our 2014 annual and special meeting of shareholders. The new bylaws reflect our current practices and recommended best practices, and include an advance notice bylaw and an enhanced quorum bylaw. The new bylaws will be available on our website, SEDAR and EDGAR.
The advance notice bylaw provides a transparent, structured and fair process for nominating directors under which all shareholders, whether voting by proxy or attending a meeting to elect directors, are made aware of potential proxy contests in advance of the meeting. Among other things, the advance notice bylaw fixes a deadline by which nominations for directors must be submitted to the corporation prior to any meeting of
2013 THIRD QUARTER REPORT 27
shareholders. We believe our shareholders should be given sufficient information and time to make appropriate decisions on the election of board representatives.
The enhanced quorum bylaw requires that at least two persons holding or representing by proxy at least a majority of our common shares issued and outstanding be present at any meeting where a shareholder proposes to replace half or more of our board of directors before the meeting can be held and business validly transacted. We believe participation by our shareholders in electing a board is very important in circumstances that may change how our corporation is managed.
New standards and interpretations
We were required to apply the following new standards and amendments to existing standards for our accounting periods beginning on or after January 1, 2013, unless otherwise noted. These standards did not have a material impact on the financial statements.
| | • | | IFRS 7 Financial Instruments: Disclosures |
| | • | | IFRS 10 Consolidated Financial Statements |
| | • | | IFRS 12 Disclosure of Interests in Other Entities |
| | • | | IFRS 13 Fair Value Measurement |
| | • | | IAS 1Presentation of Financial Statements (effective for annual periods beginning on or after July 1, 2012) |
In addition, the following two accounting changes required a restatement of prior period results:
| | • | | IFRS 11 Joint Arrangements (IFRS 11) - Under IFRS 11, we classify our interests in joint arrangements as either joint operations or joint ventures depending on our rights to the assets and obligations for the liabilities of the arrangements, the legal form of any separate vehicles, the contractual terms of the arrangements and other facts and circumstances. In accordance with IFRS 11, we have re-evaluated our involvement in joint arrangements at January 1, 2013 and as a result, we have changed our classification conclusion with respect to our investment in BPLP and have determined that our investment should be classified as a joint venture. Accordingly, we applied equity accounting to the investment commencing on January 1, 2013. Previously, the investee was accounted for as a jointly controlled entity using the proportionate consolidation method. |
| | • | | RevisedIAS 19 Employee Benefits (IAS 19R) - The revisions to IAS 19 have accelerated the recognition of past service costs and replaced interest cost and expected return on plan assets with a measure of net interest on the defined benefit asset or liability. In addition, IAS 19R has resulted in a change in the accounting for both plan administration costs and assets earning no return in refundable tax accounts. These revisions have resulted in adjustments to both our and BPLP’s defined benefit obligation balances. The adoption of this revised standard did not have a material impact on our financial statements. |
Refer to our 2012 Annual MD&A for a description of each of the above accounting standards and amendments to existing standards.
A number of new standards, interpretations and amendments to existing standards are not yet effective for the year ended December 31, 2013, and have not been applied in preparing these consolidated financial statements. The following standards, amendments to and interpretations of existing standards have been published and are mandatory for our accounting periods beginning on January 1, 2014, unless otherwise noted.
| | • | | IFRS 9, Financial Instruments (IFRS 9) -In October 2010, the International Accounting Standards Board (IASB) issued IFRS 9. This standard is part of a wider project to replace IAS 39,Financial Instruments: Recognition and Measurement(IAS 39). IFRS 9 replaces the current multiple classification and measurement models for financial assets and liabilities with a single model that has only two classification categories: amortized cost and fair value. The basis of classification depends on the entity’s business model and the contractual cash flow characteristics of the financial asset or liability. The guidance in IAS 39 on impairment of financial assets and hedge accounting continues to apply. IFRS 9 is effective for annual periods beginning on or after January 1, 2015, with early adoption permitted. We do not intend to early adopt IFRS 9. The extent of the impact of adoption of IFRS 9 has not yet been determined. |
| | • | | IAS 32, Financial Instruments: Presentation (IAS 32) -In December 2011, the IASB issued an amendment to IAS 32. The amendment clarifies matters regarding offsetting financial assets and financial liabilities as well as related disclosure requirements and is to be applied retrospectively. We do not expect the amendments to have a material impact on the financial statements. |
28 CAMECO CORPORATION
| | • | | IFRIC 21, Levies (IFRIC 21) -In May 2013, the IASB issued International Financial Reporting Interpretations Committee (IFRIC) 21,Levies.IFRIC 21 is to be applied retrospectively. IFRIC 21 provides guidance on accounting for levies in accordance with IAS 37,Provisions, Contingent Liabilities and Contingent Assets.The interpretation defines a levy as an outflow from an entity imposed by a government in accordance with legislation and confirms that an entity recognizes a liability for a levy only when the triggering event specified in the legislation occurs. The extent of the impact of IFRIC 21 has not yet been determined. |
| | • | | IAS 36 Impairment of Assets (IAS 36) - In May 2013, the IASB issued amendments to IAS 36 Impairment of Assets. The amendments are to be applied retrospectively. The amendments reverse the unintended requirement in IFRS 13,Fair Value Measurement to disclose the recoverable amount of every cash-generating unit to which significant goodwill or indefinite-lived intangible assets have been allocated. Under these amendments, the recoverable amount is required to be disclosed only when an impairment loss has been recognized or reversed. We do not expect the amendments to have a material impact on the financial statements. |
2013 THIRD QUARTER REPORT 29