Exhibit 99.1
Analyst Conference
April 2005
Legal Disclaimer
This presentation may contain statements about future events and Energy Transfer Partners, L.P.’s (“Energy Transfer”, the “Partnership” or “ETP”) outlook and expectations, which are forward-looking statements. Any statement in this presentation that is not a historical fact may be deemed to be a forward-looking statement. These forward-looking statements rely on a number of assumptions concerning future events and are subject to a number of uncertainties and factors, many of which are outside Energy Transfer’s control, and which could cause Energy Transfer’s actual results, performance or achievements to be materially different. While Energy Transfer believes that the assumptions concerning future events are reasonable, it cautions that there are inherent difficulties in predicting certain important factors that could impact the future performance or results of its business.
These risks and uncertainties are discussed in more detail in Energy Transfer’s filings with the Securities and Exchange Commission, copies of which are available to the public. Energy Transfer expressly disclaims any intention or obligation to revise or update any forward- looking statements whether as a result of new information, future events, or otherwise.
2
Agenda
Recent Developments/ Asset Update Texas Natural Gas Supply/ Demand Internal Growth Financial Review
3
Recent Developments/Asset Update
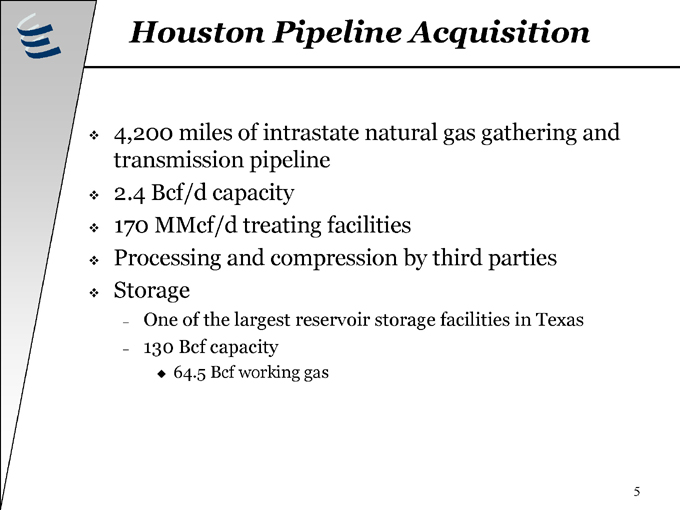
Houston Pipeline Acquisition
4,200 miles of intrastate natural gas gathering and transmission pipeline 2.4 Bcf/d capacity 170 MMcf/d treating facilities Processing and compression by third parties Storage
One of the largest reservoir storage facilities in Texas 130 Bcf capacity
64.5 Bcf working gas
5
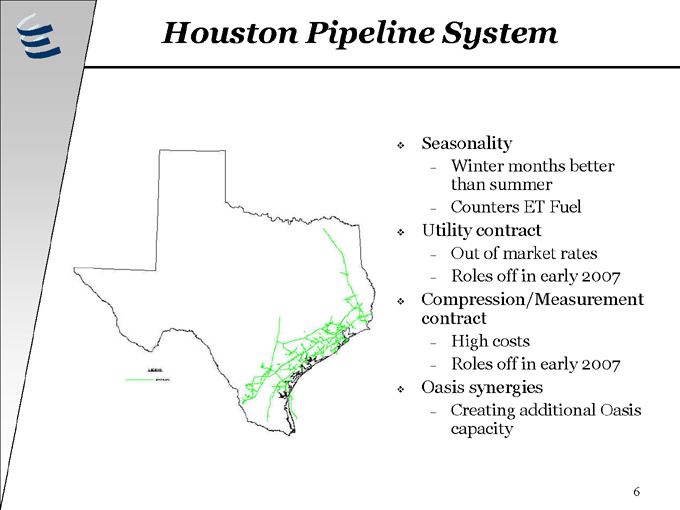
Houston Pipeline System
Seasonality
Winter months better than summer
Counters ET Fuel
Utility contract
Out of market rates
Roles off in early 2007
Compression/Measurement contract
High costs
Roles off in early 2007
Oasis synergies
Creating additional Oasis capacity
6
Elk City Sale
Purchase Price - $190 million – 100% Cash > 10x LTM EBITDA
Use of Proceeds – Debt Pay down from HPL Acquisition Increased Focus on Core Assets Increases overall fee-based cash flow
Most volatile ETP business segment
Effective Alternative to Equity Issuance Closing upon regulatory approval
HSR filed March 15, 2005
7
Propane
8
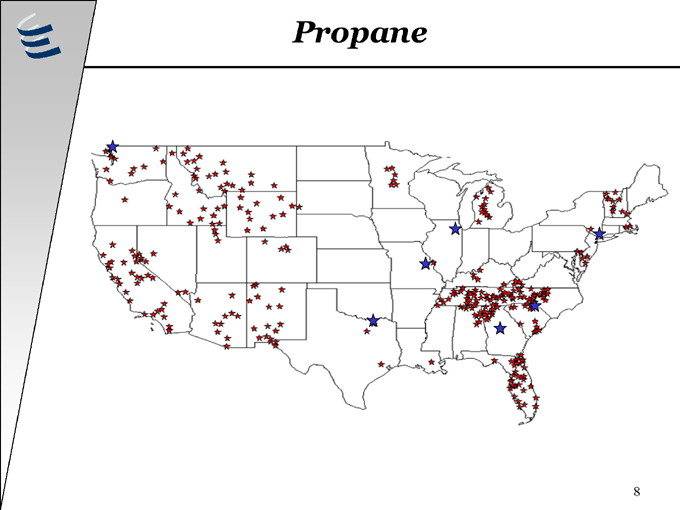
Propane
Trends
Warm weather
Increased gross margins
Increased cost of tanks, vehicles and propane
Acquisitions
Bifurcated purchase multiples
Fiscal 2006 (full 12 months activity for purchases in FY 2005) Gallons = 10.6 million EBITDA projection = $2 million Purchase multiple = 5.3X EBITDA
9
Other Assets
ET Fuel (TUFCO)
FW Basin expansions Measurement improvements
SETPS
Increasing volumes
Bossier/ East Texas
Bullish producer estimates/ activity require expansions Approaching current capacity
Additional compression to be installed
Lower Bossier trend
Recently installed treating facility (150 MMcf/d capacity)
10
Texas Natural Gas Supply/Demand
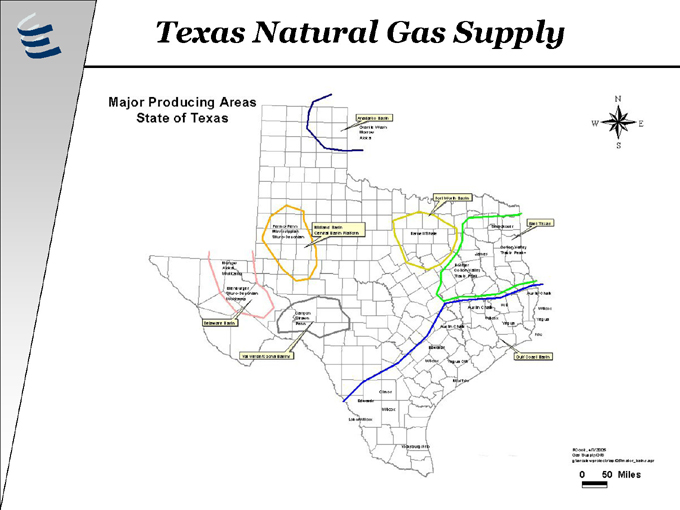
Texas Natural Gas Supply
Major Producing Areas State of Texas
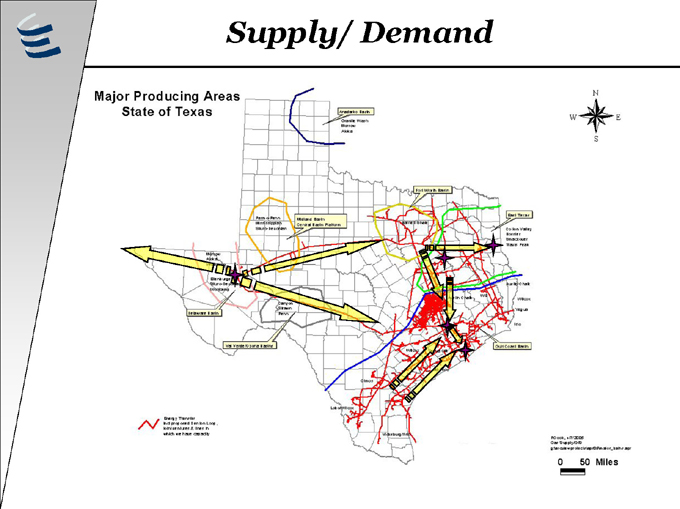
Supply/ Demand
Major Producing Areas State of Texas
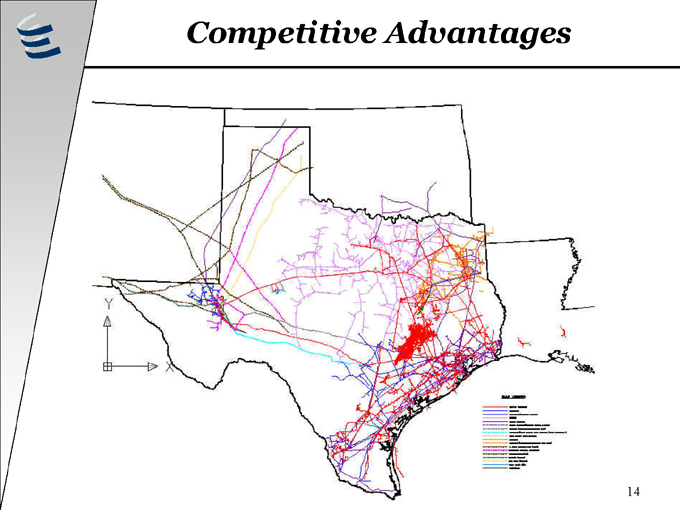
Competitive Advantages
14
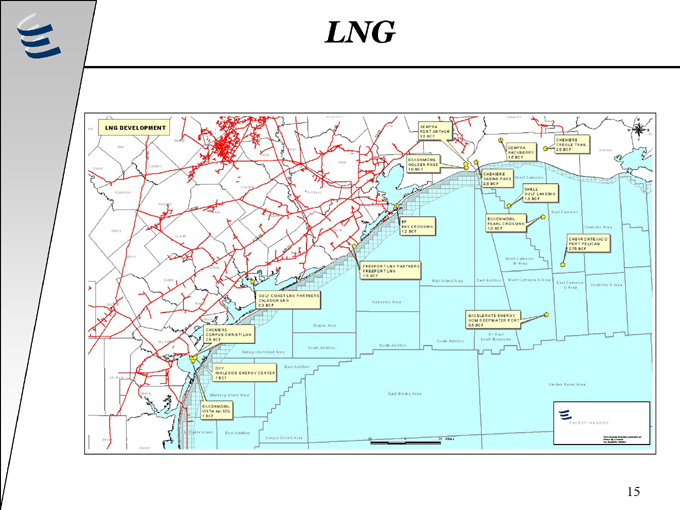
LNG
15
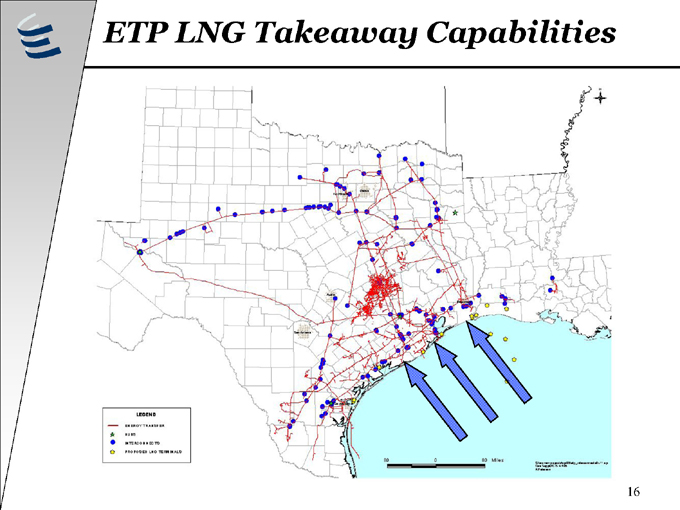
ETP LNG Takeaway Capabilities
16
Internal Growth
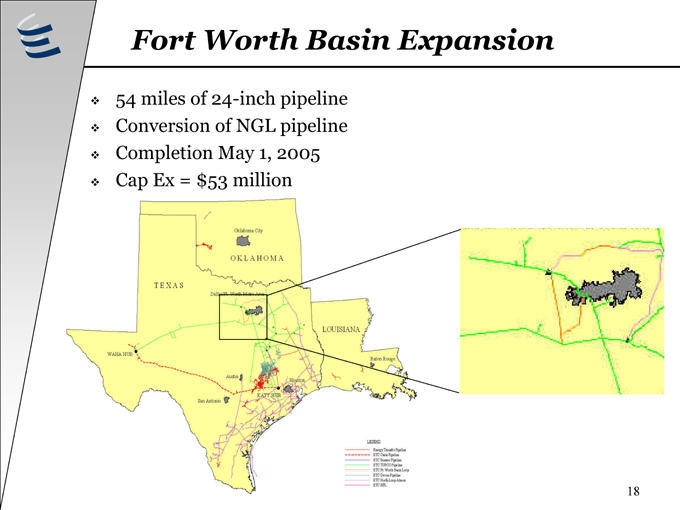
Fort Worth Basin Expansion
54 miles of 24-inch pipeline Conversion of NGL pipeline Completion May 1, 2005 Cap Ex = $53 million
18
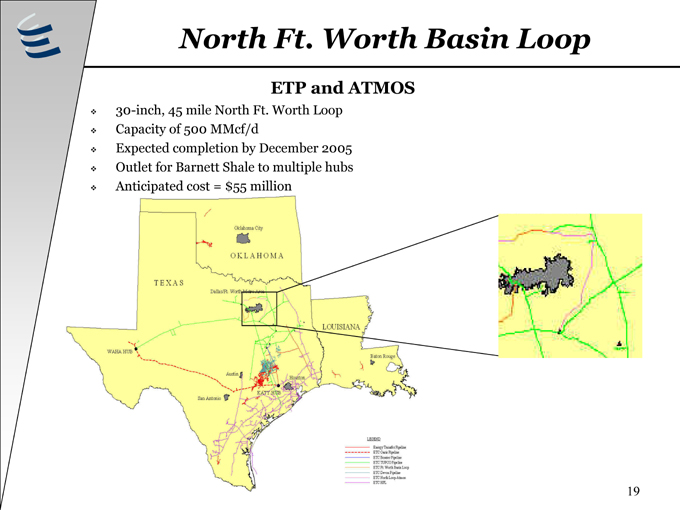
North Ft. Worth Basin Loop
ETP and ATMOS
30-inch, 45 mile North Ft. Worth Loop Capacity of 500 MMcf/d Expected completion by December 2005 Outlet for Barnett Shale to multiple hubs Anticipated cost = $55 million
19
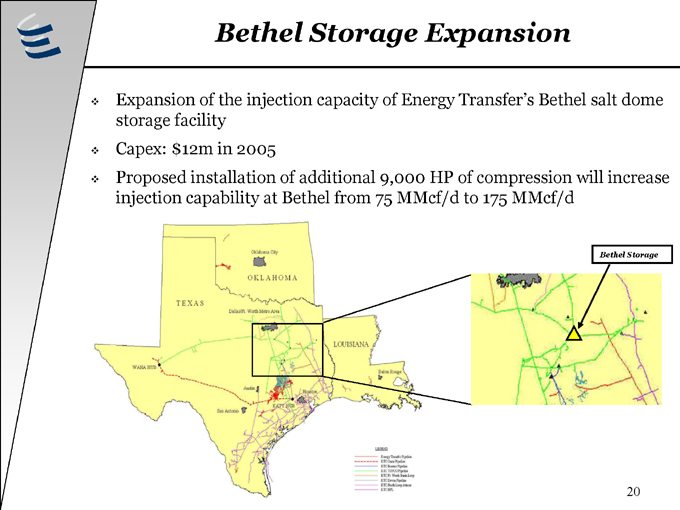
Bethel Storage Expansion
Expansion of the injection capacity of Energy Transfer’s Bethel salt dome storage facility Capex: $12m in 2005 Proposed installation of additional 9,000 HP of compression will increase injection capability at Bethel from 75 MMcf/d to 175 MMcf/d
Bethel Storage
20

Bossier to Bethel Pipeline Expansion
Will connect Bethel Salt Dome Storage Facility (part of TUFCO system) with the recently constructed Bossier Pipeline 39 miles Adds direct access to Katy hub from Bethel
Increases the value of the Bethel storage capacity
21
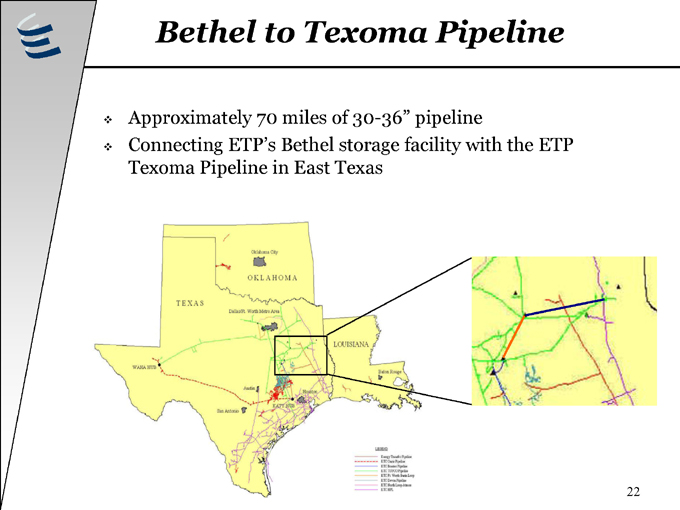
Bethel to Texoma Pipeline
Approximately 70 miles of 30-36” pipeline
Connecting ETP’s Bethel storage facility with the ETP Texoma Pipeline in East Texas
22
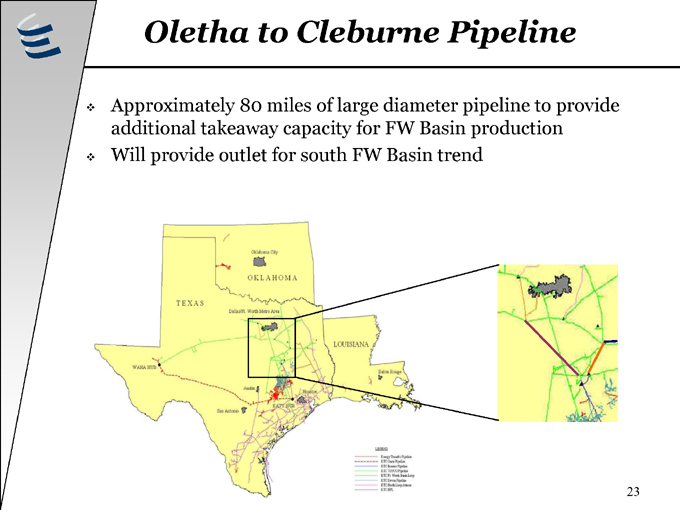
Oletha to Cleburne Pipeline
Approximately 80 miles of large diameter pipeline to provide additional takeaway capacity for FW Basin production Will provide outlet for south FW Basin trend
23
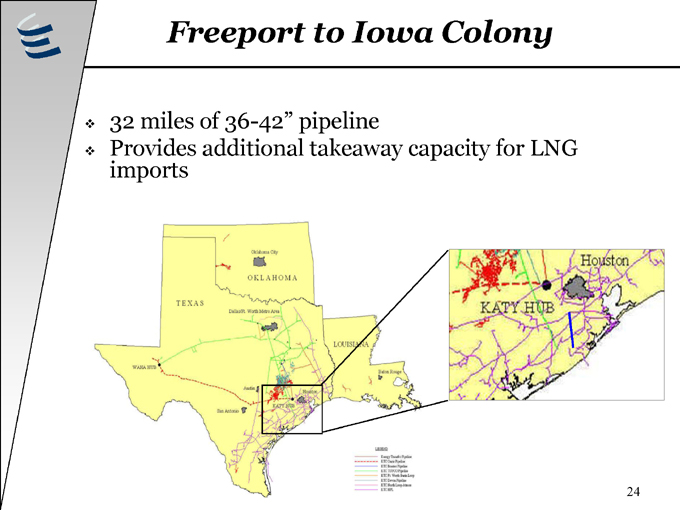
Freeport to Iowa Colony
32 miles of 36-42” pipeline
Provides additional takeaway capacity for LNG imports
24
Financial Review
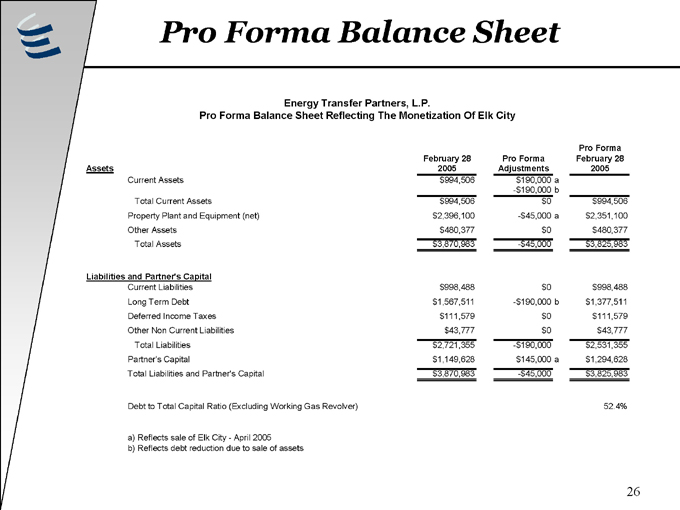
Pro Forma Balance Sheet
Energy Transfer Partners, L.P.
Pro Forma Balance Sheet Reflecting The Monetization Of Elk City
Pro Forma
February 28 2005 Pro Forma Adjustments February 28 2005
Assets
Current Assets $994,506 $190,000 a
-$190,000 b
Total Current Assets $994,506 $0 $994,506
Property Plant and Equipment (net) $2,396,100 - $45,000 a $2,351,100
Other Assets $480,377 $0 $480,377
Total Assets $3,870,983 - $45,000 $3,825,983
Liabilities and Partner’s Capital
Current Liabilities $998,488 $0 $998,488
Long Term Debt $1,567,511 - -$190,000 b $1,377,511
Deferred Income Taxes $111,579 $0 $111,579
Other Non Current Liabilities $43,777 $0 $43,777
Total Liabilities $2,721,355 -$190,000 $2,531,355
Partner’s Capital $1,149,628 $145,000 a $1,294,628
Total Liabilities and Partner’s Capital $3,870,983 - $45,000 $3,825,983
Debt to Total Capital Ratio (Excluding Working Gas Revolver) 52.4%
a) Reflects sale of Elk City—April 2005 b) Reflects debt reduction due to sale of assets
26
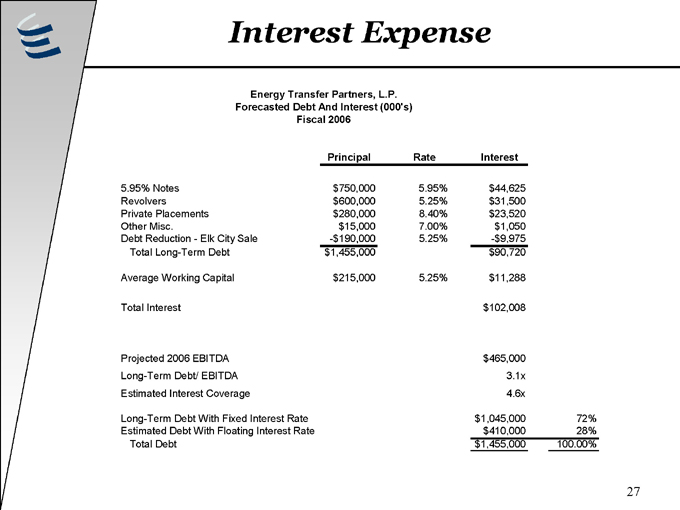
Interest Expense
Energy Transfer Partners, L.P. Forecasted Debt And Interest (000’s) Fiscal 2006
Principal Rate Interest
5.95% Notes $750,000 5.95% $44,625
Revolvers $600,000 5.25% $31,500
Private Placements $280,000 8.40% $23,520
Other Misc. $15,000 7.00% $1,050
Debt Reduction - Elk City Sale - $190,000 5.25% - $9,975
Total Long-Term Debt $1,455,000 $90,720
Average Working Capital $215,000 5.25% $11,288
Total Interest $102,008
Projected 2006 EBITDA $465,000
Long-Term Debt/ EBITDA 3.1x
Estimated Interest Coverage 4.6x
Long-Term Debt With Fixed Interest Rate $1,045,000 72%
Estimated Debt With Floating Interest Rate $410,000 28%
Total Debt $1,455,000 100.00%
27
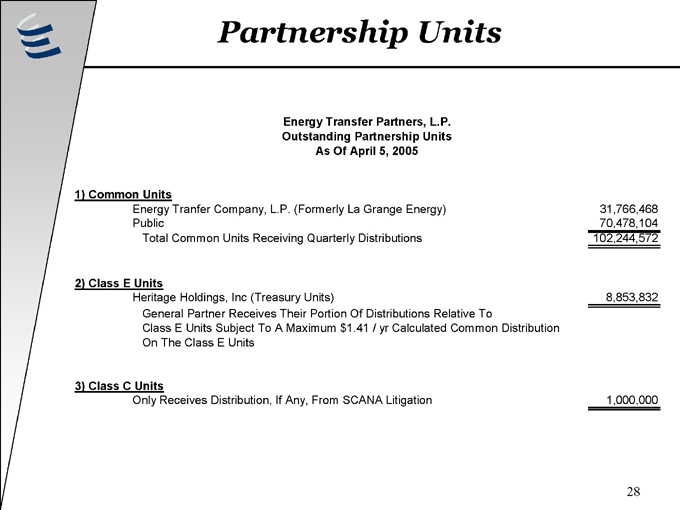
Partnership Units
Energy Transfer Partners, L.P. Outstanding Partnership Units As Of April 5, 2005
1) Common Units
Energy Tranfer Company, L.P. (Formerly La Grange Energy) 31,766,468
Public 70,478,104
Total Common Units Receiving Quarterly Distributions 102,244,572
2) Class E Units
Heritage Holdings, Inc (Treasury Units) 8,853,832
General Partner Receives Their Portion Of Distributions Relative To
Class E Units Subject To A Maximum $1.41 / yr Calculated Common Distribution
On The Class E Units
3) Class C Units
Only Receives Distribution, If Any, From SCANA Litigation 1,000,000
28
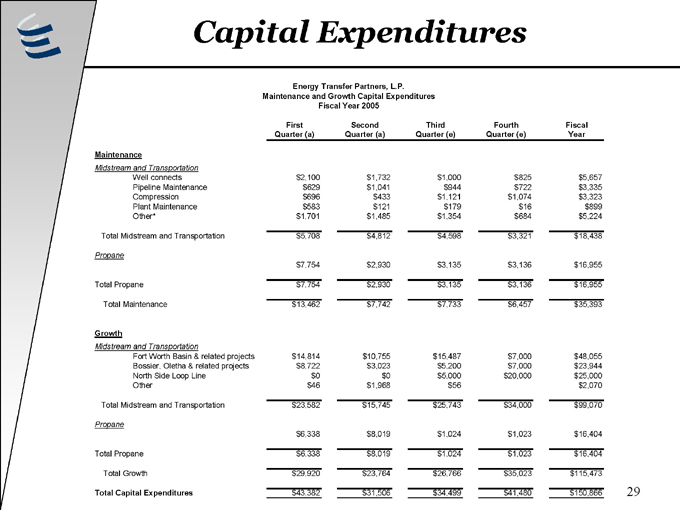
Capital Expenditures
Energy Transfer Partners, L.P. Maintenance and Growth Capital Expenditures Fiscal Year 2005
First Second Third Fourth Fiscal
Quarter (a) Quarter (a) Quarter (e) Quarter (e) Year
Maintenance
Midstream and Transportation
Well connects $2,100 $1,732 $1,000 $825 $5,657
Pipeline Maintenance $629 $1,041 $944 $722 $3,335
Compression $696 $433 $1,121 $1,074 $3,323
Plant Maintenance $583 $121 $179 $16 $899
Other* $1,701 $1,485 $1,354 $684 $5,224
Total Midstream and Transportation $5,708 $4,812 $4,598 $3,321 $18,438
Propane
$7,754 $2,930 $3,135 $3,136 $16,955
Total Propane $7,754 $2,930 $3,135 $3,136 $16,955
Total Maintenance $13,462 $7,742 $7,733 $6,457 $35,393
Growth
Midstream and Transportation
Fort Worth Basin & related projects $14,814 $10,755 $15,487 $7,000 $48,055
Bossier, Oletha & related projects $8,722 $3,023 $5,200 $7,000 $23,944
North Side Loop Line $0 $0 $5,000 $20,000 $25,000
Other $46 $1,968 $56 $2,070
Total Midstream and Transportation $23,582 $15,745 $25,743 $34,000 $99,070
Propane
$6,338 $8,019 $1,024 $1,023 $16,404
Total Propane $6,338 $8,019 $1,024 $1,023 $16,404
Total Growth $29,920 $23,764 $26,766 $35,023 $115,473
Total Capital Expenditures $43,382 $31,506 $34,499 $41,480 $150,866
29
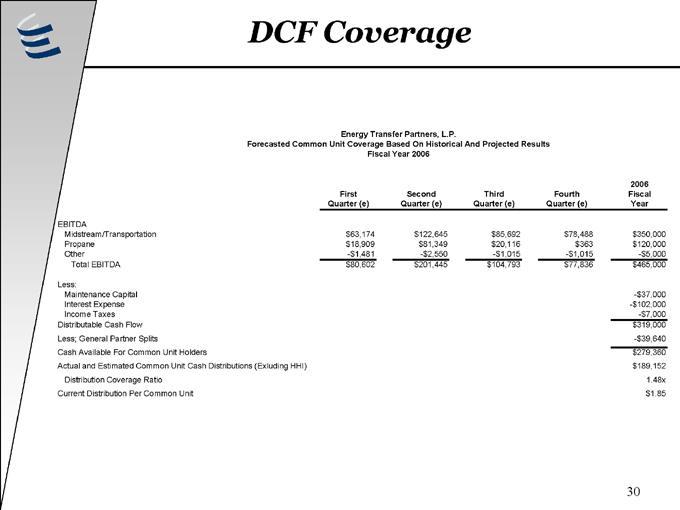
DCF Coverage
Energy Transfer Partners, L.P.
Forecasted Common Unit Coverage Based On Historical And Projected Results Fiscal Year 2006
First Quarter (e) Second Quarter (e) Third Quarter (e) Fourth Quarter (e) 2006 Fiscal Year
EBITDA
Midstream/Transportation $ 63,174 $ 122,645 $ 85,692 $ 78,488 $ 350,000
Propane $ 18,909 $ 81,349 $ 20,116 $ 363 $ 120,000
Other -$ 1,481 -$ 2,550 -$ 1,015 - $ 1,015 - $ 5,000
Total EBITDA $ 80,602 $ 201,445 $ 104,793 $ 77,836 $ 465,000
Less:
Maintenance Capital - $ 37,000
Interest Expense -$ 102,000
Income Taxes - $ 7,000
Distributable Cash Flow $ 319,000
Less; General Partner Splits - $ 39,640
Cash Available For Common Unit Holders $ 279,360
Actual and Estimated Common Unit Cash Distributions (Exluding HHI) $ 189,152
Distribution Coverage Ratio 1.48x
Current Distribution Per Common Unit $1.85
30
Investment Highlights
Successful acquisition track record
Significant internal growth projects at attractive multiples Healthy common unit coverage Strong balance sheet positioned for internal growth and acquisitions Management philosophy to minimize common unit dilution by reinvesting distributable cash flow Strong entrepreneurial management with low cost structure Significant LP ownership by management
31