UNITED STATES
SECURITIES AND EXCHANGE COMMISSION
Washington, D.C. 20549
FORM 10-K
(Mark one)
☒ ANNUAL REPORT PURSUANT TO SECTION 13 OR 15(d) OF THE SECURITIES EXCHANGE ACT OF 1934
For the fiscal year ended December 31, 2024
OR
☐ TRANSITION REPORT PURSUANT TO SECTION 13 OR 15(d) OF THE SECURITIES EXCHANGE ACT OF 1934
For the transition period from to
Commission file number 0-21423
BJ’S RESTAURANTS, INC.
(Exact name of registrant as specified in its charter)
| |
California | 33-0485615 |
(State or other jurisdiction of incorporation or organization) | (I.R.S. Employer Identification Number) |
7755 Center Avenue, Suite 300
Huntington Beach, California 92647
(714) 500-2400
(Address, including zip code, and telephone number, including
area code, of registrant’s principal executive offices)
Securities registered pursuant to Section 12(b) of the Act:
| | | | |
Title of Each Class | | Trading Symbol | | Name of each Exchange on Which Registered |
Common Stock, No Par Value | | BJRI | | NASDAQ Global Select Market |
Securities registered pursuant to Section 12(g) of the Act:
None
Indicate by check mark whether the registrant is a well-known seasoned issuer, as defined in Rule 405 of the Securities Act. Yes ☒ No ☐
Indicate by check mark if the registrant is not required to file reports pursuant to Section 13 or Section 15(d) of the Act. Yes ☐ No ☒
Indicate by check mark whether the Registrant (1) has filed all reports required to be filed by Section 13 or 15(d) of the Securities Exchange Act of 1934 during the preceding 12 months (or for such shorter period that the Registrant was required to file such reports), and (2) has been subject to such filing requirements for the past 90 days. Yes ☒ No ☐
Indicate by check mark whether the registrant has submitted electronically every Interactive Data File required to be submitted pursuant to Rule 405 of Regulation S-T (Section 232.405 of this chapter) during the preceding 12 months (or for such shorter period that the registrant was required to submit such files). Yes ☒ No ☐
Indicate by check mark whether the registrant is a large accelerated filer, an accelerated filer, a non-accelerated filer, a smaller reporting company, or an emerging growth company. See the definitions of “large accelerated filer,” “accelerated filer,” “smaller reporting company,” and “emerging growth company” in Rule 12b-2 of the Exchange Act.
| | | | | | |
Large accelerated filer |
| ☒ | Accelerated filer | ☐ | | |
| | | | | | |
Non-accelerated filer |
| ☐ | Smaller reporting company | ☐ |
| |
Emerging growth company |
| ☐ |
If an emerging growth company, indicate by check mark if the registrant has elected not to use the extended transition period for complying with any new or revised financial accounting standards provided pursuant to Section 13(a) of the Exchange Act. ☐
Indicate by check mark whether the registrant has filed a report on and attestation to its management’s assessment of the effectiveness of its internal control over financial reporting under Section 404(b) of the Sarbanes-Oxley Act (15 U.S.C. 7262(b)) by the registered public accounting firm that prepared or issued its audit report. ☒
If securities are registered pursuant to Section 12(b) of the Act, indicate by check mark whether the financial statements of the registrant included in the filing reflect the correction of an error to previously issued financial statements. ☐
Indicate by check mark whether any of those error corrections are restatements that required a recovery analysis of incentive-based compensation received by any of the registrant's executive officers during relevant recovery period pursuant to Section 240.10D-1(b). ☐
Indicate by check mark whether the registrant is a shell company (as defined in Rule 12b-2 of the Act). Yes ☐ No ☒
The aggregate market value of the common stock of the Registrant (“Common Stock”) held by non-affiliates as of the last business day of the second fiscal quarter, July 2, 2024, was $832,760,699, calculated based on the closing price of our common stock as reported by the NASDAQ Global Select Market on such date.
As of February 24, 2025, 22,718,160 shares of the common stock of the Registrant were outstanding.
DOCUMENTS INCORPORATED BY REFERENCE
Certain portions of the following documents are incorporated by reference into Part III of this Form 10-K: The Registrant’s Proxy Statement for the Annual Meeting of Shareholders to be held on June 12, 2025.
Auditor Name: KPMG LLP Auditor Location: Los Angeles, California Auditor Firm ID: 185
INDEX
BJ’S RESTAURANTS, INC.
PART I
Unless the context indicates otherwise, when we use the words “BJ’s,” “the Company,” “we,” “us” or “our” in this Form 10-K, we are referring to BJ’s Restaurants, Inc., a California corporation, and its subsidiaries.
Cautionary Statement Regarding Forward-Looking Statements
Information and statements contained in this Form 10-K, in our other filings with the Securities and Exchange Commission (“SEC”), or in our written and verbal communications that are not historical facts are forward-looking statements within the meaning of Section 27A of the Securities Act of 1933 and Section 21E of the Securities Exchange Act of 1934. Words or phrases such as “believe,” “plan,” “will likely result,” “expect,” “intend,” “will continue,” “is anticipated,” “estimate,” “project,” “may,” “could,” “would,” “should” and similar expressions that convey uncertainty about future events or outcomes in this Form 10-K are intended to identify “forward-looking” statements. A forward-looking statement is neither a prediction nor a guarantee of future events or circumstances, and those future events or circumstances may not occur.
Forward-looking statements involve risks and uncertainties that could cause actual results to differ materially from those set forth in or implied by such forward-looking statements. The risks described in this Form 10-K are not the only risks we face. New risks and uncertainties arise from time to time and we cannot predict those events or how they may affect us. There may be other risks and uncertainties that are not currently known by us or that are currently deemed by us to be immaterial. However, they may ultimately have a material adverse effect on our business, financial condition and/or operating results. We do not have any obligation to modify or revise any “forward-looking” statement to take into account or otherwise reflect subsequent events or circumstances arising after the date that the “forward-looking” statement was made. For further information regarding the risks and uncertainties that may affect our future results, please review the information set forth below under “Item 1A. Risk Factors.”
FISCAL PERIODS USED IN THIS FORM 10-K
Throughout this Form 10-K, our fiscal years ended December 31, 2024, January 2, 2024, and January 3, 2023, are referred to as fiscal years 2024, 2023, and 2022, respectively. Our fiscal years consist of 52 or 53 weeks and end on the Tuesday closest to December 31. All fiscal years presented in this Form 10-K, with the exception of fiscal year 2022, consisted of 52 weeks. Additionally, all quarters, with the exception of the fourth quarter in fiscal year 2022, consisted of 13 weeks. Fiscal year 2022 consisted of 53 weeks, with a 14-week fourth quarter; therefore, all financial references to fiscal year 2022 assume 53 weeks of operations, unless noted otherwise.
ITEM 1. BUSINESS
INTRODUCTION
BJ’s Restaurants is a leading full-service restaurant brand differentiated by a high-quality, varied menu with compelling value, a dining experience that offers our customers (referred to as “guests”) best-in-class service, hospitality and enjoyment, in a high-energy, welcoming and approachable atmosphere. BJ’s is a national restaurant chain that, as of February 26, 2025, owns and operates 218 restaurants located in 31 states.
The first BJ’s restaurant opened in 1978 in Orange County, California, and was a small sit-down pizzeria that featured Chicago style deep-dish pizza with a unique California twist. In 1996, we introduced our proprietary craft beers and expanded the BJ’s concept to a full-service, high-energy restaurant when we opened our first large format restaurant with an on-site brewing operation in Brea, California. Today our restaurants feature a broad menu with approximately 100 menu items designed to offer something for everyone including: slow roasted entrees such as prime rib, EnLIGHTened Entrees® such as our Cherry Chipotle Glazed Salmon, our original signature deep-dish pizza, and the world-famous Pizookie® dessert. We also offer our award-winning BJ’s craft beers, which are produced at four in-house brewing facilities, two standalone brewpubs and by independent third-party brewers using our proprietary recipes, alongside a full bar featuring innovative cocktails.
Our Internet address is https://www.bjsrestaurants.com. Electronic copies of our Annual Report on Form 10-K, quarterly reports on Form 10-Q and current reports on Form 8-K are available, free of charge, by visiting the “Investors” section of our website. We caution that the information on our website is not part of this or any other reports we file with, or furnish to, the SEC.
BUSINESS STRATEGY
We compete in the full-service segment of the domestic restaurant industry, which is a large, highly fragmented segment with estimated annual sales in the $100+ billion range. We believe that the BJ’s restaurant concept offers consumers a high quality, contemporary, full-service dining experience in a high-energy environment, with a diversified menu and a best-in-class bar statement. Our primary business objective is to increase our market share in the full-service restaurant industry by consistently delivering on our “Gold Standard of Operational Excellence” promise to our guests, which is our genuine commitment to take pride in passionately connecting with every guest on every visit, through flawless and relentless execution of every detail, during every shift, to create and keep fanatical fans of BJ’s. We believe that by delivering upon this commitment to our guests, while continuing our national restaurant expansion program, we create the best opportunity to generate significant repeat business and capture additional market share.
While our core strategy has remained consistent, we are always striving to evolve and enhance our guests’ experience. Our Gold Standard of Operational Excellence is focused on the following key areas that help differentiate BJ’s from other full-service restaurants:
•High-Energy Atmosphere and Facilities – We believe that one of our greatest competitive differentiators is the design, ambiance and energy of our restaurants, which feature a signature bar statement, making them a destination for our guests to spend quality time with friends and family. As part of our competitive positioning as a polished full-service concept, our restaurants have finishes consistent with upscale full-service concepts, including high ceilings and large televisions which can be viewed from any seat and provide the comfort of a restaurant and the energy of a bar. Additionally, we use a variety of higher quality guest touchpoints, including distinctive glassware to fit the beer or beverage style and linen napkins not generally found in “mass-market” full-service restaurants. In 2022, we started a remodel initiative to ensure that our restaurants maintain their contemporary look and feel. The initiative has several different remodel iterations depending on the age and condition of the restaurant. To date, we have remodeled approximately 70 of our older restaurants, and we plan to continue remodeling selected restaurants in 2025.
•Broad and Distinctive Menu – BJ’s culinary and menu strategy centers around serving guests craveable food and beverage items that are familiar, yet add a brewhouse twist that makes them unique and differentiated. Our concept includes menu options that meet our guest’s preferences for any dining occasion, and our menu items are created by our talented culinary team and prepared to order in our restaurants using high-quality ingredients. Our menu features a wide variety of choices, ensuring there’s something for everyone, and we are able to modify nearly every menu item to satisfy any guest's request to ensure it is “made their way.” We evaluate our menu offerings and prices two to three times a year in addition to offering seasonal or limited time only menu items throughout the year. Building on our early pizza legacy, we offer almost 20 signature flavors of pizza and made-to-order combinations in tavern-cut and deep-dish styles. Our hand-pressed deep-dish pizza dough is double proofed – which means it rises twice – elevating its presentation and taste. We also offer slow roast large format proteins including prime rib, double bone-in pork chops and tri-tip sirloin, as well as our better-for-you EnLIGHTened Entrees®.
•Award Winning, Proprietary Craft Beer – All of our restaurants feature BJ’s award-winning craft beer, which showcases the quality and care of the ingredients used at BJ’s. Our high-quality, craft beer further elevates BJ’s from many other restaurant concepts and complements our broad menu. Since 1996, our beers have earned 267 medals at different beer festivals and events, including 39 medals at the Great American Beer Festival and 13 medals at the World Beer Cup. We offer 12 year-round signature BJ’s beers and one or more rotating seasonal BJ’s beers on tap at any one time. We also offer a signature hard cider and approximately 20 domestic, imported and “guest” craft beers on tap, in addition to a selection of bottled beers. Additionally, our restaurants offer our craft beer and cider for take-out in cans or growlers, where legally permitted. Our expansive and unique beer offerings are intended to enhance BJ’s competitive positioning as a leading craft beer retailer in full-service dining. We also offer our BJ’s Brewhouse Beer Club throughout most of California. Our club is a subscription service, which features special and unique beer from BJ’s brewers and restaurant traffic-driving perks that are only available to club members.
•Everyday Value Proposition – We strive to offer great everyday value throughout our menu, with diverse price points and unique flavor profiles. Our menu entrées, excluding our promotional specials, generally range in price from $8.99 to $34.99. We also offer Daily Brewhouse Specials, which feature some of our most iconic food and drink items at a lower price, as well our weekday Pizookie Meal deal and happy hour offerings, where permitted, to reinforce our everyday value proposition. Additionally, we offer a series of take-out and delivery specific Family Meals and Bundles that serve 4 to 6 guests. These packages start at $45.00, make it easy to order for a family or larger group, and further enhance our value proposition. Our average per-guest check during fiscal 2024, including beverages, increased from approximately $21.50 in 2023 to approximately $22.50 in 2024, and was impacted by changes in our sales mix, higher item incidence per guest and menu price increases to help mitigate higher costs from inflationary pressures.
•A Culture Committed to Gracious Service and Hospitality – Completely satisfying dining experiences start with engaged, knowledgeable and hospitable people. We have invested carefully to recruit, select, train and retain employees, referred to as “team members,” who can take care of our guests with gracious hospitality and consistently
and efficiently execute our recipes and steps of service. In addition to hiring quality team members, we continue to invest in productivity and hospitality programs to enhance our ability to consistently deliver the Gold Standard of Operational Excellence we promise our guests. These programs include a Net Promoter Scoring program that helps us evaluate several key elements of our service including pace, hospitality, value and recommend scores, as well as mystery shopper and guest loyalty programs.
•Technology at the Right Time – Time is a finite resource for our guests, and we believe that by promptly being attentive to every detail, we can optimize our guests’ enjoyment when they choose to dine with us. Our handheld ordering tablets improve our pace and productivity, including reducing the time it takes to deliver the first drink or food item to our guests. The tablets have resulted in an improved guest experience and driven higher incident rates for beverages, appetizers and desserts. Additionally, our BJ’s mobile application allows our guests to use their smartphones to order ahead, add their name to our waitlist, pay at the table and manage their loyalty account, among other things. Through our digital order tracker, contactless curbside pickup with short message service (“SMS”) text, email technology, and automated wait list we keep our guests informed of their menu order and allow them to notify the restaurant when they arrive. We were also one of the first in full-service dining to utilize the quick response (“QR”) code and Wi-Fi geolocation technologies for both menu browsing and mobile payment to provide a touchless experience for guests who dine at our restaurants.
•Bringing the Brewhouse Home to Our Guests – Consumer preferences continue to evolve as e-commerce, mobile shopping and “food-on-demand” continue to gain traction and direct visits away from traditional brick-and-mortar shopping locations. To meet these opportunities, we have invested in the off-premise sales channel by creating new off-premise menu items, expanding our catering menu, collaborating with third-party delivery partners to provide delivery service from our restaurants, updated our website to make ordering easier for our guests, and we continue to improve our take-out and curbside experience. We also have enhanced our technology for the off-premise sales channel by leveraging our self-developed mobile application, our website and other platforms to ensure our guests can more easily enjoy BJ’s menu from home or the office. This includes web-based order tracker, contactless curbside pickup with short message service (“SMS”) text and email technology to keep our guests informed of the status of their order and allow them to notify the restaurant when they arrive. These ongoing system and operational improvements are designed to improve the guest experience and drive traffic, off-premise check growth and increased catering orders. Where permitted by law, we also sell alcoholic beverages, including BJ’s beer as well as wine and mixed drinks through take-out and delivery channels.
HUMAN CAPITAL
As of December 31, 2024, we employed approximately 21,000 team members at our 218 restaurants. We also employed approximately 230 team members at our Restaurant Support Center in Huntington Beach, California and in field supervision positions around the country, whose primary goal is to provide gold standard support to our restaurant teams so they can focus on serving our guests. Approximately 17% of our hourly restaurant team members provide their services on a full-time basis, as defined by the Affordable Care Act. We actively work to ensure positive team member relations and a respectful workplace, frequently reinforcing the high ethical and professional standards set forth in our Code of Integrity, Ethics and Conduct which we believe should guide every decision we make. Currently, no unions or collective bargaining arrangements are in place at our Company.
Culture, Values and Inclusion, Diversity, and Equity
We recognize that our greatest asset and resource is our team members. A key component of our strategic plan is to CRAFT a People-First Hospitality Culture. We provide each of our team members with a card explaining CRAFT and our expectations for them and our guests as a tangible reminder of our commitment. Our values are focused on CRAFTing an engaging experience for our team members through:
| | | | |
Connection | Respect | Advancement | Fun | Trust |
We strive to be an inclusive brand that reflects the diversity of our communities and provides equal opportunity and access for all of our team members to develop and advance within our Company. As of December 31, 2024, approximately 47% of our team members are female and, of our team members who indicated a racial or ethnic identity, or whose racial or ethnic identity can otherwise be determined, approximately 61% are from under-represented racial or ethnic communities.
Our Inclusion, Diversity and Equity Alliance (“IDEA”) focuses on celebrating and fostering inclusion and belonging among our team members and guests, appreciating and embracing diversity, and providing opportunities for our team members to listen to and learn from each other. IDEA Listening Circles give our team members the opportunity to share their personal stories and provide feedback to the Company on how we can drive intentional, meaningful change to improve our team member experience for all, recognizing that we all grow in understanding and empathy when we listen to voices and stories which are different than our own.
In addition, IDEA hosts periodic educational meetings with outside expert speakers and has created a resource center and an internal intranet page for team members designed to support education and awareness and to celebrate our differences.
Our Women’s Career Advancement Network (“WeCAN”), first introduced in 2011, focuses on developing, retaining and advancing women leaders. WeCAN hosts quarterly educational workshops and philanthropic activities. In addition, IDEA and WeCAN, in partnership with our BJ’s Restaurants Foundation (the “Foundation”), focus on charitable giving and volunteer efforts that support diversity and inclusion, including the Equal Justice Initiative, Special Olympics, and educational charities.
To win and retain our talent, we recognize we must maintain a workplace culture that encourages behaviors aligned with our values, helps our team members fulfill their career aspirations, and engages them throughout their careers. We offer our part-time team members benefit offerings, flexible hours with the ability to easily trade shifts, free or discounted meals depending on their position, and growth opportunities into management. In furtherance of this goal, we invest significant resources to retain and develop our talent. We offer a variety of career development resources to help develop, grow and enable team members to make the most of their careers at the Company, including an Emerging Leader Program to promote management readiness in our hourly team members, a Career Development Conference for managers within their first or second year with the Company, and a Leadership Development Conference to develop emerging General Managers, Managing Directors and Directors of Operations. We leverage a learning management system with numerous on-line resources for team member development, performance management and talent planning. We strive to ensure that advancement opportunities are transparent and equitable. We also host an annual General Manager Conference, which gives our General Managers, field supervision team and select Restaurant Support Center team members the opportunity to connect and learn in person, as well as regularly scheduled quarterly manager calls and Restaurant Support Center meetings.
Team Member Wellbeing Initiatives
We focus on providing health and financial wellbeing offerings that attract, retain, and engage BJ’s talent. We provide an Enlightened Living Wellbeing Program that offers educational resources that inspire participation in preventive care and wellbeing activities. Along with a variety of traditional benefit offerings, 401k and deferred compensation programs, and paid time off, we provide a variety of complimentary benefits and resources to support team members’ physical and mental health. This includes health and life assistance programs to our team members to provide counseling services, advocacy and billing support, and referrals, discounted fitness memberships, and an on-site fitness center at our Restaurant Support Center, among other services.
Team Member Safety
Throughout fiscal 2024, we have continued to comply with state and local government regulations and health recommendations, as applicable, to promote guest and team member wellness and to maintain clean restaurants. We remain vigilant and may reinstate any of the additional safety or health and wellness precautions that were instituted during the pandemic if public health conditions worsen in any of our service areas or future government regulations require us to do so.
We also continuously encourage our team members to speak up about safety matters. Our commitment to safety and culture is maintained through our open-door policy and empowering our team members to utilize our anonymous Team Member Hotline, without fear of retaliation, if they have any concerns about how they or others are treated. We also have an IDEA email address for team members to use if they have any ideas to improve our culture inclusion and belonging, and we have a “Killer Ideas” email address for team members to use to offer innovative ideas about how to improve our business.
Philanthropy
At BJ’s, we believe it is important to give back to the communities we serve and to do more good things for more people. Our Foundation, which is a 501(c)(3) qualified non-profit charitable organization, established in 2006, is principally dedicated to supporting charities benefiting children’s healthcare and education. Three of our current executive officers, our former Chairman of the Board of Directors, and our retired Executive Vice President of Operations serve on the Foundation’s eight-person Board of Directors. Our commitment to supporting humanitarian causes is exemplified by our “Cookies for Kids” program, which was created in 1998 and continues to be the heart of BJ’s continued financial support of the Cystic Fibrosis Foundation (“CFF”), to which millions of dollars have been donated throughout the years. We also promote national campaigns for the Alzheimer’s Association in June and No Kid Hungry in October, which give our guests the opportunity to donate to these charities when they dine with us. Additionally, in 2024, we brought back our craft beer for a cause, BJ’s CureVezaTM Mexican-Style lager. This year, we partnered with Pediatric Cancer Research Foundation and, once again, donated 25 cents for every pint brewed.
In addition to national campaigns, we also focus on supporting our local communities by providing volunteer hours, food and other resources for many worthwhile charitable causes and events through a program called Team Action to Support Communities (“TASC Force”). The TASC Force program recognizes and supports the volunteer efforts of our restaurant team members across the country, as they donate their own free time to benefit charitable causes and community events which are important to them, while helping give back to the communities in which our restaurants do business. Our TASC Force teams
have helped fulfill the wishes of special needs kids, placed flags at the graves of fallen soldiers, painted over unsightly graffiti, helped clean up beaches, parks and school grounds, hosted blood drives, worked with Special Olympics, packed meals for No Kid Hungry, painted houses for elderly citizens, supported Habitat for Humanity to re-build playgrounds, worked at food banks, participated in fundraising runs and walkathons, and delivered food to families in need.
At BJ’s, the act of compassionate giving influences every aspect of our Company’s culture. Caring about those in the communities we serve is only one aspect of this compassion. Caring for the BJ’s family of team members and loved ones is another. Our Give A Slice program was created to help our fellow co-workers and their families in their times of need and is fully funded by voluntary team member contributions. From funeral expenses for lost team members or their loved ones, to help in times of financial distress after a fire, natural disaster, theft or illness, Give A Slice helps hundreds of team members each year.
ENVIRONMENTAL SUSTAINABILITY AND STEWARDSHIP
We recognize that building a sustainable business is consistent with our goal of generating long-term shareholder value. Our sustainability leadership team spearheads our Environmental, Social, and Governance (“ESG”) initiatives. In partnership with others in our operations, supply chain, people, real estate and finance departments, the committee is responsible for executing a multi-year ESG strategic plan. The committee provides updates to the Governance and Nominating Committee of our Board of Directors on a quarterly basis.
We are committed to reducing our impact on air, land and water resources across our restaurants, Restaurant Support Center and global supply chain. We recognize the impact greenhouse gas emissions have on climate change and the importance of water conservation and sustainability for our planet. We have made it a priority to work with our team members and vendor partners to reduce our carbon footprint and environmental impact.
We have retained a third-party consultant to assist us in measuring our emissions and developing additional programs to reduce our overall carbon footprint. Our Human Rights and Labor Rights Policy, Environmental Stewardship Policy, Food and Personal Safety and Quality Policy, Animal Welfare Policy, and Vendor Partner Compliance Program confirm our focus on taking care of our people, communities, stakeholders and planet. More information on our environmental stewardship efforts is available on our website at: https://investors.bjsrestaurants.com/governance/governance-documents/default.aspx
EXECUTIVE OFFICERS
The following table sets forth certain information concerning our executive officers and other members of the executive leadership team as of February 26, 2025:
| | | | |
Name | | Age |
| Position |
C. Bradford Richmond | | 66 |
| Interim Chief Executive Officer and Director |
Lyle D. Tick | | 49 | | President and Chief Concept Officer |
Brian S. Krakower | | 54 | | Executive Vice President and Chief Information Officer |
Gregory S. Lynds | | 63 | | Executive Vice President and Chief Development Officer |
Kendra D. Miller | | 50 | | Executive Vice President, General Counsel and Corporate Secretary |
Christopher P. Pinsak | | 60 | | Executive Vice President and Chief Restaurant Operating Officer |
Thomas A. Houdek | | 44 | | Senior Vice President and Chief Financial Officer |
Alexander M. Puchner | | 63 | | Senior Vice President, Brewing Operations |
C. BRADFORD RICHMOND has served as our Interim Chief Executive Officer since August 2024, and as a member of our Board of Directors since February 2024. From 2006 to 2015, Mr. Richmond served as Chief Financial Officer of Darden Restaurants, Inc. (NYSE: DRI) (“Darden”), the largest casual dining restaurant company in the United States featuring a portfolio of brands that include Olive Garden, LongHorn Steakhouse, and Cheddar’s Scratch Kitchen. Prior to that, he served as Corporate Controller of Darden from 2005 to 2006. Mr. Richmond also previously held executive-level finance and strategic planning roles at Red Lobster and Olive Garden and served as a senior auditor at Price Waterhouse & Co. Mr. Richmond served on the Board of Directors of Coast Entertainment Holdings Limited (ASX: CEH) from September 2017 to November 2024.
LYLE D. TICK has served as our President and Chief Concept Officer since September 2024. He previously served as President and Chief Executive Officer of On the Border Mexican Grill & Cantina from December 2023 to August 2024, and as Brand President of Buffalo Wild Wings (Inspire Brands family of restaurants) from 2018 to 2023. From 2016 to 2018, Mr. Tick served as Managing Director of Boots Retail USA for Walgreens Boots Alliance, and in global and North American marketing leadership roles at Bacardi from 2011 to 2015. Prior to that, Mr. Tick served in various executive leadership roles at marketing and advertising agencies, including at J. Walter Thompson, Gotham, and McGarryBowen.
BRIAN S. KRAKOWER has served as our Executive Vice President and Chief Information Officer since January 2023. He previously served as our Senior Vice President and Chief Information Officer from February 2013 to December 2022. Prior to joining the Company, Mr. Krakower served as Chief Technology Officer for Restaurant Revolution Technologies, a restaurant order management technology solutions company. From 2007 to 2012, Mr. Krakower was employed by California Pizza Kitchen, Inc., operator and licensor of casual dining restaurants, where his last position was Vice President of Information Technology. From 2003 to 2007, Mr. Krakower served as Senior Director of Information Technology – Corporate Systems for The Cheesecake Factory Incorporated, a publicly held operator of upscale casual dining restaurants. Prior to that, Mr. Krakower was employed by House of Blues Entertainment, Inc., an operator of restaurant and music venues, concerts and media properties, where he served as Senior Director of Information Systems and Technology from 1997 to 2003.
GREGORY S. LYNDS has served as our Executive Vice President and Chief Development Officer since October 2007. He previously served as our Chief Development Officer from July 2003 to October 2007. Prior to joining the Company, Mr. Lynds served as a Director of Real Estate for Darden Restaurants, Inc., the largest casual dining company in America. Prior to joining Darden, Mr. Lynds served as Vice President of Real Estate and Development for Wilshire Restaurant Group (Marie Callender’s and East Side Mario’s) and was a partner responsible for expanding the Mimi’s Café brand.
KENDRA D. MILLER has served as our Executive Vice President, General Counsel and Corporate Secretary since September 2021. She previously served as our Executive Vice President, General Counsel and Assistant Corporate Secretary from January 2019 until August 2021, and as our Senior Vice President, General Counsel and Assistant Corporate Secretary from March 2011 until December 2018. From August 2008 to February 2011, Ms. Miller practiced law as a partner at the international law firm of Crowell & Moring LLP. From January 2001 to August 2008, she was employed by CDF Labor Law LLP, where she became a partner in January 2008. She began her legal career as an associate at Paul Hastings.
CHRISTOPHER P. PINSAK has served as our Executive Vice President and Chief Restaurant Operations Officer since September 2024. He previously served as our Senior Vice President of Operations from January 2010 until September 2024. Prior to that, he served as our Regional Vice President of Operations from November 2004 to December 2009. From November 2000 to October 2004, Mr. Pinsak was employed by Wood Ranch BBQ & Grill, where he served as Director of Operations. From July 1987 to October 2000, Mr. Pinsak was employed by Brinker International, Inc., where his last position was Area Director of the Chili’s Grill & Bar concept.
THOMAS A. HOUDEK has served as our Senior Vice President and Chief Financial Officer since September 2021. He previously served as our Vice President of Strategy and Financial Planning and Analysis from July 2019 until August 2021. From January 2019 to June 2019, Mr. Houdek served as Director of Strategy at KFC. Prior to that, Mr. Houdek served as Director of Strategic Planning and Marketing Analysis at Taco Bell from June 2017 to January 2019, and as Sr. Manager of Strategic Planning from June 2015 to June 2017. Mr. Houdek also served as Manager of Mergers and Acquisitions at Yum! Brands from February 2014 to June 2015. Earlier in his career he served as an investment banker with Deutsche Bank Securities and CIBC World Markets.
ALEXANDER M. PUCHNER has been the Senior Vice President of Brewing Operations since 1996. From 1993 to 1995, Mr. Puchner was a founder and brewmaster for Laguna Beach Brewing Co., Huntington Beach Beer Co., Newport Beach Brewing Co., and Westwood Brewing Co. From 1988 to 1993, Mr. Puchner served as a product manager for Aviva Sports/Mattel, Inc. and as a marketing research manager for Mattel, Inc. Mr. Puchner has been a nationally certified beer judge since 1990.
RESTAURANT OPERATIONS
At BJ’s, we take pride in our ability to generate exceptional guest traffic per square foot, compared to many other full-service concepts. Our success is rooted in our commitment to running restaurants with “quality fast” efficiency, especially during peak dining hours, ensuring every guest receives outstanding service.
Each BJ’s location is led by a dedicated management team, typically consisting of a General Manager, an Executive Kitchen Manager, and three to five additional managers, tailored to the restaurant’s sales volume. The General Manager spearheads daily operations, overseeing everything from staffing and training to driving sales and profitability. Meanwhile, the Executive Kitchen Manager ensures culinary excellence, handling food preparation, inventory, purchasing, and kitchen labor, all while mentoring the kitchen team.
Our new restaurant managers undergo a rigorous 10-week advanced management training program, covering every facet of restaurant operations, from hospitality to business acumen. This program is directed by our Vice President of Talent Acquisition and Development and supported by our field supervision team. Additionally, all hourly team members participate in a structured onboarding process, guided by experienced team member instructors, to master their roles and deliver exceptional service.
The operational structure at BJ’s ensures seamless communication and support across all levels. General Managers report to Directors of Operations or Area Vice Presidents, who, in turn, report to a Vice President of Operations. At the helm is our
Executive Vice President and Chief Restaurant Operations Officer, who oversees restaurant operations, facility management, new openings, and the integration of strategic initiatives. Complementing this leadership is our kitchen operations team, led by the Vice President of Culinary and Kitchen Operations, and our Senior Vice President of Culinary and Kitchen Operations, who champion food quality, safety, and kitchen efficiency while coaching and mentoring our culinary leaders.
Each of our restaurants typically employs approximately 100 hourly team members, many of whom work part-time. We strive to cultivate a fun, premium full-service atmosphere staffed by passionate, skilled, and enthusiastic individuals who embody our commitment to excellence on every shift. Our restaurants are generally open daily from 11:00 a.m. to midnight, with the exception of Thanksgiving and Christmas. We offer an array of services to enhance the guest experience, including takeout, delivery, online ordering, curbside pickup, call-ahead waitlists, and reservations for large parties. Whether dining in or enjoying a meal at home, we aim to provide every guest with a seamless and memorable experience.
RESTAURANT SITE SELECTION AND EXPANSION OBJECTIVES
We are constantly evaluating ways to reduce construction costs and to further enhance unit productivity and efficiency. We seek to secure high-quality, high-profile locations for our restaurants, which we believe have the ability to draw guests from a larger area than most “mass market” full-service chain restaurants. Since BJ’s has proven that it can be successful in a variety of locations (suburban shopping areas, retail strip centers, lifestyle centers, and entertainment centers – either freestanding or in-line) and in a variety of income demographics, we can be highly selective and flexible in choosing suitable locations. We prefer to open our restaurants in mature trade areas with dense populations. We generally target geographic regions that allow us to build multiple restaurants in those areas. This “clustering” approach provides economic benefits including lower supply and distribution costs, improved marketing efficiencies, management supervision leverage and increased brand awareness.
We typically enter into operating leases for our locations for periods ranging from 10 to 20 years and obtain lease extension options in most instances. Our lease payment terms vary from lease to lease but generally provide for the payment of both minimum base rent and contingent (percentage) rent based on restaurant sales. We sometimes purchase the land underlying certain restaurant locations if it becomes available and, in many cases, we subsequently enter into sale-leaseback arrangements for land parcels that we have purchased. It is not our current strategy to own a large number of land parcels that underlie our restaurants.
TARGETED NEW RESTAURANT ECONOMICS
Our fiscal 2024 restaurant prototype averaged approximately 7,500 square feet with seating for as many as 250 guests with a targeted all-in net construction cost of approximately $6.0 million, including what was reimbursed to us by our landlords in the form of tenant improvement allowance incentives. We are developing a new smaller prototype for future restaurant development. This new prototype is expected to maintain a similar number of guest seats, feature an improved bar statement, better hospitality and speed, more efficient labor as well as other restaurant expenses and a lower investment cost. In fiscal 2025, we are targeting an all-in net construction cost of approximately $6.0 million per restaurant, after landlord tenant improvement allowance incentives. The gross cost of our restaurants may vary due to a variety of factors and could be greater or less than the targeted amounts due to geographic location, site work, trade labor costs and commodity inflation for building materials, such as lumber, steel and copper, among many other factors. Potential restaurant locations may not have a tenant improvement allowance available, and such allowance, when available, will vary in amount. In selecting sites for our restaurants, an important objective is to earn a suitable rate of return on our investment that exceeds our cost of capital. However, this return usually cannot be meaningfully measured until our restaurants reach their mature sales and profitability levels. Maturation periods vary from restaurant to restaurant, but generally range from two to five years. We currently target an approximate blended 15% to 20% return on our net cash invested to build a new restaurant, as well as total capital invested. Net cash invested includes our capital less tenant improvement allowances or proceeds from the sale of the underlying land, and total capital invested includes our net cash invested and a factor for the landlord’s invested capital (based on a capitalized value of minimum rents to be paid to the landlord) for each group of new restaurants to be opened each year, measured once the restaurants reach their mature level of operations.
The return-on-investment targets for our restaurant operations do not include any allocation of opening costs, field supervision and corporate support expense, non-cash items such as depreciation, amortization, equity-related compensation expense, interest expense and income taxes, and do not represent a targeted return on our common stock. There can be no assurance that any new restaurant opened will have similar operating results to those of established restaurants. Actual results usually differ from targeted results, and such differences may be material. We generally target our new restaurants to achieve average annual sales at maturity of at least $6.5 million and an average “four wall” estimated operating cash flow margin in the range of 15% to 20% after all occupancy expenses.
It is common for full-service restaurant locations to initially open with sales volumes well in excess of their sustainable run-rate levels. Given this initial “honeymoon” sales period, it may take up to three years until a new restaurant’s sales eventually
settle at a more predictable and sustainable level. Additionally, all of our new restaurants usually require a year or longer after opening to reach their targeted restaurant-level operating profit due to cost of sales and labor inefficiencies commonly associated with opening more complex full-service restaurants.
RESTAURANT OPENING EXPENSES
Restaurant opening expenses (also referred to as “preopening” expenses) include incremental out-of-pocket costs that are directly related to the openings of new restaurants. We expense preopening costs as incurred in accordance with U.S. Generally Accepted Accounting Principles (“U.S. GAAP”). As a result of the more complex operational nature of our “casual plus” restaurant concept compared to that of a typical full-service chain restaurant, the preopening process for our new restaurants is more extensive, time consuming and costly. The preopening expense for one of our restaurants usually includes costs to compensate an average of six to eight restaurant management team members prior to opening; costs to recruit and train an average of 150 hourly restaurant team members; wages, travel and lodging costs for our opening training team and other support team members; costs to practice service activities; and straight-line minimum base rent during the construction and in-restaurant training period.
Our preopening expense averaged approximately $0.7 million per new restaurant in fiscal 2024. We usually incur the most significant portion of preopening costs within the two-month period immediately preceding a restaurant’s opening. Preopening costs can fluctuate significantly from period to period, based on the number and timing of restaurant openings and the specific preopening costs incurred for each restaurant.
BREWING OPERATIONS
Our internal brewing operations originated in 1996 with the opening of the first large format location in Brea, California, which included our first on-site brewing operation. We currently have four restaurants with in-house brewing facilities and two stand-alone brewpubs located around the country. We also utilize qualified independent third-party brewers to produce our beer, using our proprietary recipes. Our brewing operations are typically staffed with a head brewer and assistant brewers, who report to a brewing director. The brewing operations team analyzes each batch of BJ’s branded beer in internal laboratories, and we periodically send samples to an independent laboratory for quality control testing purposes.
We currently believe a combination of internal brewing and larger-scale independent third-party brewing represents the optimal production method for our craft beers as we continue the national expansion of our restaurants. This approach allows us to get the benefits provided by brewing beer in larger batches, yet also provides us the flexibility to allow our brewing operations to focus on specialty, seasonal and research and development beers. During fiscal 2024, we internally brewed approximately 76% of our branded craft beers, with approximately 56% of this amount brewed in our Temple, Texas brewpub locations. We also produce proprietary non-alcoholic craft sodas that are sold in our restaurants. Our handcrafted soda flavors include root beer, ginger beer, vanilla cream, orange cream and black cherry.
Additionally, pursuant to various laws and regulations, the majority of our proprietary craft beer must be distributed to our restaurants through independent wholesale beer distributors, whether we produce the beer or it is produced by independent third-party brewers. We currently have arrangements with a sufficient number of beer distributors in all markets where we operate restaurants; however, our continued national expansion will require us to enter into agreements with additional beer distributors.
MARKETING AND ADVERTISING
Our marketing strategy is designed to foster brand awareness, deepen guest engagement, and drive visit frequency through a mix of digital innovation, localized outreach, and in-restaurant experiences. Our key objectives include increasing visit frequency among existing guests while building awareness and cultivating new brand fans. By integrating digital innovation, localized outreach, earned marketing, and personalized guest engagement, our holistic strategy positions BJ’s to remain competitive while delivering superior food, hospitality, and memorable dining experiences.
Integrated Marketing and Media Strategies
We utilize a strategic mix of linear TV, connected TV, and digital video in key markets to build awareness and consideration. Digital channels, including social media, pay-per-click advertising, and search marketing play a critical role in engaging audiences across all markets. Signature offerings like the Pizookie® dessert and the Lucky Ducky cocktail that consistently generate “buzz” on social platforms, solidify our reputation for crave-worthy menu items. To amplify this momentum, we partner with influencers who align with our brand values, leveraging their platforms to showcase our products and generate excitement. Additionally, we engage in earned marketing through public relation efforts, spotlighting our unique products and brand story to drive broader awareness and credibility.
Local Restaurant Marketing
Our restaurants execute creative, community-based initiatives to connect with local guests, often participating in charitable, civic, and cultural programs. These efforts underscore our role as a neighborhood gathering place and foster lasting relationships within the communities we serve.
In-Restaurant Messaging and Promotions
In-restaurant marketing is central to our strategy, with messaging and merchandising designed to highlight limited-time offerings (“LTOs”), drive trial in key product categories, and encourage higher check averages. Seasonal and holiday campaigns inspire repeat visits, foster loyalty, and introduce guests to new menu favorites.
Loyalty and Personalization
Our BJ’s Premier Rewards Plus® loyalty program enables us to engage guests with personalized email marketing and direct communication. This program not only drives frequency but also nurtures ambassadorship, encouraging members to advocate for our brand within their networks.
Data-Driven Insights
We leverage our loyalty database alongside third-party data sources to gain a deeper understanding of guest demographics and behaviors. This enables us to create highly targeted and tailored campaigns, products, and experiences that attract new guests while delighting existing guests. An internal innovation team gathers real-time guest feedback in our restaurants, ensuring new products and experiences consistently exceed expectations.
Our marketing related expenditures were approximately 2.0%, 1.8%, and 1.7% of revenues for fiscal 2024, 2023 and 2022, respectively. We expect our marketing expenditures in fiscal 2025 to be 2.0% to 2.5% of our revenues.
SEASONALITY AND ADVERSE WEATHER
Our business is impacted by weather and other seasonal factors that typically impact other restaurant operations. Holidays (and shifts in the holiday calendar) and severe weather including hurricanes, tornadoes, thunderstorms, snow and ice storms, prolonged extreme temperatures and similar conditions may impact restaurant sales volumes in some of the markets where we operate. Many of our restaurants are located in or near shopping centers and malls that typically experience seasonal fluctuations in sales. Quarterly results have been and will continue to be significantly impacted by the timing of new restaurant openings and their associated restaurant opening expenses. As a result of these and other factors, our financial results for any given quarter may not be indicative of the results that may be achieved for a full fiscal year.
INFORMATION SYSTEMS
We continue to focus on providing our operators with best-in-class, intuitive, secure technology that is tailored to our business so they can provide unsurpassed hospitality to our guests and our team members in a productive and efficient manner. Our strategy of providing and enhancing integrated systems to drive operational efficiencies enables our restaurant teams to focus on achieving restaurant operations excellence. We have implemented technology-enabled business solutions for tableside order entry, ecommerce solutions through our updated website which includes online ordering and order tracker for our take-out and delivery guests, kitchen and bar system automations, labor scheduling and productivity, cost management, food preparation, table management, inventory, guest service and team member training. We also utilize a centralized accounting and human capital management system, a data center technology service with cloud-based technologies, and a talent development system to provide our team members a more engaged experience, which we believe can provide a competitive advantage in the tight labor market. We will continue to develop and deploy seamless, non-invasive restaurant and support technologies that help improve our guest experience, team member effectiveness and satisfaction, financial management and cost control. New technology is thoroughly tested and validated before any company-wide rollout is implemented.
SUPPLY CHAIN MANAGEMENT
Our supply chain department, working together with our culinary, marketing and operations teams, is responsible for the selection and procurement of all of the food ingredients, beverages, products and supplies for our restaurants and brewing operations. Specifications are mandated by the supply chain department in order to consistently maintain the highest quality ingredients and operational materials. Our goal is to obtain the highest quality menu ingredients, products and supplies from reliable sources at competitive prices. In order to maximize operating efficiencies between purchase and usage, a restaurant manager determines daily usage requirements for food ingredients, products and supplies for their restaurant and places orders with vendors approved by our supply chain department. A manager also inspects our deliveries to ensure that the items
received meet our quality specifications and negotiated prices. For many of our menu ingredients, we have arranged for acceptable alternative manufacturers, vendors, growers and shippers in order to reduce risk in our supply chain. In addition to procuring food ingredients, beverages, products and supplies for our restaurants, the supply chain department also manages the procurement agreements in the areas of energy, transportation and general corporate services.
Where economically feasible and possible, we attempt to negotiate contracts for key commodities used in the preparation of our food and beverage offerings, based on our expected requirements for each fiscal year. If our attempts are successful, most of our contracts typically range in duration from three to twelve months. Although we currently do not directly engage in future contracts or other financial risk management strategies with respect to potential commodity cost fluctuations, from time to time we may opportunistically request that our suppliers consider doing so to help minimize the impact of potential cost fluctuations. Suppliers will typically pass the cost of such strategies along to us, either directly or indirectly.
We use a leading foodservice distributor to deliver the majority of our food products to our restaurants. We also have an agreement with the largest nationwide foodservice distributor of fresh produce in the United States to service most of our restaurants and, where licensed, to distribute our proprietary craft beer to our restaurants.
COMPETITION
The domestic restaurant industry is highly competitive and generally considered to be mature. There are a substantial number of full-service, fast casual and quick service restaurant chains and other food and beverage service operations, that compete both directly and indirectly with us in every respect, including food quality and service, the price‑value relationship, beer quality and selection, atmosphere, suitable sites for new restaurants and for qualified personnel to operate our restaurants, among other factors. We also compete within each of our trade areas with locally-owned restaurants. We face growing competition as a result of the trend toward convergence in grocery, deli and restaurant services, particularly in the supermarket industry which offers “convenient meals” in the form of improved entrées and side dishes.
Our restaurant concept is a relatively small “varied menu” full-service competitor compared to the mature “mass market” chains. 59 of our restaurants are located in one state - California. Our overall brand awareness and competitive presence in states outside of California is not as significant as that of our major full-service chain competitors. Many competitors with similar concepts to ours have been in business longer than we have, have greater consumer awareness, and often have substantially greater capital, marketing and human resources.
We believe, however, that our ability to offer higher quality food and beverages at moderate prices with superior service in a distinctive dining environment provides us with the opportunity to capture additional market share in the full-service segment.
FOOD QUALITY AND SAFETY
Our revenues can be substantially affected by adverse publicity resulting from food quality, illness, or health and safety concerns if incidents occur at our restaurants or at our competitors’ restaurants. In addition, our revenues can be affected by illness or health concerns stemming from incidents occurring at our suppliers or competing suppliers or that appear to be transmitted via public interactions. We attempt to manage risks of this nature by leveraging food quality and safety controls throughout our supply chain and internal training programs. While we believe that our internal policies and procedures for food safety and sanitation are thorough, the risk of food-borne illness cannot be completely eliminated, and incidents at other restaurant chains or in the food supply chain may affect our restaurants even if our restaurants are not implicated in a food safety concern.
We are committed to serving safe, high-quality food. Our food quality and safety teams strive to ensure compliance with our food safety programs and practices, components of which include:
•Partnering with suppliers to improve food safety processes and technology
•Food safety training for all new team members
•Advanced food safety training for management trainees
•Manager food safety certifications
•Several layers of audits and inspections:
oUnannounced audits by an independent third-party auditing company to validate food safety and personal safety protocols
oBJ’s internal Quality Assurance team audits
oOperation’s team food safety audits
•Daily food safety checks based on Hazard Analysis and Critical Control Points (“HACCP”) principles
•Tamper-resistant bag seals for all take-out orders
•Utilization of technology to manage food safety risks
GOVERNMENT REGULATIONS
We are subject to various federal, state and local laws, rules and regulations that affect our business. Regulations relating to opening and closing of restaurant dining rooms or outdoor patios, business hours, sanitation practices, to-go alcohol sales, guest spacing within dining rooms and other social distancing practices, and employment and safety-related laws involving contact tracing, exclusions and paid sick leave have materially affected the way we operate our business and serve our guests, and have adversely impacted our cost structure and resulting profitability of our restaurants.
Each of our restaurants is subject to licensing and regulation by a number of governmental authorities, which may include alcoholic beverage control, labor/equal employment, building, land use, health, safety and fire agencies, and environmental regulations in the state or municipality in which the restaurant is located. We believe that we are in compliance with all relevant laws, rules and regulations in all material respects. Difficulties obtaining or maintaining the required licenses or approvals could delay or prevent the development of a new restaurant in a particular area or could adversely affect the operation of an existing restaurant.
Alcoholic beverage control regulations require each of our restaurants to apply to a federal and state authority and, in certain locations, municipal authorities for a license and permit to sell alcoholic beverages on and off-premises. Typically, licenses must be renewed annually and may be revoked or suspended for cause by such authority at any time. Alcoholic beverage control regulations impact numerous aspects of the daily operations of our restaurants, including the minimum age of patrons and team members, hours of operation, advertising, wholesale purchasing, inventory control and handling, and storage and dispensing of alcoholic beverages.
Our restaurants and brewing operations are subject to “tied house” laws and the “three tier system” of beverage alcohol distribution, which were introduced by various states after the repeal of Prohibition. These laws generally prohibit brewers from holding an interest in retail licenses and require manufacturers, distributors and retailers to remain separate “tiers.” Over the last 30 years, “brewpubs,” which are both retailers and onsite brewers, have been authorized by law in most states through specific exceptions to these laws. These exceptions are unique to each state and do not mirror one another. However, brewpubs are generally licensed as retailers and do not have the same privileges as microbreweries, and the privileges of, and restrictions imposed on, brewpubs vary from state to state. These restrictions sometimes prevent us from operating both brewpubs and restaurants in some states. We believe that we are currently in compliance with the brewpub regulations in the states where we hold such licenses. However, there is some risk that a state’s brewpub regulations or the interpretation of these regulations may change in a way that could impact our current model of brewing beer and/or supplying beer to our restaurants in that state. We apply for our alcoholic beverage licenses with the advice of outside legal and licensing counsel and consultants. Even after the issuance of these licenses, our operations could be subject to differing interpretations of the “tied house” laws and the requirements of the “three tier system” of beverage alcohol distribution in any jurisdiction that we conduct business. Additionally, the failure to receive or retain, or a delay in obtaining, a liquor license in a particular location could adversely affect our ability to obtain such a license elsewhere.
We are subject to “dram-shop” statutes in California and other states in which we operate. Those statutes generally provide a person who has been injured by an intoxicated person the right to recover damages from an establishment that has wrongfully served alcoholic beverages to such person. We carry liquor liability coverage, as part of our existing comprehensive general liability insurance, which we believe is consistent with the coverage carried by other entities in the restaurant industry and would help protect us from exposure created by possible claims. Even though we carry liquor liability insurance, a judgment against us under a dram-shop statute in excess of our liability coverage could have a materially adverse effect on us. Regardless of whether any claims against us are valid or whether we are liable, claims may also be expensive to defend and may divert management’s time and our financial resources away from our operations. We may also be adversely affected by publicity resulting from such claims.
Various federal and state labor laws, along with rules and regulations, govern our relationship with our team members, including such matters as minimum wage, overtime, tip credits, health insurance, working conditions, safety and work eligibility requirements. Significant additional governmental mandates, such as an increased minimum wage, a change in the laws governing exempt team members, an increase in paid time off or leaves of absence, mandates on health benefits and insurance or increased tax reporting and payment requirements for team members who receive gratuities, could negatively impact our restaurants’ profitability. We are also subject to the regulations of the Immigration and Customs Enforcement (“ICE”) branch of the United States Department of Homeland Security. In addition, some states in which we operate have adopted immigration employment protection laws. Even if we operate our restaurants in strict compliance with ICE and state requirements, some of our team members may not meet federal work eligibility requirements, despite our efforts and without our knowledge, which could lead to a disruption in our work force. Additionally, our suppliers may also be affected by various
federal and state labor laws which could result in supply disruptions for our various goods and services or higher costs for goods and services supplied to us.
We are subject to various laws and regulations relating to nutritional content, nutritional labeling, product safety and menu labeling. We are also subject to federal and state environmental regulations. Various laws concerning the handling, storage, and disposal of hazardous materials, such as cleaning solvents, and the operation of restaurants and brewpubs in environmentally sensitive locations may impact aspects of our operations.
Our facilities must comply with the applicable requirements of the Americans With Disabilities Act of 1990 (“ADA”) and related state statutes. The ADA prohibits discrimination on the basis of disability with respect to public accommodations and employment. Under the ADA and related state laws, when constructing new restaurants or undertaking significant remodeling of existing restaurants, we must make them readily accessible to disabled persons. We must also make reasonable accommodations for the employment of disabled persons.
INSURANCE
We maintain comprehensive insurance coverage, including, but not limited to, property, casualty, directors and officers liability and network privacy security liability, with coverage and limits we believe are currently appropriate for our operations. We retain a substantial portion of our workers’ compensation and general liability costs through self-insured retentions and large deductibles. There is no assurance that any insurance coverage maintained by us will be adequate or that we will not experience claims in excess of our coverage limits; that we can continue to obtain and maintain such insurance at all; or that our premium costs will not rise to an extent that they will adversely affect our ability to economically obtain or maintain such insurance. As with the vast majority of businesses in the United States, we do not have insurance coverage related to business interruptions or other effects of any pandemic. We carry employment practices insurance, which covers claims involving matters such as harassment, discrimination, and wrongful termination; however, it excludes class and collective action wage and hour claims. A settlement or judgment against us in excess of, or outside of, our coverage limitations could have a material adverse effect on our results of operations, liquidity, financial position and business. See “Limitations in our insurance coverage or rising insurance costs could adversely affect our business or financial condition in certain circumstances” in “Risk Factors” contained in Part I, Item 1A of this Annual Report on Form 10-K.
TRADEMARKS AND COPYRIGHTS
We believe that our trademarks, service marks and other proprietary rights have significant value and are important to our brand-building effort and the marketing of our restaurant concept. Our trademarks and service marks domestically registered with the United States Patent and Trademark Office include, among others, our stylized logos displaying the name “BJ’s” for beer, restaurant services, restaurant and bar services, on-line ordering and take-out restaurant services and the word mark “BJ’s” for beer, restaurant and bar services, take-out and carry-out restaurant services. We have also registered with the United States Patent and Trademark Office many of our standard and seasonal beer logos and names, as well as many of our signature menu item names including “Pizookie” for our proprietary dessert and “Enlightened Entrees” and “Craft Matters” for our branding. We have also registered our BJ’s logo mark in a number of foreign countries. Additional domestic and foreign trademark applications are pending. The duration of trademark registrations varies from country to country. However, generally, with appropriate use and renewal, they may be maintained indefinitely. We own numerous copyrights for items such as product packaging, promotional materials, in-restaurant graphics and training materials. We have also registered our ownership of the internet domain name “www.bjsrestaurants.com” and other internet domain names. We have in the past protected, and expect to continue to vigorously protect, our proprietary rights. There can be no assurances that and we cannot predict whether the steps taken by us to protect our proprietary rights will be adequate to prevent misappropriation of these rights or the use by others of restaurant features based upon, or otherwise similar to, our concept, trademarks, and products. There may be other restaurants, retailers and/or businesses that also use our marks in some form or fashion throughout the United States and abroad. Although our policy is to challenge infringements and other unauthorized uses of our marks, it may be difficult for us to prevent others from copying elements of our concept, trademarks, and products, and certain or unknown unauthorized uses or other misappropriation of our marks could diminish the value of our marks and adversely affect our business, growth prospects and goodwill. Any claims or litigation undertaken to enforce our rights will likely be time-consuming and costly. In addition, we may face claims of misappropriation or infringement of third parties’ trademarks, patents or other intellectual property rights. Defending these claims, whether or not they have merit, may be time-consuming and costly and, if unsuccessful, may prevent us from continuing to use certain intellectual property rights or information in the future and may result in a judgment or monetary damages.
ITEM 1A. RISK FACTORS
The risk factors presented below may affect our future operating results, financial position and cash flows. The risks described in this Item 1A and other sections of this Annual Report on Form 10-K are not exhaustive and are not the only risks we may ever face in our business. We operate in a very competitive and rapidly changing environment. New risks and uncertainties arise from time to time, and we cannot predict those events or how they may affect us. There may be other risks and uncertainties that are not currently known or that are currently deemed by us to be immaterial. However, they may ultimately adversely affect our business, financial condition and/or operating results. In addition to the risk factors presented below, changes in general economic conditions, credit markets, consumer tastes, discretionary spending patterns, demographic trends, and consumer confidence in the economy, all of which affect consumer behavior and spending for restaurant dining occasions, may have a material impact on us.
Risks Related to our Restaurant Business, Operations and Future Growth
The restaurant industry is highly competitive. Any inability to maintain our brand image and compete effectively in the restaurant industry may adversely affect our revenues, profitability and financial results.
The restaurant industry is highly competitive. We compete on the basis of the taste, quality and price of food offered, guest service, brand name identification, beer quality and selection, facilities attractiveness, restaurant location, atmosphere and overall dining experience. In addition, we compete with other restaurants and retailers for real estate. Our competitors include a large and diverse group of restaurant chains and individual restaurants that range from independent local operators that have opened restaurants in various markets to well-capitalized national restaurant companies. Many of our competitors have substantially greater financial, marketing and other resources than we do.
In addition to other full-service restaurants, we face competition from an array of food-away-from-home alternatives, including fast casual restaurants, single-serve operations, quick-service restaurants and the trend toward convergence in grocery, deli and restaurant services, particularly in the supermarket industry which offers “convenient meals” in the form of improved entrées and side dishes from the deli section. We also continue to face pressure for consumer discretionary spending on restaurant occasions, as well as less expensive alternatives to BJ’s.
Our ability to effectively compete in the restaurant industry, the successful operation of the BJ’s restaurant concept and the execution of our national expansion plan are all highly dependent upon BJ’s ability to remain relevant to consumers and being a brand they trust. Any incident that erodes consumer trust in or affinity for the BJ’s brand may significantly reduce its value. If consumers perceive or experience any reduction in our food or beverage quality, service or facility ambiance, or in any way believe we failed to deliver a consistently positive dining experience, our ability to compete and the value of the BJ’s brand may be impaired. In addition, if other restaurants are able to promote and deliver a higher degree of perceived value through heavy discounting or other methods, our guest traffic levels may suffer, which would adversely impact our revenues and profitability.
Our inability or failure to successfully and sufficiently raise menu prices to offset rising costs and expenses may adversely affect guest traffic and our results of operations.
In the past, we have experienced dramatic price increases of certain items necessary to operate our restaurants and brewing operations, including increases in the cost of food, commodities, labor, team member benefits, insurance arrangements, construction, energy and other costs. We utilize menu price increases to help offset the increased cost of commodities, minimum wage and other costs. However, there is no guarantee that our menu price increases will be accepted by our guests. If our costs increase, our operating profit and results of operations will be adversely affected if we are unable to increase our menu prices to offset such increased costs or if our increased menu prices result in less guest traffic. In addition, we cannot provide assurance that menu price increases will not deter guests from visiting our restaurants, reduce the frequency of their visits or affect their purchasing decisions.
Negative publicity about us, our restaurants, other restaurants, or others across the food supply chain, due to foodborne illness or for other reasons, whether or not accurate, may adversely affect the reputation and popularity of our restaurants and our results of operations.
The good reputation of our restaurants is a key factor to the success of our business. Incidents that occur at any of our restaurants, or at restaurants operated by other foodservice providers or generally in the food supply chain, may be damaging to the restaurant industry overall, may specifically harm our brand and reputation and may quickly result in negative publicity for us, which may adversely affect our sales and popularity with our guests. Moreover, negative publicity resulting from poor food quality, illness, injury, food tampering or other health concerns, whether related to one of our restaurants, to the restaurant industry, or to the beef, seafood, poultry or produce industries (such as negative publicity concerning the accumulation of carcinogens in seafood, e-coli, hepatitis A, Avian Flu, listeria, salmonella, and other food-borne illnesses), or operating
problems related to one or more of our restaurants, may adversely affect sales for all of our restaurants and make our brand and menu offerings less appealing to consumers.
In addition, our brewing operations are subject to certain hazards and liability risks faced by all brewers, such as potential contamination of ingredients or products by bacteria or other external agents that may be wrongfully or accidentally introduced into products or packaging. While we have not experienced any serious contamination problem in our products, the occurrence of such a problem may result in a costly product recall and serious damage to our reputation for product quality, as well as claims for product liability.
Health concerns arising from food-borne or other illnesses or specific categories of foods may adversely affect our business.
The United States and other countries have experienced, or may experience in the future, outbreaks of viruses, such as COVID-19 pandemic, Avian Flu or “SARS,” and H1N1 or “swine flu,” or other diseases such as bovine spongiform encephalopathy, commonly known as “mad cow disease.” If a virus is transmitted by human contact, our team members or guests may become infected, or may choose, or be advised, to avoid gathering in public places, any of which may adversely affect our restaurant guest traffic and our ability to adequately staff our restaurants, receive deliveries on a timely basis or perform functions at the corporate level. We also may be adversely affected if jurisdictions in which we have restaurants impose mandatory closures, seek voluntary closures or impose restrictions on operations. Even if such measures are not implemented and a virus or other disease does not spread significantly, the perceived risk of infection or significant health risk may adversely affect our business.
Although we follow industry standard food safety protocols and continue to enhance our food safety and quality assurance procedures, no food safety protocols can completely eliminate the risk of food-borne illness in any restaurant. To the extent that a virus or disease is food-borne, or perceived to be food-borne, any future outbreaks or the possibility of such outbreaks may adversely affect guest traffic generally or the price and availability of certain food products which would have a material adverse effect on our operations. Even if food-borne illnesses arise from conditions outside of our control, the negative publicity from any such illnesses is likely to be significant. If our restaurant guests or team members become ill from food-borne illnesses, we may be forced to temporarily close the affected restaurants.
In addition, public concern over health risks associated with certain foods may cause fear about the consumption of menu items which incorporate such foods. If we change our menu in response to such concerns, we may lose guests who do not prefer the new menu, and we may not be able to sufficiently attract new guests to produce the revenue needed to restore the profitability of our restaurant operations.
Any deterioration in general economic conditions which adversely affects consumer spending, our landlords or businesses neighboring our locations, may adversely affect our results of operations.
Any decrease in guest traffic or the average expenditure per guest will negatively impact our financial results, since reduced sales result in the deleveraging of the fixed and semi-fixed costs in our operations and thereby cause downward pressure on our operating profits and margins. There is also a risk that if negative economic conditions persist for a long period of time or worsen, consumers may make long-lasting changes to their discretionary purchasing behavior, including less frequent discretionary purchases on a more permanent basis.
In addition, deterioration in general economic conditions may adversely affect our landlords’ abilities to satisfy obligations to us under leases, including failures to fund or reimburse agreed-upon tenant improvement allowances. If our landlords are unable to obtain sufficient credit to continue to properly manage their retail centers, we may experience a drop in the level of quality of such centers where we operate restaurants. Our future development of new restaurants may also be adversely affected by the negative financial situation of developers and potential landlords. Any such adverse developments with respect to our landlords may adversely impact our operations.
Our restaurants are generally located in or around high traffic retail developments with nationally recognized co-tenants, which helps increase overall guest traffic into those retail developments. Some of our co-tenants have ceased or may cease operations in the future or have deferred openings or fail to open in a retail development after committing to do so. These failures may lead to reduced guest traffic and a general deterioration in the surrounding retail centers in which our restaurants are located and may contribute to lower guest traffic at our restaurants. If these retail developments experience high vacancy rates, any resulting decrease in guest traffic may adversely affect our results of operations.
Changes in consumer buying patterns, particularly e-commerce sites and off-premise sales affect our revenues, operating results and liquidity.
Our restaurants are primarily located near high consumer activity areas such as regional malls, lifestyle centers, “big box” shopping centers and entertainment centers. We depend in large part on a high volume of visitors to these centers to attract guests to our restaurants. E-commerce or online shopping continues to increase and negatively impact consumer traffic at
traditional “brick and mortar” retail sites located in regional malls, lifestyle centers, “big box” shopping centers and entertainment centers. A decline in visitors to these centers near our restaurants may negatively affect our sales. Closures of traditional “brick and mortar” retail sites may lead to reduced guest traffic and a general deterioration in the surrounding retail centers in which our restaurants are located and may contribute to lower guest traffic at our restaurants.
Any adverse change in consumer trends or traffic levels may adversely affect our business, revenues and results of operations.
Due to the nature of the restaurant industry, we are dependent upon consumer trends with respect to the public’s tastes, eating habits, public perception toward alcohol consumption and discretionary spending priorities, as well as consumer traffic rates at the sites surrounding our restaurants, which are primarily located in high-activity areas such as urban, retail, mixed-use and lifestyle centers. In general, such consumer trends and visit frequencies are significantly affected by many factors, including national, regional or local economic conditions, changes in area demographics, public perception and attitudes, increases in regional competition, food, liquor and labor costs, traffic and shopping patterns, weather, natural disasters, interest rates, co-tenancies in urban, retail and mixed-use and lifestyle centers and the availability and relative cost of gasoline. Our success will depend, in part, on our ability to anticipate and respond to such changing consumer preferences, tastes, eating and purchasing habits, as well as other factors affecting the restaurant industry, including new market entrants and demographic changes. Any adverse change in any of the above factors and our inability to respond to such changes may cause our restaurant volumes to decline and adversely affect our business, revenues and results of operations.
Changes in off-premise sales or costs may adversely affect our operating results.
Delivery from our restaurants is primarily accomplished by utilizing third-party delivery companies. These third-party delivery companies require us to pay them a commission, which adversely affects our profit margin on those sales. Off-premise sales could cannibalize dine-in sales, or our systems and procedures may not be sufficient to handle off-premise sales, which require additional investments in technology or people. To the extent that off-premise sales significantly reduce dine-in guest traffic or result in the need for additional expenditures to meet demand, our operating results will be adversely affected. In addition, if third-party delivery services cease doing business with us, or cannot make their scheduled deliveries, or do not continue their relationship with us on favorable terms, it would have a negative impact on sales or result in increased third-party delivery fees.
Any inability or failure to recognize, respond to and effectively manage the accelerated impact of social media may adversely affect our business.
There has been a significant increase in the use of social media and similar platforms. Consumers value readily available information concerning goods and services that they have or plan to purchase and may act on such information without further investigation or authentication. The dissemination of information online regarding our Company or our restaurants, together with any resulting negative publicity, may harm our business, prospects, financial condition and results of operations, regardless of the information’s accuracy.
As part of our marketing efforts, we use a variety of digital platforms including search engines, mobile, online videos and social media platforms such as Facebook®, X Corp.®, Instagram® and TikTok® to attract and retain guests. We also test new technology platforms to improve our level of digital engagement with our guests and team members to help strengthen our marketing and related consumer analytics capabilities. These initiatives may not prove to be successful and may result in expenses incurred without the benefit of higher revenues or increased engagement.
Any inability or failure to successfully expand our restaurant operations or open and adequately staff new restaurants may adversely affect our growth rate and results of operations.
A critical factor in our future success is our ability to expand our restaurant operations, which will depend in large part on our ability to open new restaurants in a profitable manner. We anticipate that our new restaurants will generally take several months or even longer to reach targeted productivity levels due to the inefficiencies typically associated with new restaurants, including lack of initial market and consumer awareness, the need to hire and train sufficient management and restaurant team members and other factors. The opening of new restaurants can also have either an expected or an unintended effect on the sales levels at existing restaurants. We cannot guarantee any restaurant we open will obtain operating results similar to those of our existing restaurants. If we are unable to open and operate new restaurants successfully, our growth rate and our results of operations will be adversely affected. Our expansion plans may also be impacted by the delay or cancellation of potential new sites by developers and landlords, which may become more common as a result of economic deterioration or tightening credit markets.
In order to achieve our targeted capacity rate of new restaurant growth, we intend to open new restaurants in both established and new markets. Opening new restaurants in established markets generally provides some advantages in the form of stronger levels of initial consumer awareness, trial and usage, as well as greater leverage of certain supply chain and field supervision resources. On the other hand, there is a risk that a portion of the sales of existing restaurants in the market may transfer to
newly opened restaurants in the same market, resulting in negative pressure on our overall comparable restaurant sales metric. While we do not generally select locations for our new restaurants where we believe that a significant sales transfer will likely occur, some unexpected sales transfer may inadvertently occur.
Some of our new restaurants may be planned for new markets where we have little or no operating experience. New markets may have different competitive conditions, consumer tastes and discretionary spending patterns than our existing markets. As a result, new restaurants in those markets may be less successful than restaurants in our existing markets. Consumers in a new market may not be familiar with the BJ’s brand. We also may find it more difficult to hire, motivate and retain qualified team members in new markets. Restaurants opened in new markets may also have lower average restaurant sales than restaurants opened in our existing markets, and may have higher construction, occupancy or operating costs than restaurants in existing markets. Sales at restaurants opened in new markets may take longer to achieve margins typical of mature restaurants in existing markets or may never achieve these targeted margins thereby affecting our overall profitability. As we expand into new markets and geographic territories, our operating cost structures may not resemble our experience in existing markets. Because there will initially be fewer restaurants in a given market, our ability to optimally leverage our field supervision, marketing and supply chain resources will be limited for a period of time. Further, our overall new restaurant development and operating costs may increase due to more lengthy geographic distances between restaurants resulting in higher purchasing, preopening, labor, transportation and supervision costs. The performance of restaurants in new markets will often be less predictable.
As part of our ongoing restaurant expansion and growth strategy, we may consider the internal development or acquisition of additional restaurant concepts. We may not be able to internally develop or acquire additional concepts that are as profitable as our existing restaurants. Additionally, growth through acquisitions will also involve additional financial and operational risks.
Our inability to renew existing leases on favorable terms may adversely affect our results of operations.
The majority of our restaurants are located on leased premises and are subject to varying lease-specific arrangements. Some of our leases require base rent that is subject to regional cost-of-living increases and other leases include base rent with specified periodic increases. Other leases are subject to renewal at fair market value, which may involve substantial increases. Additionally, many leases require contingent rent based on a percentage of gross sales. There can be no assurance that we will be able to renew our expiring leases after exercising all remaining renewal options. As a result, we may incur additional costs to operate our restaurants, including increased rent and other costs related to our renegotiation of lease terms for an existing leased premise or for a new lease in a desirable location and the relocation and development of a replacement restaurant.
Any inability to retain key personnel or difficulties in recruiting qualified personnel may adversely affect our business until a suitable replacement is found.
The success of our business continues to depend on the contributions of our senior management team, both individually and as a group. Our senior executives have been instrumental in setting our strategic direction, operating our business, identifying, recruiting and training key personnel, identifying expansion opportunities and arranging necessary financing. Losing the services of any of these individuals may materially adversely affect our business until a suitable replacement is found. We believe that these individuals cannot easily be replaced with executives of equal experience and capabilities.
Additionally, when unemployment levels are low or labor markets are otherwise challenged, it is difficult and more expensive for us to fully staff our restaurants. While we do our best to avoid business interruptions in our operating restaurants, as well as delays in opening our new restaurants, there is no guarantee or assurance that we can avoid this in the future.
Any adverse changes in the cost of food, brewing commodities and other materials, including cost increases caused by inflation, tariffs, or global conflicts may adversely affect our operating results.
Our supply chain department negotiates prices for all of our ingredients and supplies through contracts, spot market purchases or commodity pricing formulas. Furthermore, various factors beyond our control, including adverse weather conditions and governmental regulations, the imposition of tariffs on commodities and other goods in our supply chain, as well as increased public concern over food safety standards and local and state governmental requirements, could materially harm our business and may also cause our food and supply costs to increase. We cannot predict whether we will be able to anticipate and react to changing food and supply costs or safety incidents by adjusting our purchasing practices. We also have a single or a limited number of suppliers for certain of our commodity and supply items. Accordingly, supply chain risk may increase our costs and limit the availability of some products that are critical to our restaurant and brewing operations, which may adversely affect our operating results or cash flows from operations.
The overall cost environment for food commodities can be volatile primarily due to domestic and worldwide agricultural supply/demand and other macroeconomic factors that are outside of our control, including recent inflationary trends, military, trade disputes, and geopolitical conflicts. The availability and prices of food commodities are also influenced by energy prices,
droughts, animal-related diseases, natural disasters, the relationship of the dollar to other currencies, government regulated tariffs and other issues. Virtually all commodities purchased and used in the restaurant industry (meats, grains, oils, dairy products, and energy) have varying amounts of inherent price volatility associated with them. Our suppliers also may be affected by higher costs to produce and transport commodities used in our restaurants and brewpubs, labor shortages, higher minimum wage and benefit costs, and other expenses that they pass through to their customers, which may result in higher costs for goods and services supplied to us. While we attempt to manage these factors by offering a diversified menu and by contracting for our key commodities for extended periods of time whenever feasible and possible, there can be no assurance that we will be successful in this respect due to the many factors that are outside of our control. In addition, raw materials that we may purchase on the international market are subject to fluctuations in both the value of the U.S. dollar, government regulated tariffs and increases in local demand, which may increase our costs and negatively impact our profitability.
We and our major independent third-party brewing partners purchase a substantial portion of brewing raw materials and products, primarily malt and hops, from a limited number of domestic and foreign suppliers. We purchase a majority of our malts from a single supplier with multiple sources of malts. We generally enter into one-year purchase commitments with our malt and hops suppliers, based on the projected future volumes and brewing needs. We are exposed to the quality of the barley crop each year, and significant failure of a crop may adversely affect our beer costs. The quality and availability of the hops may be materially adversely affected by factors such as adverse weather and changes in currency exchange rates, resulting in increased prices. Hops and malt are agricultural products and, therefore, many outside factors, including weather conditions, farmers rotating out of hops or barley to other crops, government regulations and legislation affecting agriculture, may affect both price and supply.
We may be subject to increased labor costs resulting from wage pressure, higher turnover and changes in government regulations, any of which could adversely affect our results of operations.
Our restaurant operations are subject to federal, state and local laws governing such matters as minimum wages, working conditions, overtime and tip credits. As federal, state and local minimum wage rates increase, we may need to increase not only the wages of our minimum wage team members, but also the wages paid to team members at wage rates that are above minimum wage. Over the last several years, low unemployment, new restaurant growth, competition and state minimum wage increases have resulted in unprecedented wage pressure in the restaurant industry for managers and hourly team members. Labor shortages, increased team member turnover and health care and other benefit mandates have increased and could continue to increase our labor costs. The increased operating costs from wage related increases, or potential other benefit offerings to remain competitive in the labor market could adversely affect our results of operations, especially if we are to effectively implement price increases to offset such additional costs.
Any inability or failure of distributors, suppliers or independent third-party brewers to provide food, beverages and beer to us in a timely fashion may adversely affect our reputation, guest patronage, revenues and results of operations.
If our distributors, suppliers and independent third-party brewers cease doing business with us, or cannot make a scheduled delivery to us, or are unable to obtain credit in a tightened credit market or experience other issues, we may experience short-term product supply shortages in some or all of our restaurants and may be required to purchase food, beer and beverage products from alternate suppliers at higher prices. We may also be forced to temporarily remove popular items from the menu offering of our restaurants. If alternative suppliers cannot meet our current product specifications, the consistency and quality of our food and beverage offerings, and thus our reputation, guest patronage, revenues and results of operations, may be adversely affected.
Additionally, if these independent third-party brewers cease doing business with us, we may be required to purchase or brew our own beer at higher costs to us, or we may not be able to sell our proprietary craft beer at all, until we are able to secure an alternative supply source. If the independent third-party brewers fail to adhere to our proprietary recipe and brewing specifications, the consistency and quality of beer offerings, and thus our reputation, guest patronage, revenues and results of operations, may be adversely affected. Additionally, financial stability of those brewing operations where we currently contract for our proprietary craft beer production, as well as their ability or willingness to continue to meet our beer production requirements, continues to be a significant risk in our business model. Accordingly, there can be no guarantees that our proprietary brewing requirements will continue to be met in the future.
Any adverse weather conditions, seasonal fluctuations, natural disasters and environmental matters, including the effects of climate change, may adversely affect our results of operations.
The occurrence of natural disasters, such as fires, hurricanes, freezing weather or earthquakes (particularly in California where our centralized operating systems and Restaurant Support Center administrative personnel are located) may unfavorably affect our operations and financial performance. Any of the foregoing events may result in physical damage, temporary or permanent
closure, lack of an adequate work force, or temporary or long-term disruption in the supply of food, beverages, electric, water, sewer and waste disposal services necessary for our restaurants or Restaurant Support Center to operate.
In addition, there has been increasing focus by the United States and overseas governmental authorities and investors on other environmental matters, such as climate change, which may increase the frequency and severity of weather-related events and conditions, such as drought and forest fires. This increased focus on climate change and efforts to reduce greenhouse gas emissions, waste, and water consumption may lead to new initiatives directed at regulating a yet to be specified array of environmental matters. Legislative, regulatory or other efforts to combat climate change or other environmental concerns could result in future increases in the cost of raw materials, taxes, transportation and utilities, which could affect our results of operations and necessitate future investments in facilities and equipment.
We have disaster recovery procedures and business continuity plans in place to address most events of a crisis nature, including hurricanes and other natural disasters, back up and off-site locations for recovery of electronic and other forms of data and information. However, if we are unable to fully implement our disaster recovery plans, we may experience delays in recovery of data, inability to perform vital corporate functions, tardiness in required reporting and compliance, failures to adequately support field operations and other breakdowns in normal communication and operating procedures that may have a material adverse effect on our financial condition, results of operation and exposure to administrative and other legal claims.
Our corporate office is located in California and a significant number of our restaurants are located in California, Texas and Florida which makes us particularly sensitive to economic, regulatory, weather and other risk factors and conditions are more prevalent in those states.
Our corporate office is located in California and a significant number of our restaurants are concentrated in California, Texas and Florida. As a result, we are particularly susceptible to adverse trends and economic conditions in those states. Many states and municipalities in which our restaurants are located may experience severe revenue and budget shortfalls. Additionally, changes in state and municipal-level regulatory requirements, such as increases to the minimum wage rate, scheduling or other labor constraints not experienced in other locations, income taxes, unemployment insurance, as well as other taxes, mandatory healthcare coverage or paid leave where we operate or may desire to operate restaurants, may adversely impact our financial results. Additionally, we believe that California is subject to a greater risk for earthquakes, fires, water shortages, energy fluctuations and other natural and man-made disasters than most other states.
Risks Related to Data Security and Technology
We rely heavily upon information technology and related data security systems, including credit card processing and our loyalty and team member engagement programs, and any failure or interruption of these systems, including those operated by third parties, may adversely affect our ability to efficiently operate our business.
We rely heavily on electronic information systems in all aspects of our operations, including (but not limited to) point-of-sale transaction processing in our restaurants; credit card processing; efficient operation of our restaurant kitchens; management of our inventories and overall supply chain; collection of cash; payment of payroll and other obligations; and various other processes and procedures including our guest loyalty and team member engagement programs. Our ability to efficiently manage our business depends significantly on the reliability and capacity of our in-house information systems and those technology services and systems that we contract from third parties. Although we and our third-party providers have operational safeguards in place, these safeguards may not be effective in preventing the failure of any of our or third-party systems or platforms to operate effectively and be available. Our electronic information systems, including our back-up systems, and those of our third-party providers, are subject to damage or interruption from power outages, cyberattacks, computer and telecommunications failures, computer viruses, use of artificial intelligence, “phishing” attacks, ransomware, malware, internal or external security breaches, catastrophic events such as fires, earthquakes, tornadoes and hurricanes, and/or errors by our team members. While we have invested and continue to invest in technology security initiatives and disaster recovery plans, these measures cannot fully insulate us from technology disruption. If any of the critical IT systems on which we rely were to become unreliable, unavailable, compromised or otherwise fail, and we were unable to recover in a timely manner, we could experience an interruption in our operations that could have a material adverse impact on our results of operations and our reputation as a brand or as an employer.
Our business may be adversely affected by cybersecurity incidents which result in unauthorized access, theft, modification or destruction of confidential information that is stored in our systems or by third parties on our behalf, including confidential business, team member, or guest data.
Cybersecurity incidents or other unauthorized access to systems may result in disruption to our operations, corruption or theft of critical data, confidential information or intellectual property. As reliance on technology continues to grow and more business activities have shifted online, the risk associated with any cybersecurity incidents has grown. While we, and our
third-party vendors, have implemented security systems and infrastructure to prevent, detect, and/or mitigate the risk of unauthorized access to technology systems or platforms, there can be no assurance that these measures will be effective. Any cybersecurity or similar incident involving confidential information of our business, guests or team members could result in negative publicity, damage to our reputation, a loss of revenues, disruption of our business, litigation and regulatory actions. Significant capital investments might be required to remediate any problems, infringements, misappropriations or other third-party claims. We continue to make significant investments in technology, third-party services and personnel to develop and implement systems and processes that are designed to anticipate cyberattacks and to prevent or minimize breaches of our information technology systems or data loss, but these security measures cannot provide assurance that we will be successful in preventing such breaches or data loss.
Risk Related to Regulations and Legal Proceedings
Federal, state and local beer, liquor and food service regulations and any violations thereof may adversely affect our revenues and results of operations.
We are required to operate in compliance with federal laws and regulations relating to alcoholic beverages administered by the Alcohol and Tobacco Tax and Trade Bureau of the U.S. Department of Treasury, as well as the laws and licensing requirements for alcoholic beverages of states and municipalities where our restaurants are or will be located. In addition, each restaurant must obtain a food service license from local authorities. Failure to comply with federal, state or local regulations may cause our licenses to be revoked and force us to cease the brewing or sale of alcoholic beverages, or both, or the serving of food at our restaurants. Additionally, state liquor laws may prevent or impede the expansion of our restaurants into certain markets. The liquor laws of certain states prevent us from selling the beer brewed at our restaurants. Any difficulties, delays or failures in obtaining such licenses, permits or approvals may delay or prevent the opening of a restaurant in a particular area or increase the costs associated therewith. If we are unable to obtain or maintain our existing licenses, our guest patronage, revenues and results of operations may be adversely affected. Or, if we choose to open a restaurant in those states where the number of available licenses is limited, the cost of a new license may be significant.
Brewing operations require various federal, state, and local licenses, permits and approvals. Our restaurants and on-site brewpubs operate pursuant to exceptions to the “tied house” laws, which created the “three tier system” of liquor distribution. These “tied house” laws generally prohibit brewers from holding retail licenses and prohibit vertical integration in ownership and control among the three tiers. Brewing restaurants and brewpubs operate under exceptions to these general prohibitions. Generally, our brewing restaurants are licensed as retailers with limited privileges to brew beer on the restaurant premises, and we do not have the same privileges as a microbrewery. Other restrictions imposed by law may prevent us from operating both brewing restaurants and non-brewing restaurants in some states. We are at risk that a state’s regulations concerning brewing restaurants or the interpretation of these regulations may change. Because of the many and various state and federal licensing and permitting requirements, there is a significant risk that one or more regulatory agencies may determine that we have not complied with applicable licensing or permitting regulations or have not maintained the approvals necessary for us to conduct business within its jurisdiction. Even after the issuance of our licenses, our operations may be subject to differing interpretations of the “tied house” laws and the requirements of the “three tier system” of liquor distribution in any jurisdiction that we conduct business. Any such changes in interpretation may adversely impact our current model of brewing beer or supplying beer, or both, to our restaurants in that state, and may also cause us to lose, either temporarily or permanently, the licenses, permits and registrations necessary to conduct our restaurant operations, and subject us to fines and penalties.
The manufacture, distribution and sale of alcoholic beverages is highly regulated and taxed under federal, state and local laws and regulations. Our operations are subject to more restrictive regulations and increased taxation by federal, state, and local governmental entities than are those of non-alcohol related beverage businesses. Failure to comply with applicable federal, state, or local laws and regulations may result in higher taxes, penalties, fees, and suspension or revocation of permits, licenses or approvals. The loss or revocation of any existing licenses, permits or approvals, and/or the failure to obtain any required additional or new licenses, permits, or approvals may have a material adverse effect on our ability to conduct our business.
Increasing the federal and/or state excise tax on alcoholic beverages, or certain types of alcoholic beverages, is frequently proposed in various jurisdictions either to increase revenues or discourage purchases by underage drinkers. If adopted, these measures may affect some or all of our proprietary craft beer products. If federal or state excise taxes are increased, we may have to raise prices to maintain our current profit margins. Higher taxes may reduce overall demand for beer, thus negatively impacting sales of our beer. Some states have also been reviewing the state tax treatment for flavored malt beverages which may result in increased costs for us, as well as decreased sales.
Compliance with cybersecurity, privacy and similar laws may involve significant costs and any failure to comply could adversely affect our business, reputation and results of operations.
Cybersecurity breaches also could result in a violation of applicable privacy and other laws, and subject us to private consumer, business partner, or securities litigation and governmental investigations and proceedings, any of which could result in our
exposure to material civil or criminal liability. In addition, the California Privacy Rights Act (“CPRA”) provides a private right of action for data breaches and requires companies that process information on California residents to make new disclosures to consumers about their data collection, use and sharing practices and allow consumers to opt out of certain data sharing with third parties and request deletion of personal information (subject to certain exceptions). Compliance with the CPRA and other current and future privacy, cybersecurity and related laws may involve significant costs. If we fail to properly respond to security breaches of our or third-party’s information technology systems or fail to properly respond to consumer requests under the CPRA or any similar laws adopted in other states, our reputation and results of operations may be adversely affected.
We are subject to a variety of laws, government regulations and other legal requirements and any failure to comply with these laws and regulations or any new laws or regulations could have a material adverse effect on our operations.
Our business is subject to large number of federal, state, and laws and regulations, including those relating to:
•the production, distribution and sale of alcoholic beverages;
•employment practices and working conditions, including, among others, minimum wage and other wage and benefit requirements, overtime pay, meal and rest breaks, predictive scheduling, paid leave requirements, work eligibility requirements, team member classification as exempt/non-exempt for overtime and other purposes, immigration status, workplace safety, discrimination, and harassment;
•public accommodations and safety conditions, including the Americans with Disabilities Act and similar state laws that give protections to individuals with disabilities in the context of employment, public accommodations, and other areas;
•environmental matters, such as emissions and air quality, water consumption, and the discharge, storage, handling, release, and disposal of hazardous or toxic substances;
•preparation, sale and labeling of food, including regulations of the Food and Drug Administration, including those relating to inspections and food recalls, menu labeling and nutritional content;
•data privacy laws and standards for the protection of personal information, including social security numbers, financial information (including credit card numbers), and health information, and payment card industry standards and requirements;
•building and zoning requirements, including state and local licensing and regulation governing the design and operation of facilities and land use,
•health, sanitation, safety and fire standards; and
•public company compliance, disclosure and governance matters, including accounting regulations, Securities and Exchange Commission (“SEC”) and NASDAQ disclosure requirements.
Compliance with these laws and regulations, and future new laws or changes in these laws or regulations that impose additional requirements, can be costly. Failure to comply with the laws and regulatory requirements of federal, state and local authorities may result in, among other things, revocation of required licenses, administrative enforcement actions, fines and civil and criminal liability. Compliance with these laws and regulations can increase our exposure to litigation or governmental investigations or proceedings.
We may become party to legal proceedings which could have a material adverse effect on our business.
Our business is subject to the risk of litigation by team members, guests, suppliers, shareholders, government agencies or others through private actions, class or collective actions, administrative proceedings, regulatory actions or other litigation. These actions and proceedings may involve allegations of illegal, unfair or inconsistent employment practices, including wage and hour violations and employment discrimination; guest discrimination; food safety issues including poor food quality, food-borne illness, food tampering, food contamination, and adverse health effects from consumption of various food products or high-calorie foods (including obesity); other personal injury; violation of “dram-shop” laws (providing an injured party with recourse against an establishment that serves alcoholic beverages to an intoxicated party who then causes injury to himself or a third-party); trademark or patent infringement; violation of the federal securities laws; disputes with landlords under our leases; or other concerns. Litigation of any nature may be expensive to defend, may adversely affect our reputation and the reputation of our restaurants, and may divert money and management’s attention from our operations and adversely affect our financial condition and results of operations.
General Risk Factors
Any inability to access sources of capital and/or to raise capital in the future on favorable terms may adversely affect our business and results of operations.
There can be no guarantee that additional financing will be readily available or available on favorable terms, or at all. The unavailability of financing when needed may adversely affect our growth and other plans, as well as our financial condition. Even if available, additional financing may involve significant cash payment obligations, covenants and financial ratios that restrict our ability to operate and grow our business and would cause us to incur additional interest expense and financing costs.
The market price of our common stock may be volatile, and our shareholders may lose all or part of their investment.
The market price of our common stock may fluctuate significantly, and our shareholders may not be able to resell their shares at or above the price they paid for them. Those fluctuations may be based on various factors, including the following:
•actual or anticipated fluctuations in comparable restaurant sales or operating results, whether in our operations or in those of our competitors;
•changes in financial estimates or opinions by research analysts, either with respect to us or other full-service restaurant companies;
•any failure to meet investor or analyst expectations, particularly with respect to total restaurant operating weeks, number of restaurant openings, comparable restaurant sales, average weekly sales per restaurant, total revenues, operating profit and net income per share;
•the public’s reaction to our press releases, other public announcements and our filings with the SEC;
•actual or anticipated changes in domestic or worldwide economic, political or market conditions, such as recessions or international currency fluctuations;
•changes in the consumer spending environment;
•changes in laws or regulations, or new interpretations or applications of laws and regulations, which are applicable to our business;
•changes in accounting standards, policies, guidance, interpretations or principles;
•short sales, hedging and other derivative transactions in the shares of our common stock;
•future sales or issuances of our common stock, including sales or issuances by us, our directors or executive officers and our significant shareholders;
•changes in the market valuations of other restaurant companies;
•actions by shareholders, including actions of activist investors or unsolicited takeover proposals;
•various market factors or perceived market factors, including rumors, involving us, our suppliers and distributors, whether accurate or not;
•announcements by us or our competitors of new locations, menu items, technological advances, significant acquisitions, strategic partnerships, divestitures, joint ventures or other strategic initiatives;
•the addition or loss of a key member of management; and
•changes in the costs or availability of key inputs to our operations.
In addition, we cannot assure that an active trading market for our common stock will continue which may affect our stock price and the liquidity of any investment in our common stock.
None.
ITEM 1C. CYBERSECURITY
Risk Management & Strategy
Our management is principally responsible for defining the various risks facing us, formulating risk management policies and procedures, and managing our risk exposures on a day-to-day basis. Our information is processed, transmitted, and stored in a secure environment using hardened, proven enterprise-grade technologies to protect both our data and the physical computing
assets. We guard against business interruption by maintaining a disaster recovery plan, which includes storing critical business information in multiple off-site data centers, testing the disaster recovery plan at a host-site facility, and providing fault tolerant devices, communication services, and utilities. We have independent third-party cybersecurity audits conducted no less than annually, following a framework modeled after the National Institute of Standards and Technology standard. We also have third-party security reviews and testing of our network, processes and systems conducted on a regular basis. We use internally developed proprietary software, cloud-based software as a service (“SaaS”) as well as purchased software, with proven, non-proprietary hardware. While we believe that our internal policies, systems and procedures for cybersecurity are thorough, the risk of a cybersecurity event cannot be eliminated. We may incur increased costs to comply with privacy and data protection laws and, if we fail to comply or our systems are compromised, we could be subject to government enforcement actions, private litigation and adverse publicity.
We maintain a robust system of data protection and cybersecurity resources, technology and processes. In addition to performing an annual risk assessment and developing a mitigation plan, along with a comprehensive review and update of our cybersecurity policies and procedures, we continuously evaluate new and emerging risks and ever-changing legal and compliance requirements. We also monitor risks relating to sensitive information at our business partners, where relevant, and reevaluate the risks at these partners periodically. We make strategic investments to address these risks and compliance requirements to keep Company, guest and team member data secure, including maintaining a network privacy and security insurance policy. Although we have purchased cyber liability insurance to provide a level of financial protection should a data breach occur, such insurance may not cover us against all claims or costs associated with such a breach. Our comprehensive cybersecurity program includes agreements with third-party cybersecurity partners for continuous monitoring, alerting, and response. We perform annual and ongoing cybersecurity awareness training for our management and Restaurant Support Center team members as well as specialized training for our users with privileged access. In addition, we provide annual credit card handling training following Payment Card Industry (PCI) guidelines to all team members that handle guest credit cards.
Governance
The Audit Committee receives data protection and cybersecurity reports quarterly from our Chief Information Officer, which the Audit Committee shares with the full Board of Directors. The Board of Director's responsibility is to monitor our risk management processes by understanding our material risks and evaluating whether management has reasonable controls in place to address those risks. The involvement of the Board in reviewing our business strategy is an integral aspect of the Board’s assessment of management’s tolerance for risk and what constitutes an appropriate level of risk. While the full Board has overall responsibility for risk oversight, the Board has delegated oversight responsibility related to certain risks to the Audit Committee. As such, the Audit Committee is responsible for reviewing our risk assessment and risk management policies. Accordingly, management regularly reports to the Audit Committee on risk management, and in turn, the Audit Committee reports on the matters discussed at the Committee level to the full Board. The Audit Committee and the full Board focus on the material risks facing us, including operational, technology and cybersecurity, reputational, market, credit, liquidity and legal risks, to assess whether management has reasonable controls in place to address these risks.
Our cybersecurity risk management and strategy processes are led by our Chief Information Officer and our Director of Cybersecurity and Infrastructure. These individuals have collectively over 40 years of professional experience in various and progressive roles across multiple, regulated industries involving developing cybersecurity strategy, implementing effective information and cybersecurity programs, managing information security infrastructure and operations, risk assessment and mitigation, and satisfactorily managing multiple industry and regulatory compliance environments. Prior to their current roles, both individuals previously held positions at other large publicly traded organizations where they were the chief stewards of cybersecurity strategy and operations.
ITEM 2. PROPERTIES
RESTAURANT LOCATIONS
As of February 26, 2025, we owned and operated a total of 218 restaurants located in the following 31 states:
| | | | |
| | Number of Restaurants | |
Alabama | | | 2 | |
Arizona | | | 7 | |
Arkansas | | | 2 | |
California | | | 59 | |
Colorado | | | 6 | |
Connecticut | | | 1 | |
Florida | | | 22 | |
Illinois | | | 1 | |
Indiana | | | 7 | |
Kansas | | | 1 | |
Kentucky | | | 3 | |
Louisiana | | | 3 | |
Maryland | | | 5 | |
Massachusetts | | | 2 | |
Michigan | | | 5 | |
Nevada | | | 7 | |
New Jersey | | | 2 | |
New Mexico | | | 2 | |
New York | | | 4 | |
North Carolina | | | 3 | |
Ohio | | | 13 | |
Oklahoma | | | 4 | |
Oregon | | | 2 | |
Pennsylvania | | | 4 | |
Rhode Island | | | 1 | |
South Carolina | | | 1 | |
Tennessee | | | 1 | |
Texas | | | 37 | |
Virginia | | | 6 | |
Washington | | | 4 | |
Wisconsin | | | 1 | |
| | | 218 | |
All of our 218 existing restaurants are located on leased properties, with interior square footage primarily ranging between 7,000 to 8,500 square feet. Many of our restaurants also have outdoor patios that are utilized when weather conditions permit. In addition to our restaurants, we operate two Texas brewpub locations. We own the underlying land for these brewpub locations, as well as two parcels of land adjacent to two of our operating restaurants.
There can be no assurance that we will be able to renew expiring leases after the expiration of all remaining renewal options. Most of our restaurant leases provide for contingent rent based on a percentage of restaurant sales (to the extent this amount exceeds a minimum base rent) and payment of certain occupancy-related expenses. We own substantially all of the equipment, furnishings and trade fixtures in our restaurants. Our Restaurant Support Center is located in an approximate 57,000 square foot leased space in Huntington Beach, California. Our Restaurant Support Center lease expires July 31, 2030.
Additional information concerning our leased properties is included in Note 6 to the Consolidated Financial Statements appearing in Part II, Item 8 of this Annual Report on Form 10-K.
ITEM 3. LEGAL PROCEEDINGS
See Note 7 of Notes to Consolidated Financial Statements in Part IV, Item 15 of this Annual Report on Form 10-K for a summary of legal proceedings.
ITEM 4. MINE SAFETY DISCLOSURES
Not applicable.
PART II
ITEM 5. MARKET FOR REGISTRANT'S COMMON EQUITY, RELATED SHAREHOLDER MATTERS AND ISSUER PURCHASES OF EQUITY SECURITIES
MARKET INFORMATION
Our common stock is traded on The NASDAQ Global Select Market under the symbol “BJRI.” As of February 24, 2025, we had approximately 132 shareholders of record. As many of our shares are held by brokers and other institutions on behalf of shareholders, we are unable to estimate the total number of shareholders represented by these record holders.
STOCK-PERFORMANCE GRAPH
The Company has elected to use the S&P 600 Restaurant Group index as its peer group for fiscal 2024. The following chart compares the five-year cumulative total stock performance of our common stock, the S&P 600 Restaurant Group index and the S&P 500 index. The graph assumes that $100 was invested on December 31, 2019, in our common stock and in each of the indices and that all dividends were reinvested. The measurement points utilized in the graph consist of the last trading day in each calendar year, which closely approximates the last day of our respective fiscal year. The historical stock performance presented below is not intended to and may not be indicative of future stock performance.
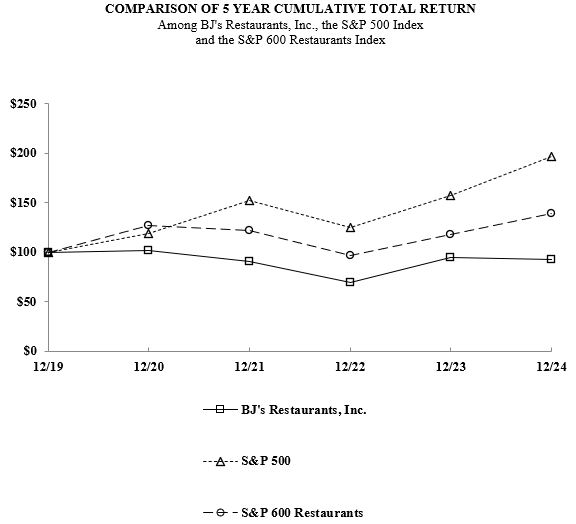
CALCULATION OF AGGREGATE MARKET VALUE OF NON-AFFILIATE SHARES
For purposes of calculating the aggregate market value of shares of our common stock held by non-affiliates as set forth on the cover page of this Annual Report on Form 10-K, we have assumed that all outstanding shares are held by non-affiliates, except for shares held by each of our executive officers, directors and 5% or greater shareholders. In the case of 5% or greater shareholders, we have not deemed such shareholders to be affiliates unless there are facts and circumstances which would indicate that such shareholders exercise any control over our Company, or unless they hold 10% or more of our outstanding common stock and are not qualified institutional investors or passive investors who have filed a Schedule 13G with respect to
their ownership. These assumptions should not be deemed to constitute an admission that all executive officers, directors and 5% or greater shareholders are, in fact, affiliates of our Company, or that there are no other persons who may be deemed to be affiliates of our Company. Further information concerning shareholdings of our officers, directors and principal shareholders, as well as information regarding our stock-based compensation plans, is included or incorporated by reference in Part III, Item 12 of this Annual Report on Form 10-K.
STOCK-BASED COMPENSATION PLAN INFORMATION
We have a shareholder approved stock-based compensation plan, the 2024 Equity Incentive Plan (as amended from time to time, “the Plan”), under which we may issue shares of our common stock to team members, officers, directors and consultants. Under the Plan, we have granted incentive stock options, non-qualified stock options and service- and performance-based restricted stock units (“RSUs”). In Fiscal 2024, we also granted market-based RSUs. The following table provides information about the shares of our common stock that may be issued upon exercise of awards as of December 31, 2024 (share numbers in thousands):
| | | | | | | | | | | | |
| | Number of Securities
to be Issued Upon Exercise of Outstanding Stock Options | | | Weighted Average Exercise Price of Outstanding Stock Options | | | Number of Securities Remaining Available for Future Issuance Under Stock-Based Compensation Plans | |
Stock-based compensation plans approved by shareholders | | | 933 | | | $ | 39.10 | | | | 1,871 | |
Stock-based compensation plans not approved by shareholders | | | — | | | | — | | | | — | |
Total | | | 933 | | | | | | | 1,871 | |
DIVIDEND POLICY AND STOCK REPURCHASES
We currently do not pay any cash dividends. Quarterly cash dividends were suspended in 2020 and any resumption of dividends will be subject to our Board of Directors determining that the resumption of dividend payments is in the best interest of the Company and its shareholders. The only cash dividends paid during fiscal 2024 were related to dividends declared prior to fiscal 2020, which vested under our stock-based compensation plans.
As of December 31, 2024, we have cumulatively repurchased shares valued at approximately $514.1 million in accordance with our approved share repurchase plan since its inception in 2014. During fiscal 2024, we repurchased and retired approximately 757,000 shares of our common stock at an average price of $33.20 per share for approximately $25.1 million, which is recorded as a reduction in common stock, with any excess charged to retained earnings. Our Board of Directors approved a $50 million increase in our share repurchase program both in February 2024 and February 2025. Currently we have $82.5 million available under our authorized $600 million share repurchase program. Repurchases may be made at any time.
The following table sets forth information with respect to the repurchase of common shares during fiscal 2024:
| | | | | | | | | | | | | | | | | | | | |
Period (1) | | Total
Number
of Shares
Purchased | | | Average
Price
Paid Per
Share | | | Total
Number of
Shares
Purchased
as Part of
the Publicly
Announced
Plans | | | Increase in
Dollars for
Share
Repurchase
Authorization | | | Dollar Value of
Shares that
May Yet Be
Purchased
Under the
Plans or
Programs | |
01/03/24 - 01/30/24 | | | — | | | $ | — | | | | — | | | $ | — | | | $ | 11,055,206 | |
01/31/24 - 02/27/24 | | | — | | | $ | — | | | | — | | | $ | 50,000,000 | | | $ | 61,055,206 | |
02/28/24 - 04/02/24 | | | — | | | $ | — | | | | — | | | $ | — | | | $ | 61,055,206 | |
04/03/24 - 04/30/24 | | | — | | | $ | — | | | | — | | | $ | — | | | $ | 61,055,206 | |
05/01/24 - 05/28/24 | | | 86,960 | | | $ | 34.54 | | | | 86,960 | | | $ | — | | | $ | 58,051,544 | |
05/29/24 - 07/02/24 | | | 167,665 | | | $ | 34.78 | | | | 167,665 | | | $ | — | | | $ | 52,220,358 | |
07/03/24 - 07/30/24 | | | — | | | $ | — | | | | — | | | $ | — | | | $ | 52,220,358 | |
07/31/24 - 08/27/24 | | | — | | | $ | — | | | | — | | | $ | — | | | $ | 52,220,358 | |
08/28/24 - 10/01/24 | | | 268,312 | | | $ | 30.74 | | | | 268,312 | | | $ | — | | | $ | 43,971,572 | |
10/02/24 - 10/29/24 | | | 110,380 | | | $ | 33.56 | | | | 110,380 | | | $ | — | | | $ | 40,267,184 | |
10/30/24 - 11/26/24 | | | 67,164 | | | $ | 34.66 | | | | 67,164 | | | $ | — | | | $ | 37,939,453 | |
11/27/24 - 12/31/24 | | | 56,187 | | | $ | 35.76 | | | | 56,187 | | | $ | — | | | $ | 35,930,111 | |
Total | | | 756,668 | | | | | | | 756,668 | | | | | | | |
(1)Period information is presented in accordance with our fiscal months during fiscal 2024.
ITEM 6. [RESERVED]
Not applicable.
ITEM 7. MANAGEMENT’S DISCUSSION AND ANALYSIS OF FINANCIAL CONDITION AND RESULTS OF OPERATIONS
The following Management’s Discussion and Analysis (“MD&A”) of Financial Condition and Results of Operations is intended to help you understand our Company, our operations and our current operating environment. For an understanding of the significant factors that influenced our performance, the MD&A should be read in conjunction with the Consolidated Financial Statements and related Notes to Consolidated Financial Statements included in Part II, Item 8 - Financial Statements and Supplementary Data of our Annual Report. Our MD&A consists of the following sections:
•Overview - a brief description of our business, financial highlights, strategy to increase shareholder value, key performance indicators, known and anticipated trends
•Results of Operations - an analysis of our Consolidated Statements of Operations for fiscal year 2024 compared to fiscal year 2023
•Liquidity and Capital Resources - an analysis of cash flows, including capital expenditures, share issuance and repurchase activity, dividends, contractual obligations and commitments, and known trends that may impact liquidity
•Critical Accounting Policies and Estimates - a discussion of accounting policies that require critical judgments and estimates, including new accounting standards, when applicable
OVERVIEW
As of February 26, 2025, we owned and operated 218 restaurants located in 31 states as described in Item 2 - Properties - “Restaurant Locations” in this Form 10-K. Our restaurants are open every day of the year except for Thanksgiving and Christmas. All of our restaurants currently offer take-out and delivery services. Additionally, all of our restaurants offer a call-ahead or online wait list, on-line ordering for dine-in, guest pick-up or curbside delivery and reservations for large parties.
Our menu features BJ’s award‑winning, signature deep-dish pizza, our proprietary craft and other beers, as well as a wide selection of appetizers, entrées, pastas, sandwiches, specialty salads and desserts, including our Pizookie® dessert. Our proprietary craft beer is produced at several of our locations, our Texas brewpub locations and by independent third-party brewers using our proprietary recipes.
Financial Highlights for Fiscal 2024
Notable fiscal 2024 financial highlights compared to fiscal 2023 include:
•Total revenues increased 1.8% to $1.4 billion
•Total restaurant operating weeks increased 0.3%
•Comparable restaurant sales increased 1.2%
•Net income of $16.7 million compared to $19.7 million
•Diluted net income per share of $0.70 compared to $0.82
Strategy to Increase Shareholder Value
Our goal is to increase shareholder value by increasing our adjusted earnings before depreciation and amortization (Adjusted EBITDA), earnings per share and return on invested capital through:
•Growing restaurant revenue through positive comparable sales and new restaurant growth
•Increasing restaurant margins through sales leverage, cost savings and culinary and menu strategies
•Enhancing new restaurant economics through restaurant margin improvement and new restaurant prototype optimization
•Returning capital to shareholders through share repurchase program
Key Performance Indicators and Non-GAAP Financial Measures
Key measures that we use in evaluating our restaurants and assessing our business include the following:
Comparable Restaurant Sales. In calculating comparable restaurant sales, we include a restaurant in the comparable base once it has been open for 18 months. This measure highlights the performance of existing restaurants, while excluding the impact of new restaurant openings and closures. Comparable restaurant sales increased 1.2% for fiscal 2024.
Restaurant Level Operating Profit. This non-GAAP financial measure is equal to the revenues generated by our restaurants, less their direct operating costs which consist of cost of sales, labor and benefits, and occupancy and operating costs. This performance measure primarily includes the costs that restaurant level managers can directly control and excludes other operating costs that are essential to conduct the Company’s business. We, similar to most of our competitors, use restaurant level operating profit as a supplemental measure of restaurant performance and believe restaurant level operating profit is useful to investors in that it highlights trends in our core business that may not otherwise be apparent to investors when relying solely on GAAP financial measures. Because other companies may calculate restaurant level operating profit differently than we do, our restaurant level operating profit calculation may not be comparable to similarly titled measures reported by other companies. A reconciliation of income (loss) from operations to restaurant level operating profit for fiscal 2024, 2023 and 2022 is set forth below:
| | | | | | | | | | | | | | | | | | | | | |
| | Fiscal Year | |
| | 2024 | | | 2023 | | | 2022 | |
Income (loss) from operations | | $ | 14,080 | | | 1.0 | % | | $ | 13,759 | | | 1.0 | % | | $ | (5,480 | ) | | (0.4 | )% |
General and administrative | | | 88,272 | | | 6.5 | | | | 82,103 | | | 6.2 | | | | 73,333 | | | 5.7 | |
Depreciation and amortization | | | 72,745 | | | 5.4 | | | | 70,992 | | | 5.3 | | | | 70,385 | | | 5.5 | |
Restaurant opening | | | 2,082 | | | 0.2 | | | | 2,808 | | | 0.2 | | | | 3,644 | | | 0.3 | |
Loss on disposal and impairment of assets, net | | | 18,414 | | | 1.4 | | | | 8,125 | | | 0.6 | | | | 6,200 | | | 0.5 | |
Gain on lease transactions, net | | | — | | | — | | | | — | | | — | | | | (3,318 | ) | | (0.3 | ) |
Restaurant level operating profit | | $ | 195,593 | | | 14.4 | % | | $ | 177,787 | | | 13.3 | % | | $ | 144,764 | | | 11.3 | % |
Adjusted Diluted Net Income Per Share. This is a non-GAAP financial measure that represents net income excluding net loss on disposal and impairment of assets, net leadership transition expenses and the related stock-based compensation credit, and charges associated with the extension of an outstanding warrant held by Act III. These adjustments are intended to provide greater transparency of underlying performance and to allow investors to evaluate our business on the same basis as our management. Because other companies may calculate this measure differently than we do, our adjusted diluted net income per share calculation may not be comparable to similarly titled measures reported by other companies. A reconciliation of net income to adjusted diluted net income per share for fiscal 2024, 2023 and 2022 is set forth below:
| | | | | | | | | | | | | | | | | | | | | |
| | Fiscal Year | |
| | 2024 | | | 2023 | | | 2022 | |
Net income | | $ | 16,687 | | | 1.2 | % | | $ | 19,660 | | | 1.5 | % | | $ | 4,076 | | | 0.3 | % |
| | | | | | | | | | | | | | | |
Loss on disposal and impairment of assets, net | | | 18,414 | | | 1.4 | | | | 8,125 | | | 0.6 | | | | 6,200 | | | 0.5 | |
Leadership transition expense, net | | | 3,231 | | | 0.2 | | | | — | | | — | | | | — | | | — | |
Stock-based compensation credit (1) | | | (2,093 | ) | | (0.2 | ) | | | — | | | — | | | | — | | | — | |
Warrant extension | | | 4,622 | | | 0.3 | | | | — | | | — | | | | — | | | — | |
Total adjustments | | | 24,174 | | | 1.8 | | | | 8,125 | | | 0.6 | | | | 6,200 | | | 0.5 | |
Tax effect of adjustments (2) | | | (5,850 | ) | | (0.4 | ) | | | (1,966 | ) | | (0.1 | ) | | | (1,500 | ) | | (0.1 | ) |
After tax effect of adjustments | | | 18,324 | | | 1.4 | | | | 6,159 | | | 0.5 | | | | 4,700 | | | 0.4 | |
| | | | | | | | | | | | | | | |
Adjusted net income | | $ | 35,011 | | | 2.6 | % | | $ | 25,819 | | | 1.9 | % | | $ | 8,776 | | | 0.7 | % |
| | | | | | | | | | | | | | | |
Diluted weighted average number of shares outstanding: | | | 23,768 | | | | | | 23,923 | | | | | | 23,662 | | | |
Diluted net (loss) income per share | | $ | 0.70 | | | | | $ | 0.82 | | | | | $ | 0.17 | | | |
Adjusted diluted net income per share | | $ | 1.47 | | | | | $ | 1.08 | | | | | $ | 0.37 | | | |
(1)Amount relates to stock-based compensation forfeited due to leadership transition.
(2)The tax effect is based on the Company’s annual statutory tax rate of 24.2% for fiscal years ending December 31, 2024, January 2, 2024 and January 3, 2023.
Adjusted EBITDA. This non-GAAP financial measure represents the sum of net income adjusted for certain expenses and gains/losses detailed within the reconciliation below. We use Adjusted EBITDA as a supplemental measure of our operating performance and believe this measure is useful to investors in that it highlights cash flow and trends in our business operations that may not otherwise be apparent to investors when relying solely on GAAP financial measures. Because other companies may calculate this measure differently than we do, our Adjusted EBITDA calculation may not be comparable to similarly titled measures reported by other companies. A reconciliation of net income to Adjusted EBITDA for fiscal 2024, 2023 and 2022 is set forth below:
| | | | | | | | | | | | | | | | | | | | | |
| | Fiscal Year | |
| | 2024 | | | 2023 | | | 2022 | |
Net income | | $ | 16,687 | | | 1.2 | % | | $ | 19,660 | | | 1.5 | % | | $ | 4,076 | | | 0.3 | % |
Interest expense, net | | | 5,484 | | | 0.4 | | | | 4,915 | | | 0.4 | | | | 2,888 | | | 0.2 | |
Income tax benefit | | | (8,422 | ) | | (0.6 | ) | | | (9,560 | ) | | (0.7 | ) | | | (12,384 | ) | | (1.0 | ) |
Depreciation and amortization | | | 72,745 | | | 5.4 | | | | 70,992 | | | 5.3 | | | | 70,385 | | | 5.5 | |
Leadership transition expense, net (1) | | | 3,231 | | | 0.2 | | | | — | | | — | | | | — | | | — | |
Stock-based compensation expense | | | 10,722 | | | 0.8 | | | | 10,902 | | | 0.8 | | | | 10,098 | | | 0.8 | |
Stock-based compensation credit (2) | | | (2,093 | ) | | (0.2 | ) | | | — | | | — | | | | — | | | — | |
Other (expense) income, net | | | 331 | | | — | | | | (1,256 | ) | | (0.1 | ) | | | (60 | ) | | — | |
Loss on disposal and impairment of assets, net | | | 18,414 | | | 1.4 | | | | 8,125 | | | 0.6 | | | | 6,200 | | | 0.5 | |
Gain on lease transactions, net | | | — | | | — | | | | — | | | — | | | | (3,318 | ) | | (0.3 | ) |
Adjusted EBITDA | | $ | 117,099 | | | 8.6 | % | | $ | 103,778 | | | 7.8 | % | | $ | 77,885 | | | 6.1 | % |
(1)Amount relates to severance, relocation, signing bonus and bonus expenses related to our leadership transition.
(2)Amount relates to stock-based compensation forfeited due to leadership transition.
Weekly Sales Average. We calculate each restaurant’s average weekly revenue to understand and manage the business trends and expectations. Our weekly sales average was approximately $120,000, $118,000 and $113,000 for fiscal 2024, 2023 and 2022, respectively.
Known or Anticipated Trends
Sales Growth. While most of our established restaurants operate close to full capacity during peak demand periods, we will continue to focus on ways to build sales, positively impact guest traffic and grow average check and weekly sales averages. We continue to focus on sales building initiatives to create more guest loyalty, increase the frequency of guest visits, further build our off-premise sales channel, better optimize our menu sales mix and develop other incremental opportunities to allow guests
to utilize BJ’s. We believe that all of these efforts combined with new restaurant openings offer significant growth opportunities and upside for weekly sales averages and comparable restaurant sales.
Restaurant Opening. Newly opened restaurants typically experience inefficiencies in the form of higher cost of sales, labor and direct operating and occupancy costs for several months after their opening relative to our more mature, established restaurants. Accordingly, the number and timing of new restaurant openings have had, and are expected to continue to have, an impact on restaurant opening expenses, cost of sales, labor and occupancy and operating expenses. Additionally, restaurant openings in new markets may experience even greater inefficiencies for several months, if not longer, due to lower initial sales volumes, which results from initially low consumer awareness levels, and a lack of supply chain and other operating cost leverage until additional restaurants can be opened in those markets.
Impacts of Inflation. Inflation has had an impact on our operations, new restaurant construction and corresponding return on invested capital. While we have been able to partially offset inflation and other changes in the costs of key operating inputs by gradually increasing menu prices, coupled with more efficient purchasing practices, productivity improvements and greater economies of scale, there can be no assurance that we will be able to continue to do so in the future. Increases in inflation could have a severe impact on the United States and global economies, which will have an adverse impact on our business, financial condition and results of operations. In addition, macroeconomic conditions that impact consumer discretionary spending for food away from home could make additional menu price increases imprudent. Whether we are able to continue to offset the effects of inflation will determine to what extent, if any, inflation affects our restaurant profitability in future periods.
Accounting Terms and Characteristics
Revenues. Our revenues are comprised of food and beverage sales from our restaurants, including takeout, delivery and catering sales. Revenues from restaurant sales are recognized when payment is tendered. Amounts paid with a credit card are recorded in accounts and other receivables until payment is collected from the credit card processor. We sell gift cards which do not have an expiration date, and we do not deduct non-usage fees from outstanding gift card balances. Gift card sales are recorded as a liability and recognized as revenues upon redemption in our restaurants. Based on historical redemption rates, a portion of our gift card sales are not expected to be redeemed and will be recognized as gift card “breakage.” Estimated gift card breakage is recorded as revenue and recognized in proportion to our historical redemption pattern, unless there is a legal obligation to remit the unredeemed gift cards to government authorities.
Guest Loyalty Program. Our program enables participants to earn points for qualifying purchases that can be redeemed for food and beverages in the future. We allocate the transaction price between the goods delivered and the future goods that will be delivered, on a relative standalone selling price basis, and defer the revenues allocated to the points until such points are redeemed.
Comparable Sales and Guest Traffic. All of our restaurants are company-owned. In calculating comparable restaurant sales, we include a restaurant in the comparable base once it has been open for 18 months. Guest traffic for our restaurants is estimated based on the number of guest checks.
Cost of Sales. Cost of sales is comprised of food and beverage costs, including the cost to produce and distribute our proprietary craft beer, soda and ciders. The components of cost of sales are variable and typically fluctuate directly with sales volumes but also may be impacted by changes in commodity prices, a shift in sales mix to higher cost proteins or other higher cost items, or varying levels of promotional activities.
Labor and Benefits. Labor and benefit costs include direct hourly and management wages, bonuses, payroll taxes, fringe benefits and stock-based compensation, and workers’ compensation expense that are directly related to restaurant level team members.
Occupancy and Operating. Occupancy and operating expenses include restaurant supplies, credit card fees, third-party delivery company commissions, marketing costs, fixed rent, percentage rent, common area maintenance charges, utilities, real estate taxes, repairs and maintenance and other related restaurant costs.
General and Administrative. General and administrative expenses include costs for our corporate administrative functions that support existing operations and provide infrastructure to facilitate our future growth. Components of this category include corporate management, field supervision and corporate hourly staff salaries and related team member benefits (including stock-based compensation expense and cash-based incentive compensation), travel and relocation costs, information systems, the cost to recruit and train new restaurant management team members, corporate rent, certain brand marketing-related expenses and legal and consulting fees.
Depreciation and Amortization. Depreciation and amortization are composed primarily of depreciation of capital expenditures for restaurant and brewing equipment and leasehold improvements.
Restaurant Opening. Restaurant opening expenses, which are expensed as incurred, consist of the costs of hiring and training the initial hourly work force for each new restaurant, travel, the cost of food and supplies used in training, grand opening promotional costs, the cost of the initial stock of operating supplies and other direct costs related to the opening of a restaurant, including rent during the construction and in-restaurant training period.
RESULTS OF OPERATIONS
The following table sets forth, for the years indicated, our Consolidated Statements of Operations both in dollars and as percentages of total revenues. All fiscal years presented consist of 52 weeks with the exception of fiscal year 2022, which consists of 53 weeks. Percentages below may not reconcile due to rounding.
| | | | | | | | | | | | | | | | | | | | | |
| | Fiscal Year | |
| | 2024 | | | 2023 | | | 2022 | |
Revenues | | $ | 1,357,302 | | | 100.0 | % | | $ | 1,333,229 | | | 100.0 | % | | $ | 1,283,926 | | | 100.0 | % |
Restaurant operating costs (excluding depreciation and amortization): | | | | | | | | | | | | | | | |
Cost of sales | | | 350,560 | | | 25.8 | | | | 346,569 | | | 26.0 | | | | 349,645 | | | 27.2 | |
Labor and benefits | | | 495,466 | | | 36.5 | | | | 491,314 | | | 36.9 | | | | 483,367 | | | 37.6 | |
Occupancy and operating | | | 315,683 | | | 23.3 | | | | 317,559 | | | 23.8 | | | | 306,150 | | | 23.8 | |
General and administrative | | | 88,272 | | | 6.5 | | | | 82,103 | | | 6.2 | | | | 73,333 | | | 5.7 | |
Depreciation and amortization | | | 72,745 | | | 5.4 | | | | 70,992 | | | 5.3 | | | | 70,385 | | | 5.5 | |
Restaurant opening | | | 2,082 | | | 0.2 | | | | 2,808 | | | 0.2 | | | | 3,644 | | | 0.3 | |
Loss on disposal and impairment of assets, net | | | 18,414 | | | 1.4 | | | | 8,125 | | | 0.6 | | | | 6,200 | | | 0.5 | |
Gain on lease transactions, net | | | — | | | — | | | | — | | | — | | | | (3,318 | ) | | (0.3 | ) |
Total costs and expenses | | | 1,343,222 | | | 99.0 | | | | 1,319,470 | | | 99.0 | | | | 1,289,406 | | | 100.4 | |
Income (loss) from operations | | | 14,080 | | | 1.0 | | | | 13,759 | | | 1.0 | | | | (5,480 | ) | | (0.4 | ) |
| | | | | | | | | | | | | | | |
Other (expense) income: | | | | | | | | | | | | | | | |
Interest expense, net | | | (5,484 | ) | | (0.4 | ) | | | (4,915 | ) | | (0.4 | ) | | | (2,888 | ) | | (0.2 | ) |
Other (expense) income, net | | | (331 | ) | | — | | | | 1,256 | | | 0.1 | | | | 60 | | | — | |
Total other expense | | | (5,815 | ) | | (0.4 | ) | | | (3,659 | ) | | (0.3 | ) | | | (2,828 | ) | | (0.2 | ) |
Income (loss) before income taxes | | | 8,265 | | | 0.6 | | | | 10,100 | | | 0.8 | | | | (8,308 | ) | | (0.6 | ) |
| | | | | | | | | | | | | | | |
Income tax benefit | | | (8,422 | ) | | (0.6 | ) | | | (9,560 | ) | | (0.7 | ) | | | (12,384 | ) | | (1.0 | ) |
Net income | | $ | 16,687 | | | 1.2 | % | | $ | 19,660 | | | 1.5 | % | | $ | 4,076 | | | 0.3 | % |
52 WEEKS ENDED DECEMBER 31, 2024 (FISCAL 2024) COMPARED TO THE 52 WEEKS ENDED JANUARY 2, 2024 (FISCAL 2023)
Revenues. Total revenues increased by $24.1 million, or 1.8%, to $1.4 billion during fiscal 2024, compared to $1.3 billion during fiscal 2023. The increase in revenues primarily consisted of a 1.2%, or $15.1 million, increase in comparable restaurant sales, and a $23.6 million increase in sales from new restaurants not yet in our comparable restaurant sales base. Revenue increases were offset primarily by a $12.7 million decrease related to closed restaurants and $1.9 million primarily related to lower gift card breakage and loyalty redemptions. The increase in comparable restaurant sales was the result of an increase in average check of approximately 1.8%, due to menu price increases coupled with changes in mix, offset by a decrease in guest traffic of approximately 0.6%.
Cost of Sales. Cost of sales increased by $4.0 million, or 1.2%, to $350.6 million during fiscal 2024, compared to $346.6 million during fiscal 2023. This increase was primarily due to higher revenues, commodity cost increases and costs related to our three new restaurants opened during fiscal 2024. As a percentage of revenues, cost of sales decreased to 25.8% for fiscal 2024 from 26.0% for the prior fiscal year. This decrease was primarily due to a higher revenue base, menu price increases and the effectiveness of our cost savings initiatives, partially offset by higher commodity costs and a higher level of promotions.
Labor and Benefits. Labor and benefit costs for our restaurants increased by $4.2 million, or 0.8%, to $495.5 million during fiscal 2024, compared to $491.3 million during fiscal 2023. This was primarily due to $3.1 million related to increased management compensation costs, $1.8 million related to taxes and benefits and $0.6 million related to higher hourly labor, offset by $1.3 million related to lower workers’ compensation. As a percentage of revenues, labor and benefit costs decreased to 36.5% for fiscal 2024 from 36.9% for the prior fiscal year. This decrease was primarily due to improved labor efficiency and
the effectiveness of our cost savings initiatives. Included in labor and benefits for fiscal 2024 and 2023 was approximately $2.5 million and $2.6 million, respectively, or 0.2% of revenues, of stock-based compensation expense, related to equity awards granted in accordance with our Gold Standard Stock Ownership Program for certain restaurant management team members.
Occupancy and Operating. Occupancy and operating expenses decreased by $1.9 million, or 0.6%, to $315.7 million during fiscal 2024, compared to $317.6 million during fiscal 2023. This was primarily due to decreases of $4.4 million in restaurant facilities expenses, $1.1 million related to equipment rental, $1.4 million in utilities and $0.4 million in supplies, offset by a $1.5 million increase in credit card processing fees, $3.1 million in marketing expenditures and $0.9 million in rent and related costs. As a percentage of revenues, occupancy and operating expenses decreased to 23.3% for fiscal 2024 from 23.8% for the prior fiscal year. This decrease was primarily related to improved operational efficiency and the effectiveness of our cost savings initiatives.
General and Administrative. General and administrative expenses increased by $6.2 million, or 7.5%, to $88.3 million during fiscal 2024, compared to $82.1 million during fiscal 2023. This was primarily due to increases of $2.6 million in personnel related costs, $2.1 million in corporate expenses related to meeting costs and software amortization, $2.0 million related to consulting fees, $1.6 million in legal fees, $0.5 million in medical insurance, $0.5 million in office expenses, $0.4 million in travel related expenses, $0.3 million related to our deferred compensation liability, and $0.2 million related to recruiting, offset by a $2.3 million decrease in incentive compensation, and lower stock-based compensation expense of $2.1 million. General and administrative costs for fiscal 2024 included a net charge of $3.2 million related to our leadership transition expenses, $1.5 million of legal costs related to shareholder cooperation agreements and related matters, and $0.3 million in severance related to personnel changes, offset by a $2.1 million stock-based compensation credit related to the reversal of previously awarded stock-based compensation expense in conjunction with our leadership transition. As a percentage of revenues, general and administrative expenses increased to 6.5% for fiscal 2024 from 6.2% for the prior fiscal year. This increase was primarily related to increased legal and corporate expenses arising in connection with our previously announced cooperation agreements with certain investors and related matters. Included in general and administrative costs for fiscal 2024 and 2023 was approximately $6.2 million and $8.3 million, or 0.5% and 0.6% of revenues, of stock-based compensation expense, respectively.
Depreciation and Amortization. Depreciation and amortization increased by $1.8 million, or 2.5%, to $72.7 million during fiscal 2024, compared to $71.0 million during fiscal 2023. This increase is related to the restaurants opened during fiscal 2024, offset by the decrease in deprecation related to the impairment and disposal charges taken in the current year as well as the prior year, coupled with the closure of one restaurant during fiscal 2024. As a percentage of revenues, depreciation and amortization increased to 5.4% for fiscal 2024 from 5.3% for the prior fiscal year.
Restaurant Opening. Restaurant opening expense decreased by $0.7 million, or 25.9%, to $2.1 million during fiscal 2024, compared to $2.8 million during fiscal 2023. This decrease was primarily due to two less restaurant openings in fiscal 2024, coupled with the timing of our openings.
Loss on Disposal and Impairment of Assets, Net. Loss on disposal and impairment of assets, net, was $18.4 million during fiscal 2024, compared to $8.1 million during fiscal 2023. In fiscal 2024, these costs primarily related to the impairment and reduction in the carrying value of the long-lived assets related to six of our restaurants, coupled with the disposals of assets in conjunction with initiatives to keep our restaurants up to date and the closure of one of our restaurants. In fiscal 2023, these costs primarily relate to disposals of assets in conjunction with initiatives to keep our restaurants up to date, including our restaurant remodel initiative and the removal of glass partitions in our dining rooms that were installed during the pandemic, as well as the closure of five under-performing restaurants.
Interest Expense, Net. Interest expense, net, increased by $0.6 million to $5.5 million during fiscal 2024, compared to $4.9 million during fiscal 2023. This increase was primarily due a higher average outstanding debt balance and weighted average interest rate during the year, as compared to fiscal 2023.
Other (Expense) Income, Net. Other (expense) income, net, was an expense of $0.3 million during fiscal 2024, compared to income of $1.3 million. This was primarily due to the charge associated with extension of an outstanding warrant held by Act III, offset by income related to a payroll tax credit and two favorable settlements with our landlords.
Income Tax Benefit. Our effective income tax rate for fiscal 2024 reflected a 101.9% tax benefit compared to a 94.7% tax benefit for fiscal 2023. The effective tax rate benefit for fiscal 2024 and 2023 was different than the statutory tax rate primarily due to Federal Insurance Contributions Act (“FICA”) tax tip credits.
52 WEEKS ENDED JANUARY 2, 2024 (FISCAL 2023) COMPARED TO THE 53 WEEKS ENDED JANUARY 3, 2023 (FISCAL 2022)
For discussion related to the results of operations and changes in financial condition for fiscal 2023 compared to fiscal 2022 refer to Part II, Item 7. Management’s Discussion and Analysis of Financial Condition and Results of Operations in our fiscal 2023 Form 10-K, which was filed with the United States Securities and Exchange Commission on February 27, 2024.
LIQUIDITY AND CAPITAL RESOURCES
The following table provides, for the periods indicated, a summary of our key liquidity measurements (dollar amounts in thousands):
| | | | | | | | |
| | December 31, 2024 | | | January 2, 2024 | |
Cash and cash equivalents | | $ | 26,096 | | | $ | 29,070 | |
Net working capital | | $ | (116,744 | ) | | $ | (116,304 | ) |
Current ratio | | 0.4:1.0 | | | 0.4:1.0 | |
Our capital requirements are driven by our fundamental financial objective to improve total shareholder return through a balanced approach of new restaurant expansion plans, enhancements and initiatives focused on existing restaurants and return of capital to our shareholders through our share repurchase program. We expect to accelerate restaurant openings in 2026. Our capital expenditures in 2025, related to future restaurant openings, will depend on the speed at which we can develop a more robust and targeted pipeline that aligns with our refined criteria for new locations. In addition, we want to maintain a flexible balance sheet to provide the financial resources necessary to manage the risks and uncertainties of conducting our business operations in the restaurant industry. In order to achieve these objectives, we use a combination of operating cash flows, debt, and landlord allowances.
Based on current operations, we believe that our current cash and cash equivalents, coupled with cash generated from operations and availability under our credit agreement will be adequate to meet our capital expenditure and working capital needs for at least the next twelve months. Our future operating performance will be subject to future economic conditions and to financial, business and other factors, many of which are beyond our control.
Similar to many restaurant chains, we typically utilize operating lease arrangements (principally ground leases) for our restaurant locations. We believe our operating lease arrangements provide appropriate leverage for our capital structure in a financially efficient manner. However, we are not limited to the use of lease arrangements as our only method of opening new restaurants and from time to time have purchased the underlying land for new restaurants. We typically lease our restaurant locations for periods of 10 to 20 years under operating lease arrangements. Our rent structures vary from lease to lease, but generally provide for the payment of both minimum and contingent (percentage) rent based on sales, as well as other expenses related to the leases (for example, our pro-rata share of common area maintenance, property tax and insurance expenses). Many of our lease arrangements include the opportunity to secure tenant improvement allowances to partially offset the cost of developing and opening the related restaurants. Generally, landlords recover the cost of such allowances from increased minimum rents. There can be no assurance that such allowances will be available to us on each project. From time to time, we may also decide to purchase the underlying land for a new restaurant if that is the only way to secure a highly desirable site. Currently, we own the underlying land for our Texas brewpub locations. We also own parcels of land adjacent to two of our restaurants. It is not our current strategy to own a large number of land parcels that underlie our restaurants. Therefore, in many cases we have subsequently entered into sale-leaseback arrangements for land parcels that we previously purchased. We disburse cash for certain site-related work, buildings, leasehold improvements, furnishings, fixtures and equipment to build our leased and owned premises. We own substantially all of the equipment, furniture and trade fixtures in our restaurants and currently plan to do so in the future.
CASH FLOWS
The following tables set forth, for the years indicated, our cash flows from operating, investing, and financing activities (dollar amounts in thousands):
| | | | | | | | | | | | |
| | Fiscal Year | |
| | 2024 | | | 2023 | | | 2022 | |
Net cash provided by operating activities | | $ | 101,472 | | | $ | 105,837 | | | $ | 51,122 | |
Net cash used in investing activities | | | (76,893 | ) | | | (98,911 | ) | | | (71,907 | ) |
Net cash (used in) provided by financing activities | | | (27,553 | ) | | | (2,729 | ) | | | 7,131 | |
Net (decrease) increase in cash and cash equivalents | | $ | (2,974 | ) | | $ | 4,197 | | | $ | (13,654 | ) |
Operating Cash Flows
Net cash provided by operating activities was $101.5 million during fiscal 2024, representing a $4.4 million decrease compared to the $105.8 million provided during fiscal 2023. The decrease over the prior year is primarily due to the timing of payments for accounts payable and the timing of receipts for accounts and other receivable, offset by higher impairments in the current year.
Investing Cash Flows
Net cash used in investing activities was $76.9 million during fiscal 2024, representing a $22.0 million decrease compared to the $98.9 million used in fiscal 2023. The decrease over prior year is primarily due to the number of new restaurant openings and fewer restaurant remodels and less maintenance incurred.
The following table provides, for the years indicated, the components of capital expenditures (dollar amounts in thousands):
| | | | | | | | | | | | |
| | Fiscal Year | |
| | 2024 | | | 2023 | | | 2022 | |
New restaurants | | $ | 28,766 | | | $ | 39,942 | | | $ | 43,778 | |
Restaurant maintenance and remodels, and productivity initiatives | | | 47,205 | | | | 57,631 | | | | 31,471 | |
Restaurant and corporate systems | | | 929 | | | | 1,341 | | | | 3,357 | |
Total capital expenditures | | $ | 76,900 | | | $ | 98,914 | | | $ | 78,606 | |
During fiscal 2024, we opened three new restaurants and closed one restaurant. We currently plan to open one new restaurant and remodel up to 30 existing locations in fiscal 2025. We currently anticipate our total capital expenditures for fiscal 2025 to be approximately $65 million to $75 million. This estimate includes costs to open new restaurants and remodel existing locations and excludes anticipated proceeds from tenant improvement allowances. We expect to fund our net capital expenditures with our current cash balance on hand, cash flows from operations and our line of credit. Our future cash requirements will depend on many factors, including the pace of our expansion, conditions in the retail property development market, construction costs, the nature of the specific sites selected for new restaurants, and the nature of the specific leases and associated tenant improvement allowances available, if any, as negotiated with landlords.
Financing Cash Flows
Net cash used in financing activities was $27.6 million during fiscal 2024, representing a $24.8 million increase in cash used compared to the $2.7 million used in fiscal 2023. This increase was primarily due to an increase in common stock repurchases, coupled with higher payments on our line of credit. We currently anticipate our common stock repurchases for fiscal 2025 to be approximately $40 million to $50 million.
Contractual Obligations and Commitments
We believe we have sufficient liquidity to fund our operations and meet our short-term and long-term obligations. Our cash requirements greater than twelve months from contractual obligations and commitments include:
•Operating Leases — Refer to Note 1 and Note 6, Leases, of the notes to the Consolidated Financial Statements for further information of our obligations and the timing of expected payments.
•Purchase Obligations— Refer to Note 7, Commitments and Contingencies, of the notes to the Consolidated Financial Statements for further detail of our obligations and the timing of expected future payments.
•Long-term Debt, Standby Letters of Credit and Interest Payments — Refer to Note 8, Long-Term Debt, of the notes to the Consolidated Financial Statements for further information of our obligations and the timing of expected payments.
Off-Balance Sheet Arrangements
We do not participate in transactions that generate relationships with unconsolidated entities or financial partnerships, such as entities often referred to as structured finance or variable interest entities (“VIEs”), which would have been established for the purpose of facilitating off-balance sheet arrangements or other contractually narrow limited purposes. As of December 31, 2024, we are not involved in any off-balance sheet arrangements.
CRITICAL ACCOUNTING POLICIES AND ESTIMATES
Our significant accounting policies are more fully described in Note 1 of Notes to Consolidated Financial Statements in Part IV, Item 15. Judgments or uncertainties regarding the application of these policies may result in materially different amounts being reported under different conditions or using different assumptions. We consider the following policies to be the most critical in understanding the judgments that are involved in preparing our consolidated financial statements.
Impairment of Long-Lived Assets
We assess the potential impairment of our long-lived assets whenever events or changes in circumstances indicate that the carrying value of the assets may not be recoverable. The assets are generally reviewed for impairment on a restaurant level basis, and inclusive of property and equipment and lease right-of-use assets; or at the lowest level for which identifiable cash flows are largely independent of the cash flows of other assets. Factors considered include, but are not limited to, significant underperformance by the restaurant relative to historical operating results; significant changes in the manner of use of the assets or the strategy for the overall business; significant negative industry or economic trends; or our expectation to dispose of long-lived assets before the end of their previously estimated useful lives. Any adverse change in these factors could have a significant impact on the recoverability of these assets and could have a material impact on our consolidated financial statements.
Self-Insurance Liability
Our estimated liability is based on information provided by a third-party actuary, combined with our judgments regarding a number of assumptions and factors, including the frequency and severity of claims, our loss development factors, loss costs, history, case jurisdiction, related legislation, and our claims settlement practice. Significant judgment is required to estimate claims incurred but not yet reported to us (“IBNR claims”) as parties have yet to assert such claims. Should a greater number of claims occur compared to what was estimated, or should medical costs increase beyond what was expected, accruals might not be sufficient, and additional expense may be recorded.
ITEM 7A. QUANTITATIVE AND QUALITATIVE DISCLOSURES ABOUT MARKET RISK
The following discussion of market risks contains “forward-looking” statements. Actual results may differ materially from the following discussion based on general conditions in the financial and commodity markets.
Interest Rate Risk
Our Credit Facility provides us with revolving loan commitments totaling $215 million. As of December 31, 2024, $66.5 million was outstanding and carries interest at a floating rate. We utilize the Credit Facility principally for letters of credit that are required to support our self-insurance programs, to fund a portion of our announced share repurchase program, and for working capital and construction requirements, as needed. We are exposed to interest rate risk through fluctuations in interest rates on our obligations under the Credit Facility. Based on our current outstanding balance, a hypothetical 1% change in the interest rates under our Credit Facility would have an approximate $0.5 million annual impact on our net income.
Food and Commodity Price Risks
We purchase food, supplies and other commodities for use in our operations based upon market prices established with our suppliers. Our business is dependent on frequent and consistent deliveries of these items. We may experience shortages, delays or interruptions due to inclement weather, natural disasters, labor issues or other operational disruptions or other conditions beyond our control such as cyber breaches or ransomware attacks at our suppliers, distributors or transportation providers. Additionally, many of the commodities purchased by us can be subject to volatility due to market supply and demand factors outside of our control, whether contracted for or not. Costs can also fluctuate due to government regulation, including the imposition of tariffs. To manage this risk in part, we attempt to enter into fixed-price purchase commitments, with terms typically up to one year, for some of our commodity requirements. However, it may not be possible for us to enter into fixed-price contracts for certain commodities or we may choose not to enter into fixed-price contracts for certain commodities. We believe that substantially all of our food and supplies are available from several sources, which helps to diversify our overall commodity cost risk. We also believe that we have some flexibility and ability to increase certain menu prices, or vary certain menu items offered or promoted, in response to food commodity price increases. Some of our commodity purchase arrangements may contain contractual features that limit the price paid by establishing certain price floors or caps. We do not use financial instruments to hedge commodity prices, since our purchase arrangements with suppliers, to the extent that we can enter into such arrangements, help control the ultimate cost that we pay.
ITEM 8. FINANCIAL STATEMENTS AND SUPPLEMENTARY DATA
See the Consolidated Financial Statements and other data attached hereto beginning on page F-1 of this Annual Report on Form 10-K.
ITEM 9. CHANGES IN AND DISAGREEMENTS WITH ACCOUNTANTS ON ACCOUNTING AND FINANCIAL DISCLOSURE
None.
ITEM 9A. CONTROLS AND PROCEDURES
Evaluation of Disclosure Controls and Procedures
Under the supervision and with the participation of our management, including the Chief Executive Officer and Chief Financial Officer, we have evaluated the effectiveness of our disclosure controls and procedures pursuant to Rules 13a-15 and 15d-15 promulgated under the Securities Exchange Act of 1934 as amended, as of the end of the period covered by this report. Based on this evaluation, our Chief Executive Officer and Chief Financial Officer concluded that, as of December 31, 2024, our disclosure controls and procedures are designed and are effective to provide reasonable assurance that information we are required to disclose in reports that we file or submit under the Exchange Act is recorded, processed, summarized, and reported within the time periods specified in the SEC’s rules and forms, and that such information is accumulated and communicated to our management, including our Chief Executive Officer and Chief Financial Officer, as appropriate, to allow timely decisions regarding required disclosure.
Changes in Internal Control Over Financial Reporting
There has not been any change in our internal control over financial reporting (as such term is defined in Rules 13a-15(f) and 15d-15(f) under the Exchange Act) during our fourth fiscal quarter that has materially affected, or is reasonably likely to materially affect, our internal control over financial reporting.
Management’s Report on Internal Control Over Financial Reporting
Our management is responsible for establishing and maintaining adequate internal control over financial reporting, as such term is defined in Exchange Act Rules 13a-15(f) and 15d-15(f). Under the supervision and with the participation of our management, including our Chief Executive Officer and Chief Financial Officer, we conducted an evaluation of the effectiveness of our internal control over financial reporting as of December 31, 2024, based on the framework in Internal Control—Integrated Framework issued by the Committee of Sponsoring Organizations of the Treadway Commission (2013 framework) (“COSO”). Based on that evaluation, our management concluded that our internal control over financial reporting was effective as of December 31, 2024.
KPMG LLP, the independent registered public accounting firm, has independently assessed the effectiveness of our internal control over financial reporting and its report is included herein.
Report of Independent Registered Public Accounting Firm
To the Shareholders and the Board of Directors
BJ’s Restaurants, Inc.:
Opinion on Internal Control Over Financial Reporting
We have audited BJ's Restaurants, Inc. and subsidiaries' (the Company) internal control over financial reporting as of December 31, 2024, based on criteria established in Internal Control – Integrated Framework (2013) issued by the Committee of Sponsoring Organizations of the Treadway Commission. In our opinion, the Company maintained, in all material respects, effective internal control over financial reporting as of December 31, 2024, based on criteria established in Internal Control – Integrated Framework (2013) issued by the Committee of Sponsoring Organizations of the Treadway Commission.
We also have audited, in accordance with the standards of the Public Company Accounting Oversight Board (United States) (PCAOB), the consolidated balance sheets of the Company as of December 31, 2024 and January 2, 2024, the related consolidated statements of operations, shareholders’ equity, and cash flows for each of the years in the three-year period ended December 31, 2024, and the related notes (collectively, the consolidated financial statements), and our report dated February 26, 2025 expressed an unqualified opinion on those consolidated financial statements.
Basis for Opinion
The Company’s management is responsible for maintaining effective internal control over financial reporting and for its assessment of the effectiveness of internal control over financial reporting, included in the accompanying Management's Report on Internal Control Over Financial Reporting. Our responsibility is to express an opinion on the Company’s internal control over financial reporting based on our audit. We are a public accounting firm registered with the PCAOB and are required to be independent with respect to the Company in accordance with the U.S. federal securities laws and the applicable rules and regulations of the Securities and Exchange Commission and the PCAOB.
We conducted our audit in accordance with the standards of the PCAOB. Those standards require that we plan and perform the audit to obtain reasonable assurance about whether effective internal control over financial reporting was maintained in all material respects. Our audit of internal control over financial reporting included obtaining an understanding of internal control over financial reporting, assessing the risk that a material weakness exists, and testing and evaluating the design and operating effectiveness of internal control based on the assessed risk. Our audit also included performing such other procedures as we considered necessary in the circumstances. We believe that our audit provides a reasonable basis for our opinion.
Definition and Limitations of Internal Control Over Financial Reporting
A company’s internal control over financial reporting is a process designed to provide reasonable assurance regarding the reliability of financial reporting and the preparation of financial statements for external purposes in accordance with generally accepted accounting principles. A company’s internal control over financial reporting includes those policies and procedures that (1) pertain to the maintenance of records that, in reasonable detail, accurately and fairly reflect the transactions and dispositions of the assets of the company; (2) provide reasonable assurance that transactions are recorded as necessary to permit preparation of financial statements in accordance with generally accepted accounting principles, and that receipts and expenditures of the company are being made only in accordance with authorizations of management and directors of the company; and (3) provide reasonable assurance regarding prevention or timely detection of unauthorized acquisition, use, or disposition of the company’s assets that could have a material effect on the financial statements.
Because of its inherent limitations, internal control over financial reporting may not prevent or detect misstatements. Also, projections of any evaluation of effectiveness to future periods are subject to the risk that controls may become inadequate because of changes in conditions, or that the degree of compliance with the policies or procedures may deteriorate.
/s/ KPMG LLP
Los Angeles, California
February 26, 2025
Inherent Limitations on Effectiveness of Controls
Our management, including the Chief Executive Officer and Chief Financial Officer, does not expect that our disclosure controls or our internal control over financial reporting will prevent or detect all errors and all fraud. A control system, no matter how well designed and operated, can provide only reasonable, not absolute, assurance that the control system’s objectives will be met. The design of a control system must reflect the fact that there are resource constraints, and the benefits of controls must be considered relative to their costs. Further, because of the inherent limitations in all control systems, no evaluation of controls can provide absolute assurance that misstatements due to error or fraud will not occur or that all control issues and instances of fraud, if any, within the Company have been detected. These inherent limitations include the realities that judgments in decision-making can be faulty and that breakdowns can occur because of simple error or mistake. Controls can also be circumvented by the individual acts of some persons, by collusion of two or more people, or by management override of the controls. The design of any system of controls is based in part on certain assumptions about the likelihood of future events, and there can be no assurance that any design will succeed in achieving its stated goals under all potential future conditions. Projections of any evaluation of control effectiveness to future periods are subject to risks. Over time, controls may become inadequate because of changes in conditions or deterioration in the degree of compliance with policies or procedures.
ITEM 9B. OTHER INFORMATION
None.
ITEM 9C. DISCLOSURE REGARDING FOREIGN JURISDICTIONS THAT PREVENT INSPECTIONS
None.
PART III
ITEM 10. DIRECTORS, EXECUTIVE OFFICERS AND CORPORATE GOVERNANCE
We have a Code of Integrity, Ethics and Conduct (the “Code”) to promote honest and ethical conduct of our business, professional and personal relationships. The Code covers all executives, including our principal executive officer, principal financial officer and principal accounting officer, directors, and other team members. A copy of our Code of Integrity, Ethics and Conduct is available on our website https://investors.bjsrestaurants.com under Corporate Governance. We intend to post any amendments to or waivers from our Code at this website location.
We have insider trading policies governing the purchase, sale and or other dispositions of our stock by directors, officers and selected employees that are reasonably designed to promote compliance with insider trading laws and applicable listing standards for our common stock.
Information with respect to our executive officers is included in Part I, Item 1 of this Annual Report on Form 10-K. Other information required by this Item is hereby incorporated by reference to the information contained in the Proxy Statement relating to the Annual Meeting of Shareholders, which we expect to be filed with the SEC no later than 120 days after the close of the year ended December 31, 2024.
ITEM 11. EXECUTIVE COMPENSATION
The information required by this Item is incorporated herein by reference to the information contained in the Proxy Statement relating to the Annual Meeting of Shareholders, which we expect to file with the SEC no later than 120 days after the close of the year ended December 31, 2024.
ITEM 12. SECURITY OWNERSHIP OF CERTAIN BENEFICIAL OWNERS AND MANAGEMENT AND RELATED SHAREHOLDER MATTERS
The information required by this Item is incorporated herein by reference to the information contained in the Proxy Statement relating to the Annual Meeting of Shareholders, which we expect to file with the SEC no later than 120 days after the close of the year ended December 31, 2024.
ITEM 13. CERTAIN RELATIONSHIPS AND RELATED TRANSACTIONS AND DIRECTOR INDEPENDENCE
The information required by this Item is incorporated herein by reference to the information contained in the Proxy Statement relating to the Annual Meeting of Shareholders, which we expect to file with the SEC no later than 120 days after the close of the year ended December 31, 2024.
See Part II, Item 5 – “Market for Registrant’s Common Equity, Related Shareholder Matters and Issuer Purchases of Equity Securities – Stock-Based Compensation Plan Information” for certain information regarding our equity compensation plans.
ITEM 14. PRINCIPAL ACCOUNTING FEES AND SERVICES
The information required by this Item is incorporated herein by reference to the information contained in the Proxy Statement relating to the Annual Meeting of Shareholders, which we expect to file with the SEC no later than 120 days after the close of the year ended December 31, 2024.
PART IV
ITEM 15. EXHIBITS AND FINANCIAL STATEMENT SCHEDULES
(a) (1) CONSOLIDATED FINANCIAL STATEMENTS
The following documents are contained in Part II, Item 8 of this Annual Report on Form 10-K:
Report of Independent Registered Public Accounting Firm
Consolidated Balance Sheets at December 31, 2024 and January 2, 2024
Consolidated Statements of Operations for Each of the Three Fiscal Years in the Period Ended December 31, 2024
Consolidated Statements of Shareholders’ Equity for Each of the Three Fiscal Years in the Period Ended December 31, 2024
Consolidated Statements of Cash Flows for Each of the Three Fiscal Years in the Period Ended December 31, 2024
Notes to the Consolidated Financial Statements
(2)FINANCIAL STATEMENT SCHEDULES
All schedules are omitted because they are not applicable or the required information is shown in the Consolidated Financial Statements or notes thereto.
| | |
Exhibit Number | | Description |
| | |
3.1 | | Amended and Restated Articles of Incorporation of the Company, incorporated by reference to Exhibit 3.1 to Form 10-K for the year ended January 2, 2018. |
| | |
3.2 | | Certificate of Amendment of Articles of Incorporation incorporated by reference to Exhibit 3.3 to Form 10-K for the year ended January 2, 2005. |
| | |
3.3 | | Certificate of Amendment of Articles of Incorporation, dated June 8, 2010, incorporated by reference to Exhibit 3.4 to Form 10-K for the year ended December 28, 2010. |
| | |
3.4 | | Amended and Restated Bylaws of the Company, incorporated by reference to Exhibit 3.1 to Form 8-K filed on August 14, 2020. |
| | |
4.1 | | Specimen Common Stock Certificate of the Company, incorporated by reference to Exhibit 4.1 of the Company’s Registration Statement on Form SB‑2A filed with the Securities and Exchange Commission on August 22, 1996 (File No. 3335182‑LA) (as amended, the “Registration Statement”). |
| | |
4.2 | | Description of the Securities, incorporated by reference to Exhibit 4.2 to Form 10-K filed on February 25, 2020. |
| | |
10.1* | | Form of Indemnification Agreement with Officers and Directors, incorporated by reference to Exhibit 10.1 to Form 10-K for the year ended January 2, 2018. |
| | |
10.2* | | Amended and Restated Equity Incentive Plan (the “Equity Incentive Plan”), incorporated by reference to Exhibit 10.1 to the Form 10-Q filed on August 1, 2022. |
| | |
10.3* | | Form of Employee Stock Option Agreement under the Equity Incentive Plan, incorporated by reference to Exhibit 10.3 to Form 10-K filed on February 25, 2020. |
| | |
10.4* | | Form of Notice of Grant of Stock Option under the Equity Incentive Plan, incorporated by reference to Exhibit 10.4 of the Form 8-K filed July 1, 2005. |
| | |
10.5* | | Form of Non-Employee Director Stock Option Agreement under the Equity Incentive Plan, incorporated by reference to Exhibit 10.8 of the Form 10-K for the year ended January 3, 2006. |
| | |
10.6* | | Form of Non-Employee Director Notice of Grant of Stock Option under the Equity Incentive Plan, incorporated by reference to Exhibit 10.9 of the Form 10-K for the year ended January 3, 2006. |
| | |
10.7* | | Form of Restricted Stock Unit Agreement (non-GSSOP) for employees under the Equity Incentive Plan, incorporated by reference to Exhibit 10.7 to Form 10-K filed on February 25, 2020. |
| | |
10.8* | | Form of Restricted Stock Unit Notice (non-GSSOP) for employees under the Equity Incentive Plan, incorporated by reference to Exhibit 10.2 to the Form 10-Q filed on November 6, 2007. |
| | |
10.9* | | BJ's Restaurants, Inc. 2024 Equity Incentive Plan, incorporated by reference to Exhibit 10.1 to Form 8-K filed on June 21, 2024. |
| | |
10.10* | | Form of Restricted Stock Unit Agreement for non-employee directors under the 2024 Equity Incentive Plan, incorporated by reference to Exhibit 10.2 to Form 8-K filed on June 25, 2024. |
| | |
10.11* | | Form of Restricted Stock Unit Award Certificate for non-employee directors under the 2024 Equity Incentive Plan, incorporated by reference to Exhibit 10.3 to Form 8-K filed on June 25, 2024. |
| | |
10.12* | | Form of Restricted Stock Unit Agreement for employees under the 2024 Equity Incentive Plan, incorporated by reference to Exhibit 10.4 to Form 8-K filed on June 25, 2024. |
| | |
10.13* | | Form of Restricted Stock Unit Award Certificate for employees under the 2024 Equity Incentive Plan, incorporated by reference to Exhibit 10.5 to Form 8-K filed on June 25, 2024. |
| | |
10.14* | | Form of Performance Stock Unit Agreement under the 2024 Equity Incentive Plan, incorporated by reference to Exhibit 10.6 to Form 8-K filed on June 25, 2024. |
| | |
10.15* | | Form of Performance Stock Unit Award Certificate under the 2024 Equity Incentive Plan, incorporated by reference to Exhibit 10.7 to Form 8-K filed on June 25, 2024. |
| | |
| | |
Exhibit Number | | Description |
10.16* | | Form of Stock Option Agreement under the 2024 Equity Incentive Plan, incorporated by reference to Exhibit 10.8 to Form 8-K filed on June 25, 2024. |
| | |
10.17* | | Form of Notice of Grant of Stock Option under the 2024 Equity Incentive Plan, incorporated by reference to Exhibit 10.9 to Form 8-K filed on June 25, 2024. |
| | |
10.18* | | Employment Agreement, dated June 12, 2003, between the Company and Gregory S. Lynds, incorporated by reference to Exhibit 10.26 to Form 10-K filed on or about March 14, 2008. |
| | |
10.19* | | Employment Agreement, effective March 1, 2011, between the Company and Kendra D. Miller, incorporated by reference to Exhibit 10.17 to Form 10-K filed on March 9, 2011. |
| | |
10.20* | | Employment Agreement dated January 28, 2013, between the Company and Brian S. Krakower, incorporated by reference to Exhibit 10.1 to Form 10-Q filed on May 6, 2013. |
| | |
10.21* | | Employment Agreement dated August 22, 2024, between the Company and C. Bradford Richmond, incorporated by reference to Exhibit 10.1 to Form 8-K filed on August 28, 2024. |
| | |
10.22* | | Employment Agreement dated August 23, 2024, between the Company and Lyle D. Tick, incorporated by reference to Exhibit 10.1 to Form 8-K filed on September 3, 2024. |
| | |
10.23* | | Form of Performance Stock Unit Agreement under the Equity Incentive Plan, incorporated by reference to Exhibit 10.28 to Form 10-K filed on February 25, 2020. |
| | |
10.24 | | Fourth Amended and Restated Credit Agreement, dated November 3, 2021, among the Company and Bank of America, N.A. and the other lenders identified therein, incorporated by reference to Exhibit 10.1 to Form 8-K filed on November 8, 2021. |
| | |
10.25* | | BJ’s Restaurants, Inc. Performance Incentive Plan (incorporated by reference to Appendix A to the Company’s Definitive Proxy Statement on Schedule 14A filed with the Securities and Exchange Commission on April 22, 2016. |
| | |
10.26* | | BJ's Restaurants, Inc. Deferred Compensation Plan. |
| | |
10.27 | | Form of Common Stock Purchase Warrant in favor of SC 2018 Trust, LLC, incorporated by reference to Exhibit 10.7 to Form 8-K filed on May 4, 2020. |
| | |
10.28 | | Amendment No. 1, dated November 24, 2020, to Common Stock Purchase Warrant, dated May 5, 2020, issued by the Company in favor of BJ’s Act III, LLC, incorporated by reference to Exhibit 10.2 to Form 8-K filed November 30, 2020. |
| | |
10.29 | | Form of Registration Rights Agreement among the Company and certain funds and accounts advised by T. Rowe Price Associates, Inc., acting as investment adviser, incorporated by reference to Exhibit 10.4 to Form 8-K filed on May 4, 2020. |
| | |
10.30 | | Form of Registration Rights Agreement between the Company and SC 2018 Trust, LLC, incorporated by reference to Exhibit 10.5 to Form 8-K filed on May 4, 2020. |
| | |
10.31 | | Amendment No. 1 (Conforming Changes) to Fourth Amended and Restated Credit Agreement dated as of October 29, 2024, among the Company and Bank of America, N.A. and the other lenders identified therein, incorporated by reference to Exhibit 10.3 to Form 10-Q filed on November 4, 2024. |
| | |
10.32 | | Cooperation Agreement, dated February 27, 2024, between the Company and Fund 1 Investments, LLC, incorporated by reference to Exhibit 10.1 of the Form 8-K filed on February 28, 2024. |
| | |
10.33 | | Cooperation Agreement, dated December 30, 2024, among the Company, Act III Holdings, LLC, Act III Management, LLC, BJ’s Act III, LLC, and SC 2018 Trust LLC, incorporated by reference to Exhibit 10.1 to Form 8-K filed January 2, 2025. |
| | |
10.34 | | Amendment No. 2, dated December 30, 2024, to Common Stock Purchase Warrant, dated May 5, 2020, issued by the Company in favor of BJ’s Act III, LLC, incorporated by reference to Exhibit 10.2 to Form 8-K filed January 2, 2025. |
| | |
19.1 | | BJ’s Restaurants, Inc. Securities Trading by Company Personnel |
| | |
21 | | List of Significant Subsidiaries. |
| | |
* Management contracts or compensation plans or arrangements in which directors or executive officers are eligible to participate.
ITEM 16. FORM 10-K SUMMARY
Not applicable.
SIGNATURES
Pursuant to the requirements of Section 13 or 15(d) of the Securities Exchange Act of 1934, the Registrant has duly caused this report to be signed on our behalf by the undersigned, thereunto duly authorized.
| | |
| BJ’S RESTAURANTS, INC. |
| By: | /s/ C. BRADFORD RICHMOND |
February 26, 2025 | | C. Bradford Richmond Interim Chief Executive Officer and Director (Principal Executive Officer) |
Pursuant to the requirements of the Securities and Exchange Act of 1934, this Report has been signed below by the following persons on behalf of the Registrant and in the capacities and on the dates indicated.
| | | | |
Signature | | Capacity | | Date |
By: /s/ C. BRADFORD RICHMOND | | | | |
C. Bradford Richmond | | Interim Chief Executive Officer and Director (Principal Executive Officer) | | February 26, 2025 |
By: /s/ THOMAS A. HOUDEK | | | | |
Thomas A. Houdek | | Senior Vice President and Chief Financial Officer (Principal Financial Officer) | | February 26, 2025 |
By: /s/ JACOB J. GUILD | | | | |
Jacob J. Guild | | Senior Vice President and Chief Accounting Officer (Principal Accounting Officer) | | February 26, 2025 |
By: /s/ BINA CHAURASIA | | | | |
Bina Chaurasia | | Director | | February 26, 2025 |
By: /s/ JAMES A. DAL POZZO | | | | |
James A. Dal Pozzo | | Director | | February 26, 2025 |
By: /s/ NOAH A. ELBOGEN | | | | |
Noah A. Elbogen | | Director | | February 26, 2025 |
By: /s/ LEA ANNE S. OTTINGER | | | | |
Lea Anne S. Ottinger | | Director | | February 26, 2025 |
By: /s/ JULIUS W. ROBINSON, JR. | | | | |
Julius W. Robinson, Jr. | | Director | | February 26, 2025 |
By: /s/ JANET M. SHERLOCK | | | | |
Janet M. Sherlock | | Director | | February 26, 2025 |
By: /s/ GREGORY A. TROJAN | | | | |
Gregory A. Trojan | | Director | | February 26, 2025 |
BJ’S RESTAURANTS, INC.
INDEX TO CONSOLIDATED FINANCIAL STATEMENTS
REPORT OF INDEPENDENT REGISTERED PUBLIC ACCOUNTING FIRM
To the Shareholders and the Board of Directors
BJ’s Restaurants, Inc.:
Opinion on the Consolidated Financial Statements
We have audited the accompanying consolidated balance sheets of BJ's Restaurants, Inc. and subsidiaries (the Company) as of December 31, 2024 and January 2, 2024, the related consolidated statements of operations, shareholders’ equity, and cash flows for each of the years in the three-year period ended December 31, 2024, and the related notes (collectively, the consolidated financial statements). In our opinion, the consolidated financial statements present fairly, in all material respects, the financial position of the Company as of December 31, 2024 and January 2, 2024, and the results of its operations and its cash flows for each of the years in the three-year period ended December 31, 2024, in conformity with U.S. generally accepted accounting principles.
We also have audited, in accordance with the standards of the Public Company Accounting Oversight Board (United States) (PCAOB), the Company’s internal control over financial reporting as of December 31, 2024, based on criteria established in Internal Control – Integrated Framework (2013)issued by the Committee of Sponsoring Organizations of the Treadway Commission, and our report dated February 26, 2025 expressed an unqualified opinion on the effectiveness of the Company’s internal control over financial reporting.
Basis for Opinion
These consolidated financial statements are the responsibility of the Company’s management. Our responsibility is to express an opinion on these consolidated financial statements based on our audits. We are a public accounting firm registered with the PCAOB and are required to be independent with respect to the Company in accordance with the U.S. federal securities laws and the applicable rules and regulations of the Securities and Exchange Commission and the PCAOB.
We conducted our audits in accordance with the standards of the PCAOB. Those standards require that we plan and perform the audit to obtain reasonable assurance about whether the consolidated financial statements are free of material misstatement, whether due to error or fraud. Our audits included performing procedures to assess the risks of material misstatement of the consolidated financial statements, whether due to error or fraud, and performing procedures that respond to those risks. Such procedures included examining, on a test basis, evidence regarding the amounts and disclosures in the consolidated financial statements. Our audits also included evaluating the accounting principles used and significant estimates made by management, as well as evaluating the overall presentation of the consolidated financial statements. We believe that our audits provide a reasonable basis for our opinion.
Critical Audit Matters
The critical audit matter communicated below is a matter arising from the current period audit of the consolidated financial statements that was communicated or required to be communicated to the audit committee and that: (1) relates to accounts or disclosures that are material to the consolidated financial statements and (2) involved our especially challenging, subjective, or complex judgments. The communication of a critical audit matter does not alter in any way our opinion on the consolidated financial statements, taken as a whole, and we are not, by communicating the critical audit matter below, providing a separate opinion on the critical audit matter or on the accounts or disclosures to which it relates.
Evaluation of long-lived assets for impairment
As discussed in Note 1 to the consolidated financial statements, the Company assesses long-lived assets for potential impairment whenever events or changes in circumstances indicate that the carrying value may not be recoverable. Factors considered include, but are not limited to, significant underperformance by a restaurant relative to historical operating results, significant changes in the manner of use of the assets or the strategy for the overall business, significant negative industry or economic trends, and the Company’s expectation to dispose of long-lived assets before the end of their previously estimated useful lives. The property and equipment, net, and operating lease asset balances as of December 31, 2024 were $510.6 million and $336.9 million, respectively.
We identified the evaluation of potential indicators of impairment of long-lived assets as a critical audit matter. Subjective auditor judgment was required to evaluate the Company’s assessment of whether any of the following were potential indicators for impairment: (1) restaurant-level cash flow results relative to historical operating results for underperforming restaurants, (2) significant changes in the manner of use of the assets or the strategy for the overall business, and (3) the impact of significant negative industry or economic trends on restaurant-level results.
The following are the primary procedures we performed to address this critical audit matter. We evaluated the design and tested the operating effectiveness of certain internal controls related to the Company’s long-lived asset impairment process, including controls related to the identification and evaluation of potential indicators of impairment. We assessed the Company’s identification and evaluation of potential indicators of impairment by:
•comparing the restaurant-level cash flows of certain restaurants to historical operating results
•considering other events or changes in circumstances that impact restaurant-level operating results for certain restaurants
•reading board of directors meeting minutes for significant changes in the manner of the use of the assets or the strategy of the overall business
•considering available industry and economic information for significant negative trends.
/s/ KPMG LLP
We have served as the Company’s auditor since 2021.
Los Angeles, California
February 26, 2025
BJ’S RESTAURANTS, INC.
CONSOLIDATED BALANCE SHEETS
(In thousands)
| | | | | | | | |
| | December 31, 2024 | | | January 2, 2024 | |
Assets | | | | | | |
Current assets: | | | | | | |
Cash and cash equivalents | | $ | 26,096 | | | $ | 29,070 | |
Accounts and other receivables, net | | | 20,402 | | | | 19,469 | |
Inventories, net | | | 12,768 | | | | 13,245 | |
Prepaid expenses and other current assets | | | 20,299 | | | | 21,237 | |
Total current assets | | | 79,565 | | | | 83,021 | |
| | | | | | |
Property and equipment, net | | | 510,581 | | | | 525,190 | |
Operating lease assets | | | 336,936 | | | | 350,091 | |
Goodwill | | | 4,673 | | | | 4,673 | |
Equity method investment | | | 4,266 | | | | 4,770 | |
Deferred income taxes, net | | | 62,318 | | | | 50,147 | |
Other assets, net | | | 42,725 | | | | 40,562 | |
Total assets | | $ | 1,041,064 | | | $ | 1,058,454 | |
| | | | | | |
Liabilities and Shareholders’ Equity | | | | | | |
Current liabilities: | | | | | | |
Accounts payable | | $ | 51,011 | | | $ | 60,641 | |
Accrued expenses | | | 105,316 | | | | 101,295 | |
Current operating lease obligations | | | 39,982 | | | | 37,389 | |
Total current liabilities | | | 196,309 | | | | 199,325 | |
| | | | | | |
Long-term operating lease obligations | | | 394,129 | | | | 414,114 | |
Long-term debt | | | 66,500 | | | | 68,000 | |
Other liabilities | | | 14,109 | | | | 11,254 | |
Total liabilities | | | 671,047 | | | | 692,693 | |
| | | | | | |
Commitments and contingencies (Note 7) | | | | | | |
| | | | | | |
Shareholders’ equity: | | | | | | |
Preferred stock, 5,000 shares authorized, none issued or outstanding | | | — | | | | — | |
Common stock, no par value, 125,000 shares authorized and 22,697 and
23,184 shares issued and outstanding as of December 31, 2024 and
January 2, 2024, respectively | | | — | | | | — | |
Capital surplus | | | 77,576 | | | | 77,036 | |
Retained earnings | | | 292,441 | | | | 288,725 | |
Total shareholders’ equity | | | 370,017 | | | | 365,761 | |
Total liabilities and shareholders’ equity | | $ | 1,041,064 | | | $ | 1,058,454 | |
The accompanying notes are an integral part of these consolidated financial statements.
BJ’S RESTAURANTS, INC.
CONSOLIDATED STATEMENTS OF OPERATIONS
(In thousands, except per share data)
| | | | | | | | | | | | |
| | Fiscal Year | |
| | 2024 | | | 2023 | | | 2022 | |
Revenues | | $ | 1,357,302 | | | $ | 1,333,229 | | | $ | 1,283,926 | |
Restaurant operating costs (excluding depreciation and amortization): | | | | | | | | | |
Cost of sales | | | 350,560 | | | | 346,569 | | | | 349,645 | |
Labor and benefits | | | 495,466 | | | | 491,314 | | | | 483,367 | |
Occupancy and operating | | | 315,683 | | | | 317,559 | | | | 306,150 | |
General and administrative | | | 88,272 | | | | 82,103 | | | | 73,333 | |
Depreciation and amortization | | | 72,745 | | | | 70,992 | | | | 70,385 | |
Restaurant opening | | | 2,082 | | | | 2,808 | | | | 3,644 | |
Loss on disposal and impairment of assets, net | | | 18,414 | | | | 8,125 | | | | 6,200 | |
Gain on lease transactions, net | | | — | | | | — | | | | (3,318 | ) |
Total costs and expenses | | | 1,343,222 | | | | 1,319,470 | | | | 1,289,406 | |
Income (loss) from operations | | | 14,080 | | | | 13,759 | | | | (5,480 | ) |
| | | | | | | | | |
Other (expense) income: | | | | | | | | | |
Interest expense, net | | | (5,484 | ) | | | (4,915 | ) | | | (2,888 | ) |
Other (expense) income, net (1) | | | (331 | ) | | | 1,256 | | | | 60 | |
Total other expense | | | (5,815 | ) | | | (3,659 | ) | | | (2,828 | ) |
Income (loss) before income taxes | | | 8,265 | | | | 10,100 | | | | (8,308 | ) |
| | | | | | | | | |
Income tax benefit | | | (8,422 | ) | | | (9,560 | ) | | | (12,384 | ) |
| | | | | | | | | |
Net income | | $ | 16,687 | | | $ | 19,660 | | | $ | 4,076 | |
| | | | | | | | | |
Net income per share: | | | | | | | | | |
Basic | | $ | 0.72 | | | $ | 0.84 | | | $ | 0.17 | |
Diluted | | $ | 0.70 | | | $ | 0.82 | | | $ | 0.17 | |
| | | | | | | | | |
Weighted average number of shares outstanding: | | | | | | | | | |
Basic | | | 23,132 | | | | 23,452 | | | | 23,405 | |
Diluted | | | 23,768 | | | | 23,923 | | | | 23,662 | |
The accompanying notes are an integral part of these consolidated financial statements.
(1)Included in other (expense) income, net was an equity method investment loss of $0.5 million and $0.2 million for fiscal 2024 and 2023, respectively. There were no related party costs for fiscal 2022. See Note 14 for further information. Also included in other (expense) income, net was a $4.6 million charge related to Act III's warrant extension for fiscal 2024. See Note 10 for further information.
BJ’S RESTAURANTS, INC.
CONSOLIDATED STATEMENTS OF SHAREHOLDERS' EQUITY
(In thousands)
| | | | | | | | | | | | | | | | | | | | |
| | Common Stock | | | Capital | | | Retained | | | | |
| | Shares | | | Amount | | | Surplus | | | Earnings | | | Total | |
Balance, December 28, 2021 | | | 23,304 | | | $ | — | | | $ | 72,513 | | | $ | 261,258 | | | $ | 333,771 | |
Issuance of restricted stock units | | | 179 | | | | 8,097 | | | | (8,478 | ) | | | — | | | | (381 | ) |
Repurchase, retirement and reclassification of common stock | | | (91 | ) | | | (8,097 | ) | | | — | | | | 5,712 | | | | (2,385 | ) |
Stock-based compensation | | | — | | | | — | | | | 10,424 | | | | — | | | | 10,424 | |
Adjustment to dividends previously accrued | | | — | | | | — | | | | — | | | | 10 | | | | 10 | |
Net income | | | — | | | | — | | | | — | | | | 4,076 | | | | 4,076 | |
Balance, January 3, 2023 | | | 23,392 | | | | — | | | | 74,459 | | | | 271,056 | | | | 345,515 | |
Exercise of stock options | | | 28 | | | | 1,073 | | | | (198 | ) | | | — | | | | 875 | |
Issuance of restricted stock units | | | 192 | | | | 7,934 | | | | (8,507 | ) | | | — | | | | (573 | ) |
Repurchase, retirement and reclassification of common stock | | | (428 | ) | | | (9,007 | ) | | | — | | | | (1,992 | ) | | | (10,999 | ) |
Stock-based compensation | | | — | | | | — | | | | 11,282 | | | | — | | | | 11,282 | |
Adjustment to dividends previously accrued | | | — | | | | — | | | | — | | | | 1 | | | | 1 | |
Net income | | | — | | | | — | | | | — | | | | 19,660 | | | | 19,660 | |
Balance, January 2, 2024 | | | 23,184 | | | | — | | | | 77,036 | | | | 288,725 | | | | 365,761 | |
Exercise of stock options | | | 7 | | | | 311 | | | | (104 | ) | | | — | | | | 207 | |
Issuance of restricted stock units | | | 263 | | | | 11,842 | | | | (12,964 | ) | | | — | | | | (1,122 | ) |
Repurchase, retirement and reclassification of common stock | | | (757 | ) | | | (12,153 | ) | | | — | | | | (12,972 | ) | | | (25,125 | ) |
Extension of warrant | | | — | | | | — | | | | 4,622 | | | | — | | | | 4,622 | |
Stock-based compensation | | | — | | | | — | | | | 8,986 | | | | — | | | | 8,986 | |
Adjustment to dividends previously accrued | | | — | | | | — | | | | — | | | | 1 | | | | 1 | |
Net income | | | — | | | | — | | | | — | | | | 16,687 | | | | 16,687 | |
Balance, December 31, 2024 | | | 22,697 | | | $ | — | | | $ | 77,576 | | | $ | 292,441 | | | $ | 370,017 | |
The accompanying notes are an integral part of these consolidated financial statements.
BJ’S RESTAURANTS, INC.
CONSOLIDATED STATEMENTS OF CASH FLOWS
(In thousands)
| | | | | | | | | | | | |
| | Fiscal Year | |
| | 2024 | | | 2023 | | | 2022 | |
Cash flows from operating activities: | | | | | | | | | |
Net income | | $ | 16,687 | | | $ | 19,660 | | | $ | 4,076 | |
Adjustments to reconcile net income to net cash provided by operating activities: | | | | | | | | | |
Depreciation and amortization | | | 72,745 | | | | 70,992 | | | | 70,385 | |
Non-cash lease expense | | | 32,227 | | | | 33,030 | | | | 33,541 | |
Amortization of financing costs | | | 211 | | | | 217 | | | | 221 | |
Deferred income taxes, net | | | (12,171 | ) | | | (11,835 | ) | | | (13,410 | ) |
Stock-based compensation expense | | | 8,629 | | | | 10,902 | | | | 10,098 | |
Loss on disposal and impairment of assets, net | | | 18,414 | | | | 8,125 | | | | 6,200 | |
Extension of warrant | | | 4,622 | | | | — | | | | — | |
Gain on lease transactions, net | | | — | | | | — | | | | (3,318 | ) |
Equity method investment | | | 504 | | | | 230 | | | | — | |
Changes in assets and liabilities: | | | | | | | | | |
Accounts and other receivables | | | (83 | ) | | | 10,776 | | | | 1,436 | |
Inventories, net | | | 1,149 | | | | (750 | ) | | | 286 | |
Prepaid expenses and other current assets | | | (1,879 | ) | | | (5,642 | ) | | | (6,026 | ) |
Other assets, net | | | (4,836 | ) | | | (3,227 | ) | | | 1,210 | |
Accounts payable | | | (4,323 | ) | | | 6,052 | | | | 4,056 | |
Accrued expenses | | | 4,035 | | | | 4,070 | | | | (13,622 | ) |
Operating lease obligations | | | (37,314 | ) | | | (37,144 | ) | | | (39,939 | ) |
Other liabilities | | | 2,855 | | | | 381 | | | | (4,072 | ) |
Net cash provided by operating activities | | | 101,472 | | | | 105,837 | | | | 51,122 | |
| | | | | | | | | |
Cash flows from investing activities: | | | | | | | | | |
Purchases of property and equipment | | | (76,900 | ) | | | (98,914 | ) | | | (78,606 | ) |
Proceeds from sale of assets | | | 7 | | | | 3 | | | | 6,699 | |
Net cash used in investing activities | | | (76,893 | ) | | | (98,911 | ) | | | (71,907 | ) |
| | | | | | | | | |
Cash flows from financing activities: | | | | | | | | | |
Borrowings on line of credit | | | 884,600 | | | | 762,000 | | | | 710,000 | |
Payments on line of credit | | | (886,100 | ) | | | (754,000 | ) | | | (700,000 | ) |
Payments of debt issuance costs | | | — | | | | — | | | | (3 | ) |
Taxes paid on vested stock units under employee plans | | | (1,122 | ) | | | (573 | ) | | | (381 | ) |
Proceeds from exercise of stock options | | | 207 | | | | 875 | | | | — | |
Cash dividends accrued under stock-based compensation plans | | | (13 | ) | | | (32 | ) | | | (100 | ) |
Repurchases of common stock | | | (25,125 | ) | | | (10,999 | ) | | | (2,385 | ) |
Net cash (used in) provided by financing activities | | | (27,553 | ) | | | (2,729 | ) | | | 7,131 | |
| | | | | | | | | |
Net (decrease) increase in cash and cash equivalents | | | (2,974 | ) | | | 4,197 | | | | (13,654 | ) |
Cash and cash equivalents, beginning of year | | | 29,070 | | | | 24,873 | | | | 38,527 | |
Cash and cash equivalents, end of year | | $ | 26,096 | | | $ | 29,070 | | | $ | 24,873 | |
The accompanying notes are an integral part of these consolidated financial statements.
BJ’S RESTAURANTS, INC.
CONSOLIDATED STATEMENTS OF CASH FLOWS
(In thousands)
| | | | | | | | | | | | |
| | Fiscal Year | |
| | 2024 | | | 2023 | | | 2022 | |
Supplemental disclosure of cash flow information: | | | | | | | | | |
Cash paid for income taxes | | $ | 5,256 | | | $ | 489 | | | $ | 543 | |
Cash paid for interest, net of capitalized interest | | $ | 4,659 | | | $ | 3,758 | | | $ | 1,790 | |
Cash paid for operating lease obligations | | $ | 62,748 | | | $ | 63,504 | | | $ | 66,872 | |
| | | | | | | | | |
Supplemental disclosure of non-cash investing and financing activities: | | | | | | | | | |
Operating lease assets obtained in exchange for operating lease liabilities | | $ | 19,922 | | | $ | 15,934 | | | $ | 38,501 | |
Receivable related to proceeds from disposal of assets | | $ | — | | | $ | 1,252 | | | $ | — | |
Property and equipment acquired and included in accounts payable | | $ | 4,607 | | | $ | 9,914 | | | $ | 14,888 | |
Equity method investment in exchange for internally developed software | | $ | — | | | $ | — | | | $ | 5,000 | |
Stock-based compensation capitalized | | $ | 357 | | | $ | 380 | | | $ | 326 | |
BJ’S RESTAURANTS, INC.
NOTES TO CONSOLIDATED FINANCIAL STATEMENTS
1. The Company and Summary of Significant Accounting Policies
Description of Business
BJ’s Restaurants, Inc. (referred to herein as the “Company,” “BJ’s,” “we,” “us” and “our”) was incorporated in California on October 1, 1991, to assume the management of five “BJ’s Chicago Pizzeria” restaurants and to develop additional BJ’s restaurants. As of December 31, 2024, we owned and operated 218 restaurants located in 31 states. During fiscal 2024, we opened three new restaurants and closed one restaurant. Four of our locations, in addition to our two brewpub locations in Texas, brew our signature, proprietary craft BJ’s beer. All of our other restaurants receive their BJ’s beer either from one of our restaurant brewing operations, our Texas brewpubs and/or independent third-party brewers using our proprietary recipes.
Basis of Presentation
The accompanying consolidated financial statements include the accounts of BJ’s Restaurants, Inc. and its wholly owned subsidiaries. All intercompany transactions and balances have been eliminated in consolidation. The financial statements presented herein include all material adjustments (consisting of normal recurring adjustments) which are, in the opinion of management, necessary for a fair statement of the financial condition, results of operations and cash flows for the period.
The consolidated financial statements and accompanying notes have been prepared in accordance with U.S. generally accepted accounting principles (“U.S. GAAP”). The Company had no components of other comprehensive income (loss) during any of the years presented, as such; a consolidated statement of comprehensive income (loss) is not presented.
The preparation of financial statements in conformity U.S. GAAP requires management to make estimates and assumptions for the reporting period and as of the financial statement date. These estimates and assumptions affect the reported amounts of assets and liabilities, the disclosure of contingent assets and liabilities, and the reported amounts of revenues and expenses. Actual results could differ from those estimates.
Our fiscal year consists of 52 or 53 weeks and ends on the Tuesday closest to December 31 for financial reporting purposes. Fiscal year 2024 ended on December 31, 2024, and consisted of 52 weeks of operations. Fiscal years 2023 and 2022 ended on January 2, 2024, and January 3, 2023, respectively, and consisted of 52 and 53 weeks of operations, respectively.
Recently Issued Accounting Standards
In November 2023, the Financial Accounting Standards Board (“FASB”) issued Accounting Standards Update (“ASU”) 2023-07, Segment Reporting (Topic 280): Improvements to Reportable Segment Disclosures, which updates reportable segment disclosure requirements. The ASU primarily enhanced disclosures of significant segment expenses and other segment items and is effective for fiscal years beginning after December 15, 2023. We adopted ASU 2023-07 on January 3, 2024, the first day of fiscal 2024. The adoption of this standard did not impact the identification or measurement of our reportable segments but enhanced the disclosure of segment expense information. The amendments were applied retrospectively to all periods presented in accordance with the standard's transition requirements. These categories are consistent with the manner in which our Chief Operating Decision Maker (“CODM”) evaluates performance and allocates resources. The enhanced disclosures for the year ended December 31, 2024, are included in Note 15 to our consolidated financial statements. Comparative periods have been restated to conform to the current year’s presentation.
In December 2023, the FASB issued ASU 2023-09, Income Taxes (Topic 740): Improvements to Income Tax Disclosures. The ASU includes amendments requiring enhanced income tax disclosures, primarily related to standardization and disaggregation of rate reconciliation categories and income taxes paid by jurisdiction. The guidance is effective for fiscal years beginning after December 15, 2024, with early adoption permitted, and should be applied either prospectively or retrospectively. We are currently evaluating the impact of adopting this ASU on our consolidated financial statements and related disclosures.
In March 2024, the Securities and Exchange Commission (“SEC”) issued its final climate disclosure rules. The rules require disclosure of climate-related information outside of the audited financial statements and disclosure in the footnotes addressing specified financial statement effects of severe weather events and other natural conditions above certain financial thresholds, certain carbon offsets and renewable energy credits or certificates, if material. Disclosure requirements will begin phasing in for fiscal years beginning on or after January 1, 2025. On April 4, 2024, the SEC determined to voluntarily stay the effective date of the final rules pending certain legal challenges. We are currently evaluating the impact of adopting the new rules and continue to monitor the status of the related legal challenges.
In November 2024, the FASB issued ASU 2024-03, Disaggregation of Income Statement Expenses (Subtopic 220-40). The ASU requires public entities to disaggregate, in a tabular presentation, certain income statement expenses into different categories, such as purchases of inventory, employee compensation, depreciation, and intangible asset amortization. The guidance is effective for fiscal years beginning after December 15, 2026, with early adoption permitted, and may be applied retrospectively. We are currently evaluating the impact of adopting the new ASU on our consolidated financial statements and related disclosures.
We reviewed all other recently issued accounting pronouncements and concluded that they were either not applicable or not expected to have a significant impact to our consolidated financial statements.
Segment Disclosure
The FASB ASC Topic 280, Segment Reporting, establishes standards for disclosures about different types of business activities in which we engage and the different economic environments in which we operate. We currently operate in one operating segment: full-service company-owned restaurants. Additionally, we operate in one geographic area: the United States of America.
Cash and Cash Equivalents
Cash and cash equivalents consist of highly liquid investments and money market funds with an original maturity of three months or less when purchased. Cash and cash equivalents are stated at cost, which approximates fair market value.
Concentration of Credit Risk
Financial instruments that potentially subject us to a concentration of credit risk and credit losses are credit card receivables and trade receivables consisting primarily of amounts due from gift card resellers, third-party delivery companies and vendor rebates. We consider the concentration of credit risk for gift card resellers, third-party delivery companies and vendor rebates to be minimal due to the payment histories and general financial condition of these gift card resellers and vendors. See Note 3 for disclosure of trade receivables by category as of December 31, 2024, and January 2, 2024. Additionally, we currently maintain our day-to-day operating cash balances with a major financial institution. At times, our operating cash balances may be in excess of the FDIC insurance limit.
Concentration of Supplier Risk
We rely on a leading foodservice distributor to deliver the majority of our food products to our restaurants. We also have an agreement with the largest nationwide foodservice distributor of fresh produce in the United States to service most of our restaurants and, where licensed, to distribute our proprietary craft beer to our restaurants. In instances where these parties fail to fulfill their obligations, we may be unable to find alternative suppliers.
Inventories
Inventories are comprised primarily of food and beverage products and are stated at the lower of cost (first-in, first-out) or net realizable value.
Property and Equipment
Property and equipment are recorded at cost and depreciated over their estimated useful lives. Leasehold improvements are amortized over the lesser of the estimated useful life of the asset or the lease term, including reasonably assured renewal periods or exercised options, of the respective lease, whichever is shorter. Renewals and betterments that materially extend the life of an asset are capitalized while maintenance and repair costs are expensed as incurred. Internal costs associated with the acquisition, development and construction of our restaurants are capitalized and allocated to the projects which they relate. When property and equipment are sold or otherwise disposed of, the asset accounts and related accumulated depreciation or amortization accounts are relieved, and any gain or loss is included in earnings. Additionally, any interest capitalized for new restaurant construction is included in “Property and equipment, net” on our Consolidated Balance Sheets.
Depreciation and amortization are recorded using the straight-line method over the following estimated useful lives:
| |
Furniture and fixtures | 3‑10 years |
Equipment | 5‑10 years |
Brewing equipment | 1-20 years |
Building improvements | the shorter of 20 years or the remaining lease term |
Leasehold improvements | the shorter of the useful life or the lease term, |
| |
| including reasonably assured renewal periods |
Goodwill
We perform impairment testing annually, during the fourth quarter, and more frequently if factors and circumstances indicate impairment may have occurred. When evaluating goodwill for impairment, we first perform a qualitative assessment to determine whether it is more likely than not that the fair value of our reporting unit is less than its carrying value. We currently have one reporting unit, which is full-service company-owned restaurants in the United States of America. If it is concluded that the fair value of our reporting unit is less than the goodwill carrying value, we estimate the fair value of the reporting unit and compare it to the carrying value of the reporting unit, including goodwill. If the carrying value of the reporting unit is greater than the estimated fair value, an impairment charge is recorded for the difference between the implied fair value of goodwill and its carrying amount. To calculate the implied fair value of the reporting unit’s goodwill, the fair value of the reporting unit is first allocated to all of the other assets and liabilities of that unit based on their relative fair values. The excess of the reporting unit’s fair value over the amount assigned to its other assets and liabilities is the implied fair value of goodwill. An impairment loss would be recognized when the carrying amount of goodwill exceeds its implied fair value. This adjusted carrying value becomes the new goodwill accounting basis value. Based on our impairment assessment, we did not record any impairment to goodwill during fiscal 2024, 2023 or 2022.
Long-Lived Assets
We assess the potential impairment of our long-lived assets whenever events or changes in circumstances indicate that the carrying value of the assets may not be recoverable. The assets are generally reviewed for impairment on a restaurant level basis, and inclusive of property and equipment and lease right-of-use assets; or at the lowest level for which identifiable cash flows are largely independent of the cash flows of other assets. Factors considered include, but are not limited to, significant underperformance by the restaurant relative to historical operating results; significant changes in the manner of use of the assets or the strategy for the overall business; significant negative industry or economic trends; or our expectation to dispose of long-lived assets before the end of their previously estimated useful lives. We use the undiscounted cash flow method to assess the recoverability of potentially impaired long-lived assets by comparing the carrying value of the assets to the undiscounted cash flows expected to be generated by the assets. If the carrying value of the assets exceeds the undiscounted cash flows expected to be generated by the assets, an impairment charge is recognized for the amount by which the carrying value exceeds the fair value of the assets. We measure the fair value by discounting estimated future cash flows using assumptions that are consistent with what a market participant would use. As a result of this analysis, in fiscal 2024, we recorded a $12.1 million impairment charge to operating income. In fiscal 2023 and fiscal 2022, we recorded a $3.4 million and $9.3 million impairment charge to operating income, respectively, for the amount by which the carrying value of the restaurant’s assets exceeded its fair value estimated using the discounted cash flow method.
Self-Insurance Liability
We retain large deductibles or self-insured retentions for a portion of our general liability insurance and our team member workers’ compensation programs. We maintain coverage with a third-party insurer to limit our total exposure for these programs. The accrued liability associated with these programs is based on our estimate of the ultimate costs within our retention amount to settle known claims as well as claims incurred but not yet reported to us (“IBNR claims”) as of the balance sheet dates. Our estimated liability is based on information provided by a third-party actuary, combined with our judgments regarding a number of assumptions and factors, including the frequency and severity of claims, our loss development factors, loss cost, history, case jurisdiction, related legislation, and our claims settlement practice. Significant judgment is required to estimate IBNR claims as parties have yet to assert such claims.
Revenue Recognition
Revenues from food and beverage sales at restaurants are recognized when payment is tendered. Amounts paid with a credit card are recorded in accounts and other receivables until payment is collected from the credit card processor. We sell gift cards which do not have an expiration date and we do not deduct non-usage fees from outstanding gift card balances. Gift card sales are recorded as a liability and recognized as revenues upon redemption in our restaurants.
Based on historical redemption rates, a portion of our gift card sales are not expected to be redeemed and will be recognized as gift card “breakage.” Estimated gift card breakage is recorded as “Revenues” on our Consolidated Statements of Operations and recognized in proportion to our historical redemption pattern, unless there is a legal obligation to remit the unredeemed gift cards to government authorities.
Our “BJ’s Premier Rewards Plus” guest loyalty program enables participants to earn points for qualifying purchases that can be redeemed for food and beverages in the future. We allocate the transaction price between the goods delivered and the future
goods that will be delivered, on a relative standalone selling price basis, and defer the revenues allocated to the points, less expected expirations, until such points are redeemed.
Cost of Sales
Cost of sales is comprised of food and beverage costs, including the cost to produce and distribute our proprietary craft beer, soda and ciders. The components of cost of sales are variable and typically fluctuate directly with sales volumes but may be impacted by changes in commodity prices or promotional activities.
Sales Taxes
Revenues are presented net of sales tax collected. The obligations to the appropriate tax authorities are included in other accrued expenses until the taxes are remitted to the appropriate taxing authorities.
Advertising Costs
Advertising costs are expensed as incurred. Advertising costs for fiscal 2024, 2023 and 2022 were approximately $26.5 million, $23.4 million and $21.3 million, respectively. Advertising costs are primarily included in “Occupancy and operating” expenses on our Consolidated Statements of Operations.
Income Taxes
We utilize the liability method of accounting for income taxes. Deferred income taxes are recognized based on the tax consequences in future years of differences between the tax basis of assets and liabilities and their financial reporting amounts at each year-end based on enacted tax laws and statutory tax rates applicable to the periods in which differences are expected to affect taxable income. Valuation allowances are established, when necessary, to reduce deferred tax assets to the amount expected to be realized. The provision for income taxes represents the tax payable for the period and the change during the period in deferred tax assets and liabilities.
We provide for income taxes based on our expected federal and state tax liabilities. Our estimates include, but are not limited to, effective federal, state and local income tax rates, allowable tax credits for items such as Federal Insurance Contributions Act (“FICA”) taxes paid on reported tip income and estimates related to depreciation expense allowable for tax purposes. We usually file our income tax returns several months after our fiscal year-end. All tax returns are subject to audit by federal and state governments for years after the returns are filed and could be subject to differing interpretations of the tax laws.
We recognize the impact of a tax position in our financial statements if that position is more likely than not of being sustained through an audit, based on the technical merits of the position. Interest and penalties related to uncertain tax positions are included in “Income tax (benefit) expense” on our Consolidated Statements of Operations.
Restaurant Opening Expense
Restaurant payroll, supplies, training, other start-up costs and rent expense incurred prior to the opening of a new restaurant are expensed as incurred.
Leases
We determine if a contract contains a lease at inception. Our material operating leases consist of restaurant locations and office space. U.S. GAAP requires that our leases be evaluated and classified as operating or finance leases for financial reporting purposes. The classification evaluation begins at the commencement date, and the lease term used in the evaluation includes the non-cancellable period for which we have the right to use the underlying asset, together with renewal option periods when the exercise of the renewal option is reasonably certain and failure to exercise such option would result in an economic penalty. All of our restaurant and office space leases are classified as operating leases. We have elected to account for lease and non-lease components as a single lease component for office and beverage gas equipment. We do not have any finance leases.
We have elected the short-term lease recognition exemption for all classes of underlying assets. Leases with an initial term of 12 months or less that do not include an option to purchase the underlying asset that we are reasonably certain to exercise are not recorded on the balance sheet. Expense for short-term leases is recognized on a straight-line basis over the lease term.
We disburse cash for leasehold improvements, furniture and fixtures and equipment to build out and equip our leased premises. Tenant improvement allowance incentives may be available to partially offset the cost of developing and opening the related restaurants, pursuant to agreed-upon terms in our leases. Tenant improvement allowances can take the form of cash payments upon the opening of the related restaurants, full or partial credits against minimum or percentage rents otherwise payable by us,
or a combination thereof. All tenant improvement allowances received by us are recorded as a contra operating lease asset and amortized over the term of the lease.
The lease term used for straight-line rent expense is calculated from the commencement date (the date we take possession of the premises) through the lease termination date (including any options where exercise is reasonably certain and failure to exercise such option would result in an economic penalty). We expense rent from commencement date through restaurant open date as preopening expense. Once a restaurant opens for business, we record straight-line rent expense plus any additional variable contingent rent expense to the extent it is due under the lease agreement.
There is potential for variability in the rent holiday period, which begins on the commencement date and ends on the restaurant open date, during which no cash rent payments are typically due under the terms of the lease. Factors that may affect the length of the rent holiday period generally pertain to construction-related delays. Extension of the rent holiday period due to delays in restaurant opening will result in greater preopening rent expense recognized during the rent holiday period and lesser occupancy expense during the rest of the lease term (post-opening).
We record a lease liability equal to the present value of future payments discounted at the estimated fully collateralized incremental borrowing rate (discount rate) corresponding with the lease term. Our lease liability calculation is the total rent payable during the lease term, including rent escalations in which the amount of future rent is certain or fixed. This liability is reduced monthly by the minimum rents paid, offset by the imputed interest. A corresponding operating lease asset is also recorded equaling the initial amount of the lease liability, plus any lease payments made to the lessor before or at the lease commencement date and any initial direct costs incurred, less any lease incentives received. Monthly, this asset is reduced by the straight-line rent, offset by the imputed interest.
Certain leases contain provisions that require additional rent payments based upon restaurant sales volume. Contingent rent is accrued each period as the liabilities are incurred, in addition to the straight-line rent expense noted above. This results in some variability in occupancy expense as a percentage of revenues over the term of the lease in restaurants where we pay contingent rent. We monitor for events or changes in circumstances that require reassessment of our leases. When a reassessment results in the re-measurement of a lease liability, a corresponding adjustment is made to the carrying amount of the operating lease asset.
Management makes judgments regarding the reasonably certain lease term and incremental borrowing rate for each restaurant property lease, which can impact the classification and accounting for a lease as finance or operating, the rent holiday and/or escalations in payments that are taken into consideration when calculating straight-line rent, and the term over which leasehold improvements for each restaurant are amortized.
Net Income Per Share
Basic and diluted net income per share is calculated by dividing net income by the weighted average number of common shares outstanding during the period. The number of diluted shares reflects the potential dilution that could occur if holders of in-the-money options and warrants were to exercise their right to convert these instruments into common stock and the restrictions on restricted stock units (“RSUs”) were to lapse. Additionally, performance-based RSUs are considered contingent shares; therefore, at each reporting date we determine the probable number of shares that will vest and include these contingently issuable shares in our diluted share calculation unless they are anti-dilutive. Once these performance-based RSUs vest, they are included in our basic net income per share calculation.
The following table presents a reconciliation of basic and diluted net income per share, including the number of dilutive equity awards that were included in the dilutive net income per share computation (in thousands):
| | | | | | | | | | | | |
| | Fiscal Year | |
| | 2024 | | | 2023 | | | 2022 | |
Numerator: | | | | | | | | | |
Net income | | $ | 16,687 | | | $ | 19,660 | | | $ | 4,076 | |
Denominator: | | | | | | | | | |
Weighted-average shares outstanding - basic | | | 23,132 | | | | 23,452 | | | | 23,405 | |
Dilutive effect of equity awards | | | 636 | | | | 471 | | | | 257 | |
Weighted-average shares outstanding - diluted | | | 23,768 | | | | 23,923 | | | | 23,662 | |
At December 31, 2024, January 2, 2024, and January 3, 2023, there were approximately 1.0 million, 0.9 million, and 1.9 million shares of common stock equivalents, respectively, that have been excluded from the calculation of diluted net income per share because they are anti-dilutive. Included in the calculation of common stock equivalents were warrants to purchase
876,949 shares, which were also anti-dilutive at January 3, 2023. The warrants were dilutive at December 31, 2024 and January 2, 2024.
Stock‑Based Compensation
Our current shareholder approved stock-based compensation plan is the BJ’s Restaurants, Inc. 2024 Equity Incentive Plan, (as it may be amended from time to time, “the Plan”). Under the Plan, we may issue shares of our common stock to team members, officers, directors and consultants. We grant non-qualified stock options, and service- and performance-based RSUs. Since fiscal 2024, we also grant performance-based RSUs with market-based metrics. Additionally, we issue time-based RSUs in connection with the BJ’s Gold Standard Stock Ownership Program (the “GSSOP”), a long-term equity incentive program for our restaurant general managers, executive kitchen managers, directors of operations and directors of kitchen operations. All GSSOP participants are required to remain in good standing during their vesting period.
Stock options are charged against the Plan share reserve on the basis of one share for each share of common stock issuable upon exercise of options granted. All options granted under the Plan expire within 10 years of their date of grant. Awards of stock options or stock appreciation rights are charged against the Plan share reserve on the basis of one share for each share granted. All other awards are charged against the 2024 Plan share reserve on the basis of 1.5 shares for each share granted. We estimate forfeitures based on historical data and we take into consideration future expectations. The Plan also contains other limits on the terms of incentive grants such as the maximum number that can be granted to a team member during any fiscal year.
We use the Black-Scholes option-pricing model to determine the fair value of our stock options, and we use the Monte Carlo simulation model to determine the fair value of our performance-based RSUs which include a market-based metric. Both models require assumptions to be made regarding our stock price volatility, the expected life of the award, risk-free interest rate and expected dividend rates. The fair value of service-based and performance-based RSUs granted, that do not include a market-based metric, is equal to the fair value of our common stock at market close on the date of grant or the last trading day prior to the date of grant when grants take place on a day when the market is closed. The grant date fair value of each stock option, performance-based RSU with market-based metrics and service-based RSU is expensed over the vesting period (e.g., one, three or five years) and the fair value of each performance-based RSU, that does not include a market-based metric, is expensed based on the estimated quantity that is expected to vest corresponding with management's current estimate of the level that the performance goal will be achieved.
The Plan permits our Board of Directors to set the vesting terms and exercise period for awards at their discretion; however, the grant of awards with no minimum vesting period or a vesting period less than one year may not exceed 5% of the total number of shares authorized under the Plan. Stock options and time-based RSUs cliff vest at one year or ratably over three years for non-GSSOP participants, and either cliff vest at five years or cliff vest at 33% on the third anniversary and 67% on the fifth anniversary for GSSOP participants. Performance-based RSUs cliff vest on the third anniversary of the grant date in an amount from 0% to 150% of the grant quantity, depending on the level of performance target achievement.
2. Revenue Recognition
Revenue recognized on our Consolidated Statements of Operations for the redemption of gift cards and loyalty rewards deferred at the beginning of each respective fiscal year were as follows (in thousands):
| | | | | | | | | | | | |
| | Fiscal Year | |
| | 2024 | | | 2023 | | | 2022 | |
Revenue recognized from gift card liability | | $ | 10,629 | | | $ | 11,261 | | | $ | 14,978 | |
Revenue recognized from guest loyalty program | | $ | 7,031 | | | $ | 7,166 | | | $ | 7,510 | |
3. Accounts and Other Receivables
Accounts and other receivables consisted of the following (in thousands):
| | | | | | | | |
| | December 31, 2024 | | | January 2, 2024 | |
Credit cards | | $ | 8,526 | | | $ | 6,051 | |
Third-party gift card sales | | | 3,984 | | | | 3,618 | |
Third-party delivery | | | 3,885 | | | | 3,803 | |
Income taxes | | | 864 | | | | 1,287 | |
Other | | | 3,143 | | | | 4,710 | |
| | $ | 20,402 | | | $ | 19,469 | |
4. Property and Equipment
Property and equipment consisted of the following (in thousands):
| | | | | | | | |
| | December 31, 2024 | | | January 2, 2024 | |
Land | | $ | 2,523 | | | $ | 2,507 | |
Building improvements | | | 428,366 | | | | 418,320 | |
Leasehold improvements | | | 345,916 | | | | 330,971 | |
Furniture and fixtures | | | 172,804 | | | | 168,086 | |
Equipment | | | 424,839 | | | | 393,430 | |
Construction in progress | | | 13,269 | | | | 21,922 | |
Property and equipment, gross | | | 1,387,717 | | | | 1,335,236 | |
Accumulated depreciation and amortization | | | (877,136 | ) | | | (810,046 | ) |
Property and equipment, net | | $ | 510,581 | | | $ | 525,190 | |
5. Accrued Expenses
Accrued expenses consisted of the following (in thousands):
| | | | | | | | |
| | December 31, 2024 | | | January 2, 2024 | |
Payroll related | | $ | 24,669 | | | $ | 27,239 | |
Workers’ compensation and general liability | | | 22,216 | | | | 23,792 | |
Deferred revenue from gift cards | | | 15,668 | | | | 14,380 | |
Deferred loyalty revenue | | | 2,910 | | | | 2,510 | |
Insurance related | | | 4,164 | | | | 550 | |
Sales taxes | | | 7,254 | | | | 7,592 | |
Other taxes | | | 8,694 | | | | 9,548 | |
Other current rent related | | | 2,806 | | | | 2,477 | |
Utilities | | | 2,475 | | | | 2,697 | |
Merchant cards | | | 2,239 | | | | 2,184 | |
Maintenance related | | | 289 | | | | 1,949 | |
Leadership transition related | | | 2,829 | | | | — | |
Consulting related | | | 2,135 | | | | — | |
Other | | | 6,968 | | | | 6,377 | |
| | $ | 105,316 | | | $ | 101,295 | |
6. Leases
Lease costs included on the Consolidated Statements of Operations consisted of the following (in thousands):
| | | | | | | | | | | | |
| | Fiscal Year | |
| | 2024 | | | 2023 | | | 2022 | |
Lease cost | | $ | 57,836 | | | $ | 59,268 | | | $ | 60,163 | |
Variable lease cost | | | 3,567 | | | | 3,864 | | | | 3,445 | |
Total lease costs | | $ | 61,403 | | | $ | 63,132 | | | $ | 63,608 | |
Weighted-average lease term and discount rate were as follows:
| | | | |
| | December 31, 2024 | | January 2, 2024 |
Weighted-average remaining lease term | | 10.3 Years | | 11.0 Years |
Weighted-average discount rate | | 5.9 | | 5.8 |
Operating lease obligation maturities as of December 31, 2024, were as follows (in thousands):
| | | | |
2025 | | $ | 65,182 | |
2026 | | | 66,011 | |
2027 | | | 62,759 | |
2028 | | | 59,034 | |
2029 | | | 53,044 | |
Thereafter | | | 234,599 | |
Total lease payments | | | 540,629 | |
Less: imputed interest | | | (106,518 | ) |
Present value of operating lease obligations | | $ | 434,111 | |
7. Commitments and Contingencies
Legal Proceedings
We are subject to lawsuits, administrative proceedings and demands that arise in the ordinary course of our business and which typically involve claims from guests, team members and others related to operational, employment, real estate and intellectual property issues common to the foodservice industry. A number of these claims may exist at any given time. We are self-insured for a portion of our general liability, team member workers’ compensation and employment practice liability insurance requirements. We maintain coverage with a third-party insurer to limit our total exposure. We believe that most of our claims will be covered by our insurance, subject to coverage limits and the portion of such claims that are self-insured; however, punitive damages awards are not covered by our insurance. To date, we have not been ordered to pay punitive damages with respect to any claims, but there can be no assurance that punitive damages will not be awarded with respect to any future claims. We could be affected by adverse publicity resulting from allegations in lawsuits, claims and proceedings, regardless of whether these allegations are valid or whether we are ultimately determined to be liable. We currently believe that the final disposition of these types of lawsuits, proceedings and claims will not have a material adverse effect on our financial position, results of operations or liquidity. It is possible, however, that our future results of operations for a particular quarter or fiscal year could be impacted by changes in circumstances relating to lawsuits, proceedings or claims.
Letters of Credit
We have irrevocable standby letters of credit outstanding, as required under our workers’ compensation insurance arrangements, of $19.3 million as of December 31, 2024. Our standby letters of credit automatically renew each October 31 for one year unless 30 days’ notice, prior to such renewal date, is given by the financial institution that provides the letters. The standby letters of credit issued under our Credit Facility reduce the amount available for borrowing.
Purchase Commitments
Purchase obligations, which include inventory purchases, equipment purchases, information technology and other miscellaneous commitments, were $41.2 million and $28.1 million at December 31, 2024 and January 2, 2024, respectively. These purchase obligations are primarily due within three years and recorded as liabilities when goods are received, or services rendered.
8. Long-Term Debt
Line of Credit
On November 3, 2021, we entered into a Fourth Amended and Restated Credit Agreement (“Credit Facility”) with Bank of America, N.A. (“BofA”), JPMorgan Chase Bank, N.A., and certain other parties to amend and restate our revolving line of credit (the “Line of Credit”) to improve the pricing, extend the maturity date, change the interest reference rate, eliminate certain financial covenants and conditions, and reset other financial covenants starting with the fourth quarter of 2021.
Our Credit Facility matures on November 3, 2026, and provides us with revolving loan commitments totaling $215 million, which may be increased up to $315 million, of which $50 million may be used for the issuance of letters of credit. Availability under the Credit Facility is reduced by outstanding letters of credit, which are used to support our self-insurance programs. On December 31, 2024, there were borrowings of $66.5 million and letters of credit of $19.3 million outstanding, leaving $129.2 million available to borrow.
Effective October 29, 2024, we entered into an Amendment No. 1 (Conforming Changes) to Fourth Amended and Restated Credit Agreement (“the Amendment”) with Bank of America, N.A., as the Administrative Agent pursuant to which the Company modified the Fourth Amended and Restated Credit Agreement, dated November 3, 2021, with Bank of America, N.A. BofA, JPMorgan Chase Bank, N.A., and certain other parties. Pursuant to the Amendment, the referenced interest rate was changed from the Bloomberg Short-Term Bank Yield Index rate (“BSBY”) (which will no longer be reported effective in November 2024), to a term Secured Overnight Financing Rate (“Term SOFR”). The impact of this change was immaterial on our Consolidated Statements of Operations.
Borrowings under the Line of Credit bear interest at an annual rate equal to either (a) the Term SOFR plus a percentage not to exceed 2.00% (with a floor on SOFR of 0.00%), or (b) a percentage not to exceed 1.00% above a Base Rate equal to the highest of (i) the Federal Funds Rate plus 1/2 of 1.00%, (ii) BofA’s Prime Rate, (iii) the Term SOFR rate plus 1.00%, and (iv) 1.00%, in either case depending on the level of lease and debt obligations of the Company as compared to EBITDA plus lease expenses. The weighted average interest rate during fiscal 2024 and 2023 was approximately 6.7%.
The Credit Facility is secured by the Company’s assets and contains provisions requiring us to maintain compliance with certain covenants, including a Fixed Charge Coverage Ratio and a Lease Adjusted Leverage Ratio. At December 31, 2024, we were in compliance with these covenants.
Pursuant to the Line of Credit, we are required to pay certain customary fees and expenses associated with maintenance and use of the Line of Credit, including letter of credit issuance fees, unused commitment fees and interest, which are payable monthly. Interest expense and commitment fees under the Credit Facility were approximately $5.5 million, $4.9 million and $2.9 million for fiscal 2024, 2023 and 2022, respectively. We also capitalized approximately $0.3 million and $0.5 million of interest expense related to new restaurant construction during fiscal 2024 and 2023.
9. Fair Value Measurements
ASC 820, Fair Value Measurements and Disclosures (“ASC 820”), establishes a framework for measuring fair value and expands disclosures about fair value measurements. ASC 820 establishes a three-level hierarchy, which requires an entity to maximize the use of observable inputs and minimize the use of unobservable inputs in measuring fair value. Fair value measurements are estimated based on valuation techniques and inputs categorized as follows:
•Level 1: Quoted prices in active markets for identical assets or liabilities.
•Level 2: Observable inputs other than quoted prices in active markets for identical assets and liabilities.
•Level 3: Unobservable inputs in which little or no market activity exists, therefore requiring the Company to develop its own assumptions.
There were no transfers among levels within the fair value hierarchy during the year ended December 31, 2024. The following table presents the fair values for our financial assets and liabilities measured on a recurring basis (in thousands):
| | | | | | | | | | |
| | Level | | December 31, 2024 | | | January 2, 2024 | |
Deferred compensation plan - liabilities | | 1 | | $ | 13,179 | | | $ | 10,579 | |
The Company’s financial statements include cash and cash equivalents, accounts and other receivables, accounts payable, and accrued expenses for which the carrying amounts approximate fair value due to their short-term maturity. At December 31, 2024 and January 2, 2024, the fair value of our amended revolving credit facility approximated its carrying value since it is a variable rate credit facility (Level 2).
10. Shareholders’ Equity
Warrant
ACT III’s warrant for 876,949 at an exercise price of $26.94 was set to expire on May 4, 2025, five years following the issuance. On December 30, 2024, the Company agreed to extend the termination date of the warrant by two years to May 4, 2027, and recorded a related expense of $4.6 million within “Other (expense) income, net” on our Consolidated Statements of Operations. The warrant extension was executed in conjunction with a Cooperation Agreement that contains material non-shareholder restrictions, such as those limiting ACT III's ability to purchase additional Company shares.
Preferred Stock
We are authorized to issue 5.0 million shares of one or more series of preferred stock and we are authorized to determine the rights, preferences, privileges and restrictions to be granted to, or imposed upon, any such series, including the voting rights, redemption provisions (including sinking fund provisions), dividend rights, dividend rates, liquidation rates, liquidation preferences, conversion rights and the description and number of shares constituting any wholly unissued series of preferred stock. No shares of preferred stock were issued or outstanding at December 31, 2024 or January 2, 2024. We currently have no plans to issue shares of preferred stock.
Common Stock
Shareholders are entitled to one vote for each share of common stock held of record. Pursuant to the requirements of California law, shareholders are entitled to accumulate votes in connection with the election of directors. Shareholders of our outstanding common stock are entitled to receive dividends if and when declared by the Board of Directors.
Cash Dividends
We currently do not pay any cash dividends. Any payment of quarterly cash dividends will be subject to our Board of Directors determining that the payment of dividends is in the best interest of the Company and its shareholders. As such, the only cash dividends paid during fiscal 2024 and 2023 were related to dividends declared prior to fiscal 2020 on restricted stock grants, which vested under our stock-based compensation plans.
Stock Repurchases
During fiscal 2024, we repurchased and retired approximately 757,000 shares of our common stock at an average price of $33.20 per share for approximately $25.1 million, which is recorded as a reduction in common stock, with any excess charged to retained earnings. Our Board of Directors approved a $50 million increase in our share repurchase program both in February 2024 and February 2025. Currently we have $82.5 million available under our authorized $600 million share repurchase program. Repurchases may be made at any time.
11. Income Taxes
Income tax benefit for the last three fiscal years consists of the following (in thousands):
| | | | | | | | | | | | |
| | Fiscal Year | |
| | 2024 | | | 2023 | | | 2022 | |
Current: | | | | | | | | | |
Federal | | $ | 2,780 | | | $ | 1,378 | | | $ | 647 | |
State | | | 969 | | | | 897 | | | | 379 | |
| | | 3,749 | | | | 2,275 | | | | 1,026 | |
Deferred: | | | | | | | | | |
Federal | | | (10,891 | ) | | | (11,344 | ) | | | (12,653 | ) |
State | | | (1,280 | ) | | | (491 | ) | | | (757 | ) |
| | | (12,171 | ) | | | (11,835 | ) | | | (13,410 | ) |
| | | | | | | | | |
Income tax benefit | | $ | (8,422 | ) | | $ | (9,560 | ) | | $ | (12,384 | ) |
Income tax benefit for the last three fiscal years differs from the amount that would result from applying the federal statutory rate as follows:
| | | | | | | | | | | | |
| | Fiscal Year | |
| | 2024 | | | 2023 | | | 2022 | |
Income tax at statutory rates | | | 21.0 | % | | | 21.0 | % | | | (21.0 | )% |
State income taxes, net of federal benefit | | | 5.5 | | | | 5.8 | | | | (10.4 | ) |
Permanent differences | | | 10.6 | | | | 7.7 | | | | 17.3 | |
Income tax credits | | | (147.1 | ) | | | (117.9 | ) | | | (156.8 | ) |
Return to provision | | | 0.4 | | | | 0.9 | | | | (4.3 | ) |
Stock warrant extension | | | 11.7 | | | | — | | | | — | |
Prior year tax credit true-up | | | 4.3 | | | | (6.4 | ) | | | 14.1 | |
Benefit from net operating loss carryback | | | — | | | | — | | | | 1.8 | |
Change in valuation allowance | | | (8.5 | ) | | | (2.6 | ) | | | 6.8 | |
Other, net | | | 0.2 | | | | (3.2 | ) | | | 3.4 | |
| | | (101.9 | )% | | | (94.7 | )% | | | (149.1 | )% |
The components of the deferred income tax asset (liability) consist of the following (in thousands):
| | | | | | | | |
| | December 31, 2024 | | | January 2, 2024 | |
Deferred income tax asset: | | | | | | |
Accrued expenses | | $ | 12,526 | | | $ | 12,939 | |
Other | | | 8,436 | | | | 6,933 | |
Deferred revenues | | | 23 | | | | — | |
Gift cards | | | 1,128 | | | | 876 | |
Stock-based compensation | | | 3,667 | | | | 5,026 | |
Operating lease liability | | | 111,254 | | | | 116,527 | |
Income tax credits | | | 74,826 | | | | 67,596 | |
Net operating losses | | | 4,831 | | | | 5,085 | |
State tax | | | 358 | | | | 226 | |
Gross deferred income tax asset | | | 217,049 | | | | 215,208 | |
Valuation allowance | | | (186 | ) | | | (889 | ) |
Deferred income tax asset, net of valuation allowance | | | 216,863 | | | | 214,319 | |
| | | | | | |
Deferred income tax liability: | |
| | |
| |
Property and equipment | | | (51,516 | ) | | | (55,269 | ) |
Intangible assets | | | (2,807 | ) | | | (2,951 | ) |
Operating lease assets | | | (96,255 | ) | | | (101,358 | ) |
Smallwares | | | (3,967 | ) | | | (4,594 | ) |
Deferred income tax liability | | | (154,545 | ) | | | (164,172 | ) |
Net deferred income tax asset | | $ | 62,318 | | | $ | 50,147 | |
At December 31, 2024, we had federal and state income tax credit carryforwards of approximately $75.0 million and $0.1 million, respectively, consisting primarily of the credit for FICA taxes paid on reported team member tip income. The FICA tax credits will begin to expire in 2039.
At December 31, 2024, we have state and city net operating loss carryforwards of $106.4 million with statutory carryforward periods ranging from 5 years to 20 years. The earliest year that a material state net operating loss will expire is 2025.
We have completed an analysis of our ability to use our federal and state tax credit and net operating loss carry forwards. As of December 31, 2024 and January 2, 2024, we have determined that no valuation allowance is required against federal tax credit carryforwards; however, we have recorded a valuation allowance against certain state net operating loss and tax credit carryforwards of $0.2 million and $0.9 million, respectively, net of the federal benefit which are not more likely than not to be realized prior to expiration. We recognize interest and penalties related to uncertain tax positions in income tax expense. At December 31, 2024 and January 2, 2024, we had accrued $0.1 million for interest and penalties with respect to uncertain tax positions.
As of December 31, 2024, unrecognized tax benefits recorded was approximately $0.9 million, of which approximately $0.9 million, if reversed would impact our effective tax rate. We anticipate no change in our liability for unrecognized tax benefits within the next twelve-month period.
A reconciliation of the beginning and ending amount of unrecognized tax benefits is as follows (in thousands):
| | | | | | | | | | | | |
| | Fiscal Year | |
| | 2024 | | | 2023 | | | 2022 | |
Gross unrecognized tax benefits at beginning of year | | $ | 967 | | | $ | 1,249 | | | $ | 1,198 | |
Increases for tax positions taken in prior years | | | 29 | | | | 102 | | | | 3 | |
Decreases for tax positions taken in prior years | | | — | | | | — | | | | (29 | ) |
Increases for tax positions taken in the current year | | | 134 | | | | 104 | | | | 91 | |
Lapse in statute of limitations | | | (256 | ) | | | (488 | ) | | | (14 | ) |
Gross unrecognized tax benefits at end of year | | $ | 874 | | | $ | 967 | | | $ | 1,249 | |
Our uncertain tax positions are related to tax years that remain subject to examination by tax agencies. As of December 31, 2024, the earliest tax year still subject to examination by the Internal Revenue Service is 2021. The earliest year still subject to examination by a significant state or local taxing authority is 2020.
12. Stock-Based Compensation Plans
The following table presents the stock-based compensation recognized within our consolidated financial statements (in thousands):
| | | | | | | | | | | | |
| | Fiscal Year | |
| | 2024 | | | 2023 | | | 2022 | |
Labor and benefits | | $ | 2,452 | | | $ | 2,583 | | | $ | 2,886 | |
General and administrative | | | 6,177 | | | | 8,319 | | | | 7,212 | |
Capitalized (1) | | | 357 | | | | 380 | | | | 326 | |
Total stock-based compensation | | $ | 8,986 | | | $ | 11,282 | | | $ | 10,424 | |
(1) Capitalized stock-based compensation relates to our restaurant development personnel and is included in “Property and equipment, net” on our Consolidated Balance Sheets.
Stock Options
The fair value of each stock option was estimated on the grant date using the Black‑Scholes option-pricing model with the following weighted average assumptions:
| | | | | | | | | | | | |
| | Fiscal Year | |
| | 2024 | | | 2023 | | | 2022 | |
Expected volatility | | | 67.6 | % | | | 66.9 | % | | | 63.5 | % |
Risk-free interest rate | | | 3.9 | % | | | 3.6 | % | | | 1.8 | % |
Expected option life | | 5 years | | | 5 years | | | 5 years | |
Dividend yield | | | — | | | | — | | | | — | |
Fair value of options granted | | $ | 19.00 | | | $ | 18.24 | | | $ | 17.15 | |
Under our stock-based compensation plan, the exercise price of a stock option is required to equal or exceed the fair value of our common stock at market close on the option grant date or the last trading day prior to the date of grant when grants take place on a day when the market is closed. The following table presents stock option activity:
| | | | | | | | | | | | | | | | | | | | |
| | Options Outstanding | | | Options Exercisable | |
| | Shares
(in thousands) | | | Weighted
Average Exercise
Price | | | Shares
(in thousands) | | | Weighted
Average Exercise
Price | | | Weighted
Average
Remaining
Contractual Life | |
Outstanding at December 28, 2021 | | | 775 | | | $ | 41.77 | | | | 519 | | | $ | 41.02 | | | | 5.0 | |
Granted | | | 111 | | | $ | 31.57 | | | | | | | | | | |
Exercised | | | — | | | $ | — | | | | | | | | | | |
Forfeited | | | (62 | ) | | $ | 40.71 | | | | | | | | | | |
Outstanding at January 3, 2023 | | | 824 | | | $ | 40.48 | | | | 601 | | | $ | 41.57 | | | | 4.7 | |
Granted | | | 124 | | | $ | 31.19 | | | | | | | | | | |
Exercised | | | (28 | ) | | $ | 29.18 | | | | | | | | | | |
Forfeited | | | (53 | ) | | $ | 37.43 | | | | | | | | | | |
Outstanding at January 2, 2024 | | | 867 | | | $ | 39.70 | | | | 648 | | | $ | 41.65 | | | | 4.4 | |
Granted | | | 156 | | | $ | 32.09 | | | | | | | | | | |
Exercised | | | (7 | ) | | $ | 31.60 | | | | | | | | | | |
Forfeited | | | (83 | ) | | $ | 32.89 | | | | | | | | | | |
Outstanding at December 31, 2024 | | | 933 | | | $ | 39.10 | | | | 741 | | | $ | 41.00 | | | | 3.9 | |
Information relating to significant option groups outstanding as of December 31, 2024, is as follows (shares in thousands):
| | | | | | | | | | | | | | | | | | | | |
| | Options Outstanding | | | Options Exercisable | |
Range of
Exercise Prices | | Outstanding | | | Weighted
Average
Remaining
Contractual Life | | | Weighted
Average Exercise
Price | | | Exercisable | | | Weighted
Average Exercise
Price | |
$22.27 – $31.34 | | | 99 | | | | 7.9 | | | $ | 30.55 | | | | 45 | | | $ | 30.29 | |
$31.86 – $31.95 | | | 104 | | | | 9.2 | | | $ | 31.88 | | | | — | | | $ | — | |
$32.27 – $35.95 | | | 173 | | | | 4.8 | | | $ | 34.30 | | | | 139 | | | $ | 34.58 | |
$37.10 – $37.10 | | | 2 | | | | 1.9 | | | $ | 37.10 | | | | 2 | | | $ | 37.10 | |
$37.70 – $37.70 | | | 126 | | | | 3.0 | | | $ | 37.70 | | | | 126 | | | $ | 37.70 | |
$38.90 – $38.90 | | | 126 | | | | 5.0 | | | $ | 38.90 | | | | 126 | | | $ | 38.90 | |
$39.33 – $46.91 | | | 147 | | | | 4.3 | | | $ | 44.78 | | | | 147 | | | $ | 44.78 | |
$47.04 – $51.08 | | | 65 | | | | 0.1 | | | $ | 47.16 | | | | 65 | | | $ | 47.16 | |
$52.98 – $52.98 | | | 7 | | | | 0.2 | | | $ | 52.98 | | | | 7 | | | $ | 52.98 | |
$53.22 – $53.22 | | | 84 | | | | 4.0 | | | $ | 53.22 | | | | 84 | | | $ | 53.22 | |
$22.27 – $53.22 | | | 933 | | | | 4.9 | | | $ | 39.10 | | | | 741 | | | $ | 41.00 | |
As of December 31, 2024, total unrecognized stock-based compensation expense related to non-vested stock options was approximately $2.0 million, which is expected to be recognized over the next three years.
Restricted Stock Units
Service-Based Restricted Stock Units
The following table presents service-based restricted stock unit activity:
| | | | | | | | |
| | Shares
(in thousands) | | | Weighted
Average
Fair Value | |
Outstanding at December 28, 2021 | | | 619 | | | $ | 39.35 | |
Granted | | | 368 | | | $ | 28.44 | |
Vested or released | | | (165 | ) | | $ | 40.59 | |
Forfeited | | | (93 | ) | | $ | 35.24 | |
Outstanding at January 3, 2023 | | | 729 | | | $ | 34.10 | |
Granted | | | 344 | | | $ | 28.93 | |
Vested or released | | | (169 | ) | | $ | 37.69 | |
Forfeited | | | (82 | ) | | $ | 31.62 | |
Outstanding at January 2, 2024 | | | 822 | | | $ | 31.46 | |
Granted | | | 306 | | | $ | 33.13 | |
Vested or released | | | (232 | ) | | $ | 37.80 | |
Forfeited | | | (124 | ) | | $ | 29.94 | |
Outstanding at December 31, 2024 | | | 772 | | | $ | 30.45 | |
As of December 31, 2024, total unrecognized stock-based compensation expense related to non-vested service-based RSUs was approximately $11.3 million, which is expected to be recognized over the next three to five years.
Performance-Based Restricted Stock Units
The following table presents performance-based restricted stock unit activity:
| | | | | | | | |
| | Shares
(in thousands) | | | Weighted
Average
Fair Value | |
Outstanding at December 28, 2021 | | | 112 | | | $ | 45.60 | |
Granted | | | 52 | | | $ | 32.27 | |
Vested or released | | | (27 | ) | | $ | 53.22 | |
Forfeited | | | (14 | ) | | $ | 40.06 | |
Outstanding at January 3, 2023 | | | 123 | | | $ | 38.89 | |
Granted | | | 52 | | | $ | 31.87 | |
Vested or released | | | (40 | ) | | $ | 38.90 | |
Forfeited | | | (7 | ) | | $ | 35.01 | |
Outstanding at January 2, 2024 | | | 128 | | | $ | 36.24 | |
Granted | | | 79 | | | $ | 39.09 | |
Vested or released | | | (65 | ) | | $ | 46.91 | |
Forfeited | | | (59 | ) | | $ | 32.93 | |
Outstanding at December 31, 2024 | | | 83 | | | $ | 32.89 | |
The fair value of performance-based RSUs which include a market-based metric was estimated on the grant date using the Monte Carlo simulation model with the following weighted average assumptions:
| | | | | | | | |
| | Fiscal Year |
| | 2024 | | | 2023 | | 2022 |
Volatility | | | 49.8 | % | | n/a | | n/a |
Risk-free interest rate | | | 3.8 | % | | n/a | | n/a |
Expected life (years) | | 3 | | | n/a | | n/a |
Expected dividend yield | | | — | % | | n/a | | n/a |
Fair value of market-based awards granted | | $ | 34.79 | | | n/a | | n/a |
As of December 31, 2024, the total unrecognized stock-based compensation expense related to non-vested performance-based RSUs was approximately $0.9 million, which is expected to be recognized over the next three years.
13. Benefit Plans
We maintain a voluntary, contributory 401(k) plan for eligible team members. Team members may elect to contribute up to the IRS maximum for the plan year. Additionally, eligible participants may also elect catch-up contributions as provided for by the IRS. Our executive officers and other highly compensated team members are not eligible to participate in the 401(k) plan. Team member contributions are matched by us at a rate of 33% for the first 6% of deferred earnings. We contributed approximately $0.8 million, $0.8 million and $0.6 million in fiscal 2024, 2023 and 2022, respectively.
We also maintain a non-qualified deferred compensation plan (the “DCP”) for our executive officers and other highly compensated team members, as defined in the DCP, who are otherwise ineligible for participation in our 401(k) plan. The DCP allows participating team members to defer the receipt of a portion of their base compensation and up to 100% of their eligible bonuses. Additionally, the DCP allows for a voluntary company match as determined by our compensation committee. During fiscal 2024, there were no Company contributions made or accrued. We pay for related administrative costs, which were not material during fiscal 2024. Team member deferrals are deposited into a rabbi trust, and the funds are generally invested in individual variable life insurance contracts owned by us that are specifically designed to informally fund savings plans of this nature. Our investment in variable life insurance contracts, reflected in “Other assets, net” on our Consolidated Balance Sheets, was $12.8 million and $10.4 million as of December 31, 2024, and January 2, 2024, respectively. Our obligation to participating team members, included in “Other liabilities” on the accompanying Consolidated Balance Sheets, was $13.2 million and $10.6 million as of December 31, 2024, and January 2, 2024, respectively. All income and expenses related to the rabbi trust are reflected in our Consolidated Statements of Operations.
14. Related Party Transactions
BJ's Act III, LLC
Our consulting agreement for defined services with Act III Management, LLC, an affiliate of BJ’s Act III, LLC, one of our beneficial stockholders, and Act III Holdings, LLC, of which one current member and one former member of the Board of Directors are partners, in the amount of $195,000, expired on December 31, 2022.
On December 30, 2024, the Company agreed to extend Act III's warrant termination date by two years to May 4, 2027, and recorded a related expense of $4.6 million within “Other (expense) income, net” on our Consolidated Statements of Operations. See Note 10 for further information.
Equity Method Investment
During fiscal 2022, we contributed assets valued at $5.0 million to a company, in which our Board member and former Chief Executive Officer has a less than 1% interest. We recorded this non-cash contribution, in exchange for a 20% ownership of the company, as an investment within “Equity method investment” on our Consolidated Balance Sheets, and the related gain within “Loss on disposal and impairment of assets, net” on our Consolidated Statements of Operations. For fiscal 2024, 2023 and 2022, we recorded a net loss related to the investment of $0.5 million, $0.2 million and zero, respectively, within “Other income, net,” and accordingly adjusted the investment carrying amount on our Consolidated Balance Sheets.
15. Segment Information
We currently operate in one operating segment: full-service company-owned restaurants and in one geographic area: the United States of America. We do not have intra-entity sales or transfers. Our revenues are comprised of food and beverage sales from our restaurants, including takeout, delivery and catering sales. Our CODM is our interim chief executive officer, and he assesses performance and decides how to allocate resources based on income (loss) from operations, which is also reported on our Consolidated Statements of Operations. Additionally, the measure of segment assets is reported on our Consolidated Balance Sheets as total assets. Our CODM uses net income to evaluate income generated from our segment assets and decides whether to reinvest profits into other parts of our business.
Reported segment revenue and expenses is presented below (in thousands):
| | | | | | | | | | | | |
| | Fiscal Year | |
| | 2024 | | | 2023 | | | 2022 | |
Revenues | | $ | 1,357,302 | | | $ | 1,333,229 | | | $ | 1,283,926 | |
Less: | | | | | | | | | |
Cost of sales | | | 348,835 | | | | 344,945 | | | | 347,463 | |
Labor and benefits | | | 486,330 | | | | 480,867 | | | | 474,045 | |
Occupancy and operating | | | 326,544 | | | | 329,630 | | | | 317,628 | |
Other segment items | | | 108,768 | | | | 93,036 | | | | 79,885 | |
Depreciation and amortization | | | 72,745 | | | | 70,992 | | | | 70,385 | |
Income (loss) from operations | | | 14,080 | | | | 13,759 | | | | (5,480 | ) |
| | | | | | | | | |
Reconciliation to net income: | | | | | | | | | |
Interest expense, net | | | 5,484 | | | | 4,915 | | | | 2,888 | |
Other expense (income), net | | | 331 | | | | (1,256 | ) | | | (60 | ) |
Income tax benefit | | | (8,422 | ) | | | (9,560 | ) | | | (12,384 | ) |
Net income | | $ | 16,687 | | | $ | 19,660 | | | $ | 4,076 | |