| FREE WRITING PROSPECTUS | ||
| FILED PURSUANT TO RULE 433 | ||
| REGISTRATION FILE NO.:333-190246-14 | ||
| Dated May 29, 2015 | JPMBB 2015-C29 | |
Free Writing Prospectus Structural and Collateral Term Sheet | ||
| JPMBB 2015-C29 | ||
$984,488,178 (Approximate Mortgage Pool Balance) | ||
$829,499,000 (Approximate Offered Certificates) | ||
J.P. Morgan Chase Commercial Mortgage Securities Corp. Depositor | ||
COMMERCIAL MORTGAGE PASS-THROUGH CERTIFICATES SERIES 2015-C29 | ||
JPMorgan Chase Bank, National Association Barclays Bank PLC RAIT Funding, LLC Redwood Commercial Mortgage Corporation Starwood Mortgage Funding II LLC Mortgage Loan Sellers | ||
J.P. Morgan Co-Lead Manager and Joint Bookrunner | Barclays Co-Lead Manager and Joint Bookrunner | |
Drexel Hamilton Co-Manager | ||
THE INFORMATION IN THIS STRUCTURAL AND COLLATERAL TERM SHEET IS NOT COMPLETE AND MAY BE AMENDED PRIOR TO THE TIME OF SALE. THIS TERM SHEET IS NOT AN OFFER TO SELL THESE SECURITIES AND IT IS NOT A SOLICITATION OF AN OFFER TO BUY THESE SECURITIES IN ANY JURISDICTION WHERE THE OFFER OR SALE IS NOT PERMITTED.
| Dated May 29, 2015 | JPMBB 2015-C29 |
This material is for your information, and none of J.P. Morgan Securities LLC (“JPMS”), Barclays Capital Inc. (“Barclays”) or Drexel Hamilton, LLC (“Drexel”) (each individually, an “Underwriter”, and together, the ‘‘Underwriters’’) is soliciting any action based upon it. This material is not to be construed as an offer to sell or the solicitation of any offer to buy any security in any jurisdiction where such an offer or solicitation would be illegal.
The Depositor has filed a registration statement (including a prospectus) with the SEC (SEC File no. 333-190246) for the offering to which this free writing prospectus relates. Before you invest, you should read the prospectus in the registration statement and other documents the Depositor has filed with the SEC for more complete information about the Depositor, the issuing entity and this offering. You may get these documents for free by visiting EDGAR on the SEC Web site at www.sec.gov. Alternatively, the Depositor or any Underwriter or any dealer participating in the offering will arrange to send you the prospectus if you request it by calling 1 (866) 400-7834 or by emailing cmbs-prospectus@jpmorgan.com.
Neither this document nor anything contained in this document shall form the basis for any contract or commitment whatsoever. The information contained in this document is preliminary as of the date of this document, supersedes any previous such information delivered to you and will be superseded by any such information subsequently delivered prior to the time of sale. These materials are subject to change, completion or amendment from time to time.
This document has been prepared by the Underwriters for information purposes only and does not constitute, in whole or in part, a prospectus for the purposes of Directive 2003/71/EC (as amended) and/or Part VI of the Financial Services and Markets Act 2000 as amended or other offering document.
The attached information contains certain tables and other statistical analyses (the “Computational Materials”) that have been prepared in reliance upon information furnished by the Mortgage Loan Sellers. Numerous assumptions were used in preparing the Computational Materials, which may or may not be reflected in this document. The Computational Materials should not be construed as either projections or predictions or as legal, tax, financial or accounting advice. You should consult your own counsel, accountant and other advisors as to the legal, tax, business, financial and related aspects of a purchase of these certificates. Any weighted average lives, yields and principal payment periods shown in the Computational Materials are based on prepayment and/or loss assumptions, and changes in such prepayment and/or loss assumptions may dramatically affect such weighted average lives, yields and principal payment periods. In addition, it is possible that prepayments or losses on the underlying assets will occur at rates higher or lower than the rates shown in the Computational Materials. The specific characteristics of the certificates may differ from those shown in the Computational Materials due to differences between the final underlying assets and the preliminary underlying assets used in preparing the Computational Materials. The principal amount and designation of any certificate described in the Computational Materials are subject to change prior to issuance. None of the Underwriters nor any of their respective affiliates make any representation or warranty as to the actual rate or timing of payments or losses on any of the underlying assets or the payments or yield on the certificates.
This information is based upon management forecasts and reflects prevailing conditions and management’s views as of this date, all of which are subject to change.
This document contains forward-looking statements. Those statements are subject to certain risks and uncertainties that could cause the success of collections and the actual cash flow generated to differ materially from the information set forth in this document. While such information reflects projections prepared in good faith based upon methods and data that are believed to be reasonable and accurate as of their dates, the Depositor undertakes no obligation to revise these forward-looking statements to reflect subsequent events or circumstances. Investors should not place undue reliance on forward-looking statements and are advised to make their own independent analysis and determination with respect to the forecasted periods, which reflect the Depositor’s view only as of the date of this document.
J.P. Morgan is the marketing name for the investment banking businesses of JPMorgan Chase & Co. and its subsidiaries worldwide. Securities, syndicated loan arranging, financial advisory and other investment banking activities are performed by JPMS and its securities affiliates, and lending, derivatives and other commercial banking activities are performed by JPMorgan Chase Bank, National Association and its banking affiliates. JPMS is a member of SIPC and the NYSE.
THE CERTIFICATES REFERRED TO IN THESE MATERIALS ARE SUBJECT TO MODIFICATION OR REVISION (INCLUDING THE POSSIBILITY THAT ONE OR MORE CLASSES OF CERTIFICATES MAY BE SPLIT, COMBINED OR ELIMINATED AT ANY TIME PRIOR TO ISSUANCE OR AVAILABILITY OF A FINAL PROSPECTUS) AND ARE OFFERED ON A “WHEN, AS AND IF ISSUED” BASIS. PROSPECTIVE INVESTORS SHOULD UNDERSTAND THAT, WHEN CONSIDERING THE PURCHASE OF THESE CERTIFICATES, A CONTRACT OF SALE WILL COME INTO BEING NO SOONER THAN THE DATE ON WHICH THE RELEVANT CLASS OF CERTIFICATES HAS BEEN PRICED AND THE UNDERWRITERS HAVE CONFIRMED THE ALLOCATION OF CERTIFICATES TO BE MADE TO INVESTORS; ANY “INDICATIONS OF INTEREST” EXPRESSED BY ANY PROSPECTIVE INVESTOR, AND ANY “SOFT CIRCLES” GENERATED BY THE UNDERWRITERS, WILL NOT CREATE BINDING CONTRACTUAL OBLIGATIONS FOR SUCH PROSPECTIVE INVESTORS, ON THE ONE HAND, OR THE UNDERWRITERS, THE DEPOSITOR OR ANY OF THEIR RESPECTIVE AGENTS OR AFFILIATES, ON THE OTHER HAND.
AS A RESULT OF THE FOREGOING, A PROSPECTIVE INVESTOR MAY COMMIT TO PURCHASE CERTIFICATES THAT HAVE CHARACTERISTICS THAT MAY CHANGE, AND EACH PROSPECTIVE INVESTOR IS ADVISED THAT ALL OR A PORTION OF THE CERTIFICATES REFERRED TO IN THESE MATERIALS MAY BE ISSUED WITHOUT ALL OR CERTAIN OF THE CHARACTERISTICS DESCRIBED IN THESE MATERIALS. EACH UNDERWRITER’S OBLIGATION TO SELL CERTIFICATES TO ANY PROSPECTIVE INVESTOR IS CONDITIONED ON THE CERTIFICATES AND THE TRANSACTION HAVING THE CHARACTERISTICS DESCRIBED IN THESE MATERIALS. IF THE UNDERWRITERS DETERMINE THAT A CONDITION IS NOT SATISFIED IN ANY MATERIAL RESPECT, SUCH PROSPECTIVE INVESTOR WILL BE NOTIFIED, AND NEITHER THE DEPOSITOR NOR THE UNDERWRITERS WILL HAVE ANY OBLIGATION TO SUCH PROSPECTIVE INVESTOR TO DELIVER ANY PORTION OF THE CERTIFICATES THAT SUCH PROSPECTIVE INVESTOR HAS COMMITTED TO PURCHASE, AND THERE WILL BE NO LIABILITY OR OBLIGATION BETWEEN THE UNDERWRITERS, THE DEPOSITOR OR ANY OF THEIR RESPECTIVE AGENTS OR AFFILIATES, ON THE ONE HAND, AND SUCH PROSPECTIVE INVESTOR, ON THE OTHER HAND, AS A CONSEQUENCE OF THE NON-DELIVERY.
THE UNDERWRITERS MAY FROM TIME TO TIME PERFORM INVESTMENT BANKING SERVICES FOR, OR SOLICIT INVESTMENT BANKING BUSINESS FROM, ANY COMPANY NAMED IN THESE MATERIALS. THE UNDERWRITERS AND/OR THEIR AFFILIATES OR RESPECTIVE EMPLOYEES MAY FROM TIME TO TIME HAVE A LONG OR SHORT POSITION IN ANY CERTIFICATE OR CONTRACT DISCUSSED IN THESE MATERIALS.
THE INFORMATION IN THIS STRUCTURAL AND COLLATERAL TERM SHEET IS NOT COMPLETE AND MAY BE AMENDED PRIOR TO THE TIME OF SALE. THIS TERM SHEET IS NOT AN OFFER TO SELL THESE SECURITIES AND IT IS NOT A SOLICITATION OF AN OFFER TO BUY THESE SECURITIES IN ANY JURISDICTION WHERE THE OFFER OR SALE IS NOT PERMITTED.
 | 1 of 122 |  |
| Structural and Collateral Term Sheet | JPMBB 2015-C29 |
| Indicative Capital Structure | |
Publicly Offered Certificates
| Class | Expected Ratings (Moody’s / Fitch / Morningstar) | Approximate Initial Certificate Balance or Notional Amount(1) | Approximate Initial Credit Support(2) | Expected Weighted Avg. Life (years)(3) | Expected Principal Window(3) | Certificate Principal to Value Ratio(4) | Underwritten NOI Debt Yield(5) | |
| A-1 | Aaa(sf) / AAAsf / AAA | $49,025,000 | 30.000% | 2.83 | 7/15-4/20 | 45.2% | 14.9% | |
| A-2 | Aaa(sf) / AAAsf / AAA | $212,993,000 | 30.000% | 4.87 | 4/20-6/20 | 45.2% | 14.9% | |
| A-3A1 | Aaa(sf) / AAAsf / AAA | $60,000,000 | 30.000% | 9.65 | 11/24-4/25 | 45.2% | 14.9% | |
| A-4 | Aaa(sf) / AAAsf / AAA | $222,921,000 | 30.000% | 9.80 | 4/25-5/25 | 45.2% | 14.9% | |
| A-SB | Aaa(sf) / AAAsf / AAA | $69,203,000 | 30.000% | 7.20 | 4/20-11/24 | 45.2% | 14.9% | |
X-A(6) | Aa1(sf) / AAAsf / AAA | $753,133,000 | N/A | N/A | N/A | N/A | N/A | |
X-B(6) | NR / AA-sf / AAA | $54,147,000 | N/A | N/A | N/A | N/A | N/A | |
A-S(7)(8) | Aa2(sf) / AAAsf / AAA | $63,991,000 | 23.500% | 9.88 | 5/25-5/25 | 49.4% | 13.6% | |
B(7)(8) | NR / AA-sf / AA- | $54,147,000 | 18.000% | 9.88 | 5/25-5/25 | 53.0% | 12.7% | |
C(7)(8) | NR / A-sf / A- | $44,302,000 | 13.500% | 9.92 | 5/25-6/25 | 55.9% | 12.0% | |
EC(7)(8)(9) | NR / A-sf / A- | $162,440,000 | 13.500% | 9.89 | 5/25-6/25 | 55.9% | 12.0% | |
| D | NR / BBB-sf / BBB- | $52,917,000 | 8.125% | 9.96 | 6/25-6/25 | 59.4% | 11.3% | |
Privately Offered Certificates(10)
| Class | Expected Ratings (Moody’s / Fitch / Morningstar) | Approximate Initial Certificate Balance or Notional Amount(1) | Approximate Initial Credit Support(2) | Expected Weighted Avg. Life (years)(3) | Expected Principal Window(3) | Certificate Principal to Value Ratio(4) | Underwritten NOI Debt Yield(5) | |
| A-3A2 | Aaa(sf) / AAAsf / AAA | $75,000,000 | 30.000% | 9.65 | 11/24-4/25 | 45.2% | 14.9% | |
X-C(6) | NR / A-sf / AAA | $44,302,000 | N/A | N/A | N/A | N/A | N/A | |
X-D(6) | NR / BBB-sf / AAA | $52,917,000 | N/A | N/A | N/A | N/A | N/A | |
X-E(6) | NR / BBsf / AAA | $20,920,000 | N/A | N/A | N/A | N/A | N/A | |
X-F(6) | NR / Bsf / AAA | $11,075,000 | N/A | N/A | N/A | N/A | N/A | |
X-NR(6) | NR / NR / AAA | $47,994,178 | N/A | N/A | N/A | N/A | N/A | |
| E | NR / BBsf / BB | $20,920,000 | 6.000% | 9.96 | 6/25-6/25 | 60.7% | 11.1% | |
| F | NR / Bsf / B+ | $11,075,000 | 4.875% | 9.96 | 6/25-6/25 | 61.5% | 10.9% | |
| NR | NR / NR / NR | $47,994,178 | 0.000% | 11.07 | 6/25-5/30 | 64.6% | 10.4% | |
| (1) | In the case of each such Class, subject to a permitted variance of plus or minus 5%. |
| (2) | The credit support percentages set forth for Class A-1, Class A-2, Class A-3A1, Class A-3A2, Class A-4 and Class A-SB Certificates represent the approximate initial credit support for the Class A-1, Class A-2, Class A-3A1, Class A-3A2, Class A-4 and Class A-SB Certificates in the aggregate. |
| (3) | Assumes 0% CPR / 0% CDR and a June 30, 2015 closing date. Based on modeling assumptions as described in the Free Writing Prospectus dated May 29, 2015 (the “Free Writing Prospectus”). |
| (4) | The “Certificate Principal to Value Ratio” for any Class (other than the Class A-1, Class A-2, Class A-3A1, Class A-3A2, Class A-4 and Class A-SB Certificates) is calculated as the product of (a) the weighted average Cut-off Date LTV Ratio for the mortgage loans, multiplied by (b) a fraction, the numerator of which is the total initial Certificate Balance of such Class of Certificates and all Classes of Principal Balance Certificates senior to such Class of Certificates and the denominator of which is the total initial Certificate Balance of all of the Principal Balance Certificates. The Class A-1, Class A-2, Class A-3A1, Class A-3A2, Class A-4 and Class A-SB Certificate Principal to Value Ratios are calculated in the aggregate for those Classes as if they were a single Class. Investors should note, however, that excess mortgaged property value associated with a mortgage loan will not be available to offset losses on any other mortgage loan. |
| (5) | The “Underwritten NOI Debt Yield” for any Class (other than the Class A-1, Class A-2, Class A-3A1, Class A-3A2, Class A-4 and Class A-SB Certificates) is calculated as the product of (a) the weighted average UW NOI Debt Yield for the mortgage loans and (b) the total initial Certificate Balance of all of the Classes of Principal Balance Certificates divided by the total initial Certificate Balance for such Class and all Classes of Principal Balance Certificates senior to such Class of Certificates. The Underwritten NOI Debt Yield for each of the Class A-1, Class A-2, Class A-3A1, Class A-3A2, Class A-4 and Class A-SB Certificates is calculated in the aggregate for those Classes as if they were a single Class. Investors should note, however, that net operating income from any mortgaged property supports only the related mortgage loan and will not be available to support any other mortgage loan. |
| (6) | The Class X-A, Class X-B, Class X-C, Class X-D, Class X-E, Class X-F and Class X-NR Notional Amounts are defined in the Free Writing Prospectus. |
| (7) | A holder of Class A-S, Class B and Class C Certificates (the “Exchangeable Certificates”) may exchange such Classes of Certificates (on an aggregate basis) for a related amount of Class EC Certificates, and Class EC Certificates may be exchanged for a ratable portion of each class of Exchangeable Certificates. |
| (8) | The initial Certificate Balance of a Class of Exchangeable Certificates represents the principal balance of such Class without giving effect to any exchange. The initial Certificate Balance of the Class EC Certificates is equal to the aggregate of the initial Certificate Balances of the Exchangeable Certificates and represents the maximum principal balance of such Class that could be issued in an exchange. See “Exchangeable Certificates and the Class EC Certificates” below. |
| (9) | Although the Class EC Certificates are listed below the Class C Certificates in the chart, the Class EC Certificates’ payment entitlements and subordination priority will be a result of the payment entitlements and subordination priority at each level of the related component classes of Class A-S, Class B and Class C Certificates. For purposes of determining the Approximate Initial Credit Support, Certificate Principal to Value Ratio and Underwritten NOI Debt Yield for Class EC Certificates, the calculation is based on the aggregate initial Certificate Balance of Class A-S, Class B and Class C Certificates as if they were a single class. |
| (10) | The Class A-3A2, Class X-C, Class X-D, Class X-E, Class X-F, Class X-NR, Class E, Class F, Class NR and Class R Certificates are not being offered by the Free Writing Prospectus and this Term Sheet. The Class R Certificates are not shown above. |
THE INFORMATION IN THIS STRUCTURAL AND COLLATERAL TERM SHEET IS NOT COMPLETE AND MAY BE AMENDED PRIOR TO THE TIME OF SALE. THIS TERM SHEET IS NOT AN OFFER TO SELL THESE SECURITIES AND IT IS NOT A SOLICITATION OF AN OFFER TO BUY THESE SECURITIES IN ANY JURISDICTION WHERE THE OFFER OR SALE IS NOT PERMITTED.
| 2 of 122 | |
| Structural and Collateral Term Sheet | JPMBB 2015-C29 |
Summary of Transaction Terms | |
| Securities Offered: | $829,499,000 monthly pay, multi-class, commercial mortgage REMIC Pass-Through Certificates. |
Co-Lead Managers and Joint Bookrunners: | J.P. Morgan Securities LLC and Barclays Capital Inc. |
| Co-Manager: | Drexel Hamilton, LLC. |
| Mortgage Loan Sellers: | JPMorgan Chase Bank, National Association (“JPMCB”) (39.4%), Barclays Bank PLC (“Barclays”) (24.4%), RAIT Funding, LLC (“RAIT”) (13.2%), Redwood Commercial Mortgage Corporation (“RCMC”) (11.7%) and Starwood Mortgage Funding II LLC (“SMF II”) (11.2%). |
| Master Servicer: | Wells Fargo Bank, National Association (“Wells Fargo”). |
| Special Servicer: | Midland Loan Services, a Division of PNC Bank, National Association (“Midland”). |
Directing Certificateholder: | An affiliated fund of, or an entity controlled by affiliated funds of, Blackrock Realty Advisors, Inc. |
| Trustee: | Wilmington Trust, National Association. |
| Certificate Administrator: | Wells Fargo Bank, National Association. |
| Senior Trust Advisor: | Pentalpha Surveillance LLC. |
| Rating Agencies: | Moody’s Investors Service, Inc. (“Moody’s”), Fitch Ratings, Inc. (“Fitch”) and Morningstar Credit Ratings, LLC (“Morningstar”). |
| Pricing Date: | On or about June 5, 2015. |
| Closing Date: | On or about June 30, 2015. |
| Cut-off Date: | With respect to each mortgage loan, the related due date in June 2015, or with respect to any mortgage loan that has its first due date in July 2015, the date that would otherwise have been the related due date in June 2015. |
| Distribution Date: | The 4th business day after the Determination Date in each month, commencing in July 2015. |
| Determination Date: | 11th day of each month, or if the 11th day is not a business day, the next succeeding business day, commencing in July 2015. |
Assumed Final Distribution Date: | The Distribution Date in May 2030, which is the latest anticipated repayment date of the Certificates. |
Rated Final Distribution Date: | The Distribution Date in May 2048. |
| Tax Treatment: | The Publicly Offered Certificates are expected to be treated as REMIC regular interests for U.S. federal income tax purposes. |
| Form of Offering: | The Class A-1, Class A-2, Class A-3A1, Class A-4, Class A-SB, Class X-A, Class X-B, Class A-S, Class B, Class C, Class EC and Class D Certificates will be offered publicly (the “Publicly Offered Certificates”). The Class A-3A2, Class X-C, Class X-D, Class X-E, Class X-F, Class X-NR, Class E, Class F, Class NR and Class R Certificates (the “Privately Offered Certificates”) will be offered domestically to Qualified Institutional Buyers and to Institutional Accredited Investors and to institutions that are not U.S. Persons pursuant to Regulation S. |
| SMMEA Status: | The Certificates will not constitute “mortgage related securities” for purposes of SMMEA. |
| ERISA: | The Publicly Offered Certificates are expected to be ERISA eligible. |
| Optional Termination: | On any distribution date on which the aggregate principal balance of the pool of mortgage loans is less than the greater of (i) 1% of the aggregate principal balance of the mortgage loans as of the cut-off date, or (ii) the product of (x) a percentage that is calculated by dividing the sum of the outstanding principal balance of the mortgage loans identified on Annex A-1 to the Free Writing Prospectus as “Bridgeway Business Center” and “The Heights” on the date that is the 10-year anniversary from the start-up date of the trust by the aggregate principal balance of the mortgage loans as of the cut-off date and (y) the aggregate principal balance of the mortgage loans as of the cut-off date. |
Minimum Denominations: | The Publicly Offered Certificates (other than the Class X-A and Class X-B Certificates) will be issued in minimum denominations of $10,000 and integral multiples of $1 in excess of $10,000. The Class X-A and Class X-B Certificates will be issued in minimum denominations of $1,000,000 and in integral multiples of $1 in excess of $1,000,000. |
| Settlement Terms: | DTC, Euroclear and Clearstream Banking. |
| Analytics: | The transaction is expected to be modeled by Intex Solutions, Inc. and Trepp, LLC and is expected to be available on Bloomberg L.P., Blackrock Financial Management Inc., Interactive Data Corporation and Markit. |
| Risk Factors: | THE CERTIFICATES INVOLVE CERTAIN RISKS AND MAY NOT BE SUITABLE FOR ALL INVESTORS. SEE THE “RISK FACTORS” SECTION OF THE FREE WRITING PROSPECTUS. |
THE INFORMATION IN THIS STRUCTURAL AND COLLATERAL TERM SHEET IS NOT COMPLETE AND MAY BE AMENDED PRIOR TO THE TIME OF SALE. THIS TERM SHEET IS NOT AN OFFER TO SELL THESE SECURITIES AND IT IS NOT A SOLICITATION OF AN OFFER TO BUY THESE SECURITIES IN ANY JURISDICTION WHERE THE OFFER OR SALE IS NOT PERMITTED.
| 3 of 122 | |
| Structural and Collateral Term Sheet | JPMBB 2015-C29 |
Collateral Characteristics | |
| Loan Pool | ||
Initial Pool Balance (“IPB”): | $984,488,178 | |
| Number of Mortgage Loans: | 63 | |
| Number of Mortgaged Properties: | 85 | |
| Average Cut-off Date Balance per Mortgage Loan: | $15,626,796 | |
| Weighted Average Current Mortgage Rate: | 4.21568% | |
| 10 Largest Mortgage Loans as % of IPB: | 43.2% | |
| Weighted Average Remaining Term to Maturity: | 107 months | |
| Weighted Average Seasoning: | 1 months | |
| Credit Statistics | ||
Weighted Average UW NCF DSCR(1)(2): | 1.79x | |
Weighted Average UW NOI Debt Yield(1): | 10.4% | |
Weighted Average Cut-off Date Loan-to-Value Ratio (“LTV”)(1)(3): | 64.6% | |
Weighted Average Maturity Date LTV(1)(3): | 55.6% | |
| Other Statistics | ||
| % of Mortgage Loans with Additional Debt: | 17.0% | |
| % of Mortgaged Properties with Single Tenants: | 1.1% | |
| Amortization | ||
Weighted Average Original Amortization Term(4): | 351 months | |
Weighted Average Remaining Amortization Term(4): | 351 months | |
| % of Mortgage Loans with Partial Interest-Only followed by Amortizing Balloon: | 49.1% | |
| % of Mortgage Loans with Amortizing Balloon: | 31.8% | |
| % of Mortgage Loans with Interest-Only: | 17.5% | |
| % of Mortgage Loans with Fully Amortizing: | 1.5% | |
Cash Management(5) | ||
| % of Mortgage Loans with Springing Lockboxes: | 47.7% | |
| % of Mortgage Loans with In-Place, Hard Lockboxes: | 30.2% | |
| % of Mortgage Loans with In-Place, CMA Lockboxes: | 19.8% | |
| % of Mortgage Loans with In-Place, Soft Lockboxes: | 1.8% | |
| % of Mortgage Loans with No Lockbox: | 0.6% | |
| Reserves | ||
| % of Mortgage Loans Requiring Monthly Tax Reserves: | 85.6% | |
| % of Mortgage Loans Requiring Monthly Insurance Reserves: | 52.9% | |
% of Mortgage Loans Requiring Monthly CapEx Reserves(6): | 92.0% | |
% of Mortgage Loans Requiring Monthly TI/LC Reserves(7): | 83.3% | |
| (1) | In the case of Loan Nos. 2, 8, 10 and 12, the UW NCF DSCR, UW NOI Debt Yield, Cut-off Date LTV and Maturity Date LTV calculations include the related Pari Passu Companion Loan. |
| (2) | In the case of Loan No. 11, the UW NCF DSCR is calculated using the average of principal and interest payments over the first 12 months following the interest-only period based on the principal payment schedule provided on Annex F of the Free Writing Prospectus. |
| (3) | In the case of Loan No. 21, the Cut-off Date LTV and the Maturity Date LTV are calculated using an appraised value based on certain hypothetical assumptions. Refer to “Description of the Mortgage Pool—Assessments of Property Value and Condition” in the Free Writing Prospectus for additional details. |
| (4) | Excludes six mortgage loans that are interest-only for the entire term. |
| (5) | For a detailed description of Cash Management, refer to “Description of the Mortgage Pool – Lockbox Accounts” in the Free Writing Prospectus. |
| (6) | CapEx Reserves include FF&E reserves for hotel properties. |
(7) | Calculated only with respect to the Cut-off Date Balance of mortgage loans secured or partially secured by retail, industrial, office and mixed use properties. |
THE INFORMATION IN THIS STRUCTURAL AND COLLATERAL TERM SHEET IS NOT COMPLETE AND MAY BE AMENDED PRIOR TO THE TIME OF SALE. THIS TERM SHEET IS NOT AN OFFER TO SELL THESE SECURITIES AND IT IS NOT A SOLICITATION OF AN OFFER TO BUY THESE SECURITIES IN ANY JURISDICTION WHERE THE OFFER OR SALE IS NOT PERMITTED.
| 4 of 122 | |
| Structural and Collateral Term Sheet | JPMBB 2015-C29 | |
| Collateral Characteristics | ||
Mortgage Loan Seller | Number of Mortgage Loans | Number of Mortgaged Properties | Aggregate Cut-off Date Balance | % of IPB | ||||
| JPMCB | 18 | 22 | $387,644,693 | 39.4% | ||||
| Barclays | 16 | 32 | 240,628,182 | 24.4 | ||||
| RAIT | 8 | 8 | 130,392,090 | 13.2 | ||||
| RCMC | 13 | 13 | 115,541,327 | 11.7 | ||||
| SMF II | 8 | 10 | 110,281,886 | 11.2 | ||||
| Total: | 63 | 85 | $984,488,178 | 100.0% |
| Ten Largest Mortgage Loans |
| No. | Loan Name | Mortgage Loan Seller | No. of Prop. | Cut-off Date Balance | % of IPB | SF/Units/ Rooms | Property Type | UW NCF DSCR(1) | UW NOI Debt Yield(1) | Cut-off Date LTV(1) | Maturity Date LTV(1) | |||||||||||
| 1 | 2025 M Street | RAIT | 1 | $63,560,000 | 6.5% | 191,248 | Office | 1.43x | 8.8% | 57.8% | 50.3% | |||||||||||
| 2 | One City Centre | JPMCB | 1 | $60,000,000 | 6.1% | 602,122 | Office | 2.04x | 9.1% | 61.7% | 61.7% | |||||||||||
| 3 | 400 Poydras | JPMCB | 1 | $55,756,339 | 5.7% | 595,566 | Mixed Use | 1.60x | 11.1% | 72.7% | 58.7% | |||||||||||
| 4 | Cole IV Retail Portfolio - Pool I | Barclays | 6 | $50,000,000 | 5.1% | 680,486 | Retail | 3.30x | 13.4% | 48.1% | 48.1% | |||||||||||
| 5 | Cole IV Retail Portfolio - Pool II | Barclays | 6 | $50,000,000 | 5.1% | 551,854 | Retail | 3.27x | 13.4% | 48.4% | 48.4% | |||||||||||
| 6 | Alta Woodlake Square | JPMCB | 1 | $31,000,000 | 3.1% | 256 | Multifamily | 1.34x | 8.0% | 77.0% | 70.1% | |||||||||||
| 7 | Little Palm Island Resort | Barclays | 1 | $30,963,678 | 3.1% | 30 | Hotel | 1.90x | 11.7% | 56.1% | 51.5% | |||||||||||
| 8 | JAGR Portfolio | JPMCB | 3 | $30,000,000 | 3.0% | 721 | Hotel | 1.78x | 11.4% | 64.6% | 61.7% | |||||||||||
| 9 | Lenox Towers | JPMCB | 1 | $27,500,000 | 2.8% | 378,838 | Office | 1.56x | 11.1% | 55.0% | 49.9% | |||||||||||
| 10 | Horizon Outlet Shoppes Portfolio | SMF II | 3 | $26,675,000 | 2.7% | 555,682 | Retail | 1.42x | 9.6% | 62.6% | 53.4% | |||||||||||
| Top 3 Total/Weighted Average | 3 | $179,316,339 | 18.2% | 1.69x | 9.6% | 63.7% | 56.7% | |||||||||||||||
| Top 5 Total/Weighted Average | 15 | $279,316,339 | 28.4% | 2.26x | 11.0% | 58.2% | 53.7% | |||||||||||||||
| Top 10 Total/Weighted Average | 24 | $425,455,018 | 43.2% | 2.03x | 10.8% | 59.9% | 55.0% | |||||||||||||||
| (1) | In the case of Loan Nos. 2, 8 and 10, the UW NCF DSCR, UW NOI Debt Yield, Cut-off Date LTV and Maturity Date LTV calculations include the related Pari Passu Companion Loans. |
| Pari Passu Note Loan Summary |
No. | Loan Name | Trust Cut- off Date Balance | Pari Passu Loan Cut-off Date Balance | Total Mortgage Loan Cut- off Date Balance | Controlling Pooling & Servicing Agreement | Master Servicer | Special Servicer | Voting Rights | ||||||||
| 2 | One City Centre | $60,000,000 | $40,000,000 | $100,000,000 | JPMBB 2015-C29 | Wells Fargo | Midland | JPMBB 2015-C29 | ||||||||
| 8 | JAGR Portfolio | $30,000,000 | $17,500,000 | $47,500,000 | JPMBB 2015-C29 | Wells Fargo | Midland | JPMBB 2015-C29 | ||||||||
| 10 | Horizon Outlet Shoppes Portfolio | $26,675,000 | $28,000,000 | $54,675,000 | JPMBB 2015-C28 | Wells Fargo | Midland | JPMBB 2015-C28 | ||||||||
| 12 | Marriott - Pittsburgh | $25,000,000 | $19,060,000 | $44,060,000 | JPMBB 2015-C29 | Wells Fargo | Midland | JPMBB 2015-C29 |
THE INFORMATION IN THIS STRUCTURAL AND COLLATERAL TERM SHEET IS NOT COMPLETE AND MAY BE AMENDED PRIOR TO THE TIME OF SALE. THIS TERM SHEET IS NOT AN OFFER TO SELL THESE SECURITIES AND IT IS NOT A SOLICITATION OF AN OFFER TO BUY THESE SECURITIES IN ANY JURISDICTION WHERE THE OFFER OR SALE IS NOT PERMITTED.
| 5 of 122 | |
| Structural and Collateral Term Sheet | JPMBB 2015-C29 | |
| Collateral Characteristics | ||
Additional Debt Summary(1) |
No. | Loan Name | Trust Cut-off Date Balance | Subordinate Debt Cut-off Date Balance | Total Debt Cut-off Date Balance | Mortgage Loan UW NCF DSCR(2)(3) | Total Debt UW NCF DSCR(3) | Mortgage Loan Cut-off Date LTV(2) | Total Debt Cut-off Date LTV | Mortgage Loan UW NOI Debt Yield(2) | Total Debt UW NOI Debt Yield | ||||||||||
| 3 | 400 Poydras | $55,756,339 | $7,000,000 | $62,756,339 | 1.60x | 1.32x | 72.7% | 81.8% | 11.1% | 9.9% | ||||||||||
| 6 | Alta Woodlake Square | $31,000,000 | $4,000,000 | $35,000,000 | 1.34x | 1.10x | 77.0% | 86.9% | 8.0% | 7.1% | ||||||||||
| 8 | JAGR Portfolio | $30,000,000 | $7,500,000 | $55,000,000 | 1.78x | 1.41x | 64.6% | 74.8% | 11.4% | 9.8% | ||||||||||
| 11 | Aspen Heights - Texas A&M University Corpus Christi | $26,000,000 | $4,380,000 | $30,380,000 | 1.54x | 1.20x | 66.3% | 77.5% | 9.0% | 7.7% | ||||||||||
| 12 | Marriott - Pittsburgh | $25,000,000 | $7,140,000 | $51,200,000 | 1.78x | 1.40x | 68.8% | 80.0% | 10.9% | 9.3% |
| (1) | In the case of Loan Nos. 3, 6, 8, 11 and 12, subordinate debt represents mezzanine loans. |
| (2) | In the case of Loan Nos. 8 and 12, Mortgage Loan UW NCF DSCR, Mortgage Loan UW NOI Debt Yield and Mortgage Loan Cut-off Date LTV calculations include the related Pari Passu Companion Loan. |
| (3) | In the case of Loan No. 11, the Mortgage Loan UW NCF DSCR and Total Debt UW NCF DSCR are calculated using the average of principal and interest payments over the first 12 months following the interest-only period based on the principal payment schedule provided on Annex F of the Free Writing Prospectus. |
THE INFORMATION IN THIS STRUCTURAL AND COLLATERAL TERM SHEET IS NOT COMPLETE AND MAY BE AMENDED PRIOR TO THE TIME OF SALE. THIS TERM SHEET IS NOT AN OFFER TO SELL THESE SECURITIES AND IT IS NOT A SOLICITATION OF AN OFFER TO BUY THESE SECURITIES IN ANY JURISDICTION WHERE THE OFFER OR SALE IS NOT PERMITTED.
| 6 of 122 | |
| Structural and Collateral Term Sheet | JPMBB 2015-C29 | |
| Collateral Characteristics | ||
Mortgaged Properties by Type(1) |
Weighted Average | ||||||||||||||||||
| Property Type | Property Subtype | Number of Properties | Cut-off Date Principal Balance | % of IPB | Occupancy | UW NCF DSCR(2)(3) | UW NOI DY(2) | Cut-off Date LTV(2)(4) | Maturity Date LTV(2)(4) | |||||||||
| Office | CBD | 5 | $170,431,534 | 17.3% | 89.5% | 1.66x | 9.3% | 60.2% | 55.3% | |||||||||
| Suburban | 7 | 43,947,105 | 4.5 | 82.4% | 1.71x | 11.5% | 72.0% | 60.7% | ||||||||||
| Medical | 4 | 24,468,000 | 2.5 | 98.2% | 1.44x | 8.9% | 73.8% | 65.1% | ||||||||||
| Subtotal: | 16 | $238,846,639 | 24.3% | 89.1% | 1.65x | 9.7% | 63.8% | 57.3% | ||||||||||
| Retail | Anchored | 17 | $142,138,912 | 14.4% | 96.7% | 2.76x | 12.8% | 53.0% | 45.2% | |||||||||
| Unanchored | 2 | 35,000,000 | 3.6 | 100.0% | 1.56x | 9.5% | 61.1% | 53.0% | ||||||||||
| Outlet Center | 3 | 26,675,000 | 2.7 | 86.7% | 1.42x | 9.6% | 62.6% | 53.4% | ||||||||||
| Shadow Anchored | 2 | 14,150,000 | 1.4 | 87.9% | 1.71x | 10.8% | 65.8% | 55.7% | ||||||||||
| Freestanding | 3 | 10,910,000 | 1.1 | 100.0% | 1.76x | 8.1% | 64.8% | 59.7% | ||||||||||
| Subtotal: | 27 | $228,873,912 | 23.2% | 95.6% | 2.31x | 11.6% | 56.7% | 48.7% | ||||||||||
| Hotel | Full Service | 7 | $124,300,322 | 12.6% | 72.9% | 1.82x | 11.2% | 63.7% | 56.6% | |||||||||
| Limited Service | 5 | 54,686,298 | 5.6 | 75.1% | 1.93x | 11.5% | 62.9% | 49.5% | ||||||||||
| Extended Stay | 2 | 18,033,970 | 1.8 | 82.0% | 1.57x | 10.2% | 69.6% | 50.8% | ||||||||||
| Subtotal: | 14 | $197,020,590 | 20.0% | 74.3% | 1.83x | 11.2% | 64.0% | 54.1% | ||||||||||
| Multifamily | Garden | 6 | $80,301,930 | 8.2% | 96.0% | 1.39x | 8.5% | 73.6% | 64.6% | |||||||||
| Student | 4 | 64,950,000 | 6.6 | 98.2% | 1.42x | 8.8% | 69.4% | 63.0% | ||||||||||
| Subtotal: | 10 | $145,251,930 | 14.8% | 97.0% | 1.41x | 8.7% | 71.7% | 63.9% | ||||||||||
| Mixed Use | Office/Retail/Parking | 1 | $55,756,339 | 5.7% | 85.2% | 1.60x | 11.1% | 72.7% | 58.7% | |||||||||
| Retail/Office | 2 | 42,125,000 | 4.3 | 85.1% | 1.35x | 8.7% | 73.8% | 63.5% | ||||||||||
| Office/Retail | 2 | 8,100,000 | 0.8 | 94.1% | 1.79x | 11.8% | 67.0% | 56.9% | ||||||||||
| Subtotal: | 5 | $105,981,339 | 10.8% | 85.9% | 1.52x | 10.2% | 72.7% | 60.5% | ||||||||||
| Self Storage | Self Storage | 10 | $42,564,184 | 4.3% | 82.5% | 1.53x | 9.0% | 73.3% | 63.9% | |||||||||
| Industrial | Warehouse | 1 | $15,958,634 | 1.6% | 98.2% | 2.03x | 17.0% | 50.7% | 17.3% | |||||||||
| Flex | 2 | $9,990,950 | 1.0 | 93.2% | 1.60x | 11.3% | 67.6% | 55.3% | ||||||||||
| Subtotal: | 3 | $25,949,584 | 2.6% | 96.3% | 1.87x | 14.8% | 57.2% | 31.9% | ||||||||||
| Total / Weighted Average: | 85 | $984,488,178 | 100.0% | 88.4% | 1.79x | 10.4% | 64.6% | 55.6% | ||||||||||
| (1) | Because this table presents information relating to the mortgaged properties and not mortgage loans, the information for mortgage loans secured by more than one mortgaged property is based on allocated loan amounts. |
| (2) | In the case of Loan Nos. 2, 8, 10 and 12, the UW NCF DSCR, UW NOI DY, Cut-off Date LTV and Maturity Date LTV calculations include the related Pari Passu Companion Loan. |
| (3) | In the case of Loan No. 11, the UW NCF DSCR is calculated using the average of principal and interest payments over the first 12 months following the interest-only period based on the principal payment schedule provided on Annex F of the Free Writing Prospectus. |
| (4) | In the case of Loan No. 21, the Cut-off Date LTV and the Maturity Date LTV are calculated using an appraised value based on certain hypothetical assumptions. Refer to “Description of the Mortgage Pool—Assessments of Property Value and Condition” in the Free Writing Prospectus for additional details. |
THE INFORMATION IN THIS STRUCTURAL AND COLLATERAL TERM SHEET IS NOT COMPLETE AND MAY BE AMENDED PRIOR TO THE TIME OF SALE. THIS TERM SHEET IS NOT AN OFFER TO SELL THESE SECURITIES AND IT IS NOT A SOLICITATION OF AN OFFER TO BUY THESE SECURITIES IN ANY JURISDICTION WHERE THE OFFER OR SALE IS NOT PERMITTED.
| 7 of 122 | |
| Structural and Collateral Term Sheet | JPMBB 2015-C29 | |
| Collateral Characteristics | ||
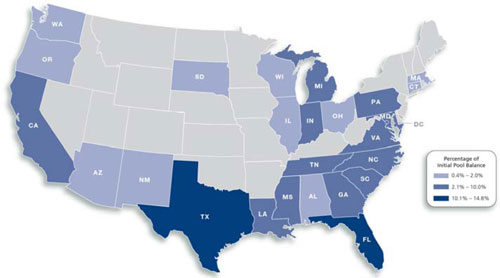
Mortgaged Properties by Location(1) |
Weighted Average | ||||||||||||||||
State | Number of Properties | Cut-off Date Principal Balance | % of IPB | Occupancy | UW NCF DSCR(2)(3) | UW NOI DY(2) | Cut-off Date LTV(2)(4) | Maturity Date LTV(2)(4) | ||||||||
| Texas | 9 | $145,810,000 | 14.8% | 90.8% | 1.80x | 9.1% | 66.4% | 62.9% | ||||||||
| Florida | 10 | 128,443,193 | 13.0 | 84.0% | 1.60x | 9.9% | 66.6% | 57.7% | ||||||||
| California | 7 | 80,336,644 | 8.2 | 90.8% | 2.18x | 11.1% | 61.6% | 53.8% | ||||||||
| Georgia | 10 | 73,207,806 | 7.4 | 85.0% | 2.03x | 11.1% | 58.1% | 51.7% | ||||||||
| Washington, D.C. | 1 | 63,560,000 | 6.5 | 99.5% | 1.43x | 8.8% | 57.8% | 50.3% | ||||||||
| Louisiana | 1 | 55,756,339 | 5.7 | 85.2% | 1.60x | 11.1% | 72.7% | 58.7% | ||||||||
| Pennsylvania | 4 | 49,300,000 | 5.0 | 83.1% | 2.00x | 11.3% | 65.2% | 56.8% | ||||||||
| Virginia | 5 | 45,158,634 | 4.6 | 87.8% | 1.68x | 13.5% | 66.5% | 45.8% | ||||||||
| South Carolina | 7 | 42,720,261 | 4.3 | 91.8% | 2.09x | 11.4% | 63.8% | 52.2% | ||||||||
| North Carolina | 3 | 38,965,422 | 4.0 | 93.4% | 1.51x | 9.4% | 69.6% | 59.1% | ||||||||
| Maryland | 3 | 32,138,158 | 3.3 | 73.0% | 1.64x | 10.4% | 64.5% | 58.4% | ||||||||
| Mississippi | 2 | 31,506,632 | 3.2 | 84.8% | 1.53x | 10.0% | 67.0% | 63.9% | ||||||||
| Indiana | 5 | 30,176,768 | 3.1 | 89.8% | 1.81x | 10.5% | 66.7% | 55.8% | ||||||||
| Michigan | 3 | 29,968,654 | 3.0 | 83.6% | 1.61x | 12.7% | 59.1% | 30.4% | ||||||||
| Tennessee | 2 | 26,118,640 | 2.7 | 76.9% | 2.32x | 12.5% | 57.8% | 48.9% | ||||||||
| Ohio | 1 | 17,200,000 | 1.7 | 100.0% | 3.30x | 13.4% | 48.1% | 48.1% | ||||||||
| Wisconsin | 1 | 15,453,692 | 1.6 | 90.4% | 1.42x | 9.6% | 62.6% | 53.4% | ||||||||
| Alabama | 1 | 13,700,000 | 1.4 | 100.0% | 1.30x | 8.5% | 72.5% | 63.5% | ||||||||
| Connecticut | 2 | 12,968,000 | 1.3 | 98.9% | 1.38x | 8.3% | 74.8% | 68.1% | ||||||||
| Arizona | 2 | 11,297,105 | 1.1 | 85.6% | 1.42x | 9.2% | 72.4% | 60.6% | ||||||||
| Massachusetts | 1 | 10,471,534 | 1.1 | 91.8% | 1.37x | 9.5% | 71.2% | 57.0% | ||||||||
| Oregon | 1 | 8,900,000 | 0.9 | 98.1% | 1.35x | 8.9% | 70.6% | 61.6% | ||||||||
| New Mexico | 1 | 6,950,000 | 0.7 | 98.1% | 3.30x | 13.4% | 48.1% | 48.1% | ||||||||
| Washington | 1 | 6,391,267 | 0.6 | 77.3% | 1.42x | 9.6% | 62.6% | 53.4% | ||||||||
| Illinois | 1 | 4,000,000 | 0.4 | 92.1% | 1.53x | 9.9% | 68.4% | 58.2% | ||||||||
| South Dakota | 1 | 3,989,430 | 0.4 | 98.5% | 1.48x | 9.2% | 74.7% | 60.0% | ||||||||
| Total / Weighted Average: | 85 | $984,488,178 | 100.0% | 88.4% | 1.79x | 10.4% | 64.6% | 55.6% | ||||||||
| (1) | Because this table presents information relating to the mortgaged properties and not mortgage loans, the information for mortgage loans secured by more than one mortgaged property is based on allocated loan amounts. |
| (2) | In the case of Loan Nos. 2, 8, 10 and 12, the UW NCF DSCR, UW NOI DY, Cut-off Date LTV and Maturity Date LTV calculations include the related Pari Passu Companion Loan. |
| (3) | In the case of Loan No. 11, the UW NCF DSCR is calculated using the average of principal and interest payments over the first 12 months following the interest-only period based on the principal payment schedule provided on Annex F of the Free Writing Prospectus. |
| (4) | In the case of Loan No. 21, the Cut-off Date LTV and the Maturity Date LTV are calculated using an appraised value based on certain hypothetical assumptions. Refer to “Description of the Mortgage Pool—Assessments of Property Value and Condition” in the Free Writing Prospectus for additional details. |
THE INFORMATION IN THIS STRUCTURAL AND COLLATERAL TERM SHEET IS NOT COMPLETE AND MAY BE AMENDED PRIOR TO THE TIME OF SALE. THIS TERM SHEET IS NOT AN OFFER TO SELL THESE SECURITIES AND IT IS NOT A SOLICITATION OF AN OFFER TO BUY THESE SECURITIES IN ANY JURISDICTION WHERE THE OFFER OR SALE IS NOT PERMITTED.
| 8 of 122 | |
| Structural and Collateral Term Sheet | JPMBB 2015-C29 | |
| Collateral Characteristics | ||
Cut-off Date Principal Balance |
Weighted Average | ||||||||||||||||||||
| Range of Principal Balances | Number of Loans | Cut-off Date Principal Balance | % of IPB | Mortgage Rate | Remaining Loan Term | UW NCF DSCR(1)(2) | UW NOI DY(1) | Cut-off Date LTV(1)(3) | Maturity Date LTV(1)(3) | |||||||||||
| $2,497,105 | - | $9,999,999 | 33 | $202,744,045 | 20.6% | 4.22147% | 119 | 1.66x | 10.1% | 69.8% | 58.8% | |||||||||
| $10,000,000 | - | $19,999,999 | 13 | 191,977,471 | 19.5 | 4.28236% | 119 | 1.58x | 10.7% | 64.5% | 49.7% | |||||||||
| $20,000,000 | - | $24,999,999 | 5 | 113,311,644 | 11.5 | 4.13269% | 119 | 1.51x | 9.7% | 71.2% | 59.9% | |||||||||
| $25,000,000 | - | $49,999,999 | 7 | 197,138,678 | 20.0 | 4.42239% | 91 | 1.62x | 10.2% | 64.4% | 58.2% | |||||||||
| $50,000,000 | - | $63,560,000 | 5 | 279,316,339 | 28.4 | 4.05344% | 97 | 2.26x | 11.0% | 58.2% | 53.7% | |||||||||
| Total / Weighted Average: | 63 | $984,488,178 | 100.0% | 4.21568% | 107 | 1.79x | 10.4% | 64.6% | 55.6% | |||||||||||
| Mortgage Interest Rates |
| Weighted Average | ||||||||||||||||||||
Range of Mortgage Interest Rates | Number of Loans | Cut-off Date Principal Balance | % of IPB | Mortgage Rate | Remaining Loan Term | UW NCF DSCR(1)(2) | UW NOI DY(1) | Cut-off Date LTV(1)(3) | Maturity Date LTV(1)(3) | |||||||||||
| 3.76800% | - | 4.40000% | 49 | $771,232,303 | 78.3% | 4.09937% | 111 | 1.84x | 10.5% | 64.2% | 55.0% | |||||||||
| 4.40001% | - | 4.60000% | 10 | 159,517,819 | 16.2 | 4.53309% | 100 | 1.56x | 10.1% | 66.6% | 57.7% | |||||||||
| 4.60001% | - | 4.80000% | 2 | 7,988,055 | 0.8 | 4.62937% | 119 | 1.54x | 11.2% | 65.8% | 50.1% | |||||||||
| 4.80001% | - | 5.07000% | 2 | 45,750,000 | 4.6 | 4.99754% | 59 | 1.76x | 11.3% | 62.4% | 59.0% | |||||||||
| Total / Weighted Average: | 63 | $984,488,178 | 100.0% | 4.21568% | 107 | 1.79x | 10.4% | 64.6% | 55.6% | |||||||||||
| Original Term to Maturity in Months |
| Weighted Average | ||||||||||||||||||
Original Term to Maturity in Months | Number of Loans | Cut-off Date Principal Balance | % of IPB | Mortgage Rate | Remaining Loan Term | UW NCF DSCR(1)(2) | UW NOI DY(1) | Cut-off Date LTV(1)(3) | Maturity Date LTV(1)(3) | |||||||||
| 60 | 7 | $221,463,678 | 22.5% | 4.24190% | 59 | 2.41x | 12.1% | 54.7% | 52.5% | |||||||||
| 120 | 54 | 731,877,422 | 74.3 | 4.21978% | 118 | 1.60x | 9.7% | 68.1% | 58.5% | |||||||||
| 180 | 2 | 31,147,077 | 3.2 | 3.93298% | 179 | 1.78x | 15.8% | 50.7% | 9.0% | |||||||||
| Total / Weighted Average: | 63 | $984,488,178 | 100.0% | 4.21568% | 107 | 1.79x | 10.4% | 64.6% | 55.6% | |||||||||
| Remaining Term to Maturity in Months | ||||||||||||||||||
| Weighted Average | ||||||||||||||||||||
| Remaining Term to Maturity in Months | Number of Loans | Cut-off Date Principal Balance | % of IPB | Mortgage Rate | Remaining Loan Term | UW NCF DSCR(1)(2) | UW NOI DY(1) | Cut-off Date LTV(1)(3) | Maturity Date LTV(1)(3) | |||||||||||
| 58 | - | 60 | 7 | $221,463,678 | 22.5% | 4.24190% | 59 | 2.41x | 12.1% | 54.7% | 52.5% | |||||||||
| 61 | - | 120 | 54 | 731,877,422 | 74.3 | 4.21978% | 118 | 1.60x | 9.7% | 68.1% | 58.5% | |||||||||
| 121 | - | 180 | 2 | 31,147,077 | 3.2 | 3.93298% | 179 | 1.78x | 15.8% | 50.7% | 9.0% | |||||||||
| Total / Weighted Average: | 63 | $984,488,178 | 100.0% | 4.21568% | 107 | 1.79x | 10.4% | 64.6% | 55.6% | |||||||||||
| (1) | In the case of Loan Nos. 2, 8, 10 and 12, the UW NCF DSCR, UW NOI DY, Cut-off Date LTV and Maturity Date LTV calculations include the related Pari Passu Companion Loan. |
| (2) | In the case of Loan No. 11, the UW NCF DSCR is calculated using the average of principal and interest payments over the first 12 months following the interest-only period based on the principal payment schedule provided on Annex F of the Free Writing Prospectus. |
| (3) | In the case of Loan No. 21, the Cut-off Date LTV and the Maturity Date LTV are calculated using an appraised value based on certain hypothetical assumptions. Refer to “Description of the Mortgage Pool—Assessments of Property Value and Condition” in the Free Writing Prospectus for additional details. |
THE INFORMATION IN THIS STRUCTURAL AND COLLATERAL TERM SHEET IS NOT COMPLETE AND MAY BE AMENDED PRIOR TO THE TIME OF SALE. THIS TERM SHEET IS NOT AN OFFER TO SELL THESE SECURITIES AND IT IS NOT A SOLICITATION OF AN OFFER TO BUY THESE SECURITIES IN ANY JURISDICTION WHERE THE OFFER OR SALE IS NOT PERMITTED.
| 9 of 122 | |
| Structural and Collateral Term Sheet | JPMBB 2015-C29 | |
| Collateral Characteristics | ||
| Original Amortization Term in Months |
| Weighted Average | ||||||||||||||||||
Original Amortization Term in Months | Number of Loans | Cut-off Date Principal Balance | % of IPB | Mortgage Rate | Remaining Loan Term | UW NCF DSCR(1)(2) | UW NOI DY(1) | Cut-off Date LTV(1)(3) | Maturity Date LTV(1)(3) | |||||||||
| Interest Only | 6 | $172,760,000 | 17.5% | 3.86533% | 84 | 2.80x | 11.7% | 53.9% | 53.9% | |||||||||
| 180 | 1 | 15,188,444 | 1.5 | 3.76800% | 179 | 1.51x | 14.6% | 50.6% | 0.3% | |||||||||
| 240 | 1 | 15,958,634 | 1.6 | 4.09000% | 179 | 2.03x | 17.0% | 50.7% | 17.3% | |||||||||
| 300 | 5 | 39,757,334 | 4.0 | 4.36933% | 119 | 1.52x | 10.2% | 69.4% | 50.8% | |||||||||
| 360 | 50 | 740,823,767 | 75.2 | 4.30103% | 109 | 1.57x | 9.9% | 67.4% | 58.2% | |||||||||
| Total / Weighted Average: | 63 | $984,488,178 | 100.0% | 4.21568% | 107 | 1.79x | 10.4% | 64.6% | 55.6% | |||||||||
| Remaining Amortization Term in Months |
| Weighted Average | ||||||||||||||||||||
Remaining Amortization Term in Months | Number of Loans | Cut-off Date Principal Balance | % of IPB | Mortgage Rate | Remaining Loan Term | UW NCF DSCR(1)(2) | UW NOI DY(1) | Cut-off Date LTV(1)(3) | Maturity Date LTV(1)(3) | |||||||||||
| Interest Only | 6 | $172,760,000 | 17.5% | 3.86533% | 84 | 2.80x | 11.7% | 53.9% | 53.9% | |||||||||||
| 179 | - | 240 | 2 | 31,147,077 | 3.2 | 3.93298% | 179 | 1.78x | 15.8% | 50.7% | 9.0% | |||||||||
| 241 | - | 300 | 5 | 39,757,334 | 4.0 | 4.36933% | 119 | 1.52x | 10.2% | 69.4% | 50.8% | |||||||||
| 301 | - | 360 | 50 | 740,823,767 | 75.2 | 4.30103% | 109 | 1.57x | 9.9% | 67.4% | 58.2% | |||||||||
| Total / Weighted Average: | 63 | $984,488,178 | 100.0% | 4.21568% | 107 | 1.79x | 10.4% | 64.6% | 55.6% | |||||||||||
| Amortization Types |
| Weighted Average | ||||||||||||||||||
| Amortization Types | Number of Loans | Cut-off Date Principal Balance | % of IPB | Mortgage Rate | Remaining Loan Term | UW NCF DSCR(1)(2) | UW NOI DY(1) | Cut-off Date LTV(1)(3) | Maturity Date LTV(1)(3) | |||||||||
| IO-Balloon | 33 | $483,628,000 | 49.1% | 4.31376% | 112 | 1.48x | 9.3% | 68.3% | 60.2% | |||||||||
| Balloon | 23 | 312,911,735 | 31.8 | 4.27927% | 108 | 1.71x | 11.4% | 65.2% | 52.0% | |||||||||
| Interest Only | 6 | 172,760,000 | 17.5 | 3.86533% | 84 | 2.80x | 11.7% | 53.9% | 53.9% | |||||||||
| Fully Amortizing | 1 | 15,188,444 | 1.5 | 3.76800% | 179 | 1.51x | 14.6% | 50.6% | 0.3% | |||||||||
| Total / Weighted Average: | 63 | $984,488,178 | 100.0% | 4.21568% | 107 | 1.79x | 10.4% | 64.6% | 55.6% | |||||||||
Underwritten Net Cash Flow Debt Service Coverage Ratios(1) |
| Weighted Average | ||||||||||||||||||||
| Underwritten Net Cash Flow Debt Service Coverage Ratios | Number of Loans | Cut-off Date Principal Balance | % of IPB | Mortgage Rate | Remaining Loan Term | UW NCF DSCR(1)(2) | UW NOI DY(1) | Cut-off Date LTV(1)(3) | Maturity Date LTV(1)(3) | |||||||||||
| 1.30x | - | 1.35x | 6 | $113,450,000 | 11.5% | 4.36841% | 110 | 1.33x | 8.4% | 72.9% | 65.3% | |||||||||
| 1.36x | - | 1.45x | 11 | 171,324,534 | 17.4 | 4.23769% | 118 | 1.40x | 8.9% | 65.8% | 56.2% | |||||||||
| 1.46x | - | 1.55x | 17 | 184,027,699 | 18.7 | 4.20365% | 124 | 1.50x | 10.1% | 69.3% | 55.0% | |||||||||
| 1.56x | - | 1.65x | 9 | 135,997,758 | 13.8 | 4.20859% | 107 | 1.59x | 10.7% | 66.4% | 55.7% | |||||||||
| 1.66x | - | 1.80x | 4 | 77,326,163 | 7.9 | 4.78609% | 81 | 1.77x | 11.2% | 65.1% | 58.3% | |||||||||
| 1.81x | - | 2.00x | 6 | 81,269,020 | 8.3 | 4.28014% | 96 | 1.90x | 11.2% | 63.8% | 54.5% | |||||||||
| 2.01x | - | 3.30x | 10 | 221,093,003 | 22.5 | 3.91145% | 96 | 2.64x | 12.3% | 54.3% | 50.0% | |||||||||
| Total / Weighted Average: | 63 | $984,488,178 | 100.0% | 4.21568% | 107 | 1.79x | 10.4% | 64.6% | 55.6% | |||||||||||
| (1) | In the case of Loan Nos. 2, 8, 10 and 12, the UW NCF DSCR, UW NOI DY, Cut-off Date LTV and Maturity Date LTV calculations include the related Pari Passu Companion Loan. |
| (2) | In the case of Loan No. 11, the UW NCF DSCR is calculated using the average of principal and interest payments over the first 12 months following the interest-only period based on the principal payment schedule provided on Annex F of the Free Writing Prospectus. |
| (3) | In the case of Loan No. 21, the Cut-off Date LTV and the Maturity Date LTV are calculated using an appraised value based on certain hypothetical assumptions. Refer to “Description of the Mortgage Pool—Assessments of Property Value and Condition” in the Free Writing Prospectus for additional details. |
THE INFORMATION IN THIS STRUCTURAL AND COLLATERAL TERM SHEET IS NOT COMPLETE AND MAY BE AMENDED PRIOR TO THE TIME OF SALE. THIS TERM SHEET IS NOT AN OFFER TO SELL THESE SECURITIES AND IT IS NOT A SOLICITATION OF AN OFFER TO BUY THESE SECURITIES IN ANY JURISDICTION WHERE THE OFFER OR SALE IS NOT PERMITTED.
| 10 of 122 | |
| Structural and Collateral Term Sheet | JPMBB 2015-C29 | |
| Collateral Characteristics | ||
LTV Ratios as of the Cut-off Date(1)(2) |
| Weighted Average | ||||||||||||||||||||
| Range of Cut-off Date LTVs | Number of Loans | Cut-off Date Principal Balance | % of IPB | Mortgage Rate | Remaining Loan Term | UW NCF DSCR(1)(2) | UW NOI DY(1) | Cut-off Date LTV(1)(3) | Maturity Date LTV(1)(3) | |||||||||||
| 48.1% | - | 59.9% | 11 | $310,865,941 | 31.6% | 4.09223% | 91 | 2.20x | 11.9% | 53.4% | 45.3% | |||||||||
| 60.0% | - | 64.9% | 7 | 137,264,184 | 13.9 | 4.29272% | 105 | 1.91x | 10.2% | 62.5% | 59.1% | |||||||||
| 65.0% | - | 69.9% | 16 | 164,274,943 | 16.7 | 4.32864% | 111 | 1.60x | 9.9% | 67.7% | 57.4% | |||||||||
| 70.0% | - | 77.0% | 29 | 372,083,110 | 37.8 | 4.24053% | 119 | 1.48x | 9.5% | 73.3% | 62.1% | |||||||||
| Total / Weighted Average: | 63 | $984,488,178 | 100.0% | 4.21568% | 107 | 1.79x | 10.4% | 64.6% | 55.6% | |||||||||||
LTV Ratios as of the Maturity Date(1)(2) |
| Weighted Average | ||||||||||||||||||||
Range of Maturity Date LTVs | Number of Loans | Cut-off Date Principal Balance | % of IPB | Mortgage Rate | Remaining Loan Term | UW NCF DSCR(1)(2) | UW NOI DY(1) | Cut-off Date LTV(1)(3) | Maturity Date LTV(1)(3) | |||||||||||
| 0.3% | - | 44.9% | 2 | $31,147,077 | 3.2% | 3.93298% | 179 | 1.78x | 15.8% | 50.7% | 9.0% | |||||||||
| 45.0% | - | 49.9% | 8 | 178,725,319 | 18.2 | 3.90571% | 76 | 2.63x | 12.5% | 52.0% | 48.2% | |||||||||
| 50.0% | - | 54.9% | 12 | 193,990,136 | 19.7 | 4.41215% | 104 | 1.57x | 10.0% | 61.3% | 51.7% | |||||||||
| 55.0% | - | 59.9% | 11 | 171,033,215 | 17.4 | 4.28602% | 118 | 1.67x | 10.6% | 70.2% | 57.5% | |||||||||
| 60.0% | - | 64.9% | 23 | 317,264,430 | 32.2 | 4.24131% | 113 | 1.62x | 9.5% | 69.3% | 62.1% | |||||||||
| 65.0% | - | 70.1% | 7 | 92,328,000 | 9.4 | 4.27994% | 108 | 1.41x | 8.6% | 73.8% | 67.8% | |||||||||
| Total / Weighted Average: | 63 | $984,488,178 | 100.0% | 4.21568% | 107 | 1.79x | 10.4% | 64.6% | 55.6% | |||||||||||
| Prepayment Protection |
| Weighted Average | ||||||||||||||||||
| Prepayment Protection | Number of Loans | Cut-off Date Principal Balance | % of IPB | Mortgage Rate | Remaining Loan Term | UW NCF DSCR(1)(2) | UW NOI DY(1) | Cut-off Date LTV(1)(3) | Maturity Date LTV(1)(3) | |||||||||
| Defeasance | 45 | $531,607,550 | 54.0% | 4.26886% | 115 | 1.59x | 9.8% | 66.7% | 57.2% | |||||||||
| Yield Maintenance | 17 | $435,630,628 | 44.2 | 4.13558% | 99 | 2.04x | 11.4% | 61.8% | 53.2% | |||||||||
| None | 1 | 17,250,000 | 1.8 | 4.60000% | 58 | 1.32x | 8.8% | 69.0% | 65.7% | |||||||||
| Total / Weighted Average: | 63 | $984,488,178 | 100.0% | 4.21568% | 107 | 1.79x | 10.4% | 64.6% | 55.6% | |||||||||
| Loan Purpose |
| Weighted Average | ||||||||||||||||||
| Loan Purpose | Number of Loans | Cut-off Date Principal Balance | % of IPB | Mortgage Rate | Remaining Loan Term | UW NCF DSCR(1)(2) | UW NOI DY(1) | Cut-off Date LTV(1)(3) | Maturity Date LTV(1)(3) | |||||||||
| Refinance | 43 | $621,859,144 | 63.2% | 4.27485% | 111 | 1.68x | 10.6% | 65.7% | 55.0% | |||||||||
| Acquisition | 18 | 322,529,034 | 32.8 | 4.09293% | 97 | 2.03x | 10.4% | 61.8% | 56.3% | |||||||||
| Refinance/Acquisition | 1 | 21,500,000 | 2.2 | 4.15000% | 119 | 1.53x | 9.3% | 65.5% | 55.5% | |||||||||
| Recapitalization | 1 | 18,600,000 | 1.9 | 4.44200% | 120 | 1.34x | 8.9% | 74.1% | 63.2% | |||||||||
| Total / Weighted Average: | 63 | $984,488,178 | 100.0% | 4.21568% | 107 | 1.79x | 10.4% | 64.6% | 55.6% | |||||||||
| (1) | In the case of Loan Nos. 2, 8, 10 and 12, the UW NCF DSCR, UW NOI DY, Cut-off Date LTV and Maturity Date LTV calculations include the related Pari Passu Companion Loan. |
| (2) | In the case of Loan No. 11, the UW NCF DSCR is calculated using the average of principal and interest payments over the first 12 months following the interest-only period based on the principal payment schedule provided on Annex F of the Free Writing Prospectus. |
| (3) | In the case of Loan No. 21, the Cut-off Date LTV and the Maturity Date LTV are calculated using an appraised value based on certain hypothetical assumptions. Refer to “Description of the Mortgage Pool—Assessments of Property Value and Condition” in the Free Writing Prospectus for additional details. |
THE INFORMATION IN THIS STRUCTURAL AND COLLATERAL TERM SHEET IS NOT COMPLETE AND MAY BE AMENDED PRIOR TO THE TIME OF SALE. THIS TERM SHEET IS NOT AN OFFER TO SELL THESE SECURITIES AND IT IS NOT A SOLICITATION OF AN OFFER TO BUY THESE SECURITIES IN ANY JURISDICTION WHERE THE OFFER OR SALE IS NOT PERMITTED.
| 11 of 122 | |
| Structural and Collateral Term Sheet | JPMBB 2015-C29 | |
| Collateral Characteristics | ||
Previous Securitization History(1) |
| No. | Loan Name | Location | Property Type | Previous Securitization | ||||
| 2 | One City Centre | Houston, TX | Office | GCCFC 2005-GG5 | ||||
| 4.02 | Marketplace at the Lakes | West Covina, CA | Retail | GSMS 2007-GG10 | ||||
| 7 | Little Palm Island Resort | Little Torch Key, FL | Hotel | GSMS 2012-GCJ7 | ||||
| 8.02 | Doubletree Grand Rapids | Grand Rapids, MI | Hotel | CSMC 2006-C1 | ||||
| 8.03 | Doubletree Annapolis | Annapolis, MD | Hotel | CSMC 2006-C1 | ||||
| 10 | Horizon Outlet Shoppes Portfolio | Various, Various | Retail | WBCMT 2006-C23 | ||||
| 12 | Marriott – Pittsburgh | Pittsburgh, PA | Hotel | GCCFC 2005-GG5 | ||||
| 19.01 | Assured Self Storage | Altamonte, FL | Self Storage | BACM 2006-1 | ||||
| 19.03 | United Self Storage | Valrico, FL | Self Storage | BSCMS 2006-PW14 | ||||
| 19.04 | Gordon Highway Self Storage | Augusta, GA | Self Storage | GSMS 2012-GC6 | ||||
| 24 | The Heights | Dearborn Heights, MI | Retail | JPMCC 2005-CB12 | ||||
| 25 | Garden District Apartments | Auburn, AL | Multifamily | BSCMS 2006-PW13 | ||||
| 26 | El Paseo Collection South | Palm Desert, CA | Retail | JPMCC 2005-LDP3 | ||||
| 29 | Chestnut Place | Worcester, MA | Office | BACM 2005-3 | ||||
| 34 | The Weatherly | Portland, OR | Office | MLCFC 2006-3 | ||||
| 36 | Fairfield Inn Destin | Destin, FL | Hotel | GSMS 2005-GG4 | ||||
| 40 | Windwood Centre | Virginia Beach, VA | Office | CD 2005-CD1 | ||||
| 47 | Cavalier Building | Nashville, TN | Office | MLMT 2005-LC1 | ||||
| 52 | 14001 Weston Parkway | Cary, NC | Industrial | BSCMS 2005-PWR8 | ||||
| 53 | Rockmead Professional Center | Kingwood, TX | Office | GMACC 2005-C1 | ||||
| 61 | AAA Storage City | Ridgeland, SC | Self Storage | BACM 2005-4 |
| (1) | The table above represents the properties for which the previously existing debt was most recently securitized, based on information provided by the related borrower or obtained through searches of a third-party database. |
THE INFORMATION IN THIS STRUCTURAL AND COLLATERAL TERM SHEET IS NOT COMPLETE AND MAY BE AMENDED PRIOR TO THE TIME OF SALE. THIS TERM SHEET IS NOT AN OFFER TO SELL THESE SECURITIES AND IT IS NOT A SOLICITATION OF AN OFFER TO BUY THESE SECURITIES IN ANY JURISDICTION WHERE THE OFFER OR SALE IS NOT PERMITTED.
| 12 of 122 | |
| Structural and Collateral Term Sheet | JPMBB 2015-C29 |
Class A-2(1) |
No. | Loan Name | Location | Cut-off Date Balance | % of IPB | Maturity Balance | % of Certificate Class(2) | Original Loan Term | Remaining Loan Term | UW NCF DSCR | UW NOI Debt Yield | Cut-off Date LTV Ratio | Maturity Date LTV Ratio | ||||||||||||
| 4 | Cole IV Retail Portfolio - Pool I | Various, Various | $50,000,000 | 5.1% | $50,000,000 | 23.5% | 60 | 59 | 3.30x | 13.4% | 48.1% | 48.1% | ||||||||||||
| 5 | Cole IV Retail Portfolio - Pool II | Various, Various | 50,000,000 | 5.1% | 50,000,000 | 23.5 | 60 | 59 | 3.27x | 13.4% | 48.4% | 48.4% | ||||||||||||
| 7 | Little Palm Island Resort | Little Torch Key, FL | 30,963,678 | 3.1% | 28,407,158 | 13.3 | 60 | 59 | 1.90x | 11.7% | 56.1% | 51.5% | ||||||||||||
| 8 | JAGR Portfolio | Various, Various | 30,000,000 | 3.0% | 28,663,111 | 13.5 | 60 | 58 | 1.78x | 11.4% | 64.6% | 61.7% | ||||||||||||
| 9 | Lenox Towers | Atlanta, GA | 27,500,000 | 2.8% | 24,952,041 | 11.7 | 60 | 60 | 1.56x | 11.1% | 55.0% | 49.9% | ||||||||||||
| 21 | Eagles Trail | Hattiesburg, MS | 17,250,000 | 1.8% | 16,427,597 | 7.7 | 60 | 58 | 1.32x | 8.8% | 69.0% | 65.7% | ||||||||||||
| 23 | Doubletree Baltimore Airport | Linthicum Heights, MD | 15,750,000 | 1.6% | 14,543,166 | 6.8 | 60 | 60 | 1.73x | 11.2% | 58.3% | 53.9% | ||||||||||||
| Total / Weighted Average: | $221,463,678 | 22.5% | $212,993,074 | 100.0% | 60 | 59 | 2.41x | 12.1% | 54.7% | 52.5% | ||||||||||||||
| (1) | The table above presents the mortgage loans whose balloon payments would be applied to pay down the principal balance of the Class A-2 Certificates, assuming a 0% CPR and applying the “Modeling Assumptions” described in the Free Writing Prospectus, including the assumptions that (i) none of the mortgage loans in the pool experience prepayments, defaults or losses; (ii) there are no extensions of maturity dates of any mortgage loans in the pool; and (iii) each mortgage loan in the pool is paid in full on its stated maturity date or anticipated repayment date, as applicable. Each class of Certificates, including the Class A-2 Certificates, evidences undivided ownership interests in the entire pool of mortgage loans. Debt service coverage ratio, debt yield and loan-to-value ratio information does not take into account subordinate debt (whether or not secured by the mortgaged property), if any, that is allowed under the terms of any mortgage loan. See Annex A-1 to the Free Writing Prospectus. |
| (2) | Reflects the percentage equal to the Maturity Balance divided by the initial Class A-2 Certificate Balance. |
THE INFORMATION IN THIS STRUCTURAL AND COLLATERAL TERM SHEET IS NOT COMPLETE AND MAY BE AMENDED PRIOR TO THE TIME OF SALE. THIS TERM SHEET IS NOT AN OFFER TO SELL THESE SECURITIES AND IT IS NOT A SOLICITATION OF AN OFFER TO BUY THESE SECURITIES IN ANY JURISDICTION WHERE THE OFFER OR SALE IS NOT PERMITTED.
| 13 of 122 | |
| Structural and Collateral Term Sheet | JPMBB 2015-C29 |
| Structural Overview |
| ■ | Accrual: | Each Class of Certificates (other than the Class R Certificates) will accrue interest on a 30/360 basis. The Class R Certificates will not accrue interest. | ||
| ■ | Distribution of Interest: | On each Distribution Date, accrued interest for each Class of Certificates (other than the Class R Certificates) at the applicable pass-through rate will be distributed in the following order of priority to the extent of available funds: first, to the Class A-1, Class A-2, Class A-3A1, Class A-3A2, Class A-4, Class A-SB, Class X-A, Class X-B, Class X-C, Class X-D, Class X-E, Class X-F and Class X-NR Certificates, on a pro rata basis, based on the interest entitlement for each such Class on such date, and then to the Class A-S, Class B, Class C, Class D, Class E, Class F and Class NR Certificates, in that order, in each case until the interest entitlement for such date payable to each such Class is paid in full. | ||
The pass-through rate applicable to the Class A-1, Class A-2, Class A-3A1, Class A-3A2, Class A-4, Class A-SB, Class A-S, Class B, Class C, Class D, Class E, Class F and Class NR certificates on each Distribution Date will be a per annum rate equal to one of (i) a fixed rate, (ii) the weighted average of the net mortgage rates on the mortgage loans (in each case adjusted, if necessary, to accrue on the basis of a 360-day year consisting of twelve 30-day months), (iii) the lesser of a specified fixed pass-through rate and the rate described in clause (ii) above or (iv) the rate described in clause (ii) above less a specified percentage. | ||||
| The pass-through rate for the Class X-A Certificates for any Distribution Date will equal the excess, if any, of (a) the weighted average of the net mortgage rates on the mortgage loans (in each case adjusted, if necessary, to accrue on the basis of a 360-day year consisting of twelve 30-day months), over (b) the weighted average of the pass-through rates on the Class A-1, Class A-2, Class A-3A1, Class A-3A2, Class A-4, Class A-SB and Class A-S Certificates, weighted on the basis of their respective Certificate Balances immediately prior to that Distribution Date and calculated without giving effect to any exchange and conversion of any Class A-S Certificates for Class EC Certificates. | ||||
| The pass-through rate for the Class X-B Certificates for any Distribution Date will equal the excess, if any, of (a) the weighted average of the net mortgage rates on the mortgage loans (in each case adjusted, if necessary, to accrue on the basis of a 360-day year consisting of twelve 30-day months), over (b) the pass-through rate of the Class B Certificates for that Distribution Date. | ||||
| The pass-through rate for the Class X-C Certificates for any Distribution Date will equal the excess, if any, of (a) the weighted average of the net mortgage rates on the mortgage loans (in each case adjusted, if necessary, to accrue on the basis of a 360-day year consisting of twelve 30-day months), over (b) the pass-through rate of the Class C Certificates for that Distribution Date. | ||||
| The pass-through rate for the Class X-D Certificates for any Distribution Date will equal the excess, if any, of (a) the weighted average of the net mortgage rates on the mortgage loans (in each case adjusted, if necessary, to accrue on the basis of a 360-day year consisting of twelve 30-day months), over (b) the pass-through rate of the Class D Certificates for that Distribution Date. | ||||
| The pass-through rate for the Class X-E Certificates for any Distribution Date will equal the excess, if any, of (a) the weighted average of the net mortgage rates on the mortgage loans (in each case adjusted, if necessary, to accrue on the basis of a 360-day year consisting of twelve 30-day months), over (b) the pass-through rate of the Class E Certificates for that Distribution Date. | ||||
| The pass-through rate for the Class X-F Certificates for any Distribution Date will equal the excess, if any, of (a) the weighted average of the net mortgage rates on the mortgage loans (in each case adjusted, if necessary, to accrue on the basis of a 360-day year consisting of twelve 30-day months), over (b) the pass-through rate on the Class F Certificates for that Distribution Date. |
THE INFORMATION IN THIS STRUCTURAL AND COLLATERAL TERM SHEET IS NOT COMPLETE AND MAY BE AMENDED PRIOR TO THE TIME OF SALE. THIS TERM SHEET IS NOT AN OFFER TO SELL THESE SECURITIES AND IT IS NOT A SOLICITATION OF AN OFFER TO BUY THESE SECURITIES IN ANY JURISDICTION WHERE THE OFFER OR SALE IS NOT PERMITTED.
| 14 of 122 | |
| Structural and Collateral Term Sheet | JPMBB 2015-C29 |
| Structural Overview |
| The pass-through rate for the Class X-NR certificates for any Distribution Date will equal the excess, if any, of (a) the weighted average of the net mortgage rates on the mortgage loans (in each case adjusted, if necessary, to accrue on the basis of a 360-day year consisting of twelve 30-day months), over (b) the pass-through rate of the Class NR certificates for that Distribution Date. | ||||
| The Class EC Certificates will not have a pass-through rate, but will be entitled to receive the sum of the interest otherwise distributable on the portion of Exchangeable Certificates that have been converted in an exchange for such Class EC Certificates. | ||||
See “Description of the Certificates—Distributions” in the Free Writing Prospectus. | ||||
■ | Distribution of Principal: | On any Distribution Date prior to the Cross-Over Date, payments in respect of principal of the Certificates will be distributed first, to the Class A-SB Certificates until the Certificate Balance of the Class A-SB Certificates is reduced to the planned principal balance for the related Distribution Date set forth in Annex E to the Free Writing Prospectus, second, to the Class A-1 Certificates, until the Certificate Balance of such Class is reduced to zero, third, to the Class A-2 Certificates, until the Certificate Balance of such Class is reduced to zero, fourth, to the Class A-3A1 and Class A-3A2 Certificates, pro rata based on the respective Certificate Balances, until the Certificate Balances of such Classes are reduced to zero, fifth, to the Class A-4 Certificates, until the Certificate Balance of such Class is reduced to zero, sixth, to the Class A-SB Certificates, until the Certificate Balance of such Class is reduced to zero and then to the Class A-S, Class B, Class C, Class D, Class E, Class F and Class NR Certificates, in that order, until the Certificate Balance of each such Class is reduced to zero. | ||
On any Distribution Date on or after the Cross-Over Date, payments in respect of principal of the Certificates will be distributed first, to the Class A-1, Class A-2, Class A-3A1, Class A-3A2, Class A-4 and Class A-SB Certificates, on a pro rata basis, based on the Certificate Balance of each such Class until the Certificate Balance of each such Class is reduced to zero and then, to the Class A-S, Class B, Class C, Class D, Class E, Class F and Class NR Certificates, in that order, until the Certificate Balance of each such Class is reduced to zero. | ||||
The “Cross-Over Date” means the Distribution Date on which the aggregate Certificate Balances of the Class A-S, Class B, Class C, Class D, Class E, Class F and Class NR Certificates (without giving effect to any exchange of the Exchangeable Certificates for Class EC Certificates) have been reduced to zero (after taking into account any allocation of realized losses on the mortgage loans (exclusive of any related companion loan) to such Classes on or prior to such date). If Exchangeable Certificates are converted in an exchange for Class EC Certificates, all principal that would otherwise be distributable to such converted Exchangeable Certificates will be distributed to such Class EC Certificates. | ||||
The Class X-A, Class X-B, Class X-C, Class X-D, Class X-E, Class X-F and Class X-NR Certificates (the “Class X Certificates”) will not be entitled to receive distributions of principal; however, the notional amount of the Class X-A Certificates will be reduced by the aggregate amount of principal distributions, realized losses and trust fund expenses allocated to Certificates that are components of the Class X-A Certificates’ notional amount (the Certificate Balances of the Class A-1, Class A-2, Class A-3A1, Class A-3A2, Class A-4, Class A-SB and Class A-S Certificates (determined without giving effect to any exchange and conversion of any Class A-S Certificates for Class EC Certificates)), the notional amount of the Class X-B Certificates will be reduced by the aggregate amount of principal distributions, realized losses and trust fund expenses allocated to Certificates that are components of the Class X-B Certificates’ notional amount (the Certificate Balance of the Class B Certificates (determined without giving effect to any exchange and conversion of any Class B Certificates for Class EC Certificates)), the notional amount of the Class X-C Certificates will be reduced by the aggregate amount of principal distributions, realized losses and trust fund expenses allocated to Certificates that are components of the Class X-C Certificates’ notional amount (the Certificate Balance of the |
THE INFORMATION IN THIS STRUCTURAL AND COLLATERAL TERM SHEET IS NOT COMPLETE AND MAY BE AMENDED PRIOR TO THE TIME OF SALE. THIS TERM SHEET IS NOT AN OFFER TO SELL THESE SECURITIES AND IT IS NOT A SOLICITATION OF AN OFFER TO BUY THESE SECURITIES IN ANY JURISDICTION WHERE THE OFFER OR SALE IS NOT PERMITTED.
| 15 of 122 | |
| Structural and Collateral Term Sheet | JPMBB 2015-C29 |
| Structural Overview |
| Class C Certificates (determined without giving effect to any exchange and conversion of any Class C Certificates for Class EC Certificates)), the notional amount of the Class X-D Certificates will be reduced by the aggregate amount of principal distributions, realized losses and trust fund expenses allocated to the Certificates that are components of the Class X-D Certificates’ notional amount (the Certificate Balance of the Class D Certificates), the notional amount of the Class X-E Certificates will be reduced by the aggregate amount of principal distributions, realized losses and trust fund expenses allocated to the Certificates that are components of the Class X-E Certificates’ notional amount (the Certificate Balance of the Class E Certificates), the notional amount of the Class X-F Certificates will be reduced by the aggregate amount of principal distributions, realized losses and trust fund expenses allocated to the Certificates that are components of the Class X-F Certificates’ notional amount (the Certificate Balance of the Class F Certificates) and the notional amount of the Class X-NR Certificates will be reduced by the aggregate amount of principal distribution, realized losses and trust fund expenses allocated to the Certificates that are components of the Class X-NR Certificates’ notional amount (the Certificate Balance of the Class NR Certificates). | ||||
■ | Exchangeable Certificates and the Class EC Certificates: | A holder of Class A-S, Class B and Class C Certificates (the “Exchangeable Certificates”) may exchange and convert such Classes of Certificates (on an aggregate basis) for a related amount of Class EC Certificates, and Class EC Certificates may be exchanged and converted for a ratable portion of each Class of Exchangeable Certificates. | ||
| The initial Certificate Balance of a Class of Exchangeable Certificates represents the principal balance of such Class without giving effect to any exchange and conversion for Class EC Certificates. The initial Certificate Balance of the Class EC Certificates is equal to the aggregate of the initial Certificate Balances of the Exchangeable Certificates and represents the maximum principal balance of such Class that could be issued in an exchange. In the event that no Exchangeable Certificates are exchanged and converted for Class EC Certificates, the Class EC Certificate Balance would be equal to zero. Any exchange of (a) a portion of the Exchangeable Certificates will result in a conversion and reduction, on a dollar-for-dollar basis, of a proportionate share of each related component Class of the Exchangeable Certificates and an increase, on a dollar-for-dollar basis, of the Certificate Balance of the Class EC Certificates, and (b) any amount of the Class EC Certificates will result in a conversion and reduction, on a dollar-for-dollar basis, of the Certificate Balance of the Class EC Certificates and an increase, on a dollar-for-dollar basis, of a proportionate share of the related Certificate Balances of each Class of Certificates that are components of the Exchangeable Certificates. | ||||
| The Class EC Certificates will not have a pass-through rate, but will be entitled to receive the sum of the interest otherwise distributable on the portion of Exchangeable Certificates that have been exchanged and converted for such Class EC Certificates. | ||||
| If an exchange and conversion has occurred, the Class EC Certificates received in such exchange will be entitled to receive on each Distribution Date distributions equal to the aggregate amount of Interest Distribution Amounts, Accrued Interest From Recoveries, distributions of principal, Yield Maintenance Charges and reimbursements of Collateral Support Deficits that would be distributable to the Exchangeable Certificates that were exchanged and converted for such Class EC Certificates. | ||||
| If an exchange and conversion has occurred, the Class EC Certificates received in such exchange and conversion will be allocated the aggregate amount of Collateral Support Deficits, Net Prepayment Interest Shortfalls and other interest shortfalls (including those resulting from Appraisal Reduction Events) that would be allocated to the Exchangeable Certificates that were exchanged and converted for such Class EC Certificates. | ||||
■ | Yield Maintenance / Fixed Penalty Allocation: | For purposes of the distribution of Yield Maintenance Charges on any Distribution Date, Yield Maintenance Charges collected in respect of the mortgage loans will first be allocated pro rata between four groups (based on the amount of principal distributed to the Principal Balance Certificates in each group), consisting of (a) the Class A-1, Class A-2, Class A-3A1, Class A-3A2, Class A-4, Class A-SB, Class X-A and Class A-S Certificates |
THE INFORMATION IN THIS STRUCTURAL AND COLLATERAL TERM SHEET IS NOT COMPLETE AND MAY BE AMENDED PRIOR TO THE TIME OF SALE. THIS TERM SHEET IS NOT AN OFFER TO SELL THESE SECURITIES AND IT IS NOT A SOLICITATION OF AN OFFER TO BUY THESE SECURITIES IN ANY JURISDICTION WHERE THE OFFER OR SALE IS NOT PERMITTED.
| 16 of 122 | |
| Structural and Collateral Term Sheet | JPMBB 2015-C29 |
| Structural Overview |
(calculated without giving effect to any exchange and conversion of Class A-S Certificates for Class EC Certificates), on the one hand (“YM Group A”), (b) the Class B and Class X-B Certificates (calculated without giving effect to any exchange and conversion of Class B Certificates for Class EC Certificates) (“YM Group B”), (c) the Class C and Class X-C Certificates (calculated without giving effect to any exchange and conversion of Class C Certificates for Class EC Certificates) (“YM Group C”) and (d) the Class D and Class X-D Certificates (“YM Group D”). As among the Classes of Certificates in each YM Group, each Class of Certificates entitled to distributions of principal will receive an amount calculated generally in accordance with the following formula and as more specifically described in the Free Writing Prospectus, with any remaining Yield Maintenance Charges on such Distribution Date being distributed to the class of Class X Certificates in such YM Group. | ||||||||
| YM Charge | X | Principal Paid to Class | x | (Pass-Through Rate on Class – Discount Rate) | ||||
| Total Principal Paid | (Mortgage Rate on Loan – Discount Rate) | |||||||
| No Yield Maintenance Charges will be distributed to the Class X-E, Class X-F, Class X-NR, Class E, Class F, Class NR or Class R Certificates. Once the Certificate Balances of the Class A-1, Class A-2, Class A-3A1, Class A-3A2, Class A-4, Class A-SB, Class A-S, Class B, Class C and Class D Certificates have been reduced to zero, all Yield Maintenance Charges will be distributed to the holders of the Class X-C Certificates, regardless of whether the notional amount of such Class of Certificates has been reduced to zero. | ||||||||
| If Exchangeable Certificates are converted in an exchange for Class EC Certificates, any Yield Maintenance Charges that otherwise would have been distributable to such Exchangeable Certificates had they not been converted will be distributed to the Class EC Certificates. | ||||||||
■ | Realized Losses: | Realized losses on the mortgage loans (exclusive of losses on any related companion loan) will be allocated first to the Class NR, Class F, Class E, Class D, Class C, Class B and Class A-S Certificates, in that order, in each case until the Certificate Balance of each such Class has been reduced to zero, and then, to the Class A-1, Class A-2, Class A-3A1, Class A-3A2, Class A-4 and Class A-SB Certificates, on a pro rata basis, based on the Certificate Balance of each such class, until the Certificate Balance of each such class has been reduced to zero. The notional amount of the Class X-A, Class X-B, Class X-C, Class X-D, Class X-E, Class X-F and Class X-NR Certificates will be reduced by the aggregate amount of realized losses allocated to Certificates that are components of the notional amounts of the Class X-A, Class X-B, Class X-C, Class X-D, Class X-E, Class X-F and Class X-NR Certificates, respectively. | ||||||
Realized losses on each whole loan will be allocated first to the related subordinate companion loan(s), if any, and then, pro rata, between the related mortgage loan and the related pari passu companion loan(s), based upon their respective Stated Principal Balances. | ||||||||
| The Class EC Certificates will be allocated the realized losses and other shortfalls otherwise allocable to the Class A-S, Class B and Class C Certificates that are converted in an exchange for such Class EC Certificates. | ||||||||
■ | Interest Shortfalls: | A shortfall with respect to the amount of available funds distributable in respect of interest can result from, among other sources: (a) delinquencies and defaults by borrowers; (b) shortfalls resulting from the application of Appraisal Reductions to reduce P&I Advances; (c) shortfalls resulting from interest on Advances made by the Master Servicer or the Trustee; (d) shortfalls resulting from the payment of Special Servicing Fees and other additional compensation that the Special Servicer is entitled to receive; (e) shortfalls resulting from extraordinary expenses of the trust, including indemnification payments payable to the Depositor, the Master Servicer, the Special Servicer, the Certificate Administrator, the Trustee or the Senior Trust Advisor; (f) shortfalls resulting from a modification of a mortgage loan’s interest rate or principal balance; and (g) shortfalls resulting from other unanticipated or default-related expenses of the trust. Any such | ||||||
THE INFORMATION IN THIS STRUCTURAL AND COLLATERAL TERM SHEET IS NOT COMPLETE AND MAY BE AMENDED PRIOR TO THE TIME OF SALE. THIS TERM SHEET IS NOT AN OFFER TO SELL THESE SECURITIES AND IT IS NOT A SOLICITATION OF AN OFFER TO BUY THESE SECURITIES IN ANY JURISDICTION WHERE THE OFFER OR SALE IS NOT PERMITTED.
| 17 of 122 | |
| Structural and Collateral Term Sheet | JPMBB 2015-C29 |
| Structural Overview |
shortfalls that decrease the amount of available funds distributable in respect of interest to the Certificateholders will reduce distributions to the classes of Certificates (other than the Class R Certificates) beginning with those with the lowest payment priorities, in reverse sequential order. See “Description of the Certificates—Distributions—Priority” in the Free Writing Prospectus. | ||||
■ | Appraisal Reductions: | With respect to mortgage loans serviced under the Pooling and Servicing Agreement, upon the occurrence of certain trigger events with respect to a mortgage loan, which are generally tied to certain events of default under the related mortgage loan documents, the Special Servicer will be obligated to obtain an appraisal of the related mortgaged property and the Master Servicer will calculate the Appraisal Reduction amount. The “Appraisal Reduction” amount is generally the amount by which the current principal balance of the related mortgage loan or whole loan, plus outstanding advances, real estate taxes, unpaid servicing fees and certain similar amounts exceeds 90% of the appraised value of the related mortgaged property, plus the amount of any escrows and letters of credit. | ||
| With respect to the Horizon Outlet Shoppes Portfolio mortgage loan, any Appraisal Reduction will be similarly determined pursuant to the JPMBB 2015-C28 pooling and servicing agreement under which it is serviced. | ||||
| In general, the Appraisal Reduction amounts that are allocated to the mortgage loans (exclusive of amounts allocated to a Companion Loan (defined below)) are notionally allocated to reduce, in reverse sequential order, the Certificate Balance of each Class of Certificates (other than the Class A-1, Class A-2, Class A-3A1, Class A-3A2, Class A-4 and Class A-SB Certificates) beginning with the Class NR Certificates for certain purposes, including certain voting rights and the determination of the controlling class. | ||||
With respect to each whole loan, the Appraisal Reduction amount is notionally allocated first to the related subordinate companion loan(s), if any (until the principal balance of such subordinate companion loan is notionally reduced to zero by such Appraisal Reductions), and then, pro rata, between the related mortgage loan and the related pari passu companion loan(s), based upon their respective Stated Principal Balances. | ||||
■ | Appraisal Reduced Interest: | Accrued and unpaid interest at the related Mortgage Rate for a mortgage loan that is not advanced by the Master Servicer or the Trustee as backup master servicer due to the application of Appraisal Reduction amounts to such mortgage loan. | ||
■ | Master Servicer Advances: | The Master Servicer will be required to advance certain delinquent scheduled mortgage loan payments of principal and interest and certain property protection advances, in each case, to the extent the Master Servicer deems such advances to be recoverable. At any time that an Appraisal Reduction amount exists, the amount that would otherwise be required to be advanced by the Master Servicer in respect of delinquent payments of interest on the mortgage loan will be reduced to equal the product of (x) the interest portion of the amount that would be advanced without regard to any Appraisal Reduction and (y) a fraction, the numerator of which is the then-outstanding principal balance of the mortgage loan minus the Appraisal Reduction amount and the denominator of which is the then-outstanding principal balance of the mortgage loan. The Master Servicer will not make any principal or interest advances with respect to any companion loan. | ||
■ | Whole Loans: | Four mortgage loans are each evidenced by one or more separate notes and are each, together with one or more companion loans (each a “Companion Loan” and collectively with the related mortgage loan, a “Whole Loan”), secured by the same mortgage(s) on the related mortgaged property or portfolio of related mortgaged properties. Each such mortgage loan and its related Companion Loan(s) are subject to an intercreditor agreement. None of these Companion Loans will be part of the trust. | ||
In the case of these Whole Loans, referred to as the “One City Centre Whole Loan”, the “JAGR Portfolio Whole Loan”, the “Horizon Outlet Shoppes Portfolio Whole Loan” and the “Marriott - Pittsburgh Whole Loan”, a related Companion Loan is pari passu with the related mortgage loan (these Companion Loans are also referred to as the “Pari Passu |
THE INFORMATION IN THIS STRUCTURAL AND COLLATERAL TERM SHEET IS NOT COMPLETE AND MAY BE AMENDED PRIOR TO THE TIME OF SALE. THIS TERM SHEET IS NOT AN OFFER TO SELL THESE SECURITIES AND IT IS NOT A SOLICITATION OF AN OFFER TO BUY THESE SECURITIES IN ANY JURISDICTION WHERE THE OFFER OR SALE IS NOT PERMITTED.
| 18 of 122 | |
| Structural and Collateral Term Sheet | JPMBB 2015-C29 |
| Structural Overview |
Companion Loans”). The One City Centre Pari Passu Companion Loan, the JAGR Portfolio Pari Passu Companion Loan and the Marriott - Pittsburgh Pari Passu Companion Loan are referred to as “Serviced Companion Loans”. | ||||
The One City Centre Whole Loan, the JAGR Portfolio Whole Loan and the Marriott-Pittsburgh Whole Loan (the “Serviced Whole Loans”) will be serviced under the pooling and servicing agreement for the JPMBB 2015-C29 transaction (the “Pooling and Servicing Agreement”). | ||||
The Horizon Outlet Shoppes Portfolio Whole Loan will be serviced pursuant to the JPMBB 2015-C28 pooling and servicing agreement as described under “Description of the Mortgage Pool—The Whole Loans—Horizon Outlet Shoppes Portfolio Whole Loan” in the Free Writing Prospectus. | ||||
■ | Liquidated Loan Waterfall: | On liquidation of any mortgage loan, all net liquidation proceeds related to the mortgage loan (but not any related Companion Loan) will be applied so that amounts allocated as a recovery of accrued and unpaid interest will not, in the first instance, include any Appraisal Reduced Interest. After the adjusted interest amount is so allocated, any remaining liquidation proceeds will be allocated to offset certain advances and to pay principal on the mortgage loan until the unpaid principal amount of the mortgage loan has been reduced to zero. Any remaining liquidation proceeds will then be allocated to pay Appraisal Reduced Interest. Any liquidation proceeds in respect of each such mortgage loan in excess of the related outstanding balance will first be applied to offset any interest shortfalls allocated to the Certificates (other than the Class X Certificates), in sequential order, and then to offset any realized losses allocated to the Certificates (other than the Class X Certificates), in sequential order. Any liquidation proceeds remaining after such applications will be distributed to the Class R Certificates. | ||
■ | Sale of Defaulted Mortgage Loans and REO Properties: | The Special Servicer may offer to sell or may offer to purchase any defaulted mortgage loan or REO property, if the Special Servicer determines that no satisfactory arrangements can be made for collection of delinquent payments and the sale would be in the best economic interests of the trust (or in the case of any Whole Loan, the trust and the holder of the related Pari Passu Companion Loan, as a collective whole, taking into account the pari passu nature of any Pari Passu Companion Loan), on a net present value basis. The Special Servicer is required to accept the highest offer for any defaulted mortgage loan or REO property in an amount at least equal to par plus accrued interest plus all other outstanding amounts due under such mortgage loan and any outstanding expenses of the trust relating to such mortgage loan (the “Defaulted Loan Purchase Price”) except as described in the Free Writing Prospectus. | ||
| With respect to each Serviced Whole Loan, any such sale of the related defaulted mortgage loan will also include the related Pari Passu Companion Loan, and the prices will be adjusted accordingly. | ||||
| In connection with such sale and fair value determination, within 30 days of a mortgage loan becoming a specially serviced mortgage loan, the Special Servicer is required to order an appraisal and, within 30 days of receipt of such appraisal, is required to determine the fair value of such defaulted mortgage loan in accordance with the applicable servicing standard. If, however, the Special Servicer is already in the process of obtaining an appraisal with respect to the related mortgaged property, the Special Servicer is required to make its fair value determination as soon as reasonably practicable (but in any event within 30 days) after its receipt of such appraisal. Additionally, with respect to the mortgage loans that have mezzanine debt (whether in existence now or permitted in the future) the mezzanine lenders may have the option to purchase the related mortgage loan after certain events of default under such mortgage loan. | ||||
| The Directing Certificateholder will not have a right of first refusal to purchase a defaulted mortgage loan. |
THE INFORMATION IN THIS STRUCTURAL AND COLLATERAL TERM SHEET IS NOT COMPLETE AND MAY BE AMENDED PRIOR TO THE TIME OF SALE. THIS TERM SHEET IS NOT AN OFFER TO SELL THESE SECURITIES AND IT IS NOT A SOLICITATION OF AN OFFER TO BUY THESE SECURITIES IN ANY JURISDICTION WHERE THE OFFER OR SALE IS NOT PERMITTED.
| 19 of 122 | |
| Structural and Collateral Term Sheet | JPMBB 2015-C29 |
| Structural Overview |
If the Special Servicer does not receive an offer at least equal to the Defaulted Loan Purchase Price, the Special Servicer may purchase the defaulted mortgage loan or REO property at the Defaulted Loan Purchase Price. If the Special Servicer does not elect to purchase the defaulted mortgage loan or REO property at the Defaulted Loan Purchase Price, the Special Servicer is required to accept the highest offer received from any person that is determined to be a fair price (supported by an appraisal required to be obtained by the Special Servicer within 30 days of a mortgage loan becoming a specially serviced mortgage loan) for such defaulted mortgage loan or REO property, provided that the highest offeror is a person other than the Depositor, the Master Servicer, the Special Servicer, the Certificate Administrator, the Trustee, the Senior Trust Advisor, any borrower, any manager of a mortgaged property, any independent contractor engaged by the Special Servicer, a holder of any related Companion Loan (but only with respect to the related Serviced Whole Loan) or mezzanine loan (but only with respect to the related mortgage loan), or any known affiliate of any such person (each, an “Interested Person”). If the highest offer is made by an Interested Person, the Trustee must approve the purchase of the defaulted mortgage loan or REO property based upon its determination of the fair price for the defaulted mortgage loan or REO property (based upon updated appraisals received by the Trustee) and the Trustee may conclusively rely on the opinion of an independent appraiser or other independent expert retained by the Trustee in connection with making such determination. Neither the Trustee nor any of its affiliates may make an offer for or purchase any defaulted mortgage loan or REO property. | ||||
| If the Special Servicer does not receive any offers that are at least equal to the Defaulted Loan Purchase Price, the Special Servicer is not required to accept the highest offer and may accept a lower offer for a defaulted mortgage loan or REO property if the Special Servicer determines, in accordance with the servicing standard, that a rejection of such offer would be in the best interests of the Certificateholders and, with respect to a Serviced Whole Loan, the holder of any related Pari Passu Companion Loan, as a collective whole, so long as such lower offer was not made by the Special Servicer or any of its affiliates. | ||||
| If title to any mortgaged property is acquired by the trust fund, the Special Servicer will be required to sell such mortgaged property prior to the close of the third calendar year beginning after the year of acquisition, unless (a) the IRS grants or has not denied an extension of time to sell such mortgaged property or (b) the Trustee, the Certificate Administrator and the Master Servicer receive an opinion of independent counsel to the effect that the holding of the property by the trust fund longer than the above-referenced three-year period will not result in the imposition of a tax on any REMIC of the trust fund or cause any REMIC of the trust fund to fail to qualify as a REMIC. | ||||
The foregoing applies to mortgage loans serviced under the Pooling and Servicing Agreement. With respect to the Horizon Outlet Shoppes Portfolio Whole Loan, if the special servicer under the JPMBB 2015-C28 pooling and servicing agreement determines to sell the related Pari Passu Companion Loan as described above, then the JPMBB 2015-C28 special servicer will be required to sell the related Whole Loan, including the related mortgage loan included in the JPMBB 2015-C29 trust (the “JPMBB 2015-C29 Trust”) and the related Pari Passu Companion Loan, as a single loan. In connection with any such sale, the then-applicable special servicer will be required to follow procedures substantially similar to those set forth above. | ||||
■ | Control Eligible Certificates: | Classes E, F and NR. | ||
■ | Control Rights: | The Control Eligible Certificates will have certain control rights attached to them. The “Directing Certificateholder” will be the Controlling Class Certificateholder (or its representative) selected by more than 50% of the Controlling Class Certificateholders; provided, however, that (1) absent that selection, (2) until a Directing Certificateholder is so selected or (3) upon receipt of a notice from a majority of the Controlling Class Certificateholders that a Directing Certificateholder is no longer designated, the Controlling Class Certificateholder that owns the largest aggregate Certificate Balance of the Controlling Class (or its representative) will be the Directing Certificateholder; provided, |
THE INFORMATION IN THIS STRUCTURAL AND COLLATERAL TERM SHEET IS NOT COMPLETE AND MAY BE AMENDED PRIOR TO THE TIME OF SALE. THIS TERM SHEET IS NOT AN OFFER TO SELL THESE SECURITIES AND IT IS NOT A SOLICITATION OF AN OFFER TO BUY THESE SECURITIES IN ANY JURISDICTION WHERE THE OFFER OR SALE IS NOT PERMITTED.
| 20 of 122 | |
| Structural and Collateral Term Sheet | JPMBB 2015-C29 |
| Structural Overview |
however, that in the case of this clause (3), in the event no one holder owns the largest aggregate Certificate Balance of the Controlling Class, then there will be no Directing Certificateholder until appointed in accordance with the terms of the Pooling and Servicing Agreement. The Directing Certificateholder will be entitled to direct the Special Servicer to take, or refrain from taking certain actions with respect to a mortgage loan. Furthermore, the Directing Certificateholder will also have the right to receive notice and provide consent with respect to certain material actions that the Master Servicer and the Special Servicer plan on taking with respect to a mortgage loan. With respect to any mortgage loan that has, or may in the future have, mezzanine debt, pursuant to the related intercreditor agreement, the related mezzanine lender may have certain consent rights with respect to certain modifications related to such mortgage loan. | ||||
| With respect to the Horizon Outlet Shoppes Portfolio mortgage loan, direction, consent and consultation rights with respect to the related Whole Loan will be exercised by the directing certificateholder or controlling class representative under the JPMBB 2015-C28 pooling and servicing agreement. | ||||
| With respect to each of the One City Centre Whole Loan, the JAGR Portfolio Whole Loan and the Marriott - Pittsburgh Whole Loan, direction, consent and consultation rights of the Directing Certificateholder, with respect to the related Whole Loan are subject to certain consultation rights of the holder of the related Pari Passu Companion Loan pursuant to the `related intercreditor agreement. | ||||
■ | Directing Certificateholder: | BlackRock Realty Advisors, Inc. on behalf of one or more managed funds or accounts is expected to be appointed the initial Directing Certificateholder. | ||
■ | Controlling Class: | The “Controlling Class” will at any time of determination be the most subordinate Class of Control Eligible Certificates then outstanding that has an aggregate Certificate Balance, as notionally reduced by any Appraisal Reduction amounts allocable to such Class, equal to no less than 25% of the initial Certificate Balance for such Class. Each holder of a certificate of the Controlling Class is referred to herein as a “Controlling Class Certificateholder”. | ||
| The Controlling Class as of the Closing Date will be the Class NR Certificates. | ||||
■ | Control Event: | A “Control Event” will occur when (i) the Certificate Balance of the Class E Certificates (taking into account the application of Appraisal Reductions to notionally reduce the Certificate Balance of the Class E Certificates) has been reduced to less than 25% of the initial Certificate Balance of such Class as of the Closing Date or (ii) a holder of the Class E Certificates becomes the majority Controlling Class Certificateholder and irrevocably waives its right to exercise any rights of the Controlling Class Certificateholder and such rights have not been reinstated to a successor Controlling Class Certificateholder. | ||
| Upon the occurrence and during the continuance of a Control Event, the Controlling Class will no longer have any control rights. After the occurrence and during the continuance of a Control Event, the Directing Certificateholder will relinquish its right to direct certain actions of the Special Servicer and will no longer have consent rights with respect to certain actions that the Master Servicer or the Special Servicer plan on taking with respect to a mortgage loan. Following the occurrence and during the continuance of a Control Event, the Directing Certificateholder will retain consultation rights with the Special Servicer with respect to certain material actions that the Special Servicer plans on taking with respect to a mortgage loan. Such consultation rights will continue until the occurrence of a Consultation Termination Event. | ||||
■ | Consultation Termination Event: | A “Consultation Termination” Event will occur (i) when, without regard to the application of any Appraisal Reduction amount (i.e., giving effect to principal reductions through principal payments and realized losses only), there is no Class of Control Eligible Certificates that satisfies the requirement of a Controlling Class or (ii) during such time as the Class E Certificates are the only Class of Control Eligible Certificates that have a then- |
THE INFORMATION IN THIS STRUCTURAL AND COLLATERAL TERM SHEET IS NOT COMPLETE AND MAY BE AMENDED PRIOR TO THE TIME OF SALE. THIS TERM SHEET IS NOT AN OFFER TO SELL THESE SECURITIES AND IT IS NOT A SOLICITATION OF AN OFFER TO BUY THESE SECURITIES IN ANY JURISDICTION WHERE THE OFFER OR SALE IS NOT PERMITTED.
| 21 of 122 | |
| Structural and Collateral Term Sheet | JPMBB 2015-C29 |
| Structural Overview |
| outstanding Principal Balance, net of Appraisal Reductions, at least equal to 25% of the initial Certificate Balance of such Class, and the then-Controlling Class Certificateholder has irrevocably waived its right to appoint a Directing Certificateholder and to exercise any of the rights of the Controlling Class Certificateholder and such rights have not been reinstated. | ||||
| Upon the occurrence of a Consultation Termination Event, there will be no Class of Certificates that will act as the Controlling Class. After the occurrence of a Consultation Termination Event, the Directing Certificateholder will have no rights under the Pooling and Servicing Agreement, other than those rights generally available to all Certificateholders. | ||||
■ | Appraised-Out Class: | A Class of Control Eligible Certificates that has been determined, as a result of Appraisal Reduction amounts allocable to such Class, to no longer be the Controlling Class. | ||
■ | Remedies Available to Holders of an Appraised-Out Class: | Holders of the majority of any Class of Control Eligible Certificates that are determined at any date of determination to no longer be the Controlling Class as a result of an Appraisal Reduction allocable to such class will have the right, at their sole expense, to require the Special Servicer to order a second appraisal report from an MAI appraiser (selected by the Special Servicer) for any mortgage loan that results in the Class becoming an Appraised-Out Class. | ||
| Upon receipt of that second appraisal, the Special Servicer will be required to determine, in accordance with the Servicing Standard, whether, based on its assessment of the second appraisal, any recalculation of the Appraisal Reduction amount is warranted, and if so warranted, the Special Servicer is required to recalculate the Appraisal Reduction amount based on the second appraisal and if required by such recalculation, the Appraised-Out Class will be reinstated as the Controlling Class. The holders of an Appraised-Out Class requesting a second appraisal are not permitted to exercise any control or consent rights of the Controlling Class until such time, if any, as the Class is reinstated as the Controlling Class. | ||||
■ | Senior Trust Advisor: | The Senior Trust Advisor will initially be Pentalpha Surveillance LLC. The Senior Trust Advisor will have certain review and consultation rights relating to the performance of the Special Servicer and with respect to its actions taken in connection with the resolution and/or liquidation of specially serviced mortgage loans. The Senior Trust Advisor will generally be responsible for reviewing the Special Servicer’s operational practices with respect to the resolution and liquidation of specially serviced mortgage loans. In addition, after the occurrence and during the continuance of a Control Event, the Senior Trust Advisor will have certain consultation rights with respect to the specially serviced mortgage loans. The Senior Trust Advisor will generally have no obligations or consultation rights under the Pooling and Servicing Agreement with respect to the Horizon Outlet Shoppes Portfolio Whole Loan. However, Pentalpha Surveillance LLC is also the senior trust advisor under the JPMBB Commercial Mortgage Securities Trust 2015-C28 pooling and servicing agreement and, in such capacity, will have certain obligations and consultation rights with respect to the Horizon Outlet Shoppes Portfolio Whole Loan that are substantially similar to those of the senior trust advisor under the Pooling and Servicing Agreement. |
THE INFORMATION IN THIS STRUCTURAL AND COLLATERAL TERM SHEET IS NOT COMPLETE AND MAY BE AMENDED PRIOR TO THE TIME OF SALE. THIS TERM SHEET IS NOT AN OFFER TO SELL THESE SECURITIES AND IT IS NOT A SOLICITATION OF AN OFFER TO BUY THESE SECURITIES IN ANY JURISDICTION WHERE THE OFFER OR SALE IS NOT PERMITTED.
| 22 of 122 | |
| Structural and Collateral Term Sheet | JPMBB 2015-C29 |
| Structural Overview |
| The Senior Trust Advisor will be responsible for: | |||
● | after the occurrence and during the continuance of a Control Event, consulting with the Special Servicer with respect to each asset status report prepared by the Special Servicer and recommending proposed alternative courses of action. | ||
● | after the occurrence and during the continuance of a Control Event, preparing an annual report addressing the Senior Trust Advisor’s overall findings and determinations and setting forth its assessment of the Special Servicer’s performance of its duties under the Pooling and Servicing Agreement on a platform-level basis with respect to the resolution and liquidation of specially serviced mortgage loans that the Special Servicer is responsible for servicing under the Pooling and Servicing Agreement. As used above, “platform-level basis” refers to the Special Servicer’s performance of its duties as they relate to the resolution and liquidation of specially serviced mortgage loans, taking into account the Special Servicer’s specific duties under the Pooling and Servicing Agreement as well as the extent to which those duties were performed in accordance with the servicing standard, with due consideration to (and as limited by) the Senior Trust Advisor’s review of any assessment of compliance report, attestation report, asset status report and other information delivered to the Senior Trust Advisor by the Special Servicer with respect to the specially serviced mortgage loans (other than any communications between the Directing Certificateholder and the Special Servicer that would be privileged information). The annual report will be based on the Senior Trust Advisor’s knowledge of the Special Servicer’s actions taken during the applicable calendar year with respect to the resolution or liquidation of specially serviced mortgage loans that the Special Servicer is responsible for servicing under the Pooling and Servicing Agreement, including knowledge obtained in connection with the Senior Trust Advisor’s review of each asset status report prepared by the Special Servicer. | ||
● | prior to the occurrence and continuance of a Control Event, the Special Servicer will forward any Appraisal Reduction and net present value calculations used in the Special Servicer’s determination of what course of action to take in connection with the workout or liquidation of a specially serviced mortgage loan to the Senior Trust Advisor after such calculations have been finalized. The Senior Trust Advisor will be required to review such calculations but will not opine on or take any affirmative action with respect to such Appraisal Reduction calculations and/or net present value calculations. | ||
● | after the occurrence and during the continuance of a Control Event, recalculating and verifying, on a limited basis, the accuracy of mathematical calculations and the corresponding application of the non-discretionary portion of the applicable formulas utilized in connection with any Appraisal Reduction or net present value calculations performed by the Special Servicer. In the event the Senior Trust Advisor does not agree with the mathematical calculations or the application of the non-discretionary portion of the applicable formulas required to be utilized for such calculation, the Senior Trust Advisor and the Special Servicer will consult with each other in order to resolve any disagreement. Any disagreement with respect to such calculations that the Senior Trust Advisor and the Special Servicer are unable to resolve will be determined by the Certificate Administrator. | ||
| In addition, the Senior Trust Advisor is required to promptly review all information available to Privileged Persons (as defined in the Free Writing Prospectus) on the Certificate Administrator’s website related to specially serviced mortgage loans and certain information available to Privileged Persons on the Certificate Administrator’s website related to mortgage loans included on the monthly CREFC® servicer watch list report, each final asset status report delivered to the Senior Trust Advisor by the Special Servicer and each assessment of compliance report and attestation report prepared by the Special Servicer in order to maintain its familiarity with the mortgage loans and the performance of the Special Servicer under the Pooling and Servicing Agreement. | |||
THE INFORMATION IN THIS STRUCTURAL AND COLLATERAL TERM SHEET IS NOT COMPLETE AND MAY BE AMENDED PRIOR TO THE TIME OF SALE. THIS TERM SHEET IS NOT AN OFFER TO SELL THESE SECURITIES AND IT IS NOT A SOLICITATION OF AN OFFER TO BUY THESE SECURITIES IN ANY JURISDICTION WHERE THE OFFER OR SALE IS NOT PERMITTED.
| 23 of 122 | |
| Structural and Collateral Term Sheet | JPMBB 2015-C29 |
| Structural Overview |
| After the occurrence and during the continuance of a Control Event, the Senior Trust Advisor will also consult with the Special Servicer in connection with certain major decisions and propose possible alternative courses of action. | ||||
| In addition, after the occurrence of a Consultation Termination Event, if the Senior Trust Advisor determines that the Special Servicer is not performing its duties as required under the Pooling and Servicing Agreement or is otherwise not acting in accordance with the Servicing Standard, the Senior Trust Advisor will have the right to recommend the replacement of the Special Servicer and will submit its formal recommendation to the Trustee and the Certificate Administrator (along with its rationale, its proposed replacement special servicer and other relevant information justifying its recommendation). | ||||
| The Senior Trust Advisor’s recommendation to replace the Special Servicer must be confirmed by an affirmative vote of holders of Certificates evidencing at least a majority of the aggregate notional balance of all Classes of Certificates entitled to principal distributions (taking into account the application of any Appraisal Reduction amounts to notionally reduce the Certificate Balances of the Classes to which such Appraisal Reduction amounts are allocable). In the event the holders of such Certificates elect to remove and replace the Special Servicer, the Certificate Administrator will be required to obtain a rating agency confirmation from each of the rating agencies at that time. | ||||
■ | Replacement of Senior Trust Advisor: | The Senior Trust Advisor may be terminated or removed under certain circumstances and a replacement Senior Trust Advisor appointed as described in the Free Writing Prospectus. | ||
| Any replacement Senior Trust Advisor (or the personnel responsible for supervising the obligations of the replacement Senior Trust Advisor) must (A) (i) be regularly engaged in the business of analyzing and advising clients in commercial mortgage-backed securities matters and have at least 5 years of experience in collateral analysis and loss projections and (ii) have at least 5 years of experience in commercial real estate asset management and experience in the workout and management of distressed commercial real estate assets or (B) be an institution that is a special servicer, senior trust advisor or operating advisor on a rated CMBS transaction, but has not been a special servicer or a senior trust advisor on a transaction that a rating agency has downgraded, qualified or withdrawn its ratings citing servicing concerns with the special servicer or a senior trust advisor as the sole or a material factor in such rating action. Any Senior Trust Advisor is prohibited from making an investment in any class of certificates in the Trust as described in the Free Writing Prospectus. | ||||
■ | Appointment and Replacement of Special Servicer: | The Directing Certificateholder will appoint the initial Special Servicer as of the Closing Date. Prior to the occurrence and continuance of a Control Event, the Special Servicer may generally be replaced at any time by the Directing Certificateholder. | ||
| Upon the occurrence and during the continuance of a Control Event, the Directing Certificateholder will no longer have the right to replace the Special Servicer and such replacement will occur based on a vote of holders of all voting eligible Classes of Certificates as described below. | ||||
| After the occurrence of a Consultation Termination Event, the Senior Trust Advisor may also recommend the replacement of the Special Servicer as described above. |
THE INFORMATION IN THIS STRUCTURAL AND COLLATERAL TERM SHEET IS NOT COMPLETE AND MAY BE AMENDED PRIOR TO THE TIME OF SALE. THIS TERM SHEET IS NOT AN OFFER TO SELL THESE SECURITIES AND IT IS NOT A SOLICITATION OF AN OFFER TO BUY THESE SECURITIES IN ANY JURISDICTION WHERE THE OFFER OR SALE IS NOT PERMITTED.
| 24 of 122 | |
| Structural and Collateral Term Sheet | JPMBB 2015-C29 |
| Structural Overview |
■ | Replacement of Special Servicer by Vote of Certificateholders: | After the occurrence and during the continuance of a Control Event and upon (a) the written direction of holders of Certificates evidencing not less than 25% of the aggregate notional balance of all Classes of Certificates entitled to principal (taking into account the application of Appraisal Reduction amounts to notionally reduce the Certificate Balances of Classes to which such Appraisal Reduction amounts are allocable) requesting a vote to replace the Special Servicer with a replacement special servicer, (b) payment by such requesting holders to the Certificate Administrator of all reasonable fees and expenses to be incurred by the Certificate Administrator in connection with administering such vote and (c) delivery by such holders to the Certificate Administrator and the Trustee of written confirmations from each Rating Agency that the appointment of such replacement special servicer will not result in a downgrade, withdrawal or qualification of the Certificates (which confirmations will be obtained at the expense of such holders), the Certificate Administrator will be required to promptly post such notice on its Internet website, and by mail conduct the solicitation of votes of all Certificates in such regard, which such vote must occur within 180 days of the posting of such notice. Upon the written direction of holders of at least 75% of a Certificateholder Quorum, the Trustee will immediately replace the Special Servicer with the replacement special servicer. | ||
A “Certificateholder Quorum” means, in connection with any solicitation of votes in connection with the replacement of the Special Servicer described above, the holders of Certificates evidencing at least 75% of the aggregate voting rights (taking into account the application of realized losses and the application of any Appraisal Reductions to notionally reduce the Certificate Balance of the Certificates) of all Classes of Certificates entitled to principal on an aggregate basis. | ||||
With respect to each of the One City Centre Whole Loan, the JAGR Portfolio Whole Loan and the Marriott - Pittsburgh Whole Loan, the holder of the related Pari Passu Companion Loan, under certain circumstances following a servicer termination event with respect to the special servicer, will be entitled to direct the Trustee (and the Trustee will be required) to terminate the special servicer solely with respect to such Whole Loan. A replacement special servicer will be selected by the Trustee or, prior to a Control Event, by the Directing Certificateholder; provided, however, that any successor special servicer appointed to replace the Special Servicer with respect to such Whole Loan can generally not be the person (or its affiliate) that was terminated at the direction of the holder of the related Pari Passu Companion Loan. | ||||
With respect to the Horizon Outlet Shoppes Portfolio Whole Loan, the JPMBB 2015-C29 Trust as holder of the related mortgage loan has similar termination rights in the event of a servicer termination event with respect to the special servicer under the JPMBB 2015-C28 pooling and servicing agreement as described above, which may be exercised by the Directing Certificateholder prior to the Control Event. However, the successor special servicer will be selected pursuant to the JPMBB 2015-C28 pooling and servicing agreement by the related directing holder prior to a control event under such pooling and servicing agreement. The Master Servicer and Special Servicer are entitled to certain fees in connection with the servicing and administration of the mortgage loans as more fully described in “Transaction Parties—Servicing and Other Compensation and Payment of Expenses” in the Free Writing Prospectus. | ||||
■ | Master Servicer and Special Servicer Compensation: | The Master Servicer is entitled to a fee (the “Servicing Fee”) payable monthly from interest received in respect of each mortgage loan (including any non-serviced mortgage loan), REO loan and any related Serviced Companion Loan that will accrue at the related servicing fee rate described in the Free Writing Prospectus. The Special Servicer is also entitled to a fee (the “Special Servicing Fee”) with respect to each specially serviced mortgage loan and REO loan at the special servicing fee rate described in the Free Writing Prospectus. | ||
| In addition to the Servicing Fee, Special Servicing Fee and certain other fees described below, the Master Servicer and Special Servicer are entitled to retain and share certain additional servicing compensation, including assumption application fees, assumption |
THE INFORMATION IN THIS STRUCTURAL AND COLLATERAL TERM SHEET IS NOT COMPLETE AND MAY BE AMENDED PRIOR TO THE TIME OF SALE. THIS TERM SHEET IS NOT AN OFFER TO SELL THESE SECURITIES AND IT IS NOT A SOLICITATION OF AN OFFER TO BUY THESE SECURITIES IN ANY JURISDICTION WHERE THE OFFER OR SALE IS NOT PERMITTED.
| 25 of 122 | |
| Structural and Collateral Term Sheet | JPMBB 2015-C29 |
| Structural Overview |
| fees, defeasance fees and certain Excess Modification Fees and consent fees with respect to the mortgage loans. The Special Servicer may also be entitled to either a Workout Fee or Liquidation Fee, but not both, from recoveries in respect of any particular mortgage loan. | ||
An “Excess Modification Fee” with respect to any mortgage loan (other than the non-serviced mortgage loan) or Serviced Whole Loan is the sum of (A) the excess of (i) any and all Modification Fees with respect to a mortgage loan or Serviced Whole Loan over (ii) all unpaid or unreimbursed additional expenses described in the Free Writing Prospectus (excluding Special Servicing Fees, Workout Fees and Liquidation Fees) outstanding with respect to the related mortgage loan or Serviced Whole Loan, as applicable, and reimbursed from such Modification Fees and (B) expenses previously paid or reimbursed from Modification Fees as described in clause (A), which expenses have subsequently been recovered from the related borrower or otherwise. | ||
With respect to the Master Servicer and Special Servicer, the Excess Modification Fees collected and earned by such servicer from the related borrower (taken in the aggregate with any other Excess Modification Fees collected and earned by such servicer from the related borrower within the prior 12 months of the collection of the current Excess Modification Fees) will be subject to a cap of 1.00% of the outstanding principal balance of the related mortgage loan or Serviced Whole Loan on the closing date of the related modification, extension, waiver or amendment. A “Modification Fee” with respect to any mortgage loan (other than the non-serviced mortgage loan) or Serviced Whole Loan is generally any fee with respect to a modification, extension, waiver or amendment of any mortgage loan or Serviced Whole Loan. | ||
A “Workout Fee” will generally be payable with respect to each corrected mortgage loan (as more specifically described in the Free Writing Prospectus) and will be calculated at a rate of 1.00% of payments of principal and interest on the respective mortgage loan for so long as it remains a corrected mortgage loan. After receipt by the Special Servicer of Workout Fees with respect to a corrected mortgage loan in an amount equal to $25,000, any Workout Fees in excess of such amount will be reduced by the Excess Modification Fee Amount; provided that in the event the Workout Fee, collected over the course of such workout, calculated at the Workout Fee Rate is less than $25,000, then the Special Servicer will be entitled to an amount from the final payment on the related corrected mortgage loan that would result in the total Workout Fees payable to the Special Servicer in respect of that corrected mortgage loan to be $25,000. | ||
The “Excess Modification Fee Amount” for any corrected mortgage loan is an amount equal to any Excess Modification Fees paid by or on behalf of the related borrower with respect to the related mortgage loan (including any related Serviced Companion Loan) and received and retained by the Master Servicer or the Special Servicer, as applicable, as additional servicing compensation within the prior 12 months of the related modification, waiver, extension or amendment resulting in the mortgage loan or REO loan being a corrected mortgage loan, but only to the extent those fees have not previously been deducted from a Workout Fee or Liquidation Fee. | ||
A “Liquidation Fee” will generally be payable with respect to each specially serviced mortgage loan or REO property as to which the Special Servicer obtains a full or partial recovery of the related asset. The Liquidation Fee for each specially serviced mortgage loan will be payable at a rate of 1.00% of the liquidation proceeds; provided, however, that no Liquidation Fee will be less than $25,000. | ||
| The Liquidation Fees will be reduced by the amount of any Excess Modification Fees received by the Special Servicer with respect to the related mortgage loan (including any Companion Loan) or REO property as additional compensation within the prior 12 months, but only to the extent those fees have not previously been deducted from a Workout Fee or Liquidation Fee. |
THE INFORMATION IN THIS STRUCTURAL AND COLLATERAL TERM SHEET IS NOT COMPLETE AND MAY BE AMENDED PRIOR TO THE TIME OF SALE. THIS TERM SHEET IS NOT AN OFFER TO SELL THESE SECURITIES AND IT IS NOT A SOLICITATION OF AN OFFER TO BUY THESE SECURITIES IN ANY JURISDICTION WHERE THE OFFER OR SALE IS NOT PERMITTED.
| 26 of 122 | |
| Structural and Collateral Term Sheet | JPMBB 2015-C29 |
| Structural Overview |
Similar fees to those described above will be payable to the special servicer for the Horizon Outlet Shoppes Portfolio Whole Loan under the JPMBB 2015-C28 pooling and servicing agreement. See “Servicing of the Mortgage Loans—Servicing of the Horizon Outlet Shoppes Portfolio Mortgage Loan” in the Free Writing Prospectus. | ||||||
| Subject to certain limited exceptions, in connection with its duties under the Pooling and Servicing Agreement, the Special Servicer and its affiliates are prohibited from receiving or retaining any compensation (other than compensation specifically provided for under the Pooling and Servicing Agreement) from anyone in connection with the disposition, workout or foreclosure of any mortgage loan, the management or disposition of any REO property, or the performance of any other special servicing duties under the Pooling and Servicing Agreement. In the event the Special Servicer does receive any such compensation, it will be required to disclose those fees to the Certificate Administrator who will include it as part of the statement to Certificateholders. | ||||||
| In addition, no liquidation fee will be payable to the Special Servicer if a mortgage loan becomes a specially serviced mortgage loan only because of a maturity default and the related liquidation proceeds are received within 90 days following the stated maturity date as a result of the related mortgage loan being refinanced or otherwise repaid in full. | ||||||
■ | Deal Website: | The Certificate Administrator will maintain a deal website to which certain persons will have access to certain information including, but not limited to the following, which will be posted: | ||||
| ■ | special notices | |||||
■ | summaries of asset status reports | |||||
■ | appraisals in connection with Appraisal Reductions plus any second appraisals ordered | |||||
■ | an “Investor Q&A Forum” | |||||
■ | a voluntary investor registry | |||||
■ | SEC EDGAR filings | |||||
THE INFORMATION IN THIS STRUCTURAL AND COLLATERAL TERM SHEET IS NOT COMPLETE AND MAY BE AMENDED PRIOR TO THE TIME OF SALE. THIS TERM SHEET IS NOT AN OFFER TO SELL THESE SECURITIES AND IT IS NOT A SOLICITATION OF AN OFFER TO BUY THESE SECURITIES IN ANY JURISDICTION WHERE THE OFFER OR SALE IS NOT PERMITTED.
| 27 of 122 | |
| Structural and Collateral Term Sheet | JPMBB 2015-C29 |
[THIS PAGE INTENTIONALLY LEFT BLANK]
THE INFORMATION IN THIS STRUCTURAL AND COLLATERAL TERM SHEET IS NOT COMPLETE AND MAY BE AMENDED PRIOR TO THE TIME OF SALE. THIS TERM SHEET IS NOT AN OFFER TO SELL THESE SECURITIES AND IT IS NOT A SOLICITATION OF AN OFFER TO BUY THESE SECURITIES IN ANY JURISDICTION WHERE THE OFFER OR SALE IS NOT PERMITTED.
| 28 of 122 | |
| Structural and Collateral Term Sheet | JPMBB 2015-C29 | |
2025 M Street | ||
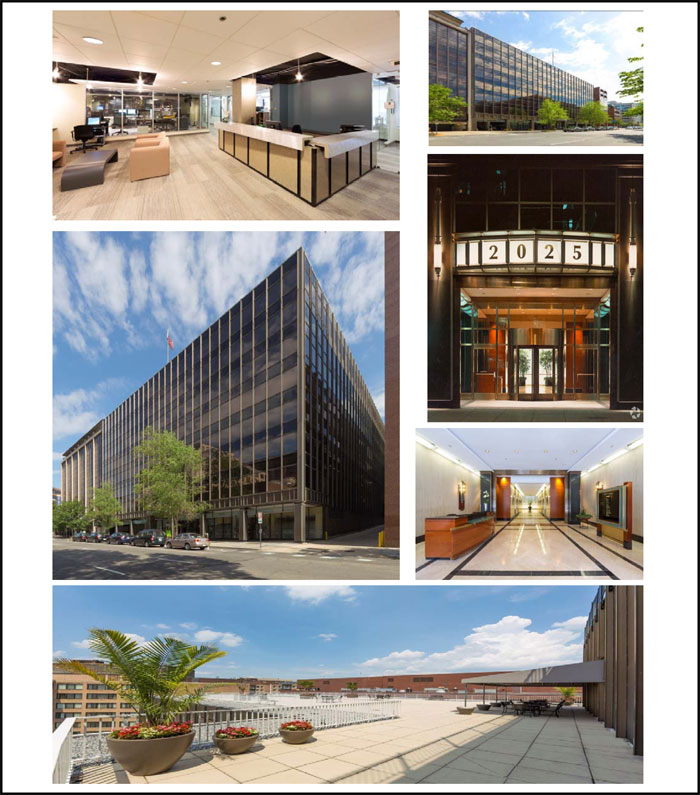
THE INFORMATION IN THIS STRUCTURAL AND COLLATERAL TERM SHEET IS NOT COMPLETE AND MAY BE AMENDED PRIOR TO THE TIME OF SALE. THIS TERM SHEET IS NOT AN OFFER TO SELL THESE SECURITIES AND IT IS NOT A SOLICITATION OF AN OFFER TO BUY THESE SECURITIES IN ANY JURISDICTION WHERE THE OFFER OR SALE IS NOT PERMITTED.
| 29 of 122 | |
| Structural and Collateral Term Sheet | JPMBB 2015-C29 | |
2025 M Street | ||
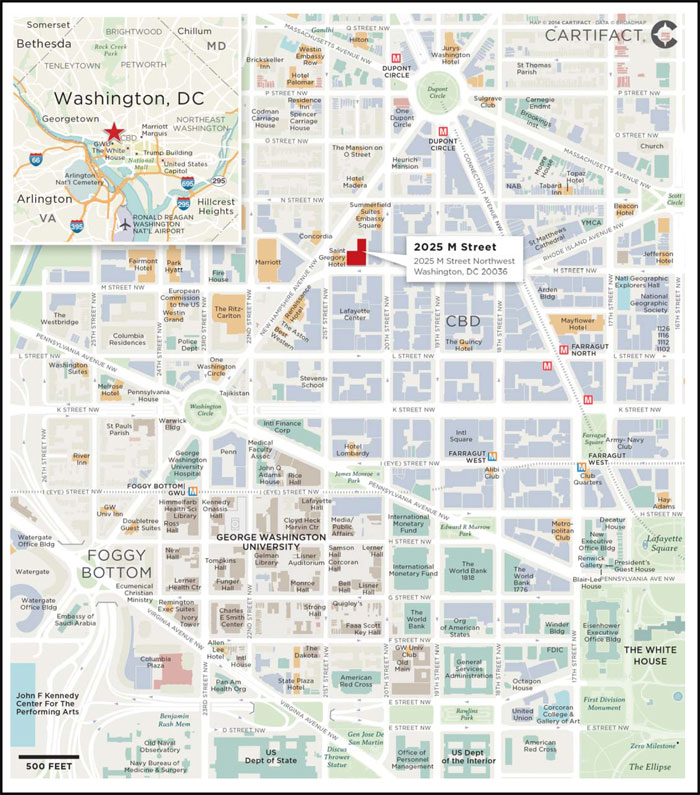
THE INFORMATION IN THIS STRUCTURAL AND COLLATERAL TERM SHEET IS NOT COMPLETE AND MAY BE AMENDED PRIOR TO THE TIME OF SALE. THIS TERM SHEET IS NOT AN OFFER TO SELL THESE SECURITIES AND IT IS NOT A SOLICITATION OF AN OFFER TO BUY THESE SECURITIES IN ANY JURISDICTION WHERE THE OFFER OR SALE IS NOT PERMITTED.
| 30 of 122 | |
| Structural and Collateral Term Sheet | JPMBB 2015-C29 | |
2025 M Street | ||
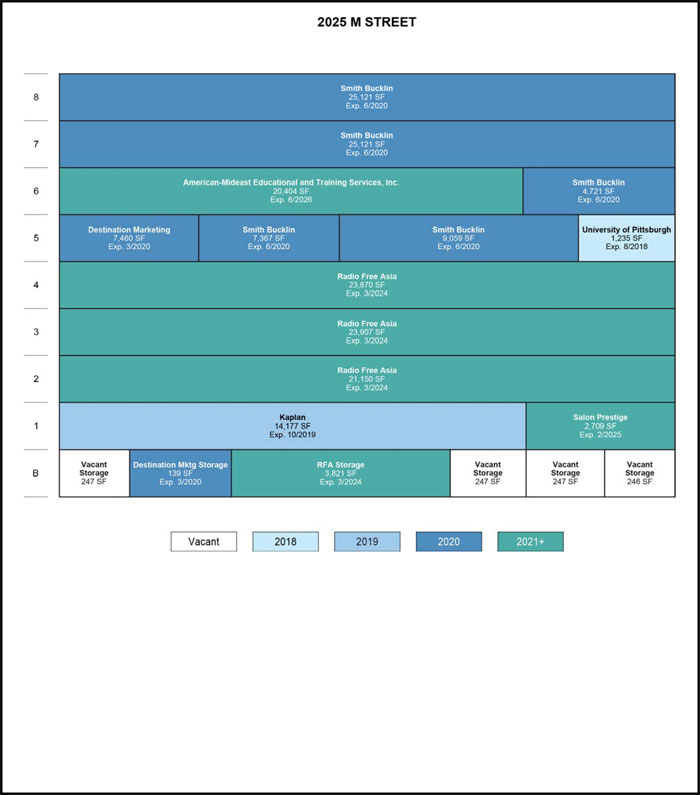
THE INFORMATION IN THIS STRUCTURAL AND COLLATERAL TERM SHEET IS NOT COMPLETE AND MAY BE AMENDED PRIOR TO THE TIME OF SALE. THIS TERM SHEET IS NOT AN OFFER TO SELL THESE SECURITIES AND IT IS NOT A SOLICITATION OF AN OFFER TO BUY THESE SECURITIES IN ANY JURISDICTION WHERE THE OFFER OR SALE IS NOT PERMITTED.
| 31 of 122 | |
| Structural and Collateral Term Sheet | JPMBB 2015-C29 | |
2025 M Street | ||
| Mortgage Loan Information | Property Information | |||
| Mortgage Loan Seller: | RAIT | Single Asset / Portfolio: | Single Asset | |
| Original Principal Balance: | $63,560,000 | Title: | Fee | |
| Cut-off Date Principal | $63,560,000 | Property Type - Subtype: | Office – CBD | |
| % of Pool by IPB: | 6.5% | Net Rentable Area (SF): | 191,248 | |
| Loan Purpose: | Acquisition | Location: | Washington, DC | |
| Borrower: | Mikeone EK M Street Holdings, | Year Built / Renovated: | 1971 / 1995 | |
| LLC | Occupancy(1): | 99.5% | ||
| Sponsors: | EK 2013 Family Trust and Michael | Occupancy Date: | 2/11/2015 | |
| Klein | Number of Tenants: | 7 | ||
| Interest Rate: | 4.25000% | 2012 NOI: | $6,807,959 | |
| Note Date: | 3/13/2015 | 2013 NOI: | $5,206,586 | |
| Maturity Date: | 4/1/2025 | 2014 NOI: | $5,107,614 | |
| Interest-only Period: | 36 months | UW Economic Occupancy: | 95.0% | |
| Original Term: | 120 months | UW Revenues: | $9,882,877 | |
| Original Amortization: | 360 months | UW Expenses: | $4,278,934 | |
| Amortization Type: | IO-Balloon | UW NOI(1): | $5,603,943 | |
| Call Protection: | L(26),Def(90),O(4) | UW NCF(1): | $5,358,823 | |
| Lockbox: | Springing | Appraised Value / Per SF: | $110,000,000 / $575 | |
| Additional Debt: | N/A | Appraisal Date: | 2/11/2015 | |
| Additional Debt Balance: | N/A | |||
| Additional Debt Type: | N/A | |||
Escrows and Reserves(2) | Financial Information | ||||||
| Initial | Monthly | Initial Cap | Cut-off Date Loan / SF: | $332 | |||
| Taxes: | $369,150 | $147,660 | N/A | Maturity Date Loan / SF: | $289 | ||
| Insurance: | $21,945 | $7,315 | N/A | Cut-off Date LTV: | 57.8% | ||
| Replacement Reserves: | $0 | $4,489 | N/A | Maturity Date LTV: | 50.3% | ||
| TI/LC: | $2,328,880 | $80,065 | N/A | UW NCF DSCR: | 1.43x | ||
| Other: | $888,242 | $0 | N/A | UW NOI Debt Yield: | 8.8% | ||
| Sources and Uses | ||||||
| Sources | Proceeds | % of Total | Uses | Proceeds | % of Total | |
| Mortgage Loan | $63,560,000 | 56.2% | Purchase Price | $105,944,200 | 93.7% | |
| Sponsor Equity | 49,518,994 | 43.8 | Upfront Reserves | 3,608,217 | 3.2 | |
| Closing Costs | 3,526,577 | 3.1 | ||||
| Total Sources | $113,078,994 | 100.0% | Total Uses | $113,078,994 | 100.0% | |
| (1) | Occupancy, UW NOI and UW NCF include a newly executed lease to American-Mideast Educational and Training Services, Inc. totaling 20,404 square feet, for which the tenant is not yet in occupancy or paying rent. The tenant is expected to take occupancy on or about July 1, 2015. American-Mideast Educational and Training Services, Inc.’s first year base rent is $816,160. Current occupancy as of February 11, 2015 excluding this tenant is 88.8%. |
| (2) | For a full description of Escrows and Reserves, please refer to “Escrows and Reserves” below. |
The Loan. The 2025 M Street loan has an outstanding principal balance of $63.56 million and is secured by a first mortgage lien on the borrower’s fee interest on a 191,248 square foot office building located in Washington, D.C. The 2025 M Street loan has a 10-year term and, subsequent to an initial three-year interest-only period, will amortize on a 30-year schedule.
The Borrower. The borrowing entity is Mikeone EK M Street Holdings, LLC, a Delaware limited liability company and special purpose entity.
The Sponsors. The sponsors and nonrecourse carve-out guarantors of the loan are Michael Klein, a Brazilian citizen who primarily resides in Brazil, and the EK 2013 Family Trust, a Florida trust (the EK 2013 Family Trust was established by Samuel Klein for the benefit of his daughter, Eva Klein, and her children). Michael Klein is the son of Samuel Klein, who was the founder of Casas Bahia, a large Brazilian retail chain that recently merged with a competitor and was taken public in 2013. The Kleins are a high-net worth family.
THE INFORMATION IN THIS STRUCTURAL AND COLLATERAL TERM SHEET IS NOT COMPLETE AND MAY BE AMENDED PRIOR TO THE TIME OF SALE. THIS TERM SHEET IS NOT AN OFFER TO SELL THESE SECURITIES AND IT IS NOT A SOLICITATION OF AN OFFER TO BUY THESE SECURITIES IN ANY JURISDICTION WHERE THE OFFER OR SALE IS NOT PERMITTED.
| 32 of 122 | |
| Structural and Collateral Term Sheet | JPMBB 2015-C29 | |
2025 M Street | ||
The Property. 2025 M Street is a 191,248 square foot, mid-rise, Class B office building built in 1971, renovated in 1995, and located on a 0.63-acre parcel in the central business district of Washington, D.C. The eight-story, “L” shaped building consists of primarily office space, with a ground-floor retail component. Amenities include a rooftop terrace with tables, chairs, and a shade canopy, and a terrace on the second floor level with tables and chairs. In addition, parking is available in a 242-space (approximately 1.3 spaces per 1,000 square feet) underground garage directly beneath the building.
As of February 11, 2015, the property was 99.5% leased by seven tenants, with two vacant spaces, one of which is currently undergoing tenant fit-out for July 2015 occupancy (occupancy as of February 11, 2015 is 88.8% without the leased but not yet occupied space). The largest tenant at the property, Radio Free Asia, leases 72,748 square feet (approximately 38.0% of the net rentable area) through March 2024 with two five-year renewal options, and has been a tenant at the property since 1996. Radio Free Asia is a private, non-profit corporation that broadcasts and publishes news to Asian countries where full, accurate and timely news reports may be unavailable. The second largest tenant at the property, Smith Bucklin, leases 71,389 square feet (approximately 37.3% of the net rentable area) through June 2020 with one, five-year renewal option, and has been a tenant at the property since 1999. Smith Bucklin is a large association management and professional services company, providing full-service management and outsourcing services to trade associations, professional societies, and public, private and non-profit corporations. Smith Bucklin subleases (i) approximately 9,059 square feet of its leased space (representing approximately 4.7% of the net rentable area of the property) to Young Women’s Christian Association of the United States of America, Inc., a non-profit corporation (“YWCA”), and (ii) approximately 4,721 square feet of its leased space (representing approximately 2.5% of the net rentable area of the property) to the Asian & Pacific Islander Scholarship Fund, a non-profit corporation (“APISF”). The third largest tenant at the property, American-Mideast Educational and Training Services, Inc. (“AMID”), recently executed a lease for 20,404 square feet (approximately 10.7% of the net rentable area) through June 2026 with one five-year renewal option, and is scheduled to take occupancy on or about July 1, 2015. AMID is a non-profit organization engaged in international education, training and development activities in the Middle East and North Africa.
The property is located in the “Golden Triangle” area of the central business district submarket of Washington, D.C., on the north side of M Street NW between its intersections with 20th Street NW and 21st Street NW, just east of New Hampshire Avenue NW. According to a third party research firm, this area encompasses 43 blocks and includes approximately 3,000 businesses, 500 retail shops and restaurants and seven luxury hotels containing approximately 2,000 rooms. The property’s location is served by the Washington Metropolitan Transportation Authority’s Metrorail, which has four stations near the property that provide transportation throughout Washington, D.C. and connect to Northern Virginia and Maryland suburban areas. According to the appraisal, the central business district office submarket contains over 33 million square feet of available office space with a direct vacancy rate of 10.5% as of the fourth quarter of 2014, which is down from 12.5% in 2013. The direct average asking rental rate for all classes of office buildings in the submarket increased by 3.3% year-over-year to $53.23 per square foot on a full service basis, which the appraisal reports is due to fewer immediate, large options available in the vicinity. The 2014 Class A office building direct weighted asking rent at $63.93 per square foot, full service, increased at a higher rate than the overall submarket, 4.5%, due in part to the higher asking rents advertised at buildings currently under construction and/or renovation. According to a marketing report, the central business district Class B office submarket contains approximately 11.8 million square feet of available office space with a direct vacancy rate of 11.1%, as of the first quarter of 2015. The direct average asking rental rate for Class B office space in the central business district office submarket is $53.10 per square foot, full service, as of the first quarter of 2015.
Historical and Current Occupancy (1) | |||
| 2012 | 2013 | 2014 | Current (2) |
| 88.9% | 88.2% | 98.6% | 99.5% |
| (1) | Historical Occupancies are as of December 31 of each year. |
| (2) | Current Occupancy as of February 11, 2015. Includes one tenant who has signed a lease but is not yet in occupancy. The tenant is expected to take occupancy on or about July 1, 2015. Current occupancy as of February 11, 2015 excluding this tenant is 88.8%. |
THE INFORMATION IN THIS STRUCTURAL AND COLLATERAL TERM SHEET IS NOT COMPLETE AND MAY BE AMENDED PRIOR TO THE TIME OF SALE. THIS TERM SHEET IS NOT AN OFFER TO SELL THESE SECURITIES AND IT IS NOT A SOLICITATION OF AN OFFER TO BUY THESE SECURITIES IN ANY JURISDICTION WHERE THE OFFER OR SALE IS NOT PERMITTED.
| 33 of 122 | |
| Structural and Collateral Term Sheet | JPMBB 2015-C29 | |
2025 M Street | ||
Tenant Summary(1) | |||||||||
| Tenant | Tenant Type | Ratings(2) Moody’s/S&P/Fitch | Net Rentable Area (SF) | % of Total NRA | Base Rent PSF | Lease Expiration Date | |||
Radio Free Asia(3) | Office | NA / NA / NA | 72,748 | 38.0% | $25.48 | 3/31/2024 | |||
Smith Bucklin(4) | Office | NA / NA / NA | 71,389 | 37.3% | $59.21 | 6/30/2020 | |||
AMID(5) | Office | NA / NA / NA | 20,404 | 10.7% | $40.00 | 6/30/2026 | |||
Kaplan(6) | Retail | NA / NA / NA | 14,177 | 7.4% | $39.46 | 10/31/2019 | |||
| Destination Marketing | Office | NA / NA / NA | 7,599 | 4.0% | $42.73 | 3/31/2020 | |||
| Salon Prestige | Retail | NA / NA / NA | 2,709 | 1.4% | $30.00 | 2/28/2025 | |||
| University of Pittsburgh | Office | NA / NA / NA | 1,235 | 0.6% | $45.00 | 8/31/2018 | |||
| (1) | Based on the underwritten rent roll dated February 11, 2015. |
| (2) | Ratings provided are for the parent company of the entity listed in the “Tenant” field whether or not the parent company guarantees the lease. |
| (3) | If the U.S. government (1) fails to renew tenant’s annual broadcasting grant or (2) reduces tenant’s annual broadcasting grant by 50% or more, the tenant has the one-time right to terminate its lease with respect to either (A) the entire premises or (B) up to 50% of the premises, in either case effective March 31, 2018 with one year’s prior notice. Such termination is subject to the tenant’s payment of a termination fee equal to the aggregate of (i) rent payments that would have been due but for the termination event for the four month period following the termination, and (ii) the unamortized cost of tenant improvements at the rate of 6.5% per annum. |
| (4) | Smith Bucklin subleases approximately (i) 9,059 square feet of its space (or 4.7% of the property’s net rentable area) to YWCA, and (ii) 4,721 square feet of its space (or 2.5% of the property’s net rentable area) to APISF. |
| (5) | Assumes a July 1, 2015 lease commencement date and that AMID is paying base rent. Tenant’s lease has been executed and commences on the earlier of (i) July 1, 2015 or (ii) the date that tenant commences business operations at the property. |
| (6) | Kaplan has a one-time right to terminate its lease effective September 30, 2016 with one year’s prior notice, which is subject to the payment of a termination fee equal to any unamortized cost of the aggregate of tenant improvements, brokerage commissions, rent abatement and legal costs at the rate of 8.0% per annum. |
Lease Rollover Schedule(1) | |||||||||||||||||||||
| Year | Number of Leases Expiring | Net Rentable Area Expiring | % of NRA Expiring | Base Rent Expiring | % of Base Rent Expiring | Cumulative Net Rentable Area Expiring | Cumulative % of NRA Expiring | Cumulative Base Rent Expiring | Cumulative % of Base Rent Expiring | ||||||||||||
| Vacant | NAP | 987 | 0.5 | % | NAP | NAP | 987 | 0.5% | NAP | NAP | |||||||||||
| 2015 & MTM | 0 | 0 | 0.0 | $0 | 0.0 | % | 0 | 0.5% | $0 | 0% | |||||||||||
| 2016 | 0 | 0 | 0.0 | 0 | 0.0 | 0 | 0.5% | $0 | 0% | ||||||||||||
| 2017 | 0 | 0 | 0.0 | 0 | 0.0 | 0 | 0.5% | $0 | 0% | ||||||||||||
| 2018 | 1 | 1,235 | 0.6 | 55,575 | 0.7 | 1,235 | 1.2% | $55,575 | 0.7% | ||||||||||||
| 2019 | 1 | 14,177 | 7.4 | 559,424 | 7.0 | 15,412 | 8.6% | $614,999 | 7.7% | ||||||||||||
| 2020 | 2 | 78,988 | 41.3 | 4,551,983 | 57.0 | 94,400 | 49.9% | $5,166,982 | 64.6% | ||||||||||||
| 2021 | 0 | 0 | 0.0 | 0 | 0.0 | 94,400 | 49.9% | $5,166,982 | 64.6% | ||||||||||||
| 2022 | 0 | 0 | 0.0 | 0 | 0.0 | 94,400 | 49.9% | $5,166,982 | 64.6% | ||||||||||||
| 2023 | 0 | 0 | 0.0 | 0 | 0.0 | 94,400 | 49.9% | $5,166,982 | 64.6% | ||||||||||||
| 2024 | 1 | 72,748 | 38.0 | 1,927,948 | 24.1 | 167,148 | 87.9% | $7,094,930 | 88.8% | ||||||||||||
| 2025 | 1 | 2,709 | 1.4 | 81,270 | 1.0 | 169,857 | 89.3% | $7,176,200 | 89.8% | ||||||||||||
| 2026 & Beyond | 1 | 20,404 | 10.7 | 816,160 | 10.2 | 190,261 | 100.0% | $7,992,360 | 100.0% | ||||||||||||
| Total | 7 | 191,248 | 100.0 | % | $7,992,360 | 100.0 | % | ||||||||||||||
| (1) | Based on the underwritten rent roll dated February 11, 2015. |
THE INFORMATION IN THIS STRUCTURAL AND COLLATERAL TERM SHEET IS NOT COMPLETE AND MAY BE AMENDED PRIOR TO THE TIME OF SALE. THIS TERM SHEET IS NOT AN OFFER TO SELL THESE SECURITIES AND IT IS NOT A SOLICITATION OF AN OFFER TO BUY THESE SECURITIES IN ANY JURISDICTION WHERE THE OFFER OR SALE IS NOT PERMITTED.
| 34 of 122 | |
| Structural and Collateral Term Sheet | JPMBB 2015-C29 | |
2025 M Street | ||
| Operating History and Underwritten Net Cash Flow | |||||||||||||
| 2012 | 2013 | 2014 | Underwritten | Per Square Foot | %(1) | ||||||||
Rents in Place(2) | $6,896,384 | $6,600,389 | $6,916,353 | $7,992,360 | 41.79 | 83.4 | % | ||||||
| Vacant Income | 0 | 0 | 0 | 19,740 | 0.10 | 0.2 | |||||||
| Gross Potential Rent | $6,896,384 | $6,600,389 | $6,916,353 | $8,012,100 | $41.89 | 83.6 | % | ||||||
| Total Reimbursements | 1,035,555 | 1,661,143 | 1,257,619 | 1,567,632 | 8.20 | 16.4 | |||||||
| Net Rental Income | $7,931,939 | $ 8,261,532 | $ 8,173,972 | $ 9,579,732 | $ 50.09 | 100.0 | % | ||||||
| (Vacancy/Credit Loss) | 0 | 0 | 0 | (478,987) | (2.50) | (5.0 | ) | ||||||
Other Income(3) | 2,113,782 | 364,421 | 67,430 | 2,000 | 0.01 | 0.0 | |||||||
| Submetered Elec. & OT HVAC | 348,666 | 398,927 | 474,176 | 459,600 | 2.40 | 4.8 | |||||||
| Parking | 280,571 | 295,483 | 308,046 | 320,531 | 1.68 | 3.3 | |||||||
| Effective Gross Income | $10,674,958 | $9,320,363 | $9,023,624 | $9,882,877 | $51.68 | 103.2 | % | ||||||
| Total Expenses | $3,866,999 | $4,113,777 | $3,916,010 | $4,278,934 | $22.37 | 43.3 | % | ||||||
| Net Operating Income | $6,807,959 | $5,206,586 | $5,107,614 | $5,603,943 | $29.30 | 56.7 | % | ||||||
| Total TI/LC, Capex/RR | 0 | 0 | 0 | 245,120 | 1.28 | 2.5 | |||||||
| Net Cash Flow | $6,807,959 | $5,206,586 | $5,107,614 | $5,358,823 | $28.02 | 54.2 | % | ||||||
| (1) | Percentage column represents percent of Net Rental Income for all revenue lines and represents percent of Effective Gross Income for the remainder of fields. |
| (2) | The increase in Underwritten Rents in Place from 2014 is primarily due to a new 20,404 square foot AMID lease, which has been executed and is expected to commence on or about July 1, 2015. AMID’s first year base rent is $816,160. |
| (3) | 2012 Other Income includes a $2,002,822 termination fee paid by then-tenant Arqiva. |
Property Management. The property is managed by Carr Properties Services Subsidiary Corporation, which was the manager of the property prior to the acquisition and is not affiliated with the borrower.
Escrows and Reserves. At origination, the borrower deposited into escrow approximately $2,328,880 for outstanding tenant improvements and leasing commissions associated with five tenants, $888,242 for future rent credits and abatements, $369,150 for real estate taxes and $21,945 for insurance premiums.
Tax Escrows - On a monthly basis, the borrower is required to escrow 1/12 of the annual estimated tax payments, which currently equates to $147,660.
Insurance Escrows - On a monthly basis, the borrower is required to escrow 1/12 of the annual insurance premiums, which currently equates to $7,315.
Replacement Reserves - On a monthly basis, the borrower is required to escrow $4,489 (approximately $0.28 per square foot annually) for replacement reserves.
TI/LC Reserves - On a monthly basis, during the interest-only period, the excess cash flow after payment of the monthly debt service is required to be escrowed for tenant improvements and leasing commissions and as of the Cut-off Date, the amount is $80,065 (approximately $5.02 per square foot annually). After the interest-only period, the required monthly deposit is $15,937 (approximately $1.00 per square foot annually).
Lockbox / Cash Management. The loan is structured with a springing lockbox and springing cash management. Upon the first occurrence of a Trigger Period (as defined below), the loan documents require the borrower to establish a lender-controlled lockbox account into which all revenue generated by the property is required to be deposited thereafter. Upon the first occurrence of a Trigger Period, a cash management account is also required to be established in the name of the borrower for the sole and exclusive benefit of the lender. The funds on deposit in the lockbox account are required to be deposited on each business day to or at the direction of the borrower, unless a Trigger Period exists, in which case, funds are required to be transferred on each business day to the cash management account. So long as no event of default has occurred and is continuing, on each monthly payment date, the lender is required to disburse all funds on deposit in the cash management account to pay required reserves, debt service, approved operating expenses and all other amounts then due and payable under the loan documents, with any remaining amounts (“Excess Cash”) to be disbursed to the borrower unless a Tenant Trigger Period (as defined below) exists. During a Tenant Trigger Period, all Excess Cash will be deposited into a lender-controlled excess cash flow account to be disbursed to the borrower for payment of approved tenant improvements and approved leasing commissions associated with the applicable tenant’s premises unless an event of default has occurred and is continuing.
THE INFORMATION IN THIS STRUCTURAL AND COLLATERAL TERM SHEET IS NOT COMPLETE AND MAY BE AMENDED PRIOR TO THE TIME OF SALE. THIS TERM SHEET IS NOT AN OFFER TO SELL THESE SECURITIES AND IT IS NOT A SOLICITATION OF AN OFFER TO BUY THESE SECURITIES IN ANY JURISDICTION WHERE THE OFFER OR SALE IS NOT PERMITTED.
| 35 of 122 | |
| Structural and Collateral Term Sheet | JPMBB 2015-C29 | |
2025 M Street | ||
A “Trigger Period” means a period commencing upon the earliest to occur of (i) the occurrence and continuance of an event of default under the loan documents, (ii) the date on which the debt service coverage ratio (as calculated under the loan documents) is less than 1.10x, and (iii) the occurrence of a Tenant Trigger Period.
A “Tenant Trigger Period” means a period commencing upon the first to occur of (i) Smith Bucklin defaulting under its lease, (ii) Smith Bucklin “going dark” in its premises, (iii) Smith Bucklin giving notice that it is terminating its lease for all or any portion of its premises, (iv) any termination or cancellation of Smith Bucklin’s lease and/or Smith Bucklin’s lease failing to otherwise be in full force and effect, (v) any bankruptcy or similar insolvency of Smith Bucklin and (vi) Smith Bucklin failing to extend or renew its lease on or prior to December 31, 2018, but not earlier than June 30, 2018 on terms acceptable to the lender in its sole but reasonable discretion; and expiring upon the first to occur of the lender’s receipt of evidence reasonably acceptable to the lender of (i) the satisfaction of the Tenant Cure Conditions (as defined below) or (ii) (x) the entirety of Smith Bucklin’s space is leased to a replacement tenant pursuant to a lender-approved lease, and (y) the replacement tenant under such replacement lease (I) is in actual, physical occupancy of, and open to the public for business in, the leased space, (II) is paying the full unabated rent under its lease and (III) has unconditionally accepted its leased premises.
The “Tenant Cure Conditions” mean, as applicable, (i) Smith Bucklin has cured all defaults under its lease, (ii) Smith Bucklin is no longer “dark”, (iii) Smith Bucklin has revoked or rescinded all termination or cancellation notices and has reaffirmed its lease as being in full force and effect, (iv) with respect to any event specified in clause (vi) of the definition of “Tenant Trigger Period”, Smith Bucklin has renewed or extended its lease on terms that are acceptable to the lender in its sole but reasonable discretion, (v) with respect to any event specified in clause (v) of the definition of “Tenant Trigger Period”, Smith Bucklin is no longer insolvent or subject to any bankruptcy or insolvency proceedings and has affirmed its lease pursuant to final, non-appealable order of a court of competent jurisdiction and (vi) Smith Bucklin is paying full, unabated rent under its lease.
THE INFORMATION IN THIS STRUCTURAL AND COLLATERAL TERM SHEET IS NOT COMPLETE AND MAY BE AMENDED PRIOR TO THE TIME OF SALE. THIS TERM SHEET IS NOT AN OFFER TO SELL THESE SECURITIES AND IT IS NOT A SOLICITATION OF AN OFFER TO BUY THESE SECURITIES IN ANY JURISDICTION WHERE THE OFFER OR SALE IS NOT PERMITTED.
| 36 of 122 | |
| Structural and Collateral Term Sheet | JPMBB 2015-C29 | |
One City Centre | ||
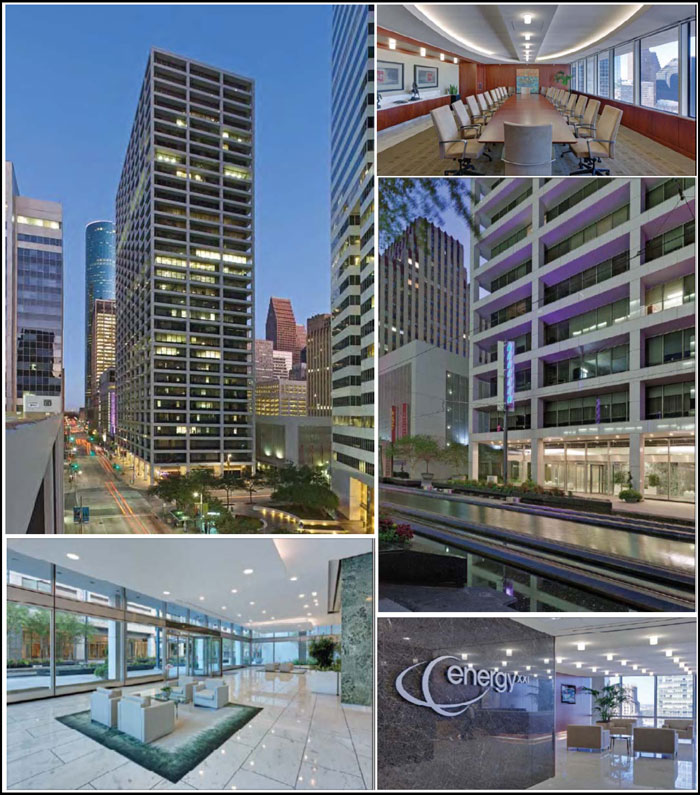
THE INFORMATION IN THIS STRUCTURAL AND COLLATERAL TERM SHEET IS NOT COMPLETE AND MAY BE AMENDED PRIOR TO THE TIME OF SALE. THIS TERM SHEET IS NOT AN OFFER TO SELL THESE SECURITIES AND IT IS NOT A SOLICITATION OF AN OFFER TO BUY THESE SECURITIES IN ANY JURISDICTION WHERE THE OFFER OR SALE IS NOT PERMITTED.
| 37 of 122 | |
| Structural and Collateral Term Sheet | JPMBB 2015-C29 | |
One City Centre | ||
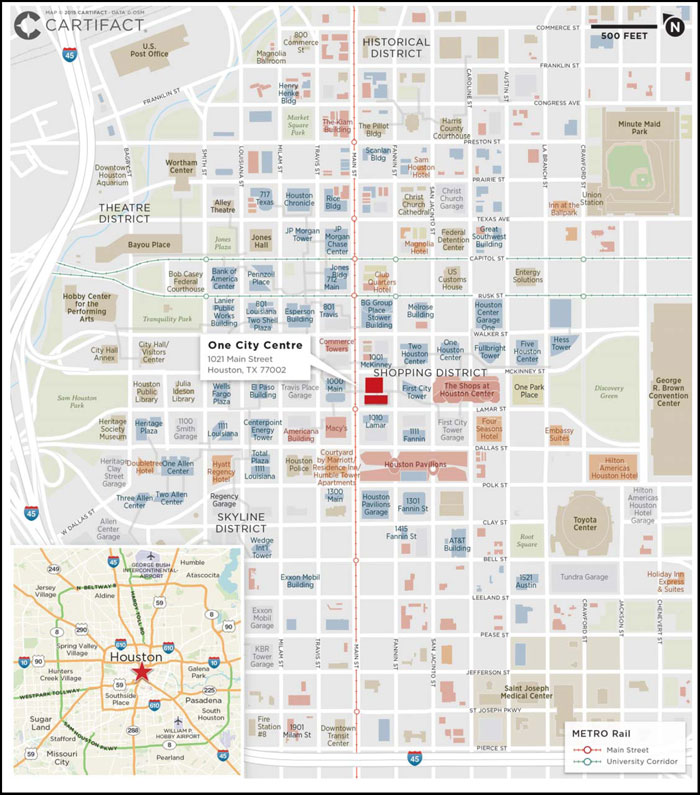
THE INFORMATION IN THIS STRUCTURAL AND COLLATERAL TERM SHEET IS NOT COMPLETE AND MAY BE AMENDED PRIOR TO THE TIME OF SALE. THIS TERM SHEET IS NOT AN OFFER TO SELL THESE SECURITIES AND IT IS NOT A SOLICITATION OF AN OFFER TO BUY THESE SECURITIES IN ANY JURISDICTION WHERE THE OFFER OR SALE IS NOT PERMITTED.
| 38 of 122 | |
| Structural and Collateral Term Sheet | JPMBB 2015-C29 | |
One City Centre | ||
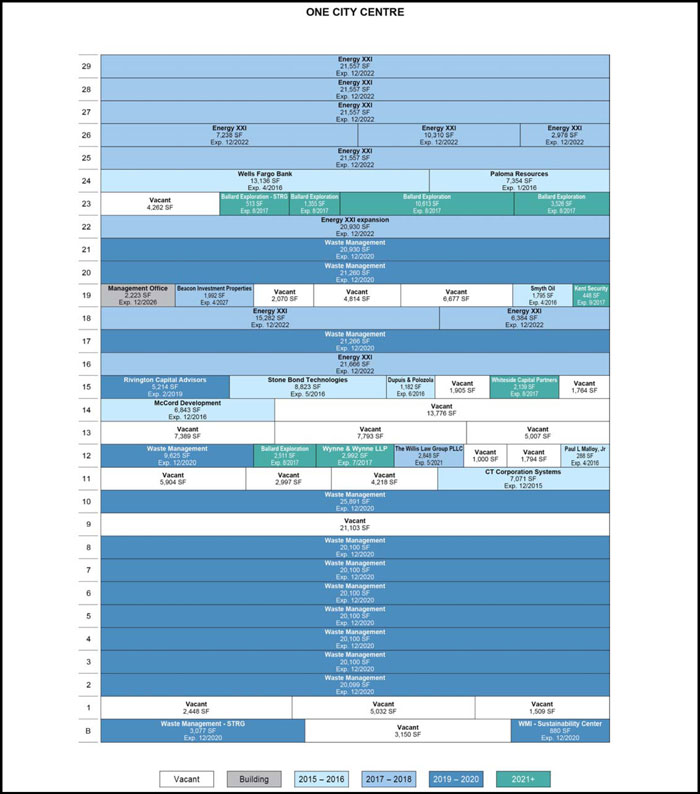
THE INFORMATION IN THIS STRUCTURAL AND COLLATERAL TERM SHEET IS NOT COMPLETE AND MAY BE AMENDED PRIOR TO THE TIME OF SALE. THIS TERM SHEET IS NOT AN OFFER TO SELL THESE SECURITIES AND IT IS NOT A SOLICITATION OF AN OFFER TO BUY THESE SECURITIES IN ANY JURISDICTION WHERE THE OFFER OR SALE IS NOT PERMITTED.
| 39 of 122 | |
| Structural and Collateral Term Sheet | JPMBB 2015-C29 | |
One City Centre | ||
| Mortgage Loan Information | Property Information | |||
| Mortgage Loan Seller: | JPMCB | Single Asset / Portfolio: | Single Asset | |
Original Principal Balance(1): | $60,000,000 | Title: | Fee | |
Cut-off Date Principal Balance(1): | $60,000,000 | Property Type - Subtype: | Office - CBD | |
| % of Pool by IPB: | 6.1% | Net Rentable Area (SF): | 602,122 | |
| Loan Purpose: | Refinance | Location: | Houston, TX | |
| Borrower: | BRI 1850 Houston OCC, LLC | Year Built / Renovated: | 1961 / 2010 | |
| Sponsor: | Accesso Partners, LLC | Occupancy(2): | 82.6% | |
| Interest Rate: | 3.95000% | Occupancy Date: | 2/28/2015 | |
| Note Date: | 3/25/2015 | Number of Tenants: | 18 | |
| Maturity Date: | 4/1/2025 | 2012 NOI(3): | $7,911,764 | |
| Interest-only Period: | 120 months | 2013 NOI: | $9,740,131 | |
| Original Term: | 120 months | 2014 NOI: | $9,107,191 | |
| Original Amortization: | None | TTM NOI (as of 2/2015): | $9,377,052 | |
| Amortization Type: | Interest Only | UW Economic Occupancy: | 81.6% | |
| Call Protection: | L(25),Grtr1%orYM(92),O(3) | UW Revenues: | $19,305,498 | |
| Lockbox: | Hard | UW Expenses: | $10,216,109 | |
| Additional Debt: | Yes | UW NOI: | $9,089,389 | |
| Additional Debt Balance: | $40,000,000 | UW NCF: | $8,176,746 | |
| Additional Debt Type: | Pari Passu | Appraised Value / Per SF: | $162,000,000 / $269 | |
| Appraisal Date: | 2/20/2015 | |||
Escrows and Reserves(4) | Financial Information(1) | ||||||
| Initial | Monthly | Initial Cap | Cut-off Date Loan / SF: | $166 | |||
| Taxes: | $954,924 | $318,308 | N/A | Maturity Date Loan / SF: | $166 | ||
| Insurance: | $0 | Springing | N/A | Cut-off Date LTV: | 61.7% | ||
| Replacement Reserves: | $10,036 | $10,036 | N/A | Maturity Date LTV: | 61.7% | ||
| TI/LC: | $62,500 | $62,500 | $2,250,000 | UW NCF DSCR: | 2.04x | ||
| Other: | $6,625,904 | Springing | $1,500,000 | UW NOI Debt Yield: | 9.1% | ||
| Sources and Uses | |||||||||||
| Sources | Proceeds | % of Total | Uses | Proceeds | % of Total | ||||||
Mortgage Loan(1) | $100,000,000 | 100.0 | % | Payoff Existing Debt | $70,840,321 | 70.8 | % | ||||
| Return of Equity | 20,382,129 | 20.4 | |||||||||
| Upfront Reserves | 7,653,364 | 7.7 | |||||||||
| Closing Costs | 1,124,186 | 1.1 | |||||||||
| Total Sources | $100,000,000 | 100.0 | % | Total Uses | $100,000,000 | 100.0 | % | ||||
| (1) | One City Centre is part of a loan evidenced by two pari passu notes with an aggregate original principal balance of $100.0 million. The Financial Information presented in the chart above reflects the Cut-off Date balance of the $100.0 million One City Centre Whole Loan. |
| (2) | Occupancy does not include a 21,103 square foot space for which Waste Management has notified the borrower of its plans to vacate at the end of December 2015. |
| (3) | 2012 NOI represents annualized Q4 figures, as the property was acquired in September 2012. |
| (4) | For a full description of Escrows and Reserves, please refer to “Escrows and Reserves” below. |
The Loan. The One City Centre loan is secured by a first mortgage lien on a 29-story, 602,122 square foot office building located in Houston, Texas. The whole loan has an outstanding principal balance as of the Cut-off Date of $100.0 million (the “One City Centre Whole Loan”), which is comprised of two pari passu notes, Note A-1 and Note A-2. Note A-1, with an outstanding principal balance as of the Cut-off Date of $60.0 million, is being contributed to the JPMBB 2015-C29 Trust. Note A-2 has an outstanding principal balance as of the Cut-off Date of $40.0 million and is expected to be contributed to a future securitization trust. The holder of Note A-1 (the “Controlling Noteholder”) is the trustee of the JPMBB 2015-C29 Trust. The trustee of the JPMBB 2015-C29 Trust (or, prior to the occurrence and continuance of a control event under the related pooling and servicing agreement, the directing certificateholder), will be entitled to exercise all of the rights of the Controlling Noteholder with respect to the One City Centre Whole Loan; however, the holder of Note A-2 will be entitled, under certain circumstances, to be consulted with respect to certain major decisions. The One City Centre Whole Loan has a 10-year term and will be interest-only for the entire term of the loan. The previously existing debt was securitized in 2005 as part of the GCCFC 2005-GG5 transaction.
THE INFORMATION IN THIS STRUCTURAL AND COLLATERAL TERM SHEET IS NOT COMPLETE AND MAY BE AMENDED PRIOR TO THE TIME OF SALE. THIS TERM SHEET IS NOT AN OFFER TO SELL THESE SECURITIES AND IT IS NOT A SOLICITATION OF AN OFFER TO BUY THESE SECURITIES IN ANY JURISDICTION WHERE THE OFFER OR SALE IS NOT PERMITTED.
| 40 of 122 | |
| Structural and Collateral Term Sheet | JPMBB 2015-C29 | |
One City Centre | ||
The Borrower. The borrowing entity for the One City Centre loan is BRI 1850 Houston OCC, LLC, a Delaware limited liability company and special purpose entity.
The Sponsor. The loan sponsor is Accesso Partners, LLC (“Accesso”). The nonrecourse carve-out guarantors are Dalet Investment Properties (US), LLLP and Dalet Investment Properties, LLLP, both Florida limited liability limited partnerships and affiliates of the loan sponsor. Accesso is a real estate investment and property development group based in Hallandale Beach, Florida, with additional offices in Houston, Texas, Dallas, Texas, Atlanta, Georgia and Minneapolis, Minnesota. Accesso was established in 2003 and has sponsored six closed-end real estate funds and separate accounts with an aggregate capital raise of approximately $500.0 million. Through these funds Accesso has acquired over $1.0 billion worth of commercial and residential real estate. Accesso’s current commercial real estate portfolio includes 38 assets totaling more than of 8.5 million square feet of office, retail, and industrial properties located throughout Texas, Pennsylvania, Florida, North Carolina and the Midwest. Accesso has 11 assets that are located in the Houston market totaling 2.7 million square feet and approximately $416.0 million of total capital.
Accesso acquired the property in 2012 from Behringer Harvard for approximately $131.0 million and assumed the existing debt on the property in order to avoid an estimated prepayment penalty of over $10.0 million. The sponsor is utilizing the loan proceeds to pay off the existing assumed debt. Prior to the acquisition, the property underwent substantial renovations from 2008-2010, including completely renovated common areas and lobby, new mechanicals, upgrades to the exterior and an elevator modernization.
The Property. One City Centre is a LEED Gold-certified Class A office building located at 1021 Main Street in Houston, Texas. The property was constructed in 1961 and renovated in 2010. The 29-story property totals 602,122 square feet of gross leasable area and consists of office space and two adjacent seven-level parking garages totaling 1,369 spaces (approximately 2.3 spaces per 1,000 square feet which is the highest ratio in the Houston central business district according to the appraisal). The property is connected to other Class A office buildings in the Houston central business district by a privately-owned, climate controlled seven-mile pedestrian tunnel system. One City Centre is located in front of the Main Street Square Light Rail Station, providing mass-transit access within the Houston area.
As of February 28, 2015, the property was 82.6% leased by 18 tenants. The largest tenant at the property, Waste Management, has been a tenant since 2000 and currently leases 40.5% of the net rentable area through December 2020. Waste Management utilizes the property as part of its downtown Houston headquarters. Waste Management also leases a smaller space in a nearby building and according to the loan sponsor is in discussions to relocate the space to One City Centre. As part of the potential relocation, Waste Management has informed the borrower that it intends to vacate its ninth floor space (21,103 square feet) on December 31, 2015, which was underwritten as vacant. Waste Management is a provider of comprehensive waste management services in North America, servicing more than 20 million customers in the United States and Canada, as well as over 100 Fortune 500 companies as of 2012. The company is rated Baa2/A-/BBB by Moody’s, S&P, and Fitch, respectively. The second largest tenant, Energy XXI (NASDAQ: EXXI), leases 28.4% of the net rentable area through December 2022, has been in occupancy at the property since 2005 and utilizes One City Centre as its headquarters. Initially occupying 13,288 square feet, Energy XXI has expanded its space at the property on several occasions, adding 86,228 square feet between 2006 and 2011 and an additional 71,500 from 2013 to 2014 for a total area leased of 171,016 square feet. Energy XXI is an independent oil and natural gas exploration and production company with a strategy emphasizing acquisitions enhanced by the implementation of value-added drilling programs that provide for organic growth. Since 2005, Energy XXI has completed five acquisitions totaling approximately $2.5 billion, most recently acquiring 130,000 acres from Exxon, essentially doubling Energy XXI’s land holdings. The third largest tenant, Ballard Exploration (“Ballard”), leases 3.1% of the net rentable area through August 2017. Ballard has been a tenant at the property since January 1999. Ballard provides an extensive range of natural gas and crude oil marketing and field services designed to meet the unique needs of independent producers operating along the onshore Texas and Louisiana Gulf. More specifically, Ballard builds and installs natural gas and crude oil production facilities and pipelines, as well as purchases, markets, transports, and balances natural gas and crude oil production.
One City Centre is located in the heart of the Houston central business district office submarket and is less than one mile from several key Houston demand drivers, such as Main Street Square, the Toyota Center, Bayou Place and Minute Maid Park. Per the appraisal, 26 Fortune 500 companies are headquartered in Houston, 10 of which are based in the Houston central business district submarket. Although known as the “Energy Capital of the World,” several non-energy companies, such as Bank of America, Deloitte & Touche, and JP Morgan Chase also maintain a presence in downtown Houston. One City Centre is located in front of the Main Street Square light rail station, part of a newly constructed seven mile light rail system that provides for transportation throughout the Houston central business district. The appraisal notes that, since 1990, approximately $5.5 billion has been invested in major residential development, infrastructure, hotels and office buildings. According to the appraisal, the Houston central business district office submarket contained approximately 57.6 million square feet of existing supply with an overall vacancy rate of 9.2% as of year-end 2014. The Class A office property vacancy rate for the Houston central business district submarket over the same time period was 8.7% with asking rents of $36.78 and $41.96 per square foot for general office properties and Class A office space, respectively. The appraisal identified four properties that are directly competitive with One City Centre. The properties range in size from 372,757 to 1,061,351 square feet and occupancy from 83.0% to 95.0%. The weighted average occupancy of the group is 89.1% and the average rental rate is $23.25 per square foot.
THE INFORMATION IN THIS STRUCTURAL AND COLLATERAL TERM SHEET IS NOT COMPLETE AND MAY BE AMENDED PRIOR TO THE TIME OF SALE. THIS TERM SHEET IS NOT AN OFFER TO SELL THESE SECURITIES AND IT IS NOT A SOLICITATION OF AN OFFER TO BUY THESE SECURITIES IN ANY JURISDICTION WHERE THE OFFER OR SALE IS NOT PERMITTED.
| 41 of 122 | |
| Structural and Collateral Term Sheet | JPMBB 2015-C29 | |
One City Centre | ||
Historical and Current Occupancy(1) | |||
2012 | 2013 | 2014 | Current(2) |
| 86.5% | 82.3% | 82.2% | 82.6% |
| (1) | Historical Occupancies are as of December 31 of each respective year. |
| (2) | Current Occupancy is as of February 28, 2015. |
Tenant Summary(1) | |||||||||||||
| Tenant | Ratings(2) Moody’s/S&P/Fitch | Net Rentable Area (SF) | % of Total NRA | Base Rent | Base Rent PSF | Lease Expiration Date | |||||||
Waste Management(3)(4) | Baa2 / A- / BBB | 243,628 | 40.5% | $4,595,568 | $18.86 | 12/31/2020 | |||||||
Energy XXI(5) | NA / B- / CCC | 171,016 | 28.4% | $3,154,271 | $18.44 | 12/31/2022 | |||||||
| Ballard Exploration | NA / NA / NA | 18,518 | 3.1% | $333,324 | $18.00 | 8/31/2017 | |||||||
| Wells Fargo Bank | A2 / A+ / AA- | 13,136 | 2.2% | $203,608 | $15.50 | 4/30/2016 | |||||||
| Stone Bond Technologies | NA / NA / NA | 8,823 | 1.5% | $136,757 | $15.50 | 5/31/2016 | |||||||
| Paloma Resources | NA / NA / NA | 7,354 | 1.2% | $147,080 | $20.00 | 1/31/2016 | |||||||
| CT Corporation Systems | NA / NA / NA | 7,071 | 1.2% | $141,420 | $20.00 | 12/31/2015 | |||||||
McCord Development(6) | NA / NA / NA | 6,843 | 1.1% | $136,860 | $20.00 | 12/31/2016 | |||||||
| Rivington Capital Advisors | NA / NA / NA | 5,214 | 0.9% | $97,763 | $18.75 | 2/28/2019 | |||||||
| Wynne & Wynne LLP | NA / NA / NA | 2,992 | 0.5% | $53,856 | $18.00 | 7/31/2017 | |||||||
| (1) | Based on the underwritten rent roll. |
| (2) | Ratings provided are for the parent company of the entity listed in the “Tenant” field whether or not the parent company guarantees the lease. |
| (3) | The Waste Management lease has two five-year extension options. |
| (4) | Waste Management has several options to contract its space: (i) approximately 880 square feet in the lower tunnel of the building any time on or after the last day of the 72nd month after lease commencement with respect to this particular space, with 12 months’ prior notice; and (ii) all of the space (but not less than all) either on the 12th floor (9,625 square feet) or the 17th floor (21,266 square feet), as of June 30, 2019, with prior written notice by October 31, 2018. In addition, Waste Management executed a contraction option earlier this year and plans to vacate the space it currently occupies on the 9th floor of the property (21,103 square feet) on December 31, 2015. According to the borrower, Waste Management is in the process of consolidating its Houston office footprint and is in discussions to expand the current lease. The ninth floor give-back is part of this long term strategy. |
| (5) | The Energy XXI lease has one five-year extension option. |
| (6) | McCord Development has the right to terminate its lease with 30 days’ notice. |
Lease Rollover Schedule(1) | ||||||||||||||||||
| Year | Number of Leases Expiring | Net Rentable Area Expiring | % of NRA Expiring | Base Rent Expiring | % of Base Rent Expiring | Cumulative Net Rentable Area Expiring | Cumulative % of NRA Expiring | Cumulative Base Rent Expiring | Cumulative % of Base Rent Expiring | |||||||||
Vacant(2) | NAP | 104,612 | 17.4% | NAP | NAP | 104,612 | 17.4% | NAP | NAP | |||||||||
| 2015 & MTM | 1 | 7,071 | 1.2 | $141,420 | 1.5% | 111,683 | 18.5% | $141,420 | 1.5% | |||||||||
| 2016 | 7 | 39,421 | 6.5 | 689,752 | 7.4 | 151,104 | 25.1% | $831,172 | 9.0% | |||||||||
| 2017 | 4 | 24,097 | 4.0 | 438,299 | 4.7 | 175,201 | 29.1% | $1,269,471 | 13.7% | |||||||||
| 2018 | 0 | 0 | 0.0 | 0 | 0.0 | 175,201 | 29.1% | $1,269,471 | 13.7% | |||||||||
| 2019 | 1 | 5,214 | 0.9 | 97,763 | 1.1 | 180,415 | 30.0% | $1,367,233 | 14.7% | |||||||||
| 2020 | 1 | 243,628 | 40.5 | 4,595,568 | 49.5 | 424,043 | 70.4% | $5,962,801 | 64.2% | |||||||||
| 2021 | 1 | 2,848 | 0.5 | 51,264 | 0.6 | 426,891 | 70.9% | $6,014,065 | 64.8% | |||||||||
| 2022 | 1 | 171,016 | 28.4 | 3,154,271 | 34.0 | 597,907 | 99.3% | $9,168,336 | 98.8% | |||||||||
| 2023 | 0 | 0 | 0.0 | 0 | 0.0 | 597,907 | 99.3% | $9,168,336 | 98.8% | |||||||||
| 2024 | 0 | 0 | 0.0 | 0 | 0.0 | 597,907 | 99.3% | $9,168,336 | 98.8% | |||||||||
| 2025 | 0 | 0 | 0.0 | 0 | 0.0 | 597,907 | 99.3% | $9,168,336 | 98.8% | |||||||||
| 2026 & Beyond | 2 | 4,215 | 0.7 | 115,653 | 1.2 | 602,122 | 100.0% | $9,283,989 | 100.0% | |||||||||
| Total | 18 | 602,122 | 100.0% | $9,283,989 | 100.0% | |||||||||||||
| (1) | Based on the underwritten rent roll. |
| (2) | Includes 21,103 square feet of space that Waste Management indicated it will vacate on December 31, 2015. |
THE INFORMATION IN THIS STRUCTURAL AND COLLATERAL TERM SHEET IS NOT COMPLETE AND MAY BE AMENDED PRIOR TO THE TIME OF SALE. THIS TERM SHEET IS NOT AN OFFER TO SELL THESE SECURITIES AND IT IS NOT A SOLICITATION OF AN OFFER TO BUY THESE SECURITIES IN ANY JURISDICTION WHERE THE OFFER OR SALE IS NOT PERMITTED.
| 42 of 122 | |
| Structural and Collateral Term Sheet | JPMBB 2015-C29 | |
One City Centre | ||
| Operating History and Underwritten Net Cash Flow | |||||||||
2012(1) | 2013 | 2014 | TTM(2) | Underwritten | Per Square Foot | %(3) | |||
Rents in Place(4) | $7,817,405 | $8,844,687 | $8,858,616 | $9,170,042 | $9,283,989 | $15.42 | 46.2 | % | |
| Vacant Income | 0 | 0 | 0 | 0 | 2,087,620 | 3.47 | 10.4 | ||
| Gross Potential Rent | $7,817,405 | $8,844,687 | $8,858,616 | $9,170,042 | $11,371,609 | $18.89 | 56.6 | % | |
| Total Reimbursements | 5,157,272 | 6,701,914 | 7,084,849 | 7,030,988 | 8,732,769 | 14.50 | 43.4 | ||
| Net Rental Income | $12,974,677 | $15,546,601 | $15,943,465 | $16,201,029 | $20,104,378 | $33.39 | 100.0 | % | |
| (Vacancy/Credit Loss) | 0 | 0 | (360,886) | (541,420) | (3,690,797) | (6.13 | ) | (18.4 | ) |
Other Income(5) | 1,818,819 | 3,352,968 | 2,780,759 | 2,706,353 | 2,891,917 | 4.80 | 14.4 | ||
| Effective Gross Income | $14,793,495 | $18,899,569 | $18,363,338 | $18,365,962 | $19,305,498 | $32.06 | 96.0 | % | |
| Total Expenses | $6,881,731 | $9,159,438 | $9,256,147 | $8,988,910 | $10,216,109 | $16.97 | 52.9 | % | |
| Net Operating Income | $7,911,764 | $9,740,131 | $9,107,191 | $9,377,052 | $9,089,389 | $15.10 | 47.1 | % | |
| Total TI/LC, Capex/RR | 0 | 0 | 0 | 0 | 912,642 | 1.52 | 4.7 | ||
| Net Cash Flow | $7,911,764 | $9,740,131 | $9,107,191 | $9,377,052 | $8,176,746 | $13.58 | 42.4 | % | |
| (1) | 2012 NOI represents annualized fourth quarter financials, as the property was acquired in September 2012. |
| (2) | TTM column represents the trailing 12-month period ending on February 28, 2015. |
| (3) | Percentage column represents percent of Net Rental Income for all revenue lines and represents percent of Effective Gross Income for the remainder of fields. |
| (4) | Underwritten Rents in Place consist of in-place rents as of February 28, 2015 including rent steps through March 2016. |
| (5) | Other Income consists primarily of income from the parking garages, totaling 1,369 spaces. The increase in 2013 Other Income is attributed to the lease termination penalty paid by Electronic Data Systems which had occupied 62,000 square feet at the property. Electronic Data Systems was acquired by Hewlett Packard in 2008 and as part of consolidation, exercised a termination option in 2013 resulting in approximately $1.0 million in termination fees. |
Property Management. The property is managed by Accesso Services, LLC, a Florida limited liability company and an affiliate of the borrower.
Escrows and Reserves. At origination, the borrower deposited into escrow $4,000,000 for an Energy XXI Reserve (as defined below), $2,104,333 for outstanding tenant improvements associated with leases in effect at closing, $954,924 for real estate taxes, $361,070 for outstanding free rent, rent abatements and tenant reimbursements associated with leases in effect at closing, $160,501 for a deferred maintenance reserve, $62,500 for future tenant improvements and leasing commissions and $10,036 for replacement reserves.
Tax Escrows - On a monthly basis, the borrower is required to escrow 1/12 of the annual estimated tax payments, which currently equates to $318,308.
Insurance Escrows - The requirement for the borrower to make monthly deposits into the insurance escrow is waived so long as (i) no event of default exists and (ii) either the borrower provides satisfactory evidence that the property is insured under an approved blanket policy in accordance with the loan documents or the property maintains a debt service coverage ratio greater than 1.75x.
Replacement Reserves - On a monthly basis, the borrower is required to escrow $10,036 (approximately $0.20 per square foot annually) for replacement reserves.
TI/LC Reserves - On a monthly basis, the borrower is required to deposit $62,500 (approximately $1.25 per square foot annually) into the TI/LC escrow. The reserve is subject to a cap of $2,250,000 (approximately $3.74 per square foot).
Energy XXI Reserve - At origination of the loan, $4,000,000 was reserved for re-leasing costs in the event Energy XXI contracts or vacates its space. Provided no event of default is continuing and the lender receives evidence that (i) there is no default under the Energy XXI lease, (ii) Energy XXI is in physical occupancy of the space covered by the lease and (iii) Energy XXI is open for business and is paying full contractual rent, the funds in this reserve will be released into the general TI/LC reserve in three installments: (a) $2,000,000 on April 1, 2017, (b) $1,000,000 on April 1, 2018 and (c) all funds remaining on deposit in the reserve account that may be used for general re-leasing costs on April 1, 2019.
THE INFORMATION IN THIS STRUCTURAL AND COLLATERAL TERM SHEET IS NOT COMPLETE AND MAY BE AMENDED PRIOR TO THE TIME OF SALE. THIS TERM SHEET IS NOT AN OFFER TO SELL THESE SECURITIES AND IT IS NOT A SOLICITATION OF AN OFFER TO BUY THESE SECURITIES IN ANY JURISDICTION WHERE THE OFFER OR SALE IS NOT PERMITTED.
| 43 of 122 | |
| Structural and Collateral Term Sheet | JPMBB 2015-C29 | |
One City Centre | ||
Waste Management Reserve - On each payment date following a Waste Management Trigger Event (as defined below) the borrower is required to deposit (a) all excess cash flows and (b) any termination deposit in connection with the Waste Management lease to be held for tenant improvements and leasing commissions pursuant to the terms more fully described in the loan agreement. The Waste Management Reserve is subject to a cap of (i) $30.00 per square foot of gross leasable space demised to Waste Management as of the origination date if triggered by clauses (i) or (ii) of the Waste Management Trigger Event or (ii) $30.00 per square foot of the leasable space demised to Waste Management as of the origination date not physically occupied by Waste Management or a replacement tenant if triggered by clause (iii).
Waste Management Sublease Reserve - On each payment date following a Waste Management Sublease Trigger Event (as defined below), the borrower is required to deposit $41,667 to be held as additional security for the loan. The Waste Management Sublease Reserve is subject to an initial cap of $1,500,000 (approximately $6.16 per square foot).
A “Waste Management Trigger Event” means the occurrence of any of the following: (i) Waste Management becomes the subject of a bankruptcy, insolvency or similar action, (ii) Waste Management goes dark or (iii) the borrower fails to satisfy the renewal criteria as described in the loan documents at least 12 months prior to expiration of the Waste Management lease.
A “Waste Management Sublease Trigger Event” means Waste Management subleasing more than 25% of the space demised to Waste Management under its lease as of the origination date.
Lockbox / Cash Management. The loan is structured with a hard lockbox and in-place cash management. The borrower was required to send tenant direction letters to tenants instructing them to deposit all rents and payments into the lockbox account controlled by the lender. All funds in the lockbox account are swept daily to a cash management account under the control of the lender and disbursed during each interest period of the term of the loan in accordance with the loan documents. To the extent that (i) there is an event of default under the loan documents, (ii) the debt service coverage ratio (as calculated in the loan documents) based on the immediately preceding trailing three-month period falls below 1.55x or (iii) the borrower or the property manager becomes the subject of a bankruptcy, insolvency or similar action, then all excess cash flow after payment of debt service, required reserves and operating expenses will be held as additional collateral for the loan. To the extent that there is a Waste Management Trigger Event, all excess cash flow after the payment of debt service and required reserves shall be swept into a Waste Management reserve subaccount.
Permitted Mezzanine Debt. Future mezzanine debt is permitted in connection with a bona fide sale to a third party and consequent assumption of the loan by a lender-approved borrower, provided, among other things as detailed in the loan agreement, (i) no event of default has occurred and is continuing, (ii) the combined loan-to-value ratio does not exceed 70.0%, (iii) the aggregate debt service coverage ratio including the mezzanine loan is no less than 1.55x, and (iv) an acceptable intercreditor agreement has been executed.
THE INFORMATION IN THIS STRUCTURAL AND COLLATERAL TERM SHEET IS NOT COMPLETE AND MAY BE AMENDED PRIOR TO THE TIME OF SALE. THIS TERM SHEET IS NOT AN OFFER TO SELL THESE SECURITIES AND IT IS NOT A SOLICITATION OF AN OFFER TO BUY THESE SECURITIES IN ANY JURISDICTION WHERE THE OFFER OR SALE IS NOT PERMITTED.
| 44 of 122 | |
| Structural and Collateral Term Sheet | JPMBB 2015-C29 | |
| 400 Poydras | ||
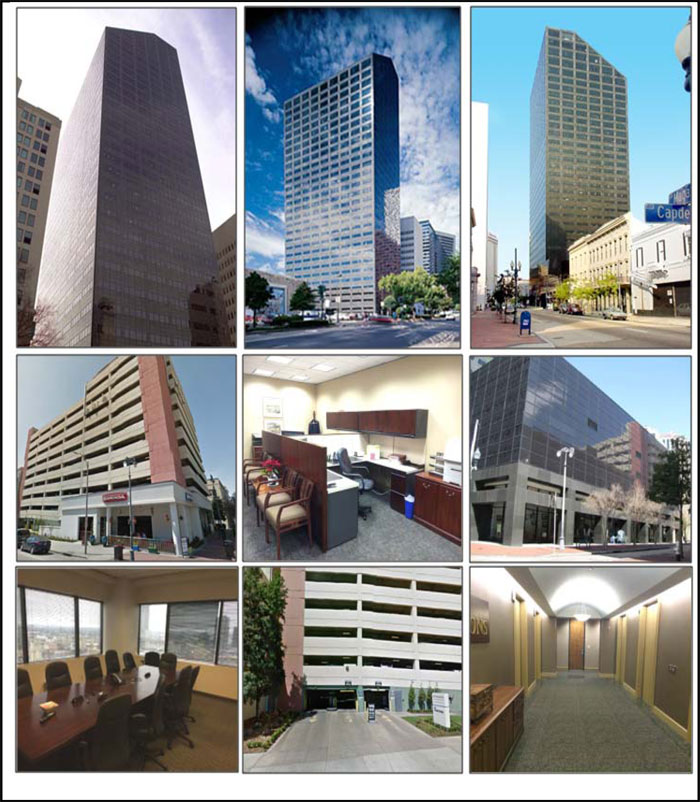
THE INFORMATION IN THIS STRUCTURAL AND COLLATERAL TERM SHEET IS NOT COMPLETE AND MAY BE AMENDED PRIOR TO THE TIME OF SALE. THIS TERM SHEET IS NOT AN OFFER TO SELL THESE SECURITIES AND IT IS NOT A SOLICITATION OF AN OFFER TO BUY THESE SECURITIES IN ANY JURISDICTION WHERE THE OFFER OR SALE IS NOT PERMITTED.
| 45 of 122 | |
| Structural and Collateral Term Sheet | JPMBB 2015-C29 | |
| 400 Poydras | ||
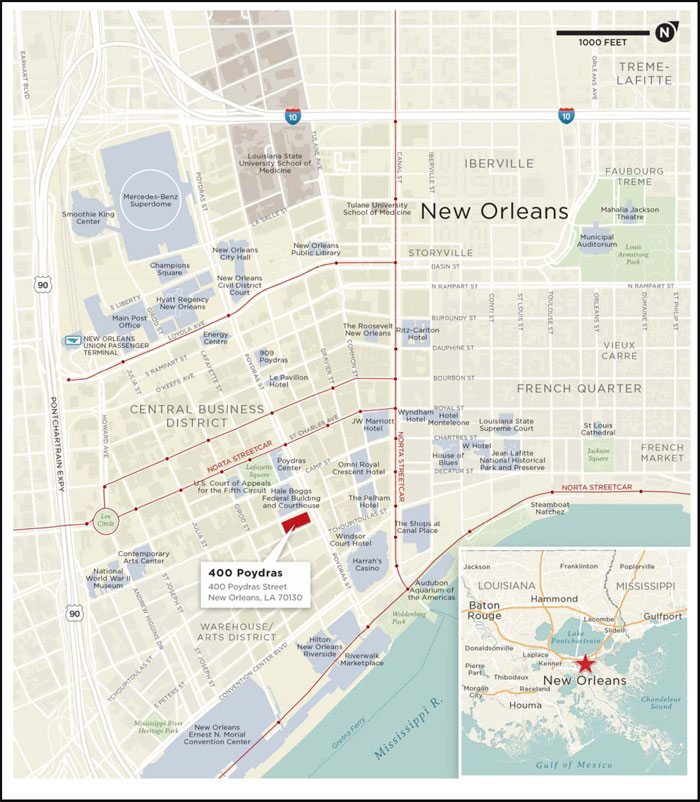
THE INFORMATION IN THIS STRUCTURAL AND COLLATERAL TERM SHEET IS NOT COMPLETE AND MAY BE AMENDED PRIOR TO THE TIME OF SALE. THIS TERM SHEET IS NOT AN OFFER TO SELL THESE SECURITIES AND IT IS NOT A SOLICITATION OF AN OFFER TO BUY THESE SECURITIES IN ANY JURISDICTION WHERE THE OFFER OR SALE IS NOT PERMITTED.
| 46 of 122 | |
| Structural and Collateral Term Sheet | JPMBB 2015-C29 | |
| 400 Poydras | ||
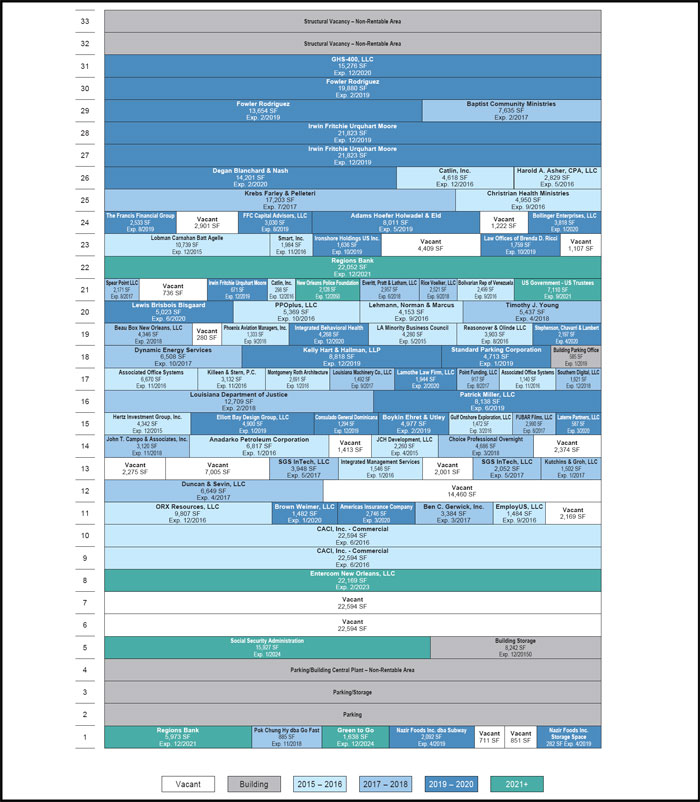
THE INFORMATION IN THIS STRUCTURAL AND COLLATERAL TERM SHEET IS NOT COMPLETE AND MAY BE AMENDED PRIOR TO THE TIME OF SALE. THIS TERM SHEET IS NOT AN OFFER TO SELL THESE SECURITIES AND IT IS NOT A SOLICITATION OF AN OFFER TO BUY THESE SECURITIES IN ANY JURISDICTION WHERE THE OFFER OR SALE IS NOT PERMITTED.
| 47 of 122 | |
| Structural and Collateral Term Sheet | JPMBB 2015-C29 | |
| 400 Poydras | ||
| Mortgage Loan Information | Property Information | |||
| Mortgage Loan Seller: | JPMCB | Single Asset / Portfolio: | Single Asset | |
| Original Principal Balance: | $55,900,000 | Title: | Fee | |
| Cut-off Date Principal Balance: | $55,756,339 | Property Type - Subtype: | Mixed Use - Office/Retail/Parking | |
| % of Pool by IPB: | 5.7% | Net Rentable Area (SF)(1): | 595,566 | |
| Loan Purpose: | Refinance | Location: | New Orleans, LA | |
| Borrower: | Hertz Texaco Center, LLC | Year Built / Renovated: | 1983 / N/A | |
| Sponsors: | William Z. Hertz, Isaac Hertz | Occupancy: | 85.2% | |
| and Sarah Hertz | Occupancy Date: | 2/25/2015 | ||
| Interest Rate: | 4.38984% | Number of Tenants: | 73 | |
| Note Date: | 3/20/2015 | 2012 NOI: | $5,109,642 | |
| Maturity Date: | 4/1/2025 | 2013 NOI(2): | $5,188,598 | |
| Interest-only Period: | None | 2014 NOI(2): | $5,708,029 | |
| Original Term: | 120 months | TTM NOI (as of 3/2015)(3): | $5,778,132 | |
| Original Amortization: | 360 months | UW Economic Occupancy: | 88.6% | |
| Amortization Type: | Balloon | UW Revenues: | $11,390,127 | |
| Call Protection: | L(25),Grtr1%orYM(92),O(3) | UW Expenses: | $5,176,925 | |
| Lockbox: | Hard | UW NOI(3): | $6,213,202 | |
| Additional Debt: | Yes | UW NCF: | $5,379,409 | |
| Additional Debt Balance: | $7,000,000 | Appraised Value / Per SF: | $76,700,000 / $129 | |
| Additional Debt Type: | Mezzanine Loan | Appraisal Date: | 1/23/2015 | |
Escrows and Reserves(4) | Financial Information | |||||||
| Initial | Monthly | Initial Cap | Cut-off Date Loan / SF: | $94 | ||||
| Taxes: | $336,644 | $84,200 | N/A | Maturity Date Loan / SF: | $76 | |||
| Insurance: | $0 | Springing | N/A | Cut-off Date LTV: | 72.7% | |||
| Replacement Reserves: | $9,925 | $9,925 | N/A | Maturity Date LTV: | 58.7% | |||
| TI/LC: | $1,500,000 | $59,557 | N/A | UW NCF DSCR: | 1.60x | |||
| Other: | $551,842 | $0 | N/A | UW NOI Debt Yield: | 11.1% | |||
| Sources and Uses | ||||||||||
| Sources | Proceeds | % of Total | Uses | Proceeds | % of Total | |||||
| Mortgage Loan | $55,900,000 | 88.9% | Payoff Existing Debt | $46,241,666 | 73.5 | % | ||||
| Mezzanine Loan | 7,000,000 | 11.1 | Return of Equity | 13,854,425 | 22.0 | |||||
| Upfront Reserves | 2,398,411 | 3.8 | ||||||||
| Closing Costs | 405,497 | 0.7 | ||||||||
| Total Sources | $62,900,000 | 100.0% | Total Uses | $62,900,000 | 100.0 | % | ||||
| (1) | Net Rentable Area (SF) excludes 11,042 square feet of structurally vacant space located at the top of the Office Property. For the purpose of underwriting, the space has been removed from any underwriting consideration. |
| (2) | The increase in 2014 NOI from 2013 NOI is primarily driven by 20 tenants that either renewed or signed new leases at the Office Property in 2014. The 20 tenants account for 124,824 square feet of net rentable area and pay approximately $2.2 million in annual rent. |
| (3) | The increase in UW NOI from TTM NOI is due to rent escalations underwritten through April 1, 2016 totaling $120,526, as well as 12 new tenants which took occupancy between October 2014 and February 2015. The 12 tenants account for 35,359 square feet of net rentable area and pay $596,155 in annual rent and the burning off of concessions from leases signed in 2014. |
| (4) | For a full description of Escrows and Reserves, please refer to “Escrows and Reserves” below. |
The Loan. The 400 Poydras loan has an outstanding principal balance of approximately $55.8 million and is secured by a first mortgage lien on a 585,639 square foot Class A office tower and a 766 space parking structure with 9,927 square feet of ground floor retail space, located in New Orleans, Louisiana. The loan has a 10-year term and will amortize on a 30-year schedule. The previously existing debt of approximately $46.2 million was originally issued by Wells Fargo Bank.
The Borrower. The borrowing entity for the 400 Poydras loan is Hertz Texaco Center, LLC, a Delaware limited liability company and special purpose entity.
THE INFORMATION IN THIS STRUCTURAL AND COLLATERAL TERM SHEET IS NOT COMPLETE AND MAY BE AMENDED PRIOR TO THE TIME OF SALE. THIS TERM SHEET IS NOT AN OFFER TO SELL THESE SECURITIES AND IT IS NOT A SOLICITATION OF AN OFFER TO BUY THESE SECURITIES IN ANY JURISDICTION WHERE THE OFFER OR SALE IS NOT PERMITTED.
| 48 of 122 | |
| Structural and Collateral Term Sheet | JPMBB 2015-C29 | |
| 400 Poydras | ||
The Sponsors. The loan sponsors and nonrecourse carve-out guarantors are William Z. Hertz, Isaac Hertz and Sarah Hertz of the Hertz Investment Group, LLC. The Hertz Investment Group is a national real estate investment and management company currently headquartered in Santa Monica, California. Hertz Investment Group focuses its acquisition strategy toward secondary central business districts and state capitals in an effort to control the market. Since its founding in 1979 by Judah Hertz, the company has grown to own and manage approximately 12.2 million square feet, with an aggregate portfolio market value of approximately $1.2 billion. Currently, the Hertz Investment Group owns four other commercial real estate assets, totaling approximately 1.9 million square feet, in New Orleans.
The sponsors purchased the property for approximately $49.0 million in July 2005, at a point when occupancy was dwindling and the largest tenant, Texaco, had announced its intentions to vacate its space. Although the sponsors were able to retain a majority of the sublet space, occupancy proceeded to drop to approximately 63.3% after Texaco vacated its space.
The Property. The 400 Poydras property consists of a 33-story building with 585,639 square feet of Class A office space and adjoining parking garage (the “400 Poydras Office Property” or the “Office Property”) and a separate 766-space parking facility located across the street from the 400 Poydras Office Property (the “Tchoupitoulas Parking Garage”). Both the 400 Poydras Office Property and the Tchoupitoulas Parking Garage were constructed in 1983 and are situated on approximately 1.2 acres and 0.7 acres, respectively. The 400 Poydras Office Property was originally designed by architectural firm Skidmore, Owings & Merrill. The lobby features 20 foot ceilings and serves as a gallery for a collection of regional artwork. Additionally, a majority of the floors offer unobstructed views of the Mississippi River, French Quarter, Warehouse District and central business district skyline. Office tenants at the property also benefit from the adjoining parking garage that offers 251 spaces allocated solely for tenant use. As of February 25, 2015, all 251 spaces were contracted on a monthly basis by tenants at the 400 Poydras Office Property. The adjoining parking garage also contains several ground floor retail spaces consisting of, among other tenants, a Regions Bank, Subway and Green to Go, a local restaurant offering an organic alternative to traditional fast food. Access to the 400 Poydras Office Property is provided by Poydras Street, Magazine Street, Constance Street and Lafayette Street. US Highway 90 is located approximately 0.6 miles south of the office property and provides regional access, as well as direct access to Interstate Highway 10.
As of February 25, 2015, the property was 85.2% occupied by 73 tenants and, since the beginning of 2014, the loan sponsors have executed 25 new or renewal leases. The largest tenant at the property, CACI, Inc. - Commercial (“CACI”), leases 7.6% of the net rentable area through June 2016 and has occupied the space since November 2007. CACI is a multinational professional services and information technology company headquartered in Arlington, Virginia. CACI is currently a member of the Fortune 1000 Largest Companies, the Russell 2000 Index and the S&P SmallCap 600 Index and in 2014 was named by Fortune as one of the World’s Most Admired Companies in the information technology services industry. CACI operates on a year-to-year basis which is consistent across their 111 office locations totaling approximately 2.4 million square feet nationwide and accounts for approximately 10.4% of the in-place base rent at the office property. The second largest tenant, Irwin Fritchie Urquhart & Moore (“IFUM”), leases approximately 7.4% of the net rentable area through December 2019 and has occupied the space since April 2001. IFUM serves as local, regional and national counsel for public companies, privately owned businesses, governmental entities, non-profit organizations, individuals and insurers. IFUM is currently headquartered at the Office Property and accounts for 8.4% of the in-place base rent. The third largest tenant, Fowler Rodriguez (“Fowler”), leases approximately 5.6% of the net rentable area through February 2019 and has occupied the space since September 2003. Additionally, the tenant most recently renewed its lease in September 2013. Fowler is an international law firm with eight offices located in the United States and South America. Fowler accounts for approximately 6.4% of the in-place base rent at the property.
The Tchoupitoulas Parking Garage, currently under a management contract with Central Parking, is located across the street from the 400 Poydras Office Property and contains 766 parking spaces, of which 434 spaces are contracted to 400 Poydras Office Property tenants on a monthly basis. The remaining spaces are allocated for transient use and cater to the surrounding office buildings, hotels, special event facilities and the French Quarter. Access to the parking garage is provided via a single point of entry on Tchoupitoulas Street, a north and south one-way street that runs perpendicular to Poydras Street. The parking garage benefits from its automatic payment systems, which allow for reduced personnel costs and a more efficient parking system. The Tchoupitoulas Parking Garage benefits from contracts with the Social Security Administration, Louisiana Department of Justice, Harrah’s Hotel and Casino and Barcadia Bar and Grill. The parking garage also contains 9,927 square feet of ground floor retail space that is currently leased to Barcadia Bar and Grill through June 2024, who accounts for approximately 2.0% of the in-place base rent.
The properties are located in the heart of the New Orleans central business district and many demand drivers lie within walking distance of the property, including the French Quarter, Mercedes-Benz Superdome, City Hall, Port of New Orleans and six casinos. The properties also benefit from their proximity to major public transportation lines, including the Poydras Station, which is located three blocks east, and the Canal Street Station, which is located four blocks northeast. Additionally, the property is located approximately 14.9 miles east of Louis Armstrong New Orleans International Airport and approximately 4.2 miles east of Tulane University.
THE INFORMATION IN THIS STRUCTURAL AND COLLATERAL TERM SHEET IS NOT COMPLETE AND MAY BE AMENDED PRIOR TO THE TIME OF SALE. THIS TERM SHEET IS NOT AN OFFER TO SELL THESE SECURITIES AND IT IS NOT A SOLICITATION OF AN OFFER TO BUY THESE SECURITIES IN ANY JURISDICTION WHERE THE OFFER OR SALE IS NOT PERMITTED.
| 49 of 122 | |
| Structural and Collateral Term Sheet | JPMBB 2015-C29 | |
| 400 Poydras | ||
According to the appraisal, the property is located in the New Orleans central business district submarket of the New Orleans / Metairie / Kenner market. As of the fourth quarter of 2014, the submarket consisted of 144 buildings totaling approximately 9.2 million square feet of office space with an overall vacancy rate of 15.3% and average rents of $16.22 per square foot, compared to 17.5% and $13.90 per square foot, respectively, from the fourth quarter of 2013. The appraisal identified four directly comparable office properties built between 1983 and 1987 and ranging in size from approximately 453,255 to 757,275 square feet. The comparable properties reported occupancies ranging from 72.0% to 95.0% with a weighted average of 87.4%. Asking rents for the comparable properties range from $17.00 to $18.50 per square foot. The appraisal concluded an office market rent of $16.00 per square foot for the Office Property’s low-rise floors (5 through 18) and $17.00 per square foot for the Office Property’s high-rise floors (19 through 31). The average in-place rents for the Office Property’s low-rise and high-rise floors are $18.53 per square foot and $16.73 per square foot, respectively, which is in line with the appraisal’s concluded office market rents. Additionally, the appraisal identified five comparable parking garage properties ranging in size from 450 spaces to 825 spaces. The daily rates at the comparable garages ranged from $20 to $30 per space with monthly rates ranging from $175 to $250 for unreserved spaces and $225 to $270 for reserved spaces.
Historical and Current Occupancy(1) | |||
| 2012 | 2013 | 2014 | Current(2) |
| 79.8% | 80.9% | 82.8% | 85.2% |
| (1) | Historical occupancies are as of December 31 of each respective year. |
| (2) | Current Occupancy is as of February 25, 2015. |
Tenant Summary(1) | ||||||
| Tenant | Ratings(2) Moody’s/S&P/Fitch | Net Rentable Area (SF) | % of Total NRA | Base Rent PSF | Lease Expiration Date | |
CACI, Inc. – Commercial(3) | Ba2 / BB+ / NA | 45,188 | 7.6% | $20.00 | 6/30/2016 | |
| Irwin Fritchie Urquhart & Moore | NA / NA / NA | 44,317 | 7.4% | $16.50 | 12/31/2019 | |
Fowler Rodriguez(4) | NA / NA / NA | 33,534 | 5.6% | $17.00 | 2/28/2019 | |
| Regions Bank | Ba1 / BBB / BBB | 28,625 | 4.8% | $18.42 | 12/31/2021 | |
| Entercom New Orleans, LLC | NA / NA / NA | 22,169 | 3.7% | $18.50 | 2/28/2023 | |
| Krebs Farley & Pelleteri | NA / NA / NA | 17,203 | 2.9% | $17.00 | 7/31/2017 | |
| Social Security Administration | NA / NA / NA | 15,927 | 2.7% | $27.99 | 1/11/2024 | |
| GHS-400, LLC | NA / NA / NA | 15,276 | 2.6% | $19.80 | 12/31/2020 | |
| Degan Blanchard & Nash | NA / NA / NA | 14,201 | 2.4% | $16.75 | 2/28/2020 | |
| Louisiana Department of Justice | NA / NA / NA | 12,709 | 2.1% | $17.23 | 2/24/2018 | |
(1) | Based on the underwritten rent roll. |
| (2) | Ratings provided are for the parent company of the entity listed in the “Tenant” field, whether or not the parent company guarantees the lease. |
| (3) | CACI has the one-time option to terminate its lease on December 31, 2015 with 60 days’ prior written notice. |
| (4) | Fowler Rodriguez occupies two suites at the property, 19,880 square feet and 13,654 square feet, respectively. The $17.00 per square foot Base Rent PSF represents a weighted average of the underwritten base rent on Fowler’s two suites. |
THE INFORMATION IN THIS STRUCTURAL AND COLLATERAL TERM SHEET IS NOT COMPLETE AND MAY BE AMENDED PRIOR TO THE TIME OF SALE. THIS TERM SHEET IS NOT AN OFFER TO SELL THESE SECURITIES AND IT IS NOT A SOLICITATION OF AN OFFER TO BUY THESE SECURITIES IN ANY JURISDICTION WHERE THE OFFER OR SALE IS NOT PERMITTED.
| 50 of 122 | |
| Structural and Collateral Term Sheet | JPMBB 2015-C29 | |
| 400 Poydras | ||
Lease Rollover Schedule(1) | |||||||||||||||||||
Year | Number of Leases Expiring | Net Rentable Area Expiring | % of NRA Expiring | Base Rent Expiring | % of Base Rent Expiring | Cumulative Net Rentable Area Expiring | Cumulative % of NRA Expiring | Cumulative Base Rent Expiring | Cumulative % of Base Rent Expiring | ||||||||||
| Vacant | NAP | 88,366 | 14.8 | % | NAP | NAP | 88,366 | 14.8% | NAP | NAP | |||||||||
| 2015 & MTM | 3 | 17,279 | 2.9 | $289,384 | 3.3 | % | 105,645 | 17.7% | $289,384 | 3.3% | |||||||||
| 2016 | 19 | 114,404 | 19.2 | 2,077,738 | 23.7 | 220,049 | 36.9% | $2,367,122 | 27.0% | ||||||||||
| 2017 | 11 | 56,451 | 9.5 | 957,321 | 10.9 | 276,500 | 46.4% | $3,324,443 | 37.9% | ||||||||||
| 2018 | 8 | 36,061 | 6.1 | 639,499 | 7.3 | 312,561 | 52.5% | $3,963,942 | 45.2% | ||||||||||
| 2019 | 15 | 130,034 | 21.8 | 2,160,380 | 24.6 | 442,595 | 74.3% | $6,124,322 | 69.8% | ||||||||||
| 2020 | 10 | 51,542 | 8.7 | 920,865 | 10.5 | 494,137 | 83.0% | $7,045,187 | 80.3% | ||||||||||
| 2021 | 2 | 35,735 | 6.0 | 658,542 | 7.5 | 529,872 | 89.0% | $7,703,729 | 87.8% | ||||||||||
| 2022 | 0 | 0 | 0.0 | 0 | 0.0 | 529,872 | 89.0% | $7,703,729 | 87.8% | ||||||||||
| 2023 | 1 | 22,169 | 3.7 | 410,127 | 4.7 | 552,041 | 92.7% | $8,113,855 | 92.5% | ||||||||||
| 2024 | 3 | 27,492 | 4.6 | 641,619 | 7.3 | 579,533 | 97.3% | $8,755,474 | 99.8% | ||||||||||
| 2025 | 0 | 0 | 0.0 | 0 | 0.0 | 579,533 | 97.3% | $8,755,474 | 99.8% | ||||||||||
2026 & Beyond(2) | 1 | 16,033 | 2.7 | 17,556 | 0.2 | 595,566 | 100.0% | $8,773,030 | 100.0% | ||||||||||
| Total | 73 | 595,566 | 100.0 | % | $8,773,030 | 100.0 | % | ||||||||||||
| (1) | Based on the underwritten rent roll as of February 25, 2015. |
| (2) | 2026 & Beyond includes a building parking office totaling 585 square feet, a building storage space totaling 8,242 square feet, a Hertz Investment Group, Inc. storage space totaling 736 square feet and the Hertz Investment Group, Inc. management office totaling 4,342 square feet, none of which have income associated with their respective spaces. The spaces are not considered vacant as they contribute to building amenities and services. |
| Operating History and Underwritten Net Cash Flow | |||||||||||||||
2012 | 2013 | 2014 | TTM(1) | Underwritten | Per Square Foot | %(2) | |||||||||
Rents in Place(3)(4) | $7,630,122 | $7,716,120 | $8,157,547 | $8,222,481 | $8,773,030 | $14.73 | 68.5 | % | |||||||
| Vacant Income | 0 | 0 | 0 | 0 | 1,458,039 | 2.45 | 11.4 | ||||||||
| Gross Potential Rent | $7,630,122 | $7,716,120 | $8,157,547 | $8,222,481 | $10,231,069 | $17.18 | 79.8 | % | |||||||
| Parking Income | 1,906,092 | 1,939,325 | 2,137,077 | 2,256,840 | 2,137,077 | 3.59 | 16.7 | ||||||||
| Total Reimbursements | 337,786 | 506,056 | 457,447 | 498,063 | 445,640 | 0.75 | 3.5 | ||||||||
| Net Rental Income | $9,874,000 | $10,161,501 | $10,752,071 | $10,977,384 | $12,813,786 | $21.52 | 100.0 | % | |||||||
| (Vacancy/Credit Loss) | 0 | 0 | 0 | 0 | (1,458,038) | (2.45) | (11.4 | ) | |||||||
| Other Income | 33,176 | 21,306 | 34,379 | 34,419 | 34,379 | 0.06 | 0.3 | ||||||||
| Effective Gross Income | $9,907,176 | $10,182,807 | $10,786,450 | $11,011,803 | $11,390,127 | $19.12 | 88.9 | % | |||||||
| Total Expenses | $4,797,534 | $4,994,209 | $5,078,421 | $5,233,671 | $5,176,925 | $8.69 | 45.5 | % | |||||||
| Net Operating Income | $5,109,642 | $5,188,598 | $5,708,029 | $5,778,132 | $6,213,202 | $10.43 | 54.5 | % | |||||||
| Total TI/LC, Capex/RR | 0 | 0 | 0 | 0 | 833,792 | 1.40 | 7.3 | ||||||||
| Net Cash Flow | $5,109,642 | $5,188,598 | $5,708,029 | $5,778,132 | $5,379,409 | $9.03 | 47.2 | % | |||||||
| (1) | TTM column represents the trailing 12-month period ending on March 31, 2015. |
| (2) | Percentage column represents percent of Net Rental Income for all revenue lines and represents percent of Effective Gross Income for the remainder of the fields. |
| (3) | The increase in 2014 Rents in Place from 2013 Rents in Place is primarily driven by 20 tenants that either renewed or signed new leases at the Office Property in 2014. The 20 tenants account for 124,824 square feet of net rentable area and pay approximately $2.2 million in annual rent. |
| (4) | The increase in Underwritten Rents in Place from TTM Rents in Place is due to rent escalations underwritten through April 1, 2016 totaling $120,526, as well as 12 new tenants which took occupancy between October 2014 and February 2015. The 12 tenants account for 35,359 square feet of net rentable area and pay $596,155 in annual rent. |
Property Management. The 400 Poydras Office Property is managed by Hertz Investment Group, LLC, an affiliate of the sponsor. The current management agreement commenced on March 16, 2015 and has a three-year term and will automatically renew for two consecutive periods of three years unless otherwise terminated by either party. The management agreement provides for a contractual management fee of 5.0% of the gross income, payable on a monthly basis. The management fees related to the 400 Poydras loan are subordinate to the liens and interests of the 400 Poydras loan.
THE INFORMATION IN THIS STRUCTURAL AND COLLATERAL TERM SHEET IS NOT COMPLETE AND MAY BE AMENDED PRIOR TO THE TIME OF SALE. THIS TERM SHEET IS NOT AN OFFER TO SELL THESE SECURITIES AND IT IS NOT A SOLICITATION OF AN OFFER TO BUY THESE SECURITIES IN ANY JURISDICTION WHERE THE OFFER OR SALE IS NOT PERMITTED.
| 51 of 122 | |
| Structural and Collateral Term Sheet | JPMBB 2015-C29 | |
| 400 Poydras | ||
Escrows and Reserves. At origination, the borrower was required to deposit into escrow $1.5 million for future tenant improvements and leasing commission reserves, $450,223 for outstanding tenant improvements and leasing commissions, $336,644 for real estate taxes, $73,494 for free rent reserves related to seven tenants, $28,125 for engineering reserves and $9,925 for capital expenditure reserves.
Tax Escrows - On a monthly basis, the borrower is required to escrow 1/12 of the annual estimated tax payments, which currently equates to $84,200.
Insurance Escrows - The requirement for the borrower to make deposits to the insurance escrow is waived so long as no event of default has occurred and is continuing and the borrower provides satisfactory evidence that the property is insured as part of a blanket policy in accordance with the loan documents.
Replacement Reserves - On a monthly basis, the borrower is required to escrow approximately $9,925 (approximately $0.20 per square foot annually) for replacement reserves. The reserve is not subject to a cap.
TI/LC Reserves - On a monthly basis, the borrower is required to escrow $59,557 (approximately $1.20 per square foot annually) for tenant improvement and leasing commission reserves. The reserve is not subject to a cap.
Lockbox / Cash Management. The loan is structured with a hard lockbox and in-place cash management. At origination, the borrower was required to send a tenant direction letter to all tenants at the properties instructing them to deposit all rents and payments into the lockbox account. All funds in the lockbox account are swept daily to a segregated cash management account under the control of the lender. To the extent there is a Cash Sweep Event (as defined below) continuing, all excess cash flow after payment of the mortgage and mezzanine debt service, required reserves and operating expenses will be held as additional collateral for the loan. The lender has a first priority security interest in the cash management account.
A “Cash Sweep Event” means the occurrence of (i) an event of default, (ii) any bankruptcy action of the borrower or property manager, or (iii) the date on which the debt service coverage ratio based on a trailing three months of gross income from operations and a 12 month operating expense calculation is less than 1.10x.
Additional Debt. The $7.0 million mezzanine loan is secured by direct equity interests in the borrower and is coterminous with the mortgage loan. The mezzanine loan was sold to a third party investor. The mezzanine loan is interest-only for the entire term of the loan and has a 10.25000% coupon. Including the mezzanine loan, the Cut-off Date LTV is 81.8%, the UW NCF DSCR is 1.32x and the UW NOI Debt Yield is 9.9%.
THE INFORMATION IN THIS STRUCTURAL AND COLLATERAL TERM SHEET IS NOT COMPLETE AND MAY BE AMENDED PRIOR TO THE TIME OF SALE. THIS TERM SHEET IS NOT AN OFFER TO SELL THESE SECURITIES AND IT IS NOT A SOLICITATION OF AN OFFER TO BUY THESE SECURITIES IN ANY JURISDICTION WHERE THE OFFER OR SALE IS NOT PERMITTED.
| 52 of 122 | |
| Structural and Collateral Term Sheet | JPMBB 2015-C29 | |
| Cole IV Retail Portfolio – Pool I | ||
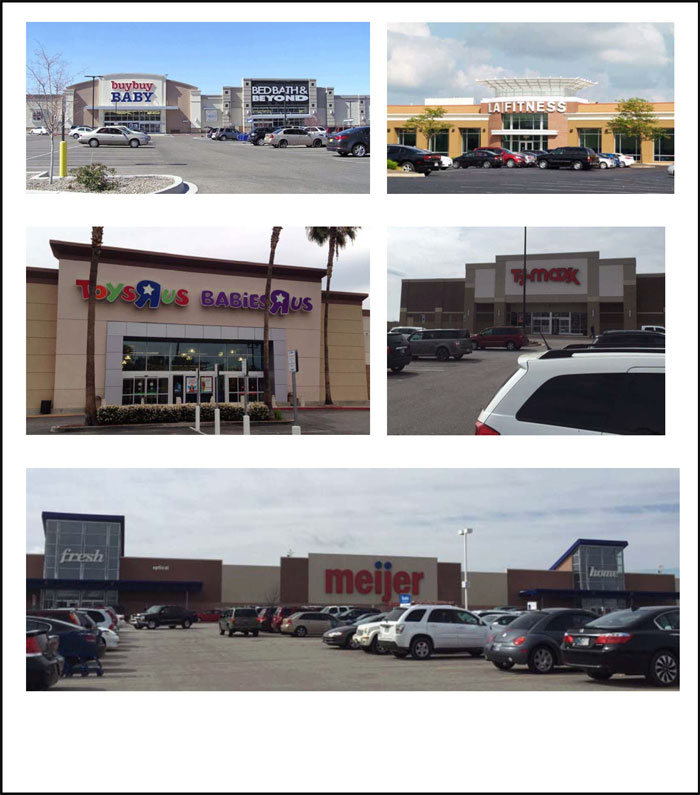
THE INFORMATION IN THIS STRUCTURAL AND COLLATERAL TERM SHEET IS NOT COMPLETE AND MAY BE AMENDED PRIOR TO THE TIME OF SALE. THIS TERM SHEET IS NOT AN OFFER TO SELL THESE SECURITIES AND IT IS NOT A SOLICITATION OF AN OFFER TO BUY THESE SECURITIES IN ANY JURISDICTION WHERE THE OFFER OR SALE IS NOT PERMITTED.
| 53 of 122 | |
| Structural and Collateral Term Sheet | JPMBB 2015-C29 | |
Cole IV Retail Portfolio – Pool I | ||
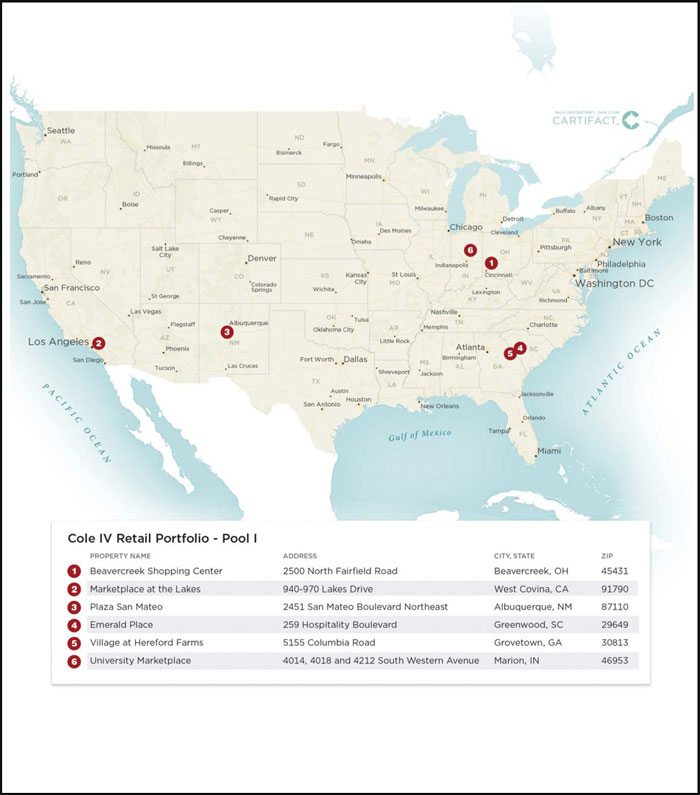
THE INFORMATION IN THIS STRUCTURAL AND COLLATERAL TERM SHEET IS NOT COMPLETE AND MAY BE AMENDED PRIOR TO THE TIME OF SALE. THIS TERM SHEET IS NOT AN OFFER TO SELL THESE SECURITIES AND IT IS NOT A SOLICITATION OF AN OFFER TO BUY THESE SECURITIES IN ANY JURISDICTION WHERE THE OFFER OR SALE IS NOT PERMITTED.
| 54 of 122 | |
| Structural and Collateral Term Sheet | JPMBB 2015-C29 | |
Cole IV Retail Portfolio – Pool I | ||
| Mortgage Loan Information | Property Information | |||
| Mortgage Loan Seller: | Barclays | Single Asset / Portfolio: | Portfolio | |
| Original Principal Balance: | $50,000,000 | Title: | Fee | |
| Cut-off Date Principal Balance: | $50,000,000 | Property Type - Subtype: | Retail - Anchored | |
| % of Pool by IPB: | 5.1% | Net Rentable Area (SF): | 680,486 | |
Loan Purpose(1): | Acquisition | Location: | Various | |
Borrowers(2): | Various | Year Built / Renovated: | Various / N/A | |
| Sponsor: | Cole Operating Partnership IV, LP | Occupancy: | 99.6% | |
| Interest Rate: | 3.80300% | Occupancy Date: | 2/10/2015 | |
| Note Date: | 4/9/2015 | Number of Tenants: | 36 | |
| Maturity Date: | 5/6/2020 | 2012 NOI(3): | N/A | |
| Interest-only Period: | 60 months | 2013 NOI(3): | N/A | |
| Original Term: | 60 months | 2014 NOI(4): | $7,244,804 | |
| Original Amortization: | None | TTM NOI (as of 2/2015)(5)(6): | $7,434,168 | |
| Amortization Type: | Interest Only | UW Economic Occupancy: | 95.1% | |
| Call Protection: | L(25),Grtr1%orYM(31),O(4) | UW Revenues: | $9,818,217 | |
| Lockbox: | Hard | UW Expenses: | $3,098,492 | |
| Additional Debt: | N/A | UW NOI(6): | $6,719,726 | |
| Additional Debt Balance: | N/A | UW NCF: | $6,389,112 | |
| Additional Debt Type: | N/A | Appraised Value / Per SF: | $103,900,000 / $153 | |
Appraisal Date(7): | Various | |||
Escrows and Reserves(8) | Financial Information | ||||||
| Initial | Monthly | Initial Cap | Cut-off Date Loan / SF: | $73 | |||
| Taxes: | $0 | Springing | N/A | Maturity Date Loan / SF: | $73 | ||
| Insurance: | $0 | Springing | N/A | Cut-off Date LTV: | 48.1% | ||
| Replacement Reserves: | $0 | $5,671 | N/A | Maturity Date LTV: | 48.1% | ||
| TI/LC: | $0 | $28,354 | N/A | UW NCF DSCR: | 3.30x | ||
| Other: | $0 | $0 | N/A | UW NOI Debt Yield: | 13.4% | ||
| Sources and Uses | ||||||
| Sources | Proceeds | % of Total | Uses | Proceeds | % of Total | |
| Mortgage Loan | $50,000,000 | 51.3% | Purchase Price(1) | $96,511,983 | 99.0% | |
| Sponsor Equity | 47,528,127 | 48.7 | Closing Costs | 1,016,144 | 1.0 | |
| Total Sources | $97,528,127 | 100.0% | Total Uses | $97,528,127 | 100.0% | |
| (1) | A portion of the mortgage loan proceeds were used to remove four of the six properties that served as collateral under the loan sponsor’s line of credit facilities. |
| (2) | For a full description of the borrowing entities, please refer to “The Borrowers” below. |
| (3) | Complete historical operating statements are unavailable for the portfolio as the properties were acquired by the loan sponsor between March 2013 and September 2014 for a combined purchase price of $96,511,983. |
| (4) | 2014 NOI encompasses the year-end 2014 period for four of the six properties, the trailing seven-month period annualized for Plaza San Mateo and the trailing four-month period for annualized Village at Hereford Farms, as these properties were acquired in May 2014 and September 2014, respectively. |
| (5) | TTM NOI encompasses the trailing 12-month period for four of the six properties, the trailing nine-month period annualized for Plaza San Mateo and the trailing six-month period annualized for Village at Hereford Farms, as these properties were acquired in May 2014 and September 2014, respectively. |
| (6) | The portfolio was 99.6% occupied as of February 10, 2015. As such, the decrease from TTM NOI to UW NOI is primarily due to the inclusion of a $504,555 vacancy adjustment. |
| (7) | The appraisals are dated as of February 12, 2015 through February 27, 2015. |
| (8) | For a full description of Escrows and Reserves, please refer to “Escrows and Reserves” below. |
The Loan. The Cole IV Retail Portfolio – Pool I loan has an outstanding principal balance of $50.0 million and is secured by a first mortgage lien on the borrowers’ fee simple interests in a portfolio of six multi-tenant retail anchored properties totaling 680,486 square feet located across six states. The loan has a five-year term and is interest-only for the entire term. The properties were acquired by the loan sponsor between March 2013 and September 2014, and at origination of the mortgage loan, two of the six assets were unencumbered (Plaza San Mateo and Village at Hereford Farms). The other four assets served as collateral under the loan sponsor’s line of credit facilities.
THE INFORMATION IN THIS STRUCTURAL AND COLLATERAL TERM SHEET IS NOT COMPLETE AND MAY BE AMENDED PRIOR TO THE TIME OF SALE. THIS TERM SHEET IS NOT AN OFFER TO SELL THESE SECURITIES AND IT IS NOT A SOLICITATION OF AN OFFER TO BUY THESE SECURITIES IN ANY JURISDICTION WHERE THE OFFER OR SALE IS NOT PERMITTED.
| 55 of 122 | |
| Structural and Collateral Term Sheet | JPMBB 2015-C29 | |
Cole IV Retail Portfolio – Pool I | ||
The Borrowers. The borrowing entities for the loan are Cole MT West Covina (Lakes) CA, LP, ARCP MT Grovetown GA, LLC, Cole MT Albuquerque (San Mateo) NM, LLC, Cole MT Beavercreek OH, LLC, Cole MT Greenwood SC, LLC and Cole MT Marion IN, LLC. Each entity is a single purpose entity and is either a Delaware limited liability company or Delaware limited partnership.
The Sponsor. The loan sponsor and nonrecourse carve-out guarantor is Cole Operating Partnership IV, LP. The sole general partner of Cole Operating Partnership IV, LP is Cole Credit Property Trust IV, Inc. (“CCPT”), a Maryland corporation formed in July 2010. CCPT is externally managed by Cole REIT Advisors IV, LLC, an affiliate of Cole Capital, which is the trade name used to refer to a group of affiliated entities directly or indirectly controlled by American Realty Capital Properties, Inc. See “Risk Factors-Litigation or Other Legal Proceedings Could Adversely Affect the Mortgage Loans” in the Free Writing Prospectus. CCPT primarily invests in power retail centers leased to creditworthy tenants under long-term net leases. As of December 31, 2014, CCPT owned 759 properties comprised of 20.2 million square feet located in 45 states that were 99.0% leased in the aggregate. As of December 31, 2014, CCPT had total assets equal to approximately $4.04 billion and a net worth of approximately $2.33 billion.
The Properties. Cole IV Retail Portfolio – Pool I is comprised of six anchored retail properties totaling 680,486 square feet located in six different states. The Cole IV Retail Portfolio – Pool I properties were constructed between 1994 and 2014 and, as of February 10, 2015, had a combined occupancy of 99.6%. There are seven investment grade rated tenants (anchors and majors) at the properties which collectively occupy 224,666 square feet (33.0% of the net rentable area) and comprise approximately $2,179,369 (28.5%) of the total underwritten rent. The credit rated tenants include Bed Bath & Beyond, Food Lion, HomeGoods, Kohl’s, Ross, Starbucks and TJ Maxx. The weighted average remaining lease term for the portfolio is approximately 9.3 years. Approximately, 85.7% of the net rentable area and 87.5% of the underwritten base rent expire after the loan maturity date. Additionally, 19 of the 36 tenants have renewal options.
| Portfolio Summary | |||||||
| Property | Location | Year Built | Net Rentable Area (SF) | Allocated Loan Amount | Appraised Value | Underwritten Net Cash Flow | % of Underwritten Net Cash Flow |
| Beavercreek Shopping Center | Beavercreek, OH | 1995, 2009, 2013 | 278,112 | $17,200,000 | $35,700,000 | $2,255,795 | 35.3% |
| Marketplace at the Lakes | West Covina, CA | 1994 | 95,628 | 11,300,000 | 23,500,000 | 1,416,057 | 22.2 |
| Plaza San Mateo | Albuquerque, NM | 2014 | 63,286 | 6,950,000 | 14,450,000 | 865,576 | 13.6 |
| Emerald Place | Greenwood, SC | 2012 | 107,628 | 6,250,000 | 13,000,000 | 697,366 | 10.9 |
| Village at Hereford Farms | Grovetown, GA | 2009 | 49,608 | 4,250,000 | 8,850,000 | 666,185 | 10.4 |
| University Marketplace | Marion, IN | 2012 | 86,224 | 4,050,000 | 8,400,000 | 488,134 | 7.6 |
| Total | 680,486 | $50,000,000 | $103,900,000 | $6,389,112 | 100.0% | ||
Beavercreek Shopping Center. The property is a 278,112 square foot anchored retail center located on approximately 30.4 acres in Beavercreek, Ohio. The property was originally built in 1995 with outlot buildings built in 2009 and 2013. The property is anchored by Gabriel Brothers (49,853 square feet), LA Fitness (49,776 square feet) and Toys R Us (49,000 square feet) and also includes several junior anchors such as Kings Furniture (30,724 square feet), HomeGoods (28,487 square feet), PetSmart (25,760 square feet) and Michaels (22,447 square feet). Other notable tenants include Five Below and Vitamin Shoppe. Gabriel Brothers has two five-year extension options remaining, LA Fitness has three five-year extension options remaining and Toys R Us has eight five-year extension options remaining. As of February 10, 2015, the property was 100.0% occupied by 11 tenants. The property benefits from being located directly across the street from Fairfield Commons Mall, a demand generator within the neighborhood. The property also benefits from its location approximately seven miles east of the Dayton central business district and less than one mile from Interstate Highway 675, which provides regional access through the Dayton area. The 2015 estimated population within a one-, three- and five-mile radius of the property is 6,832, 52,154 and 115,466, respectively. The 2015 median household income within a one-, three- and five-mile radius of the property is $76,151, $55,384 and $50,361, respectively. The appraisal concluded per square foot market rents of $8.00 (anchor), $9.00 (junior anchor), $11.00 (large in-line), $30.00 (outlot) and $15.00 (fitness center) at the property. According to the appraisal, the property is located within the Dayton retail market and Greene County submarket which had vacancy rates of approximately 16.8% and 14.8%, respectively, as of the fourth quarter of 2014.
Marketplace at the Lakes. The property is a 95,628 square foot anchored retail center located in West Covina, California. The property was built in 1994 and is located on approximately 7.1 acres. As of February 10, 2015, the property was 100.0% occupied by Toys R Us / Babies R Us (65,027 square feet) and Michaels (30,601 square feet). Both tenants have leases that expire after the mortgage loan maturity date and both tenants have four five-year extension options remaining. The property is located proximate to the West Covina shopping mall, a 1.2 million square foot regional shopping mall. Marketplace at the Lakes is also located near Interstate 10, a major east-west arterial connecting Santa Monica in the west to Phoenix in the east. The 2015 estimated population within a one-, three- and five-mile radius of the property is 6,685, 62,287 and 130,671, respectively. The 2015 median household income within a one-, three- and five-mile radius of the property is $66,581, $60,800 and $60,598, respectively. The appraisal concluded per square foot market rent
THE INFORMATION IN THIS STRUCTURAL AND COLLATERAL TERM SHEET IS NOT COMPLETE AND MAY BE AMENDED PRIOR TO THE TIME OF SALE. THIS TERM SHEET IS NOT AN OFFER TO SELL THESE SECURITIES AND IT IS NOT A SOLICITATION OF AN OFFER TO BUY THESE SECURITIES IN ANY JURISDICTION WHERE THE OFFER OR SALE IS NOT PERMITTED.
| 56 of 122 | |
| Structural and Collateral Term Sheet | JPMBB 2015-C29 | |
Cole IV Retail Portfolio – Pool I | ||
of $18.00 at the property. According to the appraisal, the property is located within the Greater Los Angeles retail market and San Gabriel Valley submarket which had vacancy rates of approximately 5.3% and 5.0%, respectively, as of the fourth quarter of 2014.
Plaza San Mateo. The property is a 63,286 square foot anchored retail center located in Albuquerque, New Mexico. The property was built in 2014 and is located on approximately 4.5 acres. The property is anchored by an investment grade tenant, Bed Bath & Beyond (58,001 square feet), who shares its space with a buybuy BABY and whose lease expires in 2025, approximately 4.5 years past the mortgage loan maturity date. The property also has a 5,285 pad retail building with Starbucks (1,779 square feet), Subway (1,219 square feet) and Keva Juice (1,068 square feet). As of February 10, 2015, the property was 98.1% occupied by four tenants. Plaza San Mateo is located on a main thoroughfare, San Mateo Boulevard NE, and benefits from the daily traffic of approximately 40,000 vehicles. The subject property is located four miles northeast of the Albuquerque central business district and directly across from Interstate 40 west, the main east-west arterial connecting Texas to Arizona. The 2015 estimated population within a one-, three- and five-mile radius of the property is 13,315, 123,639 and 299,043, respectively. The 2015 median household income within a one-, three- and five-mile radius of the property is $43,770, $35,300 and $39,063, respectively. The appraisal concluded per square foot market rents of $14.00 (anchor) and $29.00 (pad retail) at the property. According to the appraisal, the property is located within the Albuquerque retail market and Northeast Heights submarket which had vacancy rates of approximately 11.7% and 10.8%, respectively, as of the fourth quarter of 2014.
Emerald Place. The property is a 107,628 square foot anchored retail center located in Greenwood, South Carolina. The property was built in 2012 and is located on approximately 12.2 acres. The property is anchored by Kohl’s (55,459 square feet) and junior anchored by Ross (22,012 square feet), PetSmart (12,157 square feet) and Shoe Carnival (10,000 square feet). The four largest tenants, which account for 81.3% of the underwritten rent, have leases that expire after the mortgage loan maturity date and each has multiple extension options. As of February 10, 2015, the property was 100.0% occupied by eight tenants, two of which, Kohl’s and Ross, are investment grade. Emerald Place benefits from its proximity to a Wal-Mart supercenter anchored retail center to the north and Lowe’s as a shadow anchor to the east. The property is also located along a primary corridor and features high accessibility and visibility. The subject property is located approximately 50 miles south of Greenville, South Carolina and 50 miles north of Augusta, Georgia. The 2015 estimated population within a one-, three- and five-mile radius of the property is 3,031, 27,575 and 44,195, respectively. The 2015 median household income within a one-, three- and five-mile radius of the property is $52,794, $37,558 and $34,626, respectively. The appraisal concluded per square foot market rents of $14.00 (anchor) and $20.00 (in-line) at the property. Per the appraisal, the property is located within the Greenville/Spartanburg retail market and Greenwood County submarket which had vacancy rates of approximately 6.7% and 15.3%, respectively, as of the fourth quarter of 2014.
Village at Hereford Farms. The property is a 49,608 square foot anchored retail center located in Grovetown, Georgia. The property was built in 2009 and is located on approximately 8.6 acres. Village at Hereford Farms is anchored by Food Lion (34,928 square feet), with in-line tenants such as Georgia Lottery (5,600 square feet), Pizza Guys Augusta (1,650 square feet) and State Farm (1,354 square feet). Food Lion, which has an investment grade rating from Moody’s, S&P and Fitch, accounts for 69.1% of the underwritten rent and has a lease that expires more than nine years after the mortgage loan maturity date. As of February 10, 2015, the property was 96.4% occupied by eight tenants. Village at Hereford Farms benefits from being proximate to several upscale housing divisions in the area, including Tudor Branch and River Birch Landing. The subject is located approximately 135 miles east of Atlanta, Georgia and approximately 84 miles southwest of Columbia, South Carolina. The 2015 estimated population within a one-, three- and five-mile radius of the property is 1,103, 22,243 and 75,828, respectively. The 2015 median household income within a one-, three- and five-mile radius of the property is $80,711, $77,655 and $69,539, respectively. The appraisal concluded per square foot market rents of $14.50 (anchor) and $18.00 (in-line) at the property. According to the appraisal, the property is located within the Augusta retail market and Columbia County submarket which had vacancy rates of approximately 10.2% and 1.8%, respectively, as of the fourth quarter of 2014.
University Marketplace. The property is a 86,224 square foot anchored retail center located in Marion, Indiana. The property was built in 2012 and is located on approximately 6.8 acres. As of February 10, 2015, the property was 100.0% occupied by Hobby Lobby (50,000 square feet), TJ Maxx (24,000 square feet) and PetSmart (12,224 square feet). All three tenants have leases that expire after the mortgage loan maturity date and each has multiple extension options. University Marketplace is shadow anchored by Kohl’s and Meijer grocery store, which has a gas station. University Marketplace is located less than one mile east of Indiana Wesleyan University, which has enrollment exceeding 15,000 students, making it one of the largest private universities in Indiana. The property is located in the southwestern portion of the city of Marion and is approximately 25 miles east of the city of Kokomo and approximately 25 miles northwest of the city of Muncie. The 2015 estimated population within a one-, three- and five-mile radius of the property is 6,014, 23,522 and 43,792, respectively. The 2015 median household income within a one-, three- and five-mile radius of the property is $31,605, $32,294 and $35,770, respectively. The appraisal concluded per square foot market rents of $6.00 (anchor), $8.00 (junior anchor) and $13.00 (large in-line) at the property. According to the appraisal, as of the fourth quarter of 2014, direct vacancy in the lifestyle, power center and neighborhood shopping center inventory is reported to be 1.3% within the overall Marion, Indiana community.
THE INFORMATION IN THIS STRUCTURAL AND COLLATERAL TERM SHEET IS NOT COMPLETE AND MAY BE AMENDED PRIOR TO THE TIME OF SALE. THIS TERM SHEET IS NOT AN OFFER TO SELL THESE SECURITIES AND IT IS NOT A SOLICITATION OF AN OFFER TO BUY THESE SECURITIES IN ANY JURISDICTION WHERE THE OFFER OR SALE IS NOT PERMITTED.
| 57 of 122 | |
| Structural and Collateral Term Sheet | JPMBB 2015-C29 | |
Cole IV Retail Portfolio – Pool I | ||
| Reporting Tenant Sales Summary | |||||||
| Tenant | Property Name | Ratings(1) Moody’s/S&P/Fitch | Net Rentable Area (SF) | % of Total NRA | Gross Sales ($ Million)(2) | Sales Per Square Foot | |
| Toys R Us / Babies R Us | Marketplace at the Lakes | Caa2 / B- / CC | 65,027 | 9.6% | $9.1 | $140 | |
Bed Bath & Beyond(3) | Plaza San Mateo | Baa1 / A- / NA | 58,001 | 8.5% | $2.6 | $113 | |
| Kohl’s | Emerald Place | Baa1 / BBB / BBB+ | 55,459 | 8.1% | $16.9 | $305 | |
| Hobby Lobby | University Marketplace | NA / NA / NA | 50,000 | 7.3% | $6.5 | $130 | |
| Toys R Us | Beavercreek Shopping Center | NA / NA / NA | 49,000 | 7.2% | $9.1 | $186 | |
Food Lion(4)(5) | Village at Hereford Farms | Baa3 / BBB- / NA | 34,928 | 5.1% | $8.5 | $242 | |
Kings Furniture(4)(6) | Beavercreek Shopping Center | NA / NA / NA | 30,724 | 4.5% | $1.6 | $52 | |
| Michaels | Marketplace at the Lakes | NA / B+ / NA | 30,601 | 4.5% | $4.7 | $153 | |
HomeGoods(4) | Beavercreek Shopping Center | A3 / A+ / NA | 28,487 | 4.2% | $5.3 | $187 | |
| PetSmart | Beavercreek Shopping Center | NA / B+ / NA | 25,760 | 3.8% | $5.2 | $202 | |
TJ Maxx(4) | University Marketplace | A3 / A+ / NA | 24,000 | 3.5% | $3.4 | $140 | |
Michaels(4)(7) | Beavercreek Shopping Center | NA / B+ / NA | 22,447 | 3.3% | $4.3 | $192 | |
Five Below(4)(8) | Beavercreek Shopping Center | NA / NA / NA | 10,000 | 1.5% | $1.0 | $101 | |
| (1) | Ratings provided are for the parent company of the entity listed in the “Tenant” field whether or not the parent company guarantees the lease. |
| (2) | Gross Sales are third party service estimates as of March 19, 2015, unless otherwise noted. |
| (3) | Gross Sales for Bed Bath & Beyond are only for the buybuy BABY portion of the store. Sales Per Square Foot are based on the portion occupied by buybuy BABY, 23,000 square feet. |
| (4) | Gross Sales are as reported per the loan sponsor. |
| (5) | Food Lion Gross Sales are as of year-end 2013. |
| (6) | Kings Furniture Gross Sales are for the 11-month period ending in November 2014. |
| (7) | Michaels, located at the Beavercreek Shopping Center, Gross Sales are as of year-end 2012. |
| (8) | Five Below Gross Sales are for the eight-month period ending in August 2013. |
Historical and Current Occupancy(1) | |||
2012(2) | 2013(2) | 2014 | Current(3) |
| 88.6% | 99.7% | 100.0% | 99.6% |
| (1) | Historical occupancies are as of December 31 of each respective year. |
| (2) | 2012 Historical Occupancy and 2013 Historical Occupancy exclude Plaza San Mateo as it was built in 2014. |
| (3) | Current Occupancy is as of February 10, 2015. |
Top 10 Tenant Summary(1) | ||||||
| Tenant | Property | Ratings(2) Moody’s/S&P/Fitch | Net Rentable Area (SF) | % of Total NRA | Base Rent PSF | Lease Expiration Date |
Toys R Us(3) | Various | Caa2 / B- / CC | 114,027 | 16.8% | $14.13 | Various |
| Bed Bath & Beyond | Plaza San Mateo | Baa1 / A- / NA | 58,001 | 8.5% | $14.00 | 1/31/2025 |
| Kohl’s | Emerald Place | Baa1 / BBB / BBB+ | 55,459 | 8.1% | $2.70 | 1/31/2033 |
Michaels(4) | Various | NA / B+ / NA | 53,048 | 7.8% | $12.74 | Various |
PetSmart(5) | Various | NA / B+ / NA | 50,141 | 7.4% | $11.55 | Various |
| Hobby Lobby | University Marketplace | NA / NA / NA | 50,000 | 7.3% | $5.50 | 9/30/2027 |
| Gabriel Brothers | Beavercreek Shopping Center | NA / NA / NA | 49,853 | 7.3% | $5.25 | 11/30/2018 |
| LA Fitness | Beavercreek Shopping Center | NA / NA / NA | 49,776 | 7.3% | $14.75 | 5/31/2024 |
| Food Lion | Village at Hereford Farms | Baa3 / NA / NA | 34,928 | 5.1% | $14.52 | 10/20/2029 |
| Kings Furniture | Beavercreek Shopping Center | NA / NA / NA | 30,724 | 4.5% | $6.10 | 9/30/2023 |
| (1) | Based on the underwritten rent roll. |
| (2) | Ratings provided are for the parent company of the entity listed in the “Tenant” field whether or not the parent company guarantees the lease. |
| (3) | Toys R Us / Babies R Us at the Marketplace at the Lakes property (65,027 square feet) has a lease expiration of January 31, 2027 and a rent of $17.65 per square foot. Toys R Us at the Beavercreek Shopping Center property (49,000 square feet) has a lease expiration of January 31, 2024 and a rent of $9.45 per square foot. |
| (4) | Michaels at the Marketplace at the Lakes property (30,601 square feet) has a lease expiration of February 28, 2022 and a rent of $16.77 per square foot. Michaels at the Beavercreek Shopping Center property (22,447 square feet) has a lease expiration of September 30, 2018 and a rent of $7.25 per square foot. |
| (5) | PetSmart at the Beavercreek Shopping Center property (25,760 square feet) has a lease expiration of January 31, 2021 and a rent of $9.00 per square foot. PetSmart at the University Marketplace property (12,224 square feet) has a lease expiration of January 31, 2023 and a rent of $12.50 per square foot. PetSmart at the Emerald Place property (12,157 square feet) has a lease expiration of January 31, 2023 and a rent of $16.00 per square foot. |
THE INFORMATION IN THIS STRUCTURAL AND COLLATERAL TERM SHEET IS NOT COMPLETE AND MAY BE AMENDED PRIOR TO THE TIME OF SALE. THIS TERM SHEET IS NOT AN OFFER TO SELL THESE SECURITIES AND IT IS NOT A SOLICITATION OF AN OFFER TO BUY THESE SECURITIES IN ANY JURISDICTION WHERE THE OFFER OR SALE IS NOT PERMITTED.
| 58 of 122 | |
| Structural and Collateral Term Sheet | JPMBB 2015-C29 | |
Cole IV Retail Portfolio – Pool I | ||
Lease Rollover Schedule(1) | |||||||||||
| Year | Number of Leases Expiring | Net Rentable Area Expiring | % of NRA Expiring | Base Rent Expiring | % of Base Rent Expiring | Cumulative Net Rentable Area Expiring | Cumulative % of NRA Expiring | Cumulative Base Rent Expiring | Cumulative % of Base Rent Expiring | ||
| Vacant | NAP | 2,994 | 0.4 | % | NAP | NAP | 2,994 | 0.4% | NAP | NAP | |
| 2015 & MTM | 1 | 1 | 0.0 | $9,450 | 0.1 | % | 2,995 | 0.4% | $9,450 | 0.1% | |
| 2016 | 2 | 2,954 | 0.4 | 52,625 | 0.7 | 5,949 | 0.9% | $62,075 | 0.8% | ||
| 2017 | 2 | 2,800 | 0.4 | 46,480 | 0.6 | 8,749 | 1.3% | $108,555 | 1.4% | ||
| 2018 | 5 | 78,750 | 11.6 | 546,869 | 7.2 | 87,499 | 12.9% | $655,424 | 8.7% | ||
| 2019 | 1 | 1,600 | 0.2 | 32,000 | 0.4 | 89,099 | 13.1% | $687,424 | 9.1% | ||
| 2020 | 3 | 8,482 | 1.2 | 233,107 | 3.1 | 97,581 | 14.3% | $920,531 | 12.2% | ||
| 2021 | 1 | 25,760 | 3.8 | 231,840 | 3.1 | 123,341 | 18.1% | $1,152,371 | 15.2% | ||
| 2022 | 2 | 59,088 | 8.7 | 765,252 | 10.1 | 182,429 | 26.8% | $1,917,623 | 25.3% | ||
| 2023 | 8 | 126,717 | 18.6 | 1,281,128 | 16.9 | 309,146 | 45.4% | $3,198,752 | 42.3% | ||
| 2024 | 5 | 106,857 | 15.7 | 1,449,437 | 19.1 | 416,003 | 61.1% | $4,648,189 | 61.4% | ||
| 2025 | 1 | 58,001 | 8.5 | 812,014 | 10.7 | 474,004 | 69.7% | $5,460,203 | 72.1% | ||
| 2026 & Beyond | 5 | 206,482 | 30.3 | 2,110,319 | 27.9 | 680,486 | 100.0% | $7,570,522 | 100.0% | ||
| Total | 36 | 680,486 | 100.0 | % | $7,570,522 | 100.0 | % | ||||
| (1) | Based on the underwritten rent roll. |
Operating History and Underwritten Net Cash Flow(1) | ||||||
2014(2) | TTM(3) | Underwritten | Per Square Foot | %(4) | ||
| Rents in Place | $7,746,978 | $7,772,379 | $7,570,522 | $11.13 | 73.3 | % |
| Vacant Income | 0 | 0 | 67,301 | 0.10 | 0.7 | |
| Gross Potential Rent | $7,746,978 | $7,772,379 | $7,637,823 | $11.22 | 74.0 | % |
| Total Reimbursements | 2,101,485 | 2,145,545 | 2,684,949 | 3.95 | 26.0 | |
| Net Rental Income | $9,848,464 | $9,917,923 | $10,322,772 | $15.17 | 100.0 | % |
| (Vacancy/Credit Loss) | 0 | 0 | (504,555) | (0.74) | (4.9) | |
| Other Income | 24,079 | 123,304 | 0 | 0.00 | 0.0 | |
| Effective Gross Income | $9,872,543 | $10,041,227 | $9,818,217 | $14.43 | 95.1 | % |
| Total Expenses | $2,627,738 | $2,607,059 | $3,098,492 | $4.55 | 31.6 | % |
Net Operating Income(5) | $7,244,804 | $7,434,168 | $6,719,726 | $9.87 | 68.4 | % |
| Total TI/LC, Capex/RR | 0 | 0 | 330,613 | 0.49 | 3.4 | |
| Net Cash Flow | $7,244,804 | $7,434,168 | $6,389,112 | $9.39 | 65.1 | % |
| (1) | Complete historical operating statements are unavailable for the portfolio as the properties were acquired by the loan sponsor between March 2013 and September 2014 for a combined purchase price of $96,511,983. |
| (2) | 2014 NOI encompasses the year-end 2014 period for four of the six properties, the trailing seven-month period annualized for Plaza San Mateo and the trailing four-month period annualized for Village at Hereford Farms, as these properties were acquired in May 2014 and September 2014, respectively. |
| (3) | TTM encompasses the trailing 12-month period ending February 28, 2015 for four of the six properties, trailing nine-month period annualized for Plaza San Mateo and the trailing six-month period annualized for Village at Hereford Farms, as these properties were acquired in May 2014 and September 2014, respectively. |
| (4) | Percentage column represents percent of Net Rental Income for all revenue lines and represents percent of Effective Gross Income for the remainder of fields. |
| (5) | The portfolio was 99.6% occupied as of February 10, 2015. As such the decrease from TTM NOI to UW NOI is primarily due to the inclusion of a $504,555 vacancy adjustment. |
Property Management. The properties are managed by CREI Advisors, LLC, an affiliate of the loan sponsor.
THE INFORMATION IN THIS STRUCTURAL AND COLLATERAL TERM SHEET IS NOT COMPLETE AND MAY BE AMENDED PRIOR TO THE TIME OF SALE. THIS TERM SHEET IS NOT AN OFFER TO SELL THESE SECURITIES AND IT IS NOT A SOLICITATION OF AN OFFER TO BUY THESE SECURITIES IN ANY JURISDICTION WHERE THE OFFER OR SALE IS NOT PERMITTED.
| 59 of 122 | |
| Structural and Collateral Term Sheet | JPMBB 2015-C29 | |
Cole IV Retail Portfolio – Pool I | ||
Escrows and Reserves. No upfront escrows were taken at origination.
Tax Escrows - The requirement for the borrowers to make monthly deposits into the tax escrow is waived with respect to any portion of any property leased to a tenant required to pay taxes directly pursuant to the terms of its lease.
Insurance Escrows - The requirement for the borrowers to make monthly deposits into the insurance escrow is waived so long as the borrowers provide satisfactory evidence that the properties are insured under an acceptable blanket policy in accordance with the loan documents.
Replacement Reserves - On a monthly basis, the borrowers are required to escrow approximately $5,671 (approximately $0.10 per square foot annually) for replacement reserves.
TI/LC Reserves - On a monthly basis, the borrowers are required to escrow approximately $28,354 (approximately $0.50 per square foot annually) for TI/LC reserves.
Lockbox / Cash Management. The loan is structured with a hard lockbox and in-place cash management. At origination, the borrowers were required to send tenant direction letters to tenants instructing them to deposit all rents and payments directly to the lockbox account controlled by the lender. All funds in the lockbox account are swept on the 5th, 12th, 19th and 26th of each month to a cash management account under the control of the lender and disbursed on each monthly payment date during the term of the loan in accordance with the loan documents. Upon the occurrence of an Excess Cash Sweep Event (as defined below), the borrowers will deposit with the lender all excess cash into the cash management account, which will be held by the lender as additional security for the mortgage loan.
An “Excess Cash Sweep Event” means any period during which (i) an event of default occurs or (ii) the debt service coverage ratio at the end of a fiscal quarter is less than or equal to 1.75x.
Release of Individual Properties. Following the lockout period, the borrowers are permitted to sell one or more of the properties to a bona fide third party purchaser who is not a restricted party or an affiliate of a restricted party with the payment of the applicable yield maintenance premium if prior to the permitted par prepayment date, provided that, among other things (i) no event of default exists, (ii) the borrowers make a payment of 125.0% of the allocated loan amount applicable to such property, (iii) the debt service coverage ratio will not be less than the greater of (a) the debt service coverage ratio, as calculated in the loan documents, for all properties in effect as of the origination date and (b) the debt service coverage ratio in effect immediately prior to the property sale and (iv) the loan-to-value ratio then remaining will not be greater than the loan-to-value ratio for all properties in effect as of the origination date.
Condominium. The University Marketplace property within the portfolio is part of a condominium regime. The borrower owns three units of a total 14 units. A condominium declaration outlines the rights, responsibilities and obligations of each owner and outlines each unit’s proportional share of various expenses related to the common elements and management of common areas. Once 75.0% of the undivided common ownership interest in the condominium has been sold and conveyed by the declarant, all unit owners will elect the initial board of managers consisting of not less than five members, at least three of whom shall be unit owners.
THE INFORMATION IN THIS STRUCTURAL AND COLLATERAL TERM SHEET IS NOT COMPLETE AND MAY BE AMENDED PRIOR TO THE TIME OF SALE. THIS TERM SHEET IS NOT AN OFFER TO SELL THESE SECURITIES AND IT IS NOT A SOLICITATION OF AN OFFER TO BUY THESE SECURITIES IN ANY JURISDICTION WHERE THE OFFER OR SALE IS NOT PERMITTED.
| 60 of 122 | |
| Structural and Collateral Term Sheet | JPMBB 2015-C29 | |
Cole IV Retail Portfolio – PooI II | ||
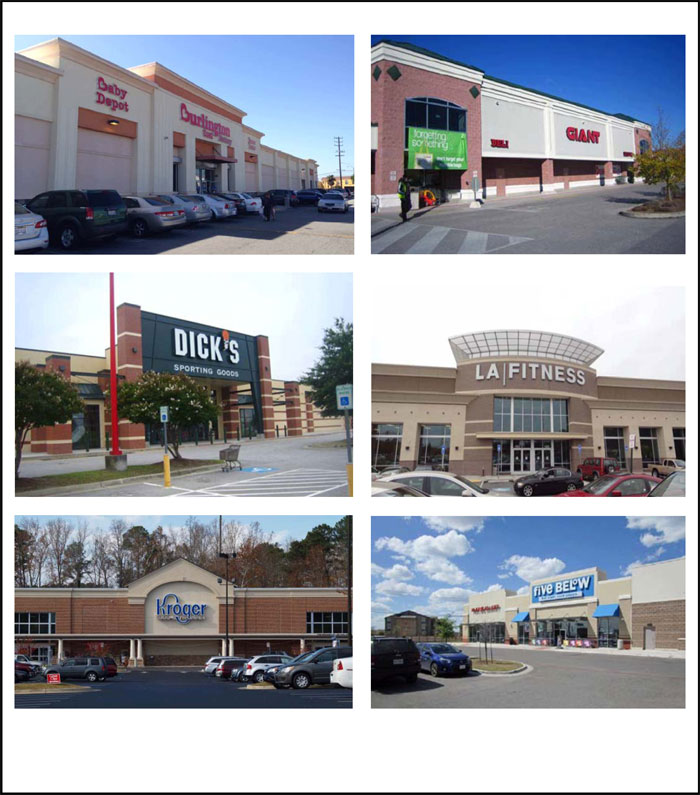
THE INFORMATION IN THIS STRUCTURAL AND COLLATERAL TERM SHEET IS NOT COMPLETE AND MAY BE AMENDED PRIOR TO THE TIME OF SALE. THIS TERM SHEET IS NOT AN OFFER TO SELL THESE SECURITIES AND IT IS NOT A SOLICITATION OF AN OFFER TO BUY THESE SECURITIES IN ANY JURISDICTION WHERE THE OFFER OR SALE IS NOT PERMITTED.
| 61 of 122 | |
| Structural and Collateral Term Sheet | JPMBB 2015-C29 | |
Cole IV Retail Portfolio – PooI II | ||
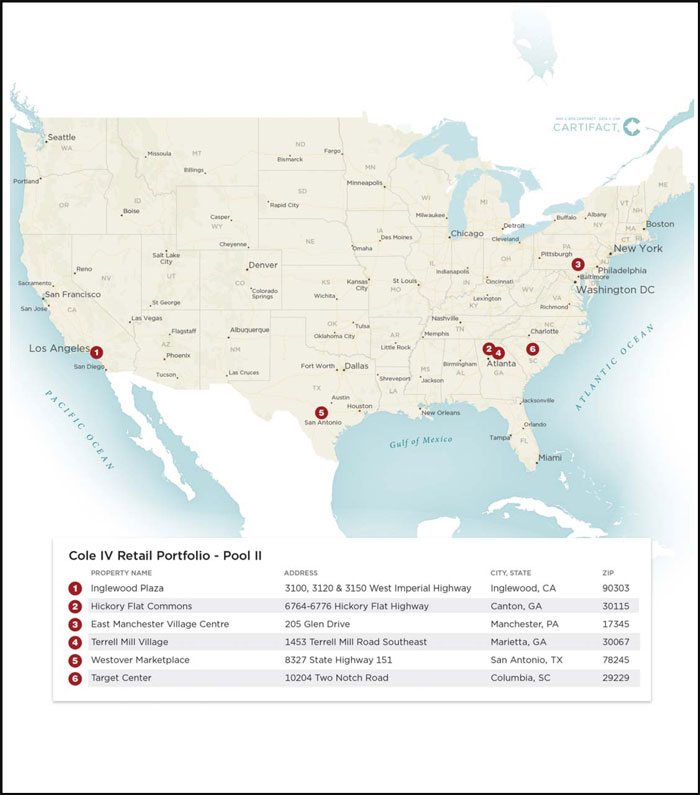
THE INFORMATION IN THIS STRUCTURAL AND COLLATERAL TERM SHEET IS NOT COMPLETE AND MAY BE AMENDED PRIOR TO THE TIME OF SALE. THIS TERM SHEET IS NOT AN OFFER TO SELL THESE SECURITIES AND IT IS NOT A SOLICITATION OF AN OFFER TO BUY THESE SECURITIES IN ANY JURISDICTION WHERE THE OFFER OR SALE IS NOT PERMITTED.
| 62 of 122 | |
| Structural and Collateral Term Sheet | JPMBB 2015-C29 | |
Cole IV Retail Portfolio – PooI II | ||
| Mortgage Loan Information | Property Information | |||
| Mortgage Loan Seller: | Barclays | Single Asset / Portfolio: | Portfolio | |
| Original Principal Balance: | $50,000,000 | Title: | Fee | |
| Cut-off Date Principal Balance: | $50,000,000 | Property Type - Subtype: | Retail - Anchored | |
| % of Pool by IPB: | 5.1% | Net Rentable Area (SF): | 551,854 | |
Loan Purpose(1): | Acquisition | Location: | Various | |
Borrowers(2): | Various | Year Built / Renovated: | Various / Various | |
| Sponsor: | Cole Operating Partnership IV, LP | Occupancy: | 96.9% | |
| Interest Rate: | 3.80300% | Occupancy Date: | 2/10/2015 | |
| Note Date: | 4/9/2015 | Number of Tenants: | 47 | |
| Maturity Date: | 5/6/2020 | 2012 NOI(3): | N/A | |
| Interest-only Period: | 60 months | 2013 NOI(3): | N/A | |
| Original Term: | 60 months | 2014 NOI(4): | $6,387,484 | |
| Original Amortization: | None | TTM NOI (as of 2/2015)(5): | $6,649,019 | |
| Amortization Type: | Interest Only | UW Economic Occupancy: | 94.0% | |
| Call Protection: | L(25),Grtr1%orYM(31),O(4) | UW Revenues: | $8,984,006 | |
| Lockbox: | Hard | UW Expenses: | $2,285,884 | |
| Additional Debt: | N/A | UW NOI: | $6,698,122 | |
| Additional Debt Balance: | N/A | UW NCF: | $6,329,251 | |
| Additional Debt Type: | N/A | Appraised Value / Per SF: | $103,370,000 / $187 | |
Appraisal Date(6): | Various | |||
Escrows and Reserves(7) | Financial Information | |||||
| Initial | Monthly | Initial Cap | Cut-off Date Loan / SF: | $91 | ||
| Taxes: | $0 | Springing | N/A | Maturity Date Loan / SF: | $91 | |
| Insurance: | $0 | Springing | N/A | Cut-off Date LTV: | 48.4% | |
| Replacement Reserves: | $0 | $4,599 | N/A | Maturity Date LTV: | 48.4% | |
| TI/LC: | $0 | $22,994 | N/A | UW NCF DSCR: | 3.27x | |
| Other: | $0 | $0 | N/A | UW NOI Debt Yield: | 13.4% | |
| Sources and Uses | ||||||
| Sources | Proceeds | % of Total | Uses | Proceeds | % of Total | |
| Mortgage Loan | $50,000,000 | 50.5% | Purchase Price(1) | $98,225,000 | 99.1% | |
| Sponsor Equity | 49,101,303 | 49.5 | Closing Costs | 876,303 | 0.9 | |
| Total Sources | $99,101,303 | 100.0% | Total Uses | $99,101,303 | 100.0% | |
| (1) | A portion of the mortgage loan proceeds were used to remove two of the six properties that served as collateral under the loan sponsor’s line of credit facilities. |
| (2) | For a full description of the borrowing entities, please refer to “The Borrowers” below. |
| (3) | Complete historical operating statements are unavailable for the portfolio as the properties were acquired by the loan sponsor between December 2012 and September 2014 for a combined purchase price of $98,225,000. |
| (4) | 2014 NOI encompasses the year-end period for three of the six properties, the trailing eleven-month period annualized for Terrell Mill Village, the trailing nine-month period annualized for Target Center and the trailing four-month period annualized for Inglewood Plaza, as these properties were acquired in January 2014, March 2014 and September 2014, respectively. |
| (5) | TTM NOI encompasses the trailing 12-month period for four of the six properties, the trailing 11-month period annualized for Target Center and the trailing six-month period annualized for Inglewood Plaza, as these properties were acquired in March 2014 and September 2014, respectively. |
| (6) | The appraisals are dated as of February 15, 2015 through February 25, 2015. |
| (7) | For a full description of Escrows and Reserves, please refer to “Escrows and Reserves” below. |
The Loan. The Cole IV Retail Portfolio – Pool II loan has an outstanding principal balance of $50.0 million and is secured by a first mortgage lien on the borrowers’ fee simple interests in a portfolio of six multi-tenant retail anchored properties totaling 551,854 square feet located in five states. The loan has a five-year term and is interest-only for the entire term. The properties were acquired by the loan sponsor between December 2012 and September 2014. At origination of the mortgage loan, four of the six assets, East Manchester Village, Target Center, Terrell Mill Village and Westover Marketplace, were unencumbered. The other two assets served as collateral under the loan sponsor’s line of credit facilities.
THE INFORMATION IN THIS STRUCTURAL AND COLLATERAL TERM SHEET IS NOT COMPLETE AND MAY BE AMENDED PRIOR TO THE TIME OF SALE. THIS TERM SHEET IS NOT AN OFFER TO SELL THESE SECURITIES AND IT IS NOT A SOLICITATION OF AN OFFER TO BUY THESE SECURITIES IN ANY JURISDICTION WHERE THE OFFER OR SALE IS NOT PERMITTED.
| 63 of 122 | |
| Structural and Collateral Term Sheet | JPMBB 2015-C29 | |
Cole IV Retail Portfolio – PooI II | ||
The Borrowers. The borrowing entities for the loan are ARCP MT Inglewood CA, LP, Cole MT Canton GA, LLC, Cole MT Columbia SC, LLC, Cole MT East Manchester, PA, LLC, Cole MT Marietta GA, LLC and Cole MT San Antonio (Highway 151) TX, LLC. Each entity is a single purpose entity and is either a Delaware limited liability company or Delaware limited partnership.
The Sponsor. The loan sponsor and nonrecourse carve-out guarantor is Cole Operating Partnership IV, LP. The sole general partner of Cole Operating Partnership IV, LP is Cole Credit Property Trust IV, Inc. (“CCPT”), a Maryland corporation formed in July 2010. CCPT is externally managed by Cole REIT Advisors IV, LLC, an affiliate of Cole Capital, which is the trade name used to refer to a group of affiliated entities directly or indirectly controlled by American Realty Capital Properties, Inc. See “Risk Factors-Litigation or Other Legal Proceedings Could Adversely Affect the Mortgage Loans” in the Free Writing Prospectus. CCPT primarily invests in power retail centers leased to creditworthy tenants under long-term net leases. As of December 31, 2014, CCPT owned 759 properties comprised of 20.2 million square feet located in 45 states that were 99.0% leased in the aggregate. As of December 31, 2014, CCPT had total assets equal to approximately $4.04 billion and a net worth of approximately $2.33 billion.
The Properties. Cole IV Retail Portfolio – Pool II is comprised of six anchored retail properties totaling 551,854 square feet located in five different states. The portfolio properties were constructed between 1974 and 2013 and had a combined physical occupancy of 96.9% as of February 10, 2015. There are six investment grade tenants in the portfolio which collectively occupy 158,322 square feet (28.7% of the net rentable area) and comprise approximately $1,904,129 of the underwritten rent. The credit rated tenants include Kroger, Giant, CVS, T-Mobile (a subsidiary of Deutsche Telekom AG), Verizon Wireless and Starbucks. The weighted average remaining lease term for the portfolio is approximately 9.2 years, and 67.2% of the net rentable area and 61.4% of underwritten base rent expire after the loan maturity date. Additionally, 12 of the 47 tenants have renewal options, comprising 52.5% of the portfolio’s net rentable area.
Portfolio Summary | ||||||||||||||||||
| Property | Location | Year Built / Year Renovated | Net Rentable Area (SF) | Allocated Loan Amount | Appraised Value | Underwritten Net Cash Flow | % of Underwritten Net Cash Flow | |||||||||||
| Inglewood Plaza | Inglewood, CA | 2008 / N/A | 96,919 | $12,700,000 | $26,200,000 | $1,604,041 | 25.3% | |||||||||||
| Hickory Flat Commons | Canton, GA | 2008 / N/A | 114,830 | 9,850,000 | 20,400,000 | 1,037,339 | 16.4 | |||||||||||
| East Manchester Village Centre | Manchester, PA | 1995, 2009 / 2008 | 120,584 | 8,300,000 | 17,200,000 | 1,092,834 | 17.3 | |||||||||||
| Terrell Mill Village | Marietta, GA | 1974 / 2012 | 75,184 | 7,500,000 | 15,500,000 | 1,060,878 | 16.8 | |||||||||||
| Westover Marketplace | San Antonio, TX | 2013 / N/A | 60,646 | 6,200,000 | 12,770,000 | 789,151 | 12.5 | |||||||||||
| Target Center | Columbia, SC | 2001 / 2012 | 83,691 | 5,450,000 | 11,300,000 | 745,008 | 11.8 | |||||||||||
| Total | 551,854 | $50,000,000 | $103,370,000 | $6,329,251 | 100.0% | |||||||||||||
Inglewood Plaza. The property is a 96,919 square foot anchored retail center located on approximately 6.0 acres in Inglewood, California. The property was built in 2008. The property is anchored by Burlington Coat Factory (80,000 square feet) and includes one junior anchor, CVS (12,900 square feet). The property’s additional in-line tenants are T-Mobile (3,019 square feet) and Louisiana Fried Chicken (1,000 square feet). Burlington Coat Factory has four five-year extension options remaining and CVS has seven five-year extension options remaining. As of February 10, 2015, the property was 100.0% occupied by the four tenants. The property is located on the southwest corner of Crenshaw Boulevard and Imperial Highway, less than one mile from the Glenn Anderson (105) Freeway, which provides regional access through the greater Los Angeles area. Inglewood Plaza is approximately 10 miles southwest of downtown Los Angeles. The 2015 estimated population within a one-, three- and five-mile radius of the property is 30,643, 359,848 and 872,652, respectively. The 2015 median household income within a one-, three- and five-mile radius of the property is $44,209, $40,873 and $43,426, respectively. The appraisal concluded per square foot market rents of $15.60 (anchor), $30.00 (junior anchor) and $51.00 (in-line) at the property. According to the appraisal, the property is located within the Greater Los Angeles retail market and South Bay submarket which had vacancy rates of approximately 5.3% and 3.1%, respectively, as of the fourth quarter of 2014.
Hickory Flat Commons. The property is a 114,830 square foot anchored retail center located in Canton, Georgia. The property was built in 2008 and is located on approximately 18.5 acres. The property is anchored by Kroger (78,846 square feet). The space at the property is also occupied by 14 in-line tenants, including Verizon Wireless, Great Clips, Little Caesars and Dos Margaritas. As of February 10, 2015, the property was 91.6% occupied by 15 tenants. Kroger, the largest tenant at the property, has six five-year extension options remaining. Hickory Flat Commons is located proximate to Harmony on the Lakes, a 630-acre master planned development. The property is located near Hickory Flat Highway (Georgia Highway 140), which provides the neighborhood access to I-575. Hickory Flat Commons is located in the northern part of the Atlanta metro area, approximately five miles southeast of Canton and 25 miles north of the Atlanta central business district. The 2015 estimated population within a one-, three- and five-mile radius of the property is 648, 19,356 and 56,434, respectively. The 2015 median household income within a one-, three- and five-mile radius of the property is $97,085, $88,832 and $80,204, respectively. The appraisal concluded per square foot market rents of $9.50 (grocery
THE INFORMATION IN THIS STRUCTURAL AND COLLATERAL TERM SHEET IS NOT COMPLETE AND MAY BE AMENDED PRIOR TO THE TIME OF SALE. THIS TERM SHEET IS NOT AN OFFER TO SELL THESE SECURITIES AND IT IS NOT A SOLICITATION OF AN OFFER TO BUY THESE SECURITIES IN ANY JURISDICTION WHERE THE OFFER OR SALE IS NOT PERMITTED.
| 64 of 122 | |
| Structural and Collateral Term Sheet | JPMBB 2015-C29 | |
Cole IV Retail Portfolio – PooI II | ||
anchor) and $20.00 (inline) at the property. According to the appraisal, the property is located within the Atlanta market and North Cobb submarket which had vacancy rates of approximately 8.4% and 7.5%, respectively, as of the fourth quarter of 2014.
East Manchester Village Centre. The property is a 120,584 square foot anchored retail center located on approximately 15.8 acres in Manchester, Pennsylvania. The property was built in 1995, renovated in 2008 and expanded in 2009. The property is anchored by a Giant Food Store (59,063 square feet), which also has a gas station component occupying 2,400 square feet, collectively (“Giant”). The property also has two junior anchors, Gold’s Gym (19,105 square feet) and Dollar Tree (14,000 square feet). The space at the property is also occupied by 12 in-line tenants, including Dunkin Donuts, Subway and Fastenal. As of February 10, 2015, the property was 96.0% occupied by 14 tenants. Each of East Manchester Village Centre’s three largest tenants have extension options. Giant has eight five-year extension options remaining, and Gold’s Gym and Dollar Tree each have two five-year extension options remaining. The subject property is located in York County, Pennsylvania and is located two miles southwest of Interstate 83, an arterial connecting the area to Harrisburg to the north and Baltimore to the south. Additionally, Interstate 83 connects to the Pennsylvania Turnpike (Interstate 76), connecting the area to Philadelphia to the east and Pittsburgh to the west. The 2015 estimated population within a one-, three- and five-mile radius of the property is 2,317, 21,083 and 54,448, respectively. The 2015 median household income within a one-, three- and five-mile radius of the property is $70,568, $66,317 and $61,286, respectively. The appraisal concluded per square foot market rents of $11.00 (grocery), $8.00 (anchor) and $18.00 (in-line) at the property. According to the appraisal, the property is located within the Central Pennsylvania market and York County submarket which had vacancy rates of approximately 5.7% and 6.6%, respectively, as of the fourth quarter of 2014.
Terrell Mill Village. The property is a 75,184 square foot anchored retail center located on approximately 8.5 acres in Marietta, Georgia. The property was built in 1974 and renovated in 2012. The property is anchored by LA Fitness (45,000 square feet) and junior anchored by Dollar Tree (12,000 square feet). The remaining space at the property is occupied by in-line tenants such as Starbucks, Animal Dermatology Clinic and Ruby Nails. LA Fitness and Dollar Tree each have three five-year extension options remaining. As of February 10, 2015, the property was 100.0% occupied by 10 tenants, of which two are investment grade. Terrell Mill Village benefits from its proximity to large commercial developments in the neighborhood, Cumberland Mall and Galleria Specialty Mall, and is located close to Market Village, a mixed use space comprised of 16 townhomes, over 40,000 square feet of retail, approximately 18,000 square feet of office and seven restaurants. The property is considered to be a suburban location and is situated in southeastern Cobb County, approximately 15 miles northwest of the Atlanta central business district. The 2015 estimated population within a one-, three- and five-mile radius of the property is 15,296, 79,235 and 200,362, respectively. The 2015 median household income within a one-, three- and five-mile radius of the property is $41,904, $48,727 and $53,524, respectively. The appraisal concluded per square foot market rents of $17.00 (gym), $11.50 (junior anchor) and $19.00 (in-line) at the property. Per the appraisal, the property is located within the Atlanta market and South Cobb submarket which had vacancy rates of approximately 8.4% and 7.7%, respectively, as of the fourth quarter of 2014.
Westover Marketplace. The property is a 60,646 square foot anchored retail center located in San Antonio, Texas. The property was built in 2013 and is located on approximately 5.5 acres. As of February 10, 2015, the property was 100.0% occupied by Toys R Us (50,646 square feet) and a junior anchor, Dollar Tree (10,000 square feet). Toys R Us has five five-year extension options remaining and Dollar Tree has three five-year extension options remaining. The property is located approximately nine miles west of the San Antonio central business district and approximately 11 miles southwest of San Antonio International Airport. The 2015 estimated population within a one-, three- and five-mile radius of the property is 7,376, 115,031 and 293,232, respectively. The 2015 median household income within a one-, three- and five-mile radius of the property is $40,527, $50,087 and $51,643, respectively. The appraisal concluded per square foot market rents of $16.00 (big box) and $14.00 (large in-line) at the property. According to the appraisal, the property is located within the San Antonio Area market and NW County submarket which had vacancy rates of approximately 5.3% and 5.4%, respectively, as of the fourth quarter of 2014.
Target Center. The property is a 83,691 square foot anchored retail center located on approximately 12.3 acres in Columbia, South Carolina. The property was built in 2001 and renovated in 2012. Target Center is shadow-anchored by Target (not collateral for the mortgage loan) and anchored by Dick’s Sporting Goods (47,511 square feet) and Michaels (23,396 square feet). The property also includes two in-line tenants, Kirkland’s (8,684 square feet) and Sport Clips (1,600 square feet). As of February 10, 2015, the property was 97.0% occupied by the four tenants. Dick’s Sporting Goods and Michaels each have four five-year extension options remaining. Target Center is located approximately half a mile northeast of Village at Sandhill, a 1.4 million square foot lifestyle center anchored by JCPenney, Home Depot, Bi-Lo, Rooms to Go, hhgregg, Books-a-Million and numerous other retail tenants. The property is located in the northeastern portion of the Columbia metropolitan statistical area and is approximately 12 miles northeast of the Columbia central business district. The 2015 estimated population within a one-, three- and five-mile radius of the property is 5,432, 54,391 and 103,255, respectively. The 2015 median household income within a one-, three- and five-mile radius of the property is $71,446, $66,810 and $61,974, respectively. The appraisal concluded per square foot market rents of $12.00 (anchor), $17.00 (in-line) and $21.00 (outbuilding) at the property. According to the appraisal, the property is located within the Columbia market and the Northeast submarket which had vacancy rates of approximately 7.6% and 7.4%, respectively, as of the fourth quarter of 2014.
THE INFORMATION IN THIS STRUCTURAL AND COLLATERAL TERM SHEET IS NOT COMPLETE AND MAY BE AMENDED PRIOR TO THE TIME OF SALE. THIS TERM SHEET IS NOT AN OFFER TO SELL THESE SECURITIES AND IT IS NOT A SOLICITATION OF AN OFFER TO BUY THESE SECURITIES IN ANY JURISDICTION WHERE THE OFFER OR SALE IS NOT PERMITTED.
| 65 of 122 | |
| Structural and Collateral Term Sheet | JPMBB 2015-C29 | |
Cole IV Retail Portfolio – PooI II | ||
| Reporting Tenant Sales Summary | ||||||||||||
| Tenant | Property Name | Ratings(1) Moody’s/S&P/Fitch | Net Rentable Area (SF) | % of Total NRA | Gross Sales ($ Million)(2) | Sales Per Square Foot | ||||||
Burlington Coat Factory(3)(4) | Inglewood Plaza | B3 / NA / NA | 80,000 | 14.5% | $11.1 | $139 | ||||||
Kroger(3)(4) | Hickory Flat Commons | Baa2 / BBB / BBB | 78,846 | 14.3% | $35.3 | $448 | ||||||
Giant(5) | East Manchester Village Center | Baa3 / BBB / BBB | 59,063 | 10.7% | $33.8 | $572 | ||||||
| Toys R Us | Westover Marketplace | Caa2 / B- / CC | 50,646 | 9.2% | $9.1 | $180 | ||||||
| Michaels | Target Center | NA / B+ / NA | 23,396 | 4.2% | $3.1 | $133 | ||||||
| Dollar Tree | East Manchester Village Center | Ba2 / BB / NA | 14,000 | 2.5% | $1.3 | $93 | ||||||
| Dollar Tree | Terrell Mill Village | Ba2 / BB / NA | 12,000 | 2.2% | $1.3 | $108 | ||||||
| CVS | Inglewood Plaza | Baa1 / BBB+ / NA | 12,900 | 2.3% | $10.4 | $806 | ||||||
| (1) | Ratings provided are for the parent company of the entity listed in the “Tenant” field whether or not the parent company guarantees the lease. |
| (2) | Gross Sales are third party service estimates as of March 19, 2015, unless otherwise noted. |
| (3) | Gross Sales are as reported per the loan sponsor. |
| (4) | Burlington Coat Factory Gross Sales and Kroger Gross Sales are as of year-end 2014. |
| (5) | Giant Gross Sales figures exclude any income derived from the gas station portion of the tenant. |
Historical and Current Occupancy(1) | |||
2012(2) | 2013 | 2014 | Current(3) |
| 89.5% | 98.4% | 97.7% | 96.9% |
| (1) | Historical Occupancies are as of December 31 of each respective year. |
| (2) | 2012 historical occupancy excludes the Westover Marketplace property, as it was built in 2013. |
| (3) | Current Occupancy is as of February 10, 2015. |
Top 10 Tenant Summary(1) | ||||||||||||
| Tenant | Property | Ratings(2) Moody’s/S&P/Fitch | Net Rentable Area (SF) | % of Total NRA | Base Rent PSF | Lease Expiration Date | ||||||
| Burlington Coat Factory | Inglewood Plaza | B3 / NA / NA | 80,000 | 14.5% | $15.60 | 1/31/2019 | ||||||
| Kroger | Hickory Flat Commons | Baa2 / BBB / BBB | 78,846 | 14.3% | $8.18 | 11/30/2028 | ||||||
Giant(3) | East Manchester Village Center | Baa3 / BBB / BBB | 61,463 | 11.1% | $11.34 | 9/30/2029 | ||||||
| Toys R Us | Westover Marketplace | Caa2 / B- / CC | 50,646 | 9.2% | $16.00 | 1/31/2029 | ||||||
| Dick’s Sporting Goods | Target Center | NA / NA / NA | 47,511 | 8.6% | $12.00 | 1/31/2023 | ||||||
| LA Fitness | Terrell Mill Village | NA / NA / NA | 45,000 | 8.2% | $17.00 | 7/31/2027 | ||||||
Dollar Tree(4) | Various | Ba2 / BB / NA | 36,000 | 6.5% | $9.65 | Various | ||||||
| Michaels | Target Center | NA / B+ / NA | 23,396 | 4.2% | $4.88 | 3/31/2022 | ||||||
| Gold’s Gym | East Manchester Village Center | NA / NA / NA | 19,105 | 3.5% | $6.50 | 1/31/2026 | ||||||
| CVS | Inglewood Plaza | Baa1 / BBB+ / NA | 12,900 | 2.3% | $28.47 | 1/31/2035 | ||||||
| (1) | Based on the underwritten rent roll. |
| (2) | Ratings provided are for the parent company of the entity listed in the “Tenant” field whether or not the parent company guarantees the lease. |
| (3) | Giant is comprised of the Giant Food Store (59,063 square feet) with a lease expiration of September 30, 2029 and a rent of $10.95 per square foot and Giant Food Gas Station (2,400 square feet) with a lease expiration of September 30, 2029 and a rent of $20.83 per square foot. |
| (4) | Dollar Tree at the East Manchester Village Center property (14,000 square feet) has a lease expiration of January 31, 2019 and a rent of $6.43 per square foot. Dollar Tree at the Terrell Mill Village property (12,000 square feet) has a lease expiration of July 31, 2017 and a rent of $11.25 per square foot. Dollar Tree at the Westover Marketplace property (10,000 square feet) has a lease expiration of June 30, 2018 and a rent of $12.25 per square foot. |
THE INFORMATION IN THIS STRUCTURAL AND COLLATERAL TERM SHEET IS NOT COMPLETE AND MAY BE AMENDED PRIOR TO THE TIME OF SALE. THIS TERM SHEET IS NOT AN OFFER TO SELL THESE SECURITIES AND IT IS NOT A SOLICITATION OF AN OFFER TO BUY THESE SECURITIES IN ANY JURISDICTION WHERE THE OFFER OR SALE IS NOT PERMITTED.
| 66 of 122 | |
| Structural and Collateral Term Sheet | JPMBB 2015-C29 | |
Cole IV Retail Portfolio – PooI II | ||
Lease Rollover Schedule(1) | ||||||||||||||||||
| Year | Number of Leases Expiring | Net Rentable Area Expiring | % of NRA Expiring | Base Rent Expiring | % of Base Rent Expiring | Cumulative Net Rentable Area Expiring | Cumulative % of NRA Expiring | Cumulative Base Rent Expiring | Cumulative % of Base Rent Expiring | |||||||||
| Vacant | NAP | 17,044 | 3.1% | NAP | NAP | 17,044 | 3.1% | NAP | NAP | |||||||||
| 2015 & MTM | 2 | 2,900 | 0.5 | $54,575 | 0.8% | 19,944 | 3.6% | $54,575 | 0.8% | |||||||||
| 2016 | 1 | 1,600 | 0.3 | 28,800 | 0.4 | 21,544 | 3.9% | $83,375 | 1.2% | |||||||||
| 2017 | 6 | 19,430 | 3.5 | 269,160 | 3.7 | 40,974 | 7.4% | $352,535 | 4.9% | |||||||||
| 2018 | 9 | 29,460 | 5.3 | 421,436 | 5.8 | 70,434 | 12.8% | $773,971 | 10.7% | |||||||||
| 2019 | 9 | 110,789 | 20.1 | 1,813,682 | 25.1 | 181,223 | 32.8% | $2,587,653 | 35.8% | |||||||||
| 2020 | 0 | 0 | 0.0 | 0 | 0.0 | 181,223 | 32.8% | $2,587,653 | 35.8% | |||||||||
| 2021 | 1 | 3,796 | 0.7 | 37,200 | 0.5 | 185,019 | 33.5% | $2,624,853 | 36.3% | |||||||||
| 2022 | 2 | 24,996 | 4.5 | 139,772 | 1.9 | 210,015 | 38.1% | $2,764,625 | 38.2% | |||||||||
| 2023 | 5 | 54,370 | 9.9 | 711,852 | 9.8 | 264,385 | 47.9% | $3,476,477 | 48.1% | |||||||||
| 2024 | 3 | 12,009 | 2.2 | 216,403 | 3.0 | 276,394 | 50.1% | $3,692,880 | 51.1% | |||||||||
| 2025 | 0 | 0 | 0.0 | 0 | 0.0 | 276,394 | 50.1% | $3,692,880 | 51.1% | |||||||||
| 2026 & Beyond | 9 | 275,460 | 49.9 | 3,536,604 | 48.9 | 551,854 | 100.0% | $7,229,484 | 100.0% | |||||||||
| Total | 47 | 551,854 | 100.0% | $7,229,484 | 100.0% | |||||||||||||
| (1) | Based on the underwritten rent roll. |
Operating History and Underwritten Net Cash Flow(1) | |||||||
2014(2) | TTM(3) | Underwritten | Per Square Foot | %(4) | |||
| Rents in Place | $7,371,429 | $7,438,488 | $7,229,484 | $13.10 | 75.6% | ||
| Vacant Income | 0 | 0 | 333,660 | 0.60 | 3.5 | ||
| Gross Potential Rent | $7,371,429 | $7,438,488 | $7,563,144 | $13.70 | 79.1% | ||
| Total Reimbursements | 1,101,194 | 1,318,938 | 1,997,628 | 3.62 | 20.9 | ||
| Net Rental Income | $8,472,624 | $8,757,426 | $9,560,772 | $17.32 | 100.0% | ||
| (Vacancy/Credit Loss) | 0 | 0 | (576,766) | (1.05) | (6.0) | ||
| Other Income | 21,187 | 25,283 | 0 | 0.00 | 0.0 | ||
| Effective Gross Income | $8,493,811 | $8,782,710 | $8,984,006 | $16.28 | 94.0% | ||
| Total Expenses | $2,106,327 | $2,133,691 | $2,285,884 | $4.14 | 25.4% | ||
| Net Operating Income | $6,387,484 | $6,649,019 | $6,698,122 | $12.14 | 74.6% | ||
| Total TI/LC, Capex/RR | 0 | 0 | 368,871 | 0.67 | 4.1 | ||
| Net Cash Flow | $6,387,484 | $6,649,019 | $6,329,251 | $11.47 | 70.5% | ||
| (1) | Complete historical operating statements are unavailable for the portfolio as the properties were acquired by the loan sponsor between December 2012 and September 2014 for a combined purchase price of $98,225,000. |
| (2) | 2014 NOI encompasses the year-end period for three of the six properties, the trailing eleven-month period annualized for Terrell Mill Village, the trailing nine-month period annualized for Target Center and the trailing four-month period annualized for Inglewood Plaza, as these properties were acquired in January 2014, March 2014 and September 2014, respectively. |
| (3) | TTM encompasses the trailing 12-months ending February 28, 2015 for four of the six properties, the trailing 11-month period annualized for Target Center and the trailing six-month period annualized for Inglewood Plaza, as these properties were acquired in March 2014 and September 2014, respectively. |
| (4) | Percentage column represents percent of Net Rental Income for all revenue lines and represents percent of Effective Gross Income for the remainder of fields. |
Property Management. The properties are managed by CREI Advisors, LLC, an affiliate of the loan sponsor.
THE INFORMATION IN THIS STRUCTURAL AND COLLATERAL TERM SHEET IS NOT COMPLETE AND MAY BE AMENDED PRIOR TO THE TIME OF SALE. THIS TERM SHEET IS NOT AN OFFER TO SELL THESE SECURITIES AND IT IS NOT A SOLICITATION OF AN OFFER TO BUY THESE SECURITIES IN ANY JURISDICTION WHERE THE OFFER OR SALE IS NOT PERMITTED.
| 67 of 122 | |
| Structural and Collateral Term Sheet | JPMBB 2015-C29 | |
Cole IV Retail Portfolio – PooI II | ||
Escrows and Reserves. No upfront escrows were taken at origination.
Tax Escrows - The requirement for the borrowers to make monthly deposits into the tax escrow is waived with respect to any portion of any property leased to a tenant required to pay taxes directly pursuant to the terms of its lease.
Insurance Escrows - The requirement for the borrowers to make monthly deposits into the insurance escrow is waived so long as the borrowers provide satisfactory evidence that the properties are insured under an acceptable blanket policy in accordance with the loan documents.
Replacement Reserves - On a monthly basis, the borrowers are required to escrow approximately $4,599 (approximately $0.10 per square foot annually) for replacement reserves.
TI/LC Reserves - On a monthly basis, the borrowers will be required to escrow approximately $22,994 (approximately $0.50 per square foot annually) for TI/LC reserves.
Lockbox / Cash Management. The loan is structured with a hard lockbox and in-place cash management. At origination, the borrowers were required to send tenant direction letters to tenants instructing them to deposit all rents and payments directly to the lockbox account controlled by the lender. All funds in the lockbox account are swept on the 5th, 12th, 19th and 26th of the month to a cash management account under the control of the lender and disbursed on each monthly payment date during the term of the loan in accordance with the loan documents. Upon the occurrence of an Excess Cash Sweep Event (as defined below), the borrowers shall deposit with the lender all excess cash into the cash management account, which will be held by the lender as additional security for the mortgage loan.
An “Excess Cash Sweep Event” means any period during which there is (i) an event of default or (ii) the debt service coverage ratio at the end of a fiscal quarter is less than or equal to 1.75x.
Release of Individual Properties. Following the lockout period, the borrowers are permitted to sell one or more of the properties to a bona fide third party purchaser who is not a restricted party or an affiliate of a restricted party with the payment of the applicable yield maintenance premium if prior to the permitted par prepayment date, provided that, among other things (i) no event of default exists, (ii) the borrowers make a payment of 125.0% of the allocated loan amount applicable to such property, (iii) the debt service coverage ratio shall not be less than the greater of (a) the debt service coverage ratio, as calculated in the loan documents, for all properties in effect as of the origination date and (b) the debt service coverage ratio in effect immediately prior to the property sale and (iv) the loan-to-value ratio then remaining shall not be greater than the loan-to-value ratio for all properties in effect as of the origination date.
THE INFORMATION IN THIS STRUCTURAL AND COLLATERAL TERM SHEET IS NOT COMPLETE AND MAY BE AMENDED PRIOR TO THE TIME OF SALE. THIS TERM SHEET IS NOT AN OFFER TO SELL THESE SECURITIES AND IT IS NOT A SOLICITATION OF AN OFFER TO BUY THESE SECURITIES IN ANY JURISDICTION WHERE THE OFFER OR SALE IS NOT PERMITTED.
| 68 of 122 | |
| Structural and Collateral Term Sheet | JPMBB 2015-C29 | |
Alta Woodlake Square | ||
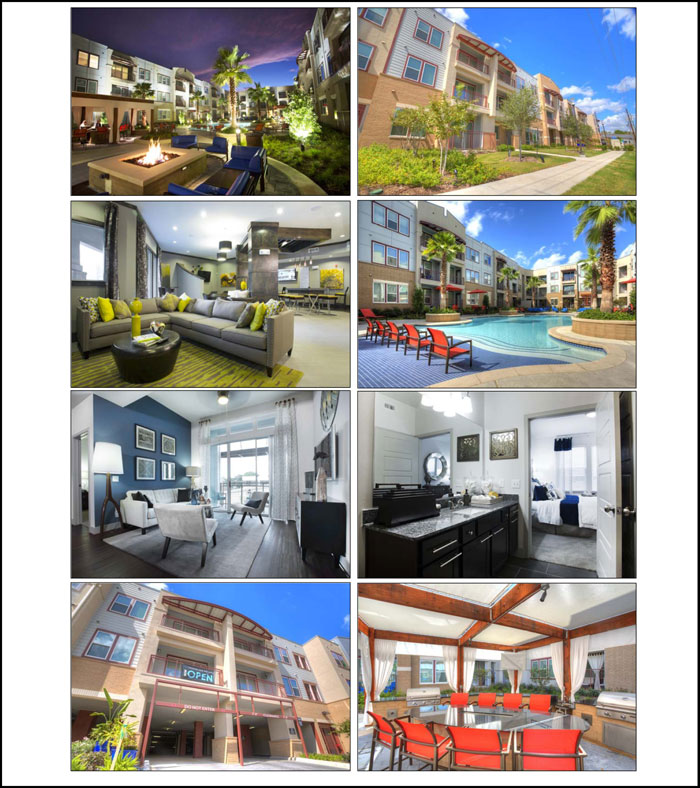
THE INFORMATION IN THIS STRUCTURAL AND COLLATERAL TERM SHEET IS NOT COMPLETE AND MAY BE AMENDED PRIOR TO THE TIME OF SALE. THIS TERM SHEET IS NOT AN OFFER TO SELL THESE SECURITIES AND IT IS NOT A SOLICITATION OF AN OFFER TO BUY THESE SECURITIES IN ANY JURISDICTION WHERE THE OFFER OR SALE IS NOT PERMITTED.
| 69 of 122 | |
| Structural and Collateral Term Sheet | JPMBB 2015-C29 | |
Alta Woodlake Square | ||

THE INFORMATION IN THIS STRUCTURAL AND COLLATERAL TERM SHEET IS NOT COMPLETE AND MAY BE AMENDED PRIOR TO THE TIME OF SALE. THIS TERM SHEET IS NOT AN OFFER TO SELL THESE SECURITIES AND IT IS NOT A SOLICITATION OF AN OFFER TO BUY THESE SECURITIES IN ANY JURISDICTION WHERE THE OFFER OR SALE IS NOT PERMITTED.
| 70 of 122 | |
| Structural and Collateral Term Sheet | JPMBB 2015-C29 | |
Alta Woodlake Square | ||
| Mortgage Loan Information | Property Information | |||
| Mortgage Loan Seller: | JPMCB | Single Asset / Portfolio: | Single Asset | |
| Original Principal Balance: | $31,000,000 | Title: | Fee | |
| Cut-off Date Principal Balance: | $31,000,000 | Property Type - Subtype: | Multifamily - Garden | |
| % of Pool by IPB: | 3.1% | Net Rentable Area (Units): | 256 | |
| Loan Purpose: | Acquisition | Location: | Houston, TX | |
| Borrower: | Elite Street Alta Woodlake | Year Built / Renovated: | 2013 / N/A | |
| Square, LLC | Occupancy: | 93.4% | ||
| Sponsor: | Yehonatan Sade | Occupancy Date: | 4/28/2015 | |
| Interest Rate: | 4.18600% | Number of Tenants: | N/A | |
| Note Date: | 5/18/2015 | 2012 NOI(1): | N/A | |
| Maturity Date: | 6/1/2025 | 2013 NOI(1): | N/A | |
| Interest-only Period: | 60 months | 2014 NOI(1): | N/A | |
| Original Term: | 120 months | TTM NOI (as of 4/2015)(2): | $1,376,182 | |
| Original Amortization: | 360 months | UW Economic Occupancy: | 88.3% | |
| Amortization Type: | IO-Balloon | UW Revenues: | $4,171,728 | |
| Call Protection: | L(25),Grtr1%orYM(93),O(2) | UW Expenses: | $1,692,641 | |
| Lockbox: | Springing | UW NOI(2): | $2,479,086 | |
| Additional Debt: | Yes | UW NCF: | $2,427,886 | |
| Additional Debt Balance: | $4,000,000 | Appraised Value / Per Unit: | $40,280,000 / $157,344 | |
| Additional Debt Type: | Mezzanine Loan / Permitted Mezzanine | Appraisal Date: | 4/8/2015 | |
Escrows and Reserves(3) | Financial Information | |||||
| Initial | Monthly | Initial Cap | Cut-off Date Loan / Unit: | $121,094 | ||
| Taxes: | $367,577 | $61,263 | N/A | Maturity Date Loan / Unit: | $110,242 | |
| Insurance: | $22,936 | $7,645 | N/A | Cut-off Date LTV: | 77.0% | |
| Replacement Reserves: | $4,267 | $4,267 | N/A | Maturity Date LTV: | 70.1% | |
| TI/LC | $0 | $0 | N/A | UW NCF DSCR: | 1.34x | |
| Other: | $33,000 | $0 | N/A | UW NOI Debt Yield: | 8.0% | |
| Sources and Uses | ||||||||
| Sources | Proceeds | % of Total | Uses | Proceeds | % of Total | |||
| Mortgage Loan | $31,000,000 | 75.7% | Purchase Price | $40,150,000 | 98.1% | |||
| Mezzanine Loan | 4,000,000 | 9.8 | Upfront Reserves | 427,780 | 1.0 | |||
| Sponsor Equity | 5,936,672 | 14.5 | Closing Costs | 358,892 | 0.9 | |||
| Total Sources | $40,936,672 | 100.0% | Total Uses | $40,936,672 | 100.0% | |||
| (1) | Historical NOI is not available as the property was built in 2013. |
| (2) | Increase from TTM NOI to UW NOI is due to the lease up of residential units from occupancy of approximately 65.0% in May 2014 to 93.4% as of April 2015. |
| (3) | For a full description of Escrows and Reserves, please refer to “Escrows and Reserves” below. |
The Loan. The Alta Woodlake Square loan has an outstanding principal balance of $31.0 million and is secured by a first mortgage lien on a newly constructed, Class A multifamily property totaling 256 units located in Houston, Texas. The loan has a 10-year term and, subsequent to a five-year interest-only period, will amortize on a 30-year schedule.
The Borrower. The borrowing entity for the loan is Elite Street Alta Woodlake Square, LLC, a Delaware limited liability company and special purpose entity.
The Sponsor. The loan sponsor and nonrecourse carve-out guarantor of the mortgage loan is Yehonatan Sade, the founder of Elite Street Capital, LLC, and formerly of Sun Holdings Group. Elite Street Capital, LLC is a newly formed investment vehicle. During his tenure at Sun Holdings Group, Yehonatan Sade oversaw the acquisition of more than 5,000 multifamily units in 2013 and 2014. The sponsor will contribute approximately $6.0 million in equity in connection with the acquisition of the property.
THE INFORMATION IN THIS STRUCTURAL AND COLLATERAL TERM SHEET IS NOT COMPLETE AND MAY BE AMENDED PRIOR TO THE TIME OF SALE. THIS TERM SHEET IS NOT AN OFFER TO SELL THESE SECURITIES AND IT IS NOT A SOLICITATION OF AN OFFER TO BUY THESE SECURITIES IN ANY JURISDICTION WHERE THE OFFER OR SALE IS NOT PERMITTED.
| 71 of 122 | |
| Structural and Collateral Term Sheet | JPMBB 2015-C29 | |
Alta Woodlake Square | ||
The Property. Alta Woodlake Square is a 256-unit Class A multifamily complex built in 2013 and situated on 4.78 acres. Despite the property being completed in 2013, it has already achieved an occupancy of 93.4% as of April 28, 2015. The property consists primarily of four three-story garden apartment buildings with a unit-mix consisting of 30 studio units, 162 one-bedroom units and 64 two-bedroom units. The apartments feature finishes including nine to ten-foot ceilings, washers/dryers, and private balconies for a majority of units. Amenities at the property include a community pool, cabana and grilling areas, fitness center and business center, as well as a structured parking facility, storage closet area, mailroom and leasing office/clubhouse. The three-story structured parking garage has 385 parking spaces, in addition to 42 indoor storage units available to tenants.
The Alta Woodlake Square property is located in Houston, Texas, approximately 10 miles west of the Houston central business district and provides convenient access to primary Houston roadways Katy Freeway, US-59, the Westpark Tollway, Beltway 8 and 610 Loop. The property is located within the Westchase Business District neighborhood. The Westchase Business District was created by the State of Texas to promote economic development, mobility, higher level of services and a long-term thriving community on Houston’s west side. Approximately 81,000 people work within the Westchase Business District and the district has some of the state’s most educated workforce with 42% of the residents having a college degree compared to 28% for the City of Houston as a whole. Major employers with operations in the Westchase Business District include Honeywell, Cardtronics, Metlife, Microsoft, Samsung Engineering and Xerox. Additionally, the property benefits from its close proximity to Houston Galleria and the Energy Corridor. Houston Galleria is a 2.4 million square foot super-regional mall owned and operated by Simon Property Group and is amongst the largest mall in the United States. The Energy Corridor is home to approximately 300 companies, some of which include British Petroleum, ConocoPhillips, Sysco and Shell Oil. The property also benefits from its proximity to the various universities that are affiliated with the University of Houston system and University of Texas system. The property is also approximately 1.0 mile from the new Phillips 66 campus, a 1.1 million square foot development that will serve as the company’s new headquarters. Upon completion, the new campus will employ approximately 1,800 people.
As of April 2015, the Woodlake/Westheimer submarket Class A occupancy rate was 83.5% with 3,363 total units. The appraisal identified six competitive properties that were built between 2003 and 2014 and range in size from 133 to 376 units. The occupancy for the rent comparables ranged from 91.0% to 98.0%, which excludes one property that is currently in a lease-up period. The average rent at the competitive properties ranged from $1,237 to $2,091 per unit or $1.34 to $1.73 per square foot. By comparison, the property’s average monthly rent is $1,454 per unit or $1.65 per square foot. The appraisal points to the property’s extensive amenities, age and higher quality as reasons for its higher rents. Within the Woodlake/Westheimer submarket there are two properties comprised of 714 units currently under construction. Despite low barriers to entry in the Houston market, the property is a well positioned Class A property in an area with substantial opportunity for commercial growth.
Historical and Current Occupancy(1) | |||
| TTM | T-6 | T-3 | Current(2) |
| 83.9% | 91.9% | 94.6% | 93.4% |
| (1) | Historical occupancies represent the average occupancies for the trailing twelve-, six- and three-month periods ended April 28, 2015. |
| (2) | Current occupancy is as of April 28, 2015. |
Multifamily Unit Mix(1) | |||||||||||||
| Unit Type | # of Units | % of Total | Occupied Units | Occupancy | Average Unit Size (Square Feet) | Average Monthly Rental Rate | Average Monthly Rental Rate PSF | ||||||
| Studio | 30 | 11.7% | 30 | 100.0% | 696 | $1,303 | $1.87 | ||||||
| 1 Bedroom | 162 | 63.3 | 152 | 93.8% | 806 | $1,404 | $1.74 | ||||||
| 2 Bedroom | 64 | 25.0 | 57 | 89.1% | 1,159 | $1,801 | $1.55 | ||||||
| Total / Wtd. Avg. | 256 | 100.0% | 239 | 93.4% | 881 | $1,492 | $1.69 | ||||||
| (1) | Based on the underwritten rent roll. |
THE INFORMATION IN THIS STRUCTURAL AND COLLATERAL TERM SHEET IS NOT COMPLETE AND MAY BE AMENDED PRIOR TO THE TIME OF SALE. THIS TERM SHEET IS NOT AN OFFER TO SELL THESE SECURITIES AND IT IS NOT A SOLICITATION OF AN OFFER TO BUY THESE SECURITIES IN ANY JURISDICTION WHERE THE OFFER OR SALE IS NOT PERMITTED.
| 72 of 122 | |
| Structural and Collateral Term Sheet | JPMBB 2015-C29 | |
Alta Woodlake Square | ||
Operating History and Underwritten Net Cash Flow(1) | |||||||||||||
TTM(2) | T-6(2)(3) | T-3(2)(3) | Underwritten | Per Unit | %(4) | ||||||||
| Rents in Place | $4,416,860 | $4,392,240 | $4,392,240 | $4,262,715 | $16,651 | 90.4% | |||||||
| Vacant Income | 0 | 0 | 0 | 319,841 | 1,249 | 6.8 | |||||||
| Gross Potential Rent | $4,416,860 | $4,392,240 | $4,392,240 | $4,582,556 | $17,901 | 97.2% | |||||||
| Reimbursements | 117,447 | 128,630 | 138,184 | 132,976 | 519 | 2.8 | |||||||
| Net Rental Income | $4,534,307 | $4,520,870 | $4,530,424 | $4,715,532 | $18,420 | 100.0% | |||||||
(Vacancy/Credit Loss/Concessions)(5) | (1,062,028) | (729,842) | (561,248) | (550,284) | (2,150) | (11.7) | |||||||
| Other Income | 6,144 | 0 | 0 | 6,480 | 25 | 0.1 | |||||||
| Effective Gross Income | $3,478,423 | $3,791,028 | $3,969,176 | $4,171,728 | $16,296 | 88.5% | |||||||
Total Expenses(5) | $2,102,241 | $2,054,680 | $1,831,696 | $1,692,641 | $6,612 | 40.6% | |||||||
| Net Operating Income | $1,376,182 | $1,736,348 | $2,137,480 | $2,479,086 | $9,684 | 59.4% | |||||||
| Replacement Reserves | 14,004 | 13,310 | 19,856 | 51,200 | 200 | 1.2 | |||||||
Net Cash Flow(6) | $1,362,178 | $1,723,038 | $2,117,624 | $2,427,886 | $9,484 | 58.2% | |||||||
| (1) | No historical cash flows are available as the property was constructed in late 2013. |
| (2) | T3, T6 and TTM columns represent the trailing twelve-, six- and three-month periods, respectively, each as of April 30, 2015. |
| (3) | T3 and T6 columns represent annualized figures. |
| (4) | Percentage column represents percent of Net Rental Income for all revenue lines and represents percent of Effective Gross Income for the remainder of fields. |
| (5) | The decrease in Underwritten Vacancy/Credit Loss/Concessions and Total Expenses from TTM Vacancy/Credit Loss/Concessions and Total Expenses is due to concessions offered in connection with the lease up of the property and the related payroll and marketing expenses. |
| (6) | The increase from TTM Net Cash Flow to Underwritten Net Cash Flow is due to the lease up of residential units during the latter half of 2014 and early 2015. |
Property Management. The Alta Woodlake Square apartment community is managed by Elite Street Capital, LLC. The current management agreement commenced on May 15, 2015 and has a 12-month term and will automatically renew each month unless otherwise terminated by either party. The management agreement provides for a contractual management fee of 3.0% of the gross income, payable on a monthly basis. The management fees related to the Alta Woodlake Square property are subordinate to the liens and interests of the Alta Woodlake Square loan.
Escrows and Reserves. At origination, the borrower was required to deposit into escrow $367,577 for tax reserves, $33,000 for deferred maintenance, $22,936 for insurance reserves and $4,267 for replacement reserves.
Tax Escrows - On a monthly basis, the borrower is required to escrow 1/12 of the annual estimated tax payments, which currently equates to $61,263 (approximately $2,872 per unit annually).
Insurance Escrows - On a monthly basis, the borrower is required to escrow 1/12 of the annual estimated insurance premium payments, which currently equates to $7,645 (approximately $358 per unit annually).
Replacement Reserves - On a monthly basis, the borrower is required to escrow approximately $4,267 (approximately $200 per unit annually) for replacement reserves. The reserve is not subject to a cap.
Lockbox / Cash Management. The loan is structured with a springing lockbox. Upon the occurrence of a Cash Sweep Event (as defined below), the borrower is required to establish the lockbox account and deposit all rents and payments into the lockbox account. During a Cash Sweep Event, all funds in the lockbox account are swept within two business days to a segregated cash management account under the control of the lender. To the extent there is a Cash Sweep Event continuing, all excess cash flow after payment of the mortgage and mezzanine debt service, required reserves and operating expenses will be held as additional collateral for the loan. The lender has a first priority security interest in the cash management account.
“Cash Sweep Event” means the occurrence of (i) an event of default, (ii) any bankruptcy action of the borrower or property manager, (iii) the date on which the debt service coverage ratio based on a trailing six months of gross income from operations is less than 1.05x, (iv) an event of default under the mezzanine loan documents or (v) failure of the mezzanine borrower to pay the mezzanine loan in full on or prior to the related anticipated repayment date under the mezzanine loan documents.
Additional Debt. The $4.0 million mezzanine loan is secured by direct equity interests in the borrowers and is coterminous with the Alta Woodlake Square loan. The mezzanine loan is interest-only for the term of the loan and has a 9.50000% coupon through December 31, 2015, and 12.50000% coupon thereafter. Including the mezzanine loan, the Cut-off Date LTV is 86.9%, the UW NCF DSCR is 1.10x and the UW NOI Debt Yield is 7.1%.
THE INFORMATION IN THIS STRUCTURAL AND COLLATERAL TERM SHEET IS NOT COMPLETE AND MAY BE AMENDED PRIOR TO THE TIME OF SALE. THIS TERM SHEET IS NOT AN OFFER TO SELL THESE SECURITIES AND IT IS NOT A SOLICITATION OF AN OFFER TO BUY THESE SECURITIES IN ANY JURISDICTION WHERE THE OFFER OR SALE IS NOT PERMITTED.
| 73 of 122 | |
| Structural and Collateral Term Sheet | JPMBB 2015-C29 | |
Alta Woodlake Square | ||
Permitted Mezzanine Debt. In connection with the prepayment in full and refinancing of the existing mezzanine loan, the mezzanine borrower will be permitted to obtain a mezzanine loan secured by the ownership interest in the borrower, subject to the terms and conditions of the loan documents, which include, without limitation, the following: (i) the aggregate combined loan-to-value ratio is not greater than 87.0%, (ii) the aggregate debt service coverage ratio (as calculated in the loan documents) is not less than 1.10x; (iii) the maturity date of the mezzanine loan is not earlier than the maturity date of the mortgage loan; and (iv) the lender of the mezzanine loan enters into an intercreditor agreement satisfactory to the lender.
THE INFORMATION IN THIS STRUCTURAL AND COLLATERAL TERM SHEET IS NOT COMPLETE AND MAY BE AMENDED PRIOR TO THE TIME OF SALE. THIS TERM SHEET IS NOT AN OFFER TO SELL THESE SECURITIES AND IT IS NOT A SOLICITATION OF AN OFFER TO BUY THESE SECURITIES IN ANY JURISDICTION WHERE THE OFFER OR SALE IS NOT PERMITTED.
| 74 of 122 | |
| Structural and Collateral Term Sheet | JPMBB 2015-C29 | |
| Little Palm Island Resort | ||

THE INFORMATION IN THIS STRUCTURAL AND COLLATERAL TERM SHEET IS NOT COMPLETE AND MAY BE AMENDED PRIOR TO THE TIME OF SALE. THIS TERM SHEET IS NOT AN OFFER TO SELL THESE SECURITIES AND IT IS NOT A SOLICITATION OF AN OFFER TO BUY THESE SECURITIES IN ANY JURISDICTION WHERE THE OFFER OR SALE IS NOT PERMITTED.
| 75 of 122 | |
| Structural and Collateral Term Sheet | JPMBB 2015-C29 | |
| Little Palm Island Resort | ||
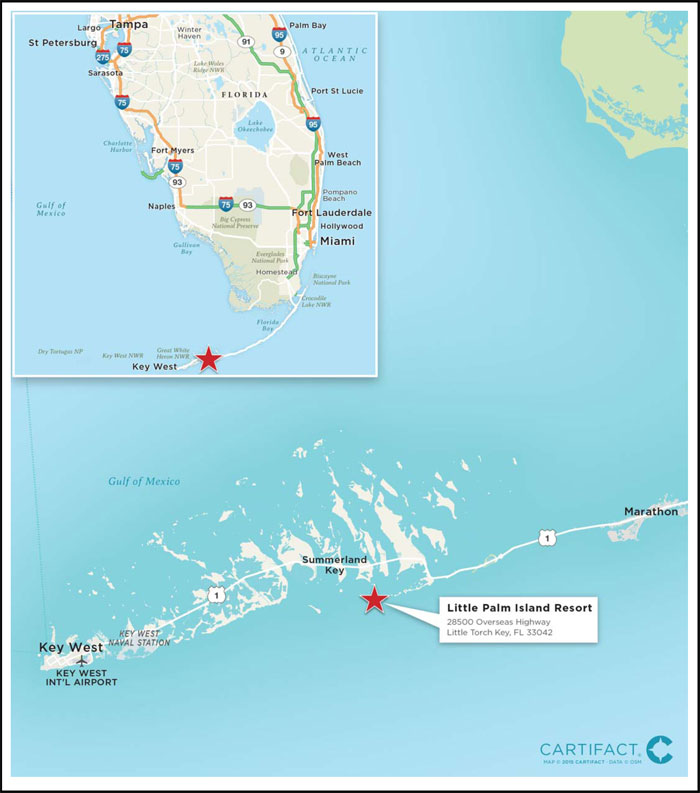
THE INFORMATION IN THIS STRUCTURAL AND COLLATERAL TERM SHEET IS NOT COMPLETE AND MAY BE AMENDED PRIOR TO THE TIME OF SALE. THIS TERM SHEET IS NOT AN OFFER TO SELL THESE SECURITIES AND IT IS NOT A SOLICITATION OF AN OFFER TO BUY THESE SECURITIES IN ANY JURISDICTION WHERE THE OFFER OR SALE IS NOT PERMITTED.
| 76 of 122 | |
| Structural and Collateral Term Sheet | JPMBB 2015-C29 | |
| Little Palm Island Resort | ||
| Mortgage Loan Information | Property Information | |||
| Mortgage Loan Seller: | Barclays | Single Asset / Portfolio: | Single Asset | |
| Original Principal Balance: | $31,000,000 | Title(1): | Fee | |
| Cut-off Date Principal Balance: | $30,963,678 | Property Type - Subtype: | Hotel - Full Service | |
| % of Pool by IPB: | 3.1% | Net Rentable Area (Rooms): | 30 | |
| Loan Purpose: | Refinance | Location: | Little Torch Key, FL | |
| Borrower: | Little Palm Island Associates, Ltd. | Year Built / Renovated: | 1988 / 2009 | |
Sponsors(2): | Various | Occupancy / ADR / RevPAR: | 75.5% / $1,135.05 / $857.15 | |
| Interest Rate: | 4.57600% | Occupancy / ADR / RevPAR Date: | 3/31/2015 | |
| Note Date: | 4/23/2015 | Number of Tenants: | N/A | |
| Maturity Date: | 5/6/2020 | 2012 NOI: | $1,979,512 | |
| Interest-only Period: | None | 2013 NOI: | $2,933,157 | |
| Original Term: | 60 months | 2014 NOI: | $3,354,724 | |
| Original Amortization: | 360 months | TTM NOI (as of 3/2015): | $3,547,169 | |
| Amortization Type: | Balloon | UW Occupancy / ADR / RevPAR: | 75.5% / $1,135.19 / $857.15 | |
| Call Protection: | L(25),Def(31),O(4) | UW Revenues: | $17,410,213 | |
| Lockbox: | CMA | UW Expenses: | $13,800,756 | |
| Additional Debt: | N/A | UW NOI: | $3,609,457 | |
| Additional Debt Balance: | N/A | UW NCF: | $3,609,457 | |
| Additional Debt Type: | N/A | Appraised Value / Per Room: | $55,200,000 / $1,840,000 | |
| Appraisal Date: | 1/27/2015 | |||
Escrows and Reserves(3) | Financial Information | ||||||
| Initial | Monthly | Initial Cap | Cut-off Date Loan / Room: | $1,032,123 | |||
| Taxes: | $59,523 | $11,905 | N/A | Maturity Date Loan / Room: | $946,905 | ||
| Insurance: | $168,661 | $60,475 | N/A | Cut-off Date LTV: | 56.1% | ||
| FF&E Reserves: | $0 | 4% of Gross Revenues | N/A | Maturity Date LTV: | 51.5% | ||
| TI/LC: | $0 | $0 | N/A | UW NCF DSCR: | 1.90x | ||
| Other: | $1,650,000 | Springing | N/A | UW NOI Debt Yield: | 11.7% | ||
| Sources and Uses | |||||||||
| Sources | Proceeds | % of Total | Uses | Proceeds | % of Total | ||||
| Mortgage Loan | $31,000,000 | 100.0 | % | Payoff Existing Debt | $22,915,988 | 73.9 | % | ||
| Return of Equity | 5,558,717 | 17.9 | |||||||
| Upfront Reserves | 1,878,184 | 6.1 | |||||||
| Closing Costs | 647,111 | 2.1 | |||||||
| Total Sources | $31,000,000 | 100.0 | % | Total Uses | $31,000,000 | 100.0 | % | ||
| (1) | The property also consists of an access lease and a submerged land lease. For a full description, please refer to “Shore Station Access Agreement” and “Submerged Land Lease” below. |
| (2) | For a full description of Sponsors, please refer to “The Sponsors” below. |
| (3) | For a full description of Escrows and Reserves, please refer to “Escrows and Reserves” below. |
The Loan. The Little Palm Island Resort loan has an outstanding principal balance of approximately $31.0 million and is secured by a first mortgage lien on the borrower’s interests in a 30-room full service luxury resort hotel located in Little Torch Key, Florida. The loan has a five-year term and will amortize on a 30-year schedule. The previously existing debt was securitized in 2004 and 2012 as a part of the WBCMT 2004-C10 and GSMS 2012-GCJ7 securitizations, respectively.
The Borrower. The borrowing entity for the loan is Little Palm Island Associates, Ltd., a Florida limited partnership and a special purpose entity.
THE INFORMATION IN THIS STRUCTURAL AND COLLATERAL TERM SHEET IS NOT COMPLETE AND MAY BE AMENDED PRIOR TO THE TIME OF SALE. THIS TERM SHEET IS NOT AN OFFER TO SELL THESE SECURITIES AND IT IS NOT A SOLICITATION OF AN OFFER TO BUY THESE SECURITIES IN ANY JURISDICTION WHERE THE OFFER OR SALE IS NOT PERMITTED.
| 77 of 122 | |
| Structural and Collateral Term Sheet | JPMBB 2015-C29 | |
| Little Palm Island Resort | ||
The Sponsors. The loan sponsors and nonrecourse carve-out guarantors are The Colee Family Trust Under Agreement and Declaration of Trust dated December 20, 1997, Patrick R. Colee and Diane F. Colee. Patrick R. Colee is the founder and chairman of Noble House Hotels & Resorts (“Noble”), a hotel ownership and management company comprised of 18 hotels and resorts located throughout the United States. Noble has received various awards and accolades for their hotel portfolio, such as Fodor’s “100 Hotel Awards List” and Condé Nast Traveler’s “Gold List” and “Reader’s Choice”.
The Property. Little Palm Island Resort (“Little Palm”) is a 30-room, full service luxury boutique hotel located on its own private island, Munson Island in the Florida Keys. Munson Island is located approximately three miles offshore from Little Torch Key. The property was built in 1988 and extensively renovated in 2009. Following Noble’s acquisition of the hotel in 1996 for approximately $12.6 million, the loan sponsors invested approximately $8.1 million on capital improvements throughout the resort, since 2001. Additionally, the loan sponsors plan to spend approximately $1.3 million on additional improvements over the next six months, 125.0% of which was reserved at origination (approximately $1.7 million).
Little Palm features 30 guestrooms, including 15 cottages/villas, as well as a freeform pool, a poolside bar, a restaurant with an indoor dining area and outdoor private tables, a lounge, a library, a beauty salon, a spa, massage rooms, a retail and rental store and marina facilities. Each of the guest suites are equipped with king-sized beds, arm chairs, end tables, coffee makers, a mini-bar, binoculars and a local bird guide. Additionally, complimentary Wi-Fi access is provided throughout the resort.
Little Palm is situated on a private island known as Munson Island, approximately three miles offshore from Little Torch Key, Florida, which is along the south side of U.S. Highway 1. U.S. Highway 1, also known as the Overseas Highway, is the main thoroughfare into the Florida Keys. Access to Munson Island is provided by private seaplane or yacht ferry made from the Dolphin Marina & Cottages property located on Little Torch Key, operated under an access agreement. For a full description of the access agreement, please refer to “Shore Station Access Agreement” below.
Due to the unique nature of the hotel, there are no true direct competitors within the Florida Keys hotel submarket. Statistics from a third party vendor show that the Florida Keys submarket ranks among the top five United States submarkets in terms of occupancy, room rate growth and ADR. The hotel caters predominantly to leisure travelers, given its location and amenities. In addition, there are several areas in the resort that are utilized for private events such as weddings and retreats.
| Historical Occupancy, ADR, RevPAR | ||||||||||
Competitive Set(1) | Little Palm Island Resort(2) | Penetration Factor(3) | ||||||||
| Year | Occupancy | ADR | RevPAR | Occupancy | ADR | RevPAR | Occupancy | ADR | RevPAR | |
| 2012 | 53.0% | $843.86 | $447.31 | 68.2% | $947.98 | $646.32 | 128.7% | 112.3% | 144.5% | |
| 2013 | 54.9% | $876.18 | $481.34 | 74.1% | $1,050.62 | $778.61 | 135.0% | 119.9% | 161.8% | |
| 2014 | 56.9% | $903.49 | $513.70 | 74.1% | $1,127.51 | $835.29 | 130.2% | 124.8% | 162.6% | |
TTM(4) | 55.0% | $937.93 | $515.54 | 75.5% | $1,135.05 | $857.15 | 137.3% | 121.0% | 166.3% | |
| (1) | Data provided by Smith Travel Research. The competitive set contains the following properties: Elbow Beach Bermuda, One & Only Ocean Club, Rosewood Jumby Bay Resort, Boutique Peter Island Resort, Rosewood Little Dix Bay, Cotton House Hotel, Cap Juluca Hotel and CuisinArt Resort & Spa. |
| (2) | Based on operating statements provided by the borrower. |
| (3) | Penetration Factor is calculated based on data provided by Smith Travel Research for the competitive set and operating statements for the property provided by the borrower. |
| (4) | TTM represents trailing 12-month period ending on March 31, 2015. |
THE INFORMATION IN THIS STRUCTURAL AND COLLATERAL TERM SHEET IS NOT COMPLETE AND MAY BE AMENDED PRIOR TO THE TIME OF SALE. THIS TERM SHEET IS NOT AN OFFER TO SELL THESE SECURITIES AND IT IS NOT A SOLICITATION OF AN OFFER TO BUY THESE SECURITIES IN ANY JURISDICTION WHERE THE OFFER OR SALE IS NOT PERMITTED.
| 78 of 122 | |
| Structural and Collateral Term Sheet | JPMBB 2015-C29 | |
| Little Palm Island Resort | ||
Competitive Hotels Profile(1) | ||||||||||||||||||
| 2014 Market Mix | 2014 Estimated Operating Statistics | |||||||||||||||||
| Property | Rooms | Year Built | Meeting Space (SF) | Meeting & Group | Leisure | Occupancy | ADR | RevPAR | ||||||||||
| Little Palm Island Resort | 30 | 1988 | 0 | 8% | 92% | 76.7% | $1,088.60 | $835.29 | ||||||||||
| Cheeca Lodge & Spa | 214 | 1988 | 5,400 | 12% | 88% | 85.0% | $370.00 | $314.50 | ||||||||||
| Westin Sunset Key | 40 | 1997 | 0 | 5% | 95% | 74.0% | $942.00 | $697.08 | ||||||||||
| Waldorf Astoria Casa Marina Resort | 311 | 1920, 1977 | 11,400 | 20% | 80% | 89.0% | $356.00 | $316.84 | ||||||||||
| Ocean Key Resort | 100 | 1983 | 870 | 10% | 90% | 91.0% | $437.00 | $396.80 | ||||||||||
| Waldorf Astoria The Reach Resort | 150 | 1985 | 4,800 | 5% | 95% | 87.0% | $322.00 | $280.14 | ||||||||||
| Pier House Resort | 142 | 1967 | 4,600 | 10% | 90% | 87.0% | $386.00 | $334.08 | ||||||||||
| Westin Key West Resort | 178 | 1996 | 10,000 | 20% | 80% | 88.0% | $341.00 | $300.08 | ||||||||||
| Hyatt Key West | 118 | 1988 | 2,400 | 10% | 90% | 96.0% | $372.00 | $357.86 | ||||||||||
Total(2) | 1,253 | |||||||||||||||||
| (1) | Based on the appraisal. |
| (2) | Excludes the Little Palm Island Resort property. |
Operating History and Underwritten Net Cash Flow(1) | |||||||||||||||
| 2012 | 2013 | 2014 | TTM(2) | Underwritten | Per Room(3) | % of Total Revenue(4) | |||||||||
| Occupancy | 68.2% | 74.1% | 74.1% | 75.5% | 75.5% | ||||||||||
| ADR | $947.98 | $1,050.62 | $1,127.51 | $1,135.05 | $1,135.19 | ||||||||||
| RevPAR | $646.32 | $778.61 | $835.29 | $857.15 | $857.15 | ||||||||||
| Room Revenue | $7,096,584 | $8,525,801 | $9,146,398 | $9,385,754 | $9,385,754 | $312,858 | 53.9 | % | |||||||
| Food and Beverage Revenues | 4,051,363 | 4,196,933 | 4,394,916 | 4,457,782 | 4,457,782 | 148,593 | 25.6 | ||||||||
| Other Departmental Revenues | 3,321,133 | 3,346,949 | 3,612,720 | 3,566,677 | 3,566,677 | 118,889 | 20.5 | ||||||||
| Total Revenue | $14,469,080 | $16,069,683 | $17,154,034 | $17,410,213 | $17,410,213 | $580,340 | 100.0 | % | |||||||
| Room Expense | $1,308,086 | $1,350,383 | $1,438,506 | $1,417,882 | $1,417,882 | $47,263 | 15.1 | % | |||||||
| Food and Beverage Expenses | 2,940,398 | 3,174,693 | 3,144,286 | 3,160,993 | 3,160,993 | 105,366 | 70.9 | ||||||||
| Other Departmental Expenses | 2,297,387 | 2,273,131 | 2,605,258 | 2,562,510 | 2,562,510 | 85,417 | 71.8 | ||||||||
| Departmental Expenses | $6,545,871 | $6,798,207 | $7,188,050 | $7,141,385 | $7,141,385 | $238,046 | 41.0 | % | |||||||
| Departmental Profit | $7,923,209 | $9,271,476 | $9,965,984 | $10,268,828 | $10,268,828 | $342,294 | 59.0 | % | |||||||
| Operating Expenses | $3,804,704 | $4,078,530 | $4,195,843 | $4,314,637 | $4,314,637 | $143,821 | 24.8 | % | |||||||
| Gross Operating Profit | $4,118,505 | $5,192,946 | $5,770,141 | $5,954,191 | $5,954,191 | $198,473 | 34.2 | % | |||||||
| Management Fee | $578,763 | $642,787 | $750,857 | $762,184 | $696,409 | $23,214 | 4.0 | % | |||||||
| Fixed Expenses | 981,467 | 975,238 | 978,399 | 951,916 | 951,916 | 31,731 | 5.5 | ||||||||
| FF&E | 578,763 | 641,764 | 686,161 | 692,922 | 696,409 | 23,214 | 4.0 | ||||||||
| Total Other Expenses | $2,138,993 | $2,259,789 | $2,415,417 | $2,407,022 | $2,344,734 | $78,158 | 13.5 | % | |||||||
| Net Operating Income | $1,979,512 | $2,933,157 | $3,354,724 | $3,547,169 | $3,609,457 | $120,315 | 20.7 | % | |||||||
| Net Cash Flow | $1,979,512 | $2,933,157 | $3,354,724 | $3,547,169 | $3,609,457 | $120,315 | 20.7 | % | |||||||
| (1) | The information provided in the table reflects the cash flow from operations of the hotel. |
| (2) | TTM column represents the trailing 12-month period ending on March 31, 2015. |
| (3) | Per Room values are based on 30 guest rooms. |
| (4) | % of Total Revenue column for Room Expense, Food and Beverage Expenses and Other Departmental Expenses is based on their corresponding revenue line item. |
Property Management. The property is managed by Noble House Little Palm Island, Ltd., an affiliate of the loan Sponsors. The management agreement commenced October 18, 1996 and has a 30-year term with four five-year extension options.
THE INFORMATION IN THIS STRUCTURAL AND COLLATERAL TERM SHEET IS NOT COMPLETE AND MAY BE AMENDED PRIOR TO THE TIME OF SALE. THIS TERM SHEET IS NOT AN OFFER TO SELL THESE SECURITIES AND IT IS NOT A SOLICITATION OF AN OFFER TO BUY THESE SECURITIES IN ANY JURISDICTION WHERE THE OFFER OR SALE IS NOT PERMITTED.
| 79 of 122 | |
| Structural and Collateral Term Sheet | JPMBB 2015-C29 | |
| Little Palm Island Resort | ||
Escrows and Reserves. At origination, the borrower deposited into escrow $1,650,000 for a suite capital upgrade reserve that will be used to convert and upgrade certain suites, $168,661 for insurance reserves and $59,523 for real estate tax reserves.
Tax Escrows - The borrower is required to escrow 1/12 of the annual estimated tax payments monthly, which currently equates to $11,905.
Insurance Escrows - The borrower is required to escrow 1/12 of the annual estimated insurance payments monthly, which currently equates to $60,475.
FF&E Reserves - On a monthly basis, the borrower is required to deposit an amount equal to 1/12 of 4.0% of gross revenues from the hotel operations from the prior year to such payment date for FF&E.
Access Lease Agreement Reserve - Upon the borrower’s failure to pay the access lease agreement rent, the borrower will be required to pay to the lender, together with the monthly debt service payment amount, an amount that is estimated by the lender to be due and payable by the borrower under the access lease agreement for all rent and any and all other charges which may be due.
Seasonality Reserve - During the first two years of the loan term, the borrower will provide evidence satisfactory to the lender that on May 31 of each respective year, the seasonality reserve, a borrower-controlled account (the “Seasonality Reserve”), has an annual balance of $250,000. During the remaining three years of the loan term, the borrower will provide evidence satisfactory to the lender that on May 31 of each respective year, the Seasonality Reserve has an annual balance of $350,000. In the event that the debt service coverage ratio, as calculated in the loan documents, falls below 1.30x at any time during the loan term, the funds in the Seasonality Reserve shall be transferred to an account held by the lender. The funds will be drawn upon as necessary to cover debt service shortfalls.
Upon the expiration of the period commencing with and including the month of May of each calendar year and continuing through the month of October of the following calendar year, if the funds on deposit in the Seasonality Reserve are less than the required deposit amount, the borrower will be required thereafter on each payment date commencing and including the month of November through and including the payment date in the month of April of each calendar year, to deposit with the lender or the bank holding the Seasonality Reserve, monthly deposits in an amount equal to the difference between the required deposit amount and the amount of funds on deposit in the Seasonality Reserve divided by six.
Lockbox / Cash Management. The loan is structured with a CMA lockbox. The borrower and property manager are required to deposit all revenues into the lockbox account controlled by the lender. All funds in the lockbox account are returned to an account controlled by the borrower until the occurrence of a Triggering Event (as defined below). During a Triggering Event, all funds on deposit in the lockbox account will be swept on a daily basis to a cash management account, and all excess cash flows after payment of debt service, required reserves and operating expenses are required to be held as additional collateral for the loan.
A “Triggering Event” means a period commencing upon the earliest of (i) an event of default under the loan documents and (ii) the debt service coverage ratio, as calculated in the loan documents, falls below 1.20x.
Shore Station Access Agreement. The property relies on access to dock space, a welcome center and a lobby building in order to receive guests in Little Torch Key for transport to the resort on Munson Island. The main access is provided by Dolphin Marina and Cottages (not collateral for the loan), which is also owned by Noble, but is controlled via a lease that has been assigned as collateral for the loan. The access lease commenced on April 29, 1997 and will expire April 30, 2037 with five five-year options remaining. The tenant under the access lease, Little Palm Island Associates Ltd., is responsible for funding all operating and maintenance expenses, inclusive of property taxes for the leased premises.
Submerged Land Lease. Portions of the submerged land area around Munson Island are leased from the Board of Trustees of the Internal Improvement Trust Fund of the State of Florida for use as a docking facility to receive and transport guests, and other related uses. The submerged land lease was executed in October 1996 and expires on January 26, 2029. The submerged land lease cannot be leased to anyone who does not have sufficient interest in the upland parcel, and as such, only the borrower can be the lessee of the submerged lands. According to the lease, provided that the lessee is not in default of the existing lease, the lessee may apply for a renewal of the lease no earlier than 120 days from and no later than 30 days prior to the expiration date of the lease.
THE INFORMATION IN THIS STRUCTURAL AND COLLATERAL TERM SHEET IS NOT COMPLETE AND MAY BE AMENDED PRIOR TO THE TIME OF SALE. THIS TERM SHEET IS NOT AN OFFER TO SELL THESE SECURITIES AND IT IS NOT A SOLICITATION OF AN OFFER TO BUY THESE SECURITIES IN ANY JURISDICTION WHERE THE OFFER OR SALE IS NOT PERMITTED.
| 80 of 122 | |
| Structural and Collateral Term Sheet | JPMBB 2015-C29 | |
JAGR Portfolio | ||

THE INFORMATION IN THIS STRUCTURAL AND COLLATERAL TERM SHEET IS NOT COMPLETE AND MAY BE AMENDED PRIOR TO THE TIME OF SALE. THIS TERM SHEET IS NOT AN OFFER TO SELL THESE SECURITIES AND IT IS NOT A SOLICITATION OF AN OFFER TO BUY THESE SECURITIES IN ANY JURISDICTION WHERE THE OFFER OR SALE IS NOT PERMITTED.
| 81 of 122 | |
| Structural and Collateral Term Sheet | JPMBB 2015-C29 | |
JAGR Portfolio | ||
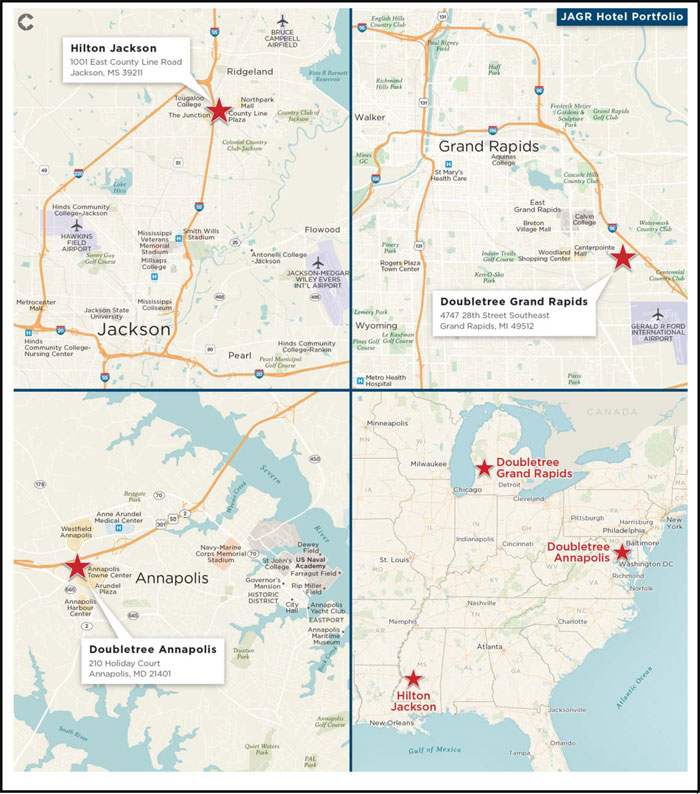
THE INFORMATION IN THIS STRUCTURAL AND COLLATERAL TERM SHEET IS NOT COMPLETE AND MAY BE AMENDED PRIOR TO THE TIME OF SALE. THIS TERM SHEET IS NOT AN OFFER TO SELL THESE SECURITIES AND IT IS NOT A SOLICITATION OF AN OFFER TO BUY THESE SECURITIES IN ANY JURISDICTION WHERE THE OFFER OR SALE IS NOT PERMITTED.
| 82 of 122 | |
| Structural and Collateral Term Sheet | JPMBB 2015-C29 | |
JAGR Portfolio | ||
| Mortgage Loan Information | Property Information | |||
| Mortgage Loan Seller: | JPMCB | Single Asset / Portfolio: | Portfolio | |
Original Principal Balance(1): | $30,000,000 | Title: | Fee | |
Cut-off Date Principal Balance(1): | $30,000,000 | Property Type - Subtype: | Hotel – Full Service | |
| % of Pool by IPB: | 3.0% | Net Rentable Area (Rooms): | 721 | |
| Loan Purpose: | Refinance | Location: | Various | |
Borrowers(2): | Various | Year Built / Renovated: | Various / Various | |
Sponsors(3): | Various | Occupancy / ADR / RevPAR: | 64.2% / $116.23 / $74.62 | |
| Interest Rate: | 4.95950% | Occupancy / ADR / RevPAR Date: | 2/28/2015 | |
| Note Date: | 3/3/2015 | Number of Tenants: | N/A | |
| Maturity Date: | 4/1/2020 | 2012 NOI: | $4,027,349 | |
| Interest-only Period: | 24 months | 2013 NOI(4): | $4,301,723 | |
| Original Term: | 60 months | 2014 NOI(4): | $5,072,210 | |
| Original Amortization: | 360 months | TTM NOI (as of 2/2015): | $5,227,459 | |
| Amortization Type: | IO-Balloon | UW Occupancy / ADR / RevPAR: | 64.2% / $116.23 / $74.62 | |
| Call Protection: | L(6),Grtr1%orYM(18),O(36) | UW Revenues: | $35,641,818 | |
| Lockbox: | Hard | UW Expenses: | $30,231,368 | |
| Additional Debt: | Yes | UW NOI: | $5,410,450 | |
| Additional Debt Balance: | $17,500,000 / $7,500,000 | UW NCF: | $5,410,450 | |
| Additional Debt Type: | Pari Passu / Mezzanine Loan | Appraised Value / Per Room: | $73,500,000 / $101,942 | |
| Appraisal Date: | 1/1/2015 | |||
Escrows and Reserves(5) | Financial Information(1) | ||||||||
| Initial | Monthly | Initial Cap | Cut-off Date Loan / Room: | $65,881 | |||||
| Taxes: | $375,291 | $78,882 | N/A | Maturity Date Loan / Room: | $62,945 | ||||
| Insurance: | $0 | Springing | N/A | Cut-off Date LTV: | 64.6% | ||||
| FF&E Reserves: | $116,939 | 4% of Gross Revenues | N/A | Maturity Date LTV: | 61.7% | ||||
| TI/LC: | $0 | $0 | N/A | UW NCF DSCR: | 1.78x | ||||
| Other: | $1,586,174 | Springing | N/A | UW NOI Debt Yield: | 11.4% | ||||
| Sources and Uses | |||||||||
| Sources | Proceeds | % of Total | Uses | Proceeds | % of Total | ||||
Mortgage Loan(1) | $47,500,000 | 86.4% | Payoff Existing Debt | $41,423,800 | 75.3% | ||||
| Mezzanine Loan | 7,500,000 | 13.6 | Return of Equity | 10,465,785 | 19.0 | ||||
| Upfront Reserves | 2,078,404 | 3.8 | |||||||
| Closing Costs | 1,032,012 | 1.9 | |||||||
| Total Sources | $55,000,000 | 100.0% | Total Uses | $55,000,000 | 100.0% | ||||
| (1) | JAGR Portfolio is part of a loan evidenced by two pari passu notes with an aggregate original principal balance of $47.5 million. The Financial Information presented in the chart above reflects the Cut-off Date balance of the $47.5 million JAGR Portfolio Whole Loan. |
| (2) | For a full description of the Borrowers, please refer to “The Borrowers” below. |
| (3) | For a full description of the Sponsors, please refer to “The Sponsors” below. |
| (4) | The increase from 2013 NOI to 2014 NOI is primarily due to the opening of the Drago’s Seafood Restaurant at the Hilton Jackson property in 2014, as well as increased occupancy across all three JAGR Portfolio properties. |
| (5) | For a full description of Escrows and Reserves, please refer to “Escrows and Reserves” below. |
THE INFORMATION IN THIS STRUCTURAL AND COLLATERAL TERM SHEET IS NOT COMPLETE AND MAY BE AMENDED PRIOR TO THE TIME OF SALE. THIS TERM SHEET IS NOT AN OFFER TO SELL THESE SECURITIES AND IT IS NOT A SOLICITATION OF AN OFFER TO BUY THESE SECURITIES IN ANY JURISDICTION WHERE THE OFFER OR SALE IS NOT PERMITTED.
| 83 of 122 | |
| Structural and Collateral Term Sheet | JPMBB 2015-C29 | |
JAGR Portfolio | ||
The Loan. The JAGR Portfolio loan is secured by a first mortgage lien on the fee interests in three full service hotels totaling 721 rooms located in Mississippi, Michigan and Maryland. The whole loan has an outstanding principal balance as of the Cut-off Date of $47.5 million (the “JAGR Portfolio Whole Loan”), and is comprised of two pari passu notes, Note A-1 and Note A-2. Note A-1 has an outstanding principal balance as of the Cut-off Date of $30.0 million and is being contributed to the JPMBB 2015-C29 Trust. Note A-2, which has an outstanding principal balance as of the Cut-off Date of $17.5 million, is expected to be contributed to a future securitization trust. The holder of the Note A-1 (the “Controlling Noteholder”) will be the trustee of the JPMBB 2015-C29 Trust. The trustee of the JPMBB 2015-C29 Trust (or, prior to the occurrence and continuance of a control event under the pooling and servicing agreement, the directing certificateholder) will be entitled to exercise all of the rights of the Controlling Noteholder with respect to the JAGR Portfolio Whole Loan; however, the holder of the Note A-2 will be entitled, under certain circumstances, to consult with respect to certain major decisions. The JAGR Portfolio Whole Loan has a five-year term, and subsequent to a two-year interest-only period, will amortize on a 30-year schedule.
The proceeds from the JAGR Portfolio Whole Loan were used to refinance existing debt on the Hilton Jackson, Doubletree Grand Rapids and Doubletree Annapolis properties, each with an outstanding balance of approximately $15.1 million, $10.5 million and $11.5 million, respectively. The three loans were originally issued by Great American Life Insurance Company for the Hilton Jackson property and Bank of America for the Doubletree Grand Rapids and Doubletree Annapolis properties.
The Borrowers. The borrowing entities for the loan are AWH-BP Annapolis Hotel, LLC, AWH-BP Grand Rapids Hotel, LLC and AWH-BP Jackson Hotel, LLC, all Delaware limited liability companies and special purpose entities.
The Sponsors. The loan sponsors and nonrecourse carve-out guarantors are Chad Cooley, Russell Flicker, Jonathan Rosenfeld and Bernard Michael, each a principal of AWH Partners. The loan sponsors formed a joint venture between AWH Partners and the Baupost Group. AWH Partners is a privately held real estate investment, development and management firm, currently managing a portfolio in excess of $800 million. The Baupost Group, led by Seth Klarman, is a hedge fund currently managing approximately $7 billion in assets. The loan sponsors purchased the three properties out of bankruptcy after the previous lender had foreclosed on the properties. The prior ownership group sold the properties and related management company to the current sponsor.
The sponsors acquired the Hilton Jackson in 2012 for approximately $19.3 million, the Doubletree Grand Rapids in 2013 for approximately $8.6 million and the Doubletree Annapolis in 2013 for approximately $13.4 million. Additionally, the sponsors have invested approximately $13.4 million in capital improvements and other costs since acquisition of the three properties bringing the loan sponsors’ total basis to approximately $54.7 million.
The Portfolio. The collateral consists of three full service hotels totaling 721 rooms located in Mississippi, Michigan and Maryland. The portfolio is comprised of three Hilton flagged hotels: the Hilton Jackson (276 rooms, 51.1% of UW NCF), the Doubletree Grand Rapids (226 rooms, 28.0% of UW NCF) and the Doubletree Annapolis (219 rooms, 20.9% of UW NCF). The portfolio has an aggregate appraised value of $73.5 million resulting in a 64.6% Cut-off Date LTV. The Hilton Jackson and Doubletree Grand Rapids properties have exhibited a strong performance in relation to their respective competitive sets in terms of occupancy, ADR and RevPAR. The Doubletree Annapolis property has operated on par with its competitive set over the previous three years; however, a soon-to-be completed property improvement plan is likely to improve upon performance going forward.
| Portfolio Summary | ||||||||||||||||
| Property | Location | Rooms | Year Built / Renovated | Cut-off Date Allocated Loan Amount | % of Allocated Loan Amount | Appraised Value | Underwritten Net Cash Flow | % of Underwritten Net Cash Flow | ||||||||
| Hilton Jackson | Jackson, MS | 276 | 1984 / 2013 | $14,256,632 | 47.5% | $34,500,000 | $2,764,383 | 51.1% | ||||||||
| Doubletree Grand Rapids | Grand Rapids, MI | 226 | 1979, 1987 / 2015 | 8,480,211 | 28.3 | 20,500,000 | 1,513,724 | 28.0 | ||||||||
| Doubletree Annapolis | Annapolis, MD | 219 | 1961, 1985 / 2015 | 7,263,158 | 24.2 | 18,500,000 | 1,132,343 | 20.9 | ||||||||
| Total | 721 | $30,000,000 | 100.0% | $73,500,000 | $5,410,450 | 100.0% | ||||||||||
THE INFORMATION IN THIS STRUCTURAL AND COLLATERAL TERM SHEET IS NOT COMPLETE AND MAY BE AMENDED PRIOR TO THE TIME OF SALE. THIS TERM SHEET IS NOT AN OFFER TO SELL THESE SECURITIES AND IT IS NOT A SOLICITATION OF AN OFFER TO BUY THESE SECURITIES IN ANY JURISDICTION WHERE THE OFFER OR SALE IS NOT PERMITTED.
| 84 of 122 | |
| Structural and Collateral Term Sheet | JPMBB 2015-C29 | |
JAGR Portfolio | ||
Historical Occupancy, ADR and RevPAR(1) | ||||||||||||||||||||||||
| Occupancy | ADR | RevPAR | ||||||||||||||||||||||
| Property | 2012 | 2013 | 2014 | TTM(2) | 2012 | 2013 | 2014 | TTM(2) | 2012 | 2013 | 2014 | TTM(2) | ||||||||||||
| Hilton Jackson | 65.2% | 66.9% | 67.5% | 68.1% | $112.02 | $115.35 | $118.63 | $120.23 | $72.99 | $77.15 | $80.09 | $81.90 | ||||||||||||
| Doubletree Grand Rapids | 62.6% | 66.5% | 67.4% | 65.0% | $106.11 | $108.89 | $113.83 | $114.77 | $66.45 | $72.42 | $76.74 | $74.63 | ||||||||||||
| Doubletree Annapolis | 60.3% | 57.7% | 59.3% | 58.4% | $111.49 | $116.15 | $114.10 | $114.34 | $67.24 | $67.00 | $67.61 | $66.79 | ||||||||||||
Weighted Average(3) | 62.9% | 64.0% | 65.0% | 64.2% | $110.02 | $113.46 | $115.81 | $116.73 | $69.20 | $72.58 | $75.25 | $75.03 | ||||||||||||
| (1) | Based on operating statements provided by the borrowers. |
| (2) | TTM as of March 31, 2015. |
| (3) | Weighted by room count. |
Historical Occupancy, ADR and RevPAR Penetration Rates(1) | ||||||||||||||||||||||||
| Occupancy | ADR | RevPAR | ||||||||||||||||||||||
| Property | 2012 | 2013 | 2014 | TTM(2) | 2012 | 2013 | 2014 | TTM(2) | 2012 | 2013 | 2014 | TTM(2) | ||||||||||||
| Hilton Jackson | 104.1% | 104.2% | 108.1% | 110.3% | 105.1% | 105.5% | 107.8% | 109.1% | 109.4% | 109.9% | 116.6% | 120.3% | ||||||||||||
Doubletree Grand Rapids(3) | 110.0% | 109.8% | 104.1% | 99.5% | 120.2% | 119.9% | 123.4% | 122.5% | 132.3% | 131.7% | 128.5% | 121.8% | ||||||||||||
| Doubletree Annapolis | 89.9% | 92.5% | 89.9% | 87.6% | 105.2% | 107.8% | 103.8% | 104.5% | 94.6% | 99.7% | 93.3% | 91.6% | ||||||||||||
Weighted Average(4) | 101.7% | 102.4% | 101.3% | 100.0% | 109.9% | 110.7% | 111.5% | 111.9% | 112.1% | 113.6% | 113.3% | 112.1% | ||||||||||||
| (1) | 2012, 2013, 2014 and TTM Penetration Rates are per reports provided by a third party data provider. |
| (2) | TTM as of March 31, 2015. |
| (3) | 2012, 2013 and 2014 figures presented are for the Hilton Grand Rapids Airport. |
| (4) | Weighted by room count. |
Hilton Jackson. The Hilton Jackson is a full service hotel located in Jackson, Mississippi. The 13-story property opened in 1984 and features 276 rooms comprised of 166 queen guestrooms, 99 king guestrooms, nine executive suites and two presidential suites. All guestrooms feature a large work desk, 42-inch flat panel television and complimentary internet access while the suite rooms feature sleeper sofas as well as separate living areas and dining areas. Hotel amenities include multiple food and beverage outlets, a fitness center, an outdoor pool, approximately 19,892 square feet of meeting space across 12 different rooms and approximately 422 surface parking spaces. Since 2012, the property has undergone approximately $2.7 million ($9,623 per room) in capital expenditures primarily related to a renovation of Drago’s Seafood Restaurant, meeting spaces and guestrooms. Among the property’s food and beverage outlets is Drago’s Seafood Restaurant, a 403-seat freestanding restaurant franchised from the popular New Orleans area eatery. The restaurant opened in December 2014 to positive reviews and has exceeded budgeted forecasts to date. Year to date food and beverage revenues specific to the Drago’s Seafood Restaurant, as of March 31, 2015, are $1.8 million as compared to budgeted revenues of $1.0 million. Additional food and beverage facilities include Fitzgeralds, an 88-seat cocktail bar offering nightly live entertainment, and Wellingtons, a 157-seat restaurant offering breakfast and lunch options.
The property is located in Hinds County, along East County Line Road, off of Interstate 55 and is among the tallest buildings in the area. The property is located adjacent to an office property that houses national tenants such as UBS, Travelers Insurance and Eco-Systems. East County Line Road is one of the major retail corridors in Jackson and is anchored by Northpark Mall, a regional shopping center anchored by Dillard’s and JCPenney. The hotel also benefits from its proximity to Tougaloo College with approximately 900 undergraduate students enrolled. Additionally, Jackson-Evers International Airport is located approximately 6.5 miles southeast and the hotel offers a complimentary shuttle to and from the airport. According to the appraisal, the property’s estimated 2014 demand segmentation was approximately 50% commercial, 40% meeting and group and 10% leisure. The primary competitive set for the property consists of eight hotels, which range in size from 96 to 303 rooms. Per the appraisal, there is one hotel project currently under construction in the Jackson market: a 93-room Hampton Inn & Suites expected to open in January 2016.
THE INFORMATION IN THIS STRUCTURAL AND COLLATERAL TERM SHEET IS NOT COMPLETE AND MAY BE AMENDED PRIOR TO THE TIME OF SALE. THIS TERM SHEET IS NOT AN OFFER TO SELL THESE SECURITIES AND IT IS NOT A SOLICITATION OF AN OFFER TO BUY THESE SECURITIES IN ANY JURISDICTION WHERE THE OFFER OR SALE IS NOT PERMITTED.
| 85 of 122 | |
| Structural and Collateral Term Sheet | JPMBB 2015-C29 | |
JAGR Portfolio | ||
Doubletree Grand Rapids. The Doubletree Grand Rapids is a full service hotel located in Grand Rapids, Michigan, and is the only full service Hilton-affiliated property in the Grand Rapids market. The four-story property opened in 1979, was subsequently expanded in 1987, and features 226 rooms comprised of 88 double-double guestrooms, 12 queen guestrooms, 124 king guestrooms and two suites. All guestrooms feature a work desk, complimentary internet access while the suites feature separate living and dining areas. Hotel amenities include a restaurant, bar lounge, a sundry shop, a business center, a fitness center, an indoor pool, seven meeting rooms totaling approximately 7,500 square feet of meeting space, outdoor courtyard and 387 parking spaces. Additionally, the food and beverage options at the hotel include the Ganders Restaurant, Ganders Lounge and room service offered 24-hours daily.
Since 2012, the property has undergone approximately $1.8 million ($7,988 per room) in capital expenditures primarily related to an extensive PIP renovation in conjunction with the hotel’s conversion to the Doubletree by Hilton brand, which was completed on April 1, 2015. The conversion to a Doubletree was done in collaboration between the sponsors and the franchisor, which both were in favor of the change. Both parties felt that a traditional Hilton brand was not as relevant in the Grand Rapids market and felt the Doubletree brand would compete at a higher level. The Doubletree Grand Rapids will still maintain the same access to Hilton rewards travelers and no other Hiltons exist or are forthcoming in the market. The recent PIP renovation included the refurbishing to all guestrooms, as well as upgrades to the lobby, restaurant, lounge and other public areas. The brand conversion is not expected to impact the property’s average daily rate.
The property is located in Kent County, approximately 10 miles southeast of Downtown Grand Rapids and approximately three miles north of Gerald R. Ford International Airport, a primary demand driver in the Kent County area. The hotel offers a complimentary shuttle to and from the airport seven days per week. Additionally, the property benefits from its proximity to many large, international corporations such as Steelcase, Amway, Wolverine Worldwide, Gordon Food Service, GE Aviation Systems, Eaton, Meijer, Boeing, Kellogg and many others. According to the appraisal, the property’s 2014 demand segmentation was approximately 60% commercial, 20% meeting and group and 20% leisure. The primary competitive set for the property consists of six hotels, which range in size from 84 to 320 rooms. The appraisal identified three proposed hotel developments within the property’s market; however, the appraisal concluded that the three projects will not compete directly with the Doubletree Grand Rapids.
Doubletree Annapolis. The Doubletree Annapolis is a full service hotel located in Annapolis, Maryland. The property consists of one three-story and one five-story building and features 219 rooms comprised of 126 double-double guestrooms, 88 king guestrooms and five suites. All guestrooms feature an LCD television, complimentary Wi-Fi internet access, desk and remote printing accessibility while the suite guestrooms feature a sofa bed and separate tub and glass shower. Hotel amenities include a fitness center, an outdoor pool, six different meeting rooms totaling 9,833 square feet of space, a business center, a sundry shop, laundry and valet service and a gift shop. Additionally, the hotel features the Chesapeake Bay Café and Ports of Call restaurant, both located on the first floor. The Ports of Call restaurant features a full service bar, outdoor patio seating and two private dining rooms. Since 2012, the property has undergone approximately $2.1 million ($9,583 per room) in capital expenditures primarily related to a PIP renovation.
The property is located in Annapolis, which is centrally located between Baltimore, Maryland to the north and Washington D.C. to the southeast. Downtown Baltimore and downtown Washington D.C. are located approximately 29.2 miles north and 28.5 miles southeast of the property, respectively. The property is a short distance from the United States Naval Academy and additional government related activities that serve as key demand drivers in the Annapolis market. Additionally, the Westfield Annapolis upscale shopping mall is located less than one mile from the hotel and serves as a major draw for the area. The approximately 1.4 million square foot mall is anchored by Macy’s, Lord & Taylor, Nordstrom, JCPenney and a large cinema. According to the appraisal, the property’s 2014 demand segmentation was approximately 45% commercial, 35% meeting and group and 20% leisure. The primary competitive set for the property consists of five hotels, which range in size from 79 to 196 rooms. Additionally, the appraisal did not identify any anticipated new supply within the hotel’s market.
THE INFORMATION IN THIS STRUCTURAL AND COLLATERAL TERM SHEET IS NOT COMPLETE AND MAY BE AMENDED PRIOR TO THE TIME OF SALE. THIS TERM SHEET IS NOT AN OFFER TO SELL THESE SECURITIES AND IT IS NOT A SOLICITATION OF AN OFFER TO BUY THESE SECURITIES IN ANY JURISDICTION WHERE THE OFFER OR SALE IS NOT PERMITTED.
| 86 of 122 | |
| Structural and Collateral Term Sheet | JPMBB 2015-C29 | |
JAGR Portfolio | ||
| Operating History and Underwritten Net Cash Flow | |||||||||||||||
| 2012 | 2013 | 2014 | TTM(1) | Underwritten | Per Room(2) | % of Total Revenue(3) | |||||||||
| Occupancy | 62.9% | 64.0% | 65.0% | 64.2% | 64.2% | ||||||||||
| ADR | $110.02 | $113.46 | $115.81 | $116.23 | $116.23 | ||||||||||
| RevPAR | $69.20 | $72.58 | $75.25 | $74.62 | $74.62 | ||||||||||
| Room Revenue | $18,228,891 | $19,101,808 | $19,802,872 | $19,636,397 | $19,636,397 | $27,235 | 55.1% | ||||||||
| Food & Beverage Revenue | 11,026,565 | 11,086,681 | 10,895,887 | 10,800,609 | 10,757,484 | 14,920 | 30.2 | ||||||||
| Telephone Revenue | 9,254 | 6,487 | 4,257 | 3,657 | 3,657 | 5 | 0.0 | ||||||||
Other Departmental Revenues(4)(5) | 424,317 | 431,768 | 962,323 | 2,438,172 | 5,244,280 | 7,274 | 14.7 | ||||||||
| Total Revenue | $29,689,027 | $30,626,744 | $31,665,339 | $32,878,835 | $35,641,818 | $49,434 | 100.0% | ||||||||
| Room Expense | $4,699,042 | $4,864,420 | $4,853,051 | $4,782,198 | $4,782,198 | $6,633 | 24.4% | ||||||||
| Food & Beverage Expense | 7,803,732 | 7,967,275 | 7,487,987 | 7,306,295 | 7,279,118 | 10,096 | 67.7 | ||||||||
| Telephone Expense | 193,314 | 230,069 | 229,971 | 227,449 | 227,449 | 315 | 6,219.6 | ||||||||
| Other Departmental Expenses | 141,248 | 157,287 | 561,029 | 1,725,551 | 4,191,517 | 5,813 | 79.9 | ||||||||
| Departmental Expenses | $12,837,336 | $13,219,051 | $13,132,038 | $14,041,493 | $16,480,282 | $22,858 | 46.2% | ||||||||
| Departmental Profit | $16,851,691 | $17,407,694 | $18,533,301 | $18,837,342 | $19,161,536 | $26,576 | 53.8% | ||||||||
| Operating Expenses | $7,931,581 | $8,149,992 | $8,387,516 | $8,464,470 | $8,464,470 | $11,740 | 23.7% | ||||||||
| Gross Operating Profit | $8,920,110 | $9,257,702 | $10,145,785 | $10,372,872 | $10,697,066 | $14,836 | 30.0% | ||||||||
| Fixed Expenses | $1,227,677 | $1,146,452 | $1,127,241 | $1,128,275 | $1,125,067 | $1,560 | 3.2% | ||||||||
| Management Fees | 890,671 | 918,803 | 951,385 | 987,773 | 1,069,255 | 1,483 | 3.0 | ||||||||
| Franchise Fee | 1,586,853 | 1,665,654 | 1,728,337 | 1,714,212 | 1,763,033 | 2,445 | 4.9 | ||||||||
| FF&E | 1,187,561 | 1,225,070 | 1,266,612 | 1,315,153 | 1,329,261 | 1,844 | 3.7 | ||||||||
| Total Other Expenses | $4,892,761 | $4,955,979 | $5,073,575 | $5,145,413 | $5,286,616 | $7,332 | 14.8% | ||||||||
| Net Operating Income | $4,027,349 | $4,301,723 | $5,072,210 | $5,227,459 | $5,410,450 | $7,504 | 15.2% | ||||||||
| Net Cash Flow | $4,027,349 | $4,301,723 | $5,072,210 | $5,227,459 | $5,410,450 | $7,504 | 15.2% | ||||||||
| (1) | TTM column represents the trailing 12-month period ending on February 28, 2015. |
| (2) | Per Room values are based on 721 guest rooms. |
| (3) | % of Total Revenue column for Room Expense, Food & Beverage Expense, Telephone Expense and Other Departmental Expenses is based on their corresponding revenue line item. |
| (4) | Underwritten Other Departmental Revenues associated with Drago’s Seafood Restaurant is based on the sponsor’s 2015 budgeted revenue. To date, Drago’s Seafood Restaurant has outperformed the monthly budgeted performance. |
| (5) | The increase from TTM Other Departmental Revenues to Underwritten Other Departmental Revenues is due to the opening of the Drago’s Seafood Restaurant at the Hilton Jackson property in 2014. |
Property Management. The Hilton Jackson property is managed by Lane Hotels, Inc. while the Doubletree Grand Rapids and Doubletree Annapolis properties are managed by Spire Hospitality, LLC. The management agreement with Lane Hotels, Inc. is dated July 11, 2012, expires July 11, 2019 and the manager is entitled to a management fee equal to 3.0% of the gross revenues. Additionally, Lane Hotels, Inc. is entitled to an incentive management fee equal to 15.0% of the net operating income over the incentive breakpoint amount. The management agreements with Spire Hospitality, LLC are dated October 2, 2013 and expire on October 2, 2020. Spire Hospitality, LLC is entitled to a management fee equal to 3.0% of gross revenues and an incentive management fee equal to 15.0% of the net operating income over the incentive breakpoint amount.
THE INFORMATION IN THIS STRUCTURAL AND COLLATERAL TERM SHEET IS NOT COMPLETE AND MAY BE AMENDED PRIOR TO THE TIME OF SALE. THIS TERM SHEET IS NOT AN OFFER TO SELL THESE SECURITIES AND IT IS NOT A SOLICITATION OF AN OFFER TO BUY THESE SECURITIES IN ANY JURISDICTION WHERE THE OFFER OR SALE IS NOT PERMITTED.
| 87 of 122 | |
| Structural and Collateral Term Sheet | JPMBB 2015-C29 | |
JAGR Portfolio | ||
Franchise Agreements. The Hilton Jackson property has a franchise agreement with Hilton Franchise LLC, a subsidiary of Hilton Hotel Corporation (“Hilton”), for use of the Hilton flag through July 2027 with no extension options. The franchise agreement provides for an aggregate program fee and royalty fee of 9.0% of the hotel’s gross room revenues. Each of the Doubletree Grand Rapids and Doubletree Annapolis properties is subject to a franchise agreement with Doubletree Franchise LLC, a subsidiary of Hilton, for use of the Doubletree by Hilton flag through October 2028 with no extension options. Their respective franchise agreements provide for an aggregate program and royalty fee of 9.0% of each hotel’s gross room revenues.
| Franchise Agreement Summary | |||
| Property | Flag | Franchise Fee(1) | Expiration Date |
| Hilton Jackson | Hilton Hotel Corporation | 9.0% | July 2027 |
| Doubletree Grand Rapids | Doubletree Franchise | 9.0% | October 2028 |
| Doubletree Annapolis | Doubletree Franchise | 9.0% | October 2028 |
| (1) | Includes marketing fees due under the franchise agreements. |
Escrows and Reserves. At origination, the borrowers deposited into escrow $1,515,449 for PIP reserves ($1,243,227 in connection with the Doubletree Grand Rapids property and $272,222 in connection with the Doubletree Annapolis property), $375,291 for real estate taxes, $116,939 for FF&E reserves and $70,725 for immediate repairs.
Tax Escrows - On a monthly basis, the borrowers are required to escrow 1/12 of the annual estimated tax payments, which currently equates to $78,882.
Insurance Escrows - The requirement for the borrowers to make monthly deposits into the insurance escrow is waived so long as no event of default exists and the borrowers provide satisfactory evidence that the properties are insured under an approved blanket policy in accordance with the loan documents.
FF&E Reserves - On a monthly basis, the borrowers are required to deposit an amount equal to 4.0% of gross revenues from the hotels, excluding gross revenues from the operation of Drago’s Seafood Restaurant, for the calendar month two months prior to such payment date for FF&E. The borrowers are required to deposit an amount equal to 2.0% of gross revenues from operation of Drago’s Seafood Restaurant at the Hilton Jackson property.
Lockbox / Cash Management. The loan is structured with a hard lockbox and in place cash management. The borrowers and property managers were required to direct credit card companies to deliver all receipts directly into the lockbox account controlled by the lender. All funds in the lockbox account are swept daily to a segregated cash management account under control of the lender. During a Cash Sweep Event (as defined below), all funds on deposit in the lockbox account will be swept on a daily basis to a cash management account established upon the occurrence of a Cash Sweep Event, and all excess cash flows after payment of debt service, required reserves and operating expenses is required to be held as additional collateral for the loan.
A “Cash Sweep Event” means (i) there is an event of default under the loan documents, (ii) the debt service coverage ratio as calculated in the loan documents based on the trailing 12-month period falls below 1.15x or (iii) the borrowers, the property manager or the concessionaire which operates the food and beverage outlets becomes the subject of a bankruptcy, insolvency or similar action.
Release of Individual Properties. After the lockout period, the borrowers are permitted to obtain the release of any individual property in connection with a partial prepayment of the loan, subject to the satisfaction of certain conditions, including, but not limited to the following: (i) partial prepayment of a principal amount equal to or exceeding the adjusted release amount for the applicable property, which is 110% of the allocated JAGR Portfolio Whole Loan amount for the Doubletree Annapolis property and 120% of the allocated JAGR Portfolio Whole Loan amount for the remaining properties, (ii) after giving effect to such release and prepayment, the debt yield of the properties then remaining shall be no less than the greater of (a) the debt yield as of the origination date and (b) the lesser of (A) the debt yield for all of the properties subject to the liens of the mortgage immediately prior to the date of such release and (B) 14.0% and (iii) after giving effect to such release and prepayment, the loan-to-value ratio of the properties then remaining may be no higher than the loan-to-value ratio as of the origination date. In addition, the Doubletree Annapolis property may not be the only property remaining subject to the lien of the loan documents.
Additional Debt. JPMCB has provided a $7.5 million mezzanine loan that is secured by the direct equity interests in the borrowers and is coterminous with the mortgage loan. The mezzanine loan was sold to a third party investor. The mezzanine loan has a 10.50000% coupon and is interest-only for the full term of the loan. Including the mezzanine loan, the Cut-off Date LTV is 74.8%, the UW NCF DSCR is 1.41x and the UW NOI Debt Yield is 9.8%.
THE INFORMATION IN THIS STRUCTURAL AND COLLATERAL TERM SHEET IS NOT COMPLETE AND MAY BE AMENDED PRIOR TO THE TIME OF SALE. THIS TERM SHEET IS NOT AN OFFER TO SELL THESE SECURITIES AND IT IS NOT A SOLICITATION OF AN OFFER TO BUY THESE SECURITIES IN ANY JURISDICTION WHERE THE OFFER OR SALE IS NOT PERMITTED.
| 88 of 122 | |
| Structural and Collateral Term Sheet | JPMBB 2015-C29 | |
| Lenox Towers | ||
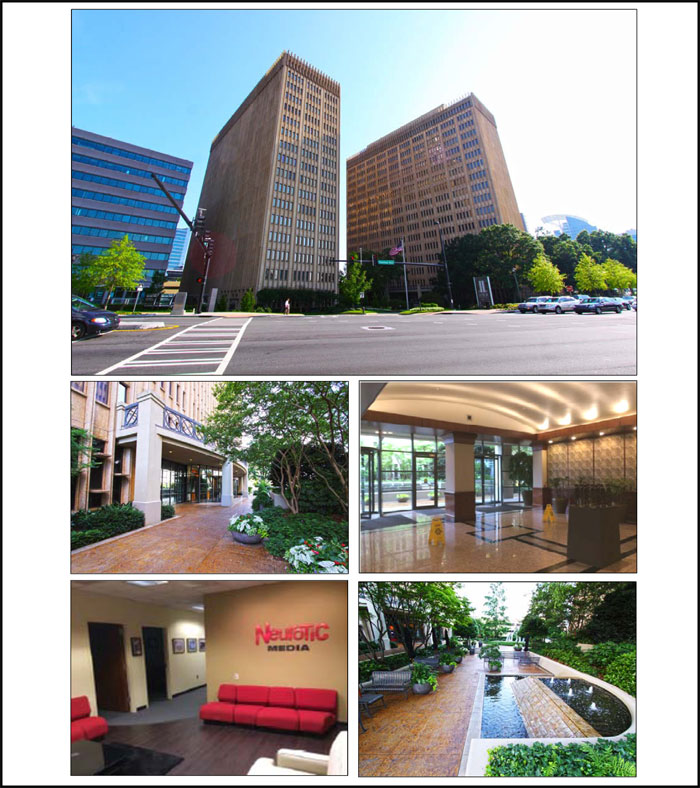
THE INFORMATION IN THIS STRUCTURAL AND COLLATERAL TERM SHEET IS NOT COMPLETE AND MAY BE AMENDED PRIOR TO THE TIME OF SALE. THIS TERM SHEET IS NOT AN OFFER TO SELL THESE SECURITIES AND IT IS NOT A SOLICITATION OF AN OFFER TO BUY THESE SECURITIES IN ANY JURISDICTION WHERE THE OFFER OR SALE IS NOT PERMITTED.
| 89 of 122 | |
| Structural and Collateral Term Sheet | JPMBB 2015-C29 | |
| Lenox Towers | ||
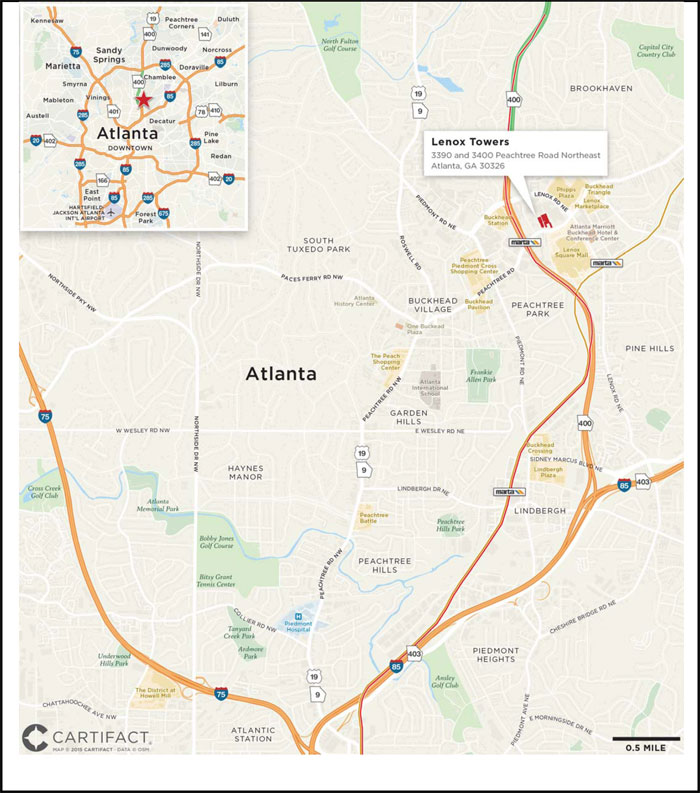
THE INFORMATION IN THIS STRUCTURAL AND COLLATERAL TERM SHEET IS NOT COMPLETE AND MAY BE AMENDED PRIOR TO THE TIME OF SALE. THIS TERM SHEET IS NOT AN OFFER TO SELL THESE SECURITIES AND IT IS NOT A SOLICITATION OF AN OFFER TO BUY THESE SECURITIES IN ANY JURISDICTION WHERE THE OFFER OR SALE IS NOT PERMITTED.
| 90 of 122 | |
| Structural and Collateral Term Sheet | JPMBB 2015-C29 | |
| Lenox Towers | ||
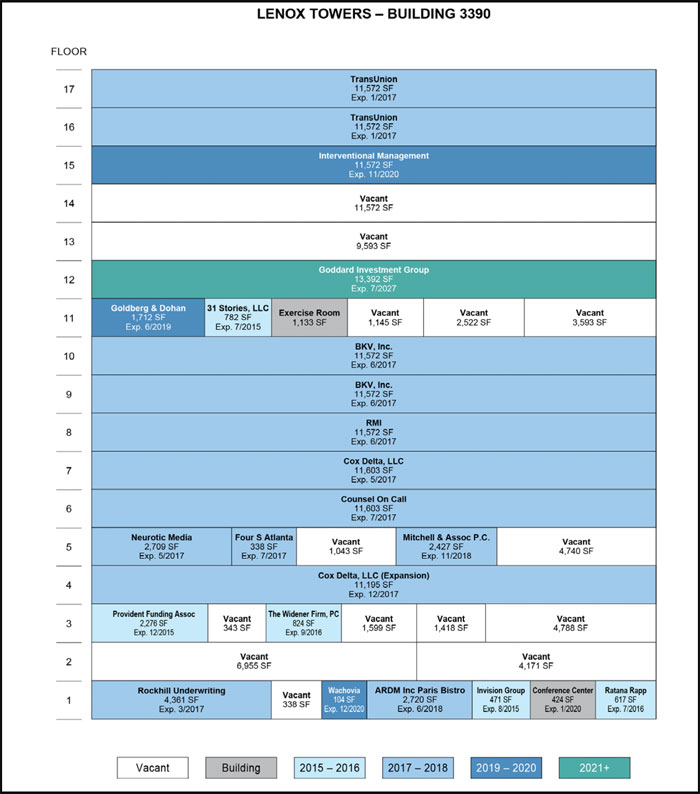
THE INFORMATION IN THIS STRUCTURAL AND COLLATERAL TERM SHEET IS NOT COMPLETE AND MAY BE AMENDED PRIOR TO THE TIME OF SALE. THIS TERM SHEET IS NOT AN OFFER TO SELL THESE SECURITIES AND IT IS NOT A SOLICITATION OF AN OFFER TO BUY THESE SECURITIES IN ANY JURISDICTION WHERE THE OFFER OR SALE IS NOT PERMITTED.
| 91 of 122 | |
| Structural and Collateral Term Sheet | JPMBB 2015-C29 | |
| Lenox Towers | ||
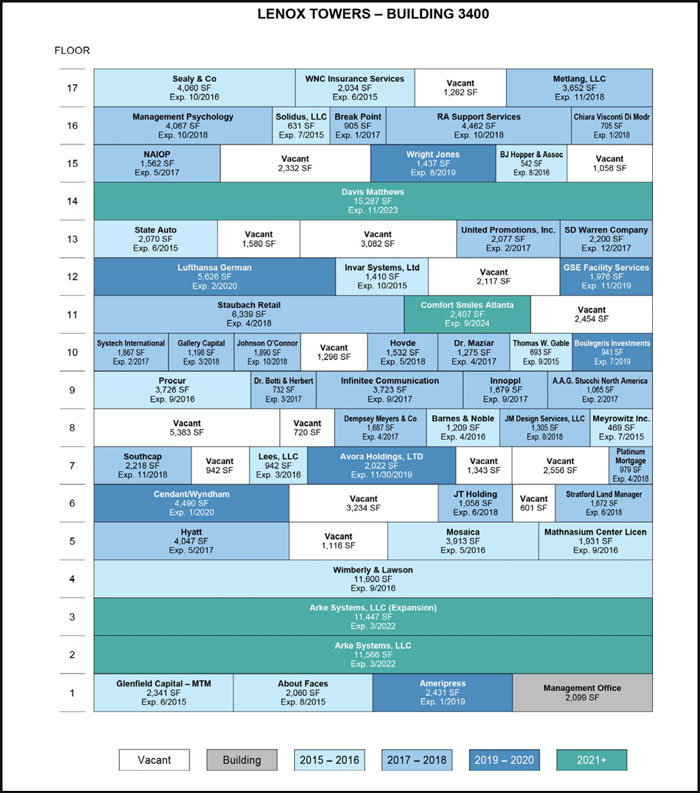
THE INFORMATION IN THIS STRUCTURAL AND COLLATERAL TERM SHEET IS NOT COMPLETE AND MAY BE AMENDED PRIOR TO THE TIME OF SALE. THIS TERM SHEET IS NOT AN OFFER TO SELL THESE SECURITIES AND IT IS NOT A SOLICITATION OF AN OFFER TO BUY THESE SECURITIES IN ANY JURISDICTION WHERE THE OFFER OR SALE IS NOT PERMITTED.
| 92 of 122 | |
| Structural and Collateral Term Sheet | JPMBB 2015-C29 | |
| Lenox Towers | ||
| Mortgage Loan Information | Property Information | |||
| Mortgage Loan Seller: | JPMCB | Single Asset / Portfolio: | Single Asset | |
| Original Principal Balance: | $27,500,000 | Title: | Fee | |
| Cut-off Date Principal Balance: | $27,500,000 | Property Type - Subtype: | Office - CBD | |
| % of Pool by IPB: | 2.8% | Net Rentable Area (SF): | 378,838 | |
| Loan Purpose: | Refinance | Location: | Atlanta, GA | |
| Borrower: | Lenox Towers, L.P. | Year Built / Renovated: | 1962, 1966 / 1995 | |
| Sponsor: | Robert C. Goddard, III | Occupancy(1): | 77.6% | |
| Interest Rate: | 3.98000% | Occupancy Date: | 4/1/2015 | |
| Note Date: | 5/12/2015 | Number of Tenants: | 81 | |
| Maturity Date: | 6/1/2020 | 2012 NOI: | $2,057,941 | |
| Interest-only Period: | None | 2013 NOI: | $1,960,033 | |
| Original Term: | 60 months | 2014 NOI: | $2,653,613 | |
| Original Amortization: | 360 months | TTM NOI (as of 4/2015)(2): | 2,880,723 | |
| Amortization Type: | Balloon | UW Economic Occupancy: | 77.2% | |
| Call Protection: | L(25),Grtr1%orYM(32),O(3) | UW Revenues: | $6,472,524 | |
| Lockbox: | Springing | UW Expenses: | $3,431,162 | |
| Additional Debt: | N/A | UW NOI(1)(2): | $3,041,362 | |
| Additional Debt Balance: | N/A | UW NCF(1): | $2,456,811 | |
| Additional Debt Type: | N/A | Appraised Value / Per SF: | $50,000,000 / $132 | |
| Appraisal Date: | 4/17/2015 | |||
Escrows and Reserves(3) | Financial Information | ||||||
| Initial | Monthly | Initial Cap | Cut-off Date Loan / SF: | $73 | |||
| Taxes: | $516,948 | $57,439 | N/A | Maturity Date Loan / SF: | $66 | ||
| Insurance: | $0 | Springing | N/A | Cut-off Date LTV: | 55.0% | ||
| Replacement Reserves: | $6,314 | $6,314 | $227,303 | Maturity Date LTV: | 49.9% | ||
| TI/LC: | $41,667 | $41,667 | $1,500,000 | UW NCF DSCR: | 1.56x | ||
| Other: | $1,159,257 | $0 | N/A | UW NOI Debt Yield: | 11.1% | ||
| Sources and Uses | ||||||||
| Sources | Proceeds | % of Total | Uses | Proceeds | % of Total | |||
| Mortgage Loan | $27,500,000 | 100.0% | Payoff Existing Debt | $23,830,756 | 86.7% | |||
| Upfront Reserves | 1,724,185 | 6.3 | ||||||
| Return of Equity | 1,570,033 | 5.7 | ||||||
| Closing Costs | 375,025 | 1.4 | ||||||
| Total Sources | $27,500,000 | 100.0% | Total Uses | $27,500,000 | 100.0% | |||
| (1) | Occupancy, UW NOI and UW NCF include the Arke Systems, LLC expansion space totaling 11,477 square feet, for which the tenant has executed a lease but is not yet in occupancy or paying rent. Arke Systems, LLC is expected to take occupancy and begin paying rent on October 1, 2015, subject to a rent abatement through December 2016. The borrower deposited $389,853 in escrow at closing for free rent associated with tenants currently in occupancy. |
| (2) | Increase from TTM NOI to UW NOI is primarily due to the execution of two leases in early 2015, totaling 22,642 square feet and accounting for $524,590 in annual rent, comprised of expansion spaces for existing tenants, Arke Systems, LLC and Cox Delta, LLC. |
| (3) | For a full description of Escrows and Reserves, please refer to “Escrows and Reserves” below. |
The Loan. The Lenox Towers loan has an outstanding principal balance of $27.5 million and is secured by a first mortgage lien on two 17-story office buildings totaling 378,838 square feet in Atlanta, Georgia. The loan has a five-year term and amortizes on a 30-year schedule.
The Borrower. The borrowing entity for the Lenox Towers loan is Lenox Towers, L.P., a Georgia limited partnership and special purpose entity.
THE INFORMATION IN THIS STRUCTURAL AND COLLATERAL TERM SHEET IS NOT COMPLETE AND MAY BE AMENDED PRIOR TO THE TIME OF SALE. THIS TERM SHEET IS NOT AN OFFER TO SELL THESE SECURITIES AND IT IS NOT A SOLICITATION OF AN OFFER TO BUY THESE SECURITIES IN ANY JURISDICTION WHERE THE OFFER OR SALE IS NOT PERMITTED.
| 93 of 122 | |
| Structural and Collateral Term Sheet | JPMBB 2015-C29 | |
| Lenox Towers | ||
The Sponsor. The loan sponsor is Robert C. Goddard, III, the head of Goddard Investment Group (“GIG”), a privately held, Atlanta based commercial real estate investment firm, chairman of Post Properties and the nonrecourse carve-out guarantor of the Lenox Towers loan. GIG concentrates on value-add opportunities in targeted, high-growth markets and has acquired over 8.0 million square feet of commercial real estate. Additionally, GIG provides third party real estate consulting services, specializing in problem resolution of distressed real estate loans and assets. GIG acquired the property in 1994 and has since completed a comprehensive ongoing renovation project. The Lenox Towers property was acquired by the seller in 1994, and according to the sponsor, since 2010, there has been approximately $3.9 million invested in capital expenditures and re-leasing costs in order to renovate the common areas and re-tenant the space. The extensive renovations to the property have brought overall occupancy from 66.1% in early 2010 to 77.6% as of April 1, 2015. GIG purchased the property 1994 for a total cost of approximately $17.5 million and has a current basis of approximately $29.2 million.
The Property. The Lenox Towers property consists of two 17-story office buildings totaling 378,838 square feet located in Atlanta, Georgia. The office buildings were built in 1962 and 1966 and include a structured parking facility containing a total of 1,174 spaces, providing for an above market parking ratio of 3.1 spaces per 1,000 square feet. The property is strategically located in the heart of Buckhead along Peachtree Road, among Atlanta’s more prominent commercial and residential areas. In addition, Buckhead is considered a dominant retail and residential market. Lenox Towers is currently zoned for 988,130 square feet of office and 633,000 square feet of residential space, which will enable future development as the sponsor has only utilized a fraction of its legally zoned square footage.
As of April 1, 2015, the property was 77.6% occupied by 81 tenants. The largest tenant, TransUnion, is a global leader in credit information and information management services. After initially executing a lease for 17,972 square feet in November 2003, TransUnion subsequently expanded its space on more than one occasion, currently occupying 23,144 square feet (6.1% of net rentable area). The current lease agreement commenced in November 2010 and expires in January 2017 with one remaining five-year renewal option. The second largest tenant, BKV, Inc., is an Atlanta based direct marketing firm with more than three decades of experience. BKV, Inc.’s lease commenced in September 2014 with an initial term of 34 months and encompasses 23,144 square feet (6.1% of net rentable area). BKV, Inc. currently has two five-year renewal options remaining. The third largest tenant, Arke Systems, LLC, is a technology-consulting firm with a focus on information technology and the implementation of technology based marketing. Arke Systems, LLC currently occupies 11,566 square feet and recently executed the lease on an expansion space for an additional 11,477 square feet (6.1% of net rentable area in total). Under the current tenant lease, Arke Systems, LLC will occupy both spaces through March 2022. With regard to the expansion space, Arke Systems, LLC will take occupancy and begin paying rent in October 2015 subject to a rent abatement through December 2016. Currently, no tenant occupies more than 6.1% of the property’s net rentable area.
Lenox Towers is located in Atlanta, Georgia, in the Buckhead neighborhood approximately 9.4 miles north of downtown Atlanta. The property is within walking distance of two separate Metropolitan Atlanta Rapid Transit Authority stations, providing access to Downtown Atlanta (15 minutes) and Hartsfield-Jackson Atlanta International Airport (25 minutes). Additionally, Buckhead benefits from an extensive network of surface roads, interstate highways and public transportation. GA 400 connects the Buckhead area with Atlanta’s primary submarkets: Midtown, Downtown, North Fulton and Central Perimeter.
The Lenox Towers property is located in the Buckhead office submarket which, according to the appraisal, contained approximately 22.6 million square feet as of year-end 2014, of which approximately 4.1 million square feet is Class B office space. The Buckhead office submarket had an estimated vacancy rate of 12.3% and average asking rents of $20.45 per square foot as of year end 2014 for Class B office properties. The Buckhead office submarket 2015 estimated population within a one-, three- and five-mile radius of the property is 17,877, 128,165 and 294,066, respectively. The 2015 median household income within a one-,three- and five-mile radius of the property is $83,546, $64,567 and $65,092, respectively. The appraisal identified five directly competitive properties built between 1964 and 1989 and ranging in size from approximately 125,699 to 279,143 square feet. The comparable properties reported occupancies ranging from 56% to 85% with a weighted average of 71.4%. Asking rents for the comparable properties range from $23.00 to $26.00 per square foot. The in-place rent at the property is $20.08 per square foot, below the appraisal’s market rent conclusion of $21.00 per square foot and the overall submarket average.
Historical and Current Occupancy(1) | |||
| 2012 | 2013 | 2014 | Current(2)(3) |
70.0% | 73.0% | 75.0% | 77.6% |
| (1) | Historical Occupancies are as of December 31 of each respective year. |
| (2) | Current Occupancy is as of April 1, 2015. |
| (3) | Current Occupancy includes the Arke Systems, LLC expansion space, for which Arke Systems, LLC has signed a lease but is not yet in occupancy. The tenant is expected to take occupancy and begin paying rent in October 2015, subject to a rent abatement through December 2016. |
THE INFORMATION IN THIS STRUCTURAL AND COLLATERAL TERM SHEET IS NOT COMPLETE AND MAY BE AMENDED PRIOR TO THE TIME OF SALE. THIS TERM SHEET IS NOT AN OFFER TO SELL THESE SECURITIES AND IT IS NOT A SOLICITATION OF AN OFFER TO BUY THESE SECURITIES IN ANY JURISDICTION WHERE THE OFFER OR SALE IS NOT PERMITTED.
| 94 of 122 | |
| Structural and Collateral Term Sheet | JPMBB 2015-C29 | |
| Lenox Towers | ||
Tenant Summary(1) | |||||||||||||
| Tenant | Ratings(2) Moody’s/S&P/Fitch | Net Rentable Area (SF) | % of Total NRA | Base Rent PSF | Lease Expiration Date | ||||||||
| TransUnion | B2 / NA / NA | 23,144 | 6.1% | $22.29 | 1/31/2017 | ||||||||
| BKV, Inc. | NA / NA / NA | 23,144 | 6.1% | $21.63 | 6/30/2017 | ||||||||
Arke Systems, LLC(3) | NA / NA / NA | 23,013 | 6.1% | $23.15 | 3/31/2022 | ||||||||
| Davis Matthews | NA / NA / NA | 15,287 | 4.0% | $17.01 | 11/30/2023 | ||||||||
| Goddard Investment Group | NA / NA / NA | 13,392 | 3.5% | $15.00 | 7/31/2027 | ||||||||
| Counsel on Call | NA / NA / NA | 11,603 | 3.1% | $23.49 | 7/31/2017 | ||||||||
| Cox Delta, LLC | NA / NA / NA | 11,603 | 3.1% | $20.56 | 5/31/2017 | ||||||||
| Wimberly & Lawson | NA / NA / NA | 11,600 | 3.1% | $21.71 | 9/30/2016 | ||||||||
| RMI | NA / NA / NA | 11,572 | 3.1% | $21.63 | 6/30/2017 | ||||||||
| Interventional Management | NA / NA / NA | 11,572 | 3.1% | $19.89 | 11/1/2020 | ||||||||
| (1) | Based on the underwritten rent roll. |
| (2) | Ratings provided are for the parent company of the entity listed in the “Tenant” field whether or not the parent company guarantees the lease. |
| (3) | Arke Systems, LLC recently executed a lease on an 11,477 square foot expansion space. The tenant is expected to take occupancy and begin paying rent in October 2015, subject to a rent abatement through December 2016. |
Lease Rollover Schedule(1) | ||||||||||||||||||||
| Year | Number of Leases Expiring | Net Rentable Area Expiring | % of NRA Expiring | Base Rent Expiring | % of Base Rent Expiring | Cumulative Net Rentable Area Expiring | Cumulative % of NRA Expiring | Cumulative Base Rent Expiring | Cumulative % of Base Rent Expiring | |||||||||||
| Vacant | NAP | 84,896 | 22.4 | % | NAP | NAP | 84,896 | 22.4% | NAP | NAP | ||||||||||
2015 & MTM(2) | 16 | 19,028 | 5.0 | 326,064 | 5.4 | % | 103,924 | 27.4% | $326,064 | 5.4% | ||||||||||
| 2016 | 10 | 29,364 | 7.8 | 633,195 | 10.4 | 133,288 | 35.2% | $959,259 | 15.8% | |||||||||||
| 2017 | 21 | 122,488 | 32.3 | 2,646,915 | 43.6 | 255,776 | 67.5% | $3,606,174 | 59.4% | |||||||||||
| 2018 | 18 | 36,227 | 9.6 | 754,464 | 12.4 | 292,003 | 77.1% | $4,360,639 | 71.8% | |||||||||||
| 2019 | 6 | 10,519 | 2.8 | 219,538 | 3.6 | 302,522 | 79.9% | $4,580,177 | 75.4% | |||||||||||
| 2020 | 5 | 22,216 | 5.9 | 453,197 | 7.5 | 324,738 | 85.7% | $5,033,374 | 82.8% | |||||||||||
| 2021 | 0 | 0 | 0.0 | 0 | 0.0 | 324,738 | 85.7% | $5,033,374 | 82.8% | |||||||||||
| 2022 | 1 | 23,013 | 6.1 | 532,728 | 8.8 | 347,751 | 91.8% | $5,566,101 | 91.6% | |||||||||||
| 2023 | 1 | 15,287 | 4.0 | 260,032 | 4.3 | 363,038 | 95.8% | $5,826,133 | 95.9% | |||||||||||
| 2024 | 2 | 2,408 | 0.6 | 49,028 | 0.8 | 365,446 | 96.5% | $5,875,162 | 96.7% | |||||||||||
| 2025 | 0 | 0 | 0.0 | 0 | 0.0 | 365,446 | 96.5% | $5,875,162 | 96.7% | |||||||||||
| 2026 & Beyond | 1 | 13,392 | 3.5 | 200,880 | 3.3 | 378,838 | 100.0% | $6,076,042 | 100.0% | |||||||||||
| Total | 81 | 378,838 | 100.0 | % | $6,076,042 | 100.0 | % | |||||||||||||
| (1) | Based on the underwritten rent roll. |
| (2) | 2015 & MTM includes a management office and exercise room totaling 3,232 square feet with no attributable base rent. The space is not considered vacant for underwriting purposes as the facilities contribute to building amenities and services. |
THE INFORMATION IN THIS STRUCTURAL AND COLLATERAL TERM SHEET IS NOT COMPLETE AND MAY BE AMENDED PRIOR TO THE TIME OF SALE. THIS TERM SHEET IS NOT AN OFFER TO SELL THESE SECURITIES AND IT IS NOT A SOLICITATION OF AN OFFER TO BUY THESE SECURITIES IN ANY JURISDICTION WHERE THE OFFER OR SALE IS NOT PERMITTED.
| 95 of 122 | |
| Structural and Collateral Term Sheet | JPMBB 2015-C29 | |
| Lenox Towers | ||
| Operating History and Underwritten Net Cash Flow | |||||||||||||||
| 2012 | 2013 | 2014 | TTM(1) | Underwritten | Per Square Foot | %(2) | |||||||||
| Rents in Place | $4,559,138 | $4,544,837 | $4,947,359 | $5,008,191 | $6,076,042 | $16.04 | 72.5% | ||||||||
| Vacant Income | 0 | 0 | 0 | 0 | 1,795,441 | 4.74 | 21.4 | ||||||||
| Gross Potential Rent | $4,559,138 | $4,544,837 | $4,947,359 | $5,008,191 | $7,871,483 | $20.78 | 93.9% | ||||||||
| Total Reimbursements | 894,097 | 662,397 | 628,900 | 714,013 | 513,641 | 1.36 | 6.1 | ||||||||
| Net Rental Income | $5,453,235 | $5,207,234 | $5,576,259 | $5,722,204 | $8,385,123 | $22.13 | 100.0% | ||||||||
| (Vacancy/Credit Loss) | 0 | 0 | 0 | 0 | (1,912,600) | (5.05) | (22.8) | ||||||||
| Other Income | 38,067 | 27,986 | 15,428 | 18,531 | 0 | 0.00 | 0.0 | ||||||||
| Effective Gross Income | $5,491,302 | $5,235,220 | $5,591,687 | $5,740,735 | $6,472,524 | $17.09 | 77.2% | ||||||||
| Total Expenses | $3,433,361 | $3,275,187 | $2,938,075 | $2,860,012 | $3,431,162 | $9.06 | 53.0% | ||||||||
Net Operating Income(3) | $2,057,941 | $1,960,033 | $2,653,613 | $2,880,723 | $3,041,362 | $8.03 | 47.0% | ||||||||
| Total TI/LC, Capex/RR | 0 | 0 | 0 | 0 | 584,551 | 1.54 | 9.0 | ||||||||
| Net Cash Flow | $2,057,941 | $1,960,033 | $2,653,613 | $2,880,723 | $2,456,811 | $6.49 | 38.0% | ||||||||
| (1) | TTM column represents the trailing 12-month period ending on April 30, 2015. |
| (2) | Percentage column represents percent of Net Rental Income for all revenue lines and represents percent of Effective Gross Income for the remainder of fields. |
| (3) | Increase from TTM Net Operating Income to Underwritten Net Operating Income is primarily due to the execution of two leases in early 2015, totaling 22,642 square feet and accounting for $524,590 in annual rent, comprised of expansion spaces for existing tenants, Arke Systems, LLC and Cox Delta, LLC. |
Escrow and Reserves. At origination, the borrower deposited into escrow $769,404 for outstanding tenant improvements associated with leases in effect at closing, $516,948 for real estate taxes, $389,853 related to outstanding free rent, $41,667 for future tenant improvements and leasing commissions and $6,314 for replacement reserves.
Tax Escrows - On a monthly basis, the borrower is required to escrow 1/12 of the annual estimated tax payments, which currently equates to $57,349.
Insurance Escrows - The requirement for the borrower to make monthly deposits into the insurance escrow is waived so long as (i) no event of default exists and (ii) the borrower provides satisfactory evidence that the property is insured under an approved blanket policy in accordance with the loan documents.
Replacement Reserves - On a monthly basis, the borrower is required to escrow $6,314 (approximately $0.20 per square foot annually) for replacement reserves. The reserve is subject to a cap of $227,303 (approximately $0.60 per square foot).
TI/LC Reserves - On a monthly basis, the borrower is required to deposit $41,667 (approximately $1.32 per square foot annually) into the TI/LC reserve. The reserve is subject to a cap of $1,500,000 (approximately $3.96 per square foot).
Lockbox / Cash Management. The loan is structured with a springing lockbox and springing cash management. Upon the occurrence and during the continuance of a Cash Sweep Event (as defined below), the borrower and manager shall cause all income from the property to be deposited directly into the lockbox account. During the continuance of a Cash Sweep Event, all funds in the lockbox account are swept daily to a cash management account under the control of the lender and disbursed during each interest period of the loan term in accordance with the loan documents.
A “Cash Sweep Event” will occur upon (i) an event of default, (ii) any bankruptcy action of the borrower or manager or (iii) the debt service coverage ratio as calculated in the loan documents based on the trailing six months falling below 1.20x.
Permitted Mezzanine Debt. In connection with the initial sale of the property to a third party and assumption of the mortgage loan as permitted by the loan documents, the owners of the transferee will be permitted to obtain a mezzanine loan subject to the terms and conditions of the loan documents, which include, without limitation, the following: (i) the aggregate combined loan-to-value ratio may not be greater than 60.0%; (ii) the aggregate debt service coverage ratio (as calculated in the loan documents) may not be less than 1.40x; (iii) the maturity date of the mezzanine loan may not be earlier than the maturity date of the mortgage loan; and (iv) the lenders enter into an intercreditor agreement satisfactory to the mortgage lender.
THE INFORMATION IN THIS STRUCTURAL AND COLLATERAL TERM SHEET IS NOT COMPLETE AND MAY BE AMENDED PRIOR TO THE TIME OF SALE. THIS TERM SHEET IS NOT AN OFFER TO SELL THESE SECURITIES AND IT IS NOT A SOLICITATION OF AN OFFER TO BUY THESE SECURITIES IN ANY JURISDICTION WHERE THE OFFER OR SALE IS NOT PERMITTED.
| 96 of 122 | |
| Structural and Collateral Term Sheet | JPMBB 2015-C29 | |
Horizon Outlet Shoppes Portfolio | ||
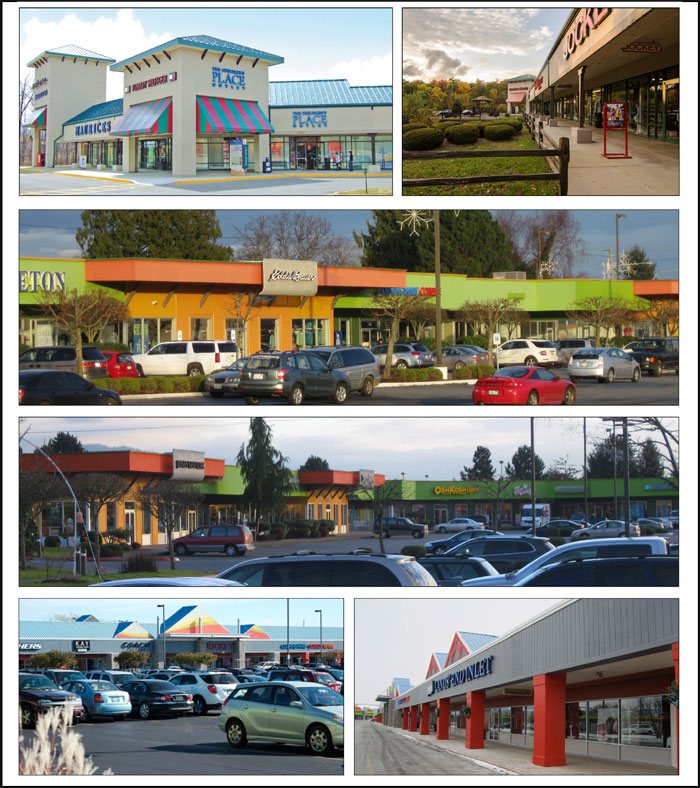
THE INFORMATION IN THIS STRUCTURAL AND COLLATERAL TERM SHEET IS NOT COMPLETE AND MAY BE AMENDED PRIOR TO THE TIME OF SALE. THIS TERM SHEET IS NOT AN OFFER TO SELL THESE SECURITIES AND IT IS NOT A SOLICITATION OF AN OFFER TO BUY THESE SECURITIES IN ANY JURISDICTION WHERE THE OFFER OR SALE IS NOT PERMITTED.
| 97 of 122 | |
| Structural and Collateral Term Sheet | JPMBB 2015-C29 | |
Horizon Outlet Shoppes Portfolio | ||
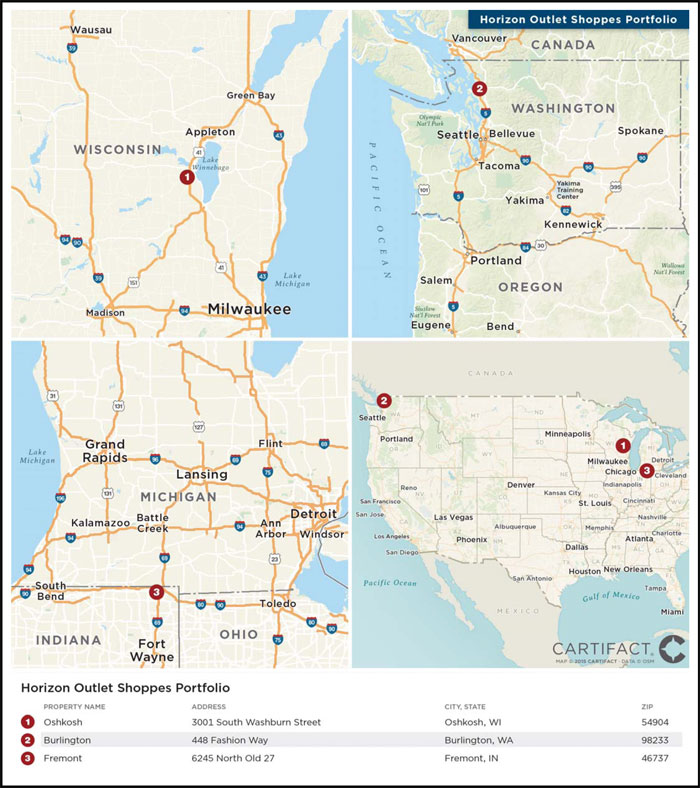
THE INFORMATION IN THIS STRUCTURAL AND COLLATERAL TERM SHEET IS NOT COMPLETE AND MAY BE AMENDED PRIOR TO THE TIME OF SALE. THIS TERM SHEET IS NOT AN OFFER TO SELL THESE SECURITIES AND IT IS NOT A SOLICITATION OF AN OFFER TO BUY THESE SECURITIES IN ANY JURISDICTION WHERE THE OFFER OR SALE IS NOT PERMITTED.
| 98 of 122 | |
| Structural and Collateral Term Sheet | JPMBB 2015-C29 | |
Horizon Outlet Shoppes Portfolio | ||
| Mortgage Loan Information | Property Information | |||
| Mortgage Loan Seller: | SMF II | Single Asset / Portfolio: | Portfolio | |
Original Principal Balance(1): | $26,675,000 | Title: | Fee | |
Cut-off Date Principal Balance(1): | $26,675,000 | Property Type - Subtype: | Retail - Outlet Centers | |
| % of Pool by IPB: | 2.7% | Net Rentable Area (SF): | 555,682 | |
| Loan Purpose: | Refinance | Location: | Various | |
| Borrower: | BFO Factory Shoppes LLC | Year Built / Renovated: | Various / Various | |
| Sponsor: | Horizon Group Properties, Inc. | Occupancy: | 85.6% | |
| Interest Rate: | 4.50900% | Occupancy Date: | 2/1/2015 | |
| Note Date: | 2/17/2015 | Number of Tenants: | 92 | |
| Maturity Date: | 3/6/2025 | 2012 NOI: | $5,275,426 | |
| Interest-only Period: | 24 months | 2013 NOI: | $5,529,549 | |
| Original Term: | 120 months | 2014 NOI: | $5,309,914 | |
| Original Amortization: | 360 months | UW Economic Occupancy: | 86.5% | |
| Amortization Type: | IO-Balloon | UW Revenues: | $9,360,656 | |
| Call Protection: | L(27),Def(89),O(4) | UW Expenses: | $4,107,547 | |
| Lockbox: | Hard | UW NOI: | $5,253,108 | |
| Additional Debt: | Yes | UW NCF: | $4,711,470 | |
| Additional Debt Balance: | $28,000,000 | Appraised Value / Per SF: | $87,400,000 / $157 | |
| Additional Debt Type: | Pari Passu | Appraisal Date(2): | January 2015 | |
Escrows and Reserves(3) | Financial Information(1) | ||||||
| Initial | Monthly | Initial Cap | Cut-off Date Loan / SF: | $98 | |||
| Taxes: | $151,880 | $89,263 | N/A | Maturity Date Loan / SF: | $84 | ||
| Insurance: | $133,817 | $18,572 | N/A | Cut-off Date LTV: | 62.6% | ||
| Replacement Reserves: | $0 | $10,406 | N/A | Maturity Date LTV: | 53.4% | ||
| TI/LC: | $200,000 | $34,730 | $1,000,000 | UW NCF DSCR: | 1.42x | ||
| Other: | $0 | $0 | N/A | UW NOI Debt Yield: | 9.6% | ||
| Sources and Uses | |||||||
| Sources | Proceeds | % of Total | Uses | Proceeds | % of Total | ||
Mortgage Loan(1) | $54,675,000 | 100.0% | Payoff Existing Debt | $47,974,957 | 87.7 | % | |
| Return of Equity | 4,991,532 | 9.1 | |||||
| Closing Costs | 1,222,814 | 2.2 | |||||
| Upfront Reserves | 485,697 | 0.9 | |||||
| Total Sources | $54,675,000 | 100.0% | Total Uses | $54,675,000 | 100.0 | % | |
| (1) | Horizon Outlet Shoppes Portfolio is part of a loan evidenced by two pari passu notes with an aggregate original principal balance of $54.675 million. The Financial Information presented in the chart above reflects the Cut-off Date balance of the $54.675 million Horizon Outlet Shoppes Portfolio Whole Loan. |
| (2) | The Appraisal Dates range from January 6, 2015 through January 13, 2015. |
| (3) | For a full description of Escrows and Reserves, please refer to “Escrows and Reserves” below. |
The Loan. The Horizon Outlet Shoppes Portfolio loan has an outstanding balance of $54.675 million and is secured by a first mortgage lien on a portfolio of three properties (the “Horizon Outlet Shoppes Portfolio Properties”) totaling 555,682 square feet located in Wisconsin, Washington and Indiana, respectively. The whole loan has an outstanding principal balance as of the Cut-off Date of $54.675 million (the “Horizon Outlet Shoppes Portfolio Whole Loan”), and is comprised of two pari passu notes, Note A-1 and Note A-2. Note A-2 has an outstanding principal balance as of the Cut-off Date of $26.675 million and is being contributed to the JPMBB 2015-C29 Trust. Note A-1, which has an outstanding principal balance as of the Cut-off Date of $28.0 million, was contributed to the JPMBB 2015-C28 trust. The holder of the Note A-1 (the “Controlling Noteholder”) is the trustee of the JPMBB 2015-C28 trust. The trustee of the JPMBB 2015-C28 trust (or, prior to the occurrence and continuance of a Control Event under the Pooling and Servicing Agreement, the Directing Certificateholder) will be entitled to exercise all of the rights of the Controlling Noteholder with respect to the Horizon Outlet Shoppes Portfolio Whole Loan; however, the holder of Note A-2 will be entitled, under certain circumstances, to be consulted with respect to certain major decisions. The loan has a 10-year term, and subsequent to a two-year interest-only period, will amortize on a 30-year schedule. The previously existing debt was securitized in WBCMT 2006-C23 transaction.
THE INFORMATION IN THIS STRUCTURAL AND COLLATERAL TERM SHEET IS NOT COMPLETE AND MAY BE AMENDED PRIOR TO THE TIME OF SALE. THIS TERM SHEET IS NOT AN OFFER TO SELL THESE SECURITIES AND IT IS NOT A SOLICITATION OF AN OFFER TO BUY THESE SECURITIES IN ANY JURISDICTION WHERE THE OFFER OR SALE IS NOT PERMITTED.
| 99 of 122 | |
| Structural and Collateral Term Sheet | JPMBB 2015-C29 | |
Horizon Outlet Shoppes Portfolio | ||
The Borrower. The borrowing entity for the Horizon Outlet Shoppes Portfolio loan is BFO Factory Shoppes LLC, a Delaware limited liability company and special purpose entity.
The Sponsor. The loan sponsor and nonrecourse carve-out guarantor is Horizon Group Properties, Inc. (“Horizon”). Horizon is an owner and developer of factory outlet shopping centers with an executive team with more than 150 combined years of shopping center experience. Horizon was founded in 1998 and is based in Norton Shores, Michigan, with executive offices in Rosemont, Illinois. In addition to the Horizon Outlet Shoppes Portfolio Properties, Horizon’s portfolio includes ownership interests in five outlet centers containing approximately 1.8 million square feet located in Atlanta, Georgia, Louisville, Kentucky, Gettysburg, Pennsylvania, Oklahoma City, Oklahoma and El Paso, Texas.
The Properties. The collateral is comprised of three properties located in Oshkosh, Wisconsin (the “Oshkosh Property”), Burlington, Washington (the “Burlington Property”) and Fremont, Indiana (the “Fremont Property”). Anchor and in-line tenants at the Horizon Outlet Shoppes Portfolio Properties consist of national tenants such as VF Outlet, Nike Factory Store, Gap Outlet, Reebok, Old Navy and lululemon, amongst others. Collectively, the Horizon Outlet Shoppes Portfolio Properties include 3,097 parking spaces, resulting in a parking ratio of approximately 5.57 spaces per 1,000 square feet of net rentable area.
As of February 1, 2015, the Horizon Outlet Shoppes Portfolio Properties were 85.6% occupied by 92 tenants and have had an average occupancy level of 89.4% over the past three years. For those tenants reporting sales, 2014 sales per square foot were $298, $287 and $278 at the Burlington, Fremont and Oshkosh properties, respectively.
| Portfolio Summary | ||||||||||||||||||
| Property | Location | Net Rentable Area (SF) | Allocated Cut-off Balance | Appraised Value | Underwritten Net Cash Flow | % of Underwritten Net Cash Flow | 2014 Sales | Occupancy Cost | ||||||||||
| Oshkosh | Oshkosh, WI | 270,512 | $15,453,692 | $45,500,000 | $2,749,765 | 58.4% | $278 | 7.4% | ||||||||||
| Burlington | Burlington, WA | 174,660 | 6,391,267 | 23,200,000 | 1,132,004 | 24.0 | $298 | 6.3% | ||||||||||
| Fremont | Fremont, IN | 110,510 | 4,830,041 | 18,700,000 | 829,701 | 17.6 | $287 | 5.9% | ||||||||||
| Total / Wtd. Avg. | 555,682 | $26,675,000 | $87,400,000 | $4,711,470 | 100.0% | $286 | 6.8% | |||||||||||
Oshkosh. The Oshkosh Property is located in Oshkosh, Wisconsin, within the Oshkosh-Neenah metropolitan statistical area. Primary access to the area is provided by Interstate 41. Within the 80-mile trade area of the Oshkosh Property, the 2014 estimated median household income was $52,716, with an estimated 2014 population of 2,988,998. The Oshkosh Property is located within a retail corridor that includes Best Buy, TJ Maxx, JCPenney, Wal-Mart Supercenter and other national retailers. The Oshkosh Property is approximately 85 miles northwest of Milwaukee, Wisconsin and 55 miles southwest of Green Bay, Wisconsin.
There are three outlet centers within 300 miles of the Oshkosh Property, with the closest outlet center, Pleasant Prairie, approximately 163 miles away. As a result, the appraisal concluded a primary trade area radius of approximately 80 miles, or areas within a drive time of approximately 90 minutes. The occupancy of the area outlet centers ranges from 94% to 98%. According to the appraisal, market rents for comparable in-line and end-cap retail space range from $18.00 to $25.00 per square foot on a triple net basis, while market rents for comparable anchor retail space range from $15.00 to $18.00 per square foot on a triple net basis. The in-place rent at the Oshkosh Property is $17.29 per square foot. According to the appraisal, there is no planned retail outlet construction in the trade area. A market research report identified six comparable anchored retail centers in the Oshkosh retail market. The comparable properties contain 773,418 square feet with occupancy ranging from 84.4% to 99.5%. The average occupancy of the comparable properties is 94.7%.
Burlington. The Burlington Property is located in Burlington, Washington. Primary access to the area is provided by Interstate 5. Within the 90-mile trade area of the Burlington Property, the 2014 estimated median household income was $67,235, with an estimated 2014 population of 2,681,106. The Burlington Property is located within a retail corridor that includes Costco, K-Mart and Burlington Crossings, a 2006-built power center with tenants such as Home Depot, Kohl’s, Best Buy and other national retailers. The Burlington Property is approximately 75 miles south of Vancouver, British Columbia and 65 miles north of Seattle, Washington.
THE INFORMATION IN THIS STRUCTURAL AND COLLATERAL TERM SHEET IS NOT COMPLETE AND MAY BE AMENDED PRIOR TO THE TIME OF SALE. THIS TERM SHEET IS NOT AN OFFER TO SELL THESE SECURITIES AND IT IS NOT A SOLICITATION OF AN OFFER TO BUY THESE SECURITIES IN ANY JURISDICTION WHERE THE OFFER OR SALE IS NOT PERMITTED.
| 100 of 122 | |
| Structural and Collateral Term Sheet | JPMBB 2015-C29 | |
Horizon Outlet Shoppes Portfolio | ||
There are five outlet centers within 160 miles of the Burlington Property. As a result, the appraisal concluded a primary trade area radius of approximately 90 miles, or areas within a drive time of approximately 90 minutes. The occupancy of the area outlet centers ranges from 80% to 93%. According to the appraisal, market rents for comparable in-line, end-cap and anchor retail space range from $14.00 to $22.00, $18.00 to $22.00 and $15.00 to $17.00 per square foot on a triple net basis, respectively. The in-place rent at the Burlington Property is $17.86 per square foot. The Mount Vernon - Burlington area retail market contains approximately 4.2 million square feet and 268 buildings. As of the third quarter of 2014, the vacancy rate was 7.6%, down from 9.1% as of the second quarter of 2014. According to a market research report, there are four proposed retail projects in the Mount Vernon - Burlington submarket totaling 74,798 square feet. Mount Vernon Commons is a proposed 55,536 square foot neighborhood center consisting of small shop space and pad buildings. The other proposals are for small standalone buildings. According to the appraisal, there are no projects that are anticipated to compete with the Burlington Property.
Fremont. The Fremont Property is located in Fremont, Indiana. The Fremont Property was developed in three phases, with Phase II and Phase III serving as collateral for the Horizon Outlet Shoppes Portfolio loan. Primary access to the area is provided by Interstate 80/90 and Interstate 69. Within the 60-mile trade area of the Fremont Property, the 2014 estimated median household income was $47,162, with an estimated 2014 population of 1,038,560. The Fremont Property is approximately 50 miles north of Fort Wayne, Indiana.
There are five outlet centers within 160 miles of the Fremont Property. As a result, the appraisal concluded a primary trade area radius of approximately 60 miles, or areas within a drive time of approximately 60 minutes. The occupancy of the area outlet centers ranges from 92% to 98%. According to the appraisal, market rents for comparable end-cap retail space range from $14.00 to $17.00 per square foot on a triple net basis for anchor retail space, while market rents for comparable in-line retail space range from $18.00 to $26.00 per square foot on a triple net basis. The in-place rent at the Fremont Property is $15.62 per square foot. According to the appraisal, there is no planned retail outlet construction in the trade area.
Historical and Current Occupancy(1) | |||
| 2012 | 2013 | 2014(2) | Current(3) |
| 91.7% | 87.2% | 89.4% | 85.6% |
| (1) | Historical Occupancies are as of December 1 of each respective year. |
| (2) | Based on the rent roll dated January 1, 2015. |
| (3) | Current Occupancy is as of February 1, 2015. |
Tenant Summary(1) | ||||||||||
| Tenant | Property | Ratings(2) Moody’s/S&P/Fitch | Net Rentable Area (SF) | % of Total NRA | Base Rent PSF | Lease Expiration Date | ||||
| VF Outlet | Oshkosh | NA / NA / NA | 27,402 | 4.9% | $11.25 | 4/30/2016 | ||||
| Old Navy | Oshkosh | Baa3 / BBB- / BBB- | 14,400 | 2.6% | $13.03 | 1/31/2016 | ||||
Gap Outlet(3) | Oshkosh | Baa3 / BBB- / BBB- | 12,960 | 2.3% | $13.93 | 6/30/2016 | ||||
| Nike Factory Store | Burlington | A1 / AA- / NA | 10,000 | 1.8% | $19.00 | 1/31/2016 | ||||
| Land’s End | Oshkosh | NA / NA / NA | 10,000 | 1.8% | $16.75 | 7/31/2016 | ||||
Brooks Brothers(3) | Oshkosh | NA / NA / NA | 9,940 | 1.8% | $6.47 | 8/31/2017 | ||||
| Nike | Oshkosh | A1 / AA- / NA | 9,642 | 1.7% | $19.50 | 1/31/2019 | ||||
Gap Outlet(3) | Fremont | Baa3 / BBB- / BBB- | 9,231 | 1.7% | $5.24 | 3/31/2016 | ||||
Gap Outlet(3)(4) | Burlington | Baa3 / BBB- / BBB- | 9,200 | 1.7% | $4.27 | 7/31/2015 | ||||
| Eddie Bauer | Oshkosh | NA / NA / NA | 9,000 | 1.6% | $17.50 | 1/31/2018 | ||||
| (1) | Based on the underwritten rent roll. |
| (2) | Ratings provided are for the parent company of the entity listed in the “Tenant” field whether or not the parent company guarantees the lease. |
| (3) | Tenant pays percentage of gross sales in lieu of base rent (“PIL”). PIL is based on the sales provided by the borrower. |
| (4) | The Gap Outlet at the Burlington Property has the right to terminate its lease at any time with 90 days’ written notice. |
THE INFORMATION IN THIS STRUCTURAL AND COLLATERAL TERM SHEET IS NOT COMPLETE AND MAY BE AMENDED PRIOR TO THE TIME OF SALE. THIS TERM SHEET IS NOT AN OFFER TO SELL THESE SECURITIES AND IT IS NOT A SOLICITATION OF AN OFFER TO BUY THESE SECURITIES IN ANY JURISDICTION WHERE THE OFFER OR SALE IS NOT PERMITTED.
| 101 of 122 | |
| Structural and Collateral Term Sheet | JPMBB 2015-C29 | |
Horizon Outlet Shoppes Portfolio | ||
Percent-in-lieu Rent Schedule | |||||||||||
| Tenant | Property | Estimated 2014 Sales(1) | Estimated Sales PSF | PIL | Underwritten Rent | ||||||
| Gap Outlet | Oshkosh | $3,641,760 | $281 | 5.00% | $180,516 | ||||||
Eddie Bauer(2) | Burlington | 1,668,000 | $278 | 10.00% | 167,672 | ||||||
Dress Barn(2) | Burlington | 993,300 | $129 | 12.00% | 125,762 | ||||||
| Puma | Burlington | 1,259,600 | $235 | 8.00% | 103,458 | ||||||
Bath & Body Works(2) | Fremont | 1,778,000 | $508 | 6.00% | 97,416 | ||||||
| Coach Factory Store | Fremont | 3,098,244 | $1,228 | 3.00% | 93,865 | ||||||
| Coach | Oshkosh | 3,569,736 | $708 | 2.50% | 90,859 | ||||||
Factory Brand Shoes(2) | Burlington | 800,100 | $254 | 8.00% | 88,703 | ||||||
| Puma | Oshkosh | 1,188,800 | $238 | 7.00% | 83,216 | ||||||
| Tommy Hilfiger | Fremont | 1,027,000 | $158 | 7.50% | 76,812 | ||||||
Nine West(2) | Burlington | 742,500 | $275 | 9.00% | 74,219 | ||||||
| Helly Hansen | Burlington | 891,708 | $160 | (3) | 69,045 | ||||||
| Brooks Brothers | Oshkosh | 795,200 | $80 | 8.00% | 64,315 | ||||||
Filson(2) | Burlington | 996,300 | $369 | 7.00% | 62,509 | ||||||
| Pendleton Woolen Mills | Burlington | 663,825 | $159 | (4) | 58,858 | ||||||
Jockey(2) | Oshkosh | 639,900 | $237 | 8.00% | 51,661 | ||||||
| Van Heusen | Burlington | 820,000 | $205 | 6.00% | 50,117 | ||||||
| Gap Outlet | Fremont | 2,418,522 | $262 | 2.00% | 48,358 | ||||||
Jockey(2) | Fremont | 619,200 | $172 | 8.00% | 48,244 | ||||||
| Bass Company Store | Fremont | 966,555 | $141 | 5.00% | 48,028 | ||||||
| Gymboree | Oshkosh | 425,040 | $161 | 10.00% | 42,928 | ||||||
| Wilson’s Leather Outlet | Oshkosh | 602,800 | $137 | 7.00% | 41,306 | ||||||
| Bass Company Store | Burlington | 651,000 | $93 | 6.00% | 40,916 | ||||||
| Polo Ralph Lauren | Oshkosh | 1,972,592 | $248 | 2.00% | 39,992 | ||||||
| Gap Outlet | Burlington | 1,932,000 | $210 | 2.00% | 39,264 | ||||||
| Bass Company Store | Oshkosh | 952,000 | $112 | 4.00% | 37,699 | ||||||
| Motherhood Maternity Outlet | Oshkosh | 342,000 | $152 | 11.00% | 37,690 | ||||||
| Maurices | Fremont | 756,000 | $216 | 5.00% | 37,324 | ||||||
| Maidenform | Burlington | 456,300 | $169 | 3.50% | 15,713 | ||||||
| Total | $36,667,982 | $2,016,465 | |||||||||
| (1) | Based on actual sales from January through November 2014 and sponsor’s estimates for December 2014. |
| (2) | Tenant pays the greater of PIL and base rent. |
| (3) | Helly Hansen pays 7.00% PIL rent up to $100 PSF of gross sales plus 8.00% PIL rent in excess of $100 PSF of gross sales. |
| (4) | Pendleton Woolen Mills pays 8.00% PIL rent up to $175 PSF of gross sales plus 10.00% PIL rent in excess of $175 PSF of gross sales. |
Of the 92 tenants, 58 tenants representing 317,698 square feet have co-tenancy provisions. These provisions generally require a minimum occupancy at each property ranging from 50.0% to 80.0%. Seven of these tenants representing 43,272 square feet, require that key tenants, such as Nike, Coach and lululemon remain at the Horizon Outlet Shoppes Portfolio Properties. If these co-tenancy clauses are breached, certain tenants may begin paying abated rent, which is calculated as a percentage of gross sales generally ranging from 1.0% to 7.5% and certain other tenants may be permitted to terminate their respective leases.
THE INFORMATION IN THIS STRUCTURAL AND COLLATERAL TERM SHEET IS NOT COMPLETE AND MAY BE AMENDED PRIOR TO THE TIME OF SALE. THIS TERM SHEET IS NOT AN OFFER TO SELL THESE SECURITIES AND IT IS NOT A SOLICITATION OF AN OFFER TO BUY THESE SECURITIES IN ANY JURISDICTION WHERE THE OFFER OR SALE IS NOT PERMITTED.
| 102 of 122 | |
| Structural and Collateral Term Sheet | JPMBB 2015-C29 | |
Horizon Outlet Shoppes Portfolio | ||
Lease Rollover Schedule(1)(2) | ||||||||||||||||||||||||||
| Year | Number of Leases Expiring | Net Rentable Area Expiring | % of NRA Expiring | Base Rent Expiring | % of Base Rent Expiring | Cumulative Net Rentable Area Expiring | Cumulative % of NRA Expiring | Cumulative Base Rent Expiring | Cumulative % of Base Rent Expiring | |||||||||||||||||
| Vacant | NAP | 79,746 | 14.4 | % | NAP | NAP | 79,746 | 14.4% | NAP | NAP | ||||||||||||||||
| 2015 & MTM | 22 | 90,893 | 16.4 | $1,100,184 | 14.4 | % | 170,639 | 30.7% | $1,100,184 | 14.4% | ||||||||||||||||
| 2016 | 30 | 208,207 | 37.5 | 3,160,154 | 41.4 | 378,846 | 68.2% | $4,260,338 | 55.9% | |||||||||||||||||
| 2017 | 15 | 67,574 | 12.2 | 1,268,931 | 16.6 | 446,420 | 80.3% | $5,529,269 | 72.5% | |||||||||||||||||
| 2018 | 6 | 27,994 | 5.0 | 456,318 | 6.0 | 474,414 | 85.4% | $5,985,587 | 78.5% | |||||||||||||||||
| 2019 | 9 | 40,802 | 7.3 | 731,415 | 9.6 | 515,216 | 92.7% | $6,717,002 | 88.1% | |||||||||||||||||
| 2020 | 2 | 8,222 | 1.5 | 134,752 | 1.8 | 523,438 | 94.2% | $6,851,754 | 89.9% | |||||||||||||||||
| 2021 | 2 | 7,720 | 1.4 | 191,460 | 2.5 | 531,158 | 95.6% | $7,043,214 | 92.4% | |||||||||||||||||
| 2022 | 3 | 10,525 | 1.9 | 330,059 | 4.3 | 541,683 | 97.5% | $7,373,273 | 96.7% | |||||||||||||||||
| 2023 | 2 | 9,580 | 1.7 | 176,560 | 2.3 | 551,263 | 99.2% | $7,549,833 | 99.0% | |||||||||||||||||
| 2024 | 1 | 4,419 | 0.8 | 75,123 | 1.0 | 555,682 | 100.0% | $7,624,956 | 100.0% | |||||||||||||||||
| 2025 | 0 | 0 | 0.0 | 0 | 0.0 | 555,682 | 100.0% | $7,624,956 | 100.0% | |||||||||||||||||
| 2026 & Beyond | 0 | 0 | 0.0 | 0 | 0.0 | 555,682 | 100.0% | $7,624,956 | 100.0% | |||||||||||||||||
| Total | 92 | 555,682 | 100.0 | % | $7,624,956 | 100.0 | % | |||||||||||||||||||
| (1) | Based on the underwritten rent roll. |
| (2) | Base rent includes underwritten base rent and 2014 PIL as estimated by the borrower. |
Operating History and Underwritten Net Cash Flow | ||||||||||||
| 2012 | 2013 | 2014 | Underwritten | Per Square Foot | %(1) | |||||||
Rents in Place(2) | $7,237,468 | $7,648,591 | $7,583,594 | $7,624,956 | $13.72 | 71.2 | % | |||||
| Vacant Income | 0 | 0 | 0 | 1,405,016 | 2.53 | 13.1 | ||||||
| Gross Potential Rent | $7,237,468 | $7,648,591 | $7,583,594 | $9,029,972 | $16.25 | 84.3 | % | |||||
| Total Reimbursements | 1,022,068 | 1,039,405 | 1,082,225 | 1,082,225 | 1.95 | 10.1 | ||||||
Percentage Rent(3) | 318,058 | 408,302 | 550,645 | 601,748 | 1.08 | 5.6 | ||||||
| Net Rental Income | $8,577,594 | $9,096,299 | $9,216,464 | $10,713,944 | $19.28 | 100.0 | % | |||||
| (Vacancy/Credit Loss) | (4,075) | (2,171) | (1,428) | (1,445,701) | (2.60) | (13.5) | ||||||
Other Income(4) | 197,614 | 162,662 | 92,412 | 92,412 | 0.17 | 0.9 | ||||||
| Effective Gross Income | $8,771,132 | $9,256,790 | $9,307,447 | $9,360,656 | $16.85 | 87.4 | % | |||||
| Total Expenses | $3,495,707 | $3,727,241 | $3,997,533 | $4,107,547 | $7.39 | 43.9 | % | |||||
| Net Operating Income | $5,275,426 | $5,529,549 | $5,309,914 | $5,253,108 | $9.45 | 56.1 | % | |||||
| Total TI/LC, Capex/RR | 0 | 0 | 0 | 541,638 | 0.97 | 5.8 | ||||||
| Net Cash Flow | $5,275,426 | $5,529,549 | $5,309,914 | $4,711,470 | $8.48 | 50.3 | % | |||||
| (1) | Percentage column represents percent of Net Rental Income for all revenue lines and represents percent of Effective Gross Income for the remainder of fields. |
| (2) | Underwritten Rents in Place are based on February 1, 2015 rent roll. Twenty-nine tenants currently pay PIL (in the case of eight tenants, the greater of base rent or PIL), which comprises approximately $2.0 million of Underwritten Rents in Place. |
| (3) | Percentage Rent includes overage income derived from tenants that have met their sales breakpoints. |
| (4) | Other Income primarily consists of temporary tenant space income and miscellaneous fees. |
Property Manager. The Horizon Outlet Shoppes Portfolio Properties are managed by Horizon Group Properties, L.P., an affiliate of the loan sponsor.
THE INFORMATION IN THIS STRUCTURAL AND COLLATERAL TERM SHEET IS NOT COMPLETE AND MAY BE AMENDED PRIOR TO THE TIME OF SALE. THIS TERM SHEET IS NOT AN OFFER TO SELL THESE SECURITIES AND IT IS NOT A SOLICITATION OF AN OFFER TO BUY THESE SECURITIES IN ANY JURISDICTION WHERE THE OFFER OR SALE IS NOT PERMITTED.
| 103 of 122 | |
| Structural and Collateral Term Sheet | JPMBB 2015-C29 | |
Horizon Outlet Shoppes Portfolio | ||
Escrows and Reserves. At origination, the borrower deposited $200,000 for future tenant improvements and leasing commissions, $151,880 for real estate taxes and $133,817 for insurance.
Tax Escrows - On a monthly basis, the borrower is required to escrow 1/12 of the annual estimated tax payments, which currently equates to $89,263.
Insurance Escrows - On a monthly basis, the borrower is required to escrow 1/12 of the annual insurance premiums, which currently equates to $18,572.
Replacement Reserves - On a monthly basis, the borrower is required to escrow $10,406 (approximately $0.22 per square foot annually as recommended in the engineering report) for replacement reserves.
TI/LC Reserves - On a monthly basis, the borrower is required to escrow $34,730 (approximately $0.75 per square foot annually) for TI/LC reserves. The reserve is subject to a cap of $1,000,000 (approximately $1.80 per square foot annually).
Lockbox / Cash Management. The loan is structured with a hard lockbox and in-place cash management. The borrower and/or property manager were required to send tenant direction letters to tenants instructing them to deposit all rents and payments into a lockbox account controlled by the lender. All funds in the lockbox account are swept daily to a cash management account under the control of the lender and disbursed during the term of the loan in accordance with the loan documents. During a Sweep Event Period (as defined below), all excess cash flow after payment of debt service, required reserves and operating expenses will be held as additional collateral for the loan.
A “Sweep Event Period” means: (i) the occurrence of an event of default under the loan documents, (ii) the debt service coverage ratio as calculated in the loan documents based on a trailing 12-month period falls below 1.10x or (iii) the loan sponsor fails to maintain a net worth equal to or greater than $25.0 million and liquidity equal to or greater than $2.0 million.
Release of Outparcel. At any time during the term of the loan, provided no Sweep Event Period has occurred or is continuing, the borrower is permitted to release an unimproved parcel at the Oshkosh Property in accordance with certain terms and conditions set forth in the loan documents.
Release of Individual Properties. Provided no Sweep Event Period has occurred or is continuing, the borrower may release one or more of the individual Horizon Outlet Shoppes Portfolio Properties, provided that, among other things, (i) the borrower will partially defease the loan in an amount equal to the greatest of (x) if the first release property is (A) the Burlington Property, 110% of the loan amount allocated to the Burlington Property, as determined by the lender, or (B) the Fremont Property or the Oshkosh Property, 130% of the loan amount allocated to such release property, as determined by the lender, and (y) for a subsequent release property, 120% of the loan amount allocated to such release property, as determined by the lender, (ii) the loan-to-value ratio for the Horizon Outlet Shoppes Portfolio Property(ies) immediately following such partial release is equal to or less than 75%, as determined by the lender, (iii) the debt service coverage ratio for the Horizon Outlet Shoppes Portfolio Property(ies) immediately following such partial release is equal to or greater than 1.30x, as determined by the lender and (iv) the debt yield for the Horizon Outlet Shoppes Portfolio Property(ies) immediately following such partial release is equal to or greater than 8.5%, as determined by the lender.
THE INFORMATION IN THIS STRUCTURAL AND COLLATERAL TERM SHEET IS NOT COMPLETE AND MAY BE AMENDED PRIOR TO THE TIME OF SALE. THIS TERM SHEET IS NOT AN OFFER TO SELL THESE SECURITIES AND IT IS NOT A SOLICITATION OF AN OFFER TO BUY THESE SECURITIES IN ANY JURISDICTION WHERE THE OFFER OR SALE IS NOT PERMITTED.
| 104 of 122 | |
| Structural and Collateral Term Sheet | JPMBB 2015-C29 | |
Aspen Heights – Texas A&M University Corpus Christi | ||
| Mortgage Loan Information | Property Information | |||
| Mortgage Loan Seller: | RAIT | Single Asset / Portfolio: | Single Asset | |
| Original Principal Balance: | $26,000,000 | Title: | Fee | |
| Cut-off Date Principal Balance: | $26,000,000 | Property Type - Subtype: | Multifamily – Student | |
| % of Pool by IPB: | 2.6% | Number of Beds: | 500 | |
| Loan Purpose: | Refinance | Location: | Corpus Christi, TX | |
| Borrower: | Breckenridge Group Corpus Christi | Year Built / Renovated: | 2014 / N/A | |
| Texas, LP | Occupancy: | 97.8% | ||
| Sponsors: | Aspen Heights, Capital Solutions, Inc. | Occupancy Date: | 3/31/2015 | |
| and Gregory Henry | Number of Tenants: | N/A | ||
| Interest Rate: | 4.18000% | 2012 NOI(1): | N/A | |
| Note Date: | 12/18/2014 | 2013 NOI(1): | N/A | |
| Maturity Date: | 1/1/2025 | 2014 NOI(1): | N/A | |
| Interest-only Period: | 60 months | TTM NOI (as of 3/2015)(2): | $2,775,487 | |
| Original Term: | 120 months | UW Economic Occupancy: | 94.5% | |
Original Amortization(3): | 360 months | UW Revenues: | $4,215,154 | |
| Amortization Type: | IO-Balloon | UW Expenses: | $1,885,214 | |
| Call Protection: | L(29),Def(87),O(4) | UW NOI: | $2,329,939 | |
| Lockbox: | Springing | UW NCF: | $2,279,939 | |
| Additional Debt: | Yes | Appraised Value / Per Bed: | $39,200,000 / $78,400 | |
| Additional Debt Balance: | $4,380,000 | Appraisal Date: | 11/18/2014 | |
| Additional Debt Type: | Mezzanine Loan | |||
| Escrows and Reserves | Financial Information | |||||
| Initial | Monthly | Initial Cap | Cut-off Date Loan / Bed: | $52,000 | ||
| Taxes: | $62,016 | $62,016 | N/A | Maturity Date Loan / Bed: | $47,779 | |
| Insurance: | $55,026 | $11,005 | N/A | Cut-off Date LTV: | 66.3% | |
| Replacement Reserves: | $0 | $4,167 | N/A | Maturity Date LTV: | 60.9% | |
| TI/LC: | $0 | $0 | N/A | UW NCF DSCR(4): | 1.54x | |
| Other: | $0 | $0 | N/A | UW NOI Debt Yield: | 9.0% | |
| Sources and Uses | ||||||||
| Sources | Proceeds | % of Total | Uses | Proceeds | % of Total | |||
| Mortgage Loan | $26,000,000 | 85.6% | Payoff Existing Debt | $24,359,611 | 80.2% | |||
| Mezzanine Loan | 4,380,000 | 14.4 | Return of Equity | 5,349,447 | 17.6 | |||
| Closing Costs | 553,899 | 1.8 | ||||||
| Upfront Reserves | 117,043 | 0.4 | ||||||
| Total Sources | $30,380,000 | 100.0% | Total Uses | $30,380,000 | 100.0% | |||
| (1) | Historical NOI is not available because the property was newly constructed in 2014. |
| (2) | The TTM NOI is based on the trailing eight-month period ending on March 31, 2015, annualized. |
| (3) | The Aspen Heights – Texas A&M University Corpus Christi loan is structured with a principal payment schedule based on a 360-month amortization period. See Annex F of the Free Writing Prospectus. |
| (4) | The UW NCF DSCR is calculated using the average of principal and interest payments over the first 12 months following the initial interest-only period based on the principal payment schedule provided on Annex F of the Free Writing Prospectus. |
The Loan. The Aspen Heights – Texas A&M University Corpus Christi loan has an outstanding principal balance of $26,000,000 and is secured by a first mortgage lien on the borrower’s fee simple interest in a student housing complex totaling 500 beds located in Corpus Christi, Texas. The loan has a 10-year term and, subsequent to a five-year interest-only period, will amortize on a planned amortization schedule. The borrowing entity is Breckenridge Group Corpus Christi Texas, LP, a Texas limited partnership and special purpose entity, which is a joint venture between Aspen Heights and Capital Solutions, Inc. The loan sponsors are Aspen Heights, Capital Solutions, Inc. and Gregory Henry, the Chief Executive Officer of Aspen Heights. The nonrecourse carve-out guarantors are Breckenridge Development 2014, LLC and BRG Partners, LP, each of which are owned by principals of Aspen Heights.
THE INFORMATION IN THIS STRUCTURAL AND COLLATERAL TERM SHEET IS NOT COMPLETE AND MAY BE AMENDED PRIOR TO THE TIME OF SALE. THIS TERM SHEET IS NOT AN OFFER TO SELL THESE SECURITIES AND IT IS NOT A SOLICITATION OF AN OFFER TO BUY THESE SECURITIES IN ANY JURISDICTION WHERE THE OFFER OR SALE IS NOT PERMITTED.
| 105 of 122 | |
| Structural and Collateral Term Sheet | JPMBB 2015-C29 | |
Aspen Heights – Texas A&M University Corpus Christi | ||
The Property. The Aspen Heights – Texas A&M University Corpus Christi property is a Class A+ student housing property located in Corpus Christi, Texas for students attending Texas A&M University – Corpus Christi (“TAMUCC”). Constructed in 2014, the Aspen Heights – Texas A&M University Corpus Christi property consists of 153 units and 500 beds and is comprised of 109 buildings with various floor plans including 48 two-bedroom, 42 three-bedroom, 37 four-bedroom, and 26 five-bedroom units. The apartments feature granite counter tops, fully-equipped kitchens with breakfast bars, vinyl wood flooring, and individual climate controls, and each bedroom has its own private bath. Amenities at the property include a club house with a fitness center and computer lab, as well as a swimming pool with sun deck, movie theater, 24-hour emergency maintenance, free parking, full-sized volleyball court and dog park. The property has 530 parking spaces, which equates to a parking ratio of approximately 3.5 spaces per unit and approximately 1.1 parking spaces per bed. The Corpus Christi Regional Transportation Authority has a B-line bus stop at the property’s entrance, which provides direct access to the TAMUCC campus. A parental or sponsor guarantee is required for tenants under 21 years old. If a tenant is over 21 and has verifiable income three times the rent, the tenant qualifies on his own. Currently, approximately 90% of the leases have a parental guaranty. All leases are per bed and are based on a 12-month term. As of March 31, 2015, the Aspen Heights – Texas A&M University Corpus Christi property was 97.8% occupied. As of April 19, 2015, the property was approximately 60% pre-leased for the 2015-2016 school year.
The Market. The Aspen Heights – Texas A&M University Corpus Christi property is located in Corpus Christi, Texas, approximately two miles south of the TAMUCC campus. Founded in 1947, TAMUCC, located on an approximately 240-acre island campus, is surrounded by Cayo del Oso and Corpus Christi Bays and is just 10 miles from downtown. According to the appraisal, the overall demand for student housing in Corpus Christi, Texas is derived from approximately 11,240 students as of fall 2014, up from 8,563 students in fall 2007 (approximately 4.0% annual growth) at TAMUCC. The total TAMUCC student housing supply is estimated at 3,774 beds (which includes projects currently under construction) consisting of 2,290 on-campus beds and an estimated 1,484 off-campus beds in privately owned properties. The property is located near the intersection of Highway 358-John F. Kennedy Memorial Highway and Route 3. Route 3 provides access to TAMUCC, while Highway 358 provides access to downtown Corpus Christi to the west and the beaches to the east. Aspen Heights and Greg Henry, two of the loan sponsors, currently have a projected 336-bed student housing development, Aspen Heights Phase II, under construction at an adjacent site. The loan sponsors reported that, as of April 19, 2015, Aspen Heights Phase II is approximately 69.0% pre-leased for the 2015-2016 school year.
According to the appraisal, on-campus housing options at TAMUCC are limited to residence halls or two housing complexes: Camden Miramar (98.0% leased) and Momentum Village. Momentum Village is currently under construction and is expected to be delivered by the beginning of the 2015-16 school year. Off-campus purpose built student housing consists of two properties (excluding the Aspen Heights – Texas A&M University Corpus Christi property and Aspen Heights Phase II): Campus Quarters, a 336-bed complex built in 2010, which is 98.0% occupied, and Islander Village, a 312-bed complex built in 2007, which is 98.0% occupied.
Multifamily Unit Mix(1) | ||||||||||||||
| Unit Type | # of Beds | % of Total | Occupied Beds | Occupancy | Average Bed Size (SF) | Average Monthly In- Place Rent per Bed | Average Monthly Rental Rate PSF | |||||||
| Aspen - 2 Bedroom / 2.5 Bath | 40 | 8.0% | 40 | 100.0% | 734 | $785 | $1.07 | |||||||
| Keystone – 2 Bedroom / 2.5 Bath | 56 | 11.2 | 55 | 98.2% | 745 | $786 | $1.05 | |||||||
| Frisco – 3 Bedroom / 3.5 Bath | 78 | 15.6 | 75 | 96.2% | 609 | $702 | $1.15 | |||||||
| Telluride – 3 Bedroom / 3.5 Bath | 48 | 9.6 | 47 | 97.9% | 609 | $705 | $1.16 | |||||||
| Vail – 4 Bedroom / 4.5 Bath | 48 | 9.6 | 48 | 100.0% | 492 | $684 | $1.39 | |||||||
| Breckenridge – 4 Bedroom / 4.5 Bath | 52 | 10.4 | 48 | 92.3% | 492 | $682 | $1.39 | |||||||
| Boulder – 4 Bedroom / 4.5 Bath | 48 | 9.6 | 47 | 97.9% | 492 | $684 | $1.39 | |||||||
| A-Basin – 5 Bedroom / 5.5 Bath | 100 | 20.0 | 100 | 100.0% | 460 | $685 | $1.49 | |||||||
| Durango – 5 Bedroom / 5.5 Bath | 30 | 6.0 | 29 | 96.7% | 469 | $679 | $1.45 | |||||||
| Total / Wtd. Avg. | 500 | 100.0% | 489 | 97.8% | 561 | $708 | $1.26 | |||||||
| (1) | Based on the underwritten rent roll dated March 31, 2015. |
THE INFORMATION IN THIS STRUCTURAL AND COLLATERAL TERM SHEET IS NOT COMPLETE AND MAY BE AMENDED PRIOR TO THE TIME OF SALE. THIS TERM SHEET IS NOT AN OFFER TO SELL THESE SECURITIES AND IT IS NOT A SOLICITATION OF AN OFFER TO BUY THESE SECURITIES IN ANY JURISDICTION WHERE THE OFFER OR SALE IS NOT PERMITTED.
| 106 of 122 | |
| Structural and Collateral Term Sheet | JPMBB 2015-C29 | |
Aspen Heights – Texas A&M University Corpus Christi | ||
| Operating History and Underwritten Net Cash Flow | |||||
TTM(1) | Underwritten | Per Bed | %(2) | ||
Rents in Place(3) | $4,306,080 | $4,154,412 | $8,309 | 97.8% | |
| Vacant Income | 0 | 94,428 | 189 | 2.2 | |
| Gross Potential Rent | $4,306,080 | $4,248,840 | $8,498 | 100.0% | |
| Reimbursements | 0 | 0 | 0 | 0.0 | |
| Net Rental Income | $4,306,080 | $4,248,840 | $8,498 | 100.0% | |
| (Vacancy/Credit Loss/Concessions) | (180,702) | (233,686) | (467) | (5.5) | |
| Other Income | 213,332 | 200,000 | 400 | 4.7 | |
| Effective Gross Income | $4,338,710 | $4,215,154 | $8,430 | 99.2% | |
| Total Expenses | $1,563,223 | $1,885,214 | $3,770 | 44.7% | |
| Net Operating Income | $2,775,487 | $2,329,939 | $4,660 | 55.3% | |
| Replacement Reserves | 0 | 50,000 | 100 | 1.2 | |
| Net Cash Flow | $2,775,487 | $2,279,939 | $4,560 | 54.1% | |
Occupancy(4) | 97.8% | 94.5% | |||
| (1) | The TTM column represents a trailing eight-month period ending March 31, 2015, annualized. |
| (2) | Percentage column represents percent of Net Rental Income for all revenue lines and represents percent of Effective Gross Income for the remainder of fields. |
| (3) | Underwritten Rents in Place are based on the November 11, 2014 rent roll. |
| (4) | TTM Occupancy is based on the underwritten rent roll dated March 31, 2015. Underwritten Occupancy represents economic occupancy. |
Additional Mezzanine Debt. A mezzanine loan of $4,380,000 secured by the equity interests in the borrower was provided by RAIT Partnership, L.P., an affiliate of the mortgage loan seller, and is coterminous with the mortgage loan. The mezzanine loan is interest-only throughout the term of the loan and has a coupon of approximately 8.13356% per annum. Including the mezzanine loan, the Cut-off Date LTV is 77.5%, the UW NCF DSCR is 1.20x and the UW NOI Debt Yield is 7.7%. The lender has entered into a customary intercreditor agreement with the mezzanine lender.
THE INFORMATION IN THIS STRUCTURAL AND COLLATERAL TERM SHEET IS NOT COMPLETE AND MAY BE AMENDED PRIOR TO THE TIME OF SALE. THIS TERM SHEET IS NOT AN OFFER TO SELL THESE SECURITIES AND IT IS NOT A SOLICITATION OF AN OFFER TO BUY THESE SECURITIES IN ANY JURISDICTION WHERE THE OFFER OR SALE IS NOT PERMITTED.
| 107 of 122 | |
| Structural and Collateral Term Sheet | JPMBB 2015-C29 |
[THIS PAGE INTENTIONALLY LEFT BLANK]
THE INFORMATION IN THIS STRUCTURAL AND COLLATERAL TERM SHEET IS NOT COMPLETE AND MAY BE AMENDED PRIOR TO THE TIME OF SALE. THIS TERM SHEET IS NOT AN OFFER TO SELL THESE SECURITIES AND IT IS NOT A SOLICITATION OF AN OFFER TO BUY THESE SECURITIES IN ANY JURISDICTION WHERE THE OFFER OR SALE IS NOT PERMITTED.
| 108 of 122 | |
| Structural and Collateral Term Sheet | JPMBB 2015-C29 | |
Marriott - Pittsburgh | ||
| Mortgage Loan Information | Property Information | |||
| Mortgage Loan Seller: | JPMCB | Single Asset / Portfolio: | Single Asset | |
Original Principal Balance(1): | $25,000,000 | Title: | Leasehold | |
Cut-off Date Principal Balance(1): | $25,000,000 | Property Type - Subtype: | Hotel - Full Service | |
| % of Pool by IPB: | 2.5% | Net Rentable Area (Rooms): | 402 | |
| Loan Purpose: | Refinance | Location: | Pittsburgh, PA | |
| Borrower: | Shaner Pittsburgh Hotel | Year Built / Renovated: | 1964 / 2012 | |
| Limited Partnership | Occupancy / ADR / RevPAR: | 72.1% / $151.89 / $109.44 | ||
| Sponsor: | Lance T. Shaner | Occupancy / ADR / RevPAR Date: | 3/31/2015 | |
| Interest Rate: | 4.52700% | Number of Tenants: | N/A | |
| Note Date: | 10/31/2014 | 2012 NOI: | $3,256,231 | |
| Maturity Date: | 11/1/2024 | 2013 NOI: | $4,206,031 | |
| Interest-only Period: | 24 months | 2014 NOI: | $4,866,696 | |
| Original Term: | 120 months | TTM NOI (as of 3/2015): | $5,241,956 | |
| Original Amortization: | 360 months | UW Occupancy / ADR / RevPAR: | 71.1% / $150.23 / $106.89 | |
| Amortization Type: | IO-Balloon | UW Revenues: | $21,506,160 | |
Call Protection(2): | L(31),Def(85),O(4) | UW Expenses: | $16,721,048 | |
| Lockbox: | Hard | UW NOI: | $4,785,112 | |
| Additional Debt: | Yes | UW NCF: | $4,785,112 | |
| Additional Debt Balance: | $19,060,000 / $7,140,000 | Appraised Value / Per Room: | $64,000,000 / $159,204 | |
| Additional Debt Type: | Pari Passu / Mezzanine Loan | Appraisal Date: | 9/1/2014 | |
| Escrows and Reserves | Financial Information(1) | |||||
| Initial | Monthly | Initial Cap | Cut-off Date Loan / Room: | $109,602 | ||
| Taxes: | $267,171 | $30,400 | N/A | Maturity Date Loan / Room: | $93,668 | |
| Insurance: | $101,105 | $16,851 | N/A | Cut-off Date LTV: | 68.8% | |
| FF&E Reserves: | $0 | 4% of Gross Revenues | N/A | Maturity Date LTV: | 58.8% | |
| TI/LC: | $0 | $0 | N/A | UW NCF DSCR: | 1.78x | |
Other(3): | $60,455 | $2,925 | N/A | UW NOI Debt Yield: | 10.9% | |
| Sources and Uses | ||||||
| Sources | Proceeds | % of Total | Uses | Proceeds | % of Total | |
Mortgage Loan(1) | $44,060,000 | 86.1% | Payoff Existing Debt | $31,869,660 | 62.2% | |
| Mezzanine Loan | 7,140,000 | 13.9 | Return of Equity | 18,530,586 | 36.2 | |
| Upfront Reserves | 428,731 | 0.8 | ||||
| Closing Costs | 371,023 | 0.7 | ||||
| Total Sources | $51,200,000 | 100.0% | Total Uses | $51,200,000 | 100.0% | |
| (1) | Marriott - Pittsburgh is part of a loan evidenced by two pari passu notes with an aggregate original principal balance of $44.06 million. The Financial Information presented in the chart above reflects the Cut-off Date balance of $44.06 million for the Marriott - Pittsburgh Whole Loan. |
| (2) | The lockout period will be at least 31 payments beginning with and including the first payment date of December 1, 2014. Defeasance of the full $44.06 million Marriott - Pittsburgh Whole Loan is permitted after the date that is two years from the closing date of the securitization that includes the last pari passu note to be securitized. |
| (3) | The Initial Other Escrows and Reserves represent a ground rent reserve and deferred maintenance reserve. |
The Loan. The Marriott - Pittsburgh loan is secured by a first mortgage lien on a 402-room, full service hotel located in Pittsburgh, Pennsylvania. The whole loan has an outstanding principal balance of $44.06 million (the “Marriott - Pittsburgh Whole Loan”), which is comprised of two pari passu notes, Note A-1 and Note A-2. Note A-1, with an outstanding principal balance as of the Cut-off Date of $25.00 million, is being contributed to the JPMBB 2015-C29 Trust. Note A-2, which has an outstanding principal balance as of the Cut-off Date of $19.06 million, is expected to be contributed to a future securitization trust. The holder of the Note A-1 (the “Controlling Noteholder”) will be the trustee of the JPMBB 2015-C29 Trust. The trustee of the JPMBB 2015-C29 Trust (or, prior to the occurrence and continuance of a control event under the pooling and servicing agreement, the directing certificateholder) will be entitled to exercise all of the rights of the Controlling Noteholder with respect to the Marriott - Pittsburgh Whole Loan; however, the holder of Note A-2 will be entitled, under certain circumstances, to consult with respect to certain major decisions. The loan has a 10-year term and, subsequent to a two-year interest-only period, will amortize on a 30-year schedule.
THE INFORMATION IN THIS STRUCTURAL AND COLLATERAL TERM SHEET IS NOT COMPLETE AND MAY BE AMENDED PRIOR TO THE TIME OF SALE. THIS TERM SHEET IS NOT AN OFFER TO SELL THESE SECURITIES AND IT IS NOT A SOLICITATION OF AN OFFER TO BUY THESE SECURITIES IN ANY JURISDICTION WHERE THE OFFER OR SALE IS NOT PERMITTED.
| 109 of 122 | |
| Structural and Collateral Term Sheet | JPMBB 2015-C29 | |
Marriott - Pittsburgh | ||
The Sponsor. The loan sponsor and nonrecourse carve-out guarantor is Lance T. Shaner, chairman and CEO of Shaner Hotel Group (“Shaner”). Shaner, an owner-operator in the hospitality industry, owns or manages 40 hotel properties in 17 states comprising of 16 different brands.
The Property. The Marriott - Pittsburgh is a 402-room, full service hotel located in downtown Pittsburgh, Pennsylvania. The property was built in 1964, commenced operations as a Marriott hotel in 1976 and was renovated in 2012. The Marriott - Pittsburgh is located within a 21-story mixed-use building known as the Chatham Center. The hotel is situated on floors 10 through 21, with additional amenities located on the first and second floors. The Marriott - Pittsburgh features a fitness center, a business center, an indoor pool, the Steelhead Grill Restaurant, a Starbucks coffee shop, a newsstand, a gift shop, and 27,000 square feet of meeting and event space. The property’s meeting and banquet area spans across 16 different spaces, all located on the second floor. The largest of these spaces is the Grand Ballroom, which measures approximately 8,831 square feet with a capacity of 600 people. Food and beverage options at the Marriott - Pittsburgh consist of Steelhead Brasserie and Wine Bar, Steelhead Lounge and Starbucks coffee shop. Steelhead Brasserie and Wine Bar is an American fusion restaurant serving breakfast, lunch, and dinner while Steelhead Lounge offers signature cocktails and an extensive wine menu throughout the day.
The property is located in downtown Pittsburgh, in Allegheny County, Pennsylvania, adjacent to Center Avenue and Interstate 579, which provide primary regional access to the greater Pittsburgh metropolitan statistical area. The property is located within a three mile radius of major highways such as Interstate 279 and Interstate 376 and is less than 20 miles east of the Pittsburgh International Airport. Port Authority of Allegheny County is the region’s mass transit system and the downtown station is located less than half mile from the property. Amtrak, an intercity rail service, serves the Pittsburgh region from Pennsylvania Station, located less than one mile north of the property. The Marriott - Pittsburgh is proximate to several demand generators. Heinz Field, home of Pittsburgh Steelers, is located approximately two miles from the property. The Pittsburgh Zoo and PPG Aquarium are located approximately seven miles from the property and the Rivers Casino is less than three miles from the property. The city’s economy thrives on technology-oriented businesses and nine Fortune 500 companies are headquartered in the area. In addition to major corporations, Pittsburgh is home to many higher level educational institutions such as Carnegie Mellon University, University of Pittsburgh, Duquesne University and Robert Morris University.
The appraisal identified three new hotel developments for the downtown Pittsburgh market that are expected to be competitive with the Marriott - Pittsburgh. The 247-room Kimpton Hotel Monaco Pittsburgh opened in January 2015 and is located 0.3 miles west of the Marriott - Pittsburgh. The Kimpton Hotel Monaco Pittsburgh is a nine-story building that features a 120-seat restaurant and approximately 9,000 square feet of meeting space. The 175-room Hilton Garden Inn Pittsburgh City Center opened in May 2015 and is located approximately 2.0 miles from the Marriott - Pittsburgh. The 229-room Embassy Suites Pittsburgh Downtown is anticipated to open in September 2015 and will be located approximately 0.4 miles west of the property.
| Historical Occupancy, ADR, RevPAR | |||||||||
Competitive Set(1) | Marriott - Pittsburgh(2) | Penetration Factor(3) | |||||||
| Year | Occupancy | ADR | RevPAR | Occupancy | ADR | RevPAR | Occupancy | ADR | RevPAR |
| 2012 | 65.0% | $148.10 | $96.20 | 71.0% | $135.88 | $96.45 | 109.2% | 91.7% | 100.3% |
| 2013 | 64.7% | $149.17 | $96.49 | 70.7% | $142.58 | $100.87 | 109.3% | 95.6% | 104.5% |
| 2014 | 67.9% | $152.16 | $103.37 | 71.3% | $149.68 | $106.68 | 105.0% | 98.4% | 103.2% |
TTM(4) | 68.8% | $153.64 | $105.70 | 72.1% | $151.89 | $109.44 | 104.8% | 98.9% | 103.5% |
| (1) | Data provided by Smith Travel Research. The competitive set contains the following properties: Wyndham Grand Pittsburgh Downtown, Omni William Penn Hotel, Doubletree Hotel Pittsburgh Downtown, Westin Convention Center Pittsburgh and Renaissance Pittsburgh Hotel. |
| (2) | Based on operating statements provided by the borrower. |
| (3) | Penetration Factor is calculated based on data provided by Smith Travel Research for the competitive set and operating statements for the property provided by the borrower. |
| (4) | TTM represents the trailing 12-month period ending on March 31, 2015. |
THE INFORMATION IN THIS STRUCTURAL AND COLLATERAL TERM SHEET IS NOT COMPLETE AND MAY BE AMENDED PRIOR TO THE TIME OF SALE. THIS TERM SHEET IS NOT AN OFFER TO SELL THESE SECURITIES AND IT IS NOT A SOLICITATION OF AN OFFER TO BUY THESE SECURITIES IN ANY JURISDICTION WHERE THE OFFER OR SALE IS NOT PERMITTED.
| 110 of 122 | |
| Structural and Collateral Term Sheet | JPMBB 2015-C29 | |
Marriott - Pittsburgh | ||
Competitive Hotels Profile(1) | ||||||||||||||||||
| 2013 Market Mix | 2013 Estimated Operating Statistics | |||||||||||||||||
| Property | Rooms | Year Built | Meeting Space (SF) | Commercial | Meeting & Group | Leisure | Occupancy | ADR | RevPAR | |||||||||
| Marriott - Pittsburgh | 402 | 1964 | 16,784 | 55% | 25% | 20% | 71% | $142.58 | $100.87 | |||||||||
| Wyndham Grand Pittsburgh Downtown | 712 | 1959 | 40,000 | 55% | 25% | 20% | 55% | $130.00 | $71.50 | |||||||||
| Omni William Penn Hotel | 596 | 1916 | 52,000 | 60% | 20% | 20% | 70% | $167.00 | $116.90 | |||||||||
| Doubletree Hotel Pittsburgh Downtown | 337 | 1952 | 10,000 | 55% | 30% | 15% | 65% | $140.00 | $91.00 | |||||||||
| Westin Convention Center Pittsburgh | 616 | 1987 | 42,000 | 50% | 30% | 20% | 68% | $150.00 | $102.00 | |||||||||
| Renaissance Pittsburgh Hotel | 300 | 2001 | 9,500 | 65% | 20% | 15% | 71% | $160.00 | $113.60 | |||||||||
Total(2) | 2,561 | |||||||||||||||||
| (1) | Based on the appraisal. |
| (2) | Excludes the subject property. |
Operating History and Underwritten Net Cash Flow(1) | |||||||
| 2012 | 2013 | 2014 | TTM(2) | Underwritten | Per Room(3) | % of Total Revenue(4) | |
| Occupancy | 71.0% | 70.7% | 71.3% | 72.1% | 71.1% | ||
| ADR | $135.88 | $142.58 | $149.68 | $151.89 | $150.23 | ||
| RevPAR | $96.45 | $100.87 | $106.68 | $109.44 | $106.89 | ||
| Room Revenue | $14,190,942 | $14,800,895 | $15,653,243 | $16,057,684 | $15,683,283 | $39,013 | 72.9% |
| Food and Beverage | 4,253,940 | 5,325,410 | 5,233,337 | 5,440,272 | 5,182,934 | 12,893 | 24.1 |
| Other Departmental Revenues | 646,687 | 661,480 | 641,163 | 653,467 | 639,943 | 1,592 | 3.0 |
| Total Revenue | $19,091,569 | $20,787,785 | $21,527,743 | $22,151,423 | $21,506,160 | $53,498 | 100.0% |
| Room Expense | $4,763,288 | $4,758,970 | $4,883,061 | $5,010,332 | $4,903,897 | $12,199 | 31.3% |
| Food and Beverage Expense | 3,028,719 | 3,445,633 | 3,226,876 | 3,301,637 | 3,198,961 | 7,958 | 61.7 |
| Other Departmental Expenses | 448,720 | 453,322 | 464,562 | 468,462 | 461,834 | 1,149 | 72.2 |
| Departmental Expenses | $8,240,727 | $8,657,925 | $8,574,499 | $8,780,431 | $8,564,692 | $21,305 | 39.8% |
| Departmental Profit | $10,850,842 | $12,129,860 | $12,953,244 | $13,370,992 | $12,941,468 | $32,193 | 60.2% |
| Operating Expenses | $5,351,346 | $5,557,479 | $5,634,508 | $5,632,683 | $5,624,864 | $13,992 | 26.2% |
| Gross Operating Profit | $5,499,496 | $6,572,381 | $7,318,736 | $7,738,309 | $7,316,604 | $18,201 | 34.0% |
| Management Fee | $572,747 | $623,633 | $645,832 | $664,598 | $645,185 | $1,605 | 3.0% |
| Fixed Expenses | 715,939 | 703,327 | 729,821 | 724,184 | 811,000 | 2,017 | 3.8 |
| FF&E | 954,578 | 1,039,389 | 1,076,387 | 1,107,571 | 1,075,308 | 2,675 | 5.0 |
| Total Other Expenses | $2,243,265 | $2,366,350 | $2,452,040 | $2,496,353 | $2,531,493 | $6,297 | 11.8% |
| Net Operating Income | $3,256,231 | $4,206,031 | $4,866,696 | $5,241,956 | $4,785,112 | $11,903 | 22.2% |
| Net Cash Flow | $3,256,231 | $4,206,031 | $4,866,696 | $5,241,956 | $4,785,112 | $11,903 | 22.2% |
| (1) | The information provided in the table reflects the cash flow from operations of the hotel. |
| (2) | TTM column represents the trailing twelve month period ending on March 31, 2015. |
| (3) | Per Room values are based on 402 guest rooms. |
| (4) | % of Total Revenue column for Room Expense, Food and Beverage Expense and Other Departmental Expenses is based on their corresponding revenue line item. |
Property Management. The property is managed by Shaner Hotel Holdings Limited Partnership, an affiliate of the loan sponsor.
Franchise Agreements. The property has a franchise agreement with Marriott International, Inc., which is set to expire on December 20, 2021 with no extension options. The loan is structured with a cash flow sweep that would begin 18 months in advance of the franchise expiration. The agreement provides for a contractual monthly program fee equal to 6.0% of gross room revenue and 3.0% of gross food and beverage sales.
Ground Lease. The property is subject to a ground lease which commenced in 1964 and will expire on October 31, 2051, with no extensions remaining. The current monthly ground rent payment is $2,925.
THE INFORMATION IN THIS STRUCTURAL AND COLLATERAL TERM SHEET IS NOT COMPLETE AND MAY BE AMENDED PRIOR TO THE TIME OF SALE. THIS TERM SHEET IS NOT AN OFFER TO SELL THESE SECURITIES AND IT IS NOT A SOLICITATION OF AN OFFER TO BUY THESE SECURITIES IN ANY JURISDICTION WHERE THE OFFER OR SALE IS NOT PERMITTED.
| 111 of 122 | |
| Structural and Collateral Term Sheet | JPMBB 2015-C29 | |
Marriott - Pittsburgh | ||
Additional Debt. The $7.14 million mezzanine loan is secured by the direct equity interests in the borrower and is coterminous with the mortgage loan. The mezzanine loan is interest-only for the term of the loan and has a 10.00000% coupon. Including the mezzanine loan, the Cut-off Date LTV is 80.0%, the UW NCF DSCR is 1.40x and the UW NOI Debt Yield is 9.3%. The lenders have entered into an intercreditor agreement. The mezzanine loan is cross-collateralized and cross-defaulted with three other mezzanine loans related to other mortgage loans through guaranties signed by the various mezzanine loan borrowers. The total amount of all four mezzanine loans including the cross-collateralized and cross-defaulted mezzanine loan related to the Marriott - Pittsburgh mortgage loan is approximately $31.6 million.
THE INFORMATION IN THIS STRUCTURAL AND COLLATERAL TERM SHEET IS NOT COMPLETE AND MAY BE AMENDED PRIOR TO THE TIME OF SALE. THIS TERM SHEET IS NOT AN OFFER TO SELL THESE SECURITIES AND IT IS NOT A SOLICITATION OF AN OFFER TO BUY THESE SECURITIES IN ANY JURISDICTION WHERE THE OFFER OR SALE IS NOT PERMITTED.
| 112 of 122 | |
| Structural and Collateral Term Sheet | JPMBB 2015-C29 | |
| Crest at Greylyn | ||
| Mortgage Loan Information | Property Information | |||
| Mortgage Loan Seller: | SMF II | Single Asset / Portfolio: | Single Asset | |
| Original Principal Balance: | $24,000,000 | Title: | Fee | |
| Cut-off Date Principal Balance: | $24,000,000 | Property Type - Subtype: | Multifamily – Garden | |
| % of Pool by IPB: | 2.4% | Net Rentable Area (Units): | 259 | |
| Loan Purpose: | Refinance | Location: | Charlotte, NC | |
| Borrower: | Golden Triangle #1, LLC | Year Built / Renovated: | 2013 / N/A | |
| Sponsor: | Daniel S. Levine | Occupancy: | 99.6% | |
| Interest Rate: | 4.27800% | Occupancy Date: | 4/27/2015 | |
| Note Date: | 5/6/2015 | Number of Tenants: | N/A | |
| Maturity Date: | 5/6/2025 | 2012 NOI(1): | N/A | |
| Interest-only Period: | 48 months | 2013 NOI(1): | N/A | |
| Original Term: | 120 months | 2014 NOI: | $1,991,421 | |
| Original Amortization: | 360 months | TTM NOI (as of 3/2015): | $2,014,190 | |
| Amortization Type: | IO-Balloon | UW Economic Occupancy: | 92.6% | |
| Call Protection: | L(25),Def(91),O(4) | UW Revenues: | $3,192,720 | |
| Lockbox: | Springing | UW Expenses: | $1,273,213 | |
| Additional Debt: | N/A | UW NOI: | $1,919,507 | |
| Additional Debt Balance: | N/A | UW NCF: | $1,861,232 | |
| Additional Debt Type: | N/A | Appraised Value / Per Unit: | $34,000,000 / $131,274 | |
| Appraisal Date: | 3/26/2015 | |||
| Escrows and Reserves | Financial Information | ||||||
| Initial | Monthly | Initial Cap | Cut-off Date Loan / Unit: | $92,664 | |||
| Taxes: | $70,723 | $14,145 | N/A | Maturity Date Loan / Unit: | $82,644 | ||
| Insurance: | $32,803 | $3,645 | N/A | Cut-off Date LTV: | 70.6% | ||
| Replacement Reserves: | $0 | $5,396 | $129,500 | Maturity Date LTV: | 63.0% | ||
| TI/LC: | $0 | $0 | N/A | UW NCF DSCR: | 1.31x | ||
| Other: | $0 | $0 | N/A | UW NOI Debt Yield: | 8.0% | ||
| Sources and Uses | ||||||||||
| Sources | Proceeds | % of Total | Uses | Proceeds | % of Total | |||||
| Mortgage Loan | $24,000,000 | 100.0 | % | Payoff Existing Debt | $18,028,321 | 75.1 | % | |||
| Return of Equity | 5,788,028 | 24.1 | ||||||||
| Upfront Reserves | 103,526 | 0.4 | ||||||||
| Closing Costs | 80,126 | 0.3 | ||||||||
| Total Sources | $24,000,000 | 100.0 | % | Total Uses | $24,000,000 | 100.0 | % | |||
| (1) | 2012 and 2013 NOI are unavailable because the property was built in 2014. |
The Loan. The Crest at Greylyn loan has an outstanding principal balance of $24.0 million and is secured by a first mortgage lien on the borrower’s fee interest in a 259-unit, garden-style multifamily property located in Charlotte, North Carolina. The loan has a 10-year term, and subsequent to a four-year interest-only period, will amortize on a 30-year schedule. The nonrecourse carve-out guarantors for the loan are Daniel S. Levine, Todd Gorelick, Israel Gorelick, Jeffrey Gorelick and Scott Gorelick. The loan sponsor is Mr. Levine, who has over 30 years of experience in commercial real estate, and co-founded Levine Properties, which is based in Charlotte. Mr. Levine is a multifamily developer and sponsor, and currently has 524 units in development. Levine Properties is currently developing a 4.0 acre park in uptown Charlotte’s First Ward.
THE INFORMATION IN THIS STRUCTURAL AND COLLATERAL TERM SHEET IS NOT COMPLETE AND MAY BE AMENDED PRIOR TO THE TIME OF SALE. THIS TERM SHEET IS NOT AN OFFER TO SELL THESE SECURITIES AND IT IS NOT A SOLICITATION OF AN OFFER TO BUY THESE SECURITIES IN ANY JURISDICTION WHERE THE OFFER OR SALE IS NOT PERMITTED.
| 113 of 122 | |
| Structural and Collateral Term Sheet | JPMBB 2015-C29 | |
| Crest at Greylyn | ||
The Property. Crest at Greylyn is a 259-unit, Class A multifamily property located in Charlotte, North Carolina. The property consists of six two-, three- and four-story apartment buildings that were built in 2013. Occupancy as of April 27, 2015 was 99.6%. The property is located in the Sardis Woods neighborhood of Charlotte, approximately 10 miles from the Charlotte central business district. The property is within a 15 minute drive from a large number of retail locations, including Walmart, Costco, Kohl’s, Target, and the SouthPark Mall, which is anchored by Neiman Marcus, Nordstrom, Macy’s, Dillard’s, Belk and Dick’s Sporting Goods. The property is LEED certified and unit features include chef kitchens with dark maple cabinets, steel appliances, balconies and washer/dryers. Property amenities include an entertainment lounge, a business center, a fitness center, a saltwater swimming pool and a grilling station. The property also has 397 parking spaces resulting in a parking ratio of 1.53 spaces per unit.
The Market. The property is located within the Charlotte apartment market and the East-3 multifamily submarket. The submarket had a 4.9% vacancy rate as of February 2015. The submarket vacancy has trended downward over the last three years with average vacancies of 6.6% in 2012, 5.3% in 2013 and 4.7% in 2014. According to the appraisal, the 2015 estimated population within a one- and three-mile radius of the property is 8,835 and 74,024, respectively. The 2015 estimated median household income within a one- and three-mile radius of the property is $47,810 and $58,214, respectively. As of March 2015, the submarket contained 8,480 units, according to a market research report. The appraisal identified five comparable rentals proximate to the Crest at Greylyn property. The property’s comparable monthly market rent for one-, two- and three-bedroom units ranges from $725 to $970, $925 to $1,160 and $1,200 to $1,465, respectively.
Multifamily Unit Mix(1) | ||||||||||||||||||||||
| Unit Type | # of Units | % of Total | Occupied Units | Occupancy | Average Unit Size (SF) | Monthly Market Rent | Monthly In- Place Rents | |||||||||||||||
| Studio | 5 | 1.9 | % | 5 | 100.0 | % | 435 | $755 | $650 | |||||||||||||
| 1 BR / 1 BA | 110 | 42.5 | 110 | 100.0 | % | 657 | $890 | $779 | ||||||||||||||
| 2 BR / 2 BA | 132 | 51.0 | 131 | 99.2 | % | 981 | $1,178 | $1,082 | ||||||||||||||
| 3 BR / 2 BA | 12 | 4.6 | 12 | 100.0 | % | 1,287 | $1,376 | $1,257 | ||||||||||||||
| Total / Wtd. Average | 259 | 100.0 | % | 258 | 99.6 | % | 847 | $1,057 | $953 | |||||||||||||
| (1) | Based on the rent roll dated April 27, 2015 provided by the borrower. |
| Operating History and Underwritten Net Cash Flow | ||||||||
| 2014 | TTM(1) | Underwritten | Per Unit | %(2) | ||||
| Rents in Place | $2,696,685 | $2,744,097 | $2,948,928 | $11,386 | 99.5 | % | ||
| Vacant Income | 0 | 0 | 15,060 | 58 | 0.5 | |||
| Gross Potential Rent | $2,696,685 | $2,744,097 | $2,963,988 | $11,444 | 100.0 | % | ||
| Total Reimbursements | 0 | 0 | 0 | 0 | 0.0 | |||
| Net Rental Income | $2,696,685 | $2,744,097 | $2,963,988 | $11,444 | 100.0 | % | ||
| (Vacancy/Credit Loss) | 0 | 0 | (219,891) | (849) | (7.4 | ) | ||
Other Income(3) | 430,869 | 448,624 | 448,624 | 1,732 | 15.1 | |||
| Effective Gross Income | $3,127,555 | $3,192,720 | $3,192,720 | $12,327 | 107.7 | % | ||
| Total Expenses | $1,136,134 | $1,178,530 | $1,273,213 | $4,916 | 39.9 | % | ||
| Net Operating Income | $1,991,421 | $2,014,190 | $1,919,507 | $7,411 | 60.1 | % | ||
| Replacement Reserves | 0 | 0 | 58,275 | 225 | 1.8 | |||
| Net Cash Flow | $1,991,421 | $2,014,190 | $1,861,232 | $7,186 | 58.3 | % | ||
Occupancy(4) | 92.5% | 99.6% | 92.6% | |||||
| (1) | TTM column represents the trailing 12-month period ending on March 31, 2015. |
(2) | Percentage column represents percent of Net Rental Income for all revenue lines and represents percent of Effective Gross Income for the remainder of fields. |
| (3) | Other Income represents cable rebill, trash removal rebill, water/sewage rebill and miscellaneous fees. |
| (4) | 2014 Occupancy represents economic occupancy. TTM Occupancy represents occupancy as of April 27, 2015. Underwritten Occupancy represents economic occupancy. |
THE INFORMATION IN THIS STRUCTURAL AND COLLATERAL TERM SHEET IS NOT COMPLETE AND MAY BE AMENDED PRIOR TO THE TIME OF SALE. THIS TERM SHEET IS NOT AN OFFER TO SELL THESE SECURITIES AND IT IS NOT A SOLICITATION OF AN OFFER TO BUY THESE SECURITIES IN ANY JURISDICTION WHERE THE OFFER OR SALE IS NOT PERMITTED.
| 114 of 122 | |
| Structural and Collateral Term Sheet | JPMBB 2015-C29 | |
| Pinecrest Town Center | ||
| Mortgage Loan Information | Property Information | |||
| Mortgage Loan Seller: | JPMCB | Single Asset / Portfolio: | Single Asset | |
| Original Principal Balance: | $23,525,000 | Title: | Fee | |
| Cut-off Date Principal Balance: | $23,525,000 | Property Type - Subtype: | Mixed Use – Retail/Office | |
| % of Pool by IPB: | 2.4% | Net Rentable Area (SF): | 94,175 | |
| Loan Purpose: | Acquisition | Location: | Pinecrest, FL | |
| Borrower: | COFE Town Center, LLC | Year Built / Renovated: | 1985 / 2004 | |
| Sponsors: | Eugenio Cosculluela, Jr. and | Occupancy: | 86.8% | |
| Mario A. Fernandez | Occupancy Date: | 2/26/2015 | ||
| Interest Rate: | 4.10000% | Number of Tenants: | 52 | |
| Note Date: | 5/1/2015 | 2012 NOI: | $1,146,726 | |
| Maturity Date: | 5/1/2025 | 2013 NOI: | $1,377,511 | |
| Interest-only Period: | 36 months | 2014 NOI(1): | $1,495,781 | |
| Original Term: | 120 months | TTM NOI(2) | N/A | |
| Original Amortization: | 360 months | UW Economic Occupancy: | 87.4% | |
| Amortization Type: | IO-Balloon | UW Revenues: | $3,226,426 | |
| Call Protection: | L(25),Grtr1%orYM(92),O(3) | UW Expenses: | $1,214,945 | |
| Lockbox: | Springing | UW NOI(1): | $2,011,481 | |
| Additional Debt: | N/A | UW NCF: | $1,856,093 | |
| Additional Debt Balance: | N/A | Appraised Value / Per SF: | $32,000,000 / $340 | |
| Additional Debt Type: | N/A | Appraisal Date: | 3/6/2015 | |
| Escrows and Reserves | Financial Information | ||||||
| Initial | Monthly | Initial Cap | Cut-off Date Loan / SF: | $250 | |||
| Taxes: | $122,526 | $17,504 | N/A | Maturity Date Loan / SF: | $217 | ||
| Insurance: | $0 | Springing | N/A | Cut-off Date LTV: | 73.5% | ||
Replacement Reserves(3): | $75,000 | Springing | $28,272 | Maturity Date LTV: | 63.8% | ||
TI/LC(4): | $475,000 | Springing | $423,792 | UW NCF DSCR: | 1.36x | ||
Other(5): | $1,140,425 | $0 | N/A | UW NOI Debt Yield: | 8.6% | ||
| Sources and Uses | ||||||
| Sources | Proceeds | % of Total | Uses | Proceeds | % of Total | |
| Mortgage Loan | $23,525,000 | 68.6% | Purchase Price | $32,000,000 | 93.3% | |
| Sponsor Equity | 10,787,566 | 31.4 | Upfront Reserves | 1,875,451 | 5.5 | |
| Closing Costs | 437,116 | 1.3 | ||||
| Total Sources | $34,312,566 | 100.0% | Total Uses | $34,312,566 | 100.0% | |
| (1) | UW NOI is higher than 2014 NOI due to new leasing, burn-off of rent concessions, reduced expenses and increased common area maintenance reimbursements attributable to new or renewal tenants in 2014 and 2015. |
| (2) | TTM NOI was not provided by the seller. |
| (3) | Monthly deposits of $1,178 into the Replacement Reserve are required on the first payment date the Replacement Reserve balance is below the $28,272 cap, and on each payment date thereafter, until such time the Replacement Reserve balance exceeds the cap. |
| (4) | Monthly deposits of $11,772 into the TI/LC reserve are required beginning on the earlier to occur of (i) the first payment date after the aggregate amount on reserve (excluding all amounts attributable to any lease termination payments) is less than $200,000 or (ii) the payment date occurring in June, 2018, until such time the amount on deposit equals or exceeds $423,792. |
| (5) | Initial Other Escrows and Reserves consist of a capital expenditures reserve in the amount of $880,000, an outstanding tenant improvement reserve in the amount of $173,492, a free rent reserve in the amount of $86,933 and an environmental remediation reserve in the amount of $62,500. |
The Loan. The Pinecrest Town Center loan has an outstanding principal balance of approximately $23.5 million as of the Cut-off Date and is secured by a first mortgage lien on a 94,175 square foot mixed use retail and office center located in Pinecrest, Florida. The loan has a 10-year term, and subsequent to a three-year interest-only period, will amortize on a 30-year schedule. The loan sponsors and nonrecourse carve-out guarantors are Eugenio Cosculluela, Jr. and Mario A. Fernandez, affiliates of COFE Properties, a full-service real estate investment firm headquartered in Dadeland, Florida. Led by Mr. Cosculluela and Mr. Fernandez, COFE Properties specializes in the acquisition and repositioning of real estate assets specifically in the South Florida region. The company currently owns six other assets in the South Florida market. Proceeds from the mortgage loan were used to acquire the property from American Commercial Realty Corp for approximately $32.0 million.
THE INFORMATION IN THIS STRUCTURAL AND COLLATERAL TERM SHEET IS NOT COMPLETE AND MAY BE AMENDED PRIOR TO THE TIME OF SALE. THIS TERM SHEET IS NOT AN OFFER TO SELL THESE SECURITIES AND IT IS NOT A SOLICITATION OF AN OFFER TO BUY THESE SECURITIES IN ANY JURISDICTION WHERE THE OFFER OR SALE IS NOT PERMITTED.
| 115 of 122 | |
| Structural and Collateral Term Sheet | JPMBB 2015-C29 | |
| Pinecrest Town Center | ||
The Property. The Pinecrest Town Center property consists of a four-story, 33,691 square foot office building with an adjacent 60,484 square foot retail center for 94,175 square feet of total space. The total property is situated on an approximately 5.24-acre site and contains 383 surface and roof deck parking spaces with a parking ratio of approximately 4.07 spaces per 1,000 square feet. Both the retail building and office component were constructed in 1985 and later renovated in 2004. Since 2011, the previous sponsor spent approximately $2.0 million in capital expenditures to make general property improvements. The property is well situated along South Dixie Highway, a major thoroughfare that traverses throughout Miami-Dade County and provides direct access to the Palmetto Expressway, approximately two miles north of the property. Additionally, the property is located approximately 3.4 miles south of Dadeland Mall, an approximately 1.5 million square foot shopping mall owned by Simon Property Group, Inc. Dadeland mall reported in-line sales per square foot of approximately $1,143 for 2014. As of February 26, 2015, Pinecrest Town Center was 86.8% occupied by 52 tenants.
The largest tenant, Coldwell Banker, is one of the largest real estate brokerage firms in the world with over 3,000 offices across 50 countries. The company is owned by Realogy Holdings Corp., a publicly traded company that owns or has ownership interests in businesses such as Better Homes and Gardens Real Estate, Century 21, The Corcoran Group, ERA, Sotheby’s International, ZipRealty, NRTY LLC and Title Resource Group. Coldwell Banker’s lease commenced in May 2011 and expires in November 2018 with an on-going termination option beginning in May 2016. The lease contains one five-year renewal option. The tenant occupies 7,982 square feet (8.5% of the net rentable area) at the property. The second largest tenant, Get Smart, is an educational superstore headquartered in Pinecrest, Florida. The company sells education supplies to cater to classrooms and offices, arts and crafts, early learning and teacher resources and tools. In addition to a physical store, the company sells its products through its online catalogue. Get Smart’s most recent lease commenced March 2014 and expires in March 2024 and contains two five-year renewal options. The tenant occupies 6,002 square feet (6.4% of the net rentable area) at the property. The third largest tenant, Esslinger Wooten-Maxwell, is a prominent South Florida real estate brokerage company. Founded in 1964, the company has expanded its presence to 10 offices with over 650 associates across Miami-Dade and Broward County. The company was acquired by HomeServices of America, Inc. in 2003, an affiliate of Berkshire Hathaway Inc. The Esslinger Wooten-Maxwell lease commenced in September 2011 and expires in September 2018 and contains two five-year renewal options. The tenant currently occupies 4,390 square feet of space (4.7% of the net rentable area) at the property.
The Market. The Pinecrest Town Center property is located in the Coral Gables / Kendall / Richmond retail submarket of Miami, which according to the appraisal had total retail inventory of approximately 7.7 million square feet with an overall vacancy rate of 7.0% as of the fourth quarter of 2014. Additionally, the property is located within the South Dade office submarket which, according to the appraisal, had total office inventory of approximately 3.7 million square feet with a vacancy rate of 14.4% as of the fourth quarter of 2014. Population within the property’s three-mile trade area was 97,797 with an estimated 2014 average household income of $103,093 as of 2014. The appraisal concluded market rent for the property of $30.00 to $33.00 per square foot for retail space and $26.50 to $40.00 per square foot for office space. The in-place retail rent at the property ranged from $19.72 to $44.71 per square foot with a weighted average of $30.64 per square foot, which is below the appraisal’s concluded market rents. The in-place office rent at the property ranged from $20.00 to $46.30 per square foot with a weighted average of $30.13, which is slightly above the appraisal’s concluded market rents.
Tenant Summary(1) | |||||||||||||
| Tenant | Ratings(2) Moody’s/S&P/Fitch | Net Rentable Area (SF) | % of Total NRA | Base Rent PSF | Lease Expiration Date | ||||||||
| Coldwell Banker | NA / NA / NA | 7,982 | 8.5% | $40.52 | 5/31/2016 | ||||||||
| Get Smart | NA / NA / NA | 6,002 | 6.4% | $20.31 | 3/31/2024 | ||||||||
| Esslinger Wooten-Maxwell | Aa2 / AA / A+ | 4,390 | 4.7% | $32.79 | 9/30/2018 | ||||||||
| Sea Siam | NA / NA / NA | 4,000 | 4.2% | $40.84 | 4/30/2026 | ||||||||
| ProMD Practice | NA / NA / NA | 3,591 | 3.8% | $20.80 | 12/31/2018 | ||||||||
| Westside Bagels too Pinecrest | NA / NA / NA | 3,552 | 3.8% | $36.26 | 2/28/2025 | ||||||||
| State Farm | NA / AA / NA | 2,973 | 3.2% | $26.03 | 1/31/2021 | ||||||||
| Miami Postal Credit Union | NA / NA / NA | 2,800 | 3.0% | $29.87 | 6/30/2023 | ||||||||
| Premiere Dental | NA / NA / NA | 2,606 | 2.8% | $28.09 | 1/31/2024 | ||||||||
| Corbett Companies | NA / NA / NA | 2,450 | 2.6% | $26.61 | 8/31/2018 | ||||||||
| (1) | Based on the underwritten rent roll. |
| (2) | Ratings provided are for the parent company of the entity listed in the “Tenant” field whether or not the parent company guarantees the lease. |
THE INFORMATION IN THIS STRUCTURAL AND COLLATERAL TERM SHEET IS NOT COMPLETE AND MAY BE AMENDED PRIOR TO THE TIME OF SALE. THIS TERM SHEET IS NOT AN OFFER TO SELL THESE SECURITIES AND IT IS NOT A SOLICITATION OF AN OFFER TO BUY THESE SECURITIES IN ANY JURISDICTION WHERE THE OFFER OR SALE IS NOT PERMITTED.
| 116 of 122 | |
| Structural and Collateral Term Sheet | JPMBB 2015-C29 | |
| Pinecrest Town Center | ||
Lease Rollover Schedule(1) | |||||||||||||||||||||
| Year | Number of Leases Expiring | Net Rentable Area Expiring | % of NRA Expiring | Base Rent Expiring | % of Base Rent Expiring | Cumulative Net Rentable Area Expiring | Cumulative % of NRA Expiring | Cumulative Base Rent Expiring | Cumulative % of Base Rent Expiring | ||||||||||||
| Vacant | NAP | 12,456 | 13.2 | % | NAP | NAP | 12,456 | 13.2% | NAP | NAP | |||||||||||
| 2015 & MTM | 13 | 7,204 | 7.6 | $212,534 | 8.4 | % | 19,660 | 20.9% | $212,534 | 8.4% | |||||||||||
| 2016 | 20 | 26,644 | 28.3 | 870,078 | 34.5 | 46,304 | 49.2% | $1,082,612 | 42.9% | ||||||||||||
| 2017 | 3 | 4,980 | 5.3 | 164,515 | 6.5 | 51,284 | 54.5% | $1,247,127 | 49.4% | ||||||||||||
| 2018 | 5 | 12,783 | 13.6 | 330,884 | 13.1 | 64,067 | 68.0% | $1,578,011 | 62.5% | ||||||||||||
| 2019 | 3 | 4,015 | 4.3 | 137,549 | 5.4 | 68,082 | 72.3% | $1,715,560 | 68.0% | ||||||||||||
| 2020 | 0 | 0 | 0.0 | 0 | 0.0 | 68,082 | 72.3% | $1,715,560 | 68.0% | ||||||||||||
| 2021 | 3 | 7,133 | 7.6 | 237,684 | 9.4 | 75,215 | 79.9% | $1,953,244 | 77.4% | ||||||||||||
| 2022 | 0 | 0 | 0.0 | 0 | 0.0 | 75,215 | 79.9% | $1,953,244 | 77.4% | ||||||||||||
| 2023 | 1 | 2,800 | 3.0 | 83,636 | 3.3 | 78,015 | 82.8% | $2,036,880 | 80.7% | ||||||||||||
| 2024 | 2 | 8,608 | 9.1 | 195,105 | 7.7 | 86,623 | 92.0% | $2,231,986 | 88.4% | ||||||||||||
| 2025 | 1 | 3,552 | 3.8 | 128,796 | 5.1 | 90,175 | 95.8% | $2,360,781 | 93.5% | ||||||||||||
| 2026 & Beyond | 1 | 4,000 | 4.2 | 163,363 | 6.5 | 94,175 | 100.0% | $2,524,144 | 100.0% | ||||||||||||
| Total | 52 | 94,175 | 100.0 | % | $2,524,144 | 100.0 | % | ||||||||||||||
| (1) | Based on the underwritten rent roll. |
| Operating History and Underwritten Net Cash Flow | |||||||||||||
| 2012 | 2013 | 2014 | Underwritten | Per Square Foot | %(1) | ||||||||
| Rents in Place | $2,009,300 | $2,102,837 | $2,319,310 | $2,524,144 | $26.80 | 68.3% | |||||||
| Vacant Income | 0 | 0 | 0 | 365,422 | 3.88 | 9.9 | |||||||
| Gross Potential Rent | $2,009,300 | $2,102,837 | $2,319,310 | $2,889,566 | $30.68 | 78.2% | |||||||
| Total Reimbursements | 515,903 | 446,498 | 386,644 | 803,952 | 8.54 | 21.8 | |||||||
| Net Rental Income | $2,525,203 | $2,549,335 | $2,705,955 | $3,693,518 | $39.22 | 100.0% | |||||||
| (Vacancy/Credit Loss) | (214,451) | (132,308) | (120,422) | (467,092) | (4.96) | (12.6) | |||||||
| Effective Gross Income | $2,310,752 | $2,417,027 | $2,585,532 | $3,226,426 | $34.26 | 87.4% | |||||||
| Total Expenses | $1,164,026 | $1,039,517 | $1,089,751 | $1,214,945 | $12.90 | 37.7% | |||||||
Net Operating Income(2) | $1,146,726 | $1,377,511 | $1,495,781 | $2,011,481 | $21.36 | 62.3% | |||||||
| Total TI/LC, Capex/RR | 0 | 0 | 0 | 155,389 | 1.65 | 4.8 | |||||||
| Net Cash Flow | $1,146,726 | $1,377,511 | $1,495,781 | $1,856,093 | $19.71 | 57.5% | |||||||
Occupancy(3) | 82.5% | 83.3% | 90.9% | 87.4% | |||||||||
| (1) | Percentage column represents percent of Net Rental Income for all revenue lines and represents percent of Effective Gross Income for the remainder of fields. |
| (2) | The increase in Underwritten Net Operating Income from 2014 Net Operating Income is due to new leasing, burn off of rent concessions, reduced expenses and increased common area maintenance reimbursements attributable to new or renewal tenants in 2014 and 2015. |
| (3) | Historical occupancies are as of December 31 of each respective year. Underwritten occupancy represents economic occupancy. |
Environmental Issue. The Phase I environmental assessment (“ESA”) obtained at origination indicates that a dry cleaning facility currently operates at the mortgaged property. The consultant observed external storage of dry cleaning solvents in two 30-gallon drums behind the dry cleaning machine without secondary containment. The consultant also noted the concrete floor in the vicinity of the dry cleaning machine and waste storage area was coated with an epoxy sealant that appeared to be deteriorating or entirely missing in certain areas. As a result of the dry cleaning operation, the ESA characterized the existence of this tenant as a recognized environmental condition. The mortgaged property is currently on a list for funding to be allocated under a state remediation database, but eligibility may be rescinded if the facility is found to not be in compliance with hazardous waste rules. In addition, the ESA also indicates that the state agency will likely not remediate the mortgaged property for some time due to its priority on the list, and soil vapor issues remain a concern at the mortgaged property. The ESA provided a worst-case estimate of $50,000 to install and operate a sub-slab depressurization system and operate it for one year to mitigate this concern. At origination, the borrower was required to reserve $62,500 to cover the cost of installation of the system.
THE INFORMATION IN THIS STRUCTURAL AND COLLATERAL TERM SHEET IS NOT COMPLETE AND MAY BE AMENDED PRIOR TO THE TIME OF SALE. THIS TERM SHEET IS NOT AN OFFER TO SELL THESE SECURITIES AND IT IS NOT A SOLICITATION OF AN OFFER TO BUY THESE SECURITIES IN ANY JURISDICTION WHERE THE OFFER OR SALE IS NOT PERMITTED.
| 117 of 122 | |
| Structural and Collateral Term Sheet | JPMBB 2015-C29 |
[THIS PAGE INTENTIONALLY LEFT BLANK]
THE INFORMATION IN THIS STRUCTURAL AND COLLATERAL TERM SHEET IS NOT COMPLETE AND MAY BE AMENDED PRIOR TO THE TIME OF SALE. THIS TERM SHEET IS NOT AN OFFER TO SELL THESE SECURITIES AND IT IS NOT A SOLICITATION OF AN OFFER TO BUY THESE SECURITIES IN ANY JURISDICTION WHERE THE OFFER OR SALE IS NOT PERMITTED.
| 118 of 122 | |
| Structural and Collateral Term Sheet | JPMBB 2015-C29 | |
Doubletree - Carson | ||
| Mortgage Loan Information | Property Information | |||
| Mortgage Loan Seller: | RCMC | Single Asset / Portfolio: | Single Asset | |
| Original Principal Balance: | $22,650,000 | Title: | Fee | |
| Cut-off Date Principal Balance: | $22,586,644 | Property Type - Subtype: | Hotel – Full Service | |
| % of Pool by IPB: | 2.3% | Net Rentable Area (Rooms): | 225 | |
| Loan Purpose: | Refinance | Location: | Carson, CA | |
| Borrower: | Carson Hotel, LLC | Year Built / Renovated: | 1988 / 2012 | |
| Sponsor: | Ensemble Investments, LLC | Occupancy / ADR / RevPAR: | 81.6% / $119.87 / $97.77 | |
| Interest Rate: | 3.96000% | Occupancy / ADR / RevPAR Date: | 1/31/2015 | |
| Note Date: | 3/27/2015 | Number of Tenants: | N/A | |
| Maturity Date: | 4/5/2025 | 2012 NOI(1): | $1,849,764 | |
| Interest-only Period: | None | 2013 NOI(1): | $2,113,029 | |
| Original Term: | 120 months | 2014 NOI(1): | $2,421,178 | |
| Original Amortization: | 360 months | TTM NOI (as of 1/2015): | $2,494,532 | |
| Amortization Type: | Balloon | UW Occupancy / ADR/ RevPAR: | 81.5% / $118.93 / $96.92 | |
| Call Protection: | L(26),Def(90),O(4) | UW Revenues: | $10,391,208 | |
| Lockbox: | CMA | UW Expenses: | $7,993,978 | |
| Additional Debt: | N/A | UW NOI(1): | $2,397,230 | |
| Additional Debt Balance: | N/A | UW NCF: | $2,397,230 | |
| Additional Debt Type: | N/A | Appraised Value / Per Room: | $31,800,000 / $141,333 | |
| Appraisal Date: | 2/17/2015 | |||
| Escrows and Reserves | Financial Information | |||||
| Initial | Monthly | Initial Cap | Cut-off Date Loan / Room: | $100,385 | ||
| Taxes: | $60,735 | $30,368 | N/A | Maturity Date Loan / Room: | $79,860 | |
| Insurance: | $32,224 | $8,056 | N/A | Cut-off Date LTV: | 71.0% | |
FF&E Reserves(2): | $0 | 4% of Gross Revenues | N/A | Maturity Date LTV: | 56.5% | |
| TI/LC: | $0 | $0 | N/A | UW NCF DSCR: | 1.86x | |
Other(2): | $0 | Springing | N/A | UW NOI Debt Yield: | 10.6% | |
| Sources and Uses | |||||||||
| Sources | Proceeds | % of Total | Uses | Proceeds | % of Total | ||||
| Mortgage Loan | $22,650,000 | 100.0% | Payoff Existing Debt | $19,864,199 | 87.7% | ||||
| Return of Equity | 2,283,213 | 10.1 | |||||||
| Closing Costs | 409,629 | 1.8 | |||||||
| Upfront Reserves | 92,959 | 0.4 | |||||||
| Total Sources | $22,650,000 | 100.0% | Total Uses | $22,650,000 | 100.0% | ||||
| (1) | The increase in historical NOI and UW NOI is partially due to an approximately $5.2 million property renovation that took place between 2010 and 2014 and was primarily completed in 2012. |
| (2) | The borrower will make monthly deposits into the FF&E Reserve equal to $34,638. Based on the annual operating statements for the property, the lender may adjust the FF&E Reserve monthly deposit to the greater of (x) the then-existing FF&E Reserve monthly deposit, (y) one-twelfth of 4% of the total gross revenue for the prior fiscal year or (z) any greater amount required to be paid under the franchise agreement, the physical conditions report or the annual budget. In addition, at any time, (i) if additional PIP work is required by the franchisor under the franchise agreement, or (ii) at any time after the date that is 24 months prior to expiration of the franchise agreement the lender determines in its reasonable discretion that any future PIP work may be required, then in either case, the borrower will deposit into the PIP reserve an amount equal to 110% of the estimated costs to complete such additional PIP work, as reasonably determined by lender. |
The Loan. The DoubleTree - Carson loan has an outstanding principal balance of approximately $22.59 million and is secured by a first mortgage lien on the borrower’s fee interest in the DoubleTree - Carson property, which is comprised of a 225-room full service hotel located in Carson, California. The loan has a 10-year term and will amortize on a 30-year schedule. The sponsor and nonrecourse carve-out guarantor is Ensemble Investments, LLC, which is controlled by Kambiz Babaoff, Shirin Babaoff, Randy McGrane, Darcy McGrane, Michael Moskowitz and Helen Kim Stockdale. Ensemble Investments, LLC has developed over 1.6 million square feet of building space consisting of office buildings, medical office buildings, healthcare facilities, multifamily high rises and hotels. The property is managed by Ensemble Hotel Partners, LLC, an affiliate of the loan sponsor.
THE INFORMATION IN THIS STRUCTURAL AND COLLATERAL TERM SHEET IS NOT COMPLETE AND MAY BE AMENDED PRIOR TO THE TIME OF SALE. THIS TERM SHEET IS NOT AN OFFER TO SELL THESE SECURITIES AND IT IS NOT A SOLICITATION OF AN OFFER TO BUY THESE SECURITIES IN ANY JURISDICTION WHERE THE OFFER OR SALE IS NOT PERMITTED.
| 119 of 122 | |
| Structural and Collateral Term Sheet | JPMBB 2015-C29 | |
Doubletree - Carson | ||
The Property. DoubleTree - Carson is a 225-room full service hotel located at 2 Civic Plaza Drive in Carson, California, approximately 17 miles south of downtown Los Angeles. The property was constructed in 1988 and the guest rooms and hotel common areas were renovated between 2010 and 2014, with primary renovations completed in 2012, at a cost, according to the loan sponsor, of approximately $5.2 million ($23,111/room). The collateral consists of a fee-owned parcel totaling approximately 1.44 acres along with a 46.5% tenant-in-common interest in a shared parking area. The hotel amenities include the Refinery Restaurant and Scoreboard Lounge, a three-meal restaurant and lounge, an outdoor pool and spa with cabanas and fireplaces, a fitness center, a business center, and a 5,764 square foot meeting and event space, including a 3,075 square foot ballroom which is further divisible into three rooms. The guestroom mix is comprised of 87 king rooms (365 square feet), 122 double queen rooms (365 square feet), 12 junior suites (450 square feet), two executive suites (900 square feet, including the balcony), and two presidential suites (1,214 square feet, including the balcony). The property is operated under a franchise license agreement with a subsidiary of Hilton Worldwide that expires on October 31, 2029 and does not contain any renewal options.
DoubleTree - Carson is located in Carson, California, just west of Interstate 405, between the 110 and 710 freeways, at the northeast corner of Carson Street and Civic Plaza Drive. The hotel is visible from Interstate 405 and is accessible from the adjacent Carson Street on/off‐ramps. The property is centrally located within a 25-minute drive of downtown Los Angeles and Long Beach and is located within 11 miles of both the Long Beach Airport and Los Angeles International Airport. In addition, the StubHub Center, a mixed sporting venue that is the home of the LA Galaxy and the California State University Dominguez Hills campus are within two miles. The property is adjacent to the Carson Center, a city-owned convention center with an 11,950-square-foot main hall and 40,000 square feet of total leasable space that’s used for trade shows, seminars, weddings, banquets, and other community events. Per the appraisal, there are no new full service hotels under construction or firmly planned in the area.
The property’s competitive set listed below includes hotels in Torrance, Long Beach, and San Pedro within the South Bay submarket. The properties are all affiliated with national franchises and compete in the full‐service market with on‐site restaurants (with the exception of the Hampton Inn-Carson).
| Historical Occupancy, ADR, RevPAR | |||||||||
Competitive Set(1) | DoubleTree - Carson(2) | Penetration Factor(3) | |||||||
| Year | Occupancy | ADR | RevPAR | Occupancy | ADR | RevPAR | Occupancy | ADR | RevPAR |
| 2012 | 77.8% | $96.22 | $74.83 | 71.7% | $113.24 | $81.24 | 92.2% | 117.7% | 108.6% |
| 2013 | 80.4% | $99.32 | $79.82 | 73.7% | $117.27 | $86.45 | 91.7% | 118.1% | 108.3% |
| 2014 | 82.2% | $106.29 | $87.32 | 81.5% | $118.93 | $96.92 | 99.1% | 111.9% | 111.0% |
TTM(4) | 83.4% | $107.36 | $89.49 | 82.3% | $121.16 | $99.73 | 98.8% | 112.9% | 111.4% |
| (1) | Data provided by Smith Travel Research. The competitive set contains the following properties: DoubleTree - Torrance South Bay, Holiday Inn - Long Beach Airport, DoubleTree - San Pedro Port of Los Angeles, Holiday Inn - Los Angeles Gateway Torrance, Courtyard - Los Angeles Torrance Palos and Hampton Inn - Los Angeles Carson Torrance. |
| (2) | 2012-2014 information is based on operating statements provided by the borrower. |
| (3) | Penetration Factor is calculated based on data provided by Smith Travel Research for the competitive set and borrower provided operating statements for the property for 2012-2014 and Smith Travel Research for the property’s TTM. |
| (4) | TTM represents period ending March 31, 2015 provided by Smith Travel Research. |
Competitive Hotels Profile(1) | |||||||||||||||||||
2014 Estimated Market Mix | 2014 Estimated Operating Statistics | ||||||||||||||||||
Property | Rooms | Year Built | Meeting Space (SF) | Commercial | Meeting & Group | Leisure | Occupancy | ADR | RevPAR | ||||||||||
| DoubleTree - Carson | 225 | 1988 | 5,764 | 40% | 20% | 15% | 81% | $118.93 | $96.92 | ||||||||||
| Hampton Inn - Los Angeles Carson Torrance | 137 | 1990 | 0 | 70% | 10% | 20% | 80% | $110.00 | $88.00 | ||||||||||
| Courtyard - Los Angeles Torrance South Bay | 330 | 1987 | 1,358 | 60% | 20% | 20% | 80% | $125.00 | $100.00 | ||||||||||
| Holiday Inn - Los Angeles Gateway Torrance | 320 | 1986 | 3,780 | 30% | 10% | 10% | 80% | $85.00 | $68.00 | ||||||||||
| DoubleTree - Torrance South Bay | 367 | 1976 | 13,253 | 30% | 10% | 20% | 90% | $115.00 | $103.50 | ||||||||||
| DoubleTree - San Pedro Port of Los Angeles | 226 | 1987 | 15,958 | 30% | 15% | 30% | 90% | $105.00 | $94.50 | ||||||||||
| Holiday Inn - Long Beach Airport | 222 | 1969 | 6,029 | 40% | 20% | 20% | 70% | $105.00 | $73.50 | ||||||||||
Total(2) | 1,602 | ||||||||||||||||||
(1) Based on the appraisal.
(2) Excludes the subject property.
THE INFORMATION IN THIS STRUCTURAL AND COLLATERAL TERM SHEET IS NOT COMPLETE AND MAY BE AMENDED PRIOR TO THE TIME OF SALE. THIS TERM SHEET IS NOT AN OFFER TO SELL THESE SECURITIES AND IT IS NOT A SOLICITATION OF AN OFFER TO BUY THESE SECURITIES IN ANY JURISDICTION WHERE THE OFFER OR SALE IS NOT PERMITTED.
| 120 of 122 | |
| Structural and Collateral Term Sheet | JPMBB 2015-C29 | |
Doubletree - Carson | ||
| Operating History and Underwritten Net Cash Flow | ||||||||||||||
| 2012 | 2013 | 2014 | TTM(1) | Underwritten | Per Room (2) | % of Total Revenue(3) | ||||||||
| Occupancy | 71.7% | 73.7% | 81.5% | 81.6% | 81.5% | |||||||||
| ADR | $113.24 | $117.27 | $118.93 | $119.87 | $118.93 | |||||||||
| RevPAR | $81.24 | $86.45 | $96.92 | $97.77 | $96.92 | |||||||||
| Room Revenue | $6,641,957 | $7,099,805 | $7,959,281 | $8,028,985 | $7,959,281 | $35,375 | 76.6% | |||||||
| Food and Beverage Revenue | 2,113,511 | 2,109,815 | 2,356,382 | 2,358,574 | 2,356,382 | 10,473 | 22.7 | |||||||
| Telephone Revenue | 3,754 | 3,900 | 2,544 | 4,546 | 2,544 | 11 | 0.0 | |||||||
| Other Revenue | 133,753 | 189,389 | 73,001 | 69,288 | 73,001 | 324 | 0.7 | |||||||
| Total Revenue | $8,892,975 | $9,402,909 | $10,391,208 | $10,461,393 | $10,391,208 | $46,183 | 100.0% | |||||||
| Room Expense | $1,582,596 | $1,655,906 | $2,096,734 | $2,113,335 | $2,096,734 | $9,319 | 20.2% | |||||||
| Food and Beverage Expense | 1,558,447 | 1,552,016 | 1,654,456 | 1,653,744 | 1,654,456 | 7,353 | 15.9 | |||||||
| Telephone Expense | 16,406 | 16,202 | 21,551 | 22,485 | 21,551 | 96 | 0.2 | |||||||
| Departmental Expenses | $3,157,449 | $3,224,124 | $3,772,741 | $3,789,564 | $3,772,741 | $16,768 | 36.3% | |||||||
| Departmental Profit | $5,735,526 | $6,178,785 | $6,618,467 | $6,671,829 | $6,618,467 | $29,415 | 63.7% | |||||||
| Operating Expenses | $2,279,723 | $2,355,709 | $2,278,414 | $2,247,031 | $2,278,414 | $10,126 | 21.9% | |||||||
| Gross Operating Profit | $3,455,803 | $3,823,076 | $4,340,053 | $4,424,798 | $4,340,053 | $19,289 | 41.8% | |||||||
| Fixed Expenses | $422,541 | $378,401 | $455,324 | $461,081 | $467,266 | $2,077 | 4.5% | |||||||
| Management Fee | 266,778 | 283,482 | 308,228 | 310,039 | 311,736 | 1,385 | 3.0 | |||||||
| Franchise Fee | 561,001 | 672,048 | 739,675 | 740,691 | 748,172 | 3,325 | 7.2 | |||||||
FF&E (4) | 355,719 | 376,116 | 415,648 | 418,456 | 415,648 | 1,847 | 4.0 | |||||||
| Total Other Expenses | $1,606,039 | $1,710,047 | $1,918,875 | $1,930,267 | $1,942,822 | $8,635 | 18.7% | |||||||
| Net Operating Income | $1,849,764 | $2,113,029 | $2,421,178 | $2,494,532 | $2,397,230 | $10,654 | 23.1% | |||||||
| Net Cash Flow | $1,849,764 | $2,113,029 | $2,421,178 | $2,494,532 | $2,397,230 | $10,654 | 23.1% | |||||||
| (1) | TTM is based on the 12 month period ending January 31, 2015. |
| (2) | Per Room values are based on 225 guest rooms. |
| (3) | % of Total Revenue column for Room Expense, Food and Beverage Expenses and Telephone Expenses is based on their corresponding revenue line item. |
| (4) | The borrower will make monthly deposits into the FF&E reserve equal to $34,638. Based on the annual operating statements for the property, the lender may adjust the FF&E reserve monthly deposit to the greater of (x) the then-existing FF&E reserve monthly deposit, (y) one-twelfth of 4% of the total gross revenue for the prior fiscal year or (z) any greater amount required to be paid under the franchise agreement, the physical conditions report, or the annual budget. |
THE INFORMATION IN THIS STRUCTURAL AND COLLATERAL TERM SHEET IS NOT COMPLETE AND MAY BE AMENDED PRIOR TO THE TIME OF SALE. THIS TERM SHEET IS NOT AN OFFER TO SELL THESE SECURITIES AND IT IS NOT A SOLICITATION OF AN OFFER TO BUY THESE SECURITIES IN ANY JURISDICTION WHERE THE OFFER OR SALE IS NOT PERMITTED.
| 121 of 122 | |
| Structural and Collateral Term Sheet | JPMBB 2015-C29 | |
Contacts | ||
| J.P. Morgan CMBS Capital Markets & Banking | ||
| Contact | Phone Number | |
Kunal Singh Managing Director | kunal.k.singh@jpmorgan.com | (212) 834-5467 |
Brad Horn Vice President | bradley.j.horn@jpmorgan.com | (212) 834-9708 |
| J.P. Morgan CMBS Trading | ||
| Contact | Phone Number | |
Andy Taylor Managing Director | andrew.b.taylor@jpmorgan.com | (212) 834-3813 |
Avinash Sharma Vice President | avinash.sharma@jpmorgan.com | (212) 272-6108 |
| J.P. Morgan Securitized Products Syndicate | ||
| Contact | Phone Number | |
Andy Cherna Managing Director | andy.cherna@jpmorgan.com | (212) 834-4154 |
Mick Wiedrick Executive Director | mick.k.wiedrick@jpmorgan.com | (212) 834-4154 |
| Barclays CMBS Capital Markets & Banking | ||
| Contact | Phone Number | |
Daniel Vinson Managing Director | daniel.vinson@barclays.com | (212) 528-8224 |
Luke Adovasio Director | luke.adovasio@barclays.com | (212) 526-5248 |
| Barclays CMBS Trading | ||
| Contact | Phone Number | |
Max Baker Director | max.baker@barclays.com | (212) 412-2084 |
David Kung Director | david.kung@barclays.com | (212) 528-7970 |
| Barclays Securitized Products Syndicate | ||
| Contact | Phone Number | |
Brian Wiele Managing Director | brian.wiele@barclays.com | (212) 412-5780 |
Kenneth Rosenberg Director | kenneth.rosenberg@barclays.com | (212) 412-5780 |
THE INFORMATION IN THIS STRUCTURAL AND COLLATERAL TERM SHEET IS NOT COMPLETE AND MAY BE AMENDED PRIOR TO THE TIME OF SALE. THIS TERM SHEET IS NOT AN OFFER TO SELL THESE SECURITIES AND IT IS NOT A SOLICITATION OF AN OFFER TO BUY THESE SECURITIES IN ANY JURISDICTION WHERE THE OFFER OR SALE IS NOT PERMITTED.
| 122 of 122 | |