| FREE WRITING PROSPECTUS | ||
| FILED PURSUANT TO RULE 433 | ||
| REGISTRATION FILE NO.: 333-206361-08 |
| February 28, 2017 | JPMCC 2017-JP5 |
Free Writing Prospectus
Structural and Collateral Term Sheet
| ||
JPMCC 2017-JP5
| ||
$ 1,092,982,047 (Approximate Mortgage Pool Balance) | ||
$ 944,063,000 (Approximate Offered Certificates) | ||
J.P. Morgan Chase Commercial Mortgage Securities Corp. Depositor | ||
| | ||
Commercial Mortgage Pass-Through Certificates Series 2017-JP5 | ||
| | ||
JPMorgan Chase Bank, National Association Starwood Mortgage Funding VI LLC Mortgage Loan Sellers
| ||
J.P. Morgan Lead Manager and Sole Bookrunner
| ||
| Drexel Hamilton |
Co-Managers
| Academy Securities |
THE INFORMATION IN THIS STRUCTURAL AND COLLATERAL TERM SHEET IS NOT COMPLETE AND MAY BE AMENDED PRIOR TO THE TIME OF SALE. THIS TERM SHEET IS NOT AN OFFER TO SELL THESE SECURITIES AND IT IS NOT A SOLICITATION OF AN OFFER TO BUY THESE SECURITIES IN ANY JURISDICTION WHERE THE OFFER OR SALE IS NOT PERMITTED.
| February 28, 2017 | JPMCC 2017-JP5 |
This material is for your information, and none of J.P. Morgan Securities LLC (“JPMS”), Drexel Hamilton, LLC (“Drexel”) or Academy Securities, Inc. (“Academy Securities”) (each individually, an “Underwriter”, and together, the ‘‘Underwriters’’) are soliciting any action based upon it. This material is not to be construed as an offer to sell or the solicitation of any offer to buy any security in any jurisdiction where such an offer or solicitation would be illegal.
The Depositor has filed a registration statement (including a prospectus) with the SEC (SEC File no. 333-206361) for the offering to which this free writing prospectus relates. Before you invest, you should read the prospectus in the registration statement and other documents the Depositor has filed with the SEC for more complete information about the Depositor, the issuing entity and this offering. You may get these documents for free by visiting EDGAR on the SEC Website at www.sec.gov. Alternatively, the Depositor or any Underwriter or any dealer participating in the offering will arrange to send you the prospectus if you request it by calling (866) 669-7629 or by emailing the ABS Syndicate Desk at abs_synd@jpmorgan.com.
Neither this document nor anything contained in this document shall form the basis for any contract or commitment whatsoever. The information contained in this document is preliminary as of the date of this document, supersedes any previous such information delivered to you and will be superseded by any such information subsequently delivered prior to the time of sale. These materials are subject to change, completion or amendment from time to time.
This document has been prepared by the Underwriters for information purposes only and does not constitute, in whole or in part, a prospectus for the purposes of Directive 2003/71/EC (as amended) and/or Part VI of the Financial Services and Markets Act 2000 (as amended) or other offering document.
The attached information contains certain tables and other statistical analyses (the “Computational Materials”) that have been prepared in reliance upon information furnished by the Mortgage Loan Sellers. Numerous assumptions were used in preparing the Computational Materials, which may or may not be reflected in this document. The Computational Materials should not be construed as either projections or predictions or as legal, tax, financial or accounting advice. You should consult your own counsel, accountant and other advisors as to the legal, tax, business, financial and related aspects of a purchase of these certificates. Any weighted average lives, yields and principal payment periods shown in the Computational Materials are based on prepayment and/or loss assumptions, and changes in such prepayment and/or loss assumptions may dramatically affect such weighted average lives, yields and principal payment periods. In addition, it is possible that prepayments or losses on the underlying assets will occur at rates higher or lower than the rates shown in the Computational Materials. The specific characteristics of the certificates may differ from those shown in the Computational Materials due to differences between the final underlying assets and the preliminary underlying assets used in preparing the Computational Materials. The principal amount and designation of any certificate described in the Computational Materials are subject to change prior to issuance. None of the Underwriters nor any of their respective affiliates make any representation or warranty as to the actual rate or timing of payments or losses on any of the underlying assets or the payments or yield on the certificates.
This information is based upon management forecasts and reflects prevailing conditions and management’s views as of this date, all of which are subject to change.
This document contains forward-looking statements. Those statements are subject to certain risks and uncertainties that could cause the success of collections and the actual cash flow generated to differ materially from the information set forth in this document. While such information reflects projections prepared in good faith based upon methods and data that are believed to be reasonable and accurate as of their dates, the Depositor undertakes no obligation to revise these forward-looking statements to reflect subsequent events or circumstances. Investors should not place undue reliance on forward-looking statements and are advised to make their own independent analysis and determination with respect to the forecasted periods, which reflect the Depositor’s view only as of the date of this document.
J.P. Morgan is the marketing name for the investment banking businesses of JPMorgan Chase & Co. and its subsidiaries worldwide. Securities, syndicated loan arranging, financial advisory and other investment banking activities are performed by JPMS and its securities affiliates, and lending, derivatives and other commercial banking activities are performed by JPMorgan Chase Bank, National Association and its banking affiliates. JPMS is a member of SIPC and the NYSE.
Capitalized terms used in this material but not defined herein shall have the meanings ascribed to them in the Preliminary Prospectus (as defined below).
THE CERTIFICATES REFERRED TO IN THESE MATERIALS ARE SUBJECT TO MODIFICATION OR REVISION (INCLUDING THE POSSIBILITY THAT ONE OR MORE CLASSES OF CERTIFICATES MAY BE SPLIT, COMBINED OR ELIMINATED AT ANY TIME PRIOR TO ISSUANCE OR AVAILABILITY OF A FINAL PROSPECTUS) AND ARE OFFERED ON A “WHEN, AS AND IF ISSUED” BASIS.
THE UNDERWRITERS MAY FROM TIME TO TIME PERFORM INVESTMENT BANKING SERVICES FOR, OR SOLICIT INVESTMENT BANKING BUSINESS FROM, ANY COMPANY NAMED IN THESE MATERIALS. THE UNDERWRITERS AND/OR THEIR AFFILIATES OR RESPECTIVE EMPLOYEES MAY FROM TIME TO TIME HAVE A LONG OR SHORT POSITION IN ANY CERTIFICATE OR CONTRACT DISCUSSED IN THESE MATERIALS.
THE INFORMATION IN THIS STRUCTURAL AND COLLATERAL TERM SHEET IS NOT COMPLETE AND MAY BE AMENDED PRIOR TO THE TIME OF SALE. THIS TERM SHEET IS NOT AN OFFER TO SELL THESE SECURITIES AND IT IS NOT A SOLICITATION OF AN OFFER TO BUY THESE SECURITIES IN ANY JURISDICTION WHERE THE OFFER OR SALE IS NOT PERMITTED.
 | 2 of 156 |
| Structural and Collateral Term Sheet | JPMCC 2017-JP5 |
| Indicative Capital Structure | |
Publicly Offered Certificates
| Class | Expected Ratings (Moody’s / Fitch / KBRA) | Approximate Initial Certificate Balance or Notional Amount(1) | Approximate Initial Credit Support(2) | Expected Weighted Avg. Life (years)(3) | Expected Principal Window(3) | Certificate Principal to Value Ratio(4) | Underwritten NOI Debt Yield(5) |
| A-1 | Aaa(sf) / AAAsf / AAA(sf) | $43,930,000 | 30.000% | 2.76 | 4/17 – 1/22 | 41.4% | 16.7% |
| A-2 | Aaa(sf) / AAAsf / AAA(sf) | $82,828,000 | 30.000% | 4.79 | 1/22 – 1/22 | 41.4% | 16.7% |
| A-3 | Aaa(sf) / AAAsf / AAA(sf) | $38,000,000 | 30.000% | 6.71 | 12/23 – 12/23 | 41.4% | 16.7% |
| A-4 | Aaa(sf) / AAAsf / AAA(sf) | $135,000,000 | 30.000% | 9.63 | 11/26 – 11/26 | 41.4% | 16.7% |
| A-5 | Aaa(sf) / AAAsf / AAA(sf) | $396,306,000 | 30.000% | 9.77 | 11/26 – 1/27 | 41.4% | 16.7% |
| A-SB | Aaa(sf) / AAAsf / AAA(sf) | $69,023,000 | 30.000% | 7.34 | 1/22 – 11/26 | 41.4% | 16.7% |
| X-A | Aa1(sf) / AAAsf / AAA(sf) | $836,131,000(6) | N/A | N/A | N/A | N/A | N/A |
| X-B | A1(sf) / AA-sf / AAA(sf) | $51,917,000(6) | N/A | N/A | N/A | N/A | N/A |
| X-C | NR / A-sf / AAA(sf) | $56,015,000(6) | N/A | N/A | N/A | N/A | N/A |
| A-S | Aa2(sf) / AAAsf / AAA(sf) | $71,044,000 | 23.500% | 9.86 | 1/27 – 2/27 | 45.2% | 15.2% |
| B | A1(sf) / AA-sf / AA+(sf) | $51,917,000 | 18.750% | 9.88 | 2/27 – 2/27 | 48.0% | 14.3% |
| C | NR / A-sf / A(sf) | $56,015,000 | 13.625% | 9.88 | 2/27 – 2/27 | 51.0% | 13.5% |
Privately Offered Certificates(7)
| Class | Expected Ratings (Moody’s / Fitch / KBRA) | Approximate Initial Certificate Balance or Notional Amount(1) | Approximate Initial Credit Support | Expected Weighted Avg. Life (years)(3) | Expected Principal Window(3) | Certificate Principal to Value Ratio(4) | Underwritten NOI Debt Yield(5) |
| D | NR / BBBsf / BBB+(sf) | $36,888,000(8) | 10.250% | 9.88 | 2/27 – 2/27 | 53.0% | 13.0% |
| D-RR | NR / BBB-sf / BBB(sf) | $27,325,000(8) | 7.750% | 9.88 | 2/27 – 2/27 | 54.5% | 12.6% |
| E-RR | NR / BB-sf / BB-(sf) | $28,691,000 | 5.125% | 9.98 | 2/27 – 4/27 | 56.1% | 12.3% |
| F-RR | NR / NR / B-(sf) | $17,761,000 | 3.500% | 10.04 | 4/27 – 4/27 | 57.0% | 12.1% |
| NR-RR | NR / NR / NR | $38,254,046 | 0.000% | 10.04 | 4/27 – 4/27 | 59.1% | 11.7% |
| (1) | In the case of each such Class, subject to a permitted variance of plus or minus 5%. |
| (2) | The credit support percentages set forth for Class A-1, Class A-2, Class A-3, Class A-4, Class A-5 and Class A-SB Certificates represent the approximate initial credit support for the Class A-1, Class A-2, Class A-3, Class A-4, Class A-5 and Class A-SB Certificates in the aggregate. |
| (3) | Assumes 0% CPR / 0% CDR and a March 29, 2017 closing date. Based on modeling assumptions as described in the Preliminary Prospectus dated February 28, 2017 (the “Preliminary Prospectus”). |
| (4) | The “Certificate Principal to Value Ratio” for any Class of Principal Balance Certificates (other than the Class A-1, Class A-2, Class A-3, Class A-4, Class A-5 and Class A-SB Certificates) is calculated as the product of (a) the weighted average Cut-off Date LTV Ratio for the mortgage loans, multiplied by (b) a fraction, the numerator of which is the total initial Certificate Balance of such Class of Certificates and all Classes of Principal Balance Certificates senior to such Class of Certificates and the denominator of which is the total initial Certificate Balance of all of the Principal Balance Certificates. The Class A-1, Class A-2, Class A-3, Class A-4, Class A-5 and Class A-SB Certificate Principal to Value Ratios are calculated in the aggregate for those Classes as if they were a single Class. Investors should note, however, that excess mortgaged property value associated with a mortgage loan will not be available to offset losses on any other mortgage loan. |
| (5) | The “Underwritten NOI Debt Yield” for any Class of Principal Balance Certificates (other than the Class A-1, Class A-2, Class A-3, Class A-4, Class A-5 and Class A-SB Certificates) is calculated as the product of (a) the weighted average UW NOI Debt Yield for the mortgage loans and (b) the total initial Certificate Balance of all of the Classes of Principal Balance Certificates divided by the total initial Certificate Balance for such Class and all Classes of Principal Balance Certificates senior to such Class of Certificates. The Underwritten NOI Debt Yield for each of the Class A-1, Class A-2, Class A-3, Class A-4, Class A-5 and Class A-SB Certificates is calculated in the aggregate for those Classes as if they were a single Class. Investors should note, however, that net operating income from any mortgaged property supports only the related mortgage loan and will not be available to support any other mortgage loan. |
| (6) | The Class X-A, Class X-B and Class X-C Notional Amounts are defined in the Preliminary Prospectus. |
| (7) | The Class D, Class D-RR, Class E-RR, Class F-RR and Class NR-RR Certificates are not being offered by the Preliminary Prospectus or this Term Sheet. The Class R Certificates are not shown above. |
| (8) | The approximate initial Certificate Balances of the Class D and Class D-RR Certificates are estimated based in part on the estimated ranges of Certificate Balances and estimated fair values described in “Credit Risk Retention” in the Preliminary Prospectus. The Class D Certificate Balances are expected to fall within a range of $31,423,000 and $43,720,000, with the ultimate Certificate Balance determined, such that the aggregate fair value of the Yield-Priced Principal Balance Certificates will equal at least 5% of the estimated fair value of all of the classes of certificates (other than the Class R Certificates) issued by the issuing entity. The Class D-RR Certificate Balances are expected to fall within a range of $20,493,000 and $32,790,000, with the ultimate Certificate Balance determined such that the aggregate fair value of the Yield-Priced Principal Balance Certificates will equal at least 5% of the estimated fair value of all the classes of certificates (other than the Class R Certificates) issued by the issuing entity. |
THE INFORMATION IN THIS STRUCTURAL AND COLLATERAL TERM SHEET IS NOT COMPLETE AND MAY BE AMENDED PRIOR TO THE TIME OF SALE. THIS TERM SHEET IS NOT AN OFFER TO SELL THESE SECURITIES AND IT IS NOT A SOLICITATION OF AN OFFER TO BUY THESE SECURITIES IN ANY JURISDICTION WHERE THE OFFER OR SALE IS NOT PERMITTED.
| | 3 of 156 |
| Structural and Collateral Term Sheet | JPMCC 2017-JP5 |
| Summary of Transaction Terms | |
| Securities Offered: | $944,063,000 monthly pay, multi-class, commercial mortgage REMIC Pass-Through Certificates. |
| Lead Manager and Sole Bookrunner: | J.P. Morgan Securities LLC. |
| Co-Managers: | Drexel Hamilton, LLC and Academy Securities, Inc. |
| Mortgage Loan Sellers: | JPMorgan Chase Bank, National Association (“JPMCB”) (84.6%) and Starwood Mortgage Funding VI LLC (“SMF VI”) (15.4%). |
| Master Servicer: | Midland Loan Services, a Division of PNC Bank, National Association (“Midland”). |
| Special Servicer: | LNR Partners, LLC (“LNR”). |
| Directing Certificateholder: | LNR Securities Holdings, LLC (or its affiliate). |
| Trustee: | Wells Fargo Bank, National Association. |
| Certificate Administrator: | Wells Fargo Bank, National Association. |
| Operating Advisor: | Pentalpha Surveillance LLC. |
| Asset Representations Reviewer: | Pentalpha Surveillance LLC. |
| Rating Agencies: | Moody’s Investors Service, Inc. (“Moody’s”), Fitch Ratings, Inc. (“Fitch”) and Kroll Bond Rating Agency, Inc. (“KBRA”). |
| U.S. Credit Risk Retention: | SMF VI, an indirect wholly-owned subsidiary of Starwood Property Trust, Inc., is expected to act as the “retaining sponsor” for this securitization and intends to satisfy the U.S. credit risk retention requirement through the purchase by LNR Securities Holdings, LLC, a majority-owned affiliate (as defined in Regulation RR) of SMF VI, from the depositor, on the Closing Date, of an “eligible horizontal residual interest”, which will be comprised of the Class D-RR, Class E-RR, Class F-RR and Class NR-RR certificates. The aggregate estimated fair value of the Class D-RR, Class E-RR, Class F-RR and Class NR-RR certificates will equal at least 5% of the estimated fair value of all of the certificates (other than the Class R Certificates) issued by the issuing entity.
SMF VI, in its capacity as the “retaining sponsor” for this transaction, will be required to comply with the hedging, transfer and financing restrictions applicable to a “retaining sponsor” under the credit risk retention rules, which generally prohibit the transfer of the applicable certificates except to a “majority-owned affiliate” of the “retaining sponsor”. The restrictions on hedging and transfer under the credit risk retention rules as in effect on the closing date of this transaction will expire on and after the date that is the latest of (i) the date on which the aggregate principal balance of the mortgage loans has been reduced to 33% of the aggregate principal balance of the mortgage loans as of the Cut-off Date; (ii) the date on which the total unpaid principal obligations under the certificates has been reduced to 33% of the aggregate total unpaid principal obligations under the certificates as of the Closing Date; or (iii) two years after the Closing Date. In particular, this means that SMF VI (or a majority-owned affiliate) is expected to have a longer minimum holding period than the minimum five-year holding period that is generally applicable to a “third party purchaser” under the credit risk retention rules as in effect on the Closing Date of this transaction.
For additional information, see “Credit Risk Retention” in the Preliminary Prospectus. |
| EU Credit Risk Retention: | The transaction is not structured to satisfy the EU risk retention and due diligence requirements. |
| Pricing Date: | On or about March 6, 2017. |
| Closing Date: | On or about March 29, 2017. |
| Cut-off Date: | With respect to each mortgage loan, the related due date in March 2017, or with respect to any mortgage loan that has its first due date in April 2017, the date that would otherwise have been the related due date in March 2017. |
| Distribution Date: | The 4th business day after the Determination Date in each month, commencing in April 2017. |
| Determination Date: | 11th day of each month, or if the 11th day is not a business day, the next succeeding business day, commencing in April 2017. |
| Assumed Final Distribution Date: | The Distribution Date in April 2027 which is the latest anticipated repayment date of the Certificates. |
| Rated Final Distribution Date: | The Distribution Date in March 2050. |
| Tax Treatment: | The Publicly Offered Certificates are expected to be treated as REMIC “regular interests” for U.S. federal income tax purposes. |
| Form of Offering: | The Class A-1, Class A-2, Class A-3, Class A-4, Class A-5, Class A-SB, Class X-A, Class X-B, Class X-C, Class A-S, Class B and Class C Certificates (the “Publicly Offered Certificates”) will be offered publicly. The Class D, Class D-RR, Class E-RR, Class F-RR, Class NR-RR and Class R Certificates (the “Privately Offered Certificates”) will be offered domestically to Qualified Institutional Buyers and to Institutional Accredited Investors and to institutions that are not U.S. Persons pursuant to Regulation S. |
| SMMEA Status: | The Certificates will not constitute “mortgage related securities” for purposes of SMMEA. |
| ERISA: | The Publicly Offered Certificates are expected to be ERISA eligible. |
THE INFORMATION IN THIS STRUCTURAL AND COLLATERAL TERM SHEET IS NOT COMPLETE AND MAY BE AMENDED PRIOR TO THE TIME OF SALE. THIS TERM SHEET IS NOT AN OFFER TO SELL THESE SECURITIES AND IT IS NOT A SOLICITATION OF AN OFFER TO BUY THESE SECURITIES IN ANY JURISDICTION WHERE THE OFFER OR SALE IS NOT PERMITTED.
| | 4 of 156 |
| Structural and Collateral Term Sheet | JPMCC 2017-JP5 |
| Summary of Transaction Terms | |
| Optional Termination: | On any Distribution Date on which the aggregate principal balance of the pool of mortgage loans is less than (or, in the case of clause (ii) below, less than or equal to) the greater of (i) 1% of the aggregate principal balance of the mortgage loans as of the Cut-off Date, or (ii) if the mortgage loan identified on Annex A-1 to the Preliminary Prospectus as “Moffett Gateway” is an asset of the trust fund, the product of (x) a percentage that is calculated by dividing (A) the sum of the outstanding principal balance of the mortgage loan identified on Annex A-1 to the Preliminary Prospectus as “Moffett Gateway” on any date of determination and 1% of the aggregate principal balance of the mortgage loans as of the Cut-off Date by (B) the aggregate principal balance of the mortgage loans as of the Cut-off Date and (y) the aggregate principal balance of the mortgage loans as of the Cut-off Date, certain entities specified in the Preliminary Prospectus will have the option to purchase all of the remaining mortgage loans (and all property acquired through exercise of remedies in respect of any mortgage loan) at the price specified in the Preliminary Prospectus (provided, however, that the termination right will not be exercisable in connection with the percentage threshold in (ii) above prior to the Distribution Date in April 2027). Refer to “Pooling and Servicing Agreement—Termination; Retirement of Certificates” in the Preliminary Prospectus. |
| Minimum Denominations: | The Publicly Offered Certificates (other than the Class X-A, Class X-B and Class X-C Certificates) will be issued in minimum denominations of $10,000 and integral multiples of $1 in excess of $10,000. The Class X-A, Class X-B and Class X-C Certificates will be issued in minimum denominations of $1,000,000 and in integral multiples of $1 in excess of $1,000,000. |
| Settlement Terms: | DTC, Euroclear and Clearstream Banking. |
| Analytics: | The transaction is expected to be modeled by Intex Solutions, Inc. and Trepp, LLC and is expected to be available on Bloomberg L.P., Blackrock Financial Management, Inc., Interactive Data Corporation, CMBS.com, Inc., Markit Group Limited, Moody’s Analytics and Thomson Reuters Corporation. |
| Risk Factors: | THE CERTIFICATES INVOLVE CERTAIN RISKS AND MAY NOT BE SUITABLE FOR ALL INVESTORS. REFER TO “RISK FACTORS” IN THE PRELIMINARY PROSPECTUS. |
THE INFORMATION IN THIS STRUCTURAL AND COLLATERAL TERM SHEET IS NOT COMPLETE AND MAY BE AMENDED PRIOR TO THE TIME OF SALE. THIS TERM SHEET IS NOT AN OFFER TO SELL THESE SECURITIES AND IT IS NOT A SOLICITATION OF AN OFFER TO BUY THESE SECURITIES IN ANY JURISDICTION WHERE THE OFFER OR SALE IS NOT PERMITTED.
| | 5 of 156 |
| Structural and Collateral Term Sheet | JPMCC 2017-JP5 |
| Collateral Characteristics | |
| Loan Pool | ||
| Initial Pool Balance (“IPB”): | $1,092,982,047 | |
| Number of Mortgage Loans: | 43 | |
| Number of Mortgaged Properties: | 59 | |
| Average Cut-off Date Balance per Mortgage Loan: | $25,418,187 | |
| Weighted Average Current Mortgage Rate: | 4.67097% | |
| 10 Largest Mortgage Loans as % of IPB: | 56.6% | |
| Weighted Average Remaining Term to Maturity: | 112 months | |
| Weighted Average Seasoning: | 2 months | |
| Credit Statistics | ||
| Weighted Average UW NCF DSCR(1)(2): | 1.97x | |
| Weighted Average UW NOI Debt Yield(1): | 11.7% | |
| Weighted Average Cut-off Date Loan-to-Value Ratio (“LTV”)(1)(3): | 59.1% | |
| Weighted Average Maturity Date LTV(1)(3): | 52.5% | |
| Other Statistics | ||
| % of Mortgage Loans with Additional Debt: | 18.3% | |
| % of Mortgaged Properties with Single Tenants: | 13.5% | |
| Amortization | ||
| Weighted Average Original Amortization Term(4): | 355 months | |
| Weighted Average Remaining Amortization Term(4): | 354 months | |
| % of Mortgage Loans with Amortizing Balloon: | 39.2% | |
| % of Mortgage Loans with Partial Interest-Only followed by Amortizing Balloon: | 32.0% | |
| % of Mortgage Loans with Interest-Only: | 28.2% | |
| % of Mortgage Loans with Amortization followed by Interest-Only followed by Balloon: | 0.6% | |
| Cash Management(5) | ||
| % of Mortgage Loans with In-Place, CMA Lockboxes: | 54.7% | |
| % of Mortgage Loans with Springing Lockboxes: | 23.2% | |
| % of Mortgage Loans with In-Place, Hard Lockboxes: | 20.7% | |
| % of Mortgage Loans with No Lockboxes: | 1.4% | |
| Reserves | ||
| % of Mortgage Loans Requiring Monthly Tax Reserves: | 77.3% | |
| % of Mortgage Loans Requiring Monthly Insurance Reserves: | 21.7% | |
| % of Mortgage Loans Requiring Monthly CapEx Reserves(6): | 59.0% | |
| % of Mortgage Loans Requiring Monthly TI/LC Reserves(7): | 58.3% | |
| (1) | In the case of Loan Nos. 1, 2, 3, 4, 5 and 8, the UW NCF DSCR, UW NOI Debt Yield, Cut-off Date LTV and Maturity Date LTV calculations include the related Pari Passu Companion Loan(s). In the case of Loan Nos. 1, 2 and 10, the UW NCF DSCR, UW NOI Debt Yield, Cut-off Date LTV and Maturity Date LTV calculations exclude the related Subordinate Companion Loan(s). |
| (2) | In the case of Loan No. 2, the UW NCF DSCR is calculated using the sum of principal and interest payments over the first 12 months following the expiration of the interest-only period based on the assumed principal payment schedule provided on Annex F to the Preliminary Prospectus. In the case of Loan No. 10, the UW NCF DSCR is calculated using the sum of principal and interest payments over the first 12 payments allocable to the Mortgage Loan following the Cut-off Date based on apro rataallocation between the Mortgage Loan and Subordinate Companion Loan of principal payable on the related Whole Loan in accordance with the amortization schedule set forth in Annex G to the Preliminary Prospectus. |
| (3) | In the case of Loan Nos. 2, 12 and 21, the Cut-off Date LTV and the Maturity Date LTV are calculated by using an appraised value based on certain hypothetical assumptions. Refer to “Description of the Mortgage Pool—Assessments of Property Value and Condition” and “—Appraised Value” in the Preliminary Prospectus for additional details. |
| (4) | Excludes seven mortgage loans that are interest-only for the entire term. |
| (5) | For a more detailed description of Cash Management, refer to “Description of the Mortgage Pool—Certain Terms of the Mortgage Loans—Mortgaged Property Accounts” in the Preliminary Prospectus. |
| (6) | CapEx Reserves include FF&E reserves for hotel properties. |
| (7) | Calculated only with respect to the Cut-off Date Balance of mortgage loans secured or partially secured by office, retail, mixed use and industrial properties. |
THE INFORMATION IN THIS STRUCTURAL AND COLLATERAL TERM SHEET IS NOT COMPLETE AND MAY BE AMENDED PRIOR TO THE TIME OF SALE. THIS TERM SHEET IS NOT AN OFFER TO SELL THESE SECURITIES AND IT IS NOT A SOLICITATION OF AN OFFER TO BUY THESE SECURITIES IN ANY JURISDICTION WHERE THE OFFER OR SALE IS NOT PERMITTED.
| | 6 of 156 |
| Structural and Collateral Term Sheet | JPMCC 2017-JP5 | |
| Collateral Characteristics | ||
Mortgage Loan Seller | Number of | Number of | Aggregate | % of IPB |
| JPMCB(1) | 22 | 22 | $924,280,100 | 84.6% |
| SMF VI | 21 | 37 | 168,701,947 | 15.4 |
| Total: | 43 | 59 | $1,092,982,047 | 100.0% |
| (1) | In the case of Loan No. 1, the whole loan was co-originated by JPMCB, Deutsche Bank AG, New York Branch, Goldman Sachs Mortgage Company, Barclays Bank PLC and Morgan Stanley Bank, N.A. In the case of Loan No. 4, the whole loan was co-originated by JPMCB and Société Générale. |
| Ten Largest Mortgage Loans | |||||||||||
| No. | Loan Name | Mortgage Loan Seller | No. of Prop. | Cut-off Date Balance | % of IPB | SF/Units/ Rooms/Beds | Property Type | UW NCF DSCR(1)(3) | UW NOI Debt Yield(1) | Cut-off Date LTV(1)(2) | Maturity Date LTV(1)(2) |
| 1 | Hilton Hawaiian Village | JPMCB | 1 | $80,000,000 | 7.3% | 2,860 | Hotel | 4.47x | 19.0% | 31.2% | 31.2% |
| 2 | Moffett Gateway | JPMCB | 1 | $80,000,000 | 7.3% | 612,691 | Office | 1.95x | 11.9% | 46.3% | 39.3% |
| 3 | Dallas Design District | JPMCB | 1 | $75,000,000 | 6.9% | 728,452 | Industrial | 1.28x | 9.4% | 62.1% | 55.3% |
| 4 | Fresno Fashion Fair Mall | JPMCB | 1 | $69,000,000 | 6.3% | 536,106 | Retail | 2.19x | 8.3% | 57.5% | 57.5% |
| 5 | Riverway | JPMCB | 1 | $64,763,123 | 5.9% | 869,120 | Office | 1.42x | 10.3% | 72.4% | 59.6% |
| 6 | 55 Hawthorne | JPMCB | 1 | $61,500,000 | 5.6% | 136,432 | Office | 2.61x | 11.8% | 50.0% | 50.0% |
| 7 | Bardmoor Palms | JPMCB | 1 | $55,352,648 | 5.1% | 553,485 | Mixed Use | 1.39x | 9.4% | 73.8% | 60.3% |
| 8 | Landmark Square | JPMCB | 1 | $51,000,000 | 4.7% | 757,917 | Mixed Use | 2.19x | 12.0% | 56.9% | 56.9% |
| 9 | Centre Market Building | JPMCB | 1 | $41,842,074 | 3.8% | 388,122 | Office | 2.48x | 18.2% | 47.0% | 34.6% |
| 10 | Courtyard Marriott - King Kamehameha | JPMCB | 1 | $39,945,058 | 3.7% | 452 | Hotel | 3.06x | 18.6% | 30.0% | 25.3% |
| Top 3 Total/Weighted Average | 3 | $235,000,000 | 21.5% | 2.59x | 13.5% | 46.2% | 41.6% | ||||
| Top 5 Total/Weighted Average | 5 | $368,763,123 | 33.7% | 2.31x | 12.0% | 52.9% | 47.8% | ||||
| Top 10 Total/Weighted Average | 10 | $618,402,903 | 56.6% | 2.31x | 12.6% | 52.9% | 47.5% | ||||
| (1) | In the case of Loan Nos. 1, 2, 3, 4, 5 and 8, the UW NCF DSCR, UW NOI Debt Yield, Cut-off Date LTV and Maturity Date LTV calculations include the related Pari Passu Companion Loan(s). In the case of Loan Nos. 1, 2 and 10, the UW NCF DSCR, UW NOI Debt Yield, Cut-off Date LTV and Maturity Date LTV calculations exclude the related Subordinate Companion Loan(s). |
| (2) | In the case of Loan No. 2, the Cut-off Date LTV and the Maturity Date LTV are calculated by using an appraised value based on certain hypothetical assumptions. Refer to “Description of the Mortgage Pool—Assessments of Property Value and Condition” and “—Appraised Value” in the Preliminary Prospectus for additional details. |
| (3) | In the case of Loan No. 2, the UW NCF DSCR is calculated using the sum of principal and interest payments over the first 12 payments following the expiration of the interest-only period based on the principal payment schedule provided in Annex F of the Preliminary Prospectus. In the case of Loan No. 10, the UW NCF DSCR is calculated using the sum of principal and interest payments over the first 12 payments allocable to the Mortgage Loan following the Cut-off Date based on apro rataallocation between the Mortgage Loan and Subordinate Companion Loan of principal payable on the related Whole Loan in accordance with the amortization schedule set forth in Annex G to the Preliminary Prospectus. |
THE INFORMATION IN THIS STRUCTURAL AND COLLATERAL TERM SHEET IS NOT COMPLETE AND MAY BE AMENDED PRIOR TO THE TIME OF SALE. THIS TERM SHEET IS NOT AN OFFER TO SELL THESE SECURITIES AND IT IS NOT A SOLICITATION OF AN OFFER TO BUY THESE SECURITIES IN ANY JURISDICTION WHERE THE OFFER OR SALE IS NOT PERMITTED.
| | 7 of 156 |
| Structural and Collateral Term Sheet | JPMCC 2017-JP5 | |
| Collateral Characteristics | ||
| Pari Passu Companion Loan Summary | |||||||||
No. | Loan Name | Trust Cut-off Date Balance | Pari Passu Loan(s) Cut-off Date Balance | Total Mortgage Loan Cut-off Date | Controlling Pooling & Servicing Agreement | Master Servicer | Special Servicer | Voting Rights | |
| 1 | Hilton Hawaiian Village | $80,000,000 | $616,600,000 | $696,600,000 | Hilton USA Trust 2016-HHV | Wells Fargo | Aegon | Hilton USA Trust 2016-HHV | |
| 2 | Moffett Gateway | $80,000,000 | $163,000,000 | $243,000,000 | JPMCC 2016-JP4 | Wells Fargo | LNR | JPMCC 2016-JP4 | |
| 3 | Dallas Design District | $75,000,000 | $45,000,000 | $120,000,000 | JPMCC 2017-JP5 | Midland | LNR | JPMCC 2017-JP5 | |
| 4 | Fresno Fashion Fair Mall | $69,000,000 | $256,000,000 | $325,000,000 | JPMDB 2016-C4 | Wells Fargo | Midland | JPMDB 2016-C4 | |
| 5 | Riverway | $64,763,123 | $62,770,411 | $127,533,534 | JPMCC 2016-JP4 | Wells Fargo | LNR | JPMCC 2016-JP4 | |
| 8 | Landmark Square | $51,000,000 | $49,000,000 | $100,000,000 | JPMCC 2017-JP5 | Midland | LNR | JPMCC 2017-JP5 | |
| (1) | In the case of Loan Nos.1 and 2, the Total Mortgage Loan Cut-off Date Balance excludes the related Subordinate Companion Loan(s). |
| Additional Debt Summary(1) |
No. | Loan Name | Trust | Subordinate Debt Cut-off Date | Total Debt Cut-off Date Balance | Mortgage Loan UW NCF DSCR(2)(3) | Total Debt UW NCF DSCR(3) | Mortgage Loan | Total Debt Cut-off Date LTV(4) | Mortgage Loan UW NOI Debt Yield(2) | Total Debt UW NOI Debt Yield |
| 1 | Hilton Hawaiian Village | $80,000,000 | $578,400,000 | $1,275,000,000 | 4.47x | 2.44x | 31.2% | 57.2% | 19.0% | 10.4% |
| 2 | Moffett Gateway | $80,000,000 | $152,000,000 | $395,000,000 | 1.95x | 1.22x | 46.3% | 75.2% | 11.9% | 7.3% |
| 10 | Courtyard Marriott - King Kamehameha | $39,945,058 | $14,979,397 | $54,924,454 | 3.06x | 1.94x | 30.0% | 41.3% | 18.6% | 13.5% |
| (1) | In the case of Loan Nos. 1 and 10, subordinate debt represents one or more Subordinate Companion Loans. In the case of Loan No. 2, subordinate debt represents a Subordinate Companion Loan and a mezzanine loan. |
| (2) | In the case of Loan Nos. 1, 2 and 10, Mortgage Loan UW NCF DSCR, Mortgage Loan Cut-off Date LTV and Mortgage Loan UW NOI Debt Yield calculations include any related Pari Passu Companion Loans, where applicable, but exclude the related Subordinate Companion Loan(s). |
| (3) | In the case of Loan No. 2, the Mortgage Loan UW NCF DSCR and Total Debt UW NCF DSCR are calculated using the sum of principal and interest payments over the first 12 payments following the expiration of the interest-only period based on the principal payment schedule provided in Annex F of the Preliminary Prospectus. In the case of Loan No. 10, the Mortgage Loan UW NCF DSCR is calculated using the sum of principal and interest payments over the first 12 payments allocable to the Mortgage Loan following the Cut-off Date based on apro rataallocation between the Mortgage Loan and Subordinate Companion Loan of principal payable on the related Whole Loan in accordance with the amortization schedule set forth in Annex G to the Preliminary Prospectus. |
| (4) | In the case of Loan No. 2, the Mortgage Loan Cut-off Date LTV and the Total Debt Cut-off Date LTV are calculated by using an appraised value based on certain hypothetical assumptions. Refer to “Description of the Mortgage Pool—Assessments of Property Value and Condition” and “—Appraised Value” in the Preliminary Prospectus for additional details. |
THE INFORMATION IN THIS STRUCTURAL AND COLLATERAL TERM SHEET IS NOT COMPLETE AND MAY BE AMENDED PRIOR TO THE TIME OF SALE. THIS TERM SHEET IS NOT AN OFFER TO SELL THESE SECURITIES AND IT IS NOT A SOLICITATION OF AN OFFER TO BUY THESE SECURITIES IN ANY JURISDICTION WHERE THE OFFER OR SALE IS NOT PERMITTED.
| | 8 of 156 |
| Structural and Collateral Term Sheet | JPMCC 2017-JP5 | |
| Collateral Characteristics | ||
| Mortgaged Properties by Type(1) |
Weighted Average | |||||||||
| Property Type | Property Subtype | Number of Properties | Cut-off Date Principal Balance | % of IPB | Occupancy | UW NCF DSCR(2)(3) | UW NOI Debt Yield(2) | Cut-off Date LTV(2)(4) | Maturity Date LTV(2)(4) |
| Office | Suburban | 9 | $313,488,123 | 28.7% | 90.4% | 1.65x | 10.8% | 63.1% | 55.6% |
| CBD | 2 | 103,342,074 | 9.5 | 95.2% | 2.56x | 14.4% | 48.8% | 43.8% | |
| Subtotal: | 11 | $416,830,197 | 38.1% | 91.6% | 1.87x | 11.7% | 59.5% | 52.7% | |
| Retail | Anchored | 6 | $121,813,314 | 11.1% | 94.3% | 1.35x | 9.3% | 68.4% | 58.0% |
| Super Regional Mall | 1 | 69,000,000 | 6.3 | 89.3% | 2.19x | 8.3% | 57.5% | 57.5% | |
| Unanchored | 2 | 7,731,809 | 0.7 | 100.0% | 1.32x | 9.9% | 71.1% | 59.5% | |
| Shadow Anchored | 1 | 6,581,000 | 0.6 | 93.9% | 1.51x | 10.5% | 74.9% | 66.1% | |
| Freestanding | 2 | 6,086,930 | 0.6 | 100.0% | 1.54x | 9.9% | 56.2% | 49.3% | |
| Subtotal: | 12 | $211,213,053 | 19.3% | 93.0% | 1.63x | 9.1% | 64.8% | 57.9% | |
| Hotel | Full Service | 5 | $183,287,842 | 16.8% | 82.9% | 3.20x | 16.1% | 42.1% | 38.3% |
| Limited Service | 2 | 12,505,845 | 1.1 | 71.9% | 1.87x | 13.2% | 65.3% | 52.1% | |
| Extended Stay | 1 | 11,882,296 | 1.1 | 76.7% | 1.70x | 10.9% | 66.7% | 54.8% | |
| Subtotal: | 8 | $207,675,983 | 19.0% | 81.9% | 3.03x | 15.7% | 44.9% | 40.1% | |
| Mixed Use | Office/Retail | 3 | $61,442,484 | 5.6% | 87.1% | 2.05x | 11.6% | 58.9% | 57.0% |
| Office/Industrial | 1 | 55,352,648 | 5.1 | 100.0% | 1.39x | 9.4% | 73.8% | 60.3% | |
| Subtotal: | 4 | $116,795,132 | 10.7% | 93.2% | 1.74x | 10.6% | 66.0% | 58.6% | |
| Industrial | Flex | 3 | $85,950,000 | 7.9% | 98.1% | 1.36x | 9.8% | 62.5% | 56.1% |
| Warehouse | 1 | 14,215,053 | 1.3 | 90.7% | 1.39x | 11.5% | 72.3% | 60.1% | |
| Subtotal: | 4 | $100,165,053 | 9.2% | 97.1% | 1.36x | 10.0% | 63.9% | 56.7% | |
| Multifamily | Garden | 18 | $31,064,623 | 2.8% | 95.6% | 1.52x | 11.0% | 68.4% | 61.4% |
| Mid-Rise | 1 | 6,438,005 | 0.6 | 95.5% | 1.70x | 14.0% | 55.1% | 42.0% | |
| Subtotal: | 19 | $37,502,628 | 3.4% | 95.6% | 1.55x | 11.5% | 66.1% | 58.1% | |
| Manufactured Housing | Manufactured Housing | 1 | $2,800,000 | 0.3% | 77.4% | 1.48x | 10.1% | 71.4% | 60.7% |
| Total / Weighted Average: | 59 | $1,092,982,047 | 100.0% | 90.8% | 1.97x | 11.7% | 59.1% | 52.5% | |
| (1) | Because this table presents information relating to the mortgaged properties and not mortgage loans, the information for mortgage loans secured by more than one mortgaged property is based on allocated loan amounts. |
| (2) | In the case of Loan Nos. 1, 2, 3, 4, 5 and 8, the UW NCF DSCR, UW NOI Debt Yield, Cut-off Date LTV and Maturity Date LTV calculations include the related Pari Passu Companion Loan(s). In the case of Loan Nos. 1, 2 and 10, the UW NCF DSCR, UW NOI Debt Yield, Cut-off Date LTV and Maturity Date LTV calculations exclude the related Subordinate Companion Loan(s). |
| (3) | In the case of Loan No. 2, the UW NCF DSCR is calculated using the sum of principal and interest payments over the first 12 months following the expiration of the interest-only period based on the assumed principal payment schedule provided on Annex F to the Preliminary Prospectus. In the case of Loan No. 10, the UW NCF DSCR is calculated using the sum of principal and interest payments over the first 12 payments allocable to the Mortgage Loan following the Cut-off Date based on apro rataallocation between the Mortgage Loan and Subordinate Companion Loan of principal payable on the related Whole Loan in accordance with the amortization schedule set forth in Annex G to the Preliminary Prospectus. |
| (4) | In the case of Loan Nos. 2, 12 and 21, the Cut-off Date LTV and the Maturity Date LTV are calculated by using an appraised value based on certain hypothetical assumptions. Refer to “Description of the Mortgage Pool—Assessments of Property Value and Condition” and “—Appraised Value” in the Preliminary Prospectus for additional details. |
THE INFORMATION IN THIS STRUCTURAL AND COLLATERAL TERM SHEET IS NOT COMPLETE AND MAY BE AMENDED PRIOR TO THE TIME OF SALE. THIS TERM SHEET IS NOT AN OFFER TO SELL THESE SECURITIES AND IT IS NOT A SOLICITATION OF AN OFFER TO BUY THESE SECURITIES IN ANY JURISDICTION WHERE THE OFFER OR SALE IS NOT PERMITTED.
| | 9 of 156 |
| Structural and Collateral Term Sheet | JPMCC 2017-JP5 | |
| Collateral Characteristics | ||

| Mortgaged Properties by Location(1) |
Weighted Average | ||||||||
State | Number of | Cut-off Date | % of | Occupancy | UW | UW | Cut-off Date | Maturity Date |
| California | 4 | $222,350,000 | 20.3% | 96.4% | 2.18x | 10.6% | 51.8% | 48.6% |
| Texas | 9 | 180,293,502 | 16.5 | 89.3% | 1.40x | 9.9% | 66.0% | 58.4% |
| Hawaii | 2 | 119,945,058 | 11.0 | 91.4% | 4.00x | 18.9% | 30.8% | 29.2% |
| Florida | 4 | 94,306,221 | 8.6 | 95.5% | 1.50x | 9.9% | 67.7% | 56.2% |
| Georgia | 4 | 76,332,165 | 7.0 | 82.2% | 1.45x | 10.6% | 67.6% | 61.2% |
| Illinois | 17 | 73,763,123 | 6.7 | 95.1% | 1.47x | 10.6% | 70.5% | 58.8% |
| Connecticut | 1 | 51,000,000 | 4.7 | 84.9% | 2.19x | 12.0% | 56.9% | 56.9% |
| New Jersey | 1 | 41,842,074 | 3.8 | 88.1% | 2.48x | 18.2% | 47.0% | 34.6% |
| Virginia | 1 | 38,000,000 | 3.5 | 85.6% | 2.18x | 10.4% | 62.1% | 62.1% |
| Massachusetts | 1 | 33,424,589 | 3.1 | 98.1% | 1.21x | 8.6% | 71.0% | 59.9% |
| Maryland | 1 | 33,250,000 | 3.0 | 79.0% | 1.45x | 10.1% | 73.7% | 64.9% |
| Ohio | 3 | 28,102,500 | 2.6 | 93.9% | 1.47x | 11.6% | 67.6% | 55.4% |
| Michigan | 1 | 21,100,000 | 1.9 | 71.7% | 1.50x | 12.0% | 63.9% | 55.6% |
| Nevada | 1 | 19,750,000 | 1.8 | 100.0% | 1.33x | 9.3% | 64.8% | 56.1% |
| North Carolina | 1 | 16,475,654 | 1.5 | 69.2% | 1.89x | 12.2% | 65.1% | 53.6% |
| Alabama | 1 | 8,850,000 | 0.8 | 94.5% | 1.34x | 9.8% | 74.5% | 65.1% |
| Oklahoma | 1 | 6,581,000 | 0.6 | 93.9% | 1.51x | 10.5% | 74.9% | 66.1% |
| Pennsylvania | 2 | 6,385,157 | 0.6 | 97.8% | 1.33x | 10.0% | 66.4% | 55.7% |
| Wisconsin | 1 | 6,335,152 | 0.6 | 100.0% | 1.28x | 9.3% | 73.1% | 64.2% |
| South Carolina | 1 | 6,170,852 | 0.6 | 79.2% | 1.91x | 14.1% | 68.6% | 52.4% |
| Arizona | 1 | 5,925,000 | 0.5 | 100.0% | 1.40x | 10.6% | 70.7% | 60.8% |
| Minnesota | 1 | 2,800,000 | 0.3 | 77.4% | 1.48x | 10.1% | 71.4% | 60.7% |
| Total / Weighted Average: | 59 | $1,092,982,047 | 100.0% | 90.8% | 1.97x | 11.7% | 59.1% | 52.5% |
| (1) | Because this table presents information relating to the mortgaged properties and not mortgage loans, the information for mortgage loans secured by more than one mortgaged property is based on allocated loan amounts. |
| (2) | In the case of Loan Nos. 1, 2, 3, 4, 5 and 8, the UW NCF DSCR, UW NOI Debt Yield, Cut-off Date LTV and Maturity Date LTV calculations include the related Pari Passu Companion Loan(s). In the case of Loan Nos. 1, 2 and 10, the UW NCF DSCR, UW NOI Debt Yield, Cut-off Date LTV and Maturity Date LTV calculations exclude the related Subordinate Companion Loan(s). |
| (3) | In the case of Loan No. 2, the UW NCF DSCR is calculated using the sum of principal and interest payments over the first 12 months following the expiration of the interest-only period based on the assumed principal payment schedule provided on Annex F to the Preliminary Prospectus. In the case of Loan No. 10, the UW NCF DSCR is calculated using the sum of principal and interest payments over the first 12 payments allocable to the Mortgage Loan following the Cut-off Date based on apro rataallocation between the Mortgage Loan and Subordinate Companion Loan of principal payable on the related Whole Loan in accordance with the amortization schedule set forth in Annex G to the Preliminary Prospectus. |
| (4) | In the case of Loan Nos. 2, 12 and 21, the Cut-off Date LTV and the Maturity Date LTV are calculated by using an appraised value based on certain hypothetical assumptions. Refer to “Description of the Mortgage Pool—Assessments of Property Value and Condition” and “—Appraised Value” in the Preliminary Prospectus for additional details. |
THE INFORMATION IN THIS STRUCTURAL AND COLLATERAL TERM SHEET IS NOT COMPLETE AND MAY BE AMENDED PRIOR TO THE TIME OF SALE. THIS TERM SHEET IS NOT AN OFFER TO SELL THESE SECURITIES AND IT IS NOT A SOLICITATION OF AN OFFER TO BUY THESE SECURITIES IN ANY JURISDICTION WHERE THE OFFER OR SALE IS NOT PERMITTED.
| | 10 of 156 |
| Structural and Collateral Term Sheet | JPMCC 2017-JP5 | |
| Collateral Characteristics | ||
| Cut-off Date Principal Balance |
Weighted Average | |||||||||||
| Range of Cut-off Date Principal Balances | Number of Loans | Cut-off Date Principal Balance | % of IPB | Mortgage Rate | Remaining Loan Term | UW NCF DSCR(1)(2) | UW NOI DY(1) | Cut-off Date LTV(1)(3) | Maturity Date LTV(1)(3) | ||
| $2,786,930 | - | $9,999,999 | 17 | $99,526,292 | 9.1% | 5.32565% | 118 | 1.58x | 11.3% | 66.7% | 57.1% |
| $10,000,000 | - | $19,999,999 | 8 | 124,002,796 | 11.3 | 5.04839% | 110 | 1.53x | 10.7% | 67.3% | 57.5% |
| $20,000,000 | - | $24,999,999 | 2 | 44,600,000 | 4.1 | 4.98130% | 119 | 1.39x | 10.4% | 69.6% | 60.2% |
| $25,000,000 | - | $49,999,999 | 8 | 288,237,188 | 26.4 | 4.83256% | 98 | 1.90x | 12.3% | 58.7% | 51.8% |
| $50,000,000 | - | $80,000,000 | 8 | 536,615,771 | 49.1 | 4.34975% | 118 | 2.24x | 11.7% | 55.1% | 50.2% |
| Total / Weighted Average: | 43 | $1,092,982,047 | 100.0% | 4.67097% | 112 | 1.97x | 11.7% | 59.1% | 52.5% | ||
| Mortgage Interest Rates |
Weighted Average | |||||||||||
| Range of Mortgage Interest Rates | Number of Loans | Cut-off Date Principal Balance | % of IPB | Mortgage Rate | Remaining Loan Term | UW NCF DSCR(1)(2) | UW NOI DY(1) | Cut-off Date LTV(1)(3) | Maturity Date LTV(1)(3) | ||
| 3.31940% | - | 3.99999% | 2 | $149,000,000 | 13.6% | 3.44332% | 119 | 2.06x | 10.2% | 51.5% | 47.7% |
| 4.00000% | - | 4.49999% | 4 | 221,342,074 | 20.3 | 4.23041% | 111 | 3.18x | 15.4% | 44.7% | 42.4% |
| 4.50000% | - | 4.99999% | 14 | 406,872,933 | 37.2 | 4.84369% | 112 | 1.70x | 11.2% | 64.6% | 56.1% |
| 5.00000% | - | 5.75200% | 23 | 315,767,040 | 28.9 | 5.33653% | 109 | 1.44x | 10.3% | 65.7% | 57.2% |
| Total / Weighted Average: | 43 | $1,092,982,047 | 100.0% | 4.67097% | 112 | 1.97x | 11.7% | 59.1% | 52.5% | ||
| Original Term to Maturity in Months |
Weighted Average | |||||||||
| Original Term to Maturity in Months | Number of Loans | Cut-off Date Principal Balance | % of IPB | Mortgage Rate | Remaining Loan Term | UW NCF DSCR(1)(2) | UW NOI DY(1) | Cut-off Date LTV(1)(3) | Maturity Date LTV(1)(3) |
| 60 | 3 | $88,006,451 | 8.1% | 5.17654% | 58 | 1.41x | 10.0% | 68.0% | 64.0% |
| 84 | 1 | 38,000,000 | 3.5 | 4.20000% | 81 | 2.18x | 10.4% | 62.1% | 62.1% |
| 120 | 38 | 886,975,596 | 81.2 | 4.76289% | 118 | 2.02x | 11.9% | 59.2% | 52.1% |
| 126 | 1 | 80,000,000 | 7.3 | 3.31940% | 121 | 1.95x | 11.9% | 46.3% | 39.3% |
| Total / Weighted Average: | 43 | $1,092,982,047 | 100.0% | 4.67097% | 112 | 1.97x | 11.7% | 59.1% | 52.5% |
| Remaining Term to Maturity in Months | |||||||||
| Weighted Average | |||||||||||||||
| Range of Remaining Term to Maturity in Months | Number of Loans | Cut-off Date Principal Balance | % of IPB | Mortgage Rate | Remaining Loan Term | UW NCF DSCR(1)(2) | UW NOI DY(1) | Cut-off Date LTV(1)(3) | Maturity Date LTV(1)(3) | ||||||
| 58 | - | 114 | 4 | $126,006,451 | 11.5% | 4.88204% | 65 | 1.64x | 10.1% | 66.2% | 63.4% | ||||
| 115 | - | 121 | 39 | 966,975,596 | 88.5 | 4.64347% | 118 | 2.02x | 11.9% | 58.2% | 51.1% | ||||
| Total / Weighted Average: | 43 | $1,092,982,047 | 100.0% | 4.67097% | 112 | 1.97x | 11.7% | 59.1% | 52.5% | ||||||
| (1) | In the case of Loan Nos. 1, 2, 3, 4, 5 and 8, the UW NCF DSCR, UW NOI DY, Cut-off Date LTV and Maturity Date LTV calculations include the related Pari Passu Companion Loan(s). In the case of Loan Nos. 1, 2 and 10, the UW NCF DSCR, UW NOI DY, Cut-off Date LTV and Maturity Date LTV calculations exclude the related Subordinate Companion Loan(s). |
| (2) | In the case of Loan No. 2, the UW NCF DSCR is calculated using the sum of principal and interest payments over the first 12 months following the expiration of the interest-only period based on the assumed principal payment schedule provided on Annex F to the Preliminary Prospectus. In the case of Loan No. 10, the UW NCF DSCR is calculated using the sum of principal and interest payments over the first 12 payments allocable to the Mortgage Loan following the Cut-off Date based on apro rataallocation between the Mortgage Loan and Subordinate Companion Loan of principal payable on the related Whole Loan in accordance with the amortization schedule set forth in Annex G to the Preliminary Prospectus. |
| (3) | In the case of Loan Nos. 2, 12 and 21, the Cut-off Date LTV and the Maturity Date LTV are calculated by using an appraised value based on certain hypothetical assumptions. Refer to “Description of the Mortgage Pool—Assessments of Property Value and Condition” and “—Appraised Value” in the Preliminary Prospectus for additional details. |
THE INFORMATION IN THIS STRUCTURAL AND COLLATERAL TERM SHEET IS NOT COMPLETE AND MAY BE AMENDED PRIOR TO THE TIME OF SALE. THIS TERM SHEET IS NOT AN OFFER TO SELL THESE SECURITIES AND IT IS NOT A SOLICITATION OF AN OFFER TO BUY THESE SECURITIES IN ANY JURISDICTION WHERE THE OFFER OR SALE IS NOT PERMITTED.
| | 11 of 156 |
| Structural and Collateral Term Sheet | JPMCC 2017-JP5 | |
| Collateral Characteristics | ||
| Original Amortization Term in Months |
| Weighted Average | |||||||||
| Original Amortization Term in Months | Number of Loans | Cut-off Date Principal Balance | % of IPB | Mortgage Rate | Remaining Loan Term | UW NCF DSCR(1)(2) | UW NOI DY(1) | Cut-off Date LTV(1)(3) | Maturity Date LTV(1)(3) |
| Interest Only | 7 | $308,500,000 | 28.2% | 4.20527% | 112 | 2.86x | 12.7% | 49.6% | 49.6% |
| 300 | 5 | 63,117,927 | 5.8 | 4.80092% | 118 | 2.21x | 16.5% | 52.7% | 39.3% |
| 360 | 31 | 721,364,119 | 66.0 | 4.85877% | 111 | 1.58x | 10.8% | 63.7% | 54.9% |
| Total / Weighted Average: | 43 | $1,092,982,047 | 100.0% | 4.67097% | 112 | 1.97x | 11.7% | 59.1% | 52.5% |
| Remaining Amortization Term in Months |
Weighted Average | |||||||||||
| Range of Remaining Amortization Term in Months | Number of Loans | Cut-off Date Principal Balance | % of IPB | Mortgage Rate | Remaining Loan Term | UW NCF DSCR(1)(2) | UW NOI DY(1) | Cut-off Date LTV(1)(3) | Maturity Date LTV(1)(3) | ||
| Interest Only | 7 | $308,500,000 | 28.2% | 4.20527% | 112 | 2.86x | 12.7% | 49.6% | 49.6% | ||
| 297 | - | 356 | 5 | 63,117,927 | 5.8 | 4.80092% | 118 | 2.21x | 16.5% | 52.7% | 39.3% |
| 357 | - | 360 | 31 | 721,364,119 | 66.0 | 4.85877% | 111 | 1.58x | 10.8% | 63.7% | 54.9% |
| Total / Weighted Average: | 43 | $1,092,982,047 | 100.0% | 4.67097% | 112 | 1.97x | 11.7% | 59.1% | 52.5% | ||
| Amortization Types |
Weighted Average | |||||||||
| Amortization Types | Number of Loans | Cut-off Date Principal Balance | % of IPB | Mortgage Rate | Remaining Loan Term | UW NCF DSCR(1)(2) | UW NOI DY(1) | Cut-off Date LTV(1)(3) | Maturity Date LTV(1)(3) |
| Balloon | 21 | $428,540,895 | 39.2% | 5.01381% | 111 | 1.72x | 11.9% | 62.9% | 52.1% |
| IO-Balloon | 14 | 349,606,000 | 32.0 | 4.64629% | 112 | 1.51x | 10.5% | 62.6% | 55.4% |
| Interest Only | 7 | 308,500,000 | 28.2 | 4.20527% | 112 | 2.86x | 12.7% | 49.6% | 49.6% |
| Amortizing-IO-Balloon | 1 | 6,335,152 | 0.6 | 5.52000% | 118 | 1.28x | 9.3% | 73.1% | 64.2% |
| Total / Weighted Average: | 43 | $1,092,982,047 | 100.0% | 4.67097% | 112 | 1.97x | 11.7% | 59.1% | 52.5% |
| Underwritten Net Cash Flow Debt Service Coverage Ratios(1)(2) |
| Weighted Average | |||||||||||
| Range of Underwritten Net Cash Flow Debt Service Coverage Ratios | Number of Loans | Cut-off Date Principal Balance | % of IPB | Mortgage Rate | Remaining Loan Term | UW NCF DSCR(1)(2) | UW NOI DY(1) | Cut-off Date LTV(1)(3) | Maturity Date LTV(1)(3) | ||
| 1.21x | - | 1.24x | 1 | $33,424,589 | 3.1% | 5.75200% | 118 | 1.21x | 8.6% | 71.0% | 59.9% |
| 1.25x | - | 1.74x | 28 | 539,643,591 | 49.4 | 5.03256% | 108 | 1.41x | 10.1% | 68.3% | 59.0% |
| 1.75x | - | 2.24x | 10 | 296,626,735 | 27.1 | 4.14102% | 114 | 2.06x | 11.0% | 56.0% | 52.3% |
| 2.25x | - | 2.74x | 2 | 103,342,074 | 9.5 | 4.26552% | 118 | 2.56x | 14.4% | 48.8% | 43.8% |
| 2.75x | - | 4.47x | 2 | 119,945,058 | 11.0 | 4.40281% | 117 | 4.00x | 18.9% | 30.8% | 29.2% |
| Total / Weighted Average: | 43 | $1,092,982,047 | 100.0% | 4.67097% | 112 | 1.97x | 11.7% | 59.1% | 52.5% | ||
| (1) | In the case of Loan Nos. 1, 2, 3, 4, 5 and 8, the UW NCF DSCR, UW NOI DY, Cut-off Date LTV and Maturity Date LTV calculations include the related Pari Passu Companion Loan(s). In the case of Loan Nos. 1, 2 and 10, the UW NCF DSCR, UW NOI DY, Cut-off Date LTV and Maturity Date LTV calculations exclude the related Subordinate Companion Loan(s). |
| (2) | In the case of Loan No. 2, the UW NCF DSCR is calculated using the sum of principal and interest payments over the first 12 months following the expiration of the interest-only period based on the assumed principal payment schedule provided on Annex F to the Preliminary Prospectus. In the case of Loan No. 10, the UW NCF DSCR is calculated using the sum of principal and interest payments over the first 12 payments allocable to the Mortgage Loan following the Cut-off Date based on apro rataallocation between the Mortgage Loan and Subordinate Companion Loan of principal payable on the related Whole Loan in accordance with the amortization schedule set forth in Annex G to the Preliminary Prospectus. |
| (3) | In the case of Loan Nos. 2, 12 and 21, the Cut-off Date LTV and the Maturity Date LTV are calculated by using an appraised value based on certain hypothetical assumptions. Refer to “Description of the Mortgage Pool—Assessments of Property Value and Condition” and “—Appraised Value” in the Preliminary Prospectus for additional details. |
THE INFORMATION IN THIS STRUCTURAL AND COLLATERAL TERM SHEET IS NOT COMPLETE AND MAY BE AMENDED PRIOR TO THE TIME OF SALE. THIS TERM SHEET IS NOT AN OFFER TO SELL THESE SECURITIES AND IT IS NOT A SOLICITATION OF AN OFFER TO BUY THESE SECURITIES IN ANY JURISDICTION WHERE THE OFFER OR SALE IS NOT PERMITTED.
| | 12 of 156 |
| Structural and Collateral Term Sheet | JPMCC 2017-JP5 | |
| Collateral Characteristics | ||
| LTV Ratios as of the Cut-off Date(1)(3) |
| Weighted Average | |||||||||||
| Range of Cut-off Date LTVs | Number of Loans | Cut-off Date Principal Balance | % of IPB | Mortgage Rate | Remaining Loan Term | UW NCF DSCR(1)(2) | UW NOI DY(1) | Cut-off Date LTV(1)(3) | Maturity Date LTV(1)(3) | ||
| 30.0% | - | 49.9% | 5 | $245,087,132 | 22.4% | 4.07363% | 118 | 3.04x | 16.4% | 38.9% | 33.7% |
| 50.0% | - | 59.9% | 6 | 226,891,578 | 20.8 | 4.29886% | 118 | 2.19x | 10.7% | 55.6% | 53.5% |
| 60.0% | - | 64.9% | 10 | 227,389,053 | 20.8 | 5.02665% | 104 | 1.57x | 10.2% | 62.8% | 56.5% |
| 65.0% | - | 69.9% | 8 | 112,843,468 | 10.3 | 5.02968% | 97 | 1.52x | 10.9% | 68.0% | 59.5% |
| 70.0% | - | 74.9% | 14 | 280,770,817 | 25.7 | 5.06088% | 114 | 1.38x | 9.8% | 73.1% | 62.0% |
| Total / Weighted Average: | 43 | $1,092,982,047 | 100.0% | 4.67097% | 112 | 1.97x | 11.7% | 59.1% | 52.5% | ||
| LTV Ratios as of the Maturity Date(1)(3) |
Weighted Average | |||||||||||
| Range of Maturity Date LTVs | Number of Loans | Cut-off Date Principal Balance | % of IPB | Mortgage Rate | Remaining Loan Term | UW NCF DSCR(1)(2) | UW NOI DY(1) | Cut-off Date LTV(1)(3) | Maturity Date LTV(1)(3) | ||
| 25.3% | - | 44.9% | 5 | $248,225,137 | 22.7% | 4.09476% | 119 | 3.02x | 16.4% | 39.2% | 33.7% |
| 45.0% | - | 49.9% | 3 | 36,040,502 | 3.3 | 4.74159% | 119 | 1.56x | 10.2% | 59.3% | 48.8% |
| 50.0% | - | 54.9% | 9 | 144,039,098 | 13.2 | 4.67208% | 118 | 2.12x | 11.8% | 58.2% | 51.7% |
| 55.0% | - | 59.9% | 11 | 398,494,206 | 36.5 | 4.89623% | 113 | 1.61x | 9.9% | 63.8% | 57.5% |
| 60.0% | - | 69.6% | 15 | 266,183,105 | 24.4 | 4.86093% | 100 | 1.51x | 10.0% | 71.1% | 63.5% |
| Total / Weighted Average: | 43 | $1,092,982,047 | 100.0% | 4.67097% | 112 | 1.97x | 11.7% | 59.1% | 52.5% | ||
| Prepayment Protection |
Weighted Average | |||||||||
| Prepayment Protection | Number of Loans | Cut-off Date Principal Balance | % of IPB | Mortgage Rate | Remaining Loan Term | UW NCF DSCR(1)(2) | UW NOI DY(1) | Cut-off Date LTV(1)(3) | Maturity Date LTV(1)(3) |
| Defeasance(5) | 29 | $584,071,768 | 53.4% | 4.69163% | 113 | 1.77x | 11.0% | 61.6% | 54.6% |
| Yield Maintenance | 10 | 323,684,625 | 29.6 | 4.93902% | 108 | 1.72x | 11.9% | 61.2% | 52.6% |
| Defeasance or Yield Maintenance | 4 | 185,225,654 | 16.9 | 4.13740% | 117 | 3.06x | 13.4% | 47.6% | 45.6% |
| Total / Weighted Average: | 43 | $1,092,982,047 | 100.0% | 4.67097% | 112 | 1.97x | 11.7% | 59.1% | 52.5% |
| Loan Purpose |
Weighted Average | |||||||||
| Loan Purpose | Number of Loans | Cut-off Date Principal Balance | % of IPB | Mortgage Rate | Remaining Loan Term | UW NCF DSCR(1)(2) | UW NOI DY(1) | Cut-off Date LTV(1)(3) | Maturity Date LTV(1)(3) |
| Refinance | 25 | $688,580,039 | 63.0% | 4.75054% | 114 | 2.05x | 12.4% | 56.3% | 49.0% |
| Acquisition | 16 | 326,402,008 | 29.9 | 4.71603% | 106 | 1.77x | 10.8% | 65.3% | 58.8% |
| Recapitalization | 2 | 78,000,000 | 7.1 | 3.78004% | 116 | 2.15x | 8.8% | 57.5% | 57.0% |
| Total / Weighted Average: | 43 | $1,092,982,047 | 100.0% | 4.67097% | 112 | 1.97x | 11.7% | 59.1% | 52.5% |
| (1) | In the case of Loan Nos. 1, 2, 3, 4, 5 and 8, the UW NCF DSCR, UW NOI DY, Cut-off Date LTV and Maturity Date LTV calculations include the related Pari Passu Companion Loan(s). In the case of Loan Nos. 1, 2 and 10, the UW NCF DSCR, UW NOI DY, Cut-off Date LTV and Maturity Date LTV calculations exclude the related Subordinate Companion Loan(s). |
| (2) | In the case of Loan No. 2, the UW NCF DSCR is calculated using the sum of principal and interest payments over the first 12 months following the expiration of the interest-only period based on the assumed principal payment schedule provided on Annex F to the Preliminary Prospectus. In the case of Loan No. 10, the UW NCF DSCR is calculated using the sum of principal and interest payments over the first 12 payments allocable to the Mortgage Loan following the Cut-off Date based on apro rataallocation between the Mortgage Loan and Subordinate Companion Loan of principal payable on the related Whole Loan in accordance with the amortization schedule set forth in Annex G to the Preliminary Prospectus. |
| (3) | In the case of Loan Nos. 2, 12 and 21, the Cut-off Date LTV and the Maturity Date LTV are calculated by using an appraised value based on certain hypothetical assumptions. Refer to “Description of the Mortgage Pool—Assessments of Property Value and Condition” and “—Appraised Value” in the Preliminary Prospectus for additional details. |
THE INFORMATION IN THIS STRUCTURAL AND COLLATERAL TERM SHEET IS NOT COMPLETE AND MAY BE AMENDED PRIOR TO THE TIME OF SALE. THIS TERM SHEET IS NOT AN OFFER TO SELL THESE SECURITIES AND IT IS NOT A SOLICITATION OF AN OFFER TO BUY THESE SECURITIES IN ANY JURISDICTION WHERE THE OFFER OR SALE IS NOT PERMITTED.
| | 13 of 156 |
| Structural and Collateral Term Sheet | JPMCC 2017-JP5 | |
| Collateral Characteristics | ||
| Previous Securitization History(1) |
| No. | Loan Name | Location | Property Type | Previous Securitization |
| 1 | Hilton Hawaiian Village | Honolulu, HI | Hotel | HILT 2013-HLT |
| 3 | Dallas Design District | Dallas, TX | Industrial | JPMCC 2015-FL7 |
| 9 | Centre Market Building | Newark, NJ | Office | JPMCC 2012-CBX |
| 10 | Courtyard Marriott - King Kamehameha | Kailua-Kona, HI | Hotel | MSBAM 2014-C17 |
| 15 | Marriott Galleria | Houston, TX | Hotel | BCMS 2007-BBA8 |
| 16 | Royal Oaks Plaza | Houston, TX | Retail | JPMCC 2007-CB19 |
| 17 | Las Palmas | San Antonio, TX | Retail | JPMCC 2007-CB19 |
| 18 | Liberty Center | Troy, MI | Office | MSC 2007-IQ14 |
| 19 | Ocotillo Plaza | Las Vegas, NV | Retail | GECMC 2007-C1 |
| 23 | Partridge Inn Augusta | Augusta, GA | Hotel | GCCFC 2007-GG9 |
| 25 | TownePlace Suites Dallas Las Colinas | Irving, TX | Hotel | CDGJ 2014-BXCH |
| 29 | Montgomery Triangle Gateway | Cincinnati, OH | Mixed Use | MSC 2007-IQ16 |
| 30 | Neilson Square | Enid, OK | Retail | CWCI 2007-C2 |
| 32.02 | St. Albans Circle | Newton Square, PA | Mixed Use | JPMCC 2006-CB16 |
| 33 | Lake Geneva Commons | Lake Geneva, WI | Retail | JPMCC 2007-CB20 |
| 35 | Holiday Inn Express Orangeburg | Orangeburg, SC | Hotel | MSC 2007-HQ11 |
| (1) | The table above represents the properties for which the previously existing debt was most recently securitized, based on information provided by the related borrower or obtained through searches of a third-party database. |
THE INFORMATION IN THIS STRUCTURAL AND COLLATERAL TERM SHEET IS NOT COMPLETE AND MAY BE AMENDED PRIOR TO THE TIME OF SALE. THIS TERM SHEET IS NOT AN OFFER TO SELL THESE SECURITIES AND IT IS NOT A SOLICITATION OF AN OFFER TO BUY THESE SECURITIES IN ANY JURISDICTION WHERE THE OFFER OR SALE IS NOT PERMITTED.
| | 14 of 156 |
| Structural and Collateral Term Sheet | JPMCC 2017-JP5 |
| Class A-2(1) |
No. | Loan Name | Location | Cut-off Date Balance | % of IPB | Maturity Date Balance | % of Certificate Class(2) | Original Loan Term | Remaining Loan Term | UW NCF DSCR | UW NOI Debt Yield | Cut-off Date LTV | Maturity Date LTV |
| 11 | Milton Park | Alpharetta, GA | $39,900,000 | 3.7% | $38,114,571 | 46.0% | 60 | 58 | 1.36x | 10.1% | 69.6% | 66.5% |
| 15 | Marriott Galleria | Houston, TX | $31,921,895 | 2.9 | 29,623,451 | 35.8 | 60 | 58 | 1.51x | 10.0% | 62.6% | 58.1% |
| 22 | Woodglen Village | Houston, TX | $16,184,557 | 1.5 | 15,090,737 | 18.2 | 60 | 58 | 1.34x | 9.7% | 74.6% | 69.6% |
| Total / Weighted Average: | $88,006,451 | 8.1% | $82,828,759 | 100.0% | 60 | 58 | 1.41x | 10.0% | 68.0% | 64.0% | ||
| (1) | The table above presents the mortgage loans whose balloon payments would be applied to pay down the certificate balance of the Class A-2 Certificates, assuming a 0% CPR and applying the “Modeling Assumptions” described in the Preliminary Prospectus, including the assumptions that (i) none of the mortgage loans in the pool experience prepayments, defaults or losses; (ii) there are no extensions of maturity dates of any mortgage loans in the pool; and (iii) each mortgage loan in the pool is paid in full on its stated maturity date. Each Class of Certificates, including the Class A-2 Certificates, evidences undivided ownership interests in the entire pool of mortgage loans. Debt service coverage ratio, debt yield and loan-to-value ratio information does not take into account subordinate debt (whether or not secured by the mortgaged property), if any, that is allowed under the terms of any mortgage loan. See Annex A-1 to the Preliminary Prospectus. |
| (2) | Reflects the percentage equal to the Maturity Date Balance divided by the initial Class A-2 Certificate Balance. |
THE INFORMATION IN THIS STRUCTURAL AND COLLATERAL TERM SHEET IS NOT COMPLETE AND MAY BE AMENDED PRIOR TO THE TIME OF SALE. THIS TERM SHEET IS NOT AN OFFER TO SELL THESE SECURITIES AND IT IS NOT A SOLICITATION OF AN OFFER TO BUY THESE SECURITIES IN ANY JURISDICTION WHERE THE OFFER OR SALE IS NOT PERMITTED.
| | 15 of 156 |
| Structural and Collateral Term Sheet | JPMCC 2017-JP5 |
| Class A-3(1) |
No. | Loan Name | Location | Cut-off Date Balance | % of IPB | Maturity Date Balance | % of Certificate Class(2) | Original Loan Term | Remaining Loan Term | UW NCF DSCR | UW NOI Debt Yield | Cut-off Date LTV | Maturity Date LTV |
| 12 | Reston EastPointe | Reston, VA | $38,000,000 | 3.5% | $38,000,000 | 100.0% | 84 | 81 | 2.18x | 10.4% | 62.1% | 62.1% |
| Total | $38,000,000 | 3.5% | $38,000,000 | 100.0% | 84 | 81 | 2.18x | 10.4% | 62.1% | 62.1% | ||
| (1) | The table above presents the mortgage loan whose balloon payments would be applied to pay down the certificate balance of the Class A-3 Certificates, assuming a 0% CPR and applying the “Modeling Assumptions” described in the Preliminary Prospectus, including the assumptions that (i) none of the mortgage loans in the pool experience prepayments, defaults or losses; (ii) there are no extensions of maturity dates of any mortgage loans in the pool; and (iii) each mortgage loan in the pool is paid in full on its stated maturity date. Each Class of Certificates, including the Class A-3 Certificates, evidences undivided ownership interests in the entire pool of mortgage loans. Debt service coverage ratio, debt yield and loan-to-value ratio information does not take into account subordinate debt (whether or not secured by the mortgaged property), if any, that is allowed under the terms of any mortgage loan. See Annex A-1 to the Preliminary Prospectus. |
| (2) | Reflects the percentage equal to the Maturity Date Balance divided by the initial Class A-3 Certificate Balance. |
THE INFORMATION IN THIS STRUCTURAL AND COLLATERAL TERM SHEET IS NOT COMPLETE AND MAY BE AMENDED PRIOR TO THE TIME OF SALE. THIS TERM SHEET IS NOT AN OFFER TO SELL THESE SECURITIES AND IT IS NOT A SOLICITATION OF AN OFFER TO BUY THESE SECURITIES IN ANY JURISDICTION WHERE THE OFFER OR SALE IS NOT PERMITTED.
| | 16 of 156 |
| Structural and Collateral Term Sheet | JPMCC 2017-JP5 |
| Structural Overview | |
| ■ Accrual: | Each Class of Certificates (other than the Class R Certificates) will accrue interest on a 30/360 basis. The Class R Certificates will not accrue interest. | |
| ■ Distribution of Interest: | On each Distribution Date, accrued interest for each Class of Certificates (other than the Class R Certificates) at the applicable pass-through rate will be distributed in the following order of priority to the extent of available funds: first, to the Class A-1, Class A-2, Class A-3, Class A-4, Class A-5, Class A-SB, Class X-A, Class X-B and Class X-C Certificates (the “Senior Certificates”), on apro rata basis, based on the interest entitlement for each such Class on such date, and then to the Class A-S, Class B, Class C, Class D, Class D-RR, Class E-RR, Class F-RR and Class NR-RR Certificates, in that order, in each case until the interest entitlement for such date payable to each such Class is paid in full.
The pass-through rate applicable to the Class A-1, Class A-2, Class A-3, Class A-4, Class A-5, Class A-SB, Class A-S, Class B, Class C, Class D, Class D-RR, Class E-RR, Class F-RR and Class NR-RR Certificates on each Distribution Date, will be aper annum rate equal to one of (i) a fixed rate, (ii) the weighted average of the net mortgage rates on the mortgage loans (in each case adjusted, if necessary, to accrue on the basis of a 360-day year consisting of twelve 30-day months), (iii) the lesser of a specified fixed pass-through rate and the rate described in clause (ii) above or (iv) the rate described in clause (ii) above less a specified percentage.
The pass-through rate for the Class X-A Certificates for any Distribution Date will be aper annum rate equal to the excess, if any, of (a) the weighted average of the net mortgage rates on the mortgage loans (in each case adjusted, if necessary, to accrue on the basis of a 360-day year consisting of twelve 30-day months), over (b) the weighted average of the pass-through rates on the Class A-1, Class A-2, Class A-3, Class A-4, Class A-5, Class A-SB and Class A-S Certificates for the related Distribution Date, weighted on the basis of their respective Certificate Balances outstanding immediately prior to that Distribution Date.
The pass-through rate for the Class X-B Certificates for any Distribution Date will be aper annum rate equal to the excess, if any, of (a) the weighted average of the net mortgage rates on the mortgage loans (in each case adjusted, if necessary, to accrue on the basis of a 360-day year consisting of twelve 30-day months), over (b) the pass-through rate on the Class B Certificates for the related Distribution Date.
The pass-through rate for the Class X-C Certificates for any Distribution Date will be aper annum rate equal to the excess, if any, of (a) the weighted average of the net mortgage rates on the mortgage loans (in each case adjusted, if necessary, to accrue on the basis of a 360-day year consisting of twelve 30-day months), over (b) the pass-through rate on the Class C Certificates for the related Distribution Date.
See “Description of the Certificates—Distributions” in the Preliminary Prospectus. | |
| ■ Distribution of Principal: | On any Distribution Date prior to the Cross-Over Date, payments in respect of principal of the Certificates will be distributed:
first, to the Class A-SB Certificates until the Certificate Balance of the Class A-SB Certificates is reduced to the Class A-SB planned principal balance for the related Distribution Date set forth in Annex E to the Preliminary Prospectus, second, to the Class A-1 Certificates, until the Certificate Balance of such Class is reduced to zero, third, to the Class A-2 Certificates, until the Certificate Balance of such Class is reduced to zero, fourth, to the Class A-3 Certificates, until the Certificate Balance of such Class is reduced to zero, fifth, to the Class A-4 Certificates, until the Certificate Balance of such Class is reduced to zero, sixth, to the Class A-5 Certificates, until the Certificate Balance of such Class is reduced to zero, and seventh, to the Class A-SB Certificates, until the Certificate Balance of such Class is reduced to zero and then to the Class A-S, Class B, Class C, Class D, Class D-RR, Class E-RR, Class F-RR and Class NR-RR Certificates, in that order, until the Certificate Balance of each such Class is reduced to zero.
On any Distribution Date on or after the Cross-Over Date, payments in respect of principal of the Certificates will be distributed to the Class A-1, Class A-2, Class A-3, Class A-4, Class A-5 and Class A-SB Certificates,pro rata based on the Certificate Balance of each such Class until the Certificate Balance of each such Class is reduced to zero.
The “Cross-Over Date” means the Distribution Date on which the aggregate Certificate Balances of the Class A-S, Class B, Class C, Class D, Class D-RR, Class E-RR, Class F-RR |
THE INFORMATION IN THIS STRUCTURAL AND COLLATERAL TERM SHEET IS NOT COMPLETE AND MAY BE AMENDED PRIOR TO THE TIME OF SALE. THIS TERM SHEET IS NOT AN OFFER TO SELL THESE SECURITIES AND IT IS NOT A SOLICITATION OF AN OFFER TO BUY THESE SECURITIES IN ANY JURISDICTION WHERE THE OFFER OR SALE IS NOT PERMITTED.
| | 17 of 156 |
| Structural and Collateral Term Sheet | JPMCC 2017-JP5 |
| Structural Overview | |
and Class NR-RR Certificates have been reduced to zero as a result of the allocation of realized losses to such Classes.
The Class X-A, Class X-B and Class X-C Certificates (the “Class X Certificates”) will not be entitled to receive distributions of principal; however, the notional amount of the Class X-A Certificates will be reduced by the aggregate amount of principal distributions, realized losses and trust fund expenses, if any, allocated to the Class A-1, Class A-2, Class A-3, Class A-4, Class A-5, Class A-SB and Class A-S Certificates, the notional amount of the Class X-B Certificates will be reduced by the amount of principal distributions, realized losses and trust fund expenses, if any, allocated to the Class B Certificates and the notional amount of the Class X-C Certificates will be reduced by the amount of principal distributions, realized losses and trust fund expenses, if any, allocated to the Class C Certificates. | ||||||
| ■ Yield Maintenance / Fixed Penalty Allocation: | For purposes of the distribution of Yield Maintenance Charges on any Distribution Date, Yield Maintenance Charges collected in respect of the mortgage loans will first be allocated pro rata among four groups (based on the aggregate amount of principal distributed to the Principal Balance Certificates in each group), consisting of (a) the Class A-1, Class A-2, Class A-3, Class A-4, Class A-5, Class A-SB, Class A-S and Class X-A Certificates (“YM Group A”), (b) the Class B and Class X-B Certificates (“YM Group B”), (c) the Class C and Class X-C Certificates (“YM Group C”), (d) the Class D Certificates (“YM Group D”) and (e) the Class D-RR, Class E-RR, Class F-RR and Class NR-RR Certificates (“YM Group RR”). As among the Classes of Certificates in each YM Group, other than the YM Group D and YM Group RR, each Class of Certificates entitled to distributions of principal will receive an amount calculated generally in accordance with the following formula and as more specifically described in the Preliminary Prospectus, with any remaining Yield Maintenance Charges on such Distribution Date being distributed to the class of Class X Certificates in such YM Group. | |||||
| YM | X | Principal Paid to Class | X | (Pass-Through Rate on Class – Discount Rate) | ||
| Charge | Total Principal Paid | (Mortgage Rate on Loan – Discount Rate) | ||||
As among the Classes of Certificates in the YM Group D and YM Group RR, each Class of Certificates in such YM Group entitled to distributions of principal will receive an amount calculated generally in accordance with the following formula and as more specifically described in the Preliminary Prospectus. | ||||||
| YM | X | Principal Paid to Class | ||||
| Charge | Total Principal Paid to the related YM Group | |||||
No Yield Maintenance Charges will be distributed to the Class R Certificates. | ||||||
| ■ Realized Losses: | Losses on the mortgage loans will be allocated first to the Class NR-RR, Class F-RR, Class E-RR, Class D-RR, Class D, Class C, Class B and Class A-S Certificates, in that order, in each case until the Certificate Balance of all such Classes have been reduced to zero, and then, to the Class A-1, Class A-2, Class A-3, Class A-4, Class A-5 and Class A-SB Certificates,pro rata, based on the Certificate Balance of each such Class, until the Certificate Balance of each such Class has been reduced to zero. The notional amounts of the Class X-A, Class X-B and Class X-C Certificates will be reduced by the aggregate amount of realized losses allocated to Certificates that are components of the notional amounts of the Class X-A, Class X-B and Class X-C Certificates, respectively.
Losses on eachpari passu Whole Loan will be allocated,pro rata, between the related mortgage loan and the relatedpari passu companion loan(s), based upon their respective principal balances. With respect to the Hilton Hawaiian Village Whole Loan, the Moffett Gateway Whole Loan and the Courtyard Marriott - King Kamehameha Whole Loan, losses will be allocated first to each related subordinate companion loan(s) until reduced to zero and then to the related mortgage loan and any relatedpari passu companion loans,pro rata, based on their respective principal balances. | |||||
| ■ Interest Shortfalls: | A shortfall with respect to the amount of available funds distributable in respect of interest can result from, among other sources: (a) delinquencies and defaults by borrowers; (b) shortfalls resulting from the application of appraisal reductions to reduce P&I Advances; (c) shortfalls resulting from interest on Advances made by the Master Servicer, the Special Servicer or the Trustee; (d) shortfalls resulting from the payment of Special Servicing Fees and other additional compensation that the Special Servicer is entitled to receive; (e) shortfalls resulting from | |||||
THE INFORMATION IN THIS STRUCTURAL AND COLLATERAL TERM SHEET IS NOT COMPLETE AND MAY BE AMENDED PRIOR TO THE TIME OF SALE. THIS TERM SHEET IS NOT AN OFFER TO SELL THESE SECURITIES AND IT IS NOT A SOLICITATION OF AN OFFER TO BUY THESE SECURITIES IN ANY JURISDICTION WHERE THE OFFER OR SALE IS NOT PERMITTED.
| | 18 of 156 |
| Structural and Collateral Term Sheet | JPMCC 2017-JP5 |
| Structural Overview | |
extraordinary expenses of the trust, including indemnification payments payable to the Depositor, the Master Servicer, the Special Servicer, the Certificate Administrator, the Trustee, the Operating Advisor and the Asset Representations Reviewer; (f) shortfalls resulting from a modification of a mortgage loan’s interest rate or principal balance; and (g) shortfalls resulting from other unanticipated or default-related expenses of the trust. Any such shortfalls that decrease the amount of available funds distributable in respect of interest to the Certificateholders will reduce distributions to the classes of Certificates (other than the Class R Certificates) beginning with those with the lowest payment priorities, in reverse sequential order. See “Description of the Certificates—Distributions—Priority of Distributions” in the Preliminary Prospectus. | ||||||
| ■ Appraisal Reduction Amounts: | With respect to mortgage loans serviced under the Pooling and Servicing Agreement, upon the occurrence of certain trigger events with respect to a mortgage loan, which are generally tied to certain events of default under the related mortgage loan documents, the Special Servicer will be obligated to obtain an appraisal of the related mortgaged property and the Master Servicer will calculate the Appraisal Reduction Amount. The “Appraisal Reduction Amount” is generally the amount by which the current principal balance of the related mortgage loan or serviced whole loan, plus outstanding advances, real estate taxes, unpaid servicing fees and certain similar amounts exceeds 90% of the appraised value of the related mortgaged property, plus the amount of any escrows and letters of credit.
With respect to the Non-Serviced Whole Loans, any Appraisal Reduction Amount will be similarly determined pursuant to the related trust and servicing agreement or pooling and servicing agreement, as applicable, under which it is serviced.
In general, the Appraisal Reduction Amounts that are allocated to the mortgage loans are notionally allocated to reduce, in reverse sequential order, the Certificate Balance of each Class of Certificates (other than the Class A-1, Class A-2, Class A-3, Class A-4, Class A-5 and Class A-SB Certificates) beginning with the Class NR-RR Certificates for certain purposes, including certain voting rights and the determination of the controlling class. As a result of calculating one or more Appraisal Reduction Amounts (and, in the case of any Whole Loan, to the extent allocated to the related mortgage loan), the amount of any required P&I Advance will be reduced, which will have the effect of reducing the amount of interest available to the most subordinate class of certificates then-outstanding (i.e.,first, to Class NR-RR Certificates;second, to the Class F-RR Certificates;third, to the Class E-RR Certificates;fourth, to the Class D-RR Certificates;fifth, to the Class D Certificates,sixth, to the Class C Certificates,seventh, to the Class B Certificates,eighth, to the Class A-S Certificates and finally,pro rata based on their respective interest entitlements, to the Senior Certificates).
With respect to each servicedpari passuWhole Loan, the Appraisal Reduction Amount is notionally allocated,pro rata, between the related mortgage loan and the related servicedpari passu companion loan(s), based upon their respective principal balances. With respect to the Courtyard Marriott - King Kamehameha Whole Loan, all appraisal reductions will first be allocated to the related subordinate companion loan until reduced to zero and then to the related mortgage loan. | |||||
| ■ Appraisal Reduced Interest: | Accrued and unpaid interest at the related Mortgage Rate for a mortgage loan that is not advanced by the Master Servicer or the Trustee as backup master servicer due to the application of Appraisal Reduction Amounts to such mortgage loan. | |||||
| ■ Master Servicer Advances: | The Master Servicer will be required to advance certain delinquent scheduled mortgage loan payments of principal and interest and certain property protection advances, in each case, to the extent the Master Servicer deems such advances to be recoverable. At any time that an Appraisal Reduction Amount exists, the amount that would otherwise be required to be advanced by the Master Servicer in respect of delinquent payments of interest on any mortgage loan will be reduced to equal the product of (x) the interest portion of the amount that would be advanced without regard to any Appraisal Reduction Amount and (y) a fraction, the numerator of which is the then-outstanding principal balance of the mortgage loan minus the Appraisal Reduction Amount and the denominator of which is the then-outstanding principal balance of the mortgage loan. The Master Servicer will not make any principal or interest advances with respect to any companion loan. | |||||
| ■ Whole Loans: | Seven mortgage loans are each evidenced by one mortgage loan and one or more companion loans (each a “Companion Loan” and collectively with the related mortgage loan, a “Whole | |||||
THE INFORMATION IN THIS STRUCTURAL AND COLLATERAL TERM SHEET IS NOT COMPLETE AND MAY BE AMENDED PRIOR TO THE TIME OF SALE. THIS TERM SHEET IS NOT AN OFFER TO SELL THESE SECURITIES AND IT IS NOT A SOLICITATION OF AN OFFER TO BUY THESE SECURITIES IN ANY JURISDICTION WHERE THE OFFER OR SALE IS NOT PERMITTED.
| | 19 of 156 |
| Structural and Collateral Term Sheet | JPMCC 2017-JP5 |
| Structural Overview | |
Loan”), secured by the same mortgage(s) on the related mortgaged property(ies). Each such mortgage loan and its related Companion Loan(s) are subject to an intercreditor agreement. None of these Companion Loans will be part of the trust.
In the case of six (6) of the Whole Loans, referred to as the “Hilton Hawaiian Village Whole Loan”, the “Moffett Gateway Whole Loan”, the “Fresno Fashion Fair Mall Whole Loan”, the “Riverway Whole Loan”, the “Dallas Design District Whole Loan” and the “Landmark Square Whole Loan”, one or more related Companion Loans arepari passu with the related mortgage loan (these Companion Loans are also referred to as the “Pari Passu Companion Loans”). In the case of each of the Hilton Hawaiian Village Whole Loan, the Moffett Gateway Whole Loan and the “Courtyard Marriott - King Kamehameha Whole Loan”, in addition to any related Pari Passu Companion Loans, one or more related Companion Loans are subordinate in right of payment to the related mortgage loan and the related Pari Passu Companion Loans (if any) (these Companion Loans are also referred to as the “Subordinate Companion Loans”).
The Dallas Design District Companion Loan, the Landmark Square Companion Loan and the Courtyard Marriott - King Kamehameha Subordinate Companion Loan are referred to as “Serviced Companion Loans”.
The Dallas Design District Whole Loan, the Landmark Square Whole Loan and the Courtyard Marriott - King Kamehameha Whole Loan (each, a “Serviced Whole Loan”) will be serviced under the pooling and servicing agreement for the JPMCC 2017-JP5 transaction (the “Pooling and Servicing Agreement”).
The Hilton Hawaiian Village Whole Loan is being serviced and administered pursuant to the Hilton USA Trust 2016-HHV trust and servicing agreement as described under “Description of the Mortgage Pool—The Whole Loans—The Non-Serviced Whole Loans—The Hilton Hawaiian Village Whole Loan” in the Preliminary Prospectus.
The Moffett Gateway Whole Loan and the Riverway Whole Loan are being serviced and administered pursuant to the JPMCC 2016-JP4 pooling and servicing agreement as described under “Description of the Mortgage Pool—The Whole Loans—The Non-Serviced Whole Loans—The Moffett Gateway Whole Loan” and “—The Riverway Whole Loan” in the Preliminary Prospectus.
The Fresno Fashion Fair Mall Whole Loan is being serviced and administered pursuant to the JPMDB 2016-C4 pooling and servicing agreement as described under “Description of the Mortgage Pool—The Whole Loans—The Non-Serviced Whole Loans—The Fresno Fashion Fair Mall Whole Loan” in the Preliminary Prospectus.
The Hilton Hawaiian Village Whole Loan, the Moffett Gateway Whole Loan, the Fresno Fashion Fair Mall Whole Loan and the Riverway Whole Loan are each a “Non-Serviced Whole Loan” and collectively the “Non-Serviced Whole Loans”. | ||||||
| ■ Highlighted Servicing Provisions: | The servicing provisions for this transaction include certain modifications to the provisions used in prior transactions. These modifications include, but are not limited to, the following:
The Special Servicer will not be entitled to any fees from the securitization trust or the related borrower during a fee restricted period, other than a portion of default interest collected on the related mortgage loan, if the Special Servicer elects to cause a mortgage loan to be transferred to special servicing under either of the following circumstances:
1. A transfer to special servicing as a result of an imminent or reasonably foreseeable default when the master servicer has not independently transferred the mortgage loan to special servicing for that reason; or
2. A transfer to special servicing after a maturity date default under circumstances where the master servicer has determined that the borrower has, prior to such maturity date, provided from an acceptable lender an executed term sheet or refinancing commitment or an executed purchase and sale agreement, in each case, that is consistent with CMBS market practices and is reasonably satisfactory in form and substance acceptable to the Master Servicer evidencing an expected refinancing of the mortgage loan or sale of the related Mortgaged Property.
A fee restricted period will end and the Special Servicer will generally be entitled to the special | |||||
THE INFORMATION IN THIS STRUCTURAL AND COLLATERAL TERM SHEET IS NOT COMPLETE AND MAY BE AMENDED PRIOR TO THE TIME OF SALE. THIS TERM SHEET IS NOT AN OFFER TO SELL THESE SECURITIES AND IT IS NOT A SOLICITATION OF AN OFFER TO BUY THESE SECURITIES IN ANY JURISDICTION WHERE THE OFFER OR SALE IS NOT PERMITTED.
| | 20 of 156 |
| Structural and Collateral Term Sheet | JPMCC 2017-JP5 |
| Structural Overview | |
servicing fees payable with respect to any specially serviced loan after such mortgage loan would become a specially serviced loan for any other reason.
Certain revisions to the rights of the Directing Certificateholder to approve “major decisions” have been incorporated in the Preliminary Prospectus, including limiting the involvement of the Directing Certificateholder in (1) the replacement of the related property management company and (2) the consent to modifications of any mezzanine intercreditor agreement in circumstances when the Directing Certificateholder is affiliated with the mezzanine lender.
The Certificate Administrator will be required to identify the then-current Directing Certificateholder as part of its monthly distribution date statement.
See“Description of the Certificates” and“Pooling and Servicing Agreement” in the Preliminary Prospectus. | ||||||
| ■ Liquidated Loan Waterfall: | On liquidation of any mortgage loan, all net liquidation proceeds related to the mortgage loan (but not any related Companion Loan) will be applied so that amounts allocated as a recovery of accrued and unpaid interest will not, in the first instance, include any delinquent interest that was not advanced as a result of Appraisal Reduction Amounts or interest that accrued on any junior note(s) if such mortgage loan is an AB Modified Loan. After the adjusted interest amount is so allocated, any remaining liquidation proceeds will be allocated to offset certain advances and to pay principal on the mortgage loan until the unpaid principal amount of the mortgage loan has been reduced to zero. Any remaining liquidation proceeds will then be allocated to pay delinquent interest that was not advanced as a result of Appraisal Reduction Amounts and any interest that accrued on any junior note(s) if such mortgage loan is an AB Modified Loan. Any liquidation proceeds in respect of each such mortgage loan in excess of the related outstanding balance will first be applied to offset any interest shortfalls allocated to the Certificates (other than the Class R Certificates), in sequential order, and then to offset any realized losses allocated to the Certificates, in sequential order. Any liquidation proceeds remaining after such applications will be distributed to the Class R Certificates. | |||||
| ■ Sale of Defaulted Loans and REO Properties: | The Special Servicer is required to solicit offers for any defaulted loan or REO property (other than a non-serviced mortgage loan), if the Special Servicer determines that no satisfactory arrangements can be made for collection of delinquent payments and the sale would be in the best economic interests of the certificateholders (or, in the case of any Serviced Whole Loan, the certificateholders and any holders of the related Serviced Pari Passu Companion Loans, as a collective whole, taking into account thepari passu or subordinate nature of such Serviced Companion Loans), on a net present value basis.
In the case of each non-serviced mortgage loan, under certain circumstances permitted under the related intercreditor agreement, to the extent that such non-serviced mortgage loan is not sold together with the related non-serviced companion loan by the special servicer for the related Non-Serviced Whole Loans, the Special Servicer will be entitled to sell (with respect to any mortgage loan other than an Excluded Loan, with the consent of the Directing Certificateholder if no Control Termination Event has occurred and is continuing) such non-serviced mortgage loan if it determines in accordance with the servicing standard that such action would be in the best interests of the certificateholders.
The Special Servicer is required to accept the highest cash offer received from any person for any defaulted loan or REO property in an amount at least equal to par plus accrued interest plus all other outstanding amounts due under such mortgage loan and any outstanding expenses of the trust relating to such mortgage loan (the “Purchase Price”) except as described in the Preliminary Prospectus.
With respect to the Serviced Whole Loans, any such sale of the related defaulted loan is required to also include the related Pari Passu Companion Loans (except that the special servicer will be permitted to sell the Courtyard Marriott - King Kamehameha Subordinate Companion Loan along with the related mortgage loan if it determines that a sale of the Courtyard Marriott - King Kamehameha Whole Loan would maximize recoveries on the related Whole Loan in accordance with the Servicing Standard), if any, and the prices will be adjusted accordingly.
In connection with such sale and fair value determination, within 30 days of a defaulted loan becoming a specially serviced loan, the Special Servicer is required to order an appraisal and, | |||||
THE INFORMATION IN THIS STRUCTURAL AND COLLATERAL TERM SHEET IS NOT COMPLETE AND MAY BE AMENDED PRIOR TO THE TIME OF SALE. THIS TERM SHEET IS NOT AN OFFER TO SELL THESE SECURITIES AND IT IS NOT A SOLICITATION OF AN OFFER TO BUY THESE SECURITIES IN ANY JURISDICTION WHERE THE OFFER OR SALE IS NOT PERMITTED.
| | 21 of 156 |
| Structural and Collateral Term Sheet | JPMCC 2017-JP5 |
| Structural Overview | |
within 30 days of receipt of such appraisal, is required to determine the fair value of such defaulted loan in accordance with the applicable servicing standard. If, however, the Special Servicer is already in the process of obtaining an appraisal with respect to the related mortgaged property, the Special Servicer is required to make its fair value determination as soon as reasonably practicable (but in any event within 30 days) after its receipt of such appraisal. Additionally, with respect to the mortgage loans that have mezzanine debt or permit mezzanine debt in the future, the mezzanine lenders may have the option to purchase the related mortgage loan after certain events of default under such mortgage loan. In addition, with respect to the Courtyard Marriott - King Kamehameha Whole Loan, the holder of the related Subordinate Companion Loan may have an option to purchase the related mortgage loan after certain events of default under such mortgage loan.
The Directing Certificateholder will not have a right of first refusal to purchase a defaulted loan.
If the Special Servicer does not receive a cash offer at least equal to the Purchase Price, the Special Servicer may purchase the defaulted loan or REO property at the Purchase Price. If the Special Servicer does not purchase the defaulted loan or REO property at the Purchase Price, the Special Servicer is required to accept the highest offer received from any person that is determined to be a fair price (supported by an appraisal required to be obtained by the Special Servicer within 30 days of a mortgage loan becoming a specially serviced mortgage loan) for such defaulted loan or REO property, if the highest offeror is a person other than a party to the Pooling and Servicing Agreement, the Directing Certificateholder, any sponsor, any borrower, any manager of a mortgaged property, any independent contractor engaged by the Special Servicer, with respect to a defaulted whole loan, the depositor, Master Servicer, Special Servicer (or independent contractor engaged by such Special Servicer) or the trustee for the securitization of a Companion Loan and each holder of any related Companion Loan or mezzanine loan (but only with respect to the related mortgage loan), or any known affiliate of any such person (each, an “Interested Person”). If the highest offer is made by an Interested Person, the Trustee will determine (based upon the most recent appraisal or updated appraisal conducted in accordance with the terms of the Pooling and Servicing Agreement) whether the offer constitutes a fair price for the defaulted loan or REO property provided that no offer from an Interested Person will constitute a fair price unless (A) it is the highest offer received and (B) if the offer is less than the applicable Purchase Price, at least two other offers are received from independent third parties and the Trustee may conclusively rely on the opinion of an independent appraiser or other independent expert retained by the Trustee in connection with making such determination. Neither the Trustee nor any of its affiliates may make an offer for or purchase any specially serviced mortgage loan or REO property.
If the Special Servicer does not receive any offers that are at least equal to the Purchase Price, the Special Servicer is not required to accept the highest offer and may accept a lower offer for a defaulted loan or REO property if the Special Servicer determines, in accordance with the servicing standard (and subject to the requirements of any related intercreditor agreement), that a rejection of such offer would be in the best interests of the Certificateholders and, with respect to any Serviced Whole Loan, the holder of the related Companion Loans, as a collective whole, as if such Certificateholders and, if applicable, the related Companion Loan Holder(s) constituted a single lender), so long as such lower offer was not made by the Special Servicer or any of its affiliates. With respect to the Courtyard Marriott - King Kamehameha Whole Loan, the special servicer will be permitted to sell the related Subordinate Companion Loan along with the related mortgage loan and any Pari Passu Companion Loans if it determines that a sale of the Courtyard Marriott - King Kamehameha Whole Loan would maximize recoveries on the related Whole Loan in accordance with the Servicing Standard. If title to any mortgaged property is acquired by the trust fund, the Special Servicer will be required to sell such mortgaged property prior to the close of the third calendar year beginning after the year of acquisition, unless (a) the IRS grants or has not denied an extension of time to sell such mortgaged property or (b) the Special Servicer, Trustee and the Certificate Administrator receive an opinion of independent counsel to the effect that the holding of the property by the trust longer than the above-referenced three-year period will not result in the imposition of a tax on any REMIC of the trust fund or cause any REMIC of the trust fund to fail to qualify as a REMIC.
The foregoing applies to mortgage loans serviced under the Pooling and Servicing Agreement. With respect to each Non-Serviced Whole Loan, if the special servicer under the applicable trust and servicing agreement or pooling and servicing agreement, as applicable, determines to sell the related Companion Loan(s) as described above, then the applicable special servicer will | ||||||
THE INFORMATION IN THIS STRUCTURAL AND COLLATERAL TERM SHEET IS NOT COMPLETE AND MAY BE AMENDED PRIOR TO THE TIME OF SALE. THIS TERM SHEET IS NOT AN OFFER TO SELL THESE SECURITIES AND IT IS NOT A SOLICITATION OF AN OFFER TO BUY THESE SECURITIES IN ANY JURISDICTION WHERE THE OFFER OR SALE IS NOT PERMITTED.
| | 22 of 156 |
| Structural and Collateral Term Sheet | JPMCC 2017-JP5 |
| Structural Overview | |
be required to sell the related non-serviced mortgage loan, included in the JPMCC 2017-JP5 Trust, and the related Companion Loan(s), as a single loan. In connection with any such sale, the then-applicable special servicer will be required to follow procedures substantially similar to those set forth above. | ||||||
| ■ Control Eligible Certificates: | Classes D-RR, E-RR, F-RR and NR-RR. | |||||
| ■ Control Rights: | The Control Eligible Certificates will have certain control rights attached to them. The “Directing Certificateholder” will be the Controlling Class Certificateholder (or its representative) selected by more than 50% of the Controlling Class Certificateholders;provided,however, that (1) absent that selection, (2) until a Directing Certificateholder is so selected or (3) upon receipt of a notice from a majority of the Controlling Class Certificateholders that a Directing Certificateholder is no longer designated, the Controlling Class Certificateholder that owns the largest aggregate Certificate Balance of the Controlling Class (or its representative) will be the Directing Certificateholder;provided,however, that in the case of this clause (3), in the event no one holder owns the largest aggregate Certificate Balance of the Controlling Class, then there will be no Directing Certificateholder until appointed in accordance with the terms of the Pooling and Servicing Agreement. With respect to any mortgage loan (other than any non-serviced mortgage loan, the Courtyard Marriott - King Kamehameha Mortgage Loan prior to the occurrence and continuance of a control appraisal period or any Excluded Loan), unless a Control Termination Event has occurred and is continuing, the Directing Certificateholder will be entitled to direct the Special Servicer to take, or refrain from taking, certain actions with respect to such mortgage loan. Furthermore, the Directing Certificateholder will also have the right to receive notice and provide consent with respect to certain material actions that the Master Servicer and the Special Servicer plan on taking with respect to a mortgage loan (other than any non-serviced mortgage loan, the Courtyard Marriott - King Kamehameha Mortgage Loan prior to the occurrence and continuance of a control appraisal period or any Excluded Loan). With respect to any mortgage loan that has or may in the future have mezzanine debt, pursuant to the related intercreditor agreement, the related mezzanine lender may have certain consent rights with respect to certain modifications related to such mortgage loan.
With respect to the Courtyard Marriott - King Kamehameha Mortgage Loan, prior to the occurrence and continuance of a control appraisal period under the related intercreditor agreement, direction and consent rights with respect to the related Whole Loan will be exercised by the holder of the related Subordinate Companion Loan pursuant to the related intercreditor agreement as described in the Preliminary Prospectus. In addition, the holder of the related Subordinate Companion Loan will have certain rights to cure defaults under the related mortgage loan, and in certain circumstances, a holder of the related Subordinate Companion Loan will have the right to purchase the related defaulted mortgage loan.
A “Borrower Party” means a borrower, a mortgagor, a manager of a Mortgaged Property, an Accelerated Mezzanine Loan Lender, any other person controlling or controlled by or under common control with such borrower, mortgagor, manager or Accelerated Mezzanine Loan Lender, as applicable, or any other person owning, directly or indirectly, 25% or more of the beneficial interests in such borrower, mortgagor, manager or Accelerated Mezzanine Loan Lender, as applicable. For purposes of this definition, “control” when used with respect to any specified person means the power to direct the management and policies of such person, directly or indirectly, whether through the ownership of voting securities, by contract or otherwise and the terms “controlling” and “controlled” have meanings correlative to the foregoing.
An “Accelerated Mezzanine Loan Lender” means a mezzanine lender under a mezzanine loan that has been accelerated or as to which foreclosure or enforcement proceedings have been commenced against the equity collateral pledged to secure such mezzanine loan.
An “Excluded Loan” is a mortgage loan or Whole Loan with respect to which the Directing Certificateholder or the holder of the majority of the controlling class is a Borrower Party. As of the Closing Date, it is expected that there will be no Excluded Loans in this securitization.
With respect to the Serviced Whole Loans, direction, consent and consultation rights with respect to the related Whole Loan are subject to certain consultation rights of the holder of the related Pari Passu Companion Loans pursuant to the related intercreditor agreement.
With respect to any Non-Serviced Whole Loan, direction, consent and consultation rights with respect to the related Whole Loan will be exercised by the directing certificateholder or controlling class representative under the applicable trust and servicing agreement or pooling and servicing agreement, as applicable. | |||||
THE INFORMATION IN THIS STRUCTURAL AND COLLATERAL TERM SHEET IS NOT COMPLETE AND MAY BE AMENDED PRIOR TO THE TIME OF SALE. THIS TERM SHEET IS NOT AN OFFER TO SELL THESE SECURITIES AND IT IS NOT A SOLICITATION OF AN OFFER TO BUY THESE SECURITIES IN ANY JURISDICTION WHERE THE OFFER OR SALE IS NOT PERMITTED.
| | 23 of 156 |
| Structural and Collateral Term Sheet | JPMCC 2017-JP5 |
| Structural Overview | |
| ■ Directing Certificateholder: | LNR Securities Holdings, LLC (or its affiliate), is expected to be appointed as the initial directing certificateholder with respect to all serviced mortgage loans (other than the Excluded Loans and the Courtyard Marriott - King Kamehameha Mortgage Loan, prior to the occurrence and continuance of a control appraisal period). | |||||
| ■ Controlling Class: | The “Controlling Class” will at any date of determination be the most subordinate Class of Control Eligible Certificates then outstanding that has an aggregate Certificate Balance, as notionally reduced by any Cumulative Appraisal Reduction Amounts allocable to such Class, equal to no less than 25% of the initial Certificate Balance for such Class. Each holder of a certificate of the Controlling Class is referred to herein as a “Controlling Class Certificateholder”.
The Controlling Class as of the Closing Date will be the Class NR-RR Certificates;provided that if at any time the principal balances of the certificates other than the Control Eligible Certificates have been reduced to zero as a result of the allocation of principal payments on the mortgage loans, then the Controlling Class will be the most subordinate Class among the Control Eligible Certificates that has an aggregate principal balance greater than zero without regard to any Appraisal Reduction Amounts. | |||||
| ■ Control Termination Event: | A “Control Termination Event” will occur when the Class D-RR certificates have a Certificate Balance (taking into account the application of any Cumulative Appraisal Reduction Amounts to notionally reduce the Certificate Balance of such class) of less than 25% of the initial Certificate Balance of that class; provided that a Control Termination Event will not be deemed to be continuing in the event the Certificate Balances of all Classes of Principal Balance Certificates other than the Control Eligible Certificates have been reduced to zero.
The “Cumulative Appraisal Reduction Amount” as of any date of determination, is equal to the sum of (i) with respect to any mortgage loan, all Appraisal Reduction Amounts then in effect, and (ii) with respect to any AB Modified Loan, any Collateral Deficiency Amount then in effect.
An “AB Modified Loan” means any corrected loan (1) that became a corrected loan (which includes for purposes of this definition any non-serviced mortgage loan that became a “corrected loan” (or any term substantially similar thereto) pursuant to the trust and servicing agreement or pooling and servicing agreement, as applicable, governing such non-serviced mortgage loan) due to a modification thereto that resulted in the creation of an A/B note structure (or similar structure) and as to which the new junior note(s) did not previously exist or the principal amount of the new junior note(s) was previously part of either an A note held by the issuing entity or the original unmodified mortgage loan and (2) as to which an Appraisal Reduction Amount is not in effect.
The “Collateral Deficiency Amount” means, with respect to any AB Modified Loan as of any date of determination, the excess of (i) the principal balance of such AB Modified Loan (taking into account the related junior note(s) and any pari passu notes included therein), over (ii) the sum of (in the case of a Whole Loan, solely to the extent allocable to the subject mortgage loan) (x) the most recent Appraised Value for the related mortgaged property or mortgaged properties, plus (y) solely to the extent not reflected or taken into account in such Appraised Value and to the extent on deposit with, or otherwise under the control of, the lender as of the date of such determination, any capital or additional collateral contributed by the related borrower at the time the mortgage loan became (and as part of the modification related to) such AB Modified Loan for the benefit of the related mortgaged property or mortgaged properties (provided, that in the case of a non-serviced mortgage loan, the amounts set forth in this clause (y) will be taken into account solely to the extent relevant information is received by the Master Servicer), plus (z) any other escrows or reserves (in addition to any amounts set forth in the immediately preceding clause (y)) held by the lender in respect of such AB Modified Loan as of the date of such determination.
Upon the occurrence and during the continuance of a Control Termination Event, the Controlling Class will no longer have any control rights. After the occurrence and during the continuance of a Control Termination Event, the Directing Certificateholder will relinquish its right to direct certain actions of the Special Servicer and will no longer have consent rights with respect to certain actions that the Master Servicer or the Special Servicer plan on taking with respect to a mortgage loan. Following the occurrence and during the continuance of a Control Termination Event, the Directing Certificateholder will retain consultation rights with the Special Servicer with respect to certain material actions that the Special Servicer plans on taking with respect to any mortgage loan other than an Excluded Loan. Such consultation rights will continue until the occurrence of a Consultation Termination Event. | |||||
THE INFORMATION IN THIS STRUCTURAL AND COLLATERAL TERM SHEET IS NOT COMPLETE AND MAY BE AMENDED PRIOR TO THE TIME OF SALE. THIS TERM SHEET IS NOT AN OFFER TO SELL THESE SECURITIES AND IT IS NOT A SOLICITATION OF AN OFFER TO BUY THESE SECURITIES IN ANY JURISDICTION WHERE THE OFFER OR SALE IS NOT PERMITTED.
| | 24 of 156 |
| Structural and Collateral Term Sheet | JPMCC 2017-JP5 |
| Structural Overview | |
With respect to the Courtyard Marriott - King Kamehameha Whole Loan, pursuant to the related intercreditor agreement, the holder of the related Subordinate Companion Loan will lose its right to direct certain actions upon the occurrence and continuance of a control appraisal event with respect to the related Subordinate Companion Loan, which will occur when the principal balance of such Subordinate Companion Loan (taking into account the application of realized losses, payments of principal and Appraisal Reductions to notionally reduce such balance) has been reduced to less than 25% of the initial principal balance of the Courtyard Marriott - King Kamehameha Subordinate Companion Loan, less payments of principal. | ||||||
| ■ Consultation Termination Event: | A “Consultation Termination Event” will occur when there is no class of Control Eligible Certificates that has a then-outstanding Certificate Balance at least equal to 25% of the initial Certificate Balance of that class, in each case, without regard to the application of any Cumulative Appraisal Reduction Amounts;provided, that a Consultation Termination Event will not be deemed to be continuing in the event the Certificate Balances of all Classes of Principal Balance Certificates other than the Control Eligible Certificates have been reduced to zero.
Upon the occurrence of a Consultation Termination Event, there will be no Class of Certificates that will act as the Controlling Class and the Directing Certificateholder will have no rights under the Pooling and Servicing Agreement, other than those rights generally available to all Certificateholders. | |||||
| ■ Appraised-Out Class: | A Class of Control Eligible Certificates that has been determined, as a result of Appraisal Reduction Amounts or Collateral Deficiency Amounts allocable to such Class, to no longer be the Controlling Class. | |||||
| ■ Remedies Available to Holders of an Appraised-Out Class: | Holders of the majority of any Class of Control Eligible Certificates that are determined at any date of determination to no longer be the Controlling Class as a result of Appraisal Reduction Amounts or Collateral Deficiency Amounts allocable to such class will have the right, at their sole expense, to require the Special Servicer to order a supplemental appraisal report from an MAI appraiser (selected by the Special Servicer) for any mortgage loan (or Serviced Whole Loan) that results in the Class becoming an Appraised-Out Class.
Upon receipt of that supplemental appraisal, the Special Servicer will be required to determine, in accordance with the Servicing Standard, whether, based on its assessment of the supplemental appraisal, any recalculation of the Appraisal Reduction Amount or Collateral Deficiency Amount is warranted, and if so warranted, the Master Servicer will be required to recalculate the Appraisal Reduction Amount or Collateral Deficiency Amount, as applicable, based on the supplemental appraisal and if required by such recalculation, the Appraised-Out Class will be reinstated as the Controlling Class. The holders of an Appraised-Out Class requesting a supplemental appraisal are not permitted to exercise any control or consent rights of the Controlling Class until such time, if any, as the Class is reinstated as the Controlling Class. | |||||
| ■ Operating Advisor: | The Operating Advisor will initially be Pentalpha Surveillance LLC. The Operating Advisor will have certain review and consultation rights relating to the performance of the Special Servicer and with respect to its actions taken in connection with the resolution and/or liquidation of specially serviced loans. The Operating Advisor will generally be responsible for reviewing the Special Servicer’s operational practices with respect to the resolution and liquidation of specially serviced loans. In addition, after the occurrence and during the continuance of a Control Termination Event, the Operating Advisor will have certain consultation rights with respect to the specially serviced loans. The Operating Advisor will generally have no obligations or consultation rights under the Pooling and Servicing Agreement with respect to (i) the Non-Serviced Whole Loans or any related REO Property and (ii) the Courtyard Marriott - King Kamehameha Mortgage Loan, prior to the occurrence and continuance of a control appraisal period with respect to the related mortgage loan.
However, Pentalpha Surveillance LLC is currently the operating advisor under the JPMCC 2016-JP4 pooling and servicing agreement and the JPMDB 2016-C4 pooling and servicing agreement and, in each such capacity, has certain obligations and consultation rights with respect to the Moffett Gateway Whole Loan, Fresno Fashion Fair Mall Whole Loan and the Riverway Whole Loan, respectively, that are substantially similar to those of the Operating Advisor under the Pooling and Servicing Agreement.
With respect to each mortgage loan or Serviced Whole Loan (in each case, other than a non- | |||||
THE INFORMATION IN THIS STRUCTURAL AND COLLATERAL TERM SHEET IS NOT COMPLETE AND MAY BE AMENDED PRIOR TO THE TIME OF SALE. THIS TERM SHEET IS NOT AN OFFER TO SELL THESE SECURITIES AND IT IS NOT A SOLICITATION OF AN OFFER TO BUY THESE SECURITIES IN ANY JURISDICTION WHERE THE OFFER OR SALE IS NOT PERMITTED.
| | 25 of 156 |
| Structural and Collateral Term Sheet | JPMCC 2017-JP5 |
| Structural Overview | |
serviced mortgage loan and the Courtyard Marriott - King Kamehameha Mortgage Loan (prior to the occurrence and continuance of a control appraisal period with respect to the related Subordinate Companion Loan)), the Operating Advisor will be responsible for:
■ after the occurrence and during the continuance of a Control Termination Event, consulting (on a non-binding basis) with the Special Servicer with respect to each asset status report prepared by the Special Servicer and recommending proposed alternative courses of action.
■ after the occurrence and during the continuance of a Control Termination Event, preparing an annual report addressing the Operating Advisor’s overall findings and determinations and setting forth its assessment of the Special Servicer’s performance of its duties under the Pooling and Servicing Agreement on a platform-level basis with respect to the resolution and/or liquidation of specially serviced loans that the Special Servicer is responsible for servicing under the Pooling and Servicing Agreement. As used above, “platform-level basis” refers to the Special Servicer’s performance of its duties as they relate to the resolution and liquidation of specially serviced loans, taking into account the Special Servicer’s specific duties under the Pooling and Servicing Agreement as well as the extent to which those duties were performed in accordance with the servicing standard, with reasonable consideration to (and as limited by) the Operating Advisor’s review of any assessment of compliance report, attestation report, asset status report and other information delivered to the Operating Advisor by the Special Servicer with respect to the specially serviced loans (other than any communications between the Directing Certificateholder and the Special Servicer that would be privileged information). The annual report will be based on the Operating Advisor’s knowledge of the Special Servicer’s actions taken during the applicable calendar year with respect to the resolution or liquidation of specially serviced loans that the Special Servicer is responsible for servicing under the Pooling and Servicing Agreement, including knowledge obtained in connection with the Operating Advisor’s review of each asset status report prepared by the Special Servicer.
■ prior to the occurrence and continuance of a Control Termination Event, the Special Servicer will forward any Appraisal Reduction Amount and net present value calculations used in the Special Servicer’s determination of what course of action to take in connection with the workout or liquidation of a specially serviced loan to the Operating Advisor after such calculations have been finalized. The Operating Advisor will be required to review such calculations (with respect to Appraisal Reduction Amounts, if the Special Servicer has calculated such amounts) but will not opine on or take any affirmative action with respect to such Appraisal Reduction Amount calculations and/or net present value calculations.
■ after the occurrence and during the continuance of a Control Termination Event, recalculating and verifying, on a limited basis, the accuracy of mathematical calculations and the corresponding application of the non-discretionary portion of the applicable formulas utilized in connection with any Appraisal Reduction Amount (with respect to Appraisal Reduction Amounts, if the Special Servicer has calculated such amounts) or net present value calculations performed by the Special Servicer. In the event the Operating Advisor does not agree with the mathematical calculations or the application of the non-discretionary portion of the applicable formulas required to be utilized for such calculation, the Operating Advisor and the Special Servicer will consult with each other in order to resolve any disagreement. If there is any disagreement with respect to such calculations that the Operating Advisor and the Special Servicer are unable to resolve, the Certificate Administrator will determine which calculation is to apply.
In addition, the Operating Advisor is required to promptly review all information available to Privileged Persons on the Certificate Administrator’s website related to specially serviced loans and certain information available to Privileged Persons on the Certificate Administrator’s website related to mortgage loans included on the monthly CREFC® servicer watch list report, each final asset status report delivered to the Operating Advisor by the Special Servicer and each assessment of compliance report and attestation report prepared by the Special Servicer in order to maintain its familiarity with the mortgage loans and the performance of the Special Servicer under the Pooling and Servicing Agreement. | ||||||
THE INFORMATION IN THIS STRUCTURAL AND COLLATERAL TERM SHEET IS NOT COMPLETE AND MAY BE AMENDED PRIOR TO THE TIME OF SALE. THIS TERM SHEET IS NOT AN OFFER TO SELL THESE SECURITIES AND IT IS NOT A SOLICITATION OF AN OFFER TO BUY THESE SECURITIES IN ANY JURISDICTION WHERE THE OFFER OR SALE IS NOT PERMITTED.
| | 26 of 156 |
| Structural and Collateral Term Sheet | JPMCC 2017-JP5 |
| Structural Overview | |
After the occurrence and during the continuance of a Control Termination Event, the Operating Advisor will also consult with the Special Servicer in connection with certain major decisions and propose possible alternative courses of action.
In addition, after the occurrence of a Consultation Termination Event, if the Operating Advisor determines that the Special Servicer is not performing its duties as required under the Pooling and Servicing Agreement or is otherwise not acting in accordance with the Servicing Standard, the Operating Advisor will have the right to recommend the replacement of the Special Servicer and will submit its formal recommendation to the Trustee and the Certificate Administrator (along with its rationale, its proposed replacement special servicer and other relevant information justifying its recommendation).
The Operating Advisor’s recommendation to replace the Special Servicer must be confirmed by an affirmative vote of holders of Certificates evidencing at least a majority of the aggregate voting rights (taking into account the application of any Appraisal Reduction Amounts to notionally reduce the Certificate Balances of the Classes to which such Appraisal Reduction Amounts are allocable). In the event the holders of such Certificates elect to remove and replace the Special Servicer, the Certificate Administrator will be required to obtain a rating agency confirmation from each of the rating agencies at that time. | ||||||
| ■ Replacement of Operating Advisor: | The Operating Advisor may be terminated or removed under certain circumstances and a replacement operating advisor appointed as described in the Preliminary Prospectus.
Any replacement operating advisor (or the personnel responsible for supervising the obligations of the replacement operating advisor) must be an institution (A) that is a special servicer or operating advisor on a commercial mortgage-backed securities transaction rated by Moody’s, Fitch and KBRA (including, in the case of the Operating Advisor, this transaction) but has not been special servicer or operating advisor on a transaction for which any of Moody’s, Fitch and KBRA has qualified, downgraded or withdrawn its rating or ratings of, one or more classes of certificates for such transaction publicly citing servicing concerns with the operating advisor in its capacity as special servicer or operating advisor on such commercial mortgage-backed securities transaction as the sole or a material factor in such rating action; (B) that can and will make the representations and warranties of the operating advisor set forth in the Pooling and Servicing Agreement; (C) that is not (and is not affiliated with) the Depositor, the Trustee, the Certificate Administrator, the Master Servicer, the Special Servicer, a Mortgage Loan Seller, the Directing Certificateholder, a depositor, a trustee, a certificate administrator, a master servicer or special servicer with respect to the securitization of a Companion Loan, or any of their respective affiliates; (D) that has not been paid by any Special Servicer or successor special servicer any fees, compensation or other remuneration (x) in respect of its obligations hereunder or (y) for the appointment or recommendation for replacement of a successor special servicer to become the Special Servicer; and (E) that (x) has been regularly engaged in the business of analyzing and advising clients in commercial mortgage-backed securities matters and that has at least 5 years of experience in collateral analysis and loss projections and (y) has at least 5 years of experience in commercial real estate asset management and experience in the workout and management of distressed commercial real estate assets. Any Operating Advisor is prohibited from making an investment in any Class of Certificates in the Trust as described in the Preliminary Prospectus.
| |||||
| ■ Asset Representations Reviewer: | The Asset Representations Reviewer will be required to review certain delinquent mortgage loans after a specified delinquency threshold has been exceeded and notification from the Certificate Administrator that the required percentage of Certificateholders have voted to direct a review of such delinquent mortgage loans. An “Asset Review Trigger” will occur when either (1) mortgage loans with an aggregate outstanding principal balance of 25.0% or more of the aggregate outstanding principal balance of all of the mortgage loans (including any REO Loans (or a portion of any REO Loan in the case of a Whole Loan) held by the issuing entity as of the end of the applicable Collection Period are Delinquent Loans, (2)(A) prior to and including the second anniversary of the Closing Date, at least 10 mortgage loans are Delinquent Loans and the outstanding principal balance of such Delinquent Loans in the aggregate constitutes at least 15.0% of the aggregate outstanding principal balance of all of the mortgage loans (including any REO Loans (or a portion of any REO Loan in the case of a Whole Loan)) held by the issuing entity as of the end of the applicable Collection Period or (B) after the second anniversary of the Closing Date, at least 15 mortgage loans are Delinquent Loans and the outstanding principal balance of such Delinquent Loans in the aggregate constitutes at least 20.0% of the aggregate outstanding principal balance of all of the mortgage loans (including | |||||
THE INFORMATION IN THIS STRUCTURAL AND COLLATERAL TERM SHEET IS NOT COMPLETE AND MAY BE AMENDED PRIOR TO THE TIME OF SALE. THIS TERM SHEET IS NOT AN OFFER TO SELL THESE SECURITIES AND IT IS NOT A SOLICITATION OF AN OFFER TO BUY THESE SECURITIES IN ANY JURISDICTION WHERE THE OFFER OR SALE IS NOT PERMITTED.
| | 27 of 156 |
| Structural and Collateral Term Sheet | JPMCC 2017-JP5 |
| Structural Overview | |
any REO Loans (or a portion of any REO Loan in the case of a Whole Loan)) held by the issuing entity as of the end of the applicable Collection Period.
Following the determination that an Asset Review Trigger has occurred, the Certificate Administrator will include in the Form 10-D relating to the distribution period in which the Asset Review Trigger occurred a description of the events that caused the Asset Review Trigger to occur. Once an Asset Review Trigger has occurred, Certificateholders evidencing not less than 5% of the voting rights may deliver to the Certificate Administrator a written direction requesting a vote on whether to commence an Asset Review within 90 days after the filing of the Form 10-D reporting the occurrence of the Asset Review Trigger (an “Asset Review Vote Election”). If directed by such Certificateholders, a vote of all Certificateholders will commence and an Asset Review will occur if more than a majority of Certificateholders voting (assuming Certificateholders representing a minimum of 5% of the voting rights respond) vote affirmatively within 150 days of the Asset Review Vote Election. If the vote does not pass, then no further votes will occur until an additional mortgage loan becomes a Delinquent Loan, an additional Asset Review Trigger occurs, and Certificateholders representing 5% of the voting rights again elect to cause a vote of all the Certificateholders. | ||||||
| ■ Replacement of the Asset Representations Reviewer: | The Asset Representations Reviewer may be terminated and replaced without cause. Upon (i) the written direction of Certificateholders evidencing not less than 25% of the voting rights (without regard to the application of any Appraisal Reduction Amounts) requesting a vote to terminate and replace the Asset Representations Reviewer with a proposed successor asset representations reviewer that is an Eligible Asset Representations Reviewer, and (ii) payment by such holders to the Certificate Administrator of the reasonable fees and expenses to be incurred by the Certificate Administrator in connection with administering such vote, the Certificate Administrator will promptly provide notice to all Certificateholders and the Asset Representations Reviewer of such request by posting such notice on its internet website, and by mailing to all Certificateholders and the Asset Representations Reviewer. Upon the written direction of Certificateholders evidencing at least 75% of a Certificateholder Quorum (without regard to the application of any Appraisal Reduction Amounts), the Trustee will terminate all of the rights and obligations of the Asset Representations Reviewer under the Pooling and Servicing Agreement by written notice to the Asset Representations Reviewer, and the proposed successor asset representations reviewer will be appointed. | |||||
| ■ Appointment and Replacement of Special Servicer: | The Directing Certificateholder will appoint the initial Special Servicer as of the Closing Date. Prior to the occurrence and continuance of a Control Termination Event, the Special Servicer may generally be replaced for cause at any time and without cause if either (i) LNR Partners, LLC or its affiliate is no longer the Special Servicer or (ii) LNR Securities Holdings, LLC or its affiliate owns less than 25% of the certificate balance of the controlling class, by the Directing Certificateholder; provided, however, that with respect to the Courtyard Marriott – King Kamehameha Whole Loan, the holder of the related Subordinate Companion Loan (prior to the occurrence and continuance of a control appraisal period with respect to such Subordinate Companion Loan) will have the right to replace the Special Servicer with respect to that Whole Loan.
If the Special Servicer obtains knowledge that it has become a Borrower Party with respect to any mortgage loan or Serviced Whole Loan (any such mortgage loan or Serviced Whole Loan, an “Excluded Special Servicer Loan”), the Special Servicer will be required to resign as Special Servicer of that Excluded Special Servicer Loan. Prior to the occurrence and continuance of a Control Termination Event, if the applicable Excluded Special Servicer Loan is not also an Excluded Loan, the Directing Certificateholder or the controlling class certificateholder on its behalf will be required to appoint (and may remove and replace with or without cause) a successor special servicer that is not a Borrower Party in accordance with the terms of the Pooling and Servicing Agreement (an “Excluded Special Servicer”) for the related Excluded Special Servicer Loan. After the occurrence and during the continuance of a Control Termination Event or if at any time the applicable Excluded Special Servicer Loan is also an Excluded Loan, the resigning Special Servicer will be required to use reasonable efforts to select the related Excluded Special Servicer.
Upon the occurrence and during the continuance of a Control Termination Event, the Directing Certificateholder will no longer have the right to replace the Special Servicer and such replacement will occur based on a vote of holders of all voting eligible Classes of Certificates as described below.
After the occurrence of a Consultation Termination Event, the Operating Advisor may also recommend the replacement of the Special Servicer as described above. | |||||
THE INFORMATION IN THIS STRUCTURAL AND COLLATERAL TERM SHEET IS NOT COMPLETE AND MAY BE AMENDED PRIOR TO THE TIME OF SALE. THIS TERM SHEET IS NOT AN OFFER TO SELL THESE SECURITIES AND IT IS NOT A SOLICITATION OF AN OFFER TO BUY THESE SECURITIES IN ANY JURISDICTION WHERE THE OFFER OR SALE IS NOT PERMITTED.
| | 28 of 156 |
| Structural and Collateral Term Sheet | JPMCC 2017-JP5 |
| Structural Overview | |
| ■ Replacement of Special Servicer by Vote of Certificateholders: | After the occurrence and during the continuance of a Control Termination Event and upon (a) the written direction of holders of Certificates evidencing not less than 25% of the Voting Rights of all Classes of Certificates entitled to principal (taking into account the application of Appraisal Reduction Amounts to notionally reduce the Certificate Balances of Classes to which such Appraisal Reduction Amounts are allocable) requesting a vote to replace the Special Servicer with a replacement special servicer, (b) payment by such requesting holders to the Certificate Administrator of all reasonable fees and expenses to be incurred by the Certificate Administrator in connection with administering such vote and (c) delivery by such holders to the Certificate Administrator and the Trustee of written confirmations from each Rating Agency that the appointment of such replacement special servicer will not result in a downgrade, withdrawal or qualification of the Certificates (which confirmations will be obtained at the expense of such holders), the Certificate Administrator will be required to post such notice on its Internet website, and by mail conduct the solicitation of votes of all Certificates in such regard, which such vote must occur within 180 days of the posting of such notice. Upon the written direction of holders of at least 66-2/3% of a Certificateholder Quorum, the Trustee will immediately replace the Special Servicer with a qualified replacement special servicer designated by such holders of Certificates.
A “Certificateholder Quorum” means, in connection with any solicitation of votes in connection with the replacement of the Special Servicer or the Asset Representations Reviewer described above, the holders of Certificates evidencing at least 50% of the aggregate Voting Rights (taking into account the application of realized losses and, other than with respect to the termination of the Asset Representations Reviewer, the application of any Appraisal Reduction Amounts to notionally reduce the Certificate Balance of the Certificates) of all Classes of Certificates entitled to principal on an aggregate basis.
With respect to each of the Serviced Whole Loan, the holders of the related Pari Passu Companion Loans, under certain circumstances following a servicer termination event with respect to the Special Servicer, will be entitled to direct the Trustee (and the Trustee will be required) to terminate the Special Servicer solely with respect to such Serviced Whole Loan. A replacement special servicer will be selected by the Trustee or, prior to a Control Termination Event, by the Directing Certificateholder;provided,however, that any successor special servicer appointed to replace the Special Servicer with respect to such Whole Loan can generally not be the person (or its affiliate) that was terminated at the direction of the holder of the related Pari Passu Companion Loan.
With respect to any Non-Serviced Whole Loan, the JPMCC 2017-JP5 trust as holder of the related mortgage loan has similar termination rights in the event of a servicer termination event with respect to the special servicer under the applicable trust and servicing agreement or pooling and servicing agreement, as applicable, as described above, which may be exercised by the Directing Certificateholder prior to the Control Termination Event. However, the successor special servicer will be selected pursuant to the applicable trust and servicing agreement or pooling and servicing agreement, as applicable, by the related directing holder prior to a control event under such trust and servicing agreement or pooling and servicing agreement, as applicable. The Master Servicer and Special Servicer are entitled to certain fees in connection with the servicing and administration of the mortgage loans as more fully described in “Pooling and Servicing Agreement—Servicing and Other Compensation and Payment of Expenses” in the Preliminary Prospectus. | |||||
| ■ Dispute Resolution Provisions: | Each Mortgage Loan Seller will be subject to the dispute resolution provisions set forth in the Pooling and Servicing Agreement to the extent those provisions are triggered with respect to any mortgage loan sold to the Depositor by a Mortgage Loan Seller and such Mortgage Loan Seller will be obligated under the related mortgage loan purchase agreement to comply with all applicable provisions and to take part in any mediation or arbitration proceedings that may result.
Generally, in the event that a request to repurchase a mortgage loan (a “Repurchase Request”) is not “Resolved” (as defined below) within 180 days after the related Mortgage Loan Seller receives such Repurchase Request (a “Resolution Failure”), then the Enforcing Servicer (as defined below) will be required to send a notice to the “Initial Requesting Certificateholder” (if any) indicating the Enforcing Servicer’s intended course of action with respect to the Repurchase Request. If (a) the Enforcing Servicer’s intended course of action with respect to |
THE INFORMATION IN THIS STRUCTURAL AND COLLATERAL TERM SHEET IS NOT COMPLETE AND MAY BE AMENDED PRIOR TO THE TIME OF SALE. THIS TERM SHEET IS NOT AN OFFER TO SELL THESE SECURITIES AND IT IS NOT A SOLICITATION OF AN OFFER TO BUY THESE SECURITIES IN ANY JURISDICTION WHERE THE OFFER OR SALE IS NOT PERMITTED.
| | 29 of 156 |
| Structural and Collateral Term Sheet | JPMCC 2017-JP5 |
| Structural Overview | |
the Repurchase Request does not involve pursuing further action to exercise rights against the related Mortgage Loan Seller with respect to the Repurchase Request and the Initial Requesting Certificateholder, if any, or any other Certificateholder or Certificate Owner wishes to exercise its right to refer the matter to mediation (including nonbinding arbitration) or arbitration, or (b) the Enforcing Servicer’s intended course of action is to pursue further action to exercise rights against the related Mortgage Loan Seller with respect to the Repurchase Request but the Initial Requesting Certificateholder, if any, or any other Certificateholder or Certificate Owner does not agree with the dispute resolution method selected by the Enforcing Servicer, then the Initial Requesting Certificateholder, if any, or such other Certificateholder or Certificate Owner may deliver a written notice to the Enforcing Servicer indicating its intent to exercise its right to refer the matter to either mediation or arbitration.
The Enforcing Servicer will be required to consult with any Certificateholder or Certificate Owner that delivers a notice of its intent to exercise its dispute resolution rights (a “Requesting Certificateholder”) so that a Requesting Certificateholder may consider the views of the Enforcing Servicer as to the claims underlying the Repurchase Request and possible dispute resolution methods. If a Requesting Certificateholder elects to exercise its right to refer the matter to either mediation or arbitration, then it will become the party responsible for enforcing the Repurchase Request and must promptly submit the matter to mediation (including nonbinding arbitration) or arbitration. Failure to make an election to exercise that right or failure to begin the elected form of proceedings within the certain timeframe set forth in the Pooling and Servicing Agreement will generally waive the Certificateholders’ or Certificate Owners’ rights with respect to the related Repurchase Request.
The “Enforcing Servicer” will be (a) with respect to a specially serviced loan, the Special Servicer, and (b) with respect to a non-specially serviced loan, (i) in the case of a Repurchase Request made by the Special Servicer, the Directing Certificateholder or a Controlling Class Certificateholder, the Master Servicer, and (ii) in the case of a Repurchase Request made by any person other than the Special Servicer, the Directing Certificateholder or a Controlling Class Certificateholder, (A) prior to a Resolution Failure relating to such non-specially serviced loan, the Master Servicer, and (B) from and after a Resolution Failure relating to such non-specially serviced Loan, the Special Servicer.
“Resolved” means, with respect to a Repurchase Request, (i) that the related Material Defect has been cured, (ii) the related mortgage loan has been repurchased in accordance with the related mortgage loan purchase agreement, (iii) a mortgage loan has been substituted for the related mortgage loan in accordance with the related mortgage loan purchase agreement, (iv) the applicable Mortgage Loan Seller has made a Loss of Value Payment, (v) a contractually binding agreement is entered into between the Enforcing Servicer, on behalf of the issuing entity, and the related Mortgage Loan Seller that settles the related Mortgage Loan Seller’s obligations under the related mortgage loan purchase agreement, or (vi) the related mortgage loan is no longer property of the issuing entity as a result of a sale or other disposition in accordance with the Pooling and Servicing Agreement.
| ||
| ■ Investor Communications: | The Certificate Administrator is required to include on any Form 10–D any request received from a Certificateholder to communicate with other Certificateholders related to Certificateholders exercising their rights under the terms of the Pooling and Servicing Agreement. Any Certificateholder wishing to communicate with other Certificateholders regarding the exercise of its rights under the terms of the Pooling and Servicing Agreement should deliver a written request signed by an authorized representative of the requesting investor to the Certificate Administrator at the address below:
9062 Old Annapolis Road
Columbia, Maryland 21045
Attention: Corporate Trust Administration Group – JPMCC 2017-JP5
With a copy to: trustadministrationgroup@wellsfargo.com | |
| ■ Master Servicer and Special Servicer Compensation: | The Master Servicer is entitled to a fee (the “Servicing Fee”) payable monthly from interest received in respect of each mortgage loan, any related REO loan and any related Serviced |
THE INFORMATION IN THIS STRUCTURAL AND COLLATERAL TERM SHEET IS NOT COMPLETE AND MAY BE AMENDED PRIOR TO THE TIME OF SALE. THIS TERM SHEET IS NOT AN OFFER TO SELL THESE SECURITIES AND IT IS NOT A SOLICITATION OF AN OFFER TO BUY THESE SECURITIES IN ANY JURISDICTION WHERE THE OFFER OR SALE IS NOT PERMITTED.
| | 30 of 156 |
| Structural and Collateral Term Sheet | JPMCC 2017-JP5 |
| Structural Overview | |
Companion Loan that will accrue at the related servicing fee rate described in the Preliminary Prospectus. The Special Servicer is also entitled to a fee (the “Special Servicing Fee”) with respect to each specially serviced loan (except with respect to any Fee Restricted Specially Serviced Loan (as defined below)) and REO loan (other than a non-serviced mortgage loan) at the special servicing fee rate described in the Preliminary Prospectus.
In addition to the Servicing Fee, Special Servicing Fee and certain other fees described below, the Master Servicer and Special Servicer are entitled to retain and share certain additional servicing compensation, including assumption application fees, assumption fees, defeasance fees and certain Excess Modification Fees and consent fees with respect to the mortgage loans. The Special Servicer may also be entitled to either a Workout Fee or Liquidation Fee, but not both, from recoveries in respect of any particular mortgage loan.
An “Excess Modification Fee” with respect to any mortgage loan (other than the non-serviced mortgage loans) or Serviced Whole Loan is the sum of (A) the excess, if any, of (i) any and all Modification Fees with respect to a mortgage loan or Serviced Whole Loan, as applicable, over (ii) all unpaid or unreimbursed additional expenses described in the Preliminary Prospectus (excluding Special Servicing Fees, Workout Fees and Liquidation Fees) outstanding with respect to the related mortgage loan or Serviced Whole Loan, as applicable, and reimbursed from such Modification Fees and (B) expenses previously paid or reimbursed from Modification Fees as described in clause (A), which expenses have subsequently been recovered from the related borrower or otherwise.
With respect to the Master Servicer and Special Servicer, the Excess Modification Fees collected and earned by such servicer from the related borrower (taken in the aggregate with any other Excess Modification Fees collected and earned by such servicer from the related borrower within the prior 18 months of the collection of the current Excess Modification Fees) will be subject to a cap of 1.00% of the outstanding principal balance of the related mortgage loan or Serviced Whole Loan, as applicable, on the closing date of the related modification, extension, waiver or amendment. A “Modification Fee” with respect to any mortgage loan (other than the non-serviced mortgage loans) or Serviced Companion Loan is generally any fee with respect to a modification, extension, waiver or amendment of any mortgage loan and/or related Serviced Companion Loan.
A specially serviced loan is a “Fee Restricted Specially Serviced Loan” if (i) such specially serviced loan is a specially serviced loan solely because of an event described in clause (1)(y), (5) or (7) of the definition of “Specially Serviced Loan” in the Preliminary Prospectus and (ii) the Special Servicer made the determination that the related mortgage loan (and any related Serviced Companion Loan) should be transferred to special servicing and the Master Servicer does not agree with the Special Servicer’s determination, as evidenced by, in the case of an event described in clause (5) or (7) of the definition of “Specially Serviced Loan” in the Preliminary Prospectus, an officer’s certificate delivered to the Special Servicer setting forth the reason for such disagreement;provided,however that no specially serviced loan will be a Fee Restricted Specially Serviced Loan if such specially serviced loan is transferred to special servicing by the determination of the Master Servicer or if the Master Servicer and the Special Servicer mutually agree to such transfer. In addition, a specially serviced loan will be a Fee Restricted Specially Serviced Loan only during (i) with respect to a specially serviced loan that is a specially serviced loan solely because of an event described in clause (1)(y) of the definition of “Specially Serviced Loan” in the Preliminary Prospectus, the Fee Restricted Period, and (ii) with respect to a specially serviced loan that is a specially serviced loan solely because of an event described in clause (5) or (7) of the definition of “Specially Serviced Loan” in the Preliminary Prospectus, the Imminent Default Fee Restricted Period.
A “Fee Restricted Period” will exist from the occurrence of a Fee Restricted Trigger until the earlier of (i) the time set forth in the applicable Refinancing/P&S Document (as defined below), as extended pursuant to the original terms of such documentation, (ii) 120 days after the balloon payment default or maturity default and (iii) the date that the related borrower fails to make the assumed scheduled payment or the date that the related mortgage loan (or serviced companion loan) would have become a specially serviced loan due to an event other than an event described in clause (1)(y) of the definition of “Specially Serviced Loan” in the Preliminary Prospectus.
A “Fee Restricted Trigger” will occur in connection with a balloon payment default or a maturity default if (A) the borrower provides on or prior to the related maturity date or, if the maturity date of such mortgage loan or serviced companion loan has been extended in accordance with the |
THE INFORMATION IN THIS STRUCTURAL AND COLLATERAL TERM SHEET IS NOT COMPLETE AND MAY BE AMENDED PRIOR TO THE TIME OF SALE. THIS TERM SHEET IS NOT AN OFFER TO SELL THESE SECURITIES AND IT IS NOT A SOLICITATION OF AN OFFER TO BUY THESE SECURITIES IN ANY JURISDICTION WHERE THE OFFER OR SALE IS NOT PERMITTED.
| | 31 of 156 |
| Structural and Collateral Term Sheet | JPMCC 2017-JP5 |
| Structural Overview | |
Pooling and Servicing Agreement, the extended maturity date, (i) a fully executed term sheet or refinancing commitment with respect to a refinancing of the related Mortgage Loan or (ii) a signed purchase and sale agreement with respect to a sale of the related Mortgaged Property (each of the documents in clauses (i) and (ii), a “Refinancing/P&S Document”) for a refinancing of the related mortgage loan or sale of the mortgaged property (in each case subject only to typical due diligence and closing conditions and, in the case of a purchase and sale agreement, if such agreement includes delivery of an acceptable deposit by the purchaser) in a manner consistent with CMBS market practices and that is satisfactory in form and substance to the Master Servicer but that is not satisfactory to the Special Servicer, from an acceptable lender or purchaser reasonably satisfactory to the Master Servicer but that is not satisfactory to the Special Servicer, and (B) the borrower thereafter continues to make the assumed scheduled payment, and (C) the mortgage loan is not a specially serviced loan due to the occurrence of any other event.
An “Imminent Default Fee Restricted Period” will exist, with respect to any specially serviced loan that is a specially serviced loan solely because of an event described in clause (5) or (7) of the definition of “Specially Serviced Loan” in the Preliminary Prospectus, during the period commencing upon the Special Servicer determining that such specially serviced loan will be transferred into special servicing (without the agreement of the Master Servicer) and ending on the date on which a payment default has occurred and remained uncured for 60 days. In the event that the Master Servicer disagrees with the Special Servicer’s determination to transfer such specially serviced loan into special servicing, the Master Servicer will be required to deliver an officer’s certificate to the Special Servicer setting forth the reasons for such disagreement.
A “Workout Fee” will generally be payable with respect to each corrected loan (except with respect to a corrected loan that was a Fee Restricted Specially Serviced Loan) (as more specifically described in the Preliminary Prospectus) and will be calculated at a rate of 1.00% of payments of principal and interest on the respective mortgage loan for so long as it remains a corrected loan, subject to a maximum of $1,000,000 in the aggregate with respect to any particular corrected mortgage loan. After receipt by the Special Servicer of Workout Fees with respect to a corrected loan in an amount equal to $25,000, any Workout Fees in excess of such amount will be reduced by the Excess Modification Fee Amount;provided that in the event the Workout Fee, collected over the course of such workout calculated at the Workout Fee Rate is less than $25,000, then the Special Servicer will be entitled to an amount from the final payment on the related corrected loan (including any related Serviced Companion Loan) that would result in the total Workout Fees payable to the Special Servicer in respect of that corrected loan (including any related Serviced Companion Loan) to be $25,000.
The “Excess Modification Fee Amount” for any corrected loan is an amount equal to any Excess Modification Fees paid by or on behalf of the related borrower with respect to the related mortgage loan (including the related Serviced Companion Loan) and received and retained by the Master Servicer or the Special Servicer, as applicable, as additional servicing compensation within the prior 18 months of the related modification, waiver, extension or amendment resulting in the mortgage loan or REO loan being a corrected loan, but only to the extent those fees have not previously been deducted from a Workout Fee or Liquidation Fee.
A “Liquidation Fee” will generally be payable with respect to each specially serviced loan (except with respect to any Fee Restricted Specially Serviced Loan) or REO property (except with respect to any non-serviced mortgage loan) as to which the Special Servicer obtains a full or partial recovery of the related asset. The Liquidation Fee for each specially serviced mortgage loan will be payable at a rate of 1.00% of the liquidation proceeds (exclusive of default interest) subject to a maximum of $1,000,000;provided,however, that no Liquidation Fee will be less than $25,000.
The Liquidation Fees will be reduced by the amount of any Excess Modification Fees received by the Special Servicer with respect to the related mortgage loan (including a Serviced Companion Loan) or REO property as additional compensation within the prior 18 months, but only to the extent those fees have not previously been deducted from a Workout Fee or Liquidation Fee.
Similar fees to those described above will be payable to the applicable special servicer for the Non-Serviced Whole Loans under the related trust and servicing agreement or pooling and servicing agreement, as applicable. |
THE INFORMATION IN THIS STRUCTURAL AND COLLATERAL TERM SHEET IS NOT COMPLETE AND MAY BE AMENDED PRIOR TO THE TIME OF SALE. THIS TERM SHEET IS NOT AN OFFER TO SELL THESE SECURITIES AND IT IS NOT A SOLICITATION OF AN OFFER TO BUY THESE SECURITIES IN ANY JURISDICTION WHERE THE OFFER OR SALE IS NOT PERMITTED.
| | 32 of 156 |
| Structural and Collateral Term Sheet | JPMCC 2017-JP5 |
| Structural Overview | |
Subject to certain limited exceptions, in connection with its duties under the Pooling and Servicing Agreement, the Special Servicer and its affiliates are prohibited from receiving or retaining any compensation (other than compensation specifically provided for under the Pooling and Servicing Agreement) from anyone in connection with the disposition, workout or foreclosure of any mortgage loan, the management or disposition of any REO property, or the performance of any other special servicing duties under the Pooling and Servicing Agreement. In the event the Special Servicer does receive any such compensation, it will be required to disclose those fees to the Certificate Administrator who will include it as part of the statement to Certificateholders.
In addition, no liquidation fee will be payable to the Special Servicer if a mortgage loan or Serviced Whole Loan becomes a specially serviced loan only because of a maturity default and the related liquidation proceeds are received within 90 days following the related maturity date as a result of the related mortgage loan or Serviced Whole Loan being refinanced or otherwise repaid in full. | ||
| ■ Deal Website: | The Certificate Administrator will maintain a deal website to which certain persons will have access to certain information including, but not limited to the following, which will be posted:
■ special notices;
■ summaries of any final asset status reports;
■ appraisals in connection with Appraisal Reductions plus any second appraisals ordered;
■ an “Investor Q&A Forum”;
■ a voluntary investor registry; and
■ SEC EDGAR filings. |
THE INFORMATION IN THIS STRUCTURAL AND COLLATERAL TERM SHEET IS NOT COMPLETE AND MAY BE AMENDED PRIOR TO THE TIME OF SALE. THIS TERM SHEET IS NOT AN OFFER TO SELL THESE SECURITIES AND IT IS NOT A SOLICITATION OF AN OFFER TO BUY THESE SECURITIES IN ANY JURISDICTION WHERE THE OFFER OR SALE IS NOT PERMITTED.
| | 33 of 156 |
| Structural and Collateral Term Sheet | JPMCC 2017-JP5 | |
| Hilton Hawaiian Village | ||

THE INFORMATION IN THIS STRUCTURAL AND COLLATERAL TERM SHEET IS NOT COMPLETE AND MAY BE AMENDED PRIOR TO THE TIME OF SALE. THIS TERM SHEET IS NOT AN OFFER TO SELL THESE SECURITIES AND IT IS NOT A SOLICITATION OF AN OFFER TO BUY THESE SECURITIES IN ANY JURISDICTION WHERE THE OFFER OR SALE IS NOT PERMITTED.
| | 34 of 156 |
| Structural and Collateral Term Sheet | JPMCC 2017-JP5 | |
| Hilton Hawaiian Village | ||
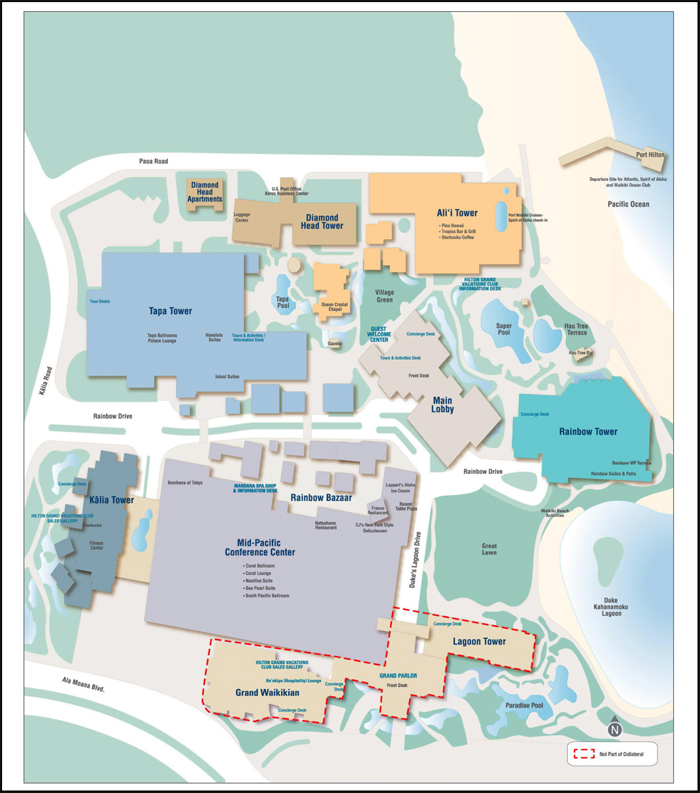
THE INFORMATION IN THIS STRUCTURAL AND COLLATERAL TERM SHEET IS NOT COMPLETE AND MAY BE AMENDED PRIOR TO THE TIME OF SALE. THIS TERM SHEET IS NOT AN OFFER TO SELL THESE SECURITIES AND IT IS NOT A SOLICITATION OF AN OFFER TO BUY THESE SECURITIES IN ANY JURISDICTION WHERE THE OFFER OR SALE IS NOT PERMITTED.
| | 35 of 156 |
| Structural and Collateral Term Sheet | JPMCC 2017-JP5 | |
| Hilton Hawaiian Village | ||
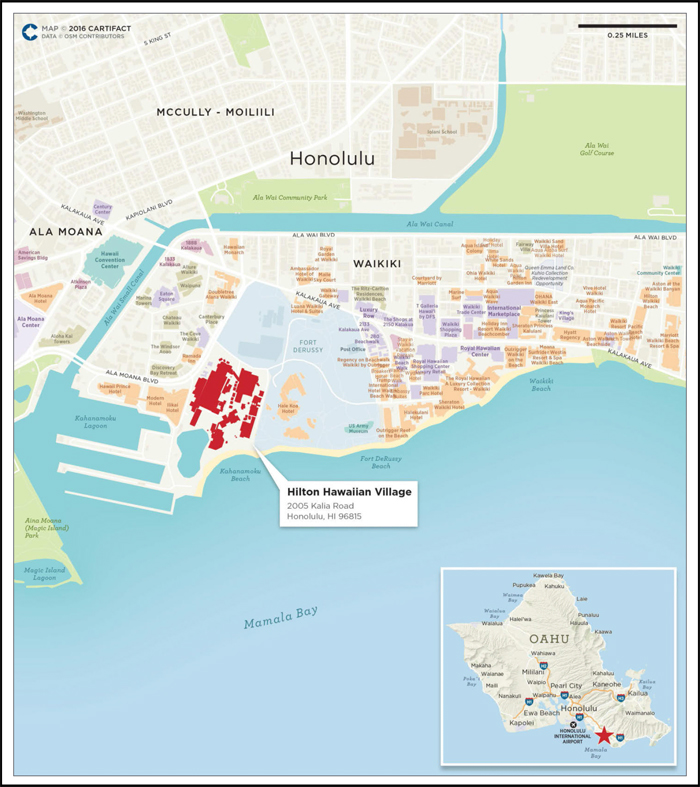
THE INFORMATION IN THIS STRUCTURAL AND COLLATERAL TERM SHEET IS NOT COMPLETE AND MAY BE AMENDED PRIOR TO THE TIME OF SALE. THIS TERM SHEET IS NOT AN OFFER TO SELL THESE SECURITIES AND IT IS NOT A SOLICITATION OF AN OFFER TO BUY THESE SECURITIES IN ANY JURISDICTION WHERE THE OFFER OR SALE IS NOT PERMITTED.
| | 36 of 156 |
| Structural and Collateral Term Sheet | JPMCC 2017-JP5 | |
| Hilton Hawaiian Village | ||
| Mortgage Loan Information | Property Information | |||
| Mortgage Loan Seller(1): | JPMCB | Single Asset / Portfolio: | Single Asset | |
| Credit Assessment | Title: | Fee / Leasehold | ||
| (Moody’s/Fitch/KBRA)(2): | Aa3 / BBB- / BBB+ | Property Type - Subtype: | Hotel – Full Service | |
| Original Principal Balance(3): | $80,000,000 | Net Rentable Area (Rooms)(6): | 2,860 | |
| Cut-off Date Principal Balance(3): | $80,000,000 | Location: | Honolulu, HI | |
| % of Pool by IPB: | 7.3% | Year Built / Renovated: | 1961 / 2016 | |
| Loan Purpose(4): | Refinance | Occupancy / ADR / RevPAR: | 94.6% / $250.09 / $236.65 | |
| Borrower: | Hilton Hawaiian Village LLC | Occupancy / ADR / RevPAR Date: | 9/30/2016 | |
| Sponsor: | Park Intermediate Holdings LLC | Number of Tenants: | N/A | |
| Interest Rate: | 4.19950% | 2013 NOI: | $110,964,835 | |
| Note Date: | 10/24/2016 | 2014 NOI: | $119,860,819 | |
| Maturity Date: | 11/1/2026 | 2015 NOI: | $128,737,723 | |
| Interest-only Period: | 120 months | TTM NOI (as of 9/2016): | $131,893,120 | |
| Original Term: | 120 months | UW Occupancy / ADR / RevPAR: | 94.6% / $250.09 / $236.65 | |
| Original Amortization: | None | UW Revenues: | $374,437,742 | |
| Amortization Type: | Interest Only | UW Expenses: | $241,850,768 | |
| Call Protection(5): | L(28),DeforGrtr1%orYM(85),O(7) | UW NOI: | $132,586,975 | |
| Lockbox: | CMA | UW NCF: | $132,586,975 | |
| Additional Debt: | Yes | Appraised Value / Per Room: | $2,230,000,000 / $779,720 | |
| Additional Debt Balance(3): | $616,600,000 / $578,400,000 | Appraisal Date: | 8/30/2016 | |
| Additional Debt Type: | Pari Passu / Subordinate Debt | |||
| Escrows and Reserves(7) | Financial Information(3) | ||||||
| Initial | Monthly | Initial Cap | Pari Passu Debt | Whole Loan | |||
| Taxes: | $0 | Springing | N/A | Cut-off Date Loan / Room: | $243,566 | $445,804 | |
| Insurance: | $0 | Springing | N/A | Maturity Date Loan / Room: | $243,566 | $445,804 | |
| FF&E: | $0 | Springing | N/A | Cut-off Date LTV: | 31.2% | 57.2% | |
| TI/LC: | $0 | $0 | N/A | Maturity Date LTV: | 31.2% | 57.2% | |
| Other: | $0 | $0 | N/A | UW NCF DSCR: | 4.47x | 2.44x | |
| UW NOI Debt Yield: | 19.0% | 10.4% | |||||
| Sources and Uses | ||||||
| Sources | Proceeds | % of Total | Uses | Proceeds | % of Total | |
| Mortgage Loan(3) | $1,275,000,000 | 100.0% | Payoff Existing Debt | $1,255,912,700 | 98.5% | |
| Excess Loan Proceeds(4) | 10,621,760 | 0.8 | ||||
| Closing Costs | 8,465,540 | 0.7 | ||||
| Total Sources | $1,275,000,000 | 100.0% | Total Uses | $1,275,000,000 | 100.0% | |
| (1) | The Hilton Hawaiian Village Whole Loan was co-originated by JPMCB, Deutsche Bank AG, New York Branch, Goldman Sachs Mortgage Company, Barclays Bank PLC and Morgan Stanley Bank, N.A. |
| (2) | Moody’s, Fitch and KBRA have confirmed that the Hilton Hawaiian Village Mortgage Loan has, in the context of its inclusion in the mortgage pool, credit characteristics consistent with an investment grade obligation. |
| (3) | The Hilton Hawaiian Village Mortgage Loan is part of a whole loan comprised of (i) the mortgage loan (comprised of one senior note with an outstanding principal balance as of the Cut-off Date of $80.0 million), (ii) two companion loans, each of which ispari passu with respect to the Hilton Hawaiian Village Mortgage Loan (such companion loans being comprised of 15pari passu notes) with an aggregate outstanding principal balance as of the Cut-off Date of $616.6 million and (iii) a subordinate companion loan (comprised of fivepari passu notes) with an aggregate outstanding principal balance as of the Cut-off Date of $578.4 million. The Pari Passu Debt Financial Information presented in the chart above reflects the $696.6 million aggregate Cut-off Date balance of the Hilton Hawaiian Village Mortgage Loan and the Hilton Hawaiian Village Pari Passu Companion Loan, excluding the Hilton Hawaiian Village Subordinate Companion Loan. The Whole Loan Financial Information presented in the chart above reflects the Cut-off Date balance of the $1.275 billion Hilton Hawaiian Village Whole Loan, as defined in“The Loan” below. |
| (4) | Excess Loan Proceeds were distributed by the borrower to its member and utilized by affiliates of Park Hotels & Resorts to prepay other outstanding CMBS loans. |
| (5) | The lockout period will be at least 28 payment dates beginning with and including the first payment date of December 1, 2016. Defeasance of the full $1.275 billion Hilton Hawaiian Village Whole Loan is permitted after the date that is the earlier of (i) May 1, 2019 and (ii) two years from the closing date of the securitization that includes the last note to be securitized (the “REMIC Prohibition Period”). If the borrower has not previously elected to defease the Hilton Hawaiian Village Whole Loan, the borrower is also permitted to prepay the Hilton Hawaiian Village Whole Loan in whole, but not in part, after the expiration of the REMIC Prohibition Period with the payment of a yield maintenance premium. |
| (6) | The Hilton Hawaiian Village property also includes approximately 130,489 square feet of commercial/retail space leased to more than 100 tenants. Additionally, the property includes the 25-story Kalia Tower which is subject to a condominium regime. Kalia Tower contains six floors totaling 72 timeshare units that are not part of the collateral for the loan. |
| (7) | For a full description of Escrows and Reserves, please refer to“Escrows and Reserves”below. |
THE INFORMATION IN THIS STRUCTURAL AND COLLATERAL TERM SHEET IS NOT COMPLETE AND MAY BE AMENDED PRIOR TO THE TIME OF SALE. THIS TERM SHEET IS NOT AN OFFER TO SELL THESE SECURITIES AND IT IS NOT A SOLICITATION OF AN OFFER TO BUY THESE SECURITIES IN ANY JURISDICTION WHERE THE OFFER OR SALE IS NOT PERMITTED.
| | 37 of 156 |
| Structural and Collateral Term Sheet | JPMCC 2017-JP5 | |
| Hilton Hawaiian Village | ||
The Loan.The Hilton Hawaiian Village loan is secured by a first mortgage lien on the borrower’s fee and leasehold interests in a 2,860-room luxury full-service destination resort located in Honolulu, Hawaii. The whole loan was co-originated by JPMCB, Deutsche Bank AG, New York Branch, Goldman Sachs Mortgage Company, Barclays Bank PLC and Morgan Stanley Bank, N.A. and has an outstanding principal balance as of the Cut-off Date of $1.275 billion (the “Hilton Hawaiian Village Whole Loan”). The Hilton Hawaiian Village Whole Loan is comprised of (i) a senior loan, comprised of 16pari passu notes, with an aggregate outstanding principal balance of $696.6 million (one of which, Note A-2-A-2, will be contributed to the JPMCC 2017-JP5 Trust, the “Hilton Hawaiian Village Mortgage Loan” and the remaining notes, collectively, the “Hilton Hawaiian Village Pari Passu Companion Loan”) and (ii) a subordinate companion loan, comprised of fivepari passu notes, with an aggregate outstanding principal balance of $578.4 million (collectively, the “Hilton Hawaiian Village Subordinate Companion Loan”), each as described below. The Hilton Hawaiian Village Mortgage Loan and the Hilton Hawaiian Village Pari Passu Companion Loan arepari passu in right of payment with each other and are generally senior in right of payment to the Hilton Hawaiian Village Subordinate Companion Loan as and to the extent described in “Description of the Mortgage Pool—The Whole Loans—The Non-Serviced Whole Loans—The Hilton Hawaiian Village Whole Loan” in the Preliminary Prospectus. The senior Note A-1-A was contributed to the Hilton USA Trust 2016-HHV securitization that governs the servicing and administration of the Hilton Hawaiian Village Whole Loan and is the controlling note under the related intercreditor agreement, the rights of which will be exercised by the related trustee (or, prior to the occurrence and continuance of a control termination event under the related trust and servicing agreement (the “Hilton USA Trust 2016-HHV Trust and Servicing Agreement”), the directing certificateholder under the Hilton USA Trust 2016-HHV Trust and Servicing Agreement). However, the JPMCC 2017-JP5 Trust will be entitled, under certain circumstances, to be consulted with respect to certain major decisions (which rights will be exercised by the Directing Certificateholder prior to a Control Termination Event). The Hilton Hawaiian Village Whole Loan has a 10-year term and will be interest-only for the term of the loan. The prior debt secured by the Hilton Hawaiian Village property was previously securitized in the Hilton USA Trust 2013-HLT trust.
| Whole Loan Summary |
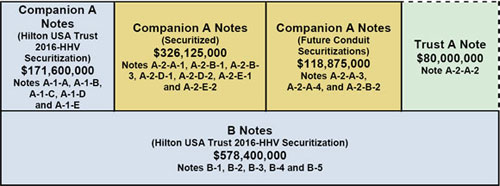
The Borrower.The borrowing entity for the Hilton Hawaiian Village Whole Loan is Hilton Hawaiian Village LLC, a Hawaii limited liability company and special purpose entity.
The Loan Sponsor.The loan sponsor and nonrecourse carve-out guarantor is Park Intermediate Holdings LLC. Park Intermediate Holdings LLC is a wholly owned subsidiary of Park Hotels & Resorts Inc. (“Park Hotels & Resorts”), one of two spin-offs announced by Hilton Worldwide Holdings Inc. (“Hilton”). On February 26, 2016, Hilton announced plans to separate into three independent, publicly traded companies: Park Hotels & Resorts (NYSE: PK), Hilton Grand Vacations Inc. (NYSE: HGV) and Hilton (NYSE: HLT). The spin-offs were completed in January 2017. Park Hotels & Resorts now owns most of Hilton’s owned and leased real estate properties and, with over 35,000 rooms and 67 hotels, is the second-largest publicly traded real estate investment trust in the lodging industry. Hilton Grand Vacations Inc. owns and operates Hilton’s timeshare business, while Hilton retains its core management and franchise business and continues to trade on the NYSE as a leading global hospitality company. The aggregate liability of the guarantor with respect to all full recourse carve-outs in the Hilton Hawaiian Village Whole Loan documents may not exceed an amount equal to 10.0% of the principal balance of the Hilton Hawaiian Village Whole Loan outstanding at the time of the occurrence of such event, plus any and all reasonable third-party collection costs actually incurred by the lender. In addition, the guarantor is not a party to the environmental indemnity. In lieu of the guarantor signing the indemnity, the Hilton Hawaiian Village Whole Loan documents require the borrower to obtain environmental insurance. At origination, the borrower obtained an environmental insurance policy with (i) a term of 10 years, (ii) limits of $10,000,000 per occurrence and $25,000,000 in the aggregate and (iii) a $25,000 deductible.
THE INFORMATION IN THIS STRUCTURAL AND COLLATERAL TERM SHEET IS NOT COMPLETE AND MAY BE AMENDED PRIOR TO THE TIME OF SALE. THIS TERM SHEET IS NOT AN OFFER TO SELL THESE SECURITIES AND IT IS NOT A SOLICITATION OF AN OFFER TO BUY THESE SECURITIES IN ANY JURISDICTION WHERE THE OFFER OR SALE IS NOT PERMITTED.
| | 38 of 156 |
| Structural and Collateral Term Sheet | JPMCC 2017-JP5 | |
| Hilton Hawaiian Village | ||
The Property. The Hilton Hawaiian Village property is a 2,860-room, full-service luxury resort located on the island of Oahu in Honolulu, Hawaii. The Hilton Hawaiian Village is one of Hawaii’s premier urban resort destinations, situated on an entire city block overlooking Waikiki Beach. The property is situated on an approximately 22-acre site, the majority of which is fee-owned. The property is comprised of 2,860 guest rooms spread across five towers: the Ali’i Tower (348 rooms), Diamond Head Tower (380 rooms), Rainbow Tower (796 rooms), Kalia Tower (315 rooms) and Tapa Tower (1,021 rooms). The towers each offer unique guest room accommodations and are situated on ocean-front property, offering views of Waikiki Beach, Diamond Head and downtown Honolulu. The property is the only self-contained destination resort in Waikiki and offers the largest guest room inventory in the state of Hawaii, as well as the most meeting space within its competitive set. The property offers a host of resort-style amenities and services, including 20 food and beverage outlets, over 150,000 square feet of flexible indoor and outdoor function space, three conference centers, five swimming pools, a saltwater lagoon, spa grottos, the Mandara Spa and Fitness Center, a chapel and a retail component comprised of over 100 retail tenants.
The property was initially constructed by Hilton in 1961 and has undergone several extensive renovations throughout its existence. According to the sponsor, since 2008, the loan sponsor has invested approximately $232.2 million (approximately $81,188 per room) in capital expenditures spread across all segments of the property. Most recently, the loan sponsor completed a full-scale renovation of its premier luxury guest room tower, the Ali’i Tower, in 2012, updating the guest rooms and suites, main lobby and library at an estimated cost of approximately $20.6 million. Additionally, the loan sponsor completed a comprehensive renovation of the Diamond Head Tower in 2014 at an estimated cost of approximately $17.9 million.
| Historical Capital Expenditures(1) | ||||||||||
| 2008 | 2009 | 2010 | 2011 | 2012 | 2013 | 2014 | 2015 | YTD 2016(2) | Total | |
| Capital Expenditures(3) | $22,216 | $16,509 | $8,834 | $56,117 | $42,568 | $28,138 | $32,965 | $15,559 | $9,293 | $232,198 |
| Per Room | $7,768 | $5,772 | $3,089 | $19,621 | $14,884 | $9,838 | $11,526 | $5,440 | $3,249 | $81,188 |
| (1) | Based on actual capital expenditures as provided by the loan sponsor. |
| (2) | YTD 2016 Capital Expenditures are as of September 30, 2016. |
| (3) | Capital Expenditures are presented in (000)’s. |
The property offers approximately 150,000 square feet of indoor and outdoor meeting and function space, which is split between three primary locations: the second floor of the Tapa Tower, the base of the Kalia Tower and the Mid-Pacific Conference Center. The property features over 65,000 square feet of indoor meeting space spread throughout four buildings, as well as two outdoor lawns: the Lagoon Green and the Village Green. The Mid-Pacific Conference Center, a stand-alone building, underwent a full-scale refurbishment in 2013 and features 35,000 square feet of meeting/event space, including the 24,840 square foot Coral Ballroom, which is divisible into five separate breakout rooms. It is among the largest conference centers in the Hawaiian Islands and offers the largest capacity ballroom, accommodating up to 2,600 guests.
The property features approximately 130,489 square feet of leased retail and restaurant space, which was 78.5% occupied by over 100 tenants as of September 2016. The retail component of the property generated TTM September 2016 sales of approximately $136.1 million for reporting tenants. For the trailing 12-month period ending September 30, 2016, the retail component of the property generated approximately $20.8 million in retail revenue (retail revenue is inclusive of reimbursements for common area maintenance, taxes and marketing expenses, as provided by the loan sponsor) which, net of undistributed expenses attributable to the retail component (as estimated by the loan sponsor), accounts for approximately 13.1% of net cash flow, providing diversity to traditional hotel revenue streams. While the majority of the property’s leased space is made up of traditional retail and restaurant tenants, the hotel also leases some office space to Hilton Grand Vacations and third-party travel wholesalers, such as Kintetsu and JTB. The hotel’s Ocean Crystal Chapel and Lagoon Chapel are also leased to a third-party operator.
| Historical Retail Component Sales(1) | ||||
| 2013 | 2014 | 2015 | TTM(2) | |
| Total Sales | $130,613,993 | $141,808,186 | $137,316,925 | $136,055,744 |
| Sales PSF | $1,552 | $1,651 | $1,590 | $1,496 |
| (1) | Historical Sales for reporting tenants were provided by the loan sponsor. |
| (2) | TTM is as of September 30, 2016. |
THE INFORMATION IN THIS STRUCTURAL AND COLLATERAL TERM SHEET IS NOT COMPLETE AND MAY BE AMENDED PRIOR TO THE TIME OF SALE. THIS TERM SHEET IS NOT AN OFFER TO SELL THESE SECURITIES AND IT IS NOT A SOLICITATION OF AN OFFER TO BUY THESE SECURITIES IN ANY JURISDICTION WHERE THE OFFER OR SALE IS NOT PERMITTED.
| | 39 of 156 |
| Structural and Collateral Term Sheet | JPMCC 2017-JP5 | |
| Hilton Hawaiian Village | ||
| Collateral Tenant Summary(1) | ||||||||
| Tenant | Ratings(2) Moody’s/S&P/Fitch | Net Rentable Area (SF) | % of Total NRA | Lease Expiration Date | Base Rent PSF | % of Total Base Rent | Most Recent Sales(3) | Most Recent Sales PSF(3) |
| Mandara Spa | NA / NA / NA | 12,583 | 9.6% | 8/31/2017 | $53.61 | 3.9% | $2,903,709 | $231 |
| Hatsuhana Hawaii | NA / NA / NA | 6,026 | 4.6% | 11/30/2018 | $52.38 | 1.8% | $2,969,958 | $493 |
| Fresco | NA / NA / NA | 5,983 | 4.6% | 12/31/2018 | $58.38 | 2.0% | $3,331,316 | $557 |
| Benihana of Tokyo | NA / NA / NA | 5,300 | 4.1% | 5/31/2021 | $127.6 | 3.9% | $6,561,789 | $1,238 |
| Best Bridal - Lagoon Chapel | NA / NA / NA | 4,755 | 3.6% | 10/31/2022 | $57.45 | 1.6% | $520,020 | $109 |
| Watabe Wedding(4) | NA / NA / NA | 4,158 | 3.2% | 1/14/2019 | $63.93 | 1.5% | $167,697 | $40 |
| ABC Stores - Tapa Tower | NA / NA / NA | 3,500 | 2.7% | 8/31/2022 | $384.2 | 7.7% | $12,225,380 | $3,493 |
| Louis Vuitton | NA / A+ / NA | 3,500 | 2.7% | 8/18/2023 | $146.7 | 2.9% | $7,978,397 | $2,280 |
| Lamonts & Whalers General Store | NA / NA / NA | 2,800 | 2.1% | MTM | $163.1 | 2.6% | $1,856,972 | $663 |
| ABC Discount Store | NA / NA / NA | 2,145 | 1.6% | 12/31/2018 | $812.2 | 10.0% | $14,519,183 | $6,769 |
| (1) | Based on the underwritten rent roll. |
| (2) | Ratings provided are for the parent company of the entity listed in the “tenant” field whether or not the parent company guarantees the lease. |
| (3) | Most Recent Sales and Most Recent Sales PSF for reporting tenants were provided by the loan sponsor as of September 30, 2016. |
| (4) | Most Recent Sales and Most Recent Sales PSF for Watabe Wedding represent only partial year performance as the venue opened in 2016. |
The Hilton Hawaiian Village property is located in Honolulu, Hawaii, in the greater Oahu lodging market and the Waikiki submarket. The island of Oahu serves as an economic center of the Hawaiian Islands. Oahu maintains its status as one of the world’s foremost tourist destinations, with cultural venues, golf courses, restaurants, retail and recreational attractions. In 2015, approximately 5.3 million tourists, or 62.4% of Hawaii’s total air tourists, visited the island of Oahu, making it the most popular destination in the Hawaiian Islands. The total number of air visitors has increased by 435,867 from 2012 to 2015, which represents a 2.9% year-over-year increase. International travel to Oahu represented 46.3% of Oahu’s 5.3 million air visitors in 2015 and was marginally unchanged from 2014. Additionally, visitor expenditures in Oahu totaled $7.4 billion in 2015, which represents 49.3% of total expenditures by air visitors in 2015. Honolulu is the strongest lodging market in Oahu and all of the eight Hawaiian Islands, a status attributable to a temperate year-round climate, popularity as one of the leading group and leisure destinations of Hawaii, superior visitor infrastructure and high barriers to new supply. Honolulu encompasses more than 24,000 guest rooms in 74 properties and consistently achieved occupancy rates in the mid 70% to 80% range, never dropping below 74%, between 2009 and 2015. During this same period, RevPAR in Honolulu increased at an average annual rate of 9.5%, ending 2015 at $190, while the average daily rate achieved a premium of $69 over 2009. The market’s RevPAR in 2009, which represented the trough during the downturn, reflects a 14.6% decline relative to 2007, less than other leading markets.
The appraisal identified two hotels either recently opened or currently under construction in the Waikiki submarket that are expected to have some degree of competitive interaction with the Hilton Hawaiian Village property. The 623-room Hilton Garden Inn (Ohana Waikiki West Redevelopment) opened in June 2016, while the 230-room boutique Hyatt Centric (Waikiki Trade Center Redevelopment) is expected to open in March 2017. Though offered at a competitive price-point with national brand affiliations, the appraisal notes that both options are non-beachfront locations with select-service product offerings. Additionally, the appraisal notes significant barriers to entry, including nearly no developable ocean-front land and prohibitively high costs.
| Historical Occupancy, ADR, RevPAR(1) | |||||||||
| Competitive Set(2) | Hilton Hawaiian Village(3) | Penetration Factor(4) | |||||||
| Year | Occupancy | ADR | RevPAR | Occupancy | ADR | RevPAR | Occupancy | ADR | RevPAR |
| 2013 | 89.0% | $248.36 | $221.07 | 89.9% | $237.77 | $213.84 | 101.0% | 95.7% | 96.7% |
| 2014 | 87.8% | $250.07 | $219.50 | 90.7% | $238.34 | $216.26 | 103.4% | 95.3% | 98.5% |
| 2015 | 89.0% | $256.75 | $228.38 | 94.4% | $240.62 | $227.20 | 106.2% | 93.7% | 99.5% |
| TTM(5) | 89.9% | $259.08 | $232.92 | 94.6% | $250.09 | $236.65 | 105.3% | 96.5% | 101.6% |
| (1) | Variances between the underwriting, the appraisal and the above table with respect to Occupancy, ADR and RevPAR at the Hilton Hawaiian Village property are attributable to variances in reporting methodologies and/or timing differences. |
| (2) | Data provided by STR. The competitive set contains the following properties: Sheraton Waikiki, Marriott Waikiki Beach Resort & Spa, Hyatt Regency Waikiki Beach Resort & Spa, Westin Moana Surfrider, Sheraton Hotel Princess Kaiulani, Outrigger Reef Waikiki Beach Resort and Outrigger Waikiki Beach Resort. |
| (3) | Based on operating statements provided by the borrower, with the exception of 2013 and 2014 which have been adjusted by STR for both ADR and RevPAR in order to normalize for a change in accounting methodology in 2015. Prior to 2015, borrower operating statements presented ADR and RevPAR inclusive of resort fees. For all years presented above, ADR and RevPAR are calculated exclusive of resort fees. |
| (4) | Penetration Factor is calculated based on data provided by STR for the competitive set and borrower-provided operating statements for the property. |
| (5) | TTM represents the trailing 12-month period ending on September 30, 2016. |
THE INFORMATION IN THIS STRUCTURAL AND COLLATERAL TERM SHEET IS NOT COMPLETE AND MAY BE AMENDED PRIOR TO THE TIME OF SALE. THIS TERM SHEET IS NOT AN OFFER TO SELL THESE SECURITIES AND IT IS NOT A SOLICITATION OF AN OFFER TO BUY THESE SECURITIES IN ANY JURISDICTION WHERE THE OFFER OR SALE IS NOT PERMITTED.
| | 40 of 156 |
| Structural and Collateral Term Sheet | JPMCC 2017-JP5 | |
| Hilton Hawaiian Village | ||
| Competitive Hotels Profile(1) | |||||||||
| 2015 Estimated Market Mix | 2015 Estimated Operating Statistics | ||||||||
| Property | Rooms | Year Opened | Meeting Space (SF) | Wholesale | Transient | Meeting & Group | Occupancy | ADR | RevPAR |
| Hilton Hawaiian Village(2) | 2,860 | 1961 | 150,000 | 37% | 44% | 19% | 94.4% | $240.62 | $227.20 |
| Primary Competitors | |||||||||
| Sheraton Waikiki | 1,636 | 1971 | 48,210 | 65% | 15% | 20% | 90-95% | $300-325 | $280-290 |
| Marriott Waikiki Beach Resort & Spa | 1,310 | 1971 | 55,000 | 20% | 60% | 20% | 85-90% | $210-220 | $180-190 |
| Hyatt Regency Waikiki Beach Resort & Spa | 1,230 | 1976 | 23,130 | 60% | 25% | 15% | 85-90% | $250-260 | $220-230 |
| Westin Moana Surfrider | 791 | 1901-1969 | 23,612 | 60% | 30% | 10% | 85-90% | $350-375 | $300-325 |
| Secondary Competitors | |||||||||
| Sheraton Hotel Princess Kaiulani | 1,000 | 1955 | 14,000 | 65% | 25% | 10% | 85-90% | $150-160 | $130-140 |
| Outrigger Reef Waikiki Beach Resort | 635 | 1956 | 9,600 | 55% | 40% | 5% | 85-90% | $250-260 | $220-230 |
| Outrigger Waikiki Beach Resort | 524 | 1967 | 5,000 | 50% | 40% | 10% | 80-85% | $260-270 | $220-230 |
| Total(3) | 7,126 | ||||||||
| (1) | Based on the appraisal. |
| (2) | Occupancy, ADR and RevPAR are based on operating statements provided by the borrower. |
| (3) | Excludes the Hilton Hawaiian Village property. |
| Operating History and Underwritten Net Cash Flow | |||||||
| 2013 | 2014 | 2015 | TTM(1) | Underwritten | Per Room(2) | % of Total Revenue(3) | |
| Occupancy | 89.9% | 90.7% | 94.4% | 94.6% | 94.6% | ||
| ADR(4) | $247.48 | $259.85 | $240.62 | $250.09 | $250.09 | ||
| RevPAR(4) | $222.57 | $235.77 | $227.20 | $236.65 | $236.65 | ||
| Room Revenue | $232,345,007 | $246,124,088 | $237,172,233 | $247,711,744 | $247,034,700 | $86,376 | 66.0% |
| Resort Fee(4) | 0 | 0 | 22,462,635 | 22,641,808 | 22,752,381 | 7,955 | 6.1 |
| Food and Beverage Revenue | 56,844,007 | 62,740,100 | 70,771,369 | 69,023,623 | 68,996,667 | 24,125 | 18.4 |
| Retail Revenue(5) | 19,071,361 | 20,048,658 | 20,582,018 | 20,786,062 | 19,162,812 | 6,700 | 5.1 |
| Other Departmental Revenue | 16,714,514 | 17,176,781 | 15,802,967 | 16,824,201 | 16,491,183 | 5,766 | 4.4 |
| Total Revenue | $324,974,888 | $346,089,627 | $366,791,222 | $376,987,438 | $374,437,742 | $130,922 | 100.0% |
| Room Expense | $55,976,889 | $59,766,137 | $62,515,991 | $64,556,543 | $64,380,098 | $22,511 | 26.1% |
| Food and Beverage Expense | 45,055,100 | 48,831,676 | 56,658,889 | 56,716,914 | 56,028,348 | 19,590 | 81.2 |
| Other Departmental Expense | 7,418,538 | 7,148,334 | 7,483,496 | 6,425,274 | 6,371,608 | 2,228 | 38.6 |
| Departmental Expenses | $108,450,526 | $115,746,148 | $126,658,376 | $127,698,731 | $126,780,054 | $44,329 | 33.9% |
| Departmental Profit | $216,524,362 | $230,343,479 | $240,132,846 | $249,288,707 | $247,657,688 | $86,594 | 66.1% |
| Operating Expenses | $61,997,168 | $64,229,329 | $62,250,540 | $64,897,454 | $62,099,714 | $21,713 | 16.6% |
| Gross Operating Profit | $154,527,194 | $166,114,150 | $177,882,306 | $184,391,253 | $185,557,974 | $64,880 | 49.6% |
| Management Fee | $9,159,509 | $9,759,316 | $10,366,617 | $11,551,940 | $10,658,248 | $3,727 | 2.8% |
| Incentive Management Fee | 7,542,587 | 8,134,544 | 8,776,701 | 9,141,675 | 9,344,215 | 3,267 | 2.5 |
| Retail Management Fee | 1,081,185 | 1,142,850 | 1,168,053 | 1,174,867 | 1,053,955 | 369 | 0.3 |
| Property Taxes | 8,335,725 | 9,129,497 | 10,512,964 | 11,773,676 | 12,249,130 | 4,283 | 3.3 |
| Property Insurance | 3,138,410 | 3,058,106 | 2,452,071 | 2,579,098 | 3,343,630 | 1,169 | 0.9 |
| Ground Rent & Other Expense | 1,305,948 | 1,185,432 | 1,196,527 | 1,197,379 | 1,344,312 | 470 | 0.4 |
| FF&E | 12,998,996 | 13,843,585 | 14,671,649 | 15,079,498 | 14,977,510 | 5,237 | 4.0 |
| Total Other Expenses | $43,562,359 | $46,253,331 | $49,144,583 | $52,498,133 | $52,971,000 | $18,521 | 14.1% |
| Net Operating Income | $110,964,835 | $119,860,819 | $128,737,723 | $131,893,120 | $132,586,975 | $46,359 | 35.4% |
| Net Cash Flow | $110,964,835 | $119,860,819 | $128,737,723 | $131,893,120 | $132,586,975 | $46,359 | 35.4% |
| (1) | TTM represents the trailing 12-month period ending on September 30, 2016. |
| (2) | Per Room values based on 2,860 guest rooms. |
| (3) | % of Total Revenue for Room Expense, Food and Beverage Expense and Other Departmental Expenses is based on their corresponding revenue line items. |
| (4) | Prior to a change in industry accounting methodology in 2015, resort fees were accounted for as a component of Room Revenue and included in ADR and RevPAR calculations. Since 2014, resort fees have been netted out of Room Revenue and shown separately in the Resort Fee category. ADR and RevPAR are shown net of resort fees for 2015 and all future years. |
| (5) | Retail tenant spaces are occupied pursuant to partial net leases. Retail Revenue is inclusive of reimbursements associated with shared common area maintenance, tax and marketing expenses. Related expenses attributable to the retail component are included in undistributed Operating Expenses for the overall property. |
THE INFORMATION IN THIS STRUCTURAL AND COLLATERAL TERM SHEET IS NOT COMPLETE AND MAY BE AMENDED PRIOR TO THE TIME OF SALE. THIS TERM SHEET IS NOT AN OFFER TO SELL THESE SECURITIES AND IT IS NOT A SOLICITATION OF AN OFFER TO BUY THESE SECURITIES IN ANY JURISDICTION WHERE THE OFFER OR SALE IS NOT PERMITTED.
| | 41 of 156 |
| Structural and Collateral Term Sheet | JPMCC 2017-JP5 | |
| Hilton Hawaiian Village | ||
Property Management. The property is currently managed by Hilton Management LLC, a Delaware limited liability company and subsidiary of Hilton. The current management agreement expires on December 31, 2047, with two 20-year extension options, and provides for (i) a base management fee equal to 3.0% of gross revenue (less revenue from the retail component of the property), (ii) an incentive management fee equal to 6.0% of adjusted gross profit (exclusive of the retail component of the property), (iii) a management fee equal to 5.5% of net retail income with respect to the retail component of the property and (iv) monthly FF&E deposits equal to 4.0% of gross revenue for the prior month.
Escrows and Reserves. No upfront reserves were taken at origination.
Tax Escrows - The requirement for the borrower to make monthly deposits to the tax escrow is waived so long as the borrower has reserved such amounts with the property manager or the manager pays such taxes, in each case pursuant to the management agreement. In the event that the borrower is no longer required to reserve such amounts with the property manager, on each payment date, the borrower will be required to deposit 1/12 of annual estimated taxes upon the occurrence of a Trigger Period (as defined below).
Insurance Escrows - The requirement for the borrower to make monthly deposits to the insurance escrow is waived so long as the borrower has reserved such amounts with the property manager or the manager pays such premiums, in each case pursuant to the management agreement. In the event that the borrower is no longer required to reserve such amounts with the property manager, on each payment date, the borrower will be required to deposit 1/12 of annual estimated insurance premiums upon the occurrence of a Trigger Period. In addition, provided that no event of default has occurred and is continuing, the requirement to deposit such amounts is waived so long as the property is insured under a blanket policy reasonably acceptable to the lender insuring substantially all of the real property owned, directly or indirectly, by the guarantor.
Replacement Reserves -The requirement for the borrower to make monthly deposits for replacements reserves is waived so long as the borrower has reserved such amounts with the property manager pursuant to the management agreement. In the event that the borrower is no longer required to reserve such amounts with the property manager, on each payment date, the borrower will be required to deposit 4.0% of gross income for the calendar month that is two months prior to the applicable payment date (as calculated in the loan documents).
Lockbox / Cash Management.The loan is structured with a CMA lockbox. All revenues will be deposited into segregated property accounts maintained by the property manager on behalf of the borrower and the operating lessee, as applicable, and controlled by the lender (the “Property Accounts”). All revenues in the Property Accounts (less any account charges payable to the bank at which the Property Accounts are maintained and less any required minimum peg balance) will be transferred on each business day to accounts maintained by the property manager on behalf of the borrower and the operating lessee, as applicable (each, an “Operating Account”). Funds on deposit in the Operating Accounts will be disbursed in an amount equal to the monthly replacement reserve deposit into the manager replacement reserve account (the “Manager FF&E Reserve Account”) (each of the Manager FF&E Reserve Account, the Operating Account and the Property Account are referred to as “Manager Accounts”). The property manager will be required to apply such funds to the payment of real property taxes and insurance, ground rent, debt service (but only prior to the restructuring), management fees, capital expenditures and reserves for the same, operating expenses, emergency repairs, tenant improvement costs and leasing commissions, working capital reserves, sales and use taxes owed to governmental authorities, custodial funds and required monthly reserves, in each case in accordance with the management agreement (the “Required Payments”). The lender will not require any reserves with respect to any Required Payments which are to be paid directly by or reserved by the property manager pursuant to the management agreement. On a monthly basis, the property manager will deposit all funds remaining in the Operating Accounts after the payment of the Required Payments (“Excess Cash”) into a lender-controlled account as additional collateral for the mortgage loan (the “Cash Management Account”). So long as no Trigger Period is continuing, all funds in the Cash Management Account after payment of debt service, required reserves and operating expenses will be released to the operating lessee and/or the borrower, as applicable, not later than the business day immediately following the date such funds are deposited by the property manager. During a Trigger Period, all funds in the Cash Management Account will be deposited into the excess cash accounts and held as additional collateral for the Hilton Hawaiian Village Whole Loan. The operating lessee and/or the borrower, as applicable, is required to grant a security interest in all Manager Accounts (and the property manager will consent to the same); provided, that such amounts on deposit in the Manager Accounts will be available for use by the property manager in accordance with the management agreement following an event of default and the lender will not apply such amounts on deposit in the Manager Accounts to Hilton Hawaiian Village Whole Loan.
A “Trigger Period” will commence upon the occurrence of: (i) an event of default or (ii) the date that the debt yield (as calculated in the loan documents) is less than 7.0%.
A Trigger Period will end when, if caused by (a) clause (i) above, the respective event of default has been cured or waived or (b) clause (ii) above, the debt yield (as calculated in the loan documents) exceeds 7.0% for two consecutive quarters.
THE INFORMATION IN THIS STRUCTURAL AND COLLATERAL TERM SHEET IS NOT COMPLETE AND MAY BE AMENDED PRIOR TO THE TIME OF SALE. THIS TERM SHEET IS NOT AN OFFER TO SELL THESE SECURITIES AND IT IS NOT A SOLICITATION OF AN OFFER TO BUY THESE SECURITIES IN ANY JURISDICTION WHERE THE OFFER OR SALE IS NOT PERMITTED.
| | 42 of 156 |
| Structural and Collateral Term Sheet | JPMCC 2017-JP5 | |
| Hilton Hawaiian Village | ||
Partial Releases.The borrower is permitted to release (i) the ground leased parcel, (ii) the retail component and/or (iii) certain other parcels of property that do not materially and adversely affect the ongoing operations of the remaining property, other than the lost income associated with the released parcels, in each case through a partial prepayment of the Hilton Hawaiian Village Whole Loan at any time after the expiration of the lockout period upon certain terms and conditions contained in the loan documents (including, without limitation, payment of the yield maintenance premium, if applicable). Please see “Description of the Mortgage Pool—Certain Terms of the Mortgage Loans—Partial Releases” in the Preliminary Prospectus for additional details.
THE INFORMATION IN THIS STRUCTURAL AND COLLATERAL TERM SHEET IS NOT COMPLETE AND MAY BE AMENDED PRIOR TO THE TIME OF SALE. THIS TERM SHEET IS NOT AN OFFER TO SELL THESE SECURITIES AND IT IS NOT A SOLICITATION OF AN OFFER TO BUY THESE SECURITIES IN ANY JURISDICTION WHERE THE OFFER OR SALE IS NOT PERMITTED.
| | 43 of 156 |
| Structural and Collateral Term Sheet | JPMCC 2017-JP5 | |
| Moffett Gateway | ||
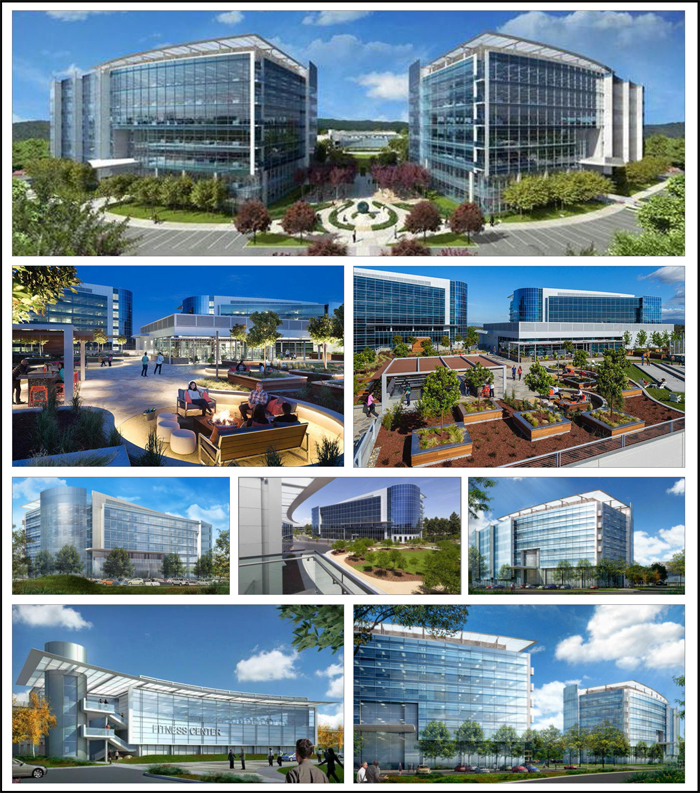
THE INFORMATION IN THIS STRUCTURAL AND COLLATERAL TERM SHEET IS NOT COMPLETE AND MAY BE AMENDED PRIOR TO THE TIME OF SALE. THIS TERM SHEET IS NOT AN OFFER TO SELL THESE SECURITIES AND IT IS NOT A SOLICITATION OF AN OFFER TO BUY THESE SECURITIES IN ANY JURISDICTION WHERE THE OFFER OR SALE IS NOT PERMITTED.
| | 44 of 156 |
| Structural and Collateral Term Sheet | JPMCC 2017-JP5 | |
| Moffett Gateway | ||
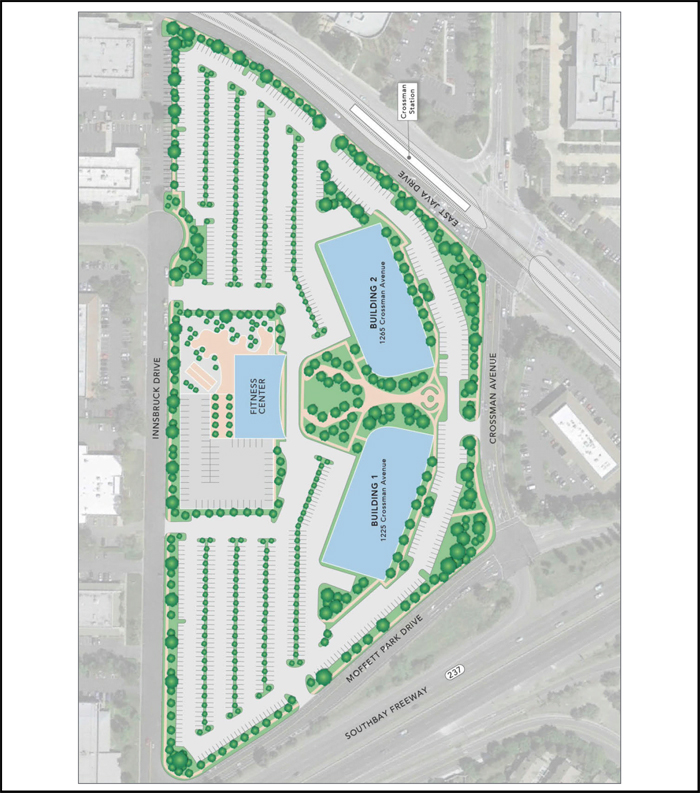
THE INFORMATION IN THIS STRUCTURAL AND COLLATERAL TERM SHEET IS NOT COMPLETE AND MAY BE AMENDED PRIOR TO THE TIME OF SALE. THIS TERM SHEET IS NOT AN OFFER TO SELL THESE SECURITIES AND IT IS NOT A SOLICITATION OF AN OFFER TO BUY THESE SECURITIES IN ANY JURISDICTION WHERE THE OFFER OR SALE IS NOT PERMITTED.
| | 45 of 156 |
| Structural and Collateral Term Sheet | JPMCC 2017-JP5 | |
| Moffett Gateway | ||
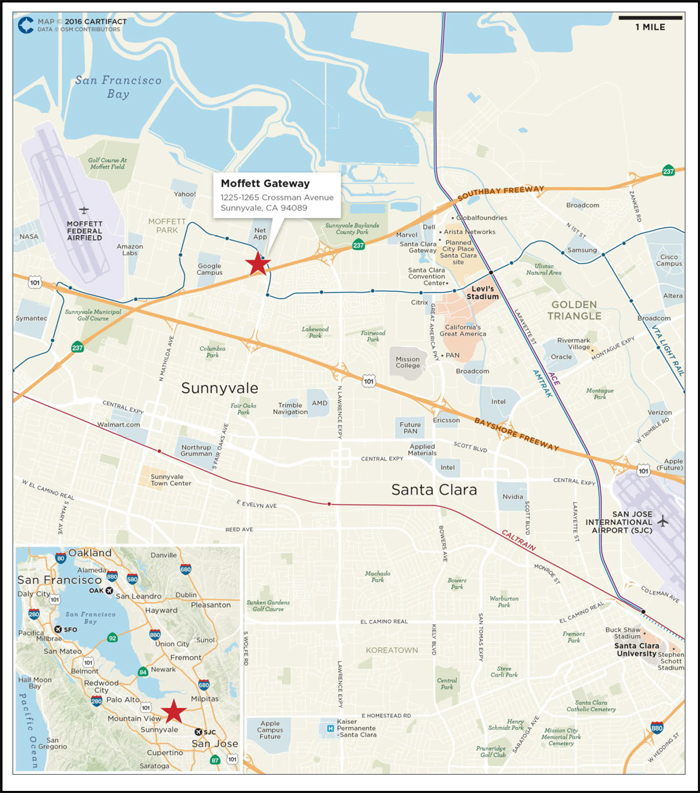
THE INFORMATION IN THIS STRUCTURAL AND COLLATERAL TERM SHEET IS NOT COMPLETE AND MAY BE AMENDED PRIOR TO THE TIME OF SALE. THIS TERM SHEET IS NOT AN OFFER TO SELL THESE SECURITIES AND IT IS NOT A SOLICITATION OF AN OFFER TO BUY THESE SECURITIES IN ANY JURISDICTION WHERE THE OFFER OR SALE IS NOT PERMITTED.
| | 46 of 156 |
| Structural and Collateral Term Sheet | JPMCC 2017-JP5 | |
| Moffett Gateway | ||
| Mortgage Loan Information | Property Information | |||
| Mortgage Loan Seller: | JPMCB | Single Asset / Portfolio: | Single Asset | |
| Credit Assessment (Fitch)(1): | BBB- | Title: | Fee | |
| Original Principal Balance(2): | $80,000,000 | Property Type - Subtype: | Office – Suburban | |
| Cut-off Date Principal Balance(2): | $80,000,000 | Net Rentable Area (SF): | 612,691 | |
| % of Pool by IPB: | 7.3% | Location: | Sunnyvale, CA | |
| Loan Purpose: | Refinance | Year Built / Renovated: | 2016 / N/A | |
| Borrower: | 441 Real Estate LLC | Occupancy(6): | 100.0% | |
| Sponsor(3): | Joseph K. Paul | Occupancy Date: | 3/1/2017 | |
| Interest Rate: | 3.319403% | Number of Tenants: | 1 | |
| Note Date: | 9/22/2016 | 2013 NOI(7): | N/A | |
| Maturity Date: | 4/1/2027 | 2014 NOI(7): | N/A | |
| Interest-only Period: | 60 months | 2015 NOI(7): | N/A | |
| Original Term: | 126 months | TTM NOI(7): | N/A | |
| Original Amortization(4): | 360 months | UW Economic Occupancy: | 95.0% | |
| Amortization Type: | IO-Balloon | UW Revenues: | $35,097,235 | |
| Call Protection(5): | L(29),Def(90),O(7) | UW Expenses: | $6,170,971 | |
| Lockbox: | Hard | UW NOI: | $28,926,265 | |
| Additional Debt: | Yes | UW NCF: | $27,631,280 | |
| Additional Debt Balance(2): | $163,000,000 / $102,000,000 / | Appraised Value / Per SF(8): | $525,000,000 / $857 | |
| $50,000,000 | Appraisal Date: | 7/20/2016 | ||
| Additional Debt Type: | Pari Passu / B-Note / | |||
| Mezzanine Loan | ||||
| Escrows and Reserves(9) | Financial Information(2) | |||||||
| Initial | Monthly | Initial Cap | A-Notes | Whole Loan | ||||
| Taxes: | $180,864 | $180,864 | N/A | Cut-off Date Loan / SF: | $397 | $563 | ||
| Insurance: | $0 | Springing | N/A | Maturity Date Loan / SF: | $337 | $503 | ||
| Replacement Reserves: | $0 | $0 | N/A | Cut-off Date LTV(8): | 46.3% | 65.7% | ||
| TI/LC: | $0 | $0 | N/A | Maturity Date LTV(8): | 39.3% | 58.7% | ||
| Other: | $86,961,915 | $0 | N/A | UW NCF DSCR(10): | 1.95x | 1.43x | ||
| UW NOI Debt Yield: | 11.9% | 8.4% | ||||||
| Sources and Uses | ||||||||
| Sources | Proceeds | % of Total | Uses | Proceeds | % of Total | |||
| A-Notes(2) | $243,000,000 | 61.5 | % | Payoff Existing Debt | $216,321,083 | 54.8 | % | |
| B-Note(2) | 102,000,000 | 25.8 | Upfront Reserves | 87,142,779 | 22.1 | |||
| Mezzanine Loan | 50,000,000 | 12.7 | Return of Equity | 84,003,847 | 21.3 | |||
| Closing Costs | 7,532,290 | 1.9 | ||||||
| Total Sources | $395,000,000 | 100.0 | % | Total Uses | $395,000,000 | 100.0 | % | |
| (1) | Fitch has confirmed that the Moffett Gateway Mortgage Loan has, in the context of its inclusion in the mortgage pool, credit characteristics consistent with an investment grade obligation. |
| (2) | The Moffett Gateway loan is part of a whole loan evidenced by fivepari passu notes with an aggregate principal balance as of the Cut-off Date of $243.0 million (the “A-Notes”) and a subordinate companion loan (the “B-Note”). The A-Notes Financial Information presented in the chart above reflects the Cut-off Date balance of the A-Notes but excludes the related B-Note and mezzanine loan. The Whole Loan Financial Information presented in the chart above reflects the Cut-off Date balance of the A-Notes and B-Note evidencing the Moffett Gateway Whole Loan, but excludes the related mezzanine loan. |
| (3) | For a full description of Sponsor, please refer to “The Loan Sponsor” below. |
| (4) | The Moffett Gateway A-Notes will amortize in accordance with the amortization schedule set forth in Annex F to the Preliminary Prospectus subsequent to a five-year interest-only period. The principal payments that would otherwise have been paid to the B-Note will be used to pay down the aggregate principal balance of the A-Notes. |
| (5) | The lockout period will be at least 29 payment dates beginning with and including the first payment date of November 1, 2016. Defeasance of the full $345.0 million Moffett Gateway Whole Loan is permitted after the date that is two years from the closing date of the securitization that includes the note to be last securitized (the “REMIC Prohibition Period”). If the REMIC Prohibition Period has not expired by November 1, 2020, the borrower is permitted to prepay the Moffett Gateway Whole Loan in whole, but not in part, with the payment of a yield maintenance premium. |
| (6) | The property is 100.0% leased to Google Inc. (“Google”) through March 2027. Google has executed two leases for the property but is not yet in occupancy of either space. Google leases the property under two separate leases, one for 1225 Crossman Avenue (“Building One”) and the second for 1265 Crossman Avenue (“Building Two”). Google is expected to take occupancy for both spaces by September 2017 and, subsequent to any applicable free rent periods, is required to begin paying full rent as applicable under each lease as follows: Building One in July 2018 and Building Two in July 2017. |
| (7) | Historical cash flows are not available as the property was constructed in 2016. |
THE INFORMATION IN THIS STRUCTURAL AND COLLATERAL TERM SHEET IS NOT COMPLETE AND MAY BE AMENDED PRIOR TO THE TIME OF SALE. THIS TERM SHEET IS NOT AN OFFER TO SELL THESE SECURITIES AND IT IS NOT A SOLICITATION OF AN OFFER TO BUY THESE SECURITIES IN ANY JURISDICTION WHERE THE OFFER OR SALE IS NOT PERMITTED.
| | 47 of 156 |
| Structural and Collateral Term Sheet | JPMCC 2017-JP5 | |
| Moffett Gateway | ||
| (8) | The Appraised Value / Per SF, Cut-off Date LTV and Maturity Date LTV are calculated based on the “hypothetical market value as stabilized”, which assumes that all tenant improvement construction is complete and that all contractual free rent has “burned off” at the “stabilized” value date. At origination, the borrower reserved approximately $87.0 million for unfunded obligations (approximately $49.4 million for outstanding tenant improvements and leasing commissions and approximately $37.6 million for free rent). The “as-is” value as of July 20, 2016 is $430.0 million, which results in a Cut-off Date LTV and Maturity Date LTV of 56.5% and 48.0%, respectively, and a Whole Loan Cut-off Date LTV and Maturity Date LTV of 80.2% and 71.7%, respectively. |
| (9) | For a full description of Escrows and Reserves, please refer to “Escrows and Reserves” below. |
| (10) | The UW NCF DSCR is calculated using the sum of principal and interest payments over the first 12 months following the expiration of the interest-only period based on the assumed principal payment schedule provided on Annex F to the Preliminary Prospectus. |
The Loan.The Moffett Gateway loan is secured by a first mortgage lien on the borrower’s fee interest in a newly constructed corporate office campus consisting of two seven-story towers, an amenities building and a parking garage, located in Sunnyvale, California. The whole loan has an outstanding principal balance as of the Cut-off Date of $345.0 million (the “Moffett Gateway Whole Loan”) and is comprised of fivepari passusenior notes, each as described below, with an aggregate outstanding principal balance as of the Cut-off Date of $243.0 million (collectively, the “Moffett Gateway A-Notes”) and a subordinate B-Note with an outstanding principal balance as of the Cut-off Date of $102.0 million (the “Moffett Gateway Subordinate Companion Loan”), each as described below. Note A-1, with an outstanding principal balance as of the Cut-off Date of $80.0 million, is being contributed to the JPMCC 2017-JP5 Trust (the “Moffett Gateway Mortgage Loan”). Note A-3 and Note A-4, with outstanding principal balances as of the Cut-off Date of $40.0 million and $20.0 million, respectively, are expected to be contributed to one or more future securitization trusts. Note A-2, with an outstanding principal balance as of the Cut-off Date of $60.0 million, was contributed to the JPMCC 2016-JP4 trust and Note A-5, with an outstanding principal balance as of the Cut-off Date of $43.0, million was contributed to the JPMDB 2016-C4 trust (together, with Note A-3 and Note A-4, the “Moffett Gateway Pari Passu Companion Loans”). The Moffett Gateway Subordinate Companion Loan has been sold to a third party investor. Under the related intercreditor agreement, prior to a control appraisal period with respect to the Moffett Gateway Subordinate Companion Loan, under certain circumstances, the holder of the Moffett Gateway Subordinate Companion Loan will have the right to approve certain major decisions with respect to the Moffett Gateway Whole Loan, to exercise certain cure rights and to replace the related special servicer with or without cause. The holder of the Moffett Gateway Subordinate Companion Loan will also have the right to purchase the Moffett Gateway A-Notes under certain circumstances. After the occurrence and during the continuance of a control appraisal period with respect to the Moffett Gateway Subordinate Companion Loan, the holder of Note A-2 will be entitled to exercise the rights of the controlling noteholder for the Moffett Gateway Whole Loan, which rights will be exercised by the related trustee (or, prior to the occurrence and continuance of a control termination event under the related pooling and servicing agreement, by the related directing certificateholder); however, the holders of the Moffett Gateway Pari Passu Companion Loans will be entitled, under certain circumstances, to be consulted with respect to certain major decisions. The Moffett Gateway Whole Loan has a 10-year, six-month term and, subsequent to a five-year interest-only period, the Moffett Gateway A-Notes will amortize in accordance with the amortization schedule set forth on Annex F to the Preliminary Prospectus. The principal payments that would otherwise have been paid to the Moffett Gateway Subordinate Companion Loan are included as part of the scheduled amortization of the Moffett Gateway A-Notes.
| Whole Loan Summary | ||||||
| Note | Original Balance | Cut-off Date Balance | Note Holder | Controlling Piece | ||
| A-1 | $80,000,000 | $80,000,000 | JPMCC 2017-JP5 | No | ||
| A-2 | 60,000,000 | 60,000,000 | JPMCC 2016-JP4 | No | ||
| A-3 | 40,000,000 | 40,000,000 | JPMCB | No | ||
| A-4 | 20,000,000 | 20,000,000 | JPMCB | No | ||
| A-5 | 43,000,000 | 43,000,000 | JPMDB 2016-C4 | No | ||
| B-1 | 102,000,000 | 102,000,000 | Third Party Investor | Yes | ||
| Total | $345,000,000 | $345,000,000 | ||||
The Borrower. The borrowing entity for the Moffett Gateway Whole Loan is 441 Real Estate LLC, a Delaware limited liability company and special purpose entity.
The Loan Sponsor. The loan sponsor is Joseph K. Paul (“Jay Paul”) and the nonrecourse carve-out guarantors are Jay Paul, Jay Paul Revocable Living Trust Dated November 9, 1999, as Amended and Restated on March 19, 2010, and Paul Guarantor LLC, a Delaware limited liability company. Jay Paul is the founder of the Jay Paul Company. The Jay Paul Company is an owner and developer of commercial office properties throughout California. Founded in 1975, the Jay Paul Company has developed or acquired over 8.5 million square feet of office space, including 21 buildings in Moffett Park totaling 5.0 million square feet. Jay Paul Company has built projects for many notable companies including Apple, Google, Amazon, Motorola, Microsoft, Boeing, Philips Electronics, HP and DreamWorks, among others. The loan sponsor focuses on sustainable design and has closed in excess of $12.0 billion in equity and debt financings since inception. The borrower is permitted to obtain the release of Jay Paul and the trust from the guaranty and environmental indemnity upon satisfaction of certain conditions in the loan documents, which include, without limitation, Paul Guarantor LLC maintaining a net worth of not less than $300.0 million and liquidity of not less than $20.0 million.
THE INFORMATION IN THIS STRUCTURAL AND COLLATERAL TERM SHEET IS NOT COMPLETE AND MAY BE AMENDED PRIOR TO THE TIME OF SALE. THIS TERM SHEET IS NOT AN OFFER TO SELL THESE SECURITIES AND IT IS NOT A SOLICITATION OF AN OFFER TO BUY THESE SECURITIES IN ANY JURISDICTION WHERE THE OFFER OR SALE IS NOT PERMITTED.
| | 48 of 156 |
| Structural and Collateral Term Sheet | JPMCC 2017-JP5 | |
| Moffett Gateway | ||
The loan sponsor purchased the land and previous buildings in 2012 for approximately $50.4 million and, according to the loan sponsor, has spent approximately $182.5 million ($298 per square foot) on the development of the Moffett Gateway office complex. Additionally, the loan sponsor has indicated it spent approximately $55.1 million ($90 per square foot) in tenant improvement and leasing commission costs. The loan sponsor’s total cost basis is approximately $336.1 million ($549 per square foot).
The Property. The Moffett Gateway property is comprised of two newly-constructed seven-story Class A LEED Platinum-Certified towers totaling 597,848 square feet and is located in Sunnyvale, California. The property is situated on approximately 15.5 acres and features a 14,843 square foot amenities building, which contains a fitness center with locker rooms, showers, steam rooms and a yoga studio, a rooftop dining area, bocce court area and common and recreation areas. Additionally, the property contains 2,022 parking spaces resulting in a parking ratio of approximately 3.3 spaces per 1,000 square feet of space. The property benefits from its location at the intersection of Highways 237 and 101, two regional highway systems that provide direct access to the surrounding areas as well as the San Francisco central business district, located approximately 38.4 miles north of the property. The property is part of the larger Moffett Park development, a 519-acre area comprised of recently developed office spaces and research and development buildings. Additionally, a Santa Clara Light Rail System is located adjacent to the property, which provides service to the surrounding residential communities. The Santa Clara County Transit System provides bus service county-wide and has four stops nearby the property.
As of March 1, 2017, the property is 100.0% leased to Google pursuant to two separate 298,924 square foot triple net leases through March 31, 2027 for Building One and Building Two, each with two seven-year extension options and no early termination options. Google does not directly lease the amenities building from the landlord. Instead, Google’s right to use the amenities building is contained within each individual lease. Google’s right to use the amenities building is exclusive during any period when Google leases both office buildings and is non-exclusive for any period of time that an additional tenant leases space at the property in the future. Additionally, the amenities building, which includes the parking structure, is part of the common areas which are owned in fee simple by an owners association, which is wholly owned by the borrower. The borrower has pledged the ownership interests in the owner’s association as collateral for the Moffett Gateway Whole Loan.
Google’s main headquarters in Mountain View, California is located approximately 6.4 miles west of the property. On October 2, 2015, Google implemented a holding company reorganization in which Alphabet became the successor issuer to Google. At that time, Alphabet recognized the assets and liabilities of Google at carryover basis. Alphabet, through its subsidiaries, provides online advertising services in the United States, the United Kingdom and rest of the world. Alphabet is the second largest publicly traded company (NASDAQ: GOOG) in the world as measured by market capitalization and is rated Aa2 and AA by Moody’s and S&P, respectively. Google represents approximately 99.4% of Alphabet’s total revenues, based on Alphabet’s 2015 annual report.
The property is located in the Sunnyvale office submarket. The submarket features one of the highest concentrations of technology, software and creative tenants within Silicon Valley. Moffett Gateway is located along Moffett Park Avenue, a part of the larger Moffett Park development, which is a 519-acre area comprised of recently developed office spaces and research and development buildings. Moffett Park is home to several notable technology firms including Amazon.com, Google, Hewlett-Packard, Juniper Networks, Lockheed Martin, Microsoft, and Yahoo!. Google owns or leases approximately 3.5 million square feet of office space in Sunnyvale, making it the largest corporate occupier in the submarket. Additionally, Google collectively owns or leases approximately 15.1 million square feet in Silicon Valley and the greater San Francisco area. As of the second quarter of 2016, the Sunnyvale market had a Class A office inventory of approximately 8.9 million square feet with an overall vacancy rate of 8.8% and annual asking rents between $43.80 and $45.60 per square foot on a triple-net basis.
| Historical and Current Occupancy(1) | |||
| 2013 | 2014 | 2015 | Current(2) |
| N/A | N/A | N/A | 100.0% |
| (1) | Historical Occupancy is not available as the property was constructed in 2016. |
| (2) | Current Occupancy is as of March 1, 2017. The property is 100.0% leased to Google through March 2027. Google has executed two leases for the property but is not yet in occupancy of either space. Google leases the property under two separate leases, one for Building One and the second for Building Two. Google is expected to take occupancy by September 2017 and, subsequent to any applicable free rent periods, is required to begin paying full rent at Building One in July 2018 and full rent at Building Two in July 2017. At origination, the borrower reserved approximately $87.0 million for unfunded obligations (approximately $49.4 million for outstanding tenant improvements and leasing commissions and approximately $37.6 million for free rent). |
THE INFORMATION IN THIS STRUCTURAL AND COLLATERAL TERM SHEET IS NOT COMPLETE AND MAY BE AMENDED PRIOR TO THE TIME OF SALE. THIS TERM SHEET IS NOT AN OFFER TO SELL THESE SECURITIES AND IT IS NOT A SOLICITATION OF AN OFFER TO BUY THESE SECURITIES IN ANY JURISDICTION WHERE THE OFFER OR SALE IS NOT PERMITTED.
| | 49 of 156 |
| Structural and Collateral Term Sheet | JPMCC 2017-JP5 | |
| Moffett Gateway | ||
| Tenant Summary(1) | ||||||||
| Tenant | Ratings(2) Moody’s/S&P/Fitch | Net Rentable Area (SF) | % of Total NRA | Base Rent PSF(3) | % of Total Base Rent | Lease Expiration Date | ||
| Google(4) | Aa2 / AA / NA | 612,691 | 100.0% | $50.87 | 100.0% | 3/31/2027 | ||
| (1) | Based on the underwritten rent roll. |
| (2) | Ratings provided are for the parent company of the entity listed in the “Tenant” field whether or not the parent company guarantees the lease. |
| (3) | Base Rent PSF includes the 14,843 square foot amenities building, for which approximately $785,298 of base rent has been underwritten. Google’s right to use the amenities building is exclusive during any period when Google leases both office buildings and is non-exclusive for any additional tenant that may sign a lease at the property in the future. |
| (4) | Google has two seven-year renewal options remaining for each lease. Google must provide notice of its intention to renew no earlier than January 2026 or later than June 2026. |
| Lease Rollover Schedule(1) | ||||||||||
| Year | Number of Leases Expiring | Net Rentable Area Expiring | % of NRA Expiring | Base Rent Expiring | % of Base Rent Expiring | Cumulative Net Rentable Area Expiring | Cumulative % of NRA Expiring | Cumulative Base Rent Expiring | Cumulative % of Base Rent Expiring | |
| Vacant | NAP | 0 | 0.0 | % | NAP | NAP | 0 | 0.0% | NAP | NAP |
| 2017 & MTM | 0 | 0 | 0.0 | $0 | 0.0% | 0 | 0.0% | $0 | 0.0% | |
| 2018 | 0 | 0 | 0.0 | 0 | 0.0 | 0 | 0.0% | $0 | 0.0% | |
| 2019 | 0 | 0 | 0.0 | 0 | 0.0 | 0 | 0.0% | $0 | 0.0% | |
| 2020 | 0 | 0 | 0.0 | 0 | 0.0 | 0 | 0.0% | $0 | 0.0% | |
| 2021 | 0 | 0 | 0.0 | 0 | 0.0 | 0 | 0.0% | $0 | 0.0% | |
| 2022 | 0 | 0 | 0.0 | 0 | 0.0 | 0 | 0.0% | $0 | 0.0% | |
| 2023 | 0 | 0 | 0.0 | 0 | 0.0 | 0 | 0.0% | $0 | 0.0% | |
| 2024 | 0 | 0 | 0.0 | 0 | 0.0 | 0 | 0.0% | $0 | 0.0% | |
| 2025 | 0 | 0 | 0.0 | 0 | 0.0 | 0 | 0.0% | $0 | 0.0% | |
| 2026 | 0 | 0 | 0.0 | 0 | 0.0 | 0 | 0.0% | $0 | 0.0% | |
| 2027 | 2 | 612,691 | 100.0 | 31,169,318 | 100.0 | 612,691 | 100.0% | $31,169,318 | 100.0% | |
| 2028 & Beyond | 0 | 0 | 0.0 | 0 | 0.0 | 612,691 | 100.0% | $31,169,318 | 100.0% | |
| Total | 2 | 612,691 | 100.0 | % | $31,169,318 | 100.0% | ||||
| (1) | Based on the underwritten rent roll. |
| Google Rent Schedule | ||||||
| Period | Building One Base Rent per Year | Building One Base Rent per Year PSF | Building Two Base Rent per Year | Building Two Base Rent per Year PSF | Cumulative Base Rent per Year | Cumulative Base Rent per Year PSF |
| Months 1 – 10(1) | $0 | $0.00 | $0 | $0.00 | $0 | $0.00 |
| Months 11 – 22(1) | 0 | 0.00 | 12,232,568 | 20.46 | 12,232,568 | 20.46 |
| Months 23 – 34 | 12,599,545 | 21.07 | 13,738,744 | 22.98 | 26,338,289 | 44.06 |
| Months 35 – 46 | 14,150,907 | 23.67 | 14,150,907 | 23.67 | 28,301,813 | 47.34 |
| Months 47 – 58 | 14,575,434 | 24.38 | 14,575,434 | 24.38 | 29,150,868 | 48.76 |
| Months 59 – 70 | 15,012,697 | 25.11 | 15,012,697 | 25.11 | 30,025,394 | 50.22 |
| Months 71 – 82 | 15,463,078 | 25.86 | 15,463,078 | 25.86 | 30,926,156 | 51.73 |
| Months 83 – 94 | 15,926,970 | 26.64 | 15,926,970 | 26.64 | 31,853,940 | 53.28 |
| Months 95 – 106 | 16,404,779 | 27.44 | 16,404,779 | 27.44 | 32,809,559 | 54.88 |
| Months 107 – 118 | 16,896,923 | 28.26 | 16,896,923 | 28.26 | 33,793,845 | 56.53 |
| Months 119 – 128 | 14,431,037 | 24.14 | 14,431,037 | 24.14 | 28,862,073 | 48.28 |
| Total/Wtd. Avg.(2) | $135,461,369 | $25.34 | $148,833,136 | $25.09 | $284,294,505 | $49.53 |
| (1) | The property is 100.0% leased to Google through March 2027. Google has executed two leases for the property but is not yet in occupancy of either space. Google leases the property under two separate leases, one for Building One and the second for Building Two. Google is expected to take occupancy by September 2017 and, after any applicable free rent periods, is required to begin paying full rent as applicable under each lease as follows: Building One in July 2018 and Building Two in July 2017. At origination, the borrower reserved approximately $87.0 million for unfunded obligations (approximately $49.4 million for outstanding tenant improvements and leasing commissions and approximately $37.6 million for free rent). |
| (2) | The Total/Wtd. Avg. Base Rent and PSF numbers exclude the 14,843 square foot amenities building, for which approximately $785,298 of base rent has been underwritten. Google’s right to use the amenities building is exclusive during any period when Google leases both office buildings and is non-exclusive for any period of time an additional tenant leases space at the property in the future. |
THE INFORMATION IN THIS STRUCTURAL AND COLLATERAL TERM SHEET IS NOT COMPLETE AND MAY BE AMENDED PRIOR TO THE TIME OF SALE. THIS TERM SHEET IS NOT AN OFFER TO SELL THESE SECURITIES AND IT IS NOT A SOLICITATION OF AN OFFER TO BUY THESE SECURITIES IN ANY JURISDICTION WHERE THE OFFER OR SALE IS NOT PERMITTED.
| | 50 of 156 |
| Structural and Collateral Term Sheet | JPMCC 2017-JP5 | |
| Moffett Gateway | ||
Proforma and Underwritten Net Cash Flow | |||||||||||||
Proforma | Proforma | Proforma | Underwritten | Per Square | %(1) | ||||||||
| Rents in Place(2) | $3,318,057 | $17,393,064 | $28,439,878 | $31,169,318 | $50.87 | 84.4 | % | ||||||
| Vacant Income | 0 | 0 | 0 | 0 | 0.00 | 0.0 | |||||||
| Gross Potential Rent | $3,318,057 | $17,393,064 | $28,439,878 | $31,169,318 | $50.87 | 84.4 | % | ||||||
| Total Reimbursements | 4,112,410 | 6,072,471 | 6,503,937 | 5,775,140 | 9.43 | 15.6 | |||||||
| Net Rental Income | $7,430,467 | $23,465,535 | $34,943,815 | $36,944,458 | $60.30 | 100.0 | % | ||||||
| (Vacancy/Credit Loss) | 0 | 0 | 0 | (1,847,223) | (3.01) | (5.0 | ) | ||||||
| Other Income | 0 | 0 | 0 | 0 | 0.00 | 0.0 | |||||||
| Effective Gross Income | $7,430,467 | $23,465,535 | $34,943,815 | $35,097,235 | $57.28 | 95.0 | % | ||||||
| Total Expenses | $5,583,716 | $6,204,727 | $6,692,827 | $6,170,971 | $10.07 | 17.6 | % | ||||||
| Net Operating Income | $1,846,751 | $17,260,808 | $28,250,988 | $28,926,265 | $47.21 | 82.4 | % | ||||||
| Total TI/LC, Capex/RR | 0 | 0 | 0 | 1,294,985 | 2.11 | 3.7 | |||||||
| Net Cash Flow | $1,846,751 | $17,260,808 | $28,250,988 | $27,631,280 | $45.10 | 78.7 | % | ||||||
| (1) | % column represents percent of Net Rental Income for all revenue lines and represents percent of Effective Gross Income for the remainder of fields. |
| (2) | The property is 100.0% leased to Google through March 2027. Google has executed two leases for the property but is not yet in occupancy of either space. Google leases the property under two separate leases, one for Building One and the second for Building Two. Google is expected to take occupancy by September 2017 and, after any applicable free rent periods, is required to begin paying full rent as applicable under each lease as follows: Building One in July 2018 and Building Two in July 2017. At origination, the borrower reserved approximately $87.0 million for unfunded obligations (approximately $49.4 million for outstanding tenant improvements and leasing commissions and approximately $37.6 million for free rent). |
Property Management. The property is subject to a management agreement with Paul Holdings, Inc., an affiliate of the loan sponsor.
Escrows and Reserves. At origination, the borrower deposited into escrow approximately $87.0 million for unfunded obligations (which included approximately $49.4 million for outstanding tenant improvements and leasing commissions and approximately $37.6 million for free rent reserves) and $180,864 for tax reserves.
Tax Escrows- On a monthly basis, the borrower is required to escrow 1/12 of the annual estimated tax payments, which currently equates to $180,864.
Insurance Escrows- The requirement for the borrower to make monthly deposits to the insurance escrow is waived so long as (i) no event of default exists and (ii) the borrower provides satisfactory evidence that the property is insured under an acceptable blanket policy in accordance with the loan documents.
Lockbox / Cash Management.The loan is structured with a hard lockbox and in-place cash management. The borrower was required to send tenant direction letters to all tenants upon the origination of the loan instructing them to deposit all rents and payments directly into the lockbox account controlled by the lender. All funds in the lockbox account are swept each business day to a segregated cash management account under the control of the lender and disbursed on each payment date during the term of the loan in accordance with the loan documents. During a Cash Sweep Period (as defined below), all excess cash flow after payment of the mortgage debt service, required reserves, operating expenses and mezzanine debt service will be held as additional collateral for the loan. The lender has a first priority security interest in the cash management account.
A “Cash Sweep Period” means the period after the occurrence of (i) an event of default, (ii) any bankruptcy action of the borrower or manager (if, with respect to the manager only, such bankruptcy action is not discharged, stayed or dismissed within 30 days), (iii) the date on which the debt service coverage ratio (as calculated in the loan documents), based on trailing three-months is less than 1.10x (including aggregate debt service for the Moffett Gateway A-Notes, Moffett Gateway Subordinate Companion Loan and mezzanine loan) or (iv) any of the following: (a) the earlier of (1) the payment date in August 2024, (2) a notification by Google of its intention to not renew its leases or (3) any failure to renew the Google leases in accordance with their terms (a “Maturity Trigger”), (b) the date on which the long term unsecured debt rating of Google or its parent company is not rated by two rating agencies, is withdrawn by two rating agencies or is downgraded to or below BBB- (or its equivalent) by two rating agencies (a “Downgrade Trigger”), (c) any default by Google under its leases (a “Default Trigger”), (d) any bankruptcy or insolvency action by Google or any party providing a guaranty or credit support for the leases (a “Tenant Bankruptcy Trigger”), or (e) Google gives notice that it intends to terminate its leases or any termination or cancellation of the leases (a “Termination Trigger”) (any of the foregoing in subpart (iv), a “Specified Tenant Trigger”).
THE INFORMATION IN THIS STRUCTURAL AND COLLATERAL TERM SHEET IS NOT COMPLETE AND MAY BE AMENDED PRIOR TO THE TIME OF SALE. THIS TERM SHEET IS NOT AN OFFER TO SELL THESE SECURITIES AND IT IS NOT A SOLICITATION OF AN OFFER TO BUY THESE SECURITIES IN ANY JURISDICTION WHERE THE OFFER OR SALE IS NOT PERMITTED.
| | 51 of 156 |
| Structural and Collateral Term Sheet | JPMCC 2017-JP5 | |
| Moffett Gateway | ||
The borrower has the right to cure a Cash Sweep Period by, if caused by (a) clause (i) above, the acceptance of a cure by the lender of the applicable event of default (in its sole and absolute discretion), (b) clause (ii) above solely with respect to the manager, the replacement of such manager with a qualified manager under a management agreement acceptable to the lender within 60 days (or, if such bankruptcy action was involuntary and the manager or borrower did not consent to or solicit or collude with the party filing such action, upon the same being discharged, stayed or dismissed within 60 days), (c) clause (ii) above solely with respect to the borrower if the bankruptcy action was involuntary and the borrower, guarantor or any affiliate did not consent to or solicit or collude with the party filing such action, upon the same not being discharged, stayed or dismissed within 60 days, (d) clause (iii) above, the achievement of a debt service coverage ratio for two consecutive quarters of at least 1.10x on a trailing three-month basis, (e) a Maturity Trigger, Google renewing both of its leases in accordance with the loan documents and paying full unabated rent without any right of offset or free rent credit or outstanding tenant improvement obligations in accordance with the loan documents, (f) a Downgrade Trigger, the initiation or reinstatement by Fitch, Moody’s and S&P, of the applicable rating required under the loan documents, (g) a Default Trigger, Google has cured all defaults and is paying full unabated rent without any right of offset or free rent credit or outstanding tenant improvement obligations (unless the tenant is rated at least BBB- (or its equivalent) by Fitch, Moody’s and S&P and the borrower reserves for such amounts in accordance with the loan documents), (h) a Tenant Bankruptcy Trigger, the bankruptcy action is dismissed pursuant to a final, non-appealable order and Google is paying full unabated rent without any right of offset or free rent credit or outstanding tenant improvement obligations (unless the tenant is rated at least BBB- (or its equivalent) by Fitch, Moody’s and S&P and the borrower reserves for such amounts in accordance with the loan documents), or (i) a Termination Trigger, Google has revoked or rescinded all termination or cancellation notices with respect to the lease(s) and has re-affirmed each lease as being in full force and effect and is paying full unabated rent without any right of offset or free rent credit or outstanding tenant improvement obligations (unless the tenant is rated at least BBB- (or its equivalent) by Fitch, Moody’s and S&P and the borrower reserves for such amounts in accordance with the loan documents). The borrower may also cure a Default Trigger, a Tenant Bankruptcy Trigger or a Termination Trigger by re-leasing the space leased by Google to a replacement tenant in accordance with the loan documents. In no event will the borrower have the right to cure a Cash Sweep Period caused by the borrower’s voluntary bankruptcy or insolvency, and the borrower is limited to curing a Cash Sweep Period caused by an event of default, a Default Trigger, a Downgrade Trigger, a Tenant Bankruptcy Trigger or a Termination Trigger to no more than three times during the term of the loan.
Additional Debt. There is a $102.0 million Moffett Gateway Subordinate Companion Loan and a $50.0 million mezzanine loan, both coterminous with the Moffett Gateway A-Notes. The Moffett Gateway Subordinate Companion Loan and the mezzanine loan have each been sold to separate third party investors. The Moffett Gateway Subordinate Companion Loan has a 5.00000% coupon and is interest only for the entire term. All principal payments on the Moffett Gateway Whole Loan once amortization begins after the expiration of the interest-only period will be applied to the Moffett Gateway A-Notes, which will cause hyper-amortization of the Moffett Gateway A-Notes. The mezzanine loan has a 6.35000% coupon and is interest only for the full term of the loan. Including the Moffett Gateway Subordinate Companion Loan and mezzanine loan, the cumulative Cut-off Date LTV, cumulative UW NCF DSCR and cumulative UW NOI Debt Yield are 75.2%, 1.22x and 7.3%, respectively. The mortgage and mezzanine lenders have entered into an intercreditor agreement.
Partial Release. The borrower is permitted to release Building One or Building Two from the lien of the security instrument through a partial defeasance of the Moffett Gateway Whole Loan at any time after the expiration of the lockout period if, among other conditions, (i) no event of default has occurred and is continuing, (ii) the borrower defeases a portion of the Moffett Gateway Whole Loan in an amount equal to (a) the allocated loan amount for the applicable building (which is $170.0 million for each building with respect to the Moffett Gateway Whole Loan and $27.5 million for each building with respect to the mezzanine loan) plus (b) if the Google Tenancy Condition (as defined below) is not satisfied, 25% of the allocated loan amount, (iii) after giving effect to the release, the debt service coverage ratio of the remaining portion of the property based on the trailing 12-month period equals or is greater than the greater of (a) 1.23x and (b) the debt service coverage ratio for the property (including the building being released) immediately preceding the release based on the trailing-three month period.
“Google Tenancy Condition” means (a) there is no Cash Sweep Period caused by a Specified Tenant Trigger and (b) either the Google lease or a lease for the Google leased premises with a tenant that has a long term unsecured debt rating of BBB or its equivalent is in full force and effect for the remaining property.
Right of First Offer. Google has a right of first offer, so long as the borrower or an affiliate owns the property, to purchase all or any portion of the property that the borrower is willing to sell. The right of first offer expressly does not apply to any third party (including any owner by reason of foreclosure or any successor-in-interest) who subsequently owns all or any portion of the property.
THE INFORMATION IN THIS STRUCTURAL AND COLLATERAL TERM SHEET IS NOT COMPLETE AND MAY BE AMENDED PRIOR TO THE TIME OF SALE. THIS TERM SHEET IS NOT AN OFFER TO SELL THESE SECURITIES AND IT IS NOT A SOLICITATION OF AN OFFER TO BUY THESE SECURITIES IN ANY JURISDICTION WHERE THE OFFER OR SALE IS NOT PERMITTED.
| | 52 of 156 |
| Structural and Collateral Term Sheet | JPMCC 2017-JP5 |
[THIS PAGE INTENTIONALLY LEFT BLANK]
THE INFORMATION IN THIS STRUCTURAL AND COLLATERAL TERM SHEET IS NOT COMPLETE AND MAY BE AMENDED PRIOR TO THE TIME OF SALE. THIS TERM SHEET IS NOT AN OFFER TO SELL THESE SECURITIES AND IT IS NOT A SOLICITATION OF AN OFFER TO BUY THESE SECURITIES IN ANY JURISDICTION WHERE THE OFFER OR SALE IS NOT PERMITTED.
| | 53 of 156 |
| Structural and Collateral Term Sheet | JPMCC 2017-JP5 | |
| Dallas Design District | ||
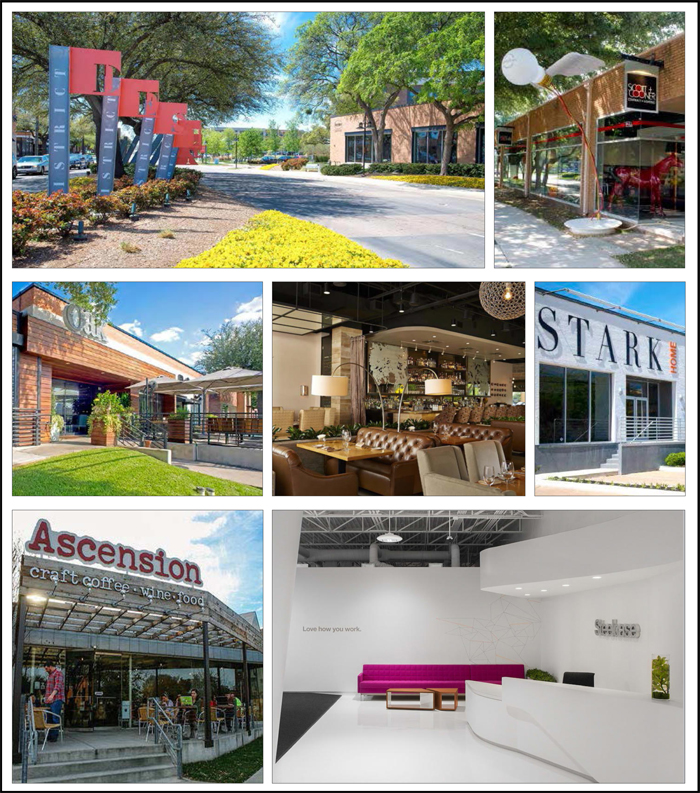
THE INFORMATION IN THIS STRUCTURAL AND COLLATERAL TERM SHEET IS NOT COMPLETE AND MAY BE AMENDED PRIOR TO THE TIME OF SALE. THIS TERM SHEET IS NOT AN OFFER TO SELL THESE SECURITIES AND IT IS NOT A SOLICITATION OF AN OFFER TO BUY THESE SECURITIES IN ANY JURISDICTION WHERE THE OFFER OR SALE IS NOT PERMITTED.
| | 54 of 156 |
| Structural and Collateral Term Sheet | JPMCC 2017-JP5 | |
| Dallas Design District | ||
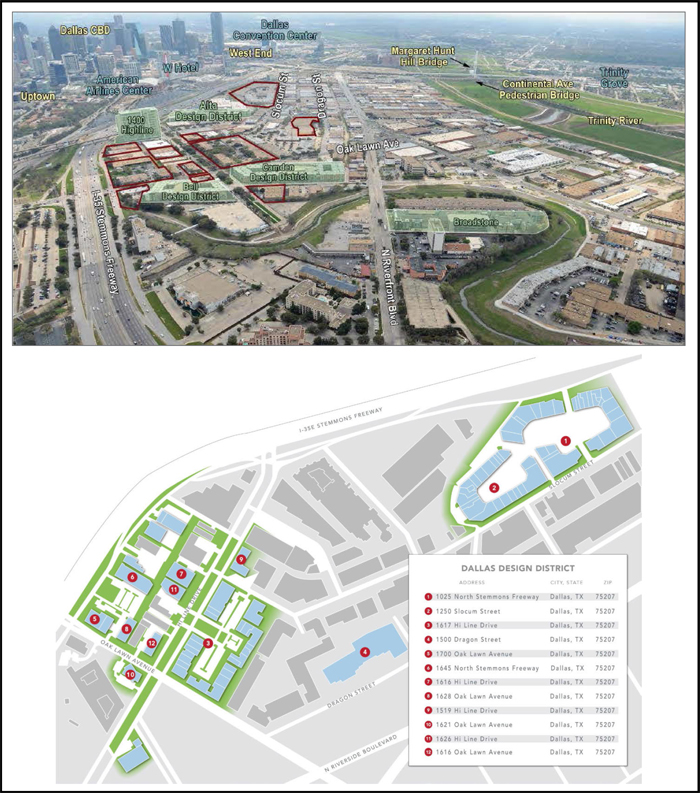
THE INFORMATION IN THIS STRUCTURAL AND COLLATERAL TERM SHEET IS NOT COMPLETE AND MAY BE AMENDED PRIOR TO THE TIME OF SALE. THIS TERM SHEET IS NOT AN OFFER TO SELL THESE SECURITIES AND IT IS NOT A SOLICITATION OF AN OFFER TO BUY THESE SECURITIES IN ANY JURISDICTION WHERE THE OFFER OR SALE IS NOT PERMITTED.
| | 55 of 156 |
| Structural and Collateral Term Sheet | JPMCC 2017-JP5 | |
| Dallas Design District | ||
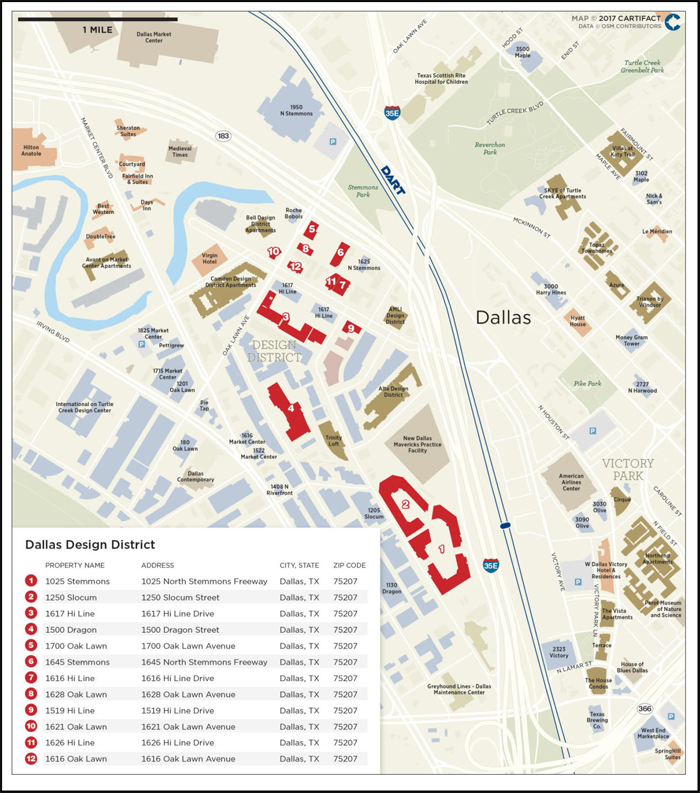
THE INFORMATION IN THIS STRUCTURAL AND COLLATERAL TERM SHEET IS NOT COMPLETE AND MAY BE AMENDED PRIOR TO THE TIME OF SALE. THIS TERM SHEET IS NOT AN OFFER TO SELL THESE SECURITIES AND IT IS NOT A SOLICITATION OF AN OFFER TO BUY THESE SECURITIES IN ANY JURISDICTION WHERE THE OFFER OR SALE IS NOT PERMITTED.
| | 56 of 156 |
| Structural and Collateral Term Sheet | JPMCC 2017-JP5 | |
| Dallas Design District | ||
| Mortgage Loan Information | Property Information | |||
| Mortgage Loan Seller: | JPMCB | Single Asset / Portfolio: | Single Asset | |
| Original Principal Balance(1): | $75,000,000 | Title: | Fee / Leasehold | |
| Cut-off Date Principal Balance(1): | $75,000,000 | Property Type - Subtype: | Industrial - Flex | |
| % of Pool by IPB: | 6.9% | Net Rentable Area (SF): | 728,452 | |
| Loan Purpose: | Refinance | Location: | Dallas, TX | |
| Borrowers(2): | Various | Year Built / Renovated(3) | Various / Various | |
| Sponsors: | Donald Engle and | Occupancy: | 98.7% | |
| William L. Hutchinson | Occupancy Date: | 12/28/2016 | ||
| Interest Rate: | 5.25700% | Number of Tenants: | 100 | |
| Note Date: | 1/5/2017 | 2013 NOI(4): | $7,626,320 | |
| Maturity Date: | 2/1/2027 | 2014 NOI(4): | $9,005,119 | |
| Interest-only Period: | 36 months | 2015 NOI: | $8,498,455 | |
| Original Term: | 120 months | TTM NOI (as of 9/2016)(5): | $9,637,865 | |
| Original Amortization: | 360 months | UW Economic Occupancy: | 95.0% | |
| Amortization Type: | IO-Balloon | UW Revenues: | $15,304,762 | |
| Call Protection: | L(25),Grtr1%orYM(91),O(4) | UW Expenses: | $4,048,471 | |
| Lockbox: | Hard | UW NOI(5): | $11,256,291 | |
| Additional Debt: | Yes | UW NCF: | $10,204,999 | |
| Additional Debt Balance: | $45,000,000 | Appraised Value / Per SF: | $193,085,000 / $265 | |
| Additional Debt Type: | Pari Passu | Appraisal Date: | Various | |
| Escrows and Reserves(6) | Financial Information(1) | ||||||||
| Initial | Monthly | Initial Cap | Cut-off Date Loan / SF: | $165 | |||||
| Taxes: | $316,270 | $316,270 | N/A | Maturity Date Loan / SF: | $147 | ||||
| Insurance: | $200,000 | Springing | N/A | Cut-off Date LTV: | 62.1% | ||||
| Replacement Reserves: | $374,106 | Springing | $372,816 | Maturity Date LTV: | 55.3% | ||||
| TI/LC: | $3,278,052 | Springing | $3,278,052 | UW NCF DSCR: | 1.28x | ||||
| Other: | $2,155,636 | $6,025 | N/A | UW NOI Debt Yield: | 9.4% | ||||
| |||||||||
| Sources and Uses | |||||||||
| Sources | Proceeds | % of Total | Uses | Proceeds | % of Total | ||||
| Mortgage Loan(1) | $120,000,000 | 100.0% | Payoff Existing Debt | $109,451,756 | 91.2% | ||||
| % | Upfront Reserves | 6,324,064 | 5.3% | ||||||
| Closing Costs | 3,812,371 | 3.2% | |||||||
| Return of Equity | 411,809 | 0.3% | |||||||
| Total Sources | $120,000,000 | 100.0% | Total Uses | $120,000,000 | 100.0% | ||||
| (1) | The Dallas Design District loan is part of a whole loan evidenced by twopari passu notes, with an aggregate outstanding principal balance as of the Cut-off Date of $120.0 million. The Financial Information presented in the chart above reflects the Cut-off Date balance of the $120.0 million Dallas Design District Whole Loan, as defined in “The Loan” below. |
| (2) | For a full description of the Borrowers, please refer to “The Borrowers” below. |
| (3) | The Dallas Design District properties were built between 1953 and 1999 and renovated between 2010 and 2016. |
| (4) | The increase in 2014 NOI from 2013 NOI is primarily due to rents in place increasing from approximately $9.0 million in 2013 to approximately $9.9 million in 2014 as a result of new/renewal leases signed at higher rents at 1025 Stemmons, 1250 Slocum, 1617 Hi Line, 1645 Stemmons and 1500 Dragon. |
| (5) | The increase in TTM NOI to UW NOI is primarily due to recent leasing across the properties along with contractual rent steps taken through January 2018 totaling $425,877. |
| (6) | For a full description of Escrows and Reserves, please refer to“Escrows and Reserves”below. |
THE INFORMATION IN THIS STRUCTURAL AND COLLATERAL TERM SHEET IS NOT COMPLETE AND MAY BE AMENDED PRIOR TO THE TIME OF SALE. THIS TERM SHEET IS NOT AN OFFER TO SELL THESE SECURITIES AND IT IS NOT A SOLICITATION OF AN OFFER TO BUY THESE SECURITIES IN ANY JURISDICTION WHERE THE OFFER OR SALE IS NOT PERMITTED.
| | 57 of 156 |
| Structural and Collateral Term Sheet | JPMCC 2017-JP5 | |
| Dallas Design District | ||
The Loan.The Dallas Design District loan is secured by a first mortgage lien on the borrowers’ fee and leasehold interests in 12 industrial-flex properties located in Dallas, Texas. The whole loan has an outstanding principal balance as of the Cut-off Date of $120.0 million (the “Dallas Design District Whole Loan”) and is comprised of twopari passu notes, each as described below. Note A-1 is being contributed to the JPMCC 2017-JP5 Trust and is the controlling note under the related intercreditor agreement, the rights of which will be exercised by the trustee under this securitization (or, prior to the occurrence and continuance of a Control Termination Event, by the Directing Certificateholder). However, the holder of Note A-2 (including any related trustee or, prior to the occurrence and continuance of a control termination event under any related pooling and servicing agreement, any related directing certificateholder) will be entitled, under certain circumstances, to be consulted with respect to certain major decisions. Note A-2, with an outstanding principal balance as of the Cut-off Date of $45.0 million, is expected to be contributed to one or more future securitization trusts. The Dallas Design District Whole Loan has a 10-year term and, subsequent to a three-year interest-only period, will amortize on a 30-year schedule. The previous debt securing the property was securitized in JPMCC 2015-FL7.
| Whole Loan Summary | ||||
| Notes | Original Balance | Cut-off Date Balance | Note Holder | Controlling Piece |
| A-1 | $75,000,000 | $75,000,000 | JPMCC 2017-JP5 | Yes |
| A-2 | 45,000,000 | 45,000,000 | JPMCB | No |
| Total | $120,000,000 | $120,000,000 | ||
The Borrowers. The borrowing entities for the Dallas Design District Whole Loan are DE Design Borrower 2017 LLC, DD Dunhill 2017 LLC and 1500 Dragon Dunhill LLC, each a Delaware limited liability company and special purpose entity. DD Dunhill 2017 LLC and DE Design Borrower 2017 LLC own the majority of the property as tenants-in-common and the remaining borrower owns the fee interest in its parcel located at 1500 Dragon Street, Dallas, Texas.
The Loan Sponsors.The Dallas Design District Whole Loan’s sponsors and nonrecourse carve-out guarantors are William L. Hutchinson, President of Dunhill Partners (“Dunhill”), and Donald Engle. Dunhill specializes in the sale, acquisition, leasing and management of retail shopping centers. Over the last 10 years, Dunhill has bought and sold approximately $3.0 billion of shopping centers throughout the Southwestern United States. Dunhill currently manages more than 5.8 million square feet of retail commercial property in Texas. Donald Engle, who owns one of the borrowers, is not a party to the environmental indemnity and is obligated under his guaranty only for certain breaches or violations of the nonrecourse carve-out provisions attributed to that borrower. The other guarantor, William L. Hutchinson, is a party to the environmental indemnity and is obligated under his guaranty for any breach or violation of the nonrecourse carve-out provisions in the loan documents.
The loan sponsors purchased 11 of the 12 properties in 2014 for $131.5 million and, according to the loan sponsors, have invested approximately $3.2 million toward tenant improvements and leasing commissions as well as approximately $1.4 million in other building improvements. The loan sponsors purchased the 12th property (1500 Dragon) in 2016 for $17.6 million. The loan sponsors’ total cost basis in the portfolio is $156.4 million.
The Property.The Dallas Design District properties consist of 728,452 square feet of industrial-flex space across 12 Class A properties located in Dallas, Texas. The 12 properties were developed between 1953 and 1999, renovated between 2010 and 2016, and are situated on approximately 32.5 acres. Among the 12 properties are three larger design and showroom centers, which comprise the majority of the property collateral.
As of December 28, 2016, the complex was 98.7% occupied by 100 tenants. The rent roll at the properties is diverse with no tenant representing more than 6.1% of net rentable area. Tenants at the properties include seven restaurants, several retail shops, and showroom/gallery space for tenants such as furniture retailers, wholesale textile retailers, interior design and architecture firms, and other professional firms including a modeling agency and photography studio. Among the properties, the largest tenant is Regulus Group LLC (“Regulus Group”), which first took occupancy in November 2006 and leases 6.1% of the net rentable area through March 2017. Regulus Group was founded in 2002 and provides processing solutions to a wide range of firms and has operations in three states. The second largest tenant is Walter Lee Culp Associates, Inc. (“Culp Associates”), which first took occupancy in September 1993 and recently exercised a lease extension option through October 2028, and leases 4.2% of the net rentable area. Culp Associates has two, five-year extension options. Culp Associates has been involved in the interior design community for over 42 years. The Culp Associates showroom has a large collection of traditional, transitional and fashion-forward textiles. The third largest tenant is David Sutherland, Inc. (“David Sutherland”), which first took occupancy in October 1997, and leases 4.1% of the net rentable area through May 2023. The David Sutherland showroom has a multi-line collection of furniture, fabric and accessories from manufacturers from around the world. David Sutherland has one, five-year extension option.
THE INFORMATION IN THIS STRUCTURAL AND COLLATERAL TERM SHEET IS NOT COMPLETE AND MAY BE AMENDED PRIOR TO THE TIME OF SALE. THIS TERM SHEET IS NOT AN OFFER TO SELL THESE SECURITIES AND IT IS NOT A SOLICITATION OF AN OFFER TO BUY THESE SECURITIES IN ANY JURISDICTION WHERE THE OFFER OR SALE IS NOT PERMITTED.
| | 58 of 156 |
| Structural and Collateral Term Sheet | JPMCC 2017-JP5 | |
| Dallas Design District | ||
The loan sponsors have recently executed several new and renewal leases with tenants at the properties, with 305,121 square feet of new, renewal and expansion leases executed since May 2015. Headington Realty signed a new lease for 10,161 square feet at $35.00 per square foot and William E. McGannon, Inc. renewed its 15,823 square foot lease starting January 2018 at 1617 Hi Line at $18.00 per square foot. Additionally, new leases were executed by Janus et Cie at 1700 Oak Lawn for 8,250 square feet at $30.00 per square foot and by Made Goods at 1025 Stemmons for 4,670 square feet at $28.00 per square foot.
| Property Summary(1) | |||||||
| Property Name | Net Rentable Area (SF) | Property Description | Class | Year Built | Occupancy(2) | Appraised Value | % of Appraised Value |
| 1025 Stemmons | 212,329 | Retail / Lifestyle Center | A | 1982 | 97.6% | $51,300,000 | 26.6% |
| 1250 Slocum | 156,659 | Retail / Lifestyle Center | A | 1999 | 98.3% | 41,500,000 | 21.5% |
| 1617 Hi Line | 136,539 | Designer / Showroom | A | 1955-1967 | 100.0% | 40,500,000 | 21.0% |
| 1500 Dragon | 104,641 | Office / Showroom | A | 1979, 1981 | 100.0% | 18,500,000 | 9.6% |
| 1700 Oak Lawn | 17,425 | Designer / Showroom | A | 1957 | 100.0% | 8,350,000 | 4.3% |
| 1645 Stemmons | 22,726 | Designer / Showroom | A | 1963 | 100.0% | 7,100,000 | 3.7% |
| 1616 Hi Line | 19,074 | Designer / Showroom | A | 1954 | 100.0% | 5,450,000 | 2.8% |
| 1628-1630 Oak Lawn | 11,655 | Restaurant / Showroom | A | 1954 | 92.6% | 4,950,000 | 2.6% |
| 1519-1525 Hi Line | 13,816 | Designer / Showroom | A | 1955 | 99.2% | 4,250,000 | 2.2% |
| 1621 Oak Lawn | 9,038 | Restaurant / Retail | A | 1953 | 96.6% | 4,000,000 | 2.1% |
| 1626 Hi Line | 14,150 | Designer / Showroom | A | 1955 | 99.4% | 3,725,000 | 1.9% |
| 1616 Oak Lawn | 10,400 | Designer / Showroom | A | 1953 | 100.0% | 3,460,000 | 1.8% |
| Total/Wtd. Avg. | 728,452 | 98.7% | $193,085,000 | 100.0% | |||
| (1) | Based on the appraisals. |
| (2) | Based on the underwritten rent roll dated December 28, 2016. |
The Dallas Design District property is located approximately 2.7 miles northwest of downtown Dallas in an area locally known as the “The Design District”. Originally developed as showrooms for home furnishings, fabrics and decorative accessories, The Design District is comprised of approximately 160.0 acres just west of downtown Dallas and on the north side of the Trinity River corridor. The area consists of residential, retail, restaurants, showrooms and trade buildings and, according to the borrowers, is known to have the fourth largest concentration of designer showroom space in the country. Approximately 186.0 acres within The Design District are part of a Tax Increment Financing (“TIF”) zone that began in June 2005 and will terminate on December 31, 2027. The mission of the TIF zone is to provide a source of funding for public infrastructure improvements that will assist in redeveloping an industrial and warehouse district to take full advantage of the expanding DART light rail system, to promote transit oriented development, and to improve access to the Trinity River and the quality of development adjacent to the Trinity River Corridor.
According to the appraisal, the Dallas Design District is also home to the Dallas Market Center (“DMC”), one of the world’s largest wholesale marts (more than five million square feet), which is located along Stemmons Freeway near Market Center Boulevard, approximately one mile north of the property. The DMC offers more than 2,000 permanent showrooms with thousands of lines from leading manufacturers of gift products, decorative accessories, home furnishing, lighting, garden accessories, gourmet products, holiday and floral items and apparel. The DMC holds approximately 50 trade and special events each year with the largest event attracting more than 50,000 attendees. According to the appraisal, approximately 400,000 people visit the DMC campus each year including more than 200,000 buyers and sellers from all 50 states and 84 countries.
The Dallas Design District property is located adjacent to Stemmons Freeway, a main north-south thoroughfare that bisects Dallas. The property is also located off Interstate 35 to the north and east, with access on the south to Riverfront Boulevard and the Trinity River. The area benefited from a 2011 Interstate 35 expansion that added additional freeway access points to the surrounding area. The Dallas Design District property is situated on the other side of Interstate 35 and is approximately one mile from the American Airlines Center, the home court of the Dallas Mavericks National Basketball Association team, Dallas Stars National Hockey League team and a venue used for concerts and events throughout the year. Mark Cuban, owner of the Dallas Mavericks National Basketball Association team, recently announced in October 2016 plans to build a $70.0 million practice facility for the Dallas Mavericks located within the Dallas Design District neighborhood. The new practice facility will be adjacent to the 1025 Stemmons and 1250 Slocum properties. Additionally, Dunhill and Gatehouse Capital Corporation are building an approximately $80.0 million Virgin Hotel Dallas, a 14-story, 240-room boutique hotel located on Hi Line Drive near Stemmons Freeway. The hotel is scheduled to open in early 2018 and will include luxury suites, restaurants, bars, meeting space and a rooftop terrace with a pool, spa and gym.
According to the 1025 Stemmons appraisal, the population within a three and five-mile radius contained 155,036 and 355,808 people, respectively, with a median household income of $54,153 and $51,771, respectively, as of 2016.
THE INFORMATION IN THIS STRUCTURAL AND COLLATERAL TERM SHEET IS NOT COMPLETE AND MAY BE AMENDED PRIOR TO THE TIME OF SALE. THIS TERM SHEET IS NOT AN OFFER TO SELL THESE SECURITIES AND IT IS NOT A SOLICITATION OF AN OFFER TO BUY THESE SECURITIES IN ANY JURISDICTION WHERE THE OFFER OR SALE IS NOT PERMITTED.
| | 59 of 156 |
| Structural and Collateral Term Sheet | JPMCC 2017-JP5 | |
| Dallas Design District | ||
| Market Rent Summary | ||
| Category | Underwritten Rent(1) | Appraisal Rent(2) |
| Showroom <20k Square Feet | $17 | $23 |
| Showroom >20k Square Feet | $15 | $18 |
| Collection Space | $24 | $19 |
| Showroom/Retail | $34 | $35 |
| Mezz/Rear | $6 | $9 |
| Restaurant | $30 | $34 |
| (1) | Based on the underwritten rent roll dated December 28, 2016 and includes rent steps through January 2018. |
| (2) | Weighted average of the appraisal concluded rent per square foot for each of the categories. |
| Historical and Current Occupancy(1) | |||
| 2013 | 2014 | 2015 | Current(2) |
| 89.6% | 86.7% | 89.6% | 98.7% |
| (1) | Historical Occupancies are as of December 31 of each respective year. |
| (2) | Current Occupancy is as of December 28, 2016. |
| Tenant Summary(1) | ||||||
| Tenant | Ratings Moody’s/S&P/Fitch | Net Rentable Area (SF) | % of Total NRA | Base Rent PSF | % of Total Base Rent | Lease Expiration Date |
| Regulus Group LLC(2) | NA / NA / NA | 44,345 | 6.1% | $11.50 | 4.1% | 3/31/2017 |
| Walter Lee Culp Associates, Inc. | NA / NA / NA | 30,650 | 4.2% | $13.41 | 3.3% | 10/31/2028 |
| David Sutherland, Inc.(3) | NA / NA / NA | 29,937 | 4.1% | $12.50 | 3.0% | 5/31/2023 |
| Interior Design Collections, Ltd. | NA / NA / NA | 24,651 | 3.4% | $16.99 | 3.4% | 6/30/2026 |
| E.C. Dicken, Inc. | NA / NA / NA | 23,083 | 3.2% | $13.75 | 2.6% | 5/31/2020 |
| George Cameron Nash, Inc. | NA / NA / NA | 21,305 | 2.9% | $20.09 | 3.5% | 12/31/2025 |
| Baker, Knapp & Tubbs, Inc./Kohler Interior | NA / NA / NA | 20,800 | 2.9% | $13.04 | 2.2% | 1/31/2018 |
| Scott + Cooner, Inc. | NA / NA / NA | 20,079 | 2.8% | $17.50 | 2.9% | 8/31/2019 |
| The Robert Allen Group, Inc. | NA / NA / NA | 16,940 | 2.3% | $15.45 | 2.1% | 10/31/2017 |
| Morrison Supply Co. | NA / NA / NA | 16,433 | 2.3% | $10.71 | 1.4% | 6/10/2024 |
| (1) | Based on the underwritten rent roll dated December 28, 2016 and includes rent steps through January 2018. |
| (2) | According to the loan sponsors, Regulus Group LLC has a lease out for signature that will extend the term of its lease until September 30, 2017. The loan sponsors are in discussions with four potential tenants to backfill the space at rents approximately 25% higher than the rent currently paid by Regulus Group LLC. |
| (3) | David Sutherland, Inc. has the right to terminate its lease on June 1, 2018, with 12 months’ notice and the payment of a termination fee. |
THE INFORMATION IN THIS STRUCTURAL AND COLLATERAL TERM SHEET IS NOT COMPLETE AND MAY BE AMENDED PRIOR TO THE TIME OF SALE. THIS TERM SHEET IS NOT AN OFFER TO SELL THESE SECURITIES AND IT IS NOT A SOLICITATION OF AN OFFER TO BUY THESE SECURITIES IN ANY JURISDICTION WHERE THE OFFER OR SALE IS NOT PERMITTED.
| | 60 of 156 |
| Structural and Collateral Term Sheet | JPMCC 2017-JP5 | |
| Dallas Design District | ||
| Lease Rollover Schedule(1) | |||||||||
| Year | Number of Leases Expiring | Net Rentable Area Expiring | % of NRA Expiring | Base Rent Expiring | % of Base Rent Expiring | Cumulative Net Rentable Area Expiring | Cumulative % of NRA Expiring | Cumulative Base Rent Expiring | Cumulative % of Base Rent Expiring |
| Vacant | NAP | 9,165 | 1.3% | NAP | NAP | 9,165 | 1.3% | NAP | NAP |
| 2017 & MTM | 9 | 92,618 | 12.7 | $1,431,094 | 11.6% | 101,783 | 14.0% | $1,431,094 | 11.6% |
| 2018 | 16 | 94,455 | 13.0 | $1,466,513 | 11.9 | 196,238 | 26.9% | $2,897,607 | 23.5% |
| 2019 | 20 | 107,321 | 14.7 | $1,853,564 | 15.0 | 303,559 | 41.7% | $4,751,171 | 38.5% |
| 2020 | 8 | 64,001 | 8.8 | $1,091,760 | 8.9 | 367,560 | 50.5% | $5,842,931 | 47.4% |
| 2021 | 11 | 53,826 | 7.4 | $1,145,051 | 9.3 | 421,386 | 57.8% | $6,987,982 | 56.7% |
| 2022 | 6 | 15,114 | 2.1 | $345,933 | 2.8 | 436,500 | 59.9% | $7,333,915 | 59.5% |
| 2023 | 9 | 80,915 | 11.1 | $1,268,392 | 10.3 | 517,415 | 71.0% | $8,602,307 | 69.8% |
| 2024 | 4 | 39,179 | 5.4 | $566,300 | 4.6 | 556,594 | 76.4% | $9,168,607 | 74.4% |
| 2025 | 5 | 60,726 | 8.3 | $1,007,427 | 8.2 | 617,320 | 84.7% | $10,176,034 | 82.6% |
| 2026 | 9 | 62,121 | 8.5 | $1,411,699 | 11.5 | 679,441 | 93.3% | $11,587,733 | 94.0% |
| 2027 | 2 | 18,361 | 2.5 | $327,039 | 2.7 | 697,802 | 95.8% | $11,914,772 | 96.7% |
| 2028 & Beyond | 1 | 30,650 | 4.2 | $410,866 | 3.3 | 728,452 | 100.0% | $12,325,638 | 100.0% |
| Total | 100 | 728,452 | 100.0% | $12,325,638 | 100.0% | ||||
| (1) | Based on the underwritten rent roll dated December 28, 2016 and includes rent steps through January 2018. |
| Operating History and Underwritten Net Cash Flow | |||||||
| 2013 | 2014 | 2015 | TTM(1) | Underwritten | Per Square Foot | %(2) | |
| Rents in Place(3)(4) | $8,960,054 | $9,866,210 | $9,805,348 | $10,552,323 | $12,325,638 | $16.92 | 76.8% |
| Vacant Income | 0 | 0 | 0 | 0 | 147,998 | 0.20 | 0.9 |
| Gross Potential Rent | $8,960,054 | $9,866,210 | $9,805,348 | $10,552,323 | $12,473,636 | $17.12 | 77.7% |
| CAM Reimbursements | 2,635,957 | 2,937,497 | 2,547,667 | 2,773,769 | 3,279,365 | 4.50 | 20.4 |
| Percentage Rent | 127,620 | 208,806 | 200,877 | 266,763 | 293,987 | 0.40 | 1.8 |
| Net Rental Income | $11,723,632 | $13,012,514 | $12,553,892 | $13,592,854 | $16,046,988 | $22.03 | 100.0% |
| (Vacancy/Credit Loss) | 599 | (39,490) | 0 | 0 | (802,349) | (1.10) | (5.0) |
| Other Income | 38,610 | 83,344 | 52,728 | 80,918 | 60,123 | 0.08 | 0.4 |
| Effective Gross Income | $11,762,840 | $13,056,367 | $12,606,620 | $13,673,772 | $15,304,762 | $21.01 | 95.4% |
| Total Expenses | $4,136,520 | $4,051,248 | $4,108,165 | $4,035,907 | $4,048,471 | $5.56 | 26.5% |
| Net Operating Income | $7,626,320 | $9,005,119 | $8,498,455 | $9,637,865 | $11,256,291 | $15.45 | 73.5% |
| Total TI/LC, Capex/RR | 0 | 0 | 0 | 0 | 1,051,292 | 1.44 | 6.9 |
| Net Cash Flow | $7,626,320 | $9,005,119 | $8,498,455 | $9,637,865 | $10,204,999 | $14.01 | 66.7% |
| (1) | TTM Column represents the trailing 12-month period ending September 30, 2016. |
| (2) | % column represents percent of Net Rental Income for all revenue lines and represents percent of Effective Gross Income for the remainder of the fields. |
| (3) | The increase in 2014 Rents in Place from 2013 Rents in Place is primarily a result of new/renewal leases signed at higher rents at 1025 Stemmons, 1250 Slocum, 1617 Hi Line, 1645 Stemmons and 1500 Dragon. |
| (4) | The increase in Underwritten Rents in Place from TTM Rents in Place is primarily due to recent leasing across the properties, along with contractual rent steps taken through January 2018 totaling $425,877. |
THE INFORMATION IN THIS STRUCTURAL AND COLLATERAL TERM SHEET IS NOT COMPLETE AND MAY BE AMENDED PRIOR TO THE TIME OF SALE. THIS TERM SHEET IS NOT AN OFFER TO SELL THESE SECURITIES AND IT IS NOT A SOLICITATION OF AN OFFER TO BUY THESE SECURITIES IN ANY JURISDICTION WHERE THE OFFER OR SALE IS NOT PERMITTED.
| | 61 of 156 |
| Structural and Collateral Term Sheet | JPMCC 2017-JP5 | |
| Dallas Design District | ||
Property Management. The property is managed by Dunhill Property Management Services, Inc., an affiliate of the borrowers.
Escrows and Reserves. At origination, the borrowers deposited into escrow $3,278,052 for future tenant improvements and leasing commissions, $1,693,764 for outstanding tenant improvements and leasing commissions related to 11 tenants, $374,106 for a replacement reserve, $320,671 for a free rent reserve related to four tenants $316,270 for a real estate tax reserve, $200,000 for an insurance reserve, $123,125 for a deferred maintenance reserve and $18,076 for a ground rent reserve.
Tax Escrows- On a monthly basis, the borrowers are required to escrow 1/12 of the annual estimated tax payments, which currently equates to $316,270.
Insurance Escrows - The requirement for the borrowers to make monthly deposits to the insurance escrow is waived so long as (i) no event of default exists and (ii) the borrowers provide satisfactory evidence that the properties are insured under an acceptable blanket policy in accordance with the loan documents.
Replacement Reserves - At origination, the borrowers reserved $374,106 for replacement reserves. If the total amount of replacement reserves on deposit decreases below $372,816 during the term of the loan, on a monthly basis, the borrowers are required to escrow $9,106 (approximately $0.13 per square foot annually) for future ongoing replacement reserves. The reserve is subject to a cap of $372,816 (approximately $0.51 per square foot).
TI/LC Reserves - At origination, the borrowers reserved $3,278,052 for tenant improvements and leasing commissions. If the total amount on deposit decreases below $3,278,052 during the term of the loan, on a monthly basis, the borrowers are required to escrow $91,057 for future tenant improvements and leasing commissions. The reserve is subject to a cap of $3,278,052 (approximately $4.50 per square foot).
Lockbox / Cash Management.The Dallas Design District Whole Loan is structured with a hard lockbox and in-place cash management. The borrowers were required within three business days after the establishment of the lockbox account to send tenant direction letters to the tenants at the property instructing them to deposit all rents and payments directly into the lockbox account controlled by the lender. All funds in the lockbox account are swept each business day to a segregated cash management account under the control of the lender and disbursed in accordance with the loan documents. During a Cash Sweep Event (as defined below) all excess cash flow after payment of the debt service, required reserves and operating expenses will be held as additional collateral for the loan. The lender has a first priority security interest in the cash management account.
A “Cash Sweep Event” means (i) the occurrence of an event of default, (ii) the bankruptcy or insolvency action of the borrowers or the property manager, or (iii) a DSCR Trigger Event (as defined below) has occurred and is ongoing.
A “DSCR Trigger Event” means the trailing three-month debt service coverage ratio as calculated in accordance with the loan documents is less than 1.15x.
A Cash Sweep Event may be cured by the following: if the Cash Sweep Event is caused solely by (a) clause (i) above, the acceptance by the lender of a cure of such event of default, (b) clause (ii) above, only with respect to the property manager, the borrowers replacing such property manager with a qualified manager under a replacement management agreement within 60 days, and (c) clause (iii) above, the debt service coverage ratio for two consecutive quarters based on the trailing three-month period is 1.20x or greater. A Cash Sweep Event cure may occur no more than four times during the term of the loan.
Ground Lease. The property located at 1621 Oak Lawn Avenue is subject to a ground lease, which commenced on December 21, 1952 for a term of 99 years and expires on December 20, 2051 with no renewal options. The annual rent under the ground lease is currently $72,305 and is payable in advance on December 21 of each year during the term of the lease. Annual rent is subject to adjustment on December 21 of every 10th year. The annual rent is adjusted pursuant to the agreement of the parties or pursuant to an appraisal every 10 years. The annual rent is required to be 6.0% of the appraised value of the land (exclusive of improvements and buildings constructed by the borrowers, but including paving, storm sewers, utilities and other improvements constructed by the ground lessor). The appraised value will be determined by three appraisers: one chosen by the borrowers under the ground lease (DD Dunhill 2017 LLC and DE Design Borrower 2017 LLC), one chosen by the ground lessor and one chosen by the other two appraisers (this third appraiser must be a realtor and a qualified member of the Dallas Real Estate Board). The next rent adjustment is expected to occur on December 21, 2017.
THE INFORMATION IN THIS STRUCTURAL AND COLLATERAL TERM SHEET IS NOT COMPLETE AND MAY BE AMENDED PRIOR TO THE TIME OF SALE. THIS TERM SHEET IS NOT AN OFFER TO SELL THESE SECURITIES AND IT IS NOT A SOLICITATION OF AN OFFER TO BUY THESE SECURITIES IN ANY JURISDICTION WHERE THE OFFER OR SALE IS NOT PERMITTED.
| | 62 of 156 |
| Structural and Collateral Term Sheet | JPMCC 2017-JP5 |
[THIS PAGE INTENTIONALLY LEFT BLANK]
THE INFORMATION IN THIS STRUCTURAL AND COLLATERAL TERM SHEET IS NOT COMPLETE AND MAY BE AMENDED PRIOR TO THE TIME OF SALE. THIS TERM SHEET IS NOT AN OFFER TO SELL THESE SECURITIES AND IT IS NOT A SOLICITATION OF AN OFFER TO BUY THESE SECURITIES IN ANY JURISDICTION WHERE THE OFFER OR SALE IS NOT PERMITTED.
| | 63 of 156 |
| Structural and Collateral Term Sheet | JPMCC 2017-JP5 |
| Fresno Fashion Fair Mall | |
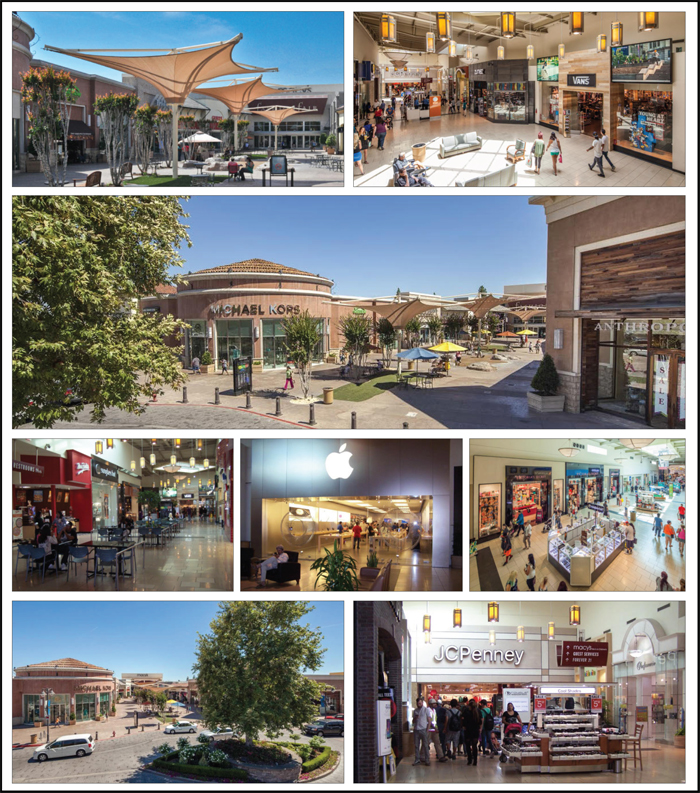
THE INFORMATION IN THIS STRUCTURAL AND COLLATERAL TERM SHEET IS NOT COMPLETE AND MAY BE AMENDED PRIOR TO THE TIME OF SALE. THIS TERM SHEET IS NOT AN OFFER TO SELL THESE SECURITIES AND IT IS NOT A SOLICITATION OF AN OFFER TO BUY THESE SECURITIES IN ANY JURISDICTION WHERE THE OFFER OR SALE IS NOT PERMITTED.
| | 64 of 156 |
| Structural and Collateral Term Sheet | JPMCC 2017-JP5 |
| Fresno Fashion Fair Mall | |
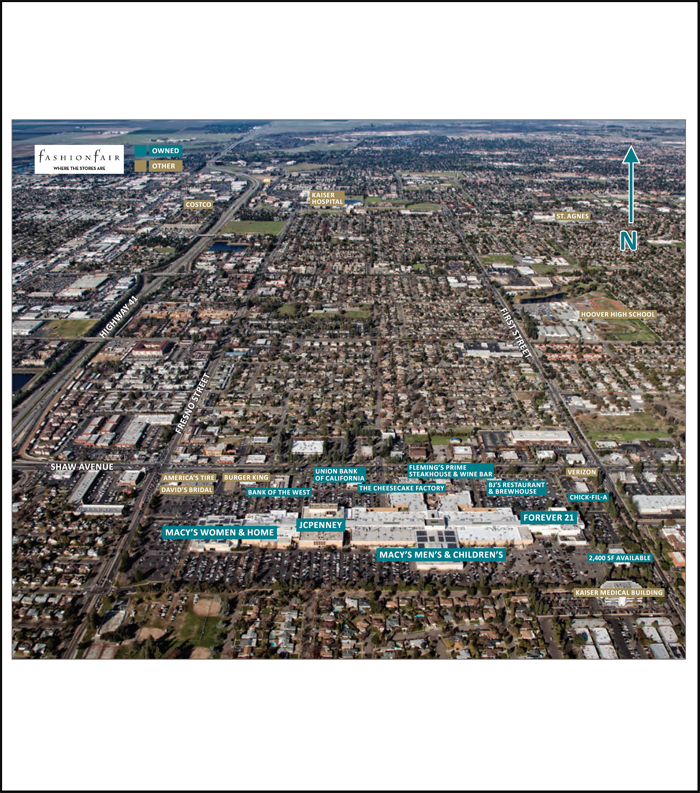
THE INFORMATION IN THIS STRUCTURAL AND COLLATERAL TERM SHEET IS NOT COMPLETE AND MAY BE AMENDED PRIOR TO THE TIME OF SALE. THIS TERM SHEET IS NOT AN OFFER TO SELL THESE SECURITIES AND IT IS NOT A SOLICITATION OF AN OFFER TO BUY THESE SECURITIES IN ANY JURISDICTION WHERE THE OFFER OR SALE IS NOT PERMITTED.
| | 65 of 156 |
| Structural and Collateral Term Sheet | JPMCC 2017-JP5 |
| Fresno Fashion Fair Mall | |
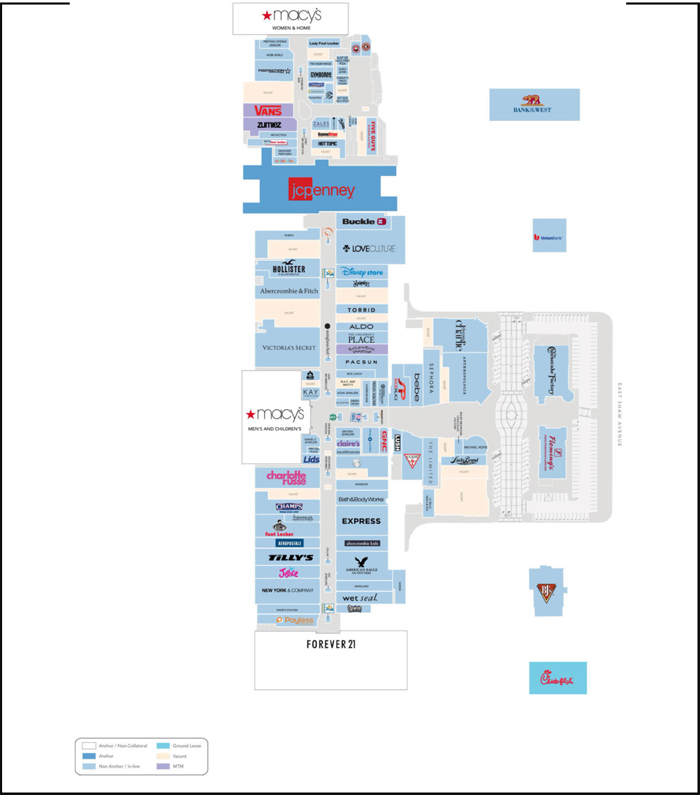
THE INFORMATION IN THIS STRUCTURAL AND COLLATERAL TERM SHEET IS NOT COMPLETE AND MAY BE AMENDED PRIOR TO THE TIME OF SALE. THIS TERM SHEET IS NOT AN OFFER TO SELL THESE SECURITIES AND IT IS NOT A SOLICITATION OF AN OFFER TO BUY THESE SECURITIES IN ANY JURISDICTION WHERE THE OFFER OR SALE IS NOT PERMITTED.
| | 66 of 156 |
| Structural and Collateral Term Sheet | JPMCC 2017-JP5 |
| Fresno Fashion Fair Mall | |
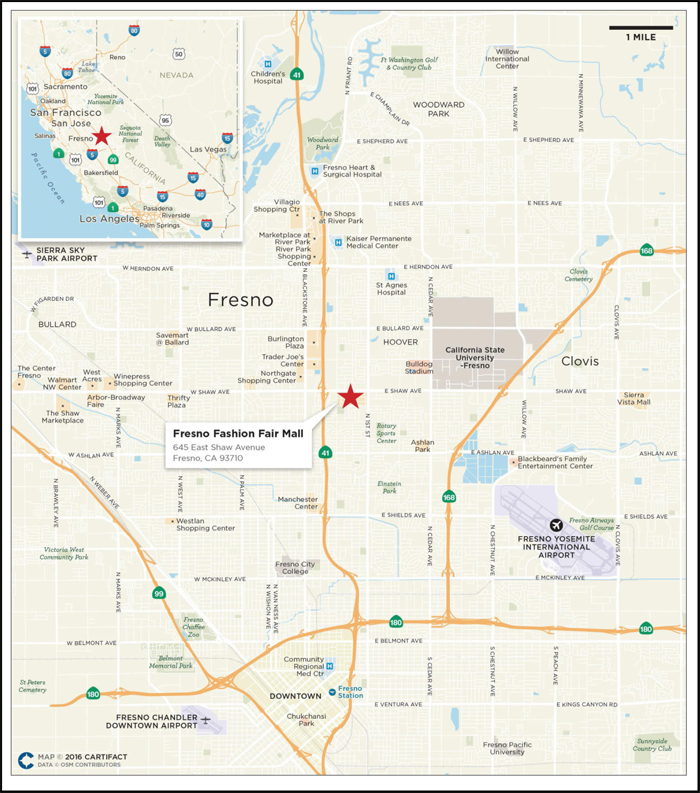
THE INFORMATION IN THIS STRUCTURAL AND COLLATERAL TERM SHEET IS NOT COMPLETE AND MAY BE AMENDED PRIOR TO THE TIME OF SALE. THIS TERM SHEET IS NOT AN OFFER TO SELL THESE SECURITIES AND IT IS NOT A SOLICITATION OF AN OFFER TO BUY THESE SECURITIES IN ANY JURISDICTION WHERE THE OFFER OR SALE IS NOT PERMITTED.
| | 67 of 156 |
| Structural and Collateral Term Sheet | JPMCC 2017-JP5 |
| Fresno Fashion Fair Mall | |
| Mortgage Loan Information | Property Information | |||
| Mortgage Loan Seller(1): | JPMCB | Single Asset / Portfolio: | Single Asset | |
| Original Principal Balance(2): | $69,000,000 | Title: | Fee | |
| Cut-off Date Principal Balance(2): | $69,000,000 | Property Type - Subtype: | Retail – Super Regional Mall | |
| % of Pool by IPB: | 6.3% | Net Rentable Area (SF)(3): | 536,106 | |
| Loan Purpose: | Recapitalization | Location: | Fresno, CA | |
| Borrower: | Macerich Fresno Limited | Year Built / Renovated: | 1970 / 2003 | |
| Partnership | Occupancy(4): | 89.3% | ||
| Sponsor: | The Macerich Partnership, L.P. | Occupancy Date: | 1/31/2017 | |
| Interest Rate: | 3.58700% | Number of Tenants: | 108 | |
| Note Date: | 10/6/2016 | 2013 NOI: | $25,136,449 | |
| Maturity Date: | 11/1/2026 | 2014 NOI: | $26,351,309 | |
| Interest-only Period: | 120 months | 2015 NOI: | $28,175,002 | |
| Original Term: | 120 months | 2016 NOI: | $27,639,900 | |
| Original Amortization: | None | UW Economic Occupancy: | 90.8% | |
| Amortization Type: | Interest Only | UW Revenues(5): | $33,363,299 | |
| Call Protection: | L(28),DeforGrtr1%orYM(88),O(4) | UW Expenses: | $6,507,414 | |
| Lockbox: | CMA | UW NOI: | $26,855,885 | |
| Additional Debt: | Yes | UW NCF: | $25,836,869 | |
| Additional Debt Balance: | $256,000,000 | Appraised Value / Per SF: | $565,000,000 / $1,054 | |
| Additional Debt Type: | Pari Passu | Appraisal Date: | 8/24/2016 | |
| Escrows and Reserves(6) | Financial Information(2) | ||||||||
| Initial | Monthly | Initial Cap | Cut-off Date Loan / SF: | $606 | |||||
| Taxes: | $0 | Springing | N/A | Maturity Date Loan / SF: | $606 | ||||
| Insurance: | $0 | Springing | N/A | Cut-off Date LTV: | 57.5% | ||||
| Replacement Reserves: | $0 | Springing | $184,080 | Maturity Date LTV: | 57.5% | ||||
| TI/LC: | $0 | Springing | $1,112,820 | UW NCF DSCR: | 2.19x | ||||
| Other: | $0 | $0 | N/A | UW NOI Debt Yield: | 8.3% | ||||
| Sources and Uses | |||||||||
| Sources | Proceeds | % of Total | Uses | Proceeds | % of Total | ||||
| Mortgage Loan(2) | $325,000,000 | 100.0% | Return of Equity(7) | $322,225,802 | 99.1% | ||||
| Closing Costs | 2,774,198 | 0.9 | |||||||
| Total Sources | $325,000,000 | 100.0% | Total Uses | $325,000,000 | 100.0% | ||||
| (1) | The Fresno Fashion Fair Mall Whole Loan was co-originated by JPMCB and Société Générale. |
| (2) | The Fresno Fashion Fair Mall loan is part of a whole loan evidenced by sevenpari passu notes with an aggregate original principal balance of $325.0 million. The Financial Information presented in the chart above reflects the Cut-off Date balance of the $325.0 million Fresno Fashion Fair Mall Whole Loan, as defined in “The Loan” below. |
| (3) | Net Rentable Area (SF) excludes square footage associated with Macy’s Women & Home, Macy’s Men’s & Children’s and Forever 21. The Macy’s Women & Home land and improvements are tenant owned with no attributable base rent, while the Forever 21 land and improvements are owned by an affiliate of the loan sponsor and not held as collateral for the Fresno Fashion Fair Mall Whole Loan. Please see “Redevelopment, Master Lease and Partial Releases” below for additional details with respect to the Macy’s Men’s & Children’s ground leased space. Reimbursements for common area maintenance and real estate taxes associated with the Macy’s Women & Home and Macy’s Men’s & Children’s parcels are included in UW NOI. Additionally, Net Rentable Area (SF) is not inclusive of square footage associated with the BJ’s Restaurant, Chick-fil-A and Fleming’s, for which the respective tenants own their improvements but not the related land, which are ground leased from the borrower. |
| (4) | Occupancy includes 681 square feet of expansion space for M.A.C. and Macy’s. The lease has been executed and is scheduled to commence on April 1, 2017. |
| (5) | UW Revenues includes $886,070 in underwritten rent associated with in-line temporary tenants and $1,410,094 in underwritten rent associated with temporary kiosks and carts. UW Revenues also includes base rent attributable to the BJ’s Restaurant, Chick-fil-A and Fleming’s ground leases in the amount of approximately $343,850 per year. |
| (6) | For a full description of Escrows and Reserves, please refer to“Escrows and Reserves”below. |
| (7) | The Fresno Fashion Fair Mall property was previously unencumbered. |
THE INFORMATION IN THIS STRUCTURAL AND COLLATERAL TERM SHEET IS NOT COMPLETE AND MAY BE AMENDED PRIOR TO THE TIME OF SALE. THIS TERM SHEET IS NOT AN OFFER TO SELL THESE SECURITIES AND IT IS NOT A SOLICITATION OF AN OFFER TO BUY THESE SECURITIES IN ANY JURISDICTION WHERE THE OFFER OR SALE IS NOT PERMITTED.
| | 68 of 156 |
| Structural and Collateral Term Sheet | JPMCC 2017-JP5 |
| Fresno Fashion Fair Mall | |
The Loan.The Fresno Fashion Fair Mall loan is secured by the borrower’s fee interest in 536,106 square feet of an approximately 957,944 square foot super regional mall located in Fresno, California. The whole loan was co-originated by JPMCB and Société Générale, has an outstanding principal balance as of the Cut-off Date of $325.0 million (the “Fresno Fashion Fair Mall Whole Loan”) and is comprised of sevenpari passu notes, each as described below. Note A-1-A was securitized in the JPMDB 2016-C4 trust and is the controlling note under the related co-lender agreement, the rights of which will be exercised by the related trustee (or, prior to the occurrence and continuance of a control termination event under the related pooling and servicing agreement, by the related directing certificateholder). However, the JPMCC 2017-JP5 Trust will be entitled, under certain circumstances, to be consulted with respect to certain major decisions. The Fresno Fashion Fair Mall Whole Loan has a 10-year term and will be interest-only for the term of the loan.
| Whole Loan Summary | |||||
| Note | Original Balance | Cut-off Date Balance | Note Holder | Controlling Piece | |
| A-1-A | $60,000,000 | $60,000,000 | JPMDB 2016-C4 | Yes | |
| A-1-B | 80,000,000 | 80,000,000 | JPMCC 2016-JP4 | No | |
| A-1-C | 69,000,000 | 69,000,000 | JPMCC 2017-JP5 | No | |
| A-2-A | 40,000,000 | 40,000,000 | CFCRE 2016-C6 | No | |
| A-2-B | 36,000,000 | 36,000,000 | CFCRE 2016-C7 | No | |
| A-2-C | 35,000,000 | 35,000,000 | CGCMT 2016-P6 | No | |
| A-2-D | 5,000,000 | 5,000,000 | CFCRE 2016-C7 | No | |
| Total | $325,000,000 | $325,000,000 | |||
The Borrower.The borrowing entity for the Fresno Fashion Fair Mall Whole Loan is Macerich Fresno Limited Partnership, a California limited partnership and special purpose entity.
The Loan Sponsor. The loan sponsor and nonrecourse carve-out guarantor for the Fresno Fashion Fair Mall Whole Loan is The Macerich Partnership, L.P., an affiliate of the Macerich Company (NYSE: MAC) (“Macerich”). Macerich is a self-administered and self-managed real estate investment trust involved in the acquisition, ownership, development, redevelopment, management and leasing of regional and community shopping centers located throughout the United States. As of December 31, 2015, Macerich owned approximately 55 million square feet of real estate consisting primarily of interests in 58 regional shopping centers. Macerich specializes in successful retail properties in many of the country’s most attractive and densely populated markets, with a significant presence in California, Arizona, Chicago and the greater New York metropolitan area. As of February 1, 2017, Macerich had a total market capitalization of approximately $10.5 billion and an enterprise value of approximately $14.9 billion. Macerich reported full-year 2015 revenues of approximately $1.3 billion with net income of approximately $488.0 million.
The loan sponsor acquired the property in 1996 for approximately $87.9 million ($164 per square foot). Since acquisition, the loan sponsor has indicated that it has invested approximately $51.9 million ($97 per square foot) in improvements to the property for a total cost basis in the property of $139.8 million ($261 per square foot). Additionally, the loan sponsor intends to invest approximately $2.5 million over the next two years in routine upgrades and maintenance.
The Property. Fresno Fashion Fair Mall is an approximately 957,944 square foot, super regional mall located in Fresno, California. Approximately 536,106 square feet of the Fresno Fashion Fair Mall serves as collateral for the Fresno Fashion Fair Mall Whole Loan. Fresno Fashion Fair Mall was originally developed in 1970 and was most recently renovated in 2003. The property is located on a 69.0 acre parcel and features four anchor spaces, six outparcel lots and approximately 351,699 square feet of in-line retail space. Since acquiring the property, the loan sponsor has undertaken two large scale redevelopment projects at the property. In 2003, the loan sponsor began an extensive interior remodeling at an estimated cost of approximately $11.7 million, aimed at repositioning and remerchandising the mall’s product offering. In addition, in 2006, the loan sponsor completed an expansion comprised of an outdoor village at an estimated cost of approximately $20.5 million. The 2006 expansion attracted well-known national brands such as Anthropologie (10,928 square feet), Michael Kors (2,225 square feet), Sephora (5,158 square feet), Cheesecake Factory (10,200 square feet) and GUESS (5,226 square feet). The property contains 5,930 surface parking spaces for an overall parking ratio of 6.19 spaces per 1,000 square feet.
THE INFORMATION IN THIS STRUCTURAL AND COLLATERAL TERM SHEET IS NOT COMPLETE AND MAY BE AMENDED PRIOR TO THE TIME OF SALE. THIS TERM SHEET IS NOT AN OFFER TO SELL THESE SECURITIES AND IT IS NOT A SOLICITATION OF AN OFFER TO BUY THESE SECURITIES IN ANY JURISDICTION WHERE THE OFFER OR SALE IS NOT PERMITTED.
| | 69 of 156 |
| Structural and Collateral Term Sheet | JPMCC 2017-JP5 |
| Fresno Fashion Fair Mall | |
The property is anchored by JCPenney, Macy’s Women & Home, Forever 21 and Macy’s Men’s & Children’s. JCPenney leases 153,769 square feet (28.7% of collateral net rentable area) through November 2017 and is the primary collateral anchor tenant. For the trailing 12-month period ending November 2016, JCPenney totaled $36.0 million in annual sales ($234 per square foot) and has outperformed the national average for equivalent JCPenney stores. JCPenney is an original tenant at the property and is not obligated to pay rent under its lease but the tenant is responsible for its proportionate share of tax and common area maintenance reimbursements. Macy’s Women & Home owns its underlying land and improvements and is not collateral for the Fresno Fashion Fair Mall Whole Loan. The Forever 21 anchor parcel was conveyed to an affiliate of the loan sponsor prior to origination and does not serve as collateral for the Fresno Fashion Fair Mall Whole Loan.
| Non-Owned Anchors | ||||
| Tenant | Ratings(1) Moody’s/S&P/Fitch | Net Rentable Area (SF) | Most Recent Sales(2) | Most Recent Sales PSF(2) |
| Macy’s Women & Home(3)(5) | Baa2 / BBB / BBB | 176,410 | $45,500,000 | $258 |
| Forever 21(3)(5) | NA / NA / NA | 148,614 | $10,914,534 | $73 |
| Macy’s Men’s & Children’s(4)(5) | Baa2 / BBB / BBB | 76,650 | $19,500,000 | $254 |
| (1) | Ratings provided are for the parent company of the entity listed in the “Tenant” field whether or not the parent company guarantees the lease. |
| (2) | Macy’s Women & Home and Macy’s Men’s & Children’s are based on the loan sponsor’s estimate, while Forever 21 is based on actual reported sales, each as of November 30, 2016. |
| (3) | The Macy’s Women & Home and Forever 21 anchor parcels are not part of the collateral for the Fresno Fashion Fair Mall Whole Loan. Macy’s Women & Home land and improvements are tenant-owned, while the Forever 21 land and improvements are owned by an affiliate of the loan sponsor and not held as collateral for the loan. |
| (4) | Please see “Redevelopment, Master Lease and Partial Releases” below for additional detail with respect to the Macy’s Men’s & Children’s ground leased space. |
| (5) | No base rent has been underwritten in connection with the Macy’s Women & Home, Forever 21 and Macy’s Men’s & Children’s spaces. |
As of January 31, 2017, the property was 89.3% leased by 108 tenants across 113 leases (93.1% including temporary tenants). The overall mall, inclusive of non-owned anchor tenants, is 93.9% occupied (96.1% including temporary tenants). The property’s tenant offering is broad with a range of higher-end and mass market tenants represented. The largest non-anchor collateral tenant, Victoria’s Secret, leases 14,530 square feet (2.7% of the collateral net rentable area) through January 2027. Victoria’s Secret contributes 3.5% of the total underwritten base rent and reported sales of $715 per square foot for the trailing 12-months ending November 30, 2016. The second largest non-anchor collateral tenant, Love Culture, leases 14,135 square feet (2.6% of the collateral net rentable area) through October 2020. Love Culture contributes 3.1% of the total underwritten base rent and reported sales of $126 per square foot for the trailing 12-months ending November 30, 2016. Outside of the four anchor tenants, no individual tenant occupies more than 2.7% of collateral net rentable area or accounts for more than 3.5% in underwritten base rent. In addition to its anchors, the property’s in-line tenants largely consist of national retailers such as Apple, Abercrombie & Fitch, American Eagle Outfitters and Foot Locker.
The property has generated more than $315.9 million in overall gross sales for the trailing 12-months ending November 30, 2016, with comparable in-line sales of approximately $699 per square foot and occupancy costs of 12.4%. The property has demonstrated consistent performance with overall mall occupancy having averaged 95.8% from 2007 to 2015, while net operating income has demonstrated steady year-over-year gains every year dating back to 2010. More recently, the property has experienced continued leasing momentum, with 37 new and renewal leases over the preceding 25-month period accounting for 100,578 square feet and approximately $6.3 million in underwritten base rent.
| Historical and Current Occupancy(1)(2)(3) | |||
| 2013 | 2014 | 2015 | Current(4) |
| 95.8% | 95.8% | 93.2% | 89.3% |
| (1) | Historical Occupancies are as of December 31 of each respective year. |
| (2) | Historical and Current Occupancy includes only permanent leases. |
| (3) | Historical and Current Occupancy including specialty tenants with leases over six months for 2013 to Current is 96.8%, 98.4%, 98.1% and 92.2%, respectively. |
| (4) | Current Occupancy is as of January 31, 2017 and includes 681 square feet of expansion space for M.A.C. and Macy’s. The lease has been executed and commences April 1, 2017. |
THE INFORMATION IN THIS STRUCTURAL AND COLLATERAL TERM SHEET IS NOT COMPLETE AND MAY BE AMENDED PRIOR TO THE TIME OF SALE. THIS TERM SHEET IS NOT AN OFFER TO SELL THESE SECURITIES AND IT IS NOT A SOLICITATION OF AN OFFER TO BUY THESE SECURITIES IN ANY JURISDICTION WHERE THE OFFER OR SALE IS NOT PERMITTED.
| | 70 of 156 |
| Structural and Collateral Term Sheet | JPMCC 2017-JP5 |
| Fresno Fashion Fair Mall | |
| Historical In-line Sales and Occupancy Costs(1)(2) | ||||
| 2013 | 2014 | 2015 | TTM(3) | |
| In-line Sales PSF(4) | $621 | $603 | $642 | $699 |
| Occupancy Costs(5) | 12.7% | 13.4% | 13.0% | 12.4% |
| (1) | Historical In-line Sales and Occupancy Costs are based on actual reported sales or estimates, in each case provided by the loan sponsor. |
| (2) | In-line Sales PSF and Occupancy Costs are for comparable tenants less than 10,000 square feet that reported full year sales and were provided by the loan sponsor. |
| (3) | TTM In-line Sales and Occupancy Costs are as of November 30, 2016. |
| (4) | In-line Sales PSF excluding Apple are $535, $524, $556 and $600 for 2013, 2014, 2015 and TTM, respectively. |
| (5) | Occupancy Costs excluding Apple are 14.9%, 15.4%, 15.0% and 14.5% for 2013, 2014, 2015 and TTM, respectively. |
Fresno Fashion Fair Mall benefits from its location approximately 5.5 miles north of downtown Fresno, California. The property is located approximately 5.8 miles east of Highway 99, the major regional highway through the Central Valley of California and is situated between Highway 41 and Highway 168. According to the California State Transportation Agency, the daily traffic count for Highway 168 was approximately 123,000 vehicles. Additionally, the property is located just over 1.0 mile west of California State University, which had a total student population of 24,403 as of the 2016 fall semester. According to the appraisal, the property benefits from regional and local accessibility, serving a 25-mile trade area covering nearly 1.0 million residents and spanning over 300,000 households. As of year-end 2015, the Fresno metropolitan statistical area is home to approximately 975,499 people with an estimated population within a five-, seven- and 25-mile radius of the property of approximately 400,022, 623,569 and 989,691 people, respectively. Additionally, estimated household income within a five-, seven- and 25-mile radius of the property is approximately $63,126, $66,212 and $66,870, respectively, with projected annual compound growth of 3.0% through 2020.
As of the second quarter of 2016, the Fresno retail market consisted of approximately 64.2 million square feet with an overall vacancy rate of 7.5% and average asking rents of $13.14 per square foot. According to the appraisal, the property’s primary and secondary competition consists of nine properties as demonstrated in the table below. The competitive properties in the primary trade area maintained a vacancy rate of approximately 9.0% and average sales ranging from $250 to $400 per square foot. The appraisal does not identify any new or proposed directly competitive properties in the area.
| Competitive Set Summary(1) | ||||||
| Property | Year Built / Renovated | Total GLA | Proximity (Miles) | Estimated Occupancy | Sales PSF | Anchor Tenants |
| Fresno Fashion Fair Mall(2) | 1970 / 2003 | 957,944 | NAP | 93.9% | $600 | Macy’s Women & Home, Macy’s Men’s and Children’s, Forever 21, JCPenney |
| Primary Competition | ||||||
| Fig Garden Village | 1956 / 2007 | 301,101 | 1.7 | 94.0% | $400 | Whole Foods Market, CVS |
| The Shops at River Park | 1997 / NAP | 677,252 | 3.5 | 93.0% | $325 | Macy’s, Edward’s Cinema, REI, Cost Plus |
| Marketplace At River Park | 1996 / NAP | 505,925 | 3.3 | 98.0% | $325 | JCPenney, Target, Best Buy, Buy Buy Baby, Marshalls, Old Navy |
| Villagio Shopping Center | 2002 / 2006 | 203,268 | 4.0 | 100.0% | NAV | Nordstrom Rack, Barnes & Noble, HomeGoods |
| Sierra Vista Mall | 1988 / 2007 | 697,980 | 4.4 | 80.0% | $250 | Sears, Kohl’s, Target, Sierra Vista Cinema |
| Secondary Competition | ||||||
| Burlington Plaza(3) | 1978 / NAP | 395,059 | 1.4 | 75.0% | NAV | Target, Smart & Final |
| Winepress S.C.(3) | 1987 / NAP | 310,650 | 4.0 | 79.0% | NAV | Target, Stein Mart, Anna’s Linens, Big 5 |
| Clovis Crossing | 2000 / 2005 | 446,643 | 5.8 | 98.0% | NAV | Walmart, Dick’s Sporting Goods, HomeGoods, Anna’s Linens |
| Marketplace at El Paseo | 2014 / NAP | 365,147 | 9.5 | 95.0% | NAV | Target, Ross Dress For Less, Old Navy, Marshalls, Burlington Coat Factory, Anna’s Linens, Petco |
| (1) | Based on the appraisal. |
| (2) | Total GLA for Fresno Fashion Fair Mall includes non-collateral space and Estimated Occupancy represents actual occupancy as of January 31, 2017, excluding temporary tenants. Sales PSF for the Fresno Fashion Fair Mall represents comparable in-line sales excluding Apple as of November 30, 2016. |
| (3) | Burlington Plaza and Winepress S.C. each have a vacant anchor tenant space. |
THE INFORMATION IN THIS STRUCTURAL AND COLLATERAL TERM SHEET IS NOT COMPLETE AND MAY BE AMENDED PRIOR TO THE TIME OF SALE. THIS TERM SHEET IS NOT AN OFFER TO SELL THESE SECURITIES AND IT IS NOT A SOLICITATION OF AN OFFER TO BUY THESE SECURITIES IN ANY JURISDICTION WHERE THE OFFER OR SALE IS NOT PERMITTED.
| | 71 of 156 |
| Structural and Collateral Term Sheet | JPMCC 2017-JP5 |
| Fresno Fashion Fair Mall | |
| Collateral Tenant Summary(1) | ||||||||
| Tenant | Ratings(2) Moody’s/S&P/Fitch | Net Rentable Area (SF) | % of Total NRA | Lease Expiration Date | Base Rent PSF | % of Total Base Rent | Most Recent Sales PSF(3) | Occupancy Cost(3) |
| JCPenney(4)(5) | B1 / B / B+ | 153,769 | 28.7% | 11/30/2017 | $0.00 | 0.0% | $234 | 0.7% |
| Victoria’s Secret | Ba1 / BB+ / BB+ | 14,530 | 2.7% | 1/31/2027 | $48.23 | 3.5% | $715 | 9.1% |
| Love Culture | NA / NA / NA | 14,135 | 2.6% | 10/31/2020 | $44.22 | 3.1% | $126 | 35.2% |
| Bank of the West | Aa3 / A- / A | 14,114 | 2.6% | 12/31/2018 | $43.86 | 3.1% | NAV | NAV |
| Anthropologie | NA / NA / NA | 10,928 | 2.0% | 10/31/2017 | $31.78 | 1.7% | $214 | 22.6% |
| Cheesecake Factory | NA / NA / NA | 10,200 | 1.9% | 1/31/2026 | $40.00 | 2.0% | $956 | 5.9% |
| Charming Charlie | NA / NA / NA | 9,563 | 1.8% | 1/31/2022 | $28.85 | 1.4% | $134 | 20.6% |
| New York & Company(6) | NA / NA / NA | 9,268 | 1.7% | MTM | $37.91 | 1.7% | $241 | 27.1% |
| American Eagle | NA / NA / NA | 8,549 | 1.6% | 3/31/2027 | $48.96 | 2.1% | $399 | 17.9% |
| Express | NA / NA / NA | 8,500 | 1.6% | 1/31/2026 | $36.39 | 1.5% | $456 | 14.0% |
| (1) | Based on the underwritten rent roll. |
| (2) | Ratings provided are for the parent company of the entity listed in the “Tenant” field whether or not the parent company guarantees the lease. |
| (3) | Most Recent Sales PSF and Occupancy Cost are based on actual reported sales or estimates, in each case provided by the loan sponsor as of November 30, 2016. Most Recent Sales PSF for American Eagle is based on 7,382 square feet. American Eagle expanded its space to 8,549 square feet under a lease extension effective January 31, 2017. |
| (4) | JCPenney is an original tenant at the property and is not obligated to pay rent under its lease. Under its current lease, JCPenney is responsible only for its proportionate share of CAM and tax reimbursements. |
| (5) | JCPenney’s lease will be terminated and the tenant will be released from its obligations under the lease in the event the borrower rejects an offer by the tenant to purchase its leased premises. See “Purchase Option” below for additional details. |
(6) New York & Company’s lease expired on January 31, 2017 and according to the loan sponsor is currently negotiating an extension.
| Lease Rollover Schedule(1)(2) | |||||||||||
| Year | Number of Leases Expiring | Net Rentable Area Expiring | % of NRA Expiring | Base Rent Expiring | % of Base Rent Expiring | Cumulative Net Rentable Area Expiring | Cumulative % of NRA Expiring | Cumulative Base Rent Expiring | Cumulative % of Base Rent Expiring | ||
| Vacant | NAP | 57,129 | 10.7% | NAP | NAP | 57,129 | 10.7% | NAP | NAP | ||
| 2017 & MTM | 21 | 217,960 | 40.7% | $3,510,874 | 17.5% | 275,089 | 51.3% | $3,510,874 | 17.5% | ||
| 2018 | 11 | 36,850 | 6.9% | 2,275,223 | 11.3% | 311,939 | 58.2% | $5,786,098 | 28.8% | ||
| 2019 | 13 | 27,178 | 5.1% | 1,805,402 | 9.0% | 339,117 | 63.3% | $7,591,500 | 37.8% | ||
| 2020 | 14 | 38,821 | 7.2% | 2,430,497 | 12.1% | 377,938 | 70.5% | $10,021,997 | 49.9% | ||
| 2021(3) | 10 | 19,901 | 3.7% | 1,365,909 | 6.8% | 397,839 | 74.2% | $11,387,906 | 56.7% | ||
| 2022 | 3 | 19,614 | 3.7% | 723,765 | 3.6% | 417,453 | 77.9% | $12,111,671 | 60.3% | ||
| 2023 | 10 | 25,011 | 4.7% | 1,627,802 | 8.1% | 442,464 | 82.5% | $13,739,473 | 68.4% | ||
| 2024(3) | 12 | 21,857 | 4.1% | 2,280,328 | 11.4% | 464,321 | 86.6% | $16,019,801 | 79.7% | ||
| 2025 | 7 | 13,250 | 2.5% | 1,017,615 | 5.1% | 477,571 | 89.1% | $17,037,417 | 84.8% | ||
| 2026 | 8 | 33,624 | 6.3% | 1,722,003 | 8.6% | 511,195 | 95.4% | $18,759,420 | 93.4% | ||
| 2027 | 3 | 24,911 | 4.6% | 1,210,831 | 6.0% | 536,106 | 100.0% | $19,970,251 | 99.4% | ||
| 2028 & Beyond(3) | 1 | 0 | 0.0% | 120,000 | 0.6% | 536,106 | 100.0% | $20,090,251 | 100.0% | ||
| Total | 113 | 536,106 | 100.0% | $20,090,251 | 100.0% | ||||||
| (1) | Based on the underwritten rent roll. |
| (2) | Lease Rollover Schedule excludes the square footage associated with the Macy’s Women & Home, Macy’s Men’s & Children’s and Forever 21 boxes. The Macy’s Women & Home land and improvements are tenant-owned with no attributable base rent, while the Forever 21 land and improvements are Macerich-owned and not collateral for the Fresno Fair Fashion Mall Whole Loan. While currently held as collateral for the loan, the Macy’s Men’s & Children’s anchor parcel is subject to free release by the borrower with no accompanying payment of a release price or prepayment of the Fresno Fashion Fair Mall Whole Loan. |
| (3) | Represents owned collateral only and excludes the square footage associated with BJ’s Restaurant (expiring in 2024), Chick-fil-A (expiring in 2035) and Fleming’s (expiring in 2021), for which the respective tenant owns its improvements but not the related land, which are ground leased from the borrower. Underwritten base rent attributable to the BJ’s Restaurant, Chick-fil-A and Fleming’s ground leases is approximately $343,850 per year and is included in each tenant’s respective expiration year. |
THE INFORMATION IN THIS STRUCTURAL AND COLLATERAL TERM SHEET IS NOT COMPLETE AND MAY BE AMENDED PRIOR TO THE TIME OF SALE. THIS TERM SHEET IS NOT AN OFFER TO SELL THESE SECURITIES AND IT IS NOT A SOLICITATION OF AN OFFER TO BUY THESE SECURITIES IN ANY JURISDICTION WHERE THE OFFER OR SALE IS NOT PERMITTED.
| | 72 of 156 |
| Structural and Collateral Term Sheet | JPMCC 2017-JP5 |
| Fresno Fashion Fair Mall | |
| Operating History and Underwritten Net Cash Flow | |||||||
| 2013 | 2014 | 2015 | 2016 | Underwritten | Per Square Foot | %(1) | |
| Rents in Place(2)(3) | $18,767,733 | $20,007,601 | $20,310,953 | $19,697,394 | $20,090,251 | $37.47 | 61.2% |
| Vacant Income | 0 | 0 | 0 | 0 | 3,006,429 | 5.61 | 9.2% |
| Gross Potential Rent | $18,767,733 | $20,007,601 | $20,310,953 | $19,697,394 | $23,096,680 | $43.08 | 70.4% |
| CAM Reimbursement | 8,043,147 | 8,289,431 | 8,666,014 | 8,153,840 | 7,630,454 | 14.23 | 23.2% |
| Real Estate | 1,646,215 | 1,693,458 | 1,809,238 | 1,927,790 | 1,714,044 | 3.20 | 5.2% |
| Percentage Rent | 455,674 | 281,211 | 295,450 | 344,621 | 246,508 | 0.46 | 0.8% |
| Other Rental Storage | 33,956 | 30,976 | 50,479 | 135,624 | 135,624 | 0.25 | 0.4% |
| Net Rental Income | $28,946,725 | $30,302,678 | $31,132,134 | $30,259,269 | $32,823,310 | $61.23 | 100.0% |
| (Vacancy/Credit Loss) | (205,366) | (244,149) | (454,317) | (218,480) | (3,006,429) | (5.61) | (9.2)-- |
| Other Income(4) | 2,846,161 | 2,735,663 | 3,150,590 | 3,546,418 | 3,546,418 | 6.62 | 10.8% |
| Effective Gross Income | $31,587,519 | $32,794,192 | $33,828,408 | $33,587,207 | $33,363,299 | $62.23 | 101.6% |
| Total Expenses | $6,451,070 | $6,442,883 | $5,653,406 | $5,947,307 | $6,507,414 | $12.14
| 19.5% |
| Net Operating Income | $25,136,449 | $26,351,309 | $28,175,002 | $27,639,900 | $26,855,885 | $50.09 | 80.5% |
| Total TI/LC, Capex/RR | 0 | 0 | 0 | 0 | 1,019,015 | 1.90 | 3.1% |
| Net Cash Flow | $25,136,449 | $26,351,309 | $28,175,002 | $27,639,900 | $25,836,869 | $48.19 | 77.4% |
| (1) | % column represents percent of Net Rental Income for all revenue lines and percent of Effective Gross Income for the remainder of fields. |
| (2) | Underwritten Rents in Place is inclusive of $480,704 in contractual rent steps underwritten through February 2018. |
| (3) | Non-collateral anchor tenants, Macy’s Women & Home, Forever 21 and Macy’s Men’s & Children’s, have not been included in Rents in Place. Underwritten Rents in Place is inclusive of approximately $343,850 attributable to the BJ’s Restaurant, Chick-fil-A and Fleming’s ground leases. |
| (4) | Other Income includes tenant marketing expense reimbursements and other rents, including $886,070 in underwritten rent associated with in-line temporary tenants and $1,410,094 in underwritten base rent associated with temporary kiosks and carts. |
Property Management. The property is managed by Macerich Property Management Company, LLC, an affiliate of the loan sponsor.
Escrows and Reserves. No upfront escrows were taken at origination.
Tax Escrows - The requirement for the borrower to make monthly deposits into the tax escrow is waived so long as (i) no Trigger Period (as defined below) has occurred and is continuing and (ii) the borrower delivers evidence reasonably satisfactory to the lender that all taxes have been timely paid.
Insurance Escrows - The requirement for the borrower to make monthly deposits into the insurance escrow is waived so long as (i) no Trigger Period has occurred and is continuing and (ii) the borrower provides satisfactory evidence that the property is insured under an acceptable blanket policy in accordance with the loan documents and that all premiums have been timely paid.
Replacement Reserves - The requirement for the borrower to make monthly deposits into the replacement reserve account is waived so long as no Trigger Period has occurred and is continuing. Following the occurrence and during the continuance of a Trigger Period, the borrower is required to deposit $7,670 per month (approximately $0.17 per square foot annually) for replacement reserves. The reserve is subject to a cap of $184,080 (approximately $0.34 per square foot).
TI/LC Reserves -The requirement for the borrower to make monthly deposits into the tenant improvements and leasing commissions reserve is waived so long as no Trigger Period has occurred and is continuing. Following the occurrence and during the continuance of a Trigger Period, the borrower is required to deposit approximately $46,368 per month (approximately $1.04 per square foot annually) for the tenant improvements and leasing commissions reserve. The TI/LC reserve is subject to a cap of $1,112,820 (approximately $2.08 per square foot). The borrower is also required to deposit any lease termination payments (regardless of the existence of a Trigger Period) into the tenant improvements and leasing commissions reserve.
THE INFORMATION IN THIS STRUCTURAL AND COLLATERAL TERM SHEET IS NOT COMPLETE AND MAY BE AMENDED PRIOR TO THE TIME OF SALE. THIS TERM SHEET IS NOT AN OFFER TO SELL THESE SECURITIES AND IT IS NOT A SOLICITATION OF AN OFFER TO BUY THESE SECURITIES IN ANY JURISDICTION WHERE THE OFFER OR SALE IS NOT PERMITTED.
| | 73 of 156 |
| Structural and Collateral Term Sheet | JPMCC 2017-JP5 |
| Fresno Fashion Fair Mall | |
Lockbox / Cash Management.The loan is structured with a CMA lockbox. Tenant direction letters were required to be sent to all tenants instructing them to deposit all rents and payments into the lockbox account controlled by the lender. The funds are then transferred to an account controlled by the borrower until the occurrence of a Trigger Period (as defined below). During the continuance of a Trigger Period, all rents will be swept weekly to a segregated cash management account and held in trust for the benefit of the lender. The lender will have a first priority security interest in the cash management account. Upon the occurrence and during the continuance of a Trigger Period until the occurrence of a Trigger Period Cure (as defined below), all excess cash after payment of debt service, required reserves and budgeted operating expenses will be held as additional security for the Fresno Fashion Fair Mall Whole Loan.
A “Trigger Period” means (i) the occurrence and continuance of an event of default or (ii) the occurrence of a DSCR Trigger Event.
A “DSCR Trigger Event” means the period commencing on the date when the debt service coverage ratio (as calculated in the loan documents) falls below 1.45x.
A “Trigger Period Cure” means with respect to the Trigger Period caused solely by (a) an event of default, the event of default has been cured (and no other event of default is continuing) or (b) a DSCR Trigger Event, the achievement of a debt service coverage ratio of 1.50x for two consecutive calendar quarters.
Redevelopment, Master Lease and Partial Releases.The borrower is permitted to engage in certain redevelopment activities at the property, which may include the modification and/or termination of the Macy’s Men’s and Children’s or JCPenney leases and the release of surface parking adjacent to the Forever 21 store and/or the Macy’s Men’s and Children’s store with the adjacent parking area, in each case without the payment of a release price or prepayment of the loan. In the event of any decrease in underwritten net operating income (as defined in the Fresno Fashion Fair Mall Whole Loan documents) as a result of the redevelopment activities, the borrower is required to enter into a master lease with the guarantor for all vacant space at the property. The rent under any such master lease is required to be in the amount of any decrease in underwritten net operating income. The loan documents provide that rent under such master lease will be reduced if and to the extent underwritten net operating income with respect to the property increases, as determined on a quarterly basis. With respect to any termination of the Macy’s Men’s & Children’s lease or the JCPenney lease, the master lease will terminate if: (x) the underwritten net operating income with respect to the property is restored to the greater of (i) pre-development levels and (ii) $27,000,000 and (y) the areas impacted by such redevelopment activities are 90% or more occupied with tenants in possession and paying rent. With respect to any modification of the Macy’s Men’s & Children’s lease and/or the JCPenney lease resulting in a decrease in underwritten net operating income, the master lease will terminate when the underwritten NOI is restored to the greater of (i) pre-modification levels and (ii) $27,000,000. No base rent has been underwritten in connection with the Macy’s Women & Home, JCPenney, Macy’s Men’s & Children’s and Forever 21 spaces. Please see “Description of the Mortgage Pool—Tenant Issues—Affiliated Leases”, “—Redevelopment, Renovation and Expansion” and “—Certain Terms of the Mortgage Loan.—Partial Releases”in the Preliminary Prospectus for additional information.
Purchase Option. JCPenney has the right to purchase its parcel under its lease. The borrower may nullify this purchase option, but the lease provides that a rejection of the offer to purchase will result in a termination of the lease and JCPenney being released from its obligations under the lease, as long as JCPenney pays all basic rents and other amounts due. The loan documents require that the borrower reject any offer by JCPenney to purchase the leased parcel.
THE INFORMATION IN THIS STRUCTURAL AND COLLATERAL TERM SHEET IS NOT COMPLETE AND MAY BE AMENDED PRIOR TO THE TIME OF SALE. THIS TERM SHEET IS NOT AN OFFER TO SELL THESE SECURITIES AND IT IS NOT A SOLICITATION OF AN OFFER TO BUY THESE SECURITIES IN ANY JURISDICTION WHERE THE OFFER OR SALE IS NOT PERMITTED.
| | 74 of 156 |
| Structural and Collateral Term Sheet | JPMCC 2017-JP5 |
[THIS PAGE INTENTIONALLY LEFT BLANK]
THE INFORMATION IN THIS STRUCTURAL AND COLLATERAL TERM SHEET IS NOT COMPLETE AND MAY BE AMENDED PRIOR TO THE TIME OF SALE. THIS TERM SHEET IS NOT AN OFFER TO SELL THESE SECURITIES AND IT IS NOT A SOLICITATION OF AN OFFER TO BUY THESE SECURITIES IN ANY JURISDICTION WHERE THE OFFER OR SALE IS NOT PERMITTED.
| | 75 of 156 |
| Structural and Collateral Term Sheet | JPMCC 2017-JP5 | |
| Riverway | ||
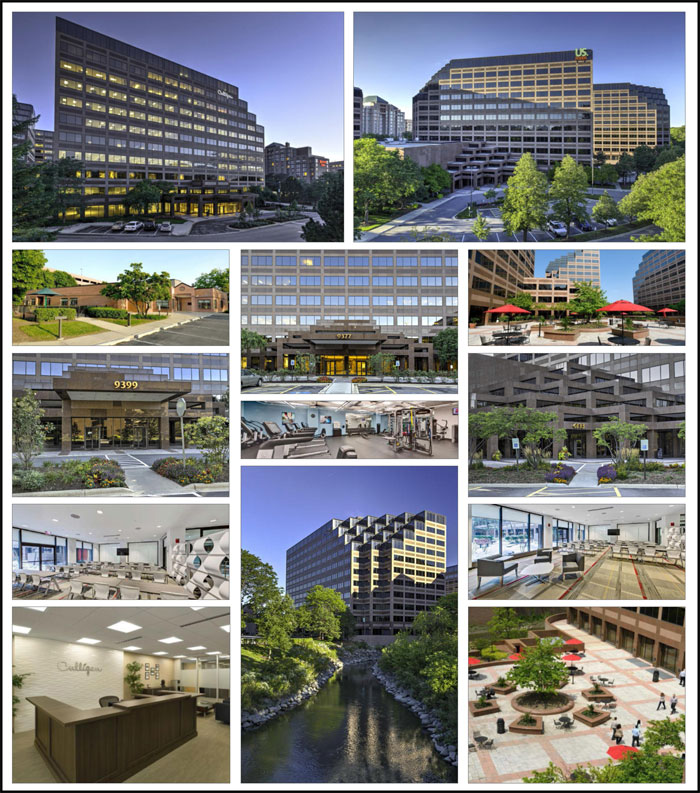
THE INFORMATION IN THIS STRUCTURAL AND COLLATERAL TERM SHEET IS NOT COMPLETE AND MAY BE AMENDED PRIOR TO THE TIME OF SALE. THIS TERM SHEET IS NOT AN OFFER TO SELL THESE SECURITIES AND IT IS NOT A SOLICITATION OF AN OFFER TO BUY THESE SECURITIES IN ANY JURISDICTION WHERE THE OFFER OR SALE IS NOT PERMITTED.
| | 76 of 156 |
| Structural and Collateral Term Sheet | JPMCC 2017-JP5 | |
| Riverway | ||
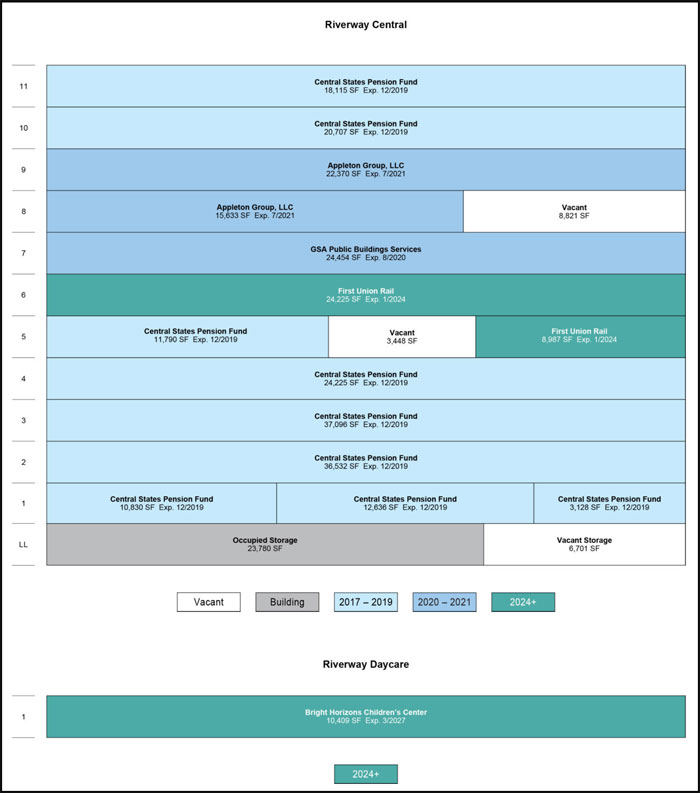
THE INFORMATION IN THIS STRUCTURAL AND COLLATERAL TERM SHEET IS NOT COMPLETE AND MAY BE AMENDED PRIOR TO THE TIME OF SALE. THIS TERM SHEET IS NOT AN OFFER TO SELL THESE SECURITIES AND IT IS NOT A SOLICITATION OF AN OFFER TO BUY THESE SECURITIES IN ANY JURISDICTION WHERE THE OFFER OR SALE IS NOT PERMITTED.
| | 77 of 156 |
| Structural and Collateral Term Sheet | JPMCC 2017-JP5 | |
| Riverway | ||
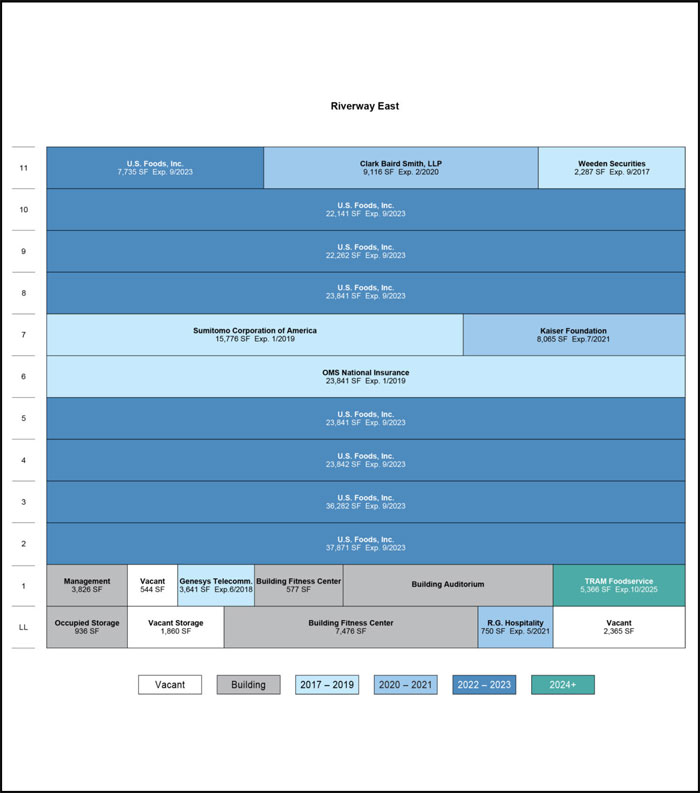
THE INFORMATION IN THIS STRUCTURAL AND COLLATERAL TERM SHEET IS NOT COMPLETE AND MAY BE AMENDED PRIOR TO THE TIME OF SALE. THIS TERM SHEET IS NOT AN OFFER TO SELL THESE SECURITIES AND IT IS NOT A SOLICITATION OF AN OFFER TO BUY THESE SECURITIES IN ANY JURISDICTION WHERE THE OFFER OR SALE IS NOT PERMITTED.
| | 78 of 156 |
| Structural and Collateral Term Sheet | JPMCC 2017-JP5 | |
| Riverway | ||
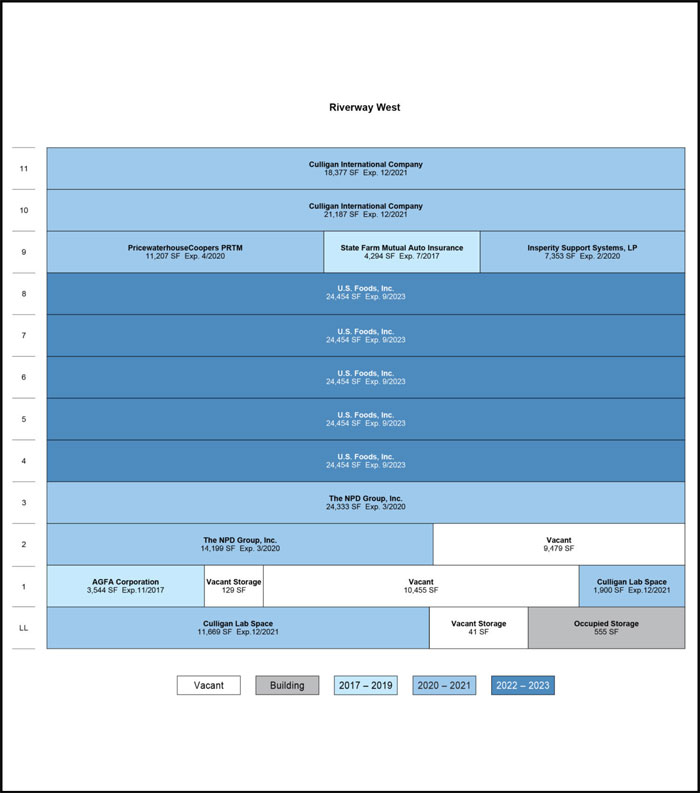
THE INFORMATION IN THIS STRUCTURAL AND COLLATERAL TERM SHEET IS NOT COMPLETE AND MAY BE AMENDED PRIOR TO THE TIME OF SALE. THIS TERM SHEET IS NOT AN OFFER TO SELL THESE SECURITIES AND IT IS NOT A SOLICITATION OF AN OFFER TO BUY THESE SECURITIES IN ANY JURISDICTION WHERE THE OFFER OR SALE IS NOT PERMITTED.
| | 79 of 156 |
| Structural and Collateral Term Sheet | JPMCC 2017-JP5 | |
| Riverway | ||
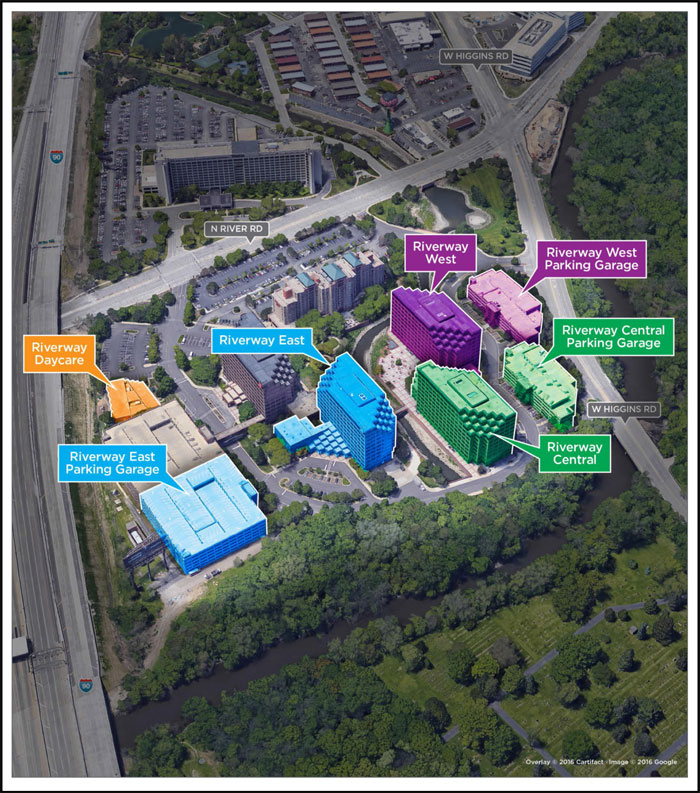
THE INFORMATION IN THIS STRUCTURAL AND COLLATERAL TERM SHEET IS NOT COMPLETE AND MAY BE AMENDED PRIOR TO THE TIME OF SALE. THIS TERM SHEET IS NOT AN OFFER TO SELL THESE SECURITIES AND IT IS NOT A SOLICITATION OF AN OFFER TO BUY THESE SECURITIES IN ANY JURISDICTION WHERE THE OFFER OR SALE IS NOT PERMITTED.
| | 80 of 156 |
| Structural and Collateral Term Sheet | JPMCC 2017-JP5 | |
| Riverway | ||
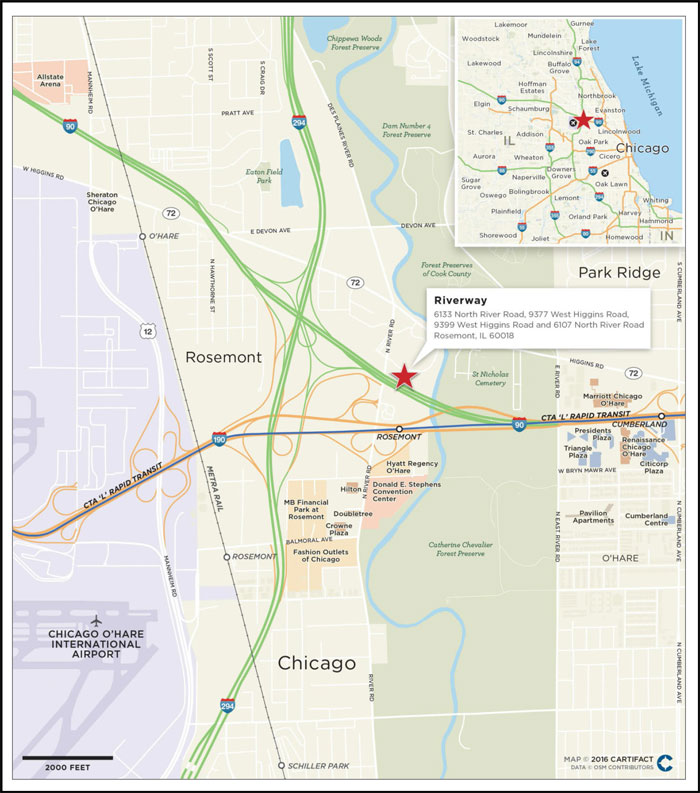
THE INFORMATION IN THIS STRUCTURAL AND COLLATERAL TERM SHEET IS NOT COMPLETE AND MAY BE AMENDED PRIOR TO THE TIME OF SALE. THIS TERM SHEET IS NOT AN OFFER TO SELL THESE SECURITIES AND IT IS NOT A SOLICITATION OF AN OFFER TO BUY THESE SECURITIES IN ANY JURISDICTION WHERE THE OFFER OR SALE IS NOT PERMITTED.
| | 81 of 156 |
| Structural and Collateral Term Sheet | JPMCC 2017-JP5 | |
| Riverway | ||
| Mortgage Loan Information | Property Information | |||
| Mortgage Loan Seller: | JPMCB | Single Asset / Portfolio: | Single Asset | |
| Original Principal Balance(1): | $65,000,000 | Title: | Fee | |
| Cut-off Date Principal Balance(1): | $64,763,123 | Property Type - Subtype: | Office – Suburban | |
| % of Pool by IPB: | 5.9% | Net Rentable Area (SF): | 869,120 | |
| Loan Purpose: | Acquisition | Location: | Rosemont, IL | |
| Borrower: | Adventus US Realty #12 LP | Year Built / Renovated: | 1988, 1994 / 2016 | |
| Sponsor: | Adventus Holdings LP | Occupancy: | 95.0% | |
| Interest Rate: | 4.96000% | Occupancy Date: | 9/30/2016 | |
| Note Date: | 11/2/2016 | Number of Tenants: | 24 | |
| Maturity Date: | 12/1/2026 | 2013 NOI(2): | $14,484,517 | |
| Interest-only Period: | None | 2014 NOI(2): | $11,696,602 | |
| Original Term: | 120 months | 2015 NOI: | $12,200,715 | |
| Original Amortization: | 360 months | TTM NOI (as of 8/2016)(3): | $12,272,361 | |
| Amortization Type: | Balloon | UW Economic Occupancy: | 90.0% | |
| Call Protection: | L(27),Def(90),O(3) | UW Revenues: | $25,871,039 | |
| Lockbox: | CMA | UW Expenses: | $12,713,001 | |
| Additional Debt: | Yes | UW NOI(3): | $13,158,038 | |
| Additional Debt Balance: | $62,770,411 | UW NCF: | $11,678,973 | |
| Additional Debt Type: | Pari Passu | Appraised Value / Per SF: | $176,200,000 / $203 | |
| Appraisal Date: | 9/7/2016 | |||
| Escrows and Reserves(4) | Financial Information(1) | ||||||||
| Initial | Monthly | Initial Cap | Cut-off Date Loan / SF: | $147 | |||||
| Taxes: | $360,173 | $500,000 | N/A | Maturity Date Loan / SF: | $121 | ||||
| Insurance: | $0 | Springing | N/A | Cut-off Date LTV: | 72.4% | ||||
| Replacement Reserves: | $14,485 | $14,485 | $869,100 | Maturity Date LTV: | 59.6% | ||||
| TI/LC: | $108,640 | $108,640 | N/A | UW NCF DSCR: | 1.42x | ||||
| Other: | $7,338,122 | $0 | N/A | UW NOI Debt Yield: | 10.3% | ||||
| Sources and Uses | |||||||||
| Sources | Proceeds | % of Total | Uses | Proceeds | % of Total | ||||
| Mortgage Loan(1) | $128,000,000 | 70.4% | Purchase Price | $173,000,000 | 95.2% | ||||
| Sponsor Equity | 53,779,281 | 29.6 | Upfront Reserves | 7,821,420 | 4.3 | ||||
| Closing Costs | 957,861 | 0.5 | |||||||
| Total Sources | $181,779,281 | 100.0% | Total Uses | $181,779,281 | 100.0% | ||||
| (1) | The Riverway loan is part of a whole loan evidenced by twopari passu notes with an aggregate outstanding principal balance as of the Cut-off Date of approximately $127.5 million. The Financial Information presented in the chart above reflects the Cut-off Date balance of the approximately $127.5 million Riverway Whole Loan, as defined in “The Loan” below. |
| (2) | The decrease in 2014 NOI from 2013 is primarily due to rent abatements for certain tenants, including Appleton and Culligan, of approximately $414,000. |
| (3) | UW NOI is higher than TTM NOI due to future contractual rent steps through September 2017 totaling $366,501 and the expiration of free rent associated with certain tenants. |
| (4) | For a full description of Escrows and Reserves, please refer to“Escrows and Reserves”below. |
The Loan. The Riverway loan is secured by a first mortgage lien on the borrower’s fee interest in a four-building property totaling 869,120 square feet located in Rosemont, Illinois. The property consists of three office buildings totaling 858,711 square feet and one 10,409 square foot daycare center. The whole loan has an outstanding principal balance as of the Cut-off Date of approximately $127.5 million (the “Riverway Whole Loan”) and is comprised of twopari passu notes, each as described below. Note A-2 was contributed to the JPMCC 2016-JP4 trust and is the controlling note under the related co-lender agreement, the rights of which will be exercised by the related trustee (or, prior to the occurrence and continuance of a control termination event under the related pooling and servicing agreement, by the related directing certificateholder). However, the JPMCC 2017-JP5 Trust will be entitled, under certaincircumstances, to be consulted with respect to certain major decisions. The Riverway Whole Loan has a 10-year term and will amortize on a 30-year schedule.
THE INFORMATION IN THIS STRUCTURAL AND COLLATERAL TERM SHEET IS NOT COMPLETE AND MAY BE AMENDED PRIOR TO THE TIME OF SALE. THIS TERM SHEET IS NOT AN OFFER TO SELL THESE SECURITIES AND IT IS NOT A SOLICITATION OF AN OFFER TO BUY THESE SECURITIES IN ANY JURISDICTION WHERE THE OFFER OR SALE IS NOT PERMITTED.
| | 82 of 156 |
| Structural and Collateral Term Sheet | JPMCC 2017-JP5 | |
| Riverway | ||
| Whole Loan Summary | ||||
| Original Balance | Cut-off Date Balance | Note Holder | Controlling Piece | |
| A-1 | $65,000,000 | $64,763,123 | JPMCC 2017-JP5 | No |
| A-2 | 63,000,000 | 62,770,411 | JPMCC 2016-JP4 | Yes |
| Total | $128,000,000 | $127,533,534 | ||
The Borrower. The borrowing entity for the Riverway Whole Loan is Adventus US Realty #12 LP, a Delaware limited partnership and special purpose entity.
The Loan Sponsor.The loan sponsor and nonrecourse carve-out guarantor is Adventus Holdings LP, a Delaware limited partnership. Adventus Holdings LP is an affiliate of Adventus Realty Trust, a private real estate investment trust formed in 2012. Based in Vancouver, Canada, Adventus Realty Trust invests in commercial real estate properties in suburban office markets outside of Chicago, Illinois and Atlanta, Georgia. The company targets properties with strong credit-worthy tenants and long term leases in place and attempts to add value through lease-up of vacant space, maximizing lease renewal rates upon maturity and strict management of operating expenses.
The Properties. Riverway is a Class A office complex consisting of three multi-tenant office buildings (“Riverway Central”, “Riverway East” and “Riverway West”, and, together, the “Riverway Office Properties”) totaling 858,711 square feet, a daycare center (“Riverway Daycare”) totaling 10,409 square feet, one owner-user office building and a Marriott Suites hotel. Riverway Central, Riverway East, Riverway West and Riverway Daycare (together, the “Riverway Properties”) serve as collateral for the Riverway Whole Loan. The Riverway Office Properties are located on a 14.1 acre parcel in Rosemont, Illinois and were constructed in 1988 and renovated in 2016. The Riverway Daycare was built in 1994. As of September 30, 2016, the Riverway Properties were 95.0% leased to 24 tenants. The three largest tenants are U.S. Foods, Inc. (“U.S. Foods”) (NYSE: USFD), which occupies space at Riverway East and Riverway West, Central States Pension Fund (“Central States”) and Culligan International Company (“Culligan”), which occupy 36.9%, 21.9% and 6.1% of the net rentable area, respectively. For additional information on the properties, see below.
| Property Summary | |||||||||
Property Name | Location | Net Rentable Area (SF) | Year Built / Renovated | Class | Number of Tenants(1) | Appraised Value | Underwritten Net Cash Flow | % of Underwritten Net Cash Flow | |
| Riverway Central | Rosemont, IL | 313,478 | 1988 / 2016 | A | 5 | $62,200,000 | $4,480,153 | 38.4 | % |
| Riverway East | Rosemont, IL | 284,241 | 1988 / 2016 | A | 12 | 57,100,000 | 3,599,812 | 30.8 | |
| Riverway West | Rosemont, IL | 260,992 | 1988 / 2016 | A | 10 | 55,600,000 | 3,574,098 | 30.6 | |
| Riverway Daycare(2) | Rosemont, IL | 10,409 | 1994 | NAP | 1 | 1,300,000 | 24,910 | 0.2 | |
| Total | 869,120 | 28 | $176,200,000 | $11,678,973 | 100.0 | % | |||
| (1) | The total number of tenants does not equal 24 because certain tenants at the Riverway Office Properties have spaces at multiple buildings. |
| (2) | The Riverway Daycare building is 100% leased to Bright Horizons under a lease that expires in March 2027. Bright Horizons also has the right to terminate its lease annually on each anniversary of the lease commencement date. |
| Historical and Current Occupancy(1) | ||||
| Property | 2013 | 2014 | 2015 | Current(2) |
| Riverway Central | 91.2% | 86.5% | 93.9% | 93.9% |
| Riverway East | 91.2% | 91.6% | 90.5% | 98.3% |
| Riverway West | 98.2% | 92.9% | 95.9% | 92.3% |
| Riverway Daycare | 100.0% | 100.0% | 100.0% | 100.0% |
| Weighted Average(3) | 93.4% | 90.2% | 93.5% | 95.0% |
| (1) | Historical Occupancies are as of December 31 of each respective year. |
| (2) | Current Occupancy is as of September 30, 2016. |
| (3) | Weighted Average based on individual property square footage. |
THE INFORMATION IN THIS STRUCTURAL AND COLLATERAL TERM SHEET IS NOT COMPLETE AND MAY BE AMENDED PRIOR TO THE TIME OF SALE. THIS TERM SHEET IS NOT AN OFFER TO SELL THESE SECURITIES AND IT IS NOT A SOLICITATION OF AN OFFER TO BUY THESE SECURITIES IN ANY JURISDICTION WHERE THE OFFER OR SALE IS NOT PERMITTED.
| | 83 of 156 |
| Structural and Collateral Term Sheet | JPMCC 2017-JP5 | |
| Riverway | ||
Riverway Central. Riverway Central is a 313,478 square foot, 11-story Class A office tower located in Rosemont, Illinois. The property includes 1,027 garage and 32 surface parking spaces (3.38 spaces per 1,000 square feet of net rentable area). As of September 30, 2016, the property was 93.9% occupied by five tenants. The largest tenant at Riverway Central is Central States, one of the country’s largest defined benefit pension plans, which first leased its space in May 2003 and currently leases 60.6% of the net rentable area at Riverway Central through December 2019 (excluding two five-year extension options) across seven floors. Established in 1955, Central States is a health management firm that provides Teamsters and their families pension, health and welfare benefits. The second largest tenant at Riverway Central is Appleton GRP LLC (“Appleton”), which first leased its space in May 2003 and currently leases 12.1% of the net rentable area at Riverway Central through July 2021 across two floors. Headquartered at the property, Appleton manufactures electrical products for a number of industries including the automotive, beverage, chemical and energy industries. The company was founded in 1903 and is an affiliate of the Emerson Electric Company (NYSE: EMR) (rated A2/A by Moody’s and S&P, respectively), a Fortune 500 company. The third largest tenant at Riverway Central is GSA Public Building Services (“GSA”) (rated Aaa/AA+/AAA by Moody’s, S&P and Fitch, respectively), which currently leases 10.6% of the net rentable area at Riverway Central through August 2, 2020. GSA’s space serves as office space for the Transportation Security Administration (“TSA”). Established by the Aviation and Transportation Security Act of 2001, the TSA is tasked with protecting the United States’ transportation systems.
Riverway East. Riverway East is a 284,241 square foot, 11-story Class A office tower located in Rosemont, Illinois. The property includes 925 garage spaces and 41 surface parking spaces (3.40 spaces per 1,000 square feet of net rentable area). As of September 30, 2016, the property was 98.3% occupied by 12 tenants. The largest tenant at Riverway East is U.S. Foods, which first leased its space in April 2006 and currently leases 69.7% of the net rentable area at Riverway East through September 2023 across eight floors. Headquartered at the property, U.S. Foods is one of the largest food distributors in the United States. It offers a range of fresh, frozen and dry food and non-food products, serving independently owned single and multi-unit restaurants, regional restaurant concepts, national restaurant chains, hospitals, nursing homes, hotels and motels, country clubs, government and military organizations, colleges and universities and retail locations. The second largest tenant at Riverway East is OMS National Insurance Company (“OMS”), which first leased its space in April 1996 and currently leases 8.6% of the net rentable area at Riverway East through January 2019. Headquartered at the property, OMS is an insurance company that provides risk management programs and insurance services to the medical industry. The third largest tenant at Riverway East is Sumitomo Corporation of America (“Sumitomo”), which first leased its space in October 2002 and currently leases 5.6% of the net rentable area at Riverway East through January 2019. Sumitomo produces steel, metal, machinery, power, chemicals, electronics, mineral resources and energy products for the automotive, electronics, energy, communications, transportation and container sectors. The company was founded in 1952 and its U.S. headquarters are located in New York, New York.
Riverway West. Riverway West is a 260,992 square foot, 11-story Class A office tower located in Rosemont, Illinois. The property includes 861 garage and 14 surface parking spaces (3.35 spaces per 1,000 square feet of net rentable area). As of September 30, 2016, the property was 92.3% occupied by 10 tenants. The property’s largest tenant is U.S. Foods, which first leased its space in January 2005 and currently leases 46.8% of the net rentable area at Riverway West through September 2023 across five floors. The second largest tenant is Culligan, which currently leases 20.4% of the net rentable area at Riverway West through December 2021 across three floors. The building serves as the headquarters for the tenant. Founded in 1936, Culligan manufactures and distributes water filtration and treatment systems for residential, office, commercial and industrial applications. The third largest tenant is The NPD Group Inc. (“NPD”), which first leased its space in September 1994 and currently leases 14.8% of the net rentable area at Riverway West through March 2020 across two floors. NPD provides market information, tracking, analytic and advisory services to clients in the Americas, Europe and the Asia-Pacific.
The Riverway Properties are located in Rosemont, Illinois in the O’Hare Area submarket. O’Hare International Airport is located approximately three miles away and the Chicago central business district is approximately 15 miles away. Primary access to the area is provided by the Kennedy Expressway, a major arterial that crosses the Chicago area in a northwest/southeast direction. Public transportation is provided by Chicago Transit Authority and Pace Suburban Bus Service, which provide access to the Chicago central business district. According to the appraisal, the trade area consisting of a five-mile radius contains approximately 154,544 people with a median household income of $60,131. As of the second quarter of 2016, the O’Hare Area submarket had an office inventory of approximately 14.1 million square feet across 106 buildings with an average occupancy rate of 74.7% and average asking rent of $24.22 per square foot. The appraisal identified eight comparable office properties that serve as a competitive set for the Riverway Office Properties. The office properties in the competitive set range from approximately 121,117 square feet to 818,000 square feet and were constructed between 1980 and 2010. The competitive set has a weighted average occupancy rate of 90.9% and an average asking rent of $18.49.
THE INFORMATION IN THIS STRUCTURAL AND COLLATERAL TERM SHEET IS NOT COMPLETE AND MAY BE AMENDED PRIOR TO THE TIME OF SALE. THIS TERM SHEET IS NOT AN OFFER TO SELL THESE SECURITIES AND IT IS NOT A SOLICITATION OF AN OFFER TO BUY THESE SECURITIES IN ANY JURISDICTION WHERE THE OFFER OR SALE IS NOT PERMITTED.
| | 84 of 156 |
| Structural and Collateral Term Sheet | JPMCC 2017-JP5 | |
| Riverway | ||
| Tenant Summary(1) | |||||||
| Tenant | Property | Ratings(2)Moody’s/S&P/Fitch | Net Rentable Area (SF) | % of Total NRA | Base Rent | Base Rent PSF(3) | Lease Expiration Date |
| U.S. Foods(2)(4) | Riverway East / West | B1 / BB- / NA | 320,341 | 36.9% | $5,998,551 | $18.73 | 9/30/2023 |
| Central States | Riverway Central | NA / NA / NA | 190,077 | 21.9% | $3,983,311 | $20.96 | 12/31/2019 |
| Culligan(5) | Riverway West | NA / NA / NA | 53,133 | 6.1% | $883,728 | $16.63 | 12/31/2021 |
| NPD | Riverway West | NA / NA / NA | 38,917 | 4.5% | $696,656 | $17.90 | 3/31/2020 |
| Appleton | Riverway Central | A2 / A / NA | 38,003 | 4.4% | $723,857 | $19.05 | 7/31/2021 |
| GSA | Riverway Central | Aaa / AA+ / AAA | 33,216 | 3.8% | $950,370 | $28.61 | 8/2/2020 |
| First Union Rail | Riverway Central | Aa2 / AA- / AA | 33,212 | 3.8% | $612,761 | $18.45 | 1/31/2024 |
| OMS | Riverway East | NA / NA / NA | 24,521 | 2.8% | $489,420 | $19.96 | 1/31/2019 |
| Sumitomo(6) | Riverway East | A1 / A- / NA | 15,776 | 1.8% | $331,296 | $21.00 | 1/31/2019 |
| PricewaterhouseCoopers | Riverway West | NA / NA / NA | 11,207 | 1.3% | $224,140 | $20.00 | 4/30/2020 |
| (1) | Based on the underwritten rent roll. |
| (2) | Ratings provided are for the parent company of the entity listed in the “Tenant” field whether or not the parent company guarantees the lease. In the case of U.S. Foods, the Moody’s credit rating provided is based on the long term rating. The Moody’s senior unsecured debt rating was B3 as of February 27, 2017. |
| (3) | Base Rent PSF represents the weighted average for each tenant in the case of tenants with various leases containing different rents per square foot. |
| (4) | U.S. Foods leases 198,071 square feet of net rentable area at Riverway East and 122,270 square feet of net rentable area at Riverway West. |
| (5) | Culligan has a one-time right to terminate its lease as of December 31, 2019, with notice on or prior to March 31, 2019 and the payment of a termination fee. |
| (6) | Sumitomo has a one-time right to terminate its lease as of January 31, 2018, with notice on or prior to April 30, 2017 and the payment of a termination fee. |
| Lease Rollover Schedule(1) | |||||||||||||
| Year | Number of Leases Expiring | Net Rentable Area Expiring | % of NRA Expiring | Base Rent Expiring | % of Base Rent Expiring | Cumulative Net Rentable Area Expiring | Cumulative % of NRA Expiring | Cumulative Base Rent Expiring | Cumulative % of Base Rent Expiring | ||||
| Vacant | NAP | 43,843 | 5.0% | NAP | NAP | 43,843 | 5.0% | NAP | NAP | ||||
| 2017 & MTM(2) | 5 | 10,125 | 1.2 | $206,196 | 1.3% | 53,968 | 6.2% | $206,196 | 1.3% | ||||
| 2018 | 3 | 3,811 | 0.4 | 106,261 | 0.7 | 57,779 | 6.6% | $312,457 | 2.0% | ||||
| 2019 | 3 | 230,374 | 26.5 | 4,804,027 | 30.4 | 288,153 | 33.2% | $5,116,484 | 32.4% | ||||
| 2020 | 5 | 99,809 | 11.5 | 2,193,406 | 13.9 | 387,962 | 44.6% | $7,309,890 | 46.3% | ||||
| 2021 | 4 | 99,951 | 11.5 | 1,770,570 | 11.2 | 487,913 | 56.1% | $9,080,460 | 57.5% | ||||
| 2022 | 0 | 0 | 0.0 | 0 | 0.0 | 487,913 | 56.1% | $9,080,460 | 57.5% | ||||
| 2023 | 1 | 320,341 | 36.9 | 5,998,551 | 38.0 | 808,254 | 93.0% | $15,079,011 | 95.5% | ||||
| 2024 | 1 | 33,212 | 3.8 | 612,761 | 3.9 | 841,466 | 96.8% | $15,691,772 | 99.4% | ||||
| 2025 | 1 | 5,366 | 0.6 | 40,737 | 0.3 | 846,832 | 97.4% | $15,732,509 | 99.6% | ||||
| 2026 | 0 | 0 | 0.0 | 0 | 0.0 | 846,832 | 97.4% | $15,732,509 | 99.6% | ||||
| 2027 | 1 | 10,409 | 1.2 | 60,000 | 0.4 | 857,241 | 98.6% | $15,792,509 | 100.0% | ||||
| 2028 & Beyond(3) | 0 | 11,879 | 1.4 | 0 | 0.0 | 869,120 | 100.0% | $15,792,509 | 100.0% | ||||
| Total | 24 | 869,120 | 100.0% | $15,792,509 | 100.0% | ||||||||
| (1) | Based on the underwritten rent roll. |
| (2) | 2017 & MTM includes United Parcel Service and Federal Express Corporation. |
| (3) | 2028 & Beyond includes an 8,053 square foot fitness center and 3,826 square foot management office located at Riverway East. |
THE INFORMATION IN THIS STRUCTURAL AND COLLATERAL TERM SHEET IS NOT COMPLETE AND MAY BE AMENDED PRIOR TO THE TIME OF SALE. THIS TERM SHEET IS NOT AN OFFER TO SELL THESE SECURITIES AND IT IS NOT A SOLICITATION OF AN OFFER TO BUY THESE SECURITIES IN ANY JURISDICTION WHERE THE OFFER OR SALE IS NOT PERMITTED.
| | 85 of 156 |
| Structural and Collateral Term Sheet | JPMCC 2017-JP5 | |
| Riverway | ||
| Operating History and Underwritten Net Cash Flow | ||||||||
| 2013 | 2014 | 2015 | TTM(1) | Underwritten | Per Square Foot | %(2) | ||
| Rents in Place(3) | $14,744,668 | $14,359,825 | $14,636,219 | $14,596,191 | $15,792,506 | $18.17 | 55.2 | % |
| Vacant Income | 0 | 0 | 0 | 0 | 789,550 | 0.91 | 2.8 | |
| Gross Potential Rent | $14,744,668 | $14,359,825 | $14,636,219 | $14,596,191 | $16,582,056 | $19.08 | 58.0 | % |
| Total Reimbursements | 10,814,946 | 9,855,267 | 10,473,991 | 11,583,580 | 12,024,877 | 13.84 | 42.0 | |
| Net Rental Income | $25,559,614 | $24,215,092 | $25,110,210 | $26,179,771 | $28,606,934 | $32.91 | 100.0 | % |
| (Vacancy/Credit Loss) | (150,651) | (968,767) | (458,594) | (1,464,547) | (2,860,693) | (3.29) | (10.0) | |
| Other Income(4) | 80,499 | 102,965 | 43,096 | 51,555 | 124,800 | 0.14 | 0.4 | |
| Effective Gross Income | $25,489,463 | $23,349,290 | $24,694,712 | $24,766,779 | $25,871,039 | $29.77 | 90.4 | % |
| Total Expenses | $11,004,945 | $11,652,689 | $12,493,997 | $12,494,418 | $12,713,001 | $14.63 | 49.1 | % |
| Net Operating Income | $14,484,517 | $11,696,602 | $12,200,715 | $12,272,361 | $13,158,038 | $15.14 | 50.9 | % |
| Total TI/LC, Capex/RR | 0 | 0 | 0 | 0 | 1,479,065 | 1.70 | 5.7 | |
| Net Cash Flow | $14,484,517 | $11,696,602 | $12,200,715 | $12,272,361 | $11,678,973 | $13.44 | 45.1 | % |
| (1) | TTM historical financials are based on the trailing 12-month period ending on August 31, 2016. |
| (2) | % column represents percent of Net Rental Income for all revenue lines and represents percent of Effective Gross Income for the remainder of fields. |
| (3) | The increase in Underwritten Rents in Place over TTM Rents in Place is due to contractual rent steps taken through September 2017 and the expiration of free rent associated with certain tenants. |
| (4) | Other Income consists primarily of auditorium fees, fitness center fees and sundry revenues. |
Property Management. The property is managed by Cushman & Wakefield U.S., Inc.
Escrows and Reserves. At origination, the borrower deposited into escrow approximately $7.0 million for outstanding tenant improvements and leasing commissions associated with three tenants, $360,173 for tax reserves, $271,509 for free rent reserves associated with one tenant, $108,640 for future tenant improvements and leasing commissions, $81,825 for immediate repairs and $14,485 for replacement reserves.
Tax Escrows- On a monthly basis, the borrower is required to escrow 1/12 of the annual estimated tax payments, which currently equates to approximately $500,000.
Insurance Escrows- The requirement for the borrower to make monthly deposits to the insurance escrow is waived so long as (i) no event of default exists and (ii) the borrower provides satisfactory evidence that the property is insured under an acceptable blanket policy in accordance with the loan documents.
Replacement Reserves- On a monthly basis, the borrower is required to escrow $14,485 ($0.20 per square foot annually) for replacement reserves. The reserve is subject to a cap of $869,100 (approximately $1.00 per square foot).
TI/LC Reserves- On a monthly basis, the borrower is required to deposit $108,640 ($1.50 per square foot annually) for tenant improvements and leasing commissions reserves. The reserve is not subject to a cap. In addition, upon the occurrence and continuance of either a Tenant Trigger Event (as defined below) or a Downgrade Trigger Event (as defined below), all excess cash flow after payment of debt service, required reserves and operating expenses is required to be deposited into the reserve.
Lockbox / Cash Management.The Riverway Whole Loan is structured with a CMA lockbox. The borrower and manager were required at origination to deliver tenant direction letters instructing all tenants to deposit rents into a lockbox account controlled by the lender. All funds in the lockbox account will be swept daily into the borrower’s operating account unless a Trigger Period (as defined below) is continuing, in which event such funds will be swept each business day into a cash management account controlled by the lender and disbursed on each payment date in accordance with the loan documents. Upon the occurrence and during the continuance of a Trigger Period, all funds deposited into the cash management account after payment of debt service, required reserves and budgeted operating expenses will be deposited into the excess cash flow subaccount and held as additional security for the loan, except in the event of a Tenant Trigger Event or a Downgrade Trigger Event, in which case the excess cash flow is required to be deposited into the tenant improvement and leasing commission reserve as described above.
THE INFORMATION IN THIS STRUCTURAL AND COLLATERAL TERM SHEET IS NOT COMPLETE AND MAY BE AMENDED PRIOR TO THE TIME OF SALE. THIS TERM SHEET IS NOT AN OFFER TO SELL THESE SECURITIES AND IT IS NOT A SOLICITATION OF AN OFFER TO BUY THESE SECURITIES IN ANY JURISDICTION WHERE THE OFFER OR SALE IS NOT PERMITTED.
| | 86 of 156 |
| Structural and Collateral Term Sheet | JPMCC 2017-JP5 | |
| Riverway | ||
A “Trigger Period” commences upon the occurrence of (i) an event of default, (ii) the bankruptcy or insolvency of the borrower or the property manager, (iii) the debt service coverage ratio (as calculated in the loan documents) falling below 1.15x based on a trailing three-month basis (a “DSCR Trigger Event”), (iv) Central States or U.S. Foods (or any replacement tenant(s) (a) terminating, vacating or giving notice of its intention to terminate its lease or vacate its space or failing to give notice of its intent to renew its lease(s) or (b) becoming insolvent or bankrupt (either (a) or (b), a “Tenant Trigger Event”) or (v) U.S. Foods’ long-term credit rating being downgraded to or below “B2” or “B” by S&P, Moody’s or Fitch (the current Moody’s and S&P long-term ratings are B1 and BB-, respectively) or the withdrawal of U.S. Foods’ credit rating (unless U.S. Foods’ rating is withdrawn solely as the result of no longer having public debt necessary to enable such rating and it maintains a net worth of at least $1 billion) (each event of this clause (iv), a “Downgrade Trigger Event”).
The borrower will have the right two times in the aggregate (except with respect to a DSCR Trigger Event, a Tenant Trigger Event or a Downgrade Trigger Event, which may be cured an unlimited number of times) during the term of the loan to cure a Trigger Period as follows: if a Trigger Period exists solely by reason of (i) an event of default, the acceptance of a cure by the lender of the applicable event of default (in its sole and absolute discretion), (ii) a bankruptcy or insolvency of a property manager, the replacement of such manager with a qualified manager under a management agreement in accordance with the loan documents, (iii) a DSCR Trigger Event, the achievement of a debt service coverage ratio for two consecutive quarters of at least 1.20x on a trailing three-month basis, (iv) a Tenant Trigger Event, the applicable space(s) is re-leased in accordance with the loan documents (which includes a requirement that annualized gross income (as defined in the loan documents) be not less than $24,895,000 (as reasonably determined by the lender), and (v) a Downgrade Trigger Event, the reinstatement or increasing of the applicable rating as required by the loan documents (or, in the case of a Downgrade Trigger Event triggered by the net worth of U.S. Foods, such net worth being at least $1,000,000,000) or the borrower has deposited $9,800,000 in the aggregate into the TI/LC reserve account from excess cash flow as described above.
Partial Releases.None.
THE INFORMATION IN THIS STRUCTURAL AND COLLATERAL TERM SHEET IS NOT COMPLETE AND MAY BE AMENDED PRIOR TO THE TIME OF SALE. THIS TERM SHEET IS NOT AN OFFER TO SELL THESE SECURITIES AND IT IS NOT A SOLICITATION OF AN OFFER TO BUY THESE SECURITIES IN ANY JURISDICTION WHERE THE OFFER OR SALE IS NOT PERMITTED.
| | 87 of 156 |
| Structural and Collateral Term Sheet | JPMCC 2017-JP5 | |
| 55 Hawthorne | ||

THE INFORMATION IN THIS STRUCTURAL AND COLLATERAL TERM SHEET IS NOT COMPLETE AND MAY BE AMENDED PRIOR TO THE TIME OF SALE. THIS TERM SHEET IS NOT AN OFFER TO SELL THESE SECURITIES AND IT IS NOT A SOLICITATION OF AN OFFER TO BUY THESE SECURITIES IN ANY JURISDICTION WHERE THE OFFER OR SALE IS NOT PERMITTED.
| | 88 of 156 |
| Structural and Collateral Term Sheet | JPMCC 2017-JP5 | |
| 55 Hawthorne | ||
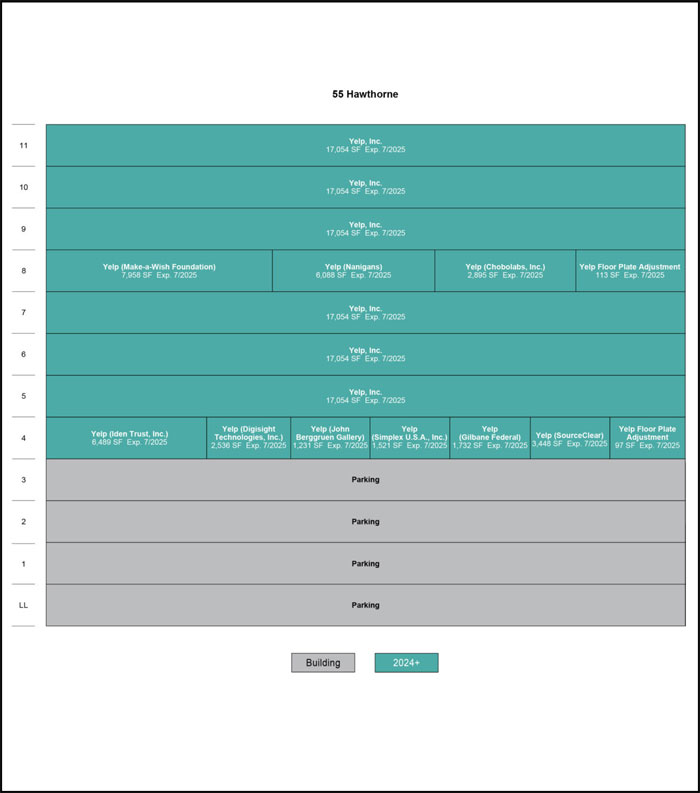
THE INFORMATION IN THIS STRUCTURAL AND COLLATERAL TERM SHEET IS NOT COMPLETE AND MAY BE AMENDED PRIOR TO THE TIME OF SALE. THIS TERM SHEET IS NOT AN OFFER TO SELL THESE SECURITIES AND IT IS NOT A SOLICITATION OF AN OFFER TO BUY THESE SECURITIES IN ANY JURISDICTION WHERE THE OFFER OR SALE IS NOT PERMITTED.
| | 89 of 156 |
| Structural and Collateral Term Sheet | JPMCC 2017-JP5 | |
| 55 Hawthorne | ||

THE INFORMATION IN THIS STRUCTURAL AND COLLATERAL TERM SHEET IS NOT COMPLETE AND MAY BE AMENDED PRIOR TO THE TIME OF SALE. THIS TERM SHEET IS NOT AN OFFER TO SELL THESE SECURITIES AND IT IS NOT A SOLICITATION OF AN OFFER TO BUY THESE SECURITIES IN ANY JURISDICTION WHERE THE OFFER OR SALE IS NOT PERMITTED.
| | 90 of 156 |
| Structural and Collateral Term Sheet | JPMCC 2017-JP5 | |
| 55 Hawthorne | ||
| Mortgage Loan Information | Property Information | |||
| Mortgage Loan Seller: | JPMCB | Single Asset / Portfolio: | Single Asset | |
| Original Principal Balance: | $61,500,000 | Title: | Fee | |
| Cut-off Date Principal Balance: | $61,500,000 | Property Type - Subtype: | Office – CBD | |
| % of Pool by IPB: | 5.6% | Net Rentable Area (SF): | 136,432 | |
| Loan Purpose: | Acquisition | Location: | San Francisco, CA | |
| Borrower: | 55 Hawthorne (SF) Owner, LLC | Year Built / Renovated: | 1970 / 2016 | |
| Sponsor: | CIM Urban Income Investments, L.P. | Occupancy: | 100.0% | |
| Interest Rate: | 4.12300% | Occupancy Date: | 3/1/2017 | |
| Note Date: | 12/22/2016 | Number of Tenants(1): | 1 | |
| Maturity Date: | 1/1/2027 | 2013 NOI(2) | N/A | |
| Interest-only Period: | 120 months | 2014 NOI(2): | N/A | |
| Original Term: | 120 months | 2015 NOI(3): | $1,375,274 | |
| Original Amortization: | None | TTM NOI (as of 11/2016)(3)(4): | $3,860,771 | |
| Amortization Type: | Interest Only | UW Economic Occupancy: | 94.6% | |
| Call Protection: | L(26),Def(87),O(7) | UW Revenues: | $10,472,045 | |
| Lockbox: | CMA | UW Expenses: | $3,220,717 | |
| Additional Debt: | N/A | UW NOI(4): | $7,251,328 | |
| Additional Debt Balance: | N/A | UW NCF: | $6,698,692 | |
| Additional Debt Type: | N/A | Appraised Value / Per SF: | $123,000,000 / $902 | |
| Appraised Dark Value / Per SF(5): | $97,200,000 / $712 | |||
| Appraisal Date: | 12/9/2016 | |||
| Escrows and Reserves(6) | Financial Information | |||||||
| Initial | Monthly | Initial Cap | Cut-off Date Loan / SF: | $451 | ||||
| Taxes: | $0 | Springing | N/A | Maturity Date Loan / SF: | $451 | |||
| Insurance: | $0 | Springing | N/A | Cut-off Date LTV: | 50.0% | |||
| Replacement Reserves: | $0 | $0 | N/A | Maturity Date LTV: | 50.0% | |||
| TI/LC: | $0 | Springing | N/A | UW NCF DSCR: | 2.61x | |||
| Other: | $2,531,359 | $0 | N/A | UW NOI Debt Yield: | 11.8% | |||
| Sources and Uses | ||||||
| Sources | Proceeds | % of Total | Uses | Proceeds | % of Total | |
| Sponsor Equity | $64,541,239 | 51.2% | Purchase Price | $123,000,000 | 97.6% | |
| Mortgage Loan | 61,500,000 | 48.8% | Upfront Reserves | 2,531,359 | 2.0 | |
| Closing Costs | 509,880 | 0.4 | ||||
| Total Sources | $126,041,239 | 100.0% | Total Uses | $126,041,239 | 100.0% | |
| (1) | There are currently 10 tenants that occupy the property. Yelp, the largest tenant, is contractually obligated to lease the spaces that are being vacated by the other current tenants at the property as their leases expire throughout 2017. Yelp is expected to lease the entire property by October 2017. One tenant, Make-a-Wish Foundation, has one five-year renewal option remaining; however, the loan sponsor does not expect them to exercise the renewal option, which would increase their rent from $32.00 per square foot to market value, which the appraisal concluded to be $72.00 per square foot. In the event Make-a-Wish Foundation elects to renew its lease, Yelp will have the option to lease such space upon the expiration of the renewal term. |
| (2) | 2013 NOI and 2014 NOI figures are not available as the previous owner acquired the property in July 2014 and historical cash flows were not provided at the time of acquisition. Additionally, between 2014 and 2015, the property underwent an approximately $26.2 million ($192 per square foot) renovation. |
| (3) | The increase in TTM NOI from 2015 NOI is predominantly a result of Yelp taking occupancy of the fifth and sixth floors in February 2016, representing approximately $2.2 million in annual base rent. |
| (4) | The increase in UW NOI from TTM NOI is driven by Yelp’s contractual obligation to occupy tenant spaces as they are vacated. Yelp is expected to occupy 100.0% of the property by October 2017. As of the Cut-off Date, Yelp occupies 75.0% of the net rentable area at an underwritten base rent of $65.78 per square foot. The remaining 25.0% of the net rentable area that Yelp is expected to occupy will be leased at $72.00 per square foot, which represents a premium of approximately 47.0% over the weighted average current rent paid by existing tenants. |
| (5) | The appraisal concluded to a “Hypothetical Go Dark Value” of $97.2 million, which assumes the property was 100% vacant and factors in market rent, downtime, expenses and lease-up costs. |
| (6) | For a full description of Escrows and Reserves, please refer to“Escrows and Reserves”below. |
THE INFORMATION IN THIS STRUCTURAL AND COLLATERAL TERM SHEET IS NOT COMPLETE AND MAY BE AMENDED PRIOR TO THE TIME OF SALE. THIS TERM SHEET IS NOT AN OFFER TO SELL THESE SECURITIES AND IT IS NOT A SOLICITATION OF AN OFFER TO BUY THESE SECURITIES IN ANY JURISDICTION WHERE THE OFFER OR SALE IS NOT PERMITTED.
| | 91 of 156 |
| Structural and Collateral Term Sheet | JPMCC 2017-JP5 | |
| 55 Hawthorne | ||
The Loan.The 55 Hawthorne loan has an outstanding principal balance as of the Cut-off Date of $61.5 million and is secured by a first mortgage lien on the borrower’s fee interest in an 11-story, 136,432 square foot, Class A/B office building located in San Francisco, California. The loan has a 10-year term and is interest-only for the entire term.
The Borrower. The borrowing entity for the 55 Hawthorne loan is 55 Hawthorne (SF) Owner, LLC, a Delaware limited liability company and special purpose entity.
The Loan Sponsor.The loan sponsor and nonrecourse carve-out guarantor for the 55 Hawthorne loan is CIM Urban Income Investments, L.P., an affiliate of CIM Group, LLC (“CIM Group”). CIM Group is a full service urban real estate and infrastructure fund manager with approximately $19.2 billion of assets under management and over 190 properties. Since its founding in 1994, CIM Group has been a process and research-driven investor that evaluates risk through the fundamental analysis of the long-term drivers in communities.
The prior owner acquired the property in July 2014 and, according to the loan sponsor, invested approximately $26.2 million ($192 per square foot) in capital improvements, including approximately $12.7 million ($93 per square foot) by Yelp. Renovations included a complete interior renovation and upgrades to modernize building systems as well as the construction of a new rooftop deck for Yelp. Additionally, according to the loan sponsor, the loan sponsor and Yelp are expected to contribute $1.8 million and $3.1 million, respectively, towards the build-out of Yelp’s expansion premises, for a combined investment of approximately $4.9 million ($36 per square foot).
The Property.The 55 Hawthorne property is an 11-story, 136,432 square foot, Class A/B office building located in the San Francisco central business district. The property was originally constructed in 1970 and is situated on approximately 0.6 acres. The property features views of downtown San Francisco and the San Francisco-Oakland Bay Bridge as well as a recently renovated rooftop terrace. Additionally, the property contains 272 on-site parking spaces resulting in a parking ratio of approximately 1.99 spaces per 1,000 square feet. The parking spaces are located on floors one, two and three as well as two sublevels and are operated by a third party provider. Pedestrian access to the property is provided via Tehama Street to the north and Hawthorne Street to the south, and vehicle access is provided via both streets.
As of March 1, 2017, the property was 100.0% leased to 10 tenants. The largest tenant, Yelp, Inc. (“Yelp”) currently leases 75.0% of the net rentable area through July 2025 and has occupied its space since February 2015. Except as noted below with respect to the Make-a-Wish Foundation renewal option, Yelp is contractually obligated to lease the space vacated by the other current tenants by October 2017. Upon taking over the vacated spaces, Yelp is expected to occupy 100.0% of the net rentable area at the property through July 2025. Yelp (NYSE: YELP) operates a platform that connects people with local businesses primarily in the United States. Yelp’s platform covers various local business categories, including restaurants, shopping, beauty and fitness, arts, entertainment and events, home and local services, health, nightlife, travel and hotel, auto and other categories. The company was founded in 2004 and is currently headquartered in San Francisco, approximately two blocks northwest of the property. Yelp has continued to expand its business and as of September 30, 2016, employed 4,353 employees, which represents an approximately 19.0% increase as compared to September 30, 2015. Yelp is obligated under its lease to occupy new space as it becomes vacant and, according to the loan sponsor, has invested approximately $12.7 million into the property. Additionally, according to the loan sponsor, Yelp is expected to invest approximately $3.1 million into the build out of new space it is expected to occupy as existing tenants vacate. Currently, one tenant, Make-a-Wish Foundation has one remaining five-year renewal option. However, the loan sponsor does not expect the tenant to exercise the renewal option, which would increase its rent from $32.00 per square foot to market value, which the appraisal has concluded to be $72.00 per square foot. In the event Make-a-Wish Foundation elects to renew its lease, Yelp will have the option to lease such space upon the expiration of the renewal term.
The 55 Hawthorne property is located in the central business district of San Francisco, California, and many demand drivers lie within walking distance of the property, including the Union Square shopping district, Treasure Island, Westfield San Francisco Centre shopping mall, several notable museums and AT&T Park, home of the San Francisco Giants Major League Baseball team. The property also benefits from its proximity to major public transportation lines, including the Montgomery BART train station, which is located six blocks northwest and Interstate Highway 80 and the San Francisco–Oakland Bay Bridge, located approximately three blocks south east. Additionally, the property is located approximately 14.2 miles north of San Francisco International Airport and approximately 10.5 miles west of the Oakland central business district. The property is expected to benefit from the completion of the Transbay Transit Center, a mass-transit hub that is expected to connect eight Bay Area counties through 11 transportation systems including the BART, AC Transit, Amtrak, Caltrain and California’s planned high speed rail system. According to the Transbay Joint Powers Authority, the project, which is located approximately 0.5 miles northeast of the property, is expected to include 3,500 residential units, 59,000 square feet of ground-level retail space and an approximately 1.4 million square foot office tower. Additionally, the project is expected to feature City Park, a 5.4-acre rooftop public park with a variety of activities and amenities including an open air amphitheater, gardens, open grass areas and restaurant and café. The Transbay Transit Center will be constructed in two phases, with the first phase expected to be complete in the fall of 2017. The first phase will include construction of the above-ground portion of the
THE INFORMATION IN THIS STRUCTURAL AND COLLATERAL TERM SHEET IS NOT COMPLETE AND MAY BE AMENDED PRIOR TO THE TIME OF SALE. THIS TERM SHEET IS NOT AN OFFER TO SELL THESE SECURITIES AND IT IS NOT A SOLICITATION OF AN OFFER TO BUY THESE SECURITIES IN ANY JURISDICTION WHERE THE OFFER OR SALE IS NOT PERMITTED.
| | 92 of 156 |
| Structural and Collateral Term Sheet | JPMCC 2017-JP5 | |
| 55 Hawthorne | ||
new Transit Center, the below-grade rail levels and the bus ramp connecting the Transit Center to the San Francisco–Oakland Bay Bridge. A timeline has not been provided yet for construction of phase two, which includes the downtown rail extension.
According to the appraisal, the property is located in the South Financial District office submarket of the greater San Francisco – Redwood City – South San Francisco market. According to CoStar, as of year-end 2016, the Class A office submarket consisted of 50 buildings totaling approximately 21.5 million square feet of office space with an overall vacancy rate of 5.4% and average asking rents of $60.90 per square foot. According to CoStar, as of year-end 2016, the Class B office submarket consisted of 55 buildings totaling approximately 5.0 million square feet of office space with an overall vacancy rate of 4.6% and average asking rents of $54.66 per square foot. The appraisal identified seven comparable office leases in the San Francisco market ranging in size from approximately 51,895 square feet to 118,000 square feet. Base rents for the comparable leases ranged from $68.00 per square foot to $80.00 per square foot, with a weighted average of approximately $72.75 per square foot, which is in line with the property.
Historical and Current Occupancy(1) | |||
| 2013 | 2014 | 2015 | Current(2) |
| N/A | N/A | 98.8% | 100.0% |
| (1) | Historical Occupancies are as of December 31 of each respective year. 2013 and 2014 occupancies were not made available by the prior owner. |
| (2) | Current Occupancy is as of March 1, 2017. There are currently 10 tenants that occupy the property. Yelp, the largest tenant, is contractually obligated to lease the spaces that are being vacated by the other current tenants at the property as their leases expire throughout 2017. One tenant, Make-a-Wish Foundation, has one five-year renewal option remaining. However, the loan sponsor does not expect the tenant to exercise the renewal option, which would increase its rent from $32.00 per square foot to market value, which the appraisal has concluded to be $72.00 per square foot. In the event Make-a-Wish Foundation elects to renew its lease, Yelp will have the option to lease such space upon the expiration of the renewal term |
| Tenant Summary(1) | |||||||
| Tenant | Ratings Moody’s/S&P/Fitch | Net Rentable Area (SF) | % of Total NRA | Base Rent PSF | % of Total Base Rent | Lease Expiration Date | |
| Yelp(2) | NA / NA / NA | 136,432 | 100.0% | $67.78 | 100.0% | 7/31/2025 | |
| (1) | Based on the underwritten rent roll dated November 1, 2016, assuming that Yelp takes occupancy of the spaces leased by the other current tenants at the property by October 2017. |
| (2) | Yelp’s lease contains one, five-year renewal option and a partial termination option with respect to two entire floors on or after January 31, 2021 and one additional floor on or after January 31, 2023 (provided, in each case, that it leases at least 65.0% of total rentable area at the property). If Yelp chooses to partially terminate its lease, it is responsible for a termination fee equal to three months of rent at the time of termination and the unamortized tenant improvements and leasing commissions outstanding. With respect to each termination option, Yelp must provide notice at least 12 months prior to each termination date. |
THE INFORMATION IN THIS STRUCTURAL AND COLLATERAL TERM SHEET IS NOT COMPLETE AND MAY BE AMENDED PRIOR TO THE TIME OF SALE. THIS TERM SHEET IS NOT AN OFFER TO SELL THESE SECURITIES AND IT IS NOT A SOLICITATION OF AN OFFER TO BUY THESE SECURITIES IN ANY JURISDICTION WHERE THE OFFER OR SALE IS NOT PERMITTED.
| | 93 of 156 |
| Structural and Collateral Term Sheet | JPMCC 2017-JP5 | |
| 55 Hawthorne | ||
| Lease Rollover Schedule(1) | |||||||||||||||||
| Year | Number of Leases Expiring | Net Rentable Area Expiring | % of NRA Expiring | Base Rent Expiring | % of Base Rent Expiring | Cumulative Net Rentable Area Expiring | Cumulative % of NRA Expiring | Cumulative Base Rent Expiring | Cumulative % of Base Rent Expiring | ||||||||
| Vacant | NAP | 0 | 0.0% | NAP | NAP | 0 | 0.0% | NAP | NAP | ||||||||
| 2017 & MTM | 0 | 0 | 0.0% | $0 | 0.0% | 0 | 0.0% | $0 | 0.0% | ||||||||
| 2018 | 0 | 0 | 0.0% | 0 | 0.0% | 0 | 0.0% | $0 | 0.0% | ||||||||
| 2019 | 0 | 0 | 0.0% | 0 | 0.0% | 0 | 0.0% | $0 | 0.0% | ||||||||
| 2020 | 0 | 0 | 0.0% | 0 | 0.0% | 0 | 0.0% | $0 | 0.0% | ||||||||
| 2021 | 0 | 0 | 0.0% | 0 | 0.0% | 0 | 0.0% | $0 | 0.0% | ||||||||
| 2022 | 0 | 0 | 0.0% | 0 | 0.0% | 0 | 0.0% | $0 | 0.0% | ||||||||
| 2023 | 0 | 0 | 0.0% | 0 | 0.0% | 0 | 0.0% | $0 | 0.0% | ||||||||
| 2024 | 0 | 0 | 0.0% | 0 | 0.0% | 0 | 0.0% | $0 | 0.0% | ||||||||
| 2025 | 1 | 136,432 | 100.0% | 9,248,039 | 100.0% | 136,432 | 100.0% | $9,248,039 | 100.0% | ||||||||
| 2026 | 0 | 0 | 0.0% | 0 | 0.0% | 136,432 | 100.0% | $9,248,039 | 100.0% | ||||||||
| 2027 | 0 | 0 | 0.0% | 0 | 0.0% | 136,432 | 100.0% | $9,248,039 | 100.0% | ||||||||
| 2028 & Beyond | 0 | 0 | 0.0% | 0 | 0.0% | 136,432 | 100.0% | $9,248,039 | 100.0% | ||||||||
| Total | 1 | 136,432 | 100.0% | $9,248,039 | 100.0% | ||||||||||||
| (1) | Based on the underwritten rent roll dated November 1, 2016. |
| Operating History and Underwritten Net Cash Flow(1) | |||||
| 2015 | TTM(2) | Underwritten | Per Square Foot | %(3) | |
| Rents in Place(4) | $4,789,701 | $7,561,694 | $9,248,039 | $67.78 | 83.5% |
| Vacant Income | 0 | 0 | 0 | 0.00 | 0.0% |
| Gross Potential Rent | $4,789,701 | $7,561,694 | $9,248,039 | $67.78 | 83.5% |
| CAM Reimbursements | 332,126 | 272,064 | 589,034 | 4.32 | 5.3% |
| Parking Income | 1,144,796 | 1,069,744 | 1,232,742 | 9.04 | 11.1% |
| Net Rental Income | $6,266,623 | $8,903,502 | $11,069,815 | $81.14 | 100.0% |
| (Vacancy/Credit Loss)(5) | (2,486,370) | (2,480,951) | (597,770) | (4.38) | (5.4)-- |
| Other Income | 143,027 | 55,866 | 0 | 0.00 | 0.0% |
| Effective Gross Income | $3,923,280 | $6,478,417 | $10,472,045 | $76.76 | 94.6% |
| Total Expenses | $2,548,006 | $2,617,646 | $3,220,717 | $23.61 | 30.8% |
| Net Operating Income(6) | $1,375,274 | $3,860,771 | $7,251,328 | $53.15 | 69.2% |
| Total TI/LC, Capex/RR | 0 | 0 | 552,636 | 4.05 | 5.3% |
| Net Cash Flow | $1,375,274 | $3,860,771 | $6,698,692 | $49.10 | 64.0% |
| (1) | Historical 2013 and 2014 Net Operating Income figures are not available as the prior owner acquired the property in July 2014 and historical cash flows were not provided at the time of acquisition. Additionally, between 2014 and 2015, the property underwent an approximately $26.2 million ($192 per square foot) renovation. |
| (2) | TTM column represents the trailing 12-month period ending November 30, 2016. |
| (3) | % column represents percent of Net Rental Income for all revenue lines and represents percent of Effective Gross Income for the remainder of the fields. |
| (4) | The increase in TTM Rents in Place from 2015 Rents in Place is predominantly a result of Yelp taking occupancy of the fifth and sixth floors in February 2016, representing approximately $2.2 million in annual base rent. |
| (5) | Vacancy/Credit Loss reflects free rent and concessions given to Yelp related to the leasing of its original space. |
| (6) | The increase in Underwritten Net Operating Income from TTM Net Operating Income is driven by Yelp’s contractual obligation to occupy tenant spaces as they vacate. Yelp is expected to occupy 100.0% of the property by October 2017. As of the Cut-off Date, Yelp occupies 75.0% of the net rentable area at an underwritten base rent of $65.78 per square foot. The remaining 25.0% of the net rentable area that Yelp is expected to occupy will be leased at $72.00 per square foot, which represents a premium of approximately 47.0% over the weighted average current rent paid by existing tenants. |
THE INFORMATION IN THIS STRUCTURAL AND COLLATERAL TERM SHEET IS NOT COMPLETE AND MAY BE AMENDED PRIOR TO THE TIME OF SALE. THIS TERM SHEET IS NOT AN OFFER TO SELL THESE SECURITIES AND IT IS NOT A SOLICITATION OF AN OFFER TO BUY THESE SECURITIES IN ANY JURISDICTION WHERE THE OFFER OR SALE IS NOT PERMITTED.
| | 94 of 156 |
| Structural and Collateral Term Sheet | JPMCC 2017-JP5 | |
| 55 Hawthorne | ||
Property Management. The property is managed by CIM Management, Inc., a subsidiary of CIM Group, and Harvest Properties, Inc., a third party management company.
Escrows and Reserves. At origination, the borrower deposited into escrow $1,484,875 for outstanding tenant improvements and leasing commissions and $1,046,484 for outstanding free rent, in each case related to Yelp.
Tax Escrows -The requirement for the borrower to make deposits to the real estate tax escrow is waived so long as no event of default has occurred and is continuing and the borrower provides satisfactory evidence that all property taxes have been paid within 10 business days after the date when due.
Insurance Escrows- The requirement for the borrower to make deposits to the insurance escrow is waived so long as no event of default has occurred and is continuing and the borrower provides satisfactory evidence that the property is insured as part of a blanket policy in accordance with the loan documents.
TI/LC Reserves - The requirement for the borrower to make deposits to the tenant improvement and leasing commissions reserve is waived so long as a Cash Sweep Event (as defined below) caused by a Tenant Trigger (as defined below) has not occurred. During a Cash Sweep Event caused by a Tenant Trigger, all excess cash flow shall be deposited and held with the lender in accordance with the loan documents.
Lockbox / Cash Management. The loan is structured with a CMA lockbox. The borrower was required at origination to deliver tenant direction letters instructing all tenants to deposit rents into a lockbox account controlled by the lender. All funds in the lockbox account will be swept each business day into the borrower’s operating account, unless a Cash Sweep Event is continuing, in which event such funds will be swept each business day into a cash management account controlled by the lender and disbursed on each payment date in accordance with the loan documents. Upon the occurrence and during the continuance of a Cash Sweep Event, all funds deposited into the cash management account after payment of debt service, required reserves and budgeted operating expenses are required to be deposited into the excess cash flow subaccount and held as additional security for the loan, except in the event of a Tenant Trigger, in which case the excess cash flow is required to be deposited into the tenant improvement and leasing commission reserve as described above.
A “Cash Sweep Event” means the occurrence of (i) an event of default, (ii) the bankruptcy or insolvency action of the borrower or the property manager, unless (a) with respect to a bankruptcy or insolvency action of a property manager that is not affiliated with the borrower, the property manager is replaced in accordance with the loan agreement within 60 days or such bankruptcy filing is discharged or dismissed within 30 days of the date of filing or (b) with respect to a bankruptcy or insolvency action of an affiliated property manager, the property manager is replaced in accordance with the loan agreement within 15 days or (iii) a Tenant Trigger.
A “Tenant Trigger” means any of the following: (i) Yelp delivers a written notice of its intention not to renew the lease, (ii) Yelp delivers a written notice of its intention to terminate its lease for a portion of the building that results in a vacancy of more than 2.5 floors of its leased space, provided that any such portion of terminated space has not been re-leased to a replacement tenant in accordance with the loan documents, (iii) Yelp’s failure to renew its lease on or prior to the date required for such renewal, (iv) Yelp goes dark, vacates or abandons a portion of its space that exceeds 2.5 floors for a period of more than 180 consecutive days or (v) any bankruptcy or insolvency action with respect to Yelp.
A Cash Sweep Event may be cured by the following: if the Cash Sweep Event is caused solely by (a) clause (i) of the definition of Cash Sweep Event above, the acceptance by the lender of a cure of such event of default, (b) clause (ii) of the definition of Cash Sweep Event above only with respect to the property manager, the lender replacing such property manager with a qualified manager under a replacement management agreement, (c) clause (ii) of the definition of Cash Sweep Event above only with respect to the borrower, if such bankruptcy is caused by a party filing an involuntary petition against the borrower and none of the borrower, guarantor or their affiliates has colluded with such party for any involuntary petition against the borrower, and such bankruptcy action is dismissed within 90 days without any material adverse modifications to the terms of the loan documents and (d) clause (iii) of the definition of Cash Sweep Event above, the occurrence of a Tenant Trigger Cure (as defined below) (each of the foregoing, a “Cash Sweep Event Cure”). Each Cash Sweep Event Cure is also subject to the following conditions: (1) no other event of default has occurred and is continuing under the loan documents (2) the borrower pays all of the lender’s reasonable out-of-pocket, non-de minimis expenses incurred in connection with the Cash Sweep Event Cure; and (3) in no event will the borrower be permitted to cure in the event of a voluntary or collusive involuntary bankruptcy or insolvency action of the borrower.
THE INFORMATION IN THIS STRUCTURAL AND COLLATERAL TERM SHEET IS NOT COMPLETE AND MAY BE AMENDED PRIOR TO THE TIME OF SALE. THIS TERM SHEET IS NOT AN OFFER TO SELL THESE SECURITIES AND IT IS NOT A SOLICITATION OF AN OFFER TO BUY THESE SECURITIES IN ANY JURISDICTION WHERE THE OFFER OR SALE IS NOT PERMITTED.
| | 95 of 156 |
| Structural and Collateral Term Sheet | JPMCC 2017-JP5 |
| 55 Hawthorne | |
A “Tenant Trigger Cure” means any of the following: with respect to a Tenant Trigger caused by (a) (i) through (iv) of the definition of Tenant Trigger above, (1) either: (A) the unleased portion of the Yelp premises does not exceed 2.5 floors or (B) Yelp (or one or more replacement tenant(s)) is open for business in its premises either pursuant to the Yelp lease (with the same having been renewed or extended in accordance with its terms) or a lease with a replacement tenant(s) and (2) the debt service coverage ratio (as calculated in the loan documents) based on the trailing three month period is at least 1.90x for one quarter, (b) (iv) of the definition of Tenant Trigger above, (1) Yelp has continued to pay full contract rent under its lease, (2) unless Yelp has vacated, gone dark or abandoned its entire premises, at least $50.00 per rentable square foot of the Yelp premises that is vacant, dark or abandoned has been swept into the tenant improvement and leasing commissions reserve or (3) if Yelp has vacated, gone dark or abandoned its entire premises at least $60.00 per rentable square foot of the Yelp premises that is vacant, dark or abandoned has been swept into the tenant improvement and leasing commissions reserve and (c) (v) of the definition of Tenant Trigger above, (1) either: (A) the Yelp lease has been affirmed in bankruptcy and Yelp is in occupancy, open for business and paying full contractual rent (without right of offset or free rent credit unless such amounts are escrowed with lender) or (B) the Yelp premises has been re-let to one or more replacement tenant(s) and (2) the debt service coverage ratio (as calculated in the loan documents) based on the trailing three-month period is at least 1.90x for one quarter.
Permitted Mezzanine Debt. One or more owners of the direct or indirect equity interests of the borrower are permitted to obtain one or more mezzanine loan(s) secured by the ownership interests in the related borrower upon satisfaction of certain terms and conditions which include, without limitation, (i) the mezzanine lender meets a qualified lender provision in the loan documents, (ii) the combined loan-to-value ratio of the mezzanine loan and mortgage loan does not exceed 50.0%, (iii) the combined debt service coverage ratio (as calculated in the loan documents) is not less than 2.60x and (iv) the lenders enter into a customary intercreditor agreement reasonably acceptable to the mortgage lender.
THE INFORMATION IN THIS STRUCTURAL AND COLLATERAL TERM SHEET IS NOT COMPLETE AND MAY BE AMENDED PRIOR TO THE TIME OF SALE. THIS TERM SHEET IS NOT AN OFFER TO SELL THESE SECURITIES AND IT IS NOT A SOLICITATION OF AN OFFER TO BUY THESE SECURITIES IN ANY JURISDICTION WHERE THE OFFER OR SALE IS NOT PERMITTED.
| | 96 of 156 |
| Structural and Collateral Term Sheet | JPMCC 2017-JP5 |
[THIS PAGE INTENTIONALLY LEFT BLANK]
THE INFORMATION IN THIS STRUCTURAL AND COLLATERAL TERM SHEET IS NOT COMPLETE AND MAY BE AMENDED PRIOR TO THE TIME OF SALE. THIS TERM SHEET IS NOT AN OFFER TO SELL THESE SECURITIES AND IT IS NOT A SOLICITATION OF AN OFFER TO BUY THESE SECURITIES IN ANY JURISDICTION WHERE THE OFFER OR SALE IS NOT PERMITTED.
| | 97 of 156 |
| Structural and Collateral Term Sheet | JPMCC 2017-JP5 |
| Bardmoor Palms | |
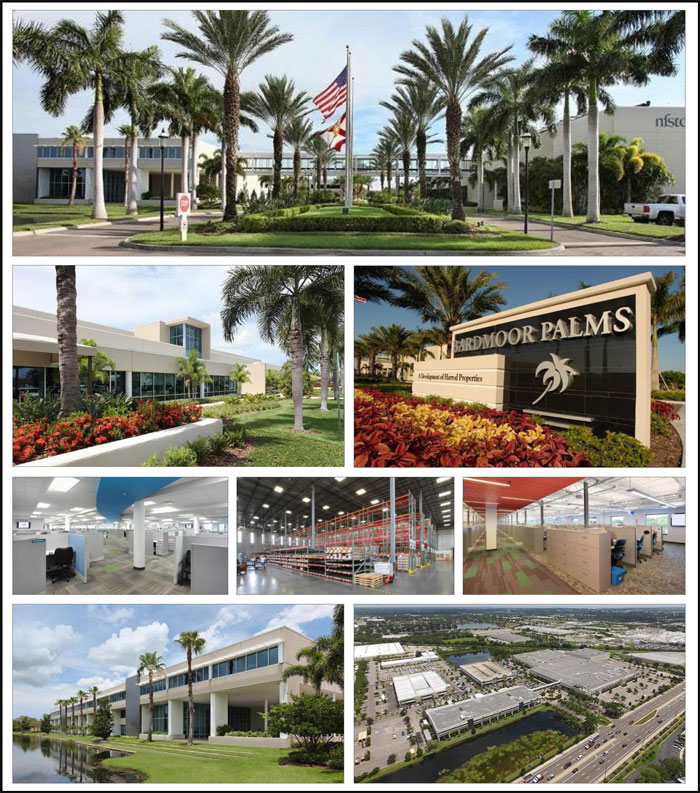
THE INFORMATION IN THIS STRUCTURAL AND COLLATERAL TERM SHEET IS NOT COMPLETE AND MAY BE AMENDED PRIOR TO THE TIME OF SALE. THIS TERM SHEET IS NOT AN OFFER TO SELL THESE SECURITIES AND IT IS NOT A SOLICITATION OF AN OFFER TO BUY THESE SECURITIES IN ANY JURISDICTION WHERE THE OFFER OR SALE IS NOT PERMITTED.
| | 98 of 156 |
| Structural and Collateral Term Sheet | JPMCC 2017-JP5 |
| Bardmoor Palms | |
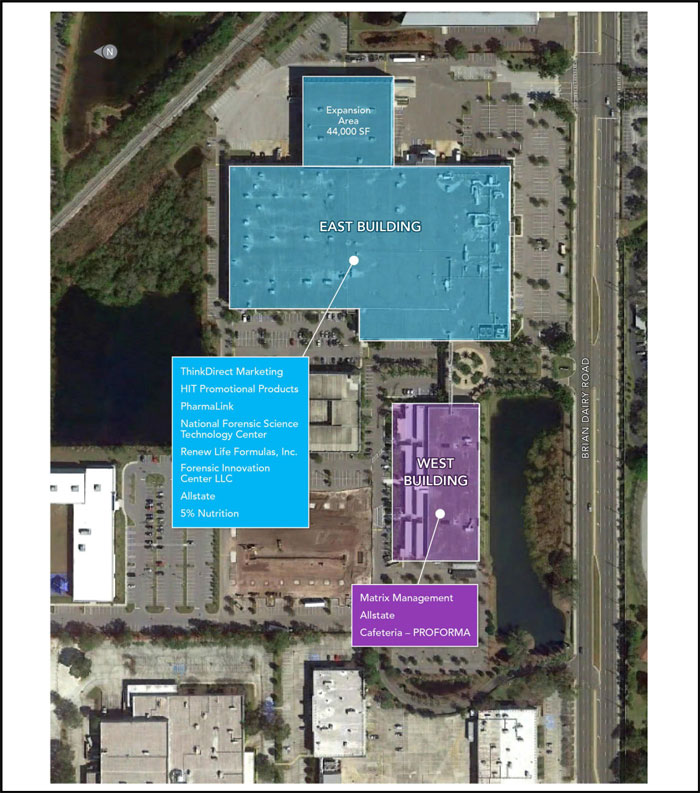
THE INFORMATION IN THIS STRUCTURAL AND COLLATERAL TERM SHEET IS NOT COMPLETE AND MAY BE AMENDED PRIOR TO THE TIME OF SALE. THIS TERM SHEET IS NOT AN OFFER TO SELL THESE SECURITIES AND IT IS NOT A SOLICITATION OF AN OFFER TO BUY THESE SECURITIES IN ANY JURISDICTION WHERE THE OFFER OR SALE IS NOT PERMITTED.
| | 99 of 156 |
| Structural and Collateral Term Sheet | JPMCC 2017-JP5 |
| Bardmoor Palms | |
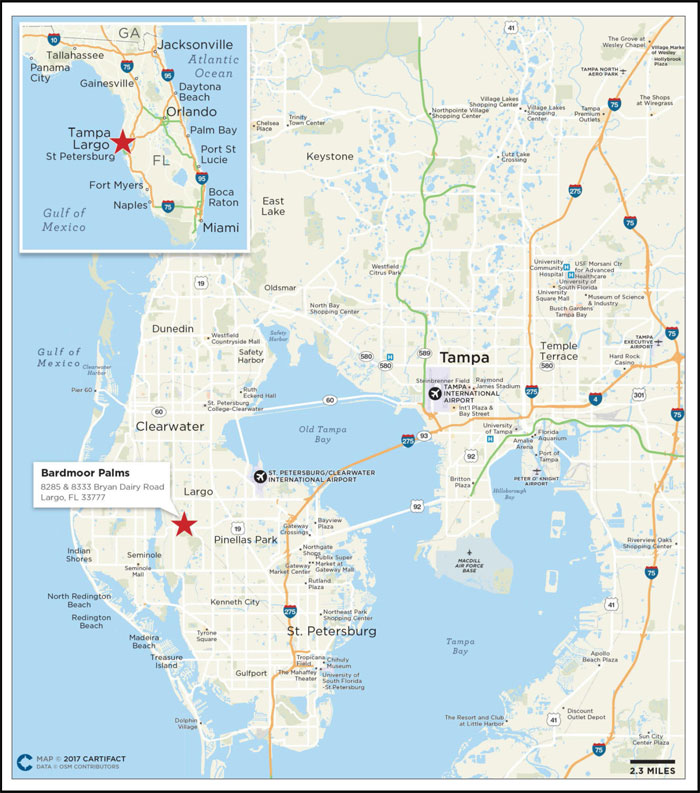
THE INFORMATION IN THIS STRUCTURAL AND COLLATERAL TERM SHEET IS NOT COMPLETE AND MAY BE AMENDED PRIOR TO THE TIME OF SALE. THIS TERM SHEET IS NOT AN OFFER TO SELL THESE SECURITIES AND IT IS NOT A SOLICITATION OF AN OFFER TO BUY THESE SECURITIES IN ANY JURISDICTION WHERE THE OFFER OR SALE IS NOT PERMITTED.
| | 100 of 156 |
| Structural and Collateral Term Sheet | JPMCC 2017-JP5 |
| Bardmoor Palms | |
| Mortgage Loan Information | Property Information | |||
| Mortgage Loan Seller: | JPMCB | Single Asset / Portfolio: | Single Asset | |
| Original Principal Balance: | $55,500,000 | Title: | Fee | |
| Cut-off Date Principal Balance: | $55,352,648 | Property Type - Subtype: | Mixed Use – Office/Industrial | |
| % of Pool by IPB: | 5.1% | Net Rentable Area (SF): | 553,485 | |
| Loan Purpose: | Refinance | Location: | Largo, FL | |
| Borrower: | BP Land Holdings, LLC | Year Built / Renovated: | 1973 / 2016 | |
| Sponsor: | Gary W. Harrod | Occupancy: | 100.0% | |
| Interest Rate: | 4.74400% | Occupancy Date: | 12/1/2016 | |
| Note Date: | 12/15/2016 | Number of Tenants: | 9 | |
| Maturity Date: | 1/1/2027 | 2013 NOI: | $1,482,510 | |
| Interest-only Period: | None | 2014 NOI(1): | $1,485,699 | |
| Original Term: | 120 months | 2015 NOI(1)(2): | $646,165 | |
| Original Amortization: | 360 months | TTM NOI (as of 9/2016)(2)(3): | $2,056,957 | |
| Amortization Type: | Balloon | UW Economic Occupancy: | 93.0% | |
| Call Protection: | L(25),Grtr1%orYM(92),O(3) | UW Revenues: | $7,514,480 | |
| Lockbox: | CMA | UW Expenses: | $2,324,477 | |
| Additional Debt: | N/A | UW NOI(3): | $5,190,003 | |
| Additional Debt Balance: | N/A | UW NCF: | $4,830,238 | |
| Additional Debt Type: | N/A | Appraised Value / Per SF: | $75,000,000 / $136 | |
| Appraisal Date: | 12/1/2016 | |||
| Escrows and Reserves(4) | Financial Information | ||||||||
| Initial | Monthly | Initial Cap | Cut-off Date Loan / SF: | $100 | |||||
| Taxes: | $93,078 | $46,539 | N/A | Maturity Date Loan / SF: | $82 | ||||
| Insurance: | $0 | Springing | N/A | Cut-off Date LTV: | 73.8% | ||||
| Replacement Reserves: | $7,110 | $7,110 | N/A | Maturity Date LTV: | 60.3% | ||||
| TI/LC: | $28,425 | $28,425 | $1,500,000 | UW NCF DSCR: | 1.39x | ||||
| Other: | $770,000 | $0 | N/A | UW NOI Debt Yield: | 9.4% | ||||
| Sources and Uses | |||||||||
| Sources | Proceeds | % of Total | Uses | Proceeds | % of Total | ||||
| Mortgage Loan | $55,500,000 | 95.9% | Payoff Existing Debt | $56,225,900 | 97.1% | ||||
| Sponsor Equity | 2,373,121 | 4.1 | Upfront Reserves | 898,613 | 1.6 | ||||
| Closing Costs | 748,608 | 1.3 | |||||||
| Total Sources | $57,873,121 | 100.0% | Total Uses | $57,873,121 | 100.0% | ||||
| (1) | The decrease from 2014 NOI to 2015 NOI is primarily due to a temporary tenant, Dex Imaging, vacating. |
| (2) | The increase from 2015 NOI to TTM NOI is primarily due to leases signed with Allstate (127,669 square feet), 5% Nutrition (36,202 square feet) and Forensic Innovation Center LLC (17,193 square feet) contributing a total of $855,571 in base rent on an annualized basis. |
| (3) | The UW NOI is greater than TTM NOI due to five tenants, Allstate, HIT Promotional Products, PharmaLink, 5% Nutrition and Forensic Innovation Center LLC, which executed leases in 2016. Allstate has been in occupancy since July 1, 2016 and began paying rent of approximately $1,648,710per annum, on October 1, 2016. HIT Promotional Products has been in occupancy and paying rent of approximately $536,536per annum since December 1, 2016. PharmaLink has been in occupancy since November 1, 2016 and began paying rent of approximately $356,328per annumon January 1, 2017. 5% Nutrition has been in occupancy since June 1, 2016 and began paying rent of approximately $253,414per annumon September 1, 2016. Forensic Innovation Center LLC has been in occupancy and paying rent of approximately $171,930per annum since April 1, 2016. The increase in UW NOI from TTM NOI is also due to rent abatements burning off for Allstate and Matrix Management totaling $500,885. |
| (4) | For a full description of Escrows and Reserves, please refer to“Escrows and Reserves”below. |
The Loan.The Bardmoor Palms loan has an outstanding principal balance as of the Cut-off Date of approximately $55.4 million and is secured by a first mortgage lien on the borrower’s fee interest in a 553,485 square foot office and industrial property located in Largo, Florida. The loan has a 10-year term and will amortize on a 30-year schedule.
The Borrower. The borrowing entity for the Bardmoor Palms loan is BP Land Holdings, LLC, a Florida limited liability company and special purpose entity.
THE INFORMATION IN THIS STRUCTURAL AND COLLATERAL TERM SHEET IS NOT COMPLETE AND MAY BE AMENDED PRIOR TO THE TIME OF SALE. THIS TERM SHEET IS NOT AN OFFER TO SELL THESE SECURITIES AND IT IS NOT A SOLICITATION OF AN OFFER TO BUY THESE SECURITIES IN ANY JURISDICTION WHERE THE OFFER OR SALE IS NOT PERMITTED.
| | 101 of 156 |
| Structural and Collateral Term Sheet | JPMCC 2017-JP5 |
| Bardmoor Palms | |
The Loan Sponsor.The loan sponsor and nonrecourse carve-out guarantor is Gary W. Harrod, who is the founder and chief executive officer of Harrod Properties Inc. (“Harrod Properties”), a commercial real estate development company that designs, builds, leases and manages office and industrial buildings throughout the United States. The firm’s portfolio includes 28 properties across Florida, New Mexico, Texas and Tennessee. Harrod Properties has been involved in the development of approximately 15.0 million square feet of office, industrial, retail and medical properties since it was founded in 1990.
According to the loan sponsor, Harrod Properties acquired the property in 2006 for $24.0 million ($43 per square foot) and has invested approximately $39.8 million ($72 per square foot) on capital improvements over the course of ownership for a total cost basis of approximately $63.8 million ($115 per square foot). The loan sponsor also informed the lender that from 2006 to 2008, he invested approximately $13.3 million on the East Building (as defined below) which included a 44,100 square foot warehouse expansion, improvements to the office space and building entrances, a new heating and air conditioning system, electrical work, a new roof, a new lobby, new restrooms and exterior renovations, and from 2015 to 2016, it invested approximately $14.3 million on improvements to the West Building (as defined below) which included the addition of the parking deck, exterior renovations, improvements to the office space and soft costs.
The Property.The Bardmoor Palms property consists of a total of 553,485 square feet comprised of a two-story office building with 148,350 square feet of net rentable area (“West Building”) and a two-story office and warehouse building with 405,135 square feet of net rentable area (“East Building”). The property is located in Largo, Florida approximately 20.0 miles west of the Tampa central business district and Tampa International Airport. The buildings are joined by an elevated crosswalk and feature two, three-level detached parking structures and open surface parking which provides 2,054 parking spaces (resulting in a parking ratio of 3.71 spaces per 1,000 square feet of net rentable area). The Bardmoor Palms property was originally built and fully occupied by Eckerd Corporation as its national headquarters. In 2012, former tenant Raytheon vacated 223,975 square feet at the property and instead of immediately reconfiguring the West Building for multi-tenant use, the loan sponsor decided to wait for a long-term lease to an investment grade tenant. In October 2015, the loan sponsor signed two leases with Allstate for a total of 127,669 square feet and subsequently signed leases for the remainder of the vacant space with HIT Promotional Products (76,648 square feet), PharmaLink (50,904 square feet), 5% Nutrition (36,202 square feet) and Forensic Innovation Center LLC (17,193 square feet), which brought occupancy to 100.0%.
As of December 1, 2016, the property was 100.0% leased to nine national and regional tenants under 11 leases. The largest tenant at the property, Allstate Corporation (“Allstate”) (NYSE: ALL, rated A3/A-/BBB+ by Moody’s, S&P and Fitch), leases 90,258 square feet of space in the West Building and 37,411 square feet in the East Building for a combined 127,669 square feet (23.1% of the net rentable area). Allstate’s leases expire in September 2026 and the tenant has been in occupancy at the Bardmoor Palms property since July 2016. Allstate has two, seven-year renewal options under both leases, which would extend its leases to 2040. Headquartered in Northfield Township, Illinois, Allstate is the largest publicly traded property casualty insurance company in the United States and provides insurance products to approximately 16.0 million households. The second largest tenant, HIT Promotional Products, leases 76,648 square feet (13.8% of the net rentable area) within the East Building. HIT Promotional Products has been a tenant at the property since December 2016 and has a lease expiration date in November 2022 with two, five-year renewal options, which would extend its lease to 2032. HIT Promotional Products has been in the customizable promotional product business for over 50 years and is ranked among the top 50 suppliers of customizable promotional products in the nation, according to Promo Marketing Magazine, with more than 1,900 items. HIT Promotional Products’ customizable products include apparel, accessories, mugs, desk toys, backpacks, food products and tech accessories, among others. The third largest tenant, National Forensic Science Technology Center (“NFSTC”), leases 71,614 square feet (12.9% of the net rentable area) within the East Building and has been a tenant at the property since May 2014. NFSTC’s lease expires in April 2024 with two, five-year renewal options, which would extend its lease to 2034. Founded in 1995, NFSTC is a not-for-profit corporation headquartered at the property, which provides forensic services including training, assessment, research and technology assistance to the justice and forensic science communities.
The property is located along the north side of Bryan Dairy Road and between West Bay Drive and Route 694 within Pinellas County in the Tampa-St. Petersburg-Clearwater metropolitan statistical area (“Tampa MSA”). According to Cushman & Wakefield, the Tampa MSA has a population of approximately 3.0 million residents and is the industrial, commercial and financial hub of Florida’s west coast with an economy that is founded on a base that includes tourism, agriculture, construction, finance, health care, technology and maritime industry. Additionally, Tampa’s economy benefits greatly from its port, the 11th largest (by tonnage) in the country and the largest in the state of Florida. Port Tampa Bay recently revealed plans for an approximately $1.5 billion redevelopment to bring residential towers, offices, parks and a hotel to 45.0 acres alongside Tampa’s cruise ship terminal. According to Cushman & Wakefield, Tampa Bay Lighting owner Jeff Vinik plans to invest approximately $1.0 billion in downtown Tampa to create an approximately 3.0 million square foot live, work, play and stay neighborhood in Tampa’s Channel District. According to Cushman & Wakefield, the Tampa Bay region has experienced growth in the innovation and technology industries, which includes financial and shared services, life sciences, defense, security, manufacturing and agribusiness, while benefiting from strong population growth with its associated demand for goods, services and housing.
THE INFORMATION IN THIS STRUCTURAL AND COLLATERAL TERM SHEET IS NOT COMPLETE AND MAY BE AMENDED PRIOR TO THE TIME OF SALE. THIS TERM SHEET IS NOT AN OFFER TO SELL THESE SECURITIES AND IT IS NOT A SOLICITATION OF AN OFFER TO BUY THESE SECURITIES IN ANY JURISDICTION WHERE THE OFFER OR SALE IS NOT PERMITTED.
| | 102 of 156 |
| Structural and Collateral Term Sheet | JPMCC 2017-JP5 |
| Bardmoor Palms | |
The Bardmoor Palms property is located within the Mid-Pinellas County office submarket which, according to the appraisal, is a submarket where vacant land is scarce and most construction activity represents redevelopment. As of the third quarter of 2016, the Mid-Pinellas County office submarket had an existing inventory of approximately 6.3 million square feet, an overall office vacancy rate of 11.0%, an average quoted rental rate of $16.78 per square foot and year-to-date net absorption of 137,317 square feet. The appraisal identified four competitive office properties built between 1979 and 2000 and ranging in size from 60,000 square feet to 178,545 square feet. The comparable properties reported occupancies ranging from 21.0% to 100.0% with a weighted average occupancy of approximately 81.6%. The appraisal concluded a stabilized occupancy rate of 96.4% for the property and an office market rental range of $11.50 to $15.25 per square foot on a triple net basis.
The property is located in the South Pinellas industrial submarket which has an existing inventory of approximately 55.9 million square feet. As of the third quarter of 2016, the industrial submarket reported an overall vacancy rate of 5.8% and overall average asking rents of $5.94 per square foot. The appraisal identified five competitive industrial properties built between 1985 and 1999 and ranging in size from 84,123 square feet to 132,548 square feet. The comparable properties reported occupancies ranging from 86.0% to 100.0% with a weighted average occupancy of approximately 95.2%. The appraisal concluded a warehouse market blended office rental range of $7.00 to $9.50 per square foot.
| Historical and Current Occupancy(1)(2) | |||
| 2013 | 2014 | 2015(3) | Current(3)(4) |
| 54.7% | 41.6% | 49.9% | 100.0% |
| (1) | Historical Occupancies are as of December 31 of each respective year. |
| (2) | In 2012, former tenant Raytheon vacated 223,975 square feet at the property, and the loan sponsor decided to wait for a long-term lease to an investment grade tenant instead of converting it to multi-tenant use. In October 2015, the loan sponsor signed two leases with Allstate for a total of 127,669 square feet and subsequently signed four additional leases for the remainder of the vacant space throughout 2016. |
| (3) | The increase in occupancy from 2015 to Current is primarily due to leases signed with Allstate (127,669 square feet), HIT Promotional Products (76,648 square feet), PharmaLink (50,904 square feet), 5% Nutrition (36,202 square feet) and Forensic Innovation Center LLC (17,193 square feet). |
| (4) | Current Occupancy is as of December 1, 2016. |
| Tenant Summary(1) | |||||||
| Tenant | Unit Type | Ratings(2) Moody’s/S&P/Fitch | Net Rentable Area (SF) | % of Total NRA | Base Rent PSF | % of Total Base Rent | Lease Expiration Date |
| Allstate(3) | Office | A3 / A- / BBB+ | 127,669 | 23.1% | $13.65 | 28.1% | 9/30/2026 |
| HIT Promotional Products | Office / R&D | NA / NA / NA | 76,648 | 13.8% | $7.14 | 8.8% | 11/30/2022 |
| NFSTC(4) | Flex | NA / NA / NA | 71,614 | 12.9% | $13.73 | 15.9% | 4/30/2024 |
| ThinkDirect Marketing | Office | NA / NA / NA | 61,063 | 11.0% | $11.25 | 11.1% | 10/31/2020 |
| Renew Life Formulas, Inc. | Warehouse | Baa1 / A- / NA | 54,100 | 9.8% | $6.25 | 5.5% | 2/29/2020 |
| PharmaLink | Flex | NA / NA / NA | 50,904 | 9.2% | $7.00 | 5.8% | 12/31/2023 |
| Matrix Management(4) | Office | NA / NA / NA | 49,511 | 8.9% | $22.15 | 17.7% | 10/31/2022 |
| 5% Nutrition(5) | Flex | NA / NA / NA | 36,202 | 6.5% | $7.21 | 4.2% | 8/31/2023 |
| Forensic Innovation Center LLC(4)(6) | Office / Lab | NA / NA / NA | 17,193 | 3.1% | $10.30 | 2.9% | 3/31/2019 |
| (1) | Based on the underwritten rent roll dated December 1, 2016. |
| (2) | Ratings provided are for the parent company of the entity listed in the “Tenant” field whether or not the parent company guarantees the lease. |
| (3) | Allstate has the right to terminate its lease with respect to (i) 37,411 square feet in the East Building beginning October 1, 2021 with 12 months’ written notice and the payment of a termination fee and (ii) 90,258 square feet in the West Building beginning October 1, 2023 with 12 months’ written notice and the payment of a termination fee. In addition, if Allstate elects to terminate its lease at either the East Building or the West Building, it may also terminate its lease at the other building at such time. Allstate’s rent is underwritten to the average rent steps through the termination options. |
| (4) | National Forensic Science Technology Center, Matrix Management and Forensic Innovation Center LLC have modified gross leases. All other tenants have triple net leases. |
| (5) | 5% Nutrition leases 36,202 square feet on the first floor of the East Building and 3,000 square feet of mezzanine space in the East Building. |
| (6) | Forensic Innovation Center LLC has the right to terminate its lease with 60 days’ written notice. |
THE INFORMATION IN THIS STRUCTURAL AND COLLATERAL TERM SHEET IS NOT COMPLETE AND MAY BE AMENDED PRIOR TO THE TIME OF SALE. THIS TERM SHEET IS NOT AN OFFER TO SELL THESE SECURITIES AND IT IS NOT A SOLICITATION OF AN OFFER TO BUY THESE SECURITIES IN ANY JURISDICTION WHERE THE OFFER OR SALE IS NOT PERMITTED.
| | 103 of 156 |
| Structural and Collateral Term Sheet | JPMCC 2017-JP5 |
| Bardmoor Palms | |
| Lease Rollover Schedule(1) | |||||||||
| Year | Number of Leases Expiring | Net Rentable Area Expiring | % of NRA Expiring | Base Rent Expiring | % of Base Rent Expiring | Cumulative Net Rentable Area Expiring | Cumulative % of NRA Expiring | Cumulative Base Rent Expiring | Cumulative % of Base Rent Expiring |
| Vacant | NAP | 0 | 0.0% | NAP | NAP | 0 | 0.0% | NAP | NAP |
| 2017 & MTM | 0 | 0 | 0.0 | $0 | 0.0% | 0 | 0.0% | $0 | 0.0% |
| 2018 | 0 | 0 | 0.0 | 0 | 0.0 | 0 | 0.0% | $0 | 0.0% |
| 2019 | 1 | 17,193 | 3.1 | 177,088 | 2.9 | 17,193 | 3.1% | $177,088 | 2.9% |
| 2020 | 2 | 115,163 | 20.8 | 1,025,084 | 16.6 | 132,356 | 23.9% | $1,202,172 | 19.4% |
| 2021 | 0 | 0 | 0.0 | 0 | 0.0 | 132,356 | 23.9% | $1,202,172 | 19.4% |
| 2022 | 2 | 126,159 | 22.8 | 1,643,935 | 26.6 | 258,515 | 46.7% | $2,846,107 | 46.0% |
| 2023 | 2 | 87,106 | 15.7 | 617,344 | 10.0 | 345,621 | 62.4% | $3,463,451 | 56.0% |
| 2024 | 1 | 71,614 | 12.9 | 983,310 | 15.9 | 417,235 | 75.4% | $4,446,762 | 71.9% |
| 2025 | 0 | 0 | 0.0 | 0 | 0.0 | 417,235 | 75.4% | $4,446,762 | 71.9% |
| 2026 | 2 | 127,669 | 23.1 | 1,742,089 | 28.1 | 544,904 | 98.4% | $6,188,850 | 100.0% |
| 2027 | 0 | 0 | 0.0 | 0 | 0.0 | 544,904 | 98.4% | $6,188,850 | 100.0% |
| 2028 & Beyond(2) | 1 | 8,581 | 1.6 | 0 | 0.0 | 553,485 | 100.0% | $6,188,850 | 100.0% |
| Total | 11 | 553,485 | 100.0% | $6,188,850 | 100.0% | ||||
| (1) | Based on the underwritten rent roll dated December 1, 2016 and includes rent steps through December 2017. |
| (2) | 2028 & Beyond includes 8,581 square feet associated with a cafeteria with no attributable base rent. |
| Operating History and Underwritten Net Cash Flow | |||||||
| 2013 | 2014 | 2015 | TTM(1) | Underwritten | Per Square Foot | %(2) | |
| Rents in Place | $2,296,243 | $2,588,937 | $1,886,669 | $3,089,820 | $6,188,850 | $11.18 | 77.1% |
| Vacant Income | 0 | 0 | 0 | 0 | 0 | 0.00 | 0.0 |
| Gross Potential Rent | $2,296,243 | $2,588,937 | $1,886,669 | $3,089,820 | $6,188,850 | $11.18 | 77.1% |
| Total Reimbursements | 940,704 | 676,858 | 670,700 | 974,298 | 1,835,874 | 3.32 | 22.9 |
| Net Rental Income | $3,236,948 | $3,265,795 | $2,557,369 | $4,064,118 | $8,024,725 | $14.50 | 100.0% |
| (Vacancy/Credit Loss) | 0 | 0 | 0 | 0 | (561,731) | (1.01) | (7.0) |
| Other Income | 65,315 | 13,974 | 0 | 10,000 | 51,486 | 0.09 | 0.6 |
| Effective Gross Income | $3,302,262 | $3,279,768 | $2,557,369 | $4,074,118 | $7,514,480 | $13.58 | 93.6% |
| Total Expenses | $1,819,752 | $1,794,069 | $1,911,205 | $2,017,161 | $2,324,477 | $4.20 | 30.9% |
| Net Operating Income(3)(4)(5) | $1,482,510 | $1,485,699 | $646,165 | $2,056,957 | $5,190,003 | $9.38 | 69.1% |
| Total TI/LC, Capex/RR | 0 | 0 | 0 | 0 | 359,765 | 0.65 | 4.8 |
| Net Cash Flow | $1,482,510 | $1,485,699 | $646,165 | $2,056,957 | $4,830,238 | $8.73 | 64.3% |
| (1) | TTM column represents the trailing 12-month period ending September 30, 2016. |
| (2) | % column represents percent of Net Rental Income for all revenue lines and represents percent of Effective Gross Income for the remainder of the fields. |
| (3) | The decrease in Net Operating Income from 2014 to 2015 is primarily due to temporary tenant Dex Imaging vacating the property. |
| (4) | The increase in Net Operating Income from 2015 to TTM is primarily due to leases signed with Allstate (127,669 square feet), 5% Nutrition (36,202 square feet) and Forensic Innovation Center LLC (17,193 square feet) contributing a total of $855,571 in base rent on an annualized basis. |
| (5) | The Underwritten Net Operating Income is greater than TTM Net Operating Income due to five tenants, Allstate, HIT Promotional Products, PharmaLink, 5% Nutrition and Forensic Innovation Center LLC, which executed leases in 2016. Allstate has been in occupancy since July 1, 2016 and began paying rent of approximately $1,648,710per annum, on October 1, 2016. HIT Promotional Products has been in occupancy and paying rent of approximately $536,536per annum since December 1, 2016. PharmaLink has been in occupancy since November 1, 2016 and began paying rent of approximately $356,328per annumon January 1, 2017. 5% Nutrition has been in occupancy since June 1, 2016 and began paying rent of approximately $253,414per annum on September 1, 2016. Forensic Innovation Center LLC has been in occupancy and paying rent of approximately $171,930per annumsince April 1, 2016. The increase in Underwritten Net Operating Income from TTM Net Operating Income is also due to rent abatements burning off for Allstate and Matrix Management totaling $500,885. |
THE INFORMATION IN THIS STRUCTURAL AND COLLATERAL TERM SHEET IS NOT COMPLETE AND MAY BE AMENDED PRIOR TO THE TIME OF SALE. THIS TERM SHEET IS NOT AN OFFER TO SELL THESE SECURITIES AND IT IS NOT A SOLICITATION OF AN OFFER TO BUY THESE SECURITIES IN ANY JURISDICTION WHERE THE OFFER OR SALE IS NOT PERMITTED.
| | 104 of 156 |
| Structural and Collateral Term Sheet | JPMCC 2017-JP5 |
| Bardmoor Palms | |
Property Management. The property is managed by HP Realty Associates, Inc., an affiliate of the borrower.
Escrows and Reserves. At origination, the borrower deposited $770,000 for outstanding tenant improvements and leasing commissions related to two tenants at the property, $93,078 for real estate taxes, $28,425 for tenant rollover reserves and $7,110 for replacement reserves.
Tax Escrows -On a monthly basis, the borrower is required to escrow 1/12 of annual estimated tax payments, which currently equates to $46,539.
Insurance Escrows- The requirement for the borrower to make monthly deposits to the insurance escrow is waived so long as (i) no event of default exists and (ii) the borrower provides satisfactory evidence that the property is insured under an acceptable blanket policy in accordance with the loan documents.
Replacement Reserves - On a monthly basis, the borrower is required to escrow $7,110 (approximately $0.15 per square foot annually) for ongoing replacement reserves.
TI/LC Reserves- On a monthly basis, the borrower is required to escrow $28,425 (approximately $0.62 per square foot annually) for tenant improvement and leasing commission reserves. The reserve is subject to a cap of $1,500,000 (approximately $2.71 per square foot).
Lockbox / Cash Management.The loan is structured with a CMA lockbox. The borrower was required at origination to deliver tenant direction letters instructing all tenants to deposit rents into a lockbox account controlled by the lender. All funds in the lockbox account are required to be transferred each business day into the borrower’s operating account, unless a Cash Sweep Event (as defined below) is continuing, in which event such funds are required to be swept each business day into a cash management account controlled by the lender and disbursed on each payment date in accordance with the loan documents.
A “Cash Sweep Event” means the occurrence of (i) an event of default, (ii) a bankruptcy or insolvency action of the borrower or the property manager, (iii) a DSCR Trigger Event (as defined below) or (iv) an Allstate Trigger Event (as defined below).
A “DSCR Trigger Event” means the trailing three-month debt service coverage ratio as calculated in accordance with the loan documents is less than 1.25x.
An “Allstate Trigger Event” means (i) Allstate terminates or gives notice that it intends to terminate any portion of its leases or (ii) the failure of the borrower to provide evidence that Allstate has renewed its leases in their entirety by exercising one of its two, seven-year renewal options on or before the date that is 12 months prior to each expiration date and extended expiration date of Allstate’s leases.
A Cash Sweep Event may be cured by the following: if the Cash Sweep Event is caused solely by (a) clause (i) above, the acceptance by the lender of a cure of such event of default, (b) clause (ii) above, only with respect to the property manager, the borrower replacing such property manager with a qualified manager under a replacement management agreement within 60 days, (c) clause (iii) above, the achievement of a debt service coverage ratio for two consecutive quarters of 1.25x or greater based on the trailing three-month period or (d) clause (iv) above, Allstate renews its leases or the borrower leases such space to a replacement tenant or tenants in accordance with the loan documents (each of the foregoing, a “Cash Sweep Event Cure”). Each Cash Sweep Event Cure is also subject to the following limitations: (1) there is no other event of default continuing under the loan documents, (2) a Cash Sweep Event caused by a bankruptcy or insolvency action of the property manager or an Allstate Trigger Event may be cured no more than three times during the term of the loan, (3) the borrower pays all of the lender’s reasonable expenses incurred in connection with such Cash Sweep Event Cure and (4) the borrower may not cure a bankruptcy or insolvency action of the borrower.
Right of First Refusal. Allstate has a right of first refusal to purchase the West Building and the East Building (if the offer covers the East Building) in the event the borrower receives an offer to purchase from a bona fide third party buyer. The tenant has signed a subordination, non-disturbance and attornment agreement that subordinates the right to any foreclosure or deed-in-lieu or any subsequent transfer by the lender or its designee.
THE INFORMATION IN THIS STRUCTURAL AND COLLATERAL TERM SHEET IS NOT COMPLETE AND MAY BE AMENDED PRIOR TO THE TIME OF SALE. THIS TERM SHEET IS NOT AN OFFER TO SELL THESE SECURITIES AND IT IS NOT A SOLICITATION OF AN OFFER TO BUY THESE SECURITIES IN ANY JURISDICTION WHERE THE OFFER OR SALE IS NOT PERMITTED.
| | 105 of 156 |
| Structural and Collateral Term Sheet | JPMCC 2017-JP5 | |
| Landmark Square | ||

THE INFORMATION IN THIS STRUCTURAL AND COLLATERAL TERM SHEET IS NOT COMPLETE AND MAY BE AMENDED PRIOR TO THE TIME OF SALE. THIS TERM SHEET IS NOT AN OFFER TO SELL THESE SECURITIES AND IT IS NOT A SOLICITATION OF AN OFFER TO BUY THESE SECURITIES IN ANY JURISDICTION WHERE THE OFFER OR SALE IS NOT PERMITTED.
| | 106 of 156 |
| Structural and Collateral Term Sheet | JPMCC 2017-JP5 | |
| Landmark Square | ||
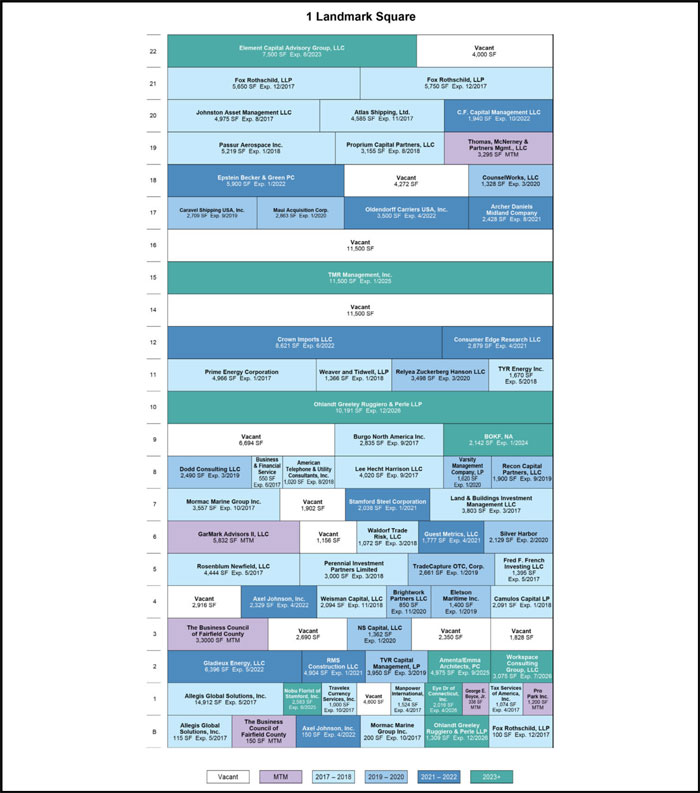
THE INFORMATION IN THIS STRUCTURAL AND COLLATERAL TERM SHEET IS NOT COMPLETE AND MAY BE AMENDED PRIOR TO THE TIME OF SALE. THIS TERM SHEET IS NOT AN OFFER TO SELL THESE SECURITIES AND IT IS NOT A SOLICITATION OF AN OFFER TO BUY THESE SECURITIES IN ANY JURISDICTION WHERE THE OFFER OR SALE IS NOT PERMITTED.
| | 107 of 156 |
| Structural and Collateral Term Sheet | JPMCC 2017-JP5 | |
| Landmark Square | ||
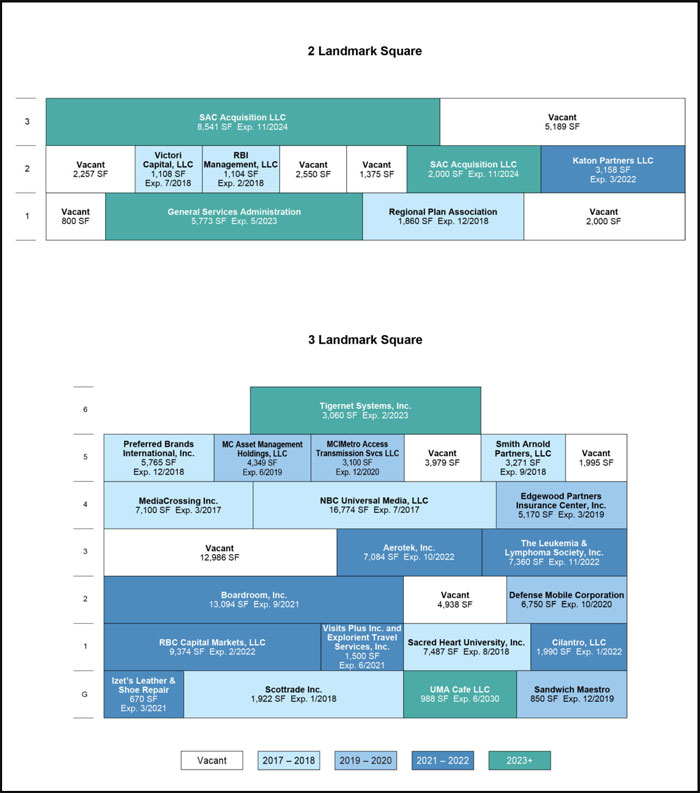
THE INFORMATION IN THIS STRUCTURAL AND COLLATERAL TERM SHEET IS NOT COMPLETE AND MAY BE AMENDED PRIOR TO THE TIME OF SALE. THIS TERM SHEET IS NOT AN OFFER TO SELL THESE SECURITIES AND IT IS NOT A SOLICITATION OF AN OFFER TO BUY THESE SECURITIES IN ANY JURISDICTION WHERE THE OFFER OR SALE IS NOT PERMITTED.
| | 108 of 156 |
| Structural and Collateral Term Sheet | JPMCC 2017-JP5 | |
| Landmark Square | ||

THE INFORMATION IN THIS STRUCTURAL AND COLLATERAL TERM SHEET IS NOT COMPLETE AND MAY BE AMENDED PRIOR TO THE TIME OF SALE. THIS TERM SHEET IS NOT AN OFFER TO SELL THESE SECURITIES AND IT IS NOT A SOLICITATION OF AN OFFER TO BUY THESE SECURITIES IN ANY JURISDICTION WHERE THE OFFER OR SALE IS NOT PERMITTED.
| | 109 of 156 |
| Structural and Collateral Term Sheet | JPMCC 2017-JP5 | |
| Landmark Square | ||
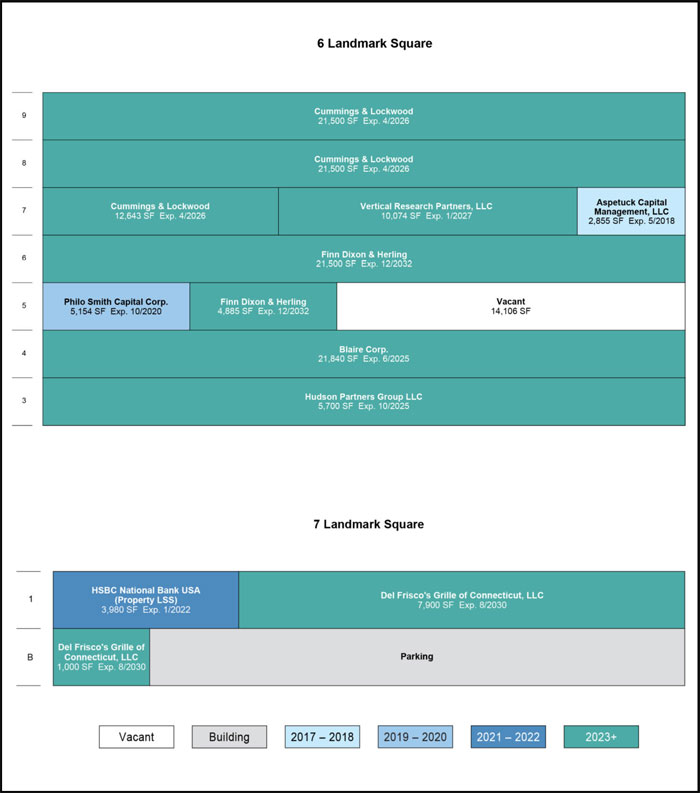
THE INFORMATION IN THIS STRUCTURAL AND COLLATERAL TERM SHEET IS NOT COMPLETE AND MAY BE AMENDED PRIOR TO THE TIME OF SALE. THIS TERM SHEET IS NOT AN OFFER TO SELL THESE SECURITIES AND IT IS NOT A SOLICITATION OF AN OFFER TO BUY THESE SECURITIES IN ANY JURISDICTION WHERE THE OFFER OR SALE IS NOT PERMITTED.
| | 110 of 156 |
| Structural and Collateral Term Sheet | JPMCC 2017-JP5 | |
| Landmark Square | ||
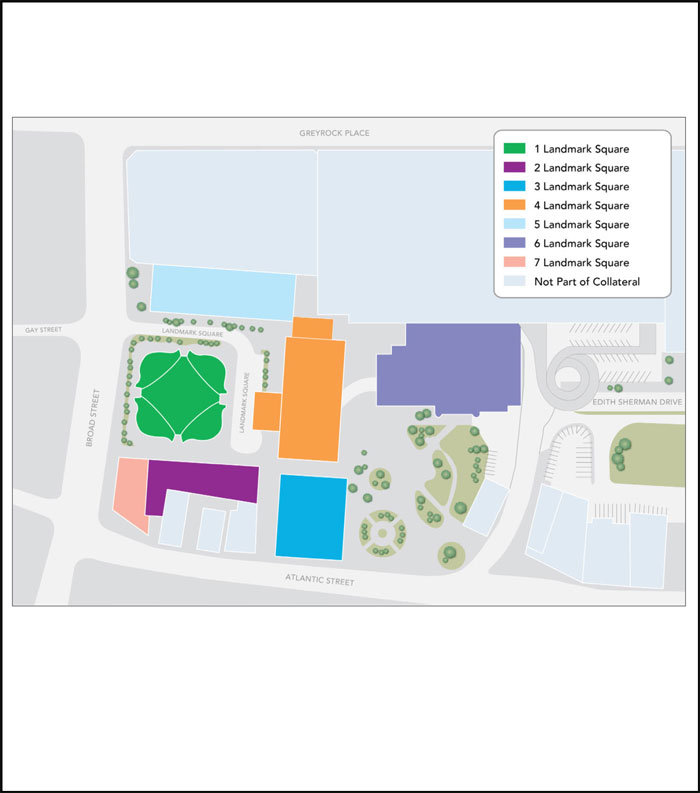
THE INFORMATION IN THIS STRUCTURAL AND COLLATERAL TERM SHEET IS NOT COMPLETE AND MAY BE AMENDED PRIOR TO THE TIME OF SALE. THIS TERM SHEET IS NOT AN OFFER TO SELL THESE SECURITIES AND IT IS NOT A SOLICITATION OF AN OFFER TO BUY THESE SECURITIES IN ANY JURISDICTION WHERE THE OFFER OR SALE IS NOT PERMITTED.
| | 111 of 156 |
| Structural and Collateral Term Sheet | JPMCC 2017-JP5 | |
| Landmark Square | ||
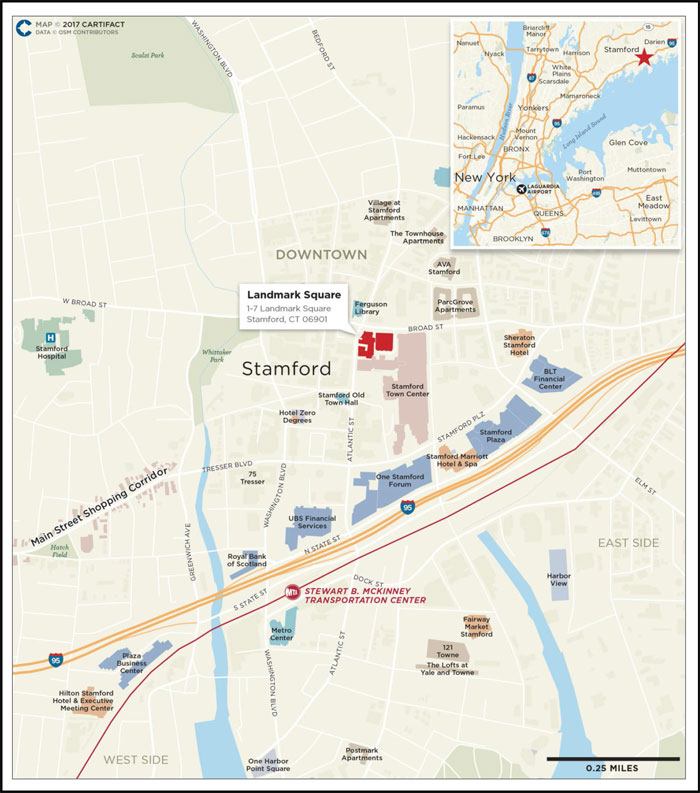
THE INFORMATION IN THIS STRUCTURAL AND COLLATERAL TERM SHEET IS NOT COMPLETE AND MAY BE AMENDED PRIOR TO THE TIME OF SALE. THIS TERM SHEET IS NOT AN OFFER TO SELL THESE SECURITIES AND IT IS NOT A SOLICITATION OF AN OFFER TO BUY THESE SECURITIES IN ANY JURISDICTION WHERE THE OFFER OR SALE IS NOT PERMITTED.
| | 112 of 156 |
| Structural and Collateral Term Sheet | JPMCC 2017-JP5 | |
| Landmark Square | ||
| Mortgage Loan Information | Property Information | |||
| Mortgage Loan Seller: | JPMCB | Single Asset / Portfolio: | Single Asset | |
| Original Principal Balance(1): | $51,000,000 | Title: | Fee / Leasehold | |
| Cut-off Date Principal Balance(1): | $51,000,000 | Property Type - Subtype: | Mixed Use – Office/Retail | |
| % of Pool by IPB: | 4.7% | Net Rentable Area (SF): | 757,917 | |
| Loan Purpose: | Refinance | Location: | Stamford, CT | |
| Borrower: | Landmark Square 1-6 LLC | Year Built / Renovated: | 1974, 1976, 1977, 1981, 1983, | |
| Sponsor: | SL Green Operating Partnership, | 2006 / N/A | ||
| L.P. | Occupancy: | 84.9% | ||
| Interest Rate: | 4.97000% | Occupancy Date: | 12/31/2016 | |
| Note Date: | 12/2/2016 | Number of Tenants: | 113 | |
| Maturity Date: | 1/1/2027 | 2013 NOI: | $9,916,119 | |
| Interest-only Period: | 120 months | 2014 NOI(3): | $10,446,258 | |
| Original Term: | 120 months | 2015 NOI(3): | $7,467,129 | |
| Original Amortization: | None | TTM NOI (as of 12/2016)(3)(4): | $9,724,228 | |
| Amortization Type: | Interest Only | UW Economic Occupancy(4): | 85.4% | |
| Call Protection(2): | L(26),Def(90),O(4) | UW Revenues: | $24,368,179 | |
| Lockbox: | CMA | UW Expenses: | $12,347,514 | |
| Additional Debt: | Yes | UW NOI(4): | $12,020,665 | |
| Additional Debt Balance: | $49,000,000 | UW NCF: | $11,058,110 | |
| Additional Debt Type: | Pari Passu | Appraised Value / Per SF: | $175,700,000 / $232 | |
| Appraisal Date: | 11/9/2016 | |||
| Escrows and Reserves(5) | Financial Information(1) | ||||||||
| Initial | Monthly | Initial Cap | Cut-off Date Loan / SF: | $132 | |||||
| Taxes: | $1,325,844 | $220,974 | N/A | Maturity Date Loan / SF: | $132 | ||||
| Insurance: | $0 | Springing | N/A | Cut-off Date LTV: | 56.9% | ||||
| Replacement Reserves: | $0 | Springing | $500,000 | Maturity Date LTV: | 56.9% | ||||
| TI/LC: | $0 | Springing | N/A | UW NCF DSCR: | 2.19x | ||||
| Other: | $0 | $0 | N/A | UW NOI Debt Yield: | 12.0% | ||||
| Sources and Uses | |||||||||
| Sources | Proceeds | % of Total | Uses | Proceeds | % of Total | ||||
| Mortgage Loan(1) | $100,000,000 | 100.0% | Payoff Existing Debt | $78,204,098 | 78.2% | ||||
| Return of Equity | 19,056,999 | 19.1 | |||||||
| Closing Costs | 1,413,059 | 1.4 | |||||||
| Upfront Reserves | 1,325,844 | 1.3 | |||||||
| Total Sources | $100,000,000 | 100.0% | Total Uses | $100,000,000 | 100.0% | ||||
| (1) | The Landmark Square loan is part of a whole loan evidenced by twopari passu notes with an aggregate outstanding principal balance as of the Cut-off Date of $100.0 million. The Financial Information presented in the chart above reflects the Cut-off Date balance of the $100.0 million Landmark Square Whole Loan, as defined in “The Loan” below. |
| (2) | The lockout period will be at least 26 payments beginning with and including the first payment date of February 1, 2017. Defeasance of the full $100.0 million Landmark Square Whole Loan is permitted at any time after the earlier to occur of (i) two years after the closing date of the final REMIC trust that holds the last note evidencing the Landmark Square Whole Loan to be securitized or (ii) February 1, 2020. |
| (3) | The decrease from 2014 NOI to 2015 NOI is primarily due to rent abatements for tenants which signed leases in 2015. The increase from 2015 NOI to TTM NOI is primarily due to rent abatements burning off from the leases executed in 2015 and an increase in other income related to licensee rent, lease buy out income and miscellaneous income in the amount of $699,848. |
| (4) | The increase in UW NOI from TTM NOI is primarily due to rent abatements burning off, additional leasing and contractual rent steps though January 1, 2018 totaling approximately $340,507. |
| (5) | For a full description of Escrows and Reserves, please refer to“Escrows and Reserves”below. |
THE INFORMATION IN THIS STRUCTURAL AND COLLATERAL TERM SHEET IS NOT COMPLETE AND MAY BE AMENDED PRIOR TO THE TIME OF SALE. THIS TERM SHEET IS NOT AN OFFER TO SELL THESE SECURITIES AND IT IS NOT A SOLICITATION OF AN OFFER TO BUY THESE SECURITIES IN ANY JURISDICTION WHERE THE OFFER OR SALE IS NOT PERMITTED.
| | 113 of 156 |
| Structural and Collateral Term Sheet | JPMCC 2017-JP5 | |
| Landmark Square | ||
The Loan.The Landmark Square loan is secured by a first mortgage lien on the borrower’s fee and leasehold interests in a mixed use office and retail complex located in downtown Stamford, Connecticut, consisting of 757,917 square feet. The whole loan has an outstanding principal balance as of the Cut-off Date of $100.0 million (the “Landmark Square Whole Loan”) and is comprised of twopari passu notes, each as described below. Note A-1, with an outstanding principal balance as of the Cut-off Date of $51.0 million, is the controlling note and is being contributed to the JPMCC 2017-JP5 Trust. Note A-2, with an outstanding principal balance as of the Cut-off Date of $49.0 million, is expected to be contributed to one or more future securitization trusts. The Landmark Square Whole Loan has a 10-year term and is interest-only for the entire term.
| Whole Loan Summary | |||||
| Note | Original Balance | Cut-off Date Balance | Note Holder | Controlling Piece | |
| A-1 | $51,000,000 | $51,000,000 | JPMCC 2017-JP5 | Yes | |
| A-2 | 49,000,000 | 49,000,000 | JPMCB | No | |
| Total | $100,000,000 | $100,000,000 | |||
The Borrower. The borrowing entity for the Landmark Square Whole Loan is Landmark Square 1-6 LLC, a Delaware limited liability company and special purpose entity.
The Loan Sponsor.The loan sponsor of the borrower and nonrecourse carve-out guarantor is SL Green Operating Partnership, L.P. (“SL Green”) (NYSE: “SLG”; rated Baa3/BBB-/BBB- by Moody’s, S&P and Fitch, respectively) which is an S&P 500 company and New York City’s largest office landlord. As of December 31, 2016, SL Green held interests in 127 Manhattan properties totaling 47.8 million square feet. In addition to the Landmark Square property, the loan sponsor owns four other office buildings (680, 750, 1055 and 1010 Washington Boulevard) totaling over 650,000 square feet in Stamford, Connecticut.
The property was acquired by the loan sponsor through its acquisition of Reckson Operating Partnership LP in January 2007 for an allocated purchase price of approximately $256.0 million ($338 per square foot). According to the loan sponsor, it invested approximately $36.5 million ($48 per square foot) in capital improvements including new building and garage entrances, fully renovated lobbies, elevator modernization, universal key card access, main arcade renovations, exterior plaza upgrades and a sustainability program that encompassed a complete exterior LED lighting retrofit along with various mechanical improvements and upgrades.
The Property.The Landmark Square property consists of 757,917 square feet of office and retail space and is situated on a 6.30 acre site in downtown Stamford, Connecticut. Landmark Square is comprised of seven buildings ranging in size from 12,880 square feet to 272,578 square feet that were built in various phases between 1974 and 2006. The largest building, 1 Landmark Square, is the tallest office building in Stamford at 22 stories and offers expansive views of the Long Island Sound and the New York City skyline. The remaining buildings are two to nine stories each. Due to its varying floorplates, the Landmark Square property is able to accommodate tenants ranging in size from approximately 55,000 square feet to less than 1,000 square feet at a wide range of price points. Property amenities include on-site parking consisting of 1,100 spaces (resulting in a parking ratio of 1.45 spaces per 1,000 square feet) with optional valet parking, a private shuttle to and from the Metro North/Amtrak transportation hub which is 0.5 miles from the property, numerous on-site restaurants including Del Frisco’s Grill and a full-time concierge for tenants. Of the total square footage, approximately 81,879 square feet is retail (10.8% of total square footage). Of the retail square footage, 50,247 square feet is leased to Bow Tie Cinemas movie theater, which is located at 5 Landmark Square, while the remainder of the retail space is located within 1, 3, 4 and 7 Landmark Square. The property also features a 21,500 square foot health club, complete with squash courts, cardio rooms, weight rooms and full locker room facilities, which is available exclusively to tenants for a monthly fee of $30.00. Tenants also have access to a state-of-the-art 50-seat conference facility, barbershop and on-site tailor and dry cleaners. Approximately 10.8% of the property’s net rentable area is attributable to retail tenants.
THE INFORMATION IN THIS STRUCTURAL AND COLLATERAL TERM SHEET IS NOT COMPLETE AND MAY BE AMENDED PRIOR TO THE TIME OF SALE. THIS TERM SHEET IS NOT AN OFFER TO SELL THESE SECURITIES AND IT IS NOT A SOLICITATION OF AN OFFER TO BUY THESE SECURITIES IN ANY JURISDICTION WHERE THE OFFER OR SALE IS NOT PERMITTED.
| | 114 of 156 |
| Structural and Collateral Term Sheet | JPMCC 2017-JP5 | |
| Landmark Square | ||
| Property Summary | |||||||
Building Name | Location | Net Rentable Area (SF)(1) | Year Built | Number of Stories | Number of Tenants(2) | Occupancy | Major Tenants |
| 1 Landmark Square | Stamford, CT | 272,578 | 1981 | 22 | 61 | 79.7% | Allegis Global Solutions |
| 2 Landmark Square | Stamford, CT | 37,715 | 1974 | 3 | 6 | 62.4% | SAC Acquisition, Katon Partners |
| 3 Landmark Square | Stamford, CT | 131,556 | 1977 | 6 | 20 | 81.8% | NBC Universal Media, Boardroom, Inc. |
| 4 Landmark Square | Stamford, CT | 103,431 | 1976 | 5 | 15 | 93.7% | Silgan Holdings, Inc |
| 5 Landmark Square | Stamford, CT | 58,000 | 1974 | 3 | 3 | 100.0% | Bow Tie Cinemas |
| 6 Landmark Square | Stamford, CT | 141,757 | 1983 | 9 | 7 | 90.0% | Cummings & Lockwood, Finn Dixon & Herling |
| 7 Landmark Square | Stamford, CT | 12,880 | 2006 | 2 | 2 | 100.0% | Del Frisco’s Grille, HSBC |
| Total/Wtd. Avg. | 757,917 | 114 | 84.9% | ||||
| (1) | Net rentable area excludes all storage space, the conference center and fitness center. |
| (2) | The total number of tenants does not equal 113 because Sacred Heart University leases space at 3 and 4 Landmark Square. |
As of December 31, 2016, the property was 84.9% leased to 113 tenants, across a wide-range of industries including legal, accounting, financial services, publishing, software, advertising, food packaging, liquor import, recruiting, human resources and mail order retail, among others. The largest tenant at the property, Cummings & Lockwood, leases 55,643 square feet (7.3% of the net rentable area) through April 2026 and has been in occupancy since 2005. Cummings & Lockwood has two five-year renewal options which would extend its lease out to 2036. Cummings & Lockwood is a law firm founded in 1909 that provides legal counsel to both private clients and commercial enterprises with one of the largest trust and estate practices in the United States. Cummings & Lockwood employs nearly 100 attorneys across six offices located in Connecticut and Florida. The second largest tenant, B and E Theaters LLC (“Bow Tie Cinemas”), leases 50,247 square feet (6.6% of the net rentable area) of the ground floor of 5 Landmark Square and has been a tenant at the property since 1996 and most recently renewed its lease in June 2016. The theater features nine screens and has an entrance from Stamford Town Center Mall. Bow Tie Cinemas’ lease expires in May 2021 and it has one five-year renewal option which would extend its lease out to 2026. Founded in 1900, Bow Tie Cinemas is a privately-held theater company with more than 400 screens across 50 theaters in Colorado, Connecticut, Maryland, New Jersey, New York and Virginia. The third largest tenant, Finn Dixon & Herling, leases 26,385 square feet (3.5% of the net rentable area). Finn Dixon & Herling is a corporate law firm headquartered at the property, which was founded in 1987 and employs more than 50 attorneys. The firm specializes in bankruptcy and corporate reorganizations, commercial litigation, banking, mergers and acquisitions, securities, private equity, public finance, executive compensation and tax law. Finn Dixon & Herling has been at the property since April 2016 and its lease expires in December 2032. The Landmark Square property has had 26 renewal or new leases since January 2016 totaling 207,147 square feet (27.3% of total net rentable area).
| Historical and Current Occupancy(1) | |||
| 2013 | 2014 | 2015 | Current(2) |
| 82.4% | 84.9% | 87.6% | 84.9% |
| (1) | Historical Occupancies are as of December 31 of each respective year. |
| (2) | Current Occupancy is as of December 31, 2016. |
The Landmark Square property is located within the Stamford central business district adjacent to Veterans Memorial Park and connected via an enclosed arcade to the adjacent Stamford Town Center Mall, an 853,000 square foot retail complex featuring more than 100 retailers and anchored by Macy’s and Saks Fifth Avenue OFF Fifth. Within one block of the property are Palace Theater, Ferguson Library and Old Town Hall, a public exhibition and event space, Courtyard by Marriott Stamford Downtown, Target and the University of Connecticut – Stamford. The property is located within three blocks of the Stamford Innovation Center which serves as an incubator and co-working space for technology start-ups. The Landmark Square property is also located within 0.75 miles of the Stamford train station, which allows for access to Manhattan in approximately 50 minutes. The property is located just north of Interstate 95 which provides access to State Routes 7 and 8 and connects to the Merritt Parkway and other points in the northern sector of the state.
Stamford is home to numerous national and multinational corporations such as Sikorsky Aircraft, General Electric Corporation, Gen Re, Pitney Bowes, UBS, Reuters, Bridgewater Associates, Vineyard Vines and Royal Bank of Scotland, among others. According to the appraisal, Stamford is a global financial center with a strong high tech manufacturing and defense industry presence which benefits from a highly educated labor force. Stamford has a growing number of residential projects including Harbor Point, Parcel 38 and Bedford House. Harbor Point, the largest development within Stamford is a mixed-use redevelopment encompassing 82 acres, currently consisting of more than 2,360 apartments and is anticipated to expand to more than 4,000 units. Harbor Point also features a significant retail component including 30 retailers with more than a dozen restaurants, 20 acres of public parks, four marinas and a water taxi. Parcel 38 and Bedford House are two additional developments projected to add approximately 754 residential units.
THE INFORMATION IN THIS STRUCTURAL AND COLLATERAL TERM SHEET IS NOT COMPLETE AND MAY BE AMENDED PRIOR TO THE TIME OF SALE. THIS TERM SHEET IS NOT AN OFFER TO SELL THESE SECURITIES AND IT IS NOT A SOLICITATION OF AN OFFER TO BUY THESE SECURITIES IN ANY JURISDICTION WHERE THE OFFER OR SALE IS NOT PERMITTED.
| | 115 of 156 |
| Structural and Collateral Term Sheet | JPMCC 2017-JP5 | |
| Landmark Square | ||
The property is located within the Stamford central business district office submarket which, according to the appraisal, as of the third quarter of 2016 had an overall vacancy rate of 21.3% and an overall availability rate of 31.7%. However, a significant amount of office vacancy in the Stamford central business district is situated in three buildings (677 Washington Boulevard, 695 East Main Street and 1 Elmcroft Road) that comprise 16.1% of the total submarket office inventory. According to the appraisal, 677 Washington Boulevard, 695 East Main Street and 1 Elmcroft Road are not directly competitive with the property since they were designed as corporate headquarters with very large floor plans, long corridors, and are inefficiently designed for a multi-tenant building while the property caters to small and medium sized tenants. Excluding these three buildings from the Stamford central business district inventory, the availability rate decreases from 31.7% to 19.1%.
According to the appraisal, as of third quarter 2016, the Stamford central business district office and retail submarket rental rates were $43.41 per square foot gross and $34.31 triple net, respectively. The appraisal identified seven competitive properties built between 1980 and 1989 and ranging in size from 133,000 square feet to 501,448 square feet. The comparable properties reported occupancies ranging from 72.0% to 99.0% with a weighted average occupancy of approximately 86.2%. The appraisal concluded a stabilized occupancy rate of 90.0% for the property and an office market rental range of $33.00 to $44.00 per square foot gross for the property. Additionally, the appraisal concluded a retail market rental range of $15.00 to $35.00 per square foot triple net.
| Tenant Summary(1) | |||||||
| Tenant | Retail / Office Component | Ratings(2) Moody’s/S&P/Fitch | Net Rentable Area (SF) | % of Total NRA | Base Rent PSF | % of Total Base Rent | Lease Expiration Date |
| Cummings & Lockwood(3) | Office | NA / NA / NA | 55,643 | 7.3% | $35.00 | 9.5% | 4/30/2026 |
| Bow Tie Cinemas | Retail | NA / NA / NA | 50,247 | 6.6% | $7.46 | 1.8% | 5/31/2021 |
| Finn Dixon & Herling(4) | Office | NA / NA / NA | 26,385 | 3.5% | $35.00 | 4.5% | 12/31/2032 |
| Morgan Stanley Smith Barney(5) | Office | A3 / BBB+ / A | 23,062 | 3.0% | $36.50 | 4.1% | 11/30/2020 |
| Blaire Corp. | Office | NA / NA / NA | 21,840 | 2.9% | $21.02 | 2.3% | 6/30/2025 |
| NBC Universal Media | Office | A3 / NA / A- | 16,774 | 2.2% | $32.25 | 2.7% | 7/31/2017 |
| Silgan Holdings, Inc(6) | Office | NA / NA / NA | 16,223 | 2.1% | $32.00 | 2.5% | 4/30/2023 |
| Allegis Global Solutions(7) | Office | NA / NA / NA | 15,027 | 2.0% | $31.38 | 2.3% | 5/31/2017 |
Sacred Heart University | Office | NA / NA / NA | 14,987 | 2.0% | $31.00 | 2.3% | 8/31/2018 |
| Luxury Mortgage Corporation(8) | Office | NA / NA / NA | 14,643 | 1.9% | $17.21 | 1.2% | MTM |
| (1) | Based on the underwritten rent roll dated December 31, 2016. |
| (2) | Ratings provided are for the parent company of the entity listed in the “Tenant” field whether or not the parent company guarantees the lease. |
| (3) | Cummings & Lockwood has the right to contract 5,000-10,000 square feet of its leased space as of April 30, 2021, with 12 months’ notice and the payment of a contraction fee. |
| (4) | Finn Dixon & Herling has the right to terminate 3,240 square feet of its 26,385 total square feet as of January 1, 2023 with 18 months’ written notice and the payment of a contraction fee. |
| (5) | Morgan Stanley Smith Barney has the right to terminate its lease beginning August 23, 2019 with 12 months’ written notice and the payment of a termination fee. |
| (6) | Silgan Holdings, Inc has the right to terminate its lease as of July 1, 2019 with 12 months’ written notice and the payment of a termination fee. |
| (7) | Allegis Global Solutions may terminate its lease at any time with 30 days’ written notice. |
| (8) | Luxury Mortgage Corporation may terminate its lease at any time with 30 days’ written notice. |
THE INFORMATION IN THIS STRUCTURAL AND COLLATERAL TERM SHEET IS NOT COMPLETE AND MAY BE AMENDED PRIOR TO THE TIME OF SALE. THIS TERM SHEET IS NOT AN OFFER TO SELL THESE SECURITIES AND IT IS NOT A SOLICITATION OF AN OFFER TO BUY THESE SECURITIES IN ANY JURISDICTION WHERE THE OFFER OR SALE IS NOT PERMITTED.
| | 116 of 156 |
| Structural and Collateral Term Sheet | JPMCC 2017-JP5 | |
| Landmark Square | ||
| Lease Rollover Schedule(1) | |||||||||
| Year | Number of Leases Expiring | Net Rentable Area Expiring | % of NRA Expiring | Base Rent Expiring | % of Base Rent Expiring | Cumulative Net Rentable Area Expiring | Cumulative % of NRA Expiring | Cumulative Base Rent Expiring | Cumulative % of Base Rent Expiring |
| Vacant | NAP | 114,084 | 15.1% | NAP | NAP | 114,084 | 15.1% | NAP | NAP |
| 2017 & MTM | 26 | 126,528 | 16.7 | $4,086,661 | 20.0% | 240,612 | 31.7% | $4,086,661 | 20.0% |
| 2018 | 19 | 63,116 | 8.3 | 2,119,068 | 10.4 | 303,728 | 40.1% | $6,205,728 | 30.4% |
| 2019 | 11 | 28,411 | 3.7 | 985,672 | 4.8 | 332,139 | 43.8% | $7,191,400 | 35.3% |
| 2020 | 14 | 60,584 | 8.0 | 2,133,342 | 10.5 | 392,723 | 51.8% | $9,324,743 | 45.7% |
| 2021 | 10 | 85,718 | 11.3 | 1,652,180 | 8.1 | 478,441 | 63.1% | $10,976,923 | 53.8% |
| 2022 | 13 | 66,352 | 8.8 | 2,412,938 | 11.8 | 544,793 | 71.9% | $13,389,861 | 65.7% |
| 2023 | 4 | 32,556 | 4.3 | 1,206,024 | 5.9 | 577,349 | 76.2% | $14,595,885 | 71.6% |
| 2024 | 2 | 12,683 | 1.7 | 410,545 | 2.0 | 590,032 | 77.8% | $15,006,430 | 73.6% |
| 2025 | 5 | 46,598 | 6.1 | 1,309,327 | 6.4 | 636,630 | 84.0% | $16,315,757 | 80.0% |
| 2026 | 4 | 72,234 | 9.5 | 2,525,892 | 12.4 | 708,864 | 93.5% | $18,841,649 | 92.4% |
| 2027 | 1 | 10,074 | 1.3 | 272,000 | 1.3 | 718,938 | 94.9% | $19,113,649 | 93.7% |
| 2028 & Beyond | 4 | 38,979 | 5.1 | 1,279,563 | 6.3 | 757,917 | 100.0% | $20,393,211 | 100.0% |
| Total | 113 | 757,917 | 100.0% | $20,393,211 | 100.0% | ||||
| (1) | Based on the underwritten rent roll dated December 31, 2016 and includes rent steps through January 1, 2018. |
| Operating History and Underwritten Net Cash Flow | |||||||
| 2013 | 2014 | 2015 | 2016 | Underwritten | Per Square Foot | %(1) | |
| Rents in Place | $17,688,150 | $17,808,307 | $18,668,997 | $19,376,081 | $20,393,211 | $26.91 | 74.1% |
| Vacant Income | 0 | 0 | 0 | 0 | 4,030,490 | 5.32 | 14.6% |
| Gross Potential Rent | $17,688,150 | $17,808,307 | $18,668,997 | $19,376,081 | $24,423,701 | $32.22 | 88.7% |
| Total Reimbursements | 2,769,707 | 3,591,215 | 3,078,349 | 3,353,847 | 3,105,660 | 4.10 | 11.3% |
| Net Rental Income | $20,457,856 | $21,399,521 | $21,747,346 | $22,729,928 | $27,529,361 | $36.32 | 100.0% |
| (Vacancy/Credit Loss)(2) | (431,586) | (705,825) | (2,869,221) | (2,162,927) | (4,030,490) | (5.32) | (14.6)-- |
| Other Income(3) | 1,063,762 | 1,513,068 | 973,897 | 1,673,745 | 869,308 | 1.15 | 3.2% |
| Effective Gross Income | $21,090,032 | $22,206,765 | $19,852,023 | $22,240,746 | $24,368,179 | $32.15 | 88.5% |
| Total Expenses | $11,173,914 | $11,760,507 | $12,384,894 | $12,516,518 | $12,347,514 | $16.29 | 50.7% |
| Net Operating Income(4) | $9,916,119 | $10,446,258 | $7,467,129 | $9,724,228 | $12,020,665 | $15.86 | 49.3% |
| Total TI/LC, Capex/RR | 0 | 0 | 0 | 0 | 962,555 | 1.27 | 4.0% |
| Net Cash Flow | $9,916,119 | $10,446,258 | $7,467,129 | $9,724,228 | $11,058,110 | $14.59 | 45.4% |
| (1) | % column represents percent of Net Rental Income for all revenue lines and represents percent of Effective Gross Income for the remainder of the fields. |
| (2) | Historical Vacancy/Credit Loss consists primarily of free rent. |
| (3) | Other Income consists of licensee rent, lease buy out income and miscellaneous income. Lease buy out income has not been underwritten. |
| (4) | The decrease in Net Operating Income from 2014 to 2015 is primarily due to rent abatements for tenants which signed leases in 2015. The increase in Net Operating Income from 2015 to 2016 is primarily due to rent abatements burning off from the leases executed in 2015 and an increase in other income related to licensee rent, lease buy out income and miscellaneous income in the amount of $698,848. The increase in Net Operating Income from 2016 to Underwritten is primarily due to rent abatements burning off, additional leasing and contractual rent steps though January 1, 2018 totaling approximately $340,507. |
Property Management. The property is managed by SL Green Management LLC, an affiliate of the borrower.
Escrows and Reserves. At origination, the borrower deposited $1,325,844 for real estate taxes. The guarantor also delivered the guaranty referenced below in“Reserve Waiver Guaranty”.
THE INFORMATION IN THIS STRUCTURAL AND COLLATERAL TERM SHEET IS NOT COMPLETE AND MAY BE AMENDED PRIOR TO THE TIME OF SALE. THIS TERM SHEET IS NOT AN OFFER TO SELL THESE SECURITIES AND IT IS NOT A SOLICITATION OF AN OFFER TO BUY THESE SECURITIES IN ANY JURISDICTION WHERE THE OFFER OR SALE IS NOT PERMITTED.
| | 117 of 156 |
| Structural and Collateral Term Sheet | JPMCC 2017-JP5 | |
| Landmark Square | ||
Reserve Waiver Guaranty. So long as an affiliate of the borrower maintains a long term unsecured debt rating of “BBB-” (or its equivalent) from each of Moody’s and Fitch or has total assets in excess of $500.0 million and maintains a net worth of at least $250.0 million (in each case, exclusive of any interest in the property), the borrower may deliver a partial payment guaranty from such entity in lieu of the borrower’s requirement to make (i) the initial deposit in the amount of $2,500,000 required at origination and monthly deposits into the tenant improvement and leasing commission reserve, (ii) the initial deposit into the free rent reserve in the amount of $2,309,168, (iii) the initial deposit into the outstanding tenant improvement and leasing commission reserve in the amount of $1,437,315 required at origination and (iv) the initial and monthly deposits into the replacement reserve. The borrower is also permitted to deliver a letter of credit in an amount required by the loan documents in lieu of such deposits or any combination of cash, a letter of credit or a partial payment guaranty. The amount of this partial payment guaranty is equal to the lesser of (A) the amount that would be contained in each reserve if not for the delivery of the partial payment guaranty and (B) the then outstanding principal balance of the Whole Loan.
Tax Escrows -On a monthly basis, the borrower is required to escrow 1/12 of annual estimated tax payments, which currently equates to $220,974.
Insurance Escrows- The requirement for the borrower to make deposits to the insurance escrow is waived so long as no event of default has occurred and is continuing and the borrower provides satisfactory evidence that the property is insured as part of a blanket policy in accordance with the loan documents.
Replacement Reserves -In the event the borrower is required to make deposits into the replacement reserve, on a monthly basis, the borrower is required to deposit approximately $17,053 (approximately $0.27 per square foot annually) for replacement reserves. The reserve is subject to a cap of $500,000 (approximately $0.66 per square foot).
TI/LC Reserves - In the event the borrower is required to make monthly deposits into the tenant improvement and leasing commission reserve, on a monthly basis, the borrower is required to deposit approximately $63,160 (approximately $1.00 per square foot annually) for tenant improvements and leasing commission reserves.
Lockbox / Cash Management.The Landmark Square Whole Loan is structured with a CMA lockbox. The borrower was required at origination to deliver tenant direction letters instructing all tenants to deposit rents into a lockbox account controlled by the lender. All funds in the lockbox account are required to be swept each business day into the borrower’s operating account, unless a Cash Sweep Event (as defined below) is continuing, in which event such funds are required to be swept each business day into a cash management account controlled by the lender and disbursed on each payment date in accordance with the loan documents.
A “Cash Sweep Event” means the occurrence of (i) an event of default, (ii) any bankruptcy or insolvency action of the borrower or the property manager, unless the property manager that files bankruptcy is not an affiliate of the borrower and is replaced with a qualified manager in accordance with the loan agreement within 30 days or (iii) a DSCR Trigger Event (as defined below). A Cash Sweep Event arising from a DSCR Trigger Event may be prevented if (a) the borrower provides cash or a letter of credit that, if used to reduce the outstanding principal balance of the loan, would otherwise prevent or cure the applicable DSCR Trigger Event or (b) provided no event of default has occurred or is continuing, SL Green Operating Partnership, L.P. or an affiliate of the borrower that maintains a long term unsecured debt rating of “BBB-” (or its equivalent) from each of Moody’s and Fitch delivers a partial payment guaranty in an amount required by the loan documents (a “DSCR Trigger Cure Deposit”).
A “DSCR Trigger Event” means the debt service coverage ratio as calculated in accordance with the loan documents is less than 1.65x (which may not be tested more than once quarterly under the loan documents).
A Cash Sweep Event may be cured by the following: if the Cash Sweep Event is caused solely by (a) clause (i) above, the acceptance by the lender of a cure of such event of default, (b) clause (ii) above only with respect to the property manager, the lender replacing such property manager with a qualified manager under a replacement management agreement within 60 days, (c) clause (ii) above only with respect to the borrower, if such bankruptcy is caused by a party filing an involuntary petition against the borrower and the borrower has not colluded with or otherwise assisted such party or solicited creditors for any involuntary petition against the borrower, and such bankruptcy action is dismissed within 90 days after the filing date without any adverse modifications to the terms of the loan documents or (d) clause (iii) above, either (1) the applicable debt service coverage ratio (as calculated in the loan documents) for two consecutive quarters is not less than 1.65x or (2) the borrower delivers a DSCR Trigger Cure Deposit (each of the foregoing, a “Cash Sweep Event Cure”). Each Cash Sweep Event Cure is also subject to the following limitations: (1) there is no other event of default continuing under the loan documents; (2) a Cash Sweep Event Cure may occur no more than four times during the term of the loan (except that there is no limit on the number of times the borrower may cure a DSCR Trigger Event); (3) the borrower pays all of the lender’s reasonable expenses incurred in connection with such Cash Sweep Event Cure; and (4) the borrower may not cure a voluntary bankruptcy or insolvency action of the borrower or for any involuntary bankruptcy or insolvency action in which the borrower has colluded with or otherwise assisted such party or has solicited creditors for any action.
THE INFORMATION IN THIS STRUCTURAL AND COLLATERAL TERM SHEET IS NOT COMPLETE AND MAY BE AMENDED PRIOR TO THE TIME OF SALE. THIS TERM SHEET IS NOT AN OFFER TO SELL THESE SECURITIES AND IT IS NOT A SOLICITATION OF AN OFFER TO BUY THESE SECURITIES IN ANY JURISDICTION WHERE THE OFFER OR SALE IS NOT PERMITTED.
| | 118 of 156 |
| Structural and Collateral Term Sheet | JPMCC 2017-JP5 | |
| Landmark Square | ||
Permitted Releases.None.
Permitted Mezzanine Debt. In connection with a bona fide sale of the property to an unaffiliated third party and assumption of the loan in accordance with the loan documents, the owners of the transferee are permitted to obtain a mezzanine loan secured by the ownership interests in the related transferee upon satisfaction of certain terms and conditions in the loan documents which include, without limitation, (i) the mezzanine lender is not an affiliate of the borrower (except that the guarantor and any of its affiliates may be the mezzanine lender in connection with a permitted assumption of the mortgage loan) and meets a qualified transferee definition in the loan documents, (ii) immediately after giving effect to the mezzanine loan, the combined loan-to-value ratio does not exceed 56.9%, (iii) immediately after giving effect to the mezzanine loan, the combined debt service coverage ratio (as calculated in the loan documents and based on the 12 months immediately following the date of determination) is not less than 2.25x and (iv) the lenders enter into an intercreditor agreement satisfactory to the mortgage lender in its sole discretion.
Ground Lease.1 Landmark Square is encumbered by a ground lease which expires February 2082 and has a rental rate of $1.00 for the entire 99-year lease term. The portion of the collateral constituting the borrower’s leasehold interest in the air rights parcel is taxed as part of the larger fee estate. The borrower pays 50% of the real estate taxes assessed against the entire parcel, with the remaining 50% of the taxes paid by the occupant of the remainder of such fee parcel, pursuant to a reciprocal easement agreement between the parties.
THE INFORMATION IN THIS STRUCTURAL AND COLLATERAL TERM SHEET IS NOT COMPLETE AND MAY BE AMENDED PRIOR TO THE TIME OF SALE. THIS TERM SHEET IS NOT AN OFFER TO SELL THESE SECURITIES AND IT IS NOT A SOLICITATION OF AN OFFER TO BUY THESE SECURITIES IN ANY JURISDICTION WHERE THE OFFER OR SALE IS NOT PERMITTED.
| | 119 of 156 |
| Structural and Collateral Term Sheet | JPMCC 2017-JP5 |
Centre Market Building |
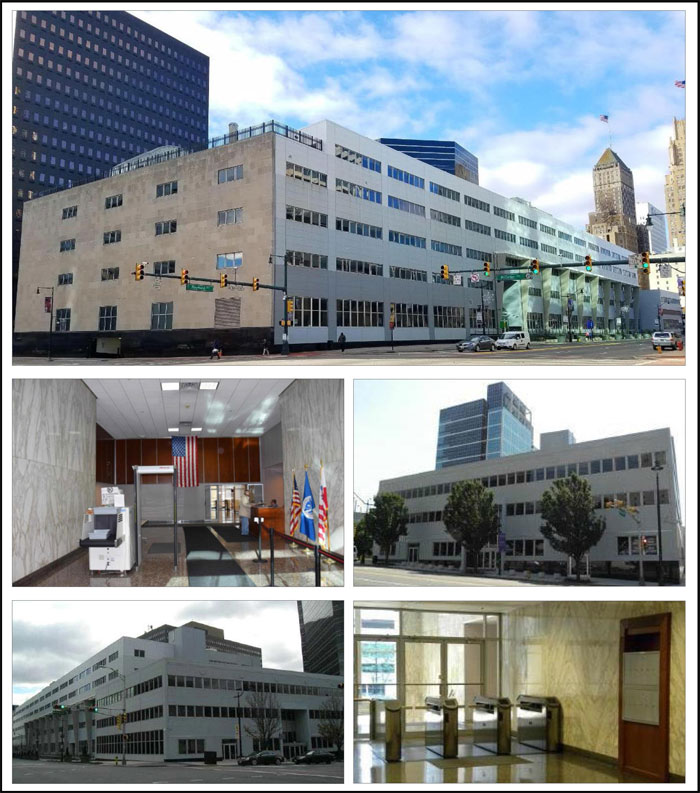
THE INFORMATION IN THIS STRUCTURAL AND COLLATERAL TERM SHEET IS NOT COMPLETE AND MAY BE AMENDED PRIOR TO THE TIME OF SALE. THIS TERM SHEET IS NOT AN OFFER TO SELL THESE SECURITIES AND IT IS NOT A SOLICITATION OF AN OFFER TO BUY THESE SECURITIES IN ANY JURISDICTION WHERE THE OFFER OR SALE IS NOT PERMITTED.
| | 120 of 156 |
| Structural and Collateral Term Sheet | JPMCC 2017-JP5 |
Centre Market Building |
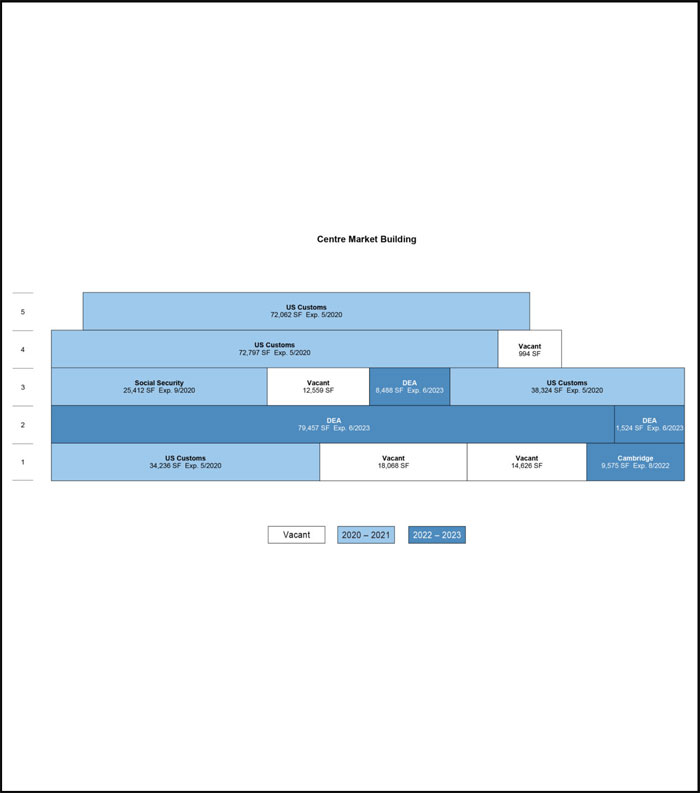
THE INFORMATION IN THIS STRUCTURAL AND COLLATERAL TERM SHEET IS NOT COMPLETE AND MAY BE AMENDED PRIOR TO THE TIME OF SALE. THIS TERM SHEET IS NOT AN OFFER TO SELL THESE SECURITIES AND IT IS NOT A SOLICITATION OF AN OFFER TO BUY THESE SECURITIES IN ANY JURISDICTION WHERE THE OFFER OR SALE IS NOT PERMITTED.
| | 121 of 156 |
| Structural and Collateral Term Sheet | JPMCC 2017-JP5 |
Centre Market Building |
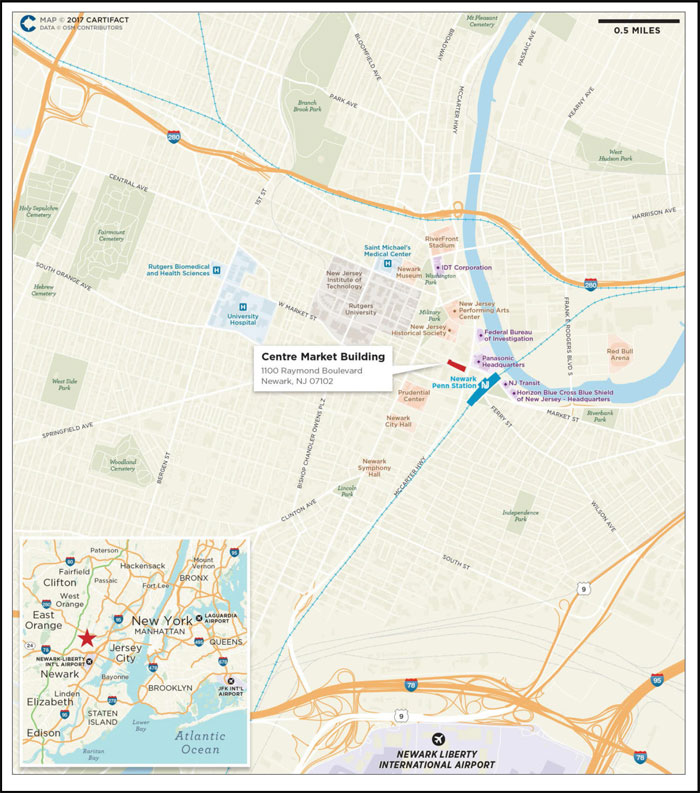
THE INFORMATION IN THIS STRUCTURAL AND COLLATERAL TERM SHEET IS NOT COMPLETE AND MAY BE AMENDED PRIOR TO THE TIME OF SALE. THIS TERM SHEET IS NOT AN OFFER TO SELL THESE SECURITIES AND IT IS NOT A SOLICITATION OF AN OFFER TO BUY THESE SECURITIES IN ANY JURISDICTION WHERE THE OFFER OR SALE IS NOT PERMITTED.
| | 122 of 156 |
| Structural and Collateral Term Sheet | JPMCC 2017-JP5 |
Centre Market Building |
| Mortgage Loan Information | Property Information | |||
| Mortgage Loan Seller: | JPMCB | Single Asset / Portfolio: | Single Asset | |
| Original Principal Balance: | $42,000,000 | Title: | Fee | |
| Cut-off Date Principal Balance: | $41,842,074 | Property Type - Subtype: | Office – CBD | |
| % of Pool by IPB: | 3.8% | Net Rentable Area (SF): | 388,122 | |
| Loan Purpose: | Refinance | Location: | Newark, NJ | |
| Borrower: | Centre Market Building, LLC | Year Built / Renovated: | 1922, 1967 / 2016 | |
| Sponsors: | Gerald S. Kaufman and | Occupancy: | 88.1% | |
| B. Jeremy Kaufman | Occupancy Date: | 10/17/2016 | ||
| Interest Rate: | 4.47500% | Number of Tenants: | 4 | |
| Note Date: | 12/8/2016 | 2013 NOI: | $11,276,169 | |
| Maturity Date: | 1/1/2027 | 2014 NOI: | $10,457,160 | |
| Interest-only Period: | None | 2015 NOI(1): | $10,842,646 | |
| Original Term: | 120 months | TTM NOI (as of 9/2016)(1)(2): | $9,734,256 | |
| Original Amortization: | 300 months | UW Economic Occupancy: | 85.0% | |
| Amortization Type: | Balloon | UW Revenues: | $13,947,168 | |
| Call Protection: | L(25),Grtr1%orYM(92),O(3) | UW Expenses: | $6,326,894 | |
| Lockbox: | CMA | UW NOI(2): | $7,620,274 | |
| Additional Debt: | N/A | UW NCF: | $6,921,654 | |
| Additional Debt Balance: | N/A | Appraised Value / Per SF: | $89,000,000 / $229 | |
| Additional Debt Type: | N/A | Appraisal Date: | 10/25/2016 | |
| Escrows and Reserves(3) | Financial Information | |||||||||
| Initial | Monthly | Initial Cap | Cut-off Date Loan / SF: | $108 | ||||||
| Taxes: | $565,953 | $143,863 | N/A | Maturity Date Loan / SF: | $79 | |||||
| Insurance: | $0 | Springing | N/A | Cut-off Date LTV: | 47.0% | |||||
| Replacement Reserves: | $6,469 | $6,469 | $388,120 | Maturity Date LTV: | 34.6% | |||||
| TI/LC: | $250,000 | $250,000 | $7,750,000 | UW NCF DSCR: | 2.48x | |||||
| Other: | $0 | $0 | N/A | UW NOI Debt Yield: | 18.2% | |||||
| Sources and Uses | ||||||
| Sources | Proceeds | % of Total | Uses | Proceeds | % of Total | |
| Mortgage Loan | $42,000,000 | 100.0% | Payoff Existing Debt | $38,715,433 | 92.2% | |
| Return of Equity | 1,801,298 | 4.3% | ||||
| Upfront Reserves | 822,422 | 2.0% | ||||
| Closing Costs | 660,847 | 1.6% | ||||
| Total Sources | $42,000,000 | 100.0% | Total Uses | $42,000,000 | 100.0% | |
| (1) | The decrease in TTM NOI from 2015 NOI was driven predominantly by a decrease in the US Customs and Border Protection’s additional rent component for maintenance contracts from approximately $2,889,186 to approximately $1,970,455 as part of its 2016 lease extension. The most recent maintenance amendment decreased the rent component for maintenance contracts based on recent historical costs. In addition, prior to its 2016 extension, US Customs and Border Protection’s rent included amortized reimbursements for tenant improvement upgrades. |
| (2) | The decrease in UW NOI from TTM NOI was driven predominantly by a one-time expense reimbursement of approximately $1,681,947 in December 2015 for the replacement of the roof. |
| (3) | For a full description of Escrows and Reserves, please refer to “Escrows and Reserves” below. |
The Loan.The Centre Market Building loan has an outstanding principal balance as of the Cut-off Date of approximately $41.8 million and is secured by a first mortgage lien on the borrower’s fee interest in a five-story, 388,122 square foot, Class B office building located in Newark, New Jersey. The loan has a 10-year term and will amortize on a 25-year schedule. The previous existing debt securing the property was originated by CIBX Commercial Mortgage, LLC and was securitized in the JPMCC 2012-CBX transaction.
The Borrower.The borrowing entity for the Centre Market Building loan is Centre Market Building, LLC, a New Jersey limited liability company and special purpose entity.
THE INFORMATION IN THIS STRUCTURAL AND COLLATERAL TERM SHEET IS NOT COMPLETE AND MAY BE AMENDED PRIOR TO THE TIME OF SALE. THIS TERM SHEET IS NOT AN OFFER TO SELL THESE SECURITIES AND IT IS NOT A SOLICITATION OF AN OFFER TO BUY THESE SECURITIES IN ANY JURISDICTION WHERE THE OFFER OR SALE IS NOT PERMITTED.
| | 123 of 156 |
| Structural and Collateral Term Sheet | JPMCC 2017-JP5 |
Centre Market Building |
The Loan Sponsors.The loan sponsors and nonrecourse carve-out guarantors for the loan are Chief Executive Officer, B. Jeremy Kaufman, and Senior Managing Director, Gerald S. Kaufman of Kaufman Jacobs, a Chicago-based real estate investment firm. According to the loan sponsors, Kaufman Jacobs was founded in 1947 and has since owned and managed tens of millions of square feet of commercial real estate with a focus on General Services Administration leased assets. The firm’s portfolio is comprised of individual investments and assets within Rubicon US REIT, which is a joint venture between affiliates of Kaufman Jacobs, Starwood Capital Group and JPMorgan Chase. Jeremy Kaufman has 20 years of experience in real estate, structured finance and project development, during which he has acquired and financed approximately $850.0 million in assets and has developed real asset projects internationally. Gerald Kaufman has 55 years of experience in real estate management, owning and managing a variety of asset classes nationally, and has over 30 years of experience managing property leased to government tenants. Kaufman Jacobs acquired the leasehold interest during the 1960s and later acquired the fee interest for the underlying land in 2006 for $13.0 million.
The Property.Centre Market Building is a five-story, 388,122 square foot, Class B office building located in the central business district of Newark, New Jersey and is situated on approximately 2.0 acres. The property was constructed in 1922 and expanded in 1967 when the third through fifth floors were added. In the 2000s, the property underwent several improvements, including a building re-skinning in 2011, a repainting and recarpeting of all common areas in 2013 and a roof replacement in 2016. All improvements were completed by the loan sponsors except for the roof replacement, which was completed by the US Customs and Border Protection (“CBP”). Additionally, the property contains 230 spaces in an underground parking garage, resulting in a parking ratio of approximately 0.6 spaces per 1,000 square feet of net rentable area.
As of October 17, 2016, the property was 88.1% occupied by four office tenants. The largest tenant at the property, CBP, first leased its space in April 2002 and currently leases 56.0% of the net rentable area. CBP most recently extended its lease for four years from June 2016 through May 2020. CBP was created as part of the Department of Homeland Security and employs approximately 60,000 people. According to the appraisal, CBP has invested more than $20.0 million into its space (approximately $92.00 per square foot) to build a cafeteria, a fitness center, an indoor shooting range and a rooftop green house. CBP’s space also includes one of four port materials testing labs in the nation. Furthermore, in 2015 and 2016, CBP replaced and upgraded the roof for $3.5 million in order to support its lab space in the building. CBP accounts for 73.5% of underwritten base rent at the property. The second largest tenant, the Drug Enforcement Administration (“DEA”), first leased its space in July 1996 and currently leases 23.1% of the net rentable area. DEA most recently extended its lease for 11 years from May 2012 through June 2023. DEA accounts for 18.4% of underwritten base rent at the property. DEA is a United States federal law enforcement agency under the U.S. Department of Justice, focusing on the enforcement of federal drug laws. The property serves as DEA’s New Jersey Division headquarters. The third largest tenant, the US Social Security Administration (“SSA”), first leased its space in October 2003 and currently leases 6.5% of the net rentable area. SSA most recently extended its lease for four years from October 2016 through September 2020. SSA is an independent agency of the U.S. federal government that assigns social security numbers and administers retirement, survivors and disability insurance programs collectively known as Social Security. SSA accounts for 6.0% of underwritten base rent at the property.
The property is located in the city of Newark, New Jersey’s largest populated urban center, and is approximately 10.0 miles west of New York City. Newark’s downtown central business district consists of a majority of the city’s office buildings, including the Gateway Complex, an office, retail and hotel development encompassing a total rentable building area of over 2.0 million square feet. Newark’s central business district has also undergone three major entertainment projects over the past two decades, including the construction of the New Jersey Performing Arts Center (“NJPAC”), which includes the 2,750-seat Great Hall and the 500-seat Victoria Theater, the completion of the Prudential Center, an approximately 18,000-seat sports arena, which is home to the National Hockey League’s New Jersey Devils and the construction of the Panasonic North American Headquarters. The NJPAC, Prudential Center and Panasonic North American Headquarters are all approximately 0.3 miles away from the property. According to the appraisal, Newark also has approximately $2.0 billion in commercial and residential development currently underway, consisting of residential, mixed-use, retail and student housing projects.
The property benefits from a number of interstate highways, which run through Newark, including the New Jersey Turnpike approximately 4.0 miles to the east, the Garden State Parkway approximately 3.4 miles to the west, Interstate 78 approximately 1.0 miles to the south and Interstate 280 approximately 1.6 miles to the north. U.S. Routes 1, 9, 22 and State Route 21 also run through Newark. Newark hosts a rail and bus service hub from Newark’s Pennsylvania Station, which serves as a stop for New Jersey Transit, Amtrak, the Port Authority Trans-Hudson rail operation and the Newark City Subway. Newark’s Pennsylvania Station lies 0.3 miles away from the property. The Newark Liberty International Airport is located approximately 2.0 miles south of Downtown Newark and 5.0 miles south of the property.
THE INFORMATION IN THIS STRUCTURAL AND COLLATERAL TERM SHEET IS NOT COMPLETE AND MAY BE AMENDED PRIOR TO THE TIME OF SALE. THIS TERM SHEET IS NOT AN OFFER TO SELL THESE SECURITIES AND IT IS NOT A SOLICITATION OF AN OFFER TO BUY THESE SECURITIES IN ANY JURISDICTION WHERE THE OFFER OR SALE IS NOT PERMITTED.
| | 124 of 156 |
| Structural and Collateral Term Sheet | JPMCC 2017-JP5 |
Centre Market Building |
According to the appraisal, the property is located in the Urban Essex office submarket of Central New Jersey. As of the second quarter of 2016, the submarket was comprised of approximately 12.5 million square feet of office space with an overall vacancy of 20.2% and average office rents of $26.30 per square foot. This compares to 11.9% and $38.61 per square foot, respectively, at the Centre Market Building property. The appraisal identified 11 competitive properties built between 1971 and 2015 and ranging in size from approximately 315,000 to 1.0 million square feet. The comparable properties reported an overall occupancy of 83.3%, compared to 88.1% for the property. The appraisal did not identify any approved office buildings for construction in the Newark central business district.
| Historical and Current Occupancy(1) | |||
| 2013 | 2014 | 2015 | Current(2) |
| 97.0% | 88.1% | 88.1% | 88.1% |
| (1) | Historical Occupancies are as of December 31 of each respective year. |
| (2) | Current Occupancy is as of October 17, 2016. |
| Tenant Summary(1) | ||||||
| Tenant | Ratings(2) Moody’s/S&P/Fitch | Net Rentable Area (SF) | % of Total NRA | Base Rent PSF | % of Total Base Rent | Lease Expiration Date |
| US Customs and Border Protection(3) | Aaa / AA+ / AAA | 217,419 | 56.0% | $45.97 | 73.5% | 5/31/2020 |
| Drug Enforcement Administration | Aaa / AA+ / AAA | 89,469 | 23.1% | $27.91 | 18.4% | 6/30/2023 |
| US Social Security Administration(4) | Aaa / AA+ / AAA | 25,412 | 6.5% | $32.16 | 6.0% | 9/30/2020 |
| Cambridge Security | NA / NA / NA | 9,575 | 2.5% | $30.08 | 2.1% | 8/31/2022 |
| (1) | Based on the underwritten rent roll. |
| (2) | Ratings provided are for the parent company of the entity listed in the “Tenant” field whether or not the parent company guarantees the lease. |
| (3) | CBP has a one-time right to terminate its lease as of May 31, 2019 with 180 days’ written notice. |
| (4) | SSA has the right at any time to terminate its lease on or after May 31, 2019 with 180 days’ written notice. |
| Lease Rollover Schedule(1) | |||||||||
| Year | Number of Leases Expiring | Net Rentable Area Expiring | % of NRA Expiring | Base Rent Expiring | % of Base Rent Expiring | Cumulative Net Rentable Area Expiring | Cumulative % of NRA Expiring | Cumulative Base Rent Expiring | Cumulative % of Base Rent Expiring |
| Vacant | NAP | 46,247 | 11.9% | NAP | NAP | 46,247 | 11.9% | NAP | NAP |
| 2017 & MTM | 0 | 0 | 0.0% | $0 | 0.0% | 46,247 | 11.9% | $0 | 0.0% |
| 2018 | 0 | 0 | 0.0% | $0 | 0.0% | 46,247 | 11.9% | $0 | 0.0% |
| 2019 | 0 | 0 | 0.0% | $0 | 0.0% | 46,247 | 11.9% | $0 | 0.0% |
| 2020 | 2 | 242,831 | 62.6% | $10,812,196 | 79.5% | 289,078 | 74.5% | $10,812,196 | 79.5% |
| 2021 | 0 | 0 | 0.0% | $0 | 0.0% | 289,078 | 74.5% | $10,812,196 | 79.5% |
| 2022 | 1 | 9,575 | 2.5% | $288,028 | 2.1% | 298,653 | 76.9% | $11,100,224 | 81.6% |
| 2023 | 1 | 89,469 | 23.1% | $2,497,080 | 18.4% | 388,122 | 100.0% | $13,597,304 | 100.0% |
| 2024 | 0 | 0 | 0.0% | $0 | 0.0% | 388,122 | 100.0% | $13,597,304 | 100.0% |
| 2025 | 0 | 0 | 0.0% | $0 | 0.0% | 388,122 | 100.0% | $13,597,304 | 100.0% |
| 2026 | 0 | 0 | 0.0% | $0 | 0.0% | 388,122 | 100.0% | $13,597,304 | 100.0% |
| 2027 | 0 | 0 | 0.0% | $0 | 0.0% | 388,122 | 100.0% | $13,597,304 | 100.0% |
| 2028 & Beyond | 0 | 0 | 0.0% | $0 | 0.0% | 388,122 | 100.0% | $13,597,304 | 100.0% |
| Total | 4 | 388,122 | 100.0% | $13,597,304 | 100.0% | ||||
| (1) | Based on the underwritten rent roll. |
THE INFORMATION IN THIS STRUCTURAL AND COLLATERAL TERM SHEET IS NOT COMPLETE AND MAY BE AMENDED PRIOR TO THE TIME OF SALE. THIS TERM SHEET IS NOT AN OFFER TO SELL THESE SECURITIES AND IT IS NOT A SOLICITATION OF AN OFFER TO BUY THESE SECURITIES IN ANY JURISDICTION WHERE THE OFFER OR SALE IS NOT PERMITTED.
| | 125 of 156 |
| Structural and Collateral Term Sheet | JPMCC 2017-JP5 |
Centre Market Building |
| Operating History and Underwritten Net Cash Flow | |||||||
2013 | 2014 | 2015 | TTM(1) | Underwritten | Per Square Foot | %(2) | |
| Rents in Place | $15,775,544 | $15,374,494 | $15,587,089 | $14,964,775 | $13,597,304 | $35.03 | 82.9% |
| Vacant Income | 0 | 0 | 0 | 0 | 1,387,410 | 3.57 | 8.5% |
| Gross Potential Rent | $15,775,544 | $15,374,494 | $15,587,089 | $14,964,775 | $14,984,714 | $38.61 | 91.3% |
| CAM Reimbursements | 1,578,783 | 1,294,326 | 1,375,438 | 1,026,366 | 1,421,532 | 3.66 | 8.7% |
| Net Rental Income | $17,354,327 | $16,668,820 | $16,962,527 | $15,991,141 | $16,406,246 | $42.27 | 100.0% |
| (Vacancy/Credit Loss) | 0 | 0 | 0 | 0 | (2,460,937) | (6.34) | (15.0) |
| Other Income | 1,714 | 1,861 | 1,859 | 1,976 | 1,859 | 0.00 | 0.0% |
| Effective Gross Income | $17,356,041 | $16,670,681 | $16,964,386 | $15,993,117 | $13,947,168 | $35.94 | 85.0% |
| Total Expenses | $6,079,872 | $6,213,521 | $6,121,740 | $6,258,861 | $6,326,894 | $16.30 | 45.4% |
| Net Operating Income(3)(4) | $11,276,169 | $10,457,160 | $10,842,646 | $9,734,256 | $7,620,274 | $19.63 | 54.6% |
| Total TI/LC, Capex/RR | 0 | 0 | 0 | 0 | 698,620 | 1.80 | 5.0% |
| Net Cash Flow | $11,276,169 | $10,457,160 | $10,842,646 | $9,734,256 | $6,921,654 | $17.83 | 49.6% |
| (1) | TTM represents the trailing 12-month period ending on September 30, 2016. |
| (2) | % column represents percent of Net Rental Income for all revenue lines and represents percent of Effective Gross Income for the remainder of the fields. |
| (3) | The decrease in TTM Net Operating Income from 2015 Net Operating Income was driven predominantly by a decrease in CBP’s additional rent component for maintenance contracts from approximately $2,889,186 to approximately $1,970,455 as part of their 2016 lease extension. The most recent maintenance amendment decreased the rent component for maintenance contracts based on recent historical costs. In addition, prior to its 2016 extension, CBP’s rent included amortized reimbursements for tenant improvement upgrades. |
| (4) | The decrease in UW Net Operating Income from TTM Net Operating Income was driven predominantly by a one-time expense reimbursement of approximately $1,681,947 in December 2015. |
Property Management.The property is managed by KJ Onsite LLC, an affiliate of the borrower.
Escrows and Reserves.At origination, the borrower deposited into escrow approximately $565,953 for tax reserves, $250,000 for tenant improvement and leasing commission reserves and approximately $6,469 for replacement reserves.
Tax Escrows -On a monthly basis, the borrower is required to escrow 1/12 of the annual estimated tax payments, which currently equates to $143,863.
Insurance Escrows - The requirement for the borrower to make monthly deposits to the insurance escrow is waived so long as (i) no event of default exists and (ii) the borrower provides satisfactory evidence that the property is insured under an acceptable blanket policy in accordance with the loan documents.
Replacement Reserves - On a monthly basis, the borrower is required to escrow approximately $6,469 for ongoing replacement reserves (approximately $0.20 per square foot annually). The replacement reserve is subject to a cap of $388,120 (approximately $1.00 per square foot).
TI/LC Reserves -On a monthly basis, the borrower is required to deposit $250,000 ($7.73 per square foot annually) for tenant improvements and leasing commissions from the origination date through the payment date in January 2021. From the payment date in February 2021 until and including the payment date in September 2023, the borrower is required to deposit approximately $208,333 ($6.44 per square foot annually) on a monthly basis. From the payment date in October 2023 through the end of the term, the monthly deposit will be equal to $56,000 ($1.73 per square foot annually). In addition, the borrower is required to deposit all excess cash flow after debt service, required reserves and operating expenses into the tenant improvement and leasing commission reserve during the continuance of a Cash Sweep Event (as defined below) caused solely by a Tenant Trigger Event (as defined below), as well as any termination fees received by the borrower. The reserve is subject to a cap of $7,750,000 (approximately $19.97 per square foot). However, starting on October 1, 2023 through and including the maturity date, if CBP executes a new lease with the borrower for a term expiring between September 30, 2023 and September 29, 2028, the cap will be reduced to $5,500,000. If CBP and the borrower execute a new lease for a term expiring between September 30, 2028 and September 30, 2030, the cap will be reduced to $2,500,000. If CBP and the borrower execute a new lease for a term expiring after September 30, 2030 and DEA and the borrower renew DEA’s lease in accordance with the loan documents or execute a new lease with base rent of not less than 85% of the then-current base rent for a term expiring after June 30, 2028, among other conditions, the cap will be reduced to $0.
THE INFORMATION IN THIS STRUCTURAL AND COLLATERAL TERM SHEET IS NOT COMPLETE AND MAY BE AMENDED PRIOR TO THE TIME OF SALE. THIS TERM SHEET IS NOT AN OFFER TO SELL THESE SECURITIES AND IT IS NOT A SOLICITATION OF AN OFFER TO BUY THESE SECURITIES IN ANY JURISDICTION WHERE THE OFFER OR SALE IS NOT PERMITTED.
| | 126 of 156 |
| Structural and Collateral Term Sheet | JPMCC 2017-JP5 |
Centre Market Building |
Lockbox / Cash Management.The loan is structured with a CMA lockbox. The borrower and manager were required within 10 calendar days after the origination date to deliver tenant direction letters instructing tenants to deposit rents into a lockbox account controlled by the lender. All funds in the lockbox account are required to be transferred to an account designated by the borrower unless a Cash Sweep Event is continuing, in which event such funds are required to be swept on each business day into a cash management account controlled by the lender and disbursed on each payment date in accordance with the loan documents.
A “Cash Sweep Event” means the occurrence of (i) an event of default, (ii) the bankruptcy or insolvency of the borrower or the property manager, (iii) the date the debt service coverage ratio (as calculated in the loan documents) falls below 1.65x based on a trailing three-month basis or (iv) CBP or DEA (a) terminating its lease or (b) failing to renew its lease on or before six months prior to expiration of its lease, but in each case only to the extent that the balance in the TI/LC Reserve is less than the applicable cap (a “Tenant Trigger Event”).
A Cash Sweep Event may be cured by the following: if the Cash Sweep Event is caused solely by (a) clause (i) above, the acceptance by the lender of a cure of such event of default, (b) clause (ii) above only with respect to the property manager, the lender replacing such property manager with a qualified manager under a replacement management agreement within sixty days, (c) clause (iii) above, the achievement of a debt service coverage ratio for two consecutive quarters of 1.70x or greater based on the trailing three-month period, or (d) clause (iv) above, the execution of a new lease for the applicable tenant or a replacement lease in accordance with the loan documents. Each cure is also subject to the following limitations: (1) there is no other event of default continuing under the loan documents; (2) a Cash Sweep Event caused by an event of default or a bankruptcy or insolvency action of the property manager may be cured no more than three times during the term of the loan; (3) the borrower pays all of the lender’s reasonable expenses actually incurred in connection with such cure; and (4) the borrower may not cure a bankruptcy or insolvency action of the borrower.
THE INFORMATION IN THIS STRUCTURAL AND COLLATERAL TERM SHEET IS NOT COMPLETE AND MAY BE AMENDED PRIOR TO THE TIME OF SALE. THIS TERM SHEET IS NOT AN OFFER TO SELL THESE SECURITIES AND IT IS NOT A SOLICITATION OF AN OFFER TO BUY THESE SECURITIES IN ANY JURISDICTION WHERE THE OFFER OR SALE IS NOT PERMITTED.
| | 127 of 156 |
| Structural and Collateral Term Sheet | JPMCC 2017-JP5 | |
| Courtyard Marriott – King Kamehameha | ||

THE INFORMATION IN THIS STRUCTURAL AND COLLATERAL TERM SHEET IS NOT COMPLETE AND MAY BE AMENDED PRIOR TO THE TIME OF SALE. THIS TERM SHEET IS NOT AN OFFER TO SELL THESE SECURITIES AND IT IS NOT A SOLICITATION OF AN OFFER TO BUY THESE SECURITIES IN ANY JURISDICTION WHERE THE OFFER OR SALE IS NOT PERMITTED.
| | 128 of 156 |
| Structural and Collateral Term Sheet | JPMCC 2017-JP5 | |
| Courtyard Marriott – King Kamehameha | ||
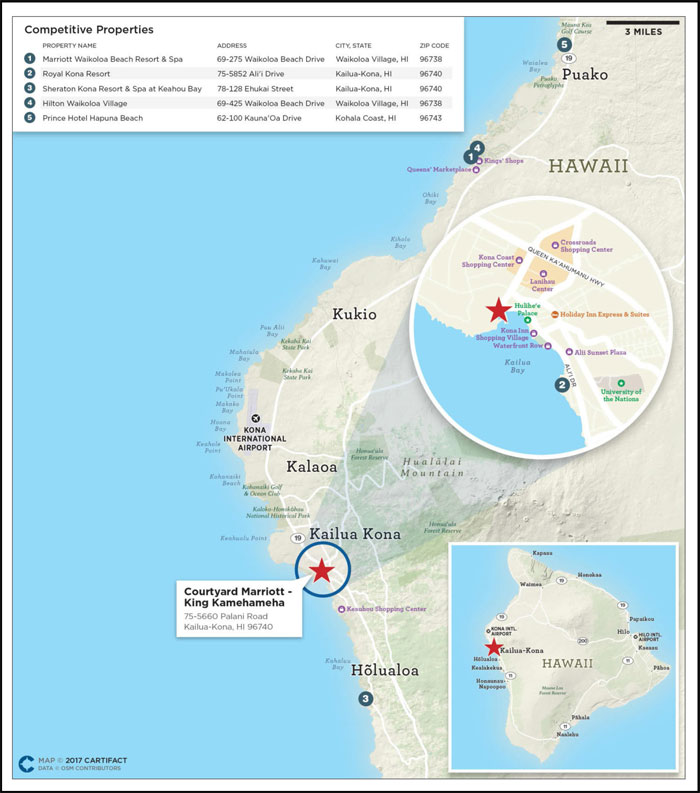
THE INFORMATION IN THIS STRUCTURAL AND COLLATERAL TERM SHEET IS NOT COMPLETE AND MAY BE AMENDED PRIOR TO THE TIME OF SALE. THIS TERM SHEET IS NOT AN OFFER TO SELL THESE SECURITIES AND IT IS NOT A SOLICITATION OF AN OFFER TO BUY THESE SECURITIES IN ANY JURISDICTION WHERE THE OFFER OR SALE IS NOT PERMITTED.
| | 129 of 156 |
| Structural and Collateral Term Sheet | JPMCC 2017-JP5 | |
| Courtyard Marriott – King Kamehameha | ||
| Mortgage Loan Information | Property Information | |||
| Mortgage Loan Seller: | JPMCB | Single Asset / Portfolio: | Single Asset | |
| Original Principal Balance(1): | $40,000,000 | Title: | Leasehold | |
| Cut-off Date Principal Balance(1): | $39,945,058 | Property Type - Subtype: | Hotel - Full Service | |
| % of Pool by IPB: | 3.7% | Net Rentable Area (Rooms): | 452 | |
| Loan Purpose: | Refinance | Location: | Kailua-Kona, HI | |
| Borrower: | IWF KKH, LLC | Year Built / Renovated: | 1975 / 2011 | |
| Sponsor: | Invest West Financial | Occupancy / ADR / RevPAR: | 85.1% / $152.16 / $129.41 | |
| Corporation | Occupancy / ADR / RevPAR Date: | 11/30/2016 | ||
| Interest Rate(2): | 4.81000% | Number of Tenants: | N/A | |
| Note Date: | 1/10/2017 | 2013 NOI: | $4,617,341 | |
| Maturity Date: | 2/1/2027 | 2014 NOI: | $6,055,229 | |
| Interest-only Period: | None | 2015 NOI: | $6,789,578 | |
| Original Term: | 120 months | TTM NOI (as of 11/2016): | $7,522,657 | |
| Original Amortization(3): | 360 months | UW Occupancy / ADR / RevPAR: | 85.1% / $152.16 / $129.42 | |
| Amortization Type: | Balloon | UW Revenues: | $30,134,131 | |
| Call Protection: | L(25),Grtr1%orYM(90),O(5) | UW Expenses: | $22,711,533 | |
| Lockbox: | CMA | UW NOI: | $7,422,598 | |
| Additional Debt(1): | Yes | UW NCF: | $7,422,598 | |
| Additional Debt Balance(1): | $14,979,397 | Appraised Value / Per Room: | $133,000,000 / $294,248 | |
| Additional Debt Type(1): | B-Note | Appraisal Date: | 10/3/2016 | |
| Escrows and Reserves(4) | Financial Information(1) | ||||||
| Initial | Monthly | Initial Cap | A Note | Whole Loan | |||
| Taxes: | $38,955 | $38,984 | N/A | Cut-off Date Loan / Room: | $88,374 | $121,514 | |
| Insurance: | $0 | Springing | N/A | Maturity Date Loan / Room: | $74,309 | $102,174 | |
| FF&E: | $81,532 | 4% of Gross Revenues | N/A | Cut-off Date LTV: | 30.0% | 41.3% | |
| TI/LC: | $0 | $0 | N/A | Maturity Date LTV: | 25.3% | 34.7% | |
| Other: | $459,021 | $421,178 | N/A | UW NCF DSCR(5): | 3.06x | 1.94x | |
| UW NOI Debt Yield: | 18.6% | 13.5% | |||||
| Sources and Uses | ||||||
| Sources | Proceeds | % of Total | Uses | Proceeds | % of Total | |
| A-Note(1) | $40,000,000 | 68.4% | Repay Existing Debt | $56,747,833 | 97.0% | |
| B-Note(1) | 15,000,000 | 25.6 | Closing Costs | 1,175,539 | 2.0% | |
| Sponsor Equity | 3,502,881 | 6.0 | Upfront Reserves | 579,508 | 1.0% | |
| Total Sources | $58,502,881 | 100.0% | Total Uses | $58,502,881 | 100.0% | |
| (1) | The Courtyard Marriott - King Kamehameha loan is part of a whole loan with an outstanding principal balance as of the Cut-off Date of approximately $54.9 million which is comprised of a senior A-Note with an outstanding principal balance as of the Cut-off Date of approximately $39.9 million, and a Subordinate Companion Loan with an outstanding principal balance as of the Cut-off Date of approximately $15.0 million. The A-Note Financial Information presented in the chart above reflects the Cut-off Date balance of the approximately $39.9 million senior A-Note portion of the Courtyard Marriott - King Kamehameha Whole Loan, exclusive of the approximately $15.0 million Subordinate Companion Loan. |
| (2) | The Interest Rate reflects the interest rate on the A-Note and is 4.81000%. The interest rate for the Subordinate Companion Loan is 8.00000%per annum. |
| (3) | The Courtyard Marriott - King Kamehameha Whole Loan will amortize in accordance with the amortization schedule set forth in Annex G to the Preliminary Prospectus. |
| (4) | For a full description of Escrows and Reserves, please refer to“Escrows and Reserves”below. |
| (5) | The UW NCF DSCR is calculated using the sum of principal and interest payments over the first 12 payments allocable to the mortgage loan following the Cut-off Date based on apro rata allocation between the A-Note and Subordinate Companion Loan of principal payable on the Courtyard Marriott - King Kamehameha Whole Loan. |
THE INFORMATION IN THIS STRUCTURAL AND COLLATERAL TERM SHEET IS NOT COMPLETE AND MAY BE AMENDED PRIOR TO THE TIME OF SALE. THIS TERM SHEET IS NOT AN OFFER TO SELL THESE SECURITIES AND IT IS NOT A SOLICITATION OF AN OFFER TO BUY THESE SECURITIES IN ANY JURISDICTION WHERE THE OFFER OR SALE IS NOT PERMITTED.
| | 130 of 156 |
| Structural and Collateral Term Sheet | JPMCC 2017-JP5 | |
| Courtyard Marriott – King Kamehameha | ||
The Loan.The Courtyard Marriott - King Kamehameha loan is secured by a first mortgage lien on the leasehold interest in a 452-room full service hotel located in Kailua-Kona, Hawaii. The whole loan has an outstanding principal balance as of the Cut-off Date of approximately $54.9 million (the “Courtyard Marriott - King Kamehameha Whole Loan”), and is comprised of a senior note, with an outstanding principal balance as of the Cut-off Date of approximately $39.9 million (the “Courtyard Marriott - King Kamehameha A-Note” or “A-Note”), and a subordinate B-Note with an outstanding principal balance as of the Cut-off Date of approximately $15.0 million (the “Courtyard Marriott - King Kamehameha Subordinate Companion Loan” or “Subordinate Companion Loan”). The Courtyard Marriott - King Kamehameha A-Note is being contributed to the JPMCC 2017-JP5 Trust. The Courtyard Marriott - King Kamehameha Subordinate Companion Loan was sold to a third party investor. Under the related intercreditor agreement, prior to a control appraisal period with respect to the Courtyard Marriott - King Kamehameha Subordinate Companion Loan, under certain circumstances, the holder of the Courtyard Marriott - King Kamehameha Subordinate Companion Loan will have the right to approve certain major decisions with respect to the Courtyard Marriott - King Kamehameha Whole Loan, to exercise certain cure and consultation rights and to replace the related special servicer with or without cause. In addition, the holder of the Courtyard Marriott - King Kamehameha Subordinate Companion Loan has the right to purchase the Courtyard Marriott - King Kamehameha A-Note after the occurrence and during the continuance of an event of default under the Courtyard Marriott - King Kamehameha Whole Loan documents. After a control appraisal period occurs with respect to the Courtyard Marriott - King Kamehameha Subordinate Companion Loan, the holder of the Courtyard Marriott - King Kamehameha A-Note, will be entitled to exercise the rights of the controlling noteholder with respect to the Courtyard Marriott - King Kamehameha Whole Loan. The Courtyard Marriott - King Kamehameha Whole Loan has a 10-year term and will amortize in accordance with the amortization schedule set forth in Annex G to the Preliminary Prospectus. The previously existing debt securing the property was securitized in MSBAM 2014-C17.
| Whole Loan Summary | |||||||
| Note | Original Balance | Cut-off Date Balance | Note Holder | Controlling Piece | |||
| A | $40,000,000 | $39,945,058 | JPMCC 2017-JP5 | No | |||
| B | 15,000,000 | 14,979,397 | Third Party Investor | Yes | |||
| Total | $55,000,000 | $54,924,454 | |||||
The Borrower. The borrowing entity for the Courtyard Marriott - King Kamehameha Whole Loan is IWF KKH, LLC, a Delaware limited liability company.
The Loan Sponsor. The loan sponsor and nonrecourse carve-out guarantor is Invest West Financial Corporation (“Invest West”), a full service real estate and private equity investment firm based in Santa Barbara, California. Invest West was founded by chairman Dale J. Marquis who is also the founder and chairman of Pacifica Hotel Company and chairman of the board of Invest West Capital Corporation, a closely held venture capital company. Mr. Marquis has been involved with the acquisition or development of over 130 real estate investment projects, including over 30 hotel projects.
According to the loan sponsor, from 2008 to 2010 the property underwent approximately $35.2 million of capital improvements ($77,876 per room) in which the guest rooms were gut-renovated. They received new carpet, paint, bedding, drapes, furniture, lighting, artwork, flat panel televisions and lanai furniture. The loan sponsor converted the property to a Courtyard by Marriott in November 2011 after completion of a $1.5 million property improvement plan. Property improvement plans since that time have included updates to the east tower guest rooms, Courtyard systems and signage, landscaping and installation of LED lighting throughout the property. The borrower is in the process of negotiating a new property improvement plan with the franchisor, which is expected to cost approximately $4.5 million and will include renovations to the public areas, exercise rooms, meeting rooms, elevators, Honu’s restaurant, guest rooms and bathrooms.
Prior Loan Disclosure.The loan sponsor acquired the property in 2007 using the proceeds of a loan from Santa Barbara Bank & Trust. The loan sponsor used the proceeds of the prior loan to acquire the property and renovate it to re-position the hotel with a major franchise. In June 2010, the loan sponsor failed to make a debt service payment to the prior lender. The prior loan was modified in May 2011 to reduce the interest rate and to sweep excess cash flow from the property to the lender. The prior loan was also subsequently amended to extend the interest only period to February 2014 and increase the interest rate. In May 2014, JPMCB purchased the prior note for 95.7% of the then-current principal balance, resulting in a 4.3% loss to the prior lender. At the time of origination of the current loan in January 2017, the prior loan originated in 2007 was performing with no defaults.
THE INFORMATION IN THIS STRUCTURAL AND COLLATERAL TERM SHEET IS NOT COMPLETE AND MAY BE AMENDED PRIOR TO THE TIME OF SALE. THIS TERM SHEET IS NOT AN OFFER TO SELL THESE SECURITIES AND IT IS NOT A SOLICITATION OF AN OFFER TO BUY THESE SECURITIES IN ANY JURISDICTION WHERE THE OFFER OR SALE IS NOT PERMITTED.
| | 131 of 156 |
| Structural and Collateral Term Sheet | JPMCC 2017-JP5 | |
| Courtyard Marriott – King Kamehameha | ||
The Property. Courtyard Marriott - King Kamehameha is a two-tower, 452-room, full service hotel located in Kailua-Kona, Hawaii. The property was originally developed in 1975 and renovated from 2008 to 2010 for approximately $35.2 million. The property was then converted to a Courtyard by Marriott in 2011 after completion of a $1.5 million property improvement plan. The hotel offers 14,337 square feet of indoor meeting space and 11,200 square feet of outdoor venue space. The Kamakahonu Ballroom is 5,200 square feet and has a 2,500 square foot pre-function space that can be divided into four separate meeting rooms. Additional amenities at the property include a business center, pool, full-service spa, tennis courts, fitness facilities, and a white-sand beach. Additionally, the property features three food and beverage options including Honu’s on the Beach, Billfish Bar, and Menehune Coffee Company. The property also hosts The Island Breeze Hawaiian Lu’au four nights a week which offers a buffet with Hawaiian food, Polynesian entertainment and complimentary drinks. The property contains 386 surface parking spaces for a parking ratio of approximately 0.85 spaces per room.
The property has 452 rooms, including 145 king rooms, 302 double queen rooms and 5 suites. The guest rooms are located between two six-story towers, the east tower and west tower, which are connected via an interior corridor. Each guest room features a coffeemaker, hairdryer, iron/ironing board, safe, refrigerator, flat-panel television, wireless internet access and a balcony with a table and two chairs. In addition, most guest rooms feature a partial or full ocean view.
The Courtyard Marriott - King Kamehameha property is located along the west side of Palani Road with an oceanfront location on the north side of Kailua Bay, approximately 8.1 miles from Kona International Airport at Keahole. Palani Road is one of the main roadways into downtown Kailua-Kona and the Kona beachfront along Alii Drive. The Kona International Airport was expanded and renovated as a part of the larger $2.3 billion Hawaii Airports Modernization Program. In 2015, arrivals at Hawaii’s Big Island airports, the majority of which come through Kona Airport, totaled approximately 1.5 million passengers, a 3.8% increase from 2014. Kailua-Kona is the second most populated city on Hawaii’s Big Island and is West Hawaii’s government, commercial and industrial center. According to the appraisal, due to the increasing number of domestic and international flights, large retailers such as Costco, K-Mart and Wal-Mart, as well as international sporting events, are becoming more prevalent in Kailua-Kona in addition to increasing tourism. Hawaii airports served approximately 8.6 million passengers in 2015, up 4.1% from the 8.3 million passengers in 2014. Hawaii Airlines and other major airlines serving Hawaii have added a variety of flights to its schedule, making the island more accessible to tourists. In December 2013, WestJet added a daily non-stop flight from Vancouver to Kona and Kauai. Alaska Airlines added two flights in March 2013, which include non-stop service from San Jose to Kauai and non-stop service from Oakland to Kauai. Allegiant Air announced $99 fares from Los Angeles to Honolulu in 2013 and Hawaiian Airlines began non-stop service from New York’s John F. Kennedy Airport to Honolulu in August 2013. Hawaiian Air also announced a 294-passenger non-stop flight from Honolulu to Beijing, which began in April 2014. Hawaiian Airlines started to offer non-stop flights between Kona and Tokyo on December 20, 2016.
The property is located near Kuakini Highway and Queen Ka’ahumanu Highway, which are approximately 0.1 miles northeast and 0.5 miles northeast of the property, respectively. Queen Ka’ahumanu Highway connects the property to Kona International Airport and the town of Kailua-Kona. Kauli-Kona benefits from its beaches, landscape, temperate climate, culture and tourism infrastructure. Hawaii’s location between the United States, China and Japan helps fuel its economy and the tourism industry. Additional demand generators include Hawaii Volcanoes National Park, a 333,000 acre park that houses two active volcanoes, Mauna Loa and Kilauea, an inactive volcano, Mauna Kea, also known as “white mountain” because of the snow covered peaks during the winter months, and numerous recreational activities including golf, sport fishing, hiking, snorkeling and whale watching. According to the appraisal, as of 2015, the estimated population within a one-, three- and five-mile radius was 2,520, 18,473 and 27,044, respectively.
The appraisal did not identify any proposed or under construction hotels as directly competitive properties. The Marriott Waikoloa Beach Resort & Spa, which is in the property’s primary competitive set, recently began converting its original 260-room south tower into a 112-unit timeshare condominium that will be operated by Marriott Vacation Club. As such, beginning in April 2016, inventory at the hotel decreased from 555 rooms to 295 available rooms. The Hilton Waikoloa Village is also converting one of its guest room towers into timeshare units, which is expected to reduce its room count from 1,241 to 641.
THE INFORMATION IN THIS STRUCTURAL AND COLLATERAL TERM SHEET IS NOT COMPLETE AND MAY BE AMENDED PRIOR TO THE TIME OF SALE. THIS TERM SHEET IS NOT AN OFFER TO SELL THESE SECURITIES AND IT IS NOT A SOLICITATION OF AN OFFER TO BUY THESE SECURITIES IN ANY JURISDICTION WHERE THE OFFER OR SALE IS NOT PERMITTED.
| | 132 of 156 |
| Structural and Collateral Term Sheet | JPMCC 2017-JP5 | |
| Courtyard Marriott – King Kamehameha | ||
| Historical Occupancy, ADR, RevPAR(1) | |||||||||||
| Competitive Set(2) | Courtyard Marriott – King Kamehameha(3) | Penetration Factor(4) | |||||||||
| Year | Occupancy | ADR | RevPAR | Occupancy | ADR | RevPAR | Occupancy | ADR | RevPAR | ||
| 2013 | 65.2% | $178.43 | $116.41 | 81.2% | $131.64 | $106.95 | 124.5% | 73.8% | 91.9% | ||
| 2014 | 68.9% | $180.40 | $124.35 | 84.3% | $138.94 | $117.06 | 122.3% | 77.0% | 94.1% | ||
| 2015 | 72.9% | $180.34 | $131.44 | 83.8% | $146.13 | $122.41 | 115.0% | 81.0% | 93.1% | ||
| TTM(5) | 78.2% | $167.71 | $131.08 | 85.1% | $152.16 | $129.41 | 108.9% | 90.7% | 98.7% | ||
| (1) | The minor variances between the underwriting, the appraisal and the above table with respect to Occupancy, ADR and RevPAR at the Courtyard Marriott - King Kamehameha property are attributable to variances in reporting methodologies and/or timing differences. |
| (2) | Data provided by STR, Inc. The competitive set contains the following properties: Marriott Waikoloa Beach Resort & Spa, Royal Kona Resort, Sheraton Kona Resort & Spa at Keahou Bay, Hilton Waikoloa Village and Prince Hotel Hapuna Beach. |
| (3) | Based on operating statements provided by the borrower. |
| (4) | Penetration Factor is calculated based on data provided by STR, Inc. for the competitive set and borrower-provided operating statements for the property. |
| (5) | TTM represents the trailing 12-month period ending on November 30, 2016. |
| Competitive Hotels Profile(1) | |||||||||
| 2015 Estimated Market Mix | 2015 Estimated Operating Statistics | ||||||||
| Property | Rooms | Year Opened | Meeting Space (SF) | Transient | Meeting and Group | Occupancy | ADR | RevPAR | |
| Courtyard Marriott - King Kamehameha(2) | 452 | 1975 | 25,531 | 79% | 16% | 83.8% | $146.13 | $122.41 | |
| Marriott Waikoloa Beach Resort & Spa | 295 | 1981 | 56,862 | 82% | 13% | 79.0% | $168.00 | $132.72 | |
| Royal Kona Resort | 393 | 1970 | 10,000 | 85% | 10% | 85.0% | $129.00 | $109.65 | |
| Sheraton Kona Resort & Spa at Keahou Bay | 509 | 1971 | 114,304 | 55% | 25% | 75.0% | $144.00 | $108.00 | |
| Hilton Waikoloa Village | 1,241 | 1988 | 410,000 | 50% | 30% | 67.0% | $213.00 | $142.71 | |
| Prince Hotel Hapuna Beach | 350 | 1994 | 85,000 | 80% | 15% | 68.0% | $225.00 | $153.00 | |
| Total(3) | 2,788 | ||||||||
| (1) | Based on the appraisal. |
| (2) | Occupancy, ADR, and RevPAR are based on operating statements provided by the borrower. |
| (3) | Excludes the Courtyard Marriott - King Kamehameha property. |
THE INFORMATION IN THIS STRUCTURAL AND COLLATERAL TERM SHEET IS NOT COMPLETE AND MAY BE AMENDED PRIOR TO THE TIME OF SALE. THIS TERM SHEET IS NOT AN OFFER TO SELL THESE SECURITIES AND IT IS NOT A SOLICITATION OF AN OFFER TO BUY THESE SECURITIES IN ANY JURISDICTION WHERE THE OFFER OR SALE IS NOT PERMITTED.
| | 133 of 156 |
| Structural and Collateral Term Sheet | JPMCC 2017-JP5 | |
| Courtyard Marriott – King Kamehameha | ||
| Operating History and Underwritten Net Cash Flow | |||||||
| 2013 | 2014 | 2015 | TTM(1) | Underwritten | Per Room(2) | % of Total Revenue(3) | |
| Occupancy | 81.2% | 84.3% | 83.8% | 85.1% | 85.1% | ||
| ADR | $131.64 | $138.94 | $146.13 | $152.16 | $152.16 | ||
| RevPAR | $106.95 | $117.06 | $122.41 | $129.41 | $129.42 | ||
| Room Revenue | $17,645,334 | $19,313,208 | $20,195,757 | $21,409,356 | $21,350,927 | $47,237 | 70.9% |
| Food and Beverage Revenue | 5,742,295 | 6,013,601 | 6,324,427 | 6,535,326 | 6,517,490 | 14,419 | 21.6% |
| Parking/Other Rental Revenue | 989,106 | 1,113,319 | 1,177,274 | 1,278,675 | 1,275,185 | 2,821 | 4.2% |
| Other Departmental Revenue | 699,225 | 845,163 | 923,564 | 962,384 | 990,529 | 2,191 | 3.3% |
| Total Revenue | $25,075,960 | $27,285,291 | $28,621,022 | $30,185,741 | $30,134,131 | $66,668 | 100.0% |
| Room Expense | $3,828,493 | $4,045,065 | $4,110,620 | $4,217,019 | $4,205,510 | $9,304 | 19.7% |
| Food and Beverage Expense | 4,509,274 | 4,571,504 | 4,807,308 | 4,969,357 | 4,955,795 | 10,964 | 76.0% |
| Parking/Other Rental Expense | 127,666 | 120,493 | 131,260 | 133,881 | 133,516 | 295 | 10.5% |
| Other Departmental Expenses | 75,036 | 98,878 | 90,653 | 111,174 | 110,870 | 245 | 11.2% |
| Departmental Expenses | $8,540,469 | $8,835,940 | $9,139,841 | $9,431,430 | $9,405,691 | $20,809 | 31.2% |
| Departmental Profit | $16,535,490 | $18,449,351 | $19,481,181 | $20,754,310 | $20,728,441 | $45,859 | 68.8% |
| Operating Expenses | $6,999,263 | $7,256,189 | $7,148,402 | $7,520,698 | $7,531,124 | $16,662 | 25.0% |
| Gross Operating Profit | $9,536,228 | $11,193,162 | $12,332,779 | $13,233,613 | $13,197,317 | $29,198 | 43.8% |
| Management Fees | $752,279 | $818,559 | $858,631 | $905,572 | $904,024 | $2,000 | 3.0% |
| Property Taxes | 428,274 | 438,917 | 450,703 | 457,927 | 467,859 | 1,035 | 1.6% |
| Property Insurance | 435,898 | 430,815 | 447,494 | 447,371 | 437,910 | 969 | 1.5% |
| Ground Lease Expense | 2,291,298 | 2,350,131 | 2,633,432 | 2,684,556 | 2,759,560 | 6,105 | 9.2% |
| Other Expenses | 8,100 | 8,100 | 8,100 | 8,100 | 0 | 0 | 0.0% |
| FF&E | 1,003,038 | 1,091,412 | 1,144,841 | 1,207,430 | 1,205,365 | 2,667 | 4.0% |
| Total Other Expenses | $4,918,887 | $5,137,933 | $5,543,201 | $5,710,956 | $5,774,719 | $12,776 | 19.2% |
| Net Operating Income | $4,617,341 | $6,055,229 | $6,789,578 | $7,522,657 | $7,422,598 | $16,422 | 24.6% |
| Net Cash Flow | $4,617,341 | $6,055,229 | $6,789,578 | $7,522,657 | $7,422,598 | $16,422 | 24.6% |
| (1) | TTM column represents the trailing 12-month period ending on November 30, 2016. |
| (2) | Per Room values based on 452 guest rooms. |
| (3) | % of Total Revenue for Room Expense, Food and Beverage Expense, Parking/Other Rental Expense and Other Departmental Expenses is based on their corresponding revenue line items. |
Property Management. The property is managed by Pacifica Hotel Management, LLC, an affiliate of Pacifica Hotel Company, which previously managed the property.
Franchise Agreement.The property has a franchise agreement with MIF, L.L.C., an affiliate of Marriott International, Inc., under the Courtyard by Marriott brand. The current franchise agreement is effective as of May 17, 2011 for a term of 20 years and provides for a program fee of (i) 5.0% of gross room sales for the time period from June 1, 2016 through May 31, 2017 and (ii) 5.5% of gross room sales for the time period from June 1, 2017, through the remainder of the term.
Escrows and Reserves. At origination, the borrower deposited $459,021 for a ground lease reserve, $81,532 for FF&E reserves and $38,955 for real estate taxes.
Tax Escrows -On a monthly basis, the borrower is required to escrow 1/12 of the annual estimated tax payments, which currently equates to $38,984.
Insurance Escrows -The requirement for the borrower to make deposits to the insurance escrow is waived so long as (i) no event of default has occurred and is continuing and (ii) the borrower provides satisfactory evidence that the property is insured as part of an acceptable blanket policy in accordance with the loan documents covering all or substantially all real property owned by affiliates of the borrower.
FF&E Reserves -On a monthly basis, the borrower is required to deposit an amount equal to 4.0% of gross revenue from operations for the calendar month two months prior to such payment date. The reserve is not subject to a cap.
THE INFORMATION IN THIS STRUCTURAL AND COLLATERAL TERM SHEET IS NOT COMPLETE AND MAY BE AMENDED PRIOR TO THE TIME OF SALE. THIS TERM SHEET IS NOT AN OFFER TO SELL THESE SECURITIES AND IT IS NOT A SOLICITATION OF AN OFFER TO BUY THESE SECURITIES IN ANY JURISDICTION WHERE THE OFFER OR SALE IS NOT PERMITTED.
| | 134 of 156 |
| Structural and Collateral Term Sheet | JPMCC 2017-JP5 | |
| Courtyard Marriott – King Kamehameha | ||
PIP Reserves - The borrower is required to pay to the lender a monthly amount to be used for the property improvement plan (“PIP”) that is currently being negotiated with the franchisor in an amount equal to $191,667. In addition, for each of the first 24 payment dates of the loan term, the borrower may deposit up to 50% of each FF&E monthly deposit into the PIP reserve account.
Ground Lease Reserve -At origination, the borrower deposited $459,021 into a ground lease reserve in respect of ground rent, and on a monthly basis thereafter, the borrower is required to pay to the lender 1/12 of the rents (including, without limitation, base rent, additional rents and any percentage rent (excluding any taxes otherwise reserved for hereunder)) (collectively, the “Ground Rent”) due under the ground lease during the next ensuing 12 months in order to accumulate with the lender sufficient funds to pay all such Ground Rent at least 30 days prior to the respective due dates, which currently equates to approximately $229,511.
Lockbox / Cash Management.The loan is structured with a CMA lockbox. On or prior to the closing date, the borrower was required to deliver written instructions to credit card companies to deposit all revenues directly to the lockbox account. On or prior to the origination date, the borrower was also required to deliver tenant direction letters to all tenants under leases to deliver all rents directly to the lockbox account. The funds are then returned to an account controlled by the borrower until the commencement of a Cash Sweep Event (as defined below). During the continuance of a Cash Sweep Event, all funds in the lockbox account are swept on each business day to a segregated cash management account under the control of the lender. To the extent there is a Cash Sweep Event continuing, all excess cash flow after payment of the mortgage debt service, required reserves and operating expenses will be held as additional collateral for the loan. The lender has a first priority security interest in the cash management account.
A “Cash Sweep Event” means (i) the occurrence of an event of default, (ii) the bankruptcy or insolvency action of the borrower or property manager or (iii) the date that the debt service coverage ratio, as calculated in the loan documents, based on the trailing 12-month period is less than 1.15x (a “DSCR Trigger Event”).
Any Cash Sweep Event will end with respect to (a) clause (i), upon the acceptance of the lender of a cure of the related event of default, which cure the lender is not obligated to accept and may reject or accept in its sole and absolute discretion, provided that the lender has not accelerated the loan, moved for a receiver or commenced foreclosure proceedings, (b) clause (ii) solely with respect to the property manager, if the property manager is replaced with a qualified property manager under a replacement management agreement within 60 days of the commencement of the bankruptcy action of property manager, or (c) clause (iii), if the debt service coverage ratio is 1.15x or greater for two consecutive calendar quarters based upon the trailing 12-month period immediately preceding the date of determination, provided that such Cash Sweep Event cure set forth in this definition is subject to the following conditions, (A) no other event of default under the loan documents has occurred and is continuing and (B) the borrower has paid all of the lender’s reasonable expenses incurred in connection with such Cash Sweep Event cure including, reasonable attorney’s fees and expenses.
Ground Lease. The Courtyard Marriott - King Kamehameha property is subject to two ground leases with HKK Hawaii, LLC. One ground lease covers the hotel improvements and portions of the eastern half of the property (the “Hotel Ground Lease”) and the other ground lease covers the parking area adjacent to the hotel on the western side of the property (the “Lanihau Ground Lease”). Each ground lease commenced on July 1, 2016, and expires on June 30, 2096, with no renewal or extension options. The annual base rent under the Hotel Ground Lease is currently $2,087,635 through June 30, 2017, and is subject to an annual increase of 3.0% until June 30, 2036. For the 10 year period of each ground lease commencing on July 1, 2036 through the expiration of the term, annual base rent is determined by agreement between the ground lessor and the borrower, and if they fail to reach an agreement, base rent is required to be the greater of fair market rent (as determined in the lease) or the base rent immediately prior to such period. Additionally, the Hotel Ground Lease requires percentage rent in the following amounts: (i) 3.0% of gross revenues from food and beverage operations; (ii) 10.0% of any sublease, license or concessionaire rentals; and (iii) 6.0% of gross room and other revenues. The annual base rent under the Lanihau Ground Lease is currently $525,000 through June 30, 2019, and is also subject to an annual increase of 3.0% until June 30, 2036, with base rent escalations commencing on July 1, 2036 being determined in a similar manner to the Hotel Ground Lease.
Permitted Mezzanine Debt.One or more (i) newly-formed bankruptcy remote owners of the borrower or (ii) a transferee assuming the loan in connection with a transfer of the property to a party other than the borrower and its affiliates may obtain mezzanine financing upon satisfaction of certain terms and conditions including, without limitation, the following: (i) the mezzanine lender meets a customary qualified lender definition and may not assign or pledge any interest in the mezzanine loan except in accordance with the related intercreditor agreement, (ii) the execution of an intercreditor agreement satisfactory to the mortgage lender and the rating agencies, (iii) immediately after giving effect to the mezzanine loan, the combined loan-to-value ratio with respect to the mezzanine loan and such mezzanine loan does not exceed 41.4%, (iv) the projected combined debt service coverage ratio based on the 12 month period immediately following the closing of the mezzanine loan is not less than 1.97x and (v) delivery of a rating agency confirmation.
THE INFORMATION IN THIS STRUCTURAL AND COLLATERAL TERM SHEET IS NOT COMPLETE AND MAY BE AMENDED PRIOR TO THE TIME OF SALE. THIS TERM SHEET IS NOT AN OFFER TO SELL THESE SECURITIES AND IT IS NOT A SOLICITATION OF AN OFFER TO BUY THESE SECURITIES IN ANY JURISDICTION WHERE THE OFFER OR SALE IS NOT PERMITTED.
| | 135 of 156 |
| Structural and Collateral Term Sheet | JPMCC 2017-JP5 |
| Milton Park |
| Mortgage Loan Information | Property Information | |||
| Mortgage Loan Seller: | JPMCB | Single Asset / Portfolio: | Single Asset | |
| Original Principal Balance: | $39,900,000 | Title: | Fee | |
| Cut-off Date Principal Balance: | $39,900,000 | Property Type - Subtype: | Office – Suburban | |
| % of Pool by IPB: | 3.7% | Net Rentable Area (SF): | 318,945 | |
| Loan Purpose: | Acquisition | Location: | Alpharetta, GA | |
| Borrower: | Adventus US Realty #13 LP | Year Built / Renovated: | 2001, 2007 / N/A | |
| Sponsor: | Adventus Holdings LP | Occupancy: | 87.8% | |
| Interest Rate: | 4.94000% | Occupancy Date: | 12/12/2016 | |
| Note Date: | 12/29/2016 | Number of Tenants: | 20 | |
| Maturity Date: | 1/1/2022 | 2013 NOI: | $3,758,473 | |
| Interest-only Period: | 24 months | 2014 NOI: | $3,504,105 | |
| Original Term: | 60 months | 2015 NOI(1): | $3,948,204 | |
| Original Amortization: | 360 months | TTM NOI (as of 10/2016)(1)(2): | $3,198,835 | |
| Amortization Type: | IO-Balloon | UW Economic Occupancy: | 86.9% | |
| Call Protection: | L(25),Grtr1%orYM(32),O(3) | UW Revenues: | $6,664,316 | |
| Lockbox: | CMA | UW Expenses: | $2,644,155 | |
| Additional Debt: | N/A | UW NOI(2): | $4,020,160 | |
| Additional Debt Balance: | N/A | UW NCF: | $3,477,954 | |
| Additional Debt Type: | N/A | Appraised Value / Per SF: | $57,300,000 / $180 | |
| Appraisal Date: | 12/8/2016 | |||
| Escrows and Reserves | Financial Information | |||||||||
| Initial | Monthly | Initial Cap | Cut-off Date Loan / SF: | $125 | ||||||
| Taxes: | $250,282 | $62,571 | N/A | Maturity Date Loan / SF: | $120 | |||||
| Insurance: | $0 | Springing | N/A | Cut-off Date LTV: | 69.6% | |||||
| Replacement Reserves: | $5,316 | $5,316 | $127,584 | Maturity Date LTV: | 66.5% | |||||
| TI/LC: | $39,868 | $39,868 | N/A | UW NCF DSCR: | 1.36x | |||||
| Other(3): | $837,490 | $0 | N/A | UW NOI Debt Yield: | 10.1% | |||||
| Sources and Uses | ||||||
| Sources | Proceeds | % of Total | Uses | Proceeds | % of Total | |
| Mortgage Loan | $39,900,000 | 67.8% | Purchase Price | $57,000,000 | 96.8% | |
| Sponsor Equity | 18,963,917 | 32.2% | Upfront Reserves | 1,132,956 | 1.9% | |
| Closing Costs | 730,961 | 1.2% | ||||
| Total Sources | $58,863,917 | 100.0% | Total Uses | $58,863,917 | 100.0% | |
| (1) | The decrease from 2015 NOI to TTM NOI is due primarily to Regency Hospital vacating its 27,002 square feet of space on the third floor of 200 Milton Park in November 2015. |
| (2) | The increase from TTM NOI to UW NOI is due primarily to contractual rent steps taken through December 2017 totaling $190,755, burn off of free rent for Pegasystems, Inc. totaling approximately $295,051, and additional leasing that occurred in late 2016. |
| (3) | Initial Other Escrows and Reserves consists of $800,717 for outstanding tenant improvements related to five tenants and $36,773 for free rent reserves related to two tenants. |
The Loan.The Milton Park loan has an outstanding principal balance as of the Cut-off Date of $39.9 million and is secured by a first mortgage lien on the borrower’s fee interest in a 318,945 square foot, two building office park located in Alpharetta, Georgia. The loan has a five-year term, and subsequent to a two-year interest-only period, will amortize on a 30-year schedule. The loan, along with approximately $19.0 million in loan sponsor equity, was used to acquire the property for a purchase price of $57.0 million. The borrowing entity for the Milton Park loan is Adventus US Realty #13 LP, a Delaware limited partnership and special purpose entity.
The loan sponsor and nonrecourse carve-out guarantor is Adventus Holdings LP (“Adventus”), a Delaware limited partnership. Adventus Holdings LP is an affiliate of Adventus Realty Trust, a private real estate investment trust formed in 2012. Based in Vancouver, Canada, Adventus Realty Trust invests in commercial real estate properties in suburban office markets outside of Chicago, Illinois and Atlanta, Georgia. Adventus has acquired 10 properties to date, totaling approximately 3.7 million square feet.
THE INFORMATION IN THIS STRUCTURAL AND COLLATERAL TERM SHEET IS NOT COMPLETE AND MAY BE AMENDED PRIOR TO THE TIME OF SALE. THIS TERM SHEET IS NOT AN OFFER TO SELL THESE SECURITIES AND IT IS NOT A SOLICITATION OF AN OFFER TO BUY THESE SECURITIES IN ANY JURISDICTION WHERE THE OFFER OR SALE IS NOT PERMITTED.
| | 136 of 156 |
| Structural and Collateral Term Sheet | JPMCC 2017-JP5 |
| Milton Park |
The Property.The Milton Park property is a 318,945 square foot Class A office park situated on 13.3 acres in Alpharetta, Georgia. The property is comprised of two six-story, LEED certified office buildings: 100 Milton Park and 200 Milton Park, constructed in 2001 and 2007, respectively. The property is located in a 108-acre mixed-use master plan community called Milton Park that contains office, retail, multi-family, townhomes and single-family homes. Residential developments in the community include the single-family units at Palisades at Milton Park, one- and two-bedroom multifamily units at AMLI at Milton Park, 74 townhomes at Enclave at Milton Park, and the 34,700 square foot retail center, Milton Park Promenade, none of which will serve as collateral for the loan. The property includes a parking structure containing 1,118 parking spaces resulting in a parking ratio of approximately 3.5 spaces per 1,000 square feet.
As of December 12, 2016, the property was 87.8% occupied by 20 tenants. The largest tenant at the property, Landis+Gyr (“Landis”), leases 101,011 square feet, or approximately 31.7% of the net rentable area. Landis specializes in energy metering products and solutions and uses the property as its North American headquarters. Landis originally took occupancy in 2002 and has expanded its space three times since taking occupancy. Landis most recently renewed its lease in 2016 and currently has a lease expiration in February 2022 with one remaining 10-year extension option. Landis accounts for approximately 34.2% of the underwritten base rent. The second largest tenant, Pegasystems, Inc., leases 26,762 square feet, or 8.4% of the net rentable area. Pegasystems, Inc. had previously subleased the second floor space from Regency Hospital but entered a direct lease that became effective upon Regency Hospital’s lease expiration in November 2015. Pegasystems, Inc. has a lease expiration in June 2021. Pegasystems, Inc. provides clients with strategic applications for marketing, sales, service and operations. Pegasystems, Inc. contributes 10.2% of underwritten base rent and has one five-year extension option remaining. The third largest tenant, Northpoint Executive Suites, leases 22,007 square feet, or 6.9% of the net rentable area. Northpoint Executive Suites executed a five-year lease in April 2014 which was amended in June 2016 and extends through October 2021. Northpoint Executive Suites offers temporary office and meeting space that includes amenities such as internet and phone services, break rooms and other office amenities. Northpoint Executive Suites contributes 8.0% of underwritten base rent and has three remaining five-year extension options. The remaining tenant mix includes various sales, finance, technology and entrepreneurial firms with varying lease terms remaining.
| Property Summary | ||||||
| Property | Net Rentable Area (SF) | Year Built | Property Type | Number of Tenants | Current Occupancy(1) | Appraised Value |
| 100 Milton Park | 162,199 | 2001 | Office | 10 | 100.0% | $28,400,000 |
| 200 Milton Park | 156,746 | 2007 | Office | 10 | 75.1% | 28,900,000 |
| Total/Wtd. Avg. | 318,945 | 20 | 87.8% | $57,300,000 | ||
| (1) | Current Occupancy is as of December 12, 2016. |
The Market.The Milton Park property is located in Alpharetta, Georgia in northern Fulton County, approximately 23.0 miles north of the Atlanta central business district. Developments in the Atlanta central business district include the Home Depot Technology Center at Tech Square, Twitter’s expansion to Ponce City Market, Google Fiber’s store opening at Ponce City Market, and Coca-Cola, Microsoft and WorldPay locating offices near Georgia Tech’s Advanced Technology Development Center. The property is located in the North Fulton submarket of the greater Atlanta office market. The North Fulton submarket is referred to as Atlanta’s Golden Corridor due to its concentration of private wealth and the continued relocation and establishment of Fortune 500 firms within the area. Within this submarket, the city of Alpharetta, according to the city’s website, is considered the “The Technology City of the South” and houses nearly 600 technology companies including Comcast, Fiserv, Google, Microsoft and Verizon. As of the third quarter of 2016, the North Fulton submarket had approximately 25.0 million square feet of net rentable area with an overall vacancy rate of 13.8% and average asking rents of approximately $22.42 per square foot. As of the third quarter 2016, the Class A sector of the North Fulton submarket consisted of approximately 14.4 million square feet of office space with an overall vacancy rate of 13.1% and average asking rents of $24.48 per square foot. The neighborhood is accessible from major roadways such as Georgia 400, Highway 9 and Old Milton Parkway/State Bridge Road. Milton Park is situated approximately 0.5 miles east of Georgia 400, the primary north-south feeder linking the property to central Atlanta, approximately 2.3 miles from Highway 9, and 2.6 miles from Old Milton Parkway.
The appraisal identified six comparable office rentals in the Atlanta office market ranging in size from approximately 125,668 square feet to 266,550 square feet. Base rents for the comparable leases ranged from $25.00 per square foot to $27.00 per square foot with a weighted average of approximately $25.92 per square foot. The appraisal did not identify any directly competitive new supply to the subject property.
THE INFORMATION IN THIS STRUCTURAL AND COLLATERAL TERM SHEET IS NOT COMPLETE AND MAY BE AMENDED PRIOR TO THE TIME OF SALE. THIS TERM SHEET IS NOT AN OFFER TO SELL THESE SECURITIES AND IT IS NOT A SOLICITATION OF AN OFFER TO BUY THESE SECURITIES IN ANY JURISDICTION WHERE THE OFFER OR SALE IS NOT PERMITTED.
| | 137 of 156 |
| Structural and Collateral Term Sheet | JPMCC 2017-JP5 |
| Milton Park |
| Tenant Summary(1) | ||||||
| Tenant | Ratings(2) Moody’s/S&P/Fitch | Net Rentable Area (SF) | % of Total NRA | Base Rent PSF | % of Total Base Rent | Lease Expiration Date |
| Landis+Gyr | NA / CCC+ / NA | 101,011 | 31.7% | $21.94 | 34.2% | 2/28/2022 |
| Pegasystems, Inc.(3) | NA / NA / NA | 26,762 | 8.4% | $24.60 | 10.2% | 6/30/2021 |
| Northpoint Executive Suites | NA / NA / NA | 22,007 | 6.9% | $23.60 | 8.0% | 10/31/2021 |
| GE Capital(4) | A1 / AA- / AA- | 21,563 | 6.8% | $23.69 | 7.9% | 5/31/2019 |
| Graebel Relocation Services | NA / NA / NA | 18,187 | 5.7% | $23.64 | 6.6% | 7/31/2019 |
| AGC Flat Glass(5) | NA / NA / NA | 16,877 | 5.3% | $23.69 | 6.2% | 6/30/2020 |
| Schneider Electric | A3 / A- / NA | 15,227 | 4.8% | $24.04 | 5.7% | 6/30/2018 |
| Eze Castle Software(6) | NA / B / NA | 8,288 | 2.6% | $24.33 | 3.1% | 11/30/2022 |
| Principal Senior Living | NA / NA / NA | 7,433 | 2.3% | $25.50 | 2.9% | 9/30/2022 |
| Ameriprise Holdings, Inc. | NA / NA / NA | 5,321 | 1.7% | $24.76 | 2.0% | 3/31/2019 |
| (1) | Based on the underwritten rent roll. |
| (2) | Ratings provided are for the parent company of the entity listed in the “tenant” field whether or not the parent company guarantees the lease. |
| (3) | Pegasystems, Inc. has the right to terminate its lease as of July 31, 2019 in the event there is a change in control of the tenant (whether by the change of 50% or more of the direct or indirect ownership interests in the tenant or possession of the right to vote more than 50% of the ownership interests in the tenant), with notice by January 31, 2019 and the payment of a termination fee. |
| (4) | GE Capital subleases 11,209 square feet of its space to Antares Capital. |
| (5) | AGC Flat Glass has the right to terminate its lease as of June 30, 2018, with one year’s notice and the payment of a termination fee. |
| (6) | Eze Castle Software has the right to terminate its lease as of November 30, 2017 or November 30, 2018, with notice by February 28, 2017 and the payment of a termination fee. |
| Lease Rollover Schedule(1) | ||||||||||
| Year | Number of Leases Expiring | Net Rentable Area Expiring | % of NRA Expiring | Base Rent Expiring | % of Base Rent Expiring | Cumulative Net Rentable Area Expiring | Cumulative % of NRA Expiring | Cumulative Base Rent Expiring | Cumulative % of Base Rent Expiring | |
| Vacant | NAP | 39,065 | 12.2% | NAP | NAP | 39,065 | 12.2% | NAP | NAP | |
| 2017 & MTM | 2 | 5,541 | 1.7% | $133,515 | 2.1% | 44,606 | 14.0% | $133,515 | 2.1% | |
| 2018 | 2 | 16,012 | 5.0% | 386,281 | 6.0% | 60,618 | 19.0% | $519,796 | 8.0% | |
| 2019 | 4 | 49,554 | 15.5% | 1,177,435 | 18.2% | 110,172 | 34.5% | $1,697,232 | 26.2% | |
| 2020 | 5 | 31,540 | 9.9% | 752,516 | 11.6% | 141,712 | 44.4% | $2,449,747 | 37.8% | |
| 2021 | 4 | 58,247 | 18.3% | 1,420,071 | 21.9% | 199,959 | 62.7% | $3,869,818 | 59.7% | |
| 2022 | 3 | 116,732 | 36.6% | 2,607,193 | 40.3% | 316,691 | 99.3% | $6,477,012 | 100.0% | |
| 2023 | 0 | 0 | 0.0% | 0 | 0.0% | 316,691 | 99.3% | $6,477,012 | 100.0% | |
| 2024 | 0 | 0 | 0.0% | 0 | 0.0% | 316,691 | 99.3% | $6,477,012 | 100.0% | |
| 2025 | 0 | 0 | 0.0% | 0 | 0.0% | 316,691 | 99.3% | $6,477,012 | 100.0% | |
| 2026 | 0 | 0 | 0.0% | 0 | 0.0% | 316,691 | 99.3% | $6,477,012 | 100.0% | |
| 2027 | 0 | 0 | 0.0% | 0 | 0.0% | 316,691 | 99.3% | $6,477,012 | 100.0% | |
| 2028 & Beyond(2) | 0 | 2,254 | 0.0.7% | 0 | 0.0% | 318,945 | 100.0% | $6,477,012 | 100.0% | |
| Total | 20 | 318,945 | 100.0% | $6,477,012 | 100.0% | |||||
| (1) | Based on the underwritten rent roll. |
| (2) | 2028 & Beyond is inclusive of a 1,057 square foot conference room, a 521 square foot building storage room, a 502 square foot engineering office and a 174 square foot break room with no attributable base rent. |
THE INFORMATION IN THIS STRUCTURAL AND COLLATERAL TERM SHEET IS NOT COMPLETE AND MAY BE AMENDED PRIOR TO THE TIME OF SALE. THIS TERM SHEET IS NOT AN OFFER TO SELL THESE SECURITIES AND IT IS NOT A SOLICITATION OF AN OFFER TO BUY THESE SECURITIES IN ANY JURISDICTION WHERE THE OFFER OR SALE IS NOT PERMITTED.
| | 138 of 156 |
| Structural and Collateral Term Sheet | JPMCC 2017-JP5 |
| Milton Park |
| Operating History and Underwritten Net Cash Flow | |||||||
| 2013 | 2014 | 2015 | TTM(1) | Underwritten | Per Square Foot | %(2) | |
| Rents in Place(3)(4) | $5,998,538 | $5,790,048 | $6,256,590 | $5,502,937 | $6,477,012 | $20.31 | 84.7% |
| Vacant Income | 0 | 0 | 0 | 0 | 976,625 | 3.06 | 12.8% |
| Gross Potential Rent | $5,998,538 | $5,790,048 | $6,256,590 | $5,502,937 | $7,453,637 | $23.37 | 97.5% |
| CAM Reimbursements | 139,695 | 212,989 | 186,420 | 178,501 | 191,150 | 0.60 | 2.5% |
| Net Rental Income | $6,138,233 | $6,003,037 | $6,443,010 | $5,681,438 | $7,644,786 | $23.97 | 100.0% |
| (Vacancy/Credit Loss) | 0 | 0 | 0 | 0 | (1,001,671) | (3.14) | (13.1)+ |
| Other Income | 29,645 | 28,960 | 30,656 | 30,784 | 21,200 | 0.07 | 0.3% |
| Effective Gross Income | $6,167,878 | $6,031,997 | $6,473,666 | $5,712,222 | $6,664,316 | $20.89 | 87.2% |
| Total Expenses | $2,409,405 | $2,527,892 | $2,525,462 | $2,513,387 | $2,644,155 | $8.29 | 39.7% |
| Net Operating Income | $3,758,473 | $3,504,105 | $3,948,204 | $3,198,835 | $4,020,160 | $12.60 | 60.3% |
| Total TI/LC, Capex/RR | 0 | 0 | 0 | 0 | 542,207 | 1.70 | 8.1% |
| Net Cash Flow | $3,758,473 | $3,504,105 | $3,948,204 | $3,198,835 | $3,477,954 | $10.90 | 52.2% |
| Occupancy(5) | NAV | 92.2% | 85.4% | 87.8% | 86.9% | ||
| (1) | TTM represents the trailing 12-month period ending on October 31, 2016. |
| (2) | % column represents percent of Net Rental Income for all revenue lines and represents percent of Effective Gross Income for the remainder of the fields. |
| (3) | The decrease in TTM Rents in Place from 2015 is primarily due to Regency Hospital vacating 27,002 square feet of space on the third floor of 200 Milton Park in November 2015. |
| (4) | The increase in Underwritten Rents in Place from TTM is due primarily to contractual rent steps taken through December 2017 totaling $190,755, burn off of free rent for Pegasystems, Inc. totaling approximately $295,051, and additional leasing that occurred in late 2016. |
| (5) | Historical Occupancies are as of December 31 of each respective year. TTM Occupancy is as of December 12, 2016. Underwritten Occupancy represents economic occupancy. Occupancy reflects the weighted average occupancy based on the individual property square footage. |
THE INFORMATION IN THIS STRUCTURAL AND COLLATERAL TERM SHEET IS NOT COMPLETE AND MAY BE AMENDED PRIOR TO THE TIME OF SALE. THIS TERM SHEET IS NOT AN OFFER TO SELL THESE SECURITIES AND IT IS NOT A SOLICITATION OF AN OFFER TO BUY THESE SECURITIES IN ANY JURISDICTION WHERE THE OFFER OR SALE IS NOT PERMITTED.
| | 139 of 156 |
| Structural and Collateral Term Sheet | JPMCC 2017-JP5 | |
| Reston EastPointe | ||
| Mortgage Loan Information | Property Information | |||
| Mortgage Loan Seller: | JPMCB | Single Asset / Portfolio: | Single Asset | |
| Original Principal Balance: | $38,000,000 | Title: | Fee | |
| Cut-off Date Principal Balance: | $38,000,000 | Property Type - Subtype: | Office - Suburban | |
| % of Pool by IPB: | 3.5% | Net Rentable Area (SF): | 195,230 | |
| Loan Purpose: | Acquisition | Location: | Reston, VA | |
| Borrower: | Reston EastPointe Property Corp. | Year Built / Renovated: | 2007 / N/A | |
| Sponsor: | LPC Commercial Services, Inc. | Occupancy: | 85.6% | |
| Interest Rate: | 4.20000% | Occupancy Date: | 8/31/2016 | |
| Note Date: | 11/8/2016 | Number of Tenants: | 5 | |
| Maturity Date: | 12/1/2023 | 2013 NOI: | $4,344,877 | |
| Interest-only Period: | 84 months | 2014 NOI: | $4,469,173 | |
| Original Term: | 84 months | 2015 NOI: | $5,068,734 | |
| Original Amortization: | None | TTM NOI (as of 9/2016)(1): | $5,024,264 | |
| Amortization Type: | Interest Only | UW Economic Occupancy: | 87.1% | |
| Call Protection: | L(27),Def(51),O(6) | UW Revenues: | $6,041,200 | |
| Lockbox: | Hard | UW Expenses: | $2,077,266 | |
| Additional Debt: | N/A | UW NOI(1): | $3,963,934 | |
| Additional Debt Balance: | N/A | UW NCF: | $3,529,182 | |
| Additional Debt Type: | N/A | Appraised Value / Per SF(2): | $61,200,000 / $313 | |
| Appraisal Date: | 10/5/2016 | |||
| Escrows and Reserves | Financial Information | |||||||
| Initial | Monthly | Initial Cap | Cut-off Date Loan / SF: | $195 | ||||
| Taxes: | $59,736 | $59,736 | N/A | Maturity Date Loan / SF: | $195 | |||
| Insurance: | $0 | Springing | N/A | Cut-off Date LTV(2): | 62.1% | |||
| Replacement Reserves: | $3,254 | $3,254 | $39,046 | Maturity Date LTV(2): | 62.1% | |||
| TI/LC: | $1,150,000 | $48,808 | N/A | UW NCF DSCR: | 2.18x | |||
| Other(3): | $2,023,260 | $0 | N/A | UW NOI Debt Yield: | 10.4% | |||
| Sources and Uses | ||||||
| Sources | Proceeds | % of Total | Uses | Proceeds | % of Total | |
| Mortgage Loan | $38,000,000 | 60.3% | Purchase Price | $58,000,000 | 92.0% | |
| Sponsor Equity | 25,068,492 | 39.7 | Upfront Reserves | 3,236,250 | 5.1 | |
| Closing Costs | 1,832,242 | 2.9 | ||||
| Total Sources | $63,068,492 | 100.0% | Total Uses | $63,068,492 | 100.0% | |
| (1) | The decrease in UW NOI from TTM NOI is primarily due to Vencore vacating 25,348 square feet, representing the entire fifth floor, in June 2016. |
| (2) | The Appraised Value / Per SF, Cut-off Date LTV and Maturity Date LTV are calculated based on the “hypothetical as-is” value, which assumes that $2.0 million is reserved to lease-up the vacant space on the 5th floor and $1.15 million is reserved for other tenant improvements and outstanding leasing commissions, all of which was reserved for at origination. The “as-is” value as of October 5, 2016 is $58.0 million, which results in a Cut-off Date LTV and Maturity Date LTV of 65.5%. |
| (3) | Initial Other Escrows and Reserves consists of a $2.0 million reserve for tenant improvements and leasing commissions related to space at the property that was vacant as of the origination date, which is required to be released to the borrower provided that the property achieves an NOI debt yield (as calculated in the loan documents) of 10.5% or greater based on the trailing three-month period and $23,260 for free rent. |
The Loan.The Reston EastPointe loan is secured by a first mortgage lien on the borrower’s fee interest in a 195,230 square foot Class A office building located in Reston, Virginia. The Reston EastPointe loan has a seven-year term and is interest-only for the full term of the loan. The borrowing entity for the Reston EastPointe loan is Reston EastPointe Property Corp., a Delaware corporation and special purpose entity. The loan is structured to be Shariah compliant with a master lease in place between the borrower and an affiliate of the borrower. See “Risk Factors–Risks Relating to Shariah Compliant Loans” and “Description of the Mortgage Pool–Certain Terms of the Mortgage Loans–Shariah Compliant Loans” in the Preliminary Prospectus for additional information regarding Shariah compliant loans.
THE INFORMATION IN THIS STRUCTURAL AND COLLATERAL TERM SHEET IS NOT COMPLETE AND MAY BE AMENDED PRIOR TO THE TIME OF SALE. THIS TERM SHEET IS NOT AN OFFER TO SELL THESE SECURITIES AND IT IS NOT A SOLICITATION OF AN OFFER TO BUY THESE SECURITIES IN ANY JURISDICTION WHERE THE OFFER OR SALE IS NOT PERMITTED.
| | 140 of 156 |
| Structural and Collateral Term Sheet | JPMCC 2017-JP5 | |
| Reston EastPointe | ||
The nonrecourse carve-out guarantor is LPC Commercial Services, Inc., an affiliate of the loan sponsor, which is a joint venture between Mohammed I. Alsubeaei & Sons Investment Company (“MASIC”), Lincoln Property Company (“LPC”) and Ritz Banc Group (“RBG”). MASIC is a professional investment company located in Saudi Arabia. Founded in 1933, MASIC is involved in asset management including equities, fixed income, private equity funds, direct investments and real estate, and its investments include real estate, financial services, agricultural manufacturing, industrial and retail. MASIC has executed multiple international real estate deals over the past three years, including four multifamily deals, a mezzanine financed condo development in the U.S., the South Bank Tower mezzanine financing in London and the acquisition of a retail store in Germany.
LPC is one of the largest privately held, full-service real estate organizations in the United States. Founded in 1965 and based in Dallas, Texas, LPC maintains a presence in more than 200 cities in the United States and 10 cities in Europe and South America in both commercial and residential real estate markets. LPC has developed approximately 75.0 million square feet of commercial office space, over 11.0 million square feet of specialty retail space, 52.0 million square feet of industrial space and currently manages over 138.0 million square feet of commercial assets globally. The cumulative development volume exceeds $28.0 billion in commercial assets.
RBG was founded in 2012 and is a private equity and alternative asset manager headquartered in Washington D.C. RBG partners with high net worth family offices and institutional investors to advise on real estate investments in the U.S. as well as to co-invest. As of January 2017, RBG had more than $250.0 million in assets under management.
The loan sponsor used loan proceeds to purchase the Reston EastPointe property for $58.0 million.
The Property. The Reston EastPointe property is an eight-story, 195,230 square foot Class A office building with an adjacent parking garage located in Reston, Virginia. As of August 31, 2016, the property was 85.6% occupied by five tenants with six leases. The largest tenant, Vencore, Inc (“Vencore”), leases 54.8% of net rentable area through November 2020. Founded in 1972, Vencore provides information solutions, engineering and analysis to the U.S. intelligence community, Department of Defense and federal and civilian agencies. Vencore and its Applied Communication Sciences subsidiary employ 4,000 employees across 17 states in the U.S. and have an international presence. Vencore originally took occupancy in October 2009 with a lease covering approximately 120,727 square feet. Vencore’s lease contained an option allowing it to downsize its space. In June 2016, Vencore exercised this option and vacated the entire fifth floor of the building, totaling approximately 25,348 square feet, which accounts for the majority of vacancy at the property. Prior to vacating the fifth floor, Vencore also subleased 59,850 square feet of its remaining space to three tenants in 2014 and 2015. The three subleases are to STG, Inc. (“STG”) for 37,243 square feet, Cyveillance, Inc. for 11,556 square feet and Vistronix, LLC for 11,051 square feet. Inclusive of the subleased spaces, Vencore accounts for 66.1% of underwritten base rent and its lease contains two five-year extension options. The second largest tenant, Blue Canopy, LLC (“Blue Canopy”), originally took occupancy of 14,855 square feet through February 2023 and expanded its space in 2015 by subleasing 25,171 square feet from Farmers Insurance Exchange through February 2019, for a total of 20.5% of net rentable area. Blue Canopy is headquartered at the property and accounts for 23.2% of underwritten base rent. Founded in 2001, Blue Canopy provides data analytics, cloud computing, data science and enterprise information technology consultancy and services for the federal government and commercial markets, including the Department of Defense, Department of Homeland Security and Fortune 1000 Companies. The third largest tenant under a direct lease, Vistronix, LLC (“Vistronix”), leases 10,374 square feet through November 2024, for a total of 5.3% of net rentable area. Headquartered at the property, Vistronix accounts for 6.3% of underwritten base rent and its lease contains one remaining five-year extension option. Inclusive of the 11,051 square feet subleased from Vencore, Vistronix occupies 11.0% of net rentable area and accounts for 12.3% of underwritten base rent. Vistronix is a software developer with a focus on advanced analytics, signal processing, cloud computing, and large-scale data management. Vistronix provides national security information systems and services to federal agencies. The third largest tenant by square footage is STG, which subleases 19.1% of net rentable area. STG was founded in 1986 and is currently headquartered at the property. STG provides mission-critical technology, cyber and data solutions to more than 50 U.S. federal agencies. STG’s client base is spread across more than 250 locations internationally. STG accounts for 20.2% of underwritten base rent under its sublease to Vencore. From 2013 to 2015, the property has maintained an average occupancy of 94.7%.
Built in 2007, the property is located near several major demand generators. Reston Town Center, approximately 1.8 miles from the property, is a mixed-use development offering more than 50 shops, 30 restaurants, an 11-screen cinema, an open-air pavilion, luxury residences and a four-diamond Hyatt Regency hotel. The property is approximately 0.8 miles from the Wiehle-Reston East Station, which opened in 2014 and is part of the transportation infrastructure servicing Northern Virginia, as well as approximately 8.9 and 21.0 miles from the Washington Dulles International Airport and Ronald Reagan Washington National Airport, respectively. Collectively, these airports served approximately 44.7 million passengers in 2015. Additionally, Washington D.C. and the Pentagon are located approximately 15.7 and 15.3 miles east of the property, respectively. The property features 461 spaces in the adjacent three-story parking garage and 193 surface spaces, for a total of 654 parking spaces (approximately 3.3 spaces per 1,000 square feet).
THE INFORMATION IN THIS STRUCTURAL AND COLLATERAL TERM SHEET IS NOT COMPLETE AND MAY BE AMENDED PRIOR TO THE TIME OF SALE. THIS TERM SHEET IS NOT AN OFFER TO SELL THESE SECURITIES AND IT IS NOT A SOLICITATION OF AN OFFER TO BUY THESE SECURITIES IN ANY JURISDICTION WHERE THE OFFER OR SALE IS NOT PERMITTED.
| | 141 of 156 |
| Structural and Collateral Term Sheet | JPMCC 2017-JP5 | |
| Reston EastPointe | ||
The Market. According to the appraisal, the property is located in the Reston office submarket. The property is located along Dulles Toll Road, which has experienced several corporate relocations. General Dynamics (NYSE: GD), a global aerospace and defense company, is building its future 160,000 square foot headquarters on an adjacent lot to the property, and Bechtel Corp., a global engineering, construction and project management company, relocated a majority of its 1,100 employees from its Maryland office to its Reston headquarters. Dulles Toll Road provides direct access to Interstate-495, which circles Washington D.C. and connects to both Maryland and Virginia suburbs. Transportation is also provided via the Washington Metropolitan Transit Authority Metrorail system, which, according to the appraisal, has the second highest ridership in the U.S. with approximately 271.2 million riders in 2014. The system is currently undergoing a project to add the Silver Line, a 23-mile extension with 11 new stations. Phase I, which added five new stations, was completed in July 2014 and provides a transfer-free ride into downtown Washington D.C. and Maryland. The property is approximately 0.8 miles from the Wiehle-Reston East station, which is one of the new stations. Phase II, which plans to add six additional stations and provide a transfer-free ride from Washington Dulles International Airport to downtown Washington, is expected to be completed by 2018.
As of the second quarter of 2016, the Reston Class A office submarket consisted of approximately 8.6 million square feet of office space with an overall vacancy rate of 9.4%. The appraisal identified five comparable properties built between 1989 and 2008 ranging in size from approximately 139,176 to 260,000 square feet. Average asking rents for the comparable properties range from $32.00 to $38.00 per square foot. The weighted average underwritten rents at the Reston EastPointe property are $35.26. The estimated 2016 population within a one-, three- and five-mile radius is approximately 8,538, 72,918 and 214,362, respectively, with median household income of $105,729, $113,902 and $126,192, respectively.
| Tenant Summary(1) | ||||||
| Tenant | Ratings Moody’s/S&P/Fitch | Net Rentable Area (SF) | % of Total NRA | Base Rent PSF | % of Total Base Rent | Lease Expiration Date |
| Vencore, Inc(2)(3) | NA / B / NA | 107,075 | 54.8% | $36.40 | 66.1% | 11/30/2020 |
| Blue Canopy, LLC(4)(5)(6) | NA / NA / NA | 40,026 | 20.5% | $34.15 | 23.2% | Various |
| Vistronix, LLC(7)(8) | NA / NA / NA | 10,374 | 5.3% | $35.67 | 6.3% | 11/30/2024 |
| Acclaim Technical Services | NA / NA / NA | 7,241 | 3.7% | $29.83 | 3.7% | 6/30/2025 |
| Uptown Reston East, Inc | NA / NA / NA | 2,485 | 1.3% | $17.82 | 0.8% | 12/31/2020 |
| (1) | Based on the underwritten rent roll. |
| (2) | The S&P rating is specific to Vencore, Inc., a subsidiary of the parent company Veritas Capital Fund Management, L.L.C. |
| (3) | Vencore subleases 37,243 square feet to STG, Inc., 11,556 square feet to Cyveillance, Inc. and 11,051 square feet to Vistronix, LLC. |
| (4) | Blue Canopy occupies a total of 40,026 square feet, of which, 14,855 square feet is on a direct lease and 25,171 square feet is subleased. Blue Canopy’s subleased space of 25,171 square feet expires February 28, 2019 and its direct lease of 14,855 square feet expires February 28, 2023. Base Rent PSF represents the weighted average underwritten base rent across both Blue Canopy leased spaces. Blue Canopy occupies 25,171 square feet at $32.00 per square foot and 14,855 square feet at $37.79 per square foot. |
| (5) | Blue Canopy subleases 25,171 square feet of its space from Farmers Insurance Exchange, which pays in-place base rent of $37.79 per square foot. |
| (6) | Blue Canopy has the right to terminate its lease on July 31, 2019 with 12 months’ notice and payment of a termination fee equal to unamortized leasing costs plus one month of base rent. |
| (7) | Inclusive of the 11,051 square feet subleased from Vencore, Vistronix occupies 21,425 square feet. |
| (8) | Vistronix has the right to terminate its lease on November 30, 2020 with nine months’ notice and payment of a termination fee equal to unamortized leasing costs, which may not exceed $600,000. |
THE INFORMATION IN THIS STRUCTURAL AND COLLATERAL TERM SHEET IS NOT COMPLETE AND MAY BE AMENDED PRIOR TO THE TIME OF SALE. THIS TERM SHEET IS NOT AN OFFER TO SELL THESE SECURITIES AND IT IS NOT A SOLICITATION OF AN OFFER TO BUY THESE SECURITIES IN ANY JURISDICTION WHERE THE OFFER OR SALE IS NOT PERMITTED.
| | 142 of 156 |
| Structural and Collateral Term Sheet | JPMCC 2017-JP5 | |
| Reston EastPointe | ||
| Lease Rollover Schedule(1) | |||||||||
| Year | Number of Leases Expiring | Net Rentable Area Expiring | % of NRA Expiring | Base Rent Expiring | % of Base Rent Expiring | Cumulative Net Rentable Area Expiring | Cumulative % of NRA Expiring | Cumulative Base Rent Expiring | Cumulative % of Base Rent Expiring |
| Vacant | NAP | 28,029 | 14.4% | NAP | NAP | 28,029 | 14.4% | NAP | NAP |
| 2017 & MTM | 0 | 0 | 0.0 | $0 | 0.0% | 28,029 | 14.4% | $0 | 0.0% |
| 2018 | 0 | 0 | 0.0 | 0 | 0.0% | 28,029 | 14.4% | $0 | 0.0% |
| 2019 | 1 | 25,171 | 12.9 | 805,472 | 13.7% | 53,200 | 27.2% | $805,472 | 13.7% |
| 2020 | 2 | 109,560 | 56.1 | 3,941,898 | 66.9% | 162,760 | 83.4% | $4,747,370 | 80.5% |
| 2021 | 0 | 0 | 0.0 | 0 | 0.0% | 162,760 | 83.4% | $4,747,370 | 80.5% |
| 2022 | 0 | 0 | 0.0 | 0 | 0.0% | 162,760 | 83.4% | $4,747,370 | 80.5% |
| 2023 | 1 | 14,855 | 7.6 | 561,370 | 9.5% | 177,615 | 91.0% | $5,308,740 | 90.1% |
| 2024 | 1 | 10,374 | 5.3 | 370,041 | 6.3% | 187,989 | 96.3% | $5,678,781 | 96.3% |
| 2025 | 1 | 7,241 | 3.7 | 215,999 | 3.7% | 195,230 | 100.0% | $5,894,780 | 100.0% |
| 2026 | 0 | 0 | 0.0 | 0 | 0.0% | 195,230 | 100.0% | $5,894,780 | 100.0% |
| 2027 | 0 | 0 | 0.0 | 0 | 0.0% | 195,230 | 100.0% | $5,894,780 | 100.0% |
| 2028 & Beyond | 0 | 0 | 0.0 | 0 | 0.0% | 195,230 | 100.0% | $5,894,780 | 100.0% |
| Total | 6 | 195,230 | 100.0% | $5,894,780 | 100.0% | ||||
| (1) | Based on the underwritten rent roll. |
| Operating History and Underwritten Net Cash Flow | |||||||
2013 | 2014 | 2015 | TTM(1) | Underwritten | Per | %(2) | |
| Rents in Place | $5,979,980 | $6,224,510 | $6,787,115 | $6,773,192 | $5,894,780 | $30.19 | 85.0% |
| Vacant Income | 0 | 0 | 0 | 0 | 896,928 | 4.59 | 12.9 |
| Gross Potential Rent | $5,979,980 | $6,224,510 | $6,787,115 | $6,773,192 | $6,791,708 | $34.79 | 97.9% |
| Total Reimbursements | 162,956 | 149,543 | 162,595 | 141,487 | 146,420 | 0.75 | 2.1 |
| Net Rental Income | $6,142,936 | $6,374,053 | $6,949,710 | $6,914,679 | $6,938,128 | $35.54 | 100.0% |
| (Vacancy/Credit Loss) | 0 | 0 | 0 | 0 | (896,928) | (4.59) | (12.9) |
| Other Income | (364) | 0 | 38 | 26,564 | 0 | 0.00 | 0.0 |
| Effective Gross Income | $6,142,572 | $6,374,053 | $6,949,747 | $6,941,243 | $6,041,200 | $30.94 | 87.1% |
| Total Expenses | $1,797,695 | $1,904,880 | $1,881,013 | $1,916,979 | $2,077,266 | $10.64 | 34.4% |
| Net Operating Income(3) | $4,344,877 | $4,469,173 | $5,068,734 | $5,024,264 | $3,963,934 | $20.30 | 65.6% |
| Total TI/LC, Capex/RR | 0 | 0 | 0 | 0 | 434,752 | 2.23 | 7.2 |
| Net Cash Flow | $4,344,877 | $4,469,173 | $5,068,734 | $5,024,264 | $3,529,182 | $18.08 | 58.4% |
| Occupancy(4) | 90.4% | 95.2% | 98.6% | 85.6% | 87.1% | ||
| (1) | TTM represents the trailing 12-month period ending September 30, 2016. |
| (2) | % column represents percent of Net Rental Income for all revenue lines and represents percent of Effective Gross Income for the remainder of fields. |
| (3) | The decrease in Underwritten Net Operating Income from TTM Net Operating Income is primarily due to Vencore vacating 25,348 square feet, representing the entire fifth floor, in June 2016. |
| (4) | Historical occupancies are as of December 31 of each respective year. TTM Occupancy is as of August 31, 2016. Underwritten Occupancy represents economic occupancy. |
Permitted Mezzanine Debt. In connection with a bona fide sale of the property to a third party and assumption of the loan in accordance with the loan agreement, the owners of the transferee are permitted to obtain a mezzanine loan secured by the ownership interests in the transferee upon satisfaction of certain terms and conditions which include, without limitation, (i) the mezzanine lender meets a qualified lender provision in the loan documents, (ii) after giving effect to the mezzanine loan, the combined loan-to-value ratio does not exceed 62.1%, (iii) after giving effect to the mezzanine loan, the combined debt service coverage ratio (as calculated in the loan documents and based on the trailing three months) is not less than 2.23x, (iv) after giving effect to the mezzanine loan, the combined debt yield (as calculated in the loan documents and based on the trailing three months) is not less than 9.4% and (iv) the lenders enter into an intercreditor agreement in form and substance reasonably acceptable to the lenders.
THE INFORMATION IN THIS STRUCTURAL AND COLLATERAL TERM SHEET IS NOT COMPLETE AND MAY BE AMENDED PRIOR TO THE TIME OF SALE. THIS TERM SHEET IS NOT AN OFFER TO SELL THESE SECURITIES AND IT IS NOT A SOLICITATION OF AN OFFER TO BUY THESE SECURITIES IN ANY JURISDICTION WHERE THE OFFER OR SALE IS NOT PERMITTED.
| | 143 of 156 |
| Structural and Collateral Term Sheet | JPMCC 2017-JP5 |
| Orchard Hill Park |
| Mortgage Loan Information | Property Information | |||
| Mortgage Loan Seller: | JPMCB | Single Asset / Portfolio: | Single Asset | |
| Original Principal Balance: | $33,500,000 | Title: | Fee | |
| Cut-off Date Principal Balance: | $33,424,589 | Property Type - Subtype: | Retail – Anchored | |
| % of Pool by IPB: | 3.1% | Net Rentable Area (SF)(1): | 190,788 | |
| Loan Purpose: | Refinance | Location: | Leominster, MA | |
| Borrowers: | Orchard Hill Park, LLC and Koles, | Year Built / Renovated: | 2006 / N/A | |
| LLC | Occupancy: | 98.1% | ||
| Sponsor: | Gregg P. Lisciotti | Occupancy Date: | 11/1/2016 | |
| Interest Rate: | 5.75200% | Number of Tenants: | 10 | |
| Note Date: | 12/23/2016 | 2013 NOI: | $2,953,325 | |
| Maturity Date: | 1/1/2027 | 2014 NOI: | $2,964,090 | |
| Interest-only Period: | None | 2015 NOI: | $2,988,403 | |
| Original Term: | 120 months | TTM NOI (as of 11/2016): | $3,130,205 | |
| Original Amortization: | 360 months | UW Economic Occupancy: | 95.0% | |
| Amortization Type: | Balloon | UW Revenues: | $3,686,777 | |
| Call Protection: | L(26),Def(90),O(4) | UW Expenses: | $795,612 | |
| Lockbox: | Hard | UW NOI: | $2,891,166 | |
| Additional Debt: | N/A | UW NCF: | $2,833,929 | |
| Additional Debt Balance: | N/A | Appraised Value / Per SF: | $47,100,000 / $247 | |
| Additional Debt Type: | N/A | Appraisal Date: | 9/7/2016 | |
| Escrows and Reserves | Financial Information | |||||||||
| Initial | Monthly | Initial Cap | Cut-off Date Loan / SF: | $175 | ||||||
| Taxes: | $75,423 | $25,141 | N/A | Maturity Date Loan / SF: | $148 | |||||
| Insurance: | $6,890 | Springing | N/A | Cut-off Date LTV: | 71.0% | |||||
| Replacement Reserves: | $1,202 | $1,202 | $43,272 | Maturity Date LTV: | 59.9% | |||||
| TI/LC: | $15,900 | $15,900 | $572,400 | UW NCF DSCR: | 1.21x | |||||
| Other: | $0 | $0 | N/A | UW NOI Debt Yield: | 8.6% | |||||
| Sources and Uses | ||||||||||
| Sources | Proceeds | % of Total | Uses | Proceeds | % of Total | |||||
| Mortgage Loan | $33,500,000 | 93.6% | Payoff Existing Debt | $35,380,851 | 98.8% | |||||
| Sponsor Equity | 2,301,261 | 6.4 | Closing Costs | 320,995 | 0.9 | |||||
| Upfront Reserves | 99,415 | 0.3 | ||||||||
| Total Sources | $35,801,261 | 100.0% | Total Uses | $35,801,261 | 100.0% | |||||
| (1) | Net Rentable Area (SF) is inclusive of 5,756 square feet of outparcel space ground leased by Chili’s. |
The Loan.The Orchard Hill Park loan has an outstanding principal balance as of the Cut-off Date of approximately $33.5 million and is secured by a first mortgage lien on the borrowers’ fee interest in a 190,788 square foot shopping center located in Leominster, Massachusetts. The loan has a 10-year term and will amortize on a 30-year schedule. The borrowing entities for the loan are Orchard Hill Park, LLC and Koles, LLC, which are Massachusetts limited liability companies and special purpose entities.
The nonrecourse carve-out guarantor and loan sponsor is Gregg P. Lisciotti, the founder and president of, Lisciotti Development (“Lisciotti”). Lisciotti was founded in 1991 and is a privately-owned company based in Leominster, Massachusetts. Lisciotti invests, acquires and develops real estate assets throughout the United States. Investments include underperforming shopping centers, vacant retail boxes and land suitable for retail development, among others, with no geographic limitation. Lisciotti has also constructed 21 properties ranging from big boxes to multi-tenant centers, including Orchard Hill Park.
THE INFORMATION IN THIS STRUCTURAL AND COLLATERAL TERM SHEET IS NOT COMPLETE AND MAY BE AMENDED PRIOR TO THE TIME OF SALE. THIS TERM SHEET IS NOT AN OFFER TO SELL THESE SECURITIES AND IT IS NOT A SOLICITATION OF AN OFFER TO BUY THESE SECURITIES IN ANY JURISDICTION WHERE THE OFFER OR SALE IS NOT PERMITTED.
| | 144 of 156 |
| Structural and Collateral Term Sheet | JPMCC 2017-JP5 |
| Orchard Hill Park |
The Property.Orchard Hill Park is a 190,788 square foot shopping center located in Leominster, Massachusetts. Built in 2006 by Lisciotti, the property is located on a 19.3 acre parcel and consists of five single-story buildings. As of November 1, 2016, the property was 98.1% occupied by 10 tenants, which are a mix of both investment grade and national tenants. The property features three anchor tenants, Kohl’s, Dick’s Sporting Goods and Bed Bath & Beyond and is shadow anchored by Target, which added a grocery component in 2012. Other national retailers at the property include, Verizon Wireless, GameStop and Sleepy’s. The three anchors account for 78.5% of underwritten base rent and 88.3% of net rentable area and each is an original tenant at the property. Kohl’s has six, five-year extension options remaining and Dick’s Sporting Goods and Bed Bath & Beyond each have three, five-year extension options remaining. Outside of these anchor tenants, no individual tenant occupies more than 3.0% of net rentable area or 5.6% in underwritten base rent. Since 2006, the property has maintained an average occupancy of 99.1%. The property contains 852 surface parking spaces for an overall parking ratio of approximately 4.47 spaces per 1,000 square feet.
The Market.Orchard Hill Park is located in Leominster, Massachusetts, within Worcester County, and is approximately 35.4 miles northwest of Boston. The property benefits from its location immediately off of Route 2 and approximately 0.7 miles from Interstate 190. Interstate 190 intersects with Route 2 just south of the property and provides access to Worcester and the Massachusetts Turnpike. According to the appraisal, the 2015 estimated population within a one-, three- and five-mile radius of the property was approximately 1,255, 32,501 and 63,783 people, respectively, with an average household income of $96,811, $73,541 and $77,029, respectively.
As of the second quarter of 2016, the Worcester retail market had an overall vacancy rate of 10.6% and average asking rents of $20.12 per square foot, which compares to 11.0% and $19.92 per square foot, respectively, as of the second quarter of 2015. The appraisal identified five properties as directly competitive with Orchard Hill Park. Excluding the Target located approximately 0.1 miles from the property, the remaining four properties are located between 3.1 and 4.8 miles from the property and range from 224,552 to 727,181 square feet. None of the comparable properties have the same anchor tenants as Orchard Hill Park. These properties range from 84.0% to 100.0% occupied, with a weighted average occupancy of 96.0%. The appraisal did not identify any proposed or newly constructed properties that are expected to be directly competitive with the property.
| Tenant Summary(1) | ||||||||
| Tenant | Ratings(2) Moody’s / S&P/ Fitch | Net Rentable Area (SF) | % of Total NRA | Base Rent PSF | % of Total Base Rent | Sales PSF(3) | Occupancy Costs(3) | Lease Expiration Date |
| Kohl’s | Baa2 / BBB- / BBB | 88,925 | 46.6% | $13.18 | 38.7% | NA | NA | 1/31/2026 |
| Dick’s Sporting Goods | NA / NA / NA | 52,900 | 27.7% | $16.00 | 27.9% | NA | NA | 1/31/2021 |
| Bed Bath & Beyond | Baa1 / BBB+ / NA | 26,718 | 14.0% | $13.50 | 11.9% | $207 | 6.5% | 1/31/2021 |
| Chili’s(4) | Ba1 / BB+ / BB+ | 5,756 | 3.0% | $23.89 | 4.5% | NA | NA | 10/31/2020 |
| Sleepy’s(5) | NA / NA / NA | 3,360 | 1.8% | $33.00 | 3.7% | NA | NA | 11/30/2022 |
| Verizon Wireless | Baa1 / BBB+ / A- | 3,035 | 1.6% | $55.55 | 5.6% | NA | NA | 8/31/2021 |
| Vitamin Shoppe | NA / NA / NA | 2,360 | 1.2% | $33.00 | 2.6% | NA | NA | 8/31/2023 |
| GameStop | Ba1 / BB / NA | 1,825 | 1.0% | $35.00 | 2.1% | NA | NA | 1/31/2022 |
| Coldstone Creamery | NA / NA / NA | 1,360 | 0.7% | $39.20 | 1.8% | NA | NA | 7/31/2022 |
| Great Clips | NA / NA / NA | 1,003 | 0.5% | $39.38 | 1.3% | NA | NA | 11/30/2022 |
| (1) | Based on the underwritten rent roll. |
| (2) | Ratings provided are for the parent company of the entity listed in the “Tenant” field whether or not the parent company guarantees the lease. |
| (3) | Sales PSF and Occupancy Costs represent tenant reported sales for the trailing 12-month period ending December 31, 2015. |
| (4) | Base Rent PSF represents ground rent paid by Chili’s for the outparcel space. |
| (5) | Sleepy’s has a one-time right to terminate its lease, effective as of November 30, 2017, at any time within a one-month period after February 28, 2017, if its gross sales do not equal or exceed $875,000 for at least one 12-month period between January 1, 2013 and February 28, 2017, with notice on or prior to the expiration of such one-month period. |
THE INFORMATION IN THIS STRUCTURAL AND COLLATERAL TERM SHEET IS NOT COMPLETE AND MAY BE AMENDED PRIOR TO THE TIME OF SALE. THIS TERM SHEET IS NOT AN OFFER TO SELL THESE SECURITIES AND IT IS NOT A SOLICITATION OF AN OFFER TO BUY THESE SECURITIES IN ANY JURISDICTION WHERE THE OFFER OR SALE IS NOT PERMITTED.
| | 145 of 156 |
| Structural and Collateral Term Sheet | JPMCC 2017-JP5 |
| Orchard Hill Park |
| Lease Rollover Schedule(1) | |||||||||
| Year | Number of Leases Expiring | Net Rentable Area Expiring(2) | % of NRA Expiring | Base Rent Expiring | % of Base Rent Expiring | Cumulative Net Rentable Area Expiring | Cumulative % of NRA Expiring | Cumulative Base Rent Expiring | Cumulative % of Base Rent Expiring |
| Vacant | NAP | 3,546 | 1.9% | NAP | NAP | 3,546 | 1.9% | NAP | NAP |
| 2017 & MTM | 0 | 0 | 0.0% | $0 | 0.0% | 3,546 | 1.9% | $0 | 0.0% |
| 2018 | 0 | 0 | 0.0% | 0 | 0.0% | 3,546 | 1.9% | $0 | 0.0% |
| 2019 | 0 | 0 | 0.0% | 0 | 0.0% | 3,546 | 1.9% | $0 | 0.0% |
| 2020 | 1 | 5,756 | 3.0% | 137,500 | 4.5% | 9,302 | 4.9% | $137,500 | 4.5% |
| 2021 | 3 | 82,653 | 43.3% | 1,375,687 | 45.4% | 91,955 | 48.2% | $1,513,187 | 49.9% |
| 2022 | 4 | 7,548 | 4.0% | 267,565 | 8.8% | 99,503 | 52.2% | $1,780,752 | 58.8% |
| 2023 | 1 | 2,360 | 1.2% | 77,880 | 2.6% | 101,863 | 53.4% | $1,858,632 | 61.3% |
| 2024 | 0 | 0 | 0.0% | 0 | 0.0% | 101,863 | 53.4% | $1,858,632 | 61.3% |
| 2025 | 0 | 0 | 0.0% | 0 | 0.0% | 101,863 | 53.4% | $1,858,632 | 61.3% |
| 2026 | 1 | 88,925 | 46.6% | 1,172,032 | 38.7% | 190,788 | 100.0% | $3,030,664 | 100.0% |
| 2027 | 0 | 0 | 0.0% | 0 | 0.0% | 190,788 | 100.0% | $3,030,664 | 100.0% |
| 2028 & Beyond | 0 | 0 | 0.0% | 0 | 0.0% | 190,788 | 100.0% | $3,030,664 | 100.0% |
| Total | 10 | 190,788 | 100.0% | $3,030,664 | 100.0% | ||||
| (1) | Based on the underwritten rent roll. |
| (2) | Net Rentable Area Expiring is inclusive of 5,756 square feet of outparcel space ground leased by Chili’s. |
| Operating History and Underwritten Net Cash Flow | |||||||
| 2013 | 2014 | 2015 | TTM(1) | Underwritten | Per Square Foot | %(2) | |
| Rents in Place | $2,991,555 | $3,043,093 | $3,054,927 | $3,033,111 | $3,030,664 | $15.88 | 78.1% |
| Vacant Income | 0 | 0 | 0 | 0 | 124,110 | 0.65 | 3.2 |
| Gross Potential Rent | $2,991,555 | $3,043,093 | $3,054,927 | $3,033,111 | $3,154,774 | $16.54 | 81.3% |
| Total Reimbursements | 584,259 | 661,366 | 753,638 | 704,288 | $726,044 | 3.81 | 18.7 |
| Net Rental Income | $3,575,814 | $3,704,459 | $3,808,565 | $3,737,399 | $3,880,818 | $20.34 | 100.0% |
| (Vacancy/Credit Loss) | 0 | 0 | 0 | 0 | (194,041) | (1.02) | (5.0) |
| Other Income | 0 | 0 | 0 | 0 | 0 | 0.00 | 0.0 |
| Effective Gross Income | $3,575,814 | $3,704,459 | $3,808,565 | $3,737,399 | $3,686,777 | $19.32 | 95.0% |
| Total Expenses | $622,489 | $740,369 | $820,162 | $607,194 | $795,612 | $4.17 | 21.6% |
| Net Operating Income | $2,953,325 | $2,964,090 | $2,988,403 | $3,130,205 | $2,891,166 | $15.15 | 78.4% |
| Total TI/LC, Capex/RR | 0 | 0 | 0 | 0 | 57,236 | 0.30 | 1.6 |
| Net Cash Flow | $2,953,325 | $2,964,090 | $2,988,403 | $3,130,205 | $2,833,929 | $14.85 | 76.9% |
| Occupancy(3) | 100.0% | 100.0% | 100.0% | 98.1% | 95.0% | ||
| (1) | TTM column represents the trailing 12-month period ending November 30, 2016. |
| (2) | % column represents percent of Net Rental Income for all revenue lines and represents percent of Effective Gross Income for the remainder of fields. |
| (3) | Historical Occupancies are as of December 31 of each respective year. TTM Occupancy is as of November 1, 2016. Underwritten Occupancy represents economic occupancy. |
Right of First Refusal.Target, which is a shadow anchor for the property and which occupies an adjacent parcel, has a right of first refusal to purchase the property under a recorded agreement with the borrowers. The right of first refusal does not apply in the event of a foreclosure or deed-in-lieu of foreclosure by the lender, but would apply to subsequent sales by the trust following foreclosure.
THE INFORMATION IN THIS STRUCTURAL AND COLLATERAL TERM SHEET IS NOT COMPLETE AND MAY BE AMENDED PRIOR TO THE TIME OF SALE. THIS TERM SHEET IS NOT AN OFFER TO SELL THESE SECURITIES AND IT IS NOT A SOLICITATION OF AN OFFER TO BUY THESE SECURITIES IN ANY JURISDICTION WHERE THE OFFER OR SALE IS NOT PERMITTED.
| | 146 of 156 |
| Structural and Collateral Term Sheet | JPMCC 2017-JP5 |
[THIS PAGE INTENTIONALLY LEFT BLANK]
THE INFORMATION IN THIS STRUCTURAL AND COLLATERAL TERM SHEET IS NOT COMPLETE AND MAY BE AMENDED PRIOR TO THE TIME OF SALE. THIS TERM SHEET IS NOT AN OFFER TO SELL THESE SECURITIES AND IT IS NOT A SOLICITATION OF AN OFFER TO BUY THESE SECURITIES IN ANY JURISDICTION WHERE THE OFFER OR SALE IS NOT PERMITTED.
| | 147 of 156 |
| Structural and Collateral Term Sheet | JPMCC 2017-JP5 | |
| 11200 Rockville Pike | ||
| Mortgage Loan Information | Property Information | |||
| Mortgage Loan Seller: | JPMCB | Single Asset / Portfolio: | Single Asset | |
| Original Principal Balance: | $33,250,000 | Title: | Fee | |
| Cut-off Date Principal Balance: | $33,250,000 | Property Type - Subtype: | Office - Suburban | |
| % of Pool by IPB: | 3.0% | Net Rentable Area (SF): | 185,219 | |
| Loan Purpose: | Acquisition | Location: | Rockville, MD | |
| Borrower: | 11200 Rockville Pike, LLC | Year Built / Renovated: | 1986 / N/A | |
| Sponsors: | William F. Peel and | Occupancy: | 79.0% | |
| Barbara K. Peel | Occupancy Date: | 11/23/2016 | ||
| Interest Rate: | 4.77500% | Number of Tenants: | 18 | |
| Note Date: | 12/22/2016 | 2013 NOI: | $3,268,795 | |
| Maturity Date: | 1/1/2027 | 2014 NOI(1): | $3,150,823 | |
| Interest-only Period: | 36 months | 2015 NOI(1): | $3,809,881 | |
| Original Term: | 120 months | TTM NOI (as of 10/2016): | $3,797,324 | |
| Original Amortization: | 360 months | UW Economic Occupancy: | 81.7% | |
| Amortization Type: | IO-Balloon | UW Revenues: | $5,241,842 | |
| Call Protection: | L(26),Def(92),O(2) | UW Expenses: | $1,887,448 | |
| Lockbox: | CMA | UW NOI: | $3,354,394 | |
| Additional Debt: | N/A | UW NCF: | $3,031,273 | |
| Additional Debt Balance: | N/A | Appraised Value / Per SF: | $45,100,000 / $243 | |
| Additional Debt Type: | N/A | Appraisal Date: | 12/6/2016 | |
| Escrows and Reserves | Financial Information | |||||||
| Initial | Monthly | Initial Cap | Cut-off Date Loan / SF: | $180 | ||||
| Taxes: | $172,630 | $43,157 | N/A | Maturity Date Loan / SF: | $158 | |||
| Insurance: | $12,951 | $3,548 | N/A | Cut-off Date LTV: | 73.7% | |||
| Replacement Reserves: | $4,014 | $4,014 | N/A | Maturity Date LTV: | 64.9% | |||
| TI/LC(2)(3): | $300,000 | $19,294 | $1,157,640 | UW NCF DSCR: | 1.45x | |||
| Other(4): | $280,627 | $0 | N/A | UW NOI Debt Yield: | 10.1% | |||
| Sources and Uses | ||||||
| Sources | Proceeds | % of Total | Uses | Proceeds | % of Total | |
| Mortgage Loan | $33,250,000 | 73.2% | Purchase Price | $43,550,000 | 95.8% | |
| Sponsor Equity | 12,189,049 | 26.8 | Closing Costs | 1,118,828 | 2.5 | |
| Upfront Reserves | 770,222 | 1.7 | ||||
| Total Sources | $45,439,049 | 100.0% | Total Uses | $45,439,049 | 100.0% | |
| (1) | The increase from 2014 NOI to 2015 NOI is primarily due to an average increase in base rent from $23.86 per square foot to $26.93 per square foot (an increase of $568,930). |
| (2) | The borrower is also required to deposit all lease termination fees into the Monthly TI/LC Escrows and Reserves. |
| (3) | The Initial TI/LC Escrows and Reserves deposit is excluded for purposes of calculating the TI/LC Initial Cap. |
| (4) | Initial Other Escrows and Reserves consists of a free rent reserve of $232,617, an outstanding tenant improvements and leasing commissions reserve of $34,228 and an upfront deferred maintenance reserve of $13,781. |
The Loan.The 11200 Rockville Pike loan has an outstanding principal balance as of the Cut-off Date of $33.25 million and is secured by a first mortgage lien on the borrower’s fee interest in a 185,219 square foot office building located in Rockville, Maryland. The loan has a 10-year term and, following a three-year interest-only period, will amortize on a 30-year schedule. The borrowing entity for the 11200 Rockville Pike loan is 11200 Rockville Pike, LLC, a Maryland limited liability company and special purpose entity. The loan sponsors and nonrecourse carve-out guarantors are William F. Peel and Barbara K. Peel, who are the founders of Peel Properties. Founded in 1971, Peel Properties currently has a portfolio consisting of 620,657 square feet encompassing 18 commercial properties, 373 multifamily units and a marina. William F. Peel and Barbara K. Peel are the co-owners of Red Coats, Inc. (“Red Coats”) and Datawatch Systems. With more than 4,500 employees, Red Coats provides commercial office cleaning services to hundreds of customers in the Mid-Atlantic region and Florida. Datawatch Systems specializes in access control systems and currently serves more than 4,000 commercial buildings throughout the United States and Canada.
THE INFORMATION IN THIS STRUCTURAL AND COLLATERAL TERM SHEET IS NOT COMPLETE AND MAY BE AMENDED PRIOR TO THE TIME OF SALE. THIS TERM SHEET IS NOT AN OFFER TO SELL THESE SECURITIES AND IT IS NOT A SOLICITATION OF AN OFFER TO BUY THESE SECURITIES IN ANY JURISDICTION WHERE THE OFFER OR SALE IS NOT PERMITTED.
| | 148 of 156 |
| Structural and Collateral Term Sheet | JPMCC 2017-JP5 | |
| 11200 Rockville Pike | ||
The Property.11200 Rockville Pike is a five-story, 185,219 square foot Class A/B multi-tenant office building constructed in 1986 that features an attached three-level subterranean parking garage with 425 parking spaces (resulting in a parking ratio of 2.29 per 1,000 square feet), located in Rockville, Maryland.
As of November 23, 2016 the property was 79.0% occupied by 18 tenants under 19 leases. The largest tenant at the property, RR Donnelley Financial, Inc. (“RR Donnelley”) (NASDAQ: RRD; rated B2/B+ by Moody’s and S&P) leases 15.2% of the net rentable area through February 2021. RR Donnelley has been a tenant at the property since 1998, and in September 2015, expanded into the fifth floor of the property for an additional 13,922 square feet. RR Donnelley is a national consulting organization that helps companies develop more efficient ways to communicate, manage and deliver financial information. RR Donnelley accounts for 18.3% of the underwritten base rent and its lease contains two three-year renewal options. The second largest tenant at the property, Snyder Cohn PC (“Snyder Cohn”), leases 10.6% of the net rentable area through November 2022 and has been in occupancy at the property since December 2010. Snyder Cohn is a mid-sized accounting and business advisory firm with clientele primarily based in the Washington D.C. metropolitan area. Snyder Cohn accounts for 13.4% of the underwritten base rent and its lease contains two five-year renewal options. The third largest tenant at the property, the American Society for Biochemistry and Molecular Biology (the “ASBMB”), leases 10.1% of the net rentable area through April 2021 and has been a tenant at the property since May 2011. The ASBMB is a nonprofit scientific and educational organization that strives to advance the sciences of biochemistry and molecular biology through publication, scientific meetings, advocacy for funding and promotion of science education. ASBMB accounts for 12.2% of the underwritten base rent and its lease contains one five-year renewal option.
The Market.The property is located along Rockville Pike which is a six-lane thoroughfare that provides direct access to the Washington D.C. central business district. In addition, the 11200 Rockville Pike property is served by public transportation with both the Metro bus and Montgomery County’s Ride-On buses stopping within 0.2 miles of the property. The property is approximately 0.5 miles south of the White Flint Metro rail station and 1.0 mile south of the Grosvenor-Strathmore Metro station.
The property is adjacent to North Bethesda Market which offers retail shopping and dining and is anchored by a Whole Foods Market and an LA Fitness. Pike and Rose, a new mixed-use property, is located 0.8 miles north of the property and offers dining and retail, including a movie theatre and bowling alley. According to the appraisal, the immediate area surrounding the property features multiple approved development sites which are anticipated to bring more than 14,000 housing units and 13.0 million square feet of commercial space to the area over the next 25 years. The property is located within the Rockville Pike office submarket, which as of the third quarter of 2016, had an office inventory of approximately 8.2 million square feet and a vacancy rate of 12.4%. As of third quarter 2016, asking rents within the Rockville Pike office submarket were $30.82 per square foot. The appraisal analyzed a set of four directly competitive properties within the immediate competitive area of the property and concluded an office market rental range of $29.00 to $32.42 per square foot, which is in line with the weighted average underwritten office rents of $31.81 per square foot at the property.
| Tenant Summary(1) | ||||||
| Tenant | Ratings(2) Moody’s/S&P/Fitch | Net Rentable Area (SF) | % of Total NRA | Base Rent PSF | % of Total Base Rent | Lease Expiration Date |
| RR Donnelley Financial, Inc.(3) | B2 / B+ / NA | 28,116 | 15.2% | $30.41 | 18.3% | 2/28/2021 |
| Snyder Cohn PC(4) | NA / NA / NA | 19,709 | 10.6% | $31.91 | 13.4% | 11/30/2022 |
| ASBMB | NA / NA / NA | 18,747 | 10.1% | $30.58 | 12.2% | 4/30/2021 |
| Capreit | NA / NA / NA | 14,934 | 8.1% | $31.46 | 10.0% | 12/31/2021 |
| Berlin, Ramos & Company, P.A. | NA / NA / NA | 11,929 | 6.4% | $36.55 | 9.3% | 11/30/2019 |
| Marketresearch.com, Inc | NA / NA / NA | 8,142 | 4.4% | $31.34 | 5.4% | 5/31/2019 |
| Metropolitan Eye Care | NA / NA / NA | 6,154 | 3.3% | $39.90 | 5.2% | 3/31/2018 |
| Agency Two | NA / NA / NA | 6,100 | 3.3% | $32.00 | 4.2% | 3/31/2021 |
| C.R.I., Inc.(5) | NA / NA / NA | 5,835 | 3.2% | $27.80 | 3.5% | 4/30/2018 |
| Clear Choice | NA / NA / NA | 5,710 | 3.1% | $33.01 | 4.0% | 9/30/2020 |
| (1) | Based on the underwritten rent roll dated November 23, 2016. |
| (2) | Ratings provided are for the parent company of the entity listed in the “Tenant” field whether or not the parent company guarantees the lease. |
| (3) | RR Donnelley has the right to terminate its lease or contract its leased space by the entire third or fifth floors on February 28, 2019, with 12 months’ notice and the payment of a termination/contraction fee. |
| (4) | Snyder Cohn PC has the right to terminate its lease on November 30, 2020, with 210 days’ notice and the payment of a termination fee. |
| (5) | C.R.I., Inc. has the right to terminate its lease at any time with 30 days’ notice. |
THE INFORMATION IN THIS STRUCTURAL AND COLLATERAL TERM SHEET IS NOT COMPLETE AND MAY BE AMENDED PRIOR TO THE TIME OF SALE. THIS TERM SHEET IS NOT AN OFFER TO SELL THESE SECURITIES AND IT IS NOT A SOLICITATION OF AN OFFER TO BUY THESE SECURITIES IN ANY JURISDICTION WHERE THE OFFER OR SALE IS NOT PERMITTED.
| | 149 of 156 |
| Structural and Collateral Term Sheet | JPMCC 2017-JP5 | |
| 11200 Rockville Pike | ||
| Lease Rollover Schedule(1) | |||||||||
| Year | Number of Leases Expiring | Net Rentable Area Expiring | % of NRA Expiring | Base Rent Expiring | % of Base Rent Expiring | Cumulative Net Rentable Area Expiring | Cumulative % of NRA Expiring | Cumulative Base Rent Expiring | Cumulative % of Base Rent Expiring |
| Vacant | NAP | 38,884 | 21.0% | NAP | NAP | 38,884 | 21.0% | NAP | NAP |
| 2017 & MTM | 0 | 0 | 0.0 | $0 | 0.0% | 38,884 | 21.0% | $0 | 0.0% |
| 2018 | 4 | 13,038 | 7.0 | 433,404 | 9.3 | 51,922 | 28.0% | $433,404 | 9.3% |
| 2019(2) | 3 | 20,072 | 10.8 | 691,147 | 14.8 | 71,994 | 38.9% | $1,124,552 | 24.0% |
| 2020 | 2 | 7,342 | 4.0 | 237,039 | 5.1 | 79,336 | 42.8% | $1,361,591 | 29.1% |
| 2021 | 5 | 72,512 | 39.1 | 2,241,834 | 47.9 | 151,848 | 82.0% | $3,603,424 | 76.9% |
| 2022 | 4 | 29,575 | 16.0 | 942,875 | 20.1 | 181,423 | 98.0% | $4,546,300 | 97.0% |
| 2023 | 0 | 0 | 0.0 | 0 | 0.0 | 181,423 | 98.0% | $4,546,300 | 97.0% |
| 2024 | 1 | 3,796 | 2.0 | 138,212 | 3.0 | 185,219 | 100.0% | $4,684,512 | 100.0% |
| 2025 | 0 | 0 | 0.0 | 0 | 0.0 | 185,219 | 100.0% | $4,684,512 | 100.0% |
| 2026 | 0 | 0 | 0.0 | 0 | 0.0 | 185,219 | 100.0% | $4,684,512 | 100.0% |
| 2027 | 0 | 0 | 0.0 | 0 | 0.0 | 185,219 | 100.0% | $4,684,512 | 100.0% |
| 2028 & Beyond | 0 | 0 | 0.0 | 0 | 0.0 | 185,219 | 100.0% | $4,684,512 | 100.0% |
| Total | 19 | 185,219 | 100.0% | $4,684,512 | 100.0% | ||||
| (1) | Based on the underwritten rent roll dated November 23, 2016. |
| (2) | 2019 includes one square foot in antenna space with no attributable base rent. |
| Operating History and Underwritten Net Cash Flow | |||||||
| 2013 | 2014 | 2015 | TTM(1) | Underwritten | Per Square Foot | %(2) | |
| Rents in Place(3) | $4,417,217 | $4,419,748 | $4,988,678 | $5,020,092 | $4,684,512 | $25.29 | 73.1% |
| Vacant Income | 0 | 0 | 0 | 0 | 1,170,480 | 6.32 | 18.3 |
| Gross Potential Rent | $4,417,217 | $4,419,748 | $4,988,678 | $5,020,092 | $5,854,992 | $31.61 | 91.3% |
| Total Reimbursements | 733,911 | 573,168 | 575,172 | 536,478 | 557,330 | 3.01 | 8.7 |
| Net Rental Income | $5,151,128 | $4,992,916 | $5,563,850 | $5,556,570 | $6,412,322 | $34.62 | 100.0% |
| (Vacancy/Credit Loss) | 0 | 0 | 1,737 | (53) | (1,170,480) | (6.32) | (18.3) |
| Other Income | 155,397 | 125,055 | 122,680 | 25,332 | 0 | 0.00 | 0.0 |
| Effective Gross Income | $5,306,525 | $5,117,970 | $5,688,267 | $5,581,849 | $5,241,842 | $28.30 | 81.7% |
| Total Expenses | $2,037,730 | $1,967,147 | $1,878,386 | $1,784,525 | $1,887,448 | $10.19 | 36.0% |
| Net Operating Income(4) | $3,268,795 | $3,150,823 | $3,809,881 | $3,797,324 | $3,354,394 | $18.11 | 64.0% |
| Total TI/LC, Capex/RR | 0 | 0 | 0 | 0 | 323,120 | 1.74 | 6.2 |
| Net Cash Flow | $3,268,795 | $3,150,823 | $3,809,881 | $3,797,324 | $3,031,273 | $16.37 | 57.8% |
| Occupancy(5) | 82.4% | 86.0% | 88.8% | 79.0% | 81.7% | ||
| (1) | TTM Column represents the trailing 12-month period ending October 31, 2016. |
| (2) | % column represents percent of Net Rental Income for all revenue lines and represents percent of Effective Gross Income for the remainder of the fields. |
| (3) | Underwritten Rents in Place includes $142,559 in contractual rent steps through December 2017. |
| (4) | The increase in Net Operating Income from 2014 to 2015 is primarily due to an average increase in base rent from $23.86 per square foot to $26.93 per square foot (an increase of $568,930). |
| (5) | Historical Occupancies are as of December 31 of each respective year. TTM occupancy is as of November 23, 2016. Underwritten Occupancy represents economic occupancy. |
THE INFORMATION IN THIS STRUCTURAL AND COLLATERAL TERM SHEET IS NOT COMPLETE AND MAY BE AMENDED PRIOR TO THE TIME OF SALE. THIS TERM SHEET IS NOT AN OFFER TO SELL THESE SECURITIES AND IT IS NOT A SOLICITATION OF AN OFFER TO BUY THESE SECURITIES IN ANY JURISDICTION WHERE THE OFFER OR SALE IS NOT PERMITTED.
| | 150 of 156 |
| Structural and Collateral Term Sheet | JPMCC 2017-JP5 |
[THIS PAGE INTENTIONALLY LEFT BLANK]
THE INFORMATION IN THIS STRUCTURAL AND COLLATERAL TERM SHEET IS NOT COMPLETE AND MAY BE AMENDED PRIOR TO THE TIME OF SALE. THIS TERM SHEET IS NOT AN OFFER TO SELL THESE SECURITIES AND IT IS NOT A SOLICITATION OF AN OFFER TO BUY THESE SECURITIES IN ANY JURISDICTION WHERE THE OFFER OR SALE IS NOT PERMITTED.
| | 151 of 156 |
| Structural and Collateral Term Sheet | JPMCC 2017-JP5 | |
| Marriott Galleria | ||
| Mortgage Loan Information | Property Information | |||
| Mortgage Loan Seller: | JPMCB | Single Asset / Portfolio: | Single Asset | |
| Original Principal Balance: | $32,000,000 | Title: | Fee | |
| Cut-off Date Principal Balance: | $31,921,895 | Property Type - Subtype: | Hotel - Full Service | |
| % of Pool by IPB: | 2.9% | Net Rentable Area (Rooms): | 301 | |
| Loan Purpose: | Refinance | Location: | Houston, TX | |
| Borrowers: | Which West Loop Owner, LLC and | Year Built / Renovated: | 1976 / 2016 | |
| Which West Loop Lessee, LLC | Occupancy / ADR / RevPAR: | 68.3% / $149.77 / $102.22 | ||
| Sponsors(1): | Various | Occupancy / ADR / RevPAR Date: | 10/31/2016 | |
| Interest Rate: | 5.25800% | Number of Tenants: | N/A | |
| Note Date: | 12/23/2016 | 2013 NOI(2): | $4,073,999 | |
| Maturity Date: | 1/1/2022 | 2014 NOI(2): | $3,721,392 | |
| Interest-only Period: | None | 2015 NOI(2): | $3,961,245 | |
| Original Term: | 60 months | TTM NOI (as of 10/2016)(2): | $3,281,215 | |
| Original Amortization: | 360 months | UW Occupancy / ADR / RevPAR: | 68.3% / $149.77 / $102.22 | |
| Amortization Type: | Balloon | UW Revenues: | $15,832,406 | |
| Call Protection: | L(26),Def(10),O(24) | UW Expenses: | $12,627,330 | |
| Lockbox: | Springing | UW NOI: | $3,205,075 | |
| Additional Debt: | N/A | UW NCF: | $3,205,075 | |
| Additional Debt Balance: | N/A | Appraised Value / Per Room: | $51,000,000 / $169,435 | |
| Additional Debt Type: | N/A | Appraisal Date: | 11/1/2016 | |
| Escrows and Reserves | Financial Information | ||||||
| Initial | Monthly | Initial Cap | Cut-off Date Loan / Room: | $106,053 | |||
| Taxes: | $0 | Springing | N/A | Maturity Date Loan / Room: | $98,417 | ||
| Insurance: | $0 | Springing | N/A | Cut-off Date LTV: | 62.6% | ||
| FF&E: | $0 | Springing | N/A | Maturity Date LTV: | 58.1% | ||
| TI/LC: | $0 | $0 | N/A | UW NCF DSCR: | 1.51x | ||
| Other: | $0 | $0 | N/A | UW NOI Debt Yield: | 10.0% | ||
| Sources and Uses | ||||||
| Sources | Proceeds | % of Total | Uses | Proceeds | % of Total | |
| Mortgage Loan | $32,000,000 | 88.6% | Payoff Existing Debt | $35,395,124 | 98.0% | |
| Sponsor Equity | 4,133,698 | 11.4 | Closing Costs | 738,575 | 2.0 | |
| Total Sources | $36,133,698 | 100.0% | Total Uses | $36,133,698 | 100.0% | |
| (1) | The loan sponsors are WHI Real Estate Partners II, L.P., WHI Real Estate Partners II-PF, L.P., WHI Real Estate Partners II-TE, L.P., WHI Real Estate Partners III, L.P., WHI Real Estate Partners III-PF, L.P. and WHI Real Estate Partners III-TE, L.P. |
| (2) | The decrease in TTM NOI from 2013 NOI is primarily driven by the overall health of the petroleum industry as the Houston, Texas economy is closely tied to that industry, which has been adversely affected by the decline in oil and gas prices. However, despite the slowdown in the Houston economy, the property has been able to maintain its market share over its competitive set, as demonstrated by an October 2016 trailing 12-month RevPAR penetration rate of approximately 100.8%, which is up from the 2013 year end RevPAR penetration rate of approximately 89.8%. |
The Loan.The Marriott Galleria loan has an outstanding principal balance as of the Cut-off Date of approximately $31.9 million and is secured by a first mortgage lien on the fee interest in the 301-room Marriott Galleria, a full service hotel located in Houston, Texas. The loan has a five-year term and will amortize on a 30-year schedule. The property was previously securitized as part of a portfolio in the BSCMS 2007-BBA8 securitization.
THE INFORMATION IN THIS STRUCTURAL AND COLLATERAL TERM SHEET IS NOT COMPLETE AND MAY BE AMENDED PRIOR TO THE TIME OF SALE. THIS TERM SHEET IS NOT AN OFFER TO SELL THESE SECURITIES AND IT IS NOT A SOLICITATION OF AN OFFER TO BUY THESE SECURITIES IN ANY JURISDICTION WHERE THE OFFER OR SALE IS NOT PERMITTED.
| | 152 of 156 |
| Structural and Collateral Term Sheet | JPMCC 2017-JP5 | |
| Marriott Galleria | ||
The borrowing entities for the Marriott Galleria loan are Which West Loop Owner, LLC and Which West Loop Lessee, LLC, each a Delaware limited liability company and special purpose entity. The loan sponsors and nonrecourse carve-out guarantors are WHI Real Estate Partners II, L.P., WHI Real Estate Partners II-PF, L.P., WHI Real Estate Partners II-TE, L.P., WHI Real Estate Partners III, L.P., WHI Real Estate Partners III-PF, L.P. and WHI Real Estate Partners III-TE, L.P., each a Delaware limited partnership and affiliate of WHI Real Estate Partners. WHI Real Estate Partners is a real estate investment firm focused on repositioning middle-market properties throughout the United States. Founded in 2008, WHI Real Estate Partners manages a series of fully-discretionary investment funds whose investors include university endowments, foundations, health care systems, pension plans and family offices. Additionally, WHI Real Estate Partners is led by an experienced team of professionals, each with at least 25 years of real estate investment and capital markets experience. The loan sponsors for the Marriott Galleria loan collectively have investments in 26 assets, including four hospitality assets.
The loan sponsors purchased the property in January 2014 for approximately $50.3 million ($167,110 per room) and, according to the loan sponsors, subsequently invested approximately $5.0 million ($16,609 per room) into a renovation of the property’s public areas and meeting spaces since acquisition. As part of the public area renovation, the lobby was upgraded to the Marriott “Great Room” concept. Additional property renovations included back of the house improvements and upgrades to the elevators and guest rooms. According to the appraisal, there is no future property improvement renovation currently scheduled or required by Marriott for maintenance of brand standards.
The Property. Marriott Galleria is a 13-story, 301-room, full service hotel located in Houston, Texas. The property was originally developed in 1976 and, according to the loan sponsors, has undergone approximately $5.0 million ($16,609 per room) in capital expenditures between January 2014 and November 2016. The Marriott Galleria property features one food and beverage venue, 17Fifty Lounge and Bistro. 17Fifty Lounge and Bistro is a 120-seat southwestern cuisine restaurant offering hotel guests breakfast, lunch and dinner daily. Additionally, the hotel offers approximately 17,330 square feet of meeting space across eight rooms and includes an approximately 5,160 square foot ballroom. Additional amenities at the property include high-speed internet access, a business center, 24-hour fitness center, indoor swimming pool, guest self-service laundry facility and a gift and sundry shop. The hotel contains 600 parking spaces provided via an adjacent parking garage for a parking ratio of approximately 1.99 spaces per room and guests have the option to self-park or valet park, both for a fee. The parking garage is shared with an adjacent office building that is connected to the hotel. In addition to the parking garage, the hotel also shares common area spaces with the office building.
In 1998, the Marriott Galleria and attached office building split the lot, creating a Reciprocal Easements, Parking and Central Plant Agreement. The agreement outlines all easements, rights of way, parking privileges and maintenance responsibilities of the property. The office building and hotel property share a common central plant that provides both chilled water and fire protection water to both buildings. Through the agreement, the office owner leases to the property a total of 13,403 square feet on the ground floor of the office building, including meeting rooms, executive offices, the gift shop and storage space for an annual rent of approximately $117,425, with adjustments to the consumer price index. In addition to the easement payment for the ground floor space, the property reimburses the office building for the hotel’s share of electricity and water expenses (the hotel is separately metered), staff and maintenance of the parking garage and 5.0% of the office owner’s property tax and insurance expenses.
The property has 301 rooms, including 155 king rooms, 144 double-double rooms and two suites. All guest rooms feature high-speed internet access, microwave, refrigerator, pull-out sofa, coffee and tea maker, work desk area and a high definition television. The guest room suites feature the same amenities with additional living space. While there are no guest room renovations currently planned, the guest rooms underwent a full renovation in 2010 under the previous owner.
The Market. The Marriott Galleria property is located at the intersection of West Loop South and Hallmark Drive and access to the property is provided via West Loop South. The property benefits from its proximity to Interstate Highway 610, located one block east. Interstate Highway 610 provides access to downtown Houston, approximately 7.0 miles east, and regional access to the surrounding cities. The property is part of the Uptown District/Galleria district of Houston. The Uptown District/Galleria district has the largest concentration of retail in Houston and is Houston’s second largest business district with over 24.0 million square feet of office space and approximately 2,000 companies. Additionally, the property is located approximately 1.0 mile north of Houston Galleria, the largest mall in Texas and fourth largest in the United States. The Houston Galleria is one of the most visited shopping centers in the United States with over 30.0 million annual visitors.
According to the appraisal, there is a 157-room Hyatt Place Houston Galleria that opened in January 2016 that is competitive with the Marriott Galleria. Additionally there is a 1,000-room Marriott Marquis that opened in December 2016 as well as a 250-room hotel proposed to be part of a luxury mixed use development expected to open in October 2017. The appraisal did not identify these hotels as directly competitive with the Marriott Galleria, but the appraisal did note that the Landry’s development should generate additional demand for the area.
THE INFORMATION IN THIS STRUCTURAL AND COLLATERAL TERM SHEET IS NOT COMPLETE AND MAY BE AMENDED PRIOR TO THE TIME OF SALE. THIS TERM SHEET IS NOT AN OFFER TO SELL THESE SECURITIES AND IT IS NOT A SOLICITATION OF AN OFFER TO BUY THESE SECURITIES IN ANY JURISDICTION WHERE THE OFFER OR SALE IS NOT PERMITTED.
| | 153 of 156 |
| Structural and Collateral Term Sheet | JPMCC 2017-JP5 | |
| Marriott Galleria | ||
| Historical Occupancy, ADR, RevPAR(1) | ||||||||||
| Competitive Set(2) | Marriott Galleria(3) | Penetration Factor(4) | ||||||||
| Year | Occupancy | ADR | RevPAR | Occupancy | ADR | RevPAR | Occupancy | ADR | RevPAR | |
| 2013 | 79.6% | $152.28 | $121.18 | 66.7% | $163.15 | $108.82 | 83.8% | 107.1% | 89.8% | |
| 2014 | 78.7% | $162.81 | $128.14 | 68.6% | $160.17 | $109.90 | 87.2% | 98.4% | 85.8% | |
| 2015 | 76.7% | $155.52 | $119.28 | 74.7% | $149.78 | $111.85 | 97.4% | 96.3% | 93.8% | |
| TTM(5) | 69.0% | $146.87 | $101.41 | 68.3% | $149.77 | $102.22 | 98.9% | 102.0% | 100.8% | |
| (1) | The minor variances between the underwriting, appraisal and above table with respect to Occupancy, ADR and RevPAR at the Marriott Galleria property are attributable to variances in reporting methodologies and/or timing differences. |
| (2) | Data provided by STR, Inc. The competitive set contains the following properties: Hilton Houston Post Oak, Omni Houston Hotel, Hotel Derek and Sheraton Hotel Suites Galleria. |
| (3) | Based on operating statements provided by the borrowers. |
| (4) | Penetration Factor is calculated based on data provided by STR, Inc. for the competitive set and borrower-provided operating statements for the property. |
| (5) | TTM represents the trailing 12-month period ending on October 31, 2016. |
| Competitive Hotels Profile(1) | |||||||||
| 2015 Estimated Market Mix | 2015 Estimated Operating Statistics | ||||||||
| Property | Rooms | Year Opened | Meeting Space (SF) | Commercial | Meeting and Group | Leisure | Occupancy | ADR | RevPAR |
| Marriott Galleria(2) | 301 | 1976 | 17,330 | 40% | 25% | 35% | 74.7% | $149.78 | $111.85 |
| Hilton Houston Post Oak | 448 | 1982 | 30,000 | 40% | 25% | 35% | 74.0% | $152.00 | $112.48 |
| Omni Houston Hotel | 378 | 1981 | 30,000 | 40% | 25% | 35% | 78.0% | $160.00 | $124.80 |
| Hotel Derek | 312 | 1979 | 10,000 | 30% | 20% | 50% | 80.0% | $162.00 | $129.60 |
| Sheraton Hotel Suites Galleria | 283 | 2000 | 9,000 | 45% | 20% | 35% | 76.0% | $148.00 | $112.48 |
| Total(3) | 1,421 | ||||||||
| (1) | Based on the appraisal. |
| (2) | 2015 Occupancy, ADR and RevPAR are based on operating statements provided by the borrowers. |
| (3) | Excludes the Marriott Galleria property. |
THE INFORMATION IN THIS STRUCTURAL AND COLLATERAL TERM SHEET IS NOT COMPLETE AND MAY BE AMENDED PRIOR TO THE TIME OF SALE. THIS TERM SHEET IS NOT AN OFFER TO SELL THESE SECURITIES AND IT IS NOT A SOLICITATION OF AN OFFER TO BUY THESE SECURITIES IN ANY JURISDICTION WHERE THE OFFER OR SALE IS NOT PERMITTED.
| | 154 of 156 |
| Structural and Collateral Term Sheet | JPMCC 2017-JP5 | |
| Marriott Galleria | ||
| Operating History and Underwritten Net Cash Flow | |||||||
| 2013 | 2014 | 2015 | TTM(1) | Underwritten | Per Room(2) | % of Total Revenue(3) | |
| Occupancy | 66.7% | 68.6% | 74.7% | 68.3% | 68.3% | ||
| ADR | $163.15 | $160.17 | $149.78 | $149.77 | $149.77 | ||
| RevPAR | $108.82 | $109.90 | $111.85 | $102.22 | $102.22 | ||
| Room Revenue | $12,053,706 | $12,074,079 | $12,288,726 | $11,261,339 | $11,230,637 | $37,311 | 70.9% |
| Food and Beverage Revenue | 3,699,826 | 3,464,022 | 4,419,988 | 4,053,729 | 4,042,677 | 13,431 | 25.5 |
| Parking Revenue | 559,520 | 741,716 | 494,317 | 417,130 | 415,993 | 1,382 | 2.6 |
| Other Departmental Revenue | 224,106 | 188,265 | 184,244 | 143,489 | 143,098 | 475 | 0.9 |
| Total Revenue | $16,537,157 | $16,468,082 | $17,387,276 | $15,875,688 | $15,832,406 | $52,599 | 100.0% |
| Room Expense | $2,711,725 | $2,774,619 | $2,789,779 | $2,466,288 | $2,459,564 | $8,171 | 21.9% |
| Food and Beverage Expense | 2,593,704 | 2,551,723 | 2,990,228 | 2,776,826 | 2,769,256 | 9,200 | 68.5 |
| Parking Expense | 327,103 | 299,269 | 55,404 | 74,694 | 74,491 | 247 | 17.9 |
| Other Departmental Expenses | 168,659 | 170,317 | 207,911 | 31,729 | 31,643 | 105 | 22.1 |
| Departmental Expenses | $5,801,190 | $5,795,927 | $6,043,322 | $5,349,537 | $5,334,953 | $17,724 | 33.7% |
| Departmental Profit | $10,735,967 | $10,672,155 | $11,343,953 | $10,526,150 | $10,497,453 | $34,875 | 66.3% |
| Operating Expenses | $4,252,708 | $4,491,652 | $4,873,984 | $4,963,478 | $4,949,946 | $16,445 | 31.3% |
| Gross Operating Profit | $6,483,258 | $6,180,504 | $6,469,970 | $5,562,673 | $5,547,507 | $18,430 | 35.0% |
| Management Fees | $496,115 | $494,042 | $521,618 | $476,271 | $474,972 | $1,578 | 3.0% |
| Property Taxes | 683,806 | 767,136 | 759,155 | 669,900 | 682,712 | 2,268 | 4.3 |
| Property Insurance | 98,429 | 141,794 | 119,321 | 108,429 | 151,924 | 505 | 1.0 |
| Other Expenses | 304,052 | 232,735 | 239,267 | 233,073 | 241,204 | 801 | 1.5 |
| FF&E | 826,858 | 823,404 | 869,364 | 793,784 | 791,620 | 2,630 | 5.0 |
| Total Other Expenses | $2,409,259 | $2,459,111 | $2,508,725 | $2,281,457 | $2,342,432 | $7,782 | 14.8% |
| Net Operating Income | $4,073,999 | $3,721,392 | $3,961,245 | $3,281,215 | $3,205,075 | $10,648 | 20.2% |
| Net Cash Flow | $4,073,999 | $3,721,392 | $3,961,245 | $3,281,215 | $3,205,075 | $10,648 | 20.2% |
| (1) | TTM column represents the trailing 12-month period ending on October 31, 2016. |
| (2) | Per Room values based on 301 guest rooms. |
| (3) | % of Total Revenue for Room Expense, Food and Beverage Expense, Parking Expenses and Other Departmental Expenses is based on their corresponding revenue line items. |
Property Management. The property is managed by Marriott Hotel Services, Inc., a Delaware corporation and an affiliate of Marriott International, Inc. pursuant to a Hotel Management Agreement (“HMA”). The HMA, dated July 10, 2007, has an initial 20-year term that commenced in 2008 and runs through 2028 with two 10-year renewal options remaining. The HMA requires a base fee of 3% and an incentive management fee (“IMF”) of 20% of available cash flow, which is equal to the net operating income less the “Owner’s Priority.” The “Owner’s Priority” is equal to (i) 10.75% of the owner’s initial invested capital plus (ii) 10.75% of capital expenditures funded by the owner plus (iii) 10.75% of the amount of the lump sum contribution by the owner to the FF&E reserve pursuant to the HMA plus (iv) 10.75% of the amount of any contribution made by the owner toward the working capital and in connection with removal of any environmentally hazardous materials at the property pursuant to the HMA. The owner’s basis for calculating the “Owner’s Priority” is $56.5 million, implying an IMF hurdle of $6.0 million.
THE INFORMATION IN THIS STRUCTURAL AND COLLATERAL TERM SHEET IS NOT COMPLETE AND MAY BE AMENDED PRIOR TO THE TIME OF SALE. THIS TERM SHEET IS NOT AN OFFER TO SELL THESE SECURITIES AND IT IS NOT A SOLICITATION OF AN OFFER TO BUY THESE SECURITIES IN ANY JURISDICTION WHERE THE OFFER OR SALE IS NOT PERMITTED.
| | 155 of 156 |
| Structural and Collateral Term Sheet | JPMCC 2017-JP5 | |
| Contacts | ||
| J.P. Morgan CMBS Capital Markets & Banking | ||
| Contact | Phone Number | |
Kunal Singh Managing Director | kunal.k.singh@jpmorgan.com | (212) 834-5467 |
Brad Horn Executive Director | bradley.j.horn@jpmorgan.com | (212) 834-9708 |
John Miller Vice President | john.miller@jpmorgan.com | (212) 272-8363 |
| J.P. Morgan CMBS Trading | ||
| Contact | Phone Number | |
Andy Taylor Managing Director | andrew.b.taylor@jpmorgan.com | (212) 834-3111 |
Avinash Sharma Executive Director | avinash.sharma@jpmorgan.com | (212) 834-3111 |
| J.P. Morgan Securitized Products Syndicate | ||
| Contact | Phone Number | |
Andy Cherna Managing Director | andy.cherna@jpmorgan.com | (212) 834-4154 |
Anusha Joly Vice President | anusha.joly@jpmorgan.com | (212) 834-4154 |
THE INFORMATION IN THIS STRUCTURAL AND COLLATERAL TERM SHEET IS NOT COMPLETE AND MAY BE AMENDED PRIOR TO THE TIME OF SALE. THIS TERM SHEET IS NOT AN OFFER TO SELL THESE SECURITIES AND IT IS NOT A SOLICITATION OF AN OFFER TO BUY THESE SECURITIES IN ANY JURISDICTION WHERE THE OFFER OR SALE IS NOT PERMITTED.
| | 156 of 156 |