| FREE WRITING PROSPECTUS | ||
| FILED PURSUANT TO RULE 433 | ||
| REGISTRATION FILE NO.: 333-206361-10 | ||
| May 18, 2017 | JPMCC 2017-JP6 |
Free Writing Prospectus
Structural and Collateral Term Sheet
| ||
JPMCC 2017-JP6
| ||
$786,622,167 (Approximate Mortgage Pool Balance) | ||
$696,161,000 (Approximate Offered Certificates) | ||
J.P. Morgan Chase Commercial Mortgage Securities Corp. Depositor | ||
| | ||
COMMERCIAL MORTGAGE PASS-THROUGH CERTIFICATES, SERIES 2017-JP6 | ||
| | ||
JPMorgan Chase Bank, National Association Starwood Mortgage Funding VI LLC Sponsors and Mortgage Loan Sellers
| ||
J.P. Morgan Lead Manager and Sole Bookrunner
| ||
| Drexel Hamilton |
Co-Managers
| Academy Securities |
THE INFORMATION IN THIS STRUCTURAL AND COLLATERAL TERM SHEET IS NOT COMPLETE AND MAY BE AMENDED PRIOR TO THE TIME OF SALE. THIS TERM SHEET IS NOT AN OFFER TO SELL THESE SECURITIES AND IT IS NOT A SOLICITATION OF AN OFFER TO BUY THESE SECURITIES IN ANY JURISDICTION WHERE THE OFFER OR SALE IS NOT PERMITTED.
| May 18, 2017 | JPMCC 2017-JP6 |
This material is for your information, and none of J.P. Morgan Securities LLC (“JPMS”), Drexel Hamilton, LLC (“Drexel”) or Academy Securities, Inc. (“Academy Securities”) (each individually, an “Underwriter”, and together, the ‘‘Underwriters’’) are soliciting any action based upon it. This material is not to be construed as an offer to sell or the solicitation of any offer to buy any security in any jurisdiction where such an offer or solicitation would be illegal.
The Depositor has filed a registration statement (including a prospectus) with the SEC (SEC File no. 333-206361) for the offering to which this free writing prospectus relates. Before you invest, you should read the prospectus in the registration statement and other documents the Depositor has filed with the SEC for more complete information about the Depositor, the issuing entity and this offering. You may get these documents for free by visiting EDGAR on the SEC Website at www.sec.gov. Alternatively, the Depositor or any Underwriter or any dealer participating in the offering will arrange to send you the prospectus if you request it by calling (866) 669-7629 or by emailing the ABS Syndicate Desk at abs_synd@jpmorgan.com.
Neither this document nor anything contained in this document shall form the basis for any contract or commitment whatsoever. The information contained in this document is preliminary as of the date of this document, supersedes any previous such information delivered to you and will be superseded by any such information subsequently delivered prior to the time of sale. These materials are subject to change, completion or amendment from time to time.
This document has been prepared by the Underwriters for information purposes only and does not constitute, in whole or in part, a prospectus for the purposes of Directive 2003/71/EC (as amended) and/or Part VI of the Financial Services and Markets Act 2000 (as amended) or other offering document.
The attached information contains certain tables and other statistical analyses (the “Computational Materials”) that have been prepared in reliance upon information furnished by the Mortgage Loan Sellers. Numerous assumptions were used in preparing the Computational Materials, which may or may not be reflected in this document. The Computational Materials should not be construed as either projections or predictions or as legal, tax, financial or accounting advice. You should consult your own counsel, accountant and other advisors as to the legal, tax, business, financial and related aspects of a purchase of these certificates. Any weighted average lives, yields and principal payment periods shown in the Computational Materials are based on prepayment and/or loss assumptions, and changes in such prepayment and/or loss assumptions may dramatically affect such weighted average lives, yields and principal payment periods. In addition, it is possible that prepayments or losses on the underlying assets will occur at rates higher or lower than the rates shown in the Computational Materials. The specific characteristics of the certificates may differ from those shown in the Computational Materials due to differences between the final underlying assets and the preliminary underlying assets used in preparing the Computational Materials. The principal amount and designation of any certificate described in the Computational Materials are subject to change prior to issuance. None of the Underwriters nor any of their respective affiliates make any representation or warranty as to the actual rate or timing of payments or losses on any of the underlying assets or the payments or yield on the certificates.
This information is based upon management forecasts and reflects prevailing conditions and management’s views as of this date, all of which are subject to change.
This document contains forward-looking statements. Those statements are subject to certain risks and uncertainties that could cause the success of collections and the actual cash flow generated to differ materially from the information set forth in this document. While such information reflects projections prepared in good faith based upon methods and data that are believed to be reasonable and accurate as of their dates, the Depositor undertakes no obligation to revise these forward-looking statements to reflect subsequent events or circumstances. Investors should not place undue reliance on forward-looking statements and are advised to make their own independent analysis and determination with respect to the forecasted periods, which reflect the Depositor’s view only as of the date of this document.
J.P. Morgan is the marketing name for the investment banking businesses of JPMorgan Chase & Co. and its subsidiaries worldwide. Securities, syndicated loan arranging, financial advisory and other investment banking activities are performed by JPMS and its securities affiliates, and lending, derivatives and other commercial banking activities are performed by JPMorgan Chase Bank, National Association and its banking affiliates. JPMS is a member of SIPC and the NYSE.
Capitalized terms used in this material but not defined herein shall have the meanings ascribed to them in the Preliminary Prospectus (as defined below).
THE CERTIFICATES REFERRED TO IN THESE MATERIALS ARE SUBJECT TO MODIFICATION OR REVISION (INCLUDING THE POSSIBILITY THAT ONE OR MORE CLASSES OF CERTIFICATES MAY BE SPLIT, COMBINED OR ELIMINATED AT ANY TIME PRIOR TO ISSUANCE OR AVAILABILITY OF A FINAL PROSPECTUS) AND ARE OFFERED ON A “WHEN, AS AND IF ISSUED” BASIS.
THE UNDERWRITERS MAY FROM TIME TO TIME PERFORM INVESTMENT BANKING SERVICES FOR, OR SOLICIT INVESTMENT BANKING BUSINESS FROM, ANY COMPANY NAMED IN THESE MATERIALS. THE UNDERWRITERS AND/OR THEIR AFFILIATES OR RESPECTIVE EMPLOYEES MAY FROM TIME TO TIME HAVE A LONG OR SHORT POSITION IN ANY CERTIFICATE OR CONTRACT DISCUSSED IN THESE MATERIALS.
THE INFORMATION IN THIS STRUCTURAL AND COLLATERAL TERM SHEET IS NOT COMPLETE AND MAY BE AMENDED PRIOR TO THE TIME OF SALE. THIS TERM SHEET IS NOT AN OFFER TO SELL THESE SECURITIES AND IT IS NOT A SOLICITATION OF AN OFFER TO BUY THESE SECURITIES IN ANY JURISDICTION WHERE THE OFFER OR SALE IS NOT PERMITTED.
 | 2 of 151 |
| Structural and Collateral Term Sheet | JPMCC 2017-JP6 |
| Indicative Capital Structure |
Publicly Offered Certificates
| Class | Expected Ratings (Moody’s / Fitch / DBRS) | Approximate Initial Certificate Balance or Notional Amount(1) | Approximate Initial Credit Support(2) | Expected Weighted Avg. Life (years)(3) | Expected Principal Window(3) | Certificate Principal to Value Ratio(4) | Underwritten NOI Debt Yield(5) | ||||||||
| A-1 | Aaa(sf) / AAAsf / AAA(sf) | $26,228,000 | 30.000% | 2.66 | 7/17 – 12/21 | 42.6% | 15.6% | ||||||||
| A-2 | Aaa(sf) / AAAsf / AAA(sf) | $123,971,000 | 30.000% | 4.79 | 12/21 – 5/22 | 42.6% | 15.6% | ||||||||
| A-3 | Aaa(sf) / AAAsf / AAA(sf) | $86,731,000 | 30.000% | 6.87 | 4/24 – 6/24 | 42.6% | 15.6% | ||||||||
| A-4 | Aaa(sf) / AAAsf / AAA(sf) | $80,000,000 | 30.000% | 9.58 | 12/26 – 2/27 | 42.6% | 15.6% | ||||||||
| A-5 | Aaa(sf) / AAAsf / AAA(sf) | $200,074,000 | 30.000% | 9.77 | 2/27 – 4/27 | 42.6% | 15.6% | ||||||||
| A-SB | Aaa(sf) / AAAsf / AAA(sf) | $33,632,000 | 30.000% | 7.30 | 5/22 – 12/26 | 42.6% | 15.6% | ||||||||
| X-A | Aa1(sf) / AAAsf /AAA(sf) | $627,331,000 | (6) | N/A | N/A | N/A | N/A | N/A | |||||||
| X-B | NR / A-sf / AA(low)(sf) | $68,830,000 | (6) | N/A | N/A | N/A | N/A | N/A | |||||||
| A-S | Aa3(sf) / AAAsf /AAA(sf) | $76,695,000 | 20.250% | 9.87 | 4/27 – 5/27 | 48.6% | 13.7% | ||||||||
| B | NR / AA-sf / AA(high)(sf) | $34,415,000 | 15.875% | 9.91 | 5/27 – 5/27 | 51.2% | 13.0% | ||||||||
| C | NR / A-sf / A(high)(sf) | $34,415,000 | 11.500% | 9.93 | 5/27 – 6/27 | 53.9% | 12.3% | ||||||||
Privately Offered Certificates(7)
| Class | Expected Ratings (Moody’s / Fitch / DBRS) | Approximate Initial Certificate Balance or Notional Amount(1) | Approximate Initial Credit Support | Expected Weighted Avg. Life (years)(3) | Expected Principal Window(3) | Certificate Principal to Value Ratio(4) | Underwritten NOI Debt Yield(5) | ||||||||
| D | NR / BBB+sf / A(sf) | $9,832,000 | (8) | 10.250% | 10.00 | 6/27 – 6/27 | 54.7% | 12.1% | |||||||
| E-RR | NR / BBB-sf / BBB(sf) | $29,499,000 | (8) | 6.500% | 10.00 | 6/27 – 6/27 | 56.9% | 11.7% | |||||||
| F-RR | NR / BB-sf / BB(sf) | $16,715,000 | 4.375% | 10.00 | 6/27 – 6/27 | 58.2% | 11.4% | ||||||||
| G-RR | NR / B-sf / B(high)(sf) | $7,867,000 | 3.375% | 10.00 | 6/27 – 6/27 | 58.8% | 11.3% | ||||||||
| NR-RR | NR / NR / NR | $26,548,166 | 0.000% | 10.00 | 6/27 – 6/27 | 60.9% | 10.9% | ||||||||
| (1) | In the case of each such Class, subject to a permitted variance of plus or minus 5%. In addition, the notional amounts of the Class X-A and Class X-B Certificates may vary depending upon the final pricing of the Classes of Principal Balance Certificates whose Certificate Balances comprise such notional amounts, and, if as a result of such pricing the pass-through rate of any Class of of the Class X-A or Class X-B Certificates, as applicable, would be equal to zero at all times, such Class of Certificates will not be issued on the closing date of this securitization. |
| (2) | The credit support percentages set forth for Class A-1, Class A-2, Class A-3, Class A-4, Class A-5 and Class A-SB Certificates represent the approximate initial credit support for the Class A-1, Class A-2, Class A-3, Class A-4, Class A-5 and Class A-SB Certificates in the aggregate. |
| (3) | Assumes 0% CPR / 0% CDR and a June 16, 2017 closing date. Based on modeling assumptions as described in the Preliminary Prospectus dated May 18, 2017 (the “Preliminary Prospectus”). |
| (4) | The “Certificate Principal to Value Ratio” for any Class of Principal Balance Certificates (other than the Class A-1, Class A-2, Class A-3, Class A-4, Class A-5 and Class A-SB Certificates) is calculated as the product of (a) the weighted average Cut-off Date LTV Ratio for the mortgage loans, multiplied by (b) a fraction, the numerator of which is the total initial Certificate Balance of such Class of Certificates and all Classes of Principal Balance Certificates senior to such Class of Certificates and the denominator of which is the total initial Certificate Balance of all of the Principal Balance Certificates. The Class A-1, Class A-2, Class A-3, Class A-4, Class A-5 and Class A-SB Certificate Principal to Value Ratios are calculated in the aggregate for those Classes as if they were a single Class. Investors should note, however, that excess mortgaged property value associated with a mortgage loan will not be available to offset losses on any other mortgage loan. |
| (5) | The “Underwritten NOI Debt Yield” for any Class of Principal Balance Certificates (other than the Class A-1, Class A-2, Class A-3, Class A-4, Class A-5 and Class A-SB Certificates) is calculated as the product of (a) the weighted average UW NOI Debt Yield for the mortgage loans and (b) the total initial Certificate Balance of all of the Classes of Principal Balance Certificates divided by the total initial Certificate Balance for such Class and all Classes of Principal Balance Certificates senior to such Class of Certificates. The Underwritten NOI Debt Yield for each of the Class A-1, Class A-2, Class A-3, Class A-4, Class A-5 and Class A-SB Certificates is calculated in the aggregate for those Classes as if they were a single Class. Investors should note, however, that net operating income from any mortgaged property supports only the related mortgage loan and will not be available to support any other mortgage loan. |
| (6) | The Class X-A and Class X-B Notional Amounts are defined in the Preliminary Prospectus. |
| (7) | The Class D, Class E-RR, Class F-RR, Class G-RR and Class NR-RR Certificates are not being offered by the Preliminary Prospectus or this Term Sheet. The Class R and the Class Z Certificates are not shown above. |
| (8) | The approximate initial Certificate Balances of the Class D and Class E-RR Certificates are estimated based in part on the estimated ranges of Certificate Balances and estimated fair values described in “Credit Risk Retention” in the Preliminary Prospectus. The Class D Certificate Balances are expected to fall within a range of $6,883,000 and $10,816,000, with the ultimate Certificate Balance determined such that the aggregate fair value of the Yield-Priced Principal Balance Certificates will equal at least 5% of the estimated fair value of all of the classes of certificates (other than the Class R and Class Z Certificates) issued by the issuing entity. The Class E-RR Certificate Balances are expected to fall within a range of $28,515,000 and $32,448,000, with the ultimate Certificate Balance determined such that the aggregate fair value of the Yield-Priced Principal Balance Certificates will equal at least 5% of the estimated fair value of all of the classes of certificates (other than the Class R and Class Z Certificates) issued by the issuing entity. |
THE INFORMATION IN THIS STRUCTURAL AND COLLATERAL TERM SHEET IS NOT COMPLETE AND MAY BE AMENDED PRIOR TO THE TIME OF SALE. THIS TERM SHEET IS NOT AN OFFER TO SELL THESE SECURITIES AND IT IS NOT A SOLICITATION OF AN OFFER TO BUY THESE SECURITIES IN ANY JURISDICTION WHERE THE OFFER OR SALE IS NOT PERMITTED.
| 3 of 151 |
| Structural and Collateral Term Sheet | JPMCC 2017-JP6 |
| Summary of Transaction Terms | |
| Securities Offered: | $696,161,000 monthly pay, multi-class, commercial mortgage Pass-Through Certificates. |
| Lead Manager and Sole Bookrunner: | J.P. Morgan Securities LLC. |
| Co-Managers: | Drexel Hamilton, LLC and Academy Securities, Inc. |
| Mortgage Loan Sellers: | JPMorgan Chase Bank, National Association (“JPMCB”) (64.7%), Benefit Street Partners CRE Finance LLC (“BSP”) (19.4%) and Starwood Mortgage Funding VI LLC (“SMF VI”) (15.9%). |
| Master Servicer: | Midland Loan Services, a Division of PNC Bank, National Association (“Midland”). |
| Special Servicer: | Rialto Capital Advisors, LLC (“Rialto”). |
| Directing Certificateholder: | RREF III-D AIV RR, LLC. |
| Trustee: | Wells Fargo Bank, National Association. |
| Certificate Administrator: | Wells Fargo Bank, National Association. |
| Operating Advisor: | Pentalpha Surveillance LLC. |
| Asset Representations Reviewer: | Pentalpha Surveillance LLC. |
| Rating Agencies: | Moody’s Investors Service, Inc. (“Moody’s”), Fitch Ratings, Inc. (“Fitch”) and DBRS, Inc. (“DBRS”). |
| U.S. Credit Risk Retention: | JPMCB is expected to act as the “retaining sponsor” (as defined in Regulation RR) for this securitization and intends to satisfy the U.S. credit risk retention requirement through the purchase by RREF III-D AIV RR, LLC, as a third-party purchaser (as defined in Regulation RR), from the depositor, on the Closing Date, of an “eligible horizontal residual interest” (as defined in Regulation RR), which will be comprised of the Class E-RR, Class F-RR, Class G-RR and Class NR-RR Certificates. The aggregate estimated fair value of the Class E-RR, Class F-RR, Class G-RR and Class NR-RR Certificates will equal at least 5% of the estimated fair value of all of the Certificates (other than the Class R and Class Z Certificates) issued by the issuing entity.
RREF III-D AIV RR, LLC, in its capacity as the “third-party purchaser” for this transaction, will be required to comply with the hedging, transfer and financing restrictions applicable to a “third-party purchaser” under the credit risk retention rules, which generally prohibit the transfer of the applicable Certificates, other than to a “majority-owned affiliate” (as defined Regulation RR) of RREF III-D AIV RR, LLC, until June 16, 2022. After that date, transfers are permitted under certain circumstances, in accordance with the credit risk retention rules, to another “third-party purchaser”.
The restrictions on hedging and transfer under the credit risk retention rules as in effect on the closing date of this transaction will expire on and after the date that is the earliest of (A) the date that is the latest of (i) the date on which the aggregate principal balance of the mortgage loans has been reduced to 33% of the aggregate principal balance of the mortgage loans as of the Cut-off Date; (ii) the date on which the total unpaid principal obligations under the certificates has been reduced to 33% of the aggregate total unpaid principal obligations under the certificates as of the Closing Date; or (iii) two years after the Closing Date and (B) the date on which all of the mortgage loans have been defeased in accordance with §244.7(b)(8)(i) of Regulation RR.
The Pooling and Servicing Agreement (as defined below) will include the required provisions applicable to an operating advisor necessary for the securitization to comply with the credit risk retention rules utilizing the “third-party purchaser” option. See “Operating Advisor” below.
For additional information, see “Credit Risk Retention” in the Preliminary Prospectus. |
| EU Credit Risk Retention: | The transaction is not structured to satisfy the EU risk retention and due diligence requirements. |
| Pricing Date: | On or about May 24, 2017. |
| Closing Date: | On or about June 16, 2017. |
| Cut-off Date: | With respect to each mortgage loan, the related due date in June 2017, or with respect to any mortgage loan that has its first due date in July 2017, the date that would otherwise have been the related due date in June 2017. |
| Distribution Date: | The 4th business day after the Determination Date in each month, commencing in July 2017. |
| Determination Date: | 11thday of each month, or if the 11th day is not a business day, the next succeeding business day, commencing in July 2017. |
| Assumed Final Distribution Date: | The Distribution Date in June 2027 which is the latest anticipated repayment date of the Certificates. |
| Rated Final Distribution Date: | The Distribution Date in July 2050. |
| Tax Treatment: | The Publicly Offered Certificates are expected to be treated as REMIC “regular interests” for U.S. federal income tax purposes. |
THE INFORMATION IN THIS STRUCTURAL AND COLLATERAL TERM SHEET IS NOT COMPLETE AND MAY BE AMENDED PRIOR TO THE TIME OF SALE. THIS TERM SHEET IS NOT AN OFFER TO SELL THESE SECURITIES AND IT IS NOT A SOLICITATION OF AN OFFER TO BUY THESE SECURITIES IN ANY JURISDICTION WHERE THE OFFER OR SALE IS NOT PERMITTED.
| 4 of 151 |
| Structural and Collateral Term Sheet | JPMCC 2017-JP6 |
| Summary of Transaction Terms | |
| Form of Offering: | The Class A-1, Class A-2, Class A-3, Class A-4, Class A-5, Class A-SB, Class X-A, Class X-B, Class A-S, Class B and Class C Certificates (the “Publicly Offered Certificates”) will be offered publicly. The Class D, Class E-RR, Class F-RR, Class G-RR, Class NR-RR, Class R and Class Z Certificates (the “Privately Offered Certificates”) will be offered domestically to Qualified Institutional Buyers and to Institutional Accredited Investors and (other than the Class R Certificates) to institutions that are not U.S. Persons pursuant to Regulation S. |
| SMMEA Status: | The Certificates will not constitute “mortgage related securities” for purposes of SMMEA. |
| ERISA: | The Publicly Offered Certificates are expected to be ERISA eligible. |
| Optional Termination: | On any Distribution Date on which the aggregate principal balance of the pool of mortgage loans is less 1% of the aggregate principal balance of the mortgage loans as of the Cut-off Date, certain entities specified in the Preliminary Prospectus will have the option to purchase all of the remaining mortgage loans (and all property acquired through exercise of remedies in respect of any mortgage loan) at the price specified in the Preliminary Prospectus. Refer to “Pooling and Servicing Agreement—Termination; Retirement of Certificates” in the Preliminary Prospectus. |
| Minimum Denominations: | The Publicly Offered Certificates (other than the Class X-A and Class X-B Certificates) will be issued in minimum denominations of $10,000 and integral multiples of $1 in excess of $10,000. The Class X-A and Class X-B Certificates will be issued in minimum denominations of $1,000,000 and in integral multiples of $1 in excess of $1,000,000. |
| Settlement Terms: | DTC, Euroclear and Clearstream Banking. |
| Analytics: | The transaction is expected to be modeled by Intex Solutions, Inc. and Trepp, LLC and is expected to be available on Bloomberg L.P., Blackrock Financial Management, Inc., Interactive Data Corporation, CMBS.com, Inc., Markit Group Limited, Moody’s Analytics, MBS Data, LLC and Thomson Reuters Corporation. |
| Risk Factors: | THE CERTIFICATES INVOLVE CERTAIN RISKS AND MAY NOT BE SUITABLE FOR ALL INVESTORS. REFER TO THE “RISK FACTORS” SECTION OF THE PRELIMINARY PROSPECTUS. |
THE INFORMATION IN THIS STRUCTURAL AND COLLATERAL TERM SHEET IS NOT COMPLETE AND MAY BE AMENDED PRIOR TO THE TIME OF SALE. THIS TERM SHEET IS NOT AN OFFER TO SELL THESE SECURITIES AND IT IS NOT A SOLICITATION OF AN OFFER TO BUY THESE SECURITIES IN ANY JURISDICTION WHERE THE OFFER OR SALE IS NOT PERMITTED.
| 5 of 151 |
| Structural and Collateral Term Sheet | JPMCC 2017-JP6 |
| Collateral Characteristics |
| Loan Pool | ||
| Initial Pool Balance (“IPB”): | $786,622,167 | |
| Number of Mortgage Loans: | 42 | |
| Number of Mortgaged Properties: | 72 | |
| Average Cut-off Date Balance per Mortgage Loan: | $18,729,099 | |
| Weighted Average Current Mortgage Rate: | 4.62663% | |
| 10 Largest Mortgage Loans as % of IPB: | 52.5% | |
| Weighted Average Remaining Term to Maturity(1): | 104 months | |
| Weighted Average Seasoning: | 2 months | |
| Credit Statistics | ||
| Weighted Average UW NCF DSCR(2)(3): | 1.91x | |
| Weighted Average UW NOI Debt Yield(2): | 10.9% | |
| Weighted Average Cut-off Date Loan-to-Value Ratio (“LTV”)(2)(4): | 60.9% | |
| Weighted Average Maturity Date LTV(1)(2)(4): | 55.7% | |
| Other Statistics | ||
| % of Mortgage Loans with Additional Debt: | 27.9% | |
| % of Mortgaged Properties with Single Tenants: | 23.2% | |
| Amortization | ||
| Weighted Average Original Amortization Term(5): | 358 months | |
| Weighted Average Remaining Amortization Term(5): | 356 months | |
| % of Mortgage Loans with Partial Interest-Only followed by Amortizing Balloon: | 34.6% | |
| % of Mortgage Loans with Amortizing Balloon: | 31.2% | |
| % of Mortgage Loans with Interest-Only: | 27.3% | |
| % of Mortgage Loans with Interest-Only followed by ARD-Structure: | 6.8% | |
| Lockbox / Cash Management(6) | ||
| % of Mortgage Loans with In-Place, Hard Lockboxes: | 61.8% | |
| % of Mortgage Loans with Springing Lockboxes: | 30.9% | |
| % of Mortgage Loans with In Place, Soft Lockboxes: | 4.2% | |
| % of Mortgage Loans with No Lockbox: | 3.1% | |
| % of Mortgage Loans with Springing Cash Management: | 80.5% | |
| % of Mortgage Loans with In Place Cash Management: | 16.4% | |
| % of Mortgage Loans with No Cash Management: | 3.1% | |
| Reserves | ||
| % of Mortgage Loans Requiring Monthly Tax Reserves: | 77.7% | |
| % of Mortgage Loans Requiring Monthly Insurance Reserves: | 43.1% | |
| % of Mortgage Loans Requiring Monthly CapEx Reserves(7): | 78.8% | |
| % of Mortgage Loans Requiring Monthly TI/LC Reserves(8): | 44.4% | |
| (1) | In the case of Loan Nos. 4 and 20, each with an anticipated repayment date, Remaining Term to Maturity and Maturity Date LTV are calculated as of the related anticipated repayment date. |
| (2) | In the case of Loan Nos. 1, 2, 4, 14 and 15, the UW NCF DSCR, UW NOI Debt Yield, Cut-off Date LTV and Maturity Date LTV calculations include the related Pari Passu Companion Loan(s). In the case of Loan Nos. 1, 2 and 15, the UW NCF DSCR, UW NOI Debt Yield, Cut-off Date LTV and Maturity Date LTV calculations exclude the related Subordinate Companion Loan(s). |
| (3) | In the case of Loan No. 15, the UW NCF DSCR is calculated using the sum of principal and interest payments over the first 12 months following the expiration of the interest-only period based on the assumed principal payment schedule provided on Annex F to the Preliminary Prospectus. In the case of Loan No. 40, the UW NCF DSCR is calculated using the sum of principal and interest payments over the first 12 months following the Cut-off Date based on the assumed principal payment schedule provided on Annex G to the Preliminary Prospectus. |
| (4) | In the case of Loan Nos. 5, 7, 8, 11, 13, 14, 15 and 22, the Cut-off Date LTV and the Maturity Date LTV are calculated by using an appraised value based on certain hypothetical assumptions. Refer to “Description of the Mortgage Pool—Assessments of Property Value and Condition” and “—Appraised Value” in the Preliminary Prospectus for additional details. |
| (5) | Excludes eight mortgage loans that are interest-only for the entire term or through the anticipated repayment date. |
| (6) | For a more detailed description of Lockbox / Cash Management terms, refer to “Description of the Mortgage Pool—Certain Terms of the Mortgage Loans—Mortgaged Property Accounts” in the Preliminary Prospectus. |
| (7) | CapEx Reserves include FF&E reserves for hotel properties. |
| (8) | Calculated only with respect to the Cut-off Date Balance of mortgage loans secured or partially secured by retail, industrial, office and mixed use properties. |
THE INFORMATION IN THIS STRUCTURAL AND COLLATERAL TERM SHEET IS NOT COMPLETE AND MAY BE AMENDED PRIOR TO THE TIME OF SALE. THIS TERM SHEET IS NOT AN OFFER TO SELL THESE SECURITIES AND IT IS NOT A SOLICITATION OF AN OFFER TO BUY THESE SECURITIES IN ANY JURISDICTION WHERE THE OFFER OR SALE IS NOT PERMITTED.
| 6 of 151 |
| Structural and Collateral Term Sheet | JPMCC 2017-JP6 |
| Collateral Characteristics |
Mortgage Loan Seller | Number of | Number of | Aggregate | % of |
| JPMCB(1) | 17 | 20 | $508,880,799 | 64.7% |
| BSP | 11 | 17 | 152,336,787 | 19.4 |
| SMF VI | 14 | 35 | 125,404,580 | 15.9 |
| Total: | 42 | 72 | $786,622,167 | 100.0% |
| (1) | In the case of Loan No. 1, the whole loan was co-originated by JPMCB, Natixis Real Estate Capital LLC, Société Générale, Deutsche Bank AG, New York Branch and Barclays Bank PLC. |
| Ten Largest Mortgage Loans | |||||||||||||
| No. | Loan Name | Mortgage Loan Seller | No. of Prop. | Cut-off Date Balance | % of IPB | SF / Rooms / Units | Property Type | UW NCF DSCR(1) | UW NOI Debt Yield(1) | Cut-off Date LTV(1)(2) | Maturity Date LTV(1)(2)(3) | ||
| 1 | 245 Park Avenue | JPMCB | 1 | $98,000,000 | 12.5% | 1,723,993 | Office | 2.73x | 10.7% | 48.9% | 48.9% | ||
| 2 | 211 Main Street | JPMCB | 1 | $65,219,000 | 8.3% | 417,266 | Office | 2.49x | 9.0% | 57.9% | 57.9% | ||
| 3 | Browning Place | JPMCB | 1 | $42,749,531 | 5.4% | 442,639 | Office | 1.34x | 10.9% | 69.2% | 64.3% | ||
| 4 | 740 Madison | JPMCB | 1 | $40,000,000 | 5.1% | 33,176 | Retail | 1.96x | 8.0% | 60.0% | 60.0% | ||
| 5 | Diamond Hill Denver | JPMCB | 1 | $32,000,000 | 4.1% | 374,137 | Office | 1.37x | 10.6% | 61.8% | 59.1% | ||
| 6 | Bingham Office Center | JPMCB | 1 | $31,000,000 | 3.9% | 522,379 | Office | 1.99x | 13.7% | 59.6% | 49.2% | ||
| 7 | 2950 North Hollywood Way | JPMCB | 1 | $30,842,460 | 3.9% | 162,551 | Office | 1.76x | 12.3% | 48.2% | 39.5% | ||
| 8 | Marriott Colorado Springs | JPMCB | 1 | $25,611,823 | 3.3% | 309 | Hotel | 2.07x | 13.5% | 62.8% | 51.9% | ||
| 9 | Pillsbury Portfolio | JPMCB | 4 | $24,175,000 | 3.1% | 245 | Multifamily | 1.55x | 10.6% | 60.6% | 53.9% | ||
| 10 | Raytheon – 16800 Centretech | BSP | 1 | $23,200,000 | 2.9% | 216,786 | Office | 1.81x | 10.4% | 56.6% | 56.6% | ||
| Top 3 Total/Weighted Average | 3 | $205,968,531 | 26.2% | 2.37x | 10.2% | 56.0% | 54.9% | ||||||
| Top 5 Total/Weighted Average | 5 | $277,968,531 | 35.3% | 2.19x | 9.9% | 57.2% | 56.2% | ||||||
| Top 10 Total/Weighted Average | 13 | $412,797,814 | 52.5% | 2.08x | 10.7% | 57.2% | 54.0% | ||||||
| (1) | In the case of Loan Nos. 1, 2 and 4, the UW NCF DSCR, UW NOI Debt Yield, Cut-off Date LTV and Maturity Date LTV calculations include the related Pari Passu Companion Loan(s). In the case of Loan Nos. 1 and 2, the UW NCF DSCR, UW NOI Debt Yield, Cut-off Date LTV and Maturity Date LTV calculations exclude the related Subordinate Companion Loan(s). |
| (2) | In the case of Loan Nos. 5, 7 and 8, the Cut-off Date LTV and the Maturity Date LTV are calculated by using an appraised value based on certain hypothetical assumptions. Refer to “Description of the Mortgage Pool—Assessments of Property Value and Condition” and “—Appraised Value” in the Preliminary Prospectus for additional details. |
| (3) | In the case of Loan No. 4, with an anticipated repayment date, Maturity Date LTV is as of the related anticipated repayment date. |
THE INFORMATION IN THIS STRUCTURAL AND COLLATERAL TERM SHEET IS NOT COMPLETE AND MAY BE AMENDED PRIOR TO THE TIME OF SALE. THIS TERM SHEET IS NOT AN OFFER TO SELL THESE SECURITIES AND IT IS NOT A SOLICITATION OF AN OFFER TO BUY THESE SECURITIES IN ANY JURISDICTION WHERE THE OFFER OR SALE IS NOT PERMITTED.
| 7 of 151 |
| Structural and Collateral Term Sheet | JPMCC 2017-JP6 |
| Collateral Characteristics |
| Pari Passu Companion Loan Summary | |||||||||
No. | Loan Name | Trust Cut-off Date Balance | Pari Passu | Total Mortgage Loan Cut-off Date Balance(1) | Leading | Master Servicer | Special Servicer | Controlling Rights | |
| 1 | 245 Park Avenue(2) | $98,000,000 | $982,000,000 | $1,080,000,000 | PRKAV 2017-245P | Wells Fargo | Aegon | PRKAV 2017-245P | |
| 2 | 211 Main Street | $65,219,000 | $105,000,000 | $170,219,000 | (3) | (3) | (3) | (3) | |
| 4 | 740 Madison | $40,000,000 | $50,000,000 | $90,000,000 | (3) | (3) | (3) | (3) | |
| 14 | Apex Fort Washington | $21,000,000 | $33,500,000 | $54,500,000 | (3) | (3) | (3) | (3) | |
| 15 | Moffett Gateway | $20,000,000 | $223,000,000 | $243,000,000 | JPMCC 2016-JP4 | Wells Fargo | LNR | (4) | |
| (1) | In the case of Loan Nos.1, 2 and 15, the Total Mortgage Loan Cut-off Date Balance excludes the related Subordinate Companion Loan(s). |
| (2) | In the case of Loan No. 1, the related whole loan is expected to be serviced pursuant to the 245 Park Avenue Trust 2017-245P trust and servicing agreement. The parties identified above are those expected to be applicable to such trust and servicing agreement. |
| (3) | In the case of Loan Nos. 2, 4 and 14, each related whole loan will be serviced pursuant to the JPMCC 2017-JP6 Pooling and Servicing Agreement until such time as the related leadpari passu companion loan is securitized, at which point the whole loan will be serviced under the related pooling and servicing agreement in connection with such securitization. The initial controlling noteholder of each such whole loan will be the holder of the related controlling companion loan, subordinate or otherwise ((i) with respect to Loan No. 2, a third party investor as holder of the related controlling subordinate companion loan and (ii) with respect to Loan Nos. 4 and 14, JPMCB and BSP, respectively, each as holder of the related controllingpari passu companion loan). After the securitization of the related leadingpari passucompanion loan (and, with respect to Loan No. 2, after the occurrence and during the continuance of a control appraisal period under the related intercreditor agreement), the controlling noteholder of each such whole loan is expected to be the related controlling class representative or other directing certificateholder (or equivalent entity) under such securitization. |
| (4) | The initial controlling noteholder is a third party investor, as holder of the related controlling subordinate companion loan. Upon the occurrence and during the continuance of a control appraisal period, the JPMCC 2016-JP4 trust will be the controlling noteholder. |
| Additional Debt Summary |
No. | Loan Name | Trust | Subordinate Debt Cut-off Date Balance(1) | Total Debt Cut-off Date Balance | Mortgage Loan UW NCF DSCR(2)(3) | Total Debt UW NCF DSCR(3) | Mortgage Loan | Total Debt Cut-off Date LTV(4) | Mortgage Loan UW NOI Debt Yield(2) | Total Debt UW NOI Debt Yield |
| 1 | 245 Park Avenue | $98,000,000 | $688,000,000 | $1,768,000,000 | 2.73x | 1.42x | 48.9% | 80.0% | 10.7% | 6.5% |
| 2 | 211 Main Street | $65,219,000 | $25,000,000 | $195,219,000 | 2.49x | 2.07x | 57.9% | 66.4% | 9.0% | 7.9% |
| 6 | Bingham Office Center | $31,000,000 | $8,000,000 | $39,000,000 | 1.99x | 1.40x | 59.6% | 75.0% | 13.7% | 10.9% |
| 15 | Moffett Gateway | $20,000,000 | $152,000,000 | $395,000,000 | 1.95x | 1.22x | 46.3% | 75.2% | 11.9% | 7.3% |
| 40 | NW Florida Apartment Portfolio | $5,408,983 | $749,074 | $6,158,057 | 1.82x | 1.44x | 59.8% | 68.1% | 14.2% | 12.5% |
| (1) | In the case of Loan Nos. 1 and 15, Subordinate Debt Cut-off Date Balance represents the aggregate of one or more Subordinate Companion Loans and one or more mezzanine loans. In the case of Loan No. 2, Subordinate Debt Cut-off Date Balance represents one or more Subordinate Companion Loans. In the case of Loan Nos. 6 and 40, Subordinate Debt Cut-off Date Balance represents a mezzanine loan. |
| (2) | In the case of Loan Nos. 1, 2 and 15, Mortgage Loan UW NCF DSCR, Mortgage Loan Cut-off Date LTV and Mortgage Loan UW NOI Debt Yield calculations include any related Pari Passu Companion Loans, but exclude the related Subordinate Companion Loan(s). |
| (3) | In the case of Loan No. 15, the Mortgage Loan UW NCF DSCR and Total Debt UW NCF DSCR are calculated using the sum of principal and interest payments over the first 12 months following the expiration of the interest-only period based on the assumed principal payment schedule provided on Annex F to the Preliminary Prospectus. In the case of Loan No. 40, the UW NCF DSCR is calculated using the sum of principal and interest payments over the first 12 months following the Cut-off Date based on the assumed principal payment schedule provided on Annex G to the Preliminary Prospectus. |
| (4) | In the case of Loan No. 15, the Mortgage Loan Cut-off Date LTV and the Total Debt Cut-off Date LTV are calculated by using an appraised value based on certain hypothetical assumptions. Refer to “Description of the Mortgage Pool—Assessments of Property Value and Condition” and “—Appraised Value” in the Preliminary Prospectus for additional details. |
THE INFORMATION IN THIS STRUCTURAL AND COLLATERAL TERM SHEET IS NOT COMPLETE AND MAY BE AMENDED PRIOR TO THE TIME OF SALE. THIS TERM SHEET IS NOT AN OFFER TO SELL THESE SECURITIES AND IT IS NOT A SOLICITATION OF AN OFFER TO BUY THESE SECURITIES IN ANY JURISDICTION WHERE THE OFFER OR SALE IS NOT PERMITTED.
| 8 of 151 |
| Structural and Collateral Term Sheet | JPMCC 2017-JP6 |
| Collateral Characteristics |
| Mortgaged Properties by Type(1) |
Weighted Average | |||||||||
| Property Type | Property Subtype | Number of Properties | Cut-off Date Principal Balance | % of IPB | Occupancy | UW NCF DSCR(2)(3) | UW NOI Debt Yield(2) | Cut-off Date LTV(2)(4) | Maturity Date LTV(2)(4)(5) |
| Office | Suburban | 10 | $234,681,992 | 29.8% | 90.2% | 1.61x | 11.3% | 60.7% | 54.4% |
| CBD | 3 | 175,537,265 | 22.3 | 94.2% | 2.60x | 10.4% | 53.6% | 52.8% | |
| Subtotal: | 13 | $410,219,257 | 52.1% | 91.9% | 2.03x | 10.9% | 57.6% | 53.7% | |
| Retail | Anchored | 5 | $72,063,606 | 9.2% | 89.9% | 1.62x | 11.1% | 66.3% | 59.8% |
| Single Tenant | 1 | 40,000,000 | 5.1 | 100.0% | 1.96x | 8.0% | 60.0% | 60.0% | |
| Freestanding | 6 | 33,776,173 | 4.3 | 100.0% | 1.38x | 8.6% | 69.0% | 60.6% | |
| Shadow Anchored | 3 | 24,045,453 | 3.1 | 99.0% | 1.55x | 10.0% | 65.0% | 57.4% | |
| Unanchored | 1 | 5,587,020 | 0.7 | 97.2% | 1.47x | 10.1% | 62.8% | 51.6% | |
| Subtotal: | 16 | $175,472,251 | 22.3% | 95.6% | 1.64x | 9.7% | 65.1% | 59.4% | |
| Hotel | Limited Service | 5 | $52,415,655 | 6.7% | 74.4% | 2.06x | 13.6% | 62.0% | 52.7% |
| Full Service | 1 | 25,611,823 | 3.3 | 68.9% | 2.07x | 13.5% | 62.8% | 51.9% | |
| Subtotal: | 6 | $78,027,477 | 9.9% | 72.6% | 2.07x | 13.5% | 62.3% | 52.4% | |
| Multifamily | Garden | 23 | $45,749,303 | 5.8% | 94.4% | 1.65x | 10.5% | 68.8% | 63.6% |
| Senior Housing | 4 | 24,175,000 | 3.1 | 91.6% | 1.55x | 10.6% | 60.6% | 53.9% | |
| Subtotal: | 27 | $69,924,303 | 8.9% | 93.5% | 1.61x | 10.5% | 65.9% | 60.3% | |
| Industrial | Flex | 4 | $33,825,000 | 4.3% | 92.4% | 2.27x | 12.9% | 60.6% | 56.5% |
| Subtotal: | 4 | $33,825,000 | 4.3% | 92.4% | 2.27x | 12.9% | 60.6% | 56.5% | |
| Self Storage | Self Storage | 5 | $15,187,500 | 1.9% | 88.2% | 1.45x | 9.4% | 68.5% | 58.3% |
| Subtotal: | 5 | $15,187,500 | 1.9% | 88.2% | 1.45x | 9.4% | 68.5% | 58.3% | |
| Mixed Use | Office/Retail | 1 | $3,966,378 | 0.5% | 95.4% | 1.47x | 10.8% | 72.1% | 59.8% |
| Subtotal: | 1 | $3,966,378 | 0.5% | 95.4% | 1.47x | 10.8% | 72.1% | 59.8% | |
| Total / Weighted Average: | 72 | $786,622,167 | 100% | 90.9% | 1.91x | 10.9% | 60.9% | 55.7% | |
| (1) | Because this table presents information relating to the mortgaged properties and not mortgage loans, the information for mortgage loans secured by more than one mortgaged property is based on allocated loan amounts. |
| (2) | In the case of Loan Nos. 1, 2, 4, 14 and 15, the UW NCF DSCR, UW NOI Debt Yield, Cut-off Date LTV and Maturity Date LTV calculations include the related Pari Passu Companion Loan(s). In the case of Loan Nos. 1, 2 and 15, the UW NCF DSCR, UW NOI Debt Yield, Cut-off Date LTV and Maturity Date LTV calculations exclude the related Subordinate Companion Loan(s). |
| (3) | In the case of Loan No. 15, the UW NCF DSCR is calculated using the sum of principal and interest payments over the first 12 months following the expiration of the interest-only period based on the assumed principal payment schedule provided on Annex F to the Preliminary Prospectus. In the case of Loan No. 40, the UW NCF DSCR is calculated using the sum of principal and interest payments over the first 12 months following the Cut-off Date based on the assumed principal payment schedule provided on Annex G to the Preliminary Prospectus. |
| (4) | In the case of Loan Nos. 5, 7, 8, 11, 13, 14, 15 and 22, the Cut-off Date LTV and the Maturity Date LTV are calculated by using an appraised value based on certain hypothetical assumptions. Refer to “Description of the Mortgage Pool—Assessments of Property Value and Condition” and “—Appraised Value” in the Preliminary Prospectus for additional details. |
| (5) | In the case of Loan Nos. 4 and 20, each with an anticipated repayment date, Maturity Date LTV is as of the related anticipated repayment date. |
THE INFORMATION IN THIS STRUCTURAL AND COLLATERAL TERM SHEET IS NOT COMPLETE AND MAY BE AMENDED PRIOR TO THE TIME OF SALE. THIS TERM SHEET IS NOT AN OFFER TO SELL THESE SECURITIES AND IT IS NOT A SOLICITATION OF AN OFFER TO BUY THESE SECURITIES IN ANY JURISDICTION WHERE THE OFFER OR SALE IS NOT PERMITTED.
| 9 of 151 |
| Structural and Collateral Term Sheet | JPMCC 2017-JP6 |
| Collateral Characteristics |
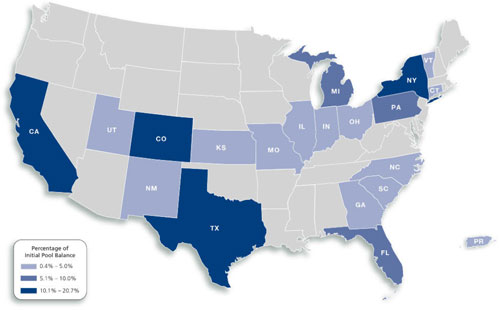
| Mortgaged Properties by Location(1) | ||||||||||||
Weighted Average | ||||||||||||
State | Number of Properties | Cut-off Date Principal Balance | % of | Occupancy | UW | UW | Cut-off Date LTV(2)(4) | Maturity Date LTV(2)(4)(5) | ||||
| California | 8 | $163,138,480 | 20.7% | 96.0% | 2.05x | 10.6% | 56.2% | 51.8% | ||||
| New York | 2 | 138,000,000 | 17.5 | 93.7% | 2.51x | 9.9% | 52.1% | 52.1% | ||||
| Texas | 6 | 112,789,852 | 14.3 | 90.5% | 1.44x | 10.4% | 70.2% | 65.0% | ||||
| Colorado | 3 | 80,811,823 | 10.3 | 80.8% | 1.72x | 11.5% | 60.6% | 56.1% | ||||
| Michigan | 5 | 58,347,808 | 7.4 | 87.9% | 2.14x | 13.2% | 59.9% | 51.5% | ||||
| Florida | 7 | 52,002,248 | 6.6 | 91.4% | 1.73x | 12.2% | 65.2% | 57.0% | ||||
| Pennsylvania | 4 | 51,766,378 | 6.6 | 92.6% | 1.50x | 10.7% | 67.4% | 58.4% | ||||
| Vermont | 4 | 24,175,000 | 3.1 | 91.6% | 1.55x | 10.6% | 60.6% | 53.9% | ||||
| Connecticut | 1 | 13,800,000 | 1.8 | 100.0% | 1.53x | 8.1% | 66.5% | 66.5% | ||||
| South Carolina | 1 | 12,842,665 | 1.6 | 70.9% | 2.11x | 13.1% | 66.2% | 54.2% | ||||
| Puerto Rico | 2 | 12,551,400 | 1.6 | 100.0% | 1.28x | 8.9% | 70.7% | 56.6% | ||||
| Georgia | 2 | 12,112,380 | 1.5 | 74.0% | 2.03x | 13.2% | 60.9% | 49.7% | ||||
| Utah | 1 | 9,200,000 | 1.2 | 100.0% | 1.58x | 10.6% | 72.4% | 65.5% | ||||
| Ohio | 1 | 9,170,000 | 1.2 | 94.9% | 1.67x | 11.7% | 67.7% | 58.4% | ||||
| Illinois | 18 | 9,000,000 | 1.1 | 98.0% | 2.56x | 12.8% | 57.8% | 57.8% | ||||
| Indiana | 2 | 7,875,000 | 1.0 | 89.0% | 1.45x | 9.4% | 68.5% | 58.3% | ||||
| New Mexico | 1 | 6,243,606 | 0.8 | 79.0% | 1.53x | 10.9% | 60.6% | 50.1% | ||||
| North Carolina | 1 | 5,483,026 | 0.7 | 65.7% | 2.68x | 19.4% | 49.8% | 37.7% | ||||
| Kansas | 2 | 4,462,500 | 0.6 | 89.1% | 1.45x | 9.4% | 68.5% | 58.3% | ||||
| Missouri | 1 | 2,850,000 | 0.4 | 84.5% | 1.45x | 9.4% | 68.5% | 58.3% | ||||
| Total / Weighted Average: | 72 | $786,622,167 | 100.0% | 90.9% | 1.91x | 10.9% | 60.9% | 55.7% | ||||
| (1) | Because this table presents information relating to the mortgaged properties and not mortgage loans, the information for mortgage loans secured by more than one mortgaged property is based on allocated loan amounts. |
| (2) | In the case of Loan Nos. 1, 2, 4, 14 and 15, the UW NCF DSCR, UW NOI Debt Yield, Cut-off Date LTV and Maturity Date LTV calculations include the related Pari Passu Companion Loan(s). In the case of Loan Nos. 1, 2 and 15, the UW NCF DSCR, UW NOI Debt Yield, Cut-off Date LTV and Maturity Date LTV calculations exclude the related Subordinate Companion Loan(s). |
| (3) | In the case of Loan No. 15, the UW NCF DSCR is calculated using the sum of principal and interest payments over the first 12 months following the expiration of the interest-only period based on the assumed principal payment schedule provided on Annex F to the Preliminary Prospectus. In the case of Loan No. 40, the UW NCF DSCR is calculated using the sum of principal and interest payments over the first 12 months following the Cut-off Date based on the assumed principal payment schedule provided on Annex G to the Preliminary Prospectus. |
| (4) | In the case of Loan Nos. 5, 7, 8, 11, 13, 14, 15 and 22, the Cut-off Date LTV and the Maturity Date LTV are calculated by using an appraised value based on certain hypothetical assumptions. Refer to “Description of the Mortgage Pool—Assessments of Property Value and Condition” and “—Appraised Value” in the Preliminary Prospectus for additional details. |
| (5) | In the case of Loan Nos. 4 and 20, each with an anticipated repayment date, Maturity Date LTV is as of the related anticipated repayment date. |
THE INFORMATION IN THIS STRUCTURAL AND COLLATERAL TERM SHEET IS NOT COMPLETE AND MAY BE AMENDED PRIOR TO THE TIME OF SALE. THIS TERM SHEET IS NOT AN OFFER TO SELL THESE SECURITIES AND IT IS NOT A SOLICITATION OF AN OFFER TO BUY THESE SECURITIES IN ANY JURISDICTION WHERE THE OFFER OR SALE IS NOT PERMITTED.
| 10 of 151 |
| Structural and Collateral Term Sheet | JPMCC 2017-JP6 |
| Collateral Characteristics |
| Cut-off Date Principal Balance |
Weighted Average | |||||||||||
| Range of Cut-off Date Principal Balances | Number of Loans | Cut-off Date Principal Balance | % of IPB | Mortgage Rate | Remaining Loan Term(1) | UW NCF DSCR(2)(3) | UW NOI DY(2) | Cut-off Date LTV(2)(4) | Maturity Date LTV(1)(2)(4) | ||
| $3,966,378 | - | $9,999,999 | 16 | $117,759,229 | 15.0% | 5.01052% | 113 | 1.75x | 11.7% | 64.2% | 56.3% |
| $10,000,000 | - | $19,999,999 | 11 | 149,314,603 | 19.0 | 4.99976% | 117 | 1.79x | 11.3% | 66.2% | 58.0% |
| $20,000,000 | - | $24,999,999 | 7 | 154,125,521 | 19.6 | 4.87192% | 95 | 1.60x | 10.5% | 62.4% | 57.2% |
| $25,000,000 | - | $49,999,999 | 6 | 202,203,814 | 25.7 | 4.75024% | 96 | 1.72x | 11.3% | 60.7% | 55.0% |
| $50,000,000 | - | $98,000,000 | 2 | 163,219,000 | 20.7 | 3.62357% | 105 | 2.63x | 10.0% | 52.5% | 52.5% |
| Total / Weighted Average: | 42 | $786,622,167 | 100.0% | 4.62663% | 104 | 1.91x | 10.9% | 60.9% | 55.7% | ||
| Mortgage Interest Rates |
Weighted Average | |||||||||||
| Range of Mortgage Interest Rates | Number of Loans | Cut-off Date Principal Balance | % of IPB | Mortgage Rate | Remaining Loan Term(1) | UW NCF DSCR(2)(3) | UW NOI DY(2) | Cut-off Date LTV(2)(4) | Maturity Date LTV(1)(2)(4) | ||
| 3.31940% | - | 3.99999% | 3 | $183,219,000 | 23.3% | 3.59037% | 106 | 2.56x | 10.2% | 51.8% | 51.1% |
| 4.00000% | - | 4.49999% | 3 | 84,300,000 | 10.7 | 4.11860% | 119 | 2.18x | 11.3% | 58.7% | 54.9% |
| 4.50000% | - | 4.99999% | 13 | 161,262,874 | 20.5 | 4.78842% | 109 | 1.84x | 12.1% | 62.0% | 54.2% |
| 5.00000% | - | 5.53300% | 23 | 357,840,293 | 45.5 | 5.20398% | 97 | 1.54x | 10.7% | 65.6% | 58.9% |
| Total / Weighted Average: | 42 | $786,622,167 | 100.0% | 4.62663% | 104 | 1.91x | 10.9% | 60.9% | 55.7% | ||
| Original Term to Maturity/ARD in Months(1) |
Weighted Average | |||||||||
| Original Term to Maturity/ARD in Months | Number of Loans | Cut-off Date Principal Balance | % of IPB | Mortgage Rate | Remaining Loan Term(1) | UW NCF DSCR(2)(3) | UW NOI DY(2) | Cut-off Date LTV(2)(4) | Maturity Date LTV(1)(2)(4) |
| 60 | 5 | $128,239,852 | 16.3% | 5.09854% | 58 | 1.43x | 10.6% | 68.3% | 64.2% |
| 84 | 2 | 89,394,000 | 11.4 | 4.00992% | 83 | 2.24x | 9.4% | 58.6% | 56.8% |
| 120 | 34 | 548,988,315 | 69.8 | 4.66444% | 118 | 1.96x | 11.2% | 60.1% | 54.1% |
| 126 | 1 | 20,000,000 | 2.5 | 3.31940% | 118 | 1.95x | 11.9% | 46.3% | 39.3% |
| Total / Weighted Average: | 42 | $786,622,167 | 100.0% | 4.62663% | 104 | 1.91x | 10.9% | 60.9% | 55.7% |
| Remaining Term to Maturity/ARD in Months(1) | |||||||||
| Weighted Average | |||||||||||
| Range of Remaining Term to Maturity/ARD in Months | Number of Loans | Cut-off Date Principal Balance | % of IPB | Mortgage Rate | Remaining Loan Term(1) | UW NCF DSCR(2)(3) | UW NOI DY(2) | Cut-off Date LTV(2)(4) | Maturity Date | ||
| 54 | - | 84 | 7 | $217,633,852 | 27.7% | 4.65138% | 68 | 1.76x | 10.1% | 64.4% | 61.2% |
| 85 | - | 119 | 34 | 470,988,315 | 59.9 | 4.81437% | 117 | 1.80x | 11.3% | 61.8% | 54.5% |
| 120 | 1 | 98,000,000 | 12.5 | 3.66940% | 120 | 2.73x | 10.7% | 48.9% | 48.9% | ||
| Total / Weighted Average: | 42 | $786,622,167 | 100.0% | 4.62663% | 104 | 1.91x | 10.9% | 60.9% | 55.7% | ||
| (1) | In the case of Loan Nos. 4 and 20, each with an anticipated repayment date, Remaining Loan Term, Maturity Date LTV, Original Term to Maturity/ARD in Months and Remaining Term to Maturity/ARD in Months are as of the related anticipated repayment date. |
| (2) | In the case of Loan Nos. 1, 2, 4, 14 and 15, the UW NCF DSCR, UW NOI DY, Cut-off Date LTV and Maturity Date LTV calculations include the related Pari Passu Companion Loan(s). In the case of Loan Nos. 1, 2 and 15, the UW NCF DSCR, UW NOI DY, Cut-off Date LTV and Maturity Date LTV calculations exclude the related Subordinate Companion Loan(s). |
| (3) | In the case of Loan No. 15, the UW NCF DSCR is calculated using the sum of principal and interest payments over the first 12 months following the expiration of the interest-only period based on the assumed principal payment schedule provided on Annex F to the Preliminary Prospectus. In the case of Loan No. 40, the UW NCF DSCR is calculated using the sum of principal and interest payments over the first 12 months following the Cut-off Date based on the assumed principal payment schedule provided on Annex G to the Preliminary Prospectus. |
| (4) | In the case of Loan Nos. 5, 7, 8, 11, 13, 14, 15 and 22, the Cut-off Date LTV and the Maturity Date LTV are calculated by using an appraised value based on certain hypothetical assumptions. Refer to “Description of the Mortgage Pool—Assessments of Property Value and Condition” and “—Appraised Value” in the Preliminary Prospectus for additional details. |
THE INFORMATION IN THIS STRUCTURAL AND COLLATERAL TERM SHEET IS NOT COMPLETE AND MAY BE AMENDED PRIOR TO THE TIME OF SALE. THIS TERM SHEET IS NOT AN OFFER TO SELL THESE SECURITIES AND IT IS NOT A SOLICITATION OF AN OFFER TO BUY THESE SECURITIES IN ANY JURISDICTION WHERE THE OFFER OR SALE IS NOT PERMITTED.
| 11 of 151 |
| Structural and Collateral Term Sheet | JPMCC 2017-JP6 |
| Collateral Characteristics |
| Original Amortization Term in Months |
| Weighted Average | |||||||||
| Original Amortization Term in Months | Number of Loans | Cut-off Date Principal Balance | % of IPB | Mortgage Rate | Remaining Loan Term(1) | UW NCF DSCR(2)(3) | UW NOI DY(2) | Cut-off Date LTV(2)(4) | Maturity Date LTV(1)(2)(4) |
| Interest Only | 8 | $268,919,000 | 34.2% | 3.99388% | 110 | 2.42x | 10.0% | 55.0% | 55.0% |
| 300 | 2 | 10,892,009 | 1.4 | 5.40061% | 117 | 2.25x | 16.8% | 54.8% | 42.4% |
| 336 | 1 | 19,976,173 | 2.5 | 5.15000% | 119 | 1.28x | 8.9% | 70.7% | 56.6% |
| 360 | 31 | 486,834,985 | 61.9 | 4.93736% | 100 | 1.64x | 11.4% | 63.9% | 56.3% |
| Total / Weighted Average: | 42 | $786,622,167 | 100.0% | 4.62663% | 104 | 1.91x | 10.9% | 60.9% | 55.7% |
| Remaining Amortization Term in Months |
| Weighted Average | |||||||||||
| Range of Remaining Amortization Term in Months | Number of Loans | Cut-off Date Principal Balance | % of IPB | Mortgage Rate | Remaining Loan Term(1) | UW NCF DSCR(2)(3) | UW NOI DY(2) | Cut-off Date LTV(2)(4) | Maturity Date LTV(1)(2)(4) | ||
| Interest Only | 8 | $268,919,000 | 34.2% | 3.99388% | 110 | 2.42x | 10.0% | 55.0% | 55.0% | ||
| 295 | - | 354 | 5 | 65,311,367 | 8.3 | 5.07306% | 96 | 1.62x | 11.0% | 68.4% | 58.0% |
| 355 | - | 360 | 29 | 452,391,799 | 57.5 | 4.93831% | 102 | 1.64x | 11.5% | 63.4% | 55.8% |
| Total / Weighted Average: | 42 | $786,622,167 | 100.0% | 4.62663% | 104 | 1.91x | 10.9% | 60.9% | 55.7% | ||
| Amortization Types |
Weighted Average | |||||||||
| Amortization Types | Number of Loans | Cut-off Date Principal Balance | % of IPB | Mortgage Rate | Remaining | UW NCF DSCR(2)(3) | UW NOI DY(2) | Cut-off Date LTV(2)(4) | Maturity Date LTV(1)(2)(4) |
| IO-Balloon | 18 | $272,422,500 | 34.6% | 4.83413% | 106 | 1.62x | 11.2% | 64.0% | 56.9% |
| Balloon | 16 | 245,280,667 | 31.2 | 5.08989% | 96 | 1.66x | 11.6% | 64.0% | 55.1% |
| Interest Only | 6 | 215,119,000 | 27.3 | 3.91858% | 108 | 2.56x | 10.5% | 53.3% | 53.3% |
| ARD-Interest Only | 2 | 53,800,000 | 6.8 | 4.29498% | 118 | 1.85x | 8.0% | 61.7% | 61.7% |
| Total / Weighted Average: | 42 | $786,622,167 | 100.0% | 4.62663% | 104 | 1.91x | 10.9% | 60.9% | 55.7% |
| Underwritten Net Cash Flow Debt Service Coverage Ratios(2)(3) |
| Weighted Average | |||||||||||
| Range of Underwritten Net Cash Flow Debt Service Coverage Ratios | Number of Loans | Cut-off Date Principal Balance | % of IPB | Mortgage Rate | Remaining Loan Term(1) | UW NCF DSCR(2)(3) | UW NOI DY(2) | Cut-off Date LTV(2)(4) | Maturity Date LTV(1)(2)(4) | ||
| 1.28x | - | 1.49x | 15 | $234,742,375 | 29.8% | 5.14647% | 90 | 1.37x | 9.9% | 67.6% | 60.4% |
| 1.50x | - | 1.74x | 7 | 89,388,606 | 11.4 | 5.14866% | 108 | 1.57x | 10.5% | 66.0% | 59.1% |
| 1.75x | - | 1.99x | 10 | 203,701,443 | 25.9 | 4.51355% | 111 | 1.88x | 11.4% | 57.8% | 52.6% |
| 2.00x | - | 2.24x | 4 | 58,397,753 | 7.4 | 4.91134% | 116 | 2.10x | 13.9% | 64.8% | 54.1% |
| 2.25x | - | 3.30x | 6 | 200,391,990 | 25.5 | 3.81680% | 107 | 2.66x | 11.0% | 53.0% | 52.1% |
| Total / Weighted Average: | 42 | $786,622,167 | 100.0% | 4.62663% | 104 | 1.91x | 10.9% | 60.9% | 55.7% | ||
| (1) | In the case of Loan Nos. 4 and 20, each with an anticipated repayment date, Remaining Loan Term and Maturity Date LTV are as of the related anticipated repayment date. |
| (2) | In the case of Loan Nos. 1, 2, 4, 14 and 15, the UW NCF DSCR, UW NOI DY, Cut-off Date LTV and Maturity Date LTV calculations include the related Pari Passu Companion Loan(s). In the case of Loan Nos. 1, 2 and 15, the UW NCF DSCR, UW NOI DY, Cut-off Date LTV and Maturity Date LTV calculations exclude the related Subordinate Companion Loan(s). |
| (3) | In the case of Loan No. 15, the UW NCF DSCR is calculated using the sum of principal and interest payments over the first 12 months following the expiration of the interest-only period based on the assumed principal payment schedule provided on Annex F to the Preliminary Prospectus. In the case of Loan No. 40, the UW NCF DSCR is calculated using the sum of principal and interest payments over the first 12 months following the Cut-off Date based on the assumed principal payment schedule provided on Annex G to the Preliminary Prospectus. |
| (4) | In the case of Loan Nos. 5, 7, 8, 11, 13, 14, 15 and 22, the Cut-off Date LTV and the Maturity Date LTV are calculated by using an appraised value based on certain hypothetical assumptions. Refer to “Description of the Mortgage Pool—Assessments of Property Value and Condition” and “—Appraised Value” in the Preliminary Prospectus for additional details. |
THE INFORMATION IN THIS STRUCTURAL AND COLLATERAL TERM SHEET IS NOT COMPLETE AND MAY BE AMENDED PRIOR TO THE TIME OF SALE. THIS TERM SHEET IS NOT AN OFFER TO SELL THESE SECURITIES AND IT IS NOT A SOLICITATION OF AN OFFER TO BUY THESE SECURITIES IN ANY JURISDICTION WHERE THE OFFER OR SALE IS NOT PERMITTED.
| 12 of 151 |
| Structural and Collateral Term Sheet | JPMCC 2017-JP6 |
| Collateral Characteristics |
| LTV Ratios as of the Cut-off Date(1)(4) |
| Weighted Average | |||||||||||
| Range of Cut-off Date LTVs | Number of Loans | Cut-off Date Principal Balance | % of IPB | Mortgage Rate | Remaining Loan Term(2) | UW NCF DSCR(1)(3) | UW NOI DY(1) | Cut-off Date LTV(1)(4) | Maturity Date LTV(1)(2)(4) | ||
| 46.3% | - | 49.9% | 4 | $154,325,486 | 19.6% | 3.89327% | 119 | 2.43x | 11.5% | 48.5% | 45.4% |
| 50.0% | - | 59.9% | 8 | 162,917,947 | 20.7 | 4.24705% | 103 | 2.31x | 11.4% | 57.7% | 54.7% |
| 60.0% | - | 64.9% | 11 | 208,942,448 | 26.6 | 4.93411% | 104 | 1.68x | 10.6% | 62.3% | 56.7% |
| 65.0% | - | 69.9% | 12 | 173,353,414 | 22.0 | 5.00594% | 95 | 1.59x | 11.0% | 67.8% | 60.7% |
| 70.0% | - | 74.5% | 7 | 87,082,871 | 11.1 | 5.14356% | 95 | 1.39x | 9.7% | 72.1% | 63.3% |
| Total / Weighted Average: | 42 | $786,622,167 | 100.0% | 4.62663% | 104 | 1.91x | 10.9% | 60.9% | 55.7% | ||
| LTV Ratios as of the Maturity Date(1)(2)(4) |
Weighted Average | |||||||||||
| Range of Maturity Date/ARD LTVs | Number of Loans | Cut-off Date Principal Balance | % of IPB | Mortgage Rate | Remaining Loan Term(2) | UW NCF DSCR(1)(3) | UW NOI DY(1) | Cut-off Date LTV(1)(4) | Maturity Date LTV(1)(2)(4) | ||
| 37.7% | - | 44.9% | 3 | $56,325,486 | 7.2% | 4.28279% | 117 | 1.92x | 12.8% | 47.7% | 39.3% |
| 45.0% | - | 49.9% | 4 | 143,798,947 | 18.3 | 3.95108% | 120 | 2.50x | 11.7% | 52.2% | 48.8% |
| 50.0% | - | 54.9% | 7 | 97,105,566 | 12.3 | 4.94213% | 108 | 1.99x | 12.4% | 61.5% | 53.0% |
| 55.0% | - | 59.9% | 18 | 302,902,316 | 38.5 | 4.75808% | 103 | 1.80x | 10.4% | 62.9% | 57.7% |
| 60.0% | - | 69.3% | 10 | 186,489,852 | 23.7 | 4.87360% | 87 | 1.58x | 9.8% | 68.1% | 64.0% |
| Total / Weighted Average: | 42 | $786,622,167 | 100.0% | 4.62663% | 104 | 1.91x | 10.9% | 60.9% | 55.7% | ||
| Prepayment Protection |
Weighted Average | |||||||||
| Prepayment Protection | Number of Loans | Cut-off Date Principal Balance | % of IPB | Mortgage Rate | Remaining Loan Term(2) | UW NCF DSCR(1)(3) | UW NOI DY(1) | Cut-off Date LTV(1)(4) | Maturity Date LTV(1)(2)(4) |
| Defeasance | 27 | $427,146,328 | 54.3% | 4.61925% | 115 | 1.98x | 11.3% | 59.0% | 53.5% |
| Yield Maintenance | 13 | 279,069,339 | 35.5 | 4.87465% | 92 | 1.68x | 10.9% | 64.1% | 58.4% |
| Defeasance or Yield Maintenance | 2 | 80,406,500 | 10.2 | 3.80503% | 89 | 2.29x | 9.1% | 59.9% | 58.0% |
| Total / Weighted Average: | 42 | $786,622,167 | 100.0% | 4.62663% | 104 | 1.91x | 10.9% | 60.9% | 55.7% |
| Loan Purpose |
Weighted Average | |||||||||
| Loan Purpose | Number of Loans | Cut-off Date Principal Balance | % of IPB | Mortgage Rate | Remaining Loan Term(2) | UW NCF DSCR(1)(3) | UW NOI DY(1) | Cut-off Date LTV(1)(4) | Maturity Date LTV(1)(2)(4) |
| Refinance | 27 | $411,273,119 | 52.3% | 4.85307% | 102 | 1.70x | 10.9% | 63.2% | 57.3% |
| Acquisition | 13 | 335,506,588 | 42.7 | 4.33699% | 105 | 2.15x | 10.8% | 59.3% | 55.1% |
| Recapitalization | 2 | 39,842,460 | 5.1 | 4.72816% | 116 | 1.94x | 12.4% | 50.4% | 43.6% |
| Total / Weighted Average: | 42 | $786,622,167 | 100.0% | 4.62663% | 104 | 1.91x | 10.9% | 60.9% | 55.7% |
| (1) | In the case of Loan Nos. 1, 2, 4, 14 and 15, the UW NCF DSCR, UW NOI DY, Cut-off Date LTV and Maturity Date LTV calculations include the related Pari Passu Companion Loan(s). In the case of Loan Nos. 1, 2 and 15, the UW NCF DSCR, UW NOI DY, Cut-off Date LTV and Maturity Date LTV calculations exclude the related Subordinate Companion Loan(s). |
| (2) | In the case of Loan Nos. 4 and 20, each with an anticipated repayment date, Remaining Loan Term and Maturity Date LTV are as of the related anticipated repayment date. |
| (3) | In the case of Loan No. 15, the UW NCF DSCR is calculated using the sum of principal and interest payments over the first 12 months following the expiration of the interest-only period based on the assumed principal payment schedule provided on Annex F to the Preliminary Prospectus. In the case of Loan No. 40, the UW NCF DSCR is calculated using the sum of principal and interest payments over the first 12 months following the Cut-off Date based on the assumed principal payment schedule provided on Annex G to the Preliminary Prospectus. |
| (4) | In the case of Loan Nos. 5, 7, 8, 11, 13, 14, 15 and 22, the Cut-off Date LTV and the Maturity Date LTV are calculated by using an appraised value based on certain hypothetical assumptions. Refer to “Description of the Mortgage Pool—Assessments of Property Value and Condition” and “—Appraised Value” in the Preliminary Prospectus for additional details. |
THE INFORMATION IN THIS STRUCTURAL AND COLLATERAL TERM SHEET IS NOT COMPLETE AND MAY BE AMENDED PRIOR TO THE TIME OF SALE. THIS TERM SHEET IS NOT AN OFFER TO SELL THESE SECURITIES AND IT IS NOT A SOLICITATION OF AN OFFER TO BUY THESE SECURITIES IN ANY JURISDICTION WHERE THE OFFER OR SALE IS NOT PERMITTED.
| 13 of 151 |
| Structural and Collateral Term Sheet | JPMCC 2017-JP6 |
| Collateral Characteristics |
| Previous Securitization History(1) |
| No. | Loan Name | Location | Property Type | Previous Securitization |
| 6 | Bingham Office Center | Bingham Farms, MI | Office | GSMS 2007-GG10 |
| 7 | 2950 North Hollywood Way | Burbank, CA | Office | JPMCC 2006-LDP6 |
| 12 | Wellington Marketplace | Wellington, FL | Retail | WBCMT 2007-C32 |
| 16.01 | Walgreens - Carolina | Carolina, PR | Retail | BACM 2007-2 |
| 16.02 | Walgreens - Catano | Guaynabo, PR | Retail | BACM 2007-2 |
| 16.03 | Eckerd (La-Z-Boy) | McDonough, GA | Retail | BACM 2007-2 |
| 16.04 | Rite Aid - Shelby | Shelby Township, MI | Retail | BACM 2007-2 |
| 16.05 | Rite Aid - Coldwater | Coldwater, MI | Retail | BACM 2007-2 |
| 18 | Island View Crossing | Bristol, PA | Office | A10 2014-1 |
| 24 | Monroe Park Tower | Tallahassee, FL | Office | WBCMT 2006-C27 |
| 26 | Atrium Office | Bakersfield, CA | Office | GCCFC 2007-GG9 |
| 30 | 106th South Office Building | South Jordan, UT | Office | JPMCC 2007-CB19 |
| 33 | Village Center Plaza | Katy, TX | Retail | CWCI 2007-C3 |
| 36 | Paradise Victoria Village | Ventura, CA | Retail | CGCMT 2007-C6 |
| 39 | Sleep Inn Charlotte | Charlotte, NC | Hotel | CGCMT 2007-C6 |
| 41 | Airport Center Warehouses | Miami, FL | Industrial | WBCMT 2007-C31 |
| (1) | The table above represents the properties for which the previously existing debt was most recently securitized, based on information provided by the related borrower or obtained through searches of a third-party database. |
THE INFORMATION IN THIS STRUCTURAL AND COLLATERAL TERM SHEET IS NOT COMPLETE AND MAY BE AMENDED PRIOR TO THE TIME OF SALE. THIS TERM SHEET IS NOT AN OFFER TO SELL THESE SECURITIES AND IT IS NOT A SOLICITATION OF AN OFFER TO BUY THESE SECURITIES IN ANY JURISDICTION WHERE THE OFFER OR SALE IS NOT PERMITTED.
| 14 of 151 |
| Structural and Collateral Term Sheet | JPMCC 2017-JP6 | |
| Class A-2(1) | ||
No. | Loan Name | Location | Cut-off Date Balance | % of IPB | Maturity Date Balance | % of Certificate Class(2) | Original Loan Term | Remaining Loan Term | UW NCF DSCR | UW NOI Debt Yield | Cut-off Date LTV(3) | Maturity Date LTV(3) |
| 3 | Browning Place | Farmers Branch, TX | $42,749,531 | 5.4% | $39,710,047 | 32.0% | 60 | 58 | 1.34x | 10.9% | 69.2% | 64.3% |
| 5 | Diamond Hill Denver | Denver, CO | 32,000,000 | 4.1 | 30,625,136 | 24.7 | 60 | 58 | 1.37x | 10.6% | 61.8% | 59.1% |
| 11 | Humblewood Center | Humble, TX | 22,150,000 | 2.8 | 21,089,495 | 17.0 | 60 | 59 | 1.82x | 12.1% | 68.9% | 65.6% |
| 13 | Diamond Hill Apartments | Houston, TX | 21,600,521 | 2.7 | 20,087,203 | 16.2 | 60 | 54 | 1.31x | 8.9% | 74.5% | 69.3% |
| 27 | Quail Creek | Houston, TX | 9,739,799 | 1.2 | 9,001,155 | 7.3 | 60 | 59 | 1.45x | 9.9% | 71.1% | 65.7% |
| Total / Weighted Average: | $128,239,852 | 16.3% | $120,513,036 | 97.2% | 60 | 58 | 1.43x | 10.6% | 68.3% | 64.2% | ||
| (1) | The table above presents the mortgage loans whose balloon payments would be applied to pay down the certificate balance of the Class A-2 Certificates, assuming a 0% CPR and applying the “Modeling Assumptions” described in the Preliminary Prospectus, including the assumptions that (i) none of the mortgage loans in the pool experience prepayments, defaults or losses; (ii) there are no extensions of maturity dates of any mortgage loans in the pool; and (iii) each mortgage loan in the pool is paid in full on its stated maturity date. Each Class of Certificates, including the Class A-2 Certificates, evidences undivided ownership interests in the entire pool of mortgage loans. Debt service coverage ratio, debt yield and loan-to-value ratio information does not take into account subordinate debt (whether or not secured by the mortgaged property), if any, that exists or is allowed under the terms of any mortgage loan. See Annex A-1 to the Preliminary Prospectus. |
| (2) | Reflects the percentage equal to the Maturity Date Balance divided by the initial Class A-2 Certificate Balance. |
| (3) | In the case of Loan Nos. 5, 11 and 13, the Cut-off Date LTV and the Maturity Date LTV are calculated by using an appraised value based on certain hypothetical assumptions. Refer to “Description of the Mortgage Pool—Assessments of Property Value and Condition” and “—Appraised Value” in the Preliminary Prospectus for additional details. |
THE INFORMATION IN THIS STRUCTURAL AND COLLATERAL TERM SHEET IS NOT COMPLETE AND MAY BE AMENDED PRIOR TO THE TIME OF SALE. THIS TERM SHEET IS NOT AN OFFER TO SELL THESE SECURITIES AND IT IS NOT A SOLICITATION OF AN OFFER TO BUY THESE SECURITIES IN ANY JURISDICTION WHERE THE OFFER OR SALE IS NOT PERMITTED.
| 15 of 151 |
| Structural and Collateral Term Sheet | JPMCC 2017-JP6 | |
| Class A-3(1) | ||
No. | Loan Name | Location | Cut-off Date Balance | % of IPB | Maturity Date Balance | % of Certificate Class(2) | Original Loan Term | Remaining Loan Term | UW NCF DSCR(3) | UW NOI Debt Yield(3) | Cut-off Date LTV(3) | Maturity Date LTV(3) |
| 2 | 211 Main Street | San Francisco, CA | $65,219,000 | 8.3% | $65,219,000 | 75.2% | 84 | 82 | 2.49x | 9.0% | 57.9% | 57.9% |
| 9 | Pillsbury Portfolio | Various, VT | 24,175,000 | 3.1 | 21,511,582 | 24.8 | 84 | 84 | 1.55x | 10.6% | 60.6% | 53.9% |
| Total / Weighted Average: | $89,394,000 | 11.4% | $86,730,582 | 100.0% | 84 | 83 | 2.24x | 9.4% | 58.6% | 56.8% | ||
| (1) | The table above presents the mortgage loans whose balloon payments would be applied to pay down the certificate balance of the Class A-3 Certificates, assuming a 0% CPR and applying the “Modeling Assumptions” described in the Preliminary Prospectus, including the assumptions that (i) none of the mortgage loans in the pool experience prepayments, defaults or losses; (ii) there are no extensions of maturity dates of any mortgage loans in the pool; and (iii) each mortgage loan in the pool is paid in full on its stated maturity date. Each Class of Certificates, including the Class A-3 Certificates, evidences undivided ownership interests in the entire pool of mortgage loans. Debt service coverage ratio, debt yield and loan-to-value ratio information does not take into account subordinate debt (whether or not secured by the mortgaged property), if any, that exists or is allowed under the terms of any mortgage loan. See Annex A-1 to the Preliminary Prospectus. |
| (2) | Reflects the percentage equal to the Maturity Date Balance divided by the initial Class A-3 Certificate Balance. |
| (3) | In the case of Loan No. 2, the UW NCF DSCR, UW NOI Debt Yield, Cut-off Date LTV and Maturity Date LTV calculations include the related Pari Passu Companion Loan(s), but exclude the related Subordinate Companion Loan(s). |
THE INFORMATION IN THIS STRUCTURAL AND COLLATERAL TERM SHEET IS NOT COMPLETE AND MAY BE AMENDED PRIOR TO THE TIME OF SALE. THIS TERM SHEET IS NOT AN OFFER TO SELL THESE SECURITIES AND IT IS NOT A SOLICITATION OF AN OFFER TO BUY THESE SECURITIES IN ANY JURISDICTION WHERE THE OFFER OR SALE IS NOT PERMITTED.
| 16 of 151 |
| Structural and Collateral Term Sheet | JPMCC 2017-JP6 | |
| Structural Overview | ||
| ■ Accrual: | Each Class of Certificates (other than the Class R and Class Z Certificates) will accrue interest on a 30/360 basis. The Class R Certificates will not accrue interest. On each Distribution Date, any excess interest collected in respect of any mortgage loan in the trust with an anticipated repayment date, solely to the extent received from the related borrower during the related collection period, will be distributed to the holders of the Class Z Certificates. | |
| ■ Distribution of Interest: | On each Distribution Date, accrued interest for each Class of Certificates (other than the Class R and Class Z Certificates) at the applicable pass-through rate will be distributed in the following order of priority to the extent of available funds: first, to the Class A-1, Class A-2, Class A-3, Class A-4, Class A-5, Class A-SB, Class X-A and Class X-B Certificates (the “Senior Certificates”), on apro rata basis, based on the interest entitlement for each such Class on such date, and then to the Class A-S, Class B, Class C, Class D, Class E-RR, Class F-RR, Class G-RR and Class NR-RR Certificates, in that order, in each case until the interest entitlement for such date payable to each such Class is paid in full.
The pass-through rate applicable to the Class A-1, Class A-2, Class A-3, Class A-4, Class A-5, Class A-SB, Class A-S, Class B, Class C, Class D, Class E-RR, Class F-RR, Class G-RR and Class NR-RR Certificates on each Distribution Date, will be aper annum rate equal to one of (i) a fixed rate, (ii) the weighted average of the net mortgage rates on the mortgage loans (in each case adjusted, if necessary, to accrue on the basis of a 360-day year consisting of twelve 30-day months), (iii) the lesser of a specified fixed pass-through rate and the rate described in clause (ii) above or (iv) the rate described in clause (ii) above less a specified percentage.
The pass-through rate for the Class X-A Certificates for any Distribution Date will be aper annum rate equal to the excess, if any, of (a) the weighted average of the net mortgage rates on the mortgage loans (in each case adjusted, if necessary, to accrue on the basis of a 360-day year consisting of twelve 30-day months), over (b) the weighted average of the pass-through rates on the Class A-1, Class A-2, Class A-3, Class A-4, Class A-5, Class A-SB and Class A-S Certificates for the related Distribution Date, weighted on the basis of their respective Certificate Balances outstanding immediately prior to that Distribution Date.
The pass-through rate for the Class X-B Certificates for any Distribution Date will be aper annum rate equal to the excess, if any, of (a) the weighted average of the net mortgage rates on the mortgage loans (in each case adjusted, if necessary, to accrue on the basis of a 360-day year consisting of twelve 30-day months), over (b) the weighted average of the pass-through rates on the Class B and Class C Certificates for the related Distribution Date, weighted on the basis of their respective Certificate Balances outstanding immediately prior to that Distribution Date.
The Class Z Certificates will not have a pass-through rate. On each Distribution Date, any excess interest collected in respect of any mortgage loan in the trust with an anticipated repayment date, solely to the extent received from the related borrower during the related collection period, will be distributed to the holders of the Class Z Certificates.
See “Description of the Certificates—Distributions” in the Preliminary Prospectus. | |
| ■ Distribution of Principal: | On any Distribution Date prior to the Cross-Over Date, payments in respect of principal of the Certificates will be distributed:
first, to the Class A-SB Certificates until the Certificate Balance of the Class A-SB Certificates is reduced to the Class A-SB planned principal balance for the related Distribution Date set forth in Annex E to the Preliminary Prospectus, second, to the Class A-1 Certificates, until the Certificate Balance of such Class is reduced to zero, third, to the Class A-2 Certificates, until the Certificate Balance of such Class is reduced to zero, fourth, to the Class A-3 Certificates, until the Certificate Balance of such Class is reduced to zero, fifth, to the Class A-4 Certificates, until the Certificate Balance of such Class is reduced to zero, sixth, to the Class A-5 Certificates, until the Certificate Balance of such Class is reduced to zero and seventh, to the Class A-SB Certificates, until the Certificate Balance of such Class is reduced to zero and then to the Class A-S, Class B, Class C, Class D, Class E-RR, Class F-RR, Class G-RR and Class NR-RR Certificates, in that order, until the Certificate Balance of each such Class is reduced to zero.
On any Distribution Date on or after the Cross-Over Date, payments in respect of principal of the Certificates will be distributed to the Class A-1, Class A-2, Class A-3, Class A-4, Class A-5 |
THE INFORMATION IN THIS STRUCTURAL AND COLLATERAL TERM SHEET IS NOT COMPLETE AND MAY BE AMENDED PRIOR TO THE TIME OF SALE. THIS TERM SHEET IS NOT AN OFFER TO SELL THESE SECURITIES AND IT IS NOT A SOLICITATION OF AN OFFER TO BUY THESE SECURITIES IN ANY JURISDICTION WHERE THE OFFER OR SALE IS NOT PERMITTED.
| 17 of 151 |
| Structural and Collateral Term Sheet | JPMCC 2017-JP6 | |
| Structural Overview | ||
and Class A-SB Certificates,pro rata based on the Certificate Balance of each such Class until the Certificate Balance of each such Class is reduced to zero.
The “Cross-Over Date” means the Distribution Date on which the aggregate Certificate Balances of the Class A-S, Class B, Class C, Class D, Class E-RR, Class F-RR, Class G-RR and Class NR-RR Certificates have been reduced to zero as a result of the allocation of realized losses to such Classes.
The Class X-A and Class X-B Certificates (the “Class X Certificates”) will not be entitled to receive distributions of principal; however, the notional amount of the Class X-A Certificates will be reduced by the aggregate amount of principal distributions, realized losses and trust fund expenses, if any, allocated to the Class A-1, Class A-2, Class A-3, Class A-4, Class A-5, Class A-SB and Class A-S Certificates and the notional amount of the Class X-B Certificates will be reduced by the aggregate amount of principal distributions, realized losses and trust fund expenses, if any, allocated to the Class B and Class C Certificates.
The Class Z Certificates have no certificate balance, notional amount, credit support, pass-through rate, rated final distribution date or rating, and will not be entitled to distributions of principal. The Class Z Certificates are entitled to distributions of excess interest collected on the mortgage loan with an anticipated repayment date solely to the extent received from the related borrower and will represent beneficial ownership of the grantor trust, as further described in “Description of the Certificates—Distributions” in the Preliminary Prospectus. | |||||||||
| ■ Yield Maintenance / Fixed Penalty Allocation: | For purposes of the distribution of Yield Maintenance Charges on any Distribution Date, Yield Maintenance Charges collected in respect of any mortgage loan will be allocated pro rata among four groups (based on the aggregate amount of principal distributed to the Principal Balance Certificates in each group), consisting of (a) the Class A-1, Class A-2, Class A-3, Class A-4, Class A-5, Class A-SB, Class A-S and Class X-A Certificates (“YM Group A”), (b) the Class B, Class C and Class X-B Certificates (“YM Group B”), (c) the Class D Certificates (“YM Group C”) and (d) the Class E-RR, Class F-RR, Class G-RR and Class NR-RR Certificates (“YM Group RR”). As among the Classes of Certificates in each YM Group, other than the YM Group C and the YM Group RR, each Class of Certificates entitled to distributions of principal will receive an amount calculated generally in accordance with the following formula and as more specifically described in the Preliminary Prospectus, with any remaining Yield Maintenance Charges on such Distribution Date being distributed to the class of Class X Certificates in such YM Group. | ||||||||
| YM Charge | X | Principal Paid to Class | X | (Pass-Through Rate on Class – Discount Rate) | |||||
| Total Principal Paid to YM Group | (Mortgage Rate on Loan – Discount Rate) | ||||||||
| As among the Classes of Certificates in the YM Group C and the YM Group RR, each Class of Certificates entitled to distributions of principal will receive an amount calculated generally in accordance with the following formula and as more specifically described in the Preliminary Prospectus. | |||||||||
| YM Charge | X | Principal Paid to Class | |||||||
| Total Principal Paid to YM Group | |||||||||
| No Yield Maintenance Charges will be distributed to the Class R or Class Z Certificates. | |||||||||
| ■ Realized Losses: | Losses on the mortgage loans will be allocated first to the Class NR-RR, Class G-RR, Class F-RR, Class E-RR, Class D, Class C, Class B and Class A-S Certificates, in that order, in each case until the Certificate Balance of all such Classes have been reduced to zero, and then, to the Class A-1, Class A-2, Class A-3, Class A-4, Class A-5 and Class A-SB Certificates,pro rata, based on the Certificate Balance of each such Class, until the Certificate Balance of each such Class has been reduced to zero. The notional amounts of the Class X-A and Class X-B Certificates will be reduced by the aggregate amount of realized losses allocated to Certificates that are components of the notional amounts of the Class X-A and Class X-B Certificates, respectively.
Losses on each Whole Loan will be allocated,first to any related subordinate companion loan(s) until reduced to zero andthen, pro rata, between the related mortgage loan and the relatedpari passu companion loan(s), based upon their respective principal balances. | ||||||||
THE INFORMATION IN THIS STRUCTURAL AND COLLATERAL TERM SHEET IS NOT COMPLETE AND MAY BE AMENDED PRIOR TO THE TIME OF SALE. THIS TERM SHEET IS NOT AN OFFER TO SELL THESE SECURITIES AND IT IS NOT A SOLICITATION OF AN OFFER TO BUY THESE SECURITIES IN ANY JURISDICTION WHERE THE OFFER OR SALE IS NOT PERMITTED.
| 18 of 151 |
| Structural and Collateral Term Sheet | JPMCC 2017-JP6 | |
| Structural Overview | ||
| ■ Interest Shortfalls: | A shortfall with respect to the amount of available funds distributable in respect of interest can result from, among other sources: (a) delinquencies and defaults by borrowers; (b) shortfalls resulting from the application of appraisal reductions to reduce P&I Advances; (c) shortfalls resulting from interest on Advances made by the Master Servicer, the Special Servicer or the Trustee; (d) shortfalls resulting from the payment of Special Servicing Fees and other additional compensation that the Special Servicer is entitled to receive; (e) shortfalls resulting from extraordinary expenses of the trust, including indemnification payments payable to the Depositor, the Master Servicer, the Special Servicer, the Certificate Administrator, the Trustee, the Operating Advisor and the Asset Representations Reviewer; (f) shortfalls resulting from a modification of a mortgage loan’s interest rate or principal balance; and (g) shortfalls resulting from other unanticipated or default-related expenses of the trust. Any such shortfalls that decrease the amount of available funds distributable in respect of interest to the Certificateholders will reduce distributions to the classes of Certificates (other than the Class R and Class Z Certificates) beginning with those with the lowest payment priorities, in reverse sequential order. See “Description of the Certificates—Distributions—Priority of Distributions” in the Preliminary Prospectus. | ||||||||
| ■ Appraisal Reduction Amounts: | With respect to mortgage loans serviced under the Pooling and Servicing Agreement, upon the occurrence of certain trigger events with respect to a mortgage loan, which are generally tied to certain events of default under the related mortgage loan documents, the Special Servicer will be obligated to obtain an appraisal of the related mortgaged property and the Master Servicer will calculate the Appraisal Reduction Amount. The “Appraisal Reduction Amount” is generally the amount by which the current principal balance of the related mortgage loan or serviced whole loan, plus outstanding advances, real estate taxes, unpaid servicing fees and certain similar amounts exceeds the sum of (a) 90% of the appraised value of the related mortgaged property, (b) the amount of any escrows, letters of credit and reserves and (c) all insurance and casualty proceeds and condemnation awards that are collateral for the related mortgage loan.
With respect to the Non-Serviced Whole Loans, any Appraisal Reduction Amount will be similarly determined pursuant to the related trust and servicing agreement or pooling and servicing agreement, as applicable, under which it is serviced.
In general, the Appraisal Reduction Amounts that are allocated to the mortgage loans are notionally allocated to reduce, in reverse sequential order, the Certificate Balance of each Class of Certificates (other than the Class A-1, Class A-2, Class A-3, Class A-4, Class A-5 and Class A-SB Certificates) beginning with the Class NR-RR Certificates for certain purposes, including certain voting rights and the determination of the controlling class. As a result of calculating one or more Appraisal Reduction Amounts (and, in the case of any Whole Loan, to the extent allocated to the related mortgage loan), the amount of any required P&I Advance will be reduced, which will have the effect of reducing the amount of interest available to the most subordinate class of certificates then-outstanding (i.e.,first, to Class NR-RR Certificates;second, to the Class G-RR Certificates;third, to the Class F-RR Certificates;fourth, to the Class E-RR Certificates;fifthto the Class D Certificates,sixth, to the Class C Certificates,seventh, to the Class B Certificates,eighth, to the Class A-S Certificates and finally,pro rata based on their respective interest entitlements, to the Senior Certificates).
With respect to each serviced Whole Loan, the Appraisal Reduction Amount is notionally allocated,first to any related subordinate companion loan(s) until reduced to zero andthen, pro rata, between the related mortgage loan and the relatedpari passucompanion loan(s), based upon their respective principal balances. | ||||||||
| ■ Appraisal Reduced Interest: | Accrued and unpaid interest at the related Mortgage Rate for a mortgage loan that is not advanced by the Master Servicer or the Trustee due to the application of Appraisal Reduction Amounts to such mortgage loan. | ||||||||
| ■ Master Servicer Advances: | The Master Servicer will be required to advance certain delinquent scheduled mortgage loan payments of principal and interest and certain property protection advances, in each case, to the extent the Master Servicer deems such advances to be recoverable. At any time that an Appraisal Reduction Amount exists, the amount that would otherwise be required to be advanced by the Master Servicer in respect of delinquent payments of interest on any mortgage loan will be reduced to equal the product of (x) the interest portion of the amount that would be advanced without regard to any Appraisal Reduction Amount and (y) a fraction, the numerator of which is the then-outstanding principal balance of the mortgage loan minus the Appraisal | ||||||||
THE INFORMATION IN THIS STRUCTURAL AND COLLATERAL TERM SHEET IS NOT COMPLETE AND MAY BE AMENDED PRIOR TO THE TIME OF SALE. THIS TERM SHEET IS NOT AN OFFER TO SELL THESE SECURITIES AND IT IS NOT A SOLICITATION OF AN OFFER TO BUY THESE SECURITIES IN ANY JURISDICTION WHERE THE OFFER OR SALE IS NOT PERMITTED.
| 19 of 151 |
| Structural and Collateral Term Sheet | JPMCC 2017-JP6 | |
| Structural Overview | ||
| Reduction Amount and the denominator of which is the then-outstanding principal balance of the mortgage loan. The Master Servicer will not make any principal or interest advances with respect to any companion loan. | |||||||||
| ■ Whole Loans: | Five mortgage loans are each evidenced by one mortgage loan and one or more companion loans (each a “Companion Loan” and collectively with the related mortgage loan, a “Whole Loan”), secured by the same mortgage(s) on the related mortgaged property(ies). Each such mortgage loan and its related Companion Loan(s) are subject to an intercreditor agreement. None of these Companion Loans will be part of the trust.
In the case of the Whole Loans referred to as the “245 Park Avenue Whole Loan”, the “211 Main Street Whole Loan”, the “740 Madison Whole Loan”, the “Apex Fort Washington Whole Loan” and the “Moffett Gateway Whole Loan”, one or more related Companion Loans arepari passu with the related mortgage loan (these Companion Loans are also referred to as the “Pari Passu Companion Loans”). In the case of each of the 245 Park Avenue Whole Loan, the 211 Main Street Whole Loan and the Moffett Gateway Whole Loan, in addition to the related Pari Passu Companion Loans, one or more related Companion Loans are subordinate in right of payment to the related mortgage loan and the related Pari Passu Companion Loans (these Companion Loans are also referred to as the “Subordinate Companion Loans”).
The 211 Main Street Whole Loan (prior to the securitization of the related lead Pari Passu Companion Loan), the 740 Madison Whole Loan (prior to the securitization of the related lead Pari Passu Companion Loan) and the Apex Fort Washington Whole Loan (prior to the securitization of the related lead Pari Passu Companion Loan) (each, a “Serviced Whole Loan”) will be serviced under the pooling and servicing agreement for the JPMCC 2017-JP6 transaction (the “Pooling and Servicing Agreement”).
The 211 Main Street Pari Passu Companion Loans (prior to the securitization of the related lead Pari Passu Companion Loan), the 740 Madison Pari Passu Companion Loan (prior to the securitization of the related lead Pari Passu Companion Loan) and the Apex Fort Washington Companion Loans (prior to the securitization of the related lead Pari Passu Companion Loan) are referred to as “Serviced Companion Loans”.
The 211 Main Street Whole Loan, the 740 Madison Whole Loan and the Apex Fort Washington Whole Loan (each a “Servicing Shift Whole Loan”, and each of the related mortgage loans, a “Servicing Shift Mortgage Loan”) will initially be serviced pursuant to the Pooling and Servicing Agreement. After the securitization of the related lead Pari Passu Companion Loan, the related Servicing Shift Whole Loan is expected to be serviced pursuant to the pooling and servicing agreement relating to the securitization of such lead Pari Passu Companion Loan as described under “Description of the Mortgage Pool—The Whole Loans—The Servicing Shift Whole Loans—The 211 Main Street Whole Loan”, “—The 740 Madison Whole Loan” and “—The Apex Fort Washington Whole Loan” in the Preliminary Prospectus.
The 245 Park Avenue Whole Loan is expected to be serviced and administered under the trust and servicing agreement for the 245 Park Avenue Trust 2017-245P transaction as described under “Description of the Mortgage Pool—The Whole Loans—The Non-Serviced Whole Loans—The 245 Park Avenue Whole Loan” and “Pooling and Servicing Agreement—Servicing of the Non-Serviced Mortgage Loan—Servicing of the 245 Park Avenue Mortgage Loan” in the Preliminary Prospectus.
The Moffett Gateway Whole Loan is being serviced and administered under the pooling and servicing agreement for the JPMCC 2017-JP4 transaction as described under “Description of the Mortgage Pool—The Whole Loans—The Non-Serviced Whole Loan—The Moffett Gateway Whole Loan” and “Pooling and Servicing Agreement—Servicing of the Non-Serviced Mortgage Loans—Servicing of the Moffett Gateway Mortgage Loan” in the Preliminary Prospectus.
The 245 Park Avenue Whole Loan, the 211 Main Street Whole Loan (on and after the securitization of the related lead Pari Passu Companion Loan), the 740 Madison Whole Loan (on and after the securitization of the related lead 740 Madison Pari Passu Companion Loan), the Apex Fort Washington Whole Loan (on and after the securitization of the related lead Pari Passu Companion Loan) and the Moffett Gateway Whole Loan are each referred to as a “Non-Serviced Whole Loan” and collectively referred to as the “Non-Serviced Whole Loans”. | ||||||||
THE INFORMATION IN THIS STRUCTURAL AND COLLATERAL TERM SHEET IS NOT COMPLETE AND MAY BE AMENDED PRIOR TO THE TIME OF SALE. THIS TERM SHEET IS NOT AN OFFER TO SELL THESE SECURITIES AND IT IS NOT A SOLICITATION OF AN OFFER TO BUY THESE SECURITIES IN ANY JURISDICTION WHERE THE OFFER OR SALE IS NOT PERMITTED.
| 20 of 151 |
| Structural and Collateral Term Sheet | JPMCC 2017-JP6 | |
| Structural Overview | ||
| ■ Highlighted Servicing Provisions: | The servicing provisions for this transaction include certain modifications to the provisions used in prior transactions. These modifications include, but are not limited to, the following:
The Special Servicer will not be entitled to any fees from the securitization trust or the related borrower during a fee restricted period, other than a special servicing fee, a portion of default interest collected on the related mortgage loan and, in certain circumstances described in the succeeding paragraph, a liquidation fee, if the Special Servicer elects to cause a mortgage loan to be transferred to special servicing under either of the following circumstances:
1. A transfer to special servicing as a result of an imminent or reasonably foreseeable default when the Master Servicer has not independently transferred the mortgage loan to special servicing for that reason; or
2. A transfer to special servicing after a maturity date default under circumstances where the Master Servicer has determined that the borrower has, prior to such maturity date, provided from an acceptable lender an executed term sheet or refinancing commitment or an executed purchase and sale agreement, in each case, that is consistent with CMBS market practices and is reasonably satisfactory in form and substance acceptable to the Master Servicer evidencing an expected refinancing of the mortgage loan or sale of the related Mortgaged Property.
Notwithstanding the foregoing, the special servicer will be entitled to a liquidation fee if it transfers a mortgage loan into special servicing as described in clause (1) above and a default occurs that leads to a liquidation of the applicable mortgage loan, unless (A) the related imminent or reasonably foreseeable default was a payment default and (B) a subsequent maturity date default occurs under the circumstances described in clause (2) above.
Certain revisions to the rights of the Directing Certificateholder to approve “major decisions” have been incorporated in the Preliminary Prospectus, including limiting the involvement of the Directing Certificateholder in (1) the replacement of the related property management company, (2) the approval of annual budgets and (3) the consent to modifications of any mezzanine intercreditor agreement in circumstances when the Directing Certificateholder is affiliated with the mezzanine lender.
The Certificate Administrator will be required to identify the then-current Directing Certificateholder as part of its monthly distribution date statement.
See“Description of the Certificates” and“Pooling and Servicing Agreement”in the Preliminary Prospectus. | |
| ■ Liquidated Loan Waterfall: | On liquidation of any mortgage loan, all net liquidation proceeds related to the mortgage loan (but not any related Companion Loan) will be applied so that amounts allocated as a recovery of accrued and unpaid interest will not, in the first instance, include any delinquent interest that was not advanced as a result of Appraisal Reduction Amounts or interest that accrued on any junior note(s) if such mortgage loan is an AB Modified Loan. After the adjusted interest amount is so allocated, any remaining liquidation proceeds will be allocated to offset certain advances and to pay principal on the mortgage loan until the unpaid principal amount of the mortgage loan has been reduced to zero. Any remaining liquidation proceeds will then be allocated to pay delinquent interest that was not advanced as a result of Appraisal Reduction Amounts and any interest that accrued on any junior note(s) if such mortgage loan is an AB Modified Loan. Any liquidation proceeds in respect of each such mortgage loan in excess of the related outstanding balance will first be applied to offset any interest shortfalls allocated to the Certificates (other than the Class R and Class Z Certificates), in sequential order, and then to offset any realized losses allocated to the Certificates, in sequential order. Any liquidation proceeds remaining after such applications will be distributed to the Class R Certificates. |
THE INFORMATION IN THIS STRUCTURAL AND COLLATERAL TERM SHEET IS NOT COMPLETE AND MAY BE AMENDED PRIOR TO THE TIME OF SALE. THIS TERM SHEET IS NOT AN OFFER TO SELL THESE SECURITIES AND IT IS NOT A SOLICITATION OF AN OFFER TO BUY THESE SECURITIES IN ANY JURISDICTION WHERE THE OFFER OR SALE IS NOT PERMITTED.
| 21 of 151 |
| Structural and Collateral Term Sheet | JPMCC 2017-JP6 | |
| Structural Overview | ||
| ■ Sale of Defaulted Loans and REO Properties: | The Special Servicer is required to solicit offers for any defaulted loan (other than a non-serviced mortgage loan) in such a manner as will be reasonably likely to maximize the value of the defaulted loan on a net present value basis, if the Special Servicer determines that no satisfactory arrangements can be made for collection of delinquent payments and the sale would be in the best economic interests of the certificateholders (or, in the case of any Serviced Whole Loan, the certificateholders and any holders of the related Serviced Companion Loans, as a collective whole, taking into account thepari passu or subordinate nature of any Companion Loans). Additionally, the Special Servicer may offer to sell any REO property if, and when, the Special Servicer determines that such a sale would be in the best economic interest of the issuing entity and the holders of any related Companion Loans.
In the case of each non-serviced mortgage loan, under certain circumstances permitted under the related intercreditor agreement, to the extent that such non-serviced mortgage loan is not sold together with the related non-serviced companion loan by the special servicer for the related Non-Serviced Whole Loans, the Special Servicer will be entitled to sell (with respect to any mortgage loan other than an Excluded Loan, with the consent of the Directing Certificateholder if no Control Termination Event has occurred and is continuing) such non-serviced mortgage loan if it determines in accordance with the servicing standard that such action would be in the best interests of the certificateholders.
The Special Servicer is generally required to accept a cash offer received from any person for any defaulted loan or REO property in an amount at least equal to par plus accrued interest plus all other outstanding amounts due under such mortgage loan and any outstanding expenses of the trust relating to such mortgage loan (the “Purchase Price”) except as described in the Preliminary Prospectus.
With respect to the Serviced Whole Loans, any such sale of the related defaulted loan is required to also include the relatedpari passu Companion Loans, if any, and the prices will be adjusted accordingly.
Within 30 days of a defaulted loan becoming a specially serviced loan, the Special Servicer is required to order an appraisal and, within 30 days of receipt of such appraisal, is required to determine the fair value of such defaulted loan in accordance with the applicable servicing standard. If, however, the Special Servicer is already in the process of obtaining an appraisal with respect to the related mortgaged property, the Special Servicer is required to make its fair value determination as soon as reasonably practicable (but in any event within 30 days) after its receipt of such appraisal. Additionally, with respect to the mortgage loans that have mezzanine debt or permit mezzanine debt in the future, the mezzanine lenders may have the option to purchase the related mortgage loan after certain events of default under such mortgage loan. In addition, with respect to the 211 Main Street Whole Loan, the holders of the related Subordinate Companion Loans have an option to purchase the related mortgage loan after certain events of default under such mortgage loan.
The Directing Certificateholder will not have a right of first refusal to purchase a defaulted loan.
If the Special Servicer does not receive a cash offer at least equal to the Purchase Price, the Special Servicer may purchase the defaulted loan or REO property at the Purchase Price. If the Special Servicer does not purchase the defaulted loan or REO property at the Purchase Price, the Special Servicer is required to accept the highest offer received from any person that is determined to be a fair price (supported by an appraisal required to be obtained by the Special Servicer within 30 days of a mortgage loan becoming a specially serviced mortgage loan) for such defaulted loan or REO property, if the highest offeror is a person other than an Interested Person. If the highest offer is made by an Interested Person, the Trustee will determine (based upon the most recent appraisal or updated appraisal conducted in accordance with the terms of the Pooling and Servicing Agreement) whether the offer constitutes a fair price for the defaulted loan or REO property, provided that (i) no offer from an Interested Person will constitute a fair price unless (A) it is the highest offer received and (B) if the offer is less than the applicable Purchase Price, at least two other offers are received from independent third parties and (ii) the Trustee may conclusively rely on the opinion of an independent appraiser or other independent expert retained by the Trustee in connection with making such determination. Neither the Trustee nor any of its affiliates may make an offer for or purchase any specially serviced mortgage loan or REO property. An “Interested Person” is any person that is (i) a party to the Pooling and Servicing Agreement, the Directing Certificateholder, any sponsor, any borrower, |
THE INFORMATION IN THIS STRUCTURAL AND COLLATERAL TERM SHEET IS NOT COMPLETE AND MAY BE AMENDED PRIOR TO THE TIME OF SALE. THIS TERM SHEET IS NOT AN OFFER TO SELL THESE SECURITIES AND IT IS NOT A SOLICITATION OF AN OFFER TO BUY THESE SECURITIES IN ANY JURISDICTION WHERE THE OFFER OR SALE IS NOT PERMITTED.
| 22 of 151 |
| Structural and Collateral Term Sheet | JPMCC 2017-JP6 | |
| Structural Overview | ||
any manager of a mortgaged property, any independent contractor engaged by the Special Servicer, any holder of a mezzanine loan (but only with respect to the related mortgage loan) or any known affiliate of any such person or, (ii) with respect to a defaulted whole loan, the depositor, the master servicer, the special servicer (or independent contractor engaged by such special servicer) or the trustee for the securitization of any related Companion Loan and each holder of any related Companion Loan, or any known affiliate of any such person.
The Special Servicer is not obligated to accept the highest offer and may accept a lower offer for a defaulted loan or REO property if the Special Servicer determines, in accordance with the servicing standard (and subject to the requirements of any related intercreditor agreement), that a rejection of such offer would be in the best interests of the Certificateholders and, with respect to any Serviced Whole Loan, the holder of the related Companion Loans, as a collective whole, as if such Certificateholders and, if applicable, the related Companion Loan Holder(s) constituted a single lender), so long as such lower offer was not made by the Special Servicer or any of its affiliates. With respect to the 211 Main Street Whole Loan (prior to the securitization of the related leadpari passu companion loan), the special servicer will be permitted to sell the related Subordinate Companion Loans along with the related mortgage loan and any Pari Passu Companion Loans if it determines that a sale of such Whole Loan would maximize recoveries on the related Whole Loan in accordance with the Servicing Standard, subject to the consent of the holder of the related controlling Subordinate Companion Loan.
The foregoing applies to mortgage loans serviced under the Pooling and Servicing Agreement. With respect to each Non-Serviced Whole Loan, if the special servicer under the applicable trust and servicing agreement or pooling and servicing agreement, as applicable, determines to sell the related Companion Loan(s) as described above, then the applicable special servicer will be required to sell the related non-serviced mortgage loan, included in the JPMCC 2017-JP6 Trust, and the related Companion Loan(s), as a single loan. In connection with any such sale, the then-applicable special servicer will be required to follow procedures substantially similar to those set forth above. In addition, with respect to the Moffet Gateway Whole Loan, the holder of the related Subordinate Companion Loan have an option to purchase the related mortgage loan after certain events of default under such mortgage loan. | ||
| ■ Control Eligible Certificates: | Classes E-RR, F-RR, G-RR and NR-RR. | |
| ■ Control Rights: | The Control Eligible Certificates will have certain control rights attached to them. The “Directing Certificateholder” will be with respect to (i) the Servicing Shift Mortgage Loans, the “controlling holder” or any analogous concept under the related intercreditor agreement, which, prior to the securitization of the related leadpari passucompanion loan, will be the holder of the related controlling companion loan; and (ii) each mortgage loan other than the Servicing Shift Mortgage Loans, the Controlling Class Certificateholder (or its representative) selected by more than 50% of the Controlling Class Certificateholders;provided,however, that (1) absent that selection, (2) until a Directing Certificateholder is so selected or (3) upon receipt of a notice from a majority of the Controlling Class Certificateholders that a Directing Certificateholder is no longer designated, the Controlling Class Certificateholder that owns the largest aggregate Certificate Balance of the Controlling Class (or its representative) will be the Directing Certificateholder;provided,however, that in the case of this clause (3), in the event no one holder owns the largest aggregate Certificate Balance of the Controlling Class, then there will be no Directing Certificateholder until appointed in accordance with the terms of the Pooling and Servicing Agreement. With respect to any mortgage loan (other than any non-serviced mortgage loan and any Excluded Loan), unless a Control Termination Event has occurred and is continuing, the Directing Certificateholder will be entitled to direct the Special Servicer to take, or refrain from taking, certain actions with respect to such mortgage loan. Furthermore, the Directing Certificateholder will also have the right to receive notice and provide consent with respect to certain material actions that the Master Servicer and the Special Servicer plan on taking with respect to a mortgage loan (other than any non-serviced mortgage loan and any Excluded Loan). With respect to any mortgage loan that has or may in the future have mezzanine debt, pursuant to the related intercreditor agreement, the related mezzanine lender may have certain consent rights with respect to certain modifications related to such mortgage loan.
A “Borrower Party” means a borrower, a mortgagor, a manager of a Mortgaged Property, an Accelerated Mezzanine Loan Lender, any other person controlling or controlled by or under common control with such borrower, mortgagor, manager or Accelerated Mezzanine Loan Lender, as applicable, or any other person owning, directly or indirectly, 25% or more of the |
THE INFORMATION IN THIS STRUCTURAL AND COLLATERAL TERM SHEET IS NOT COMPLETE AND MAY BE AMENDED PRIOR TO THE TIME OF SALE. THIS TERM SHEET IS NOT AN OFFER TO SELL THESE SECURITIES AND IT IS NOT A SOLICITATION OF AN OFFER TO BUY THESE SECURITIES IN ANY JURISDICTION WHERE THE OFFER OR SALE IS NOT PERMITTED.
| 23 of 151 |
| Structural and Collateral Term Sheet | JPMCC 2017-JP6 | |
| Structural Overview | ||
beneficial interests in such borrower, mortgagor, manager or Accelerated Mezzanine Loan Lender, as applicable. For purposes of this definition, “control” when used with respect to any specified person means the power to direct the management and policies of such person, directly or indirectly, whether through the ownership of voting securities, by contract or otherwise and the terms “controlling” and “controlled” have meanings correlative to the foregoing.
An “Accelerated Mezzanine Loan Lender” means a mezzanine lender under a mezzanine loan that has been accelerated or as to which foreclosure or enforcement proceedings have been commenced against the equity collateral pledged to secure such mezzanine loan.
An “Excluded Loan” is a mortgage loan or Whole Loan with respect to which the Directing Certificateholder or the holder of the majority of the controlling class is a Borrower Party. As of the Closing Date, it is expected that there will be no Excluded Loans in this securitization.
With respect to any Serviced Whole Loan, direction, consent and consultation rights with respect to such Whole Loan are subject to certain consultation rights of the holders of the related Companion Loans pursuant to the related intercreditor agreement.
With respect to any Non-Serviced Whole Loan, direction, consent and consultation rights with respect to such Whole Loan will be exercised by the directing certificateholder or controlling class representative under the applicable pooling and servicing agreement (provided that with respect to the Moffett Gateway Whole Loan, prior to the occurrence and continuance of a related control appraisal period, all such rights will be exercised by the holder of the related Subordinate Companion Loan).
With respect to any Servicing Shift Whole Loan, direction, consent and consultation rights with respect to such Whole Loan will be exercised (i) prior to the securitization of the related leadpari passuCompanion Loan, by the holder of the related controlling Companion Loan and (ii) on and after the securitization of the related leadpari passuCompanion Loan, by the directing holder or controlling class representative under the applicable pooling and servicing agreement (provided, that with respect to the 211 Main Street Whole Loan, at all times prior to the occurrence and continuance of a related appraisal period, all such rights will be exercised by the holder of the related controlling Subordinate Companion Loan). | ||
| ■ Directing Certificateholder: | RREF III-D AIV RR, LLC is expected to be appointed as the initial Directing Certificateholder with respect to all mortgage loans (other than the Servicing Shift Mortgage Loans). | |
| ■ Controlling Class: | The “Controlling Class” will at any date of determination be the most subordinate Class of Control Eligible Certificates then outstanding that has an aggregate Certificate Balance, as notionally reduced by any Cumulative Appraisal Reduction Amounts allocable to such Class, equal to no less than 25% of the initial Certificate Balance for such Class;provided that if at any time the principal balances of the certificates other than the Control Eligible Certificates have been reduced to zero as a result of the allocation of principal payments on the mortgage loans, then the Controlling Class will be the most subordinate Class among the Control Eligible Certificates that has an aggregate principal balance greater than zero without regard to any Cumulative Appraisal Reduction Amounts. Each holder of a certificate of the Controlling Class is referred to herein as a “Controlling Class Certificateholder”.
The Controlling Class as of the Closing Date will be the Class NR-RR Certificates. | |
| ■ Control Termination Event: | A “Control Termination Event” will occur when the Class E-RR certificates have a Certificate Balance (taking into account the application of any Cumulative Appraisal Reduction Amounts to notionally reduce the Certificate Balance of such class) of less than 25% of the initial Certificate Balance of that class; provided that prior to the applicable securitization of the leadpari passu Companion Loan with respect to any Servicing Shift Whole Loan, no Control Termination Event may occur with respect to the Directing Certificateholder related to such Servicing Shift Whole Loan, and the term “Control Termination Event” will not be applicable to the Directing Certificateholder related to such Servicing Shift Whole Loan;provided, further, that a Control Termination Event will not be deemed to be continuing in the event the Certificate Balances of all Classes of Principal Balance Certificates other than the Control Eligible Certificates have been reduced to zero.
The “Cumulative Appraisal Reduction Amount” as of any date of determination, is equal to the sum of (i) with respect to any mortgage loan, all Appraisal Reduction Amounts then in effect, and (ii) with respect to any AB Modified Loan, any Collateral Deficiency Amount then in effect. |
THE INFORMATION IN THIS STRUCTURAL AND COLLATERAL TERM SHEET IS NOT COMPLETE AND MAY BE AMENDED PRIOR TO THE TIME OF SALE. THIS TERM SHEET IS NOT AN OFFER TO SELL THESE SECURITIES AND IT IS NOT A SOLICITATION OF AN OFFER TO BUY THESE SECURITIES IN ANY JURISDICTION WHERE THE OFFER OR SALE IS NOT PERMITTED.
| 24 of 151 |
| Structural and Collateral Term Sheet | JPMCC 2017-JP6 | |
| Structural Overview | ||
An “AB Modified Loan” means any corrected loan (1) that became a corrected loan (which includes for purposes of this definition any non-serviced mortgage loan that became a “corrected loan” (or any term substantially similar thereto) pursuant to the trust and servicing agreement or pooling and servicing agreement, as applicable, governing such non-serviced mortgage loan) due to a modification thereto that resulted in the creation of an A/B note structure (or similar structure) and as to which the new junior note(s) did not previously exist or the principal amount of the new junior note(s) was previously part of either an A note held by the issuing entity or the original unmodified mortgage loan and (2) as to which an Appraisal Reduction Amount is not in effect.
The “Collateral Deficiency Amount” means, with respect to any AB Modified Loan as of any date of determination, the excess of (i) the principal balance of such AB Modified Loan (taking into account the related junior note(s) and anypari passu notes included therein), over (ii) the sum of (in the case of a Whole Loan, solely to the extent allocable to the subject mortgage loan) (x) the most recent Appraised Value for the related mortgaged property or mortgaged properties, plus (y) solely to the extent not reflected or taken into account in such Appraised Value and to the extent on deposit with, or otherwise under the control of, the lender as of the date of such determination, any capital or additional collateral contributed by the related borrower at the time the mortgage loan became (and as part of the modification related to) such AB Modified Loan for the benefit of the related mortgaged property or mortgaged properties (provided, that in the case of a non-serviced mortgage loan, the amounts set forth in this clause (y) will be taken into account solely to the extent relevant information is received by the Master Servicer), plus (z) any other escrows or reserves (in addition to any amounts set forth in the immediately preceding clause (y)) held by the lender in respect of such AB Modified Loan as of the date of such determination.
Upon the occurrence and during the continuance of a Control Termination Event, the Controlling Class will no longer have any control rights. After the occurrence and during the continuance of a Control Termination Event, the Directing Certificateholder will relinquish its right to direct certain actions of the Special Servicer and will no longer have consent rights with respect to certain actions that the Master Servicer or the Special Servicer plan on taking with respect to a mortgage loan. Following the occurrence and during the continuance of a Control Termination Event, the Directing Certificateholder will retain consultation rights with the Special Servicer with respect to certain material actions that the Special Servicer plans on taking with respect to any mortgage loan other than an Excluded Loan. Such consultation rights will continue until the occurrence of a Consultation Termination Event. | ||
| ■ Consultation Termination Event: | A “Consultation Termination Event” will occur when there is no class of Control Eligible Certificates that has a then-outstanding Certificate Balance at least equal to 25% of the initial Certificate Balance of that class, in each case, without regard to the application of any Cumulative Appraisal Reduction Amounts;provided that prior to the applicable securitization of the leadpari passu Companion Loan with respect to any Servicing Shift Whole Loan, no Consultation Termination Event may occur with respect to the Directing Certificateholder related to such Servicing Shift Whole Loan, and the term “Consultation Termination Event” will not be applicable to the Directing Certificateholder related to such Servicing Shift Whole Loan;provided, further, that a Consultation Termination Event will not be deemed to be continuing in the event the Certificate Balances of all Classes of Principal Balance Certificates other than the Control Eligible Certificates have been reduced to zero.
Upon the occurrence of a Consultation Termination Event, there will be no Class of Certificates that will act as the Controlling Class and the Directing Certificateholder will have no rights under the Pooling and Servicing Agreement, other than those rights generally available to all Certificateholders. | |
| ■ Operating Advisor Consultation Event: | An “Operating Advisor Consultation Event” will occur when the Certificate Balances of the Class E-RR, Class F-RR, Class G-RR and Class NR-RR Certificates in the aggregate (taking into account the application of any Cumulative Appraisal Reduction Amounts to notionally reduce the Certificate Balances of such classes) is 25% or less of the initial Certificate Balances of such classes in the aggregate. | |
| ■ Appraised-Out Class: | A Class of Control Eligible Certificates that has been determined, as a result of Appraisal Reduction Amounts or Collateral Deficiency Amounts allocable to such Class, to no longer be the Controlling Class. |
THE INFORMATION IN THIS STRUCTURAL AND COLLATERAL TERM SHEET IS NOT COMPLETE AND MAY BE AMENDED PRIOR TO THE TIME OF SALE. THIS TERM SHEET IS NOT AN OFFER TO SELL THESE SECURITIES AND IT IS NOT A SOLICITATION OF AN OFFER TO BUY THESE SECURITIES IN ANY JURISDICTION WHERE THE OFFER OR SALE IS NOT PERMITTED.
| 25 of 151 |
| Structural and Collateral Term Sheet | JPMCC 2017-JP6 | |
| Structural Overview | ||
| ■ Remedies Available to Holders of an Appraised-Out Class: | Holders of the majority of any Appraised-Out Class will have the right, at their sole expense, to require the Special Servicer to order a supplemental appraisal report from an MAI appraiser (selected by the Special Servicer) for any mortgage loan (or Serviced Whole Loan) that results in the Class becoming an Appraised-Out Class.
Upon receipt of that supplemental appraisal, the Special Servicer will be required to determine, in accordance with the Servicing Standard, whether, based on its assessment of the supplemental appraisal, any recalculation of the Appraisal Reduction Amount or Collateral Deficiency Amount is warranted, and if so warranted, the Master Servicer will be required to recalculate the Appraisal Reduction Amount or Collateral Deficiency Amount, as applicable, based on the supplemental appraisal and if required by such recalculation, the Appraised-Out Class will be reinstated as the Controlling Class. The holders of an Appraised-Out Class requesting a supplemental appraisal are not permitted to exercise any control or consent rights of the Controlling Class until such time, if any, as the Class is reinstated as the Controlling Class.
| |
| ■ Operating Advisor: | The Operating Advisor will initially be Pentalpha Surveillance LLC. The Operating Advisor will have certain review and consultation rights relating to the performance of the Special Servicer and with respect to its actions taken in connection with the resolution and/or liquidation of specially serviced loans. With respect to each mortgage loan (other than a non-serviced mortgage loan) or Serviced Whole Loan, the Operating Advisor will be responsible for:
● reviewing the actions of the Special Servicer with respect to any Specially Serviced Loan;
● promptly reviewing (i) all reports by the Special Servicer made available to Privileged Persons on the Certificate Administrator’s website and (ii) each Final Asset Status Report;
● recalculating and reviewing for accuracy and consistency with the Pooling and Servicing Agreement, the mathematical calculations and the corresponding application of the non-discretionary portion of the applicable formulas required to be utilized in connection with net present value calculations used in the Special Servicer’s determination of what course of action to take in connection with the workout or liquidation of a Specially Serviced Loan; and
● preparing an annual report (if any mortgage loan was a Specially Serviced Loan at any time during the prior calendar year or an Operating Advisor Consultation Event occurred during the prior calendar year) that sets forth whether the Operating Advisor believes, in its sole discretion exercised in good faith, that the Special Servicer is operating in compliance with the Servicing Standard with respect to its performance of its duties under the Pooling and Servicing Agreement with respect to Specially Serviced Loans (and, after the occurrence and continuance of an Operating Advisor Consultation Event, with respect to Major Decisions on Non-Specially Serviced Loans) during the prior calendar year on a “trust-level basis”. The Operating Advisor will identify (1) which, if any, standards the Operating Advisor believes, in its sole discretion exercised in good faith, the Special Servicer has failed to comply with and (2) any material deviations from the Special Servicer’s obligations under the Pooling and Servicing Agreement with respect to the resolution or liquidation of any Specially Serviced Loan or REO Property (other than with respect to any REO Property related to any non-serviced mortgage loan or any Servicing Shift Mortgage Loan). In preparing any Operating Advisor Annual Report, the Operating Advisor will not be required to report on instances of non-compliance with, or deviations from, the Servicing Standard or the Special Servicer’s obligations under the Pooling and Servicing Agreement that the Operating Advisor determines, in its sole discretion exercised in good faith, to be immaterial.
With respect to each mortgage loan (other than any non-serviced mortgage loan) or Serviced Whole Loan, after an Operating Advisor Consultation Event has occurred and is continuing, in addition to the duties described above, the Operating Advisor will be required to perform the following additional duties:
● to consult (on a non-binding basis) with the Special Servicer in respect of Asset Status Reports; and
● to consult (on a non-binding basis) with the Special Servicer with respect to “major decisions” processed by the Special Servicer or for which the consent of the Special Servicer is required. |
THE INFORMATION IN THIS STRUCTURAL AND COLLATERAL TERM SHEET IS NOT COMPLETE AND MAY BE AMENDED PRIOR TO THE TIME OF SALE. THIS TERM SHEET IS NOT AN OFFER TO SELL THESE SECURITIES AND IT IS NOT A SOLICITATION OF AN OFFER TO BUY THESE SECURITIES IN ANY JURISDICTION WHERE THE OFFER OR SALE IS NOT PERMITTED.
| 26 of 151 |
| Structural and Collateral Term Sheet | JPMCC 2017-JP6 | |
| Structural Overview | ||
In addition, if at any time the Operating Advisor determines, in its sole discretion exercised in good faith, that (1) the Special Servicer is not performing its duties as required under the Pooling and Servicing Agreement in accordance with the Servicing Standard and (2) the replacement of the Special Servicer would be in the best interest of the certificateholders as a collective whole, then, the Operating Advisor will have the right to recommend the replacement of the Special Servicer and will submit its formal recommendation to the Trustee and the Certificate Administrator (along with its rationale, its proposed replacement special servicer and other relevant information justifying its recommendation).
The Operating Advisor’s recommendation to replace the Special Servicer must be confirmed by an affirmative vote of holders of Principal Balance Certificates evidencing at least a majority of a quorum of certificateholders (which, for this purpose, is the holders of Certificates that (i) evidence at least 20% of the Voting Rights (taking into account the application of any appraisal reduction amounts to notionally reduce the respective Certificate Balances) of all Principal Balance Certificates on an aggregate basis, and (ii) consist of at least three Certificateholders or certificate owners that are not affiliated with each other). In the event the holders of Principal Balance Certificates evidencing at least a majority of a quorum of certificateholders elect to remove and replace the Special Servicer (which requisite affirmative votes must be received within 180 days of the posting of the notice of the Operating Advisor’s recommendation to replace the Special Servicer to the Certificate Administrator’s website), the Certificate Administrator will be required to receive a Rating Agency Confirmation from each of the Rating Agencies at that time. Notwithstanding the foregoing, the operating advisor will not be permitted to recommend the replacement of the special servicer with respect to the 211 Main Street Whole Loan so long as such Whole Loan is not subject to a control appraisal period under the related intercreditor agreement.
Pentalpha Surveillance LLC is currently the operating advisor under the JPMCC 2016-JP4 pooling and servicing agreement and, in such capacity, has certain obligations and consultation rights with respect to the Moffett Gateway Whole Loan, that vary in certain respects from those of the Operating Advisor under the Pooling and Servicing Agreement. | ||
| ■ Replacement of Operating Advisor: | The Operating Advisor may be terminated or removed under certain circumstances and a replacement operating advisor appointed as described in the Preliminary Prospectus.
Any replacement operating advisor (or the personnel responsible for supervising the obligations of the replacement operating advisor) must be an institution (A) that is a special servicer or operating advisor on a commercial mortgage-backed securities transaction rated by Moody’s, Fitch and DBRS (including, in the case of the Operating Advisor, this transaction) but has not been special servicer or operating advisor on a transaction for which any of Moody’s, Fitch and DBRS has qualified, downgraded or withdrawn its rating or ratings of, one or more classes of certificates for such transaction citing servicing concerns with the operating advisor in its capacity as special servicer or operating advisor on such commercial mortgage-backed securities transaction as the sole or a material factor in such rating action; (B) that can and will make the representations and warranties of the operating advisor set forth in the Pooling and Servicing Agreement; (C) that is not (and is not affiliated with) the Depositor, the Trustee, the Certificate Administrator, the Master Servicer, the Special Servicer, a Mortgage Loan Seller, the Directing Certificateholder, a depositor, a trustee, a certificate administrator, a master servicer or special servicer with respect to the securitization of a Companion Loan, or any of their respective affiliates; (D) that has not been paid by any Special Servicer or successor special servicer any fees, compensation or other remuneration (x) in respect of its obligations hereunder or (y) for the appointment or recommendation for replacement of a successor special servicer to become the Special Servicer; (E) that (x) has been regularly engaged in the business of analyzing and advising clients in commercial mortgage-backed securities matters and that has at least 5 years of experience in collateral analysis and loss projections and (y) has at least 5 years of experience in commercial real estate asset management and experience in the workout and management of distressed commercial real estate assets and (F) that does not directly or indirectly, through one or more affiliates or otherwise, own or have derivative exposure in any interest in any certificates, any mortgage loans, any Companion Loan or any securities backed by a Companion Loan or otherwise have any financial interest in the securitization transaction to which the PSA relates, other than in fees from its role as operating advisor and asset representations reviewer (to the extent it also acts as the asset representations reviewer).
|
THE INFORMATION IN THIS STRUCTURAL AND COLLATERAL TERM SHEET IS NOT COMPLETE AND MAY BE AMENDED PRIOR TO THE TIME OF SALE. THIS TERM SHEET IS NOT AN OFFER TO SELL THESE SECURITIES AND IT IS NOT A SOLICITATION OF AN OFFER TO BUY THESE SECURITIES IN ANY JURISDICTION WHERE THE OFFER OR SALE IS NOT PERMITTED.
| 27 of 151 |
| Structural and Collateral Term Sheet | JPMCC 2017-JP6 | |
| Structural Overview | ||
| ■ Asset Representations Reviewer: | The Asset Representations Reviewer will be required to review certain delinquent mortgage loans (such review, an “Asset Review”) after a specified delinquency threshold has been exceeded and notification from the Certificate Administrator that the required percentage of Certificateholders have voted to direct a review of such delinquent mortgage loans. An “Asset Review Trigger” will occur when either (1) mortgage loans with an aggregate outstanding principal balance of 25.0% or more of the aggregate outstanding principal balance of all of the mortgage loans (including any REO Loans (or a portion of any REO Loan in the case of a Whole Loan) held by the issuing entity as of the end of the applicable Collection Period are Delinquent Loans, (2)(A) prior to and including the second anniversary of the Closing Date, at least 10 mortgage loans are Delinquent Loans and the outstanding principal balance of such Delinquent Loans in the aggregate constitutes at least 15.0% of the aggregate outstanding principal balance of all of the mortgage loans (including any REO Loans (or a portion of any REO Loan in the case of a Whole Loan)) held by the issuing entity as of the end of the applicable Collection Period or (B) after the second anniversary of the Closing Date, at least 15 mortgage loans are Delinquent Loans and the outstanding principal balance of such Delinquent Loans in the aggregate constitutes at least 20.0% of the aggregate outstanding principal balance of all of the mortgage loans (including any REO Loans (or a portion of any REO Loan in the case of a Whole Loan)) held by the issuing entity as of the end of the applicable Collection Period.
Following the determination that an Asset Review Trigger has occurred, the Certificate Administrator will include in the Form 10-D relating to the distribution period in which the Asset Review Trigger occurred a description of the events that caused the Asset Review Trigger to occur. Once an Asset Review Trigger has occurred, Certificateholders evidencing not less than 5% of the voting rights may deliver to the Certificate Administrator a written direction requesting a vote on whether to commence an Asset Review within 90 days after the filing of the Form 10-D reporting the occurrence of the Asset Review Trigger (an “Asset Review Vote Election”). If directed by such Certificateholders, a vote of all Certificateholders will commence and an Asset Review will occur if more than a majority of Certificateholders voting (assuming Certificateholders representing a minimum of 5% of the voting rights respond) vote affirmatively within 150 days of the Asset Review Vote Election. If the vote does not pass, then no Certificateholder may request a vote or case a vote for an Asset Review and the Asset Representations Reviewer will not be required to review any delinquent mortgage loan until an additional mortgage loan becomes a Delinquent Loan, an Asset Review Trigger occurs as a result or otherwise in effect, another Asset Review Vote Election is made and more than a majority of Certificateholders voting (assuming Certificateholders representing a minimum of 5% of the voting rights respond) vote affirmatively within 150 days of such Asset Review Vote Election.
| |
| ■ Replacement of the Asset Representations Reviewer: | The Asset Representations Reviewer may be terminated and replaced without cause upon (i) the written direction of Certificateholders evidencing not less than 25% of the voting rights (without regard to the application of any Appraisal Reduction Amounts) requesting a vote to terminate and replace the Asset Representations Reviewer with a proposed successor asset representations reviewer that is an Eligible Asset Representations Reviewer, and (ii) payment by such holders to the Certificate Administrator of the reasonable fees and expenses to be incurred by the Certificate Administrator in connection with administering such vote, the Certificate Administrator will promptly provide notice to all Certificateholders and the Asset Representations Reviewer of such request by posting such notice on its website, and by mailing to all Certificateholders and the Asset Representations Reviewer. Upon the written direction of Certificateholders evidencing at least 75% of a Certificateholder Quorum (without regard to the application of any Appraisal Reduction Amounts), the Trustee will terminate all of the rights and obligations of the Asset Representations Reviewer under the Pooling and Servicing Agreement by written notice to the Asset Representations Reviewer, and the proposed successor asset representations reviewer will be appointed. | |
| ■ Appointment and Replacement of Special Servicer: | The Directing Certificateholder will appoint the initial Special Servicer as of the Closing Date. Prior to the occurrence and continuance of a Control Termination Event, the Special Servicer may generally be replaced at any time, with or without cause, by the Directing Certificateholder.
If the Special Servicer obtains knowledge that it has become a Borrower Party with respect to any mortgage loan or Serviced Whole Loan (any such mortgage loan or Serviced Whole Loan, |
THE INFORMATION IN THIS STRUCTURAL AND COLLATERAL TERM SHEET IS NOT COMPLETE AND MAY BE AMENDED PRIOR TO THE TIME OF SALE. THIS TERM SHEET IS NOT AN OFFER TO SELL THESE SECURITIES AND IT IS NOT A SOLICITATION OF AN OFFER TO BUY THESE SECURITIES IN ANY JURISDICTION WHERE THE OFFER OR SALE IS NOT PERMITTED.
| 28 of 151 |
| Structural and Collateral Term Sheet | JPMCC 2017-JP6 | |
| Structural Overview | ||
an “Excluded Special Servicer Loan”), the Special Servicer will be required to resign as Special Servicer of that Excluded Special Servicer Loan. Prior to the occurrence and continuance of a Control Termination Event, if the applicable Excluded Special Servicer Loan is not also an Excluded Loan, the Directing Certificateholder or the controlling class certificateholder on its behalf will be required to appoint (and may remove and replace with or without cause) a successor special servicer that is not a Borrower Party in accordance with the terms of the Pooling and Servicing Agreement (an “Excluded Special Servicer”) for the related Excluded Special Servicer Loan. After the occurrence and during the continuance of a Control Termination Event or if at any time the applicable Excluded Special Servicer Loan is also an Excluded Loan, the resigning Special Servicer will be required to use reasonable efforts to select the related Excluded Special Servicer.
Upon the occurrence and during the continuance of a Control Termination Event, the Directing Certificateholder will no longer have the right to replace the Special Servicer and such replacement will occur based on a vote of holders of all voting eligible Classes of Certificates as described below.
The Operating Advisor may also recommend the replacement of the Special Servicer as described above.
| ||
| ■ Replacement of Special Servicer by Vote of Certificateholders: | After the occurrence and during the continuance of a Control Termination Event, upon (a) the written direction of holders of Principal Balance Certificates evidencing not less than 25% of the Voting Rights of the Principal Balance Certificates (taking into account the application of Appraisal Reduction Amounts to notionally reduce the Certificate Balances of the Principal Balance Certificates) requesting a vote to replace the Special Servicer with a replacement special servicer, (b) payment by such requesting holders to the Certificate Administrator of all reasonable fees and expenses to be incurred by the Certificate Administrator in connection with administering such vote and (c) delivery by such holders to the Certificate Administrator and the Trustee of written confirmations from each Rating Agency that the appointment of such replacement special servicer will not result in a downgrade, withdrawal or qualification of the Certificates (which confirmations will be obtained at the expense of such holders), the Certificate Administrator will be required to post notice of such direction on its website, and concurrently by mail, and conduct the solicitation of votes of all Certificates in such regard, which such vote must occur within 180 days of the posting of such notice. Upon the written direction of holders of Principal Balance Certificates evidencing at least 66-2/3% of a Certificateholder Quorum, the Trustee will immediately replace the Special Servicer with a qualified replacement special servicer designated by such holders of Certificates.
A “Certificateholder Quorum” means, in connection with any solicitation of votes in connection with the replacement of the Special Servicer or the Asset Representations Reviewer described above, the holders of Certificates evidencing at least 50% of the aggregate Voting Rights (taking into account the application of realized losses and, other than with respect to the termination of the Asset Representations Reviewer, the application of any Appraisal Reduction Amounts to notionally reduce the Certificate Balance of the Certificates) of all Principal Balance Certificates on an aggregate basis.
With respect to each of the Serviced Whole Loan, subject to the related intercreditor agreement, the holders of the relatedpari passu Companion Loans, under certain circumstances following a servicer termination event with respect to the Special Servicer, will be entitled to direct the Trustee (and the Trustee will be required) to terminate the Special Servicer solely with respect to such Serviced Whole Loan. A replacement special servicer will be selected by the Trustee or, prior to a Control Termination Event, by the Directing Certificateholder;provided,however, that any successor special servicer appointed to replace the Special Servicer with respect to such Whole Loan can generally not be the person (or its affiliate) that was terminated at the direction of the holder of the relatedpari passu Companion Loan.
With respect to any Non-Serviced Whole Loan, subject to the related intercreditor agreement, the JPMCC 2017-JP6 trust as holder of the related mortgage loan has similar termination rights in the event of a servicer termination event with respect to the special servicer under the applicable trust and servicing agreement or pooling and servicing agreement, as applicable, as described above, which may be exercised by the Directing Certificateholder prior to the Control Termination Event. However, the successor special servicer will be selected pursuant to the applicable trust and servicing agreement or pooling and servicing agreement, as applicable, by |
THE INFORMATION IN THIS STRUCTURAL AND COLLATERAL TERM SHEET IS NOT COMPLETE AND MAY BE AMENDED PRIOR TO THE TIME OF SALE. THIS TERM SHEET IS NOT AN OFFER TO SELL THESE SECURITIES AND IT IS NOT A SOLICITATION OF AN OFFER TO BUY THESE SECURITIES IN ANY JURISDICTION WHERE THE OFFER OR SALE IS NOT PERMITTED.
| 29 of 151 |
| Structural and Collateral Term Sheet | JPMCC 2017-JP6 | |
| Structural Overview | ||
| the related directing holder prior to a control event under such trust and servicing agreement or pooling and servicing agreement, as applicable. The Master Servicer and Special Servicer are entitled to certain fees in connection with the servicing and administration of the mortgage loans as more fully described in “Pooling and Servicing Agreement—Servicing and Other Compensation and Payment of Expenses” in the Preliminary Prospectus. | ||
| ■ Dispute Resolution Provisions: | Each Mortgage Loan Seller will be subject to the dispute resolution provisions set forth in the Pooling and Servicing Agreement to the extent those provisions are triggered with respect to any mortgage loan sold to the Depositor by a Mortgage Loan Seller and such Mortgage Loan Seller will be obligated under the related mortgage loan purchase agreement to comply with all applicable provisions and to take part in any mediation or arbitration proceedings that may result.
Generally, in the event that a request to repurchase a mortgage loan (a “Repurchase Request”) is not “Resolved” (as defined below) within 180 days after the related Mortgage Loan Seller receives such Repurchase Request (a “Resolution Failure”), then the Enforcing Servicer (as defined below) will be required to send a notice to the “Initial Requesting Certificateholder” (if any) indicating the Enforcing Servicer’s intended course of action with respect to the Repurchase Request. If (a) the Enforcing Servicer’s intended course of action with respect to the Repurchase Request does not involve pursuing further action to exercise rights against the related Mortgage Loan Seller with respect to the Repurchase Request and the Initial Requesting Certificateholder, if any, or any other Certificateholder or Certificate Owner wishes to exercise its right to refer the matter to mediation (including nonbinding arbitration) or arbitration, or (b) the Enforcing Servicer’s intended course of action is to pursue further action to exercise rights against the related Mortgage Loan Seller with respect to the Repurchase Request but the Initial Requesting Certificateholder, if any, or any other Certificateholder or Certificate Owner does not agree with the dispute resolution method selected by the Enforcing Servicer, then the Initial Requesting Certificateholder, if any, or such other Certificateholder or Certificate Owner may deliver a written notice to the Enforcing Servicer indicating its intent to exercise its right to refer the matter to either mediation or arbitration.
The Enforcing Servicer will be required to consult with any Certificateholder or Certificate Owner that delivers a notice of its intent to exercise its dispute resolution rights (a “Requesting Certificateholder”) so that a Requesting Certificateholder may consider the views of the Enforcing Servicer as to the claims underlying the Repurchase Request and possible dispute resolution methods. If a Requesting Certificateholder elects to exercise its right to refer the matter to either mediation or arbitration, then it will become the party responsible for enforcing the Repurchase Request and must promptly submit the matter to mediation (including nonbinding arbitration) or arbitration. Failure to make an election to exercise that right or failure to begin the elected form of proceedings within the certain timeframe set forth in the Pooling and Servicing Agreement will generally waive the Certificateholders’ or Certificate Owners’ rights with respect to the related Repurchase Request.
The “Enforcing Servicer” will be (a) with respect to a specially serviced loan, the Special Servicer, and (b) with respect to a non-specially serviced loan, (i) in the case of a Repurchase Request made by the Special Servicer, the Directing Certificateholder or a Controlling Class Certificateholder, the Master Servicer, and (ii) in the case of a Repurchase Request made by any person other than the Special Servicer, the Directing Certificateholder or a Controlling Class Certificateholder, (A) prior to a Resolution Failure relating to such non-specially serviced loan, the Master Servicer, and (B) from and after a Resolution Failure relating to such non-specially serviced Loan, the Special Servicer.
“Resolved” means, with respect to a Repurchase Request, (i) that the related Material Defect has been cured, (ii) the related mortgage loan has been repurchased in accordance with the related mortgage loan purchase agreement, (iii) a mortgage loan has been substituted for the related mortgage loan in accordance with the related mortgage loan purchase agreement, (iv) the applicable Mortgage Loan Seller has made a Loss of Value Payment, (v) a contractually binding agreement is entered into between the Enforcing Servicer, on behalf of the issuing entity, and the related Mortgage Loan Seller that settles the related Mortgage Loan Seller’s obligations under the related mortgage loan purchase agreement, or (vi) the related mortgage loan is no longer property of the issuing entity as a result of a sale or other disposition in accordance with the Pooling and Servicing Agreement. |
THE INFORMATION IN THIS STRUCTURAL AND COLLATERAL TERM SHEET IS NOT COMPLETE AND MAY BE AMENDED PRIOR TO THE TIME OF SALE. THIS TERM SHEET IS NOT AN OFFER TO SELL THESE SECURITIES AND IT IS NOT A SOLICITATION OF AN OFFER TO BUY THESE SECURITIES IN ANY JURISDICTION WHERE THE OFFER OR SALE IS NOT PERMITTED.
| 30 of 151 |
| Structural and Collateral Term Sheet | JPMCC 2017-JP6 | |
| Structural Overview | ||
| ■ Credit Risk Retention: | JPMCB is expected to act as the “retaining sponsor” (as defined in Regulation RR) for this securitization and intends to satisfy the U.S. credit risk retention requirement through the purchase by RREF III-D AIV RR, LLC, as a third-party purchaser (as defined in Regulation RR), from the depositor, on the Closing Date, of an “eligible horizontal residual interest”, which will be comprised of the Class E-RR, Class F-RR, Class G-RR and Class NR-RR Certificates. The aggregate estimated fair value of the Class E-RR, Class F-RR, Class G-RR and Class NR-RR Certificates will equal at least 5% of the estimated fair value of all of the Certificates (other than the Class R and Class Z Certificates) issued by the issuing entity.
RREF III-D AIV RR, LLC, in its capacity as the “third-party purchaser” for this transaction, will be required to comply with the hedging, transfer and financing restrictions applicable to a “third-party purchaser” under the credit risk retention rules, which generally prohibit the transfer of the applicable Certificates until June 16, 2022. The restrictions on hedging and transfer under the credit risk retention rules as in effect on the closing date of this transaction will expire on and after the date that is the earliest of (A) the date that is the latest of (i) the date on which the aggregate principal balance of the mortgage loans has been reduced to 33% of the aggregate principal balance of the mortgage loans as of the Cut-off Date; (ii) the date on which the total unpaid principal obligations under the certificates has been reduced to 33% of the aggregate total unpaid principal obligations under the certificates as of the Closing Date; or (iii) two years after the Closing Date and (B) the date on which all of the mortgage loans have been defeased in accordance with §244.7(b)(8(i) of Regulation RR.
For additional information, see “Credit Risk Retention” in the Preliminary Prospectus.
| |
| ■ Investor Communications: | The Certificate Administrator is required to include on any Form 10–D any request received from a Certificateholder to communicate with other Certificateholders related to Certificateholders exercising their rights under the terms of the Pooling and Servicing Agreement. Any Certificateholder wishing to communicate with other Certificateholders regarding the exercise of its rights under the terms of the Pooling and Servicing Agreement should deliver a written request signed by an authorized representative of the requesting investor to the Certificate Administrator at the address below:
9062 Old Annapolis Road
Columbia, Maryland 21045
Attention: Corporate Trust Administration Group – JPMCC 2017-JP6
With a copy to: trustadministrationgroup@wellsfargo.com
| |
| ■ Master Servicer and Special Servicer Compensation: | The Master Servicer is entitled to a fee (the “Servicing Fee”) payable monthly from interest received in respect of each mortgage loan, any related REO loan and any related Serviced Companion Loan that will accrue at the related servicing fee rate described in the Preliminary Prospectus. The Special Servicer is also entitled to a fee (the “Special Servicing Fee”) with respect to each specially serviced loan and REO loan (other than a non-serviced mortgage loan) at the special servicing fee rate described in the Preliminary Prospectus.
In addition to the Servicing Fee, Special Servicing Fee and certain other fees described below, the Master Servicer and Special Servicer are entitled to retain and share certain additional servicing compensation, including assumption application fees, assumption fees, defeasance fees and certain Excess Modification Fees and consent fees with respect to the mortgage loans. The Special Servicer may also be entitled to either a Workout Fee or Liquidation Fee, but not both, from recoveries in respect of any particular mortgage loan.
An “Excess Modification Fee” with respect to any mortgage loan (other than the non-serviced mortgage loans) or Serviced Whole Loan is the sum of (A) the excess, if any, of (i) any and all Modification Fees with respect to a mortgage loan or Serviced Whole Loan, as applicable, over (ii) all unpaid or unreimbursed additional expenses described in the Preliminary Prospectus (excluding Special Servicing Fees, Workout Fees and Liquidation Fees) outstanding or previously incurred on behalf of the issuing entity with respect to the related mortgage loan or Serviced Whole Loan, as applicable, and reimbursed from such Modification Fees and (B) expenses previously paid or reimbursed from Modification Fees as described in clause (A), which expenses have subsequently been recovered from the related borrower or otherwise. |
THE INFORMATION IN THIS STRUCTURAL AND COLLATERAL TERM SHEET IS NOT COMPLETE AND MAY BE AMENDED PRIOR TO THE TIME OF SALE. THIS TERM SHEET IS NOT AN OFFER TO SELL THESE SECURITIES AND IT IS NOT A SOLICITATION OF AN OFFER TO BUY THESE SECURITIES IN ANY JURISDICTION WHERE THE OFFER OR SALE IS NOT PERMITTED.
| 31 of 151 |
| Structural and Collateral Term Sheet | JPMCC 2017-JP6 | |
| Structural Overview | ||
With respect to the Master Servicer and Special Servicer, the Excess Modification Fees collected and earned by such servicer from the related borrower (taken in the aggregate with any other Excess Modification Fees collected and earned by such servicer from the related borrower within the prior 18 months of the collection of the current Excess Modification Fees) will be subject to a cap of 1.00% of the outstanding principal balance of the related mortgage loan or Serviced Whole Loan, as applicable, on the closing date of the related modification, extension, waiver or amendment. A “Modification Fee” with respect to any mortgage loan (other than the non-serviced mortgage loans) or Serviced Companion Loan is generally any fee with respect to a modification, extension, waiver or amendment of any mortgage loan and/or related Serviced Companion Loan (other than any assumption fees, assumption application fees, consent fees, defeasance fees, Special Servicing Fees, Liquidation Fees or Workout Fees).
A “Workout Fee” will generally be payable with respect to each corrected loan (except with respect to a corrected loan that was a fee restricted specially serviced loan and became a corrected loan while it was a fee restricted specially serviced loan) (as more specifically described in the Preliminary Prospectus) and will be calculated at a rate of 1.00% of payments of principal and interest on the respective mortgage loan for so long as it remains a corrected loan, subject to a maximum of $1,000,000 in the aggregate with respect to any particular corrected loan. After receipt by the Special Servicer of Workout Fees with respect to a corrected loan in an amount equal to $25,000, any Workout Fees in excess of such amount will be reduced by the Excess Modification Fee Amount;provided that in the event the Workout Fee, collected over the course of such workout calculated at the Workout Fee Rate is less than $25000, then the Special Servicer will be entitled to an amount from the final payment on the related corrected loan (including any related Serviced Companion Loan) that would result in the total Workout Fees payable to the Special Servicer in respect of that corrected loan (including any related Serviced Companion Loan) to be $25,000.
The “Excess Modification Fee Amount” for any corrected loan is generally an amount equal to any Excess Modification Fees paid by or on behalf of the related borrower with respect to the related mortgage loan (including the related Serviced Companion Loan) and received and retained by the Master Servicer or the Special Servicer, as applicable, as additional servicing compensation within the prior 18 months of the related modification, waiver, extension or amendment resulting in the mortgage loan or REO loan being a corrected loan, but only to the extent those fees have not previously been deducted from a Workout Fee or Liquidation Fee.
A “Liquidation Fee” will generally be payable with respect to each specially serviced loan (except, under certain circumstances, with respect to any fee restricted specially serviced loan) (as more specifically described in the Preliminary Prospectus) or REO property (except with respect to any non-serviced mortgage loan) as to which the Special Servicer obtains a full or partial recovery of the related asset. The Liquidation Fee for each specially serviced loan will be payable at a rate of 1.00% of the liquidation proceeds (exclusive of default interest) subject to a maximum of $1,000,000;provided,however, that no Liquidation Fee will be less than $25,000.
The Liquidation Fee with respect to any specially serviced loan will be reduced by the amount of any Excess Modification Fees received by the Special Servicer with respect to the related mortgage loan (including a Serviced Companion Loan) or REO property as compensation within the prior 12 months, but only to the extent those fees have not previously been deducted from a Workout Fee or Liquidation Fee.
Similar fees to those described above will be payable to the applicable special servicer for the Non-Serviced Whole Loans under the related trust and servicing agreement or pooling and servicing agreement, as applicable.
Subject to certain limited exceptions, in connection with its duties under the Pooling and Servicing Agreement, the Special Servicer and its affiliates are prohibited from receiving or retaining any compensation (other than compensation specifically provided for under the Pooling and Servicing Agreement) from anyone in connection with the disposition, workout or foreclosure of any mortgage loan, the management or disposition of any REO property, or the performance of any other special servicing duties under the Pooling and Servicing Agreement. In the event the Special Servicer does receive any such compensation, it will be required to disclose those fees to the Certificate Administrator who will include it as part of the statement to Certificateholders.
In addition, no liquidation fee will be payable to the Special Servicer if a mortgage loan or |
THE INFORMATION IN THIS STRUCTURAL AND COLLATERAL TERM SHEET IS NOT COMPLETE AND MAY BE AMENDED PRIOR TO THE TIME OF SALE. THIS TERM SHEET IS NOT AN OFFER TO SELL THESE SECURITIES AND IT IS NOT A SOLICITATION OF AN OFFER TO BUY THESE SECURITIES IN ANY JURISDICTION WHERE THE OFFER OR SALE IS NOT PERMITTED.
| 32 of 151 |
| Structural and Collateral Term Sheet | JPMCC 2017-JP6 | |
| Structural Overview | ||
Serviced Whole Loan becomes a specially serviced loan only because of a maturity default and the related liquidation proceeds are received within 90 days following the related maturity date as a result of the related mortgage loan or Serviced Whole Loan being refinanced or otherwise repaid in full.
See“Pooling and Servicing Agreement—Servicing and Other Compensation and Payment of Expenses”in the Preliminary Prospectus. | ||
| ■ Deal Website: | The Certificate Administrator will maintain a deal website to which certain persons will have access to certain information including, but not limited to the following, which will be posted: ■ special notices; ■ summaries of any final asset status reports; ■ appraisals in connection with Appraisal Reductions plus any second appraisals ordered; ■ an “Investor Q&A Forum”; ■ a voluntary investor registry; and ■ SEC EDGAR filings. |
THE INFORMATION IN THIS STRUCTURAL AND COLLATERAL TERM SHEET IS NOT COMPLETE AND MAY BE AMENDED PRIOR TO THE TIME OF SALE. THIS TERM SHEET IS NOT AN OFFER TO SELL THESE SECURITIES AND IT IS NOT A SOLICITATION OF AN OFFER TO BUY THESE SECURITIES IN ANY JURISDICTION WHERE THE OFFER OR SALE IS NOT PERMITTED.
| 33 of 151 |
| Structural and Collateral Term Sheet | JPMCC 2017-JP6 |
| 245 Park Avenue | |
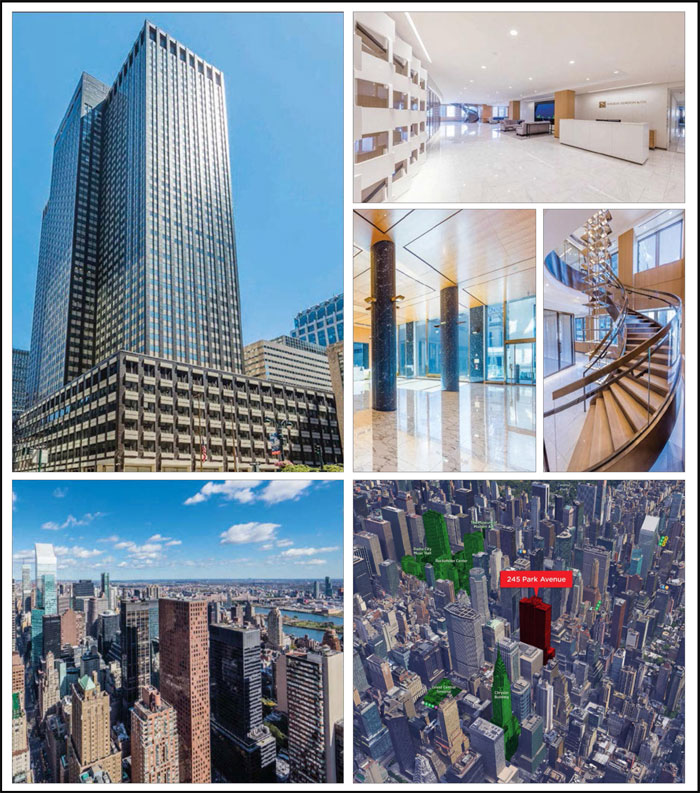
THE INFORMATION IN THIS STRUCTURAL AND COLLATERAL TERM SHEET IS NOT COMPLETE AND MAY BE AMENDED PRIOR TO THE TIME OF SALE. THIS TERM SHEET IS NOT AN OFFER TO SELL THESE SECURITIES AND IT IS NOT A SOLICITATION OF AN OFFER TO BUY THESE SECURITIES IN ANY JURISDICTION WHERE THE OFFER OR SALE IS NOT PERMITTED.
| 34 of 151 |
| Structural and Collateral Term Sheet | JPMCC 2017-JP6 |
| 245 Park Avenue | |

THE INFORMATION IN THIS STRUCTURAL AND COLLATERAL TERM SHEET IS NOT COMPLETE AND MAY BE AMENDED PRIOR TO THE TIME OF SALE. THIS TERM SHEET IS NOT AN OFFER TO SELL THESE SECURITIES AND IT IS NOT A SOLICITATION OF AN OFFER TO BUY THESE SECURITIES IN ANY JURISDICTION WHERE THE OFFER OR SALE IS NOT PERMITTED.
| 35 of 151 |
| Structural and Collateral Term Sheet | JPMCC 2017-JP6 |
| 245 Park Avenue | |
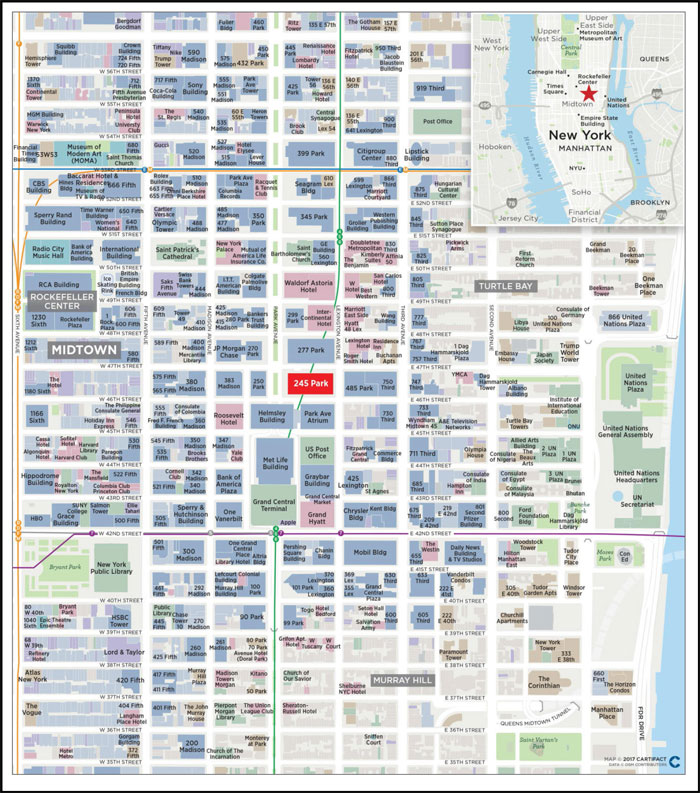
THE INFORMATION IN THIS STRUCTURAL AND COLLATERAL TERM SHEET IS NOT COMPLETE AND MAY BE AMENDED PRIOR TO THE TIME OF SALE. THIS TERM SHEET IS NOT AN OFFER TO SELL THESE SECURITIES AND IT IS NOT A SOLICITATION OF AN OFFER TO BUY THESE SECURITIES IN ANY JURISDICTION WHERE THE OFFER OR SALE IS NOT PERMITTED.
| 36 of 151 |
| Structural and Collateral Term Sheet | JPMCC 2017-JP6 |
| 245 Park Avenue | |
| Mortgage Loan Information | Property Information | |||
| Mortgage Loan Seller(1): | JPMCB | Single Asset / Portfolio: | Single Asset | |
| Credit Assessment | Title: | Fee | ||
| (Fitch / KBRA)(2): | BBB- / BBB | Property Type - Subtype: | Office – CBD | |
| Original Principal Balance(3): | $98,000,000 | Net Rentable Area (SF)(6): | 1,779,515 | |
| Cut-off Date Principal Balance(3): | $98,000,000 | Location: | New York, NY | |
| % of Pool by IPB: | 12.5% | Year Built / Renovated: | 1965 / 2006 | |
| Loan Purpose: | Acquisition | Occupancy(6)(7): | 91.2% | |
| Borrower: | 245 Park Avenue Property LLC | Occupancy Date: | 2/28/2017 | |
| Sponsor(4): | HNA Group | Number of Tenants: | 19 | |
| Interest Rate: | 3.66940% | 2014 NOI(8): | $98,558,305 | |
| Note Date: | 5/5/2017 | 2015 NOI(8): | $102,667,706 | |
| Maturity Date: | 6/1/2027 | 2016 NOI(8): | $106,715,962 | |
| Interest-only Period: | 120 months | TTM NOI (as of 3/2017)(8): | $107,676,675 | |
| Original Term: | 120 months | UW Economic Occupancy: | 91.5% | |
| Original Amortization: | None | UW Revenues: | $177,756,680 | |
| Amortization Type: | Interest Only | UW Expenses: | $62,448,738 | |
| Call Protection(5): | L(24),Def(92),O(4) | UW NOI(8): | $115,307,942 | |
| Lockbox / Cash Management: | Hard / Springing | UW NCF: | $109,564,903 | |
| Additional Debt: | Yes | Appraised Value / Per SF(6): | $2,210,000,000 / $1,242 | |
| Additional Debt Balance: | $982,000,000 / $120,000,000 / | Appraisal Date: | 4/1/2017 | |
| $568,000,000 | ||||
| Additional Debt Type: | Pari Passu / Subordinate Debt / | |||
| Mezzanine Loans | ||||
| Escrows and Reserves(9) | Financial Information(3) | ||||||||
| Initial | Monthly | Initial Cap | A-Notes | Whole Loan | |||||
| Taxes: | $0 | $3,878,518 | N/A | Cut-off Date Loan / SF(6): | $607 | $674 | |||
| Insurance: | $227,000 | $113,500 | N/A | Maturity Date Loan / SF(6): | $607 | $674 | |||
| Replacement Reserves: | $47,738 | $47,738 | N/A | Cut-off Date LTV: | 48.9% | 54.3% | |||
| TI/LC: | $0 | Springing | N/A | Maturity Date LTV: | 48.9% | 54.3% | |||
| Other: | $11,431,608 | $0 | N/A | UW NCF DSCR: | 2.73x | 2.45x | |||
| UW NOI Debt Yield: | 10.7% | 9.6% | |||||||
| Sources and Uses | |||||||||
| Sources | Proceeds | % of Total | Uses | Proceeds | % of Total | ||||
| Mortgage Loan(3) | $1,200,000,000 | 52.4% | Purchase Price | $2,210,000,000 | 96.4% | ||||
| Mezzanine Loan A | 236,500,000 | 10.3% | Closing Costs | 70,356,233 | 3.1% | ||||
| Mezzanine Loan B | 221,000,000 | 9.6% | Upfront Reserves | 11,706,346 | 0.5% | ||||
| Mezzanine Loan C | 110,500,000 | 4.8% | |||||||
| Sponsor Equity | 524,062,579 | 22.9% | |||||||
| Total Sources | $2,292,062,579 | 100.0% | Total Uses | $2,292,062,579 | 100.0% | ||||
| (1) | The 245 Park Avenue Whole Loan was co-originated by JPMorgan Chase Bank, National Association, Natixis Real Estate Capital LLC, Barclays Bank PLC, Deutsche Bank AG, New York Branch and Société Générale. |
| (2) | Fitch has confirmed that the 245 Park Avenue Mortgage Loan (as defined below), in the context of its inclusion in the mortgage pool, has credit characteristics consistent with an investment grade obligation. |
| (3) | The 245 Park Avenue Whole Loan is comprised of (i) the 245 Park Avenue Mortgage Loan (comprised of one senior note with an outstanding principal balance as of the Cut-off Date of $98.0 million), (ii) a companion loan, which ispari passuwith the 245 Park Avenue Mortgage Loan (comprised of 18pari passunotes) with an aggregate outstanding principal balance as of the Cut-off Date of $982.0 million and (iii) a subordinate companion loan (comprised of fivepari passunotes) with an aggregate outstanding principal balance as of the Cut-off Date of $120.0 million. The A-Notes Financial Information presented in the chart above reflects the $1.08 billion aggregate Cut-off Date balance of the 245 Park Avenue Mortgage Loan and the 245 Park Avenue Pari Passu Companion Loan, excluding the 245 Park Avenue Subordinate Companion Loan. The Whole Loan Financial Information presented in the chart above reflects the Cut-off Date balance of the $1.2 billion 245 Park Avenue Whole Loan, as defined in“The Loan”below, and excludes the related mezzanine loans. |
| (4) | For a full description of Sponsor, please refer to“The Loan Sponsor” below. |
| (5) | The lockout period will be at least 24 payments beginning with and including the first payment date of July 1, 2017. Defeasance of the full $1.2 billion 245 Park Avenue Whole Loan is permitted at any time after the earlier to occur of (i) July 1, 2020 or (ii) two years after the closing date of the securitization that includes the last note to be securitized (the “REMIC Prohibition Period”). |
THE INFORMATION IN THIS STRUCTURAL AND COLLATERAL TERM SHEET IS NOT COMPLETE AND MAY BE AMENDED PRIOR TO THE TIME OF SALE. THIS TERM SHEET IS NOT AN OFFER TO SELL THESE SECURITIES AND IT IS NOT A SOLICITATION OF AN OFFER TO BUY THESE SECURITIES IN ANY JURISDICTION WHERE THE OFFER OR SALE IS NOT PERMITTED.
| 37 of 151 |
| Structural and Collateral Term Sheet | JPMCC 2017-JP6 |
| 245 Park Avenue | |
| (6) | Based on remeasured net rentable area of 1,779,515 square feet in accordance with current REBNY standards which is the basis for the square footage in future leasing. The property’s contractual square footage is 1,723,993 square feet as leased. |
| (7) | Current Occupancy includes HNA Capital USA LLC (an affiliate of the loan sponsor) and MIO Partners (together, approximately 2.7% of the remeasured net rentable area), which have executed leases but have not yet taken occupancy. |
| (8) | The increase in 2015 NOI from 2014 NOI was primarily due to contractual rent increases resulting in an increase in the weighted average base rent per square foot from approximately $68.87 to approximately $72.69 per square foot. The increase in 2016 NOI from 2015 NOI is primarily due to an increase in occupancy from 93.6% to 95.0% and an increase in in-place weighted average base rent per square foot from approximately $72.69 to approximately $74.66 per square foot. The increase in UW NOI from TTM NOI is primarily due to the inclusion of underwritten rent steps over underwritten rents in place, which rent steps equate to (i) for non-investment-grade tenants, base rent steps through April 2018, and (ii) for investment-grade tenants, the average base rent over the lesser of the loan term and lease term; with respect to the JPMorgan Chase Bank space subleased to Société Générale, the underwritten rent step is calculated using the average over the loan term of the JPMorgan Chase Bank base rent of $61.50 per square foot to October 2022 and the base rent pursuant to Société Générale’s direct lease of $88.00 per square foot on a remeasured square footage that is 30,831 square feet higher than the current JPMorgan Chase Bank net rentable area through the remainder of the loan term. |
| (9) | For a full description of Escrows and Reserves, please refer to“Escrows and Reserves”below. |
The Loan.The 245 Park Avenue loan is secured by a first mortgage lien on the borrower’s fee interest in a 44-story, remeasured 1,779,515 square foot office building that occupies the entire city block between 46th and 47th Streets and Park and Lexington Avenues in Midtown Manhattan, New York. The whole loan has an outstanding principal balance as of the Cut-off Date of $1.2 billion (the “245 Park Avenue Whole Loan”) and is comprised of (i) a senior loan, comprised of 19pari passu notes, with an aggregate outstanding principal balance of $1.08 billion (one of which, Note A-2-A-1, with an outstanding principal balance as of the Cut-off Date of $98.0 million, will be contributed to the JPMCC 2017-JP6 Trust, (the “245 Park Avenue Mortgage Loan”) and the remaining notes, collectively, the “245 Park Avenue Pari Passu Companion Loan”) and (ii) a subordinate companion loan, comprised of fivepari passu notes, with an aggregate outstanding principal balance as of the Cut-off Date of $120.0 million (collectively, the “245 Park Avenue Subordinate Companion Loan”), each as described below. The 245 Park Avenue Mortgage Loan and the 245 Park Avenue Pari Passu Companion Loan arepari passu in right of payment with each other and are senior in right of payment to the 245 Park Avenue Subordinate Companion Loan as and to the extent described in “Description of the Mortgage Pool—The Whole Loans—The Non-Serviced Whole Loans—The 245 Park Avenue Whole Loan” in the Preliminary Prospectus. The senior Note A-1-A (along with four other senior notes within the 245 Park Avenue Pari Passu Companion Loan and the 245 Park Avenue Subordinate Companion Loan) was contributed to the 245 Park Avenue Trust 2017-245P securitization that governs the servicing and administration of the 245 Park Avenue Whole Loan and is the controlling note under the related intercreditor agreement, the rights of which will be exercised by the related trustee (or, prior to the occurrence and continuance of a control termination event under the related trust and servicing agreement (the “245 Park Avenue Trust 2017-245P Trust and Servicing Agreement”), the directing certificateholder under the 245 Park Avenue Trust 2017-245P Trust and Servicing Agreement). However, the JPMCC 2017-JP6 Trust will be entitled, under certain circumstances, to be consulted with respect to certain major decisions (which rights will be exercised by the Directing Certificateholder prior to a Control Termination Event). The 245 Park Avenue Whole Loan has a 10-year term and will be interest-only for the term of the loan.
| Whole Loan Summary |
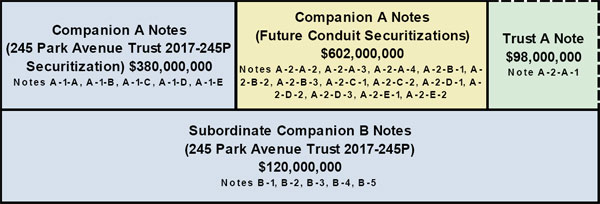 |
The Borrower. The borrowing entity for the 245 Park Avenue Whole Loan is 245 Park Avenue Property LLC, a Delaware limited liability company and special purpose entity.
The Loan Sponsor.The nonrecourse carve-out guarantor is 181 West Madison Holding LLC, an affiliate of the loan sponsor, HNA Group (“HNA”). HNA is a China-based global Fortune 500 conglomerate with core divisions of aviation, hospitality, tourism, real estate, retail, finance, logistics, shipbuilding and eco-tech. In 2016, HNA had total assets of approximately $140.0 billion with revenues of approximately $87.0 billion. HNA Finance’s main business is leasing and insurance and it also provides financial services such as securities, banking, futures, fund and investment banking. HNA Real Estate focuses on the development and management of central business district and urban real estate assets and, as of December 31, 2016, it had 34 real estate investments in over 40 cities. HNA owns more than $1.3 billion of United States commercial real estate including 850 Third Avenue, 1180 Sixth Avenue, the Cassa Hotel at 70 West 45th Street and two golf courses, Nicklaus Club-Monterey in Monterey California and Somers Pointe Country Club in Somers, New York. In 2016, HNA purchased a 25% stake in Hilton Worldwide Holdings Inc. from Blackstone Group LP for $6.5 billion.
THE INFORMATION IN THIS STRUCTURAL AND COLLATERAL TERM SHEET IS NOT COMPLETE AND MAY BE AMENDED PRIOR TO THE TIME OF SALE. THIS TERM SHEET IS NOT AN OFFER TO SELL THESE SECURITIES AND IT IS NOT A SOLICITATION OF AN OFFER TO BUY THESE SECURITIES IN ANY JURISDICTION WHERE THE OFFER OR SALE IS NOT PERMITTED.
| 38 of 151 |
| Structural and Collateral Term Sheet | JPMCC 2017-JP6 |
| 245 Park Avenue | |
The Property.The 245 Park Avenue property is a Class A office tower located along Park Avenue between 46th and 47th Streets that consists of 44 stories with 42 office levels, 57,799 square feet of retail space and 1,580 square feet of lobby retail space in Midtown Manhattan, New York. The 245 Park Avenue property is one of approximately 12 buildings that feature direct underground access to Grand Central Terminal, Metro North Transit and the 4, 5, 6, 7 and S subway lines. The property is located in the Park Avenue office submarket, adjacent to Grand Central Terminal, and within 0.6 miles of 5th Avenue, Rockefeller Center, Radio City Music Hall, St. Patrick’s Cathedral and the Museum of Modern Art. According to the appraisal, Park Avenue is widely considered to be one of the premier office corridors in the United States due to its central location, prestigious tenancy, proximity to Grand Central Station and other amenities. As of February 28, 2017, the property was 91.2% leased to 19 tenants based on remeasured net rentable area and the property has demonstrated average occupancy of 95.0% from 2007 to 2016.
The property’s largest tenant is Société Générale, a French multinational banking and financial services company, which utilizes the 245 Park Avenue property as its United States headquarters and leases 33.3% of the remeasured net rentable area through October 2032 across 12 floors. In 2010, Société Générale executed a sublease from JPMorgan Chase Bank for 562,347 contractual square feet through October 31, 2022. Additionally, in 2010, Société Générale executed a 10-year direct lease with the prior owner of 245 Park Avenue for 593,344 remeasured square feet which has a start date of November 1, 2022 at (i) approximately $88.00 per square foot for the first five years of the term and (ii) a base rent for the second five-year period of the term equal to the higher of the rent payable for the first five years and a fair market rental value (not to exceed $110 per square foot). Société Générale’s direct lease has a base year of 2013 and in addition, Société Générale subleases 36,425 contractual square feet to Brunswick Group and 36,425 contractual square feet to MIO Partners. As of April 28, 2017, Société Générale reported a market capitalization of approximately €40.8 billion, and it had revenues of €25.3 billion in 2016. Société Générale has offices in 67 countries, employing 145,700 people and serving approximately 31 million customers as of December 31, 2016. The second largest tenant, JPMorgan Chase Bank, National Association (“JPMorgan Chase Bank”), leases 13.4% of the remeasured net rentable area through October 2022. JPMorgan Chase Bank is the largest banking institution in the United States with a market capitalization of $308.9 billion as of May 5, 2017, operates in more than 60 countries, has more than 240,000 employees and serves consumers, small businesses, corporate, institutional and government clients. As of 2016, JPMorgan Chase Bank reported revenues of $95.7 billion and assets of $2.5 trillion.The JPMorgan Chase Bank space does not include the space subleased to Société Générale due to the fact that Société Générale has executed a direct lease which begins November 1, 2022. Of the 225,438 contractual square feet of JPMorgan Chase Bank space, a total of 189,686 contractual square feet is subleased through October 30, 2022. This includes 90,556 contractual square feet to Houlihan Lokey Inc., 49,133 contractual square feet to The Nemec Agency, 34,058 contractual square feet to Pierpont Capital Holdings LLC and 15,939 contractual square feet to JLL. The JPMorgan Chase Bank space also includes 17,813 contractual square feet of retail space that it leases at the property. The third largest tenant, Major League Baseball (“MLB”), is headquartered at the property and leases 12.6% of the remeasured net rentable area through October 2022. MLB is a professional baseball league in North America and currently headquartered at the 245 Park Avenue property. MLB reported record revenues in 2015, up $500 million from the prior year and approaching $9.5 billion. MLB had attendance of more than 73 million fans in 2016. MLB subleases 37,385 contractual square feet to the National Bank of Australia, 24,840 contractual square feet to Houlihan Lokey Inc. and 10,525 contractual square feet to Anthos USA Inc. through October 30, 2022. MLB’s lease expires in October 2022 and it has announced that it plans to vacate its space at the end of its lease term. In addition, MLB has signed a lease at another location and declared its intention to move into that space in 2019, which is approximately three years prior to its lease expiration date. If MLB does not renew its lease 12 months before its lease expiration date or if MLB vacates or abandons all or substantially all of its premises, a Cash Sweep Event (as defined below) will occur.
As of February 28, 2017, 65.1% of the property’s annual in-place base rent was attributed to investment grade tenants. The 245 Park Avenue property serves as the United States headquarters for Société Générale (33.3% of remeasured net rentable area, rated A2/A by Moody’s and S&P) and features other investment grade and institutional tenants including JPMorgan Chase Bank (13.4% of remeasured net rentable area, rated Aa3/A+/AA- by Moody’s, S&P and Fitch), Major League Baseball (12.6% of remeasured net rentable area), Angelo Gordon (6.4% of remeasured net rentable area) and Rabobank (6.3% of remeasured net rentable area, rated Aa2/A+/AA- by Moody’s, S&P and Fitch).
Midtown Manhattan is home to numerous national and multinational corporations, such as Bloomberg L.P., BlackRock, the Blackstone Group, Colgate-Palmolive, JPMorgan Chase Bank and NBC. The surrounding area offers a number of luxury hotels including the Waldorf Astoria, The Four Seasons and the New York Palace as well as Michelin starred restaurants such as Aquavit, The Modern and Le Bernardin.
THE INFORMATION IN THIS STRUCTURAL AND COLLATERAL TERM SHEET IS NOT COMPLETE AND MAY BE AMENDED PRIOR TO THE TIME OF SALE. THIS TERM SHEET IS NOT AN OFFER TO SELL THESE SECURITIES AND IT IS NOT A SOLICITATION OF AN OFFER TO BUY THESE SECURITIES IN ANY JURISDICTION WHERE THE OFFER OR SALE IS NOT PERMITTED.
| 39 of 151 |
| Structural and Collateral Term Sheet | JPMCC 2017-JP6 |
| 245 Park Avenue | |
According to the appraisal, as of the fourth quarter of 2016, the Park Avenue office submarket had approximately 21.8 million square feet of office inventory, direct weighted average Class A asking rents of $102.15 per square foot and a vacancy rate of 10.5%. The appraisal identified seven comparable Class A office buildings including 200 Park Avenue, 277 Park Avenue, 299 Park Avenue, 300 Park Avenue, 320 Park Avenue, 345 Park Avenue and 350 Park Avenue with current asking rents ranging from $85.00 per square foot to $125.00 per square foot, which is in-line with the property. The comparable buildings had a weighted average occupancy of 97.0%. The property’s weighted average in place office rent of $80.72 per square foot is approximately $14.58 per square foot lower than the appraisals concluded weighted average in place market rent of $95.30 per square foot.
| Historical and Current Occupancy(1) | |||||
| 2012 | 2013 | 2014 | 2015 | 2016 | Current(2) |
| 95.8% | 93.6% | 93.6% | 93.6% | 95.0% | 91.2% |
| (1) | Historical Occupancies are as of December 31 of each respective year. |
| (2) | Current Occupancy is as of February 28, 2017, is based on remeasured net rentable area of 1,779,515 and includes HNA Capital USA LLC (an affiliate of the loan sponsor) and MIO Partners (together, approximately 2.7% of the remeasured net rentable area), which have executed leases but have not yet taken occupancy. |
| Tenant Summary(1) | ||||||
| Tenant | Ratings(2) Moody’s/S&P/Fitch | Net Rentable Area (SF)(3) | % of Total NRA(3) | Base Rent PSF(4) | % of Total Base Rent | Lease Expiration Date |
| Société Générale(5)(6) | A2 / A / NA | 593,344 | 33.3% | $61.50 | 27.4% | 10/31/2032 |
| JPMorgan Chase Bank(5)(7) | Aa3 / A+ / AA- | 237,781 | 13.4% | $52.42 | 9.4% | 10/31/2022 |
| MLB(8) | NA / NA / NA | 224,477 | 12.6% | $124.75 | 21.8% | 10/31/2022 |
| Angelo Gordon | NA / NA / NA | 113,408 | 6.4% | $81.00 | 7.3% | 5/31/2026 |
| Rabobank | Aa2 / A+ / AA- | 112,662 | 6.3% | $138.00 | 12.0% | 9/30/2026 |
| Ares Capital | NA / BBB+ / BBB+ | 97,101 | 5.5% | $83.91 | 6.5% | 5/31/2026 |
| HNA Capital US LLC(9) | NA / NA / NA | 38,382 | 2.2% | $74.00 | 2.3% | 1/31/2026 |
| Regus Business Centre | NA / NA / NA | 38,383 | 2.2% | $84.00 | 2.6% | 9/30/2021 |
| WisdomTree Investments(10) | NA / NA / NA | 37,924 | 2.1% | $73.00 | 2.2% | 8/31/2029 |
| The Norinchukin Bank | A1 / A / NA | 37,342 | 2.1% | $99.00 | 2.9% | 3/31/2022 |
| (1) | Based on the underwritten rent roll dated February 28, 2017. |
| (2) | Ratings provided are for the parent company of the entity listed in the “Tenant” field whether or not the parent company guarantees the lease. |
| (3) | Based on remeasured net rentable square feet of 1,779,515. |
| (4) | Based on 1,723,993 contractual square feet. |
| (5) | JPMorgan Chase Bank subleases 562,347 contractual square feet to Société Générale through October 31, 2022. In 2010, Société Générale executed a 10-year direct lease with the prior owner for 593,344 remeasured square feet which has a start date of November 1, 2022 at (i) approximately $88.00 per square foot for the first five years of the term and (ii) a base rent for the second five-year period of the term equal to the higher of the rent payable for the first five years and a fair market rental value (not to exceed $110 per square foot). Société Générale’s direct lease has a base year of 2013 and two five-year renewal options and in addition, Société Générale subleases 36,425 contractual square feet to Brunswick Group and 36,425 contractual square feet to MIO Partners. The terms shown for Société Générale in the table above are based on JPMorgan Chase Bank’s direct lease. |
| (6) | Société Générale has the right to terminate either the highest floor or the highest two full floors that it leases (if such floors are contiguous) under either the related sublease described above or under its direct lease with the borrower, with notice by May 1, 2021. Société Générale may not exercise the option if all or any portion of the termination space is covered by a non-disturbance agreement granted by the borrower. |
| (7) | The JPMorgan Chase Bank space does not include the space subleased to Société Générale due to the fact that Société Générale has executed a direct lease which begins November 1, 2022. Of the 225,438 contractual square feet of JPMorgan Chase Bank space, a total of 189,686 contractual square feet is subleased through October 30, 2022. This includes 90,556 contractual square feet to Houlihan Lokey Inc., 49,133 contractual square feet to The Nemec Agency, 34,058 contractual square feet to Pierpont Capital Holdings LLC and 15,939 contractual square feet to JLL. The JPMorgan Chase Bank space also includes 17,813 contractual square feet of retail space that it leases at the property. The terms shown for JPMorgan Chase Bank in the table above are based on its direct lease. JPMorgan Chase Bank may not extend any portion of its lease currently subleased to Société Générale pursuant to its sublease agreement with Société Générale. |
| (8) | MLB subleases 37,385 contractual square feet to the National Bank of Australia, 24,840 contractual square feet to Houlihan Lokey Inc. and 10,525 contractual square feet to Anthos USA Inc. through October 30, 2022. MLB does not have any remaining renewal options. The terms shown for MLB in the table above are based on its direct lease. MLB has announced that it plans to vacate its space at the end of its lease term and that it signed a lease at another location and declared its intention to move into that space in 2019, which is approximately three years prior to its lease expiration. |
| (9) | The HNA Capital US LLC space was originally leased to Heineken Americas Inc. from January 2010 through January 2026. On May 4, 2017, Heineken Americas Inc. assigned its space at the property to HNA Capital US LLC, an affiliate of the sponsor. |
| (10) | WisdomTree Investments has the right to terminate its lease effective as of August 20, 2024, with 12 months’ notice and the payment of a termination fee. |
THE INFORMATION IN THIS STRUCTURAL AND COLLATERAL TERM SHEET IS NOT COMPLETE AND MAY BE AMENDED PRIOR TO THE TIME OF SALE. THIS TERM SHEET IS NOT AN OFFER TO SELL THESE SECURITIES AND IT IS NOT A SOLICITATION OF AN OFFER TO BUY THESE SECURITIES IN ANY JURISDICTION WHERE THE OFFER OR SALE IS NOT PERMITTED.
| 40 of 151 |
| Structural and Collateral Term Sheet | JPMCC 2017-JP6 |
| 245 Park Avenue | |
| Lease Rollover Schedule(1)(2) | |||||||||||||||||||||||||||
| Year | Number of Leases Expiring | Net Rentable Area Expiring(3) | % of NRA Expiring(3) | Base Rent Expiring | % of Base Rent Expiring | Cumulative Net Rentable Area Expiring(3) | Cumulative % of NRA Expiring(3) | Cumulative Base Rent Expiring | Cumulative % of Base Rent Expiring | ||||||||||||||||||
| Vacant | NAP | 153,915 | 8.9 | % | NAP | NAP | 153,915 | 8.9 | % | NAP | NAP | ||||||||||||||||
| 2017 | 0 | 0 | 0.0 | $0 | 0.0 | % | 153,915 | 8.9 | % | $0 | 0.0 | % | |||||||||||||||
| 2018 | 2 | 13,352 | 0.8 | 1,282,100 | 1.0 | 167,267 | 9.7 | % | $1,282,100 | 1.0 | % | ||||||||||||||||
| 2019 | 0 | 0 | 0.0 | 0 | 0.0 | 167,267 | 9.7 | % | $1,282,100 | 1.0 | % | ||||||||||||||||
| 2020 | 1 | 22,502 | 1.3 | 1,597,404 | 1.3 | 189,769 | 11.0 | % | $2,879,504 | 2.3 | % | ||||||||||||||||
| 2021 | 1 | 38,382 | 2.2 | 3,224,088 | 2.6 | 228,151 | 13.2 | % | $6,103,592 | 4.8 | % | ||||||||||||||||
| 2022(4) | 6 | 505,781 | 29.3 | 45,017,995 | 35.7 | 733,932 | 42.6 | % | $51,121,587 | 40.5 | % | ||||||||||||||||
| 2023 | 0 | 0 | 0.0 | 0 | 0.0 | 733,932 | 42.6 | % | $51,121,587 | 40.5 | % | ||||||||||||||||
| 2024 | 0 | 0 | 0.0 | 0 | 0.0 | 733,932 | 42.6 | % | $51,121,587 | 40.5 | % | ||||||||||||||||
| 2025 | 0 | 0 | 0.0 | 0 | 0.0 | 733,932 | 42.6 | % | $51,121,587 | 40.5 | % | ||||||||||||||||
| 2026 | 6 | 376,592 | 21.8 | 36,765,311 | 29.1 | 1,110,524 | 64.4 | % | $87,886,898 | 69.7 | % | ||||||||||||||||
| 2027 | 1 | 10,538 | 0.6 | 937,882 | 0.7 | 1,121,062 | 65.0 | % | $88,824,780 | 70.4 | % | ||||||||||||||||
| 2028 & Beyond(4)(5) | 2 | 602,931 | 35.0 | 37,352,719 | 29.6 | 1,723,993 | 100.0 | % | $126,177,5000 | 100.0 | % | ||||||||||||||||
| Total | 19 | 1,723,993 | 100.0 | % | $126,177,500 | 100.0 | % | ||||||||||||||||||||
| (1) | Based on the underwritten rent roll dated February 28, 2017 and includes rent steps through April 2018. |
| (2) | Certain tenants may have termination or contraction options (which may become exercisable prior to the originally stated expiration date of the tenant lease) that are not considered in the above Lease Rollover Schedule. |
| (3) | Based on 1,723,993 contractual square feet. |
| (4) | JPMorgan Chase Bank subleases 562,347 square feet to Société Générale through October 31, 2022. In 2010, Société Générale executed a direct lease with the prior owner that has a start date of November 1, 2022 and is for an initial term of 10 years, with two five-year extension options. The lease maturity of this space is reflected as 2032 in the table above. |
| (5) | 2028 & Beyond includes 2,661 square feet of building office space. |
| Operating History and Underwritten Net Cash Flow | |||||||
| 2014 | 2015 | 2016 | TTM(1) | Underwritten | Per Square Foot(2) | %(3) | |
| Rents in Place | $118,736,577 | $125,320,974 | $128,705,034 | $129,095,683 | $126,177,500 | $73.19 | 65.1% |
| Vacant Income | 0 | 0 | 0 | 0 | 16,425,575 | 9.53 | 8.5% |
| Rent Steps | 0 | 0 | 0 | 0 | 10,341,838 | 6.00 | 5.3 |
| Gross Potential Rent(4) | $118,736,577 | $125,320,974 | $128,705,034 | $129,095,683 | $152,944,913 | $88.72 | 78.9% |
| Total Reimbursements(5) | 31,667,499 | 34,635,748 | 37,032,022 | 37,903,249 | 40,918,609 | 23.73 | 21.1% |
| Net Rental Income | $150,404,076 | $159,956,722 | $165,737,056 | $166,998,932 | $193,863,523 | $112.45 | 100.0% |
| (Vacancy/Credit Loss) | 0 | 0 | 0 | 0 | (16,425,575) | (9.53) | (8.5)% |
| Other Income(6) | 488,183 | 704,333 | 1,901,893 | 1,888,513 | 318,732 | 0.18 | 0.2% |
| Effective Gross Income | $150,892,259 | $160,661,057 | $167,638,950 | $168,887,445 | $177,756,680 | $103.11 | 91.7% |
| Total Expenses | $52,333,954 | $57,993,351 | $60,922,988 | $61,210,770 | $62,448,738 | $36.22 | 35.1% |
| Net Operating Income(7)(8) | $98,558,305 | $102,667,706 | $106,715,962 | $107,676,675 | $115,307,942 | $66.88 | 64.9% |
| Total TI/LC, Capex/RR | 0 | 0 | 0 | 0 | 5,743,040 | 3.33 | 3.2% |
| Net Cash Flow | $98,558,305 | $102,667,706 | $106,715,962 | $107,676,675 | $109,564,903 | $63.55 | 61.6% |
| Average Annual Rent PSF(9) | $68.87 | $72.69 | $74.66 | $74.88 | |||
| (1) | TTM represents the trailing 12-month period ending March 31, 2017. |
| (2) | Based on 1,723,993 contractual square feet. |
| (3) | Percentage column represents percent of Net Rental Income for all revenue lines and represents percent of Effective Gross Income for the remainder of fields. |
| (4) | The increase in Underwritten Gross Potential Rent from TTM Gross Potential Rent is primarily due to the inclusion of rent steps, which are underwritten to (i) for non-investment-grade tenants, rent steps through April 2018 and (ii) for investment-grade tenants, the average base rent over the lesser of the 245 Park Avenue Whole Loan term and the applicable lease term. With respect to the Société Générale subleased space, rent steps are underwritten based on the average of the JPMorgan Chase base rent of $61.50 per square foot through October 2022 and base rent pursuant to Société Générale’s direct lease of $88.00 per square foot through the remainder of the loan term. |
| (5) | Expense Recoveries are calculated on a tenant-by-tenant basis according to each tenant’s reimbursement methodology. Reimbursements for the JPMorgan Chase Bank space subleased to Société Générale are underwritten pursuant to the triple-net JPMorgan Chase Bank lease; upon the commencement of Société Générale’s direct modified gross lease in October 2022, the tenant is instead required to reimburse expenses over a base year of 2013. |
| (6) | Other Income consists of licensing fees, utility fees, generator fees and other miscellaneous items. |
| (7) | The increase in 2015 Net Operating Income from 2014 Net Operating Income was primarily due to contractual rent increases resulting in an increase in the weighted average base rent per square foot from approximately $68.87 to approximately $72.69 per square foot. |
| (8) | The increase in 2016 Net Operating Income from 2015 Net Operating Income is primarily due to an increase in occupancy from 93.6% to 95.0% and an increase in the weighted average base rent per square foot from approximately $72.69 to approximately $74.66 per square foot. |
| (9) | Average Annual Rent PSF is based on historical Rents in Place and 1,723,993 contractual leased square feet as of December 31 of each respective year. |
THE INFORMATION IN THIS STRUCTURAL AND COLLATERAL TERM SHEET IS NOT COMPLETE AND MAY BE AMENDED PRIOR TO THE TIME OF SALE. THIS TERM SHEET IS NOT AN OFFER TO SELL THESE SECURITIES AND IT IS NOT A SOLICITATION OF AN OFFER TO BUY THESE SECURITIES IN ANY JURISDICTION WHERE THE OFFER OR SALE IS NOT PERMITTED.
| 41 of 151 |
| Structural and Collateral Term Sheet | JPMCC 2017-JP6 |
| 245 Park Avenue | |
Property Management. The property is managed by Brookfield Properties Management LLC (“Brookfield”) on an interim basis subject to a property management agreement which is in place until October 31, 2017. The borrower has indicated that it expects to replace Brookfield and select a long term property manager on or before the expiration of the current management agreement. Under the loan agreement, the loan sponsor may replace the property manager with a qualified manager, which will include certain preapproved parties or, among other criteria, a nationally recognized property management company having at least 7.5 million rentable square feet under management (excluding the property), including at least 5.0 million rentable square feet under management in office properties in New York City.
Escrows and Reserves. At origination, the borrower deposited $10,298,441 for outstanding tenant improvements and leasing commissions, $1,133,167 for free rent, $227,000 for insurance reserves and $47,738 for required repairs. In lieu of depositing any reserve amounts required under the loan documents in cash, the borrower may deliver to the lender one or more letters of credit for all or any portion of the deposit requirements. The amount of any such letter(s) of credit may not exceed 10% of the 245 Park Avenue Whole Loan, unless such excess is permitted under a new non-consolidation opinion delivered to the lender.
Tax Escrows -On a monthly basis, the borrower is required to escrow 1/12 of annual estimated tax payments, which currently equates to $3,878,518 (approximately $26.15 per remeasured square foot annually).
Insurance Escrows -On a monthly basis, the borrower is required to escrow 1/12 of the annual insurance premiums, which currently equates to $113,500 (approximately $0.77 per remeasured square foot annually).
Replacement Reserves -On a monthly basis, the borrower is required to escrow $47,738 (approximately $0.32 per remeasured square foot annually) for ongoing replacement reserves.
Rollover Reserves - Commencing on May 1, 2025 and continuing on a monthly basis, the borrower is required to deposit $446,775 per month ($3.00 per remeasured square foot annually) with the lender for costs related to tenant improvements and leasing commissions. The borrower is also required to deposit any lease modification fees, settlement of claims against third parties related to any lease, any rejection, termination, cancellation or surrender fee and any holdover rents or use and occupancy fees from any current or former tenants.
Lockbox / Cash Management.The 245 Park Avenue Whole Loan is structured with a hard lockbox and springing cash management. The borrower and property manager were required at origination to deliver letters to all tenants at the property directing them to pay rents into a lockbox account. All funds in the lockbox account are required to be swept within one business day into the borrower’s operating account, unless a Cash Sweep Event (as defined below) is continuing, in which event such funds are required to be swept each business day into the cash management account controlled by the lender and disbursed on each payment date in accordance with the loan documents. The lender has been granted a first priority security interest in the cash management account.
A “Cash Sweep Event” means the occurrence of (a) an event of default under the 245 Park Avenue Whole Loan or an event of default under the mezzanine loans, (b) the bankruptcy or insolvency of the borrower or property manager (in the case of the property manager, to the extent such action results in the cash or bank accounts associated with the property being subsumed in the action or that has a material adverse effect on the property or the value or security of the lender’s interests), (c) if the debt service coverage ratio (as calculated in the loan documents) for the 245 Park Avenue Whole Loan and mezzanine loans based on underwritten net cash flow falls below 1.15x at the end of any quarter, based on the trailing three-month period or (d) if MLB does not renew all or substantially all of its premises at least 12 months before its lease expiration date or if MLB vacates or abandons all or substantially all of its premises (provided that any sweep, in the case of (d), will be capped at $85.00 per square foot with respect to the space leased by MLB) (a “Tenant Trigger Event”).
THE INFORMATION IN THIS STRUCTURAL AND COLLATERAL TERM SHEET IS NOT COMPLETE AND MAY BE AMENDED PRIOR TO THE TIME OF SALE. THIS TERM SHEET IS NOT AN OFFER TO SELL THESE SECURITIES AND IT IS NOT A SOLICITATION OF AN OFFER TO BUY THESE SECURITIES IN ANY JURISDICTION WHERE THE OFFER OR SALE IS NOT PERMITTED.
| 42 of 151 |
| Structural and Collateral Term Sheet | JPMCC 2017-JP6 |
| 245 Park Avenue | |
A Cash Sweep Event may be cured in accordance with the following conditions: (i) with respect to a Cash Sweep Event caused solely by clause (a) above, the acceptance of a cure by the applicable lender of the related event of default, (ii) with respect to a Cash Sweep Event caused by clause (b) above, if the borrower replaces such manager within 60 days of such action in accordance with the loan documents, (iii) with respect to a Cash Sweep Event caused solely by clause (c) above, either (1) the achievement of a debt service coverage ratio for the 245 Park Avenue Whole Loan and mezzanine loans of at least 1.15x for six consecutive months based on the trailing three-month period or (2) the borrower effects a DSCR Cure (as defined below) or (iv) with respect to a Cash Sweep Event caused solely by a Tenant Trigger Event, the occurrence of a Tenant Trigger Cure (as defined below). Each Cash Sweep Event cure is also subject to the following: (x) no other event of default has occurred and is continuing, (y) a cure may not occur more than five times in the aggregate during the term of the loan (except that there are no limits on the number of times a DSCR Cure may occur and a DSCR Cure is excluded from the foregoing limit) and (z) the borrower may not cure a Cash Sweep Event caused by a bankruptcy or insolvency of the borrower.
A “DSCR Cure” means the satisfaction of the following conditions: (a) the borrower delivers a letter of credit with a notional amount which, if applied to the 245 Park Avenue Whole Loan and each mezzanine loan, would result in a debt service coverage ratio of at least 1.15x based upon the trailing three-month period immediately preceding the date of determination; and (b) no Cash Sweep Event resulting from a separate event has occurred which has not been cured;provided that (x) the amount of the letter of credit (together with the amount of any other letters of credit that have been delivered by the borrower under the loan documents) may not exceed 10% of the 245 Park Avenue Whole Loan, unless such excess is permitted under a new non-consolidation opinion and (y) the borrower has no reimbursement obligations with respect to such letter of credit.
A “Tenant Trigger Cure” means either (x) the replacement of MLB with one or more tenants approved by the lender if required under the loan documents leasing not less than 90% of the leasable area of the MLB space (including any portion of the space retained by MLB), which tenant(s) are in occupancy and paying full contractual rent, without right of offset or free rent credit, as evidenced by an estoppel certificate or (y) during the period of any Cash Sweep Event from and after a Tenant Trigger Event, excess cash flow shall have been deposited in the cash management account in an amount equal to or exceeding $85.00 per rentable square foot with respect to the space demised under the MLB lease.
Additional Debt.The $568.0 million mezzanine debt consists of a $236.5 million mezzanine loan A, a $221.0 million mezzanine loan B and a $110.5 million mezzanine loan C. The mezzanine loan A has a 5.00000% coupon, the mezzanine loan B has a 5.70000% coupon and the mezzanine Loan C has a 6.85000% coupon. The mezzanine loans are interest-only for the full term of the loans and are coterminous with the 245 Park Avenue Whole Loan. Including the 245 Park Avenue Subordinate Companion Loan and mezzanine loans, the cumulative Cut-off Date LTV, cumulative UW NOI DSCR and cumulative UW NOI Debt Yield are 80.0%, 1.42x and 6.5%, respectively. The mortgage and mezzanine lenders have entered into an intercreditor agreement. The mezzanine loans have been or are expected to be sold to institutional investors.
THE INFORMATION IN THIS STRUCTURAL AND COLLATERAL TERM SHEET IS NOT COMPLETE AND MAY BE AMENDED PRIOR TO THE TIME OF SALE. THIS TERM SHEET IS NOT AN OFFER TO SELL THESE SECURITIES AND IT IS NOT A SOLICITATION OF AN OFFER TO BUY THESE SECURITIES IN ANY JURISDICTION WHERE THE OFFER OR SALE IS NOT PERMITTED.
| 43 of 151 |
| Structural and Collateral Term Sheet | JPMCC 2017-JP6 | |
| 211 Main Street | ||
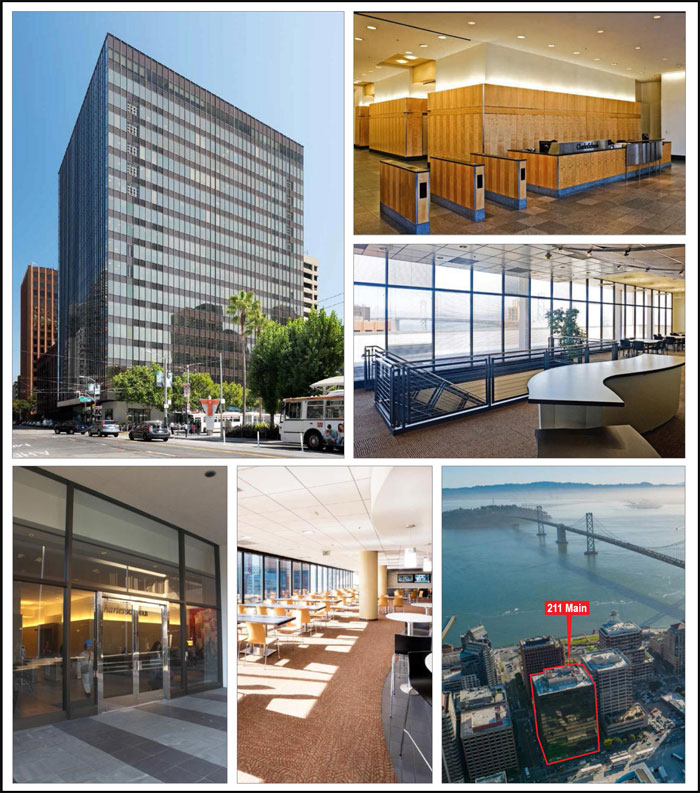
THE INFORMATION IN THIS STRUCTURAL AND COLLATERAL TERM SHEET IS NOT COMPLETE AND MAY BE AMENDED PRIOR TO THE TIME OF SALE. THIS TERM SHEET IS NOT AN OFFER TO SELL THESE SECURITIES AND IT IS NOT A SOLICITATION OF AN OFFER TO BUY THESE SECURITIES IN ANY JURISDICTION WHERE THE OFFER OR SALE IS NOT PERMITTED.
| 44 of 151 |
| Structural and Collateral Term Sheet | JPMCC 2017-JP6 | |
| 211 Main Street | ||
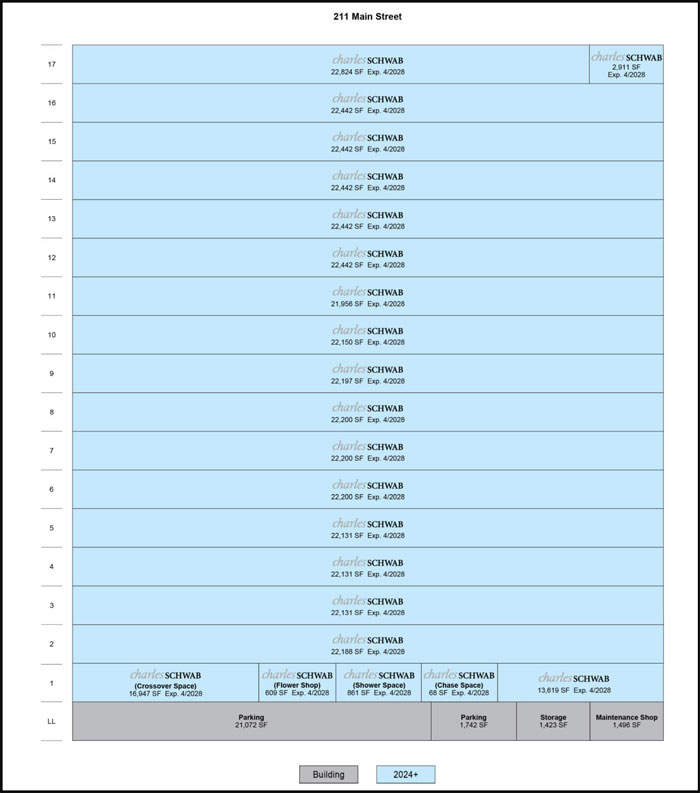
THE INFORMATION IN THIS STRUCTURAL AND COLLATERAL TERM SHEET IS NOT COMPLETE AND MAY BE AMENDED PRIOR TO THE TIME OF SALE. THIS TERM SHEET IS NOT AN OFFER TO SELL THESE SECURITIES AND IT IS NOT A SOLICITATION OF AN OFFER TO BUY THESE SECURITIES IN ANY JURISDICTION WHERE THE OFFER OR SALE IS NOT PERMITTED.
| 45 of 151 |
| Structural and Collateral Term Sheet | JPMCC 2017-JP6 | |
| 211 Main Street | ||
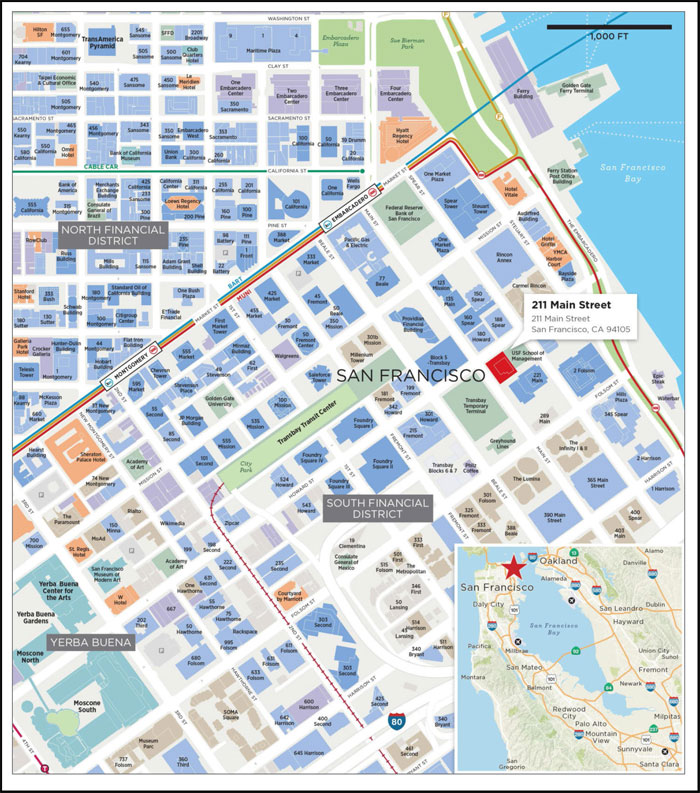
THE INFORMATION IN THIS STRUCTURAL AND COLLATERAL TERM SHEET IS NOT COMPLETE AND MAY BE AMENDED PRIOR TO THE TIME OF SALE. THIS TERM SHEET IS NOT AN OFFER TO SELL THESE SECURITIES AND IT IS NOT A SOLICITATION OF AN OFFER TO BUY THESE SECURITIES IN ANY JURISDICTION WHERE THE OFFER OR SALE IS NOT PERMITTED.
| 46 of 151 |
| Structural and Collateral Term Sheet | JPMCC 2017-JP6 | |
| 211 Main Street | ||
| Mortgage Loan Information | Property Information | |||
| Mortgage Loan Seller: | JPMCB | Single Asset / Portfolio: | Single Asset | |
| Original Principal Balance(1): | $65,219,000 | Title: | Fee | |
| Cut-off Date Principal Balance(1): | $65,219,000 | Property Type - Subtype: | Office – CBD | |
| % of Pool by IPB: | 8.3% | Net Rentable Area (SF): | 417,266 | |
| Loan Purpose: | Acquisition | Location: | San Francisco, CA | |
| Borrower: | BPP 211 Main Owner LLC | Year Built / Renovated: | 1973 / 1998 | |
| Sponsor: | Blackstone Property Partners | Occupancy: | 100.0% | |
| Lower Fund 1 L.P. | Occupancy Date: | 6/6/2017 | ||
| Interest Rate(1): | 3.55470% | Number of Tenants: | 1 | |
| Note Date: | 3/28/2017 | 2014 NOI: | $9,753,604 | |
| Maturity Date: | 4/6/2024 | 2015 NOI: | $9,822,319 | |
| Interest-only Period: | 84 months | 2016 NOI(3): | $9,770,862 | |
| Original Term: | 84 months | TTM NOI: | N/A | |
| Original Amortization: | None | UW Economic Occupancy: | 98.0% | |
| Amortization Type: | Interest Only | UW Revenues: | $19,906,520 | |
| Call Protection(2): | Grtr1%orYM(26),DeforGrtr1%or | UW Expenses: | $4,533,300 | |
| YM(51),O(7) | UW NOI(3): | $15,373,221 | ||
| Lockbox / Cash Management: | Hard / Springing | UW NCF: | $15,289,768 | |
| Additional Debt: | Yes | Appraised Value / Per SF: | $294,000,000 / $705 | |
| Additional Debt Balance: | $105,000,000 / $25,000,000 | Appraised Dark Value / Per SF(4): | $197,000,000 / $472 | |
| Additional Debt Type: | Pari Passu / B-Notes | Appraisal Date: | 3/13/2017 | |
| Escrows and Reserves(5) | Financial Information(1) | |||||||
| Initial | Monthly | Initial Cap | A-Notes | Whole Loan | ||||
| Taxes: | $0 | Springing | N/A | Cut-off Date Loan / SF: | $408 | $468 | ||
| Insurance: | $0 | Springing | N/A | Maturity Date Loan / SF: | $408 | $468 | ||
| Replacement Reserves: | $0 | Springing | $183,597 | Cut-off Date LTV: | 57.9% | 66.4% | ||
| TI/LC: | $0 | Springing | $1,251,798 | Maturity Date LTV: | 57.9% | 66.4% | ||
| Other: | $0 | $0 | N/A | UW NCF DSCR: | 2.49x | 2.07x | ||
| UW NOI Debt Yield: | 9.0% | 7.9% | ||||||
| Sources and Uses | ||||||||
| Sources | Proceeds | % of Total | Uses | Proceeds | % of Total | |||
| A-Notes(1) | $170,219,000 | 56.3 | % | Purchase Price | $292,881,810 | 96.9 | % | |
| B-Notes(1) | 25,000,000 | 8.3 | Closing Costs | 9,400,010 | 3.1 | |||
| Sponsor Equity | 107,062,820 | 35.4 | ||||||
| Total Sources | $302,281,820 | 100.0 | % | Total Uses | $302,281,820 | 100.0 | % | |
| (1) | The 211 Main Street loan is part of a whole loan evidenced by threepari passusenior notes, with an aggregate outstanding principal balance as of the Cut-off Date of approximately $170.2 million (the “A-Notes”) and three subordinate notes, with an aggregate outstanding principal balance as of the Cut-off Date of $25.0 million (the “B-Notes”). The A-Notes Financial Information presented in the chart above reflects the aggregate Cut-off Date balance of the approximately $170.2 million senior portion of the 211 Main Street Whole Loan, exclusive of the $25.0 million B-Notes. The Whole Loan Financial Information presented in the chart above reflects the aggregate Cut-off Date balance of the approximately $195.2 million 211 Main Street Whole Loan. The Interest Rate above reflects the interest rate on the A-Notes only. The interest rate on the B-Notes is 4.90000%per annum. |
| (2) | Defeasance of the full approximately $195.2 million 211 Main Street Whole Loan is permitted at any time after the earlier to occur of (i) two years after the closing date of the final REMIC trust that holds any note evidencing the 211 Main Street Whole Loan or (ii) the third anniversary of the first payment date. The borrower is also permitted to prepay the 211 Main Street Whole Loan in whole or in part at any time during the term of the loan with the payment of a yield maintenance premium, if such prepayment occurs prior to the open period. The assumed lockout period of 26 months for a defeasance is based on the expected closing date of the JPMCC 2017-JP6 Trust in June 2017. The actual defeasance lockout period for a defeasance may be longer. |
| (3) | The increase in UW NOI from 2016 NOI is driven by a straight line average of Charles Schwab’s future rent inclusive of rent steps over the course of the loan term. Charles Schwab renewed its lease in October 2016 and, beginning in May 2018 through April 2028, is required to pay contractual base rent of $37.78 per square foot with 3.0% annual increases. |
| (4) | The appraisal concluded a “Go Dark Value” of $197.0 million, which assumes the property is 100.0% vacant and factors in market rent, downtime, expenses and lease-up costs. |
| (5) | Initial Escrows and Reserves excludes a guaranty delivered by the loan sponsor for certain outstanding tenant improvements required by the Charles Schwab lease. For a full description of Escrows and Reserves, please refer to“Escrows and Reserves” below. |
THE INFORMATION IN THIS STRUCTURAL AND COLLATERAL TERM SHEET IS NOT COMPLETE AND MAY BE AMENDED PRIOR TO THE TIME OF SALE. THIS TERM SHEET IS NOT AN OFFER TO SELL THESE SECURITIES AND IT IS NOT A SOLICITATION OF AN OFFER TO BUY THESE SECURITIES IN ANY JURISDICTION WHERE THE OFFER OR SALE IS NOT PERMITTED.
| 47 of 151 |
| Structural and Collateral Term Sheet | JPMCC 2017-JP6 | |
| 211 Main Street | ||
The Loan.The 211 Main Street loan is secured by a first mortgage lien on the fee interest in a 417,266 square foot Class A office building located in San Francisco, California. The whole loan has an outstanding principal balance as of the Cut-off Date of approximately $195.2 million (the “211 Main Street Whole Loan”) and is comprised of threepari passusenior notes, each as described below, with an aggregate outstanding principal balance as of the Cut-off Date of approximately $170.2 million (collectively, the “211 Main Street A-Notes”) and three subordinate B-Notes with an aggregate outstanding principal balance as of the Cut-off Date of $25.0 million (the “211 Main Street Subordinate Companion Loans”). Note A-3, with an outstanding principal balance as of the Cut-off Date of $65.219 million, is being contributed to the JPMCC 2017-JP6 Trust (the “211 Main Street Mortgage Loan”). Note A-1 and Note A-2, with an aggregate outstanding principal balance as of the Cut-off Date of approximately $105.0 million (the “211 Main Street Pari Passu Companion Loans”), are expected to be contributed to one or more future securitization trusts. The 211 Main Street Subordinate Companion Loans have been sold to a third party investor. Under the related intercreditor agreement, prior to a control appraisal period with respect to the 211 Main Street Subordinate Companion Loans, the holder of the 211 Main Street Subordinate Companion Loan evidenced by Note B-1 will have the right, under certain circumstances, to approve certain major decisions with respect to the 211 Main Street Whole Loan, to exercise certain cures and purchase option rights and to replace the related special servicer with or without cause. The holders of the 211 Main Street Subordinate Companion Loans will also have the right to exercise certain cures and purchase option rights with respect to the 211 Main Street Whole Loan under certain circumstances. After a control appraisal period occurs with respect to the 211 Main Street Subordinate Companion Loans, the holder of Note A-2 will be entitled to exercise the rights of the controlling noteholder for the 211 Main Street Whole Loan; however, the JPMCC 2017-JP6 Trust will be entitled, under certain circumstances, to be consulted with respect to certain major decisions (which rights will be exercised by the Directing Certificateholder prior to a Consultation Termination Event). The 211 Main Street Whole Loan has a seven-year term and will be interest-only for the entire loan term.
| Whole Loan Summary | |||||
| Note | Original Balance | Cut-off Date Balance | Note Holder | Controlling Piece | |
| A-1 | $45,000,000 | $45,000,000 | JPMCB | No | |
| A-2 | 60,000,000 | 60,000,000 | JPMCB | No | |
| A-3 | 65,219,000 | 65,219,000 | JPMCC 2017-JP6 | No | |
| B-1, B-2, B-3 | 25,000,000 | 25,000,000 | Third Party Investor | Yes(1) | |
| Total | $195,219,000 | $195,219,000 | |||
| (1) | Note B-1 is the controlling note with respect to the 211 Main Street Whole Loan. |
The Borrower. The borrowing entity for the 211 Main Street Whole Loan is BPP 211 Main Owner LLC, a Delaware limited liability company and special purpose entity.
The Loan Sponsor.The loan sponsor and nonrecourse carve-out guarantor for the 211 Main Street Whole Loan is Blackstone Property Partners Lower Fund 1 L.P., an affiliate of The Blackstone Group L.P. (“Blackstone”). Blackstone is a global alternative asset manager, with total assets under management of approximately $366.6 billion as of December 31, 2016. Specifically, Blackstone’s real estate group, founded in 1991, is a large real estate investment manager, with approximately $102.0 billion of total assets under management as of December 31, 2016. Blackstone was founded in 1985 by Stephen Schwarzman and Peter Peterson and has grown to employ over 2,200 employees across 30 cities around the world. The liability of the guarantor under the full recourse carve-out provisions in the loan documents is capped at 15% of the then current outstanding principal balance of the 211 Main Street Whole Loan plus enforcement costs in accordance with enforcing of the guaranty. In addition, the guarantor is not a party to the environmental indemnity agreement. The 211 Main Street Whole Loan documents require that the borrower obtain (and the borrower did obtain at origination) an environmental insurance policy meeting the requirements of the 211 Main Street Whole Loan documents, which, among other things, has a term expiring on March 28, 2026 and includes policy limits of $5.0 million for each pollution condition and $5.0 million in the aggregate, with a $50,000 deductible.
The Property.The 211 Main Street property is a 17-story, 417,266 square foot, Class A office building located in the San Francisco central business district. The property was originally constructed in 1973 and most recently renovated in 1998 and is situated on approximately 0.72 acres. The property features views of downtown San Francisco and the San Francisco – Oakland Bay Bridge, as well as a penthouse boardroom, executive level offices on the top three floors, a full kitchen, cafeteria and dining hall on the ninth floor, a large ground floor conference room and an auditorium. Additionally, the property features an on-site parking garage with 42 parking spaces resulting in a parking ratio of approximately 0.10 per 1,000 square feet of space. There are three additional parking garages located within a one-block radius of the property. Pedestrian access to the property is provided via Main Street to the southwest and Howard Street to the northwest and vehicle access is provided via Spear Street to the northeast.
THE INFORMATION IN THIS STRUCTURAL AND COLLATERAL TERM SHEET IS NOT COMPLETE AND MAY BE AMENDED PRIOR TO THE TIME OF SALE. THIS TERM SHEET IS NOT AN OFFER TO SELL THESE SECURITIES AND IT IS NOT A SOLICITATION OF AN OFFER TO BUY THESE SECURITIES IN ANY JURISDICTION WHERE THE OFFER OR SALE IS NOT PERMITTED.
| 48 of 151 |
| Structural and Collateral Term Sheet | JPMCC 2017-JP6 | |
| 211 Main Street | ||
As of June 6, 2017, the property was 100.0% leased to a single tenant, Charles Schwab & Co., Inc. (“Charles Schwab”). Charles Schwab (NYSE: SCHW) has been a tenant at the property since April 1998 and renewed its lease in October 2016 for an extension term starting in May 2018 for a 10-year period through April 2028. Charles Schwab’s lease contains two consecutive options to extend the lease for the entire premises, with different extension periods applying to different floors, ranging from five years to 14 years when fully exercised. Additionally, the lease contains two partial extension options ranging from seven-year to 14-year periods, contingent on how many floors Charles Schwab elects to renew. The property currently serves as Charles Schwab’s global headquarters, and since 1998, Charles Schwab has reportedly invested over $25.0 million ($60.00 per square foot) in capital improvements to the property. Major capital improvement projects have included the renovation of the second and third floors to trading floors, construction of an auditorium, penthouse expansion, lobby renovation and general updates to the building mechanics. As part of the October 2016 renewal, the lease includes a provision that requires approximately $18.2 million ($44.00 per square foot) in additional capital expenditures to be invested in the property, of which approximately $6.0 million ($14.00 per square foot) is required to be paid for by Charles Schwab and approximately $12.2 million ($29.00 per square foot) is required to be paid for by the borrower. At origination, the loan sponsor provided a guaranty for all outstanding tenant improvement obligations, which is capped as described below under “Escrows and Reserves”.
The 211 Main Street property is located in the central business district of San Francisco, California. Within walking distance of the property are the Union Square shopping district, Treasure Island, Westfield San Francisco Centre shopping mall, Rincon Park, several notable museums and AT&T Park, home of the San Francisco Giants major league baseball team. The property also benefits from its proximity to major public transportation lines, including the Embarcadero BART train station, which is located two blocks northwest, Interstate Highway 80 and the San Francisco – Oakland Bay Bridge, located approximately three blocks southeast. Additionally, the property is located approximately 14.4 miles north of San Francisco International Airport and approximately 9.2 miles west of the Oakland central business district. The property is expected to benefit from the completion of the Transbay Transit Center, a mass-transit hub that is expected to connect eight Bay Area counties through 11 transportation systems including the BART, AC Transit, Amtrak, Caltrain and California’s planned high speed rail system. According to the Transbay Joint Powers Authority, the larger development, which is located approximately 0.5 miles northeast of the property, is expected to include 4,400 residential units, approximately 100,000 square feet of new retail space and an approximately 1.4 million square foot office tower. Additionally, the project is expected to feature City Park, a 5.4-acre rooftop public park with a variety of activities and amenities including an open air amphitheater, gardens, open grass areas and restaurant and café. The Transbay Transit Center consists of two primary components, with the first phase expected to be completed in the fall of 2017. The first phase will include construction of the above-ground portion of the new Transit Center, the below-grade rail levels and the bus ramp connecting the Transit Center to the San Francisco – Oakland Bay Bridge. A timeline has not been provided yet for the construction of phase two, which includes the downtown rail extension.
According to the appraisal, the property is located in the South Financial District office submarket of the greater San Francisco – Redwood City – South San Francisco market. According to CoStar, as of year-end 2016, the South Financial District Class A office submarket consisted of 50 buildings totaling approximately 21.5 million square feet of office space with an overall vacancy rate of 5.4% and average rents of $60.90 per square foot. The appraisal identified seven comparable office leases in the San Francisco market ranging in size from approximately 25,524 square feet to 91,950 square feet. Base rents for the comparable leases ranged from $60.00 per square foot to $70.00 per square foot, with a weighted average of approximately $66.37 per square foot. The comparable leases identified by the appraisal are all on a modified gross basis. Per Charles Schwab’s recently executed 10-year lease extension, Charles Schwab is required to pay $37.38 per square foot on a triple-net basis beginning in May 2018. The appraisal adjusted the rent to a modified gross basis to conform to market convention and has adjusted the Charles Schwab rent to $63.65 per square foot, which is in-line with the comparable modified gross office leases identified by the appraisal.
THE INFORMATION IN THIS STRUCTURAL AND COLLATERAL TERM SHEET IS NOT COMPLETE AND MAY BE AMENDED PRIOR TO THE TIME OF SALE. THIS TERM SHEET IS NOT AN OFFER TO SELL THESE SECURITIES AND IT IS NOT A SOLICITATION OF AN OFFER TO BUY THESE SECURITIES IN ANY JURISDICTION WHERE THE OFFER OR SALE IS NOT PERMITTED.
| 49 of 151 |
| Structural and Collateral Term Sheet | JPMCC 2017-JP6 | |
| 211 Main Street | ||
| Historical and Current Occupancy(1) | |||
| 2014 | 2015 | 2016 | Current(2) |
| 100.0% | 100.0% | 100.0% | 100.0% |
| (1) | Historical Occupancies are as of December 31 of each respective year. |
| (2) | Current Occupancy is as of June 6, 2017. |
| Tenant Summary(1) | |||||||
| Tenant | Ratings(2) Moody’s/S&P/Fitch | Net Rentable Area (SF) | % of Total NRA | Base Rent PSF(3) | % of Total Base Rent | Lease Expiration Date | |
| Charles Schwab | A2 / A / A | 417,266 | 100.0% | $38.25 | 100.0% | 4/30/2028 | |
| (1) | Based on the underwritten rent roll dated June 6, 2017. |
| (2) | Ratings provided are for the parent company of the entity listed in the “Tenant” field whether or not the parent company guarantees the lease. |
| (3) | Base Rent PSF represents the straight-line average of Charles Schwab’s rent steps over the course of the loan term. The initial rent under the extension term starting in May 2018 is $37.78 per square foot, and the rent under the current term is $23.40 per square foot. |
| Lease Rollover Schedule(1) | |||||||||
| Year | Number of Leases Expiring | Net Rentable Area Expiring | % of NRA Expiring | Base Rent Expiring | % of Base Rent Expiring | Cumulative Net Rentable Area Expiring | Cumulative % of NRA Expiring | Cumulative Base Rent Expiring | Cumulative % of Base Rent Expiring |
| Vacant | NAP | 0 | 0.0% | NAP | NAP | 0 | 0.0% | NAP | NAP |
| 2017 & MTM | 0 | 0 | 0.0 | $0 | 0.0% | 0 | 0.0% | $0 | 0.0% |
| 2018 | 0 | 0 | 0.0 | 0 | 0.0 | 0 | 0.0% | $0 | 0.0% |
| 2019 | 0 | 0 | 0.0 | 0 | 0.0 | 0 | 0.0% | $0 | 0.0% |
| 2020 | 0 | 0 | 0.0 | 0 | 0.0 | 0 | 0.0% | $0 | 0.0% |
| 2021 | 0 | 0 | 0.0 | 0 | 0.0 | 0 | 0.0% | $0 | 0.0% |
| 2022 | 0 | 0 | 0.0 | 0 | 0.0 | 0 | 0.0% | $0 | 0.0% |
| 2023 | 0 | 0 | 0.0 | 0 | 0.0 | 0 | 0.0% | $0 | 0.0% |
| 2024 | 0 | 0 | 0.0 | 0 | 0.0 | 0 | 0.0% | $0 | 0.0% |
| 2025 | 0 | 0 | 0.0 | 0 | 0.0 | 0 | 0.0% | $0 | 0.0% |
| 2026 | 0 | 0 | 0.0 | 0 | 0.0 | 0 | 0.0% | $0 | 0.0% |
| 2027 | 0 | 0 | 0.0 | 0 | 0.0 | 0 | 0.0% | $0 | 0.0% |
| 2028 & Beyond | 1 | 417,266 | 100.0 | 15,962,095 | 100.0 | 417,266 | 100.0% | $15,962,095 | 100.0% |
| Total | 1 | 417,266 | 100.0% | $15,962,095 | 100.0% | ||||
| (1) | Based on the underwritten rent roll dated June 6, 2017. |
THE INFORMATION IN THIS STRUCTURAL AND COLLATERAL TERM SHEET IS NOT COMPLETE AND MAY BE AMENDED PRIOR TO THE TIME OF SALE. THIS TERM SHEET IS NOT AN OFFER TO SELL THESE SECURITIES AND IT IS NOT A SOLICITATION OF AN OFFER TO BUY THESE SECURITIES IN ANY JURISDICTION WHERE THE OFFER OR SALE IS NOT PERMITTED.
| 50 of 151 |
| Structural and Collateral Term Sheet | JPMCC 2017-JP6 | |
| 211 Main Street | ||
| Operating History and Underwritten Net Cash Flow | |||||||
| 2014 | 2015 | 2016 | Underwritten | Per Square Foot | %(1) | ||
| Rents in Place(2) | $9,694,906 | $9,775,848 | $9,775,848 | $15,962,095 | $38.25 | 78.6% | |
| Vacant Income | 0 | 0 | 0 | 0 | 0.00 | 0.0% | |
| Gross Potential Rent | $9,694,906 | $9,775,848 | $9,775,848 | $15,962,095 | $38.25 | 78.6% | |
| Total Reimbursements | 2,140,357 | 2,210,209 | 2,231,186 | 4,350,681 | 10.43 | 21.4% | |
| Net Rental Income | $11,835,263 | $11,986,057 | $12,007,034 | $20,312,776 | $48.68 | 100.0% | |
| (Vacancy/Credit Loss) | 0 | 0 | 0 | (406,256) | (0.97) | (2.0) | |
| Effective Gross Income | $11,835,263 | $11,986,057 | $12,007,034 | $19,906,520 | $47.71 | 98.0% | |
| Total Expenses | $2,081,659 | $2,163,738 | $2,236,172 | $4,533,300 | $10.86 | 22.8% | |
| Net Operating Income | $9,753,604 | $9,822,319 | $9,770,862 | $15,373,221 | $36.84 | 77.2% | |
| Total TI/LC, Capex/RR | 0 | 0 | 0 | 83,453 | 0.20 | 0.4 | |
| Net Cash Flow | $9,753,604 | $9,822,319 | $9,770,862 | $15,289,768 | $36.64 | 76.8% | |
| (1) | % column represents percent of Net Rental Income for all revenue lines and represents percent of Effective Gross Income for the remainder of the fields. |
| (2) | The increase in Underwritten Rents in Place from 2016 Rents in Place is due to underwriting a straight line average of Charles Schwab’s future rent over the course of the loan term. Charles Schwab renewed its lease in October 2016 and, starting in May 2018 through the lease expiration in April 2028, the tenant is required to pay base rent at a rate of $37.78 per square foot with 3.0% annual increases. The rent under the current term is $23.40 per square foot. |
Property Management. The property is managed by Equity Office Management, L.L.C., a Delaware limited liability company and an affiliate of the loan sponsor.
Escrows and Reserves. At origination, the lender did not require the borrower to deposit into escrow any reserves. The guarantor delivered a guaranty which (i) guarantees the borrower’s outstanding tenant improvements and leasing commissions allowances under the Charles Schwab lease as of the origination date and (ii) requires the guarantor to deposit with the lender any such amounts that remain outstanding upon the consummation of any remedial or enforcement action by the lender or transfer as the result of the exercise of the lender’s remedies. The guaranty is subject to a cap of approximately $12,191,209, which cap is required to be decreased on a dollar-for-dollar basis by any amounts on deposit in the excess cash flow account as of the date of determination (and during the continuance of an event of default, the date of determination is required to be the date that is immediately prior to the event of default).
Tax Escrows -The requirement for the borrower to make deposits to the real estate tax escrow is waived so long as no Cash Trap Event (as defined below) has occurred and is continuing. In addition, to the extent the borrower provides invoices or other evidence of payment that property taxes have been paid by Charles Schwab under its lease, the monthly deposit is required to be reduced on a dollar-for-dollar basis by such amounts paid.
Insurance Escrows- The requirement for the borrower to make deposits to the insurance escrow is waived so long as (i) no Cash Trap Event has occurred and is continuing or (ii) no event of default has occurred and is continuing and the property is insured as part of a blanket policy (which insures significant other real property not subject to the lien of the loan documents and owned or managed, directly or indirectly, by the guarantor, any parallel partnerships and alternative investment vehicles comprising the real estate fund commonly known as Blackstone Property Partners, any property manager or any their respective affiliates, in an amount reasonably acceptable to the lender) in accordance with the loan documents or otherwise reasonably acceptable to the lender. In addition, to the extent the borrower provides invoices or other evidence of payment that insurance premiums have been paid by Charles Schwab under its lease, the monthly deposit is required to be reduced on a dollar-for-dollar basis by such amounts paid.
Replacement Reserves- The requirement for the borrower to make monthly deposits to the replacement reserve is waived so long as no Cash Trap Event has occurred and is continuing. In the event the borrower is required to make deposits into the replacement reserve, on a monthly basis, the borrower is required to deposit approximately $7,650 ($0.22 per square foot annually) for replacement reserves. The reserve is subject to a cap of approximately $183,597 ($0.44 per square foot).
TI/LC Reserves- The requirement for the borrower to make monthly deposits to the tenant improvement and leasing commission reserve is waived so long as no Cash Trap Event has occurred and is continuing. In the event the borrower is required to make deposits into the tenant improvement and leasing commission reserve, on a monthly basis, the borrower is required to deposit approximately $52,158 ($1.50 per square foot annually) for tenant improvements and leasing commission reserves. The reserve is subject to a cap of $1,251,798 ($3.00 per square foot).
THE INFORMATION IN THIS STRUCTURAL AND COLLATERAL TERM SHEET IS NOT COMPLETE AND MAY BE AMENDED PRIOR TO THE TIME OF SALE. THIS TERM SHEET IS NOT AN OFFER TO SELL THESE SECURITIES AND IT IS NOT A SOLICITATION OF AN OFFER TO BUY THESE SECURITIES IN ANY JURISDICTION WHERE THE OFFER OR SALE IS NOT PERMITTED.
| 51 of 151 |
| Structural and Collateral Term Sheet | JPMCC 2017-JP6 | |
| 211 Main Street | ||
Lockbox / Cash Management.The 211 Main Street Whole Loan is structured with a hard lockbox and springing cash management account. The borrower was required at origination to deliver tenant direction letters instructing all tenants to deposit rents into a lockbox account controlled by the lender. All funds in the lockbox account are required to be swept each business day into the borrower’s operating account, unless a Cash Trap Event is continuing, in which event such funds are required to be swept not less than twice per week into a cash management account controlled by the lender and disbursed on each payment date in accordance with the loan documents. The lender has been granted a first priority security interest in the cash management account. During a Cash Trap Event, so long as no event of default has occurred and is continuing and no bankruptcy or insolvency action of the borrower has occurred, the lender is required, upon the written request of the borrower to disburse within three business days (and not more frequently than weekly) excess cash flow from the excess cash flow reserve subaccount to pay costs and expenses in connection with the ownership, management and/or operation of the property, including, without limitation: (i) operating expenses; (ii) emergency repairs and / or life safety repairs; (iii) capital expenditures; (iv) replacements; (v) fees and costs associated with the 211 Main Street Whole Loan and legal expenses (other than legal expenses arising in connection with the enforcement of the borrower’s rights under the 211 Main Street Whole Loan documents or any defense of any enforcement by the lender of its rights); (vi) audit, tax and accounting expenses (up to a maximum amount of $250,000); (vii) debt service shortfalls; (viii) leasing costs; (ix) voluntary prepayments of the 211 Main Street Whole Loan in the amount necessary to achieve a Debt Yield Cure (as defined below); (x) shortfalls in any restoration of the property after a casualty or condemnation; (xi) shortfalls in any reserves; (xii) marketing costs for vacant space at the property; (xiii) distributions to any real estate investment trust that is affiliated with the guarantor and owns a direct or indirect equity interest in the borrower (subject to a maximum amount of $40,000 annually); and (xiv) such other items as reasonably approved by the lender. In addition, notwithstanding anything else to the contrary in the 211 Main Street Whole Loan documents or the existence of an event of default under the 211 Main Street Whole Loan documents, prior to the occurrence of (a) the initiation of (1) judicial or non-judicial foreclosure proceedings, (2) proceedings for the appointment of a receiver or (3) similar remedies permitted by the 211 Main Street Whole Loan documents relating to all or a material portion of the property or (b) the imposition of a stay, an injunction or a similar judicially imposed device that has the effect of preventing the lender from exercising its remedies, the lender is required to apply amounts on deposit in the cash management account to the payment of taxes and insurance premiums.
A “Cash Trap Event” means the occurrence of (i) an event of default or (ii) the date on which the debt yield (as calculated in the 211 Main Street Whole Loan documents) falls below (a) 4.50% on any date prior to June 30, 2018 or (b) 7.00% on any date on or after July 1, 2018, in each case for the calendar quarter immediately preceding the date of determination and based on the trailing 12 month period immediately preceding such date.
A Cash Trap Event may be cured by the following: if the Cash Trap Event has occurred (i) solely as a result of an event of default, the lender has accepted a cure by the borrower of such event of default or (ii) solely as a result of either (a) or (b) of clause (ii) above, the achievement of a Debt Yield Cure.
A “Debt Yield Cure” means no event of default is continuing under the 211 Main Street Whole Loan documents and either (i) the achievement of a debt yield that is not less than 4.50% on any date prior to June 30, 2018 or 7.00% on any date on or after July 1, 2018, in each case for one calendar quarter immediately preceding the date of determination based on the trailing 12 month period, or (ii) the borrower making, in its sole discretion, voluntary prepayments in accordance with the loan documents in an amount necessary to achieve the required debt yield provided in clause (i).
THE INFORMATION IN THIS STRUCTURAL AND COLLATERAL TERM SHEET IS NOT COMPLETE AND MAY BE AMENDED PRIOR TO THE TIME OF SALE. THIS TERM SHEET IS NOT AN OFFER TO SELL THESE SECURITIES AND IT IS NOT A SOLICITATION OF AN OFFER TO BUY THESE SECURITIES IN ANY JURISDICTION WHERE THE OFFER OR SALE IS NOT PERMITTED.
| 52 of 151 |
| Structural and Collateral Term Sheet | JPMCC 2017-JP6 |
[THIS PAGE INTENTIONALLY LEFT BLANK]
THE INFORMATION IN THIS STRUCTURAL AND COLLATERAL TERM SHEET IS NOT COMPLETE AND MAY BE AMENDED PRIOR TO THE TIME OF SALE. THIS TERM SHEET IS NOT AN OFFER TO SELL THESE SECURITIES AND IT IS NOT A SOLICITATION OF AN OFFER TO BUY THESE SECURITIES IN ANY JURISDICTION WHERE THE OFFER OR SALE IS NOT PERMITTED.
| 53 of 151 |
| Structural and Collateral Term Sheet | JPMCC 2017-JP6 | |
| Browning Place | ||
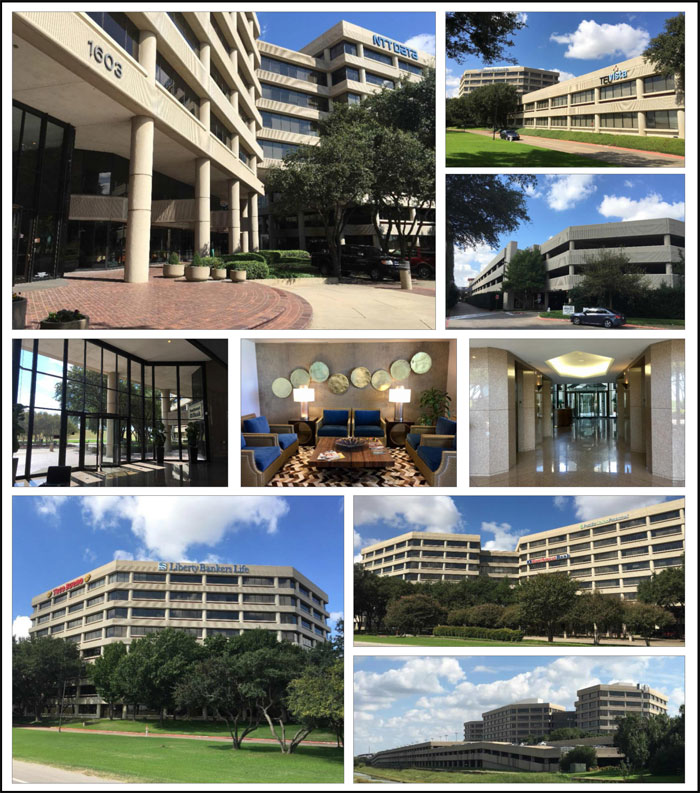
THE INFORMATION IN THIS STRUCTURAL AND COLLATERAL TERM SHEET IS NOT COMPLETE AND MAY BE AMENDED PRIOR TO THE TIME OF SALE. THIS TERM SHEET IS NOT AN OFFER TO SELL THESE SECURITIES AND IT IS NOT A SOLICITATION OF AN OFFER TO BUY THESE SECURITIES IN ANY JURISDICTION WHERE THE OFFER OR SALE IS NOT PERMITTED.
| 54 of 151 |
| Structural and Collateral Term Sheet | JPMCC 2017-JP6 | |
| Browning Place | ||
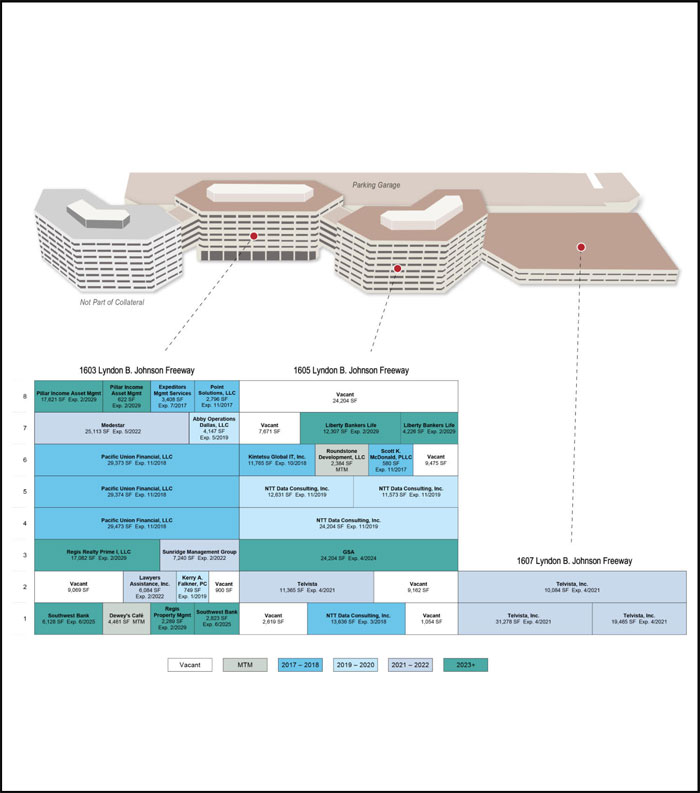
THE INFORMATION IN THIS STRUCTURAL AND COLLATERAL TERM SHEET IS NOT COMPLETE AND MAY BE AMENDED PRIOR TO THE TIME OF SALE. THIS TERM SHEET IS NOT AN OFFER TO SELL THESE SECURITIES AND IT IS NOT A SOLICITATION OF AN OFFER TO BUY THESE SECURITIES IN ANY JURISDICTION WHERE THE OFFER OR SALE IS NOT PERMITTED.
| 55 of 151 |
| Structural and Collateral Term Sheet | JPMCC 2017-JP6 | |
| Browning Place | ||
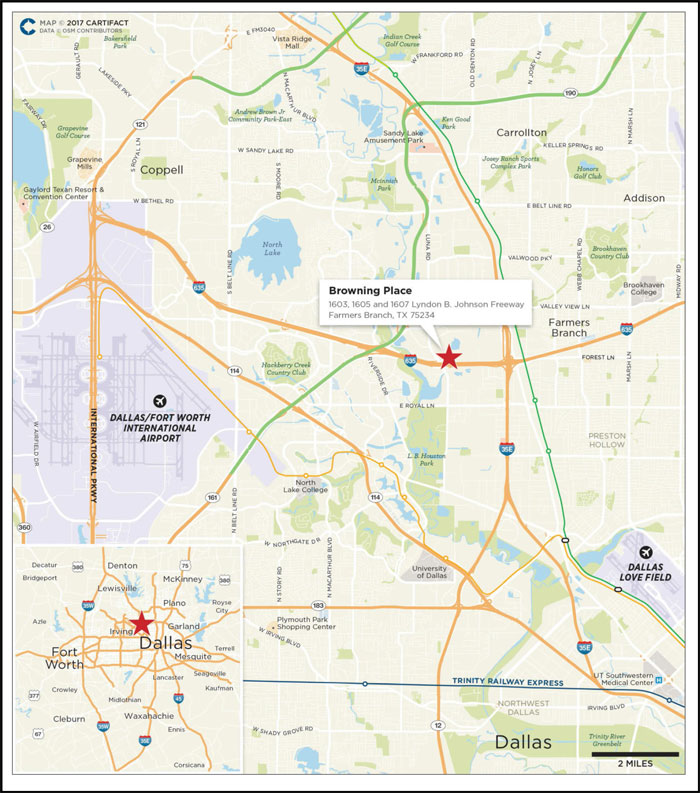
THE INFORMATION IN THIS STRUCTURAL AND COLLATERAL TERM SHEET IS NOT COMPLETE AND MAY BE AMENDED PRIOR TO THE TIME OF SALE. THIS TERM SHEET IS NOT AN OFFER TO SELL THESE SECURITIES AND IT IS NOT A SOLICITATION OF AN OFFER TO BUY THESE SECURITIES IN ANY JURISDICTION WHERE THE OFFER OR SALE IS NOT PERMITTED.
| 56 of 151 |
| Structural and Collateral Term Sheet | JPMCC 2017-JP6 | |
| Browning Place | ||
| Mortgage Loan Information | Property Information | |||
| Mortgage Loan Seller: | JPMCB | Single Asset / Portfolio: | Single Asset | |
| Original Principal Balance: | $42,840,000 | Title: | Fee | |
| Cut-off Date Principal Balance: | $42,749,531 | Property Type - Subtype: | Office – Suburban | |
| % of Pool by IPB: | 5.4% | Net Rentable Area (SF): | 442,639 | |
| Loan Purpose: | Refinance | Location: | Farmers Branch, TX | |
| Borrower: | Browning Place, LLC | Year Built / Renovated: | 1983-1984 / 2016 | |
| Sponsor: | Transcontinental Realty Investors, Inc. | Occupancy(1): | 85.5% | |
| Interest Rate: | 5.34200% | Occupancy Date: | 3/8/2017 | |
| Note Date: | 3/31/2017 | Number of Tenants: | 20 | |
| Maturity Date: | 4/1/2022 | 2014 NOI(2): | $2,949,417 | |
| Interest-only Period: | None | 2015 NOI(2)(3): | $4,174,131 | |
| Original Term: | 60 months | 2016 NOI(3): | $4,883,664 | |
| Original Amortization: | 360 months | TTM NOI (as of 3/2017): | $5,194,621 | |
| Amortization Type: | Balloon | UW Economic Occupancy: | 85.0% | |
| Call Protection: | L(25),Grtr1%orYM(11),O(24) | UW Revenues: | $8,090,202 | |
| Lockbox / Cash Management: | Hard / In Place | UW Expenses: | $3,443,212 | |
| Additional Debt: | N/A | UW NOI: | $4,646,990 | |
| Additional Debt Balance: | N/A | UW NCF: | $3,857,461 | |
| Additional Debt Type: | N/A | Appraised Value / Per SF: | $61,800,000 / $140 | |
| Appraisal Date: | 2/8/2017 | |||
| Escrows and Reserves(4) | Financial Information | |||||||
| Initial | Monthly | Initial Cap | Cut-off Date Loan / SF: | $97 | ||||
| Taxes: | $408,036 | $102,009 | N/A | Maturity Date Loan / SF: | $90 | |||
| Insurance: | $0 | Springing | N/A | Cut-off Date LTV: | 69.2% | |||
| Replacement Reserves: | $14,017 | $14,017 | $504,605 | Maturity Date LTV: | 64.3% | |||
| TI/LC: | $3,000,000 | Springing | $1,991,862 | UW NCF DSCR: | 1.34x | |||
| Other: | $82,765 | $0 | N/A | UW NOI Debt Yield: | 10.9% | |||
| Sources and Uses | ||||||
| Sources | Proceeds | % of Total | Uses | Proceeds | % of Total | |
| Mortgage Loan | $42,840,000 | 100.0% | Payoff Existing Debt | $23,178,298 | 54.1% | |
| Upfront Reserves | 3,504,818 | 8.2 | ||||
| Closing Costs | 1,134,455 | 2.6 | ||||
| Return of Equity | 15,022,429 | 35.1 | ||||
| Total Sources | $42,840,000 | 100.0% | Total Uses | $42,840,000 | 100.0% | |
| (1) | Occupancy does not include 24,204 square feet associated with one tenant that is dark, Taco Bueno Restaurants (“Taco Bueno”). Taco Bueno is required to pay rent through its lease expiration in December 2017. Including Taco Bueno, the property is 91.0% occupied. |
| (2) | The increase in 2015 NOI from 2014 NOI is primarily due to Pacific Union and NTT expanding their spaces by a total of approximately 53,677 square feet and Medestar signing a new 25,113 square foot lease between July 2014 and July 2015, accounting for approximately $1,526,483 in underwritten base rent annually. |
| (3) | The increase in 2016 NOI from 2015 NOI is primarily due to NTT expanding its space by 11,573 square feet in July 2015 and 13,636 square feet in April 2016, accounting for a total of $478,971 in underwritten base rent annually. |
| (4) | For a full description of Escrows and Reserves, please refer to “Escrows and Reserves” below. |
The Loan.The Browning Place loan has an outstanding principal balance as of the Cut-off Date of approximately $42.8 million and is secured by a first mortgage lien on the borrower’s fee interest in a three-building office park comprised of 442,639 square feet, located in Farmers Branch, Texas. The loan has a five-year term and will amortize on a 30-year schedule.
The Borrower. The borrowing entity for the Browning Place loan is Browning Place, LLC, a Delaware limited liability company and special purpose entity.
THE INFORMATION IN THIS STRUCTURAL AND COLLATERAL TERM SHEET IS NOT COMPLETE AND MAY BE AMENDED PRIOR TO THE TIME OF SALE. THIS TERM SHEET IS NOT AN OFFER TO SELL THESE SECURITIES AND IT IS NOT A SOLICITATION OF AN OFFER TO BUY THESE SECURITIES IN ANY JURISDICTION WHERE THE OFFER OR SALE IS NOT PERMITTED.
| 57 of 151 |
| Structural and Collateral Term Sheet | JPMCC 2017-JP6 | |
| Browning Place | ||
The Loan Sponsor. The loan sponsor and nonrecourse carve-out guarantor is Transcontinental Realty Investors, Inc. (“Transcontinental”). Transcontinental is a publicly traded real estate investment company (NYSE: TCI) that acquires, develops and owns residential and commercial real estate properties throughout the United States. As of September 30, 2016, Transcontinental owned 49 multifamily communities, seven commercial properties comprising approximately 1.7 million rentable square feet, an approximately 96.0-acre golf course and 3,608 acres of land held for development.
The loan sponsor acquired 1605 LBJ and 1607 LBJ (each as defined below) in 2005 for $10.0 million and spent approximately $6.1 million in capital improvements, tenant improvements and leasing commissions in 2006. The loan sponsor acquired 1603 LBJ (defined below) in 2007 for approximately $19.7 million and, according to the loan sponsor, it subsequently spent approximately $8.5 million in tenant improvements, $2.7 million in leasing commissions and $1.2 million in capital improvements for a total cost basis of $48.2 million.
The Property. The Browning Place property is a Class A office complex located approximately 14.9 miles northwest of the Dallas central business district. The property is comprised of two eight-story office buildings (“1603 LBJ” and “1605 LBJ”) and one two-story annex building (“1607 LBJ”) with an adjoining four-level parking garage. The property was built from 1983 to 1984 and was most recently renovated between 2013 and 2016. Renovations included building improvements such as HVAC work, roof replacement and updates to certain hallways, restrooms and floor lobbies as well as tenant-specific improvements relating to 14 tenants. Each eight-story building features a two-story atrium at the front entrance in addition to a landscaped courtyard and seating area that separates the two buildings. The property has a total of 1,460 parking spaces in an adjoining four-level parking garage (approximately 3.3 spaces per 1,000 square feet). The site includes a third eight-story building that is owned by the loan sponsor, but is not part of the collateral for the Browning Place loan, and is currently 7.4% occupied. The loan documents contain provisions prohibiting the borrower and its affiliates or persons acting on their behalf from relocating any tenant at the Browning Place property to any other building owned by the borrower, or any of its affiliates, within a five-mile radius of the property or the submarket, including the adjacent on-site non-collateral building, until repayment of the loan in full or unless otherwise consented to by the lender.
As of March 8, 2017, the property was 85.5% occupied by 20 tenants over 21 leases. The largest tenant, Pacific Union Financial, LLC (“Pacific Union”), leases 88,220 square feet (19.9% of net rentable area) through November 2018 and accounts for 23.7% of underwritten base rent. Headquartered in Irving, Texas, Pacific Union provides residential mortgage loans through wholesale, retail and correspondent origination channels. The company offers programs such as Federal Housing Administration (“FHA”) loans, FHA flipping and agency loans, among others. Pacific Union employs more than 1,500 mortgage professionals across five offices in Texas, California, North Carolina and Virginia. Pacific Union has been at the property since 2013 and expanded its space by 29,473 square feet in December 2014. Pacific Union’s lease contains two remaining five-year extension options. The second largest tenant, Telvista, Inc. (“Telvista”), leases 72,192 square feet (16.3% of net rentable area) through April 2021 and accounts for 18.3% of underwritten base rent. Headquartered at the property, Telvista is a bilingual call center outsourcing company that serves as a single point of contact for customers’ telecommunications, business process outsourcing and technology needs. Telvista offers services in both English and Spanish and has contact centers located in California, Texas and Virginia as well as Tijuana and Mexico City in Mexico. Telvista has been at the property since 2006 and renewed its lease in December 2015 for an additional five years. Telvista’s lease has no extension options remaining. The third largest tenant, NTT Data Consulting, Inc. (“NTT”), leases 13,636 square feet through March 2018 and 48,408 square feet through November 2019, for a total of 14.0% of net rentable area. NTT has occupied its space since November 2011 and accounts for 16.4% of underwritten base rent. Founded in 1988, NTT is a provider of consulting, system and business IT outsourcing solutions. NTT is headquartered in Tokyo, Japan and is publicly traded on the Tokyo Stock Exchange. NTT’s lease contains one remaining three-year extension option. The property has experienced recent leasing momentum, with seven new and renewal leases having been signed since April 2016. The new and renewal leases comprise approximately 76,881 square feet (17.4% of net rentable area) and 21.4% of underwritten base rent, of which 49,921 square feet (14.2% of underwritten base rent) is leased by tenants that are affiliates of the loan sponsor. The property has four tenants, Regis Property Management, Regis Realty Prime LLC, Pillar Income Asset Management and Liberty Bankers Life, affiliated with the loan sponsor, which account for 54,147 square feet (12.2% of net rentable area) and 15.4% of underwritten base rent. At the property, the affiliated tenants are in property management, asset management and insurance.
The Browning Place property is located in Farmers Branch, Texas, a suburb of the Dallas-Plano-Irving, Texas metropolitan statistical area. The property is located approximately 14.5 miles northwest of the Dallas central business district along the LBJ Freeway/Interstate Highway 635, which connects the property to Dallas and to Fort Worth, which is approximately 29.8 miles southwest of the property. The LBJ Freeway corridor features many hotel, office, retail centers and multifamily developments. The property is in close proximity to other major roadways including Interstate 35 East, State Highway 114, Luna Road and MacArthur Boulevard. Browning Place is approximately 11.4 miles east of the Dallas Fort Worth Airport. According to the appraisal, the Dallas Fort Worth airport is the eighth busiest airport in the world with approximately 155,905 average daily passengers and the second-largest in the United States in terms of land mass.
THE INFORMATION IN THIS STRUCTURAL AND COLLATERAL TERM SHEET IS NOT COMPLETE AND MAY BE AMENDED PRIOR TO THE TIME OF SALE. THIS TERM SHEET IS NOT AN OFFER TO SELL THESE SECURITIES AND IT IS NOT A SOLICITATION OF AN OFFER TO BUY THESE SECURITIES IN ANY JURISDICTION WHERE THE OFFER OR SALE IS NOT PERMITTED.
| 58 of 151 |
| Structural and Collateral Term Sheet | JPMCC 2017-JP6 | |
| Browning Place | ||
According to the appraisal, the property is located in the Las Colinas office submarket, a major employment center for the Dallas/Fort Worth Metroplex. In 2015 and 2016, several companies announced planned expansions in or relocation to the area. Corporate expansion announcements include Amazon, AT&T, General Motors, Bed Bath and Beyond and Southwest Airlines. Corporate headquarters relocations include Jacobs Engineering Group Inc., Jamba Inc., OKI Data Americas, Sunoco LP and United Scientific Group, LLC. In 2014, Toyota decided to relocate its American headquarters to Dallas and is constructing an approximately $1.0 billion campus, which is expected to be completed by the end of 2017. The Dallas/Fort Worth Metroplex is home to 20 Fortune 500 company headquarters including ExxonMobil, Kimberly-Clark, Fluor, AT&T, Energy Transfer Equity, Southwest Airlines, American Airlines Group and Texas Instruments. Other major employers in the area include Zale Corporation, NCH Corporation, Verizon, Siemens, Nokia, Microsoft, State Farm, Allstate, Federal Express, Honda, Nissan and Citigroup. According to the appraisal, the estimated 2016 total population within a one-, three- and five-mile radius is 3,134, 71,213 and 239,466, respectively. The estimated average household income within a one-, three- and five- mile radius is $113,797, $85,453 and $87,973, respectively.
The property is proximate to several demand generators such as MacArthur Marketplace, a 601,708 square foot retail center and the Irving Convention Center, a 275,000 square foot convention center with an adjoining mixed use entertainment district. Additional developments include the Music Factory, an all-in-one dining and entertainment venue expected to open mid-2017, Mercer Crossing, a 370-acre, $1.0 billion mixed-use development located adjacent to the property, and Cypress Waters, a 1,000-acre master-planned office, retail, and residential development located approximately 5.0 miles from the property.
According to the appraisal, as of the fourth quarter of 2016, the Dallas/Fort Worth office market consisted of approximately 212.6 million square feet of office space, with an overall vacancy rate of 18.6% and average asking rents of $23.86 per square foot. As of the same period, the Las Colinas office submarket consisted of approximately 29.2 million square feet, with an overall vacancy rate of 14.7% and average asking rent of $24.48 per square foot. The appraisal identified five directly comparable office properties built between 1989 and 2002 ranging in size from 181,961 to 347,514 square feet. Occupancies at the comparable properties ranged from 77.0% to 97.0% with a weighted average occupancy of 85.5%. Recently quoted rental rates for the comparable office properties ranged from $19.00 to $26.00 per square foot, with a weighted average of $23.83 per square foot. The weighted average underwritten in-place office rent for the Browning Place property is $19.38 per square foot for the two towers and $18.25 per square foot for the annex, which are in-line with the appraisal’s concluded average market rents of $19.75 and $18.25, respectively.
| Historical and Current Occupancy(1) | |||
| 2014 | 2015 | 2016 | Current(2) |
| 85.5% | 89.3% | 91.0% | 85.5% |
| (1) | Historical Occupancies are as of December 31 of each respective year. |
| (2) | Current Occupancy is as of March 8, 2017 and does not include 24,204 square feet associated with one tenant that is dark, Taco Bueno. Taco Bueno is required to pay rent through its lease expiration in December 2017. Including Taco Bueno, the property is 91.0% occupied. |
THE INFORMATION IN THIS STRUCTURAL AND COLLATERAL TERM SHEET IS NOT COMPLETE AND MAY BE AMENDED PRIOR TO THE TIME OF SALE. THIS TERM SHEET IS NOT AN OFFER TO SELL THESE SECURITIES AND IT IS NOT A SOLICITATION OF AN OFFER TO BUY THESE SECURITIES IN ANY JURISDICTION WHERE THE OFFER OR SALE IS NOT PERMITTED.
| 59 of 151 |
| Structural and Collateral Term Sheet | JPMCC 2017-JP6 | |
| Browning Place | ||
| Tenant Summary(1) | |||||||
| Tenant | Ratings(2) Moody’s/S&P/Fitch | Net Rentable Area (SF) | % of Total NRA | Base Rent PSF | % of Total Base Rent | Lease Expiration Date | |
| Pacific Union | NA / NA / NA | 88,220 | 19.9% | $19.33 | 23.7% | 11/30/2018 | |
| Telvista(3) | NA / NA / NA | 72,192 | 16.3% | $18.25 | 18.3% | 4/30/2021 | |
| NTT(4) | Aa3 / AA- / NA | 62,044 | 14.0% | $19.00 | 16.4% | Various | |
| Medestar | NA / NA / NA | 25,113 | 5.7% | $19.00 | 6.6% | 5/31/2022 | |
| GSA(5) | Aaa / AA+ / AAA | 24,204 | 5.5% | $19.73 | 6.6% | 4/16/2024 | |
| Pillar Income Asset Management, Inc.(6)(7) | NA / NA / NA | 18,243 | 4.1% | $20.50 | 5.2% | 2/28/2029 | |
| Regis Realty Prime I, LLC(6)(8) | NA / NA / NA | 17,082 | 3.9% | $20.50 | 4.9% | 2/28/2029 | |
| Liberty Bankers Life(6)(9) | NA / NA / NA | 16,533 | 3.7% | $20.50 | 4.7% | 2/28/2029 | |
| Kintetsu Global IT, Inc. | NA / NA / NA | 11,765 | 2.7% | $17.25 | 2.8% | 10/31/2018 | |
| Southwest Bank | NA / NA / NA | 8,951 | 2.0% | $20.50 | 2.5% | 6/30/2025 | |
| (1) | Based on the underwritten rent roll dated March 8, 2017. |
| (2) | Ratings provided are for the parent company of the entity listed in the “Tenant” field whether or not the parent company guarantees the lease. |
| (3) | Telvista has the one-time right to terminate its lease as of April 30, 2019, with notice by April 30, 2018 and the payment of a termination fee. |
| (4) | NTT leases 13,636 square feet through March 31, 2018, in addition to 48,408 square feet through November 30, 2019. |
| (5) | GSA has the right to terminate its lease at any time with 90 days’ notice. |
| (6) | Pillar Income Asset Management, Inc., Regis Realty Prime, LLC and Liberty Bankers Life are affiliates of the loan sponsor. |
| (7) | Pillar Income Asset Management, Inc. has the right to terminate its lease at any time with 120 days’ notice. |
| (8) | Regis Realty Prime, LLC has the right to terminate its lease at any time with 120 days’ notice. |
| (9) | Liberty Bankers Life has the right to terminate its lease if there is a change of ownership of the building at any time with 180 days’ notice and the payment of a termination fee. |
| Lease Rollover Schedule(1)(2) | |||||||||||||||||
| Year | Number of Leases Expiring | Net Rentable Area Expiring | % of NRA Expiring | Base Rent Expiring | % of Base Rent Expiring | Cumulative Net Rentable Area Expiring | Cumulative % of NRA Expiring | Cumulative Base Rent Expiring | Cumulative % of Base Rent Expiring | ||||||||
| Vacant | NAP | 64,154 | 14.5% | NAP | NAP | 64,154 | 14.5% | NAP | NAP | ||||||||
| 2017 & MTM | 5 | 13,629 | 3.1% | $185,074 | 2.6% | 77,783 | 17.6% | $185,074 | 2.6% | ||||||||
| 2018 | 3 | 113,621 | 25.7% | 2,167,683 | 30.1% | 191,404 | 43.2% | $2,352,757 | 32.7% | ||||||||
| 2019 | 3 | 53,304 | 12.0% | 1,021,059 | 14.2% | 244,708 | 55.3% | $3,373,816 | 46.9% | ||||||||
| 2020 | 0 | 0 | 0.0% | 0 | 0.0% | 244,708 | 55.3% | $3,373,816 | 46.9% | ||||||||
| 2021 | 1 | 72,192 | 16.3% | 1,317,504 | 18.3% | 316,900 | 71.6% | $4,691,320 | 65.2% | ||||||||
| 2022 | 3 | 38,437 | 8.7% | 736,965 | 10.2% | 355,337 | 80.3% | $5,428,285 | 75.4% | ||||||||
| 2023 | 0 | 0 | 0.0% | 0 | 0.0% | 355,337 | 80.3% | $5,428,285 | 75.4% | ||||||||
| 2024 | 1 | 24,204 | 5.5% | 477,453 | 6.6% | 379,541 | 85.7% | $5,905,738 | 82.0% | ||||||||
| 2025 | 1 | 8,951 | 2.0% | 183,495 | 2.5% | 388,492 | 87.8% | $6,089,234 | 84.6% | ||||||||
| 2026 | 0 | 0 | 0.0% | 0 | 0.0% | 388,492 | 87.8% | $6,089,234 | 84.6% | ||||||||
| 2027 | 0 | 0 | 0.0% | 0 | 0.0% | 388,492 | 87.8% | $6,089,234 | 84.6% | ||||||||
| 2028 & Beyond | 4 | 54,147 | 12.2% | 1,110,013 | 15.4% | 442,639 | 100.0% | $7,199,247 | 100.0% | ||||||||
| Total | 21 | 442,639 | 100.0% | $7,199,247 | 100.0% | ||||||||||||
| (1) | Based on the underwritten rent roll dated March 8, 2017. |
| (2) | Certain tenants may have termination or contraction options (which may become exercisable prior to the originally stated expiration date of the tenant lease) that are not considered in the above Lease Rollover Schedule. |
THE INFORMATION IN THIS STRUCTURAL AND COLLATERAL TERM SHEET IS NOT COMPLETE AND MAY BE AMENDED PRIOR TO THE TIME OF SALE. THIS TERM SHEET IS NOT AN OFFER TO SELL THESE SECURITIES AND IT IS NOT A SOLICITATION OF AN OFFER TO BUY THESE SECURITIES IN ANY JURISDICTION WHERE THE OFFER OR SALE IS NOT PERMITTED.
| 60 of 151 |
| Structural and Collateral Term Sheet | JPMCC 2017-JP6 | |
| Browning Place | ||
| Operating History and Underwritten Net Cash Flow | |||||||
| 2014 | 2015 | 2016 | TTM(1) | Underwritten | Per Square Foot | %(2) |
| Rents in Place(3)(4) | $5,221,280 | $6,537,547 | $7,299,178 | $7,402,302 | $7,199,247 | $16.26 | 78.7% |
| Vacant Income | 0 | 0 | 0 | 0 | 1,267,042 | 2.86 | 13.8 |
| Gross Potential Rent | $5,221,280 | $6,537,547 | $7,299,178 | $7,402,302 | $8,466,289 | $19.13 | 92.5% |
| Total Reimbursements | 631,780 | 596,634 | 694,897 | 703,610 | 686,927 | 1.55 | 7.5 |
| Net Rental Income | $5,853,060 | $7,134,181 | $7,994,075 | $8,105,912 | $9,153,215 | $20.68 | 100.0% |
| (Vacancy/Credit Loss) | 0 | 0 | 0 | 0 | (1,369,845) | (3.09) | (15.0) |
| Other Income | 290,959 | 301,671 | 306,832 | 300,805 | 306,832 | 0.69 | 3.4 |
| Effective Gross Income | $6,144,019 | $7,435,852 | $8,300,907 | $8,406,717 | $8,090,202 | $18.28 | 88.4% |
| Total Expenses | $3,194,602 | $3,261,721 | $3,417,243 | $3,212,096 | $3,443,212 | $7.78 | 42.6% |
| Net Operating Income | $2,949,417 | $4,174,131 | $4,883,664 | $5,194,621 | $4,646,990 | $10.50 | 57.4% |
| Total TI/LC, Capex/RR | 0 | 0 | 0 | 0 | 789,530 | 1.78 | 9.8 |
| Net Cash Flow | $2,949,417 | $4,174,131 | $4,883,664 | $5,194,621 | $3,857,461 | $8.71 | 47.7% |
| (1) | TTM represents the trailing 12-month period ending March 31, 2017. |
| (2) | % column represents percent of Net Rental Income for all revenue lines and represents percent of Effective Gross Income for the remainder of fields. |
| (3) | The increase in 2015 Rents in Place from 2014 Rents in Place is primarily due to Pacific Union and NTT expanding their spaces by a total of approximately 52,677 square feet and Medestar signing a new 25,113 square foot lease between July 2014 and July 2015, accounting for approximately $1,526,483 in underwritten base rent annually. |
| (4) | The increase in 2016 Rents in Place from 2015 Rents in Place is primarily due to NTT expanding its space by 11,573 square feet in July 2015 and 13,636 square feet in April 2016, accounting for a total of $478,971 in underwritten base rent annually. |
Property Management. The property is subject to a management agreement with Regis Realty Prime, LLC, a Nevada limited liability company and an affiliate of the loan sponsor.
Escrows and Reserves. At origination, the borrower deposited into escrow $3.0 million for future tenant improvements and leasing commissions obligations, $408,036 for tax reserves, $82,765 for outstanding tenant improvements and leasing commissions and $14,017 for replacement reserves.
Tax Escrows- On a monthly basis, the borrower is required to escrow 1/12 of the annual estimated tax payments, which currently equates to $102,009.
Insurance Escrows- The requirement for the borrower to make monthly deposits to the insurance escrow is waived so long as (i) no event of default exists and (ii) the borrower provides satisfactory evidence that the property is insured under an acceptable blanket policy covering substantially all of the real property controlled directly or indirectly by the guarantor or its affiliates in accordance with the loan documents.
Replacement Reserves- On a monthly basis, the borrower is required to escrow $14,017 (approximately $0.38 per square foot annually) for replacement reserves. The reserve is subject to a cap of $504,605 (approximately $1.14 per square foot).
TI/LC Reserves- At origination, the borrowers reserved $3.0 million for future tenant improvements and leasing commissions. If the total amount on deposit decreases below $1,991,862 during the term of the loan, on a monthly basis, the borrower is required to deposit $55,330 (approximately $1.50 per square foot annually) for future tenant improvements and leasing commissions. The reserve is subject to a cap of $1,991,862 (approximately $4.50 per square foot).
Lockbox / Cash Management.The loan is structured with a hard lockbox and in-place cash management. The borrower was required to send tenant direction letters to all tenants upon the origination of the loan instructing them to deposit all rents and payments directly into the lockbox account controlled by the lender. All funds in the lockbox account are required to be swept each business day to a segregated cash management account under the control of the lender and disbursed on each payment date during the term of the loan in accordance with the loan documents. During a Cash Sweep Period (as defined below), all excess cash flow after payment of debt service, required reserves and operating expenses are required to be held as additional collateral for the loan. The lender has been granted a first priority security interest in the cash management account.
THE INFORMATION IN THIS STRUCTURAL AND COLLATERAL TERM SHEET IS NOT COMPLETE AND MAY BE AMENDED PRIOR TO THE TIME OF SALE. THIS TERM SHEET IS NOT AN OFFER TO SELL THESE SECURITIES AND IT IS NOT A SOLICITATION OF AN OFFER TO BUY THESE SECURITIES IN ANY JURISDICTION WHERE THE OFFER OR SALE IS NOT PERMITTED.
| 61 of 151 |
| Structural and Collateral Term Sheet | JPMCC 2017-JP6 | |
| Browning Place | ||
A “Cash Sweep Period” means the occurrence of (i) an event of default, (ii) any bankruptcy or insolvency action of the borrower or property manager or (iii) the date on which the debt service coverage ratio (as calculated in the loan documents), based on the trailing three months, is less than 1.25x. A Cash Sweep Period may be cured by (a) with respect to clause (i) above, a cure of the related event of default, (b) with respect to clause (ii) above only with respect to the property manager, the borrower replacing the property manager with a qualified manager under a new management agreement within 60 days after such bankruptcy action or (c) with respect to clause (iii) above, the achievement of a debt service coverage ratio equal to or greater than 1.25x for two consecutive calendar quarters based on the trailing three month period (each of the foregoing (a) through (c), a “Cash Sweep Event Cure”). Each Cash Sweep Event Cure is also subject to the following limitations: (1) there is no other event of default continuing under the loan documents; (2) a Cash Sweep Event Cure may occur no more than two times during the term of the loan (except with respect to clause (iii) above, for which an unlimited amount of cures are permitted); (3) the borrower pays all of the lender’s reasonable expenses incurred in connection with such Cash Sweep Event Cure; and (4) the borrower may not cure a bankruptcy or insolvency action of the borrower.
THE INFORMATION IN THIS STRUCTURAL AND COLLATERAL TERM SHEET IS NOT COMPLETE AND MAY BE AMENDED PRIOR TO THE TIME OF SALE. THIS TERM SHEET IS NOT AN OFFER TO SELL THESE SECURITIES AND IT IS NOT A SOLICITATION OF AN OFFER TO BUY THESE SECURITIES IN ANY JURISDICTION WHERE THE OFFER OR SALE IS NOT PERMITTED.
| 62 of 151 |
| Structural and Collateral Term Sheet | JPMCC 2017-JP6 |
[THIS PAGE INTENTIONALLY LEFT BLANK]
THE INFORMATION IN THIS STRUCTURAL AND COLLATERAL TERM SHEET IS NOT COMPLETE AND MAY BE AMENDED PRIOR TO THE TIME OF SALE. THIS TERM SHEET IS NOT AN OFFER TO SELL THESE SECURITIES AND IT IS NOT A SOLICITATION OF AN OFFER TO BUY THESE SECURITIES IN ANY JURISDICTION WHERE THE OFFER OR SALE IS NOT PERMITTED.
| 63 of 151 |
| Structural and Collateral Term Sheet | JPMCC 2017-JP6 |
| 740 Madison |

THE INFORMATION IN THIS STRUCTURAL AND COLLATERAL TERM SHEET IS NOT COMPLETE AND MAY BE AMENDED PRIOR TO THE TIME OF SALE. THIS TERM SHEET IS NOT AN OFFER TO SELL THESE SECURITIES AND IT IS NOT A SOLICITATION OF AN OFFER TO BUY THESE SECURITIES IN ANY JURISDICTION WHERE THE OFFER OR SALE IS NOT PERMITTED.
| 64 of 151 |
| Structural and Collateral Term Sheet | JPMCC 2017-JP6 |
| 740 Madison |
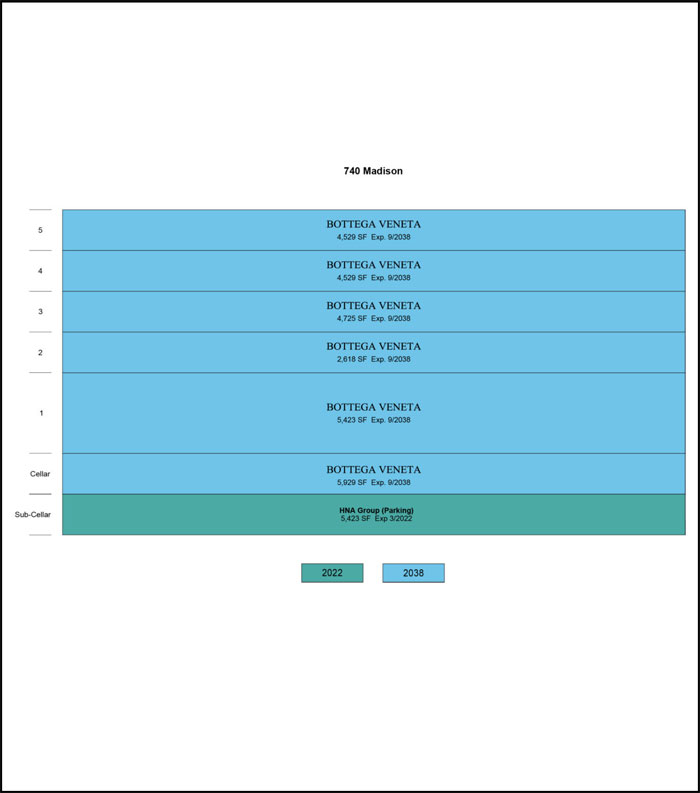
THE INFORMATION IN THIS STRUCTURAL AND COLLATERAL TERM SHEET IS NOT COMPLETE AND MAY BE AMENDED PRIOR TO THE TIME OF SALE. THIS TERM SHEET IS NOT AN OFFER TO SELL THESE SECURITIES AND IT IS NOT A SOLICITATION OF AN OFFER TO BUY THESE SECURITIES IN ANY JURISDICTION WHERE THE OFFER OR SALE IS NOT PERMITTED.
| 65 of 151 |
| Structural and Collateral Term Sheet | JPMCC 2017-JP6 |
| 740 Madison |
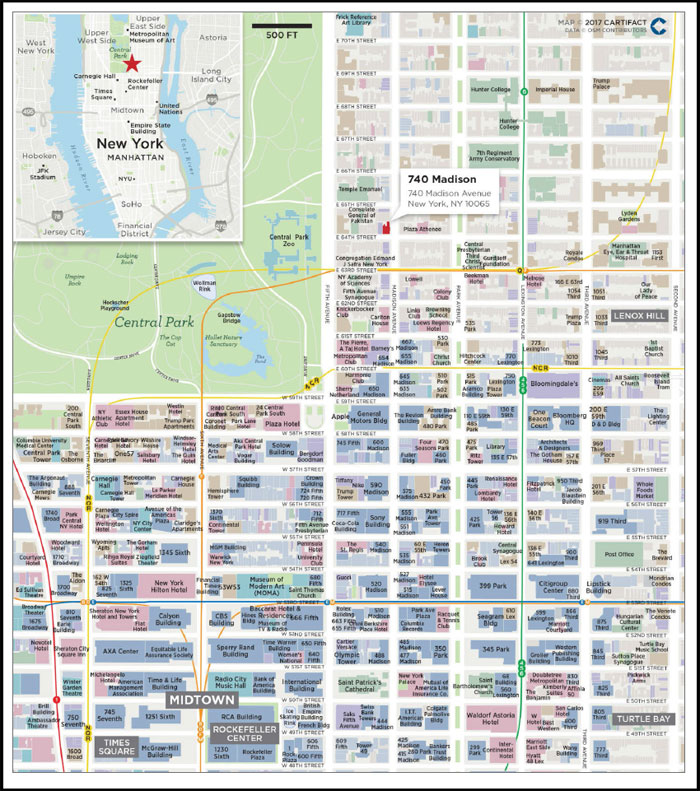
THE INFORMATION IN THIS STRUCTURAL AND COLLATERAL TERM SHEET IS NOT COMPLETE AND MAY BE AMENDED PRIOR TO THE TIME OF SALE. THIS TERM SHEET IS NOT AN OFFER TO SELL THESE SECURITIES AND IT IS NOT A SOLICITATION OF AN OFFER TO BUY THESE SECURITIES IN ANY JURISDICTION WHERE THE OFFER OR SALE IS NOT PERMITTED.
| 66 of 151 |
| Structural and Collateral Term Sheet | JPMCC 2017-JP6 |
| 740 Madison |
| Mortgage Loan Information | Property Information | |||
| Mortgage Loan Seller: | JPMCB | Single Asset / Portfolio: | Single Asset | |
| Original Principal Balance(1): | $40,000,000 | Title: | Fee | |
| Cut-off Date Principal Balance(1): | $40,000,000 | Property Type - Subtype(3): | Retail – Single Tenant | |
| % of Pool by IPB: | 5.1% | Net Rentable Area (SF)(3): | 33,176 | |
| Loan Purpose: | Refinance | Location: | New York, NY | |
| Borrower: | 740 Madison SPE LLC | Year Built / Renovated: | 1920 / 2017 | |
| Sponsor: | Wildenstein & Co. Inc. | Occupancy(4): | 100.0% | |
| Interest Rate(2): | 4.00000% | Occupancy Date: | 6/1/2017 | |
| Note Date: | 4/5/2017 | Number of Tenants(3): | 2 | |
| Anticipated Repayment Date(2): | 5/1/2027 | 2014 NOI(5): | N/A | |
| Interest-only Period: | 120 months | 2015 NOI(5): | N/A | |
| Original Term(2): | 120 months | 2016 NOI(5): | N/A | |
| Original Amortization: | None | TTM NOI(5): | N/A | |
| Amortization Type: | ARD-Interest Only | UW Economic Occupancy: | 96.5% | |
| Call Protection: | L(25),Grtr1%orYM(92),O(3) | UW Revenues(6): | $8,850,115 | |
| Lockbox / Cash Management: | Springing / Springing | UW Expenses: | $1,681,076 | |
| Additional Debt: | Yes | UW NOI(4)(6): | $7,169,038 | |
| Additional Debt Balance: | $50,000,000 | UW NCF: | $7,164,062 | |
| Additional Debt Type: | Pari Passu | Appraised Value / Per SF(7): | $150,000,000 / $4,521 | |
| Appraisal Date: | 3/13/2017 | |||
| Escrows and Reserves(8) | Financial Information(1) | ||||||||
| Initial | Monthly | Initial Cap | Cut-off Date Loan / SF: | $2,713 | |||||
| Taxes: | $2,595,218 | Springing | N/A | Maturity Date Loan / SF(9): | $2,713 | ||||
| Insurance: | $0 | Springing | N/A | Cut-off Date LTV(7): | 60.0% | ||||
| Replacement Reserves: | $0 | $0 | N/A | Maturity Date LTV(7)(9): | 60.0% | ||||
| TI/LC: | $0 | $0 | N/A | UW NCF DSCR: | 1.96x | ||||
| Other: | $7,190,000 | $0 | N/A | UW NOI Debt Yield: | 8.0% | ||||
| Sources and Uses | |||||||||
| Sources | Proceeds | % of Total | Uses | Proceeds | % of Total | ||||
| Mortgage Loan(1) | $90,000,000 | 100.0% | Payoff Existing Debt | $35,339,994 | 39.3% | ||||
| Upfront Reserves | 9,785,218 | 10.9% | |||||||
| Closing Costs | 4,406,086 | 4.9% | |||||||
| Return of Equity | 40,468,703 | 45.0 | |||||||
| Total Sources | $90,000,000 | 100.0% | Total Uses | $90,000,000 | 100.0% | ||||
| (1) | The 740 Madison loan is part of a whole loan evidenced by twopari passu notes with an aggregate original principal balance of $90.0 million. The Financial Information presented in the chart above reflects the Cut-off Date balance of the $90.0 million 740 Madison Whole Loan (as defined below). |
| (2) | The 740 Madison Whole Loan has an anticipated repayment date of May 1, 2027 (the “Anticipated Repayment Date” or “ARD”) and a final maturity date of May 1, 2029. From and after the Anticipated Repayment Date, the 740 Madison Whole Loan accrues interest at a fixed rate that is equal to the greater of (i) 7.00000% and (ii) the 10-year swap spread as of the first business day after the Anticipated Repayment Date plus 3.00000%per annum (provided that such revised rate may not exceed 9.00000%per annum). On and after the Anticipated Repayment Date, the 740 Madison Whole Loan requires a constant monthly payment equal to approximately $429,674, to be applied first to interest accrued at the initial Interest Rate shown above and the remainder to principal as further described in“The Loan” below. |
| (3) | Net Rentable Area (SF) and Number of Tenants are inclusive of 5,423 square feet (16.3% of net rentable area) consisting of the sub-cellar parking garage leased to HNA Group with no attributable underwritten base rent. The loan sponsor leased the sub-cellar space consisting of a four-car parking garage to HNA Group for a five-year term with no contractual rent as part of a contract related to the acquisition of the adjacent Wildenstein Mansion. |
| (4) | The sole tenant with attributable underwritten base rent, Bottega Veneta, has taken possession of its space, but is not yet in occupancy or paying rent. Bottega Veneta is currently building-out its space at its own expense at an estimated cost of reportedly in excess of $20.0 million. The Bottega Veneta lease requires an approximately 21-month free rent period extending through October 2018, as well as an additional $2.0 million rent credit to be applied as a monthly credit of $100,000 against the first 20 rent payments. Bottega Veneta is required to begin paying full unabated rent in November 2018. At origination, the borrower reserved approximately $5.2 million to cover debt service during the initial rent abatement period through October 2018, as well as an additional $2.0 million for rent credits to be applied in equal $100,000 disbursements between November 2018 and June 2020. Bottega Veneta is expected to open in February 2018. |
| (5) | Historical operating performance is not available as the property underwent a full-scale gut renovation that was completed in January 2017 at an estimated cost of approximately $44.0 million. The property is currently undergoing a comprehensive interior renovation for a tenant specific flagship retail buildout at an estimated cost of reportedly in excess of $20.0 million. |
| (6) | UW Revenues and UW NOI are calculated based on Bottega Veneta’s straight-line average rent over the first 10 years of the lease term. |
THE INFORMATION IN THIS STRUCTURAL AND COLLATERAL TERM SHEET IS NOT COMPLETE AND MAY BE AMENDED PRIOR TO THE TIME OF SALE. THIS TERM SHEET IS NOT AN OFFER TO SELL THESE SECURITIES AND IT IS NOT A SOLICITATION OF AN OFFER TO BUY THESE SECURITIES IN ANY JURISDICTION WHERE THE OFFER OR SALE IS NOT PERMITTED.
| 67 of 151 |
| Structural and Collateral Term Sheet | JPMCC 2017-JP6 |
| 740 Madison |
| (7) | Appraised Value / Per SF, Cut-off Date LTV and Maturity Date LTV are calculated based on the “as is” appraised value of the property. Based on the “as complete” appraised value of $160.0 million as of February 1, 2018, which assumes that Bottega Veneta has completed its interior build-out and is open for business, the Cut-off Date LTV and Maturity Date LTV are 56.3% and 56.3%, respectively. |
| (8) | For a full description of Escrows and Reserves, please refer to“Escrows and Reserves”below. |
| (9) | Maturity Date Loan / SF and Maturity Date LTV are calculated as of the Anticipated Repayment Date. |
The Loan.The 740 Madison loan is secured by a first mortgage lien on the borrower’s fee interest in a five-story, 33,176 square foot, Class A retail property located on the corner of East 64th Street in the Upper Madison Avenue submarket, an upscale submarket in Manhattan. The whole loan has an outstanding principal balance as of the Cut-off Date of $90.0 million (the “740 Madison Whole Loan”), and is comprised of twopari passu notes, each as described below. Note A-1, with an outstanding principal balance as of the Cut-off Date of $40.0 million, is being contributed to the JPMCC 2017-JP6 Trust. Note A-2, with an outstanding principal balance as of the Cut-off Date of $50.0 million, is expected to be contributed to a future securitization trust and is the controlling note under the related intercreditor agreement, the rights of which will be exercised by JPMCB or, upon such contribution, by the related trustee (or, prior to the occurrence and continuance of a control termination event under the related pooling and servicing agreement, the related directing certificateholder). However, the JPMCC 2017-JP6 Trust will be entitled, under certain circumstances, to be consulted with respect to certain major decisions (which rights will be exercised by the Directing Certificateholder prior to a Consultation Termination Event). The 740 Madison Whole Loan is structured with an Anticipated Repayment Date of May 1, 2027, a final maturity date of May 1, 2029 and the 740 Madison Whole Loan is interest-only through the Anticipated Repayment Date. On and after the Anticipated Repayment Date, the 740 Madison Whole Loan requires a constant monthly payment equal to approximately $429,674, to be applied first to interest accrued at the initial interest rate and the remainder to principal. In addition, after the Anticipated Repayment Date, provided that there is no other Cash Sweep Event continuing, all excess cash flow after payment of debt service, required reserves and operating expenses is required to be applied first to the prepayment of principal (without payment of a prepayment premium), until paid in full, and then to the payment of interest accrued at the excess of the revised interest rate over the initial interest rate.
| Whole Loan Summary | |||||
| Note | Original Balance | Cut-off Date Balance | Note Holder | Controlling Piece | |
| A-1 | $40,000,000 | $40,000,000 | JPMCC 2017-JP6 | No | |
| A-2 | 50,000,000 | 50,000,000 | JPMCB | Yes | |
| Total | $90,000,000 | $90,000,000 | |||
The Borrower. The borrowing entity for the 740 Madison Whole Loan is 740 Madison SPE LLC, a Delaware limited liability company and special purpose entity.
The Loan Sponsor.The loan sponsor and nonrecourse carve-out guarantor is Wildenstein & Co. Inc. (“Wildenstein”), a New York corporation. Wildenstein is the operator of a prominent art gallery with locations in New York, London and Tokyo and a research institute in Paris. Founded in the late 19th century by Nathan Wildenstein, the gallery has amassed a substantial art collection over the subsequent three generations of Wildenstein heirs. In recent years, Wildenstein has evolved with a focus on real estate investment over the traditional art focus.
The loan sponsor originally acquired the property in phases between 1938 and 1961 for a total purchase price of approximately $388,000. The loan sponsor’s recent renovation of the property at an estimated cost of $44.0 million (approximately $1,326 per square foot), in addition to approximately $6.6 million ($199 per square foot) in leasing costs, results in a total cost basis of approximately $51.0 million ($1,537 per square foot).
The Property.The 740 Madison property is a five-story, 33,176 square foot, Class A retail flagship located on the northwest corner of Madison Avenue and East 64th Street on the Upper East Side of Manhattan, New York. The property consists of what was three adjacent buildings that have since been gut renovated and combined into a single five-story flagship retail space with a sub-cellar parking level. The renovation was completed in January 2017 at a total cost of approximately $44.0 million. The property is a historic landmarked site, requiring the loan sponsor to maintain the exterior façade of the building. Subsequent to completion of the exterior renovation, the sole retail tenant, Bottega Veneta, Inc. (“Bottega Veneta”), commenced a comprehensive renovation and build-out of the interior space at an estimated cost of reportedly in excess of $20.0 million, expected to be completed in February 2018. Bottega Veneta is required to begin paying rent in November 2018, subject to a $2.0 million rent credit to be applied in equal $100,000 monthly disbursements through June 2020. As further described in “Escrows and Reserves”below, at origination, the borrower was required to deposit amounts sufficient to cover all debt service payments through October 2018, as well as all rent credits to be applied through June 2020. The Bottega Veneta lease has no outstanding termination options, with the exception of customary termination rights for casualties or condemnations. Upon opening, the property is expected to be Bottega Veneta’s largest store in the world and one of three “Maison” concept locations in the world (the other two being located in Beverly Hills and Milan). “Maison” concept locations showcase the brand’s entire collection and feature high-end interior finishes, consistent with competitive high-end luxury boutiques in the market.
THE INFORMATION IN THIS STRUCTURAL AND COLLATERAL TERM SHEET IS NOT COMPLETE AND MAY BE AMENDED PRIOR TO THE TIME OF SALE. THIS TERM SHEET IS NOT AN OFFER TO SELL THESE SECURITIES AND IT IS NOT A SOLICITATION OF AN OFFER TO BUY THESE SECURITIES IN ANY JURISDICTION WHERE THE OFFER OR SALE IS NOT PERMITTED.
| 68 of 151 |
| Structural and Collateral Term Sheet | JPMCC 2017-JP6 |
| 740 Madison |
As of June 1, 2017, the property was 100.0% leased to two tenants. The retail component of the property is 100.0% leased to Bottega Veneta for a 20-year term through September 2038 with 3.0% annual rent escalations. Bottega Veneta is an Italian luxury goods and high fashion brand house best known for its leather goods and ready-to-wear fashion sold worldwide. Founded in 1966 in northeastern Italy, the company is currently headquartered in Lugano, Switzerland. Bottega Veneta was acquired by Gucci Group in 2001 and is now part of the French multinational Kering Luxury Group (“Kering”). The Bottega Veneta lease is guaranteed by Kering, an investment grade rated French luxury goods holding company consisting of brands such as Alexander McQueen, Balenciaga, Brioni and Gucci, among other luxury, sport and lifestyle brands distributed in 120 countries. As of April 12, 2017, Kering had a market capitalization of over €30.0 billion. As of year-end 2016, the Bottega Veneta segment accounted for approximately €1.2 billion in revenue, €297.0 million in recurring operating income and employed 3,417 people across 255 stores worldwide. Bottega Veneta accounts for 100.0% of underwritten base rent and its lease contains one 10-year extension option. The sub-cellar space, consisting of a four-space parking garage, is occupied by HNA Group through March 2022 with no contractual base rent. The loan sponsor leased the sub-cellar space to HNA Group as part of a contract related to the acquisition of the adjacent Wildenstein Mansion.
The property is located in the Special Madison Avenue Preservation District, near numerous high-end retailers and restaurants. Local zoning regulations within the Special Madison Avenue Preservation District preserve and reinforce the retail and residential character of Madison Avenue and the surrounding area from East 61st Street to East 96th Street. Retail continuity is ensured for specialty shops by mandating that the ground floor of buildings on Madison Avenue be occupied by selected commercial uses. The property benefits from its proximity to high-end retailers including Prada, Cartier, Chanel, Hermes, Gucci, Dolce & Gabbana, Giorgio Armani, Roberto Cavalli and Jimmy Choo, among others. Furthermore, the property is proximate to several well-known New York City attractions, including Bergdorf Goodman, Barneys, the Plaza Hotel, the Apple Store, Tiffany & Co., The MoMA and Central Park.
According to the appraisal, the property is located in the Upper Madison Avenue retail corridor in the Upper East Side neighborhood of Manhattan, New York. The neighborhood benefits from a large tourist base and affluent resident population, while the Upper Madison Avenue retail corridor is among the top retail destinations in New York City. The area is home to numerous high-end, luxury tenants with the 740 Madison property occupying, per the appraisal, a prime location within the retail corridor. The cultural attractions of the Upper East Side, along with its residential population, safety and proximity to other parts of Manhattan have long made it among the more desirable retail neighborhoods in the broader market. While the market benefits from the high-income demographic in its direct vicinity, the submarket is largely driven by traffic from the broader trade area and both national and international tourism. New York City tourism reached a record 60.3 million visitors in 2016, with increases from both foreign and domestic tourists. According to the appraisal, the health of the New York City economy remains sound, with strong population growth, increasing household income, continued tourism growth and a stable, diverse employment base.
According to the appraisal, as of year-end 2016, the Upper East Side market consisted of 367 buildings totaling approximately 3.2 million square feet, with quoted rental rates of $85.28 per square foot and an overall vacancy rate of 2.4%. According to the appraisal, overall average asking rents as of year-end 2016 for grade-level retail space in the Upper Madison Avenue neighborhood were $1,543 per square foot, behind only the Times Square ($2,326 per square foot) and Midtown 5th Avenue ($3,723 per square foot) neighborhoods. The appraisal identified 10 comparable retail leases in the surrounding area executed between January 2014 and August 2016 with rents ranging from $1,100 per square foot to $1,900 per square foot for grade-level retail space with a weighted average of $1,671 per square foot. Further, the comparable leases included six properties containing leased second floor retail space with rents ranging from $185 per square foot to $764 per square foot with a weighted average of approximately $250 per square foot. Only one comparable lease contained third through fifth floor retail space with contractual rents of $125 per square foot for each floor. The appraisal’s concluded blended market rent, as outlined in the table below, was approximately $290 per square foot, in-line with the contractual in-place base rent of $288 per square foot at the property, prior to consideration of future rent steps.
Estimate of Blended Market Rent for Bottega Veneta Leased Space(1) | |||
| Floor | Square Feet | Rent PSF | Total Rent |
| Cellar | 5,929 | $0 | $0 |
| 1 | 5,423 | $1,200 | 6,507,600 |
| 2 | 2,618 | $150 | 392,700 |
| 3 | 4,725 | $100 | 472,500 |
| 4 | 4,529 | $75 | 339,675 |
| 5 | 4,529 | $75 | 339,675 |
| Total / Wtd. Avg. | 27,753 | $290 | $8,502,150 |
| (1) | Source: Appraisal. |
THE INFORMATION IN THIS STRUCTURAL AND COLLATERAL TERM SHEET IS NOT COMPLETE AND MAY BE AMENDED PRIOR TO THE TIME OF SALE. THIS TERM SHEET IS NOT AN OFFER TO SELL THESE SECURITIES AND IT IS NOT A SOLICITATION OF AN OFFER TO BUY THESE SECURITIES IN ANY JURISDICTION WHERE THE OFFER OR SALE IS NOT PERMITTED.
| 69 of 151 |
| Structural and Collateral Term Sheet | JPMCC 2017-JP6 |
| 740 Madison |
| Historical and Current Occupancy(1) | |||
| 2014 | 2015 | 2016 | Current(2) |
| N/A | N/A | N/A | 100.0% |
| (1) | Historical occupancy is not available as the property was previously gut renovated and is currently undergoing a full-scale renovation for a tenant specific flagship retail buildout. |
| (2) | Current Occupancy is as of June 1, 2017. The property is 100.0% leased to Bottega Veneta through September 2038. Though not currently open for business, Bottega Veneta has taken possession of its space and begun an extensive renovation at a total estimated cost of reportedly in excess of $20.0 million. Bottega Veneta is expected to open in February 2018. |
| Tenant Summary(1) | ||||||
| Tenant | Ratings(2) Moody’s/S&P/Fitch | Net Rentable Area (SF) | % of Total NRA | Base Rent PSF | % of Total Base Rent | Lease Expiration Date |
| Bottega Veneta(3) | NA / BBB / NA | 27,753 | 83.7% | $330.45 | 100.0% | 9/30/2038 |
| HNA Group(4) | NA / NA / NA | 5,423 | 16.3% | $0.00 | 0.00% | 3/31/2022 |
| (1) | Based on the underwritten rent roll dated as of June 1, 2017. |
| (2) | Ratings provided are for the parent company of the entity listed in the “Tenant” field whether or not the parent company guarantees the lease. |
| (3) | Base Rent PSF for Bottega Veneta represents the straight-line average rent over the first 10 years of the lease term. Bottega Veneta’s initial contractual rent is $288 per square foot. The Bottega Veneta lease is structured as a double net lease, except that the borrower is liable for taxes under the Bottega Veneta lease up to $1.5 million, with Bottega Veneta responsible under the lease for all taxes in excess of the $1.5 million cap. |
| (4) | HNA Group leases the sub-cellar space, consisting of the sub-cellar parking garage, from the loan sponsor with no attributable underwritten base rent. The loan sponsor leased the sub-cellar space to HNA Group for a five-year term with no contractual rent as part of a contract related to the acquisition of the adjacent Wildenstein Mansion. |
| Lease Rollover Schedule(1)(2) | |||||||||
| Year | Number of Leases Expiring | Net Rentable Area Expiring | % of NRA Expiring | Base Rent Expiring | % of Base Rent Expiring | Cumulative Net Rentable Area Expiring | Cumulative % of NRA Expiring | Cumulative Base Rent Expiring | Cumulative % of Base Rent Expiring |
| Vacant | NAP | 0 | 0.0% | NAP | NAP | 0 | 0.0% | NAP | NAP |
| 2017 & MTM | 0 | 0 | 0.0 | $0 | 0.0% | 0 | 0.0% | $0 | 0.0% |
| 2018 | 0 | 0 | 0.0 | 0 | 0.0 | 0 | 0.0% | $0 | 0.0% |
| 2019 | 0 | 0 | 0.0 | 0 | 0.0 | 0 | 0.0% | $0 | 0.0% |
| 2020 | 0 | 0 | 0.0 | 0 | 0.0 | 0 | 0.0% | $0 | 0.0% |
| 2021 | 0 | 0 | 0.0 | 0 | 0.0 | 0 | 0.0% | $0 | 0.0% |
| 2022(3) | 1 | 5,423 | 16.3 | 0 | 0.0 | 5,423 | 16.3% | $0 | 0.0% |
| 2023 | 0 | 0 | 0.0 | 0 | 0.0 | 5,423 | 16.3% | $0 | 0.0% |
| 2024 | 0 | 0 | 0.0 | 0 | 0.0 | 5,423 | 16.3% | $0 | 0.0% |
| 2025 | 0 | 0 | 0.0 | 0 | 0.0 | 5,423 | 16.3% | $0 | 0.0% |
| 2026 | 0 | 0 | 0.0 | 0 | 0.0 | 5,423 | 16.3% | $0 | 0.0% |
| 2027 | 0 | 0 | 0.0 | 0 | 0.0 | 5,423 | 16.3% | $0 | 0.0% |
| 2028 & Beyond | 1 | 27,753 | 83.7 | 9,171,103 | 100.0 | 33,176 | 100.0% | $9,171,103 | 100.0% |
| Total | 2 | 33,176 | 100.0% | $9,171,103 | 100.0% | ||||
| (1) | Based on the underwritten rent roll dated as of June 1, 2017. |
| (2) | Certain tenants may have termination or contraction options (which may become exercisable prior to the originally stated expiration date of the tenant lease) that are not considered in the above Lease Rollover Schedule. |
| (3) | 2022 is inclusive of 5,423 square feet associated with the sub-cellar parking garage leased to the HNA Group with no attributable underwritten base rent. |
THE INFORMATION IN THIS STRUCTURAL AND COLLATERAL TERM SHEET IS NOT COMPLETE AND MAY BE AMENDED PRIOR TO THE TIME OF SALE. THIS TERM SHEET IS NOT AN OFFER TO SELL THESE SECURITIES AND IT IS NOT A SOLICITATION OF AN OFFER TO BUY THESE SECURITIES IN ANY JURISDICTION WHERE THE OFFER OR SALE IS NOT PERMITTED.
| 70 of 151 |
| Structural and Collateral Term Sheet | JPMCC 2017-JP6 |
| 740 Madison |
| Underwritten Net Cash Flow(1) | |||
| Underwritten | Per Square Foot(2) | %(3) | |
| Rents in Place(4)(5) | $9,171,103 | $276.44 | 100.0% |
| Vacant Income | 0 | 0.00 | 0.0 |
| Gross Potential Rent | $9,171,103 | $276.44 | 100.0% |
| Total Reimbursements | 0 | 0.00 | 0.0 |
| Net Rental Income | $9,171,103 | $276.44 | 100.0% |
| (Vacancy/Credit Loss) | (320,989) | (9.68) | (3.5) |
| Other Income | 0 | 0.00 | 0.0 |
| Effective Gross Income | $8,850,115 | $266.76 | 96.5% |
| Total Expenses(6) | $1,681,076 | $50.67 | 19.0% |
| Net Operating Income | $7,169,038 | $216.09 | 81.0% |
| Total TI/LC, Capex/RR | 4,976 | 0.15 | 0.1 |
| Net Cash Flow | $7,164,062 | $215.94 | 80.9% |
| (1) | Historical operating performance is not available as the property has undergone a full-scale gut renovation that was completed in January 2017 at an estimated cost of approximately $44.0 million. The property is currently undergoing a comprehensive interior renovation for a tenant specific flagship retail buildout at an estimated cost of reportedly in excess of $20.0 million. Bottega Veneta is expected to open in February 2018. |
| (2) | Per Square Foot is based on the total 33,176 square feet, including 5,423 square feet associated with the sub-cellar space leased to HNA Group with no attributable underwritten base rent. |
| (3) | % column represents percent of Net Rental Income for all revenue lines and represents percent of Effective Gross Income for the remainder of fields. |
| (4) | 100.0% of Underwritten Rents in Place is attributable to Bottega Veneta pursuant to a 20-year lease extending through September 2038. The Bottega Veneta lease requires an approximately 21-month free rent period extending through October 2018, as well as an additional $2.0 million rent credit to be applied as a monthly credit of $100,000 against the first 20 rent payments. Bottega Veneta is required to begin paying rent in November 2018. At origination, the borrower reserved approximately $5.2 million to cover debt service during the initial rent abatement period through October 2018, as well as an additional $2.0 million for rent credits to be applied between November 2018 and June 2020. |
| (5) | Underwritten Rents in Place represents the Bottega Veneta straight-line average rent over the first 10 years of the lease term. Bottega Veneta’s initial contractual rent is $288 per square foot. |
| (6) | Underwritten Total Expenses are comprised of (i) real estate taxes underwritten based on the 2017/2018 tentative assessed value and the 2016/2017 tax rate (capped at $1.5 million, consistent with the borrower’s obligation pursuant to the Bottega Veneta lease) and (ii) management fees underwritten to 3.0% of Underwritten Effective Gross Income. |
Property Management. The 740 Madison property is managed by Wildenstein & Co. Inc., a New York corporation and an affiliate of the borrower.
Escrows and Reserves. At origination, the borrower was required to deposit into escrow approximately $5.2 million for a debt service reserve covering the rent abatement period extending through October 2018, approximately $2.6 million for real estate taxes and $2.0 million for rent credits to be applied in equal $100,000 disbursements for the period between November 2018 and June 2020. Notwithstanding the foregoing, in the event that Kering’s rating is downgraded below investment grade, the borrower will be required to deposit additional funds equal to all rent abatements remaining under the Bottega Veneta lease within five business days.
Tax Escrows - The requirement for the borrower to make monthly deposits into the tax escrow is waived so long as (i) no Cash Sweep Event (as defined below) has occurred and is continuing and (ii) the lender receives evidence reasonably satisfactory that the taxes are paid by the borrower no later than the date that is 10 days prior to the date such taxes would be delinquent; provided that the borrower is not required to make any such monthly tax deposits prior to the payment date in November 2018.
Insurance Escrows - The requirement for the borrower to make deposits into the insurance escrow is waived so long as (i) no event of default has occurred and is continuing, and (ii) the borrower provides satisfactory evidence that (a) the property is insured under a blanket insurance policy in accordance with the loan documents or (b) the property is insured in accordance with the loan documents by one or more insurance policies provided by Bottega Veneta; provided that the borrower is not required to make any such monthly insurance deposits prior to the payment date in November 2018.
THE INFORMATION IN THIS STRUCTURAL AND COLLATERAL TERM SHEET IS NOT COMPLETE AND MAY BE AMENDED PRIOR TO THE TIME OF SALE. THIS TERM SHEET IS NOT AN OFFER TO SELL THESE SECURITIES AND IT IS NOT A SOLICITATION OF AN OFFER TO BUY THESE SECURITIES IN ANY JURISDICTION WHERE THE OFFER OR SALE IS NOT PERMITTED.
| 71 of 151 |
| Structural and Collateral Term Sheet | JPMCC 2017-JP6 |
| 740 Madison |
Lockbox / Cash Management.The 740 Madison Whole Loan is structured with a springing lockbox and springing cash management. Upon the earlier to occur of (i) September 1, 2018 and (ii) 10 business days following the occurrence of a Cash Sweep Event (the “Lockbox Account Opening Date”), the borrower will be required to establish and maintain the lockbox account. On or prior to the Lockbox Account Opening Date, the borrower will be required to send or cause the property manager to send tenant direction letters instructing all tenants to deposit all rents and payments directly into the lender-controlled lockbox account. All funds in the lockbox account will be required to be swept each business day into the borrower’s operating account, unless a Cash Sweep Event has occurred and is continuing, in which case such funds are required to be swept each business day into a lender-controlled cash management account and disbursed on each payment date in accordance with the loan documents. Except as described in the“The Loan” above, upon the occurrence and during the continuance of a Cash Sweep Event, all funds deposited in the cash management account after payment of debt service, required reserves and budgeted operating expenses are required to be deposited into the excess cash flow subaccount and held as additional security for the loan. The lender has been granted a first priority security interest in the cash management account.
A “Cash Sweep Event” means the occurrence of one or more of the following: (i) an event of default, (ii) any bankruptcy or insolvency action of the borrower or the property manager, (iii) a Bottega Lease Trigger Event (as defined below) or (iv) an ARD Trigger Event (as defined below).
A Cash Sweep Event may be cured by (a) with respect to clause (i) above, a cure or waiver of such event of default, (b) with respect to clause (ii) above, only with respect only to a bankruptcy or insolvency action of the property manager, the lender replacing such property manager with a qualified manager under a replacement management agreement or (c) with respect to clause (iii) above, the occurrence of a Bottega Lease Trigger Event Cure (as defined below) (each a “Cash Sweep Event Cure”). Each Cash Sweep Event Cure is also subject to the following conditions: (i) no event of default has occurred and is continuing, (ii) the borrower may cure a Cash Sweep Event no more than a total of two times in the aggregate during the term of the loan and (iii) the borrower pays all of the lender’s reasonable expenses incurred in connection with curing any Cash Sweep Event, including reasonable attorney’s fees and expenses. The borrower has no right to cure a Cash Sweep Event caused by a bankruptcy or insolvency action of the borrower or an ARD Trigger Event. Notwithstanding the foregoing, if a Cash Sweep Event is caused solely as a result of clause (ii) of the Bottega Lease Trigger Event definition below and the Bottega Veneta lease guarantor maintains an investment grade rating (i.e. at least “Baa3” for Moody’s, “BBB-“ for S&P and “BBB-“ for Fitch), such Cash Sweep Event will be deemed cured as of the payment date that is 36 months following the occurrence of such Cash Sweep Event provided, that (i) no other Cash Sweep Event has occurred and is continuing and (ii) such Cash Sweep Event is required to be reinstated during the 24 months prior to the Anticipated Repayment Date through the final maturity date.
An “ARD Trigger Event” means the 740 Madison Whole Loan has not been repaid in full pursuant to the terms of the loan documents on or before the payment date that is one month prior to the May 1, 2027 Anticipated Repayment Date.
A “Bottega Lease Trigger Event” means the occurrence of any of the following (i) Bottega Veneta being in default under the Bottega Veneta lease beyond any applicable notice and/or cure periods, (ii) Bottega Veneta or any other subsidiary of the Bottega Veneta lease guarantor failing to be in actual physical possession of all or a substantial part of its leased space and/or going dark in all or a substantial part of its leased space, (iii) Bottega Veneta giving written notice that it is terminating, canceling or surrendering all or any portion of the leased space, (iv) any termination or cancellation of the Bottega Veneta lease and/or the Bottega Veneta lease failing to be in full force and effect or (v) any bankruptcy or insolvency action of Bottega Veneta or the Bottega Veneta lease guarantor.
A “Bottega Lease Trigger Event Cure” means the occurrence of any of the following: (a) with respect to clause (i) above, Bottega Veneta or the Bottega Veneta lease guarantor, as applicable, has cured all defaults under the Bottega Veneta lease, (b) with respect to clause (ii) above, Bottega Veneta or any other subsidiary of the Bottega Veneta lease guarantor is in actual, physical possession of the leased space and is no longer dark, (c) with respect to clauses (iii) and (iv) above, Bottega Veneta has irrevocably revoked or rescinded all written termination or cancellation notices or otherwise has indicated its intention to not terminate, cancel or surrender the Bottega Veneta lease and re-affirmed the Bottega Veneta lease in writing as being in full force and effect, (d) with respect to clause (v) above, Bottega Veneta or the Bottega Veneta lease guarantor is no longer insolvent or subject to any bankruptcy action and has re-affirmed the Bottega Veneta lease or (e) replacement of Bottega Veneta with a replacement tenant pursuant to a lease approved by the lender and such tenant being in occupancy and paying full contractual rent.
THE INFORMATION IN THIS STRUCTURAL AND COLLATERAL TERM SHEET IS NOT COMPLETE AND MAY BE AMENDED PRIOR TO THE TIME OF SALE. THIS TERM SHEET IS NOT AN OFFER TO SELL THESE SECURITIES AND IT IS NOT A SOLICITATION OF AN OFFER TO BUY THESE SECURITIES IN ANY JURISDICTION WHERE THE OFFER OR SALE IS NOT PERMITTED.
| 72 of 151 |
| Structural and Collateral Term Sheet | JPMCC 2017-JP6 |
[THIS PAGE INTENTIONALLY LEFT BLANK]
THE INFORMATION IN THIS STRUCTURAL AND COLLATERAL TERM SHEET IS NOT COMPLETE AND MAY BE AMENDED PRIOR TO THE TIME OF SALE. THIS TERM SHEET IS NOT AN OFFER TO SELL THESE SECURITIES AND IT IS NOT A SOLICITATION OF AN OFFER TO BUY THESE SECURITIES IN ANY JURISDICTION WHERE THE OFFER OR SALE IS NOT PERMITTED.
| 73 of 151 |
| Structural and Collateral Term Sheet | JPMCC 2017-JP6 | |
| Diamond Hill Denver | ||
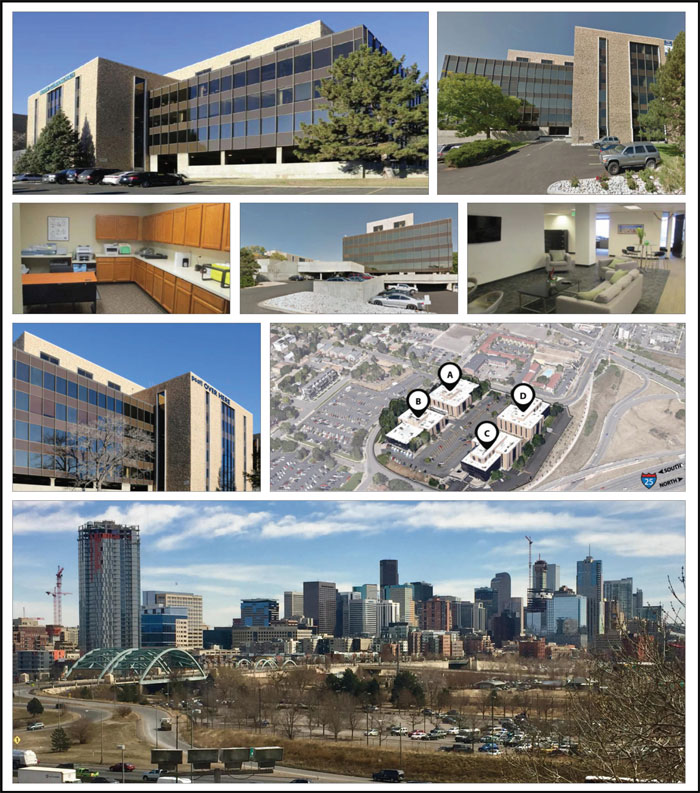
THE INFORMATION IN THIS STRUCTURAL AND COLLATERAL TERM SHEET IS NOT COMPLETE AND MAY BE AMENDED PRIOR TO THE TIME OF SALE. THIS TERM SHEET IS NOT AN OFFER TO SELL THESE SECURITIES AND IT IS NOT A SOLICITATION OF AN OFFER TO BUY THESE SECURITIES IN ANY JURISDICTION WHERE THE OFFER OR SALE IS NOT PERMITTED.
| 74 of 151 |
| Structural and Collateral Term Sheet | JPMCC 2017-JP6 | |
| Diamond Hill Denver | ||
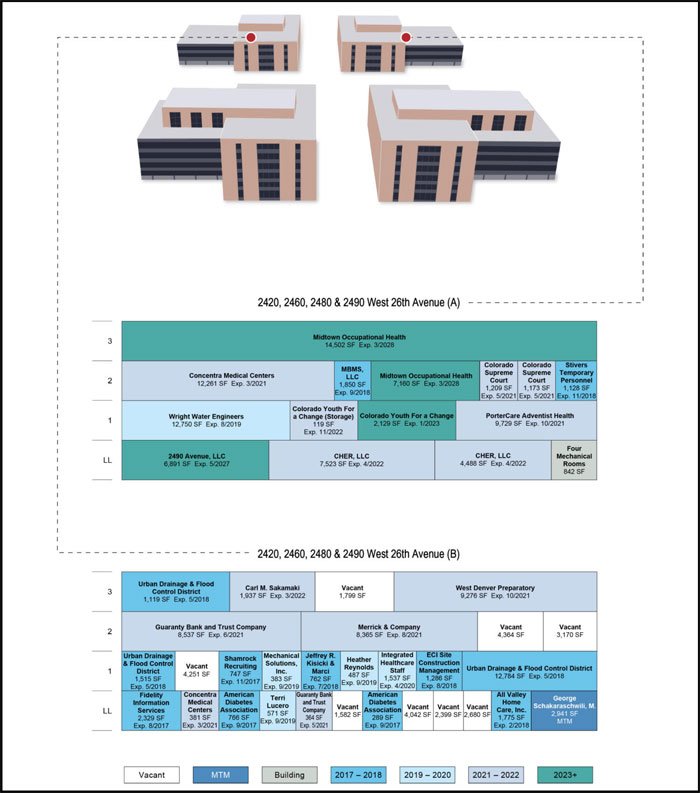
THE INFORMATION IN THIS STRUCTURAL AND COLLATERAL TERM SHEET IS NOT COMPLETE AND MAY BE AMENDED PRIOR TO THE TIME OF SALE. THIS TERM SHEET IS NOT AN OFFER TO SELL THESE SECURITIES AND IT IS NOT A SOLICITATION OF AN OFFER TO BUY THESE SECURITIES IN ANY JURISDICTION WHERE THE OFFER OR SALE IS NOT PERMITTED.
| 75 of 151 |
| Structural and Collateral Term Sheet | JPMCC 2017-JP6 | |
| Diamond Hill Denver | ||
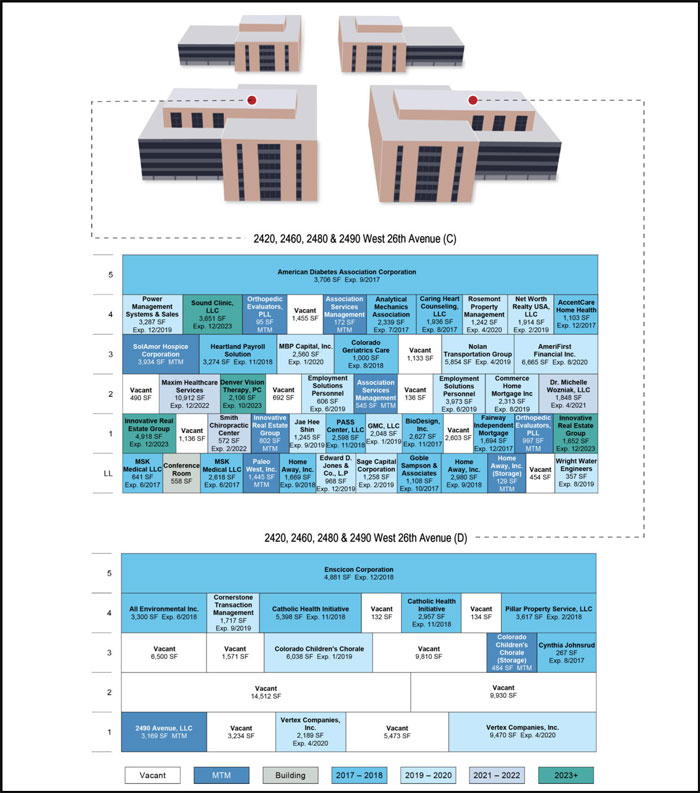
THE INFORMATION IN THIS STRUCTURAL AND COLLATERAL TERM SHEET IS NOT COMPLETE AND MAY BE AMENDED PRIOR TO THE TIME OF SALE. THIS TERM SHEET IS NOT AN OFFER TO SELL THESE SECURITIES AND IT IS NOT A SOLICITATION OF AN OFFER TO BUY THESE SECURITIES IN ANY JURISDICTION WHERE THE OFFER OR SALE IS NOT PERMITTED.
| 76 of 151 |
| Structural and Collateral Term Sheet | JPMCC 2017-JP6 | |
| Diamond Hill Denver | ||

THE INFORMATION IN THIS STRUCTURAL AND COLLATERAL TERM SHEET IS NOT COMPLETE AND MAY BE AMENDED PRIOR TO THE TIME OF SALE. THIS TERM SHEET IS NOT AN OFFER TO SELL THESE SECURITIES AND IT IS NOT A SOLICITATION OF AN OFFER TO BUY THESE SECURITIES IN ANY JURISDICTION WHERE THE OFFER OR SALE IS NOT PERMITTED.
| 77 of 151 |
| Structural and Collateral Term Sheet | JPMCC 2017-JP6 | |
| Diamond Hill Denver | ||
| Mortgage Loan Information | Property Information | |||
| Mortgage Loan Seller: | JPMCB | Single Asset / Portfolio: | Single Asset | |
| Original Principal Balance: | $32,000,000 | Title: | Fee | |
| Cut-off Date Principal Balance: | $32,000,000 | Property Type - Subtype: | Office – Suburban | |
| % of Pool by IPB: | 4.1% | Net Rentable Area (SF): | 374,137 | |
| Loan Purpose: | Refinance | Location: | Denver, CO | |
| Borrower: | Diamond Hill Operating LLC | Year Built / Renovated: | 1969-1973 / 2016 | |
| Sponsor: | Gemini-Rosemont Realty LLC | Occupancy: | 76.5% | |
| Interest Rate: | 5.14800% | Occupancy Date: | 3/3/2017 | |
| Note Date: | 3/20/2017 | Number of Tenants: | 68 | |
| Maturity Date: | 4/1/2022 | 2014 NOI: | $2,916,716 | |
| Interest-only Period: | 24 months | 2015 NOI(1): | $2,794,979 | |
| Original Term: | 60 months | 2016 NOI(1): | $3,279,149 | |
| Original Amortization: | 360 months | TTM NOI (as of 2/2017): | $3,319,789 | |
| Amortization Type: | IO-Balloon | UW Economic Occupancy: | 74.2% | |
| Call Protection: | L(24),Grtr1%orYM(11),O(25) | UW Revenues: | $6,444,581 | |
| Lockbox / Cash Management: | Hard / In Place | UW Expenses: | $3,056,508 | |
| Additional Debt: | N/A | UW NOI: | $3,388,073 | |
| Additional Debt Balance: | N/A | UW NCF: | $2,876,143 | |
| Additional Debt Type: | N/A | Appraised Value / Per SF(2): | $51,800,000 / $138 | |
| Appraisal Date: | 2/24/2017 | |||
| Escrows and Reserves(3) | Financial Information | |||||||
| Initial | Monthly | Initial Cap | Cut-off Date Loan / SF: | $86 | ||||
| Taxes: | $0 | $78,939 | N/A | Maturity Date Loan / SF: | $82 | |||
| Insurance: | $0 | Springing | N/A | Cut-off Date LTV(2): | 61.8% | |||
| Replacement Reserves: | $6,236 | $6,236 | N/A | Maturity Date LTV(2): | 59.1% | |||
| TI/LC: | $546,767 | $46,767 | N/A | UW NCF DSCR: | 1.37x | |||
| Other: | $615,520 | $0 | N/A | UW NOI Debt Yield: | 10.6% | |||
| Sources and Uses | ||||||
| Sources | Proceeds | % of Total | Uses | Proceeds | % of Total | |
| Mortgage Loan | $32,000,000 | 97.2% | Payoff Existing Debt | $30,774,621 | 93.5% | |
| Sponsor Equity | 922,018 | 2.8 | Upfront Reserves | 1,168,523 | 3.5 | |
| Closing Costs | 978,874 | 3.0 | ||||
| Total Sources | $32,922,018 | 100.0% | Total Uses | $32,922,018 | 100.0% | |
| (1) | The increase in 2016 NOI from 2015 NOI was primarily due to increased base rent of approximately $498,780 due to new and renewal leases executed at rents in excess of previously existing leases. |
| (2) | Appraised Value / Per SF, Cut-off Date LTV and Maturity Date LTV are calculated based on the “hypothetical as-is” value, which assumes that all deferred maintenance, as well as all outstanding tenant improvements, leasing commissions and free rent have been paid or escrowed at origination. At origination, the borrower reserved $376,875 for deferred maintenance, $188,558 for outstanding tenant improvements and leasing commissions and $50,087 for outstanding free rent obligations. The “as-is” value as of February 24, 2017 is $51.2 million, which results in a Cut-off Date LTV and Maturity Date LTV of 62.5% and 59.8%, respectively. |
| (3) | For a full description of Escrows and Reserves, please refer to “Escrows and Reserves” below. |
The Loan.The Diamond Hill Denver loan has an outstanding principal balance as of the Cut-off Date of $32.0 million and is secured by a first mortgage lien on the borrower’s fee interest in four four-story office buildings totaling 374,137 square feet, located in Denver, Colorado. The loan has a five-year term and, subsequent to a two-year interest-only period, will amortize on a 30-year schedule.
The Borrower. The borrowing entity for the Diamond Hill Denver loan is Diamond Hill Operating LLC, a Delaware limited liability company and special purpose entity.
THE INFORMATION IN THIS STRUCTURAL AND COLLATERAL TERM SHEET IS NOT COMPLETE AND MAY BE AMENDED PRIOR TO THE TIME OF SALE. THIS TERM SHEET IS NOT AN OFFER TO SELL THESE SECURITIES AND IT IS NOT A SOLICITATION OF AN OFFER TO BUY THESE SECURITIES IN ANY JURISDICTION WHERE THE OFFER OR SALE IS NOT PERMITTED.
| 78 of 151 |
| Structural and Collateral Term Sheet | JPMCC 2017-JP6 | |
| Diamond Hill Denver | ||
The Loan Sponsor. The loan sponsor and nonrecourse carve-out guarantor is Gemini-Rosemont Realty LLC (“Gemini Rosemont”), a fully integrated commercial property acquisition and asset management company operating in 20 states with a portfolio comprised of approximately 13.0 million square feet. Founded in 1992, Gemini Rosemont has completed transactions in excess of $2.5 billion to date. Gemini Rosemont’s operating experience has been developed through multiple real estate cycles with a focus on assets in certain secondary markets.
The loan sponsor acquired the property in 1994 for approximately $13.5 million (approximately $36.08 per square foot). Since acquisition, the loan sponsor has indicated that it invested approximately $11.3 million (approximately $30.20 per square foot) for a total cost basis in the property of approximately $24.8 million (approximately $66.29 per square foot).
The Property. The Diamond Hill Denver property is comprised of four four-story Class B office buildings (buildings A, B, C and D), totaling 374,137 square feet, situated on an approximately 10.5-acre site. The property was constructed in phases between 1969 and 1973 and most recently renovated in 2016. The most recent renovation at the property included improvements to the lobbies, roofs and parking surface with the loan sponsor having indicated that approximately $1.8 million in capital expenditures were spent in 2016. Other amenities at the property include an on-site deli, conference center, on-site management office and a 235-stall subterranean parking garage. Overall the property features 941 total parking spaces for a parking ratio of approximately 2.52 per 1,000 square feet. The property is located approximately 2.0 miles from the state capitol building and 1.7 miles from the Denver central business district, featuring skyline views of downtown Denver. The property’s central location and proximity to the downtown area is expected to attract prospective tenants. The loan sponsor has indicated that it believes this location has allowed for a strategic positioning of the asset as a cost-conscious alternative to the central business district, without fully sacrificing the benefits of a convenient urban location.
As of March 3, 2017, the property was 76.5% occupied by 68 tenants across 79 leases. The property features a granular tenant mix with no individual tenant accounting for more than 5.8% of the net rentable area at the property or 8.9% of the total underwritten base rent. Tenancy consists of a mix of both local and national companies and organizations from a range of industries including medical, finance and government, while the property has achieved an average occupancy over the preceding 10 years of approximately 88.3%. Of the currently vacant square footage at the property, approximately 58.3% is concentrated in building D. Upon relocating its corporate headquarters from Kansas, a large tenant, SCL Health Systems, vacated building D in 2015 as the property could not accommodate a space large enough for the 920 workers now located in Broomfield, Colorado. Building D is situated on the easternmost side of the property with unobstructed views of the Denver skyline. Building D also features a newly renovated lobby and is situated directly above the subterranean parking garage. The loan sponsor has opted to relocate several tenants within the complex in hopes that a concentrated vacancy would allow for a re-positioning of building D as a premium option to the currently below market in-place rent at the property.
The largest tenant at the property, Midtown Occupational Health (“Midtown”), leases a total of 21,662 square feet (5.8% of net rentable area) and has occupied space at the property since April 2004. In October 2016, Midtown vacated its space in building D and relocated to building A (14,502 square feet), in addition to expanding its existing space (7,160 square feet), also in building A, thereby extending its lease through March 2028 for all spaces. Formed in 1982, Midtown is an occupational health clinic that focuses on work related injury care for Denver employers. Midtown accounts for approximately 8.9% of underwritten base rent and its lease contains no extension options. The second largest tenant at the property, Urban Drainage & Flood Control District (“UDFCD”), leases 15,418 square feet (4.1% of net rentable area) through May 2018 and has occupied its space since 1992. UDFCD was established by the Colorado Legislature in 1969 with the principal mandate of assisting local governments in the Denver metropolitan area with multi-jurisdictional drainage and flood control problems. UDFCD is responsible for an area of approximately 1,608 square miles and approximately 2.8 million residents, covering Denver, parts of six surrounding counties and all or parts of 33 incorporated cities and towns. UDFCD accounts for 4.7% of underwritten base rent and its lease contains no extension options. The third largest tenant, Wright Water Engineers (“WWE”), leases 13,107 square feet (3.5% of net rentable area) through August 2019 and has occupied its space since November 1991. WWE was founded by Kenneth Wright in 1961 to provide integrated water resource engineering services. WWE currently employs approximately 45 engineers, hydrologists, biologists, chemists, geologists and hydrogeologists across Colorado. WWE’s Denver location is the largest of three offices, with about 35 staff members operating on-site in various areas of integrated water resource management and design. WWE’s client base covers a range of users consisting of, among others industries, municipalities, developers and utilities. WWE accounts for approximately 5.2% of underwritten base rent and its lease contains no extension options.
THE INFORMATION IN THIS STRUCTURAL AND COLLATERAL TERM SHEET IS NOT COMPLETE AND MAY BE AMENDED PRIOR TO THE TIME OF SALE. THIS TERM SHEET IS NOT AN OFFER TO SELL THESE SECURITIES AND IT IS NOT A SOLICITATION OF AN OFFER TO BUY THESE SECURITIES IN ANY JURISDICTION WHERE THE OFFER OR SALE IS NOT PERMITTED.
| 79 of 151 |
| Structural and Collateral Term Sheet | JPMCC 2017-JP6 | |
| Diamond Hill Denver | ||
The property is located on 26th Avenue and adjacent to Interstate-25, providing access to downtown Denver approximately 1.7 miles south of the property. Additionally, the property is 0.7 miles west of Union Station, providing access to Denver International Airport approximately 24.0 miles northeast of the property. Other demand drivers in close proximity include the University of Colorado Denver (1.0 mile), the Colorado Convention Center (1.3 miles) and professional sporting venues including Sports Authority Field at Mile High, Coors Field and Pepsi Center, all within one mile of the property. The Denver metropolitan statistical area is the 19th most populous metropolitan area in the United States and has demonstrated an average annual population increase of 1.8% dating back to 2010. Local industries include energy, aerospace, transportation and information systems, while, per the appraisal, white-collar services have been the backbone of the Denver economy, supplying well-paying jobs and drawing new workers to the metro area.
According to the appraisal, the property is located in the West submarket, a part of the broader Denver market; however, the appraisal notes that the property is more directly impacted by the dynamics of the Downtown submarket, given its proximity to the downtown area. Further, according to the appraisal, the property is well positioned to offer a lower cost alternative to tenants seeking space near the central business district at a significantly reduced rental rate relative to comparable Class B/C downtown product. As of the fourth quarter of 2016, the West submarket consisted of approximately 7.2 million square feet of office space with an overall vacancy rate of 16.4% and average lease rates of approximately $21.36 per square foot, representing an approximately 5.3% increase over the 2015 lease rate. At a more granular level, the West Class B submarket consisted of approximately 2.4 million square feet with an overall vacancy rate of 22.6% and average lease rates of $20.88 per square foot. The appraisal identified seven directly comparable office properties built between 1903 and 1987 and ranging in size from 118,384 to 502,429 square feet. Occupancies at the comparable properties ranged from 84.0% to 98.0% with a weighted average occupancy of 91.8%. Recently quoted rental rates for the comparable office properties ranged from $23.00 per square foot to $28.50 per square foot, with a weighted average of $26.50 per square foot, while recently executed leases ranged from $15.00 per square foot triple net ($25.20 per square foot on a corresponding gross basis) to $29.00 per square foot. The weighted average underwritten office rent for the Diamond Hill Denver property is $20.85 per square foot, which is below the appraisal’s concluded market rent of $24.00 per square foot for office space at the property.
| Historical and Current Occupancy(1) | |||
| 2014(2) | 2015(2) | 2016 | Current(3) |
| 90.6% | 77.8% | 79.2% | 76.5% |
| (1) | Historical Occupancies are as of December 31 of each respective year. |
| (2) | The decrease in occupancy from 2014 to 2015 is primarily the result of SCL Health Systems vacating its space in 2015. After relocating its corporate headquarters from Kansas to Colorado, SCL Health Systems required a larger space capable of accommodating approximately 920 workers, which the Diamond Hill Denver property could not accommodate. |
| (3) | Current Occupancy is based on the underwritten rent roll as of March 3, 2017. |
| Tenant Summary(1) | ||||||
| Tenant | Ratings Moody’s/S&P/Fitch | Net Rentable Area (SF) | % of Total NRA | Base Rent PSF | % of Total Base Rent | Lease Expiration Date |
| Midtown Occupational Health | NA / NA / NA | 21,662 | 5.8% | $24.00 | 8.9% | 3/31/2028 |
| Urban Drainage & Flood Control District | NA / NA / NA | 15,418 | 4.1% | $18.00 | 4.7% | 5/31/2018 |
| Wright Water Engineers | NA / NA / NA | 13,107 | 3.5% | $23.06 | 5.2% | 8/31/2019 |
| Concentra Medical Centers | NA / NA / NA | 12,642 | 3.4% | $23.98 | 5.2% | 3/31/2021 |
| CHER, LLC | NA / NA / NA | 12,011 | 3.2% | $17.12 | 3.5% | 4/30/2022 |
| Vertex Companies, Inc. | NA / NA / NA | 11,659 | 3.1% | $22.00 | 4.4% | 4/30/2020 |
| Maxim Healthcare Services | NA / NA / NA | 10,912 | 2.9% | $22.50 | 4.2% | 12/31/2022 |
| 2490 Avenue, LLC(2) | NA / NA / NA | 10,060 | 2.7% | $19.88 | 3.4% | Various |
| PorterCare Adventist Health | NA / NA / NA | 9,729 | 2.6% | $21.50 | 3.6% | 10/31/2021 |
| West Denver Preparatory | NA / NA / NA | 9,276 | 2.5% | $20.00 | 3.2% | 10/31/2021 |
| (1) | Based on the underwritten rent roll dated as of March 3, 2017. |
| (2) | 2490 Avenue, LLC leases 6,891 square feet through May 2027, in addition to 3,169 square feet on a month-to-month basis. |
THE INFORMATION IN THIS STRUCTURAL AND COLLATERAL TERM SHEET IS NOT COMPLETE AND MAY BE AMENDED PRIOR TO THE TIME OF SALE. THIS TERM SHEET IS NOT AN OFFER TO SELL THESE SECURITIES AND IT IS NOT A SOLICITATION OF AN OFFER TO BUY THESE SECURITIES IN ANY JURISDICTION WHERE THE OFFER OR SALE IS NOT PERMITTED.
| 80 of 151 |
| Structural and Collateral Term Sheet | JPMCC 2017-JP6 | |
| Diamond Hill Denver | ||
| Lease Rollover Schedule(1)(2) | |||||||||
| Year | Number of Leases Expiring | Net Rentable Area Expiring | % of NRA Expiring | Base Rent Expiring | % of Base Rent Expiring | Cumulative Net Rentable Area Expiring | Cumulative % of NRA Expiring | Cumulative Base Rent Expiring | Cumulative % of Base Rent Expiring |
| Vacant | NAP | 88,037 | 23.5% | NAP | NAP | 88,037 | 23.5% | NAP | NAP |
| 2017 & MTM | 21 | 37,264 | 10.0% | $662,398 | 11.3% | 125,301 | 33.5% | $662,398 | 11.3% |
| 2018 | 14 | 53,893 | 14.4% | 1,049,175 | 17.9% | 179,194 | 47.9% | $1,711,574 | 29.2% |
| 2019 | 15 | 45,769 | 12.2% | 966,108 | 16.5% | 224,963 | 60.1% | $2,677,681 | 45.6% |
| 2020 | 5 | 23,663 | 6.3% | 501,474 | 8.5% | 248,626 | 66.5% | $3,179,155 | 54.2% |
| 2021 | 8 | 52,762 | 14.1% | 1,174,879 | 20.0% | 301,388 | 80.6% | $4,354,034 | 74.2% |
| 2022 | 5 | 25,551 | 6.8% | 499,673 | 8.5% | 326,939 | 87.4% | $4,853,707 | 82.7% |
| 2023 | 3 | 14,456 | 3.9% | 320,920 | 5.5% | 341,395 | 91.2% | $5,174,627 | 88.2% |
| 2024 | 0 | 0 | 0.0% | 0 | 0.0% | 341,395 | 91.2% | $5,174,627 | 88.2% |
| 2025 | 0 | 0 | 0.0% | 0 | 0.0% | 341,395 | 91.2% | $5,174,627 | 88.2% |
| 2026 | 0 | 0 | 0.0% | 0 | 0.0% | 341,395 | 91.2% | $5,174,627 | 88.2% |
| 2027 | 1 | 6,891 | 1.8% | 172,275 | 2.9% | 348,286 | 93.1% | $5,346,902 | 91.1% |
| 2028 & Beyond(3) | 7 | 25,851 | 6.9% | 520,488 | 8.9% | 374,137 | 100.0% | $5,867,390 | 100.0% |
| Total | 79 | 374,137 | 100.0% | $5,867,390 | 100.0% | ||||
| (1) | Based on the underwritten rent roll dated as of March 3, 2017. |
| (2) | Certain tenants may have termination or contraction options (which may become exercisable prior to the originally stated expiration date of the tenant lease) that are not considered in the above Lease Rollover Schedule. |
| (3) | 2028 & Beyond is inclusive of (i) 4,189 square feet associated with building amenities with no attributable underwritten base rent and (ii) $600 in underwritten base rent attributable to a UPS drop box in the building lobby. |
| Operating History and Underwritten Net Cash Flow | |||||||
2014 | 2015 | 2016 | TTM(1) | Underwritten | Per Square Foot | %(2) | |
| Rents in Place(3) | $5,621,136 | $5,177,065 | $5,675,845 | $5,773,644 | $5,867,390 | $15.68 | 67.7% |
| Vacant Income | 0 | 0 | 0 | 0 | 2,043,208 | 5.46 | 23.6% |
| Gross Potential Rent | $5,621,136 | $5,177,065 | $5,675,845 | $5,773,644 | $7,910,598 | $21.14 | 91.2% |
| Parking Garage Income | 78,465 | 72,507 | 71,373 | 69,465 | 96,228 | 0.26 | 1.1% |
| Total Reimbursements | 154,475 | 527,182 | 538,328 | 531,840 | 663,828 | 1.77 | 7.7% |
| Net Rental Income | $5,854,076 | $5,776,754 | $6,285,546 | $6,374,950 | $8,670,653 | $23.18 | 100.0% |
| (Vacancy/Credit Loss) | 0 | 0 | 0 | 0 | (2,239,521) | (5.99) | (25.8) |
| Other Income | 592 | 13,907 | 18,952 | 16,325 | 13,449 | 0.04 | 0.2% |
| Effective Gross Income | $5,854,668 | $5,790,661 | $6,304,497 | $6,391,274 | $6,444,581 | $17.23 | 74.3% |
| Total Expenses | $2,937,952 | $2,995,682 | $3,025,349 | $3,071,486 | $3,056,508 | $8.17 | 47.4% |
| Net Operating Income(4) | $2,916,716 | $2,794,979 | $3,279,149 | $3,319,789 | $3,388,073 | $9.06 | 52.6% |
| Total TI/LC, Capex/RR | 0 | 0 | 0 | 0 | 511,930 | 1.37 | 7.9% |
| Net Cash Flow | $2,916,716 | $2,794,979 | $3,279,149 | $3,319,789 | $2,876,143 | $7.69 | 44.6% |
| (1) | TTM represents the trailing 12-month period ending February 28, 2017. |
| (2) | % column represents percent of Net Rental Income for all revenue lines and represents percent of Effective Gross Income for the remainder of fields. |
| (3) | Underwritten Rents in Place is inclusive of contractual rent steps through March 2018. |
| (4) | The increase in 2016 Net Operating Income from 2015 Net Operating Income was primarily due to increased rental revenue of approximately $498,780 due to new and renewal leases executed at rents in excess of previously existing leases. |
Property Management. The property is subject to a management agreement with Gemini Rosemont Property Management of Denver LLC, a New Mexico limited liability company and an affiliate of the loan sponsor. There is also a leasing agreement in place between the borrower and Jones Lang LaSalle Brokerage, Inc., an unaffiliated Texas corporation.
THE INFORMATION IN THIS STRUCTURAL AND COLLATERAL TERM SHEET IS NOT COMPLETE AND MAY BE AMENDED PRIOR TO THE TIME OF SALE. THIS TERM SHEET IS NOT AN OFFER TO SELL THESE SECURITIES AND IT IS NOT A SOLICITATION OF AN OFFER TO BUY THESE SECURITIES IN ANY JURISDICTION WHERE THE OFFER OR SALE IS NOT PERMITTED.
| 81 of 151 |
| Structural and Collateral Term Sheet | JPMCC 2017-JP6 | |
| Diamond Hill Denver | ||
Escrows and Reserves. At origination, the borrower deposited into escrow $546,767 for tenant improvements and leasing commissions, $376,875 for deferred maintenance, $188,558 for outstanding tenant improvements associated with four tenants, $50,087 for outstanding free rent obligations associated with two tenants and $6,236 for replacement reserves.
Tax Escrows- On a monthly basis, the borrower is required to escrow 1/12 of the annual estimated tax payments, which currently equates to $78,939.
Insurance Escrows– The requirement for the borrower to make deposits to the insurance escrow is waived so long as (i) no event of default has occurred and is continuing and (ii) the borrower provides satisfactory evidence that the property is insured as part of a blanket policy in accordance with the loan documents.
Replacement Reserves- On a monthly basis, the borrower is required to escrow $6,236 (approximately $0.20 per square foot annually) for replacement reserves.
TI/LC Reserves- On a monthly basis, the borrower is required to deposit $46,767 (approximately $1.50 per square foot annually) for tenant improvements and leasing commission reserves.
Lockbox / Cash Management.The loan is structured with a hard lockbox and in-place cash management. The borrower and property manager were required at origination to deliver tenant direction letters to all tenants instructing them to deposit all rents and payments directly into the lender-controlled lockbox account. All funds in the lockbox account are required to be swept each business day to a lender-controlled cash management account and disbursed on each payment date during the term of the loan in accordance with the loan documents. To the extent there is a Cash Sweep Event (as defined below) continuing, all excess cash flow after payment of debt service, required reserves and operating expenses on deposit in the cash management account is required to be held in the excess cash flow subaccount. The lender has been granted a first priority security interest in the cash management account.
A “Cash Sweep Event” means the occurrence of (i) an event of default, (ii) a bankruptcy or insolvency action of the borrower or property manager or (iii) the date on which the debt service coverage ratio (as calculated in the loan documents), based on the trailing 12-months, is less than 1.15x. A Cash Sweep Event may be cured by (a) with respect to clause (i) above, a cure of the related event of default, (b) with respect to clause (ii) above solely with respect to the property manager, if the borrower replaces the manager with a qualified manager under a replacement management agreement within 60 days or the dismissal of any such bankruptcy or insolvency action without any material adverse consequence to the Diamond Hill Denver loan or property (as reasonably determined by the lender) and (c) with respect to clause (iii) above, the achievement of a debt service coverage ratio based on the trailing 12-months equal to or greater than 1.20x for two consecutive calendar quarters. Notwithstanding the foregoing, (i) a Cash Sweep Event cure may occur no more than a total of four times in the aggregate during the term of the loan and (ii) a Cash Sweep Event may not be cured to the extent that such Cash Sweep Event exists as a result of a bankruptcy action of the borrower.
THE INFORMATION IN THIS STRUCTURAL AND COLLATERAL TERM SHEET IS NOT COMPLETE AND MAY BE AMENDED PRIOR TO THE TIME OF SALE. THIS TERM SHEET IS NOT AN OFFER TO SELL THESE SECURITIES AND IT IS NOT A SOLICITATION OF AN OFFER TO BUY THESE SECURITIES IN ANY JURISDICTION WHERE THE OFFER OR SALE IS NOT PERMITTED.
| 82 of 151 |
| Structural and Collateral Term Sheet | JPMCC 2017-JP6 |
[THIS PAGE INTENTIONALLY LEFT BLANK]
THE INFORMATION IN THIS STRUCTURAL AND COLLATERAL TERM SHEET IS NOT COMPLETE AND MAY BE AMENDED PRIOR TO THE TIME OF SALE. THIS TERM SHEET IS NOT AN OFFER TO SELL THESE SECURITIES AND IT IS NOT A SOLICITATION OF AN OFFER TO BUY THESE SECURITIES IN ANY JURISDICTION WHERE THE OFFER OR SALE IS NOT PERMITTED.
| 83 of 151 |
| Structural and Collateral Term Sheet | JPMCC 2017-JP6 | |
| Bingham Office Center | ||

THE INFORMATION IN THIS STRUCTURAL AND COLLATERAL TERM SHEET IS NOT COMPLETE AND MAY BE AMENDED PRIOR TO THE TIME OF SALE. THIS TERM SHEET IS NOT AN OFFER TO SELL THESE SECURITIES AND IT IS NOT A SOLICITATION OF AN OFFER TO BUY THESE SECURITIES IN ANY JURISDICTION WHERE THE OFFER OR SALE IS NOT PERMITTED.
| 84 of 151 |
| Structural and Collateral Term Sheet | JPMCC 2017-JP6 | |
| Bingham Office Center | ||
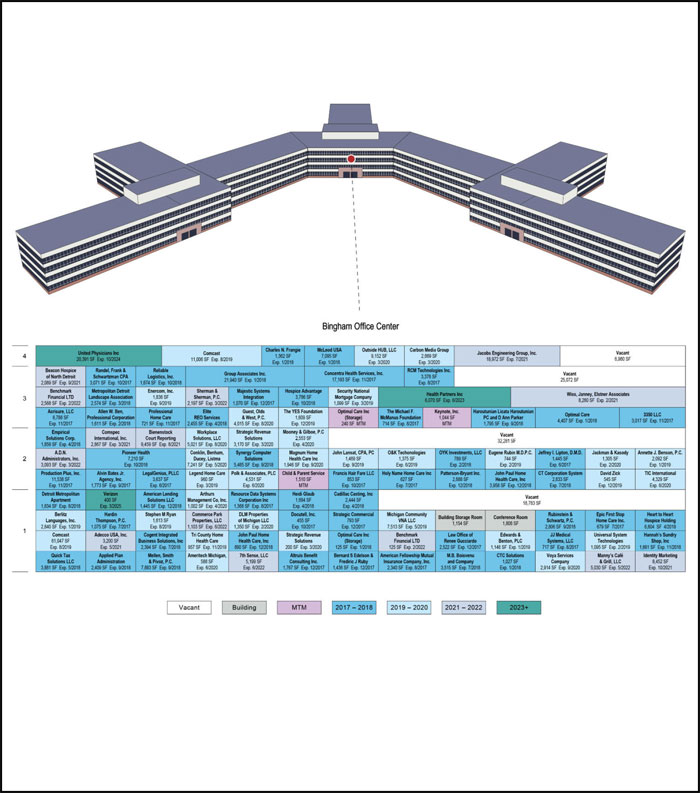
THE INFORMATION IN THIS STRUCTURAL AND COLLATERAL TERM SHEET IS NOT COMPLETE AND MAY BE AMENDED PRIOR TO THE TIME OF SALE. THIS TERM SHEET IS NOT AN OFFER TO SELL THESE SECURITIES AND IT IS NOT A SOLICITATION OF AN OFFER TO BUY THESE SECURITIES IN ANY JURISDICTION WHERE THE OFFER OR SALE IS NOT PERMITTED.
| 85 of 151 |
| Structural and Collateral Term Sheet | JPMCC 2017-JP6 | |
| Bingham Office Center | ||

THE INFORMATION IN THIS STRUCTURAL AND COLLATERAL TERM SHEET IS NOT COMPLETE AND MAY BE AMENDED PRIOR TO THE TIME OF SALE. THIS TERM SHEET IS NOT AN OFFER TO SELL THESE SECURITIES AND IT IS NOT A SOLICITATION OF AN OFFER TO BUY THESE SECURITIES IN ANY JURISDICTION WHERE THE OFFER OR SALE IS NOT PERMITTED.
| 86 of 151 |
| Structural and Collateral Term Sheet | JPMCC 2017-JP6 | |
| Bingham Office Center | ||
| Mortgage Loan Information | Property Information | |||
| Mortgage Loan Seller: | JPMCB | Single Asset / Portfolio: | Single Asset | |
| Original Principal Balance: | $31,000,000 | Title: | Fee | |
| Cut-off Date Principal Balance: | $31,000,000 | Property Type - Subtype: | Office – Suburban | |
| % of Pool by IPB: | 3.9% | Net Rentable Area (SF): | 522,379 | |
| Loan Purpose: | Refinance | Location: | Bingham Farms, MI | |
| Borrower: | Bingham Center Owner LLC | Year Built / Renovated: | 1974 / N/A | |
| Sponsor(1): | Farbman Group | Occupancy: | 84.1% | |
| Interest Rate: | 4.253871% | Occupancy Date: | 4/24/2017 | |
| Note Date: | 5/1/2017 | Number of Tenants: | 108 | |
| Maturity Date: | 5/1/2027 | 2014 NOI: | $3,544,747 | |
| Interest-only Period: | 12 months | 2015 NOI: | $3,632,584 | |
| Original Term: | 120 months | 2016 NOI: | $3,752,136 | |
| Original Amortization: | 360 months | TTM NOI (as of 3/2017)(2): | $3,879,529 | |
| Amortization Type: | IO-Balloon | UW Economic Occupancy: | 83.6% | |
| Call Protection: | L(25),Grtr1%orYM(91),O(4) | UW Revenues: | $7,251,878 | |
| Lockbox / Cash Management: | Hard / Springing | UW Expenses: | $3,017,488 | |
| Additional Debt: | Yes | UW NOI(2): | $4,234,390 | |
| Additional Debt Balance: | $8,000,000 | UW NCF: | $3,645,181 | |
| Additional Debt Type: | Mezzanine Loan | Appraised Value / Per SF: | $52,000,000 / $100 | |
| Appraisal Date: | 3/7/2017 | |||
| Escrows and Reserves(3) | Financial Information | |||||||
| Initial | Monthly | Initial Cap | Cut-off Date Loan / SF: | $59 | ||||
| Taxes: | $469,845 | $58,731 | N/A | Maturity Date Loan / SF: | $49 | |||
| Insurance: | $0 | Springing | N/A | Cut-off Date LTV: | 59.6% | |||
| Replacement Reserves: | $200,000 | $8,706 | N/A | Maturity Date LTV: | 49.2% | |||
| TI/LC: | $800,000 | $65,297 | $2,500,000 | UW NCF DSCR: | 1.99x | |||
| Other: | $305,292 | $0 | N/A | UW NOI Debt Yield: | 13.7% | |||
| Sources and Uses | |||||||
| Sources | Proceeds | % of Total | Uses | Proceeds | % of Total | ||
| Mortgage Loan | $31,000,000 | 70.6% | Payoff Existing Debt | $41,769,187 | 95.1% | ||
| Mezzanine Loan | 8,000,000 | 18.2% | Upfront Reserves | 1,775,137 | 4.0% | ||
| Sponsor Equity | 4,907,562 | 11.2% | Closing Costs | 363,238 | 0.8% | ||
| Total Sources | $43,907,562 | 100.0% | Total Uses | $43,907,562 | 100.0% | ||
| (1) | For a full description of Sponsor, please refer to “The Loan Sponsor” below. |
| (2) | The increase in UW NOI from TTM NOI is primarily driven by approximately $125,837 in underwritten contractual rent steps and approximately $112,178 in underwritten base rent related to three new leases executed in early 2017 at the property. |
| (3) | For a full description of Escrows and Reserves, please refer to“Escrows and Reserves”below. |
The Loan.The Bingham Office Center loan is secured by a first mortgage lien on the borrower’s fee interest in a 522,379 square foot three-building Class B office property located in Bingham Farms, Michigan. The Bingham Office Center loan has a 10-year term and, subsequent to a one-year interest-only period, will amortize on a 30-year schedule. The previously existing debt was securitized in the GSMS 2007-GG10 transaction.
The Borrower. The borrowing entity for the Bingham Office Center mortgage loan is Bingham Center Owner LLC, a Delaware limited liability company and special purpose entity.
THE INFORMATION IN THIS STRUCTURAL AND COLLATERAL TERM SHEET IS NOT COMPLETE AND MAY BE AMENDED PRIOR TO THE TIME OF SALE. THIS TERM SHEET IS NOT AN OFFER TO SELL THESE SECURITIES AND IT IS NOT A SOLICITATION OF AN OFFER TO BUY THESE SECURITIES IN ANY JURISDICTION WHERE THE OFFER OR SALE IS NOT PERMITTED.
| 87 of 151 |
| Structural and Collateral Term Sheet | JPMCC 2017-JP6 | |
| Bingham Office Center | ||
The Loan Sponsor.The nonrecourse carve-out guarantor is The Farbman Family #2, LLC, an affiliate of the loan sponsor, Farbman Group. Farbman Group is a full-service real estate company with development, management, brokerage and planning services. Headquartered in Southfield, Michigan, the company manages over 25.0 million square feet of office, retail, multifamily and industrial space throughout seven states in the Midwest. The company employs over 200 people with offices across Michigan, Ohio, Illinois and Florida.
The loan sponsor purchased the Bingham Office Center property in 2006 for approximately $38.5 million and has a total cost basis of approximately $43.1 million. Since 2015, the loan sponsor has invested approximately $327,000 (approximately $0.63 per square foot) in building and land improvements.
The Property.The Bingham Office Center property consists of three, four-story interconnected Class B office buildings comprising 522,379 square feet. The property was constructed in 1974 and is situated on an approximately 23.9 acre site. The property features a fully staffed on-site management team, 24/7 security card entry system and after hours security, full-service cafeteria, 1,800 square foot conference room and training center and a sundry shop. Additionally, the property was awarded Building Owners and Managers Association International (“BOMA”) recognition for buildings in its size category and location in 2013 and 2014. The BOMA award recognizes buildings that excel in both operations and management. The property features 1,621 surface parking spaces resulting in a parking ratio of approximately 3.1 spaces per 1,000 square feet of space. Access to the property is provided via Telegraph Road to the west.
As of April 24, 2017, the property was 84.1% occupied by 108 tenants. The largest tenant, Comcast, leases 72,053 square feet (13.8% of the net rentable area) through August 2019 and has been a tenant at the property since 2003. Comcast (NYSE: CMCSA) is a global media and technology company and is one of the nation’s largest providers of video, high-speed internet and phone service. Comcast accounts for approximately 18.0% of the underwritten base rent at the property and its lease does not contain any renewal options remaining. The second largest tenant, Group Associates Inc. (“Group Associates”), leases 21,940 square feet (4.2% of the net rentable area) through January 2018 and has been a tenant at the property since 2007. Group Associates is a provider of benefits administration services for employers throughout the United States and clients range from local employers to Fortune 500 companies. The property currently serves as the company’s headquarters. Group Associates accounts for approximately 5.4% of the underwritten base rent at the property and its lease does not contain any renewal options remaining. The third largest tenant, United Physicians Inc (“United Physicians”), leases 20,391 square feet (3.9% of the net rentable area) through October 2024 and has been a tenant at the property since 2014. United Physicians is one of Michigan’s largest physician organizations, representing more than 2,400 physicians with medical staff privileges at hospitals throughout Southeastern Michigan. United Physicians accounts for approximately 4.0% of the underwritten base rent at the property and its lease contains two remaining five-year extension options.
The property is located in Bingham Farms, Michigan within the Detroit-Warren-Dearborn metropolitan statistical area and is approximately 19.8 miles northwest of the Detroit central business district. The property benefits from its proximity to major roadways, including Interstate 696, which is located approximately 2.0 miles south of the property and provides access to the surrounding areas. Additionally, the property is located approximately 28.6 miles north of Detroit Metropolitan Wayne County Airport. The property also benefits from its proximity to several restaurants and food outlets, including Qdoba, Biggby Coffee and DiBella’s Subs, which are all located one block from the property. According to the appraisal, the estimated 2017 population within a one-, three- and five-mile radius is 5,136, 59,605 and 190,113, respectively, with a median household income of $84,423, $69,892 and $74,658, respectively.
According to the appraisal, the property is located in the North Southfield office submarket of the greater Detroit market. According to the appraisal, as of year-end 2016, the North Southfield office submarket consisted of 87 buildings totaling approximately 9.7 million square feet of office space with an overall vacancy rate of 30.0% and average rents of $19.49 per square foot. The appraisal identified five office properties as directly competitive with the Bingham Office Center property. The five properties were built between 1980 and 1986 and range in size from 154,063 square feet to 520,000 square feet. The competitive properties reported occupancies ranging from 61.4% to 93.0% with a weighted average of approximately 82.0%. Asking rents at the five competitive office properties ranged from $13.51 to $25.39 per square foot. Additionally, the appraisal identified four comparable office leases ranging in size from 8,300 square feet to 10,227 square feet and ranging in rent from $16.50 to $18.25 per square foot. The four comparable leases identified by the appraisal are leased at properties located within 17.0 miles of the Bingham Office Center property. Based on an analysis of the comparable leases identified, the appraisal concluded to office rents of $15.75 per square foot, which is in line with the Bingham Office Center property’s average rents of $15.18 per square foot. Additionally, the appraisal did not identify any new supply that is expected to directly compete with the property.
THE INFORMATION IN THIS STRUCTURAL AND COLLATERAL TERM SHEET IS NOT COMPLETE AND MAY BE AMENDED PRIOR TO THE TIME OF SALE. THIS TERM SHEET IS NOT AN OFFER TO SELL THESE SECURITIES AND IT IS NOT A SOLICITATION OF AN OFFER TO BUY THESE SECURITIES IN ANY JURISDICTION WHERE THE OFFER OR SALE IS NOT PERMITTED.
| 88 of 151 |
| Structural and Collateral Term Sheet | JPMCC 2017-JP6 | |
| Bingham Office Center | ||
| Historical and Current Occupancy(1) | |||
| 2014 | 2015 | 2016 | Current(2) |
| 78.7% | 73.3% | 81.6% | 84.1% |
| (1) | Historical Occupancies are as of December 31 of each respective year. |
| (2) | Current Occupancy is as of April 24, 2017. |
| Tenant Summary(1) | |||||||
| Tenant | Ratings(2) Moody’s/S&P/Fitch | Net Rentable Area (SF) | % of Total NRA | Base Rent PSF | % of Total Base Rent | Lease Expiration Date | |
| Comcast | A3 / A- / A- | 72,053 | 13.8% | $16.68 | 18.0% | 8/31/2019 | |
| Group Associates | NA / NA / NA | 21,940 | 4.2% | $16.41 | 5.4% | 1/31/2018 | |
| United Physicians(3) | NA / NA / NA | 20,391 | 3.9% | $12.92 | 4.0% | 10/31/2024 | |
| Jacobs Engineering Group, Inc.(4) | NA / NA / NA | 18,972 | 3.6% | $15.50 | 4.4% | 7/31/2021 | |
| Concentra Health Services, Inc. | NA / NA / NA | 17,193 | 3.3% | $17.10 | 4.4% | 11/30/2017 | |
| Production Plus, Inc. | NA / NA / NA | 11,538 | 2.2% | $14.22 | 2.5% | 11/30/2017 | |
| Bienenstock Court Reporting(5) | NA / NA / NA | 9,459 | 1.8% | $15.25 | 2.2% | 8/31/2021 | |
| Outdoor Hub, LLC(6) | NA / NA / NA | 9,152 | 1.8% | $11.67 | 1.6% | 3/31/2020 | |
| Identity Marketing | NA / NA / NA | 8,452 | 1.6% | $15.20 | 1.9% | 10/31/2021 | |
| Wiss, Janney, Elstner Associates | NA / NA / NA | 8,280 | 1.6% | $16.20 | 2.0% | 2/28/2021 | |
| (1) | Based on the underwritten rent roll dated April 24, 2017. |
| (2) | Ratings provided are for the parent company of the entity listed in the “Tenant” field whether or not the parent company guarantees the lease. |
| (3) | United Physicians has the right to terminate its lease at any time after March 31, 2019, with 12 months’ notice and the payment of a termination fee. |
| (4) | Jacobs Engineering Group, Inc. has the right to terminate its lease at any time after July 31, 2019 but before October 31, 2020, with nine months’ notice and the payment of a termination fee. |
| (5) | Bienenstock Court Reporting has a one-time right to terminate its lease as of August 31, 2019, with a six months’ notice and the payment of a termination fee. |
| (6) | Outdoor Hub, LLC has the right to terminate its lease at any time with 120 days’ notice. |
| Lease Rollover Schedule(1)(2) | |||||||||
| Year | Number of Leases Expiring | Net Rentable Area Expiring | % of NRA Expiring | Base Rent Expiring | % of Base Rent Expiring | Cumulative Net Rentable Area Expiring | Cumulative % of NRA Expiring | Cumulative Base Rent Expiring | Cumulative % of Base Rent Expiring |
| Vacant | NAP | 83,116 | 15.9% | NAP | NAP | 83,116 | 15.9% | NAP | NAP |
| 2017 & MTM | 29 | 71,771 | 13.7% | $1,128,178 | 16.9% | 154,887 | 29.7% | $1,128,178 | 16.9% |
| 2018 | 30 | 114,103 | 21.8% | 1,686,287 | 25.3% | 268,990 | 51.5% | $2,814,465 | 42.2% |
| 2019 | 17 | 98,946 | 18.9% | 1,623,913 | 24.3% | 367,936 | 70.4% | $4,438,378 | 66.6% |
| 2020 | 15 | 51,986 | 10.0% | 764,547 | 11.5% | 419,922 | 80.4% | $5,202,925 | 78.0% |
| 2021 | 7 | 53,319 | 10.2% | 833,443 | 12.5% | 473,241 | 90.6% | $6,036,367 | 90.5% |
| 2022 | 7 | 19,315 | 3.7% | 264,559 | 4.0% | 492,556 | 94.3% | $6,300,926 | 94.5% |
| 2023 | 1 | 6,070 | 1.2% | 91,050 | 1.4% | 498,626 | 95.5% | $6,391,976 | 95.8% |
| 2024 | 1 | 20,391 | 3.9% | 263,501 | 4.0% | 519,017 | 99.4% | $6,655,477 | 99.8% |
| 2025 | 1 | 400 | 0.1% | 13,656 | 0.2% | 519,417 | 99.4% | $6,669,133 | 100.0% |
| 2026 | 0 | 0 | 0.0% | 0 | 0.0% | 519,417 | 99.4% | $6,669,133 | 100.0% |
| 2027 | 0 | 0 | 0.0% | 0 | 0.0% | 519,417 | 99.4% | $6,669,133 | 100.0% |
| 2028 & Beyond(3) | 0 | 2,962 | 0.6% | 0 | 0.0% | 522,379 | 100.0% | $6,669,133 | 100.0% |
| Total | 108 | 522,379 | 100.0% | $6,669,133 | 100.0% | ||||
| (1) | Based on the underwritten rent roll dated April 24, 2017. |
| (2) | Certain tenants may have termination or contraction options (which may become exercisable prior to the originally stated expiration date of the tenant lease) that are not considered in the above Lease Rollover Schedule. |
| (3) | 2028 & Beyond is inclusive of a 1,154 square foot building storage room and 1,808 square foot conference room with no attributable underwritten base rent. |
THE INFORMATION IN THIS STRUCTURAL AND COLLATERAL TERM SHEET IS NOT COMPLETE AND MAY BE AMENDED PRIOR TO THE TIME OF SALE. THIS TERM SHEET IS NOT AN OFFER TO SELL THESE SECURITIES AND IT IS NOT A SOLICITATION OF AN OFFER TO BUY THESE SECURITIES IN ANY JURISDICTION WHERE THE OFFER OR SALE IS NOT PERMITTED.
| 89 of 151 |
| Structural and Collateral Term Sheet | JPMCC 2017-JP6 | |
| Bingham Office Center | ||
| Operating History and Underwritten Net Cash Flow | ||||||||
| 2014 | 2015 | 2016 | TTM(1) | Underwritten | Per Square Foot | %(2) | ||
| Rents in Place | $6,120,838 | $6,025,438 | $6,217,518 | $6,312,995 | $6,669,133 | $12.77 | 77.5% | |
| Vacant Income | 0 | 0 | 0 | 0 | 1,309,077 | 2.51 | 15.2% | |
| Gross Potential Rent | $6,120,838 | $6,025,438 | $6,217,518 | $6,312,995 | $7,978,210 | $15.27 | 92.7% | |
| Total Reimbursements | 547,553 | 491,416 | 459,290 | 521,986 | 624,446 | 1.20 | 7.3% | |
| Net Rental Income | $6,668,391 | $6,516,854 | $6,676,808 | $6,834,981 | $8,602,656 | $16.47 | 100.0% | |
| (Vacancy/Credit Loss) | 0 | 0 | 0 | 0 | (1,411,537) | (2.70) | (16.4)-- | |
| Other Income | 53,634 | 59,632 | 57,850 | 60,759 | 60,759 | 0.12 | 0.7% | |
| Effective Gross Income | $6,722,025 | $6,576,486 | $6,734,658 | $6,895,740 | $7,251,878 | $13.88 | 84.3% | |
| Total Expenses | $3,177,278 | $2,943,902 | $2,982,522 | $3,016,212 | $3,017,488 | $5.78 | 41.6% | |
| Net Operating Income(3) | $3,544,747 | $3,632,584 | $3,752,136 | $3,879,529 | $4,234,390 | $8.11 | 58.4% | |
| Total TI/LC, Capex/RR | 0 | 0 | 0 | 0 | 589,209 | 1.13 | 8.1% | |
| Net Cash Flow | $3,544,747 | $3,632,584 | $3,752,136 | $3,879,529 | $3,645,181 | $6.98 | 50.3% | |
| (1) | TTM represents the trailing 12-month period ended March 31, 2017. |
| (2) | % column represents percent of Net Rental Income for all revenue lines and represents percent of Effective Gross Income for the remainder of the fields. |
| (3) | The increase in Underwritten Net Operating Income from TTM Net Operating Income is primarily driven by approximately $125,837 in underwritten contractual rent steps and approximately $112,178 in underwritten base rent related to three new leases executed in early 2017 at the property. |
Property Management. The property is managed by Farbman Group IV, LLC, a Michigan limited liability company and an affiliate of the loan sponsor.
Escrows and Reserves. At origination, the borrower deposited into escrow $800,000 for future tenant improvements and leasing commissions, $469,845 for real estate taxes, $200,000 for replacement reserves, $176,839 for outstanding tenant improvements and leasing commissions related to eight tenants and $128,453 for free rent reserves related to five tenants.
Tax Escrows -On a monthly basis, the borrower is required to escrow 1/12 of the annual estimated tax payments, which currently equates to $58,731.
Insurance Escrows- The requirement for the borrower to make deposits to the insurance escrow is waived so long as (i) no event of default has occurred and is continuing and (ii) the borrower provides satisfactory evidence that the property is insured as part of a blanket policy in accordance with the loan documents.
Replacement Reserves - On a monthly basis, the borrower is required to escrow $8,706 (approximately $0.20 per square foot annually) for replacement reserves. The reserve is not subject to a cap.
TI/LC Reserve - On a monthly basis, the borrower is required to escrow $65,297 (approximately $1.50 per square foot annually) for future tenant improvements and leasing commissions. The reserve is capped at $2,500,000 (approximately $4.79 per square foot). The borrower is also required to deposit any termination fee or other consideration payable to the borrower in connection with any tenant’s election to exercise any early termination option contained in its respective lease or in connection with any other termination, amendment or modification of any lease, reduction of rents, shortening of the lease term or surrender of space, other than any termination fee in connection with the Comcast lease.
Comcast Reserve – During any Cash Sweep Event caused by a Comcast Trigger Event (each as defined below), all excess cash flow after payment of debt service, required reserves and operating expenses, together with any termination deposits received in connection with the Comcast lease, are required to be deposited into a tenant-specific reserve for tenant improvement and leasing commission obligations incurred with respect to the space leased by Comcast.
Lockbox / Cash Management.The Bingham Office Center loan is structured with a hard lockbox and springing cash management. At origination, the borrower was required to send tenant direction letters to all tenants at the property instructing them to deposit all rents and payments into the lender-controlled lockbox account. If there is no Cash Sweep Event in effect, all funds in the lockbox account are required to be transferred to or at the direction of the borrower. Upon the occurrence and during the continuance of a Cash Sweep Event, all funds in the lockbox account are required to be swept on each business day to a segregated cash management account under the control of the lender. The lender has been granted a first priority security interest in the cash management account.
THE INFORMATION IN THIS STRUCTURAL AND COLLATERAL TERM SHEET IS NOT COMPLETE AND MAY BE AMENDED PRIOR TO THE TIME OF SALE. THIS TERM SHEET IS NOT AN OFFER TO SELL THESE SECURITIES AND IT IS NOT A SOLICITATION OF AN OFFER TO BUY THESE SECURITIES IN ANY JURISDICTION WHERE THE OFFER OR SALE IS NOT PERMITTED.
| 90 of 151 |
| Structural and Collateral Term Sheet | JPMCC 2017-JP6 | |
| Bingham Office Center | ||
A “Cash Sweep Event” means the occurrence of (i) an event of default, (ii) any bankruptcy or insolvency action of the borrower or the property manager, (iii) the date on which the combined mortgage and mezzanine debt service coverage ratio (as calculated in the loan documents) falls below 1.20x based on the trailing three-month period immediately preceding the date of such determination or (iv) a Comcast Trigger Event.
A Cash Sweep Event may be cured by (a) with respect to clause (i) above, the lender has accepted a cure by the borrower of such event of default, (b) with respect to clause (ii) above, solely with respect to a bankruptcy or insolvency action of the property manager, if the borrower replaces the property manager within 60 days of such action, (c) with respect to clause (ii) above, solely with respect to an involuntary bankruptcy or insolvency action of the borrower, the guarantor or their affiliates that is not consented to or colluded in by such parties, if such action is discharged, stayed or dismissed within 60 days of the filing without any adverse consequences to the loan or the property, (d) with respect to clause (iii) above, the achievement of a combined mortgage and mezzanine debt service coverage ratio of at least 1.25x for two consecutive quarters based on the trailing three-month period immediately preceding the date of determination, and (e) with respect to clause (iv) above, the occurrence of a Comcast Trigger Event Cure (as defined below).
A “Comcast Trigger Event” means that 12 months prior to the expiration of the Comcast lease or any renewal of the lease, the borrower fails to either (i) renew 100% of the space demised by Comcast as of the origination date in accordance with the loan documents or (ii) renew at least 50% of the space demised to Comcast in accordance with the loan documents, provided that the combined mortgage and mezzanine debt service coverage ratio is greater than 1.25x based on the trailing three month period.
A “Comcast Trigger Event Cure” means the borrower’s satisfaction of any of the following: (i) the renewal of the Comcast lease or the execution and delivery of one or more replacement leases for 100% of the space leased to Comcast as of the origination date, all in accordance with the loan documents, (ii) the renewal of the Comcast lease, or the execution and delivery of one or more replacement leases, in each case for 50% of the space leased to Comcast as of the origination date, provided that the combined mortgage and mezzanine debt service coverage ratio is greater than 1.25x based on the trailing three-month period and the funds on deposit in the Comcast reserve equal or exceed an amount equal to the product of $10.00 multiplied by the square footage of the unleased space or (iii) the combined mortgage and mezzanine debt service coverage ratio is greater than 1.30x based on the trailing three-month period, provided that there are no free rent credit or outstanding tenant improvement obligations on the part of the borrower unless the borrower reserves for such amounts in accordance with the loan documents.
Partial Release.None.
Additional Debt.The $8.0 million mezzanine loan is secured by direct equity interests in the borrower and is coterminous with the Bingham Office Center loan. The mezzanine loan is currently held by JPMCB but is expected to be sold to one or more third party investors. The mezzanine loan has a 9.50000% coupon and will be interest-only for the term of the loan. Including the mezzanine loan, the cumulative Cut-off Date LTV, cumulative UW NCF DSCR and cumulative UW NOI Debt Yield are 75.0%, 1.40x and 10.9%, respectively. The mortgage and mezzanine lenders are negotiating an intercreditor agreement.
THE INFORMATION IN THIS STRUCTURAL AND COLLATERAL TERM SHEET IS NOT COMPLETE AND MAY BE AMENDED PRIOR TO THE TIME OF SALE. THIS TERM SHEET IS NOT AN OFFER TO SELL THESE SECURITIES AND IT IS NOT A SOLICITATION OF AN OFFER TO BUY THESE SECURITIES IN ANY JURISDICTION WHERE THE OFFER OR SALE IS NOT PERMITTED.
| 91 of 151 |
| Structural and Collateral Term Sheet | JPMCC 2017-JP6 | |
| 2950 North Hollywood Way | ||
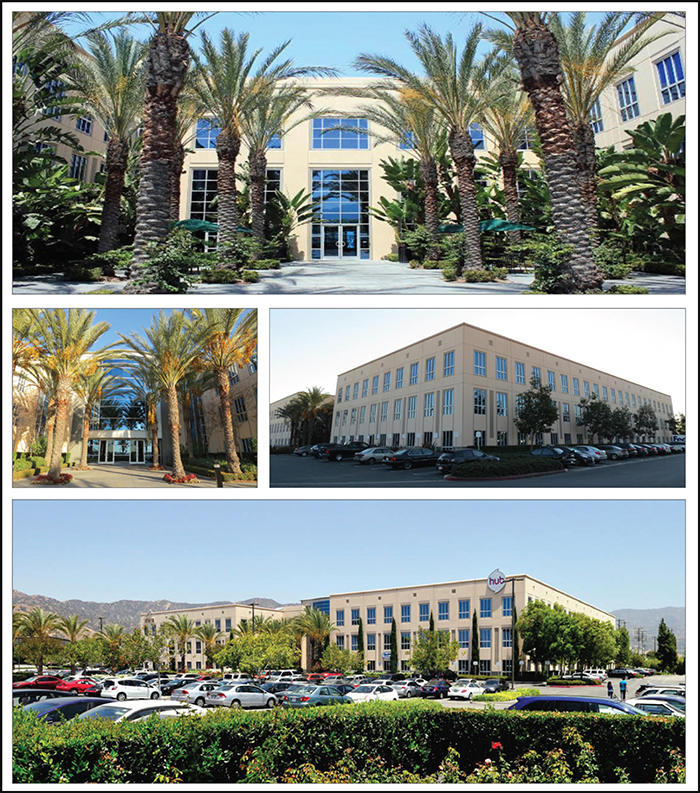
THE INFORMATION IN THIS STRUCTURAL AND COLLATERAL TERM SHEET IS NOT COMPLETE AND MAY BE AMENDED PRIOR TO THE TIME OF SALE. THIS TERM SHEET IS NOT AN OFFER TO SELL THESE SECURITIES AND IT IS NOT A SOLICITATION OF AN OFFER TO BUY THESE SECURITIES IN ANY JURISDICTION WHERE THE OFFER OR SALE IS NOT PERMITTED.
| 92 of 151 |
| Structural and Collateral Term Sheet | JPMCC 2017-JP6 | |
| 2950 North Hollywood Way | ||
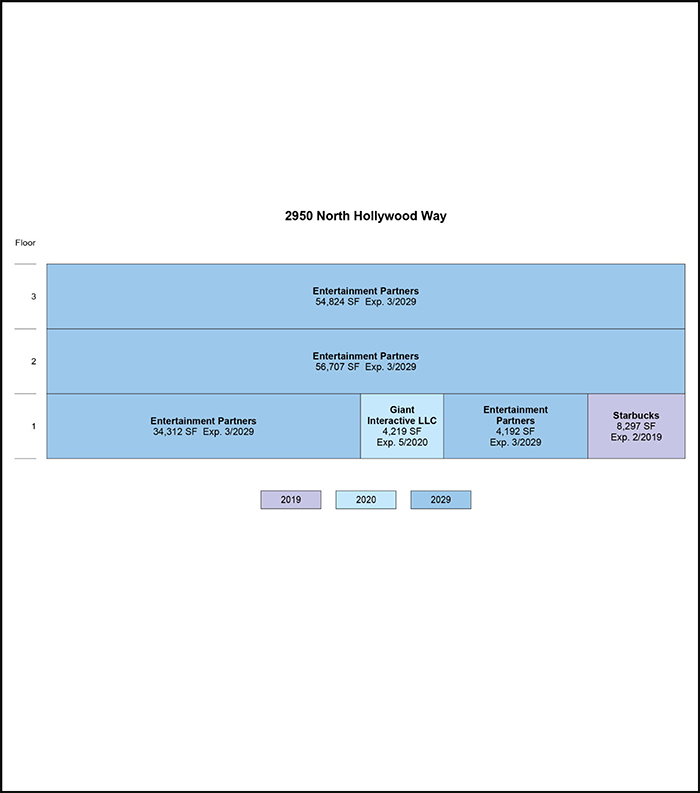
THE INFORMATION IN THIS STRUCTURAL AND COLLATERAL TERM SHEET IS NOT COMPLETE AND MAY BE AMENDED PRIOR TO THE TIME OF SALE. THIS TERM SHEET IS NOT AN OFFER TO SELL THESE SECURITIES AND IT IS NOT A SOLICITATION OF AN OFFER TO BUY THESE SECURITIES IN ANY JURISDICTION WHERE THE OFFER OR SALE IS NOT PERMITTED.
| 93 of 151 |
| Structural and Collateral Term Sheet | JPMCC 2017-JP6 | |
| 2950 North Hollywood Way | ||
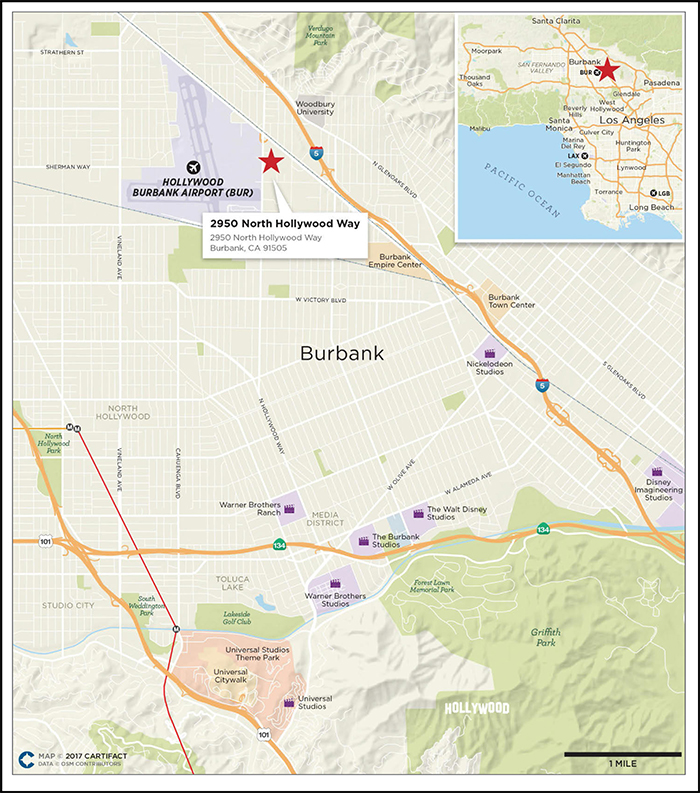
THE INFORMATION IN THIS STRUCTURAL AND COLLATERAL TERM SHEET IS NOT COMPLETE AND MAY BE AMENDED PRIOR TO THE TIME OF SALE. THIS TERM SHEET IS NOT AN OFFER TO SELL THESE SECURITIES AND IT IS NOT A SOLICITATION OF AN OFFER TO BUY THESE SECURITIES IN ANY JURISDICTION WHERE THE OFFER OR SALE IS NOT PERMITTED.
| 94 of 151 |
| Structural and Collateral Term Sheet | JPMCC 2017-JP6 | |
| 2950 North Hollywood Way | ||
| Mortgage Loan Information | Property Information | |||
| Mortgage Loan Seller: | JPMCB | Single Asset / Portfolio: | Single Asset | |
| Original Principal Balance: | $31,000,000 | Title: | Fee | |
| Cut-off Date Principal Balance: | $30,842,460 | Property Type - Subtype: | Office – Suburban | |
| % of Pool by IPB: | 3.9% | Net Rentable Area (SF): | 162,551 | |
| Loan Purpose: | Recapitalization | Location: | Burbank, CA | |
| Borrower: | Burbank Plaza Owner LLC | Year Built / Renovated: | 2001 / 2017 | |
| Sponsor: | Treeview Income Properties | Occupancy(1): | 100.0% | |
| Holdco LLC | Occupancy Date: | 4/7/2017 | ||
| Interest Rate: | 4.73200% | Number of Tenants(1): | 3 | |
| Note Date: | 1/27/2017 | 2014 NOI: | $3,404,658 | |
| Maturity Date: | 2/1/2027 | 2015 NOI(2): | $3,248,482 | |
| Interest-only Period: | None | 2016 NOI(2)(3): | $2,397,924 | |
| Original Term: | 120 months | TTM NOI: | N/A | |
| Original Amortization: | 360 months | UW Economic Occupancy: | 95.0% | |
| Amortization Type: | Balloon | UW Revenues: | $5,627,133 | |
| Call Protection: | L(28),Def(88),O(4) | UW Expenses: | $1,839,907 | |
| Lockbox / Cash Management: | Hard / Springing | UW NOI(3): | $3,787,226 | |
| Additional Debt: | N/A | UW NCF: | $3,409,792 | |
| Additional Debt Balance: | N/A | Appraised Value / Per SF(4): | $64,000,000 / $394 | |
| Additional Debt Type: | N/A | Appraisal Date: | 12/14/2016 | |
| Escrows and Reserves(5) | Financial Information | |||||||
| Initial | Monthly | Initial Cap | Cut-off Date Loan / SF: | $190 | ||||
| Taxes: | $227,454 | $45,491 | N/A | Maturity Date Loan / SF: | $155 | |||
| Insurance: | $0 | Springing | N/A | Cut-off Date LTV(4): | 48.2% | |||
| Replacement Reserves: | $0 | $2,083 | N/A | Maturity Date LTV(4): | 39.5% | |||
| TI/LC: | $0 | Springing | N/A | UW NCF DSCR: | 1.76x | |||
| Other: | $12,569,711 | $0 | N/A | UW NOI Debt Yield: | 12.3% | |||
| Sources and Uses(6) | ||||||
| Sources | Proceeds | % of Total | Uses | Proceeds | % of Total | |
| Mortgage Loan | $31,000,000 | 100.0% | Upfront Reserves | $12,797,165 | 41.3% | |
| Closing Costs | 305,287 | 1.0 | ||||
| Return of Equity(6) | 17,897,548 | 57.7 | ||||
| Total Sources | $31,000,000 | 100.0% | Total Uses | $31,000,000 | 100.0% | |
| (1) | The largest tenant, Entertainment Partners, has taken possession of 132,727 square feet, but is not yet in occupancy or paying rent with respect to this space. With respect to the remaining 17,308 square feet, Entertainment Partners has taken possession of its space pursuant to an assignment and assumption agreement with the prior tenant, PSI, and is required to pay rent through the June 2020 lease expiration date of the original PSI lease, as further described in“The Property” below. Entertainment Partners is currently building out its entire space, both directly leased and assigned, a portion of which is being funded by the tenant out-of-pocket, and has a free rent period through October 2017 with respect to the 132,727 square foot leased space. At origination, the borrower reserved approximately $12.6 million for outstanding obligations related to tenant improvements, leasing commissions and free rent through October 2017. |
| (2) | The decrease in 2016 NOI from 2015 NOI is primarily a result of the departure of two large tenants in 2016, Starz and Hasbro, though, as further detailed below, the loan sponsor was able to backfill the space via the Entertainment Partners lease executed in September 2016. |
| (3) | The increase in UW NOI from 2016 NOI is primarily a result of the anticipated burn-off of free rent associated with the Entertainment Partners lease. Subsequent to a free rent period with respect to the Directly Leased Space (as defined below) extending through October 2017 totaling approximately $2.7 million, Entertainment Partners is required to pay full contractual rent amounting to approximately $5.2 million annually. |
| (4) | Appraised Value / Per SF, Cut-off Date LTV and Maturity Date LTV are calculated based on the “hypothetical as if stabilized” value, which assumes that all lease-up costs have been incurred, including tenant improvements, leasing commissions and free rent. At origination, the borrower reserved approximately $9.3 million for outstanding tenant improvement and leasing commission obligations and approximately $3.3 million for outstanding free rent obligations. The “as is” value as of December 14, 2016 is $51.0 million, which results in a Cut-off Date LTV and Maturity Date LTV of 60.5% and 49.5%, respectively. Additionally, the appraisal concluded a “hypothetical – go dark” value of approximately $35.0 million, which assumes the property was 100.0% vacant and factors in market rent, downtime, expenses and lease-up costs. |
| (5) | For a full description of Escrows and Reserves, please refer to“Escrows and Reserves”below. |
| (6) | The property was previously unencumbered. In April 2016, the borrower repaid an outstanding CMBS loan secured by the property in the amount of $25.8 million. The prior debt was securitized in the JPMCC 2006-LDP6 transaction. Subsequent to executing a lease with Entertainment Partners for all vacant space, the loan sponsor refinanced the property in order to recoup a portion of the cash equity contributed in April 2016. |
THE INFORMATION IN THIS STRUCTURAL AND COLLATERAL TERM SHEET IS NOT COMPLETE AND MAY BE AMENDED PRIOR TO THE TIME OF SALE. THIS TERM SHEET IS NOT AN OFFER TO SELL THESE SECURITIES AND IT IS NOT A SOLICITATION OF AN OFFER TO BUY THESE SECURITIES IN ANY JURISDICTION WHERE THE OFFER OR SALE IS NOT PERMITTED.
| 95 of 151 |
| Structural and Collateral Term Sheet | JPMCC 2017-JP6 | |
| 2950 North Hollywood Way | ||
The Loan.The 2950 North Hollywood Way loan has an outstanding principal balance as of the Cut-off Date of approximately $30.8 million and is secured by a first mortgage lien on the borrower’s fee interest in a three-story, 162,551 square foot, Class B+ office building located in Burbank, California. The loan has a 10-year term and will amortize on a 30-year schedule. The previously existing debt, which the borrower repaid separate from this financing, was securitized in the JPMCC 2006-LDP6 transaction.
The Borrower. The borrowing entity for the 2950 North Hollywood Way loan is Burbank Plaza Owner LLC, a Delaware limited liability company and special purpose entity.
The Loan Sponsor.The loan sponsor and nonrecourse carve-out guarantor for the 2950 North Hollywood Way loan is Treeview Income Properties Holdco LLC, a Delaware limited liability company and an affiliate of Treeview Real Estate Advisors LP (“Treeview”). Treeview, formerly known as Interventure Advisors LP, is a privately owned independent advisory firm headquartered in New York City, providing full-service investment advisory, real estate portfolio and asset management services to high net worth individuals, families and other private investors. Treeview was founded in 2010 and currently manages a portfolio in excess of 10.0 million square feet of office, industrial and residential properties throughout the United States.
The 2950 North Hollywood Way property was initially purchased by the loan sponsor in 2006 at an estimated cost of $38.1 million (approximately $234 per square foot). Over the course of 2016, two major tenants, Starz and Hasbro, vacated their respective spaces, leaving the property 18.3% physically occupied; however, the loan sponsor backfilled the space signing a lease with Entertainment Partners in September 2016 encompassing the entirety of vacant space, as further described in “The Property” section below.
The Property.The 2950 North Hollywood Way property is a three-story, 162,551 square foot, Class B+ office building located in Burbank, California. The property was originally constructed in 2001 and is situated on an approximately 8.0 acre site. The property is located along North Hollywood Way, a primary local thoroughfare adjacent to Bob Hope Airport, and is within 12.0 miles of Downtown Los Angeles. The property features a two-story lobby atrium and 50,000+ square foot floorplates, which provide the large open design concept in demand among creative office space users. Additionally, the property contains 726 surface parking spaces resulting in a parking ratio of approximately 4.61 spaces per 1,000 square feet.
As of April 7, 2017, the property was 100.0% leased to three tenants. The largest tenant, GEP Administrative Services, Inc. (“Entertainment Partners”), leases a total of 150,035 square feet (92.3% of the net rentable area) through March 2029. With respect to 132,727 square feet (the “Directly Leased Space”), Entertainment Partners took possession of its space upon lease commencement in April 2017, but is not yet in occupancy or paying rent. With respect to 17,308 square feet (the “Assigned Space”), Entertainment Partners has taken possession of its space pursuant to an assignment and assumption agreement with the prior tenant, PSI, and is required to pay rent under the assigned lease (the “PSI Lease”) through June 2020. Upon expiration of the PSI Lease in June 2020, Entertainment Partners will lease the Assigned Space pursuant to its lease executed in September 2016 through the March 2029 lease expiration date. With respect only to the Assigned Space, Entertainment Partners will have a free rent period from July 2020 through February 2021, which was not reserved for at origination. According to the loan sponsor, Entertainment Partners is currently completing a tenant specific customization and buildout of its entire space, including both the Directly Leased Space and the Assigned Space, at an estimated cost of approximately $18.8 million ($126 per square foot). Of this amount, the loan sponsor has committed to pay approximately $7.9 million ($53 per square foot) in the form of a tenant improvement allowance, with the tenant coming out-of-pocket for the remaining budgeted amount. Upon completion, it is expected that the property will serve as Entertainment Partners’ corporate headquarters. Entertainment Partners has a free rent period with respect to the Directly Leased Space extending through October 2017, after which it is required to commence paying its full unabated contractual base rent of approximately $4.6 million annually ($34.80 per square foot) with annual rent increases of approximately 3.0%. At origination, the borrower reserved approximately $12.6 million for outstanding tenant improvement, leasing commission and free rent obligations through October 2017 associated with the Entertainment Partners lease. For the excess amount, funded out-of-pocket by the tenant, the tenant, pursuant to its lease, was required to obtain a bonded construction contract for the tenant’s portion of the build-out (which bond is conditioned on performance of the tenant’s payment and other obligations under the construction contract and compliance with the terms of the bond). Founded in 1976, Entertainment Partners is a 100.0% employee-owned service provider focusing exclusively on the entertainment industry. The company provides entertainment payroll, residuals, tax incentives, finance and other integrated production management solutions with over 900 employees, located throughout the United States, with offices in California, Florida, Georgia, Louisiana, New Mexico, New York and North Carolina. Entertainment Partners accounts for approximately 92.6% of underwritten base rent and its lease contains two five-year extension options. The second largest tenant, Starbucks, leases 8,297 square feet (5.1% of net rentable area) through February 2019 and has occupied its space since 2003. Starbucks houses its regional offices and training facilities at the property. Starbucks accounts for approximately 5.0% of underwritten base rent and its lease contains one remaining five-year extension option. The third largest tenant, Giant Interactive LLC (“Giant Interactive”), leases 4,219 square feet (2.6% of net rentable area) through May 2020 and has occupied its space since 2014. Giant Interactive is an award-winning digital studio, offering creative and technical production services for the entertainment, media and sports markets. Through offices in Burbank, New York and Denver, Giant Interactive services clients including HBO, Lionsgate, CBS and Warner Bros. Giant Interactive accounts for approximately 2.4% of underwritten base rent and its lease contains one remaining four-year extension option.
THE INFORMATION IN THIS STRUCTURAL AND COLLATERAL TERM SHEET IS NOT COMPLETE AND MAY BE AMENDED PRIOR TO THE TIME OF SALE. THIS TERM SHEET IS NOT AN OFFER TO SELL THESE SECURITIES AND IT IS NOT A SOLICITATION OF AN OFFER TO BUY THESE SECURITIES IN ANY JURISDICTION WHERE THE OFFER OR SALE IS NOT PERMITTED.
| 96 of 151 |
| Structural and Collateral Term Sheet | JPMCC 2017-JP6 | |
| 2950 North Hollywood Way | ||
The 2950 North Hollywood Way property is located in the northern portion of the city of Burbank, California, which, according to the appraisal, is often referred to as “the media capital of the world.” This description is based on a concentration of entertainment/media companies with a presence in the Burbank area, many of which are headquartered in Burbank. Companies with a substantial presence in the market include ABC Television, Cartoon Network, Clear Channel Communication, IDT Entertainment, NBC/Universal, Nickelodeon, Sony Pictures Digital, The Walt Disney Company, Warner Bros., Warner Music and Yahoo!. The aforementioned companies, among others, serve as primary demand drivers for related uses in tangential industries including special effects, production studios and post-production operations. According to the appraisal, there are currently over 700 media related businesses operating in the city of Burbank, supporting a nearly one to one ratio of employment to population. Additionally, the property is conveniently located within 5.0 miles of downtown Burbank and 12.0 miles from downtown Los Angeles, with direct access provided via the Golden State Freeway (Interstate 5). The property is also located within close proximity to major roadways including Ventura Freeway (State Highway 134) and Hollywood (170) Freeway. Access to public transit is provided via the Bob Hope Airport Metrolink station, located within one mile of the property, and the BurbankBus. These options connect the property to downtown Burbank as well as the greater Los Angeles area.
According to the appraisal, the property is located in the Burbank submarket, which for purposes of market reporting is considered a portion of the broader Tri-Cities/Glendale market of the greater Los Angeles County. According to the appraisal, as of the third quarter of 2016, the Tri-Cities/Glendale office market consisted of 224 buildings totaling approximately 27.0 million square feet with an overall vacancy rate of 12.1% and average asking rents of $33.60 per square foot. Also as of the third quarter of 2016, the Burbank office submarket consisted of 51 buildings totaling approximately 6.8 million square feet with an overall vacancy rate of 14.1% and average asking rents of $38.52 per square foot. The appraisal identified six comparable office properties in the Burbank submarket built between 1983 and 2002 and ranging in size from approximately 118,818 square feet to 488,362 square feet. Occupancies at the comparable properties ranged from 55.0% to 95.0% with a weighted average occupancy of 80.9%. Recently executed leases at the comparable office properties ranged from $30.60 per square foot to $43.20 per square foot with a weighted average of $39.65 per square foot based on the underlying square footage of each comparable property. The weighted average underwritten rent for the 2950 North Hollywood Way property is $34.35 per square foot, which is in-line with the appraisal’s concluded market rent of $34.80 per square foot for office space at the property.
| Historical and Current Occupancy(1) | |||
| 2014 | 2015 | 2016(2) | Current(3) |
| 100.0% | 100.0% | 18.3% | 100.0% |
| (1) | Historical Occupancies are as of December 31 of each respective year. |
| (2) | At year-end 2016, the property was 18.3% physically occupied; however, the loan sponsor had entered into a lease dated as of September 27, 2016 for 132,727 square feet with Entertainment Partners with a lease commencement date of April 1, 2017. |
| (3) | Current Occupancy is as of April 7, 2017. With respect to the Directly Leased Space, the largest tenant, Entertainment Partners, has taken possession of its space, but is not yet in occupancy or paying rent. With respect to the Assigned Space, Entertainment Partners, has taken possession of its space and is paying rent pursuant to the assigned PSI lease, but is not yet in occupancy. Entertainment Partners is currently building out its space, a portion of which is being funded by the tenant out-of-pocket, and has a free rent period through October 2017 with respect to the Directly Leased Space. At origination, the borrower reserved approximately $12.6 million for outstanding obligations related to tenant improvements, leasing commissions and free rent through October 2017. |
THE INFORMATION IN THIS STRUCTURAL AND COLLATERAL TERM SHEET IS NOT COMPLETE AND MAY BE AMENDED PRIOR TO THE TIME OF SALE. THIS TERM SHEET IS NOT AN OFFER TO SELL THESE SECURITIES AND IT IS NOT A SOLICITATION OF AN OFFER TO BUY THESE SECURITIES IN ANY JURISDICTION WHERE THE OFFER OR SALE IS NOT PERMITTED.
| 97 of 151 |
| Structural and Collateral Term Sheet | JPMCC 2017-JP6 | |
| 2950 North Hollywood Way | ||
| Tenant Summary(1) | ||||||
| Tenant | Ratings(2) Moody’s/S&P/Fitch | Net Rentable Area (SF) | % of Total NRA | Base Rent PSF | % of Total Base Rent | Lease Expiration Date |
| Entertainment Partners(3) | NA / NA / NA | 132,727 | 81.7% | $34.80 | 82.7% | 3/31/2029 |
| Entertainment Partners (Assigned from PSI)(4) | NA / NA / NA | 17,308 | 10.6% | $31.92 | 9.9% | 3/31/2029 |
| Starbucks | A2 / A / A | 8,297 | 5.1% | $33.72 | 5.0% | 2/28/2019 |
| Giant Interactive | NA / NA / NA | 4,219 | 2.6% | $31.47 | 2.4% | 5/31/2020 |
| (1) | Based on the underwritten rent roll dated April 7, 2017. |
| (2) | Ratings provided are for the parent company of the entity listed in the “Tenant” field whether or not the parent company guarantees the lease. |
| (3) | Entertainment Partners has taken possession of its space but is not yet is occupancy or paying rent. Entertainment Partners is currently building out its space, a portion of which is being funded by the tenant out-of-pocket, and has a free rent period through October 2017. At origination, the borrower reserved approximately $12.6 million for all outstanding obligations related to both tenant improvements, leasing commissions and free rent with respect to this space. |
| (4) | Entertainment Partners has taken possession of the PSI space pursuant to an assignment and assumption agreement with the former tenant. The former PSI space is currently being renovated by Entertainment Partners as described above. Entertainment Partners is required to pay rent on PSI space through the June 2020 expiration date of the original PSI lease. Beginning in July 2020, Entertainment Partners is required to lease this space pursuant to the Entertainment Partners lease, which extends through March 2029 with a free rent period through February 2021 for the Assigned Space, which was not reserved for at origination. |
| Lease Rollover Schedule(1)(2) | |||||||||
| Year | Number of Leases Expiring | Net Rentable Area Expiring | % of NRA Expiring | Base Rent Expiring | % of Base Rent Expiring | Cumulative Net Rentable Area Expiring | Cumulative % of NRA Expiring | Cumulative Base Rent Expiring | Cumulative % of Base Rent Expiring |
| Vacant | NAP | 0 | 0.0% | NAP | NAP | 0 | 0.0% | NAP | NAP |
| 2017 & MTM | 0 | 0 | 0.0 | $0 | 0.0% | 0 | 0.0% | $0 | 0.0% |
| 2018 | 0 | 0 | 0.0 | 0 | 0.0 | 0 | 0.0% | $0 | 0.0% |
| 2019 | 1 | 8,297 | 5.1 | 279,775 | 5.0 | 8,297 | 5.1% | $279,775 | 5.0% |
| 2020 | 1 | 4,219 | 2.6 | 132,774 | 2.4 | 12,516 | 7.7% | $412,549 | 7.4% |
| 2021 | 0 | 0 | 0.0 | 0 | 0.0 | 12,516 | 7.7% | $412,549 | 7.4% |
| 2022 | 0 | 0 | 0.0 | 0 | 0.0 | 12,516 | 7.7% | $412,549 | 7.4% |
| 2023 | 0 | 0 | 0.0 | 0 | 0.0 | 12,516 | 7.7% | $412,549 | 7.4% |
| 2024 | 0 | 0 | 0.0 | 0 | 0.0 | 12,516 | 7.7% | $412,549 | 7.4% |
| 2025 | 0 | 0 | 0.0 | 0 | 0.0 | 12,516 | 7.7% | $412,549 | 7.4% |
| 2026 | 0 | 0 | 0.0 | 0 | 0.0 | 12,516 | 7.7% | $412,549 | 7.4% |
| 2027 | 0 | 0 | 0.0 | 0 | 0.0 | 12,516 | 7.7% | $412,549 | 7.4% |
| 2028 & Beyond | 1 | 150,035 | 92.3 | 5,171,371 | 92.6 | 162,551 | 100.0% | $5,583,920 | 100.0% |
| Total | 3 | 162,551 | 100.0% | $5,583,920 | 100.0% | ||||
| (1) | Based on the underwritten rent roll dated April 7, 2017. |
| (2) | Certain tenants may have termination or contraction options (which may become exercisable prior to the originally stated expiration date of the tenant lease) that are not considered in the above Lease Rollover Schedule. |
THE INFORMATION IN THIS STRUCTURAL AND COLLATERAL TERM SHEET IS NOT COMPLETE AND MAY BE AMENDED PRIOR TO THE TIME OF SALE. THIS TERM SHEET IS NOT AN OFFER TO SELL THESE SECURITIES AND IT IS NOT A SOLICITATION OF AN OFFER TO BUY THESE SECURITIES IN ANY JURISDICTION WHERE THE OFFER OR SALE IS NOT PERMITTED.
| 98 of 151 |
| Structural and Collateral Term Sheet | JPMCC 2017-JP6 | |
| 2950 North Hollywood Way | ||
| Operating History and Underwritten Net Cash Flow | ||||||
| 2014 | 2015 | 2016 | Underwritten | Per Square Foot | %(1) | |
| Rents in Place(2) | $4,592,763 | $4,590,705 | $3,565,541 | $5,583,920 | $34.35 | 94.3% |
| Vacant Income | 0 | 0 | 0 | 0 | 0 | 0.0 |
| Gross Potential Rent | $4,592,763 | $4,590,705 | $3,565,541 | $5,583,920 | $34.35 | 94.3% |
| CAM Reimbursements | 184,784 | 174,748 | 285,974 | 39,378 | 0.24 | 0.7 |
| Parking Income | 327,603 | 263,809 | 166,430 | 300,000 | 1.85 | 5.1 |
| Net Rental Income | $5,105,150 | $5,029,262 | $4,017,945 | $5,923,298 | $36.44 | 100.0% |
| (Vacancy/Credit Loss) | 0 | 0 | 0 | (296,165) | (1.82) | (5.0) |
| Effective Gross Income | $5,105,150 | $5,029,262 | $4,017,945 | $5,627,133 | $34.62 | 95.0% |
| Total Expenses | $1,700,492 | $1,780,780 | $1,620,021 | $1,839,907 | $11.32 | 32.7% |
| Net Operating Income | $3,404,658 | $3,248,482 | $2,397,924 | $3,787,226 | $23.30 | 67.3% |
| Total TI/LC, Capex/RR | 0 | 0 | 0 | 377,434 | 2.32 | 6.7 |
| Net Cash Flow | $3,404,658 | $3,248,482 | $2,397,924 | $3,409,792 | $20.98 | 60.6% |
| (1) | % column represents percent of Net Rental Income for all revenue lines and represents percent of Effective Gross Income for the remainder of the fields. |
| (2) | The increase in Underwritten Rents in Place from 2016 Rents in Place is primarily a result of the anticipated burn-off of free rent associated with the Entertainment Partners lease. Subsequent to a free rent period with respected to the Directly Leased Space extending through October 2017 totaling approximately $2.7 million, Entertainment Partners is required to pay full contractual rent amounting to approximately $5.2 million annually. |
Property Management. The property is managed by Stream Realty Partners – Orange County, L.P., a Texas limited partnership and unaffiliated third party.
Escrows and Reserves. At origination, the borrower deposited into escrow $12,569,711 for outstanding obligations associated with the Entertainment Partners space ($9,314,933 related to outstanding tenant improvements and leasing commissions and $3,254,778 associated with outstanding free rent obligations on the Directly Leased Space) and $227,454 for real estate taxes.
Tax Escrows -On a monthly basis, the borrower is required to deposit 1/12 of the annual estimated tax payments, which currently equates to $45,491.
Insurance Escrows- The requirement for the borrower to make deposits to the insurance escrow is waived so long as (i) no event of default has occurred and is continuing and (ii) the borrower provides satisfactory evidence that the property is insured as part of a blanket policy in accordance with the loan documents.
Replacement Reserves - On a monthly basis, the borrower is required to escrow $2,083 (approximately $0.15 per square foot annually) for replacement reserves.
TI/LC Reserves - The requirement for the borrower to make deposits to the tenant improvements and leasing commissions reserve is waived so long as no Cash Sweep Event (as defined below) caused by a DSCR Trigger Event or Tenant Trigger Event (each as defined below) has occurred and is continuing. During a Cash Sweep Event caused by a Tenant Trigger Event, all excess cash flow is required to be deposited and held with the lender in accordance with the loan documents. The borrower is also required to deposit all lease termination fees into the tenant improvements and leasing commissions reserve.
Lockbox / Cash Management.The loan is structured with a hard lockbox and springing cash management. The borrower was required at origination to deliver tenant direction letters instructing all tenants to deposit all rents and payments directly into the lender-controlled lockbox account. All funds in the lockbox account are required to be swept each business day into the borrower’s operating account, unless a Cash Sweep Event has occurred and is continuing, in which case such funds are required to be swept each business day into a lender-controlled cash management account and disbursed on each payment date in accordance with the loan documents. Except as provided in “TI/LC Reserves” above, upon the occurrence and during the continuance of a Cash Sweep Event, all funds deposited into the cash management account after payment of debt service, required reserves and budgeted operating expenses are required to be deposited into the excess cash flow subaccount and held as additional security for the loan. The lender has been granted a first priority security interest in the cash management account.
THE INFORMATION IN THIS STRUCTURAL AND COLLATERAL TERM SHEET IS NOT COMPLETE AND MAY BE AMENDED PRIOR TO THE TIME OF SALE. THIS TERM SHEET IS NOT AN OFFER TO SELL THESE SECURITIES AND IT IS NOT A SOLICITATION OF AN OFFER TO BUY THESE SECURITIES IN ANY JURISDICTION WHERE THE OFFER OR SALE IS NOT PERMITTED.
| 99 of 151 |
| Structural and Collateral Term Sheet | JPMCC 2017-JP6 | |
| 2950 North Hollywood Way | ||
A “Cash Sweep Event” means the occurrence of (i) an event of default, (ii) any bankruptcy or insolvency action of the borrower or the property manager (unless, with respect to a bankruptcy or insolvency action of an unaffiliated property manager, the borrower replaces the manager with a qualified manager in accordance with the loan documents within 60 days following the borrower’s knowledge of the filing (which time period may be extended by an additional 30 days to the extent the borrower has diligently found an otherwise reasonably acceptable replacement manager and the failure to finalize such replacement is due solely to a delay in servicer approval or rating agency confirmation) or such bankruptcy filing is discharged or dismissed within 30 days of the date of filing), (iii) following April 1, 2018, the date on which the debt service coverage ratio (as calculated in the loan documents), based on the trailing three-month period, is less than 1.10x (a “DSCR Trigger Event”) or (iv) a Tenant Trigger Event.
A Cash Sweep Event may be cured by (a) with respect to clause (i) above, a cure of the related event of default, (b) with respect to clause (ii) above, only with respect to a bankruptcy or insolvency action of the borrower, if such bankruptcy is caused by a party filing an involuntary petition against the borrower and none of the borrower, guarantor or their affiliates has colluded with such party for any involuntary petition against the borrower, such bankruptcy action is dismissed within 90 days without any material adverse modifications to the terms of the loan documents, (c) with respect to clause (ii) above, only with respect to a bankruptcy or insolvency action of the property manager, the lender replacing such property manager with a qualified manager under a replacement management agreement, (d) with respect to clause (iii) above, the achievement of a debt service coverage ratio, based on the trailing three-month period, equal to or greater than 1.10x for one calendar quarter and (e) with respect to clause (iv) above, the occurrence of a Tenant Trigger Event Cure (as defined below) (each of the foregoing, a “Cash Sweep Event Cure”). Each Cash Sweep Event Cure is also subject to the following conditions: (1) no other event of default has occurred and is continuing under the loan documents, (2) a Cash Sweep Event Cure related to clauses (i) and (ii) above may occur no more than a total of two times during the term of the loan, (3) the borrower pays all of the lender’s reasonable out-of-pocket expenses incurred in connection with the Cash Sweep Event Cure; and (4) in no event will the borrower be permitted to cure a Cash Sweep Event associated with a voluntary or collusive involuntary bankruptcy or insolvency action of the borrower.
A “Tenant Trigger Event” means any one or more of the following: (i) following its initial occupancy, Entertainment Partners goes dark, vacates or abandons more than 50.0% of its leased space for a period of 120 consecutive days, unless such vacation or abandonment is the result of a casualty or condemnation and the borrower is restoring the property or (ii) any bankruptcy or insolvency action of Entertainment Partners.
A “Tenant Trigger Event Cure” means any of the following: with respect to a Tenant Trigger Event caused by (1) clause (i) above, (a) all or a portion of the Entertainment Partners leased space has been re-let to one or more replacement tenants such that the property achieves a debt service coverage ratio of at least 1.10x for one calendar quarter, based on the trailing three-month period, or (b) Entertainment Partners is in occupancy of 50.0% or more of the Entertainment Partners leased space and (2) clause (ii) above, (w) the irrevocable assumption of the Entertainment Partners lease in bankruptcy and approval of such assumption by the bankruptcy court such that Entertainment Partners is no longer in bankruptcy and the tenant (or a sub-tenant reasonably acceptable to the lender) is in occupancy and paying full contractual rent, (x) the assignment and assumption of the Entertainment Partners lease by a tenant reasonably acceptable to the lender pursuant to bankruptcy court proceedings and such tenant is in occupancy and paying full contractual rent, (y) the Entertainment Partners leased space, or a portion thereof, has been re-let to one or more replacement tenants such that the property achieves a debt service coverage ratio of at least 1.10x for one calendar quarter, based on the trailing three-month period or (z) if such bankruptcy or insolvency action was involuntary and not consented to by Entertainment Partners, upon such event being discharged, stayed or dismissed.
THE INFORMATION IN THIS STRUCTURAL AND COLLATERAL TERM SHEET IS NOT COMPLETE AND MAY BE AMENDED PRIOR TO THE TIME OF SALE. THIS TERM SHEET IS NOT AN OFFER TO SELL THESE SECURITIES AND IT IS NOT A SOLICITATION OF AN OFFER TO BUY THESE SECURITIES IN ANY JURISDICTION WHERE THE OFFER OR SALE IS NOT PERMITTED.
| 100 of 151 |
| Structural and Collateral Term Sheet | JPMCC 2017-JP6 |
[THIS PAGE INTENTIONALLY LEFT BLANK]
THE INFORMATION IN THIS STRUCTURAL AND COLLATERAL TERM SHEET IS NOT COMPLETE AND MAY BE AMENDED PRIOR TO THE TIME OF SALE. THIS TERM SHEET IS NOT AN OFFER TO SELL THESE SECURITIES AND IT IS NOT A SOLICITATION OF AN OFFER TO BUY THESE SECURITIES IN ANY JURISDICTION WHERE THE OFFER OR SALE IS NOT PERMITTED.
| 101 of 151 |
| Structural and Collateral Term Sheet | JPMCC 2017-JP6 | |
| Marriott Colorado Springs | ||

THE INFORMATION IN THIS STRUCTURAL AND COLLATERAL TERM SHEET IS NOT COMPLETE AND MAY BE AMENDED PRIOR TO THE TIME OF SALE. THIS TERM SHEET IS NOT AN OFFER TO SELL THESE SECURITIES AND IT IS NOT A SOLICITATION OF AN OFFER TO BUY THESE SECURITIES IN ANY JURISDICTION WHERE THE OFFER OR SALE IS NOT PERMITTED.
| 102 of 151 |
| Structural and Collateral Term Sheet | JPMCC 2017-JP6 | |
| Marriott Colorado Springs | ||

THE INFORMATION IN THIS STRUCTURAL AND COLLATERAL TERM SHEET IS NOT COMPLETE AND MAY BE AMENDED PRIOR TO THE TIME OF SALE. THIS TERM SHEET IS NOT AN OFFER TO SELL THESE SECURITIES AND IT IS NOT A SOLICITATION OF AN OFFER TO BUY THESE SECURITIES IN ANY JURISDICTION WHERE THE OFFER OR SALE IS NOT PERMITTED.
| 103 of 151 |
| Structural and Collateral Term Sheet | JPMCC 2017-JP6 | |
| Marriott Colorado Springs | ||
| Mortgage Loan Information | Property Information | |||
| Mortgage Loan Seller: | JPMCB | Single Asset / Portfolio: | Single Asset | |
| Original Principal Balance: | $25,735,000 | Title: | Fee | |
| Cut-off Date Principal Balance: | $25,611,823 | Property Type - Subtype: | Hotel – Full Service | |
| % of Pool by IPB: | 3.3% | Net Rentable Area (Rooms): | 309 | |
| Loan Purpose: | Acquisition | Location: | Colorado Springs, CO | |
| Borrower: | Colorado Springs Hotel Owner, LLC | Year Built / Renovated: | 1989 / 2016 | |
| Sponsors: | Julie A. Dumon, Trustee of the Julie | Occupancy / ADR / RevPAR: | 68.9% / $123.61 / $85.12 | |
| A. Dumon Trust dated March 24, | Occupancy / ADR / RevPAR Date: | 12/31/2016 | ||
| 2006, Julie A. Dumon, Graham | Number of Tenants: | N/A | ||
| Hershman and Michael S. Payne | 2014 NOI: | $1,970,525 | ||
| Interest Rate: | 5.06000% | 2015 NOI: | $3,037,925 | |
| Note Date: | 1/31/2017 | 2016 NOI : | $3,536,607 | |
| Maturity Date: | 2/1/2027 | TTM NOI(1): | N/A | |
| Interest-only Period: | None | UW Occupancy / ADR / RevPAR: | 68.9% / $123.61 / $85.12 | |
| Original Term: | 120 months | UW Revenues: | $13,298,302 | |
| Original Amortization: | 360 months | UW Expenses: | $9,835,601 | |
| Amortization Type: | Balloon | UW NOI: | $3,462,701 | |
| Call Protection: | L(25),Grtr1%orYM(93),O(2) | UW NCF: | $3,462,701 | |
| Lockbox / Cash Management: | Hard / Springing | Appraised Value / Per Room(2): | $40,800,000 / $132,039 | |
| Additional Debt: | N/A | Appraisal Date: | 12/13/2016 | |
| Additional Debt Balance: | N/A | |||
| Additional Debt Type: | N/A | |||
| Escrows and Reserves(3) | Financial Information | |||||||
| Initial | Monthly | Initial Cap | Cut-off Date Loan / Room: | $82,886 | ||||
| Taxes: | $0 | $23,000 | N/A | Maturity Date Loan / Room: | $68,587 | |||
| Insurance: | $0 | Springing | N/A | Cut-off Date LTV(2): | 62.8% | |||
| FF&E: | $32,612 | 3% of Gross Revenues | N/A | Maturity Date LTV(2): | 51.9% | |||
| TI/LC: | $0 | $0 | N/A | UW NCF DSCR: | 2.07x | |||
| Other: | $8,023,640 | Springing | N/A | UW NOI Debt Yield: | 13.5% | |||
| Sources and Uses | ||||||
| Sources | Proceeds | % of Total | Uses | Proceeds | % of Total | |
| Mortgage Loan | $25,735,000 | 65.0% | Purchase Price | $30,100,000 | 76.1% | |
| Sponsor Equity | 13,830,242 | 35.0 | Upfront Reserves | 8,056,252 | 20.4 | |
| Closing Costs | 1,408,990 | 3.6 | ||||
| Total Sources | $39,565,242 | 100.0% | Total Uses | $39,565,242 | 100.0% | |
| (1) | TTM NOI not available due to acquisition timing. |
| (2) | Appraised Value / Per Room, Cut-off Date LTV and Maturity Date LTV are calculated based on the “As If Complete” hypothetical appraised value, which assumes that the proposed property improvement plan required by the franchise agreement has been completed. At origination, the borrower was required to reserve the full estimated cost of the property improvement plan, which is estimated by the loan sponsors to be approximately $8.0 million. The “as-is” value as of December 13, 2016 is $32.5 million, which results in a Cut-off Date LTV and a Maturity Date LTV of 78.8% and 65.2%, respectively. |
| (3) | For a full description of Escrows and Reserves, please refer to “Escrows and Reserves” below. |
The Loan.The Marriott Colorado Springs loan has an outstanding principal balance as of the Cut-off Date of approximately $25.6 million and is secured by a first mortgage lien on the borrower’s fee interest in the 309-room Marriott Colorado Springs, a full service hotel located in downtown Colorado Springs, Colorado. The loan has a 10-year term and will amortize on a 30-year schedule.
The Borrower.The borrowing entity for the Marriott Colorado Springs loan is Colorado Springs Hotel Owner, LLC, a Delaware limited liability company and special purpose entity.
THE INFORMATION IN THIS STRUCTURAL AND COLLATERAL TERM SHEET IS NOT COMPLETE AND MAY BE AMENDED PRIOR TO THE TIME OF SALE. THIS TERM SHEET IS NOT AN OFFER TO SELL THESE SECURITIES AND IT IS NOT A SOLICITATION OF AN OFFER TO BUY THESE SECURITIES IN ANY JURISDICTION WHERE THE OFFER OR SALE IS NOT PERMITTED.
| 104 of 151 |
| Structural and Collateral Term Sheet | JPMCC 2017-JP6 | |
| Marriott Colorado Springs | ||
The Loan Sponsors.The loan sponsors and nonrecourse carve-out guarantors are Julie A. Dumon, Trustee of the Julie A. Dumon Trust dated March 24, 2006, Julie A. Dumon, Graham Hershman and Michael S. Payne. Graham Hershman and Helmut Horn co-founded Coastal Hotel Group (“Coastal”), a Seattle-based hospitality management company, in 1987 and Portfolio Hotels & Resorts (“Portfolio Hotels”) in 2005. Mr. Hershman has more than 30 years of real estate experience. He served as Chief Operating Officer of Coastal for 18 years and is currently the Chief Financial Officer of Portfolio Hotels. Michael S. Payne was formerly the Operations Manager at Coastal before joining Portfolio Hotels in 2005, where he now serves as the Vice President of Operations. Headquartered in Westmont, Illinois, Portfolio Hotels is a hospitality management company that manages both franchised and independent, boutique hotels and resorts. Portfolio Hotels currently manages 18 hotels across eight states, with an additional hotel expected to open in the spring of 2018. Julie A. Dumon currently has an ownership interest in 13 hotels across eight states with a total of 2,482 rooms. Graham Hershman, Michael S. Payne and Julie A. Dumon are each partial equity owners in Portfolio Hotels.
Upon acquisition of the property for $30.1 million ($97,411 per room), the loan sponsors began an approximately $8.0 million ($25,966 per room) franchisor-required property improvement plan (“PIP”) to bring the property to current Marriott brand standards. The PIP is required to be completed by January 31, 2019 and primarily includes upgrades to guestrooms, guest bathrooms and common areas, as well as mechanical, plumbing and electrical work.
The Property. The Marriott Colorado Springs property is a nine-story, 309-room, full service hotel located in Colorado Springs, Colorado and is situated on approximately 12.5 acres. The property was originally developed in 1989 as a Wyndham hotel and underwent an approximately $14.0 million ($45,307 per room) renovation between 2006 and 2007 in connection with a Marriott flag conversion. According to the loan sponsors, the previous owner has spent approximately $4.2 million ($13,633 per room) in capital expenditures at the property since 2012, of which approximately $3.5 million was spent from 2015 to 2016. Expenditures included upgrades to guestroom soft goods and meeting space, among other improvements.
The property features one 80-seat restaurant, the Ascent, which serves breakfast, lunch and dinner, a two-story lobby lounge, approximately 8,585 square feet of indoor meeting space across 10 rooms and a 7,128 square foot ballroom. The property also features 4,779 square feet of outdoor meeting space. Additional amenities at the property include an indoor and an outdoor pool, a fitness center, a business center, a market pantry, a concierge lounge, a guest laundry room, an outdoor patio and a gazebo and an airport and a local shuttle. The property features 586 parking spaces, resulting in a parking ratio of approximately 1.9 spaces per room.
The property has 309 rooms, comprised of 145 king rooms, 124 double-double rooms, 36 junior suites and four hospitality suites. Each guestroom features high-speed internet access, a 42-inch LED television, a coffee maker, a mini-refrigerator and a safe. Each suite features an additional sitting area as well as concierge lounge access.
The Marriott Colorado Springs property is located along the west side of Interstate 25 at the Rockrimmon Boulevard exit. The property benefits from its proximity to the Interstate 25 corridor, which is located approximately 0.4 miles from the property and provides primary regional north/south access to the Colorado Springs metro-area and Denver, which is approximately 63.0 miles north. U.S. Highway 24, which is accessible via Interstate 25 approximately 4.8 miles south of the property, provides primary east/west access. The property is located approximately 6.8 miles north of the Colorado Springs central business district and benefits from its proximity to several demand drivers such as the U.S. Air Force Academy, which is home to 4,400 cadets and attracts approximately 1.0 million visitors annually and Pikes Peak, which is the second most visited mountain in the world according to a non-profit conservancy organization. Additional demand drivers include the University of Colorado - Colorado Springs, which had more than 12,000 students enrolled for the fall 2016 semester, the Garden of the Gods National Landmark and the Cheyenne Mountain Zoo.
Colorado Springs features numerous military bases and institutions, including the Peterson Air Force Base, Fort Carson Military Reservation, Schriever Air Force Base and the North American Aerospace Defense Command, and is home to approximately 240 aerospace and defense contractors. According to the appraisal, Colorado Springs has been experiencing new development, such as the downtown Innovation District, which is currently under development and the National Cyber Security Intelligence Center, which opened in 2016. Other notable developments include the approximately $100.0 million expansion of the St. Francis Medical Center and the new Children’s Hospital Colorado, Colorado Springs, which will be the first pediatric-only hospital in southern Colorado. These projects are expected to be completed in 2019 and 2018, respectively. Colorado Springs also features the 35-acre U.S. Olympic Complex, which serves as the home to the U.S. Olympic Committee, 23 National Olympic Governing Bodies and over 50 National Sports Organizations. The complex is also expected to include the U.S. Olympic Museum that is expected to open in 2018.
According to the appraisal, the estimated population within a one-, three- and five-mile radius is 6,450, 65,986 and 181,410, respectively. The estimated median income within a one-, three- and five-mile radius is $55,414, $60,794 and $59,820, respectively. The appraisal does not identify any new or proposed directly competitive properties in the area.
THE INFORMATION IN THIS STRUCTURAL AND COLLATERAL TERM SHEET IS NOT COMPLETE AND MAY BE AMENDED PRIOR TO THE TIME OF SALE. THIS TERM SHEET IS NOT AN OFFER TO SELL THESE SECURITIES AND IT IS NOT A SOLICITATION OF AN OFFER TO BUY THESE SECURITIES IN ANY JURISDICTION WHERE THE OFFER OR SALE IS NOT PERMITTED.
| 105 of 151 |
| Structural and Collateral Term Sheet | JPMCC 2017-JP6 | |
| Marriott Colorado Springs | ||
| Historical Occupancy, ADR, RevPAR(1) | |||||||||
| Competitive Set(2) | Marriott Colorado Springs(3) | Penetration Factor(4) | |||||||
| Year | Occupancy | ADR | RevPAR | Occupancy | ADR | RevPAR | Occupancy | ADR | RevPAR |
| 2014 | 57.1% | $97.06 | $55.41 | 57.9% | $110.95 | $64.25 | 101.4% | 114.3% | 116.0% |
| 2015 | 57.2% | $102.90 | $58.88 | 61.1% | $119.29 | $72.86 | 106.8% | 115.9% | 123.7% |
| 2016 | 59.9% | $109.79 | $65.78 | 68.9% | $123.61 | $85.12 | 115.0% | 112.6% | 129.4% |
| (1) | The variances between the underwriting, appraisal and above table with respect to Occupancy, ADR and RevPAR at the Marriott Colorado Springs property are attributable to variances in reporting methodologies and/or timing differences. |
| (2) | Data provided by STR, Inc. The competitive set contains the following properties: Radisson Hotel Colorado Springs Airport, Hotel Eleganté Conference & Event Center Colorado Springs, Embassy Suites by Hilton Colorado Springs, The Antlers A Wyndham Hotel Colorado Springs and Doubletree by Hilton Colorado Springs World Arena. |
| (3) | Based on operating statements provided by the borrower. |
| (4) | Penetration Factor is calculated based on data provided by STR, Inc. for the competitive set and borrower-provided operating statements for the property. |
| Competitive Hotels Profile(1)(2) | ||||||||
| 2016 Estimated Market Mix | 2016 Estimated Operating Statistics | |||||||
| Property | Rooms | Year Opened | Commercial | Meeting | Leisure | Occupancy | ADR | RevPAR |
| Marriott Colorado Springs(3) | 309 | 1989 | 59% | 31% | 10% | 68.9% | $123.61 | $85.12 |
| Embassy Suites by Hilton Colorado Springs | 205 | 1985 | 40% | 30% | 30% | 65-70% | $120-125 | $80-85 |
| The Antlers A Wyndham Hotel Colorado Springs | 273 | 1990 | 45% | 30% | 25% | 65-70% | $125-130 | $85-90 |
| Mining Exchange A Wyndham Grand Hotel & Spa | 117 | 2012 | 35% | 25% | 40% | 65-70% | $140-150 | $95-100 |
| DoubleTree by Hilton Colorado Springs World Arena | 299 | 1986 | 40% | 40% | 20% | 55-60% | $80-85 | $45-50 |
| Hotel Eleganté Conference & Event Center Colorado Springs | 500 | 1974 | 20% | 40% | 40% | 45-50% | $100-105 | $45-50 |
| Total(4) | 1,394 | |||||||
| (1) | The variances between the underwriting, appraisal and above table with respect to Occupancy, ADR and RevPAR at the Marriott Colorado Springs property are attributable to variances in reporting methodologies and/or timing differences. |
| (2) | Based on the appraisal. |
| (3) | 2016 Occupancy, ADR and RevPAR are based on operating statements provided by the borrower. |
| (4) | Excludes the Marriott Colorado Springs property. |
THE INFORMATION IN THIS STRUCTURAL AND COLLATERAL TERM SHEET IS NOT COMPLETE AND MAY BE AMENDED PRIOR TO THE TIME OF SALE. THIS TERM SHEET IS NOT AN OFFER TO SELL THESE SECURITIES AND IT IS NOT A SOLICITATION OF AN OFFER TO BUY THESE SECURITIES IN ANY JURISDICTION WHERE THE OFFER OR SALE IS NOT PERMITTED.
| 106 of 151 |
| Structural and Collateral Term Sheet | JPMCC 2017-JP6 | |
| Marriott Colorado Springs | ||
| Operating History and Underwritten Net Cash Flow | |||||||||||
| 2014 | 2015 | 2016 | Underwritten | Per Room(1) | % of Total Revenue(2) | ||||||
| Occupancy | 57.9% | 61.1% | 68.9% | 68.9% | |||||||
| ADR | $110.95 | $119.29 | $123.61 | $123.61 | |||||||
| RevPAR(3) | $64.25 | $72.86 | $85.12 | $85.12 | |||||||
| Room Revenue | $7,246,130 | $8,217,863 | $9,626,069 | $9,626,069 | $31,152 | 72.4% | |||||
| Food and Beverage Revenue | 2,874,929 | 3,378,013 | 3,431,265 | 3,431,265 | 11,104 | 25.8 | |||||
| Other Departmental Revenue | 248,409 | 375,176 | 240,353 | 240,968 | 780 | 1.8 | |||||
| Total Revenue | $10,369,468 | $11,971,052 | $13,297,687 | $13,298,302 | $43,037 | 100.0% | |||||
| Room Expense | $1,624,946 | $1,763,915 | $2,062,439 | $2,062,439 | $6,675 | 21.4% | |||||
| Food and Beverage Expense | 1,883,508 | 1,979,663 | 2,050,155 | 2,050,155 | 6,635 | 59.7 | |||||
| Other Departmental Expenses | 26,267 | 18,313 | 19,708 | 19,708 | 64 | 8.2 | |||||
| Departmental Expenses | $3,534,721 | $3,761,891 | $4,132,302 | $4,132,302 | $13,373 | 31.1% | |||||
| Departmental Profit | $6,834,747 | $8,209,161 | $9,165,385 | $9,166,000 | $29,663 | 68.9% | |||||
| Operating Expenses | $3,709,164 | $3,924,094 | $4,261,962 | $4,333,069 | $14,023 | 32.6% | |||||
| Gross Operating Profit | $3,125,583 | $4,285,067 | $4,903,423 | $4,832,931 | $15,641 | 36.3% | |||||
| Management Fees | $309,528 | $351,354 | $396,878 | $398,949 | $1,291 | 3.0% | |||||
| Property Taxes | 305,589 | 301,852 | 306,696 | 328,286 | 1,062 | 2.5 | |||||
| Property Insurance | 104,447 | 102,950 | 100,988 | 80,716 | 261 | 0.6 | |||||
| Other Expenses | 25,053 | 22,241 | 30,347 | 30,347 | 98 | 0.2 | |||||
| FF&E | 410,441 | 468,745 | 531,907 | 531,932 | 1,721 | 4.0 | |||||
| Total Other Expenses | $1,155,058 | $1,247,142 | $1,366,816 | $1,370,230 | $4,434 | 10.3% | |||||
| Net Operating Income | $1,970,525 | $3,037,925 | $3,536,607 | $3,462,701 | $11,206 | 26.0% | |||||
| Net Cash Flow | $1,970,525 | $3,037,925 | $3,536,607 | $3,462,701 | $11,206 | 26.0% | |||||
| (1) | Per Room values based on 309 guest rooms. |
| (2) | % of Total Revenue for Room Expense, Food and Beverage Expense and Other Departmental Expenses is based on their corresponding revenue line items. |
| (3) | Historical RevPAR for 2010, 2011, 2012 and 2013 was $56.28, $56.86, $57.18 and $63.88, respectively, and Net Cash Flow was approximately $1.5 million, $1.7 million, $1.6 million and $2.1 million, respectively. |
Property Management. The property is managed by Portfolio Hotels, LLC, an Illinois limited liability company and an affiliate of the borrower.
Franchise Agreement.The borrower has a franchise agreement with Marriott International, Inc., a Delaware corporation. The current franchise agreement is effective as of January 31, 2017 for a term of 20 years, with a final expiration date of January 31, 2037. The franchise agreement provides for monthly program fees equal to (i) 5.0% of gross room revenues for the first two years of the term and 6.0% thereafter, and (ii) 3.0% of gross food and beverage revenues. There is also a marketing fee equal to 1.0% of gross room revenues.
Escrows and Reserves. At origination, the borrower deposited into escrow $8,023,640 for the property improvement plan and $32,612 for FF&E reserves.
Tax Escrows - On a monthly basis, the borrower is required to deposit 1/12 of the annual estimated tax payments, which currently equates to $23,000.
Insurance Escrows- The requirement for the borrower to make monthly deposits to the insurance escrow is waived so long as (i) no event of default exists and (ii) the borrower provides satisfactory evidence that the property is insured under an acceptable blanket policy in accordance with the loan documents.
FF&E Reserves- On a monthly basis, commencing on the first payment date through the payment date in January 2018, the borrower is required to deposit an amount equal to 3.0% of gross revenues from operations for the calendar month two months prior to such payment date for FF&E. On the payment date in February 2018 and on each payment date through and including the payment date in January 2019, the borrower is required to deposit an amount equal to 4.0% of gross revenues from operations for the calendar month two months prior to such payment date. On the payment date in February 2019 and on each payment date remaining in the term, the borrower is required to deposit an amount equal to 5.0% of gross revenues from operations for the calendar month two months prior to such payment date.
THE INFORMATION IN THIS STRUCTURAL AND COLLATERAL TERM SHEET IS NOT COMPLETE AND MAY BE AMENDED PRIOR TO THE TIME OF SALE. THIS TERM SHEET IS NOT AN OFFER TO SELL THESE SECURITIES AND IT IS NOT A SOLICITATION OF AN OFFER TO BUY THESE SECURITIES IN ANY JURISDICTION WHERE THE OFFER OR SALE IS NOT PERMITTED.
| 107 of 151 |
| Structural and Collateral Term Sheet | JPMCC 2017-JP6 | |
| Marriott Colorado Springs | ||
PIP Reserves -In the event that the borrower is required to complete a future property improvement plan mandated by any franchisor, the borrower will be required, on a monthly basis, to deposit an amount reasonably estimated by the lender to complete the related property improvement plan.
Lockbox / Cash Management.The loan is structured with a hard lockbox and springing cash management. At origination, the borrower and property manager were required to deliver written instructions to credit card companies to deposit all revenues into a lockbox account controlled by the lender. All funds in the lockbox account are returned to an account controlled by the borrower until the occurrence of a Cash Sweep Event (as defined below). Following the occurrence and during the continuance of a Cash Sweep Event, all funds are required to be swept each business day to a segregated cash management account under the control of the lender and disbursed on each payment date in accordance with the loan documents. To the extent a Cash Sweep Event is continuing, all excess cash flow on deposit in the cash management account is required to be held in the excess cash flow subaccount as additional security for the loan. The lender has been granted a first priority security interest in the cash management account.
A “Cash Sweep Event” means the occurrence of (i) an event of default, (ii) a bankruptcy or insolvency action of the borrower or property manager or (iii) the date that the debt service coverage ratio (as calculated in the loan documents) based on the trailing 12-month period is less than 1.30x on any date of determination from the origination date through March 1, 2019 or 1.40x thereafter (a “DSCR Trigger Event”).
A Cash Sweep Event may be cured by, (a) with respect to clause (i) above, the acceptance by the lender of a cure of the related event of default, (b) with respect to clause (ii) above, solely with respect to the property manager, if the property manager is replaced with a qualified property manager in accordance with the loan documents within 60 days of the bankruptcy or insolvency action and (c) with respect to clause (iii) above, if the debt service coverage ratio based on the trailing 12-month period is 1.35x or greater for two consecutive calendar quarters through March 1, 2019 and 1.45x or greater thereafter. Each cure is subject to the following conditions: (1) a Cash Sweep Event cure may occur no more than two times in the aggregate during the term of the loan and (2) the borrower must pay all of the lender’s reasonable expenses incurred in connection with the cure. The borrower may not cure a Cash Sweep Event caused by the bankruptcy or insolvency action of a borrower.
THE INFORMATION IN THIS STRUCTURAL AND COLLATERAL TERM SHEET IS NOT COMPLETE AND MAY BE AMENDED PRIOR TO THE TIME OF SALE. THIS TERM SHEET IS NOT AN OFFER TO SELL THESE SECURITIES AND IT IS NOT A SOLICITATION OF AN OFFER TO BUY THESE SECURITIES IN ANY JURISDICTION WHERE THE OFFER OR SALE IS NOT PERMITTED.
| 108 of 151 |
| Structural and Collateral Term Sheet | JPMCC 2017-JP6 |
[THIS PAGE INTENTIONALLY LEFT BLANK]
THE INFORMATION IN THIS STRUCTURAL AND COLLATERAL TERM SHEET IS NOT COMPLETE AND MAY BE AMENDED PRIOR TO THE TIME OF SALE. THIS TERM SHEET IS NOT AN OFFER TO SELL THESE SECURITIES AND IT IS NOT A SOLICITATION OF AN OFFER TO BUY THESE SECURITIES IN ANY JURISDICTION WHERE THE OFFER OR SALE IS NOT PERMITTED.
| 109 of 151 |
| Structural and Collateral Term Sheet | JPMCC 2017-JP6 | |
| Pillsbury Portfolio | ||
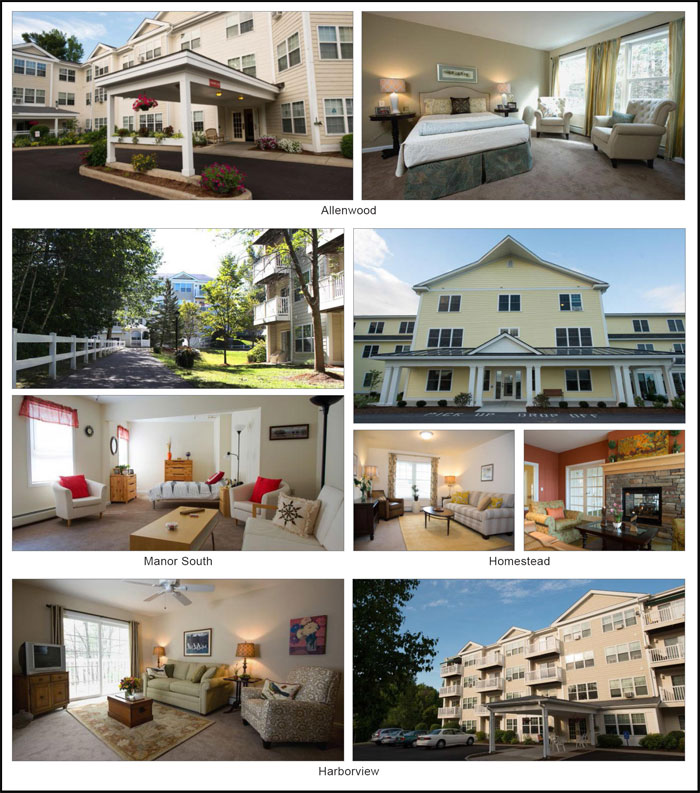
THE INFORMATION IN THIS STRUCTURAL AND COLLATERAL TERM SHEET IS NOT COMPLETE AND MAY BE AMENDED PRIOR TO THE TIME OF SALE. THIS TERM SHEET IS NOT AN OFFER TO SELL THESE SECURITIES AND IT IS NOT A SOLICITATION OF AN OFFER TO BUY THESE SECURITIES IN ANY JURISDICTION WHERE THE OFFER OR SALE IS NOT PERMITTED.
| 110 of 151 |
| Structural and Collateral Term Sheet | JPMCC 2017-JP6 | |
| Pillsbury Portfolio | ||
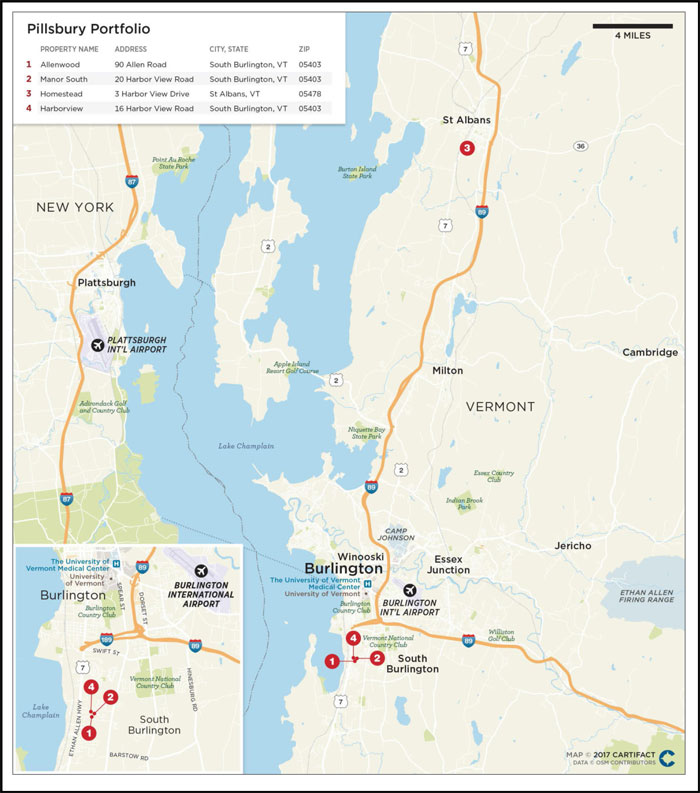
THE INFORMATION IN THIS STRUCTURAL AND COLLATERAL TERM SHEET IS NOT COMPLETE AND MAY BE AMENDED PRIOR TO THE TIME OF SALE. THIS TERM SHEET IS NOT AN OFFER TO SELL THESE SECURITIES AND IT IS NOT A SOLICITATION OF AN OFFER TO BUY THESE SECURITIES IN ANY JURISDICTION WHERE THE OFFER OR SALE IS NOT PERMITTED.
| 111 of 151 |
| Structural and Collateral Term Sheet | JPMCC 2017-JP6 | |
| Pillsbury Portfolio | ||
| Mortgage Loan Information | Property Information | |||
| Mortgage Loan Seller: | JPMCB | Single Asset / Portfolio: | Portfolio | |
| Original Principal Balance: | $24,175,000 | Title: | Fee | |
| Cut-off Date Principal Balance: | $24,175,000 | Property Type - Subtype: | Multifamily – Senior Housing | |
| % of Pool by IPB: | 3.1% | Net Rentable Area (Units): | 245 | |
| Loan Purpose: | Acquisition | Location: | Various | |
| Borrowers: | ELCM Manor South Owner LLC, | Year Built / Renovated: | Various / N/A | |
| ELCM Homestead Owner LLC and | Occupancy(1): | 91.7% | ||
| ELCM Allenwood Owner LLC | Occupancy Date: | 1/31/2017 | ||
| Sponsor(2): | ELCM HCRE Operating Entity I LLC | Number of Tenants: | N/A | |
| Interest Rate: | 5.23800% | 2014 NOI: | $2,460,500 | |
| Note Date: | 5/5/2017 | 2015 NOI(3): | $2,513,402 | |
| Maturity Date: | 6/1/2024 | 2016 NOI(3): | $3,117,248 | |
| Interest-only Period: | None | TTM NOI (as of 3/2017)(4): | $3,173,046 | |
| Original Term: | 84 months | UW Economic Occupancy: | 88.1% | |
| Original Amortization: | 360 months | UW Revenues: | $10,816,423 | |
| Amortization Type: | Balloon | UW Expenses: | $8,252,740 | |
| Call Protection: | L(24),Grtr1%orYM(57),O(3) | UW NOI(4): | $2,563,683 | |
| Lockbox / Cash Management: | Soft / Springing | UW NCF: | $2,477,933 | |
| Additional Debt: | N/A | Appraised Value / Per Unit: | $39,900,000 / $162,857 | |
| Additional Debt Balance: | N/A | Appraisal Date: | 12/12/2016 | |
| Additional Debt Type: | N/A | |||
| Escrows and Reserves(5) | Financial Information | |||||
| Initial | Monthly | Initial Cap | Cut-off Date Loan / Unit: | $98,673 | ||
| Taxes: | $83,197 | $23,865 | N/A | Maturity Date Loan / Unit: | $87,802 | |
| Insurance: | $0 | Springing | N/A | Cut-off Date LTV: | 60.6% | |
| Replacement Reserves: | $7,146 | $7,146 | N/A | Maturity Date LTV: | 53.9% | |
| TI/LC: | $0 | $0 | N/A | UW NCF DSCR: | 1.55x | |
| Other: | $0 | $0 | N/A | UW NOI Debt Yield: | 10.6% | |
| Sources and Uses | ||||||||
| Sources | Proceeds | % of Total | Uses | Proceeds | % of Total | |||
| Mortgage Loan | $24,175,000 | 61.3 | % | Purchase Price(6) | $36,000,000 | 91.4 | % | |
| Sponsor Equity | 15,231,453 | 38.7 | Closing Costs | 3,316,110 | 8.4 | |||
| Upfront Reserves | 90,343 | 0.2 | ||||||
| Total Sources | $39,406,453 | 100.0 | % | Total Uses | $39,406,453 | 100.0 | % | |
| (1) | Occupancy is calculated based on the average occupancy over the trailing 12-month period ending January 31, 2017 across all properties. |
| (2) | Please see“The Loan Sponsor” and“Master Lease and Subleases”below for further details. |
| (3) | The increase in 2016 NOI from 2015 NOI is primarily a result of an affiliate of the loan sponsor taking over property management duties in April 2016. The affiliated property manager identified and reduced several areas of redundant labor costs and increased rents across the portfolio through strategic marketing and leasing initiatives. |
| (4) | The decrease in UW NOI from TTM NOI is primarily attributable to (i) an increased management fee of 5.0% pursuant to the property management agreement entered into as of origination of the loan and (ii) increased expenses consistent with the loan sponsor’s budget attributable to marketing initiatives and activity/social events at the properties. |
| (5) | For a full description of Escrows and Reserves, please refer to“Escrows and Reserves”below. |
| (6) | Purchase Price is shown inclusive of approximately $1,476,288 in seller prorations primarily attributable to prepaid rent and tenant security deposits. |
The Loan. The Pillsbury Portfolio loan has an outstanding principal balance as of the Cut-off Date of approximately $24.2 million and is secured by a first mortgage lien on the borrowers’ fee interest in a portfolio of four senior living facilities totaling 245 units located in South Burlington and Saint Albans, Vermont. The loan has a seven-year term and will amortize on a 30-year schedule.
THE INFORMATION IN THIS STRUCTURAL AND COLLATERAL TERM SHEET IS NOT COMPLETE AND MAY BE AMENDED PRIOR TO THE TIME OF SALE. THIS TERM SHEET IS NOT AN OFFER TO SELL THESE SECURITIES AND IT IS NOT A SOLICITATION OF AN OFFER TO BUY THESE SECURITIES IN ANY JURISDICTION WHERE THE OFFER OR SALE IS NOT PERMITTED.
| 112 of 151 |
| Structural and Collateral Term Sheet | JPMCC 2017-JP6 | |
| Pillsbury Portfolio | ||
The Borrowers. The borrowing entities for the Pillsbury Portfolio loan are ELCM Manor South Owner LLC, ELCM Homestead Owner LLC and ELCM Allenwood Owner LLC, each a Delaware limited liability company and special purpose entity. The properties are subject to a master lease between the borrowers and ELCM Pillsbury Leasing LLC, a Delaware limited liability company (the “Master Tenant”). The Master Tenant subleases the properties to three sub-tenants. Each of the Master Tenant and sub-tenants are required to be a special purpose entity. Please see“Master Lease and Subleases” for further details.
The Loan Sponsor. The loan sponsor and nonrecourse carve-out guarantor is ELCM HCRE Operating Entity I LLC, an affiliate of East Lake Capital Management (“ELCM”), a Dallas, Texas based investment management firm specializing in real estate and healthcare related opportunities. ELCM was founded in 2015 by Andrew White and Paul Boethel, both previously of Fortress Investment Group (“Fortress”), each with experience in the senior housing sector. Andrew White previously served as managing director and head of the Fortress senior housing group, while Paul Boethel previously served as head of the Fortress senior housing offices in Dallas, Texas. Since ELCM’s inception, the company has deployed approximately $140.0 million in equity towards healthcare specific real estate investments. In addition to the nonrecourse carve-out guaranty provided by the loan sponsor (i) ELCM HCRE Holdco LLC, a Delaware limited liability company (“ELCM Holdco”) and the owner of 100.0% of the direct equity interests in the loan sponsor, delivered a guaranty of the loan sponsor’s obligations under the nonrecourse carve-out guaranty; and (ii) ELCM Healthcare Real Estate Fund LP, a Delaware limited partnership and the owner of 100.0% of the direct equity interests in ELCM Holdco, delivered a guaranty of ELCM Holdco’s obligations under ELCM Holdco’s guaranty agreement, as additional credit support for the loan.
The loan sponsor’s property management affiliate, New Horizons Senior Living (“NHSL”), assumed property management duties of the portfolio in April 2016. Including the Pillsbury Portfolio properties, NHSL has nine properties, comprised of approximately 800 units, currently under management. Since assuming management responsibilities, NHSL has identified and reduced redundant labor costs, increased the marketing budget to support new leasing initiatives and raised rents across the portfolio, while maintaining a stable occupancy rate. Following acquisition of the properties by the borrowers, NHSL (through certain affiliates) is expected to continue to act as property manager pursuant to the property management agreements as described under“Property Management” below.
The Properties.The Pillsbury Portfolio consists of four senior living facilities with a total of 245 units located in South Burlington and Saint Albans, Vermont. The properties were built between 1989 and 2013 and are generally in good condition with limited deferred maintenance noted in the property condition reports delivered at origination of the loan. The properties range in size from 44 to 83 units with varying degrees of independent and assisted living accommodations. Allenwood, Manor South and Harborview (the “South Campus”) are each located in South Burlington, Vermont and are within walking distance from one another, while Homestead is located approximately 30.0 miles north in Saint Albans, Vermont. As noted below, the portfolio is comprised almost entirely of private pay tenants (97.1% by unit count as of January 31, 2017) with limited exposure to Medicaid and various state sponsored senior housing and medical initiatives, allowing for an income stream largely independent of government assistance and less exposure to legislative risk. Going forward, the loan sponsor has indicated that it currently plans to convert the portfolio to a 100.0% private pay structure across all properties. Overall, as of January 31, 2017, the portfolio is comprised of 122 independent living units (49.8% by unit count) and 123 assisted living units (50.2% by unit count). Each property features customary amenities and various community activities catering to the target demographic. Each property is in close proximity to The University of Vermont Medical Center, a primary demand driver for senior housing in the market. The South Campus properties are located within 4.0 miles of downtown Burlington, while the Homestead property is located approximately 25.0 miles to the north of the downtown area.
| Portfolio Summary | ||||||||
| Property | Location | Year Built | Units | Occupancy(1) | Cut-off Date Allocated Loan Amount | % of Allocated Loan Amount | Appraised Value | Underwritten Net Cash Flow |
| Allenwood | South Burlington, VT | 1997, 2011 | 83 | 92.1% | $8,240,000 | 34.1% | $13,600,000 | $962,712 |
| Manor South | South Burlington, VT | 1989 | 62 | 95.1% | 5,998,000 | 24.8% | 9,900,000 | 688,917 |
| Homestead | Saint Albans, VT | 2013 | 56 | 94.4% | 5,514,000 | 22.8% | 9,100,000 | 421,624 |
| Harborview | South Burlington, VT | 1998 | 44 | 82.7% | 4,423,000 | 18.3% | 7,300,000 | 404,680 |
| Total / Wtd. Avg. | 245 | 91.7% | $24,175,000 | 100.0% | $39,900,000 | $2,477,933 | ||
| (1) | Occupancy is calculated based on the average occupancy over the trailing 12-month period ending January 31, 2017. |
THE INFORMATION IN THIS STRUCTURAL AND COLLATERAL TERM SHEET IS NOT COMPLETE AND MAY BE AMENDED PRIOR TO THE TIME OF SALE. THIS TERM SHEET IS NOT AN OFFER TO SELL THESE SECURITIES AND IT IS NOT A SOLICITATION OF AN OFFER TO BUY THESE SECURITIES IN ANY JURISDICTION WHERE THE OFFER OR SALE IS NOT PERMITTED.
| 113 of 151 |
| Structural and Collateral Term Sheet | JPMCC 2017-JP6 | |
| Pillsbury Portfolio | ||
| Historical and Current Occupancy(1) | ||||
| 2014 | 2015 | 2016 | Current(2) | |
| Allenwood | 98.4% | 95.4% | 91.5% | 92.1% |
| Manor South | 93.6% | 91.0% | 94.0% | 95.1% |
| Homestead | 92.5% | 95.0% | 93.6% | 94.4% |
| Harborview | 91.9% | 85.4% | 83.7% | 82.7% |
| Weighted Average: | 94.7% | 92.4% | 91.2% | 91.7% |
| (1) | Historical Occupancies are calculated based on the trailing 12-month period ending December 31 of each respective year. |
| (2) | Current Occupancy is based on the trailing 12-month period ending January 31, 2017. |
Allenwood. Allenwood is an 83-unit senior housing facility with both independent and assisted living accommodations located in South Burlington, Vermont. Constructed in two phases in 1997 and 2011, the property consists of a three-story building located on an approximately 2.6 acre parcel. The property is licensed to accommodate up to 30 assisted living units, which typically operate at a premium to independent living given the increased level of care associated with such tenants. For the trailing 12-month period ending January 31, 2017, the property was 92.1% occupied with in-place occupancy of 88.0%. The property features a mix of studio, one and two-bedroom units with amenities including restaurant style dining, weekly housekeeping, shuttle transportation, 24/7 emergency support, security foyer doors, exercise classes and equipment, community activities, wellness clinics, assigned parking, beauty salon access, walking paths and community gardens. Across all unit types, the appraisal noted a market rent either in excess of or in-line with in-place rents at the property.
| Allenwood Senior Housing Unit Mix(1) | ||||||
| Unit Type | # of Units | % of Total | In-place Occupied Units | In-place Occupancy | Average Monthly Rental Rate | Monthly Market Rental Rate(2) |
| Independent Living | ||||||
| Studio | 5 | 6.0% | 3 | 60.0% | $2,795 | $2,900 |
| 1 Bedroom | 31 | 37.3% | 29 | 93.5% | $3,099 | $3,300 |
| 2 Bedroom | 24 | 28.9% | 19 | 79.2% | $3,655 | $3,600 |
| Assisted Living | ||||||
| Studio | 1 | 1.2% | 1 | 100.0% | $2,665 | $2,900 |
| 1 Bedroom | 18 | 21.7% | 17 | 94.4% | $3,122 | $3,300 |
| 2 Bedroom | 4 | 4.8% | 4 | 100.0% | $3,688 | $3,900 |
| Total / Wtd. Avg. | 83 | 100.0% | 73 | 88.0% | $3,263 | $3,389 |
| (1) | Based on the in-place rent roll provided by the borrowers as of January 31, 2017. |
| (2) | Based on the appraisal’s concluded market rent. |
Manor South. Manor South is a 62-unit assisted living senior housing facility located in South Burlington, Vermont. Constructed in 1989, the property consists of a two-story building located on an approximately 2.5 acre parcel and is licensed to accommodate up to 70 assisted living units. For the trailing 12-month period ending January 31, 2017, the property was 95.1% occupied with in-place occupancy of 95.2%. The property features a mix of studio and one-bedroom units with amenities including full meal service, medication management, 24-hour nursing care, refreshments served twice daily, transportation to local doctors, exercise classes, daily social activities, dietary consultation, beauty salon access, walking paths and community gardens. Across all unit types (with the exception of below market Assisted Living (Medicaid) units), the appraisal noted a market rent either in excess of or in-line with in-place rents at the property.
THE INFORMATION IN THIS STRUCTURAL AND COLLATERAL TERM SHEET IS NOT COMPLETE AND MAY BE AMENDED PRIOR TO THE TIME OF SALE. THIS TERM SHEET IS NOT AN OFFER TO SELL THESE SECURITIES AND IT IS NOT A SOLICITATION OF AN OFFER TO BUY THESE SECURITIES IN ANY JURISDICTION WHERE THE OFFER OR SALE IS NOT PERMITTED.
| 114 of 151 |
| Structural and Collateral Term Sheet | JPMCC 2017-JP6 | |
| Pillsbury Portfolio | ||
| Manor South Senior Housing Unit Mix(1) | ||||||
| Unit Type | # of Units | % of Total | In-place Occupied Units | In-place Occupancy | Average Monthly Rental Rate | Monthly Market Rental Rate(2) |
| Assisted Living | ||||||
| Studio | 50 | 80.6% | 47 | 94.0% | $4,700 | $4,600 |
| 1 Bedroom | 9 | 14.5% | 9 | 100.0% | $5,927 | $5,750 |
| Assisted Living (Medicaid)(3) | ||||||
| Studio | 3 | 4.8% | 3 | 100.0% | $3,809 | $4,600 |
| Total / Wtd. Avg. | 62 | 100.0% | 59 | 95.2% | $4,723 | $4,775 |
| (1) | Based on the in-place rent roll provided by the borrowers as of January 31, 2017. |
| (2) | Based on the appraisal’s concluded market rent. |
| (3) | Average Monthly Rental Rate for Assisted Living (Medicaid) units is calculated inclusive of governmental Medicaid reimbursements. |
Homestead. Homestead is a 56-unit senior housing facility with both independent living and assisted living accommodations located in Saint Albans, Vermont. Constructed in 2013, the property consists of a three-story building located on an approximately 2.7 acre parcel and is licensed to accommodate up to 56 assisted living units. For the trailing 12-month period ending January 31, 2017, the property was 94.4% occupied with in-place occupancy of 100.0%. The property features a mix of studio, one and two-bedroom units with amenities including daily breakfast and dinner, weekly housekeeping, organized shopping trips, 24/7 emergency support, exercise classes and equipment, community activities, wellness clinics, library access, a community living room with fireplace, assigned parking, beauty salon access and community gardens. Across all unit types (with the exception of below market Assisted Living (Medicaid) units), the appraisal noted a market rent either in excess of or in-line with in-place rents at the property.
| Homestead Senior Housing Unit Mix(1) | ||||||
| Unit Type | # of Units | % of Total | In-place Occupied Units | In-place Occupancy | Average Monthly Rental Rate | Monthly Market Rental Rate(2) |
| Independent Living | ||||||
| Studio | 9 | 16.1% | 9 | 100.0% | $2,514 | $2,600 |
| 1 Bedroom | 9 | 16.1% | 9 | 100.0% | $2,848 | $2,850 |
| Assisted Living | ||||||
| Studio | 17 | 30.4% | 17 | 100.0% | $4,596 | $4,650 |
| 1 Bedroom(3) | 17 | 30.4% | 17 | 100.0% | $3,937 | $6,200 |
| Assisted Living (Medicaid)(4) | ||||||
| Studio | 4 | 7.1% | 4 | 100.0% | $3,615 | $4,650 |
| Total / Wtd. Avg. | 56 | 100.0% | 56 | 100.0% | $3,520 | $4,502 |
| (1) | Based on the in-place rent roll provided by the borrowers as of January 31, 2017. |
| (2) | Based on the appraisal’s concluded market rent. |
| (3) | Average Monthly Rental Rate for 1 Bedroom Assisted Living units is calculated inclusive of fees associated with personal care and nursing that are typically included in base rent. Nine 1 Bedroom Assisted Living Units previously designated as Independent Living have since been reclassified as Assisted Living due to upgrades in the level of care provided to existing tenants. For these units, such additional care is reflected in personal care and nursing fees assessed on top of what was previously the Independent Living rental rate. Given the property is licensed to accommodate up to 56 assisted living units, the loan sponsor has indicated it intends to convert additional units to a level of care consistent with the Assisted Living designation. |
| (4) | Average Monthly Rental Rate for Assisted Living (Medicaid) units is calculated inclusive of governmental Medicaid reimbursements. |
Harborview. Harborview is a 44-unit independent living senior housing facility located in South Burlington, Vermont. Constructed in 1998, the property consists of a four-story building located on an approximately 1.0 acre parcel. For the trailing 12-month period ending January 31, 2017, the property was 82.7% occupied with in-place occupancy of 75.0%. The property features a mix of one and two-bedroom units with amenities including restaurant style dining, weekly housekeeping, shuttle transportation, 24/7 emergency support, security foyer doors, exercise classes and equipment, community activities, wellness clinics, assigned parking, beauty salon access, walking paths and community gardens. Across all unit types, the appraisal noted a market rent either in excess of or in-line with in-place rents at the property.
THE INFORMATION IN THIS STRUCTURAL AND COLLATERAL TERM SHEET IS NOT COMPLETE AND MAY BE AMENDED PRIOR TO THE TIME OF SALE. THIS TERM SHEET IS NOT AN OFFER TO SELL THESE SECURITIES AND IT IS NOT A SOLICITATION OF AN OFFER TO BUY THESE SECURITIES IN ANY JURISDICTION WHERE THE OFFER OR SALE IS NOT PERMITTED.
| 115 of 151 |
| Structural and Collateral Term Sheet | JPMCC 2017-JP6 | |
| Pillsbury Portfolio | ||
| Harborview Senior Housing Unit Mix(1) | ||||||
| Unit Type | # of Units | % of Total | In-place Occupied Units | In-place Occupancy | Average Monthly Rental Rate | Monthly Market Rental Rate(2) |
| Independent Living | ||||||
| 1 Bedroom | 37 | 84.1% | 26 | 70.3% | $2,549 | $2,650 |
| 2 Bedroom | 7 | 15.9% | 7 | 100.0% | $3,085 | $3,300 |
| Total / Wtd. Avg. | 44 | 100.0% | 33 | 75.0% | $2,663 | $2,788 |
| (1) | Based on the in-place rent roll provided by the borrowers as of January 31, 2017. |
| (2) | Based on the appraisal’s concluded market rent. |
The Pillsbury Portfolio is located in the Burlington and South Burlington metropolitan statistical area (“MSA”). The portfolio properties are accessible via U.S. Route 7, the major north-south throughway in western Vermont and are also within a short distance of Interstate 89, providing regional access to Concord, New Hampshire and north to the Canadian border. Each property is within a short distance of The University of Vermont Medical Center, which was recently recognized by a well known third party medical survey as the 13th ranked academic medical center in the nation, citing the hospital’s low re-admission rates, excellent patient safety and shorter than average length of stay. The Burlington MSA is also home to the University of Vermont, a major economic driver in the region. According to the appraisal, the university employs over 3,440 people and supports a well-paid and highly educated workforce. As of year-end 2015, median household income in the Burlington MSA was approximately $62,287 with approximately 40.6% of household earning in excess of $75,000 per year. As of April 2016, the Bureau of Labor Statistics reported an unemployment rate for the Burlington MSA of 2.1%, below both the state and national average. With the vast majority of senior living users re-locating within a short distance of their former residence or adult children, the portfolio benefits from what the appraisal deems to be a stable economic environment.
Per the appraisal, each property’s primary market area (“PMA”) is located within a 10-mile radius of such property, with 75.0% of all residents originating from within the PMA. As of year-end 2015, the population within a 10-mile radius of the South Campus properties was 129,966, of which 13.5% are in the 65+ age demographic. Population in this radius has demonstrated approximately 17.2% growth for the 65+ age demographic since 2010, with an additional 16.9% in growth projected through 2020. According to the appraisal, the senior population is growing both in terms of absolute numbers and as a percentage of total population, suggesting increasing demand for senior housing in the market. With respect to the South Campus properties, the appraisal identified four comparable properties built between 1985 and 2016 and ranging in size from 67 to 172 units. Exclusive of one property currently in a lease-up phase, as noted by the appraisal, the comparable properties reported occupancies ranging from 87.0% to 100.0% with a weighted average occupancy of 93.4%. The appraisal identified two directly competitive projects within the South Burlington PMA that are either under construction or in an initial planning stage. Stuart Chase on Lime Kiln Road, a 26-unit congregate care facility, is currently under construction and located within five miles of the property. Additionally, there is a proposed expansion to an existing competitive property, Pillsbury North; however, this project is still in early planning stages and, according to the appraisal, is expected to be of inferior quality.
According to the appraisal, as of year-end 2015, the population within a 10-mile radius of the Homestead property was 33,557, of which 13.7% are in the 65+ age demographic. Population in this radius has demonstrated approximately 16.9% growth for the 65+ age demographic since 2010, with an additional 21.5% in growth projected through 2020. With respect to the Homestead property, the appraisal identified four comparable properties built between 1996 and 2016 and ranging in size from 38 to 172 units. Exclusive of one property currently in a lease-up phase, as noted by the appraisal, the comparable properties reported occupancies ranging from 87.0% to 100.0% with a weighted average occupancy of 91.4%. The appraisal identified no planned facilities or facilities currently under construction within the Saint Albans PMA.
THE INFORMATION IN THIS STRUCTURAL AND COLLATERAL TERM SHEET IS NOT COMPLETE AND MAY BE AMENDED PRIOR TO THE TIME OF SALE. THIS TERM SHEET IS NOT AN OFFER TO SELL THESE SECURITIES AND IT IS NOT A SOLICITATION OF AN OFFER TO BUY THESE SECURITIES IN ANY JURISDICTION WHERE THE OFFER OR SALE IS NOT PERMITTED.
| 116 of 151 |
| Structural and Collateral Term Sheet | JPMCC 2017-JP6 | |
| Pillsbury Portfolio | ||
| Operating History and Underwritten Net Cash Flow | |||||||
| 2014 | 2015 | 2016 | TTM(1) | Underwritten | Per Unit | % of Total Revenue | |
| Independent Living(2) | $1,117,798 | $1,062,539 | $1,140,170 | $1,120,202 | $3,675,437 | $15,002 | 34.0% |
| Assisted Living(2) | 8,382,597 | 8,626,758 | 8,598,153 | 8,741,907 | 5,621,011 | 22,943 | 52.0% |
| Assisted Living (Medicaid)(2) | 0 | 0 | 0 | 0 | 288,928 | 1,179 | 2.7% |
| Total Rental Revenue | $9,500,395 | $9,689,298 | $9,738,322 | $9,862,110 | $9,585,376 | $39,124 | 88.6% |
| Level of Care | 663,289 | 633,210 | 736,329 | 726,385 | 716,280 | 2,924 | 6.6% |
| Second Person Fees | 0 | 0 | 0 | 0 | 132,000 | 539 | 1.2% |
| Respite | 0 | 2,800 | 120,456 | 112,831 | 112,831 | 461 | 1.0% |
| Other Income | 230,276 | 249,553 | 267,038 | 269,936 | 269,936 | 1,102 | 2.5% |
| Total Revenue | $10,393,960 | $10,574,861 | $10,862,145 | $10,971,262 | $10,816,423 | $44,149 | 100.0% |
| Total Expenses | $7,933,460 | $8,061,459 | $7,744,898 | $7,798,216 | $8,252,740 | $33,685 | 76.3% |
| Net Operating Income(3)(4) | $2,460,500 | $2,513,402 | $3,117,248 | $3,173,046 | $2,563,683 | $10,464 | 23.7% |
| Replacement Reserves | 85,750 | 85,750 | 85,750 | 85,750 | 85,750 | 350 | 0.8% |
| Net Cash Flow | $2,374,750 | $2,427,652 | $3,031,498 | $3,087,296 | $2,477,933 | $10,114 | 22.9% |
| (1) | TTM represents the trailing 12-month period ending March 31, 2017. |
| (2) | Prior ownership classified a number of units as Assisted Living, for which the loan sponsor has deemed the level of care provided consistent of Independent Living. Underwritten Independent Living revenue and Underwritten Assisted Living revenue reflect this reclassification of unit types. Additionally, Underwritten Assisted Living (Medicaid) revenue has been segregated as its own revenue line item, a distinction not made by prior ownership in historical financials. |
| (3) | The increase in 2016 Net Operating Income from 2015 Net Operating Income is primarily a result of an affiliate of the loan sponsor taking over property management duties in April 2016 prior to the acquisition. The loan sponsor affiliated property manager identified and reduced several areas of redundant labor costs and increased rents across the portfolio through strategic marketing and leasing initiatives. |
| (4) | The decrease in Underwritten Net Operating Income from TTM Net Operating Income is primarily attributable to (i) an increased management fee of 5.0% pursuant to the property management agreement entered into as of origination of the loan and (ii) increased expenses consistent with the loan sponsor’s budget attributable to marketing initiatives and activity/social events at the properties. |
Property Management. Each portfolio property is subject to a management agreement between the applicable sub-tenant, ELCM Manor South Leasing, LLC, ELCM Homestead Leasing LLC and ELCM Allenwood Leasing LLC, and one of ELCM Manor South Management LLC, ELCM Homestead Management LLC or ELCM Allenwood Management LLC, each a Delaware limited liability company and an affiliate of the loan sponsor.
Escrows and Reserves.At origination, the borrowers deposited into escrow $83,197 for real estate taxes and $7,146 for replacement reserves.
Tax Escrows- On a monthly basis, the borrowers are required to escrow 1/12 of the annual estimated tax payments, which currently equates to $23,865.
Insurance Escrows- The requirement for the borrowers to make deposits to the insurance escrow is waived so long as (i) no event of default has occurred and is continuing and (ii) the borrowers provide satisfactory evidence that the property is insured as part of a blanket policy in accordance with the loan documents.
Replacement Reserves- On a monthly basis, the borrowers are required to escrow $7,146 (approximately $350 per unit annually) for replacement reserves.
Lockbox / Cash Management.The loan is structured with a soft lockbox and springing cash management. The borrowers were required at origination to cause all sub-tenants to instruct all property managers to deposit all rents and payments directly into the lender-controlled lockbox account within two business days of receipt. All funds in the lockbox account are required to be transferred at the direction of the borrowers or sub-tenants, unless a Cash Sweep Event (as defined below) has occurred and is continuing, in which case such funds are required to be swept each business day into a lender-controlled cash management account and disbursed on each payment date during the term of the loan in accordance with the loan documents. To the extent a Cash Sweep Event has occurred and is continuing, all excess cash flow after payment of debt service, required reserves and operating expenses on deposit in the cash management account is required to be held in the excess cash flow subaccount. The lender has been granted a first priority security interest in the cash management account.
THE INFORMATION IN THIS STRUCTURAL AND COLLATERAL TERM SHEET IS NOT COMPLETE AND MAY BE AMENDED PRIOR TO THE TIME OF SALE. THIS TERM SHEET IS NOT AN OFFER TO SELL THESE SECURITIES AND IT IS NOT A SOLICITATION OF AN OFFER TO BUY THESE SECURITIES IN ANY JURISDICTION WHERE THE OFFER OR SALE IS NOT PERMITTED.
| 117 of 151 |
| Structural and Collateral Term Sheet | JPMCC 2017-JP6 | |
| Pillsbury Portfolio | ||
A “Cash Sweep Event” means the occurrence of (i) an event of default, (ii) a bankruptcy or insolvency action of an individual borrower or property manager (unless, with respect to a bankruptcy or insolvency action of a property manager, the borrowers replace the manager with a qualified manager in accordance with the loan documents within 30 days following the initiation of such bankruptcy or insolvency action) or (iii) the date on which the debt service coverage ratio (as calculated in the loan documents), based on the trailing 6-months, annualized, with respect to gross income from operations and the trailing 12 months with respect to operating expenses, is less than 1.20x.
A Cash Sweep Event may be cured by (a) with respect to clause (i) above, a cure of the related event of default, (b) with respect to clause (ii) above, solely with respect to the property manager, if the borrowers replace the manager with a qualified manager under a replacement management agreement within 60 days, (c) with respect to clause (ii) above, solely with respect to an involuntary or non-collusive bankruptcy or insolvency action of any individual borrower, the dismissal of any such bankruptcy or insolvency action within 60 days of the filing of such bankruptcy or insolvency action and (d) with respect to clause (iii) above, the achievement of a debt service coverage ratio based on the trailing six-months, annualized, with respect to gross income from operations and the trailing 12-months with respect to operating expenses equal to or greater than 1.20x for two consecutive calendar quarters (each a “Cash Sweep Event Cure”). Notwithstanding the foregoing, any such Cash Sweep Event Cure is subject to the following conditions: (i) no other event of default has occurred and is continuing under the loan documents, (ii) a Cash Sweep Event Cure may occur no more than a total of four times in the aggregate during the term of the loan with respect to a Cash Sweep Event caused by an event of default or a bankruptcy or insolvency action of any borrower or the property manager, (iii) a Cash Sweep Event may not be cured to the extent that such Cash Sweep Event exists as a result of a voluntary or collusive involuntary bankruptcy action of the borrower and (iv) the borrowers pay all of the lender’s reasonable expenses incurred in connection with such a Cash Sweep Event Cure.
Partial Release.None.
Master Lease and Subleases.The properties are subject to a master lease between the borrowers and the Master Tenant in order to accommodate certain regulatory and licensure requirements relating to health care/assisted living facilities. The Master Tenant subleases the properties to three affiliated sub-tenants, with one of the sub-tenants operating two of the properties. Each of the subleases requires that the sub-tenant pay monthly rent to the Master Tenant in an amount equal to the total revenues and income from the operation of the related property less any operating expenses for the property. The master lease requires the Master Tenant to pay to the borrowers minimum rent in the amount of $2,300,000 for the first year of the lease, which amount increases by 3.5% each year during the term of the master lease. The lease also requires percentage rent in amounts ranging from 25% to 35% of the amount by which total revenues exceed certain revenue thresholds set forth in the master lease, which thresholds range from $8,600,000 to $10,941,602. The term of the master lease expires on September 30, 2024, with three consecutive renewal terms of five years each. The sub-tenants have also provided a guaranty of the Master Tenant’s obligations under the master lease, including the payment of all rent and other sums due under the master lease. The borrowers have collaterally assigned their rights in the master lease and sub-leases to the lender as security for the loan, and the loan documents require that all revenues from the properties be deposited into a lockbox account controlled by the lender.
THE INFORMATION IN THIS STRUCTURAL AND COLLATERAL TERM SHEET IS NOT COMPLETE AND MAY BE AMENDED PRIOR TO THE TIME OF SALE. THIS TERM SHEET IS NOT AN OFFER TO SELL THESE SECURITIES AND IT IS NOT A SOLICITATION OF AN OFFER TO BUY THESE SECURITIES IN ANY JURISDICTION WHERE THE OFFER OR SALE IS NOT PERMITTED.
| 118 of 151 |
| Structural and Collateral Term Sheet | JPMCC 2017-JP6 |
[THIS PAGE INTENTIONALLY LEFT BLANK]
THE INFORMATION IN THIS STRUCTURAL AND COLLATERAL TERM SHEET IS NOT COMPLETE AND MAY BE AMENDED PRIOR TO THE TIME OF SALE. THIS TERM SHEET IS NOT AN OFFER TO SELL THESE SECURITIES AND IT IS NOT A SOLICITATION OF AN OFFER TO BUY THESE SECURITIES IN ANY JURISDICTION WHERE THE OFFER OR SALE IS NOT PERMITTED.
| 119 of 151 |
| Structural and Collateral Term Sheet | JPMCC 2017-JP6 | |
| Raytheon – 16800 Centretech | ||

THE INFORMATION IN THIS STRUCTURAL AND COLLATERAL TERM SHEET IS NOT COMPLETE AND MAY BE AMENDED PRIOR TO THE TIME OF SALE. THIS TERM SHEET IS NOT AN OFFER TO SELL THESE SECURITIES AND IT IS NOT A SOLICITATION OF AN OFFER TO BUY THESE SECURITIES IN ANY JURISDICTION WHERE THE OFFER OR SALE IS NOT PERMITTED.
| 120 of 151 |
| Structural and Collateral Term Sheet | JPMCC 2017-JP6 | |
| Raytheon – 16800 Centretech | ||
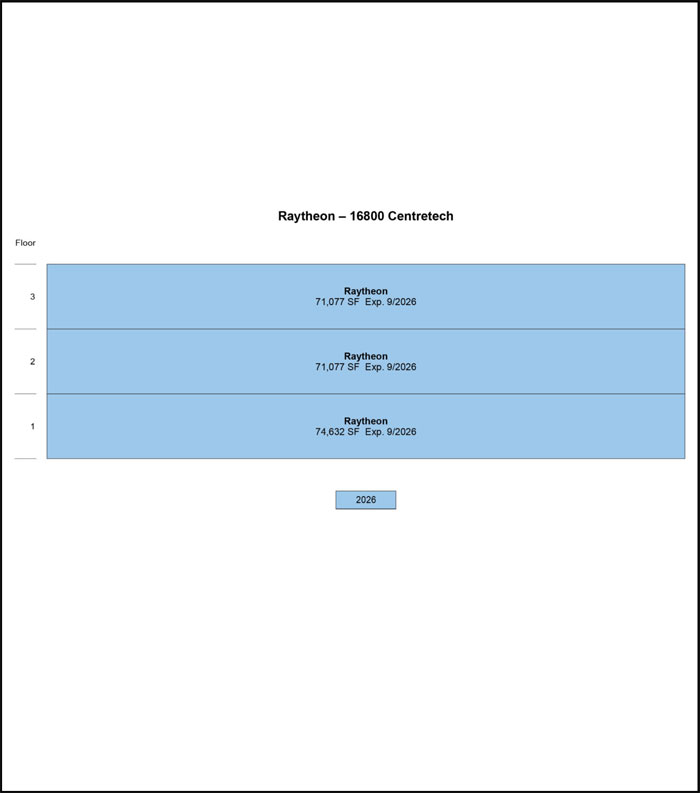
THE INFORMATION IN THIS STRUCTURAL AND COLLATERAL TERM SHEET IS NOT COMPLETE AND MAY BE AMENDED PRIOR TO THE TIME OF SALE. THIS TERM SHEET IS NOT AN OFFER TO SELL THESE SECURITIES AND IT IS NOT A SOLICITATION OF AN OFFER TO BUY THESE SECURITIES IN ANY JURISDICTION WHERE THE OFFER OR SALE IS NOT PERMITTED.
| 121 of 151 |
| Structural and Collateral Term Sheet | JPMCC 2017-JP6 | |
| Raytheon – 16800 Centretech | ||

THE INFORMATION IN THIS STRUCTURAL AND COLLATERAL TERM SHEET IS NOT COMPLETE AND MAY BE AMENDED PRIOR TO THE TIME OF SALE. THIS TERM SHEET IS NOT AN OFFER TO SELL THESE SECURITIES AND IT IS NOT A SOLICITATION OF AN OFFER TO BUY THESE SECURITIES IN ANY JURISDICTION WHERE THE OFFER OR SALE IS NOT PERMITTED.
| 122 of 151 |
| Structural and Collateral Term Sheet | JPMCC 2017-JP6 | |
| Raytheon – 16800 Centretech | ||
| Mortgage Loan Information | Property Information | |||
| Mortgage Loan Seller: | BSP | Single Asset / Portfolio: | Single Asset | |
| Original Principal Balance: | $23,200,000 | Title: | Fee | |
| Cut-off Date Principal Balance: | $23,200,000 | Property Type - Subtype: | Office – Suburban | |
| % of Pool by IPB: | 2.9% | Net Rentable Area (SF): | 216,786 | |
| Loan Purpose: | Refinance | Location: | Aurora, CO | |
| Borrower: | Brixton Centretech Holdings, LLC | Year Built / Renovated: | 1987 / 2014 | |
| Sponsors: | Villanova Equities, LLC, Travis King | Occupancy(1): | 100.0% | |
| and Corey Eagle | Occupancy Date: | 6/6/2017 | ||
| Interest Rate: | 5.30000% | Number of Tenants(1): | 1 | |
| Note Date: | 12/16/2016 | 2014 NOI(2): | N/A | |
| Maturity Date: | 1/6/2027 | 2015 NOI(3): | $3,523,078 | |
| Interest-only Period: | 120 months | 2016 NOI: | $2,745,860 | |
| Original Term: | 120 months | TTM NOI (as of 2/2017)(3): | $2,669,002 | |
| Original Amortization: | None | UW Economic Occupancy: | 95.0% | |
| Amortization Type: | Interest Only | UW Revenues: | $2,462,368 | |
| Call Protection: | L(29),Def(87),O(4) | UW Expenses: | $50,000 | |
| Lockbox / Cash Management: | Hard / Springing | UW NOI(4): | $2,412,368 | |
| Additional Debt: | N/A | UW NCF: | $2,260,618 | |
| Additional Debt Balance: | N/A | Appraised Value / Per SF(5): | $41,000,000 / $189 | |
| Additional Debt Type: | N/A | Appraisal Date: | 10/14/2016 | |
| Escrows and Reserves(6) | Financial Information | |||||||
| Initial | Monthly | Initial Cap | Cut-off Date Loan / SF: | $107 | ||||
| Taxes: | $0 | Springing | N/A | Maturity Date Loan / SF: | $107 | |||
| Insurance: | $0 | Springing | N/A | Cut-off Date LTV: | 56.6% | |||
| Replacement Reserves: | $0 | Springing | N/A | Maturity Date LTV: | 56.6% | |||
| TI/LC: | $0 | $13,549 | N/A | UW NCF DSCR: | 1.81x | |||
| Other: | $0 | $0 | N/A | UW NOI Debt Yield: | 10.4% | |||
| Sources and Uses(7) | ||||||
| Sources | Proceeds | % of Total | Uses | Proceeds | % of Total | |
| Mortgage Loan | $23,200,000 | 100.0% | Payoff Existing Debt | $11,978,344 | 51.6% | |
| Closing Costs | 407,919 | 1.8 | ||||
| % | Return of Equity | 10,813,737 | 46.6 | |||
| Total Sources | $23,200,000 | 100.0% | Total Uses | $23,200,000 | 100.0% | |
| (1) | The property is 100.0% occupied by Raytheon. Raytheon has been at the property since acquiring the Hughes Aircraft Company in 1997, and recently negotiated a 10-year lease extension through September 2026 (with annual 1.25% rent increases). The lease extension provides the tenant with four five-year renewal options (each option has annual rent increases). |
| (2) | 2014 NOI figures are not available as the borrower purchased the property in December 2014 and historical cash flows were not provided at the time of acquisition. |
| (3) | The decrease from 2015 NOI through TTM NOI is primarily due to a lease extension option exercised in 2014 (effective in 2015), followed by a new 10-year lease executed in 2016. The original lease (effective 1988) allowed for a three-year extension option, which called for a fixed rent (90% of the average rent over the primary term). This option was exercised prior to the borrower’s purchase of the property and was scheduled to run through September 2018. Subsequently, the borrower negotiated with Raytheon to amend and extend their lease (August 2016, effective October 2016) for 10 years at a lower base rent, which was more inline with the market. |
| (4) | Underwritten based on the straight-line average rent of Raytheon through its lease expiration in September 2026. |
| (5) | The appraisal also concluded an estimated market value for the property as if it were vacant (i.e. “go dark value”) of $28,100,000. |
| (6) | For a full description of Escrows and Reserves, please refer to “Escrows and Reserves” below. |
| (7) | The borrower’s total cost basis in the property is $21.0 million. That figure includes the total acquisition cost of $19.0 million, approximately $1.48 million given to the tenant as a tenant improvement allowance as part of its 10-year lease extension, approximately $0.12 million paid in leasing commissions and approximately $0.4 million in closing costs in connection with this transaction. The property was acquired in late 2014 for $19.0 million ($18.8 million purchase price and $0.2 million in closing costs) with a personal loan from Marc R. Brutten (the founder and Chairman of Brixton Capital) and Robert K. Barth (Director of Financial Institutions at Brutten Global) which was paid off at closing of the current loan. As shown above, the net outstanding debt at closing was $11,978,344. The total return of equity above the borrower’s cost basis in this transaction is $2.2 million. |
THE INFORMATION IN THIS STRUCTURAL AND COLLATERAL TERM SHEET IS NOT COMPLETE AND MAY BE AMENDED PRIOR TO THE TIME OF SALE. THIS TERM SHEET IS NOT AN OFFER TO SELL THESE SECURITIES AND IT IS NOT A SOLICITATION OF AN OFFER TO BUY THESE SECURITIES IN ANY JURISDICTION WHERE THE OFFER OR SALE IS NOT PERMITTED.
| 123 of 151 |
| Structural and Collateral Term Sheet | JPMCC 2017-JP6 | |
| Raytheon – 16800 Centretech | ||
The Loan.The Raytheon – 16800 Centretech loan has an outstanding principal balance as of the Cut-off Date of $23.2 million and is secured by a first mortgage lien on the borrower’s fee interest in a 216,786 square foot single-tenant office building located in Aurora, Colorado. The loan has a 10-year term and is interest-only for the entire term of the loan.
The Borrower.The borrowing entity for the Raytheon – 16800 Centretech loan is Brixton Centretech Holdings, LLC, a Delaware limited liability company and special purpose entity.
The Loan Sponsors.Brixton Capital, led by its founder and Chairman Marc R. Brutten, is the investment vehicle for the Brutten Global family office. The loan sponsors and nonrecourse carve-out guarantors are Villanova Equities, LLC, a Delaware limited liability company, Travis King and Corey Eagle. Villanova Equities, LLC is fully controlled by Marc Brutten and 90.0% owned by the Marc R. Brutten Family Trust of which Marc R. Brutten is the trustee. Travis King and Corey Eagle are executives for Brixton Capital, with Travis King serving as the Chief Executive Officer and Corey Eagle serving as the Chief Financial Officer. Brixton Capital was founded in 2012 and is headquartered in San Diego, California. Brixton Capital owns and manages over 8.8 million square feet of assets and owns 166 properties.
The Property.The Raytheon – 16800 Centretech property consists of one three-story Class B office building totaling 216,786 square feet that is situated on an approximately 28.07-acre site in Aurora, Colorado. The property offers 760 parking spaces, resulting in a ratio of approximately 3.5 spaces per 1,000 square feet. The building was originally constructed in 1987. As of June 6, 2017, the property was 100.0% occupied by the sole tenant, Raytheon (A3/A/A- by Moody’s, S&P and Fitch, respectively). Raytheon’s predecessor-in-interest, Hughes Aircraft Company occupied the property from 1988, when they took occupancy on a 27-year lease, until 1997 when Raytheon acquired Hughes Aircraft Company and began occupying the property. In 2016 Raytheon executed a 10-year extension of its lease through September 30, 2026. The lease, which is structured as absolute net, requires $2,400,000 ($11.07 per square foot) in annual base rent effective October 1, 2016 with 1.25% escalations each year and affords the tenant four five-year renewal options (with annual increases). Raytheon has the right of first offer (“ROFO”) to purchase the property. The ROFO excludes any portfolio sale or any sale in conjunction with any other property owned by the landlord. Raytheon executed an SNDA at closing subordinating this ROFO in connection with the lender exercising remedies. The property was originally purpose-built for Hughes Aircraft Company in 1987 and opened in 1988, and is one of five buildings Raytheon occupies that together form an approximately 592,000 square foot corporate campus in Aurora. Raytheon owns two of the five buildings in the campus. Raytheon employs over 2,400 employees, making it the second-largest private employer in Aurora.
Raytheon, founded in 1922, is an international aerospace and defense company headquartered in Waltham, Massachusetts that specializes in defense, civil government and cybersecurity solutions. The company provides electronics, mission systems integrations, capabilities in C5I (command, control, communications, computing, cyber and intelligence), sensing, effects and mission support services. Raytheon employs approximately 63,000 people worldwide and reported 2016 sales at an estimated $24 billion. The property is located approximately 13.5 miles east of the Denver central business district and is located 3.4 miles west of the Buckley Air Force Base. Buckley Air Force Base is home to various intelligence agencies, including the National Security Agency and the National Reconnaissance Office, the Aerospace Data Facility - Colorado, Army, Navy, Air Force and Marine intelligence and information units and Marine and Coast Guard cryptologic units. Due to Raytheon’s substantial work with the US Government, the property is required to meet Sensitive Compartmented Information Facility (“SCIF”) requirements. Extensive planning and design are necessary to make the property SCIF-accredited. The majority of the property has no windows due to security requirements.
The property is located in the Denver-Aurora-Lakewood, CO metropolitan statistical area (“Denver MSA”). According to the appraisal, the Denver MSA is the 19th most populous metropolitan area in the nation and the 18th largest metropolitan area economy in the nation based on GDP. The Denver MSA has an estimated 2016 population of 2,830,748, which represents an average annual 1.8% increase over the 2010 census. The Denver MSA added approximately 47,878 residents per year over the 2010-2016 period, and its annual growth rate exceeded the State of Colorado rate of 1.4%. Between year-end 2005 and the present, employment rose by approximately 203,400 jobs, which is equivalent to a 16.8% increase over the period. The Denver MSA has a median household income of $66,682, which is 6.6% greater than the State of Colorado overall.
According to the appraisal, the 2016 estimated population within a three- and five-mile radius of the property was 123,354 and 331,296, respectively. Additionally, the 2016 estimated average household income within a three- and five-mile radius was $57,206 and $62,807, respectively. According to the appraisal, as of the third quarter of 2016, the Aurora submarket contained approximately 9.3 million square feet of office space and reported a vacancy rate of 7.8% with asking rents of $17.28 per square foot.
THE INFORMATION IN THIS STRUCTURAL AND COLLATERAL TERM SHEET IS NOT COMPLETE AND MAY BE AMENDED PRIOR TO THE TIME OF SALE. THIS TERM SHEET IS NOT AN OFFER TO SELL THESE SECURITIES AND IT IS NOT A SOLICITATION OF AN OFFER TO BUY THESE SECURITIES IN ANY JURISDICTION WHERE THE OFFER OR SALE IS NOT PERMITTED.
| 124 of 151 |
| Structural and Collateral Term Sheet | JPMCC 2017-JP6 | |
| Raytheon – 16800 Centretech | ||
| Historical and Current Occupancy(1) | |||
| 2014 | 2015 | 2016 | Current(2) |
| 100.0% | 100.0% | 100.0% | 100.0% |
| (1) | Historical Occupancies are as of December 31 of each respective year. |
| (2) | Current Occupancy is as of June 6, 2017. The property is 100.0% leased to Raytheon through September 2026. |
| Tenant Summary(1) | ||||||
| Tenant | Ratings(2) Moody’s/S&P/Fitch | Net Rentable Area (SF) | % of Total NRA | Base Rent PSF(3) | % of Total Base Rent | Lease Expiration Date(4) |
| Raytheon | A3 / A / A- | 216,786 | 100.0% | $11.21 | 100.0% | 9/30/2026 |
| (1) | Based on the underwritten rent roll dated June 6, 2017. |
| (2) | Ratings provided are for the parent company of the entity listed in the “Tenant” field whether or not the parent company guarantees the lease. |
| (3) | Base Rent PSF represents underwritten base rent excluding the straight-line average rent ($111,966) for Raytheon, an investment-grade tenant, through its lease expiration of September 30, 2026. The tenant’s current in-place rent is $11.07 per square foot. |
| (4) | The lease extension provides the tenant with four five-year renewal options (each option has annual rent increases). |
| Lease Rollover Schedule(1)(2) | |||||||||
| Year | Number of Leases Expiring | Net Rentable Area Expiring | % of NRA Expiring | Base Rent Expiring | % of Base Rent Expiring | Cumulative Net Rentable Area Expiring | Cumulative % of NRA Expiring | Cumulative Base Rent Expiring | Cumulative % of Base Rent Expiring |
| Vacant | NAP | 0 | 0.0% | NAP | NAP | 0 | 0.0% | NAP | NAP |
| 2017 & MTM | 0 | 0 | 0.0% | $0 | 0.0% | 0 | 0.0% | $0 | 0.0% |
| 2018 | 0 | 0 | 0.0% | 0 | 0.0% | 0 | 0.0% | $0 | 0.0% |
| 2019 | 0 | 0 | 0.0% | 0 | 0.0% | 0 | 0.0% | $0 | 0.0% |
| 2020 | 0 | 0 | 0.0% | 0 | 0.0% | 0 | 0.0% | $0 | 0.0% |
| 2021 | 0 | 0 | 0.0% | 0 | 0.0% | 0 | 0.0% | $0 | 0.0% |
| 2022 | 0 | 0 | 0.0% | 0 | 0.0% | 0 | 0.0% | $0 | 0.0% |
| 2023 | 0 | 0 | 0.0% | 0 | 0.0% | 0 | 0.0% | $0 | 0.0% |
| 2024 | 0 | 0 | 0.0% | 0 | 0.0% | 0 | 0.0% | $0 | 0.0% |
| 2025 | 0 | 0 | 0.0% | 0 | 0.0% | 0 | 0.0% | $0 | 0.0% |
| 2026 | 1 | 216,786 | 100.0% | 2,430,000 | 100.0% | 216,786 | 100.0% | $2,430,000 | 100.0% |
| 2027 | 0 | 0 | 0.0% | 0 | 0.0% | 216,786 | 100.0% | $2,430,000 | 100.0% |
| 2028 & Beyond | 0 | 0 | 0.0% | 0 | 0.0% | 216,786 | 100.0% | $2,430,000 | 100.0% |
| Total | 1 | 216,786 | 100.0% | $2,430,000 | 100.0% | ||||
| (1) | Based on the underwritten rent roll dated June 6, 2017 and excludes $111,966 of straight-line average rent. |
| (2) | Certain tenants may have termination or contraction options (which may become exercisable prior to the originally stated expiration date of the tenant lease) that are not considered in the above Lease Rollover Schedule. |
THE INFORMATION IN THIS STRUCTURAL AND COLLATERAL TERM SHEET IS NOT COMPLETE AND MAY BE AMENDED PRIOR TO THE TIME OF SALE. THIS TERM SHEET IS NOT AN OFFER TO SELL THESE SECURITIES AND IT IS NOT A SOLICITATION OF AN OFFER TO BUY THESE SECURITIES IN ANY JURISDICTION WHERE THE OFFER OR SALE IS NOT PERMITTED.
| 125 of 151 |
| Structural and Collateral Term Sheet | JPMCC 2017-JP6 | |
| Raytheon – 16800 Centretech | ||
| Operating History and Underwritten Net Cash Flow(1) | ||||||
| 2015 | 2016 | TTM(2) | Underwritten | Per Square Foot | %(3) | |
| Rents in Place(4) | $3,523,078 | $2,745,860 | $2,669,002 | $2,541,966 | $11.73 | 98.1% |
| Vacant Income | 0 | 0 | 0 | 0 | 0.00 | 0.0% |
| Gross Potential Rent | $3,523,078 | $2,745,860 | $2,669,002 | $2,541,966 | $11.73 | 98.1% |
| Total Reimbursements | 0 | 0 | 0 | 50,000 | 0.23 | 1.9% |
| Net Rental Income | $3,523,078 | $2,745,860 | $2,669,002 | $2,591,966 | $11.96 | 100.0% |
| (Vacancy/Credit Loss) | 0 | 0 | 0 | (129,598) | (0.60) | (5.0)-- |
| Other Income | 0 | 0 | 0 | 0 | 0.00 | 0.0% |
| Effective Gross Income | $3,523,078 | $2,745,860 | $2,669,002 | $2,462,368 | $11.36 | 95.0% |
| Total Expenses(5) | $0 | $0 | $0 | $50,000 | $0.23 | 2.0% |
| Net Operating Income(6) | $3,523,078 | $2,745,860 | $2,669,002 | $2,412,368 | $11.13 | 98.0% |
| Total TI/LC, Capex/RR | 0 | 0 | 0 | 151,750 | 0.70 | 6.2% |
| Net Cash Flow | $3,523,078 | $2,745,860 | $2,669,002 | $2,260,618 | $10.43 | 91.8%
|
| (1) | 2014 financials are not available as the borrower acquired the property in December 2014 and historical cash flows were not provided at the time of acquisition. |
| (2) | TTM column represents the trailing 12-month period ending February 28, 2017. |
| (3) | % column represents percent of Net Rental Income for all revenue lines and represents percent of Effective Gross Income for the remainder of fields. |
| (4) | Underwritten Rents in Place includes $111,966 of straight-line average rent for Raytheon, an investment-grade tenant, through its lease expiration of September 30, 2026. The tenant recently executed a 10-year extension that commenced October 1, 2016. Historical statements have been adjusted to reflect actual rent due over the applicable time period. Due to the fact that historical rent payments were made semiannually, the historical rent payments did not always reflect actual rent due in the time period. |
| (5) | Underwritten Total Expenses are based on in-place expenses and the terms of the lease. The lease is structured as an absolute net lease with the tenant paying all expenses directly. |
| (6) | The decrease from 2015 Net Operating Income through TTM Net Operating Income is primarily due to a lease extension option exercised in 2014 (effective in 2015), followed by a new 10-year lease executed in 2016. The original lease (effective 1988) allowed for a three-year extension option, which called for a fixed rent (90% of the average rent over the primary term). This option was exercised prior to the borrower’s purchase of the property and was scheduled to run through September 2018. Subsequently, the borrower negotiated with Raytheon to amend and extend their lease (August 2016, effective October 2016) for 10 years at a lower base rent. |
Property Management.The property is managed by Brixton Investment Management, LLC, an affiliate of the borrower.
Escrows and Reserves.No upfront reserves were taken at origination.
Tax Escrows – The requirement for the borrower to make monthly deposits to the tax escrow is suspended so long as (i) no event of default exists, (ii) Raytheon timely pays taxes directly to the applicable taxing authority pursuant to Raytheon’s lease, (iii) the lender receives satisfactory evidence that all taxes have been timely paid, and (iv) on or prior to the payment date occurring in August 2025, Raytheon has extended or renewed its lease for not less than five years beyond the expiration date of its current lease term.
Insurance Escrows –The requirement for the borrower to make monthly deposits to the insurance escrow is suspended so long as (i) no event of default exists, (ii) Raytheon maintains insurance, which complies with the terms and conditions of the loan documents, (iii) the lender receives satisfactory evidence that the insurance premiums have been timely paid for a period no later than 10 days prior to the insurance expiration, (iv) the lender receives satisfactory evidence of policies when requested, and (v) on or prior to the payment date occurring in August 2025, Raytheon has extended or renewed its lease for not less than five years beyond the expiration date of its current lease term.
Replacement Reserves -The requirement for the borrower to make monthly deposits to the replacement reserve escrow is suspended so long as (i) no event of default exists, (ii) Raytheon maintains the property in good condition and repair, and no default has occurred under the lease and (iii) on or prior to the payment date occurring in August 2025, Raytheon has extended or renewed its lease for not less than five years beyond the expiration date of its current lease term. The borrower will be required to escrow $4,516 (approximately $0.25 per square foot annually) if the borrower fails to satisfy any of the above conditions.
TI/LC Reserves –On a monthly basis, the borrower is required to deposit $13,549 (approximately $0.75 per square foot annually) for tenant improvements and leasing commissions reserves. The reserve is not subject to a cap.
THE INFORMATION IN THIS STRUCTURAL AND COLLATERAL TERM SHEET IS NOT COMPLETE AND MAY BE AMENDED PRIOR TO THE TIME OF SALE. THIS TERM SHEET IS NOT AN OFFER TO SELL THESE SECURITIES AND IT IS NOT A SOLICITATION OF AN OFFER TO BUY THESE SECURITIES IN ANY JURISDICTION WHERE THE OFFER OR SALE IS NOT PERMITTED.
| 126 of 151 |
| Structural and Collateral Term Sheet | JPMCC 2017-JP6 | |
| Raytheon – 16800 Centretech | ||
Lockbox / Cash Management.The Raytheon – 16800 Centretech loan is structured with a hard lockbox and springing cash management. The borrower was required at origination to deliver tenant direction letters instructing all tenants to deposit rents into a lockbox account controlled by the lender. All funds in the lockbox account are required to be swept each business day into the borrower’s operating account, unless a Cash Sweep Period (as defined below) is continuing, in which event such funds are required to be swept each business day into a cash management account controlled by the lender and disbursed on each payment date in accordance with the loan documents.
A “Cash Sweep Period” commences upon the occurrence of (i) an event of default or (ii) the occurrence of a Specified Tenant Sweep Event (as defined below).
A Cash Sweep Period will end upon (a) with respect to clause (i) above, the cure or written waiver by lender of such event of default or (b) with respect to clause (ii) above, the occurrence of Specified Tenant Sweep Event Cure (as defined below).
A “Specified Tenant Sweep Event” commences upon the occurrence of (i) a default by Raytheon under its lease beyond all applicable notice and/or cure periods, (ii) Raytheon vacating, abandoning or ceasing ordinary business operations at, or otherwise “going dark” at all or substantially all of the leased space, or giving notice of its intent to do any of the foregoing (provided, however, no sweep pursuant to this clause (ii) shall be deemed to have occurred, if Raytheon is paying its rent, maintains a long term unsecured debt rating of at least “BBB-“ by S&P or the equivalent rating by a reasonably equivalent rating agency, and it is more than five years prior to the maturity date of the loan), (iii) any bankruptcy or insolvency of Raytheon, (iv) any termination, cancellation or surrender of Raytheon’s lease, or notification by Raytheon of its intent to effect any of the foregoing, (v) the failure of Raytheon to extend or renew its lease for not less than five years beyond the expiration date of its current lease term by 24 months prior to the lease expiration or (vi) the failure of Raytheon to maintain a long term unsecured debt rating of at least BBB- by S&P or the equivalent of such rating by a reasonably equivalent rating agency.
A “Specified Tenant Sweep Event Cure” means, (a) with respect to clause (i) above, the cure of all defaults under the Raytheon lease, (b) with respect to clause (ii) above, Raytheon resumes ordinary course business operations and delivers to lender an acceptable tenant estoppel, (c) with respect to clause (iii) above, Raytheon is no longer insolvent or subject to any bankruptcy proceedings, (d) with respect to clause (iv) above, Raytheon revokes any notification of any termination, cancellation or surrender and resumes ordinary course business operations or the achievement of a debt yield (as calculated in the loan documents) based on the trailing 12-month period equal to or greater than 8.0%, (e) with respect to clause (v) above, lender receives satisfactory evidence that Raytheon has extended or renewed its lease for the entire space leased for a term of at least five years beyond the current scheduled lease expiration or (f) with respect to clause (vi) above, Raytheon satisfies and maintains the credit rating requirement as described in the loan documents, and/or (g) with respect to any Specified Tenant Sweep Event, the space leased to Raytheon is re-leased pursuant to one or more leases that contain terms and conditions acceptable to lender with replacement tenants acceptable to lender and delivers to lender an acceptable tenant estoppel.
THE INFORMATION IN THIS STRUCTURAL AND COLLATERAL TERM SHEET IS NOT COMPLETE AND MAY BE AMENDED PRIOR TO THE TIME OF SALE. THIS TERM SHEET IS NOT AN OFFER TO SELL THESE SECURITIES AND IT IS NOT A SOLICITATION OF AN OFFER TO BUY THESE SECURITIES IN ANY JURISDICTION WHERE THE OFFER OR SALE IS NOT PERMITTED.
| 127 of 151 |
| Structural and Collateral Term Sheet | JPMCC 2017-JP6 | |
| Humblewood Center | ||
| Mortgage Loan Information | Property Information | |||
| Mortgage Loan Seller: | JPMCB | Single Asset / Portfolio: | Single Asset | |
| Original Principal Balance: | $22,150,000 | Title: | Fee | |
| Cut-off Date Principal Balance: | $22,150,000 | Property Type - Subtype: | Retail – Anchored | |
| % of Pool by IPB: | 2.8% | Net Rentable Area (SF): | 160,897 | |
| Loan Purpose: | Acquisition | Location: | Humble, TX | |
| Borrower: | FREP III – Humblewood Center, LLC | Year Built / Renovated: | 1979-1988 / 2016 | |
| Sponsor: | Forge Real Estate Partners III, LP | Occupancy: | 88.2% | |
| Interest Rate: | 4.57400% | Occupancy Date: | 4/7/2017 | |
| Note Date: | 4/7/2017 | Number of Tenants: | 30 | |
| Maturity Date: | 5/1/2022 | 2014 NOI(1): | $2,749,148 | |
| Interest-only Period: | 24 months | 2015 NOI(1)(2): | $2,349,881 | |
| Original Term: | 60 months | 2016 NOI(2): | $2,680,111 | |
| Original Amortization: | 360 months | TTM NOI(3): | N/A | |
| Amortization Type: | IO-Balloon | UW Economic Occupancy: | 88.8% | |
| Call Protection: | L(25),Def(32),O(3) | UW Revenues: | $3,719,654 | |
| Lockbox / Cash Management: | Springing / Springing | UW Expenses: | $1,041,724 | |
| Additional Debt: | N/A | UW NOI: | $2,677,930 | |
| Additional Debt Balance: | N/A | UW NCF: | $2,466,630 | |
| Additional Debt Type: | N/A | Appraised Value / Per SF(4): | $32,130,000 / $200 | |
| Appraisal Date: | 3/4/2017 | |||
| Escrows and Reserves | Financial Information | |||||||||||
| Initial | Monthly | Initial Cap | Cut-off Date Loan / SF: | $138 | ||||||||
| Taxes: | $247,149 | $49,430 | N/A | Maturity Date Loan / SF: | $131 | |||||||
| Insurance: | $0 | Springing | N/A | Cut-off Date LTV(4): | 68.9% | |||||||
| Replacement Reserves: | $5,527 | $5,527 | N/A | Maturity Date LTV(4): | 65.6% | |||||||
| TI/LC(5): | $12,500 | $12,500 | $675,000 | UW NCF DSCR: | 1.82x | |||||||
| Other(6): | $604,851 | $0 | N/A | UW NOI Debt Yield: | 12.1% | |||||||
| Sources and Uses | ||||||||||||
| Sources | Proceeds | % of Total | Uses | Proceeds | % of Total | |||||||
| Mortgage Loan | $22,150,000 | 59.1% | Purchase Price | $36,350,000 | 96.9% | |||||||
| Sponsor Equity | 15,347,348 | 40.9 % | Upfront Reserves | 870,026 | 2.3% | |||||||
| Closing Costs | 277,322 | 0.7% | ||||||||||
| Total Sources | $37,497,348 | 100.0% | Total Uses | $37,497,348 | 100.0% | |||||||
| (1) | The decrease in 2015 NOI from 2014 NOI is primarily due to a decrease in occupancy from 100.0% to 90.5%. |
| (2) | The increase in 2016 NOI from 2015 NOI is primarily due to the expansion of Conn’s from 27,171 square feet to 55,322 square feet in September 2015. |
| (3) | TTM NOI was not available due to the timing of the acquisition. |
| (4) | Appraised Value / Per SF, Cut-off Date LTV and Maturity Date LTV exclude value attributable to the Chick-fil-A and Pappas BBQ release parcels with an aggregate ground lease value of approximately $4.5 million. Both the Chick-fil-A and Pappas BBQ parcels may be released with no related prepayment of the loan pursuant to the terms outlined in the loan documents as further described in“Release Parcels”below. The “as-is” value as of March 4, 2017 including the appraised value of the release parcels is $36,590,000, which results in a Cut-off Date LTV and Maturity Date LTV of 60.5% and 57.6%, respectively. |
| (5) | The TI/LC Initial Cap is required to be reduced to $375,000, provided, among other conditions as outlined in the loan documents, the borrower has entered into a lease for the 11,569 square foot vacant space identified in the loan documents at a rent of $10.00 per square foot or greater. Additionally, as part of the acquisition, the borrower and seller agreed to escrow $300,000 of the total Purchase Price to be withheld from the seller until such time a letter of intent with K&G Fashion for the 11,569 square foot space identified in the loan documents has been converted to a fully executed lease. In the event that such letter of intent is not converted to a fully executed lease within 12 months of origination, the escrow agent is to release such funds to the Monthly TI/LC reserve account to be held as additional collateral for the loan. |
| (6) | Initial Other Escrows includes a roof reserve in the amount of $275,124, a reserve for outstanding tenant improvements and leasing commissions in the amount of $183,750 and required repairs reserve in the amount of approximately $145,976. |
THE INFORMATION IN THIS STRUCTURAL AND COLLATERAL TERM SHEET IS NOT COMPLETE AND MAY BE AMENDED PRIOR TO THE TIME OF SALE. THIS TERM SHEET IS NOT AN OFFER TO SELL THESE SECURITIES AND IT IS NOT A SOLICITATION OF AN OFFER TO BUY THESE SECURITIES IN ANY JURISDICTION WHERE THE OFFER OR SALE IS NOT PERMITTED.
| 128 of 151 |
| Structural and Collateral Term Sheet | JPMCC 2017-JP6 | |
| Humblewood Center | ||
The Loan.The Humblewood Center loan has an outstanding principal balance as of the Cut-off Date of $22.15 million and is secured by a first mortgage lien on the borrower’s fee interest in a 160,897 square foot shopping center located in Humble, Texas. The loan has a five-year term, and subsequent to a two-year interest-only period, will amortize on a 30-year schedule. The borrowing entity for the loan is FREP III - Humblewood Center, LLC which is a Delaware limited liability company and special purpose entity.
��
The loan sponsor and nonrecourse carve-out guarantor is Forge Real Estate Partners III, LP (“Forge”), a privately-owned real estate investment firm based in Tampa, Florida. Forge was founded in 2000 and has since sponsored three real estate-oriented closed-end private equity funds focused on direct real estate investment, real estate development and redevelopment and real estate collateralized-debt acquisitions from financial institutions. The loan sponsor owns eight retail centers comprising over 1.0 million square feet across Texas, Florida, North Carolina, and Georgia.
The Property.The Humblewood Center property is a 160,897 square foot anchored retail shopping center situated on a 17.4 acre parcel located in Humble, Texas. The improvements were built in phases between 1979 and 1988, most recently renovated in 2016 and consist of six single-story buildings and three pad sites. The property contains 927 surface parking spaces for an overall parking ratio of approximately 5.76 spaces per 1,000 square feet. The property is located on the southwest corner of FM 1960 and Interstate 59 across from Deerbrook Mall, a retail center in the surrounding area. The well-established retail trade area benefits from traffic counts exceeding 129,000 vehicles per day along Interstate 59.
As of April 7, 2017, the property was 88.2% occupied by 30 tenants including a variety of national and regional tenants. The property is anchored by Conn’s and junior anchored by Petco, Walgreens and Skechers, which account for 42.5% of underwritten base rent and 55.1% of net rentable area, in the aggregate. Other national tenants at the property include, IHOP, AT&T, The Vitamin Shoppe, H&R Block, FedEx Kinko’s and GameStop. The largest tenant, Conn’s, leases 55,322 square feet (34.4% of net rentable area) through September 2026 and has been in occupancy since 1997. In September 2015, Conn’s extended its lease through September 2026 and expanded from 27,171 square feet to its current footprint. Conn’s is a specialty retailer of furniture, mattresses, home appliances and consumer electronics with more than 100 retail locations throughout the United States. Conn’s accounts for 21.5% of underwritten base rent at the property and its lease contains three remaining five-year extension options. The second largest tenant at the property, Petco, leases 12,500 square feet (7.8% of the net rentable area) through January 2027 and has been in occupancy since September 2016. Petco is a privately held pet and pet products retailer with more than 1,430 stores across the United States, Mexico and Puerto Rico. Petco accounts for 6.7% of underwritten base rent at the property and its lease contains two remaining five-year extension options. The third largest tenant at the property, Walgreens, leases 10,575 square feet (6.6% of the net rentable area) through January 2021 and has occupied its space since May 1979. Walgreens operates the largest drug retailing chain in the United States. As of February 2016, the company operated 8,177 stores in all 50 states, Washington DC, Puerto Rico and the Virgin Islands. Walgreens recently executed a five-year lease extension through January 2021 and has no remaining extension options. Walgreens accounts for 6.1% of underwritten base rent at the property.
Outside of the anchor and junior anchor tenants, no individual tenant occupies more than 3.2% of net rentable area or accounts for more than 4.8% in underwritten base rent. The property features three additional pad sites occupied by Burger King, Chick-fil-A and Pappas BBQ. Burger King occupies its pad site through May 2019 pursuant to a ground lease and accounts for 2.2% of underwritten base rent. The Chick-fil-A and Pappas BBQ parcels, also occupied pursuant to a ground lease for each individual pad site, may be released with no related prepayment of the loan as further described in“Release Parcels” below.
The Market. The Humblewood Center property is located in Humble, Texas, within Harris County. The property is approximately 25.0 miles northeast of the Houston central business district. The property is conveniently located along Interstate 59, which provides access to downtown Houston, as well as George Bush International Airport, approximately 2.5 miles from the property. The property is located directly across from the 1.2 million square foot super-regional Deerbrook Mall. The Deerbrook mall is anchored by Dillard’s, Macy’s, JCPenney and Sears. Other local demand drivers include the Kingwood Medical Center and Memorial Hermann Northeast Hospital. According to the appraisal, the 2016 estimated population within a one-, three- and five-mile radius of the property was approximately 5,797, 40,411 and 127,130, respectively, with an average household income of $55,909, $65,427 and $79,036, respectively.
The property is located in Houston’s Northeast retail submarket, which, according to the appraisal, consists of approximately 15.1 million square feet. As of the fourth quarter of 2016, the Northeast retail submarket had an overall vacancy rate of 4.0% and average asking rents of $15.22 per square foot. The appraisal identified five comparable properties in the surrounding area, built between 1978 and 2014 and ranging in size from 47,326 to 164,140 square feet. Occupancies at the comparable properties ranged from 62.0% to 100.0% with a weighted average occupancy of 86.1%. Recently quoted rental rates at the comparable retail properties ranged from $20.00 per square foot to $40.00 per square foot with a weighted average of $25.61 per square foot. The appraisal’s concluded market rent for the anchor, junior anchor and multitenant pad in-line space is equal to $11.00, $15.50-$22.00 and $21.00-$39.00 per square foot, respectively, each in-line with underwritten base rent with respect to each tenant classification. The appraisal did not identify any proposed or newly constructed properties that are expected to be directly competitive with the property.
THE INFORMATION IN THIS STRUCTURAL AND COLLATERAL TERM SHEET IS NOT COMPLETE AND MAY BE AMENDED PRIOR TO THE TIME OF SALE. THIS TERM SHEET IS NOT AN OFFER TO SELL THESE SECURITIES AND IT IS NOT A SOLICITATION OF AN OFFER TO BUY THESE SECURITIES IN ANY JURISDICTION WHERE THE OFFER OR SALE IS NOT PERMITTED.
| 129 of 151 |
| Structural and Collateral Term Sheet | JPMCC 2017-JP6 | |
| Humblewood Center | ||
| Tenant Summary(1) | ||||||||
| Tenant | Ratings(2)Moody’s/S&P/Fitch | Net Rentable Area (SF) | % of Total NRA | Base Rent PSF | % of Total Base Rent | Sales PSF(3) | Occupancy Costs(3) | Lease Expiration Date |
| Conn’s | B3 / B / NA | 55,322 | 34.4% | $10.84 | 21.5% | N/A | N/A | 9/30/2026 |
| Petco | NA / B / NA | 12,500 | 7.8% | $15.00 | 6.7% | N/A | N/A | 1/31/2027 |
| Walgreens | Baa2 / BBB / BBB | 10,575 | 6.6% | $16.00 | 6.1% | N/A | N/A | 1/31/2021 |
| Skechers(4) | NA / NA / NA | 10,250 | 6.4% | $22.00 | 8.1% | N/A | N/A | 2/28/2027 |
| IHOP | NA / NA / NA | 5,170 | 3.2% | $14.16 | 2.6% | $630 | 2.2% | 12/31/2019 |
| AT&T | Baa1 / BBB+ / A- | 4,125 | 2.6% | $26.40 | 3.9% | N/A | N/A | 11/30/2020 |
| Jason’s Deli | NA / NA / NA | 4,029 | 2.5% | $29.00 | 4.2% | $685 | 4.2% | 7/31/2019 |
| CiCi’s Pizza | NA / NA / NA | 4,000 | 2.5% | $25.42 | 3.7% | N/A | N/A | 6/30/2020 |
| The Vitamin Shoppe | NA / NA / NA | 3,525 | 2.2% | $38.00 | 4.8% | N/A | N/A | 6/30/2024 |
| New Hawaiian Grill Restaurant | NA / NA / NA | 3,190 | 2.0% | $32.00 | 3.7% | N/A | N/A | 7/31/2021 |
| (1) | Based on the underwritten rent roll dated April 7, 2017. |
| (2) | Ratings provided are for the parent company of the entity listed in the “Tenant” field, whether or not the parent company guarantees the lease. |
| (3) | Sales PSF and Occupancy Costs represent tenant reported sales for the 12-month period ending September 30, 2016 for IHOP and March 31, 2016 for Jason’s Deli. |
| (4) | Skechers took occupancy in February 2017 and has the right to terminate its lease if, within 60 days following August 31, 2021, the tenant delivers a written statement showing the tenant’s aggregate gross sales for the period of September 2020 through August 2021 have been less than $1,500,000, and a written notice, such termination to be effective as of February 28, 2022. |
| Lease Rollover Schedule(1)(2) | |||||||||
Year | Number of Leases Expiring | Net Rentable Area Expiring | % of NRA Expiring | Base Rent Expiring | % of Base Rent Expiring | Cumulative Net Rentable Area Expiring | Cumulative % of NRA Expiring | Cumulative Base Rent Expiring | Cumulative % of Base Rent Expiring |
| Vacant | NAP | 19,059 | 11.8% | NAP | NAP | 19,059 | 11.8% | NAP | NAP |
| 2017 & MTM | 1 | 672 | 0.4% | $44,802 | 1.6% | 19,731 | 12.3% | $44,802 | 1.6% |
| 2018 | 8 | 13,453 | 8.4% | 391,144 | 14.1% | 33,184 | 20.6% | $435,946 | 15.7% |
| 2019 | 4 | 10,279 | 6.4% | 293,201 | 10.5% | 43,463 | 27.0% | $729,147 | 26.2% |
| 2020 | 4 | 12,084 | 7.5% | 344,345 | 12.4% | 55,547 | 34.5% | $1,073,492 | 38.6% |
| 2021 | 7 | 21,753 | 13.5% | 510,348 | 18.3% | 77,300 | 48.0% | $1,583,840 | 56.9% |
| 2022 | 1 | 2,000 | 1.2% | 53,000 | 1.9% | 79,300 | 49.3% | $1,636,840 | 58.8% |
| 2023 | 0 | 0 | 0.0% | 0 | 0.0% | 79,300 | 49.3% | $1,636,840 | 58.8% |
| 2024 | 1 | 3,525 | 2.2% | 133,950 | 4.8% | 82,825 | 51.5% | $1,770,790 | 63.6% |
| 2025 | 1 | 0 | 0.0% | 0 | 0.0% | 82,825 | 51.5% | $1,770,790 | 63.6% |
| 2026 | 1 | 55,322 | 34.4% | 599,690 | 21.5% | 138,147 | 85.9% | $2,370,481 | 85.2% |
| 2027 | 2 | 22,750 | 14.1% | 413,000 | 14.8% | 160,897 | 100.0% | $2,783,481 | 100.0% |
| 2028 & Beyond | 0 | 0 | 0.0% | 0 | 0.0% | 160,897 | 100.0% | $2,783,481 | 100.0% |
| Total | 30 | 160,897 | 100.0% | $2,783,481 | 100.0% | ||||
| (1) | Based on the underwritten rent roll dated April 7, 2017. |
| (2) | Certain tenants may have termination or contraction options (which may become exercisable prior to the originally stated expiration date of the tenant lease) that are not considered in the above Lease Rollover Schedule. |
THE INFORMATION IN THIS STRUCTURAL AND COLLATERAL TERM SHEET IS NOT COMPLETE AND MAY BE AMENDED PRIOR TO THE TIME OF SALE. THIS TERM SHEET IS NOT AN OFFER TO SELL THESE SECURITIES AND IT IS NOT A SOLICITATION OF AN OFFER TO BUY THESE SECURITIES IN ANY JURISDICTION WHERE THE OFFER OR SALE IS NOT PERMITTED.
| 130 of 151 |
| Structural and Collateral Term Sheet | JPMCC 2017-JP6 | |
| Humblewood Center | ||
| Operating History and Underwritten Net Cash Flow | |||||||
| 2014 | 2015 | 2016 | Underwritten | Per Square Foot | %(1) | ||
| Rents in Place(2) | $2,684,734 | $2,575,247 | $2,890,190 | $2,783,481 | $17.30 | 66.8% | |
| Vacant Income | 0 | 0 | 0 | 465,654 | 2.89 | 11.2 | |
| Gross Potential Rent | $2,684,734 | $2,575,247 | $2,890,190 | $3,249,135 | $20.19 | 78.0% | |
| CAM Reimbursements | 937,343 | 734,397 | 871,720 | 871,720 | 5.42 | 20.9 | |
| Percentage Rent | 57,025 | 66,399 | 43,855 | 43,855 | 0.27 | 1.1 | |
| Net Rental Income | $3,679,102 | $3,376,043 | $3,805,765 | $4,164,710 | $25.88 | 100.0% | |
| (Vacancy/Credit Loss) | 3,234 | (39) | 0 | (465,654) | (2.89) | (11.2) | |
| Other Income | 33,731 | 22,813 | 20,598 | 20,598 | 0.13 | 0.5 | |
| Effective Gross Income | $3,716,067 | $3,398,817 | $3,826,363 | $3,719,654 | $23.12 | 89.3% | |
| Total Expenses | $966,919 | $1,048,936 | $1,146,252 | $1,041,724 | $6.47 | 28.0% | |
| Net Operating Income(3) | $2,749,148 | $2,349,881 | $2,680,111 | $2,677,930 | $16.64 | 72.0% | |
| Total TI/LC, Capex/RR | 0 | 0 | 0 | 211,299 | 1.31 | 5.7 | |
| Net Cash Flow | $2,749,148 | $2,349,881 | $2,680,111 | $2,466,630 | $15.33 | 66.3% | |
| Occupancy(4) | 100.0% | 90.5% | 88.2% | 88.8% | |||
| (1) | % column represents percent of Net Rental Income for all revenue lines and percent of Effective Gross Income for the remainder of fields. |
| (2) | Rents in Place does not include rental income associated with the Chick-fil-A and Pappas BBQ release parcels. |
| (3) | The decrease in 2015 Net Operating Income from 2014 Net Operating Income is primarily due to a decrease in occupancy from 100.0% to 90.5%. The increase in 2015 Net Operating Income to 2016 Net Operating Income is primarily due to the expansion of Conn’s from 27,171 square feet to 55,322 square feet in September 2015. |
| (4) | Historical occupancies are as of December 31 of each respective year. Underwritten occupancy represents economic occupancy. |
Release Parcels.The borrower may obtain the release of the parcels ground leased to Pappas BBQ and/or Chick-fil-A (together, the “Release Parcels”) at any time (including during the lockout period) without any principal prepayment of the loan so long as, among other conditions: (i) the borrower conveys the Release Parcels to an entity other than the borrower; (ii) the borrower delivers a REMIC opinion, if required by the lender; (iii) the borrower provides evidence that the remaining parking will be in compliance with legal requirements; and (iv) the borrower and the owner(s) of the Release Parcels enter into and record a reciprocal easement agreement or other agreement reasonably acceptable to the lender providing for easements and similar rights. The related appraisal attributed an aggregate value of $4,460,000 to the Release Parcels, which was not considered in the calculation of the appraised value of the property. See“Description of the Mortgage Pool—Certain Terms of the Mortgage Loans—Partial Releases” in the Preliminary Prospectus for additional information.
Purchase Option.The property is subject to a Deed, Restrictions and Option agreement (the “REA”), to which the borrower and the owner of a tract that is contiguous to the property are parties. During the period designated by the REA (December 31, 2036 to December 31, 2037), the parties to the REA may request an extension of the REA and, if either party and its “institutional lender” (as defined in the REA) does not execute an extension upon request, the other party to the REA has the right to purchase the applicable tract(s) in accordance with the terms of the REA. See“Description of the Mortgage Pool—Certain Terms of the Mortgage Loans—Purchase Options and Rights of First Refusal” in the Preliminary Prospectus for additional information.
THE INFORMATION IN THIS STRUCTURAL AND COLLATERAL TERM SHEET IS NOT COMPLETE AND MAY BE AMENDED PRIOR TO THE TIME OF SALE. THIS TERM SHEET IS NOT AN OFFER TO SELL THESE SECURITIES AND IT IS NOT A SOLICITATION OF AN OFFER TO BUY THESE SECURITIES IN ANY JURISDICTION WHERE THE OFFER OR SALE IS NOT PERMITTED.
| 131 of 151 |
| Structural and Collateral Term Sheet | JPMCC 2017-JP6 |
| Wellington Marketplace |
| Mortgage Loan Information | Property Information | |||
| Mortgage Loan Seller: | BSP | Single Asset / Portfolio: | Single Asset | |
| Original Principal Balance: | $22,000,000 | Title: | Fee | |
| Cut-off Date Principal Balance: | $22,000,000 | Property Type - Subtype: | Retail – Anchored | |
| % of Pool by IPB: | 2.8% | Net Rentable Area (SF)(1): | 189,213 | |
| Loan Purpose: | Refinance | Location: | Wellington, FL | |
| Borrower: | FWI 16 LLC | Year Built / Renovated: | 1989 / 2014 | |
| Sponsor: | Thomas J. Cannon | Occupancy: | 92.0% | |
| Interest Rate: | 5.12000% | Occupancy Date: | 3/1/2017 | |
| Note Date: | 3/30/2017 | Number of Tenants: | 50 | |
| Maturity Date: | 4/6/2027 | 2014 NOI: | $1,730,105 | |
| Interest-only Period: | 48 months | 2015 NOI: | $1,831,835 | |
| Original Term: | 120 months | 2016 NOI: | $1,910,904 | |
| Original Amortization: | 360 months | TTM NOI (as of 2/2017)(2): | $1,965,133 | |
| Amortization Type: | IO-Balloon | UW Economic Occupancy: | 92.9% | |
| Call Protection: | L(26),Def(90),O(4) | UW Revenues: | $3,212,027 | |
| Lockbox / Cash Management: | Springing / Springing | UW Expenses: | $1,078,158 | |
| Additional Debt: | N/A | UW NOI(2): | $2,133,868 | |
| Additional Debt Balance: | N/A | UW NCF: | $2,006,959 | |
| Additional Debt Type: | N/A | Appraised Value / Per SF: | $33,975,000 / $180 | |
| Appraisal Date: | 3/2/2017 | |||
| Escrows and Reserves | Financial Information | ||||||||||
| Initial | Monthly | Initial Cap | Cut-off Date Loan / SF: | $116 | |||||||
| Taxes: | $252,213 | $42,036 | N/A | Maturity Date Loan / SF: | $105 | ||||||
| Insurance: | $128,781 | $9,199 | N/A | Cut-off Date LTV: | 64.8% | ||||||
| Replacement Reserves: | $0 | $2,365 | N/A | Maturity Date LTV: | 58.7% | ||||||
| TI/LC: | $0 | $9,461 | $400,000 | UW NCF DSCR: | 1.40x | ||||||
| Other(3): | $536,031 | $0 | N/A | UW NOI Debt Yield: | 9.7% | ||||||
| Sources and Uses | |||||||||||
| Sources | Proceeds | % of Total | Uses | Proceeds | % of Total | ||||||
| Mortgage Loan | $22,000,000 | 97.3% | Payoff Existing Debt(4) | $21,515,907 | 95.1% | ||||||
| Sponsor Equity | 616,567 | 2.7 | Upfront Reserves | 917,024 | 4.1 | ||||||
| Closing Costs | 183,636 | 0.8 | |||||||||
| Total Sources | $22,616,567 | 100.0% | Total Uses | $22,616,567 | 100.0% | ||||||
| (1) | The property’s square footage of 189,213 includes 13,386 square feet built on an outparcel ground leased by Walgreens and built by Walgreens in 2014. Walgreens is in year five of its 20-year initial ground lease term. The fully-extended ground lease term expires in February 2088. |
| (2) | UW NOI is higher than TTM NOI in part due to UW NOI including future contractual rent steps taken through April 2018. |
| (3) | Initial Other Escrows and Reserves consists of (i) a $500,000 Rocky’s Ace Hardware lease renewal reserve, (ii) a $24,193 free rent reserve for four months of free rent relating to Once Upon a Child and (iii) an $11,838 deferred maintenance reserve. Upon Rocky’s Ace Hardware extending the term of its lease or borrower re-leasing the space demised under the Rocky’s Ace Hardware lease to an acceptable replacement tenant, and payment of any leasing costs associated with the space, $150,000 of the reserve, if available, is required to be transferred into a general tenant improvements and leasing commissions reserve account for future re-tenanting costs with the balance of the reserve, if any, required to either be returned to the borrower, if no cash sweep period then exists, or be deposited to the cash management account, if a cash sweep period then exists. |
| (4) | The mortgage loan refinanced a CMBS loan in the original principal amount of approximately $30 million that was included in the WBCMT 2007-C32 transaction. The prior mortgage loan was transferred to special servicing in April 2012 for imminent monetary default after Walmart, which was expected to take occupancy at the property, exercised a termination option due to failure to obtain permits within an expedited period, various smaller tenants vacated the property and the property experienced higher-than-expected operating expenses. In August 2012, the borrower and the special servicer agreed to a workout strategy, including applying an approximately $5.8 million Walmart holdback reserve to make a partial prepayment of the prior loan. In connection with such workout, a prior joint venture partner of the current loan sponsor assigned its interests in the borrower to the loan sponsor. |
THE INFORMATION IN THIS STRUCTURAL AND COLLATERAL TERM SHEET IS NOT COMPLETE AND MAY BE AMENDED PRIOR TO THE TIME OF SALE. THIS TERM SHEET IS NOT AN OFFER TO SELL THESE SECURITIES AND IT IS NOT A SOLICITATION OF AN OFFER TO BUY THESE SECURITIES IN ANY JURISDICTION WHERE THE OFFER OR SALE IS NOT PERMITTED.
| 132 of 151 |
| Structural and Collateral Term Sheet | JPMCC 2017-JP6 |
| Wellington Marketplace |
The Loan.The Wellington Marketplace loan has an outstanding principal balance as of the Cut-off Date of approximately $22.0 million and is secured by a first mortgage lien on the borrower’s fee interest in a 189,213 square foot anchored shopping center located in Wellington, Florida. The loan has a 10-year term and, subsequent to a four-year interest-only period, will amortize on a 30-year schedule. The borrowing entity for the loan is FWI 16 LLC, a Delaware limited liability company. The previously existing debt secured by the Wellington Marketplace property was securitized in the WBCMT 2007-C32 transaction.
The loan sponsor and nonrecourse carve-out guarantor is Thomas J. Cannon. Mr. Cannon is the owner of Flag Wharf Inc., a commercial real estate company that began its operations in 1972. Flag Wharf Inc. is focused on the acquisition and long-term ownership of commercial income-producing real estate. The company currently owns and/or manages in excess of 4.0 million square feet of commercial space including retail, industrial and office. Flag Wharf Inc. has a portfolio of 12 grocery anchored shopping centers located primarily in Georgia and Florida, including eight other grocery anchored shopping centers in Florida. Flag Wharf Inc. also offers property management services to the company’s existing properties, as well as to third-party owners.
The Property.The Wellington Marketplace property is a 189,213 square foot shopping center located in Wellington, Florida, approximately 17.0 miles southwest ofdowntown West Palm Beach. The improvements were constructed in 1989 and consist of three single-story buildings and three freestanding buildings on an approximately 18.7 acre site. The site has frontage on two arterial roads. Primary access to the property is provided by Wellington Trace and Greenview Shores Boulevard through six curb cuts located along both arterials. The property is also accessible via cross easements with adjacent properties, adding two additional access points to bring the total curb cuts providing access to the property to eight. According to the appraisal, in 2015, the average daily traffic count on the Wellington Trace and Greenview Shores Boulevard was 23,500 and 17,800, respectively. Regional access is provided by Florida’s Turnpike, which is a north–south toll road that runs through 11 counties in the Florida peninsula. The property is located along a retail corridor with diversified tenancy within a residential area. According to the zoning report, the property contains 888 parking spaces, resulting in a parking ratio of approximately 4.7 spaces per 1,000 square feet, with 31 additional parking spaces available via a cross-easement agreement with an adjacent property.
As of March 1, 2017, the Wellington Marketplace property was 92.0% occupied by 50 diverse tenants that provide a variety of goods and services to the surrounding neighborhood. The property is anchored by Rocky’s Ace Hardware (23,411 square feet; 12.4% of net rentable area; 11.5% of underwritten base rent; July 2018 expiration), Beall’s Outlet (22,888 square feet; 12.1% of net rentable area; 8.0% of underwritten base rent; November 2018 expiration), Movies at Wellington (20,490 square feet; 10.8% of net rentable area; 5.3% of underwritten base rent; November 2020 expiration) and Walgreens (13,386 square feet; 7.1% of net rentable area; 5.6% of underwritten base rent; February 2033 expiration). The two largest tenants, Rocky’s Ace Hardware and Beall’s Outlet, have been at the property since 2008. The largest tenant, Rocky’s AceHardware, is a franchise of Ace Hardware Corporation, a retailers’ cooperative based in Oak Brook, Illinois. Ace Hardware operates 17 distribution centers in the United States and additional distribution facilities in China, Panama and the United Arab Emirates. Rocky’s Ace Hardware is in its initial ten-year term with three additional five-year renewal options remaining. On May 4, 2017, Rocky’s Ace Hardware executed its first renewal option early for an additional five years, which expires on July 31, 2023. The second largest tenant, Beall’s Outlet, is a subsidiary discount clothing store of Beall’s, Inc. that operates over 530 retail store sites across the southern and eastern United States. Beall’s Inc. is the parent company of Beall’s Department Store, Inc, Beall’s Outlets, Inc. and Burke’s Outlet Stores, LLC. Beall’s Outlet has been at the property since 2008 and is in its initial ten-year term and has three five-year renewal options remaining. The third largest tenant, Movies at Wellington, is an independent movie theatre showing a mixture of current blockbuster movies and smaller-release films. The theatre features eight screens and has been open for business since 2000. Movies at Wellington has two five-year renewal options remaining under its lease. The fourth largest tenant, Walgreens, has been at the property since 1988, built a new building at its outparcel location in 2014, and is in year five of its 20-year initial ground lease. Its fully extended ground lease term expires in February 2088. Other national and regional tenants include You Fit Health Clubs, Dunkin’ Donuts, Subway, Papa John’s Pizza and H&R Block. The property also includes a freestanding bank (Floridian Community Bank) and a freestanding restaurant (Park Avenue BBQ & Grill).
The Market.The Wellington Marketplace property is located in Wellington, Palm Beach County, Florida. Wellington is approximately 17 miles southwest of downtown PalmBeach, Florida, 70 miles northwest of Miami and 200 miles southeast of Tampa. According to the appraisal, the estimated 2016 average household income within a one-, three- and five-mile radius is approximately $104,925, $103,101 and $105,824, respectively. In 2016, the estimated total population within a one-, three- and five-mile radius was approximately 12,795, 46,828 and 109,599, respectively. Total employment has increased annually from 2006 to 2015 in the state of Florida by an average of 0.5% and increased annually by an average of 0.6% in the local area. From 2014 to 2015 unemployment decreased in Florida by 0.9% and decreased by 0.9% in the local area.
THE INFORMATION IN THIS STRUCTURAL AND COLLATERAL TERM SHEET IS NOT COMPLETE AND MAY BE AMENDED PRIOR TO THE TIME OF SALE. THIS TERM SHEET IS NOT AN OFFER TO SELL THESE SECURITIES AND IT IS NOT A SOLICITATION OF AN OFFER TO BUY THESE SECURITIES IN ANY JURISDICTION WHERE THE OFFER OR SALE IS NOT PERMITTED.
| 133 of 151 |
| Structural and Collateral Term Sheet | JPMCC 2017-JP6 |
| Wellington Marketplace |
According to the appraisal, for 2016, the South Florida retail market had an overall average vacancy rate of 4.0% and average asking rents of $25.03 per square foot. The average vacancy rate declined to 4.2% in 2016, from 4.9% during 2015, with the average asking rent for 2016 increasing to $24.19 per square foot, from $23.18 per square foot in 2015. Within the Royal Palm Beach / Wellington retail submarket, where the Wellington Marketplace property is located, the average vacancy rate declined to 5.5% in 2016 from 6.3% during 2015, with average asking rents increasing to $17.97 per square foot in 2016, from $17.66 per square foot in 2015. During the fourth quarter of 2016, average vacancy rates and average asking rents were 4.5% and $20.28, respectively. The appraisal identified five properties as directly competitive with the Wellington Marketplace property, ranging insize from 62,251 square feet to 123,807 square feet. The competitive properties reported occupancies ranging from 94% to 100% with a weighted average of approximately 96.5%. The competitive properties have average asking rents ranging from $18.00 to $25.00 per square foot, versus weighted average in-place rents of $13.69 per square foot at the Wellington Marketplace property.
| Tenant Summary(1) | ||||||
| Tenant | Ratings(2) Moody’s / S&P/ Fitch | Net Rentable Area (SF) | % of Total NRA | Base Rent PSF | % of Total Base Rent | Lease Expiration Date |
| Rocky’s Ace Hardware(3) | NA / NA / NA | 23,411 | 12.4% | $12.00 | 11.5% | 7/31/2018 |
| Beall’s Outlet | NA / NA / NA | 22,888 | 12.1% | $8.52 | 8.0% | 11/1/2018 |
| Movies at Wellington | NA / NA / NA | 20,490 | 10.8% | $6.37 | 5.3% | 11/30/2020 |
| Walgreens(4) | Baa2 / BBB / BBB | 13,386 | 7.1% | $10.27 | 5.6% | 2/28/2033 |
| You Fit Health Clubs | NA / NA / NA | 10,350 | 5.5% | $11.00 | 4.6% | 4/30/2022 |
| Consign & Design | NA / NA / NA | 6,600 | 3.5% | $15.95 | 4.3% | 6/30/2017 |
| Jo Jo’s Raw Bar & Grill | NA / NA / NA | 6,059 | 3.2% | $13.50 | 3.3% | 4/30/2021 |
| Park Avenue BBQ & Grill | NA / NA / NA | 5,200 | 2.7% | $20.46 | 4.3% | 8/31/2019 |
| Romeo’s Pizzeria | NA / NA / NA | 4,323 | 2.3% | $12.11 | 2.1% | 8/31/2017 |
| Floridian Community Bank | NA / NA / NA | 4,047 | 2.1% | $25.00 | 4.1% | 7/31/2019 |
| (1) | Based on the underwritten rent roll dated March 1, 2017. |
| (2) | Ratings provided are for the parent company of the entity listed in the “Tenant” field whether or not the parent company guarantees the lease. |
| (3) | On May 4, 2017, Rocky’s Ace Hardware executed its first renewal option early for an additional five years, which expires on July 31, 2023. |
| (4) | Walgreens has been at the property since 1988, built its improvements on an outparcel location in 2014, and is in year five of its 20-year initial ground lease term. The fully extended term expires in February 2088. |
| Lease Rollover Schedule(1) (2) | |||||||||||
| Year | Number of Leases Expiring | Net Rentable Area Expiring(2) | % of NRA Expiring | Base Rent Expiring | % of Base Rent Expiring | Cumulative Net Rentable Area Expiring | Cumulative % of NRA Expiring | Cumulative Base Rent Expiring | Cumulative % of Base Rent Expiring | ||
| Vacant | NAP | 15,064 | 8.0 | % | NAP | NAP | 15,064 | 8.0% | NAP | NAP | |
| 2017 & MTM | 6 | 13,974 | 7.4 | $236,582 | 9.6 | % | 29,038 | 15.3% | $236,582 | 9.6% | |
| 2018 | 9 | 56,567 | 29.9 | 657,355 | 26.8 | 85,605 | 45.2% | $893,937 | 36.5% | ||
| 2019 | 16 | 32,425 | 17.1 | 698,059 | 28.5 | 118,030 | 62.4% | $1,591,996 | 64.9% | ||
| 2020 | 10 | 30,916 | 16.3 | 313,918 | 12.8 | 148,946 | 78.7% | $1,905,915 | 77.7% | ||
| 2021 | 4 | 9,609 | 5.1 | 162,774 | 6.6 | 158,555 | 83.8% | $2,068,689 | 84.4% | ||
| 2022 | 3 | 15,472 | 8.2 | 215,129 | 8.8 | 174,027 | 92.0% | $2,283,818 | 93.1% | ||
| 2023 | 0 | 0 | 0.0 | 0 | 0.0 | 174,027 | 92.0% | $2,283,818 | 93.1% | ||
| 2024 | 0 | 0 | 0.0 | 0 | 0.0 | 174,027 | 92.0% | $2,283,818 | 93.1% | ||
| 2025 | 1 | 1,800 | 1.0 | 30,600 | 1.2 | 175,827 | 92.9% | $2,314,418 | 94.4% | ||
| 2026 | 0 | 0 | 0.0 | 0 | 0.0 | 175,827 | 92.9% | $2,314,418 | 94.4% | ||
| 2027 | 0 | 0 | 0.0 | 0 | 0.0 | 175,827 | 92.9% | $2,314,418 | 94.4% | ||
| 2028 & Beyond | 1 | 13,386 | 7.1 | 137,500 | 5.6 | 189,213 | 100.0% | $2,451,917 | 100.0% | ||
| Total | 50 | 189,213 | 100.0 | % | $2,451,917 | 100.0 | % | ||||
| (1) | Based on the underwritten rent roll dated March 1, 2017 and includes rent steps through April 2018. |
| (2) | Certain tenants may have termination or contraction options (which may become exercisable prior to the originally stated expiration date of the tenant lease) that are not considered in the above Lease Rollover Schedule. |
THE INFORMATION IN THIS STRUCTURAL AND COLLATERAL TERM SHEET IS NOT COMPLETE AND MAY BE AMENDED PRIOR TO THE TIME OF SALE. THIS TERM SHEET IS NOT AN OFFER TO SELL THESE SECURITIES AND IT IS NOT A SOLICITATION OF AN OFFER TO BUY THESE SECURITIES IN ANY JURISDICTION WHERE THE OFFER OR SALE IS NOT PERMITTED.
| 134 of 151 |
| Structural and Collateral Term Sheet | JPMCC 2017-JP6 |
| Wellington Marketplace |
| Operating History and Underwritten Net Cash Flow | |||||||
| 2014 | 2015 | 2016 | TTM(1) | Underwritten(2) | Per Square Foot | %(3) | |
| Rents in Place | $2,278,512 | $2,343,969 | $2,461,061 | $2,461,122 | $2,451,917 | $12.96 | 71.0% |
| Vacant Income | 0 | 0 | 0 | 0 | 179,628 | 0.95 | 5.2 |
| Gross Potential Rent | $2,278,512 | $2,343,969 | $2,461,061 | $2,461,122 | $2,631,545 | $13.91 | 76.2% |
| Total Reimbursements | 746,348 | 757,428 | 704,142 | 770,440 | 820,643 | 4.34 | 23.8 |
| Net Rental Income | $3,024,860 | $3,101,397 | $3,165,203 | $3,231,562 | $3,452,188 | $18.24 | 100.0% |
| (Vacancy/Credit Loss) | (317,330) | (283,068) | (227,767) | (232,538) | (244,963) | (1.29) | (7.1) |
| Other Income | 14,697 | 6,248 | 29,281 | 29,839 | 4,800 | 0.03 | 0.1 |
| Effective Gross Income | $2,722,227 | $2,824,577 | $2,966,717 | $3,028,863 | $3,212,027 | $16.98 | 93.0% |
| Total Expenses | $992,122 | $992,742 | $1,055,813 | $1,063,730 | $1,078,158 | $5.70 | 33.6% |
| Net Operating Income | $1,730,105 | $1,831,835 | $1,910,904 | $1,965,133 | $2,133,868 | $11.28 | 66.4% |
| Total TI/LC, Capex/RR | 0 | 0 | 0 | 0 | 126,909 | 0.67 | 4.0 |
| Net Cash Flow(4) | $1,730,105 | $1,831,835 | $1,910,904 | $1,965,133 | $2,006,959 | $10.61 | 62.5% |
| Occupancy(5) | 89.6% | 90.9% | 92.9% | 92.0% | 92.9% | ||
| (1) | TTM column represents the trailing 12-month period ending February 28, 2017. |
| (2) | Underwritten Rents in Place includes rent steps taken through April 2018. |
| (3) | % column represents percent of Net Rental Income for all revenue lines and represents percent of Effective Gross Income for the remainder of fields. |
| (4) | Underwritten Net Operating Income is higher than TTM Net Operating Income in part due to Underwritten Net Operating Income including future contractual rent steps taken through April 2018. |
| (5) | Historical Occupancies are as of December 31 of each respective year. TTM Occupancy is as of March 1, 2017. Underwritten Occupancy represents economic occupancy. |
THE INFORMATION IN THIS STRUCTURAL AND COLLATERAL TERM SHEET IS NOT COMPLETE AND MAY BE AMENDED PRIOR TO THE TIME OF SALE. THIS TERM SHEET IS NOT AN OFFER TO SELL THESE SECURITIES AND IT IS NOT A SOLICITATION OF AN OFFER TO BUY THESE SECURITIES IN ANY JURISDICTION WHERE THE OFFER OR SALE IS NOT PERMITTED.
| 135 of 151 |
| Structural and Collateral Term Sheet | JPMCC 2017-JP6 |
| Diamond Hill Apartments |
| Mortgage Loan Information | Property Information | |||
| Mortgage Loan Seller: | JPMCB | Single Asset / Portfolio: | Single Asset | |
| Original Principal Balance: | $21,750,000 | Title: | Fee | |
| Cut-off Date Principal Balance: | $21,600,521 | Property Type - Subtype: | Multifamily – Garden | |
| % of Pool by IPB: | 2.7% | Net Rentable Area (Units): | 301 | |
| Loan Purpose: | Refinance | Location: | Houston, TX | |
| Borrower: | Diamond Hill at Westheimer, LLC | Year Built / Renovated: | 1968 / 2015 | |
| Sponsor: | Swapnil Agarwal | Occupancy: | 94.0% | |
| Interest Rate: | 5.09600% | Occupancy Date: | 3/8/2017 | |
| Note Date: | 11/2/2016 | Number of Tenants: | N/A | |
| Maturity Date: | 12/1/2021 | 2014 NOI: | $1,336,574 | |
| Interest-only Period: | None | 2015 NOI: | $1,435,816 | |
| Original Term: | 60 months | 2016 NOI: | $1,564,450 | |
| Original Amortization: | 360 months | TTM NOI (as of 1/2017)(1): | $1,577,288 | |
| Amortization Type: | Balloon | UW Economic Occupancy: | 91.8% | |
| Call Protection: | L(25),Grtr1%orYM(32),O(3) | UW Revenues: | $3,493,364 | |
| Lockbox / Cash Management: | Springing / Springing | UW Expenses: | $1,569,455 | |
| Additional Debt: | N/A | UW NOI(1): | $1,923,909 | |
| Additional Debt Balance: | N/A | UW NCF: | $1,848,659 | |
| Additional Debt Type: | N/A | Appraised Value / Per Unit(2): | $29,000,000 / $96,346 | |
| Appraisal Date: | 3/23/2017 | |||
| Escrows and Reserves | Financial Information | |||||
| Initial | Monthly | Initial Cap | Cut-off Date Loan / Unit: | $71,763 | ||
| Taxes: | $330,620 | $27,643 | N/A | Maturity Date Loan / Unit: | $66,735 | |
| Insurance: | $0 | Springing | N/A | Cut-off Date LTV(2): | 74.5% | |
| Replacement Reserves: | $500,000 | $8,750 | N/A | Maturity Date LTV(2): | 69.3% | |
| TI/LC: | $0 | $0 | N/A | UW NCF DSCR: | 1.31x | |
| Other: | $0 | $0 | N/A | UW NOI Debt Yield: | 8.9% | |
| ||||||
| Sources and Uses | ||||||
| Sources | Proceeds | % of Total | Uses | Proceeds | % of Total | |
| Mortgage Loan | $21,750,000 | 100.0% | Payoff Existing Debt | $17,889,898 | 82.3% | |
| Upfront Reserves | 830,620 | 3.8% | ||||
| Closing Costs | 435,958 | 2.0% | ||||
| Return of Equity | 2,593,524 | 11.9% | ||||
| Total Sources | $21,750,000 | 100.0% | Total Uses | $21,750,000 | 100.0% | |
| (1) | The increase in UW NOI from TTM NOI is primarily due to higher rents in place and lower expenses. Since acquisition in May 2015, the loan sponsor has carried out approximately $2.3 million in renovations at the property thereby achieving higher rents per unit. Payroll expenses were inflated during the room renovations. |
| (2) | The Appraised Value / Per Unit, Cut-off Date LTV and Maturity Date LTV are calculated based on the “Prospective As-Stabilized” appraised value, which assumes that the remaining renovations related to a capital improvements plan ongoing at origination will be completed and the property achieves a 93.0% occupancy as of March 23, 2017. At origination, the borrower was required to reserve the full estimated remaining cost of the renovations. As of March 8, 2017 the property was 94.0% occupied. The “as-is” appraised value as of September 23, 2016 was $28,700,000, which results in a Cut-off Date LTV and Maturity Date LTV of 75.3% and 70.0%, respectively. |
THE INFORMATION IN THIS STRUCTURAL AND COLLATERAL TERM SHEET IS NOT COMPLETE AND MAY BE AMENDED PRIOR TO THE TIME OF SALE. THIS TERM SHEET IS NOT AN OFFER TO SELL THESE SECURITIES AND IT IS NOT A SOLICITATION OF AN OFFER TO BUY THESE SECURITIES IN ANY JURISDICTION WHERE THE OFFER OR SALE IS NOT PERMITTED.
| 136 of 151 |
| Structural and Collateral Term Sheet | JPMCC 2017-JP6 |
| Diamond Hill Apartments |
The Loan.The Diamond Hill Apartments loan has an outstanding principal balance as of the Cut-off Date of approximately $21.6 million and is secured by a first mortgage lien on the borrower’s fee interest in a 301-unit, Class B garden-style multifamily complex located in Houston, Texas. The loan has a five-year term and will amortize on a 30-year schedule. The borrowing entity for the Diamond Hill Apartments loan is Diamond Hill at Westheimer, LLC, a Delaware limited liability company and special purpose entity. The loan sponsor and nonrecourse carve-out guarantor is Swapnil Agarwal, the founder and managing principal of Nitya Capital (“Nitya”). Based in Houston, Texas, Nitya is a privately held real estate investment firm that focuses on the acquisition and management of multifamily properties. Since its inception in 2013, Nitya has acquired approximately 8,500 units and currently owns 30 properties. The portfolio is managed by Nitya’s fully-owned property management company, Karya Property Management, LLC. Swapnil Agarwal has more than 11 years of financial and investment experience with more than eight years of global real estate experience. Mr. Agarwal was formerly the head of Alternative Investments at Virtus Real Estate Capital in Austin, Texas, where he was responsible for multifamily assets across the United States. The sponsor acquired the property in 2015 for approximately $19.8 million ($66,000 per unit) with approximately $1.3 million in closing costs and, according to the loan sponsor, it subsequently spent approximately $2.3 million (approximately $7,714 per unit) in capital improvements, for a total cost basis of $23.4 million ($78,033 per unit).
The Diamond Hill Apartments borrower is an affiliate of the borrower under the mortgage loan secured by the property identified in Annex A-1 to the Preliminary Prospectus as Quail Creek.
The Property. Diamond Hill Apartments is a 301-unit, Class B garden-style multifamily complex situated on approximately 6.8 acres in Houston, Texas. The property was built in 1968 and renovated in 2015. The unit mix consists of 212 one-bedroom units and 89 two-bedroom units across 36 three-story apartment buildings. Amenities include an on-site leasing office, access gates, three swimming pools and three laundry rooms. Units feature stainless-steel appliances, including an electric range/oven, a refrigerator, a garbage disposal and a dishwasher. As of March 8, 2017, the property was 94.0% occupied.
According to the loan sponsor, since acquiring the property in May 2015, approximately $2.3 million (approximately $7,714 per unit) has been spent on capital improvements. Approximately $1.4 million was spent to fully renovate 213 units and to partially renovate an additional 47 units by replacing carpets, tiles, appliances and fixtures. The remaining approximately $350,000 was spent on general property improvements and HVAC replacements. Each renovated unit features wood cabinets with granite countertops and vinyl wood flooring in the kitchen. After the completion of these renovations, rents have increased by an average of $147 per unit per month. The property also features 408 parking spaces resulting in a parking ratio of approximately 1.36 spaces per unit.
| Unit Mix(1) | |||||||
| Unit Type | # of Units | % of Total | Occupied Units | Occupancy | Average Unit Size (SF) | Average Monthly In- Place Rents | Average Market Rent Per Unit(2) |
| 1 BR / 1 BA | 212 | 70.4% | 195 | 92.0% | 714 | $885 | $949 |
| 2 BR / 1 BA | 1 | 0.3% | 1 | 100.0% | 1,050 | $1,350 | $1,350 |
| 2 BR / 2 BA | 88 | 29.2% | 87 | 98.9% | 1,148 | $1,221 | $1,250 |
| Total / Wtd. Avg. | 301 | 100.0% | 283 | 94.0% | 842 | $990 | $1,038 |
| (1) | Based on underwritten rent roll dated March 8, 2017. |
| (2) | According to the appraisal. |
The Market.Diamond Hill Apartments is located on Westheimer Road within the Westchase District, a master-planned, municipal management district in the western portion of Houston, Texas. Westheimer road provides direct access to the Houston Galleria mall and downtown Houston, approximately 4.3 and 13.0 miles east of the property, respectively. Primary access to the property’s neighborhood is provided by Interstate Highway 45, connecting Dallas from the north to Galveston in the south, and Beltway-8, which circumnavigates Houston approximately 12.0 miles outside of the central business district.
The property is located in the Westchase submarket of Houston. Houston is home to 26 Fortune 500 and 57 Fortune 1000 company headquarters, ranking third in the nation. According to the appraisal, among major metropolitan areas, Houston ranks first in job creation over the past 15 years and third in job creation over the past 25 years. The Westchase District is attractive due to its location, freeway access and amenity offerings for its commercial and residential population base. The Westchase area has experienced growth over the last two decades since the opening of the Westpark Tollway, which has made Inner Loop destinations more accessible. The property benefits from its proximity to multiple retail and office developments along Westheimer Road and is located approximately 1.5 miles from a Walmart-anchored retail center. Westchase generates office demand from companies such as BMC Software, ABB, Microsoft and Ranger Insurance and offers more than 100 restaurants, banks, fitness centers and numerous public and private schools. The area has a large presence of energy and energy service firms such as Halliburton, PGS Tensor, Veritas and Petrobras America and is in close proximity to the Energy Corridor, which is approximately 10.3 miles northwest of the Westchase District. Other demand generators include the Texas Medical Center and Westchase Business Park. The Texas Medical Center is a large medical complex serving approximately 10.0 million patients per year.
THE INFORMATION IN THIS STRUCTURAL AND COLLATERAL TERM SHEET IS NOT COMPLETE AND MAY BE AMENDED PRIOR TO THE TIME OF SALE. THIS TERM SHEET IS NOT AN OFFER TO SELL THESE SECURITIES AND IT IS NOT A SOLICITATION OF AN OFFER TO BUY THESE SECURITIES IN ANY JURISDICTION WHERE THE OFFER OR SALE IS NOT PERMITTED.
| 137 of 151 |
| Structural and Collateral Term Sheet | JPMCC 2017-JP6 |
| Diamond Hill Apartments |
According to the appraisal, the estimated total population within a one-, three- and five-mile radius of the property is 26,661, 215,194 and 542,785, respectively. As of December 2016, the estimated median income within a one-, three- and five-mile radius is $49,001, $46,369 and $49,862, respectively. The appraisal did not identify any new or proposed projects as directly competitive with the property. According to the appraisal, as of September 2016, the Westchase submarket had a multifamily vacancy of 12.6%. The appraisal identified five directly comparable multifamily properties built between 1970 and 1976 and ranging in size from 221 to 396 units. Occupancies at the comparable properties ranged from 91.0% to 97.0% with a weighted average occupancy of 94.0%. Asking rental rates for the comparable multifamily properties ranged from $902 per unit to $1,201 per unit, with a weighted average of $982 per unit. The average underwritten in-place rent of $990 per unit is below the appraisal concluded rent of $1,039.
| Operating History and Underwritten Net Cash Flow | |||||||
| 2014 | 2015 | 2016 | TTM(1) | Underwritten | Per Unit | %(2) | |
| Rents in Place(3)(4) | $2,757,589 | $2,887,503 | $3,277,875 | $3,281,655 | $3,362,436 | $11,170.88 | 92.4% |
| Vacant Income | 0 | 0 | 0 | 0 | 197,784 | 657.09 | 5.4 |
| Gross Potential Rent | $2,757,589 | $2,887,503 | $3,277,875 | $3,281,655 | $3,560,220 | $11,827.97 | 97.9% |
| Total Reimbursements | 0 | 114,776 | 91,938 | 75,448 | 78,088 | 259.43 | 2.1 |
| Net Rental Income | $2,757,589 | $3,002,278 | $3,369,813 | $3,357,103 | $3,638,308 | $12,087 | 100.0 |
| (Vacancy/Credit Loss)(5) | 0 | (221,085) | (320,401) | (284,736) | (298,544) | (992) | (8.2) |
| Other Income | 0 | 161,983 | 207,056 | 210,429 | 153,600 | 510 | 4.2 |
| Effective Gross Income | $2,757,589 | $2,943,177 | $3,256,468 | $3,282,796 | $3,493,364 | $11,606 | 96.0% |
| Total Expenses | $1,421,015 | $1,507,361 | $1,692,018 | $1,705,508 | $1,569,455 | $5,214 | 44.9% |
| Net Operating Income(4) | $1,336,574 | $1,435,816 | $1,564,450 | $1,577,288 | $1,923,909 | $6,392 | 55.1% |
| Replacement Reserves | 0 | 0 | 0 | 0 | 75,250 | $250 | 2.2 |
| Net Cash Flow | $1,336,574 | $1,435,816 | $1,564,450 | $1,577,288 | $1,848,659 | $6,142 | 52.9% |
| Occupancy(6) | 91.0% | 83.0% | 92.0% | 94.0% | 91.8% | ||
| (1) | TTM column represents the trailing 12-month period ending on January 31, 2017. |
| (2) | % column represents percent of Net Rental Income for all revenue lines and represents percent of Effective Gross Income for the remainder of fields. |
| (3) | The increase in Rents in Place from 2015 to TTM is due to ongoing renovations. The sponsor is achieving higher rents. Underwritten Rents in Place is based on the rent roll dated March 8, 2017. |
| (4) | The increase in Underwritten Net Operating Income from TTM Net Operating Income is primarily due to higher Rents in Place and lower expenses. Payroll expenses were inflated during the room renovations. |
| (5) | Vacancy/Credit Loss for historic operating periods represents concessions and credit loss. Underwritten credit loss is based on the trailing three-month period as of January 31, 2017. |
| (6) | Historical Occupancies are as of December 31 of each year. TTM Occupancy is as of March 8, 2017. Underwritten Occupancy represents economic occupancy. |
THE INFORMATION IN THIS STRUCTURAL AND COLLATERAL TERM SHEET IS NOT COMPLETE AND MAY BE AMENDED PRIOR TO THE TIME OF SALE. THIS TERM SHEET IS NOT AN OFFER TO SELL THESE SECURITIES AND IT IS NOT A SOLICITATION OF AN OFFER TO BUY THESE SECURITIES IN ANY JURISDICTION WHERE THE OFFER OR SALE IS NOT PERMITTED.
| 138 of 151 |
| Structural and Collateral Term Sheet | JPMCC 2017-JP6 |
[THIS PAGE INTENTIONALLY LEFT BLANK]
THE INFORMATION IN THIS STRUCTURAL AND COLLATERAL TERM SHEET IS NOT COMPLETE AND MAY BE AMENDED PRIOR TO THE TIME OF SALE. THIS TERM SHEET IS NOT AN OFFER TO SELL THESE SECURITIES AND IT IS NOT A SOLICITATION OF AN OFFER TO BUY THESE SECURITIES IN ANY JURISDICTION WHERE THE OFFER OR SALE IS NOT PERMITTED.
| 139 of 151 |
| Structural and Collateral Term Sheet | JPMCC 2017-JP6 | |
| Apex Fort Washington | ||
| Mortgage Loan Information | Property Information | |||
| Mortgage Loan Seller: | BSP | Single Asset / Portfolio: | Single Asset | |
| Original Principal Balance(1): | $21,000,000 | Title: | Fee | |
| Cut-off Date Principal Balance(1): | $21,000,000 | Property Type - Subtype: | Office – Suburban | |
| % of Pool by IPB: | 2.7% | Net Rentable Area (SF): | 388,318 | |
| Loan Purpose: | Acquisition | Location: | Fort Washington, PA | |
| Borrower: | ZCA Ft. Washington, LLC | Year Built / Renovated: | 1988 / 2015 | |
| Sponsor: | Edward N. Antoian | Occupancy: | 91.9% | |
| Interest Rate: | 5.28000% | Occupancy Date: | 2/28/2017 | |
| Note Date: | 2/17/2017 | Number of Tenants: | 8 | |
| Maturity Date: | 3/6/2027 | 2014 NOI(3): | N/A | |
| Interest-only Period: | 24 months | 2015 NOI(4): | $2,933,749 | |
| Original Term: | 120 months | 2016 NOI(4): | $1,694,024 | |
| Original Amortization: | 360 months | TTM NOI (as of 2/2017): | $1,905,820 | |
| Amortization Type: | IO-Balloon | UW Economic Occupancy: | 89.1% | |
| Call Protection(2): | L(27),Def(89),O(4) | UW Revenues: | $9,066,246 | |
| Lockbox / Cash Management: | Hard / Springing | UW Expenses: | $3,535,452 | |
| Additional Debt: | Yes | UW NOI(4): | $5,530,794 | |
| Additional Debt Balance: | $33,500,000 | UW NCF: | $5,066,331 | |
| Additional Debt Type: | Pari Passu | Appraised Value / Per SF(5): | $84,600,000 / $218 | |
| Appraisal Date: | 1/1/2018 | |||
| Escrows and Reserves | Financial Information(1) | ||||||||||
| Initial | Monthly | Initial Cap | Cut-off Date Loan / SF: | $140 | |||||||
| Taxes: | $349,538 | $69,908 | N/A | Maturity Date Loan / SF: | $122 | ||||||
| Insurance: | $14,782 | $7,391 | N/A | Cut-off Date LTV(5): | 64.4% | ||||||
| Replacement Reserves: | $0 | $6,472 | N/A | Maturity Date LTV(5): | 56.1% | ||||||
| TI/LC: | $704,651 | $32,360 | N/A | UW NCF DSCR: | 1.40x | ||||||
| Other(6): | $6,818,679 | $0 | N/A | UW NOI Debt Yield: | 10.1% | ||||||
| Sources and Uses | |||||||||||
| Sources | Proceeds | % of Total | Uses | Proceeds | % of Total | ||||||
| Mortgage Loan(1) | $54,500,000 | 62.7% | Purchase Price(7) | $77,700,000 | 89.4% | ||||||
| Sponsor Equity | 32,365,726 | 37.3% | Upfront Reserves | 7,887,650 | 9.1 | ||||||
| Closing Costs | 1,278,076 | 1.5 | |||||||||
| Total Sources | $86,865,726 | 100.0% | Total Uses | $86,865,726 | 100.0% | ||||||
| (1) | The Apex Fort Washington loan is part of a whole loan evidenced by threepari passu notes with an aggregate original principal balance of $54.5 million. The Financial Information presented in the chart above reflects the Cut-off Date balance of the $54.5 million Apex Fort Washington Whole Loan, as defined in “The Loan” below. |
| (2) | The lockout period will be at least 27 payment dates beginning with and including the first payment date of April 6, 2017. Defeasance of the full $54.5 million Apex Fort Washington Whole Loan is permitted after the earlier to occur of (i) April 6, 2021 and (ii) the date that is two years from the closing date of the securitization that includes the note to be last securitized. |
| (3) | 2014 NOI figures are not available as the prior owner purchased the property in January 2015 and historical cash flows were not provided at the time of acquisition. |
| (4) | The Apex Fort Washington property was purchased by the prior owner from a foreclosing lender in January 2015 for $30.2 million. The decrease in 2016 NOI from 2015 NOI is primarily due to two tenant vacancies in 2015 that led to a decline in occupancy at the property from approximately 79.2% to 42.0%. See “The Property” section below for additional information. The increases in UW NOI over 2016 NOI and TTM NOI reflect approximately 192,000 square feet of new leasing and the partial burn-off of free rent. In addition, UW NOI includes $95,041 in rent steps underwritten through September 2017 and $87,020 in straight-line rent for Citizens Bank of Pennsylvania and Allstate Insurance Company. UW NOI also includes approximately $3.8 million in underwritten rent for four tenants, Lincoln Investment Planning, Impax Laboratories, Inc., Citizens Bank of Pennsylvania and Connexin Software, Inc., representing approximately 41.1% of net rentable area and approximately 45.8% of underwritten base rent, which have not yet taken occupancy and/or are in free rent periods for which reserves were taken at closing. |
| (5) | The Appraised Value / Per SF, Cut-off Date LTV and Maturity Date LTV are calculated based on the “prospective value upon stabilization”, with an anticipated date of January 1, 2018, which assumes the burn-off of approximately $4.5 million of lease-up costs (including tenant improvements, leasing commissions, free rent, rent loss, and expense carry) associated with tenants already in place and which have been reserved at loan closing, and also includes the appraisal’s projections of property cash flows as of such date. The “as-is” value as of December 5, 2016 is $78.8 million, which results in a Cut-off Date LTV and Maturity Date LTV of 69.2% and 60.3%, respectively. |
| (6) | Initial Other Escrows and Reserves consists of $2,736,408 for outstanding free rent for Lincoln Investment Planning, Impax Laboratories, Inc., Citizens Bank of Pennsylvania and Connexin Software, Inc., $2,206,689 for outstanding tenant improvements and leasing commissions in regard to the borrower’s obligations to complete the tenant improvements for the specific tenants specified in the loan documents, $1,750,000 for tenant improvements and leasing commissions in regard to AstraZeneca Pharmaceuticals and $125,581 for immediate repair reserves. |
| (7) | At closing, the borrower received approximately $10.5 million in credits from the seller inclusive of (a) approximately $6.9 million for outstanding tenant improvements, leasing commissions, and free rent (which were reserved at closing) and (b) an approximately $3.6 million treasury price credit provided from seller to buyer based upon the increase in the 10-year US Treasury yield from a base rate of 1.725% to the 10-year US Treasury yield as of the loan closing date. The Purchase Price represents the gross purchase price prior to seller credits. |
THE INFORMATION IN THIS STRUCTURAL AND COLLATERAL TERM SHEET IS NOT COMPLETE AND MAY BE AMENDED PRIOR TO THE TIME OF SALE. THIS TERM SHEET IS NOT AN OFFER TO SELL THESE SECURITIES AND IT IS NOT A SOLICITATION OF AN OFFER TO BUY THESE SECURITIES IN ANY JURISDICTION WHERE THE OFFER OR SALE IS NOT PERMITTED.
| 140 of 151 |
| Structural and Collateral Term Sheet | JPMCC 2017-JP6 | |
| Apex Fort Washington | ||
The Loan. The Apex Fort Washington loan is secured by a first mortgage lien on the borrower’s fee interest in three three-story Class A office buildings, totaling 388,318 square feet located in Fort Washington, Pennsylvania. The whole loan has an outstanding principal balance as of the Cut-off Date of $54.5 million (the “Apex Fort Washington Whole Loan”) and is comprised of threepari passu notes, each as described below. Note A-1, with an outstanding principal balance as of the Cut-off Date of $21.0 million, is a non-controlling note and is being contributed to the JPMCC 2017-JP6 Trust. The controlling Note A-2 and non-controlling Note A-3, with an aggregate outstanding principal balance as of the Cut-off Date of $33.5 million, are expected to be contributed to one or more future securitization trusts. The Apex Fort Washington Whole Loan has a 10-year term and, subsequent to a two-year interest-only period, will amortize on a 30-year schedule.
| Whole Loan Summary | ||||
| Note | Original Balance | Cut-off Date Balance | Note Holder | Controlling Note |
| A-1 | $21,000,000 | $21,000,000 | JPMCC 2017-JP6 | No |
| A-2 | 16,750,000 | 16,750,000 | BSP | Yes |
| A-3 | 16,750,000 | 16,750,000 | BSP | No |
| Total | $54,500,000 | $54,500,000 | ||
The borrowing entity for the Apex Fort Washington Whole Loan is ZCA Ft. Washington, LLC, a Delaware limited liability company and special purpose entity.
The loan sponsor and nonrecourse carve-out guarantor for the Apex Fort Washington Whole Loan is Edward N. Antoian. Mr. Antoian, CPA, CFA, is a partner in Zeke Capital Advisors. From 1997 to 2014, Mr. Antoian, a founding member of the institutional asset manager Chartwell Investment Partners, oversaw the growth strategy investment portfolios. Prior to his experience with Chartwell Investment Partners, Mr. Antoian was a Senior Portfolio Manager at Delaware Investment Advisors, managing institutional assets.
The Property. The Apex Fort Washington property consists of three, three-story Class A multi-tenant office buildings (600-602 Office Center Drive), totaling 388,318 square feet. The property is located in Fort Washington, Pennsylvania, approximately 20 miles north of the Philadelphia central business district. Built in 1988 and renovated in 2015, the buildings are situated on an approximately 49.4-acre site. The three buildings are connected via a common entrance/central “hub”. The property provides 2,100 surface parking spaces yielding a parking ratio of 5.4 per 1,000 square feet. On-site amenities include the central “hub” / urban plaza with walking paths and outdoor seating, a café, a conference and training center, an on-site fitness center and a lounge. The property provides an electrical power feed from two substations, nine-foot finished ceiling heights, efficient floor plates and on-site surface and structured parking. The property is located approximately 2.5 miles east of the SEPTA Fort Washington station, which is on a regional rail line that connects with downtown Philadelphia’s 30th Street Station approximately 20 miles to the south via interchange with the Broad Street line. Additionally, the property is serviced by SEPTA Route 201 bus service that stops directly in front of the building and ends at the Fort Washington Train Station in 15 minutes. The property is located approximately 25 miles north of Philadelphia International Airport. The property has regional access, as it is located directly off West Office Center Drive’s interchange with the westbound lane of I-276 (the Pennsylvania Turnpike), a six-lane (three in each direction) east/west arterial that traverses the State of Pennsylvania. The property is accessible from the Pennsylvania Turnpike via the Virginia Drive slip ramp approximately 0.4 miles from property.
The property was previously encumbered by two cross-collateralized/cross-defaulted loans totaling $49.0 million that were securitized as part of the GMAC 2004-C1 securitization. The loans transferred to special servicing in March 2010 after a major tenant vacated the property and the trust subsequently foreclosed on the property in March 2011. The prior owner acquired the property from the trust in January 2015 for $30.2 million, at which time the occupancy at the property was approximately 79.2%. At the time of the prior acquisition, two tenants had given notice of their intention to vacate and occupancy was expected to decline to 42.0%. After the 2015 acquisition, the prior owner invested approximately $17.0 million in interior renovations and common area upgrades, and executed six new leases with six new tenants totaling approximately 192,000 square feet and approximately $4.47 million of base rent. Upon completion of the capital improvements and renovation and lease-up of the property to 91.9% occupancy, the prior owner sold the property to the current loan sponsor for approximately $74.1 million (after adjustments).
As of February 28, 2017, the Apex Fort Washington property was 91.9% leased to a mix of international, national and regional tenants, spanning a variety of industries. The largest tenant at the property is Nutrisystem (NASDAQ: NTRI), which accounts for 30.8% of net rentable area and 33.4% of underwritten base rent, with a lease expiration date in July 2022. Nutrisystem has been a tenant at the property since 2010, and the property serves as Nutrisystem’s corporate headquarters. The tenant has two renewal options totaling 10 years (first renewal is three to seven years at tenant’s discretion, and the second renewal is the balance of the 10 years) with 12 months’ notice. In 2016 the company reported approximately $545.5 million of revenues and $35.5 million of net income. As of April 17, 2017, Nutrisystem has a market capitalization of approximately $1.63 billion. The second largest tenant, Lincoln Investment Planning,
THE INFORMATION IN THIS STRUCTURAL AND COLLATERAL TERM SHEET IS NOT COMPLETE AND MAY BE AMENDED PRIOR TO THE TIME OF SALE. THIS TERM SHEET IS NOT AN OFFER TO SELL THESE SECURITIES AND IT IS NOT A SOLICITATION OF AN OFFER TO BUY THESE SECURITIES IN ANY JURISDICTION WHERE THE OFFER OR SALE IS NOT PERMITTED.
| 141 of 151 |
| Structural and Collateral Term Sheet | JPMCC 2017-JP6 | |
| Apex Fort Washington | ||
which accounts for 13.6% of net rentable area and 14.9% of underwritten base rent, is headquartered at the property. Lincoln Investment Planning is a financial firm that provides individuals and families with financial planning, wealth management, investment solutions and asset management. The company is a broker/dealer that was founded in 1968, and currently has over 800 financial advisors servicing 270,000 clients. Lincoln Investment Planning has been at the property since June 2016. The current lease expires in June 2027 and the tenant has one 10-year renewal option available. The tenant is currently in a free rent period through July 2017. The third largest tenant, Impax Laboratories, Inc., which accounts for 12.2% of net rentable area and 13.5% of underwritten base rent, is a pharmaceutical company focused on drug delivery and formulation. The tenant’s lease expires in August 2027 and has one 10-year renewal option. Impax Laboratories, Inc. is in a free rent period until September 2017. Additionally, three tenants totaling 108,176 square feet (27.9% of net rentable area) and approximately $2.4 million of underwritten base rent (29.5% of underwritten base rent) at the property carry investment-grade ratings by Moody’s / S&P. AstraZeneca Pharmaceuticals (45,484 square feet, 12.2% of underwritten base rent, August 2024 expiration) is rated A3 / A-, Citizens Bank of Pennsylvania (37,860 square feet, 10.8% of underwritten base rent, December 2024 expiration) is rated NA / A- and Allstate Insurance Company (24,832 square feet, 6.5% of underwritten base rent, October 2022 expiration) is rated A3 / A-. Citizens Bank of Pennsylvania is not yet in occupancy and is in a free rent period; it is expected to take occupancy in July 2017, and its free rent period expires February 15, 2018. AstraZeneca Pharmaceuticals is currently dark but paying rent and is included in the lender’s underwriting. AstraZeneca Pharmaceuticals may terminate its lease effective August 2021 with nine months’ notice and payment of a termination fee of $734,526. At loan closing, $1.75 million ($38.48 per square foot) was deposited into a reserve for the retenanting of the space either prior to expiration (through subleases) or at expiration.
The Market.The Apex Fort Washington property is located in the Philadelphia-Camden-Wilmington, PA-NJ-DE-MD metropolitan statistical area (“MSA”), often referred to as the Delaware Valley. The MSA includes five counties in Pennsylvania, four counties in New Jersey, one county in Delaware and one county in Maryland. According to the appraisal, the Philadelphia-Camden-Wilmington MSA is the largest MSA in Pennsylvania and the sixth largest MSA in the United States, with a 2016 total population of approximately 6.1 million people, accounting for 47.5% of Pennsylvania’s population. The MSA’s economy has transitioned from manufacturing to professional services, with over 80.0% of the region’s workforce currently employed in the service sectors. The MSA has a diverse employment base rooted in the educational and healthcare industries, with recent growth in technology and related sectors. The unemployment rate in the MSA was 5.2% as of September 2016, which is 0.2% lower than Pennsylvania’s unemployment rate of 5.4% and 0.4% higher than the national average of 4.8%.
According to the appraisal, the Apex Fort Washington property is located in the Fort Washington/Spring House office submarket which consists of approximately 5.5 million square feet of office space. As of the third quarter of 2016, the submarket had a vacancy rate of 14.7% and average asking rents of $24.45 per square foot. The appraisal identified four directly comparable office properties built between 1964 and 2002 and ranging in size from 104,303 to 751,143 square feet and occupancies ranging from 82.8% to 100%. The weighted average underwritten in-place office rent for the Apex Fort Washington property is $23.71 per square foot, which is in-line with the appraisal’s concluded average market rent of $24.00.
THE INFORMATION IN THIS STRUCTURAL AND COLLATERAL TERM SHEET IS NOT COMPLETE AND MAY BE AMENDED PRIOR TO THE TIME OF SALE. THIS TERM SHEET IS NOT AN OFFER TO SELL THESE SECURITIES AND IT IS NOT A SOLICITATION OF AN OFFER TO BUY THESE SECURITIES IN ANY JURISDICTION WHERE THE OFFER OR SALE IS NOT PERMITTED.
| 142 of 151 |
| Structural and Collateral Term Sheet | JPMCC 2017-JP6 | |
| Apex Fort Washington | ||
| Tenant Summary(1) | ||||||
| Tenant | Ratings(2) Moody’s/S&P/Fitch | Net Rentable Area (SF) | % of Total NRA | Base Rent PSF | % of Total Base Rent | Lease Expiration Date |
| Nutrisystem(3) | NA / NA / NA | 119,767 | 30.8% | $22.95 | 33.4% | 7/31/2022 |
| Lincoln Investment Planning(4) | NA / NA / NA | 52,767 | 13.6% | $23.25 | 14.9% | 6/30/2027 |
| Impax Laboratories, Inc.(5) | NA / BB- / NA | 47,379 | 12.2% | $23.50 | 13.5% | 8/31/2027 |
| AstraZeneca Pharmaceuticals(6) | A3 / A- / A | 45,484 | 11.7% | $22.00 | 12.2% | 8/31/2024 |
| Citizens Bank of Pennsylvania(7) | NA / A- / NA | 37,860 | 9.7% | $23.50 | 10.8% | 12/31/2024 |
| Allstate Insurance Company | A3 / A- / BBB+ | 24,832 | 6.4% | $21.50 | 6.5% | 10/31/2022 |
| Connexin Software, Inc.(8) | NA / NA / NA | 21,501 | 5.5% | $25.00 | 6.5% | 9/30/2024 |
| Compassus - Greater Philadelphia(9) | NA / NA / NA | 7,417 | 1.9% | $22.75 | 2.1% | 6/30/2024 |
| (1) | Based on the underwritten rent roll dated February 28, 2017. |
| (2) | Ratings provided are for the parent company of the entity listed in the “Tenant” field whether or not the parent company guarantees the lease. |
| (3) | Nutrisystem has the right to downsize their space to a minimum of 70,000 square feet of contiguous space upon renewal. |
| (4) | Lincoln Investment Planning is in a free rent period through July 2017. It is required to pay partial rent of $18.00 per square foot for the month of August 2017. Full rent of $23.25 per square foot commences in September 2017. The lender has reserved for all free rent. |
| (5) | Impax Laboratories, Inc. executed a new lease at the property (consolidating its three Pennsylvania locations at the property) extending from September 2016 through August 2027, with one, 10-year renewal option at 95% of fair market rent. The tenant received an approximately $2.1 million ($45 per square foot) tenant improvement allowance, for which the lender reserved $31,448 upfront for the remaining allowance. The tenant also received 12 months of free rent totaling approximately $1.1 million, for which the lender reserved $649,487 upfront which represents the seven months of free rent remaining at the time of origination. Rent commencement is in September 2017. |
| (6) | AstraZeneca Pharmaceuticals is currently dark but paying rent and is included in the lender’s underwriting. The lender has reserved $1.75 million ($38.50 per square foot) for the retenanting of the space either prior to expiration (through subleases) or at expiration. The tenant may terminate its lease effective August 2021 with nine months’ notice and payment of a termination fee of $734,526. If AstraZeneca Pharmaceuticals does not exercise its termination option it is entitled to an additional refurbishment allowance of $68,226 at the end of the 85th month of its lease. |
| (7) | Citizens Bank of Pennsylvania is not yet in occupancy, and is in a free rent period through February 2018. The tenant is expected to take occupancy by July 2017 and is required to commence paying rent by February 2018. The lender has reserved for all gap rent and free rent. |
| (8) | Connexin Software, Inc. leases two spaces, a 18,473 square foot initial space and a 3,028 square foot expansion space. Both spaces were scheduled for delivery and lease commencement in February 2017; however, the initial space is in a free rent period until October 2017, and the expansion space will not be occupied until March 2018 and is in a free rent period until October 2018. The lender has escrowed all gap rent and free rent, including two additional months’ rent for each space to account for possible delivery delays. |
| (9) | Compassus – Greater Philadelphia has a one-time right to terminate its lease in the 66th lease month (the estimated effective date is June 2022) with 12 months’ notice and payment of a termination fee equal to unamortized landlord costs (based on a 90-month amortization period) at an 8.0% interest rate. |
| Lease Rollover Schedule(1)(2) | |||||||||
| Year | Number of Leases Expiring | Net Rentable Area Expiring | % of NRA Expiring | Base Rent Expiring | % of Base Rent Expiring | Cumulative Net Rentable Area Expiring | Cumulative % of NRA Expiring | Cumulative Base Rent Expiring | Cumulative % of Base Rent Expiring |
| Vacant | NAP | 31,311 | 8.1% | NAP | NAP | 31,311 | 8.1% | NAP | NAP |
| 2017 & MTM | 0 | 0 | 0.0% | $0 | 0.0% | 31,311 | 8.1% | 0 | 0.0% |
| 2018 | 0 | 0 | 0.0% | 0 | 0.0% | 31,311 | 8.1% | 0 | 0.0% |
| 2019 | 0 | 0 | 0.0% | 0 | 0.0% | 31,311 | 8.1% | 0 | 0.0% |
| 2020 | 0 | 0 | 0.0% | 0 | 0.0% | 31,311 | 8.1% | 0 | 0.0% |
| 2021 | 0 | 0 | 0.0% | 0 | 0.0% | 31,311 | 8.1% | 0 | 0.0% |
| 2022 | 2 | 144,599 | 37.2% | 3,282,541 | 39.9% | 175,910 | 45.3% | 3,282,541 | 39.9% |
| 2023 | 0 | 0 | 0.0% | 0 | 0.0% | 175,910 | 45.3% | 3,282,541 | 39.9% |
| 2024 | 4 | 112,262 | 28.9% | 2,596,620 | 31.6% | 288,172 | 74.2% | 5,879,161 | 71.5% |
| 2025 | 0 | 0 | 0.0% | 0 | 0.0% | 288,172 | 74.2% | 5,879,161 | 71.5% |
| 2026 | 0 | 0 | 0.0% | 0 | 0.0% | 288,172 | 74.2% | 5,879,161 | 71.5% |
| 2027 | 2 | 100,146 | 25.8% | 2,340,239 | 28.5% | 388,318 | 100.0% | 8,219,400 | 100.0% |
| 2028 & Beyond | 0 | 0 | 0.0% | 0 | 0.0% | 388,318 | 100.0% | 8,219,400 | 100.0% |
| Total | 8 | 388,318 | 100.0% | $8,219,400 | 100.0% | ||||
| (1) | Based on the underwritten rent roll dated February 28, 2017, including rent steps through September 2017 and excluding $87,020 of straight-line rent. |
| (2) | Certain tenants may have termination or contraction options (which may become exercisable prior to the originally stated expiration date of the tenant lease) that are not considered in the above Lease Rollover Schedule. |
THE INFORMATION IN THIS STRUCTURAL AND COLLATERAL TERM SHEET IS NOT COMPLETE AND MAY BE AMENDED PRIOR TO THE TIME OF SALE. THIS TERM SHEET IS NOT AN OFFER TO SELL THESE SECURITIES AND IT IS NOT A SOLICITATION OF AN OFFER TO BUY THESE SECURITIES IN ANY JURISDICTION WHERE THE OFFER OR SALE IS NOT PERMITTED.
| 143 of 151 |
| Structural and Collateral Term Sheet | JPMCC 2017-JP6 | |
| Apex Fort Washington | ||
| Operating History and Underwritten Net Cash Flow(1) | |||||||
| 2015 | 2016 | TTM(2) | Underwritten | Per Square Foot | %(3) | ||
| Rents in Place(4) | $5,695,188 | $4,290,828 | $4,342,429 | $8,306,420 | $21.39 | 81.6% | |
| Vacant Income | 0 | 0 | 0 | 751,464 | 1.94 | 7.4 | |
| Gross Potential Rent | $5,695,188 | $4,290,828 | $4,342,429 | $9,057,884 | $23.33 | 89.0% | |
| Total Reimbursements | 868,281 | 668,607 | 672,120 | 1,049,273 | 2.70 | 10.3 | |
| Other Income | 57,182 | 90,050 | 93,675 | 68,701 | 0.18 | 0.7 | |
| Net Rental Income | $6,620,651 | $5,049,485 | $5,108,224 | $10,175,858 | $26.20 | 100.0% | |
| (Vacancy/Credit Loss) | 0 | 0 | 0 | (1,109,612) | (2.86) | (10.9) | |
| Effective Gross Income | $6,620,651 | $5,049,485 | $5,108,224 | $9,066,246 | $23.35 | 89.1% | |
| Total Expenses | $3,686,902 | $3,355,461 | $3,202,404 | $3,535,452 | $9.10 | 39.0% | |
| Net Operating Income(5) | $2,933,749 | $1,694,024 | $1,905,820 | $5,530,794 | $14.24 | 61.0% | |
| Total TI/LC, Capex/RR | 0 | 0 | 0 | 464,463 | 1.20 | 5.1 | |
| Net Cash Flow | $2,933,749 | $1,694,024 | $1,905,820 | $5,066,331 | $13.05 | 55.9% | |
| Occupancy(6) | 79.2% | 73.8% | 91.9% | 89.1% | |||
| (1) | 2014 operating figures are not available as the prior owner purchased the property in January 2015 and historical cash flows were not provided to the prior owner at the time of acquisition. |
| (2) | TTM Column represents the trailing 12-month period ending February 28, 2017. |
| (3) | % column represents percent of Net Rental Income for all revenue lines and represents percent of Effective Gross Income for the remainder of fields. |
| (4) | Underwritten Rents in Place is inclusive of $95,041 in rent steps underwritten through September 2017 and straight-line rent of $87,020. Underwritten Rents in Place includes approximately $1.0 million in rent for AstraZeneca Pharmaceuticals, which is currently dark but paying rent. Underwritten Rents in Place also includes $3,767,474 in underwritten rent for four tenants, Lincoln Investment Planning, Impax Laboratories, Inc., Citizens Bank of Pennsylvania and Connexin Software, Inc., representing approximately 41.1% of net rentable area and approximately 45.8% of underwritten base rent, which are not in occupancy and/or are in free rent periods. |
| (5) | The decrease in 2016 Net Operating Income from 2015 Net Operating Income is primarily due to two tenant vacancies in 2015. The property was approximately 79.0% occupied at the time of the sale to the prior owner. Following the sale, the occupancy declined to 42.0% as a result of the two tenants vacating. The prior owner purchased the property from a prior foreclosing lender for $30.2 million in January 2015 as described above under “The Property”; after acquiring the property, the prior owner executed six new leases to six tenants totaling approximately 192,000 square feet and approximately $4.47 million of base rent. The increases in Underwritten Net Operating Income over 2016 and TTM Net Operating Income reflect the new leasing and the partial burn-off of free rent, as well as the rent steps and straight-lined rent identified in footnote (4) above. |
| (6) | Historical Occupancies are as of December 31 of each respective year. TTM Occupancy is as of February 28, 2017. Underwritten Occupancy represents economic occupancy. Occupancy includes AstraZeneca Pharmaceuticals, which is currently dark but paying rent. |
THE INFORMATION IN THIS STRUCTURAL AND COLLATERAL TERM SHEET IS NOT COMPLETE AND MAY BE AMENDED PRIOR TO THE TIME OF SALE. THIS TERM SHEET IS NOT AN OFFER TO SELL THESE SECURITIES AND IT IS NOT A SOLICITATION OF AN OFFER TO BUY THESE SECURITIES IN ANY JURISDICTION WHERE THE OFFER OR SALE IS NOT PERMITTED.
| 144 of 151 |
| Structural and Collateral Term Sheet | JPMCC 2017-JP6 |
[THIS PAGE INTENTIONALLY LEFT BLANK]
THE INFORMATION IN THIS STRUCTURAL AND COLLATERAL TERM SHEET IS NOT COMPLETE AND MAY BE AMENDED PRIOR TO THE TIME OF SALE. THIS TERM SHEET IS NOT AN OFFER TO SELL THESE SECURITIES AND IT IS NOT A SOLICITATION OF AN OFFER TO BUY THESE SECURITIES IN ANY JURISDICTION WHERE THE OFFER OR SALE IS NOT PERMITTED.
| 145 of 151 |
| Structural and Collateral Term Sheet | JPMCC 2017-JP6 | |
| Moffett Gateway | ||
| Mortgage Loan Information | Property Information | |||
| Mortgage Loan Seller: | JPMCB | Single Asset / Portfolio: | Single Asset | |
| Credit Assessment (Fitch)(1): | BBB- | Title: | Fee | |
| Original Principal Balance(2): | $20,000,000 | Property Type - Subtype: | Office – Suburban | |
| Cut-off Date Principal Balance(2): | $20,000,000 | Net Rentable Area (SF): | 612,691 | |
| % of Pool by IPB: | 2.5% | Location: | Sunnyvale, CA | |
| Loan Purpose: | Refinance | Year Built / Renovated: | 2016 / N/A | |
| Borrower: | 441 Real Estate LLC | Occupancy(5): | 100.0% | |
| Sponsor(3): | Joseph K. Paul | Occupancy Date: | 6/1/2017 | |
| Interest Rate: | 3.319403% | Number of Tenants: | 1 | |
| Note Date: | 9/22/2016 | 2013 NOI(6): | N/A | |
| Maturity Date: | 4/1/2027 | 2014 NOI(6): | N/A | |
| Interest-only Period: | 60 months | 2015 NOI(6): | N/A | |
| Original Term: | 126 months | TTM NOI(6): | N/A | |
| Original Amortization(4): | 360 months | UW Economic Occupancy: | 95.0% | |
| Amortization Type: | IO-Balloon | UW Revenues: | $35,097,235 | |
| Call Protection: | L(32),Def(87),O(7) | UW Expenses: | $6,170,971 | |
| Lockbox / Cash Management: | Hard / In Place | UW NOI: | $28,926,265 | |
| Additional Debt: | Yes | UW NCF: | $27,631,280 | |
| Additional Debt Balance(2): | $223,000,000 / $102,000,000 / | Appraised Value / Per SF(7): | $525,000,000 / $857 | |
| $50,000,000 | Appraisal Date: | 7/20/2016 | ||
| Additional Debt Type: | Pari Passu / B-Note / | |||
| Mezzanine Loan | ||||
| Escrows and Reserves | Financial Information(2) | |||||||
| Initial | Monthly | Initial Cap | A-Notes | Whole Loan | ||||
| Taxes: | $180,864 | $180,864 | N/A | Cut-off Date Loan / SF: | $397 | $563 | ||
| Insurance: | $0 | Springing | N/A | Maturity Date Loan / SF: | $337 | $503 | ||
| Replacement Reserves: | $0 | $0 | N/A | Cut-off Date LTV(7): | 46.3% | 65.7% | ||
| TI/LC: | $0 | $0 | N/A | Maturity Date LTV(7): | 39.3% | 58.7% | ||
| Other(8): | $86,961,915 | $0 | N/A | UW NCF DSCR(9): | 1.95x | 1.43x | ||
| UW NOI Debt Yield: | 11.9% | 8.4% | ||||||
| Sources and Uses | ||||||
| Sources | Proceeds | % of Total | Uses | Proceeds | % of Total | |
| A-Notes(2) | $243,000,000 | 61.5% | Payoff Existing Debt | $216,321,083 | 54.8% | |
| B-Note(2) | 102,000,000 | 25.8 | Upfront Reserves | 87,142,779 | 22.1 | |
| Mezzanine Loan | 50,000,000 | 12.7 | Closing Costs | 7,532,290 | 1.9 | |
| Return of Equity | 84,003,847 | 21.3 | ||||
| Total Sources | $395,000,000 | 100.0% | Total Uses | $395,000,000 | 100.0% | |
| (1) | Fitch has confirmed that the Moffett Gateway Mortgage Loan has, in the context of its inclusion in the mortgage pool, credit characteristics consistent with an investment grade obligation. |
| (2) | The Moffett Gateway loan is part of a whole loan evidenced by fivepari passu notes with an aggregate principal balance as of the Cut-off Date of $243.0 million (the “A-Notes”) and a subordinate companion loan (the “B-Note”). The A-Notes Financial Information presented in the chart above reflects the Cut-off Date balance of the A-Notes but excludes the related B-Note and mezzanine loan. The Whole Loan Financial Information presented in the chart above reflects the Cut-off Date balance of the A-Notes and B-Note evidencing the Moffett Gateway Whole Loan, but excludes the related mezzanine loan. |
| (3) | For a full description of Sponsor, please refer to “The Loan” below. |
| (4) | The Moffett Gateway A-Notes will amortize in accordance with the amortization schedule set forth in Annex G to the Preliminary Prospectus subsequent to a five-year interest-only period. The principal payments that would otherwise have been paid to the B-Note will be used to pay down the aggregate principal balance of the A-Notes. |
| (5) | The property is 100.0% leased to Google Inc. (“Google”) through March 2027. Google has executed two leases for the property but is not yet in occupancy of either space. Google leases the property under two separate leases, one for 1225 Crossman Avenue (“Building One”) and the second for 1265 Crossman Avenue (“Building Two”). Google is expected to take occupancy for both spaces by September 2017 and, subsequent to any applicable free rent periods, is required to begin paying full rent as applicable under each lease as follows: Building One in July 2018 and Building Two in July 2017. |
| (6) | Historical cash flows are not available as the property was constructed in 2016. |
| (7) | The Appraised Value / Per SF, Cut-off Date LTV and Maturity Date LTV are calculated based on the “hypothetical market value as stabilized”, which assumes that all tenant improvement construction is complete and that all contractual free rent has “burned off” at the “stabilized” value date. At origination, the borrower reserved approximately $87.0 million for unfunded obligations (approximately $49.4 million for outstanding tenant improvements and leasing commissions and approximately $37.6 million for free rent). The “as-is” value as of July 20, 2016 is $430.0 million, which results in a Cut-off Date LTV and Maturity Date LTV of 56.5% and 48.0%, respectively, and a Whole Loan Cut-off Date LTV and Maturity Date LTV of 80.2% and 71.7%, respectively. |
THE INFORMATION IN THIS STRUCTURAL AND COLLATERAL TERM SHEET IS NOT COMPLETE AND MAY BE AMENDED PRIOR TO THE TIME OF SALE. THIS TERM SHEET IS NOT AN OFFER TO SELL THESE SECURITIES AND IT IS NOT A SOLICITATION OF AN OFFER TO BUY THESE SECURITIES IN ANY JURISDICTION WHERE THE OFFER OR SALE IS NOT PERMITTED.
| 146 of 151 |
| Structural and Collateral Term Sheet | JPMCC 2017-JP6 | |
| Moffett Gateway | ||
| (8) | Initial Other Escrows and Reserves include approximately $87.0 million for unfunded obligations which included (i) approximately $49.4 million for outstanding tenant improvements and leasing commissions, (ii) $37.6 million for free rent reserves and (iii) $180,864 for tax reserves. |
| (9) | The UW NCF DSCR is calculated using the sum of principal and interest payments over the first 12 months following the expiration of the interest-only period based on the assumed principal payment schedule provided on Annex F to the Preliminary Prospectus. |
The Loan.The Moffett Gateway loan is secured by a first mortgage lien on the borrower’s fee interest in a newly constructed corporate office campus consisting of two seven-story towers, an amenities building and a parking garage, located in Sunnyvale, California. The whole loan has an outstanding principal balance as of the Cut-off Date of $345.0 million (the “Moffett Gateway Whole Loan”) and is comprised of fivepari passusenior notes, each as described below, with an aggregate outstanding principal balance as of the Cut-off Date of $243.0 million (collectively, the “Moffett Gateway A-Notes”) and a subordinate B-Note with an outstanding principal balance as of the Cut-off Date of $102.0 million (the “Moffett Gateway Subordinate Companion Loan”), each as described below. Note A-4, with an outstanding principal balance as of the Cut-off Date of $20.0 million, is being contributed to the JPMCC 2017-JP6 Trust (the “Moffett Gateway Mortgage Loan”). Note A-1 with an outstanding principal balances as of the Cut-off Date of $80.0 million was contributed to the JPMCC 2017-JP5 trust, Note A-2, with an outstanding principal balance as of the Cut-off Date of $60.0 million, was contributed to the JPMCC 2016-JP4 trust, Note A-3, with an outstanding principal balance as of the Cut-off Date of $40.0 million was contributed to the JPMDB 2017-C5 trust and Note A-5, with an outstanding principal balance as of the Cut-off Date of $43.0, million was contributed to the JPMDB 2016-C4 trust (together, the “Moffett Gateway Pari Passu Companion Loans”). The Moffett Gateway Subordinate Companion Loan has been sold to a third party investor. Under the related intercreditor agreement, prior to a control appraisal period with respect to the Moffett Gateway Subordinate Companion Loan, under certain circumstances, the holder of the Moffett Gateway Subordinate Companion Loan will have the right to approve certain major decisions with respect to the Moffett Gateway Whole Loan, to exercise certain cure rights and to replace the related special servicer with or without cause. The holder of the Moffett Gateway Subordinate Companion Loan will also have the right to purchase the Moffett Gateway A-Notes under certain circumstances. After the occurrence and during the continuance of a control appraisal period with respect to the Moffett Gateway Subordinate Companion Loan, the holder of Note A-2 will be entitled to exercise the rights of the controlling noteholder for the Moffett Gateway Whole Loan, which rights will be exercised by the related trustee (or, prior to the occurrence and continuance of a control termination event under the related pooling and servicing agreement, by the related directing certificateholder); however, the holders of the Moffett Gateway Mortgage Loan and Moffett Gateway Pari Passu Companion Loans will be entitled, under certain circumstances, to be consulted with respect to certain major decisions. The Moffett Gateway Whole Loan has a 10-year, six-month term and, subsequent to a five-year interest-only period, the Moffett Gateway A-Notes will amortize in accordance with the amortization schedule set forth on Annex F to the Preliminary Prospectus. The principal payments that would otherwise have been paid to the Moffett Gateway Subordinate Companion Loan are included as part of the scheduled amortization of the Moffett Gateway A-Notes.
| Whole Loan Summary | ||||||
| Note | Original Balance | Cut-off Date Balance | Note Holder | Controlling Piece | ||
| A-1 | $80,000,000 | $80,000,000 | JPMCC 2017-JP5 | No | ||
| A-2 | 60,000,000 | 60,000,000 | JPMCC 2016-JP4 | No | ||
| A-3 | 40,000,000 | 40,000,000 | JPMDB 2017-C5 | No | ||
| A-4 | 20,000,000 | 20,000,000 | JPMCC 2017-JP6 | No | ||
| A-5 | 43,000,000 | 43,000,000 | JPMDB 2016-C4 | No | ||
| B-1 | 102,000,000 | 102,000,000 | Third Party Investor | Yes | ||
| Total | $345,000,000 | $345,000,000 | ||||
The borrowing entity for the Moffett Gateway Whole Loan is 441 Real Estate LLC, a Delaware limited liability company and special purpose entity.
The loan sponsor is Joseph K. Paul (“Jay Paul”) and the nonrecourse carve-out guarantors are Jay Paul, Jay Paul Revocable Living Trust Dated November 9, 1999, as Amended and Restated on March 19, 2010, and Paul Guarantor LLC, a Delaware limited liability company. Jay Paul is the founder of the Jay Paul Company. The Jay Paul Company is an owner and developer of commercial office properties throughout California. Founded in 1975, the Jay Paul Company has developed or acquired over 8.5 million square feet of office space, including 21 buildings in Moffett Park totaling 5.0 million square feet. Jay Paul Company has built projects for many notable companies including Apple, Google, Amazon, Motorola, Microsoft, Boeing, Philips Electronics, HP and DreamWorks, among others. The loan sponsor focuses on sustainable design and has closed in excess of $12.0 billion in equity and debt financings since inception. The borrower is permitted to obtain the release of Jay Paul and the trust from the guaranty and environmental indemnity upon satisfaction of certain conditions in the loan documents, which include, without limitation, Paul Guarantor LLC maintaining a net worth of not less than $300.0 million and liquidity of not less than $20.0 million.
The loan sponsor purchased the land and previous buildings in 2012 for approximately $50.4 million and, according to the loan sponsor, has spent approximately $182.5 million ($298 per square foot) on the development of the Moffett Gateway office complex. Additionally, the loan sponsor has indicated it spent approximately $55.1 million ($90 per square foot) in tenant improvement and leasing commission costs. The loan sponsor’s total cost basis is approximately $336.1 million ($549 per square foot).
THE INFORMATION IN THIS STRUCTURAL AND COLLATERAL TERM SHEET IS NOT COMPLETE AND MAY BE AMENDED PRIOR TO THE TIME OF SALE. THIS TERM SHEET IS NOT AN OFFER TO SELL THESE SECURITIES AND IT IS NOT A SOLICITATION OF AN OFFER TO BUY THESE SECURITIES IN ANY JURISDICTION WHERE THE OFFER OR SALE IS NOT PERMITTED.
| 147 of 151 |
| Structural and Collateral Term Sheet | JPMCC 2017-JP6 | |
| Moffett Gateway | ||
The Property. The Moffett Gateway property is comprised of two newly-constructed seven-story Class A LEED Platinum-Certified towers totaling 597,848 square feet and is located in Sunnyvale, California. The property is situated on approximately 15.5 acres and features a 14,843 square foot amenities building, which contains a fitness center with locker rooms, showers, steam rooms and a yoga studio, a rooftop dining area, bocce court area and common and recreation areas. Additionally, the property contains 2,022 parking spaces resulting in a parking ratio of approximately 3.3 spaces per 1,000 square feet of space. The property benefits from its location at the intersection of Highways 237 and 101, two regional highway systems that provide direct access to the surrounding areas as well as the San Francisco central business district, located approximately 38.4 miles north of the property. The property is part of the larger Moffett Park development, a 519-acre area comprised of recently developed office spaces and research and development buildings. Additionally, a Santa Clara Light Rail System is located adjacent to the property, which provides service to the surrounding residential communities. The Santa Clara County Transit System provides bus service county-wide and has four stops nearby the property.
As of June 1, 2017, the property is 100.0% leased to Google pursuant to two separate 298,924 square foot triple net leases through March 31, 2027 for Building One and Building Two, each with two seven-year extension options and no early termination options. Google does not directly lease the amenities building from the landlord. Instead, Google’s right to use the amenities building is contained within each individual lease. Google’s right to use the amenities building is exclusive during any period when Google leases both office buildings and is non-exclusive for any period of time that an additional tenant leases space at the property in the future. Additionally, the amenities building, which includes the parking structure, is part of the common areas which are owned in fee simple by an owners association, which is wholly owned by the borrower. The borrower has pledged the ownership interests in the owner’s association as collateral for the Moffett Gateway Whole Loan.
Google’s main headquarters in Mountain View, California is located approximately 6.4 miles west of the property. On October 2, 2015, Google implemented a holding company reorganization in which Alphabet became the successor issuer to Google. At that time, Alphabet recognized the assets and liabilities of Google at carryover basis. Alphabet, through its subsidiaries, provides online advertising services in the United States, the United Kingdom and rest of the world. Alphabet is the second largest publicly traded company (NASDAQ: GOOG) in the world as measured by market capitalization and is rated Aa2 and AA by Moody’s and S&P, respectively. Google represents approximately 99.4% of Alphabet’s total revenues, based on Alphabet’s 2015 annual report.
The Market. The property is located in the Sunnyvale office submarket. The submarket features one of the highest concentrations of technology, software and creative tenants within Silicon Valley. Moffett Gateway is located along Moffett Park Avenue, a part of the larger Moffett Park development, which is a 519-acre area comprised of recently developed office spaces and research and development buildings. Moffett Park is home to several notable technology firms including Amazon.com, Google, Hewlett-Packard, Juniper Networks, Lockheed Martin, Microsoft, and Yahoo!. Google owns or leases approximately 3.5 million square feet of office space in Sunnyvale, making it the largest corporate occupier in the submarket. Additionally, Google collectively owns or leases approximately 15.1 million square feet in Silicon Valley and the greater San Francisco area. As of the second quarter of 2016, the Sunnyvale market had a Class A office inventory of approximately 8.9 million square feet with an overall vacancy rate of 8.8% and annual asking rents between $43.80 and $45.60 per square foot on a triple-net basis.
| Tenant Summary(1) | ||||||||
| Tenant | Ratings(2)Moody’s/S&P/Fitch | Net Rentable Area (SF) | % of Total NRA | Base Rent PSF(3) | % of Total Base Rent | Lease Expiration Date | ||
| Google(4) | Aa2 / AA / NA | 612,691 | 100.0% | $50.87 | 100.0% | 3/31/2027 | ||
| (1) | Based on the underwritten rent roll. |
| (2) | Ratings provided are for the parent company of the entity listed in the “Tenant” field whether or not the parent company guarantees the lease. |
| (3) | Base Rent PSF includes the 14,843 square foot amenities building, for which approximately $785,298 of base rent has been underwritten. Google’s right to use the amenities building is exclusive during any period when Google leases both office buildings and is non-exclusive for any additional tenant that may sign a lease at the property in the future. Additionally, Base Rent PSF represents the straight-line average of Google’s rent steps over the course of the loan term inclusive of the free rent reserve. |
| (4) | Google has two seven-year renewal options remaining for each lease. Google must provide notice of its intention to renew no earlier than January 2026 or later than June 2026. |
THE INFORMATION IN THIS STRUCTURAL AND COLLATERAL TERM SHEET IS NOT COMPLETE AND MAY BE AMENDED PRIOR TO THE TIME OF SALE. THIS TERM SHEET IS NOT AN OFFER TO SELL THESE SECURITIES AND IT IS NOT A SOLICITATION OF AN OFFER TO BUY THESE SECURITIES IN ANY JURISDICTION WHERE THE OFFER OR SALE IS NOT PERMITTED.
| 148 of 151 |
| Structural and Collateral Term Sheet | JPMCC 2017-JP6 | |
| Moffett Gateway | ||
| Lease Rollover Schedule(1) | |||||||||
| Year | Number of Leases Expiring | Net Rentable Area Expiring | % of NRA Expiring | Base Rent Expiring | % of Base Rent Expiring | Cumulative Net Rentable Area Expiring | Cumulative % of NRA Expiring | Cumulative Base Rent Expiring | Cumulative % of Base Rent Expiring |
| Vacant | NAP | 0 | 0.0% | NAP | NAP | 0 | 0.0% | NAP | NAP |
| 2017 & MTM | 0 | 0 | 0.0 | $0 | 0.0% | 0 | 0.0% | $0 | 0.0% |
| 2018 | 0 | 0 | 0.0 | 0 | 0.0 | 0 | 0.0% | $0 | 0.0% |
| 2019 | 0 | 0 | 0.0 | 0 | 0.0 | 0 | 0.0% | $0 | 0.0% |
| 2020 | 0 | 0 | 0.0 | 0 | 0.0 | 0 | 0.0% | $0 | 0.0% |
| 2021 | 0 | 0 | 0.0 | 0 | 0.0 | 0 | 0.0% | $0 | 0.0% |
| 2022 | 0 | 0 | 0.0 | 0 | 0.0 | 0 | 0.0% | $0 | 0.0% |
| 2023 | 0 | 0 | 0.0 | 0 | 0.0 | 0 | 0.0% | $0 | 0.0% |
| 2024 | 0 | 0 | 0.0 | 0 | 0.0 | 0 | 0.0% | $0 | 0.0% |
| 2025 | 0 | 0 | 0.0 | 0 | 0.0 | 0 | 0.0% | $0 | 0.0% |
| 2026 | 0 | 0 | 0.0 | 0 | 0.0 | 0 | 0.0% | $0 | 0.0% |
| 2027 | 2 | 612,691 | 100.0 | 31,169,318 | 100.0 | 612,691 | 100.0% | $31,169,318 | 100.0% |
| 2028 & Beyond | 0 | 0 | 0.0 | 0 | 0.0 | 612,691 | 100.0% | $31,169,318 | 100.0% |
| Total | 2 | 612,691 | 100.0% | $31,169,318 | 100.0% | ||||
| (1) | Based on the underwritten rent roll dated June 1, 2017. |
| Google Rent Schedule | ||||||
| Period | Building One Base Rent per Year | Building One Base Rent per Year PSF | Building Two Base Rent per Year | Building Two Base Rent per Year PSF | Cumulative Base Rent per Year | Cumulative Base Rent per Year PSF |
| Months 1 – 10(1) | $0 | $0.00 | $0 | $0.00 | $0 | $0.00 |
| Months 11 – 22(1) | 0 | $0.00 | 12,232,568 | $20.46 | $12,232,568 | $20.46 |
| Months 23 – 34 | 12,599,545 | $21.07 | 13,738,744 | $22.98 | $26,338,289 | $44.06 |
| Months 35 – 46 | 14,150,907 | $23.67 | 14,150,907 | $23.67 | $28,301,813 | $47.34 |
| Months 47 – 58 | 14,575,434 | $24.38 | 14,575,434 | $24.38 | $29,150,868 | $48.76 |
| Months 59 – 70 | 15,012,697 | $25.11 | 15,012,697 | $25.11 | $30,025,394 | $50.22 |
| Months 71 – 82 | 15,463,078 | $25.86 | 15,463,078 | $25.86 | $30,926,156 | $51.73 |
| Months 83 – 94 | 15,926,970 | $26.64 | 15,926,970 | $26.64 | $31,853,940 | $53.28 |
| Months 95 – 106 | 16,404,779 | $27.44 | 16,404,779 | $27.44 | $32,809,559 | $54.88 |
| Months 107 – 118 | 16,896,923 | $28.26 | 16,896,923 | $28.26 | $33,793,845 | $56.53 |
| Months 119 – 128 | 14,431,037 | $24.14 | 14,431,037 | $24.14 | $28,862,073 | $48.28 |
| Total/Wtd. Avg.(2) | $135,461,369 | $25.34 | $148,833,136 | $25.09 | $284,294,505 | $49.53 |
| (1) | The property is 100.0% leased to Google through March 2027. Google has executed two leases for the property but is not yet in occupancy of either space. Google leases the property under two separate leases, one for Building One and the second for Building Two. Google is expected to take occupancy by September 2017 and, after any applicable free rent periods, is required to begin paying full rent as applicable under each lease as follows: Building One in July 2018 and Building Two in July 2017. At origination, the borrower reserved approximately $87.0 million for unfunded obligations (approximately $49.4 million for outstanding tenant improvements and leasing commissions and approximately $37.6 million for free rent). |
| (2) | The Total/Wtd. Avg. Base Rent and PSF numbers exclude the 14,843 square foot amenities building, for which approximately $785,298 of base rent has been underwritten. Google’s right to use the amenities building is exclusive during any period when Google leases both office buildings and is non-exclusive for any period of time an additional tenant leases space at the property in the future. |
THE INFORMATION IN THIS STRUCTURAL AND COLLATERAL TERM SHEET IS NOT COMPLETE AND MAY BE AMENDED PRIOR TO THE TIME OF SALE. THIS TERM SHEET IS NOT AN OFFER TO SELL THESE SECURITIES AND IT IS NOT A SOLICITATION OF AN OFFER TO BUY THESE SECURITIES IN ANY JURISDICTION WHERE THE OFFER OR SALE IS NOT PERMITTED.
| 149 of 151 |
| Structural and Collateral Term Sheet | JPMCC 2017-JP6 | |
| Moffett Gateway | ||
Proforma and Underwritten Net Cash Flow | |||||||
Proforma | Proforma | Proforma | Underwritten | Per Square | %(1) | ||
| Rents in Place(2) | $3,318,057 | $17,393,064 | $28,439,878 | $31,169,318 | $50.87 | 84.4% | |
| Vacant Income | 0 | 0 | 0 | 0 | 0.00 | 0.0 | |
| Gross Potential Rent | $3,318,057 | $17,393,064 | $28,439,878 | $31,169,318 | $50.87 | 84.4% | |
| Total Reimbursements | 4,112,410 | 6,072,471 | 6,503,937 | 5,775,140 | 9.43 | 15.6 | |
| Net Rental Income | $7,430,467 | $23,465,535 | $34,943,815 | $36,944,458 | $60.30 | 100.0% | |
| (Vacancy/Credit Loss) | 0 | 0 | 0 | (1,847,223) | (3.01) | (5.0)- | |
| Other Income | 0 | 0 | 0 | 0 | 0.00 | 0.0 | |
| Effective Gross Income | $7,430,467 | $23,465,535 | $34,943,815 | $35,097,235 | $57.28 | 95.0% | |
| Total Expenses | $5,583,716 | $6,204,727 | $6,692,827 | $6,170,971 | $10.07 | 17.6% | |
| Net Operating Income | $1,846,751 | $17,260,808 | $28,250,988 | $28,926,265 | $47.21 | 82.4% | |
| Total TI/LC, Capex/RR | 0 | 0 | 0 | 1,294,985 | 2.11 | 3.7 | |
| Net Cash Flow | $1,846,751 | $17,260,808 | $28,250,988 | $27,631,280 | $45.10 | 78.7% | |
| (1) | % column represents percent of Net Rental Income for all revenue lines and represents percent of Effective Gross Income for the remainder of fields. |
| (2) | The property is 100.0% leased to Google through March 2027. Google has executed two leases for the property but is not yet in occupancy of either space. Google leases the property under two separate leases, one for Building One and the second for Building Two. Google is expected to take occupancy by September 2017 and, after any applicable free rent periods, is required to begin paying full rent as applicable under each lease as follows: Building One in July 2018 and Building Two in July 2017. At origination, the borrower reserved approximately $87.0 million for unfunded obligations (approximately $49.4 million for outstanding tenant improvements and leasing commissions and approximately $37.6 million for free rent). Additionally, Underwritten Rents in Place represents the straight-line average of Google’s rent steps over the course of the loan term. |
Additional Debt. There is a $102.0 million Moffett Gateway Subordinate Companion Loan and a $50.0 million mezzanine loan, both coterminous with the Moffett Gateway A-Notes. The Moffett Gateway Subordinate Companion Loan and the mezzanine loan have each been sold to separate third party investors. The Moffett Gateway Subordinate Companion Loan has a 5.00000% coupon and is interest only for the entire term. All principal payments on the Moffett Gateway Whole Loan once amortization begins after the expiration of the interest-only period will be applied to the Moffett Gateway A-Notes, which will cause hyper-amortization of the Moffett Gateway A-Notes. The mezzanine loan has a 6.35000% coupon and is interest only for the full term of the loan. Including the Moffett Gateway Subordinate Companion Loan and mezzanine loan, the cumulative Cut-off Date LTV, cumulative UW NCF DSCR and cumulative UW NOI Debt Yield are 75.2%, 1.22x and 7.3%, respectively. The mortgage and mezzanine lenders have entered into an intercreditor agreement.
Partial Release. The borrower is permitted to release Building One or Building Two from the lien of the security instrument through a partial defeasance of the Moffett Gateway Whole Loan at any time after the expiration of the lockout period if, among other conditions, (i) no event of default has occurred and is continuing, (ii) the borrower defeases a portion of the Moffett Gateway Whole Loan in an amount equal to (a) the allocated loan amount for the applicable building (which is $170.0 million for each building with respect to the Moffett Gateway Whole Loan and $27.5 million for each building with respect to the mezzanine loan) plus (b) if the Google Tenancy Condition (as defined below) is not satisfied, 25% of the allocated loan amount, (iii) after giving effect to the release, the debt service coverage ratio of the remaining portion of the property based on the trailing 12-month period equals or is greater than the greater of (a) 1.23x and (b) the debt service coverage ratio for the property (including the building being released) immediately preceding the release based on the trailing-three month period.
“Google Tenancy Condition” means (a) there is no Cash Sweep Period caused by a Specified Tenant Trigger and (b) either the Google lease or a lease for the Google leased premises with a tenant that has a long term unsecured debt rating of BBB or its equivalent is in full force and effect for the remaining property.
Right of First Offer. Google has a right of first offer, so long as the borrower or an affiliate owns the property, to purchase all or any portion of the property that the borrower is willing to sell. The right of first offer expressly does not apply to any third party (including any owner by reason of foreclosure or any successor-in-interest) who subsequently owns all or any portion of the property.
THE INFORMATION IN THIS STRUCTURAL AND COLLATERAL TERM SHEET IS NOT COMPLETE AND MAY BE AMENDED PRIOR TO THE TIME OF SALE. THIS TERM SHEET IS NOT AN OFFER TO SELL THESE SECURITIES AND IT IS NOT A SOLICITATION OF AN OFFER TO BUY THESE SECURITIES IN ANY JURISDICTION WHERE THE OFFER OR SALE IS NOT PERMITTED.
| 150 of 151 |
| Structural and Collateral Term Sheet | JPMCC 2017-JP6 | |
| Contacts | ||
| J.P. Morgan CMBS Capital Markets & Banking | ||
| Contact | Phone Number | |
Kunal Singh Managing Director | kunal.k.singh@jpmorgan.com | (212) 834-5467 |
Dwayne McNicholas Vice President | dwayne.p.mcnicholas@jpmorgan.com | (212) 834-9328 |
| J.P. Morgan CMBS Trading | ||
| Contact | Phone Number | |
Andy Taylor Managing Director | andrew.b.taylor@jpmorgan.com | (212) 834-3111 |
Avinash Sharma Executive Director | avinash.sharma@jpmorgan.com | (212) 834-3111 |
| J.P. Morgan Securitized Products Syndicate | ||
| Contact | Phone Number | |
Andy Cherna Managing Director | andy.cherna@jpmorgan.com | (212) 834-4154 |
Anusha Joly Vice President | anusha.joly@jpmorgan.com | (212) 834-4154 |
THE INFORMATION IN THIS STRUCTURAL AND COLLATERAL TERM SHEET IS NOT COMPLETE AND MAY BE AMENDED PRIOR TO THE TIME OF SALE. THIS TERM SHEET IS NOT AN OFFER TO SELL THESE SECURITIES AND IT IS NOT A SOLICITATION OF AN OFFER TO BUY THESE SECURITIES IN ANY JURISDICTION WHERE THE OFFER OR SALE IS NOT PERMITTED.
| 151 of 151 |