EXHIBIT 16(c)(2)
Presentation to:
South Street Financial Corp.
William J. Wagner, CPA, Managing Director
HOWE BARNES INVESTMENTS, INC.
4000 WestChase Boulevard, Suite 110 Raleigh, NC 27607 Phone: 919-424-0100 Fax: 919-424-0110 www.howebarnes.com
October 27, 2005
AGENDA
Contents
1 |
| Trading Analysis |
2 |
| Going Private Analysis |
2 |
|
Key HBI Contacts
Corporate Finance—Raleigh
John F. Schramm
First Vice President & Managing Director Office: 800-448-7239 Mobile: 919-349-8541 jschramm@howebarnes.com
William J. Wagner, CPA
First Vice President & Managing Director Office: 800-638-4250 Mobile: 919-812-8033 bwagner@howebarnes.com
Charles L. Stubbs
Vice President Office: 919-424-0103 Mobile: 919-740-4671 cstubbs@howebarnes.com
Matthew H. Paramore
Assistant Vice President Office: 919-424-0104 Mobile: 252-670-4532 mparamore@howebarnes.com
Sales & Trading—Chicago
Gregory Gersack
Senior Vice President Office: 312-655-2982 ggersack@howebarnes.com
Nick Bach
Vice President Office: 312-655-2946 nbach@howebarnes.com
3 |
|
1. Trading Analysis
4 |
|
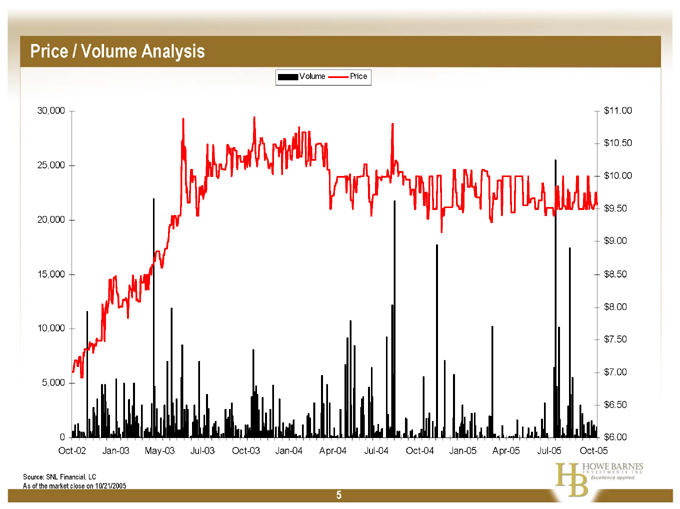
Price / Volume Analysis
Volume Price
30,000 25,000 20,000 15,000 10,000 5,000 0 $11.00 $10.50 $10.00 $9.50 $9.00 $8.50 $8.00 $7.50 $7.00 $6.50 $6.00
Oct-02 Jan-03 May-03 Jul-03 Oct-03 Jan-04 Apr-04 Jul-04 Oct-04 Jan-05 Apr-05 Jul-05 Oct-05
Source: SNL Financial, LC
As of the market close on 10/21/2005
5 |
|
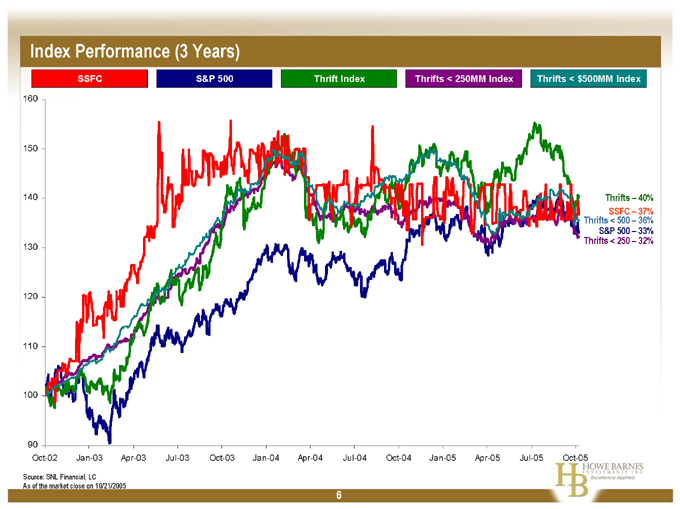
Index Performance (3 Years)
SSFC S&P 500 Thrift Index Thrifts < 250MM Index Thrifts < $500MM Index
160 150 140 130 120 110 100 90
Thrifts – 40% SSFC – 37% Thrifts < 500 – 36% S&P 500 – 33% Thrifts < 250 – 32%
Oct-02 Jan-03 Apr-03 Jul-03 Oct-03 Jan-04 Apr-04 Jul-04 Oct-04 Jan-05 Apr-05 Jul-05 Oct-05
Source: SNL Financial, LC
As of the market close on 10/21/2005
6 |
|
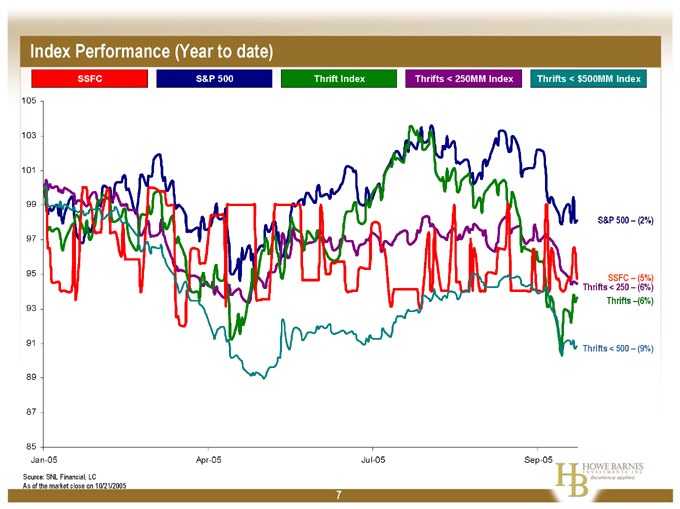
Index Performance (Year to date)
SSFC S&P 500 Thrift Index Thrifts < 250MM Index Thrifts < $500MM Index
105
103
101
99
97 95 93
91
89
87
85
S&P 500 – (2%)
SSFC – (5%) Thrifts < 250 – (6%) Thrifts –(6%)
Thrifts < 500 – (9%)
Jan-05 Apr-05 Jul-05 Sep-05
Source: SNL Financial, LC
As of the market close on 10/21/2005
7 |
|
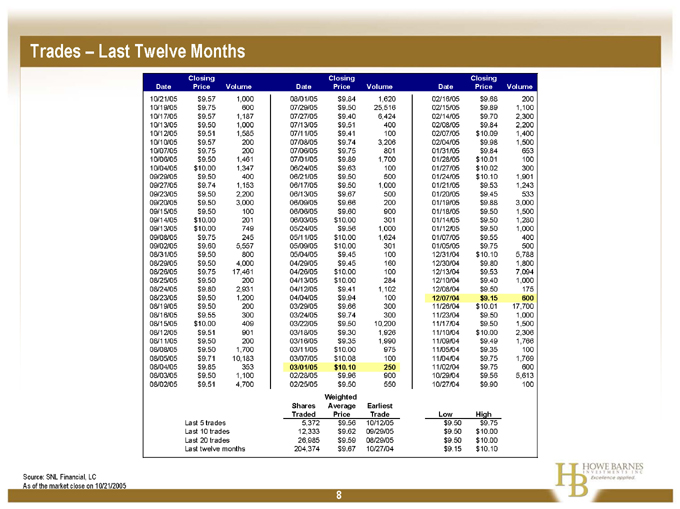
Trades – Last Twelve Months
Date Closing Price Volume Date Closing Price Volume Date Closing Price Volume
10/21/05 $9.57 1,000 08/01/05 $9.84 1,620 02/16/05 $9.68 200
10/19/05 $9.75 600 07/29/05 $9.50 25,516 02/15/05 $9.89 1,100
10/17/05 $9.57 1,187 07/27/05 $9.40 6,424 02/14/05 $9.70 2,300
10/13/05 $9.50 1,000 07/13/05 $9.51 400 02/08/05 $9.84 2,200
10/12/05 $9.51 1,585 07/11/05 $9.41 100 02/07/05 $10.09 1,400
10/10/05 $9.57 200 07/08/05 $9.74 3,206 02/04/05 $9.98 1,500
10/07/05 $9.75 200 07/06/05 $9.75 801 01/31/05 $9.84 653
10/06/05 $9.50 1,461 07/01/05 $9.89 1,700 01/28/05 $10.01 100
10/04/05 $10.00 1,347 06/24/05 $9.63 100 01/27/05 $10.02 300
09/29/05 $9.50 400 06/21/05 $9.50 500 01/24/05 $10.10 1,901
09/27/05 $9.74 1,153 06/17/05 $9.50 1,000 01/21/05 $9.53 1,243
09/23/05 $9.50 2,200 06/13/05 $9.67 500 01/20/05 $9.45 533
09/20/05 $9.50 3,000 06/09/05 $9.66 200 01/19/05 $9.88 3,000
09/15/05 $9.50 100 06/06/05 $9.60 900 01/18/05 $9.50 1,500
09/14/05 $10.00 201 06/03/05 $10.00 301 01/14/05 $9.50 1,280
09/13/05 $10.00 749 05/24/05 $9.56 1,000 01/12/05 $9.50 1,000
09/08/05 $9.75 245 05/11/05 $10.00 1,624 01/07/05 $9.55 400
09/02/05 $9.60 5,557 05/09/05 $10.00 301 01/05/05 $9.75 500
08/31/05 $9.50 800 05/04/05 $9.45 100 12/31/04 $10.10 5,788
08/29/05 $9.50 4,000 04/29/05 $9.45 160 12/30/04 $9.80 1,800
08/26/05 $9.75 17,461 04/26/05 $10.00 100 12/13/04 $9.53 7,094
08/25/05 $9.50 200 04/13/05 $10.00 284 12/10/04 $9.40 1,000
08/24/05 $9.80 2,931 04/12/05 $9.41 1,102 12/08/04 $9.50 175
08/23/05 $9.50 1,200 04/04/05 $9.94 100 12/07/04 $9.15 600
08/19/05 $9.50 200 03/29/05 $9.66 300 11/26/04 $10.01 17,700
08/16/05 $9.55 300 03/24/05 $9.74 300 11/23/04 $9.50 1,000
08/15/05 $10.00 409 03/22/05 $9.50 10,200 11/17/04 $9.50 1,500
08/12/05 $9.51 901 03/18/05 $9.30 1,926 11/10/04 $10.00 2,306
08/11/05 $9.50 200 03/16/05 $9.35 1,990 11/09/04 $9.49 1,766
08/08/05 $9.50 1,700 03/11/05 $10.00 975 11/05/04 $9.35 100
08/05/05 $9.71 10,183 03/07/05 $10.08 100 11/04/04 $9.75 1,769
08/04/05 $9.85 353 03/01/05 $10.10 250 11/02/04 $9.75 600
08/03/05 $9.50 1,100 02/28/05 $9.96 900 10/29/04 $9.56 5,613
08/02/05 $9.51 4,700 02/25/05 $9.50 550 10/27/04 $9.90 100
Shares Traded Weighted Average Price Earliest Trade Low High
Last 5 trades 5,372 $9.56 10/12/05 $9.50 $9.75
Last 10 trades 12,333 $9.62 09/29/05 $9.50 $10.00
Last 20 trades 26,985 $9.59 08/29/05 $9.50 $10.00
Last twelve months 204,374 $9.67 10/27/04 $9.15 $10.10
Source: SNL Financial, LC
As of the market close on 10/21/2005
8 |
|
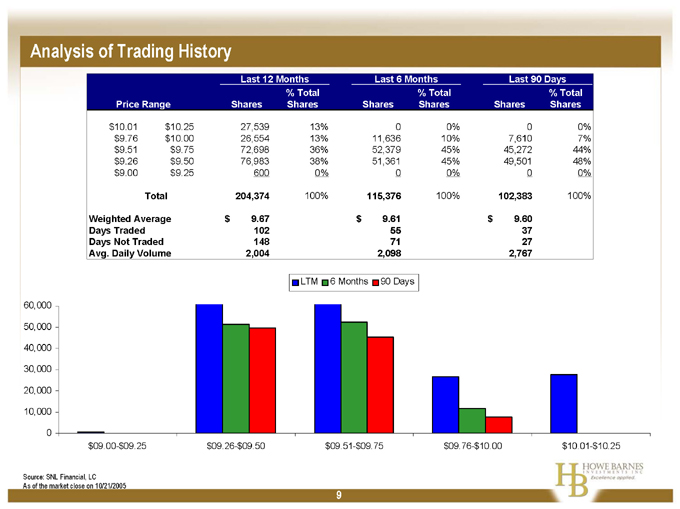
Analysis of Trading History
Last 12 Months Last 6 Months Last 90 Days
Price Range Shares % Total Shares Shares % Total Shares Shares % Total Shares
$10.01 $10.25 27,539 13% 0 0% 0 0%
$9.76 $10.00 26,554 13% 11,636 10% 7,610 7%
$9.51 $9.75 72,698 36% 52,379 45% 45,272 44%
$9.26 $9.50 76,983 38% 51,361 45% 49,501 48%
$9.00 $9.25 600 0% 0 0% 0 0%
Total 204,374 100% 115,376 100% 102,383 100%
Weighted Average $9.67 $9.61 $9.60
Days Traded 102 55 37
Days Not Traded 148 71 27
Avg. Daily Volume 2,004 2,098 2,767
LTM 6 Months 90 Days
60,000 50,000 40,000 30,000 20,000 10,000 0 $09.00-$09.25 $09.26-$09.50 $09.51-$09.75 $09.76-$10.00 $10.01-$10.25
Source: SNL Financial, LC
As of the market close on 10/21/2005
9
2. Going Private Analysis
10
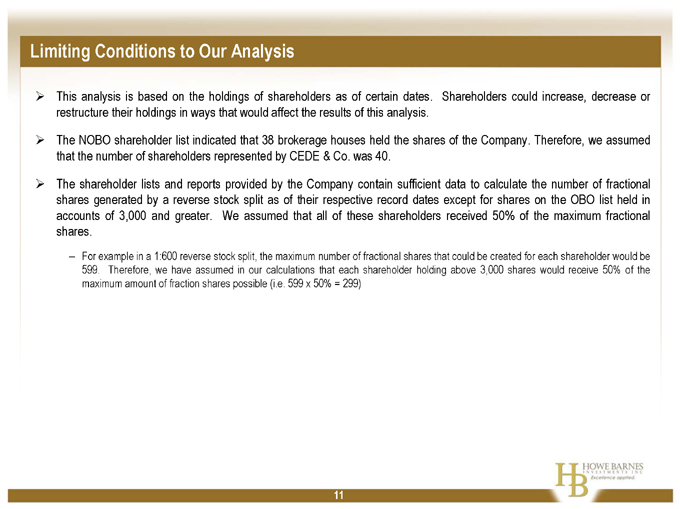
Limiting Conditions to Our Analysis
This analysis is based on the holdings of shareholders as of certain dates. Shareholders could increase, decrease or restructure their holdings in ways that would affect the results of this analysis.
The NOBO shareholder list indicated that 38 brokerage houses held the shares of the Company. Therefore, we assumed that the number of shareholders represented by CEDE & Co. was 40.
The shareholder lists and reports provided by the Company contain sufficient data to calculate the number of fractional shares generated by a reverse stock split as of their respective record dates except for shares on the OBO list held in accounts of 3,000 and greater. We assumed that all of these shareholders received 50% of the maximum fractional shares.
For example in a 1:600 reverse stock split, the maximum number of fractional shares that could be created for each shareholder would be 599. Therefore, we have assumed in our calculations that each shareholder holding above 3,000 shares would receive 50% of the maximum amount of fraction shares possible (i.e. 599 x 50% = 299)
11
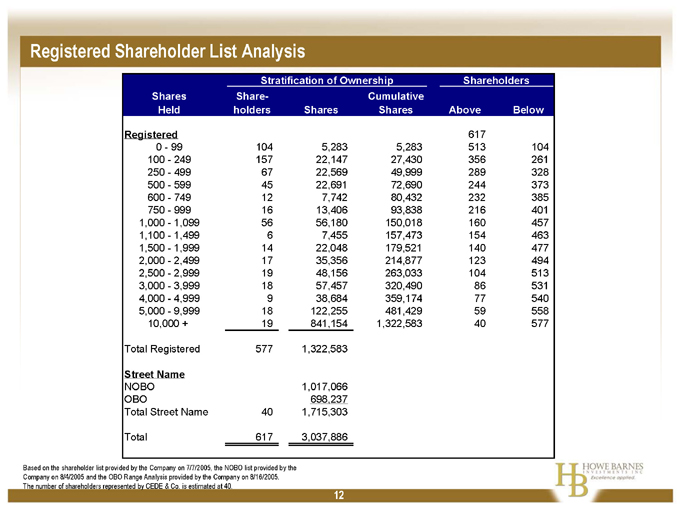
Registered Shareholder List Analysis
Stratification of Ownership Shareholders
Shares Held Share- holders Shares Cumulative Shares Above Below
Registered 617
0—99 104 5,283 5,283 513 104
100—249 157 22,147 27,430 356 261
250—499 67 22,569 49,999 289 328
500—599 45 22,691 72,690 244 373
600—749 12 7,742 80,432 232 385
750—999 16 13,406 93,838 216 401
1,000—1,099 56 56,180 150,018 160 457
1,100—1,499 6 7,455 157,473 154 463
1,500—1,999 14 22,048 179,521 140 477
2,000—2,499 17 35,356 214,877 123 494
2,500—2,999 19 48,156 263,033 104 513
3,000—3,999 18 57,457 320,490 86 531
4,000—4,999 9 38,684 359,174 77 540
5,000—9,999 18 122,255 481,429 59 558
10,000 + 19 841,154 1,322,583 40 577
Total Registered 577 1,322,583
Street Name
NOBO 1,017,066
OBO 698,237
Total Street Name 40 1,715,303
Total 617 3,037,886
Based on the shareholder list provided by the Company on 7/7/2005, the NOBO list provided by the Company on 8/4/2005 and the OBO Range Analysis provided by the Company on 8/16/2005. The number of shareholders represented by CEDE & Co. is estimated at 40.
12
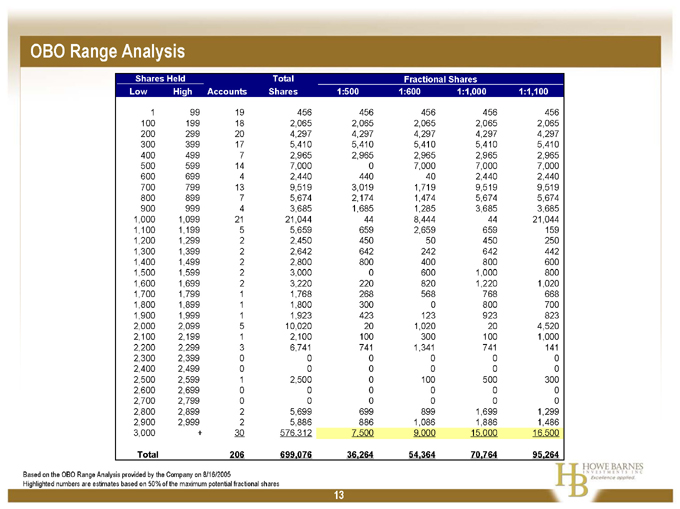
OBO Range Analysis
Shares Held Total Fractional Shares
Low High Accounts Shares 1:500 1:600 1:1,000 1:1,100
1 |
| 99 19 456 456 456 456 456 |
100 199 18 2,065 2,065 2,065 2,065 2,065
200 299 20 4,297 4,297 4,297 4,297 4,297
300 399 17 5,410 5,410 5,410 5,410 5,410
400 499 7 2,965 2,965 2,965 2,965 2,965
500 599 14 7,000 0 7,000 7,000 7,000
600 699 4 2,440 440 40 2,440 2,440
700 799 13 9,519 3,019 1,719 9,519 9,519
800 899 7 5,674 2,174 1,474 5,674 5,674
900 999 4 3,685 1,685 1,285 3,685 3,685
1,000 1,099 21 21,044 44 8,444 44 21,044
1,100 1,199 5 5,659 659 2,659 659 159
1,200 1,299 2 2,450 450 50 450 250
1,300 1,399 2 2,642 642 242 642 442
1,400 1,499 2 2,800 800 400 800 600
1,500 1,599 2 3,000 0 600 1,000 800
1,600 1,699 2 3,220 220 820 1,220 1,020
1,700 1,799 1 1,768 268 568 768 668
1,800 1,899 1 1,800 300 0 800 700
1,900 1,999 1 1,923 423 123 923 823
2,000 2,099 5 10,020 20 1,020 20 4,520
2,100 2,199 1 2,100 100 300 100 1,000
2,200 2,299 3 6,741 741 1,341 741 141
2,300 2,399 0 0 0 0 0 0
2,400 2,499 0 0 0 0 0 0
2,500 2,599 1 2,500 0 100 500 300
2,600 2,699 0 0 0 0 0 0
2,700 2,799 0 0 0 0 0 0
2,800 2,899 2 5,699 699 899 1,699 1,299
2,900 2,999 2 5,886 886 1,086 1,886 1,486
3,000 + 30 576,312 7,500 9,000 15,000 16,500
Total 206 699,076 36,264 54,364 70,764 95,264
Based on the OBO Range Analysis provided by the Company on 8/16/2005
Highlighted numbers are estimates based on 50% of the maximum potential fractional shares
13
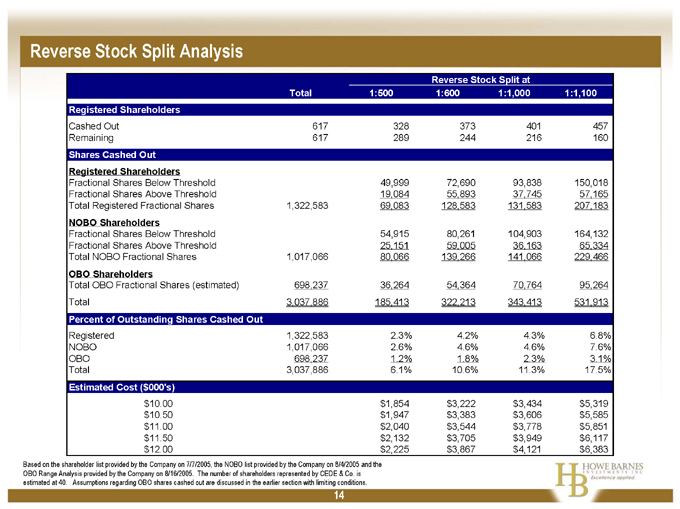
Reverse Stock Split Analysis
Reverse Stock Split at
Total 1:500 1:600 1:1,000 1:1,100
Registered Shareholders
Cashed Out 617 328 373 401 457
Remaining 617 289 244 216 160
Shares Cashed Out
Registered Shareholders
Fractional Shares Below Threshold 49,999 72,690 93,838 150,018
Fractional Shares Above Threshold 19,084 55,893 37,745 57,165
Total Registered Fractional Shares 1,322,583 69,083 128,583 131,583 207,183
NOBO Shareholders
Fractional Shares Below Threshold 54,915 80,261 104,903 164,132
Fractional Shares Above Threshold 25,151 59,005 36,163 65,334
Total NOBO Fractional Shares 1,017,066 80,066 139,266 141,066 229,466
OBO Shareholders
Total OBO Fractional Shares (estimated) 698,237 36,264 54,364 70,764 95,264
Total 3,037,886 185,413 322,213 343,413 531,913
Percent of Outstanding Shares Cashed Out
Registered 1,322,583 2.3% 4.2% 4.3% 6.8%
NOBO 1,017,066 2.6% 4.6% 4.6% 7.6%
OBO 698,237 1.2% 1.8% 2.3% 3.1%
Total 3,037,886 6.1% 10.6% 11.3% 17.5%
Estimated Cost ($000’s)
$10.00 $1,854 $3,222 $3,434 $5,319
$10.50 $1,947 $3,383 $3,606 $5,585
$11.00 $2,040 $3,544 $3,778 $5,851
$11.50 $2,132 $3,705 $3,949 $6,117
$12.00 $2,225 $3,867 $4,121 $6,383
Based on the shareholder list provided by the Company on 7/7/2005, the NOBO list provided by the Company on 8/4/2005 and the OBO Range Analysis provided by the Company on 8/16/2005. The number of shareholders represented by CEDE & Co. is estimated at 40. Assumptions regarding OBO shares cashed out are discussed in the earlier section with limiting conditions.
14
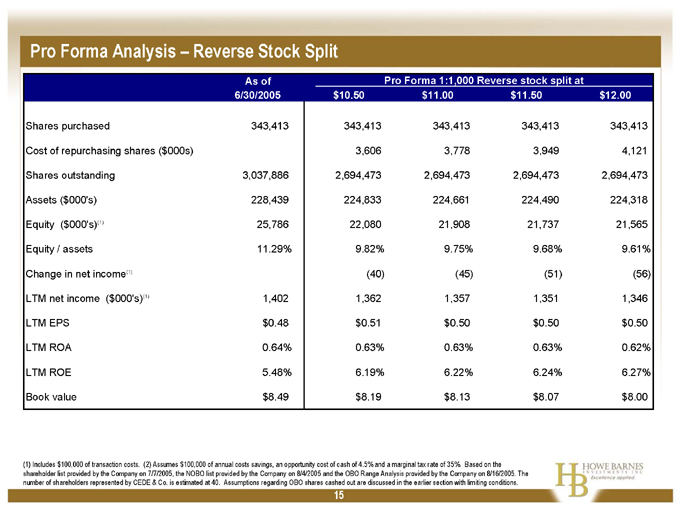
Pro Forma Analysis – Reverse Stock Split
Pro Forma 1:1,000 Reverse stock split at
As of 6/30/2005 $10.50 $11.00 $11.50 $12.00
Shares purchased 343,413 343,413 343,413 343,413 343,413
Cost of repurchasing shares ($000s) 3,606 3,778 3,949 4,121
Shares outstanding 3,037,886 2,694,473 2,694,473 2,694,473 2,694,473
Assets ($000’s) 228,439 224,833 224,661 224,490 224,318
Equity ($000’s)(1) 25,786 22,080 21,908 21,737 21,565
Equity / assets 11.29% 9.82% 9.75% 9.68% 9.61%
Change in net income(1) (40) (45) (51) (56)
LTM net income ($000’s)(1) 1,402 1,362 1,357 1,351 1,346
LTM EPS $0.48 $0.51 $0.50 $0.50 $0.50
LTM ROA 0.64% 0.63% 0.63% 0.63% 0.62%
LTM ROE 5.48% 6.19% 6.22% 6.24% 6.27%
Book value $8.49 $8.19 $8.13 $8.07 $8.00
(1) Includes $100,000 of transaction costs. (2) Assumes $100,000 of annual costs savings, an opportunity cost of cash of 4.5% and a marginal tax rate of 35%. Based on the shareholder list provided by the Company on 7/7/2005, the NOBO list provided by the Company on 8/4/2005 and the OBO Range Analysis provided by the Company on 8/16/2005. The number of shareholders represented by CEDE & Co. is estimated at 40. Assumptions regarding OBO shares cashed out are discussed in the earlier section with limiting conditions.
15
These materials are for discussion purposes only. They should not be construed as an offer or solicitation with respect to the purchase or sale of any security or to enter into any particular transaction and may not be relied on in evaluating the merits of investing in any security or entering into any transaction.
The information contained herein and any supplemental information or other documents provided in connection herewith are submitted to you on a strictly confidential basis, should be kept confidential and should not be used other than in connection with your evaluation of a proposed structure or transaction. By accepting a copy of this presentation, the recipient agrees that neither it nor any of its employees or advisors shall use the information for any purpose other than evaluating a proposed structure or transaction or divulge the information to any other party. The information contained herein shall not be photocopied, reproduced or distributed to others, in whole or in part, without the prior written consent of Howe Barnes Investments, Inc.
16