EXHIBIT 16(c)(4)
Presentation to:
South Street Financial Corp.
William J. Wagner Managing Director
HOWE BARNES HOEFER & ARNETT, INC. 4000 WESTCHASE BOULEVARD, SUITE 110 RALEIGH, NC 27608 (919) 424-0100 (PHONE) (919) 424-0110 (FAX) WWW.HOWEBARNES.COM
August 10, 2006
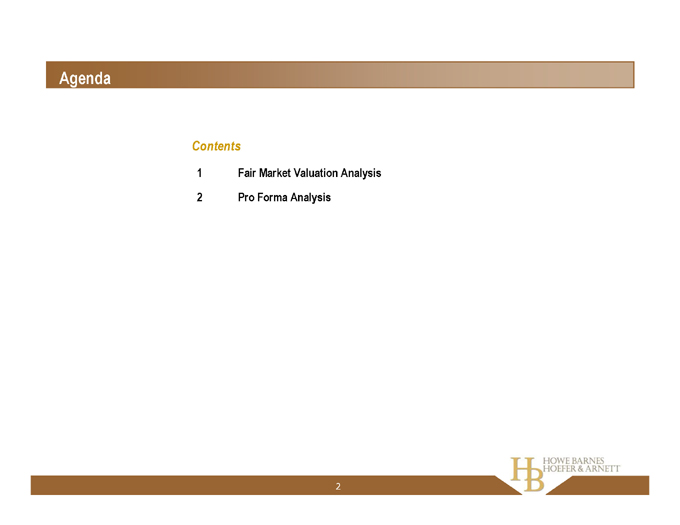
Agenda
Contents
1 |
| Fair Market Valuation Analysis |
2 |
| Pro Forma Analysis |
2 |
|
1. Fair Market Valuation Analysis
3 |
|
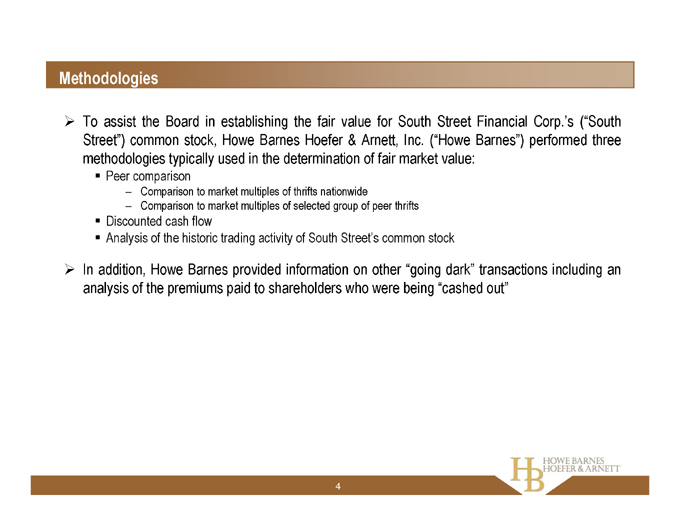
Methodologies
To assist the Board in establishing the fair value for South Street Financial Corp.’s (“South Street”) common stock, Howe Barnes Hoefer & Arnett, Inc. (“Howe Barnes”) performed three methodologies typically used in the determination of fair market value:
Peer comparison
Discounted cash flow
Analysis of the historic trading activity of South Street’s common stock
Comparison to market multiples of thrifts nationwide
Comparison to market multiples of selected group of peer thrifts
In addition, Howe Barnes provided information on other “going dark” transactions including an analysis of the premiums paid to shareholders who were being “cashed out”
4 |
|
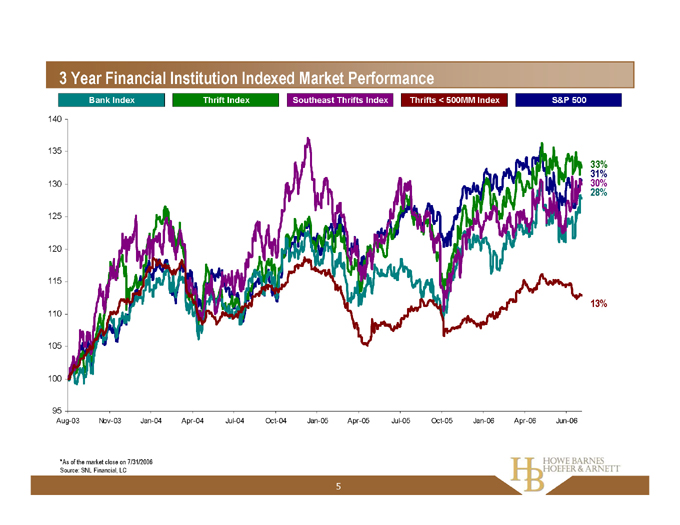
3 |
| Year Financial Institution Indexed Market Performance |
Bank Index Thrift Index Southeast Thrifts Index Thrifts < 500MM Index S&P 500
140 135 130 125 120 115 110 105 100 95
Aug-03 Nov-03 Jan-04 Apr-04 Jul-04 Oct-04 Jan-05 Apr-05 Jul-05 Oct-05 Jan-06 Apr-06 Jun-06
33% 31% 30% 28%
13%
*As of the market close on 7/31/2006 Source: SNL Financial, LC
5 |
|
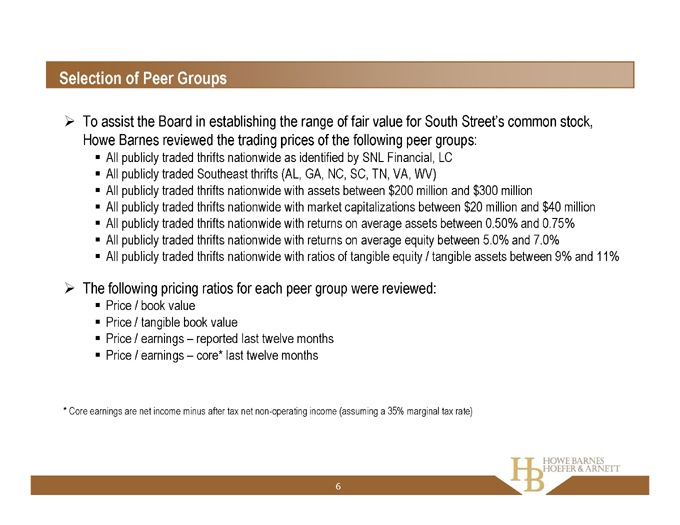
Selection of Peer Groups
To assist the Board in establishing the range of fair value for South Street’s common stock, Howe Barnes reviewed the trading prices of the following peer groups:
All publicly traded thrifts nationwide as identified by SNL Financial, LC All publicly traded Southeast thrifts (AL, GA, NC, SC, TN, VA, WV)
All publicly traded thrifts nationwide with assets between $200 million and $300 million
All publicly traded thrifts nationwide with market capitalizations between $20 million and $40 million All publicly traded thrifts nationwide with returns on average assets between 0.50% and 0.75% All publicly traded thrifts nationwide with returns on average equity between 5.0% and 7.0% All publicly traded thrifts nationwide with ratios of tangible equity / tangible assets between 9% and 11%
The following pricing ratios for each peer group were reviewed:
Price / book value
Price / tangible book value
Price / earnings – reported last twelve months Price / earnings – core* last twelve months
* |
| Core earnings are net income minus after tax net non-operating income (assuming a 35% marginal tax rate) |
6 |
|
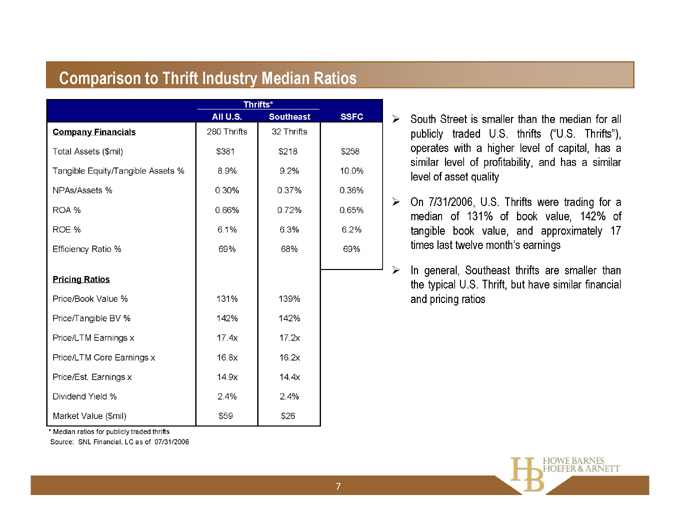
Comparison to Thrift Industry Median Ratios
Thrifts*
All U.S. Southeast SSFC
Company Financials 280 Thrifts 32 Thrifts
Total Assets ($mil) $381 $218 $258
Tangible Equity/Tangible Assets % 8.9% 9.2% 10.0%
NPAs/Assets % 0.30% 0.37% 0.36%
ROA % 0.66% 0.72% 0.65%
ROE % 6.1% 6.3% 6.2%
Efficiency Ratio % 69% 68% 69%
Pricing Ratios
Price/Book Value % 131% 139%
Price/Tangible BV % 142% 142%
Price/LTM Earnings x 17.4x 17.2x
Price/LTM Core Earnings x 16.8x 16.2x
Price/Est. Earnings x 14.9x 14.4x
Dividend Yield % 2.4% 2.4%
Market Value ($mil) $59 $26
* |
| Median ratios for publicly traded thrifts Source: SNL Financial, LC as of 07/31/2006 |
South Street is smaller than the median for all publicly traded U.S. thrifts (“U.S. Thrifts”), operates with a higher level of capital, has a similar level of profitability, and has a similar level of asset quality On 7/31/2006, U.S. Thrifts were trading for a median of 131% of book value, 142% of tangible book value, and approximately 17 times last twelve month’s earnings In general, Southeast thrifts are smaller than the typical U.S. Thrift, but have similar financial and pricing ratios
7 |
|
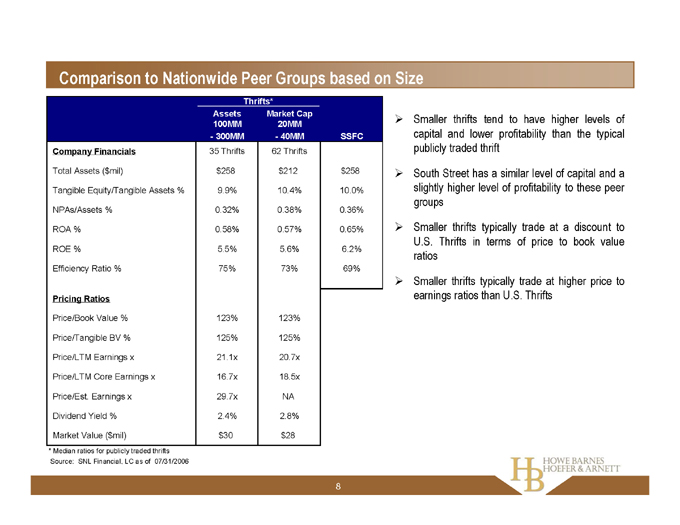
Comparison to Nationwide Peer Groups based on Size
Thrifts*
Assets 100MM—300MM Market Cap 20MM—40MM SSFC
Company Financials 35 Thrifts 62 Thrifts
Total Assets ($mil) $258 $212 $258
Tangible Equity/Tangible Assets % 9.9% 10.4% 10.0%
NPAs/Assets % 0.32% 0.38% 0.36%
ROA % 0.58% 0.57% 0.65%
ROE % 5.5% 5.6% 6.2%
Efficiency Ratio % 75% 73% 69%
Pricing Ratios
Price/Book Value % 123% 123%
Price/Tangible BV % 125% 125%
Price/LTM Earnings x 21.1x 20.7x
Price/LTM Core Earnings x 16.7x 18.5x
Price/Est. Earnings x 29.7x NA
Dividend Yield % 2.4% 2.8%
Market Value ($mil) $30 $28
* |
| Median ratios for publicly traded thrifts Source: SNL Financial, LC as of 07/31/2006 |
Smaller thrifts tend to have higher levels of capital and lower profitability than the typical publicly traded thrift South Street has a similar level of capital and a slightly higher level of profitability to these peer groups Smaller thrifts typically trade at a discount to U.S. Thrifts in terms of price to book value ratios Smaller thrifts typically trade at higher price to earnings ratios than U.S. Thrifts
8 |
|
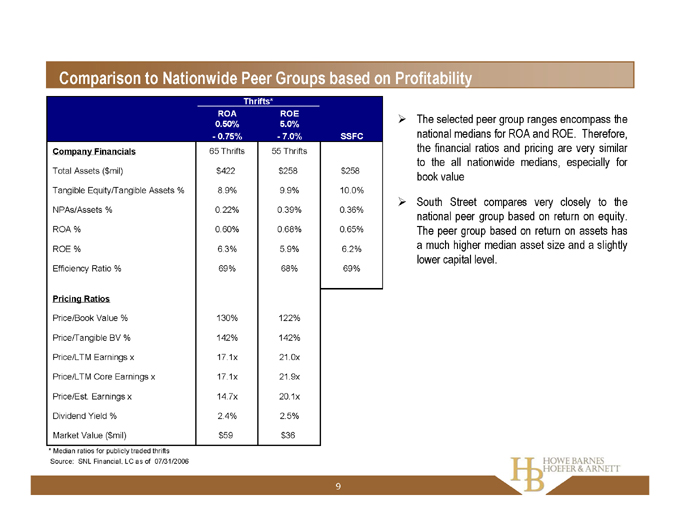
Comparison to Nationwide Peer Groups based on Profitability
Thrifts*
ROA 0.50%—0.75% ROE 5.0%—7.0% SSFC
Company Financials 65 Thrifts 55 Thrifts
Total Assets ($mil) $422 $258 $258
Tangible Equity/Tangible Assets % 8.9% 9.9% 10.0%
NPAs/Assets % 0.22% 0.39% 0.36%
ROA % 0.60% 0.68% 0.65%
ROE % 6.3% 5.9% 6.2%
Efficiency Ratio % 69% 68% 69%
Pricing Ratios
Price/Book Value % 130% 122%
Price/Tangible BV % 142% 142%
Price/LTM Earnings x 17.1x 21.0x
Price/LTM Core Earnings x 17.1x 21.9x
Price/Est. Earnings x 14.7x 20.1x
Dividend Yield % 2.4% 2.5%
Market Value ($mil) $59 $36
* |
| Median ratios for publicly traded thrifts Source: SNL Financial, LC as of 07/31/2006 |
The selected peer group ranges encompass the national medians for ROA and ROE. Therefore, the financial ratios and pricing are very similar to the all nationwide medians, especially for book value South Street compares very closely to the national peer group based on return on equity. The peer group based on return on assets has a much higher median asset size and a slightly lower capital level.
9
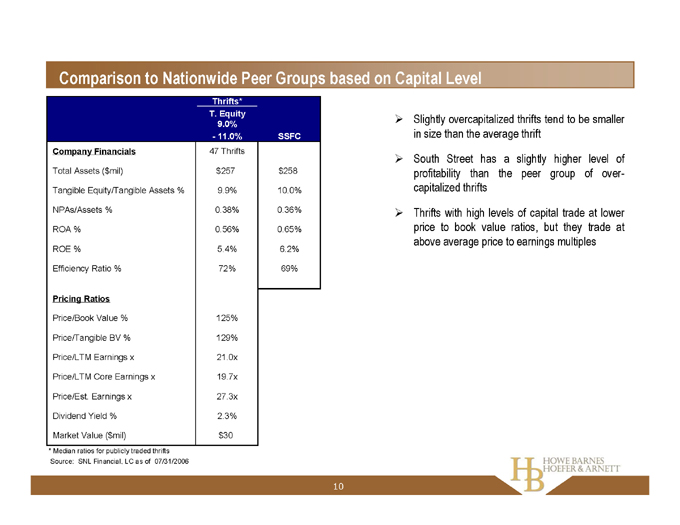
Comparison to Nationwide Peer Groups based on Capital Level
Thrifts*
T. Equity 9.0%—11.0% SSFC
Company Financials 47 Thrifts
Total Assets ($mil) $257 $258
Tangible Equity/Tangible Assets % 9.9% 10.0%
NPAs/Assets % 0.38% 0.36%
ROA % 0.56% 0.65%
ROE % 5.4% 6.2%
Efficiency Ratio % 72% 69%
Pricing Ratios
Price/Book Value % 125%
Price/Tangible BV % 129%
Price/LTM Earnings x 21.0x
Price/LTM Core Earnings x 19.7x
Price/Est. Earnings x 27.3x
Dividend Yield % 2.3%
Market Value ( $mil) $30
* |
| Median ratios for publicly traded thrifts Source: SNL Financial, LC as of 07/31/2006 |
Slightly overcapitalized thrifts tend to be smaller in size than the average thrift South Street has a slightly higher level of profitability than the peer group of overcapitalized thrifts Thrifts with high levels of capital trade at lower price to book value ratios, but they trade at above average price to earnings multiples
10
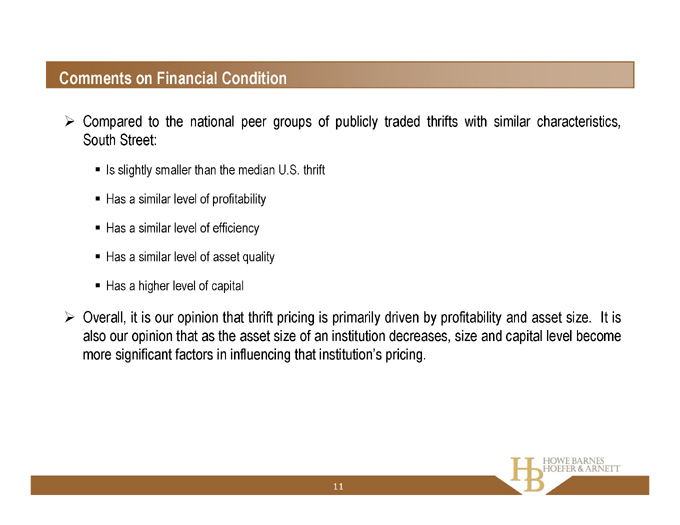
Comments on Financial Condition
Compared to the national peer groups of publicly traded thrifts with similar characteristics, South Street:
Is slightly smaller than the median U.S. thrift Has a similar level of profitability Has a similar level of efficiency Has a similar level of asset quality Has a higher level of capital
Overall, it is our opinion that thrift pricing is primarily driven by profitability and asset size. It is also our opinion that as the asset size of an institution decreases, size and capital level become more significant factors in influencing that institution’s pricing.
11
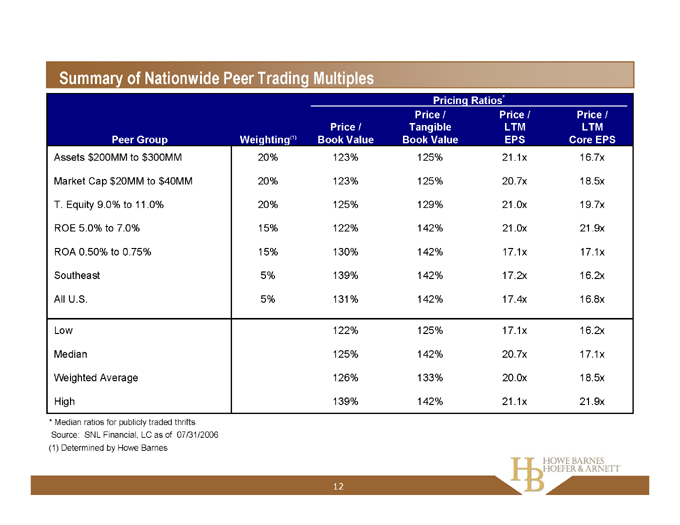
Summary of Nationwide Peer Trading Multiples
Pricing Ratios*
Peer Group Weighting(1) Price / Book Value Price / Tangible Book Value Price / LTM EPS Price / LTM Core EPS
Assets $200MM to $300MM 20% 123% 125% 21.1x 16.7x
Market Cap $20MM to $40MM 20% 123% 125% 20.7x 18.5x
T. Equity 9.0% to 11.0% 20% 125% 129% 21.0x 19.7x
ROE 5.0% to 7.0% 15% 122% 142% 21.0x 21.9x
ROA 0.50% to 0.75% 15% 130% 142% 17.1x 17.1x
Southeast 5% 139% 142% 17.2x 16.2x
All U.S. 5% 131% 142% 17.4x 16.8x
Low 122% 125% 17.1x 16.2x
Median 125% 142% 20.7x 17.1x
Weighted Average 126% 133% 20.0x 18.5x
High 139% 142% 21.1x 21.9x
* |
| Median ratios for publicly traded thrifts Source: SNL Financial, LC as of 07/31/2006 (1) Determined by Howe Barnes |
12
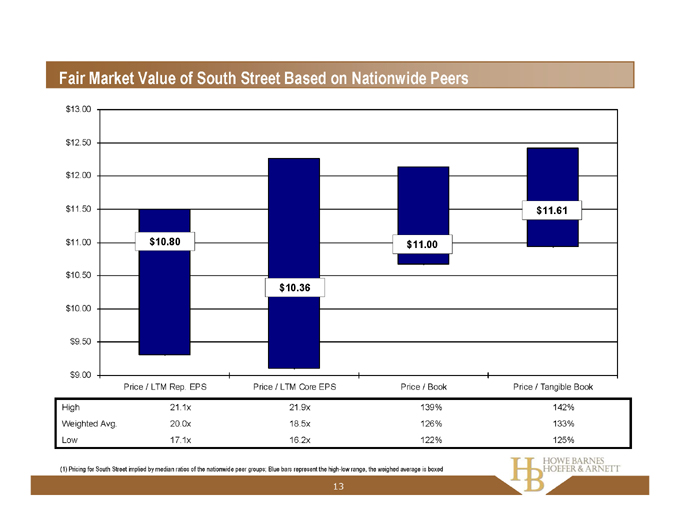
Fair Market Value of South Street Based on Nationwide Peers $13.00 $12.50 $12.00 $11.50 $11.00 $10.50 $10.00 $9.50 $9.00 $10.80 $10.36 $11.00 $11.61
Price / LTM Rep. EPS Price / LTM Core EPS Price / Book Price / Tangible Book
High 21.1x 21.9x 139% 142% Weighted Avg. 20.0x 18.5x 126% 133% Low 17.1x 16.2x 122% 125%
(1) Pricing for South Street implied by median ratios of the nationwide peer groups; Blue bars represent the high-low range, the weighed average is boxed
13
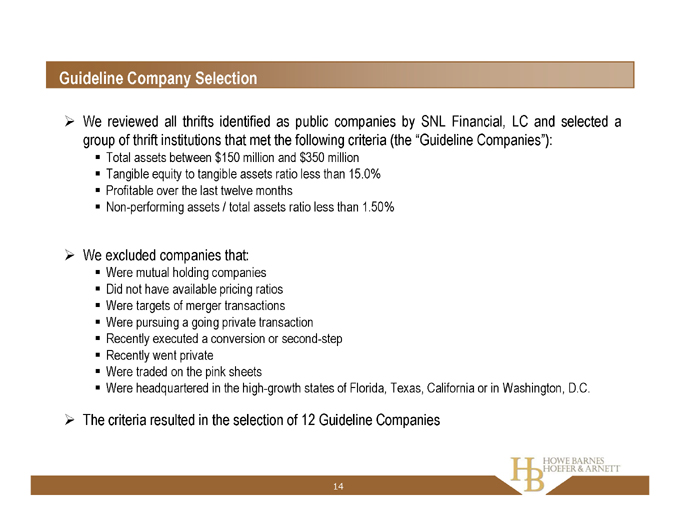
Guideline Company Selection
We reviewed all thrifts identified as public companies by SNL Financial, LC and selected a group of thrift institutions that met the following criteria (the “Guideline Companies”):
Total assets between $150 million and $350 million Tangible equity to tangible assets ratio less than 15.0% Profitable over the last twelve months Non-performing assets / total assets ratio less than 1.50%
We excluded companies that:
Were mutual holding companies Did not have available pricing ratios Were targets of merger transactions Were pursuing a going private transaction Recently executed a conversion or second-step Recently went private Were traded on the pink sheets
Were headquartered in the high-growth states of Florida, Texas, California or in Washington, D.C.
The criteria resulted in the selection of 12 Guideline Companies
14

Financial Comparison to Guideline Companies
South Street Financial Corp. Guideline Companies*
Balance Sheet Ratios
Total Assets ($MM) $258 $287
Net Loans / Assets 76.3% 71.2%
Deposits / Assets 84.8% 71.7%
Borrowings / Assets 3.9% 20.1%
GAAP Tangible Equity / Assets 10.0% 8.6%
Profitability Ratios
Interest Rate Margin (1) 3.46% 3.39%
Non-interest Income / Average Assets 0.35% 0.63%
Non-interest Expense / Average Assets 2.40% 2.61%
Efficiency Ratio 69% 80%
ROA 0.65% 0.53%
ROE 6.2% 5.6%
Reserves & Asset Quality
LLR / Loans 0.37% 0.96%
NPL’s / Loans 0.35% 0.81%
NPA’s / Assets 0.36% 0.38%
LLR / NPA’s 79% 45%
Other
Insider Ownership 24.4% 17.1%
Institutional Ownership 9.2% 11.0%
Deposits / Branch ($MM) $73 $34
* |
| Median ratios for the Guideline Companies (LTM) |
(1) |
| LTM as of March 31, 2006; All other numbers are for the LTM 6/30/2006 Source: SNL Financial, LC as of 07/31/2006 |
South Street is similar to the Guideline Companies in size, but operates with fewer borrowings and more capital
South Street’s profitability is slightly higher than the Guideline Companies
South Street has similar asset quality but a much lower level of reserves than the Guideline Companies
South Street has a higher level of insider ownership and a much larger ratio of deposits per branch
15
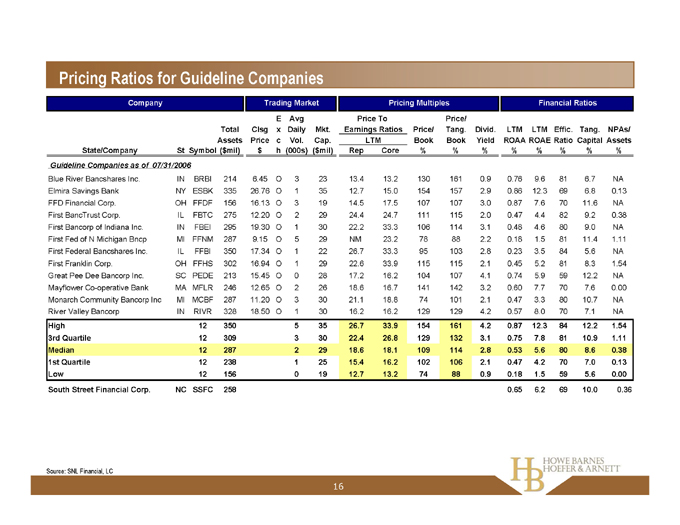
Pricing Ratios for Guideline Companies
Company Trading Market Pricing Multiples Financial Ratios
Price To Earnings Ratios LTM
State/Company St Symbol Total Assets ($mil) Clsg Price $ E x c h Avg Daily Vol. (000s) Mkt. Cap. ($mil) Rep Core Price/ Book % Price/ Tang. Book % Divid. Yield % LTM ROAA% ROAE % LTM Ratio % Effic. Capital % Tang. Assets % NPAs/ %
Guideline Companies as of 07/31/2006
Blue River Bancshares Inc. IN BRBI 214 6.45 O 3 23 13.4 13.2 130 161 0.9 0.76 9.6 81 6.7 NA
Elmira Savings Bank NY ESBK 335 26.76 O 1 35 12.7 15.0 154 157 2.9 0.86 12.3 69 6.8 0.13
FFD Financial Corp. OH FFDF 156 16.13 O 3 19 14.5 17.5 107 107 3.0 0.87 7.6 70 11.6 NA
First BancTrust Corp. IL FBTC 275 12.20 O 2 29 24.4 24.7 111 115 2.0 0.47 4.4 82 9.2 0.38
First Bancorp of Indiana Inc. IN FBEI 295 19.30 O 1 30 22.2 33.3 106 114 3.1 0.48 4.6 80 9.0 NA
First Fed of N Michigan Bncp MI FFNM 287 9.15 O 5 29 NM 23.2 78 88 2.2 0.18 1.5 81 11.4 1.11
First Federal Bancshares Inc. IL FFBI 350 17.34 O 1 22 26.7 33.3 95 103 2.8 0.23 3.5 84 5.6 NA
First Franklin Corp. OH FFHS 302 16.94 O 1 29 22.6 33.9 115 115 2.1 0.45 5.2 81 8.3 1.54
Great Pee Dee Bancorp Inc. SC PEDE 213 15.45 O 0 28 17.2 16.2 104 107 4.1 0.74 5.9 59 12.2 NA
Mayflower Co-operative Bank MA MFLR 246 12.65 O 2 26 18.6 16.7 141 142 3.2 0.60 7.7 70 7.6 0.00
Monarch Community Bancorp Inc MI MCBF 287 11.20 O 3 30 21.1 18.8 74 101 2.1 0.47 3.3 80 10.7 NA
River Valley Bancorp IN RIVR 328 18.50 O 1 30 16.2 16.2 129 129 4.2 0.57 8.0 70 7.1 NA
High 12 350 5 35 26.7 33.9 154 161 4.2 0.87 12.3 84 12.2 1.54
3rd Quartile 12 309 3 30 22.4 26.8 129 132 3.1 0.75 7.8 81 10.9 1.11
Median 12 287 2 29 18.6 18.1 109 114 2.8 0.53 5.6 80 8.6 0.38
1st Quartile 12 238 1 25 15.4 16.2 102 106 2.1 0.47 4.2 70 7.0 0.13
Low 12 156 0 19 12.7 13.2 74 88 0.9 0.18 1.5 59 5.6 0.00
South Street Financial Corp. NC SSFC 258 0.65 6.2 69 10.0 0.36
Source: SNL Financial, LC
16
Observations on Guideline Companies
The Guideline Companies consist of 12 thrifts which are slightly smaller than the average actively traded thrift with a slightly lower level of profitability and capital
The median pricing ratios for these Guideline Companies were significantly lower for price to book value but slightly higher for price to earnings ratios than national medians
17
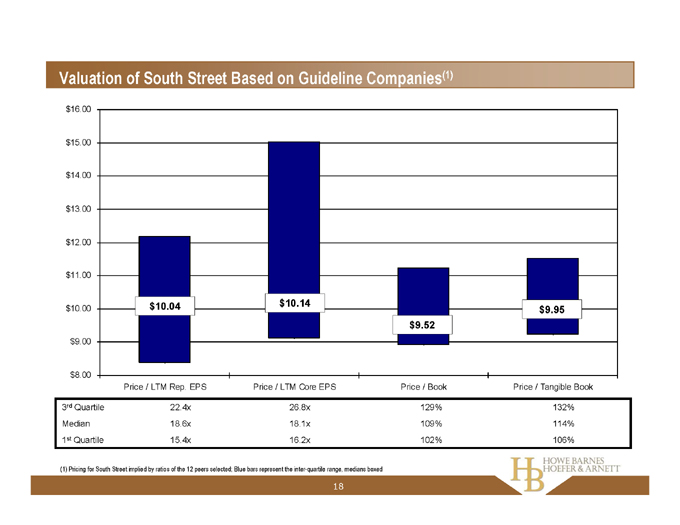
Valuation of South Street Based on Guideline Companies(1) $16.00 $15.00 $14.00 $13.00 $12.00 $11.00 $10.00 $9.00 $8.00 $10.04 $10.14 $9.52 $9.95
3rd Quartile 22.4x 26.8x 129% 132%
Median 18.6x 18.1x 109% 114%
1st Quartile 15.4x 16.2x 102% 106%
Price / LTM Rep. EPS Price / LTM Core EPS Price / Book Price / Tangible Book
(1) Pricing for South Street implied by ratios of the 12 peers selected; Blue bars represent the inter-quartile range, medians boxed
18
Dividend Discount Analysis
A range of fair value for a common stock can be determined based on the present value of the expected future dividends to be received and an assumed sale price of the common stock at the end of the holding period South Street provided Howe Barnes with financial projections through 12/31/10 To determine the present value of future dividends beyond 12/31/10, assumptions were made regarding an appropriate terminal multiple
19
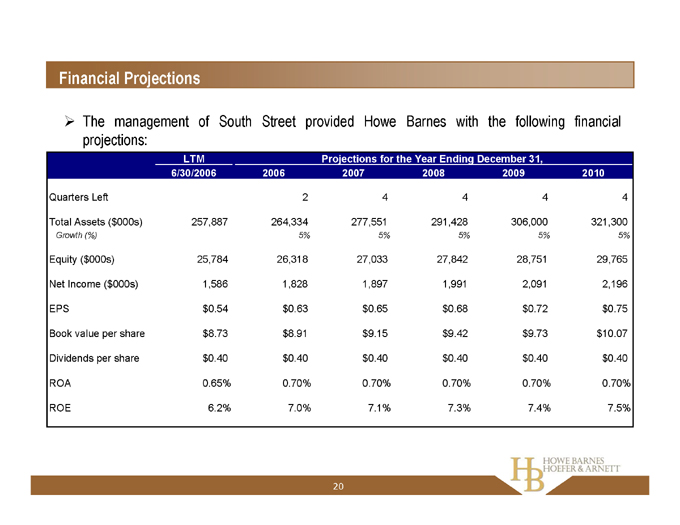
Financial Projections
The management of South Street provided Howe Barnes with the following financial projections:
LTM Projections for the Year Ending December 31,
6/30/2006 2006 2007 2008 2009 2010
Quarters Left 2 4 4 4 4
Total Assets ( $000s) 257,887 264,334 277,551 291,428 306,000 321,300
Growth (%) 5% 5% 5% 5% 5%
Equity ($000s) 25,784 26,318 27,033 27,842 28,751 29,765
Net Income ($000s) 1,586 1,828 1,897 1,991 2,091 2,196
EPS $0.54 $0.63 $0.65 $0.68 $0.72 $0.75
Book value per share $8.73 $8.91 $9.15 $9.42 $9.73 $10.07
Dividends per share $0.40 $0.40 $0.40 $0.40 $0.40 $0.40
ROA 0.65% 0.70% 0.70% 0.70% 0.70% 0.70%
ROE 6.2% 7.0% 7.1% 7.3% 7.4% 7.5%
20

Dividend Discount Analysis
Implied Value per Share(1)
Terminal Multiple
16x 20x
11.0% $8.63 $10.42
11.5% $8.45 $10.20
12.0% $8.28 $9.99
Discount Rate 12.5% $8.11 $9.78
13.0% $7.95 $9.58
Howe Barnes discounted South Street’s projected dividends for 2006 to 2010 to present value at discount rates between 11% and 13%.
Howe Barnes assumed that an appropriate terminal multiple for South Street would be between 16x and 20x. Howe Barnes multiplied South Street’s 2010 estimated earnings per share by the selected terminal multiples and discounted this value using the same discount rate selected for dividends.
The sum of these values was the implied present value per share.
(1) |
| Based on South Street’s projections |
21
Going Private Premium Study
Howe Barnes selected 36 going private transactions announced in the last four years The analysis included only reverse stock splits and cash-out mergers The analysis included only bank and thrift transactions
The analysis excluded transactions that could be deemed a change of control Howe Barnes analyzed the range of premiums paid over the trading price
22
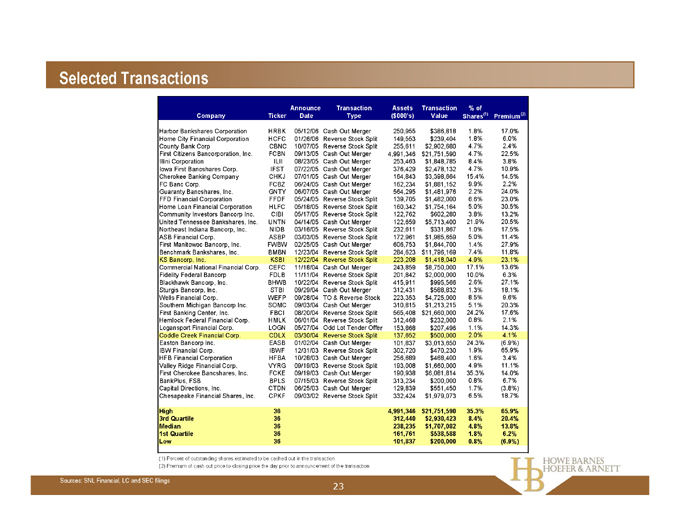
Selected Transactions
Company Ticker Announce Date Transaction Type Assets ($000’s) Transaction Value % of Shares(1) Premium(2)
Harbor Bankshares Corporation HRBK 05/12/06 Cash Out Merger 250,955 $386,818 1.8% 17.0%
Home City Financial Corporation HCFC 01/26/06 Reverse Stock Split 149,553 $239,404 1.8% 6.0%
County Bank Corp CBNC 10/07/05 Reverse Stock Split 255,611 $2,902,680 4.7% 2.4%
First Citizens Bancorporation, Inc. FCBN 09/13/05 Cash Out Merger 4,991,346 $21,751,590 4.7% 22.5%
Illini Corporation ILII 08/23/05 Cash Out Merger 253,463 $1,848,785 8.4% 3.8%
Iowa First Bancshares Corp. IFST 07/22/05 Cash Out Merger 376,429 $2,478,132 4.7% 10.9%
Cherokee Banking Company CHKJ 07/01/05 Cash Out Merger 164,843 $3,398,664 15.4% 14.5%
FC Banc Corp. FCBZ 06/24/05 Cash Out Merger 162,234 $1,881,152 9.9% 2.2%
Guaranty Bancshares, Inc. GNTY 06/07/05 Cash Out Merger 564,295 $1,481,976 2.2% 24.0%
FFD Financial Corporation FFDF 05/24/05 Reverse Stock Split 139,705 $1,482,000 6.6% 23.0%
Home Loan Financial Corporation HLFC 05/18/05 Reverse Stock Split 160,342 $1,754,164 5.0% 30.5%
Community Investors Bancorp Inc. CIBI 05/17/05 Reverse Stock Split 122,762 $602,280 3.8% 13.2%
United Tennessee Bankshares, Inc. UNTN 04/14/05 Cash Out Merger 122,659 $5,713,400 21.9% 20.5%
Northeast Indiana Bancorp, Inc. NIDB 03/16/05 Reverse Stock Split 232,611 $331,867 1.0% 17.5%
ASB Financial Corp. ASBP 03/03/05 Reverse Stock Split 172,961 $1,985,659 5.0% 11.4%
First Manitowoc Bancorp, Inc. FWBW 02/25/05 Cash Out Merger 606,753 $1,844,700 1.4% 27.9%
Benchmark Bankshares, Inc. BMBN 12/23/04 Reverse Stock Split 284,623 $11,796,169 7.4% 11.8%
KS Bancorp, Inc. KSBI 12/22/04 Reverse Stock Split 223,208 $1,418,040 4.9% 23.1%
Commercial National Financial Corp. CEFC 11/18/04 Cash Out Merger 243,859 $8,750,000 17.1% 13.6%
Fidelity Federal Bancorp FDLB 11/11/04 Reverse Stock Split 201,842 $2,000,000 10.0% 6.3%
Blackhawk Bancorp, Inc. BHWB 10/22/04 Reverse Stock Split 415,911 $995,566 2.6% 27.1%
Sturgis Bancorp, Inc. STBI 09/29/04 Cash Out Merger 312,431 $588,832 1.3% 18.1%
Wells Financial Corp. WEFP 09/28/04 TO & Reverse Stock 223,353 $4,725,000 8.5% 9.6%
Southern Michigan Bancorp Inc. SOMC 09/03/04 Cash Out Merger 310,815 $1,213,215 5.1% 20.3%
First Banking Center, Inc. FBCI 08/20/04 Reverse Stock Split 565,408 $21,660,000 24.2% 17.6%
Hemlock Federal Financial Corp. HMLK 06/01/04 Reverse Stock Split 312,468 $232,000 0.8% 2.1%
Logansport Financial Corp. LOGN 05/27/04 Odd Lot Tender Offer 153,868 $207,496 1.1% 14.3%
Coddle Creek Financial Corp. CDLX 03/30/04 Reverse Stock Split 137,652 $500,000 2.0% 4.1%
Easton Bancorp Inc. EASB 01/02/04 Cash Out Merger 101,837 $3,013,650 24.3% (6.9%)
IBW Financial Corp. IBWF 12/31/03 Reverse Stock Split 302,720 $470,230 1.9% 65.9%
HFB Financial Corporation HFBA 10/28/03 Cash Out Merger 256,689 $468,400 1.6% 3.4%
Valley Ridge Financial Corp. VYRG 09/19/03 Reverse Stock Split 193,008 $1,660,000 4.9% 11.1%
First Cherokee Bancshares, Inc. FCKE 09/19/03 Cash Out Merger 190,938 $6,081,814 35.3% 14.0%
BankPlus, FSB BPLS 07/15/03 Reverse Stock Split 313,234 $200,000 0.8% 6.7%
Capital Directions, Inc. CTDN 06/25/03 Cash Out Merger 129,839 $551,450 1.7% (3.8%)
Chesapeake Financial Shares, Inc. CPKF 09/03/02 Reverse Stock Split 332,424 $1,979,073 6.5% 18.7%
High 36 4,991,346 $21,751,590 35.3% 65.9%
3rd Quartile 36 312,440 $2,930,423 8.4% 20.4%
Median 36 238,235 $1,707,082 4.8% 13.8%
1st Quartile 36 161,761 $538,588 1.8% 6.2%
Low 36 101,837 $200,000 0.8% (6.9%)
(1) |
| Percent of outstanding shares estimated to be cashed out in the transaction |
(2) |
| Premium of cash out price to closing price the day prior to announcement of the transaction |
Sources: SNL Financial, LC and SEC filings
23
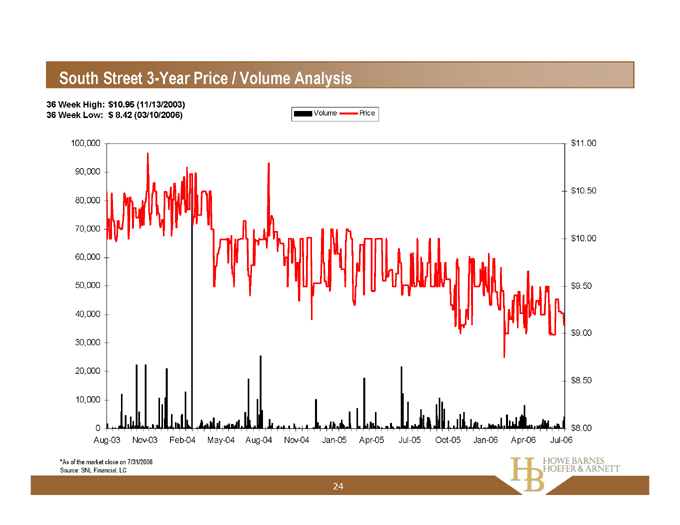
South Street 3-Year Price / Volume Analysis
36 Week High: $10.95 (11/13/2003) 36 Week Low: $8.42 (03/10/2006)
Volume Price
100,000 90,000 80,000 70,000 60,000 50,000 40,000 30,000 20,000 10,000 0 $11.00 $10.50 $10.00 $9.50 $9.00 $8.50 $8.00
Aug-03 Nov-03 Feb-04 May-04 Aug-04 Nov-04 Jan-05 Apr-05 Jul-05 Oct-05 Jan-06 Apr-06 Jul-06
*As of the market close on 7/31/2006 Source: SNL Financial, LC
24
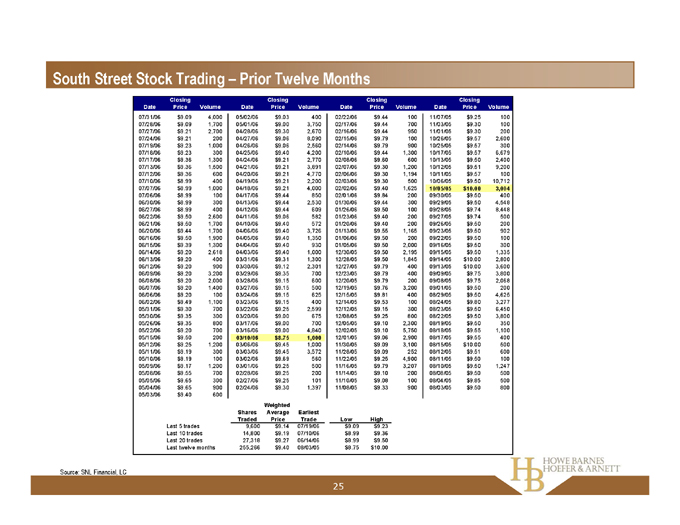
South Street Stock Trading – Prior Twelve Months
Date Closing Price Volume Date Closing Price Volume Date Closing Price Volume Date Closing Price Volume
07/31/06 $9.09 4,000 05/02/06 $9.03 400 02/22/06 $9.44 100 11/07/05 $9.25 100
07/28/06 $9.09 1,700 05/01/06 $9.00 3,750 02/17/06 $9.44 700 11/03/05 $9.30 100
07/27/06 $9.21 2,700 04/28/06 $9.30 2,670 02/16/06 $9.44 950 11/01/05 $9.30 200
07/24/06 $9.21 200 04/27/06 $9.06 8,090 02/15/06 $9.79 100 10/26/05 $9.57 2,600
07/19/06 $9.23 1,000 04/26/06 $9.06 2,560 02/14/06 $9.79 900 10/25/05 $9.57 300
07/18/06 $9.23 300 04/25/06 $9.40 4,200 02/10/06 $9.44 1,300 10/17/05 $9.57 6,679
07/17/06 $9.36 1,300 04/24/06 $9.21 2,770 02/08/06 $9.60 600 10/13/05 $9.50 2,400
07/13/06 $9.36 1,500 04/21/06 $9.21 3,891 02/07/06 $9.30 1,200 10/12/05 $9.51 9,200
07/12/06 $9.36 600 04/20/06 $9.21 4,770 02/06/06 $9.30 1,194 10/11/05 $9.57 100
07/10/06 $8.99 400 04/19/06 $9.21 2,200 02/03/06 $9.30 500 10/06/05 $9.50 10,712
07/07/06 $8.99 1,000 04/18/06 $9.21 4,000 02/02/06 $9.40 1,625 10/05/05 $10.00 3,004
07/06/06 $8.99 100 04/17/06 $9.44 850 02/01/06 $9.84 200 09/30/05 $9.50 400
06/30/06 $8.99 300 04/13/06 $9.44 2,530 01/30/06 $9.44 300 09/29/05 $9.50 4,548
06/27/06 $8.99 400 04/12/06 $9.44 609 01/26/06 $9.50 100 09/28/05 $9.74 8,448
06/22/06 $9.50 2,600 04/11/06 $9.06 582 01/23/06 $9.40 200 09/27/05 $9.74 500
06/21/06 $9.50 1,700 04/10/06 $9.40 572 01/20/06 $9.40 200 09/26/05 $9.50 200
06/20/06 $9.44 1,700 04/06/06 $9.40 3,726 01/13/06 $9.55 1,165 09/23/05 $9.50 902
06/16/06 $9.50 1,900 04/05/06 $9.40 1,350 01/06/06 $9.50 200 09/22/05 $9.50 100
06/15/06 $9.39 1,300 04/04/06 $9.40 930 01/05/06 $9.50 2,000 09/16/05 $9.50 300
06/14/06 $9.20 2,618 04/03/06 $9.40 1,000 12/30/05 $9.50 2,195 09/15/05 $9.50 1,335
06/13/06 $9.20 400 03/31/06 $9.31 1,300 12/28/05 $9.50 1,845 09/14/05 $10.00 2,800
06/12/06 $9.20 900 03/30/06 $9.12 2,301 12/27/05 $9.79 400 09/13/05 $10.00 3,600
06/09/06 $9.20 3,200 03/29/06 $9.35 700 12/23/05 $9.79 400 09/09/05 $9.75 3,800
06/08/06 $9.20 2,000 03/28/06 $9.15 600 12/20/05 $9.79 200 09/08/05 $9.75 2,068
06/07/06 $9.20 1,400 03/27/06 $9.15 500 12/19/05 $9.76 3,200 09/01/05 $9.50 200
06/06/06 $9.20 100 03/24/06 $9.15 625 12/15/05 $9.81 400 08/29/05 $9.50 4,625
06/02/06 $9.49 1,100 03/23/06 $9.15 400 12/14/05 $9.53 100 08/24/05 $9.80 3,277
05/31/06 $9.30 700 03/22/06 $9.25 2,599 12/12/05 $9.15 300 08/23/05 $9.50 6,450
05/30/06 $9.35 300 03/20/06 $9.00 675 12/08/05 $9.25 800 08/22/05 $9.50 3,800
05/26/06 $9.35 800 03/17/06 $9.00 700 12/05/05 $9.10 2,300 08/19/05 $9.50 350
05/22/06 $9.20 700 03/16/06 $9.00 4,840 12/02/05 $9.10 5,750 08/18/05 $9.55 1,100
05/15/06 $9.50 200 03/10/06 $8.75 1,000 12/01/05 $9.06 2,900 08/17/05 $9.55 400
05/12/06 $9.25 1,200 03/06/06 $9.45 1,000 11/30/05 $9.09 3,100 08/15/05 $10.00 500
05/11/06 $9.19 300 03/03/06 $9.45 3,572 11/28/05 $9.09 252 08/12/05 $9.51 600
05/10/06 $9.19 100 03/02/06 $9.69 560 11/22/05 $9.25 4,900 08/11/05 $9.50 100
05/09/06 $9.17 1,200 03/01/06 $9.25 500 11/16/05 $9.79 3,207 08/10/05 $9.50 1,247
05/08/06 $9.55 700 02/28/06 $9.25 200 11/14/05 $9.10 200 08/08/05 $9.50 500
05/05/06 $9.65 300 02/27/06 $9.25 101 11/10/05 $9.08 100 08/04/05 $9.85 500
05/04/06 $9.65 900 02/24/06 $9.30 1,397 11/08/05 $9.33 900 08/03/05 $9.50 800
05/03/06 $9.40 600
Shares Traded Weighted Average Price Earliest Trade Low High
Last 5 trades 9,600 $9.14 07/19/06 $9.09 $9.23
Last 10 trades 14,800 $9.19 07/10/06 $8.99 $9.36
Last 20 trades 27,318 $9.27 06/14/06 $8.99 $9.50
Last twelve months 255,266 $9.40 08/03/05 $8.75 $10.00
Source: SNL Financial, LC
25
Analysis of Trading History Prior Twelve Months
Last 12 Months Last 6 Months Last 90 Days
Price Range Shares % Total Shares Shares % Total Shares Shares % Total Shares
$9.75 $10.00 28,556 11% 1,200 1% 0 0%
$9.50 $9.74 85,961 34% 9,460 7% 8,300 17%
$9.25 $9.49 56,175 22% 48,475 38% 11,100 23%
$9.00 $9.24 81,374 32% 66,472 52% 26,968 56%
$8.75 $8.99 3,200 1% 3,200 2% 2,200 5%
Total 255,266 100% 128,807 100% 48,568 100%
Weighted Average $9.40 $9.26 $9.26
Days Traded 157 91 42
Days Not Traded 93 35 22
Avg. Daily Volume 1,626 1,415 1,156
LTM 6 Months 90 Days
100,000 80,000 60,000 40,000 20,000 0 $08.75-$08.99 $09.00-$09.24 $09.25-$09.49 $09.50-$09.74 $09.75-$10.00
Source: SNL Financial, LC
26
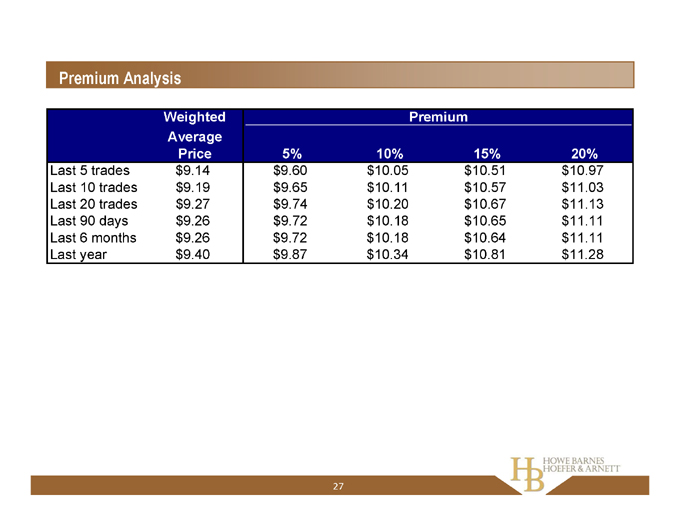
Premium Analysis
Premium
Weighted Average Price 5% 10% 15% 20%
Last 5 trades $9.14 $9.60 $10.05 $10.51 $10.97
Last 10 trades $9.19 $9.65 $10.11 $10.57 $11.03
Last 20 trades $9.27 $9.74 $10.20 $10.67 $11.13
Last 90 days $9.26 $9.72 $10.18 $10.65 $11.11
Last 6 months $9.26 $9.72 $10.18 $10.64 $11.11
Last year $9.40 $9.87 $10.34 $10.81 $11.28
27
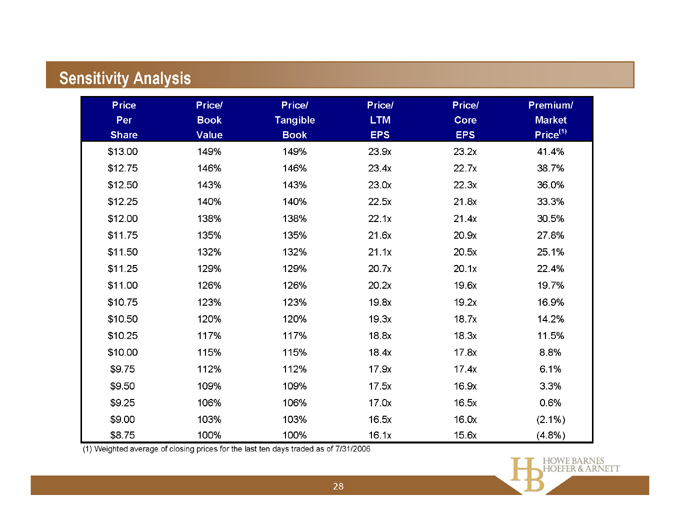
Sensitivity Analysis
Price Per Share Price/ Book Value Price/ Tangible Book Price/ LTM EPS Price/ Core EPS Premium/ Market Price(1)
$13.00 149% 149% 23.9x 23.2x 41.4%
$12.75 146% 146% 23.4x 22.7x 38.7%
$12.50 143% 143% 23.0x 22.3x 36.0%
$12.25 140% 140% 22.5x 21.8x 33.3%
$12.00 138% 138% 22.1x 21.4x 30.5%
$11.75 135% 135% 21.6x 20.9x 27.8%
$11.50 132% 132% 21.1x 20.5x 25.1%
$11.25 129% 129% 20.7x 20.1x 22.4%
$11.00 126% 126% 20.2x 19.6x 19.7%
$10.75 123% 123% 19.8x 19.2x 16.9%
$10.50 120% 120% 19.3x 18.7x 14.2%
$10.25 117% 117% 18.8x 18.3x 11.5%
$10.00 115% 115% 18.4x 17.8x 8.8%
$9.75 112% 112% 17.9x 17.4x 6.1%
$9.50 109% 109% 17.5x 16.9x 3.3%
$9.25 106% 106% 17.0x 16.5x 0.6%
$9.00 103% 103% 16.5x 16.0x (2.1%)
$8.75 100% 100% 16.1x 15.6x (4.8%)
(1) |
| Weighted average of closing prices for the last ten days traded as of 7/31/2006 |
28
2. Pro Forma Analysis
29
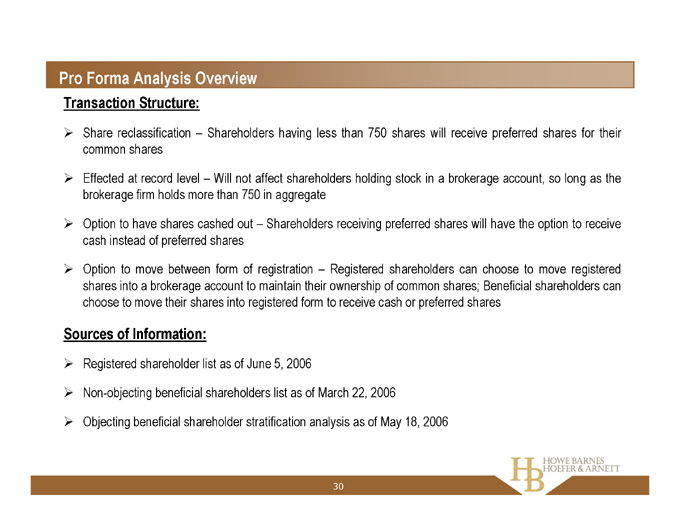
Pro Forma Analysis Overview
Transaction Structure:
Share reclassification – Shareholders having less than 750 shares will receive preferred shares for their common shares
Effected at record level – Will not affect shareholders holding stock in a brokerage account, so long as the brokerage firm holds more than 750 in aggregate
Option to have shares cashed out – Shareholders receiving preferred shares will have the option to receive cash instead of preferred shares
Option to move between form of registration – Registered shareholders can choose to move registered shares into a brokerage account to maintain their ownership of common shares; Beneficial shareholders can choose to move their shares into registered form to receive cash or preferred shares
Sources of Information:
Registered shareholder list as of June 5, 2006
Non-objecting beneficial shareholders list as of March 22, 2006
Objecting beneficial shareholder stratification analysis as of May 18, 2006
30
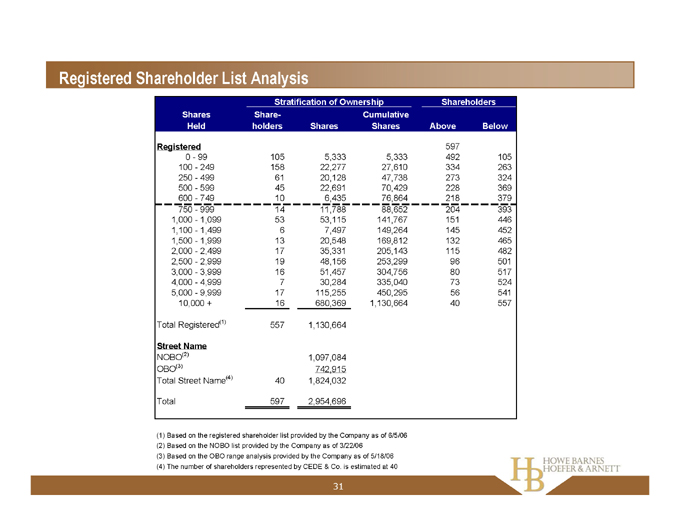
Registered Shareholder List Analysis
Stratification of Ownership Shareholders
Shares Held Shareholders Shares Cumulative Shares Above Below
Registered 597
0—99 105 5,333 5,333 492 105
100—249 158 22,277 27,610 334 263
250—499 61 20,128 47,738 273 324
500—599 45 22,691 70,429 228 369
600—749 10 6,435 76,864 218 379
750—999 14 11,788 88,652 204 393
1,000—1,099 53 53,115 141,767 151 446
1,100—1,499 6 7,497 149,264 145 452
1,500—1,999 13 20,548 169,812 132 465
2,000—2,499 17 35,331 205,143 115 482
2,500—2,999 19 48,156 253,299 96 501
3,000—3,999 16 51,457 304,756 80 517
4,000—4,999 7 30,284 335,040 73 524
5,000—9,999 17 115,255 450,295 56 541
10,000 + 16 680,369 1,130,664 40 557
Total Registered(1) 557 1,130,664
Street Name
NOBO(2) 1,097,084
OBO(3) 742,915
Total Street Name(4) 40 1,824,032
Total 597 2,954,696
(1) Based on the registered shareholder list provided by the Company as of 6/5/06 (2) Based on the NOBO list provided by the Company as of 3/22/06 (3) Based on the OBO range analysis provided by the Company as of 5/18/06 (4) The number of shareholders represented by CEDE & Co. is estimated at 40
31
Pro Forma Analysis: Maximum Shareholders of Record Cashed Out
Reclassification & Cash Out of Shareholders Less than 750 Shares
As of 6/30/2006 $9.50 $10.00 $10.50 $11.00 $11.50
Shares purchased 76,864 76,864 76,864 76,864 76,864 76,864
Cost ($000s) 730 769 807 846 884
Shares outstanding 2,954,696 2,877,832 2,877,832 2,877,832 2,877,832 2,877,832
Assets ( $000’s) 257,887 257,157 257,118 257,080 257,041 257,003
Equity ($000’s)(1) 25,784 24,954 24,915 24,877 24,838 24,800
Equity / assets 10.00% 9.70% 9.69% 9.68% 9.66% 9.65%
Change in net income(1) 99 98 96 94 93
LTM net income ($000’s)(1) 1,586 1,685 1,684 1,682 1,680 1,679
LTM EPS $0.54 $0.59 $0.59 $0.59 $0.59 $0.59
LTM ROA 0.65% 0.70% 0.69% 0.69% 0.69% 0.69%
LTM ROE 6.2% 6.7% 6.7% 6.7% 6.7% 6.7%
Book value $8.73 $8.67 $8.66 $8.64 $8.63 $8.62
(1) Based on the following assumptions Cost savings of $200,000 Opportunity cost of funds of 6.5% Tax rate of 35% Transaction costs of $100,000
32

These materials are for discussion purposes only. They should not be construed as an offer or solicitation with respect to the purchase or sale of any security or to enter into any particular transaction and may not be relied on in evaluating the merits of investing in any security or entering into any transaction.
The information contained herein and any supplemental information or other documents provided in connection herewith are submitted to you on a strictly confidential basis, should be kept confidential and should not be used other than in connection with your evaluation of a proposed structure or transaction. By accepting a copy of this presentation, the recipient agrees that neither it nor any of its employees or advisors shall use the information for any purpose other than evaluating a proposed structure or transaction or divulge the information to any other party. The information contained herein shall not be photocopied, reproduced or distributed to others, in whole or in part, without the prior written consent of Howe Barnes Hoefer & Arnett, Inc.
33