As filed with the Securities and Exchange Commission on April 3, 2009
Securities Act File No.
SECURITIES AND EXCHANGE COMMISSION
WASHINGTON, D.C. 20549
Form N-14
REGISTRATION STATEMENT UNDER THE SECURITIES ACT OF 1933 x
Pre-Effective Amendment No. o
Post-Effective Amendment No. o
ING VARIABLE PORTFOLIOS, INC.
(Exact Name of Registrant as Specified in Charter)
7337 East Doubletree Ranch Road, Scottsdale, Arizona 85258-2034
(Address of Principal Executive Offices) (Zip Code)
1-800-366-0066
(Registrant’s Area Code and Telephone Number)
Huey P. Falgout, Jr.
ING Investments, LLC
7337 East Doubletree Ranch Road
Scottsdale, Arizona 85258-2034
(Name and Address of Agent for Service)
With copies to:
Philip H. Newman, Esq.
Goodwin Procter, LLP
Exchange Place
53 State Street
Boston, MA 02109
Approximate Date of Proposed Public Offering:
As soon as practicable after this Registration Statement becomes effective.
The Registrant hereby amends this Registration Statement on such date or dates as may be necessary to delay its effective date until the Registrant shall file a further amendment which specifically states that this Registration Statement shall thereafter become effective in accordance with Section 8(a) of the Securities Act of 1933 or until this Registration Statement shall become effective on such date as the Commission, acting pursuant to Section 8(a), may determine.
No filing fee is required because an indefinite number of shares have previously been registered pursuant to Rule 24f-2 under the Investment Company Act of 1940, as amended.
ING NEUBERGER BERMAN PARTNERS PORTFOLIO
ING OPPENHEIMER MAIN STREET PORTFOLIO®
7337 East Doubletree Ranch Road
Scottsdale, Arizona 85258-2034
May 18, 2009
Dear Variable Contract Owner/Plan Participant:
The Board of Directors/Trustees (the “Board”) has called a special meeting of shareholders (the “Special Meeting”) of ING Neuberger Berman Partners Portfolio (“Neuberger Berman Partners Portfolio”) and ING Oppenheimer Main Street Portfolio® (“Oppenheimer Main Street Portfolio”) (each, a “Disappearing Portfolio,” and collectively, the “Disappearing Portfolios”), which is scheduled for 10:00 a.m., Local time, on June 30, 2009, at 7337 East Doubletree Ranch Road, Scottsdale, Arizona 85258-2034. At the Special Meeting, shareholders of each Disappearing Portfolio will be asked to vote on: (1) a proposed reorganization (each, a “Reorganization” and collectively, the “Reorganizations”) of that Disappearing Portfolio with and into ING Russell™ Large Cap Index Portfolio (“Russell™ Large Cap Index Portfolio” or the “Surviving Portfolio”) (each Disappearing Portfolio and Surviving Portfolio, a “Portfolio” and collectively, the “Portfolios”); and (2) subject to shareholder approval of a Reorganization, an investment sub-advisory agreement appointing ING Investment Management Co. (“ING IM”) as the investment sub-adviser to the Disappearing Portfolio (the “ING IM Sub-Advisory Agreement”) during a transition period until the Reorganization is consummated.
The Portfolios are members of the mutual fund group called the “ING Funds.” OppenheimerFunds, Inc. has sub-advised Oppenheimer Main Street Portfolio since November 2004, while Neuberger Berman Management Inc. has sub-advised Neuberger Berman Partners Portfolio since its inception in January 2006.
On March 27, 2009, the Board reviewed and approved the proposed Reorganizations. To plan for a smooth transition prior to each Reorganization, and upon management’s recommendation, the Board determined to retain ING IM, the current sub-adviser to Russell™ Large Cap Index Portfolio, to manage each Disappearing Portfolio for a short period until the consummation of each Reorganization. On March 27, 2009, the Board, on behalf of each Disappearing Portfolio, approved the ING IM Sub-Advisory Agreement, which, subject to shareholder approval, is scheduled to be effective on July 3, 2009 until the closing of the applicable Reorganization. Contingent upon shareholder approval of the applicable Reorganization, shareholders are also being asked to approve the ING IM Sub-Advisory Agreement. If shareholders of a Disappearing Portfolio approve both the respective Reorganization and the ING IM Sub-Advisory Agreement, ING IM would serve as the sub-adviser to that Disappearing Portfolio and would be tasked with implementing a transitioning strategy of that Disappearing Portfolio in connection with the respective Reorganization.
You should note that each Reorganization is independent and not contingent upon the approval or consummation of the other Reorganization. The accompanying documents describe the proposed transactions and compare the strategies and expenses of each Portfolio for your evaluation.
Shares of the applicable Disappearing Portfolio have been purchased at your direction by your insurance company (“Insurance Company”) through its separate account to fund benefits payable under your variable annuity contract or variable life insurance policy (each a “Variable Contract”) or at your direction by your qualified pension or retirement plan (“Qualified Plan”). Your Insurance Company and/or Qualified Plan, as the legal owner of that separate account, has been asked to approve the Reorganization and the ING IM Sub-Advisory Agreement. You, as either a participant in a Qualified Plan (“Plan Participant”) or as an owner of a Variable Contract for which a Disappearing Portfolio serves as an investment option, are being asked by your Qualified Plan and/or Insurance Company for instructions as to how to vote the shares of that Portfolio to which you have either allocated cash values under your Variable Contract or invested through your Qualified Plan. As such, this letter, the accompanying notice, combined proxy statement and prospectus (“Proxy Statement/Prospectus”) and voting instructions card are, therefore, being furnished to Variable Contract owners and Plan Participants entitled to provide voting instructions with regard to the proposals to be considered at the Special Meeting.
If the Reorganization is approved and consummated with respect to each Portfolio, the separate account in which you have an interest or the Qualified Plan in which you are a participant will own shares of Russell™ Large Cap Index Portfolio instead of shares of a Disappearing Portfolio. The Reorganization would provide the separate account in which you have an interest or the Qualified Plan in which you are a participant with an opportunity to participate in a portfolio, which seeks investment results (before fees and expenses) that correspond to the total return of the Russell Top 200® Index.
AFTER CAREFUL CONSIDERATION, THE BOARD OF EACH DISAPPEARING PORTFOLIO APPROVED THE PROPOSED REORGANIZATION AND THE ING IM SUB-ADVISORY AGREEMENT FOR THAT DISAPPEARING PORTFOLIO AND RECOMMENDS SHAREHOLDERS VOTE “FOR” THESE PROPOSALS.
A Proxy Statement/Prospectus that describes these proposals in detail is enclosed. We hope that you can attend the Special Meeting in person; however, we urge you in any event to provide voting instructions by completing and returning the enclosed voting instructions card in the envelope provided at your earliest convenience.
Your vote is important regardless of the number of shares attributable to your Variable Contract and/or Qualified Plan. To avoid the added cost of follow-up solicitations and possible adjournments, please take a few minutes to read this Proxy Statement/Prospectus and provide voting instructions. It is important that your voting instructions be received no later than June 29, 2009.
We appreciate your participation and prompt response in this matter and thank you for your continued support.
| Sincerely, |
|
|
|
|
| Shaun P. Mathews, |
| President and Chief Executive Officer |
ING NEUBERGER BERMAN PARTNERS PORTFOLIO
ING OPPENHEIMER MAIN STREET PORTFOLIO®
7337 East Doubletree Ranch Road
Scottsdale, Arizona 85258-2034
1-800-262-3862
1-800-366-0066
Notice of Special Meeting of Shareholders
of ING Neuberger Berman Partners Portfolio and ING Oppenheimer Main Street Portfolio®
Scheduled for June 30, 2009
To the Shareholders:
NOTICE IS HEREBY GIVEN that a special meeting of shareholders (the “Special Meeting”) of ING Neuberger Berman Partners Portfolio (“Neuberger Berman Partners Portfolio”) and ING Oppenheimer Main Street Portfolio® (“Oppenheimer Main Street Portfolio”) is scheduled for 10:00 a.m., Local time, on June 30, 2009, at 7337 East Doubletree Ranch Road, Scottsdale, Arizona 85258-2034 for the following purposes:
For Shareholders of Neuberger Berman Partners Portfolio:
(1) To approve an Agreement and Plan of Reorganization by and between Neuberger Berman Partners Portfolio and ING Russell™ Large Cap Index Portfolio (“Russell™ Large Cap Index Portfolio”), providing for the reorganization of Neuberger Berman Partners Portfolio with and into Russell™ Large Cap Index Portfolio; and
(2) Subject to shareholder approval of the Agreement and Plan of Reorganization by and between Neuberger Berman Partners Portfolio and ING Russell™ Large Cap Index Portfolio, to approve an investment sub-advisory agreement between Directed Services LLC (“DSL”), Neuberger Berman Partners Portfolio’s investment adviser, and ING Investment Management Co. (“ING IM”), pursuant to which ING IM, an affiliate of DSL, would serve as the sub-adviser to Neuberger Berman Partners Portfolio during a transition period until the reorganization of Neuberger Berman Partners Portfolio with and into Russell™ Large Cap Index Portfolio is consummated.
For Shareholders of Oppenheimer Main Street Portfolio:
(1) To approve an Agreement and Plan of Reorganization by and between Oppenheimer Main Street Portfolio and Russell™ Large Cap Index Portfolio, providing for the reorganization of Oppenheimer Main Street Portfolio with and into Russell™ Large Cap Index Portfolio; and
(2) Subject to shareholder approval of the Agreement and Plan of Reorganization by and between Oppenheimer Main Street Portfolio and Russell™ Large Cap Index Portfolio, to approve an investment sub-advisory agreement between DSL, Oppenheimer Main Street Portfolio’s investment adviser, and ING IM, pursuant to which ING IM would serve as the sub-adviser to Oppenheimer Main Street Portfolio during a transition period until the reorganization of Oppenheimer Main Street Portfolio with and into Russell™ Large Cap Index Portfolio is consummated.
For shareholders of both Neuberger Berman Partners Portfolio and Oppenheimer Main Street Portfolio:
(1) To transact such other business, not currently contemplated, that may properly come before the Special Meeting, or any adjournment(s) or postponement(s) thereof, in the discretion of the proxies or their substitutes.
Shareholders of record as of the close of business on April 1, 2009 are entitled to notice of, and to vote at, the Special Meeting, and are also entitled to vote at any adjournment thereof. Your attention is called to the accompanying Proxy Statement/Prospectus. Regardless of whether you plan to attend the Special Meeting, PLEASE COMPLETE, SIGN AND RETURN PROMPTLY THE ENCLOSED PROXY CARD so that a quorum will be present and a maximum number of shares may be voted. Proxies may be revoked at any time before they are exercised by executing and submitting a revised proxy, by giving written notice of revocation to Neuberger Berman Partners Portfolio or Oppenheimer Main Street Portfolio, as applicable, or by voting in person at the Special Meeting.
| By Order of the Board of Trustees |
|
|
|
|
| Huey P. Falgout, Jr. |
| Secretary |
|
|
May 18, 2009 |
|

(This page intentionally left blank)
PROXY STATEMENT/PROSPECTUS
May 18, 2009
TABLE OF CONTENTS
INTRODUCTION |
|
SUMMARY OF THE PROPOSALS |
|
The Proposed Reorganizations |
|
The Proposed ING IM Sub-Advisory Agreement |
|
PROPOSAL I – APPROVAL OF REORGANIZATION AGREEMENTS |
|
Comparison of Investment Objectives and Principal Investment Strategies |
|
Comparison of Portfolio Characteristics |
|
Comparison of Investment Techniques and Principal Risks of Investing in the Portfolios |
|
Portfolio Performance |
|
COMPARISON OF FEES AND EXPENSES |
|
Management Fees |
|
Sub-Adviser Fees |
|
Administration Fees |
|
Distribution and Service Fees |
|
Expense Limitation Agreements |
|
Expense Tables |
|
Portfolio Expenses |
|
Portfolio Transitioning |
|
Key Differences in the Rights of each Disappearing Portfolio’s Shareholders and the Surviving Portfolio’s Shareholders |
|
INFORMATION ABOUT THE REORGANIZATIONS |
|
The Reorganization Agreements |
|
Reasons for the Reorganizations |
|
Board Considerations |
|
Tax Considerations |
|
Expenses of the Reorganizations |
|
Future Allocation of Premiums |
|
ADDITIONAL INFORMATION ABOUT THE PORTFOLIOS |
|
Form of Organization |
|
Advisers |
|
Distributor |
|
Dividends, Distributions and Taxes |
|
Capitalization |
|
PROPOSAL II – APPROVAL OF THE ING IM SUB-ADVISORY AGREEMENT |
|
Each Disappearing Portfolio’s Investment Advisory Arrangement |
|
Each Disappearing Portfolio’s Prior Sub-Advisory Agreement |
|
The ING IM Sub-Advisory Agreement |
|
Board Considerations |
|
GENERAL INFORMATION ABOUT THE PROXY STATEMENT |
|
Solicitation of Proxies |
|
TABLE OF CONTENTS
(continued)
Voting Rights |
|
Other Matters to Come Before the Special Meeting |
|
Shareholder Proposals |
|
APPENDICES |
|
Appendix A-1 – Agreement and Plan of Reorganization (Neuberger Berman Partners Portfolio) | A-1-1 |
Appendix A-2 – Agreement and Plan of Reorganization (Oppenheimer Main Street Portfolio) | A-2-1 |
Appendix B – Form of ING IM Sub-Advisory Agreement | B-1 |
Appendix C – Additional Information Regarding ING Russell™ Large Cap Index Portfolio | C-1 |
Appendix D – Principal Executive Officers and Directors of ING Investment Management Co. | D-1 |
Appendix E – Advisory Fee Rate of Funds with Similar Investment Objectives Advised or Sub-Advised by ING Investment Management Co. | E-1 |
Appendix F – Security Ownership of Certain Beneficial and Record Owners | F-1 |
PROXY STATEMENT/PROSPECTUS
May 18, 2009
PROXY STATEMENT FOR:
ING NEUBERGER BERMAN PARTNERS PORTFOLIO
(A Series of ING Partners, Inc.)
1-800-262-3862
AND
ING OPPENHEIMER MAIN STREET PORTFOLIO®
(A Series of ING Investors Trust)
1-800-366-0066
7337 East Doubletree Ranch Road
Scottsdale, Arizona 85258-2034
PROSPECTUS FOR:
ING RUSSELL™ LARGE CAP INDEX PORTFOLIO
(A Series of ING Variable Portfolios, Inc.)
7337 East Doubletree Ranch Road
Scottsdale, Arizona 85258-2034
1-800-992-0180
INTRODUCTION
This combined proxy statement and prospectus (“Proxy Statement/Prospectus”) relates to a special meeting of shareholders (the “Special Meeting”) of ING Neuberger Berman Partners Portfolio (“Neuberger Berman Partners Portfolio”) and ING Oppenheimer Main Street Portfolio® (“Oppenheimer Main Street Portfolio”) (each, a “Disappearing Portfolio,” and collectively, the “Disappearing Portfolios”) to be held on June 30, 2009, as adjourned from time to time, at which shareholders of each Disappearing Portfolio will vote on: (1) a proposed reorganization (each, a “Reorganization” and collectively, the “Reorganizations”) of that Disappearing Portfolio with and into ING Russell™ Large Cap Index Portfolio (“Russell™ Large Cap Index Portfolio” or the “Surviving Portfolio”) (each Disappearing Portfolio and Surviving Portfolio, a “Portfolio” and collectively, the “Portfolios”); and (2) subject to shareholder approval of a Reorganization, an investment sub-advisory agreement appointing ING Investment Management Co. (“ING IM”) as the investment sub-adviser to the Disappearing Portfolio (the “ING IM Sub-Advisory Agreement”) during a transition period scheduled to begin on or around July 3, 2009 until the Reorganization is consummated (the “Transition Period”). This Proxy Statement/Prospectus is being mailed to shareholders of the Disappearing Portfolios on or about May 18, 2009.
On March 27, 2009, the Board of Directors/Trustees (the “Board”) of each Disappearing Portfolio reviewed and approved an Agreement and Plan of Reorganization (each a “Reorganization Agreement” and collectively, the “Reorganization Agreements”) relating to the Reorganization of such Disappearing Portfolio with and into Russell™ Large Cap Index Portfolio, which is currently sub-advised by ING IM. Because you, as a shareholder of a Disappearing Portfolio, are being asked to approve the Reorganization Agreement that will result in a transaction in which you will ultimately hold shares of Russell™ Large Cap Index Portfolio, this Proxy Statement also serves as a prospectus for Russell™ Large Cap Index Portfolio. Russell™ Large Cap Index Portfolio is an open-end management investment company, which seeks investment results (before fees and expenses) that correspond to the total return of the Russell Top 200® Index, as described more fully below. You should note that each Reorganization is independent and not contingent upon the approval or consummation of the other Reorganization.
OppenheimerFunds, Inc. (“Oppenheimer”) has sub-advised Oppenheimer Main Street Portfolio since November 2004, while Neuberger Berman Management Inc. (“Neuberger Berman”) has sub-advised Neuberger Berman Partners Portfolio since its inception in January 2006. On March 27, 2009, to plan for a smooth transition prior to the Reorganizations, and upon management’s recommendation, the Board determined to retain ING IM, the current sub-adviser to Russell™ Large Cap Index Portfolio, to manage each Disappearing Portfolio during the Transition Period. Consequently, shareholders are also being asked to approve the ING IM Sub-Advisory Agreement. If shareholders of a Disappearing Portfolio approve both the respective Reorganization and the ING IM Sub-Advisory Agreement, ING IM would serve as the sub-adviser to such Disappearing Portfolio and would be tasked with implementing a transitioning strategy of such Disappearing Portfolio in connection with the respective Reorganization. If shareholders of a Disappearing Portfolio approve a Reorganization but not the ING IM Sub-Advisory Agreement, ING IM will not serve as the sub-adviser to that
1
Disappearing Portfolio during the Transition Period, and, there can be no assurance that such Disappearing Portfolio could be effectively transitioned prior to the consummation of the Reorganization.
The approval of the ING IM Sub-Advisory Agreement is contingent upon shareholder approval of such Disappearing Portfolio’s Reorganization. ING IM will not serve as sub-adviser to a Disappearing Portfolio unless shareholders approve the Reorganization of that Disappearing Portfolio. If either proposal is not approved with respect to any Disappearing Portfolio, the Board will consider its options with respect to such Disappearing Portfolio, in accordance with applicable law.
Shares of the Portfolios are not offered directly to the public but are sold to qualified pension and retirement plans (each a “Qualified Plan”) and to separate accounts (“Separate Accounts”) of certain participating life insurance companies (“Participating Insurance Companies”) and are used to fund variable annuity and/or variable life contracts (each a “Variable Contract” and collectively, “Variable Contracts”). Participants in a Qualified Plan (“Plan Participants”) or Variable Contract owners who select a Portfolio for investment through a Qualified Plan or Variable Contract, respectively, have a beneficial interest in the Portfolio, but do not invest directly in or hold shares of the Portfolio. The Qualified Plan or Participating Insurance Company that uses a Portfolio as a funding vehicle, is, in most cases, the true shareholder of the Portfolio and, as the legal owner of the Portfolio’s shares, has sole voting and investment power with respect to the shares, but generally will pass through any voting rights to Plan Participants and Variable Contract owners. As such and for ease of reference throughout the Proxy Statement/Prospectus, Plan Participants and Variable Contract owners will be referred to as “shareholders” of the Portfolios.
This Proxy Statement/Prospectus, which should be read and retained for future reference, sets forth concisely the information that a shareholder should know in considering the applicable Reorganization. A Statement of Additional Information (“SAI”) relating to this Proxy Statement, dated May 18, 2009, containing additional information about the Reorganization and the parties thereto, has been filed with the U.S. Securities and Exchange Commission (the “SEC”) and is incorporated herein by reference. For a more detailed discussion of the investment objectives, strategies and restrictions of the Portfolios, see the Adviser Class (“ADV Class”), Initial Class (“Class I”) Service Class (“Class S”) and Service 2 Class (“Class S2”) prospectuses of Neuberger Berman Partners Portfolio, each dated May 1, 2009, which are incorporated by reference (File No. 333-32575); the ADV Class, Institutional Class (hereinafter referred to as “Class I”), Class S and Class S2 prospectuses of Oppenheimer Main Street Portfolio, each dated May 1, 2009 which are incorporated by reference (File No. 033-23512); and the ADV Class, Class I, Class S and Class S2 prospectuses of Russell™ Large Cap Index Portfolio, each dated May 1, 2009. Each Portfolio’s SAI, dated May 1, 2009, is also incorporated by reference (for Neuberger Berman Partners Portfolio, File No. 333-32575; for Oppenheimer Main Street Portfolio File No. 033-23512; and for Russell™ Large Cap Index Portfolio, File No. 333-05173). Each Portfolio also provides periodic reports to its shareholders, which highlight certain important information about the Portfolios, including investment results and financial information. The semi-annual report for each Portfolio, for the fiscal period ended June 30, 2008 and each Portfolio’s annual report for the fiscal year ended December 31, 2008 (for Neuberger Berman Partners Portfolio File No. 811-08319; for Oppenheimer Main Street Portfolio File No. 811-05629; and for Russell™ Large Cap Index Portfolio File No. 811-07651) are incorporated herein by reference. For a copy of the current prospectus, SAI, annual report, and semi-annual report for each of the Portfolios without charge, or for a copy of the SAI relating to this Proxy Statement/Prospectus, contact the Portfolios at ING Funds, 7337 East Doubletree Ranch Road, Scottsdale, Arizona 85258-2034 or call 1-800-262-3862 (for Neuberger Berman Partners Portfolio) or 1-800-366-0066 (for Oppenheimer Main Street Portfolio).
Each Portfolio is subject to the informational requirements of the Securities Exchange Act of 1934, as amended, and the Investment Company Act of 1940, as amended (the “1940 Act”), and files reports, proxy materials and other information with the SEC. You can copy and review information about each Portfolio, including the SAI, reports, proxy materials and other information at the SEC’s Public Reference Room in Washington, D.C. You may obtain information on the Public Reference Room by calling the SEC at 1-202-551-8090. Such materials are also available in the EDGAR Database on the SEC’s internet site at http://www.sec.gov. You may obtain copies of this information, after paying a duplication fee, by electronic request at the following e-mail address: publicinfo@sec.gov, or by writing to the SEC’s Public Reference Section, Office of Consumer Affairs and Information, U.S. Securities and Exchange Commission, 100 F. Street N.E., Washington, D.C. 20549.
THE SEC HAS NOT APPROVED OR DISAPPROVED THESE SECURITIES, OR DETERMINED THAT THIS PROSPECTUS IS TRUTHFUL OR COMPLETE. ANY REPRESENTATION TO THE CONTRARY IS A CRIMINAL OFFENSE.
2
SUMMARY OF THE PROPOSALS
You should read this entire Proxy Statement/Prospectus carefully. You should also review the Reorganization Agreements, which are attached hereto as Appendix A-1 and Appendix A-2 and the ING IM Sub-Advisory Agreement, a form of which is attached hereto as Appendix B. Also, you should consult the ADV Class, Class I, Class S and Class S2 prospectuses, each dated May 1, 2009, for more information about Russell™ Large Cap Index Portfolio.
The Proposed Reorganization
At a meeting held on March 27, 2009, the Board of each Disappearing Portfolio approved each respective Reorganization Agreement. Subject to shareholder approval, each Reorganization Agreement provides for:
· the transfer of all of the assets of the respective Disappearing Portfolio to Russell™ Large Cap Index Portfolio in exchange for shares of beneficial interest of Russell™ Large Cap Index Portfolio;
· the assumption by Russell™ Large Cap Index Portfolio of the liabilities of the respective Disappearing Portfolio known as of the Closing Date (as described below);
· the distribution of shares of Russell™ Large Cap Index Portfolio to the shareholders of the respective Disappearing Portfolio; and
· the complete liquidation of the respective Disappearing Portfolio.
Shares of Russell™ Large Cap Index Portfolio would be distributed to shareholders of the respective Disappearing Portfolio so that each shareholder would receive a number of full and fractional shares of Russell™ Large Cap Index Portfolio equal to the aggregate value of shares of the respective Disappearing Portfolio held by such shareholder.
As a result of the Reorganizations, each owner of ADV Class, Class I, Class S and, where applicable, Class S2 shares of a Disappearing Portfolio would become a shareholder of the corresponding share class of Russell™ Large Cap Index Portfolio. The Reorganizations are expected to be effective on July 18, 2009, or such other date as the parties may agree (the “Closing Date”). Class S2 of Neuberger Berman Partners Portfolio is scheduled to be launched on May 1, 2009, but shares of this class are not expecded to be offered to shareholders prior to the closing date. Each Reorganization is independent and not contingent upon the approval or consummation of the other Reorganization.
Each shareholder will hold, immediately after the Closing Date, shares of the corresponding class of Russell™ Large Cap Index Portfolio having an aggregate value equal to the aggregate value of the shares of the corresponding class of the Disappearing Portfolio held by that shareholder as of the close of business on the Closing Date.
In considering whether to approve the Reorganization for the Disappearing Portfolio that you own, you should note, as applicable, that:
· While the Surviving Portfolio seeks investment results (before fees and expenses) that correspond to the total return of the Russell Top 200® Index (“Index”), Neuberger Berman Partners Portfolio seeks capital growth and Oppenheimer Main Street Portfolio seeks long-term growth of capital and future income;
· Each Disappearing Portfolio is an actively managed fund - Neuberger Berman Partners Portfolio invests mainly in common stocks of mid- to large-capitalization companies and Oppenheimer Main Street Portfolio invests mainly in equity securities of U.S. companies of different capitalization ranges but presently focuses on large-capitalization issuers - while the Surviving Portfolio is a passively-managed index fund and primarily invests in equity securities of large-capitalization companies, which are included in the Index, convertible securities that are convertible into stocks included in the Index, other derivatives whose economic returns are, by design, closely equivalent to the returns of the Index, or its components and exchange-traded funds;
· Neuberger Berman Partners Portfolio commenced operations in January 2006; Oppenheimer Main Street Portfolio commenced operations in August 1998; and Russell™ Large Cap Index Portfolio was launched in March 2008;
· Directed Services LLC (“DSL”) serves as the investment adviser to each Disappearing Portfolio, while ING Investments, LLC is the investment adviser to the Surviving Portfolio;
· Neuberger Berman and Oppenheimer serve as sub-adviser to Neuberger Berman Partners Portfolio and Oppenheimer Main Street Portfolio, respectively, while Russell™ Large Cap Index Portfolio is sub-advised by ING IM;
3
· The gross and net expense ratios for all classes of each Disappearing Portfolio are expected to decrease as a result of that Portfolio’s Reorganization;
· The purchase and redemption of shares of each Portfolio may be made by Separate Accounts of Participating Insurance Companies and by Plan Participants in a Qualified Plan; consequently, Variable Contract owners and Plan Participants should consult the underlying product prospectus or Qualified Plan documents, respectively, with respect to purchases, exchanges and redemption of shares;
· Each Portfolio is distributed by ING Funds Distributor, LLC (“IFD” or the “Distributor”);
· If shareholders of a Disappearing Portfolio approve the ING IM Sub-Advisory Agreement, ING IM will implement a transition strategy, under which it may, at its discretion, reposition the Disappearing Portfolio’s investment portfolio as discussed in “Portfolio Transitioning” on page 27. The sub-adviser to Russell™ Large Cap Index Portfolio may also sell portfolio securities that it acquires from the Disappearing Portfolio after the Closing Date. In addition, each Portfolio may engage in a variety of transition management techniques to facilitate the portfolio transition process. Such sales and purchases would result in increased transaction costs, which are ultimately borne by shareholders, and may result in the realization of taxable gains or losses for the Portfolio(s); and
· Each Reorganization is intended to qualify for federal income tax purposes as a tax-free reorganization pursuant to Section 368(a) of Internal Revenue Code of 1986, as amended (the “Code”); accordingly, pursuant to this treatment, neither a Disappearing Portfolio nor its shareholders, nor the Surviving Portfolio nor its shareholders are expected to recognize any gain or loss for federal income tax purposes from the transactions contemplated by the Reorganization Agreement.
Prior to the Closing Date, each Disappearing Portfolio will pay to the Separate Accounts of Participating Insurance Companies and Qualified Plans that own its shares, a cash distribution consisting of any undistributed investment company taxable income and/or any undistributed realized net capital gains, including any net gains realized from any sales of assets prior to the Closing Date.
The gross and net operating expenses before and after the Reorganization, expressed as an annual percentage of the average daily net asset value per share for shares of each Portfolio as of December 31, 2008, are as follows:
Gross Expenses Before the Reorganizations
|
| ADV Class |
| Class I |
| Class S |
| Class S2 |
|
Neuberger Berman Partners Portfolio |
| 1.25 | % | 0.75 | % | 1.00 | % | 1.25 | %(1) |
Oppenheimer Main Street Portfolio |
| 1.41 | % | 0.66 | % | 0.91 | % | 1.16 | % |
Russell™ Large Cap Index Portfolio |
| 0.89 | % | 0.39 | % | 0.64 | % | 0.89 | %(1) |
Net Expenses Before the Reorganizations (After Fee Waiver)
|
| ADV Class |
| Class I |
| Class S |
| Class S2 |
|
Neuberger Berman Partners Portfolio(2) |
| 1.17 | % | 0.67 | % | 0.89 | %(3) | 1.07 | %(1) |
Oppenheimer Main Street Portfolio |
| 1.26 | % | 0.66 | % | 0.91 | % | 1.06 | % |
Russell™ Large Cap Index Portfolio(2) |
| 0.87 | % | 0.37 | % | 0.62 | % | 0.77 | %(1) |
After the Reorganization: Neuberger Berman Partners Portfolio only into Russell™ Large Cap Index Portfolio Pro Forma (Unaudited)
|
| ADV Class |
| Class I |
| Class S |
| Class S2 |
|
Gross estimated expenses of Surviving Portfolio |
| 0.89 | % | 0.39 | % | 0.64 | % | 0.89 | % |
Net estimated expenses of Surviving Portfolio (After Fee Waiver) |
| 0.87 | % | 0.37 | % | 0.62 | % | 0.77 | % |
4
After the Reorganization: Oppenheimer Main Street Portfolio only into Russell™ Large Cap Index Portfolio Pro Forma (Unaudited)
|
| ADV Class |
| Class I |
| Class S |
| Class S2 |
|
Gross estimated expenses of Surviving Portfolio |
| 0.89 | % | 0.39 | % | 0.64 | % | 0.89 | % |
Net estimated expenses of Surviving Portfolio (After Fee Waiver) |
| 0.87 | % | 0.37 | % | 0.62 | % | 0.77 | % |
After the Reorganizations: Both Disappearing Portfolios into Russell™ Large Cap Index Portfolio Pro Forma (Unaudited)
|
| ADV Class |
| Class I |
| Class S |
| Class S2 |
|
Gross estimated expenses of Surviving Portfolio |
| 0.89 | % | 0.39 | % | 0.64 | % | 0.89 | % |
Net estimated expenses of Surviving Portfolio (After Fee Waiver) |
| 0.87 | % | 0.37 | % | 0.62 | % | 0.77 | % |
(1) Since Class S2 shares of the Portfolio had not commenced operations as of December 31, 2008, expenses are estimated for the current fiscal year.
(2) The Portfolio’s investment adviser has entered into a written expense limitation agreement with the Portfolio, under which it will limit expenses of the Portfolio, excluding interest, taxes, brokerage commissions, extraordinary expenses and acquired fund fees and expenses, subject to possible recoupment by the investment adviser within three years. The expense limitation agreement shall continue until May 1, 2010. The expense limitation agreement is contractual and shall renew automatically for one-year terms unless the adviser provides written notice of termination of the expense limitation agreement at least 90 days prior to the end of the then current term or upon termination of the management agreement.
(3) IFD has contractually agreed to waive all or a portion of its shareholder services fees and/or reimburse shareholder services fees for Class S of Neuberger Berman Partners Portfolio so that the Portfolio’s “Net Operating Expenses” do not exceed 0.89% through May 1, 2010.
5
The Proposed ING IM Sub-Advisory Agreement
At a meeting held on March 27, 2009, the Board, including all of the directors/trustees who are not “interested persons” of each Disappearing Portfolio, as defined in the 1940 Act (“Independent Directors/Trustees”), approved the ING IM Sub-Advisory Agreement on behalf of the respective Disappearing Portfolio. Shareholders of a Disappearing Portfolio must approve both the respective Reorganization and the proposed ING IM Sub-Advisory Agreement for the ING IM Sub-Advisory Agreement to become effective.
In considering whether to approve the ING IM Sub-Advisory Agreement with respect to a Disappearing Portfolio in which you hold shares, you should note, as applicable, that:
· Oppenheimer has sub-advised Oppenheimer Main Street Portfolio since November 2004, while Neuberger Berman has sub-advised Neuberger Berman Partners Portfolio since its inception in January 2006;
· On March 27, 2009, the Board approved the Reorganizations, as described above;
· At the same meeting, the Board approved the termination of the investment sub-advisory agreements with Neuberger Berman (with respect to Neuberger Berman Partners Portfolio) and Oppenheimer (with respect to Oppenheimer Main Street Portfolio) and approved the ING IM Sub-Advisory Agreement on behalf of each Disappearing Portfolio, appointing ING IM as the sub-adviser to each Disappearing Portfolio during the Transition Period;
· Approval of the ING IM Sub-Advisory Agreement on behalf of a Disappearing Portfolio will provide for uninterrupted sub-advisory services to such Disappearing Portfolio and enable ING IM to transition the Portfolio into the Russell™ Large Cap Index Portfolio during the Transition Period, providing the opportunity for Russell™ Large Cap Index Portfolio to be as fully invested as practicable after the Reorganization is consummated;
· With respect to each Reorganization, shareholders must approve both the Reorganization and the proposed ING IM Sub-Advisory Agreement for the ING IM Sub-Advisory Agreement to become effective;
· The terms of the ING IM Sub-Advisory Agreement are substantially similar to those of the prior sub-advisory agreements with Neuberger Berman (with respect to Neuberger Berman Partners Portfolio) and Oppenheimer (with respect to Oppenheimer Main Street Portfolio); and
· DSL continues to be responsible for monitoring the investment program and performance of ING IM with respect to each Disappearing Portfolio.
· If the ING IM Sub-Advisory Agreement is approved by shareholders of a Disappearing Portfolio, ING IM will be tasked to transition that Disappearing Portfolio as discussed in “Portfolio Transitioning” on page 27.
Approval of each Reorganization Agreement and the ING IM Sub-Advisory Agreement for each Disappearing Portfolio requires the affirmative vote of the lesser of (i) 67% or more of the voting securities of that Disappearing Portfolio present or represented at the meeting, provided that more than 50% of the voting securities of such Disappearing Portfolio are present in person or represented by proxy at the Special Meeting, or (ii) a majority of the shares of a Disappearing Portfolio entitled to vote. The holders of 30% of outstanding shares present in person or by proxy shall constitute a quorum at any meeting of the shareholders of Oppenheimer Main Street Portfolio, while the holders of a majority of outstanding shares present in person or by proxy shall constitute a quorum at the meeting of shareholders of Neuberger Berman Partners Portfolio. A majority of the shareholders of a Disappearing Portfolio present in person or proxy may adjourn the meeting of such Disappearing Portfolio (i) in the absence of a quorum at such meeting or (ii), in the event a quorum is present, for any reason permitted by law, including for the purpose of providing time for the solicitation of additional shareholder votes. In the event a meeting is adjourned, the time and place of such adjourned meeting shall be announced at the meeting and no additional notice shall be given unless, if after the adjournment, a new record date is fixed.
AFTER CAREFUL CONSIDERATION, THE BOARD OF EACH DISAPPEARING PORTFOLIO APPROVED THE PROPOSED REORGANIZATION AND THE PROPOSED ING IM SUB-ADVISORY AGREEMENT FOR THAT DISAPPEARING PORTFOLIO AND RECOMMENDS THAT SHAREHOLDERS OF THAT DISAPPEARING PORTFOLIO VOTE “FOR” THESE PROPOSALS.
6
PROPOSAL I -APPROVAL OF REORGANIZATION AGREEMENT
Comparison of Investment Objectives and Principal Investment Strategies
The following summarizes the investment objective, principal investment strategies and management differences, if any, among the Portfolios:
|
| Neuberger Berman Partners |
| Oppenheimer Main Street |
| Russell™ Large Cap Index |
Investment Objective |
| Capital growth. The Portfolio’s investment objective is not fundamental and may be changed without a shareholder vote. |
| Long-term growth of capital and future income. The Portfolio’s investment objective is not fundamental and may be changed without a shareholder vote. |
| The Portfolio seeks investment results (before fees and expenses) that correspond to the total return of the Russell Top 200® Index (“Index”). The Portfolio’s investment objective is not fundamental and may be changed without a shareholder vote. |
|
|
|
|
|
|
|
Principal Investment Strategies |
| · Under normal market conditions, the Portfolio invests mainly in common stocks of mid- to large-capitalization companies. Neuberger Berman considers mid- capitalization companies to be those with total market capitalizations within the market capitalization range of the Russell Midcap® Index. As of December 31, 2008, the capitalization of companies represented by the Russell Midcap® Index ranged between $24 million and $14.9 billion. Neuberger Berman considers large-capitalization companies to be those with total market capitalizations within the market capitalization range of the Russell 1000® Index. As of December 31, 2008, the capitalization of companies represented by the Russell 1000® Index ranged between $24 million and $421.8 billion.
· In selecting investments for the Portfolio, Neuberger Berman looks for well-managed companies with strong |
| · The Portfolio normally invests mainly in equity securities of U.S. companies of different capitalization ranges, presently focusing on large-capitalization issuers. Equity securities include common stocks, as well as “equity equivalents” such as preferred stocks and securities convertible into common stocks. The Portfolio may also invest in debt securities, such as bonds and debentures, but does not currently emphasize these investments. Equity securities include common stocks, as well as “equity equivalents” such as preferred stocks and securities convertible into common stocks.
· In selecting securities to buy or sell for the Portfolio, the portfolio managers use an investment process that uses multi-factor quantitative models to rank more than 3,000 stocks on a daily basis. While the process may change over time or vary in particular cases, in general the selection process currently uses: |
| · The Portfolio normally invests at least 80% of its assets (plus borrowings for investment purposes) in equity securities of companies included in the Index, convertible securities that are convertible into stocks included in the Index, other derivatives whose economic returns are, by design, closely equivalent to the returns of the Index, or its components and exchange-traded funds. The Portfolio will provide shareholders with at least 60 days’ prior notice of any change in this investment policy.
· The Portfolio invests principally in common stock and employs a “passive management” approach designed to track the performance of the Index, which is an unmanaged index that measures the performance of the 200 largest companies in the Russell 1000® Index, which together represent approximately 69% of the total market |
7
|
| Neuberger Berman Partners |
| Oppenheimer Main Street |
| Russell™ Large Cap Index |
|
| balance sheets whose stock prices are undervalued. The factors that Neuberger Berman uses to identify such companies may include: · strong fundamentals, such as a company��s financial, operational, and competitive positions; · relatively high operating profit margins and returns; and · historically low valuation.
· Neuberger Berman also may seek other characteristics in a company in which the Portfolio may invest, such as a strong market position relative to competitors; a high level of stock ownership among management; and a recent sharp decline in stock price that appears to be the result of a short-term market overreaction to negative news.
· The Portfolio may invest a portion of its assets in derivative instruments, including options and futures. The Portfolio may invest up to 20% of its assets in securities of foreign issuers. The Portfolio also may engage in borrowing to the extent permitted under the federal securities laws.
· The Portfolio may invest in other investment companies to the extent permitted under the Investment Company Act of 1940, as amended, and the rules and regulations thereunder.
· Neuberger Berman may sell securities for a variety of reasons, such as to secure gains, limit losses, or redeploy assets into opportunities believed to |
| · Multi-factor quantitative models: The Portfolio uses both “top down” and “bottom up” quantitative models.
· The “top down” market capitalization model seeks to predict the future market direction of the capitalization environment. The portfolio managers divide the domestic equity market into five market-capitalization segments and market capitalization exposure is managed using proprietary modeling that incorporates factors such as relative price momentum and reversals, relative valuations and measures of investors risk tolerance.
· The “bottom up” stock selection models seek to rank securities within each capitalization range in order of attractiveness. Over a hundred company-specific factors are analyzed in constructing the “bottom up” models, including valuation, profitability, quality, momentum, volatility and special effects. Different models are used for each of the different market capitalization segments. The Portfolio also uses two seasonal models to capture seasonal effects.
· The Portfolio is then constructed and continuously monitored based on the quantitative investment |
| capitalization of the Russell 1000® Index. As of January 31, 2008 the smallest company in the Index had a market capitalization of $4.1 billion and the largest company had a market capitalization of $486.7 billion. The Portfolio attempts to replicate the Index by investing all, or substantially all, of its assets in stock that make up the Index.
· The Portfolio may not always hold all of the same securities as the Index. The Portfolio may also invest in stock index futures and other derivatives as a substitute for the sale or purchase of securities in the Index and to provide equity exposure to the Portfolio’s cash position. Although the Portfolio attempts to track, as closely as possible, the performance of the Index, the Portfolio does not always perform exactly like the Index. Unlike the Index, the Portfolio has operating expenses and transaction costs and therefore, has a performance disadvantage versus the Index.
· The Portfolio may lend portfolio securities on a short-term or long-term basis, up to 331/3% of its total assets.
· The Portfolio may invest in other investment companies to the extent permitted under the Investment Company Act of 1940, as amended, and the rules and regulations thereunder. |
8
|
| Neuberger Berman Partners |
| Oppenheimer Main Street |
| Russell™ Large Cap Index |
|
| be more promising, among others.
· The Portfolio may also lend portfolio securities on a short-term or long-term basis, up to 331/3% of its assets. |
| models. Security weightings are determined according to capitalization outlook, stock ranking and benchmark weighting. The Portfolio aims to maintain a broadly diversified portfolio that limits idiosyncratic company-specific risks and is scalable, efficient and adaptable.
· The Portfolio may invest in other investment companies to the extent permitted under the Investment Company Act of 1940, as amended, and the rules and regulations thereunder.
· The sub-adviser may sell securities for a variety of reasons, such as to secure gains, limit losses, or redeploy assets into opportunities believed to be more promising, among others.
· The Portfolio may lend portfolio securities on a short-term or long-term basis, up to 331/3% of its total assets. |
| · The Portfolio may engage in frequent and active trading of portfolio securities to achieve its investment objective. |
|
|
|
|
|
|
|
Investment Adviser |
| DSL |
| DSL |
| ING Investments |
|
|
|
|
|
|
|
Sub-Adviser |
| Neuberger Berman |
| Oppenheimer |
| ING IM |
|
|
|
|
|
|
|
Portfolio Manager |
| S. Basu Mullick |
| Marc Reinganum, Mark Zavanelli and Wentong Alex Zhou |
| Vincent Costa, CFA |
As you can see from the chart above, there are some differences in the investment strategies of Neuberger Berman Partners Portfolio and Russell™ Large Cap Index Portfolio. Neuberger Berman Partners Portfolio is an actively-managed fund and invests mainly in common stocks of mid- to large-capitalization companies, while Russell™ Large Cap Index Portfolio is a passively-managed index fund and invests in securities of large-capitalization companies as it seeks to track the performance of the Russell Top 200® Index, which is an unmanaged index that measures the performance of the 200 largest companies in the Russell 1000® Index. Unlike Russell™ Large Cap Index Portfolio, Neuberger Berman Partners Portfolio may invest up to 20% of its assets in foreign securities. Both Portfolios can lend portfolio securities, invest in derivatives and other investment companies. However, unlike Neuberger Berman Partners Portfolio, Russell™ Large Cap Index Portfolio can invest in convertible securities as a principal strategy.
A comparison between Oppenheimer Main Street Portfolio and Russell™ Large Cap Index Portfolio also reveals some differences. Oppenheimer Main Street Portfolio is an actively-managed fund, while Russell™ Large Cap Index Portfolio is a passively-managed index fund. Oppenheimer Main Street Portfolio invests mainly in equity securities of U.S. companies and although it is presently focusing on large-capitalization issuers, the Portfolio may invest in companies of
9
different capitalization ranges. Russell™ Large Cap Index Portfolio also invests primarily in large-capitalization companies but selects its investments from a smaller universe of investable securities, which are companies included in the Russell Top 200® Index. While both Portfolios may lend portfolio securities and invest in convertible securities and in other investment companies, unlike Russell™ Large Cap Index Portfolio, Oppenheimer Main Street Portfolio may invest in debt securities as a principal strategy. Please refer to the “Comparison of Portfolio Characteristics” table on the next page for more specific information regarding the characteristics of the Portfolios.
10
Comparison of Portfolio Characteristics
The following table compares certain characteristics of the Portfolios as of December 31, 2008:
|
| Neuberger Berman Partners |
| Oppenheimer Main Street |
| Russell™ Large Cap Index | |||
Net Assets |
| $250,970,319 |
| $251,507,670 |
| $1,087,638,890 | |||
|
|
|
|
|
|
| |||
Number of Holdings |
| 70 |
| 847 |
| 192 | |||
|
|
|
|
|
|
| |||
Portfolio Turnover Rate |
| 63 |
| 119 |
| 8 | |||
|
|
|
|
|
|
| |||
Average market capitalization of companies in the Fund |
| $14,299,789,903 |
| $62,106,865,021 |
| $90,702,513,658 | |||
|
|
|
|
|
|
| |||
Market capitalization range of companies in Fund: |
|
|
|
|
|
| |||
Holdings in companies with market capitalizations over $10 billion (as a% of market value*) |
| 31.0% |
| 62.5% |
| 97.5% | |||
Holdings in companies with market capitalizations between $10 billion and $1 billion (as a% of market value*) |
| 45.5% |
| 27.0% |
| 1.6% | |||
Holdings in companies with market capitalizations under $1 billion (as a% of market value*) |
| 4.0% |
| 8.6% |
| — | |||
|
|
|
|
|
|
|
|
|
|
|
| Oil & Gas | 14.0% |
| Oil & Gas | 17.6% |
| Oil & Gas | 12.6% |
|
| Insurance | 6.3% |
| Telecommunications | 6.5% |
| Banks | 8.0% |
Top 5 Sectors (as % of net assets) |
| Banks | 5.4% |
| Computers | 5.4% |
| Pharmaceuticals | 6.8% |
|
| Pharmaceuticals | 5.4% |
| Semiconductors | 5.0% |
| Telecommunications | 6.6% |
|
| Software | 5.4% |
| Software | 4.7% |
| Retail | 5.9% |
|
|
|
|
|
|
| |||
U.S. Equity Securities (as a % of market value*) |
| 80.5% |
| 98.1% |
| 99.1% | |||
|
|
|
|
|
|
| |||
Foreign Securities (as a % of market value*) |
| 19.5% |
| 1.9% |
| 0.9% | |||
|
|
|
|
|
|
| |||
Securities Lending Collateral (as a % of market value*) |
| — |
| 3.4% |
| — | |||
|
|
|
|
|
|
|
|
|
|
|
| Berkshire Hathaway, Inc. — Class B | 3.2% |
| ExxonMobil Corp. | 4.6% |
| ExxonMobil Corp. | 6.1% |
|
| Shire PLC ADR | 2.5% |
| Microsoft Corp. | 2.2% |
| Procter & Gamble Co. | 2.7% |
|
| Invesco Ltd. | 2.3% |
| Chevron Corp. | 2.2% |
| General Electric Co. | 2.5% |
|
| Aetna, Inc. | 2.3% |
| International Business Machines Corp. | 1.7% |
| AT&T, Inc. | 2.5% |
Top 10 Holdings (as a % of net assets) |
| China Mobile Ltd. ADR | 2.3% |
| AT&T, Inc. | 1.7% |
| Johnson & Johnson | 2.5% |
|
| Petroleo Brasileiro SA ADR | 2.3% |
| Hewlett-Packard Co. | 1.7% |
| Microsoft Corp. | 2.3% |
|
| Energizer Holdings, Inc. | 2.2% |
| Intel Corp. | 1.6% |
| Chevron Corp. | 2.2% |
|
| Moody’s Corp. | 2.2% |
| ConocoPhillips | 1.6% |
| Wal-Mart Stores, Inc. | 1.8% |
|
| Canadian Natural Resources Ltd. | 2.2% |
| Cisco Systems, Inc. | 1.6% |
| Pfizer, Inc. | 1.7% |
|
| Constellation Brands, Inc. | 2.2% |
| Johnson & Johnson | 1.5% |
| JPMorgan Chase & Co. | 1.7% |
* Excluding short-term investments.
11
Comparison of Investment Techniques and Principal Risks of Investing in the Portfolios
Because of each Disappearing Portfolio and the Surviving Portfolio have some similar investment strategies, some of the risks of investing in the Disappearing Portfolios are the same as the risks of investing in the Surviving Portfolio. The value of each Portfolio’s shares may go up or down, sometimes rapidly and unpredictably. Market conditions, financial conditions of issuers represented in the Portfolio, investment strategies, portfolio management, and other factors affect the volatility of each Portfolio’s shares. The following summarizes and compares the principal investment techniques and risks of investing in the Portfolios, as disclosed in each Portfolio’s prospectus. The fact that a risk is not listed as a principal risk in a Portfolio’s prospectus does not necessarily mean that shareholders of that Portfolio are not subject to that risk. You may lose money on your investment in any Portfolio.
Principal Risks |
| Neuberger Berman |
| Oppenheimer |
| Russell™ Large |
Call |
|
|
| X |
|
|
Convertible Securities |
|
|
| X |
| X |
Debt Securities |
|
|
| X |
|
|
Derivatives |
| X |
|
|
| X |
Equity Securities |
| X |
| X |
|
|
Foreign Investment |
| X |
|
|
|
|
Index Strategy |
|
|
|
|
| X |
Investment by Funds-of-Funds |
|
|
|
|
| X |
Investment Models |
|
|
| X |
|
|
Leveraging |
| X |
|
|
|
|
Liquidity |
| X |
| X |
| X |
Manager |
| X |
| X |
|
|
Market and Company |
| X |
| X |
|
|
Market Capitalization |
|
|
| X |
|
|
Mid-Capitalization Company |
| X |
| X |
|
|
Other Investment Companies |
| X |
| X |
| X |
Portfolio Turnover |
|
|
|
|
| X |
Price Volatility |
| X |
|
|
| X |
Securities Lending |
| X |
| X |
| X |
Small-Capitalization Company |
|
|
| X |
|
|
Value Investing |
| X |
|
|
|
|
Call Risk. During periods of falling interest rates, a bond issuer may “call,” or repay, its high-yielding bond before the bond’s maturity date. If forced to invest the unanticipated proceeds at lower interest rates, a Portfolio would experience a decline in income.
Convertible Securities Risk. The value of convertible securities may fall when interest rates rise. Convertible securities with longer maturities tend to be more sensitive to changes in interest rates, usually making them more volatile than convertible securities with shorter maturities. The Portfolio could lose money if the issuer of a convertible security is unable to meet its financial obligations or goes bankrupt.
Debt Securities Risk. The value of debt securities may fall when interest rates rise. Debt securities with longer maturities tend to be more sensitive to changes in interest rates, usually making them more volatile than debt securities with shorter maturities. In addition, debt securities, such as bonds, involve credit risk as described above. These securities are also subject to interest rate risk. This is the risk that the value of the security may fall when interest rates rise. In general, the market price of debt securities with longer maturities tends to be more volatile in response to changes in interest rates than the market price of shorter-term securities.
12
Derivatives Risk. Generally, derivatives can be characterized as financial instruments whose performance is derived, at least in part, from the performance of an underlying asset or assets. Some derivatives are sophisticated instruments that typically involve a small investment of cash relative to the magnitude of risks assumed. These may include swap agreements, options, forwards, and futures. Derivative securities are subject to market risk which could be significant for those that have a leveraging effect. Derivatives are also subject to credit risks related to the counterparty’s ability to perform and any deterioration in the counterparty’s creditworthiness could adversely affect the instrument. In addition, derivatives and their underlying securities may experience periods of illiquidity which could cause a portfolio to hold a security it might otherwise sell or could force the sale of a security at inopportune times or for prices that do not reflect current market value. A risk of using derivatives is that the adviser or sub-adviser might imperfectly judge the market’s direction. For instance, if a derivative is used as a hedge to offset investment risk in another security, the hedge might not correlate to the market’s movements and may have unexpected or undesired results such as a loss or a reduction in gains.
Equity Securities Risk. Equity securities include common, preferred and convertible preferred stocks and securities with values that are tied to the price of the stocks, such as rights, warrants and convertible debt securities. Common and preferred stocks represent equity ownership in a company. Stock markets are volatile. The price of equity securities will fluctuate and can decline and reduce the value of an investment in equities. The price of equity securities fluctuates based on changes in a company’s financial condition and overall market and economic conditions. The value of equity securities purchased by a Portfolio could decline if the financial condition of the companies decline or if overall market economic conditions deteriorate. Even investment in high quality or “blue chip” equity securities or securities of established companies with large market capitalization (which generally have strong financial characteristics) can be negatively impacted by poor overall market and economic conditions. Companies with large market capitalizations may also have less growth potential than smaller companies and may be able to react less quickly to change in the marketplace.
Foreign Investment Risk. Foreign investments may be riskier than U.S. investments for many reasons, including changes in currency exchange rates; unstable political, social, and economic conditions; possible security illiquidity: a lack of adequate or accurate company information; differences in the way securities markets operate; less secure foreign banks or securities depositaries than those in the United States; less standardization of accounting standards and market regulations in certain foreign countries; foreign taxation issues; and varying foreign controls on investments. Foreign investments may also be affected by administrative difficulties, such as delays in clearing and settling transactions. In addition, securities of foreign companies may be denominated in foreign currencies and the costs of buying, selling and holding foreign securities, including brokerage, tax and custody costs, may be higher than those involved in domestic transactions. American Depositary Receipts (“ADRs”), European Depositary Receipts (“EDRs”) and Global Depositary Receipts (“GDRs”) are subject to risks of foreign investments, and they may not always track the price of the underlying foreign security. These factors may make foreign investments more volatile and potentially less liquid than U.S. investments.
Index Strategy Risk. The Portfolio uses an indexing strategy that does not attempt to manage market volatility, use defensive strategies, or reduce the effects of any long-term periods of poor market performance. The correlation between the Portfolio and index performance may be affected by the Portfolio’s expenses and the timing of purchases and redemptions of the Portfolio’s shares.
Investment by Funds-of-Funds. A Portfolio’s shares may be purchased by other investment companies, including through fund-of-funds arrangements within the ING Funds family. In some cases, a Portfolio may serve as a primary or significant investment vehicle for a fund-of-funds. From time to time, a Portfolio may experience large inflows or redemptions due to allocations or rebalancings by these funds-of funds. While it is impossible to predict the overall impact of these transactions over time, there could be adverse effects on portfolio management. For example, a Portfolio may be required to sell securities or invest cash at times when it would not otherwise do so. These transactions could also increase transaction costs or portfolio turnover. The adviser or sub-adviser will monitor transactions by the funds-of funds and will attempt to minimize any adverse effects on the portfolio and funds-of-funds as a result of these transactions. So long as a Portfolio accepts investments by other investment companies, it will not purchase securities of other investment companies, except to the extent permitted by the 1940 Act or under the terms of an exemptive order granted by the SEC.
Investment Models Risk. The proprietary models used by a sub-adviser to evaluate securities or securities markets are based on the Sub-Adviser’s understanding of the interplay of market factors and do not assure successful investment. The markets, or the price of individual securities, may be affected by factors not foreseen in developing the models.
Leveraging Risk. Certain transactions may give rise to a form of leverage. Such transactions may include, among others, reverse repurchase agreements, loans of portfolio securities, and the use of when-issued, delayed delivery or forward commitment transactions. The use of derivatives may also create leveraging risk. To mitigate leveraging risk, a Portfolio
13
will segregate liquid assets or otherwise cover the transactions that may give rise to such risk. The use of leverage may cause a Portfolio to liquidate portfolio positions when it may not be advantageous to do so to satisfy its obligations or to meet segregation requirements. Leverage, including borrowing, may cause a Portfolio to be more volatile than if a Portfolio had not been leveraged. This is because leverage tends to exaggerate the effect of any increase or decrease in the value of a Portfolio’s assets.
Liquidity Risk. If a security is illiquid, the Portfolio might be unable to sell the security at a time when the sub-adviser might wish to sell, and the security could have the effect of decreasing the overall level of the Portfolio’s liquidity. Further, the lack of an established secondary market may make it more difficult to value illiquid securities, which could vary from the amount the Portfolio could realize upon disposition. The Portfolio may make investments that become less liquid in response to market developments or adverse investor perception. The Portfolio could lose money if it cannot sell a security at the time and price that would be most beneficial to the Portfolio.
Manager Risk. A sub-adviser will apply investment techniques and risk analyses in making investment decisions for a Portfolio, but there can be no assurance that these will achieve the Portfolio’s objective. A sub-adviser could do a poor job in executing an investment strategy. A sub-adviser may use the investment techniques or invest in securities that are not part of a Portfolio’s principal investment strategy. For example, if market conditions warrant, Portfolios that invest principally in equity securities may temporarily invest in U.S. government securities, high-quality corporate fixed-income securities, mortgage-related and asset-backed securities or money market instruments. Likewise, Portfolios that invest principally in small- to medium-sized companies may shift to preferred stocks and larger-capitalization stocks. These shifts may alter the risk/return characteristics of the Portfolios and cause them to miss investment opportunities. Individuals primarily responsible for managing a Portfolio may leave their firm or be replaced.
Many sub-advisers of equity Portfolios employ styles that are characterized as “value” or “growth.” However, these terms can have different application by different managers. One sub-adviser’s value approach may be different from another, and one sub-adviser’s growth approach may be different from another. For example, some value managers employ a style in which they seek to identify companies that they believe are valued at a more substantial or “deeper discount” to a company’s net worth than other value managers. Therefore, some Portfolios that are characterized as growth or value can have greater volatility than other Portfolios managed by other managers in a growth or value style.
Market and Company Risk. The price of a security held by a Portfolio may fall due to changing economic, political or market conditions or disappointing earnings or losses. Stock prices in general may decline over short or even extended periods. The stock market tends to be cyclical, with periods when stock prices generally rise and periods when stock prices generally decline. Further, even though the stock market is cyclical in nature, returns from a particular stock market segment in which a Portfolio invests may still trail returns from the overall stock market.
Market Capitalization Risk. Stocks fall into three broad market capitalization categories- large, medium and small. Investing primarily in one category carries the risk that, due to current market conditions, that category may be out of favor with investors. For example, if valuations of large-capitalization companies appear to be greatly out of proportion to the valuations of small- or medium-capitalization companies, investors may migrate to the stocks of small- and mid-sized companies causing the Portfolio that invests in these companies to increase in value more rapidly than the Portfolio that invests in larger, fully-valued companies. Investing in small- and medium-capitalization companies may be subject to special risks associated with narrower product lines, more limited financial resources, smaller management groups, and a more limited trading market for their stocks as compared with larger companies. As a result, stocks of small- and medium-capitalization companies may decline significantly in market downturns. In addition, the market capitalization of a small or mid-sized company may change due to appreciation in the stock price, so that it may no longer have the attributes of the capitalization category that was considered at the time of purchase.
Mid-Capitalization Company Risk. Investment in securities of mid-capitalization companies entails greater risks than investments in larger, more established companies. Mid-capitalization companies tend to have more narrow product lines, more limited financial resources, a more limited trading market for their stocks, and may be dependent on a few key managers, as compared with larger companies. As a result, their stock prices may decline significantly as market conditions change. Securities of mid-capitalization companies tend to be more volatile and less liquid than stocks of larger companies.
Other Investment Companies Risk. A Portfolio may invest in other investment companies to the extent permitted by the 1940 Act and the rules and regulations thereunder. These may include exchange-traded funds (“ETFs”) and Holding Company Depositary Receipts (“HOLDRs”), among others. ETFs are exchange traded investment companies that are designed to provide investment results corresponding to an equity index and include, among others, Standard & Poor’s Depositary Receipts (“SPDRs”), PowerShares QQQTM (“QQQQ”), Dow Jones Industrial Average Trading Stocks
14
(“Diamonds”) and iShares® exchange-traded funds (“iShares”). The main risk of investing in other investment companies (including ETFs) is that the value of the underlying securities held by the investment company might decrease. The value of the underlying securities can fluctuate in response to activities of individual companies or in response to general market and/or economic conditions. Because a Portfolio may invest in other investment companies, you will pay a proportionate share of the expenses of that other investment company (including management fees, administration fees and custodial fees) in addition to the expenses of the Portfolio. Additional risks of investments in ETFs include: (i) the market price of an ETF’s shares may trade at a discount to its net asset value; (ii) an active trading market for an ETF’s shares may not develop or be maintained; or (iii) trading may be halted if the listing exchanges’ officials deem such action appropriate, the shares are delisted from the exchange, or the activation of market-wide “circuit breakers” (which are tied to large decreases in stock prices) halts trading generally. Because HOLDRs concentrate in the stock of a particular industry, trends in that industry may have a dramatic impact on their value.
To seek to achieve a return on un-invested cash or for other reasons, a Portfolio may invest its assets in ING Institutional Prime Money Market Fund and/or one or more other money market funds advised by ING affiliates (“ING Money Market Funds”). A Portfolio’s purchase of shares of an ING Money Market Fund will result in the Portfolio paying a proportionate share of the expenses of the ING Money Market Fund. A Portfolio’s adviser will waive its fee in an amount equal to the advisory fee received by the adviser of the ING Money Market Fund in which the Portfolio invests resulting from the Portfolio’s investment into the ING Money Market Fund.
Portfolio Turnover Risk. A high portfolio turnover rate involves greater expenses to the Portfolio, including brokerage commissions and other transaction costs, which may have an adverse impact on performance.
Price Volatility Risk. The value of a Portfolio changes as the prices of its investments go up or down. Equity securities face market, issuer and other risks, and their values may fluctuate, sometimes rapidly and unpredictably. Market risk is the risk that securities may decline in value due to factors affecting securities markets generally or particular industries. Issuer risk is the risk that the value of a security may decline for reasons relating to the issuer, such as changes in the financial condition of the issuer. While equities may offer the potential for greater long-term growth than most debt securities, they generally have higher volatility. The Portfolio invests primarily in securities of larger companies, which sometimes have more stable prices than smaller companies.
Securities Lending Risk. In order to generate additional income, a Portfolio may lend portfolio securities in an amount up to 331/3% of portfolio assets to broker-dealers, major banks, or other recognized domestic institutional borrowers of securities. When a Portfolio lends its securities, it is responsible for investing the cash collateral it receives from the borrower of the securities, and the Portfolio could incur losses in connection with the investment of such cash collateral. As with other extensions of credit, there are risks of delay in recovery or even loss of rights in the collateral should the borrower default or fail financially.
Small-Capitalization Company Risk. Investment in securities of small companies may entail greater risk than investments in larger, more established companies. Smaller companies may have limited product lines and market diversification or fewer financial resources, and may be dependent on a few key managers. Their securities may trade less frequently and in more limited volume than the securities of larger companies. Consequently, the prices of small company stocks tend to rise and fall in value more than other stocks, and/or may be less liquid. When selling a large quantity of a particular stock, the Portfolio may have to sell at a discount from quoted prices or may have to make a series of small sales over an extended period of time due to the more limited trading volume of smaller company stocks. Although investing in small companies offers potential for above-average returns, the companies may not succeed, and the value of stock shares could decline significantly. Securities of smaller companies tend to be more volatile and less liquid than stocks of larger companies.
Value Investing Risk. A Portfolio may invest in “value” stocks. A sub-adviser may be wrong in its assessment of a company’s value and the stocks a Portfolio holds may not reach what the sub-adviser believes are their full values. A particular risk of a Portfolio’s value approach is that some holdings may not recover and provide the capital growth anticipated or a stock judged to be undervalued may actually be appropriately priced. Further, because the prices of value-oriented securities tend to correlate more closely with economic cycles than growth-oriented securities, they generally are more sensitive to changing economic conditions, such as changes in interest rates, corporate earnings and industrial production. The market may not favor value-oriented stocks and may not favor equities at all. During these periods, a Portfolio’s relative performance may suffer.
15
Portfolio Performance
Set forth below is the performance information for each Portfolio. The Surviving Portfolio commenced operations in March 2008 and does not have performance information for one calendar year. For information about the performance of the Surviving Portfolio’s benchmark index, the Russell Top 200® Index, please see the section titled “Performance of the Russell Top 200® Index” in Appendix C. The bar charts and table below provide some indication of the risks of investing in each Portfolio by showing changes in the performance of each Disappearing Portfolio from year to year and comparing each Portfolio’s performance to that of a broad measure of market performance for the same period.
The bar charts show the performance of Neuberger Berman Partners Portfolio’s ADV Class shares and of Oppenheimer Main Street Portfolio’s Class S shares for each year since inception. Shares of each class of each Portfolio will have different performance due to differing expenses. The performance information does not include insurance-related charges which are, or may be imposed, under a Variable Contract or expenses related to a Qualified Plan. Any charges will reduce your return. Thus, you should not compare the Portfolios’ performance directly with the performance information of other products without taking into account all insurance-related charges and expenses payable under your Variable Contract or direct expenses of your Qualified Plan. Past performance is not necessarily an indication of how the Portfolio will perform in the future.
Neuberger Berman Partners Portfolio
Year-by-Year Total Returns(1) (2)
(For the periods ended December 31 of each year

(1) | These figures are for the year ended December 31 of each year. They do not reflect expenses or charges which are, or may be, |
|
|
(2) | During the period shown in the chart, the Class ADV shares’ best and worst quarterly returns during this period were: Best: 2nd |
16
Oppenheimer Main Street Portfolio
Year-by-Year Total Returns(1) (2) (3)
(For the periods ended December 31 of each year)

(1) | These figures are for the year ended December 31 of each year. They do not reflect expenses or charges which are, or may be, imposed under your Variable Contract or Qualified Plan, and would be lower if they did. |
|
|
(2) | During the period shown in the chart, the Class S shares’ best and worst quarterly returns during this period were: Best: 4th Quarter 1999: 21.71% Worst: 4th Quarter 2008: (22.29)%. |
|
|
(3) | Oppenheimer Funds, Inc. has managed the Portfolio since November 8, 2004. Prior to November 8, 2004, the Portfolio was managed by Massachusetts Financial Services Company, and had a different investment objective and principal investment strategies. Performance prior to November 8, 2004 is attributable to Massachusetts Financial Services Company. |
17
Average Annual Total Returns
(For the periods ended December 31, 2008)
|
| 1 Year |
| 5 Years |
| 10 Years |
|
Neuberger Berman Partners Portfolio* |
|
|
|
|
|
|
|
ADV Class |
| (51.52 | )% | (27.41 | )% | — |
|
S&P 500® Index(1) |
| (37.00 | )% | (18.47 | )%(3) | — |
|
Class I |
| (51.12 | )% | (17.34 | )% | — |
|
S&P 500® Index(1) |
| (37.00 | )% | (9.40 | )%(4) | — |
|
Class S |
| (51.29 | )% | (16.79 | )% | — |
|
S&P 500® Index(1) |
| (37.00 | )% | (8.36 | )%(5) | — |
|
|
|
|
|
|
|
|
|
Oppenheimer Main Street Portfolio** |
|
|
|
|
|
|
|
ADV Class |
| (39.01 | )% | (13.26 | )% | — |
|
S&P 500® Index(1) |
| (37.00 | )% | (11.19 | )%(6) | — |
|
Class I |
| (38.57 | )% | (2.35 | )% | 1.10 | % |
S&P 500® Index(1) |
| (37.00 | )% | (2.19 | )% | 1.68 | %(7) |
Class S |
| (38.69 | )% | (2.59 | )% | (2.65 | )% |
S&P 500® Index(1) |
| (37.00 | )% | (2.19 | )% | (1.38 | )% |
Class S2 |
| (38.80 | )% | (2.74 | )% | 1.02 | % |
S&P 500® Index(1) |
| (37.00 | )% | (2.19 | )% | 1.71 | %(8) |
|
|
|
|
|
|
|
|
RussellTM Large Cap Index Portfolio*** |
|
|
|
|
|
|
|
ADV Class |
| (27.42 | )% | — |
| — |
|
Russell Top 200® Index(2) |
| (29.78 | )%(9) | — |
| — |
|
Class I |
| (27.06 | )% | — |
| — |
|
Russell Top 200® Index(2) |
| (29.78 | )%(9) | — |
| — |
|
Class S |
| (27.23 | )% | — |
| — |
|
Russell Top 200® Index(2) |
| (29.78 | )%(9) | — |
| — |
|
* | ADV Class, Class I and Class S of Neuberger Berman Partners Portfolio commenced operations on December 29, 2006, January 19, 2006 and January 3, 2006, respectively. Class S2 had not commenced operations as of December 31, 2008. |
|
|
** | ADV Class, Class I, Class S and Class S2 of Oppenheimer Main Street Portfolio commenced operations on April 28, 2006, May 1, 2003, August 14, 1998 and September 9, 2002, respectively. |
|
|
*** | ADV Class, Class I and Class S of RussellTM Large Cap Index commenced operations March 10, 2008. Class S2 had not commenced operations as of December 31, 2008. |
|
|
(1) | The S&P 500® Index is an unmanaged index that measures the performance of the securities of approximately 500 of the largest companies in the U.S. |
|
|
(2) | The Russell Top 200® Index is an unmanaged index that measures the performance of the largest cap segment of the U.S. equity universe. The Russell Top 200® Index is subset of the Russell Top 300® Index. It includes approximately 200 of the largest securities based on a combination of their market cap and current index membership and represents approximately 68% of the U.S. market. |
|
|
(3) | Since inception performance of the index is shown from January 1, 2007. |
|
|
(4) | Since inception performance of the index is shown from February 1, 2006. |
|
|
(5) | Since inception performance of the index is shown from January 1, 2006. |
|
|
(6) | Since inception performance of the index is shown from May 1, 2006. |
18
(7) | Since inception performance of the index is shown from May 1, 2003. |
|
|
(8) | Since inception performance of the index is shown from September 1, 2002. |
|
|
(9) | Since inception performance of the index is shown from March 1, 2008. |
Additional information regarding Russell™ Large Cap Index Portfolio is included in Appendix C to this Proxy Statement/Prospectus.
19
COMPARISON OF FEES AND EXPENSES
The following discussion describes and compares the fees and expenses of the Portfolios. For further information on the fees and expenses of Russell™ Large Cap Index Portfolio, see “Appendix C: Additional Information Regarding ING Russell™ Large Cap Index Portfolio.”
Management Fees
Each Portfolio pays its investment adviser — DSL for each Disappearing Portfolio and ING Investments for the Surviving Portfolio - a management fee, payable monthly, based on the average daily net assets of the respective Portfolio. The following table shows the aggregate annual management fee paid by each Portfolio as a percentage of that Portfolio’s average daily net assets:
Portfolio |
| Management Fees |
Neuberger Berman Partners Portfolio |
| 0.60% of the Portfolio’s average daily net assets |
|
|
|
Oppenheimer Main Street Portfolio(1) |
| 0.750% on the first $250 million; |
|
|
|
Russell™ Large Cap Index Portfolio |
| 0.25% of the Portfolio’s average daily net assets |
If shareholders approve the Reorganization(s), Russell™ Large Cap Index Portfolio will pay the same management fee currently in place. For more information regarding the management fees for each Portfolio, please see the SAI of each Portfolio, dated May 1, 2009.
Sub-Adviser Fees
DSL and ING Investments each pay the sub-adviser to each respective Portfolio - Neuberger Berman for Neuberger Berman Partners Portfolio, Oppenheimer for Oppenheimer Main Street Portfolio and ING IM for Russell™ Large Cap Index Portfolio - a sub-advisory fee, payable monthly, based on the average daily net assets of each respective Portfolio. The following table shows the aggregate annual sub-advisory fee paid by each adviser to the sub-adviser, as a percentage of each respective Portfolio’s average daily net assets:
Portfolio |
| Sub-Adviser Fees |
Neuberger Berman Partners Portfolio |
| 0.35% of the first $1 billion; and |
|
|
|
Oppenheimer Main Street Portfolio(2) |
| 0.30% if total assets at any month-end are less than or equal to $1 billion; and |
|
|
|
Russell™ Large Cap Index Portfolio |
| 0.1125% of the Portfolio’s average daily net assets |
(1) For the purpose of calculating the advisory fee, the assets of Oppenheimer Main Street Portfolio are aggregated with the assets of ING MFS Total Return Portfolio, a separate series of ING Investors Trust, which is not a party to the Reorganization. The aggregated assets will be applied to the above schedule and the resulting fee rate shall be prorated back to the portfolios and their respective investment adviser based on relative net assets.
(2) For the purpose of calculating the sub-advisory fee, the assets of Oppenheimer Main Street Portfolio are aggregated with those of ING Oppenheimer Global Portfolio and ING Oppenheimer Strategic Income Portfolio, two series managed by ING Investments and sub-advised by Oppenheimer.
20
If shareholders approve the Reorganization(s), ING Investments will continue to pay ING IM, the sub-adviser to Russell™ Large Cap Index Portfolio, the same sub-advisory fee currently in place for Russell™ Large Cap Index Portfolio. For more information regarding the sub-advisory fees for each Portfolio, please see the SAI of each Portfolio, dated May 1, 2009.
With respect to Neuberger Berman Partners Portfolio, as a result of the change in sub-adviser from Neuberger Berman to ING IM, the investment management subsidiaries of ING Groep N.V. (“ING Groep”), as a group, will be able to retain the entire advisory fee. Based on the net assets of the Surviving Portfolio as of December 31, 2008, the additional retained amount is estimated to be $137,000 in the first year and $169,000 per year thereafter. There is no additional benefit to ING Groep as a result of the change in sub-adviser from Oppenheimer to ING IM in connection with the proposed Reorganization of Oppenheimer Main Street Portfolio.
Administration Fees
Pursuant to an administrative services agreement between ING Partners, Inc. (“IPI”) and ING Funds Services, LLC (“IFS”), IFS provides all administrative services in support of Neuberger Berman Partners Portfolio and is responsible for the supervision of the Portfolio’s other service providers. As compensation for its services, IFS receives a monthly fee from Neuberger Berman Partners Portfolio. The fee is computed daily and payable monthly, at an annual rate of 0.10% of the Portfolio’s average daily net assets. For the fiscal year ended December 31, 2008, the Portfolio paid a total of $415,081 in administrative fees.
The management agreement between ING Investors Trust (“IIT”), on behalf of Oppenheimer Main Street Portfolio, and DSL, provides for a “bundled fee” arrangement, under which DSL provides, in addition to advisory services, administrative services and other services necessary for the ordinary operation of the Portfolio and pays for the services and information necessary to the proper conduct of the Portfolio’s business, including custodial, administrative, transfer agency, portfolio accounting, auditing, and ordinary legal services, in return for the single management fee. As such, the Portfolio does not pay separate administration fees.
ING Variable Portfolios, Inc. (“IVP”) on behalf of Russell™ Large Cap Index Portfolio and IFS also have an administrative services agreement, pursuant to which IFS provides all administrative services in support of Russell™ Large Cap Index Portfolio. As compensation for its services, IFS receives a monthly fee from the Portfolio at an annual rate of 0.10% of the Portfolio’s average daily net assets. For the fiscal year ended December 31, 2008, the Portfolio paid a total of $512,903 in administrative fees.
If shareholders approve the Reorganization(s), Russell™ Large Cap Index Portfolio will continue to pay the current fees for administrative services.
Distribution and Service Fees
ADV Class, Class S and Class S2 shares of the Portfolios pay the distribution (12b-1) and/or service fees as described in the table entitled “Annual Portfolio Operating Expenses” below. Because these fees are paid out of the Portfolios’ assets on an on-going basis, over time these fees will increase the cost of your investment.
Expense Limitation Arrangements
DSL entered into a written expense limitation agreement with Neuberger Berman Partners Portfolio, under which it will limit expenses of the Portfolio, excluding interest, taxes, brokerage commissions, extraordinary expenses and acquired fund fees and expenses, subject to possible recoupment by DSL within three years. The expense limitation agreement shall continue until May 1, 2010. The expense limitation agreement is contractual and shall renew automatically for one-year terms unless DSL provides written notice of termination of the expense limitation agreement at least 90 days prior to the end of the then current term or upon termination of the management agreement. Pursuant to the expense limitation agreement, the expense limits for Neuberger Berman Partners Portfolio are 1.17%, 0.67%, 0.92% and 1.07% for ADV Class, Class I, Class S and Class S2 shares, respectively.
Separately, IFD has contractually agreed to waive all or a portion of its shareholder services fees and/or reimburse shareholder services fees for Class S of Neuberger Berman Partners Portfolio so that the Portfolio’s “Net Operating Expenses” do not exceed 0.89% through May 1, 2010. This waiver is not subject to recoupment.
Oppenheimer Main Street Portfolio does not currently have an expense limitation agreement in place.
21
ING Investments has entered into a written expense limitation agreement with Russell™ Large Cap Index Portfolio, under which it will limit expenses of the Portfolio, excluding interest, taxes, brokerage commissions, extraordinary expenses and acquired fund fees and expenses, subject to possible recoupment by ING Investments within three years. The expense limitation agreement shall continue until May 1, 2010. The expense limitation agreement is contractual and shall renew automatically for one-year terms unless ING Investments provides written notice of termination of the expense limitation agreement at least 90 days prior to the end of the then current term or upon termination of the management agreement. Pursuant to the expense limitation agreement, the expense limits for Russell™ Large Cap Index Portfolio are 0.87%, 0.37%, 0.62% and 0.77% for ADV Class, Class I, Class S and Class S2 shares, respectively.
22
Expense Tables
As shown in the table below, shares of the Portfolios are not subject to sales charges or shareholder transaction fees. The table below does not reflect surrender charges and other charges assessed by your Insurance Company under your Variable Contract or Qualified Plan.
Transaction Fees on New Investments
(fees paid directly from your investment)
|
| Neuberger Berman |
| Oppenheimer Main |
| Russell™ Large Cap |
|
Maximum sales charge (load) imposed on purchases (as a percentage of offering price) |
| N/A |
| N/A |
| N/A |
|
|
|
|
|
|
|
|
|
Maximum deferred sales charge (load) (as a percentage of the lower of original purchase price or redemption proceeds) |
| N/A |
| N/A |
| N/A |
|
None of the Portfolios has any redemption fees, exchange fees or sales charges on reinvested dividends.
Portfolio Expenses
The following table shows the current expenses of each of the Portfolios and estimated pro forma expenses, giving effect to: (i) the proposed Reorganization of Neuberger Berman Partners Portfolio into Russell™ Large Cap Index Portfolio (assuming the Reorganization of Oppenheimer Main Street Portfolio does not occur); (ii) the proposed Reorganization of Oppenheimer Main Street Portfolio into Russell™ Large Cap Index Portfolio (assuming the Reorganization of Neuberger Berman Partners Portfolio does not occur); and (iii) the proposed Reorganization of both Disappearing Portfolios into Russell™ Large Cap Index Portfolio. Expenses are based upon the operating expenses incurred by each Portfolio for the fiscal year ended December 31, 2008, except that expenses of Class S2 shares of Neuberger Berman Partners Portfolio and Russell™ Large Cap Index Portfolio are estimated for the current fiscal year. Pro forma fees show estimated fees of Russell™ Large Cap Index Portfolio after giving effect to the proposed Reorganization(s) as adjusted to reflect applicable expense limitation and fee waivers arrangements. Pro forma numbers are estimated in good faith and are hypothetical. Your Variable Contract is a contract between you and the issuing Participating Insurance Company. Neither Portfolio is a party to that Variable Contract. The Portfolios are merely an investment option made available to you by your Participating Insurance Company under your Variable Contract. The fees and expenses of the Portfolios are not fixed or specified under the terms of your Variable Contract. The table does not reflect expenses and charges that are, or may be, imposed under your Variable Contract. For information on these charges, please refer to the applicable Variable Contract prospectus, prospectus summary or disclosure statement. If you participate through a Qualified Plan, the table does not reflect the direct expenses of the Qualified Plan, and you should consult your plan administrator for more information.
23
Annual Portfolio Operating Expenses
(as of December 31, 2008)(1)
(expenses that are deducted from Portfolio assets, shown as a ratio of expenses to average daily net assets)
|
| Neuberger |
| Oppenheimer |
| Russell™ |
| Pro Forma |
| Pro Forma |
| Pro Forma |
|
|
|
|
|
|
|
|
|
|
|
|
|
|
|
ADV Class |
|
|
|
|
|
|
|
|
|
|
|
|
|
Management Fee |
| 0.60 | % | 0.66 | % | 0.25 | % | 0.25 | % | 0.25 | % | 0.25 | % |
Distribution (12b-1) and Shareholder Servicing Fees(2) |
| 0.50 | % | 0.75 | % | 0.50 | % | 0.50 | % | 0.50 | % | 0.50 | % |
Other Expenses(3) |
| 0.15 | % | 0.00 | % | 0.14 | % | 0.14 | % | 0.14 | % | 0.14 | % |
Acquired Portfolio Fees and Expenses(4) |
| N/A |
| 0.00 | % | 0.00 | % | 0.00 | % | 0.00 | % | 0.00 | % |
Total Portfolio Operating Expenses |
| 1.25 | % | 1.41 | % | 0.89 | % | 0.89 | % | 0.89 | % | 0.89 | % |
Waivers, Reimbursement and Recoupment(5) |
| (0.08 | )% | (0.15 | )% | (0.02 | )% | (0.02 | )% | (0.02 | )% | (0.02 | )% |
Net Expenses |
| 1.17 | % | 1.26 | % | 0.87 | % | 0.87 | % | 0.87 | % | 0.87 | % |
|
|
|
|
|
|
|
|
|
|
|
|
|
|
Class I |
|
|
|
|
|
|
|
|
|
|
|
|
|
Management Fee |
| 0.60 | % | 0.66 | % | 0.25 | % | 0.25 | % | 0.25 | % | 0.25 | % |
Distribution (12b-1) and Shareholder Servicing Fees(2) |
| N/A |
| N/A |
| N/A |
| N/A |
| N/A |
| N/A |
|
Other Expenses(3) |
| 0.15 | % | 0.00 | % | 0.14 | % | 0.14 | % | 0.14 | % | 0.14 | % |
Acquired Portfolio Fees and Expenses(4) |
| N/A |
| 0.00 | % | 0.00 | % | 0.00 | % | 0.00 | % | 0.00 | % |
Total Portfolio Operating Expenses |
| 0.75 | % | 0.66 | % | 0.39 | % | 0.39 | % | 0.39 | % | 0.39 | % |
Waivers, Reimbursement and Recoupment(5) |
| (0.08 | )% | — |
| (0.02 | )% | (0.02 | )% | (0.02 | )% | (0.02 | )% |
Net Expenses |
| 0.67 | % | 0.66 | % | 0.37 | % | 0.37 | % | 0.37 | % | 0.37 | % |
|
|
|
|
|
|
|
|
|
|
|
|
|
|
Class S |
|
|
|
|
|
|
|
|
|
|
|
|
|
Management Fee |
| 0.60 | % | 0.66 | % | 0.25 | % | 0.25 | % | 0.25 | % | 0.25 | % |
Distribution (12b-1) and Shareholder Servicing Fees(2) |
| 0.25 | %(6) | 0.25 | % | 0.25 | % | 0.25 | % | 0.25 | % | 0.25 | % |
Other Expenses(3) |
| 0.15 | % | 0.00 | % | 0.14 | % | 0.14 | % | 0.14 | % | 0.14 | % |
Acquired Portfolio Fees and Expenses(4) |
| N/A |
| 0.00 | % | 0.00 | % | 0.00 | % | 0.00 | % | 0.00 | % |
Total Portfolio Operating Expenses |
| 1.00 | % | 0.91 | % | 0.64 | % | 0.64 | % | 0.64 | % | 0.64 | % |
Waivers, Reimbursement and Recoupment(5) |
| (0.11 | )% | — |
| (0.02 | )% | (0.02 | )% | (0.02 | )% | (0.02 | )% |
Net Expenses |
| 0.89 | % | 0.91 | % | 0.62 | % | 0.62 | % | 0.62 | % | 0.62 | % |
|
|
|
|
|
|
|
|
|
|
|
|
|
|
Class S2 (7) |
|
|
|
|
|
|
|
|
|
|
|
|
|
Management Fee |
| 0.60 | % | 0.66 | % | 0.25 | % | 0.25 | % | 0.25 | % | 0.25 | % |
Distribution (12b-1) and Shareholder Servicing Fees(2) |
| 0.50 | % | 0.50 | % | 0.50 | % | 0.50 | % | 0.50 | % | 0.50 | % |
Other Expenses(3) |
| 0.15 | % | 0.00 | % | 0.14 | % | 0.14 | % | 0.14 | % | 0.14 | % |
Acquired Portfolio Fees and Expenses(4) |
| N/A |
| 0.00 | % | 0.00 | % | 0.00 | % | 0.00 | % | 0.00 | % |
Total Portfolio Operating Expenses |
| 1.25 | % | 1.16 | % | 0.89 | % | 0.89 | % | 0.89 | % | 0.89 | % |
Waivers, Reimbursement and Recoupment(5) |
| (0.18 | )% | (0.10 | )% | (0.12 | )% | (0.12 | )% | (0.12 | )% | (0.12 | )% |
Net Expenses |
| 1.07 | % | 1.06 | % | 0.77 | % | 0.77 | % | 0.77 | % | 0.77 | % |
24
(1) The fiscal year end for each Portfolio is December 31. This table shows the estimated operating expenses for shares of the Portfolios, as a ratio of expenses to average daily net assets. These ratios are based on each Portfolio’s actual operating expenses as of December 31, 2008, as adjusted for contractual changes and waivers, if any.
(2) IFD has contractually agreed to waive a portion of the distribution fee (0.15% for the ADV Class shares of Oppenheimer Main Street Portfolio and 0.10% for the Class S2 shares of Oppenheimer Main Street Portfolio and Russell™ Large Cap Index Portfolio) so that the actual fee paid by the applicable ADV Class and Class S2 shares, is an annual rate of 0.35% and 0.15%, respectively. Absent the waiver, the distribution fee is 0.50% for ADV Class shares of Oppenheimer Main Street Portfolio and 0.25% for Class S2 shares of Oppenheimer Main Street Portfolio and Russell™ Large Cap Index Portfolio. The waiver will continue through at least May 1, 2010. There is no guarantee that this waiver will continue after this date.
(3) Pursuant to an administration agreement, IFS receives an annual administration fee equal to 0.10% of the average daily net assets of each of Neuberger Berman Partners Portfolio and Russell™ Large Cap Index Portfolio. Russell Investment Group receives an annual licensing fee for the Russell Top 200® Index. The management agreement between IIT, on behalf of Oppenheimer Main Street Portfolio, and DSL, provides for a “bundled fee” arrangement, under which DSL provides, in addition to advisory services, administrative services and other services necessary for the ordinary operation of the Portfolio and pays for the services and information necessary to the proper conduct of the Portfolio’s business, including custodial, administrative, transfer agency, portfolio accounting, auditing, and ordinary legal services, in return for the single management fee. As such, Oppenheimer Main Street Portfolio does not pay a separate administration fee.
(4) The Acquired Portfolio Fees and Expenses are not fees or expenses incurred by the Portfolio directly. These fees and expenses include each Portfolio’s pro rata share of the cumulative expenses charged by the acquired funds in which the Portfolios invest. The fees and expenses will vary based on the Portfolio’s allocation of assets to, and the annualized net expenses of, the particular acquired funds. The impact of these fees is shown in “Net Expenses.” The amounts of these fees and expenses represent less than 0.01% and are included in “Other Expenses.”
(5) Each Portfolio’s respective investment adviser has entered into a written expense limitation agreement with the Portfolio (except Oppenheimer Main Street Portfolio), under which it will limit expenses of the Portfolio, excluding interest, taxes, brokerage commissions, extraordinary expenses and acquired fund fees and expenses, subject to possible recoupment by the investment adviser within three years. With respect to each applicable Portfolio, the expense limitation agreement shall continue until May 1, 2010. The amount of the Portfolio’s expenses waived, reimbursed or recouped during the last fiscal year is shown under the heading Waivers, Reimbursements, and Recoupment. This amount also includes the distribution fee waiver discussed in footnote 2. The expense limitation agreement is contractual and shall renew automatically for one-year terms unless the adviser provides written notice of termination of the expense limitation agreement at least 90 days prior to the end of the then current term or upon termination of the management agreement.
(6) IFD has contractually agreed to waive all or a portion of its shareholder services fees and/or reimburse shareholder services fees for Class S of Neuberger Berman Partners Portfolio so that the Portfolio’s “Net Operating Expenses” do not exceed 0.89% through May 1, 2010. This waiver is not subject to recoupment.
(7) Since Class S2 shares of Neuberger Berman Partners Portfolio and Russell™ Large Cap Index Portfolio had not commenced operations as of December 31, 2008, expenses are estimated for the current fiscal year.
25
Examples(1). The following examples are intended to help you compare the cost of investing in each Portfolio and the combined Portfolio. The examples assume that you invest $10,000 in each Portfolio and in the combined Portfolio after the Reorganization(s) for the time periods indicated. The examples also assume that your investment has a 5% return each year and that each Portfolio’s operating expenses remain the same. The 5% return is an assumption and is not intended to portray past or future investment results. Based on the above assumptions, you would pay the following expenses if you redeem all your shares at the end of each period shown. Your actual costs may be higher or lower.
|
| 1 Year |
| 3 Years |
| 5 Years |
| 10 Years |
| ||||
ADV Class |
|
|
|
|
|
|
|
|
| ||||
Neuberger Berman Partners Portfolio |
| $ | 119 |
| $ | 389 |
| $ | 679 |
| $ | 1,504 |
|
Oppenheimer Main Street Portfolio |
| $ | 128 |
| $ | 431 |
| $ | 757 |
| $ | 1,678 |
|
Russell™ Large Cap Index Portfolio |
| $ | 89 |
| $ | 282 |
| $ | 491 |
| $ | 1,094 |
|
The Surviving Portfolio Pro Forma (Assuming only the Neuberger Berman Partners Portfolio with and into Russell™ Large Cap Index Portfolio Reorganization was consummated) |
| $ | 89 |
| $ | 282 |
| $ | 491 |
| $ | 1,094 |
|
The Surviving Portfolio Pro Forma (Assuming only the Oppenheimer Main Street Portfolio with and into Russell™ Large Cap Index Portfolio Reorganization was consummated) |
| $ | 89 |
| $ | 282 |
| $ | 491 |
| $ | 1,094 |
|
The Surviving Portfolio Pro Forma (Assuming both Reorganizations were consummated) |
| $ | 89 |
| $ | 282 |
| $ | 491 |
| $ | 1,094 |
|
|
|
|
|
|
|
|
|
|
| ||||
Class I |
|
|
|
|
|
|
|
|
| ||||
Neuberger Berman Partners Portfolio |
| $ | 68 |
| $ | 232 |
| $ | 409 |
| $ | 923 |
|
Oppenheimer Main Street Portfolio |
| $ | 67 |
| $ | 211 |
| $ | 368 |
| $ | 822 |
|
Russell™ Large Cap Index Portfolio |
| $ | 38 |
| $ | 123 |
| $ | 217 |
| $ | 491 |
|
The Surviving Portfolio Pro Forma (Assuming only the Neuberger Berman Partners Portfolio with and into Russell™ Large Cap Index Portfolio Reorganization was consummated) |
| $ | 38 |
| $ | 123 |
| $ | 217 |
| $ | 491 |
|
The Surviving Portfolio Pro Forma (Assuming only the Oppenheimer Main Street Portfolio with and into Russell™ Large Cap Index Portfolio Reorganization was consummated) |
| $ | 38 |
| $ | 123 |
| $ | 217 |
| $ | 491 |
|
The Surviving Portfolio Pro Forma (Assuming both Reorganizations were consummated) |
| $ | 38 |
| $ | 123 |
| $ | 217 |
| $ | 491 |
|
|
|
|
|
|
|
|
|
|
| ||||
Class S |
|
|
|
|
|
|
|
|
| ||||
Neuberger Berman Partners Portfolio |
| $ | 91 |
| $ | 307 |
| $ | 542 |
| $ | 1,215 |
|
Oppenheimer Main Street Portfolio |
| $ | 93 |
| $ | 290 |
| $ | 504 |
| $ | 1,120 |
|
Russell™ Large Cap Index Portfolio |
| $ | 63 |
| $ | 203 |
| $ | 355 |
| $ | 796 |
|
The Surviving Portfolio Pro Forma (Assuming only the Neuberger Berman Partners Portfolio with and into Russell™ Large Cap Index Portfolio Reorganization was consummated) |
| $ | 63 |
| $ | 203 |
| $ | 355 |
| $ | 796 |
|
26
The Surviving Portfolio Pro Forma (Assuming only the Oppenheimer Main Street Portfolio with and into Russell™ Large Cap Index Portfolio Reorganization was consummated) |
| $ | 63 |
| $ | 203 |
| $ | 355 |
| $ | 796 |
|
The Surviving Portfolio Pro Forma (Assuming both Reorganizations were consummated) |
| $ | 63 |
| $ | 203 |
| $ | 355 |
| $ | 796 |
|
|
|
|
|
|
|
|
|
|
| ||||
Class S2 |
|
|
|
|
|
|
|
|
| ||||
Neuberger Berman Partners Portfolio(2) |
| $ | 109 |
| $ | 379 |
| $ | 669 |
| $ | 1,495 |
|
Oppenheimer Main Street Portfolio |
| $ | 108 |
| $ | 359 |
| $ | 629 |
| $ | 1,400 |
|
Russell™ Large Cap Index Portfolio(2) |
| $ | 79 |
| $ | 272 |
| $ | 481 |
| $ | 1,085 |
|
The Surviving Portfolio Pro Forma (Assuming only the Neuberger Berman Partners Portfolio with and into Russell™ Large Cap Index Portfolio Reorganization was consummated) |
| $ | 79 |
| $ | 272 |
| $ | 481 |
| $ | 1,085 |
|
The Surviving Portfolio Pro Forma (Assuming only the Oppenheimer Main Street Portfolio with and into Russell™ Large Cap Index Portfolio Reorganization was consummated) |
| $ | 79 |
| $ | 272 |
| $ | 481 |
| $ | 1,085 |
|
The Surviving Portfolio Pro Forma (Assuming both Reorganizations were consummated) |
| $ | 79 |
| $ | 272 |
| $ | 481 |
| $ | 1,085 |
|
(1) The Examples reflect the expense limitation agreements/waivers for the one-year period and the first year of the three-, five-, and ten-year periods.
(2) Since Class S2 shares had not commenced operations as of December 31, 2008, expenses are estimated for the current fiscal year.
Portfolio Transitioning
If shareholders of a Disappearing Portfolio approve the applicable Reorganization, the adviser or sub-adviser to such Disappearing Portfolio is expected to sell all or a significant portion of the Portfolio’s holdings shortly prior to the Closing Date to transition its portfolio holdings to Russell™ Large Cap Index Portfolio. The proceeds of such sales may be held in temporary investments or invested in assets that Russell™ Large Cap Index Portfolio may hold or wish to hold. After the Closing Date, the sub-adviser to Russell™ Large Cap Index Portfolio may also sell portfolio securities that it acquired from a Disappearing Portfolio, and Russell™ Large Cap Index Portfolio may not be immediately fully invested in accordance with its strategies. Each Portfolio may engage in a variety of transition management techniques to facilitate the portfolio transition process, including without limitation, the purchase and sale of baskets of securities and exchange traded funds, and enter into and close futures contracts or other derivative transactions. During the Transition Period, a Disappearing Portfolio may not be pursuing its investment objective and strategies, and limitations on permissible investments and investment restrictions will not apply. Furthermore, such sales and purchases may be made at a disadvantageous time, would result in increased transactional costs, which are ultimately borne by shareholders, and may result in the realization of taxable gains or losses for the Portfolios.
27
Key Differences in the Rights of Each Disappearing Portfolio’s Shareholders and the Surviving Portfolio’s Shareholders
Neuberger Berman Partners Portfolio is organized as a separate series of IPI, while Russell™ Large Cap Index Portfolio is organized as a separate series of IVP. Each of IPI and IVP is a Maryland corporation that is governed by Articles of Incorporation and Bylaws. There is no material difference in the rights of Neuberger Berman Partners Portfolio’s shareholders and Russell™ Large Cap Index Portfolio’s shareholders under the Portfolios’ respective Articles of Incorporation and Bylaws.
Oppenheimer Main Street Portfolio is organized as a separate series of IIT, a Massachusetts business trust that is governed by a Declaration of Trust and Bylaws. Key differences in shareholders’ rights under IIT’s Declaration of Trust and Bylaws and IVP’s Articles of Incorporation and Bylaws, as they affect shareholders of Oppenheimer Main Street Portfolio and Russell™ Large Cap Index Portfolio, are presented below.
Oppenheimer Main Street Portfolio |
| Russell™ Large Cap Index Portfolio |
Both shareholders and Trustees have the power to amend the Declaration of Trust. Trustees have the power to amend the Declaration of Trust, subject to certain conditions, so long as such amendment does not materially adversely affect the rights of any shareholders and is not in contravention of applicable law. Trustees may also amend the Declaration of Trust without a shareholder vote if they deem it necessary to conform the Declaration of Trust to applicable federal and state laws, to change the name of the Trust, or to supply any omission or to cure any ambiguous, defective or inconsistent provisions. No amendment to the Declaration of Trust shall repeal the prohibition of assessment upon the shareholders without the express consent of each shareholder involved. |
| The Corporation reserves the right from time to time to make any amendment to its Charter now or hereafter authorized by law, including any amendment which alters the rights, as expressly set forth in its Charter, of any outstanding Shares, except that no action affecting the validity or assessibility of such Shares shall be taken without the unanimous approval of the outstanding Shares affected thereby. |
Because Oppenheimer Main Street Portfolio is organized as a series of a Massachusetts business trust and Russell™ Large Cap Index Portfolio is organized as a series of a Maryland corporation there are some differences between the rights of shareholders of the Portfolios. Under Massachusetts law, shareholders of a Massachusetts business trust, under certain circumstances, could be held personally liable for the obligations of the business trust. However, IIT’s Declaration of Trust disclaims shareholder liability for acts or obligations of the Portfolio. As such, shareholders of Oppenheimer Main Street Portfolio have no personal liability for the Portfolio’s acts or obligations. Under Maryland law, shareholders of Russell™ Large Cap Index Portfolio have no personal liability for the Portfolio’s acts or obligations.
28
INFORMATION ABOUT THE REORGANIZATIONS
The Reorganization Agreements
The terms and conditions under which proposed transactions may be consummated are set forth in the Reorganization Agreements. Significant provisions of the Reorganization Agreements are summarized below; however, this summary is qualified in its entirety by reference to the Reorganization Agreements, copies of which are attached to this Proxy Statement/Prospectus as Appendix A-1 and Appendix A-2.
Each Reorganization Agreement provides for: (i) the transfer, as of the Closing Date, of all of the assets of the respective Disappearing Portfolio in exchange for shares of beneficial interest of Russell™ Large Cap Index Portfolio and the assumption by Russell™ Large Cap Index Portfolio of such Disappearing Portfolio’s known liabilities, as set forth in that Portfolio’s Statement of Assets and Liabilities as of the Closing Date; and (ii) the distribution of shares of Russell™ Large Cap Index Portfolio to shareholders of such Disappearing Portfolio, as provided for in the Reorganization Agreement. The applicable Disappearing Portfolio will then be liquidated. You should note that each Reorganization is independent and not contingent upon the approval or consummation of the other Reorganization.
Each shareholder of ADV Class, Class I, Class S and, where applicable, Class S2 shares of a Disappearing Portfolio will hold, immediately after the Closing Date, shares of the corresponding class of Russell™ Large Cap Index Portfolio having an aggregate value equal to the aggregate value of the shares of such Disappearing Portfolio held by that shareholder as of the close of business on the Closing Date. Class S2 of Neuberger Berman Partners Portfolio is scheduled to be launched on May 1, 2009, but shares of this class are not expecded to be offered to shareholders prior to the closing date. In the interest of economy and convenience, shares of Russell™ Large Cap Index Portfolio generally will not be represented by physical certificates, unless you request the certificates in writing.
The obligations of the Portfolios under the each Reorganization Agreement are subject to various conditions, including approval of the shareholders of the respective Disappearing Portfolio. Each Reorganization Agreement also requires that each of the Portfolios involved take, or cause to be taken, all actions, and do or cause to be done, all things reasonably necessary, proper or advisable to consummate and make effective the transactions contemplated by the Reorganization Agreement. Each Reorganization Agreement may be terminated by mutual agreement of the parties or on certain other grounds. Please refer to Appendix A-1 and/or Appendix A-2 to review the terms and conditions of the Reorganization Agreement involving the Portfolio in which you are invested.
Reasons for the Reorganizations
Each Reorganization is one of several proposed reorganizations of actively-managed funds into passively-managed index funds. The ING family of funds has recently expanded its mutual fund offerings and made available a group of index funds. For the reorganizations, the index funds are intended to provide current shareholders of the disappearing funds with investment options that have a greater potential for long-term viability. The Disappearing Portfolios were available as investment options for Variable Contracts issued by ING-affiliated Participating Insurance Companies, but effective May 1, 2009, are no longer available as investment options under certain Variable Contracts. The Participating Insurance Companies that issued the Variable Contracts bear the investment risk for guarantees and benefits under those Variable Contracts and related riders. Those Participating Insurance Companies have informed the investment advisers to the ING Funds and the Boards of the ING Funds that they are seeking funds for their Variable Contract platform that could help reduce their potential investment risk or make it easier for them to hedge their investment risk. In this context and in light of recent market conditions, the Participating Insurance Companies removed certain actively-managed funds, including the Disappearing Portfolios, as investment options for certain Variable Contracts in the insurers’ product menu. As a result, those funds have lost important sources of asset inflows, which is detrimental to their long-term viability. In the meantime, the Participating Insurance Companies have added the new passively-managed index funds, including Russell™ Large Cap Index Portfolio, to their product menu. The investment advisers believe and recommended the reorganizations on the basis that each index fund, including Russell™ Large Cap Index Portfolio, will be a prominent offering on the Variable Contract platform in the future and that each reorganization would help provide investors with a surviving fund with comparable risk/return characteristics at lower expenses and greater prospects for long-term viability.
The proposed Reorganizations were presented for consideration to the Board of Directors/Trustees of the Disappearing Portfolios (the directors of Neuberger Berman Partners Portfolio are the same individuals who serve as trustees of Oppenheimer Main Street Portfolio) at a meeting held on March 27, 2009 and the Board of Directors of Russell™ Large Cap Index Portfolio at a meeting held on March 19, 2009. The Board of Directors/Trustees of each Portfolio, including all Independent Directors/Trustees of such Portfolio, determined that the interests of the shareholders of such Portfolio will not be diluted as a result of the proposed Reorganization, and that the proposed Reorganization is in the best interests of such Portfolio and its shareholders.
29
Each Reorganization will allow the respective Disappearing Portfolio’s shareholders to participate in a professionally managed portfolio that seeks investment results (before fees and expenses) that correspond to the total return of the Russell Top 200® Index. Additionally, the gross and net expense ratios for all classes of each Disappearing Portfolio are expected to decrease as a result of the relevant Reorganization.
Board Considerations
The Board of the Disappearing Portfolios, in recommending each proposed Reorganization, considered a number of factors, including the following:
· as each respective Disappearing Portfolio is no longer available as an investment option under certain Variable Contracts effective May 1, 2009, it has lost important sources of asset inflows, which is detrimental to its long-term viability;
· representations from an insurance company that issues certain Variable Contracts that the use of index funds by Variable Contract owners as opposed to actively-managed funds would allow an insurer to more effectively hedge its investment risk arising under its Variable Contracts, and thus Russell™ Large Cap Index Portfolio, as an index fund, would be likely to remain on the menu of investment options under the Variable Contracts for the long term;
· changes in investment objective, policies, restrictions, management and portfolio holdings of each Disappearing Portfolio as a result of that Disappearing Portfolio’s proposed Reorganization, including that each Disappearing Portfolio is an actively managed fund and Russell™ Large Cap Index Portfolio is a passively-managed index fund;
· the gross and net expense ratios for all classes of the Disappearing Portfolios are expected to decrease as a result of the relevant Reorganization;
· before and after the Reorganization, Variable Contract owners and Plan Participants who selected a Disappearing Portfolio for investment will continue to have an option to transfer to other actively-managed funds or index funds in the ING family of funds;
· management’s explanation of potential alternative mutual funds that could have served as the surviving mutual fund;
· the potential benefits of each proposed Reorganization to the respective Disappearing Portfolio’s shareholders;
· the relative investment performance of each Disappearing Portfolio, while noting that the Russell™ Large Cap Index Portfolio commenced operations in March 2008;
· that the Reorganization will not dilute the interests of the shareholders of either of the Portfolios (i.e., the Separate Accounts or the Qualified Plans) or the interests of Variable Contract Owners or Plan Participants;
· the direct or indirect costs to be incurred by each Portfolio and its respective shareholders in connection with the Reorganization; and
· the net revenue benefits for the group of DSL, ING Investments and ING IM, including the net revenue benefits accrued as the result of ING IM replacing Neuberger Berman, a sub-adviser unaffiliated with DSL and ING Investments, to manage the assets of Neuberger Berman Partners Portfolio after the respective Reorganization.
The Board of the Disappearing Portfolios recommends that shareholders of each Disappearing Portfolio approve the Reorganization of that Disappearing Portfolio with Russell™ Large Cap Index Portfolio.
30
Tax Considerations
Each Reorganization is intended to qualify for federal income tax purposes as a tax-free reorganization under Section 368 of the Code. Accordingly, pursuant to this treatment, neither a Disappearing Portfolio nor its shareholders, nor Russell™ Large Cap Index Portfolio nor its shareholders, are expected to recognize any gain or loss for federal income tax purposes from the transactions contemplated by each Reorganization Agreement. As a condition to the Closing of a Reorganization, the Portfolios involved will receive an opinion from the law firm of Dechert LLP to the effect that such Reorganization will qualify as a tax-free reorganization for federal income tax purposes. That opinion will be based in part upon certain assumptions and upon certain representations made by the Portfolios.
Prior to the Closing Date, a Disappearing Portfolio will pay to the Separate Accounts of Participating Insurance Companies and Qualified Plans that own its shares, a cash distribution consisting of any undistributed investment company taxable income and/or any undistributed realized net capital gains, including any net gains realized from any sales of assets prior to the Closing Date.
Expenses of the Reorganization
The expenses relating to each proposed Reorganization will borne by ING Investments (or an affiliate). The expenses of each Reorganization shall include, but not be limited to, the costs associated with the preparation of any necessary filings with the SEC, printing and distributing the Proxy Statement/Prospectus and proxy materials, legal fees, accounting fees, securities registration fees, and expenses of holding the Special Meeting.
Future Allocation of Premiums
Shares of each Disappearing Portfolio have been purchased at the direction of Variable Contract owners by Participating Insurance Companies through Separate Accounts to fund benefits payable under a Variable Contract. If a Reorganization is approved, Participating Insurance Companies have advised us that all premiums or transfers to such Disappearing Portfolio will be allocated to Russell™ Large Cap Index Portfolio.
31
ADDITIONAL INFORMATION ABOUT THE PORTFOLIOS
Form of Organization
Neuberger Berman Partners Portfolio is organized as a separate series of IPI, an open-end management investment company organized as a Maryland corporation. IPI is governed by a Board consisting of ten members. For more information on the history of IPI, see the SAI of Neuberger Berman Partners Portfolio.
Oppenheimer Main Street Portfolio is organized as a separate series of IIT, an open-end management investment company organized as a Massachusetts business trust. IIT is governed by a Board consisting of ten members. For more information on the history of IIT, see the SAI of Oppenheimer Main Street Portfolio.
Russell™ Large Cap Index Portfolio is organized as a separate series of IVP, an open-end management investment company organized as a Maryland corporation. IVP is governed by a Board consisting of seven members. For more information on the history of IVP, see the SAI of Russell™ Large Cap Index Portfolio.
Advisers
DSL, a Delaware limited liability company, serves as the investment adviser to each Disappearing Portfolio. DSL has overall responsibility for the management of each Portfolio. DSL provides or oversees all investment advisory and portfolio management services for, and assists in managing and supervising all aspects of the general day-to-day business activities and operations of each Portfolio, including custodial, transfer agency, dividend disbursing, accounting, auditing, compliance and related services. DSL is registered with the SEC as an investment adviser and is registered with the Financial Industry Regulatory Authority (“FINRA”) as a broker-dealer. As of December 31, 2008, DSL managed over $34.2 billion in registered investment company assets. DSL’s principal offices are located at 1475 Dunwoody Drive, West Chester, PA 19380.
DSL is an indirect, wholly-owned subsidiary of ING Groep, which is located at Amstelveensesweg 500, 1081 KL Amsterdam, P.O. Box 810, 1000 AV Amsterdam, the Netherlands. ING Groep is a global financial institution of Dutch origin offering banking, investments, life insurance and retirement services to over 75 million private, corporate and institutional clients in more than 50 countries. With a diverse workforce of about 125,000 people, ING Groep comprises a broad spectrum of prominent companies that increasingly serve their clients under the ING brand.
Pursuant to a sub-advisory agreement, DSL has engaged Neuberger Berman as sub-adviser to Neuberger Berman Partners Portfolio, and separately, Oppenheimer as sub-adviser to Oppenheimer Main Street Portfolio. Each sub-adviser has been retained to provide the day-to-day management of the respective Portfolio.
Oppenheimer has been an investment adviser since January 1960. The principal address of Oppenheimer is Two World Financial Center, 225 Liberty Street — 11th Floor, New York, New York 10281-1008. Oppenheimer and its subsidiaries and controlled affiliates managed over $[ ] billion in assets as of December 31, 2008 including other Oppenheimer funds, with more than 6 million shareholder accounts.
The principal offices of Neuberger Berman are located at 605 Third Avenue, 2nd Floor, New York, NY 10158-0180. As of December 31, 2008, Neuberger Berman and its affiliates had approximately $[ ] billion in assets under management.
Under the terms of the sub-advisory agreement with each of Neuberger Berman and Oppenheimer, the agreement can be terminated by either the respective Portfolio’s Board or DSL. In the event the agreement is terminated, the sub-adviser may be replaced subject to any regulatory requirements, or DSL may assume day-to-day investment management of the Portfolio. DSL has full investment discretion and ultimate authority to make all determinations with respect to the investment of each Disappearing Portfolio’s assets and the purchase and sale of portfolio securities.
For information regarding the basis for the Board’s approval of portfolio management relationships, please refer to each Disappearing Portfolio’s annual report for the fiscal year ended December 31, 2008.
ING Investments, an Arizona limited liability company, serves as the investment adviser to Russell™ Large Cap Index Portfolio. ING Investments has overall responsibility for the management of the Portfolio. ING Investments provides or oversees all investment advisory and portfolio management services for the Portfolio, and assists in managing and supervising all aspects of the general day-to-day business activities and operations of the Portfolio, including custodial, transfer agency, dividend disbursing, accounting, auditing, compliance and related services.
32
ING Investments is registered with the SEC as an investment adviser. ING Investments is an indirect, wholly- owned subsidiary of ING Groep. ING Investments became an investment management firm in April of 1995. As of December 31, 2008, ING Investments managed approximately $35.7 billion in assets. The principal address of ING Investments is 7337 East Doubletree Ranch Road, Scottsdale, Arizona 85258.
ING Investments receives a monthly fee for its services based on the average daily net assets of Russell™ Large Cap Index Portfolio.
ING Investments has engaged ING IM to serve as sub-adviser to Russell™ Large Cap Index Portfolio. ING IM is responsible for managing the assets of the Portfolio in accordance with the Portfolio’s investment objective and policies, subject to oversight by ING Investments and the Board. The sub-advisory agreement can be terminated by either the Portfolio’s Board or ING Investments.
For information regarding the basis for the Board’s approval of the investment advisory and investment sub-advisory relationships, please refer to Russell™ Large Cap Index Portfolio’s semi-annual shareholder report dated June 30, 2008.
Distributor
IFD serves as the distributor for the Portfolios. IFD is a Delaware limited liability company with its principal offices at 7337 East Doubletree Ranch Road, Scottsdale, Arizona 85258-2034 and is a member of FINRA.
To obtain information about FINRA member firms and their associated persons, you may contact FINRA Regulation, Inc. at www.finra.org or the FINRA BrokerCheck Hotline at 1-800-289-9999. An investment brochure describing the Public Disclosure Program is available from FINRA.
Dividends, Distributions and Taxes
Each Portfolio distributes to its Participating Insurance Company Separate Accounts and Qualified Plans that own its shares, substantially all its net investment income and net capital gains, if any, each year. Each Portfolio intends to qualify as a regulated investment company for federal income tax purposes by satisfying the requirements under Sub-Chapter M of the Code. As qualified regulated investment companies, the Portfolios are generally not subject to federal income tax on their ordinary income and net realized capital gain that is distributed. It is each Portfolio’s intention to distribute all such income and gains.
Each Portfolio also intends to comply with the diversification requirements of Section 817(h) of the Code for variable annuity contracts and variable life insurance policies so that owners of these contracts should not be subject to federal tax on distribution of dividends and income from a Portfolio to Participating Insurance Company Separate Accounts.
The foregoing is only a summary of some of the important federal income tax considerations generally affecting a Portfolio and you. Please refer to the Statement of Additional Information for more information about the tax status of the Portfolios. You should consult the prospectus for the Variable Contracts or with your tax adviser for information regarding taxes applicable to the Variable Contracts.
If a Reorganization Agreement is approved by a Disappearing Portfolio’s shareholders, then as soon as practicable before the Closing Date, that Disappearing Portfolio will pay Participating Insurance Company Separate Accounts and Qualified Plans that own its shares, a cash distribution of substantially all undistributed net investment income and undistributed realized net capital gains.
33
Capitalization
The following tables show on an unaudited basis the capitalization of each of the Portfolios as of December 31, 2008, and the pro forma combined capitalization of the Surviving Portfolio as of December 31, 2008 under three scenarios: (i) the Reorganization of only Neuberger Berman Partners Portfolio with and into Russell™ Large Cap Index Portfolio; (ii) the Reorganization of only Oppenheimer Main Street Portfolio with and into Russell™ Large Cap Index Portfolio; and (iii) the Reorganization of both Neuberger Berman Partners Portfolio and Oppenheimer Main Street Portfolio with and into Russell™ Large Cap Index Portfolio:
PRO FORMA: Proposed Reorganization of Neuberger Berman Partners Portfolio with and into Russell™ Large Cap Index Portfolio
|
| Neuberger Berman |
| Russell™ Large |
| Adjustments |
| Russell™ Large |
| ||||
ADV Class |
|
|
|
|
|
|
|
|
| ||||
Net Assets |
| $ | 1,594 |
| $ | 1,135,332 |
| $ | — |
| $ | 1,136,926 |
|
Net Asset Value Per Share |
| $ | 5.44 |
| $ | 7.19 |
|
|
| $ | 7.19 |
| |
Shares Outstanding |
| 293 |
| 157,913 |
| (71 | ) | 158,135 |
| ||||
CLASS I |
|
|
|
|
|
|
|
|
| ||||
Net Assets |
| $ | 187,621,010 |
| $ | 1,057,974,224 |
| $ | (23,736 | )(1) | $ | 1,245,571,498 |
|
Net Asset Value Per Share |
| $ | 5.51 |
| $ | 7.21 |
|
|
| $ | 7.21 |
| |
Shares Outstanding |
| 34,081,480 |
| 146,789,804 |
| (8,062,441 | )(2) | 172,808,843 |
| ||||
CLASS S |
|
|
|
|
|
|
|
|
| ||||
Net Assets |
| $ | 63,347,715 |
| $ | 28,529,334 |
| $ | (8,014 | )(1) | $ | 91,869,035 |
|
Net Asset Value Per Share |
| $ | 5.48 |
| $ | 7.20 |
|
|
| $ | 7.20 |
| |
Shares Outstanding |
| 11,556,312 |
| 3,962,706 |
| (2,759,131 | )(2) | 12,759,887 |
| ||||
CLASS S2(3) |
|
|
|
|
|
|
|
|
| ||||
Net Assets |
| n/a |
| n/a |
|
|
| n/a |
| ||||
Net Asset Value Per Share |
| n/a |
| $ | 10.00 |
|
|
| $ | 10.00 |
| ||
Shares Outstanding |
| n/a |
| n/a |
|
|
| n/a |
| ||||
(1) Reflects adjustment for estimated one time merger expenses.
(2) Reflects net of retired shares of Neuberger Berman Partners Portfolio.
(3) Class S2 shares of Neuberger Berman Partners Portfolio and Russell™ Large Cap Index Portfolio had not commenced operations as of December 31, 2008.
34
PRO FORMA: Proposed Reorganization of Oppenheimer Main Street Portfolio with and into Russell™ Large Cap Index Portfolio
|
| Oppenheimer Main |
| Russell™ Large |
| Adjustments |
| Russell™ Large |
| ||||
ADV Class |
|
|
|
|
|
|
|
|
| ||||
Net Assets |
| $ | 676 |
| $ | 1,135,332 |
| $ | — |
| $ | 1,136,008 |
|
Net Asset Value Per Share |
| $ | 12.07 |
| $ | 7.19 |
|
|
| $ | 7.19 |
| |
Shares Outstanding |
| 56 |
| 157,913 |
| 38 | (1) | 158,007 |
| ||||
CLASS I |
|
|
|
|
|
|
|
|
| ||||
Net Assets |
| $ | 3,491,014 |
| $ | 1,057,974,224 |
| $ | — |
| $ | 1,061,465,238 |
|
Net Asset Value Per Share |
| $ | 12.10 |
| $ | 7.21 |
|
|
| $ | 7.21 |
| |
Shares Outstanding |
| 288,502 |
| 146,789,804 |
| 195,689 | (1) | 147,273,995 |
| ||||
CLASS S |
|
|
|
|
|
|
|
|
| ||||
Net Assets |
| $ | 245,382,963 |
| $ | 28,529,334 |
| $ | — |
| $ | 273,912,297 |
|
Net Asset Value Per Share |
| $ | 12.17 |
| $ | 7.20 |
|
|
| $ | 7.20 |
| |
Shares Outstanding |
| 20,169,062 |
| 3,962,706 |
| 13,911,905 | (1) | 38,043,673 |
| ||||
CLASS S2 |
|
|
|
|
|
|
|
|
| ||||
Net Assets |
| $ | 2,633,017 |
| n/a |
| $ | — |
| $ | 2,633,017 |
| |
Net Asset Value Per Share |
| $ | 12.13 |
| $ | 10.00 |
|
|
| $ | 10.00 |
| |
Shares Outstanding |
| 217,034 |
| n/a |
| 46,268 | (1) | 263,302 |
| ||||
(1) Reflects net of retired shares of Oppenheimer Main Street Portfolio.
(2) Class S2 shares of Russell™ Large Cap Index Portfolio had not commenced operations as of December 31, 2008.
35
PRO FORMA: PROPOSED REORGANIZATION OF BOTH NEUBERGER BERMAN PARTNERS PORTFOLIO AND OPPENHEIMER MAIN STREET PORTFOLIO WITH AND INTO RUSSELL™ LARGE CAP INDEX PORTFOLIO
|
| Neuberger |
| Oppenheimer |
| Russell™ |
| Adjustments |
| Russell™ |
| |||||
ADV CLASS |
|
|
|
|
|
|
|
|
|
|
| |||||
Net Assets |
| $ | 1,594 |
| $ | 676 |
| $ | 1,135,332 |
| $ | — |
| $ | 1,137,602 |
|
Net Asset Value Per Share |
| $ | 5.44 |
| $ | 12.07 |
| $ | 7.19 |
|
|
| $ | 7.19 |
| |
Shares Outstanding |
| 293 |
| 56 |
| 157,913 |
| (33 | )(2) | 158,229 |
| |||||
CLASS I |
|
|
|
|
|
|
|
|
|
|
| |||||
Net Assets |
| $ | 187,621,010 |
| $ | 3,491,014 |
| $ | 1,057,974,224 |
| $ | (23,736 | )(1) | $ | 1,249,062,512 |
|
Net Asset Value Per Share |
| $ | 5.51 |
| $ | 12.10 |
| $ | 7.21 |
|
|
| $ | 7.21 |
| |
Shares Outstanding |
| 34,081,480 |
| 288,502 |
| 146,789,804 |
| (7,866,752 | )(2) | 173,293,034 |
| |||||
CLASS S |
|
|
|
|
|
|
|
|
|
|
| |||||
Net Assets |
| $ | 63,347,715 |
| $ | 245,382,963 |
| $ | 28,529,334 |
| $ | (8,014 | )(1) | $ | 337,251,998 |
|
Net Asset Value Per Share |
| $ | 5.48 |
| $ | 12.17 |
| $ | 7.20 |
|
|
| $ | 7.20 |
| |
Shares Outstanding |
| 11,556,312 |
| 20,169,062 |
| 3,962,706 |
| 11,152,774 | (2) | 46,840,854 |
| |||||
CLASS S2(3) |
|
|
|
|
|
|
|
|
|
|
| |||||
Net Assets |
| n/a |
| $ | 2,633,017 |
| n/a |
| $ | — |
| $ | 2,633,017 |
| ||
Net Asset Value Per Share |
| n/a |
| $ | 12.13 |
| $ | 10.00 |
|
|
| $ | 10.00 |
| ||
Shares Outstanding |
| n/a |
| 217,034 |
| n/a |
| 46,268 | (2) | 263,302 |
| |||||
(1) Reflects adjustment for estimated one time merger expenses.
(2) Reflects net of retired shares.
(3) Class S2 shares of Neuberger Berman Partners Portfolio and Russell™ Large Cap Index Portfolio had not commenced operations as of December 31, 2008.
36
PROPOSAL II — APPROVAL OF THE ING IM SUB-ADVISORY AGREEMENT
Each Disappearing Portfolio’s Investment Advisory Arrangement
DSL, a Delaware limited liability company, serves as the investment adviser to each Disappearing Portfolio pursuant to separate investment advisory agreements (each an “Investment Advisory Agreement”) dated as of May 1, 2003 with respect to Neuberger Berman Partners Portfolio and October 24, 1997, as amended May 24, 2002 and further amended and restated January 1, 2007 with respect to Oppenheimer Main Street Portfolio. The Investment Advisory Agreement on behalf of Neuberger Berman Partners Portfolio was last renewed by a majority of the Independent Directors on November 14, 2008, and was approved by via the written consent of the Portfolio’s initial shareholder on January 3, 2006. The Investment Advisory Agreement on behalf of Oppenheimer Main Street Portfolio was last renewed by a majority of the Independent Trustees on November 14, 2008, and was approved by via the written consent of the Portfolio’s initial shareholder on April 28, 2006.
Each Investment Advisory Agreement provides, among other things that in carrying out its responsibility to supervise and manage all aspects of the respective Disappearing Portfolio’s operations, DSL may engage, subject to the approval of the Board, and where required, the shareholders of the respective Disappearing Portfolio, sub-advisers to provide day-to-day advisory services to that Portfolio. DSL may delegate to the sub-advisers duties, among other things, to formulate and implement a Disappearing Portfolio’s investment programs, including the duty to determine what securities will be purchased and sold for that Portfolio. If the proposed ING IM Sub-Advisory Agreement is approved, DSL would oversee the investment management services of ING IM with respect to each Disappearing Portfolio.
Each Investment Advisory Agreement provides that DSL is liable and shall indemnify IIT or IPI, as applicable, for any loss incurred by IIT or IPI (as applicable) to the extent that such losses resulted from an act or omission on the part of DSL or its officers, directors or employees that is found to involve willful misfeasance, bad faith or gross negligence, or reckless disregard by DSL of its duties under the relevant Investment Advisory Agreement. After an initial two-year term, the Investment Management Agreement continues in effect with respect to a series from year to year, so long as such continuance is specifically approved at least annually by (1) the Board or (2) the vote of a “majority” (as defined in the 1940 Act) of the respective Disappearing Portfolio’s outstanding shares; provided that, in either event the continuance is also approved by at least a majority of those Directors/Trustees who are neither parties to the Investment Advisory Agreement nor “interested persons” (as defined in the 1940 Act) of any such party nor have any interest in the Investment Advisory Agreement, by vote cast in person at a meeting called for the purpose of voting on such approval.
Pursuant to the terms of the Investment Advisory Agreement and in return for its services for Neuberger Berman Partners Portfolio, DSL receives compensation, calculated daily and paid monthly, equal to 0.60% of that Portfolio’s average daily net assets.
Pursuant to the terms of the Investment Advisory Agreement and in return for its services for Oppenheimer Main Street Portfolio, DSL receives compensation, calculated daily and paid monthly, from that Portfolio as follows: 0.750% of the first $250 million; 0.700% of the next $400 million; 0.650% of the next $450 million; and 0.600% of the assets in excess of $1.1 billion (all as a percentage of the Portfolio’s average daily net assets).
Each Disappearing Portfolio’s Prior Sub-Advisory Agreement
Neuberger Berman has served as Neuberger Berman Partners Portfolio’s sub-adviser pursuant to a sub-advisory agreement between DSL and Neuberger Berman dated December 7, 2005, as amended December 15, 2006. Pursuant to the sub-advisory agreement, Neuberger Berman receives monthly compensation from DSL at the annual rate of a specified percentage of Neuberger Berman Partners Portfolio’s average daily net assets as follows: 0.35% of the first $1 billion; and
0.30% of the Portfolio’s average daily net assets in excess of $1 billion. During Neuberger Berman Partners Portfolio’s most recently completed fiscal year ended December 31, 2008, Neuberger Berman received an aggregate total of $1,452,806 from DSL for services rendered to the Portfolio.
Oppenheimer has served as Oppenheimer Main Street Portfolio’s sub-adviser pursuant to a sub-advisory agreement among IIT, DSL and Oppenheimer dated November 8, 2004, as amended December 15, 2006. Pursuant to the sub-advisory agreement, Oppenheimer receives monthly compensation from DSL at the annual rate of a specified percentage of Oppenheimer Main Street Portfolio’s average daily net assets as follows: 0.30% if total assets at any month-end are less than or equal to $1 billion; and 0.23% if total assets at any month-end are in excess of $1 billion. For the purpose of calculating the sub-advisory fee, the assets of Oppenheimer Main Street Portfolio are aggregated with those of ING Oppenheimer Global Portfolio and ING Oppenheimer Strategic Income Portfolio, two series managed by ING Investments and sub-advised by Oppenheimer. During Oppenheimer Main Street Portfolio’s most recently completed fiscal
37
year ended December 31, 2008, Oppenheimer received an aggregate total of $851,439 from DSL for services rendered to the Portfolio.
The ING IM Sub-Advisory Agreement
The following summary of the ING IM Sub-Advisory Agreement is qualified in its entirety by reference to the agreement, a form of which is attached as Appendix B.
The terms of the ING IM Sub-Advisory Agreement are substantially similar to those of the prior sub-advisory agreemenst with Neuberger Berman (with respect to Neuberger Berman Partners Portfolio) and Oppenheimer (with respect to Oppenheimer Main Street Portfolio). The ING IM Sub-Advisory Agreement provides that, subject to DSL’s and the Board’s supervision, ING IM is responsible for managing the investment operations of each Disappearing Portfolio and for making investment decisions and placing orders to purchase and sell securities for such Portfolio, all in accordance with the investment objective and policies of the Portfolio as reflected in its current prospectus and statement of additional information and as may be adopted from time to time by the Board. In accordance with the requirements of the 1940 Act, ING IM will also maintain, and provide DSL with, all books and records relating to the transactions it executes or that are otherwise required under the 1940 Act, and render to the Directors/Trustees such periodic and special reports as the Board may reasonably request. The ING IM Sub-Advisory Agreement provides that, in the absence of willful misfeasance, bad faith, gross negligence in the performance of its duties, or reckless disregard of its obligations and duties thereunder, ING IM will not be liable for any act or omission in connection with its activities as sub-adviser to a Disappearing Portfolio.
Although the ING IM Sub-Advisory Agreement is intended to terminate upon the liquidation of the Disappearing Portfolios subject to the terms of each Reorganization, the terms of the ING IM Sub-Advisory Agreement with respect to each Disappearing Portfolio will remain in full force and effect for a period of up to two years from the date of its execution, and will continue thereafter as long as its continuance is approved at least annually by the Board or by vote of a majority of the outstanding shares of that Disappearing Portfolio, as well as by a majority of the Independent Directors/Trustees by vote cast in person at a meeting called for that purpose. However, the ING IM Sub-Advisory Agreement may be terminated with respect to a Disappearing Portfolio at any time upon 60 days’ written notice without the payment of any penalty, either by vote of the Board or by vote of a majority of the outstanding voting securities of that Disappearing Portfolio. Additionally, the ING IM Sub-Advisory Agreement will terminate immediately in the event of its assignment (within the meaning of the 1940 Act) or upon the termination of a Disappearing Portfolio’s Investment Advisory Agreement with DSL, and may also be terminated at any time by ING IM or DSL on 60 days’ written notice to the other.
The ING IM Sub-Advisory Agreement is being proposed so that ING IM can manage each Disappearing Portfolio during the Transition Period and oversee the transition of that Disappearing Portfolio into Russell™ Large Cap Index Portfolio. Both the Reorganization of a Disappearing Portfolio discussed in Proposal I and the ING IM Sub-Advisory Agreement discussed in this Proposal II need to be approved by shareholders of that Disappearing Portfolio before ING IM can begin serving as the sub-adviser to that Disappearing Portfolio. During the Transition Period, ING IM will transition each Disappearing Portfolio as discussed in “Portfolio Transitioning” on page 27. If shareholders of a Disappearing Portfolio approve the Reorganization but not the ING IM Sub-Advisory Agreement, ING IM will not serve as the sub-adviser to that Disappearing Portfolio, and, in accordance with applicable law, the Board would consider various options including the appointment of a new sub-adviser to provide the day-to-day management of the Portfolio during the Transition Period. If neither proposal is approved with respect to a Disappearing Portfolio, the Board will consider various options with respect to that Disappearing Portfolio in accordance with applicable law.
Compensation payable by DSL to ING IM under the ING IM Sub-Advisory Agreement for its sub-advisory services to Neuberger Berman Partners Portfolio and Oppenheimer Main Street Portfolio is the same as the compensation payable under the sub-advisory agreements with Neuberger Berman (with respect to Neuberger Berman Partners Portfolio) and Oppenheimer (with respect to Oppenheimer Main Street Portfolio), respectively.
Other Information
Appendix D hereto lists the names, addresses, and the principal occupations of the principal executive officers of ING IM. As of December 31, 2008, no Director/Trustee or Officer of a Disappearing Portfolio was an officer, director, employee, or shareholder of ING IM. No Trustee or Officer of a Disappearing Portfolio owns securities or has any other material direct or indirect interest in ING IM.
[Appendix E sets forth the name of another investment company with an investment objective and strategies similar to those adopted for each Disappearing Portfolio, for which ING IM acts as an investment as sub-adviser, the annual
38
rate of compensation and the net assets of the investment company as of December 31, 2008.]
[During the fiscal year ended December 31, 2008, Neuberger Berman Partners Portfolio did not pay commissions on portfolio brokerage transactions to brokers who may be deemed to be affiliated persons of Neuberger Berman Partners Portfolio, DSL, Neuberger Berman, ING IM or affiliated persons of such persons. During the same fiscal year, Oppenheimer Main Street Portfolio did not pay commissions on portfolio brokerage transactions to brokers who may be deemed to be affiliated persons of Oppenheimer Main Street Portfolio, DSL, Oppenheimer, ING IM or affiliated persons of such persons. ]
IFS serves as administrator for Neuberger Berman Partners Portfolio pursuant to the administration agreement with IIT. For the fiscal year ended December 31, 2008, the Portfolio paid IFS an estimated amount of $415,081 for administrative services.
The management agreement between IIT, on behalf of Oppenheimer Main Street Portfolio and DSL provides for a “bundled fee” arrangement, under which DSL provides, in addition to advisory services, administrative services and other services necessary for the ordinary operation of the Portfolio. As such, there are no separate administration fees.
IFD serves as the distributor for each Disappearing Portfolio. During the fiscal year ended December 31, 2008, Neuberger Berman Partners Portfolio and Oppenheimer Main Street Portfolio paid IFD an estimated amount of $292,104 and $922,666, respectively, in distribution and shareholder servicing fees. If the proposed ING IM Sub-Advisory Agreement is approved with respect to a Disappearing Portfolio, IFS and IFD will continue to render the same services as they currently render. Each of IFS and IFD is a wholly-owned subsidiary of ING Groep.
39
Board Considerations
On March 27, 2009, the Board of the Disappearing Portfolios held an in-person meeting at which a majority of the Directors/Trustees were in attendance, to consider whether to approve a proposal from DSL to terminate Neuberger Berman as the sub-adviser to Neuberger Berman Partners Portfolio and Oppenheimer as the sub-adviser to Oppenheimer Main Street Portfolio and to approve the ING IM Sub-Advisory Agreement for each Portfolio. In determining whether to appoint a new sub-adviser for each Disappearing Portfolio, the Board considered that initiating the transition of the Portfolio’s investment portfolio prior to the Reorganization would benefit the shareholders of that Disappearing Portfolio by giving them earlier exposure to a portfolio managed by ING IM and allow Russell™ Large Cap Index Portfolio to be as fully invested as practicable following consummation of the applicable Reorganization. The Board also thought this would be beneficial to the Russell™ Large Cap Index Portfolio, and noted that all or a substantial portion of the cost of the transition may be borne by the shareholders of the Disappearing Portfolios.
At the meeting, in determining whether to take these actions, the Board received and evaluated such information as it deemed necessary for an informed determination of whether the ING IM Sub-Advisory Agreement be approved for the respective Disappearing Portfolio. The material provided to the Board or legal counsel to the Independent Directors/Trustees in support of the sub-advisory arrangement with ING IM included the following: (1) a memorandum presenting management’s rationale for proposing a change in sub-adviser to the respective Disappearing Portfolio and its recommendation that ING IM be retained as the sub-adviser to that Portfolio; (2) information about the proposed new portfolio management team for the Disappearing Portfolios and how the team intends to affect the transitioning of the Portfolio’s securities during the Transition Period; (3) responses from ING IM to questions posed by K&L Gates, independent legal counsel, on behalf of the Independent Directors/Trustees; (4) supporting documents, including a copy of the ING IM Sub-Advisory Agreement; and (5) other information relevant to the Board’s evaluation.
The Board’s consideration of whether to approve the ING IM Sub-Advisory Agreement for each Disappearing Portfolio took into account several factors including, but not limited to, the following: (1) the view of DSL with respect to the reputation of ING IM as an investment manager; (2) ING IM’ strength and reputation in the industry; (3) the limited nature and quality of the services to be provided by ING IM under the agreement; (4) the personnel, operations, financial condition, and investment management capabilities, methodologies and resources of ING IM and its fit among the stable of managers in the ING Funds line-up; (5) the fairness of the compensation under the agreement in light of the services to be provided by ING IM as each Disappearing Portfolio’s sub-adviser; (6) the sub-advisory fee payable by DSL to ING IM and the profitability of DSL; (7) ING IM’s operations and compliance program, including its policies and procedures intended to ensure compliance with the federal securities laws; (8) ING IM’s financial condition; (9) the appropriateness of the selection of ING IM in light of the Portfolio’s investment objective and investor base; (10) ING IM’s Code of Ethics, and related procedures for complying with that Code of Ethics; (11) the fact that the expenses relating to the proposed Reorganization of Neuberger Berman Partners Portfolio will be borne by ING Investments (or an affiliate), while the expenses relating to the proposed Reorganization of Oppenheimer Main Street Portfolio will be borne by DSL (or an affiliate); and (12) the fact that ING IM is the sub-adviser of the Surviving Portfolio, Russell™ Large Cap Index Portfolio, into which each Disappearing Portfolio is proposed to be merged.
The Board’s consideration of whether to approve the ING IM Sub-Advisory Agreement for a respective Disappearing Portfolio took into account several factors including, but not limited to, the following:
THE NATURE, EXTENT AND QUALITY OF THE SUB-ADVISORY SERVICE TO BE PROVIDED. The Board considered the limited scope of the sub-advisory services anticipated to be provided by ING IM to the Disappearing Portfolio and the level of staffing, quality and experience of ING IM’s portfolio management team. The Board concluded that ING IM is capable of providing high quality services to the Disappearing Portfolio, as indicated by the experience, capability and integrity of ING IM’ management, the financial resources of ING IM, and the professional qualifications and experience of ING IM’ portfolio management team to manage the Disappearing Portfolio. The Directors/Trustees also concluded that ING IM proposed to provide services that are appropriate in scope and extent in light of the Disappearing Portfolio’s current operations and during the Transition Period.
THE INVESTMENT PERFORMANCE. The Board reviewed Disappearing Portfolio’s performance under the management of its sub-adviser, compared with its benchmark index. The Board also noted that although the Russell™ Large Cap Index Portfolio commenced operations in March 2008, ING IM had experience managing other index funds and compared the performance of such funds with their respective benchmark indices. The Board considered that the Disappearing Portfolio will be managed by ING IM in a manner similar to Russell™ Large Cap Index Portfolio during the Transition Period. The Board concluded, based on the Directors’/Trustees’ assessment of the limited nature, extent and quality of investment sub-advisory services expected to be provided by ING IM during the Transition period, that ING IM
40
is capable of managing the Disappearing Portfolio in light of that Disappearing Portfolio’s investment objective, policies and strategies during the Transition Period.
THE COST OF SUB-ADVISORY SERVICES PROVIDED AND THE LEVEL OF PROFITABILITY. The Board concluded that the level of anticipated investment sub-advisory fees payable under the ING IM Sub-Advisory Agreement is appropriate in light of the proposed sub-advisory fee schedule, the expense ratio of the Disappearing Portfolio (which will not be impacted by the implementation of the ING IM Sub-Advisory Agreement), the competitiveness of the Disappearing Portfolio’s expenses when compared to the expense ratios of comparable investment companies (based on information prepared by management) and the anticipated benefits that may accrue to ING IM from its relationship with the Portfolio.
ECONOMIES OF SCALE. The Board noted that the asset-based breakpoints in the Disappearing Portfolio’s advisory fee schedule (in the case of Oppenheimer Main Street Portfolio) and the Disappearing Portfolio’s management fees would remain unchanged if ING IM was appointed the Disappearing Portfolio’s sub-adviser. In addition, the Board recently reviewed and concluded that the Disappearing Portfolio’s management fees appropriately reflect its current size, the current economic environment for DSL and ING IM, the competitive nature of the investment company market, and DSL’s pricing strategy.
OTHER CONSIDERATIONS. In approving the ING IM Sub-Advisory Agreement, the Board also considered the view of DSL with respect to the reputation of ING IM as an investment manager, its strength and reputation in the industry and the personnel, operations, financial condition, and investment management capabilities, methodologies and resources of ING IM and its fit among the stable of managers in the ING Funds line-up. Additionally, the Board considered ING IM’s Code of Ethics, and related procedures for complying with that Code of Ethics.
Based on its review and after considering DSL’s recommendation, the Board determined that the ING IM Sub-Advisory Agreement would enable shareholders of each respective Disappearing Portfolio to obtain high quality services during the relevant Transition Period, at a cost that is appropriate, reasonable and in the best interests of the Portfolio and its shareholders. The Board then approved the ING IM Sub-Advisory Agreement with respect to each Disappearing Portfolio and directed it be submitted to shareholders of the Portfolio for approval.
The Board recommends that shareholders of a Disappearing Portfolio vote “FOR” Proposal II to approve the ING IM Sub-Advisory Agreement.
41
GENERAL INFORMATION ABOUT THE PROXY STATEMENT
Solicitation of Proxies
Solicitation of voting instructions is being made primarily by the mailing of the Notice and this Proxy Statement/Prospectus with its enclosures on or about May 18, 2009. In addition to the solicitation of proxies by mail, employees of DSL and its affiliates, without additional compensation, may solicit proxies in person or by telephone, telegraph, facsimile, or oral communications.
If a shareholder wishes to participate in the Special Meeting, the shareholder may submit the proxy originally sent with the Proxy Statement/Prospectus, attend in person or vote online by logging on to www.proxyweb.com and following the on-line directions. Should shareholders require additional information regarding the proxy or require replacement of the proxy, they may contact Shareholder Services toll-free at 1-800-992-0180.
A shareholder may revoke the accompanying proxy at any time prior to its use by filing with Neuberger Berman Partners Portfolio or Oppenheimer Main Street Portfolio, as applicable, a written revocation or duly executed proxy bearing a later date. In addition, any shareholder who attends the Special Meeting in person may vote by ballot at the Special Meeting, thereby canceling any proxy previously given. The persons named in the accompanying proxy will vote as directed by the proxy, but in the absence of voting directions in any proxy that is signed and returned, they intend to vote “FOR” the Reorganization(s) proposal and the ING IM Sub-Advisory Agreement and may vote in their discretion with respect to other matters not now known to the Board of the Disappearing Portfolios that may be presented at the Special Meeting.
Voting Rights
The Separate Accounts of the Participating Insurance Companies and Qualified Plans are the record owners of the shares of the Disappearing Portfolios. The Qualified Plans and Participating Insurance Companies will vote a Disappearing Portfolio’s shares at the Special Meeting in accordance with the timely instructions received from persons entitled to give voting instructions under the Variable Contracts or Qualified Plans.
Each shareholder of a Disappearing Portfolio is entitled to one vote for each share held as to any matter on which such shareholder is entitled to vote and for each fractional share that is owned, the shareholder shall be entitled to a proportionate fractional vote. Shares have no preemptive or subscription rights.
Only shareholders of a Disappearing Portfolio at the close of business on April 1, 2009 (the “Record Date”), will be entitled to be present and give voting instructions for that Disappearing Portfolio at the Special Meeting with respect to their shares owned as of that Record Date. To be counted, the properly executed Voting Instruction Form must be received no later than 5:00 p.m. on June 29, 2009. As of the Record Date, the following shares of beneficial interest of the Disappearing Portfolios were outstanding and entitled to vote:
Neuberger Berman |
| Shares Outstanding |
| Oppenheimer Main |
| Shares Outstanding |
|
ADV Class |
|
|
| ADV Class |
|
|
|
Class I |
|
|
| Class I |
|
|
|
Class S |
|
|
| Class S |
|
|
|
Total |
|
|
| Class S2 |
|
|
|
|
|
|
| Total |
|
|
|
Approval of each Reorganization Agreement and the ING IM Sub-Advisory Agreement for each Disappearing Portfolio requires the affirmative vote of the lesser of (i) 67% or more of the voting securities of that Disappearing Portfolio present or represented at the meeting, provided that more than 50% of the voting securities of such Disappearing Portfolio are present in person or represented by proxy at the Special Meeting, or (ii) a majority of the shares of a Disappearing Portfolio entitled to vote. The holders of 30% of outstanding shares present in person or by proxy shall constitute a quorum at any meeting of the shareholders of Oppenheimer Main Street Portfolio, while the holders of a majority of outstanding shares present in person or by proxy shall constitute a quorum at the meeting of shareholders of Neuberger Berman Partners Portfolio. A majority of the shareholders of a Disappearing Portfolio present in person or proxy may adjourn the meeting of such Disappearing Portfolio (i) in the absence of a quorum at such meeting or (ii), in the event a quorum is present, for any reason permitted by law, including for the purpose of providing time for the solicitation of additional shareholder votes. In the event a meeting is adjourned, the time and place of such adjourned meeting shall be announced at the meeting and no
42
additional notice shall be given unless, if after the adjournment, a new record date is fixed. If a shareholder of a Disappearing Portfolio abstains from voting as to any matter, or if a broker returns a “non-vote” proxy, indicating a lack of authority to vote on a matter, the shares represented by the abstention or non-vote will be deemed present at the Special Meeting for purposes of determining a quorum. However, abstentions and broker non-votes will not be deemed represented at the Special Meeting for purposes of calculating the vote on any matter. For this reason, an abstention or broker non-vote will have the effect of a vote against the proposals.
Where Variable Contract owners and Plan Participants fail to give instructions as to how to vote their shares, the Qualified Plans and Participating Insurance Companies will use proportional voting and vote those shares in proportion to the instructions given by other Variable Contract owners and Plan Participants who voted. The effect of proportional voting is that if a large number of Variable Contract owners and Plan Participants fail to give voting instructions, a small number of Variable Contract owners and Plan Participants may determine the outcome of the vote.
[To the knowledge of DSL, as of April 1, 2009, no current Director/Trustee owns 1% or more of the outstanding shares of each Portfolio, and the officers and Directors/Trustees own, as a group, less than 1% of the shares of each Portfolio].
Appendix F hereto lists the persons that, as of [April 1, 2009], owned beneficially or of record 5% or more of the outstanding shares of any class of the Portfolios.
Other Matters to Come Before the Special Meeting
Neither Neuberger Berman Partners Portfolio nor Oppenheimer Main Street Portfolio knows of any matters to be presented at its Special Meeting of other than those described in this Proxy Statement/Prospectus. If other business should properly come before the Special Meeting, the proxy holders will vote thereon in accordance with their best judgment.
Shareholder Proposals
Neither Neuberger Berman Partners Portfolio nor Oppenheimer Main Street Portfolio is required to hold regular annual meetings and, in order to minimize its costs, do not intend to hold meetings of shareholders unless so required by applicable law, regulation, regulatory policy or if otherwise deemed advisable by the respective Portfolio’s management. Therefore, it is not practicable to specify a date by which shareholder proposals must be received in order to be incorporated in an upcoming proxy statement for an annual meeting.
In order that the presence of a quorum at the Special Meeting may be assured, prompt execution and return of the enclosed proxy card is requested. A self-addressed, postage-paid envelope is enclosed for your convenience.
|
|
| Huey P. Falgout, Jr., |
| Secretary |

May 18, 2009
7337 East Doubletree Ranch Road
Scottsdale, Arizona 85258-2034
43
APPENDIX A-1
AGREEMENT AND PLAN OF REORGANIZATION
THIS AGREEMENT AND PLAN OF REORGANIZATION (the “Agreement”) is made as of March 27, 2009, by and between ING Variable Portfolios, Inc., a Maryland corporation with its principal place of business at 7337 East Doubletree Ranch Road, Scottsdale, Arizona 85258-2034 (“IVP”), on behalf of its series, ING Russell™ Large Cap Index Portfolio (the “Acquiring Portfolio”), and ING Partners, Inc., a Maryland corporation with its principal place of business at 7337 East Doubletree Ranch Road, Scottsdale, Arizona 85258-2034 (“IPI”), on behalf of its series, ING Neuberger Berman Partners Portfolio (the “Acquired Portfolio”).
This Agreement is intended to be and is adopted as a plan of reorganization and liquidation within the meaning of Section 368(a)(1) of the United States Internal Revenue Code of 1986, as amended (the “Code”). The reorganization (the “Reorganization”) will consist of the transfer of all of the assets of the Acquired Portfolio to the Acquiring Portfolio in exchange solely for Adviser Class (“ADV Class”), Class I, Class S and Class S2 voting shares of beneficial interest of the Acquiring Portfolio (the “Acquiring Portfolio Shares”), the assumption by the Acquiring Portfolio of the liabilities of the Acquired Portfolio described in paragraph 1.3, and the distribution of the Acquiring Portfolio Shares to the shareholders of the Acquired Portfolio in complete liquidation of the Acquired Portfolio as provided herein, all upon the terms and conditions hereinafter set forth in this Agreement.
WHEREAS, the Acquired Portfolio and the Acquiring Portfolio are series of open-end, registered investment companies of the management type and the Acquired Portfolio owns securities which generally are assets of the character in which the Acquiring Portfolio is permitted to invest; and
WHEREAS, the Board of Directors of IVP has determined that the exchange of all of the assets of the Acquired Portfolio for Acquiring Portfolio Shares and the assumption of the liabilities of the Acquired Portfolio, as described in paragraph 1.3 herein, by the Acquiring Portfolio are in the best interests of the Acquiring Portfolio and its shareholders and that the interests of the existing shareholders of the Acquiring Portfolio would not be diluted as a result of this transaction; and
WHEREAS, the Board of Directors of IPI has determined that the exchange of all of the assets of the Acquired Portfolio for Acquiring Portfolio Shares and the assumption of the liabilities of the Acquired Portfolio by the Acquiring Portfolio, as described in paragraph 1.3 herein, is in the best interests of the Acquired Portfolio and its shareholders and that the interests of the existing shareholders of the Acquired Portfolio would not be diluted as a result of this transaction.
NOW, THEREFORE, in consideration of the premises and of the covenants and agreements hereinafter set forth, the parties hereto covenant and agree as follows:
1. TRANSFER OF ASSETS OF THE ACQUIRED PORTFOLIO TO THE ACQUIRING PORTFOLIO IN EXCHANGE FOR THE ACQUIRING PORTFOLIO SHARES, THE ASSUMPTION OF ALL KNOWN ACQUIRED PORTFOLIO LIABILITIES AND THE LIQUIDATION OF THE ACQUIRED PORTFOLIO
1.1. Subject to the requisite approval of the Acquired Portfolio shareholders and the other terms and conditions herein set forth and on the basis of the representations and warranties contained herein, the Acquired Portfolio agrees to transfer all of the Acquired Portfolio’s assets, as set forth in paragraph 1.2, to the Acquiring Portfolio, and the Acquiring Portfolio agrees in exchange therefor: (i) to deliver to the Acquired Portfolio the number of full and fractional ADV Class, Class I, Class S and Class S2 Acquiring Portfolio Shares determined by dividing the value of the Acquired Portfolio’s net assets with respect to each class, computed in the manner and as of the time and date set forth in paragraph 2.1, by the net asset value of one Acquiring Portfolio Share of the same class, computed in the manner and as of the time and date set forth in paragraph 2.2 and (ii) to assume the liabilities of the Acquired Portfolio, as set forth in paragraph 1.3. Such transactions shall take place at the closing provided for in paragraph 3.1 (the “Closing”).
1.2. The assets of the Acquired Portfolio to be acquired by the Acquiring Portfolio shall consist of all assets and property, including, without limitation, all cash, securities, commodities and futures interests and dividends or interests receivable that are owned by the Acquired Portfolio and any deferred or prepaid expenses shown as an asset on the books of the Acquired Portfolio on the closing date provided for in paragraph 3.1 (the “Closing Date”) (collectively, “Assets”).
1.3. The Acquired Portfolio will endeavor to discharge all of its known liabilities and obligations prior to the Closing Date. The Acquiring Portfolio shall assume the liabilities of the Acquired Portfolio set forth in the Acquired
A-1-1
Portfolio’s Statement of Assets and Liabilities as of the Closing Date delivered by IPI, on behalf of the Acquired Portfolio, to IVP, on behalf of the Acquiring Portfolio, pursuant to paragraph 7.2 hereof. On or as soon as practicable prior to the Closing Date, the Acquired Portfolio will declare and pay to its shareholders of record one or more dividends and/or other distributions so that it will have distributed substantially all (and in no event less than 98%) of its investment company taxable income (computed without regard to any deduction for dividends paid) and realized net capital gain, if any, for the current taxable year through the Closing Date.
1.4. Immediately after the transfer of assets provided for in paragraph 1.1, the Acquired Portfolio will: (i) distribute to the Acquired Portfolio’s shareholders of record with respect to its ADV Class, Class I, Class S and Class S2 shares, determined as of immediately after the close of business on the Closing Date, on a pro rata basis within each class, the Acquiring Portfolio Shares of the same class received by the Acquired Portfolio pursuant to paragraph 1.1 and (ii) completely liquidate. Such distribution and liquidation will be accomplished, with respect to each class of the Acquired Portfolio’s shares, by the transfer of the Acquiring Portfolio Shares then credited to the account of the Acquired Portfolio on the books of the Acquiring Portfolio to open accounts on the share records of the Acquiring Portfolio in the names of the shareholders of record of each class of the Acquired Portfolio’s shares, determined as of immediately after the close of business on the Closing Date (the “Acquired Portfolio Shareholders”). The aggregate net asset value of ADV Class, Class I, Class S and Class S2 Acquiring Portfolio Shares to be so credited to ADV Class, Class I, Class S and Class S2 Acquired Portfolio Shareholders shall, with respect to each class, be equal to the aggregate net asset value of the Acquired Portfolio shares of that same class owned by such shareholders on the Closing Date. All issued and outstanding ADV Class, Class I, Class S and Class S2 Acquired Portfolio shares will simultaneously be canceled on the books of the Acquired Portfolio, although share certificates representing interests in ADV Class, Class I, Class S and Class S2 of the Acquired Portfolio will represent a number of the same class of Acquiring Portfolio Shares after the Closing Date, as determined in accordance with Section 2.3. The Acquiring Portfolio shall not issue certificates representing the ADV Class, Class I, Class S and Class S2 Acquiring Portfolio Shares in connection with such exchange.
1.5. Ownership of Acquiring Portfolio Shares will be shown on the books of the Acquiring Portfolio’s transfer agent, as defined in paragraph 3.3.
1.6. Any reporting responsibility of the Acquired Portfolio including, but not limited to, the responsibility for filing of regulatory reports, tax returns, or other documents with the U.S. Securities and Exchange Commission (the “Commission”), any state securities commission, and any federal, state or local tax authorities or any other relevant regulatory authority, is and shall remain the responsibility of the Acquired Portfolio.
2. VALUATION
2.1. The value of the Assets shall be the value computed as of immediately after the close of business of the New York Stock Exchange and after the declaration of any dividends on the Closing Date (such time and date being hereinafter called the “Valuation Date”), using the valuation procedures in the then-current prospectus and statement of additional information with respect to the Acquiring Portfolio, and valuation procedures established by the Acquiring Portfolio’s Board of Directors.
2.2. The net asset value of a ADV Class, Class I, Class S and Class S2 Acquiring Portfolio Share shall be the net asset value per share computed with respect to that class as of the Valuation Date, using the valuation procedures set forth in the Acquiring Portfolio’s then-current prospectus and statement of additional and valuation procedures established by the Acquiring Portfolio’s Board of Directors.
2.3. The number of the ADV Class, Class I, Class S and Class S2 Acquiring Portfolio Shares to be issued (including fractional shares, if any) in exchange for the Acquired Portfolio’s assets shall be determined with respect to each such class by dividing the value of the net assets with respect to the ADV Class, Class I, Class S and Class S2 shares of the Acquired Portfolio, as the case may be, determined using the same valuation procedures referred to in paragraph 2.1, by the net asset value of an Acquiring Portfolio Share of the same class, determined in accordance with paragraph 2.2.
2.4. All computations of value shall be made by the Acquired Portfolio’s designated record keeping agent and shall be subject to review by Acquiring Portfolio’s record keeping agent and by each Portfolio’s respective independent registered public accounting firm.
A-1-2
3. CLOSING AND CLOSING DATE
3.1. The Closing Date shall be July 18, 2009, or such other date as the parties may agree. All acts taking place at the Closing shall be deemed to take place simultaneously as of immediately after the close of business on the Closing Date unless otherwise agreed to by the parties. The close of business on the Closing Date shall be as of 4:00 p.m., Eastern Time. The Closing shall be held at the offices of the Acquiring Portfolio or at such other time and/or place as the parties may agree.
3.2. The Acquired Portfolio shall direct the Bank of New York Mellon Corporation, as custodian for the Acquired Portfolio (the “Custodian”), to deliver, at the Closing, a certificate of an authorized officer stating that (i) the Assets shall have been delivered in proper form to the Acquiring Portfolio within two business days prior to or on the Closing Date; and (ii) all necessary taxes in connection with the delivery of the Assets, including all applicable federal and state stock transfer stamps, if any, have been paid or provision for payment has been made. The Acquired Portfolio’s portfolio securities represented by a certificate or other written instrument shall be presented for examination by the Custodian to the custodian for the Acquiring Portfolio no later than five business days preceding the Closing Date, and shall be transferred and delivered by the Acquired Portfolio as of the Closing Date for the account of the Acquiring Portfolio duly endorsed in proper form for transfer in such condition as to constitute good delivery thereof. The Custodian shall deliver as of the Closing Date by book entry, in accordance with the customary practices of the Custodian and any securities depository (as defined in Rule 17f-4 under the Investment Company Act of 1940, as amended (the “1940 Act”)) in which the Acquired Portfolio’s Assets are deposited, the Acquired Portfolio’s portfolio securities and instruments deposited with such depositories. The cash to be transferred by the Acquired Portfolio shall be delivered by wire transfer of federal funds on the Closing Date.
3.3. The Acquired Portfolio shall direct PNC Global Investment Servicing (the “Transfer Agent”), on behalf of the Acquired Portfolio, to deliver at the Closing a certificate of an authorized officer stating that its records contain the names and addresses of the Acquired Portfolio Shareholders and the number and percentage ownership of outstanding ADV Class, Class I, Class S and Class S2 shares owned by each such shareholder immediately prior to the Closing. The Acquiring Portfolio shall issue and deliver a confirmation evidencing the Acquiring Portfolio Shares to be credited on the Closing Date to the Secretary of the Acquiring Portfolio, or provide evidence satisfactory to the Acquired Portfolio that such Acquiring Portfolio Shares have been credited to the Acquired Portfolio’s account on the books of the Acquiring Portfolio. At the Closing, each party shall deliver to the other such bills of sale, checks, assignments, share certificates, if any, receipts or other documents as such other party or its counsel may reasonably request.
3.4. In the event that on the Valuation Date (a) the New York Stock Exchange or another primary trading market for portfolio securities of the Acquiring Portfolio or the Acquired Portfolio shall be closed to trading or trading thereupon shall be restricted, or (b) trading or the reporting of trading on such Exchange or elsewhere shall be disrupted so that, in the judgment of the Board of Directors of the Acquired Portfolio or the Board of Directors of the Acquiring Portfolio, accurate appraisal of the value of the net assets of the Acquiring Portfolio or the Acquired Portfolio is impracticable, the Closing Date shall be postponed until the first business day after the day when trading shall have been fully resumed and reporting shall have been restored.
4. REPRESENTATIONS AND WARRANTIES
4.1. Except as has been disclosed to the Acquiring Portfolio in a written instrument executed by an officer of IPI, IPI, on behalf of the Acquired Portfolio, represents and warrants to IVP as follows:
(a) The Acquired Portfolio is duly organized as a series of IPI, which is a corporation duly organized, validly existing and in good standing under the laws of the State of Maryland, with power under IPI’s Articles of Incorporation to own all of its properties and assets and to carry on its business as it is now being conducted;
(b) IPI is a registered investment company classified as a management company of the open-end type, and its registration with the Commission as an investment company under the 1940 Act and the registration of shares of the Acquired Portfolio under the Securities Act of 1933, as amended (“1933 Act”), are in full force and effect;
(c) No consent, approval, authorization, or order of any court or governmental authority is required for the consummation by the Acquired Portfolio of the transactions contemplated herein, except such as have been obtained under the 1933 Act, the Securities Exchange Act of 1934, as amended (the “1934 Act”) and the 1940 Act and such as may be required by state securities laws;
A-1-3
(d) The current prospectus and statement of additional information of the Acquired Portfolio and each prospectus and statement of additional information of the Acquired Portfolio used during the three years previous to the date of this Agreement conforms or conformed at the time of its use in all material respects to the applicable requirements of the 1933 Act and the 1940 Act and the rules and regulations of the Commission thereunder and does not, or did not at the time of its use, include any untrue statement of a material fact or omit to state any material fact required to be stated therein or necessary to make the statements therein, in light of the circumstances under which they were made, not materially misleading;
(e) On the Closing Date, the Acquired Portfolio will have good and marketable title to the Assets and full right, power, and authority to sell, assign, transfer and deliver such Assets hereunder free of any liens or other encumbrances, and upon delivery and payment for such Assets, the Acquiring Portfolio will acquire good and marketable title thereto, subject to no restrictions on the full transfer thereof, including such restrictions as might arise under the 1933 Act, other than as disclosed to the Acquiring Portfolio;
(f) The Acquired Portfolio is not engaged currently, and the execution, delivery and performance of this Agreement will not result, in (i) a material violation of IPI’s Articles of Incorporation or By-Laws or of any agreement, indenture, instrument, contract, lease or other undertaking to which IPI, on behalf of the Acquired Portfolio, is a party or by which it is bound; or (ii) the acceleration of any obligation, or the imposition of any penalty, under any agreement, indenture, instrument, contract, lease, judgment or decree to which IPI, on behalf of the Acquired Portfolio, is a party or by which it is bound;
(g) All material contracts or other commitments of the Acquired Portfolio (other than this Agreement and certain investment contracts including options, futures and forward contracts) will terminate without liability to the Acquired Portfolio prior to the Closing Date;
(h) Except as otherwise disclosed in writing to and accepted by IVP, on behalf of the Acquiring Portfolio, no litigation or administrative proceeding or investigation of or before any court or governmental body is presently pending or, to its knowledge, threatened against the Acquired Portfolio or any of its properties or assets that, if adversely determined, would materially and adversely affect its financial condition or the conduct of its business. IPI, on behalf of the Acquired Portfolio, knows of no facts which might form the basis for the institution of such proceedings and is not a party to or subject to the provisions of any order, decree or judgment of any court or governmental body which materially and adversely affects its business or its ability to consummate the transactions herein contemplated;
(i) The Statement of Assets and Liabilities, Statements of Operations and Changes in Net Assets, and Schedule of Investments of the Acquired Portfolio at December 31, 2008, have been audited by KPMG LLP, an independent registered public accounting firm, and are in accordance with U.S. generally accepted accounting principles (“U.S. GAAP”) consistently applied, and such statements (copies of which have been furnished to the Acquiring Portfolio) present fairly, in all material respects, the financial condition of the Acquired Portfolio as of such date in accordance with U.S. GAAP, and there are no known contingent liabilities of the Acquired Portfolio required to be reflected on a balance sheet (including the notes thereto) in accordance with U.S. GAAP as of such date not disclosed therein;
(j) Since December 31, 2008, there has not been any material adverse change in the Acquired Portfolio’s financial condition, assets, liabilities or business, other than changes occurring in the ordinary course of business, or any incurrence by the Acquired Portfolio of indebtedness maturing more than one year from the date such indebtedness was incurred, except as otherwise disclosed to and accepted by the Acquiring Portfolio (for the purposes of this subparagraph (j), a decline in net asset value per share of the Acquired Portfolio due to declines in market values of securities in the Acquired Portfolio’s portfolio, the discharge of Acquired Portfolio liabilities, or the redemption of Acquired Portfolio shares by shareholders of the Acquired Portfolio shall not constitute a material adverse change);
(k) On the Closing Date, all Federal and other tax returns, dividend reporting forms, and other tax-related reports of the Acquired Portfolio required by law to have been filed by such date (including any extensions) shall have been filed and are or will be correct in all material respects, and all Federal and other taxes shown as due or required to be shown as due on said returns and reports shall have been paid or provision shall have been made for the payment thereof, and to the best of the Acquired Portfolio’s knowledge, no such return is currently under audit and no assessment has been asserted with respect to such returns;
(l) For each taxable year of its operation (including the taxable year ending on the Closing Date), the Acquired Portfolio has met (or will meet) the requirements of Sub-chapter M of the Code for qualification as a regulated investment company, has been (or will be) eligible to and has computed (or will compute) its federal income tax
A-1-4
under Section 852 of the Code, and will have distributed all of its investment company taxable income and net capital gain (as defined in the Code) that has accrued through the Closing Date, and before the Closing Date will have declared dividends sufficient to distribute all of its investment company taxable income and net capital gain for the period ending on the Closing Date;
(m) All issued and outstanding shares of the Acquired Portfolio are, and on the Closing Date will be, duly and validly issued and outstanding, fully paid and non-assessable, and have been offered and sold in every state and the District of Columbia in compliance in all material respects with applicable registration requirements of the 1933 Act and state securities laws. All of the issued and outstanding shares of the Acquired Portfolio will, at the time of Closing, be held by the persons and in the amounts set forth in the records of the Transfer Agent, on behalf of the Acquired Portfolio, as provided in paragraph 3.3. The Acquired Portfolio does not have outstanding any options, warrants or other rights to subscribe for or purchase any of the shares of the Acquired Portfolio, nor is there outstanding any security convertible into any of the Acquired Portfolio shares;
(n) The execution, delivery and performance of this Agreement will have been duly authorized prior to the Closing Date by all necessary action, if any, on the part of the Directors of IPI, on behalf of the Acquired Portfolio, and, subject to the approval of the shareholders of the Acquired Portfolio, this Agreement will constitute a valid and binding obligation of the Acquired Portfolio, enforceable in accordance with its terms, subject, as to enforcement, to bankruptcy, insolvency, reorganization, moratorium and other laws relating to or affecting creditors’ rights and to general equity principles;
(o) The information to be furnished by the Acquired Portfolio for use in registration statements, proxy materials and other documents filed or to be filed with any federal, state or local regulatory authority (including the Financial Industry Regulatory Authority), which may be necessary in connection with the transactions contemplated hereby, shall be accurate and complete in all material respects and shall comply in all material respects with Federal securities and other laws and regulations thereunder applicable thereto; and
(p) The proxy statement of the Acquired Portfolio (the “Proxy Statement”) to be included in the Registration Statement referred to in paragraph 5.6, insofar as it relates to the Acquired Portfolio, will, on the effective date of the Registration Statement and on the Closing Date (i) not contain any untrue statement of a material fact or omit to state a material fact required to be stated therein or necessary to make the statements therein, in light of the circumstances under which such statements were made, not materially misleading provided, however, that the representations and warranties in this subparagraph (p) shall not apply to statements in or omissions from the Proxy Statement and the Registration Statement made in reliance upon and in conformity with information that was furnished by the Acquiring Portfolio for use therein; and (ii) comply in all material respects with the provisions of the 1933 Act, the 1934 Act and the 1940 Act and the rules and regulations thereunder.
4.2. Except as has been disclosed to the Acquired Portfolio in a written instrument executed by an officer of IVP, IVP, on behalf of the Acquiring Portfolio, represents and warrants to IPI as follows:
(a) The Acquiring Portfolio is duly organized as a series of IVP, which is a corporation duly organized, validly existing and in good standing under the laws of the State of Maryland, with power under IVP’s Articles of Incorporation to own all of its properties and assets and to carry on its business as it is now being conducted;
(b) IVP is a registered investment company classified as a management company of the open-end type, and its registration with the Commission as an investment company under the 1940 Act and the registration of the shares of the Acquiring Portfolio under the 1933 Act, are in full force and effect;
(c) No consent, approval, authorization, or order of any court or governmental authority is required for the consummation by the Acquiring Portfolio of the transactions contemplated herein, except such as have been obtained under the 1933 Act, the 1934 Act and the 1940 Act and such as may be required by state securities laws;
(d) The current prospectus and statement of additional information of the Acquiring Portfolio conforms at the time of its use in all material respects to the applicable requirements of the 1933 Act and the 1940 Act and the rules and regulations of the Commission thereunder and does not at the time of its use include any untrue statement of a material fact or omit to state any material fact required to be stated therein or necessary to make the statements therein, in light of the circumstances under which they were made, not materially misleading;
A-1-5
(e) On the Closing Date, the Acquiring Portfolio will have good and marketable title to the Acquiring Portfolio’s assets, free of any liens of other encumbrances, except those liens or encumbrances as to which the Acquired Portfolio has received notice and necessary documentation at or prior to the Closing;
(f) The Acquiring Portfolio is not engaged currently, and the execution, delivery and performance of this Agreement will not result, in (i) a material violation of IVP’s Articles of Incorporation or By-Laws or of any agreement, indenture, instrument, contract, lease or other undertaking to which IVP, on behalf of the Acquiring Portfolio, is a party or by which it is bound; or (ii) the acceleration of any obligation, or the imposition of any penalty, under any agreement, indenture, instrument, contract, lease, judgment or decree to which IVP, on behalf of the Acquiring Portfolio, is a party or by which it is bound;
(g) Except as otherwise disclosed in writing to and accepted by IPI, on behalf of the Acquired Portfolio, no litigation or administrative proceeding or investigation of or before any court or governmental body is presently pending or, to its knowledge, threatened against IVP, on behalf of the Acquiring Portfolio, or any of the Acquiring Portfolio’s properties or assets that, if adversely determined, would materially and adversely affect the Acquiring Portfolio’s financial condition or the conduct of the Acquiring Portfolio’s business. IVP, on behalf of the Acquiring Portfolio, knows of no facts which might form the basis for the institution of such proceedings and is not a party to or subject to the provisions of any order, decree or judgment of any court or governmental body which materially and adversely affects its business or its ability to consummate the transactions herein contemplated;
(h) The Statement of Assets and Liabilities, Statements of Operations and Changes in Net Assets and Schedule of Investments of the Acquiring Portfolio at December 31, 2008 have been audited by KPMG LLP, an independent registered public accounting firm, and are in accordance with U.S. GAAP consistently applied, and such statements (copies of which have been furnished to the Acquired Portfolio) present fairly, in all material respects, the financial condition of the Acquiring Portfolio as of such date in accordance with U.S. GAAP, and there are no known contingent liabilities of the Acquiring Portfolio required to be reflected on a balance sheet (including the notes thereto) in accordance with U.S. GAAP as of such date not disclosed therein;
(i) Since December 31, 2008, there has not been any material adverse change in the Acquiring Portfolio’s financial condition, assets, liabilities or business, other than changes occurring in the ordinary course of business, or any incurrence by the Acquiring Portfolio of indebtedness maturing more than one year from the date such indebtedness was incurred, except as otherwise disclosed to and accepted by the Acquired Portfolio (For purposes of this subparagraph (i), a decline in net asset value per share of the Acquiring Portfolio due to declines in market values of securities in the Acquiring Portfolio’s portfolio, the discharge of Acquiring Portfolio liabilities, or the redemption of Acquiring Portfolio Shares by shareholders of the Acquiring Portfolio, shall not constitute a material adverse change).
(j) On the Closing Date, all Federal and other tax returns, dividend reporting forms, and other tax-related reports of the Acquiring Portfolio required by law to have been filed by such date (including any extensions) shall have been filed and are or will be correct in all material respects, and all Federal and other taxes shown as due or required to be shown as due on said returns and reports shall have been paid or provision shall have been made for the payment thereof, and to the best of the Acquiring Portfolio’s knowledge no such return is currently under audit and no assessment has been asserted with respect to such returns;
(k) For each taxable year of its operation (including the taxable year that includes the Closing Date), the Acquiring Portfolio has met (or will meet) the requirements of Sub-chapter M of the Code for qualification as a regulated investment company, has been eligible to (or will be eligible to) and has computed (or will compute) its federal income tax under Section 852 of the Code, and has distributed all of its investment company taxable income and net capital gain (as defined in the Code) for periods ending prior to the Closing Date;
(l) All issued and outstanding shares of the Acquiring Portfolio are, and on the Closing Date will be, duly and validly issued and outstanding, fully paid and non-assessable by IVP and have been offered and sold in every state and the District of Columbia in compliance in all material respects with applicable registration requirements of the 1933 Act and state securities laws. The Acquiring Portfolio does not have outstanding any options, warrants or other rights to subscribe for or purchase any Acquiring Portfolio Shares, nor is there outstanding any security convertible into any Acquiring Portfolio Shares;
(m) The execution, delivery and performance of this Agreement will have been fully authorized prior to the Closing Date by all necessary action, if any, on the part of the Directors of IVP, on behalf of the Acquiring Portfolio, and this Agreement will constitute a valid and binding obligation of the Acquiring Portfolio, enforceable in accordance with
A-1-6
its terms, subject, as to enforcement, to bankruptcy, insolvency, reorganization, moratorium and other laws relating to or affecting creditors’ rights and to general equity principles;
(n) The ADV Class, Class I, Class S and Class S2 Acquiring Portfolio Shares to be issued and delivered to the Acquired Portfolio, for the account of the Acquired Portfolio Shareholders, pursuant to the terms of this Agreement, will on the Closing Date have been duly authorized and, when so issued and delivered, will be duly and validly issued Acquiring Portfolio Shares, and will be fully paid and non-assessable;
(o) The information to be furnished by IVP for use in the registration statements, proxy materials and other documents that may be necessary in connection with the transactions contemplated hereby shall be accurate and complete in all material respects and shall comply in all material respects with Federal securities and other laws and regulations applicable thereto; and
(p) That insofar as it relates to the Acquiring Portfolio, the Registration Statement relating to the Acquiring Portfolio Shares issuable hereunder, and the proxy materials of the Acquired Portfolio to be included in the Registration Statement, and any amendment or supplement to the foregoing, will, from the effective date of the Registration Statement through the date of the meeting of shareholders of the Acquired Portfolio contemplated therein (i) not contain any untrue statement of a material fact or omit to state a material fact required to be stated therein or necessary to make the statements therein, in light of the circumstances under which such statements were made, not misleading, provided, however, that the representations and warranties in this subparagraph (p) shall not apply to statements in or omissions from the Registration Statement made in reliance upon and in conformity with information that was furnished by the Acquired Portfolio for use therein; and (ii) comply in all material respects with the provisions of the 1933 Act, the 1934 Act and the 1940 Act and the rules and regulations thereunder.
5. COVENANTS OF THE ACQUIRING PORTFOLIO AND THE ACQUIRED PORTFOLIO
5.1. The Acquiring Portfolio and the Acquired Portfolio each will operate its business in the ordinary course between the date hereof and the Closing Date, it being understood that such ordinary course of business will include the declaration and payment of customary dividends and distributions, and any other distribution that may be advisable.
5.2. The Acquired Portfolio will call a meeting of the shareholders of the Acquired Portfolio to consider and act upon this Agreement and to take all other action necessary to obtain approval of the transactions contemplated herein.
5.3. The Acquired Portfolio covenants that the ADV Class, Class I, Class S and Class S2 Acquiring Portfolio Shares to be issued hereunder are not being acquired for the purpose of making any distribution thereof, other than in accordance with the terms of this Agreement.
5.4. The Acquired Portfolio will assist the Acquiring Portfolio in obtaining such information as the Acquiring Portfolio reasonably requests concerning the beneficial ownership of the Acquired Portfolio shares.
5.5. Subject to the provisions of this Agreement, the Acquiring Portfolio and the Acquired Portfolio will each take, or cause to be taken, all action, and do or cause to be done, all things reasonably necessary, proper or advisable to consummate and make effective the transactions contemplated by this Agreement.
5.6. The Acquired Portfolio will provide the Acquiring Portfolio with information reasonably necessary for the preparation of a prospectus (the “Prospectus”), which will include the Proxy Statement referred to in paragraph 4.1(p), all to be included in a Registration Statement on Form N-14 of the Acquiring Portfolio (the “Registration Statement”), in compliance with the 1933 Act, the 1934 Act and the 1940 Act, in connection with the meeting of the shareholders of the Acquired Portfolio to consider approval of this Agreement and the transactions contemplated herein.
5.7. As soon as is reasonably practicable after the Closing, the Acquired Portfolio will make a liquidating distribution to its shareholders consisting of the ADV Class, Class I, Class S and Class S2 Acquiring Portfolio Shares received at the Closing.
5.8. The Acquiring Portfolio and the Acquired Portfolio shall each use its reasonable best efforts to fulfill or obtain the fulfillment of the conditions precedent to effect the transactions contemplated by this Agreement as promptly as practicable.
A-1-7
5.9. IPI, on behalf of the Acquired Portfolio, covenants that IPI will, from time to time, as and when reasonably requested by the Acquiring Portfolio, execute and deliver or cause to be executed and delivered all such assignments and other instruments, and will take or cause to be taken such further action as IVP, on behalf of the Acquiring Portfolio, may reasonably deem necessary or desirable in order to vest in and confirm (a) IPI’s, on behalf of the Acquired Portfolio’s, title to and possession of the Acquiring Portfolio’s Shares to be delivered hereunder, and (b) IVP’s, on behalf of the Acquiring Portfolio’s, title to and possession of all the assets and otherwise to carry out the intent and purpose of this Agreement.
5.10. The Acquiring Portfolio will use all reasonable efforts to obtain the approvals and authorizations required by the 1933 Act, the 1940 Act and such of the state blue sky or securities laws as may be necessary in order to continue its operations after the Closing Date.
6. CONDITIONS PRECEDENT TO OBLIGATIONS OF THE ACQUIRED PORTFOLIO
The obligations of IPI, on behalf of the Acquired Portfolio, to consummate the transactions provided for herein shall be subject, at IPI’s election, to the performance by IVP, on behalf of the Acquiring Portfolio, of all the obligations to be performed by it hereunder on or before the Closing Date, and, in addition thereto, the following further conditions:
6.1. All representations and warranties of IVP, on behalf of the Acquiring Portfolio, contained in this Agreement shall be true and correct in all material respects as of the date hereof and, except as they may be affected by the transactions contemplated by this Agreement, as of the Closing Date, with the same force and effect as if made on and as of the Closing Date;
6.2. IVP shall have delivered to IPI a certificate executed in its name by its President or Vice President and its Treasurer or Assistant Treasurer, in a form reasonably satisfactory to IPI and dated as of the Closing Date, to the effect that the representations and warranties of IVP, on behalf of the Acquiring Portfolio, made in this Agreement are true and correct at and as of the Closing Date, except as they may be affected by the transactions contemplated by this Agreement and as to such other matters as IPI shall reasonably request;
6.3. IVP, on behalf of the Acquiring Portfolio, shall have performed all of the covenants and complied with all of the provisions required by this Agreement to be performed or complied with by IVP, on behalf of the Acquiring Portfolio, on or before the Closing Date; and
6.4. The Acquired Portfolio and the Acquiring Portfolio shall have agreed on the number of full and fractional Acquiring Portfolio Shares of each class to be issued in connection with the Reorganization after such number has been calculated in accordance with paragraph 1.1.
7. CONDITIONS PRECEDENT TO OBLIGATIONS OF THE ACQUIRING PORTFOLIO
The obligations of IVP, on behalf of the Acquiring Portfolio, to complete the transactions provided for herein shall be subject, at IVP’s election, to the performance by IPI, on behalf of the Acquired Portfolio, of all of the obligations to be performed by it hereunder on or before the Closing Date and, in addition thereto, the following conditions:
7.1. All representations and warranties of IPI, on behalf of the Acquired Portfolio, contained in this Agreement shall be true and correct in all material respects as of the date hereof and, except as they may be affected by the transactions contemplated by this Agreement, as of the Closing Date, with the same force and effect as if made on and as of the Closing Date;
7.2. IPI shall have delivered to IVP a statement of the Acquired Portfolio’s assets and liabilities, as of the Closing Date, certified by the Treasurer of IPI;
7.3. IPI shall have delivered to IVP on the Closing Date a certificate executed in its name by its President or Vice President and its Treasurer or Assistant Treasurer, in form and substance satisfactory to IVP and dated as of the Closing Date, to the effect that the representations and warranties of IPI, on behalf of the Acquired Portfolio, made in this Agreement are true and correct at and as of the Closing Date, except as they may be affected by the transactions contemplated by this Agreement, and as to such other matters as IVP shall reasonably request;
A-1-8
7.4. IPI, on behalf of the Acquired Portfolio, shall have performed all of the covenants and complied with all of the provisions required by this Agreement to be performed or complied with by IPI, on behalf of the Acquired Portfolio, on or before the Closing Date;
7.5. The Acquired Portfolio and the Acquiring Portfolio shall have agreed on the number of full and fractional Acquiring Portfolio Shares of each class to be issued in connection with the Reorganization after such number has been calculated in accordance with paragraph 1.1; and
7.6. The Acquired Portfolio shall have declared and paid a distribution or distributions prior to the Closing that, together with all previous distributions, shall have the effect of distributing to its shareholders (i) all of its investment company taxable income and all of its net realized capital gains, if any, for the period from the close of its last fiscal year to 4:00 p.m. Eastern time on the Closing; and (ii) any undistributed investment company taxable income and net realized capital gains from any period to the extent not otherwise already distributed.
8. FURTHER CONDITIONS PRECEDENT TO OBLIGATIONS OF THE ACQUIRING PORTFOLIO AND THE ACQUIRED PORTFOLIO
If any of the conditions set forth below have not been satisfied on or before the Closing Date with respect to IPI, on behalf of the Acquired Portfolio, or IVP, on behalf of the Acquiring Portfolio, the other party to this Agreement shall, at its option, not be required to consummate the transactions contemplated by this Agreement:
8.1. The Agreement and the transactions contemplated herein shall have been approved by the requisite vote of the holders of the outstanding shares of the Acquired Portfolio in accordance with the provisions of IPI’s Articles of Incorporation, By-Laws, applicable Maryland law and the 1940 Act, and certified copies of the resolutions evidencing such approval shall have been delivered to IVP. Notwithstanding anything herein to the contrary, neither IPI nor IVP may waive the conditions set forth in this paragraph 8.1;
8.2. On the Closing Date no action, suit or other proceeding shall be pending or, to its knowledge, threatened before any court or governmental agency in which it is sought to restrain or prohibit, or obtain damages or other relief in connection with, this Agreement or the transactions contemplated herein;
8.3. All consents of other parties and all other consents, orders and permits of Federal, state and local regulatory authorities deemed necessary by IVP or IPI to permit consummation, in all material respects, of the transactions contemplated hereby shall have been obtained, except where failure to obtain any such consent, order or permit would not involve a risk of a material adverse effect on the assets or properties of the Acquiring Portfolio or the Acquired Portfolio, provided that either party hereto may for itself waive any of such conditions;
8.4. The Registration Statement shall have become effective under the 1933 Act and no stop orders suspending the effectiveness thereof shall have been issued and, to the best knowledge of the parties hereto, no investigation or proceeding for that purpose shall have been instituted or be pending, threatened or contemplated under the 1933 Act; and
8.5. The parties shall have received the opinion of Dechert LLP addressed to IPI and IVP substantially to the effect that, based upon certain facts, assumptions, and representations, the transaction contemplated by this Agreement shall constitute a tax-free reorganization for Federal income tax purposes. The delivery of such opinion is conditioned upon receipt by Dechert LLP of representations it shall request of IVP and IPI. Notwithstanding anything herein to the contrary, neither IPI nor IVP may waive the condition set forth in this paragraph 8.5.
9. BROKERAGE FEES AND EXPENSES
9.1. IPI, on behalf of the Acquired Portfolio, and IVP, on behalf of the Acquiring Portfolio, represent and warrant to each other that there are no brokers or finders entitled to receive any payments in connection with the transactions provided for herein.
9.2. The expenses relating to the proposed Reorganization will be borne by the investment adviser to the Acquiring Portfolio (or an affiliate of the investment adviser). The costs of the Reorganization shall include, but not be limited to, costs associated with obtaining any necessary order of exemption from the 1940 Act, preparation of the Registration Statement, printing and distributing the Acquiring Portfolio’s prospectus and the Acquired Portfolio’s proxy materials, legal fees, accounting fees, securities registration fees, and expenses of holding shareholders’ meetings.
A-1-9
Notwithstanding any of the foregoing, expenses will in any event be paid by the party directly incurring such expenses if and to the extent that the payment by another person of such expenses would result in the disqualification of such party as a “regulated investment company” within the meaning of Section 851 of the Code.
10. ENTIRE AGREEMENT; SURVIVAL OF WARRANTIES
10.1. IPI and IVP agree that neither party has made any representation, warranty or covenant not set forth herein and that this Agreement constitutes the entire agreement between the parties.
10.2. The representations, warranties and covenants contained in this Agreement or in any document delivered pursuant hereto or in connection herewith shall survive the consummation of the transactions contemplated hereunder. The covenants to be performed after the Closing shall survive the Closing.
11. TERMINATION
This Agreement may be terminated and the transactions contemplated hereby may be abandoned by either party by (i) mutual agreement of the parties; or (ii) by either party if the Closing shall not have occurred on or before October 31, 2009, unless such date is extended by mutual agreement of the parties; or (iii) by either party if the other party shall have materially breached its obligations under this Agreement or made a material and intentional misrepresentation herein or in connection herewith. In the event of any such termination, this Agreement shall become void and there shall be no liability hereunder on the part of any party or their respective Directors or officers, except for any such material breach or intentional misrepresentation, as to each of which all remedies at law or in equity of the party adversely affected shall survive.
12. AMENDMENTS
This Agreement may be amended, modified or supplemented in such manner as may be deemed necessary or advisable by the authorized officers of IPI and IVP; provided, however, that following the meeting of the shareholders of the Acquired Portfolio called by IPI pursuant to paragraph 5.2 of this Agreement, no such amendment may have the effect of changing the provisions for determining the number of the ADV Class, Class I, Class S and Class S2 Acquiring Portfolio Shares to be issued to the Acquired Portfolio Shareholders under this Agreement to the detriment of such shareholders without their further approval.
13. NOTICES
Any notice, report, statement or demand required or permitted by any provisions of this Agreement shall be in writing and shall be given by facsimile, personal service or prepaid or certified mail addressed to:
a. | ING Variable Portfolios, Inc. | b. | ING Partners, Inc. |
| 7337 East Doubletree Ranch Road |
| 7337 East Doubletree Ranch Road |
| Scottsdale, Arizona 85258-2034 |
| Scottsdale, Arizona 85258-2034 |
| Attn: Huey P. Falgout, Jr. |
| Attn: Huey P. Falgout, Jr. |
|
|
|
|
| With a copy to: |
| With a copy to: |
| Goodwin Procter LLP |
| Dechert LLP |
| Exchange Place |
| 1775 I Street, N.W. |
| 53 State Street |
| Washington, D.C. 20006 |
| Boston, MA 02109 |
| Attn: Jeffrey S. Puretz |
| Attn: Philip H. Newman |
|
|
14. HEADINGS; COUNTERPARTS; GOVERNING LAW; ASSIGNMENT; LIMITATION OF LIABILITY
14.1. The Article and paragraph headings contained in this Agreement are for reference purposes only and shall not affect in any way the meaning or interpretation of this Agreement.
14.2. This Agreement may be executed in any number of counterparts, each of which shall be deemed an original.
A-1-10
14.3. This Agreement shall be governed by and construed in accordance with the laws of the State of Maryland without regard to its principles of conflicts of laws.
14.4. This Agreement shall bind and inure to the benefit of the parties hereto and their respective successors and assigns, but no assignment or transfer hereof or of any rights or obligations hereunder shall be made by any party without the written consent of the other party. Nothing herein expressed or implied is intended or shall be construed to confer upon or give any person, firm or corporation, other than the parties hereto and their respective successors and assigns, any rights or remedies under or by reason of this Agreement.
14.5. It is expressly agreed that the obligations of the parties hereunder shall not be binding upon any of their respective Directors, shareholders, nominees, officers, agents, or employees personally, but shall bind only the property of the Acquired Portfolio or Acquiring Portfolio, as the case may be, as provided in the Articles of Incorporation of ING Partners, Inc. and the Articles of Incorporation of IVP, respectively. The execution and delivery by such officers shall not be deemed to have been made by any of them individually or to impose any liability on any of them personally, but shall bind only the property of such party.
A-1-11
IN WITNESS WHEREOF, each of the parties hereto has caused this Agreement to be executed by its President or Vice President.
| ING VARIABLE PORTFOLIOS, INC. on behalf of its | ||
| ING RUSSELL™ LARGE CAP INDEX PORTFOLIO series | ||
|
| ||
|
| ||
| By: | /s/ Michael J. Roland | |
|
|
| |
| Name: | Michael J. Roland | |
|
|
| |
| Title: | Executive Vice President | |
|
| ||
|
| ||
| ING PARTNERS, INC. on behalf of its | ||
| ING NEUBERGER BERMAN PARTNERS PORTFOLIO series | ||
|
| ||
|
| ||
| By: | /s/ Todd Modic | |
|
|
| |
| Name: | Todd Modic | |
|
|
| |
| Title: | Senior Vice President | |
A-1-12
APPENDIX A-2
AGREEMENT AND PLAN OF REORGANIZATION
THIS AGREEMENT AND PLAN OF REORGANIZATION (the “Agreement”) is made as of this 27th day of March, 2009, by and between ING Variable Portfolios, Inc., a Maryland corporation with its principal place of business at 7337 East Doubletree Ranch Road, Scottsdale, Arizona 85258-2034 (the “Company”), on behalf of its series, ING Russell™ Large Cap Index Portfolio (the “Acquiring Portfolio”), and ING Investors Trust, a Massachusetts business trust with its principal place of business at 7337 East Doubletree Ranch Road, Scottsdale, Arizona 85258-2034 (the “Trust”), on behalf of its series, ING Oppenheimer Main Street Portfolio® (the “Acquired Portfolio”).
This Agreement is intended to be and is adopted as a plan of reorganization and liquidation within the meaning of Section 368(a)(1) of the United States Internal Revenue Code of 1986, as amended (the “Code”). The reorganization (the “Reorganization”) will consist of the transfer of all of the assets of the Acquired Portfolio to the Acquiring Portfolio in exchange solely for Adviser Class (“ADV Class”), Class I, Service Class (“Class S”) and Service 2 Class (Class S2”) voting shares of beneficial interest of the Acquiring Portfolio (the “Acquiring Portfolio Shares”), the assumption by the Acquiring Portfolio of the liabilities of the Acquired Portfolio described in paragraph 1.3, and the distribution of the Acquiring Portfolio Shares to the shareholders of the Acquired Portfolio in complete liquidation of the Acquired Portfolio as provided herein, all upon the terms and conditions hereinafter set forth in this Agreement.
WHEREAS, the Acquired Portfolio and the Acquiring Portfolio are series of open-end, registered investment companies of the management type and the Acquired Portfolio owns securities which generally are assets of the character in which the Acquiring Portfolio is permitted to invest; and
WHEREAS, the Board of Directors of the Company has determined that the exchange of all of the assets of the Acquired Portfolio for Acquiring Portfolio Shares and the assumption of the liabilities of the Acquired Portfolio, as described in paragraph 1.3 herein, by the Acquiring Portfolio are in the best interests of the Acquiring Portfolio and its shareholders and that the interests of the existing shareholders of the Acquiring Portfolio would not be diluted as a result of this transaction; and
WHEREAS, the Board of Trustees of the Trust has determined that the exchange of all of the assets of the Acquired Portfolio for Acquiring Portfolio Shares and the assumption of the liabilities of the Acquired Portfolio by the Acquiring Portfolio, as described in paragraph 1.3 herein, is in the best interests of the Acquired Portfolio and its shareholders and that the interests of the existing shareholders of the Acquired Portfolio would not be diluted as a result of this transaction.
NOW, THEREFORE, in consideration of the premises and of the covenants and agreements hereinafter set forth, the parties hereto covenant and agree as follows:
1. TRANSFER OF ASSETS OF THE ACQUIRED PORTFOLIO TO THE ACQUIRING PORTFOLIO IN EXCHANGE FOR THE ACQUIRING PORTFOLIO SHARES, THE ASSUMPTION OF ALL KNOWN ACQUIRED PORTFOLIO LIABILITIES AND THE LIQUIDATION OF THE ACQUIRED PORTFOLIO
1.1. Subject to the requisite approval of the Acquired Portfolio shareholders and the other terms and conditions herein set forth and on the basis of the representations and warranties contained herein, the Acquired Portfolio agrees to transfer all of the Acquired Portfolio’s assets, as set forth in paragraph 1.2, to the Acquiring Portfolio, and the Acquiring Portfolio agrees in exchange therefor: (i) to deliver to the Acquired Portfolio the number of full and fractional ADV Class, Class I, Class S and Class S2 Acquiring Portfolio Shares determined by dividing the value of the Acquired Portfolio’s net assets with respect to each class, computed in the manner and as of the time and date set forth in paragraph 2.1, by the net asset value of one Acquiring Portfolio Share of the same class, computed in the manner and as of the time and date set forth in paragraph 2.2; and (ii) to assume the liabilities of the Acquired Portfolio, as set forth in paragraph 1.3. Such transactions shall take place at the closing provided for in paragraph 3.1 (the “Closing”).
1.2. The assets of the Acquired Portfolio to be acquired by the Acquiring Portfolio shall consist of all assets and property, including, without limitation, all cash, securities, commodities and futures interests and dividends or interests receivable that are owned by the Acquired Portfolio and any deferred or prepaid expenses shown as an asset on the books of the Acquired Portfolio on the closing date provided for in paragraph 3.1 (the “Closing Date”) (collectively, “Assets”).
A-2-1
1.3. The Acquired Portfolio will endeavor to discharge all of its known liabilities and obligations prior to the Closing Date. The Acquiring Portfolio shall assume the liabilities of the Acquired Portfolio set forth in the Acquired Portfolio’s Statement of Assets and Liabilities as of the Closing Date delivered by the Trust, on behalf of the Acquired Portfolio, to the Company, on behalf of the Acquiring Portfolio, pursuant to paragraph 7.2 hereof. On or as soon as practicable prior to the Closing Date, the Acquired Portfolio will declare and pay to its shareholders of record one or more dividends and/or other distributions so that it will have distributed substantially all (and in no event less than 98%) of its investment company taxable income (computed without regard to any deduction for dividends paid) and realized net capital gain, if any, for the current taxable year through the Closing Date.
1.4. Immediately after the transfer of assets provided for in paragraph 1.1, the Acquired Portfolio will: (i) distribute to the Acquired Portfolio’s shareholders of record with respect to its ADV Class, Class I, Class S and Class S2 shares, determined as of immediately after the close of business on the Closing Date, on a pro rata basis within each class, the Acquiring Portfolio Shares of the same class received by the Acquired Portfolio pursuant to paragraph 1.1; and (ii) completely liquidate. Such distribution and liquidation will be accomplished, with respect to each class of the Acquired Portfolio’s shares, by the transfer of the Acquiring Portfolio Shares then credited to the account of the Acquired Portfolio on the books of the Acquiring Portfolio to open accounts on the share records of the Acquiring Portfolio in the names of the shareholders of record of each class of the Acquired Portfolio’s shares, determined as of immediately after the close of business on the Closing Date (the “Acquired Portfolio Shareholders”). The aggregate net asset value of ADV Class, Class I, Class S and Class S2 Acquiring Portfolio Shares to be so credited to shareholders of ADV Class, Class I, Class S and Class S2 shares of the Acquired Portfolio shall, with respect to each class, be equal to the aggregate net asset value of the Acquired Portfolio shares of that same class owned by such shareholders on the Closing Date. All issued and outstanding ADV Class, Class I, Class S and Class S2 Acquired Portfolio shares will simultaneously be canceled on the books of the Acquired Portfolio, although share certificates representing interests in ADV Class, Class I, Class S and Class S2 shares of the Acquired Portfolio will represent a number of the same class of Acquiring Portfolio Shares after the Closing Date, as determined in accordance with Section 2.3. The Acquiring Portfolio shall not issue certificates representing the ADV Class, Class I, Class S and Class S2 Acquiring Portfolio Shares in connection with such exchange.
1.5. Ownership of Acquiring Portfolio Shares will be shown on the books of the Acquiring Portfolio’s transfer agent, as defined in paragraph 3.3.
1.6. Any reporting responsibility of the Acquired Portfolio including, but not limited to, the responsibility for filing of regulatory reports, tax returns, or other documents with the U.S. Securities and Exchange Commission (the “Commission”), any state securities commission, and any federal, state or local tax authorities or any other relevant regulatory authority, is and shall remain the responsibility of the Acquired Portfolio.
2. VALUATION
2.1. The value of the Assets shall be the value computed as of immediately after the close of business of the New York Stock Exchange and after the declaration of any dividends on the Closing Date (such time and date being hereinafter called the “Valuation Date”), using the valuation procedures in the then-current prospectus and statement of additional information with respect to the Acquiring Portfolio, and valuation procedures established by the Acquiring Portfolio’s Board of Directors.
2.2. The net asset value of a ADV Class, Class I, Class S and Class S2 Acquiring Portfolio Share shall be the net asset value per share computed with respect to that class as of the Valuation Date, using the valuation procedures set forth in the Acquiring Portfolio’s then-current prospectus and statement of additional and valuation procedures established by the Acquiring Portfolio’s Board of Directors.
2.3. The number of the ADV Class, Class I, Class S and Class S2 Acquiring Portfolio Shares to be issued (including fractional shares, if any) in exchange for the Acquired Portfolio’s assets shall be determined with respect to each such class by dividing the value of the net assets with respect to the ADV Class, Class I, Class S and Class S2 shares of the Acquired Portfolio, as the case may be, determined using the same valuation procedures referred to in paragraph 2.1, by the net asset value of an Acquiring Portfolio Share of the same class, determined in accordance with paragraph 2.2.
2.4. All computations of value shall be made by the Acquired Portfolio’s designated record keeping agent and shall be subject to review by Acquiring Portfolio’s record keeping agent and by each Portfolio’s respective independent registered public accounting firm.
A-2-2
3. CLOSING AND CLOSING DATE
3.1. The Closing Date shall be July 18, 2009 or such other date as the parties may agree. All acts taking place at the Closing shall be deemed to take place simultaneously as of immediately after the close of business on the Closing Date unless otherwise agreed to by the parties. The close of business on the Closing Date shall be as of 4:00p.m., Eastern Time. The Closing shall be held at the offices of the Acquiring Portfolio or at such other time and/or place as the parties may agree.
3.2. The Acquired Portfolio shall direct the Bank of New York Mellon Corporation, as custodian for the Acquired Portfolio (the “Custodian”), to deliver, at the Closing, a certificate of an authorized officer stating that (i) the Assets shall have been delivered in proper form to the Acquiring Portfolio within two business days prior to or on the Closing Date; and (ii) all necessary taxes in connection with the delivery of the Assets, including all applicable federal and state stock transfer stamps, if any, have been paid or provision for payment has been made. The Acquired Portfolio’s portfolio securities represented by a certificate or other written instrument shall be presented for examination by the Custodian to the custodian for the Acquiring Portfolio no later than five business days preceding the Closing Date, and shall be transferred and delivered by the Acquired Portfolio as of the Closing Date for the account of the Acquiring Portfolio duly endorsed in proper form for transfer in such condition as to constitute good delivery thereof. The Custodian shall deliver as of the Closing Date by book entry, in accordance with the customary practices of the Custodian and any securities depository (as defined in Rule 17f-4 under the Investment Company Act of 1940, as amended (the “1940 Act”)) in which the Acquired Portfolio’s Assets are deposited, the Acquired Portfolio’s portfolio securities and instruments deposited with such depositories. The cash to be transferred by the Acquired Portfolio shall be delivered by wire transfer of federal funds on the Closing Date.
3.3. The Acquired Portfolio shall direct PNC Global Investment Servicing (the “Transfer Agent”), on behalf of the Acquired Portfolio, to deliver at the Closing a certificate of an authorized officer stating that its records contain the names and addresses of the Acquired Portfolio shareholders and the number and percentage ownership of outstanding ADV Class, Class I, Class S and Class S2 shares owned by each such shareholder immediately prior to the Closing. The Acquiring Portfolio shall issue and deliver a confirmation evidencing the Acquiring Portfolio Shares to be credited on the Closing Date to the Secretary of the Acquiring Portfolio, or provide evidence satisfactory to the Acquired Portfolio that such Acquiring Portfolio Shares have been credited to the Acquired Portfolio’s account on the books of the Acquiring Portfolio. At the Closing, each party shall deliver to the other such bills of sale, checks, assignments, share certificates, if any, receipts or other documents as such other party or its counsel may reasonably request.
3.4. In the event that on the Valuation Date (a) the New York Stock Exchange or another primary trading market for portfolio securities of the Acquiring Portfolio or the Acquired Portfolio shall be closed to trading or trading thereupon shall be restricted, or (b) trading or the reporting of trading on such Exchange or elsewhere shall be disrupted so that, in the judgment of the Board of Trustees of the Acquired Portfolio or the Board of Directors of the Acquiring Portfolio, accurate appraisal of the value of the net assets of the Acquiring Portfolio or the Acquired Portfolio is impracticable, the Closing Date shall be postponed until the first business day after the day when trading shall have been fully resumed and reporting shall have been restored.
4. REPRESENTATIONS AND WARRANTIES
4.1. Except as has been disclosed to the Acquiring Portfolio in a written instrument executed by an officer of the Trust, the Trust, on behalf of the Acquired Portfolio, represents and warrants to the Company as follows:
(a) The Acquired Portfolio is duly organized as a series of the Trust, which is a business trust duly organized, validly existing and in good standing under the laws of the Commonwealth of Massachusetts, with power under the Trust’s Declaration of Trust to own all of its properties and assets and to carry on its business as it is now being conducted;
(b) The Trust is a registered investment company classified as a management company of the open-end type, and its registration with the Commission as an investment company under the 1940 Act and the registration of shares of the Acquired Portfolio under the Securities Act of 1933, as amended (“1933 Act”), are in full force and effect;
(c) No consent, approval, authorization, or order of any court or governmental authority is required for the consummation by the Acquired Portfolio of the transactions contemplated herein, except such as have been obtained
A-2-3
under the 1933 Act, the Securities Exchange Act of 1934, as amended (the “1934 Act”) and the 1940 Act and such as may be required by state securities laws;
(d) The current prospectus and statement of additional information of the Acquired Portfolio and each prospectus and statement of additional information of the Acquired Portfolio used during the three years previous to the date of this Agreement conforms or conformed at the time of its use in all material respects to the applicable requirements of the 1933 Act and the 1940 Act and the rules and regulations of the Commission thereunder and does not, or did not at the time of its use, include any untrue statement of a material fact or omit to state any material fact required to be stated therein or necessary to make the statements therein, in light of the circumstances under which they were made, not materially misleading;
(e) On the Closing Date, the Acquired Portfolio will have good and marketable title to the Assets and full right, power, and authority to sell, assign, transfer and deliver such Assets hereunder free of any liens or other encumbrances, and upon delivery and payment for such Assets, the Acquiring Portfolio will acquire good and marketable title thereto, subject to no restrictions on the full transfer thereof, including such restrictions as might arise under the 1933 Act, other than as disclosed to the Acquiring Portfolio;
(f) The Acquired Portfolio is not engaged currently, and the execution, delivery and performance of this Agreement will not result, in (i) a material violation of the Trust’s Declaration of Trust or By-Laws or of any agreement, indenture, instrument, contract, lease or other undertaking to which the Trust, on behalf of the Acquired Portfolio, is a party or by which it is bound; or (ii) the acceleration of any obligation, or the imposition of any penalty, under any agreement, indenture, instrument, contract, lease, judgment or decree to which the Trust, on behalf of the Acquired Portfolio, is a party or by which it is bound;
(g) All material contracts or other commitments of the Acquired Portfolio (other than this Agreement and certain investment contracts including options, futures and forward contracts) will terminate without liability to the Acquired Portfolio prior to the Closing Date;
(h) Except as otherwise disclosed in writing to and accepted by the Company, on behalf of the Acquiring Portfolio, no litigation or administrative proceeding or investigation of or before any court or governmental body is presently pending or, to its knowledge, threatened against the Acquired Portfolio or any of its properties or assets that, if adversely determined, would materially and adversely affect its financial condition or the conduct of its business. The Trust, on behalf of the Acquired Portfolio, knows of no facts which might form the basis for the institution of such proceedings and is not a party to or subject to the provisions of any order, decree or judgment of any court or governmental body which materially and adversely affects its business or its ability to consummate the transactions herein contemplated;
(i) The Statement of Assets and Liabilities, Statements of Operations and Changes in Net Assets, and Schedule of Investments of the Acquired Portfolio at December 31, 2008 have been audited by KPMG LLP, an independent registered public accounting firm, and are in accordance with U.S. generally accepted accounting principles (“U.S. GAAP”) consistently applied, and such statements (copies of which have been furnished to the Acquiring Portfolio) present fairly, in all material respects, the financial condition of the Acquired Portfolio as of such date in accordance with U.S. GAAP, and there are no known contingent liabilities of the Acquired Portfolio required to be reflected on a balance sheet (including the notes thereto) in accordance with U.S. GAAP as of such date not disclosed therein;
(j) Since December 31, 2008, there has not been any material adverse change in the Acquired Portfolio’s financial condition, assets, liabilities or business, other than changes occurring in the ordinary course of business, or any incurrence by the Acquired Portfolio of indebtedness maturing more than one year from the date such indebtedness was incurred, except as otherwise disclosed to and accepted by the Acquiring Portfolio (for the purposes of this subparagraph (j), a decline in net asset value per share of the Acquired Portfolio due to declines in market values of securities in the Acquired Portfolio’s portfolio, the discharge of Acquired Portfolio liabilities, or the redemption of Acquired Portfolio shares by shareholders of the Acquired Portfolio shall not constitute a material adverse change);
(k) On the Closing Date, all Federal and other tax returns, dividend reporting forms, and other tax-related reports of the Acquired Portfolio required by law to have been filed by such date (including any extensions) shall have been filed and are or will be correct in all material respects, and all Federal and other taxes shown as due or required to be shown as due on said returns and reports shall have been paid or provision shall have been made for the payment thereof, and to the best of the Acquired Portfolio’s knowledge, no such return is currently under audit and no assessment has been asserted with respect to such returns;
A-2-4
(l) For each taxable year of its operation (including the taxable year ending on the Closing Date), the Acquired Portfolio has met (or will meet) the requirements of Sub-chapter M of the Code for qualification as a regulated investment company, has been (or will be) eligible to and has computed (or will compute) its federal income tax under Section 852 of the Code, and will have distributed all of its investment company taxable income and net capital gain (as defined in the Code) that has accrued through the Closing Date, and before the Closing Date will have declared dividends sufficient to distribute all of its investment company taxable income and net capital gain for the period ending on the Closing Date;
(m) All issued and outstanding shares of the Acquired Portfolio are, and on the Closing Date will be, duly and validly issued and outstanding, fully paid and non-assessable, and have been offered and sold in every state and the District of Columbia in compliance in all material respects with applicable registration requirements of the 1933 Act and state securities laws. All of the issued and outstanding shares of the Acquired Portfolio will, at the time of Closing, be held by the persons and in the amounts set forth in the records of the Transfer Agent, on behalf of the Acquired Portfolio, as provided in paragraph 3.3. The Acquired Portfolio does not have outstanding any options, warrants or other rights to subscribe for or purchase any of the shares of the Acquired Portfolio, nor is there outstanding any security convertible into any of the Acquired Portfolio shares;
(n) The execution, delivery and performance of this Agreement will have been duly authorized prior to the Closing Date by all necessary action, if any, on the part of the Trustees of the Trust, on behalf of the Acquired Portfolio, and, subject to the approval of the shareholders of the Acquired Portfolio, this Agreement will constitute a valid and binding obligation of the Acquired Portfolio, enforceable in accordance with its terms, subject, as to enforcement, to bankruptcy, insolvency, reorganization, moratorium and other laws relating to or affecting creditors’ rights and to general equity principles;
(o) The information to be furnished by the Acquired Portfolio for use in registration statements, proxy materials and other documents filed or to be filed with any federal, state or local regulatory authority (including the Financial Industry Regulatory Authority), which may be necessary in connection with the transactions contemplated hereby, shall be accurate and complete in all material respects and shall comply in all material respects with Federal securities and other laws and regulations thereunder applicable thereto; and
(p) The proxy statement of the Acquired Portfolio (the “Proxy Statement”) to be included in the Registration Statement referred to in paragraph 5.6, insofar as it relates to the Acquired Portfolio, will, on the effective date of the Registration Statement and on the Closing Date (i) not contain any untrue statement of a material fact or omit to state a material fact required to be stated therein or necessary to make the statements therein, in light of the circumstances under which such statements were made, not materially misleading provided, however, that the representations and warranties in this subparagraph (p) shall not apply to statements in or omissions from the Proxy Statement and the Registration Statement made in reliance upon and in conformity with information that was furnished by the Acquiring Portfolio for use therein; and (ii) comply in all material respects with the provisions of the 1933 Act, the 1934 Act and the 1940 Act and the rules and regulations thereunder.
4.2. Except as has been disclosed to the Acquired Portfolio in a written instrument executed by an officer of the Company, the Company, on behalf of the Acquiring Portfolio, represents and warrants to the Trust as follows:
(a) The Acquiring Portfolio is duly organized as a series of the Company, which is a corporation duly organized, validly existing and in good standing under the laws of the State of Maryland, with power under the Company’s Articles of Incorporation to own all of its properties and assets and to carry on its business as it is now being conducted;
(b) The Company is a registered investment company classified as a management company of the open-end type, and its registration with the Commission as an investment company under the 1940 Act and the registration of the shares of the Acquiring Portfolio under the 1933 Act, are in full force and effect;
(c) No consent, approval, authorization, or order of any court or governmental authority is required for the consummation by the Acquiring Portfolio of the transactions contemplated herein, except such as have been obtained under the 1933 Act, the 1934 Act and the 1940 Act and such as may be required by state securities laws;
(d) The current prospectus and statement of additional information of the Acquiring Portfolio conforms at the time of its use in all material respects to the applicable requirements of the 1933 Act and the 1940 Act and the rules and regulations of the Commission thereunder and does not at the time of its use include any untrue statement of a
A-2-5
material fact or omit to state any material fact required to be stated therein or necessary to make the statements therein, in light of the circumstances under which they were made, not materially misleading;
(e) On the Closing Date, the Acquiring Portfolio will have good and marketable title to the Acquiring Portfolio’s assets, free of any liens or other encumbrances, except those liens or encumbrances as to which the Acquired Portfolio has received notice and necessary documentation at or prior to the Closing;
(f) The Acquiring Portfolio is not engaged currently, and the execution, delivery and performance of this Agreement will not result, in (i) a material violation of the Company’s Articles of Incorporation or By-Laws or of any agreement, indenture, instrument, contract, lease or other undertaking to which the Company, on behalf of the Acquiring Portfolio, is a party or by which it is bound; or (ii) the acceleration of any obligation, or the imposition of any penalty, under any agreement, indenture, instrument, contract, lease, judgment or decree to which the Company, on behalf of the Acquiring Portfolio, is a party or by which it is bound;
(g) Except as otherwise disclosed in writing to and accepted by the Trust, on behalf of the Acquired Portfolio, no litigation or administrative proceeding or investigation of or before any court or governmental body is presently pending or, to its knowledge, threatened against the Company, on behalf of the Acquiring Portfolio, or any of the Acquiring Portfolio’s properties or assets that, if adversely determined, would materially and adversely affect the Acquiring Portfolio’s financial condition or the conduct of the Acquiring Portfolio’s business. The Company, on behalf of the Acquiring Portfolio, knows of no facts which might form the basis for the institution of such proceedings and is not a party to or subject to the provisions of any order, decree or judgment of any court or governmental body which materially and adversely affects its business or its ability to consummate the transactions herein contemplated;
(h) The Statement of Assets and Liabilities, Statements of Operations and Changes in Net Assets and Schedule of Investments of the Acquiring Portfolio at December 31, 2008 have been audited by KPMG LLP, an independent registered public accounting firm, and are in accordance with U.S. GAAP consistently applied, and such statements (copies of which have been furnished to the Acquired Portfolio) present fairly, in all material respects, the financial condition of the Acquiring Portfolio as of such date in accordance with U.S. GAAP, and there are no known contingent liabilities of the Acquiring Portfolio required to be reflected on a balance sheet (including the notes thereto) in accordance with U.S. GAAP as of such date not disclosed therein;
(i) Since December 31, 2008, there has not been any material adverse change in the Acquiring Portfolio’s financial condition, assets, liabilities or business, other than changes occurring in the ordinary course of business, or any incurrence by the Acquiring Portfolio of indebtedness maturing more than one year from the date such indebtedness was incurred, except as otherwise disclosed to and accepted by the Acquired Portfolio (For purposes of this subparagraph (i), a decline in net asset value per share of the Acquiring Portfolio due to declines in market values of securities in the Acquiring Portfolio’s portfolio, the discharge of Acquiring Portfolio liabilities, or the redemption of Acquiring Portfolio Shares by shareholders of the Acquiring Portfolio, shall not constitute a material adverse change).
(j) On the Closing Date, all Federal and other tax returns, dividend reporting forms, and other tax-related reports of the Acquiring Portfolio required by law to have been filed by such date (including any extensions) shall have been filed and are or will be correct in all material respects, and all Federal and other taxes shown as due or required to be shown as due on said returns and reports shall have been paid or provision shall have been made for the payment thereof, and to the best of the Acquiring Portfolio’s knowledge no such return is currently under audit and no assessment has been asserted with respect to such returns;
(k) For each taxable year of its operation (including the taxable year that includes the Closing Date), the Acquiring Portfolio has met (or will meet) the requirements of Sub-chapter M of the Code for qualification as a regulated investment company, has been eligible to (or will be eligible to) and has computed (or will compute) its federal income tax under Section 852 of the Code, and has distributed all of its investment company taxable income and net capital gain (as defined in the Code) for periods ending prior to the Closing Date;
(l) All issued and outstanding shares of the Acquiring Portfolio are, and on the Closing Date will be, duly and validly issued and outstanding, fully paid and non-assessable by the Company and have been offered and sold in every state and the District of Columbia in compliance in all material respects with applicable registration requirements of the 1933 Act and state securities laws. The Acquiring Portfolio does not have outstanding any options, warrants or other rights to subscribe for or purchase any Acquiring Portfolio Shares, nor is there outstanding any security convertible into any Acquiring Portfolio Shares;
A-2-6
(m) The execution, delivery and performance of this Agreement will have been fully authorized prior to the Closing Date by all necessary action, if any, on the part of the Directors of the Company, on behalf of the Acquiring Portfolio, and this Agreement will constitute a valid and binding obligation of the Acquiring Portfolio, enforceable in accordance with its terms, subject, as to enforcement, to bankruptcy, insolvency, reorganization, moratorium and other laws relating to or affecting creditors’ rights and to general equity principles;
(n) The ADV Class, Class I, Class S and Class S2 Acquiring Portfolio Shares to be issued and delivered to the Acquired Portfolio, for the account of the Acquired Portfolio shareholders, pursuant to the terms of this Agreement, will on the Closing Date have been duly authorized and, when so issued and delivered, will be duly and validly issued Acquiring Portfolio Shares, and will be fully paid and non-assessable;
(o) The information to be furnished by the Company for use in the registration statements, proxy materials and other documents that may be necessary in connection with the transactions contemplated hereby shall be accurate and complete in all material respects and shall comply in all material respects with Federal securities and other laws and regulations applicable thereto; and
(p) That insofar as it relates to the Acquiring Portfolio, the Registration Statement relating to the Acquiring Portfolio Shares issuable hereunder, and the proxy materials with respect to the Acquired Portfolio to be included in the Registration Statement, and any amendment or supplement to the foregoing, will, from the effective date of the Registration Statement through the date of the meeting of shareholders of the Acquired Portfolio contemplated therein (i) not contain any untrue statement of a material fact or omit to state a material fact required to be stated therein or necessary to make the statements therein, in light of the circumstances under which such statements were made, not misleading, provided, however, that the representations and warranties in this subparagraph (p) shall not apply to statements in or omissions from the Registration Statement made in reliance upon and in conformity with information that was furnished by the Acquired Portfolio for use therein; and (ii) comply in all material respects with the provisions of the 1933 Act, the 1934 Act and the 1940 Act and the rules and regulations thereunder.
5. COVENANTS OF THE ACQUIRING PORTFOLIO AND THE ACQUIRED PORTFOLIO
5.1. The Acquiring Portfolio and the Acquired Portfolio each will operate its business in the ordinary course between the date hereof and the Closing Date, it being understood that such ordinary course of business will include the declaration and payment of customary dividends and distributions, and any other distribution that may be advisable.
5.2. The Acquired Portfolio will call a meeting of the shareholders of the Acquired Portfolio to consider and act upon this Agreement and to take all other action necessary to obtain approval of the transactions contemplated herein.
5.3. The Acquired Portfolio covenants that the ADV Class, Class I, Class S and Class S2 Acquiring Portfolio Shares to be issued hereunder are not being acquired for the purpose of making any distribution thereof, other than in accordance with the terms of this Agreement.
5.4. The Acquired Portfolio will assist the Acquiring Portfolio in obtaining such information as the Acquiring Portfolio reasonably requests concerning the beneficial ownership of the Acquired Portfolio’s shares.
5.5. Subject to the provisions of this Agreement, the Acquiring Portfolio and the Acquired Portfolio will each take, or cause to be taken, all action, and do or cause to be done, all things reasonably necessary, proper or advisable to consummate and make effective the transactions contemplated by this Agreement.
5.6. The Acquired Portfolio will provide the Acquiring Portfolio with information reasonably necessary for the preparation of a prospectus (the “Prospectus”), which will include the Proxy Statement referred to in paragraph 4.1(p), all to be included in a Registration Statement on Form N-14 of the Acquiring Portfolio (the “Registration Statement”), in compliance with the 1933 Act, the 1934 Act and the 1940 Act, in connection with the meeting of the shareholders of the Acquired Portfolio to consider approval of this Agreement and the transactions contemplated herein.
5.7. As soon as is reasonably practicable after the Closing, the Acquired Portfolio will make a liquidating distribution to its shareholders consisting of the ADV Class, Class I, Class S and Class S2 Acquiring Portfolio Shares received at the Closing.
A-2-7
5.8. The Acquiring Portfolio and the Acquired Portfolio shall each use its reasonable best efforts to fulfill or obtain the fulfillment of the conditions precedent to effect the transactions contemplated by this Agreement as promptly as practicable.
5.9. The Trust, on behalf of the Acquired Portfolio, covenants that the Trust will, from time to time, as and when reasonably requested by the Acquiring Portfolio, execute and deliver or cause to be executed and delivered all such assignments and other instruments, and will take or cause to be taken such further action as the Company, on behalf of the Acquiring Portfolio, may reasonably deem necessary or desirable in order to vest in and confirm (a) the Trust’s, on behalf of the Acquired Portfolio’s, title to and possession of the Acquiring Portfolio Shares to be delivered hereunder, and (b) the Company’s, on behalf of the Acquiring Portfolio’s, title to and possession of all the assets and otherwise to carry out the intent and purpose of this Agreement.
5.10. The Acquiring Portfolio will use all reasonable efforts to obtain the approvals and authorizations required by the 1933 Act, the 1940 Act and such of the state blue sky or securities laws as may be necessary in order to continue its operations after the Closing Date.
6. CONDITIONS PRECEDENT TO OBLIGATIONS OF THE ACQUIRED PORTFOLIO
The obligations of the Trust, on behalf of the Acquired Portfolio, to consummate the transactions provided for herein shall be subject, at the Trust’ election, to the performance by the Company, on behalf of the Acquiring Portfolio, of all the obligations to be performed by it hereunder on or before the Closing Date, and, in addition thereto, the following further conditions:
6.1. All representations and warranties of the Company, on behalf of the Acquiring Portfolio, contained in this Agreement shall be true and correct in all material respects as of the date hereof and, except as they may be affected by the transactions contemplated by this Agreement, as of the Closing Date, with the same force and effect as if made on and as of the Closing Date;
6.2. The Company shall have delivered to the Trust a certificate executed in its name by its President or Vice President and its Treasurer or Assistant Treasurer, in a form reasonably satisfactory to the Trust and dated as of the Closing Date, to the effect that the representations and warranties of the Company, on behalf of the Acquiring Portfolio, made in this Agreement are true and correct at and as of the Closing Date, except as they may be affected by the transactions contemplated by this Agreement and as to such other matters as the Trust shall reasonably request;
6.3. The Company, on behalf of the Acquiring Portfolio, shall have performed all of the covenants and complied with all of the provisions required by this Agreement to be performed or complied with by the Company, on behalf of the Acquiring Portfolio, on or before the Closing Date; and
6.4. The Acquired Portfolio and the Acquiring Portfolio shall have agreed on the number of full and fractional Acquiring Portfolio Shares of each class to be issued in connection with the Reorganization after such number has been calculated in accordance with paragraph 1.1.
7. CONDITIONS PRECEDENT TO OBLIGATIONS OF THE ACQUIRING PORTFOLIO
The obligations of the Company, on behalf of the Acquiring Portfolio, to complete the transactions provided for herein shall be subject, at the Company’s election, to the performance by the Trust, on behalf of the Acquired Portfolio, of all of the obligations to be performed by it hereunder on or before the Closing Date and, in addition thereto, the following conditions:
7.1. All representations and warranties of the Trust, on behalf of the Acquired Portfolio, contained in this Agreement shall be true and correct in all material respects as of the date hereof and, except as they may be affected by the transactions contemplated by this Agreement, as of the Closing Date, with the same force and effect as if made on and as of the Closing Date;
7.2. The Trust shall have delivered to the Company a statement of the Acquired Portfolio’s assets and liabilities, as of the Closing Date, certified by the Treasurer of the Trust;
A-2-8
7.3. The Trust shall have delivered to the Company on the Closing Date a certificate executed in its name by its President or Vice President and its Treasurer or Assistant Treasurer, in form and substance satisfactory to the Company and dated as of the Closing Date, to the effect that the representations and warranties of the Trust, on behalf of the Acquired Portfolio, made in this Agreement are true and correct at and as of the Closing Date, except as they may be affected by the transactions contemplated by this Agreement, and as to such other matters as the Company shall reasonably request;
7.4. The Trust, on behalf of the Acquired Portfolio, shall have performed all of the covenants and complied with all of the provisions required by this Agreement to be performed or complied with by the Trust, on behalf of the Acquired Portfolio, on or before the Closing Date;
7.5. The Acquired Portfolio and the Acquiring Portfolio shall have agreed on the number of full and fractional Acquiring Portfolio Shares of each class to be issued in connection with the Reorganization after such number has been calculated in accordance with paragraph 1.1; and
7.6. The Acquired Portfolio shall have declared and paid a distribution or distributions prior to the Closing that, together with all previous distributions, shall have the effect of distributing to its shareholders (i) all of its investment company taxable income and all of its net realized capital gains, if any, for the period from the close of its last fiscal year to 4:00 p.m. Eastern time on the Closing; and (ii) any undistributed investment company taxable income and net realized capital gains from any period to the extent not otherwise already distributed.
8. FURTHER CONDITIONS PRECEDENT TO OBLIGATIONS OF THE ACQUIRING PORTFOLIO AND THE ACQUIRED PORTFOLIO
If any of the conditions set forth below have not been satisfied on or before the Closing Date with respect to the Trust, on behalf of the Acquired Portfolio, or the Company, on behalf of the Acquiring Portfolio, the other party to this Agreement shall, at its option, not be required to consummate the transactions contemplated by this Agreement:
8.1. The Agreement and the transactions contemplated herein shall have been approved by the requisite vote of the holders of the outstanding shares of the Acquired Portfolio in accordance with the provisions of the Trust’s Declaration of Trust, By-Laws, applicable Massachusetts law and the 1940 Act, and certified copies of the resolutions evidencing such approval shall have been delivered to the Company. Notwithstanding anything herein to the contrary, neither the Trust nor the Company may waive the conditions set forth in this paragraph 8.1;
8.2. On the Closing Date no action, suit or other proceeding shall be pending or, to its knowledge, threatened before any court or governmental agency in which it is sought to restrain or prohibit, or obtain damages or other relief in connection with, this Agreement or the transactions contemplated herein;
8.3. All consents of other parties and all other consents, orders and permits of Federal, state and local regulatory authorities deemed necessary by the Company or the Trust to permit consummation, in all material respects, of the transactions contemplated hereby shall have been obtained, except where failure to obtain any such consent, order or permit would not involve a risk of a material adverse effect on the assets or properties of the Acquiring Portfolio or the Acquired Portfolio, provided that either party hereto may for itself waive any of such conditions;
8.4. The Registration Statement shall have become effective under the 1933 Act and no stop orders suspending the effectiveness thereof shall have been issued and, to the best knowledge of the parties hereto, no investigation or proceeding for that purpose shall have been instituted or be pending, threatened or contemplated under the 1933 Act; and
8.5. The parties shall have received the opinion of Dechert LLP addressed to the Trust and the Company substantially to the effect that, based upon certain facts, assumptions, and representations, the transaction contemplated by this Agreement shall constitute a tax-free reorganization for Federal income tax purposes. The delivery of such opinion is conditioned upon receipt by Dechert LLP of representations it shall request of the Trust and the Company. Notwithstanding anything herein to the contrary, neither the Trust nor the Company may waive the condition set forth in this paragraph 8.5.
A-2-9
9. BROKERAGE FEES AND EXPENSES
9.1. The Trust, on behalf of the Acquired Portfolio, and the Company, on behalf of the Acquiring Portfolio, represent and warrant to each other that there are no brokers or finders entitled to receive any payments in connection with the transactions provided for herein.
9.2 The expenses relating to the proposed Reorganization will be borne by the investment adviser to the Acquiring Portfolio (or an affiliate of the investment adviser). The costs of the Reorganization shall include, but not be limited to, costs associated with obtaining any necessary order of exemption from the 1940 Act, preparation of the Registration Statement, printing and distributing the Acquiring Portfolio’s prospectus and the Acquired Portfolio’s proxy materials, legal fees, accounting fees, securities registration fees, and expenses of holding shareholders’ meetings. Notwithstanding any of the foregoing, expenses will in any event be paid by the party directly incurring such expenses if and to the extent that the payment by another person of such expenses would result in the disqualification of such party as a “regulated investment company” within the meaning of Section 851 of the Code.
10. ENTIRE AGREEMENT; SURVIVAL OF WARRANTIES
10.1. The Trust and the Company agree that neither party has made any representation, warranty or covenant not set forth herein and that this Agreement constitutes the entire agreement between the parties.
10.2. The representations, warranties and covenants contained in this Agreement or in any document delivered pursuant hereto or in connection herewith shall survive the consummation of the transactions contemplated hereunder. The covenants to be performed after the Closing shall survive the Closing.
A-2-10
11. TERMINATION
This Agreement may be terminated and the transactions contemplated hereby may be abandoned by either party by (i) mutual agreement of the parties; or (ii) by either party if the Closing shall not have occurred on or before October 31, 2009, unless such date is extended by mutual agreement of the parties; or (iii) by either party if the other party shall have materially breached its obligations under this Agreement or made a material and intentional misrepresentation herein or in connection herewith. In the event of any such termination, this Agreement shall become void and there shall be no liability hereunder on the part of any party or their respective Trustees or Directors or officers, except for any such material breach or intentional misrepresentation, as to each of which all remedies at law or in equity of the party adversely affected shall survive.
12. AMENDMENTS
This Agreement may be amended, modified or supplemented in such manner as may be deemed necessary or advisable by the authorized officers of the Trust and the Company; provided, however, that following the meeting of the shareholders of the Acquired Portfolio called by the Trust pursuant to paragraph 5.2 of this Agreement, no such amendment may have the effect of changing the provisions for determining the number of the ADV Class, Class I, Class S and Class S2 Acquiring Portfolio Shares to be issued to the Acquired Portfolio Shareholders under this Agreement to the detriment of such shareholders without their further approval.
13. NOTICES
Any notice, report, statement or demand required or permitted by any provisions of this Agreement shall be in writing and shall be given by facsimile, personal service or prepaid or certified mail addressed to:
ING Variable Portfolios, Inc. |
| ING Investors Trust |
7337 East Doubletree Ranch Road |
| 7337 East Doubletree Ranch Road |
Scottsdale, Arizona 85258-2034 |
| Scottsdale, Arizona 85258-2034 |
Attn: Huey P. Falgout, Jr. |
| Attn: Huey P. Falgout, Jr. |
|
|
|
With a copy to: |
| With a copy to: |
Goodwin Procter LLP |
| Dechert LLP |
Exchange Place |
| 1775 I Street, N.W. |
53 State Street |
| Washington, D.C. 20006 |
Boston, MA 02109 |
| Attn: Jeffrey S. Puretz. |
Attn: Philip H. Newman |
|
|
14. HEADINGS; COUNTERPARTS; GOVERNING LAW; ASSIGNMENT; LIMITATION OF LIABILITY
14.1. The Article and paragraph headings contained in this Agreement are for reference purposes only and shall not affect in any way the meaning or interpretation of this Agreement.
14.2. This Agreement may be executed in any number of counterparts, each of which shall be deemed an original.
14.3. This Agreement shall be governed by and construed in accordance with the laws of the State of Maryland without regard to its principles of conflicts of laws.
14.4. This Agreement shall bind and inure to the benefit of the parties hereto and their respective successors and assigns, but no assignment or transfer hereof or of any rights or obligations hereunder shall be made by any party without the written consent of the other party. Nothing herein expressed or implied is intended or shall be construed to confer upon or give any person, firm or corporation, other than the parties hereto and their respective successors and assigns, any rights or remedies under or by reason of this Agreement.
14.5. It is expressly agreed that the obligations of the parties hereunder shall not be binding upon any of their respective Trustees, Directors, shareholders, nominees, officers, agents, or employees personally, but shall bind only the property of the Acquired Portfolio or the corporate property of the Acquiring Portfolio, as the case may be, as provided in
A-2-11
the Declaration of Trust of the Trust or the Articles of Incorporation of the Company, respectively. The execution and delivery by such officers shall not be deemed to have been made by any of them individually or to impose any liability on any of them personally, but shall bind only the property of such party.
A-2-12
IN WITNESS WHEREOF, each of the parties hereto has caused this Agreement to be executed by its President or Vice President.
| ING INVESTORS TRUST, on behalf of its | ||
|
| ||
| ING OPPENHEIMER MAIN STREET PORTFOLIO® series | ||
|
| ||
|
| ||
| By: | /s/ Michael J. Roland | |
|
|
| |
| Name: | Michael J. Roland | |
|
|
| |
| Title: | Executive Vice President | |
|
| ||
|
| ||
| ING VARIABLE PORTFOLIOS, INC., on behalf of its | ||
|
| ||
| ING RUSSELL™ LARGE CAP INDEX PORTFOLIO series | ||
|
| ||
|
| ||
| By: | /s/ Todd Modic | |
|
|
| |
| Name: | Todd Modic | |
|
|
| |
| Title: | Senior Vice President | |
A-2-13
(This page intentionally left blank)
APPENDIX B
FORM OF SUB-ADVISORY AGREEMENT
This AGREEMENT is made as of this day of , , between Directed Services LLC, a Delaware limited liability company (the “Manager”), and ING Investment Management Co., a Connecticut corporation (the “Sub-Adviser”).
WHEREAS, [ ] (the “Fund”) is registered under the Investment Company Act of 1940, as amended (the “1940 Act”), as an open-end, management investment company; and
WHEREAS, the Fund is authorized to issue separate series, each series having its own investment objective or objectives, policies, and limitations; and
WHEREAS, the Fund may offer shares of additional series in the future; and
WHEREAS, pursuant to an Investment Advisory Agreement, dated [ , ], as amended (the “Management Agreement”), a copy of which has been provided to the Sub-Adviser, the Fund has retained the Manager to render advisory and management services with respect to certain of the Fund’s series; and
WHEREAS, pursuant to authority granted to the Manager in the Management Agreement, the Manager wishes to retain the Sub-Adviser to furnish investment advisory services to one or more of the series of the Fund, and the Sub-Adviser is willing to furnish such services to the Fund and the Manager.
NOW, THEREFORE, in consideration of the premises and the promises and mutual covenants herein contained, it is agreed between the Manager and the Sub-Adviser as follows:
1. Appointment. The Manager hereby appoints the Sub-Adviser to act as the investment adviser and manager to the series of the Fund set forth on Schedule A hereto (the “Series”) for the periods and on the terms set forth in this Agreement. The Sub-Adviser accepts such appointment and agrees to furnish the services herein set forth for the compensation herein provided.
In the event the Fund designates one or more series (other than the Series) with respect to which the Manager wishes to retain the Sub-Adviser to render investment advisory services hereunder, it shall notify the Sub-Adviser in writing. If the Sub-Adviser is willing to render such services, it shall notify the Manager in writing, whereupon such series shall become a Series hereunder, and be subject to this Agreement.
2. Sub-Adviser Duties. Subject to the supervision of the Fund’s Board of [Directors/Trustees] and the Manager, the Sub-Adviser will provide a continuous investment program for each Series’ portfolio and determine in its discretion the composition of the assets of each Series’ portfolio, including determination of the purchase, retention, or sale of the securities, cash, and other investments contained in the portfolio. The Sub-Adviser will provide investment research and conduct a continuous program of evaluation, investment, sales, and reinvestment of each Series’ assets by determining the securities and other investments that shall be purchased, entered into, sold, closed, or exchanged for the Series, when these transactions should be executed, and what portion of the assets of the Series should be held in the various securities and other investments in which it may invest. To the extent permitted by the investment policies of each Series, the Sub-Adviser shall make decisions for the Series as to foreign currency matters and make determinations as to and execute and perform foreign currency exchange contracts on behalf of the Series. The Sub-Adviser will provide the services under this Agreement in accordance with each Series’ investment objective or objectives, policies, and restrictions as stated in the Fund’s Registration Statement filed with the Securities and Exchange Commission (“SEC”), as amended, copies of which shall be sent to the Sub-Adviser by the Manager prior to the commencement of this Agreement and promptly following any such amendment. The Sub-Adviser further agrees as follows:
(a) The Sub-Adviser will conform with the 1940 Act and all rules and regulations
B-1
thereunder, all other applicable federal and state laws and regulations, with any applicable procedures adopted by the Fund’s Board of [Directors/Trustees] of which the Sub-Adviser has been sent a copy, and the provisions of the Registration Statement of the Fund filed under the Securities Act of 1933 (the “1933 Act”) and the 1940 Act, as supplemented or amended, of which the Sub-Adviser has received a copy, and with the Manager’s portfolio manager operating policies and procedures as in effect on the date hereof, as such policies and procedures may be revised or amended by the Manager and agreed to by the Sub-Adviser. In carrying out its duties under the Sub-Adviser Agreement, the Sub-Adviser will comply with the following policies and procedures:
(i) The Sub-Adviser will manage each Series so that it meets the income and asset diversification requirements of Section 851 of the Internal Revenue Code.
(ii) The Sub-Adviser will have no duty to vote any proxy solicited by or with respect to the issuers of securities in which assets of the Series are invested unless the Manager gives the Sub-Adviser written instructions to the contrary. The Sub-Adviser will immediately forward any proxy it receives on behalf of the Fund solicited by or with respect to the issuers of securities in which assets of the Series are invested to the Manager or to any agent of the Manager designated by the Manager in writing.
The Sub-Adviser will make appropriate personnel reasonably available for consultation for the purpose of reviewing with representatives of the Manager and/or the Board any proxy solicited by or with respect to the issuers of securities in which assets of the Series are invested. Upon request, the Sub-Adviser will submit a voting recommendation to the Manager for such proxies. In making such recommendations, the Sub-Adviser shall use its good faith judgment to act in the best interests of the Series. The Sub-Adviser shall disclose to the best of its knowledge any conflict of interest with the issuers of securities that are the subject of such recommendation including whether such issuers are clients or are being solicited as clients of the Sub-Adviser or of its affiliates.
(iii) In connection with the purchase and sale of securities for each Series, the Sub-Adviser will arrange for the transmission to the custodian and portfolio accounting agent for the Series on a daily basis, such confirmation, trade tickets, and other documents and information, including, but not limited to, Cusip, Cedel, or other numbers that identify securities to be purchased or sold on behalf of the Series, as may be reasonably necessary to enable the custodian and portfolio accounting agent to perform its administrative and recordkeeping responsibilities with respect to the Series. With respect to portfolio securities to be settled through the Depository Trust Company, the Sub-Adviser will arrange for the prompt transmission of the confirmation of such trades to the Fund’s custodian and portfolio accounting agent.
(iv) The Sub-Adviser will assist the custodian and portfolio accounting agent for the Fund in determining or confirming, consistent with the procedures and policies stated in the Registration Statement for the Fund or adopted by the Board of [Directors/Trustees], the value of any portfolio securities or other assets of the Series for which the custodian and portfolio accounting agent seeks assistance from or identifies for review by the Sub-Adviser. The parties acknowledge that the Sub-Adviser is not a custodian of the Series’ assets and will not take possession or custody of such assets.
(v) The Sub-Adviser will provide the Manager, no later than the 10th business day following the end of each Series’ semi-annual period and fiscal year, a letter to shareholders (to be subject to review and editing by the Manager) containing a discussion of those factors referred to in Item 22(b)(7) of 1940 Act Form N-1A in respect of both the prior quarter and the fiscal year to date.
(vi) The Sub-Adviser will complete and deliver to the Manager a written compliance checklist in a form provided by the Manager for each month by the 10th business day of the following month.
(b) The Sub-Adviser will make available to the Fund and the Manager, promptly upon request, any of the Series’ investment records and ledgers maintained by the Sub-Adviser (which shall not include the records and ledgers maintained by the custodian or portfolio accounting agent for the Fund) as are necessary to assist the Fund and the Manager to comply with requirements of the 1940 Act and the Investment Advisers Act of 1940 (the “Advisers Act”), as well as other applicable laws. The Sub-Adviser will furnish to regulatory authorities having the requisite authority any information or reports in connection with such services in respect to the Series which may be requested in order to ascertain whether the operations of the Fund are being conducted in a manner
B-2
consistent with applicable laws and regulations.
(c) The Sub-Adviser will provide reports to the Fund’s Board of [Directors/Trustees] for consideration at meetings of the Board of [Directors/Trustees] on the investment program for each Series and the issuers and securities represented in each Series’ portfolio, and will furnish the Fund’s Board of [Directors/Trustees] with respect to each Series such periodic and special reports as the [Directors/Trustees] and the Manager may reasonably request.
(d) With respect to any investments, including, but not limited, to repurchase and reverse repurchase agreements, derivatives contracts, futures contracts, International Swaps and Derivatives Association, Inc. Master Agreements, and options on futures contracts (“futures”), which are permitted to be made by the Sub-Adviser in accordance with this Agreement and the investment objectives and strategies of the Series, as outlined in the Registration Statement for the Fund, the Manager hereby authorizes and directs the Sub-Adviser to do and perform every act and thing whatsoever necessary or incidental in performing its duties and obligations under this Agreement including, but not limited to, executing as agent on behalf of each Series, brokerage agreements and other documents to establish, operate and conduct all brokerage or other trading accounts, and executing as agent on behalf of each Series, such agreements and other documentation as may be required for the purchase or sale, assignment, transfer and ownership of any permitted investment, including limited partnership agreements, repurchase and derivative master agreements, including any schedules and annexes to such agreements, releases, consents, elections and confirmations. The Manager acknowledges and understands that it will be bound by any such trading accounts established, and agreements and other documentation executed, by the Sub-Adviser for such investment purposes.
3. Broker-Dealer Selection. The Sub-Adviser is authorized to make decisions to buy and sell securities and other investments for each Series’ portfolio, broker-dealer selection, and negotiation of brokerage commission rates in effecting a security transaction. The Sub-Adviser’s primary consideration in effecting a security transaction will be to obtain the best execution for the Series, taking into account the factors specified in the prospectus and/or statement of additional information for the Fund, and determined in consultation with the Manager, which include price (including the applicable brokerage commission or dollar spread), the size of the order, the nature of the market for the security, the timing of the transaction, the reputation, the experience and financial stability of the broker-dealer involved, the quality of the service, the difficulty of execution, and the execution capabilities and operational facilities of the firm involved, and the firm’s risk in positioning a block of securities. Accordingly, the price to a Series in any transaction may be less favorable than that available from another broker-dealer if the difference is reasonably justified, in the judgment of the Sub-Adviser in the exercise of its fiduciary obligations to the Fund, by other aspects of the portfolio execution services offered. Subject to such policies as the Fund’s Board of [Directors/Trustees] or Manager may determine and consistent with Section 28(e) of the Securities Exchange Act of 1934, the Sub-Adviser shall not be deemed to have acted unlawfully or to have breached any duty created by this Agreement or otherwise solely by reason of its having caused a Series to pay a broker-dealer for effecting a portfolio investment transaction in excess of the amount of commission another broker-dealer would have charged for effecting that transaction, if the Sub-Adviser determines in good faith that such amount of commission was reasonable in relation to the value of the brokerage and research services provided by such broker-dealer, viewed in terms of either that particular transaction or the Sub-Adviser’s or the Manager’s overall responsibilities with respect to the Series and to their respective other clients as to which they exercise investment discretion. The Sub-Adviser will consult with the Manager to the end that portfolio transactions on behalf of a Series are directed to broker-dealers on the basis of criteria reasonably considered appropriate by the Manager. To the extent consistent with these standards, the Sub-Adviser is further authorized to allocate the orders placed by it on behalf of a Series to the Sub-Adviser if it is registered as a broker-dealer with the SEC, to an affiliated broker-dealer, or to such brokers and dealers who also provide research or statistical material, or other services to the Series, the Sub-Adviser, or an affiliate of the Sub-Adviser. Such allocation shall be in such amounts and proportions as the Sub-Adviser shall determine consistent with the above standards, and the Sub-Adviser will report on said allocation regularly to the Fund’s Board of [Directors/Trustees] indicating the broker-dealers to which such allocations have been made and the basis therefore.
4. Disclosure about Sub-Adviser. The Sub-Adviser has reviewed the most recent Post-Effective Amendment to the Registration Statement for the Fund filed with the SEC that contains disclosure about the Sub-Adviser, and represents and warrants that, with respect to the disclosure about the Sub-Adviser or information
B-3
relating, directly or indirectly, to the Sub-Adviser, such Registration Statement contains, as of the date hereof, no untrue statement of any material fact and does not omit any statement of a material fact which was required to be stated therein or necessary to make the statements contained therein, in light of the circumstances under which they were made, not misleading. The Sub-Adviser further represents and warrants that it is a duly registered investment adviser under the Advisers Act and will maintain such registration so long as this Agreement remains in effect. The Sub-Adviser will provide the Manager with a copy of the Sub-Adviser’s Form ADV, Part II, at the time the Form ADV is filed with the SEC.
5. Expenses. During the term of this Agreement, the Sub-Adviser will pay all expenses incurred by it and its staff and for their activities in connection with its portfolio management duties under this Agreement. The Manager or the Fund shall be responsible for all the expenses of the Fund’s operations.
6. Compensation. For the services provided to each Series, the Manager will pay the Sub-Adviser an annual fee equal to the amount specified for such Series in Schedule A hereto, payable monthly in arrears. The fee will be appropriately prorated to reflect any portion of a calendar month that this Agreement is not in effect among the parties. In accordance with the provisions of the Management Agreement, the Manager is solely responsible for the payment of fees to the Sub-Adviser, and the Sub-Adviser agrees to seek payment of its fees solely from the Manager; provided, however, that if the Fund fails to pay the Manager all or a portion of the management fee under said Management Agreement when due, and the amount that was paid is insufficient to cover the Sub-Adviser’s fee under this Agreement for the period in question, then the Sub-Adviser may enforce against the Fund any rights it may have as a third-party beneficiary under the Management Agreement and the Manager will take all steps appropriate under the circumstances to collect the amount due from the Fund.
7. Marketing Materials.
(a) During the term of this Agreement, the Sub-Adviser agrees to furnish the Manager at its principal office for prior review and approval by the Manager all written and/or printed materials, including but not limited to, PowerPointÒ or slide presentations, news releases, advertisements, brochures, fact sheets and other promotional, informational or marketing materials (the “Marketing Materials”) for internal use or public dissemination, that are produced or are for use or reference by the Sub-Adviser, its affiliates or other designees, broker-dealers or the public in connection with the Series, and Sub-Adviser shall not use any such materials if the Manager reasonably objects in writing within five business days (or such other period as may be mutually agreed) after receipt thereof. Marketing Materials may be furnished to the Manager by first class or overnight mail, facsimile transmission equipment, electronic delivery or hand delivery.
(b) During the term of this Agreement, the Manager agrees to furnish the Sub-Adviser at its principal office all prospectuses, proxy statements, reports to shareholders, or Marketing Materials prepared for distribution to shareholders of each Series, or the public that refer to the Sub-Adviser in any way, prior to the use thereof, and the Manager shall not use any such materials if the Sub-Adviser reasonably objects in writing within five business days (or such other period as may be mutually agreed) after receipt thereof. The Sub-Adviser’s right to object to such materials is limited to the portions of such materials that expressly relate to the Sub-Adviser, its services and its clients. The Manager agrees to use its reasonable best efforts to ensure that materials prepared by its employees or agents or its affiliates that refer to the Sub-Adviser or its clients in any way are consistent with those materials previously approved by the Sub-Adviser as referenced in the first sentence of this paragraph. Marketing Materials may be furnished to the Sub-Adviser by first class or overnight mail, facsimile transmission equipment, electronic delivery or hand delivery.
8. Compliance.
(a) The Sub-Adviser agrees to use reasonable compliance techniques as the Manager or the Board of [Directors/Trustees] may adopt, including any written compliance procedures.
(b) The Sub-Adviser agrees that it shall promptly notify the Manager and the Fund (1) in the event that the SEC has censured the Sub-Adviser; placed limitations upon its activities, functions or operations; suspended or revoked its registration as an investment adviser; or has commenced proceedings or an investigation that may result in any of these actions, or (2) upon having a reasonable basis for believing that the Series has ceased
B-4
to qualify or might not qualify as a regulated investment company under Subchapter M of the Internal Revenue Code. The Sub-Adviser further agrees to notify the Manager and the Fund promptly of any material fact known to the Sub-Adviser respecting or relating to the Sub-Adviser that is not contained in the Registration Statement or prospectus for the Fund (which describes the Series), or any amendment or supplement thereto, or if any statement contained therein that becomes untrue in any material respect.
(c) The Manager agrees that it shall promptly notify the Sub-Adviser (1) in the event that the SEC has censured the Manager or the Fund; placed limitations upon either of their activities, functions, or operations; suspended or revoked the Manager’s registration as an investment adviser; or has commenced proceedings or an investigation that may result in any of these actions, or (2) upon having a reasonable basis for believing that the Series has ceased to qualify or might not qualify as a regulated investment company under Subchapter M of the Internal Revenue Code.
9. Books and Records. The Sub-Adviser hereby agrees that all records which it maintains for the Series may be the property of the Fund and further agrees to promptly make available to the Fund any of such records upon the Fund’s or the Manager’s request in compliance with the requirements of Rule 31a-3 under the 1940 Act. The Sub-Adviser further agrees to preserve for the periods prescribed by Rule 31a-2 under the 1940 Act the records required to be maintained by Rule 31a-l under the 1940 Act.
10. Cooperation; Confidentiality. Each party to this Agreement agrees to cooperate with the other party and with all appropriate governmental authorities having the requisite jurisdiction (including, but not limited to, the SEC) in connection with any investigation or inquiry relating to this Agreement or the Fund. Subject to the foregoing, the Sub-Adviser shall treat as confidential all information pertaining to the Fund and actions of the Fund, the Manager and the Sub-Adviser, and the Manager shall treat as confidential and use only in connection with the Series all information furnished to the Fund or the Manager by the Sub-Adviser, in connection with its duties under the agreement except that the aforesaid information need not be treated as confidential if required to be disclosed under applicable law, if generally available to the public through means other than by disclosure by the Sub-Adviser or the Manager, or if available from a source other than the Manager, Sub-Adviser or this Fund.
11. Non-Exclusivity. The services of the Sub-Adviser to the Series and the Fund are not to be deemed to be exclusive, and the Sub-Adviser shall be free to render investment advisory or other services to others (including other investment companies) and to engage in other activities, provided, however, that the Sub-Adviser may not consult with any other sub-adviser of the Fund concerning transactions in securities or other assets for any investment portfolio of the Fund, including the Series, except that such consultations are permitted between the current and successor sub-advisers of the Series in order to effect an orderly transition of sub-advisory duties so long as such consultations are not concerning transactions prohibited by Section 17(a) of the 1940 Act.
12. Representations Respecting Sub-Adviser. The Manager agrees that neither the Manager, nor affiliated persons of the Manager, shall give any information or make any representations or statements in connection with the sale of shares of the Series concerning the Sub-Adviser or the Series other than the information or representations contained in the Registration Statement, prospectus, or statement of additional information for the Fund’s shares, as they may be amended or supplemented from time to time, or in reports or proxy statements for the Fund, or in sales literature or other promotional material approved in advance by the Sub-Adviser, except with the prior permission of the Sub-Adviser.
13. Control. Notwithstanding any other provision of the Agreement, it is understood and agreed that the Fund shall at all times retain the ultimate responsibility for and control of all functions performed pursuant to this Agreement and has reserved the right to reasonably direct any action hereunder taken on its behalf by the Sub-Adviser.
14. Liability. Except as may otherwise be required by the 1940 Act or the rules thereunder or other applicable law, the Manager agrees that the Sub-Adviser, any affiliated person of the Sub-Adviser, and each person, if any, who, within the meaning of Section 15 of the 1933 Act controls the Sub-Adviser (1) shall bear no responsibility and shall not be subject to any liability for any act or omission respecting any series of the Fund that is not a Series hereunder, and (2) shall not be liable for, or subject to any damages, expenses, or losses in connection with, any act or omission connected with or arising out of any services rendered under this Agreement, except by
B-5
reason of willful misfeasance, bad faith, or gross negligence in the performance of the Sub-Adviser’s duties, or by reason of reckless disregard of the Sub-Adviser’s obligations and duties under this Agreement.
15. Indemnification.
(a) The Manager agrees to indemnify and hold harmless the Sub-Adviser, any affiliated person of the Sub-Adviser, and each person, if any, who, within the meaning of Section 15 of the 1933 Act controls (“controlling person”) the Sub-Adviser (all of such persons being referred to as “Sub-Adviser Indemnified Persons”) against any and all losses, claims, damages, liabilities, or litigation (including legal and other expenses) to which a Sub-Adviser Indemnified Person may become subject under the 1933 Act, the 1940 Act, the Advisers Act, under any other statute, at common law or otherwise, arising out of the Manager’s responsibilities to the Fund which (1) may be based upon the Manager’s negligence, willful misfeasance, or bad faith in the performance of its duties (which could include a negligent action or a negligent omission to act), or by reason of the Manager’s reckless disregard of its obligations and duties under this Agreement, or (2) may be based upon any untrue statement or alleged untrue statement of a material fact contained in the Registration Statement or prospectus covering shares of the Fund or any Series, or any amendment thereof or any supplement thereto, or the omission or alleged omission to state therein a material fact required to be stated therein or necessary to make the statements therein not misleading, unless such statement or omission was made in reliance upon information furnished to the Manager or the Fund or to any affiliated person of the Manager by a Sub-Adviser Indemnified Person; provided however, that in no case shall the indemnity in favor of the Sub-Adviser Indemnified Person be deemed to protect such person against any liability to which any such person would otherwise be subject by reason of willful misfeasance, bad faith, or gross negligence in the performance of its duties, or by reason of its reckless disregard of obligations and duties under this Agreement.
(b) Notwithstanding Section 14 of this Agreement, the Sub-Adviser agrees to indemnify and hold harmless the Manager, any affiliated person of the Manager, and any controlling person of the Manager (all of such persons being referred to as “Manager Indemnified Persons”) against any and all losses, claims, damages, liabilities, or litigation (including legal and other expenses) to which a Manager Indemnified Person may become subject under the 1933 Act, 1940 Act, the Advisers Act, under any other statute, at common law or otherwise, arising out of the Sub-Adviser’s responsibilities as Sub-Adviser of the Series which (1) may be based upon the Sub-Adviser’s negligence, willful misfeasance, or bad faith in the performance of its duties (which could include a negligent action or a negligent omission to act), or by reason of the Sub-Adviser’s reckless disregard of its obligations and duties under this Agreement, or (2) may be based upon any untrue statement or alleged untrue statement of a material fact contained in the Registration Statement or prospectus covering the shares of the Fund or any Series, or any amendment or supplement thereto, or the omission or alleged omission to state therein a material fact known or which should have been known to the Sub-Adviser and was required to be stated therein or necessary to make the statements therein not misleading, if such a statement or omission was made in reliance upon information furnished to the Manager, the Fund, or any affiliated person of the Manager or Fund by the Sub-Adviser or any affiliated person of the Sub-Adviser; provided, however, that in no case shall the indemnity in favor of a Manager Indemnified Person be deemed to protect such person against any liability to which any such person would otherwise be subject by reason of willful misfeasance, bad faith, gross negligence in the performance of its duties, or by reason of its reckless disregard of its obligations and duties under this Agreement.
(c) The Manager shall not be liable under Paragraph (a) of this Section 15 with respect to any claim made against a Sub-Adviser Indemnified Person unless such Sub-Adviser Indemnified Person shall have notified the Manager in writing within a reasonable time after the summons or other first legal process giving information of the nature of the claim shall have been served upon such Sub-Adviser Indemnified Person (or after such Sub-Adviser Indemnified Person shall have received notice of such service on any designated agent), but failure to notify the Manager of any such claim shall not relieve the Manager from any liability which it may have to the Sub-Adviser Indemnified Person against whom such action is brought except to the extent the Manager is prejudiced by the failure or delay in giving such notice. In case any such action is brought against the Sub-Adviser Indemnified Person, the Manager will be entitled to participate, at its own expense, in the defense thereof or, after notice to the Sub-Adviser Indemnified Person, to assume the defense thereof, with counsel satisfactory to the Sub-Adviser Indemnified Person. If the Manager assumes the defense of any such action and the selection of counsel by the Manager to represent the Manager and the Sub-Adviser Indemnified Person would result in a conflict of interests and therefore, would not, in the reasonable judgment of the Sub-Adviser Indemnified Person, adequately represent
B-6
the interests of the Sub-Adviser Indemnified Person, the Manager will, at its own expense, assume the defense with counsel to the Manager and, also at its own expense, with separate counsel to the Sub-Adviser Indemnified Person, which counsel shall be satisfactory to the Manager and to the Sub-Adviser Indemnified Person. The Sub-Adviser Indemnified Person shall bear the fees and expenses of any additional counsel retained by it, and the Manager shall not be liable to the Sub-Adviser Indemnified Person under this Agreement for any legal or other expenses subsequently incurred by the Sub-Adviser Indemnified Person independently in connection with the defense thereof other than reasonable costs of investigation. The Manager shall not have the right to compromise on or settle the litigation without the prior written consent of the Sub-Adviser Indemnified Person if the compromise or settlement results, or may result in a finding of wrongdoing on the part of the Sub-Adviser Indemnified Person.
(d) The Sub-Adviser shall not be liable under Paragraph (b) of this Section 15 with respect to any claim made against a Manager Indemnified Person unless such Manager Indemnified Person shall have notified the Sub-Adviser in writing within a reasonable time after the summons or other first legal process giving information of the nature of the claim shall have been served upon such Manager Indemnified Person (or after such Manager Indemnified Person shall have received notice of such service on any designated agent), but failure to notify the Sub-Adviser of any such claim shall not relieve the Sub-Adviser from any liability which it may have to the Manager Indemnified Person against whom such action is brought except to the extent the Sub-Adviser is prejudiced by the failure or delay in giving such notice. In case any such action is brought against the Manager Indemnified Person, the Sub-Adviser will be entitled to participate, at its own expense, in the defense thereof or, after notice to the Manager Indemnified Person, to assume the defense thereof, with counsel satisfactory to the Manager Indemnified Person. If the Sub-Adviser assumes the defense of any such action and the selection of counsel by the Sub-Adviser to represent both the Sub-Adviser and the Manager Indemnified Person would result in a conflict of interests and therefore, would not, in the reasonable judgment of the Manager Indemnified Person, adequately represent the interests of the Manager Indemnified Person, the Sub-Adviser will, at its own expense, assume the defense with counsel to the Sub-Adviser and, also at its own expense, with separate counsel to the Manager Indemnified Person, which counsel shall be satisfactory to the Sub-Adviser and to the Manager Indemnified Person. The Manager Indemnified Person shall bear the fees and expenses of any additional counsel retained by it, and the Sub-Adviser shall not be liable to the Manager Indemnified Person under this Agreement for any legal or other expenses subsequently incurred by the Manager Indemnified Person independently in connection with the defense thereof other than reasonable costs of investigation. The Sub-Adviser shall not have the right to compromise on or settle the litigation without the prior written consent of the Manager Indemnified Person if the compromise or settlement results, or may result in a finding of wrongdoing on the part of the Manager Indemnified Person.
16. Duration and Termination.
(a) With respect to each Series identified as a Series on Schedule A hereto as in effect on , , unless earlier terminated with respect to any Series this Agreement shall continue in full force and effect through [November 30, 2010]. Thereafter, unless earlier terminated with respect to a Series, the Agreement shall continue in full force and effect with respect to each such Series for periods of one year, provided that such continuance is specifically approved at least annually by (i) the vote of a majority of the Board of [Directors/Trustees] of the Fund, or (ii) the vote of a majority of the outstanding voting shares of the Series (as defined in the 1940 Act), and provided that such continuance is also approved by the vote of a majority of the Board of [Directors/Trustees] of the Fund who are not parties to this Agreement or “interested persons” (as defined in the 1940 Act) of the Fund or the Manager, cast in person at a meeting called for the purpose of voting on such approval.
With respect to any Series that was added to Schedule A hereto as a Series after the date of this Amendment, the Agreement shall become effective on the later of (i) the date Schedule A is amended to reflect the addition of such Series as a Series under the Agreement or (ii) the date upon which the shares of the Series are first sold to the public, subject to the condition that the Fund’s Board of [Directors/Trustees], including a majority of those [Directors/Trustees] who are not interested persons (as such term is defined in the 1940 Act) of the Manager, and the shareholders of such Series, shall have approved this Agreement. Unless terminated earlier as provided herein with respect to any such Series, the Agreement shall continue in full force and effect for a period of two years from the date of its effectiveness (as identified above) with respect to that Series. Thereafter, unless earlier terminated with respect to a Series, the Agreement shall continue in full force and effect with respect to each such Series for periods of one year, provided that such continuance is specifically
B-7
approved at least annually by (i) the vote of a majority of the Board of [Directors/Trustees] of the Fund, or (ii) vote of a majority of the outstanding voting shares of such Series (as defined in the 1940 Act), and provided that such continuance is also approved by the vote of a majority of the Board of [Directors/Trustees] of the Fund who are not parties to this Agreement or “interested persons” (as defined in the 1940 Act) of the Fund or the Manager, cast in person at a meeting called for the purpose of voting on such approval. However, any approval of this Agreement by the holders of a majority of the outstanding shares (as defined in the 1940 Act) of a Series shall be effective to continue this Agreement with respect to such Series notwithstanding (i) that this Agreement has not been approved by the holders of a majority of the outstanding shares of any other Series or (ii) that this agreement has not been approved by the vote of a majority of the outstanding shares of the Fund, unless such approval shall be required by any other applicable law or otherwise. Notwithstanding the foregoing, this Agreement may be terminated with respect to any Series covered by this Agreement: (a) by the Manager at any time, upon sixty (60) days’ written notice to the Sub-Adviser and the Fund, (b) at any time without payment of any penalty by the Fund, by the Fund’s Board of [Directors/Trustees] or a majority of the outstanding voting securities of each Series, upon sixty (60) days’ written notice to the Manager and the Sub-Adviser, or (c) by the Sub-Adviser upon three (3) months’ written notice unless the Fund or the Manager requests additional time to find a replacement for the Sub-Adviser, in which case the Sub-Adviser shall allow the additional time requested by the Fund or Manager not to exceed three (3) additional months beyond the initial three-month notice period; provided, however, that the Sub-Adviser may terminate this Agreement at any time without penalty, effective upon written notice to the Manager and the Fund, in the event either the Sub-Adviser (acting in good faith) or the Manager ceases to be registered as an investment adviser under the Advisers Act or otherwise becomes legally incapable of providing investment management services pursuant to its respective contract with the Fund, or in the event the Manager becomes bankrupt or otherwise incapable of carrying out its obligations under this Agreement, or in the event that the Sub-Adviser does not receive compensation for its services from the Manager or the Fund as required by the terms of this agreement.
In the event of termination for any reason, all records of each Series for which the Agreement is terminated shall promptly be returned to the Manager or the Fund, free from any claim or retention of rights in such record by the Sub-Adviser, although the Sub-Adviser may, at its own expense, make and retain a copy of such records. This Agreement shall automatically terminate in the event of its assignment (as such term is described in the 1940 Act). In the event this Agreement is terminated or is not approved in the manner described above, the Sections or Paragraphs numbered 9, 10, 12, 13, 14 and 15 of this Agreement shall remain in effect, as well as any applicable provision of this Section numbered 16 and, to the extent that only amounts are owed to the Sub-Adviser as compensation for services rendered while the agreement was in effect, Section 6.
(b) Notices. Any notice must be in writing and shall be sufficiently given (1) when delivered in person, (2) when dispatched by telegram or electronic facsimile transfer (confirmed in writing by postage prepaid first class air mail simultaneously dispatched), (3) when sent by internationally recognized overnight courier service (with receipt confirmed by such overnight courier service), or (4) when sent by registered or certified mail, to the other party at the address of such party set forth below or at such other address as such party may from time to time specify in writing to the other party.
If to the Fund:
[Registrant]
7337 E. Doubletree Ranch Rd.
Scottsdale, AZ 85258
Attention: Huey P. Falgout, Jr.
If to the Sub-Adviser:
ING Investment Management Co.
10 State House Square
Hartford, CT 06103-3602
Attention: Michael Gioffre
17. Amendments. No provision of this Agreement may be changed, waived, discharged or terminated orally, but only by an instrument in writing signed by the party against which enforcement of the change,
B-8
waiver, discharge or termination is sought, and no amendment of this Agreement shall be effective until approved as required by applicable law.
18. Miscellaneous.
(a) This Agreement shall be governed by the laws of the State of Delaware, provided that nothing herein shall be construed in a manner inconsistent with the 1940 Act, the Advisers Act or rules or orders of the SEC thereunder, and without regard for the conflicts of laws principle thereof. The term “affiliate” or “affiliated person” as used in this Agreement shall mean “affiliated person” as defined in Section 2(a)(3) of the 1940 Act.
(b) The Manager and the Sub-Adviser acknowledge that the Fund enjoys the rights of a third-party beneficiary under this Agreement, and the Manager acknowledges that the Sub-Adviser enjoys the rights of a third party beneficiary under the Management Agreement.
(c) The captions of this Agreement are included for convenience only and in no way define or limit any of the provisions hereof or otherwise affect their construction or effect.
(d) To the extent permitted under Section 16 of this Agreement, this Agreement may only be assigned by any party with the prior written consent of the other parties.
(e) If any provision of this Agreement shall be held or made invalid by a court decision, statute, rule or otherwise, the remainder of this Agreement shall not be affected thereby, and to this extent, the provisions of this Agreement shall be deemed to be severable.
(f) Nothing herein shall be construed as constituting the Sub-Adviser as an agent or co-partner of the Manager, or constituting the Manager as an agent or co-partner of the Sub-Adviser.
(g) This agreement may be executed in counterparts.
IN WITNESS WHEREOF, the parties hereto have caused this instrument to be executed as of the day and year first above written.
| DIRECTED SERVICES LLC | |||
|
|
| ||
|
| By: |
| |
|
|
|
| |
|
| Name: |
| |
|
|
|
| |
|
| Title: |
| |
|
|
| ||
|
|
| ||
| ING INVESTMENT MANAGEMENT CO. | |||
|
|
| ||
|
| By: |
| |
|
|
|
| |
|
| Name: |
| |
|
|
|
| |
|
| Title: |
| |
B-9
SCHEDULE A
with respect to the
SUB-ADVISORY AGREEMENT
between
DIRECTED SERVICES LLC
and
ING INVESTMENT MANAGEMENT CO.
Series |
| Annual Sub-Adviser Fee |
|
|
|
ING Neuberger Berman Partners Portfolio |
| 0.35% on the first $1 billion in assets; |
|
| 0.30% thereafter |
B-10
SCHEDULE A
with respect to the
SUB-ADVISORY AGREEMENT
between
DIRECTED SERVICES LLC
and
ING INVESTMENT MANAGEMENT CO.
Series |
| Annual Sub-Adviser Fee |
|
|
|
ING Oppenheimer Main Street Portfolio® |
| 0.30% if total assets at any month-end are less than or equal to $1 billion |
|
| 0.23% if total assets at any month-end are in excess of $1 billion |
B-11
(This page intentionally left blank)
APPENDIX C
ADDITIONAL INFORMATION REGARDING
ING RUSSELL™ LARGE CAP INDEX PORTFOLIO (THE “PORTFOLIO”)
About Your Investment
Shares of the Portfolio are offered for purchase by separate accounts to serve as investment options under Variable Contacts, to Qualified Plans, to certain other investment companies, and to other investors as permitted to satisfy the diversification and other requirements under Section 817(h) of the Internal Revenue Code of 1986, as amended (“Code”), and under federal tax regulations, revenue rulings or private letter rulings issued by the Internal Revenue Service.
You do not buy, sell, or exchange shares of the Portfolio. You choose investment options through your Variable Contract or Qualified Plan.
The insurance company that issued your Variable Contract is responsible for investing in the Portfolio according to the investment options you’ve chosen. You should consult your Variable Contract prospectus, prospectus summary or disclosure statement for additional information about how this works. The Portfolio assumes no responsibility for such prospectus, prospectus summary, or disclosure statement.
ING Funds Distributor, LLC (“IFD” or “Distributor”), the distributor for the Portfolio, also offers directly to the public other ING Funds that have similar names, investment objectives, and strategies as those of the Portfolio. You should be aware that the Portfolio is likely to differ from these other ING Funds in size and cash flow pattern. Accordingly, the performance of the Portfolio can be expected to vary from those of the other funds.
The Portfolio currently does not foresee any disadvantages to investors if it serves as an investment option for Variable Contracts, offers its shares directly to Qualified Plans or offers its shares to other permitted investors. However, it is possible that the interests of owners of Variable Contracts and Qualified Plans for which the Portfolio serves as an investment option and other permitted investors might, at some time, be in conflict because of differences in tax treatment or other considerations. The Portfolio’s Board of Directors (“Board”) directed ING Investments, LLC (“ING Investments” or “Adviser”) to monitor events to identify any material conflicts between Variable Contract owners, Qualified Plans, and other permitted investors and would have to determine what actions, if any, should be taken in the event of such a conflict. If such a conflict occurred, an insurance company participating in the Portfolio might be required to redeem the investment of one or more of its separate accounts from the Portfolio, a pension plan, investment company, or other permitted investor which might force the Portfolio to sell securities at disadvantageous prices.
The Portfolio may discontinue offering shares at any time.
Net Asset Value
The net asset value (“NAV”) per share for each class of the Portfolio is determined each business day as of the close of regular trading (“Market Close”) on the New York Stock Exchange (“NYSE”) (normally 4:00 p.m. Eastern time unless otherwise designated by the NYSE). The Portfolio is open for business every day the NYSE is open. The NYSE is closed on all weekends and on all national holidays and Good Friday. Portfolio shares will not be priced on those days. The NAV per share of each class of the Portfolio is calculated by taking the value of the Portfolio’s assets attributable to that class, subtracting the Portfolio’s liabilities attributable to that class, and dividing by the number of shares of that class that are outstanding.
In general, assets are valued based on actual or estimated market value, with special provisions for assets not having readily available market quotations and short-term debt securities, and for situations where market quotations are deemed unreliable. Investments in securities maturing in 60 days or less are valued at amortized cost, which, when combined with accrued interest, approximates market value. Securities prices may be obtained from automated pricing services. Shares of investment companies held by the Portfolio will generally be valued at the latest NAV reported by that investment company. The prospectuses for those investment companies explain the circumstances under which they will use fair value pricing and the effects of using fair value pricing.
Trading of foreign securities may not take place every day the NYSE is open. Also, trading in some foreign markets and on some electronic trading networks may occur on weekends or holidays when the Portfolio’s NAV is not
C-1
calculated. As a result, the NAV of the Portfolio may change on days when shareholders will not be able to purchase or redeem the Portfolio’s shares.
When market quotations are not available or are deemed unreliable, the Portfolio will use a fair value for the security that is determined in accordance with procedures adopted by the Board. The types of securities for which such fair value pricing might be required include, but are not limited to:
· Foreign securities, where a foreign security whose value at the close of the foreign market on which it principally trades likely would have changed by the time of the close of the NYSE, or the closing value is otherwise deemed unreliable;
· Securities of an issuer that has entered into a restructuring;
· Securities whose trading has been halted or suspended;
· Fixed-income securities that have gone into default and for which there are no current market value quotations; and
· Securities that are restricted as to transfer or resale.
The Portfolio or the adviser may rely on the recommendations of a fair value pricing service approved by the Portfolio’s Board in valuing foreign securities. Valuing securities at fair value involves greater reliance on judgment than securities that have readily available market quotations. The adviser makes such determinations in good faith in accordance with procedures adopted by the Portfolio’s Board. Fair value determinations can also involve reliance on quantitative models employed by a fair value pricing service. There can be no assurance that the Portfolio could obtain the fair value assigned to a security if it were to sell the security at approximately the time at which the Portfolio determines its NAV per share.
When an insurance company’s Variable Contract or Qualified Plan is buying shares of the Portfolio, it will pay the NAV that is next calculated after the order from the insurance company’s Variable Contract holder or Qualified Plan participant is received in proper form. When an insurance company or Qualified Plan is selling shares, it will normally receive the NAV that is next calculated after the order from the insurance company’s Variable Contract holder or Qualified Plan is received in proper form.
Management of the Portfolio
Adviser
ING Investments, an Arizona limited liability company, serves as the investment adviser to the Portfolio. ING Investments has overall responsibility for the management of the Portfolio. ING Investments provides or oversees all investment advisory and portfolio management services for the Portfolio, and assists in managing and supervising all aspects of the general day-to-day business activities and operations of the Portfolio, including custodial, transfer agency, dividend disbursing, accounting, auditing, compliance and related services.
ING Investments is registered with the SEC as an investment adviser. ING Investments is an indirect, wholly- owned subsidiary of ING Groep N.V. (“ING Groep”) (NYSE:ING). ING Groep is a global financial institution of Dutch origin offering banking, investments, life insurance and retirement services to over 75 million private, corporate and institutional clients in more than 50 countries. With a diverse workforce of about 125,000 people, ING Groep comprises a broad spectrum of prominent companies that increasingly serve their clients under the ING brand. ING Investments became an investment management firm in April, 1995.
As of December 31, 2008, ING Investments managed approximately $35.7 billion in assets. The principal address of ING Investments is 7337 East Doubletree Ranch Road, Scottsdale, Arizona 85258. ING Investments receives a monthly fee for its services based on the average daily net assets of the Portfolio.
ING Investments has engaged a sub-adviser to provide the day-to-day management of the Portfolio’s investment portfolio pursuant to a sub-advisory agreement. ING Investments is responsible for monitoring the investment program and performance of the sub-adviser. Under the terms of the sub-advisory agreement, the agreement can be terminated by either ING Investments or the Portfolio’s Board. In the event the sub-advisory agreement is terminated, the sub-adviser may be replaced subject to any regulatory requirements or ING Investments may assume day-to-day investment management of the
C-2
Portfolio.
For information regarding the basis for the Board’s approval of the investment advisory and investment sub-advisory relationships, please refer to the Portfolio’s semi-annual shareholder report dated June 30, 2008.
Sub-Adviser and Portfolio Manager
ING Investments has engaged ING Investment Management Co. (“ING IM”), a Connecticut corporation, to serve as sub-adviser to the Portfolio. ING IM is responsible for managing the assets of the Portfolio in accordance with the Portfolio’s investment objective and policies, subject to oversight by ING Investments and the Board. Founded in 1972, ING IM is registered with the SEC as an investment adviser. ING IM is an indirect, wholly owned subsidiary of ING Groep and is an affiliate of ING Investments. ING IM has acted as adviser or sub-adviser to mutual funds since 1994 and has managed institutional accounts since 1972. As of December 31, 2008, ING IM managed approximately $54.3 billion in assets. The principal address of ING IM is 230 Park Avenue, New York, NY 10169.
Vincent Costa, CFA, Senior Vice President and Head of Portfolio Management of Quantitative Equity for ING IM has managed the Portfolio since its inception in March 2008. Mr. Costa joined ING IM in April 2006 as Head of Portfolio Management of quantitative equity. Prior to joining ING IM he was with Merrill Lynch Investment Management, where he worked for 7 years in quantitative equity leadership positions, including managing director and head of their quantitative investments organization.
ING Investments has overall responsibility for monitoring the investment program maintained by ING IM for compliance with applicable laws and regulations and the Portfolio’s investment objective.
ING Investments pays ING IM a fee at an annual rate based on the average daily net asset value of the Portfolio. ING Investments pays the sub-advisory fee out of its advisory fee.
Additional Information Regarding Portfolio Managers
The Portfolio’s SAI provides additional information about each Portfolio Manager’s compensation, other accounts managed by the Portfolio Manager and each Portfolio Manager’s ownership of securities in the Portfolio.
Portfolio Distribution
The Portfolio is distributed by IFD. IFD is a Delaware limited liability company with its principal offices at 7337 East Doubletree Ranch Road, Scottsdale AZ 85258.
IFD is a member of the Financial Industry Regulatory Authority (“FINRA”). To obtain information about FINRA member firms and their associated persons, you may contact FINRA Regulation, Inc. at www.finra.org or the FINRA BrokerCheck Hotline at 1-800-289-9999. An investment brochure describing the Public Disclosure Program is available from FINRA.
Additional Information Regarding the Classes of Shares
The Portfolio’s shares are classified into Adviser Class, Class I, Service Class and Service 2 Class shares. The four classes of shares of the Portfolio are identical except for different expenses, certain related rights and certain shareholder services. All classes of the Portfolio have a common investment objective and investment portfolio.
Shareholder Service and Distribution Plan Fees
ING Variable Portfolios, Inc. (“IVP” or “Company”) has adopted shareholder services and distribution plans (each a “Distribution Plan”) for the ADV Class, Class S and Class S2 shares of the Portfolio in accordance with Rule 12b-1 under the 1940 Act. Under these plans, the Portfolio pays certain fees to IFD, the Portfolio’s principal underwriter, for IFD’s distribution/shareholder services for the ADV Class, Class S and Class S2 shares. Because these fees are paid out on an ongoing basis, over time these fees will increase the cost of your investment and may cost you more than paying other types of sales charges.
Under the Distribution Plan for the ADV Class shares, IFD is paid an annual shareholder services fee equal to 0.25% and an annual distribution fee equal to 0.25% in each case computed as a percentage of average daily net assets of the ADV Class shares of the Portfolio. The shareholder services fee is paid for the shareholder services and account
C-3
maintenance services provided by IFD to the Portfolio and could be used by IFD to pay securities dealers (including IFD) and other financial institutions, plan administrators, and organizations for servicing shareholder accounts. The distribution fee would be paid for IFD’s services as distributor of the Portfolio in connection with any activities or expenses primarily intended to result in the sale of ADV Class shares of the Portfolio.
Under the Distribution Plan for the Class S shares, IFD is paid an annual distribution/shareholder service fee at the rate of 0.25% as a percentage of average daily net assets of the Class S shares of the Portfolio. The distribution/shareholder service fee may be used to cover expenses incurred in promoting the sale of Class S shares and for providing shareholder services and/or account maintenance services to shareholders. IFD may reallow all or a portion of these fees to broker-dealers entering into selling agreements with it, including affiliates.
Under the Distribution Plan for the Class S2 shares, IFD is paid an annual shareholder services fee equal to 0.25% and an annual distribution fee equal to 0.25% in each case computed as a percentage of average daily net assets of the Class S2 shares of each Portfolio. IFD has agreed to waive 0.10% of the distribution fee for Class S2 shares. The shareholder services fee is paid for the shareholder services and account maintenance services provided by IFD to the Portfolio and could be used by IFD to pay securities dealers (including IFD) and other financial institutions, plan administrators, and organizations for servicing shareholder accounts. The distribution fee would be paid for IFD’s services as distributor of the Portfolio in connection with any activities or expenses primarily intended to result in the sale of Class S2 shares of the Portfolio.
Frequent Trading — Market Timing
The Portfolio is intended for long-term investment and not as a short-term trading vehicle. Accordingly, organizations or individuals that use market timing investment strategies and make frequent transfers should not purchase shares of a Portfolio. Shares of the Portfolio are primarily sold through omnibus account arrangements with financial intermediaries as investment options for the Variable Contracts issued by insurance companies, and as investment options for the Qualified Plans. Omnibus accounts generally do not identify customers’ trading activity on an individual basis. The Portfolio’s administrator has agreements which require such intermediaries to provide detailed account information, including trading history, upon request of the Portfolio.
The Portfolio relies on the financial intermediaries to monitor frequent, short-term trading within a Portfolio by their customers. You should review the materials provided to you by your financial intermediary, including, in the case of a Variable Contract, the prospectus that describes the contract, or in the case of a Qualified Plan, the plan documentation, for its policies regarding frequent, short-term trading. With trading information received as a result of these agreements, the Portfolio may make a determination that certain trading activity would be harmful to the Portfolio and their shareholders, even if such activity is not strictly prohibited by the intermediaries’ excessive trading policy. As a result, a shareholder investing directly or indirectly in the Portfolio may have their trading privileges suspended without violating the stated excessive trading policy of the intermediary. The Portfolio reserves the right, in its sole discretion and without prior notice, to reject, restrict or refuse purchase orders, whether directly or by exchange, including purchase orders that have been accepted by a financial intermediary. The Portfolio seeks assurances from financial intermediaries that they have procedures adequate to monitor and address frequent short-term trading. There is, however, no guarantee that the procedures of the financial intermediaries will be able to curtail frequent, short-term trading activity.
The Portfolio believes that market timing or frequent, short-term trading in any account, including a Variable Contract or Qualified Plan, is not in the best interest of the Portfolio or its shareholders. Due to the disruptive nature of this activity, it can adversely impact the ability of the Adviser or Sub-Adviser to invest assets in an orderly, long-term manner. Frequent trading can disrupt the management of the Portfolio and raise its expenses through: increased trading and transaction costs; forced and unplanned portfolio turnover; lost opportunity costs; and large asset swings that decrease the Portfolio’s ability to provide maximum investment return to all shareholders. This in turn can have an adverse effect on Portfolio performance.
A Portfolio that invests in foreign securities may present greater opportunities for market timers and thus be at a greater risk for excessive trading. If an event occurring after the close of a foreign market, but before the time a Portfolio computes its current NAV, causes a change in the price of the foreign security and such price is not reflected in the Portfolio’s current NAV, investors may attempt to take advantage of anticipated price movements in securities held by the Portfolio based on such pricing discrepancies. This is often referred to as “price arbitrage.” Such price arbitrage opportunities may also occur in a Portfolio which does not invest in foreign securities. For example, if trading in a security held by a Portfolio is halted and does not resume prior to the time the Portfolio calculates its NAV, such “stale pricing” presents an opportunity for investors to take advantage of the pricing discrepancy. Similarly, a Portfolio that holds
C-4
thinly-traded securities, such as certain small-capitalization securities, may be exposed to varying levels of pricing arbitrage. The Portfolio has adopted fair valuation policies and procedures intended to reduce the Portfolio’s exposure to price arbitrage, stale pricing and other potential pricing discrepancies, however, to the extent that a Portfolio’s NAV does not immediately reflect these changes in market conditions, short-term trading may dilute the value of Portfolio shares, which negatively affects long-term shareholders.
Although the policies and procedures known to the Portfolio that are followed by the financial intermediaries that use the Portfolio and the monitoring by the Portfolio are designed to discourage frequent, short-term trading, none of these measures can eliminate the possibility that frequent, short-term trading activity in the Portfolio will occur. Moreover, decisions about allowing trades in the Portfolio may be required. These decisions are inherently subjective, and will be made in a manner that is in the best interest of a Portfolio’s shareholders.
Portfolio Holdings Disclosure Policy
A description of the Portfolio’s policies and procedures with respect to the disclosure of the Portfolio’s portfolio securities is available in the SAI. The Portfolio posts its portfolio holdings schedule on its website on a calendar-quarter basis and makes it available 30 calendar days following the end of the previous calendar quarter. The portfolio holdings schedule is as of the last day of the previous calendar quarter (e.g., the Portfolio will post the quarter ending June 30 holdings on July 31). The Portfolio’s portfolio holdings schedule will, at a minimum, remain available on the Portfolio’s website until the Portfolio files a Form N-CSR or Form N-Q with the SEC for the period that includes the date as of which the website information is current. The Portfolio’s website is located at www.ingfunds.com.
How ING Compensates Entities Offering Its Portfolios as Investment Options in Their Insurance Products
ING mutual funds may be offered as investment options in Variable Contracts by affiliated and non-affiliated insurance companies. In addition to the Portfolio paying fees under the Portfolio’s Shareholder Service and Distribution Plan (collectively, “ING”), the Portfolio’s Adviser or Distributor, out of their own resources and without additional cost to the Portfolio or its shareholders, may pay additional compensation to these insurance companies. The amount of the payment is based upon an annual percentage of the average net assets held in the Portfolio by those companies. The Portfolio’s Adviser and Distributor may make these payments for administrative, recordkeeping or other services that insurance companies provide to the Portfolio. These payments may also provide incentive for insurance companies to make the Portfolio available through the Variable Contracts issued by the insurance company, and thus they may promote the distribution of the shares of the Portfolio.
The distributing broker-dealer for the Portfolio is IFD. IFD has entered into such agreements with non-affiliated insurance companies. Fees payable under these arrangements are at annual rates that range from 0.15% to 0.25%. This is computed as a percentage of the average aggregate amount invested in the Portfolio by Variable Contract holders through the relevant insurance company’s Variable Contracts. As of May 1, 2009, the Adviser had entered into such arrangements with the following insurance companies: Zürich Kemper Life Insurance Company; Symetra Life Insurance Company; and First Fortis Life Insurance Company.
The Adviser also has entered into similar agreements with affiliated insurers, including, but not limited to: ING Life Insurance and Annuity Company; ReliaStar Life Insurance Company; ReliaStar Life Insurance Company of New York; Security Life of Denver; and ING USA Annuity and Life Insurance Company. ING uses a variety of financial and accounting techniques to allocate resources and profits across the organization. These methods may take the form of cash payments to affiliates. These methods do not impact the costs incurred when investing in the Portfolio. Additionally, if the Portfolio is not sub-advised or is sub-advised by an ING entity, ING may retain more revenue than on the Portfolio if it must pay to have it sub-advised by non-affiliated entities. Management personnel of ING may receive additional compensation if the overall amount of investments in the portfolios advised by ING meets certain target levels or increases over time.
The insurance companies through which investors hold shares of the Portfolio may also pay fees to third parties in connection with distribution of Variable Contracts and for services provided to Variable Contract owners. Each of the Portfolio, the Adviser and the Distributor is not a party to these arrangements. Investors should consult the prospectus and SAI for their Variable Contracts for a discussion of these payments.
Ultimately, the agent or broker selling the Variable Contract to you could have a financial interest in selling you a particular product to increase the compensation they receive. Please make sure you read fully each prospectus and discuss any questions you have with your agent or broker.
C-5
Dividends and Capital Gains Distributions
The Portfolio declares and pay dividends and capital gains distributions, if any, on a semi-annual basis usually in June. To comply with federal tax regulations, the Portfolio may also pay an additional capital gains distribution, usually in June.
Tax Matters
Holders of Variable Contracts should refer to the prospectus for their contracts for information regarding the tax consequences of owning such contracts and should consult their tax advisers before investing.
The Portfolio intends to qualify as a regulated investment company (“RIC”) for federal income tax purposes by satisfying the requirements under Subchapter M of the Code, including requirements with respect to diversification of assets, distribution of income and sources of income. As a RIC, the Portfolio generally will not be subject to tax on its net investment company taxable income and net realized capital gains. The Portfolio also intends to comply with the diversification requirements of Section 817(h) of the Code and the underlying regulations for Variable Contracts so that owners of these contracts should not be subject to federal tax on distributions of dividends and income from the Portfolio to the insurance company’s separate accounts.
Since the sole shareholders of the Portfolio will be separate accounts or other permitted investors, no discussion is included herein as to the federal income tax consequences at the shareholder level.
See the Portfolio’s SAI for further information about tax matters.
THE TAX STATUS OF YOUR INVESTMENT IN THE PORTFOLIO DEPENDS UPON THE FEATURES OF YOUR VARIABLE CONTRACT. FOR FURTHER INFORMATION, PLEASE REFER TO THE PROSPECTUS FOR THE VARIABLE CONTRACT.
C-6
FINANCIAL HIGHLIGHTS
The information in the table below has been derived from ING Russell™ Large Cap Index Portfolio’s financial statements, which have been audited by KPMG LLP an independent registered public accounting firm.
Selected data for a share of beneficial interest outstanding throughout each year or period.
|
|
|
| ADV |
| CLASS I |
| CLASS S |
|
|
|
|
| March 10, |
| March 10, |
| March 10, |
|
Income (loss) from Investment Operations: |
|
|
|
|
|
|
|
|
|
Net asset value, beginning of period |
| $ |
| 10.00 |
| 10.00 |
| 10.00 |
|
Net investment income (loss) |
| $ |
| 0.13 | * | 0.17 | * | 0.14 | * |
Net realized and unrealized loss |
| $ |
| (2.87 | ) | (2.88 | ) | (2.87 | ) |
Total from investment operations |
| $ |
| (2.74 | ) | (2.71 | ) | (2.73 | ) |
Less distributions: |
|
|
|
|
|
|
|
|
|
From net investment income |
| $ |
| 0.07 |
| 0.08 |
| 0.07 |
|
From net realized gains |
| $ |
| — |
| — |
| — |
|
From return of capital |
| $ |
| — |
| — |
| — |
|
Total distributions |
| $ |
| 0.07 |
| 0.08 |
| 0.07 |
|
Net asset value, end of period |
| $ |
| 7.19 |
| 7.21 |
| 7.20 |
|
Total Return(2) |
| % |
| (27.42 | ) | (27.06 | ) | (27.23 | ) |
Ratios to average net assets: |
|
|
|
|
|
|
|
|
|
Expenses before reductions/additions(3) (4) |
| % |
| 0.89 | + | 0.39 | + | 0.64 | + |
Expenses net of fee waivers and/or recoupments, if any(3) (4) |
| % |
| 0.87 | + | 0.37 | + | 0.62 | + |
Expenses net of all reductions/additions(3) (4) |
| % |
| 0.87 | + | 0.37 | + | 0.62 | + |
Net investment income (loss)(3) (4) |
| % |
| 1.98 | + | 2.31 | + | 2.19 | + |
Supplemental data |
|
|
|
|
|
|
|
|
|
|
|
|
|
|
|
|
|
|
|
Net assets, end of period |
| ($000’s) |
| 1,135 |
| 1,057,974 |
| 28,529 |
|
Portfolio turnover rate |
| % |
| 8 |
| 8 |
| 8 |
|
(1) | Commencement of operations. |
(2) | Total return is calculated assuming reinvestment of all dividends and capital gain distributions at net asset value and does not reflect the effect of insurance contract charges. Total return for periods less than one year is not annualized. |
(3) | Annualized for periods less than one year. |
(4) | Expense ratios reflect operating expenses of a Portfolio. Expenses before reductions do not reflect amounts reimbursed by the Investment Adviser and/or Distributor or reductions from brokerage commission recapture arrangements or other expense offset arrangements and do not represent the amount paid by a Portfolio during periods when reimbursements or reductions occur. Expenses net of fee waivers reflect expenses after reimbursement by the Investment Adviser and/or Distributor but prior to reductions from brokerage commission recapture arrangements or other expense offset arrangements. Expenses net of all reductions represent the net expenses paid by a Portfolio. Net investment income (loss) is net of all such additions or reductions. |
* | Calculated using average number of shares outstanding throughout the period. |
+ | Impact of waiving the advisory fee for the ING Institutional Prime Money Market Fund holding has less than 0.005% impact on the expense ratios and net investment income or loss ratio. |
C-7
Performance of the Russell Top 200® Index
ING RussellTM Large Cap Index Portfolio’s investment objective is to seek investment results (before fees and expenses) that correspond to the total return of the Russell Top 200® Index. The performance shown below is for the Russell Top 200® Index and is not the past performance of ING RussellTM Large Cap Index Portfolio or any other investment.
The Russell Top 200® Index performance does not include any fees and expenses associated with investing, including management fees and brokerage costs, and would be lower if it did. The Russell Top 200® Index performance also does not reflect the deduction of any insurance fees or charges that are imposed by the insurance company in connection with its sale of variable contracts. You should refer to the separate account prospectuses, prospectus summary or disclosure statement describing variable contracts for information pertaining to these insurance fees or charges. If the insurance fees or charges were included, the performance would be lower. Past Russell Top 200® Index performance is no guarantee of future results, either for the index or for any mutual fund. You cannot invest directly in an index.
The bar chart below shows the changes in the Russell Top 200® Index performance from year to year and the table shows the average annual total returns for the Russell Top 200® Index over the periods indicated as of December 31, 2008. These returns reflect reinvestment of dividends and other earnings.
Past performance is not indicative of future results and, as with any investment, there is always a potential for loss as well as profit. It should be noted that the long-term performance of the Russell Top 200® Index coincides with a long period of rising markets.

|
| 1 Year |
| 3 Years |
| 5 Years |
| 10 Years |
|
Russell Top 200® Index |
| (36.07 | )% | (7.86 | )% | (2.55 | )% | (2.45 | )% |
As stated above, Russell Top 200® Index returns do not represent actual Portfolio performance. Russell Top 200® Index performance returns do not reflect management fees, transaction costs or expenses.
C-8
(This page intentionally left blank)
Appendix D
Principal Executive Officers of ING Investment Management Co.
230 Park Avenue
New York, New York 10169
Name and Title
Robert G. Leary — President and Chief Executive Officer
Jeffrey T. Becker — Vice Chairman and Chief Financial and Operating Officer
Michael J. Gioffre — Chief Compliance Officer
Mark D. Weber — Executive Vice President and Head of Structured Assets and
Innovation
Gerald T. Lins — General Counsel
D-1
(This page intentionally left blank)
Appendix E
ADVISORY FEE RATE OF A FUND WITH SIMILAR INVESTMENT OBJECTIVES ADVISER OR SUB-ADVISED BY ING INVESTMENT MANAGEMENT CO. (“ING IM”)
The following table sets forth the name of another investment company, with investment objective and strategies similar to Neuberger Berman Partners Portfolio, for which ING IM acts as an investment sub-adviser, the annual rate of compensation and the net assets of the investment company. The information below is given as of December 31, 2008.
FUND |
| NET ASSETS ($) |
| ANNUAL COMPENSATION |
|
|
|
|
|
|
|
|
|
|
|
|
|
|
|
|
|
|
|
The following table sets forth the name of another investment company, with investment objective and strategies similar to Oppenheimer Main Street Portfolio, for which ING IM acts as an investment sub-adviser, the annual rate of compensation and the net assets of the investment company. The information below is given as of December 31, 2008.
FUND |
| NET ASSETS ($) |
| ANNUAL COMPENSATION |
|
|
|
|
|
|
|
|
|
|
|
|
|
|
|
|
|
|
|
E-1
(This page intentionally left blank)
APPENDIX F
SECURITY OWNERSHIP OF CERTAIN BENEFICIAL AND RECORD OWNERS
The following tables provide information about the persons or entities who, to the knowledge of each Portfolio, owned beneficially or of record 5% or more of any class of that Portfolio’s outstanding shares as of April 1, 2009:
ING Neuberger Berman Partners Portfolio
Name and Address of Shareholder |
| Percent of Class of |
| Percentage of |
| Percentage of |
|
|
|
|
|
|
|
|
|
|
|
|
|
|
|
|
|
|
|
|
|
|
|
|
|
ING Oppenheimer Main Street Portfolio
Name and Address of Shareholder |
| Percent of Class of |
| Percentage of |
| Percentage of |
|
|
|
|
|
|
|
|
|
|
|
|
|
|
|
|
|
|
|
|
|
|
|
|
|
ING Russell™ Large Cap Index Portfolio
Name and Address of Shareholder |
| Percent of Class of |
| Percentage of |
| Percentage of Combined |
|
|
|
|
|
|
|
|
|
|
|
|
|
|
|
|
|
|
|
|
|
|
|
|
|
* On a pro forma basis, assuming that the value of the shareholder’s interest in the Portfolio on the date of consummation of the Reorganization is the same as on April 1, 2009.
3 EASY WAYS TO VOTE YOUR VOTING INSTRUCTION CARD
VOTE BY PHONE: Call toll-free 1-888-221-0697 and follow the recorded instructions.
VOTE ON THE INTERNET: Log on to Proxyweb.com and follow the on-line directions.
VOTE BY MAIL: Check the appropriate boxes on the reverse side of the Voting Instruction Card, sign and date the Voting Instruction Card and return in the envelope provided.
If you vote via phone or the Internet, you do not need to return your Voting Instruction Card.
PROXY FOR A SPECIAL MEETING OF SHAREHOLDERS ON JUNE 30, 2009
PROXY SOLICITED ON BEHALF OF THE BOARD OF DIRECTORS
FUND/INSURANCE COMPANY NAME PRINTS HERE
The undersigned hereby appoints the above-referenced Insurance Company and hereby authorizes them to represent and to vote, as designated on reverse, at the Special Meeting of Shareholders and at any adjournment(s) or postponement(s) thereof, all shares of the above-referenced Portfolio (the “Portfolio”) attributable to his or her contract or interest therein as directed on the reverse side of this Card. IF THIS VOTING INSTRUCTION CARD IS SIGNED AND RETURNED WITH NO CHOICES INDICATED, THE SHARES WILL BE VOTED “FOR” THE APPROVAL OF THE PROPOSALS. If you fail to return this Voting Instruction Card, the Insurance Company will vote all shares attributable to your account value in proportion to all voting instructions for the Portfolio actually received from contract owners in the Separate Account, when applicable. The proxies voting shares at the Special Meeting on behalf of the Insurance Company are authorized to vote, at their discretion, upon such other business as may properly come before the Special Meeting and any adjournment(s) or postponement(s) thereof.
Voting Instruction Card must be signed and dated below.
|
|
|
Signature (s) (if held jointly) |
| Date |
NOTE: PLEASE SIGN EXACTLY AS YOUR NAME APPEARS ON THIS VOTING INSTRUCTION CARD. All joint owners should sign. When signing as executor, administrator, attorney, trustee or guardian or as custodian for a minor, please give full title as such. If a corporation, please sign in full corporate name and indicate the signer’s office. If a partner, please sign in the partnership name.
Please fill in box(es) as shown using black or blue ink or number 2 pencil. x
PLEASE DO NOT USE FINE POINT PENS.
To avoid the additional expense of further solicitation, we strongly urge you to review, complete and return your Voting Instruction Card as soon as possible. Your vote is important regardless of the number of shares you own. If you vote via phone or the Internet, you do not need to return your Voting Instruction Card.
THIS VOTING INSTRUCTION CARD IS VALID ONLY WHEN SIGNED AND DATED
THE BOARD OF DIRECTORS RECOMMENDS A VOTE “FOR” THE FOLLOWING PROPOSALS:
1. To approve an Agreement and Plan of Reorganization (“Reorganization Agreement”) by and between ING Neuberger Berman Partners Portfolio and ING Russell™ Large Cap Index Portfolio, providing for the reorganization of ING Neuberger Berman Partners Portfolio with and into ING Russell™ Large Cap Index Portfolio.
For o | Against o | Abstain o |
2. Subject to shareholder approval of the Reorganization Agreement, to approve an investment sub-advisory agreement between Directed Services LLC (“DSL”), ING Neuberger Berman Partners Portfolio investment adviser, and ING Investment Management Co. (“ING IM”), pursuant to which ING IM, an affiliate of DSL, would serve as the sub-adviser to ING Neuberger Berman Partners Portfolio during a transition period until the Reorganization is consummated.
For o | Against o | Abstain o |
PLEASE SIGN AND DATE ON THE REVERSE SIDE.
![]()
FUNDS
7337 East Doubletree Ranch Road
Scottsdale, Arizona 85258-2034
3 EASY WAYS TO VOTE YOUR PROXY
VOTE BY PHONE: Call toll-free 1-888-221-0697 and follow the recorded instructions.
VOTE ON THE INTERNET: Log on to Proxyweb.com and follow the on-line directions.
VOTE BY MAIL: Check the appropriate boxes on the reverse side of the Proxy Ballot,
sign and date the Proxy Ballot and return in the envelope provided.
If you vote via phone or the Internet, you do not need to return your Proxy Ballot.
PROXY FOR A SPECIAL MEETING OF SHAREHOLDERS TO BE HELD ON JUNE 30, 2009
THIS PROXY IS SOLICITED ON BEHALF OF THE BOARD OF DIRECTORS
ING NEUBERGER BERMAN PARTNERS PORTFOLIO
The undersigned hereby appoint(s) Huey P. Falgout, Jr., Theresa K. Kelety, and Todd Modic or any one or all of them, proxies, with full power of substitution, to vote all shares of the above-referenced Portfolio (the “Portfolio”), which the undersigned is entitled to vote at the Special Meeting of Shareholders of the Portfolio to be held at the offices of the Portfolio at 7337 East Doubletree Ranch Road, Scottsdale, AZ 85258-2034 on June 30, 2009, at 10:00 a.m., Local time and at any adjournment(s) or postponement(s) thereof.
This proxy will be voted as instructed. If no specification is made, the proxy will be voted “FOR” the proposals.
Please vote, date and sign this proxy and return it promptly in the enclosed envelope.
|
|
|
Signature (s) (if held jointly) |
| Date |
This Proxy Ballot must be signed exactly as your name(s) appears hereon. If as an attorney, executor, guardian or in some representative capacity or as an officer of a corporation, please add title(s) as such. Joint owners must each sign.
Please fill in box(es) as shown using black or blue ink or number 2 pencil. x
PLEASE DO NOT USE FINE POINT PENS.
To avoid the additional expense of further solicitation, we strongly urge you to review, complete and return your Proxy Ballot as soon as possible. Your vote is important regardless of the number of shares you own. If you vote via phone or the Internet, you do not need to return your Proxy Ballot.
THIS PROXY BALLOT IS VALID ONLY WHEN SIGNED AND DATED
THE BOARD OF DIRECTORS RECOMMENDS A VOTE “FOR” THE FOLLOWING PROPOSALS:
1. To approve an Agreement and Plan of Reorganization (“Reorganization Agreement”) by and between ING Neuberger Berman Partners Portfolio and ING Russell™ Large Cap Index Portfolio, providing for the reorganization of ING Neuberger Berman Partners Portfolio with and into ING Russell™ Large Cap Index Portfolio.
For o | Against o | Abstain o |
2. Subject to shareholder approval of the Reorganization Agreement, to approve an investment sub-advisory agreement between Directed Services LLC (“DSL”), ING Neuberger Berman Partners Portfolio’s investment adviser, and ING Investment Management Co. (“ING IM”), pursuant to which ING IM, an affiliate of DSL, would serve as the sub-adviser to ING Neuberger Berman Partners Portfolio during a transition period until the Reorganization is consummated.
For o | Against o | Abstain o |
PLEASE SIGN AND DATE ON THE REVERSE SIDE.
3 EASY WAYS TO VOTE YOUR VOTING INSTRUCTION CARD
VOTE BY PHONE: Call toll-free 1-888-221-0697 and follow the recorded instructions.
VOTE ON THE INTERNET: Log on to Proxyweb.com and follow the on-line directions.
VOTE BY MAIL: Check the appropriate boxes on the reverse side of the Voting Instruction Card, sign and date the Voting Instruction Card and return in the envelope provided.
If you vote via phone or the Internet, you do not need to return your Voting Instruction Card.
PROXY FOR A SPECIAL MEETING OF SHAREHOLDERS ON JUNE 30, 2009
PROXY SOLICITED ON BEHALF OF THE BOARD OF TRUSTEES
FUND/INSURANCE COMPANY NAME PRINTS HERE
The undersigned hereby appoints the above-referenced Insurance Company and hereby authorizes them to represent and to vote, as designated on reverse, at the Special Meeting of Shareholders and at any adjournment(s) or postponement(s) thereof, all shares of the above-referenced Portfolio (the “Portfolio”) attributable to his or her contract or interest therein as directed on the reverse side of this Card. IF THIS VOTING INSTRUCTION CARD IS SIGNED AND RETURNED WITH NO CHOICES INDICATED, THE SHARES WILL BE VOTED “FOR” THE APPROVAL OF THE PROPOSALS. If you fail to return this Voting Instruction Card, the Insurance Company will vote all shares attributable to your account value in proportion to all voting instructions for the Portfolio actually received from contract owners in the Separate Account, when applicable. The proxies voting shares at the Special Meeting on behalf of the Insurance Company are authorized to vote, at their discretion, upon such other business as may properly come before the Special Meeting and any adjournment(s) or postponement(s) thereof.
Voting Instruction Card must be signed and dated below.
|
|
|
Signature (s) (if held jointly) |
| Date |
NOTE: PLEASE SIGN EXACTLY AS YOUR NAME APPEARS ON THIS VOTING INSTRUCTION CARD. All joint owners should sign. When signing as executor, administrator, attorney, trustee or guardian or as custodian for a minor, please give full title as such. If a corporation, please sign in full corporate name and indicate the signer’s office. If a partner, please sign in the partnership name.
Please fill in box(es) as shown using black or blue ink or number 2 pencil. x
PLEASE DO NOT USE FINE POINT PENS.
To avoid the additional expense of further solicitation, we strongly urge you to review, complete and return your Voting Instruction Card as soon as possible. Your vote is important regardless of the number of shares you own. If you vote via phone or the Internet, you do not need to return your Voting Instruction Card.
THIS VOTING INSTRUCTION CARD IS VALID ONLY WHEN SIGNED AND DATED
THE BOARD OF TRUSTEES RECOMMENDS A VOTE “FOR” THE FOLLOWING PROPOSALS:
1. To approve an Agreement and Plan of Reorganization (“Reorganization Agreement”) by and between ING Oppenheimer Main Street Portfolio® and ING Russell™ Large Cap Index Portfolio, providing for the reorganization of ING Oppenheimer Main Street Portfolio® with and into ING Russell™ Large Cap Index Portfolio.
For o | Against o | Abstain o |
2. Subject to shareholder approval of the Reorganization Agreement, to approve an investment sub-advisory agreement between Directed Services LLC (“DSL”), ING Oppenheimer Main Street Portfolio®’s investment adviser, and ING Investment Management Co. (“ING IM”), pursuant to which ING IM, an affiliate of DSL, would serve as the sub-adviser to ING Oppenheimer Main Street Portfolio® during a transition period until the Reorganization is consummated.
For o | Against o | Abstain o |
PLEASE SIGN AND DATE ON THE REVERSE SIDE.
![]()
FUNDS
7337 East Doubletree Ranch Road
Scottsdale, Arizona 85258-2034
3 EASY WAYS TO VOTE YOUR PROXY
VOTE BY PHONE: Call toll-free 1-888-221-0697 and follow the recorded instructions.
VOTE ON THE INTERNET: Log on to Proxyweb.com and follow the on-line directions.
VOTE BY MAIL: Check the appropriate boxes on the reverse side of the Proxy Ballot,
sign and date the Proxy Ballot and return in the envelope provided.
If you vote via phone or the Internet, you do not need to return your Proxy Ballot.
PROXY FOR A SPECIAL MEETING OF SHAREHOLDERS TO BE HELD ON JUNE 30, 2009
THIS PROXY IS SOLICITED ON BEHALF OF THE BOARD OF TRUSTEES
ING OPPENHEIMER MAIN STREET PORTFOLIO®
The undersigned hereby appoint(s) Huey P. Falgout, Jr., Theresa K. Kelety, and Todd Modic or any one or all of them, proxies, with full power of substitution, to vote all shares of the above-referenced Portfolio (the “Portfolio”), which the undersigned is entitled to vote at the Special Meeting of Shareholders of the Portfolio to be held at the offices of the Portfolio at 7337 East Doubletree Ranch Road, Scottsdale, AZ 85258-2034 on June 30, 2009, at 10:00 a.m., Local time and at any adjournment(s) or postponement(s) thereof.
This proxy will be voted as instructed. If no specification is made, the proxy will be voted “FOR” the proposals.
Please vote, date and sign this proxy and return it promptly in the enclosed envelope.
|
|
|
Signature (s) (if held jointly) |
| Date |
This Proxy Ballot must be signed exactly as your name(s) appears hereon. If as an attorney, executor, guardian or in some representative capacity or as an officer of a corporation, please add title(s) as such. Joint owners must each sign.
Please fill in box(es) as shown using black or blue ink or number 2 pencil. x
PLEASE DO NOT USE FINE POINT PENS.
To avoid the additional expense of further solicitation, we strongly urge you to review, complete and return your Proxy Ballot as soon as possible. Your vote is important regardless of the number of shares you own. If you vote via phone or the Internet, you do not need to return your Proxy Ballot.
THIS PROXY BALLOT IS VALID ONLY WHEN SIGNED AND DATED
THE BOARD OF TRUSTEES RECOMMENDS A VOTE “FOR” THE FOLLOWING PROPOSALS:
1. To approve an Agreement and Plan of Reorganization (“Reorganization Agreement”) by and between ING Oppenheimer Main Street Portfolio® and ING Russell™ Large Cap Index Portfolio, providing for the reorganization of ING Oppenheimer Main Street Portfolio® with and into ING Russell™ Large Cap Index Portfolio.
For o | Against o | Abstain o |
2. Subject to shareholder approval of the Reorganization Agreement, to approve an investment sub-advisory agreement between Directed Services LLC (“DSL”), ING Oppenheimer Main Street Portfolio®’s investment adviser, and ING Investment Management Co. (“ING IM”), pursuant to which ING IM, an affiliate of DSL, would serve as the sub-adviser to ING Oppenheimer Main Street Portfolio® during a transition period until the Reorganization is consummated.
For o | Against o | Abstain o |
PLEASE SIGN AND DATE ON THE REVERSE SIDE.
PART B
ING VARIABLE PORTFOLIOS, INC.
Statement of Additional Information
May 18, 2009
Acquisition of the Assets and Liabilities of each of : ING Neuberger Berman Partners Portfolio and ING Oppenheimer Main Street Portfolio®
| By and in Exchange for Shares of: |
This Statement of Additional Information of ING Variable Portfolios, Inc. (“SAI”) is available to the shareholders of ING Neuberger Berman Partners Portfolio, a series of ING Partners, Inc. and shareholders of ING Oppenheimer Main Street Portfolio®, a series of ING Investors Trust, in connection with proposed transactions whereby all of the assets and known liabilities of each of ING Neuberger Berman Partners Portfolio and ING Oppenheimer Main Street Portfolio® will be transferred to ING Russell™ Large Cap Index Portfolio, a series of ING Variable Portfolios, Inc., in exchange for shares of ING Russell™ Large Cap Index Portfolio.
This SAI consists of: (i) this cover page; (ii) the accompanying Pro Forma Financial Statements; (iii) the Portfolio Manager’s Report for ING Russell™ Large Cap Index Portfolio; and (iv) the following documents, each of which was filed electronically with the U.S. Securities and Exchange Commission and is incorporated by reference herein:
1. The SAI for ING Neuberger Berman Partners Portfolio dated May 1, 2009, as filed on [ ] (File No: 333-32575).
2. The SAI for ING Oppenheimer Main Street Portfolio® dated May 1, 2009, as filed on [ ] (File No: 033-23512).
3. The SAI for ING Russell™ Large Cap Index Portfolio dated May 1, 2009, as filed on [ ] (File No: 333-05173).
4. The Financial Statements of ING Neuberger Berman Partners Portfolio, which are included in the Annual Report dated December 31, 2008, as filed on March 6, 2009 and the Semi-Annual Report dated June 30, 2008, as filed on September 5, 2008 (File No: 811-08319).
5. The Financial Statements of ING Oppenheimer Main Street Portfolio®, which are included in the Annual Report dated December 31, 2008, as filed on March 6, 2009 and the Semi-Annual Report dated June 30, 2008, as filed on September 5, 2008 (File No: 811-05629).
6. The Financial Statements of ING Russell™ Large Cap Index Portfolio, which are included in the Annual Report dated December 31, 2008, as filed on March 6, 2009 and the Semi-Annual Report dated June 30, 2008, as filed on September 5, 2008 (File No: 811-07651).
This SAI is not a prospectus. A Prospectus/Proxy Statement dated May 18, 2009, relating to the Reorganizations of each of ING Neuberger Berman Partners Portfolio and ING Oppenheimer Main Street Portfolio® may be obtained, without charge, by writing to the ING Funds at 7337 East Doubletree Ranch Road, Scottsdale, Arizona 85258-2034 or calling 1-800-262-3862. This SAI should be read in conjunction with the Prospectus/Proxy.
PRO FORMA FINANCIAL STATEMENTS
In connection with proposed transactions whereby all of the assets and known liabilities of each of ING Neuberger Berman Partners Portfolio and ING Oppenheimer Main Street Portfolio® will be transferred to Russell™ Large Cap Index Portfolio (each, a “Portfolio” and collectively, the “Portfolios”), in exchange for shares of ING Russell™ Large Cap Index Portfolio, shown below are financial statements for each Portfolio and Pro Forma Financial Statements for the combined Portfolio, assuming both Reorganizations are consummated, as of December 31, 2008. The first table presents Statements of Assets and Liabilities for each Portfolio and estimated pro forma figures for the combined Portfolio. The second table presents Statements of Operations for each Portfolio and estimated pro forma figures for the combined Portfolio. The third table presents Portfolio of Investments for each Portfolio and estimated pro forma figures for the combined Portfolio. The tables are followed by the Notes to the Pro Forma Financial Statements.
STATEMENTS OF ASSETS AND LIABILITIES as of December 31, 2008
|
| ING |
| ING |
|
|
|
|
| ||||
|
| Neuberger Berman |
| RussellTM Large Cap |
| Pro Forma |
| Pro Forma |
| ||||
|
| Partners Portfolio |
| Index Portfolio |
| Adjustments |
| Combined (unaudited) |
| ||||
ASSETS: |
|
|
|
|
|
|
|
|
| ||||
Investments in securities at value* |
| $ | 241,289,905 |
| $ | 1,033,265,655 |
| $ | (7,628,125 | ) | $ | 1,266,927,435 |
|
Short-term investments in affiliate** |
| — |
| 33,732,000 |
| 7,628,125 |
| 41,360,125 |
| ||||
Cash |
| 8,554,856 |
| 8,998,832 |
|
|
| 17,553,688 |
| ||||
Cash collateral for futures |
| — |
| 5,247,000 |
|
|
| 5,247,000 |
| ||||
Receivables: |
|
|
|
|
|
|
|
|
| ||||
Investment securities sold |
| 2,943,296 |
| — |
|
|
| 2,943,296 |
| ||||
Fund shares sold |
| 1,184,719 |
| 4,206,100 |
|
|
| 5,390,819 |
| ||||
Dividends and interest |
| 518,540 |
| 1,975,529 |
|
|
| 2,494,069 |
| ||||
Variation margin |
| — |
| 634,488 |
|
|
| 634,488 |
| ||||
Prepaid expenses |
| 1,784 |
| 29,234 |
|
|
| 31,018 |
| ||||
Reimbursement due from manager |
| 31,876 |
| 30,451 |
|
|
| 62,327 |
| ||||
Total assets |
| 254,524,976 |
| 1,088,119,289 |
|
|
| 1,342,644,265 |
| ||||
|
|
|
|
|
|
|
|
|
| ||||
LIABILITIES: |
|
|
|
|
|
|
|
|
| ||||
Payable for investment securities purchased |
| 3,261,136 |
| 9,015 |
|
|
| 3,270,151 |
| ||||
Payable for fund shares redeemed |
| 38,001 |
| 166,888 |
|
|
| 204,889 |
| ||||
Payable to affiliates |
| 189,642 |
| 233,530 |
|
|
| 423,172 |
| ||||
Payable for trustee/director fees |
| 7,092 |
| 6,582 |
|
|
| 13,674 |
| ||||
Other accrued expenses and liabilities |
| 58,786 |
| 54,384 |
|
|
| 113,170 |
| ||||
Payable for licensing fees |
| — |
| 10,000 |
|
|
| 10,000 |
| ||||
Total liabilities |
| 3,554,657 |
| 480,399 |
| — |
| 4,035,056 |
| ||||
NET ASSETS |
| $ | 250,970,319 |
| $ | 1,087,638,890 |
| $ | — |
| $ | 1,338,609,209 |
|
|
|
|
|
|
|
|
|
|
| ||||
NET ASSETS CONSIST OF: |
|
|
|
|
|
|
|
|
| ||||
Paid-in capital |
| $ | 501,253,716 |
| $ | 1,406,246,700 |
|
|
| $ | 1,907,500,416 |
| |
Undistributed net investment income |
| 2,624,225 |
| 158,673 |
|
|
| 2,782,898 |
| ||||
Accumulated net realized loss on investments, foreign currency related transactions, and futures |
| (131,385,110 | ) | (34,438,005 | ) |
|
| (165,823,115 | ) | ||||
Net unrealized depreciation of investments, foreign currency related transactions, and futures |
| (121,522,512 | ) | (284,328,478 | ) |
|
| (405,850,990 | ) | ||||
NET ASSETS |
| $ | 250,970,319 |
| $ | 1,087,638,890 |
| $ | — |
| $ | 1,338,609,209 |
|
*Cost of investments in securities |
| $ | 362,806,838 |
| $ | 1,318,650,544 |
| $ | (7,628,125 | ) | $ | 1,673,829,257 |
|
** Cost of short-term investments in affiliate |
| $ | — |
| $ | 33,732,000 |
| $ | 7,628,125 |
| $ | 41,360,125 |
|
Class ADV: |
|
|
|
|
|
|
|
|
| |||
Net Assets |
| $ | 1,594 |
| $ | 1,135,332 |
|
|
| $ | 1,136,926 |
|
Shares authorized |
| 100,000,000 |
| 100,000,000 |
|
|
| 100,000,000 |
| |||
Par value |
| $ | 0.001 |
| $ | 0.001 |
|
|
| $ | 0.001 |
|
Shares outstanding |
| 293 |
| 157,913 |
| (71 | ) (A) | 158,135 |
| |||
Net asset value and redemption price per share |
| $ | 5.44 |
| $ | 7.19 |
|
|
| $ | 7.19 |
|
|
|
|
|
|
|
|
|
|
| |||
Class I: |
|
|
|
|
|
|
|
|
| |||
Net Assets |
| $ | 187,621,010 |
| $ | 1,057,974,224 |
|
|
| $ | 1,245,595,234 |
|
Shares authorized |
| 100,000,000 |
| 200,000,000 |
|
|
| 200,000,000 |
| |||
Par value |
| $ | 0.001 |
| $ | 0.001 |
|
|
| $ | 0.001 |
|
Shares outstanding |
| 34,081,480 |
| 146,789,804 |
| (8,059,149 | ) (A) | 172,812,135 |
| |||
Net asset value and redemption price per share |
| $ | 5.51 |
| $ | 7.21 |
|
|
| $ | 7.21 |
|
|
|
|
|
|
|
|
|
|
| |||
Class S: |
|
|
|
|
|
|
|
|
| |||
Net Assets |
| $ | 63,347,715 |
| $ | 28,529,334 |
|
|
| $ | 91,877,049 |
|
Shares authorized |
| 100,000,000 |
| 100,000,000 |
|
|
| 100,000,000 |
| |||
Par value |
| $ | 0.001 |
| $ | 0.001 |
|
|
| $ | 0.001 |
|
Shares outstanding |
| 11,556,312 |
| 3,962,706 |
| (2,758,018 | ) (A) | 12,761,000 |
| |||
Net asset value and redemption price per share |
| $ | 5.48 |
| $ | 7.20 |
|
|
| $ | 7.20 |
|
(A) Reflects new shares issued, net of retired shares of ING Neuberger Berman Partners Portfolio. Calculation: Net Assets ÷ NAV per share)
See Accompanying Notes to Financial Statements
STATEMENTS OF OPERATIONS for the year ended December 31, 2008
|
| ING |
| ING |
|
|
|
|
| ||||
|
| Neuberger Berman |
| RussellTM Large Cap |
| Pro Forma |
| Pro Forma |
| ||||
|
| Partners Portfolio |
| Index Portfolio |
| Adjustments |
| Combined (unaudited) |
| ||||
INVESTMENT INCOME: |
|
|
|
|
|
|
|
|
| ||||
Dividends, net of foreign taxes withheld*(1) |
| $ | 5,707,179 |
| $ | 17,060,303 |
|
|
| $ | 22,767,482 |
| |
Interest |
| 13,635 |
| 11,829 |
|
|
| 25,464 |
| ||||
Total investment income |
| 5,720,814 |
| 17,072,132 |
| — |
| 22,792,946 |
| ||||
|
|
|
|
|
|
|
|
|
| ||||
EXPENSES: |
|
|
|
|
|
|
|
|
| ||||
Investment management fees |
| 2,490,516 |
| 1,590,890 |
| (1,458,172 | ) (A) | 2,623,234 |
| ||||
Distribution and service fees: |
|
|
|
|
|
|
|
|
| ||||
Class ADV |
| 12 |
| 2,933 |
|
|
| 2,945 |
| ||||
Class S |
| 292,092 |
| 28,794 |
|
|
| 320,886 |
| ||||
Transfer agent fees |
| 696 |
| 784 |
|
|
| 1,480 |
| ||||
Administrative service fees |
| 415,081 |
| 636,347 |
|
|
| 1,051,428 |
| ||||
Shareholder reporting expense |
| 69,912 |
| 26,913 |
|
|
| 96,825 |
| ||||
Registration fees |
| 323 |
| — |
|
|
| 323 |
| ||||
Professional fees |
| 48,746 |
| 68,845 |
|
|
| 117,591 |
| ||||
Custody and accounting expense |
| 51,231 |
| 59,158 |
|
|
| 110,389 |
| ||||
Directors fees |
| 15,006 |
| 46,628 |
|
|
| 61,634 |
| ||||
Offering expense |
| — |
| 16,154 |
|
|
| 16,154 |
| ||||
Licensing fees |
| — |
| 12,407 |
|
|
| 12,407 |
| ||||
Miscellaneous expense |
| 12,879 |
| 16,795 |
|
|
| 29,674 |
| ||||
Total expenses |
| 3,396,494 |
| 2,506,648 |
| (1,458,172 | ) | 4,444,970 |
| ||||
Less: |
|
|
|
|
|
|
|
|
| ||||
Net waived and reimbursed/recouped fees |
| (351,898 | ) | (119,428 | ) | 261,467 | (A) | (209,859 | ) | ||||
Brokerage commission recapture |
| — |
| — |
| — |
| — |
| ||||
Net expenses |
| 3,044,596 |
| 2,387,221 |
| (1,196,705 | ) | 4,235,112 |
| ||||
Net investment income (loss) |
| 2,676,218 |
| 14,684,911 |
| 1,196,705 |
| 18,557,834 |
| ||||
|
|
|
|
|
|
|
|
|
| ||||
REALIZED AND UNREALIZED GAIN (LOSS) ON INVESTMENTS, FOREIGN CURRENCY RELATED TRANSACTIONS, FUTURES, AND WRITTEN OPTIONS: |
|
|
|
|
|
|
|
|
| ||||
Net realized loss on: |
|
|
|
|
|
|
|
|
| ||||
Investments |
| (117,953,182 | ) | (19,554,391 | ) |
|
| (137,507,573 | ) | ||||
Foreign currency related transactions |
| (45,555 | ) | — |
|
|
| (45,555 | ) | ||||
Futures |
| — |
| (14,884,382 | ) |
|
| (14,884,382 | ) | ||||
Net realized loss on investments, foreign currency related transactions, and futures |
| (117,998,737 | ) | (34,438,773 | ) |
|
| (152,437,510 | ) | ||||
Net change in unrealized appreciation or depreciation on: |
|
|
|
|
|
|
|
|
| ||||
Investments |
| (190,064,282 | ) | (285,384,889 | ) |
|
| (475,449,171 | ) | ||||
Foreign currency related transactions |
| (5,579 | ) | — |
|
|
| (5,579 | ) | ||||
Futures |
| — |
| 1,056,411 |
|
|
| 1,056,411 |
| ||||
Net change in unrealized appreciation or depreciation on investments, foreign currency related transactions, and futures |
| (190,069,861 | ) | (284,328,478 | ) |
|
| (474,398,339 | ) | ||||
Net realized and unrealized gain (loss) on investments, foreign currency related transactions, and futures |
| (308,068,598 | ) | (318,767,251 | ) |
|
| (626,835,849 | ) | ||||
Decrease in net assets resulting from operations |
| $ | (305,392,380 | ) | $ | (304,082,340 | ) | $ | 1,196,705 |
| $ | (608,278,015 | ) |
* Foreign taxes withheld |
| $ | 17,680 |
| $ | — |
| $ | — |
| $ | 17,680 |
|
(1) Dividends from affiliates |
| $ | — |
| $ | 440,429 |
| $ | — |
| $ | 440,429 |
|
(A) Reflects adjustment in expenses due to effects of new contractual rates.
See Accompanying Notes to Financial Statements
Portfolios of Investments as of December 31, 2008 (UNAUDITED):
|
|
|
|
|
| Pro Forma |
|
|
|
|
| ING Neuberger |
|
|
|
|
| Pro Forma |
| Cost Adjustments |
| ||||
ING Neuberger Berman |
| ING Russell TM Large |
| Adjustments |
| ING Russell TM Large |
|
|
|
|
| Berman Partners |
| ING Russell TM Large |
| Adjustments |
| ING Russell TM Large |
| ING Neuberger Berman |
| ||||
Shares |
|
|
|
|
| Value |
|
|
| ||||||||||||||||
COMMON STOCK: 94.2% |
|
|
|
|
|
|
|
|
|
|
|
|
|
|
|
|
|
|
|
|
| ||||
|
|
|
|
|
|
|
|
|
| Advertising: 0.1% |
|
|
|
|
|
|
|
|
|
|
| ||||
— |
| 50,850 |
| 11,499 |
| 62,349 |
|
|
| Omnicom Group |
| $ | — |
| $ | 1,368,882 |
| $ | 309,558 |
| $ | 1,678,440 |
| — |
|
|
|
|
|
|
|
|
|
|
|
|
| — |
| 1,368,882 |
| 309,558 |
| 1,678,440 | cs |
|
| ||||
|
|
|
|
|
|
|
|
|
| Aerospace/Defense: 2.5% |
|
|
|
|
|
|
|
|
|
|
| ||||
— |
| 119,100 |
| 26,933 |
| 146,033 |
|
|
| Boeing Co. |
| — |
| 5,081,997 |
| 1,149,238 |
| 6,231,235 |
| — |
| ||||
— |
| 63,150 |
| 14,281 |
| 77,431 |
|
|
| General Dynamics Corp. |
| — |
| 3,636,809 |
| 822,425 |
| 4,459,234 |
| — |
| ||||
61,100 |
| — |
| (61,100 | ) | — |
|
|
| L-3 Communications Holdings, Inc. |
| 4,507,958 |
| — |
| (4,507,958 | ) | — |
| 4,507,958 |
| ||||
— |
| 52,100 |
| 11,782 |
| 63,882 |
|
|
| Lockheed Martin Corp. |
| — |
| 4,380,568 |
| 990,618 |
| 5,371,186 |
| — |
| ||||
— |
| 54,350 |
| 12,291 |
| 66,641 |
|
|
| Northrop Grumman Corp. |
| — |
| 2,447,924 |
| 553,571 |
| 3,001,495 |
| — |
| ||||
— |
| 67,050 |
| 15,163 |
| 82,213 |
|
|
| Raytheon Co. |
| — |
| 3,422,232 |
| 773,901 |
| 4,196,133 |
| — |
| ||||
— |
| 154,300 |
| 34,893 |
| 189,193 |
|
|
| United Technologies Corp. |
| — |
| 8,270,480 |
| 1,870,279 |
| 10,140,759 |
| — |
| ||||
|
|
|
|
|
|
|
|
|
|
|
| 4,507,958 |
| 27,240,010 |
| 1,652,074 |
| 33,400,042 | cs |
|
| ||||
|
|
|
|
|
|
|
|
|
| Agriculture: 2.2% |
|
|
|
|
|
|
|
|
|
|
| ||||
— |
| 332,150 |
| 75,112 |
| 407,262 |
|
|
| Altria Group, Inc. |
| — |
| 5,002,179 |
| 1,131,188 |
| 6,133,367 |
| — |
| ||||
— |
| 102,150 |
| 23,100 |
| 125,250 |
|
|
| Archer-Daniels-Midland Co. |
| — |
| 2,944,985 |
| 665,976 |
| 3,610,961 |
| — |
| ||||
— |
| 334,250 |
| 75,587 |
| 409,837 |
|
|
| Philip Morris International, Inc. |
| — |
| 14,543,218 |
| 3,288,790 |
| 17,832,008 |
| — |
| ||||
— |
| 27,100 |
| 6,128 |
| 33,228 |
|
|
| Reynolds American, Inc. |
| — |
| 1,092,401 |
| 247,035 |
| 1,339,436 |
| — |
| ||||
|
|
|
|
|
|
|
|
|
|
|
| — |
| 23,582,783 |
| 5,332,989 |
| 28,915,772 | cs |
|
| ||||
|
|
|
|
|
|
|
|
|
| Apparel: 0.3% |
|
|
|
|
|
|
|
|
|
|
| ||||
— |
| 56,000 |
| 12,664 |
| 68,664 |
|
|
| Nike, Inc. |
| — |
| 2,856,000 |
| 645,853 |
| 3,501,853 |
| — |
| ||||
|
|
|
|
|
|
|
|
|
|
|
| — |
| 2,856,000 |
| 645,853 |
| 3,501,853 | cs |
|
| ||||
|
|
|
|
|
|
|
|
|
| Auto Manufacturers: 0.1% |
|
|
|
|
|
|
|
|
|
|
| ||||
— |
| 58,050 |
| 13,127 |
| 71,177 |
|
|
| Paccar, Inc. |
| — |
| 1,660,230 |
| 375,443 |
| 2,035,673 |
| — |
| ||||
|
|
|
|
|
|
|
|
|
|
|
| — |
| 1,660,230 |
| 375,443 |
| 2,035,673 | cs |
|
| ||||
|
|
|
|
|
|
|
|
|
| Auto Parts & Equipment: 0.2% |
|
|
|
|
|
|
|
|
|
|
| ||||
— |
| 94,050 |
| 21,268 |
| 115,318 |
|
|
| Johnson Controls, Inc. |
| — |
| 1,707,948 |
| 386,234 |
| 2,094,182 |
| — |
| ||||
|
|
|
|
|
|
|
|
|
|
|
| — |
| 1,707,948 |
| 386,234 |
| 2,094,182 | cs |
|
| ||||
|
|
|
|
|
|
|
|
|
| Banks: 8.0% |
|
|
|
|
|
|
|
|
|
|
| ||||
88,700 |
| 796,700 |
| 91,465 |
| 976,865 |
|
|
| Bank of America Corp. |
| 1,248,896 |
| 11,217,536 |
| 1,287,828 |
| 13,754,260 |
| 1,248,896 |
| ||||
79,000 |
| 181,300 |
| (38,001 | ) | 222,299 |
|
|
| Bank of New York Mellon Corp. |
| 2,238,070 |
| 5,136,229 |
| (1,076,568 | ) | 6,297,731 |
| 2,238,070 |
| ||||
— |
| 86,750 |
| 19,618 |
| 106,368 |
|
|
| BB&T Corp. |
| — |
| 2,382,155 |
| 538,698 |
| 2,920,853 |
| — |
| ||||
— |
| 59,400 |
| 13,433 |
| 72,833 |
|
|
| Capital One Financial Corp. |
| — |
| 1,894,266 |
| 428,368 |
| 2,322,634 |
| — |
| ||||
481,800 |
| 863,100 |
| (286,619 | ) | 1,058,281 |
|
|
| Citigroup, Inc. |
| 3,232,878 |
| 5,791,401 |
| (1,923,216 | ) | 7,101,063 |
| 3,232,878 |
| ||||
57,550 |
| 69,850 |
| (41,754 | ) | 85,646 |
|
|
| Goldman Sachs Group, Inc. |
| 4,856,645 |
| 5,894,642 |
| (3,523,636 | ) | 7,227,651 |
| 4,856,645 |
| ||||
— |
| 585,235 |
| 132,345 |
| 717,580 |
|
|
| JPMorgan Chase & Co. |
| — |
| 18,452,460 |
| 4,172,823 |
| 22,625,283 |
| — |
| ||||
126,800 |
| 175,550 |
| (87,101 | ) | 215,249 |
|
|
| Morgan Stanley |
| 2,033,872 |
| 2,815,822 |
| (1,397,105 | ) | 3,452,589 |
| 2,033,872 |
| ||||
— |
| 54,800 |
| 12,392 |
| 67,192 |
|
|
| PNC Financial Services Group, Inc. |
| — |
| 2,685,200 |
| 607,229 |
| 3,292,429 |
| — |
| ||||
— |
| 67,700 |
| 15,310 |
| 83,010 |
|
|
| State Street Corp. |
| — |
| 2,662,641 |
| 602,127 |
| 3,264,768 |
| — |
| ||||
— |
| 56,000 |
| 12,664 |
| 68,664 |
|
|
| SunTrust Bank |
| — |
| 1,654,240 |
| 374,088 |
| 2,028,328 |
| — |
| ||||
— |
| 276,000 |
| 62,414 |
| 338,414 |
|
|
| US Bancorp. |
| — |
| 6,902,760 |
| 1,560,984 |
| 8,463,744 |
| — |
| ||||
— |
| 342,400 |
| 77,430 |
| 419,830 |
|
|
| Wachovia Corp. |
| — |
| 1,896,896 |
| 428,962 |
| 2,325,858 |
| — |
| ||||
— |
| 598,800 |
| 135,412 |
| 734,212 |
|
|
| Wells Fargo & Co. |
| — |
| 17,652,624 |
| 3,991,949 |
| 21,644,573 |
| — |
| ||||
|
|
|
|
|
|
|
|
|
|
|
| 13,610,361 |
| 87,038,872 |
| 6,072,531 |
| 106,721,764 | cs |
|
| ||||
|
|
|
|
|
|
|
|
|
| Beverages: 2.8% |
|
|
|
|
|
|
|
|
|
|
| ||||
— |
| 368,200 |
| 83,264 |
| 451,464 |
|
|
| Coca-Cola Co. |
| — |
| 16,668,414 |
| 3,769,380 |
| 20,437,794 |
| — |
| ||||
342,242 |
| — |
| (342,242 | ) | — |
| @ |
| Constellation Brands, Inc. |
| 5,397,156 |
| — |
| (5,397,156 | ) | — |
| 5,397,156 |
| ||||
207,300 |
| — |
| (207,300 | ) | — |
| @ |
| Dr Pepper Snapple Group, Inc. |
| 3,368,625 |
| — |
| (3,368,625 | ) | — |
| 3,368,625 |
| ||||
— |
| 251,400 |
| 56,851 |
| 308,251 |
|
|
| PepsiCo, Inc. |
| — |
| 13,769,178 |
| 3,113,750 |
| 16,882,928 |
| — |
| ||||
|
|
|
|
|
|
|
|
|
|
|
| 8,765,781 |
| 30,437,592 |
| (1,882,651 | ) | 37,320,722 | cs |
|
| ||||
|
|
|
|
|
|
|
|
|
| Biotechnology: 3.0% |
|
|
|
|
|
|
|
|
|
|
| ||||
— |
| 172,550 |
| 39,020 |
| 211,570 |
| @ |
| Amgen, Inc. |
| — |
| 9,964,763 |
| 2,253,423 |
| 12,218,186 |
| — |
| ||||
— |
| 46,100 |
| 10,425 |
| 56,525 |
| @ |
| Biogen Idec, Inc. |
| — |
| 2,195,743 |
| 496,543 |
| 2,692,286 |
| — |
| ||||
— |
| 69,300 |
| 15,671 |
| 84,971 |
| @ |
| Celgene Corp. |
| — |
| 3,830,904 |
| 866,317 |
| 4,697,221 |
| — |
| ||||
— |
| 73,700 |
| 16,666 |
| 90,366 |
| @ |
| Genentech, Inc. |
| — |
| 6,110,467 |
| 1,381,816 |
| 7,492,283 |
| — |
| ||||
— |
| 42,350 |
| 9,577 |
| 51,927 |
| @ |
| Genzyme Corp. |
| — |
| 2,810,770 |
| 635,625 |
| 3,446,395 |
| — |
| ||||
— |
| 146,250 |
| 33,073 |
| 179,323 |
| @ |
| Gilead Sciences, Inc. |
| — |
| 7,479,225 |
| 1,691,345 |
| 9,170,570 |
| — |
| ||||
|
|
|
|
|
|
|
|
|
|
|
| — |
| 32,391,872 |
| 7,325,069 |
| 39,716,941 | cs |
|
| ||||
|
|
|
|
|
|
|
|
|
| Chemicals: 1.6% |
|
|
|
|
|
|
|
|
|
|
| ||||
— |
| 33,400 |
| 7,553 |
| 40,953 |
| S |
| Air Products & Chemicals, Inc. |
| — |
| 1,679,018 |
| 379,692 |
| 2,058,710 |
| — |
| ||||
— |
| 147,600 |
| 33,378 |
| 180,978 |
|
|
| Dow Chemical Co. |
| — |
| 2,227,284 |
| 503,676 |
| 2,730,960 |
| — |
| ||||
— |
| 142,800 |
| 32,293 |
| 175,093 |
|
|
| EI Du Pont de Nemours & Co. |
| — |
| 3,612,840 |
| 817,004 |
| 4,429,844 |
| — |
| ||||
— |
| 87,050 |
| 19,685 |
| 106,735 |
|
|
| Monsanto Co. |
| — |
| 6,123,968 |
| 1,384,869 |
| 7,508,837 |
| — |
| ||||
— |
| 24,700 |
| 5,586 |
| 30,286 |
|
|
| Mosaic Co. |
| — |
| 854,620 |
| 193,263 |
| 1,047,883 |
| — |
| ||||
— |
| 49,700 |
| 11,239 |
| 60,939 |
|
|
| Praxair, Inc. |
| — |
| 2,950,192 |
| 667,154 |
| 3,617,346 |
| — |
| ||||
|
|
|
|
|
|
|
|
|
|
|
| — |
| 17,447,922 |
| 3,945,658 |
| 21,393,580 | cs |
|
| ||||
|
|
|
|
|
|
|
|
|
| Coal: 0.1% |
|
|
|
|
|
|
|
|
|
|
|
112,800 |
| 43,000 |
| (103,076 | ) | 52,724 |
|
|
| Peabody Energy Corp. |
| 2,566,200 |
| 978,250 |
| (2,344,979 | ) | 1,199,471 |
| 2,566,200 |
|
107,400 |
| — |
| (107,400 | ) | — |
|
|
| Walter Industries, Inc. |
| 1,880,574 |
| — |
| (1,880,574 | ) | — |
| 1,880,574 |
|
|
|
|
|
|
|
|
|
|
|
|
| 4,446,774 |
| 978,250 |
| (4,225,553 | ) | 1,199,471 | cs |
|
|
|
|
|
|
|
|
|
|
|
| Commercial Services: 1.1% |
|
|
|
|
| — |
| — |
|
|
|
— |
| 82,100 |
| 18,566 |
| 100,666 |
|
|
| Automatic Data Processing, Inc. |
| — |
| 3,229,814 |
| 730,387 |
| 3,960,201 |
| — |
|
131,650 |
| — |
| (131,650 | ) | — |
|
|
| Lender Processing Services, Inc. |
| 3,877,093 |
| — |
| (3,877,093 | ) | — |
| 3,877,093 |
|
— |
| 11,600 |
| 2,623 |
| 14,223 |
|
|
| Mastercard, Inc. |
| — |
| 1,657,988 |
| 374,936 |
| 2,032,924 |
| — |
|
— |
| 43,850 |
| 9,916 |
| 53,766 |
|
|
| McKesson Corp. |
| — |
| 1,698,311 |
| 384,055 |
| 2,082,366 |
| — |
|
276,200 |
| — |
| (276,200 | ) | — |
|
|
| Moody’s Corp. |
| 5,548,858 |
| — |
| (5,548,858 | ) | — |
| 5,548,858 |
|
— |
| 70,900 |
| 16,033 |
| 86,933 |
|
|
| Visa, Inc. |
| — |
| 3,718,705 |
| 840,945 |
| 4,559,650 |
| — |
|
— |
| 117,200 |
| 26,503 |
| 143,703 |
|
|
| Western Union Co. |
| — |
| 1,680,648 |
| 380,060 |
| 2,060,708 |
| — |
|
|
|
|
|
|
|
|
|
|
|
|
| 9,425,951 |
| 11,985,466 |
| (6,715,568 | ) | 14,695,849 | cs |
|
|
|
|
|
|
|
|
|
|
|
| Computers: 4.9% |
|
|
|
|
|
|
|
|
|
|
|
— |
| 94,750 |
| 21,427 |
| 116,177 |
| @@ |
| Accenture Ltd. |
| — |
| 3,106,853 |
| 702,581 |
| 3,809,434 |
| — |
|
105,100 |
| — |
| (105,100 | ) | — |
| @ |
| Affiliated Computer Services, Inc. |
| 4,829,345 |
| — |
| (4,829,345 | ) | — |
| 4,829,345 |
|
— |
| 139,750 |
| 31,603 |
| 171,353 |
| @ |
| Apple, Inc. |
| — |
| 11,927,663 |
| 2,697,311 |
| 14,624,974 |
| — |
|
— |
| 287,800 |
| 65,083 |
| 352,883 |
| @ |
| Dell, Inc. |
| — |
| 2,947,072 |
| 666,448 |
| 3,613,520 |
| — |
|
— |
| 327,800 |
| 74,128 |
| 401,928 |
| @ |
| EMC Corp. |
| — |
| 3,432,066 |
| 776,124 |
| 4,208,190 |
| — |
|
— |
| 390,850 |
| 88,386 |
| 479,236 |
|
|
| Hewlett-Packard Co. |
| — |
| 14,183,947 |
| 3,207,545 |
| 17,391,492 |
| — |
|
— |
| 217,850 |
| 49,264 |
| 267,114 |
|
|
| International Business Machines Corp. |
| — |
| 18,334,256 |
| 4,146,092 |
| 22,480,348 |
| — |
|
|
|
|
|
|
|
|
|
|
|
|
| 4,829,345 |
| 53,931,857 |
| 7,366,756 |
| 66,127,958 | cs |
|
|
|
|
|
|
|
|
|
|
|
| Cosmetics/Personal Care: 3.2% |
|
|
|
|
|
|
|
|
|
|
|
— |
| 80,750 |
| 18,261 |
| 99,011 |
|
|
| Colgate-Palmolive Co. |
| — |
| 5,534,605 |
| 1,251,591 |
| 6,786,196 |
| — |
|
— |
| 478,100 |
| 108,117 |
| 586,217 |
|
|
| Procter & Gamble Co. |
| — |
| 29,556,142 |
| 6,683,803 |
| 36,239,945 |
| — |
|
|
|
|
|
|
|
|
|
|
|
|
| — |
| 35,090,747 |
| 7,935,394 |
| 43,026,141 | cs |
|
|
|
|
|
|
|
|
|
|
|
| Diversified Financial Services: 1.3% |
|
|
|
|
|
|
|
|
|
|
|
203,300 |
| 159,800 |
| (167,163 | ) | 195,937 |
|
|
| American Express Co. |
| 3,771,215 |
| 2,964,290 |
| (3,100,873 | ) | 3,634,632 |
| 3,771,215 |
|
— |
| 2,900 |
| 656 |
| 3,556 |
| S |
| Blackrock, Inc. |
| — |
| 389,035 |
| 87,976 |
| 477,011 |
| — |
|
— |
| 148,150 |
| 33,503 |
| 181,653 |
|
|
| Charles Schwab Corp. |
| — |
| 2,395,586 |
| 541,736 |
| 2,937,322 |
| — |
|
— |
| 10,700 |
| 2,420 |
| 13,120 |
|
|
| CME Group, Inc. |
| — |
| 2,226,777 |
| 503,561 |
| 2,730,338 |
| — |
|
— |
| 102,550 |
| 23,190 |
| 125,740 |
| ## |
| Federal Home Loan Mortgage Corporation |
| — |
| 74,862 |
| 16,929 |
| 91,791 |
| — |
|
— |
| 177,150 |
| 40,061 |
| 217,211 |
| ## |
| Federal National Mortgage Association |
| — |
| 134,634 |
| 30,446 |
| 165,080 |
| — |
|
— |
| 24,450 |
| 5,529 |
| 29,979 |
|
|
| Franklin Resources, Inc. |
| — |
| 1,559,421 |
| 352,646 |
| 1,912,067 |
| — |
|
405,300 |
| — |
| (405,300 | ) | — |
|
|
| Invesco Ltd. |
| 5,852,532 |
| — |
| (5,852,532 | ) | — |
| 5,852,532 |
|
— |
| 242,450 |
| 54,827 |
| 297,277 |
|
|
| Merrill Lynch & Co., Inc. |
| — |
| 2,822,118 |
| 638,191 |
| 3,460,309 |
| — |
|
— |
| 42,050 |
| 9,509 |
| 51,559 |
|
|
| NYSE Euronext |
| — |
| 1,151,329 |
| 260,361 |
| 1,411,690 |
| — |
|
|
|
|
|
|
|
|
|
|
|
|
| 9,623,747 |
| 13,718,052 |
| (6,521,559 | ) | 16,820,240 | cs |
|
|
|
|
|
|
|
|
|
|
|
| Electric: 2.5% |
|
|
|
|
|
|
|
|
|
|
|
— |
| 91,550 |
| 20,703 |
| 112,253 |
|
|
| Dominion Resources, Inc. |
| — |
| 3,281,152 |
| 741,997 |
| 4,023,149 |
| — |
|
— |
| 200,450 |
| 45,330 |
| 245,780 |
|
|
| Duke Energy Corp. |
| — |
| 3,008,755 |
| 680,397 |
| 3,689,152 |
| — |
|
— |
| 30,450 |
| 6,886 |
| 37,336 |
|
|
| Entergy Corp. |
| — |
| 2,531,309 |
| 572,428 |
| 3,103,737 |
| — |
|
— |
| 103,800 |
| 23,473 |
| 127,273 |
|
|
| Exelon Corp. |
| — |
| 5,772,318 |
| 1,305,347 |
| 7,077,665 |
| — |
|
78,900 |
| 48,350 |
| (67,966 | ) | 59,284 |
|
|
| FirstEnergy Corp. |
| 3,832,962 |
| 2,348,843 |
| (3,301,797 | ) | 2,880,008 |
| 3,832,962 |
|
— |
| 64,450 |
| 14,575 |
| 79,025 |
|
|
| FPL Group, Inc. |
| — |
| 3,243,769 |
| 733,543 |
| 3,977,312 |
| — |
|
217,000 |
| — |
| (217,000 | ) | — |
| @ |
| NRG Energy, Inc. |
| 5,062,610 |
| — |
| (5,062,610 | ) | — |
| 5,062,610 |
|
— |
| 80,750 |
| 18,261 |
| 99,011 |
|
|
| Public Service Enterprise Group, Inc. |
| — |
| 2,355,478 |
| 532,666 |
| 2,888,144 |
| — |
|
— |
| 121,500 |
| 27,476 |
| 148,976 |
|
|
| Southern Co. |
| — |
| 4,495,500 |
| 1,016,608 |
| 5,512,108 |
| — |
|
|
|
|
|
|
|
|
|
|
|
|
| 8,895,572 |
| 27,037,124 |
| (2,781,421 | ) | 33,151,275 | cs |
|
|
|
|
|
|
|
|
|
|
|
| Electrical Components & Equipment: 0.4% |
|
|
|
|
|
|
|
|
|
|
|
— |
| 123,850 |
| 28,007 |
| 151,857 |
|
|
| Emerson Electric Co. |
| — |
| 4,534,149 |
| 1,025,348 |
| 5,559,497 |
| — |
|
102,500 |
| — |
| (102,500 | ) | — |
| @ |
| Energizer Holdings, Inc. |
| 5,549,350 |
| — |
| (5,549,350 | ) | — |
| 5,549,350 |
|
|
|
|
|
|
|
|
|
|
|
|
| 5,549,350 |
| 4,534,149 |
| (4,524,002 | ) | 5,559,497 | cs |
|
|
|
|
|
|
|
|
|
|
|
| Electronics: 0.3% |
|
|
|
|
|
|
|
|
|
|
|
— |
| 66,400 |
| 15,016 |
| 81,416 |
| @ |
| Thermo Electron Corp. |
| — |
| 2,262,248 |
| 511,583 |
| 2,773,831 |
| — |
|
— |
| 75,800 |
| 17,141 |
| 92,941 |
| @@ |
| Tyco Electronics Ltd. |
| — |
| 1,228,718 |
| 277,861 |
| 1,506,579 |
| — |
|
|
|
|
|
|
|
|
|
|
|
|
| — |
| 3,490,966 |
| 789,444 |
| 4,280,410 | cs |
|
|
|
|
|
|
|
|
|
|
|
| Energy - Alternate Sources: 0.1% |
|
|
|
|
|
|
|
|
|
|
|
— |
| 7,100 |
| 1,606 |
| 8,706 |
| @ |
| First Solar, Inc. |
| — |
| 979,516 |
| 221,507 |
| 1,201,023 |
| — |
|
|
|
|
|
|
|
|
|
|
|
|
| — |
| 979,516 |
| 221,507 |
| 1,201,023 | cs |
|
|
|
|
|
|
|
|
|
|
|
| Engineering & Construction: 0.0% |
|
|
|
|
|
|
|
|
|
|
|
252,300 |
| — |
| (252,300 | ) | — |
| @@ |
| ABB Ltd. ADR |
| 3,787,023 |
| — |
| (3,787,023 | ) | — |
| 3,787,023 |
|
344,500 |
| — |
| (344,500 | ) | — |
| @@, L |
| Chicago Bridge & Iron Co. NV |
| 3,462,225 |
| — |
| (3,462,225 | ) | — |
| 3,462,225 |
|
203,200 |
| — |
| (203,200 | ) | — |
|
|
| KBR, Inc. |
| 3,088,640 |
| — |
| (3,088,640 | ) | — |
| 3,088,640 |
|
228,200 |
| — |
| (228,200 | ) | — |
| @ |
| McDermott International, Inc. |
| 2,254,616 |
| — |
| (2,254,616 | ) | — |
| 2,254,616 |
|
|
|
|
|
|
|
|
|
|
|
|
| 12,592,504 |
| — |
| (12,592,504 | ) | — | cs |
|
|
|
|
|
|
|
|
|
|
|
| Environmental Control: 0.2% |
|
|
|
|
|
|
|
|
|
|
|
— |
| 77,750 |
| 17,582 |
| 95,332 |
|
|
| Waste Management, Inc. |
| — |
| 2,576,635 |
| 582,678 |
| 3,159,313 |
| — |
|
|
|
|
|
|
|
|
|
|
|
|
| — |
| 2,576,635 |
| 582,678 |
| 3,159,313 | cs |
|
|
|
|
|
|
|
|
|
|
|
| Food: 1.5% |
|
|
|
|
|
|
|
|
|
|
|
— |
| 53,200 |
| 12,031 |
| 65,231 |
|
|
| General Mills, Inc. |
| — |
| 3,231,900 |
| 730,859 |
| 3,962,759 |
| — |
|
— |
| 39,650 |
| 8,966 |
| 48,616 |
|
|
| Kellogg Co. |
| — |
| 1,738,653 |
| 393,177 |
| 2,131,830 |
| — |
|
— |
| 233,100 |
| 52,713 |
| 285,813 |
|
|
| Kraft Foods, Inc. |
| — |
| 6,258,735 |
| 1,415,345 |
| 7,674,080 |
| — |
|
— |
| 104,700 |
| 23,677 |
| 128,377 |
|
|
| Kroger Co. |
| — |
| 2,765,127 |
| 625,303 |
| 3,390,430 |
| — |
|
— |
| 95,150 |
| 21,517 |
| 116,667 |
|
|
| Sysco Corp. |
| — |
| 2,182,741 |
| 493,603 |
| 2,676,344 |
| — |
|
|
|
|
|
|
|
|
|
|
|
|
| — |
| 16,177,156 |
| 3,658,287 |
| 19,835,443 | cs |
|
|
|
|
|
|
|
|
|
|
|
| Healthcare - Products: 4.3% |
|
|
|
|
|
|
|
|
|
|
|
— |
| 99,350 |
| 22,467 |
| 121,817 |
|
|
| Baxter International, Inc. |
| — |
| 5,324,167 |
| 1,204,002 |
| 6,528,169 |
| — |
|
— |
| 38,800 |
| 8,774 |
| 47,574 |
|
|
| Becton Dickinson & Co. |
| — |
| 2,653,532 |
| 600,067 |
| 3,253,599 |
| — |
|
— |
| 237,350 |
| 53,674 |
| 291,024 |
| @ |
| Boston Scientific Corp. |
| — |
| 1,837,089 |
| 415,438 |
| 2,252,527 |
| — |
|
37,300 |
| 79,100 |
| (19,412 | ) | 96,988 |
| @@ |
| Covidien Ltd. |
| 1,351,752 |
| 2,866,584 |
| (703,505 | ) | 3,514,831 |
| 1,351,752 |
|
— |
| 446,650 |
| 101,005 |
| 547,655 |
|
|
| Johnson & Johnson |
| — |
| 26,723,070 |
| 6,043,131 |
| 32,766,201 |
| — |
|
— |
| 177,850 |
| 40,219 |
| 218,069 |
|
|
| Medtronic, Inc. |
| — |
| 5,588,047 |
| 1,263,676 |
| 6,851,723 |
| — |
|
— |
| 48,650 |
| 11,002 |
| 59,652 |
|
|
| Stryker Corp. |
| — |
| 1,943,568 |
| 439,517 |
| 2,383,085 |
| — |
|
43,600 |
| 36,650 |
| (35,312 | ) | 44,938 |
| @ |
| Zimmer Holdings, Inc. |
| 1,762,312 |
| 1,481,393 |
| (1,427,311 | ) | 1,816,394 |
| 1,762,312 |
|
|
|
|
|
|
|
|
|
|
|
|
| 3,114,064 |
| 48,417,450 |
| 7,835,015 |
| 59,366,529 | cs |
|
|
|
|
|
|
|
|
|
|
|
| Healthcare - Services: 1.0% |
|
|
|
|
|
|
|
|
|
|
|
204,600 |
| 76,850 |
| (187,221 | ) | 94,229 |
|
|
| Aetna, Inc. |
| 5,831,100 |
| 2,190,225 |
| (5,335,804 | ) | 2,685,521 |
| 5,831,100 |
|
— |
| 194,750 |
| 44,041 |
| 238,791 |
|
|
| UnitedHealth Group, Inc. |
| — |
| 5,180,350 |
| 1,171,480 |
| 6,351,830 |
| — |
|
117,300 |
| 83,350 |
| (98,451 | ) | 102,199 |
| @ |
| WellPoint, Inc. |
| 4,941,849 |
| 3,511,536 |
| (4,147,753 | ) | 4,305,632 |
| 4,941,849 |
|
|
|
|
|
|
|
|
|
|
|
|
| 10,772,949 |
| 10,882,111 |
| (8,312,077 | ) | 13,342,983 | cs |
|
|
|
|
|
|
|
|
|
|
|
| Home Builders: 0.0% |
|
|
|
|
|
|
|
|
|
|
|
8,700 |
| — |
| (8,700 | ) | — |
| @ |
| NVR, Inc. |
| 3,969,375 |
| — |
| (3,969,375 | ) | — |
| 3,969,375 |
|
|
|
|
|
|
|
|
|
|
|
|
| 3,969,375 |
| — |
| (3,969,375 | ) | — | cs |
|
|
|
|
|
|
|
|
|
|
|
| Household Products/Wares: 0.3% |
|
|
|
|
|
|
|
|
|
|
|
— |
| 66,400 |
| 15,016 |
| 81,416 |
|
|
| Kimberly-Clark Corp. |
| — |
| 3,501,936 |
| 791,925 |
| 4,293,861 |
| — |
|
|
|
|
|
|
|
|
|
|
|
|
| — |
| 3,501,936 |
| 791,925 |
| 4,293,861 | cs |
|
|
|
|
|
|
|
|
|
|
|
| Insurance: 1.9% |
|
|
|
|
|
|
|
|
|
|
|
— |
| 75,400 |
| 17,051 |
| 92,451 |
|
|
| Aflac, Inc. |
| — |
| 3,456,336 |
| 781,613 |
| 4,237,949 |
| — |
|
— |
| 87,200 |
| 19,719 |
| 106,919 |
|
|
| Allstate Corp. |
| — |
| 2,856,672 |
| 646,005 |
| 3,502,677 |
| — |
|
— |
| 368,200 |
| 83,264 |
| 451,464 |
|
|
| American International Group, Inc. |
| — |
| 578,074 |
| 130,725 |
| 708,799 |
| — |
|
158,300 |
| — |
| (158,300 | ) | — |
|
|
| Assurant, Inc. |
| 4,749,000 |
| — |
| (4,749,000 | ) | — |
| 4,749,000 |
|
2,500 |
| — |
| (2,500 | ) | — |
| @ |
| Berkshire Hathaway, Inc. - Class B |
| 8,035,000 |
| — |
| (8,035,000 | ) | — |
| 8,035,000 |
|
— |
| 58,050 |
| 13,127 |
| 71,177 |
|
|
| Chubb Corp. |
| — |
| 2,960,550 |
| 669,496 |
| 3,630,046 |
| — |
|
— |
| 50,000 |
| 11,307 |
| 61,307 |
|
|
| Hartford Financial Services Group, Inc. |
| — |
| 821,000 |
| 185,660 |
| 1,006,660 |
| — |
|
— |
| 49,772 |
| 11,255 |
| 61,027 |
|
|
| Loews Corp. |
| — |
| 1,406,059 |
| 317,965 |
| 1,724,024 |
| — |
|
87,900 |
| 79,750 |
| (69,865 | ) | 97,785 |
|
|
| Metlife, Inc. |
| 3,064,194 |
| 2,780,085 |
| (2,435,508 | ) | 3,408,771 |
| 3,064,194 |
|
— |
| 68,850 |
| 15,570 |
| 84,420 |
|
|
| Prudential Financial, Inc. |
| — |
| 2,083,401 |
| 471,138 |
| 2,554,539 |
| — |
|
— |
| 95,750 |
| 21,653 |
| 117,403 |
|
|
| Travelers Cos., Inc. |
| — |
| 4,327,900 |
| 978,707 |
| 5,306,607 |
| — |
|
|
|
|
|
|
|
|
|
|
|
|
| 15,848,194 |
| 21,270,077 |
| (11,038,199 | ) | 26,080,072 | cs |
|
|
|
|
|
|
|
|
|
|
|
| Internet: 1.9% |
|
|
|
|
|
|
|
|
|
|
|
— |
| 49,850 |
| 11,273 |
| 61,123 |
| @ |
| Amazon.com, Inc. |
| — |
| 2,556,308 |
| 578,081 |
| 3,134,389 |
| — |
|
— |
| 176,000 |
| 39,801 |
| 215,801 |
| @ |
| eBay, Inc. |
| — |
| 2,456,960 |
| 555,615 |
| 3,012,575 |
| — |
|
— |
| 37,650 |
| 8,514 |
| 46,164 |
| @ |
| Google, Inc. - Class A |
| — |
| 11,583,023 |
| 2,619,375 |
| 14,202,398 |
| — |
|
185,500 |
| 133,200 |
| (155,378 | ) | 163,322 |
| @ |
| Symantec Corp. |
| 2,507,960 |
| 1,800,864 |
| (2,100,714 | ) | 2,208,110 |
| 2,507,960 |
|
— |
| 218,600 |
| 49,434 |
| 268,034 |
| @ |
| Yahoo!, Inc. |
| — |
| 2,666,920 |
| 603,095 |
| 3,270,015 |
| — |
|
|
|
|
|
|
|
|
|
|
|
|
| 2,507,960 |
| 21,064,075 |
| 2,255,452 |
| 25,827,487 | cs |
|
|
|
|
|
|
|
|
|
|
|
| Iron/Steel: 0.3% |
|
|
|
|
|
|
|
|
|
|
|
67,400 |
| — |
| (67,400 | ) | — |
|
|
| Cliffs Natural Resources, Inc. |
| 1,726,114 |
| — |
| (1,726,114 | ) | — |
| 1,726,114 |
|
— |
| 50,150 |
| 11,341 |
| 61,491 |
|
|
| Nucor Corp. |
| — |
| 2,316,930 |
| 523,948 |
| 2,840,878 |
| — |
|
62,500 |
| 18,800 |
| (58,249 | ) | 23,051 |
|
|
| United States Steel Corp. |
| 2,325,000 |
| 699,360 |
| (2,166,847 | ) | 857,513 |
| 2,325,000 |
|
|
|
|
|
|
|
|
|
|
|
|
| 4,051,114 |
| 3,016,290 |
| (3,369,013 | ) | 3,698,391 | cs |
|
|
|
|
|
|
|
|
|
|
|
| Leisure Time: 0.1% |
|
|
|
|
|
|
|
|
|
|
|
— |
| 69,150 |
| 15,638 |
| 84,788 |
|
|
| Carnival Corp. |
| — |
| 1,681,728 |
| 380,304 |
| 2,062,032 |
| — |
|
52,400 |
| — |
| (52,400 | ) | — |
|
|
| Harley-Davidson, Inc. |
| 889,228 |
| — |
| (889,228 | ) | — |
| 889,228 |
|
|
|
|
|
|
|
|
|
|
|
|
| 889,228 |
| 1,681,728 |
| (508,924 | ) | 2,062,032 | cs |
|
|
|
|
|
|
|
|
|
|
|
| Lodging: 0.0% |
|
|
|
|
|
|
|
|
|
|
|
— |
| 16,700 |
| 3,777 |
| 20,477 |
| @ |
| Las Vegas Sands Corp. |
| — |
| 99,031 |
| 22,395 |
| 121,426 |
| — |
|
|
|
|
|
|
|
|
|
|
|
|
| — |
| 99,031 |
| 22,395 |
| 121,426 | cs |
|
|
|
|
|
|
|
|
|
|
|
| Machinery - Construction & Mining: 0.4% |
|
|
|
|
|
|
|
|
|
|
|
— |
| 97,700 |
| 22,094 |
| 119,794 |
|
|
| Caterpillar, Inc. |
| — |
| 4,364,259 |
| 986,930 |
| 5,351,189 |
| — |
|
266,800 |
| — |
| (266,800 | ) | — |
| @ |
| Terex Corp. |
| 4,620,976 |
| — |
| (4,620,976 | ) | — |
| 4,620,976 |
|
|
|
|
|
|
|
|
|
|
|
|
| 4,620,976 |
| 4,364,259 |
| (3,634,046 | ) | 5,351,189 | cs |
|
|
|
|
|
|
|
|
|
|
|
| Machinery - Diversified: 0.2% |
|
|
|
|
|
|
|
|
|
|
|
— |
| 68,300 |
| 15,445 |
| 83,745 |
|
|
| Deere & Co. |
| — |
| 2,617,256 |
| 591,864 |
| 3,209,120 |
| — |
|
|
|
|
|
|
|
|
|
|
|
|
| — |
| 2,617,256 |
| 591,864 |
| 3,209,120 | cs |
|
|
|
|
|
|
|
|
|
|
|
| Media: 2.4% |
|
|
|
|
|
|
|
|
|
|
|
47,000 |
| — |
| (47,000 | ) | — |
|
|
| Cablevision Systems Corp. |
| 791,480 |
| — |
| (791,480 | ) | — |
| 791,480 |
|
— |
| 444,550 |
| 100,530 |
| 545,080 |
|
|
| Comcast Corp. - Class A |
| — |
| 7,504,004 |
| 1,696,949 |
| 9,200,953 |
| — |
|
— |
| 94,400 |
| 21,348 |
| 115,748 |
| @ |
| DIRECTV Group, Inc. |
| — |
| 2,162,704 |
| 489,072 |
| 2,651,776 |
| — |
|
215,400 |
| — |
| (215,400 | ) | — |
|
|
| McGraw-Hill Cos., Inc. |
| 4,995,126 |
| — |
| (4,995,126 | ) | — |
| 4,995,126 |
|
— |
| 367,450 |
| 83,095 |
| 450,545 |
|
|
| News Corp. - Class A |
| — |
| 3,340,121 |
| 755,332 |
| 4,095,453 |
| — |
|
— |
| 24,650 |
| 5,574 |
| 30,224 |
| @ |
| Time Warner Cable, Inc. |
| — |
| 528,743 |
| 119,569 |
| 648,312 |
| — |
|
— |
| 567,450 |
| 128,323 |
| 695,773 |
|
|
| Time Warner, Inc. |
| — |
| 5,708,547 |
| 1,290,926 |
| 6,999,473 |
| — |
|
— |
| 88,800 |
| 20,081 |
| 108,881 |
| @ |
| Viacom - Class B |
| — |
| 1,692,528 |
| 382,747 |
| 2,075,275 |
| — |
|
— |
| 302,100 |
| 68,317 |
| 370,417 |
|
|
| Walt Disney Co. |
| — |
| 6,854,649 |
| 1,550,104 |
| 8,404,753 |
| — |
|
|
|
|
|
|
|
|
|
|
|
|
| 5,786,606 |
| 27,791,296 |
| 498,093 |
| 34,075,995 | cs |
|
|
|
|
|
|
|
|
|
|
|
| Metal Fabricate/Hardware: 0.0% |
|
|
|
|
|
|
|
|
|
|
|
225,900 |
| — |
| (225,900 | ) | — |
| @@ |
| Sterlite Industries India Ltd. ADR |
| 1,246,968 |
| — |
| (1,246,968 | ) | — |
| 1,246,968 |
|
|
|
|
|
|
|
|
|
|
|
|
| 1,246,968 |
| — |
| (1,246,968 | ) | — | cs |
|
|
|
|
|
|
|
|
|
|
|
| Mining: 0.6% |
|
|
|
|
|
|
|
|
|
|
|
— |
| 129,300 |
| 29,240 |
| 158,540 |
|
|
| Alcoa, Inc. |
| — |
| 1,455,918 |
| 329,240 |
| 1,785,158 |
| — |
|
149,600 |
| 60,700 |
| (135,873 | ) | 74,427 |
|
|
| Freeport-McMoRan Copper & Gold, Inc. |
| 3,656,224 |
| 1,483,508 |
| (3,320,745 | ) | 1,818,987 |
| 3,656,224 |
|
— |
| 69,300 |
| 15,671 |
| 84,971 |
|
|
| Newmont Mining Corp. |
| — |
| 2,820,510 |
| 637,828 |
| 3,458,338 |
| — |
|
— |
| 34,900 |
| 7,892 |
| 42,792 |
| L |
| Southern Copper Corp. |
| — |
| 560,494 |
| 126,750 |
| 687,244 |
| — |
|
343,300 |
| — |
| (343,300 | ) | — |
| @@ |
| Teck Cominco Ltd. - Class B |
| 1,689,036 |
| — |
| (1,689,036 | ) | — |
| 1,689,036 |
|
183,100 |
| — |
| (183,100 | ) | — |
| @@ |
| Xstrata PLC |
| 1,713,336 |
| — |
| (1,713,336 | ) | — |
| 1,713,336 |
|
|
|
|
|
|
|
|
|
|
|
|
| 7,058,596 |
| 6,320,430 |
| (5,629,299 | ) | 7,749,727 | cs |
|
|
|
|
|
|
|
|
|
|
|
| Miscellaneous Manufacturing: 4.0% |
|
|
|
|
|
|
|
|
|
|
|
— |
| 111,550 |
| 25,226 |
| 136,776 |
|
|
| 3M Co. |
| — |
| 6,418,587 |
| 1,451,494 |
| 7,870,081 |
| — |
|
— |
| 40,600 |
| 9,181 |
| 49,781 |
|
|
| Danaher Corp. |
| — |
| 2,298,366 |
| 519,750 |
| 2,818,116 |
| — |
|
— |
| 1,662,500 |
| 375,956 |
| 2,038,456 |
|
|
| General Electric Co. |
| — |
| 26,932,478 |
| 6,090,487 |
| 33,022,965 |
| — |
|
— |
| 117,600 |
| 26,594 |
| 144,194 |
|
|
| Honeywell International, Inc. |
| — |
| 3,860,808 |
| 873,080 |
| 4,733,888 |
| — |
|
— |
| 74,500 |
| 16,847 |
| 91,347 |
|
|
| Illinois Tool Works, Inc. |
| — |
| 2,611,225 |
| 590,500 |
| 3,201,725 |
| — |
|
— |
| 76,200 |
| 17,232 |
| 93,432 |
| @@ |
| Tyco International Ltd. |
| — |
| 1,645,920 |
| 372,207 |
| 2,018,127 |
| — |
|
|
|
|
|
|
|
|
|
|
|
|
| — |
| 43,767,384 |
| 9,897,518 |
| 53,664,902 | cs |
|
|
|
|
|
|
|
|
|
|
|
| Oil & Gas: 12.6% |
|
|
|
|
|
|
|
|
|
|
|
— |
| 74,300 |
| 16,802 |
| 91,102 |
|
|
| Anadarko Petroleum Corp. |
| — |
| 2,864,265 |
| 647,722 |
| 3,511,987 |
| — |
|
— |
| 52,750 |
| 11,929 |
| 64,679 |
| S |
| Apache Corp. |
| — |
| 3,931,458 |
| 889,056 |
| 4,820,514 |
| — |
|
136,400 |
| — |
| (136,400 | ) | — |
| @@ |
| Canadian Natural Resources Ltd. |
| 5,453,272 |
| — |
| (5,453,272 | ) | — |
| 5,453,272 |
|
— |
| 91,500 |
| 20,692 |
| 112,192 |
|
|
| Chesapeake Energy Corp. |
| — |
| 1,479,555 |
| 334,585 |
| 1,814,140 |
| — |
|
— |
| 328,150 |
| 74,208 |
| 402,358 |
|
|
| Chevron Corp. |
| — |
| 24,273,256 |
| 5,489,133 |
| 29,762,389 |
| — |
|
— |
| 244,400 |
| 55,268 |
| 299,668 |
|
|
| ConocoPhillips |
| — |
| 12,659,920 |
| 2,862,903 |
| 15,522,823 |
| — |
|
231,500 |
| — |
| (231,500 | ) | — |
| @ |
| Denbury Resources, Inc. |
| 2,527,980 |
| — |
| (2,527,980 | ) | — |
| 2,527,980 |
|
— |
| 70,650 |
| 15,977 |
| 86,627 |
|
|
| Devon Energy Corp. |
| — |
| 4,642,412 |
| 1,049,831 |
| 5,692,243 |
| — |
|
62,700 |
| 39,400 |
| (53,790 | ) | 48,310 |
|
|
| EOG Resources, Inc. |
| 4,174,566 |
| 2,623,252 |
| (3,581,346 | ) | 3,216,472 |
| 4,174,566 |
|
14,400 |
| 834,800 |
| 174,381 |
| 1,023,581 |
|
|
| ExxonMobil Corp. |
| 1,149,552 |
| 66,642,084 |
| 13,920,830 |
| 81,712,466 |
| 1,149,552 |
|
— |
| 44,400 |
| 10,041 |
| 54,441 |
|
|
| Hess Corp. |
| — |
| 2,381,616 |
| 538,577 |
| 2,920,193 |
| — |
|
— |
| 112,350 |
| 25,407 |
| 137,757 |
|
|
| Marathon Oil Corp. |
| — |
| 3,073,896 |
| 695,128 |
| 3,769,024 |
| — |
|
127,100 |
| — |
| (127,100 | ) | — |
|
|
| Noble Corp. |
| 2,807,639 |
| — |
| (2,807,639 | ) | — |
| 2,807,639 |
|
— |
| 130,150 |
| 29,432 |
| 159,582 |
|
|
| Occidental Petroleum Corp. |
| — |
| 7,807,699 |
| 1,765,626 |
| 9,573,325 |
| — |
|
231,900 |
| — |
| (231,900 | ) | — |
| @@ |
| Petroleo Brasileiro SA ADR |
| 5,679,231 |
| — |
| (5,679,231 | ) | — |
| 5,679,231 |
|
167,800 |
| — |
| (167,800 | ) | — |
| @ |
| Southwestern Energy Co. |
| 4,861,166 |
| — |
| (4,861,166 | ) | — |
| 4,861,166 |
|
154,660 |
| — |
| (154,660 | ) | — |
| @@ |
| Suncor Energy, Inc. |
| 3,015,870 |
| — |
| (3,015,870 | ) | — |
| 3,015,870 |
|
225,480 |
| — |
| (225,480 | ) | — |
| @@ |
| Talisman Energy, Inc. |
| 2,252,545 |
| — |
| (2,252,545 | ) | — |
| 2,252,545 |
|
— |
| 83,750 |
| 18,939 |
| 102,689 |
|
|
| Valero Energy Corp. |
| — |
| 1,812,350 |
| 409,843 |
| 2,222,193 |
| — |
|
92,650 |
| 87,450 |
| (72,874 | ) | 107,226 |
|
|
| XTO Energy, Inc. |
| 3,267,766 |
| 3,084,362 |
| (2,570,271 | ) | 3,781,857 |
| 3,267,766 |
|
|
|
|
|
|
|
|
|
|
|
|
| 35,189,587 |
| 137,276,125 |
| (4,146,086 | ) | 168,319,626 | cs |
|
|
|
|
|
|
|
|
|
|
|
| Oil & Gas Services: 1.4% |
|
|
|
|
|
|
|
|
|
|
|
— |
| 48,700 |
| 11,013 |
| 59,713 |
|
|
| Baker Hughes, Inc. |
| — |
| 1,561,809 |
| 353,186 |
| 1,914,995 |
| — |
|
192,400 |
| 138,200 |
| (161,148 | ) | 169,452 |
|
|
| Halliburton Co. |
| 3,497,832 |
| 2,512,476 |
| (2,929,663 | ) | 3,080,645 |
| 3,497,832 |
|
134,800 |
| 65,800 |
| (119,920 | ) | 80,680 |
| @ |
| National Oilwell Varco, Inc. |
| 3,294,512 |
| 1,608,152 |
| (2,930,846 | ) | 1,971,818 |
| 3,294,512 |
|
— |
| 189,000 |
| 42,740 |
| 231,740 |
|
|
| Schlumberger Ltd. |
| — |
| 8,000,370 |
| 1,809,197 |
| 9,809,567 |
| — |
|
— |
| 107,800 |
| 24,378 |
| 132,178 |
| @ |
| Weatherford International Ltd. |
| — |
| 1,166,396 |
| 263,768 |
| 1,430,164 |
| — |
|
|
|
|
|
|
|
|
|
|
|
|
| 6,792,344 |
| 14,849,203 |
| (3,434,358 | ) | 18,207,189 | cs |
|
|
|
|
|
|
|
|
|
|
|
| Pharmaceuticals: 6.8% |
|
|
|
|
|
|
|
|
|
|
|
— |
| 244,550 |
| 55,302 |
| 299,852 |
|
|
| Abbott Laboratories |
| — |
| 13,051,634 |
| 2,951,485 |
| 16,003,119 |
| — |
|
— |
| 313,850 |
| 70,974 |
| 384,824 |
|
|
| Bristol-Myers Squibb Co. |
| — |
| 7,297,013 |
| 1,650,140 |
| 8,947,153 |
| — |
|
81,900 |
| 56,450 |
| (69,134 | ) | 69,216 |
|
|
| Cardinal Health, Inc. |
| 2,823,093 |
| 1,945,832 |
| (2,383,064 | ) | 2,385,861 |
| 2,823,093 |
|
— |
| 158,500 |
| 35,843 |
| 194,343 |
|
|
| Eli Lilly & Co. |
| — |
| 6,382,795 |
| 1,443,400 |
| 7,826,195 |
| — |
|
— |
| 80,300 |
| 18,159 |
| 98,459 |
| @ |
| Medco Health Solutions, Inc. |
| — |
| 3,365,373 |
| 761,042 |
| 4,126,415 |
| — |
|
— |
| 340,400 |
| 76,978 |
| 417,378 |
|
|
| Merck & Co., Inc. |
| — |
| 10,348,160 |
| 2,340,124 |
| 12,688,284 |
| — |
|
278,500 |
| — |
| (278,500 | ) | — |
| @ |
| NBTY, Inc. |
| 4,358,525 |
| — |
| (4,358,525 | ) | — |
| 4,358,525 |
|
— |
| 1,072,500 |
| 242,534 |
| 1,315,034 |
|
|
| Pfizer, Inc. |
| — |
| 18,993,975 |
| 4,295,281 |
| 23,289,256 |
| — |
|
— |
| 257,050 |
| 58,129 |
| 315,179 |
|
|
| Schering-Plough Corp. |
| — |
| 4,377,562 |
| 989,938 |
| 5,367,500 |
| — |
|
141,600 |
| — |
| (141,600 | ) | — |
| @@ |
| Shire PLC ADR |
| 6,340,847 |
| — |
| (6,340,847 | ) | — |
| 6,340,847 |
|
— |
| 211,400 |
| 47,806 |
| 259,206 |
|
|
| Wyeth |
| — |
| 7,929,614 |
| 1,793,196 |
| 9,722,810 |
| — |
|
|
|
|
|
|
|
|
|
|
|
|
| 13,522,465 |
| 73,691,958 |
| 3,142,170 |
| 90,356,593 | cs |
|
|
|
|
|
|
|
|
|
|
|
| Pipelines: 0.1% |
|
|
|
|
|
|
|
|
|
|
|
— |
| 92,800 |
| 20,986 |
| 113,786 |
|
|
| Williams Cos., Inc. |
| — |
| 1,343,744 |
| 303,873 |
| 1,647,617 |
| — |
|
|
|
|
|
|
|
|
|
|
|
|
| — |
| 1,343,744 |
| 303,873 |
| 1,647,617 | cs |
|
|
|
|
|
|
|
|
|
|
|
| Retail: 5.9% |
|
|
|
|
|
|
|
|
|
|
|
140,700 |
| 53,150 |
| (128,681 | ) | 65,169 |
|
|
| Best Buy Co., Inc. |
| 3,955,077 |
| 1,494,047 |
| (3,617,215 | ) | 1,831,909 |
| 3,955,077 |
|
— |
| 68,850 |
| 15,570 |
| 84,420 |
|
|
| Costco Wholesale Corp. |
| — |
| 3,614,625 |
| 817,408 |
| 4,432,033 |
| — |
|
— |
| 226,650 |
| 51,254 |
| 277,904 |
|
|
| CVS Caremark Corp. |
| — |
| 6,513,921 |
| 1,473,052 |
| 7,986,973 |
| — |
|
— |
| 267,950 |
| 60,594 |
| 328,544 |
|
|
| Home Depot, Inc. |
| — |
| 6,168,209 |
| 1,394,873 |
| 7,563,082 |
| — |
|
200,600 |
| — |
| (200,600 | ) | — |
|
|
| JC Penney Co., Inc. |
| 3,951,820 |
| — |
| (3,951,820 | ) | — |
| 3,951,820 |
|
— |
| 231,750 |
| 52,408 |
| 284,158 |
|
|
| Lowe’s Cos., Inc. |
| — |
| 4,987,260 |
| 1,127,815 |
| 6,115,075 |
| — |
|
438,700 |
| — |
| (438,700 | ) | — |
|
|
| Macy’s, Inc. |
| 4,540,545 |
| — |
| (4,540,545 | ) | — |
| 4,540,545 |
| |||||
— |
| 179,650 |
| 40,626 |
| 220,276 |
|
|
| McDonald’s Corp. |
| — |
| 11,172,434 |
| 2,526,524 |
| 13,698,958 |
| — |
| |||||
— |
| 111,200 |
| 25,147 |
| 136,347 |
|
|
| Staples, Inc. |
| — |
| 1,992,704 |
| 450,628 |
| 2,443,332 |
| — |
| |||||
— |
| 125,100 |
| 28,290 |
| 153,390 |
|
|
| Target Corp. |
| — |
| 4,319,703 |
| 976,854 |
| 5,296,557 |
| — |
| |||||
— |
| 157,000 |
| 35,504 |
| 192,504 |
|
|
| Walgreen Co. |
| — |
| 3,873,190 |
| 875,880 |
| 4,749,070 |
| — |
| |||||
— |
| 355,800 |
| 80,460 |
| 436,260 |
|
|
| Wal-Mart Stores, Inc. |
| — |
| 19,946,148 |
| 4,510,604 |
| 24,456,752 |
| — |
| |||||
|
|
|
|
|
|
|
|
|
|
|
| 12,447,442 |
| 64,082,241 |
| 2,044,058 |
| 78,573,741 | cs |
|
| |||||
|
|
|
|
|
|
|
|
|
| Semiconductors: 1.7% |
|
|
|
|
|
|
|
|
|
|
| |||||
— |
| 214,600 |
| 48,529 |
| 263,129 |
|
|
| Applied Materials, Inc. |
| — |
| 2,173,898 |
| 491,603 |
| 2,665,501 |
| — |
| |||||
— |
| 908,000 |
| 205,334 |
| 1,113,334 |
|
|
| Intel Corp. |
| — |
| 13,311,280 |
| 3,010,201 |
| 16,321,481 |
| — |
| |||||
148,700 |
| — |
| (148,700 | ) | — |
| @ |
| International Rectifier Corp. |
| 2,007,450 |
| — |
| (2,007,450 | ) | — |
| 2,007,450 |
| |||||
— |
| 209,650 |
| 47,410 |
| 257,060 |
|
|
| Texas Instruments, Inc. |
| — |
| 3,253,768 |
| 735,804 |
| 3,989,572 |
| — |
| |||||
|
|
|
|
|
|
|
|
|
|
|
| 2,007,450 |
| 18,738,946 |
| 2,230,158 |
| 22,976,554 | cs |
|
| |||||
|
|
|
|
|
|
|
|
|
| Software: 3.4% |
|
|
|
|
|
|
|
|
|
|
| |||||
— |
| 84,450 |
| 19,097 |
| 103,547 |
| @ |
| Adobe Systems, Inc. |
| — |
| 1,797,941 |
| 406,585 |
| 2,204,526 |
| — |
| |||||
104,200 |
| — |
| (104,200 | ) | — |
| @, @@ |
| Check Point Software Technologies |
| 1,978,758 |
| — |
| (1,978,758 | ) | — |
| 1,978,758 |
| |||||
278,800 |
| — |
| (278,800 | ) | — |
|
|
| Fidelity National Information Services, Inc. |
| 4,536,076 |
| — |
| (4,536,076 | ) | — |
| 4,536,076 |
| |||||
174,480 |
| 1,272,650 |
| 113,316 |
| 1,560,446 |
| S |
| Microsoft Corp. |
| 3,391,891 |
| 24,740,316 |
| 2,202,862 |
| 30,335,069 |
| 3,391,891 |
| |||||
208,310 |
| 617,450 |
| (68,680 | ) | 757,080 |
| @ |
| Oracle Corp. |
| 3,693,336 |
| 10,947,389 |
| (1,217,703 | ) | 13,423,022 |
| 3,693,336 |
| |||||
— |
| 6,700 |
| 1,515 |
| 8,215 |
| @ |
| VMware, Inc. |
| — |
| 158,723 |
| 35,893 |
| 194,616 |
| — |
| |||||
|
|
|
|
|
|
|
|
|
|
|
| 13,600,061 |
| 37,644,369 |
| (5,087,197 | ) | 46,157,233 | cs |
|
| |||||
|
|
|
|
|
|
|
|
|
| Telecommunications: 6.5% |
|
|
|
|
|
|
|
|
|
|
| |||||
— |
| 941,900 |
| 213,000 |
| 1,154,900 |
|
|
| AT&T, Inc. |
| — |
| 26,844,150 |
| 6,070,512 |
| 32,914,662 |
| — |
| |||||
113,900 |
| — |
| (113,900 | ) | — |
| @@ |
| China Mobile Ltd. ADR |
| 5,791,815 |
| — |
| (5,791,815 | ) | — |
| 5,791,815 |
| |||||
— |
| 936,600 |
| 211,802 |
| 1,148,402 |
| @ |
| Cisco Systems, Inc. |
| — |
| 15,266,580 |
| 3,452,371 |
| 18,718,951 |
| — |
| |||||
— |
| 249,750 |
| 56,478 |
| 306,228 |
|
|
| Corning, Inc. |
| — |
| 2,380,118 |
| 538,238 |
| 2,918,356 |
| — |
| |||||
— |
| 357,450 |
| 80,833 |
| 438,283 |
|
|
| Motorola, Inc. |
| — |
| 1,583,504 |
| 358,092 |
| 1,941,596 |
| — |
| |||||
— |
| 256,400 |
| 57,982 |
| 314,382 |
|
|
| Qualcomm, Inc. |
| — |
| 9,186,812 |
| 2,077,498 |
| 11,264,310 |
| — |
| |||||
— |
| 440,250 |
| 99,558 |
| 539,808 |
|
|
| Sprint Nextel Corp. |
| — |
| 805,658 |
| 182,191 |
| 987,849 |
| — |
| |||||
— |
| 452,000 |
| 102,215 |
| 554,215 |
|
|
| Verizon Communications, Inc. |
| — |
| 15,322,800 |
| 3,465,084 |
| 18,787,884 |
| — |
| |||||
|
|
|
|
|
|
|
|
|
|
|
| 5,791,815 |
| 71,389,622 |
| 10,352,171 |
| 87,533,608 | cs |
|
| |||||
|
|
|
|
|
|
|
|
|
| Transportation: 2.0% |
|
|
|
|
|
|
|
|
|
|
| |||||
— |
| 44,700 |
| 10,108 |
| 54,808 |
|
|
| Burlington Northern Santa Fe Corp. |
| — |
| 3,384,237 |
| 765,308 |
| 4,149,545 |
| — |
| |||||
— |
| 64,200 |
| 14,518 |
| 78,718 |
|
|
| CSX Corp. |
| — |
| 2,084,574 |
| 471,404 |
| 2,555,978 |
| — |
| |||||
135,500 |
| — |
| (135,500 | ) | — |
|
|
| DryShips, Inc. |
| 1,444,430 |
| — |
| (1,444,430 | ) | — |
| 1,444,430 |
| |||||
— |
| 49,250 |
| 11,137 |
| 60,387 |
|
|
| FedEx Corp. |
| — |
| 3,159,388 |
| 714,461 |
| 3,873,849 |
| — |
| |||||
60,750 |
| — |
| (60,750 | ) | — |
| @@, L |
| Frontline Ltd. |
| 1,783,498 |
| — |
| (1,783,498 | ) | — |
| 1,783,498 |
| |||||
— |
| 59,500 |
| 13,455 |
| 72,955 |
|
|
| Norfolk Southern Corp. |
| — |
| 2,799,475 |
| 633,071 |
| 3,432,546 |
| — |
| |||||
137,972 |
| — |
| (137,972 | ) | — |
| @@ |
| Ship Finance International Ltd. |
| 1,524,591 |
| — |
| (1,524,591 | ) | — |
| 1,524,591 |
| |||||
— |
| 81,900 |
| 18,521 |
| 100,421 |
|
|
| Union Pacific Corp. |
| — |
| 3,914,820 |
| 885,294 |
| 4,800,114 |
| — |
| |||||
— |
| 108,500 |
| 24,536 |
| 133,036 |
|
|
| United Parcel Service, Inc. - Class B |
| — |
| 5,984,860 |
| 1,353,411 |
| 7,338,271 |
| — |
| |||||
|
|
|
|
|
|
|
|
|
|
|
| 4,752,519 |
| 21,327,354 |
| 70,430 |
| 26,150,303 | cs |
|
| |||||
|
|
|
|
|
|
|
|
|
|
|
|
|
|
|
|
|
|
|
|
|
| |||||
|
|
|
|
|
|
|
|
|
| Total Common Stock |
| 236,217,056 |
| 1,031,368,914 |
| (2,984,203 | ) | 1,264,601,767 | lt |
|
| |||||
|
|
|
|
|
|
|
|
|
| (Cost $) |
| 357,946,551 |
| 1,315,775,095 |
| — |
| 1,673,721,646 | ltc |
|
| |||||
|
|
|
|
|
|
|
|
|
|
|
|
|
|
|
|
|
|
|
|
|
| |||||
REAL ESTATE INVESTMENT TRUSTS: 0.2% |
|
|
|
|
|
|
|
|
|
|
|
|
|
|
|
|
|
|
| |||||||
|
|
|
|
|
|
|
|
|
| Diversified: 0.0% |
|
|
|
|
|
|
|
|
|
|
| |||||
10,900 |
| — |
| (10,900 | ) | — |
|
|
| Vornado Realty Trust |
| 657,815 |
| — |
| (657,815 | ) | — |
| 657,815 |
| |||||
|
|
|
|
|
|
|
|
|
|
|
| 657,815 |
| — |
| (657,815 | ) | — | reit |
|
| |||||
|
|
|
|
|
|
|
|
|
| Mortgage: 0.0% |
|
|
|
|
|
|
|
|
|
|
| |||||
278,200 |
| — |
| (278,200 | ) | — |
|
|
| Annaly Capital Management, Inc. |
| 4,415,034 |
|
|
| (4,415,034 | ) | — |
| 4,415,034 |
| |||||
|
|
|
|
|
|
|
|
|
|
|
| 4,415,034 |
| — |
| (4,415,034 | ) | — | reit |
|
| |||||
|
|
|
|
|
|
|
|
|
|
|
|
|
|
|
|
|
|
|
|
|
| |||||
|
|
|
|
|
|
|
|
|
| Regional Malls: 0.2% |
|
|
|
|
|
|
|
|
|
|
| |||||
— |
| 35,700 |
| 8,073 |
| 43,773 |
|
|
| Simon Property Group, Inc. |
| — |
| 1,896,741 |
| 428,927 |
| 2,325,668 |
| — |
| |||||
|
|
|
|
|
|
|
|
|
|
|
| — |
| 1,896,741 |
| 428,927 |
| 2,325,668 | reit |
|
| |||||
|
|
|
|
|
|
|
|
|
|
|
|
|
|
|
|
|
|
|
|
|
| |||||
|
|
|
|
|
|
|
|
|
| Total Real Estate Investment Trusts |
| 5,072,849 |
| 1,896,741 |
| (4,643,922 | ) | 2,325,668 | lt |
|
| |||||
|
|
|
|
|
|
|
|
|
| (Cost $) |
| 4,860,287 |
| 2,875,449 |
| — |
| 7,735,736 | ltc |
|
| |||||
|
|
|
|
|
|
|
|
|
|
|
|
|
|
|
|
|
|
|
|
|
| |||||
|
|
|
|
|
|
|
|
|
| Total Long-Term Investments |
| 241,289,905 |
| 1,033,265,655 |
| (7,628,125 | ) | 1,266,927,435 | tis |
|
| |||||
|
|
|
|
|
|
|
|
|
| (Cost $) |
| 362,806,838 |
| 1,318,650,544 |
| — |
| 1,681,457,382 | tisc |
|
| |||||
|
|
|
|
|
|
|
|
|
|
|
|
|
|
|
|
|
|
|
|
|
| |||||
SHORT-TERM INVESTMENTS: 3.1% |
|
|
|
|
|
|
|
|
|
|
|
|
|
|
|
|
|
|
|
|
| |||||
|
|
|
|
|
|
|
|
|
| Affiliated Mutual Fund: 3.1% |
|
|
|
|
|
|
|
|
|
|
| |||||
— |
| 33,732,000 |
| 7,628,125 |
| 41,360,125 |
| S |
| ING Institutional Prime Money Market Fund - Class I |
| — |
| 33,732,000 |
| 7,628,125 |
| 41,360,125 |
| — |
| |||||
|
|
|
|
|
|
|
|
|
|
|
|
|
|
|
|
|
|
|
|
|
| |||||
|
|
|
|
|
|
|
|
|
| Total Short-Term Investments |
| — |
| 33,732,000 |
| 7,628,125 |
| 41,360,125 | tis |
|
| |||||
|
|
|
|
|
|
|
|
|
| (Cost $) |
| — |
| 33,732,000 |
| — |
| 33,732,000 | tisc |
|
| |||||
|
|
|
|
|
|
|
|
|
|
|
|
|
|
|
|
|
|
|
|
|
| |||||
|
|
|
|
|
|
|
|
|
| Total Investments in Securities 97.7% |
|
| $ | 241,289,905 |
| $ | 1,066,997,655 |
| $ | — |
| $ | 1,308,287,560 |
|
|
|
|
|
|
|
|
|
|
|
|
| (Cost $)* |
|
| 362,806,838 |
| 1,352,382,544 |
| 241,289,905 |
| 1,593,672,449 |
|
|
| ||||
|
|
|
|
|
|
|
|
|
| Other Assets and Liabilities - Net | 2.3 |
| 9,680,414 |
| 20,641,235 |
| — |
| 30,321,649 |
|
|
| ||||
|
|
|
|
|
|
|
|
|
| Net Assets prior proforma adjustments | 100.0 | % | $ | 250,970,319 |
| $ | 1,087,638,890 |
| $ | — |
| $ | 1,338,609,209 |
|
|
|
|
|
|
|
|
|
|
|
|
|
|
|
|
|
|
|
|
|
|
|
|
|
| ||||
|
|
|
|
|
|
|
|
|
| Proforma adjustments | — |
| — |
| — |
|
|
| — |
|
|
| ||||
|
|
|
|
|
|
|
|
|
| Net Assets after proforma adjustments | 100.0 | % | $ | 250,970,319 |
| $ | 1,087,638,890 |
| $ | — |
| $ | 1,338,609,209 |
| 241,289,905 |
|
|
|
|
|
|
|
|
| @ |
| Non-income producing security | ||||||||||||||||||||||||
|
|
|
|
|
|
|
| @@ |
| Foreign Issuer | ||||||||||||||||||||||||
|
|
|
|
|
|
|
| ADR |
| American Depositary Receipt | ||||||||||||||||||||||||
|
|
|
|
|
|
|
| cc |
| Securities purchased with cash collateral for securities loaned. | ||||||||||||||||||||||||
|
|
|
|
|
|
|
| I |
| Illiquid security | ||||||||||||||||||||||||
|
|
|
|
|
|
|
| L |
| Loaned security, a portion or all of the security is on loan at December 31, 2008. | ||||||||||||||||||||||||
|
|
|
|
|
|
|
| ## |
| On September 7, 2008, the Federal Housing Finance Agency placed the Federal National Mortgage Association and the Federal Home Loan Mortgage Corporation into conservatorship and the U.S. Treasury guaranteed the debt issued by those organizations. | ||||||||||||||||||||||||
|
|
|
|
|
|
|
| S |
| All or a portion of this security is segregated to cover collateral requirements for applicable futures, options, swaps, foreign forward currency contracts and/or when-issued or delayed-delivery securities. | ||||||||||||||||||||||||
|
|
|
|
|
|
|
|
|
|
| ||||||||||||||||||||||||
|
|
|
|
|
|
|
| * |
| Cost for federal income tax purposes is |
| $ | 415,546,164 |
| $ | 1,362,798,818 |
| $ | 241,289,905 |
| $ | 1,604,088,723 |
|
|
| |||||||||
|
|
|
|
|
|
|
|
|
| Net unrealized depreciation consists of: |
|
|
|
|
|
|
|
|
|
|
| |||||||||||||
|
|
|
|
|
|
|
|
|
| Gross Unrealized Appreciation |
| $ | 1,954,392 |
| $ | 3,029,284 |
| $ | (1,954,392 | ) | 3,029,284 |
|
|
| ||||||||||
|
|
|
|
|
|
|
|
|
| Gross Unrealized Depreciation |
| (176,210,651 | ) | (298,830,447 | ) | 176,210,651 |
| (298,830,447 | ) |
|
| |||||||||||||
|
|
|
|
|
|
|
|
|
| Net Unrealized Depreciation |
| $ | (174,256,259 | ) | $ | (295,801,163 | ) | $ | 174,256,259 |
| $ | (295,801,163 | ) |
|
| |||||||||
|
|
|
|
|
|
|
|
|
|
|
|
|
|
|
|
|
|
|
|
|
| |||||||||||||
|
|
|
|
|
|
|
|
|
| The following table summarizes the inputs used as of December 31, 2008 in determining the Portfolio’s investments at fair value for purposes of SFAS 157: | ||||||||||||||||||||||||
|
|
|
|
|
|
|
|
|
|
|
|
|
|
|
|
|
|
|
|
|
| |||||||||||||
|
|
|
|
|
|
|
|
|
| Investments in Securities |
|
|
|
|
|
|
|
|
|
|
| |||||||||||||
|
|
|
|
|
|
|
|
|
| Level 1- Quoted Prices |
| $ | 237,793,071 |
| $ | 1,066,788,159 |
| $ | — |
| $ | 1,304,581,230 |
|
|
| |||||||||
|
|
|
|
|
|
|
|
|
| Level 2- Other Significant Observable Inputs |
| 3,496,834 |
| 209,496 |
| — |
| 3,706,330 |
|
|
| |||||||||||||
|
|
|
|
|
|
|
|
|
| Level 3- Significant Unobservable Inputs |
| — |
| — |
| — |
| — |
|
|
| |||||||||||||
|
|
|
|
|
|
|
|
|
| Total |
| $ | 241,289,905 |
| $ | 1,066,997,655 |
| $ | — |
| $ | 1,308,287,560 |
|
|
| |||||||||
|
|
|
|
|
|
|
|
|
|
|
|
|
|
|
|
|
|
|
|
|
| |||||||||||||
|
|
|
|
|
|
|
|
|
| Other Financial Instruments* |
|
|
|
|
|
|
|
|
|
|
| |||||||||||||
|
|
|
|
|
|
|
|
|
| Level 1- Quoted Prices |
| $ | — |
| $ | 1,056,411 |
| $ | — |
| $ | 1,056,411 |
|
|
| |||||||||
|
|
|
|
|
|
|
|
|
| Level 2- Other Significant Observable Inputs |
| — |
| — |
| — |
| — |
|
|
| |||||||||||||
|
|
|
|
|
|
|
|
|
| Level 3- Significant Unobservable Inputs |
| — |
| — |
| — |
| — |
|
|
| |||||||||||||
|
|
|
|
|
|
|
|
|
| Total |
| $ | — |
| $ | 1,056,411 |
| $ | — |
| $ | 1,056,411 |
|
|
| |||||||||
|
|
|
|
|
|
|
|
|
|
|
|
|
|
|
|
|
|
|
|
|
| |||||||||||||
|
|
|
|
|
|
|
|
|
| “Fair value” for purposes of SFAS 157 is different from “fair value” as used in the 1940 Act. The former generally implies market value, and can include market quotations as a source of value, and the latter refers to determinations of actual value in absence of available market quotations. | ||||||||||||||||||||||||
|
|
|
|
|
|
|
|
|
|
|
|
|
|
|
|
|
|
|
|
|
| |||||||||||||
|
|
|
|
|
|
|
|
|
| * Other financial instruments may include forward foreign currency contracts, futures, swaps, and written options. Forward foreign currency contracts and futures are reported at their unrealized gain/loss at year end. Swaps and written options are reported at their market value at year end. | ||||||||||||||||||||||||
|
|
|
|
|
|
|
|
|
|
|
|
|
|
|
|
|
|
|
|
|
| |||||||||||||
|
|
|
|
|
|
|
|
|
| ING Russell Large Cap Index Portfolio Open Futures Contracts on December 31, 2008 | ||||||||||||||||||||||||
|
|
|
|
|
|
|
|
|
|
| ||||||||||||||||||||||||
|
|
|
|
|
|
|
|
|
|
|
| Number |
| Unrealized |
|
|
| |||||||||||||||||
|
|
|
|
|
|
|
|
|
| Contract Description |
| of Contracts |
| Appreciation/(Depreciation) |
|
|
| |||||||||||||||||
|
|
|
|
|
|
|
|
|
| Long Contracts |
| 216 |
| $ | 1,056,411 |
|
|
| ||||||||||||||||
|
|
|
|
|
|
|
|
|
| S&P 500 |
|
|
| $ | 1,056,411 |
|
|
| ||||||||||||||||
STATEMENTS OF ASSETS AND LIABILITIES as of December 31, 2008
|
| ING |
| ING |
|
|
|
|
| ||||
|
| Oppenheimer Main |
| RussellTM Large Cap |
| Pro Forma |
| Pro Forma |
| ||||
|
| Street Portfolio® |
| Index Portfolio |
| Adjustments |
| Combined (unaudited) |
| ||||
ASSETS: |
|
|
|
|
|
|
|
|
| ||||
Investments in securities at value+* |
| $ | 248,177,213 |
| $ | 1,033,265,655 |
| $ | (5,425,822 | ) | $ | 1,276,017,046 |
|
Short-term investments** |
| 8,415,873 |
| — |
| (8,415,873 | ) | — |
| ||||
Short-term investments in affiliate*** |
| 2,499,042 |
| 33,732,000 |
| 5,425,822 |
| 41,656,864 |
| ||||
Cash |
| 15,135 |
| 8,998,832 |
|
|
| 9,013,967 |
| ||||
Cash collateral for futures |
| — |
| 5,247,000 |
|
|
| 5,247,000 |
| ||||
Receivables: |
|
|
|
|
|
|
| — |
| ||||
Investment securities sold |
| 191,171 |
| — |
|
|
| 191,171 |
| ||||
Fund shares sold |
| 703,859 |
| 4,206,100 |
|
|
| 4,909,959 |
| ||||
Dividends and interest |
| 389,880 |
| 1,975,529 |
|
|
| 2,365,409 |
| ||||
Variation margin |
| — |
| 634,488 |
|
|
| 634,488 |
| ||||
Prepaid expenses |
| 1,688 |
| 29,234 |
|
|
| 30,922 |
| ||||
Reimbursement due from manager |
| — |
| 30,451 |
|
|
| 30,451 |
| ||||
Total assets |
| 260,393,861 |
| 1,088,119,289 |
| (8,415,873 | ) | 1,348,513,150 |
| ||||
|
|
|
|
|
|
|
|
|
| ||||
LIABILITIES: |
|
|
|
|
|
|
|
|
| ||||
Payable for investment securities purchased |
| 5,240 |
| 9,015 |
|
|
| 14,255 |
| ||||
Payable for fund shares redeemed |
| 170,920 |
| 166,888 |
|
|
| 337,808 |
| ||||
Payable upon receipt of securities loaned |
| 8,520,461 |
| — |
| (8,520,461 | ) | — |
| ||||
Payable to affiliates |
| 189,570 |
| 233,530 |
|
|
| 423,100 |
| ||||
Payable for trustee/director fees |
| — |
| 6,582 |
|
|
| 6,582 |
| ||||
Other accrued expenses and liabilities |
| — |
| 54,384 |
| 104,588 |
| 158,972 |
| ||||
Payable for licensing fees |
| — |
| 10,000 |
|
|
| 10,000 |
| ||||
Total liabilities |
| 8,886,191 |
| 480,399 |
| (8,415,873 | ) | 950,717 |
| ||||
NET ASSETS |
| $ | 251,507,670 |
| $ | 1,087,638,890 |
| $ | — |
| $ | 1,339,146,560 |
|
|
|
|
|
|
|
|
|
|
| ||||
NET ASSETS CONSIST OF: |
|
|
|
|
|
|
|
|
| ||||
Paid-in capital |
| $ | 544,556,565 |
| $ | 1,406,246,700 |
|
|
| $ | 1,950,803,265 |
| |
Undistributed net investment income |
| 262,553 |
| 158,673 |
|
|
| 421,226 |
| ||||
Accumulated net realized loss on investments, foreign currency related transactions, and futures | �� | (186,396,549 | ) | (34,438,005 | ) |
|
| (220,834,554 | ) | ||||
Net unrealized depreciation of investments, foreign currency related transactions, and futures |
| (106,914,899 | ) | (284,328,478 | ) |
|
| (391,243,377 | ) | ||||
NET ASSETS |
| $ | 251,507,670 |
| $ | 1,087,638,890 |
| $ | — |
| $ | 1,339,146,560 |
|
+ Including securities loaned at value |
| $ | 8,494,093 |
| $ | — |
| $ | (8,494,093 | ) | $ | — |
|
*Cost of investments in securities |
| $ | 354,987,767 |
| $ | 1,318,650,544 |
| $ | (5,425,822 | ) | $ | 1,668,212,489 |
|
** Cost of short-term investments |
| $ | 8,520,461 |
| $ | — |
| $ | (8,520,461 | ) | $ | — |
|
*** Cost of short-term investments in affiliate |
| $ | 2,499,042 |
| $ | 33,732,000 |
| $ | 5,425,822 |
| $ | 41,656,864 |
|
|
|
|
|
|
|
|
|
|
| ||||
Class ADV: |
|
|
|
|
|
|
|
|
| ||||
Net Assets |
| $ | 676 |
| $ | 1,135,332 |
|
|
| $ | 1,136,008 |
| |
Shares authorized |
| unlimited |
| 100,000,000 |
|
|
| 100,000,000 |
| ||||
Par value |
| $ | 0.001 |
| $ | 0.001 |
|
|
| $ | 0.001 |
| |
Shares outstanding |
| 56 |
| 157,913 |
| 38 | (A) | 158,007 |
| ||||
Net asset value and redemption price per share |
| $ | 12.07 |
| $ | 7.19 |
|
|
| $ | 7.19 |
| |
Class I: |
|
|
|
|
|
|
|
|
| |||
Net Assets |
| $ | 3,491,014 |
| $ | 1,057,974,224 |
|
|
| $ | 1,061,465,238 |
|
Shares authorized |
| unlimited |
| 200,000,000 |
|
|
| 200,000,000 |
| |||
Par value |
| $ | 0.001 |
| $ | 0.001 |
|
|
| $ | 0.001 |
|
Shares outstanding |
| 288,502 |
| 146,789,804 |
| 195,689 | (A) | 147,273,995 |
| |||
Net asset value and redemption price per share |
| $ | 12.10 |
| $ | 7.21 |
|
|
| $ | 7.21 |
|
|
|
|
|
|
|
|
|
|
| |||
Class S: |
|
|
|
|
|
|
|
|
| |||
Net Assets |
| $ | 245,382,963 |
| $ | 28,529,334 |
|
|
| $ | 273,912,297 |
|
Shares authorized |
| unlimited |
| 100,000,000 |
|
|
| 100,000,000 |
| |||
Par value |
| $ | 0.001 |
| $ | 0.001 |
|
|
| $ | 0.001 |
|
Shares outstanding |
| 20,169,062 |
| 3,962,706 |
| 13,911,905 | (A) | 38,043,673 |
| |||
Net asset value and redemption price per share |
| $ | 12.17 |
| $ | 7.20 |
|
|
| $ | 7.20 |
|
|
|
|
|
|
|
|
|
|
| |||
Class S2: |
|
|
|
|
|
|
|
|
| |||
Net Assets |
| $ | 2,633,017 |
| $ | — |
|
|
| $ | 2,633,017 |
|
Shares authorized |
| unlimited |
| 100,000,000 |
|
|
| 100,000,000 |
| |||
Par value |
| $ | 0.001 |
| $ | 0.001 |
|
|
| $ | 0.001 |
|
Shares outstanding |
| 217,034 |
| 0 |
| 46,268 | (A) | 263,302 |
| |||
Net asset value and redemption price per share |
| $ | 12.13 |
| $ | 10.00 |
|
|
| $ | 10.00 |
|
(A) Reflects new shares issued, net of retired shares of ING Oppenheimer Main Street Portfolio. Calculation: Net Assets ÷ NAV per share)
STATEMENTS OF OPERATIONS for the year ended December 31, 2008
|
| ING |
| ING |
|
|
|
|
| ||||
|
| Oppenheimer Main |
| RussellTM Large Cap |
| Pro Forma |
| Pro Forma |
| ||||
|
| Street Portfolio® |
| Index Portfolio |
| Adjustments |
| Combined (unaudited) |
| ||||
INVESTMENT INCOME: |
|
|
|
|
|
|
|
|
| ||||
Dividends, net of foreign taxes withheld*(1) |
| $ | 7,337,904 |
| $ | 17,060,303 |
|
|
| $ | 24,398,207 |
| |
Interest |
| 27,230 |
| 11,829 |
|
|
| 39,059 |
| ||||
Securities lending income |
| 197,463 |
| — |
|
|
| 197,463 |
| ||||
Total investment income |
| 7,562,597 |
| 17,072,132 |
| — |
| 24,634,729 |
| ||||
|
|
|
|
|
|
|
|
|
| ||||
EXPENSES: |
|
|
|
|
|
|
|
|
| ||||
Investment management fees |
| — |
| 1,590,890 |
| 920,104 | (A) | 2,510,994 |
| ||||
Unified fees |
| 2,432,420 |
| — |
| (2,432,420 | ) (A) | — |
| ||||
Distribution and service fees: |
|
|
|
|
|
|
|
|
| ||||
Class ADV |
| 8 |
| 2,933 |
|
|
| 2,941 |
| ||||
Class S |
| 903,668 |
| 28,794 |
|
|
| 932,462 |
| ||||
Class S2 |
| 18,990 |
| — |
|
|
| 18,990 |
| ||||
Transfer agent fees |
| — |
| 784 |
|
|
| 784 |
| ||||
Administrative service fees |
| — |
| 636,347 |
| 368,050 | (A) | 1,004,397 |
| ||||
Shareholder reporting expense |
| — |
| 26,913 |
|
|
| 26,913 |
| ||||
Registration fees |
| — |
| — |
|
|
| — |
| ||||
Professional fees |
| — |
| 68,845 |
|
|
| 68,845 |
| ||||
Custody and accounting expense |
| — |
| 59,158 |
|
|
| 59,158 |
| ||||
Directors fees |
| 17,833 |
| 46,628 |
|
|
| 64,461 |
| ||||
Offering expense |
| — |
| 16,154 |
|
|
| 16,154 |
| ||||
Licensing fees |
| — |
| 12,407 |
|
|
| 12,407 |
| ||||
Miscellaneous expense |
| — |
| 16,795 |
|
|
| 16,795 |
| ||||
Total expenses |
| 3,372,919 |
| 2,506,648 |
| (1,144,266 | ) | 4,735,301 |
| ||||
Less: |
|
|
|
|
|
|
|
|
| ||||
Net waived and reimbursed/recouped fees |
| (4,469 | ) | (119,428 | ) | — |
| (123,897 | ) | ||||
Brokerage commission recapture |
|
|
| — |
| — |
| — |
| ||||
Net expenses |
| 3,368,450 |
| 2,387,221 |
| (1,144,266 | ) | 4,611,405 |
| ||||
Net investment income (loss) |
| 4,194,147 |
| 14,684,911 |
| 1,144,266 |
| 20,023,324 |
| ||||
|
|
|
|
|
|
|
|
|
| ||||
REALIZED AND UNREALIZED GAIN (LOSS) ON INVESTMENTS, FOREIGN CURRENCY RELATED TRANSACTIONS, AND FUTURES: |
|
|
|
|
|
|
|
|
| ||||
Net realized gain (loss) on: |
|
|
|
|
|
|
|
|
| ||||
Investments |
| (55,862,894 | ) | (19,554,391 | ) |
|
| (75,417,285 | ) | ||||
Foreign currency related transactions |
| 1 |
| — |
|
|
| 1 |
| ||||
Futures |
| — |
| (14,884,382 | ) |
|
| (14,884,382 | ) | ||||
Net realized gain (loss) on investments, foreign currency related transactions, and futures |
| (55,862,893 | ) | (34,438,773 | ) |
|
| (90,301,666 | ) | ||||
Net change in unrealized appreciation or depreciation on: |
|
|
|
|
|
|
|
|
| ||||
Investments |
| (120,984,939 | ) | (285,384,889 | ) |
|
| (406,369,828 | ) | ||||
Foreign currency related transactions |
| (66 | ) | — |
|
|
| (66 | ) | ||||
Futures |
| — |
| 1,056,411 |
|
|
| 1,056,411 |
| ||||
Net change in unrealized appreciation or depreciation on investments, foreign currency related transactions, and futures |
| (120,985,005 | ) | (284,328,478 | ) |
|
| (405,313,483 | ) | ||||
Net realized and unrealized gain (loss) on investments, foreign currency related transactions, and futures |
| (176,847,898 | ) | (318,767,251 | ) |
|
| (495,615,149 | ) | ||||
Decrease in net assets resulting from operations |
| $ | (172,653,751 | ) | $ | (304,082,340 | ) | $ | 1,144,266 |
| $ | (475,591,825 | ) |
* Foreign taxes withheld |
| $ | 582 |
| $ | — |
| $ | — |
| $ | 582 |
|
(1) Dividends from affiliates |
| $ | 17,731 |
| $ | 440,429 |
| $ | — |
| $ | 458,160 |
|
(A) Reflects adjustment in expenses due to effects of new contractual rates.
Portfolios of Investments as of December 31, 2008 (UNAUDITED):
|
|
|
|
|
| Pro Forma |
|
|
|
|
| ING Oppenheimer |
|
|
|
|
| Pro Forma |
|
|
| ||||
ING Oppenheimer Main |
| ING Russell TM Large |
| Adjustments |
| ING Russell TM Large |
|
|
|
|
| Main Street |
| ING Russell TM Large |
| Adjustments |
| ING Russell TM Large |
| ING Oppenheimer |
| ||||
94.9% |
|
|
|
|
|
|
|
|
|
|
|
|
|
|
|
|
|
|
|
|
| ||||
|
|
|
|
|
|
|
|
|
| Advertising: 0.1% |
|
|
|
|
|
|
|
|
|
|
| ||||
4,400 |
| — |
| (4,400 | ) | — |
| @ |
| Clear Channel Outdoor Holdings, Inc. |
| $ | 27,060 |
| $ | — |
| $ | (27,060 | ) | $ | — |
| 27,060 |
|
3,000 |
| — |
| (3,000 | ) | — |
|
|
| Harte-Hanks, Inc. |
| 18,720 |
| — |
| (18,720 | ) | — |
| 18,720 |
| ||||
8,300 |
| — |
| (8,300 | ) | — |
| @, L |
| Lamar Advertising Co. |
| 104,248 |
| — |
| (104,248 | ) | — |
| 104,248 |
| ||||
— |
| 50,850 |
| 11,947 |
| 62,797 |
|
|
| Omnicom Group |
| — |
| 1,368,882 |
| 321,600 |
| 1,690,482 |
| — |
| ||||
|
|
|
|
|
|
|
|
|
|
|
| 150,028 |
| 1,368,882 |
| 171,572 |
| 1,690,482 | cs |
|
| ||||
|
|
|
|
|
|
|
|
|
| Aerospace/Defense: 2.5% |
|
|
|
|
|
|
|
|
|
|
| ||||
13,800 |
| — |
| (13,800 | ) | — |
| @ |
| BE Aerospace, Inc. |
| 106,122 |
| — |
| (106,122 | ) | — |
| 106,122 |
| ||||
27,000 |
| 119,100 |
| 981 |
| 147,081 |
|
|
| Boeing Co. |
| 1,152,091 |
| 5,081,997 |
| 41,853 |
| 6,275,941 |
| 1,152,091 |
| ||||
1,500 |
| — |
| (1,500 | ) | — |
|
|
| Cubic Corp. |
| 40,800 |
| — |
| (40,800 | ) | — |
| 40,800 |
| ||||
5,700 |
| — |
| (5,700 | ) | — |
| @ |
| Esterline Technologies Corp. |
| 215,973 |
| — |
| (215,973 | ) | — |
| 215,973 |
| ||||
15,100 |
| 63,150 |
| (264 | ) | 77,986 |
|
|
| General Dynamics Corp. |
| 869,609 |
| 3,636,809 |
| (15,191 | ) | 4,491,227 |
| 869,609 |
| ||||
5,600 |
| — |
| (5,600 | ) | — |
|
|
| Goodrich Corp. |
| 207,312 |
| — |
| (207,312 | ) | — |
| 207,312 |
| ||||
9,100 |
| — |
| (9,100 | ) | — |
|
|
| L-3 Communications Holdings, Inc. |
| 671,398 |
| — |
| (671,398 | ) | — |
| 671,398 |
| ||||
3,200 |
| 52,100 |
| 9,040 |
| 64,340 |
|
|
| Lockheed Martin Corp. |
| 269,056 |
| 4,380,568 |
| 760,098 |
| 5,409,722 |
| 269,056 |
| ||||
43,400 |
| 54,350 |
| (30,631 | ) | 67,119 |
|
|
| Northrop Grumman Corp. |
| 1,954,736 |
| 2,447,924 |
| (1,379,630 | ) | 3,023,030 |
| 1,954,736 |
| ||||
3,300 |
| — |
| (3,300 | ) | — |
| @ |
| Orbital Sciences Corp. |
| 64,449 |
| — |
| (64,449 | ) | — |
| 64,449 |
| ||||
19,500 |
| 67,050 |
| (3,748 | ) | 82,802 |
|
|
| Raytheon Co. |
| 995,280 |
| 3,422,232 |
| (191,274 | ) | 4,226,238 |
| 995,280 |
| ||||
5,000 |
| — |
| (5,000 | ) | — |
| @ |
| Spirit Aerosystems Holdings, Inc. |
| 50,850 |
| — |
| (50,850 | ) | — |
| 50,850 |
| ||||
3,200 |
| — |
| (3,200 | ) | — |
| L |
| Triumph Group, Inc. |
| 135,872 |
| — |
| (135,872 | ) | — |
| 135,872 |
| ||||
18,800 |
| 154,300 |
| 17,451 |
| 190,551 |
|
|
| United Technologies Corp. |
| 1,007,680 |
| 8,270,480 |
| 935,354 |
| 10,213,514 |
| 1,007,680 |
| ||||
|
|
|
|
|
|
|
|
|
|
|
| 7,741,228 |
| 27,240,010 |
| (1,341,566 | ) | 33,639,672 | cs |
|
| ||||
|
|
|
|
|
|
|
|
|
| Agriculture: 2.2% |
|
|
|
|
|
|
|
|
|
|
| ||||
15,700 |
| 332,150 |
| 62,334 |
| 410,184 |
|
|
| Altria Group, Inc. |
| 236,442 |
| 5,002,179 |
| 938,750 |
| 6,177,371 |
| 236,442 |
| ||||
— |
| 102,150 |
| 23,999 |
| 126,149 |
|
|
| Archer-Daniels-Midland Co. |
| — |
| 2,944,985 |
| 691,883 |
| 3,636,868 |
| — |
| ||||
800 |
| — |
| (800 | ) | — |
| L |
| Bunge Ltd. |
| 41,416 |
| — |
| (41,416 | ) | — |
| 41,416 |
| ||||
43,200 |
| 334,250 |
| 35,327 |
| 412,777 |
|
|
| Philip Morris International, Inc. |
| 1,879,632 |
| 14,543,218 |
| 1,537,095 |
| 17,959,945 |
| 1,879,632 |
| ||||
— |
| 27,100 |
| 6,367 |
| 33,467 |
|
|
| Reynolds American, Inc. |
| — |
| 1,092,401 |
| 256,644 |
| 1,349,045 |
| — |
| ||||
2,000 |
| — |
| (2,000 | ) | — |
|
|
| Universal Corp. |
| 59,740 |
| — |
| (59,740 | ) | — |
| 59,740 |
| ||||
|
|
|
|
|
|
|
|
|
|
|
| 2,217,230 |
| 23,582,783 |
| 3,323,216 |
| 29,123,229 | cs |
|
| ||||
|
|
|
|
|
|
|
|
|
| Airlines: 0.0% |
|
|
|
|
|
|
|
|
|
|
| ||||
2,900 |
| — |
| (2,900 | ) | — |
| @ |
| Alaska Air Group, Inc. |
| 84,825 |
| — |
| (84,825 | ) | — |
| 84,825 |
| ||||
10,700 |
| — |
| (10,700 | ) | — |
| @ |
| Continental Airlines, Inc. |
| 193,242 |
| — |
| (193,242 | ) | — |
| 193,242 |
| ||||
7,200 |
| — |
| (7,200 | ) | — |
|
|
| Skywest, Inc. |
| 133,920 |
| — |
| (133,920 | ) | — |
| 133,920 |
| ||||
15,100 |
| — |
| (15,100 | ) | — |
| @ |
| UAL Corp. |
| 166,402 |
| — |
| (166,402 | ) | — |
| 166,402 |
| ||||
13,800 |
| — |
| (13,800 | ) | — |
| @, L |
| US Airways Group, Inc. |
| 106,674 |
| — |
| (106,674 | ) | — |
| 106,674 |
| ||||
|
|
|
|
|
|
|
|
|
|
|
| 685,063 |
| — |
| (685,063 | ) | — | cs |
|
| ||||
|
|
|
|
|
|
|
|
|
| Apparel: 0.3% |
|
|
|
|
|
|
|
|
|
|
| ||||
4,800 |
| — |
| (4,800 | ) | — |
| @ |
| Carter’s, Inc. |
| 92,448 |
| — |
| (92,448 | ) | — |
| 92,448 |
| ||||
13,700 |
| — |
| (13,700 | ) | — |
| @ |
| Coach, Inc. |
| 284,549 |
| — |
| (284,549 | ) | — |
| 284,549 |
| ||||
13,800 |
| — |
| (13,800 | ) | — |
|
|
| Jones Apparel Group, Inc. |
| 80,868 |
| — |
| (80,868 | ) | — |
| 80,868 |
| ||||
— |
| 56,000 |
| 13,156 |
| 69,156 |
|
|
| Nike, Inc. |
| — |
| 2,856,000 |
| 670,977 |
| 3,526,977 |
| — |
| ||||
3,200 |
| — |
| (3,200 | ) | — |
|
|
| Polo Ralph Lauren Corp. |
| 145,312 |
| — |
| (145,312 | ) | — |
| 145,312 |
| ||||
11,900 |
| — |
| (11,900 | ) | — |
| @ |
| Quiksilver, Inc. |
| 21,896 |
| — |
| (21,896 | ) | — |
| 21,896 |
| ||||
3,400 |
| — |
| (3,400 | ) | — |
| @ |
| Skechers USA, Inc. |
| 43,588 |
| — |
| (43,588 | ) | — |
| 43,588 |
| ||||
8,300 |
| — |
| (8,300 | ) | — |
| @ |
| Timberland Co. |
| 95,865 |
| — |
| (95,865 | ) | — |
| 95,865 |
| ||||
11,000 |
| — |
| (11,000 | ) | — |
| @ |
| Warnaco Group, Inc. |
| 215,930 |
| — |
| (215,930 | ) | — |
| 215,930 |
| ||||
6,500 |
| — |
| (6,500 | ) | — |
|
|
| Wolverine World Wide, Inc. |
| 136,760 |
| — |
| (136,760 | ) | — |
| 136,760 |
| ||||
|
|
|
|
|
|
|
|
|
|
|
| 1,117,216 |
| 2,856,000 |
| (446,239 | ) | 3,526,977 | cs |
|
| ||||
|
|
|
|
|
|
|
|
|
| Auto Manufacturers: 0.1% |
|
|
|
|
|
|
|
|
|
|
| ||||
4,000 |
| — |
| (4,000 | ) | — |
| @ |
| Navistar International Corp. |
| 85,520 |
| — |
| (85,520 | ) | — |
| 85,520 |
| ||||
14,100 |
| — |
| (14,100 | ) | — |
|
|
| Oshkosh Truck Corp. |
| 125,349 |
| — |
| (125,349 | ) | — |
| 125,349 |
| ||||
— |
| 58,050 |
| 13,638 |
| 71,688 |
|
|
| Paccar, Inc. |
| — |
| 1,660,230 |
| 390,048 |
| 2,050,278 |
| — |
| ||||
|
|
|
|
|
|
|
|
|
|
|
| 210,869 |
| 1,660,230 |
| 179,179 |
| 2,050,278 | cs |
|
| ||||
|
|
|
|
|
|
|
|
|
| Auto Parts & Equipment: 0.2% |
|
|
|
|
|
|
|
|
|
|
| ||||
9,900 |
| — |
| (9,900 | ) | — |
|
|
| ArvinMeritor, Inc. |
| 28,215 |
| — |
| (28,215 | ) | — |
| 28,215 |
| ||||
8,900 |
| — |
| (8,900 | ) | — |
| @@ |
| Autoliv, Inc. |
| 190,994 |
| — |
| (190,994 | ) | — |
| 190,994 |
| ||||
7,600 |
| — |
| (7,600 | ) | — |
|
|
| BorgWarner, Inc. |
| 165,452 |
| — |
| (165,452 | ) | — |
| 165,452 |
| ||||
1,000 |
| — |
| (1,000 | ) | — |
| @ |
| Exide Technologies |
| 5,290 |
| — |
| (5,290 | ) | — |
| 5,290 |
| ||||
22,500 |
| — |
| (22,500 | ) | — |
| @ |
| Goodyear Tire & Rubber Co. |
| 134,325 |
| — |
| (134,325 | ) | — |
| 134,325 |
| ||||
23,600 |
| 94,050 |
| (1,504 | ) | 116,146 |
|
|
| Johnson Controls, Inc. |
| 428,576 |
| 1,707,948 |
| (27,317 | ) | 2,109,207 |
| 428,576 |
| ||||
11,900 |
| — |
| (11,900 | ) | — |
| @ |
| Lear Corp. |
| 16,779 |
| — |
| (16,779 | ) | — |
| 16,779 |
| ||||
7,600 |
| — |
| (7,600 | ) | — |
| �� |
| Titan International, Inc. |
| 62,700 |
| — |
| (62,700 | ) | — |
| 62,700 |
| ||||
17,200 |
| — |
| (17,200 | ) | — |
| @ |
| TRW Automotive Holdings Corp. |
| 61,920 |
| — |
| (61,920 | ) | — |
| 61,920 |
| ||||
10,700 |
| — |
| (10,700 | ) | — |
|
|
| WABCO Holdings, Inc. |
| 168,953 |
| — |
| (168,953 | ) | — |
| 168,953 |
| ||||
|
|
|
|
|
|
|
|
|
|
|
| 1,263,204 |
| 1,707,948 |
| (861,945 | ) | 2,109,207 | cs |
|
| ||||
|
|
|
|
|
|
|
|
|
| Banks: 8.0% |
|
|
|
|
|
|
|
|
|
|
| ||||
101,708 |
| 796,700 |
| 85,466 |
| 983,874 |
|
|
| Bank of America Corp. |
| 1,432,049 |
| 11,217,536 |
| 1,203,355 |
| 13,852,940 |
| 1,432,049 |
| ||||
— |
| 181,300 |
| 42,594 |
| 223,894 |
|
|
| Bank of New York Mellon Corp. |
| — |
| 5,136,229 |
| 1,206,686 |
| 6,342,915 |
| — |
|
— |
| 86,750 |
| 20,381 |
| 107,131 |
|
|
| BB&T Corp. |
| — |
| 2,382,155 |
| 559,654 |
| 2,941,809 |
| — |
|
4,100 |
| 59,400 |
| 9,855 |
| 73,355 |
|
|
| Capital One Financial Corp. |
| 130,749 |
| 1,894,266 |
| 314,282 |
| 2,339,297 |
| 130,749 |
|
3,000 |
| — |
| (3,000 | ) | — |
| L |
| Cathay General Bancorp. |
| 71,250 |
| — |
| (71,250 | ) | — |
| 71,250 |
|
— |
| 863,100 |
| 202,773 |
| 1,065,873 |
|
|
| Citigroup, Inc. |
| — |
| 5,791,401 |
| 1,360,609 |
| 7,152,010 |
| — |
|
19,800 |
| — |
| (19,800 | ) | — |
| L |
| Colonial BancGroup, Inc. |
| 40,986 |
| — |
| (40,986 | ) | — |
| 40,986 |
|
9,500 |
| — |
| (9,500 | ) | — |
| L |
| East-West Bancorp., Inc. |
| 151,715 |
| — |
| (151,715 | ) | — |
| 151,715 |
|
2,800 |
| — |
| (2,800 | ) | — |
| @@, L |
| First Bancorp. Puerto Rico |
| 31,192 |
| — |
| (31,192 | ) | — |
| 31,192 |
|
100 |
| — |
| (100 | ) | — |
|
|
| First Commonwealth Financial Corp. |
| 1,238 |
| — |
| (1,238 | ) | — |
| 1,238 |
|
26,024 |
| — |
| (26,024 | ) | — |
| L |
| First Horizon National Corp. |
| 275,074 |
| — |
| (275,074 | ) | — |
| 275,074 |
|
3,600 |
| — |
| (3,600 | ) | — |
|
|
| First Midwest Bancorp., Inc. |
| 71,892 |
| — |
| (71,892 | ) | — |
| 71,892 |
|
2,900 |
| — |
| (2,900 | ) | — |
|
|
| FirstMerit Corp. |
| 59,711 |
| — |
| (59,711 | ) | — |
| 59,711 |
|
9,800 |
| 69,850 |
| 6,610 |
| 86,260 |
|
|
| Goldman Sachs Group, Inc. |
| 827,022 |
| 5,894,642 |
| 557,842 |
| 7,279,506 |
| 827,022 |
|
1,100 |
| — |
| (1,100 | ) | — |
|
|
| Hancock Holding Co. |
| 50,006 |
| — |
| (50,006 | ) | — |
| 50,006 |
|
2,500 |
| — |
| (2,500 | ) | — |
|
|
| International Bancshares Corp. |
| 54,575 |
| — |
| (54,575 | ) | — |
| 54,575 |
|
60,300 |
| 585,235 |
| 77,193 |
| 722,728 |
|
|
| JPMorgan Chase & Co. |
| 1,901,259 |
| 18,452,460 |
| 2,433,890 |
| 22,787,609 |
| 1,901,259 |
|
— |
| 175,550 |
| 41,243 |
| 216,793 |
|
|
| Morgan Stanley |
| — |
| 2,815,822 |
| 661,538 |
| 3,477,360 |
| — |
|
5,700 |
| — |
| (5,700 | ) | — |
|
|
| National Penn Bancshares, Inc. |
| 82,707 |
| — |
| (82,707 | ) | — |
| 82,707 |
|
5,200 |
| — |
| (5,200 | ) | — |
|
|
| Old National Bancorp. |
| 94,432 |
| — |
| (94,432 | ) | — |
| 94,432 |
|
9,800 |
| — |
| (9,800 | ) | — |
| L |
| Pacific Capital Bancorp. |
| 165,424 |
| — |
| (165,424 | ) | — |
| 165,424 |
|
4,200 |
| — |
| (4,200 | ) | — |
| L |
| PacWest Bancorp |
| 112,980 |
| — |
| (112,980 | ) | — |
| 112,980 |
|
300 |
| — |
| (300 | ) | — |
|
|
| Park National Corp. |
| 21,525 |
| — |
| (21,525 | ) | — |
| 21,525 |
|
— |
| 54,800 |
| 12,874 |
| 67,674 |
|
|
| PNC Financial Services Group, Inc. |
| — |
| 2,685,200 |
| 630,850 |
| 3,316,050 |
| — |
|
25,500 |
| — |
| (25,500 | ) | — |
| @@, L |
| Popular, Inc. |
| 131,580 |
| — |
| (131,580 | ) | — |
| 131,580 |
|
28,300 |
| — |
| (28,300 | ) | — |
|
|
| Regions Financial Corp. |
| 225,268 |
| — |
| (225,268 | ) | — |
| 225,268 |
|
— |
| 67,700 |
| 15,905 |
| 83,605 |
|
|
| State Street Corp. |
| — |
| 2,662,641 |
| 625,550 |
| 3,288,191 |
| — |
|
2,300 |
| — |
| (2,300 | ) | — |
| L |
| Sterling Financial Corp. |
| 20,240 |
| — |
| (20,240 | ) | — |
| 20,240 |
|
— |
| 56,000 |
| 13,156 |
| 69,156 |
|
|
| SunTrust Bank |
| — |
| 1,654,240 |
| 388,641 |
| 2,042,881 |
| — |
|
6,200 |
| — |
| (6,200 | ) | — |
|
|
| Susquehanna Bancshares, Inc. |
| 98,642 |
| — |
| (98,642 | ) | — |
| 98,642 |
|
2,500 |
| — |
| (2,500 | ) | — |
|
|
| Trustmark Corp. |
| 53,975 |
| — |
| (53,975 | ) | — |
| 53,975 |
|
9,400 |
| — |
| (9,400 | ) | — |
|
|
| UCBH Holdings, Inc. |
| 64,672 |
| — |
| (64,672 | ) | — |
| 64,672 |
|
3,400 |
| — |
| (3,400 | ) | — |
|
|
| Umpqua Holdings Corp. |
| 49,198 |
| — |
| (49,198 | ) | — |
| 49,198 |
|
2,004 |
| — |
| (2,004 | ) | — |
| L |
| United Community Banks, Inc. |
| 27,214 |
| — |
| (27,214 | ) | — |
| 27,214 |
|
31,500 |
| 276,000 |
| 33,342 |
| 340,842 |
|
|
| US Bancorp. |
| 787,815 |
| 6,902,760 |
| 833,892 |
| 8,524,467 |
| 787,815 |
|
— |
| 342,400 |
| 80,442 |
| 422,842 |
|
|
| Wachovia Corp. |
| — |
| 1,896,896 |
| 445,649 |
| 2,342,545 |
| — |
|
9,500 |
| — |
| (9,500 | ) | — |
| L |
| Webster Financial Corp. |
| 130,910 |
| — |
| (130,910 | ) | — |
| 130,910 |
|
34,000 |
| 598,800 |
| 106,680 |
| 739,480 |
|
|
| Wells Fargo & Co. |
| 1,002,320 |
| 17,652,624 |
| 3,144,918 |
| 21,799,862 |
| 1,002,320 |
|
1,700 |
| — |
| (1,700 | ) | — |
|
|
| Whitney Holding Corp. |
| 27,183 |
| — |
| (27,183 | ) | — |
| 27,183 |
|
400 |
| — |
| (400 | ) | — |
|
|
| Wintrust Financial Corp. |
| 8,228 |
| — |
| (8,228 | ) | — |
| 8,228 |
|
3,000 |
| — |
| (3,000 | ) | — |
| L |
| Zions Bancorp. |
| 73,530 |
| — |
| (73,530 | ) | — |
| 73,530 |
|
|
|
|
|
|
|
|
|
|
|
|
| 8,276,561 |
| 87,038,872 |
| 12,172,009 |
| 107,487,442 | cs |
|
|
|
|
|
|
|
|
|
|
|
| Beverages: 2.8% |
|
|
|
|
|
|
|
|
|
|
|
28,000 |
| 368,200 |
| 58,503 |
| 454,703 |
|
|
| Coca-Cola Co. |
| 1,267,560 |
| 16,668,414 |
| 2,648,452 |
| 20,584,426 |
| 1,267,560 |
|
16,600 |
| 251,400 |
| 42,463 |
| 310,463 |
|
|
| PepsiCo, Inc. |
| 909,182 |
| 13,769,178 |
| 2,325,695 |
| 17,004,055 |
| 909,182 |
|
|
|
|
|
|
|
|
|
|
|
|
| 2,176,742 |
| 30,437,592 |
| 4,974,147 |
| 37,588,481 | cs |
|
|
|
|
|
|
|
|
|
|
|
| Biotechnology: 3.0% |
|
|
|
|
|
|
|
|
|
|
|
25,200 |
| 172,550 |
| 15,338 |
| 213,088 |
| @ |
| Amgen, Inc. |
| 1,455,300 |
| 9,964,763 |
| 885,782 |
| 12,305,845 |
| 1,455,300 |
|
— |
| 46,100 |
| 10,831 |
| 56,931 |
| @ |
| Biogen Idec, Inc. |
| — |
| 2,195,743 |
| 515,859 |
| 2,711,602 |
| — |
|
100 |
| — |
| (100 | ) | — |
| @ |
| Celera Corp. |
| 1,113 |
| — |
| (1,113 | ) | — |
| 1,113 |
|
— |
| 69,300 |
| 16,281 |
| 85,581 |
| @ |
| Celgene Corp. |
| — |
| 3,830,904 |
| 900,018 |
| 4,730,922 |
| — |
|
4,000 |
| — |
| (4,000 | ) | — |
| @ |
| Cubist Pharmaceuticals, Inc. |
| 96,640 |
| — |
| (96,640 | ) | — |
| 96,640 |
|
2,880 |
| — |
| (2,880 | ) | — |
| @ |
| Facet Biotech Corp. |
| 27,619 |
| — |
| (27,619 | ) | — |
| 27,619 |
|
9,900 |
| 73,700 |
| 7,415 |
| 91,015 |
| @ |
| Genentech, Inc. |
| 820,809 |
| 6,110,467 |
| 614,760 |
| 7,546,036 |
| 820,809 |
|
— |
| 42,350 |
| 9,950 |
| 52,300 |
| @ |
| Genzyme Corp. |
| — |
| 2,810,770 |
| 660,351 |
| 3,471,121 |
| — |
|
— |
| 146,250 |
| 34,359 |
| 180,609 |
| @ |
| Gilead Sciences, Inc. |
| — |
| 7,479,225 |
| 1,757,140 |
| 9,236,365 |
| — |
|
2,800 |
| — |
| (2,800 | ) | — |
| @, L |
| Martek Biosciences Corp. |
| 84,868 |
| — |
| (84,868 | ) | — |
| 84,868 |
|
14,400 |
| — |
| (14,400 | ) | — |
| @ |
| PDL BioPharma, Inc. |
| 88,992 |
| — |
| (88,992 | ) | — |
| 88,992 |
|
|
|
|
|
|
|
|
|
|
|
|
| 2,575,341 |
| 32,391,872 |
| 5,034,678 |
| 40,001,891 | cs |
|
|
|
|
|
|
|
|
|
|
|
| Building Materials: 0.0% |
|
|
|
|
|
|
|
|
|
|
|
4,100 |
| — |
| (4,100 | ) | — |
| @ |
| Armstrong World Industries, Inc. |
| 88,642 |
| — |
| (88,642 | ) | — |
| 88,642 |
|
6,000 |
| — |
| (6,000 | ) | — |
|
|
| Lennox International, Inc. |
| 193,740 |
| — |
| (193,740 | ) | — |
| 193,740 |
|
5,300 |
| — |
| (5,300 | ) | — |
|
|
| Louisiana-Pacific Corp. |
| 8,268 |
| — |
| (8,268 | ) | — |
| 8,268 |
|
7,600 |
| — |
| (7,600 | ) | — |
| @, L |
| Owens Corning, Inc. |
| 131,480 |
| — |
| (131,480 | ) | — |
| 131,480 |
|
900 |
| — |
| (900 | ) | — |
|
|
| Simpson Manufacturing Co., Inc. |
| 24,984 |
| — |
| (24,984 | ) | — |
| 24,984 |
|
|
|
|
|
|
|
|
|
|
|
|
| 447,114 |
| — |
| (447,114 | ) | — | cs |
|
|
|
|
|
|
|
|
|
|
|
| Chemicals: 1.6% |
|
|
|
|
|
|
|
|
|
|
|
1,500 |
| 33,400 |
| 6,347 |
| 41,247 |
| S |
| Air Products & Chemicals, Inc. |
| 75,405 |
| 1,679,018 |
| 319,057 |
| 2,073,480 |
| 75,405 |
|
15,390 |
| — |
| (15,390 | ) | — |
|
|
| Ashland, Inc. |
| 161,749 |
| — |
| (161,749 | ) | — |
| 161,749 |
|
1,400 |
| — |
| (1,400 | ) | — |
|
|
| Cabot Corp. |
| 21,420 |
| — |
| (21,420 | ) | — |
| 21,420 |
|
9,100 |
| — |
| (9,100 | ) | — |
|
|
| Celanese Corp. |
| 113,113 |
| — |
| (113,113 | ) | — |
| 113,113 |
|
3,200 |
| — |
| (3,200 | ) | — |
|
|
| CF Industries Holdings, Inc. |
| 157,312 |
| — |
| (157,312 | ) | — |
| 157,312 |
|
28,700 |
| — |
| (28,700 | ) | — |
|
|
| Chemtura Corp. |
| 40,180 |
| — |
| (40,180 | ) | — |
| 40,180 |
|
4,300 |
| — |
| (4,300 | ) | — |
|
|
| Cytec Industries, Inc. |
| 91,246 |
| — |
| (91,246 | ) | — |
| 91,246 |
|
11,500 |
| 147,600 |
| 23,177 |
| 182,277 |
|
|
| Dow Chemical Co. |
| 173,535 |
| 2,227,284 |
| 349,734 |
| 2,750,553 |
| 173,535 |
|
4,000 |
| — |
| (4,000 | ) | — |
|
|
| Eastman Chemical Co. |
| 126,840 |
| — |
| (126,840 | ) | — |
| 126,840 |
|
4,800 |
| 142,800 |
| 28,749 |
| 176,349 |
|
|
| EI Du Pont de Nemours & Co. |
| 121,440 |
| 3,612,840 |
| 727,346 |
| 4,461,626 |
| 121,440 |
|
5,100 |
| — |
| (5,100 | ) | — |
|
|
| Ferro Corp. |
| 35,955 |
| — |
| (35,955 | ) | — |
| 35,955 |
|
8,000 |
| — |
| (8,000 | ) | — |
|
|
| HB Fuller Co. |
| 128,880 |
| — |
| (128,880 | ) | — |
| 128,880 |
|
2,700 |
| — |
| (2,700 | ) | — |
|
|
| Minerals Technologies, Inc. |
| 110,430 |
| — |
| (110,430 | ) | — |
| 110,430 |
|
10,700 |
| 87,050 |
| 9,751 |
| 107,501 |
|
|
| Monsanto Co. |
| 752,745 |
| 6,123,968 |
| 685,996 |
| 7,562,709 |
| 752,745 |
|
34,100 |
| 24,700 |
| (28,297 | ) | 30,503 |
|
|
| Mosaic Co. |
| 1,179,860 |
| 854,620 |
| (979,079 | ) | 1,055,401 |
| 1,179,860 |
|
1,800 |
| — |
| (1,800 | ) | — |
|
|
| NewMarket Corp. |
| 62,838 |
| — |
| (62,838 | ) | — |
| 62,838 |
|
9,600 |
| — |
| (9,600 | ) | — |
| @@, L |
| Nova Chemicals Corp. |
| 45,792 |
| — |
| (45,792 | ) | — |
| 45,792 |
|
4,900 |
| — |
| (4,900 | ) | — |
|
|
| Olin Corp. |
| 88,592 |
| — |
| (88,592 | ) | — |
| 88,592 |
|
— |
| 49,700 |
| 11,676 |
| 61,376 |
|
|
| Praxair, Inc. |
| — |
| 2,950,192 |
| 693,107 |
| 3,643,299 |
| — |
|
4,100 |
| — |
| (4,100 | ) | — |
| @ |
| Rockwood Holdings, Inc. |
| 44,280 |
| — |
| (44,280 | ) | — |
| 44,280 |
|
9,700 |
| — |
| (9,700 | ) | — |
|
|
| RPM International, Inc. |
| 128,913 |
| — |
| (128,913 | ) | — |
| 128,913 |
|
3,500 |
| — |
| (3,500 | ) | — |
|
|
| Sherwin-Williams Co. |
| 209,125 |
| — |
| (209,125 | ) | — |
| 209,125 |
|
9,500 |
| — |
| (9,500 | ) | — |
|
|
| Terra Industries, Inc. |
| 158,365 |
| — |
| (158,365 | ) | — |
| 158,365 |
|
500 |
| — |
| (500 | ) | — |
|
|
| Valhi, Inc. |
| 5,350 |
| — |
| (5,350 | ) | — |
| 5,350 |
|
7,200 |
| — |
| (7,200 | ) | — |
|
|
| Valspar Corp. |
| 130,248 |
| — |
| (130,248 | ) | — |
| 130,248 |
|
3,500 |
| — |
| (3,500 | ) | — |
|
|
| Westlake Chemical Corp. |
| 57,015 |
| — |
| (57,015 | ) | — |
| 57,015 |
|
1,100 |
| — |
| (1,100 | ) | — |
| @ |
| WR Grace & Co. |
| 6,567 |
| — |
| (6,567 | ) | — |
| 6,567 |
|
|
|
|
|
|
|
|
|
|
|
|
| 4,227,195 |
| 17,447,922 |
| (128,049 | ) | 21,547,068 | cs |
|
|
|
|
|
|
|
|
|
|
|
| Coal: 0.1% |
|
|
|
|
|
|
|
|
|
|
|
11,100 |
| — |
| (11,100 | ) | — |
|
|
| Foundation Coal Holdings, Inc. |
| 155,622 |
| — |
| (155,622 | ) | — |
| 155,622 |
|
8,500 |
| — |
| (8,500 | ) | — |
|
|
| Massey Energy Co. |
| 117,215 |
| — |
| (117,215 | ) | — |
| 117,215 |
|
— |
| 43,000 |
| 10,102 |
| 53,102 |
|
|
| Peabody Energy Corp. |
| — |
| 978,250 |
| 229,826 |
| 1,208,076 |
| — |
|
2,500 |
| — |
| (2,500 | ) | — |
|
|
| Walter Industries, Inc. |
| 43,775 |
| — |
| (43,775 | ) | — |
| 43,775 |
|
|
|
|
|
|
|
|
|
|
|
|
| 316,612 |
| 978,250 |
| (86,786 | ) | 1,208,076 | cs |
|
|
|
|
|
|
|
|
|
|
|
| Commercial Services: 1.1% |
|
|
|
|
|
|
| — |
|
|
|
2,600 |
| — |
| (2,600 | ) | — |
|
|
| Aaron Rents, Inc. |
| 69,212 |
| — |
| (69,212 | ) | — |
| 69,212 |
|
2,800 |
| — |
| (2,800 | ) | — |
|
|
| Administaff, Inc. |
| 60,704 |
| — |
| (60,704 | ) | — |
| 60,704 |
|
900 |
| — |
| (900 | ) | — |
|
|
| Arbitron, Inc. |
| 11,952 |
| — |
| (11,952 | ) | — |
| 11,952 |
|
— |
| 82,100 |
| 19,288 |
| 101,388 |
|
|
| Automatic Data Processing, Inc. |
| — |
| 3,229,814 |
| 758,800 |
| 3,988,614 |
| — |
|
10,000 |
| — |
| (10,000 | ) | — |
| @ |
| Avis Budget Group, Inc. |
| 7,000 |
| — |
| (7,000 | ) | — |
| 7,000 |
|
2,000 |
| — |
| (2,000 | ) | — |
| @ |
| Brink’s Home Security Holdings, Inc. |
| 43,840 |
| — |
| (43,840 | ) | — |
| 43,840 |
|
7,500 |
| — |
| (7,500 | ) | — |
| @ |
| Career Education Corp. |
| 134,550 |
| — |
| (134,550 | ) | — |
| 134,550 |
|
3,900 |
| — |
| (3,900 | ) | — |
|
|
| Chemed Corp. |
| 155,103 |
| — |
| (155,103 | ) | — |
| 155,103 |
|
26,700 |
| — |
| (26,700 | ) | — |
| @ |
| Convergys Corp. |
| 171,147 |
| — |
| (171,147 | ) | — |
| 171,147 |
|
3,800 |
| — |
| (3,800 | ) | — |
| @, L |
| Corinthian Colleges, Inc. |
| 62,206 |
| — |
| (62,206 | ) | — |
| 62,206 |
|
3,300 |
| — |
| (3,300 | ) | — |
|
|
| Corporate Executive Board Co. |
| 72,798 |
| — |
| (72,798 | ) | — |
| 72,798 |
|
2,300 |
| — |
| (2,300 | ) | — |
| @, L |
| CoStar Group, Inc. |
| 75,762 |
| — |
| (75,762 | ) | — |
| 75,762 |
|
12,100 |
| — |
| (12,100 | ) | — |
|
|
| Deluxe Corp. |
| 181,016 |
| — |
| (181,016 | ) | — |
| 181,016 |
|
200 |
| — |
| (200 | ) | — |
| @ |
| DynCorp International, Inc. |
| 3,034 |
| — |
| (3,034 | ) | — |
| 3,034 |
|
900 |
| — |
| (900 | ) | — |
| @, L |
| Emergency Medical Services Corp. |
| 32,949 |
| — |
| (32,949 | ) | — |
| 32,949 |
|
6,500 |
| — |
| (6,500 | ) | — |
|
|
| Equifax, Inc. |
| 172,380 |
| — |
| (172,380 | ) | — |
| 172,380 |
|
700 |
| — |
| (700 | ) | — |
| @ |
| First Advantage Corp. |
| 9,905 |
| — |
| (9,905 | ) | — |
| 9,905 |
|
6,500 |
| — |
| (6,500 | ) | — |
| @ |
| Gartner, Inc. |
| 115,895 |
| — |
| (115,895 | ) | — |
| 115,895 |
|
1,200 |
| — |
| (1,200 | ) | — |
|
|
| Heartland Payment Systems, Inc. |
| 21,000 |
| — |
| (21,000 | ) | — |
| 21,000 |
|
24,100 |
| — |
| (24,100 | ) | — |
| @ |
| Hertz Global Holdings, Inc. |
| 122,187 |
| — |
| (122,187 | ) | — |
| 122,187 |
|
5,000 |
| — |
| (5,000 | ) | — |
| @ |
| Hewitt Associates, Inc. |
| 141,900 |
| — |
| (141,900 | ) | — |
| 141,900 |
|
400 |
| — |
| (400 | ) | — |
|
|
| Hillenbrand, Inc. |
| 6,672 |
| — |
| (6,672 | ) | — |
| 6,672 |
|
10,400 |
| — |
| (10,400 | ) | — |
| @, L |
| Korn/Ferry International |
| 118,768 |
| — |
| (118,768 | ) | — |
| 118,768 |
|
— |
| — |
| — |
| — |
|
|
| Lender Processing Services, Inc. |
| — |
| — |
| — |
| — |
| — |
|
5,900 |
| — |
| (5,900 | ) | — |
|
|
| Manpower, Inc. |
| 200,541 |
| — |
| (200,541 | ) | — |
| 200,541 |
|
— |
| 11,600 |
| 2,725 |
| 14,325 |
|
|
| Mastercard, Inc. |
| — |
| 1,657,988 |
| 389,521 |
| 2,047,509 |
| — |
|
— |
| 43,850 |
| 10,302 |
| 54,152 |
|
|
| McKesson Corp. |
| — |
| 1,698,311 |
| 398,995 |
| 2,097,306 |
| — |
|
18,900 |
| — |
| (18,900 | ) | — |
| @ |
| Monster Worldwide, Inc. |
| 228,501 |
| — |
| (228,501 | ) | — |
| 228,501 |
|
— |
| — |
| — |
| — |
|
|
| Moody’s Corp. |
| — |
| — |
| — |
| — |
| — |
|
21,300 |
| — |
| (21,300 | ) | — |
| @ |
| MPS Group, Inc. |
| 160,389 |
| — |
| (160,389 | ) | — |
| 160,389 |
|
1,100 |
| — |
| (1,100 | ) | — |
| @ |
| Navigant Consulting, Inc. |
| 17,457 |
| — |
| (17,457 | ) | — |
| 17,457 |
|
6,000 |
| — |
| (6,000 | ) | — |
| @, @@ |
| Net 1 UEPS Technologies, Inc. |
| 82,200 |
| — |
| (82,200 | ) | — |
| 82,200 |
|
4,300 |
| — |
| (4,300 | ) | — |
| @ |
| PHH Corp. |
| 54,739 |
| — |
| (54,739 | ) | — |
| 54,739 |
|
8,000 |
| — |
| (8,000 | ) | — |
| @ |
| Rent-A-Center, Inc. |
| 141,200 |
| — |
| (141,200 | ) | — |
| 141,200 |
|
6,700 |
| — |
| (6,700 | ) | — |
| @ |
| Resources Connection, Inc. |
| 109,746 |
| — |
| (109,746 | ) | — |
| 109,746 |
|
12,300 |
| — |
| (12,300 | ) | — |
|
|
| Robert Half International, Inc. |
| 256,086 |
| — |
| (256,086 | ) | — |
| 256,086 |
|
12,600 |
| — |
| (12,600 | ) | — |
|
|
| RR Donnelley & Sons Co. |
| 171,108 |
| — |
| (171,108 | ) | — |
| 171,108 |
|
1,700 |
| — |
| (1,700 | ) | — |
| @, L |
| RSC Holdings, Inc. |
| 14,484 |
| — |
| (14,484 | ) | — |
| 14,484 |
|
16,100 |
| — |
| (16,100 | ) | — |
|
|
| Service Corp. International |
| 80,017 |
| — |
| (80,017 | ) | — |
| 80,017 |
|
8,100 |
| — |
| (8,100 | ) | — |
| @ |
| TeleTech Holdings, Inc. |
| 67,635 |
| — |
| (67,635 | ) | — |
| 67,635 |
|
3,180 |
| — |
| (3,180 | ) | — |
| @ |
| Ticketmaster |
| 20,416 |
| — |
| (20,416 | ) | — |
| 20,416 |
|
10,400 |
| — |
| (10,400 | ) | — |
|
|
| Total System Services, Inc. |
| 145,600 |
| — |
| (145,600 | ) | — |
| 145,600 |
|
529 |
| — |
| (529 | ) | — |
| @ |
| Tree.com, Inc. |
| 1,375 |
| — |
| (1,375 | ) | — |
| 1,375 |
|
3,800 |
| — |
| (3,800 | ) | — |
| @ |
| TrueBlue, Inc. |
| 36,366 |
| — |
| (36,366 | ) | — |
| 36,366 |
|
17,543 |
| — |
| (17,543 | ) | — |
| @ |
| United Rentals, Inc. |
| 159,992 |
| — |
| (159,992 | ) | — |
| 159,992 |
|
900 |
| — |
| (900 | ) | — |
|
|
| Viad Corp. |
| 22,266 |
| — |
| (22,266 | ) | — |
| 22,266 |
|
— |
| 70,900 |
| 16,657 |
| 87,557 |
|
|
| Visa, Inc. |
| — |
| 3,718,705 |
| 873,658 |
| 4,592,363 |
| — |
|
2,200 |
| — |
| (2,200 | ) | — |
| @, L |
| Vistaprint Ltd. |
| 40,942 |
| — |
| (40,942 | ) | — |
| 40,942 |
|
3,600 |
| — |
| (3,600 | ) | — |
|
|
| Watson Wyatt Worldwide, Inc. |
| 172,152 |
| — |
| (172,152 | ) | — |
| 172,152 |
|
27,900 |
| 117,200 |
| (365 | ) | 144,735 |
|
|
| Western Union Co. |
| 400,086 |
| 1,680,648 |
| (5,241 | ) | 2,075,493 |
| 400,086 |
|
|
|
|
|
|
|
|
|
|
|
|
| 4,373,278 |
| 11,985,466 |
| (1,557,459 | ) | 14,801,285 | cs |
|
|
|
|
|
|
|
|
|
|
|
| Computers: 5.0% |
|
|
|
|
|
|
|
|
|
|
|
— |
| 94,750 |
| 22,260 |
| 117,010 |
| @@ |
| Accenture Ltd. |
| — |
| 3,106,853 |
| 729,912 |
| 3,836,765 |
| — |
|
900 |
| — |
| (900 | ) | — |
| @ |
| Affiliated Computer Services, Inc. |
| 41,355 |
| — |
| (41,355 | ) | — |
| 41,355 |
|
17,000 |
| 139,750 |
| 15,832 |
| 172,582 |
| @ |
| Apple, Inc. |
| 1,450,950 |
| 11,927,663 |
| 1,351,288 |
| 14,729,901 |
| 1,450,950 |
|
53,900 |
| — |
| (53,900 | ) | — |
| @ |
| Brocade Communications Systems, Inc. |
| 150,920 |
| — |
| (150,920 | ) | — |
| 150,920 |
|
35,300 |
| — |
| (35,300 | ) | — |
| @ |
| Cadence Design Systems, Inc. |
| 129,198 |
| — |
| (129,198 | ) | — |
| 129,198 |
|
7,800 |
| — |
| (7,800 | ) | — |
| @ |
| Computer Sciences Corp. |
| 274,092 |
| — |
| (274,092 | ) | — |
| 274,092 |
|
14,000 |
| 287,800 |
| 53,615 |
| 355,415 |
| @ |
| Dell, Inc. |
| 143,360 |
| 2,947,072 |
| 549,014 |
| 3,639,446 |
| 143,360 |
|
3,100 |
| — |
| (3,100 | ) | — |
| @, L |
| DST Systems, Inc. |
| 117,738 |
| — |
| (117,738 | ) | — |
| 117,738 |
|
3,900 |
| — |
| (3,900 | ) | — |
| @ |
| Electronics for Imaging |
| 37,284 |
| — |
| (37,284 | ) | — |
| 37,284 |
|
53,400 |
| 327,800 |
| 23,612 |
| 404,812 |
| @ |
| EMC Corp. |
| 559,098 |
| 3,432,066 |
| 247,218 |
| 4,238,382 |
| 559,098 |
|
114,400 |
| 390,850 |
| (22,575 | ) | 482,675 |
|
|
| Hewlett-Packard Co. |
| 4,151,576 |
| 14,183,947 |
| (819,255 | ) | 17,516,268 |
| 4,151,576 |
|
51,000 |
| 217,850 |
| 181 |
| 269,031 |
|
|
| International Business Machines Corp. |
| 4,292,160 |
| 18,334,256 |
| 15,218 |
| 22,641,634 |
| 4,292,160 |
|
4,100 |
| — |
| (4,100 | ) | — |
|
|
| Jack Henry & Associates, Inc. |
| 79,581 |
| — |
| (79,581 | ) | — |
| 79,581 |
|
8,300 |
| — |
| (8,300 | ) | — |
| @ |
| Lexmark International, Inc. |
| 223,270 |
| — |
| (223,270 | ) | — |
| 223,270 |
|
6,400 |
| — |
| (6,400 | ) | — |
| @ |
| Mentor Graphics Corp. |
| 33,088 |
| — |
| (33,088 | ) | — |
| 33,088 |
|
5,700 |
| — |
| (5,700 | ) | — |
| @ |
| Micros Systems, Inc. |
| 93,024 |
| — |
| (93,024 | ) | — |
| 93,024 |
|
200 |
| — |
| (200 | ) | — |
|
|
| MTS Systems Corp. |
| 5,328 |
| — |
| (5,328 | ) | — |
| 5,328 |
|
13,000 |
| — |
| (13,000 | ) | — |
| @ |
| NCR Corp. |
| 183,820 |
| — |
| (183,820 | ) | — |
| 183,820 |
|
8,000 |
| — |
| (8,000 | ) | — |
| @, L |
| NetApp, Inc. |
| 111,760 |
| — |
| (111,760 | ) | — |
| 111,760 |
|
11,800 |
| — |
| (11,800 | ) | — |
| @ |
| Perot Systems Corp. |
| 161,306 |
| — |
| (161,306 | ) | — |
| 161,306 |
|
15,600 |
| — |
| (15,600 | ) | — |
| @, L |
| Sandisk Corp. |
| 149,760 |
| — |
| (149,760 | ) | — |
| 149,760 |
|
73,600 |
| — |
| (73,600 | ) | — |
|
|
| Seagate Technology, Inc. |
| 326,048 |
| — |
| (326,048 | ) | — |
| 326,048 |
|
130,700 |
| — |
| (130,700 | ) | — |
| I |
| Seagate Technology, Inc. - Escrow |
| 1 |
| — |
| (1 | ) | — |
| 1 |
|
40,800 |
| — |
| (40,800 | ) | — |
| @ |
| Sun Microsystems, Inc. |
| 155,856 |
| — |
| (155,856 | ) | — |
| 155,856 |
|
1,700 |
| — |
| (1,700 | ) | — |
| @ |
| SYKES Enterprises, Inc. |
| 32,504 |
| — |
| (32,504 | ) | — |
| 32,504 |
|
7,700 |
| — |
| (7,700 | ) | — |
| @, L |
| Synaptics, Inc. |
| 127,512 |
| — |
| (127,512 | ) | — |
| 127,512 |
|
10,600 |
| — |
| (10,600 | ) | — |
| @ |
| Synopsys, Inc. |
| 196,312 |
| — |
| (196,312 | ) | — |
| 196,312 |
|
600 |
| — |
| (600 | ) | — |
|
|
| Syntel, Inc. |
| 13,872 |
| — |
| (13,872 | ) | — |
| 13,872 |
|
9,100 |
| — |
| (9,100 | ) | — |
| @ |
| Teradata Corp. |
| 134,953 |
| — |
| (134,953 | ) | — |
| 134,953 |
|
19,400 |
| — |
| (19,400 | ) | — |
| @ |
| Unisys Corp. |
| 16,490 |
| — |
| (16,490 | ) | — |
| 16,490 |
|
13,200 |
| — |
| (13,200 | ) | — |
| @ |
| Western Digital Corp. |
| 151,140 |
| — |
| (151,140 | ) | — |
| 151,140 |
|
|
|
|
|
|
|
|
|
|
|
|
| 13,543,356 |
| 53,931,857 |
| (872,817 | ) | 66,602,396 | cs |
|
|
|
|
|
|
|
|
|
|
|
| Cosmetics/Personal Care: 3.2% |
|
|
|
|
|
|
|
|
|
|
|
1,300 |
| — |
| (1,300 | ) | — |
| @, L |
| Chattem, Inc. |
| 92,989 |
| — |
| (92,989 | ) | — |
| 92,989 |
|
— |
| 80,750 |
| 18,971 |
| 99,721 |
|
|
| Colgate-Palmolive Co. |
| — |
| 5,534,605 |
| 1,300,278 |
| 6,834,883 |
| — |
|
58,032 |
| 478,100 |
| 54,291 |
| 590,423 |
|
|
| Procter & Gamble Co. |
| 3,587,538 |
| 29,556,142 |
| 3,356,266 |
| 36,499,946 |
| 3,587,538 |
|
500 |
| — |
| (500 | ) | — |
| @ |
| Revlon, Inc. - Class A |
| 3,335 |
| — |
| (3,335 | ) | — |
| 3,335 |
|
|
|
|
|
|
|
|
|
|
|
|
| 3,683,862 |
| 35,090,747 |
| 4,560,220 |
| 43,334,829 | cs |
|
|
|
|
|
|
|
|
|
|
|
| Distribution/Wholesale: 0.0% |
|
|
|
|
|
|
|
|
|
|
|
6,800 |
| — |
| (6,800 | ) | — |
| @ |
| Fossil, Inc. |
| 113,560 |
| — |
| (113,560 | ) | — |
| 113,560 |
|
15,900 |
| — |
| (15,900 | ) | — |
| @ |
| Ingram Micro, Inc. |
| 212,901 |
| — |
| (212,901 | ) | — |
| 212,901 |
|
3,000 |
| — |
| (3,000 | ) | — |
| @ |
| LKQ Corp. |
| 34,980 |
| — |
| (34,980 | ) | — |
| 34,980 |
|
900 |
| — |
| (900 | ) | — |
|
|
| Owens & Minor, Inc. |
| 33,885 |
| — |
| (33,885 | ) | — |
| 33,885 |
|
1,300 |
| — |
| (1,300 | ) | — |
| L |
| Pool Corp. |
| 23,361 |
| — |
| (23,361 | ) | — |
| 23,361 |
|
500 |
| — |
| (500 | ) | — |
| @ |
| Scansource, Inc. |
| 9,635 |
| — |
| (9,635 | ) | — |
| 9,635 |
|
3,200 |
| — |
| (3,200 | ) | — |
| @ |
| Tech Data Corp. |
| 57,088 |
| — |
| (57,088 | ) | — |
| 57,088 |
|
1,500 |
| — |
| (1,500 | ) | — |
| @ |
| United Stationers, Inc. |
| 50,235 |
| — |
| (50,235 | ) | — |
| 50,235 |
|
2,200 |
| — |
| (2,200 | ) | — |
| L |
| Watsco, Inc. |
| 84,480 |
| — |
| (84,480 | ) | — |
| 84,480 |
|
9,600 |
| — |
| (9,600 | ) | — |
| @ |
| Wesco International, Inc. |
| 184,608 |
| — |
| (184,608 | ) | — |
| 184,608 |
|
|
|
|
|
|
|
|
|
|
|
|
| 804,733 |
| — |
| (804,733 | ) | — | cs |
|
|
|
|
|
|
|
|
|
|
|
| Diversified Financial Services: 1.3% |
|
|
|
|
|
|
|
|
|
|
|
1,000 |
| — |
| (1,000 | ) | — |
| @, L |
| Affiliated Managers Group, Inc. |
| 41,920 |
| — |
| (41,920 | ) | — |
| 41,920 |
|
— |
| 159,800 |
| 37,543 |
| 197,343 |
|
|
| American Express Co. |
| — |
| 2,964,290 |
| 696,419 |
| 3,660,709 |
| — |
|
12,400 |
| — |
| (12,400 | ) | — |
| @, L |
| AmeriCredit Corp. |
| 94,736 |
| — |
| (94,736 | ) | — |
| 94,736 |
|
8,200 |
| — |
| (8,200 | ) | — |
|
|
| Ameriprise Financial, Inc. |
| 191,552 |
| — |
| (191,552 | ) | — |
| 191,552 |
|
1,800 |
| 2,900 |
| (1,119 | ) | 3,581 |
| S |
| Blackrock, Inc. |
| 241,470 |
| 389,035 |
| (150,072 | ) | 480,433 |
| 241,470 |
|
— |
| 148,150 |
| 34,806 |
| 182,956 |
|
|
| Charles Schwab Corp. |
| — |
| 2,395,586 |
| 562,810 |
| 2,958,396 |
| — |
|
27,000 |
| — |
| (27,000 | ) | — |
| L |
| CIT Group, Inc. |
| 122,580 |
| — |
| (122,580 | ) | — |
| 122,580 |
|
— |
| 10,700 |
| 2,514 |
| 13,214 |
|
|
| CME Group, Inc. |
| — |
| 2,226,777 |
| 523,150 |
| 2,749,927 |
| — |
|
25,950 |
| — |
| (25,950 | ) | — |
|
|
| Discover Financial Services |
| 247,304 |
| — |
| (247,304 | ) | — |
| 247,304 |
|
44,700 |
| — |
| (44,700 | ) | — |
| @, L |
| E*Trade Financial Corp. |
| 51,405 |
| — |
| (51,405 | ) | — |
| 51,405 |
|
— |
| 102,550 |
| 24,093 |
| 126,643 |
| ## |
| Federal Home Loan Mortgage Corporation |
| — |
| 74,862 |
| 17,588 |
| 92,450 |
| — |
|
— |
| 177,150 |
| 41,618 |
| 218,768 |
| ## |
| Federal National Mortgage Association |
| — |
| 134,634 |
| 31,630 |
| 166,264 |
| — |
|
8,600 |
| 24,450 |
| (2,856 | ) | 30,194 |
|
|
| Franklin Resources, Inc. |
| 548,508 |
| 1,559,421 |
| (182,144 | ) | 1,925,785 |
| 548,508 |
|
600 |
| — |
| (600 | ) | — |
|
|
| GAMCO Investors, Inc. |
| 16,392 |
| — |
| (16,392 | ) | — |
| 16,392 |
|
1,600 |
| — |
| (1,600 | ) | — |
| L |
| Greenhill & Co., Inc. |
| 111,632 |
| — |
| (111,632 | ) | — |
| 111,632 |
|
6,800 |
| — |
| (6,800 | ) | — |
| @ |
| Interactive Brokers Group, Inc. |
| 121,652 |
| — |
| (121,652 | ) | — |
| 121,652 |
|
2,000 |
| — |
| (2,000 | ) | — |
| @ |
| Investment Technology Group, Inc. |
| 45,440 |
| — |
| (45,440 | ) | — |
| 45,440 |
|
11,400 |
| — |
| (11,400 | ) | — |
|
|
| Janus Capital Group, Inc. |
| 91,542 |
| — |
| (91,542 | ) | — |
| 91,542 |
|
2,700 |
| — |
| (2,700 | ) | — |
|
|
| Jefferies Group, Inc. |
| 37,962 |
| — |
| (37,962 | ) | — |
| 37,962 |
|
2,200 |
| — |
| (2,200 | ) | — |
| @, L |
| KBW, Inc. |
| 50,600 |
| — |
| (50,600 | ) | — |
| 50,600 |
|
8,900 |
| — |
| (8,900 | ) | — |
| @ |
| Knight Capital Group, Inc. |
| 143,735 |
| — |
| (143,735 | ) | — |
| 143,735 |
|
2,300 |
| — |
| (2,300 | ) | — |
| @@ |
| Lazard Ltd. |
| 68,402 |
| — |
| (68,402 | ) | — |
| 68,402 |
|
8,300 |
| — |
| (8,300 | ) | — |
|
|
| Legg Mason, Inc. |
| 181,853 |
| — |
| (181,853 | ) | — |
| 181,853 |
|
— |
| 242,450 |
| 56,960 |
| 299,410 |
|
|
| Merrill Lynch & Co., Inc. |
| — |
| 2,822,118 |
| 663,017 |
| 3,485,135 |
| — |
|
1,900 |
| — |
| (1,900 | ) | — |
|
|
| Nelnet, Inc. |
| 27,227 |
| — |
| (27,227 | ) | — |
| 27,227 |
|
16,100 |
| 42,050 |
| (6,221 | ) | 51,929 |
|
|
| NYSE Euronext |
| 440,818 |
| 1,151,329 |
| (170,329 | ) | 1,421,818 |
| 440,818 |
|
3,000 |
| — |
| (3,000 | ) | — |
| @ |
| Piper Jaffray Cos. |
| 119,280 |
| — |
| (119,280 | ) | — |
| 119,280 |
|
2,100 |
| — |
| (2,100 | ) | — |
| @ |
| Stifel Financial Corp. |
| 96,285 |
| — |
| (96,285 | ) | — |
| 96,285 |
|
500 |
| — |
| (500 | ) | — |
|
|
| Student Loan Corp. |
| 20,500 |
| — |
| (20,500 | ) | — |
| 20,500 |
|
14,600 |
| — |
| (14,600 | ) | — |
| L |
| T. Rowe Price Group, Inc. |
| 517,424 |
| — |
| (517,424 | ) | — |
| 517,424 |
|
30,900 |
| — |
| (30,900 | ) | — |
| @, L |
| TD Ameritrade Holding Corp. |
| 440,325 |
| — |
| (440,325 | ) | — |
| 440,325 |
|
600 |
| — |
| (600 | ) | — |
|
|
| Waddell & Reed Financial, Inc. |
| 9,276 |
| — |
| (9,276 | ) | — |
| 9,276 |
|
|
|
|
|
|
|
|
|
|
|
|
| 4,079,820 |
| 13,718,052 |
| (856,955 | ) | 16,940,917 | cs |
|
|
|
|
|
|
|
|
|
|
|
| Electric: 2.5% |
|
|
|
|
|
|
|
|
|
|
|
6,400 |
| — |
| (6,400 | ) | — |
|
|
| Avista Corp. |
| 124,032 |
| — |
| (124,032 | ) | — |
| 124,032 |
|
500 |
| — |
| (500 | ) | — |
|
|
| CH Energy Group, Inc. |
| 25,695 |
| — |
| (25,695 | ) | — |
| 25,695 |
|
— |
| 91,550 |
| 21,508 |
| 113,058 |
|
|
| Dominion Resources, Inc. |
| — |
| 3,281,152 |
| 770,861 |
| 4,052,013 |
| — |
|
46,700 |
| 200,450 |
| 393 |
| 247,543 |
|
|
| Duke Energy Corp. |
| 700,967 |
| 3,008,755 |
| 5,898 |
| 3,715,620 |
| 700,967 |
|
— |
| 30,450 |
| 7,154 |
| 37,604 |
|
|
| Entergy Corp. |
| — |
| 2,531,309 |
| 594,696 |
| 3,126,005 |
| — |
|
— |
| 103,800 |
| 24,386 |
| 128,186 |
|
|
| Exelon Corp. |
| — |
| 5,772,318 |
| 1,356,126 |
| 7,128,444 |
| — |
|
— |
| 48,350 |
| 11,359 |
| 59,709 |
|
|
| FirstEnergy Corp. |
| — |
| 2,348,843 |
| 551,828 |
| 2,900,671 |
| — |
|
— |
| 64,450 |
| 15,142 |
| 79,592 |
|
|
| FPL Group, Inc. |
| — |
| 3,243,769 |
| 762,078 |
| 4,005,847 |
| — |
|
1,400 |
| — |
| (1,400 | ) | — |
|
|
| Integrys Energy Group, Inc. |
| 60,172 |
| — |
| (60,172 | ) | — |
| 60,172 |
|
7,100 |
| — |
| (7,100 | ) | — |
| @ |
| Mirant Corp. |
| 133,977 |
| — |
| (133,977 | ) | — |
| 133,977 |
|
— |
| — |
| — |
| — |
| @ |
| NRG Energy, Inc. |
| — |
| — |
| — |
| — |
| — |
|
— |
| 80,750 |
| 18,971 |
| 99,721 |
|
|
| Public Service Enterprise Group, Inc. |
| — |
| 2,355,478 |
| 553,387 |
| 2,908,865 |
| — |
|
18,000 |
| — |
| (18,000 | ) | — |
| @ |
| Reliant Energy, Inc. |
| 104,040 |
| — |
| (104,040 | ) | — |
| 104,040 |
|
— |
| 121,500 |
| 28,545 |
| 150,045 |
|
|
| Southern Co. |
| — |
| 4,495,500 |
| 1,056,155 |
| 5,551,655 |
| — |
|
3,000 |
| — |
| (3,000 | ) | — |
|
|
| Unisource Energy Corp. |
| 88,080 |
| — |
| (88,080 | ) | — |
| 88,080 |
|
|
|
|
|
|
|
|
|
|
|
|
| 1,236,963 |
| 27,037,124 |
| 5,115,033 |
| 33,389,120 | cs |
|
|
|
|
|
|
|
|
|
|
|
| Electrical Components & Equipment: 0.4% |
|
|
|
|
|
|
|
|
|
|
|
9,300 |
| — |
| (9,300 | ) | — |
|
|
| Belden CDT, Inc. |
| 194,184 |
| — |
| (194,184 | ) | — |
| 194,184 |
|
25,200 |
| 123,850 |
| 3,897 |
| 152,947 |
|
|
| Emerson Electric Co. |
| 922,572 |
| 4,534,149 |
| 142,663 |
| 5,599,384 |
| 922,572 |
|
26,300 |
| — |
| (26,300 | ) | — |
| @ |
| GrafTech International Ltd. |
| 218,816 |
| — |
| (218,816 | ) | — |
| 218,816 |
|
3,900 |
| — |
| (3,900 | ) | — |
|
|
| Hubbell, Inc. |
| 127,452 |
| — |
| (127,452 | ) | — |
| 127,452 |
|
100 |
| — |
| (100 | ) | — |
| @ |
| Littelfuse, Inc. |
| 1,660 |
| — |
| (1,660 | ) | — |
| 1,660 |
|
12,600 |
| — |
| (12,600 | ) | — |
|
|
| Molex, Inc. |
| 182,574 |
| — |
| (182,574 | ) | — |
| 182,574 |
|
|
|
|
|
|
|
|
|
|
|
|
| 1,647,258 |
| 4,534,149 |
| (582,023 | ) | 5,599,384 | cs |
|
|
|
|
|
|
|
|
|
|
|
| Electronics: 0.3% |
|
|
|
|
|
|
|
|
|
|
|
20,300 |
| — |
| (20,300 | ) | — |
| @ |
| Agilent Technologies, Inc. |
| 317,289 |
| — |
| (317,289 | ) | — |
| 317,289 |
|
6,000 |
| — |
| (6,000 | ) | — |
|
|
| Amphenol Corp. |
| 143,880 |
| — |
| (143,880 | ) | — |
| 143,880 |
|
1,200 |
| — |
| (1,200 | ) | — |
| L |
| Analogic Corp. |
| 32,736 |
| — |
| (32,736 | ) | — |
| 32,736 |
|
10,500 |
| — |
| (10,500 | ) | — |
| @ |
| Arrow Electronics, Inc. |
| 197,820 |
| — |
| (197,820 | ) | — |
| 197,820 |
|
11,600 |
| — |
| (11,600 | ) | — |
| @ |
| Avnet, Inc. |
| 211,236 |
| — |
| (211,236 | ) | — |
| 211,236 |
|
4,900 |
| — |
| (4,900 | ) | — |
|
|
| AVX Corp. |
| 38,906 |
| — |
| (38,906 | ) | — |
| 38,906 |
|
14,400 |
| — |
| (14,400 | ) | — |
| @ |
| Benchmark Electronics, Inc. |
| 183,888 |
| — |
| (183,888 | ) | — |
| 183,888 |
|
2,200 |
| — |
| (2,200 | ) | — |
|
|
| Brady Corp. |
| 52,690 |
| — |
| (52,690 | ) | — |
| 52,690 |
|
6,100 |
| — |
| (6,100 | ) | — |
| @ |
| Cogent, Inc. |
| 82,777 |
| — |
| (82,777 | ) | — |
| 82,777 |
|
2,600 |
| — |
| (2,600 | ) | — |
| @ |
| Coherent, Inc. |
| 55,796 |
| — |
| (55,796 | ) | — |
| 55,796 |
|
4,000 |
| — |
| (4,000 | ) | — |
| @ |
| Cymer, Inc. |
| 87,640 |
| — |
| (87,640 | ) | — |
| 87,640 |
|
4,000 |
| — |
| (4,000 | ) | — |
| @ |
| Dolby Laboratories, Inc. |
| 131,040 |
| — |
| (131,040 | ) | — |
| 131,040 |
|
1,300 |
| — |
| (1,300 | ) | — |
| @ |
| FEI Co. |
| 24,518 |
| — |
| (24,518 | ) | — |
| 24,518 |
|
9,400 |
| — |
| (9,400 | ) | — |
|
|
| Gentex Corp. |
| 83,002 |
| — |
| (83,002 | ) | — |
| 83,002 |
|
1,600 |
| — |
| (1,600 | ) | — |
| @, L |
| Itron, Inc. |
| 101,984 |
| — |
| (101,984 | ) | — |
| 101,984 |
|
21,700 |
| — |
| (21,700 | ) | — |
|
|
| Jabil Circuit, Inc. |
| 146,475 |
| — |
| (146,475 | ) | — |
| 146,475 |
|
1,800 |
| — |
| (1,800 | ) | — |
| @ |
| L-1 Identity Solutions, Inc. |
| 12,132 |
| — |
| (12,132 | ) | — |
| 12,132 |
|
5,000 |
| — |
| (5,000 | ) | — |
|
|
| National Instruments Corp. |
| 121,800 |
| — |
| (121,800 | ) | — |
| 121,800 |
|
3,400 |
| — |
| (3,400 | ) | — |
| @ |
| Plexus Corp. |
| 57,630 |
| — |
| (57,630 | ) | — |
| 57,630 |
|
2,000 |
| — |
| (2,000 | ) | — |
| @ |
| Rofin-Sinar Technologies, Inc. |
| 41,160 |
| — |
| (41,160 | ) | — |
| 41,160 |
|
1,100 |
| — |
| (1,100 | ) | — |
|
|
| Technitrol, Inc. |
| 3,828 |
| — |
| (3,828 | ) | — |
| 3,828 |
|
3,400 |
| 66,400 |
| 12,200 |
| 82,000 |
| @ |
| Thermo Electron Corp. |
| 115,838 |
| 2,262,248 |
| 415,646 |
| 2,793,732 |
| 115,838 |
|
6,200 |
| — |
| (6,200 | ) | — |
| @ |
| Thomas & Betts Corp. |
| 148,924 |
| — |
| (148,924 | ) | — |
| 148,924 |
|
9,300 |
| — |
| (9,300 | ) | — |
| @ |
| Trimble Navigation Ltd. |
| 200,973 |
| — |
| (200,973 | ) | — |
| 200,973 |
|
13,500 |
| 75,800 |
| 4,308 |
| 93,608 |
| @@ |
| Tyco Electronics Ltd. |
| 218,835 |
| 1,228,718 |
| 69,835 |
| 1,517,388 |
| 218,835 |
|
1,400 |
| — |
| (1,400 | ) | — |
| @ |
| Varian, Inc. |
| 46,914 |
| — |
| (46,914 | ) | — |
| 46,914 |
|
32,500 |
| — |
| (32,500 | ) | — |
| @ |
| Vishay Intertechnology, Inc. |
| 111,150 |
| — |
| (111,150 | ) | — |
| 111,150 |
|
5,000 |
| — |
| (5,000 | ) | — |
|
|
| Watts Water Technologies, Inc. |
| 124,850 |
| — |
| (124,850 | ) | — |
| 124,850 |
|
6,800 |
| — |
| (6,800 | ) | — |
|
|
| Woodward Governor Co. |
| 156,536 |
| — |
| (156,536 | ) | — |
| 156,536 |
|
|
|
|
|
|
|
|
|
|
|
|
| 3,252,247 |
| 3,490,966 |
| (2,432,093 | ) | 4,311,120 | cs |
|
|
|
|
|
|
|
|
|
|
|
| Energy - Alternate Sources: 0.1% |
|
|
|
|
|
|
|
|
|
|
|
— |
| 7,100 |
| 1,668 |
| 8,768 |
| @ |
| First Solar, Inc. |
| — |
| 979,516 |
| 230,124 |
| 1,209,640 |
| — |
|
|
|
|
|
|
|
|
|
|
|
|
| — |
| 979,516 |
| 230,124 |
| 1,209,640 | cs |
|
|
|
|
|
|
|
|
|
|
|
| Engineering & Construction: 0.0% |
|
|
|
|
|
|
|
|
|
|
|
200 |
| — |
| (200 | ) | — |
| @ |
| Aecom Technology Corp. |
| 6,146 |
| — |
| (6,146 | ) | — |
| 6,146 |
|
11,700 |
| — |
| (11,700 | ) | — |
| @@, L |
| Chicago Bridge & Iron Co. NV |
| 117,585 |
| — |
| (117,585 | ) | — |
| 117,585 |
|
11,900 |
| — |
| (11,900 | ) | — |
| @ |
| EMCOR Group, Inc. |
| 266,917 |
| — |
| (266,917 | ) | — |
| 266,917 |
|
14,800 |
| — |
| (14,800 | ) | — |
|
|
| Fluor Corp. |
| 664,076 |
| — |
| (664,076 | ) | — |
| 664,076 |
|
4,600 |
| — |
| (4,600 | ) | — |
|
|
| Granite Construction, Inc. |
| 202,078 |
| — |
| (202,078 | ) | — |
| 202,078 |
|
3,300 |
| — |
| (3,300 | ) | — |
|
|
| KBR, Inc. |
| 50,160 |
| — |
| (50,160 | ) | — |
| 50,160 |
|
2,600 |
| — |
| (2,600 | ) | — |
| @ |
| McDermott International, Inc. |
| 25,688 |
| — |
| (25,688 | ) | — |
| 25,688 |
|
9,000 |
| — |
| (9,000 | ) | — |
| @ |
| Perini Corp. |
| 210,420 |
| — |
| (210,420 | ) | — |
| 210,420 |
|
5,100 |
| — |
| (5,100 | ) | — |
| @ |
| Shaw Group, Inc. |
| 104,397 |
| — |
| (104,397 | ) | — |
| 104,397 |
|
|
|
|
|
|
|
|
|
|
|
|
| 1,647,467 |
| — |
| (1,647,467 | ) | — | cs |
|
|
|
|
|
|
|
|
|
|
|
| Entertainment: 0.0% |
|
|
|
|
|
|
|
|
|
|
|
1,400 |
| — |
| (1,400 | ) | — |
| @ |
| Bally Technologies, Inc. |
| 33,642 |
| — |
| (33,642 | ) | — |
| 33,642 |
|
8,300 |
| — |
| (8,300 | ) | — |
| @ |
| DreamWorks Animation SKG, Inc. |
| 209,658 |
| — |
| (209,658 | ) | — |
| 209,658 |
|
2,800 |
| — |
| (2,800 | ) | — |
|
|
| International Speedway Corp. |
| 80,444 |
| — |
| (80,444 | ) | — |
| 80,444 |
|
2,300 |
| — |
| (2,300 | ) | — |
|
|
| Speedway Motorsports, Inc. |
| 37,053 |
| — |
| (37,053 | ) | — |
| 37,053 |
|
3,400 |
| — |
| (3,400 | ) | — |
| @, L |
| Vail Resorts, Inc. |
| 90,440 |
| — |
| (90,440 | ) | — |
| 90,440 |
|
5,300 |
| — |
| (5,300 | ) | — |
| L |
| Warner Music Group Corp. |
| 16,006 |
| — |
| (16,006 | ) | — |
| 16,006 |
|
|
|
|
|
|
|
|
|
|
|
|
| 467,243 |
| — |
| (467,243 | ) | — | cs |
|
|
|
|
|
|
|
|
|
|
|
| Environmental Control: 0.2% |
|
|
|
|
|
|
|
|
|
|
|
1,000 |
| — |
| (1,000 | ) | — |
| @ |
| Clean Harbors, Inc. |
| 63,440 |
| — |
| (63,440 | ) | — |
| 63,440 |
|
2,200 |
| — |
| (2,200 | ) | — |
| @ |
| Darling International, Inc. |
| 12,078 |
| — |
| (12,078 | ) | — |
| 12,078 |
|
500 |
| — |
| (500 | ) | — |
|
|
| Energy Solutions, Inc. |
| 2,825 |
| — |
| (2,825 | ) | — |
| 2,825 |
|
8,900 |
| — |
| (8,900 | ) | — |
|
|
| Nalco Holding Co. |
| 102,706 |
| — |
| (102,706 | ) | — |
| 102,706 |
|
9,700 |
| 77,750 |
| 8,566 |
| 96,016 |
|
|
| Waste Management, Inc. |
| 321,458 |
| 2,576,635 |
| 283,887 |
| 3,181,980 |
| 321,458 |
|
|
|
|
|
|
|
|
|
|
|
|
| 502,507 |
| 2,576,635 |
| 102,838 |
| 3,181,980 | cs |
|
|
|
|
|
|
|
|
|
|
|
| Food: 1.5% |
|
|
|
|
|
|
|
|
|
|
|
4,200 |
| — |
| (4,200 | ) | — |
|
|
| Del Monte Foods Co. |
| 29,988 |
| — |
| (29,988 | ) | — |
| 29,988 |
|
900 |
| — |
| (900 | ) | — |
| @, @@ |
| Fresh Del Monte Produce, Inc. |
| 20,178 |
| — |
| (20,178 | ) | — |
| 20,178 |
|
— |
| 53,200 |
| 12,499 |
| 65,699 |
|
|
| General Mills, Inc. |
| — |
| 3,231,900 |
| 759,290 |
| 3,991,190 |
| — |
|
— |
| 39,650 |
| 9,315 |
| 48,965 |
|
|
| Kellogg Co. |
| — |
| 1,738,653 |
| 408,472 |
| 2,147,125 |
| — |
|
— |
| 233,100 |
| 54,764 |
| 287,864 |
|
|
| Kraft Foods, Inc. |
| — |
| 6,258,735 |
| 1,470,403 |
| 7,729,138 |
| — |
|
27,100 |
| 104,700 |
| (2,502 | ) | 129,298 |
|
|
| Kroger Co. |
| 715,711 |
| 2,765,127 |
| (66,083 | ) | 3,414,755 |
| 715,711 |
|
200 |
| — |
| (200 | ) | — |
| @ |
| M&F Worldwide Corp. |
| 3,090 |
| — |
| (3,090 | ) | — |
| 3,090 |
|
1,100 |
| — |
| (1,100 | ) | — |
| @ |
| Ralcorp Holdings, Inc. |
| 64,240 |
| — |
| (64,240 | ) | — |
| 64,240 |
|
71,400 |
| — |
| (71,400 | ) | — |
|
|
| Safeway, Inc. |
| 1,697,178 |
| — |
| (1,697,178 | ) | — |
| 1,697,178 |
|
4,800 |
| — |
| (4,800 | ) | — |
|
|
| Supervalu, Inc. |
| 70,080 |
| — |
| (70,080 | ) | — |
| 70,080 |
|
— |
| 95,150 |
| 22,354 |
| 117,504 |
|
|
| Sysco Corp. |
| — |
| 2,182,741 |
| 512,805 |
| 2,695,546 |
| — |
|
400 |
| — |
| (400 | ) | — |
|
|
| Weis Markets, Inc. |
| 13,452 |
| — |
| (13,452 | ) | — |
| 13,452 |
|
500 |
| — |
| (500 | ) | — |
| @ |
| Winn-Dixie Stores, Inc. |
| 8,050 |
| — |
| (8,050 | ) | — |
| 8,050 |
|
|
|
|
|
|
|
|
|
|
|
|
| 2,621,967 |
| 16,177,156 |
| 1,178,631 |
| 19,977,754 | cs |
|
|
|
|
|
|
|
|
|
|
|
| Forest Products & Paper: 0.0% |
|
|
|
|
|
|
|
|
|
|
|
63,800 |
| — |
| (63,800 | ) | — |
| @, @@ |
| Domtar Corp. |
| 106,546 |
| — |
| (106,546 | ) | — |
| 106,546 |
|
25,700 |
| — |
| (25,700 | ) | — |
|
|
| International Paper Co. |
| 303,260 |
| — |
| (303,260 | ) | — |
| 303,260 |
|
5,400 |
| — |
| (5,400 | ) | — |
|
|
| MeadWestvaco Corp. |
| 60,426 |
| — |
| (60,426 | ) | — |
| 60,426 |
|
|
|
|
|
|
|
|
|
|
|
|
| 470,232 |
| — |
| (470,232 | ) | — | cs |
|
|
|
|
|
|
|
|
|
|
|
| Gas: 0.0% |
|
|
|
|
|
|
|
|
|
|
|
1,900 |
| — |
| (1,900 | ) | — |
|
|
| Laclede Group, Inc. |
| 88,996 |
| — |
| (88,996 | ) | — |
| 88,996 |
|
100 |
| — |
| (100 | ) | — |
|
|
| South Jersey Industries, Inc. |
| 3,985 |
| — |
| (3,985 | ) | — |
| 3,985 |
|
1,700 |
| — |
| (1,700 | ) | — |
|
|
| Southwest Gas Corp. |
| 42,874 |
| — |
| (42,874 | ) | — |
| 42,874 |
|
1,900 |
| — |
| (1,900 | ) | — |
|
|
| WGL Holdings, Inc. |
| 62,111 |
| — |
| (62,111 | ) | — |
| 62,111 |
|
|
|
|
|
|
|
|
|
|
|
|
| 197,966 |
| — |
| (197,966 | ) | — | cs |
|
|
|
|
|
|
|
|
|
|
|
| Hand/Machine Tools: 0.0% |
|
|
|
|
|
|
|
|
|
|
|
10,500 |
| — |
| (10,500 | ) | — |
|
|
| Baldor Electric Co. |
| 187,425 |
| — |
| (187,425 | ) | — |
| 187,425 |
|
11,300 |
| — |
| (11,300 | ) | — |
|
|
| Kennametal, Inc. |
| 250,747 |
| — |
| (250,747 | ) | — |
| 250,747 |
|
3,900 |
| — |
| (3,900 | ) | — |
|
|
| Lincoln Electric Holdings, Inc. |
| 198,627 |
| — |
| (198,627 | ) | — |
| 198,627 |
|
900 |
| — |
| (900 | ) | — |
|
|
| Regal-Beloit Corp. |
| 34,191 |
| — |
| (34,191 | ) | — |
| 34,191 |
|
4,800 |
| — |
| (4,800 | ) | — |
|
|
| Snap-On, Inc. |
| 189,024 |
| — |
| (189,024 | ) | — |
| 189,024 |
|
4,300 |
| — |
| (4,300 | ) | — |
|
|
| Stanley Works |
| 146,630 |
| — |
| (146,630 | ) | — |
| 146,630 |
|
|
|
|
|
|
|
|
|
|
|
|
| 1,006,644 |
| — |
| (1,006,644 | ) | — | cs |
|
|
|
|
|
|
|
|
|
|
|
| Healthcare - Products: 4.4% |
|
|
|
|
|
|
|
|
|
|
|
600 |
| — |
| (600 | ) | — |
| @ |
| American Medical Systems Holdings, Inc. |
| 5,394 |
| — |
| (5,394 | ) | — |
| 5,394 |
|
— |
| 99,350 |
| 23,341 |
| 122,691 |
|
|
| Baxter International, Inc. |
| — |
| 5,324,167 |
| 1,250,839 |
| 6,575,006 |
| — |
|
— |
| 38,800 |
| 9,116 |
| 47,916 |
|
|
| Becton Dickinson & Co. |
| — |
| 2,653,532 |
| 623,410 |
| 3,276,942 |
| — |
|
— |
| 237,350 |
| 55,762 |
| 293,112 |
| @ |
| Boston Scientific Corp. |
| — |
| 1,837,089 |
| 431,599 |
| 2,268,688 |
| — |
|
— |
| 79,100 |
| 18,583 |
| 97,683 |
| @@ |
| Covidien Ltd. |
| — |
| 2,866,584 |
| 673,464 |
| 3,540,048 |
| — |
|
3,900 |
| — |
| (3,900 | ) | — |
|
|
| Hill-Rom Holdings, Inc. |
| 64,194 |
| — |
| (64,194 | ) | — |
| 64,194 |
|
1,900 |
| — |
| (1,900 | ) | — |
| @, L |
| Inverness Medical Innovations, Inc. |
| 35,929 |
| — |
| (35,929 | ) | — |
| 35,929 |
|
65,100 |
| 446,650 |
| 39,834 |
| 551,584 |
|
|
| Johnson & Johnson |
| 3,894,933 |
| 26,723,070 |
| 2,383,281 |
| 33,001,284 |
| 3,894,933 |
|
5,500 |
| 177,850 |
| 36,283 |
| 219,633 |
|
|
| Medtronic, Inc. |
| 172,810 |
| 5,588,047 |
| 1,140,024 |
| 6,900,881 |
| 172,810 |
|
2,400 |
| — |
| (2,400 | ) | — |
| @ |
| Sirona Dental Systems, Inc. |
| 25,200 |
| — |
| (25,200 | ) | — |
| 25,200 |
|
1,800 |
| — |
| (1,800 | ) | — |
|
|
| Steris Corp. |
| 43,002 |
| — |
| (43,002 | ) | — |
| 43,002 |
|
— |
| 48,650 |
| 11,430 |
| 60,080 |
|
|
| Stryker Corp. |
| — |
| 1,943,568 |
| 456,614 |
| 2,400,182 |
| — |
|
9,100 |
| 36,650 |
| (490 | ) | 45,260 |
| @ |
| Zimmer Holdings, Inc. |
| 367,822 |
| 1,481,393 |
| (19,789 | ) | 1,829,426 |
| 367,822 |
|
|
|
|
|
|
|
|
|
|
|
|
| 4,609,284 |
| 48,417,450 |
| 6,765,723 |
| 59,792,457 | cs |
|
|
|
|
|
|
|
|
|
|
|
| Healthcare - Services: 1.0% |
|
|
|
|
|
|
|
|
|
|
|
80,300 |
| 76,850 |
| (62,245 | ) | 94,905 |
|
|
| Aetna, Inc. |
| 2,288,548 |
| 2,190,225 |
| (1,773,985 | ) | 2,704,788 |
| 2,288,548 |
|
8,400 |
| — |
| (8,400 | ) | — |
| @ |
| AMERIGROUP Corp. |
| 247,968 |
| — |
| (247,968 | ) | — |
| 247,968 |
|
6,300 |
| — |
| (6,300 | ) | — |
| L |
| Brookdale Senior Living, Inc. |
| 35,154 |
| — |
| (35,154 | ) | — |
| 35,154 |
|
8,900 |
| — |
| (8,900 | ) | — |
| @ |
| Centene Corp. |
| 175,419 |
| — |
| (175,419 | ) | — |
| 175,419 |
|
14,100 |
| — |
| (14,100 | ) | — |
|
|
| Cigna Corp. |
| 237,585 |
| — |
| (237,585 | ) | — |
| 237,585 |
|
2,300 |
| — |
| (2,300 | ) | — |
| @ |
| Community Health Systems, Inc. |
| 33,534 |
| — |
| (33,534 | ) | — |
| 33,534 |
|
7,900 |
| — |
| (7,900 | ) | — |
| @ |
| Coventry Health Care, Inc. |
| 117,552 |
| — |
| (117,552 | ) | — |
| 117,552 |
|
13,300 |
| — |
| (13,300 | ) | — |
| @ |
| Health Net, Inc. |
| 144,837 |
| — |
| (144,837 | ) | — |
| 144,837 |
|
4,000 |
| — |
| (4,000 | ) | — |
| @ |
| Healthspring, Inc. |
| 79,880 |
| — |
| (79,880 | ) | — |
| 79,880 |
|
5,500 |
| — |
| (5,500 | ) | — |
| @ |
| Kindred Healthcare, Inc. |
| 71,610 |
| — |
| (71,610 | ) | — |
| 71,610 |
|
7,300 |
| — |
| (7,300 | ) | — |
| @ |
| LifePoint Hospitals, Inc. |
| 166,732 |
| — |
| (166,732 | ) | — |
| 166,732 |
|
5,000 |
| — |
| (5,000 | ) | — |
| @ |
| Lincare Holdings, Inc. |
| 134,650 |
| — |
| (134,650 | ) | — |
| 134,650 |
|
1,200 |
| — |
| (1,200 | ) | — |
| @ |
| Magellan Health Services, Inc. |
| 46,992 |
| — |
| (46,992 | ) | — |
| 46,992 |
|
900 |
| — |
| (900 | ) | — |
| @, L |
| Molina Healthcare, Inc. |
| 15,849 |
| — |
| (15,849 | ) | — |
| 15,849 |
|
2,400 |
| — |
| (2,400 | ) | — |
| @ |
| Pediatrix Medical Group, Inc. |
| 76,080 |
| — |
| (76,080 | ) | — |
| 76,080 |
|
— |
| 194,750 |
| 45,754 |
| 240,504 |
|
|
| UnitedHealth Group, Inc. |
| — |
| 5,180,350 |
| 1,217,051 |
| 6,397,401 |
| — |
|
3,700 |
| — |
| (3,700 | ) | — |
|
|
| Universal Health Services, Inc. |
| 139,009 |
| — |
| (139,009 | ) | — |
| 139,009 |
|
3,900 |
| — |
| (3,900 | ) | — |
| @ |
| WellCare Health Plans, Inc. |
| 50,154 |
| — |
| (50,154 | ) | — |
| 50,154 |
|
53,300 |
| 83,350 |
| (33,718 | ) | 102,932 |
| @ |
| WellPoint, Inc. |
| 2,245,529 |
| 3,511,536 |
| (1,420,542 | ) | 4,336,523 |
| 2,245,529 |
|
|
|
|
|
|
|
|
|
|
|
|
| 6,307,082 |
| 10,882,111 |
| (3,750,481 | ) | 13,438,712 | cs |
|
|
|
|
|
|
|
|
|
|
|
| Home Builders: 0.0% |
|
|
|
|
|
|
|
|
|
|
|
7,900 |
| — |
| (7,900 | ) | — |
| L |
| Centex Corp. |
| 84,056 |
| — |
| (84,056 | ) | — |
| 84,056 |
|
3,700 |
| — |
| (3,700 | ) | — |
| L |
| KB Home |
| 50,394 |
| — |
| (50,394 | ) | — |
| 50,394 |
|
11,900 |
| — |
| (11,900 | ) | — |
|
|
| Lennar Corp. |
| 103,173 |
| — |
| (103,173 | ) | — |
| 103,173 |
|
1,000 |
| — |
| (1,000 | ) | — |
|
|
| MDC Holdings, Inc. |
| 30,300 |
| — |
| (30,300 | ) | — |
| 30,300 |
|
1,900 |
| — |
| (1,900 | ) | — |
| @ |
| Meritage Homes Corp. |
| 23,123 |
| — |
| (23,123 | ) | — |
| 23,123 |
|
1,400 |
| — |
| (1,400 | ) | — |
|
|
| Pulte Homes, Inc. |
| 15,302 |
| — |
| (15,302 | ) | — |
| 15,302 |
|
5,000 |
| — |
| (5,000 | ) | — |
|
|
| Ryland Group, Inc. |
| 88,350 |
| — |
| (88,350 | ) | — |
| 88,350 |
|
7,800 |
| — |
| (7,800 | ) | — |
| L |
| Thor Industries, Inc. |
| 102,804 |
| — |
| (102,804 | ) | — |
| 102,804 |
|
|
|
|
|
|
|
|
|
|
|
|
| 497,502 |
| — |
| (497,502 | ) | — | cs |
|
|
|
|
|
|
|
|
|
|
|
| Home Furnishings: 0.0% |
|
|
|
|
|
|
|
|
|
|
|
9,300 |
| — |
| (9,300 | ) | — |
|
|
| Harman International Industries, Inc. |
| 155,589 |
| — |
| (155,589 | ) | — |
| 155,589 |
|
11,200 |
| — |
| (11,200 | ) | — |
| L |
| Tempur-Pedic International, Inc. |
| 79,408 |
| — |
| (79,408 | ) | — |
| 79,408 |
|
|
|
|
|
|
|
|
|
|
|
|
| 234,997 |
| — |
| (234,997 | ) | — | cs |
|
|
|
|
|
|
|
|
|
|
|
| Household Products/Wares: 0.3% |
|
|
|
|
|
|
|
|
|
|
|
6,400 |
| — |
| (6,400 | ) | — |
|
|
| American Greetings Corp. |
| 48,448 |
| — |
| (48,448 | ) | — |
| 48,448 |
|
1,500 |
| — |
| (1,500 | ) | — |
| @ |
| Jarden Corp. |
| 17,250 |
| — |
| (17,250 | ) | — |
| 17,250 |
|
— |
| 66,400 |
| 15,600 |
| 82,000 |
|
|
| Kimberly-Clark Corp. |
| — |
| 3,501,936 |
| 822,731 |
| 4,324,667 |
| — |
|
2,700 |
| — |
| (2,700 | ) | — |
|
|
| Scotts Miracle-Gro Co. |
| 80,244 |
| — |
| (80,244 | ) | — |
| 80,244 |
|
|
|
|
|
|
|
|
|
|
|
|
| 145,942 |
| 3,501,936 |
| 676,789 |
| 4,324,667 | cs |
|
|
|
|
|
|
|
|
|
|
|
| Housewares: 0.0% |
|
|
|
|
|
|
|
|
|
|
|
6,300 |
| — |
| (6,300 | ) | — |
|
|
| Toro Co. |
| 207,900 |
| — |
| (207,900 | ) | — |
| 207,900 |
|
|
|
|
|
|
|
|
|
|
|
|
| 207,900 |
| — |
| (207,900 | ) | — | cs |
|
|
|
|
|
|
|
|
|
|
|
| Insurance: 2.0% |
|
|
|
|
|
|
|
|
|
|
|
— |
| 75,400 |
| 17,714 |
| 93,114 |
|
|
| Aflac, Inc. |
| — |
| 3,456,336 |
| 812,018 |
| 4,268,354 |
| — |
|
4,200 |
| — |
| (4,200 | ) | — |
|
|
| Allied World Assurance Holdings Ltd. |
| 170,520 |
| — |
| (170,520 | ) | — |
| 170,520 |
|
7,700 |
| 87,200 |
| 12,786 |
| 107,686 |
|
|
| Allstate Corp. |
| 252,252 |
| 2,856,672 |
| 418,883 |
| 3,527,807 |
| 252,252 |
|
9,500 |
| — |
| (9,500 | ) | — |
|
|
| American Financial Group, Inc. |
| 217,360 |
| — |
| (217,360 | ) | — |
| 217,360 |
|
— |
| 368,200 |
| 86,503 |
| 454,703 |
|
|
| American International Group, Inc. |
| — |
| 578,074 |
| 135,810 |
| 713,884 |
| — |
|
100 |
| — |
| (100 | ) | — |
|
|
| American National Insurance |
| 7,373 |
| — |
| (7,373 | ) | — |
| 7,373 |
|
600 |
| — |
| (600 | ) | — |
|
|
| Amtrust Financial Services, Inc. |
| 6,960 |
| — |
| (6,960 | ) | — |
| 6,960 |
|
1,700 |
| — |
| (1,700 | ) | — |
| @, @@ |
| Arch Capital Group Ltd. |
| 119,170 |
| — |
| (119,170 | ) | — |
| 119,170 |
|
7,900 |
| — |
| (7,900 | ) | — |
| @@ |
| Aspen Insurance Holdings Ltd. |
| 191,575 |
| — |
| (191,575 | ) | — |
| 191,575 |
|
4,000 |
| — |
| (4,000 | ) | — |
| @@, L |
| Assured Guaranty Ltd. |
| 45,600 |
| — |
| (45,600 | ) | — |
| 45,600 |
|
7,800 |
| — |
| (7,800 | ) | — |
| @@ |
| Axis Capital Holdings Ltd. |
| 227,136 |
| — |
| (227,136 | ) | — |
| 227,136 |
|
320 |
| — |
| (320 | ) | — |
| @ |
| Berkshire Hathaway, Inc. - Class B |
| 1,028,480 |
| — |
| (1,028,480 | ) | — |
| 1,028,480 |
|
10,600 |
| — |
| (10,600 | ) | — |
|
|
| Brown & Brown, Inc. |
| 221,540 |
| — |
| (221,540 | ) | — |
| 221,540 |
|
19,900 |
| 58,050 |
| (6,262 | ) | 71,688 |
|
|
| Chubb Corp. |
| 1,014,900 |
| 2,960,550 |
| (319,360 | ) | 3,656,090 |
| 1,014,900 |
|
4,300 |
| — |
| (4,300 | ) | — |
|
|
| Cincinnati Financial Corp. |
| 125,001 |
| — |
| (125,001 | ) | — |
| 125,001 |
|
9,600 |
| — |
| (9,600 | ) | — |
|
|
| CNA Financial Corp. |
| 157,824 |
| — |
| (157,824 | ) | — |
| 157,824 |
|
800 |
| — |
| (800 | ) | — |
| @ |
| CNA Surety Corp. |
| 15,360 |
| — |
| (15,360 | ) | — |
| 15,360 |
|
6,000 |
| — |
| (6,000 | ) | — |
| @ |
| Conseco, Inc. |
| 31,080 |
| — |
| (31,080 | ) | — |
| 31,080 |
|
5,800 |
| — |
| (5,800 | ) | — |
|
|
| Delphi Financial Group |
| 106,952 |
| — |
| (106,952 | ) | — |
| 106,952 |
|
4,700 |
| — |
| (4,700 | ) | — |
|
|
| Employers Holdings, Inc. |
| 77,550 |
| — |
| (77,550 | ) | — |
| 77,550 |
|
3,200 |
| — |
| (3,200 | ) | — |
| @@ |
| Endurance Specialty Holdings Ltd. |
| 97,696 |
| — |
| (97,696 | ) | — |
| 97,696 |
|
200 |
| — |
| (200 | ) | — |
| L |
| FBL Financial Group, Inc. |
| 3,090 |
| — |
| (3,090 | ) | — |
| 3,090 |
|
3,900 |
| — |
| (3,900 | ) | — |
|
|
| Fidelity National Title Group, Inc. |
| 69,225 |
| — |
| (69,225 | ) | — |
| 69,225 |
|
1,000 |
| — |
| (1,000 | ) | — |
|
|
| First American Corp. |
| 28,890 |
| — |
| (28,890 | ) | — |
| 28,890 |
|
300 |
| — |
| (300 | ) | — |
|
|
| Flagstone Reinsurance Holdings Ltd. |
| 2,931 |
| — |
| (2,931 | ) | — |
| 2,931 |
|
21,800 |
| — |
| (21,800 | ) | — |
|
|
| Genworth Financial, Inc. |
| 61,694 |
| — |
| (61,694 | ) | — |
| 61,694 |
|
3,500 |
| — |
| (3,500 | ) | — |
|
|
| Hanover Insurance Group, Inc. |
| 150,395 |
| — |
| (150,395 | ) | — |
| 150,395 |
|
1,600 |
| — |
| (1,600 | ) | — |
|
|
| Harleysville Group, Inc. |
| 55,568 |
| — |
| (55,568 | ) | — |
| 55,568 |
|
5,400 |
| 50,000 |
| 6,347 |
| 61,747 |
|
|
| Hartford Financial Services Group, Inc. |
| 88,668 |
| 821,000 |
| 104,215 |
| 1,013,883 |
| 88,668 |
|
5,200 |
| — |
| (5,200 | ) | — |
|
|
| HCC Insurance Holdings, Inc. |
| 139,100 |
| — |
| (139,100 | ) | — |
| 139,100 |
|
200 |
| — |
| (200 | ) | — |
|
|
| Infinity Property & Casualty Corp. |
| 9,346 |
| — |
| (9,346 | ) | — |
| 9,346 |
|
6,300 |
| — |
| (6,300 | ) | — |
| @@ |
| IPC Holdings Ltd. |
| 188,370 |
| — |
| (188,370 | ) | — |
| 188,370 |
|
9,100 |
| — |
| (9,100 | ) | — |
|
|
| Lincoln National Corp. |
| 171,444 |
| — |
| (171,444 | ) | — |
| 171,444 |
|
29,545 |
| 49,772 |
| (17,852 | ) | 61,465 |
|
|
| Loews Corp. |
| 834,646 |
| 1,406,059 |
| (504,312 | ) | 1,736,393 |
| 834,646 |
|
6,500 |
| — |
| (6,500 | ) | — |
| @@ |
| Max Re Capital Ltd. |
| 115,050 |
| — |
| (115,050 | ) | — |
| 115,050 |
|
— |
| 79,750 |
| 18,736 |
| 98,486 |
|
|
| Metlife, Inc. |
| — |
| 2,780,085 |
| 653,142 |
| 3,433,227 |
| — |
|
11,900 |
| — |
| (11,900 | ) | — |
|
|
| MGIC Investment Corp. |
| 41,412 |
| — |
| (41,412 | ) | — |
| 41,412 |
|
2,700 |
| — |
| (2,700 | ) | — |
| @@ |
| Montpelier Re Holdings Ltd. |
| 45,333 |
| — |
| (45,333 | ) | — |
| 45,333 |
|
1,300 |
| — |
| (1,300 | ) | — |
|
|
| Nationwide Financial Services |
| 67,873 |
| — |
| (67,873 | ) | — |
| 67,873 |
|
800 |
| — |
| (800 | ) | — |
| @ |
| Navigators Group, Inc. |
| 43,928 |
| — |
| (43,928 | ) | — |
| 43,928 |
|
4,300 |
| — |
| (4,300 | ) | — |
|
|
| Odyssey Re Holdings Corp. |
| 222,783 |
| — |
| (222,783 | ) | — |
| 222,783 |
|
6,800 |
| — |
| (6,800 | ) | — |
|
|
| Old Republic International Corp. |
| 81,056 |
| — |
| (81,056 | ) | — |
| 81,056 |
|
2,000 |
| — |
| (2,000 | ) | — |
|
|
| OneBeacon Insurance Group Ltd. |
| 20,880 |
| — |
| (20,880 | ) | — |
| 20,880 |
|
2,600 |
| — |
| (2,600 | ) | — |
| @@ |
| PartnerRe Ltd. |
| 185,302 |
| — |
| (185,302 | ) | — |
| 185,302 |
|
5,500 |
| — |
| (5,500 | ) | — |
|
|
| Phoenix Cos., Inc. |
| 17,985 |
| — |
| (17,985 | ) | — |
| 17,985 |
|
6,000 |
| — |
| (6,000 | ) | — |
| @@ |
| Platinum Underwriters Holdings Ltd. |
| 216,480 |
| — |
| (216,480 | ) | — |
| 216,480 |
|
2,500 |
| — |
| (2,500 | ) | — |
| @ |
| ProAssurance Corp. |
| 131,950 |
| — |
| (131,950 | ) | — |
| 131,950 |
|
12,600 |
| — |
| (12,600 | ) | — |
|
|
| Protective Life Corp. |
| 180,810 |
| — |
| (180,810 | ) | — |
| 180,810 |
|
22,100 |
| 68,850 |
| (5,925 | ) | 85,025 |
|
|
| Prudential Financial, Inc. |
| 668,746 |
| 2,083,401 |
| (179,280 | ) | 2,572,867 |
| 668,746 |
|
1,900 |
| — |
| (1,900 | ) | — |
|
|
| RLI Corp. |
| 116,204 |
| — |
| (116,204 | ) | — |
| 116,204 |
|
4,200 |
| — |
| (4,200 | ) | — |
|
|
| Selective Insurance Group |
| 96,306 |
| — |
| (96,306 | ) | — |
| 96,306 |
|
4,400 |
| — |
| (4,400 | ) | — |
|
|
| Stancorp Financial Group, Inc. |
| 183,788 |
| — |
| (183,788 | ) | — |
| 183,788 |
|
400 |
| — |
| (400 | ) | — |
|
|
| State Auto Financial Corp. |
| 12,024 |
| — |
| (12,024 | ) | — |
| 12,024 |
|
1,100 |
| — |
| (1,100 | ) | — |
|
|
| Transatlantic Holdings, Inc. |
| 44,066 |
| — |
| (44,066 | ) | — |
| 44,066 |
|
14,900 |
| 95,750 |
| 7,595 |
| 118,245 |
|
|
| Travelers Cos., Inc. |
| 673,480 |
| 4,327,900 |
| 343,300 |
| 5,344,680 |
| 673,480 |
|
800 |
| — |
| (800 | ) | — |
|
|
| United Fire & Casualty Co. |
| 24,856 |
| — |
| (24,856 | ) | — |
| 24,856 |
|
5,400 |
| — |
| (5,400 | ) | — |
|
|
| Unitrin, Inc. |
| 86,076 |
| — |
| (86,076 | ) | — |
| 86,076 |
|
2,600 |
| — |
| (2,600 | ) | — |
| @ |
| Universal American Financial Corp. |
| 22,932 |
| — |
| (22,932 | ) | — |
| 22,932 |
|
300 |
| — |
| (300 | ) | — |
|
|
| Validus Holdings Ltd. |
| 7,848 |
| — |
| (7,848 | ) | — |
| 7,848 |
|
9,200 |
| — |
| (9,200 | ) | — |
|
|
| WR Berkley Corp. |
| 285,200 |
| — |
| (285,200 | ) | — |
| 285,200 |
|
9,200 |
| — |
| (9,200 | ) | — |
| @@ |
| XL Capital, Ltd. |
| 34,040 |
| — |
| (34,040 | ) | — |
| 34,040 |
|
2,000 |
| — |
| (2,000 | ) | — |
|
|
| Zenith National Insurance Corp. |
| 63,140 |
| — |
| (63,140 | ) | — |
| 63,140 |
|
|
|
|
|
|
|
|
|
|
|
|
| 9,607,244 |
| 21,270,077 |
| (4,610,136 | ) | 26,267,185 | cs |
|
|
|
|
|
|
|
|
|
|
|
| Internet: 1.9% |
|
|
|
|
|
|
|
|
|
|
|
11,600 |
| — |
| (11,600 | ) | — |
| @ |
| Akamai Technologies, Inc. |
| 175,044 |
| — |
| (175,044 | ) | — |
| 175,044 |
|
— |
| 49,850 |
| 11,712 |
| 61,562 |
| @ |
| Amazon.com, Inc. |
| — |
| 2,556,308 |
| 600,569 |
| 3,156,877 |
| — |
|
9,800 |
| — |
| (9,800 | ) | — |
| @ |
| Avocent Corp. |
| 175,518 |
| — |
| (175,518 | ) | — |
| 175,518 |
|
7,400 |
| — |
| (7,400 | ) | — |
| @ |
| Digital River, Inc. |
| 183,520 |
| — |
| (183,520 | ) | — |
| 183,520 |
|
16,400 |
| — |
| (16,400 | ) | — |
| @, L |
| Earthlink, Inc. |
| 110,864 |
| — |
| (110,864 | ) | — |
| 110,864 |
|
28,200 |
| 176,000 |
| 13,149 |
| 217,349 |
| @ |
| eBay, Inc. |
| 393,672 |
| 2,456,960 |
| 183,557 |
| 3,034,189 |
| 393,672 |
|
19,900 |
| — |
| (19,900 | ) | — |
| @ |
| Expedia, Inc. |
| 163,976 |
| — |
| (163,976 | ) | — |
| 163,976 |
|
11,500 |
| — |
| (11,500 | ) | — |
| @ |
| F5 Networks, Inc. |
| 262,890 |
| — |
| (262,890 | ) | — |
| 262,890 |
|
2,200 |
| 37,650 |
| 6,645 |
| 46,495 |
| @ |
| Google, Inc. - Class A |
| 676,830 |
| 11,583,023 |
| 2,044,440 |
| 14,304,293 |
| 676,830 |
|
200 |
| — |
| (200 | ) | — |
| @ |
| IAC/InterActiveCorp |
| 3,146 |
| — |
| (3,146 | ) | — |
| 3,146 |
|
10,000 |
| — |
| (10,000 | ) | — |
| @ |
| j2 Global Communications, Inc. |
| 200,400 |
| — |
| (200,400 | ) | — |
| 200,400 |
|
34,800 |
| — |
| (34,800 | ) | — |
| @ |
| Liberty Media Corp. - Interactive - Class A |
| 108,576 |
| — |
| (108,576 | ) | — |
| 108,576 |
|
8,400 |
| — |
| (8,400 | ) | — |
| @, L |
| NetFlix, Inc. |
| 251,076 |
| — |
| (251,076 | ) | — |
| 251,076 |
|
2,900 |
| — |
| (2,900 | ) | — |
| @ |
| Priceline.com, Inc. |
| 213,585 |
| — |
| (213,585 | ) | — |
| 213,585 |
|
1,500 |
| — |
| (1,500 | ) | — |
| @ |
| RealNetworks, Inc. |
| 5,295 |
| — |
| (5,295 | ) | — |
| 5,295 |
|
14,900 |
| — |
| (14,900 | ) | — |
| @ |
| Sapient Corp. |
| 66,156 |
| — |
| (66,156 | ) | — |
| 66,156 |
|
2,800 |
| — |
| (2,800 | ) | — |
| @, @@ |
| Sohucom, Inc. |
| 132,552 |
| — |
| (132,552 | ) | — |
| 132,552 |
|
173,900 |
| 133,200 |
| (142,607 | ) | 164,493 |
| @ |
| Symantec Corp. |
| 2,351,128 |
| 1,800,864 |
| (1,928,040 | ) | 2,223,952 |
| 2,351,128 |
|
37,700 |
| — |
| (37,700 | ) | — |
| @ |
| TIBCO Software, Inc. |
| 195,663 |
| — |
| (195,663 | ) | — |
| 195,663 |
|
16,300 |
| — |
| (16,300 | ) | — |
| @ |
| Valueclick, Inc. |
| 111,492 |
| — |
| (111,492 | ) | — |
| 111,492 |
|
8,900 |
| — |
| (8,900 | ) | — |
| @ |
| VeriSign, Inc. |
| 169,812 |
| — |
| (169,812 | ) | — |
| 169,812 |
|
— |
| 218,600 |
| 51,357 |
| 269,957 |
| @ |
| Yahoo!, Inc. |
| — |
| 2,666,920 |
| 626,556 |
| 3,293,476 |
| — |
|
|
|
|
|
|
|
|
|
|
|
|
| 5,951,195 |
| 21,064,075 |
| (1,002,483 | ) | 26,012,787 | cs |
|
|
|
|
|
|
|
|
|
|
|
| Iron/Steel: 0.3% |
|
|
|
|
|
|
|
|
|
|
|
19,100 |
| — |
| (19,100 | ) | — |
|
|
| AK Steel Holding Corp. |
| 178,012 |
| — |
| (178,012 | ) | — |
| 178,012 |
|
5,900 |
| — |
| (5,900 | ) | — |
|
|
| Allegheny Technologies, Inc. |
| 150,627 |
| — |
| (150,627 | ) | — |
| 150,627 |
|
9,700 |
| — |
| (9,700 | ) | — |
|
|
| Carpenter Technology Corp. |
| 199,238 |
| — |
| (199,238 | ) | — |
| 199,238 |
|
41,400 |
| 50,150 |
| (29,618 | ) | 61,932 |
|
|
| Nucor Corp. |
| 1,912,680 |
| 2,316,930 |
| (1,368,350 | ) | 2,861,260 |
| 1,912,680 |
|
500 |
| — |
| (500 | ) | — |
|
|
| Olympic Steel, Inc. |
| 10,185 |
| — |
| (10,185 | ) | — |
| 10,185 |
|
7,400 |
| — |
| (7,400 | ) | — |
|
|
| Reliance Steel & Aluminum Co. |
| 147,556 |
| — |
| (147,556 | ) | — |
| 147,556 |
|
5,800 |
| — |
| (5,800 | ) | — |
|
|
| Schnitzer Steel Industries, Inc. |
| 218,370 |
| — |
| (218,370 | ) | — |
| 218,370 |
|
6,800 |
| 18,800 |
| (2,383 | ) | 23,217 |
|
|
| United States Steel Corp. |
| 252,960 |
| 699,360 |
| (88,655 | ) | 863,665 |
| 252,960 |
|
|
|
|
|
|
|
|
|
|
|
|
| 3,069,628 |
| 3,016,290 |
| (2,360,993 | ) | 3,724,925 | cs |
|
|
|
|
|
|
|
|
|
|
|
| Leisure Time: 0.1% |
|
|
|
|
|
|
|
|
|
|
|
17,100 |
| — |
| (17,100 | ) | — |
|
|
| Brunswick Corp. |
| 71,991 |
| — |
| (71,991 | ) | — |
| 71,991 |
|
12,100 |
| — |
| (12,100 | ) | — |
|
|
| Callaway Golf Co. |
| 112,409 |
| — |
| (112,409 | ) | — |
| 112,409 |
|
11,500 |
| 69,150 |
| 4,746 |
| 85,396 |
|
|
| Carnival Corp. |
| 279,680 |
| 1,681,728 |
| 115,419 |
| 2,076,827 |
| 279,680 |
|
3,180 |
| — |
| (3,180 | ) | — |
| @ |
| Interval Leisure Group, Inc. |
| 17,140 |
| — |
| (17,140 | ) | — |
| 17,140 |
|
2,900 |
| — |
| (2,900 | ) | — |
| @, L |
| Life Time Fitness, Inc. |
| 37,555 |
| — |
| (37,555 | ) | — |
| 37,555 |
|
3,500 |
| — |
| (3,500 | ) | — |
| L |
| Polaris Industries, Inc. |
| 100,275 |
| — |
| (100,275 | ) | — |
| 100,275 |
|
6,700 |
| — |
| (6,700 | ) | — |
| @ |
| WMS Industries, Inc. |
| 180,230 |
| — |
| (180,230 | ) | — |
| 180,230 |
|
|
|
|
|
|
|
|
|
|
|
|
| 799,280 |
| 1,681,728 |
| (404,181 | ) | 2,076,827 | cs |
|
|
|
|
|
|
|
|
|
|
|
| Lodging: 0.0% |
|
|
|
|
|
|
|
|
|
|
|
1,600 |
| — |
| (1,600 | ) | — |
|
|
| Ameristar Casinos, Inc. |
| 13,824 |
| — |
| (13,824 | ) | — |
| 13,824 |
|
15,500 |
| — |
| (15,500 | ) | — |
| L |
| Boyd Gaming Corp. |
| 73,315 |
| — |
| (73,315 | ) | — |
| 73,315 |
|
— |
| 16,700 |
| 3,923 |
| 20,623 |
| @ |
| Las Vegas Sands Corp. |
| — |
| 99,031 |
| 23,266 |
| 122,297 |
| — |
|
18,400 |
| — |
| (18,400 | ) | — |
|
|
| Wyndham Worldwide Corp. |
| 120,520 |
| — |
| (120,520 | ) | — |
| 120,520 |
|
|
|
|
|
|
|
|
|
|
|
|
| 207,659 |
| 99,031 |
| (184,393 | ) | 122,297 | cs |
|
|
|
|
|
|
|
|
|
|
|
| Machinery - Construction & Mining: 0.4% |
|
|
|
|
|
|
|
|
|
|
|
7,300 |
| — |
| (7,300 | ) | — |
|
|
| Bucyrus International, Inc. |
| 135,196 |
| — |
| (135,196 | ) | — |
| 135,196 |
|
37,400 |
| 97,700 |
| (14,447 | ) | 120,653 |
|
|
| Caterpillar, Inc. |
| 1,670,658 |
| 4,364,259 |
| (645,336 | ) | 5,389,581 |
| 1,670,658 |
|
5,900 |
| — |
| (5,900 | ) | — |
|
|
| Joy Global, Inc. |
| 135,051 |
| — |
| (135,051 | ) | — |
| 135,051 |
|
4,500 |
| — |
| (4,500 | ) | — |
| @ |
| Terex Corp. |
| 77,940 |
| — |
| (77,940 | ) | — |
| 77,940 |
|
|
|
|
|
|
|
|
|
|
|
|
| 2,018,845 |
| 4,364,259 |
| (993,523 | ) | 5,389,581 | cs |
|
|
|
|
|
|
|
|
|
|
|
| Machinery - Diversified: 0.2% |
|
|
|
|
|
|
|
|
|
|
|
900 |
| — |
| (900 | ) | — |
| @ |
| AGCO Corp. |
| 21,231 |
| — |
| (21,231 | ) | — |
| 21,231 |
|
4,700 |
| — |
| (4,700 | ) | — |
|
|
| Applied Industrial Technologies, Inc. |
| 88,924 |
| — |
| (88,924 | ) | — |
| 88,924 |
|
4,800 |
| — |
| (4,800 | ) | — |
| L |
| Briggs & Stratton Corp. |
| 84,432 |
| — |
| (84,432 | ) | — |
| 84,432 |
|
1,700 |
| — |
| (1,700 | ) | — |
| @ |
| Chart Industries, Inc. |
| 18,071 |
| — |
| (18,071 | ) | — |
| 18,071 |
|
1,900 |
| — |
| (1,900 | ) | — |
|
|
| Cognex Corp. |
| 28,120 |
| — |
| (28,120 | ) | — |
| 28,120 |
|
36,900 |
| — |
| (36,900 | ) | — |
|
|
| Cummins, Inc. |
| 986,337 |
| — |
| (986,337 | ) | — |
| 986,337 |
|
7,400 |
| 68,300 |
| 8,646 |
| 84,346 |
|
|
| Deere & Co. |
| 283,568 |
| 2,617,256 |
| 331,320 |
| 3,232,144 |
| 283,568 |
|
800 |
| — |
| (800 | ) | — |
|
|
| Flowserve Corp. |
| 41,200 |
| — |
| (41,200 | ) | — |
| 41,200 |
|
8,658 |
| — |
| (8,658 | ) | — |
| @ |
| Gardner Denver, Inc. |
| 202,078 |
| — |
| (202,078 | ) | — |
| 202,078 |
|
5,000 |
| — |
| (5,000 | ) | — |
|
|
| Graco, Inc. |
| 118,650 |
| — |
| (118,650 | ) | — |
| 118,650 |
|
7,000 |
| — |
| (7,000 | ) | — |
|
|
| IDEX Corp. |
| 169,050 |
| — |
| (169,050 | ) | — |
| 169,050 |
|
3,200 |
| — |
| (3,200 | ) | — |
| @ |
| Intermec, Inc. |
| 42,496 |
| — |
| (42,496 | ) | — |
| 42,496 |
|
18,100 |
| — |
| (18,100 | ) | — |
|
|
| Manitowoc Co., Inc. |
| 156,746 |
| — |
| (156,746 | ) | — |
| 156,746 |
|
3,900 |
| — |
| (3,900 | ) | — |
|
|
| Nordson Corp. |
| 125,931 |
| — |
| (125,931 | ) | — |
| 125,931 |
|
6,100 |
| — |
| (6,100 | ) | — |
|
|
| Robbins & Myers, Inc. |
| 98,637 |
| — |
| (98,637 | ) | — |
| 98,637 |
|
6,100 |
| — |
| (6,100 | ) | — |
|
|
| Rockwell Automation, Inc. |
| 196,664 |
| — |
| (196,664 | ) | — |
| 196,664 |
|
1,700 |
| — |
| (1,700 | ) | — |
|
|
| Roper Industries, Inc. |
| 73,797 |
| — |
| (73,797 | ) | — |
| 73,797 |
|
300 |
| — |
| (300 | ) | — |
|
|
| Sauer-Danfoss, Inc. |
| 2,625 |
| — |
| (2,625 | ) | — |
| 2,625 |
|
300 |
| — |
| (300 | ) | — |
|
|
| Wabtec Corp. |
| 11,925 |
| — |
| (11,925 | ) | — |
| 11,925 |
|
8,700 |
| — |
| (8,700 | ) | — |
| @ |
| Zebra Technologies Corp. |
| 176,262 |
| — |
| (176,262 | ) | — |
| 176,262 |
|
|
|
|
|
|
|
|
|
|
|
|
| 2,926,744 |
| 2,617,256 |
| (2,311,856 | ) | 3,232,144 | cs |
|
|
|
|
|
|
|
|
|
|
|
| Media: 2.5% |
|
|
|
|
|
|
|
|
|
|
|
10,900 |
| — |
| (10,900 | ) | — |
|
|
| Cablevision Systems Corp. |
| 183,556 |
| — |
| (183,556 | ) | — |
| 183,556 |
|
140,900 |
| — |
| (140,900 | ) | — |
|
|
| CBS Corp. - Class B |
| 1,153,971 |
| — |
| (1,153,971 | ) | — |
| 1,153,971 |
|
700 |
| — |
| (700 | ) | — |
| @, @@, L |
| Central European Media Enterprises Ltd. |
| 15,204 |
| — |
| (15,204 | ) | — |
| 15,204 |
|
— |
| 444,550 |
| 104,441 |
| 548,991 |
|
|
| Comcast Corp. - Class A |
| — |
| 7,504,004 |
| 1,762,961 |
| 9,266,965 |
| — |
|
3,700 |
| — |
| (3,700 | ) | — |
| @, L |
| Cox Radio, Inc. |
| 22,237 |
| — |
| (22,237 | ) | — |
| 22,237 |
|
25,700 |
| 94,400 |
| (3,522 | ) | 116,578 |
| @ |
| DIRECTV Group, Inc. |
| 588,787 |
| 2,162,704 |
| (80,690 | ) | 2,670,801 |
| 588,787 |
|
15,300 |
| — |
| (15,300 | ) | — |
| @ |
| Dish Network Corp. |
| 169,677 |
| — |
| (169,677 | ) | — |
| 169,677 |
|
3,200 |
| — |
| (3,200 | ) | — |
| L |
| Factset Research Systems, Inc. |
| 141,568 |
| — |
| (141,568 | ) | — |
| 141,568 |
|
14,600 |
| — |
| (14,600 | ) | — |
| L |
| Gannett Co., Inc. |
| 116,800 |
| — |
| (116,800 | ) | — |
| 116,800 |
|
500 |
| — |
| (500 | ) | — |
|
|
| Hearst-Argyle Television, Inc. |
| 3,030 |
| — |
| (3,030 | ) | — |
| 3,030 |
|
3,000 |
| — |
| (3,000 | ) | — |
| @ |
| Liberty Media Corp. - Capital Shares A |
| 14,130 |
| — |
| (14,130 | ) | — |
| 14,130 |
|
9,400 |
| — |
| (9,400 | ) | — |
| @ |
| Liberty Media Corp. - Entertainment |
| 164,312 |
| — |
| (164,312 | ) | — |
| 164,312 |
|
19,600 |
| — |
| (19,600 | ) | — |
|
|
| McGraw-Hill Cos., Inc. |
| 454,524 |
| — |
| (454,524 | ) | — |
| 454,524 |
|
200 |
| — |
| (200 | ) | — |
| @ |
| Mediacom Communications Corp. |
| 860 |
| — |
| (860 | ) | — |
| 860 |
|
9,400 |
| — |
| (9,400 | ) | — |
| L |
| Meredith Corp. |
| 160,928 |
| — |
| (160,928 | ) | — |
| 160,928 |
|
119,200 |
| 367,450 |
| (32,873 | ) | 453,777 |
|
|
| News Corp. - Class A |
| 1,083,528 |
| 3,340,121 |
| (298,813 | ) | 4,124,836 |
| 1,083,528 |
|
4,900 |
| — |
| (4,900 | ) | — |
|
|
| Scholastic Corp. |
| 66,542 |
| — |
| (66,542 | ) | — |
| 66,542 |
|
— |
| 24,650 |
| 5,791 |
| 30,441 |
| @ |
| Time Warner Cable, Inc. |
| — |
| 528,743 |
| 124,221 |
| 652,964 |
| — |
|
270,900 |
| 567,450 |
| (137,585 | ) | 700,765 |
|
|
| Time Warner, Inc. |
| 2,725,254 |
| 5,708,547 |
| (1,384,110 | ) | 7,049,691 |
| 2,725,254 |
|
15,600 |
| 88,800 |
| 5,262 |
| 109,662 |
| @ |
| Viacom - Class B |
| 297,336 |
| 1,692,528 |
| 100,300 |
| 2,090,164 |
| 297,336 |
|
43,300 |
| 302,100 |
| 27,674 |
| 373,074 |
|
|
| Walt Disney Co. |
| 982,477 |
| 6,854,649 |
| 627,927 |
| 8,465,053 |
| 982,477 |
|
|
|
|
|
|
|
|
|
|
|
|
| 8,344,721 |
| 27,791,296 |
| (1,815,543 | ) | 34,320,474 | cs |
|
|
|
|
|
|
|
|
|
|
|
| Metal Fabricate/Hardware: 0.0% |
|
|
|
|
|
|
|
|
|
|
|
2,700 |
| — |
| (2,700 | ) | — |
|
|
| CIRCOR International, Inc. |
| 74,250 |
| — |
| (74,250 | ) | — |
| 74,250 |
|
13,400 |
| — |
| (13,400 | ) | — |
|
|
| Commercial Metals Co. |
| 159,058 |
| — |
| (159,058 | ) | — |
| 159,058 |
|
5,900 |
| — |
| (5,900 | ) | — |
|
|
| Mueller Industries, Inc. |
| 147,972 |
| — |
| (147,972 | ) | — |
| 147,972 |
|
10,100 |
| — |
| (10,100 | ) | — |
| L |
| Mueller Water Products, Inc. |
| 84,840 |
| — |
| (84,840 | ) | — |
| 84,840 |
|
8,200 |
| — |
| (8,200 | ) | — |
|
|
| Precision Castparts Corp. |
| 487,736 |
| — |
| (487,736 | ) | — |
| 487,736 |
|
13,100 |
| — |
| (13,100 | ) | — |
|
|
| Timken Co. |
| 257,153 |
| — |
| (257,153 | ) | — |
| 257,153 |
|
8,200 |
| — |
| (8,200 | ) | — |
| L |
| Worthington Industries |
| 90,364 |
| — |
| (90,364 | ) | — |
| 90,364 |
|
|
|
|
|
|
|
|
|
|
|
|
| 1,301,373 |
| — |
| (1,301,373 | ) | — | cs |
|
|
|
|
|
|
|
|
|
|
|
| Mining: 0.6% |
|
|
|
|
|
|
|
|
|
|
|
123,400 |
| 129,300 |
| (93,023 | ) | 159,677 |
|
|
| Alcoa, Inc. |
| 1,389,484 |
| 1,455,918 |
| (1,047,436 | ) | 1,797,966 |
| 1,389,484 |
|
10,600 |
| — |
| (10,600 | ) | — |
| @, L |
| Century Aluminum Co. |
| 106,000 |
| — |
| (106,000 | ) | — |
| 106,000 |
|
800 |
| — |
| (800 | ) | — |
|
|
| Compass Minerals International, Inc. |
| 46,928 |
| — |
| (46,928 | ) | — |
| 46,928 |
|
50,500 |
| 60,700 |
| (36,239 | ) | 74,961 |
|
|
| Freeport-McMoRan Copper & Gold, Inc. |
| 1,234,220 |
| 1,483,508 |
| (885,690 | ) | 1,832,038 |
| 1,234,220 |
|
1,600 |
| — |
| (1,600 | ) | — |
| L |
| Kaiser Aluminum Corp. |
| 36,032 |
| — |
| (36,032 | ) | — |
| 36,032 |
|
— |
| 69,300 |
| 16,281 |
| 85,581 |
|
|
| Newmont Mining Corp. |
| — |
| 2,820,510 |
| 662,640 |
| 3,483,150 |
| — |
|
300 |
| — |
| (300 | ) | — |
| @ |
| RTI International Metals, Inc. |
| 4,293 |
| — |
| (4,293 | ) | — |
| 4,293 |
|
115,600 |
| 34,900 |
| (107,401 | ) | 43,099 |
| L |
| Southern Copper Corp. |
| 1,856,536 |
| 560,494 |
| (1,724,856 | ) | 692,174 |
| 1,856,536 |
|
|
|
|
|
|
|
|
|
|
|
|
| 4,673,493 |
| 6,320,430 |
| (3,188,595 | ) | 7,805,328 | cs |
|
|
|
|
|
|
|
|
|
|
|
| Miscellaneous Manufacturing: 4.0% |
|
|
|
|
|
|
|
|
|
|
|
13,300 |
| 111,550 |
| 12,907 |
| 137,757 |
|
|
| 3M Co. |
| 765,282 |
| 6,418,587 |
| 742,676 |
| 7,926,545 |
| 765,282 |
|
3,900 |
| — |
| (3,900 | ) | — |
|
|
| Actuant Corp. |
| 74,178 |
| — |
| (74,178 | ) | — |
| 74,178 |
|
6,600 |
| — |
| (6,600 | ) | — |
|
|
| Acuity Brands, Inc. |
| 230,406 |
| — |
| (230,406 | ) | — |
| 230,406 |
|
100 |
| — |
| (100 | ) | — |
|
|
| Ameron International Corp. |
| 6,292 |
| — |
| (6,292 | ) | — |
| 6,292 |
|
3,700 |
| — |
| (3,700 | ) | — |
|
|
| AO Smith Corp. |
| 109,224 |
| — |
| (109,224 | ) | — |
| 109,224 |
|
2,600 |
| — |
| (2,600 | ) | — |
|
|
| Barnes Group, Inc. |
| 37,700 |
| — |
| (37,700 | ) | — |
| 37,700 |
|
3,400 |
| — |
| (3,400 | ) | — |
|
|
| Brink’s Co. |
| 91,392 |
| — |
| (91,392 | ) | — |
| 91,392 |
|
800 |
| — |
| (800 | ) | — |
|
|
| Carlisle Cos., Inc. |
| 16,560 |
| — |
| (16,560 | ) | — |
| 16,560 |
|
6,500 |
| — |
| (6,500 | ) | — |
| @, L |
| Ceradyne, Inc. |
| 132,015 |
| — |
| (132,015 | ) | — |
| 132,015 |
|
3,900 |
| — |
| (3,900 | ) | — |
|
|
| Cooper Industries Ltd. |
| 113,997 |
| — |
| (113,997 | ) | — |
| 113,997 |
|
6,100 |
| — |
| (6,100 | ) | — |
|
|
| Crane Co. |
| 105,164 |
| — |
| (105,164 | ) | — |
| 105,164 |
|
— |
| 40,600 |
| 9,538 |
| 50,138 |
|
|
| Danaher Corp. |
| — |
| 2,298,366 |
| 539,969 |
| 2,838,335 |
| — |
|
9,000 |
| — |
| (9,000 | ) | — |
|
|
| Dover Corp. |
| 296,280 |
| — |
| (296,280 | ) | — |
| 296,280 |
|
400 |
| — |
| (400 | ) | — |
|
|
| Eaton Corp. |
| 19,884 |
| — |
| (19,884 | ) | — |
| 19,884 |
|
4,000 |
| — |
| (4,000 | ) | — |
| @ |
| EnPro Industries, Inc. |
| 86,160 |
| — |
| (86,160 | ) | — |
| 86,160 |
|
220,700 |
| 1,662,500 |
| 169,881 |
| 2,053,081 |
|
|
| General Electric Co. |
| 3,575,340 |
| 26,932,478 |
| 2,752,071 |
| 33,259,889 |
| 3,575,340 |
|
6,700 |
| — |
| (6,700 | ) | — |
|
|
| Harsco Corp. |
| 185,456 |
| — |
| (185,456 | ) | — |
| 185,456 |
|
28,700 |
| 117,600 |
| (1,072 | ) | 145,228 |
|
|
| Honeywell International, Inc. |
| 942,221 |
| 3,860,808 |
| (35,178 | ) | 4,767,851 |
| 942,221 |
|
21,200 |
| 74,500 |
| (3,697 | ) | 92,003 |
|
|
| Illinois Tool Works, Inc. |
| 743,060 |
| 2,611,225 |
| (129,589 | ) | 3,224,696 |
| 743,060 |
|
42,000 |
| — |
| (42,000 | ) | — |
| @@ |
| Ingersoll-Rand Co. |
| 728,700 |
| — |
| (728,700 | ) | — |
| 728,700 |
|
1,800 |
| — |
| (1,800 | ) | — |
|
|
| Koppers Holdings, Inc. |
| 38,916 |
| — |
| (38,916 | ) | — |
| 38,916 |
|
35,200 |
| — |
| (35,200 | ) | — |
|
|
| Parker Hannifin Corp. |
| 1,497,408 |
| — |
| (1,497,408 | ) | — |
| 1,497,408 |
|
10,200 |
| — |
| (10,200 | ) | — |
|
|
| Trinity Industries, Inc. |
| 160,752 |
| — |
| (160,752 | ) | — |
| 160,752 |
|
4,000 |
| 76,200 |
| 13,902 |
| 94,102 |
| @@ |
| Tyco International Ltd. |
| 86,400 |
| 1,645,920 |
| 300,286 |
| 2,032,606 |
| 86,400 |
|
|
|
|
|
|
|
|
|
|
|
|
| 10,042,787 |
| 43,767,384 |
| 239,751 |
| 54,049,922 | cs |
|
|
|
|
|
|
|
|
|
|
|
| Office Furnishings: 0.0% |
|
|
|
|
|
|
|
|
|
|
|
7,400 |
| — |
| (7,400 | ) | — |
|
|
| Herman Miller, Inc. |
| 96,422 |
| — |
| (96,422 | ) | — |
| 96,422 |
|
8,200 |
| — |
| (8,200 | ) | — |
| L |
| HNI, Corp. |
| 129,888 |
| — |
| (129,888 | ) | — |
| 129,888 |
|
7,000 |
| — |
| (7,000 | ) | — |
|
|
| Interface, Inc. |
| 32,480 |
| — |
| (32,480 | ) | — |
| 32,480 |
|
20,600 |
| — |
| (20,600 | ) | — |
|
|
| Steelcase, Inc. |
| 115,772 |
| — |
| (115,772 | ) | — |
| 115,772 |
|
|
|
|
|
|
|
|
|
|
|
|
| 374,562 |
| — |
| (374,562 | ) | — | cs |
|
|
|
|
|
|
|
|
|
|
|
| Office/Business Equipment: 0.0% |
|
|
|
|
|
|
|
|
|
|
|
8,500 |
| — |
| (8,500 | ) | — |
|
|
| Pitney Bowes, Inc. |
| 216,580 |
| — |
| (216,580 | ) | — |
| 216,580 |
|
198,000 |
| — |
| (198,000 | ) | — |
|
|
| Xerox Corp. |
| 1,578,060 |
| — |
| (1,578,060 | ) | — |
| 1,578,060 |
|
|
|
|
|
|
|
|
|
|
|
|
| 1,794,640 |
| — |
| (1,794,640 | ) | — | cs |
|
|
|
|
|
|
|
|
|
|
|
| Oil & Gas: 12.7% |
|
|
|
|
|
|
|
|
|
|
|
58,300 |
| 74,300 |
| (40,844 | ) | 91,756 |
|
|
| Anadarko Petroleum Corp. |
| 2,247,465 |
| 2,864,265 |
| (1,574,546 | ) | 3,537,184 |
| 2,247,465 |
|
35,400 |
| 52,750 |
| (23,007 | ) | 65,143 |
| S |
| Apache Corp. |
| 2,638,362 |
| 3,931,458 |
| (1,714,721 | ) | 4,855,099 |
| 2,638,362 |
|
1,400 |
| — |
| (1,400 | ) | — |
| @ |
| Arena Resources, Inc. |
| 39,326 |
| — |
| (39,326 | ) | — |
| 39,326 |
|
7,700 |
| — |
| (7,700 | ) | — |
|
|
| Berry Petroleum Co. |
| 58,212 |
| — |
| (58,212 | ) | — |
| 58,212 |
|
4,500 |
| — |
| (4,500 | ) | — |
| @ |
| Bill Barrett Corp. |
| 95,085 |
| — |
| (95,085 | ) | — |
| 95,085 |
|
400 |
| — |
| (400 | ) | — |
| @, L |
| BPZ Energy, Inc. |
| 2,560 |
| — |
| (2,560 | ) | — |
| 2,560 |
|
2,400 |
| — |
| (2,400 | ) | — |
| @ |
| Carrizo Oil & Gas, Inc. |
| 38,640 |
| — |
| (38,640 | ) | — |
| 38,640 |
|
20,100 |
| 91,500 |
| 1,397 |
| 112,997 |
|
|
| Chesapeake Energy Corp. |
| 325,017 |
| 1,479,555 |
| 22,584 |
| 1,827,156 |
| 325,017 |
|
74,994 |
| 328,150 |
| 2,100 |
| 405,244 |
|
|
| Chevron Corp. |
| 5,547,306 |
| 24,273,256 |
| 155,358 |
| 29,975,920 |
| 5,547,306 |
|
5,100 |
| — |
| (5,100 | ) | — |
|
|
| Cimarex Energy Co. |
| 136,578 |
| — |
| (136,578 | ) | — |
| 136,578 |
|
400 |
| — |
| (400 | ) | — |
| @ |
| Clayton Williams Energy, Inc. |
| 18,176 |
| — |
| (18,176 | ) | — |
| 18,176 |
|
75,900 |
| 244,400 |
| (18,482 | ) | 301,818 |
|
|
| ConocoPhillips |
| 3,931,620 |
| 12,659,920 |
| (957,348 | ) | 15,634,192 |
| 3,931,620 |
|
200 |
| — |
| (200 | ) | — |
| @ |
| Contango Oil & Gas Co. |
| 11,260 |
| — |
| (11,260 | ) | — |
| 11,260 |
|
2,500 |
| — |
| (2,500 | ) | — |
| @ |
| CVR Energy, Inc. |
| 10,000 |
| — |
| (10,000 | ) | — |
| 10,000 |
|
3,700 |
| — |
| (3,700 | ) | — |
| @, L |
| Delta Petroleum Corp. |
| 17,612 |
| — |
| (17,612 | ) | — |
| 17,612 |
|
12,300 |
| — |
| (12,300 | ) | — |
| @ |
| Denbury Resources, Inc. |
| 134,316 |
| — |
| (134,316 | ) | — |
| 134,316 |
|
14,600 |
| 70,650 |
| 1,998 |
| 87,248 |
|
|
| Devon Energy Corp. |
| 959,366 |
| 4,642,412 |
| 131,304 |
| 5,733,082 |
| 959,366 |
|
5,200 |
| — |
| (5,200 | ) | — |
|
|
| Diamond Offshore Drilling |
| 306,488 |
| — |
| (306,488 | ) | — |
| 306,488 |
|
4,200 |
| — |
| (4,200 | ) | — |
| @ |
| Encore Acquisition Co. |
| 107,184 |
| — |
| (107,184 | ) | — |
| 107,184 |
|
6,100 |
| — |
| (6,100 | ) | — |
|
|
| ENSCO International, Inc. |
| 173,179 |
| — |
| (173,179 | ) | — |
| 173,179 |
|
— |
| 39,400 |
| 9,256 |
| 48,656 |
|
|
| EOG Resources, Inc. |
| — |
| 2,623,252 |
| 616,297 |
| 3,239,549 |
| — |
|
143,400 |
| 834,800 |
| 52,725 |
| 1,030,925 |
|
|
| ExxonMobil Corp. |
| 11,447,622 |
| 66,642,084 |
| 4,209,009 |
| 82,298,715 |
| 11,447,622 |
|
14,500 |
| — |
| (14,500 | ) | — |
|
|
| Frontier Oil Corp. |
| 183,135 |
| — |
| (183,135 | ) | — |
| 183,135 |
|
4,700 |
| — |
| (4,700 | ) | — |
|
|
| Helmerich & Payne, Inc. |
| 106,925 |
| — |
| (106,925 | ) | — |
| 106,925 |
|
30,500 |
| 44,400 |
| (20,069 | ) | 54,831 |
|
|
| Hess Corp. |
| 1,636,020 |
| 2,381,616 |
| (1,076,492 | ) | 2,941,144 |
| 1,636,020 |
|
3,300 |
| — |
| (3,300 | ) | — |
|
|
| Holly Corp. |
| 60,159 |
| — |
| (60,159 | ) | — |
| 60,159 |
|
61,700 |
| 112,350 |
| (35,305 | ) | 138,745 |
|
|
| Marathon Oil Corp. |
| 1,688,112 |
| 3,073,896 |
| (965,943 | ) | 3,796,065 |
| 1,688,112 |
|
15,400 |
| — |
| (15,400 | ) | — |
| @ |
| Mariner Energy, Inc. |
| 157,080 |
| — |
| (157,080 | ) | — |
| 157,080 |
|
3,200 |
| — |
| (3,200 | ) | — |
| @ |
| McMoRan Exploration Co. |
| 31,360 |
| — |
| (31,360 | ) | — |
| 31,360 |
|
27,500 |
| — |
| (27,500 | ) | — |
|
|
| Murphy Oil Corp. |
| 1,219,625 |
| — |
| (1,219,625 | ) | — |
| 1,219,625 |
|
11,300 |
| — |
| (11,300 | ) | — |
| @, @@ |
| Nabors Industries Ltd. |
| 135,261 |
| — |
| (135,261 | ) | — |
| 135,261 |
|
53,300 |
| — |
| (53,300 | ) | — |
|
|
| Noble Corp. |
| 1,177,397 |
| — |
| (1,177,397 | ) | — |
| 1,177,397 |
|
24,200 |
| — |
| (24,200 | ) | — |
|
|
| Noble Energy, Inc. |
| 1,191,124 |
| — |
| (1,191,124 | ) | — |
| 1,191,124 |
|
61,500 |
| 130,150 |
| (30,923 | ) | 160,727 |
|
|
| Occidental Petroleum Corp. |
| 3,689,385 |
| 7,807,699 |
| (1,855,075 | ) | 9,642,009 |
| 3,689,385 |
|
12,300 |
| — |
| (12,300 | ) | — |
| @ |
| Parker Drilling Co. |
| 35,670 |
| — |
| (35,670 | ) | — |
| 35,670 |
|
11,200 |
| — |
| (11,200 | ) | — |
|
|
| Patterson-UTI Energy, Inc. |
| 128,912 |
| — |
| (128,912 | ) | — |
| 128,912 |
|
600 |
| — |
| (600 | ) | — |
| @ |
| Pioneer Drilling Co. |
| 3,342 |
| — |
| (3,342 | ) | — |
| 3,342 |
|
3,800 |
| — |
| (3,800 | ) | — |
|
|
| Pioneer Natural Resources Co. |
| 61,484 |
| — |
| (61,484 | ) | — |
| 61,484 |
|
7,000 |
| — |
| (7,000 | ) | — |
| @ |
| Plains Exploration & Production Co. |
| 162,680 |
| — |
| (162,680 | ) | — |
| 162,680 |
|
1,003 |
| — |
| (1,003 | ) | — |
| @@ |
| Precision Drilling Trust |
| 8,415 |
| — |
| (8,415 | ) | — |
| 8,415 |
|
7,900 |
| — |
| (7,900 | ) | — |
| @ |
| Pride International, Inc. |
| 126,242 |
| — |
| (126,242 | ) | — |
| 126,242 |
|
10,700 |
| — |
| (10,700 | ) | — |
| @ |
| Quicksilver Resources, Inc. |
| 59,599 |
| — |
| (59,599 | ) | — |
| 59,599 |
|
6,200 |
| — |
| (6,200 | ) | — |
| @ |
| Rosetta Resources, Inc. |
| 43,896 |
| — |
| (43,896 | ) | — |
| 43,896 |
|
1,800 |
| — |
| (1,800 | ) | — |
|
|
| St. Mary Land & Exploration Co. |
| 36,558 |
| — |
| (36,558 | ) | — |
| 36,558 |
|
11,081 |
| — |
| (11,081 | ) | — |
| @ |
| Stone Energy Corp. |
| 122,113 |
| — |
| (122,113 | ) | — |
| 122,113 |
|
5,600 |
| — |
| (5,600 | ) | — |
|
|
| Sunoco, Inc. |
| 243,376 |
| — |
| (243,376 | ) | — |
| 243,376 |
|
6,700 |
| — |
| (6,700 | ) | — |
| @ |
| Swift Energy Co. |
| 112,627 |
| — |
| (112,627 | ) | — |
| 112,627 |
|
23,000 |
| — |
| (23,000 | ) | — |
|
|
| Tesoro Corp. |
| 302,910 |
| — |
| (302,910 | ) | — |
| 302,910 |
|
12,200 |
| — |
| (12,200 | ) | — |
| @ |
| Transocean, Ltd. |
| 576,450 |
| — |
| (576,450 | ) | — |
| 576,450 |
|
6,200 |
| — |
| (6,200 | ) | — |
| @ |
| Unit Corp. |
| 165,664 |
| — |
| (165,664 | ) | — |
| 165,664 |
|
82,500 |
| 83,750 |
| (62,824 | ) | 103,426 |
|
|
| Valero Energy Corp. |
| 1,785,300 |
| 1,812,350 |
| (1,359,514 | ) | 2,238,136 |
| 1,785,300 |
|
11,600 |
| — |
| (11,600 | ) | — |
|
|
| W&T Offshore, Inc. |
| 166,112 |
| — |
| (166,112 | ) | — |
| 166,112 |
|
1,100 |
| — |
| (1,100 | ) | — |
| @ |
| Whiting Petroleum Corp. |
| 36,806 |
| — |
| (36,806 | ) | — |
| 36,806 |
|
18,900 |
| 87,450 |
| 1,645 |
| 107,995 |
|
|
| XTO Energy, Inc. |
| 666,603 |
| 3,084,362 |
| 58,025 |
| 3,808,990 |
| 666,603 |
|
|
|
|
|
|
|
|
|
|
|
|
| 44,365,716 |
| 137,276,125 |
| (12,114,600 | ) | 169,527,241 | cs |
|
|
|
|
|
|
|
|
|
|
|
| Oil & Gas Services: 1.4% |
|
|
|
|
|
|
|
|
|
|
|
25,400 |
| 48,700 |
| (13,959 | ) | 60,141 |
|
|
| Baker Hughes, Inc. |
| 814,578 |
| 1,561,809 |
| (447,653 | ) | 1,928,734 |
| 814,578 |
|
2,700 |
| — |
| (2,700 | ) | — |
| @ |
| Basic Energy Services, Inc. |
| 35,208 |
| — |
| (35,208 | ) | — |
| 35,208 |
|
12,000 |
| — |
| (12,000 | ) | — |
|
|
| BJ Services Co. |
| 140,040 |
| — |
| (140,040 | ) | — |
| 140,040 |
|
12,800 |
| — |
| (12,800 | ) | — |
| @ |
| Complete Production Services, Inc. |
| 104,320 |
| — |
| (104,320 | ) | — |
| 104,320 |
|
8,800 |
| — |
| (8,800 | ) | — |
| @ |
| Dresser-Rand Group, Inc. |
| 151,800 |
| — |
| (151,800 | ) | — |
| 151,800 |
|
2,200 |
| — |
| (2,200 | ) | — |
| @ |
| Dril-Quip, Inc. |
| 45,122 |
| — |
| (45,122 | ) | — |
| 45,122 |
|
4,000 |
| — |
| (4,000 | ) | — |
| @, L |
| Exterran Holdings, Inc. |
| 85,200 |
| — |
| (85,200 | ) | — |
| 85,200 |
|
39,100 |
| 138,200 |
| (6,632 | ) | 170,668 |
|
|
| Halliburton Co. |
| 710,838 |
| 2,512,476 |
| (120,567 | ) | 3,102,747 |
| 710,838 |
|
5,700 |
| — |
| (5,700 | ) | — |
| @ |
| Helix Energy Solutions Group, Inc. |
| 41,268 |
| — |
| (41,268 | ) | — |
| 41,268 |
|
23,500 |
| — |
| (23,500 | ) | — |
| @ |
| Key Energy Services, Inc. |
| 103,635 |
| — |
| (103,635 | ) | — |
| 103,635 |
|
1,100 |
| — |
| (1,100 | ) | — |
|
|
| Lufkin Industries, Inc. |
| 37,950 |
| — |
| (37,950 | ) | — |
| 37,950 |
|
21,300 |
| 65,800 |
| (5,841 | ) | 81,259 |
| @ |
| National Oilwell Varco, Inc. |
| 520,572 |
| 1,608,152 |
| (142,759 | ) | 1,985,965 |
| 520,572 |
|
4,200 |
| — |
| (4,200 | ) | — |
| @ |
| Oceaneering International, Inc. |
| 122,388 |
| — |
| (122,388 | ) | — |
| 122,388 |
|
9,800 |
| — |
| (9,800 | ) | — |
| @ |
| Oil States International, Inc. |
| 183,162 |
| — |
| (183,162 | ) | — |
| 183,162 |
|
23,600 |
| 189,000 |
| 20,803 |
| 233,403 |
|
|
| Schlumberger Ltd. |
| 998,988 |
| 8,000,370 |
| 880,588 |
| 9,879,946 |
| 998,988 |
|
2,800 |
| — |
| (2,800 | ) | — |
| @ |
| SEACOR Holdings, Inc. |
| 186,620 |
| — |
| (186,620 | ) | — |
| 186,620 |
|
1,000 |
| — |
| (1,000 | ) | — |
|
|
| Smith International, Inc. |
| 22,890 |
| — |
| (22,890 | ) | — |
| 22,890 |
|
8,900 |
| — |
| (8,900 | ) | — |
| @ |
| Superior Energy Services |
| 141,777 |
| — |
| (141,777 | ) | — |
| 141,777 |
|
2,000 |
| — |
| (2,000 | ) | — |
| @ |
| Tetra Technologies, Inc. |
| 9,720 |
| — |
| (9,720 | ) | — |
| 9,720 |
|
38,200 |
| 107,800 |
| (12,874 | ) | 133,126 |
| @ |
| Weatherford International Ltd. |
| 413,324 |
| 1,166,396 |
| (139,295 | ) | 1,440,425 |
| 413,324 |
|
|
|
|
|
|
|
|
|
|
|
|
| 4,869,400 |
| 14,849,203 |
| (1,380,786 | ) | 18,337,817 | cs |
|
|
|
|
|
|
|
|
|
|
|
| Packaging & Containers: 0.0% |
|
|
|
|
|
|
|
|
|
|
|
21,900 |
| — |
| (21,900 | ) | — |
| @ |
| Jefferson Smurfit Corp. |
| 5,585 |
| — |
| (5,585 | ) | — |
| 5,585 |
|
9,300 |
| — |
| (9,300 | ) | — |
| @ |
| Owens-Illinois, Inc. |
| 254,169 |
| — |
| (254,169 | ) | — |
| 254,169 |
|
4,400 |
| — |
| (4,400 | ) | — |
|
|
| Packaging Corp. of America |
| 59,224 |
| — |
| (59,224 | ) | — |
| 59,224 |
|
3,000 |
| — |
| (3,000 | ) | — |
|
|
| Rock-Tenn Co. |
| 102,540 |
| — |
| (102,540 | ) | — |
| 102,540 |
|
11,200 |
| — |
| (11,200 | ) | — |
|
|
| Sealed Air Corp. |
| 167,328 |
| — |
| (167,328 | ) | — |
| 167,328 |
|
7,400 |
| — |
| (7,400 | ) | — |
|
|
| Sonoco Products Co. |
| 171,384 |
| — |
| (171,384 | ) | — |
| 171,384 |
|
27,900 |
| — |
| (27,900 | ) | — |
|
|
| Temple-Inland, Inc. |
| 133,920 |
| — |
| (133,920 | ) | — |
| 133,920 |
|
|
|
|
|
|
|
|
|
|
|
|
| 894,150 |
| — |
| (894,150 | ) | — | cs |
|
|
|
|
|
|
|
|
|
|
|
| Pharmaceuticals: 6.8% |
|
|
|
|
|
|
|
|
|
|
|
10,600 |
| 244,550 |
| 46,854 |
| 302,004 |
|
|
| Abbott Laboratories |
| 565,722 |
| 13,051,634 |
| 2,500,578 |
| 16,117,934 |
| 565,722 |
|
— |
| 313,850 |
| 73,735 |
| 387,585 |
|
|
| Bristol-Myers Squibb Co. |
| — |
| 7,297,013 |
| 1,714,332 |
| 9,011,345 |
| — |
|
2,200 |
| 56,450 |
| 11,062 |
| 69,712 |
|
|
| Cardinal Health, Inc. |
| 75,834 |
| 1,945,832 |
| 381,312 |
| 2,402,978 |
| 75,834 |
|
1,900 |
| — |
| (1,900 | ) | — |
| @ |
| Catalyst Health Solutions, Inc. |
| 46,265 |
| — |
| (46,265 | ) | — |
| 46,265 |
|
29,800 |
| 158,500 |
| 7,437 |
| 195,737 |
|
|
| Eli Lilly & Co. |
| 1,200,046 |
| 6,382,795 |
| 299,503 |
| 7,882,344 |
| 1,200,046 |
|
7,200 |
| — |
| (7,200 | ) | — |
| @ |
| Endo Pharmaceuticals Holdings, Inc. |
| 186,336 |
| — |
| (186,336 | ) | — |
| 186,336 |
|
12,240 |
| — |
| (12,240 | ) | — |
| @ |
| Forest Laboratories, Inc. |
| 311,753 |
| — |
| (311,753 | ) | — |
| 311,753 |
|
9,100 |
| — |
| (9,100 | ) | — |
| @@ |
| Herbalife Ltd. |
| 197,288 |
| — |
| (197,288 | ) | — |
| 197,288 |
|
25,900 |
| — |
| (25,900 | ) | — |
| @ |
| King Pharmaceuticals, Inc. |
| 275,058 |
| — |
| (275,058 | ) | — |
| 275,058 |
|
500 |
| — |
| (500 | ) | — |
| @ |
| KV Pharmaceutical Co. |
| 1,440 |
| — |
| (1,440 | ) | — |
| 1,440 |
|
— |
| 80,300 |
| 18,865 |
| 99,165 |
| @ |
| Medco Health Solutions, Inc. |
| — |
| 3,365,373 |
| 790,648 |
| 4,156,021 |
| — |
|
12,500 |
| — |
| (12,500 | ) | — |
|
|
| Medicis Pharmaceutical Corp. |
| 173,750 |
| — |
| (173,750 | ) | — |
| 173,750 |
|
52,600 |
| 340,400 |
| 27,372 |
| 420,372 |
|
|
| Merck & Co., Inc. |
| 1,599,040 |
| 10,348,160 |
| 832,116 |
| 12,779,316 |
| 1,599,040 |
|
9,100 |
| — |
| (9,100 | ) | — |
| @ |
| NBTY, Inc. |
| 142,415 |
| — |
| (142,415 | ) | — |
| 142,415 |
|
4,400 |
| — |
| (4,400 | ) | — |
|
|
| Omnicare, Inc. |
| 122,144 |
| — |
| (122,144 | ) | — |
| 122,144 |
|
201,500 |
| 1,072,500 |
| 50,469 |
| 1,324,469 |
|
|
| Pfizer, Inc. |
| 3,568,565 |
| 18,993,975 |
| 893,805 |
| 23,456,345 |
| 3,568,565 |
|
— |
| 257,050 |
| 60,390 |
| 317,440 |
|
|
| Schering-Plough Corp. |
| — |
| 4,377,562 |
| 1,028,447 |
| 5,406,009 |
| — |
|
7,700 |
| — |
| (7,700 | ) | — |
| @ |
| Sepracor, Inc. |
| 84,546 |
| — |
| (84,546 | ) | — |
| 84,546 |
|
400 |
| — |
| (400 | ) | — |
| @ |
| Warner Chilcott Ltd. |
| 5,800 |
| — |
| (5,800 | ) | — |
| 5,800 |
|
5,100 |
| — |
| (5,100 | ) | — |
| @ |
| Watson Pharmaceuticals, Inc. |
| 135,507 |
| — |
| (135,507 | ) | — |
| 135,507 |
|
5,900 |
| 211,400 |
| 43,765 |
| 261,065 |
|
|
| Wyeth |
| 221,309 |
| 7,929,614 |
| 1,641,643 |
| 9,792,566 |
| 221,309 |
|
|
|
|
|
|
|
|
|
|
|
|
| 8,912,818 |
| 73,691,958 |
| 8,400,082 |
| 91,004,858 | cs |
|
|
|
|
|
|
|
|
|
|
|
| Pipelines: 0.1% |
|
|
|
|
|
|
|
|
|
|
|
— |
| 92,800 |
| 21,802 |
| 114,602 |
|
|
| Williams Cos., Inc. |
| — |
| 1,343,744 |
| 315,694 |
| 1,659,438 |
| — |
|
|
|
|
|
|
|
|
|
|
|
|
| — |
| 1,343,744 |
| 315,694 |
| 1,659,438 | cs |
|
|
|
|
|
|
|
|
|
|
|
| Real Estate: 0.0% |
|
|
|
|
|
|
|
|
|
|
|
10,300 |
| — |
| (10,300 | ) | — |
| @ |
| CB Richard Ellis Group, Inc. |
| 44,496 |
| — |
| (44,496 | ) | — |
| 44,496 |
|
5,500 |
| — |
| (5,500 | ) | — |
| L |
| Forest City Enterprises, Inc. |
| 36,850 |
| — |
| (36,850 | ) | — |
| 36,850 |
|
1,400 |
| — |
| (1,400 | ) | — |
|
|
| Jones Lang LaSalle, Inc. |
| 38,780 |
| — |
| (38,780 | ) | — |
| 38,780 |
|
|
|
|
|
|
|
|
|
|
|
|
| 120,126 |
| — |
| (120,126 | ) | — | cs |
|
|
|
|
|
|
|
|
|
|
|
| Retail: 5.9% |
|
|
|
|
|
|
|
|
|
|
|
8,100 |
| — |
| (8,100 | ) | — |
| L |
| Abercrombie & Fitch Co. |
| 186,867 |
| — |
| (186,867 | ) | — |
| 186,867 |
|
14,400 |
| — |
| (14,400 | ) | — |
| @ |
| Aeropostale, Inc. |
| 231,840 |
| — |
| (231,840 | ) | — |
| 231,840 |
|
15,700 |
| — |
| (15,700 | ) | — |
|
|
| American Eagle Outfitters |
| 146,952 |
| — |
| (146,952 | ) | — |
| 146,952 |
|
18,500 |
| — |
| (18,500 | ) | — |
| @ |
| AnnTaylor Stores Corp. |
| 106,745 |
| — |
| (106,745 | ) | — |
| 106,745 |
|
22,100 |
| — |
| (22,100 | ) | — |
| @, L |
| Autonation, Inc. |
| 218,348 |
| — |
| (218,348 | ) | — |
| 218,348 |
|
9,500 |
| — |
| (9,500 | ) | — |
|
|
| Barnes & Noble, Inc. |
| 142,500 |
| — |
| (142,500 | ) | — |
| 142,500 |
|
5,900 |
| — |
| (5,900 | ) | — |
|
|
| Bebe Stores, Inc. |
| 44,073 |
| — |
| (44,073 | ) | — |
| 44,073 |
|
52,100 |
| 53,150 |
| (39,613 | ) | 65,637 |
|
|
| Best Buy Co., Inc. |
| 1,464,531 |
| 1,494,047 |
| (1,113,525 | ) | 1,845,053 |
| 1,464,531 |
|
9,800 |
| — |
| (9,800 | ) | — |
| @ |
| Big Lots, Inc. |
| 142,002 |
| — |
| (142,002 | ) | — |
| 142,002 |
|
4,100 |
| — |
| (4,100 | ) | — |
|
|
| Bob Evans Farms, Inc. |
| 83,763 |
| — |
| (83,763 | ) | — |
| 83,763 |
|
13,100 |
| — |
| (13,100 | ) | — |
|
|
| Brinker International, Inc. |
| 138,074 |
| — |
| (138,074 | ) | — |
| 138,074 |
|
5,500 |
| — |
| (5,500 | ) | — |
|
|
| Buckle, Inc. |
| 120,010 |
| — |
| (120,010 | ) | — |
| 120,010 |
|
3,900 |
| — |
| (3,900 | ) | — |
|
|
| Casey’s General Stores, Inc. |
| 88,803 |
| — |
| (88,803 | ) | — |
| 88,803 |
|
5,800 |
| — |
| (5,800 | ) | — |
|
|
| Cash America International, Inc. |
| 158,630 |
| — |
| (158,630 | ) | — |
| 158,630 |
|
6,600 |
| — |
| (6,600 | ) | — |
| @ |
| CEC Entertainment, Inc. |
| 160,050 |
| — |
| (160,050 | ) | — |
| 160,050 |
|
7,600 |
| — |
| (7,600 | ) | — |
| @ |
| Childrens Place Retail Stores, Inc. |
| 164,768 |
| — |
| (164,768 | ) | — |
| 164,768 |
|
129 |
| — |
| (129 | ) | — |
| @ |
| Chipotle Mexican Grill, Inc. |
| 7,390 |
| — |
| (7,390 | ) | — |
| 7,390 |
|
3,200 |
| — |
| (3,200 | ) | — |
| @ |
| Copart, Inc. |
| 87,008 |
| — |
| (87,008 | ) | — |
| 87,008 |
|
— |
| 68,850 |
| 16,175 |
| 85,025 |
|
|
| Costco Wholesale Corp. |
| — |
| 3,614,625 |
| 849,206 |
| 4,463,831 |
| — |
|
10,200 |
| 226,650 |
| 43,048 |
| 279,898 |
|
|
| CVS Caremark Corp. |
| 293,148 |
| 6,513,921 |
| 1,237,207 |
| 8,044,276 |
| 293,148 |
|
17,000 |
| — |
| (17,000 | ) | — |
|
|
| Dillard’s, Inc. |
| 67,490 |
| — |
| (67,490 | ) | — |
| 67,490 |
|
6,300 |
| — |
| (6,300 | ) | — |
| @ |
| Dollar Tree, Inc. |
| 263,340 |
| — |
| (263,340 | ) | — |
| 263,340 |
|
10,900 |
| — |
| (10,900 | ) | — |
| @, L |
| Dress Barn, Inc. |
| 117,066 |
| — |
| (117,066 | ) | — |
| 117,066 |
|
1,400 |
| — |
| (1,400 | ) | — |
| @ |
| Ezcorp, Inc. |
| 21,294 |
| — |
| (21,294 | ) | — |
| 21,294 |
|
12,600 |
| — |
| (12,600 | ) | — |
|
|
| Foot Locker, Inc. |
| 92,484 |
| — |
| (92,484 | ) | — |
| 92,484 |
|
85,300 |
| — |
| (85,300 | ) | — |
|
|
| Gap, Inc. |
| 1,142,167 |
| — |
| (1,142,167 | ) | — |
| 1,142,167 |
|
5,300 |
| — |
| (5,300 | ) | — |
|
|
| Guess ?, Inc. |
| 81,355 |
| — |
| (81,355 | ) | — |
| 81,355 |
|
2,300 |
| — |
| (2,300 | ) | — |
| @ |
| Gymboree Corp. |
| 60,007 |
| — |
| (60,007 | ) | — |
| 60,007 |
|
15,700 |
| 267,950 |
| 47,251 |
| 330,901 |
|
|
| Home Depot, Inc. |
| 361,414 |
| 6,168,209 |
| 1,087,721 |
| 7,617,344 |
| 361,414 |
|
3,180 |
| — |
| (3,180 | ) | — |
| @ |
| HSN, Inc. |
| 23,119 |
| — |
| (23,119 | ) | — |
| 23,119 |
|
700 |
| — |
| (700 | ) | — |
| @, L |
| J Crew Group, Inc. |
| 8,540 |
| — |
| (8,540 | ) | — |
| 8,540 |
|
8,400 |
| — |
| (8,400 | ) | — |
| @ |
| Jack in the Box, Inc. |
| 185,556 |
| — |
| (185,556 | ) | — |
| 185,556 |
|
8,400 |
| — |
| (8,400 | ) | — |
| @ |
| Kohl’s Corp. |
| 304,080 |
| — |
| (304,080 | ) | — |
| 304,080 |
|
19,900 |
| — |
| (19,900 | ) | — |
|
|
| Limited Brands, Inc. |
| 199,796 |
| — |
| (199,796 | ) | — |
| 199,796 |
|
28,000 |
| — |
| (28,000 | ) | — |
|
|
| Liz Claiborne, Inc. |
| 72,800 |
| — |
| (72,800 | ) | — |
| 72,800 |
|
4,500 |
| 231,750 |
| 49,946 |
| 286,196 |
|
|
| Lowe’s Cos., Inc. |
| 96,840 |
| 4,987,260 |
| 1,074,847 |
| 6,158,947 |
| 96,840 |
|
19,500 |
| — |
| (19,500 | ) | — |
|
|
| Macy’s, Inc. |
| 201,825 |
| — |
| (201,825 | ) | — |
| 201,825 |
|
6,500 |
| 179,650 |
| 35,706 |
| 221,856 |
|
|
| McDonald’s Corp. |
| 404,235 |
| 11,172,434 |
| 2,220,573 |
| 13,797,242 |
| 404,235 |
|
8,800 |
| — |
| (8,800 | ) | — |
| L |
| Men’s Wearhouse, Inc. |
| 119,152 |
| — |
| (119,152 | ) | — |
| 119,152 |
|
4,600 |
| — |
| (4,600 | ) | — |
|
|
| MSC Industrial Direct Co. |
| 169,418 |
| — |
| (169,418 | ) | — |
| 169,418 |
|
9,400 |
| — |
| (9,400 | ) | — |
| L |
| Nordstrom, Inc. |
| 125,114 |
| — |
| (125,114 | ) | — |
| 125,114 |
|
2,800 |
| — |
| (2,800 | ) | — |
|
|
| Nu Skin Enterprises, Inc. |
| 29,204 |
| — |
| (29,204 | ) | — |
| 29,204 |
|
32,800 |
| — |
| (32,800 | ) | — |
| @ |
| Office Depot, Inc. |
| 97,744 |
| — |
| (97,744 | ) | — |
| 97,744 |
|
1,400 |
| — |
| (1,400 | ) | — |
|
|
| OfficeMax, Inc. |
| 10,696 |
| — |
| (10,696 | ) | — |
| 10,696 |
|
2,200 |
| — |
| (2,200 | ) | — |
| @ |
| Panera Bread Co. |
| 114,928 |
| — |
| (114,928 | ) | — |
| 114,928 |
|
1,000 |
| — |
| (1,000 | ) | — |
| @ |
| Papa John’s International, Inc. |
| 18,430 |
| — |
| (18,430 | ) | — |
| 18,430 |
|
6,100 |
| — |
| (6,100 | ) | — |
| L |
| Penske Auto Group, Inc. |
| 46,848 |
| — |
| (46,848 | ) | — |
| 46,848 |
|
7,200 |
| — |
| (7,200 | ) | — |
|
|
| Phillips-Van Heusen |
| 144,936 |
| — |
| (144,936 | ) | — |
| 144,936 |
|
11,600 |
| — |
| (11,600 | ) | — |
|
|
| RadioShack Corp. |
| 138,504 |
| — |
| (138,504 | ) | — |
| 138,504 |
|
2,600 |
| — |
| (2,600 | ) | — |
|
|
| Regis Corp. |
| 37,778 |
| — |
| (37,778 | ) | — |
| 37,778 |
|
2,800 |
| — |
| (2,800 | ) | — |
|
|
| Ross Stores, Inc. |
| 83,244 |
| — |
| (83,244 | ) | — |
| 83,244 |
|
10,800 |
| — |
| (10,800 | ) | — |
| @ |
| Sally Beauty Holdings, Inc. |
| 61,452 |
| — |
| (61,452 | ) | — |
| 61,452 |
|
3,600 |
| — |
| (3,600 | ) | — |
| @ |
| Sonic Corp. |
| 43,812 |
| — |
| (43,812 | ) | — |
| 43,812 |
|
— |
| 111,200 |
| 26,125 |
| 137,325 |
|
|
| Staples, Inc. |
| — |
| 1,992,704 |
| 468,158 |
| 2,460,862 |
| — |
|
6,400 |
| — |
| (6,400 | ) | — |
| L |
| Talbots, Inc. |
| 15,296 |
| — |
| (15,296 | ) | — |
| 15,296 |
|
— |
| 125,100 |
| 29,391 |
| 154,491 |
|
|
| Target Corp. |
| — |
| 4,319,703 |
| 1,014,854 |
| 5,334,557 |
| — |
|
14,300 |
| — |
| (14,300 | ) | — |
|
|
| TJX Cos., Inc. |
| 294,151 |
| — |
| (294,151 | ) | — |
| 294,151 |
|
5,500 |
| — |
| (5,500 | ) | — |
| @ |
| Tractor Supply Co. |
| 198,770 |
| — |
| (198,770 | ) | — |
| 198,770 |
|
3,000 |
| — |
| (3,000 | ) | — |
| @ |
| Urban Outfitters, Inc. |
| 44,940 |
| — |
| (44,940 | ) | — |
| 44,940 |
|
— |
| 157,000 |
| 36,885 |
| 193,885 |
|
|
| Walgreen Co. |
| — |
| 3,873,190 |
| 909,952 |
| 4,783,142 |
| — |
|
35,500 |
| 355,800 |
| 48,090 |
| 439,390 |
|
|
| Wal-Mart Stores, Inc. |
| 1,990,130 |
| 19,946,148 |
| 2,695,940 |
| 24,632,218 |
| 1,990,130 |
|
19,900 |
| — |
| (19,900 | ) | — |
|
|
| Williams-Sonoma, Inc. |
| 156,414 |
| — |
| (156,414 | ) | — |
| 156,414 |
|
7,000 |
| — |
| (7,000 | ) | — |
| @, L |
| Zale Corp. |
| 23,310 |
| — |
| (23,310 | ) | — |
| 23,310 |
|
|
|
|
|
|
|
|
|
|
|
|
| 11,653,181 |
| 64,082,241 |
| 3,402,050 |
| 79,137,472 | cs |
|
|
|
|
|
|
|
|
|
|
|
| Savings & Loans: 0.0% |
|
|
|
|
|
|
|
|
|
|
|
2,600 |
| — |
| (2,600 | ) | — |
|
|
| NewAlliance Bancshares, Inc. |
| 34,242 |
| — |
| (34,242 | ) | — |
| 34,242 |
|
100 |
| — |
| (100 | ) | — |
|
|
| Northwest Bancorp, Inc. |
| 2,138 |
| — |
| (2,138 | ) | — |
| 2,138 |
|
3,600 |
| — |
| (3,600 | ) | — |
|
|
| Provident Financial Services, Inc. |
| 55,080 |
| — |
| (55,080 | ) | — |
| 55,080 |
|
|
|
|
|
|
|
|
|
|
|
|
| 91,460 |
| — |
| (91,460 | ) | — | cs |
|
|
|
|
|
|
|
|
|
|
|
| Semiconductors: 1.7% |
|
|
|
|
|
|
|
|
|
|
|
3,700 |
| — |
| (3,700 | ) | — |
| @, L |
| Advanced Micro Devices, Inc. |
| 7,992 |
| — |
| (7,992 | ) | — |
| 7,992 |
|
17,900 |
| — |
| (17,900 | ) | — |
|
|
| Altera Corp. |
| 299,109 |
| — |
| (299,109 | ) | — |
| 299,109 |
|
34,400 |
| — |
| (34,400 | ) | — |
| @ |
| Amkor Technology, Inc. |
| 74,992 |
| — |
| (74,992 | ) | — |
| 74,992 |
|
14,000 |
| — |
| (14,000 | ) | — |
|
|
| Analog Devices, Inc. |
| 266,280 |
| — |
| (266,280 | ) | — |
| 266,280 |
|
153,600 |
| 214,600 |
| (103,183 | ) | 265,017 |
|
|
| Applied Materials, Inc. |
| 1,555,968 |
| 2,173,898 |
| (1,045,241 | ) | 2,684,625 |
| 1,555,968 |
|
29,000 |
| — |
| (29,000 | ) | — |
| @ |
| Atmel Corp. |
| 90,770 |
| — |
| (90,770 | ) | — |
| 90,770 |
|
18,900 |
| — |
| (18,900 | ) | — |
| @ |
| Broadcom Corp. |
| 320,733 |
| — |
| (320,733 | ) | — |
| 320,733 |
|
2,300 |
| — |
| (2,300 | ) | — |
| @ |
| Cabot Microelectronics Corp. |
| 59,961 |
| — |
| (59,961 | ) | — |
| 59,961 |
|
22,100 |
| — |
| (22,100 | ) | — |
| @ |
| Emulex Corp. |
| 154,258 |
| — |
| (154,258 | ) | — |
| 154,258 |
|
6,100 |
| — |
| (6,100 | ) | — |
| @ |
| Entegris, Inc. |
| 13,359 |
| — |
| (13,359 | ) | — |
| 13,359 |
|
28,700 |
| — |
| (28,700 | ) | — |
| @ |
| Fairchild Semiconductor International, Inc. |
| 140,343 |
| — |
| (140,343 | ) | — |
| 140,343 |
|
31,900 |
| — |
| (31,900 | ) | — |
| @ |
| Integrated Device Technology, Inc. |
| 178,959 |
| — |
| (178,959 | ) | — |
| 178,959 |
|
278,500 |
| 908,000 |
| (65,178 | ) | 1,121,322 |
|
|
| Intel Corp. |
| 4,082,810 |
| 13,311,280 |
| (955,510 | ) | 16,438,580 |
| 4,082,810 |
|
5,200 |
| — |
| (5,200 | ) | — |
| @ |
| International Rectifier Corp. |
| 70,200 |
| — |
| (70,200 | ) | — |
| 70,200 |
|
16,700 |
| — |
| (16,700 | ) | — |
|
|
| Intersil Corp. |
| 153,473 |
| — |
| (153,473 | ) | — |
| 153,473 |
|
9,800 |
| — |
| (9,800 | ) | — |
|
|
| KLA-Tencor Corp. |
| 213,542 |
| — |
| (213,542 | ) | — |
| 213,542 |
|
52,400 |
| — |
| (52,400 | ) | — |
| @ |
| LSI Logic Corp. |
| 172,396 |
| — |
| (172,396 | ) | — |
| 172,396 |
|
27,900 |
| — |
| (27,900 | ) | — |
| @, @@ |
| Marvell Technology Group Ltd. |
| 186,093 |
| — |
| (186,093 | ) | — |
| 186,093 |
|
12,300 |
| — |
| (12,300 | ) | — |
| @ |
| MEMC Electronic Materials, Inc. |
| 175,644 |
| — |
| (175,644 | ) | — |
| 175,644 |
|
3,100 |
| — |
| (3,100 | ) | — |
| @ |
| Microsemi Corp. |
| 39,184 |
| — |
| (39,184 | ) | — |
| 39,184 |
|
10,500 |
| — |
| (10,500 | ) | — |
| @ |
| MKS Instruments, Inc. |
| 155,295 |
| — |
| (155,295 | ) | — |
| 155,295 |
|
12,200 |
| — |
| (12,200 | ) | — |
|
|
| National Semiconductor Corp. |
| 122,854 |
| — |
| (122,854 | ) | — |
| 122,854 |
|
13,700 |
| — |
| (13,700 | ) | — |
| @ |
| Novellus Systems, Inc. |
| 169,058 |
| — |
| (169,058 | ) | — |
| 169,058 |
|
23,800 |
| — |
| (23,800 | ) | — |
| @ |
| Nvidia Corp. |
| 192,066 |
| — |
| (192,066 | ) | — |
| 192,066 |
|
12,600 |
| — |
| (12,600 | ) | — |
| @ |
| ON Semiconductor Corp. |
| 42,840 |
| — |
| (42,840 | ) | — |
| 42,840 |
|
28,300 |
| — |
| (28,300 | ) | — |
| @ |
| PMC - Sierra, Inc. |
| 137,538 |
| — |
| (137,538 | ) | — |
| 137,538 |
|
700 |
| — |
| (700 | ) | — |
|
|
| Power Integrations, Inc. |
| 13,916 |
| — |
| (13,916 | ) | — |
| 13,916 |
|
19,700 |
| — |
| (19,700 | ) | — |
| @ |
| QLogic Corp. |
| 264,768 |
| — |
| (264,768 | ) | — |
| 264,768 |
|
14,100 |
| — |
| (14,100 | ) | — |
| @ |
| Semtech Corp. |
| 158,907 |
| — |
| (158,907 | ) | — |
| 158,907 |
|
7,500 |
| — |
| (7,500 | ) | — |
| @ |
| Silicon Laboratories, Inc. |
| 185,850 |
| — |
| (185,850 | ) | — |
| 185,850 |
|
14,100 |
| — |
| (14,100 | ) | — |
| @ |
| Skyworks Solutions, Inc. |
| 78,114 |
| — |
| (78,114 | ) | — |
| 78,114 |
|
41,000 |
| — |
| (41,000 | ) | — |
| @ |
| Teradyne, Inc. |
| 173,020 |
| — |
| (173,020 | ) | — |
| 173,020 |
|
3,000 |
| — |
| (3,000 | ) | — |
| @ |
| Tessera Technologies, Inc. |
| 35,640 |
| — |
| (35,640 | ) | — |
| 35,640 |
|
148,700 |
| 209,650 |
| (99,446 | ) | 258,904 |
|
|
| Texas Instruments, Inc. |
| 2,307,824 |
| 3,253,768 |
| (1,543,396 | ) | 4,018,196 |
| 2,307,824 |
|
5,700 |
| — |
| (5,700 | ) | — |
| @ |
| Varian Semiconductor Equipment Associates, Inc. |
| 103,284 |
| — |
| (103,284 | ) | — |
| 103,284 |
|
6,700 |
| — |
| (6,700 | ) | — |
| @, @@ |
| Verigy Ltd. |
| 64,454 |
| — |
| (64,454 | ) | — |
| 64,454 |
|
12,100 |
| — |
| (12,100 | ) | — |
|
|
| Xilinx, Inc. |
| 215,622 |
| — |
| (215,622 | ) | — |
| 215,622 |
|
|
|
|
|
|
|
|
|
|
|
|
| 12,677,116 |
| 18,738,946 |
| (8,274,661 | ) | 23,141,401 | cs |
|
|
|
|
|
|
|
|
|
|
|
| Software: 3.5% |
|
|
|
|
|
|
|
|
|
|
|
15,000 |
| — |
| (15,000 | ) | — |
|
|
| Acxiom Corp. |
| 121,650 |
| — |
| (121,650 | ) | — |
| 121,650 |
|
4,400 |
| 84,450 |
| 15,440 |
| 104,290 |
| @ |
| Adobe Systems, Inc. |
| 93,676 |
| 1,797,941 |
| 328,725 |
| 2,220,342 |
| 93,676 |
|
600 |
| — |
| (600 | ) | — |
| @ |
| Advent Software, Inc. |
| 11,982 |
| — |
| (11,982 | ) | — |
| 11,982 |
|
2,000 |
| — |
| (2,000 | ) | — |
| @, L |
| Allscripts Healthcare Solutions, Inc. |
| 19,840 |
| — |
| (19,840 | ) | — |
| 19,840 |
|
800 |
| — |
| (800 | ) | — |
| @ |
| American Reprographics Co. |
| 5,520 |
| — |
| (5,520 | ) | — |
| 5,520 |
|
4,300 |
| — |
| (4,300 | ) | — |
| @ |
| Ansys, Inc. |
| 119,927 |
| — |
| (119,927 | ) | — |
| 119,927 |
|
11,700 |
| — |
| (11,700 | ) | — |
| @ |
| Autodesk, Inc. |
| 229,905 |
| — |
| (229,905 | ) | — |
| 229,905 |
|
2,800 |
| — |
| (2,800 | ) | — |
| @, L |
| Avid Technology, Inc. |
| 30,548 |
| — |
| (30,548 | ) | — |
| 30,548 |
|
3,200 |
| — |
| (3,200 | ) | — |
| @ |
| BMC Software, Inc. |
| 86,112 |
| — |
| (86,112 | ) | — |
| 86,112 |
|
12,000 |
| — |
| (12,000 | ) | — |
|
|
| Broadridge Financial Solutions ADR |
| 150,480 |
| — |
| (150,480 | ) | — |
| 150,480 |
|
31,723 |
| — |
| (31,723 | ) | — |
|
|
| CA, Inc. |
| 587,827 |
| — |
| (587,827 | ) | — |
| 587,827 |
|
5,200 |
| — |
| (5,200 | ) | — |
| @, @@ |
| Check Point Software Technologies |
| 98,748 |
| — |
| (98,748 | ) | — |
| 98,748 |
|
8,200 |
| — |
| (8,200 | ) | — |
| @ |
| Citrix Systems, Inc. |
| 193,274 |
| — |
| (193,274 | ) | — |
| 193,274 |
|
31,200 |
| — |
| (31,200 | ) | — |
| @ |
| Compuware Corp. |
| 210,600 |
| — |
| (210,600 | ) | — |
| 210,600 |
|
2,000 |
| — |
| (2,000 | ) | — |
| @ |
| Concur Technologies, Inc. |
| 65,640 |
| — |
| (65,640 | ) | — |
| 65,640 |
|
4,400 |
| — |
| (4,400 | ) | — |
| @ |
| CSG Systems International |
| 76,868 |
| — |
| (76,868 | ) | — |
| 76,868 |
|
11,000 |
| — |
| (11,000 | ) | — |
|
|
| Fair Isaac Corp. |
| 185,460 |
| — |
| (185,460 | ) | — |
| 185,460 |
|
4,200 |
| — |
| (4,200 | ) | — |
|
|
| Fidelity National Information Services, Inc. |
| 68,334 |
| — |
| (68,334 | ) | — |
| 68,334 |
|
2,000 |
| — |
| (2,000 | ) | — |
|
|
| IMS Health, Inc. |
| 30,320 |
| — |
| (30,320 | ) | — |
| 30,320 |
|
5,800 |
| — |
| (5,800 | ) | — |
| @ |
| Informatica Corp. |
| 79,634 |
| — |
| (79,634 | ) | — |
| 79,634 |
|
8,400 |
| — |
| (8,400 | ) | — |
| @ |
| Lawson Software, Inc. |
| 39,816 |
| — |
| (39,816 | ) | — |
| 39,816 |
|
289,500 |
| 1,272,650 |
| 9,491 |
| 1,571,641 |
| S |
| Microsoft Corp. |
| 5,627,880 |
| 24,740,316 |
| 184,513 |
| 30,552,709 |
| 5,627,880 |
|
400 |
| — |
| (400 | ) | — |
| @ |
| MicroStrategy, Inc. |
| 14,852 |
| — |
| (14,852 | ) | — |
| 14,852 |
|
13,700 |
| — |
| (13,700 | ) | — |
| @ |
| Nuance Communications, Inc. |
| 141,932 |
| — |
| (141,932 | ) | — |
| 141,932 |
|
3,900 |
| — |
| (3,900 | ) | — |
| @, @@, L |
| Open Text Corp. |
| 117,507 |
| — |
| (117,507 | ) | — |
| 117,507 |
|
136,935 |
| 617,450 |
| 8,126 |
| 762,511 |
| @ |
| Oracle Corp. |
| 2,427,858 |
| 10,947,389 |
| 144,079 |
| 13,519,326 |
| 2,427,858 |
|
15,100 |
| — |
| (15,100 | ) | — |
| @ |
| Parametric Technology Corp. |
| 191,015 |
| — |
| (191,015 | ) | — |
| 191,015 |
|
3,100 |
| — |
| (3,100 | ) | — |
| @ |
| Progress Software Corp. |
| 59,706 |
| — |
| (59,706 | ) | — |
| 59,706 |
|
11,300 |
| — |
| (11,300 | ) | — |
| @ |
| Quest Software, Inc. |
| 142,267 |
| — |
| (142,267 | ) | — |
| 142,267 |
|
5,000 |
| — |
| (5,000 | ) | — |
|
|
| SEI Investments Co. |
| 78,550 |
| — |
| (78,550 | ) | — |
| 78,550 |
|
2,100 |
| — |
| (2,100 | ) | — |
| @ |
| Solera Holdings, Inc. |
| 50,610 |
| — |
| (50,610 | ) | — |
| 50,610 |
|
8,600 |
| — |
| (8,600 | ) | — |
| @ |
| Sybase, Inc. |
| 213,022 |
| — |
| (213,022 | ) | — |
| 213,022 |
|
2,700 |
| — |
| (2,700 | ) | — |
| @ |
| SYNNEX Corp. |
| 30,591 |
| — |
| (30,591 | ) | — |
| 30,591 |
|
11,400 |
| — |
| (11,400 | ) | — |
| @ |
| Take-Two Interactive Software, Inc. |
| 86,184 |
| — |
| (86,184 | ) | — |
| 86,184 |
|
3,000 |
| — |
| (3,000 | ) | — |
| @ |
| THQ, Inc. |
| 12,570 |
| — |
| (12,570 | ) | — |
| 12,570 |
|
— |
| 6,700 |
| 1,574 |
| 8,274 |
| @ |
| VMware, Inc. |
| — |
| 158,723 |
| 37,290 |
| 196,013 |
| — |
|
13,200 |
| — |
| (13,200 | ) | — |
| @ |
| Wind River Systems, Inc. |
| 119,196 |
| — |
| (119,196 | ) | — |
| 119,196 |
|
|
|
|
|
|
|
|
|
|
|
|
| 11,819,901 |
| 37,644,369 |
| (2,975,880 | ) | 46,488,390 | cs |
|
|
|
|
|
|
|
|
|
|
|
| Telecommunications: 6.6% |
|
|
|
|
|
|
|
|
|
|
|
39,400 |
| — |
| (39,400 | ) | — |
| @ |
| 3Com Corp. |
| 89,832 |
| — |
| (89,832 | ) | — |
| 89,832 |
|
9,500 |
| — |
| (9,500 | ) | — |
|
|
| Adtran, Inc. |
| 141,360 |
| — |
| (141,360 | ) | — |
| 141,360 |
|
12,300 |
| — |
| (12,300 | ) | — |
| @, @@ |
| Amdocs Ltd. |
| 224,967 |
| — |
| (224,967 | ) | — |
| 224,967 |
|
4,500 |
| — |
| (4,500 | ) | — |
| @ |
| Anixter International, Inc. |
| 135,540 |
| — |
| (135,540 | ) | — |
| 135,540 |
|
149,800 |
| 941,900 |
| 71,486 |
| 1,163,186 |
|
|
| AT&T, Inc. |
| 4,269,300 |
| 26,844,150 |
| 2,037,360 |
| 33,150,810 |
| 4,269,300 |
|
8,400 |
| — |
| (8,400 | ) | — |
| @ |
| Atheros Communications, Inc. |
| 120,204 |
| — |
| (120,204 | ) | — |
| 120,204 |
|
6,200 |
| — |
| (6,200 | ) | — |
| @ |
| Centennial Communications Corp. |
| 49,972 |
| — |
| (49,972 | ) | — |
| 49,972 |
|
16,100 |
| — |
| (16,100 | ) | — |
| @, L |
| Ciena Corp. |
| 107,870 |
| — |
| (107,870 | ) | — |
| 107,870 |
|
19,100 |
| — |
| (19,100 | ) | — |
| @ |
| Cincinnati Bell, Inc. |
| 36,863 |
| — |
| (36,863 | ) | — |
| 36,863 |
|
240,800 |
| 936,600 |
| (20,759 | ) | 1,156,641 |
| @ |
| Cisco Systems, Inc. |
| 3,925,040 |
| 15,266,580 |
| (338,369 | ) | 18,853,251 |
| 3,925,040 |
|
11,700 |
| — |
| (11,700 | ) | — |
| @ |
| CommScope, Inc. |
| 181,818 |
| — |
| (181,818 | ) | — |
| 181,818 |
|
1,100 |
| — |
| (1,100 | ) | — |
| @ |
| Comtech Telecommunications |
| 50,402 |
| — |
| (50,402 | ) | — |
| 50,402 |
|
36,400 |
| 249,750 |
| 22,275 |
| 308,425 |
|
|
| Corning, Inc. |
| 346,892 |
| 2,380,118 |
| 212,284 |
| 2,939,294 |
| 346,892 |
|
5,420 |
| — |
| (5,420 | ) | — |
| @ |
| EchoStar Holding Corp. |
| 80,595 |
| — |
| (80,595 | ) | — |
| 80,595 |
|
8,700 |
| — |
| (8,700 | ) | — |
|
|
| Embarq Corp. |
| 312,852 |
| — |
| (312,852 | ) | — |
| 312,852 |
|
1,400 |
| — |
| (1,400 | ) | — |
| @ |
| Global Crossing Ltd. |
| 11,116 |
| — |
| (11,116 | ) | — |
| 11,116 |
|
5,800 |
| — |
| (5,800 | ) | — |
|
|
| Harris Corp. |
| 220,690 |
| — |
| (220,690 | ) | — |
| 220,690 |
|
6,500 |
| — |
| (6,500 | ) | — |
| @, L |
| InterDigital, Inc. |
| 178,750 |
| — |
| (178,750 | ) | — |
| 178,750 |
|
50,800 |
| — |
| (50,800 | ) | — |
| @, L |
| JDS Uniphase Corp. |
| 185,420 |
| — |
| (185,420 | ) | — |
| 185,420 |
|
7,500 |
| — |
| (7,500 | ) | — |
| @ |
| Mastec, Inc. |
| 86,850 |
| — |
| (86,850 | ) | — |
| 86,850 |
|
— |
| 357,450 |
| 83,978 |
| 441,428 |
|
|
| Motorola, Inc. |
| — |
| 1,583,504 |
| 372,022 |
| 1,955,526 |
| — |
|
6,400 |
| — |
| (6,400 | ) | — |
| @ |
| NeuStar, Inc. |
| 122,432 |
| — |
| (122,432 | ) | — |
| 122,432 |
|
7,700 |
| — |
| (7,700 | ) | — |
| @ |
| NII Holdings, Inc. |
| 139,986 |
| — |
| (139,986 | ) | — |
| 139,986 |
|
4,300 |
| — |
| (4,300 | ) | — |
|
|
| NTELOS Holdings Corp. |
| 106,038 |
| — |
| (106,038 | ) | — |
| 106,038 |
|
11,800 |
| — |
| (11,800 | ) | — |
|
|
| Plantronics, Inc. |
| 155,760 |
| — |
| (155,760 | ) | — |
| 155,760 |
|
8,600 |
| — |
| (8,600 | ) | — |
| @ |
| Polycom, Inc. |
| 116,186 |
| — |
| (116,186 | ) | — |
| 116,186 |
|
5,500 |
| — |
| (5,500 | ) | — |
| @ |
| Premier Global Services, Inc. |
| 47,355 |
| — |
| (47,355 | ) | — |
| 47,355 |
|
31,700 |
| 256,400 |
| 28,538 |
| 316,638 |
|
|
| Qualcomm, Inc. |
| 1,135,811 |
| 9,186,812 |
| 1,022,503 |
| 11,345,126 |
| 1,135,811 |
|
64,900 |
| — |
| (64,900 | ) | — |
| L |
| Qwest Communications International, Inc. |
| 236,236 |
| — |
| (236,236 | ) | — |
| 236,236 |
|
15,000 |
| — |
| (15,000 | ) | — |
| @ |
| RF Micro Devices, Inc. |
| 11,700 |
| — |
| (11,700 | ) | — |
| 11,700 |
|
164,187 |
| 440,250 |
| (60,756 | ) | 543,681 |
|
|
| Sprint Nextel Corp. |
| 300,462 |
| 805,658 |
| (111,184 | ) | 994,936 |
| 300,462 |
|
1,100 |
| — |
| (1,100 | ) | — |
| @ |
| Starent Networks Corp. |
| 13,123 |
| — |
| (13,123 | ) | — |
| 13,123 |
|
8,400 |
| — |
| (8,400 | ) | — |
| @ |
| Syniverse Holdings, Inc. |
| 100,296 |
| — |
| (100,296 | ) | — |
| 100,296 |
|
8,600 |
| — |
| (8,600 | ) | — |
| @ |
| Tekelec |
| 114,724 |
| — |
| (114,724 | ) | — |
| 114,724 |
|
7,300 |
| — |
| (7,300 | ) | — |
|
|
| Telephone & Data Systems, Inc. |
| 231,775 |
| — |
| (231,775 | ) | — |
| 231,775 |
|
55,600 |
| — |
| (55,600 | ) | — |
| @ |
| Tellabs, Inc. |
| 229,072 |
| — |
| (229,072 | ) | — |
| 229,072 |
|
18,400 |
| — |
| (18,400 | ) | — |
| @, L |
| TW Telecom, Inc. |
| 155,848 |
| — |
| (155,848 | ) | — |
| 155,848 |
|
2,900 |
| — |
| (2,900 | ) | — |
| @ |
| US Cellular Corp. |
| 125,396 |
| — |
| (125,396 | ) | — |
| 125,396 |
|
57,800 |
| 452,000 |
| 48,391 |
| 558,191 |
|
|
| Verizon Communications, Inc. |
| 1,959,420 |
| 15,322,800 |
| 1,640,459 |
| 18,922,679 |
| 1,959,420 |
|
600 |
| — |
| (600 | ) | — |
| @, L |
| Viasat, Inc. |
| 14,448 |
| — |
| (14,448 | ) | — |
| 14,448 |
|
21,100 |
| — |
| (21,100 | ) | — |
|
|
| Windstream Corp. |
| 194,120 |
| — |
| (194,120 | ) | — |
| 194,120 |
|
|
|
|
|
|
|
|
|
|
|
|
| 16,266,521 |
| 71,389,622 |
| 505,479 |
| 88,161,622 | cs |
|
|
|
|
|
|
|
|
|
|
|
| Textiles: 0.0% |
|
|
|
|
|
|
|
|
|
|
|
800 |
| — |
| (800 | ) | — |
|
|
| Unifirst Corp. |
| 23,752 |
| — |
| (23,752 | ) | — |
| 23,752 |
|
|
|
|
|
|
|
|
|
|
|
|
| 23,752 |
| — |
| (23,752 | ) | — | cs |
|
|
|
|
|
|
|
|
|
|
|
| Transportation: 2.0% |
|
|
|
|
|
|
|
|
|
|
|
2,200 |
| — |
| (2,200 | ) | — |
|
|
| Alexander & Baldwin, Inc. |
| 55,132 |
| — |
| (55,132 | ) | — |
| 55,132 |
|
6,100 |
| — |
| (6,100 | ) | — |
| L |
| Arkansas Best Corp. |
| 183,671 |
| — |
| (183,671 | ) | — |
| 183,671 |
|
— |
| 44,700 |
| 10,502 |
| 55,202 |
|
|
| Burlington Northern Santa Fe Corp. |
| — |
| 3,384,237 |
| 795,079 |
| 4,179,316 |
| — |
|
6,500 |
| 64,200 |
| 8,583 |
| 79,283 |
|
|
| CSX Corp. |
| 211,055 |
| 2,084,574 |
| 278,687 |
| 2,574,316 |
| 211,055 |
|
1,300 |
| — |
| (1,300 | ) | — |
| @@, L |
| Excel Maritime Carriers Ltd. |
| 9,152 |
| — |
| (9,152 | ) | — |
| 9,152 |
|
— |
| 49,250 |
| 11,571 |
| 60,821 |
|
|
| FedEx Corp. |
| — |
| 3,159,388 |
| 742,254 |
| 3,901,642 |
| — |
|
3,700 |
| — |
| (3,700 | ) | — |
| @@, L |
| Frontline Ltd. |
| 109,557 |
| — |
| (109,557 | ) | — |
| 109,557 |
|
5,700 |
| — |
| (5,700 | ) | — |
| L |
| Genco Shipping & Trading Ltd. |
| 84,360 |
| — |
| (84,360 | ) | — |
| 84,360 |
|
1,800 |
| — |
| (1,800 | ) | — |
| @ |
| Gulfmark Offshore, Inc. |
| 42,822 |
| — |
| (42,822 | ) | — |
| 42,822 |
|
3,000 |
| — |
| (3,000 | ) | — |
|
|
| Heartland Express, Inc. |
| 47,280 |
| — |
| (47,280 | ) | — |
| 47,280 |
|
3,000 |
| — |
| (3,000 | ) | — |
| @ |
| HUB Group, Inc. |
| 79,590 |
| — |
| (79,590 | ) | — |
| 79,590 |
|
1,300 |
| — |
| (1,300 | ) | — |
| @ |
| Kirby Corp. |
| 35,568 |
| — |
| (35,568 | ) | — |
| 35,568 |
|
100 |
| — |
| (100 | ) | — |
| @@, L |
| Nordic American Tanker Shipping |
| 3,375 |
| — |
| (3,375 | ) | — |
| 3,375 |
|
18,800 |
| 59,500 |
| (4,821 | ) | 73,479 |
|
|
| Norfolk Southern Corp. |
| 884,540 |
| 2,799,475 |
| (226,842 | ) | 3,457,173 |
| 884,540 |
|
200 |
| — |
| (200 | ) | — |
| @ |
| Old Dominion Freight Line |
| 5,692 |
| — |
| (5,692 | ) | — |
| 5,692 |
|
4,600 |
| — |
| (4,600 | ) | — |
|
|
| Overseas Shipholding Group |
| 193,706 |
| — |
| (193,706 | ) | — |
| 193,706 |
|
1,800 |
| — |
| (1,800 | ) | — |
|
|
| Pacer International, Inc. |
| 18,774 |
| — |
| (18,774 | ) | — |
| 18,774 |
|
400 |
| — |
| (400 | ) | — |
|
|
| Ryder System, Inc. |
| 15,512 |
| — |
| (15,512 | ) | — |
| 15,512 |
|
300 |
| — |
| (300 | ) | — |
| @, @@ |
| TBS International Ltd. |
| 3,009 |
| — |
| (3,009 | ) | — |
| 3,009 |
|
3,500 |
| — |
| (3,500 | ) | — |
|
|
| Tidewater, Inc. |
| 140,945 |
| — |
| (140,945 | ) | — |
| 140,945 |
|
— |
| 81,900 |
| 19,241 |
| 101,141 |
|
|
| Union Pacific Corp. |
| — |
| 3,914,820 |
| 919,732 |
| 4,834,552 |
| — |
|
— |
| 108,500 |
| 25,491 |
| 133,991 |
|
|
| United Parcel Service, Inc. - Class B |
| — |
| 5,984,860 |
| 1,406,060 |
| 7,390,920 |
| — |
|
2,900 |
| — |
| (2,900 | ) | — |
| @@ |
| UTI Worldwide, Inc. |
| 41,586 |
| — |
| (41,586 | ) | — |
| 41,586 |
|
9,400 |
| — |
| (9,400 | ) | — |
|
|
| Werner Enterprises, Inc. |
| 162,996 |
| — |
| (162,996 | ) | — |
| 162,996 |
|
5,500 |
| — |
| (5,500 | ) | — |
| @, L |
| YRC Worldwide, Inc. |
| 15,785 |
| — |
| (15,785 | ) | — |
| 15,785 |
|
|
|
|
|
|
|
|
|
|
|
|
| 2,344,107 |
| 21,327,354 |
| 2,666,458 |
| 26,337,919 | cs |
|
|
|
|
|
|
|
|
|
|
|
| Trucking & Leasing: 0.0% |
|
|
|
|
|
|
|
|
|
|
|
200 |
| — |
| (200 | ) | — |
| @ |
| Amerco, Inc. |
| 6,906 |
| — |
| (6,906 | ) | — |
| 6,906 |
|
2,100 |
| — |
| (2,100 | ) | — |
|
|
| GATX Corp. |
| 65,037 |
| — |
| (65,037 | ) | — |
| 65,037 |
|
900 |
| — |
| (900 | ) | — |
| @@ |
| Textainer Group Holdings Ltd. |
| 9,540 |
| — |
| (9,540 | ) | — |
| 9,540 |
|
|
|
|
|
|
|
|
|
|
|
|
| 81,483 |
| — |
| (81,483 | ) | — | cs |
|
|
|
|
|
|
|
|
|
|
|
| Water: 0.0% |
|
|
|
|
|
|
|
|
|
|
|
100 |
| — |
| (100 | ) | — |
| @, L |
| Pico Holdings, Inc. |
| 2,658 |
| — |
| (2,658 | ) | — |
| 2,658 |
|
|
|
|
|
|
|
|
|
|
|
|
| 2,658 |
| — |
| (2,658 | ) | — | cs |
|
|
|
|
|
|
|
|
|
|
|
|
|
|
|
|
|
|
|
|
|
|
|
|
|
|
|
|
|
|
|
|
|
| Total Common Stock |
| 248,177,213 |
| 1,031,368,914 |
| (5,871,435 | ) | 1,273,674,692 | lt |
|
|
|
|
|
|
|
|
|
|
|
| (Cost $) |
| 354,987,767 |
| 1,315,775,095 |
| (5,871,435 | ) | 1,664,891,427 | ltc |
|
|
|
|
|
|
|
|
|
|
|
|
|
|
|
|
|
|
|
|
|
|
|
|
0.2% |
|
|
|
|
|
|
|
|
|
|
|
|
|
|
|
|
|
|
|
|
|
|
|
|
|
|
|
|
|
|
| Regional Malls: 0.2% |
|
|
|
|
|
|
|
|
|
|
|
— |
| 35,700 |
| 8,387 |
| 44,087 |
|
|
| Simon Property Group, Inc. |
| — |
| 1,896,741 |
| 445,613 |
| 2,342,354 |
| — |
|
|
|
|
|
|
|
|
|
|
|
|
| — |
| 1,896,741 |
| 445,613 |
| 2,342,354 | reit |
|
|
|
|
|
|
|
|
|
|
|
|
|
|
|
|
|
|
|
|
|
|
|
|
|
|
|
|
|
|
|
|
|
| Total Real Estate Investment Trusts |
| — |
| 1,896,741 |
| 445,613 |
| 2,342,354 | lt |
|
|
|
|
|
|
|
|
|
|
|
| (Cost $) |
| — |
| 2,875,449 |
| 445,613 |
| 3,321,062 | ltc |
|
|
|
|
|
|
|
|
|
|
|
|
|
|
|
|
|
|
|
|
|
|
|
|
|
|
|
|
|
|
|
|
|
| Total Long-Term Investments |
| 248,177,213 |
| 1,033,265,655 |
| (5,425,822 | ) | 1,276,017,046 | tis |
|
|
|
|
|
|
|
|
|
|
|
| (Cost $) |
| 354,987,767 |
| 1,318,650,544 |
| (5,425,822 | ) | 1,668,212,489 | tisc |
|
|
|
|
|
|
|
|
|
|
|
|
|
|
|
|
|
|
|
|
|
|
|
|
3.1% |
|
|
|
|
|
|
|
|
|
|
|
|
|
|
|
|
|
|
|
|
|
|
|
|
|
|
|
|
|
|
| Affiliated Mutual Fund: 3.1% |
|
|
|
|
|
|
|
|
|
|
|
2,499,042 |
| 33,732,000 |
| 5,425,822 |
| 41,656,864 |
| S |
| ING Institutional Prime Money Market Fund - Class I |
| 2,499,042 |
| 33,732,000 |
| 5,425,822 |
| 41,656,864 |
| 2,499,042 |
|
|
|
|
|
|
|
|
|
|
|
|
|
|
|
|
|
|
|
|
|
|
|
|
|
|
|
|
|
|
|
|
| Total Affiliated Mutual Fund |
| 2,499,042 |
| 33,732,000 |
| 5,425,822 |
| 41,656,864 | st |
|
|
|
|
|
|
|
|
|
|
|
| (Cost $) |
| 2,499,042 |
| 33,732,000 |
| 5,425,822 |
| 41,656,864 | stc |
|
|
|
|
|
|
|
|
|
|
|
|
|
|
|
|
|
|
|
|
|
|
|
|
| ||||||||||||||||||
Principal Amount |
|
|
|
|
|
|
|
|
|
|
|
|
|
|
|
|
|
|
|
|
| |||||||||||||||||||
|
|
|
|
|
|
|
|
|
|
|
|
|
|
|
|
|
|
|
|
|
| |||||||||||||||||||
|
|
|
|
|
|
|
|
|
| Securities Lending Collateralcc: 0.0% |
|
|
|
|
|
|
|
|
|
|
| |||||||||||||||||||
8,520,461 |
| — |
| (8,520,461 | ) | — |
|
|
| Bank of New York Mellon Corp. Institutional Cash Reserves |
| 8,415,873 |
| — |
| (8,415,873 | ) | — |
| 8,415,873 |
| |||||||||||||||||||
|
|
|
|
|
|
|
|
|
|
|
|
|
|
|
|
|
|
|
|
|
| |||||||||||||||||||
|
|
|
|
|
|
|
|
|
| Total Securities Lending Collateral |
| 8,415,873 |
| — |
| (8,415,873 | ) | — | st |
|
| |||||||||||||||||||
|
|
|
|
|
|
|
|
|
| (Cost $) |
| 8,520,461 |
| — |
| (8,520,461 | ) | — | stc |
|
| |||||||||||||||||||
|
|
|
|
|
|
|
|
|
|
|
| �� |
|
|
|
|
|
|
|
|
| |||||||||||||||||||
|
|
|
|
|
|
|
|
|
| Total Short-Term Investments |
| 10,914,915 |
| 33,732,000 |
| (2,990,051 | ) | 41,656,864 | tis |
|
| |||||||||||||||||||
|
|
|
|
|
|
|
|
|
| (Cost $) |
| 11,019,503 |
| 33,732,000 |
| (3,094,639 | ) | 41,656,864 | tisc |
|
| |||||||||||||||||||
|
|
|
|
|
|
|
|
|
|
|
|
|
|
|
|
|
|
|
|
|
| |||||||||||||||||||
|
|
|
|
|
|
|
|
|
| Total Investments in Securities | 98.4 | % | $ | 259,092,128 |
| $ | 1,066,997,655 |
| $ | (8,415,873 | ) | $ | 1,317,673,910 |
|
|
| ||||||||||||||
|
|
|
|
|
|
|
|
|
| (Cost $)* |
|
| 366,007,270 |
| 1,352,382,544 |
| 259,092,128 |
| 1,602,954,211 |
|
|
| ||||||||||||||||||
|
|
|
|
|
|
|
|
|
| Other Assets and Liabilities – Net | 1.6 |
| (7,584,458 | ) | 20,641,235 |
| 8,415,873 |
| 21,472,650 |
|
|
| ||||||||||||||||||
|
|
|
|
|
|
|
|
|
| Net Assets prior proforma adjustments | 100.0 | % | $ | 251,507,670 |
| $ | 1,087,638,890 |
| $ | — |
| $ | 1,339,146,560 |
|
|
| ||||||||||||||
|
|
|
|
|
|
|
|
|
|
|
|
|
|
|
|
|
|
|
|
|
|
| ||||||||||||||||||
|
|
|
|
|
|
|
|
|
| Proforma adjustments | — |
| — |
| — |
| — |
| — |
|
|
| ||||||||||||||||||
|
|
|
|
|
|
|
|
|
| Net Assets after proforma adjustments | 100.0 | % | $ | 251,507,670 |
| $ | 1,087,638,890 |
| $ | — |
| $ | 1,339,146,560 |
| 259,092,128 |
| ||||||||||||||
|
|
|
|
|
|
|
|
|
|
|
|
|
|
|
|
|
|
|
|
|
|
|
|
|
|
| ||||||||||||||
|
|
|
|
|
|
|
|
|
|
|
|
|
|
|
|
|
|
|
|
|
|
|
|
|
|
| ||||||||||||||
|
|
|
|
|
|
|
| @ |
| Non-income producing security | ||||||||||||||||||||||||||||||
|
|
|
|
|
|
|
| @@ |
| Foreign Issuer | ||||||||||||||||||||||||||||||
|
|
|
|
|
|
|
| ADR |
| American Depositary Receipt | ||||||||||||||||||||||||||||||
|
|
|
|
|
|
|
| cc |
| Securities purchased with cash collateral for securities loaned. | ||||||||||||||||||||||||||||||
|
|
|
|
|
|
|
| I |
| Illiquid security | ||||||||||||||||||||||||||||||
|
|
|
|
|
|
|
| L |
| Loaned security, a portion or all of the security is on loan at December 31, 2008. | ||||||||||||||||||||||||||||||
|
|
|
|
|
|
|
| ## |
| On September 7, 2008, the Federal Housing Finance Agency placed the Federal National Mortgage Association and the Federal Home Loan Mortgage Corporation into conservatorship and the U.S. Treasury guaranteed the debt issued by those organizations. | ||||||||||||||||||||||||||||||
|
|
|
|
|
|
|
| S |
| All or a portion of this security is segregated to cover collateral requirements for applicable futures, options, swaps, foreign forward currency contracts and/or when-issued or delayed-delivery securities. | ||||||||||||||||||||||||||||||
|
|
|
|
|
|
|
|
|
|
|
|
|
|
|
|
|
|
|
|
|
| |||||||||||||||||||
|
|
|
|
|
|
|
| * |
| Cost for federal income tax purposes is |
| $ | 371,709,034 |
| $ | 1,362,798,818 |
| $ | 250,676,255 |
| $ | 1,613,475,073 |
|
|
| |||||||||||||||
|
|
|
|
|
|
|
|
|
| Net unrealized depreciation consists of: |
|
|
|
|
|
|
|
|
|
|
| |||||||||||||||||||
|
|
|
|
|
|
|
|
|
| Gross Unrealized Appreciation |
| $ | 3,623,539 |
| $ | 3,029,284 |
| $ | (3,623,539 | ) | 3,029,284 |
|
|
| ||||||||||||||||
|
|
|
|
|
|
|
|
|
| Gross Unrealized Depreciation |
| (116,240,445 | ) | (298,830,447 | ) | 116,240,445 |
| (298,830,447 | ) |
|
| |||||||||||||||||||
|
|
|
|
|
|
|
|
|
| Net Unrealized Depreciation |
| $ | (112,616,906 | ) | $ | (295,801,163 | ) | $ | 112,616,906 |
| $ | (295,801,163 | ) |
|
| |||||||||||||||
|
|
|
|
|
|
|
|
|
|
|
|
|
|
|
|
|
|
|
|
|
| |||||||||||||||||||
|
|
|
|
|
|
|
|
|
| The following table summarizes the inputs used as of December 31, 2008 in determining the Portfolio’s investments at fair value for purposes of SFAS 157: | ||||||||||||||||||||||||||||||
|
|
|
|
|
|
|
|
|
|
| ||||||||||||||||||||||||||||||
|
|
|
|
|
|
|
|
|
| Investments in Securities |
|
|
|
|
|
|
|
|
|
|
| |||||||||||||||||||
|
|
|
|
|
|
|
|
|
| Level 1- Quoted Prices |
| $ | 250,676,254 |
| $ | 1,066,788,159 |
| $ | — |
| $ | 1,317,464,413 |
|
|
| |||||||||||||||
|
|
|
|
|
|
|
|
|
| Level 2- Other Significant Observable Inputs |
| 8,415,874 |
| 209,496 |
| (8,415,873 | ) | 209,497 |
|
|
| |||||||||||||||||||
|
|
|
|
|
|
|
|
|
| Level 3- Significant Unobservable Inputs |
| — |
| — |
| — |
| — |
|
|
| |||||||||||||||||||
|
|
|
|
|
|
|
|
|
| Total |
| $ | 259,092,128 |
| $ | 1,066,997,655 |
| $ | (8,415,873 | ) | $ | 1,317,673,910 |
|
|
| |||||||||||||||
|
|
|
|
|
|
|
|
|
|
|
|
|
|
|
|
|
|
|
|
|
| |||||||||||||||||||
|
|
|
|
|
|
|
|
|
| Other Financial Instruments* |
|
|
|
|
|
|
|
|
|
|
| |||||||||||||||||||
|
|
|
|
|
|
|
|
|
| Level 1- Quoted Prices |
| $ | — |
| $ | 1,056,411 |
| $ | — |
| $ | 1,056,411 |
|
|
| |||||||||||||||
|
|
|
|
|
|
|
|
|
| Level 2- Other Significant Observable Inputs |
| — |
| — |
| — |
| — |
|
|
| |||||||||||||||||||
|
|
|
|
|
|
|
|
|
| Level 3- Significant Unobservable Inputs |
| — |
| — |
| — |
| — |
|
|
| |||||||||||||||||||
|
|
|
|
|
|
|
|
|
| Total |
| $ | — |
| $ | 1,056,411 |
| $ | — |
| $ | 1,056,411 |
|
|
| |||||||||||||||
|
|
|
|
|
|
|
|
|
|
| ||||||||||||||||||||||||||||||
|
|
|
|
|
|
|
|
|
| “Fair value” for purposes of SFAS 157 is different from “fair value” as used in the 1940 Act. The former generally implies market value, and can include market quotations as a source of value, and the latter refers to determinations of actual value in absence of available market quotations. | ||||||||||||||||||||||||||||||
|
|
|
|
|
|
|
|
|
|
| ||||||||||||||||||||||||||||||
|
|
|
|
|
|
|
|
|
| * Other financial instruments may include forward foreign currency contracts, futures, swaps, and written options. Forward foreign currency contracts and futures are reported at their unrealized gain/loss at year end. Swaps and written options are reported at their market value at year end. | ||||||||||||||||||||||||||||||
|
|
|
|
|
|
|
|
|
|
| ||||||||||||||||||||||||||||||
|
|
|
|
|
|
|
|
|
| ING Russell Large Cap Index Portfolio Open Futures Contracts on December 31, 2008 | ||||||||||||||||||||||||||||||
|
|
|
|
|
|
|
|
|
|
|
|
|
|
|
|
|
|
|
|
|
| |||||||||||||||||||
|
|
|
|
|
|
|
|
|
|
|
| Number |
|
|
| Unrealized |
|
|
|
|
| |||||||||||||||||||
|
|
|
|
|
|
|
|
|
| Contract Description |
| of Contracts |
| Expiration Date |
| Appreciation/(Depreciation) |
|
|
|
|
| |||||||||||||||||||
|
|
|
|
|
|
|
|
|
| Long Contracts |
|
|
|
|
|
|
|
|
|
|
| |||||||||||||||||||
|
|
|
|
|
|
|
|
|
| S&P 500 |
| 216 |
| 03/19/09 |
| $ | 1,056,411 |
|
|
|
|
| ||||||||||||||||||
|
|
|
|
|
|
|
|
|
|
|
|
|
|
|
| $ | 1,056,411 |
|
|
|
|
| ||||||||||||||||||
STATEMENTS OF ASSETS AND LIABILITIES as of December 31, 2008
|
| ING |
| ING |
| ING |
|
|
|
|
| |||||
|
| Neuberger Berman |
| Oppenheimer Main |
| RussellTM Large Cap |
| Pro Forma |
| Pro Forma |
| |||||
|
| Partners Portfolio |
| Street Portfolio® |
| Index Portfolio |
| Adjustments |
| Combined (unaudited) |
| |||||
ASSETS: |
|
|
|
|
|
|
|
|
|
|
| |||||
Investments in securities at value+* |
| $ | 241,289,905 |
| $ | 248,177,213 |
| $ | 1,033,265,655 |
| $ | (13,053,947 | ) | $ | 1,509,678,826 |
|
Short-term investments** |
| — |
| 8,415,873 |
| — |
| (8,415,873 | ) | — |
| |||||
Short-term investments in affiliate*** |
| — |
| 2,499,042 |
| 33,732,000 |
| 13,053,947 |
| 49,284,989 |
| |||||
Cash |
| 8,554,856 |
| 15,135 |
| 8,998,832 |
|
|
| 17,568,823 |
| |||||
Cash collateral for futures |
| — |
| — |
| 5,247,000 |
|
|
| 5,247,000 |
| |||||
Receivables: |
|
|
|
|
|
|
|
|
| — |
| |||||
Investment securities sold |
| 2,943,296 |
| 191,171 |
| — |
|
|
| 3,134,467 |
| |||||
Fund shares sold |
| 1,184,719 |
| 703,859 |
| 4,206,100 |
|
|
| 6,094,678 |
| |||||
Dividends and interest |
| 518,540 |
| 389,880 |
| 1,975,529 |
|
|
| 2,883,949 |
| |||||
Variation margin |
| — |
| — |
| 634,488 |
|
|
| 634,488 |
| |||||
Prepaid expenses |
| 1,784 |
| 1,688 |
| 29,234 |
|
|
| 32,706 |
| |||||
Reimbursement due from manager |
| 31,876 |
| — |
| 30,451 |
|
|
| 62,327 |
| |||||
Total assets |
| 254,524,976 |
| 260,393,861 |
| 1,088,119,289 |
| (8,415,873 | ) | 1,594,622,253 |
| |||||
|
|
|
|
|
|
|
|
|
|
|
| |||||
LIABILITIES: |
|
|
|
|
|
|
|
|
|
|
| |||||
Payable for investment securities purchased |
| 3,261,136 |
| 5,240 |
| 9,015 |
|
|
| 3,275,391 |
| |||||
Payable for fund shares redeemed |
| 38,001 |
| 170,920 |
| 166,888 |
|
|
| 375,809 |
| |||||
Payable upon receipt of securities loaned |
| — |
| 8,520,461 |
| — |
| (8,520,461 | ) | — |
| |||||
Payable to affiliates |
| 189,642 |
| 189,570 |
| 233,530 |
|
|
| 612,742 |
| |||||
Payable for trustee/director fees |
| 7,092 |
| — |
| 6,582 |
|
|
| 13,674 |
| |||||
Other accrued expenses and liabilities |
| 58,786 |
| — |
| 54,384 |
| 104,588 |
| 217,758 |
| |||||
Payable for licensing fees |
| — |
| — |
| 10,000 |
|
|
| 10,000 |
| |||||
Total liabilities |
| 3,554,657 |
| 8,886,191 |
| 480,399 |
| (8,415,873 | ) | 4,505,374 |
| |||||
NET ASSETS |
| $ | 250,970,319 |
| $ | 251,507,670 |
| $ | 1,087,638,890 |
| $ | — |
| $ | 1,590,116,879 |
|
|
|
|
|
|
|
|
|
|
|
|
| |||||
NET ASSETS CONSIST OF: |
|
|
|
|
|
|
|
|
|
|
| |||||
Paid-in capital |
| $ | 501,253,716 |
| $ | 544,556,565 |
| $ | 1,406,246,700 |
|
|
| $ | 2,452,056,981 |
| |
Undistributed net investment income |
| 2,624,225 |
| 262,553 |
| 158,673 |
|
|
| 3,045,451 |
| |||||
Accumulated net realized loss on investments, foreign currency related transactions, and futures |
| (131,385,110 | ) | (186,396,549 | ) | (34,438,005 | ) |
|
| (352,219,664 | ) | |||||
Net unrealized depreciation of investments, foreign currency related transactions, and futures |
| (121,522,512 | ) | (106,914,899 | ) | (284,328,478 | ) |
|
| (512,765,889 | ) | |||||
NET ASSETS |
| $ | 250,970,319 |
| $ | 251,507,670 |
| $ | 1,087,638,890 |
| $ | — |
| $ | 1,590,116,879 |
|
+ Including securities loaned at value |
| $ | — |
| $ | 8,494,093 |
| $ | — |
| $ | (8,494,093 | ) | $ | — |
|
*Cost of investments in securities |
| $ | 362,806,838 |
| $ | 354,987,767 |
| $ | 1,318,650,544 |
| $ | (13,053,947 | ) | $ | 2,023,391,202 |
|
** Cost of short-term investments |
| $ | — |
| $ | 8,520,461 |
| $ | — |
| $ | (8,520,461 | ) | $ | — |
|
*** Cost of short-term investments in affiliate |
| $ | — |
| $ | 2,499,042 |
| $ | 33,732,000 |
| $ | 13,053,947 |
| $ | 49,284,989 |
|
|
|
|
|
|
|
|
|
|
|
|
| |||||
Class ADV: |
|
|
|
|
|
|
|
|
|
|
| |||||
Net Assets |
| $ | 1,594 |
| $ | 676 |
| $ | 1,135,332 |
|
|
| $ | 1,137,602 |
| |
Shares authorized |
| 100,000,000 |
| unlimited |
| 100,000,000 |
|
|
| 100,000,000 |
| |||||
Par value |
| $ | 0.001 |
| $ | 0.001 |
| $ | 0.001 |
|
|
| $ | 0.001 |
| |
Shares outstanding |
| 293 |
| 56 |
| 157,913 |
| (33 | ) (A) | 158,229 |
| |||||
Net asset value and redemption price per share |
| $ | 5.44 |
| $ | 12.07 |
| $ | 7.19 |
|
|
| $ | 7.19 |
| |
|
|
|
|
|
|
|
|
|
|
|
| |||||
Class I: |
|
|
|
|
|
|
|
|
|
|
| |||||
Net Assets |
| $ | 187,621,010 |
| $ | 3,491,014 |
| $ | 1,057,974,224 |
|
|
| $ | 1,249,086,248 |
| |
Shares authorized |
| 100,000,000 |
| unlimited |
| 200,000,000 |
|
|
| 200,000,000 |
| |||||
Par value |
| $ | 0.001 |
| $ | 0.001 |
| $ | 0.001 |
|
|
| $ | 0.001 |
| |
Shares outstanding |
| 34,081,480 |
| 288,502 |
| 146,789,804 |
| (7,863,460 | ) (A) | 173,296,326 |
| |||||
Net asset value and redemption price per share |
| $ | 5.51 |
| $ | 12.10 |
| $ | 7.21 |
|
|
| $ | 7.21 |
| |
|
|
|
|
|
|
|
|
|
|
|
| |||||
Class S: |
|
|
|
|
|
|
|
|
|
|
| |||||
Net Assets |
| $ | 63,347,715 |
| $ | 245,382,963 |
| $ | 28,529,334 |
|
|
| $ | 337,260,012 |
| |
Shares authorized |
| 100,000,000 |
| unlimited |
| 100,000,000 |
|
|
| 100,000,000 |
| |||||
Par value |
| $ | 0.001 |
| $ | 0.001 |
| $ | 0.001 |
|
|
| $ | 0.001 |
| |
Shares outstanding |
| 11,556,312 |
| 20,169,062 |
| 3,962,706 |
| 11,153,887 | (A) | 46,841,967 |
| |||||
Net asset value and redemption price per share |
| $ | 5.48 |
| $ | 12.17 |
| $ | 7.20 |
|
|
| $ | 7.20 |
| |
|
|
|
|
|
|
|
|
|
|
|
| |||||
Class S2: |
|
|
|
|
|
|
|
|
|
|
| |||||
Net Assets |
| $ | — |
| $ | 2,633,017 |
| $ | — |
|
|
| $ | 2,633,017 |
| |
Shares authorized |
| 100,000,000 |
| unlimited |
| 100,000,000 |
|
|
| 100,000,000 |
| |||||
Par value |
| $ | 0.001 |
| $ | 0.001 |
| $ | 0.001 |
|
|
| $ | 0.001 |
| |
Shares outstanding |
| 0 |
| 217,034 |
| 0 |
| 46,268 | (A) | 263,302 |
| |||||
Net asset value and redemption price per share |
| $ | — |
| $ | 12.13 |
| $ | 10.00 |
|
|
| $ | 10.00 |
| |
(A) Reflects new shares issued, net of retired shares of ING Oppenheimer Main Street Portfolio. Calculation: Net Assets ÷ NAV per share)
STATEMENTS OF OPERATIONS for the year ended December 31, 2008
|
| ING |
| ING |
| ING |
|
|
|
|
| |||||
|
| Neuberger Berman |
| Oppenheimer Main |
| RussellTM Large Cap |
| Pro Forma |
| Pro Forma |
| |||||
|
| Partners Portfolio |
| Street Portfolio® |
| Index Portfolio (A) |
| Adjustments |
| Combined (unaudited) |
| |||||
INVESTMENT INCOME: |
|
|
|
|
|
|
|
|
|
|
| |||||
Dividends, net of foreign taxes withheld*(1) |
| $ | 5,707,179 |
| $ | 7,337,904 |
| $ | 17,060,303 |
|
|
| $ | 30,105,386 |
| |
Interest |
| 13,635 |
| 27,230 |
| 11,829 |
|
|
| 52,694 |
| |||||
Securities lending income |
| — |
| 197,463 |
| — |
|
|
| 197,463 |
| |||||
Total investment income |
| 5,720,814 |
| 7,562,597 |
| 17,072,132 |
| — |
| 30,355,543 |
| |||||
|
|
|
|
|
|
|
|
|
|
|
| |||||
EXPENSES: |
|
|
|
|
|
|
|
|
|
|
| |||||
Investment management fees |
| 2,490,516 |
| — |
| 1,590,890 |
| (532,694 | ) (B) | 3,548,712 |
| |||||
Unified fees |
| — |
| 2,432,420 |
| — |
| (2,432,420 | ) (B) | — |
| |||||
Distribution and service fees: |
|
|
|
|
|
|
|
|
|
|
| |||||
Class ADV |
| 12 |
| 8 |
| 2,933 |
|
|
| 2,953 |
| |||||
Class S |
| 292,092 |
| 903,668 |
| 28,794 |
|
|
| 1,224,554 |
| |||||
Class S2 |
| — |
| 18,990 |
| — |
|
|
| 18,990 |
| |||||
Transfer agent fees |
| 696 |
| — |
| 784 |
|
|
| 1,480 |
| |||||
Administrative service fees |
| 415,081 |
| — |
| 636,347 |
| 368,056 | (B) | 1,419,484 |
| |||||
Shareholder reporting expense |
| 69,912 |
| — |
| 26,913 |
|
|
| 96,825 |
| |||||
Registration fees |
| 323 |
| — |
| — |
|
|
| 323 |
| |||||
Professional fees |
| 48,746 |
| — |
| 68,845 |
|
|
| 117,591 |
| |||||
Custody and accounting expense |
| 51,231 |
| — |
| 59,158 |
|
|
| 110,389 |
| |||||
Directors fees |
| 15,006 |
| 17,833 |
| 46,628 |
|
|
| 79,467 |
| |||||
Offering expense |
| — |
| — |
| 16,154 |
|
|
| 16,154 |
| |||||
Licensing fees |
| — |
| — |
| 12,407 |
|
|
| 12,407 |
| |||||
Miscellaneous expense |
| 12,879 |
| — |
| 16,795 |
|
|
| 29,674 |
| |||||
Total expenses |
| 3,396,494 |
| 3,372,919 |
| 2,506,648 |
| (2,597,058 | ) | 6,679,003 |
| |||||
Less: |
|
|
|
|
|
|
|
|
|
|
| |||||
Net waived and reimbursed/recouped fees |
| (351,898 | ) | (4,469 | ) | (119,428 | ) |
|
| (475,795 | ) | |||||
Brokerage commission recapture |
| — |
|
|
| — |
| — |
| — |
| |||||
Net expenses |
| 3,044,596 |
| 3,368,450 |
| 2,387,221 |
| (2,597,058 | ) | 6,203,209 |
| |||||
Net investment income (loss) |
| 2,676,218 |
| 4,194,147 |
| 14,684,911 |
| 2,597,058 |
| 24,152,334 |
| |||||
|
|
|
|
|
|
|
|
|
|
|
| |||||
REALIZED AND UNREALIZED GAIN (LOSS) ON INVESTMENTS, FOREIGN CURRENCY RELATED TRANSACTIONS, AND FUTURES: |
|
|
|
|
|
|
|
|
|
|
| |||||
Net realized gain (loss) on: |
|
|
|
|
|
|
|
|
|
|
| |||||
Investments |
| (117,953,182 | ) | (55,862,894 | ) | (19,554,391 | ) |
|
| (193,370,467 | ) | |||||
Foreign currency related transactions |
| (45,555 | ) | 1 |
| — |
|
|
| (45,554 | ) | |||||
Futures |
| — |
| — |
| (14,884,382 | ) |
|
| (14,884,382 | ) | |||||
Net realized gain (loss) on investments, foreign currency related transactions, and futures |
| (117,998,737 | ) | (55,862,893 | ) | (34,438,773 | ) |
|
| (208,300,403 | ) | |||||
Net change in unrealized appreciation or depreciation on: |
|
|
|
|
|
|
|
|
|
|
| |||||
Investments |
| (190,064,282 | ) | (120,984,939 | ) | (285,384,889 | ) |
|
| (596,434,110 | ) | |||||
Foreign currency related transactions |
| (5,579 | ) | (66 | ) | — |
|
|
| (5,645 | ) | |||||
Futures |
| — |
| — |
| 1,056,411 |
|
|
| 1,056,411 |
| |||||
Net change in unrealized appreciation or depreciation on investments, foreign currency related transactions, and futures |
| (190,069,861 | ) | (120,985,005 | ) | (284,328,478 | ) |
|
| (595,383,344 | ) | |||||
Net realized and unrealized gain (loss) on investments, foreign currency related transactions, and futures |
| (308,068,598 | ) | (176,847,898 | ) | (318,767,251 | ) |
|
| (803,683,747 | ) | |||||
Decrease in net assets resulting from operations |
| $ | (305,392,380 | ) | $ | (172,653,751 | ) | $ | (304,082,340 | ) | $ | 2,597,058 |
| $ | (779,531,413 | ) |
* Foreign taxes withheld |
| $ | 17,680 |
| $ | 582 |
| $ | — |
| $ | — |
| $ | 18,262 |
|
(1) Dividends from affiliates |
| $ | — |
| $ | 17,731 |
| $ | 440,429 |
| $ | — |
| $ | 458,160 |
|
(A) Investment Income and Expenses have been annualized
(B) Reflects adjustment in expenses due to effects of new contractual rates.
Portfolios of Investments as of December 31, 2008 (UNAUDITED):
|
|
|
|
|
|
|
| Pro Forma |
|
|
|
|
|
|
|
|
|
|
|
|
| Pro Forma |
| Cost Adjustments |
| |||||||
ING |
| ING |
| ING |
| Adjustments |
| ING |
|
|
|
|
| ING |
| ING |
| ING |
| Adjustments |
| ING |
| ING |
| ING |
| |||||
Shares |
|
|
|
|
| Value |
|
|
|
|
| |||||||||||||||||||||
COMMON STOCK: 94.7% |
|
|
|
|
|
|
|
|
|
|
|
|
|
|
|
|
|
|
|
|
|
|
|
|
| |||||||
|
|
|
|
|
|
|
|
|
|
|
| Advertising: 0.1% |
|
|
|
|
|
|
|
|
|
|
|
|
|
|
| |||||
— |
| 4,400 |
| — |
| (4,400 | ) | — |
| @ |
| Clear Channel Outdoor Holdings, Inc. |
| $ | — |
| $ | 27,060 |
| $ | — |
| $ | (27,060 | ) | $ | — |
| — |
| 27,060 |
|
— |
| 3,000 |
| — |
| (3,000 | ) | — |
|
|
| Harte-Hanks, Inc. |
| — |
| 18,720 |
| — |
| (18,720 | ) | — |
| — |
| 18,720 |
| |||||
— |
| 8,300 |
| — |
| (8,300 | ) | — |
| @, L |
| Lamar Advertising Co. |
| — |
| 104,248 |
| — |
| (104,248 | ) | — |
| — |
| 104,248 |
| |||||
— |
| — |
| 50,850 |
| 23,446 |
| 74,296 |
|
|
| Omnicom Group |
| — |
| — |
| 1,368,882 |
| 631,158 |
| 2,000,040 |
| — |
| — |
| |||||
|
|
|
|
|
|
|
|
|
|
|
|
|
| — |
| 150,028 |
| 1,368,882 |
| 481,130 |
| 2,000,040 | cs |
|
|
|
| |||||
|
|
|
|
|
|
|
|
|
|
|
| Aerospace/Defense: 2.5% |
|
|
|
|
|
|
|
|
|
|
|
|
|
|
| |||||
— |
| 13,800 |
| — |
| (13,800 | ) | — |
| @ |
| BE Aerospace, Inc. |
| — |
| 106,122 |
| — |
| (106,122 | ) | — |
| — |
| 106,122 |
| |||||
— |
| 27,000 |
| 119,100 |
| 27,914 |
| 174,014 |
|
|
| Boeing Co. |
| — |
| 1,152,091 |
| 5,081,997 |
| 1,191,091 |
| 7,425,179 |
| — |
| 1,152,091 |
| |||||
— |
| 1,500 |
| — |
| (1,500 | ) | — |
|
|
| Cubic Corp. |
| — |
| 40,800 |
| — |
| (40,800 | ) | — |
| — |
| 40,800 |
| |||||
— |
| 5,700 |
| — |
| (5,700 | ) | — |
| @ |
| Esterline Technologies Corp. |
| — |
| 215,973 |
| — |
| (215,973 | ) | — |
| — |
| 215,973 |
| |||||
— |
| 15,100 |
| 63,150 |
| 14,017 |
| 92,267 |
|
|
| General Dynamics Corp. |
| — |
| 869,609 |
| 3,636,809 |
| 807,234 |
| 5,313,652 |
| — |
| 869,609 |
| |||||
— |
| 5,600 |
| — |
| (5,600 | ) | — |
|
|
| Goodrich Corp. |
| — |
| 207,312 |
| — |
| (207,312 | ) | — |
| — |
| 207,312 |
| |||||
61,100 |
| 9,100 |
| — |
| (70,200 | ) | — |
|
|
| L-3 Communications Holdings, Inc. |
| 4,507,958 |
| 671,398 |
| — |
| (5,179,356 | ) | — |
| 4,507,958 |
| 671,398 |
| |||||
— |
| 3,200 |
| 52,100 |
| 20,822 |
| 76,122 |
|
|
| Lockheed Martin Corp. |
| — |
| 269,056 |
| 4,380,568 |
| 1,750,716 |
| 6,400,340 |
| — |
| 269,056 |
| |||||
— |
| 43,400 |
| 54,350 |
| (18,341 | ) | 79,409 |
|
|
| Northrop Grumman Corp. |
| — |
| 1,954,736 |
| 2,447,924 |
| (826,059 | ) | 3,576,601 |
| — |
| 1,954,736 |
| |||||
— |
| 3,300 |
| — |
| (3,300 | ) | — |
| @ |
| Orbital Sciences Corp. |
| — |
| 64,449 |
| — |
| (64,449 | ) | — |
| — |
| 64,449 |
| |||||
— |
| 19,500 |
| 67,050 |
| 11,415 |
| 97,965 |
|
|
| Raytheon Co. |
| — |
| 995,280 |
| 3,422,232 |
| 582,627 |
| 5,000,139 |
| — |
| 995,280 |
| |||||
— |
| 5,000 |
| — |
| (5,000 | ) | — |
| @ |
| Spirit Aerosystems Holdings, Inc. |
| — |
| 50,850 |
| — |
| (50,850 | ) | — |
| — |
| 50,850 |
| |||||
— |
| 3,200 |
| — |
| (3,200 | ) | — |
| L |
| Triumph Group, Inc. |
| — |
| 135,872 |
| — |
| (135,872 | ) | — |
| — |
| 135,872 |
| |||||
— |
| 18,800 |
| 154,300 |
| 52,344 |
| 225,444 |
|
|
| United Technologies Corp. |
| — |
| 1,007,680 |
| 8,270,480 |
| 2,805,633 |
| 12,083,793 |
| — |
| 1,007,680 |
| |||||
|
|
|
|
|
|
|
|
|
|
|
|
|
| 4,507,958 |
| 7,741,228 |
| 27,240,010 |
| 310,508 |
| 39,799,704 | cs |
|
|
|
| |||||
|
|
|
|
|
|
|
|
|
|
|
| Agriculture: 2.2% |
|
|
|
|
|
|
|
|
|
|
|
|
|
|
| |||||
— |
| 15,700 |
| 332,150 |
| 137,446 |
| 485,296 |
|
|
| Altria Group, Inc. |
| — |
| 236,442 |
| 5,002,179 |
| 2,069,938 |
| 7,308,559 |
| — |
| 236,442 |
| |||||
— |
| — |
| 102,150 |
| 47,099 |
| 149,249 |
|
|
| Archer-Daniels-Midland Co. |
| — |
| — |
| 2,944,985 |
| 1,357,859 |
| 4,302,844 |
| — |
| — |
| |||||
— |
| 800 |
| — |
| (800 | ) | — |
| L |
| Bunge Ltd. |
| — |
| 41,416 |
| — |
| (41,416 | ) | — |
| — |
| 41,416 |
| |||||
— |
| 43,200 |
| 334,250 |
| 110,914 |
| 488,364 |
|
|
| Philip Morris International, Inc. |
| — |
| 1,879,632 |
| 14,543,218 |
| 4,825,885 |
| 21,248,735 |
| — |
| 1,879,632 |
| |||||
— |
| — |
| 27,100 |
| 12,495 |
| 39,595 |
|
|
| Reynolds American, Inc. |
| — |
| — |
| 1,092,401 |
| 503,679 |
| 1,596,080 |
| — |
| — |
| |||||
— |
| 2,000 |
| — |
| (2,000 | ) | — |
|
|
| Universal Corp. |
| — |
| 59,740 |
| — |
| (59,740 | ) | — |
| — |
| 59,740 |
| |||||
|
|
|
|
|
|
|
|
|
|
|
|
|
| — |
| 2,217,230 |
| 23,582,783 |
| 8,656,205 |
| 34,456,218 | cs |
|
|
|
| |||||
|
|
|
|
|
|
|
|
|
|
|
| Airlines: 0.0% |
|
|
|
|
|
|
|
|
|
|
|
|
|
|
| |||||
— |
| 2,900 |
| — |
| (2,900 | ) | — |
| @ |
| Alaska Air Group, Inc. |
| — |
| 84,825 |
| — |
| (84,825 | ) | — |
| — |
| 84,825 |
| |||||
— |
| 10,700 |
| — |
| (10,700 | ) | — |
| @ |
| Continental Airlines, Inc. |
| — |
| 193,242 |
| — |
| (193,242 | ) | — |
| — |
| 193,242 |
| |||||
— |
| 7,200 |
| — |
| (7,200 | ) | — |
|
|
| Skywest, Inc. |
| — |
| 133,920 |
| — |
| (133,920 | ) | — |
| — |
| 133,920 |
| |||||
— |
| 15,100 |
| — |
| (15,100 | ) | — |
| @ |
| UAL Corp. |
| — |
| 166,402 |
| — |
| (166,402 | ) | — |
| — |
| 166,402 |
| |||||
— |
| 13,800 |
| — |
| (13,800 | ) | — |
| @, L |
| US Airways Group, Inc. |
| — |
| 106,674 |
| — |
| (106,674 | ) | — |
| — |
| 106,674 |
| |||||
|
|
|
|
|
|
|
|
|
|
|
|
|
| — |
| 685,063 |
| — |
| (685,063 | ) | — | cs |
|
|
|
| |||||
|
|
|
|
|
|
|
|
|
|
|
| Apparel: 0.3% |
|
|
|
|
|
|
|
|
|
|
|
|
|
|
| |||||
— |
| 4,800 |
| — |
| (4,800 | ) | — |
| @ |
| Carter’s, Inc. |
| — |
| 92,448 |
| — |
| (92,448 | ) | — |
| — |
| 92,448 |
| |||||
— |
| 13,700 |
| — |
| (13,700 | ) | — |
| @ |
| Coach, Inc. |
| — |
| 284,549 |
| — |
| (284,549 | ) | — |
| — |
| 284,549 |
| |||||
— |
| 13,800 |
| — |
| (13,800 | ) | — |
|
|
| Jones Apparel Group, Inc. |
| — |
| 80,868 |
| — |
| (80,868 | ) | — |
| — |
| 80,868 |
| |||||
— |
| — |
| 56,000 |
| 25,820 |
| 81,820 |
|
|
| Nike, Inc. |
| — |
| — |
| 2,856,000 |
| 1,316,830 |
| 4,172,830 |
| — |
| — |
| |||||
— |
| 3,200 |
| — |
| (3,200 | ) | — |
|
|
| Polo Ralph Lauren Corp. |
| — |
| 145,312 |
| — |
| (145,312 | ) | — |
| — |
| 145,312 |
| |||||
— |
| 11,900 |
| — |
| (11,900 | ) | — |
| @ |
| Quiksilver, Inc. |
| — |
| 21,896 |
| — |
| (21,896 | ) | — |
| — |
| 21,896 |
| |||||
— |
| 3,400 |
| — |
| (3,400 | ) | — |
| @ |
| Skechers USA, Inc. |
| — |
| 43,588 |
| — |
| (43,588 | ) | — |
| — |
| 43,588 |
| |||||
— |
| 8,300 |
| — |
| (8,300 | ) | — |
| @ |
| Timberland Co. |
| — |
| 95,865 |
| — |
| (95,865 | ) | — |
| — |
| 95,865 |
| |||||
— |
| 11,000 |
| — |
| (11,000 | ) | — |
| @ |
| Warnaco Group, Inc. |
| — |
| 215,930 |
| — |
| (215,930 | ) | — |
| — |
| 215,930 |
| |||||
— |
| 6,500 |
| — |
| (6,500 | ) | — |
|
|
| Wolverine World Wide, Inc. |
| — |
| 136,760 |
| — |
| (136,760 | ) | — |
| — |
| 136,760 |
| |||||
|
|
|
|
|
|
|
|
|
|
|
|
|
| — |
| 1,117,216 |
| 2,856,000 |
| 199,614 |
| 4,172,830 | cs |
|
|
|
| |||||
|
|
|
|
|
|
|
|
|
|
|
| Auto Manufacturers: 0.1% |
|
|
|
|
|
|
|
|
|
|
|
|
|
|
| |||||
— |
| 4,000 |
| — |
| (4,000 | ) | — |
| @ |
| Navistar International Corp. |
| — |
| 85,520 |
| — |
| (85,520 | ) | — |
| — |
| 85,520 |
| |||||
— |
| 14,100 |
| — |
| (14,100 | ) | — |
|
|
| Oshkosh Truck Corp. |
| — |
| 125,349 |
| — |
| (125,349 | ) | — |
| — |
| 125,349 |
| |||||
— |
| — |
| 58,050 |
| 26,765 |
| 84,815 |
|
|
| Paccar, Inc. |
| — |
| — |
| 1,660,230 |
| 765,491 |
| 2,425,721 |
| — |
| — |
| |||||
|
|
|
|
|
|
|
|
|
|
|
|
|
| — |
| 210,869 |
| 1,660,230 |
| 554,622 |
| 2,425,721 | cs |
|
|
|
| |||||
|
|
|
|
|
|
|
|
|
|
|
| Auto Parts & Equipment: 0.2% |
|
|
|
|
|
|
|
|
|
|
|
|
|
|
| |||||
— |
| 9,900 |
| — |
| (9,900 | ) | — |
|
|
| ArvinMeritor, Inc. |
| — |
| 28,215 |
| — |
| (28,215 | ) | — |
| — |
| 28,215 |
| |||||
— |
| 8,900 |
| — |
| (8,900 | ) | — |
| @@ |
| Autoliv, Inc. |
| — |
| 190,994 |
| — |
| (190,994 | ) | — |
| — |
| 190,994 |
| |||||
— |
| 7,600 |
| — |
| (7,600 | ) | — |
|
|
| BorgWarner, Inc. |
| — |
| 165,452 |
| — |
| (165,452 | ) | — |
| — |
| 165,452 |
| |||||
— |
| 1,000 |
| — |
| (1,000 | ) | — |
| @ |
| Exide Technologies |
| — |
| 5,290 |
| — |
| (5,290 | ) | — |
| — |
| 5,290 |
| |||||
— |
| 22,500 |
| — |
| (22,500 | ) | — |
| @ |
| Goodyear Tire & Rubber Co. |
| — |
| 134,325 |
| — |
| (134,325 | ) | — |
| — |
| 134,325 |
| |||||
— |
| 23,600 |
| 94,050 |
| 19,764 |
| 137,414 |
|
|
| Johnson Controls, Inc. |
| — |
| 428,576 |
| 1,707,948 |
| 358,917 |
| 2,495,441 |
| — |
| 428,576 |
| |||||
— |
| 11,900 |
| — |
| (11,900 | ) | — |
| @ |
| Lear Corp. |
| — |
| 16,779 |
| — |
| (16,779 | ) | — |
| — |
| 16,779 |
| |||||
— |
| 7,600 |
| — |
| (7,600 | ) | — |
|
|
| Titan International, Inc. |
| — |
| 62,700 |
| — |
| (62,700 | ) | — |
| — |
| 62,700 |
| |||||
— |
| 17,200 |
| — |
| (17,200 | ) | — |
| @ |
| TRW Automotive Holdings Corp. |
| — |
| 61,920 |
| — |
| (61,920 | ) | — |
| — |
| 61,920 |
| |||||
— |
| 10,700 |
| — |
| (10,700 | ) | — |
|
|
| WABCO Holdings, Inc. |
| — |
| 168,953 |
| — |
| (168,953 | ) | — |
| — |
| 168,953 |
| |||||
|
|
|
|
|
|
|
|
|
|
|
|
|
| — |
| 1,263,204 |
| 1,707,948 |
| (475,711 | ) | 2,495,441 | cs |
|
|
|
| |||||
|
|
|
|
|
|
|
|
|
|
|
| Banks: 8.0% |
|
|
|
|
|
|
|
|
|
|
|
|
|
|
| |||||
88,700 |
| 101,708 |
| 796,700 |
| 176,931 |
| 1,164,039 |
|
|
| Bank of America Corp. |
| 1,248,896 |
| 1,432,049 |
| 11,217,536 |
| 2,491,183 |
| 16,389,664 |
| 1,248,896 |
| 1,432,049 |
| |||||
79,000 |
| — |
| 181,300 |
| 4,593 |
| 264,893 |
|
|
| Bank of New York Mellon Corp. |
| 2,238,070 |
| — |
| 5,136,229 |
| 130,118 |
| 7,504,417 |
| 2,238,070 |
| — |
| |||||
— |
| — |
| 86,750 |
| 39,998 |
| 126,748 |
|
|
| BB&T Corp. |
| — |
| — |
| 2,382,155 |
| 1,098,352 |
| 3,480,507 |
| — |
| — |
| |||||
— |
| 4,100 |
| 59,400 |
| 23,288 |
| 86,788 |
|
|
| Capital One Financial Corp. |
| — |
| 130,749 |
| 1,894,266 |
| 742,650 |
| 2,767,665 |
| — |
| 130,749 |
| |||||
— |
| 3,000 |
| — |
| (3,000 | ) | — |
| L |
| Cathay General Bancorp. |
| — |
| 71,250 |
| — |
| (71,250 | ) | — |
| — |
| 71,250 |
| |||||
481,800 |
| — |
| 863,100 |
| (83,846 | ) | 1,261,054 |
|
|
| Citigroup, Inc. |
| 3,232,878 |
| — |
| 5,791,401 |
| (562,607 | ) | 8,461,672 |
| 3,232,878 |
| — |
| |||||
— |
| 19,800 |
| — |
| (19,800 | ) | — |
| L |
| Colonial BancGroup, Inc. |
| — |
| 40,986 |
| — |
| (40,986 | ) | — |
| — |
| 40,986 |
| |||||
— |
| 9,500 |
| — |
| (9,500 | ) | — |
| L |
| East-West Bancorp., Inc. |
| — |
| 151,715 |
| — |
| (151,715 | ) | — |
| — |
| 151,715 |
| |||||
— |
| 2,800 |
| — |
| (2,800 | ) | — |
| @@, L |
| First Bancorp. Puerto Rico |
| — |
| 31,192 |
| — |
| (31,192 | ) | — |
| — |
| 31,192 |
| |||||
— |
| 100 |
| — |
| (100 | ) | — |
|
|
| First Commonwealth Financial Corp. |
| — |
| 1,238 |
| — |
| (1,238 | ) | — |
| — |
| 1,238 |
| |||||
— |
| 26,024 |
| — |
| (26,024 | ) | — |
| L |
| First Horizon National Corp. |
| — |
| 275,074 |
| — |
| (275,074 | ) | — |
| — |
| 275,074 |
| |||||
— |
| 3,600 |
| — |
| (3,600 | ) | — |
|
|
| First Midwest Bancorp., Inc. |
| — |
| 71,892 |
| — |
| (71,892 | ) | — |
| — |
| 71,892 |
|
— |
| 2,900 |
| — |
| (2,900 | ) | — |
|
|
| FirstMerit Corp. |
| — |
| 59,711 |
| — |
| (59,711 | ) | — |
| — |
| 59,711 |
|
57,550 |
| 9,800 |
| 69,850 |
| (35,144 | ) | 102,056 |
|
|
| Goldman Sachs Group, Inc. |
| 4,856,645 |
| 827,022 |
| 5,894,642 |
| (2,965,794 | ) | 8,612,515 |
| 4,856,645 |
| 827,022 |
|
— |
| 1,100 |
| — |
| (1,100 | ) | — |
|
|
| Hancock Holding Co. |
| — |
| 50,006 |
| — |
| (50,006 | ) | — |
| — |
| 50,006 |
|
— |
| 2,500 |
| — |
| (2,500 | ) | — |
|
|
| International Bancshares Corp. |
| — |
| 54,575 |
| — |
| (54,575 | ) | — |
| — |
| 54,575 |
|
— |
| 60,300 |
| 585,235 |
| 209,537 |
| 855,072 |
|
|
| JPMorgan Chase & Co. |
| — |
| 1,901,259 |
| 18,452,460 |
| 6,606,713 |
| 26,960,432 |
| — |
| 1,901,259 |
|
126,800 |
| — |
| 175,550 |
| (45,858 | ) | 256,492 |
|
|
| Morgan Stanley |
| 2,033,872 |
| — |
| 2,815,822 |
| (735,567 | ) | 4,114,127 |
| 2,033,872 |
| — |
|
— |
| 5,700 |
| — |
| (5,700 | ) | — |
|
|
| National Penn Bancshares, Inc. |
| — |
| 82,707 |
| — |
| (82,707 | ) | — |
| — |
| 82,707 |
|
— |
| 5,200 |
| — |
| (5,200 | ) | — |
|
|
| Old National Bancorp. |
| — |
| 94,432 |
| — |
| (94,432 | ) | — |
| — |
| 94,432 |
|
— |
| 9,800 |
| — |
| (9,800 | ) | — |
| L |
| Pacific Capital Bancorp. |
| — |
| 165,424 |
| — |
| (165,424 | ) | — |
| — |
| 165,424 |
|
— |
| 4,200 |
| — |
| (4,200 | ) | — |
| L |
| PacWest Bancorp |
| — |
| 112,980 |
| — |
| (112,980 | ) | — |
| — |
| 112,980 |
|
— |
| 300 |
| — |
| (300 | ) | — |
|
|
| Park National Corp. |
| — |
| 21,525 |
| — |
| (21,525 | ) | — |
| — |
| 21,525 |
|
— |
| — |
| 54,800 |
| 25,267 |
| 80,067 |
|
|
| PNC Financial Services Group, Inc. |
| — |
| — |
| 2,685,200 |
| 1,238,079 |
| 3,923,279 |
| — |
| — |
|
— |
| 25,500 |
| — |
| (25,500 | ) | — |
| @@, L |
| Popular, Inc. |
| — |
| 131,580 |
| — |
| (131,580 | ) | — |
| — |
| 131,580 |
|
— |
| 28,300 |
| — |
| (28,300 | ) | — |
|
|
| Regions Financial Corp. |
| — |
| 225,268 |
| — |
| (225,268 | ) | — |
| — |
| 225,268 |
|
— |
| — |
| 67,700 |
| 31,215 |
| 98,915 |
|
|
| State Street Corp. |
| — |
| — |
| 2,662,641 |
| 1,227,677 |
| 3,890,318 |
| — |
| — |
|
— |
| 2,300 |
| — |
| (2,300 | ) | — |
| L |
| Sterling Financial Corp. |
| — |
| 20,240 |
| — |
| (20,240 | ) | — |
| — |
| 20,240 |
|
— |
| — |
| 56,000 |
| 25,820 |
| 81,820 |
|
|
| SunTrust Bank |
| — |
| — |
| 1,654,240 |
| 762,729 |
| 2,416,969 |
| — |
| — |
|
— |
| 6,200 |
| — |
| (6,200 | ) | — |
|
|
| Susquehanna Bancshares, Inc. |
| — |
| 98,642 |
| — |
| (98,642 | ) | — |
| — |
| 98,642 |
|
— |
| 2,500 |
| — |
| (2,500 | ) | — |
|
|
| Trustmark Corp. |
| — |
| 53,975 |
| — |
| (53,975 | ) | — |
| — |
| 53,975 |
|
— |
| 9,400 |
| — |
| (9,400 | ) | — |
|
|
| UCBH Holdings, Inc. |
| — |
| 64,672 |
| — |
| (64,672 | ) | — |
| — |
| 64,672 |
|
— |
| 3,400 |
| — |
| (3,400 | ) | — |
|
|
| Umpqua Holdings Corp. |
| — |
| 49,198 |
| — |
| (49,198 | ) | — |
| — |
| 49,198 |
|
— |
| 2,004 |
| — |
| (2,004 | ) | — |
| L |
| United Community Banks, Inc. |
| — |
| 27,214 |
| — |
| (27,214 | ) | — |
| — |
| 27,214 |
|
— |
| 31,500 |
| 276,000 |
| 95,757 |
| 403,257 |
|
|
| US Bancorp. |
| — |
| 787,815 |
| 6,902,760 |
| 2,394,876 |
| 10,085,451 |
| — |
| 787,815 |
|
— |
| — |
| 342,400 |
| 157,872 |
| 500,272 |
|
|
| Wachovia Corp. |
| — |
| — |
| 1,896,896 |
| 874,611 |
| 2,771,507 |
| — |
| — |
|
— |
| 9,500 |
| — |
| (9,500 | ) | — |
| L |
| Webster Financial Corp. |
| — |
| 130,910 |
| — |
| (130,910 | ) | — |
| — |
| 130,910 |
|
— |
| 34,000 |
| 598,800 |
| 242,092 |
| 874,892 |
|
|
| Wells Fargo & Co. |
| — |
| 1,002,320 |
| 17,652,624 |
| 7,136,867 |
| 25,791,811 |
| — |
| 1,002,320 |
|
— |
| 1,700 |
| — |
| (1,700 | ) | — |
|
|
| Whitney Holding Corp. |
| — |
| 27,183 |
| — |
| (27,183 | ) | — |
| — |
| 27,183 |
|
— |
| 400 |
| — |
| (400 | ) | — |
|
|
| Wintrust Financial Corp. |
| — |
| 8,228 |
| — |
| (8,228 | ) | — |
| — |
| 8,228 |
|
— |
| 3,000 |
| — |
| (3,000 | ) | — |
| L |
| Zions Bancorp. |
| — |
| 73,530 |
| — |
| (73,530 | ) | — |
| — |
| 73,530 |
|
|
|
|
|
|
|
|
|
|
|
|
|
|
| 13,610,361 |
| 8,276,561 |
| 87,038,872 |
| 18,244,540 |
| 127,170,334 | cs |
|
|
|
|
|
|
|
|
|
|
|
|
|
|
|
| Beverages: 2.8% |
|
|
|
|
|
|
|
|
|
|
|
|
|
|
|
— |
| 28,000 |
| 368,200 |
| 141,768 |
| 537,968 |
|
|
| Coca-Cola Co. |
| — |
| 1,267,560 |
| 16,668,414 |
| 6,417,832 |
| 24,353,806 |
| — |
| 1,267,560 |
|
342,242 |
| — |
| — |
| (342,242 | ) | — |
| @ |
| Constellation Brands, Inc. |
| 5,397,156 |
| — |
| — |
| (5,397,156 | ) | — |
| 5,397,156 |
| — |
|
207,300 |
| — |
| — |
| (207,300 | ) | — |
| @ |
| Dr Pepper Snapple Group, Inc. |
| 3,368,625 |
| — |
| — |
| (3,368,625 | ) | — |
| 3,368,625 |
| — |
|
— |
| 16,600 |
| 251,400 |
| 99,314 |
| 367,314 |
|
|
| PepsiCo, Inc. |
| — |
| 909,182 |
| 13,769,178 |
| 5,439,445 |
| 20,117,805 |
| — |
| 909,182 |
|
|
|
|
|
|
|
|
|
|
|
|
|
|
| 8,765,781 |
| 2,176,742 |
| 30,437,592 |
| 3,091,496 |
| 44,471,611 | cs |
|
|
|
|
|
|
|
|
|
|
|
|
|
|
|
| Biotechnology: 3.0% |
|
|
|
|
|
|
|
|
|
|
|
|
|
|
|
— |
| 25,200 |
| 172,550 |
| 54,359 |
| 252,109 |
| @ |
| Amgen, Inc. |
| — |
| 1,455,300 |
| 9,964,763 |
| 3,139,205 |
| 14,559,268 |
| — |
| 1,455,300 |
|
— |
| — |
| 46,100 |
| 21,256 |
| 67,356 |
| @ |
| Biogen Idec, Inc. |
| — |
| — |
| 2,195,743 |
| 1,012,402 |
| 3,208,145 |
| — |
| — |
|
— |
| 100 |
| — |
| (100 | ) | — |
| @ |
| Celera Corp. |
| — |
| 1,113 |
| — |
| (1,113 | ) | — |
| — |
| 1,113 |
|
— |
| — |
| 69,300 |
| 31,953 |
| 101,253 |
| @ |
| Celgene Corp. |
| — |
| — |
| 3,830,904 |
| 1,766,335 |
| 5,597,239 |
| — |
| — |
|
— |
| 4,000 |
| — |
| (4,000 | ) | — |
| @ |
| Cubist Pharmaceuticals, Inc. |
| — |
| 96,640 |
| — |
| (96,640 | ) | — |
| — |
| 96,640 |
|
— |
| 2,880 |
| — |
| (2,880 | ) | — |
| @ |
| Facet Biotech Corp. |
| — |
| 27,619 |
| — |
| (27,619 | ) | — |
| — |
| 27,619 |
|
— |
| 9,900 |
| 73,700 |
| 24,081 |
| 107,681 |
| @ |
| Genentech, Inc. |
| — |
| 820,809 |
| 6,110,467 |
| 1,996,576 |
| 8,927,852 |
| — |
| 820,809 |
|
— |
| — |
| 42,350 |
| 19,527 |
| 61,877 |
| @ |
| Genzyme Corp. |
| — |
| — |
| 2,810,770 |
| 1,295,976 |
| 4,106,746 |
| — |
| — |
|
— |
| — |
| 146,250 |
| 67,432 |
| 213,682 |
| @ |
| Gilead Sciences, Inc. |
| — |
| — |
| 7,479,225 |
| 3,448,485 |
| 10,927,710 |
| — |
| — |
|
— |
| 2,800 |
| — |
| (2,800 | ) | — |
| @, L |
| Martek Biosciences Corp. |
| — |
| 84,868 |
| — |
| (84,868 | ) | — |
| — |
| 84,868 |
|
— |
| 14,400 |
| — |
| (14,400 | ) | — |
| @ |
| PDL BioPharma, Inc. |
| — |
| 88,992 |
| — |
| (88,992 | ) | — |
| — |
| 88,992 |
|
|
|
|
|
|
|
|
|
|
|
|
|
|
| — |
| 2,575,341 |
| 32,391,872 |
| 12,359,747 |
| 47,326,960 | cs |
|
|
|
|
|
|
|
|
|
|
|
|
|
|
|
| Building Materials: 0.0% |
|
|
|
|
|
|
|
|
|
|
|
|
|
|
|
— |
| 4,100 |
| — |
| (4,100 | ) | — |
| @ |
| Armstrong World Industries, Inc. |
| — |
| 88,642 |
| — |
| (88,642 | ) | — |
| — |
| 88,642 |
|
— |
| 6,000 |
| — |
| (6,000 | ) | — |
|
|
| Lennox International, Inc. |
| — |
| 193,740 |
| — |
| (193,740 | ) | — |
| — |
| 193,740 |
|
— |
| 5,300 |
| — |
| (5,300 | ) | — |
|
|
| Louisiana-Pacific Corp. |
| — |
| 8,268 |
| — |
| (8,268 | ) | — |
| — |
| 8,268 |
|
— |
| 7,600 |
| — |
| (7,600 | ) | — |
| @, L |
| Owens Corning, Inc. |
| — |
| 131,480 |
| — |
| (131,480 | ) | — |
| — |
| 131,480 |
|
— |
| 900 |
| — |
| (900 | ) | — |
|
|
| Simpson Manufacturing Co., Inc. |
| — |
| 24,984 |
| — |
| (24,984 | ) | — |
| — |
| 24,984 |
|
|
|
|
|
|
|
|
|
|
|
|
|
|
| — |
| 447,114 |
| — |
| (447,114 | ) | — | cs |
|
|
|
|
|
|
|
|
|
|
|
|
|
|
|
| Chemicals: 1.6% |
|
|
|
|
|
|
|
|
|
|
|
|
|
|
|
— |
| 1,500 |
| 33,400 |
| 13,900 |
| 48,800 |
| S |
| Air Products & Chemicals, Inc. |
| — |
| 75,405 |
| 1,679,018 |
| 698,749 |
| 2,453,172 |
| — |
| 75,405 |
|
— |
| 15,390 |
| — |
| (15,390 | ) | — |
|
|
| Ashland, Inc. |
| — |
| 161,749 |
| — |
| (161,749 | ) | — |
| — |
| 161,749 |
|
— |
| 1,400 |
| — |
| (1,400 | ) | — |
|
|
| Cabot Corp. |
| — |
| 21,420 |
| — |
| (21,420 | ) | — |
| — |
| 21,420 |
|
— |
| 9,100 |
| — |
| (9,100 | ) | — |
|
|
| Celanese Corp. |
| — |
| 113,113 |
| — |
| (113,113 | ) | — |
| — |
| 113,113 |
|
— |
| 3,200 |
| — |
| (3,200 | ) | — |
|
|
| CF Industries Holdings, Inc. |
| — |
| 157,312 |
| — |
| (157,312 | ) | — |
| — |
| 157,312 |
|
— |
| 28,700 |
| — |
| (28,700 | ) | — |
|
|
| Chemtura Corp. |
| — |
| 40,180 |
| — |
| (40,180 | ) | — |
| — |
| 40,180 |
|
— |
| 4,300 |
| — |
| (4,300 | ) | — |
|
|
| Cytec Industries, Inc. |
| — |
| 91,246 |
| — |
| (91,246 | ) | — |
| — |
| 91,246 |
|
— |
| 11,500 |
| 147,600 |
| 56,555 |
| 215,655 |
|
|
| Dow Chemical Co. |
| — |
| 173,535 |
| 2,227,284 |
| 853,410 |
| 3,254,229 |
| — |
| 173,535 |
|
— |
| 4,000 |
| — |
| (4,000 | ) | — |
|
|
| Eastman Chemical Co. |
| — |
| 126,840 |
| — |
| (126,840 | ) | — |
| — |
| 126,840 |
|
— |
| 4,800 |
| 142,800 |
| 61,042 |
| 208,642 |
|
|
| EI Du Pont de Nemours & Co. |
| — |
| 121,440 |
| 3,612,840 |
| 1,544,350 |
| 5,278,630 |
| — |
| 121,440 |
|
— |
| 5,100 |
| — |
| (5,100 | ) | — |
|
|
| Ferro Corp. |
| — |
| 35,955 |
| — |
| (35,955 | ) | — |
| — |
| 35,955 |
|
— |
| 8,000 |
| — |
| (8,000 | ) | — |
|
|
| HB Fuller Co. |
| — |
| 128,880 |
| — |
| (128,880 | ) | — |
| — |
| 128,880 |
|
— |
| 2,700 |
| — |
| (2,700 | ) | — |
|
|
| Minerals Technologies, Inc. |
| — |
| 110,430 |
| — |
| (110,430 | ) | — |
| — |
| 110,430 |
|
— |
| 10,700 |
| 87,050 |
| 29,437 |
| 127,187 |
|
|
| Monsanto Co. |
| — |
| 752,745 |
| 6,123,968 |
| 2,070,865 |
| 8,947,578 |
| — |
| 752,745 |
|
— |
| 34,100 |
| 24,700 |
| (22,711 | ) | 36,089 |
|
|
| Mosaic Co. |
| — |
| 1,179,860 |
| 854,620 |
| (785,816 | ) | 1,248,664 |
| — |
| 1,179,860 |
|
— |
| 1,800 |
| — |
| (1,800 | ) | — |
|
|
| NewMarket Corp. |
| — |
| 62,838 |
| — |
| (62,838 | ) | — |
| — |
| 62,838 |
|
— |
| 9,600 |
| — |
| (9,600 | ) | — |
| @@, L |
| Nova Chemicals Corp. |
| — |
| 45,792 |
| — |
| (45,792 | ) | — |
| — |
| 45,792 |
|
— |
| 4,900 |
| — |
| (4,900 | ) | — |
|
|
| Olin Corp. |
| — |
| 88,592 |
| — |
| (88,592 | ) | — |
| — |
| 88,592 |
|
— |
| — |
| 49,700 |
| 22,915 |
| 72,615 |
|
|
| Praxair, Inc. |
| — |
| — |
| 2,950,192 |
| 1,360,261 |
| 4,310,453 |
| — |
| — |
|
— |
| 4,100 |
| — |
| (4,100 | ) | — |
| @ |
| Rockwood Holdings, Inc. |
| — |
| 44,280 |
| — |
| (44,280 | ) | — |
| — |
| 44,280 |
|
— |
| 9,700 |
| — |
| (9,700 | ) | — |
|
|
| RPM International, Inc. |
| — |
| 128,913 |
| — |
| (128,913 | ) | — |
| — |
| 128,913 |
|
— |
| 3,500 |
| — |
| (3,500 | ) | — |
|
|
| Sherwin-Williams Co. |
| — |
| 209,125 |
| — |
| (209,125 | ) | — |
| — |
| 209,125 |
|
— |
| 9,500 |
| — |
| (9,500 | ) | — |
|
|
| Terra Industries, Inc. |
| — |
| 158,365 |
| — |
| (158,365 | ) | — |
| — |
| 158,365 |
|
— |
| 500 |
| — |
| (500 | ) | — |
|
|
| Valhi, Inc. |
| — |
| 5,350 |
| — |
| (5,350 | ) | — |
| — |
| 5,350 |
|
— |
| 7,200 |
| — | �� | (7,200 | ) | — |
|
|
| Valspar Corp. |
| — |
| 130,248 |
| — |
| (130,248 | ) | — |
| — |
| 130,248 |
|
— |
| 3,500 |
| — |
| (3,500 | ) | — |
|
|
| Westlake Chemical Corp. |
| — |
| 57,015 |
| — |
| (57,015 | ) | — |
| — |
| 57,015 |
|
— |
| 1,100 |
| — |
| (1,100 | ) | — |
| @ |
| WR Grace & Co. |
| — |
| 6,567 |
| — |
| (6,567 | ) | — |
| — |
| 6,567 |
|
|
|
|
|
|
|
|
|
|
|
|
|
|
| — |
| 4,227,195 |
| 17,447,922 |
| 3,817,609 |
| 25,492,726 | cs |
|
|
|
|
|
|
|
|
|
|
|
|
|
|
|
| Coal: 0.1% |
|
|
|
|
|
|
|
|
|
|
|
|
|
|
|
— |
| 11,100 |
| — |
| (11,100 | ) | — |
|
|
| Foundation Coal Holdings, Inc. |
| — |
| 155,622 |
| — |
| (155,622 | ) | — |
| — |
| 155,622 |
|
— |
| 8,500 |
| — |
| (8,500 | ) | — |
|
|
| Massey Energy Co. |
| — |
| 117,215 |
| — |
| (117,215 | ) | — |
| — |
| 117,215 |
|
112,800 |
| — |
| 43,000 |
| (92,974 | ) | 62,826 |
|
|
| Peabody Energy Corp. |
| 2,566,200 |
| — |
| 978,250 |
| (2,115,153 | ) | 1,429,297 |
| 2,566,200 |
| — |
|
107,400 |
| 2,500 |
| — |
| (109,900 | ) | — |
|
|
| Walter Industries, Inc. |
| 1,880,574 |
| 43,775 |
| — |
| (1,924,349 | ) | — |
| 1,880,574 |
| 43,775 |
|
|
|
|
|
|
|
|
|
|
|
|
|
|
| 4,446,774 |
| 316,612 |
| 978,250 |
| (4,312,339 | ) | 1,429,297 | cs |
|
|
|
|
|
|
|
|
|
|
|
|
|
|
|
| Commercial Services: 1.1% |
|
|
|
|
|
|
|
|
|
|
|
|
|
|
|
— |
| 2,600 |
| — |
| (2,600 | ) | — |
|
|
| Aaron Rents, Inc. |
| — |
| 69,212 |
| — |
| (69,212 | ) | — |
| — |
| 69,212 |
|
— |
| 2,800 |
| — |
| (2,800 | ) | — |
|
|
| Administaff, Inc. |
| — |
| 60,704 |
| — |
| (60,704 | ) | — |
| — |
| 60,704 |
|
— |
| 900 |
| — |
| (900 | ) | — |
|
|
| Arbitron, Inc. |
| — |
| 11,952 |
| — |
| (11,952 | ) | — |
| — |
| 11,952 |
|
— |
| — |
| 82,100 |
| 37,854 |
| 119,954 |
|
|
| Automatic Data Processing, Inc. |
| — |
| — |
| 3,229,814 |
| 1,489,187 |
| 4,719,001 |
| — |
| — |
|
— |
| 10,000 |
| — |
| (10,000 | ) | — |
| @ |
| Avis Budget Group, Inc. |
| — |
| 7,000 |
| — |
| (7,000 | ) | — |
| — |
| 7,000 |
|
— |
| 2,000 |
| — |
| (2,000 | ) | — |
| @ |
| Brink’s Home Security Holdings, Inc. |
| — |
| 43,840 |
| — |
| (43,840 | ) | — |
| — |
| 43,840 |
|
— |
| 7,500 |
| — |
| (7,500 | ) | — |
| @ |
| Career Education Corp. |
| — |
| 134,550 |
| — |
| (134,550 | ) | — |
| — |
| 134,550 |
|
— |
| 3,900 |
| — |
| (3,900 | ) | — |
|
|
| Chemed Corp. |
| — |
| 155,103 |
| — |
| (155,103 | ) | — |
| — |
| 155,103 |
|
— |
| 26,700 |
| — |
| (26,700 | ) | — |
| @ |
| Convergys Corp. |
| — |
| 171,147 |
| — |
| (171,147 | ) | — |
| — |
| 171,147 |
|
— |
| 3,800 |
| — |
| (3,800 | ) | — |
| @, L |
| Corinthian Colleges, Inc. |
| — |
| 62,206 |
| — |
| (62,206 | ) | — |
| — |
| 62,206 |
|
— |
| 3,300 |
| — |
| (3,300 | ) | — |
|
|
| Corporate Executive Board Co. |
| — |
| 72,798 |
| — |
| (72,798 | ) | — |
| — |
| 72,798 |
|
— |
| 2,300 |
| — |
| (2,300 | ) | — |
| @, L |
| CoStar Group, Inc. |
| — |
| 75,762 |
| — |
| (75,762 | ) | — |
| — |
| 75,762 |
|
— |
| 12,100 |
| — |
| (12,100 | ) | — |
|
|
| Deluxe Corp. |
| — |
| 181,016 |
| — |
| (181,016 | ) | — |
| — |
| 181,016 |
|
— |
| 200 |
| — |
| (200 | ) | — |
| @ |
| DynCorp International, Inc. |
| — |
| 3,034 |
| — |
| (3,034 | ) | — |
| — |
| 3,034 |
|
— |
| 900 |
| — |
| (900 | ) | — |
| @, L |
| Emergency Medical Services Corp. |
| — |
| 32,949 |
| — |
| (32,949 | ) | — |
| — |
| 32,949 |
|
— |
| 6,500 |
| — |
| (6,500 | ) | — |
|
|
| Equifax, Inc. |
| — |
| 172,380 |
| — |
| (172,380 | ) | — |
| — |
| 172,380 |
|
— |
| 700 |
| — |
| (700 | ) | — |
| @ |
| First Advantage Corp. |
| — |
| 9,905 |
| — |
| (9,905 | ) | — |
| — |
| 9,905 |
|
— |
| 6,500 |
| — |
| (6,500 | ) | — |
| @ |
| Gartner, Inc. |
| — |
| 115,895 |
| — |
| (115,895 | ) | — |
| — |
| 115,895 |
|
— |
| 1,200 |
| — |
| (1,200 | ) | — |
|
|
| Heartland Payment Systems, Inc. |
| — |
| 21,000 |
| — |
| (21,000 | ) | — |
| — |
| 21,000 |
|
— |
| 24,100 |
| — |
| (24,100 | ) | — |
| @ |
| Hertz Global Holdings, Inc. |
| — |
| 122,187 |
| — |
| (122,187 | ) | — |
| — |
| 122,187 |
|
— |
| 5,000 |
| — |
| (5,000 | ) | — |
| @ |
| Hewitt Associates, Inc. |
| — |
| 141,900 |
| — |
| (141,900 | ) | — |
| — |
| 141,900 |
|
— |
| 400 |
| — |
| (400 | ) | — |
|
|
| Hillenbrand, Inc. |
| — |
| 6,672 |
| — |
| (6,672 | ) | — |
| — |
| 6,672 |
|
— |
| 10,400 |
| — |
| (10,400 | ) | — |
| @, L |
| Korn/Ferry International |
| — |
| 118,768 |
| — |
| (118,768 | ) | — |
| — |
| 118,768 |
|
131,650 |
| — |
| — |
| (131,650 | ) | — |
|
|
| Lender Processing Services, Inc. |
| 3,877,093 |
| — |
| — |
| (3,877,093 | ) | — |
| 3,877,093 |
| — |
|
— |
| 5,900 |
| — |
| (5,900 | ) | — |
|
|
| Manpower, Inc. |
| — |
| 200,541 |
| — |
| (200,541 | ) | — |
| — |
| 200,541 |
|
— |
| — |
| 11,600 |
| 5,348 |
| 16,948 |
|
|
| Mastercard, Inc. |
| — |
| — |
| 1,657,988 |
| 764,457 |
| 2,422,445 |
| — |
| — |
|
— |
| — |
| 43,850 |
| 20,218 |
| 64,068 |
|
|
| McKesson Corp. |
| — |
| — |
| 1,698,311 |
| 783,050 |
| 2,481,361 |
| — |
| — |
|
— |
| 18,900 |
| — |
| (18,900 | ) | — |
| @ |
| Monster Worldwide, Inc. |
| — |
| 228,501 |
| — |
| (228,501 | ) | — |
| — |
| 228,501 |
|
276,200 |
| — |
| — |
| (276,200 | ) | — |
|
|
| Moody’s Corp. |
| 5,548,858 |
| — |
| — |
| (5,548,858 | ) | — |
| 5,548,858 |
| — |
|
— |
| 21,300 |
| — |
| (21,300 | ) | — |
| @ |
| MPS Group, Inc. |
| — |
| 160,389 |
| — |
| (160,389 | ) | — |
| — |
| 160,389 |
|
— |
| 1,100 |
| — |
| (1,100 | ) | — |
| @ |
| Navigant Consulting, Inc. |
| — |
| 17,457 |
| — |
| (17,457 | ) | — |
| — |
| 17,457 |
|
— |
| 6,000 |
| — |
| (6,000 | ) | — |
| @, @@ |
| Net 1 UEPS Technologies, Inc. |
| — |
| 82,200 |
| — |
| (82,200 | ) | — |
| — |
| 82,200 |
|
— |
| 4,300 |
| — |
| (4,300 | ) | — |
| @ |
| PHH Corp. |
| — |
| 54,739 |
| — |
| (54,739 | ) | — |
| — |
| 54,739 |
|
— |
| 8,000 |
| — |
| (8,000 | ) | — |
| @ |
| Rent-A-Center, Inc. |
| — |
| 141,200 |
| — |
| (141,200 | ) | — |
| — |
| 141,200 |
|
— |
| 6,700 |
| — |
| (6,700 | ) | — |
| @ |
| Resources Connection, Inc. |
| — |
| 109,746 |
| — |
| (109,746 | ) | — |
| — |
| 109,746 |
|
— |
| 12,300 |
| — |
| (12,300 | ) | — |
|
|
| Robert Half International, Inc. |
| — |
| 256,086 |
| — |
| (256,086 | ) | — |
| — |
| 256,086 |
|
— |
| 12,600 |
| — |
| (12,600 | ) | — |
|
|
| RR Donnelley & Sons Co. |
| — |
| 171,108 |
| — |
| (171,108 | ) | — |
| — |
| 171,108 |
|
— |
| 1,700 |
| — |
| (1,700 | ) | — |
| @, L |
| RSC Holdings, Inc. |
| — |
| 14,484 |
| — |
| (14,484 | ) | — |
| — |
| 14,484 |
|
— |
| 16,100 |
| — |
| (16,100 | ) | — |
|
|
| Service Corp. International |
| — |
| 80,017 |
| — |
| (80,017 | ) | — |
| — |
| 80,017 |
|
— |
| 8,100 |
| — |
| (8,100 | ) | — |
| @ |
| TeleTech Holdings, Inc. |
| — |
| 67,635 |
| — |
| (67,635 | ) | — |
| — |
| 67,635 |
|
— |
| 3,180 |
| — |
| (3,180 | ) | — |
| @ |
| Ticketmaster |
| — |
| 20,416 |
| — |
| (20,416 | ) | — |
| — |
| 20,416 |
|
— |
| 10,400 |
| — |
| (10,400 | ) | — |
|
|
| Total System Services, Inc. |
| — |
| 145,600 |
| — |
| (145,600 | ) | — |
| — |
| 145,600 |
|
— |
| 529 |
| — |
| (529 | ) | — |
| @ |
| Tree.com, Inc. |
| — |
| 1,375 |
| — |
| (1,375 | ) | — |
| — |
| 1,375 |
|
— |
| 3,800 |
| — |
| (3,800 | ) | — |
| @ |
| TrueBlue, Inc. |
| — |
| 36,366 |
| — |
| (36,366 | ) | — |
| — |
| 36,366 |
|
— |
| 17,543 |
| — |
| (17,543 | ) | — |
| @ |
| United Rentals, Inc. |
| — |
| 159,992 |
| — |
| (159,992 | ) | — |
| — |
| 159,992 |
|
— |
| 900 |
| — |
| (900 | ) | — |
|
|
| Viad Corp. |
| — |
| 22,266 |
| — |
| (22,266 | ) | — |
| — |
| 22,266 |
|
— |
| — |
| 70,900 |
| 32,690 |
| 103,590 |
|
|
| Visa, Inc. |
| — |
| — |
| 3,718,705 |
| 1,714,603 |
| 5,433,308 |
| — |
| — |
|
— |
| 2,200 |
| — |
| (2,200 | ) | — |
| @, L |
| Vistaprint Ltd. |
| — |
| 40,942 |
| — |
| (40,942 | ) | — |
| — |
| 40,942 |
|
— |
| 3,600 |
| — |
| (3,600 | ) | — |
|
|
| Watson Wyatt Worldwide, Inc. |
| — |
| 172,152 |
| — |
| (172,152 | ) | — |
| — |
| 172,152 |
|
— |
| 27,900 |
| 117,200 |
| 26,138 |
| 171,238 |
|
|
| Western Union Co. |
| — |
| 400,086 |
| 1,680,648 |
| 374,819 |
| 2,455,553 |
| — |
| 400,086 |
|
|
|
|
|
|
|
|
|
|
|
|
|
|
| 9,425,951 |
| 4,373,278 |
| 11,985,466 |
| (8,273,027 | ) | 17,511,668 | cs |
|
|
|
|
|
|
|
|
|
|
|
|
|
|
|
| Computers: 5.0% |
|
|
|
|
|
|
|
|
|
|
|
|
|
|
|
— |
| — |
| 94,750 |
| 43,687 |
| 138,437 |
| @@ |
| Accenture Ltd. |
| — |
| — |
| 3,106,853 |
| 1,432,493 |
| 4,539,346 |
| — |
| — |
|
105,100 |
| 900 |
| — |
| (106,000 | ) | — |
| @ |
| Affiliated Computer Services, Inc. |
| 4,829,345 |
| 41,355 |
| — |
| (4,870,700 | ) | — |
| 4,829,345 |
| 41,355 |
|
— |
| 17,000 |
| 139,750 |
| 47,435 |
| 204,185 |
| @ |
| Apple, Inc. |
| — |
| 1,450,950 |
| 11,927,663 |
| 4,048,599 |
| 17,427,212 |
| — |
| 1,450,950 |
|
— |
| 53,900 |
| — |
| (53,900 | ) | — |
| @ |
| Brocade Communications Systems, Inc. |
| — |
| 150,920 |
| — |
| (150,920 | ) | — |
| — |
| 150,920 |
|
— |
| 35,300 |
| — |
| (35,300 | ) | — |
| @ |
| Cadence Design Systems, Inc. |
| — |
| 129,198 |
| — |
| (129,198 | ) | — |
| — |
| 129,198 |
|
— |
| 7,800 |
| — |
| (7,800 | ) | — |
| @ |
| Computer Sciences Corp. |
| — |
| 274,092 |
| — |
| (274,092 | ) | — |
| — |
| 274,092 |
|
— |
| 14,000 |
| 287,800 |
| 118,697 |
| 420,497 |
| @ |
| Dell, Inc. |
| — |
| 143,360 |
| 2,947,072 |
| 1,215,462 |
| 4,305,894 |
| — |
| 143,360 |
|
— |
| 3,100 |
| — |
| (3,100 | ) | — |
| @, L |
| DST Systems, Inc. |
| — |
| 117,738 |
| — |
| (117,738 | ) | — |
| — |
| 117,738 |
|
— |
| 3,900 |
| — |
| (3,900 | ) | — |
| @ |
| Electronics for Imaging |
| — |
| 37,284 |
| — |
| (37,284 | ) | — |
| — |
| 37,284 |
|
— |
| 53,400 |
| 327,800 |
| 97,740 |
| 478,940 |
| @ |
| EMC Corp. |
| — |
| 559,098 |
| 3,432,066 |
| 1,023,342 |
| 5,014,506 |
| — |
| 559,098 |
|
— |
| 114,400 |
| 390,850 |
| 65,811 |
| 571,061 |
|
|
| Hewlett-Packard Co. |
| — |
| 4,151,576 |
| 14,183,947 |
| 2,388,290 |
| 20,723,813 |
| — |
| 4,151,576 |
|
— |
| 51,000 |
| 217,850 |
| 49,445 |
| 318,295 |
|
|
| International Business Machines Corp. |
| — |
| 4,292,160 |
| 18,334,256 |
| 4,161,310 |
| 26,787,726 |
| — |
| 4,292,160 |
|
— |
| 4,100 |
| — |
| (4,100 | ) | — |
|
|
| Jack Henry & Associates, Inc. |
| — |
| 79,581 |
| — |
| (79,581 | ) | — |
| — |
| 79,581 |
|
— |
| 8,300 |
| — |
| (8,300 | ) | — |
| @ |
| Lexmark International, Inc. |
| — |
| 223,270 |
| — |
| (223,270 | ) | — |
| — |
| 223,270 |
|
— |
| 6,400 |
| — |
| (6,400 | ) | — |
| @ |
| Mentor Graphics Corp. |
| — |
| 33,088 |
| — |
| (33,088 | ) | — |
| — |
| 33,088 |
|
— |
| 5,700 |
| — |
| (5,700 | ) | — |
| @ |
| Micros Systems, Inc. |
| — |
| 93,024 |
| — |
| (93,024 | ) | — |
| — |
| 93,024 |
|
— |
| 200 |
| — |
| (200 | ) | — |
|
|
| MTS Systems Corp. |
| — |
| 5,328 |
| — |
| (5,328 | ) | — |
| — |
| 5,328 |
|
— |
| 13,000 |
| — |
| (13,000 | ) | — |
| @ |
| NCR Corp. |
| — |
| 183,820 |
| — |
| (183,820 | ) | — |
| — |
| 183,820 |
|
— |
| 8,000 |
| — |
| (8,000 | ) | — |
| @, L |
| NetApp, Inc. |
| — |
| 111,760 |
| — |
| (111,760 | ) | — |
| — |
| 111,760 |
|
— |
| 11,800 |
| — |
| (11,800 | ) | — |
| @ |
| Perot Systems Corp. |
| — |
| 161,306 |
| — |
| (161,306 | ) | — |
| — |
| 161,306 |
|
— |
| 15,600 |
| — |
| (15,600 | ) | — |
| @, L |
| Sandisk Corp. |
| — |
| 149,760 |
| — |
| (149,760 | ) | — |
| — |
| 149,760 |
|
— |
| 73,600 |
| — |
| (73,600 | ) | — |
|
|
| Seagate Technology, Inc. |
| — |
| 326,048 |
| — |
| (326,048 | ) | — |
| — |
| 326,048 |
|
— |
| 130,700 |
| — |
| (130,700 | ) | — |
| I |
| Seagate Technology, Inc. - Escrow |
| — |
| 1 |
| — |
| (1 | ) | — |
| — |
| 1 |
|
— |
| 40,800 |
| — |
| (40,800 | ) | — |
| @ |
| Sun Microsystems, Inc. |
| — |
| 155,856 |
| — |
| (155,856 | ) | — |
| — |
| 155,856 |
|
— |
| 1,700 |
| — |
| (1,700 | ) | — |
| @ |
| SYKES Enterprises, Inc. |
| — |
| 32,504 |
| — |
| (32,504 | ) | — |
| — |
| 32,504 |
|
— |
| 7,700 |
| — |
| (7,700 | ) | — |
| @, L |
| Synaptics, Inc. |
| — |
| 127,512 |
| — |
| (127,512 | ) | — |
| — |
| 127,512 |
|
— |
| 10,600 |
| — |
| (10,600 | ) | — |
| @ |
| Synopsys, Inc. |
| — |
| 196,312 |
| — |
| (196,312 | ) | — |
| — |
| 196,312 |
|
— |
| 600 |
| — |
| (600 | ) | — |
|
|
| Syntel, Inc. |
| — |
| 13,872 |
| — |
| (13,872 | ) | — |
| — |
| 13,872 |
|
— |
| 9,100 |
| — |
| (9,100 | ) | — |
| @ |
| Teradata Corp. |
| — |
| 134,953 |
| — |
| (134,953 | ) | — |
| — |
| 134,953 |
|
— |
| 19,400 |
| — |
| (19,400 | ) | — |
| @ |
| Unisys Corp. |
| — |
| 16,490 |
| — |
| (16,490 | ) | — |
| — |
| 16,490 |
|
— |
| 13,200 |
| — |
| (13,200 | ) | — |
| @ |
| Western Digital Corp. |
| — |
| 151,140 |
| — |
| (151,140 | ) | — |
| — |
| 151,140 |
|
|
|
|
|
|
|
|
|
|
|
|
|
|
| 4,829,345 |
| 13,543,356 |
| 53,931,857 |
| 6,493,939 |
| 78,798,497 | cs |
|
|
|
|
|
|
|
|
|
|
|
|
|
|
|
| Cosmetics/Personal Care: 3.2% |
|
|
|
|
|
|
|
|
|
|
|
|
|
|
|
— |
| 1,300 |
| — |
| (1,300 | ) | — |
| @, L |
| Chattem, Inc. |
| — |
| 92,989 |
| — |
| (92,989 | ) | — |
| — |
| 92,989 |
|
— |
| — |
| 80,750 |
| 37,232 |
| 117,982 |
|
|
| Colgate-Palmolive Co. |
| — |
| — |
| 5,534,605 |
| 2,551,869 |
| 8,086,474 |
| — |
| — |
|
— |
| 58,032 |
| 478,100 |
| 162,408 |
| 698,540 |
|
|
| Procter & Gamble Co. |
| — |
| 3,587,538 |
| 29,556,142 |
| 10,040,066 |
| 43,183,746 |
| — |
| 3,587,538 |
|
— |
| 500 |
| — |
| (500 | ) | — |
| @ |
| Revlon, Inc. - Class A |
| — |
| 3,335 |
| — |
| (3,335 | ) | — |
| — |
| 3,335 |
|
|
|
|
|
|
|
|
|
|
|
|
|
|
| — |
| 3,683,862 |
| 35,090,747 |
| 12,495,611 |
| 51,270,220 | cs |
|
|
|
|
|
|
|
|
|
|
|
|
|
|
|
| Distribution/Wholesale: 0.0% |
|
|
|
|
|
|
|
|
|
|
|
|
|
|
|
— |
| 6,800 |
| — |
| (6,800 | ) | — |
| @ |
| Fossil, Inc. |
| — |
| 113,560 |
| — |
| (113,560 | ) | — |
| — |
| 113,560 |
|
— |
| 15,900 |
| — |
| (15,900 | ) | — |
| @ |
| Ingram Micro, Inc. |
| — |
| 212,901 |
| — |
| (212,901 | ) | — |
| — |
| 212,901 |
|
— |
| 3,000 |
| — |
| (3,000 | ) | — |
| @ |
| LKQ Corp. |
| — |
| 34,980 |
| — |
| (34,980 | ) | — |
| — |
| 34,980 |
|
— |
| 900 |
| — |
| (900 | ) | — |
|
|
| Owens & Minor, Inc. |
| — |
| 33,885 |
| — |
| (33,885 | ) | — |
| — |
| 33,885 |
|
— |
| 1,300 |
| — |
| (1,300 | ) | — |
| L |
| Pool Corp. |
| — |
| 23,361 |
| — |
| (23,361 | ) | — |
| — |
| 23,361 |
|
— |
| 500 |
| — |
| (500 | ) | — |
| @ |
| Scansource, Inc. |
| — |
| 9,635 |
| — |
| (9,635 | ) | — |
| — |
| 9,635 |
|
— |
| 3,200 |
| — |
| (3,200 | ) | — |
| @ |
| Tech Data Corp. |
| — |
| 57,088 |
| — |
| (57,088 | ) | — |
| — |
| 57,088 |
|
— |
| 1,500 |
| — |
| (1,500 | ) | — |
| @ |
| United Stationers, Inc. |
| — |
| 50,235 |
| — |
| (50,235 | ) | — |
| — |
| 50,235 |
|
— |
| 2,200 |
| — |
| (2,200 | ) | — |
| L |
| Watsco, Inc. |
| — |
| 84,480 |
| — |
| (84,480 | ) | — |
| — |
| 84,480 |
|
— |
| 9,600 |
| — |
| (9,600 | ) | — |
| @ |
| Wesco International, Inc. |
| — |
| 184,608 |
| — |
| (184,608 | ) | — |
| — |
| 184,608 |
|
|
|
|
|
|
|
|
|
|
|
|
|
|
| — |
| 804,733 |
| — |
| (804,733 | ) | — | cs |
|
|
|
|
|
|
|
|
|
|
|
|
|
|
|
| Diversified Financial Services: 1.3% |
|
|
|
|
|
|
|
|
|
|
|
|
|
|
|
— |
| 1,000 |
| — |
| (1,000 | ) | — |
| @, L |
| Affiliated Managers Group, Inc. |
| — |
| 41,920 |
| — |
| (41,920 | ) | — |
| — |
| 41,920 |
|
203,300 |
| — |
| 159,800 |
| (129,620 | ) | 233,480 |
|
|
| American Express Co. |
| 3,771,215 |
| — |
| 2,964,290 |
| (2,404,454 | ) | 4,331,051 |
| 3,771,215 |
| — |
|
— |
| 12,400 |
| — |
| (12,400 | ) | — |
| @, L |
| AmeriCredit Corp. |
| — |
| 94,736 |
| — |
| (94,736 | ) | — |
| — |
| 94,736 |
|
— |
| 8,200 |
| — |
| (8,200 | ) | — |
|
|
| Ameriprise Financial, Inc. |
| — |
| 191,552 |
| — |
| (191,552 | ) | — |
| — |
| 191,552 |
|
— |
| 1,800 |
| 2,900 |
| (463 | ) | 4,237 |
| S |
| Blackrock, Inc. |
| — |
| 241,470 |
| 389,035 |
| (62,096 | ) | 568,409 |
| — |
| 241,470 |
|
— |
| — |
| 148,150 |
| 68,308 |
| 216,458 |
|
|
| Charles Schwab Corp. |
| — |
| — |
| 2,395,586 |
| 1,104,546 |
| 3,500,132 |
| — |
| — |
|
— |
| 27,000 |
| — |
| (27,000 | ) | — |
| L |
| CIT Group, Inc. |
| — |
| 122,580 |
| — |
| (122,580 | ) | — |
| — |
| 122,580 |
|
— |
| — |
| 10,700 |
| 4,934 |
| 15,634 |
|
|
| CME Group, Inc. |
| — |
| — |
| 2,226,777 |
| 1,026,711 |
| 3,253,488 |
| — |
| — |
|
— |
| 25,950 |
| — |
| (25,950 | ) | — |
|
|
| Discover Financial Services |
| — |
| 247,304 |
| — |
| (247,304 | ) | — |
| — |
| 247,304 |
|
— |
| 44,700 |
| — |
| (44,700 | ) | — |
| @, L |
| E*Trade Financial Corp. |
| — |
| 51,405 |
| — |
| (51,405 | ) | — |
| — |
| 51,405 |
|
— |
| — |
| 102,550 |
| 47,283 |
| 149,833 |
| ## |
| Federal Home Loan Mortgage Corporation |
| — |
| — |
| 74,862 |
| 34,517 |
| 109,379 |
| — |
| — |
|
— |
| — |
| 177,150 |
| 81,679 |
| 258,829 |
| ## |
| Federal National Mortgage Association |
| — |
| — |
| 134,634 |
| 62,076 |
| 196,710 |
| — |
| — |
|
— |
| 8,600 |
| 24,450 |
| 2,673 |
| 35,723 |
|
|
| Franklin Resources, Inc. |
| — |
| 548,508 |
| 1,559,421 |
| 170,502 |
| 2,278,431 |
| — |
| 548,508 |
|
— |
| 600 |
| — |
| (600 | ) | — |
|
|
| GAMCO Investors, Inc. |
| — |
| 16,392 |
| — |
| (16,392 | ) | — |
| — |
| 16,392 |
|
— |
| 1,600 |
| — |
| (1,600 | ) | — |
| L |
| Greenhill & Co., Inc. |
| — |
| 111,632 |
| — |
| (111,632 | ) | — |
| — |
| 111,632 |
|
— |
| 6,800 |
| — |
| (6,800 | ) | — |
| @ |
| Interactive Brokers Group, Inc. |
| — |
| 121,652 |
| — |
| (121,652 | ) | — |
| — |
| 121,652 |
|
405,300 |
| — |
| — |
| (405,300 | ) | — |
|
|
| Invesco Ltd. |
| 5,852,532 |
| — |
| — |
| (5,852,532 | ) | — |
| 5,852,532 |
| — |
|
— |
| 2,000 |
| — |
| (2,000 | ) | — |
| @ |
| Investment Technology Group, Inc. |
| — |
| 45,440 |
| — |
| (45,440 | ) | — |
| — |
| 45,440 |
|
— |
| 11,400 |
| — |
| (11,400 | ) | — |
|
|
| Janus Capital Group, Inc. |
| — |
| 91,542 |
| — |
| (91,542 | ) | — |
| — |
| 91,542 |
|
— |
| 2,700 |
| — |
| (2,700 | ) | — |
|
|
| Jefferies Group, Inc. |
| — |
| 37,962 |
| — |
| (37,962 | ) | — |
| — |
| 37,962 |
|
— |
| 2,200 |
| — |
| (2,200 | ) | — |
| @, L |
| KBW, Inc. |
| — |
| 50,600 |
| — |
| (50,600 | ) | — |
| — |
| 50,600 |
|
— |
| 8,900 |
| — |
| (8,900 | ) | — |
| @ |
| Knight Capital Group, Inc. |
| — |
| 143,735 |
| — |
| (143,735 | ) | — |
| — |
| 143,735 |
|
— |
| 2,300 |
| — |
| (2,300 | ) | — |
| @@ |
| Lazard Ltd. |
| — |
| 68,402 |
| — |
| (68,402 | ) | — |
| — |
| 68,402 |
|
— |
| 8,300 |
| — |
| (8,300 | ) | — |
|
|
| Legg Mason, Inc. |
| — |
| 181,853 |
| — |
| (181,853 | ) | — |
| — |
| 181,853 |
|
— |
| — |
| 242,450 |
| 111,788 |
| 354,238 |
|
|
| Merrill Lynch & Co., Inc. |
| — |
| — |
| 2,822,118 |
| 1,301,208 |
| 4,123,326 |
| — |
| — |
|
— |
| 1,900 |
| — |
| (1,900 | ) | — |
|
|
| Nelnet, Inc. |
| — |
| 27,227 |
| — |
| (27,227 | ) | — |
| — |
| 27,227 |
|
— |
| 16,100 |
| 42,050 |
| 3,288 |
| 61,438 |
|
|
| NYSE Euronext |
| — |
| 440,818 |
| 1,151,329 |
| 90,032 |
| 1,682,179 |
| — |
| 440,818 |
|
— |
| 3,000 |
| — |
| (3,000 | ) | — |
| @ |
| Piper Jaffray Cos. |
| — |
| 119,280 |
| — |
| (119,280 | ) | — |
| — |
| 119,280 |
|
— |
| 2,100 |
| — |
| (2,100 | ) | — |
| @ |
| Stifel Financial Corp. |
| — |
| 96,285 |
| — |
| (96,285 | ) | — |
| — |
| 96,285 |
|
— |
| 500 |
| — |
| (500 | ) | — |
|
|
| Student Loan Corp. |
| — |
| 20,500 |
| — |
| (20,500 | ) | — |
| — |
| 20,500 |
|
— |
| 14,600 |
| — |
| (14,600 | ) | — |
| L |
| T. Rowe Price Group, Inc. |
| — |
| 517,424 |
| — |
| (517,424 | ) | — |
| — |
| 517,424 |
|
— |
| 30,900 |
| — |
| (30,900 | ) | — |
| @, L |
| TD Ameritrade Holding Corp. |
| — |
| 440,325 |
| — |
| (440,325 | ) | — |
| — |
| 440,325 |
|
— |
| 600 |
| — |
| (600 | ) | — |
|
|
| Waddell & Reed Financial, Inc. |
| — |
| 9,276 |
| — |
| (9,276 | ) | — |
| — |
| 9,276 |
|
|
|
|
|
|
|
|
|
|
|
|
|
|
| 9,623,747 |
| 4,079,820 |
| 13,718,052 |
| (7,378,514 | ) | 20,043,105 | cs |
|
|
|
|
|
|
|
|
|
|
|
|
|
|
|
| Electric: 2.5% |
|
|
|
|
|
|
|
|
|
|
|
|
|
|
|
— |
| 6,400 |
| — |
| (6,400 | ) | — |
|
|
| Avista Corp. |
| — |
| 124,032 |
| — |
| (124,032 | ) | — |
| — |
| 124,032 |
|
— |
| 500 |
| — |
| (500 | ) | — |
|
|
| CH Energy Group, Inc. |
| — |
| 25,695 |
| — |
| (25,695 | ) | — |
| — |
| 25,695 |
|
— |
| — |
| 91,550 |
| 42,211 |
| 133,761 |
|
|
| Dominion Resources, Inc. |
| — |
| — |
| 3,281,152 |
| 1,512,858 |
| 4,794,010 |
| — |
| — |
|
— |
| 46,700 |
| 200,450 |
| 45,723 |
| 292,873 |
|
|
| Duke Energy Corp. |
| — |
| 700,967 |
| 3,008,755 |
| 686,295 |
| 4,396,017 |
| — |
| 700,967 |
|
— |
| — |
| 30,450 |
| 14,040 |
| 44,490 |
|
|
| Entergy Corp. |
| — |
| — |
| 2,531,309 |
| 1,167,124 |
| 3,698,433 |
| — |
| — |
|
— |
| — |
| 103,800 |
| 47,860 |
| 151,660 |
|
|
| Exelon Corp. |
| — |
| — |
| 5,772,318 |
| 2,661,473 |
| 8,433,791 |
| — |
| — |
|
78,900 |
| — |
| 48,350 |
| (56,607 | ) | 70,643 |
|
|
| FirstEnergy Corp. |
| 3,832,962 |
| — |
| 2,348,843 |
| (2,749,969 | ) | 3,431,836 |
| 3,832,962 |
| — |
|
— |
| — |
| 64,450 |
| 29,716 |
| 94,166 |
|
|
| FPL Group, Inc. |
| — |
| — |
| 3,243,769 |
| 1,495,621 |
| 4,739,390 |
| — |
| — |
|
— |
| 1,400 |
| — |
| (1,400 | ) | — |
|
|
| Integrys Energy Group, Inc. |
| — |
| 60,172 |
| — |
| (60,172 | ) | — |
| — |
| 60,172 |
|
— |
| 7,100 |
| — |
| (7,100 | ) | — |
| @ |
| Mirant Corp. |
| — |
| 133,977 |
| — |
| (133,977 | ) | — |
| — |
| 133,977 |
|
217,000 |
| — |
| — |
| (217,000 | ) | — |
| @ |
| NRG Energy, Inc. |
| 5,062,610 |
| — |
| — |
| (5,062,610 | ) | — |
| 5,062,610 |
| — |
|
— |
| — |
| 80,750 |
| 37,232 |
| 117,982 |
|
|
| Public Service Enterprise Group, Inc. |
| �� |
| — |
| 2,355,478 |
| 1,086,053 |
| 3,441,531 |
| — |
| — |
|
— |
| 18,000 |
| — |
| (18,000 | ) | — |
| @ |
| Reliant Energy, Inc. |
| — |
| 104,040 |
| — |
| (104,040 | ) | — |
| — |
| 104,040 |
|
— |
| — |
| 121,500 |
| 56,021 |
| 177,521 |
|
|
| Southern Co. |
| — |
| — |
| 4,495,500 |
| 2,072,763 |
| 6,568,263 |
| — |
| — |
|
— |
| 3,000 |
| — |
| (3,000 | ) | — |
|
|
| Unisource Energy Corp. |
| — |
| 88,080 |
| — |
| (88,080 | ) | — |
| — |
| 88,080 |
|
|
|
|
|
|
|
|
|
|
|
|
|
|
| 8,895,572 |
| 1,236,963 |
| 27,037,124 |
| 2,333,612 |
| 39,503,271 | cs |
|
|
|
|
|
|
|
|
|
|
|
|
|
|
|
| Electrical Components & Equipment: 0.4% |
|
|
|
|
|
|
|
|
|
|
|
|
|
|
|
— |
| 9,300 |
| — |
| (9,300 | ) | — |
|
|
| Belden CDT, Inc. |
| — |
| 194,184 |
| — |
| (194,184 | ) | — |
| — |
| 194,184 |
|
— |
| 25,200 |
| 123,850 |
| 31,904 |
| 180,954 |
|
|
| Emerson Electric Co. |
| — |
| 922,572 |
| 4,534,149 |
| 1,168,011 |
| 6,624,732 |
| — |
| 922,572 |
|
102,500 |
| — |
| — |
| (102,500 | ) | — |
| @ |
| Energizer Holdings, Inc. |
| 5,549,350 |
| — |
| — |
| (5,549,350 | ) | — |
| 5,549,350 |
| — |
|
— |
| 26,300 |
| — |
| (26,300 | ) | — |
| @ |
| GrafTech International Ltd. |
| — |
| 218,816 |
| — |
| (218,816 | ) | — |
| — |
| 218,816 |
|
— |
| 3,900 |
| — |
| (3,900 | ) | — |
|
|
| Hubbell, Inc. |
| — |
| 127,452 |
| — |
| (127,452 | ) | — |
| — |
| 127,452 |
|
— |
| 100 |
| — |
| (100 | ) | — |
| @ |
| Littelfuse, Inc. |
| — |
| 1,660 |
| — |
| (1,660 | ) | — |
| — |
| 1,660 |
|
— |
| 12,600 |
| — |
| (12,600 | ) | — |
|
|
| Molex, Inc. |
| — |
| 182,574 |
| — |
| (182,574 | ) | — |
| — |
| 182,574 |
|
|
|
|
|
|
|
|
|
|
|
|
|
|
| 5,549,350 |
| 1,647,258 |
| 4,534,149 |
| (5,106,025 | ) | 6,624,732 | cs |
|
|
|
|
|
|
|
|
|
|
|
|
|
|
|
| Electronics: 0.3% |
|
|
|
|
|
|
|
|
|
|
|
|
|
|
|
— |
| 20,300 |
| — |
| (20,300 | ) | — |
| @ |
| Agilent Technologies, Inc. |
| — |
| 317,289 |
| — |
| (317,289 | ) | — |
| — |
| 317,289 |
|
— |
| 6,000 |
| — |
| (6,000 | ) | — |
|
|
| Amphenol Corp. |
| — |
| 143,880 |
| — |
| (143,880 | ) | — |
| — |
| 143,880 |
|
— |
| 1,200 |
| — |
| (1,200 | ) | — |
| L |
| Analogic Corp. |
| — |
| 32,736 |
| — |
| (32,736 | ) | — |
| — |
| 32,736 |
|
— |
| 10,500 |
| — |
| (10,500 | ) | — |
| @ |
| Arrow Electronics, Inc. |
| — |
| 197,820 |
| — |
| (197,820 | ) | — |
| — |
| 197,820 |
|
— |
| 11,600 |
| — |
| (11,600 | ) | — |
| @ |
| Avnet, Inc. |
| — |
| 211,236 |
| — |
| (211,236 | ) | — |
| — |
| 211,236 |
|
— |
| 4,900 |
| — |
| (4,900 | ) | — |
|
|
| AVX Corp. |
| — |
| 38,906 |
| — |
| (38,906 | ) | — |
| — |
| 38,906 |
|
— |
| 14,400 |
| — |
| (14,400 | ) | — |
| @ |
| Benchmark Electronics, Inc. |
| — |
| 183,888 |
| — |
| (183,888 | ) | — |
| — |
| 183,888 |
|
— |
| 2,200 |
| — |
| (2,200 | ) | — |
|
|
| Brady Corp. |
| — |
| 52,690 |
| — |
| (52,690 | ) | — |
| — |
| 52,690 |
|
— |
| 6,100 |
| — |
| (6,100 | ) | — |
| @ |
| Cogent, Inc. |
| — |
| 82,777 |
| — |
| (82,777 | ) | — |
| — |
| 82,777 |
|
— |
| 2,600 |
| — |
| (2,600 | ) | — |
| @ |
| Coherent, Inc. |
| — |
| 55,796 |
| — |
| (55,796 | ) | — |
| — |
| 55,796 |
|
— |
| 4,000 |
| — |
| (4,000 | ) | — |
| @ |
| Cymer, Inc. |
| — |
| 87,640 |
| — |
| (87,640 | ) | — |
| — |
| 87,640 |
|
— |
| 4,000 |
| — |
| (4,000 | ) | — |
| @ |
| Dolby Laboratories, Inc. |
| — |
| 131,040 |
| — |
| (131,040 | ) | — |
| — |
| 131,040 |
|
— |
| 1,300 |
| — |
| (1,300 | ) | — |
| @ |
| FEI Co. |
| — |
| 24,518 |
| — |
| (24,518 | ) | — |
| — |
| 24,518 |
|
— |
| 9,400 |
| — |
| (9,400 | ) | — |
|
|
| Gentex Corp. |
| — |
| 83,002 |
| — |
| (83,002 | ) | — |
| — |
| 83,002 |
|
— |
| 1,600 |
| — |
| (1,600 | ) | — |
| @, L |
| Itron, Inc. |
| — |
| 101,984 |
| — |
| (101,984 | ) | — |
| — |
| 101,984 |
|
— |
| 21,700 |
| — |
| (21,700 | ) | — |
|
|
| Jabil Circuit, Inc. |
| — |
| 146,475 |
| — |
| (146,475 | ) | — |
| — |
| 146,475 |
|
— |
| 1,800 |
| — |
| (1,800 | ) | — |
| @ |
| L-1 Identity Solutions, Inc. |
| — |
| 12,132 |
| — |
| (12,132 | ) | — |
| — |
| 12,132 |
|
— |
| 5,000 |
| — |
| (5,000 | ) | — |
|
|
| National Instruments Corp. |
| — |
| 121,800 |
| — |
| (121,800 | ) | — |
| — |
| 121,800 |
|
— |
| 3,400 |
| — |
| (3,400 | ) | — |
| @ |
| Plexus Corp. |
| — |
| 57,630 |
| — |
| (57,630 | ) | — |
| — |
| 57,630 |
|
— |
| 2,000 |
| — |
| (2,000 | ) | — |
| @ |
| Rofin-Sinar Technologies, Inc. |
| — |
| 41,160 |
| — |
| (41,160 | ) | — |
| — |
| 41,160 |
|
— |
| 1,100 |
| — |
| (1,100 | ) | — |
|
|
| Technitrol, Inc. |
| — |
| 3,828 |
| — |
| (3,828 | ) | — |
| — |
| 3,828 |
|
— |
| 3,400 |
| 66,400 |
| 27,215 |
| 97,015 |
| @ |
| Thermo Electron Corp. |
| — |
| 115,838 |
| 2,262,248 |
| 927,229 |
| 3,305,315 |
| — |
| 115,838 |
|
— |
| 6,200 |
| — |
| (6,200 | ) | — |
| @ |
| Thomas & Betts Corp. |
| — |
| 148,924 |
| — |
| (148,924 | ) | — |
| — |
| 148,924 |
|
— |
| 9,300 |
| — |
| (9,300 | ) | — |
| @ |
| Trimble Navigation Ltd. |
| — |
| 200,973 |
| — |
| (200,973 | ) | — |
| — |
| 200,973 |
|
— |
| 13,500 |
| 75,800 |
| 21,449 |
| 110,749 |
| @@ |
| Tyco Electronics Ltd. |
| — |
| 218,835 |
| 1,228,718 |
| 347,696 |
| 1,795,249 |
| — |
| 218,835 |
|
— |
| 1,400 |
| — |
| (1,400 | ) | — |
| @ |
| Varian, Inc. |
| — |
| 46,914 |
| — |
| (46,914 | ) | — |
| — |
| 46,914 |
|
— |
| 32,500 |
| — |
| (32,500 | ) | — |
| @ |
| Vishay Intertechnology, Inc. |
| — |
| 111,150 |
| — |
| (111,150 | ) | — |
| — |
| 111,150 |
|
— |
| 5,000 |
| — |
| (5,000 | ) | — |
|
|
| Watts Water Technologies, Inc. |
| — |
| 124,850 |
| — |
| (124,850 | ) | — |
| — |
| 124,850 |
|
— |
| 6,800 |
| — |
| (6,800 | ) | — |
|
|
| Woodward Governor Co. |
| — |
| 156,536 |
| — |
| (156,536 | ) | — |
| — |
| 156,536 |
|
|
|
|
|
|
|
|
|
|
|
|
|
|
| — |
| 3,252,247 |
| 3,490,966 |
| (1,642,649 | ) | 5,100,564 | cs |
|
|
|
|
|
|
|
|
|
|
|
|
|
|
|
| Energy - Alternate Sources: 0.1% |
|
|
|
|
|
|
|
|
|
|
|
|
|
|
|
— |
| — |
| 7,100 |
| 3,274 |
| 10,374 |
| @ |
| First Solar, Inc. |
| — |
| — |
| 979,516 |
| 451,631 |
| 1,431,147 |
| — |
| — |
|
|
|
|
|
|
|
|
|
|
|
|
|
|
| — |
| — |
| 979,516 |
| 451,631 |
| 1,431,147 | cs |
|
|
|
|
|
|
|
|
|
|
|
|
|
|
|
| Engineering & Construction: 0.0% |
|
|
|
|
|
|
|
|
|
|
|
|
|
|
|
252,300 |
| — |
| — |
| (252,300 | ) | — |
| @@ |
| ABB Ltd. ADR |
| 3,787,023 |
| — |
| — |
| (3,787,023 | ) | — |
| 3,787,023 |
| — |
|
— |
| 200 |
| — |
| (200 | ) | — |
| @ |
| Aecom Technology Corp. |
| — |
| 6,146 |
| — |
| (6,146 | ) | — |
| — |
| 6,146 |
|
344,500 |
| 11,700 |
| — |
| (356,200 | ) | — |
| @@, L |
| Chicago Bridge & Iron Co. NV |
| 3,462,225 |
| 117,585 |
| — |
| (3,579,810 | ) | — |
| 3,462,225 |
| 117,585 |
|
— |
| 11,900 |
| — |
| (11,900 | ) | — |
| @ |
| EMCOR Group, Inc. |
| — |
| 266,917 |
| — |
| (266,917 | ) | — |
| — |
| 266,917 |
|
— |
| 14,800 |
| — |
| (14,800 | ) | — |
|
|
| Fluor Corp. |
| — |
| 664,076 |
| — |
| (664,076 | ) | — |
| — |
| 664,076 |
|
— |
| 4,600 |
| — |
| (4,600 | ) | — |
|
|
| Granite Construction, Inc. |
| — |
| 202,078 |
| — |
| (202,078 | ) | — |
| — |
| 202,078 |
|
203,200 |
| 3,300 |
| — |
| (206,500 | ) | — |
|
|
| KBR, Inc. |
| 3,088,640 |
| 50,160 |
| — |
| (3,138,800 | ) | — |
| 3,088,640 |
| 50,160 |
|
228,200 |
| 2,600 |
| — |
| (230,800 | ) | — |
| @ |
| McDermott International, Inc. |
| 2,254,616 |
| 25,688 |
| — |
| (2,280,304 | ) | — |
| 2,254,616 |
| 25,688 |
|
— |
| 9,000 |
| — |
| (9,000 | ) | — |
| @ |
| Perini Corp. |
| — |
| 210,420 |
| — |
| (210,420 | ) | — |
| — |
| 210,420 |
|
— |
| 5,100 |
| — |
| (5,100 | ) | — |
| @ |
| Shaw Group, Inc. |
| — |
| 104,397 |
| — |
| (104,397 | ) | — |
| — |
| 104,397 |
|
|
|
|
|
|
|
|
|
|
|
|
|
|
| 12,592,504 |
| 1,647,467 |
| — |
| (14,239,971 | ) | — | cs |
|
|
|
|
|
|
|
|
|
|
|
|
|
|
|
| Entertainment: 0.0% |
|
|
|
|
|
|
|
|
|
|
|
|
|
|
|
— |
| 1,400 |
| — |
| (1,400 | ) | — |
| @ |
| Bally Technologies, Inc. |
| — |
| 33,642 |
| — |
| (33,642 | ) | — |
| — |
| 33,642 |
|
— |
| 8,300 |
| — |
| (8,300 | ) | — |
| @ |
| DreamWorks Animation SKG, Inc. |
| — |
| 209,658 |
| — |
| (209,658 | ) | — |
| — |
| 209,658 |
|
— |
| 2,800 |
| — |
| (2,800 | ) | — |
|
|
| International Speedway Corp. |
| — |
| 80,444 |
| — |
| (80,444 | ) | — |
| — |
| 80,444 |
|
— |
| 2,300 |
| — |
| (2,300 | ) | — |
|
|
| Speedway Motorsports, Inc. |
| — |
| 37,053 |
| — |
| (37,053 | ) | — |
| — |
| 37,053 |
|
— |
| 3,400 |
| — |
| (3,400 | ) | — |
| @, L |
| Vail Resorts, Inc. |
| — |
| 90,440 |
| — |
| (90,440 | ) | — |
| — |
| 90,440 |
|
— |
| 5,300 |
| — |
| (5,300 | ) | — |
| L |
| Warner Music Group Corp. |
| — |
| 16,006 |
| — |
| (16,006 | ) | — |
| — |
| 16,006 |
|
|
|
|
|
|
|
|
|
|
|
|
|
|
| — |
| 467,243 |
| — |
| (467,243 | ) | — | cs |
|
|
|
|
|
|
|
|
|
|
|
|
|
|
|
| Environmental Control: 0.2% |
|
|
|
|
|
|
|
|
|
|
|
|
|
|
|
— |
| 1,000 |
| — |
| (1,000 | ) | — |
| @ |
| Clean Harbors, Inc. |
| — |
| 63,440 |
| — |
| (63,440 | ) | — |
| — |
| 63,440 |
|
— |
| 2,200 |
| — |
| (2,200 | ) | — |
| @ |
| Darling International, Inc. |
| — |
| 12,078 |
| — |
| (12,078 | ) | — |
| — |
| 12,078 |
|
— |
| 500 |
| — |
| (500 | ) | — |
|
|
| Energy Solutions, Inc. |
| — |
| 2,825 |
| — |
| (2,825 | ) | — |
| — |
| 2,825 |
|
— |
| 8,900 |
| — |
| (8,900 | ) | — |
|
|
| Nalco Holding Co. |
| — |
| 102,706 |
| — |
| (102,706 | ) | — |
| — |
| 102,706 |
|
— |
| 9,700 |
| 77,750 |
| 26,149 |
| 113,599 |
|
|
| Waste Management, Inc. |
| — |
| 321,458 |
| 2,576,635 |
| 866,565 |
| 3,764,658 |
| — |
| 321,458 |
|
|
|
|
|
|
|
|
|
|
|
|
|
|
| — |
| 502,507 |
| 2,576,635 |
| 685,516 |
| 3,764,658 | cs |
|
|
|
|
|
|
|
|
|
|
|
|
|
|
|
| Food: 1.5% |
|
|
|
|
|
|
|
|
|
|
|
|
|
|
|
— |
| 4,200 |
| — |
| (4,200 | ) | — |
|
|
| Del Monte Foods Co. |
| — |
| 29,988 |
| — |
| (29,988 | ) | — |
| — |
| 29,988 |
|
— |
| 900 |
| — |
| (900 | ) | — |
| @, @@ |
| Fresh Del Monte Produce, Inc. |
| — |
| 20,178 |
| — |
| (20,178 | ) | — |
| — |
| 20,178 |
|
— |
| — |
| 53,200 |
| 24,529 |
| 77,729 |
|
|
| General Mills, Inc. |
| — |
| — |
| 3,231,900 |
| 1,490,149 |
| 4,722,049 |
| — |
| — |
|
— |
| — |
| 39,650 |
| 18,282 |
| 57,932 |
|
|
| Kellogg Co. |
| — |
| — |
| 1,738,653 |
| 801,649 |
| 2,540,302 |
| — |
| — |
|
— |
| — |
| 233,100 |
| 107,477 |
| 340,577 |
|
|
| Kraft Foods, Inc. |
| — |
| — |
| 6,258,735 |
| 2,885,748 |
| 9,144,483 |
| — |
| — |
|
— |
| 27,100 |
| 104,700 |
| 21,175 |
| 152,975 |
|
|
| Kroger Co. |
| — |
| 715,711 |
| 2,765,127 |
| 559,220 |
| 4,040,058 |
| — |
| 715,711 |
|
— |
| 200 |
| — |
| (200 | ) | — |
| @ |
| M&F Worldwide Corp. |
| — |
| 3,090 |
| — |
| (3,090 | ) | — |
| — |
| 3,090 |
|
— |
| 1,100 |
| — |
| (1,100 | ) | — |
| @ |
| Ralcorp Holdings, Inc. |
| — |
| 64,240 |
| — |
| (64,240 | ) | — |
| — |
| 64,240 |
|
— |
| 71,400 |
| — |
| (71,400 | ) | — |
|
|
| Safeway, Inc. |
| — |
| 1,697,178 |
| — |
| (1,697,178 | ) | — |
| — |
| 1,697,178 |
|
— |
| 4,800 |
| — |
| (4,800 | ) | — |
|
|
| Supervalu, Inc. |
| — |
| 70,080 |
| — |
| (70,080 | ) | — |
| — |
| 70,080 |
|
— |
| — |
| 95,150 |
| 43,871 |
| 139,021 |
|
|
| Sysco Corp. |
| — |
| — |
| 2,182,741 |
| 1,006,408 |
| 3,189,149 |
| — |
| — |
|
— |
| 400 |
| — |
| (400 | ) | — |
|
|
| Weis Markets, Inc. |
| — |
| 13,452 |
| — |
| (13,452 | ) | — |
| — |
| 13,452 |
|
— |
| 500 |
| — |
| (500 | ) | — |
| @ |
| Winn-Dixie Stores, Inc. |
| — |
| 8,050 |
| — |
| (8,050 | ) | — |
| — |
| 8,050 |
|
|
|
|
|
|
|
|
|
|
|
|
|
|
| — |
| 2,621,967 |
| 16,177,156 |
| 4,836,918 |
| 23,636,041 | cs |
|
|
|
|
|
|
|
|
|
|
|
|
|
|
|
| Forest Products & Paper: 0.0% |
|
|
|
|
|
|
|
|
|
|
|
|
|
|
|
— |
| 63,800 |
| — |
| (63,800 | ) | — |
| @, @@ |
| Domtar Corp. |
| — |
| 106,546 |
| — |
| (106,546 | ) | — |
| — |
| 106,546 |
|
— |
| 25,700 |
| — |
| (25,700 | ) | — |
|
|
| International Paper Co. |
| — |
| 303,260 |
| — |
| (303,260 | ) | — |
| — |
| 303,260 |
|
— |
| 5,400 |
| — |
| (5,400 | ) | — |
|
|
| MeadWestvaco Corp. |
| — |
| 60,426 |
| — |
| (60,426 | ) | — |
| — |
| 60,426 |
|
|
|
|
|
|
|
|
|
|
|
|
|
|
| — |
| 470,232 |
| — |
| (470,232 | ) | — | cs |
|
|
|
|
|
|
|
|
|
|
|
|
|
|
|
| Gas: 0.0% |
|
|
|
|
|
|
|
|
|
|
|
|
|
|
|
— |
| 1,900 |
| — |
| (1,900 | ) | — |
|
|
| Laclede Group, Inc. |
| — |
| 88,996 |
| — |
| (88,996 | ) | — |
| — |
| 88,996 |
|
— |
| 100 |
| — |
| (100 | ) | — |
|
|
| South Jersey Industries, Inc. |
| — |
| 3,985 |
| — |
| (3,985 | ) | — |
| — |
| 3,985 |
|
— |
| 1,700 |
| — |
| (1,700 | ) | — |
|
|
| Southwest Gas Corp. |
| — |
| 42,874 |
| — |
| (42,874 | ) | — |
| — |
| 42,874 |
|
— |
| 1,900 |
| — |
| (1,900 | ) | — |
|
|
| WGL Holdings, Inc. |
| — |
| 62,111 |
| — |
| (62,111 | ) | — |
| — |
| 62,111 |
|
|
|
|
|
|
|
|
|
|
|
|
|
|
| — |
| 197,966 |
| — |
| (197,966 | ) | — | cs |
|
|
|
|
|
|
|
|
|
|
|
|
|
|
|
| Hand/Machine Tools: 0.0% |
|
|
|
|
|
|
|
|
|
|
|
|
|
|
|
— |
| 10,500 |
| — |
| (10,500 | ) | — |
|
|
| Baldor Electric Co. |
| — |
| 187,425 |
| — |
| (187,425 | ) | — |
| — |
| 187,425 |
|
— |
| 11,300 |
| — |
| (11,300 | ) | — |
|
|
| Kennametal, Inc. |
| — |
| 250,747 |
| — |
| (250,747 | ) | — |
| — |
| 250,747 |
|
— |
| 3,900 |
| — |
| (3,900 | ) | — |
|
|
| Lincoln Electric Holdings, Inc. |
| — |
| 198,627 |
| — |
| (198,627 | ) | — |
| — |
| 198,627 |
|
— |
| 900 |
| — |
| (900 | ) | — |
|
|
| Regal-Beloit Corp. |
| — |
| 34,191 |
| — |
| (34,191 | ) | — |
| — |
| 34,191 |
|
— |
| 4,800 |
| — |
| (4,800 | ) | — |
|
|
| Snap-On, Inc. |
| — |
| 189,024 |
| — |
| (189,024 | ) | — |
| — |
| 189,024 |
|
— |
| 4,300 |
| — |
| (4,300 | ) | — |
|
|
| Stanley Works |
| — |
| 146,630 |
| — |
| (146,630 | ) | — |
| — |
| 146,630 |
|
|
|
|
|
|
|
|
|
|
|
|
|
|
| — |
| 1,006,644 |
| — |
| (1,006,644 | ) | — | cs |
|
|
|
|
|
|
|
|
|
|
|
|
|
|
|
| Healthcare - Products: 4.3% |
|
|
|
|
|
|
|
|
|
|
|
|
|
|
|
— |
| 600 |
| — |
| (600 | ) | — |
| @ |
| American Medical Systems Holdings, Inc. |
| — |
| 5,394 |
| — |
| (5,394 | ) | — |
| — |
| 5,394 |
|
— |
| — |
| 99,350 |
| 45,808 |
| 145,158 |
|
|
| Baxter International, Inc. |
| — |
| — |
| 5,324,167 |
| 2,454,841 |
| 7,779,008 |
| — |
| — |
|
— |
| — |
| 38,800 |
| 17,890 |
| 56,690 |
|
|
| Becton Dickinson & Co. |
| — |
| — |
| 2,653,532 |
| 1,223,477 |
| 3,877,009 |
| — |
| — |
|
— |
| — |
| 237,350 |
| 109,436 |
| 346,786 |
| @ |
| Boston Scientific Corp. |
| — |
| — |
| 1,837,089 |
| 847,037 |
| 2,684,126 |
| — |
| — |
|
37,300 |
| — |
| 79,100 |
| (829 | ) | 115,571 |
| @@ |
| Covidien Ltd. |
| 1,351,752 |
| — |
| 2,866,584 |
| (30,041 | ) | 4,188,295 |
| 1,351,752 |
| — |
|
— |
| 3,900 |
| — |
| (3,900 | ) | — |
|
|
| Hill-Rom Holdings, Inc. |
| — |
| 64,194 |
| — |
| (64,194 | ) | — |
| — |
| 64,194 |
|
— |
| 1,900 |
| — |
| (1,900 | ) | — |
| @, L |
| Inverness Medical Innovations, Inc. |
| — |
| 35,929 |
| — |
| (35,929 | ) | — |
| — |
| 35,929 |
|
— |
| 65,100 |
| 446,650 |
| 140,839 |
| 652,589 |
|
|
| Johnson & Johnson |
| — |
| 3,894,933 |
| 26,723,070 |
| 8,426,412 |
| 39,044,415 |
| — |
| 3,894,933 |
|
— |
| 5,500 |
| 177,850 |
| 76,502 |
| 259,852 |
|
|
| Medtronic, Inc. |
| — |
| 172,810 |
| 5,588,047 |
| 2,403,700 |
| 8,164,557 |
| — |
| 172,810 |
|
— |
| 2,400 |
| — |
| (2,400 | ) | — |
| @ |
| Sirona Dental Systems, Inc. |
| — |
| 25,200 |
| — |
| (25,200 | ) | — |
| — |
| 25,200 |
|
— |
| 1,800 |
| — |
| (1,800 | ) | — |
|
|
| Steris Corp. |
| — |
| 43,002 |
| — |
| (43,002 | ) | — |
| — |
| 43,002 |
|
— |
| — |
| 48,650 |
| 22,431 |
| 71,081 |
|
|
| Stryker Corp. |
| — |
| — |
| 1,943,568 |
| 896,131 |
| 2,839,699 |
| — |
| — |
|
43,600 |
| 9,100 |
| 36,650 |
| (35,802 | ) | 53,548 |
| @ |
| Zimmer Holdings, Inc. |
| 1,762,312 |
| 367,822 |
| 1,481,393 |
| (1,447,100 | ) | 2,164,427 |
| 1,762,312 |
| 367,822 |
|
|
|
|
|
|
|
|
|
|
|
|
|
|
| 3,114,064 |
| 4,609,284 |
| 48,417,450 |
| 14,600,738 |
| 70,741,536 | cs |
|
|
|
|
|
|
|
|
|
|
|
|
|
|
|
| Healthcare - Services: 1.0% |
|
|
|
|
|
|
|
|
|
|
|
|
|
|
|
204,600 |
| 80,300 |
| 76,850 |
| (249,466 | ) | 112,284 |
|
|
| Aetna, Inc. |
| 5,831,100 |
| 2,288,548 |
| 2,190,225 |
| (7,109,789 | ) | 3,200,084 |
| 5,831,100 |
| 2,288,548 |
|
— |
| 8,400 |
| — |
| (8,400 | ) | — |
| @ |
| AMERIGROUP Corp. |
| — |
| 247,968 |
| — |
| (247,968 | ) | — |
| — |
| 247,968 |
|
— |
| 6,300 |
| — |
| (6,300 | ) | — |
| L |
| Brookdale Senior Living, Inc. |
| — |
| 35,154 |
| — |
| (35,154 | ) | — |
| — |
| 35,154 |
|
— |
| 8,900 |
| — |
| (8,900 | ) | — |
| @ |
| Centene Corp. |
| — |
| 175,419 |
| — |
| (175,419 | ) | — |
| — |
| 175,419 |
|
— |
| 14,100 |
| — |
| (14,100 | ) | — |
|
|
| Cigna Corp. |
| — |
| 237,585 |
| — |
| (237,585 | ) | — |
| — |
| 237,585 |
|
— |
| 2,300 |
| — |
| (2,300 | ) | — |
| @ |
| Community Health Systems, Inc. |
| — |
| 33,534 |
| — |
| (33,534 | ) | — |
| — |
| 33,534 |
|
— |
| 7,900 |
| — |
| (7,900 | ) | — |
| @ |
| Coventry Health Care, Inc. |
| — |
| 117,552 |
| — |
| (117,552 | ) | — |
| — |
| 117,552 |
|
— |
| 13,300 |
| — |
| (13,300 | ) | — |
| @ |
| Health Net, Inc. |
| — |
| 144,837 |
| — |
| (144,837 | ) | — |
| — |
| 144,837 |
|
— |
| 4,000 |
| — |
| (4,000 | ) | — |
| @ |
| Healthspring, Inc. |
| — |
| 79,880 |
| — |
| (79,880 | ) | — |
| — |
| 79,880 |
|
— |
| 5,500 |
| — |
| (5,500 | ) | — |
| @ |
| Kindred Healthcare, Inc. |
| — |
| 71,610 |
| — |
| (71,610 | ) | — |
| — |
| 71,610 |
|
— |
| 7,300 |
| — |
| (7,300 | ) | — |
| @ |
| LifePoint Hospitals, Inc. |
| — |
| 166,732 |
| — |
| (166,732 | ) | — |
| — |
| 166,732 |
|
— |
| 5,000 |
| — |
| (5,000 | ) | — |
| @ |
| Lincare Holdings, Inc. |
| — |
| 134,650 |
| — |
| (134,650 | ) | — |
| — |
| 134,650 |
|
— |
| 1,200 |
| — |
| (1,200 | ) | — |
| @ |
| Magellan Health Services, Inc. |
| — |
| 46,992 |
| — |
| (46,992 | ) | — |
| — |
| 46,992 |
|
— |
| 900 |
| — |
| (900 | ) | — |
| @, L |
| Molina Healthcare, Inc. |
| — |
| 15,849 |
| — |
| (15,849 | ) | — |
| — |
| 15,849 |
|
— |
| 2,400 |
| — |
| (2,400 | ) | — |
| @ |
| Pediatrix Medical Group, Inc. |
| — |
| 76,080 |
| — |
| (76,080 | ) | — |
| — |
| 76,080 |
|
— |
| — |
| 194,750 |
| 89,794 |
| 284,544 |
|
|
| UnitedHealth Group, Inc. |
| — |
| — |
| 5,180,350 |
| 2,388,531 |
| 7,568,881 |
| — |
| ��� |
|
— |
| 3,700 |
| — |
| (3,700 | ) | — |
|
|
| Universal Health Services, Inc. |
| — |
| 139,009 |
| — |
| (139,009 | ) | — |
| — |
| 139,009 |
|
— |
| 3,900 |
| — |
| (3,900 | ) | — |
| @ |
| WellCare Health Plans, Inc. |
| — |
| 50,154 |
| — |
| (50,154 | ) | — |
| — |
| 50,154 |
|
117,300 |
| 53,300 |
| 83,350 |
| (132,169 | ) | 121,781 |
| @ |
| WellPoint, Inc. |
| 4,941,849 |
| 2,245,529 |
| 3,511,536 |
| (5,568,295 | ) | 5,130,619 |
| 4,941,849 |
| 2,245,529 |
|
|
|
|
|
|
|
|
|
|
|
|
|
|
| 10,772,949 |
| 6,307,082 |
| 10,882,111 |
| (12,062,558 | ) | 15,899,584 | cs |
|
|
|
|
|
|
|
|
|
|
|
|
|
|
|
| Home Builders: 0.0% |
|
|
|
|
|
|
|
|
|
|
|
|
|
|
|
— |
| 7,900 |
| — |
| (7,900 | ) | — |
| L |
| Centex Corp. |
| — |
| 84,056 |
| — |
| (84,056 | ) | — |
| — |
| 84,056 |
|
— |
| 3,700 |
| — |
| (3,700 | ) | — |
| L |
| KB Home |
| — |
| 50,394 |
| — |
| (50,394 | ) | — |
| — |
| 50,394 |
|
— |
| 11,900 |
| — |
| (11,900 | ) | — |
|
|
| Lennar Corp. |
| — |
| 103,173 |
| — |
| (103,173 | ) | — |
| — |
| 103,173 |
|
— |
| 1,000 |
| — |
| (1,000 | ) | — |
|
|
| MDC Holdings, Inc. |
| — |
| 30,300 |
| — |
| (30,300 | ) | — |
| — |
| 30,300 |
|
— |
| 1,900 |
| — |
| (1,900 | ) | — |
| @ |
| Meritage Homes Corp. |
| — |
| 23,123 |
| — |
| (23,123 | ) | — |
| — |
| 23,123 |
|
8,700 |
| — |
| — |
| (8,700 | ) | — |
| @ |
| NVR, Inc. |
| 3,969,375 |
| — |
| — |
| (3,969,375 | ) | — |
| 3,969,375 |
| — |
|
— |
| 1,400 |
| — |
| (1,400 | ) | — |
|
|
| Pulte Homes, Inc. |
| — |
| 15,302 |
| — |
| (15,302 | ) | — |
| — |
| 15,302 |
|
— |
| 5,000 |
| — |
| (5,000 | ) | — |
|
|
| Ryland Group, Inc. |
| — |
| 88,350 |
| — |
| (88,350 | ) | — |
| — |
| 88,350 |
|
— |
| 7,800 |
| — |
| (7,800 | ) | — |
| L |
| Thor Industries, Inc. |
| — |
| 102,804 |
| — |
| (102,804 | ) | — |
| — |
| 102,804 |
|
|
|
|
|
|
|
|
|
|
|
|
|
|
| 3,969,375 |
| 497,502 |
| — |
| (4,466,877 | ) | — | cs |
|
|
|
|
|
|
|
|
|
|
|
|
|
|
|
| Home Furnishings: 0.0% |
|
|
|
|
|
|
|
|
|
|
|
|
|
|
|
— |
| 9,300 |
| — |
| (9,300 | ) | — |
|
|
| Harman International Industries, Inc. |
| — |
| 155,589 |
| — |
| (155,589 | ) | — |
| — |
| 155,589 |
|
— |
| 11,200 |
| — |
| (11,200 | ) | — |
| L |
| Tempur-Pedic International, Inc. |
| — |
| 79,408 |
| — |
| (79,408 | ) | — |
| — |
| 79,408 |
|
|
|
|
|
|
|
|
|
|
|
|
|
|
| — |
| 234,997 |
| — |
| (234,997 | ) | — | cs |
|
|
|
|
|
|
|
|
|
|
|
|
|
|
|
| Household Products/Wares: 0.3% |
|
|
|
|
|
|
|
|
|
|
|
|
|
|
|
— |
| 6,400 |
| — |
| (6,400 | ) | — |
|
|
| American Greetings Corp. |
| — |
| 48,448 |
| — |
| (48,448 | ) | — |
| — |
| 48,448 |
|
— |
| 1,500 |
| — |
| (1,500 | ) | — |
| @ |
| Jarden Corp. |
| — |
| 17,250 |
| — |
| (17,250 | ) | — |
| — |
| 17,250 |
|
— |
| — |
| 66,400 |
| 30,615 |
| 97,015 |
|
|
| Kimberly-Clark Corp. |
| — |
| — |
| 3,501,936 |
| 1,614,656 |
| 5,116,592 |
| — |
| — |
|
— |
| 2,700 |
| — |
| (2,700 | ) | — |
|
|
| Scotts Miracle-Gro Co. |
| — |
| 80,244 |
| — |
| (80,244 | ) | — |
| — |
| 80,244 |
|
|
|
|
|
|
|
|
|
|
|
|
|
|
| — |
| 145,942 |
| 3,501,936 |
| 1,468,714 |
| 5,116,592 | cs |
|
|
|
|
|
|
|
|
|
|
|
|
|
|
|
| Housewares: 0.0% |
|
|
|
|
|
|
|
|
|
|
|
|
|
|
|
— |
| 6,300 |
| — |
| (6,300 | ) | — |
|
|
| Toro Co. |
| — |
| 207,900 |
| — |
| (207,900 | ) | — |
| — |
| 207,900 |
|
|
|
|
|
|
|
|
|
|
|
|
|
|
| — |
| 207,900 |
| — |
| (207,900 | ) | — | cs |
|
|
|
|
|
|
|
|
|
|
|
|
|
|
|
| Insurance: 2.0% |
|
|
|
|
|
|
|
|
|
|
|
|
|
|
|
— |
| — |
| 75,400 |
| 34,765 |
| 110,165 |
|
|
| Aflac, Inc. |
| — |
| — |
| 3,456,336 |
| 1,593,631 |
| 5,049,967 |
| — |
| — |
|
— |
| 4,200 |
| — |
| (4,200 | ) | — |
|
|
| Allied World Assurance Holdings Ltd. |
| — |
| 170,520 |
| — |
| (170,520 | ) | — |
| — |
| 170,520 |
|
— |
| 7,700 |
| 87,200 |
| 32,506 |
| 127,406 |
|
|
| Allstate Corp. |
| — |
| 252,252 |
| 2,856,672 |
| 1,064,888 |
| 4,173,812 |
| — |
| 252,252 |
|
— |
| 9,500 |
| — |
| (9,500 | ) | — |
|
|
| American Financial Group, Inc. |
| — |
| 217,360 |
| — |
| (217,360 | ) | — |
| — |
| 217,360 |
|
— |
| — |
| 368,200 |
| 169,768 |
| 537,968 |
|
|
| American International Group, Inc. |
| — |
| — |
| 578,074 |
| 266,535 |
| 844,609 |
| — |
| — |
|
— |
| 100 |
| — |
| (100 | ) | — |
|
|
| American National Insurance |
| — |
| 7,373 |
| — |
| (7,373 | ) | — |
| — |
| 7,373 |
|
— |
| 600 |
| — |
| (600 | ) | — |
|
|
| Amtrust Financial Services, Inc. |
| — |
| 6,960 |
| — |
| (6,960 | ) | — |
| — |
| 6,960 |
|
— |
| 1,700 |
| — |
| (1,700 | ) | — |
| @, @@ |
| Arch Capital Group Ltd. |
| — |
| 119,170 |
| — |
| (119,170 | ) | — |
| — |
| 119,170 |
|
— |
| 7,900 |
| — |
| (7,900 | ) | — |
| @@ |
| Aspen Insurance Holdings Ltd. |
| — |
| 191,575 |
| — |
| (191,575 | ) | — |
| — |
| 191,575 |
|
158,300 |
| — |
| — |
| (158,300 | ) | — |
|
|
| Assurant, Inc. |
| 4,749,000 |
| — |
| — |
| (4,749,000 | ) | — |
| 4,749,000 |
| — |
|
— |
| 4,000 |
| — |
| (4,000 | ) | — |
| @@, L |
| Assured Guaranty Ltd. |
| — |
| 45,600 |
| — |
| (45,600 | ) | — |
| — |
| 45,600 |
|
— |
| 7,800 |
| — |
| (7,800 | ) | — |
| @@ |
| Axis Capital Holdings Ltd. |
| — |
| 227,136 |
| — |
| (227,136 | ) | — |
| — |
| 227,136 |
|
2,500 |
| 320 |
| — |
| (2,820 | ) | — |
| @ |
| Berkshire Hathaway, Inc. - Class B |
| 8,035,000 |
| 1,028,480 |
| — |
| (9,063,480 | ) | — |
| 8,035,000 |
| 1,028,480 |
|
— |
| 10,600 |
| — |
| (10,600 | ) | — |
|
|
| Brown & Brown, Inc. |
| — |
| 221,540 |
| — |
| (221,540 | ) | — |
| — |
| 221,540 |
|
— |
| 19,900 |
| 58,050 |
| 6,865 |
| 84,815 |
|
|
| Chubb Corp. |
| — |
| 1,014,900 |
| 2,960,550 |
| 350,136 |
| 4,325,586 |
| — |
| 1,014,900 |
|
— |
| 4,300 |
| — |
| (4,300 | ) | — |
|
|
| Cincinnati Financial Corp. |
| — |
| 125,001 |
| — |
| (125,001 | ) | — |
| — |
| 125,001 |
|
— |
| 9,600 |
| — |
| (9,600 | ) | — |
|
|
| CNA Financial Corp. |
| — |
| 157,824 |
| — |
| (157,824 | ) | — |
| — |
| 157,824 |
|
— |
| 800 |
| — |
| (800 | ) | — |
| @ |
| CNA Surety Corp. |
| — |
| 15,360 |
| — |
| (15,360 | ) | — |
| — |
| 15,360 |
|
— |
| 6,000 |
| — |
| (6,000 | ) | — |
| @ |
| Conseco, Inc. |
| — |
| 31,080 |
| — |
| (31,080 | ) | — |
| — |
| 31,080 |
|
— |
| 5,800 |
| — |
| (5,800 | ) | — |
|
|
| Delphi Financial Group |
| — |
| 106,952 |
| — |
| (106,952 | ) | — |
| — |
| 106,952 |
|
— |
| 4,700 |
| — |
| (4,700 | ) | — |
|
|
| Employers Holdings, Inc. |
| — |
| 77,550 |
| — |
| (77,550 | ) | — |
| — |
| 77,550 |
|
— |
| 3,200 |
| — |
| (3,200 | ) | — |
| @@ |
| Endurance Specialty Holdings Ltd. |
| — |
| 97,696 |
| — |
| (97,696 | ) | — |
| — |
| 97,696 |
|
— |
| 200 |
| — |
| (200 | ) | — |
| L |
| FBL Financial Group, Inc. |
| — |
| 3,090 |
| — |
| (3,090 | ) | — |
| — |
| 3,090 |
|
— |
| 3,900 |
| — |
| (3,900 | ) | — |
|
|
| Fidelity National Title Group, Inc. |
| — |
| 69,225 |
| — |
| (69,225 | ) | — |
| — |
| 69,225 |
|
— |
| 1,000 |
| — |
| (1,000 | ) | — |
|
|
| First American Corp. |
| — |
| 28,890 |
| — |
| (28,890 | ) | — |
| — |
| 28,890 |
|
— |
| 300 |
| — |
| (300 | ) | — |
|
|
| Flagstone Reinsurance Holdings Ltd. |
| — |
| 2,931 |
| — |
| (2,931 | ) | — |
| — |
| 2,931 |
|
— |
| 21,800 |
| — |
| (21,800 | ) | — |
|
|
| Genworth Financial, Inc. |
| — |
| 61,694 |
| — |
| (61,694 | ) | — |
| — |
| 61,694 |
|
— |
| 3,500 |
| — |
| (3,500 | ) | — |
|
|
| Hanover Insurance Group, Inc. |
| — |
| 150,395 |
| — |
| (150,395 | ) | — |
| — |
| 150,395 |
|
— |
| 1,600 |
| — |
| (1,600 | ) | — |
|
|
| Harleysville Group, Inc. |
| — |
| 55,568 |
| — |
| (55,568 | ) | — |
| — |
| 55,568 |
|
— |
| 5,400 |
| 50,000 |
| 17,654 |
| 73,054 |
|
|
| Hartford Financial Services Group, Inc. |
| — |
| 88,668 |
| 821,000 |
| 289,875 |
| 1,199,543 |
| — |
| 88,668 |
|
— |
| 5,200 |
| — |
| (5,200 | ) | — |
|
|
| HCC Insurance Holdings, Inc. |
| — |
| 139,100 |
| — |
| (139,100 | ) | — |
| — |
| 139,100 |
|
— |
| 200 |
| — |
| (200 | ) | — |
|
|
| Infinity Property & Casualty Corp. |
| — |
| 9,346 |
| — |
| (9,346 | ) | — |
| — |
| 9,346 |
|
— |
| 6,300 |
| — |
| (6,300 | ) | — |
| @@ |
| IPC Holdings Ltd. |
| — |
| 188,370 |
| — |
| (188,370 | ) | — |
| — |
| 188,370 |
|
— |
| 9,100 |
| — |
| (9,100 | ) | — |
|
|
| Lincoln National Corp. |
| — |
| 171,444 |
| — |
| (171,444 | ) | — |
| — |
| 171,444 |
|
— |
| 29,545 |
| 49,772 |
| (6,596 | ) | 72,721 |
|
|
| Loews Corp. |
| — |
| 834,646 |
| 1,406,059 |
| (186,347 | ) | 2,054,358 |
| — |
| 834,646 |
|
— |
| 6,500 |
| — |
| (6,500 | ) | — |
| @@ |
| Max Re Capital Ltd. |
| — |
| 115,050 |
| — |
| (115,050 | ) | — |
| — |
| 115,050 |
|
87,900 |
| — |
| 79,750 |
| (51,129 | ) | 116,521 |
|
|
| Metlife, Inc. |
| 3,064,194 |
| — |
| 2,780,085 |
| (1,782,366 | ) | 4,061,913 |
| 3,064,194 |
| — |
|
— |
| 11,900 |
| — |
| (11,900 | ) | — |
|
|
| MGIC Investment Corp. |
| — |
| 41,412 |
| — |
| (41,412 | ) | — |
| — |
| 41,412 |
|
— |
| 2,700 |
| — |
| (2,700 | ) | — |
| @@ |
| Montpelier Re Holdings Ltd. |
| — |
| 45,333 |
| — |
| (45,333 | ) | — |
| — |
| 45,333 |
|
— |
| 1,300 |
| — |
| (1,300 | ) | — |
|
|
| Nationwide Financial Services |
| — |
| 67,873 |
| — |
| (67,873 | ) | — |
| — |
| 67,873 |
|
— |
| 800 |
| — |
| (800 | ) | — |
| @ |
| Navigators Group, Inc. |
| — |
| 43,928 |
| — |
| (43,928 | ) | — |
| — |
| 43,928 |
|
— |
| 4,300 |
| — |
| (4,300 | ) | — |
|
|
| Odyssey Re Holdings Corp. |
| — |
| 222,783 |
| — |
| (222,783 | ) | — |
| — |
| 222,783 |
|
— |
| 6,800 |
| — |
| (6,800 | ) | — |
|
|
| Old Republic International Corp. |
| — |
| 81,056 |
| — |
| (81,056 | ) | — |
| — |
| 81,056 |
|
— |
| 2,000 |
| — |
| (2,000 | ) | — |
|
|
| OneBeacon Insurance Group Ltd. |
| — |
| 20,880 |
| — |
| (20,880 | ) | — |
| — |
| 20,880 |
|
— |
| 2,600 |
| — |
| (2,600 | ) | — |
| @@ |
| PartnerRe Ltd. |
| — |
| 185,302 |
| — |
| (185,302 | ) | — |
| — |
| 185,302 |
|
— |
| 5,500 |
| — |
| (5,500 | ) | — |
|
|
| Phoenix Cos., Inc. |
| — |
| 17,985 |
| — |
| (17,985 | ) | — |
| — |
| 17,985 |
|
— |
| 6,000 |
| — |
| (6,000 | ) | — |
| @@ |
| Platinum Underwriters Holdings Ltd. |
| — |
| 216,480 |
| — |
| (216,480 | ) | — |
| — |
| 216,480 |
|
— |
| 2,500 |
| — |
| (2,500 | ) | — |
| @ |
| ProAssurance Corp. |
| — |
| 131,950 |
| — |
| (131,950 | ) | — |
| — |
| 131,950 |
|
— |
| 12,600 |
| — |
| (12,600 | ) | — |
|
|
| Protective Life Corp. |
| — |
| 180,810 |
| — |
| (180,810 | ) | — |
| — |
| 180,810 |
|
— |
| 22,100 |
| 68,850 |
| 9,645 |
| 100,595 |
|
|
| Prudential Financial, Inc. |
| — |
| 668,746 |
| 2,083,401 |
| 291,858 |
| 3,044,005 |
| — |
| 668,746 |
|
— |
| 1,900 |
| — |
| (1,900 | ) | — |
|
|
| RLI Corp. |
| — |
| 116,204 |
| — |
| (116,204 | ) | — |
| — |
| 116,204 |
|
— |
| 4,200 |
| — |
| (4,200 | ) | — |
|
|
| Selective Insurance Group |
| — |
| 96,306 |
| — |
| (96,306 | ) | — |
| — |
| 96,306 |
|
— |
| 4,400 |
| — |
| (4,400 | ) | — |
|
|
| Stancorp Financial Group, Inc. |
| — |
| 183,788 |
| — |
| (183,788 | ) | — |
| — |
| 183,788 |
|
— |
| 400 |
| — |
| (400 | ) | — |
|
|
| State Auto Financial Corp. |
| — |
| 12,024 |
| — |
| (12,024 | ) | — |
| — |
| 12,024 |
|
— |
| 1,100 |
| — |
| (1,100 | ) | — |
|
|
| Transatlantic Holdings, Inc. |
| — |
| 44,066 |
| — |
| (44,066 | ) | — |
| — |
| 44,066 |
|
— |
| 14,900 |
| 95,750 |
| 29,248 |
| 139,898 |
|
|
| Travelers Cos., Inc. |
| — |
| 673,480 |
| 4,327,900 |
| 1,322,007 |
| 6,323,387 |
| — |
| 673,480 |
|
— |
| 800 |
| — |
| (800 | ) | — |
|
|
| United Fire & Casualty Co. |
| — |
| 24,856 |
| — |
| (24,856 | ) | — |
| — |
| 24,856 |
|
— |
| 5,400 |
| — |
| (5,400 | ) | — |
|
|
| Unitrin, Inc. |
| — |
| 86,076 |
| — |
| (86,076 | ) | — |
| — |
| 86,076 |
|
— |
| 2,600 |
| — |
| (2,600 | ) | — |
| @ |
| Universal American Financial Corp. |
| — |
| 22,932 |
| — |
| (22,932 | ) | — |
| — |
| 22,932 |
|
— |
| 300 |
| — |
| (300 | ) | — |
|
|
| Validus Holdings Ltd. |
| — |
| 7,848 |
| — |
| (7,848 | ) | — |
| — |
| 7,848 |
|
— |
| 9,200 |
| — |
| (9,200 | ) | — |
|
|
| WR Berkley Corp. |
| — |
| 285,200 |
| — |
| (285,200 | ) | — |
| — |
| 285,200 |
|
— |
| 9,200 |
| — |
| (9,200 | ) | — |
| @@ |
| XL Capital, Ltd. |
| — |
| 34,040 |
| — |
| (34,040 | ) | — |
| — |
| 34,040 |
|
— |
| 2,000 |
| — |
| (2,000 | ) | — |
|
|
| Zenith National Insurance Corp. |
| — |
| 63,140 |
| — |
| (63,140 | ) | — |
| — |
| 63,140 |
|
|
|
|
|
|
|
|
|
|
|
|
|
|
| 15,848,194 |
| 9,607,244 |
| 21,270,077 |
| (15,648,335 | ) | 31,077,180 | cs |
|
|
|
|
|
|
|
|
|
|
|
|
|
|
|
| Internet: 1.9% |
|
|
|
|
|
|
|
|
|
|
|
|
|
|
|
— |
| 11,600 |
| — |
| (11,600 | ) | — |
| @ |
| Akamai Technologies, Inc. |
| — |
| 175,044 |
| — |
| (175,044 | ) | — |
| — |
| 175,044 |
|
— |
| — |
| 49,850 |
| 22,985 |
| 72,835 |
| @ |
| Amazon.com, Inc. |
| — |
| — |
| 2,556,308 |
| 1,178,650 |
| 3,734,958 |
| — |
| — |
|
— |
| 9,800 |
| — |
| (9,800 | ) | — |
| @ |
| Avocent Corp. |
| — |
| 175,518 |
| — |
| (175,518 | ) | — |
| — |
| 175,518 |
|
— |
| 7,400 |
| — |
| (7,400 | ) | — |
| @ |
| Digital River, Inc. |
| — |
| 183,520 |
| — |
| (183,520 | ) | — |
| — |
| 183,520 |
|
— |
| 16,400 |
| — |
| (16,400 | ) | — |
| @, L |
| Earthlink, Inc. |
| — |
| 110,864 |
| — |
| (110,864 | ) | — |
| — |
| 110,864 |
|
— |
| 28,200 |
| 176,000 |
| 52,949 |
| 257,149 |
| @ |
| eBay, Inc. |
| — |
| 393,672 |
| 2,456,960 |
| 739,172 |
| 3,589,804 |
| — |
| 393,672 |
|
— |
| 19,900 |
| — |
| (19,900 | ) | — |
| @ |
| Expedia, Inc. |
| — |
| 163,976 |
| — |
| (163,976 | ) | — |
| — |
| 163,976 |
|
— |
| 11,500 |
| — |
| (11,500 | ) | — |
| @ |
| F5 Networks, Inc. |
| — |
| 262,890 |
| — |
| (262,890 | ) | — |
| — |
| 262,890 |
|
— |
| 2,200 |
| 37,650 |
| 15,159 |
| 55,009 |
| @ |
| Google, Inc. - Class A |
| — |
| 676,830 |
| 11,583,023 |
| 4,663,815 |
| 16,923,668 |
| — |
| 676,830 |
|
— |
| 200 |
| — |
| (200 | ) | — |
| @ |
| IAC/InterActiveCorp |
| — |
| 3,146 |
| — |
| (3,146 | ) | — |
| — |
| 3,146 |
|
— |
| 10,000 |
| — |
| (10,000 | ) | — |
| @ |
| j2 Global Communications, Inc. |
| — |
| 200,400 |
| — |
| (200,400 | ) | — |
| — |
| 200,400 |
|
— |
| 34,800 |
| — |
| (34,800 | ) | — |
| @ |
| Liberty Media Corp. - Interactive - Class A |
| — |
| 108,576 |
| — |
| (108,576 | ) | — |
| — |
| 108,576 |
|
— |
| 8,400 |
| — |
| (8,400 | ) | — |
| @, L |
| NetFlix, Inc. |
| — |
| 251,076 |
| — |
| (251,076 | ) | — |
| — |
| 251,076 |
|
— |
| 2,900 |
| — |
| (2,900 | ) | — |
| @ |
| Priceline.com, Inc. |
| — |
| 213,585 |
| — |
| (213,585 | ) | — |
| — |
| 213,585 |
|
— |
| 1,500 |
| — |
| (1,500 | ) | — |
| @ |
| RealNetworks, Inc. |
| — |
| 5,295 |
| — |
| (5,295 | ) | — |
| — |
| 5,295 |
|
— |
| 14,900 |
| — |
| (14,900 | ) | — |
| @ |
| Sapient Corp. |
| — |
| 66,156 |
| — |
| (66,156 | ) | — |
| — |
| 66,156 |
|
— |
| 2,800 |
| — |
| (2,800 | ) | — |
| @, @@ |
| Sohucom, Inc. |
| — |
| 132,552 |
| — |
| (132,552 | ) | — |
| — |
| 132,552 |
|
185,500 |
| 173,900 |
| 133,200 |
| (297,985 | ) | 194,615 |
| @ |
| Symantec Corp. |
| 2,507,960 |
| 2,351,128 |
| 1,800,864 |
| (4,028,754 | ) | 2,631,198 |
| 2,507,960 |
| 2,351,128 |
|
— |
| 37,700 |
| — |
| (37,700 | ) | — |
| @ |
| TIBCO Software, Inc. |
| — |
| 195,663 |
| — |
| (195,663 | ) | — |
| — |
| 195,663 |
|
— |
| 16,300 |
| — |
| (16,300 | ) | — |
| @ |
| Valueclick, Inc. |
| — |
| 111,492 |
| — |
| (111,492 | ) | — |
| — |
| 111,492 |
|
— |
| 8,900 |
| — |
| (8,900 | ) | — |
| @ |
| VeriSign, Inc. |
| — |
| 169,812 |
| — |
| (169,812 | ) | — |
| — |
| 169,812 |
|
— |
| — |
| 218,600 |
| 100,791 |
| 319,391 |
| @ |
| Yahoo!, Inc. |
| — |
| — |
| 2,666,920 |
| 1,229,651 |
| 3,896,571 |
| — |
| — |
|
|
|
|
|
|
|
|
|
|
|
|
|
|
| 2,507,960 |
| 5,951,195 |
| 21,064,075 |
| 1,252,969 |
| 30,776,199 | cs |
|
|
|
|
|
|
|
|
|
|
|
|
|
|
|
| Iron/Steel: 0.3% |
|
|
|
|
|
|
|
|
|
|
|
|
|
|
|
— |
| 19,100 |
| — |
| (19,100 | ) | — |
|
|
| AK Steel Holding Corp. |
| — |
| 178,012 |
| — |
| (178,012 | ) | — |
| — |
| 178,012 |
|
— |
| 5,900 |
| — |
| (5,900 | ) | — |
|
|
| Allegheny Technologies, Inc. |
| — |
| 150,627 |
| — |
| (150,627 | ) | — |
| — |
| 150,627 |
|
— |
| 9,700 |
| — |
| (9,700 | ) | — |
|
|
| Carpenter Technology Corp. |
| — |
| 199,238 |
| — |
| (199,238 | ) | — |
| — |
| 199,238 |
|
67,400 |
| — |
| — |
| (67,400 | ) | — |
|
|
| Cliffs Natural Resources, Inc. |
| 1,726,114 |
| — |
| — |
| (1,726,114 | ) | — |
| 1,726,114 |
| — |
|
— |
| 41,400 |
| 50,150 |
| (18,277 | ) | 73,273 |
|
|
| Nucor Corp. |
| — |
| 1,912,680 |
| 2,316,930 |
| (844,402 | ) | 3,385,208 |
| — |
| 1,912,680 |
|
— |
| 500 |
| — |
| (500 | ) | — |
|
|
| Olympic Steel, Inc. |
| — |
| 10,185 |
| — |
| (10,185 | ) | — |
| — |
| 10,185 |
|
— |
| 7,400 |
| — |
| (7,400 | ) | — |
|
|
| Reliance Steel & Aluminum Co. |
| — |
| 147,556 |
| — |
| (147,556 | ) | — |
| — |
| 147,556 |
|
— |
| 5,800 |
| — |
| (5,800 | ) | — |
|
|
| Schnitzer Steel Industries, Inc. |
| — |
| 218,370 |
| — |
| (218,370 | ) | — |
| — |
| 218,370 |
|
62,500 |
| 6,800 |
| 18,800 |
| (60,632 | ) | 27,468 |
|
|
| United States Steel Corp. |
| 2,325,000 |
| 252,960 |
| 699,360 |
| (2,255,502 | ) | 1,021,818 |
| 2,325,000 |
| 252,960 |
|
|
|
|
|
|
|
|
|
|
|
|
|
|
| 4,051,114 |
| 3,069,628 |
| 3,016,290 |
| (5,730,006 | ) | 4,407,026 | cs |
|
|
|
|
|
|
|
|
|
|
|
|
|
|
|
| Leisure Time: 0.1% |
|
|
|
|
|
|
|
|
|
|
|
|
|
|
|
— |
| 17,100 |
| — |
| (17,100 | ) | — |
|
|
| Brunswick Corp. |
| — |
| 71,991 |
| — |
| (71,991 | ) | — |
| — |
| 71,991 |
|
— |
| 12,100 |
| — |
| (12,100 | ) | — |
|
|
| Callaway Golf Co. |
| — |
| 112,409 |
| — |
| (112,409 | ) | — |
| — |
| 112,409 |
|
— |
| 11,500 |
| 69,150 |
| 20,383 |
| 101,033 |
|
|
| Carnival Corp. |
| — |
| 279,680 |
| 1,681,728 |
| 495,723 |
| 2,457,131 |
| — |
| 279,680 |
|
52,400 |
| — |
| — |
| (52,400 | ) | — |
|
|
| Harley-Davidson, Inc. |
| 889,228 |
| — |
| — |
| (889,228 | ) | — |
| 889,228 |
| — |
|
— |
| 3,180 |
| — |
| (3,180 | ) | — |
| @ |
| Interval Leisure Group, Inc. |
| — |
| 17,140 |
| — |
| (17,140 | ) | — |
| — |
| 17,140 |
|
— |
| 2,900 |
| — |
| (2,900 | ) | — |
| @, L |
| Life Time Fitness, Inc. |
| — |
| 37,555 |
| — |
| (37,555 | ) | — |
| — |
| 37,555 |
|
— |
| 3,500 |
| — |
| (3,500 | ) | — |
| L |
| Polaris Industries, Inc. |
| — |
| 100,275 |
| — |
| (100,275 | ) | — |
| — |
| 100,275 |
|
— |
| 6,700 |
| — |
| (6,700 | ) | — |
| @ |
| WMS Industries, Inc. |
| — |
| 180,230 |
| — |
| (180,230 | ) | — |
| — |
| 180,230 |
|
|
|
|
|
|
|
|
|
|
|
|
|
|
| 889,228 |
| 799,280 |
| 1,681,728 |
| (913,105 | ) | 2,457,131 | cs |
|
|
|
|
|
|
|
|
|
|
|
|
|
|
|
| Lodging: 0.0% |
|
|
|
|
|
|
|
|
|
|
|
|
|
|
|
— |
| 1,600 |
| — |
| (1,600 | ) | — |
|
|
| Ameristar Casinos, Inc. |
| — |
| 13,824 |
| — |
| (13,824 | ) | — |
| — |
| 13,824 |
|
— |
| 15,500 |
| — |
| (15,500 | ) | — |
| L |
| Boyd Gaming Corp. |
| — |
| 73,315 |
| — |
| (73,315 | ) | — |
| — |
| 73,315 |
|
— |
| — |
| 16,700 |
| 7,700 |
| 24,400 |
| @ |
| Las Vegas Sands Corp. |
| — |
| — |
| 99,031 |
| 45,661 |
| 144,692 |
| — |
| — |
|
— |
| 18,400 |
| — |
| (18,400 | ) | — |
|
|
| Wyndham Worldwide Corp. |
| — |
| 120,520 |
| — |
| (120,520 | ) | — |
| — |
| 120,520 |
|
|
|
|
|
|
|
|
|
|
|
|
|
|
| — |
| 207,659 |
| 99,031 |
| (161,998 | ) | 144,692 | cs |
|
|
|
|
|
|
|
|
|
|
|
|
|
|
|
| Machinery - Construction & Mining: 0.4% |
|
|
|
|
|
|
|
|
|
|
|
|
|
|
|
— |
| 7,300 |
| — |
| (7,300 | ) | — |
|
|
| Bucyrus International, Inc. |
| — |
| 135,196 |
| — |
| (135,196 | ) | — |
| — |
| 135,196 |
|
— |
| 37,400 |
| 97,700 |
| 7,647 |
| 142,747 |
|
|
| Caterpillar, Inc. |
| — |
| 1,670,658 |
| 4,364,259 |
| 341,594 |
| 6,376,511 |
| — |
| 1,670,658 |
|
— |
| 5,900 |
| — |
| (5,900 | ) | — |
|
|
| Joy Global, Inc. |
| — |
| 135,051 |
| — |
| (135,051 | ) | — |
| — |
| 135,051 |
|
266,800 |
| 4,500 |
| — |
| (271,300 | ) | — |
| @ |
| Terex Corp. |
| 4,620,976 |
| 77,940 |
| — |
| (4,698,916 | ) | — |
| 4,620,976 |
| 77,940 |
|
|
|
|
|
|
|
|
|
|
|
|
|
|
| 4,620,976 |
| 2,018,845 |
| 4,364,259 |
| (4,627,569 | ) | 6,376,511 | cs |
|
|
|
|
|
|
|
|
|
|
|
|
|
|
|
| Machinery - Diversified: 0.2% |
|
|
|
|
|
|
|
|
|
|
|
|
|
|
|
— |
| 900 |
| — |
| (900 | ) | — |
| @ |
| AGCO Corp. |
| — |
| 21,231 |
| — |
| (21,231 | ) | — |
| — |
| 21,231 |
|
— |
| 4,700 |
| — |
| (4,700 | ) | — |
|
|
| Applied Industrial Technologies, Inc. |
| — |
| 88,924 |
| — |
| (88,924 | ) | — |
| — |
| 88,924 |
|
— |
| 4,800 |
| — |
| (4,800 | ) | — |
| L |
| Briggs & Stratton Corp. |
| — |
| 84,432 |
| — |
| (84,432 | ) | — |
| — |
| 84,432 |
|
— |
| 1,700 |
| — |
| (1,700 | ) | — |
| @ |
| Chart Industries, Inc. |
| — |
| 18,071 |
| — |
| (18,071 | ) | — |
| — |
| 18,071 |
|
— |
| 1,900 |
| — |
| (1,900 | ) | — |
|
|
| Cognex Corp. |
| — |
| 28,120 |
| — |
| (28,120 | ) | — |
| — |
| 28,120 |
|
— |
| 36,900 |
| — |
| (36,900 | ) | — |
|
|
| Cummins, Inc. |
| — |
| 986,337 |
| — |
| (986,337 | ) | — |
| — |
| 986,337 |
|
— |
| 7,400 |
| 68,300 |
| 24,091 |
| 99,791 |
|
|
| Deere & Co. |
| — |
| 283,568 |
| 2,617,256 |
| 923,184 |
| 3,824,008 |
| — |
| 283,568 |
|
— |
| 800 |
| — |
| (800 | ) | — |
|
|
| Flowserve Corp. |
| — |
| 41,200 |
| — |
| (41,200 | ) | — |
| — |
| 41,200 |
|
— |
| 8,658 |
| — |
| (8,658 | ) | — |
| @ |
| Gardner Denver, Inc. |
| — |
| 202,078 |
| — |
| (202,078 | ) | — |
| — |
| 202,078 |
|
— |
| 5,000 |
| — |
| (5,000 | ) | — |
|
|
| Graco, Inc. |
| — |
| 118,650 |
| — |
| (118,650 | ) | — |
| — |
| 118,650 |
|
— |
| 7,000 |
| — |
| (7,000 | ) | — |
|
|
| IDEX Corp. |
| — |
| 169,050 |
| — |
| (169,050 | ) | — |
| — |
| 169,050 |
|
— |
| 3,200 |
| — |
| (3,200 | ) | — |
| @ |
| Intermec, Inc. |
| — |
| 42,496 |
| — |
| (42,496 | ) | — |
| — |
| 42,496 |
|
— |
| 18,100 |
| — |
| (18,100 | ) | — |
|
|
| Manitowoc Co., Inc. |
| — |
| 156,746 |
| — |
| (156,746 | ) | — |
| — |
| 156,746 |
|
— |
| 3,900 |
| — |
| (3,900 | ) | — |
|
|
| Nordson Corp. |
| — |
| 125,931 |
| — |
| (125,931 | ) | — |
| — |
| 125,931 |
|
— |
| 6,100 |
| — |
| (6,100 | ) | — |
|
|
| Robbins & Myers, Inc. |
| — |
| 98,637 |
| — |
| (98,637 | ) | — |
| — |
| 98,637 |
|
— |
| 6,100 |
| — |
| (6,100 | ) | — |
|
|
| Rockwell Automation, Inc. |
| — |
| 196,664 |
| — |
| (196,664 | ) | — |
| — |
| 196,664 |
|
— |
| 1,700 |
| — |
| (1,700 | ) | — |
|
|
| Roper Industries, Inc. |
| — |
| 73,797 |
| — |
| (73,797 | ) | — |
| — |
| 73,797 |
|
— |
| 300 |
| — |
| (300 | ) | — |
|
|
| Sauer-Danfoss, Inc. |
| — |
| 2,625 |
| — |
| (2,625 | ) | — |
| — |
| 2,625 |
|
— |
| 300 |
| — |
| (300 | ) | — |
|
|
| Wabtec Corp. |
| — |
| 11,925 |
| — |
| (11,925 | ) | — |
| — |
| 11,925 |
|
— |
| 8,700 |
| — |
| (8,700 | ) | — |
| @ |
| Zebra Technologies Corp. |
| — |
| 176,262 |
| — |
| (176,262 | ) | — |
| — |
| 176,262 |
|
|
|
|
|
|
|
|
|
|
|
|
|
|
| — |
| 2,926,744 |
| 2,617,256 |
| (1,719,992 | ) | 3,824,008 | cs |
|
|
|
|
|
|
|
|
|
|
|
|
|
|
|
| Media: 2.5% |
|
|
|
|
|
|
|
|
|
|
|
|
|
|
|
47,000 |
| 10,900 |
| — |
| (57,900 | ) | — |
|
|
| Cablevision Systems Corp. |
| 791,480 |
| 183,556 |
| — |
| (975,036 | ) | — |
| 791,480 |
| 183,556 |
|
— |
| 140,900 |
| — |
| (140,900 | ) | — |
|
|
| CBS Corp. - Class B |
| — |
| 1,153,971 |
| — |
| (1,153,971 | ) | — |
| — |
| 1,153,971 |
|
— |
| 700 |
| — |
| (700 | ) | — |
| @, @@, L |
| Central European Media Enterprises Ltd. |
| — |
| 15,204 |
| — |
| (15,204 | ) | — |
| — |
| 15,204 |
|
— |
| — |
| 444,550 |
| 204,971 |
| 649,521 |
|
|
| Comcast Corp. - Class A |
| — |
| — |
| 7,504,004 |
| 3,459,910 |
| 10,963,914 |
| — |
| — |
|
— |
| 3,700 |
| — |
| (3,700 | ) | — |
| @, L |
| Cox Radio, Inc. |
| — |
| 22,237 |
| — |
| (22,237 | ) | — |
| — |
| 22,237 |
|
— |
| 25,700 |
| 94,400 |
| 17,825 |
| 137,925 |
| @ |
| DIRECTV Group, Inc. |
| — |
| 588,787 |
| 2,162,704 |
| 408,382 |
| 3,159,873 |
| — |
| 588,787 |
|
— |
| 15,300 |
| — |
| (15,300 | ) | — |
| @ |
| Dish Network Corp. |
| — |
| 169,677 |
| — |
| (169,677 | ) | — |
| — |
| 169,677 |
|
— |
| 3,200 |
| — |
| (3,200 | ) | — |
| L |
| Factset Research Systems, Inc. |
| — |
| 141,568 |
| — |
| (141,568 | ) | — |
| — |
| 141,568 |
|
— |
| 14,600 |
| — |
| (14,600 | ) | — |
| L |
| Gannett Co., Inc. |
| — |
| 116,800 |
| — |
| (116,800 | ) | — |
| — |
| 116,800 |
|
— |
| 500 |
| — |
| (500 | ) | — |
|
|
| Hearst-Argyle Television, Inc. |
| — |
| 3,030 |
| — |
| (3,030 | ) | — |
| — |
| 3,030 |
|
— |
| 3,000 |
| — |
| (3,000 | ) | — |
| @ |
| Liberty Media Corp. - Capital Shares A |
| — |
| 14,130 |
| — |
| (14,130 | ) | — |
| — |
| 14,130 |
|
— |
| 9,400 |
| — |
| (9,400 | ) | — |
| @ |
| Liberty Media Corp. - Entertainment |
| — |
| 164,312 |
| — |
| (164,312 | ) | — |
| — |
| 164,312 |
|
215,400 |
| 19,600 |
| — |
| (235,000 | ) | — |
|
|
| McGraw-Hill Cos., Inc. |
| 4,995,126 |
| 454,524 |
| — |
| (5,449,650 | ) | — |
| 4,995,126 |
| 454,524 |
|
— |
| 200 |
| — |
| (200 | ) | — |
| @ |
| Mediacom Communications Corp. |
| — |
| 860 |
| — |
| (860 | ) | — |
| — |
| 860 |
|
— |
| 9,400 |
| — |
| (9,400 | ) | — |
| L |
| Meredith Corp. |
| — |
| 160,928 |
| — |
| (160,928 | ) | — |
| — |
| 160,928 |
|
— |
| 119,200 |
| 367,450 |
| 50,222 |
| 536,872 |
|
|
| News Corp. - Class A |
| — |
| 1,083,528 |
| 3,340,121 |
| 456,519 |
| 4,880,168 |
| — |
| 1,083,528 |
|
— |
| 4,900 |
| — |
| (4,900 | ) | — |
|
|
| Scholastic Corp. |
| — |
| 66,542 |
| — |
| (66,542 | ) | — |
| — |
| 66,542 |
|
— |
| — |
| 24,650 |
| 11,365 |
| 36,015 |
| @ |
| Time Warner Cable, Inc. |
| — |
| — |
| 528,743 |
| 243,790 |
| 772,533 |
| — |
| — |
|
— |
| 270,900 |
| 567,450 |
| (9,263 | ) | 829,087 |
|
|
| Time Warner, Inc. |
| — |
| 2,725,254 |
| 5,708,547 |
| (93,184 | ) | 8,340,617 |
| — |
| 2,725,254 |
|
— |
| 15,600 |
| 88,800 |
| 25,343 |
| 129,743 |
| @ |
| Viacom - Class B |
| — |
| 297,336 |
| 1,692,528 |
| 483,047 |
| 2,472,911 |
| — |
| 297,336 |
|
— |
| 43,300 |
| 302,100 |
| 95,991 |
| 441,391 |
|
|
| Walt Disney Co. |
| — |
| 982,477 |
| 6,854,649 |
| 2,178,031 |
| 10,015,157 |
| — |
| 982,477 |
|
|
|
|
|
|
|
|
|
|
|
|
|
|
| 5,786,606 |
| 8,344,721 |
| 27,791,296 |
| (1,317,450 | ) | 40,605,173 | cs |
|
|
|
|
|
|
|
|
|
|
|
|
|
|
|
| Metal Fabricate/Hardware: 0.0% |
|
|
|
|
|
|
|
|
|
|
|
|
|
|
|
— |
| 2,700 |
| — |
| (2,700 | ) | — |
|
|
| CIRCOR International, Inc. |
| — |
| 74,250 |
| — |
| (74,250 | ) | — |
| — |
| 74,250 |
|
— |
| 13,400 |
| — |
| (13,400 | ) | — |
|
|
| Commercial Metals Co. |
| — |
| 159,058 |
| — |
| (159,058 | ) | — |
| — |
| 159,058 |
|
— |
| 5,900 |
| — |
| (5,900 | ) | — |
|
|
| Mueller Industries, Inc. |
| — |
| 147,972 |
| — |
| (147,972 | ) | — |
| — |
| 147,972 |
|
— |
| 10,100 |
| — |
| (10,100 | ) | — |
| L |
| Mueller Water Products, Inc. |
| — |
| 84,840 |
| — |
| (84,840 | ) | — |
| — |
| 84,840 |
|
— |
| 8,200 |
| — |
| (8,200 | ) | — |
|
|
| Precision Castparts Corp. |
| — |
| 487,736 |
| — |
| (487,736 | ) | — |
| — |
| 487,736 |
|
225,900 |
| — |
| — |
| (225,900 | ) | — |
| @@ |
| Sterlite Industries India Ltd. ADR |
| 1,246,968 |
| — |
| — |
| (1,246,968 | ) | — |
| 1,246,968 |
| — |
|
— |
| 13,100 |
| — |
| (13,100 | ) | — |
|
|
| Timken Co. |
| — |
| 257,153 |
| — |
| (257,153 | ) | — |
| — |
| 257,153 |
|
— |
| 8,200 |
| — |
| (8,200 | ) | — |
| L |
| Worthington Industries |
| — |
| 90,364 |
| — |
| (90,364 | ) | — |
| — |
| 90,364 |
|
|
|
|
|
|
|
|
|
|
|
|
|
|
| 1,246,968 |
| 1,301,373 |
| — |
| (2,548,341 | ) | — | cs |
|
|
|
|
|
|
|
|
|
|
|
|
|
|
|
| Mining: 0.6% |
|
|
|
|
|
|
|
|
|
|
|
|
|
|
|
— |
| 123,400 |
| 129,300 |
| (63,783 | ) | 188,917 |
|
|
| Alcoa, Inc. |
| — |
| 1,389,484 |
| 1,455,918 |
| (718,196 | ) | 2,127,206 |
| — |
| 1,389,484 |
|
— |
| 10,600 |
| — |
| (10,600 | ) | — |
| @, L |
| Century Aluminum Co. |
| — |
| 106,000 |
| — |
| (106,000 | ) | — |
| — |
| 106,000 |
|
— |
| 800 |
| — |
| (800 | ) | — |
|
|
| Compass Minerals International, Inc. |
| — |
| 46,928 |
| — |
| (46,928 | ) | — |
| — |
| 46,928 |
|
149,600 |
| 50,500 |
| 60,700 |
| (172,113 | ) | 88,687 |
|
|
| Freeport-McMoRan Copper & Gold, Inc. |
| 3,656,224 |
| 1,234,220 |
| 1,483,508 |
| (4,206,435 | ) | 2,167,517 |
| 3,656,224 |
| 1,234,220 |
|
— |
| 1,600 |
| — |
| (1,600 | ) | — |
| L |
| Kaiser Aluminum Corp. |
| — |
| 36,032 |
| — |
| (36,032 | ) | — |
| — |
| 36,032 |
|
— |
| — |
| 69,300 |
| 31,953 |
| 101,253 |
|
|
| Newmont Mining Corp. |
| — |
| — |
| 2,820,510 |
| 1,300,468 |
| 4,120,978 |
| — |
| — |
|
— |
| 300 |
| — |
| (300 | ) | — |
| @ |
| RTI International Metals, Inc. |
| — |
| 4,293 |
| — |
| (4,293 | ) | — |
| — |
| 4,293 |
|
— |
| 115,600 |
| 34,900 |
| (99,508 | ) | 50,992 |
| L |
| Southern Copper Corp. |
| — |
| 1,856,536 |
| 560,494 |
| (1,598,106 | ) | 818,924 |
| — |
| 1,856,536 |
|
343,300 |
| — |
| — |
| (343,300 | ) | — |
| @@ |
| Teck Cominco Ltd. - Class B |
| 1,689,036 |
| — |
| — |
| (1,689,036 | ) | — |
| 1,689,036 |
| — |
|
183,100 |
| — |
| — |
| (183,100 | ) | — |
| @@ |
| Xstrata PLC |
| 1,713,336 |
| — |
| — |
| (1,713,336 | ) | — |
| 1,713,336 |
| — |
|
|
|
|
|
|
|
|
|
|
|
|
|
|
| 7,058,596 |
| 4,673,493 |
| 6,320,430 |
| (8,817,894 | ) | 9,234,625 | cs |
|
|
|
|
|
|
|
|
|
|
|
|
|
|
|
| Miscellaneous Manufacturing: 4.0% |
|
|
|
|
|
|
|
|
|
|
|
|
|
|
|
— |
| 13,300 |
| 111,550 |
| 38,133 |
| 162,983 |
|
|
| 3M Co. |
| — |
| 765,282 |
| 6,418,587 |
| 2,194,170 |
| 9,378,039 |
| — |
| 765,282 |
|
— |
| 3,900 |
| — |
| (3,900 | ) | — |
|
|
| Actuant Corp. |
| — |
| 74,178 |
| — |
| (74,178 | ) | — |
| — |
| 74,178 |
|
— |
| 6,600 |
| — |
| (6,600 | ) | — |
|
|
| Acuity Brands, Inc. |
| — |
| 230,406 |
| — |
| (230,406 | ) | — |
| — |
| 230,406 |
|
— |
| 100 |
| — |
| (100 | ) | — |
|
|
| Ameron International Corp. |
| — |
| 6,292 |
| — |
| (6,292 | ) | — |
| — |
| 6,292 |
|
— |
| 3,700 |
| — |
| (3,700 | ) | — |
|
|
| AO Smith Corp. |
| — |
| 109,224 |
| — |
| (109,224 | ) | — |
| — |
| 109,224 |
|
— |
| 2,600 |
| — |
| (2,600 | ) | — |
|
|
| Barnes Group, Inc. |
| — |
| 37,700 |
| — |
| (37,700 | ) | — |
| — |
| 37,700 |
|
— |
| 3,400 |
| — |
| (3,400 | ) | — |
|
|
| Brink’s Co. |
| — |
| 91,392 |
| — |
| (91,392 | ) | — |
| — |
| 91,392 |
|
— |
| 800 |
| — |
| (800 | ) | — |
|
|
| Carlisle Cos., Inc. |
| — |
| 16,560 |
| — |
| (16,560 | ) | — |
| — |
| 16,560 |
|
— |
| 6,500 |
| — |
| (6,500 | ) | — |
| @, L |
| Ceradyne, Inc. |
| — |
| 132,015 |
| — |
| (132,015 | ) | — |
| — |
| 132,015 |
|
— |
| 3,900 |
| — |
| (3,900 | ) | — |
|
|
| Cooper Industries Ltd. |
| — |
| 113,997 |
| — |
| (113,997 | ) | — |
| — |
| 113,997 |
|
— |
| 6,100 |
| — |
| (6,100 | ) | — |
|
|
| Crane Co. |
| — |
| 105,164 |
| — |
| (105,164 | ) | — |
| — |
| 105,164 |
|
— |
| — |
| 40,600 |
| 18,720 |
| 59,320 |
|
|
| Danaher Corp. |
| — |
| — |
| 2,298,366 |
| 1,059,719 |
| 3,358,085 |
| — |
| — |
|
— |
| 9,000 |
| — |
| (9,000 | ) | — |
|
|
| Dover Corp. |
| — |
| 296,280 |
| — |
| (296,280 | ) | — |
| — |
| 296,280 |
|
— |
| 400 |
| — |
| (400 | ) | — |
|
|
| Eaton Corp. |
| — |
| 19,884 |
| — |
| (19,884 | ) | — |
| — |
| 19,884 |
|
— |
| 4,000 |
| — |
| (4,000 | ) | — |
| @ |
| EnPro Industries, Inc. |
| — |
| 86,160 |
| — |
| (86,160 | ) | — |
| — |
| 86,160 |
|
— |
| 220,700 |
| 1,662,500 |
| 545,837 |
| 2,429,037 |
|
|
| General Electric Co. |
| — |
| 3,575,340 |
| 26,932,478 |
| 8,842,558 |
| 39,350,376 |
| — |
| 3,575,340 |
|
— |
| 6,700 |
| — |
| (6,700 | ) | — |
|
|
| Harsco Corp. |
| — |
| 185,456 |
| — |
| (185,456 | ) | — |
| — |
| 185,456 |
|
— |
| 28,700 |
| 117,600 |
| 25,522 |
| 171,822 |
|
|
| Honeywell International, Inc. |
| — |
| 942,221 |
| 3,860,808 |
| 837,902 |
| 5,640,931 |
| — |
| 942,221 |
|
— |
| 21,200 |
| 74,500 |
| 13,150 |
| 108,850 |
|
|
| Illinois Tool Works, Inc. |
| — |
| 743,060 |
| 2,611,225 |
| 460,911 |
| 3,815,196 |
| — |
| 743,060 |
|
— |
| 42,000 |
| — |
| (42,000 | ) | — |
| @@ |
| Ingersoll-Rand Co. |
| — |
| 728,700 |
| — |
| (728,700 | ) | — |
| — |
| 728,700 |
|
— |
| 1,800 |
| — |
| (1,800 | ) | — |
|
|
| Koppers Holdings, Inc. |
| — |
| 38,916 |
| — |
| (38,916 | ) | — |
| — |
| 38,916 |
|
— |
| 35,200 |
| — |
| (35,200 | ) | — |
|
|
| Parker Hannifin Corp. |
| — |
| 1,497,408 |
| — |
| (1,497,408 | ) | — |
| — |
| 1,497,408 |
|
— |
| 10,200 |
| — |
| (10,200 | ) | — |
|
|
| Trinity Industries, Inc. |
| — |
| 160,752 |
| — |
| (160,752 | ) | — |
| — |
| 160,752 |
|
— |
| 4,000 |
| 76,200 |
| 31,134 |
| 111,334 |
| @@ |
| Tyco International Ltd. |
| — |
| 86,400 |
| 1,645,920 |
| 672,493 |
| 2,404,813 |
| — |
| 86,400 |
|
|
|
|
|
|
|
|
|
|
|
|
|
|
| — |
| 10,042,787 |
| 43,767,384 |
| 10,137,269 |
| 63,947,440 | cs |
|
|
|
|
|
|
|
|
|
|
|
|
|
|
|
| Office Furnishings: 0.0% |
|
|
|
|
|
|
|
|
|
|
|
|
|
|
|
— |
| 7,400 |
| — |
| (7,400 | ) | — |
|
|
| Herman Miller, Inc. |
| — |
| 96,422 |
| — |
| (96,422 | ) | — |
| — |
| 96,422 |
|
— |
| 8,200 |
| — |
| (8,200 | ) | — |
| L |
| HNI, Corp. |
| — |
| 129,888 |
| — |
| (129,888 | ) | — |
| — |
| 129,888 |
|
— |
| 7,000 |
| — |
| (7,000 | ) | — |
|
|
| Interface, Inc. |
| — |
| 32,480 |
| — |
| (32,480 | ) | — |
| — |
| 32,480 |
|
— |
| 20,600 |
| — |
| (20,600 | ) | — |
|
|
| Steelcase, Inc. |
| — |
| 115,772 |
| — |
| (115,772 | ) | — |
| — |
| 115,772 |
|
|
|
|
|
|
|
|
|
|
|
|
|
|
| — |
| 374,562 |
| — |
| (374,562 | ) | — | cs |
|
|
|
|
|
|
|
|
|
|
|
|
|
|
|
| Office/Business Equipment: 0.0% |
|
|
|
|
|
|
|
|
|
|
|
|
|
|
|
— |
| 8,500 |
| — |
| (8,500 | ) | — |
|
|
| Pitney Bowes, Inc. |
| — |
| 216,580 |
| — |
| (216,580 | ) | — |
| — |
| 216,580 |
|
— |
| 198,000 |
| — |
| (198,000 | ) | — |
|
|
| Xerox Corp. |
| — |
| 1,578,060 |
| — |
| (1,578,060 | ) | — |
| — |
| 1,578,060 |
|
|
|
|
|
|
|
|
|
|
|
|
|
|
| — |
| 1,794,640 |
| — |
| (1,794,640 | ) | — | cs |
|
|
|
|
|
|
|
|
|
|
|
|
|
|
|
| Oil & Gas: 12.6% |
|
|
|
|
|
|
|
|
|
|
|
|
|
|
|
— |
| 58,300 |
| 74,300 |
| (24,042 | ) | 108,558 |
|
|
| Anadarko Petroleum Corp. |
| — |
| 2,247,465 |
| 2,864,265 |
| (926,824 | ) | 4,184,906 |
| — |
| 2,247,465 |
|
— |
| 35,400 |
| 52,750 |
| (11,078 | ) | 77,072 |
| S |
| Apache Corp. |
| — |
| 2,638,362 |
| 3,931,458 |
| (825,665 | ) | 5,744,155 |
| — |
| 2,638,362 |
|
— |
| 1,400 |
| — |
| (1,400 | ) | — |
| @ |
| Arena Resources, Inc. |
| — |
| 39,326 |
| — |
| (39,326 | ) | — |
| — |
| 39,326 |
|
— |
| 7,700 |
| — |
| (7,700 | ) | — |
|
|
| Berry Petroleum Co. |
| — |
| 58,212 |
| — |
| (58,212 | ) | — |
| — |
| 58,212 |
|
— |
| 4,500 |
| — |
| (4,500 | ) | — |
| @ |
| Bill Barrett Corp. |
| — |
| 95,085 |
| — |
| (95,085 | ) | — |
| — |
| 95,085 |
|
— |
| 400 |
| — |
| (400 | ) | — |
| @, L |
| BPZ Energy, Inc. |
| — |
| 2,560 |
| — |
| (2,560 | ) | — |
| — |
| 2,560 |
|
136,400 |
| — |
| — |
| (136,400 | ) | — |
| @@ |
| Canadian Natural Resources Ltd. |
| 5,453,272 |
| — |
| — |
| (5,453,272 | ) | — |
| 5,453,272 |
| — |
|
— |
| 2,400 |
| — |
| (2,400 | ) | — |
| @ |
| Carrizo Oil & Gas, Inc. |
| — |
| 38,640 |
| — |
| (38,640 | ) | — |
| — |
| 38,640 |
|
— |
| 20,100 |
| 91,500 |
| 22,088 |
| 133,688 |
|
|
| Chesapeake Energy Corp. |
| — |
| 325,017 |
| 1,479,555 |
| 357,169 |
| 2,161,741 |
| — |
| 325,017 |
|
— |
| 74,994 |
| 328,150 |
| 76,308 |
| 479,452 |
|
|
| Chevron Corp. |
| — |
| 5,547,306 |
| 24,273,256 |
| 5,644,491 |
| 35,465,053 |
| — |
| 5,547,306 |
|
— |
| 5,100 |
| — |
| (5,100 | ) | — |
|
|
| Cimarex Energy Co. |
| — |
| 136,578 |
| — |
| (136,578 | ) | — |
| — |
| 136,578 |
|
— |
| 400 |
| — |
| (400 | ) | — |
| @ |
| Clayton Williams Energy, Inc. |
| — |
| 18,176 |
| — |
| (18,176 | ) | — |
| — |
| 18,176 |
|
— |
| 75,900 |
| 244,400 |
| 36,787 |
| 357,087 |
|
|
| ConocoPhillips |
| — |
| 3,931,620 |
| 12,659,920 |
| 1,905,555 |
| 18,497,095 |
| — |
| 3,931,620 |
|
— |
| 200 |
| — |
| (200 | ) | — |
| @ |
| Contango Oil & Gas Co. |
| — |
| 11,260 |
| — |
| (11,260 | ) | — |
| — |
| 11,260 |
|
— |
| 2,500 |
| — |
| (2,500 | ) | — |
| @ |
| CVR Energy, Inc. |
| — |
| 10,000 |
| — |
| (10,000 | ) | — |
| — |
| 10,000 |
|
— |
| 3,700 |
| — |
| (3,700 | ) | — |
| @, L |
| Delta Petroleum Corp. |
| — |
| 17,612 |
| — |
| (17,612 | ) | — |
| — |
| 17,612 |
|
231,500 |
| 12,300 |
| — |
| (243,800 | ) | — |
| @ |
| Denbury Resources, Inc. |
| 2,527,980 |
| 134,316 |
| — |
| (2,662,296 | ) | — |
| 2,527,980 |
| 134,316 |
|
— |
| 14,600 |
| 70,650 |
| 17,975 |
| 103,225 |
|
|
| Devon Energy Corp. |
| — |
| 959,366 |
| 4,642,412 |
| 1,181,135 |
| 6,782,913 |
| — |
| 959,366 |
|
— |
| 5,200 |
| — |
| (5,200 | ) | — |
|
|
| Diamond Offshore Drilling |
| — |
| 306,488 |
| — |
| (306,488 | ) | — |
| — |
| 306,488 |
|
— |
| 4,200 |
| — |
| (4,200 | ) | — |
| @ |
| Encore Acquisition Co. |
| — |
| 107,184 |
| — |
| (107,184 | ) | — |
| — |
| 107,184 |
|
— |
| 6,100 |
| — |
| (6,100 | ) | — |
|
|
| ENSCO International, Inc. |
| — |
| 173,179 |
| — |
| (173,179 | ) | — |
| — |
| 173,179 |
|
62,700 |
| — |
| 39,400 |
| (44,534 | ) | 57,566 |
|
|
| EOG Resources, Inc. |
| 4,174,566 |
| — |
| 2,623,252 |
| (2,965,049 | ) | 3,832,769 |
| 4,174,566 |
| — |
|
14,400 |
| 143,400 |
| 834,800 |
| 227,106 |
| 1,219,706 |
|
|
| ExxonMobil Corp. |
| 1,149,552 |
| 11,447,622 |
| 66,642,084 |
| 18,129,839 |
| 97,369,097 |
| 1,149,552 |
| 11,447,622 |
|
— |
| 14,500 |
| — |
| (14,500 | ) | — |
|
|
| Frontier Oil Corp. |
| — |
| 183,135 |
| — |
| (183,135 | ) | — |
| — |
| 183,135 |
|
— |
| 4,700 |
| — |
| (4,700 | ) | — |
|
|
| Helmerich & Payne, Inc. |
| — |
| 106,925 |
| — |
| (106,925 | ) | — |
| — |
| 106,925 |
|
— |
| 30,500 |
| 44,400 |
| (10,028 | ) | 64,872 |
|
|
| Hess Corp. |
| — |
| 1,636,020 |
| 2,381,616 |
| (537,915 | ) | 3,479,721 |
| — |
| 1,636,020 |
|
— |
| 3,300 |
| — |
| (3,300 | ) | — |
|
|
| Holly Corp. |
| — |
| 60,159 |
| — |
| (60,159 | ) | — |
| — |
| 60,159 |
|
— |
| 61,700 |
| 112,350 |
| (9,898 | ) | 164,152 |
|
|
| Marathon Oil Corp. |
| — |
| 1,688,112 |
| 3,073,896 |
| (270,815 | ) | 4,491,193 |
| — |
| 1,688,112 |
|
— |
| 15,400 |
| — |
| (15,400 | ) | — |
| @ |
| Mariner Energy, Inc. |
| — |
| 157,080 |
| — |
| (157,080 | ) | — |
| — |
| 157,080 |
|
— |
| 3,200 |
| — |
| (3,200 | ) | — |
| @ |
| McMoRan Exploration Co. |
| — |
| 31,360 |
| — |
| (31,360 | ) | — |
| — |
| 31,360 |
|
— |
| 27,500 |
| — |
| (27,500 | ) | — |
|
|
| Murphy Oil Corp. |
| — |
| 1,219,625 |
| — |
| (1,219,625 | ) | — |
| — |
| 1,219,625 |
|
— |
| 11,300 |
| — |
| (11,300 | ) | — |
| @, @@ |
| Nabors Industries Ltd. |
| — |
| 135,261 |
| — |
| (135,261 | ) | — |
| — |
| 135,261 |
|
127,100 |
| 53,300 |
| — |
| (180,400 | ) | — |
|
|
| Noble Corp. |
| 2,807,639 |
| 1,177,397 |
| — |
| (3,985,036 | ) | — |
| 2,807,639 |
| 1,177,397 |
|
— |
| 24,200 |
| — |
| (24,200 | ) | — |
|
|
| Noble Energy, Inc. |
| — |
| 1,191,124 |
| — |
| (1,191,124 | ) | — |
| — |
| 1,191,124 |
|
— |
| 61,500 |
| 130,150 |
| (1,491 | ) | 190,159 |
|
|
| Occidental Petroleum Corp. |
| — |
| 3,689,385 |
| 7,807,699 |
| (89,449 | ) | 11,407,635 |
| — |
| 3,689,385 |
|
— |
| 12,300 |
| — |
| (12,300 | ) | — |
| @ |
| Parker Drilling Co. |
| — |
| 35,670 |
| — |
| (35,670 | ) | — |
| — |
| 35,670 |
|
— |
| 11,200 |
| — |
| (11,200 | ) | — |
|
|
| Patterson-UTI Energy, Inc. | �� | — |
| 128,912 |
| — |
| (128,912 | ) | — |
| — |
| 128,912 |
|
231,900 |
| — |
| — |
| (231,900 | ) | — |
| @@ |
| Petroleo Brasileiro SA ADR |
| 5,679,231 |
| — |
| — |
| (5,679,231 | ) | — |
| 5,679,231 |
| — |
|
— |
| 600 |
| — |
| (600 | ) | — |
| @ |
| Pioneer Drilling Co. |
| — |
| 3,342 |
| — |
| (3,342 | ) | — |
| — |
| 3,342 |
|
— |
| 3,800 |
| — |
| (3,800 | ) | — |
|
|
| Pioneer Natural Resources Co. |
| — |
| 61,484 |
| — |
| (61,484 | ) | — |
| — |
| 61,484 |
|
— |
| 7,000 |
| — |
| (7,000 | ) | — |
| @ |
| Plains Exploration & Production Co. |
| — |
| 162,680 |
| — |
| (162,680 | ) | — |
| — |
| 162,680 |
|
— |
| 1,003 |
| — |
| (1,003 | ) | — |
| @@ |
| Precision Drilling Trust |
| — |
| 8,415 |
| — |
| (8,415 | ) | — |
| — |
| 8,415 |
|
— |
| 7,900 |
| — |
| (7,900 | ) | — |
| @ |
| Pride International, Inc. |
| — |
| 126,242 |
| — |
| (126,242 | ) | — |
| — |
| 126,242 |
|
— |
| 10,700 |
| — |
| (10,700 | ) | — |
| @ |
| Quicksilver Resources, Inc. |
| — |
| 59,599 |
| — |
| (59,599 | ) | — |
| — |
| 59,599 |
|
— |
| 6,200 |
| — |
| (6,200 | ) | — |
| @ |
| Rosetta Resources, Inc. |
| — |
| 43,896 |
| — |
| (43,896 | ) | — |
| — |
| 43,896 |
|
167,800 |
| — |
| — |
| (167,800 | ) | — |
| @ |
| Southwestern Energy Co. |
| 4,861,166 |
| — |
| — |
| (4,861,166 | ) | — |
| 4,861,166 |
| — |
|
— |
| 1,800 |
| — |
| (1,800 | ) | — |
|
|
| St. Mary Land & Exploration Co. |
| — |
| 36,558 |
| — |
| (36,558 | ) | — |
| — |
| 36,558 |
|
— |
| 11,081 |
| — |
| (11,081 | ) | — |
| @ |
| Stone Energy Corp. |
| — |
| 122,113 |
| — |
| (122,113 | ) | — |
| — |
| 122,113 |
|
154,660 |
| — |
| — |
| (154,660 | ) | — |
| @@ |
| Suncor Energy, Inc. |
| 3,015,870 |
| — |
| — |
| (3,015,870 | ) | — |
| 3,015,870 |
| — |
|
— |
| 5,600 |
| — |
| (5,600 | ) | — |
|
|
| Sunoco, Inc. |
| — |
| 243,376 |
| — |
| (243,376 | ) | — |
| — |
| 243,376 |
|
— |
| 6,700 |
| — |
| (6,700 | ) | — |
| @ |
| Swift Energy Co. |
| — |
| 112,627 |
| — |
| (112,627 | ) | — |
| — |
| 112,627 |
|
225,480 |
| — |
| — |
| (225,480 | ) | — |
| @@ |
| Talisman Energy, Inc. |
| 2,252,545 |
| — |
| — |
| (2,252,545 | ) | — |
| 2,252,545 |
| — |
|
— |
| 23,000 |
| — |
| (23,000 | ) | — |
|
|
| Tesoro Corp. |
| — |
| 302,910 |
| — |
| (302,910 | ) | — |
| — |
| 302,910 |
|
— |
| 12,200 |
| — |
| (12,200 | ) | — |
| @ |
| Transocean, Ltd. |
| — |
| 576,450 |
| — |
| (576,450 | ) | — |
| — |
| 576,450 |
|
— |
| 6,200 |
| — |
| (6,200 | ) | — |
| @ |
| Unit Corp. |
| — |
| 165,664 |
| — |
| (165,664 | ) | — |
| — |
| 165,664 |
|
— |
| 82,500 |
| 83,750 |
| (43,885 | ) | 122,365 |
|
|
| Valero Energy Corp. |
| — |
| 1,785,300 |
| 1,812,350 |
| (949,671 | ) | 2,647,979 |
| — |
| 1,785,300 |
|
— |
| 11,600 |
| — |
| (11,600 | ) | — |
|
|
| W&T Offshore, Inc. |
| — |
| 166,112 |
| — |
| (166,112 | ) | — |
| — |
| 166,112 |
|
— |
| 1,100 |
| — |
| (1,100 | ) | — |
| @ |
| Whiting Petroleum Corp. |
| — |
| 36,806 |
| — |
| (36,806 | ) | — |
| — |
| 36,806 |
|
92,650 |
| 18,900 |
| 87,450 |
| (71,229 | ) | 127,771 |
|
|
| XTO Energy, Inc. |
| 3,267,766 |
| 666,603 |
| 3,084,362 |
| (2,512,246 | ) | 4,506,485 |
| 3,267,766 |
| 666,603 |
|
|
|
|
|
|
|
|
|
|
|
|
|
|
| 35,189,587 |
| 44,365,716 |
| 137,276,125 |
| (16,260,686 | ) | 200,570,742 | cs |
|
|
|
|
|
|
|
|
|
|
|
|
|
|
|
| Oil & Gas Services: 1.4% |
|
|
|
|
|
|
|
|
|
|
|
|
|
|
|
— |
| 25,400 |
| 48,700 |
| (2,946 | ) | 71,154 |
|
|
| Baker Hughes, Inc. |
| — |
| 814,578 |
| 1,561,809 |
| (94,467 | ) | 2,281,920 |
| — |
| 814,578 |
|
— |
| 2,700 |
| — |
| (2,700 | ) | — |
| @ |
| Basic Energy Services, Inc. |
| — |
| 35,208 |
| — |
| (35,208 | ) | — |
| — |
| 35,208 |
|
— |
| 12,000 |
| — |
| (12,000 | ) | — |
|
|
| BJ Services Co. |
| — |
| 140,040 |
| — |
| (140,040 | ) | — |
| — |
| 140,040 |
|
— |
| 12,800 |
| — |
| (12,800 | ) | — |
| @ |
| Complete Production Services, Inc. |
| — |
| 104,320 |
| — |
| (104,320 | ) | — |
| — |
| 104,320 |
|
— |
| 8,800 |
| — |
| (8,800 | ) | — |
| @ |
| Dresser-Rand Group, Inc. |
| — |
| 151,800 |
| — |
| (151,800 | ) | — |
| — |
| 151,800 |
|
— |
| 2,200 |
| — |
| (2,200 | ) | — |
| @ |
| Dril-Quip, Inc. |
| — |
| 45,122 |
| — |
| (45,122 | ) | — |
| — |
| 45,122 |
|
— |
| 4,000 |
| — |
| (4,000 | ) | — |
| @, L |
| Exterran Holdings, Inc. |
| — |
| 85,200 |
| — |
| (85,200 | ) | — |
| — |
| 85,200 |
|
192,400 |
| 39,100 |
| 138,200 |
| (167,779 | ) | 201,921 |
|
|
| Halliburton Co. |
| 3,497,832 |
| 710,838 |
| 2,512,476 |
| (3,050,230 | ) | 3,670,916 |
| 3,497,832 |
| 710,838 |
|
— |
| 5,700 |
| — |
| (5,700 | ) | — |
| @ |
| Helix Energy Solutions Group, Inc. |
| — |
| 41,268 |
| — |
| (41,268 | ) | — |
| — |
| 41,268 |
|
— |
| 23,500 |
| — |
| (23,500 | ) | — |
| @ |
| Key Energy Services, Inc. |
| — |
| 103,635 |
| — |
| (103,635 | ) | — |
| — |
| 103,635 |
|
— |
| 1,100 |
| — |
| (1,100 | ) | — |
|
|
| Lufkin Industries, Inc. |
| — |
| 37,950 |
| — |
| (37,950 | ) | — |
| — |
| 37,950 |
|
134,800 |
| 21,300 |
| 65,800 |
| (125,761 | ) | 96,139 |
| @ |
| National Oilwell Varco, Inc. |
| 3,294,512 |
| 520,572 |
| 1,608,152 |
| (3,073,605 | ) | 2,349,631 |
| 3,294,512 |
| 520,572 |
|
— |
| 4,200 |
| — |
| (4,200 | ) | — |
| @ |
| Oceaneering International, Inc. |
| — |
| 122,388 |
| — |
| (122,388 | ) | — |
| — |
| 122,388 |
|
— |
| 9,800 |
| — |
| (9,800 | ) | — |
| @ |
| Oil States International, Inc. |
| — |
| 183,162 |
| — |
| (183,162 | ) | — |
| — |
| 183,162 |
|
— |
| 23,600 |
| 189,000 |
| 63,543 |
| 276,143 |
|
|
| Schlumberger Ltd. |
| — |
| 998,988 |
| 8,000,370 |
| 2,689,785 |
| 11,689,143 |
| — |
| 998,988 |
|
— |
| 2,800 |
| — |
| (2,800 | ) | — |
| @ |
| SEACOR Holdings, Inc. |
| — |
| 186,620 |
| — |
| (186,620 | ) | — |
| — |
| 186,620 |
|
— |
| 1,000 |
| — |
| (1,000 | ) | — |
|
|
| Smith International, Inc. |
| — |
| 22,890 |
| — |
| (22,890 | ) | — |
| — |
| 22,890 |
|
— |
| 8,900 |
| — |
| (8,900 | ) | — |
| @ |
| Superior Energy Services |
| — |
| 141,777 |
| — |
| (141,777 | ) | — |
| — |
| 141,777 |
|
— |
| 2,000 |
| — |
| (2,000 | ) | — |
| @ |
| Tetra Technologies, Inc. |
| — |
| 9,720 |
| — |
| (9,720 | ) | — |
| — |
| 9,720 |
|
— |
| 38,200 |
| 107,800 |
| 11,504 |
| 157,504 |
| @ |
| Weatherford International Ltd. |
| — |
| 413,324 |
| 1,166,396 |
| 124,473 |
| 1,704,193 |
| — |
| 413,324 |
|
|
|
|
|
|
|
|
|
|
|
|
|
|
| 6,792,344 |
| 4,869,400 |
| 14,849,203 |
| (4,815,144 | ) | 21,695,803 | cs |
|
|
|
|
|
|
|
|
|
|
|
|
|
|
|
| Packaging & Containers: 0.0% |
|
|
|
|
|
|
|
|
|
|
|
|
|
|
|
— |
| 21,900 |
| — |
| (21,900 | ) | — |
| @ |
| Jefferson Smurfit Corp. |
| — |
| 5,585 |
| — |
| (5,585 | ) | — |
| — |
| 5,585 |
|
— |
| 9,300 |
| — |
| (9,300 | ) | — |
| @ |
| Owens-Illinois, Inc. |
| — |
| 254,169 |
| — |
| (254,169 | ) | — |
| — |
| 254,169 |
|
— |
| 4,400 |
| — |
| (4,400 | ) | — |
|
|
| Packaging Corp. of America |
| — |
| 59,224 |
| — |
| (59,224 | ) | — |
| — |
| 59,224 |
|
— |
| 3,000 |
| — |
| (3,000 | ) | — |
|
|
| Rock-Tenn Co. |
| — |
| 102,540 |
| — |
| (102,540 | ) | — |
| — |
| 102,540 |
|
— |
| 11,200 |
| — |
| (11,200 | ) | — |
|
|
| Sealed Air Corp. |
| — |
| 167,328 |
| — |
| (167,328 | ) | — |
| — |
| 167,328 |
|
— |
| 7,400 |
| — |
| (7,400 | ) | — |
|
|
| Sonoco Products Co. |
| — |
| 171,384 |
| — |
| (171,384 | ) | — |
| — |
| 171,384 |
|
— |
| 27,900 |
| — |
| (27,900 | ) | — |
|
|
| Temple-Inland, Inc. |
| — |
| 133,920 |
| — |
| (133,920 | ) | — |
| — |
| 133,920 |
|
|
|
|
|
|
|
|
|
|
|
|
|
|
| — |
| 894,150 |
| — |
| (894,150 | ) | — | cs |
|
|
|
|
|
|
|
|
|
|
|
|
|
|
|
| Pharmaceuticals: 6.8% |
|
|
|
|
|
|
|
|
|
|
|
|
|
|
|
— |
| 10,600 |
| 244,550 |
| 102,156 |
| 357,306 |
|
|
| Abbott Laboratories |
| — |
| 565,722 |
| 13,051,634 |
| 5,452,063 |
| 19,069,419 |
| — |
| 565,722 |
|
— |
| — |
| 313,850 |
| 144,708 |
| 458,558 |
|
|
| Bristol-Myers Squibb Co. |
| — |
| — |
| 7,297,013 |
| 3,364,472 |
| 10,661,485 |
| — |
| — |
|
81,900 |
| 2,200 |
| 56,450 |
| (58,072 | ) | 82,478 |
|
|
| Cardinal Health, Inc. |
| 2,823,093 |
| 75,834 |
| 1,945,832 |
| (2,001,752 | ) | 2,843,007 |
| 2,823,093 |
| 75,834 |
|
— |
| 1,900 |
| — |
| (1,900 | ) | — |
| @ |
| Catalyst Health Solutions, Inc. |
| — |
| 46,265 |
| — |
| (46,265 | ) | — |
| — |
| 46,265 |
|
— |
| 29,800 |
| 158,500 |
| 43,280 |
| 231,580 |
|
|
| Eli Lilly & Co. |
| — |
| 1,200,046 |
| 6,382,795 |
| 1,742,903 |
| 9,325,744 |
| — |
| 1,200,046 |
|
— |
| 7,200 |
| — |
| (7,200 | ) | — |
| @ |
| Endo Pharmaceuticals Holdings, Inc. |
| — |
| 186,336 |
| — |
| (186,336 | ) | — |
| — |
| 186,336 |
|
— |
| 12,240 |
| — |
| (12,240 | ) | — |
| @ |
| Forest Laboratories, Inc. |
| — |
| 311,753 |
| — |
| (311,753 | ) | — |
| — |
| 311,753 |
|
— |
| 9,100 |
| — |
| (9,100 | ) | — |
| @@ |
| Herbalife Ltd. |
| — |
| 197,288 |
| — |
| (197,288 | ) | — |
| — |
| 197,288 |
|
— |
| 25,900 |
| — |
| (25,900 | ) | — |
| @ |
| King Pharmaceuticals, Inc. |
| — |
| 275,058 |
| — |
| (275,058 | ) | — |
| — |
| 275,058 |
|
— |
| 500 |
| — |
| (500 | ) | — |
| @ |
| KV Pharmaceutical Co. |
| — |
| 1,440 |
| — |
| (1,440 | ) | — |
| — |
| 1,440 |
|
— |
| — |
| 80,300 |
| 37,024 |
| 117,324 |
| @ |
| Medco Health Solutions, Inc. |
| — |
| — |
| 3,365,373 |
| 1,551,690 |
| 4,917,063 |
| — |
| — |
|
— |
| 12,500 |
| — |
| (12,500 | ) | — |
|
|
| Medicis Pharmaceutical Corp. |
| — |
| 173,750 |
| — |
| (173,750 | ) | — |
| — |
| 173,750 |
|
— |
| 52,600 |
| 340,400 |
| 104,350 |
| 497,350 |
|
|
| Merck & Co., Inc. |
| — |
| 1,599,040 |
| 10,348,160 |
| 3,172,240 |
| 15,119,440 |
| — |
| 1,599,040 |
|
278,500 |
| 9,100 |
| — |
| (287,600 | ) | — |
| @ |
| NBTY, Inc. |
| 4,358,525 |
| 142,415 |
| — |
| (4,500,940 | ) | — |
| 4,358,525 |
| 142,415 |
|
— |
| 4,400 |
| — |
| (4,400 | ) | — |
|
|
| Omnicare, Inc. |
| — |
| 122,144 |
| — |
| (122,144 | ) | — |
| — |
| 122,144 |
|
— |
| 201,500 |
| 1,072,500 |
| 293,003 |
| 1,567,003 |
|
|
| Pfizer, Inc. |
| — |
| 3,568,565 |
| 18,993,975 |
| 5,189,086 |
| 27,751,626 |
| — |
| 3,568,565 |
|
— |
| — |
| 257,050 |
| 118,519 |
| 375,569 |
|
|
| Schering-Plough Corp. |
| — |
| — |
| 4,377,562 |
| 2,018,385 |
| 6,395,947 |
| — |
| — |
|
— |
| 7,700 |
| — |
| (7,700 | ) | — |
| @ |
| Sepracor, Inc. |
| — |
| 84,546 |
| — |
| (84,546 | ) | — |
| — |
| 84,546 |
|
141,600 |
| — |
| — |
| (141,600 | ) | — |
| @@ |
| Shire PLC ADR |
| 6,340,847 |
| — |
| — |
| (6,340,847 | ) | — |
| 6,340,847 |
| — |
|
— |
| 400 |
| — |
| (400 | ) | — |
| @ |
| Warner Chilcott Ltd. |
| — |
| 5,800 |
| — |
| (5,800 | ) | — |
| — |
| 5,800 |
|
— |
| 5,100 |
| — |
| (5,100 | ) | — |
| @ |
| Watson Pharmaceuticals, Inc. |
| — |
| 135,507 |
| — |
| (135,507 | ) | — |
| — |
| 135,507 |
|
— |
| 5,900 |
| 211,400 |
| 91,571 |
| 308,871 |
|
|
| Wyeth |
| — |
| 221,309 |
| 7,929,614 |
| 3,434,839 |
| 11,585,762 |
| — |
| 221,309 |
|
|
|
|
|
|
|
|
|
|
|
|
|
|
| 13,522,465 |
| 8,912,818 |
| 73,691,958 |
| 11,542,252 |
| 107,669,493 | cs |
|
|
|
|
|
|
|
|
|
|
|
|
|
|
|
| Pipelines: 0.1% |
|
|
|
|
|
|
|
|
|
|
|
|
|
|
|
— |
| — |
| 92,800 |
| 42,788 |
| 135,588 |
|
|
| Williams Cos., Inc. |
| — |
| — |
| 1,343,744 |
| 619,567 |
| 1,963,311 |
| — |
| — |
|
|
|
|
|
|
|
|
|
|
|
|
|
|
| — |
| — |
| 1,343,744 |
| 619,567 |
| 1,963,311 | cs |
|
|
|
|
|
|
|
|
|
|
|
|
|
|
|
| Real Estate: 0.0% |
|
|
|
|
|
|
|
|
|
|
|
|
|
|
|
— |
| 10,300 |
| — |
| (10,300 | ) | — |
| @ |
| CB Richard Ellis Group, Inc. |
| — |
| 44,496 |
| — |
| (44,496 | ) | — |
| — |
| 44,496 |
|
— |
| 5,500 |
| — |
| (5,500 | ) | — |
| L |
| Forest City Enterprises, Inc. |
| — |
| 36,850 |
| — |
| (36,850 | ) | — |
| — |
| 36,850 |
|
— |
| 1,400 |
| — |
| (1,400 | ) | — |
|
|
| Jones Lang LaSalle, Inc. |
| — |
| 38,780 |
| — |
| (38,780 | ) | — |
| — |
| 38,780 |
|
|
|
|
|
|
|
|
|
|
|
|
|
|
| — |
| 120,126 |
| — |
| (120,126 | ) | — | cs |
|
|
|
|
|
|
|
|
|
|
|
|
|
|
|
| Retail: 5.9% |
|
|
|
|
|
|
|
|
|
|
|
|
|
|
|
— |
| 8,100 |
| — |
| (8,100 | ) | — |
| L |
| Abercrombie & Fitch Co. |
| — |
| 186,867 |
| — |
| (186,867 | ) | — |
| — |
| 186,867 |
|
— |
| 14,400 |
| — |
| (14,400 | ) | — |
| @ |
| Aeropostale, Inc. |
| — |
| 231,840 |
| — |
| (231,840 | ) | — |
| — |
| 231,840 |
|
— |
| 15,700 |
| — |
| (15,700 | ) | — |
|
|
| American Eagle Outfitters |
| — |
| 146,952 |
| — |
| (146,952 | ) | — |
| — |
| 146,952 |
|
— |
| 18,500 |
| — |
| (18,500 | ) | — |
| @ |
| AnnTaylor Stores Corp. |
| — |
| 106,745 |
| — |
| (106,745 | ) | — |
| — |
| 106,745 |
|
— |
| 22,100 |
| — |
| (22,100 | ) | — |
| @, L |
| Autonation, Inc. |
| — |
| 218,348 |
| — |
| (218,348 | ) | — |
| — |
| 218,348 |
|
— |
| 9,500 |
| — |
| (9,500 | ) | — |
|
|
| Barnes & Noble, Inc. |
| — |
| 142,500 |
| — |
| (142,500 | ) | — |
| — |
| 142,500 |
|
— |
| 5,900 |
| — |
| (5,900 | ) | — |
|
|
| Bebe Stores, Inc. |
| — |
| 44,073 |
| — |
| (44,073 | ) | — |
| — |
| 44,073 |
|
140,700 |
| 52,100 |
| 53,150 |
| (168,294 | ) | 77,656 |
|
|
| Best Buy Co., Inc. |
| 3,955,077 |
| 1,464,531 |
| 1,494,047 |
| (4,730,740 | ) | 2,182,915 |
| 3,955,077 |
| 1,464,531 |
|
— |
| 9,800 |
| — |
| (9,800 | ) | — |
| @ |
| Big Lots, Inc. |
| — |
| 142,002 |
| — |
| (142,002 | ) | — |
| — |
| 142,002 |
|
— |
| 4,100 |
| — |
| (4,100 | ) | — |
|
|
| Bob Evans Farms, Inc. |
| — |
| 83,763 |
| — |
| (83,763 | ) | — |
| — |
| 83,763 |
|
— |
| 13,100 |
| — |
| (13,100 | ) | — |
|
|
| Brinker International, Inc. |
| — |
| 138,074 |
| — |
| (138,074 | ) | — |
| — |
| 138,074 |
|
— |
| 5,500 |
| — |
| (5,500 | ) | — |
|
|
| Buckle, Inc. |
| — |
| 120,010 |
| — |
| (120,010 | ) | — |
| — |
| 120,010 |
|
— |
| 3,900 |
| — |
| (3,900 | ) | — |
|
|
| Casey’s General Stores, Inc. |
| — |
| 88,803 |
| — |
| (88,803 | ) | — |
| — |
| 88,803 |
|
— |
| 5,800 |
| — |
| (5,800 | ) | — |
|
|
| Cash America International, Inc. |
| — |
| 158,630 |
| — |
| (158,630 | ) | — |
| — |
| 158,630 |
|
— |
| 6,600 |
| — |
| (6,600 | ) | — |
| @ |
| CEC Entertainment, Inc. |
| — |
| 160,050 |
| — |
| (160,050 | ) | — |
| — |
| 160,050 |
|
— |
| 7,600 |
| — |
| (7,600 | ) | — |
| @ |
| Childrens Place Retail Stores, Inc. |
| — |
| 164,768 |
| — |
| (164,768 | ) | — |
| — |
| 164,768 |
|
— |
| 129 |
| — |
| (129 | ) | — |
| @ |
| Chipotle Mexican Grill, Inc. |
| — |
| 7,390 |
| — |
| (7,390 | ) | — |
| — |
| 7,390 |
|
— |
| 3,200 |
| — |
| (3,200 | ) | — |
| @ |
| Copart, Inc. |
| — |
| 87,008 |
| — |
| (87,008 | ) | — |
| — |
| 87,008 |
|
— |
| — |
| 68,850 |
| 31,745 |
| 100,595 |
|
|
| Costco Wholesale Corp. |
| — |
| — |
| 3,614,625 |
| 1,666,614 |
| 5,281,239 |
| — |
| — |
|
— |
| 10,200 |
| 226,650 |
| 94,303 |
| 331,153 |
|
|
| CVS Caremark Corp. |
| — |
| 293,148 |
| 6,513,921 |
| 2,710,259 |
| 9,517,328 |
| — |
| 293,148 |
|
— |
| 17,000 |
| — |
| (17,000 | ) | — |
|
|
| Dillard’s, Inc. |
| — |
| 67,490 |
| — |
| (67,490 | ) | — |
| — |
| 67,490 |
|
— |
| 6,300 |
| — |
| (6,300 | ) | — |
| @ |
| Dollar Tree, Inc. |
| — |
| 263,340 |
| — |
| (263,340 | ) | — |
| — |
| 263,340 |
|
— |
| 10,900 |
| — |
| (10,900 | ) | — |
| @, L |
| Dress Barn, Inc. |
| — |
| 117,066 |
| — |
| (117,066 | ) | — |
| — |
| 117,066 |
|
— |
| 1,400 |
| — |
| (1,400 | ) | — |
| @ |
| Ezcorp, Inc. |
| — |
| 21,294 |
| — |
| (21,294 | ) | — |
| — |
| 21,294 |
|
— |
| 12,600 |
| — |
| (12,600 | ) | — |
|
|
| Foot Locker, Inc. |
| — |
| 92,484 |
| — |
| (92,484 | ) | — |
| — |
| 92,484 |
|
— |
| 85,300 |
| — |
| (85,300 | ) | — |
|
|
| Gap, Inc. |
| — |
| 1,142,167 |
| — |
| (1,142,167 | ) | — |
| — |
| 1,142,167 |
|
— |
| 5,300 |
| — |
| (5,300 | ) | — |
|
|
| Guess ?, Inc. |
| — |
| 81,355 |
| — |
| (81,355 | ) | — |
| — |
| 81,355 |
|
— |
| 2,300 |
| — |
| (2,300 | ) | — |
| @ |
| Gymboree Corp. |
| — |
| 60,007 |
| — |
| (60,007 | ) | — |
| — |
| 60,007 |
|
— |
| 15,700 |
| 267,950 |
| 107,845 |
| 391,495 |
|
|
| Home Depot, Inc. |
| — |
| 361,414 |
| 6,168,209 |
| 2,482,594 |
| 9,012,217 |
| — |
| 361,414 |
|
— |
| 3,180 |
| — |
| (3,180 | ) | — |
| @ |
| HSN, Inc. |
| — |
| 23,119 |
| — |
| (23,119 | ) | — |
| — |
| 23,119 |
|
— |
| 700 |
| — |
| (700 | ) | — |
| @, L |
| J Crew Group, Inc. |
| — |
| 8,540 |
| — |
| (8,540 | ) | — |
| — |
| 8,540 |
|
— |
| 8,400 |
| — |
| (8,400 | ) | — |
| @ |
| Jack in the Box, Inc. |
| — |
| 185,556 |
| — |
| (185,556 | ) | — |
| — |
| 185,556 |
|
200,600 |
| — |
| — |
| (200,600 | ) | — |
|
|
| JC Penney Co., Inc. |
| 3,951,820 |
| — |
| — |
| (3,951,820 | ) | — |
| 3,951,820 |
| — |
|
— |
| 8,400 |
| — |
| (8,400 | ) | — |
| @ |
| Kohl’s Corp. |
| — |
| 304,080 |
| — |
| (304,080 | ) | — |
| — |
| 304,080 |
|
— |
| 19,900 |
| — |
| (19,900 | ) | — |
|
|
| Limited Brands, Inc. |
| — |
| 199,796 |
| — |
| (199,796 | ) | — |
| — |
| 199,796 |
|
— |
| 28,000 |
| — |
| (28,000 | ) | — |
|
|
| Liz Claiborne, Inc. |
| — |
| 72,800 |
| — |
| (72,800 | ) | — |
| — |
| 72,800 |
|
— |
| 4,500 |
| 231,750 |
| 102,354 |
| 338,604 |
|
|
| Lowe’s Cos., Inc. |
| — |
| 96,840 |
| 4,987,260 |
| 2,202,662 |
| 7,286,762 |
| — |
| 96,840 |
|
438,700 |
| 19,500 |
| — |
| (458,200 | ) | — |
|
|
| Macy’s, Inc. |
| 4,540,545 |
| 201,825 |
| — |
| (4,742,370 | ) | — |
| 4,540,545 |
| 201,825 |
|
— |
| 6,500 |
| 179,650 |
| 76,332 |
| 262,482 |
|
|
| McDonald’s Corp. |
| — |
| 404,235 |
| 11,172,434 |
| 4,747,097 |
| 16,323,766 |
| — |
| 404,235 |
|
— |
| 8,800 |
| — |
| (8,800 | ) | — |
| L |
| Men’s Wearhouse, Inc. |
| — |
| 119,152 |
| — |
| (119,152 | ) | — |
| — |
| 119,152 |
|
— |
| 4,600 |
| — |
| (4,600 | ) | — |
|
|
| MSC Industrial Direct Co. |
| — |
| 169,418 |
| — |
| (169,418 | ) | — |
| — |
| 169,418 |
|
— |
| 9,400 |
| — |
| (9,400 | ) | — |
| L |
| Nordstrom, Inc. |
| — |
| 125,114 |
| — |
| (125,114 | ) | — |
| — |
| 125,114 |
|
— |
| 2,800 |
| — |
| (2,800 | ) | — |
|
|
| Nu Skin Enterprises, Inc. |
| — |
| 29,204 |
| — |
| (29,204 | ) | — |
| — |
| 29,204 |
|
— |
| 32,800 |
| — |
| (32,800 | ) | — |
| @ |
| Office Depot, Inc. |
| — |
| 97,744 |
| — |
| (97,744 | ) | — |
| — |
| 97,744 |
|
— |
| 1,400 |
| — |
| (1,400 | ) | — |
|
|
| OfficeMax, Inc. |
| — |
| 10,696 |
| — |
| (10,696 | ) | — |
| — |
| 10,696 |
|
— |
| 2,200 |
| — |
| (2,200 | ) | — |
| @ |
| Panera Bread Co. |
| — |
| 114,928 |
| — |
| (114,928 | ) | — |
| — |
| 114,928 |
|
— |
| 1,000 |
| — |
| (1,000 | ) | — |
| @ |
| Papa John’s International, Inc. |
| — |
| 18,430 |
| — |
| (18,430 | ) | — |
| — |
| 18,430 |
|
— |
| 6,100 |
| — |
| (6,100 | ) | — |
| L |
| Penske Auto Group, Inc. |
| — |
| 46,848 |
| — |
| (46,848 | ) | — |
| — |
| 46,848 |
|
— |
| 7,200 |
| — |
| (7,200 | ) | — |
|
|
| Phillips-Van Heusen |
| — |
| 144,936 |
| — |
| (144,936 | ) | — |
| — |
| 144,936 |
|
— |
| 11,600 |
| — |
| (11,600 | ) | — |
|
|
| RadioShack Corp. |
| — |
| 138,504 |
| — |
| (138,504 | ) | — |
| — |
| 138,504 |
|
— |
| 2,600 |
| — |
| (2,600 | ) | — |
|
|
| Regis Corp. |
| — |
| 37,778 |
| — |
| (37,778 | ) | — |
| — |
| 37,778 |
|
— |
| 2,800 |
| — |
| (2,800 | ) | — |
|
|
| Ross Stores, Inc. |
| — |
| 83,244 |
| — |
| (83,244 | ) | — |
| — |
| 83,244 |
|
— |
| 10,800 |
| — |
| (10,800 | ) | — |
| @ |
| Sally Beauty Holdings, Inc. |
| — |
| 61,452 |
| — |
| (61,452 | ) | — |
| — |
| 61,452 |
|
— |
| 3,600 |
| — |
| (3,600 | ) | — |
| @ |
| Sonic Corp. |
| — |
| 43,812 |
| — |
| (43,812 | ) | — |
| — |
| 43,812 |
|
— |
| — |
| 111,200 |
| 51,272 |
| 162,472 |
|
|
| Staples, Inc. |
| — |
| — |
| 1,992,704 |
| 918,786 |
| 2,911,490 |
| — |
| — |
|
— |
| 6,400 |
| — |
| (6,400 | ) | — |
| L |
| Talbots, Inc. |
| — |
| 15,296 |
| — |
| (15,296 | ) | — |
| — |
| 15,296 |
|
— |
| — |
| 125,100 |
| 57,681 |
| 182,781 |
|
|
| Target Corp. |
| — |
| — |
| 4,319,703 |
| 1,991,708 |
| 6,311,411 |
| — |
| — |
|
— |
| 14,300 |
| — |
| (14,300 | ) | — |
|
|
| TJX Cos., Inc. |
| — |
| 294,151 |
| — |
| (294,151 | ) | — |
| — |
| 294,151 |
|
— |
| 5,500 |
| — |
| (5,500 | ) | — |
| @ |
| Tractor Supply Co. |
| — |
| 198,770 |
| — |
| (198,770 | ) | — |
| — |
| 198,770 |
|
— |
| 3,000 |
| — |
| (3,000 | ) | — |
| @ |
| Urban Outfitters, Inc. |
| — |
| 44,940 |
| — |
| (44,940 | ) | — |
| — |
| 44,940 |
|
— |
| — |
| 157,000 |
| 72,389 |
| 229,389 |
|
|
| Walgreen Co. |
| — |
| — |
| 3,873,190 |
| 1,785,832 |
| 5,659,022 |
| — |
| — |
|
— |
| 35,500 |
| 355,800 |
| 128,551 |
| 519,851 |
|
|
| Wal-Mart Stores, Inc. |
| — |
| 1,990,130 |
| 19,946,148 |
| 7,206,544 |
| 29,142,822 |
| — |
| 1,990,130 |
|
— |
| 19,900 |
| — |
| (19,900 | ) | — |
|
|
| Williams-Sonoma, Inc. |
| — |
| 156,414 |
| — |
| (156,414 | ) | — |
| — |
| 156,414 |
|
— |
| 7,000 |
| — |
| (7,000 | ) | — |
| @, L |
| Zale Corp. |
| — |
| 23,310 |
| — |
| (23,310 | ) | — |
| — |
| 23,310 |
|
|
|
|
|
|
|
|
|
|
|
|
|
|
| 12,447,442 |
| 11,653,181 |
| 64,082,241 |
| 5,446,108 |
| 93,628,972 | cs |
|
|
|
|
|
|
|
|
|
|
|
|
|
|
|
| Savings & Loans: 0.0% |
|
|
|
|
|
|
|
|
|
|
|
|
|
|
|
— |
| 2,600 |
| — |
| (2,600 | ) | — |
|
|
| NewAlliance Bancshares, Inc. |
| — |
| 34,242 |
| — |
| (34,242 | ) | — |
| — |
| 34,242 |
|
— |
| 100 |
| — |
| (100 | ) | — |
|
|
| Northwest Bancorp, Inc. |
| — |
| 2,138 |
| — |
| (2,138 | ) | — |
| — |
| 2,138 |
|
— |
| 3,600 |
| — |
| (3,600 | ) | — |
|
|
| Provident Financial Services, Inc. |
| — |
| 55,080 |
| — |
| (55,080 | ) | — |
| — |
| 55,080 |
|
|
|
|
|
|
|
|
|
|
|
|
|
|
| — |
| 91,460 |
| — |
| (91,460 | ) | — | cs |
|
|
|
|
|
|
|
|
|
|
|
|
|
|
|
| Semiconductors: 1.7% |
|
|
|
|
|
|
|
|
|
|
|
|
|
|
|
— |
| 3,700 |
| — |
| (3,700 | ) | — |
| @, L |
| Advanced Micro Devices, Inc. |
| — |
| 7,992 |
| — |
| (7,992 | ) | — |
| — |
| 7,992 |
|
— |
| 17,900 |
| — |
| (17,900 | ) | — |
|
|
| Altera Corp. |
| — |
| 299,109 |
| — |
| (299,109 | ) | — |
| — |
| 299,109 |
|
— |
| 34,400 |
| — |
| (34,400 | ) | — |
| @ |
| Amkor Technology, Inc. |
| — |
| 74,992 |
| — |
| (74,992 | ) | — |
| — |
| 74,992 |
|
— |
| 14,000 |
| — |
| (14,000 | ) | — |
|
|
| Analog Devices, Inc. |
| — |
| 266,280 |
| — |
| (266,280 | ) | — |
| — |
| 266,280 |
|
— |
| 153,600 |
| 214,600 |
| (54,653 | ) | 313,547 |
|
|
| Applied Materials, Inc. |
| — |
| 1,555,968 |
| 2,173,898 |
| (553,638 | ) | 3,176,228 |
| — |
| 1,555,968 |
|
— |
| 29,000 |
| — |
| (29,000 | ) | — |
| @ |
| Atmel Corp. |
| — |
| 90,770 |
| — |
| (90,770 | ) | — |
| — |
| 90,770 |
|
— |
| 18,900 |
| — |
| (18,900 | ) | — |
| @ |
| Broadcom Corp. |
| — |
| 320,733 |
| — |
| (320,733 | ) | — |
| — |
| 320,733 |
|
— |
| 2,300 |
| — |
| (2,300 | ) | — |
| @ |
| Cabot Microelectronics Corp. |
| — |
| 59,961 |
| — |
| (59,961 | ) | — |
| — |
| 59,961 |
|
— |
| 22,100 |
| — |
| (22,100 | ) | — |
| @ |
| Emulex Corp. |
| — |
| 154,258 |
| — |
| (154,258 | ) | — |
| — |
| 154,258 |
|
— |
| 6,100 |
| — |
| (6,100 | ) | — |
| @ |
| Entegris, Inc. |
| — |
| 13,359 |
| — |
| (13,359 | ) | — |
| — |
| 13,359 |
|
— |
| 28,700 |
| — |
| (28,700 | ) | — |
| @ |
| Fairchild Semiconductor International, Inc. |
| — |
| 140,343 |
| — |
| (140,343 | ) | — |
| — |
| 140,343 |
|
— |
| 31,900 |
| — |
| (31,900 | ) | — |
| @ |
| Integrated Device Technology, Inc. |
| — |
| 178,959 |
| — |
| (178,959 | ) | — |
| — |
| 178,959 |
|
— |
| 278,500 |
| 908,000 |
| 140,156 |
| 1,326,656 |
|
|
| Intel Corp. |
| — |
| 4,082,810 |
| 13,311,280 |
| 2,054,691 |
| 19,448,781 |
| — |
| 4,082,810 |
|
148,700 |
| 5,200 |
| — |
| (153,900 | ) | — |
| @ |
| International Rectifier Corp. |
| 2,007,450 |
| 70,200 |
| — |
| (2,077,650 | ) | — |
| 2,007,450 |
| 70,200 |
|
— |
| 16,700 |
| — |
| (16,700 | ) | — |
|
|
| Intersil Corp. |
| — |
| 153,473 |
| — |
| (153,473 | ) | — |
| — |
| 153,473 |
|
— |
| 9,800 |
| — |
| (9,800 | ) | — |
|
|
| KLA-Tencor Corp. |
| — |
| 213,542 |
| — |
| (213,542 | ) | — |
| — |
| 213,542 |
|
— |
| 52,400 |
| — |
| (52,400 | ) | — |
| @ |
| LSI Logic Corp. |
| — |
| 172,396 |
| — |
| (172,396 | ) | — |
| — |
| 172,396 |
|
— |
| 27,900 |
| — |
| (27,900 | ) | — |
| @, @@ |
| Marvell Technology Group Ltd. |
| — |
| 186,093 |
| — |
| (186,093 | ) | — |
| — |
| 186,093 |
|
— |
| 12,300 |
| — |
| (12,300 | ) | — |
| @ |
| MEMC Electronic Materials, Inc. |
| — |
| 175,644 |
| — |
| (175,644 | ) | — |
| — |
| 175,644 |
|
— |
| 3,100 |
| — |
| (3,100 | ) | — |
| @ |
| Microsemi Corp. |
| — |
| 39,184 |
| — |
| (39,184 | ) | — |
| — |
| 39,184 |
|
— |
| 10,500 |
| — |
| (10,500 | ) | — |
| @ |
| MKS Instruments, Inc. |
| — |
| 155,295 |
| — |
| (155,295 | ) | — |
| — |
| 155,295 |
|
— |
| 12,200 |
| — |
| (12,200 | ) | — |
|
|
| National Semiconductor Corp. |
| — |
| 122,854 |
| — |
| (122,854 | ) | — |
| — |
| 122,854 |
|
— |
| 13,700 |
| — |
| (13,700 | ) | — |
| @ |
| Novellus Systems, Inc. |
| — |
| 169,058 |
| — |
| (169,058 | ) | — |
| — |
| 169,058 |
|
— |
| 23,800 |
| — |
| (23,800 | ) | — |
| @ |
| Nvidia Corp. |
| — |
| 192,066 |
| — |
| (192,066 | ) | — |
| — |
| 192,066 |
|
— |
| 12,600 |
| — |
| (12,600 | ) | — |
| @ |
| ON Semiconductor Corp. |
| — |
| 42,840 |
| — |
| (42,840 | ) | — |
| — |
| 42,840 |
|
— |
| 28,300 |
| — |
| (28,300 | ) | — |
| @ |
| PMC - Sierra, Inc. |
| — |
| 137,538 |
| — |
| (137,538 | ) | — |
| — |
| 137,538 |
|
— |
| 700 |
| — |
| (700 | ) | — |
|
|
| Power Integrations, Inc. |
| — |
| 13,916 |
| — |
| (13,916 | ) | — |
| — |
| 13,916 |
|
— |
| 19,700 |
| — |
| (19,700 | ) | — |
| @ |
| QLogic Corp. |
| — |
| 264,768 |
| — |
| (264,768 | ) | — |
| — |
| 264,768 |
|
— |
| 14,100 |
| — |
| (14,100 | ) | — |
| @ |
| Semtech Corp. |
| — |
| 158,907 |
| — |
| (158,907 | ) | — |
| — |
| 158,907 |
|
— |
| 7,500 |
| — |
| (7,500 | ) | — |
| @ |
| Silicon Laboratories, Inc. |
| — |
| 185,850 |
| — |
| (185,850 | ) | — |
| — |
| 185,850 |
|
— |
| 14,100 |
| — |
| (14,100 | ) | — |
| @ |
| Skyworks Solutions, Inc. |
| — |
| 78,114 |
| — |
| (78,114 | ) | — |
| — |
| 78,114 |
|
— |
| 41,000 |
| — |
| (41,000 | ) | — |
| @ |
| Teradyne, Inc. |
| — |
| 173,020 |
| — |
| (173,020 | ) | — |
| — |
| 173,020 |
|
— |
| 3,000 |
| — |
| (3,000 | ) | — |
| @ |
| Tessera Technologies, Inc. |
| — |
| 35,640 |
| — |
| (35,640 | ) | — |
| — |
| 35,640 |
|
— |
| 148,700 |
| 209,650 |
| (52,036 | ) | 306,314 |
|
|
| Texas Instruments, Inc. |
| — |
| 2,307,824 |
| 3,253,768 |
| (807,592 | ) | 4,754,000 |
| — |
| 2,307,824 |
|
— |
| 5,700 |
| — |
| (5,700 | ) | — |
| @ |
| Varian Semiconductor Equipment Associates, Inc. |
| — |
| 103,284 |
| — |
| (103,284 | ) | — |
| — |
| 103,284 |
|
— |
| 6,700 |
| — |
| (6,700 | ) | — |
| @, @@ |
| Verigy Ltd. |
| — |
| 64,454 |
| — |
| (64,454 | ) | — |
| — |
| 64,454 |
|
— |
| 12,100 |
| — |
| (12,100 | ) | — |
|
|
| Xilinx, Inc. |
| — |
| 215,622 |
| — |
| (215,622 | ) | — |
| — |
| 215,622 |
|
|
|
|
|
|
|
|
|
|
|
|
|
|
| 2,007,450 |
| 12,677,116 |
| 18,738,946 |
| (6,044,503 | ) | 27,379,009 | cs |
|
|
|
|
|
|
|
|
|
|
|
|
|
|
|
| Software: 3.5% |
|
|
|
|
|
|
|
|
|
|
|
|
|
|
|
— |
| 15,000 |
| — |
| (15,000 | ) | — |
|
|
| Acxiom Corp. |
| — |
| 121,650 |
| — |
| (121,650 | ) | — |
| — |
| 121,650 |
|
— |
| 4,400 |
| 84,450 |
| 34,538 |
| 123,388 |
| @ |
| Adobe Systems, Inc. |
| — |
| 93,676 |
| 1,797,941 |
| 735,310 |
| 2,626,927 |
| — |
| 93,676 |
|
— |
| 600 |
| — |
| (600 | ) | — |
| @ |
| Advent Software, Inc. |
| — |
| 11,982 |
| — |
| (11,982 | ) | — |
| — |
| 11,982 |
|
— |
| 2,000 |
| — |
| (2,000 | ) | — |
| @, L |
| Allscripts Healthcare Solutions, Inc. |
| — |
| 19,840 |
| — |
| (19,840 | ) | — |
| — |
| 19,840 |
|
— |
| 800 |
| — |
| (800 | ) | — |
| @ |
| American Reprographics Co. |
| — |
| 5,520 |
| — |
| (5,520 | ) | — |
| — |
| 5,520 |
|
— |
| 4,300 |
| — |
| (4,300 | ) | — |
| @ |
| Ansys, Inc. |
| — |
| 119,927 |
| — |
| (119,927 | ) | — |
| — |
| 119,927 |
|
— |
| 11,700 |
| — |
| (11,700 | ) | — |
| @ |
| Autodesk, Inc. |
| — |
| 229,905 |
| — |
| (229,905 | ) | — |
| — |
| 229,905 |
|
— |
| 2,800 |
| — |
| (2,800 | ) | — |
| @, L |
| Avid Technology, Inc. |
| — |
| 30,548 |
| — |
| (30,548 | ) | — |
| — |
| 30,548 |
|
— |
| 3,200 |
| — |
| (3,200 | ) | — |
| @ |
| BMC Software, Inc. |
| — |
| 86,112 |
| — |
| (86,112 | ) | — |
| — |
| 86,112 |
|
— |
| 12,000 |
| — |
| (12,000 | ) | — |
|
|
| Broadridge Financial Solutions ADR |
| — |
| 150,480 |
| — |
| (150,480 | ) | — |
| — |
| 150,480 |
|
— |
| 31,723 |
| — |
| (31,723 | ) | — |
|
|
| CA, Inc. |
| — |
| 587,827 |
| — |
| (587,827 | ) | — |
| — |
| 587,827 |
|
104,200 |
| 5,200 |
| — |
| (109,400 | ) | — |
| @, @@ |
| Check Point Software Technologies |
| 1,978,758 |
| 98,748 |
| — |
| (2,077,506 | ) | — |
| 1,978,758 |
| 98,748 |
|
— |
| 8,200 |
| — |
| (8,200 | ) | — |
| @ |
| Citrix Systems, Inc. |
| — |
| 193,274 |
| — |
| (193,274 | ) | — |
| — |
| 193,274 |
|
— |
| 31,200 |
| — |
| (31,200 | ) | — |
| @ |
| Compuware Corp. |
| — |
| 210,600 |
| — |
| (210,600 | ) | — |
| — |
| 210,600 |
|
— |
| 2,000 |
| — |
| (2,000 | ) | — |
| @ |
| Concur Technologies, Inc. |
| — |
| 65,640 |
| — |
| (65,640 | ) | — |
| — |
| 65,640 |
|
— |
| 4,400 |
| — |
| (4,400 | ) | — |
| @ |
| CSG Systems International |
| — |
| 76,868 |
| — |
| (76,868 | ) | — |
| — |
| 76,868 |
|
— |
| 11,000 |
| — |
| (11,000 | ) | — |
|
|
| Fair Isaac Corp. |
| — |
| 185,460 |
| — |
| (185,460 | ) | — |
| — |
| 185,460 |
|
278,800 |
| 4,200 |
| — |
| (283,000 | ) | — |
|
|
| Fidelity National Information Services, Inc. |
| 4,536,076 |
| 68,334 |
| — |
| (4,604,410 | ) | — |
| 4,536,076 |
| 68,334 |
|
— |
| 2,000 |
| — |
| (2,000 | ) | — |
|
|
| IMS Health, Inc. |
| — |
| 30,320 |
| — |
| (30,320 | ) | — |
| — |
| 30,320 |
|
— |
| 5,800 |
| — |
| (5,800 | ) | — |
| @ |
| Informatica Corp. |
| — |
| 79,634 |
| — |
| (79,634 | ) | — |
| — |
| 79,634 |
|
— |
| 8,400 |
| — |
| (8,400 | ) | — |
| @ |
| Lawson Software, Inc. |
| — |
| 39,816 |
| — |
| (39,816 | ) | — |
| — |
| 39,816 |
|
174,480 |
| 289,500 |
| 1,272,650 |
| 122,807 |
| 1,859,437 |
| S |
| Microsoft Corp. |
| 3,391,891 |
| 5,627,880 |
| 24,740,316 |
| 2,387,375 |
| 36,147,462 |
| 3,391,891 |
| 5,627,880 |
|
— |
| 400 |
| — |
| (400 | ) | — |
| @ |
| MicroStrategy, Inc. |
| — |
| 14,852 |
| — |
| (14,852 | ) | — |
| — |
| 14,852 |
|
— |
| 13,700 |
| — |
| (13,700 | ) | — |
| @ |
| Nuance Communications, Inc. |
| — |
| 141,932 |
| — |
| (141,932 | ) | — |
| — |
| 141,932 |
|
— |
| 3,900 |
| — |
| (3,900 | ) | — |
| @, @@, L |
| Open Text Corp. |
| — |
| 117,507 |
| — |
| (117,507 | ) | — |
| — |
| 117,507 |
|
208,310 |
| 136,935 |
| 617,450 |
| (60,554 | ) | 902,141 |
| @ |
| Oracle Corp. |
| 3,693,336 |
| 2,427,858 |
| 10,947,389 |
| (1,073,624 | ) | 15,994,959 |
| 3,693,336 |
| 2,427,858 |
|
— |
| 15,100 |
| — |
| (15,100 | ) | — |
| @ |
| Parametric Technology Corp. |
| — |
| 191,015 |
| — |
| (191,015 | ) | — |
| — |
| 191,015 |
|
— |
| 3,100 |
| — |
| (3,100 | ) | — |
| @ |
| Progress Software Corp. |
| — |
| 59,706 |
| — |
| (59,706 | ) | — |
| — |
| 59,706 |
|
— |
| 11,300 |
| — |
| (11,300 | ) | — |
| @ |
| Quest Software, Inc. |
| — |
| 142,267 |
| — |
| (142,267 | ) | — |
| — |
| 142,267 |
|
— |
| 5,000 |
| — |
| (5,000 | ) | — |
|
|
| SEI Investments Co. |
| — |
| 78,550 |
| — |
| (78,550 | ) | — |
| — |
| 78,550 |
|
— |
| 2,100 |
| — |
| (2,100 | ) | — |
| @ |
| Solera Holdings, Inc. |
| — |
| 50,610 |
| — |
| (50,610 | ) | — |
| — |
| 50,610 |
|
— |
| 8,600 |
| — |
| (8,600 | ) | — |
| @ |
| Sybase, Inc. |
| — |
| 213,022 |
| — |
| (213,022 | ) | — |
| — |
| 213,022 |
|
— |
| 2,700 |
| — |
| (2,700 | ) | — |
| @ |
| SYNNEX Corp. |
| — |
| 30,591 |
| — |
| (30,591 | ) | — |
| — |
| 30,591 |
|
— |
| 11,400 |
| — |
| (11,400 | ) | — |
| @ |
| Take-Two Interactive Software, Inc. |
| — |
| 86,184 |
| — |
| (86,184 | ) | — |
| — |
| 86,184 |
|
— |
| 3,000 |
| — |
| (3,000 | ) | — |
| @ |
| THQ, Inc. |
| — |
| 12,570 |
| — |
| (12,570 | ) | — |
| — |
| 12,570 |
|
— |
| — |
| 6,700 |
| 3,089 |
| 9,789 |
| @ |
| VMware, Inc. |
| — |
| — |
| 158,723 |
| 73,183 |
| 231,906 |
| — |
| — |
|
— |
| 13,200 |
| — |
| (13,200 | ) | — |
| @ |
| Wind River Systems, Inc. |
| — |
| 119,196 |
| — |
| (119,196 | ) | — |
| — |
| 119,196 |
|
|
|
|
|
|
|
|
|
|
|
|
|
|
| 13,600,061 |
| 11,819,901 |
| 37,644,369 |
| (8,063,077 | ) | 55,001,254 | cs |
|
|
|
|
|
|
|
|
|
|
|
|
|
|
|
| Telecommunications: 6.6% |
|
|
|
|
|
|
|
|
|
|
|
|
|
|
|
— |
| 39,400 |
| — |
| (39,400 | ) | — |
| @ |
| 3Com Corp. |
| — |
| 89,832 |
| — |
| (89,832 | ) | — |
| — |
| 89,832 |
|
— |
| 9,500 |
| — |
| (9,500 | ) | — |
|
|
| Adtran, Inc. |
| — |
| 141,360 |
| — |
| (141,360 | ) | — |
| — |
| 141,360 |
|
— |
| 12,300 |
| — |
| (12,300 | ) | — |
| @, @@ |
| Amdocs Ltd. |
| — |
| 224,967 |
| — |
| (224,967 | ) | — |
| — |
| 224,967 |
|
— |
| 4,500 |
| — |
| (4,500 | ) | — |
| @ |
| Anixter International, Inc. |
| — |
| 135,540 |
| — |
| (135,540 | ) | — |
| — |
| 135,540 |
|
— |
| 149,800 |
| 941,900 |
| 284,487 |
| 1,376,187 |
|
|
| AT&T, Inc. |
| — |
| 4,269,300 |
| 26,844,150 |
| 8,107,872 |
| 39,221,322 |
| — |
| 4,269,300 |
|
— |
| 8,400 |
| — |
| (8,400 | ) | — |
| @ |
| Atheros Communications, Inc. |
| — |
| 120,204 |
| — |
| (120,204 | ) | — |
| — |
| 120,204 |
|
— |
| 6,200 |
| — |
| (6,200 | ) | — |
| @ |
| Centennial Communications Corp. |
| — |
| 49,972 |
| — |
| (49,972 | ) | — |
| — |
| 49,972 |
|
113,900 |
| — |
| — |
| (113,900 | ) | — |
| @@ |
| China Mobile Ltd. ADR |
| 5,791,815 |
| — |
| — |
| (5,791,815 | ) | — |
| 5,791,815 |
| — |
|
— |
| 16,100 |
| — |
| (16,100 | ) | — |
| @, L |
| Ciena Corp. |
| — |
| 107,870 |
| — |
| (107,870 | ) | — |
| — |
| 107,870 |
|
— |
| 19,100 |
| — |
| (19,100 | ) | — |
| @ |
| Cincinnati Bell, Inc. |
| — |
| 36,863 |
| — |
| (36,863 | ) | — |
| — |
| 36,863 |
|
— |
| 240,800 |
| 936,600 |
| 191,043 |
| 1,368,443 |
| @ |
| Cisco Systems, Inc. |
| — |
| 3,925,040 |
| 15,266,580 |
| 3,114,002 |
| 22,305,622 |
| — |
| 3,925,040 |
|
— |
| 11,700 |
| — |
| (11,700 | ) | — |
| @ |
| CommScope, Inc. |
| — |
| 181,818 |
| — |
| (181,818 | ) | — |
| — |
| 181,818 |
|
— |
| 1,100 |
| — |
| (1,100 | ) | — |
| @ |
| Comtech Telecommunications |
| — |
| 50,402 |
| — |
| (50,402 | ) | — |
| — |
| 50,402 |
|
— |
| 36,400 |
| 249,750 |
| 78,754 |
| 364,904 |
|
|
| Corning, Inc. |
| — |
| 346,892 |
| 2,380,118 |
| 750,522 |
| 3,477,532 |
| — |
| 346,892 |
|
— |
| 5,420 |
| — |
| (5,420 | ) | — |
| @ |
| EchoStar Holding Corp. |
| — |
| 80,595 |
| — |
| (80,595 | ) | — |
| — |
| 80,595 |
|
— |
| 8,700 |
| — |
| (8,700 | ) | — |
|
|
| Embarq Corp. |
| — |
| 312,852 |
| — |
| (312,852 | ) | — |
| — |
| 312,852 |
|
— |
| 1,400 |
| — |
| (1,400 | ) | — |
| @ |
| Global Crossing Ltd. |
| — |
| 11,116 |
| — |
| (11,116 | ) | — |
| — |
| 11,116 |
|
— |
| 5,800 |
| — |
| (5,800 | ) | — |
|
|
| Harris Corp. |
| — |
| 220,690 |
| — |
| (220,690 | ) | — |
| — |
| 220,690 |
|
— |
| 6,500 |
| — |
| (6,500 | ) | — |
| @, L |
| InterDigital, Inc. |
| — |
| 178,750 |
| — |
| (178,750 | ) | — |
| — |
| 178,750 |
|
— |
| 50,800 |
| — |
| (50,800 | ) | — |
| @, L |
| JDS Uniphase Corp. |
| — |
| 185,420 |
| — |
| (185,420 | ) | — |
| — |
| 185,420 |
|
— |
| 7,500 |
| — |
| (7,500 | ) | — |
| @ |
| Mastec, Inc. |
| — |
| 86,850 |
| — |
| (86,850 | ) | — |
| — |
| 86,850 |
|
— |
| — |
| 357,450 |
| 164,811 |
| 522,261 |
|
|
| Motorola, Inc. |
| — |
| — |
| 1,583,504 |
| 730,114 |
| 2,313,618 |
| — |
| — |
|
— |
| 6,400 |
| — |
| (6,400 | ) | — |
| @ |
| NeuStar, Inc. |
| — |
| 122,432 |
| — |
| (122,432 | ) | — |
| — |
| 122,432 |
|
— |
| 7,700 |
| — |
| (7,700 | ) | — |
| @ |
| NII Holdings, Inc. |
| — |
| 139,986 |
| — |
| (139,986 | ) | — |
| — |
| 139,986 |
|
— |
| 4,300 |
| — |
| (4,300 | ) | — |
|
|
| NTELOS Holdings Corp. |
| — |
| 106,038 |
| — |
| (106,038 | ) | — |
| — |
| 106,038 |
|
— |
| 11,800 |
| — |
| (11,800 | ) | — |
|
|
| Plantronics, Inc. |
| — |
| 155,760 |
| — |
| (155,760 | ) | — |
| — |
| 155,760 |
|
— |
| 8,600 |
| — |
| (8,600 | ) | — |
| @ |
| Polycom, Inc. |
| — |
| 116,186 |
| — |
| (116,186 | ) | — |
| — |
| 116,186 |
|
— |
| 5,500 |
| — |
| (5,500 | ) | — |
| @ |
| Premier Global Services, Inc. |
| — |
| 47,355 |
| — |
| (47,355 | ) | — |
| — |
| 47,355 |
|
— |
| 31,700 |
| 256,400 |
| 86,520 |
| 374,620 |
|
|
| Qualcomm, Inc. |
| — |
| 1,135,811 |
| 9,186,812 |
| 3,100,001 |
| 13,422,624 |
| — |
| 1,135,811 |
|
— |
| 64,900 |
| — |
| (64,900 | ) | — |
| L |
| Qwest Communications International, Inc. |
| — |
| 236,236 |
| — |
| (236,236 | ) | — |
| — |
| 236,236 |
|
— |
| 15,000 |
| — |
| (15,000 | ) | — |
| @ |
| RF Micro Devices, Inc. |
| — |
| 11,700 |
| — |
| (11,700 | ) | — |
| — |
| 11,700 |
|
— |
| 164,187 |
| 440,250 |
| 38,802 |
| 643,239 |
|
|
| Sprint Nextel Corp. |
| — |
| 300,462 |
| 805,658 |
| 71,007 |
| 1,177,127 |
| — |
| 300,462 |
|
— |
| 1,100 |
| — |
| (1,100 | ) | — |
| @ |
| Starent Networks Corp. |
| — |
| 13,123 |
| — |
| (13,123 | ) | — |
| — |
| 13,123 |
|
— |
| 8,400 |
| — |
| (8,400 | ) | — |
| @ |
| Syniverse Holdings, Inc. |
| — |
| 100,296 |
| — |
| (100,296 | ) | — |
| — |
| 100,296 |
|
— |
| 8,600 |
| — |
| (8,600 | ) | — |
| @ |
| Tekelec |
| — |
| 114,724 |
| — |
| (114,724 | ) | — |
| — |
| 114,724 |
|
— |
| 7,300 |
| — |
| (7,300 | ) | — |
|
|
| Telephone & Data Systems, Inc. |
| — |
| 231,775 |
| — |
| (231,775 | ) | — |
| — |
| 231,775 |
|
— |
| 55,600 |
| — |
| (55,600 | ) | — |
| @ |
| Tellabs, Inc. |
| — |
| 229,072 |
| — |
| (229,072 | ) | — |
| — |
| 229,072 |
|
— |
| 18,400 |
| — |
| (18,400 | ) | — |
| @, L |
| TW Telecom, Inc. |
| — |
| 155,848 |
| — |
| (155,848 | ) | — |
| — |
| 155,848 |
|
— |
| 2,900 |
| — |
| (2,900 | ) | — |
| @ |
| US Cellular Corp. |
| — |
| 125,396 |
| — |
| (125,396 | ) | — |
| — |
| 125,396 |
|
— |
| 57,800 |
| 452,000 |
| 150,606 |
| 660,406 |
|
|
| Verizon Communications, Inc. |
| — |
| 1,959,420 |
| 15,322,800 |
| 5,105,543 |
| 22,387,763 |
| — |
| 1,959,420 |
|
— |
| 600 |
| — |
| (600 | ) | — |
| @, L |
| Viasat, Inc. |
| — |
| 14,448 |
| — |
| (14,448 | ) | — |
| — |
| 14,448 |
|
— |
| 21,100 |
| — |
| (21,100 | ) | — |
|
|
| Windstream Corp. |
| — |
| 194,120 |
| — |
| (194,120 | ) | — |
| — |
| 194,120 |
|
|
|
|
|
|
|
|
|
|
|
|
|
|
| 5,791,815 |
| 16,266,521 |
| 71,389,622 |
| 10,857,650 |
| 104,305,608 | cs |
|
|
|
|
|
|
|
|
|
|
|
|
|
|
|
| Textiles: 0.0% |
|
|
|
|
|
|
|
|
|
|
|
|
|
|
|
— |
| 800 |
| — |
| (800 | ) | — |
|
|
| Unifirst Corp. |
| — |
| 23,752 |
| — |
| (23,752 | ) | — |
| — |
| 23,752 |
|
|
|
|
|
|
|
|
|
|
|
|
|
|
| — |
| 23,752 |
| — |
| (23,752 | ) | — | cs |
|
|
|
|
|
|
|
|
|
|
|
|
|
|
|
| Transportation: 2.0% |
|
|
|
|
|
|
|
|
|
|
|
|
|
|
| ||||||
— |
| 2,200 |
| — |
| (2,200 | ) | — |
|
|
| Alexander & Baldwin, Inc. |
| — |
| 55,132 |
| — |
| (55,132 | ) | — |
| — |
| 55,132 |
| ||||||
— |
| 6,100 |
| — |
| (6,100 | ) | — |
| L |
| Arkansas Best Corp. |
| — |
| 183,671 |
| — |
| (183,671 | ) | — |
| — |
| 183,671 |
| ||||||
— |
| — |
| 44,700 |
| 20,610 |
| 65,310 |
|
|
| Burlington Northern Santa Fe Corp. |
| — |
| — |
| 3,384,237 |
| 1,560,387 |
| 4,944,624 |
| — |
| — |
| ||||||
— |
| 6,500 |
| 64,200 |
| 23,101 |
| 93,801 |
|
|
| CSX Corp. |
| — |
| 211,055 |
| 2,084,574 |
| 750,091 |
| 3,045,720 |
| — |
| 211,055 |
| ||||||
135,500 |
| — |
| — |
| (135,500 | ) | — |
|
|
| DryShips, Inc. |
| 1,444,430 |
| — |
| — |
| (1,444,430 | ) | — |
| 1,444,430 |
| — |
| ||||||
— |
| 1,300 |
| — |
| (1,300 | ) | — |
| @@, L |
| Excel Maritime Carriers Ltd. |
| — |
| 9,152 |
| — |
| (9,152 | ) | — |
| — |
| 9,152 |
| ||||||
— |
| — |
| 49,250 |
| 22,708 |
| 71,958 |
|
|
| FedEx Corp. |
| — |
| — |
| 3,159,388 |
| 1,456,715 |
| 4,616,103 |
| — |
| — |
| ||||||
60,750 |
| 3,700 |
| — |
| (64,450 | ) | — |
| @@, L |
| Frontline Ltd. |
| 1,783,498 |
| 109,557 |
| — |
| (1,893,055 | ) | — |
| 1,783,498 |
| 109,557 |
| ||||||
— |
| 5,700 |
| — |
| (5,700 | ) | — |
| L |
| Genco Shipping & Trading Ltd. |
| — |
| 84,360 |
| — |
| (84,360 | ) | — |
| — |
| 84,360 |
| ||||||
— |
| 1,800 |
| — |
| (1,800 | ) | — |
| @ |
| Gulfmark Offshore, Inc. |
| — |
| 42,822 |
| — |
| (42,822 | ) | — |
| — |
| 42,822 |
| ||||||
— |
| 3,000 |
| — |
| (3,000 | ) | — |
|
|
| Heartland Express, Inc. |
| — |
| 47,280 |
| — |
| (47,280 | ) | — |
| — |
| 47,280 |
| ||||||
— |
| 3,000 |
| — |
| (3,000 | ) | — |
| @ |
| HUB Group, Inc. |
| — |
| 79,590 |
| — |
| (79,590 | ) | — |
| — |
| 79,590 |
| ||||||
— |
| 1,300 |
| — |
| (1,300 | ) | — |
| @ |
| Kirby Corp. |
| — |
| 35,568 |
| — |
| (35,568 | ) | — |
| — |
| 35,568 |
| ||||||
— |
| 100 |
| — |
| (100 | ) | — |
| @@, L |
| Nordic American Tanker Shipping |
| — |
| 3,375 |
| — |
| (3,375 | ) | — |
| — |
| 3,375 |
| ||||||
— |
| 18,800 |
| 59,500 |
| 8,634 |
| 86,934 |
|
|
| Norfolk Southern Corp. |
| — |
| 884,540 |
| 2,799,475 |
| 406,229 |
| 4,090,244 |
| — |
| 884,540 |
| ||||||
— |
| 200 |
| — |
| (200 | ) | — |
| @ |
| Old Dominion Freight Line |
| — |
| 5,692 |
| — |
| (5,692 | ) | — |
| — |
| 5,692 |
| ||||||
— |
| 4,600 |
| — |
| (4,600 | ) | — |
|
|
| Overseas Shipholding Group |
| — |
| 193,706 |
| — |
| (193,706 | ) | — |
| — |
| 193,706 |
| ||||||
— |
| 1,800 |
| — |
| (1,800 | ) | — |
|
|
| Pacer International, Inc. |
| — |
| 18,774 |
| — |
| (18,774 | ) | — |
| — |
| 18,774 |
| ||||||
— |
| 400 |
| — |
| (400 | ) | — |
|
|
| Ryder System, Inc. |
| — |
| 15,512 |
| — |
| (15,512 | ) | — |
| — |
| 15,512 |
| ||||||
137,972 |
| — |
| — |
| (137,972 | ) | — |
| @@ |
| Ship Finance International Ltd. |
| 1,524,591 |
| — |
| — |
| (1,524,591 | ) | — |
| 1,524,591 |
| — |
| ||||||
— |
| 300 |
| — |
| (300 | ) | — |
| @, @@ |
| TBS International Ltd. |
| — |
| 3,009 |
| — |
| (3,009 | ) | — |
| — |
| 3,009 |
| ||||||
— |
| 3,500 |
| — |
| (3,500 | ) | — |
|
|
| Tidewater, Inc. |
| — |
| 140,945 |
| — |
| (140,945 | ) | — |
| — |
| 140,945 |
| ||||||
— |
| — |
| 81,900 |
| 37,762 |
| 119,662 |
|
|
| Union Pacific Corp. |
| — |
| — |
| 3,914,820 |
| 1,805,026 |
| 5,719,846 |
| — |
| — |
| ||||||
— |
| — |
| 108,500 |
| 50,027 |
| 158,527 |
|
|
| United Parcel Service, Inc. - Class B |
| — |
| — |
| 5,984,860 |
| 2,759,474 |
| 8,744,334 |
| — |
| — |
| ||||||
— |
| 2,900 |
| — |
| (2,900 | ) | — |
| @@ |
| UTI Worldwide, Inc. |
| — |
| 41,586 |
| — |
| (41,586 | ) | — |
| — |
| 41,586 |
| ||||||
— |
| 9,400 |
| — |
| (9,400 | ) | — |
|
|
| Werner Enterprises, Inc. |
| — |
| 162,996 |
| — |
| (162,996 | ) | — |
| — |
| 162,996 |
| ||||||
— |
| 5,500 |
| — |
| (5,500 | ) | — |
| @, L |
| YRC Worldwide, Inc. |
| — |
| 15,785 |
| — |
| (15,785 | ) | — |
| — |
| 15,785 |
| ||||||
|
|
|
|
|
|
|
|
|
|
|
|
|
| 4,752,519 |
| 2,344,107 |
| 21,327,354 |
| 2,736,891 |
| 31,160,871 | cs |
|
|
|
| ||||||
|
|
|
|
|
|
|
|
|
|
|
| Trucking & Leasing: 0.0% |
|
|
|
|
|
|
|
|
|
|
|
|
|
|
| ||||||
— |
| 200 |
| — |
| (200 | ) | — |
| @ |
| Amerco, Inc. |
| — |
| 6,906 |
| — |
| (6,906 | ) | — |
| — |
| 6,906 |
| ||||||
— |
| 2,100 |
| — |
| (2,100 | ) | — |
|
|
| GATX Corp. |
| — |
| 65,037 |
| — |
| (65,037 | ) | — |
| — |
| 65,037 |
| ||||||
— |
| 900 |
| — |
| (900 | ) | — |
| @@ |
| Textainer Group Holdings Ltd. |
| — |
| 9,540 |
| — |
| (9,540 | ) | — |
| — |
| 9,540 |
| ||||||
|
|
|
|
|
|
|
|
|
|
|
|
|
| — |
| 81,483 |
| — |
| (81,483 | ) | — | cs |
|
|
|
| ||||||
|
|
|
|
|
|
|
|
|
|
|
| Water: 0.0% |
|
|
|
|
|
|
|
|
|
|
|
|
|
|
| ||||||
— |
| 100 |
| — |
| (100 | ) | — |
| @, L |
| Pico Holdings, Inc. |
| — |
| 2,658 |
| — |
| (2,658 | ) | — |
| — |
| 2,658 |
| ||||||
|
|
|
|
|
|
|
|
|
|
|
|
|
| — |
| 2,658 |
| — |
| (2,658 | ) | — | cs |
|
|
|
| ||||||
|
|
|
|
|
|
|
|
|
|
|
|
|
|
|
|
|
|
|
|
|
|
|
|
|
|
|
| ||||||
|
|
|
|
|
|
|
|
|
|
|
| Total Common Stock |
| 236,217,056 |
| 248,177,213 |
| 1,031,368,914 |
| (8,855,638 | ) | 1,506,907,545 | lt |
|
|
|
| ||||||
|
|
|
|
|
|
|
|
|
|
|
| (Cost $) |
| 357,946,551 |
| 354,987,767 |
| 1,315,775,095 |
| — |
| 2,028,709,413 | ltc |
|
|
|
| ||||||
|
|
|
|
|
|
|
|
|
|
|
|
|
|
|
|
|
|
|
|
|
|
|
|
|
|
|
| ||||||
REAL ESTATE INVESTMENT TRUSTS: 0.2% |
|
|
|
|
|
|
|
|
|
|
|
|
|
|
|
|
|
|
|
|
|
|
| ||||||||||
|
|
|
|
|
|
|
|
|
|
|
|
|
|
|
|
|
|
|
|
|
|
|
|
|
|
|
| ||||||
|
|
|
|
|
|
|
|
|
|
|
| Diversified: 0.0% |
|
|
|
|
|
|
|
|
|
|
|
|
|
|
| ||||||
10,900 |
| — |
| — |
| (10,900 | ) | — |
|
|
| Vornado Realty Trust |
| 657,815 |
| — |
| — |
| (657,815 | ) | — |
| 657,815 |
| — |
| ||||||
|
|
|
|
|
|
|
|
|
|
|
|
|
| 657,815 |
| — |
| — |
| (657,815 | ) | — | reit |
|
|
|
| ||||||
|
|
|
|
|
|
|
|
|
|
|
| Mortgage: 0.0% |
|
|
|
|
|
|
|
|
|
|
|
|
|
|
| ||||||
278,200 |
| — |
| — |
| (278,200 | ) | — |
|
|
| Annaly Capital Management, Inc. |
| 4,415,034 |
|
|
|
|
| (4,415,034 | ) | — |
| 4,415,034 |
| — |
| ||||||
|
|
|
|
|
|
|
|
|
|
|
|
|
| 4,415,034 |
| — |
| — |
| (4,415,034 | ) | — | reit |
|
|
|
| ||||||
|
|
|
|
|
|
|
|
|
|
|
|
|
|
|
|
|
|
|
|
|
|
|
|
|
|
|
| ||||||
|
|
|
|
|
|
|
|
|
|
|
| Regional Malls: 0.2% |
|
|
|
|
|
|
|
|
|
|
|
|
|
|
| ||||||
— |
| — |
| 35,700 |
| 16,460 |
| 52,160 |
|
|
| Simon Property Group, Inc. |
| — |
| — |
| 1,896,741 |
| 874,540 |
| 2,771,281 |
| — |
| — |
| ||||||
|
|
|
|
|
|
|
|
|
|
|
|
|
| — |
| — |
| 1,896,741 |
| 874,540 |
| 2,771,281 | reit |
|
|
|
| ||||||
|
|
|
|
|
|
|
|
|
|
|
|
|
|
|
|
|
|
|
|
|
|
|
|
|
|
|
| ||||||
|
|
|
|
|
|
|
|
|
|
|
| Total Real Estate Investment Trusts |
| 5,072,849 |
| — |
| 1,896,741 |
| (4,198,309 | ) | 2,771,281 | lt |
|
|
|
| ||||||
|
|
|
|
|
|
|
|
|
|
|
| (Cost $) |
| 4,860,287 |
| — |
| 2,875,449 |
| — |
| 7,735,736 | ltc |
|
|
|
| ||||||
|
|
|
|
|
|
|
|
|
|
|
|
|
|
|
|
|
|
|
|
|
|
|
|
|
|
|
| ||||||
|
|
|
|
|
|
|
|
|
|
|
| Total Long-Term Investments |
| 241,289,905 |
| 248,177,213 |
| 1,033,265,655 |
| (13,053,947 | ) | 1,509,678,826 | tis |
|
|
|
| ||||||
|
|
|
|
|
|
|
|
|
|
|
| (Cost $) |
| 362,806,838 |
| 354,987,767 |
| 1,318,650,544 |
| (13,053,947 | ) | 2,036,445,149 | tisc |
|
|
|
| ||||||
|
|
|
|
|
|
|
|
|
|
|
|
|
|
|
|
|
|
|
|
|
|
|
|
|
|
|
| ||||||
SHORT—TERM INVESTMENTS: 3.1% |
|
|
|
|
|
|
|
|
|
|
|
|
|
|
|
|
|
|
|
|
|
|
| ||||||||||
|
|
|
|
|
|
|
|
|
|
|
| Affiliated Mutual Fund: 3.1% |
|
|
|
|
|
|
|
|
|
|
|
|
|
|
| ||||||
— |
| 2,499,042 |
| 33,732,000 |
| 13,053,947 |
| 49,284,989 |
| S |
| ING Institutional Prime Money Market Fund - Class I |
| — |
| 2,499,042 |
| 33,732,000 |
| 13,053,947 |
| 49,284,989 |
| — |
| 2,499,042 |
| ||||||
|
|
|
|
|
|
|
|
|
|
|
|
|
|
|
|
|
|
|
|
|
|
|
|
|
|
|
| ||||||
|
|
|
|
|
|
|
|
|
|
|
| Total Affiliated Mutual Fund |
| — |
| 2,499,042 |
| 33,732,000 |
| 13,053,947 |
| 49,284,989 | st |
|
|
|
| ||||||
|
|
|
|
|
|
|
|
|
|
|
| (Cost $) |
| — |
| 2,499,042 |
| 33,732,000 |
| 13,053,947 |
| 49,284,989 | stc |
|
|
|
| ||||||
|
|
|
|
|
|
|
|
|
|
|
|
|
|
|
|
|
|
|
|
|
|
|
|
|
|
|
| ||||||
Principal Amount |
|
|
|
|
|
|
|
|
|
|
|
|
|
|
| Value |
|
|
|
|
|
|
|
|
|
|
| ||||||
|
|
|
|
|
|
|
|
|
|
|
|
|
|
|
|
|
|
|
|
|
|
|
|
|
|
|
| ||||||
|
|
|
|
|
|
|
|
|
|
|
| Securities Lending Collateralcc: 0.0% |
|
|
|
|
|
|
|
|
|
|
|
|
|
|
| ||||||
— |
| 8,520,461 |
| — |
| (8,520,461 | ) | — |
|
|
| Bank of New York Mellon Corp. Institutional Cash Reserves |
| — |
| 8,415,873 |
| — |
| (8,415,873 | ) | — |
| — |
| 8,415,873 |
| ||||||
|
|
|
|
|
|
|
|
|
|
|
|
|
|
|
|
|
|
|
|
|
|
|
|
|
|
|
| ||||||
|
|
|
|
|
|
|
|
|
|
|
| Total Securities Lending Collateral |
| — |
| 8,415,873 |
| — |
| (8,415,873 | ) | — | st |
|
|
|
| ||||||
|
|
|
|
|
|
|
|
|
|
|
| (Cost $) |
| — |
| 8,520,461 |
| — |
| (8,520,461 | ) | — | stc |
|
|
|
| ||||||
|
|
|
|
|
|
|
|
|
|
|
|
|
|
|
|
|
|
|
|
|
|
|
|
|
|
|
| ||||||
|
|
|
|
|
|
|
|
|
|
|
| Total Short-Term Investments |
| — |
| 10,914,915 |
| 33,732,000 |
| 4,638,074 |
| 49,284,989 | tis |
|
|
|
| ||||||
|
|
|
|
|
|
|
|
|
|
|
| (Cost $) |
| — |
| 11,019,503 |
| 33,732,000 |
| 4,533,486 |
| 49,284,989 | tisc |
|
|
|
| ||||||
|
|
|
|
|
|
|
|
|
|
|
|
|
|
|
|
|
|
|
|
|
|
|
|
|
|
|
| ||||||
|
|
|
|
|
|
|
|
|
|
|
| Total Investments in Securities | 98.0 | % | $ | 241,289,905 |
| $ | 259,092,128 |
| $ | 1,066,997,655 |
| $ | (8,415,873 | ) | $ | 1,558,963,815 |
|
|
|
|
|
|
|
|
|
|
|
|
|
|
|
|
| (Cost $) * |
|
| 362,806,838 |
| 366,007,270 |
| 1,352,382,544 |
| 500,382,033 |
| 1,857,298,063 |
|
|
|
|
| |||||
|
|
|
|
|
|
|
|
|
|
|
| Other Assets and Liabilities - Net | 2.0 |
| 9,680,414 |
| (7,584,458 | ) | 20,641,235 |
| 8,415,873 |
| 31,153,064 |
|
|
|
|
| |||||
|
|
|
|
|
|
|
|
|
|
|
| Net Assets prior proforma adjustments | 100.0 | % | $ | 250,970,319 |
| $ | 251,507,670 |
| $ | 1,087,638,890 |
| $ | — |
| $ | 1,590,116,879 |
|
|
|
|
|
|
|
|
|
|
|
|
|
|
|
|
|
|
|
|
|
|
|
|
|
|
|
|
|
|
|
|
|
| |||||
|
|
|
|
|
|
|
|
|
|
|
| Proforma adjustments | — |
| — |
| — |
| — |
| — |
| — |
|
|
|
|
| |||||
|
|
|
|
|
|
|
|
|
|
|
| Net Assets after proforma adjustments | 100.0 | % | $ | 250,970,319 |
| $ | 251,507,670 |
| $ | 1,087,638,890 |
| $ | — |
| $ | 1,590,116,879 |
| 241,289,905 |
| 259,092,128 |
|
|
|
|
|
|
|
|
|
|
|
|
|
|
|
|
|
|
|
|
|
|
|
|
|
|
|
|
| ||||||
|
|
|
|
|
|
|
|
|
| @ |
| Non-income producing security | |||||||||||||||||||||
|
|
|
|
|
|
|
|
|
| @@ |
| Foreign Issuer | |||||||||||||||||||||
|
|
|
|
|
|
|
|
|
| ADR |
| American Depositary Receipt | ||||||||||||||||||||
|
|
|
|
|
|
|
|
|
| cc |
| Securities purchased with cash collateral for securities loaned. | ||||||||||||||||||||
|
|
|
|
|
|
|
|
|
| I |
| Illiquid security | ||||||||||||||||||||
|
|
|
|
|
|
|
|
|
| L |
| Loaned security, a portion or all of the security is on loan at December 31, 2008. | ||||||||||||||||||||
|
|
|
|
|
|
|
|
|
| ## |
| On September 7, 2008, the Federal Housing Finance Agency placed the Federal National Mortgage Association and the Federal Home Loan Mortgage Corporation into conservatorship and the U.S. Treasury guaranteed the debt issued by those organizations. | ||||||||||||||||||||
|
|
|
|
|
|
|
|
|
| S |
| All or a portion of this security is segregated to cover collateral requirements for applicable futures, options, swaps, foreign forward currency contracts and/or when-issued or delayed-delivery securities. | ||||||||||||||||||||
|
|
|
|
|
|
|
|
|
|
|
|
| ||||||||||||||||||||
|
|
|
|
|
|
|
|
|
| * |
| Cost for federal income tax purposes is |
| $ | 415,546,164 |
| $ | 371,709,034 |
| $ | 1,362,798,818 |
| $ | 491,966,160 |
| $ | 1,854,764,978 |
|
|
|
|
|
|
|
|
|
|
|
|
|
|
|
|
| Net unrealized depreciation consists of: |
|
|
|
|
|
|
|
|
|
|
|
|
|
|
| |||||
|
|
|
|
|
|
|
|
|
|
|
| Gross Unrealized Appreciation |
| $ | 1,954,392 |
| $ | 3,623,539 |
| $ | 3,029,284 |
| $ | (5,577,931 | ) | 3,029,284 |
|
|
|
|
| |
|
|
|
|
|
|
|
|
|
|
|
| Gross Unrealized Depreciation |
| (176,210,651 | ) | (116,240,445 | ) | (298,830,447 | ) | 292,451,096 |
| (298,830,447 | ) |
|
|
|
| |||||
|
|
|
|
|
|
|
|
|
|
|
| Net Unrealized Depreciation |
| $ | (174,256,259 | ) | $ | (112,616,906 | ) | $ | (295,801,163 | ) | $ | 286,873,165 |
| $ | (295,801,163 | ) |
|
|
|
|
|
|
|
|
|
|
|
|
|
|
|
|
|
|
|
|
|
|
|
|
|
|
|
|
|
|
|
| |||||
|
|
|
|
|
|
|
|
|
|
|
| The following table summarizes the inputs used as of December 31, 2008 in determining the Portfolio’s investments at fair value for purposes of SFAS 157: | ||||||||||||||||||||
|
|
|
|
|
|
|
|
|
|
|
|
|
|
|
|
|
|
|
|
|
|
|
|
|
|
|
| |||||
|
|
|
|
|
|
|
|
|
|
|
| Investments in Securities |
|
|
|
|
|
|
|
|
|
|
|
|
|
|
| |||||
|
|
|
|
|
|
|
|
|
|
|
| Level 1- Quoted Prices |
| $ | 237,793,071 |
| $ | 250,676,254 |
| $ | 1,066,788,159 |
| $ | — |
| $ | 1,555,257,484 |
|
|
|
|
|
|
|
|
|
|
|
|
|
|
|
|
| Level 2- Other Significant Observable Inputs |
| 3,496,834 |
| 8,415,874 |
| 209,496 |
| (8,415,873 | ) | 3,706,331 |
|
|
|
|
| |||||
|
|
|
|
|
|
|
|
|
|
|
| Level 3- Significant Unobservable Inputs |
| — |
| — |
| — |
| — |
| — |
|
|
|
|
| |||||
|
|
|
|
|
|
|
|
|
|
|
| Total |
| $ | 241,289,905 |
| $ | 259,092,128 |
| $ | 1,066,997,655 |
| $ | (8,415,873 | ) | $ | 1,558,963,815 |
|
|
|
|
|
|
|
|
|
|
|
|
|
|
|
|
|
|
|
|
|
|
|
|
|
|
|
|
|
|
|
|
| |||||
|
|
|
|
|
|
|
|
|
|
|
| Other Financial Instruments* |
|
|
|
|
|
|
|
|
|
|
|
|
|
|
| |||||
|
|
|
|
|
|
|
|
|
|
|
| Level 1- Quoted Prices |
| $ | — |
| $ | — |
| $ | 1,056,411 |
| $ | — |
| $ | 1,056,411 |
|
|
|
|
|
|
|
|
|
|
|
|
|
|
|
|
| Level 2- Other Significant Observable Inputs |
| — |
| — |
| — |
| — |
| — |
|
|
|
|
| |||||
|
|
|
|
|
|
|
|
|
|
|
| Level 3- Significant Unobservable Inputs |
| — |
| — |
| — |
| — |
| — |
|
|
|
|
| |||||
|
|
|
|
|
|
|
|
|
|
|
| Total |
| $ | — |
| $ | — |
| $ | 1,056,411 |
| $ | — |
| $ | 1,056,411 |
|
|
|
|
|
|
|
|
|
|
|
|
|
|
|
|
|
|
|
|
|
|
|
|
|
|
|
|
|
|
|
|
| |||||
|
|
|
|
|
|
|
|
|
|
|
| “Fair value” for purposes of SFAS 157 is different from “fair value” as used in the 1940 Act. The former generally implies market value, and can include market quotations as a source of value, and the latter refers to determinations of actual value in absence of available market quotations. | ||||||||||||||||||||
|
|
|
|
|
|
|
|
|
|
|
|
| ||||||||||||||||||||
|
|
|
|
|
|
|
|
|
|
|
| * Other financial instruments may include forward foreign currency contracts, futures, swaps, and written options. Forward foreign currency contracts and futures are reported at their unrealized gain/loss at year end. Swaps and written options are reported at their market value at year end. | ||||||||||||||||||||
|
|
|
|
|
|
|
|
|
|
|
| ING Russell Large Cap Index Portfolio Open Futures Contracts on December 31, 2008 |
|
|
|
|
|
|
| |||||||
|
|
|
|
|
|
|
|
|
|
|
|
|
|
|
|
|
|
|
| |||||||
|
|
|
|
|
|
|
|
|
|
|
| Contract Description |
| Number |
| Expiration Date |
| Unrealized |
|
|
|
|
|
|
| |
|
|
|
|
|
|
|
|
|
|
|
| Long Contracts |
|
|
|
|
|
|
|
|
|
|
|
|
| |
|
|
|
|
|
|
|
|
|
|
|
| S&P 500 |
| 216 |
| 03/19/09 |
| $ | 1,056,411 |
|
|
|
|
|
|
|
|
|
|
|
|
|
|
|
|
|
|
|
|
|
|
|
|
| $ | 1,056,411 |
|
|
|
|
|
|
|
NOTES TO PRO FORMA FINANCIAL STATEMENTS
Note 1 — Basis of Combination:
The Board of Directors/Trustees (“Board”) of each of ING Neuberger Berman Partners Portfolio (“Neuberger Berman Partners”), ING Oppenheimer Main Street Portfolio®(“Oppenheimer Main Street”) and ING RussellTM Large Cap Index Portfolio (“Russell Large Cap”) (each of Neuberger Berman Partners and Oppenheimer Main Street a “Disappearing Portfolio” and along with Russell Large Cap each a “Portfolio” and collectively, the “Portfolios”) approved the Agreements and Plans of Reorganization dated March 27, 2009 (each, a “Plan”) whereby, subject to approval by the shareholders of each Disappearing Portfolio, Russell Large Cap will acquire all of the assets of the Disappearing Portfolio, subject to the liabilities of that Disappearing Portfolio, in exchange for a number of shares of Russell Large Cap equal in value to the net assets of that Disappearing Portfolio (each, a “Merger”).
Each Merger will be accounted for as a tax-free merger of investment companies with Russell Large Cap remaining as both the tax and accounting survivor. The unaudited pro forma combined financial statements are presented for the information of the reader and may not necessarily be representative of what the actual combined financial statements would have been had the reorganization(s) occurred at December 31, 2008. The unaudited pro forma combined Portfolio of Investments and Statement of Assets and Liabilities reflect the combined financial position of Neuberger Berman Partners, Oppenheimer Main Street and Russell Large Cap at December 31, 2008. The unaudited pro forma combined Statement of Operations reflects combined the results of operations of Neuberger Berman Partners, Oppenheimer Main Street and Russell Large Cap for the twelve-months ended December 31, 2008. These statements have been derived from the Portfolios’ respective books and records utilized in calculating daily net asset value at the date indicated above for Neuberger Berman Partners, Oppenheimer Main Street and Russell Large Cap under U.S. generally accepted accounting principles for investment companies. The unaudited pro forma Portfolio of Investments reflects the pro forma combined portfolio holdings of Neuberger Berman Partners, Oppenheimer Main Street and Russell Large Cap as of December 31, 2008. This pro forma Portfolio of Investments reflects management’s anticipation that most portfolio transitioning, including the sale of most holdings of Neuberger Berman Partners and Oppenheimer Main Street and the purchases of assets Russell Large Cap may hold or wish to hold, will take place shortly prior to the closing date of the Mergers. The historical cost of investment securities will be carried forward to the surviving entity and the results of operations of Russell Large Cap for pre-combination periods will not be restated.
The unaudited pro forma combined Portfolio of Investments, and unaudited pro forma combined Statement of Assets and Liabilities and Statement of Operations should be read in conjunction with the historical financial statements of each Portfolio, which are incorporated by reference in the Statement of Additional Information.
Note 2 — Security Valuation:
Investments in equity securities traded on a national securities exchange are valued at the last reported sale price. Securities reported by the NASDAQ will be valued at the NASDAQ official closing price. Portfolio securities traded on an exchange or NASDAQ for which there has been no sale and securities traded in the over-the-counter-market are valued at the mean between the last reported bid and ask prices. All investments quoted in foreign currencies will be valued daily in U.S. dollars on the basis of the foreign currency exchange rates prevailing at the time such valuation is determined by each Portfolio’s custodian. Debt securities are valued at bid prices obtained from independent services or from one or more dealers making markets in the securities and may be adjusted based on the Portfolios’ valuation procedures. U.S. Government obligations are valued by using market quotations or independent pricing services that use prices provided by market-makers or estimates of market values obtained from yield data relating to instruments or securities with similar characteristics. Securities for which market quotations are not readily available are valued at their fair values as determined in good faith and in accordance with policies set by the Board of the Portfolios. Among elements of analysis, the Board has authorized the use of one or more research services to assist with the determination of the fair value of foreign securities in light of significant
events. Research services use statistical analyses and quantitative models to help determine fair value as of the time a Portfolio calculates its net asset value. Investments in securities maturing in 60 days or less are valued at amortized cost, which, when combined with accrued interest, approximates market value.
Note 3 — Capital Shares:
The unaudited pro forma net asset value per share assumes additional shares of common Russell Large Cap issued in connection with the proposed acquisition of Neuberger Berman Partners and Oppenheimer Main Street by Russell Large Cap as of December 31, 2008. The number of additional shares issued was calculated by dividing the net assets of each Class of Neuberger Berman Partners and Oppenheimer Main Street by the respective class net asset value per share of Russell Large Cap.
Note 4 — Unaudited Pro Forma Adjustments:
The accompanying unaudited pro forma financial statements reflect changes in Portfolio shares as if the merger had taken place on December 31, 2008. Neuberger Berman Partners and Oppenheimer Main Street expenses were adjusted assuming Russell Large Cap’s fee structure was in effect for the twelve months ended December 31, 2008.
Note 5 — Merger Costs:
The expenses relating to each proposed Reorganization will be borne by ING Investments, LLC (or an affiliate). The expenses of each Reorganization shall include, but not limited to, the costs associated with the preparation of any necessary filings with the SEC, printing and distributing the Proxy Statement/Prospectus and proxy materials, legal fees, accounting fees, securities registration fees, and expenses of holding the Special Meeting.
Note 6 — Use of Estimates in Preparation of Pro Forma Financial Statements:
Management of the Portfolios has made certain estimates and assumptions relating to the reporting of assets, liabilities, income, and expenses to prepare these financial statements in conformity with U.S. generally accepted accounting principles for investment companies. Actual results could differ from these estimates.
Note 7 — Federal Income Taxes:
It is the policy of the Portfolios to comply with subchapter M of the Internal Revenue Code and related excise tax provisions applicable to regulated investment companies and to distribute substantially all of their net investment income and any net realized capital gains to their shareholders. Therefore, no federal income tax provision is required. No capital gain distributions shall be made until any capital loss carryforwards have been fully utilized or expired. A portion of the amount of these capital loss carryforwards may be limited in the future.
PORTFOLIO MANAGERS’ REPORT FOR
ING RUSSELL™ LARGE CAP INDEX PORTFOLIO
Set forth below is an excerpt from ING Russell™ Large Cap Index Portfolio’s Annual Report for the fiscal year ended December 31, 2008.
* * *
MARKET PERSPECTIVE: YEAR ENDED DECEMBER 31, 2008
In our semi-annual report, we described a failed second quarter rally that fizzled when investors realized that borderline recessionary conditions and a credit crunch had not gone away. By year-end, governments were committing previously unimaginable sums of taxpayer money to prevent systemic collapse. Global equities in the form of the MSCI World® Index(1) measured in local currencies, including net reinvested dividends (“MSCI” for regions discussed below) plunged 29.70% in the six months ended December 31, 2008 (down 38.70% for the entire fiscal year). (The MSCI World® Index plunged 40.71% for the entire fiscal year, measured in U.S. dollars.) In currencies, the dollar at first drifted near record lows against the euro. But the tide turned in mid-July and for the six months ended December 31, 2008, the dollar strengthened by 12.10% (4.50% for the entire fiscal year). The dollar also soared 37.80% against the pound for the six months ended December 31, 2008 (37.90% for the entire fiscal year). But the yen advanced as carry trades (essentially short yen positions) were unwound and the dollar fell 14.90% for the six months ended December 31, 2008 (down 19.60% for the entire fiscal year).
Even more dramatic was the price of oil which marched to an all-time high of around $147 per barrel in mid-July, only to lose more than two thirds of that price by December 31, 2008.
The economic statistics remained bleak. By the end of October, the Standard & Poor’s (“S&P”)/Case-Shiller National U.S. Home Price Index(2) of house prices had fallen a record 18% over the year. New home sales were at 1991 levels. Some 45% of existing home sales were distressed.
Payrolls declined in every month of 2008, as the number of people claiming unemployment reached 4.1 million, a 26-year high. Gross domestic product (“GDP”) fell at an annualized rate of 0.50% in the third quarter, and the National Bureau of Economic Research announced that the recession had actually started in December 2007.
Yet these were side-shows to the fireworks display in the financial sector, where major institutions — hanging by a thread through problems rooted in unwise mortgage borrowing, lending and investment — met different fates in September 2008 at the hands of the U.S. government.
The Federal National Mortgage Association (“Fannie Mae”) and the Federal Home Loan Mortgage Corporation (“Freddie Mac”) were taken into “conservatorship.” Merrill Lynch was acquired by the Bank of America with a wink from the authorities. AIG received an $85 billion loan from a reluctant government, which also took a 79.90% equity stake in AIG. But Lehman Brothers having sought capital, then a buyer, found neither and was left to file for Chapter 11 bankruptcy protection.
The U.S. government was now in the position of choosing winners and losers among financial institutions: none too successfully, for it quickly became obvious that by pointedly leaving Lehman Brothers to go under, a credit crisis had become a credit market collapse. Lending all but seized up.
Policy response was huge but at least initially muddled. A Troubled Asset Relief Plan (“TARP”) would set up a $700 billion fund to buy illiquid mortgage securities from financial institutions. But on November 12, 2008 with half of the money already used to recapitalize banks, Treasury Secretary Paulson announced that the rest of the funds would not be used to buy illiquid mortgage securities after all. This merely renewed the pressure on the holders of such securities like Citigroup, which within two weeks received guarantees from the government against losses and another $20 billion in capital.
Other programs were of more practical use, like support for the commercial paper market and a guarantee facility for money market funds. Arguably the most effective measure was the announced intention to buy vast quantities of agency mortgage-backed securities and debentures. This had the effect of driving down rates on the 30-year mortgage towards 5.00%, a record low. In the meantime, the newly-elected president promised a stimulus package worth approximately $1 trillion. And by year end, the Federal Open Market Committee (“FOMC”) reduced interest rates to a range of between 0% and 0.25%.
2008 ended with much gloom and bad news still to come, but the platform for recovery was perhaps taking shape.
2
In U.S. fixed-income markets, yields on the 90-day Treasury Bills briefly turned negative in December 2008, while the yield on the ten-year Treasury Note fell below 2.50%, something we had not seen in 50 years. The Barclays Capital U.S. Aggregate Bond Index(3), formerly known as the Lehman Brothers U.S. Aggregate Bond Index, of investment grade bonds returned 4.10% for the six months ended December 31, 2008, (5.20% for the entire fiscal year). By contrast, high yield bonds, represented by the Barclays Capital High Yield Bond — 2% Issuer Constrained Composite Index(4), formerly known as the Lehman Brothers High Yield Bond — 2% Issuer Constrained Composite Index, behaved more like a stock index and returned (25.10)% for the six months ended December 31, 2008 (down 25.90% for the entire fiscal year).
U.S. equities, represented by the S&P 500® Composite Stock Price (“S&P 500®”) Index(5), including dividends, returned (28.50)% for the six months ended December 31, 2008, (down 37.00% for the entire fiscal year), increasingly unimpressed by sharply falling oil prices. Profits for S&P 500® Index companies suffered their fifth straight quarter of decline, led again by the financials sector, although taxpayer money was also potentially committed to save the big three auto makers from bankruptcy. On November 20, 2008, the S&P 500® Index plumbed a level not seen since April 1997, before a December recovery.
In international markets, plainly entering recession, the MSCI Japan® Index(6) slumped 35.90% for the six months ended December 31, 2008, (down 42.60% for the entire fiscal year). The strengthening yen hit exports in an export-dependent economy even as global demand slowed for other reasons. The MSCI Europe ex UK® Index(7) sagged 29.40% for the six months ended December 31, 2008 (down 43.20% for the entire fiscal year), beset by sharply falling economic activity and a European Central Bank in denial that inflation was falling fast. Finally, rates were reduced by an unprecedented 175 basis points (or 1.75%) in two months near the end of the year while governments, one after the other, proposed large stimulus packages. In the UK, the MSCI UK® Index(8) fell 19.40% for the six months ended December 31, 2008 (down 28.50% for the entire fiscal year). The UK had allowed a bigger housing bubble than the United States and deeper personal indebtedness in an economy more dependent on the financial sector. Rates were reduced to 1951 levels as venerable banks ceased to exist as independent entities.
(1) The MSCI World® Index is an unmanaged index that measures the performance of over 1,400 securities listed on exchanges in the U.S., Europe, Canada, Australia, New Zealand and the Far East.
(2) The S&P/Case-Shiller National U.S. Home Price Index tracks the value of single-family housing within the United States. The index is a composite of single-family home price indices for the nine U.S. Census divisions and is calculated quarterly.
(3) The Barclays Capital U.S. Aggregate Bond Index is an unmanaged index of publicly issued investment grade U.S. Government, mortgage-backed, asset-backed and corporate debt securities.
(4) The Barclays Capital High Yield Bond — 2% Issuer Constrained Composite Index is an unmanaged index that measures the performance of non-investment grade fixed-income securities.
(5) The S&P 500® Index is an unmanaged index that measures the performance of securities of approximately 500 of the largest companies in the United States.
(6) The MSCI Japan® Index is a free float-adjusted market capitalization index that is designed to measure developed market equity performance in Japan.
(7) The MSCI Europe ex UK® Index is a free float-adjusted market capitalization index that is designed to measure developed market equity performance in Europe, excluding the UK.
(8) The MSCI UK® Index is a free float-adjusted market capitalization index that is designed to measure developed market equity performance in the UK.
All indices are unmanaged and investors cannot invest directly in an index.
Past performance does not guarantee future results. The performance quoted represents past performance. Investment return and principal value of an investment will fluctuate, and shares, when redeemed, may be worth more or less than their original cost. The Portfolios’ performance is subject to change since the period’s end and may be lower or higher than the performance data shown. Please call (800) 992-0180 or log on to www.ingfunds.com to obtain performance data current to the most recent month end.
Market Perspective reflects the views of ING’s Chief Investment Risk Officer only through the end of the period, and is subject to change based on market and other conditions.
* * *
3
ING RUSSELL™ LARGE CAP INDEX PORTFOLIO
PORTFOLIO MANAGERS’ REPORT
ING Russell™ Large Cap Index Portfolio (the “Portfolio”) seeks investment results (before fees and expenses) that correspond to the total return of the Russell Top 200® Index(1). The Portfolio is managed by Omar Aguilar, Ph.D. and Vincent Costa, Portfolio Managers* of ING Investment Management Co. (“ING IM”) — the Sub-Adviser.
Performance: Since its inception on March 10, 2008 through December 31, 2008, the Portfolio’s Class S shares provided a total return of (27.23)% compared to the Russell Top 200® Index, which returned (29.78)% for the period of March 1, 2008 through December 31, 2008.
Portfolio Specifics: The Portfolio employs a “passive management” approach designed to track the performance of the Russell Top 200® Index. The Portfolio attempts to track the Russell Top 200® Index by investing all, or substantially all, of its assets in stocks that make up the Russell Top 200® Index. The Portfolio may not always hold all of the same securities as the Russell Top 200® Index.
Most sectors had negative returns during the period with financials, information technology, energy and industrials leading the way down.
Current Outlook & Strategy: Our view is that the decline in economic activity is global. The plunge in Germany’s Ifo Business Climate Index of business confidence and Japan’s Shoko Chukin Bank Index of small business confidence, along with sharp declines in industrial production, point to a sharp contraction in economic activity in Europe and Japan that could last several quarters.
The challenge to policymakers around the world is to break the cycle by which tighter credit conditions result in an economic contraction, which leads in turn to further losses and tightening in the financial system. In our view, massive fiscal stimulus packages and central bank easing eventually will break that loop, but that has not occurred yet.
While it appears that this recession may be the most severe since that of 1981-82, many of the extreme market movements in October and November reflect de-leveraging by hedge funds and other investors, in our view, rather than an exceptionally pessimistic assessment of the outlook for the global economy.
It is worth remembering that the stock market often retests its lows again before a bear market rally turns into a bull market.
4
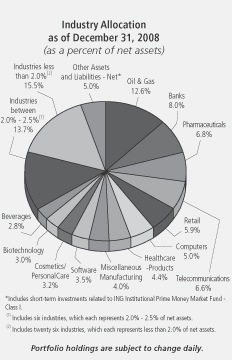
Top Ten Holdings*
as of December 31, 2008
(as a percent of net assets)
ExxonMobil Corp |
| 6.1 | % |
Procter & Gamble Co. |
| 2.7 | % |
General Electric Co. |
| 2.5 | % |
AT&T, Inc. |
| 2.5 | % |
Johnson & Johnson |
| 2.5 | % |
Microsoft Corp. |
| 2.3 | % |
Chevron Corp |
| 2.2 | % |
Wal-Mart Stores, Inc. |
| 1.8 | % |
Pfizer, Inc. |
| 1.7 | % |
JPMorgan Chase & Co. |
| 1.7 | % |
* Excludes short-term investments related to ING Institutional Prime Money Market Fund - Class I
Portfolio holdings are subject to change daily.
* Effective January 13, 2009, Mr. Aguilar is no longer a portfolio manager to the Portfolio.
Portfolio holdings and characteristics are subject to change and may not be representative of current holdings and characteristics. The outlook for this Portfolio may differ from that presented for other ING Funds. Performance for the different classes of shares will vary based on differences in fees associated with each class.
5
ING Russell™ Large Cap Index Portfolio
Portfolio Manager’s Report
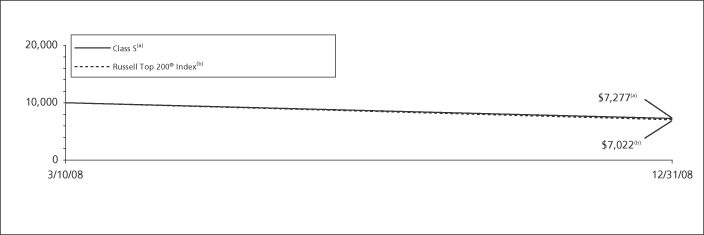
Cumulative Total Returns for the Period Ended December 31, 2008
|
| Since Inception |
|
Class ADV |
| (27.42 | )% |
Class I |
| (27.06 | )% |
Class S |
| (27.23 | )% |
Russell Top 200® Index(1) |
| (29.78 | )%(2) |
Based on a $10,000 initial investment, the graph and table above illustrate the total return of ING Russell™ Large Cap Index Portfolio against the index indicated. An index has no cash in its portfolio, imposes no sales charges and incurs no operating expenses. An investor cannot invest directly in an Index. The Portfolio’s performance is shown without the imposition of any expenses or charges which are, or may be, imposed under your annuity contract. Total returns would have been lower if such expenses or charges were included.
The performance graph and table do not reflect the deduction of taxes that a shareholder will pay on portfolio distributions or the redemption of portfolio shares.
The performance shown may include the effect of fee waivers and/or expense reimbursements by the Investment Adviser and/or other service providers, which have the effect of increasing total return. Had all fees and expenses been considered, the total returns would have been lower.
The performance update illustrates performance for a variable investment option available through a variable annuity contract. The performance shown indicates past performance and is not a projection or prediction of future results. Actual investment returns and principal value will fluctuate so that shares and/or units, at redemption, may be worth more or less than their original cost. Please call (800) 992-0180 to get performance through the most recent month end.
It is important to note that the Portfolio has a limited operating history. Performance over a longer period of time may be more meaningful than short-term performance.
This report contains statements that may be “forward-looking” statements. Actual results may differ materially from those projected in the “forward-looking” statements.
6
The views expressed in this report reflect those of the portfolio managers, only through the end of the period as stated on the cover. The portfolio managers’ views are subject to change at any time based on market and other conditions.
Portfolio holdings are subject to change daily.
(1) The Russell Top 200® Index measures the performance of the largest cap segment of the U.S. equity universe. The Russell Top 200® Index is a subset of the Russell Top 300® Index. It includes approximately 200 of the largest securities based on a combination of their market cap and current index membership and represents approximately 68% of the U.S. market.
(2) Since inception performance for the index is shown from March 1, 2008.
7
PART C:
OTHER INFORMATION
ITEM 15. INDEMNIFICATION
Article 10, Section (iv) of ING Variable Portfolios, Inc.’s Articles of Incorporation, as amended, provides the following:
(iv) The Corporation shall indemnify its officers, Directors, employees and agents, and any person who serves at the request of the Corporation as a director, officer, employee, or agent of another corporation, partnership, joint venture, trust or other enterprise as follows:
(a) Every person who is or has been a Director, officer, employee or agent of the Corporation, and persons who serve at the Corporation’s request as director, officer, employee or agent of another corporation, partnership, joint venture, trust or other enterprise, shall be indemnified by the Corporation to the fullest extent permitted by law against liability and against all expenses reasonably incurred or paid by him in connection with any debt, claim, action, demand, suit, proceeding, judgment, decree, liability or obligation of any kind in which he becomes involved as a party or otherwise by virtue of his being or having been a Director, officer, employee or agent of the Corporation or of another corporation, partnership, joint venture, trust or other enterprise at the request of the Corporation, and against amounts paid or incurred by him in the settlement thereof.
(b) The words “claim,” “action,” “suit” or “proceeding” shall apply to all claims, actions, suits or proceedings (civil, criminal, administrative, legislative, investigative or other, including appeals), actual or threatened, and the words “liability” and “expenses” shall include, without limitation, attorneys’ fees, costs, judgments, amounts paid in settlement, fines, penalties and other liabilities.
(c) No indemnification shall be provided hereunder to a Director, officer, employee or agent against any liability to the Corporation or its shareholders by reason of willful misfeasance, bad faith, gross negligence, or reckless disregard of the duties involved in the conduct of his office.
(d) The rights of indemnification provided herein may be insured against by policies maintained by the Corporation, shall be several, shall not affect any other rights to which any Director, officer, employee or agent may now or hereafter be entitled, shall continue as to a person who has ceased to be such Director, officer, employee, or agent, and shall inure to the benefit of the heirs, executors and administrators of such a person.
(e) In the absence of a final decision on the merits by a court or other body before which such proceeding was brought, an indemnification payment will not be made, except as provided in subparagraph (f) of this paragraph (iv), unless in the absence of such a decision, a reasonable determination based upon a factual review has been made:
(1) by a majority vote of a quorum of non-party Directors who are not “interested persons” of the Corporation (as defined in the 1940 Act), or
(2) by independent legal counsel in a written opinion that the indemnitee was not liable for an act of willful misfeasance, bad faith, gross negligence, or reckless disregard of duties.
(f) The Corporation further undertakes that advancement of expenses incurred in the defense of a proceeding (upon undertaking for repayment unless it is ultimately determined that indemnification is appropriate) against an officer, Director or controlling person of the Corporation will not be made absent the fulfillment of at least one of the following conditions:
(1) the indemnity provides security for his undertaking,
(2) the Corporation is insured against losses arising by reason of any lawful advances or
1
(3) a majority of a quorum of non-party Directors who are not “interested persons” or independent legal counsel in a written opinion makes a factual determination that there is a reason to believe the indemnity will be entitled to indemnification.
(g) Neither the amendment nor repeal of this paragraph (iv) of Article 9, nor the adoption of any amendment of any other provision of the Charter or Bylaws of the Corporation inconsistent with this paragraph (iv) of Article 10 shall apply to or affect in any respect the applicability of the preceding provisions with respect to any act or failure to act which occurred prior to such amendment, repeal or adoption.
In addition, ING Variable Portfolios, Inc.’s officers and Directors are currently covered under a directors and officers errors and omissions liability insurance policy issued by ICI Mutual Insurance Company, which expires October 1, 2009.
Insofar as indemnification for liabilities arising under the Securities Act of 1933, as amended (the “1933 Act”) may be permitted to Directors, officers and controlling persons of ING Variable Portfolios, Inc. pursuant to the foregoing provisions or otherwise, ING Variable Portfolios, Inc. has been advised that in the opinion of the Securities and Exchange Commission such indemnification is against public policy as expressed in the 1933 Act and is therefore, unenforceable. In the event that a claim for indemnification against such liabilities (other than the payment by ING Variable Portfolios, Inc. of expenses incurred or paid by a Trustee, officer or controlling person of ING Variable Portfolios, Inc. in connection with the successful defense of any action, suit or proceeding) is asserted by such Director, officer or controlling person in connection with the shares being registered, ING Variable Portfolios, Inc. will, unless in the opinion of its counsel the matter has been settled by controlling precedent, submit to a court of appropriate jurisdiction the question whether such indemnification by it is against public policy, as expressed in the Act and be governed by final adjudication of such issue.
ITEM 16. EXHIBITS
(1) (a) Articles of Amendment and Restatement dated May 1, 2002 — Filed as an Exhibit to Post Effective Amendment No. 22 to the Registrant’s Form N-1A Registration Statement on April 30, 2004 and incorporated herein by reference.
(b) Articles Supplementary dated August 12, 2002 — Filed as an Exhibit to Post Effective Amendment No. 22 to the Registrant’s Form N-1A Registration Statement on April 30, 2004 and incorporated herein by reference.
(c) Articles Supplementary effective April 29, 2005 (Issuance of Class ADV shares) — Filed as an Exhibit to Post-Effective Amendment No. 25 to the Registrant’s Form N-1A Registration Statement on April 28, 2005 and incorporated herein by reference.
(d) Articles of Amendment dated February 17, 2004 (name change from ING VP Technology Portfolio to ING VP Global Science and Technology Portfolio) — Filed as an Exhibit to Post-Effective Amendment No. 24 to the Registrant’s Registration Statement filed on Form N-1A on February 11, 2005 and incorporated herein by reference.
(e) Articles of Amendment dated April 30, 2004 (redesignation of Class R shares to Class I shares) — Filed as an Exhibit to Post-Effective Amendment No. 23 to the Registrant’s Registration Statement filed on Form N-1A on February 11, 2005 and incorporated herein by reference.
(f) Articles of Amendment dated November 29, 2007 (dissolve ING VP International Equity Portfolio) - Filed as an Exhibit to Post-Effective Amendment No. 34 to the Registrant’s Registration Statement filed on Form N-1A on January 25, 2008 and incorporated herein by reference.
(g) Articles Supplementary dated November 30, 2007 (establishment of new series - ING WisdomTreeSM Global High-Yielding Equity Index Portfolio) - Filed as an Exhibit to Post-Effective Amendment No. 34 to the Registrant’s Registration Statement filed on Form N-1A on January 25, 2008 and incorporated herein by reference.
(h) Articles Supplementary dated February 15, 2008 (establishment of new series — ING International Index Portfolio, ING Lehman Brother Aggregate Bond Index® Portfolio, ING MorningTMStar U.S. Growth Index Portfolio, ING RussellTM Large Cap Index Portfolio, ING RussellTM Mid Cap Index Portfolio, ING RussellTM Small Cap Index Portfolio) — Filed as an Exhibit to Post-Effective Amendment No. 37 to the Registrant’s Registration Statement filed on Form N-1A on February 29, 2008 and incorporated herein by reference.
2
(i) Articles of Amendment dated March 7, 2008 (name change from ING Lehman Brothers Aggregate Bond Index Portfolio to ING Lehman Brothers U.S. Aggregate Bond Index Portfolio — Filed as an Exhibit to Post-Effective Amendment No. 39 to the Registrant’s Registration Statement filed on Form N-1A on April 25, 2008 and incorporated herein by reference.
(j) Articles of Amendment dated April 28, 2008 (name change from ING VP Global Science and Technology Portfolio to ING BlackRock Global Science and Technology Portfolio; ING VP Growth Portfolio to ING Opportunistic LargeCap Growth Portfolio; and ING VP Value Opportunity Portfolio to ING Opportunistic LargeCap Value Portfolio) - Filed as an Exhibit to Post-Effective Amendment No. 42 to the Registrant’s Registration Statement filed on Form N-1A on August 19, 2008 and incorporated herein by reference.
(k) Articles Supplementary dated June 6, 2008 (establishment of new series - ING Russell Global LargeCap Index 85% Portfolio) — Filed as an Exhibit to Post-Effective Amendment No. 42 to the Registrant’s Registration Statement filed on Form N-1A on August 19, 2008 and incorporated herein by reference.
(l) Articles of Amendment dated July 9, 2008 (establishment of new series - ING Global Equity Option Portfolio) — Filed as an Exhibit to Post-Effective Amendment No. 42 to the Registrant’s Registration Statement filed on Form N-1A on August 19, 2008 and incorporated herein by reference.
(m) Articles Supplementary dated October 15, 2008 (establishment of new series — ING U.S. Government Money market Portfolio). — Filed as an Exhibit to Post-Effective Amendment No. 44 to the Registrant’s Registration Statement filed on Form N-1A on October 30, 2008 and incorporated herein by reference.
(n) Articles Supplementary dated January 23, 2009 (Issuance of Service 2 Class shares) — Filed as an Exhibit to Post-Effective Amendment No. 49 to the Registrant’s Registration Statement filed on Form N-1A on February 20, 2009 and incorporated herein by reference.
(2) Second Amended and Restated Bylaws - Filed as an Exhibit to the Post —Effective Amendment No. 27 to the Registrant’s Registration Statement filed on Form N-1A on April 27, 2006 and incorporated herein by reference.
(3) Not applicable.
(4) (a) Agreement and Plan of Reorganization between ING Variable Portfolios, Inc., on behalf of its series, ING Russell™ Large Cap Index Portfolio, and ING Partners, Inc., on behalf of its series, ING Neuberger Berman Partners Portfolio - Attached as Appendix A-1 to the Proxy Statement/Prospectus.
(b) Agreement and Plan of Reorganization between ING Variable Portfolios, Inc., on behalf of its series, ING Russell™ Large Cap Index Portfolio, and ING Investors Trust, on behalf of its series, ING Oppenheimer Main Street Portfolio® - Attached as Appendix A-2 to the Proxy Statement/Prospectus.
(5) Instruments Defining Rights of Holders - Filed as an Exhibit to Pre-Effective Amendment No. 1 to the Registrant’s Form N-1A Registration Statement on June 4, 1996 and incorporated herein by reference.
(6) (a) Amended Investment Management Agreement between ING Investments, LLC and ING Variable Portfolios, Inc. dated April 1, 2004 — Filed as an Exhibit to Post Effective Amendment No. 22 to the Registrant’s Form N-1A Registration Statement on April 30, 2004 and incorporated herein by reference.
(i) Amended Schedule A, effective October 31, 2008, to the Amended Investment Management Agreement between ING Variable Portfolios, Inc. and ING Investments, LLC — Filed as an Exhibit to Post Effective Amendment No. 45 to the Registrant’s Form N-1A Registration Statement on December 15, 2008 and incorporated herein by reference.
(ii) Amendment dated January 1, 2007 to the Amended Investment Management Agreement between ING Investments, LLC and ING Variable Portfolios, Inc. dated April 1, 2004 — Filed as an Exhibit to Post Effective Amendment No. 29 to the Registrant’s Form N-1A Registration Statement on April 27, 2007 and incorporated herein by reference.
3
(b) Sub-Advisory Agreement between ING Investments, LLC and Aeltus Investment Management, Inc. dated March 1, 2002 - Filed as an Exhibit to Post-Effective Amendment No. 18 to the Registrant’s Form N-1A Registration Statement on April 19, 2002 and incorporated herein by reference.
(i) First Amendment to the Sub-Advisory Agreement between ING Investments, LLC and Aeltus Investment Management, Inc. effective as of July 29, 2003 — Filed as an Exhibit to Post Effective Amendment No. 22 to the Registrant’s Form N-1A Registration Statement on April 30, 2004 and incorporated herein by reference.
(ii) Second Amendment dated January 1, 2007 to the Sub-Advisory Agreement, between ING Investments, LLC and ING Investment Management Co. dated March 1, 2002 — Filed as an Exhibit to Post Effective Amendment No. 29 to the Registrant’s Form N-1A Registration Statement on April 27, 2007 and incorporated herein by reference.
(iii) Third Amendment dated October 1, 2007 to the Sub-Advisory Agreement between ING Investments, LLC and ING Investment Management Co., dated March 1, 2002 — Filed as an Exhibit to Post-Effective Amendment No. 37 to the Registrant’s Registration Statement filed on Form N-1A on February 29, 2008 and incorporated herein by reference.
(iv) Amended Schedule A, effective October 31, 2008, to the Sub-Advisory Agreement between ING Investments, LLC and ING Investment Management Co. dated March 1, 2002 — Filed as an Exhibit to Post Effective Amendment No. 45 to the Registrant’s Form N-1A Registration Statement on December 31, 2008 and incorporated herein by reference.
(c) Sub-Advisory Agreement between ING Investments, LLC and BlackRock Advisors, LLC., dated February 2, 2007 — Filed as an Exhibit to Post-Effective Amendment No. 29 to the Registrant’s Registration Statement filed on Form N-1A on April 27, 2007 and incorporated herein by reference.
(i) Amendment dated June 16, 2008 to the Sub-Advisory Agreement between ING Investments, LLC and BlackRock Advisors, LLC dated February 2, 2007 — Filed as an Exhibit to Post-Effective Amendment No. 42 to the Registrant’s Registration Statement filed on Form N-1A on August 19, 2008 and incorporated herein by reference.
(ii) Amended Schedule A dated April 26, 2008 to the Sub-Advisory Agreement between ING Investments, LLC and BlackRock Advisors, LLC — Filed as an Exhibit to Post-Effective Amendment No. 39 to the Registrant’s Registration Statement filed on Form N-1A on April 25, 2008 and incorporated herein by reference.
(d) Sub-Advisory Agreement between ING Investments, LLC and Lehman Brothers Asset Management, LLC dated March 7, 2008 — Filed as an Exhibit to Post-Effective Amendment No. 42 to the Registrant’s Registration Statement filed on Form N-1A on August 19, 2008 and incorporated herein by reference.
(i) Schedule A dated March 7, 2008 to the Sub-Advisory Agreement between ING Investments, LLC and Lehman Brothers Asset Management, LLC dated March 7, 2008 — Filed as an Exhibit to Post-Effective Amendment No. 42 to the Registrant’s Registration Statement filed on Form N-1A on August 19, 2008 and incorporated herein by reference.
(d) Amended and Restated Expense Limitation Agreement between ING Investments, LLC and ING Variable Portfolios, Inc. dated April 1, 2005 — Filed as an Exhibit to Post-Effective Amendment No. 29 to the Registrant’s Registration Statement filed on Form N-1A on February 7, 2007 and incorporated herein by reference.
(i) Amended Schedule A, dated December 11, 2008, to the Amended and Restated Expense Limitation Agreement between ING Investments, LLC and ING Variable Portfolios, Inc.- Filed as an Exhibit to Post-Effective Amendment No. 49 to the Registrant’s Registration Statement filed on Form N-1A on February 20, 2009 and incorporated herein by reference.
(7) Distribution Agreement between Aetna Variable Portfolios, Inc. and ING Pilgrim Securities, Inc. dated January 1, 2002 - Filed as an Exhibit to Post-Effective Amendment No. 18 to the Registrant’s Form N-1A Registration Statement on April 19, 2002 and incorporated herein by reference.
4
(i) Amended Schedule of Approvals, effective October 31, 2008, to the Distribution Agreement between ING Variable Portfolios, Inc. and ING Funds Distributor, LLC — Filed as an Exhibit to Post Effective Amendment No. 45 to the Registrant’s Form N-1A Registration Statement on December 15, 2008 and incorporated herein by reference.
(ii) Substitution Agreement dated October 8, 2002 to the Distribution Agreement between Aetna Variable Portfolios, Inc. and ING Pilgrim Securities, Inc. dated January 1, 2002 — Filed as an Exhibit to Post Effective Amendment No. 22 to the Registrant’s Form N-1A Registration Statement on April 30, 2004 and incorporated herein by reference.
(8) Directors’ Deferred Compensation Plan effective September 15, 2005 — Filed as an Exhibit to Post-Effective Amendment No. 42 to the Registrant’s Registration Statement filed on Form N-1A on August 19, 2008 and incorporated herein by reference.
(9) (a) Custody Agreement with The Bank of New York dated January 6, 2003 — Filed as an Exhibit to Post Effective Amendment No. 22 to the Registrant’s Form N-1A Registration Statement on April 30, 2004 and incorporated herein by reference.
(i) Amended Exhibit A, effective October 31, 2008, to the Custody Agreement with The Bank of New York Mellon Corporation - Filed as an Exhibit to Post Effective Amendment No. 45 to the Registrant’s Form N-1A Registration Statement on December 15, 2008 and incorporated herein by reference.
(b) Foreign Custody Manager Agreement with the Bank of New York dated January 6, 2003 — Filed as an Exhibit to Post Effective Amendment No. 22 to the Registrant’s Form N-1A Registration Statement on April 30, 2004 and incorporated herein by reference.
(i) Amended Exhibit A, effective October 31, 2008 to the Foreign Custody Manager Agreement with The Bank of New York Mellon Corporation — Filed as an Exhibit to Post Effective Amendment No. 45 to the Registrant’s Form N-1A Registration Statement on December 15, 2008 and incorporated herein by reference.
(ii) Amended Schedule 2 effective June 4, 2008 to the Foreign Custody Manager Agreement with the Bank of New York Mellon Corporation — Filed as an Exhibit to Post-Effective Amendment No. 42 to the Registrant’s Registration Statement filed on Form N-1A on August 19, 2008 and incorporated herein by reference.
(c) Securities Lending Agreement and Guaranty with The Bank of New York dated August 7, 2003 — Filed as an Exhibit to Post Effective Amendment No. 22 to the Registrant’s Form N- 1A Registration Statement on April 30, 2004 and incorporated herein by reference.
(i) Amended Exhibit A, effective October 31, 2008, to the Securities Lending Agreement and Guaranty with The Bank of New York Mellon Corporation — Filed as an Exhibit to Post Effective Amendment No. 45 to the Registrant’s Form N-1A Registration Statement on December 15, 2008 and incorporated herein by reference.
(10) (a) Amended and Restated Shareholder Services and Distribution Plan for Class S shares effective January 1, 2008 - Filed as an Exhibit to Post-Effective Amendment No. 34 to the Registrant’s Registration Statement filed on Form N-1A on January 25, 2008 and incorporated herein by reference.
(i) Waiver of Fee Payable under the Amended and Restated Shareholder Services and Distribution Plan for the Class S Shares - ING WisdomTreeSM Global High-Yielding Equity Index Portfolio — Filed as an Exhibit to Post-Effective Amendment No. 39 to the Registrant’s Registration Statement filed on Form N-1A on April 25, 2008 and incorporated herein by reference.
(ii) Amended Schedule 1, effective October 31, 2008, to the Amended and Restated Shareholder Services and Distribution Plan for Class S shares - Filed as an Exhibit to Post Effective Amendment No. 45 to the Registrant’s Form N-1A Registration Statement on December 15, 2008 and incorporated herein by reference.
(b) Shareholder Service and Distribution Plan for Class A shares effective April 29, 2005 — Filed as an exhibit to Post-Effective Amendment No. 25 to the Registrant’s Registration Statement filed on Form N-1A on April 28, 2005 and incorporated herein by reference.
5
(i) Amended Schedule A to the Shareholder Service and Distribution Plan for Class A shares effective April 29, 2005 - Filed as an Exhibit to Post-Effective Amendment No. 49 to the Registrant’s Registration Statement filed on Form N-1A on February 20, 2009 and incorporated herein by reference.
(c) Shareholder Service and Distribution Plan for Service 2 Class (“Class S2”) shares between ING Variable Portfolios, Inc. and ING Funds Distributor, LLC effective October 31, 2008 — Filed as an Exhibit to Post Effective Amendment No. 45 to the Registrant’s Form N-1A Registration Statement on December 15, 2008 and incorporated herein by reference.
(i) Amended Schedule A to the Shareholder Service and Distribution Plan for Class S2 shares between ING Variable Portfolios, Inc. and ING Funds Distributor, LLC effective October 31, 2008 — Filed as an Exhibit to Post-Effective Amendment No. 49 to the Registrant’s Registration Statement filed on Form N-1A on February 20, 2009 and incorporated herein by reference.
(ii) Reduction of Fee Payable under the Shareholder Service and Distribution Plan for the Class S2 shares February 28, 2009 — Filed as an Exhibit to Post-Effective Amendment No. 49 to the Registrant’s Registration Statement filed on Form N-1A on February 20, 2009 and incorporated herein by reference.
(d) Amended and restated Multi-Class Plan pursuant to Rule 18f-3 for ING Variable Portfolios, Inc., effective January 8, 2008 — Filed as an Exhibit to Post Effective Amendment No. 34 to the Registrant’s Form N-1A Registration Statement on January 25, 2008 and incorporated herein by reference.
(i) Amended Schedule A to the Amended and Restated Multiple Class Plan pursuant to Rule 18f-3 for ING Variable Portfolios, Inc.- Filed as an Exhibit to Post-Effective Amendment No. 49 to the Registrant’s Registration Statement filed on Form N-1A on February 20, 2009 and incorporated herein by reference.
(11) Opinion and Consent of Counsel - Filed herewith.
(12) Opinion and Consent of Counsel Supporting Tax Matters and Consequences — To be filed by subsequent post-effective amendment.
(13) (a) Administration Agreement between ING Funds Services, LLC and Aetna Variable Portfolios, Inc. dated April 1, 2002 - Filed as an Exhibit to Post-Effective Amendment No. 18 to the Registrant’s Form N-1A Registration Statement on April 19, 2002 and incorporated herein by reference.
(i) Amended Schedule A, effective October 31, 2008 to the Administration Agreement between ING Variable Portfolios, Inc. and ING Funds Services, LLC - Filed as an Exhibit to Post Effective Amendment No. 45 to the Registrant’s Form N-1A Registration Statement on December 15, 2008 and incorporated herein by reference.
(b) License Agreement between Aetna Services, Inc. and Aetna Variable Portfolios, Inc. dated June 19, 1996 - Filed as an Exhibit to Post-Effective Amendment No. 1 to the Registrant’s Form N-1A Registration Statement on March 7, 1997 and incorporated herein by reference.
(c) Fund Accounting Agreement with The Bank of New York dated January 6, 2003 — Filed as an Exhibit to Post Effective Amendment No. 22 to the Registrant’s Form N-1A Registration Statement on April 30, 2004 and incorporated herein by reference.
(i) Amended Exhibit A, effective October 31, 2008 to the Fund Accounting Agreement with The Bank of New York Mellon Corporation - Filed as an Exhibit to Post Effective Amendment No. 45 to the Registrant’s Form N-1A Registration Statement on December 15, 2008 and incorporated herein by reference.
(d) Allocation Agreement (Investment Company Blanket Bond) dated September 24, 2003 — Filed as an Exhibit to Post Effective Amendment No. 22 to the Registrant’s Form N-1A Registration Statement on April 30, 2004 and incorporated herein by reference.
6
(i) Amended Schedule A to the Allocation Agreement, dated December 2005 — Filed as an Exhibit to Post-Effective Amendment No. 29 to the Registrant’s Registration Statement filed on Form N-1A on April 27, 2007 and incorporated herein by reference.
(e) Allocation Agreement (Directors and Officers Liability) dated September 26, 2002 — Filed as an Exhibit to Post-Effective Amendment No. 29 to the Registrant’s Registration Statement filed on Form N-1A on April 27, 2007 and incorporated herein by reference.
(i) Amended Schedule A to the Allocation Agreement (Directors and Officers Liability) dated April 2007 — Filed as an Exhibit to Post-Effective Amendment No. 39 to the Registrant’s Registration Statement filed on Form N-1A on April 25, 2008 and incorporated herein by reference.
(f) Agency Agreement with DST Systems, Inc. dated July 7, 2001 — Filed as an Exhibit to Post Effective Amendment No. 22 to the Registrant’s Form N-1A Registration Statement on April 30, 2004 and incorporated herein by reference.
(i) Amended Exhibit A, effective October 31, 2008, to the Agency Agreement with DST Systems, Inc. dated July 7, 2001 - Filed as an Exhibit to Post Effective Amendment No. 45 to the Registrant’s Form N-1A Registration Statement on December 15, 2008 and incorporated herein by reference.
(g) Participation Agreement between ING Variable Portfolios, Inc., Connecticut General Life Insurance Company and ING Funds Distributor, Inc. dated August 15, 2002 — Filed as an Exhibit to Post Effective Amendment No. 22 to the Registrant’s Form N-1A Registration Statement on April 30, 2004 and incorporated herein by reference.
(h) Participation Agreement between ING Variable Portfolios, Inc., ReliaStar Life Insurance Company and ING Funds Distributor, Inc. dated May 1, 2002 — Filed as an Exhibit to Post Effective Amendment No. 22 to the Registrant’s Form N-1A Registration Statement on April 30, 2004 and incorporated herein by reference.
(i) Amendment to Participation Agreement between ING Variable Portfolios, Inc., ReliaStar Life Insurance Company and ING Funds Distributor, Inc. executed October 15, 2002 — Filed as an Exhibit to Post Effective Amendment No. 22 to the Registrant’s Form N-1A Registration Statement on April 30, 2004 and incorporated herein by reference.
(ii) Amendment to Participation Agreement between ING Variable Portfolios, Inc., ReliaStar Life Insurance Company and ING Funds Distributor, Inc. executed September 22, 2003 — Filed as an Exhibit to Post Effective Amendment No. 22 to the Registrant’s Form N-1A Registration Statement on April 30, 2004 and incorporated herein by reference.
(i) Participation Agreement between ING Variable Portfolios, Inc., ReliaStar Life Insurance Company of New York and ING Funds Distributor, Inc. dated May 1, 2002 — Filed as an Exhibit to Post Effective Amendment No. 22 to the Registrant’s Form N-1A Registration Statement on April 30, 2004 and incorporated herein by reference.
(j) Participation Agreement between ING Variable Portfolios, Inc., Security Life of Denver Insurance Company and ING Funds Distributor, Inc. dated May 1, 2001 — Filed as an Exhibit to Post Effective Amendment No. 22 to the Registrant’s Form N-1A Registration Statement on April 30, 2004 and incorporated herein by reference.
(k) Participation Agreement between ING Variable Portfolios, Inc., Southland Life Insurance Company and ING Funds Distributor, Inc. dated May 1, 2001 — Filed as an Exhibit to Post Effective Amendment No. 22 to the Registrant’s Form N-1A Registration Statement on April 30, 2004 and incorporated herein by reference.
(l) Fund Participation Agreement between Aetna Insurance Company of America, Aetna Variable Fund, Aetna Variable Encore Fund, Aetna Income Shares, Aetna Balanced VP, Inc., Aetna GET Fund, Aetna Generation Portfolios, Inc., Aetna Variable Portfolios, Inc. and Aeltus Investment Management, Inc. dated May 1, 1998 — Filed as an Exhibit to Post Effective Amendment No. 22 to the Registrant’s Form N-1A Registration Statement on April 30, 2004 and incorporated herein by reference.
(i) Amendment No. 1 to Fund Participation Agreement between Aetna Insurance Company of America, Aetna Variable Fund, Aetna Variable Encore Fund, Aetna Income Shares, Aetna Balanced VP, Inc., Aetna GET
7
Fund, Aetna Generation Portfolios, Inc., Aetna Variable Portfolios, Inc. and Aeltus Investment Management, Inc. executed May 1, 2000 — Filed as an Exhibit to Post Effective Amendment No. 22 to the Registrant’s Form N-1A Registration Statement on April 30, 2004 and incorporated herein by reference.
(ii) Amendment No. 2 to Fund Participation Agreement between Aetna Insurance Company of America, Aetna Variable Fund, Aetna Variable Encore Fund, Aetna Income Shares, Aetna Balanced VP, Inc., Aetna GET Fund, Aetna Generation Portfolios, Inc., Aetna Variable Portfolios, Inc. and Aeltus Investment Management, Inc. executed June 26, 2001 — Filed as an Exhibit to Post Effective Amendment No. 22 to the Registrant’s Form N-1A Registration Statement on April 30, 2004 and incorporated herein by reference.
(m) Fund Participation Agreement between Aetna Life Insurance and Annuity Company, Aetna Variable Fund, Aetna Variable Encore Fund, Aetna Income Shares, Aetna Balanced VP, Inc., Aetna GET Fund, Aetna Generation Portfolios, Inc., Aetna Variable Portfolios, Inc. and Aeltus Investment Management, Inc. dated May 1, 1998 — Filed as an Exhibit to Post Effective Amendment No. 22 to the Registrant’s Form N-1A Registration Statement on April 30, 2004 and incorporated herein by reference.
(i) Amendment to Fund Participation Agreement between Aetna Life Insurance and Annuity Company, Aetna Variable Fund, Aetna Variable Encore Fund, Aetna Income Shares, Aetna Balanced VP, Inc., Aetna GET Fund, Aetna Generation Portfolios, Inc., Aetna Variable Portfolios, Inc. and Aeltus Investment Management, Inc. executed November 9, 1998 — Filed as an Exhibit to Post Effective Amendment No. 22 to the Registrant’s Form N-1A Registration Statement on April 30, 2004 and incorporated herein by reference.
(ii) Amendment to Fund Participation Agreement between Aetna Life Insurance and Annuity Company, Aetna Variable Fund, Aetna Variable Encore Fund, Aetna Income Shares, Aetna Balanced VP, Inc., Aetna GET Fund, Aetna Generation Portfolios, Inc., Aetna Variable Portfolios, Inc. and Aeltus Investment Management, Inc. executed June 1, 1999 — Filed as an Exhibit to Post Effective Amendment No. 22 to the Registrant’s Form N-1A Registration Statement on April 30, 2004 and incorporated herein by reference.
(iii) Second Amendment to Fund Participation Agreement between Aetna Life Insurance and Annuity Company, Aetna Variable Fund, Aetna Variable Encore Fund, Aetna Income Shares, Aetna Balanced VP, Inc., Aetna GET Fund, Aetna Generation Portfolios, Inc., Aetna Variable Portfolios, Inc. and Aeltus Investment Management, Inc. executed December 31, 1999 — Filed as an Exhibit to Post Effective Amendment No. 22 to the Registrant’s Form N-1A Registration Statement on April 30, 2004 and incorporated herein by reference.
(iv) Third Amendment to Fund Participation Agreement between Aetna Life Insurance and Annuity Company, Aetna Variable Fund, Aetna Variable Encore Fund, Aetna Income Shares, Aetna Balanced VP, Inc., Aetna GET Fund, Aetna Generation Portfolios, Inc., Aetna Variable Portfolios, Inc. and Aeltus Investment Management, Inc. executed February 11, 2000 — Filed as an Exhibit to Post Effective Amendment No. 22 to the Registrant’s Form N-1A Registration Statement on April 30, 2004 and incorporated herein by reference.
(v) Fourth Amendment to Fund Participation Agreement between Aetna Life Insurance and Annuity Company, Aetna Variable Fund, Aetna Variable Encore Fund, Aetna Income Shares, Aetna Balanced VP, Inc., Aetna GET Fund, Aetna Generation Portfolios, Inc., Aetna Variable Portfolios, Inc. and Aeltus Investment Management, Inc. executed May 1, 2000 — Filed as an Exhibit to Post Effective Amendment No. 22 to the Registrant’s Form N-1A Registration Statement on April 30, 2004 and incorporated herein by reference.
(vi) Fifth Amendment to Fund Participation Agreement between Aetna Life Insurance and Annuity Company, Aetna Variable Fund, Aetna Variable Encore Fund, Aetna Income Shares, Aetna Balanced VP, Inc., Aetna GET Fund, Aetna Generation Portfolios, Inc., Aetna Variable Portfolios, Inc. and Aeltus Investment Management, Inc. executed February 27, 2001 — Filed as an Exhibit to Post Effective Amendment No. 22 to the Registrant’s Form N-1A Registration Statement on April 30, 2004 and incorporated herein by reference.
(vii) Sixth Amendment to Fund Participation Agreement between Aetna Life Insurance and Annuity Company, Aetna Variable Fund, Aetna Variable Encore Fund, Aetna Income Shares, Aetna Balanced VP, Inc., Aetna GET Fund, Aetna Generation Portfolios, Inc., Aetna Variable Portfolios, Inc. and Aeltus Investment Management, Inc. executed June 19, 2001 — Filed as an Exhibit to Post Effective Amendment No. 22 to the Registrant’s Form N-1A Registration Statement on April 30, 2004 and incorporated herein by reference. 14) Fund Participation Agreement between Golden American Life Insurance Company, Aetna Variable Fund,
8
Aetna Variable Encore Fund, Aetna Income Shares, Aetna Balanced VP, Inc., Aetna GET Fund, Aetna Generation Portfolios, Inc., Aetna Variable Portfolios, Inc. and Aeltus Investment Management, Inc. dated July 16, 2001 — Filed as an Exhibit to Post Effective Amendment No. 22 to the Registrant’s Form N-1A Registration Statement on April 30, 2004 and incorporated herein by reference.
(n) Fund Participation Agreement between Golden American Life Insurance Company, Aetna Variable Fund, Aetna
Variable Encore Fund, Aetna Income Shares, Aetna Balanced VP, Inc., Aetna GET Fund, Aetna Generation Portfolios, Inc., Aetna Variable Portfolios, Inc. and Aeltus Investment Management, Inc. dated July 16, 2001 - Filed as an Exhibit to Post Effective Amendment No. 22 to the Registrant’s Form N-1A Registration Statement on April 30, 2004 and incorporated herein by reference.
(14) Consent of Independent Registered Public Accounting Firm - Filed herewith.
(15) Not applicable.
(16) Powers of Attorney - Filed herewith.
(17) Not applicable.
ITEM 17. UNDERTAKINGS
(1) The undersigned registrant agrees that prior to any public reoffering of the securities registered through the use of a prospectus which is a part of this registration statement by any person or party who is deemed to be an underwriter within the meaning of Rule 145(c) under the Securities Act (17 CFR 230.145(c)), the reoffering prospectus will contain the information called for by the applicable registration form for reofferings by persons who may be deemed underwriters, in addition to the information called for by the other items of the applicable form.
(2) The undersigned registrant agrees that every prospectus that is filed under paragraph (1) above will be filed as a part of an amendment to the registration statement and will not be used until the amendment is effective, and that, in determining any liability under the 1933 Act, each post-effective amendment shall be deemed to be a new registration statement for the securities offered therein, and the offering of the securities at that time shall be deemed to be the initial bona fide offering of them.
(3) The undersigned registrant undertakes to file a post-effective amendment to this registration statement upon the closing of the Reorganization described in this Registration Statement that contains an opinion of counsel supporting the tax matters discussed in this Registration Statement.
9
SIGNATURES
Pursuant to the requirements of the Securities Act of 1933, as amended (the “1933 Act”), the Registrant has duly caused this Registration Statement on Form N-14 to be signed on its behalf by the undersigned, thereunto duly authorized, in the City of Scottsdale and the State of Arizona on the 3rd day of April, 2009.
| ING VARIABLE PORTFOLIOS, INC. | |
|
| |
|
| |
| By: | /s/ Theresa K. Kelety |
|
| Theresa K. Kelety |
|
| Secretary |
Pursuant to the requirements of the Securities Act of 1933, this Registration Statement has been signed below by the following persons in the capacities and on the date indicated.
SIGNATURE |
| TITLE |
| DATE |
|
|
|
|
|
|
| Senior Vice President and Chief/Principal |
| April 3, 2009 |
Todd Modic* |
| Financial Officer |
|
|
|
|
|
|
|
|
| Director |
| April 3, 2009 |
Albert E. DePrince Jr.* |
|
|
|
|
|
|
|
|
|
|
| Director |
| April 3, 2009 |
Russell Jones* |
|
|
|
|
|
|
|
|
|
|
| Director |
| April 3, 2009 |
Martin J. Gavin* |
|
|
|
|
|
|
|
|
|
|
| Director |
| April 3, 2009 |
Sidney Koch* |
|
|
|
|
|
|
|
|
|
|
| Interested Director, President and Chief Executive |
| April 3, 2009 |
Shaun P. Mathews * |
| Officer |
|
|
|
|
|
|
|
|
| Director |
| April 3, 2009 |
Corine T. Norgaard* |
|
|
|
|
|
|
|
|
|
|
| Director |
| April 3, 2009 |
Joseph E. Obermeyer* |
|
|
|
|
* By: | /s/ Theresa K. Kelety |
|
| Theresa K. Kelety |
|
| Attorney-in-Fact** |
|
** Powers of attorney for Shaun P. Mathews, Todd Modic and each Director — Filed herewith.
10
Exhibit Index
Exhibit Number |
| Name of Exhibit |
11 |
| Opinion and Consent of Counsel |
14 |
| Consent of Independent Registered Public Accounting Firm |
16 |
| Powers of Attorney |
11