UNITED STATES
SECURITIES AND EXCHANGE COMMISSION
Washington, D.C. 20549
FORM N-CSR
CERTIFIED SHAREHOLDER REPORT OF REGISTERED
MANAGEMENT INVESTMENT COMPANIES
Investment Company Act file number 811-07655
Driehaus Mutual Funds
(Exact name of registrant as specified in charter)
25 East Erie Street
Chicago, IL 60611
(Address of principal executive offices) (Zip code)
Janet L. McWilliams
Driehaus Capital Management LLC
25 East Erie Street
Chicago, IL 60611
(Name and address of agent for service)
Registrant’s telephone number, including area code: 312-587-3800
Date of fiscal year end: December 31
Date of reporting period: December 31, 2012
Form N-CSR is to be used by management investment companies to file reports with the Commission not later than 10 days after the transmission to stockholders of any report that is required to be transmitted to stockholders under Rule 30e-1 under the Investment Company Act of 1940 (17 CFR 270.30e-1). The Commission may use the information provided on Form N-CSR in its regulatory, disclosure review, inspection, and policymaking roles.
A registrant is required to disclose the information specified by Form N-CSR, and the Commission will make this information public. A registrant is not required to respond to the collection of information contained in Form N-CSR unless the Form displays a currently valid Office of Management and Budget (“OMB”) control number. Please direct comments concerning the accuracy of the information collection burden estimate and any suggestions for reducing the burden to Secretary, Securities and Exchange Commission, 100 F Street, NE, Washington, DC 20549. The OMB has reviewed this collection of information under the clearance requirements of 44 U.S.C. § 3507.
Item 1. Reports to Stockholders.
The Reports to Shareholders are attached herewith.
Driehaus Mutual Funds
Trustees & Officers
Richard H. Driehaus
Trustee
A.R. Umans
Chairman of the Board
Theodore J. Beck
Trustee
Francis J. Harmon
Trustee
Dawn M. Vroegop
Trustee
Daniel F. Zemanek
Trustee
Robert H. Gordon
President
Michelle L. Cahoon
Vice President & Treasurer
Janet L. McWilliams
Assistant Vice President
Michael Shoemaker
Chief Compliance Officer &
Assistant Vice President
Diane J. Drake
Secretary
Michael P. Kailus
Assistant Secretary
William H. Wallace, III
Assistant Secretary
Investment Adviser
Driehaus Capital Management LLC
25 East Erie Street
Chicago, IL 60611
Distributor
Driehaus Securities LLC
25 East Erie Street
Chicago, IL 60611
Administrator
BNY Mellon Investment Servicing (US) Inc.
4400 Computer Drive
Westborough, MA 01581
Transfer Agent
BNY Mellon Investment Servicing (US) Inc.
4400 Computer Drive
Westborough, MA 01581
Custodian
The Northern Trust Company
50 South LaSalle Street
Chicago, IL 60603
Annual Report to Shareholders
December 31, 2012

Driehaus International Discovery Fund
Driehaus Emerging Markets Growth Fund
Driehaus Emerging Markets Small Cap Growth Fund
Driehaus International Small Cap Growth Fund
Driehaus Global Growth Fund
Driehaus Mid Cap Growth Fund
Driehaus Large Cap Growth Fund
Distributed by:
Driehaus Securities LLC
This report has been prepared for the shareholders of the Funds and is not an offering to sell or buy any Fund securities. Such offering is only made by the Funds' prospectus.
Investment Philosophy:
The Adviser seeks to achieve superior investment returns primarily by investing in global companies that are currently demonstrating rapid growth in their sales and earnings and which, in its judgement, have the ability to continue or accelerate their growth rates in the future. The Adviser manages the portfolios actively (above average turnover) to ensure that the Funds are fully invested, under appropriate market conditions, in companies that meet these criteria. Investors should note that investments in overseas markets can pose more risks than U.S. investments, and the international Funds’ share prices are expected to be more volatile than those of the U.S.-only Funds. In addition, the Funds’ returns will fluctuate with changes in stock market conditions, currency values, interest rates, government regulations, and economic and political conditions in countries in which the Funds invest. These risks are generally greater when investing in emerging markets.
Annual Report to Shareholders December 31, 2012
Driehaus International Discovery Fund
Driehaus Emerging Markets Growth Fund
Driehaus Emerging Markets Small Cap Growth Fund
Driehaus International Small Cap Growth Fund
Driehaus Global Growth Fund
Driehaus Mid Cap Growth Fund
Driehaus Large Cap Growth Fund
Portfolio Managers’ Letter, Performance Overview and Schedule of Investments: | ||||
| 1 | ||||
| 8 | ||||
| 15 | ||||
| 22 | ||||
| 28 | ||||
| 34 | ||||
| 39 | ||||
| 44 | ||||
| 46 | ||||
| 48 | ||||
| 51 | ||||
| 58 | ||||
| 70 | ||||
| 71 | ||||
| 73 | ||||
| 74 | ||||
| 76 | ||||
Board Considerations in Connection with the Annual Review of the Investment Advisory Agreement | 78 | |||
Driehaus International Discovery Fund — Portfolio Managers’ Letter
Dear Fellow Shareholders,
The Driehaus International Discovery Fund (“Fund”) returned 14.75% for the year ended December 31, 2012. This return was below the performance of the Morgan Stanley Capital International (“MSCI”) All Country World ex USA Growth Index (“Benchmark”) (which returned 17.07% for the year) and below the performance of the MSCI All Country World ex USA Index (which returned 17.39%), which is another index for the Fund.
Assisted by currency gains, the European indices saw strong gains for 2012, as did many equity markets in emerging Asia. From a sector perspective, financial stocks were favored while defensive sectors, such as utilities and consumer staples, were laggards after years of stronger relative performance. Energy also was a weak sector globally, as oil prices ended the year close to their starting point despite a volatile ride in between. As the year closed, an appreciating euro aided returns within the euro zone’s more defensive markets as well as its more speculative markets. Greek equities were the big winner thanks to further European largesse, posting strong returns for 2012. While countries with higher beta to the European crisis were rewarded, investors also continued to favor German stocks, helping it to also be one of the top developed markets for the year. Elsewhere, the Nikkei seemed to garner much attention due to the unusual nature of the yen’s descent.
Certain areas detracted from Fund performance during the year. Two sectors where stock selection negatively affected the performance of the Fund relative to the Benchmark were the health care and energy sectors. Additionally, holdings in China, Brazil and Australia detracted from Fund performance versus the Benchmark.
Stock selection within health care detracted from returns, including Korea-based holding Seegene, Inc. (Ticker: 096530 KS), which was a significant detractor for the year. Seegene specializes in molecular diagnostics and develops technology and products that diagnose disease from the genetic level. Seegene’s molecular diagnosis technology and products allow patients to benefit from cost effective and personalized diagnosis tools and allow doctors to offer accurate and effective treatment to patients. Seegene’s share price fell steeply mid-year due in part to a perceived delay in an expected global distribution deal.
Within China, Baidu, Inc. SP ADR (Ticker: BIDU) was a significant detractor from performance for 2012. Baidu is a Chinese-language Internet search provider. The company offers a Chinese-language search platform that enables users to find relevant information online, including Web pages, news, images, documents and multimedia files, through links provided on its websites. Baidu’s share price declined during the year due to the combination of lost market share to recently-launched competitor Qihoo 360 Technology (which continues to expand its vertical search engine platforms) and reduced advertising revenue due to macroeconomic uncertainty.
Over the course of 2012, key contributors to performance versus the Benchmark were the Fund’s holdings in the consumer discretionary and consumer staples sectors. In addition, stock selection in the United Kingdom, France and Canada positively contributed to the performance of the Fund.
Within the consumer discretionary sector, Sands China, Ltd. (Ticker: 1928 HK) was a significant contributor to performance for 2012. Sands China is a leading developer, owner and operator of multi-use integrated resorts in Macao, China. Sands China is a subsidiary of the Las Vegas Sands Corporation. Sands China’s stock stumbled during the second quarter but recovered during the summer and saw a strong second half of 2012. Sands China remains an earnings leader among gaming companies in Macao and continues to expand its market share.
Canadian-headquartered Catamaran Corp. (Ticker: CTRX) was the holding that contributed the most to the Fund’s return versus its Benchmark in 2012. Catamaran is a provider of pharmacy benefit management (PBM) services and health care information technology solutions to the health care benefit management industry. The company’s product offerings and solutions combine a range of applications and PBM services designed to assist its customers in reducing the cost and managing the complexity of their prescription drug programs. Catamaran merged with Catalyst Health Solutions during the year. The increased scale has left the company well positioned to expand its market share and it continues to acquire middle-market PBMs. Additionally, the company’s new business pipeline remains robust.
1
Looking ahead, each of the last few years has seen periods of extreme concern regarding the state of the world, and equivalently exuberant market responses when those concerns ultimately fade. These worries usually have been driven by risks in Europe, though increasingly those ‘risk-off’ events are occurring at the hands of U.S. policymakers. However, we believe that the ability of the global economy to withstand shocks, from the perspectives of economic strength and financial liquidity, is better than it has been in recent years. As such, we would not anticipate the global markets getting as near the cliff’s edge as they have in each of the past few years.
Recent improving global economic data is something we have been watching quite closely. We believe in the economic growth suggested by the data, but remain cautious. We remember this narrative from the past few years where expectations ramp up at the start of the year only to be revised downward as the year progresses. We continue to believe that we reside in a low-growth world and that investors must be nimble to manage the volatility that accompanies such environments.
Globally, we are seeing many new opportunities in non-U.S. markets that did not look possible at this time last year. Financial conditions in Europe have meaningfully eased and the emerging markets outlook has improved thanks to low inflation, lower cost of capital, and inflecting growth trajectories. We remain optimistic but expect periods of volatility as government actions help and hurt economies in the year ahead.
As always, we remain committed to uncovering attractive growth equity investment opportunities that we believe will adequately compensate our clients for the risk taken with their capital. Thank you for your continued confidence in our management capabilities and your interest in the Driehaus International Discovery Fund.
Sincerely,
 |  | |
| Daniel M. Rea | Sebastien Pigeon | |
| Portfolio Manager | Assistant Portfolio Manager |
Performance is historical and does not represent future results.
Please see the following performance overview page for index descriptions.
2
Driehaus International Discovery Fund
Performance Overview (unaudited)
The performance summarized below is historical and does not represent future results. Investment returns and principal value vary, and you may have a gain or loss when you sell shares. Performance data presented measures the change in the value of an investment in the Fund, assuming reinvestment of all dividends and capital gains. Average annual total return reflects annualized change.
The table does not reflect the deduction of taxes that a shareholder would pay on Fund distributions or the redemption of Fund shares. The graph compares the results of a $10,000 investment in the Fund since December 31, 1998 (the date of the Fund’s inception), with all dividends and capital gains reinvested, with the indicated indices (and dividends reinvested) for the same period.
| Average Annual Total Returns as of 12/31/12 | 1 Year | 3 Years | 5 Years | 10 Years | Since Inception (12/31/98 - 12/31/12) | |||||||||||||||
Driehaus International Discovery Fund (DRIDX)1 | 14.75% | 1.43% | –6.89% | 10.93% | 13.46% | |||||||||||||||
MSCI AC World ex USA Index2 | 17.39% | 4.32% | –2.44% | 10.21% | 5.14% | |||||||||||||||
MSCI AC World ex USA Growth Index3 | 17.07% | 4.97% | –2.55% | 9.36% | 3.54% | |||||||||||||||
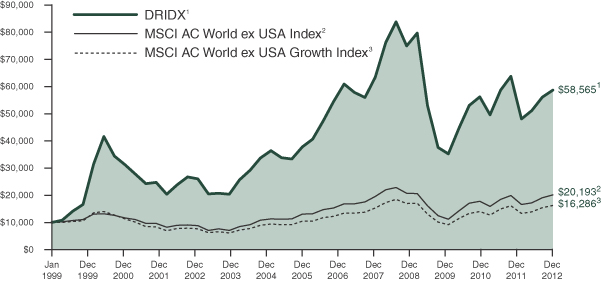
| 1 | The returns for the periods prior to July 1, 2003, reflect fee waivers and/or reimbursements without which performance would have been lower. |
| 2 | The Morgan Stanley Capital International All Country World ex USA Index (MSCI AC World ex USA Index) is a market capitalization-weighted index designed to measure equity market performance in 44 global developed and emerging markets, excluding the U.S. Data is in U.S. dollars. Source: Morgan Stanley Capital International Inc. |
| 3 | The Morgan Stanley Capital International All Country World ex USA Growth Index (MSCI AC World ex USA Growth Index) is a subset of the MSCI AC World ex USA Index and is composed only of the MSCI AC World ex USA Index stocks which are categorized as growth stocks. Data is in U.S. dollars. Source: Morgan Stanley Capital International Inc. |
3
Driehaus International Discovery Fund
Schedule of Investments
December 31, 2012
Number of Shares | Market Value (Note A) | |||||||
| EQUITY SECURITIES — 96.8% | ||||||||
| EUROPE — 51.2% | ||||||||
United Kingdom — 9.9% |
| |||||||
African Minerals, Ltd.** | 323,820 | $ | 1,718,201 | |||||
Antofagasta PLC | 100,450 | 2,201,368 | ||||||
ARM Holdings PLC | 94,892 | 1,198,373 | ||||||
ASOS PLC** | 56,590 | 2,496,096 | ||||||
Fenner PLC | 157,200 | 1,024,412 | ||||||
GlaxoSmithKline PLC | 75,120 | 1,635,544 | ||||||
Rio Tinto PLC — SP ADR | 28,130 | 1,634,072 | ||||||
Rolls-Royce Holdings PLC — C** | 5,770,680 | 9,374 | ||||||
Rotork PLC | 28,480 | 1,188,860 | ||||||
Telecity Group PLC | 295,574 | 3,817,188 | ||||||
The Weir Group PLC | 114,400 | 3,537,622 | ||||||
|
| |||||||
| 20,461,110 | ||||||||
|
| |||||||
France — 6.4% |
| |||||||
Ingenico SA | 49,240 | 2,801,244 | ||||||
Safran SA | 107,670 | 4,662,885 | ||||||
Societe BIC SA | 28,852 | 3,458,440 | ||||||
Technip SA | 20,235 | 2,339,906 | ||||||
|
| |||||||
| 13,262,475 | ||||||||
|
| |||||||
Denmark — 6.3% |
| |||||||
Christian Hansen Holding AS | 78,440 | 2,554,543 | ||||||
Coloplast AS — B | 26,640 | 1,306,430 | ||||||
Danske Bank AS** | 175,903 | 2,987,567 | ||||||
GN Store Nord AS | 177,189 | 2,575,086 | ||||||
Novo Nordisk AS — B | 21,502 | 3,501,314 | ||||||
|
| |||||||
| 12,924,940 | ||||||||
|
| |||||||
Switzerland — 5.3% |
| |||||||
Cie Financiere Richemont SA — A | 26,830 | 2,106,036 | ||||||
Dufry AG** | 12,703 | 1,679,743 | ||||||
Partners Group Holding AG | 9,857 | 2,278,737 | ||||||
Syngenta AG | 6,231 | 2,517,239 | ||||||
Temenos Group AG** | 74,979 | 1,311,610 | ||||||
Xstrata PLC | 59,790 | 1,043,688 | ||||||
|
| |||||||
| 10,937,053 | ||||||||
|
| |||||||
Netherlands — 4.6% |
| |||||||
ASML Holding NV | 18,980 | 1,217,263 | ||||||
Core Laboratories NV | 19,808 | 2,165,212 | ||||||
Koninklijke Vopak NV | 42,369 | 2,994,980 | ||||||
Sensata Technologies Holding NV** | 95,219 | 3,092,713 | ||||||
|
| |||||||
| 9,470,168 | ||||||||
|
| |||||||
Italy — 3.8% |
| |||||||
Lottomatica Group SpA | 49,280 | 1,125,987 | ||||||
Pirelli & C. SpA | 243,869 | 2,809,799 | ||||||
Saipem SpA | 45,184 | 1,760,062 | ||||||
Salvatore Ferragamo Italia SpA | 100,372 | 2,222,028 | ||||||
|
| |||||||
| 7,917,876 | ||||||||
|
| |||||||
Number of Shares | Market Value (Note A) | |||||||
Ireland — 3.8% |
| |||||||
Covidien PLC | 38,416 | $ | 2,218,140 | |||||
Elan Corp. PLC — SP ADR** | 136,186 | 1,390,459 | ||||||
Experian PLC | 133,620 | 2,153,555 | ||||||
Jazz Pharmaceuticals PLC** | 39,409 | 2,096,559 | ||||||
|
| |||||||
| 7,858,713 | ||||||||
|
| |||||||
Germany — 3.2% |
| |||||||
Aareal Bank AG** | 41,861 | 876,621 | ||||||
Adidas AG | 22,974 | 2,050,423 | ||||||
Bayerische Motoren Werke AG | 13,013 | 1,266,315 | ||||||
Infineon Technologies AG | 310,899 | 2,532,736 | ||||||
|
| |||||||
| 6,726,095 | ||||||||
|
| |||||||
Norway — 2.8% |
| |||||||
Gjensidige Forsikring ASA | 142,276 | 2,044,586 | ||||||
Seadrill, Ltd. | 27,580 | 1,016,100 | ||||||
Telenor ASA | 131,500 | 2,677,581 | ||||||
|
| |||||||
| 5,738,267 | ||||||||
|
| |||||||
Russia — 2.6% |
| |||||||
Magnit — SP GDR | 63,670 | 2,588,553 | ||||||
Sberbank RF — SP ADR | 219,187 | 2,747,967 | ||||||
|
| |||||||
| 5,336,520 | ||||||||
|
| |||||||
Portugal — 1.2% |
| |||||||
Jeronimo Martins SGPS SA | 126,981 | 2,455,369 | ||||||
|
| |||||||
Spain — 0.8% |
| |||||||
Viscofan SA | 29,624 | 1,677,985 | ||||||
|
| |||||||
Sweden — 0.5% |
| |||||||
Elekta AB — B | 66,210 | 1,032,376 | ||||||
|
| |||||||
Total EUROPE | 105,798,947 | |||||||
|
| |||||||
| FAR EAST — 24.6% | ||||||||
China — 8.2% |
| |||||||
AIA Group, Ltd. | 769,356 | 3,051,524 | ||||||
Baidu, Inc. — SP ADR** | 25,213 | 2,528,612 | ||||||
Golden Eagle Retail Group, Ltd. | 771,660 | 1,921,924 | ||||||
Michael Kors Holdings, Ltd.** | 41,370 | 2,111,111 | ||||||
New Oriental Education & Technology Group, Inc. — SP ADR | 66,980 | 1,301,421 | ||||||
Sands China, Ltd. | 777,562 | 3,476,219 | ||||||
Want Want China Holdings, Ltd. | 1,746,397 | 2,447,411 | ||||||
|
| |||||||
| 16,838,222 | ||||||||
|
| |||||||
Japan — 6.8% |
| |||||||
Astellas Pharma, Inc. | 59,096 | 2,657,050 | ||||||
FANUC Corp. | 12,507 | 2,326,922 | ||||||
M3, Inc. | 2,066 | 3,297,496 | ||||||
MonotaRO Co., Ltd. | 74,459 | 2,398,931 | ||||||
Shionogi & Co., Ltd. | 60,238 | 1,003,796 | ||||||
Notes to Financial Statements are an integral part of this Schedule.
4
Driehaus International Discovery Fund
Schedule of Investments
December 31, 2012
Number of Shares | Market Value (Note A) | |||||||
Ship Healthcare Holdings, Inc. | 11,504 | $ | 305,756 | |||||
Sugi Holdings Co., Ltd. | 56,444 | 1,991,310 | ||||||
|
| |||||||
| 13,981,261 | ||||||||
|
| |||||||
Australia — 4.1% |
| |||||||
Aurizon Holdings, Ltd. | 538,070 | 2,115,908 | ||||||
Aurora Oil & Gas, Ltd.** | 419,529 | 1,613,075 | ||||||
BHP Billiton, Ltd. — SP ADR | 46,108 | 3,616,711 | ||||||
Telstra Corp., Ltd. | 262,520 | 1,196,237 | ||||||
|
| |||||||
| 8,541,931 | ||||||||
|
| |||||||
South Korea — 2.1% |
| |||||||
Samsung Electronics Co., Ltd. | 2,977 | 4,277,353 | ||||||
|
| |||||||
Philippines — 1.0% |
| |||||||
SM Investments Corp. | 99,780 | 2,153,003 | ||||||
|
| |||||||
India — 0.9% |
| |||||||
Tata Motors, Ltd. — SP ADR | 67,690 | 1,944,057 | ||||||
|
| |||||||
Indonesia — 0.7% |
| |||||||
PT Bank Central Asia Tbk | 1,488,761 | 1,410,582 | ||||||
|
| |||||||
Thailand — 0.5% |
| |||||||
CP All PCL — NVDR | 680,980 | 1,023,977 | ||||||
|
| |||||||
Cambodia — 0.3% |
| |||||||
NagaCorp, Ltd. | 1,020,875 | 623,700 | ||||||
|
| |||||||
Total FAR EAST | 50,794,086 | |||||||
|
| |||||||
| NORTH AMERICA — 9.8% | ||||||||
Canada — 7.4% |
| |||||||
B2Gold Corp.** | 475,510 | 1,701,835 | ||||||
Finning International, Inc. | 104,022 | 2,569,439 | ||||||
Imax Corp.** | 47,440 | 1,066,451 | ||||||
Intact Financial Corp. | 13,931 | 907,119 | ||||||
Lululemon Athletica, Inc.** | 14,570 | 1,110,671 | ||||||
New Gold, Inc.** | 144,399 | 1,598,304 | ||||||
Pacific Rubiales Energy Corp. | 59,673 | 1,386,391 | ||||||
Suncor Energy, Inc. | 82,420 | 2,710,323 | ||||||
Trilogy Energy Corp. | 71,107 | 2,080,954 | ||||||
|
| |||||||
| 15,131,487 | ||||||||
|
| |||||||
United States — 1.4% |
| |||||||
Catamaran Corp.** | 62,118 | 2,926,379 | ||||||
|
| |||||||
Mexico — 1.0% |
| |||||||
Fibra Uno Administracion SA de CV — REIT | 694,680 | 2,095,922 | ||||||
|
| |||||||
Total NORTH AMERICA | 20,153,788 | |||||||
|
| |||||||
| SOUTH AMERICA — 9.5% | ||||||||
Brazil — 6.5% |
| |||||||
Anhanguera Educacional Participacoes SA | 178,310 | 3,010,587 | ||||||
BR Malls Participacoes SA | 155,360 | 2,050,221 | ||||||
Number of Shares | Market Value (Note A) | |||||||
Brazil Pharma SA | 170,712 | $ | 1,200,612 | |||||
Gerdau SA — SP ADR | 153,420 | 1,379,246 | ||||||
Multiplus SA | 53,100 | 1,237,574 | ||||||
OdontoPrev SA | 265,750 | 1,392,673 | ||||||
Qualicorp SA** | 305,655 | 3,166,272 | ||||||
|
| |||||||
| 13,437,185 | ||||||||
|
| |||||||
Chile — 1.9% |
| |||||||
SACI Falabella | 200,854 | 2,068,912 | ||||||
Sociedad Quimica y Minera de Chile SA — SP ADR | 30,410 | 1,752,832 | ||||||
|
| |||||||
| 3,821,744 | ||||||||
|
| |||||||
Peru — 1.1% |
| |||||||
Credicorp, Ltd. | 15,780 | 2,312,717 | ||||||
|
| |||||||
Total SOUTH AMERICA | 19,571,646 | |||||||
|
| |||||||
| MIDDLE EAST — 1.7% | ||||||||
Israel — 1.7% |
| |||||||
Mellanox Technologies, Ltd.** | 26,540 | 1,575,945 | ||||||
Teva Pharmaceutical Industries, Ltd. — SP ADR | 49,730 | 1,856,918 | ||||||
|
| |||||||
| 3,432,863 | ||||||||
|
| |||||||
Total MIDDLE EAST | 3,432,863 | |||||||
|
| |||||||
Total EQUITY SECURITIES | 199,751,330 | |||||||
|
| |||||||
| ||||||||
TOTAL INVESTMENTS | 96.8 | % | $ | 199,751,330 | ||||
Other Assets In Excess Of Liabilities | 3.2 | % | 6,641,981 | |||||
|
|
|
| |||||
| Net Assets | 100.0 | % | $ | 206,393,311 | ||||
| ||||||||
The federal income tax basis and unrealized appreciation (depreciation) for all investments is as follows:
| Basis: | $ | 172,278,532 | ||
|
| |||
| Gross Appreciation | $ | 30,128,015 | ||
| Gross Depreciation | (2,655,217 | ) | ||
|
| |||
Net Appreciation | $ | 27,472,798 | ||
|
|
| ** | Non-income producing security |
NVDR — Non-Voting Depository Receipt
REIT — Real Estate Investment Trust
SP ADR — Sponsored American Depository Receipt
SP GDR — Sponsored Global Depository Receipt
Notes to Financial Statements are an integral part of this Schedule.
5
Driehaus International Discovery Fund
Schedule of Investments
December 31, 2012
Regional Weightings*
Western Europe | 48.6% | |||
Asia/Far East Ex-Japan | 17.8% | |||
North America | 9.8% | |||
South America | 9.5% | |||
Japan | 6.8% | |||
Eastern Europe | 2.6% | |||
Middle East | 1.7% |
Top Ten Holdings*
Safran SA | 2.3% | |||
Samsung Electronics Co., Ltd. | 2.1% | |||
Telecity Group PLC | 1.8% | |||
BHP Billton, Ltd. — SP ADR | 1.8% | |||
The Weir Group PLC | 1.7% | |||
Novo Nordisk AS — B | 1.7% | |||
Sands China, Ltd. | 1.7% | |||
Societe BIC SA | 1.7% | |||
M3, Inc. | 1.6% | |||
Qualicorp SA | 1.5% |
| * | All percentages are stated as a percent of net assets at December 31, 2012. |
Notes to Financial Statements are an integral part of this Schedule.
6
Driehaus International Discovery Fund
Schedule of Investments
December 31, 2012
Industry | Percent of Net Assets | |||
Aerospace & Defense | 2.3% | |||
Auto Components | 1.4% | |||
Automobiles | 1.6% | |||
Biotechnology | 0.7% | |||
Capital Markets | 1.1% | |||
Chemicals | 3.3% | |||
Commercial Banks | 4.6% | |||
Commercial Services & Supplies | 2.3% | |||
Diversified Consumer Services | 2.1% | |||
Diversified Telecommunications | 1.9% | |||
Electrical Equipment | 1.5% | |||
Electronic Equipment, Instruments & Components | 1.4% | |||
Energy Equipment & Services | 3.5% | |||
Food & Staples Retailing | 4.5% | |||
Food Products | 2.0% | |||
Health Care Equipment & Supplies | 3.5% | |||
Health Care Providers & Services | 3.8% | |||
Health Care Technology | 1.6% | |||
Hotels, Restaurants & Leisure | 2.5% | |||
Industrial Conglomerates | 1.0% | |||
Insurance | 2.9% | |||
Industry | Percent of Net Assets | |||
Internet & Catalog Retail | 1.2% | |||
Internet Software & Services | 3.1% | |||
Machinery | 3.9% | |||
Media | 0.5% | |||
Metals & Mining | 7.2% | |||
Multiline Retail | 1.9% | |||
Oil, Gas & Consumable Fuels | 3.8% | |||
Pharmaceuticals | 6.2% | |||
Professional Services | 1.0% | |||
Real Estate Investment Trust | 1.0% | |||
Real Estate Management & Development | 1.0% | |||
Road & Rail | 1.0% | |||
Semiconductors & Semiconductor Equipment | 5.2% | |||
Software | 0.6% | |||
Specialty Retail | 0.8% | |||
Textiles, Apparel & Luxury Goods | 4.7% | |||
Thrifts & Mortgage Finance | 0.4% | |||
Trading Companies & Distributors | 2.4% | |||
Transportation Infrastructure | 1.4% | |||
Other Assets in Excess of Liabilities | 3.2% | |||
|
| |||
TOTAL | 100.0% | |||
|
| |||
Notes to Financial Statements are an integral part of this Schedule.
7
Driehaus Emerging Markets Growth Fund — Portfolio Managers’ Letter
Dear Fellow Shareholders,
The Driehaus Emerging Markets Growth Fund (“Fund”) returned 19.51% for the year ended December 31, 2012. This return was above the performance of the Morgan Stanley Capital International (“MSCI”) Emerging Markets Index (“Benchmark”) (which returned 18.63% for the year) and below the MSCI Emerging Markets Growth Index (which returned 20.86% for the year).
The Fund now uses the MSCI Emerging Markets Index as its Benchmark. The MSCI Emerging Markets Growth Index, which was previously used as the Fund’s primary benchmark, will be used as a secondary performance benchmark. The broad-based MSCI Emerging Markets Index is a more accurate representative of the Fund’s investment universe.
The strong returns within emerging markets during 2012 were fuelled by the significant increase in global liquidity by developed market central banks, which benefited most financial assets. Also, as emerging markets growth slowed due to the economic slowdown in Europe and China, a disinflationary tailwind swept across developing economies. This allowed many emerging market central banks to aggressively ease monetary policy and continue to stimulate their economies. This presented an attractive investment environment and emerging markets equities rallied strongly in the second half of 2012. As the year came to a close, there were signs that the Chinese economy was improving. Stimulus implemented at the start of the second quarter began to show up in the economic data. The quarter also brought new leadership in Beijing and optimism that the new leaders would usher in a more proactive reform agenda. Elsewhere in emerging markets, other large economies, such as Brazil, India and South Korea, were showing signs that the worst of the growth slowdown of 2012 had passed.
Over the course of 2012, key contributors to performance versus the Benchmark were the Fund’s holdings in the consumer discretionary and materials sectors. In addition, stock selection in Brazil and Mexico contributed positively to the performance of the Fund.
Consumer discretionary holding NagaCorp, Ltd. (Ticker: 3918 HK) was the most significant contributor to the Fund’s return for 2012 relative to the Benchmark. NagaCorp, Ltd. owns, manages and operates the largest integrated gaming and entertainment hotel complex in Cambodia, NagaWorld. During the past several years NagaWorld has seen strong earnings growth, which has coincided with the steady rise in tourism in Cambodia. The hotel complex is currently going through various upgrades that that should contribute to its near-term earnings growth. Additionally, the company is scheduled to open its Naga2 property by the end of 2015.
Within Brazil, Kroton Educacional SA (Ticker: KROT3 BZ) was a holding that significantly contributed to relative returns for the year. Kroton Educacional SA is active in the private education sector. The company manages preschool, elementary, secondary and college preparatory schools, as well as higher, professional and post-graduation education, free courses and other related educational activities. In addition, it is involved in the wholesale, retail, distribution, import and export of textbooks. Kroton is well-positioned to benefit from government efforts to establish a strong student financing platform. The Brazilian government is actively seeking to drive increased levels of post-secondary education to build a higher skilled workforce. With a new government financing program in place, we believe post-secondary education demand should noticeably strengthen as income potential can increase significantly with the attainment of a post-secondary degree.
Certain areas detracted from Fund performance during the year. Two sectors that negatively affected performance of the Fund versus the Benchmark were information technology and health care. Additionally, holdings in South Korea and China detracted from Fund performance versus the Benchmark.
Within information technology, China-based Baidu, Inc. SP ADR (Ticker: BIDU) was a significant detractor from performance for 2012. Baidu is a Chinese-language Internet search provider. The company offers a Chinese-language search platform that enables users to find relevant information online, including Web pages, news, images, documents and multimedia files, through links provided on its websites. Baidu’s share price declined during the year due to the combination of lost market share to recently launched competitor Qihu (which continues to expand its vertical search engine platforms) and reduced advertising revenue due to macroeconomic uncertainty.
8
Within South Korea, health care holding Seegene, Inc. (Ticker: 096530 KS) was the most significant detractor for the year. Seegene specializes in molecular diagnostics and develops technology and products that diagnose disease at the genetic level. Seegene’s molecular diagnosis technology and products allow patients to benefit from cost effective and personalized diagnosis tools and allow doctors to offer accurate and effective treatment to patients. Seegene’s share price fell steeply mid-year due in part to a perceived delay in an expected global distribution deal.
Looking ahead, each of the last few years has seen periods of extreme concern regarding the state of the world, and equivalently exuberant market responses when those concerns ultimately fade. These worries usually have been driven by risks in Europe, though increasingly those ‘risk-off’ events are occurring at the hands of U.S. policymakers. However, we believe that the ability of the global economy to withstand shocks, from the perspectives of economic strength and financial liquidity, is better than it has been in the recent years. As such, we would not anticipate the global markets getting as near the cliff’s edge as they have in each of the past few years.
Recent improving global economic data is something we have been watching quite closely. We believe in the economic growth suggested by the data but remain cautious. We remember this narrative from the past few years where expectations ramp up at the start of the year only to be revised downward as the year progresses. We continue to believe that we reside in a low-growth world and that investors must be nimble to manage the volatility that accompanies such environments.
Globally, we are seeing many new opportunities in non-U.S. markets that did not look possible at this time last year. Financial conditions in Europe have meaningfully eased and the emerging markets outlook has improved thanks to low inflation, lower cost of capital, and inflecting growth trajectories. We remain optimistic but expect periods of volatility as government actions help and hurt economies in the year ahead.
We at Driehaus Capital Management LLC thank you for your interest in the Driehaus Emerging Markets Growth Fund and would like to express our gratitude to you as shareholders for your confidence in our management capabilities.
Sincerely,
 |  | |
| Howard Schwab | Chad Cleaver | |
| Lead Portfolio Manager | Co-Portfolio Manager |
Performance is historical and does not represent future results.
Please see the following performance overview page for index descriptions.
9
Driehaus Emerging Markets Growth Fund
Performance Overview (unaudited)
The performance summarized below is historical and does not represent future results. Investment returns and principal value vary, and you may have a gain or loss when you sell shares. Performance data presented measures the change in the value of an investment in the Fund, assuming reinvestment of all dividends and capital gains. Average annual total return reflects annualized change.
The table does not reflect the deduction of taxes that a shareholder would pay on Fund distributions or the redemption of Fund shares. The graph compares the results of a $10,000 investment in the Fund since December 31, 1997 (the date of the Fund’s inception), with all dividends and capital gains reinvested, with the indicated indices (and dividends reinvested) for the same period.
| Average Annual Total Returns as of 12/31/12 | 1 Year | 3 Years | 5 Years | 10 Years | Since Inception (12/31/97 - 12/31/12) | |||||||||||||||
Driehaus Emerging Markets Growth Fund (DREGX)1 | 19.51% | 7.86% | –0.56% | 18.76% | 14.17% | |||||||||||||||
MSCI Emerging Markets Index2 | 18.63% | 4.98% | –0.61% | 16.89% | 9.24% | |||||||||||||||
MSCI Emerging Markets Growth Index3 | 20.86% | 5.50% | –1.71% | 15.11% | 8.22% | |||||||||||||||
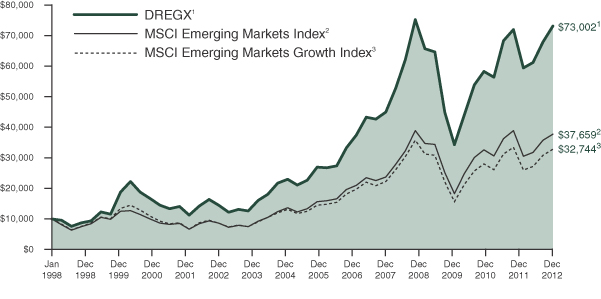
| 1 | The returns for the periods prior to July 1, 2003, reflect fee waivers and/or reimbursements without which performance would have been lower. |
| 2 | The Morgan Stanley Capital International Emerging Markets Index (MSCI Emerging Markets Index) is a market capitalization-weighted index designed to measure equity market performance in 21 global emerging markets. Data is in U.S. dollars. Source: Morgan Stanley Capital International Inc. |
| 3 | The Morgan Stanley Capital International Emerging Markets Growth Index (MSCI Emerging Markets Growth Index) is a subset of the MSCI Emerging Markets Index and includes only the MSCI Emerging Markets Index stocks which are categorized as growth stocks. Data is in U.S. dollars. Source: Morgan Stanley Capital International Inc. |
10
Driehaus Emerging Markets Growth Fund
Schedule of Investments
December 31, 2012
| Number of Shares | Market Value (Note A) | |||||||
| EQUITY SECURITIES — 92.5% | ||||||||
| FAR EAST — 50.1% | ||||||||
China — 16.8% |
| |||||||
AIA Group, Ltd. | 2,835,910 | $ | 11,248,170 | |||||
Belle International Holdings, Ltd. | 3,002,000 | 6,639,149 | ||||||
China Life Insurance Co., Ltd. — H | 2,801,077 | 9,277,342 | ||||||
China State Construction International Holdings, Ltd. | 6,178,270 | 7,541,588 | ||||||
CIMC Enric Holdings, Ltd. | 13,386,583 | 12,122,862 | ||||||
CNOOC, Ltd. | 4,454,000 | 9,812,220 | ||||||
ENN Energy Holdings, Ltd. | 2,158,000 | 9,456,116 | ||||||
Geely Automobile Holdings, Ltd. | 15,645,344 | 7,560,463 | ||||||
Haier Electronics Group Co., Ltd.** | 11,910,886 | 17,666,210 | ||||||
Industrial & Commercial Bank of China, Ltd. — H | 20,062,000 | 14,480,287 | ||||||
Kunlun Energy Co., Ltd. | 4,648,000 | 9,827,459 | ||||||
Lenovo Group, Ltd. | 11,316,000 | 10,434,031 | ||||||
Sino-Ocean Land Holdings, Ltd. | 3,973,774 | 3,022,136 | ||||||
Sunac China Holdings, Ltd. | 9,598,000 | 7,510,613 | ||||||
Tencent Holdings, Ltd. | 622,400 | 20,412,670 | ||||||
Want Want China Holdings, Ltd. | 3,076,580 | 4,311,537 | ||||||
Zoomlion Heavy Industry Science and Technology Co., Ltd. — H | 3,219,000 | 4,847,117 | ||||||
|
| |||||||
| 166,169,970 | ||||||||
|
| |||||||
South Korea — 9.1% |
| |||||||
Hyundai Glovis Co., Ltd. | 58,847 | 12,248,410 | ||||||
Kolao Holdings | 243,063 | 4,196,097 | ||||||
Samsung Electro-Mechanics Co., Ltd. | 63,930 | 5,976,226 | ||||||
Samsung Electronics Co., Ltd. | 39,240 | 56,380,026 | ||||||
SK Innovation Co., Ltd. | 68,375 | 11,313,577 | ||||||
|
| |||||||
| 90,114,336 | ||||||||
|
| |||||||
India — 5.7% |
| |||||||
Axis Bank, Ltd. | 329,702 | 8,284,079 | ||||||
HCL Technologies, Ltd. | 638,777 | 7,256,478 | ||||||
HDFC Bank, Ltd. | 364,986 | 4,550,252 | ||||||
IDFC, Ltd. | 5,674,746 | 17,998,615 | ||||||
Maruti Suzuki India, Ltd. | 249,918 | 6,848,234 | ||||||
Sun Pharmaceutical Industries, Ltd. | 280,592 | 3,795,360 | ||||||
Yes Bank, Ltd. | 896,217 | 7,633,049 | ||||||
|
| |||||||
| 56,366,067 | ||||||||
|
| |||||||
| Number of Shares | Market Value (Note A) | |||||||
Taiwan — 4.3% |
| |||||||
Asustek Computer, Inc. | 458,000 | $ | 5,186,566 | |||||
Far EasTone Telecommunications Co., Ltd. | 2,586,000 | 6,603,037 | ||||||
MediaTek, Inc. | 529,000 | 5,917,966 | ||||||
Taiwan Semiconductor Manufacturing Co., Ltd. — SP ADR | 1,413,681 | 24,258,766 | ||||||
|
| |||||||
| 41,966,335 | ||||||||
|
| |||||||
Philippines — 3.5% |
| |||||||
Ayala Land, Inc. | 6,085,100 | 3,933,236 | ||||||
Bank of Philippine Islands | 4,417,804 | 10,248,529 | ||||||
International Container Terminal Services, Inc. | 3,039,461 | 5,491,058 | ||||||
SM Investments Corp. | 438,700 | 9,466,052 | ||||||
SM Prime Holdings, Inc. | 12,877,200 | 5,190,733 | ||||||
|
| |||||||
| 34,329,608 | ||||||||
|
| |||||||
Singapore — 2.9% |
| |||||||
Lippo Malls Indonesia Retail Trust — REIT | 22,142,888 | 8,919,620 | ||||||
Yoma Strategic Holdings, Ltd. | 33,774,152 | 19,936,468 | ||||||
|
| |||||||
| 28,856,088 | ||||||||
|
| |||||||
Malaysia — 2.3% |
| |||||||
Axiata Group BHD | 6,079,900 | 13,150,456 | ||||||
Public Bank BHD | 1,872,234 | 9,989,693 | ||||||
|
| |||||||
| 23,140,149 | ||||||||
|
| |||||||
Thailand — 1.9% |
| |||||||
CP All PCL — NVDR | 3,850,512 | 5,789,946 | ||||||
Land & Houses PCL — NVDR | 27,658,000 | 8,869,692 | ||||||
Siam Commercial Bank PCL — NVDR | 686,064 | 4,094,167 | ||||||
|
| |||||||
| 18,753,805 | ||||||||
|
| |||||||
Cambodia — 1.9% |
| |||||||
NagaCorp, Ltd. | 30,464,696 | 18,612,289 | ||||||
|
| |||||||
Indonesia — 1.7% |
| |||||||
PT Bank Mandiri Persero Tbk | 5,022,500 | 4,242,576 | ||||||
PT Semen Indonesia Persero Tbk | 2,679,947 | 4,426,791 | ||||||
PT Telekomunikasi Indonesia Persero Tbk | 4,183,592 | 3,943,150 | ||||||
PT Tower Bersama Infrastructure Tbk** | 7,731,445 | 4,576,557 | ||||||
|
| |||||||
| 17,189,074 | ||||||||
|
| |||||||
Total FAR EAST | 495,497,721 | |||||||
|
| |||||||
Notes to Financial Statements are an integral part of this Schedule.
11
Driehaus Emerging Markets Growth Fund
Schedule of Investments
December 31, 2012
| Number of Shares | Market Value (Note A) | |||||||
| SOUTH AMERICA — 15.5% | ||||||||
Brazil — 13.0% |
| |||||||
Anhanguera Educacional Participacoes SA | 605,700 | $ | 10,226,642 | |||||
Arezzo Industria e Comercio SA | 79,295 | 1,531,681 | ||||||
Banco Bradesco SA — Pref. | 391,201 | 6,719,677 | ||||||
BR Malls Participacoes SA | 642,578 | 8,479,833 | ||||||
Brazil Pharma SA | 841,202 | 5,916,146 | ||||||
Cia. de Bebidas das Americas — Pref. | 272,800 | 11,402,307 | ||||||
Even Construtora e Incorporadora SA | 1,407,875 | 6,463,504 | ||||||
Itau Unibanco Holding SA — PREF ADR | 678,823 | 11,173,427 | ||||||
Kroton Educacional SA** | 735,119 | 16,605,252 | ||||||
Mills Estruturas e Servicos de Engenharia SA | 465,228 | 7,725,398 | ||||||
Qualicorp SA** | 1,027,613 | 10,645,017 | ||||||
Randon Participacoes SA — Pref. | 486,570 | 3,015,665 | ||||||
Vale SA — Pref. | 1,424,872 | 28,441,767 | ||||||
|
| |||||||
| 128,346,316 | ||||||||
|
| |||||||
Peru — 1.4% |
| |||||||
Credicorp, Ltd. | 97,327 | 14,264,245 | ||||||
|
| |||||||
Chile — 0.7% |
| |||||||
SACI Falabella | 729,495 | 7,514,218 | ||||||
|
| |||||||
Colombia — 0.4% |
| |||||||
Almacenes Exito SA | 189,575 | 3,808,666 | ||||||
|
| |||||||
Total SOUTH AMERICA | 153,933,445 | |||||||
|
| |||||||
| EUROPE — 11.7% | ||||||||
Russia — 6.8% |
| |||||||
Eurasia Drilling Co., Ltd. —GDR | 496,363 | 17,989,114 | ||||||
Magnit — SP GDR | 593,532 | 24,130,500 | ||||||
Rosneft OAO — GDR | 1,337,622 | 12,120,533 | ||||||
Sberbank RF — SP ADR | 1,030,699 | 12,921,965 | ||||||
|
| |||||||
| 67,162,112 | ||||||||
|
| |||||||
Turkey — 2.5% |
| |||||||
Aselsan Elektronik Sanayi Ve Ticaret AS | 1,041,740 | 4,951,851 | ||||||
Tofas Turk Otomobil Fabrikasi AS | 454,873 | 2,677,702 | ||||||
Trakya Cam Sanayii AS** | 1,741,978 | 2,382,506 | ||||||
Turkiye Garanti Bankasi AS | 942,944 | 4,921,630 | ||||||
Turkiye Halk Bankasi AS | 992,534 | 9,784,055 | ||||||
|
| |||||||
| 24,717,744 | ||||||||
|
| |||||||
Netherlands — 1.4% |
| |||||||
LyondellBasell Industries NV | 243,212 | 13,884,973 | ||||||
|
| |||||||
| Number of Shares | Market Value (Note A) | |||||||
Poland — 0.5% |
| |||||||
Eurocash SA | 380,689 | $ | 5,374,896 | |||||
|
| |||||||
United Kingdom — 0.5% |
| |||||||
Old Mutual PLC | 1,618,348 | 4,704,185 | ||||||
|
| |||||||
Total EUROPE | 115,843,910 | |||||||
|
| |||||||
| NORTH AMERICA — 7.1% | ||||||||
Mexico — 7.1% |
| |||||||
Bolsa Mexicana de Valores SAB de CV | 1,953,005 | 4,925,459 | ||||||
El Puerto de Liverpool SAB de CV | 746,468 | 7,898,194 | ||||||
Fibra Uno Administracion SA de CV — REIT | 5,958,468 | 17,977,322 | ||||||
Fomento Economico Mexicano SAB de CV — SP ADR | 48,642 | 4,898,249 | ||||||
Grupo Financiero Banorte SAB de CV — O | 2,435,078 | 15,724,218 | ||||||
Kimberly-Clark de Mexico SAB de CV — A | 2,670,631 | 6,859,267 | ||||||
Mexichem SAB de CV | 2,096,254 | 11,645,405 | ||||||
|
| |||||||
| 69,928,114 | ||||||||
|
| |||||||
Total NORTH AMERICA | 69,928,114 | |||||||
|
| |||||||
| AFRICA — 5.2% | ||||||||
South Africa — 3.6% |
| |||||||
Barloworld, Ltd. | 17,164 | 178,006 | ||||||
FirstRand, Ltd. | 1,379,277 | 5,075,406 | ||||||
Impala Platinum Holdings, Ltd. | 264,968 | 5,299,130 | ||||||
Life Healthcare Group Holdings, Ltd. | 1,374,232 | 5,522,722 | ||||||
Mr. Price Group, Ltd. | 563,812 | 9,344,145 | ||||||
MTN Group, Ltd. | 484,489 | 10,197,875 | ||||||
|
| |||||||
| 35,617,284 | ||||||||
|
| |||||||
Nigeria — 1.6% |
| |||||||
Zenith Bank PLC | 125,462,191 | 15,659,674 | ||||||
|
| |||||||
Total AFRICA | 51,276,958 | |||||||
|
| |||||||
| MIDDLE EAST — 2.9% | ||||||||
Qatar — 1.2% |
| |||||||
Industries Qatar QSC | 268,641 | 11,485,565 | ||||||
|
| |||||||
United Arab Emirates — 1.1% |
| |||||||
Emaar Properties PJSC | 11,023,747 | 11,388,917 | ||||||
|
| |||||||
Pakistan — 0.6% |
| |||||||
Engro Foods, Ltd.** | 5,749,243 | 5,804,544 | ||||||
|
| |||||||
Total MIDDLE EAST | 28,679,026 | |||||||
|
| |||||||
Total EQUITY SECURITIES (Cost $769,883,793) | 915,159,174 | |||||||
|
| |||||||
Notes to Financial Statements are an integral part of this Schedule.
12
Driehaus Emerging Markets Growth Fund
Schedule of Investments
December 31, 2012
| Number of Shares | Market Value (Note A) | |||||||
| EQUITY CERTIFICATES — 1.0% | ||||||||
| MIDDLE EAST — 1.0% | ||||||||
Saudi Arabia — 1.0% |
| |||||||
Etihad Etisalat Co.† | 475,416 | $ | 9,634,584 | |||||
|
| |||||||
Total MIDDLE EAST | 9,634,584 | |||||||
|
| |||||||
Total EQUITY CERTIFICATES (Cost $8,851,698) | 9,634,584 | |||||||
|
| |||||||
| ||||||||
| EXCHANGE-TRADED FUNDS — 0.5% | ||||||||
| NORTH AMERICA — 0.5% | ||||||||
United States — 0.5% |
| |||||||
Energy Select Sector SPDR Fund | 71,997 | 5,143,466 | ||||||
|
| |||||||
Total NORTH AMERICA | 5,143,466 | |||||||
|
| |||||||
Total EXCHANGE-TRADED FUNDS | 5,143,466 | |||||||
|
| |||||||
| ||||||||
TOTAL INVESTMENTS | 94.0 | % | $ | 929,937,224 | ||||
Other Assets In Excess Of Liabilities | 6.0 | % | 59,320,786 | |||||
|
|
|
| |||||
| Net Assets | 100.0 | % | $ | 989,258,010 | ||||
| ||||||||
The federal income tax basis and unrealized appreciation (depreciation) for all investments is as follows:
| Basis: | $ | 788,366,456 | ||
|
| |||
| Gross Appreciation | $ | 146,752,637 | ||
| Gross Depreciation | (5,181,869 | ) | ||
|
| |||
Net Appreciation | $ | 141,570,768 | ||
|
|
| ** | Non-income producing security |
| † | Restricted security — Investments in securities not registered under the Securities Act of 1933, excluding 144A securities. At December 31, 2012, the value of these restricted securities amounted to $9,634,584 or 1.0% of net assets. |
Additional information on each restricted security is as follows (see Note A in Notes to Financial Statements):
Security | Counter- party | Acquisition Date(s) | Acquisition Cost | |||||||||
Etihad Etisalat Co. | MSCO | | 08/27/12 to 10/10/12 | | $ | 8,851,698 | ||||||
GDR — Global Depository Receipt
MSCO — Morgan Stanley & Co., Inc.
NVDR — Non-Voting Depository Receipt
PREF ADR — Preferred American Depository Receipt
REIT — Real Estate Investment Trust
SP ADR — Sponsored American Depository Receipt
SP GDR — Sponsored Global Depository Receipt
Regional Weightings*
Asia/Far East Ex-Japan | 50.1% | |||
South America | 15.5% | |||
Eastern Europe | 9.8% | |||
North America | 7.6% | |||
Africa | 5.2% | |||
Middle East | 3.9% | |||
Western Europe | 1.9% |
Top Ten Holdings*
Samsung Electronics Co., Ltd. | 5.7% | |||
Vale SA — Pref. | 2.9% | |||
Taiwan Semiconductor Manufacturing Co., Ltd. — SP ADR | 2.5% | |||
Magnit — SP GDR | 2.4% | |||
Tencent Holdings, Ltd. | 2.1% | |||
Yoma Strategic Holdings, Ltd. | 2.0% | |||
NagaCorp, Ltd. | 1.9% | |||
IDFC, Ltd. | 1.8% | |||
Eurasia Drilling Co., Ltd. — GDR | 1.8% | |||
Fibra Uno Administracion SA de CV — REIT | 1.8% |
| * | All percentages are stated as a percent of net assets at December 31, 2012. |
Notes to Financial Statements are an integral part of this Schedule.
13
Driehaus Emerging Markets Growth Fund
Schedule of Investments
December 31, 2012
Industry | Percent of Net Assets | |||
Aerospace & Defense | 0.5% | |||
Air Freight & Logistics | 1.2% | |||
Automobiles | 2.2% | |||
Beverages | 1.6% | |||
Buliding Products | 0.2% | |||
Chemicals | 2.6% | |||
Commercial Banks | 15.6% | |||
Computers & Peripherals | 1.6% | |||
Construction & Engineering | 2.8% | |||
Construction Materials | 0.4% | |||
Diversified Consumer Services | 2.7% | |||
Diversified Financial Services | 2.8% | |||
Diversified Telecommunications | 0.4% | |||
Electronic Equipment, Instruments & Components | 0.6% | |||
Energy Equipment & Services | 1.8% | |||
Food & Staples Retailing | 4.6% | |||
Food Products | 1.0% | |||
Gas Utilities | 1.0% | |||
Health Care Providers & Services | 1.6% | |||
Hotels, Restaurants & Leisure | 1.9% | |||
Household Durables | 2.4% | |||
Industry | Percent of Net Assets | |||
Household Products | 0.7% | |||
Industrial Conglomerates | 2.1% | |||
Insurance | 2.6% | |||
Internet Software & Services | 2.1% | |||
IT Services | 0.7% | |||
Machinery | 2.0% | |||
Metals & Mining | 3.4% | |||
Multiline Retail | 1.6% | |||
Oil, Gas & Consumable Fuels | 4.4% | |||
Other | 0.5% | |||
Pharmaceuticals | 0.4% | |||
Real Estate Investment Trust | 2.7% | |||
Real Estate Management & Development | 4.9% | |||
Semiconductors & Semiconductor Equipment | 8.7% | |||
Specialty Retail | 1.6% | |||
Textiles, Apparel & Luxury Goods | 0.2% | |||
Trading Companies & Distributors | 0.8% | |||
Transportation Infrastructure | 0.6% | |||
Wireless Telecommunication Services | 4.5% | |||
Other Assets in Excess of Liabilities | 6.0% | |||
|
| |||
TOTAL | 100.0% | |||
|
| |||
Notes to Financial Statements are an integral part of this Schedule.
14
Driehaus Emerging Markets Small Cap Growth Fund — Portfolio Managers’ Letter
Dear Fellow Shareholders,
The Driehaus Emerging Markets Small Cap Growth Fund (“Fund”) returned 28.83% for the year ended December 31, 2012.1 This return was above the performance of the Morgan Stanley Capital International (“MSCI”) Emerging Markets Small Cap Index (“Benchmark”) (which returned 22.60% for the same period) and above the performance of the MSCI Emerging Markets Index (which returned 18.63% for the same period), which is the Fund’s secondary benchmark index.
The strong returns within emerging markets during 2012 were fuelled by the significant increase in global liquidity by developed market central banks, which benefited most financial assets. Also, as emerging markets growth slowed due to the economic slowdown in Europe and China, a disinflationary tailwind swept across developing economies. This allowed many emerging market central banks to aggressively ease monetary policy and continue to stimulate their economies. This presented an attractive investment environment and emerging markets equities rallied strongly in the second half of 2012. As the year came to a close, there were signs that the Chinese economy was improving. Stimulus implemented at the start of the second quarter began to show up in the economic data. The quarter also brought new leadership in Beijing and optimism that the new leaders would usher in a more proactive reform agenda. Elsewhere in emerging markets, other large economies, such as Brazil, India and South Korea, were showing signs that the worst of the growth slowdown of 2012 had passed.
For 2012, key contributors to performance versus the Benchmark were the Fund’s holdings in the consumer staples and consumer discretionary sectors. In addition, stock selection in South Korea, Indonesia and Malaysia contributed to the Fund’s outperformance.
Consumer discretionary holding NagaCorp, Ltd. (Ticker: 3918 HK) was the most significant contributor to return for 2012. NagaCorp, Ltd. owns, manages and operates the largest integrated gaming and entertainment hotel complex in Cambodia, NagaWorld. During the past several years NagaWorld has seen strong earnings growth, which has coincided with the steady rise in tourism in Cambodia. The hotel complex is currently going through various upgrades that should contribute to its near-term earnings growth. Additionally, the company is scheduled to open its Naga2 property by the end of 2015.
Within South Korea, consumer staples company Cosmax, Inc. (Ticker: 044820 KS) was a significant contributor to the Fund’s return for 2012. Cosmax develops skincare, makeup, hair care, and health care products. The market for domestic brands in South Korea continued to expand during the year, benefiting domestic manufacturers such as Cosmax. Within China, Cosmax sales also grew at a strong pace. Earnings are likely to remain strong due to capacity increases from overseas operations and strong growth within its domestic market.
Certain areas detracted from Fund performance during the year. Two sectors that negatively affected performance of the Fund versus the Benchmark were health care and materials. Additionally, holdings in Canada (companies with significant exposure to emerging markets), the United Kingdom and Hong Kong detracted from Fund performance versus the Benchmark.
Within health care, South Korean holding Seegene, Inc. (Ticker: 096530 KS) was the most significant detractor for the year. Seegene specializes in molecular diagnostics and develops technology and products that diagnose disease at the genetic level. Seegene’s molecular diagnosis technology and products allow patients to benefit from cost effective and personalized diagnosis tools and allow doctors to offer accurate and effective treatment to patients. Seegene’s share price fell steeply mid-year due in part to a perceived delay in an expected global distribution deal.
Within the United Kingdom, energy holding Chariot Oil & Gas Ltd. (Ticker: CHAR LN) was the most significant detractor. Chariot Oil & Gas Ltd. is an independent oil and gas exploration company focused on offshore West Africa with a portfolio of assets located in the underexplored regions of Namibia, Mauritania and Morocco. Chariot’s exploration efforts during 2012 were less successful than investors had hoped and costs increased significantly during the year.
We utilized option strategies in the Fund primarily to hedge a portion of the Fund’s portfolio, dampen volatility, and manage downside risk. These strategies primarily consisted of puts and put spreads on exchange-traded funds (ETFs). As the market posted strong returns during 2012, the options detracted from
15
performance. However, the options did help lessen volatility and manage downside risk, which are key considerations in the management of the Fund.
Looking ahead, each of the last few years has seen periods of extreme concern regarding the state of the world, and equivalently exuberant market responses when those concerns ultimately fade. These worries usually have been driven by risks in Europe, though increasingly those ‘risk-off’ events are occurring at the hands of U.S. policymakers. However, we believe that the ability of the global economy to withstand shocks, from the perspectives of economic strength and financial liquidity, is better than it has been in the recent years. As such, we would not anticipate the global markets getting as near the cliff’s edge as they have in each of the past few years.
Recent improving global economic data is something we have been watching quite closely. We believe in the economic growth suggested by the data, but remain cautious. We remember this narrative from the past few years where expectations ramp up at the start of the year only to be revised downward as the year progresses. We continue to believe that we reside in a low-growth world and that investors must be nimble to manage the volatility that accompanies such environments.
Globally, we are seeing many new opportunities in non-U.S. markets that did not look possible at this time last year. Financial conditions in Europe have meaningfully eased and the emerging markets outlook has improved thanks to low inflation, lower cost of capital, and inflecting growth trajectories. We remain optimistic but expect periods of volatility as government actions help and hurt economies in the year ahead.
We at Driehaus Capital Management LLC thank you for your interest in the Driehaus Emerging Markets Small Cap Growth Fund and would like to express our gratitude to you as shareholders for your confidence in our management capabilities.
Sincerely,
| | |
| Chad Cleaver | Howard Schwab | |
| Lead Portfolio Manager | Co-Portfolio Manager |
| 1 | During this period, the Fund’s returns reflect fee waivers and/or reimbursements without which performance would have been lower. |
Performance is historical and does not represent future results.
Please see the following performance overview page for index descriptions.
16
Driehaus Emerging Markets Small Cap Growth Fund
Performance Overview (unaudited)
The performance summarized below is historical and does not represent future results. Investment returns and principal value vary, and you may have a gain or loss when you sell shares. Performance data presented measures the change in the value of an investment in the Fund, assuming reinvestment of all dividends and capital gains. Average annual total return reflects annualized change.
The table does not reflect the deduction of taxes that a shareholder would pay on Fund distributions or the redemption of Fund shares. The graph compares the results of a $10,000 investment in the Fund since December 1, 2008 (the date of the Predecessor Limited Partnership’s inception), with all dividends and capital gains reinvested, with the indicated indices (and dividends reinvested) for the same period.
| Fund Only | Including Predecessor Limited Partnership | |||||||||||||||
| Average Annual Total Returns as of 12/31/12 | 1 Year | Since Inception (08/22/11 - 12/31/12) | 3 Years | Since Inception (12/01/08 - 12/31/12) | ||||||||||||
Driehaus Emerging Markets Small Cap Growth | 28.83% | 9.75% | 11.66% | 23.10% | ||||||||||||
MSCI Emerging Markets Small Cap Index2 | 22.60% | 4.17% | 4.51% | 28.20% | ||||||||||||
MSCI Emerging Markets Index3 | 18.63% | 9.27% | 4.98% | 21.72% | ||||||||||||
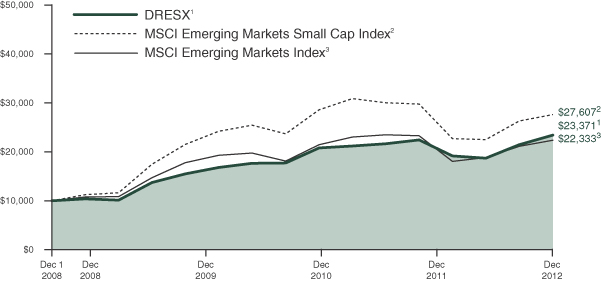
| 1 | The Driehaus Emerging Markets Small Cap Growth Fund (the “Fund”) performance shown above includes the performance of the Driehaus Emerging Markets Small Cap Growth Fund, L.P. (the “Predecessor Limited Partnership”), the Fund’s predecessor, for the periods before the Fund’s registration statement became effective. The Predecessor Limited Partnership, which was established on December 1, 2008, was managed with substantially the same investment objective, policies and philosophies as are followed by the Fund. The Fund succeeded to the Predecessor Limited Partnership’s assets on August 22, 2011. The Predecessor Limited Partnership was not registered under the Investment Company Act of 1940, as amended (“1940 Act”), and thus was not subject to certain investment and operational restrictions that are imposed by the 1940 Act. If the Predecessor Limited Partnership had been registered under the 1940 Act, its performance may have been adversely affected. The Predecessor Limited Partnership’s performance has been restated to reflect estimated expenses of the Fund. The returns for the periods reflect fee waivers and/or reimbursements without which performance would have been lower. |
| 2 | The Morgan Stanley Capital International Emerging Markets Small Cap Index (MSCI Emerging Markets Small Cap Index) is a market capitalization-weighted index designed to measure equity market performance of small cap stocks in 21 global emerging markets. Data is in U.S. dollars. Source: Morgan Stanley Capital International Inc. |
| 3 | The Morgan Stanley Capital International Emerging Markets Index (MSCI Emerging Markets Index) is a market capitalization weighted index designed to measure equity market performance in 21 global emerging markets. Data is in U.S. dollars. Source: Morgan Stanley Capital International Inc. |
17
Driehaus Emerging Markets Small Cap Growth Fund
Schedule of Investments
December 31, 2012
| Number of Shares | Market Value (Note A) | |||||||
| EQUITY SECURITIES — 81.3% | ||||||||
| FAR EAST — 51.2% | ||||||||
China — 13.8% |
| |||||||
China Medical System Holdings, Ltd. | 1,515,000 | $ | 1,182,514 | |||||
CIMC Enric Holdings, Ltd. | 1,280,000 | 1,159,165 | ||||||
Geely Automobile Holdings, Ltd. | 2,457,839 | 1,187,727 | ||||||
GOME Electrical Appliances Holding, Ltd.** | 6,134,000 | 742,209 | ||||||
Haier Electronics Group Co., Ltd.** | 1,464,853 | 2,172,668 | ||||||
Hilong Holding, Ltd. | 3,267,000 | 1,161,956 | ||||||
Honghua Group, Ltd. | 3,153,000 | 1,406,299 | ||||||
Ju Teng International Holdings, Ltd. | 1,308,000 | 630,328 | ||||||
Sunac China Holdings, Ltd. | 1,062,000 | 831,035 | ||||||
Trinity, Ltd. | 1,082,000 | 716,319 | ||||||
|
| |||||||
| 11,190,220 | ||||||||
|
| |||||||
Indonesia — 6.2% |
| |||||||
PT Ace Hardware Indonesia Tbk | 10,102,000 | 864,069 | ||||||
PT Bekasi Fajar Industrial Estate Tbk** | 6,551,000 | 463,921 | ||||||
PT Jasa Marga Persero Tbk | 798,000 | 452,047 | ||||||
PT Summarecon Agung Tbk | 3,624,000 | 717,024 | ||||||
PT Surya Esa Perkasa Tbk** | 1,422,000 | 458,968 | ||||||
PT Tempo Scan Pacific Tbk | 870,000 | 336,905 | ||||||
PT Tower Bersama Infrastructure Tbk** | 2,902,000 | 1,717,812 | ||||||
|
| |||||||
| 5,010,746 | ||||||||
|
| |||||||
Philippines — 6.2% |
| |||||||
Bloomberry Resorts Corp.** | 2,001,613 | 643,441 | ||||||
Megaworld Corp. | 8,305,000 | 562,162 | ||||||
Metro Pacific Investments Corp. | 7,521,000 | 818,415 | ||||||
Philippine Seven Corp. | 173,610 | 391,209 | ||||||
Robinsons Land Corp. | 1,455,800 | 737,035 | ||||||
Security Bank Corp. | 126,784 | 482,840 | ||||||
Universal Robina Corp. | 186,690 | 381,450 | ||||||
Vista Land & Lifescapes, Inc. | 8,263,000 | 980,310 | ||||||
|
| |||||||
| 4,996,862 | ||||||||
|
| |||||||
Thailand — 4.9% |
| |||||||
Beauty Community PCL — NVDR** | 1,215,900 | 635,973 | ||||||
Home Products Center PCL — NVDR | 1,858,380 | 772,688 | ||||||
Land & Houses PCL — NVDR | 4,805,300 | 1,541,020 | ||||||
| Number of Shares | Market Value (Note A) | |||||||
Malee Sampran Factory PCL — NVDR | 172,700 | $ | 641,534 | |||||
Siam Makro PCL — NVDR | 26,461 | 387,010 | ||||||
|
| |||||||
| 3,978,225 | ||||||||
|
| |||||||
Malaysia — 4.6% |
| |||||||
Dialog Group BHD | 854,700 | 674,536 | ||||||
Guinness Anchor BHD | 112,600 | 611,236 | ||||||
Oldtown BHD | 3,307,800 | 2,464,805 | ||||||
|
| |||||||
| 3,750,577 | ||||||||
|
| |||||||
South Korea — 4.2% |
| |||||||
Cosmax, Inc. | 14,670 | 595,559 | ||||||
Kolao Holdings | 164,533 | 2,840,401 | ||||||
|
| |||||||
| 3,435,960 | ||||||||
|
| |||||||
Singapore — 3.9% |
| |||||||
First REIT | 852,000 | 742,123 | ||||||
Lippo Malls Indonesia Retail Trust — REIT | 1,860,000 | 749,247 | ||||||
Parkson Retail Asia, Ltd. | 80,000 | 86,544 | ||||||
Yoma Strategic Holdings, Ltd. | 2,719,000 | 1,604,992 | ||||||
|
| |||||||
| 3,182,906 | ||||||||
|
| |||||||
Cambodia — 3.9% |
| |||||||
NagaCorp, Ltd. | 5,166,098 | 3,156,208 | ||||||
|
| |||||||
Taiwan — 2.5% |
| |||||||
Chailease Holding Co., Ltd. | 241,000 | 556,144 | ||||||
Hiwin Technologies Corp. | 102,150 | 755,009 | ||||||
St. Shine Optical Co., Ltd. | 45,000 | 688,258 | ||||||
|
| |||||||
| 1,999,411 | ||||||||
|
| |||||||
Sri Lanka — 1.0% |
| |||||||
John Keells Holdings PLC | 444,250 | 769,821 | ||||||
|
| |||||||
Total FAR EAST | 41,470,936 | |||||||
|
| |||||||
| SOUTH AMERICA — 9.9% | ||||||||
Brazil — 8.6% |
| |||||||
Arezzo Industria e Comercio SA | 47,374 | 915,088 | ||||||
BR Properties SA | 64,573 | 804,206 | ||||||
Iguatemi Empresa de Shopping Centers SA | 54,200 | 721,078 | ||||||
Kroton Educacional SA** | 47,200 | 1,066,178 | ||||||
Marcopolo SA — Pref. | 96,900 | 610,505 | ||||||
Mills Estruturas e Servicos de Engenharia SA | 49,100 | 815,336 | ||||||
OdontoPrev SA | 99,000 | 518,813 | ||||||
Qualicorp SA** | 59,846 | 619,943 | ||||||
Randon Participacoes SA — Pref. | 151,988 | 941,992 | ||||||
|
| |||||||
| 7,013,139 | ||||||||
|
| |||||||
Notes to Financial Statements are an integral part of this Schedule.
18
Driehaus Emerging Markets Small Cap Growth Fund
Schedule of Investments
December 31, 2012
| Number of Shares | Market Value (Note A) | |||||||
Peru — 1.3% |
| |||||||
Alicorp SA | 102,348 | $ | 332,806 | |||||
Intercorp Financial Services Inc. | 20,209 | 723,482 | ||||||
|
| |||||||
| 1,056,288 | ||||||||
|
| |||||||
Total SOUTH AMERICA | 8,069,427 | |||||||
|
| |||||||
| AFRICA — 7.8% | ||||||||
Nigeria — 5.4% |
| |||||||
Guaranty Trust Bank PLC | 9,796,926 | 1,443,031 | ||||||
Guinness Nigeria PLC | 534,757 | 941,775 | ||||||
Unilever Nigeria PLC | 1,232,564 | 367,924 | ||||||
Zenith Bank PLC | 13,038,278 | 1,627,384 | ||||||
|
| |||||||
| 4,380,114 | ||||||||
|
| |||||||
South Africa — 2.0% |
| |||||||
Life Healthcare Group Holdings, Ltd. | 201,186 | 808,520 | ||||||
The Spar Group, Ltd. | 50,536 | 788,852 | ||||||
|
| |||||||
| 1,597,372 | ||||||||
|
| |||||||
Kenya — 0.4% |
| |||||||
Safaricom, Ltd. | 5,575,500 | 327,399 | ||||||
|
| |||||||
Total AFRICA | 6,304,885 | |||||||
|
| |||||||
| NORTH AMERICA — 5.0% | ||||||||
Mexico — 4.6% |
| |||||||
Alsea SAB de CV** | 181,600 | 362,040 | ||||||
Banregio Grupo Financiero SAB de CV | 192,943 | 879,164 | ||||||
Bolsa Mexicana de Valores SAB de CV | 374,376 | 944,173 | ||||||
Fibra Uno Administracion SA de CV — REIT | 522,100 | 1,575,230 | ||||||
|
| |||||||
| 3,760,607 | ||||||||
|
| |||||||
Canada — 0.4% |
| |||||||
Africa Oil Corp.** | 44,412 | 315,407 | ||||||
|
| |||||||
Total NORTH AMERICA | 4,076,014 | |||||||
|
| |||||||
| EUROPE — 4.2% | ||||||||
Turkey — 2.1% |
| |||||||
Koza Altin Isletmeleri AS | 15,256 | 369,079 | ||||||
Tofas Turk Otomobil Fabrikasi AS | 91,439 | 538,274 | ||||||
Trakya Cam Sanayii AS** | 560,988 | 767,264 | ||||||
|
| |||||||
| 1,674,617 | ||||||||
|
| |||||||
United Kingdom — 1.3% |
| |||||||
Ophir Energy PLC** | 129,063 | 1,066,564 | ||||||
|
| |||||||
Kazakhstan — 0.8% |
| |||||||
Halyk Savings Bank of Kazakhstan — GDR** | 79,945 | 655,549 | ||||||
|
| |||||||
Total EUROPE | 3,396,730 | |||||||
|
| |||||||
| Number of Shares | Market Value (Note A) | |||||||
| MIDDLE EAST — 3.2% | ||||||||
Pakistan — 1.8% |
| |||||||
Engro Foods, Ltd.** | 909,797 | $ | 918,548 | |||||
Fatima Fertilizer Co., Ltd. | 1,864,817 | 506,467 | ||||||
|
| |||||||
| 1,425,015 | ||||||||
|
| |||||||
Egypt — 1.4% |
| |||||||
Commercial International Bank Egypt SAE | 95,912 | 521,333 | ||||||
Juhayna Food Industries | 508,882 | 615,299 | ||||||
|
| |||||||
| 1,136,632 | ||||||||
|
| |||||||
Total MIDDLE EAST | 2,561,647 | |||||||
|
| |||||||
Total EQUITY SECURITIES (Cost $52,776,606) | 65,879,639 | |||||||
|
| |||||||
| ||||||||
| EQUITY CERTIFICATES— 8.7% | ||||||||
| FAR EAST — 6.8% | ||||||||
India — 6.8% |
| |||||||
Colgate-Palmolive, Ltd.† | 43,001 | 1,229,912 | ||||||
Federal Bank, Ltd.† | 116,215 | 1,141,575 | ||||||
Jaiprakash Associates, Ltd.† | 593,755 | 1,050,098 | ||||||
Kaveri Seed Co., Ltd.† | 28,723 | 674,118 | ||||||
Page Industries, Ltd.† | 8,242 | 515,121 | ||||||
Yes Bank, Ltd.†** | 107,667 | 911,898 | ||||||
|
| |||||||
| 5,522,722 | ||||||||
|
| |||||||
Total FAR EAST | 5,522,722 | |||||||
|
| |||||||
| MIDDLE EAST — 1.9% | ||||||||
Saudi Arabia — 1.9% |
| |||||||
Fawaz Abdulaziz Alhokair & Co.† | 28,608 | 793,353 | ||||||
Herfy Food Services Co.† | 25,992 | 727,737 | ||||||
|
| |||||||
| 1,521,090 | ||||||||
|
| |||||||
Total MIDDLE EAST | 1,521,090 | |||||||
|
| |||||||
Total EQUITY CERTIFICATES (Cost $6,278,516) | 7,043,812 | |||||||
|
| |||||||
| ||||||||
| EXCHANGE-TRADED FUNDS —2.2% | ||||||||
| FAR EAST — 1.2% | ||||||||
China — 1.2% |
| |||||||
iShares A50 China Index | 674,600 | 969,577 | ||||||
|
| |||||||
Total FAR EAST | 969,577 | |||||||
|
| |||||||
| NORTH AMERICA — 1.0% | ||||||||
United States — 1.0% |
| |||||||
Market Vectors Junior Gold Miners | 43,713 | 865,517 | ||||||
|
| |||||||
Total NORTH AMERICA | 865,517 | |||||||
|
| |||||||
Total EXCHANGE-TRADED FUNDS | 1,835,094 | |||||||
|
| |||||||
Notes to Financial Statements are an integral part of this Schedule.
19
Driehaus Emerging Markets Small Cap Growth Fund
Schedule of Investments
December 31, 2012
| Number of Shares | Market Value (Note A) | |||||||
| PURCHASED CALL OPTIONS — 0.2% | ||||||||
iShares MSCI Taiwan Index Fund, Exercise Price: $13.00, Expiration Date January, 2013** | 1,000 | $ | 55,000 | |||||
SPDR Gold Trust, Exercise Price: $164.00, Expiration Date March, 2013** | 250 | 81,000 | ||||||
|
| |||||||
Total PURCHASED CALL OPTIONS (Premiums paid $157,803) | 136,000 | |||||||
|
| |||||||
| ||||||||
| PURCHASED PUT OPTIONS — 0.3% | ||||||||
iShares MSCI Emerging Markets Index Fund, Exercise Price: $43.00, Expiration Date January, 2013** | 5,000 | 140,000 | ||||||
iShares MSCI Brazil Index Fund, Exercise Price: $50.00, Expiration Date March, 2013 ** | 500 | 35,500 | ||||||
SPDR Gold Trust, Exercise Price: $157.00, Expiration Date March, 2013** | 250 | 46,000 | ||||||
|
| |||||||
Total PURCHASED PUT OPTIONS | 221,500 | |||||||
|
| |||||||
| ||||||||
TOTAL INVESTMENTS | 92.7 | % | $ | 75,116,045 | ||||
Other Assets In Excess Of Liabilities | 7.3 | % | 5,881,345 | |||||
|
|
|
| |||||
| Net Assets | 100.0 | % | $ | 80,997,390 | ||||
| ||||||||
The federal income tax basis and unrealized appreciation (depreciation) for all investments is as follows:
| Basis: | $ | 62,354,539 | ||||
|
|
| ||||
| Gross Appreciation | $ | 14,511,280 | ||||
| Gross Depreciation | (1,749,774 | ) | ||||
|
|
| ||||
Net Appreciation | $ | 12,761,506 | ||||
|
|
| ||||
| ** | Non-income producing security |
| † | Restricted security — Investments in securities not registered under the Securities Act of 1933, excluding 144A securities. At December 31, 2012, the value of these restricted securities amounted to $7,043,812 or 8.7% of net assets. |
Additional information on each restricted security is as follows (see Note A in Notes to Financial Statements):
Security | Counter- party | Acquisition Date(s) | Acquisition Cost | |||||||||
Colgate-Palmolive, Ltd. | MLCO | | 08/16/12 to 12/19/12 | | $ | 963,504 | ||||||
Fawaz Abdulaziz Alhokair & Co. | | MLCO & MSCO | | | 10/09/12 to 11/05/12 | | $ | 750,686 | ||||
Federal Bank, Ltd. | MLCO | | 12/04/12 to 12/11/12 | | $ | 1,054,209 | ||||||
Herfy Food Services Co. | MSCO | | 09/11/12 to 10/01/12 | | $ | 705,543 | ||||||
Jaiprakash Associates, Ltd. | MLCO | | 11/30/12 to 12/19/12 | | $ | 1,069,972 | ||||||
Kaveri Seed Co., Ltd. | MLCO | | 10/05/12 to 11/01/12 | | $ | 588,605 | ||||||
Page Industries, Ltd. | MLCO | | 04/27/12 to 05/11/12 | | $ | 480,548 | ||||||
Yes Bank, Ltd. | MLCO | | 08/22/11 to 09/28/12 | | $ | 665,449 | ||||||
GDR — Global Depository Receipt
MLCO — Merrill Lynch & Co., Inc.
MSCO — Morgan Stanley & Co., Inc.
NVDR — Non-Voting Depository Receipt
REIT — Real Estate Investment Trust
Regional weightings(a)(b)
Asia/Far East Ex-Japan | 59.2% | |||
South America | 9.9% | |||
Africa | 7.8% | |||
North America | 6.0% | |||
Middle East | 5.1% | |||
Eastern Europe | 2.9% | |||
Western Europe | 1.3% |
Top Ten Holdings(a)
NagaCorp, Ltd. | 3.9% | |||
Kolao Holdings | 3.5% | |||
Oldtown BHD | 3.0% | |||
Haier Electronics Group Co., Ltd. | 2.7% | |||
PT Tower Bersama Infrastructure Tbk | 2.1% | |||
Zenith Bank PLC | 2.0% | |||
Yoma Strategic Holdings, Ltd. | 2.0% | |||
Fibra Uno Administracion SA de CV — REIT | 1.9% | |||
Land & Houses PCL — NVDR | 1.9% | |||
Guaranty Trust Bank PLC | 1.8% |
(a) All percentages are stated as a percent of net assets at December 31, 2012.
| (b) | Excludes purchased options. |
Notes to Financial Statements are an integral part of this Schedule.
20
Driehaus Emerging Markets Small Cap Growth Fund
Schedule of Investments
December 31, 2012
Industry | Percent of Net Assets | |||
Automobiles | 5.6% | |||
Beverages | 1.9% | |||
Building Products | 0.9% | |||
Chemicals | 0.6% | |||
Commercial Banks | 9.5% | |||
Construction & Engineering | 2.8% | |||
Diversified Consumer Services | 1.3% | |||
Diversified Financial Services | 3.8% | |||
Electronic Equipment, Instruments & Components | 0.8% | |||
Energy Equipment & Services | 3.2% | |||
Food & Staples Retailing | 1.9% | |||
Food Products | 7.4% | |||
Health Care Equipment & Supplies | 0.8% | |||
Health Care Providers & Services | 2.4% | |||
Hotels, Restaurants & Leisure | 6.0% | |||
Household Durables | 2.7% | |||
Household Products | 0.5% | |||
Industry | Percent of Net Assets | |||
Industrial Conglomerates | 2.2% | |||
Machinery | 4.3% | |||
Metals & Mining | 0.5% | |||
Multiline Retail | 0.1% | |||
Oil, Gas & Consumable Fuels | 2.3% | |||
Other | 2.7% | |||
Personal Products | 2.3% | |||
Pharmaceuticals | 1.9% | |||
Real Estate Investment Trust | 3.8% | |||
Real Estate Management & Development | 9.1% | |||
Specialty Retail | 4.7% | |||
Textiles, Apparel & Luxury Goods | 2.6% | |||
Trading Companies & Distributors | 1.0% | |||
Transportation Infrastructure | 0.6% | |||
Wireless Telecommunication Services | 2.5% | |||
Other Assets in Excess of Liabilities | 7.3% | |||
|
| |||
TOTAL | 100.0% | |||
|
| |||
Notes to Financial Statements are an integral part of this Schedule.
21
Driehaus International Small Cap Growth Fund — Portfolio Managers’ Letter
Dear Fellow Shareholders,
The Driehaus International Small Cap Growth Fund (“Fund”) returned 11.67% for the year ended December 31, 2012. This return was below the performance of the Morgan Stanley Capital International (“MSCI”) All Country World ex USA Small Cap Growth Index (“Benchmark”), which returned 17.19%.
In 2012, the MSCI World ex USA Small Cap Index was removed as a benchmark for the Fund as it is less representative of the Fund’s investment universe. The MSCI All Country World ex USA Small Cap Growth Index includes the emerging markets, in which the Fund invests, whereas the MSCI World ex USA Small Cap Index does not.
Assisted by strong currency gains, the European indices saw strong gains for 2012, as did many equity markets in emerging Asia. From a sector perspective, financial stocks were favored while defensive sectors, such as utilities and consumer staples, were laggards after years of stronger relative performance. Energy also was a weak sector globally, as oil prices ended the year close to their starting point despite a volatile ride in between. As the year closed, an appreciating euro aided returns within the euro zone’s more defensive markets as well as its more speculative markets. Greek equities were the big winner thanks to further European largesse, posting the strongest returns in the developed world for 2012. While countries with higher beta to the European crisis were rewarded, investors also continued to favor German stocks, helping it to also be one of the top markets for the year. Elsewhere, the Nikkei seemed to garner much attention due to the unusual nature of the yen’s descent.
For 2012, security selection within the energy and consumer discretionary sectors detracted from the Fund’s performance versus the Benchmark. At the country level, security selection within South Korea and Norway provided negative relative returns.
Within the energy sector, Lamprell PLC (LSE: LAM LN) was the most significant detractor from returns for the year. Lamprell provides specialized refurbishment and construction services to the oil and gas industry. The company upgrades and refurbishes offshore jack-up rigs; provides fabrication, assembly and new build construction for the offshore oil and gas sector, including jack-up rigs, floating, production, storage and offloading and other offshore and onshore structures; and provides oilfield engineering services. It also upgrades and refurbishes land rigs. Lamprell shares declined during the second quarter of the year after the company provided guidance that it would see a loss for the first half of 2012 due to cost overruns associated with continued delays on one of its projects.
Within South Korea, holding Seegene, Inc. (Ticker: 096530 KS) was a significant detractor for the year. Seegene specializes in molecular diagnostics and develops technology and products that diagnose disease from the genetic level. Seegene’s molecular diagnosis technology and products allow patients to benefit from cost effective and personalized diagnosis tools and allow doctors to offer accurate and effective treatment to patients. Seegene’s share price fell steeply mid-year due in part to a perceived delay in an expected global distribution deal.
Over the course of 2012, key contributors to performance versus the Benchmark were the Fund’s holdings in the financials and industrials sectors. In addition, stock selection in Germany and the Philippines contributed positively to the performance of the Fund compared to the Benchmark. The Fund was significantly underweight the materials sector throughout the year, which also proved beneficial.
Within financials, Great Portland Estates PLC — REIT (Ticker: GPOR LN) contributed to returns for 2012. Great Portland Estates is a central London property investment and development REIT (real estate investment trust) with a portfolio of around $3 billion, including its share of joint ventures. Around 80% of its portfolio is focused on London’s West End, with the remainder located around London and in Southwark. Around 80% of the property is offices, while the rest is retail. Great Portland posted good financial results during 2012. The company continues to see strong interest in London’s West End.
From a country perspective, German-based Deutsche Wohnen AG (Ticker: DWNI GY) contributed to returns during the year. Deutsche Wohnen is a leading German residential property company with units in several metropolitan areas. Shares of Deutsche Wohnen saw a strong, steady increase during 2012. Recent acquisitions have added several thousand units to the company’s portfolio during a period where rental growth in its core markets looks to potentially be increasing.
22
Looking ahead, each of the last few years has seen periods of extreme concern regarding the state of the world, and equivalently exuberant market responses when those concerns ultimately fade. These worries usually have been driven by risks in Europe, though increasingly those ‘risk-off’ events are occurring at the hands of U.S. policymakers. However, we believe that the ability of the global economy to withstand shocks, from the perspectives of economic strength and financial liquidity, is better than it has been in the recent years. As such, we would not anticipate the global markets getting as near the cliff’s edge as they have in each of the past few years.
Recent improving global economic data is something we have been watching quite closely. We believe in the economic growth suggested by the data, but remain cautious. We remember this narrative from the past few years where expectations ramp up at the start of the year only to be revised downward as the year progresses. We continue to believe that we reside in a low-growth world and that investors must be nimble to manage the volatility that accompanies such environments.
Globally, we are seeing many new opportunities in non-U.S. markets that did not look possible at this time last year. Financial conditions in Europe have meaningfully eased and the emerging markets outlook has improved thanks to low inflation, lower cost of capital, and inflecting growth trajectories. We remain optimistic but expect periods of volatility as government actions help and hurt economies in the year ahead.
As always, we at Driehaus Capital Management LLC thank you for your interest in the Driehaus International Small Cap Growth Fund and would like to express our gratitude to you as a shareholder for your continued confidence in our management capabilities.
Sincerely,
 | |  | ||
| David Mouser | Howard Schwab | Ryan Carpenter | ||
| Lead Portfolio Manager | Co-Portfolio Manager | Assistant Portfolio Manager |
Performance is historical and does not represent future results.
Please see the following performance overview page for index descriptions.
23
Driehaus International Small Cap Growth Fund
Performance Overview (unaudited)
The performance summarized below is historical and does not represent future results. Investment returns and principal value vary, and you may have a gain or loss when you sell shares. Performance data presented measures the change in the value of an investment in the Fund, assuming reinvestment of all dividends and capital gains. Average annual total return reflects annualized change.
The table does not reflect the deduction of taxes that a shareholder would pay on Fund distributions or the redemption of Fund shares. The graph compares the results of a $10,000 investment in the Fund since August 1, 2002 (the date of the Predecessor Limited Partnership’s inception), with all dividends and capital gains reinvested, with the indicated indices (and dividends reinvested) for the same period.
| Fund Only | Including Predecessor Limited Partnership | |||||||||||||||||||||||
| Average Annual Total Returns as of 12/31/12 | 1 Year | 3 Years | 5 Years | Since Inception (09/17/07 - 12/31/12) | 10 Years | Since Inception (08/1/02 - 12/31/12) | ||||||||||||||||||
Driehaus International Small Cap | 11.67% | 7.95% | –1.76% | 1.60% | 20.03% | 17.61% | ||||||||||||||||||
MSCI AC World ex USA Small Cap Growth Index2 | 17.19% | 7.17% | –1.12% | -0.69% | 12.44% | 11.03% | ||||||||||||||||||
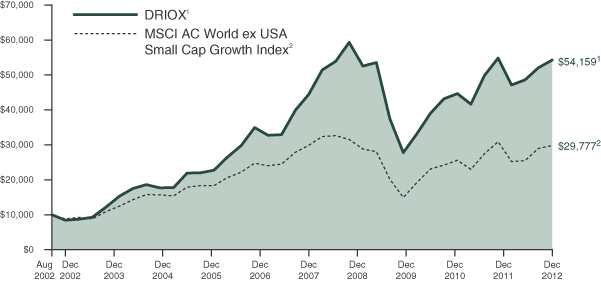
| 1 | The Driehaus International Small Cap Growth Fund (the “Fund”) performance shown above includes the performance of the Driehaus International Opportunities Fund, L.P. (the “Predecessor Limited Partnership”), the Fund’s predecessor, for the periods before the Fund’s registration statement became effective. The Predecessor Limited Partnership, which was established on August 1, 2002, was managed with substantially the same investment objective, policies and philosophies as are followed by the Fund. The Fund succeeded to the Predecessor Limited Partnership’s assets on September 17, 2007. The Predecessor Limited Partnership was not registered under the Investment Company Act of 1940, as amended (“1940 Act”), and thus was not subject to certain investment and operational restrictions that are imposed by the 1940 Act. If the Predecessor Limited Partnership had been registered under the 1940 Act, its performance may have been adversely affected. The Predecessor Limited Partnership’s performance has been restated to reflect estimated expenses of the Fund. The returns for the periods prior to January 1, 2010, reflect fee waivers and/or reimbursements without which performance would have been lower. |
| 2 | The Morgan Stanley Capital International All Country World ex USA Small Cap Growth Index (MSCI AC World ex USA Small Cap Growth Index) is a market capitalization-weighted index designed to measure equity performance in 44 global developed markets and emerging markets, excluding the U.S., and is composed of stocks which are categorized as small capitalization growth stocks. Data is in U.S. dollars. Source: Morgan Stanley Capital International, Inc. |
In 2012, the Morgan Stanley Capital International World ex USA Small Cap Index (MSCI World ex USA Small Cap Index) was removed as a benchmark for the Fund as it is less representative of the Fund’s investment universe. The MSCI All Country World ex USA Small Cap Growth Index includes the emerging markets, which the Fund invests in, whereas the MSCI World ex USA Small Cap Index does not. |
24
Driehaus International Small Cap Growth Fund
Schedule of Investments
December 31, 2012
Number of Shares | Market Value (Note A) | |||||||
| EQUITY SECURITIES — 96.8% | ||||||||
| EUROPE — 47.3% | ||||||||
United Kingdom — 23.5% |
| |||||||
ASOS PLC** | 94,026 | $ | 4,147,339 | |||||
Aveva Group PLC | 142,390 | 5,109,746 | ||||||
Babcock International Group PLC | 194,685 | 3,073,123 | ||||||
Barratt Developments PLC** | 888,314 | 3,034,013 | ||||||
Booker Group PLC | 1,540,819 | 2,458,830 | ||||||
Britvic PLC | 506,055 | 3,372,510 | ||||||
Domino’s Pizza UK & IRL PLC | 287,292 | 2,345,270 | ||||||
Fenner PLC | 177,003 | 1,153,461 | ||||||
Filtrona PLC | 271,649 | 2,443,091 | ||||||
Great Portland Estates PLC — REIT | 630,162 | 5,066,579 | ||||||
Home Retail Group PLC | 1,089,986 | 2,274,358 | ||||||
New Melrose PLC** | 641,445 | 2,356,186 | ||||||
Rotork PLC | 121,051 | 5,053,115 | ||||||
RPC Group PLC | 338,464 | 2,193,177 | ||||||
Spectris PLC | 71,810 | 2,423,363 | ||||||
Spirax-Sarco Engineering PLC | 103,208 | 3,864,491 | ||||||
Telecity Group PLC | 170,701 | 2,204,517 | ||||||
Victrex PLC | 98,837 | 2,634,207 | ||||||
|
| |||||||
| 55,207,376 | ||||||||
|
| |||||||
Germany — 12.1% |
| |||||||
Deutsche Wohnen AG | 287,095 | 5,329,957 | ||||||
Freenet AG | 94,260 | 1,746,975 | ||||||
Gerresheimer AG | 47,108 | 2,503,095 | ||||||
Gerry Weber International AG | 70,158 | 3,398,179 | ||||||
GSW Immobilien AG | 121,637 | 5,153,345 | ||||||
Krones AG | 29,437 | 1,834,057 | ||||||
MTU Aero Engines Holding AG | 26,121 | 2,383,806 | ||||||
Wincor Nixdorf AG | 50,875 | 2,399,392 | ||||||
Wirecard AG | 149,239 | 3,684,350 | ||||||
|
| |||||||
| 28,433,156 | ||||||||
|
| |||||||
Spain — 2.1% |
| |||||||
Viscofan SA | 89,232 | 5,054,346 | ||||||
|
| |||||||
France — 2.0% |
| |||||||
Ingenico SA | 81,125 | 4,615,168 | ||||||
|
| |||||||
Norway — 1.5% |
| |||||||
Opera Software ASA | 212,388 | 1,216,805 | ||||||
Petroleum Geo-Services ASA | 134,634 | 2,344,972 | ||||||
|
| |||||||
| 3,561,777 | ||||||||
|
| |||||||
Switzerland — 1.5% |
| |||||||
Ferrexpo PLC | 814,590 | 3,420,299 | ||||||
|
| |||||||
Sweden — 1.4% |
| |||||||
Axis Communications AB | 122,202 | 3,365,770 | ||||||
|
| |||||||
Number of Shares | Market Value (Note A) | |||||||
Denmark — 1.1% |
| |||||||
Christian Hansen Holding AS | 77,005 | $ | 2,507,809 | |||||
|
| |||||||
Finland — 1.0% |
| |||||||
Konecranes OYJ | 70,845 | 2,417,665 | ||||||
|
| |||||||
Luxembourg — 0.9% |
| |||||||
AZ Electronic Materials SA | 356,820 | 2,052,984 | ||||||
|
| |||||||
Italy — 0.2% |
| |||||||
Yoox SpA** | 30,517 | 483,354 | ||||||
|
| |||||||
Total EUROPE | 111,119,704 | |||||||
|
| |||||||
| FAR EAST — 37.4% | ||||||||
Japan — 18.3% |
| |||||||
Aeon Credit Service Co., Ltd. | 116,600 | 2,359,343 | ||||||
Anritsu Corp. | 292,543 | 3,475,404 | ||||||
Calbee, Inc. | 23,900 | 1,684,057 | ||||||
H2O Retailing Corp. | 432,018 | 4,037,811 | ||||||
Hulic Co., Ltd. | 405,800 | 2,753,316 | ||||||
Kakaku.com, Inc. | 44,629 | 1,473,345 | ||||||
M3, Inc. | 1,422 | 2,269,622 | ||||||
Miraca Holdings, Inc. | 108,697 | 4,382,748 | ||||||
MonotaRO Co., Ltd. | 141,472 | 4,557,966 | ||||||
Nabtesco Corp. | 169,000 | 3,774,828 | ||||||
Ryohin Keikaku Co., Ltd. | 39,200 | 2,192,372 | ||||||
Seven Bank, Ltd. | 677,800 | 1,787,895 | ||||||
Ship Healthcare Holdings, Inc. | 82,893 | 2,203,148 | ||||||
Sugi Holdings Co., Ltd. | 66,973 | 2,362,767 | ||||||
Tokyo Tatemono Co., Ltd. | 270,000 | 1,390,782 | ||||||
Wacom Co., Ltd. | 903 | 2,377,370 | ||||||
|
| |||||||
| 43,082,774 | ||||||||
|
| |||||||
China — 8.1% |
| |||||||
Geely Automobile Holdings, Ltd. | 3,665,000 | 1,771,076 | ||||||
Giordano International, Ltd. | 2,544,000 | 2,466,404 | ||||||
Haier Electronics Group Co., Ltd.** | 5,599,939 | 8,305,822 | ||||||
Techtronic Industries Co. | 3,359,764 | 6,359,525 | ||||||
|
| |||||||
| 18,902,827 | ||||||||
|
| |||||||
Philippines — 6.3% |
| |||||||
Bloomberry Resorts Corp.** | 6,581,693 | 2,115,759 | ||||||
Megaworld Corp. | 51,000,000 | 3,452,171 | ||||||
Puregold Price Club, Inc. | 6,374,682 | 5,123,032 | ||||||
Security Bank Corp. | 335,353 | 1,277,146 | ||||||
Universal Robina Corp. | 1,380,940 | 2,821,570 | ||||||
|
| |||||||
| 14,789,678 | ||||||||
|
| |||||||
Notes to Financial Statements are an integral part of this Schedule.
25
Driehaus International Small Cap Growth Fund
Schedule of Investments
December 31, 2012
Number of Shares | Market Value (Note A) | |||||||
Thailand — 3.7% |
| |||||||
Home Products Center PCL — NVDR | 11,722,260 | $ | 4,873,949 | |||||
Land & Houses PCL — NVDR | 11,744,500 | 3,766,364 | ||||||
|
| |||||||
| 8,640,313 | ||||||||
|
| |||||||
Australia — 1.0% |
| |||||||
Aurora Oil & Gas, Ltd.** | 629,526 | 2,420,507 | ||||||
|
| |||||||
Total FAR EAST | 87,836,099 | |||||||
|
| |||||||
| NORTH AMERICA — 6.4% | ||||||||
Canada — 4.4% |
| |||||||
Cineplex, Inc. | 175,050 | 5,601,530 | ||||||
Open Text Corp.** | 40,900 | 2,287,390 | ||||||
Primaris Retail — REIT | 87,623 | 2,369,618 | ||||||
|
| |||||||
| 10,258,538 | ||||||||
|
| |||||||
Mexico — 1.0% |
| |||||||
Fibra Uno Administracion SA de CV — REIT | 820,318 | 2,474,985 | ||||||
|
| |||||||
Bermuda — 1.0% |
| |||||||
Catlin Group, Ltd. | 298,003 | 2,451,881 | ||||||
|
| |||||||
Total NORTH AMERICA | 15,185,404 | |||||||
|
| |||||||
Number of Shares | Market Value (Note A) | |||||||
| SOUTH AMERICA — 5.7% | ||||||||
Brazil — 5.7% |
| |||||||
Arezzo Industria e Comercio SA | 126,475 | $ | 2,443,021 | |||||
BR Properties SA | 192,793 | 2,401,085 | ||||||
Brazil Pharma SA | 493,035 | 3,467,499 | ||||||
Mills Estruturas e Servicos de Engenharia SA | 156,405 | 2,597,201 | ||||||
Qualicorp SA** | 237,700 | 2,462,328 | ||||||
|
| |||||||
| 13,371,134 | ||||||||
|
| |||||||
Total SOUTH AMERICA | 13,371,134 | |||||||
|
| |||||||
Total EQUITY SECURITIES | 227,512,341 | |||||||
|
| |||||||
| ||||||||
TOTAL INVESTMENTS | 96.8 | % | $ | 227,512,341 | ||||
Other Assets In Excess Of Liabilities | 3.2 | % | 7,446,242 | |||||
|
|
|
| |||||
| Net Assets | 100.0 | % | $ | 234,958,583 | ||||
| ||||||||
The federal income tax basis and unrealized appreciation (depreciation) for all investments is as follows:
| Basis: | $ | 199,034,741 | ||
|
| |||
| Gross Appreciation | $ | 32,438,078 | ||
| Gross Depreciation | (3,960,478 | ) | ||
|
| |||
Net Appreciation | $ | 28,477,600 | ||
|
|
| ** | Non-income producing security |
NVDR — Non-Voting Depository Receipt
REIT — Real Estate Investment Trust
Regional Weightings*
Western Europe | 47.3% | |||
Asia/Far East Ex-Japan | 19.1% | |||
Japan | 18.3% | |||
North America | 6.4% | |||
South America | 5.7% |
Top Ten Holdings*
Haier Electronics Group Co., Ltd. | 3.5% | |||
Techtronic Industries Co. | 2.7% | |||
Cineplex, Inc. | 2.4% | |||
Deutsche Wohnen AG | 2.3% | |||
GSW Immobilien AG | 2.2% | |||
Puregold Price Club, Inc. | 2.2% | |||
Aveva Group PLC | 2.2% | |||
Great Portland Estates PLC — REIT | 2.2% | |||
Viscofan SA | 2.2% | |||
Rotork PLC | 2.2% |
| * | All percentages are stated as a percent of net assets at December 31, 2012. |
Notes to Financial Statements are an integral part of this Schedule.
26
Driehaus International Small Cap Growth Fund
Schedule of Investments
December 31, 2012
Industry | Percent of Net Assets | |||
Aerospace & Defense | 1.0% | |||
Automobiles | 0.8% | |||
Beverages | 1.4% | |||
Chemicals | 4.1% | |||
Commercial Banks | 1.3% | |||
Commercial Services & Supplies | 1.3% | |||
Communications Equipment | 1.4% | |||
Computers & Peripherals | 2.0% | |||
Consumer Finance | 1.0% | |||
Containers & Packaging | 0.9% | |||
Electronic Equipment, Instruments & Components | 4.5% | |||
Energy Equipment & Services | 1.0% | |||
Food & Staples Retailing | 5.7% | |||
Food Products | 4.1% | |||
Health Care Providers & Services | 3.9% | |||
Health Care Technology | 1.0% | |||
Hotels, Restaurants & Leisure | 1.9% | |||
Household Durables | 7.5% | |||
Industry | Percent of Net Assets | |||
Insurance | 1.0% | |||
Internet & Catalog Retail | 2.9% | |||
Internet Software & Services | 3.1% | |||
IT Services | 1.6% | |||
Life Sciences Tools & Services | 1.1% | |||
Machinery | 8.7% | |||
Media | 2.4% | |||
Metals & Mining | 1.5% | |||
Multiline Retail | 2.7% | |||
Oil, Gas & Consumable Fuels | 1.0% | |||
Real Estate Investment Trust | 4.2% | |||
Real Estate Management & Development | 10.3% | |||
Software | 2.2% | |||
Specialty Retail | 3.1% | |||
Textiles, Apparel & Luxury Goods | 2.5% | |||
Trading Companies & Distributors | 3.0% | |||
Wireless Telecommunication Services | 0.7% | |||
Other Assets in Excess of Liabilities | 3.2% | |||
|
| |||
TOTAL | 100.0% | |||
|
| |||
Notes to Financial Statements are an integral part of this Schedule.
27
Driehaus Global Growth Fund — Portfolio Manager’s Letter
Dear Fellow Shareholders,
The Driehaus Global Growth Fund (“Fund”) returned 14.36% for the year ended December 31, 2012. This return was below the performance of the Fund’s benchmark index, the Morgan Stanley Capital International All Country World Growth Index (“Benchmark”), which returned 17.17% for the year.
Assisted by currency gains, the European indices saw strong gains for 2012, as did many equity markets in emerging Asia. From a sector perspective, financial stocks were favored while defensive sectors, such as utilities and consumer staples, were laggards after years of stronger relative performance. Energy also was a weak sector globally, as oil prices ended the year close to their starting point despite a volatile ride in between. As the year closed, an appreciating euro aided returns within the euro zone’s more defensive markets as well as its more speculative markets. Greek equities were the big winner thanks to further European largesse, posting strong returns for 2012. While countries with higher beta to the European crisis were rewarded, investors also continued to favor German stocks, helping it to also be one of the top developed markets for the year. The United States also posted solid gains for the year and surprised economists with early evidence of improving disposable income and hourly wages in the U.S. Within Japan, the Nikkei seemed to garner much attention due to the unusual nature of the yen’s descent.
Certain areas detracted from Fund performance during the year. Two sectors in which stock selection negatively affected the performance of the Fund versus the Benchmark were the financials and consumer discretionary sectors. Additionally, holdings in the Brazil and Israel detracted from Fund performance versus the Benchmark.
Within the consumer discretionary sector, Tempur-Pedic International, Inc. (Ticker: TPX) detracted from performance. The company engages in the manufacturing, marketing and distribution of bedding products in North America and internationally. During the first half of 2012, the company cut its full-year profit and revenue forecasts due to increased competition and lower-than-expected sales. The revised earnings, increasing competition and concerns over higher promotion costs all weighed on the company’s stock price.
Within Israel, Mellanox Technologies, Ltd. (Ticker: MLNX) detracted from returns. Mellanox is a semiconductor company that produces and supplies interconnect products that facilitate data transmission between servers, storage systems and communications infrastructure equipment and other embedded systems. Mellanox’s fourth quarter revenue forecast missed expectations after growing 115% since the fourth quarter of 2011. Investor interest has waned as competition from Intel is expected to increase, likely depressing Mellanox’s revenue growth.
Over the course of 2012, key contributors to performance versus the Benchmark were the Fund’s holdings in the information technology and consumer staples sectors. In addition, stock selection in the United States and the United Kingdom positively contributed to the performance of the Fund versus the Benchmark.
Within the technology sector, Equinix, Inc. (Ticker: EQIX) contributed to relative performance during the year. Equinix provides data center services to protect and connect the information assets for the enterprises, financial services companies, and content and network providers primarily in the Americas, Europe, the Middle East, Africa, and Asia Pacific. Equinix’s stock was up significantly for 2012 as supply/demand trends were favorable for data center companies. Management also has discussed Equinix’s ongoing plans of becoming a REIT (real estate investment trust), which could act as a catalyst for positive valuations.
Within the United States, United Rentals, Inc. (Ticker: URI) was a significant contributor to returns. United Rentals is an equipment rental company. It operates in two segments: general rentals and trench safety, power and HVAC. The general rentals segment includes the rental of construction, aerial, industrial and homeowner equipment and related services and activities. The trench safety, power and HVAC segment includes the rental of specialty construction products and related services. The company’s share price rose significantly from its low for the year in July through the close of 2012 due primarily to a 58% increase in revenues.
28
Looking ahead, each of the last few years has seen periods of extreme concern regarding the state of the world, and equivalently exuberant market responses when those concerns ultimately fade. These worries usually have been driven by risks in Europe, though increasingly those ‘risk-off’ events are occurring at the hands of U.S. policymakers. However, we believe that the ability of the global economy to withstand shocks, from the perspectives of economic strength and financial liquidity, is better than it has been in recent years. As such, we would not anticipate the global markets getting as near the cliff’s edge as they have in each of the past few years.
Recent improving global economic data is something we have been watching quite closely. We believe in the economic growth suggested by the data, but remain cautious. We remember this narrative from the past few years where expectations ramp up at the start of the year only to be revised downward as the year progresses. We continue to believe that we reside in a low-growth world and that investors must be nimble to manage the volatility that accompanies such environments.
Globally, we are seeing many new opportunities in non-U.S. markets that did not look possible at this time last year. Financial conditions in Europe have meaningfully eased and the emerging markets outlook has improved thanks to low inflation, lower cost of capital, and inflecting growth trajectories. We remain optimistic but expect periods of volatility as government actions help and hurt economies in the year ahead.
As always, we remain committed to uncovering attractive global growth equity investment opportunities that we believe will adequately compensate our clients for the risk taken with their capital. Thank you for your continued confidence in our management capabilities.
Sincerely,
|
| Daniel M. Rea |
| Portfolio Manager |
Performance is historical and does not represent future results.
Please see the following performance overview page for index description.
29
Driehaus Global Growth Fund
Performance Overview (unaudited)
The performance summarized below is historical and does not represent future results. Investment returns and principal value vary, and you may have a gain or loss when you sell shares. Performance data presented measures the change in the value of an investment in the Fund, assuming reinvestment of all dividends and capital gains. Average annual total return reflects annualized change.
The table does not reflect the deduction of taxes that a shareholder would pay on Fund distributions or the redemption of Fund shares. The graph compares the results of a $10,000 investment in the Fund since May 1, 2008 (the date of the Fund’s inception), with all dividends and capital gains reinvested, with the indicated index (and dividends reinvested) for the same period.
| Average Annual Total Returns as of 12/31/12 | 1 Year | 3 Years | Since Inception (05/01/08 - 12/31/12) | |||||||||
Driehaus Global Growth Fund (DRGGX)1 | 14.36% | 3.66% | –3.53% | |||||||||
MSCI AC World Growth Index2 | 17.17% | 7.95% | 0.75% | |||||||||
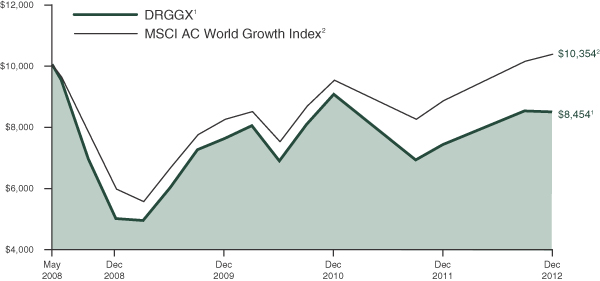
| 1 | The returns for the periods prior to September 1, 2009, reflect fee waivers and/or reimbursements without which performance would have been lower. |
| 2 | The Morgan Stanley Capital International All Country World Growth Index (MSCI AC World Growth Index) is a subset of the MSCI All Country World Index (MSCI ACWI) and includes only the MSCI ACWI stocks which are categorized as growth stocks. The MSCI ACWI is a free float-adjusted market-capitalization weighted index that is designed to measure the equity market performance of 24 developed and 21 emerging markets. Data is in U.S. dollars. Source: Morgan Stanley Capital International Inc. |
30
Driehaus Global Growth Fund
Schedule of Investments
December 31, 2012
Number of Shares | Market Value (Note A) | |||||||
| EQUITY SECURITIES — 96.9% | ||||||||
| NORTH AMERICA — 64.7% | ||||||||
United States — 61.1% |
| |||||||
Alexion Pharmaceuticals, Inc.** | 4,829 | $ | 453,008 | |||||
Allergan, Inc. | 3,870 | 354,995 | ||||||
Altera Corp. | 7,026 | 241,975 | ||||||
Amazon.com, Inc.** | 1,568 | 393,787 | ||||||
Apple Inc. | 3,432 | 1,829,359 | ||||||
Ariad Pharmaceuticals, Inc.** | 9,751 | 187,024 | ||||||
Beam, Inc. | 5,710 | 348,824 | ||||||
Biogen Idec, Inc.** | 2,570 | 376,942 | ||||||
BioMarin Pharmaceutical, Inc.** | 9,121 | 449,209 | ||||||
Bristol-Myers Squibb Co. | 5,381 | 175,367 | ||||||
Carpenter Technology Corp. | 9,247 | 477,423 | ||||||
Catamaran Corp.** | 10,992 | 517,833 | ||||||
Cerner Corp.** | 3,170 | 246,119 | ||||||
Chart Industries, Inc.** | 3,619 | 241,279 | ||||||
Concho Resources, Inc.** | 5,194 | 418,429 | ||||||
Cornerstone OnDemand, Inc.** | 6,650 | 196,374 | ||||||
Costco Wholesale Corp. | 5,394 | 532,765 | ||||||
Cummins, Inc. | 4,960 | 537,416 | ||||||
DSW, Inc. — A | 8,253 | 542,140 | ||||||
Edwards Lifesciences Corp.** | 5,767 | 520,010 | ||||||
Ellie Mae, Inc.** | 13,080 | 362,970 | ||||||
Equinix, Inc.** | 2,949 | 608,084 | ||||||
Facebook, Inc. — A** | 8,265 | 220,097 | ||||||
Family Dollar Stores, Inc. | 7,970 | 505,378 | ||||||
FMC Technologies, Inc.** | 8,630 | 369,623 | ||||||
Gilead Sciences, Inc.** | 3,470 | 254,872 | ||||||
GNC Holdings, Inc. — A | 10,463 | 348,209 | ||||||
Google, Inc. — A** | 524 | 371,710 | ||||||
Halliburton Co. | 7,683 | 266,523 | ||||||
Helmerich & Payne, Inc. | 4,475 | 250,645 | ||||||
Intuitive Surgical, Inc.** | 1,066 | 522,734 | ||||||
Joy Global, Inc. | 7,690 | 490,468 | ||||||
MasterCard, Inc. — A | 824 | 404,815 | ||||||
McDonald’s Corp. | 1,967 | 173,509 | ||||||
Mead Johnson Nutrition Co. | 4,880 | 321,543 | ||||||
Medivation, Inc.** | 8,897 | 455,171 | ||||||
Palo Alto Networks, Inc.** | 4,820 | 257,966 | ||||||
Pioneer Natural Resources Co. | 3,551 | 378,501 | ||||||
Polaris Industries, Inc. | 4,340 | 365,211 | ||||||
Precision Castparts Corp. | 1,388 | 262,915 | ||||||
priceline.com, Inc.** | 428 | 265,874 | ||||||
Pricesmart, Inc. | 2,380 | 183,379 | ||||||
Qualcomm, Inc. | 8,597 | 533,186 | ||||||
Rackspace Hosting, Inc.** | 5,677 | 421,631 | ||||||
Salesforce.com, Inc.** | 3,339 | 561,286 | ||||||
SolarWinds, Inc.** | 7,160 | 375,542 | ||||||
Starbucks Corp. | 6,573 | 352,444 | ||||||
Number of Shares | Market Value (Note A) | |||||||
Synageva BioPharma Corp.** | 7,747 | $ | 358,609 | |||||
The Coca-Cola Co. | 9,614 | 348,507 | ||||||
Tidewater, Inc. | 8,629 | 385,544 | ||||||
Ulta Salon Cosmetics & Fragrance, Inc. | 3,757 | 369,163 | ||||||
Vertex Pharmaceuticals, Inc.** | 5,910 | 247,865 | ||||||
Whole Foods Market, Inc. | 5,898 | 538,664 | ||||||
WW Grainger, Inc. | 2,160 | 437,119 | ||||||
|
| |||||||
| 21,610,035 | ||||||||
|
| |||||||
Canada — 1.9% |
| |||||||
Lululemon Athletica, Inc.** | 4,690 | 357,519 | ||||||
New Gold, Inc.** | 28,523 | 315,712 | ||||||
|
| |||||||
| 673,231 | ||||||||
|
| |||||||
Mexico — 1.0% |
| |||||||
Wal-Mart de Mexico SAB de CV — V | 105,740 | 345,042 | ||||||
|
| |||||||
Bermuda — 0.7% |
| |||||||
Energy XXI Bermuda | 7,825 | 251,887 | ||||||
|
| |||||||
Total NORTH AMERICA | 22,880,195 | |||||||
|
| |||||||
| EUROPE — 19.4% | ||||||||
United Kingdom — 5.3% |
| |||||||
Aggreko PLC | 3,779 | 107,848 | ||||||
ASOS PLC** | 4,920 | 217,013 | ||||||
Diageo PLC | 13,994 | 407,600 | ||||||
Rio Tinto PLC — SP ADR | 8,130 | 472,272 | ||||||
Telecity Group PLC | 21,214 | 273,968 | ||||||
The Weir Group PLC | 12,610 | 389,942 | ||||||
|
| |||||||
| 1,868,643 | ||||||||
|
| |||||||
France — 3.8% |
| |||||||
Edenred | 11,550 | 357,224 | ||||||
Safran SA | 14,090 | 610,198 | ||||||
Technip SA | 3,154 | 364,718 | ||||||
|
| |||||||
| 1,332,140 | ||||||||
|
| |||||||
Netherlands — 2.0% |
| |||||||
ASML Holding NV | 3,311 | 212,348 | ||||||
Sensata Technologies Holding NV** | 15,360 | 498,893 | ||||||
|
| |||||||
| 711,241 | ||||||||
|
| |||||||
Germany — 1.8% |
| |||||||
Bayerische Motoren Werke AG | 2,274 | 221,286 | ||||||
Infineon Technologies AG | 51,070 | 416,041 | ||||||
|
| |||||||
| 637,327 | ||||||||
|
| |||||||
Denmark — 1.7% |
| |||||||
Danske Bank AS** | 15,304 | 259,926 | ||||||
Novo Nordisk AS — B | 2,236 | 364,103 | ||||||
|
| |||||||
| �� | 624,029 | |||||||
|
| |||||||
Notes to Financial Statements are an integral part of this Schedule.
31
Driehaus Global Growth Fund
Schedule of Investments
December 31, 2012
Number of Shares | Market Value (Note A) | |||||||
Norway — 1.5% |
| |||||||
Telenor ASA | 25,897 | $ | 527,310 | |||||
|
| |||||||
Russia — 1.3% |
| |||||||
Sberbank RF — SP ADR | 36,293 | 455,009 | ||||||
|
| |||||||
Italy — 0.8% |
| |||||||
Pirelli & C. SpA | 24,350 | 280,555 | ||||||
|
| |||||||
Portugal — 0.7% |
| |||||||
Jeronimo Martins SGPS SA | 13,359 | 258,316 | ||||||
|
| |||||||
Switzerland — 0.5% |
| |||||||
Temenos Group AG** | 9,888 | 172,971 | ||||||
|
| |||||||
Total EUROPE | 6,867,541 | |||||||
|
| |||||||
| FAR EAST — 9.4% | ||||||||
China — 6.5% |
| |||||||
AIA Group, Ltd. | 88,147 | 349,621 | ||||||
Baidu, Inc. — SP ADR** | 4,415 | 442,780 | ||||||
Michael Kors Holdings, Ltd.** | 9,116 | 465,189 | ||||||
Sands China, Ltd. | 106,159 | 474,601 | ||||||
Want Want China Holdings, Ltd. | 391,153 | 548,164 | ||||||
|
| |||||||
| 2,280,355 | ||||||||
|
| |||||||
Australia — 1.8% |
| |||||||
Aurizon Holdings, Ltd. | 94,840 | 372,949 | ||||||
Aurora Oil & Gas, Ltd.** | 68,940 | 265,072 | ||||||
|
| |||||||
| 638,021 | ||||||||
|
| |||||||
Japan — 1.1% |
| |||||||
FANUC Corp. | 2,073 | 385,681 | ||||||
|
| |||||||
Total FAR EAST | 3,304,057 | |||||||
|
| |||||||
Number of Shares | Market Value (Note A) | |||||||
| SOUTH AMERICA — 2.6% | ||||||||
Brazil — 1.9% |
| |||||||
Anhanguera Educacional Participacoes SA | 10,737 | $ | 181,284 | |||||
OdontoPrev SA | 45,290 | 237,344 | ||||||
Qualicorp SA** | 25,645 | 265,656 | ||||||
|
| |||||||
| 684,284 | ||||||||
|
| |||||||
Argentina — 0.7% |
| |||||||
MercadoLibre, Inc. | 3,100 | 243,567 | ||||||
|
| |||||||
Total SOUTH AMERICA | 927,851 | |||||||
|
| |||||||
| MIDDLE EAST — 0.8% | ||||||||
Israel — 0.8% |
| |||||||
Mellanox Technologies, Ltd.** | 4,700 | 279,086 | ||||||
|
| |||||||
Total MIDDLE EAST | 279,086 | |||||||
|
| |||||||
Total EQUITY SECURITIES (Cost $29,177,585) | 34,258,730 | |||||||
|
| |||||||
| ||||||||
TOTAL INVESTMENTS | 96.9 | % | $ | 34,258,730 | ||||
Other Assets In Excess Of Liabilities | 3.1 | % | 1,090,948 | |||||
|
|
|
| |||||
| Net Assets | 100.0 | % | $ | 35,349,678 | ||||
| ||||||||
The federal income tax basis and unrealized appreciation (depreciation) for all investments is as follows:
| Basis: | $ | 29,264,480 | ||
|
| |||
| Gross Appreciation | $ | 5,756,797 | ||
| Gross Depreciation | (762,547 | ) | ||
|
| |||
Net Appreciation | $ | 4,994,250 | ||
|
|
| ** | Non-income producing security |
SP ADR — Sponsored American Depository Receipt
Regional Weightings*
North America | 64.7% | |||
Western Europe | 18.1% | |||
Asia/Far East Ex-Japan | 8.3% | |||
South America | 2.6% | |||
Eastern Europe | 1.3% | |||
Japan | 1.1% | |||
Middle East | 0.8% |
Top Ten Holdings*
Apple Inc. | 5.2% | |||
Safran SA | 1.7% | |||
Equinix, Inc. | 1.7% | |||
Salesforce.com, Inc. | 1.6% | |||
Want Want China Holdings, Ltd. | 1.6% | |||
DSW, Inc. — A | 1.5% | |||
Whole Foods Market, Inc. | 1.5% | |||
Cummins, Inc. | 1.5% | |||
Qualcomm, Inc. | 1.5% | |||
Costco Wholesale Corp. | 1.5% |
| * | All percentages are stated as a percent of net assets at December 31, 2012. |
Notes to Financial Statements are an integral part of this Schedule.
32
Driehaus Global Growth Fund
Schedule of Investments
December 31, 2012
Industry | Percent of Net Assets | |||
Aerospace & Defense | 2.5% | |||
Auto Components | 0.8% | |||
Automobiles | 0.6% | |||
Beverages | 3.1% | |||
Biotechnology | 7.9% | |||
Commercial Banks | 2.0% | |||
Commercial Services & Supplies | 1.3% | |||
Communications Equipment | 2.2% | |||
Computers & Peripherals | 5.2% | |||
Diversified Consumer Services | 0.5% | |||
Diversified Telecommunication Services | 1.5% | |||
Electrical Equipment | 1.4% | |||
Energy Equipment & Services | 4.6% | |||
Food & Staples Retailing | 5.3% | |||
Food Products | 2.5% | |||
Health Care Equipment & Supplies | 2.9% | |||
Health Care Providers & Services | 2.9% | |||
Health Care Technology | 0.7% | |||
Industry | Percent of Net Assets | |||
Hotels, Restaurants & Leisure | 2.8% | |||
Insurance | 1.0% | |||
Internet & Catalog Retail | 2.5% | |||
Internet Software & Services | 7.9% | |||
IT Services | 1.1% | |||
Leisure Equipment & Products | 1.0% | |||
Machinery | 5.8% | |||
Metals & Mining | 3.6% | |||
Multiline Retail | 1.4% | |||
Oil, Gas & Consumable Fuels | 3.7% | |||
Pharmaceuticals | 2.5% | |||
Road & Rail | 1.1% | |||
Semiconductors & Semiconductor Equipment | 3.3% | |||
Software | 4.2% | |||
Specialty Retail | 3.6% | |||
Textiles, Apparel & Luxury Goods | 2.3% | |||
Trading Companies & Distributors | 1.2% | |||
Other Assets in Excess of Liabilities | 3.1% | |||
|
| |||
TOTAL | 100.0% | |||
|
| |||
Notes to Financial Statements are an integral part of this Schedule.
33
Driehaus Mid Cap Growth Fund — Portfolio Managers’ Letter
Dear Fellow Shareholders,
The Driehaus Mid Cap Growth Fund (“Fund”) returned 11.97% for the year ended December 31, 2012.1 This return was below the performance of the Fund’s benchmark index, the Russell Midcap® Growth Index (the “Benchmark”), which returned 15.81% for the same period.
The United States economy began 2012 on solid footing, only to see the momentum fade during the summer due to poor U.S. payroll data and three straight manufacturing surveys indicating economic contraction. The fourth quarter brought evidence that the U.S. was again experiencing a surprising improvement in manufacturing activity, stronger and more consistent payroll gains, and, arguably most importantly, a healing housing market. The close of 2012 saw U.S. equities with solid gains for the year and surprised economists with early evidence of improving disposable income and hourly wages in the U.S. Evidence of economic momentum continues to mount and we maintain a positive outlook for the year ahead.
During 2012, the two sectors that detracted the most value from Fund performance versus the Benchmark were industrials and materials.
At the security level, Fund holding Bankrate, Inc. (Ticker: RATE) detracted the most value during 2012. The Bankrate network of companies includes Bankrate.com and several other websites that help inform consumers on personal finance matters. During the fourth quarter, after the company made its third quarter earnings announcement, some Wall Street analysts downgraded the company due to ongoing weakness in the credit card business and continued difficulty building an insurance product.
Within industrials, Spirit AeroSystems Holdings, Inc. (Ticker: SPR) was a significant detractor from relative performance. Spirit AeroSystems is an independent non-original equipment manufacturer aircraft parts designer and manufacturer of commercial aerostructures. The company is an independent supplier of aerostructures to Boeing and to Airbus. On October 25, 2012, Spirit stunned investors when it announced for the first time that it expected to record charges against 2012 earnings totaling $590 million, attributed to significant operational problems across multiple product lines. Spirit’s common stock dropped 30% in a single day.
Over the course of 2012, key contributors to performance versus the Benchmark were the Fund’s selection of holdings in the information technology and consumer discretionary sectors.
Technology holding Equinix, Inc. (Ticker: EQIX) was the most significant contributor to Fund performance for the year. Equinix provides data center services to protect and connect the information assets for the enterprises, financial services companies, and content and network providers primarily in the Americas, Europe, the Middle East, Africa, and Asia Pacific. Equinix’s stock was up significantly for 2012 as supply/demand trends were favorable for data center companies. Management also has discussed Equinix’s ongoing plans of becoming a REIT (real estate investment trust), which could act as a catalyst for positive valuations.
Additionally, within the health care sector, Alexion Pharmaceuticals, Inc. (Ticker: ALXN) was a holding that contributed significantly to the Fund’s performance in 2012. The biopharmaceutical company engages in the discovery, development and commercialization of biologic therapeutic products for treating patients with severe and life-threatening diseases. The company continues to see strong revenues from its drug, Solaris, which is used to treat paroxysmal nocturnal hemoglobinuria (a rare blood disease).
Looking ahead, each of the last few years has seen periods of extreme concern regarding the state of the world, and equivalently exuberant market responses when those concerns ultimately fade. These worries usually have been driven by risks in Europe, though increasingly those ‘risk-off’ events are occurring at the hands of U.S. policymakers. However, we believe that the ability of the global economy to withstand shocks, from the perspectives of economic strength and financial liquidity, is better than it has been in the recent years. As such, we would not anticipate the U.S. equity market getting as near the cliff’s edge as it has in each of the past few years. And while fiscal concerns remain, there are factors that may provide significant support to U.S. equities, including:
| • | Moving past the fiscal cliff could lower worldwide systemic risk, creating a more stable market and economic growth |
34
| • | Investor positioning is generally defensive and pent-up demand for equities could result in a market rally |
| • | Resolving the uncertainty caused by the fiscal debate may allow companies greater visibility, encouraging capital expenditures and increased hiring |
| • | The European Union stabilizing and emerging markets seeing continued growth |
| • | Private sector economic growth continuing and corporate balance sheets remaining strong |
These factors could lead to more attractive valuations, lower correlations among individual equities, and provide a tailwind for active U.S. equity managers.
As always, we at Driehaus Capital Management LLC thank you for your interest in the Driehaus Mid Cap Growth Fund and would like to express our gratitude to you as shareholders for your continued confidence in our management capabilities.
Sincerely,
 | 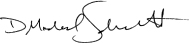 | |
| Dan Wasiolek | Michael Schmidt | |
| Portfolio Manager | Assistant Portfolio Manager |
| 1 | During this period, the Fund’s returns reflect fee waivers and/or reimbursements without which performance would have been lower. |
Performance is historical and does not represent future results.
Please see the following performance overview page for index descriptions.
35
Driehaus Mid Cap Growth Fund
Performance Overview (unaudited)
The performance summarized below is historical and does not represent future results. Investment returns and principal value vary, and you may have a gain or loss when you sell shares. Performance data presented measures the change in the value of an investment in the Fund, assuming reinvestment of all dividends and capital gains. Average annual total return reflects annualized change.
The table does not reflect the deduction of taxes that a shareholder would pay on Fund distributions or the redemption of Fund shares. The graph compares the results of a $10,000 investment in the Fund since January 1, 1999, with all dividends and capital gains reinvested, with the indicated index (and dividends reinvested) for the same period.
| Fund Only | Including Predecessor Limited Partnership | |||||||||||||||||||||||
| Average Annual Total Returns as of 12/31/12 | 1 Year | 3 Years | Since Inception (04/27/09 - 12/31/12) | 5 Years | 10 Years | Since Inception (01/01/99 - 12/31/12) | ||||||||||||||||||
Driehaus Mid Cap Growth Fund (DRMGX)1 | 11.97% | 11.52% | 16.78% | –4.40% | 11.20% | 8.20% | ||||||||||||||||||
Russell Midcap® Growth Index2 | 15.81% | 12.91% | 19.56% | 3.23% | 10.32% | 5.32% | ||||||||||||||||||
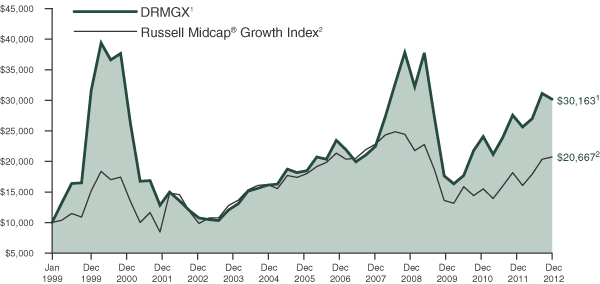
| 1 | The Driehaus Mid Cap Growth Fund (the “Fund”) performance shown above includes the performance of the Driehaus Institutional Mid Cap, L.P. (the “Predecessor Limited Partnership”), one of the Fund’s predecessors, for the periods before the Fund’s registration statement became effective. The Predecessor Limited Partnership, which was established on July 1, 1986, was managed with substantially the same investment objective, policies and philosophies as are followed by the Fund. The Fund succeeded to the Predecessor Limited Partnership’s assets together with the assets of the Driehaus Mid Cap Investors, L.P. on April 27, 2009. The Predecessor Limited Partnership was not registered under the Investment Company Act of 1940, as amended (“1940 Act”), and thus was not subject to certain investment and operational restrictions that are imposed by the 1940 Act. If the Predecessor Limited Partnership had been registered under the 1940 Act, its performance may have been adversely affected. The Predecessor Limited Partnership’s performance has been restated to reflect estimated expenses of the Fund. The returns reflect fee waivers and/or reimbursements without which performance would have been lower. |
| 2 | The Russell Midcap® Growth Index measures the performance of those Russell Midcap® Index companies with higher price-to-book ratios and higher forecasted growth values. The Russell Midcap® Index measures the performance of the 800 smallest companies in the Russell 1000® Index. Source: Russell Indices |
36
Driehaus Mid Cap Growth Fund
Schedule of Investments
December 31, 2012
Number of Shares | Market Value (Note A) | |||||||
| EQUITY SECURITIES — 95.4% | ||||||||
| CONSUMER DISCRETIONARY — 22.2% | ||||||||
Specialty Retail — 8.1% |
| |||||||
DSW, Inc. — A | 6,419 | $ | 421,664 | |||||
GNC Holdings, Inc. — A | 12,915 | 429,811 | ||||||
O’Reilly Automotive, Inc.** | 4,198 | 375,385 | ||||||
Ross Stores, Inc. | 7,360 | 398,544 | ||||||
Ulta Salon Cosmetics & Fragrance, Inc. | 3,393 | 333,396 | ||||||
|
| |||||||
| 1,958,800 | ||||||||
|
| |||||||
Textiles, Apparel & Luxury Goods — 4.2% |
| |||||||
Lululemon Athletica, Inc.** | 4,538 | 345,932 | ||||||
Michael Kors Holdings, Ltd.** | 13,054 | 666,146 | ||||||
|
| |||||||
| 1,012,078 | ||||||||
|
| |||||||
Leisure Equipment & Products — 3.5% |
| |||||||
Mattel, Inc. | 10,756 | 393,885 | ||||||
Polaris Industries, Inc. | 5,376 | 452,390 | ||||||
|
| |||||||
| 846,275 | ||||||||
|
| |||||||
Multiline Retail — 2.4% |
| |||||||
Family Dollar Stores, Inc. | 9,243 | 586,099 | ||||||
|
| |||||||
Hotels, Restaurants & Leisure — 2.2% |
| |||||||
Bloomin’ Brands, Inc.** | 15,095 | 236,086 | ||||||
Domino’s Pizza, Inc. | 6,842 | 297,969 | ||||||
|
| |||||||
| 534,055 | ||||||||
|
| |||||||
Distributors — 1.8% |
| |||||||
LKQ Corp.** | 20,241 | 427,085 | ||||||
|
| |||||||
Total CONSUMER DISCRETIONARY | 5,364,392 | |||||||
|
| |||||||
| HEALTH CARE — 17.5% | ||||||||
Biotechnology — 7.9% |
| |||||||
Alexion Pharmaceuticals, Inc.** | 4,093 | 383,964 | ||||||
Ariad Pharmaceuticals, Inc.** | 8,667 | 166,233 | ||||||
BioMarin Pharmaceutical, Inc.** | 7,245 | 356,816 | ||||||
Cubist Pharmaceuticals, Inc.** | 5,972 | 251,182 | ||||||
Infinity Pharmaceuticals, Inc.** | 2,558 | 89,530 | ||||||
Medivation, Inc.** | 5,812 | 297,342 | ||||||
Synageva BioPharma Corp.** | 4,259 | 197,149 | ||||||
Vertex Pharmaceuticals, Inc.** | 4,090 | 171,535 | ||||||
|
| |||||||
| 1,913,751 | ||||||||
|
| |||||||
Health Care Providers & Services — 3.6% |
| |||||||
Air Methods Corp. | 7,677 | 283,205 | ||||||
Catamaran Corp.** | 12,639 | 595,423 | ||||||
|
| |||||||
| 878,628 | ||||||||
|
| |||||||
Health Care Equipment & Supplies — 3.2% |
| |||||||
Edwards Lifesciences Corp.** | 3,878 | 349,679 | ||||||
Intuitive Surgical, Inc.** | 859 | 421,228 | ||||||
|
| |||||||
| 770,907 | ||||||||
|
| |||||||
Number of Shares | Market Value (Note A) | |||||||
Pharmaceuticals — 1.6% |
| |||||||
Jazz Pharmaceuticals PLC** | 7,382 | $ | 392,722 | |||||
|
| |||||||
Health Care Technology — 1.2% |
| |||||||
Cerner Corp.** | 3,813 | 296,042 | ||||||
|
| |||||||
Total HEALTH CARE | 4,252,050 | |||||||
|
| |||||||
| INFORMATION TECHNOLOGY — 17.2% | ||||||||
Software — 7.5% |
| |||||||
Guidewire Software, Inc.** | 16,221 | 482,088 | ||||||
Salesforce.com, Inc.** | 2,703 | 454,374 | ||||||
SolarWinds, Inc.** | 5,108 | 267,915 | ||||||
Ultimate Software Group, Inc.** | 4,635 | 437,590 | ||||||
Workday, Inc. — A** | 3,270 | 178,215 | ||||||
|
| |||||||
| 1,820,182 | ||||||||
|
| |||||||
Internet Software & Services — 6.6% |
| |||||||
Cornerstone OnDemand, Inc.** | 4,331 | 127,894 | ||||||
CoStar Group, Inc.** | 1,660 | 148,354 | ||||||
Equinix, Inc.** | 3,060 | 630,972 | ||||||
MercadoLibre, Inc. | 3,535 | 277,745 | ||||||
Rackspace Hosting, Inc.** | 5,599 | 415,838 | ||||||
|
| |||||||
| 1,600,803 | ||||||||
|
| |||||||
Communications Equipment — 1.3% |
| |||||||
F5 Networks, Inc.** | 1,271 | 123,478 | ||||||
Palo Alto Networks, Inc.** | 3,477 | 186,089 | ||||||
|
| |||||||
| 309,567 | ||||||||
|
| |||||||
Semiconductors & Semiconductor Equipment — 1.0% |
| |||||||
ARM Holdings PLC — SP ADR | 2,691 | 101,801 | ||||||
Mellanox Technologies, Ltd.** | 2,553 | 151,597 | ||||||
|
| |||||||
| 253,398 | ||||||||
|
| |||||||
Computers & Peripherals — 0.8% |
| |||||||
Stratasys, Ltd.** | 2,361 | 189,234 | ||||||
|
| |||||||
Total INFORMATION TECHNOLOGY |
| 4,173,184 | ||||||
|
| |||||||
| INDUSTRIALS — 12.1% | ||||||||
Trading Companies & Distributors — 3.3% |
| |||||||
MRC Global, Inc.** | 13,695 | 380,447 | ||||||
WW Grainger, Inc. | 2,021 | 408,990 | ||||||
|
| |||||||
| 789,437 | ||||||||
|
| |||||||
Machinery — 2.6% |
| |||||||
Chart Industries, Inc.** | 3,858 | 257,213 | ||||||
Joy Global, Inc. | 5,882 | 375,154 | ||||||
|
| |||||||
| 632,367 | ||||||||
|
| |||||||
Aerospace & Defense — 2.5% |
| |||||||
Triumph Group, Inc. | 9,330 | 609,249 | ||||||
|
| |||||||
Road & Rail — 1.6% |
| |||||||
Genesee & Wyoming, Inc. — A** | 4,962 | 377,509 | ||||||
|
| |||||||
Notes to Financial Statements are an integral part of this Schedule.
37
Driehaus Mid Cap Growth Fund
Schedule of Investments
December 31, 2012
Number of Shares | Market Value (Note A) | |||||||
Electrical Equipment — 1.3% |
| |||||||
Sensata Technologies Holding NV** | 9,343 | $ | 303,461 | |||||
|
| |||||||
Marine — 0.8% |
| |||||||
Kirby Corp.** | 3,277 | 202,814 | ||||||
|
| |||||||
Total INDUSTRIALS | 2,914,837 | |||||||
|
| |||||||
| CONSUMER STAPLES — 10.8% | ||||||||
Beverages — 3.9% |
| |||||||
Beam, Inc. | 7,972 | 487,009 | ||||||
Brown-Forman Corp. — B | 7,355 | 465,204 | ||||||
|
| |||||||
| 952,213 | ||||||||
|
| |||||||
Food & Staples Retailing — 3.7% |
| |||||||
Pricesmart, Inc. | 6,816 | 525,173 | ||||||
Whole Foods Market, Inc. | 4,076 | 372,261 | ||||||
|
| |||||||
| 897,434 | ||||||||
|
| |||||||
Food Products — 2.1% |
| |||||||
The Hershey Co. | 7,065 | 510,234 | ||||||
|
| |||||||
Household Products — 1.1% |
| |||||||
Church & Dwight Co., Inc. | 4,748 | 254,351 | ||||||
|
| |||||||
Total CONSUMER STAPLES | 2,614,232 | |||||||
|
| |||||||
| ENERGY — 6.8% | ||||||||
Energy Equipment & Services — 3.6% |
| |||||||
FMC Technologies, Inc.** | 6,952 | 297,754 | ||||||
Helmerich & Payne, Inc. | 4,848 | 271,536 | ||||||
Hornbeck Offshore Services, Inc.** | 8,580 | 294,637 | ||||||
|
| |||||||
| 863,927 | ||||||||
|
| |||||||
Oil, Gas & Consumable Fuels — 3.2% |
| |||||||
Concho Resources, Inc.** | 2,683 | 216,143 | ||||||
Energy XXI Bermuda | 4,694 | 151,100 | ||||||
Pioneer Natural Resources Co. | 3,794 | 404,402 | ||||||
|
| |||||||
| 771,645 | ||||||||
|
| |||||||
Total ENERGY | 1,635,572 | |||||||
|
| |||||||
| MATERIALS — 5.1% | ||||||||
Metals & Mining — 2.9% |
| |||||||
Carpenter Technology Corp. | 6,299 | 325,217 | ||||||
Royal Gold, Inc. | 4,519 | 367,440 | ||||||
|
| |||||||
| 692,657 | ||||||||
|
| |||||||
Containers & Packaging — 1.1% |
| |||||||
Berry Plastics Group, Inc.** | 17,082 | 274,679 | ||||||
|
| |||||||
Construction Materials — 1.1% |
| |||||||
Texas Industries, Inc.** | 5,017 | 255,917 | ||||||
|
| |||||||
Total MATERIALS | 1,223,253 | |||||||
|
| |||||||
Number of Shares | Market Value (Note A) | |||||||
| FINANCIALS — 2.5% | ||||||||
Real Estate Investment Trust — 1.8% |
| |||||||
Boston Properties, Inc. | 4,008 | $ | 424,086 | |||||
|
| |||||||
Diversified Financial Services — 0.7% |
| |||||||
MarketAxess Holdings, Inc. | 4,919 | 173,641 | ||||||
|
| |||||||
Total FINANCIALS | 597,727 | |||||||
|
| |||||||
| TELECOMMUNICATION SERVICES — 1.2% | ||||||||
Wireless Telecommunication Services — 1.2% |
| |||||||
Crown Castle International Corp.** | 4,120 | 297,299 | ||||||
|
| |||||||
Total TELECOMMUNICATION SERVICES | 297,299 | |||||||
|
| |||||||
Total EQUITY SECURITIES | 23,072,546 | |||||||
|
| |||||||
| ||||||||
TOTAL INVESTMENTS | 95.4 | % | $ | 23,072,546 | ||||
Other Assets In Excess Of Liabilities | 4.6 | % | 1,108,361 | |||||
|
|
|
| |||||
| Net Assets | 100.0 | % | $ | 24,180,907 | ||||
| ||||||||
The federal income tax basis and unrealized appreciation (depreciation) for all investments is as follows:
| Basis: | $ | 19,341,018 | ||
|
| |||
| Gross Appreciation | $ | 4,104,975 | ||
| Gross Depreciation | (373,446 | ) | ||
|
| |||
Net Appreciation | $ | 3,731,529 | ||
|
|
| ** | Non-income producing security |
SP ADR — Sponsored American Depository Receipt
Top Ten Holdings*
Michael Kors Holdings, Ltd. | 2.8% | |||
Equinix, Inc. | 2.6% | |||
Triumph Group, Inc. | 2.5% | |||
Catamaran Corp. | 2.5% | |||
Family Dollar Stores, Inc. | 2.4% | |||
Pricesmart, Inc. | 2.2% | |||
The Hershey Co. | 2.1% | |||
Beam, Inc. | 2.0% | |||
Guidewire Software, Inc. | 2.0% | |||
Brown-Forman Corp. — B | 1.9% |
| * | All percentages are stated as a percent of net assets at December 31, 2012. |
Notes to Financial Statements are an integral part of this Schedule.
38
Driehaus Large Cap Growth Fund — Portfolio Managers’ Letter
Dear Fellow Shareholders,
The Driehaus Large Cap Growth Fund (“Fund”) returned 10.75% for the year ended December 31, 2012.1 This return was below the performance of the Fund’s benchmark index, the Russell 1000® Growth Index (the “Benchmark”), which returned 15.26% for the same period.
The United States economy began 2012 on solid footing, only to see the momentum fade during the summer due to poor U.S. payroll data and three straight manufacturing surveys indicating economic contraction. The fourth quarter brought evidence that the U.S. was again experiencing a surprising improvement in manufacturing activity, stronger and more consistent payroll gains, and, arguably most importantly, a healing housing market. The close of 2012 saw U.S. equities with solid gains for the year and surprised economists with early evidence of improving disposable income and hourly wages in the U.S. Evidence of economic momentum continues to mount and we maintain a positive outlook for the year ahead.
During 2012, two sectors where allocation and stock selection detracted from Fund performance versus the Benchmark were the consumer discretionary and materials sectors.
Within consumer discretionary, the most significant detractor from relative performance was the McDonald’s Corp. (Ticker: MCD). McDonald’s franchises and operates over 34,000 McDonald’s quick-service restaurants in 119 countries. Approximately 80% of the restaurants are operated by franchisees. McDonald’s shares underperformed during the year due to macro challenges, increased competitive pressures, and the impact from currency exchange rates.
Within the materials sector, the most significant detractor from relative returns was Newmont Mining Corp. (Ticker: NEM). Newmont Mining is a gold and copper producer. The company’s operating segments include North America, South America, Asia Pacific and Africa. The company’s share price trended down during the year as metal commodity prices were down during much of the year while operating costs increased slightly.
Over the course of 2012, key contributors to performance versus the Benchmark were the Fund’s holdings in the consumer staples and information technology sectors.
Within the information technology sector, portfolio holding Apple Inc. (Ticker: AAPL) was the most significant contributor to Fund return in 2012. The company designs, manufactures and markets personal computers, mobile communication devices, and portable digital music and video players, as well as sells various related software, services, peripherals and networking solutions. During the year, the anticipation of product launches of the latest version of its iPhone and iPad boosted shares.
Within consumer staples, the holding Costco Wholesale Corp. (Ticker: COST) was the most significant contributor to returns for the year. Costco operates membership warehouses in North America, the United Kingdom and Japan. Costco shares advanced strongly during the second and third quarters of 2012. Costco continues to enjoy a steady stream of revenues from membership fees, as memberships themselves have trended higher.
Looking ahead, each of the last few years has seen periods of extreme concern regarding the state of the world, and equivalently exuberant market responses when those concerns ultimately fade. These worries usually have been driven by risks in Europe, though increasingly those ‘risk-off’ events are occurring at the hands of U.S. policymakers. However, we believe that the ability of the global economy to withstand shocks, from the perspectives of economic strength and financial liquidity, is better than it has been in the recent years. As such, we would not anticipate the U.S. equity market getting as near the cliff’s edge as it has in each of the past few years. And while fiscal concerns remain, there are factors that may provide significant support to U.S. equities, including:
| • | Moving past the fiscal cliff could lower worldwide systemic risk, creating a more stable market and economic growth |
| • | Investor positioning is generally defensive and pent-up demand for equities could result in a market rally |
| • | Resolving the uncertainty caused by the fiscal debate may allow companies greater visibility, encouraging capital expenditures and increased hiring |
39
| • | The European Union stabilizing and emerging markets seeing continued growth |
| • | Private sector economic growth continuing and corporate balance sheets remaining strong |
These factors could lead to more attractive valuations, lower correlations among individual equities, and provide a tailwind for active U.S. equity managers.
As always, we at Driehaus Capital Management LLC thank you for your interest in the Driehaus Large Cap Growth Fund and would like to express our gratitude to you as a shareholder for your continued confidence in our management capabilities.
Sincerely,
| | |
| Dan Wasiolek | Michael Schmidt | |
| Portfolio Manager | Assistant Portfolio Manager |
| 1 | During this period, the Fund’s returns reflect fee waivers and/or reimbursements without which performance would have been lower. |
Performance is historical and does not represent future results.
Please see the following performance overview page for index descriptions.
40
Driehaus Large Cap Growth Fund
Performance Overview (unaudited)
The performance summarized below is historical and does not represent future results. Investment returns and principal value vary, and you may have a gain or loss when you sell shares. Performance data presented measures the change in the value of an investment in the Fund, assuming reinvestment of all dividends and capital gains. Average annual total return reflects annualized change.
The table does not reflect the deduction of taxes that a shareholder would pay on Fund distributions or the redemption of Fund shares. The graph compares the results of a $10,000 investment in the Fund since January 1, 2008 (the date of the Predecessor Limited Partnership’s inception), with all dividends and capital gains reinvested, with the indicated index (and dividends reinvested) for the same period.
| Fund Only | Including Predecessor Limited Partnership | |||||||||||||||
Average Annual Total Returns as of 12/31/12 | 1 Year | 3 Years | Since Inception (04/27/09 - 12/31/12) | 5 Years | ||||||||||||
Driehaus Large Cap Growth Fund (DRLGX)1 | 10.75% | 10.00% | 14.36% | –1.50% | ||||||||||||
Russell 1000® Growth Index2 | 15.26% | 11.36% | 17.67% | 3.12% | ||||||||||||
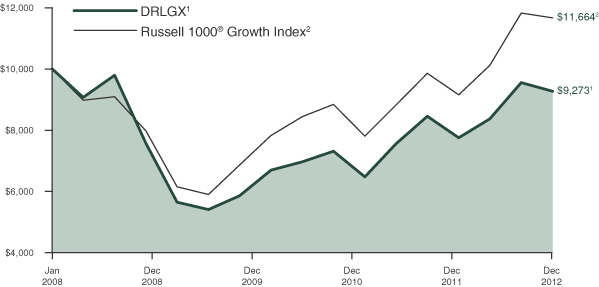
| 1 | The Driehaus Large Cap Growth Fund (the “Fund”) performance shown above includes the performance of the Driehaus Large Cap Growth Fund, L.P. (the “Predecessor Limited Partnership”), the Fund’s predecessor, for the periods before the Fund’s registration statement became effective. The Predecessor Limited Partnership, which was established on January 1, 2008, was managed with substantially the same investment objective, policies and philosophies as are followed by the Fund. The Fund succeeded to the Predecessor Limited Partnership’s assets on April 27, 2009. The Predecessor Limited Partnership was not registered under the Investment Company Act of 1940, as amended (“1940 Act”), and thus was not subject to certain investment and operational restrictions that are imposed by the 1940 Act. If the Predecessor Limited Partnership had been registered under the 1940 Act, its performance may have been adversely affected. The Predecessor Limited Partnership’s performance has been restated to reflect estimated expenses of the Fund. The returns reflect fee waivers and/or reimbursements without which performance would have been lower. |
| 2 | The Russell 1000® Growth Index measures the performance of those Russell 1000® Index companies with higher price-to-book ratios and higher forecasted growth values. The Russell 1000® Index measures the performance of the 1000 largest companies in the Russell 3000® Index, which represents approximately 98% of the investable U.S. equity market. Source: Russell Indices |
41
Driehaus Large Cap Growth Fund
Schedule of Investments
December 31, 2012
| Number of Shares | Market Value (Note A) | |||||||
| EQUITY SECURITIES — 96.8% | ||||||||
| INFORMATION TECHNOLOGY — 26.1% | ||||||||
Internet Software & Services — 7.8% |
| |||||||
Baidu, Inc. — SP ADR** | 2,722 | $ | 272,989 | |||||
Equinix, Inc.** | 2,140 | 441,268 | ||||||
Facebook, Inc. — A** | 9,799 | 260,947 | ||||||
Google, Inc. — A** | 276 | 195,237 | ||||||
Rackspace Hosting, Inc.** | 4,637 | 344,390 | ||||||
|
| |||||||
| 1,514,831 | ||||||||
|
| |||||||
Computers & Peripherals — 7.6% |
| |||||||
Apple Inc. | 2,747 | 1,464,233 | ||||||
|
| |||||||
Software — 4.0% |
| |||||||
Salesforce.com, Inc.** | 2,895 | 486,650 | ||||||
SolarWinds, Inc.** | 3,440 | 180,428 | ||||||
Workday, Inc. — A** | 1,971 | 107,420 | ||||||
|
| |||||||
| 774,498 | ||||||||
|
| |||||||
Communications Equipment — 3.7% |
| |||||||
F5 Networks, Inc.** | 1,436 | 139,508 | ||||||
Qualcomm, Inc. | 9,362 | 580,631 | ||||||
|
| |||||||
| 720,139 | ||||||||
|
| |||||||
IT Services — 1.9% |
| |||||||
Accenture PLC — A | 2,980 | 198,170 | ||||||
Visa, Inc. — A | 1,145 | 173,559 | ||||||
|
| |||||||
| 371,729 | ||||||||
|
| |||||||
Semiconductors & Semiconductor Equipment — 1.1% |
| |||||||
ARM Holdings PLC — SP ADR | 3,201 | 121,094 | ||||||
ASML Holding NV | 1,286 | 82,831 | ||||||
|
| |||||||
| 203,925 | ||||||||
|
| |||||||
Total INFORMATION TECHNOLOGY | 5,049,355 | |||||||
|
| |||||||
| HEALTH CARE — 19.4% | ||||||||
Biotechnology — 6.4% |
| |||||||
Alexion Pharmaceuticals, Inc.** | 3,299 | 309,479 | ||||||
Biogen Idec, Inc.** | 1,221 | 179,084 | ||||||
BioMarin Pharmaceutical, Inc.** | 5,003 | 246,398 | ||||||
Gilead Sciences, Inc.** | 2,272 | 166,879 | ||||||
Medivation, Inc.** | 4,313 | 220,653 | ||||||
Vertex Pharmaceuticals, Inc.** | 2,830 | 118,690 | ||||||
|
| |||||||
| 1,241,183 | ||||||||
|
| |||||||
Pharmaceuticals — 4.7% |
| |||||||
Allergan, Inc. | 4,261 | 390,862 | ||||||
Novo Nordisk AS — SP ADR | 927 | 151,296 | ||||||
Pfizer, Inc. | 14,993 | 376,024 | ||||||
|
| |||||||
| 918,182 | ||||||||
|
| |||||||
| Number of Shares | Market Value (Note A) | |||||||
Health Care Equipment & Supplies — 4.0% |
| |||||||
Covidien PLC | 3,496 | $ | 201,859 | |||||
Edwards Lifesciences Corp.** | 3,367 | 303,602 | ||||||
Intuitive Surgical, Inc.** | 558 | 273,627 | ||||||
|
| |||||||
| 779,088 | ||||||||
|
| |||||||
Health Care Providers & Services — 3.2% |
| |||||||
Catamaran Corp.** | 8,794 | 414,285 | ||||||
Express Scripts Holding Co.** | 3,684 | 198,936 | ||||||
|
| |||||||
| 613,221 | ||||||||
|
| |||||||
Health Care Technology — 1.1% |
| |||||||
Cerner Corp.** | 2,614 | 202,951 | ||||||
|
| |||||||
Total HEALTH CARE | 3,754,625 | |||||||
|
| |||||||
| CONSUMER DISCRETIONARY — 16.7% | ||||||||
Specialty Retail — 5.0% |
| |||||||
DSW, Inc. — A | 4,616 | 303,225 | ||||||
GNC Holdings, Inc. — A | 5,810 | 193,357 | ||||||
Ross Stores, Inc. | 3,994 | 216,275 | ||||||
Ulta Salon Cosmetics & Fragrance, Inc. | 2,666 | 261,961 | ||||||
|
| |||||||
| 974,818 | ||||||||
|
| |||||||
Multiline Retail — 4.4% |
| |||||||
Family Dollar Stores, Inc. | 7,269 | 460,927 | ||||||
Macy’s, Inc. | 5,162 | 201,421 | ||||||
Target Corp. | 3,148 | 186,267 | ||||||
|
| |||||||
| 848,615 | ||||||||
|
| |||||||
Textiles, Apparel & Luxury Goods — 3.6% |
| |||||||
Lululemon Athletica, Inc.** | 2,570 | 195,911 | ||||||
Michael Kors Holdings, Ltd.** | 6,870 | 350,576 | ||||||
NIKE, Inc. — B | 3,108 | 160,373 | ||||||
|
| |||||||
| 706,860 | ||||||||
|
| |||||||
Hotels, Restaurants & Leisure — 2.4% |
| |||||||
McDonald’s Corp. | 1,572 | 138,666 | ||||||
Starbucks Corp. | 6,167 | 330,675 | ||||||
|
| |||||||
| 469,341 | ||||||||
|
| |||||||
Internet & Catalog Retail — 1.3% |
| |||||||
priceline.com, Inc.** | 404 | 250,965 | ||||||
|
| |||||||
Total CONSUMER DISCRETIONARY | 3,250,599 | |||||||
|
| |||||||
| CONSUMER STAPLES — 13.2% | ||||||||
Food & Staples Retailing — 5.6% |
| |||||||
Costco Wholesale Corp. | 5,707 | 563,680 | ||||||
Wal-Mart Stores, Inc. | 3,520 | 240,170 | ||||||
Whole Foods Market, Inc. | 3,079 | 281,205 | ||||||
|
| |||||||
| 1,085,055 | ||||||||
|
| |||||||
Beverages — 3.4% |
| |||||||
Beam, Inc. | 5,753 | 351,451 | ||||||
Brown-Forman Corp. — B | 4,779 | 302,272 | ||||||
|
| |||||||
| 653,723 | ||||||||
|
| |||||||
Notes to Financial Statements are an integral part of this Schedule.
42
Driehaus Large Cap Growth Fund
Schedule of Investments
December 31, 2012
| Number of Shares | Market Value (Note A) | |||||||
Food Products — 3.3% |
| |||||||
Mondelez International, Inc. — A | 12,243 | $ | 311,829 | |||||
The Hershey Co. | 4,501 | 325,062 | ||||||
|
| |||||||
| 636,891 | ||||||||
|
| |||||||
Household Products — 0.9% |
| |||||||
Church & Dwight Co., Inc. | 3,337 | 178,763 | ||||||
|
| |||||||
Total CONSUMER STAPLES | 2,554,432 | |||||||
|
| |||||||
| INDUSTRIALS — 9.2% | ||||||||
Aerospace & Defense — 4.0% |
| |||||||
Precision Castparts Corp. | 1,765 | 334,326 | ||||||
Triumph Group, Inc. | 6,654 | 434,506 | ||||||
|
| |||||||
| 768,832 | ||||||||
|
| |||||||
Trading Companies & Distributors — 2.9% |
| |||||||
MRC Global, Inc.** | 11,305 | 314,053 | ||||||
WW Grainger, Inc. | 1,257 | 254,379 | ||||||
|
| |||||||
| 568,432 | ||||||||
|
| |||||||
Machinery — 2.3% |
| |||||||
Cummins, Inc. | 2,412 | 261,340 | ||||||
Joy Global, Inc. | 2,994 | 190,957 | ||||||
|
| |||||||
| 452,297 | ||||||||
|
| |||||||
Total INDUSTRIALS | 1,789,561 | |||||||
|
| |||||||
| ENERGY — 5.2% | ||||||||
Oil, Gas & Consumable Fuels — 3.3% |
| |||||||
Continental Resources, Inc.** | 1,981 | 145,584 | ||||||
Kinder Morgan, Inc. | 6,007 | 212,227 | ||||||
Pioneer Natural Resources Co. | 2,731 | 291,097 | ||||||
|
| |||||||
| 648,908 | ||||||||
|
| |||||||
Energy Equipment & Services — 1.9% |
| |||||||
FMC Technologies, Inc.** | 3,689 | 158,000 | ||||||
Halliburton Co. | 5,974 | 207,238 | ||||||
|
| |||||||
| 365,238 | ||||||||
|
| |||||||
Total ENERGY | 1,014,146 | |||||||
|
| |||||||
| Number of Shares | Market Value (Note A) | |||||||
| MATERIALS — 3.8% | ||||||||
Metals & Mining — 2.6% |
| |||||||
Carpenter Technology Corp. | 4,946 | $ | 255,362 | |||||
Royal Gold, Inc. | 3,112 | 253,037 | ||||||
|
| |||||||
| 508,399 | ||||||||
|
| |||||||
Chemicals — 1.2% |
| |||||||
Praxair, Inc. | 2,004 | 219,338 | ||||||
|
| |||||||
Total MATERIALS | 727,737 | |||||||
|
| |||||||
| FINANCIALS — 3.2% | ||||||||
Real Estate Investment Trusts — 3.2% |
| |||||||
American Tower Corp. | 4,144 | 320,207 | ||||||
Boston Properties, Inc. | 2,821 | 298,490 | ||||||
|
| |||||||
| 618,697 | ||||||||
|
| |||||||
Total FINANCIALS | 618,697 | |||||||
|
| |||||||
Total EQUITY SECURITIES (Cost $15,211,165) | 18,759,152 | |||||||
|
| |||||||
| ||||||||
TOTAL INVESTMENTS | 96.8 | % | $ | 18,759,152 | ||||
Other Assets In Excess Of Liabilities | 3.2 | % | 626,328 | |||||
|
|
|
| |||||
| Net Assets | 100.0 | % | $ | 19,385,480 | ||||
| ||||||||
The federal income tax basis and unrealized appreciation (depreciation) for all investments is as follows:
| Basis | $ | 15,266,973 | ||
|
| |||
| Gross Appreciation | $ | 3,828,039 | ||
| Gross Depreciation | (335,860 | ) | ||
|
| |||
Net Appreciation | $ | 3,492,179 | ||
|
|
| ** | Non-income producing security |
SP ADR — Sponsored American Depository Receipt
Top Ten Holdings*
Apple Inc. | 7.6% | |||
Qualcomm, Inc. | 3.0% | |||
Costco Wholesale Corp. | 2.9% | |||
Salesforce.com, Inc. | 2.5% | |||
Family Dollar Stores, Inc. | 2.4% | |||
Equinix, Inc. | 2.3% | |||
Triumph Group, Inc. | 2.2% | |||
Catamaran Corp. | 2.1% | |||
Allergan, Inc. | 2.0% | |||
Pfizer, Inc. | 1.9% |
| * | All percentages are stated as a percent of net assets at December 31, 2012. |
Notes to Financial Statements are an integral part of this Schedule.
43
Statements of Assets and Liabilities
December 31, 2012
| Driehaus International Discovery Fund | Driehaus Emerging Markets Growth Fund | |||||||
ASSETS: | ||||||||
Investments, at cost | $ | 172,068,447 | $ | 784,008,861 | ||||
|
|
|
| |||||
Investments, at market value | $ | 199,751,330 | $ | 929,937,224 | ||||
Foreign currency* | 1,069,394 | 10,986,590 | ||||||
Cash | 8,945,686 | 41,862,863 | ||||||
Segregated cash | — | — | ||||||
Receivables: | ||||||||
Dividends | 253,413 | 826,060 | ||||||
Interest | 100 | 97 | ||||||
Investment securities sold | 915,161 | 22,744,324 | ||||||
Fund shares sold | 2,863 | 8,357,385 | ||||||
Net unrealized appreciation on unsettled foreign currency transactions | 6,365 | — | ||||||
Prepaid expenses | 9,636 | 16,363 | ||||||
|
|
|
| |||||
| ||||||||
TOTAL ASSETS | 210,953,948 | 1,014,730,906 | ||||||
|
|
|
| |||||
| ||||||||
LIABILITIES: | ||||||||
Payables: | ||||||||
Investment securities purchased | 3,885,923 | 22,286,022 | ||||||
Fund shares redeemed | 320,506 | 1,724,378 | ||||||
Net unrealized depreciation on unsettled foreign currency transactions | — | 35,815 | ||||||
Due to affiliates | 259,688 | 1,200,663 | ||||||
Foreign taxes | — | 477 | ||||||
Audit and tax fees | 49,300 | 54,300 | ||||||
Accrued expenses | 45,220 | 171,241 | ||||||
|
|
|
| |||||
| ||||||||
TOTAL LIABILITIES | 4,560,637 | 25,472,896 | ||||||
|
|
|
| |||||
| ||||||||
NET ASSETS | $ | 206,393,311 | $ | 989,258,010 | ||||
|
|
|
| |||||
SHARES OUTSTANDING (Unlimited shares authorized, no par value) | 7,410,390 | 32,323,118 | ||||||
|
|
|
| |||||
NET ASSET VALUE | $ | 27.85 | $ | 30.61 | ||||
|
|
|
| |||||
| ||||||||
NET ASSETS CONSISTED OF THE FOLLOWING AT DECEMBER 31, 2012: | ||||||||
Paid-in capital | $ | 440,784,079 | $ | 895,699,110 | ||||
Accumulated net investment income (loss) | (124,055 | ) | (1,325,050 | ) | ||||
Accumulated net realized gain (loss) | (262,052,595 | ) | (51,253,856 | ) | ||||
Unrealized net foreign exchange gain (loss) | 102,999 | 209,443 | ||||||
Unrealized net appreciation (depreciation) on investments | 27,682,883 | 145,928,363 | ||||||
|
|
|
| |||||
NET ASSETS | $ | 206,393,311 | $ | 989,258,010 | ||||
|
|
|
| |||||
| ||||||||
| * | The cost of foreign currency was $990,103, $10,747,595, $841,996, $0, $65,363, $0 and $0, respectively. |
Notes to Financial Statements are an integral part of this Statement.
44
Statements of Assets and Liabilities
December 31, 2012
| Driehaus Emerging Markets Small Cap Growth Fund | Driehaus International Small Cap Growth Fund | Driehaus Global Growth Fund | Driehaus Mid Cap Growth Fund | Driehaus Large Cap Growth Fund | ||||||||||||||
| $ | 61,469,344 | $ | 196,401,737 | $ | 29,177,585 | $ | 19,247,682 | $ | 15,211,165 | |||||||||
|
|
|
|
|
|
|
|
|
| |||||||||
| $ | 75,116,045 | $ | 227,512,341 | $ | 34,258,730 | $ | 23,072,546 | $ | 18,759,152 | |||||||||
| 842,825 | — | 74,537 | — | — | ||||||||||||||
| 864,888 | 9,081,134 | 909,676 | 1,214,776 | 954,017 | ||||||||||||||
| 999,988 | — | — | — | — | ||||||||||||||
| 100,452 | 327,056 | 6,600 | 2,991 | 4,458 | ||||||||||||||
| 29 | 121 | 13 | 260 | 167 | ||||||||||||||
| 176,467 | 4,960,621 | 254,987 | 112,317 | — | ||||||||||||||
| 3,777,072 | 154,183 | 500 | — | — | ||||||||||||||
| — | — | — | — | — | ||||||||||||||
| 11,844 | 6,367 | 6,439 | 6,374 | 6,354 | ||||||||||||||
|
|
|
|
|
|
|
|
|
| |||||||||
|
| |||||||||||||||||
| 81,889,610 | 242,041,823 | 35,511,482 | 24,409,264 | 19,724,148 | ||||||||||||||
|
|
|
|
|
|
|
|
|
| |||||||||
|
| |||||||||||||||||
| 727,863 | 6,253,529 | 58,654 | 62,615 | 258,708 | ||||||||||||||
| — | 405,038 | — | 90,000 | 11,367 | ||||||||||||||
| 977 | 36,412 | — | — | — | ||||||||||||||
| 88,271 | 293,913 | 36,692 | 17,871 | 11,385 | ||||||||||||||
| 323 | — | — | — | — | ||||||||||||||
| 44,300 | 53,300 | 46,300 | 40,500 | 40,500 | ||||||||||||||
| 30,486 | 41,048 | 20,158 | 17,371 | 16,708 | ||||||||||||||
|
|
|
|
|
|
|
|
|
| |||||||||
|
| |||||||||||||||||
| 892,220 | 7,083,240 | 161,804 | 228,357 | 338,668 | ||||||||||||||
|
|
|
|
|
|
|
|
|
| |||||||||
|
| |||||||||||||||||
| $ | 80,997,390 | $ | 234,958,583 | $ | 35,349,678 | $ | 24,180,907 | $ | 19,385,480 | |||||||||
|
|
|
|
|
|
|
|
|
| |||||||||
| 7,261,632 | 24,859,821 | 4,899,255 | 1,878,614 | 1,537,562 | ||||||||||||||
|
|
|
|
|
|
|
|
|
| |||||||||
| $ | 11.15 | $ | 9.45 | $ | 7.22 | $ | 12.87 | $ | 12.61 | |||||||||
|
|
|
|
|
|
|
|
|
| |||||||||
|
| |||||||||||||||||
| $ | 72,981,249 | $ | 220,439,150 | $ | 30,308,588 | $ | 20,289,232 | $ | 15,776,055 | |||||||||
| (611,537 | ) | 847,767 | — | — | — | |||||||||||||
| (5,019,079 | ) | (17,437,708 | ) | (49,307 | ) | 66,811 | 61,438 | |||||||||||
| 56 | (1,230 | ) | 9,252 | — | — | |||||||||||||
| 13,646,701 | 31,110,604 | 5,081,145 | 3,824,864 | 3,547,987 | ||||||||||||||
|
|
|
|
|
|
|
|
|
| |||||||||
| $ | 80,997,390 | $ | 234,958,583 | $ | 35,349,678 | $ | 24,180,907 | $ | 19,385,480 | |||||||||
|
|
|
|
|
|
|
|
|
| |||||||||
|
| |||||||||||||||||
Notes to Financial Statements are an integral part of this Statement.
45
For the Year Ended December 31, 2012
| Driehaus International Discovery Fund | Driehaus Emerging Markets Growth Fund | |||||||
INVESTMENT INCOME (LOSS): | ||||||||
Income: | ||||||||
Dividends* | $ | 3,977,115 | $ | 18,443,969 | ||||
|
|
|
| |||||
| ||||||||
Total income | 3,977,115 | 18,443,969 | ||||||
|
|
|
| |||||
| ||||||||
Expenses: | ||||||||
Investment advisory fee | 3,207,345 | 12,876,247 | ||||||
Administration fee | 218,784 | 530,622 | ||||||
Professional fees | 47,420 | 158,422 | ||||||
Audit and tax fees | 63,360 | 61,012 | ||||||
Federal and state registration fees | 19,398 | 63,712 | ||||||
Custodian fees | 31,951 | 263,528 | ||||||
Transfer agent fees | 72,810 | 209,529 | ||||||
Trustees’ and Advisory Board Members’ fees | 30,520 | 59,400 | ||||||
Chief compliance officer fees | 7,411 | 7,411 | ||||||
Reports to shareholders | 26,862 | 127,184 | ||||||
Interest expense | 2,847 | — | ||||||
Miscellaneous | 38,697 | 56,822 | ||||||
|
|
|
| |||||
Total expenses | 3,767,405 | 14,413,889 | ||||||
|
|
|
| |||||
| ||||||||
Investment advisory fees recaptured (waived) | — | — | ||||||
Administration fees waived | — | — | ||||||
Transfer agent fees waived | — | — | ||||||
Fees paid indirectly | (35,000 | ) | (127,483 | ) | ||||
|
|
|
| |||||
Net expenses | 3,732,405 | 14,286,406 | ||||||
|
|
|
| |||||
| ||||||||
Net investment income (loss) | 244,710 | 4,157,563 | ||||||
|
|
|
| |||||
| ||||||||
| NET REALIZED AND UNREALIZED GAIN (LOSS) ON INVESTMENTS, WRITTEN OPTIONS AND FOREIGN CURRENCY TRANSACTIONS: | ||||||||
Net realized gain (loss) from security transactions | 8,466,086 | 21,349,756 | ||||||
Net realized foreign exchange gain (loss) | 61,405 | (1,979,818 | ) | |||||
Net realized gain (loss) on written options | — | — | ||||||
Net change in unrealized foreign exchange gain (loss) | 54,090 | 21,291 | ||||||
Net change in unrealized appreciation (depreciation) on written options | — | — | ||||||
Net change in unrealized appreciation (depreciation) on investments | 20,467,132 | 125,717,253 | ||||||
|
|
|
| |||||
| ||||||||
Net realized and unrealized gain (loss) on investments, written options and foreign currency transactions | 29,048,713 | 145,108,482 | ||||||
|
|
|
| |||||
| ||||||||
NET INCREASE (DECREASE) IN NET ASSETS RESULTING FROM OPERATIONS | $ | 29,293,423 | $ | 149,266,045 | ||||
|
|
|
| |||||
| ||||||||
| * | Dividends are net of $276,107, $1,683,574, $74,858, $234,458, $24,322, $0 and $0 nonreclaimable foreign taxes withheld, respectively. |
Notes to Financial Statements are an integral part of this Statement.
46
Statements of Operations
For the Year Ended December 31, 2012
| Driehaus Emerging Markets Small Cap Growth Fund | Driehaus International Small Cap Growth Fund | Driehaus Global Growth Fund | Driehaus Mid Cap Growth Fund | Driehaus Large Cap Growth Fund | ||||||||||||||
| $ | 1,025,601 | $ | 4,714,112 | $ | 497,931 | $ | 230,584 | $ | 323,916 | |||||||||
|
|
|
|
|
|
|
|
|
| |||||||||
|
| |||||||||||||||||
| 1,025,601 | 4,714,112 | 497,931 | 230,584 | 323,916 | ||||||||||||||
|
|
|
|
|
|
|
|
|
| |||||||||
|
| |||||||||||||||||
| 782,657 | 3,456,133 | 447,507 | 237,991 | 182,453 | ||||||||||||||
| 102,827 | 226,442 | 81,691 | 56,146 | 53,601 | ||||||||||||||
| 20,210 | 50,271 | 17,181 | 15,144 | 14,529 | ||||||||||||||
| 54,080 | 56,360 | 48,860 | 40,300 | 40,300 | ||||||||||||||
| 28,831 | 31,364 | 19,348 | 16,661 | 16,654 | ||||||||||||||
| 37,965 | 59,682 | 5,622 | 4,114 | 4,800 | ||||||||||||||
| 39,621 | 66,551 | 38,202 | 38,400 | 37,677 | ||||||||||||||
| 22,645 | 31,238 | 22,124 | 21,565 | 21,408 | ||||||||||||||
| 7,411 | 7,411 | 7,411 | 7,411 | 7,411 | ||||||||||||||
| 11,544 | 21,389 | 10,989 | 10,722 | 10,600 | ||||||||||||||
| — | — | 1,613 | — | — | ||||||||||||||
| 12,391 | 40,178 | 20,982 | 20,120 | 20,038 | ||||||||||||||
|
|
|
|
|
|
|
|
|
| |||||||||
| 1,120,182 | 4,047,019 | 721,530 | 468,574 | 409,471 | ||||||||||||||
|
|
|
|
|
|
|
|
|
| |||||||||
|
| |||||||||||||||||
| (50,543 | ) | — | — | (52,090 | ) | (54,700 | ) | |||||||||||
| (2,097 | ) | — | — | — | — | |||||||||||||
| (24,000 | ) | — | — | — | — | |||||||||||||
| (7,212 | ) | (46,750 | ) | (2,500 | ) | (450 | ) | (600 | ) | |||||||||
|
|
|
|
|
|
|
|
|
| |||||||||
| 1,036,330 | 4,000,269 | 719,030 | 416,034 | 354,171 | ||||||||||||||
|
|
|
|
|
|
|
|
|
| |||||||||
|
| |||||||||||||||||
| (10,729 | ) | 713,843 | (221,099 | ) | (185,450 | ) | (30,255 | ) | ||||||||||
|
|
|
|
|
|
|
|
|
| |||||||||
|
| |||||||||||||||||
| (1,882,344 | ) | 1,103,249 | 2,054,426 | 1,946,830 | 1,712,793 | |||||||||||||
| (130,046 | ) | (257,909 | ) | 980 | — | — | ||||||||||||
| 1,195,821 | — | — | — | — | ||||||||||||||
| (1,696 | ) | 15 | 3,457 | — | — | |||||||||||||
| (96,924 | ) | — | — | — | — | |||||||||||||
| 14,386,719 | 23,642,134 | 3,295,841 | 837,646 | 384,988 | ||||||||||||||
|
|
|
|
|
|
|
|
|
| |||||||||
|
| |||||||||||||||||
| | 13,471,530 | | 24,487,489 | 5,354,704 | 2,784,476 | 2,097,781 | ||||||||||||
|
|
|
|
|
|
|
|
|
| |||||||||
|
| |||||||||||||||||
| $ | 13,460,801 | $ | 25,201,332 | $ | 5,133,605 | $ | 2,599,026 | $ | 2,067,526 | |||||||||
|
|
|
|
|
|
|
|
|
| |||||||||
|
| |||||||||||||||||
Notes to Financial Statements are an integral part of this Statement.
47
Statements of Changes in Net Assets
| Driehaus International Discovery Fund | Driehaus Emerging Markets Growth Fund | |||||||||||||||
| For the year ended December 31, 2012 | For the year ended December 31, 2011 | For the year ended December 31, 2012 | For the year ended December 31, 2011 | |||||||||||||
INCREASE (DECREASE) IN NET ASSETS: | ||||||||||||||||
Operations: | ||||||||||||||||
Net investment income (loss) | $ | 244,710 | $ | 1,240,370 | $ | 4,157,563 | $ | 4,053,368 | ||||||||
Net realized gain (loss) on investments, written options and foreign currency transactions | 8,527,491 | 19,452,598 | 19,369,938 | (68,664,043 | ) | |||||||||||
Net change in unrealized gain (loss) on investments, written options and foreign currency transactions | 20,521,222 | (75,763,331 | ) | 125,738,544 | (69,751,981 | ) | ||||||||||
|
|
|
|
|
|
|
| |||||||||
| ||||||||||||||||
Net increase (decrease) in net assets resulting from operations | 29,293,423 | (55,070,363 | ) | 149,266,045 | (134,362,656 | ) | ||||||||||
|
|
|
|
|
|
|
| |||||||||
| ||||||||||||||||
Distributions to shareholders: | ||||||||||||||||
Net investment income | — | — | (3,661,528 | ) | — | |||||||||||
Capital gains | — | — | — | (45,863,976 | ) | |||||||||||
|
|
|
|
|
|
|
| |||||||||
Total distributions to shareholders | — | — | (3,661,528 | ) | (45,863,976 | ) | ||||||||||
|
|
|
|
|
|
|
| |||||||||
| ||||||||||||||||
Capital share transactions: | ||||||||||||||||
Proceeds from shares sold | 24,049,036 | 12,941,401 | 312,726,256 | 301,459,540 | ||||||||||||
Reinvestment of distributions | — | — | 3,382,086 | 43,894,950 | ||||||||||||
Cost of shares redeemed | (58,882,173 | ) | (84,785,765 | ) | (213,801,609 | ) | (258,212,279 | ) | ||||||||
Redemption fees | 6,317 | 1,670 | 55,671 | 64,812 | ||||||||||||
|
|
|
|
|
|
|
| |||||||||
Net increase (decrease) in net assets derived from capital share transactions | (34,826,820 | ) | (71,842,694 | ) | 102,362,404 | 87,207,023 | ||||||||||
|
|
|
|
|
|
|
| |||||||||
Total increase (decrease) in net assets | (5,533,397 | ) | (126,913,057 | ) | 247,966,921 | (93,019,609 | ) | |||||||||
|
|
|
|
|
|
|
| |||||||||
| ||||||||||||||||
NET ASSETS: | ||||||||||||||||
| ||||||||||||||||
Beginning of period | $ | 211,926,708 | $ | 338,839,765 | $ | 741,291,089 | $ | 834,310,698 | ||||||||
|
|
|
|
|
|
|
| |||||||||
End of period | $ | 206,393,311 | $ | 211,926,708 | $ | 989,258,010 | $ | 741,291,089 | ||||||||
|
|
|
|
|
|
|
| |||||||||
Accumulated net investment income (loss) | $ | (124,055 | ) | $ | (1,778,973 | ) | $ | (1,325,050 | ) | $ | (22,884 | ) | ||||
|
|
|
|
|
|
|
| |||||||||
| ||||||||||||||||
Capital share transactions are as follows: | ||||||||||||||||
Shares issued | 911,174 | 470,032 | 11,029,785 | 9,680,600 | ||||||||||||
Shares reinvested | — | — | 111,842 | 1,705,983 | ||||||||||||
Shares redeemed | (2,232,234 | ) | (2,931,206 | ) | (7,645,029 | ) | (8,467,597 | ) | ||||||||
|
|
|
|
|
|
|
| |||||||||
Net increase (decrease) from capital share transactions | (1,321,060 | ) | (2,461,174 | ) | 3,496,598 | 2,918,986 | ||||||||||
|
|
|
|
|
|
|
| |||||||||
| ||||||||||||||||
Notes to Financial Statements are an integral part of this Statement.
48
Statements of Changes in Net Assets
| Driehaus Emerging Markets Small Cap Growth Fund | Driehaus International Small Cap Growth Fund | Driehaus Global Growth Fund | ||||||||||||||||||||
| For the year ended December 31, 2012 | For the period August 22, 2011 through December 31, 2011 | For the year ended December 31, 2012 | For the year ended December 31, 2011 | For the year ended December 31, 2012 | For the year ended December 31, 2011 | |||||||||||||||||
| $ | (10,729 | ) | $ | (95,922 | ) | $ | 713,843 | $ | 1,840,114 | $ | (221,099 | ) | $ | (493,760 | ) | |||||||
| (816,569 | ) | (3,439,883 | ) | 845,340 | 1,081,006 | 2,055,406 | 1,725,242 | ||||||||||||||
| | 14,288,099 | | (641,342 | ) | 23,642,149 | (32,150,405 | ) | 3,299,298 | (9,918,461 | ) | ||||||||||||
|
|
|
|
|
|
|
|
|
|
|
| |||||||||||
|
| |||||||||||||||||||||
| | 13,460,801 | | (4,177,147 | ) | 25,201,332 | (29,229,285 | ) | 5,133,605 | (8,686,979 | ) | ||||||||||||
|
|
|
|
|
|
|
|
|
|
|
| |||||||||||
|
| |||||||||||||||||||||
| (1,246,733 | ) | — | (1,069,444 | ) | (1,347,630 | ) | — | — | ||||||||||||||
| — | — | — | — | (1,436,164 | ) | (3,868,133 | ) | |||||||||||||||
|
|
|
|
|
|
|
|
|
|
|
| |||||||||||
| (1,246,733 | ) | — | (1,069,444 | ) | (1,347,630 | ) | (1,436,164 | ) | (3,868,133 | ) | |||||||||||
|
|
|
|
|
|
|
|
|
|
|
| |||||||||||
|
| |||||||||||||||||||||
| 53,977,441 | 36,999,932 | 35,435,959 | 84,575,481 | 7,015,096 | 7,143,933 | |||||||||||||||||
| 1,219,637 | — | 935,098 | 1,244,851 | 1,436,164 | 3,868,133 | |||||||||||||||||
| (19,133,876 | ) | (103,015 | ) | (58,279,425 | ) | (80,964,036 | ) | (12,378,753 | ) | (15,596,557 | ) | |||||||||||
| 350 | — | 5,968 | 3,636 | 61 | 568 | |||||||||||||||||
|
|
|
|
|
|
|
|
|
|
|
| |||||||||||
| | 36,063,552 | | 36,896,917 | (21,902,400 | ) | 4,859,932 | (3,927,432 | ) | (4,583,923 | ) | ||||||||||||
|
|
|
|
|
|
|
|
|
|
|
| |||||||||||
| | 48,277,620 | | 32,719,770 | 2,229,488 | (25,716,983 | ) | (229,991 | ) | (17,139,035 | ) | ||||||||||||
|
|
|
|
|
|
|
|
|
|
|
| |||||||||||
|
| |||||||||||||||||||||
|
| |||||||||||||||||||||
| $ | 32,719,770 | $ | — | $ | 232,729,095 | $ | 258,446,078 | $ | 35,579,669 | $ | 52,718,704 | |||||||||||
|
|
|
|
|
|
|
|
|
|
|
| |||||||||||
| $ | 80,997,390 | $ | 32,719,770 | $ | 234,958,583 | $ | 232,729,095 | $ | 35,349,678 | $ | 35,579,669 | |||||||||||
|
|
|
|
|
|
|
|
|
|
|
| |||||||||||
| $ | (611,537 | ) | $ | (60,764 | ) | $ | 847,767 | $ | 636,313 | $ | — | $ | (181,564 | ) | ||||||||
|
|
|
|
|
|
|
|
|
|
|
| |||||||||||
|
| |||||||||||||||||||||
| 5,222,635 | 3,726,377 | 3,956,697 | 8,803,227 | 969,774 | 804,222 | |||||||||||||||||
| 112,513 | — | 98,847 | 148,373 | 198,365 | 587,862 | |||||||||||||||||
| (1,788,732 | ) | (11,161 | ) | (6,557,312 | ) | (8,344,929 | ) | (1,680,121 | ) | (1,832,167 | ) | |||||||||||
|
|
|
|
|
|
|
|
|
|
|
| |||||||||||
| | 3,546,416 | | 3,715,216 | (2,501,768 | ) | 606,671 | (511,982 | ) | (440,083 | ) | ||||||||||||
|
|
|
|
|
|
|
|
|
|
|
| |||||||||||
|
| |||||||||||||||||||||
Notes to Financial Statements are an integral part of this Statement.
49
Statements of Changes in Net Assets
| Driehaus Mid Cap Growth Fund | Driehaus Large Cap Growth Fund | |||||||||||||||
| For the year ended December 31, 2012 | For the year ended December 31, 2011 | For the year ended December 31, 2012 | For the year ended December 31, 2011 | |||||||||||||
INCREASE (DECREASE) IN NET ASSETS: | ||||||||||||||||
Operations: | ||||||||||||||||
Net investment income (loss) | $ | (185,450 | ) | $ | (283,279 | ) | $ | (30,255 | ) | $ | (165,417 | ) | ||||
Net realized gain (loss) on investments, written options and foreign currency transactions | 1,946,830 | 1,118,775 | 1,712,793 | 1,324,203 | ||||||||||||
Net change in unrealized gain (loss) on investments, written options and foreign currency transactions | 837,646 | (1,492,884 | ) | 384,988 | (1,452,726 | ) | ||||||||||
|
|
|
|
|
|
|
| |||||||||
| ||||||||||||||||
Net increase (decrease) in net assets resulting from operations | 2,599,026 | (657,388 | ) | 2,067,526 | (293,940 | ) | ||||||||||
|
|
|
|
|
|
|
| |||||||||
| ||||||||||||||||
Distributions to shareholders: | ||||||||||||||||
Net investment income | — | — | — | — | ||||||||||||
Capital gains | (2,022,728 | ) | (1,411,100 | ) | (1,784,487 | ) | (1,600,488 | ) | ||||||||
|
|
|
|
|
|
|
| |||||||||
Total distributions to shareholders | (2,022,728 | ) | (1,411,100 | ) | (1,784,487 | ) | (1,600,488 | ) | ||||||||
|
|
|
|
|
|
|
| |||||||||
| ||||||||||||||||
Capital share transactions: | ||||||||||||||||
Proceeds from shares sold | 728,944 | 5,187,425 | 638,410 | 3,177,254 | ||||||||||||
Reinvestment of distributions | 1,961,290 | 1,365,613 | 1,756,299 | 1,575,209 | ||||||||||||
Cost of shares redeemed | (980,231 | ) | (4,163,241 | ) | (2,627,388 | ) | (4,692,707 | ) | ||||||||
Redemption fees | — | 692 | — | 894 | ||||||||||||
|
|
|
|
|
|
|
| |||||||||
Net increase (decrease) in net assets derived from capital share transactions | 1,710,003 | 2,390,489 | (232,679 | ) | 60,650 | |||||||||||
|
|
|
|
|
|
|
| |||||||||
Total increase (decrease) in net assets | 2,286,301 | 322,001 | 50,360 | (1,833,778 | ) | |||||||||||
|
|
|
|
|
|
|
| |||||||||
| ||||||||||||||||
NET ASSETS: | ||||||||||||||||
| ||||||||||||||||
Beginning of period | $ | 21,894,606 | $ | 21,572,605 | $ | 19,335,120 | $ | 21,168,898 | ||||||||
|
|
|
|
|
|
|
| |||||||||
End of period | $ | 24,180,907 | $ | 21,894,606 | $ | 19,385,480 | $ | 19,335,120 | ||||||||
|
|
|
|
|
|
|
| |||||||||
Accumulated net investment income (loss) | $ | — | $ | — | $ | — | $ | — | ||||||||
|
|
|
|
|
|
|
| |||||||||
| ||||||||||||||||
Capital share transactions are as follows: | ||||||||||||||||
Shares issued | 52,589 | 352,650 | 48,122 | 226,550 | ||||||||||||
Shares reinvested | 151,568 | 109,249 | 138,728 | 126,421 | ||||||||||||
Shares redeemed | (73,229 | ) | (289,931 | ) | (193,195 | ) | (344,046 | ) | ||||||||
|
|
|
|
|
|
|
| |||||||||
Net increase (decrease) from capital share transactions | 130,928 | 171,968 | (6,345 | ) | 8,925 | |||||||||||
|
|
|
|
|
|
|
| |||||||||
| ||||||||||||||||
Notes to Financial Statements are an integral part of this Statement.
50
Driehaus International Discovery Fund
| For the year ended December 31, 2012 | For the year ended December 31, 2011 | For the year ended December 31, 2010 | For the year ended December 31, 2009 | For the year ended December 31, 2008 | ||||||||||||||||
Net asset value, beginning of period | $ | 24.27 | $ | 30.27 | $ | 27.19 | $ | 18.28 | $ | 41.55 | ||||||||||
|
|
|
|
|
|
|
|
|
| |||||||||||
INCOME (LOSS) FROM INVESTMENT OPERATIONS: | ||||||||||||||||||||
Net investment income (loss) | 0.03 | ^ | 0.13 | ^ | (0.22 | ) | 0.00 | ~ | (0.06 | ) | ||||||||||
Net realized and unrealized gain (loss) on investments and foreign currency transactions | 3.55 | (6.13 | ) | 3.86 | 9.02 | (22.85 | ) | |||||||||||||
|
|
|
|
|
|
|
|
|
| |||||||||||
Total income (loss) from investment operations | 3.58 | (6.00 | ) | 3.64 | 9.02 | (22.91 | ) | |||||||||||||
|
|
|
|
|
|
|
|
|
| |||||||||||
LESS DISTRIBUTIONS: | ||||||||||||||||||||
Dividends from net investment income | — | — | (0.56 | ) | (0.11 | ) | — | |||||||||||||
Distributions from capital gains | — | — | — | — | (0.38 | ) | ||||||||||||||
|
|
|
|
|
|
|
|
|
| |||||||||||
Total distributions | — | — | (0.56 | ) | (0.11 | ) | (0.38 | ) | ||||||||||||
|
|
|
|
|
|
|
|
|
| |||||||||||
Redemption fees added to paid-in capital | 0.00 | ~ | 0.00 | ~ | 0.00 | ~ | 0.00 | ~ | 0.02 | |||||||||||
|
|
|
|
|
|
|
|
|
| |||||||||||
Net asset value, end of period | $ | 27.85 | $ | 24.27 | $ | 30.27 | $ | 27.19 | $ | 18.28 | ||||||||||
|
|
|
|
|
|
|
|
|
| |||||||||||
Total Return | 14.75 | % | (19.85 | )% | 13.47 | % | 49.28 | % | (55.07 | )% | ||||||||||
RATIOS/SUPPLEMENTAL DATA | ||||||||||||||||||||
Net assets, end of period (in 000’s) | $ | 206,393 | $ | 211,927 | $ | 338,840 | $ | 364,411 | $ | 302,112 | ||||||||||
Ratio of expenses before reimbursements, waivers and fees paid indirectly to average net assets | 1.76 | %¥ | 1.72 | %¥ | 1.71 | % | 1.75 | % | 1.65 | % | ||||||||||
Ratio of net expenses to average net assets | 1.75 | %#¥ | 1.71 | %#¥ | 1.70 | %# | 1.74 | %# | 1.64 | %# | ||||||||||
Ratio of net investment income (loss) to average net assets | 0.11 | %# | 0.44 | %# | (0.77 | )%# | 0.07 | %# | (0.07 | )%# | ||||||||||
Portfolio turnover | 112 | % | 119 | % | 93 | % | 145 | % | 188 | % | ||||||||||
| ||||||||||||||||||||
| ^ | Net investment income (loss) per share has been calculated using the average shares method. |
| ~ | Amount represents less than $0.01 per share |
| # | Such ratios are net of fees paid indirectly (see Note B in the Notes to Financial Statements). |
| ¥ | Ratio of expenses to average net assets include interest expense of less than 0.005% for the years ended December 31, 2012 and 2011. The interest expense is from utilizing the line of credit (see Note F in the Notes to Financial Statements). |
Notes to Financial Statements are an integral part of this Statement.
51
Driehaus Emerging Markets Growth Fund
Financial Highlights
| For the year ended December 31, 2012 | For the year ended December 31, 2011 | For the year ended December 31, 2010 | For the year ended December 31, 2009 | For the year ended December 31, 2008 | ||||||||||||||||
Net asset value, beginning of period | $ | 25.72 | $ | 32.20 | $ | 29.24 | $ | 17.19 | $ | 43.45 | ||||||||||
|
|
|
|
|
|
|
|
|
| |||||||||||
INCOME (LOSS) FROM INVESTMENT OPERATIONS: | ||||||||||||||||||||
Net investment income (loss) | 0.13 | 0.16 | (0.04 | )^ | (0.05 | ) | (0.08 | ) | ||||||||||||
Net realized and unrealized gain (loss) on investments and foreign currency transactions | 4.88 | (4.97 | ) | 6.84 | 12.09 | (23.53 | ) | |||||||||||||
|
|
|
|
|
|
|
|
|
| |||||||||||
Total income (loss) from investment operations | 5.01 | (4.81 | ) | 6.80 | 12.04 | (23.61 | ) | |||||||||||||
|
|
|
|
|
|
|
|
|
| |||||||||||
LESS DISTRIBUTIONS: | ||||||||||||||||||||
Dividends from net investment income | (0.12 | ) | — | (0.69 | ) | — | — | |||||||||||||
Distributions from capital gains | — | (1.67 | ) | (3.15 | ) | — | (2.65 | ) | ||||||||||||
|
|
|
|
|
|
|
|
|
| |||||||||||
Total distributions | (0.12 | ) | (1.67 | ) | (3.84 | ) | — | (2.65 | ) | |||||||||||
|
|
|
|
|
|
|
|
|
| |||||||||||
Redemption fees added to paid-in capital | 0.00 | ~ | 0.00 | ~ | 0.00 | ~ | 0.01 | 0.00 | ~ | |||||||||||
|
|
|
|
|
|
|
|
|
| |||||||||||
Net asset value, end of period | $ | 30.61 | $ | 25.72 | $ | 32.20 | $ | 29.24 | $ | 17.19 | ||||||||||
|
|
|
|
|
|
|
|
|
| |||||||||||
Total Return | 19.51 | % | (15.02 | )% | 23.56 | % | 70.10 | % | (54.45 | )% | ||||||||||
RATIOS/SUPPLEMENTAL DATA | ||||||||||||||||||||
Net assets, end of period (in 000’s) | $ | 989,258 | $ | 741,291 | $ | 834,311 | $ | 575,842 | $ | 263,406 | ||||||||||
Ratio of expenses before reimbursements, waivers and fees paid indirectly to average net assets | 1.68 | % | 1.68 | % | 1.69 | % | 1.78 | % | 1.77 | % | ||||||||||
Ratio of net expenses to average net assets | 1.66 | %# | 1.64 | %# | 1.63 | %# | 1.75 | %# | 1.75 | %# | ||||||||||
Ratio of net investment income (loss) to average net assets | 0.48 | %# | 0.49 | %# | (0.15 | )%# | (0.30 | )%# | (0.19 | )%# | ||||||||||
Portfolio turnover | 278 | % | 342 | % | 293 | % | 275 | % | 313 | % | ||||||||||
| ||||||||||||||||||||
| ^ | Net investment income (loss) per share has been calculated using the average shares method. |
| ~ | Amount represents less than $0.01 per share |
| # | Such ratios are net of fees paid indirectly (see Note B in the Notes to Financial Statements). |
Notes to Financial Statements are an integral part of this Statement.
52
Driehaus Emerging Markets Small Cap Growth Fund
Financial Highlights
| For the year ended December 31, 2012 | For the period August 22, 2011 through December 31, 2011 | |||||||
Net asset value, beginning of period | $ | 8.81 | $ | 10.00 | ||||
|
|
|
| |||||
INCOME (LOSS) FROM INVESTMENT OPERATIONS: | ||||||||
Net investment income (loss) | 0.00 | ^~ | (0.03 | ) | ||||
Net realized and unrealized gain (loss) on investments | 2.52 | (1.16 | ) | |||||
|
|
|
| |||||
Total income (loss) from investment operations | 2.52 | (1.19 | ) | |||||
|
|
|
| |||||
LESS DISTRIBUTIONS: | ||||||||
Dividends from net investment income | (0.18 | ) | — | |||||
Distributions from capital gains | — | — | ||||||
|
|
|
| |||||
Total distributions | (0.18 | ) | — | |||||
|
|
|
| |||||
Redemption fees added to paid-in capital | 0.00 | ~ | — | |||||
|
|
|
| |||||
Net asset value, end of period | $ | 11.15 | $ | 8.81 | ||||
|
|
|
| |||||
Total Return | 28.83 | % | (11.90 | )%** | ||||
RATIOS/SUPPLEMENTAL DATA | ||||||||
Net assets, end of period (in 000’s) | $ | 80,997 | $ | 32,720 | ||||
Ratio of expenses before reimbursements and waivers to average net assets | 2.15 | % | 2.74 | %* | ||||
Ratio of net expenses to average net assets | 1.99 | %+# | 1.97 | %*+# | ||||
Ratio of net investment loss to average net assets | (0.02 | )%+# | (0.91 | )%*+# | ||||
Portfolio turnover | 183 | % | 74 | %** | ||||
| ||||||||
| * | Annualized |
| ** | Not Annualized |
| ^ | Net investment income (loss) per share has been calculated using the average shares method. |
| ~ | Amount represents less than $0.01 per share |
| + | Such ratios are after administrative and transfer agent waivers and adviser expense reimbursements, when applicable. BNY Mellon Investment Servicing (US) Inc., the administrative agent and transfer agent, waived a portion of its fees beginning with the Fund’s commencement of operations, August 22, 2011. The Adviser agreed to waive its investment advisory fee or absorb other operating expenses to the extent necessary to ensure that total Fund operating expenses (other than interest, taxes, brokerage commissions and other portfolio transaction expenses, capital expenditures, and extraordinary expenses) would not exceed the Fund’s operating expense cap of 2.00% of average daily net assets until August 21, 2014. |
| # | Such ratios are net of fees paid indirectly (see Note B in the Notes to Financial Statements). |
Notes to Financial Statements are an integral part of this Schedule.
53
Driehaus International Small Cap Growth Fund
Financial Highlights
| For the year ended December 31, 2012 | For the year ended December 31, 2011 | For the year ended December 31, 2010 | For the year ended December 31, 2009 | For the year ended December 31, 2008 | ||||||||||||||||
Net asset value, beginning of period | $ | 8.51 | $ | 9.66 | $ | 7.64 | $ | 4.93 | $ | 11.14 | ||||||||||
|
|
|
|
|
|
|
|
|
| |||||||||||
INCOME (LOSS) FROM INVESTMENT OPERATIONS: | ||||||||||||||||||||
Net investment income (loss) | 0.03 | 0.07 | (0.06 | ) | (0.02 | ) | (0.01 | ) | ||||||||||||
Net realized and unrealized gain (loss) on investments and foreign currency transactions | 0.95 | (1.17 | ) | 2.14 | 2.73 | (5.90 | ) | |||||||||||||
|
|
|
|
|
|
|
|
|
| |||||||||||
Total income (loss) from investment operations | 0.98 | (1.10 | ) | 2.08 | 2.71 | (5.91 | ) | |||||||||||||
|
|
|
|
|
|
|
|
|
| |||||||||||
LESS DISTRIBUTIONS: | ||||||||||||||||||||
Dividends from net investment income | (0.04 | ) | (0.05 | ) | (0.06 | ) | — | (0.01 | ) | |||||||||||
Distributions from capital gains | — | — | — | — | (0.29 | ) | ||||||||||||||
|
|
|
|
|
|
|
|
|
| |||||||||||
Total distributions | (0.04 | ) | (0.05 | ) | (0.06 | ) | — | (0.30 | ) | |||||||||||
|
|
|
|
|
|
|
|
|
| |||||||||||
Redemption fees added to paid-in capital | 0.00 | ~ | 0.00 | ~ | 0.00 | ~ | 0.00 | ~ | 0.00 | ~ | ||||||||||
|
|
|
|
|
|
|
|
|
| |||||||||||
Net asset value, end of period | $ | 9.45 | $ | 8.51 | $ | 9.66 | $ | 7.64 | $ | 4.93 | ||||||||||
|
|
|
|
|
|
|
|
|
| |||||||||||
Total Return | 11.67 | % | (11.39 | )% | 27.13 | % | 55.17 | % | (53.12 | )% | ||||||||||
RATIOS/SUPPLEMENTAL DATA | ||||||||||||||||||||
Net assets, end of period (in 000’s) | $ | 234,959 | $ | 232,729 | $ | 258,446 | $ | 201,020 | $ | 111,446 | ||||||||||
Ratio of expenses before reimbursements, waivers and fees paid indirectly to average net assets | 1.76 | % | 1.73 | % | 1.75 | % | 1.87 | % | 1.88 | % | ||||||||||
Ratio of net expenses to average net assets | 1.74 | %# | 1.69 | %# | 1.72 | %+# | 1.85 | %+# | 1.83 | %+# | ||||||||||
Ratio of net investment income (loss) to average net assets | 0.31 | %# | 0.66 | %# | (0.76 | )%+# | (0.54 | )%+# | (0.71 | )%+# | ||||||||||
Portfolio turnover | 280 | % | 311 | % | 298 | % | 265 | % | 271 | % | ||||||||||
| ||||||||||||||||||||
| ~ | Amount represents less than $0.01 per share |
| + | Such ratios are after administrative and transfer agent waivers and adviser expense reimbursements, when applicable. BNY Mellon Investment Servicing (US) Inc., the administrative agent and transfer agent, waived a portion of its fees beginning with the Fund’s commencement of operations, September 17, 2007. The Adviser agreed to waive its investment advisory fee or absorb other operating expenses to the extent necessary to ensure that total Fund operating expenses (other than interest, taxes, brokerage commissions and other portfolio transaction expenses, capital expenditures, and extraordinary expenses) would not exceed the Fund’s operating expense cap of 2.00% of average daily net assets until September 16, 2010. |
| # | Such ratios are net of fees paid indirectly (see Note B in the Notes to Financial Statements). |
Notes to Financial Statements are an integral part of this Schedule.
54
Driehaus Global Growth Fund
Financial Highlights
| For the year ended December 31, 2012 | For the year ended December 31, 2011 | For the year ended December 31, 2010 | For the year ended December 31, 2009 | For the period May 1, 2008 through December 31, 2008 | ||||||||||||||||
Net asset value, beginning of period | $ | 6.58 | $ | 9.01 | $ | 7.59 | $ | 4.98 | $ | 10.00 | ||||||||||
|
|
|
|
|
|
|
|
|
| |||||||||||
INCOME (LOSS) FROM INVESTMENT OPERATIONS: | ||||||||||||||||||||
Net investment income (loss) | (0.05 | ) | (0.10 | ) | (0.11 | ) | (0.05 | ) | (0.02 | ) | ||||||||||
Net realized and unrealized gain (loss) on investments and foreign currency transactions | 1.00 | (1.53 | ) | 1.55 | 2.66 | (5.00 | ) | |||||||||||||
|
|
|
|
|
|
|
|
|
| |||||||||||
Total income (loss) from investment operations | 0.95 | (1.63 | ) | 1.44 | 2.61 | (5.02 | ) | |||||||||||||
|
|
|
|
|
|
|
|
|
| |||||||||||
LESS DISTRIBUTIONS: | ||||||||||||||||||||
Dividends from net investment income | — | — | (0.02 | ) | — | — | ||||||||||||||
Distributions from capital gains | (0.31 | ) | (0.80 | ) | — | — | — | |||||||||||||
|
|
|
|
|
|
|
|
|
| |||||||||||
Total distributions | (0.31 | ) | (0.80 | ) | (0.02 | ) | — | — | ||||||||||||
|
|
|
|
|
|
|
|
|
| |||||||||||
Redemption fees added to paid-in capital | 0.00 | ~ | 0.00 | ~ | — | 0.00 | ~ | 0.00 | ~ | |||||||||||
|
|
|
|
|
|
|
|
|
| |||||||||||
Net asset value, end of period | $ | 7.22 | $ | 6.58 | $ | 9.01 | $ | 7.59 | $ | 4.98 | ||||||||||
|
|
|
|
|
|
|
|
|
| |||||||||||
Total Return | 14.36 | % | (18.15 | )% | 19.00 | % | 52.41 | % | (50.20 | )%** | ||||||||||
RATIOS/SUPPLEMENTAL DATA | ||||||||||||||||||||
Net assets, end of period (in 000’s) | $ | 35,350 | $ | 35,580 | $ | 52,719 | $ | 40,301 | $ | 14,557 | ||||||||||
Ratio of expenses before reimbursements and/or recapture, waivers and fees paid indirectly to average net assets | 2.02 | %¥ | 1.88 | %¥ | 1.81 | % | 2.34 | % | 3.94 | %* | ||||||||||
Ratio of net expenses to average net assets | 2.01 | %#¥ | 1.97 | %+#¥ | 2.00 | %+# | 2.00 | %+# | 2.00 | %*+# | ||||||||||
Ratio of net investment income (loss) to average net assets | (0.62 | )%# | (1.08 | )%+# | (1.37 | )%+# | (1.09 | )%+# | (0.86 | )%*+# | ||||||||||
Portfolio turnover | 103 | % | 142 | % | 145 | % | 119 | % | 74 | %** | ||||||||||
| ||||||||||||||||||||
| * | Annualized |
| ** | Not Annualized |
| ~ | Amount represents less than $0.01 per share |
| + | Such ratios are after administrative and transfer agent waivers and adviser expense reimbursements and/or recapture, when applicable. BNY Mellon Investment Servicing (US) Inc., the administrative agent and transfer agent, waived a portion of its fees beginning with the Fund’s commencement of operations, May 1, 2008. The Adviser agreed to waive its investment advisory fee or absorb other operating expenses to the extent necessary to ensure that total Fund operating expenses (other than interest, taxes, brokerage commissions and other portfolio transaction expenses, capital expenditures, and extraordinary expenses) would not exceed the Fund’s operating expense cap of 2.00% of average daily net assets until April 30, 2011. |
| # | Such ratios are net of fees paid indirectly (see Note B in the Notes to Financial Statements). |
| ¥ | Ratio of expenses to average net assets include interest expense of less than 0.005% for the years ended December 31, 2012 and 2011. The interest expense is from utilizing the line of credit (see Note F in the Notes to Financial Statements). |
Notes to Financial Statements are an integral part of this Schedule.
55
Driehaus Mid Cap Growth Fund
Financial Highlights
| For the year ended December 31, 2012 | For the year ended December 31, 2011 | For the year ended December 31, 2010 | For the period 2009 through | |||||||||||||
Net asset value, beginning of period | $ | 12.53 | $ | 13.69 | $ | 11.63 | $ | 10.00 | ||||||||
|
|
|
|
|
|
|
| |||||||||
INCOME (LOSS) FROM INVESTMENT OPERATIONS: | ||||||||||||||||
Net investment income (loss) | (0.10 | ) | (0.16 | ) | (0.14 | ) | (0.08 | ) | ||||||||
Net realized and unrealized gain (loss) on investments | 1.61 | (0.14 | ) | 3.25 | 2.85 | |||||||||||
|
|
|
|
|
|
|
| |||||||||
Total income (loss) from investment operations | 1.51 | (0.30 | ) | 3.11 | 2.77 | |||||||||||
|
|
|
|
|
|
|
| |||||||||
LESS DISTRIBUTIONS: | ||||||||||||||||
Dividends from net investment income | — | — | — | — | ||||||||||||
Distributions from capital gains | (1.17 | ) | (0.86 | ) | (1.05 | ) | (1.14 | ) | ||||||||
|
|
|
|
|
|
|
| |||||||||
Total distributions | (1.17 | ) | (0.86 | ) | (1.05 | ) | (1.14 | ) | ||||||||
|
|
|
|
|
|
|
| |||||||||
Redemption fees added to paid-in capital | 0.00 | ~ | 0.00 | ~ | 0.00 | ~ | 0.00 | ~ | ||||||||
|
|
|
|
|
|
|
| |||||||||
Net asset value, end of period | $ | 12.87 | $ | 12.53 | $ | 13.69 | $ | 11.63 | ||||||||
|
|
|
|
|
|
|
| |||||||||
Total Return | 11.97 | % | (2.15 | )% | 26.59 | % | 27.66 | %** | ||||||||
RATIOS/SUPPLEMENTAL DATA | ||||||||||||||||
Net assets, end of period (in 000’s) | $ | 24,181 | $ | 21,895 | $ | 21,573 | $ | 14,821 | ||||||||
Ratio of expenses before reimbursements and waivers to average net assets | 1.97 | % | 1.95 | % | 2.47 | % | 2.82 | %* | ||||||||
Ratio of net expenses to average net assets | 1.75 | %+ | 1.75 | %+ | 1.75 | %+ | 1.75 | %*+ | ||||||||
Ratio of net investment income (loss) to average net assets | (0.78 | )%+ | (1.13 | )%+ | (1.39 | )%+ | (1.15 | )%*+ | ||||||||
Portfolio turnover | 123 | % | 193 | % | 182 | % | 208 | %** | ||||||||
| ||||||||||||||||
| * | Annualized |
| ** | Not Annualized |
| ~ | Amount represents less than $0.01 per share |
| + | Such ratios are after administrative and transfer agent waivers and adviser expense reimbursements, when applicable. BNY Mellon Investment Servicing (US) Inc., the administrative agent and transfer agent, waived a portion of its fees beginning with the Fund’s commencement of operations, April 27, 2009. The Adviser agreed to waive its investment advisory fee or absorb other operating expenses to the extent necessary to ensure that total Fund operating expenses (other than interest, taxes, brokerage commissions and other portfolio transaction expenses, capital expenditures, and extraordinary expenses) would not exceed the Fund’s operating expense cap of 1.75% of average daily net assets until April 30, 2015. |
Notes to Financial Statements are an integral part of this Schedule.
56
Driehaus Large Cap Growth Fund
Financial Highlights
| For the year ended December 31, 2012 | For the year ended December 31, 2011 | For the year ended December 31, 2010 | For the period April 27, 2009 through December 31, 2009 | |||||||||||||
Net asset value, beginning of period | $ | 12.52 | $ | 13.79 | $ | 11.94 | $ | 10.00 | ||||||||
|
|
|
|
|
|
|
| |||||||||
INCOME (LOSS) FROM INVESTMENT OPERATIONS: | ||||||||||||||||
Net investment income (loss) | (0.02 | ) | (0.11 | ) | (0.12 | ) | (0.05 | ) | ||||||||
Net realized and unrealized gain (loss) on investments | 1.37 | (0.03 | ) | 2.67 | 2.36 | |||||||||||
|
|
|
|
|
|
|
| |||||||||
Total income (loss) from investment operations | 1.35 | (0.14 | ) | 2.55 | 2.31 | |||||||||||
|
|
|
|
|
|
|
| |||||||||
LESS DISTRIBUTIONS: | ||||||||||||||||
Dividends from net investment income | — | — | — | — | ||||||||||||
Distributions from capital gains | (1.26 | ) | (1.13 | ) | (0.70 | ) | (0.37 | ) | ||||||||
|
|
|
|
|
|
|
| |||||||||
Total distributions | (1.26 | ) | (1.13 | ) | (0.70 | ) | (0.37 | ) | ||||||||
|
|
|
|
|
|
|
| |||||||||
Redemption fees added to paid-in capital | 0.00 | ~ | 0.00 | ~ | 0.00 | ~ | 0.00 | ~ | ||||||||
|
|
|
|
|
|
|
| |||||||||
Net asset value, end of period | $ | 12.61 | $ | 12.52 | $ | 13.79 | $ | 11.94 | ||||||||
|
|
|
|
|
|
|
| |||||||||
Total Return | 10.75 | % | (0.97 | )% | 21.36 | % | 23.14 | %** | ||||||||
RATIOS/SUPPLEMENTAL DATA | ||||||||||||||||
Net assets, end of period (in 000’s) | $ | 19,385 | $ | 19,335 | $ | 21,169 | $ | 13,875 | ||||||||
Ratio of expenses before reimbursements and waivers to average net assets | 2.02 | % | 1.96 | % | 2.28 | % | 2.72 | %* | ||||||||
Ratio of net expenses to average net assets | 1.75 | %+ | 1.75 | %+ | 1.75 | %+ | 1.75 | %*+ | ||||||||
Ratio of net investment loss to average net assets | (0.15 | )%+ | (0.76 | )%+ | (1.12 | )%+ | (0.67 | )%*+ | ||||||||
Portfolio turnover | 103 | % | 156 | % | 140 | % | 142 | %** | ||||||||
| ||||||||||||||||
| * | Annualized |
| ** | Not Annualized |
| ~ | Amount represents less than $0.01 per share |
| + | Such ratios are after administrative and transfer agent waivers and adviser expense reimbursements, when applicable. BNY Mellon Investment Servicing (US) Inc., the administrative agent and transfer agent, waived a portion of its fees beginning with the Fund’s commencement of operations, April 27, 2009. The Adviser agreed to waive its investment advisory fee or absorb other operating expenses to the extent necessary to ensure that total Fund operating expenses (other than interest, taxes, brokerage commissions and other portfolio transaction expenses, capital expenditures, and extraordinary expenses) would not exceed the Fund’s operating expense cap of 1.75% of average daily net assets until April 30, 2015. |
Notes to Financial Statements are an integral part of this Schedule.
57
Driehaus Mutual Funds
A. SUMMARY OF SIGNIFICANT ACCOUNTING POLICIES
Organization
The Driehaus Mutual Funds (the “Trust”) is a registered management investment company, organized as a Delaware statutory trust, with ten separate series currently in operation. The Trust was organized under an Agreement and Declaration of Trust dated May 31, 1996 and may issue an unlimited number of full and fractional units of beneficial interest (shares) without par value. The seven series (“Funds” or each a “Fund”) included in this report are as follows:
| Fund | Commencement of Operations | |||
Driehaus International Discovery Fund | 12/31/98 | |||
Driehaus Emerging Markets Growth Fund | 12/31/97 | |||
Driehaus Emerging Markets Small Cap Growth Fund | 08/22/11 | |||
Driehaus International Small Cap Growth Fund* | 09/17/07 | |||
Driehaus Global Growth Fund | 05/01/08 | |||
Driehaus Mid Cap Growth Fund | 04/27/09 | |||
Driehaus Large Cap Growth | 04/27/09 | |||
|
|
| ||
| * | On December 29, 2010, the Driehaus International Small Cap Growth Fund was closed to new investors. |
The investment objective of each Fund is to maximize capital appreciation.
Driehaus International Discovery Fund seeks to achieve its objective by generally investing in equity securities of non-U.S. companies exhibiting strong growth characteristics.
Driehaus Emerging Markets Growth Fund seeks to achieve its objective by investing primarily in equity securities of emerging markets companies.
Driehaus Emerging Markets Small Cap Growth Fund seeks to achieve its objective by investing primarily in equity securities of small capitalization emerging markets companies.
Driehaus International Small Cap Growth Fund seeks to achieve its objective by investing primarily in equity securities of smaller capitalization non-U.S. companies exhibiting strong growth characteristics.
Driehaus Global Growth Fund seeks to achieve its objective by investing primarily in equity securities of both U.S. and non-U.S. companies exhibiting strong growth characteristics.
Driehaus Mid Cap Growth Fund seeks to achieve its objective by investing primarily in equity securities of mid capitalization U.S. companies exhibiting strong growth characteristics.
Driehaus Large Cap Growth Fund seeks to achieve its objective by investing primarily in equity securities of large capitalization U.S. companies exhibiting strong growth characteristics.
Fiscal Year-End
The fiscal year-end for the Funds is December 31.
Securities Valuation and Transactions
Equity securities and exchange traded options are valued at the last sale price as of the close of the primary exchange or other designated time. In addition, if quotations are not readily available, if the values have been materially affected by events occurring after the closing of a foreign market, or if there has been a movement in the United States market that exceeds a certain threshold, assets may be valued at fair value as determined in good faith by or under the direction of the Trust’s Board of Trustees. Events that may materially affect asset values that could cause a fair value determination include, but are not limited to: corporate announcements relating to a specific security; natural and other disasters which may impact an entire market or region; and political and other events which may be global or impact a particular country or region. The frequency with which these procedures are used cannot be predicted and may be utilized to a significant extent. To the extent utilized, securities would be considered level 2 in the hierarchy described below. Substantially all transfers between level 1 and level 2 relate to the use of these procedures.
58
Driehaus Mutual Funds
Notes to Financial Statements — (Continued)
Each Fund is subject to fair value accounting standards that define fair value, establish the framework for measuring fair value and provide a three-level hierarchy for fair valuation based upon the inputs to the valuation as of the measurement date. The three levels of the fair value hierarchy are as follows:
Level 1 — quoted prices in active markets for identical securities
Level 2 — significant observable inputs (including quoted prices for similar securities, interest rates, prepayment speeds, credit risk, etc.)
Level 3 — significant unobservable inputs (including the Funds’ own assumptions in determining the fair value of investments)
The inputs or methodology used for valuing securities are not necessarily an indication of the risk associated with investing in those securities.
The summary of the Funds’ investments that are measured at fair value by Level within the fair value hierarchy as of December 31, 2012 is as follows:
Fund | Total Value at December 31, 2012 | Level 1 Quoted Price | Level 2 Significant Observable Inputs | Level 3 Significant Unobservable Inputs | ||||||||||||
Driehaus International Discovery Fund | ||||||||||||||||
Equity Securities: | ||||||||||||||||
Europe | $ | 105,798,947 | $ | 14,941,141 | $ | 90,857,806 | $ | — | ||||||||
Far East | 50,794,086 | 11,501,912 | 39,292,174 | — | ||||||||||||
Middle East | 3,432,863 | 3,432,863 | — | — | ||||||||||||
North America | 20,153,788 | 20,153,788 | — | — | ||||||||||||
South America | 19,571,646 | 19,571,646 | — | — | ||||||||||||
|
|
|
|
|
|
|
| |||||||||
Total Investments | $ | 199,751,330 | $ | 69,601,350 | $ | 130,149,980 | $ | — | ||||||||
|
|
|
|
|
|
|
| |||||||||
Driehaus Emerging Markets Growth Fund | ||||||||||||||||
Equity Securities: | ||||||||||||||||
Africa | $ | 51,276,958 | $ | 15,659,674 | $ | 35,617,284 | $ | — | ||||||||
Europe | 115,843,910 | 19,259,869 | 96,584,041 | — | ||||||||||||
Far East | 495,497,721 | 24,258,766 | 471,238,955 | — | ||||||||||||
Middle East | 28,679,026 | 5,804,544 | 22,874,482 | — | ||||||||||||
North America | 69,928,114 | 69,928,114 | — | — | ||||||||||||
South America | 153,933,445 | 153,933,445 | — | — | ||||||||||||
Equity Certificates | 9,634,584 | — | 9,634,584 | — | ||||||||||||
Exchange-Traded Funds | 5,143,466 | 5,143,466 | — | — | ||||||||||||
|
|
|
|
|
|
|
| |||||||||
Total Investments | $ | 929,937,224 | $ | 293,987,878 | $ | 635,949,346 | $ | — | ||||||||
|
|
|
|
|
|
|
| |||||||||
59
Driehaus Mutual Funds
Notes to Financial Statements — (Continued)
Fund | Total Value at December 31, 2012 | Level 1 Quoted Price | Level 2 Significant Observable Inputs | Level 3 Significant Unobservable Inputs | ||||||||||||
Driehaus Emerging Markets Small Cap Growth Fund | ||||||||||||||||
Equity Securities: | ||||||||||||||||
Africa | $ | 6,304,885 | $ | 4,339,589 | $ | 1,965,296 | $ | — | ||||||||
Europe | 3,396,730 | 655,549 | 2,741,181 | — | ||||||||||||
Far East | 41,470,936 | 1,890,650 | 39,580,286 | — | ||||||||||||
Middle East | 2,561,647 | 2,561,647 | — | — | ||||||||||||
North America | 4,076,014 | 3,760,607 | 315,407 | — | ||||||||||||
South America | 8,069,427 | 8,069,427 | — | — | ||||||||||||
Equity Certificates | 7,043,812 | — | 7,043,812 | — | ||||||||||||
Exchange-Traded Funds | 1,835,094 | 1,835,094 | — | — | ||||||||||||
Purchased Call Options by Risk Category | ||||||||||||||||
Equity Contracts | 55,000 | 55,000 | — | — | ||||||||||||
Commodity Contracts | 81,000 | 81,000 | — | — | ||||||||||||
Purchased Put Options by Risk Category | ||||||||||||||||
Equity Contracts | 175,500 | 175,500 | — | — | ||||||||||||
Commodity Contracts | 46,000 | 46,000 | — | — | ||||||||||||
|
|
|
|
|
|
|
| |||||||||
Total Investments | $ | 75,116,045 | $ | 23,470,063 | $ | 51,645,982 | $ | — | ||||||||
|
|
|
|
|
|
|
| |||||||||
Driehaus International Small Cap Growth Fund | ||||||||||||||||
Equity Securities: | ||||||||||||||||
Europe | $ | 111,119,704 | $ | — | $ | 111,119,704 | $ | — | ||||||||
Far East | 87,836,099 | 7,238,791 | 80,597,308 | — | ||||||||||||
North America | 15,185,404 | 12,733,523 | 2,451,881 | — | ||||||||||||
South America | 13,371,134 | 13,371,134 | — | — | ||||||||||||
|
|
|
|
|
|
|
| |||||||||
Total Investments | $ | 227,512,341 | $ | 33,343,448 | $ | 194,168,893 | $ | — | ||||||||
|
|
|
|
|
|
|
| |||||||||
Driehaus Global Growth Fund | ||||||||||||||||
Equity Securities: | ||||||||||||||||
Europe | $ | 6,867,541 | $ | 1,144,136 | $ | 5,723,405 | $ | — | ||||||||
Far East | 3,304,057 | 907,969 | 2,396,088 | — | ||||||||||||
Middle East | 279,086 | 279,086 | — | — | ||||||||||||
North America | 22,880,195 | 22,880,195 | — | — | ||||||||||||
South America | 927,851 | 927,851 | — | — | ||||||||||||
|
|
|
|
|
|
|
| |||||||||
Total Investments | $ | 34,258,730 | $ | 26,139,237 | $ | 8,119,493 | $ | — | ||||||||
|
|
|
|
|
|
|
| |||||||||
Driehaus Mid Cap Growth Fund | ||||||||||||||||
Investments in Securities* | $ | 23,072,546 | $ | 23,072,546 | $ | — | $ | — | ||||||||
|
|
|
|
|
|
|
| |||||||||
Driehaus Large Cap Growth Fund | ||||||||||||||||
Investments in Securities* | $ | 18,759,152 | $ | 18,759,152 | $ | — | $ | — | ||||||||
|
|
|
|
|
|
|
| |||||||||
| * | See Schedule of Investments for industry breakout. |
60
Driehaus Mutual Funds
Notes to Financial Statements — (Continued)
Transfers between levels, if any, are recognized as of the last day in the fiscal quarter of the period in which the event or change in circumstances that caused the reclassification occurred. The Funds used observable inputs in their valuation methodologies whenever they were available and deemed reliable.
When fair value pricing is employed, the prices of securities used by a Fund to calculate its net asset value may differ from closing prices for the same securities, which means that a Fund may value those securities higher or lower than another fund that does not employ fair value. In addition, the fair value price may differ materially from the value a Fund may ultimately realize.
For the year ended December 31, 2012, securities with end of period values of $45,412,392, $84,134,619, $7,363,767, $59,482,041 and $4,114,636 held by Driehaus International Discovery Fund, Driehaus Emerging Markets Growth Fund, Driehaus Emerging Markets Small Cap Growth Fund, Driehaus International Small Cap Growth Fund, and Driehaus Global Growth Fund, respectively, were transferred from Level 1 to Level 2.
Securities transactions are accounted for on trade date. The cost of investments sold is determined by the use of the specific identification method for both financial reporting and income tax purposes. Interest income is recorded on an accrual basis. Dividend income, net of non-reclaimable foreign taxes withheld, is recorded on the ex-dividend date or as soon as the information is available. Income and expenses are accrued daily.
Options Contracts
The Funds are subject to equity and other risk exposures in the normal course of pursuing their investment objective. The Funds may use options contracts to hedge their portfolio or a portion thereof or speculatively for the purpose of profiting from a decline in the market value of a security.
The Funds may write covered call and put options on futures, securities or currencies the Funds own or in which they may invest. Writing put options tends to increase a Fund’s exposure to the underlying instrument. Writing call options tends to decrease a Fund’s exposure to the underlying instrument. When a Fund writes a call or put option, an amount equal to the premium received is recorded as a liability and subsequently marked to market to reflect the current value of the option written. These liabilities are reflected as written options outstanding in the Schedule of Investments. Payments received or made, if any, from writing options with premiums to be determined on a future date are reflected as such in the Schedule of Investments. Premiums received from writing options which expire are treated as realized gains. Premiums received from writing options which are exercised or closed are added to the proceeds or offset against amounts paid on the underlying future, security or currency transaction to determine the realized gain or loss. A Fund, as a writer of an option, has no control over whether the underlying future, security or currency may be sold (call) or purchased (put) and, as a result, bears the market risk of an unfavorable change in the price of the future, security or currency underlying the written option. The risk exists that a Fund may not be able to enter into a closing transaction because of an illiquid market.
For the year ended December 31, 2012, the average volume of purchased and written options for Driehaus Emerging Markets Small Cap Growth Fund was $495,042 and $116,947, respectively.
The premiums received and the number of option contracts written during the year ended December 31, 2012, were as follows:
Driehaus Emerging Markets Small Cap Growth Fund | Number of Contracts | Premiums Received | ||||||
Options outstanding at December 31, 2011 | 4,583 | $ | 204,989 | |||||
Options written | 84,209 | 2,632,968 | ||||||
Options closed | (73,292 | ) | (2,561,360 | ) | ||||
Options expired | (15,500 | ) | (276,597 | ) | ||||
|
|
|
| |||||
Options outstanding at December 31, 2012 | — | $ | — | |||||
|
|
|
| |||||
61
Driehaus Mutual Funds
Notes to Financial Statements — (Continued)
The Funds may also purchase put and call options. Purchasing call options tends to increase a Fund’s exposure to the underlying instrument. Purchasing put options tends to decrease a Fund’s exposure to the underlying instrument. A Fund pays a premium which is included in its Schedule of Investments as an investment and subsequently marked-to-market to reflect the current value of the option. Premiums paid for purchasing options which expire are treated as realized losses. The risk associated with purchasing put and call options is limited to the premium paid. Premiums paid for purchasing options which are exercised or closed are added to the amounts paid or offset against the proceeds on the underlying future, security or currency transaction to determine the realized gain or loss. When entering into purchased option contracts, a Fund bears the risk of securities prices moving unexpectedly, in which case, a Fund may not achieve the anticipated benefits of the purchased option contracts; however, the risk of loss is limited to the premium paid. As of December 31, 2012, the Funds had outstanding options as listed on the Schedule of Investments.
Equity Certificates
The Funds may invest in equity certificates which allow the Funds to participate in the appreciation (depreciation) of the underlying security without actually owning the underlying security. These derivative instruments are purchased pursuant to an agreement with a financial institution and are valued at a calculated market price based on the value of the underlying security in accordance with the agreement. These equity certificates are subject to the credit risk of the issuing financial institution. There is no off-balance sheet risk associated with equity certificates and the Funds’ potential loss is limited to the purchase price of the securities. The Funds are exposed to credit risk associated with the counterparty to the transaction, which is monitored by the Funds’ management on a periodic basis.
On December 31, 2012, Driehaus Emerging Markets Growth Fund and Driehaus Emerging Markets Small Cap Growth Fund had unrealized appreciation of $782,886 and $765,296, respectively, as a result of their investments in these financial instruments. The aggregate market values of these certificates for Driehaus Emerging Markets Growth Fund and Driehaus Emerging Markets Small Cap Growth Fund represented 1.0% and 8.7%, respectively, of their total market values at December 31, 2012.
Derivative Investment Holdings Categorized by Risk Exposure
Each Fund is subject to the Financial Accounting Standards Board’s (“FASB”) “Disclosures about Derivative Instruments and Hedging Activities” (the “Derivatives Statement”). The Derivatives Statement amends and expands disclosures about derivative instruments and hedging activities. The Derivatives Statement is intended to improve financial reporting about derivative instruments requiring enhanced disclosures to enable investors to better understand how and why the Funds use derivative instruments, how these derivative instruments are accounted for and their effects on the Funds’ financial position and results of operations.
The following table sets forth the fair value and the location in the Statement of Assets and Liabilities of the Driehaus Emerging Markets Growth Fund’s derivative contracts by primary risk exposure as of December 31, 2012:
Asset derivatives | ||||||
Risk exposure category | Statement of Assets and Liabilities location | Fair value | ||||
Equity contracts | Investments, at market value | $ | 9,634,584 | |||
|
|
|
| |||
62
Driehaus Mutual Funds
Notes to Financial Statements — (Continued)
The following table sets forth the fair value and the location in the Statement of Assets and Liabilities of the Driehaus Emerging Markets Small Cap Growth Fund’s derivative contracts by primary risk exposure as of December 31, 2012:
Asset derivatives | ||||||
Risk exposure category | Statement of Assets and Liabilities location | Fair value | ||||
Equity contracts* | Investments, at market value | $ | 7,274,312 | |||
Commodity contracts* | Investments, at market value | 127,000 | ||||
|
|
|
| |||
| * | Includes cumulative appreciation (depreciation) of options contracts shown in the Schedule of Investments. |
Driehaus Emerging Markets Growth Fund did not have any realized gain (loss) on derivative contracts for the year ended December 31, 2012.
The following table sets forth the Driehaus Emerging Markets Small Cap Growth Fund’s realized gain (loss) by primary risk exposure and by type of derivative contract for the year ended December 31, 2012.
| Amount of realized gain (loss) on derivatives | ||||||||||||
Risk exposure category | Equity Certificates | Purchased Options | Written Options | |||||||||
Equity contracts | $ | (474,413 | ) | $ | (3,409,276 | ) | $ | 1,085,945 | ||||
Commodity contracts | — | (485,840 | ) | 109,876 | ||||||||
|
|
|
|
|
|
| ||||||
The following table sets forth the Driehaus Emerging Markets Growth Fund’s change in unrealized appreciation (depreciation) by primary risk exposure and by type of derivative contract for the year ended December 31, 2012.
| Change in unrealized appreciation (depreciation) on derivatives | ||||
Risk exposure category | Equity Certificates | |||
Equity contracts | $ | 782,885 | ||
|
|
| ||
The following table sets forth the Driehaus Emerging Markets Small Cap Growth Fund’s change in unrealized appreciation (depreciation) by primary risk exposure and by type of derivative contract for the year ended December 31, 2012.
| Change in unrealized appreciation (depreciation) on derivatives | ||||||||||||
Risk exposure category | Equity Certificates | Purchased Options | Written Options | |||||||||
Equity contracts | $ | 1,361,996 | $ | (26,558 | ) | $ | (96,924 | ) | ||||
Commodity contracts | — | (64,280 | ) | — | ||||||||
|
|
|
|
|
|
| ||||||
Federal Income Taxes
No provision is made for Federal income taxes since each Fund has elected to be taxed as a “regulated investment company” under Subchapter M of the Internal Revenue Code (the “Code”) and has made and declared all the required distributions to its shareholders in amounts sufficient to relieve each Fund from all or substantially all Federal income and excise taxes under provisions of current Federal tax law.
Each Fund is subject to accounting standards that establish a minimum threshold for recognizing, and a system for measuring, the benefits of a tax position taken or expected to be taken in a tax return. Taxable years ending 2012, 2011, 2010 and 2009 remain open to Federal and state audit. As of December 31, 2012, management has evaluated the application of these standards to each Fund, and has determined that no provision for income tax is required in each Fund’s financial statements for uncertain tax provisions. The Funds recognize interest and penalties, if any, related to unrecognized tax benefits as income tax expense in the Statement of Operations. During the year, the Funds did not incur any interest or penalties. The Funds may be subject to foreign taxes on income, gains on investments or currency repatriation, a portion which may be recoverable. Foreign taxes are provided for based on the Funds’ understanding of the tax rules and regulations that exist in the foreign markets in which they invest.
63
Driehaus Mutual Funds
Notes to Financial Statements — (Continued)
The amount of dividends and distributions from net investment income and net realized capital gains are determined in accordance with Federal income tax regulations, which may differ from U.S. generally accepted accounting principles.
For the year ended December 31, 2012, reclassifications were recorded to undistributed net investment income, undistributed net realized gain and paid-in capital for any permanent tax differences. These reclassifications relate primarily to foreign currency losses, sales of passive foreign investment companies, net operating losses and capital loss carryforwards expiring. Results of operations and net assets were not affected by these reclassifications.
| Driehaus International Discovery Fund | Driehaus Emerging Markets Growth Fund | Driehaus Emerging Markets Small Cap Growth Fund | Driehaus International Small Cap Growth Fund | Driehaus Global Growth Fund | Driehaus Mid Cap Growth Fund | Driehaus Large Cap Growth Fund | ||||||||||||||||||||||
Undistributed net investment income | $ | 1,410,208 | $ | (1,798,201 | ) | $ | 706,689 | $ | 567,055 | $ | 402,663 | $ | 185,450 | $ | 30,255 | |||||||||||||
Undistributed net realized gain | (991,196 | ) | 1,798,201 | (706,689 | ) | (567,055 | ) | (40,300 | ) | (183,392 | ) | (30,255 | ) | |||||||||||||||
Paid-in capital | (419,012 | ) | — | — | — | (362,363 | ) | (2,058 | ) | — | ||||||||||||||||||
For Federal income tax purposes, capital loss carryforwards represent net capital losses of a Fund that may be carried forward for a maximum period of eight years and applied against future net realized gains. On December 22, 2010, the Regulated Investment Company Modernization Act of 2010 was enacted to modernize several of the Federal income and excise tax provisions related to regulated investment companies. Under pre-enactment law, capital losses could be carried forward for up to eight years, and carried forward as short-term capital losses, irrespective of the character of the original loss. New net capital losses (those earned in taxable years beginning after December 22, 2010) may be carried forward indefinitely and must retain the character of the original loss. Such new net capital losses generally must be used by a regulated investment company before it uses any net capital losses incurred in taxable years beginning on or before December 22, 2010. This increases the likelihood that net capital losses incurred in taxable years beginning on or before December 22, 2010 will expire unused.
During the year ended December 31, 2012, Driehaus International Discovery Fund utilized $2,881,445 of capital loss carryforwards and as of December 31, 2012, had capital loss carryforwards of $2,472,213 expiring in 2015, $150,326,332 expiring in 2016 and $109,113,076 expiring in 2017. During the year ended December 31, 2012, Driehaus Emerging Markets Growth Fund did not utilize any capital loss carryforwards and as of December 31, 2012, had capital loss carryforwards of $47,142,275 with no expiration date. During the year ended December 31, 2012, Driehaus Emerging Markets Small Cap Growth Fund did not utilize any capital loss carryforwards and as of December 31, 2012, had capital loss carryforwards of $4,922,289 with no expiration date. During the year ended December 31, 2012, Driehaus International Small Cap Growth Fund did not utilize any capital loss carryforwards and as of December 31, 2012, had capital loss carryforwards of $3,818,027 expiring in 2017 and $12,209,878 with no expiration date. During the year ended December 31, 2012, Driehaus Global Growth Fund, Driehaus Mid Cap Growth Fund and Driehaus Large Cap Growth Fund did not utilize any capital loss carryforwards and as of December 31, 2012, had no capital loss carryforwards. To the extent that the Funds realize future net capital gains, those capital gains will be offset by any unused capital loss carryforwards subject to the limitations described below. For the year ended December 31, 2012, Driehaus Emerging Markets Growth Fund had late-year ordinary loss deferrals of $1,108,847 which was deferred for tax purposes and was recognized on January 1, 2013. For the year ended December 31, 2012, Driehaus International Discovery Fund, and Driehaus Large Cap Growth Fund had late-year capital loss deferrals of $48,625, and $160,438, respectively, which were deferred for tax purposes and were recognized on January 1, 2013.
64
Driehaus Mutual Funds
Notes to Financial Statements — (Continued)
Included in the capital loss carryforward amounts stated above are capital losses that Driehaus International Discovery Fund inherited from its merger with Driehaus International Equity Yield Fund on September 19, 2008 of approximately $2,472,213, which may be applied against any realized net taxable capital gains in future years. Section 382 of the Code imposes certain limitations that will likely reduce the Fund’s ability to use these capital loss carryforwards.
Distributions to Shareholders
The tax character of distributions paid during the fiscal year ended December 31, 2012 was as follows:
Distributions paid from: | Driehaus International Discovery Fund | Driehaus Emerging Markets Growth Fund | Driehaus Emerging Markets Small Cap Growth Fund | Driehaus International Small Cap Growth Fund | Driehaus Global Growth Fund | Driehaus Mid Cap Growth Fund | Driehaus Large Cap Growth Fund | |||||||||||||||||||||
Ordinary income | $ | — | $ | 3,661,528 | $ | 1,246,733 | $ | 1,069,444 | $ | — | $ | — | $ | 116,590 | ||||||||||||||
Net long-term capital gain | — | — | — | — | 1,436,164 | 2,022,728 | 1,667,897 | |||||||||||||||||||||
|
|
|
|
|
|
|
|
|
|
|
|
|
| |||||||||||||||
Total distributions paid | $ | — | $ | 3,661,528 | $ | 1,246,733 | $ | 1,069,444 | $ | 1,436,164 | $ | 2,022,728 | $ | 1,784,487 | ||||||||||||||
|
|
|
|
|
|
|
|
|
|
|
|
|
| |||||||||||||||
The tax character of distributions paid during the fiscal year ended December 31, 2011 was as follows:
Distributions paid from: | Driehaus International Discovery Fund | Driehaus Emerging Markets Growth Fund | Driehaus Emerging Markets Small Cap Growth Fund | Driehaus International Small Cap Growth Fund | Driehaus Global Growth Fund | Driehaus Mid Cap Growth Fund | Driehaus Large Cap Growth Fund | |||||||||||||||||||||
Ordinary income | $ | — | $ | 44,003,425 | $ | — | $ | 1,347,630 | $ | — | $ | 254,377 | $ | 414,273 | ||||||||||||||
Net long-term capital gain | — | 1,860,551 | — | — | 3,868,133 | 1,156,723 | 1,186,215 | |||||||||||||||||||||
|
|
|
|
|
|
|
|
|
|
|
|
|
| |||||||||||||||
Total distributions paid | $ | — | $ | 45,863,976 | $ | — | $ | 1,347,630 | $ | 3,868,133 | $ | 1,411,100 | $ | 1,600,488 | ||||||||||||||
|
|
|
|
|
|
|
|
|
|
|
|
|
| |||||||||||||||
As of December 31, 2012, the components of net assets on a tax basis were as follows:
Distributions paid from: | Driehaus International Discovery Fund | Driehaus Emerging Markets Growth Fund | Driehaus Emerging Markets Small Cap Growth Fund | Driehaus International Small Cap Growth Fund | Driehaus Global Growth Fund | Driehaus Mid Cap Growth Fund | Driehaus Large Cap Growth Fund | |||||||||||||||||||||
Undistributed ordinary income | $ | — | $ | — | $ | 175,925 | $ | 2,030,993 | $ | — | $ | — | $ | — | ||||||||||||||
Undistributed long-term capital gain | — | — | — | — | 37,588 | 160,146 | 277,685 | |||||||||||||||||||||
|
|
|
|
|
|
|
|
|
|
|
|
|
| |||||||||||||||
Accumulated earnings | $ | — | $ | — | $ | 175,925 | $ | 2,030,993 | $ | 37,588 | $ | 160,146 | $ | 277,685 | ||||||||||||||
Paid-in capital | 440,784,079 | 895,699,110 | 72,981,249 | 220,439,150 | 30,308,588 | 20,289,232 | 15,776,055 | |||||||||||||||||||||
Accumulated capital and other losses | (261,960,246 | ) | (48,251,122 | ) | (4,922,289 | ) | (16,027,903 | ) | — | — | (160,439 | ) | ||||||||||||||||
Unrealized appreciation (depreciation) on foreign currency | 96,680 | 239,254 | 999 | 38,743 | 9,252 | — | — | |||||||||||||||||||||
Unrealized appreciation on investments | 27,472,798 | 141,570,768 | 12,761,506 | 28,477,600 | 4,994,250 | 3,731,529 | 3,492,179 | |||||||||||||||||||||
|
|
|
|
|
|
|
|
|
|
|
|
|
| |||||||||||||||
Net assets | $ | 206,393,311 | $ | 989,258,010 | $ | 80,997,390 | $ | 234,958,583 | $ | 35,349,678 | $ | 24,180,907 | $ | 19,385,480 | ||||||||||||||
|
|
|
|
|
|
|
|
|
|
|
|
|
| |||||||||||||||
65
Driehaus Mutual Funds
Notes to Financial Statements — (Continued)
The differences between book-basis and tax-basis unrealized appreciation are attributable primarily to the tax deferral of losses on wash sales and passive foreign investment company (PFIC) mark-to-market.
Foreign Currency Translation
Foreign currency and equity securities not denominated in U.S. dollars are translated into U.S. dollar values based upon the current rates of exchange on the date of the Funds’ valuations.
Net realized foreign exchange gains or losses which are reported by the Funds result from currency gains and losses on transaction hedges arising from changes in exchange rates between the trade and settlement dates on spot contracts underlying securities transactions and the difference between the amounts accrued for dividends, interest, and foreign taxes and the amounts actually received or paid in U.S. dollars for these items. Net unrealized foreign exchange gains and losses result from changes in the U.S. dollar value of assets and liabilities (other than investments in securities), which are denominated in foreign currencies, as a result of changes in exchange rates.
Net realized foreign exchange gains or losses on portfolio hedges result from the use of spot contracts to hedge portfolio positions denominated or quoted in a particular currency in order to reduce or limit exposure in that currency. The Funds had no portfolio hedges during the year ended December 31, 2012.
The Funds do not isolate that portion of the results of operations which results from fluctuations in foreign exchange rates on investments. These fluctuations are included with the net realized gain (loss) from security transactions and the net change in unrealized appreciation (depreciation) of investments.
Use of Estimates
The preparation of financial statements, in conformity with U.S. generally accepted accounting principles, requires management to make estimates and assumptions that affect the reported amount of assets and liabilities and disclosure of contingent assets and liabilities at the date of the financial statements and the reported amounts of net increases or decreases in net assets from operations during the reporting period. Actual results could differ from those estimates.
Indemnifications
Under the Trust’s organizational documents, the officers and Trustees are indemnified against certain liabilities arising out of the performance of their duties to the Trust. In addition, in the normal course of business, the Trust enters into contracts that provide general indemnifications to other parties. The Funds’ maximum exposure under these agreements is unknown as this would involve future claims that may be made against the Funds that have not yet occurred. However, the Funds have not had prior claims or losses pursuant to these contracts and expect the risk of loss to be remote.
New Accounting Pronouncements
In December 2011, the Financial Accounting Standards Board issued Accounting Standards Update (“ASU”) No. 2011-11, “Disclosures about Offsetting Assets and Liabilities.” ASU No. 2011-11 requires disclosures to make financial statements that are prepared under U.S. Generally Accepted Accounting Principles more comparable to those prepared under International Financial Reporting Standards. The new disclosure requirements mandate that entities disclose both gross and net information about instruments and transactions eligible for offset in the statement of assets and liabilities as well as instruments and transactions subject to an agreement similar to a master netting arrangement. In addition, ASU No. 2011-11 requires disclosure of collateral received and posted in connection with master netting agreements or similar arrangements. New disclosures are required for annual reporting periods beginning on or after January 1, 2013, and interim periods within those annual periods. Management is evaluating the impact of ASU No. 2011-11 on the financial statements and disclosures.
66
Driehaus Mutual Funds
Notes to Financial Statements — (Continued)
Subsequent Events
On September 20, 2012, the Board of Trustees of the Trust approved reductions in the management fees for the Driehaus International Discovery Fund and the Driehaus Global Growth Fund pursuant to the amended investment advisory agreement between the Trust, on behalf of the Funds, and Driehaus Capital Management LLC (the “Adviser”). The reduction in each Fund’s management fee became effective on January 1, 2013.
Effective January 1, 2013, the Driehaus International Discovery Fund pays the Adviser an annual management fee on a monthly basis computed and accrued daily as follows: 1.35% on the first $1 billion of average daily net assets and 1.25% of average daily net assets in excess of $1 billion.
Effective January 1, 2013, the Driehaus Global Growth Fund pays the Adviser an annual management fee on a monthly basis computed and accrued daily at an annual rate of 1.15% of the Fund’s average daily net assets.
B. INVESTMENT ADVISORY FEES, TRANSACTIONS WITH AFFILIATES, AND ADMINISTRATIVE FEES
Richard H. Driehaus, an Interested Trustee of the Trust, is also the Chairman of the Board of Driehaus Capital Management LLC (“DCM” or the “Adviser”), a registered investment adviser, and of Driehaus Securities LLC (“DS LLC” or the “Distributor”), a registered broker-dealer.
DCM serves as the Funds’ investment adviser. In return for its services to the Funds, DCM receives monthly fees. During 2012, Driehaus International Discovery Fund paid the Adviser an annual management fee on a monthly basis computed and accrued daily as follows: 1.50% on the first $500 million of average daily net assets, 1.35% on the next $500 million and 1.25% of average daily net assets in excess of $1 billion. Driehaus Emerging Markets Growth Fund, Driehaus Emerging Markets Small Cap Growth Fund and Driehaus International Small Cap Growth Fund each pay the Adviser a monthly fee computed and accrued daily at an annual rate of 1.50% of each Fund’s average daily net assets. During 2012, Driehaus Global Growth Fund paid the Adviser a monthly fee computed and accrued daily at an annual rate of 1.25% of the Fund’s average daily net assets. Driehaus Mid Cap Growth Fund pays the Adviser a monthly fee computed and accrued daily at an annual rate of 1.00% of the Fund’s average daily net assets. Driehaus Large Cap Growth Fund pays the Adviser a monthly fee computed and accrued daily at an annual rate of 0.90% of the Fund’s average daily net assets. See Subsequent Events above for reductions in annual management fee rates effective January 1, 2013.
DCM has entered into an agreement to cap Driehaus Emerging Markets Small Cap Growth Fund’s annual operating expenses (other than interest, taxes, brokerage commissions and other portfolio transaction expenses, capital expenditures and extraordinary expenses) at 2.00% of average daily net assets until August 21, 2014. For a period of three years subsequent to the Fund’s commencement of operations, DCM is entitled to reimbursement for previously waived fees and reimbursed expenses to the extent that the Fund’s expense ratio remains below the operating expense cap. For the year ended December 31, 2012, DCM waived fees for Driehaus Emerging Markets Small Cap Growth Fund totaling $50,543 under this agreement, and the total amount subject to recapture is $108,124.
DCM has entered into agreements to cap Driehaus Mid Cap Growth Fund’s and Driehaus Large Cap Growth Fund’s annual operating expenses (other than interest, taxes, brokerage commissions and other portfolio transaction expenses, capital expenditures and extraordinary expenses) at 1.75% of average daily net assets until April 30, 2015. For a period of three years subsequent to each Fund’s commencement of operations, DCM is entitled to reimbursement for previously waived fees and reimbursed expenses to the extent that each Fund’s expense ratio remains below the operating expense cap. For the year ended December 31, 2012, DCM waived fees for Driehaus Mid Cap Growth Fund and Driehaus Large Cap Growth Fund totaling $52,090 and $54,700, respectively, under these agreements, and the amount of potential recovery expiring December 31, 2013, December 31, 2014 and December 31, 2015 was $90,076, $48,478 and $52,090, respectively, for Driehaus Mid Cap Growth Fund and $67,291, $43,939 and $54,700, respectively, for Driehaus Large Cap Growth Fund.
67
Driehaus Mutual Funds
Notes to Financial Statements — (Continued)
The amounts accrued and payable to DCM during the year ended December 31, 2012, are as follows:
| Fund | Advisory Fees | Advisory Fees Payable (included in Due to affiliates) | ||||||
Driehaus International Discovery Fund | $ | 3,207,345 | $ | 259,688 | ||||
Driehaus Emerging Markets Growth Fund | 12,876,247 | 1,200,663 | ||||||
Driehaus Emerging Markets Small Cap Growth Fund | 782,657 | 88,271 | ||||||
Driehaus International Small Cap Growth Fund | 3,456,133 | 293,913 | ||||||
Driehaus Global Growth Fund | 447,507 | 36,692 | ||||||
Driehaus Mid Cap Growth Fund | 237,991 | 17,871 | ||||||
Driehaus Large Cap Growth Fund | 182,453 | 11,385 | ||||||
|
|
|
|
| ||||
Certain of the Funds direct certain portfolio trades, subject to obtaining the best price and execution, to brokers who have agreed to pay a portion of the Funds’ operating expenses using part of the commissions generated. For the year ended December 31, 2012, these arrangements reduced the expenses of Driehaus International Discovery Fund, Driehaus Emerging Markets Growth Fund, Driehaus Emerging Markets Small Cap Growth Fund, Driehaus International Small Cap Growth Fund, Driehaus Global Growth Fund, Driehaus Mid Cap Growth Fund and Driehaus Large Cap Growth Fund by $35,000 (0.9%), $127,483 (0.9%), $7,212 (0.6%), $46,750 (1.2%), $2,500 (0.3%), $450 (0.1%) and $600 (0.1%), respectively.
Certain officers of the Trust are also officers of DCM and DS LLC. The Funds pay a portion of the Chief Compliance Officer’s salary and bonus. No other officers received compensation from the Funds.
BNY Mellon Investment Servicing (US) Inc. (“BNY Mellon”) serves as the Funds’ administrative and accounting agent. In compensation for these services, BNY Mellon receives the larger of a monthly minimum fee or a monthly fee based upon average net assets. BNY Mellon has agreed to waive a portion of its monthly fee for administrative and accounting agent services for the first six months of operations for Driehaus Emerging Markets Small Cap Growth Fund. For the year ended December 31, 2012, BNY Mellon waived $2,097 for Driehaus Emerging Markets Small Cap Growth Fund. BNY Mellon also acts as the transfer agent and dividend disbursing agent for the Funds. For these services, BNY Mellon receives a monthly fee based on shareholder processing activity during the month. BNY Mellon has agreed to waive a portion of its monthly fee for transfer agent service for the first two years of operations for Driehaus Emerging Markets Small Cap Growth Fund. For the year ended December 31, 2012, BNY Mellon waived $24,000 for Driehaus Emerging Markets Small Cap Growth Fund.
C. OTHER FINANCIAL INSTRUMENTS
The Funds enter into foreign currency spot contracts to facilitate transactions in foreign denominated securities. These spot contracts are typically open for 2 to 5 days, depending on the settlement terms of the underlying security transaction. On December 31, 2012, the Funds had foreign currency spot contracts outstanding under which they are obligated to exchange currencies at specified future dates. The unrealized appreciation or depreciation on spot contracts is reflected as a separate line item in the Statement of Assets and Liabilities. On December 31, 2012, the Funds’ currency transactions were limited to transaction hedges.
68
Driehaus Mutual Funds
Notes to Financial Statements — (Continued)
D. INVESTMENT TRANSACTIONS
The aggregate purchases and sales of investment securities, other than short-term obligations and options, for the year ended December 31, 2012 were as follows:
| Fund | Purchases | Sales | ||||||
Driehaus International Discovery Fund | $ | 229,233,143 | $ | 263,129,096 | ||||
Driehaus Emerging Markets Growth Fund | 2,378,679,173 | 2,277,624,751 | ||||||
Driehaus Emerging Markets Small Cap Growth Fund | 121,254,998 | 89,717,283 | ||||||
Driehaus International Small Cap Growth Fund | 622,447,296 | 638,301,237 | ||||||
Driehaus Global Growth Fund | 35,479,466 | 40,944,524 | ||||||
Driehaus Mid Cap Growth Fund | 27,832,976 | 27,982,032 | ||||||
Driehaus Large Cap Growth Fund | 20,453,860 | 22,604,854 | ||||||
|
|
|
|
| ||||
E. RESTRICTED SECURITIES
Restricted securities are securities that are not registered for sale under the Securities Act of 1933 or applicable foreign law and that may be re-sold only in transactions exempt from applicable registration. Restricted securities include Rule 144A securities which may be sold normally to qualified institutional buyers. On December 31, 2012, the Funds held no restricted securities, other than equity certificates. Since an investment in equity certificates represents an agreement entered into with a financial institution, with terms set by such financial institution, these instruments are also deemed to be restricted (see Note A).
F. LINE OF CREDIT
Driehaus International Discovery Fund, Driehaus Emerging Markets Growth Fund and Driehaus International Small Cap Growth Fund have obtained an uncommitted line of credit in the amount of $25,000,000 and Driehaus Emerging Markets Small Cap Growth Fund, Driehaus Global Growth Fund, Driehaus Mid Cap Growth Fund and Driehaus Large Cap Growth Fund have obtained an uncommitted line of credit in the amount of $5,000,000. These lines of credit are available primarily to meet large, unexpected shareholder withdrawals subject to certain restrictions. Interest is charged at a rate per annum equal to the Federal Funds Rate in effect at the time of the borrowings plus 1.5%. Driehaus International Discovery Fund utilized the line of credit during the period January 25, 2012 to February 10, 2012. The average daily loan balance outstanding on days where borrowings existed was $4,000,000, the weighted average interest rate was 0.77% and the interest expense, which is included on the Statement of Operations, was $2,847 for Driehaus International Discovery Fund. Driehaus Global Growth Fund utilized the line of credit during the period March 1, 2012 to March 13, 2012. The average daily loan balance outstanding on days where borrowings existed was $3,000,000, the weighted average interest rate was 0.02% and the interest expense, which is included on the Statement of Operations, was $1,613 for Driehaus Global Growth Fund.
G. RISKS CONCENTRATIONS
To the extent a Fund invests in foreign securities, it may entail risks due to the potential for political and economic instability in the countries where the issuers of these securities are located. In addition, foreign exchange fluctuations could affect the value of positions held. These risks are generally intensified in emerging markets.
H. REDEMPTION FEES
The Funds may charge a redemption fee of 2.00% of the redemption amount for shares redeemed within 60 days of purchase. The redemption fees are recorded in paid-in capital.
69
Report of Independent Registered Public Accounting Firm
To the Board of Trustees and Shareholders of the Driehaus Mutual Funds:
We have audited the accompanying statements of assets and liabilities, including the schedules of investments of Driehaus International Discovery Fund, Driehaus Emerging Markets Growth Fund, Driehaus Emerging Markets Small Cap Growth Fund, Driehaus International Small Cap Growth Fund, Driehaus Global Growth Fund, Driehaus Mid Cap Growth Fund, and Driehaus Large Cap Growth Fund (collectively, the “Funds”) as of December 31, 2012, and the related statements of operations, statements of changes in net assets and financial highlights for each of the periods indicated therein. These financial statements and financial highlights are the responsibility of the Funds’ management. Our responsibility is to express an opinion on these financial statements and financial highlights based on our audits.
We conducted our audits in accordance with the standards of the Public Company Accounting Oversight Board (United States). Those standards require that we plan and perform the audit to obtain reasonable assurance about whether the financial statements and financial highlights are free of material misstatement. We were not engaged to perform an audit of the Funds’ internal control over financial reporting. Our audits included consideration of internal control over financial reporting as a basis for designing audit procedures that are appropriate in the circumstances, but not for the purpose of expressing an opinion on the effectiveness of the Funds’ internal control over financial reporting. Accordingly, we express no such opinion. An audit also includes examining, on a test basis, evidence supporting the amounts and disclosures in the financial statements and financial highlights, assessing the accounting principles used and significant estimates made by management, and evaluating the overall financial statement presentation. Our procedures included confirmation of securities owned as of December 31, 2012, by correspondence with the custodian and brokers or by other appropriate auditing procedures where replies from brokers were not received. We believe that our audits provide a reasonable basis for our opinion.
In our opinion, the financial statements and financial highlights referred to above present fairly, in all material respects, the financial position of each of the respective Funds noted above at December 31, 2012, the results of their operations, the changes in net assets and the financial highlights for the periods indicated therein, in conformity with U.S. generally accepted accounting principles.

Chicago, Illinois
February 25, 2013
70
Interested and Independent Trustees of the Trust
The following table sets forth certain information with respect to the Trustees of the Trust:
Name, Address and | Position(s) the Trust | Term of Office and Time | Number of Overseen | Principal Occupation(s) During Past 5 Years | Other Directorships Held by Trustee During the Past 5 Years | |||||
Interested Trustee:* | ||||||||||
Richard H. Driehaus 25 East Erie Street Chicago, IL 60611 YOB: 1942 | Trustee | Since 1996 | 11 | Chairman of the Board of the Adviser, the Distributor and Driehaus Capital Management (USVI) LLC (“USVI”); Chief Investment Officer and Portfolio Manager of the Adviser. President of the Trust from 1996-2011. | Driehaus Capital Holdings LLC; Driehaus Enterprise Management, Inc.; The Richard H. Driehaus Foundation; and The Richard H. Driehaus Museum | |||||
Independent Trustees: | ||||||||||
A.R. Umans c/o Driehaus Capital Management LLC 25 East Erie Street Chicago, IL 60611 YOB: 1927 | Trustee and Chairman | Since 1996 Since 2005 | 11 | Chairman of the Board, Commerce National Group (investment company) since 2005; Chairman of the Board and Chief Executive Officer, RHC/Spacemaster Corporation (manufacturing corporation) prior thereto. | Sinai Health System; Schwab Rehabilitation Hospital | |||||
Theodore J. Beck c/o Driehaus Capital Management LLC 25 East Erie Street Chicago, IL 60611 YOB: 1952 | Trustee | Since 2012 | 11 | President and Chief Executive Officer, National Endowment for Financial Education, 2005 to present; Associate Dean for Executive Education and Corporate Relations and President for the Center for Advanced Studies in Business at the University of Wisconsin-Madison, 1999-2005. | President’s Advisory Council on Financial Capability since 2010; Federal Deposit Insurance Corporation Advisory Committee on Economic Inclusion since 2007; Jump$tart Coalition for Personal Financial Literacy since 2008; Wisconsin Alumni Association Board from 2006-2012; President’s Advisory Council on Financial Literacy from 2008-2010; Wilshire Variable Insurance Trust, 2008-2010; Wilshire Mutual Funds Inc, 2008-2010; Advisory Board of the Trust 2011-2012. | |||||
Francis J. Harmon c/o Driehaus Capital Management LLC 25 East Erie Street Chicago, IL 60611 YOB: 1942 | Trustee | Since 1998 | 11 | Relationship Manager, Great Lakes Advisors, Inc. since February 2008; Principal Account Executive – Labor Affairs, Blue Cross and Blue Shield of Illinois prior thereto. | None |
71
Interested and Independent Trustees of the Trust
Name, Address and | Position(s) the Trust | Term of Office and Time | Number of Overseen | Principal Occupation(s) During Past 5 Years | Other Directorships Held by Trustee During the Past 5 Years | |||||
Independent Trustees: | ||||||||||
Dawn M. Vroegop c/o Driehaus Capital Management LLC 25 East Erie Street Chicago, IL 60611 YOB: 1966 | Trustee | Since 2012 | 11 | Managing Director, Dresdner RCM Global Investors from September 1999 to September 2003. | Independent Trustee, Met Investors Series Trust since December 2000; Director, Metropolitan Series Fund, Inc. since May 2009; Director and Investment Committee Chair, City College of San Francisco Foundation since 2003; Advisory Board of the Trust 2011-2012. | |||||
Daniel F. Zemanek c/o Driehaus Capital Management LLC 25 East Erie Street Chicago, IL 60611 YOB: 1942 | Trustee | Since 1996 | 11 | President of Ludan, Inc. (real estate services specializing in senior housing) since April 2008; Senior Vice President of Sunrise Development, Inc. (senior living) from 2003-2007; Consultant, real estate development prior thereto. | None |
| * | Mr. Driehaus is an “interested person” of the Trust, the Adviser and the Distributor, as defined in the 1940 Act, because he is an officer of the Adviser and the Distributor. In addition, Mr. Driehaus has a controlling interest in the Adviser and the Distributor. |
| ** | Each Trustee will serve as a Trustee of the Trust until (i) termination of the Trust, or (ii) the Trustee’s retirement, resignation, or death, or (iii) as otherwise specified in the Trust’s governing documents. |
72
The following table sets forth certain information with respect to the officers of the Trust.
Name, Address and Year of Birth | Position(s) the Trust | Length of | Principal Occupation(s) During Past 5 Years | |||
Robert H. Gordon Chicago, IL 60611 | President | Since 2011 | President and Chief Executive Officer of Adviser, Distributor and USVI since October 2006; Senior Vice President of the Trust from 2006-2011. | |||
Michelle L. Cahoon 25 East Erie Street Chicago, IL 60611 YOB: 1966 | Vice President and Treasurer | Since 2006 Since 2002 | Managing Director, Treasurer and Chief Financial Officer of the Adviser and Distributor since 2012; Vice President, Treasurer and Chief Financial Officer of the USVI since 2004; Vice President, Treasurer and Chief Financial Officer of the Advisor and Distributor from 2004-2012. | |||
Janet L. McWilliams 25 East Erie Street Chicago, IL 60611 YOB: 1970 | Assistant Vice President | Since 2007 | Managing Director, Secretary and General Counsel of the Adviser since 2012; Chief Compliance Officer of the Trust, Adviser and Distributor from 2006-2012; Senior Attorney with the Adviser from 2003-2012. | |||
Michael R. Shoemaker 25 East Erie Street Chicago, IL 60611 YOB: 1981 | Chief Compliance Office and Assistant Vice President | Since 2012 | Assistant Vice President and Chief Compliance Officer of the Adviser and Distributor since 2012; Associate Chief Compliance Officer of the Adviser and Distributor from 2011-2012; Compliance Officer, Pacific Investment Management Company LLC and PIMCO Investments LLC from 2010-2011; Senior Compliance Analyst of the Adviser and Distributor from 2007-2010. | |||
Diane J. Drake 301 Bellevue Parkway Wilmington, DE 19809 YOB: 1967 | Secretary | Since 2006 | Managing Director and Senior Counsel, BNY Mellon Investment Servicing (US) Inc. (formerly, PNC Global Investment Servicing (U.S.) Inc. (“PNC”), (financial services company) since 2010; Vice President and Counsel, PNC from 2008-2010. | |||
Michael P. Kailus 25 East Erie Street Chicago, IL 60611 YOB: 1971 | Assistant Secretary and Anti-Money Laundering Compliance Officer | Since 2010 | Assistant Secretary of the Adviser, Distributor and USVI since 2010; Associate General Counsel of Superfund Group (formerly, Quadriga Group, a financial services company) from 2005-2010. | |||
William H. Wallace, III 301 Bellevue Parkway Wilmington, DE 19809 YOB: 1969 | Assistant Secretary | Since 2008 | Vice President and Manager, BNY Mellon Investment Servicing (US) Inc. (formerly, PNC, a financial services company) since 2010; Assistant Vice President and Manager, PNC from 2008-2010. |
The Statement of Additional Information for Driehaus Mutual Funds contains more detail about the Trust’s Trustees and officers and is available upon request, without charge. For further information, please call 1-800-560-6111.
73
As a mutual fund shareholder, you may incur two types of costs: (1) transaction costs, including sales charges; redemption fees; and exchange fees and (2) ongoing costs, including management fees; distribution (12b-1) fees; and other fund expenses. This example is intended to help you understand your ongoing costs (in dollars) of investing in each Fund and to compare these costs with the ongoing costs of investing in other mutual funds.
The example is based on an investment of $1,000 invested at the beginning of the period and held for the entire six months ending December 31, 2012.
Actual Expenses
The first line of the tables below (“Actual”) provides information about actual account values and actual expenses. You may use the information in this line, together with the amount you invested, to estimate the expense that you paid over the period. Simply divide your account value by $1,000 (for example, an $8,600 account value divided by $1,000 = 8.6), then multiply the result by the number in the first line under the heading entitled “Expenses Paid During Period” to estimate the expenses you paid on your account during this period.
Hypothetical Example for Comparison Purposes
The second line of the tables below (“Hypothetical”) provides information about hypothetical account values and hypothetical expenses based on the Fund’s actual expense ratio and an assumed rate of return of 5% per year before expenses, which is not the Fund’s actual return. You may use this information to compare the ongoing costs of investing in the Funds versus other funds. To do so, compare this 5% hypothetical example with the 5% hypothetical examples that appear in the shareholder reports of the other funds.
Please note that the expenses shown in the table are meant to highlight your ongoing costs only and do not reflect any transactional costs, such as sales charges, redemption fees or exchange fees. Therefore, the second line of the table is useful in comparing ongoing costs only, and will not help you determine the relative total costs of owning different funds. In addition, if these transactional costs were included, your costs would have been higher.
Driehaus International Discovery Fund
Beginning Account Value July 1, 2012 | Ending Account Value December 31, 2012 | Expenses Paid During December 31, 2012* | ||||||||||
Actual | $ | 1,000 | $ | 1,103.40 | $ | 9.25 | ||||||
Hypothetical (5% return before expenses) | $ | 1,000 | $ | 1,016.34 | $ | 8.87 | ||||||
Driehaus Emerging Markets Growth Fund
Beginning Account Value July 1, 2012 | Ending Account Value December 31, 2012 | Expenses Paid During December 31, 2012* | ||||||||||
Actual | $ | 1,000 | $ | 1,145.70 | $ | 9.01 | ||||||
Hypothetical (5% return before expenses) | $ | 1,000 | $ | 1,016.74 | $ | 8.47 | ||||||
Driehaus Emerging Markets Small Cap Growth Fund
Beginning Account Value July 1, 2012 | Ending Account Value December 31, 2012 | Expenses Paid During Six Months Ending | ||||||||||
Actual | $ | 1,000 | $ | 1,193.50 | $ | 11.03 | ||||||
Hypothetical (5% return before expenses) | $ | 1,000 | $ | 1,015.08 | $ | 10.13 | ||||||
74
Fund Expense Examples — (Continued)
Driehaus International Small Cap Growth Fund
Beginning Account Value July 1, 2012 | Ending Account Value December 31, 2012 | Expenses Paid During December 31, 2012* | ||||||||||
Actual | $ | 1,000 | $ | 1,111.50 | $ | 9.24 | ||||||
Hypothetical (5% return before expenses) | $ | 1,000 | $ | 1,016.39 | $ | 8.82 | ||||||
Driehaus Global Growth Fund
Beginning Account Value July 1, 2012 | Ending Account Value December 31, 2012 | Expenses Paid During December 31, 2012* | ||||||||||
Actual | $ | 1,000 | $ | 1,059.90 | $ | 10.41 | ||||||
Hypothetical (5% return before expenses) | $ | 1,000 | $ | 1,015.03 | $ | 10.18 | ||||||
Driehaus Mid Cap Growth Fund
Beginning Account Value July 1, 2012 | Ending Account Value December 31, 2012 | Expenses Paid During December 31, 2012* | ||||||||||
Actual | $ | 1,000 | $ | 1,047.80 | $ | 9.01 | ||||||
Hypothetical (5% return before expenses) | $ | 1,000 | $ | 1,016.34 | $ | 8.87 | ||||||
Driehaus Large Cap Growth Fund
Beginning Account Value July 1, 2012 | Ending Account Value December 31, 2012 | Expenses Paid During December 31, 2012* | ||||||||||
Actual | $ | 1,000 | $ | 1,035.50 | $ | 8.95 | ||||||
Hypothetical (5% return before expenses) | $ | 1,000 | $ | 1,016.34 | $ | 8.87 | ||||||
| * | Expenses are equal to the Fund’s annualized expense ratios for the six-month period in the table below multiplied by the average account value over the period, multiplied by the number of days in the most recent fiscal half-year (184), then divided by 366 to reflect the half-year period. |
Driehaus International Discovery Fund | 1.75% | |
Driehaus Emerging Markets Growth Fund | 1.67% | |
Driehaus Emerging Markets Small Cap Growth Fund | 2.00% | |
Driehaus International Small Cap Growth Fund | 1.74% | |
Driehaus Global Growth Fund | 2.01% | |
Driehaus Mid Cap Growth Fund | 1.75% | |
Driehaus Large Cap Growth Fund | 1.75% |
75
TAX INFORMATION (UNAUDITED) FOR THE YEAR ENDED DECEMBER 31, 2012
We are providing this information as required by the Internal Revenue Code. The amounts shown may differ from those elsewhere in this report because of differences between tax and financial reporting requirements.
The Funds’ distributions included capital gain amounts as follows:
| Driehaus International Discovery Fund | Driehaus Emerging Markets Growth Fund | Driehaus Emerging Markets Small Cap Growth Fund | Driehaus International Small Cap Growth Fund | Driehaus Global Growth Fund | Driehaus Mid Cap Growth Fund | Driehaus Large Cap Growth Fund | ||||||||||||||||||||||
Total long-term gains 15% rate gains . | $ | — | $ | — | $ | — | $ | — | $ | 1,436,164 | $ | 2,022,728 | $ | 1,667,897 | ||||||||||||||
For taxable non-corporate shareholders, the following percentages of income and short-term capital gains represent qualified dividend income subject to the 15% rate category:
Driehaus International Discovery Fund | Driehaus Emerging Markets Growth Fund | Driehaus Emerging Markets Small Cap Growth Fund | Driehaus International Small Cap Growth Fund | Driehaus Global Growth Fund | Driehaus Mid Cap Growth Fund | Driehaus Large Cap Growth Fund | ||||||||||||||||||||
| 0.00% | 22.03% | 30.94% | 100.00% | 0.00% | 0.00% | 100.00% | ||||||||||||||||||||
For corporate shareholders, the following percentages of income and short-term capital gains qualified for the dividends-received deduction:
Driehaus International Discovery | Driehaus Emerging Markets Growth Fund | Driehaus Emerging Markets Small Cap Growth Fund | Driehaus International Small Cap Growth Fund | Driehaus Global Growth Fund | Driehaus Mid Cap Growth Fund | Driehaus Large Cap Growth Fund | ||||||||||||||||||||
| 0.00% | 0.00% | 4.58% | 0.00% | 0.00% | 0.00% | 100.00% | ||||||||||||||||||||
PROXY VOTING POLICIES AND PROCEDURES AND PROXY VOTING RECORD
A description of the Funds’ policies and procedures with respect to the voting of proxies relating to the Funds’ portfolio securities is available without charge, upon request, by calling 1-800-560-6111. This information is also available on the Funds’ website at http://www.driehaus.com.
Information regarding how the Funds voted proxies related to portfolio securities during the 12-month period ended June 30, 2012 is available without charge, upon request, by calling 1-800-560-6111. This information is also available on the Securities and Exchange Commission’s (“SEC”) website at http://www.sec.gov.
HOW TO OBTAIN QUARTERLY PORTFOLIO HOLDINGS
Each Fund files a complete schedule of portfolio holdings with the SEC for the first and third quarters of each fiscal year on Form N-Q. The Funds’ Form N-Q is available electronically on the SEC’s website at http://www.sec.gov; hard copies may be reviewed and copied at the SEC’s Public Reference Room in Washington, DC 20549. For more information on the Public Reference Room, call 1-800-SEC-0330. Each Fund’s complete schedule of portfolio holdings is also available on the Fund’s website at http://www.driehaus.com.
76
Shareholder Information — (Continued)
SPECIAL MEETING OF SHAREHOLDERS
At a Special Meeting of Shareholders of Driehaus Mutual Funds (the “Trust”) held on November 27, 2012, the Trust’s shareholders approved the election of the following persons to the Board of Trustees of the Trust (the “Board”) by the following votes:
| Affirmative | Withheld | |||||||
Theodore J. Beck | 331,113,166 | 1,544,986 | ||||||
Richard H. Driehaus | 190,855,228 | 141,802,924 | ||||||
Francis J. Harmon | 331,183,248 | 1,474,904 | ||||||
A.R. Umans | 331,053,586 | 1,604,566 | ||||||
Dawn M. Vroegop | 331,089,504 | 1,568,648 | ||||||
Daniel F. Zemanek | 331,191,235 | 1,466,917 | ||||||
77
Board Considerations in Connection with the Annual Review of the Investment Advisory Agreement
In September 2012, the Board of Trustees of Driehaus Mutual Funds (the “Trust”) approved (i) the renewal of the investment advisory agreement (the “Agreement”) with Driehaus Capital Management LLC (the “Adviser”) for Driehaus Emerging Markets Growth Fund (“DREGX”), Driehaus International Discovery Fund (“DRIDX”), Driehaus International Small Cap Growth Fund (“DRIOX”), Driehaus Global Growth Fund (“DRGGX”), Driehaus Mid Cap Growth Fund (“DRMGX”), Driehaus Large Cap Growth Fund (“DRLGX”) and Driehaus Emerging Markets Small Cap Growth Fund (DRESX) (DREGX, DRIDX, DRIOX, DRGGX, DRMGX, DRLGX and DRESX are each a “Fund” and collectively the “Funds”); and (ii) amended Letter Agreements for DRIDX and DRGGX, effective January 1, 2013. As part of its review process, the Board requested and evaluated all information it deemed reasonably necessary to evaluate the Agreement. The Board reviewed comprehensive materials received from the Adviser and from independent legal counsel. The Board also received extensive information throughout the year regarding performance and operating results of each Fund. The Independent Trustees, represented by independent legal counsel, met independent of Fund management to consider renewal of the Agreement. After their review of the information received, the Independent Trustees presented their findings and their recommendation to renew the Agreement to the full Board.
In connection with the contract review process, the Board considered the factors discussed below, among others. The Board also considered that the Adviser has managed each Fund since its inception, and the Board believes that a long-term relationship with a capable, conscientious adviser is in the best interests of each Fund. The Board considered, generally, that shareholders invested in each Fund, knowing that the Adviser managed the Fund and knowing the investment advisory fee schedule.
Nature, Quality and Extent of Services. The Board considered the nature, extent and quality of services provided under the Agreement, including portfolio management services and administrative services. The Board considered the experience and skills of senior management and investment personnel, the resources made available to such personnel, the ability of the Adviser to attract and retain high-quality personnel, and the organizational depth of the Adviser. The Board also considered compliance with legal and regulatory requirements, as well as the Adviser’s handling of portfolio brokerage, and noted the Adviser’s process for evaluating best execution. The Board considered the Adviser’s risk management strategies and the process developed by the Adviser for analyzing, reviewing and assessing risk exposure for the Funds.
The Board reviewed DREGX’s and DRIDX’s performance on a net return basis over the 1-, 3- and 5-year periods and for the year-to-date period ended June 30, 2012. For those Funds with less than five years of performance without taking into account any predecessor performance, if applicable (i.e., inception of DRGGX on May 1, 2008, DRMGX from the conversion of two predecessor limited partnerships’ assets in April 2009, DRLGX from the conversion of a predecessor limited partnership’s assets in April 2009 and DRIOX from the conversion of a predecessor limited partnership’s assets in September 2007), the Board considered the performance on a net return basis for the 1- and 3-year and year-to-date periods ended June 30, 2012, and for DRESX, the Board considered the performance on a net return basis for the year-to-date period ended June 30, 2012 (from the conversion of a predecessor limited partnership’s assets in August 2011). The Board also reviewed (i) performance for DRMGX, including that of one of its predecessor limited partnerships, on a net return basis for the 5-year period ended June 30, 2012; (ii) performance for DRIOX, including that of its predecessor limited partnership, on a net return basis for the 5-year period ended June 30, 2012; and (iii) performance for DRESX, including that of its predecessor limited partnership, for the 1- and 3-year periods ended June 30, 2012. Because the predecessor limited partnerships to DRMGX, DRIOX and DRESX did not operate as mutual funds and were not subject to certain investment and operational restrictions, the Board factored those differences into its evaluation of these Funds’ performance information. The Board noted that the Adviser represented that because the Funds’ performance can be volatile over shorter time periods, for Funds with longer performance records, it was meaningful to also analyze the performance over rolling time periods, and the Board reviewed rolling relative performance to benchmark information for certain Funds. The Board compared short-term and longer-term returns to various agreed-upon performance measures, including market indices and peer groups. Peer group data was compiled from Lipper Inc., an independent provider of mutual fund data. The Board also considered whether investment results were consistent with each Fund’s investment objective and policies.
78
On the basis of this evaluation and its ongoing review of investment results, the Board concluded that the nature, quality and extent of services provided by the Adviser for DREGX, DRIOX, DRGGX, DRMGX, DRLGX and DRESX continue to be satisfactory.
As to the specific Funds, the Board noted that DREGX’s performance was above the median of its peer group for the 1-, 3- and 5-year periods. The Board also noted that DREGX outperformed its benchmark index for the 1-, 3-, 5- and 10-year and since-inception (December 31, 1997) periods. The Board noted that although DRIOX’s performance for the 1-year period was below the median of its peer group, it was above the median of its peer group for the 3- and 5-year periods (the latter of which includes the performance of its predecessor limited partnership). In addition, the Board noted that DRIOX outperformed its benchmark index for the 3- and 5-year periods (the latter of which includes the performance of its predecessor partnership) and underperformed its benchmark index for the 1-year period. With respect to DRGGX, the Board noted that its performance was above the median for the 3-year period and was below the median for the 1-year period. In addition, the Board noted that DRGGX underperformed its benchmark index for the 1- and 3-year periods and outperformed the index for the year-to-date period. The Board noted that DRMGX’s performance for the 1-, 3- and 5-year periods was below the median of its peer group (the latter of which includes the performance of a predecessor partnership), although it was near the median for the 3- and 5-year periods. In addition, the Board noted that DRMGX underperformed its benchmark index for the 1-, 3- and 5-year periods (the latter of which includes the performance of a predecessor partnership) and that the Fund outperformed the index for the 10-year period (including the performance of a predecessor partnership). The Board noted that DRLGX had outperformed its peer group median for the 1- and 3-year periods. In addition, the Board noted that DRLGX slightly underperformed its benchmark index for the 1-year period and underperformed for the 3-year period. For DRESX, the Board noted that the Fund outperformed its peer group median and its benchmark for the 1- and 3-year periods (including the performance of its predecessor limited partnership).
On the basis of its evaluation of the information presented and its ongoing review of investment results, the Board concluded that based on the nature, quality and extent of services provided by the Adviser for DRIDX, it continues to be in the best interests of the Fund to continue the Agreement. The Board noted the Adviser’s ongoing adherence to its investment style, including maintaining its high ratio of active share in comparison to its benchmark. Recognizing that this investment style produces a differentiated outcome from the benchmark, the Board noted that DRIDX underperformed the median of its peer group for the 1-, 3- and 5-year periods. For the year-to-date period, the Board found performance to be competitive, ranking in the 62nd percentile of its peer group. The Board also noted that the Fund underperformed its benchmark index for the 1-, 3- and 5-year periods, but outperformed its benchmark index for the 10-year and since-inception (December 31, 1998) periods. The Board reviewed the reasons for the periods of underperformance, which were primarily related to the Fund’s bias to emerging market and small capitalization stocks during the past year and the fact that the Adviser’s style is adversely affected by highly correlated markets. The Board also reviewed the steps taken to improve performance, including the addition of portfolio management resources.
The Board also considered DREGX’s, DRIDX’s, DRIOX’s and DRMGX’s rolling 1-year, 3-year and 5-year returns over the life of the Funds relative to their benchmarks and noted that, in a majority of the time periods measured, each Fund outperformed its benchmark index. For DRLGX the Board reviewed the rolling returns for 1- and 3-year periods. The Board noted the underperformance to the index over a majority of the rolling periods, but took into consideration that the limited number of periods did not provide a sufficient basis upon which to make a judgment. As to the Funds in general, the Board concluded that the Adviser had consistently implemented its investment philosophy, and that over the long term, the investment philosophy produces value for shareholders.
Fees. The Board considered each Fund’s advisory fee rates, operating expenses and total expense ratio as of June 30, 2012, and compared the advisory fee and total expense ratio to the fees and expense ratios of peer group funds based on data compiled from Lipper Inc. as of June 30, 2012. The information provided to the Board showed that each Fund’s advisory fee rate ranked high as compared to its peer group. However, because of the Funds’ fee structures, total expense ratios are relatively competitive, as they all fall between the 24th and 99th percentiles (1st percentile being the highest expense ratio). The Board considered that the Adviser proposed a reduction in advisory fee rates for DRIDX and DRGGX and also considered the Funds’ asset size and, for DRMGX, DRLGX and DRESX, the expense reimbursement arrangements with the Adviser. The Board also considered the Funds’ advisory fee rates as compared to fees charged by the Adviser for similarly managed institutional accounts. With respect to institutional accounts, the Board noted that: (i) both the mix of services provided and the level of responsibility required under the Agreement were significantly greater as compared to the Adviser’s obligations for managing the other accounts; and (ii) the advisory fees for
79
the other accounts are less relevant to the Board’s consideration because they reflect significantly different competitive forces than those in the mutual fund marketplace. In considering the reasonableness of the advisory fees, the Board took into account the Adviser’s aggressive growth style and the substantial human and technological resources devoted to investing for the Funds, the relatively small amount of assets under management and the limited capacity of the investment style. In addition, the Board noted that the Adviser’s directed brokerage program had resulted in a total of approximately $500,000 in directed brokerage credits which were used in reducing expenses of the Funds, and that the Adviser is expanding its ability to generate directed brokerage commissions for the Funds’ U.S. trades.
The Board noted that the Adviser stated that there will be no diminution in the quality or quantity of the services provided to DRIDX or DRGGX. On the basis of the information reviewed, the Board concluded that the advisory fee schedule for each Fund, and as amended for DRIDX and DRGGX, was reasonable and appropriate in light of the nature and quality of services provided by the Adviser.
Profitability. The Board reviewed information regarding revenues received by the Adviser under the Agreement from each Fund and discussed the Adviser’s methodology in allocating its costs to the management of the Funds. The Board considered the estimated costs to the Adviser of managing the Funds. The Board noted that DRIOX is currently closed to new investors in order to maintain assets at a level that the Adviser feels are prudent, which limits the Fund’s profitability to the Adviser. The Board also noted that the Funds do not have a Rule 12b-1 fee or shareholder service fee, and that the Adviser’s affiliate, Driehaus Securities LLC (“DS LLC”), serves as distributor of the Funds without compensation and that DS LLC provides compensation to intermediaries for distribution of Fund shares and for shareholder and administrative services to shareholders, the expense of which is reimbursed by the Adviser under an expense sharing arrangement with DS LLC. The Board concluded that, based on the projected profitability calculated for the Trust as well as for the Funds individually (noting that DRESX, DRGGX, DRMGX and DRLGX were expected to continue to be operated at a loss), the advisory fees appeared to be reasonable.
Economies of Scale. The Board considered whether there are economies of scale with respect to the management of the Funds and whether the Funds benefit from any such economies of scale. Given the size of the Funds and the capacity constraints of the investment style, the Board concluded that the advisory fee rates under the Agreement are reasonable and reflect an appropriate sharing of any such economies of scale, noting the breakpoints in DRIDX’s advisory fee schedule (as further amended effective January 1, 2013).
Other Benefits to the Adviser and its Affiliates. The Board also considered the character and amount of other incidental benefits received by the Adviser and its affiliates. The Board also considered benefits to the Adviser related to soft dollar allocations. The Board concluded that advisory fees were reasonable in light of these fall-out benefits.
Based on all of the information considered and the conclusions reached, the Board determined that the terms of the Agreement continue to be fair and reasonable and that the continuation of the Agreement is in the best interests of each Fund. No single factor was determinative in the Board’s analysis.
80
DRH-AR2012
Driehaus Mutual Funds
Trustees & Officers
Richard H. Driehaus
Trustee
A.R. Umans
Chairman of the Board
Theodore J. Beck
Trustee
Francis J. Harmon
Trustee
Dawn M. Vroegop
Trustee
Daniel F. Zemanek
Trustee
Robert H. Gordon
President
Michelle L. Cahoon
Vice President & Treasurer
Janet L. McWilliams
Assistant Vice President
Michael Shoemaker
Chief Compliance Officer &
Assistant Vice President
Diane J. Drake
Secretary
Michael P. Kailus
Assistant Secretary
William H. Wallace, III
Assistant Secretary
Investment Adviser
Driehaus Capital Management LLC
25 East Erie Street
Chicago, IL 60611
Distributor
Driehaus Securities LLC
25 East Erie Street
Chicago, IL 60611
Administrator & Transfer Agent
UMB Fund Services, Inc.
803 W. Michigan St.
Milwaukee, WI 53233
Custodians
UMB Bank, n.a.
928 Grand Blvd.
Kansas City, MO 64106
The Northern Trust Company
50 South LaSalle Street
Chicago, IL 60603
Annual Report to Shareholders
December 31, 2012

Driehaus Active Income Fund
Driehaus Select Credit Fund
Driehaus International Credit Opportunities Fund
Distributed by:
Driehaus Securities LLC
This report has been prepared for the shareholders of the Funds and is not an offering to sell or buy any Fund securities. Such offering is only made by the Funds’ prospectus.
Table of Contents
Portfolio Managers’ Letter, Performance Overview and Schedule of Investments: | ||||
| 1 | ||||
| 13 | ||||
| 19 | ||||
| 27 | ||||
| 28 | ||||
| 30 | ||||
| 32 | ||||
| 35 | ||||
| 51 | ||||
| 52 | ||||
| 54 | ||||
| 55 | ||||
| 57 | ||||
Board Considerations in Connection with the Annual Review of the Investment Advisory Agreement | 58 | |||
Driehaus Active Income Fund — Portfolio Managers’ Letter
Dear Shareholders,
The Driehaus Active Income Fund (“Fund”) returned 9.34% for the year ending December 31, 2012. This return was above the performance of the Fund’s benchmark index, the Citigroup 3-Month T-Bill Index (the “Benchmark”), which returned 0.07% for the same period. The Fund also outperformed the Barclays Capital U.S. Aggregate Bond Index (the “Index”), which returned 4.22% for the same period.
Generally speaking, 2012 saw most risk assets increase in value. Just about everything finished the year up, save for crude oil and volatility. Returns in fixed income were strong across the board. Falling interest rates aided returns once again in the fixed income market.
Overall, this was a pretty good year for the Fund — one that we felt we owed our investors following a disappointing 2011. Most of the Fund’s gains were generated in the first quarter of the year, as many of the factors that were a headwind to performance in 2011 eased or, in some cases, reversed course. These factors included the rapid shrinkage of capital that large banks devote to trading, the sharp descent in U.S. Treasury yields, and the extraordinarily high correlation of asset prices to the health of Europe’s economy.
For the year, the most significant contributions to returns came from the directional long trading strategy. This strategy consistently contributed to returns, providing positive performance every month of the year. Security selection and a renewed interest in risk assets helped this strategy generate strong returns. Additionally, many of the securities held were high yield names that benefited from spread compression. Other meaningful contributions to the Fund came from the capital structure arbitrage strategy and event driven trades. Event driven trading, which focuses on corporate events such as mergers or company announcements, is an area of the market where we are increasingly finding attractive investment opportunities.
The most significant detractors from performance for the year were the interest rate hedge, the directional short strategy, and the volatility trading strategy. The interest rate hedge, which is constructed by shorting U.S. Treasury futures and U.S. Treasury securities, detracted as the 10-year U.S. Treasury bond yields fell to new lows during the year. The directional short strategy was hampered by a declining interest rate environment. Volatility trades are generally constructed by implementing various option strategies, such as straddles or strangles on the S&P 500 Index or other indices. During the year, as market pressures eased and investors grew more optimistic, market volatility decreased significantly. The Fund generally held long volatility trades that benefit performance only when volatility increases.
One of the benefits of the Fund for investors is the diversification it offers through low correlations to other asset classes. We were particularly pleased with the low correlations of many major asset classes to the Fund during 2012. For the year, the Fund had a correlation between 0.5 and -0.5 (based on daily return data) to the S&P 500 Index, the 10-Year U.S. Treasury, the Barclays Aggregate ETF (AGG), the Investment Grade Bond ETF (LQD), the High Yield Bond ETF (JNK), the HFRX Global Hedge Fund Index, and the Dow Jones-UBS Commodity Index.
In addition to achieving low correlations to many asset classes, the Fund exhibited rather low volatility throughout 2012. The 100-day volatility of the Fund averaged 3.09% and ended the year at 1.76%.
Looking ahead, we expect a lower return environment for fixed income in 2013. Based on our outlook, positive returns within the asset class will be best earned through a tactical approach to the credit markets. We believe investors must tactically take advantage of moves in interest rates and credit spreads to quickly over- and under-weight various exposures in their fixed income portfolio as the year progresses. Additionally, employing hedged strategies to take advantage of mispricings in the market may offer investors a more compelling risk/reward profile than investing in long-only, buy-and-hold strategies. While it will be a challenging year, it won’t be one without opportunities for flexible investment approaches.
1
As always, we at Driehaus Capital Management LLC thank you for your interest in the Driehaus Active Income Fund and would like to express our gratitude to you as shareholders for your continued confidence in our management capabilities.
Sincerely,
 |  |  | ||
| K.C. Nelson | Mirsada Durakovic | Elizabeth Cassidy | ||
| Portfolio Manager | Assistant Portfolio Manager | Assistant Portfolio Manager |
Performance is historical and does not represent future results.
Please see the following performance page for index definitions.
2
Driehaus Active Income Fund
Performance Overview (unaudited)
The performance summarized below is historical and does not represent future results. Investment returns and principal value vary, and you may have a gain or loss when you sell shares. Performance data presented measures the change in the value of an investment in the Fund, assuming reinvestment of all dividends and capital gains. Average annual total return reflects annualized change.
The table does not reflect the deduction of taxes that a shareholder would pay on Fund distributions or the redemption of Fund shares. The graph compares the results of a $25,000 investment (minimum investment) in the Fund since November 8, 2005 (the date of the Predecessor Fund’s inception), with all dividends and capital gains reinvested, with the indicated indices (and dividends reinvested) for the same period.
| Average Annual Total Returns as of 12/31/12 | 1 Year | 3 Years | 5 Years | Since Inception (11/08/05 - 12/31/12) | ||||||||||||
Driehaus Active Income Fund (LCMAX)1 | 9.34% | 2.77% | 5.88% | 4.99% | ||||||||||||
Citigroup 3-Month T-Bill Index2 | 0.07% | 0.09% | 0.45% | 1.71% | ||||||||||||
Barclays Capital U.S. Aggregate Bond Index3 | 4.22% | 6.20% | 5.95% | 6.22% | ||||||||||||
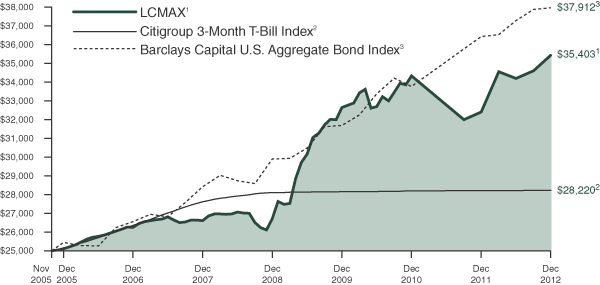
| 1 | The Driehaus Active Income Fund (the “Fund”) performance shown above includes the performance of the Lotsoff Capital Management Active Income Fund (the “Predecessor Fund”) for the periods before the Fund’s registration statement became effective. The Fund received the assets and liabilities of the Predecessor Fund on June 1, 2009 through a reorganization of the Predecessor Fund into the Fund. The Predecessor Fund was a nondiversified fund that was a series of another management investment company registered under the Investment Company Act of 1940, as amended. The Fund had no prior operating history prior to succeeding to the assets of the Predecessor Fund. The Fund has substantially similar investment objectives, strategies, and policies as the Predecessor Fund. Financial and performance information of the Fund includes the Predecessor Fund information. The returns for the periods prior to October 1, 2006, reflect fee waivers and/or reimbursements without which performance would have been lower. |
| 2 | The Citigroup 3-Month T-Bill Index is designed to mirror the performance of the 3 month U.S. Treasury Bill. The Citigroup 3-Month T-Bill Index is unmanaged and its returns reflect reinvestment of all distributions and changes in market prices. |
| 3 | The Barclays Capital U.S. Aggregate Bond Index, an unmanaged index, represents securities that are SEC-registered, taxable and dollar denominated. This index covers the U.S. investment grade fixed rate bond market, with index components for government and corporate securities, mortgage pass-through securities and asset-backed securities. These major sectors are subdivided into more specific indices that are calculated and reported on a regular basis. |
3
Driehaus Active Income Fund
Schedule of Investments
December 31, 2012
| Shares, Principal Amount, or Number of Contracts | Value | |||||||
| ASSET-BACKED SECURITIES — 2.16% | ||||||||
Citigroup Mortgage Loan Trust, Inc. | $ | 387,177 | $ | 188,185 | ||||
Countrywide Asset-Backed Certificates | 122,988 | 116,894 | ||||||
Fannie Mae REMICS | 12,074,982 | 12,215,535 | ||||||
Fannie Mae REMICS | 12,897,745 | 12,920,780 | ||||||
Freddie Mac REMICS | 7,273,055 | 7,273,018 | ||||||
JP Morgan Alternative Loan Trust | 48,702 | 47,967 | ||||||
Merrill Lynch Mortgage Investors, Inc. | 124,929 | 108,045 | ||||||
Wells Fargo Mortgage Loan Trust | 30,699,227 | 29,053,533 | ||||||
|
| |||||||
Total ASSET-BACKED SECURITIES | 61,923,957 | |||||||
|
| |||||||
| BANK LOANS — 12.99% | ||||||||
Commercial Services — 1.28% |
| |||||||
Altegrity, Inc. | 36,788,930 | 36,635,520 | ||||||
Electronics — 0.33% |
| |||||||
NuSil Technology LLC | 9,403,231 | 9,406,146 | ||||||
Entertainment — 1.51% |
| |||||||
Graton Resort & Casino | 18,000,000 | 18,472,500 | ||||||
Peninsula Gaming LLC | 8,500,000 | 8,595,625 | ||||||
WMG Acquisition Corp. 5.25%, 10/25/182 | 16,000,000 | 16,170,080 | ||||||
|
| |||||||
| 43,238,205 | ||||||||
|
| |||||||
Food — 0.64% |
| |||||||
SUPERVALU, Inc. | 18,142,773 | 18,388,789 | ||||||
Holding Companies — Diversified — 0.35% |
| |||||||
Osmose Holdings, Inc. | 1,130,000 | 1,130,000 | ||||||
Osmose Holdings, Inc. | 8,870,000 | 8,870,000 | ||||||
|
| |||||||
| 10,000,000 | ||||||||
|
| |||||||
Internet — 0.44% |
| |||||||
Mood Media Corp. (Canada) | 12,572,184 | 12,544,651 | ||||||
| Shares, Principal Amount, or Number of Contracts | Value | |||||||
Leisure Time — 1.58% |
| |||||||
Equinox Holdings, Inc. | $ | 35,000,000 | $ | 35,262,500 | ||||
Equinox Holdings, Inc. | 10,000,000 | 10,000,000 | ||||||
|
| |||||||
| 45,262,500 | ||||||||
|
| |||||||
Lodging — 0.52% |
| |||||||
MGM Resorts International | 7,000,000 | 6,927,060 | ||||||
MGM Resorts International | 8,000,000 | 8,078,000 | ||||||
|
| |||||||
| 15,005,060 | ||||||||
|
| |||||||
Mining — 0.56% |
| |||||||
American Rock Salt Co. | 16,236,848 | 16,004,499 | ||||||
Oil & Gas — 1.54% |
| |||||||
Chesapeake Energy Corp. | 44,000,000 | 44,011,000 | ||||||
Retail — 3.26% |
| |||||||
Gymboree Corp. | 17,918,025 | 16,439,788 | ||||||
Neiman Marcus Group, Inc. | 59,000,000 | 59,014,750 | ||||||
Party City Holdings, Inc. | 17,955,000 | 18,137,243 | ||||||
|
| |||||||
| 93,591,781 | ||||||||
|
| |||||||
Software — 0.60% |
| |||||||
First Data Corp. | 1,706,469 | 1,704,097 | ||||||
First Data Corp. | 499,771 | 499,076 | ||||||
First Data Corp. | 367,346 | 366,836 | ||||||
First Data Corp. | 15,000,000 | 14,689,350 | ||||||
|
| |||||||
| 17,259,359 | ||||||||
|
| |||||||
Telecommunications — 0.38% |
| |||||||
Arinc, Inc. | 11,172,414 | 10,990,862 | ||||||
|
| |||||||
Total BANK LOANS (Cost $368,373,109) | 372,338,372 | |||||||
|
| |||||||
| CORPORATE BONDS — 42.75% | ||||||||
Banks — 2.73% | ||||||||
Chase Capital II | 11,879,000 | 9,744,059 | ||||||
First Chicago NBD Institutional Capital I 0.86%, 2/1/272 | 725,000 | 594,361 | ||||||
Notes to Financial Statements are an integral part of this Schedule.
4
Driehaus Active Income Fund
Schedule of Investments
December 31, 2012
| Shares, Principal Amount, or Number of Contracts | Value | |||||||
JP Morgan Chase Capital XXIII | $ | 9,000,000 | $ | 6,839,352 | ||||
JPMorgan Chase & Co. | 43,813,000 | 49,640,567 | ||||||
JPMorgan Chase Capital XXI | 15,000,000 | 11,548,545 | ||||||
|
| |||||||
| 78,366,884 | ||||||||
|
| |||||||
Biotechnology — 0.82% |
| |||||||
STHI Holding Corp. | 21,639,000 | 23,424,218 | ||||||
Chemicals — 0.28% | ||||||||
Hexion U.S. Finance Corp. / Hexion Nova Scotia Finance ULC | 2,000,000 | 2,055,000 | ||||||
Momentive Performance Materials, Inc. | 10,240,000 | 5,990,400 | ||||||
|
| |||||||
| 8,045,400 | ||||||||
|
| |||||||
Commercial Services — 1.57% |
| |||||||
DynCorp International, Inc. | 22,780,000 | 20,843,700 | ||||||
Wyle Services Corp. | 22,285,000 | 24,290,650 | ||||||
|
| |||||||
| 45,134,350 | ||||||||
|
| |||||||
Computers — 1.95% |
| |||||||
Seagate HDD Cayman (Cayman Islands) | 36,330,000 | 39,917,587 | ||||||
Seagate HDD Cayman (Cayman Islands) | 15,000,000 | 15,956,250 | ||||||
|
| |||||||
| 55,873,837 | ||||||||
|
| |||||||
Diversified Financial Services — 3.32% |
| |||||||
American Express Co. | 56,843,000 | 61,035,171 | ||||||
General Electric Capital Corp. | 22,000,000 | 24,866,380 | ||||||
Textron Financial Corp. 6.00%, 2/15/671,2 | 10,824,000 | 9,416,880 | ||||||
|
| |||||||
| 95,318,431 | ||||||||
|
| |||||||
Entertainment — 0.71% |
| |||||||
Production Resource Group, Inc. | 27,720,000 | 20,235,600 | ||||||
Healthcare — Products — 1.16% |
| |||||||
ConvaTec Healthcare E S.A. (Luxembourg) 10.50%, 12/15/181,3 | 30,166,000 | 33,258,015 | ||||||
| Shares, Principal Amount, or Number of Contracts | Value | |||||||
Healthcare — Services — 2.72% |
| |||||||
Aurora Diagnostics Holdings / Aurora Diagnostics Financing, Inc. | $ | 17,035,000 | $ | 14,990,800 | ||||
Healthsouth Corp. | 1,348,000 | 1,462,580 | ||||||
Healthsouth Corp. | 18,487,000 | 20,266,374 | ||||||
HealthSouth Corp. | 13,000,000 | 13,227,500 | ||||||
Kindred Healthcare, Inc. | 12,250,000 | 11,913,125 | ||||||
National Mentor, Inc. | 15,850,000 | 16,206,625 | ||||||
|
| |||||||
| 78,067,004 | ||||||||
|
| |||||||
Household Products/Wares — 0.55% |
| |||||||
Armored Autogroup, Inc. | 18,575,000 | 15,742,313 | ||||||
Insurance — 1.12% |
| |||||||
Chubb Corp. | 29,500,000 | 32,155,000 | ||||||
Iron/Steel — 1.27% |
| |||||||
Allegheny Technologies, Inc. | 11,200,000 | 14,249,491 | ||||||
Edgen Murray Corp. | 22,000,000 | 22,220,000 | ||||||
|
| |||||||
| 36,469,491 | ||||||||
|
| |||||||
Leisure Time — 2.39% |
| |||||||
Equinox Holdings, Inc. | 64,877,000 | 68,445,235 | ||||||
Media — 1.14% |
| |||||||
Clear Channel Worldwide Holdings, Inc. | 810,000 | 832,275 | ||||||
Clear Channel Worldwide Holdings, Inc. | 2,190,000 | 2,272,125 | ||||||
ProQuest LLC/ProQuest Notes Co. | 31,325,000 | 29,602,125 | ||||||
|
| |||||||
| 32,706,525 | ||||||||
|
| |||||||
Metal Fabricate/Hardware — 0.21% |
| |||||||
Dynacast International LLC / Dynacast Finance, Inc. | 5,527,000 | 5,913,890 | ||||||
Notes to Financial Statements are an integral part of this Schedule.
5
Driehaus Active Income Fund
Schedule of Investments
December 31, 2012
| Shares, Principal Amount, or Number of Contracts | Value | |||||||
Miscellaneous Manufacturing — 2.56% |
| |||||||
Amsted Industries, Inc. 8.13%, 3/15/181 | $ | 34,990,000 | $ | 37,439,300 | ||||
GE Capital Trust I | 34,140,000 | 35,975,025 | ||||||
|
| |||||||
| 73,414,325 | ||||||||
|
| |||||||
Oil & Gas — 2.50% |
| |||||||
Chesapeake Energy Corp. | 24,820,000 | 28,170,700 | ||||||
Comstock Resources, Inc. | 3,000,000 | 3,225,000 | ||||||
PetroBakken Energy Ltd. (Canada) | 2,000,000 | 2,030,000 | ||||||
Venoco, Inc. | 40,780,000 | 38,231,250 | ||||||
|
| |||||||
| 71,656,950 | ||||||||
|
| |||||||
Packaging & Containers — 1.07% |
| |||||||
Berry Plastics Corp. | 14,000,000 | 14,000,000 | ||||||
Berry Plastics Corp. | 14,500,000 | 16,711,250 | ||||||
|
| |||||||
| 30,711,250 | ||||||||
|
| |||||||
Pipelines — 1.25% |
| |||||||
Enbridge Energy Partners LP | 31,500,000 | 35,778,298 | ||||||
Retail — 6.77% |
| |||||||
Claire’s Stores, Inc. | 11,000,000 | 11,797,500 | ||||||
Michaels Stores, Inc. | 18,730,000 | 19,572,850 | ||||||
Michaels Stores, Inc. | 39,800,000 | 43,680,500 | ||||||
Michaels Stores, Inc. | 5,000,000 | 5,487,500 | ||||||
Rite Aid Corp. | 11,400,000 | 11,713,500 | ||||||
Rite Aid Corp. | 35,350,000 | 37,382,625 | ||||||
Rite Aid Corp. | 30,000,000 | 30,825,000 | ||||||
Rite Aid Corp. | 13,850,000 | 14,455,937 | ||||||
Rite Aid Corp. | 3,000,000 | 3,420,000 | ||||||
Rite Aid Corp. | 14,800,000 | 15,762,000 | ||||||
|
| |||||||
| 194,097,412 | ||||||||
|
| |||||||
Software — 1.82% |
| |||||||
First Data Corp. | 16,500,000 | 16,335,000 | ||||||
First Data Corp. | 22,250,000 | 22,472,500 | ||||||
| Shares, Principal Amount, or Number of Contracts | Value | |||||||
SSI Investments II/SSI Co.-Issuer LLC | $ | 12,000,000 | $ | 13,275,000 | ||||
|
| |||||||
| 52,082,500 | ||||||||
|
| |||||||
Telecommunications — 4.84% |
| |||||||
Clearwire Communications LLC/Clearwire Finance, Inc. | 36,600,000 | 39,162,000 | ||||||
Clearwire Communications LLC/Clearwire Finance, Inc. | 22,000,000 | 23,870,000 | ||||||
CommScope, Inc. | 52,300,000 | 57,268,500 | ||||||
Nortel Networks Ltd. (Canada) | 10,000,000 | 11,450,000 | ||||||
Nortel Networks Ltd. (Canada) | 6,000,000 | 6,885,000 | ||||||
|
| |||||||
| 138,635,500 | ||||||||
|
| |||||||
Total CORPORATE BONDS | 1,225,532,428 | |||||||
|
| |||||||
| CONVERTIBLE CORPORATE BONDS — 10.27% | ||||||||
Auto Manufacturers — 2.11% |
| |||||||
Ford Motor Co. | 38,150,000 | 60,467,750 | ||||||
Electrical Components & Equipment — 1.91% |
| |||||||
SunPower Corp. | 45,534,000 | 42,232,785 | ||||||
Suntech Power Holdings Co., Ltd. (China) 3.00%, 3/15/133 | 27,872,000 | 12,681,760 | ||||||
|
| |||||||
| 54,914,545 | ||||||||
|
| |||||||
Internet — 1.72% | ||||||||
Equinix, Inc. | 13,600,000 | 26,528,500 | ||||||
WebMD Health Corp. | 24,450,000 | 22,799,625 | ||||||
|
| |||||||
| 49,328,125 | ||||||||
|
| |||||||
Lodging — 1.96% | ||||||||
Gaylord Entertainment Co. | 13,730,000 | 23,907,363 | ||||||
MGM Resorts International | 30,500,000 | 32,272,812 | ||||||
|
| |||||||
| 56,180,175 | ||||||||
|
| |||||||
Notes to Financial Statements are an integral part of this Schedule.
6
Driehaus Active Income Fund
Schedule of Investments
December 31, 2012
| Shares, Principal Amount, or Number of Contracts | Value | |||||||
Real Estate Investment Trusts — 1.05% |
| |||||||
Host Hotels & Resorts LP | $ | 23,000,000 | $ | 30,000,625 | ||||
Telecommunications — 1.52% |
| |||||||
Alcatel-Lucent USA, Inc. | 5,000,000 | 4,587,500 | ||||||
Anixter International, Inc. | 20,800,000 | 23,738,000 | ||||||
Nortel Networks Corp. (Canada) | 6,000,000 | 6,057,000 | ||||||
Nortel Networks Corp. (Canada) | 9,000,000 | 9,123,750 | ||||||
|
| |||||||
| 43,506,250 | ||||||||
|
| |||||||
Total CONVERTIBLE CORPORATE BONDS | 294,397,470 | |||||||
|
| |||||||
| U.S. GOVERNMENT AND AGENCY SECURITY — 0.03% | ||||||||
Freddie Mac Non Gold Pool | 868,439 | 923,388 | ||||||
|
| |||||||
Total U.S. GOVERNMENT AND AGENCY SECURITIES (Cost $868,413) | 923,388 | |||||||
|
| |||||||
| COMMON STOCK — 1.20% | ||||||||
Auto Manufacturers — 0.94% |
| |||||||
General Motors Co.* | 701,946 | 20,237,103 | ||||||
Motors Liquidation Co. GUC Trust | 313,752 | 6,651,543 | ||||||
|
| |||||||
| 26,888,646 | ||||||||
|
| |||||||
Software — 0.26% | ||||||||
Microsoft Corp. | 280,637 | 7,501,427 | ||||||
|
| |||||||
Total COMMON STOCK (Cost $22,519,119) | 34,390,073 | |||||||
|
| |||||||
| CONVERTIBLE PREFERRED STOCK — 2.53% | ||||||||
Auto Manufacturers — 0.00% |
| |||||||
General Motors Corp. Senior Convertible Preferred Escrow — B 5.25%, 3/6/344 | 475,000 | — | ||||||
General Motors Corp. Senior Convertible Preferred Escrow — C | 11,790,650 | — | ||||||
|
| |||||||
| — | ||||||||
|
| |||||||
Banks — 0.84% | ||||||||
Bank of America Corp. | 21,322 | 24,200,470 | ||||||
| Shares, Principal Amount, or Number of Contracts | Value | |||||||
Telecommunications — 1.69% |
| |||||||
Lucent Technologies Capital Trust I | 58,412 | $ | 48,462,684 | |||||
|
| |||||||
Total CONVERTIBLE PREFERRED STOCK (Cost $75,433,596) | 72,663,154 | |||||||
|
| |||||||
| PREFERRED STOCKS — 3.33% | ||||||||
Banks — 0.36% | ||||||||
Goldman Sachs Group, Inc. | 400,000 | 10,448,000 | ||||||
Holding Companies — Diversified — 1.78% |
| |||||||
Pitney Bowes International Holdings, Inc. | 57,130 | 50,920,683 | ||||||
Telecommunications — 1.19% |
| |||||||
Centaur Funding Corp. (Cayman Islands) | 27,242 | 34,137,631 | ||||||
|
| |||||||
Total PREFERRED STOCKS | 95,506,314 | |||||||
|
| |||||||
| PURCHASED PUT OPTIONS — 0.52% | ||||||||
Standard & Poor’s 500 Index, Exercise Price: $1,250.00, Expiration Date: January, 2013* | 2,223 | 200,070 | ||||||
Standard & Poor’s 500 Index, Exercise Price: $1,400.00, Expiration Date: January, 2013* | 2,223 | 2,556,450 | ||||||
Standard & Poor’s 500 Index, Exercise Price: $1,300.00, Expiration Date: January, 2013* | 2,800 | 490,000 | ||||||
Standard & Poor’s 500 Index, Exercise Price: $1,460.00, Expiration Date: January, 2013* | 2,800 | 11,522,000 | ||||||
|
| |||||||
Total PURCHASED PUT OPTIONS | 14,768,520 | |||||||
|
| |||||||
| SHORT-TERM INVESTMENTS — 24.86% | ||||||||
UMB Money Market Fiduciary 0.01% | 712,702,135 | 712,702,135 | ||||||
|
| |||||||
Total SHORT-TERM INVESTMENTS | 712,702,135 | |||||||
|
| |||||||
Notes to Financial Statements are an integral part of this Schedule.
7
Driehaus Active Income Fund
Schedule of Investments
December 31, 2012
| Shares, Principal Amount, or Number of Contracts | Value | |||||||
WARRANTS — 0.49% | ||||||||
General Motors Co. — CW 19, Strike Price $18.33, Expiration Date 7/10/19* | 1,136,155 | $ | 14,190,576 | |||||
|
| |||||||
Total WARRANTS | 14,190,576 | |||||||
|
| |||||||
| ||||||||
TOTAL INVESTMENTS (Cost $2,838,759,582) | 101.13 | % | $ | 2,899,336,387 | ||||
Liabilities less Other Assets | (1.13 | )% | (32,314,915 | ) | ||||
|
|
|
| |||||
| Net Assets | 100.00 | % | $ | 2,867,021,472 | ||||
| ||||||||
| ||||||||
| SECURITIES SOLD SHORT — (8.99)% | ||||||||
| CORPORATE BONDS — (2.58)% | ||||||||
Auto Manufacturers — (1.16)% |
| |||||||
Chrysler Group LLC/CG Co.-Issuer, Inc. | $ | (30,250,000 | ) | (33,275,000 | ) | |||
Chemicals — (0.24)% |
| |||||||
Huntsman International LLC | (6,000,000 | ) | (6,915,000 | ) | ||||
Lodging — (0.49)% |
| |||||||
MGM Resorts International | (13,000,000 | ) | (14,040,000 | ) | ||||
Oil & Gas — (0.60)% |
| |||||||
Chesapeake Energy Corp. | (16,000,000 | ) | (17,160,000 | ) | ||||
Retail — (0.09)% |
| |||||||
Party City Holdings, Inc. 8.88%, 8/1/201 | (2,250,000 | ) | (2,435,625 | ) | ||||
|
| |||||||
Total CORPORATE BONDS (Proceeds $66,951,792) | (73,825,625 | ) | ||||||
|
| |||||||
| CONVERTIBLE CORPORATE BONDS — (1.60)% | ||||||||
Software — (1.32)% |
| |||||||
Microsoft Corp. | (37,500,000 | ) | (37,898,437 | ) | ||||
Telecommunications — (0.28)% |
| |||||||
Alcatel-Lucent USA, Inc. 2.88%, 6/15/25 | (7,850,000 | ) | (7,957,938 | ) | ||||
|
| |||||||
Total CONVERTIBLE CORPORATE BONDS (Proceeds $44,957,653) | (45,856,375 | ) | ||||||
|
| |||||||
| Shares, Principal Amount, or Number of Contracts | Value | |||||||
| COMMON STOCK — (4.62)% | ||||||||
Auto Manufacturers — (1.58)% |
| |||||||
Ford Motor Co. | (3,491,935 | ) | $ | (45,220,558 | ) | |||
Banks — (0.25)% |
| |||||||
Bank of America Corp. | (628,321 | ) | (7,288,524 | ) | ||||
Healthcare — Services — (0.05)% |
| |||||||
Kindred Healthcare, | (126,521 | ) | (1,368,957 | ) | ||||
Internet — (0.91)% |
| |||||||
Equinix, Inc.* | (121,311 | ) | (25,014,328 | ) | ||||
WebMD Health Corp.* | (71,575 | ) | (1,026,386 | ) | ||||
|
| |||||||
| (26,040,714 | ) | |||||||
|
| |||||||
Lodging — (0.64)% |
| |||||||
MGM Resorts International* | (132,300 | ) | (1,539,972 | ) | ||||
Ryman Hospitality Properties | (438,718 | ) | (16,873,094 | ) | ||||
|
| |||||||
| (18,413,066 | ) | |||||||
|
| |||||||
Real Estate Investment Trusts — (0.65)% |
| |||||||
Host Hotels & Resorts, Inc. | (1,193,449 | ) | (18,701,346 | ) | ||||
Telecommunications — (0.54)% |
| |||||||
Anixter International, Inc. | (241,571 | ) | (15,455,712 | ) | ||||
|
| |||||||
Total COMMON STOCK (Proceeds $128,004,690) | (132,488,877 | ) | ||||||
|
| |||||||
WRITTEN PUT OPTIONS — (0.19)% |
| |||||||
Standard & Poor’s 500 Index, Exercise Price: $1,325.00, Expiration Date: January, 2013* | (4,447 | ) | (1,111,750 | ) | ||||
Standard & Poor’s 500 Index, Exercise Price: $1,380.00, Expiration Date: January, 2013* | (5,600 | ) | (4,373,600 | ) | ||||
|
| |||||||
Total WRITTEN PUT OPTIONS (Proceeds $20,798,313) | (5,485,350 | ) | ||||||
|
| |||||||
| ||||||||
TOTAL INVESTMENT | (8.99 | )% | $ | (257,656,227 | ) | |||
| ||||||||
Notes to Financial Statements are an integral part of this Schedule.
8
Driehaus Active Income Fund
Schedule of Investments
December 31, 2012
| * | Non-income producing security. |
| 1 | 144A restricted security. |
| 2 | Variable rate security. |
| 3 | Foreign security denominated in U.S. dollars and traded on a U.S. exchange. |
| 4 | Security valued at fair value as determined in good faith by Driehaus Capital Management LLC, investment adviser to the Fund, in accordance with procedures established by, and under the general supervision of, the Fund’s Board of Trustees. |
| 5 | Security is in default. |
Percentages are stated as a percent of net assets.
Notes to Financial Statements are an integral part of this Schedule.
9
Driehaus Active Income Fund
Schedule of Investments
December 31, 2012
SWAP CONTRACTS
Credit Default Swaps
| Counterparty | Reference Instrument | Currency | Notional AmountB | Pay/ ReceiveA Fixed Rate | Fixed Rate | Expiration Date | Premium Paid (Received) | Unrealized Appreciation/ (Depreciation) | Credit Event | RatingC | ||||||||||||||||||||||
Goldman Sachs | Alcatel-Lucent USA, Inc. 6.50%, 1/15/28 | USD | 43,500,000 | Pay | 5.00 | % | 9/20/2014 | $ | 3,756,250 | $ | (4,402,832 | ) | Bankruptcy/FTP | CCC+ | ||||||||||||||||||
Morgan Stanley | American Express Co. 5.50%, 9/12/16 | USD | 20,000,000 | Pay | 1.00 | 12/20/2016 | 263,406 | (143,001 | ) | Bankruptcy/FTP | NR | |||||||||||||||||||||
Goldman Sachs | American Express Co. 5.50%, 9/12/16 | USD | 5,000,000 | Pay | 1.00 | 12/20/2016 | 61,174 | (590,714 | ) | Bankruptcy/FTP | NR | |||||||||||||||||||||
Goldman Sachs | Bank of America Corp. 6.25%, 4/15/12 | USD | 10,000,000 | Pay | 1.00 | 12/20/2016 | 1,499,776 | (1,472,458 | ) | Bankruptcy/FTP | NR | |||||||||||||||||||||
Goldman Sachs | Boston Properties L.P. 6.25%, 1/15/13 | USD | 11,000,000 | Pay | 1.00 | 9/20/2014 | 848,323 | (980,413 | ) | Bankruptcy/FTP | NR | |||||||||||||||||||||
Goldman Sachs | Brunswick Corp. 7.13%, 8/1/27 | USD | 10,000,000 | Pay | 5.00 | 12/20/2014 | 40,542 | (930,229 | ) | Bankruptcy/FTP | BB- | |||||||||||||||||||||
Goldman Sachs | Brunswick Corp. 7.13%, 8/1/27 | USD | 10,000,000 | Pay | 5.00 | 12/20/2014 | (143,212 | ) | (746,475 | ) | Restructuring/ Bankruptcy/FTP | BB- | ||||||||||||||||||||
Goldman Sachs | Centex Corp. 5.25%, 6/15/15 | USD | 5,000,000 | Pay | 4.21 | 3/20/2013 | — | (51,678 | ) | Bankruptcy/FTP | BB- | |||||||||||||||||||||
Merrill Lynch | Citigroup, Inc. 6.13%, 5/15/18 | USD | 5,000,000 | Pay | 1.00 | 12/20/2016 | 432,520 | (420,794 | ) | Bankruptcy/FTP | A- | |||||||||||||||||||||
Goldman Sachs | Citigroup, Inc. 6.13%, 5/15/18 | USD | 5,000,000 | Pay | 1.00 | 12/20/2016 | 379,663 | (367,937 | ) | Bankruptcy/FTP | A- | |||||||||||||||||||||
Goldman Sachs | Continental Airlines, Inc. 5.00%, 6/15/23 | USD | 1,000,000 | Receive | 5.00 | 6/20/2013 | (400,000 | ) | 412,775 | Bankruptcy/FTP | NR | |||||||||||||||||||||
Goldman Sachs | Continental Airlines, Inc. 5.00%, 6/15/23 | USD | 1,000,000 | Receive | 5.00 | 6/20/2013 | (290,000 | ) | 302,775 | Bankruptcy/FTP | NR | |||||||||||||||||||||
Goldman Sachs | CVS Caremark Corp. 4.88%, 9/15/14 | USD | 10,000,000 | Pay | 1.00 | 9/20/2014 | (286,840 | ) | 136,761 | Bankruptcy/FTP | BBB+ | |||||||||||||||||||||
Goldman Sachs | Dow Jones CDX NA High Yield Series II Index | USD | 7,470,000 | Pay | 5.00 | 12/20/2013 | 2,058,919 | (2,348,342 | ) | Bankruptcy/FTP | NR | |||||||||||||||||||||
Morgan Stanley | Enbridge Energy, L.P. 4.75%, 6/1/13 | USD | 10,000,000 | Pay | 1.00 | 6/20/2015 | 56,732 | (166,539 | ) | Bankruptcy/FTP | BBB | |||||||||||||||||||||
Goldman Sachs | First Data Corp. 9.88%, 9/24/15 | USD | 5,000,000 | Pay | 5.00 | 6/20/2016 | 350,000 | (192,779 | ) | Bankruptcy/FTP | B- | |||||||||||||||||||||
Goldman Sachs | First Data Corp. 9.88%, 9/24/15 | USD | 3,000,000 | Pay | 5.00 | 3/10/2017 | 540,000 | (307,669 | ) | Bankruptcy/FTP | B- | |||||||||||||||||||||
Morgan Stanley | First Data Corp. 9.88%, 9/24/15 | USD | 10,000,000 | Pay | 5.00 | 3/10/2017 | 1,150,000 | (375,562 | ) | Bankruptcy/FTP | B- | |||||||||||||||||||||
Goldman Sachs | H.J. Heinz Co. 6.38%, 7/15/28 | USD | 10,000,000 | Pay | 1.00 | 9/20/2014 | (320,193 | ) | 169,170 | Bankruptcy/FTP | BBB+ | |||||||||||||||||||||
Goldman Sachs | Host Hotels & Resorts, Inc. 6.75%, 6/1/16 | USD | 10,000,000 | Pay | 1.00 | 12/20/2016 | 1,067,644 | (1,003,648 | ) | Bankruptcy/FTP | BB+ | |||||||||||||||||||||
Goldman Sachs | Huntsman Corp. 11.50%, 7/15/12 | USD | 5,000,000 | Pay | 5.00 | 12/20/2016 | 124,119 | (563,190 | ) | Bankruptcy/FTP | NR | |||||||||||||||||||||
Goldman Sachs | iStar Financial, Inc. 6.00%, 12/15/10 | USD | 4,000,000 | Pay | 5.50 | 3/20/2013 | — | (46,052 | ) | Bankruptcy/FTP | NR | |||||||||||||||||||||
Notes to Financial Statements are an integral part of this Schedule.
10
Driehaus Active Income Fund
Schedule of Investments
December 31, 2012
| Counterparty | Reference Instrument | Currency | Notional AmountB | Pay/ ReceiveA Fixed Rate | Fixed Rate | Expiration Date | Premium Paid (Received) | Unrealized Appreciation/ (Depreciation) | Credit Event | RatingC | ||||||||||||||||||||||
Goldman Sachs | iStar Financial, Inc. 6.00%, 12/15/10 | USD | 4,000,000 | Pay | 5.05 | % | 6/20/2013 | $ | — | $ | (81,732 | ) | Bankruptcy/FTP | NR | ||||||||||||||||||
Goldman Sachs | iStar Financial, Inc. 5.95%, 10/15/13 | USD | 5,000,000 | Pay | 5.00 | 6/20/2013 | 700,000 | (800,902 | ) | Bankruptcy/FTP | B+ | |||||||||||||||||||||
Goldman Sachs | iStar Financial, Inc. 5.95%, 10/15/13 | USD | 5,000,000 | Pay | 5.00 | 6/20/2013 | 725,000 | (825,902 | ) | Restructuring/ Bankruptcy/FTP | B+ | |||||||||||||||||||||
Goldman Sachs | Limited Brands, Inc. 6.13%, 12/1/12 | USD | 4,150,000 | Pay | 3.38 | 6/20/2013 | — | (62,994 | ) | Restructuring/ Bankruptcy/FTP | NR | |||||||||||||||||||||
Goldman Sachs | Limited Brands, Inc. 6.13%, 12/1/12 | USD | 4,700,000 | Pay | 2.55 | 6/20/2013 | — | (51,691 | ) | Restructuring/ Bankruptcy/FTP | NR | |||||||||||||||||||||
Goldman Sachs | Limited Brands, Inc. 6.90%, 7/15/17 | USD | 15,000,000 | Pay | 1.00 | 12/20/2015 | 679,159 | (564,628 | ) | Restructuring/ Bankruptcy/FTP | BB- | |||||||||||||||||||||
Goldman Sachs | Liz Claiborne, Inc. 5.00%, 7/8/13 | USD | 15,000,000 | Pay | 5.00 | 9/20/2014 | 1,875,000 | (2,870,433 | ) | Restructuring/ Bankruptcy/FTP | CCC+ | |||||||||||||||||||||
Goldman Sachs | Liz Claiborne, Inc. 5.00%, 7/8/13 | USD | 15,000,000 | Pay | 5.00 | 12/20/2014 | 1,087,500 | (2,170,688 | ) | Restructuring/ Bankruptcy/FTP | CCC+ | |||||||||||||||||||||
Goldman Sachs | The Markit CDX NA High Yield Series 16 Index | USD | 14,200,000 | Pay | 5.00 | 12/20/2016 | 1,500,750 | (1,873,098 | ) | Bankruptcy/FTP | NA | |||||||||||||||||||||
Merrill Lynch | The Markit CDX NA High Yield Series 16 Index | USD | 5,000,000 | Pay | 5.00 | 12/20/2016 | 550,000 | (681,108 | ) | Bankruptcy/FTP | NA | |||||||||||||||||||||
Goldman Sachs | The Markit iTraxx Europe Crossover Index Series 17 | EUR | 25,000,000 | Pay | 5.00 | 6/20/2017 | 1,152,303 | (2,286,876 | ) | Bankruptcy/FTP | NA | |||||||||||||||||||||
Goldman Sachs | Masco Corp. 6.13%, 10/3/16 | USD | 15,000,000 | Pay | 1.00 | 12/20/2015 | 1,047,333 | (948,313 | ) | Bankruptcy/FTP | BBB- | |||||||||||||||||||||
Morgan Stanley | Masco Corp. 6.13%, 10/3/16 | USD | 4,500,000 | Pay | 1.00 | 3/20/2016 | 273,169 | (229,626 | ) | Bankruptcy/FTP | BBB- | |||||||||||||||||||||
Goldman Sachs | Newell Rubbermaid, Inc. 5.50%, 4/15/13 | USD | 30,000,000 | Pay | 1.00 | 6/20/2014 | 620,488 | (979,534 | ) | Bankruptcy/FTP | BBB- | |||||||||||||||||||||
Merrill Lynch | Pitney Bowes, Inc. 4.63%, 10/1/12 | USD | 20,000,000 | Pay | 1.00 | 3/20/2016 | 436,253 | 690,889 | Bankruptcy/FTP | NR | ||||||||||||||||||||||
Goldman Sachs | Pitney Bowes, Inc. 6.25%, 3/15/19 | USD | 5,000,000 | Pay | 1.00 | 9/20/2016 | 164,656 | 253,347 | Bankruptcy/FTP | BBB | ||||||||||||||||||||||
Morgan Stanley | Pitney Bowes, Inc. 6.25%, 3/15/19 | USD | 5,000,000 | Pay | 1.00 | 12/20/2016 | 244,614 | 237,306 | Bankruptcy/FTP | BBB | ||||||||||||||||||||||
Goldman Sachs | RadioShack Corp. 7.38%, 5/15/11 | USD | 9,000,000 | Pay | 2.27 | 9/20/2013 | — | 406,092 | Bankruptcy/FTP | NR | ||||||||||||||||||||||
Goldman Sachs | Realogy Corp. 10.50%, 4/15/14 | USD | 3,000,000 | Pay | 5.00 | 3/20/2016 | 285,000 | (473,134 | ) | Bankruptcy/FTP | CC | |||||||||||||||||||||
Merrill Lynch | Realogy Corp. 10.50%, 4/15/14 | USD | 2,000,000 | Pay | 5.00 | 3/20/2016 | 190,000 | (315,423 | ) | Bankruptcy/FTP | CC | |||||||||||||||||||||
Merrill Lynch | Rite Aid Corp. 7.70%, 2/15/27 | USD | 10,000,000 | Pay | 5.00 | 12/20/2013 | 700,000 | (1,079,549 | ) | Bankruptcy/FTP | CCC | |||||||||||||||||||||
Goldman Sachs | Saks, Inc. 2.00%, 3/15/24 | USD | 10,000,000 | Pay | 5.00 | 12/20/2016 | 406,250 | (1,382,595 | ) | Bankruptcy/FTP | NR | |||||||||||||||||||||
Morgan Stanley | Sprint Nextel Corp. 6.00%, 12/1/16 | USD | 5,000,000 | Pay | 5.00 | 3/20/2016 | (354,760 | ) | (162,454 | ) | Bankruptcy/FTP | B+ | ||||||||||||||||||||
Notes to Financial Statements are an integral part of this Schedule.
11
Driehaus Active Income Fund
Schedule of Investments
December 31, 2012
| Counterparty | Reference Instrument | Currency | Notional AmountB | Pay/ ReceiveA Fixed Rate | Fixed Rate | Expiration Date | Premium Paid (Received) | Unrealized Appreciation/ (Depreciation) | Credit Event | RatingC | ||||||||||||||||||||||
Goldman Sachs | Standard Pacific Corp. 7.00%, 8/15/15 | USD | 4,000,000 | Receive | 6.70 | % | 9/20/2013 | $ | — | $ | 188,734 | Bankruptcy/FTP | B | |||||||||||||||||||
Goldman Sachs | The Chubb Corp. 6.60%, 8/15/18 | USD | 10,000,000 | Pay | 1.00 | 12/20/2014 | (242,813 | ) | 81,482 | Bankruptcy/FTP | A+ | |||||||||||||||||||||
Goldman Sachs | The Chubb Corp. 6.60%, 8/15/18 | USD | 10,000,000 | Pay | 1.00 | 3/20/2015 | (257,326 | ) | 79,028 | Bankruptcy/FTP | A+ | |||||||||||||||||||||
Goldman Sachs | TRW Automotive, Inc. 7.25%, 3/15/17 | USD | 5,000,000 | Pay | 5.00 | 3/20/2015 | 92,579 | (559,731 | ) | Bankruptcy/FTP | BB | |||||||||||||||||||||
Goldman Sachs | TRW Automotive, Inc. 7.25%, 3/15/17 | USD | 3,000,000 | Pay | 5.00 | 6/20/2015 | (133,100 | ) | (165,264 | ) | Bankruptcy/FTP | BB | ||||||||||||||||||||
Goldman Sachs | Tyson Foods, Inc. 6.85%, 4/1/16 | USD | 6,000,000 | Pay | 3.05 | 9/20/2013 | — | (130,934 | ) | Bankruptcy/FTP | BBB- | |||||||||||||||||||||
Goldman Sachs | Vornado Realty L.P. 4.75%, 12/1/10 | USD | 5,500,000 | Pay | 1.50 | 6/20/2013 | — | (37,159 | ) | Restructuring/ Bankruptcy/FTP | NR | |||||||||||||||||||||
Morgan Stanley | Vulcan Materials Co. 6.40%, 11/30/17 | USD | 5,000,000 | Pay | 5.00 | 12/20/2016 | 255,000 | (855,101 | ) | Bankruptcy/FTP | BB | |||||||||||||||||||||
|
|
|
| |||||||||||||||||||||||||||||
Total Credit Default Swaps |
| 23,185,878 | (31,740,822 | ) | ||||||||||||||||||||||||||||
|
|
|
| |||||||||||||||||||||||||||||
Total Swap Contracts |
| $ | 23,185,878 | $ | (31,740,822 | ) | ||||||||||||||||||||||||||
|
|
|
| |||||||||||||||||||||||||||||
| A | If the Fund is paying a fixed rate, the counterparty acts as guarantor of the variable instrument and thus the Fund is a buyer of protection. If the Fund is receiving a fixed rate, the Fund acts as guarantor of the variable instrument and thus is a seller of protection. |
| B | For contracts to sell protection, the notional amount is equal to the maximum potential amount of the future payments and no recourse has been entered into in association with the contracts. |
| C | Based on Moody’s or Standard & Poor’s credit rating for the underlying reference instrument entity (unaudited). |
FTP=Failure to Pay
NR=Not Rated
NA=Not Applicable
EUR — Euro
USD — United States Dollar
FUTURES CONTRACTS
| Futures Contracts | Number of Contracts Long/(Short) | Expiration Date | Unrealized Appreciation/ (Depreciation) | |||||||||
U.S. 5 Year Treasury Note | (1,244 | ) | March 2013 | $ | 308,674 | |||||||
U.S. 10 Year Treasury Note | (2,676 | ) | March 2013 | 2,378,691 | ||||||||
U.S. 30 Year Treasury Note | (212 | ) | March 2013 | 714,228 | ||||||||
|
| |||||||||||
Total Futures Contracts | $ | 3,401,593 | ||||||||||
|
| |||||||||||
Notes to Financial Statements are an integral part of this Schedule.
12
Driehaus Select Credit Fund — Portfolio Managers’ Letter
Dear Shareholders,
The Driehaus Select Credit Fund (“Fund”) returned 8.37% for the year ending December 31, 2012. This return was above the performance of the Fund’s benchmark index, the Citigroup 3-Month T-Bill Index (the “Benchmark”), which returned 0.07% for the same period. The Fund underperformed the BofA Merrill Lynch U.S. High Yield Index (the “Index”), which returned 15.58% for the same period.
Generally speaking, 2012 saw most risk assets increase in value. Just about everything finished the year up, save for crude oil and volatility. Returns in fixed income were strong across the board. Falling interest rates aided returns once again in the fixed income market.
Overall, this was a pretty good year for the Fund — one that we felt we owed our investors following a disappointing 2011. Most of the Fund’s gains were generated in the first quarter of the year, as many of the factors that were a headwind to performance in 2011 eased or, in some cases, reversed course. These factors included the rapid shrinkage of capital that large banks devote to trading, the sharp descent in U.S. Treasury yields, and the extraordinarily high correlation of asset prices to the health of Europe’s economy.
For the year, the most significant contributions to returns came from the directional long strategy. Security selection and a renewed interest in risk assets helped this strategy generate strong returns. Additionally, many of the securities held were high yield names that benefited from spread compression. Other meaningful contributions to the Fund came from the capital structure arbitrage strategy and event driven trades. Event driven trading, which focuses on corporate events such as mergers or company announcements, is an area of the market where we are increasingly finding attractive investment opportunities.
The most significant detractor from performance for the year came from the volatility trading strategy. Volatility trades are generally constructed by implementing various option strategies, such as straddles or strangles on the S&P 500 Index or other indices. During the year, as market pressures eased and investors grew more optimistic, market volatility decreased significantly. The Fund generally held long volatility trades that benefit performance only when volatility increases. In addition, the directional short strategy was hampered by a declining interest rate environment.
One of the benefits of the Fund for investors is the diversification it offers through low correlations to other asset classes. We were particularly pleased with the low correlations of many major asset classes to the Fund during 2012. For the year, the Fund had a correlation between 0.5 and -0.5 (based on daily return data) to the S&P 500 Index, the 10-Year U.S. Treasury, the Barclays Aggregate ETF (AGG), the Investment Grade Bond ETF (LQD), the High Yield Bond ETF (JNK), the HFRX Global Hedge Fund Index, and the Dow Jones-UBS Commodity Index.
In addition to achieving low correlations to many asset classes, the Fund exhibited rather low volatility throughout 2012. The 100-day volatility of the Fund averaged 3.59% and ended the year at 2.78%.
Looking ahead, we expect a lower return environment for fixed income in 2013. Based on our outlook, positive returns within the asset class will be best earned through a tactical approach to the credit markets. We believe investors must tactically take advantage of moves in interest rates and credit spreads to quickly over- and under-weight various exposures in their fixed income portfolio as the year progresses. Additionally, employing hedged strategies to take advantage of mispricings in the market may offer investors a more compelling risk/reward profile than investing in long-only, buy-and-hold strategies. While it will be a challenging year, it won’t be one without opportunities for flexible investment approaches.
As always, we at Driehaus Capital Management LLC thank you for your interest in the Driehaus Select Credit Fund and would like to express our gratitude to you as shareholders for your continued confidence in our management capabilities.
Sincerely,
| | | ||
| K.C. Nelson | Mirsada Durakovic | Elizabeth Cassidy | ||
| Portfolio Manager | Assistant Portfolio Manager | Assistant Portfolio Manager |
Performance is historical and does not represent future results.
Please see the following performance page for index definitions.
13
Driehaus Select Credit Fund
Performance Overview (unaudited)
The performance summarized below is historical and does not represent future results. Investment returns and principal value vary, and you may have a gain or loss when you sell shares. Performance data presented measures the change in the value of an investment in the Fund, assuming reinvestment of all dividends and capital gains.
The table does not reflect the deduction of taxes that a shareholder would pay on Fund distributions or the redemption of Fund shares. The graph compares the results of a $25,000 investment (minimum investment) in the Fund since September 30, 2010 (the date of the Fund’s inception), with all dividends and capital gains reinvested, with the indicated indices (and dividends reinvested) for the same period.
| Average Annual Total Returns as of 12/31/12 | 1 Year | Since Inception (09/30/10 - 12/31/12) | ||||||
Driehaus Select Credit Fund (DRSLX)1 | 8.37% | 3.95% | ||||||
Citigroup 3-Month T-Bill Index2 | 0.07% | 0.08% | ||||||
BofA Merrill Lynch U.S. High Yield Index3 | 15.58% | 10.16% | ||||||
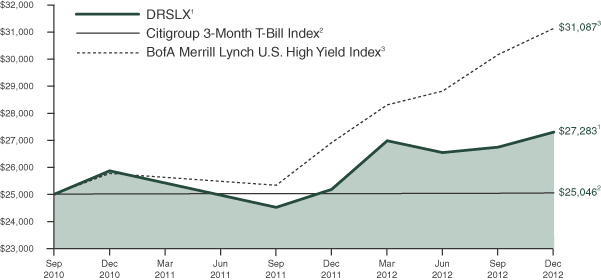
| 1 | The returns for the periods prior to February 1, 2011, reflect fee waivers and/or reimbursements without which performance would have been lower. |
| 2 | The Citigroup 3-Month T-Bill Index is designed to mirror the performance of the 3 month U.S. Treasury Bill. The Citigroup 3-Month T-Bill Index is unmanaged and its returns reflect reinvestment of all distributions and changes in market prices. |
| 3 | The BofA Merrill Lynch U.S. High Yield Index is an unmanaged index that tracks the performance of below-investment grade, U.S.-dollar denominated corporate bonds publicly issued in the U.S. domestic market. |
14
Driehaus Select Credit Fund
Schedule of Investments
December 31, 2012
| Shares, Principal Amount, or Number of Contracts | Value | |||||||
| BANK LOANS — 5.98% | ||||||||
Food — 1.99% |
| |||||||
Fairway Group Acquisition Co. | $ | 997,500 | $ | 1,003,735 | ||||
SUPERVALU, Inc. | 5,393,797 | 5,466,937 | ||||||
|
| |||||||
| 6,470,672 | ||||||||
|
| |||||||
Leisure Time — 3.08% |
| |||||||
Equinox Holdings, Inc. | 10,000,000 | 10,000,000 | ||||||
Retail — 0.91% |
| |||||||
Targus Group International | 2,955,003 | 2,969,777 | ||||||
|
| |||||||
Total BANK LOANS | 19,440,449 | |||||||
|
| |||||||
| CORPORATE BONDS — 53.97% | ||||||||
Agriculture — 1.70% |
| |||||||
American Rock Salt Co. LLC/American Rock Capital Corp. | 6,080,000 | 5,532,800 | ||||||
Building Materials — 4.58% |
| |||||||
Cemex Finance LLC | 7,000,000 | 7,875,000 | ||||||
Cemex SAB de CV (Mexico) | 6,930,000 | 7,016,625 | ||||||
|
| |||||||
| 14,891,625 | ||||||||
|
| |||||||
Chemicals — 1.86% |
| |||||||
Hexion U.S. Finance Corp. / Hexion Nova Scotia Finance ULC | 3,000,000 | 2,812,500 | ||||||
Momentive Performance Materials, Inc. | 5,530,000 | 3,235,050 | ||||||
|
| |||||||
| 6,047,550 | ||||||||
|
| |||||||
Commercial Services — 3.91% |
| |||||||
DynCorp International, Inc. | 6,147,000 | 5,624,505 | ||||||
iPayment, Inc. | 8,833,000 | 7,088,483 | ||||||
|
| |||||||
| 12,712,988 | ||||||||
|
| |||||||
| Shares, Principal Amount, or Number of Contracts | Value | |||||||
Entertainment — 5.67% |
| |||||||
Graton Economic Development Authority | $ | 8,500,000 | $ | 9,105,625 | ||||
Production Resource Group, Inc. | 7,255,000 | 5,296,150 | ||||||
WMG Acquisition Corp. | 3,500,000 | 4,042,500 | ||||||
|
| |||||||
| 18,444,275 | ||||||||
|
| |||||||
Healthcare — Products — 2.69% |
| |||||||
ConvaTec Healthcare E S.A. (Luxembourg) | 7,930,000 | 8,742,825 | ||||||
Healthcare — Services — 6.62% |
| |||||||
Aurora Diagnostics Holdings / Aurora Diagnostics Financing, Inc. | 8,500,000 | 7,480,000 | ||||||
Kindred Healthcare, Inc. | 7,205,000 | 7,006,863 | ||||||
National Mentor, Inc. | 6,875,000 | 7,029,687 | ||||||
|
| |||||||
| 21,516,550 | ||||||||
|
| |||||||
Household Products/Wares — 0.76% |
| |||||||
Armored Autogroup, Inc. | 2,900,000 | 2,457,750 | ||||||
Insurance — 0.17% |
| |||||||
MBIA Insurance Corp. | 3,250,000 | 552,500 | ||||||
Internet — 2.59% |
| |||||||
Mood Media Corp. (Canada) | 8,000,000 | 8,430,000 | ||||||
Iron/Steel — 1.55% |
| |||||||
Edgen Murray Corp. | 5,000,000 | 5,050,000 | ||||||
Mining — 1.39% |
| |||||||
Cuco Resources Ltd. | 6,000,000 | 4,500,000 | ||||||
Oil & Gas — 10.54% |
| |||||||
ATP Oil & Gas Corp. | 6,640,000 | 730,400 | ||||||
Chesapeake Energy Corp. | 7,500,000 | 8,512,500 | ||||||
Newfield Exploration Co. | 1,000,000 | 1,100,000 | ||||||
Shelf Drilling Holdings Ltd. (United Arab Emirates) | 5,000,000 | 5,125,000 | ||||||
United Refining Co. | 12,060,000 | 13,085,100 | ||||||
Notes to Financial Statements are an integral part of this Schedule.
15
Driehaus Select Credit Fund
Schedule of Investments
December 31, 2012
| Shares, Principal Amount, or Number of Contracts | Value | |||||||
Venoco, Inc. | $ | 6,075,000 | $ | 5,695,312 | ||||
|
| |||||||
| 34,248,312 | ||||||||
|
| |||||||
Packaging & Containers — 1.42% |
| |||||||
Berry Plastics Corp. | 4,000,000 | 4,610,000 | ||||||
Retail — 2.97% |
| |||||||
Michaels Stores, Inc. | 3,000,000 | 3,135,000 | ||||||
Rite Aid Corp. | 2,000,000 | 2,055,000 | ||||||
Rite Aid Corp. | 4,200,000 | 4,473,000 | ||||||
|
| |||||||
| 9,663,000 | ||||||||
|
| |||||||
Software — 2.91% |
| |||||||
First Data Corp. | 9,000,000 | 9,472,500 | ||||||
Telecommunications — 2.64% |
| |||||||
Nortel Networks Ltd. (Canada) | 7,500,000 | 8,587,500 | ||||||
|
| |||||||
Total CORPORATE BONDS | 175,460,175 | |||||||
|
| |||||||
| CONVERTIBLE CORPORATE BONDS — 8.09% | ||||||||
Electrical Components & Equipment — 2.51% |
| |||||||
SunPower Corp. | 6,836,000 | 6,340,390 | ||||||
Suntech Power Holdings Co., Ltd. (China) | 4,000,000 | 1,820,000 | ||||||
|
| |||||||
| 8,160,390 | ||||||||
|
| |||||||
Internet — 0.96% |
| |||||||
Equinix, Inc. | 1,600,000 | 3,121,000 | ||||||
Mining — 0.45% |
| |||||||
Great Western Minerals Group Ltd. (Canada) | 2,000,000 | 1,454,000 | ||||||
Software — 2.67% |
| |||||||
Nuance Communications, Inc. | 8,000,000 | 8,685,000 | ||||||
Telecommunications — 1.50% |
| |||||||
Alcatel-Lucent USA, Inc. | 2,000,000 | 1,835,000 | ||||||
Nortel Networks Corp. (Canada) | 3,000,000 | 3,041,250 | ||||||
|
| |||||||
| 4,876,250 | ||||||||
|
| |||||||
Total CONVERTIBLE CORPORATE BONDS | 26,296,640 | |||||||
|
| |||||||
| Shares, Principal Amount, or Number of Contracts | Value | |||||||
| COMMON STOCK — 0.93% | ||||||||
Auto Manufacturers — 0.10% |
| |||||||
General Motors Co. * | 9,541 | $ | 275,067 | |||||
Motors Liquidation Co. GUC Trust | 2,395 | 50,774 | ||||||
|
| |||||||
| 325,841 | ||||||||
|
| |||||||
Beverages — 0.40% |
| |||||||
Molson Coors Brewing | 30,400 | 1,300,816 | ||||||
Oil & Gas Services — 0.43% |
| |||||||
Edgen Group, Inc. * | 199,215 | 1,406,458 | ||||||
|
| |||||||
Total COMMON STOCK | 3,033,115 | |||||||
|
| |||||||
| CONVERTIBLE PREFERRED STOCK — 2.62% | ||||||||
Auto Manufacturers — 1.09% |
| |||||||
General Motors Co. | 80,000 | 3,530,400 | ||||||
General Motors Corp. Senior Convertible Preferred Escrow — C | 94,958 | — | ||||||
|
| |||||||
| 3,530,400 | ||||||||
|
| |||||||
Telecommunications — 1.53% |
| |||||||
Lucent Technologies Capital Trust I | 6,000 | 4,978,020 | ||||||
|
| |||||||
Total CONVERTIBLE PREFERRED STOCK | 8,508,420 | |||||||
|
| |||||||
PURCHASED CALL OPTIONS — 0.15% |
| |||||||
Standard & Poor’s 500 Index, Exercise Price: $1,425.00, Expiration | 119 | 476,000 | ||||||
|
| |||||||
Total PURCHASED CALL OPTIONS | 476,000 | |||||||
|
| |||||||
PURCHASED PUT OPTIONS — 0.37% |
| |||||||
Netflix, Inc., Exercise Price: $47.50, Expiration Date: March, 2013* | 175 | 1,925 | ||||||
Netflix, Inc., Exercise Price: $50.00, Expiration Date: March, 2013* | 1,188 | 26,136 | ||||||
Overseas Shipholding Group, Inc., Exercise Price: $8.00, Expiration Date: January, 2013* | 793 | 563,030 | ||||||
Standard & Poor’s 500 Index, Exercise Price: $1,250.00, Expiration | 254 | 22,860 | ||||||
Notes to Financial Statements are an integral part of this Schedule.
16
Driehaus Select Credit Fund
Schedule of Investments
December 31, 2012
| Shares, Principal Amount, or Number of Contracts | Value | |||||||
Standard & Poor’s 500 Index, Exercise Price: $1,400.00, Expiration | 254 | $ | 292,100 | |||||
Standard & Poor’s 500 Index, Exercise Price: $1,375.00, Expiration | 119 | 311,780 | ||||||
|
| |||||||
Total PURCHASED PUT OPTIONS | 1,217,831 | |||||||
|
| |||||||
| SHORT-TERM INVESTMENTS — 32.40% | ||||||||
UMB Money Market Fiduciary 0.01% | 105,337,764 | 105,337,764 | ||||||
|
| |||||||
Total SHORT-TERM INVESTMENTS | 105,337,764 | |||||||
|
| |||||||
| WARRANTS — 0.08% | ||||||||
Cuco Resources Ltd. —Strike Price $4.00, Expiration Date 12/1/16*4 | 600,000 | — | ||||||
General Motors Co. — CW 16, Strike Price $10.00, Expiration Date 07/10/16* | 8,675 | 169,163 | ||||||
General Motors Co. — CW 19, Strike Price $18.33, Expiration Date 07/10/19* | 8,675 | 108,351 | ||||||
|
| |||||||
Total WARRANTS | 277,514 | |||||||
|
| |||||||
| ||||||||
TOTAL INVESTMENTS | 104.59 | % | $ | 340,047,908 | ||||
Liabilities less Other Assets | (4.59 | )% | (14,924,830 | ) | ||||
|
|
|
| |||||
| Net Assets | 100.00 | % | $ | 325,123,078 | ||||
| ||||||||
| ||||||||
| SECURITIES SOLD SHORT — (7.64)% | ||||||||
| CORPORATE BONDS — (4.29)% | ||||||||
Oil & Gas — (2.32)% |
| |||||||
Chesapeake Energy Corp. 6.63%, 8/15/20 | $ | (2,000,000 | ) | (2,145,000 | ) | |||
Newfield Exploration Co. 6.88%, 2/1/20 | (5,000,000 | ) | (5,400,000 | ) | ||||
|
| |||||||
| (7,545,000 | ) | |||||||
|
| |||||||
Retail — (0.75)% |
| |||||||
Party City Holdings, Inc. 8.88%, 8/1/201 | (2,250,000 | ) | (2,435,625 | ) | ||||
| Shares, Principal Amount, or Number of Contracts | Value | |||||||
Software — (1.22)% |
| |||||||
First Data Corp. | $ | (4,000,000 | ) | $ | (3,960,000 | ) | ||
|
| |||||||
Total CORPORATE BONDS (Proceeds $13,497,001) | (13,940,625 | ) | ||||||
|
| |||||||
| CONVERTIBLE CORPORATE BONDS — (1.57)% | ||||||||
Beverages — (1.57)% |
| |||||||
Molson Coors Brewing Co. 2.50%, 7/30/13 | (5,000,000 | ) | (5,103,125 | ) | ||||
|
| |||||||
Total CONVERTIBLE CORPORATE BONDS (Proceeds $5,125,076) | (5,103,125 | ) | ||||||
|
| |||||||
| COMMON STOCK — (1.74)% | ||||||||
Healthcare—Services — (0.11)% |
| |||||||
Kindred Healthcare, | (34,290 | ) | (371,018 | ) | ||||
Internet — (0.91)% |
| |||||||
Equinix, Inc.* | (14,272 | ) | (2,942,886 | ) | ||||
Software — (0.72)% |
| |||||||
Nuance Communications, Inc.* | (104,944 | ) | (2,342,350 | ) | ||||
|
| |||||||
Total COMMON STOCK (Proceeds | (5,656,254 | ) | ||||||
|
| |||||||
WRITTEN PUT OPTIONS — (0.04)% |
| |||||||
Standard & Poor’s 500 Index, Exercise Price: $1,325.00, Expiration Date: January, 2013* | (507 | ) | (126,750 | ) | ||||
|
| |||||||
Total WRITTEN PUT OPTIONS (Proceeds $1,063,671) | (126,750 | ) | ||||||
|
| |||||||
| ||||||||
TOTAL INVESTMENT SECURITIES SOLD SHORT (Proceeds $25,148,986) | (7.64 | )% | $ | (24,826,754 | ) | |||
| ||||||||
| * | Non-income producing security. |
| 1 | 144A restricted security. |
| 2 | Variable rate security. |
| 3 | Foreign security denominated in U.S. dollars and traded on a U.S. exchange. |
| 4 | Security valued at fair value as determined in good faith by Driehaus Capital Management LLC, investment adviser to the Fund, in accordance with procedures established by, and under the general supervision of, the Fund’s Board of Trustees. |
| 5 | Security is in default. |
Percentages are stated as a percent of net assets.
Notes to Financial Statements are an integral part of this Schedule.
17
Schedule of Investments
December 31, 2012
SWAP CONTRACTS
Credit Default Swaps
| Counterparty | Reference Instrument | Currency | Notional AmountB | Pay/ ReceiveA Fixed Rate | Fixed Rate | Expiration Date | Premium Paid (Received) | Unrealized Appreciation/ (Depreciation) | Credit Event | RatingC | ||||||||||||||||||||||
Merrill Lynch | Freeport-McMoRan Copper & Gold, Inc. 8.38%, 3/14/12 | USD | 2,000,000 | Pay | 1.00 | % | 3/20/2017 | $ | 40,381 | $ | (23,400 | ) | Bankruptcy/FTP | NR | ||||||||||||||||||
Goldman Sachs | Masco Corp. 6.13%, 10/3/16 | USD | 500,000 | Pay | 1.00 | 12/20/2015 | 39,569 | (36,269 | ) | Bankruptcy/FTP | BBB- | |||||||||||||||||||||
JP Morgan | Masco Corp. 6.13%, 10/3/16 | USD | 500,000 | Pay | 1.00 | 3/20/2016 | 30,352 | (25,514 | ) | Bankruptcy/FTP | BBB- | |||||||||||||||||||||
Morgan Stanley | Masco Corp. 6.13%, 10/3/16 | USD | 1,000,000 | Pay | 1.00 | 6/20/2016 | 66,735 | (51,939 | ) | Bankruptcy/FTP | BBB- | |||||||||||||||||||||
Goldman Sachs | The Markit iTraxx Europe Crossover Index Series 17 | EUR | 5,200,000 | Pay | 5.00 | 6/20/2017 | (39,992 | ) | (195,999 | ) | Bankruptcy/FTP | NA | ||||||||||||||||||||
Morgan Stanley | Vulcan Materials Co. 6.40%, 11/30/17 | USD | 3,000,000 | Pay | 5.00 | 12/20/2016 | 202,500 | (562,561 | ) | Bankruptcy/FTP | BB | |||||||||||||||||||||
|
|
|
| |||||||||||||||||||||||||||||
Total Credit Default Swaps |
| 339,545 | (895,682 | ) | ||||||||||||||||||||||||||||
|
|
|
| |||||||||||||||||||||||||||||
Total Swap Contracts |
| $ | 339,545 | $ | (895,682 | ) | ||||||||||||||||||||||||||
|
|
|
| |||||||||||||||||||||||||||||
| A | If the Fund is paying a fixed rate, the counterparty acts as guarantor of the variable instrument and thus the Fund is a buyer of protection. If the Fund is receiving a fixed rate, the Fund acts as guarantor of the variable instrument and thus is a seller of protection. |
| B | For contracts to sell protection, the notional amount is equal to the maximum potential amount of the future payments and no recourse has been entered into in association with the contracts. |
| C | Based on Moody’s or Standard & Poor’s credit rating for the underlying reference instrument entity (unaudited). |
FTP=Failure to Pay
NR=Not Rated
NA=Not Applicable
EUR — Euro
USD — United States Dollar
FUTURES CONTRACTS
| Futures Contracts | Number of Contracts Long/(Short) | Expiration Date | Unrealized Appreciation/ (Depreciation) | |||||||||
U.S. 5 Year Treasury Note | (29 | ) | March 2013 | $ | 7,196 | |||||||
U.S. 10 Year Treasury Note | (86 | ) | March 2013 | 76,448 | ||||||||
U.S. 30 Year Treasury Note | (2 | ) | March 2013 | 5,871 | ||||||||
|
| |||||||||||
Total Futures Contracts | $ | 89,515 | ||||||||||
|
| |||||||||||
Notes to Financial Statements are an integral part of this Schedule.
18
Driehaus International Credit Opportunities Fund — Portfolio Managers’ Letter
Dear Shareholders,
The Driehaus International Credit Opportunities Fund (“Fund”) launched on March 1, 2012. Since the Fund’s inception through December 31, 2012, it returned -2.29%. This return was below the performance of the Fund’s new benchmark index, the Citigroup 3-Month T-Bill Index (the “Benchmark”), which returned 0.07% for the same period. The Fund also underperformed the BofA Merrill Lynch Global High Yield Index, which returned 11.21%, and the J.P. Morgan Emerging Markets Bond Index (EMBI) Global Diversified, which returned 12.90% for the same period.
Since the Fund’s launch in March 2012, it has compared its performance to the BofA Merrill Lynch Global High Yield Index and the J.P. Morgan Emerging Markets Bond Index (EMBI) Global Diversified. These indices, as noted in the prospectus, were chosen because of the Fund’s goal to have an annualized volatility equal to or less than the annualized volatility of a blend of these indices. The Citigroup 3-Month T-Bill Index has been selected as the appropriate broad-based securities market index as it is a more appropriate performance benchmark for an absolute return fund. The BofA Merrill Lynch Global High Yield Index will continue to be provided as a performance benchmark. The J.P. Morgan Emerging Markets Bond Index (EMBI) Global Diversified will no longer be used as a performance benchmark as it is representative of an investment universe much narrower than the investment universe of the Fund. However, it will continue to be used as a part of our blended volatility benchmark.
When the Fund launched, its positioning was initially built around a net long position in emerging markets sovereign and corporate credit, coupled with a net short position in European sovereign and bank credit. This positioning served the Fund well during its first few months but eventually detracted from performance as a series of policy announcements from Europe caused the Fund to have significant drawdowns in June and July. We had expected policy announcements short of quantitative easing by the European Central Bank (ECB). We did not anticipate the strong market reactions and the resulting destabilized correlations versus other parts of the portfolio, such as exposure to emerging markets credits, which caused the Fund’s negative performance during the summer.
Mario Draghi’s announcement of the Outright Monetary Transactions program on August 2 was a medium-term turning point for the European sovereign crisis in our view. It was not quite quantitative easing/monetization, but it represented a credible threat thereof. This caused us to make some major portfolio shifts.
In August, we took off most of our short European credit positions, built up our emerging markets high yield (and some emerging markets investment grade) positions to a much more significant size, and briefly went long some short-term Italian and Spanish credits. We also continued to implement paired and relative value trades. Finally, as we were increasing our long credit exposure, we implemented tail risk hedges to provide some protection against a downside move in the broad market. This stance allowed us to claw back more than half of the drawdown by year end.
Since the Fund’s March 1, 2012 inception through December 31, 2012, the credit directional long strategy was the most significant contributor to performance. Almost all of this strategy’s contribution to performance occurred after the Fund’s repositioning in August as emerging markets benefited from investors seeking higher yielding fixed income securities. The most significant detractor from performance was the credit directional short strategy. Most of the lost value in that strategy occurred before or during the portfolio repositioning. As mentioned previously, the short positions taken in European debt in the spring detracted value as credit risk abated due to support from the ECB.
With regard to volatility, the Fund has stayed well within its stated range of 10% or lower over the course of 2012. The 60-day rolling volatility has been in a range of 1.4% to 4.7%.
Another benefit of the Fund has been its low correlation to other asset classes. Correlations (based on daily data) since the Fund’s inception on March 1, 2012 through December 31, 2012 have been between -0.35 and +0.35 relative to the 10-Year U.S. Treasury Yield, the S&P 500 Index, the Barclays Aggregate ETF (AGG), the JP Morgan Emerging Markets Bond Index, the Merrill Lynch Global High Yield Index, the HFRX Global Hedge Fund Index, and the Dow Jones-UBS Commodity Index.
Looking ahead, we think the opportunities in emerging markets and other non-U.S. high yield credits remain compelling, even in the face of tightening spreads. Additionally, employing hedged strategies to take
19
advantage of opportunities in the market may offer investors a more compelling risk/reward profile than investing in long-only, buy-and-hold strategies. While it will be a challenging year, it won’t be one without opportunities for flexible investment approaches.
We at Driehaus Capital Management LLC thank you for your interest in the Driehaus International Credit Opportunities Fund and would like to express our gratitude to you as shareholders for your confidence in our management capabilities.
Sincerely,
 |  | |
| Adam M. Weiner | Sabya Roy | |
| Portfolio Manager | Assistant Portfolio Manager |
Performance is historical and does not represent future results.
Please see the following performance page for index definitions.
20
Driehaus International Credit Opportunities Fund
Performance Overview (unaudited)
The performance summarized below is historical and does not represent future results. Investment returns and principal value vary, and you may have a gain or loss when you sell shares. Performance data presented measures the change in the value of an investment in the Fund, assuming reinvestment of all dividends and capital gains.
The table does not reflect the deduction of taxes that a shareholder would pay on Fund distributions or the redemption of Fund shares. The graph compares the results of a $10,000 investment in the Fund since March 1, 2012 (the date of the Fund’s inception), with all dividends and capital gains reinvested, with the indicated indices (and dividends reinvested) for the same period.
| Cumulative Total Returns as of 12/31/12 | Since Inception (03/01/12 - 12/31/12) | |||
Driehaus International Credit Opportunities Fund (DRCIX) | –2.29% | |||
Citigroup 3-Month T-Bill Index1 | 0.07% | |||
BofA Merrill Lynch Global High Yield Index2 | 11.21% | |||
J.P. Morgan EMBI Global Diversified Index3 | 12.90% | |||
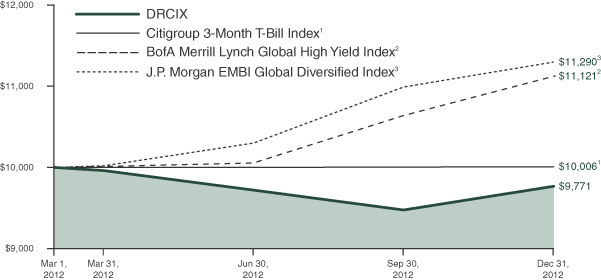
| 1 | The Citigroup 3-Month T-Bill Index is designed to mirror the performance of the 3 month U.S. Treasury Bill. The Citigroup 3-Month T-Bill Index is unmanaged and its returns reflect reinvestment of all distributions and changes in market prices. The Citigroup 3-Month T-Bill Index has been added as the appropriate broad-based securities market index as it is a more appropriate performance benchmark for an absolute return fund. |
| 2 | The BofA Merrill Lynch Global High Yield Index is an unmanaged index that tracks the performance of below and border-line investment grade global debt markets denominated in the major developed market currencies. |
| 3 | The J.P. Morgan Emerging Markets Bond Index (EMBI) Global Diversified is an unmanaged, market-capitalization weighted, total-return index tracking the traded market for U.S. dollar-denominated Brady bonds, Eurobonds, traded loans, and local market debt instruments issued by emerging markets' sovereign and quasi-sovereign entities. |
21
Driehaus International Credit Opportunities Fund
Schedule of Investments
December 31, 2012
Shares, Amount, | Value | |||||||
| FIXED INCOME INVESTMENTS — 73.30% | ||||||||
Austria — 0.77% |
| |||||||
OAS Investments GmbH | $ | 200,000 | $ | 212,000 | ||||
Bermuda — 1.19% |
| |||||||
Chloe Marine Corp. Ltd. | 300,000 | 328,500 | ||||||
Brazil — 1.75% |
| |||||||
Hypermarcas SA | 250,000 | 270,625 | ||||||
USJ Acucar e Alcool SA | 200,000 | 213,000 | ||||||
|
| |||||||
| 483,625 | ||||||||
|
| |||||||
British Virgin Islands — 1.17% |
| |||||||
Sinochem Overseas Capital Co., Ltd. | 300,000 | 324,070 | ||||||
Canada — 1.85% |
| |||||||
First Quantum Minerals Ltd. | 250,000 | 252,500 | ||||||
Inmet Mining Corp. | 250,000 | 259,375 | ||||||
|
| |||||||
| 511,875 | ||||||||
|
| |||||||
Cayman Islands — 4.96% |
| |||||||
AES Andres Dominicana Ltd. / Itabo Dominicana Ltd. | 200,000 | 221,300 | ||||||
Banco Bradesco SA/Cayman Islands | 200,000 | 216,000 | ||||||
China Overseas Finance Cayman IV Ltd. | 300,000 | 324,299 | ||||||
Dubai Holding Commercial Operations MTN Ltd. | 250,000 | 3 | 393,322 | |||||
PSOS Finance Ltd. | 215,385 | 215,923 | ||||||
|
| |||||||
| 1,370,844 | ||||||||
|
| |||||||
China — 6.03% |
| |||||||
Agile Property Holdings Ltd. | 250,000 | 268,750 | ||||||
China Shanshui Cement Group Ltd. | 250,000 | 286,250 | ||||||
Country Garden Holdings Co., Ltd. | 250,000 | 288,750 | ||||||
Shares, Amount, | Value | |||||||
Evergrande Real Estate Group Ltd. | $ | 250,000 | $ | 271,250 | ||||
MIE Holdings Corp. | 250,000 | 271,250 | ||||||
Yuzhou Properties Co. | 250,000 | 280,000 | ||||||
|
| |||||||
| 1,666,250 | ||||||||
|
| |||||||
Cyprus — 1.11% |
| |||||||
Ocean Rig UDW, Inc. | 300,000 | 306,000 | ||||||
France — 1.23% |
| |||||||
Labco SAS | 250,000 | 3 | 339,064 | |||||
Hong Kong — 7.01% |
| |||||||
Central China Real Estate Ltd. | 200,000 | 221,000 | ||||||
China Oriental Group Co., Ltd. | 250,000 | 248,750 | ||||||
China Resources Gas Group Ltd. | 300,000 | 330,300 | ||||||
China Resources Land Ltd. | 300,000 | 317,858 | ||||||
Glorious Property Holdings Ltd. | 250,000 | 253,750 | ||||||
Pacnet Ltd. | 250,000 | 255,625 | ||||||
Yancoal International Resources Development Co., Ltd. | 300,000 | 310,150 | ||||||
|
| |||||||
| 1,937,433 | ||||||||
|
| |||||||
Indonesia — 1.70% |
| |||||||
Alam Sutera International Pvt Ltd. | 250,000 | 272,500 | ||||||
PT Berau Coal Energy Tbk | 200,000 | 197,000 | ||||||
|
| |||||||
| 469,500 | ||||||||
|
| |||||||
Luxembourg — 4.25% |
| |||||||
Cirsa Funding Luxembourg SA | 150,000 | 3 | 197,003 | |||||
Minerva Luxembourg SA | 300,000 | 359,250 | ||||||
Pacific Drilling V Ltd. | 300,000 | 311,250 | ||||||
Virgolino de Oliveira Finance Ltd. | 300,000 | 309,000 | ||||||
|
| |||||||
| 1,176,503 | ||||||||
|
| |||||||
Notes to Financial Statements are an integral part of this Schedule.
22
Driehaus International Credit Opportunities Fund
Schedule of Investments
December 31, 2012
| Shares, Principal Amount, or Number of Contracts | Value | |||||||
Mexico — 2.52% |
| |||||||
Grupo Papelero Scribe SA de CV | $ | 250,000 | $ | 232,500 | ||||
Servicios Corporativos Javer S.A.P.I. de CV | 250,000 | 267,500 | ||||||
Urbi Desarrollos Urbanos SAB de CV | 200,000 | 197,000 | ||||||
|
| |||||||
| 697,000 | ||||||||
|
| |||||||
Mongolia — 0.97% |
| |||||||
Mongolian Mining Corp. | 250,000 | 267,500 | ||||||
Morocco — 0.73% |
| |||||||
Morocco Government International Bond | 200,000 | 201,500 | ||||||
Netherlands — 2.76% |
| |||||||
Aerospace Satellite Corp. Holding BV | 250,000 | 275,625 | ||||||
GT 2005 Bonds BV | 250,000 | 251,250 | ||||||
Hyva Global BV | 250,000 | 237,500 | ||||||
|
| |||||||
| 764,375 | ||||||||
|
| |||||||
Nigeria — 3.75% |
| |||||||
Nigerian Treasury Bill | 1,000,000 | 1,038,310 | ||||||
Peru — 4.16% |
| |||||||
Camposol SA | 150,000 | 162,000 | ||||||
Peru Government Bond | 2,000,000 | 3 | 987,502 | |||||
|
| |||||||
| 1,149,502 | ||||||||
|
| |||||||
Turkey — 1.80% |
| |||||||
Tupras Turkiye Petrol Rafinerileri AS | 500,000 | 498,125 | ||||||
Ukraine — 0.90% |
| |||||||
Financing of Infrastructural Projects State Enterprise | 250,000 | 250,000 | ||||||
United Kingdom — 8.88% |
| |||||||
Afren PLC | 250,000 | 291,832 | ||||||
Boparan Finance PLC | 250,000 | 3 | 458,909 | |||||
DFS Furniture Holdings PLC | 225,000 | 3 | 393,830 | |||||
Gala Electric Casinos PLC 11.50%, 6/1/19 | 250,000 | 3 | 395,962 | |||||
| Shares, Principal Amount, or Number of Contracts | Value | |||||||
Priory Group No. 3 PLC 8.88%, 2/15/19 | $ | 250,000 | 3 | $ | 418,298 | |||
Vedanta Resources PLC 9.50%, 7/18/18 | 250,000 | 288,450 | ||||||
Viridian Group FundCo II 11.13%, 4/1/17 | 150,000 | 3 | 206,903 | |||||
|
| |||||||
| 2,454,184 | ||||||||
|
| |||||||
United States — 10.97% |
| |||||||
Cemex Finance LLC | 250,000 | 271,250 | ||||||
Cemex Finance LLC | 250,000 | 281,250 | ||||||
United States Treasury Bond | 2,000,000 | 1,986,876 | ||||||
United States Treasury Bond | 500,000 | 494,531 | ||||||
|
| |||||||
| 3,033,907 | ||||||||
|
| |||||||
Venezuela — 1.94% |
| |||||||
CA La Electricidad de Caracas | 625,000 | 537,500 | ||||||
Zambia — 0.90% |
| |||||||
Zambia Government International Bond 5.38%, 9/20/221,4 | 250,000 | 249,375 | ||||||
|
| |||||||
Total FIXED INCOME INVESTMENTS | 20,266,942 | |||||||
|
| |||||||
| PURCHASED PUT OPTIONS — 0.01% | ||||||||
OTC AUD versus USD, Exercise Price: $0.96, Expiration Date: February, 2013* | 2,000,000 | 604 | ||||||
OTC AUD versus USD, Exercise Price: $0.95, Expiration Date: February, 2013* | 2,000,000 | 81 | ||||||
The KOSPI 200 Index, Exercise Price: $237.50, (Republic of South Korea) Expiration Date: February, 2013* | 9 | 1,500 | ||||||
The S&P/ASX 200 Index, Exercise Price: $4,300.00, Expiration Date: January, 2013* | 24 | 562 | ||||||
|
| |||||||
Total PURCHASED PUT OPTIONS (Premiums paid $46,679) | 2,747 | |||||||
|
| |||||||
Notes to Financial Statements are an integral part of this Schedule.
23
Driehaus International Credit Opportunities Fund
Schedule of Investments
December 31, 2012
| Shares, Principal Amount, or Number of Contracts | Value | |||||||
| MONEY MARKET FUND — 12.41% | ||||||||
Northern Institutional U.S. Government Select Portfolio 0.01% | 3,432,416 | $ | 3,432,416 | |||||
|
| |||||||
Total MONEY MARKET FUND | 3,432,416 | |||||||
|
| |||||||
| ||||||||
TOTAL INVESTMENTS | 85.72 | % | $ | 23,702,105 | ||||
Other Assets less Liabilities | 14.28 | % | 3,949,323 | |||||
|
|
|
| |||||
| Net Assets | 100.00 | % | $ | 27,651,428 | ||||
| ||||||||
| ||||||||
| SECURITIES SOLD SHORT — 0.00% | ||||||||
| WRITTEN PUT OPTIONS — 0.00% | ||||||||
The KOSPI 200 Index, Exercise Price: $217.50, (Republic of South Korea) Expiration | (9 | ) | (487 | ) | ||||
The S&P/ASX 200 Index, Exercise Price: $4,000.00, Expiration | (24 | ) | (146 | ) | ||||
|
| |||||||
Total WRITTEN PUT OPTIONS | (633 | ) | ||||||
|
| |||||||
| ||||||||
TOTAL INVESTMENT SECURITIES SOLD SHORT | 0.00 | % | $ | (633 | ) | |||
| ||||||||
| * | Non-income producing security. |
| 1 | 144A restricted security. |
| 2 | Variable rate security. |
| 3 | Local currency. |
| 4 | Security valued at fair value as determined in good faith by Driehaus Capital Management LLC, investment adviser to the Fund, in accordance with procedures established by, and under the general supervision of, the Fund’s Board of Trustees. |
Percentages are stated as a percent of net assets.
OTC — Over the Counter
AUD — Australian Dollar
USD — United States Dollar
Regional Weightings(a)
North America(b) | 35.07% | |||
Europe | 21.70% | |||
Far East | 15.71% | |||
South America | 7.85% | |||
Africa | 5.38% |
| (a) | All percentages are stated as a percent of net assets at December 31, 2012 and exclude purchased options and securities sold short. |
| (b) | Includes money market fund. |
Notes to Financial Statements are an integral part of this Schedule.
24
Driehaus International Credit Opportunities Fund
Schedule of Investments
December 31, 2012
SWAP CONTRACTS
|
| |||||||||||||||||||||||||||||
| Interest Rate Swaps | ||||||||||||||||||||||||||||||
| Counterparty | Floating Rate Index | Currency | Notional AmountB | Pay/ ReceiveA Fixed Rate | Fixed Rate | Expiration Date | Premium (Received) | Unrealized (Depreciation) | ||||||||||||||||||||||
Goldman Sachs | 3 month AUD-BBR- BBSW — 1Year/1Year | |||||||||||||||||||||||||||||
| 12/20/14D | AUD | 3,000,000 | Receive | 2.97 | % | 12/20/2014 | $ | — | $ | 2,521 | ||||||||||||||||||||
|
|
|
| |||||||||||||||||||||||||||
| Total Interest Rate Swaps | $ | — | $ | 2,521 | ||||||||||||||||||||||||||
Credit Default Swaps
| Counterparty | Reference Instrument | Currency | Notional AmountB | Pay/ ReceiveA Fixed Rate | Fixed Rate | Expiration Date | Premium Paid (Received) | Unrealized Appreciation/ (Depreciation) | Credit Event | RatingC | ||||||||||||||||||||||||||||
Goldman Sachs | Santander International Debt SA 5.78%, 2/17/28 | EUR | 1,000,000 | Receive | 3.00 | % | 12/20/2017 | $ | (15,268 | ) | $ | 41,563 | Bankruptcy/FTP | NR | ||||||||||||||||||||||||
Merrill Lynch | The Markit iTraxx Asia Excluding Japan IG Index Series 18 Version 1 | EUR | 3,000,000 | Pay | 1.00 | 12/20/2017 | 65,430 | (47,968 | ) | Bankruptcy/FTP | A- | |||||||||||||||||||||||||||
Societe Generale | Unicredit SPA 4.38%, 2/10/14 | EUR | 1,000,000 | Pay | 3.00 | 12/20/2017 | 35,110 | (41,763 | ) | Bankruptcy/FTP | BBB+ | |||||||||||||||||||||||||||
|
|
|
| |||||||||||||||||||||||||||||||||||
| Total Credit Default Swaps | 85,272 | (48,168 | ) | |||||||||||||||||||||||||||||||||||
|
|
|
| |||||||||||||||||||||||||||||||||||
| Total Swap Contracts | $ | 85,272 | $ | (45,647 | ) | |||||||||||||||||||||||||||||||||
|
|
|
| |||||||||||||||||||||||||||||||||||
| A | If the Fund is paying a fixed rate, the counterparty acts as guarantor of the variable instrument and thus the Fund is a buyer of protection. If the Fund is receiving a fixed rate, the Fund acts as guarantor of the variable insturment and thus is a seller of protection. |
| B | For contracts to sell protection, the notional amout is equal to the maximum potential amount of the future payments and no recourse has been entered into in association with the contracts. |
| C | Based on Standard & Poor’s or Moody’s credit rating for the underlying reference instrument entity (unaudited). |
| D | The 3 month AUD-BBR-BBSW will begin accruing interest on December 20, 2013. |
FTP=Failure to Pay
NA=Not Applicable
NR=Not Rated
AUD — Australian Dollar
EUR — Euro
Notes to Financial Statements are an integral part of this Schedule.
25
Driehaus International Credit Opportunities Fund
Schedule of Investments
December 31, 2012
SWAPTIONS
|
| |||||||||||||||||||||||||||||
| Credit Default Swaptions | ||||||||||||||||||||||||||||||
| Counterparty | Reference Instrument | Currency | Notional Amount | Buy/Sell Protection | Exercise Price | Expiration Date | Premium Paid (Received) | Market Value | ||||||||||||||||||||||
Morgan Stanley | The Markit iTraxx North American Invesment Grade High Volitility Series 19 Index | USD | 2,000,000 | Buy | 130 | 3/20/2013 | $ | 7,700 | $ | 1,626 | ||||||||||||||||||||
|
|
|
| |||||||||||||||||||||||||||
| Total Credit Default Swaptions | 7,700 | 1,626 | ||||||||||||||||||||||||||||
|
|
|
| |||||||||||||||||||||||||||
| TOTAL SWAPTIONS | $ | 7,700 | $ | 1,626 | ||||||||||||||||||||||||||
|
|
|
| |||||||||||||||||||||||||||
USD — United States Dollar
FORWARD FOREIGN CURRENCY EXCHANGE CONTRACTS
|
| |||||||||||||||||||
| Purchase Contracts | Settlement Date | Currency Amount Purchased | Value At Settlement Date | Value At December 31, 2012 | Unrealized Appreciation (Depreciation) | |||||||||||||||
British Pound | February 5, 2013 | 235,000 | $ | 373,758 | $ | 381,706 | $ | 7,948 | ||||||||||||
Euro | February 19, 2013 | 648,000 | 830,369 | 855,700 | 25,331 | |||||||||||||||
|
|
|
|
|
| |||||||||||||||
| 1,204,127 | 1,237,406 | 33,279 | ||||||||||||||||||
| Sale Contracts | Settlement Date | Currency Amount Sold | Value At Settlement Date | Value At December 31, 2012 | Unrealized Appreciation (Depreciation) | |||||||||||||||
Argentine Peso | May 17, 2013 | (2,257,500 | ) | $ | (401,690 | ) | $ | (414,264 | ) | $ | (12,574 | ) | ||||||||
British Pound | February 5, 2013 | (1,535,000 | ) | (2,473,142 | ) | (2,493,276 | ) | (20,134 | ) | |||||||||||
Euro | February 19, 2013 | (1,210,000 | ) | (1,544,462 | ) | (1,597,834 | ) | (53,372 | ) | |||||||||||
|
|
|
|
|
| |||||||||||||||
| (4,419,294 | ) | (4,505,374 | ) | (86,080 | ) | |||||||||||||||
|
|
|
|
|
| |||||||||||||||
| TOTAL FORWARD FOREIGN CURRENCY EXCHANGE CONTRACTS | $ | (3,215,167 | ) | $ | (3,267,968 | ) | $ | (52,801 | ) | |||||||||||
|
|
|
|
|
| |||||||||||||||
Notes to Financial Statements are an integral part of this Schedule.
26
Statements of Assets and Liabilities
December 31, 2012
Driehaus Active Income Fund | Driehaus Select Credit Fund | Driehaus International Credit Opportunities Fund | ||||||||||
ASSETS: | ||||||||||||
Investment securities, at fair value (cost $2,811,638,660, $341,565,935 and $22,787,535, respectively) | $ | 2,884,567,867 | $ | 338,354,077 | $ | 23,699,358 | ||||||
Purchased options, at fair value (premiums paid $27,120,922, $3,455,505 and $46,679, respectively) | 14,768,520 | 1,693,831 | 2,747 | |||||||||
Purchased swaptions, at fair value (premiums paid $0, $0 and $7,700, respectively) | — | — | 1,626 | |||||||||
Unrealized appreciation on forward foreign currency contracts | — | — | 33,279 | |||||||||
Unrealized appreciation on open swap contracts | 2,958,359 | — | 44,084 | |||||||||
Premiums paid on open swap contracts | 25,614,122 | 379,537 | 100,540 | |||||||||
Cash | 209,191 | — | 231,369 | |||||||||
Collateral held at custodian for the benefit of brokers | 259,431,255 | 16,085,600 | 3,456,382 | |||||||||
Receivable for investment securities sold | 20,831,006 | 78,702 | — | |||||||||
Receivable for capital stock sold | 7,190,574 | 1,604,325 | — | |||||||||
Receivable for interest and dividends | 28,683,383 | 4,758,570 | 348,118 | |||||||||
Receivable for variation margin | 626,020 | 16,078 | — | |||||||||
Prepaid expenses | 61,168 | 24,976 | 19,842 | |||||||||
|
|
|
|
|
| |||||||
| ||||||||||||
TOTAL ASSETS | 3,244,941,465 | 362,995,696 | 27,937,345 | |||||||||
|
|
|
|
|
| |||||||
| ||||||||||||
LIABILITIES: | ||||||||||||
Payable for investment securities sold short, at fair value (proceeds $239,914,135, $24,085,315 and $0, respectively) | 252,170,877 | 24,700,004 | — | |||||||||
Written options outstanding, at fair value (premiums received $20,798,313, $1,063,671 and $8,524, respectively) | 5,485,350 | 126,750 | 633 | |||||||||
Unrealized depreciation on open swap contracts | 34,699,181 | 895,682 | 89,731 | |||||||||
Unrealized depreciation on forward foreign currency contracts | — | — | 86,080 | |||||||||
Premiums received on open swap contracts | 2,428,244 | 39,992 | 15,268 | |||||||||
Payable for capital stock redeemed | 4,148,349 | 1,439,410 | — | |||||||||
Payable for investment securities purchased | 75,076,351 | 9,800,019 | — | |||||||||
Payable for interest and dividends on securities sold short | 1,320,314 | 444,887 | — | |||||||||
Accrued investment advisory fees | 1,306,972 | 219,161 | 20,960 | |||||||||
Accrued shareholder services plan fees | 770,413 | 78,204 | 1,940 | |||||||||
Accrued administration and accounting fees | 84,763 | 19,185 | 2,513 | |||||||||
Accrued chief compliance officer fees | 938 | 938 | 937 | |||||||||
Accrued expenses | 428,241 | 108,386 | 67,855 | |||||||||
|
|
|
|
|
| |||||||
| ||||||||||||
TOTAL LIABILITIES | 377,919,993 | 37,872,618 | 285,917 | |||||||||
|
|
|
|
|
| |||||||
| ||||||||||||
NET ASSETS | $ | 2,867,021,472 | $ | 325,123,078 | $ | 27,651,428 | ||||||
|
|
|
|
|
| |||||||
SHARES OUTSTANDING (Unlimited shares authorized, no par value) | 268,655,217 | 32,933,623 | 2,836,494 | |||||||||
|
|
|
|
|
| |||||||
NET ASSET VALUE, OFFERING AND REDEMPTION PRICE PER SHARE | $ | 10.67 | $ | 9.87 | $ | 9.75 | ||||||
|
|
|
|
|
| |||||||
| ||||||||||||
NET ASSETS CONSISTED OF THE FOLLOWING AT DECEMBER 31, 2012: | ||||||||||||
Paid-in-capital | $ | 3,019,845,510 | $ | 330,310,286 | $ | 28,010,674 | ||||||
Undistributed net investment income (loss) | 31,636,794 | 1,255,836 | 83,396 | |||||||||
Undistributed net realized gain (loss) on investments, futures, swap contracts and foreign currency | (219,754,629 | ) | (985,577 | ) | (1,215,962 | ) | ||||||
Net unrealized appreciation (depreciation) on: | ||||||||||||
Investments | 72,929,207 | (3,211,858 | ) | 911,823 | ||||||||
Purchased options | (12,352,402 | ) | (1,761,674 | ) | (43,932 | ) | ||||||
Purchased swaptions | — | — | (6,074 | ) | ||||||||
Securities sold short | (12,256,742 | ) | (614,689 | ) | — | |||||||
Written options | 15,312,963 | 936,921 | 7,891 | |||||||||
Futures contracts | 3,401,593 | 89,515 | — | |||||||||
Swap contracts | (31,740,822 | ) | (895,682 | ) | (45,647 | ) | ||||||
Foreign currency translations | — | — | (50,741 | ) | ||||||||
|
|
|
|
|
| |||||||
NET ASSETS | $ | 2,867,021,472 | $ | 325,123,078 | $ | 27,651,428 | ||||||
|
|
|
|
|
| |||||||
| ||||||||||||
Notes to Financial Statements are an integral part of this Schedule.
27
For the year ended December 31, 2012
Driehaus Active Income | Driehaus Select Credit Fund | Driehaus International Credit Opportunities Fund* | ||||||||||
INVESTMENT INCOME: | ||||||||||||
Interest income** | $ | 129,263,719 | $ | 19,753,709 | $ | 939,736 | ||||||
Dividend income | 15,802,063 | 864,543 | — | |||||||||
|
|
|
|
|
| |||||||
| ||||||||||||
Total investment income | 145,065,782 | 20,618,252 | 939,736 | |||||||||
|
|
|
|
|
| |||||||
| ||||||||||||
Expenses: | ||||||||||||
Investment advisory fees | 14,408,431 | 2,196,783 | 206,324 | |||||||||
Shareholder services plan fees | 4,608,801 | 395,504 | 1,758 | |||||||||
Custody fees | 2,410,276 | 218,218 | 11,471 | |||||||||
Administration and fund accounting fees | 954,929 | 192,219 | 19,743 | |||||||||
Transfer agent fees and expenses | 518,202 | 122,247 | 20,061 | |||||||||
Reports to shareholders | 259,752 | 51,597 | 13,814 | |||||||||
Federal and state registration fees | 173,336 | 49,795 | 23,966 | |||||||||
Trustees’ and Advisory Board Members’ fees | 134,549 | 30,540 | 15,281 | |||||||||
Legal fees | 85,876 | 24,081 | 13,157 | |||||||||
Audit and tax fees | 51,600 | 51,600 | 51,600 | |||||||||
Chief compliance officer fees | 7,393 | 7,407 | 2,813 | |||||||||
Miscellaneous | 152,560 | 34,928 | 25,979 | |||||||||
Dividends on short positions | 5,940,079 | 366,282 | — | |||||||||
Interest on short positions | 4,203,782 | 842,439 | 25,062 | |||||||||
Interest expense | 466,120 | 65,896 | 1,460 | |||||||||
|
|
|
|
|
| |||||||
Total expenses | 34,375,686 | 4,649,536 | 432,489 | |||||||||
|
|
|
|
|
| |||||||
| ||||||||||||
Net investment income | 110,690,096 | 15,968,716 | 507,247 | |||||||||
|
|
|
|
|
| |||||||
| ||||||||||||
| NET REALIZED AND UNREALIZED GAIN (LOSS) ON INVESTMENTS: | ||||||||||||
Net realized gain (loss) on transactions from: | ||||||||||||
Investments | (59,599,068 | ) | 3,932,343 | (514,938 | ) | |||||||
Purchased options | (24,078,220 | ) | (2,388,820 | ) | (286,008 | ) | ||||||
Purchased swaptions | — | — | (75,548 | ) | ||||||||
Securities sold short | 4,171,555 | (1,937,877 | ) | (24,235 | ) | |||||||
Written options | 11,279,920 | 1,374,298 | 209,115 | |||||||||
Written swaptions | — | — | 48,424 | |||||||||
Futures contracts | (27,257,187 | ) | (579,143 | ) | — | |||||||
Swap contracts | (15,142,161 | ) | (1,231,333 | ) | (718,875 | ) | ||||||
Foreign currency | (136,545 | ) | (151,528 | ) | (573,423 | ) | ||||||
|
|
|
|
|
| |||||||
| ||||||||||||
Total realized gain (loss) on investments | (110,761,706 | ) | (982,060 | ) | (1,935,488 | ) | ||||||
|
|
|
|
|
| |||||||
| ||||||||||||
Change in net unrealized appreciation (depreciation) on: | ||||||||||||
Investments | 269,615,548 | 6,117,486 | 911,823 | |||||||||
Purchased options | (2,775,737 | ) | (1,109,371 | ) | (43,932 | ) | ||||||
Purchased swaptions | — | — | (6,074 | ) | ||||||||
Short positions | (30,467,060 | ) | (511,726 | ) | — | |||||||
Written options | 10,646,759 | 609,541 | 7,891 | |||||||||
Futures contracts | 9,745,078 | 172,094 | — | |||||||||
Swap contracts | (25,784,084 | ) | (677,630 | ) | (45,647 | ) | ||||||
Foreign currency translations | — | 135,066 | (50,741 | ) | ||||||||
|
|
|
|
|
| |||||||
Total change in net unrealized appreciation (depreciation) on investments | 230,980,504 | 4,735,460 | 773,320 | |||||||||
|
|
|
|
|
| |||||||
| ||||||||||||
Net realized and unrealized gain (loss) on investments | 120,218,798 | 3,753,400 | (1,162,168 | ) | ||||||||
|
|
|
|
|
| |||||||
| ||||||||||||
NET INCREASE (DECREASE) IN NET ASSETS RESULTING FROM OPERATIONS | $ | 230,908,894 | $ | 19,722,116 | $ | (654,921 | ) | |||||
|
|
|
|
|
| |||||||
| ||||||||||||
| * | Fund commenced operations on March 1, 2012. |
| ** | Interest income is net of $0, $21,711 and $15,497, respectively, of non-reclaimable foreign taxes withheld. |
Notes to Financial Statements are an integral part of this Schedule.
28
(This page intentionally left blank)
29
Statements of Changes in Net Assets
| Driehaus Active Income Fund | Driehaus Select Credit Fund | |||||||||||||||
| Year ended December 31, 2012 | Year ended December 31, 2011 | Year ended December 31, 2012 | Year ended December 31, 2011 | |||||||||||||
Operations: | ||||||||||||||||
Net investment income | $ | 110,690,096 | $ | 132,981,334 | $ | 15,968,716 | $ | 5,893,534 | ||||||||
Net realized gain (loss) on investments | (110,761,706 | ) | (105,403,215 | ) | (982,060 | ) | (524,272 | ) | ||||||||
Net change in unrealized appreciation (depreciation) on investments | 230,980,504 | (257,759,999 | ) | 4,735,460 | (11,069,512 | ) | ||||||||||
|
|
|
|
|
|
|
| |||||||||
| ||||||||||||||||
Net increase (decrease) in net assets resulting from operations | 230,908,894 | (230,181,880 | ) | 19,722,116 | (5,700,250 | ) | ||||||||||
|
|
|
|
|
|
|
| |||||||||
| ||||||||||||||||
Distributions: | ||||||||||||||||
Net investment income | (67,114,475 | ) | (124,363,014 | ) | (14,216,095 | ) | (5,908,053 | ) | ||||||||
Tax return of capital | — | — | — | — | ||||||||||||
Net capital gains | — | (911,125 | ) | — | — | |||||||||||
|
|
|
|
|
|
|
| |||||||||
Total distributions | (67,114,475 | ) | (125,274,139 | ) | (14,216,095 | ) | (5,908,053 | ) | ||||||||
|
|
|
|
|
|
|
| |||||||||
| ||||||||||||||||
Capital share transactions: | ||||||||||||||||
Proceeds from shares sold | 1,321,631,772 | 2,567,335,879 | 236,144,860 | 235,170,355 | ||||||||||||
Reinvested distributions | 54,187,169 | 106,285,193 | 11,378,976 | 4,992,614 | ||||||||||||
Cost of shares redeemed | (1,102,326,211 | ) | (2,071,493,070 | ) | (112,017,532 | ) | (68,082,955 | ) | ||||||||
|
|
|
|
|
|
|
| |||||||||
Net increase from capital transactions | 273,492,730 | 602,128,002 | 135,506,304 | 172,080,014 | ||||||||||||
|
|
|
|
|
|
|
| |||||||||
Total increase in net assets | 437,287,149 | 246,671,983 | 141,012,325 | 160,471,711 | ||||||||||||
|
|
|
|
|
|
|
| |||||||||
| ||||||||||||||||
NET ASSETS: | ||||||||||||||||
| ||||||||||||||||
Beginning of period | $ | 2,429,734,323 | $ | 2,183,062,340 | $ | 184,110,753 | $ | 23,639,042 | ||||||||
|
|
|
|
|
|
|
| |||||||||
End of period | $ | 2,867,021,472 | $ | 2,429,734,323 | $ | 325,123,078 | $ | 184,110,753 | ||||||||
|
|
|
|
|
|
|
| |||||||||
Undistributed net investment income (loss) | $ | 31,636,794 | $ | 11,075,496 | $ | 1,255,836 | $ | (50,592 | ) | |||||||
|
|
|
|
|
|
|
| |||||||||
| ||||||||||||||||
Capital share transactions in shares: | ||||||||||||||||
Shares sold | 125,838,382 | 233,708,393 | 23,833,725 | 23,452,516 | ||||||||||||
Reinvested distributions | 5,173,996 | 10,151,083 | 1,149,636 | 514,078 | ||||||||||||
Shares redeemed | (105,128,123 | ) | (198,619,052 | ) | (11,282,895 | ) | (7,037,721 | ) | ||||||||
|
|
|
|
|
|
|
| |||||||||
Net increase | 25,884,255 | 45,240,424 | 13,700,466 | 16,928,873 | ||||||||||||
|
|
|
|
|
|
|
| |||||||||
| ||||||||||||||||
| * | Fund commenced operations on March 1, 2012. |
Notes to Financial Statements are an integral part of this Schedule.
30
Statements of Changes in Net Assets
| Driehaus International Credit Opportunities Fund | |||
| For the period March 1, 2012* through December 31, 2012 | |||
|
| ||
| $ | 507,247 | ||
| (1,935,488 | ) | |
| 773,320 |
| |
|
| ||
| (654,921 | ) | |
|
| ||
| — | |||
| (59,478 | ) | ||
| — | |||
|
| ||
| (59,478 | ) | ||
|
| ||
| 29,499,018 | |||
| 59,478 | |||
| (1,192,669 | ) | ||
|
| ||
| 28,365,827 |
| |
|
| ||
| 27,651,428 | |||
|
| ||
| — | |||
|
| ||
| $ | 27,651,428 | ||
|
| ||
$ | 83,396 |
| |
|
| ||
| 2,952,007 | |||
| 6,088 | |||
| (121,601 | ) | ||
|
| ||
| 2,836,494 | |||
|
| ||
Notes to Financial Statements are an integral part of this Schedule.
31
Driehaus Active Income Fund
| For the year ended December 31, 2012 | For the year ended December 31, 2011 | For the year ended December 31, 2010 | For the period ended October 1, 2009* through December 31, 2009 | For the year ended September 30, 2009 | For the year ended September 30, 2008 | |||||||||||||||||||
Net asset value, beginning of period | $ | 10.01 | $ | 11.05 | $ | 10.81 | $ | 12.12 | $ | 10.17 | $ | 10.25 | ||||||||||||
|
|
|
|
|
|
|
|
|
|
|
| |||||||||||||
INCOME FROM INVESTMENT OPERATIONS: | ||||||||||||||||||||||||
Net investment income | 0.44 | 0.48 | 0.36 | 0.09 | 0.38 | 0.23 | ||||||||||||||||||
Net realized and unrealized gain/(loss) on investments | 0.49 | (1.09 | ) | 0.20 | 0.26 | 1.61 | (0.24 | ) | ||||||||||||||||
|
|
|
|
|
|
|
|
|
|
|
| |||||||||||||
Total from investment operations | 0.93 | (0.61 | ) | 0.56 | 0.35 | 1.99 | (0.01 | ) | ||||||||||||||||
|
|
|
|
|
|
|
|
|
|
|
| |||||||||||||
LESS DISTRIBUTIONS TO SHAREHOLDERS FROM: | ||||||||||||||||||||||||
Net investment income | (0.27 | ) | (0.43 | ) | (0.26 | ) | (1.66 | ) | (0.04 | ) | (0.04 | ) | ||||||||||||
Tax return of capital | — | — | — | — | — | (0.03 | ) | |||||||||||||||||
Net realized gains | — | — | † | (0.06 | ) | — | — | — | ||||||||||||||||
|
|
|
|
|
|
|
|
|
|
|
| |||||||||||||
Total distributions | (0.27 | ) | (0.43 | ) | (0.32 | ) | (1.66 | ) | (0.04 | ) | (0.07 | ) | ||||||||||||
|
|
|
|
|
|
|
|
|
|
|
| |||||||||||||
Net asset value, end of period | $ | 10.67 | $ | 10.01 | $ | 11.05 | $ | 10.81 | $ | 12.12 | $ | 10.17 | ||||||||||||
|
|
|
|
|
|
|
|
|
|
|
| |||||||||||||
Total Return | 9.34 | % | (5.61 | )% | 5.18 | % | 2.87 | %1 | 19.66 | % | (0.13 | )% | ||||||||||||
SUPPLEMENTAL DATA AND RATIOS: | ||||||||||||||||||||||||
Net assets, end of period (in 000’s) | $ | 2,867,021 | $ | 2,429,734 | $ | 2,183,062 | $ | 1,259,714 | $ | 1,036,182 | $ | 487,110 | ||||||||||||
Ratio of total expenses to average net assets | 1.31 | %3 | 1.01 | %5 | 1.79 | %7 | 1.99 | %2,9 | 1.96 | %11 | 1.45 | %13 | ||||||||||||
Ratio of net investment income to average net assets | 4.22 | %4 | 4.44 | %6 | 3.24 | %8 | 2.85 | %2,10 | 3.52 | %12 | 2.54 | %14 | ||||||||||||
Portfolio turnover rate | 42 | % | 55 | % | 51 | % | 7 | %1 | 150 | % | 387 | % | ||||||||||||
| ||||||||||||||||||||||||
| * | Fiscal year end change to December 31. |
| † | Represents less than $0.01 per share. |
| 1 | Not annualized. |
| 2 | Annualized. |
| 3 | The ratio of expenses to average net assets includes dividends and interest on short positions and interest expense. Excluding dividends and interest on short positions and interest expense, the ratio of expenses to average net assets was 0.91%. |
| 4 | The ratio of net investment income to average net assets includes dividends and interest on short positions and interest expense. Excluding dividends and interest on short positions and interest expense, the net investment income to average net assets was 4.63%. |
| 5 | The ratio of expenses to average net assets includes dividends and interest on short positions and interest expense. Excluding dividends and interest on short positions and interest expense, the ratio of expenses to average net assets was 0.88%. |
| 6 | The ratio of net investment income to average net assets includes dividends and interest on short positions and interest expense. Excluding dividends and interest on short positions and interest expense, the net investment income to average net assets was 4.58%. |
| 7 | The ratio of expenses to average net assets includes dividends and interest on short positions and interest expense. Excluding dividends and interest on short positions and interest expense, the ratio of expenses to average net assets was 0.92%. |
| 8 | The ratio of net investment income to average net assets includes dividends and interest on short positions and interest expense. Excluding dividends and interest on short positions and interest expense, the net investment income to average net assets was 4.12%. |
| 9 | The ratio of expenses to average net assets includes dividends and interest on short positions and interest expense. Excluding dividends and interest on short positions and interest expense, the ratio of expenses to average net assets was 0.96%. |
| 10 | The ratio of net investment income to average net assets includes dividends and interest on short positions and interest expense. Excluding dividends and interest on short positions and interest expense, the net investment income to average net assets was 3.88%. |
| 11 | The ratio of expenses to average net assets includes dividends and interest on short positions and interest expense. Excluding dividends and interest on short positions and interest expense, the ratio of expenses to average net assets was 0.91%. |
| 12 | The ratio of net investment income to average net assets includes dividends and interest on short positions and interest expense. Excluding dividends and interest on short positions and interest expense, the net investment income to average net assets was 4.56%. |
| 13 | The ratio of expenses to average net assets includes dividends and interest on short positions and interest expense. Excluding dividends and interest on short positions and interest expense, the ratio of expenses to average net assets was 0.94%. |
| 14 | The ratio of net investment income to average net assets includes dividends and interest on short positions and interest expense. Excluding dividends and interest on short positions and interest expense, the net investment income to average net assets was 3.05%. |
Notes to Financial Statements are an integral part of this Schedule.
32
Driehaus Select Credit Fund
Financial Highlights
For the year ended | For the year ended December 31, 2011 | For the period September 30, 2010* to December 31, 2010 | ||||||||||
Net asset value, beginning of period | $ | 9.57 | $ | 10.26 | $ | 10.00 | ||||||
|
|
|
|
|
| |||||||
INCOME FROM INVESTMENT OPERATIONS: | ||||||||||||
Net investment income | 0.58 | 0.57 | 0.05 | |||||||||
Net realized and unrealized gain (loss) on investments | 0.21 | (0.84 | ) | 0.29 | ||||||||
|
|
|
|
|
| |||||||
Total from investment operations | 0.79 | (0.27 | ) | 0.34 | ||||||||
|
|
|
|
|
| |||||||
LESS DISTRIBUTIONS TO SHAREHOLDERS FROM: | ||||||||||||
Net investment income | (0.49 | ) | (0.42 | ) | (0.06 | ) | ||||||
Tax return of capital | — | — | (0.02 | ) | ||||||||
|
|
|
|
|
| |||||||
Total distributions | (0.49 | ) | (0.42 | ) | (0.08 | ) | ||||||
|
|
|
|
|
| |||||||
Net asset value, end of period | $ | 9.87 | $ | 9.57 | $ | 10.26 | ||||||
|
|
|
|
|
| |||||||
Total return | 8.37 | % | (2.64 | ) % | 3.43 | %1 | ||||||
SUPPLEMENTAL DATA AND RATIOS: | ||||||||||||
Net assets, end of period (in 000’s) | $ | 325,123 | $ | 184,111 | $ | 23,639 | ||||||
Ratio of total expenses to average net assets including waivers and recapture | 1.69 | %3 | 1.87 | %5 | 2.15 | %2,7 | ||||||
Ratio of total expenses to average net assets before waivers and recapture | 1.69 | %3 | 1.81 | %5 | 3.54 | %2,7 | ||||||
Ratio of net investment income to average net assets, including waivers and recapture | 5.82 | %4 | 5.75 | %6 | 1.98 | %2,8 | ||||||
Ratio of net investment income to average net assets, before waivers and recapture | 5.82 | %4 | 5.81 | %6 | 0.59 | %2,8 | ||||||
Portfolio turnover rate | 78 | % | 64 | % | 52 | %1 | ||||||
| ||||||||||||
| * | Fund commenced operations on September 30, 2010. |
| 1 | Not annualized. |
| 2 | Annualized. |
| 3 | The ratio of expenses to average net assets includes dividends and interest on short positions and interest expense. Excluding dividends and interest on short positions and interest expense, the ratio of expenses to average net assets was 1.23%. |
| 4 | The ratio of net investment income to average net assets includes dividends and interest on short positions and interest expense. Excluding dividends and interest on short positions and interest expense, the ratio of net investment income to average net assets was 6.28%. |
| 5 | The ratio of expenses to average net assets includes dividends and interest on short positions and interest expense. Excluding dividends and interest on short positions and interest expense, the ratio of expenses to average net assets, including recapture, was 1.43%. Excluding dividends and interest on short positions and interest expense, the ratio of expenses to average net assets before recapture was 1.37%. |
| 6 | The ratio of net investment income to average net assets includes dividends and interest on short positions and interest expense. Excluding dividends and interest on short positions and interest expense, the ratio of net investment income to average net assets, including recapture, was 6.20%. Excluding dividends and interest on short positions and interest expense, the ratio of net investment income to average net assets before recapture was 6.26%. |
| 7 | The ratio of expenses to average net assets includes dividends and interest on short positions and interest expense. Excluding dividends and interest on short positions and interest expense, the ratio of expenses to average net assets, less waivers, was 1.75%. Excluding dividends and interest on short positions and interest expense, the ratio of expenses to average net assets before waivers was 3.14%. |
| 8 | The ratio of net investment income to average net assets includes dividends and interest on short positions and interest expense. Excluding dividends and interest on short positions and interest expense, the ratio of net investment income to average net assets, less waivers, was 2.38%. Excluding dividends and interest on short positions and interest expense, the ratio of net investment income to average net assets before waivers was 0.99%. |
Notes to Financial Statements are an integral part of this Schedule.
33
Driehaus International Credit Opportunities Fund
Financial Highlights
| For the period March 1, 2012* through December 31, 2012 | ||||
Net asset value, beginning of period | $ | 10.00 | ||
|
| |||
INCOME FROM INVESTMENT OPERATIONS: | ||||
Net investment income | 0.18 | |||
Net realized and unrealized gain/(loss) on investments | (0.41 | ) | ||
|
| |||
Total from investment operations | (0.23 | ) | ||
|
| |||
LESS DISTRIBUTIONS TO SHAREHOLDERS FROM: | ||||
Tax return of capital | (0.02 | ) | ||
|
| |||
Net asset value, end of period | $ | 9.75 | ||
|
| |||
Total Return | (2.29 | )%1 | ||
SUPPLEMENTAL DATA AND RATIOS: | ||||
Net assets, end of period (in 000’s) | $ | 27,651 | ||
Ratio of total expenses to average net assets | 1.89 | %2,3 | ||
Ratio of net investment income to average net assets | 2.21 | %2,4 | ||
Portfolio turnover rate | 463 | %1 | ||
| ||||
| * | Fund commenced operations on March 1, 2012. |
| 1 | Not annualized. |
| 2 | Annualized. |
| 3 | The ratio of expenses to average net assets includes interest expense. Excluding interest expense, the ratio of expenses to average net assets was 1.77%. |
| 4 | The ratio of net investment income to average net assets includes interest expense. Excluding interest expense, the net investment income to average net assets was 2.33%. |
Notes to Financial Statements are an integral part of this Schedule.
34
Driehaus Mutual Funds
A. ORGANIZATION AND SUMMARY OF SIGNIFICANT ACCOUNTING POLICIES
Organization
The Driehaus Mutual Funds (the “Trust”) is an open-end registered management investment company, organized as a Delaware statutory trust, with ten separate series currently in operation. The Trust was organized under an Agreement and Declaration of Trust dated May 31, 1996, as subsequently amended, and may issue an unlimited number of full and fractional units of beneficial interest (shares) without par value. The Driehaus Active Income Fund (the “Active Income Fund”) commenced operations on June 1, 2009 following the receipt of the assets and liabilities of the Lotsoff Capital Management Active Income Fund (the “Acquired Fund”) pursuant to a plan of reorganization approved by the shareholders of the Acquired Fund. The reorganization was accomplished by a tax-free exchange of Acquired Fund shares for an equal number of shares of the Active Income Fund as of June 1, 2009. The Active Income Fund seeks to provide current income and capital appreciation. The Active Income Fund was closed to new investors as of March 1, 2011. The Driehaus Select Credit Fund (the “Select Credit Fund”) and the Driehaus International Credit Opportunities Fund (the “International Credit Opportunities Fund”) (together with the Active Income Fund, the “Funds”) commenced operations on September 30, 2010 and March 1, 2012, respectively. The Select Credit Fund seeks to provide positive returns under a variety of market conditions. The International Credit Opportunities Fund seeks to provide positive returns under a variety of market conditions.
Significant Accounting Policies
The presentation of financial statements in conformity with U.S. generally accepted accounting principles (“GAAP”) requires management to make estimates and assumptions that affect the reported amounts of assets and liabilities at the date of the financial statements and the reported amounts of income and expenses. Actual results may differ from those estimates.
Securities Valuation
Investments in securities traded on a national securities exchange, including exchange-traded futures and options, are valued at the last reported sales or settlement price on the day of valuation and are generally classified as level 1. Securities traded on the Nasdaq markets are valued at the Nasdaq Official Closing Price (“NOCP”) and are generally classified as level 1. Exchange-traded securities for which no sale was reported and Nasdaq-traded securities for which there is no NOCP are valued at the mean of the closing bid and ask prices from the exchange the security is primarily traded on and are generally classified as level 1. Long-term fixed income securities are valued at the representative quoted bid price when held long or the representative quoted ask price if sold short or, if such prices are not available, at prices for securities of comparable maturity, quality and type or as determined by an independent pricing service and are generally classified as level 2. Short-term investments with remaining maturities of 60 days or less are stated at amortized cost, which approximates fair value. If amortized cost does not approximate fair value, short-term securities are reported at fair value. These securities are generally classified as level 2. Swaps, forward foreign currency contracts and other financial derivatives are valued daily, primarily by an independent pricing service using pricing models and are generally classified as level 2. The pricing models use inputs that are observed from actively quoted markets such as issuer details, indices, spreads, interest rates, yield curves, dividends and exchange rates. If valuations are not available from the independent pricing service or values received are deemed not representative of market value, values will be obtained from a third party broker-dealer or counterparty. Investments initially valued in currencies other than the U.S. dollar are converted to the U.S. dollar using exchange rates obtained from an independent pricing service. Securities for which market quotations are not readily available are valued at their fair value as determined in good faith in accordance with procedures established by or under the direction of the Trust’s Board of Trustees and are generally classified as level 3. Under these procedures, the Funds primarily employ a market-based approach which may use related or comparable assets or liabilities, recent transactions, market multiples, book values and other relevant information for the investment to determine the fair value of the investment. It is possible that the estimated values may differ significantly from the values that would have been used had a ready market existed for the investments, and such differences could be material.
Each Fund is subject to fair value accounting standards that define fair value, establish the framework for measuring fair value and provide a three-level hierarchy for fair valuation based upon the inputs to the valuation as of the measurement date. The three levels of the fair value hierarchy are as follows:
Level 1 — quoted prices for active markets for identical securities
35
Driehaus Mutual Funds
Notes to Financial Statements — (Continued)
Level 2 — significant observable inputs (including quoted prices for similar securities, interest rates, prepayment speeds, credit risk, etc.)
Level 3 — significant unobservable inputs (including the Fund’s own assumptions in determining the fair value of investments).
The Funds adopted the Financial Accounting Standards Board (“FASB”) amendments to authoritative guidance which require the Funds to disclose details of transfers in and out of Level 1 and Level 2 measurements and Level 2 and Level 3 measurements and the reasons for the transfers. During the period ended December 31, 2012, there were no significant transfers between levels for the Active Income Fund, Select Credit Fund or International Credit Opportunities Fund. It is the Funds’ policy to recognize transfers into and out of all levels at the end of the reporting period.
The inputs or methodology used for valuing securities are not necessarily an indication of the risk associated with investing in those securities. The following is a summary of the inputs used to value the Active Income Fund’s investments as of December 31, 2012:
Assets | Level 1 | Level 2 | Level 3 | Total | ||||||||||||
Asset-Backed Securities | $ | — | $ | 61,923,957 | $ | — | $ | 61,923,957 | ||||||||
Bank Loans | — | 372,338,372 | — | 372,338,372 | ||||||||||||
Common Stocks | ||||||||||||||||
Auto Manufacturers | 26,888,646 | — | — | 26,888,646 | ||||||||||||
Software | 7,501,427 | — | — | 7,501,427 | ||||||||||||
Convertible Corporate Bonds | — | 294,397,470 | — | 294,397,470 | ||||||||||||
Convertible Preferred Stocks | ||||||||||||||||
Auto Manufacturers | — | — | — | — | ||||||||||||
Banks | 24,200,470 | — | — | 24,200,470 | ||||||||||||
Telecommunications | 48,462,684 | — | — | 48,462,684 | ||||||||||||
Corporate Bonds | — | 1,225,532,428 | — | 1,225,532,428 | ||||||||||||
Demand Deposit | 712,702,135 | — | — | 712,702,135 | ||||||||||||
Preferred Stocks | ||||||||||||||||
Banks | 10,448,000 | — | — | 10,448,000 | ||||||||||||
Holding Companies — Diversified | — | 50,920,683 | — | 50,920,683 | ||||||||||||
Telecommunications | — | 34,137,631 | — | 34,137,631 | ||||||||||||
Purchased Put Options | 14,768,520 | — | — | 14,768,520 | ||||||||||||
U.S. Government And Agency Securities | — | 923,388 | — | 923,388 | ||||||||||||
Warrants | 14,190,576 | — | — | 14,190,576 | ||||||||||||
|
|
|
|
|
|
|
| |||||||||
Total | $ | 859,162,458 | $ | 2,040,173,929 | $ | — | $ | 2,899,336,387 | ||||||||
|
|
|
|
|
|
|
| |||||||||
Liabilities | ||||||||||||||||
Common Stocks | ||||||||||||||||
Auto Manufacturers | $ | (45,220,558 | ) | $ | — | $ | — | $ | (45,220,558 | ) | ||||||
Banks | (7,288,524 | ) | — | — | (7,288,524 | ) | ||||||||||
Healthcare-Services | (1,368,957 | ) | — | — | (1,368,957 | ) | ||||||||||
Internet | (26,040,714 | ) | — | — | (26,040,714 | ) | ||||||||||
Lodging | (18,413,066 | ) | — | — | (18,413,066 | ) | ||||||||||
Real Estate Investment Trusts | (18,701,346 | ) | — | — | (18,701,346 | ) | ||||||||||
Telecommunications | (15,455,712 | ) | — | — | (15,455,712 | ) | ||||||||||
Convertible Corporate Bonds | — | (45,856,375 | ) | — | (45,856,375 | ) | ||||||||||
Corporate Bonds | — | (73,825,625 | ) | — | (73,825,625 | ) | ||||||||||
Written Put Options | (5,485,350 | ) | — | — | (5,485,350 | ) | ||||||||||
|
|
|
|
|
|
|
| |||||||||
Total | $ | (137,974,227 | ) | $ | (119,682,000 | ) | $ | — | $ | (257,656,227 | ) | |||||
|
|
|
|
|
|
|
| |||||||||
36
Driehaus Mutual Funds
Notes to Financial Statements — (Continued)
Other Financial Instruments* | Level 1 | Level 2 | Level 3 | Total | ||||||||||||
Credit Default Swaps | $ | — | $ | (8,554,944 | ) | $ | — | $ | (8,554,944 | ) | ||||||
Futures Contracts | 3,401,593 | — | — | 3,401,593 | ||||||||||||
|
|
|
|
|
|
|
| |||||||||
Total Swap and Futures Contracts | $ | 3,401,593 | $ | (8,554,944 | ) | $ | — | $ | (5,153,351 | ) | ||||||
|
|
|
|
|
|
|
| |||||||||
| * | Other financial instruments are swap and futures contracts, which are detailed in the Schedule of Investments. |
Following is a reconciliation of Level 3 assets for which significant unobservable inputs were used to determine fair value in the Active Income Fund:
| Investments, at Value | ||||
Balance as of 12/31/11 | $ | 2,330,473 | ||
Realized gain (loss) | — | |||
Change in unrealized appreciation (depreciation) | (2,330,473 | ) | ||
Purchase | — | |||
Sales | — | |||
Transfers in and/or out of Level 3 | — | |||
|
| |||
Balance as of 12/31/12 | $ | — | ||
|
| |||
As of December 31, 2012, the Active Income Fund held Level 3 investments in General Motors Corp. senior convertible preferred stock, valued at fair value as determined in good faith in accordance with procedures established by or under the direction of the Trust’s Board of Trustees. As a part of the ongoing restructuring of General Motors, any value previously ascribed to these holdings has been transferred to the General Motors Co. Motors Liquidation Co. GUC Trust common stock, which is freely and actively traded, and therefore the senior convertible preferred stock was fair valued at $0.
The following is a summary of the inputs used to value the Select Credit Fund’s investments as of December 31, 2012:
Assets | Level 1 | Level 2 | Level 3 | Total | ||||||||||||
Bank Loans | $ | — | $ | 19,440,449 | $ | — | $ | 19,440,449 | ||||||||
Common Stocks | ||||||||||||||||
Auto Manufacturers | 325,841 | — | — | 325,841 | ||||||||||||
Beverages | 1,300,816 | — | — | 1,300,816 | ||||||||||||
Oil & Gas Services | 1,406,458 | — | — | 1,406,458 | ||||||||||||
Convertible Corporate Bonds | — | 26,296,640 | — | 26,296,640 | ||||||||||||
Convertible Preferred Stocks | ||||||||||||||||
Auto Manufacturers | 3,530,400 | — | — | 3,530,400 | ||||||||||||
Telecommunications | 4,978,020 | — | — | 4,978,020 | ||||||||||||
Corporate Bonds | — | 170,960,175 | 4,500,000 | 175,460,175 | ||||||||||||
Purchased Call Options | 476,000 | — | — | 476,000 | ||||||||||||
Purchased Put Options | 1,217,831 | — | — | 1,217,831 | ||||||||||||
Demand Deposit | 105,337,764 | — | — | 105,337,764 | ||||||||||||
Warrants | 277,514 | — | — | 277,514 | ||||||||||||
|
|
|
|
|
|
|
| |||||||||
Total | $ | 118,850,644 | $ | 216,697,264 | $ | 4,500,000 | $ | 340,047,908 | ||||||||
|
|
|
|
|
|
|
| |||||||||
37
Driehaus Mutual Funds
Notes to Financial Statements — (Continued)
Liabilities | Level 1 | Level 2 | Level 3 | Total | ||||||||||||
Common Stocks | ||||||||||||||||
Health Care — Services | $ | (371,018 | ) | $ | — | $ | — | $ | (371,018 | ) | ||||||
Internet | (2,942,886 | ) | — | — | (2,942,886 | ) | ||||||||||
Software | (2,342,350 | ) | — | — | (2,342,350 | ) | ||||||||||
Convertible Corporate Bonds | — | (5,103,125 | ) | — | (5,103,125 | ) | ||||||||||
Corporate Bonds | $ | — | $ | (13,940,625 | ) | $ | — | $ | (13,940,625 | ) | ||||||
Written Put Options | (126,750 | ) | — | — | (126,750 | ) | ||||||||||
|
|
|
|
|
|
|
| |||||||||
Total | $ | (5,783,004 | ) | $ | (19,043,750 | ) | $ | — | $ | (24,826,754 | ) | |||||
|
|
|
|
|
|
|
| |||||||||
Other Financial Instruments* | ||||||||||||||||
Credit Default Swaps | $ | — | $ | (556,137 | ) | $ | — | $ | (556,137 | ) | ||||||
Futures Contracts | 89,515 | — | — | 89,515 | ||||||||||||
|
|
|
|
|
|
|
| |||||||||
Total Swap and Futures Contracts | $ | 89,515 | $ | (556,137 | ) | $ | — | $ | (466,622 | ) | ||||||
|
|
|
|
|
|
|
| |||||||||
| * | Other financial instruments are swap and futures contracts, which are detailed in the Schedule of Investments. |
Following is a reconciliation of Level 3 assets for which significant unobservable inputs were used to determine fair value in the Select Credit Fund:
| Investments, at Value | ||||
Balance as of 12/31/11 | $ | 6,018,042 | ||
Realized gain (loss) | — | |||
Change in unrealized appreciation (depreciation) | (1,518,042 | ) | ||
Purchase | — | |||
Sales | — | |||
Transfers in and/or out of Level 3 | — | |||
|
| |||
Balance as of 12/31/12 | $ | 4,500,000 | ||
|
| |||
As of December 31, 2012, the Select Credit Fund held Level 3 investments, including Cuco Resources Ltd. (corporate bond and warrant), valued at fair value as determined in good faith in accordance with procedures established by or under the direction of the Trust’s Board of Trustees. Factors considered in fair valuing the bond position included the likelihood and pricing of a successful equity raise by the company and the implications of failing to raise additional equity, including a possible restructuring. Given these considerations, the likelihood of the various scenarios and the expected outcome for each scenario, the bond position was fair valued at 75% of its principal amount. In addition, taking into consideration the strike price for the warrants, the current equity valuations in the mining space, the uncertainty regarding the potential success of a future equity raise and the potential for a future restructuring, the warrant was fair valued at $0. The Select Credit Fund also held an investment in General Motors Corp. senior convertible preferred stock, which was valued in the same manner as described above for the Active Income Fund.
The following is a summary of the inputs used to value the International Credit Opportunities Fund’s investments as of December 31, 2012:
Assets | Level 1 | Level 2 | Level 3 | Total | ||||||||||||
Fixed Income Investments | $ | — | $ | 20,266,942 | $ | — | $ | 20,266,942 | ||||||||
Purchased Put Options | — | 2,747 | — | 2,747 | ||||||||||||
Money Market Fund | 3,432,416 | — | — | 3,432,416 | ||||||||||||
|
|
|
|
|
|
|
| |||||||||
Total | $ | 3,432,416 | $ | 20,269,689 | $ | — | $ | 23,702,105 | ||||||||
|
|
|
|
|
|
|
| |||||||||
38
Driehaus Mutual Funds
Notes to Financial Statements — (Continued)
Liabilities | Level 1 | Level 2 | Level 3 | Total | ||||||||||||
Written Put Options | $ | — | $ | (633 | ) | $ | — | $ | (633 | ) | ||||||
|
|
|
|
|
|
|
| |||||||||
Total | $ | — | $ | (633 | ) | $ | — | $ | (633 | ) | ||||||
|
|
|
|
|
|
|
| |||||||||
Other Financial Instruments* | ||||||||||||||||
Credit Default Swaps | $ | — | $ | 37,104 | $ | — | $ | 37,104 | ||||||||
Credit Default Swaptions | — | 1,626 | — | 1,626 | ||||||||||||
Forward Foreign Currency Contracts | — | (52,801 | ) | — | (52,801 | ) | ||||||||||
Interest Rate Swaps | — | 2,521 | — | 2,521 | ||||||||||||
|
|
|
|
|
|
|
| |||||||||
Total Other Financial Instruments | $ | — | $ | (11,550 | ) | $ | — | $ | (11,550 | ) | ||||||
|
|
|
|
|
|
|
| |||||||||
| * | Other financial instruments are swap contracts, swaptions and forward contracts which are detailed in the Schedule of Investments. |
Securities Sold Short
The Funds are engaged in selling securities short, which obligates them to replace a borrowed security with the same security at current market value. Each Fund incurs a loss if the price of the security increases between the date of the short sale and the date on which the Fund replaces the borrowed security. Each Fund realizes a gain if the price of the security declines between those dates. Gains are limited to the price at which the Fund sold the security short, while losses are potentially unlimited in size.
The Funds are required to establish a margin account with the broker lending the security sold short. While the short sale is outstanding, the broker retains the proceeds of the short sale and the Fund must maintain a deposit with the broker consisting of cash and securities having a value equal to a specified percentage of the value of the securities sold short. Such deposit is included in “Collateral held at custodian for the benefit of brokers” on the Statements of Assets and Liabilities. Each Fund is obligated to pay the counterparty any dividends or interest due on securities sold short. Such dividends and interest are recorded as an expense to the Funds on the Statements of Operations.
Federal Income Taxes
The Funds’ policy is to continue to comply with the requirements of Subchapter M of the Internal Revenue Code that are applicable to regulated investment companies and to distribute substantially all their taxable income to their shareholders. Therefore, no Federal income tax provision is required.
The FASB’s “Accounting for Uncertainty in Income Taxes” (“Tax Statement”) requires the evaluation of tax positions taken or expected to be taken in the course of preparing the Funds’ tax returns to determine whether the tax positions are “more-likely-than-not” of being sustained by the applicable tax authority. Tax positions not deemed to meet the more-likely-than-not threshold would be recorded as a tax benefit or expense in the current year. Management has evaluated the implications of the Tax Statement and all of the uncertain tax positions and has determined that no liability is required to be recorded in the financial statements as of December 31, 2012. The Funds file tax returns with the U.S. Internal Revenue Service and various states. Generally, the tax years ended September 30, 2009, December 31, 2009, December 31, 2010, December 31, 2011 and December 31, 2012 remain subject to examination by taxing authorities.
For Federal income tax purposes, capital loss carryforwards represent net capital losses of a fund that may be carried forward for a maximum period of eight years and applied against future net realized gains. On December 22, 2010, the Regulated Investment Company Modernization Act of 2010 was enacted to modernize several of the Federal income and excise tax provisions related to regulated investment companies. Under pre-enactment law, capital losses could be carried forward for up to eight years, and were required to be carried forward as short-term capital losses, irrespective of the character of the original loss. New net capital losses (those earned in taxable years beginning after December 22, 2010) may be carried forward indefinitely and must retain the character of the original loss. Such new net capital losses generally must be used by a
39
Driehaus Mutual Funds
Notes to Financial Statements — (Continued)
regulated investment company before it uses any net capital losses incurred in taxable years beginning on or before December 22, 2010. This increases the likelihood that net capital losses incurred in taxable years beginning on or before December 22, 2010 will expire unused.
At December 31, 2012, gross unrealized appreciation and depreciation on investments, based on cost for Federal income tax purposes, were as follows:
| Active Income Fund | Select Credit Fund | International Credit Opportunities Fund | ||||||||||
Cost of investments | $ | 2,856,834,778 | $ | 345,021,440 | $ | 22,844,663 | ||||||
|
|
|
|
|
| |||||||
Gross unrealized appreciation | $ | 125,961,604 | $ | 12,724,743 | $ | 941,357 | ||||||
Gross unrealized depreciation | (83,459,995 | ) | (17,698,275 | ) | (83,915 | ) | ||||||
|
|
|
|
|
| |||||||
Net unrealized appreciation (depreciation) on investments | $ | 42,501,609 | $ | (4,973,532 | ) | $ | 857,442 | |||||
|
|
|
|
|
| |||||||
The difference between cost amounts for financial statement and Federal income tax purposes is due primarily to the tax deferral of losses on wash sales.
The amount of dividends and distributions from net investment income and net realized capital gains are determined in accordance with Federal income tax regulations, which may differ from U.S. GAAP.
For the year ended December 31, 2012, reclassifications were recorded to undistributed net investment income, undistributed net realized gain and paid-in capital for any permanent tax differences. These reclassifications relate primarily to the differing tax treatment of income from paydowns and swaps, return of capital and capital gain distributions on real estate investment trusts and regulated investment companies, and foreign currency gains and losses. Results of operations and net assets were not affected by these reclassifications.
| Active Income Fund | Select Credit Fund | International Credit Opportunities Fund | ||||||||||
Paid-in capital | $ | 485,355 | $ | (472,207 | ) | $ | (355,153 | ) | ||||
Undistributed net investment income (loss) | (23,014,323 | ) | (446,193 | ) | (364,373 | ) | ||||||
Undistributed net realized gain (loss) on investments, futures, swap contracts and foreign currency | 22,528,968 | 918,400 | 719,526 | |||||||||
The tax character of distributions paid were as follows:
| Active Income Fund | ||||||||
Distributions paid from: | January 1, 2012 to December 31, 2012 | January 1, 2011 to December 31, 2011 | ||||||
Ordinary income | $ | 67,114,475 | $ | 125,274,139 | ||||
|
|
|
| |||||
Total distributions paid | $ | 67,114,475 | $ | 125,274,139 | ||||
|
|
|
| |||||
| Select Credit Fund | ||||||||
Distributions paid from: | January 1, 2012 to December 31, 2012 | January 1, 2011 to December 31, 2011 | ||||||
Ordinary income | $ | 14,216,095 | $ | 5,908,053 | ||||
|
|
|
| |||||
Total distributions paid | $ | 14,216,095 | $ | 5,908,053 | ||||
|
|
|
| |||||
40
Driehaus Mutual Funds
Notes to Financial Statements — (Continued)
| International Credit Opportunities Fund | ||||
Distributions paid from: | March 1, 2012 to December 31, 2012 | |||
Return of capital | $ | 59,478 | ||
|
| |||
Total distributions paid | $ | 59,478 | ||
|
| |||
As of December 31, 2012, the components of accumulated earnings (deficit) were as follows:
| Active Income Fund | Select Credit Fund | International Credit Opportunities Fund | ||||||||||
Undistributed ordinary income | $ | 11,543,896 | $ | 360,154 | $ | — | ||||||
Undistributed long-term capital gains | — | — | — | |||||||||
|
|
|
|
|
| |||||||
Accumulated earnings | 11,543,896 | 360,154 | — | |||||||||
Accumulated capital and other losses | (209,637,271 | ) | (1,119,449 | ) | (1,210,512 | ) | ||||||
Unrealized appreciation (depreciation) | 42,501,609 | (4,973,532 | ) | 857,442 | ||||||||
|
|
|
|
|
| |||||||
Total accumulated earnings (deficit) | $ | (155,591,766 | ) | $ | (5,732,827 | ) | $ | (353,070 | ) | |||
|
|
|
|
|
| |||||||
As of December 31, 2012, the Funds had net capital loss carryforwards to offset future net capital gains, if any, to the extent provided by Treasury regulations:
| Not Subject to Expiration | ||||||||
| Short-Term | Long-Term | |||||||
Active Income Fund | $ | 112,020,214 | $ | 83,443,109 | ||||
Select Credit Fund | — | 770,317 | ||||||
International Credit Opportunities Fund | 1,128,310 | — | ||||||
The Select Credit Fund utilized $345,165 of its capital loss carryforwards during the year ended December 31, 2012.
Post-October capital losses and late-year ordinary losses incurred after October 31 and within the taxable year are deemed to arise on the first business day of the Funds’ taxable year. As of December 31, 2012, the Funds had the following post-October capital losses and late-year ordinary losses:
| Post-October Capital Losses | Late-Year Ordinary Losses | |||||||
Active Income Fund | $ | 2,526,024 | $ | 11,647,924 | ||||
Select Credit Fund | 349,132 | — | ||||||
International Credit Opportunities Fund | 77,203 | 4,999 | ||||||
Foreign Currency Translation
The value of securities, currencies and other assets and liabilities not denominated in U.S. dollars are translated into U.S. dollar values based upon the current rates of exchange on the date of the Funds’ valuations.
Net realized foreign exchange gains or losses which are reported by the Funds result from currency gains and losses on transaction hedges arising from changes in exchange rates between the trade and settlement dates on forward contract transactions, and the difference between the amounts accrued for dividends, interest, and foreign taxes and the amounts actually received or paid in U.S. dollars for these items. Net unrealized foreign exchange gains and losses result from changes in the U.S. dollar value of assets and liabilities (other than investments in securities), which are denominated in foreign currencies, as a result of changes in exchange rates.
41
Driehaus Mutual Funds
Notes to Financial Statements — (Continued)
Net realized foreign exchange gains or losses on portfolio hedges result from the use of forward contracts to hedge portfolio positions denominated or quoted in a particular currency in order to reduce or limit exposure in that currency. The Active Income Fund and Select Credit Fund had no portfolio hedges during the period January 1, 2012 through December 31, 2012. The International Credit Opportunities Fund held portfolio hedges as of December 31, 2012 as disclosed in the Schedule of Investments.
The Funds do not isolate that portion of the results of operations which results from fluctuations in foreign exchange rates on investments. These fluctuations are included with the net realized gain (loss) from security transactions and the net change in unrealized appreciation (depreciation) of investments.
Indemnifications
Under the Trust’s organizational documents, the officers and Trustees are indemnified against certain liabilities arising out of the performance of their duties to the Trust. In addition, in the normal course of business, the Trust enters into contracts that provide general indemnifications to other parties. A Fund’s maximum exposure under these agreements is unknown as this would involve future claims that may be made against a Fund that have not yet occurred. However, the Funds have not had prior claims or losses pursuant to these contracts and expect the risk of loss to be remote.
New Accounting Pronouncement
In December 2011, FASB issued Accounting Standards Update (“ASU”) No. 2011-11, “Disclosures about Offsetting Assets and Liabilities.” ASU No. 2011-11 requires disclosures to make financial statements that are prepared under U.S. GAAP more comparable to those prepared under International Financial Reporting Standards. The new disclosure requirements mandate that entities disclose both gross and net information about instruments and transactions eligible for offset in the statement of assets and liabilities as well as instruments and transactions subject to an agreement similar to a master netting arrangement. In addition, ASU No. 2011-11 requires disclosure of collateral received and posted in connection with master netting agreements or similar arrangements. New disclosures are required for annual reporting periods beginning on or after January 1, 2013, and interim periods within those annual periods. Management is evaluating the impact of ASU No. 2011-11 on the financial statements and disclosures.
Other
The Trust records security transactions based on trade date. Realized gains and losses on sales of securities are calculated using the first-in, first-out method. Dividend income is recognized on the ex-dividend date, and interest income is recognized on an accrual basis. Discounts and premiums on securities purchased are amortized over the lives of the respective securities using the effective yield method. Withholding taxes on foreign dividends and interest have been provided for in accordance with the Trust’s understanding of the applicable country’s tax rules and rates.
Pursuant to the terms of certain of the senior unsecured loan agreements, the Funds may have unfunded loan commitments, which are callable on demand. Each Fund would have available with its custodian, cash and/or liquid securities having an aggregate value at least equal to the amount of the unfunded senior loan commitments. At December 31, 2012, the Active Income Fund, Select Credit Fund and International Credit Opportunities Fund had no unfunded senior loan commitments.
With respect to the senior loans held in each Fund’s portfolio, the Funds may: 1) invest in assignments; 2) act as a participant in primary lending syndicates; or 3) invest in participations. If a Fund purchases a participation of a senior loan interest, the Fund would typically enter into a contractual agreement with the lender or other third party selling the participation, rather than directly with the borrower. As such, the Fund not only assumes the credit risk of the borrower, but also that of the selling participant or other persons interpositioned between the Fund and the borrower. At December 31, 2012, the Funds had no such outstanding senior loan participation commitments.
42
Driehaus Mutual Funds
Notes to Financial Statements — (Continued)
B. INVESTMENTS IN DERIVATIVES
Swap Contracts
The Funds are subject to credit risk and interest rate risk exposure in the normal course of pursuing their investment objectives. The Funds may engage in various swap transactions, including forward rate agreements and interest rate, currency, index and total return swaps, primarily to manage duration and yield curve risk, or as alternatives to direct investments. In addition to the swap contracts described above, the Funds may also engage in credit default swaps which involve the exchange of a periodic premium for protection against a defined credit event (such as payment default, refinancing or bankruptcy).
Interest rate swaps are agreements between two parties to exchange cash flows based on a notional principal amount. The Funds may elect to pay a fixed rate and receive a floating rate or receive a floating rate and pay a fixed rate on a notional principal amount. The net interest received or paid on interest rate swap agreements is accrued daily as interest income/expense. Interest rate swaps are marked-to-market daily using fair value estimates provided by an independent pricing service. Changes in value, including accrued interest, are recorded as unrealized appreciation (depreciation). Unrealized gains are reported as an asset and unrealized losses are reported as a liability. The change in value of swaps, including accruals of periodic amounts of interest to be paid or received on swaps, is reported as unrealized gains or losses. Gains or losses are realized upon termination of the contracts. The risk of loss under a swap contract may exceed the amount recorded as an asset or a liability.
Under the terms of a credit default swap contract, one party acts as a guarantor receiving a periodic payment that is a fixed percentage applied to a notional amount. In return, the party agrees to purchase the notional amount of the underlying instrument, at par, if a credit event occurs during the term of the contract. Each Fund may enter into credit default swaps in which the Fund acts as guarantor (a seller of protection), and may enter into credit default swaps in which the counterparty acts as guarantor (a buyer of protection). Premiums paid to or by the Funds are accrued daily and included in realized gain (loss) on swaps. The contracts are marked-to-market daily using fair value estimates provided by an independent pricing service. Changes in value are recorded as unrealized appreciation/(depreciation). Unrealized gains are reported as an asset and unrealized losses are reported as a liability. The change in value of swaps, including accruals of periodic amounts of interest to be paid or received on swaps is reported as unrealized gains or losses. Gains or losses are realized upon termination of the contracts. The risk of loss under a swap contract may exceed the amount recorded as an asset or a liability. The notional amount of a swap contract is the reference amount pursuant to which the counterparties make payments. For swaps in which the referenced obligation is an index, in the event of default of any debt security included in the corresponding index, the Fund pays or receives the percentage of the corresponding index that the defaulted security comprises (1) multiplied by the notional value and (2) multiplied by the ratio of one minus the ratio of the market value of the defaulted debt security to its par value. The maximum exposure to loss of the notional value as a seller of credit default swaps outstanding at December 31, 2012 for Active Income Fund and International Credit Opportunities Fund is $6,000,000 and Euro 1,000,000, respectively.
Risks associated with swap contracts include changes in the returns of underlying instruments, failure of the counterparties to perform under the contracts’ terms and the possible lack of liquidity with respect to the contracts. Credit default swaps can involve greater risks than if an investor had invested in the reference obligation directly since, in addition to general market risks, credit default swaps are subject to counterparty credit risk, leverage risk, hedging risk, correlation risk and liquidity risk. The Funds disclose swap contracts on a gross basis, with no netting of contracts held with the same counterparty. As of December 31, 2012, the Funds had outstanding swap contracts as listed on the Schedule of Investments and the required collateral is included in the Statements of Assets and Liabilities.
Futures Contracts
The Funds may enter into futures contracts to produce incremental earnings, hedge existing positions or protect against market changes in the value of equities or interest rates. Upon entering into a futures contract with a broker, a Fund is required to deposit in a segregated account a specified amount of cash or U.S. government securities. Futures contracts are valued daily and unrealized gains or losses are recorded in a
43
Driehaus Mutual Funds
Notes to Financial Statements — (Continued)
“variation margin” account. Daily, the Fund receives from or pays to the broker a specified amount of cash based upon changes in the variation margin account. When a contract is closed, the Fund recognizes a realized gain or loss. Futures contracts have market risks, including the risk that the change in the value of the contract may not correlate with changes in the value of the underlying securities. With futures, there is minimal counterparty credit risk to the Funds since futures are exchange traded and the exchange’s clearinghouse, as counterparty to all exchange traded futures, guarantees the futures contract against default. As of December 31, 2012, the Funds had outstanding futures contracts as listed on the Schedule of Investments and the required collateral is included in the Statements of Assets and Liabilities.
Options Contracts
The Funds may use options contracts to hedge downside risk on their fixed income holdings, produce incremental earnings or protect against market changes in the value of equities or interest rates. The Funds may write covered call and put options on futures, swaps, securities or currencies the Funds own or in which they may invest. Writing put options tends to increase a Fund’s exposure to the underlying instrument. Writing call options tends to decrease a Fund’s exposure to the underlying instrument. When a Fund writes a call or put option, an amount equal to the premium received is recorded as a liability and subsequently marked to market to reflect the current value of the option written. These liabilities are reflected as written options outstanding in the Schedule of Investments. Payments received or made, if any, from writing options with premiums to be determined on a future date are reflected as such in the Schedule of Investments. Premiums received from writing options which expire are treated as realized gains. Premiums received from writing options which are exercised or closed are added to the proceeds or offset against amounts paid on the underlying future, swap, security or currency transaction to determine the realized gain or loss. A Fund, as a writer of an option, has no control over whether the underlying future, swap, security or currency may be sold (call) or purchased (put) and, as a result, bears the market risk of an unfavorable change in the price of the future, swap, security or currency underlying the written option. The risk exists that a Fund may not be able to enter into a closing transaction because of an illiquid market. In addition, to the extent a Fund purchases an over-the-counter (“OTC”) option, it is subject to credit risk that the counterparty to the trade does not perform under the contract’s terms. The Funds are not subject to credit risk on OTC options written as the counterparty has already performed its obligation by paying the premium at the inception of the contract.
The premium amount and the number of option contracts written by the Active Income Fund during the period January 1, 2012 through December 31, 2012, were as follows:
Active Income Fund | Number of Contracts | Premium Amount | ||||||
Options outstanding at December 31, 2011 | 1,874 | $ | 6,039,349 | |||||
Options written | 19,891 | 30,600,959 | ||||||
Options closed | (1,738 | ) | (1,386,881 | ) | ||||
Options expired | (9,980 | ) | (14,455,114 | ) | ||||
|
|
|
| |||||
Options outstanding at December 31, 2012 | 10,047 | $ | 20,798,313 | |||||
|
|
|
| |||||
The premium amount and the number of option contracts written by the Select Credit Fund during the period January 1, 2012 through December 31, 2012, were as follows:
Select Credit Fund | Number of Contracts | Premium Amount | ||||||
Options outstanding at December 31, 2011 | 545 | $ | 420,220 | |||||
Options written | 4,775 | 2,623,393 | ||||||
Options closed | (2,035 | ) | (232,588 | ) | ||||
Options expired | (2,778 | ) | (1,747,354 | ) | ||||
|
|
|
| |||||
Options outstanding at December 31, 2012 | 507 | $ | 1,063,671 | |||||
|
|
|
| |||||
44
Driehaus Mutual Funds
Notes to Financial Statements — (Continued)
The premium amount and the number of option contracts written by the International Credit Opportunities Fund during the period from inception through December 31, 2012, were as follows:
International Credit Opportunities Fund | Number of Contracts | Premium Amount | ||||||
Options outstanding at inception on March 1, 2012 | — | $ | — | |||||
Options written | 61,001,736 | 474,768 | ||||||
Options closed | (30,001,252 | ) | (281,289 | ) | ||||
Options expired | (31,000,451 | ) | (184,955 | ) | ||||
|
|
|
| |||||
Options outstanding at December 31, 2012 | 33 | $ | 8,524 | |||||
|
|
|
| |||||
The Funds may also purchase put and call options. Purchasing call options tends to increase a Fund’s exposure to the underlying instrument. Purchasing put options tends to decrease a Fund’s exposure to the underlying instrument. A Fund pays a premium which is included in its Schedule of Investments as an investment and subsequently marked-to-market to reflect the current value of the option. Premiums paid for purchasing options which expire are treated as realized losses. The risk associated with purchasing put and call options is limited to the premium paid. Premiums paid for purchasing options which are exercised or closed are added to the amounts paid or offset against the proceeds on the underlying future, swap, security or currency transaction to determine the realized gain or loss. When entering into purchased option contracts, a Fund bears the risk of securities prices moving unexpectedly, in which case, a Fund may not achieve the anticipated benefits of the purchased option contracts; however, the risk of loss is limited to the premium paid. As of December 31, 2012, the Funds had outstanding options as listed on the Schedule of Investments and the required collateral is included in the Statements of Assets and Liabilities.
Swaptions
An option on a swap contract, also called a “swaption,” is an option that gives the buyer the right, but not the obligation, to enter into a swap on a future date in exchange for paying a market-based “premium.” A call or receiver swaption gives the owner the right to receive the total return of a specified asset, reference rate, or index swap. A put or payer swaption gives the owner the right to pay the total return of a specified asset, reference rate, or index swap. Swaptions also include options that allow an existing swap to be terminated or extended by one of the counterparties. The Active Income Fund and Select Credit Fund did not enter into any swaptions during the period January 1, 2012 through December 31, 2012. As of December 31, 2012, the International Credit Opportunities Fund had outstanding swaptions as listed on the Schedule of Investments.
Forward Foreign Currency Contracts
The Funds may use forward foreign currency contracts to manage foreign currency, to produce incremental earnings or hedge existing positions. A forward foreign currency contract involves an obligation to purchase or sell a specific currency at a future date, which may be any fixed number of days from the date of the contract agreed upon by the parties, at a price set at the time of the contract. These contracts are principally traded in the inter-bank market conducted directly between currency traders (usually large commercial banks) and their customers.
The market value of a forward foreign currency contract fluctuates with changes in currency exchange rates. Outstanding forward foreign currency contracts are valued daily at current market rates and the resulting change in market value is recorded as unrealized appreciation or depreciation. When a forward foreign currency contract is settled, the Fund records a realized gain or loss equal to the difference between the value at the time the forward foreign currency contract was opened and the value at the time it was settled. A forward foreign currency contract may involve market risk in excess of the unrealized gain or loss reflected on the Statements of Assets and Liabilities. In addition, the Funds could be exposed to a credit risk if the counterparties are unable or unwilling to meet the terms of the contracts or if the value of the foreign currency changes unfavorably. The Active Income Fund and Select Credit Fund did not enter into any forward foreign currency contracts during the period January 1, 2012 through December 31, 2012. At December 31, 2012, the International Credit Opportunities Fund had forward foreign currency contracts as listed in the Schedule of Investments.
45
Driehaus Mutual Funds
Notes to Financial Statements — (Continued)
Derivative Investment Holdings Categorized by Risk Exposure
Each Fund is subject to FASB’s “Disclosures about Derivative Instruments and Hedging Activities” (the “Derivatives Statement”). The Derivatives Statement amends and expands disclosures about derivative instruments and hedging activities. The Derivatives Statement is intended to improve financial reporting about derivative instruments by requiring enhanced disclosures to enable investors to better understand how and why the Fund uses derivative instruments, how these derivative instruments are accounted for and their effects on the Funds’ financial position and results of operations.
The following table sets forth the fair value and the location in the Statement of Assets and Liabilities of the Active Income Fund’s derivative contracts by primary risk exposure as of December 31, 2012:
| Asset derivatives | Liability derivatives | |||||||||||
Risk exposure category | Statement of Assets and Liabilities location | Fair value | Statement of Assets and Liabilities location | Fair value | ||||||||
Credit contracts | Unrealized appreciation on open swap contracts | $ | 2,958,359 | Unrealized depreciation on open swap contracts | $ | 34,699,181 | ||||||
Equity contracts | Purchased options, at fair value | 14,768,520 | Written options, at fair value | 5,485,350 | ||||||||
Interest rate contracts* | N/A | 3,401,593 | N/A | N/A | ||||||||
Total | $ | 21,128,472 | $ | 40,184,531 | ||||||||
| * | Includes cumulative appreciation/depreciation of futures contracts as shown in the Schedule of Investments. |
Only current day’s variation margin is reported in the Statement of Assets and Liabilities.
The following table sets forth the fair value and the location in the Statement of Assets and Liabilities of the Select Credit Fund’s derivative contracts by primary risk exposure as of December 31, 2012:
| Asset derivatives | Liability derivatives | |||||||||||
Risk exposure category | Statement of Assets and Liabilities location | Fair value | Statement of Assets and Liabilities location | Fair value | ||||||||
Credit contracts | Unrealized appreciation on open swap contracts | $ | — | Unrealized depreciation on open swap contracts | $ | 895,682 | ||||||
Equity contracts | Purchased options, at fair value | 1,693,831 | Written options outstanding, at fair value | 126,750 | ||||||||
Interest rate contracts* | N/A | 89,515 | N/A | — | ||||||||
Total | $ | 1,783,346 | $ | 1,022,432 | ||||||||
| * | Includes cumulative appreciation/depreciation of futures contracts as shown in the Schedule of Investments. |
Only current day’s variation margin is reported in the Statement of Assets and Liabilities.
The following table sets forth the fair value and the location in the Statement of Assets and Liabilities of the International Credit Opportunities Fund’s derivative contracts by primary risk exposure as of December 31, 2012:
| Asset derivatives | Liability derivatives | |||||||||||
Risk exposure category | Statement of Assets and Liabilities location | Fair value | Statement of Assets and Liabilities location | Fair value | ||||||||
Credit contracts | Unrealized appreciation on open swap contracts | $ | 41,563 | Unrealized depreciation on open swap contracts | $ | 89,731 | ||||||
Credit contracts | Purchased swaptions, at fair value | 1,626 | Written swaptions outstanding, at fair value | — | ||||||||
46
Driehaus Mutual Funds
Notes to Financial Statements — (Continued)
| Asset derivatives | Liability derivatives | |||||||||||
Risk exposure category | Statement of Assets and Liabilities location | Fair value | Statement of Assets and Liabilities location | Fair value | ||||||||
Interest rate contracts | Unrealized appreciation on open swap contracts | 2,521 | Unrealized depreciation on open swap contracts | — | ||||||||
Equity contracts | Purchased options, at fair value | 2,747 | Written options outstanding, at fair value | 633 | ||||||||
Forward foreign currency contracts | Unrealized appreciation on forward foreign currency contracts | 33,279 | Unrealized depreciation on forward foreign currency contracts | 86,080 | ||||||||
Total | $ | 81,736 | $ | 176,444 | ||||||||
The following table sets forth the Active Income Fund’s realized gain/loss by primary risk exposure and by type of derivative contract for the period January 1, 2012 through December 31, 2012:
Amount of realized gain (loss) on derivatives | ||||||||||||||||||||
Risk exposure category | Purchased Options | Written Options | Futures Contracts | Swap Contracts | Total | |||||||||||||||
Credit contracts | $ | — | $ | — | $ | — | $ | (15,142,161 | ) | $ | (15,142,161 | ) | ||||||||
Equity contracts | (24,078,220 | ) | 11,279,920 | — | — | (12,798,300 | ) | |||||||||||||
Interest rate contracts | — | — | (27,257,187 | ) | — | (27,257,187 | ) | |||||||||||||
|
|
|
|
|
|
|
|
|
| |||||||||||
Total | $ | (24,078,220 | ) | $ | 11,279,920 | $ | (27,257,187 | ) | $ | (15,142,161 | ) | $ | (55,197,648 | ) | ||||||
|
|
|
|
|
|
|
|
|
| |||||||||||
The following table sets forth the Select Credit Fund’s realized gain/loss by primary risk exposure and by type of derivative contract for the period January 1, 2012 through December 31, 2012:
Amount of realized gain (loss) on derivatives | ||||||||||||||||||||
Risk exposure category | Purchased Options | Written Options | Futures Contracts | Swap Contracts | Total | |||||||||||||||
Credit contracts | $ | — | $ | — | $ | — | $ | (1,231,333 | ) | $ | (1,231,333 | ) | ||||||||
Equity contracts | (2,388,820 | ) | 1,374,298 | — | — | (1,014,522 | ) | |||||||||||||
Interest rate contracts | — | — | (579,143 | ) | — | (579,143 | ) | |||||||||||||
|
|
|
|
|
|
|
|
|
| |||||||||||
Total | $ | (2,388,820 | ) | $ | 1,374,298 | $ | (579,143 | ) | $ | (1,231,333 | ) | $ | (2,824,998 | ) | ||||||
|
|
|
|
|
|
|
|
|
| |||||||||||
The following table sets forth the International Credit Opportunities Fund’s realized gain/loss by primary risk exposure and by type of derivative contract for the period from inception through December 31, 2012:
Amount of realized gain (loss) on derivatives | ||||||||||||||||||||||||||||
Risk exposure category | Purchased Options | Written Options | Foreign Currency | Swap Contracts | Purchased Swaptions | Written Swaptions | Total | |||||||||||||||||||||
Credit contracts | $ | — | $ | — | $ | — | $ | (679,724 | ) | $ | (44,248 | ) | $ | 29,224 | $ | (694,748 | ) | |||||||||||
Foreign currency | — | — | (573,423 | ) | — | — | — | (573,423 | ) | |||||||||||||||||||
Equity contracts | (286,008 | ) | 209,115 | — | — | — | — | (76,893 | ) | |||||||||||||||||||
Interest rate contracts | — | — | — | (39,151 | ) | (31,300 | ) | 19,200 | (51,251 | ) | ||||||||||||||||||
|
|
|
|
|
|
|
|
|
|
|
|
|
| |||||||||||||||
Total | $ | (286,008 | ) | $ | 209,115 | $ | (573,423 | ) | $ | (718,875 | ) | $ | (75,548 | ) | $ | 48,424 | $ | (1,396,315 | ) | |||||||||
|
|
|
|
|
|
|
|
|
|
|
|
|
| |||||||||||||||
47
Driehaus Mutual Funds
Notes to Financial Statements — (Continued)
The following table sets forth the Active Income Fund’s change in unrealized appreciation/depreciation by primary risk exposure and by type of derivative contract for the period January 1, 2012 through December 31, 2012:
Change in unrealized appreciation (depreciation) on derivatives | ||||||||||||||||||||
Risk exposure category | Purchased Options | Written Options | Futures Contracts | Swap Contracts | Total | |||||||||||||||
Credit contracts | $ | — | $ | — | $ | — | $ | (25,784,084 | ) | $ | (25,784,084 | ) | ||||||||
Equity contracts | (2,775,737 | ) | 10,646,759 | — | — | 7,871,022 | ||||||||||||||
Interest rate contracts | — | — | 9,745,078 | — | 9,745,078 | |||||||||||||||
|
|
|
|
|
|
|
|
|
| |||||||||||
Total | $ | (2,775,737 | ) | $ | 10,646,759 | $ | 9,745,078 | $ | (25,784,084 | ) | $ | (8,167,984 | ) | |||||||
|
|
|
|
|
|
|
|
|
| |||||||||||
The gross notional amount of swap contracts and the number of option contracts for the Active Income Fund as of December 31, 2012 is included on the Schedule of Investments. The quarterly average gross notional amount of the swap contracts for the Active Income Fund was $479,562,000 for the period January 1, 2012 through December 31, 2012. The quarterly average number of purchased futures contracts for the Active Income Fund was 0 for the period January 1, 2012 through December 31, 2012. The quarterly average number of short futures contracts for the Active Income Fund was (4,637) for the period January 1, 2012 through December 31, 2012. The quarterly average number of purchased option contracts for the Active Income Fund was 12,146 for the period January 1, 2012 through December 31, 2012. The fair value of such contracts at December 31, 2012 is set forth in the table above.
The following table sets forth the Select Credit Fund’s change in unrealized appreciation/depreciation by primary risk exposure and by type of derivative contract for the period January 1, 2012 through December 31, 2012:
Change in unrealized appreciation (depreciation) on derivatives | ||||||||||||||||||||
Risk exposure category | Purchased Options | Written Options | Futures Contracts | Swap Contracts | Total | |||||||||||||||
Credit contracts | $ | — | $ | — | $ | — | $ | (677,630 | ) | $ | (677,630 | ) | ||||||||
Equity contracts | (1,109,371 | ) | 609,541 | — | — | (499,830 | ) | |||||||||||||
Interest rate contracts | — | — | 172,094 | — | 172,094 | |||||||||||||||
|
|
|
|
|
|
|
|
|
| |||||||||||
Total | $ | (1,109,371 | ) | $ | 609,541 | $ | 172,094 | $ | (677,630 | ) | $ | (1,005,366 | ) | |||||||
|
|
|
|
|
|
|
|
|
| |||||||||||
The gross notional amount of swap contracts and the number of option contracts for the Select Credit Fund as of December 31, 2012 is included on the Schedule of Investments. The quarterly average gross notional amount of the swap contracts for the Select Credit Fund was $12,160,000 for the period January 1, 2012 through December 31, 2012. The quarterly average number of purchased futures contracts for the Select Credit Fund was 0 for the period January 1, 2012 through December 31, 2012. The quarterly average number of short futures contracts for the Select Credit Fund was (119) for the period January 1, 2012 through December 31, 2012. The quarterly average number of purchased option contracts for the Select Credit Fund was 5,762 for the period January 1, 2012 through December 31, 2012. The fair value of such contracts at December 31, 2012 is set forth in the table above.
The following table sets forth the International Credit Opportunities Fund’s change in unrealized appreciation/depreciation by primary risk exposure and by type of derivative contract for the period from inception through December 31, 2012:
| Change in unrealized appreciation/(depreciation) on derivatives | ||||||||||||||||||||||||||||
Risk exposure category | Purchased Options | Written Options | Foreign Currency | Swap Contracts | Purchased Swaptions | Written Swaptions | Total | |||||||||||||||||||||
Credit contracts | $ | — | $ | — | $ | — | $ | (48,168 | ) | $ | (6,074 | ) | $ | — | $ | (54,242 | ) | |||||||||||
Foreign currency translations | — | — | (50,741 | ) | — | — | — | (50,741 | ) | |||||||||||||||||||
Equity contracts | (43,932 | ) | 7,891 | — | — | — | — | (36,041 | ) | |||||||||||||||||||
Interest rate contracts | — | — | — | 2,521 | — | — | 2,521 | |||||||||||||||||||||
|
|
|
|
|
|
|
|
|
|
|
|
|
| |||||||||||||||
Total | $ | (43,932 | ) | $ | 7,891 | $ | (50,741 | ) | $ | (45,647 | ) | $ | (6,074 | ) | $ | — | $ | (138,503 | ) | |||||||||
|
|
|
|
|
|
|
|
|
|
|
|
|
| |||||||||||||||
48
Driehaus Mutual Funds
Notes to Financial Statements — (Continued)
The gross notional amount of swap contracts and the number of option contracts for the International Credit Opportunities Fund as of December 31, 2012 is included on the Schedule of Investments. The quarterly average gross notional amount of the swap contracts for the International Credit Opportunities Fund was $8,741,098 for the period March 1, 2012 through December 31, 2012. The quarterly average number of purchased futures contracts for the International Credit Opportunities Fund was 0 for the period March 1, 2012 through December 31, 2012. The quarterly average number of short futures contracts for the International Credit Opportunities Fund was 0 for the period March 1, 2012 through December 31, 2012. The quarterly average value of purchased forwards contracts for the International Credit Opportunities Fund was $3,831,848 for the period March 1, 2012 through December 31, 2012. The quarterly average value of short forward contracts for the International Credit Opportunities Fund was ($7,415,637) for the period March 1, 2012 through December 31, 2012. The quarterly average number of purchased option contracts for the International Credit Opportunities Fund was 5,125,141 for the period March 1, 2012 through December 31, 2012. The quarterly average number of purchased swaption contracts for the International Credit Opportunities Fund was 3,250,000 for the period March 1, 2012 through December 31, 2012. The quarterly average number of written swaption contracts for the International Credit Opportunities Fund was 1,750,000 for the period March 1, 2012 through December 31, 2012. The fair value of such contracts at December 31, 2012 is set forth in the table above.
C. INVESTMENT ADVISORY FEES, TRANSACTIONS WITH AFFILIATES, AND ADMINISTRATIVE FEES
Richard H. Driehaus, an Interested Trustee of the Trust, is also the Chairman of the Board of Driehaus Capital Management LLC (“DCM” or the “Adviser”), a registered investment adviser, and of Driehaus Securities LLC (“DS LLC” or the “Distributor”), a registered broker-dealer.
DCM serves as the Funds’ investment adviser. In return for its services to the Funds, the Funds pay the Adviser an annual management fee on a monthly basis of 0.55%, 0.80% and 0.90% of average net assets respectively, for the Active Income Fund, Select Credit Fund and International Credit Opportunities Fund.
DCM has entered into a written agreement to cap the Select Credit Fund’s annual ordinary operating expenses (other than interest, taxes, brokerage commissions, dividends and interest on short sales, other investment-related expenses and extraordinary expenses) at 1.75% of average daily net assets until at least September 30, 2013. For this same time period, DCM is entitled to reimbursement for previously waived fees and reimbursed expenses to the extent that the Select Credit Fund’s expense ratio remains below the operating expense cap. During the period January 1, 2012 through December 31, 2012, the Select Credit Fund did not have any fees waived by DCM and as of December 31, 2012 there are no amounts subject to recapture.
DCM has entered into a written agreement to cap the International Credit Opportunities Fund’s annual ordinary operating expenses (other than interest, taxes, brokerage commissions, dividends and interest on short sales, other investment-related expenses and extraordinary expenses) at 2.00% of average daily net assets until at least February 28, 2015. For this same time period, DCM is entitled to reimbursement for previously waived fees and reimbursed expenses to the extent that the International Credit Opportunities Fund’s expense ratio remains below the operating expense cap. For the period March 1, 2012 through December 31, 2012, the International Credit Opportunities Fund did not have any fees waived by DCM.
The Active Income Fund accrued $14,408,431 for investment advisory fees during the period January 1, 2012 through December 31, 2012, of which $1,306,972 was payable to DCM at December 31, 2012. The Select Credit Fund accrued $2,196,783 for investment advisory fees during the period January 1, 2012 through December 31, 2012, and $219,161 was payable to DCM at December 31, 2012. The International Credit Opportunities Fund accrued $206,324 for investment advisory fees during the period from inception through December 31, 2012, and $20,960 was payable to DCM at December 31, 2012.
DS LLC is the Funds’ distributor. DS LLC does not earn any compensation from the Funds for these services. DS LLC has entered into a Fee Reimbursement Agreement with the Funds. Under this agreement, the Funds reimburse DS LLC for certain fees paid by DS LLC to intermediaries who provide shareholder administrative and/or sub-transfer agency services to the Fund. Currently, the amount to be reimbursed will not exceed 0.25% of the average daily net assets held by such intermediaries. As of December 31, 2012, the Active Income Fund owes $715,602 in reimbursements to DS LLC under this agreement, which is included in accrued shareholder services plan fees on the Statement of Assets and Liabilities. As of December 31, 2012, the Select Credit Fund owes $72,828 in reimbursements to DS LLC under this agreement, which is included in
49
Driehaus Mutual Funds
Notes to Financial Statements — (Continued)
accrued shareholder services plan fees on the Statement of Assets and Liabilities. As of December 31, 2012, the International Credit Opportunities Fund owes $1,940 in reimbursements to DS LLC under this agreement, which is included in accrued shareholder services plan fees on the Statement of Assets and Liabilities.
Certain officers of the Trust are also officers of DCM and DS LLC. The Funds pay a portion of the Chief Compliance Officer’s salary. No other officers received compensation from the Funds during the period January 1, 2012 through December 31, 2012.
Affiliates of DCM hold approximately 96% of the International Credit Opportunities Fund’s outstanding shares as of December 31, 2012.
UMB Fund Services, Inc. (“UMBFS”), an affiliate of UMB Financial Corporation, serves as the Funds’ administrative and accounting agent. In compensation for these services, UMBFS receives the larger of a monthly minimum fee or a monthly fee based upon each Fund’s average daily net assets. UMBFS also acts as the transfer agent and dividend disbursing agent for the Funds. For these services, UMBFS receives a monthly fee based in part on shareholder processing activity during the month.
D. INVESTMENT TRANSACTIONS
Purchases and sales of investment securities (excluding swaps, options, futures, short-term securities and U.S. government obligations) for the Active Income Fund and Select Credit Fund for the period January 1, 2012 through December 31, 2012, and the International Credit Opportunities Fund for the period from inception through December 31, 2012, were as follows:
Active Income Fund | Select Credit Fund | International Credit | ||||||||||||||
Purchases | $ | 887,989,886 | Purchases | $ | 234,007,109 | Purchases | $ | 77,723,638 | ||||||||
Sales | $ | 1,229,951,719 | Sales | $ | 173,821,345 | Sales | $ | 61,416,667 | ||||||||
The aggregate purchases and sales of U.S. government obligations for the Active Income Fund and Select Credit Fund for the period January 1, 2012 through December 31, 2012, and the International Credit Opportunities Fund for the period from inception through December 31, 2012, were as follows:
Active Income Fund | Select Credit Fund | International Credit Opportunities Fund | ||||||||||||||
Purchases | $ | — | Purchases | $ | — | Purchases | $ | 2,985,019 | ||||||||
Sales | $ | 241,187 | Sales | $ | — | Sales | $ | 488,281 | ||||||||
E. RESTRICTED SECURITIES
Restricted securities are securities that are not registered for sale under the Securities Act of 1933 or applicable foreign law and that may be re-sold only in transactions exempt from applicable registration. Restricted securities include Rule 144A securities which may be sold normally to qualified institutional buyers. At December 31, 2012, the Funds held restricted securities as denoted on the Schedule of Investments.
F. SHAREHOLDER SERVICING AGREEMENTS
The Active Income Fund and Select Credit Fund have a Shareholder Servicing Agreement (the “Agreement”) in place with a shareholder. Under the terms of this Agreement, the Active Income Fund and Select Credit Fund make payments for services provided on behalf of the Active Income Fund and Select Credit Fund. Such services may include, but shall not be limited to: transfer agent and sub-transfer agent services; aggregating and processing purchase and redemption orders; providing periodic statements; receiving and transmitting funds; processing dividend payments; providing sub-accounting services; forwarding shareholder communications; receiving, tabulating and transmitting proxies; responding to inquiries and performing such other related services as the Active Income Fund and Select Credit Fund may request. The Shareholder Services Plan allows for annual payments not to exceed 0.25% of average daily net assets of the Funds. For the period January 1, 2012 through December 31, 2012, the Active Income Fund and Select Credit Fund had expenses of $948,860 and $86,337, respectively, under the terms of this Agreement with this shareholder.
50
Report of Independent Registered Public Accounting Firm
The Board of Trustees and Shareholders of Driehaus Mutual Funds
We have audited the accompanying statements of assets and liabilities, including the schedules of investments of Driehaus Active Income Fund, Driehaus Select Credit Fund and Driehaus International Credit Opportunities Fund (collectively, the “Funds”) as of December 31, 2012, and the related statements of operations, statements of changes in net assets and financial highlights for each of the periods indicated therein. These financial statements and financial highlights are the responsibility of the Funds’ management. Our responsibility is to express an opinion on these financial statements and financial highlights based on our audits.
We conducted our audits in accordance with the standards of the Public Company Accounting Oversight Board (United States). Those standards require that we plan and perform the audit to obtain reasonable assurance about whether the financial statements and financial highlights are free of material misstatement. We were not engaged to perform an audit of the Funds’ internal control over financial reporting. Our audits included consideration of internal control over financial reporting as a basis for designing audit procedures that are appropriate in the circumstances, but not for the purpose of expressing an opinion on the effectiveness of the Funds’ internal control over financial reporting. Accordingly, we express no such opinion. An audit also includes examining, on a test basis, evidence supporting the amounts and disclosures in the financial statements and financial highlights, assessing the accounting principles used and significant estimates made by management, and evaluating the overall financial statement presentation. Our procedures included confirmation of securities owned as of December 31, 2012, by correspondence with the custodian, brokers, and agent banks or by other appropriate auditing procedures where replies from brokers and agent banks were not received. We believe that our audits provide a reasonable basis for our opinion.
In our opinion, the financial statements and financial highlights referred to above present fairly, in all material respects, the financial position of each of the respective Funds noted above at December 31, 2012, the results of their operations, the changes in net assets and the financial highlights for the periods indicated therein, in conformity with U.S. generally accepted accounting principles.

Chicago, Illinois
February 25, 2013
51
Interested and Independent Trustees of the Trust
The following table sets forth certain information with respect to the Trustees of the Trust:
Name, Address and | Position(s) the Trust | Term of Office and Time | Number of Overseen | Principal Occupation(s) During Past 5 Years | Other Directorships Held by Trustee During the Past 5 Years | |||||
Interested Trustee:* | ||||||||||
Richard H. Driehaus 25 East Erie Street Chicago, IL 60611 YOB: 1942 | Trustee | Since 1996 | 11 | Chairman of the Board of the Adviser, the Distributor and Driehaus Capital Management (USVI) LLC (“USVI”); Chief Investment Officer and Portfolio Manager of the Adviser. President of the Trust from 1996-2011. | Driehaus Capital Holdings LLC; Driehaus Enterprise Management, Inc.; The Richard H. Driehaus Foundation; and The Richard H. Driehaus Museum | |||||
Independent Trustees: | ||||||||||
A.R. Umans c/o Driehaus Capital Management LLC 25 East Erie Street Chicago, IL 60611 YOB: 1927 | Trustee and Chairman | Since 1996 Since 2005 | 11 | Chairman of the Board, Commerce National Group (investment company) since 2005; Chairman of the Board and Chief Executive Officer, RHC/Spacemaster Corporation (manufacturing corporation) prior thereto. | Sinai Health System; Schwab Rehabilitation Hospital | |||||
Theodore J. Beck c/o Driehaus Capital Management LLC 25 East Erie Street Chicago, IL 60611 YOB: 1952 | Trustee | Since 2012 | 11 | President and Chief Executive Officer, National Endowment for Financial Education, 2005 to present; Associate Dean for Executive Education and Corporate Relations and President for the Center for Advanced Studies in Business at the University of Wisconsin-Madison, 1999-2005. | President’s Advisory Council on Financial Capability since 2010; Federal Deposit Insurance Corporation Advisory Committee on Economic Inclusion since 2007; Jump$tart Coalition for Personal Financial Literacy since 2008; Wisconsin Alumni Association Board from 2006-2012; President’s Advisory Council on Financial Literacy from 2008-2010; Wilshire Variable Insurance Trust, 2008-2010; Wilshire Mutual Funds Inc, 2008-2010; Advisory Board of the Trust 2011-2012. | |||||
Francis J. Harmon c/o Driehaus Capital Management LLC 25 East Erie Street Chicago, IL 60611 YOB: 1942 | Trustee | Since 1998 | 11 | Relationship Manager, Great Lakes Advisors, Inc. since February 2008; Principal Account Executive – Labor Affairs, Blue Cross and Blue Shield of Illinois prior thereto. | None |
52
Interested and Independent Trustees of the Trust
Name, Address and | Position(s) the Trust | Term of Office and Time | Number of Overseen | Principal Occupation(s) During Past 5 Years | Other Directorships Held by Trustee During the Past 5 Years | |||||
Independent Trustees: | ||||||||||
Dawn M. Vroegop c/o Driehaus Capital Management LLC 25 East Erie Street Chicago, IL 60611 YOB: 1966 | Trustee | Since 2012 | 11 | Managing Director, Dresdner RCM Global Investors from September 1999 to September 2003. | Independent Trustee, Met Investors Series Trust since December 2000; Director, Metropolitan Series Fund, Inc. since May 2009; Director and Investment Committee Chair, City College of San Francisco Foundation since 2003; Advisory Board of the Trust 2011-2012. | |||||
Daniel F. Zemanek c/o Driehaus Capital Management LLC 25 East Erie Street Chicago, IL 60611 YOB: 1942 | Trustee | Since 1996 | 11 | President of Ludan, Inc. (real estate services specializing in senior housing) since April 2008; Senior Vice President of Sunrise Development, Inc. (senior living) from 2003-2007; Consultant, real estate development prior thereto. | None |
| * | Mr. Driehaus is an “interested person” of the Trust, the Adviser and the Distributor, as defined in the 1940 Act, because he is an officer of the Adviser and the Distributor. In addition, Mr. Driehaus has a controlling interest in the Adviser and the Distributor. |
| ** | Each Trustee will serve as a Trustee of the Trust until (i) termination of the Trust, or (ii) the Trustee’s retirement, resignation, or death, or (iii) as otherwise specified in the Trust’s governing documents. |
53
The following table sets forth certain information with respect to the officers of the Trust.
Name, Address and Year of Birth | Position(s) the Trust | Length of | Principal Occupation(s) During Past 5 Years | |||
Robert H. Gordon Chicago, IL 60611 | President | Since 2011 | President and Chief Executive Officer of Adviser, Distributor and USVI since October 2006; Senior Vice President of the Trust from 2006-2011. | |||
Michelle L. Cahoon 25 East Erie Street Chicago, IL 60611 YOB: 1966 | Vice President and Treasurer | Since 2006 Since 2002 | Managing Director, Treasurer and Chief Financial Officer of the Adviser and Distributor since 2012; Vice President, Treasurer and Chief Financial Officer of the USVI since 2004; Vice President, Treasurer and Chief Financial Officer of the Advisor and Distributor from 2004-2012. | |||
Janet L. McWilliams 25 East Erie Street Chicago, IL 60611 YOB: 1970 | Assistant Vice President | Since 2007 | Managing Director, Secretary and General Counsel of the Adviser since 2012; Chief Compliance Officer of the Trust, Adviser and Distributor from 2006-2012; Senior Attorney with the Adviser from 2003-2012. | |||
Michael R. Shoemaker 25 East Erie Street Chicago, IL 60611 YOB: 1981 | Chief Compliance Office and Assistant Vice President | Since 2012 | Assistant Vice President and Chief Compliance Officer of the Adviser and Distributor since 2012; Associate Chief Compliance Officer of the Adviser and Distributor from 2011-2012; Compliance Officer, Pacific Investment Management Company LLC and PIMCO Investments LLC from 2010-2011; Senior Compliance Analyst of the Adviser and Distributor from 2007-2010. | |||
Diane J. Drake 301 Bellevue Parkway Wilmington, DE 19809 YOB: 1967 | Secretary | Since 2006 | Managing Director and Senior Counsel, BNY Mellon Investment Servicing (US) Inc. (formerly, PNC Global Investment Servicing (U.S.) Inc. (“PNC”), (financial services company) since 2010; Vice President and Counsel, PNC from 2008-2010. | |||
Michael P. Kailus 25 East Erie Street Chicago, IL 60611 YOB: 1971 | Assistant Secretary and Anti-Money Laundering Compliance Officer | Since 2010 | Assistant Secretary of the Adviser, Distributor and USVI since 2010; Associate General Counsel of Superfund Group (formerly, Quadriga Group, a financial services company) from 2005-2010. | |||
William H. Wallace, III 301 Bellevue Parkway Wilmington, DE 19809 YOB: 1969 | Assistant Secretary | Since 2008 | Vice President and Manager, BNY Mellon Investment Servicing (US) Inc. (formerly, PNC, a financial services company) since 2010; Assistant Vice President and Manager, PNC from 2008-2010. |
The Statement of Additional Information for Driehaus Mutual Funds contains more detail about the Trust’s Trustees and officers and is available upon request, without charge. For further information, please call 1-877-779-0079.
54
As a mutual fund shareholder, you may incur two types of costs: (1) transaction costs, including sales charges; redemption fees; and exchange fees and (2) ongoing costs, including management fees; distribution (12b-1) and/or service fees; and other fund expenses. This example is intended to help you understand your ongoing costs (in dollars) of investing in the Fund and to compare these costs with the ongoing costs of investing in other mutual funds.
The example is based on an investment of $1,000 invested at the beginning of the period and held for the entire six month period ending December 31, 2012.
Actual Expenses
The first line of the table below (“Actual”) provides information about actual account values and actual expenses. You may use the information in this line, together with the amount you invested, to estimate the expense that you paid over the period. Simply divide your account value by $1,000 (for example, an $8,600 account value divided by $1,000 = 8.6), then multiply the result by the number in the first line under the heading entitled “Expenses Paid During Period” to estimate the expenses you paid on your account during this period.
Hypothetical Example for Comparison Purposes
The second line of the tables below (“Hypothetical”) provides information about hypothetical account values and hypothetical expenses based on the Fund’s actual expense ratio and an assumed rate of return of 5% per year before expenses, which is not the Fund’s actual return. You may use this information to compare the ongoing costs of investing in the Fund versus other funds. To do so, compare this 5% hypothetical example with the 5% hypothetical examples that appear in the shareholder reports of the other funds.
Please note that the expenses shown in the table are meant to highlight your ongoing costs only and do not reflect any transactional costs, such as sales charges, redemption fees or exchange fees. Therefore, the second line of the table is useful in comparing ongoing costs only, and will not help you determine the relative total costs of owning different funds. In addition, if these transactional costs were included, your costs would have been higher.
Driehaus Active Income Fund
| Beginning Account Value July 1, 2012 | Ending Account Value December 31, 2012 | Expenses Paid During Six Months Ended December 31, 2012* | ||||||||||
Actual | $ | 1,000.00 | $ | 1,036.50 | $ | 7.27 | ||||||
Hypothetical Example, assuming a 5% return before expenses | $ | 1,000.00 | $ | 1,018.00 | $ | 7.20 | ||||||
Driehaus Select Credit Fund
| Beginning Account Value July 1, 2012 | Ending Account Value December 31, 2012 | Expenses Paid During Six Months Ended December 31, 2012* | ||||||||||
Actual | $ | 1,000.00 | $ | 1,028.50 | $ | 9.05 | ||||||
Hypothetical Example, assuming a 5% return before expenses | $ | 1,000.00 | $ | 1,016.22 | $ | 8.99 | ||||||
55
Fund Expense Examples — (Continued)
Driehaus International Credit Opportunities Fund
| Beginning Account Value July 1, 2012 | Ending Account Value December 31, 2012 | Expenses Paid During Six Months Ended December 31, 2012* | ||||||||||
Actual | $ | 1,000.00 | $ | 1,005.20 | $ | 9.61 | ||||||
Hypothetical Example, assuming a 5% return before expenses | $ | 1,000.00 | $ | 1,015.55 | $ | 9.66 | ||||||
| * | Expenses are equal to the Funds’ annualized expense ratios for the six-month period in the table below multiplied by the average account value over the period, multiplied by the number of days in the most recent fiscal half-year (184), then divided by 366 to reflect the half-year period. |
Driehaus Active Income Fund | 1.42% | |
Driehaus Select Credit Fund | 1.77% | |
Driehaus International Credit Opportunities Fund | 1.91% |
56
TAX INFORMATION (UNAUDITED) FOR THE YEAR ENDED DECEMBER 31, 2012
We are providing this information as required by the Internal Revenue Code. The amounts shown may differ from those elsewhere in this report because of differences between tax and financial reporting requirements.
For taxable non-corporate shareholders, the following percentages of income and short-term capital gains represent qualified dividend income subject to the 15% rate category:
Active Income Fund | Select Credit Fund | International Credit Opportunities Fund | ||||||
| 22.79% | 5.93% | — | ||||||
For corporate shareholders, the following percentages of income and short-term capital gains qualified for the dividends-received deduction:
Active Income Fund | Select Credit Fund | International Credit Opportunities Fund | ||||||
| 22.79% | 5.93% | — | ||||||
PROXY VOTING POLICIES AND PROCEDURES AND PROXY VOTING RECORD
A description of the Funds’ policies and procedures with respect to the voting of proxies relating to the Funds’ portfolio securities is available, without charge, upon request, by calling 1-877-779-0079. This information is also available on the Funds’ website at http://www.driehaus.com.
Information regarding how the Driehaus Active Income Fund, Driehaus Select Credit Fund and Driehaus International Credit Opportunities Fund voted proxies related to portfolio securities during the 12-month period ended June 30, 2012 is available without charge, upon request, by calling 1-877-779-0079. This information is also available on the Securities and Exchange Commission’s (“SEC”) website at http://www.sec.gov.
HOW TO OBTAIN QUARTERLY PORTFOLIO HOLDINGS
Each Fund files a complete schedule of portfolio holdings with the SEC for the first and third quarters of each fiscal year on Form N-Q. The Funds’ Form N-Q is available electronically on the SEC’s website at http://www.sec.gov; hard copies may be reviewed and copied at the SEC’s Public Reference Room in Washington, DC. For more information on the Public Reference Room, call 1-800-SEC-0330. Each Fund’s complete schedule of portfolio holdings is also available on the Funds’ website at http://www.driehaus.com.
SPECIAL MEETING OF SHAREHOLDERS
At a Special Meeting of Shareholders of Driehaus Mutual Funds (the “Trust”) held on November 27, 2012, the Trust’s shareholders approved the election of the following persons to the Board of Trustees of the Trust (the “Board”) by the following votes:
| Affirmative | Withheld | |||||||
Theodore J. Beck | 331,113,166 | 1,544,986 | ||||||
Richard H. Driehaus | 190,855,228 | 141,802,924 | ||||||
Francis J. Harmon | 331,183,248 | 1,474,904 | ||||||
A.R. Umans | 331,053,586 | 1,604,566 | ||||||
Dawn M. Vroegop | 331,089,504 | 1,568,648 | ||||||
Daniel F. Zemanek | 331,191,235 | 1,466,917 | ||||||
57
Board Considerations in Connection with the Annual Review of the
Investment Advisory Agreement
In September 2012, the Board of Trustees of Driehaus Mutual Funds (the “Trust”) approved the renewal of the investment advisory agreement (the “Agreement”) with Driehaus Capital Management LLC (the “Adviser”) for Driehaus Active Income Fund (“LCMAX”) and Driehaus Select Credit Fund (“DRSLX”) (LCMAX and DRSLX are each a “Fund” and collectively the “Funds”). As part of its review process, the Board requested and evaluated all information it deemed reasonably necessary to evaluate the Agreement. The Board reviewed comprehensive materials received from the Adviser and from independent legal counsel. The Board also received extensive information throughout the year regarding performance and operating results of each Fund. The Independent Trustees, represented by independent legal counsel, met independent of Fund management to consider renewal of the Agreement. After their review of the information received, the Independent Trustees presented their findings and their recommendation to renew the Agreement to the full Board. In connection with the contract review process, the Board considered the factors discussed below, among others.
Nature, Quality and Extent of Services. The Board considered the nature, extent and quality of services provided under the Agreement, including portfolio management services and administrative services. The Board considered the experience and skills of senior management and investment personnel, the resources made available to such personnel, the ability of the Adviser to attract and retain high-quality personnel, and the organizational depth of the Adviser. The Board also considered the Trust’s compliance with legal and regulatory requirements, as well as the Adviser’s handling of portfolio brokerage, and noted the Adviser’s process for evaluating best execution. The Board considered the Adviser’s risk management strategies and the process developed by the Adviser for analyzing, reviewing and assessing risk exposure for the Funds. In addition, the Board reviewed LCMAX’s performance, including that of LCMAX’s predecessor fund (which was reorganized into LCMAX on June 1, 2009), given that a core portion of the portfolio management team managed the predecessor fund of LCMAX from 2007 to 2009. Given the investment strategies of LCMAX, the Board noted the limitations in comparing the performance of LCMAX to a peer group of general bond funds compiled from Lipper Inc., an independent provider of mutual fund data, and the Board also considered LCMAX’s performance compared to an additional Lipper peer group, which includes long/short funds. The Board compared LCMAX’s performance to peer groups of funds and to two benchmark indices for the 1-, 3- and 5-year periods ended June 30, 2012, and considered the Adviser’s explanation for the Fund’s 1- and 3-year underperformance compared to its peers, and noted its improved performance in comparison to both peer groups for the year-to-date period. The Board also reviewed DRSLX’s performance, comparing it to a peer group of funds compiled from Lipper Inc. and to benchmark indices for the year-to-date and 1-year periods ended June 30, 2012 (the Fund’s inception date was September 30, 2010). The Board noted that DRSLX’s performance was above the median of its peer group for these periods. For both LCMAX and DRSLX, the Board considered whether investment results were consistent with each Fund’s investment objective and policies. The Board concluded that performance was satisfactory.
On the basis of this evaluation and its ongoing review of investment results, the Board concluded that the nature, quality and extent of services provided by the Adviser continue to be satisfactory.
Fees. The Board considered the Funds’ advisory fees, operating expenses and total expense ratios, and compared the advisory fees and expense ratios to peer groups based on data compiled from Lipper Inc. as of the fiscal year end of each fund in the peer groups. The Board noted the limitations in comparing the fees and expense ratios of LCMAX to the peer group of funds designated by Lipper (which changed from the prior year to the general bond funds peer group), which consists primarily of funds that are long-only and tend to invest solely in high grade fixed income securities that pursue a different investment strategy, so the Board also compared the Fund’s advisory fees and expense ratios to the Lipper-designated peer group for DRSLX, which is a long/short funds category that the Adviser believes also is applicable to LCMAX. The Board noted that LCMAX’s annual advisory fee rate of ..55% is in the 19th percentile and the 57th percentile, respectively; of the two Lipper peer groups (1st percentile being the highest fee) and that the second peer group was more applicable to LCMAX. The Board noted that DRSLX’s advisory fee rate of .86% was in the 42nd percentile of its peer group, and that this included 6 basis points of recouped fee waivers. The Board also considered that the Adviser had agreed to waive fees or reimburse DRSLX for expenses in excess of 1.75% of net assets (excluding dividends and interest on short sales) until September 30, 2013, and that since all previously waived fees have been recaptured, its advisory fee of 0.80% would be in the 44th percentile. In addition, the Board considered the fees charged by the Adviser to limited partnerships that follow a similar strategy as LCMAX and DRSLX. In considering the reasonableness of the advisory fees, the Board took into account the substantial human and technological resources devoted to investing for the Funds and the limited capacity of the investment styles, noting that LCMAX is currently closed to new investors.
58
The Board also considered that for the fiscal year ended December 31, 2011, LCMAX’s expense ratio was in the 38th percentile and 99th percentile, respectively; of the two Lipper peer groups and that the second peer group was more applicable to LCMAX. The Board noted that DRSLX’s expense ratio for the fiscal year ended December 31, 2011 was in the 75th percentile. On the basis of the information provided, the Board concluded that the advisory fees were reasonable and appropriate in light of the nature and quality of services provided by the Adviser.
Profitability. The Board reviewed information regarding the revenues received by the Adviser under the Agreement and discussed the methodology in allocating its costs to the management of the Funds. The Board considered the estimated costs to the Adviser of each Fund. The Board also noted that the Funds do not have a Rule 12b-1 fee and that the Adviser’s affiliate, serves as distributor of the Funds without compensation, that DS LLC provides compensation to intermediaries for distribution of the Funds’ shares and for shareholder services, and that DS LLC is reimbursed by the Funds under a Shareholder Services Plan for certain amounts paid for shareholder services covered under the Plan. The Board concluded that, based on the projected profitability calculated for the Trust as well as the Funds individually (noting that DRSLX was expected to continue to be operated at a loss), the advisory fees appeared to be reasonable.
Economies of Scale. In considering the reasonableness of the advisory fee, the Board considered whether there are economies of scale with respect to the management of the Funds and whether the Funds benefit from any economies of scale. Given the size of DRSLX and the capacity constraints of the Funds, the Board concluded that the advisory fee rates under the Agreement are reasonable and reflect an appropriate sharing of any such economies of scale.
Other Benefits to the Adviser and its Affiliates. The Board also considered the character and amount of other incidental benefits received by the Adviser and its affiliates. The Board noted that the Adviser’s affiliated broker-dealer does not execute any portfolio transactions for the Funds, and that payments to DS LLC under a Shareholder Services Plan are in reimbursement of payments made to intermediaries for shareholder services. The Board noted that there are no benefits to the Adviser related to soft dollar allocations. The Board concluded that the advisory fees were reasonable in light of any fall-out benefits.
Based on all of the information considered and the conclusions reached, the Board determined that the terms of the Agreement continue to be fair and reasonable and that the continuation of the Agreement is in the best interests of each Fund. No single factor was determinative in the Board’s analysis.
59
| Item 2. | Code of Ethics. |
| (a) | The registrant, as of the end of the period covered by this report, has adopted a code of ethics that applies to the registrant’s principal executive officer, principal financial officer, principal accounting officer or controller, or persons performing similar functions, regardless of whether these individuals are employed by the registrant or a third party. |
| (b) | No response required. |
| (c) | None. |
| (d) | None. |
| (e) | Not applicable. |
| (f) | The registrant’s Code of Ethics for Principal Executive and Financial Officers was filed as Exhibit 12(a)(1) to the registrant’s Certified Shareholder Report on Form N-CSR, Accession Number 0001193125-12-093739, on March 2, 2012, and is incorporated herein by reference. |
| Item 3. | Audit Committee Financial Expert. |
The registrant’s Board of Trustees has designated A.R. Umans as an audit committee financial expert. Mr. Umans is “independent,” as defined by this Item 3.
| Item 4. | Principal Accountant Fees and Services. |
| (a) | Audit Fees |
For the fiscal years ended December 31, 2012 and 2011, Ernst & Young LLP, the registrant’s principal accountant (“E&Y”), billed the registrant $404,100 and $340,300, respectively, for professional services rendered for the audit of the registrant’s annual financial statements or services that are normally provided in connection with statutory and regulatory filings.
| (b) | Audit-Related Fees |
For the fiscal years ended December 31, 2012 and 2011, E&Y billed the registrant $0 and $0, respectively, for assurance and related services that are reasonably related to the performance of the audit of the registrant’s financial statements and that are not reported above.
For engagements that Driehaus Capital Management LLC, the registrant’s investment adviser (“DCM”), or Driehaus Securities LLC, the registrant’s distributor (“DS”), entered into with E&Y for fiscal years 2012 and 2011, E&Y provided no audit-related services to DCM or DS that were for engagements directly related to the registrant’s operations and financial reporting.
| (c) | Tax Fees |
For the fiscal years ended December 31, 2012 and 2011, E&Y billed the registrant $93,350 and $82,900, respectively, for professional services rendered for tax compliance, tax advice and tax planning. Such services consisted of review of the registrant’s income tax returns and tax distribution requirements and analysis related to passive foreign investment company status. The Audit Committee pre-approved all tax services that E&Y provided to the registrant.
For fiscal years 2012 and 2011, E&Y provided no tax services to DCM or DS that were for engagements directly related to the registrant’s operations and financial reporting.
| (d) | All Other Fees |
For the fiscal years ended December 31, 2012 and 2011, E&Y billed the registrant $0 and $0, respectively, for products and services provided, other than the services reported above.
For fiscal years 2012 and 2011, E&Y provided no other services to DCM or DS that were for engagements directly related to the registrant’s operations and financial reporting.
| (e)(1) | Audit Committee Pre-Approval Policies and Procedures |
Pursuant to registrant’s Audit Committee Charter (the “Charter”), the Audit Committee is responsible for pre-approving any engagement of the principal accountant to provide non-prohibited services to the registrant, including the fees and other compensation to be paid to the principal accountant, to the extent required by Rule 2-01(c)(7) of Regulation S-X. The Chairman of the Audit Committee may grant pre-approval for engagements of $5,000 or less. All such delegated pre-approvals will be presented to the Audit Committee no later than the next Audit Committee meeting.
Pursuant to the Charter, the Audit Committee is also responsible for pre-approving any engagement of the principal accountant, including the fees and other compensation to be paid to the principal accountant, to provide non-audit services to the registrant’s investment adviser (or any entity controlling, controlled by, or under common control with the adviser that provides ongoing services to the registrant), if the engagement relates directly to the operations and financial reporting of the registrant, to the extent required by Rule 2-01(c)(7) of Regulation S-X. The Chairman of the Audit Committee may grant pre-approval for engagements of $5,000 or less. All such delegated pre-approvals will be presented to the Audit Committee no later than the next Audit Committee meeting.
| (e)(2) | The percentage of services described in each of paragraphs (b) through (d) of this Item that were approved by the audit committee pursuant to paragraph (c)(7)(i)(C) of Rule 2-01 of Regulation S-X is 0%. |
| (f) | Not applicable. |
| (g) | Non-Audit Fees |
| For the fiscal years ended December 31, 2012 and 2011, E&Y billed the registrant $93,350 and $82,900, respectively, in aggregate non-audit fees. For the fiscal years ended December 31, 2012 and 2011, E&Y billed DCM or DS $0 and $0, respectively, in aggregate non-audit fees. |
| (h) | Not applicable. |
| Item 5. | Audit Committee of Listed Registrants. |
Not applicable.
| Item 6. | Investments. |
| (a) | Schedule of Investments in securities of unaffiliated issuers as of the close of the reporting period is included as part of the report to shareholders filed under Item 1 of this form. |
| (b) | Not applicable. |
| Item 7. | Disclosure of Proxy Voting Policies and Procedures for Closed-End Management Investment Companies. |
Not applicable.
| Item 8. | Portfolio Managers of Closed-End Management Investment Companies. |
Not applicable.
| Item 9. | Purchases of Equity Securities by Closed-End Management Investment Company and Affiliated Purchasers. |
Not applicable.
| Item 10. | Submission of Matters to a Vote of Security Holders. |
There have been no material changes to the procedures by which the shareholders may recommend nominees to the registrant’s board of directors, where those changes were implemented after the registrant last provided disclosure in response to the requirements of Item 407(c)(2)(iv) of Regulation S-K (17 CFR 229.407) (as required by Item 22(b)(15) of Schedule 14A (17 CFR 240.14a-101)), or this Item.
| Item 11. | Controls and Procedures. |
| (a) | The registrant’s principal executive and principal financial officers, or persons performing similar functions, have concluded that the registrant’s disclosure controls and procedures (as defined in Rule 30a-3(c) under the Investment Company Act of 1940, as amended (the “1940 Act”) (17 CFR 270.30a-3(c))) are effective, as of a date within 90 days of the filing date of the report that includes the disclosure required by this paragraph, based on their evaluation of these controls and procedures required by Rule 30a-3(b) under the 1940 Act (17 CFR 270.30a-3(b)) and Rules 13a-15(b) or 15d-15(b) under the Securities Exchange Act of 1934, as amended (17 CFR 240.13a-15(b) or 240.15d-15(b)). |
| (b) | There were no changes in the registrant’s internal control over financial reporting (as defined in Rule 30a-3(d) under the 1940 Act (17 CFR 270.30a-3(d)) that occurred during the registrant’s second fiscal quarter of the period covered by this report that has materially affected, or is reasonably likely to materially affect, the registrant’s internal control over financial reporting. |
| Item 12. | Exhibits. |
| (a)(1) | Code of ethics, or any amendment thereto, that is the subject of disclosure required by Item 2, filed as Exhibit 12(a)(1) to the Registrant’s Form N-CSR, filed on March 2, 2012 (Accession No. 0001193125-12-093738) incorporated herein by reference. |
| (a)(2) | Certifications pursuant to Rule 30a-2(a) under the 1940 Act and Section 302 of the Sarbanes-Oxley Act of 2002 are attached hereto. |
| (a)(3) | Not applicable. |
| (b) | Certifications pursuant to Rule 30a-2(b) under the 1940 Act and Section 906 of the Sarbanes-Oxley Act of 2002 are attached hereto. |
SIGNATURES
Pursuant to the requirements of the Securities Exchange Act of 1934 and the Investment Company Act of 1940, the registrant has duly caused this report to be signed on its behalf by the undersigned, thereunto duly authorized.
| (registrant) | Driehaus Mutual Funds | |
| By (Signature and Title)* /s/ Robert H. Gordon | ||
Robert H. Gordon, President | ||
(principal executive officer) | ||
| Date March 6, 2013 | ||
Pursuant to the requirements of the Securities Exchange Act of 1934 and the Investment Company Act of 1940, this report has been signed below by the following persons on behalf of the registrant and in the capacities and on the dates indicated.
| By (Signature and Title)* /s/ Robert H. Gordon | ||
| Robert H. Gordon, President | ||
| (principal executive officer) | ||
| Date March 6, 2013 | ||
| By (Signature and Title)* /s/ Michelle L. Cahoon | ||
| Michelle L. Cahoon, Vice President and Treasurer | ||
| (principal financial officer) | ||
| Date March 6, 2013 | ||
| * | Print the name and title of each signing officer under his or her signature. |