UNITED STATES
SECURITIES AND EXCHANGE COMMISSION
Washington, D.C. 20549
FORM N-CSR
CERTIFIED SHAREHOLDER REPORT OF REGISTERED
MANAGEMENT INVESTMENT COMPANIES
Investment Company Act file number 811-07655
Driehaus Mutual Funds
(Exact name of registrant as specified in charter)
25 East Erie Street
Chicago, IL 60611
(Address of principal executive offices) (Zip code)
Janet L. McWilliams
Driehaus Capital Management LLC
25 East Erie Street
Chicago, IL 60611
(Name and address of agent for service)
Registrant’s telephone number, including area code: 312-587-3800
Date of fiscal year end: December 31
Date of reporting period: June 30, 2018
Form N-CSR is to be used by management investment companies to file reports with the Commission not later than 10 days after the transmission to stockholders of any report that is required to be transmitted to stockholders under Rule 30e-1 under the Investment Company Act of 1940 (17 CFR 270.30e-1). The Commission may use the information provided on Form N-CSR in its regulatory, disclosure review, inspection, and policymaking roles.
A registrant is required to disclose the information specified by Form N-CSR, and the Commission will make this information public. A registrant is not required to respond to the collection of information contained in Form N-CSR unless the Form displays a currently valid Office of Management and Budget (“OMB”) control number. Please direct comments concerning the accuracy of the information collection burden estimate and any suggestions for reducing the burden to Secretary, Securities and Exchange Commission, 450 Fifth Street, NW, Washington, DC 20549-0609. The OMB has reviewed this collection of information under the clearance requirements of 44 U.S.C. § 3507.
| Item 1. | Reports to Stockholders. |
Driehaus Mutual Funds
Trustees & Officers
Theodore J. Beck
Trustee
Francis J. Harmon
Trustee
Christopher J. Towle
Trustee
Dawn M. Vroegop
Trustee
Daniel F. Zemanek
Chairman of the Board
Stephen J. Kneeley
President & Trustee
Michelle L. Cahoon
Vice President & Treasurer
Janet L. McWilliams
Chief Legal Officer &
Assistant Vice President
Michael R. Shoemaker
Chief Compliance Officer &
Assistant Vice President
William H. Wallace, III
Secretary
Michael P. Kailus
Assistant Secretary & Anti-Money
Laundering Compliance Officer
Christine Mason
Assistant Secretary
Investment Adviser
Driehaus Capital Management LLC
25 East Erie Street
Chicago, IL 60611
Distributor
Driehaus Securities LLC
25 East Erie Street
Chicago, IL 60611
Administrator
The Bank of New York Mellon
4400 Computer Drive
Westborough, MA 01581
Transfer Agent
BNY Mellon Investment Servicing (US) Inc.
4400 Computer Drive
Westborough, MA 01581
Custodian
The Northern Trust Company
50 South LaSalle Street
Chicago, IL 60603
Semi-Annual Report to Shareholders
June 30, 2018

Driehaus Emerging Markets Growth Fund
Driehaus Emerging Markets Small Cap Growth Fund
Driehaus Frontier Emerging Markets Fund
Driehaus International Small Cap Growth Fund
Driehaus Micro Cap Growth Fund
Driehaus Small Cap Growth Fund
Distributed by:
Driehaus Securities LLC
This report has been prepared for the shareholders of the Funds and is not an offer to sell or buy any Fund securities. Such offer is only made by the Funds’ prospectus.
Semi-Annual Report to Shareholders
June 30, 2018
Investment Philosophy:
The Adviser seeks to achieve superior investment returns primarily by investing in global companies that are currently demonstrating rapid growth in their sales and earnings and which, in its judgment, have the ability to continue or accelerate their growth rates in the future. The Adviser manages the portfolios actively (above average turnover) to ensure that the Funds are fully invested, under appropriate market conditions, in companies that meet these criteria. Investors should note that investments in overseas markets can pose more risks than U.S. investments, and the international Funds’ share prices are expected to be more volatile than those of the U.S.-only Funds. In addition, the Funds’ returns will fluctuate with changes in stock market conditions, currency values, interest rates, government regulations, and economic and political conditions in countries in which the Funds invest. These risks are generally greater when investing in emerging markets.
Driehaus Emerging Markets Growth Fund
Driehaus Emerging Markets Small Cap Growth Fund
Driehaus Frontier Emerging Markets Fund
Driehaus International Small Cap Growth Fund
Driehaus Micro Cap Growth Fund
Driehaus Small Cap Growth Fund
Performance Overview and Schedule of Investments: | ||||
| 1 | ||||
| 6 | ||||
| 12 | ||||
| 17 | ||||
| 22 | ||||
| 27 | ||||
| 32 | ||||
| 34 | ||||
| 36 | ||||
| 38 | ||||
| 46 | ||||
| 60 | ||||
| 63 | ||||
PROXY VOTING POLICIES AND PROCEDURES AND PROXY VOTING RECORD
A description of the Funds’ policies and procedures with respect to the voting of proxies relating to the Funds’ portfolio securities is available without charge, upon request, by calling 1-800-560-6111. This information is also available on the Funds’ website at http://www.driehaus.com.
Information regarding how the Funds voted proxies related to portfolio securities during the 12-month period ended June 30, 2018 is available without charge, upon request, by calling 1-800-560-6111. This information is also available on the Securities and Exchange Commission’s (“SEC”) website at http://www.sec.gov.
HOW TO OBTAIN QUARTERLY PORTFOLIO HOLDINGS
Each Fund files a complete schedule of portfolio holdings with the SEC for the first and third quarters of each fiscal year on Form N-Q. The Funds’ Form N-Q is available electronically on the SEC’s website at http://www.sec.gov; hard copies may be reviewed and copied at the SEC’s Public Reference Room in Washington, DC 20549. For more information on the Public Reference Room, call 1-800-SEC-0330. Each Fund’s complete schedule of portfolio holdings is also available on the Fund’s website at http://www.driehaus.com.
Driehaus Emerging Markets Growth Fund
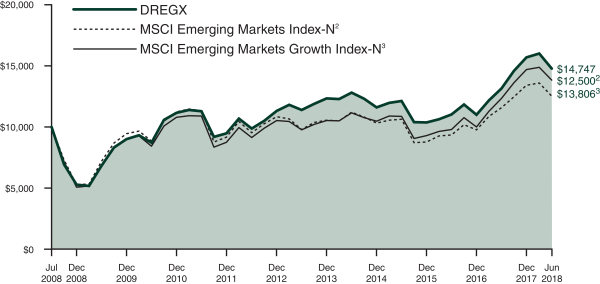
Performance Overview (unaudited)
The performance summarized below is historical and does not represent future results. Investment returns and principal value vary, and you may have a gain or loss when you sell shares. Performance data presented measures the change in the value of an investment in the Fund, assuming reinvestment of all dividends and capital gains. Average annual total return reflects annualized change.
The table does not reflect the deduction of taxes that a shareholder would pay on Fund distributions or the redemption of Fund shares. The graph compares the results of a $10,000 investment in the Fund over the last 10 fiscal year periods, with all dividends and capital gains reinvested, with the indicated indices (and dividends reinvested) for the same period.
| Average Annual Total Returns as of 6/30/18 | 1 Year | 3 Years | 5 Years | 10 Years | ||||||||||||
Driehaus Emerging Markets Growth Fund Investor Class (DREGX) | 12.24% | 6.72% | 5.31% | 3.95% | ||||||||||||
Driehaus Emerging Markets Growth Fund Institutional Class (DIEMX)1 | 12.40% | 6.78% | 5.34% | 3.96% | ||||||||||||
MSCI Emerging Markets Index-N2 | 8.20% | 5.60% | 5.01% | 2.26% | ||||||||||||
MSCI Emerging Markets Growth Index-N3 | 11.92% | 8.34% | 7.16% | 3.28% | ||||||||||||
| 1 | The returns for the periods prior to July 17, 2017 (institutional share class inception date) include the performance of the investor share class. |
| 2 | The Morgan Stanley Capital International Emerging Markets Index-Net (MSCI Emerging Markets Index-N) is a market capitalization-weighted index designed to measure equity market performance in emerging markets. Data is in U.S. dollars and is calculated with net dividend reinvestment. Source: Morgan Stanley Capital International Inc. |
| 3 | The Morgan Stanley Capital International Emerging Markets Growth Index-Net (MSCI Emerging Markets Growth Index-N) is a subset of the MSCI Emerging Markets Index and includes only the MSCI Emerging Markets Index stocks which are categorized as growth stocks. Data is in U.S. dollars and is calculated with net dividend reinvestment. Source: Morgan Stanley Capital International Inc. |
1
Driehaus Emerging Markets Growth Fund
Schedule of Investments
June 30, 2018 (unaudited)
| Number of Shares | Value (Note A) | |||||||
| EQUITY SECURITIES — 94.3% |
| |||||||
| FAR EAST — 64.1% |
| |||||||
China — 32.3% |
| |||||||
AIA Group, Ltd. | 5,453,800 | $ | 47,686,688 | |||||
Alibaba Group Holding, Ltd. — SP ADR** | 349,802 | 64,898,765 | ||||||
Anhui Conch Cement Co., Ltd. — H | 2,213,342 | 12,695,063 | ||||||
Baidu, Inc. — SP ADR** | 33,322 | 8,097,246 | ||||||
China Construction Bank Corp. — H | 34,918,116 | 32,267,301 | ||||||
China Gas Holdings, Ltd. | 4,310,427 | 17,333,789 | ||||||
China Overseas Land & Investment, Ltd. | 4,192,464 | 13,813,500 | ||||||
CSPC Pharmaceutical Group, Ltd. | 5,125,732 | 15,483,819 | ||||||
Ctrip.com International, Ltd. — ADR** | 388,551 | 18,506,684 | ||||||
GDS Holdings, Ltd. — ADR** | 509,773 | 20,436,800 | ||||||
Hangzhou Tigermed Consulting Co., Ltd. — A | 1,234,243 | 11,525,910 | ||||||
Huazhu Group, Ltd. — ADR | 156,912 | 6,588,735 | ||||||
Industrial & Commercial Bank of China, Ltd. — H | 44,829,186 | 33,540,752 | ||||||
Kweichow Moutai Co., Ltd. — A | 154,201 | 17,024,416 | ||||||
Li Ning Co., Ltd.** | 7,767,120 | 8,563,473 | ||||||
New Oriental Education & Technology Group, Inc. — SP ADR | 86,473 | 8,185,534 | ||||||
Ping An Insurance Group Co. of China, Ltd. — H | 2,146,902 | 19,757,103 | ||||||
Sands China, Ltd. | 3,674,859 | 19,649,273 | ||||||
Shanghai International Airport Co., Ltd. — A | 3,865,774 | 32,371,838 | ||||||
Shenzhou International Group Holdings, Ltd. | 1,704,941 | 21,046,642 | ||||||
Tencent Holdings, Ltd. | 1,964,464 | 98,603,794 | ||||||
Wise Talent Information Technology Co., Ltd.** | 678,751 | 2,811,692 | ||||||
Wuxi Biologics Cayman, Inc.1** | 814,776 | 9,071,414 | ||||||
|
| |||||||
| 539,960,231 | ||||||||
|
| |||||||
India — 13.0% | ||||||||
HDFC Bank, Ltd. — ADR | 592,210 | 62,193,894 | ||||||
Hindustan Unilever, Ltd. | 583,411 | 13,974,531 | ||||||
ICICI Bank, Ltd. — SP ADR | 998,035 | 8,014,221 | ||||||
| Number of Shares | Value (Note A) | |||||||
ICICI Prudential Life Insurance Co., Ltd.1 | 2,721,413 | $ | 14,986,341 | |||||
Infosys, Ltd. — SP ADR | 464,975 | 9,034,464 | ||||||
ITC, Ltd. | 2,190,027 | 8,508,869 | ||||||
Larsen & Toubro, Ltd. | 665,061 | 12,377,133 | ||||||
Maruti Suzuki India, Ltd. | 98,049 | 12,629,953 | ||||||
Petronet LNG, Ltd. | 2,929,159 | 9,371,257 | ||||||
Reliance Industries, Ltd. | 1,258,486 | 17,861,997 | ||||||
Sun Pharmaceutical Industries, Ltd. | 1,208,976 | 9,952,017 | ||||||
Tata Consultancy Services, Ltd. | 1,080,764 | 29,146,635 | ||||||
Titan Co., Ltd. | 619,439 | 7,942,453 | ||||||
|
| |||||||
| 215,993,765 | ||||||||
|
| |||||||
Taiwan — 7.0% | ||||||||
Airtac International Group | 478,494 | 6,803,455 | ||||||
Cathay Financial Holding Co., Ltd. | 11,110,944 | 19,606,369 | ||||||
Formosa Plastics Corp. | 5,698,898 | 21,028,454 | ||||||
MediaTek, Inc. | 1,661,891 | 16,352,635 | ||||||
Parade Technologies, Ltd. | 267,801 | 4,497,240 | ||||||
Taiwan Semiconductor Manufacturing Co., Ltd. — SP ADR | 1,326,852 | 48,509,709 | ||||||
|
| |||||||
| 116,797,862 | ||||||||
|
| |||||||
South Korea — 6.4% | ||||||||
LG Household & Health Care, Ltd. | 6,937 | 8,689,145 | ||||||
Macquarie Korea Infrastructure Fund2 | 750,408 | 6,032,890 | ||||||
Medy-Tox, Inc. | 16,552 | 11,395,558 | ||||||
Samsung Electro-Mechanics Co., Ltd. | 111,720 | 14,885,976 | ||||||
Samsung Electronics Co., Ltd. | 1,289,780 | 53,986,754 | ||||||
SK Hynix, Inc. | 159,790 | 12,287,127 | ||||||
|
| |||||||
| 107,277,450 | ||||||||
|
| |||||||
Indonesia — 2.0% | ||||||||
PT Bank Central Asia Tbk | 16,417,469 | 24,603,290 | ||||||
PT Telekomunikasi Indonesia Persero Tbk | 34,254,475 | 8,964,011 | ||||||
|
| |||||||
| 33,567,301 | ||||||||
|
| |||||||
Thailand — 2.0% | ||||||||
Bangkok Dusit Medical Services PCL — NVDR | 18,168,204 | 13,709,783 | ||||||
CP ALL PCL — NVDR | 3,185,436 | 7,066,995 | ||||||
Indorama Ventures PCL — NVDR | 7,593,442 | 12,548,776 | ||||||
|
| |||||||
| 33,325,554 | ||||||||
|
| |||||||
Notes to Financial Statements are an integral part of this Schedule.
2
Driehaus Emerging Markets Growth Fund
Schedule of Investments
June 30, 2018 (unaudited)
| Number of Shares | Value (Note A) | |||||||
Philippines — 0.6% | ||||||||
BDO Unibank, Inc. | 4,281,150 | $ | 10,067,632 | |||||
Malaysia — 0.4% | ||||||||
Public Bank BHD | 1,169,866 | 6,765,211 | ||||||
Singapore — 0.4% | ||||||||
Sea, Ltd. — ADR** | 443,284 | 6,649,260 | ||||||
|
| |||||||
Total FAR EAST | 1,070,404,266 | |||||||
|
| |||||||
| EUROPE — 14.3% | ||||||||
Russia — 8.4% | ||||||||
Alrosa PJSC | 6,339,601 | 10,094,705 | ||||||
Lukoil PJSC — SP ADR | 434,078 | 29,682,254 | ||||||
Novatek PJSC — SP GDR | 59,977 | 8,894,589 | ||||||
Sberbank of Russia PJSC — SP ADR | 3,761,319 | 54,294,640 | ||||||
Yandex NV — A** | 1,053,265 | 37,812,214 | ||||||
|
| |||||||
| 140,778,402 | ||||||||
|
| |||||||
France — 1.8% | ||||||||
LVMH Moet Hennessy Louis Vuitton SE | 58,601 | 19,517,470 | ||||||
Pernod Ricard SA | 68,935 | 11,262,284 | ||||||
|
| |||||||
| 30,779,754 | ||||||||
|
| |||||||
Hungary — 1.2% | ||||||||
OTP Bank PLC | 543,360 | 19,672,687 | ||||||
Netherlands — 1.1% | ||||||||
Core Laboratories NV | 138,152 | 17,436,164 | ||||||
Switzerland — 0.8% | ||||||||
Wizz Air Holdings PLC1** | 296,193 | 14,072,412 | ||||||
Turkey — 0.6% | ||||||||
Turkcell Iletisim Hizmetleri AS | 3,430,131 | 9,087,083 | ||||||
Austria — 0.2% | ||||||||
Erste Group Bank AG | 88,646 | 3,700,873 | ||||||
Germany — 0.2% | ||||||||
Siltronic AG | 23,733 | 3,396,526 | ||||||
|
| |||||||
Total EUROPE | 238,923,901 | |||||||
|
| |||||||
| SOUTH AMERICA — 6.3% | ||||||||
Brazil — 5.0% | ||||||||
Ambev SA — ADR | 1,564,397 | 7,243,158 | ||||||
B3 SA — Brasil Bolsa Balcao | 1,727,404 | 9,154,584 | ||||||
Hypera SA | 566,115 | 4,022,655 | ||||||
Itau Unibanco Holding SA — SP PREF ADR | 2,949,816 | 30,619,090 | ||||||
Localiza Rent a Car SA | 2,223,694 | 13,569,080 | ||||||
Magazine Luiza SA | 249,736 | 8,215,530 | ||||||
Vale SA — SP ADR | 859,866 | 11,023,482 | ||||||
|
| |||||||
| 83,847,579 | ||||||||
|
| |||||||
Argentina — 0.8% | ||||||||
MercadoLibre, Inc. | 42,793 | 12,792,111 | ||||||
| Number of Shares | Value (Note A) | |||||||
Peru — 0.5% | ||||||||
Credicorp, Ltd. | 39,428 | $ | 8,876,031 | |||||
|
| |||||||
Total SOUTH AMERICA | 105,515,721 | |||||||
|
| |||||||
| NORTH AMERICA — 3.8% | ||||||||
Mexico — 2.7% | ||||||||
Arca Continental SAB de CV | 1,099,277 | 6,750,007 | ||||||
Grupo Financiero Banorte SAB de CV — O | 2,462,499 | 14,479,709 | ||||||
Wal-Mart de Mexico SAB de CV | 8,937,687 | 23,590,516 | ||||||
|
| |||||||
| 44,820,232 | ||||||||
|
| |||||||
United States — 1.1% | ||||||||
EPAM Systems, Inc.** | 152,641 | 18,977,856 | ||||||
|
| |||||||
Total NORTH AMERICA | 63,798,088 | |||||||
|
| |||||||
| AFRICA — 3.7% | ||||||||
South Africa — 3.2% | ||||||||
Bidvest Group, Ltd. | 872,324 | 12,528,271 | ||||||
Mr. Price Group, Ltd. | 914,411 | 15,082,532 | ||||||
Naspers, Ltd. — N | 34,427 | 8,746,353 | ||||||
Sasol, Ltd. | 138,919 | 5,092,532 | ||||||
Shoprite Holdings, Ltd. | 704,416 | 11,328,683 | ||||||
|
| |||||||
| 52,778,371 | ||||||||
|
| |||||||
Egypt — 0.5% | ||||||||
Commercial International Bank Egypt SAE | 1,726,366 | 8,229,429 | ||||||
|
| |||||||
Total AFRICA | 61,007,800 | |||||||
|
| |||||||
| MIDDLE EAST — 2.1% | ||||||||
Saudi Arabia — 1.3% | ||||||||
Al Rajhi Bank | 964,191 | 22,187,178 | ||||||
United Arab Emirates — 0.8% |
| |||||||
DP World, Ltd.2 | 292,163 | 6,719,749 | ||||||
NMC Health PLC | 149,022 | 7,044,776 | ||||||
|
| |||||||
| 13,764,525 | ||||||||
|
| |||||||
Total MIDDLE EAST | 35,951,703 | |||||||
|
| |||||||
Total EQUITY SECURITIES | 1,575,601,479 | |||||||
|
| |||||||
| ||||||||
TOTAL INVESTMENTS | 94.3 | % | $ | 1,575,601,479 | ||||
Other Assets In Excess Of Liabilities | 5.7 | % | 94,521,652 | |||||
|
|
|
| |||||
Net Assets | 100.0 | % | $ | 1,670,123,131 | ||||
| ||||||||
| 1 | 144A — This security was purchased pursuant to Rule 144A of the Securities Act of 1933 and may not be resold subject to that rule except to qualified institutional buyers. At June 30, 2018, these securities amounted to $38,130,167 or 2.3% of net assets. These 144A securities have not been deemed illiquid. |
Notes to Financial Statements are an integral part of this Schedule.
3
Driehaus Emerging Markets Growth Fund
Schedule of Investments
June 30, 2018 (unaudited)
| 2 | Pursuant to procedures adopted by Driehaus Mutual Funds’ (the “Trust”) Board of Trustees, this security has been determined to be illiquid by Driehaus Capital Management LLC, the Fund’s investment advisor. |
| ** | Non-income producing security |
ADR — American Depository Receipt
NVDR — Non-Voting Depository Receipt
SP ADR — Sponsored American Depository Receipt
SP GDR — Sponsored Global Depository Receipt
SP PREF ADR — Sponsored Preferred American Depository Receipt
Notes to Financial Statements are an integral part of this Schedule.
Regional Weightings*
Asia/Far East Ex-Japan | 64.1% | |||
Eastern Europe | 10.2% | |||
South America | 6.3% | |||
Western Europe | 4.1% | |||
North America | 3.8% | |||
Africa | 3.7% | |||
Middle East | 2.1% |
Top Ten Holdings*
Tencent Holdings, Ltd. | 5.9% | |||
Alibaba Group Holding, Ltd. — SP ADR | 3.9% | |||
HDFC Bank, Ltd. — ADR | 3.7% | |||
Sberbank of Russia PJSC — SP ADR | 3.3% | |||
Samsung Electronics Co., Ltd. | 3.2% | |||
Taiwan Semiconductor Manufacturing Co., Ltd. — SP ADR | 2.9% | |||
AIA Group, Ltd. | 2.9% | |||
Yandex NV — A | 2.3% | |||
Industrial & Commercial Bank of China, Ltd. — H | 2.0% | |||
Shanghai International Airport Co., Ltd. — A | 1.9% |
| * | All percentages are stated as a percent of net assets at June 30, 2018. |
4
Driehaus Emerging Markets Growth Fund
Schedule of Investments
June 30, 2018 (unaudited)
Industry | Percent of Net Assets | |||
Airlines | 0.8% | |||
Automobiles | 0.8% | |||
Beverages | 2.5% | |||
Biotechnology | 0.7% | |||
Capital Markets | 0.9% | |||
Chemicals | 2.3% | |||
Commercial Banks | 20.3% | |||
Computers & Peripherals | 3.2% | |||
Construction & Engineering | 0.7% | |||
Construction Materials | 0.8% | |||
Diversified Consumer Services | 0.5% | |||
Diversified Telecommunication Services | 0.5% | |||
Electronic Equipment, Instruments & Components | 0.9% | |||
Energy Equipment & Services | 1.1% | |||
Food & Staples Retailing | 2.5% | |||
Gas Utilities | 1.0% | |||
Health Care Providers & Services | 1.3% | |||
Hotels, Restaurants & Leisure | 1.6% | |||
Household Products | 0.8% | |||
Industrial Conglomerates | 0.8% | |||
Information Technology Services | 4.7% | |||
Industry | Percent of Net Assets | |||
Insurance | 6.1% | |||
Internet & Catalog Retail | 1.1% | |||
Internet Software & Services | 13.5% | |||
Life Sciences Tools & Services | 1.2% | |||
Machinery | 0.4% | |||
Media | 0.5% | |||
Metals & Mining | 1.3% | |||
Multiline Retail | 0.5% | |||
Oil, Gas & Consumable Fuels | 3.9% | |||
Personal Products | 0.5% | |||
Pharmaceuticals | 1.8% | |||
Real Estate Management & Development | 0.8% | |||
Road & Rail | 0.8% | |||
Semiconductors & Semiconductor Equipment | 5.1% | |||
Software | 0.4% | |||
Specialty Retail | 0.9% | |||
Textiles, Apparel & Luxury Goods | 3.4% | |||
Tobacco | 0.5% | |||
Transportation Infrastructure | 2.3% | |||
Wireless Telecommunication Services | 0.6% | |||
Other Assets in Excess of Liabilities | 5.7% | |||
|
| |||
TOTAL | 100.0% | |||
|
| |||
Notes to Financial Statements are an integral part of this Schedule.
5
Driehaus Emerging Markets Small Cap Growth Fund
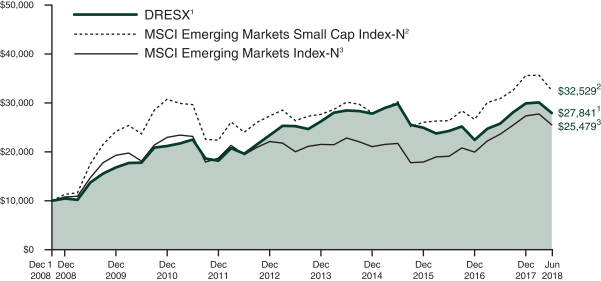
Performance Overview (unaudited)
The performance summarized below is historical and does not represent future results. Investment returns and principal value vary, and you may have a gain or loss when you sell shares. Performance data presented measures the change in the value of an investment in the Fund, assuming reinvestment of all dividends and capital gains. Average annual total return reflects annualized change.
The table does not reflect the deduction of taxes that a shareholder would pay on Fund distributions or the redemption of Fund shares. The graph compares the results of a $10,000 investment in the Fund since December 1, 2008 (the date of the Predecessor Limited Partnership’s inception), with all dividends and capital gains reinvested, with the indicated indices (and dividends reinvested) for the same period.
| Fund Only | Including Predecessor Limited Partnership | |||||||||||||||||||
| Average Annual Total Returns as of 6/30/18 | 1 Year | 3 Years | 5 Years | Since Inception (8/22/11 - 6/30/17) | Since Inception (12/1/08 - 6/30/18) | |||||||||||||||
Driehaus Emerging Markets Small Cap Growth Fund (DRESX)1 | 8.16% | –2.18% | 2.04% | 4.49% | 11.28% | |||||||||||||||
MSCI Emerging Markets Small Cap Index-N2 | 5.64% | 2.55% | 4.32% | 3.37% | 13.09% | |||||||||||||||
MSCI Emerging Markets Index-N3 | 8.20% | 5.60% | 5.01% | 3.87% | 10.25% | |||||||||||||||
| 1 | The Driehaus Emerging Markets Small Cap Growth Fund (the “Fund”) performance shown above includes the performance of the Driehaus Emerging Markets Small Cap Growth Fund, L.P. (the “Predecessor Limited Partnership”), the Fund’s predecessor, for the periods before the Fund’s registration statement became effective. The Predecessor Limited Partnership, which was established on December 1, 2008, was managed with substantially the same investment objective, policies and philosophies as are followed by the Fund. The Fund succeeded to the Predecessor Limited Partnership’s assets on August 22, 2011. The Predecessor Limited Partnership was not registered under the Investment Company Act of 1940, as amended (“1940 Act”), and thus was not subject to certain investment and operational restrictions that are imposed by the 1940 Act. If the Predecessor Limited Partnership had been registered under the 1940 Act, its performance may have been adversely affected. The Predecessor Limited Partnership’s performance has been restated to reflect estimated expenses of the Fund. The returns for the periods prior to August 21, 2014, reflect fee waivers and/or reimbursements without which performance would have been lower. |
| 2 | The Morgan Stanley Capital International Emerging Markets Small Cap Index-Net (MSCI Emerging Markets Small Cap Index-N) is a market capitalization-weighted index designed to measure equity market performance of small cap stocks in emerging markets. Data is in U.S. dollars and is calculated with net dividend reinvestment. Source: Morgan Stanley Capital International Inc. |
| 3 | The Morgan Stanley Capital International Emerging Markets Index-Net (MSCI Emerging Markets Index-N) is a market capitalization weighted index designed to measure equity market performance in emerging markets. Data is in U.S. dollars and is calculated with net dividend reinvestment. Source: Morgan Stanley Capital International Inc. |
6
Driehaus Emerging Markets Small Cap Growth Fund
Schedule of Investments
June 30, 2018 (unaudited)
Number Shares | Value (Note A) | |||||||
| EQUITY SECURITIES — 90.8% |
| |||||||
| FAR EAST — 69.8% |
| |||||||
China — 29.4% |
| |||||||
51 Job, Inc. — ADR** | 11,686 | $ | 1,141,021 | |||||
Angang Steel Co., Ltd. — H | 2,608,000 | 2,353,503 | ||||||
Baozun, Inc. — SP ADR1** | 37,700 | 2,062,190 | ||||||
BEST, Inc. — ADR1** | 229,408 | 2,803,366 | ||||||
China Resources Cement Holdings, Ltd. | 1,080,914 | 1,095,298 | ||||||
Chinasoft International, Ltd. | 2,298,000 | 1,792,566 | ||||||
CIMC Enric Holdings, Ltd. | 2,976,187 | 2,833,705 | ||||||
Country Garden Services Holdings Co., Ltd.** | 791,000 | 1,014,258 | ||||||
Fanhua, Inc. — SP ADR1 | 85,263 | 2,429,996 | ||||||
Future Land Development Holdings, Ltd. | 1,444,000 | 1,306,771 | ||||||
GDS Holdings, Ltd. — ADR1** | 120,761 | 4,841,308 | ||||||
Greentown Service Group Co., Ltd. | 2,328,696 | 2,113,327 | ||||||
GreenTree Hospitality Group, Ltd. — ADR1** | 122,075 | 2,208,337 | ||||||
Guangzhou Baiyun International Airport Co., Ltd. — A | 477,731 | 943,882 | ||||||
Hangzhou Tigermed Consulting Co., Ltd. — A | 260,107 | 2,428,995 | ||||||
Health and Happiness H&H International Holdings, Ltd.** | 323,500 | 2,230,722 | ||||||
Hua Hong Semiconductor, Ltd.2 | 1,049,000 | 3,603,364 | ||||||
Huazhu Group, Ltd. — ADR1 | 25,159 | 1,056,426 | ||||||
Huifu Payment, Ltd.2** | 1,343,131 | 1,162,417 | ||||||
Kingdee International Software Group Co., Ltd. | 1,100,000 | 1,125,854 | ||||||
Lee & Man Paper Manufacturing, Ltd. | 2,697,312 | 2,729,767 | ||||||
Li Ning Co., Ltd.** | 2,593,310 | 2,859,199 | ||||||
Maanshan Iron & Steel Co., Ltd. — H | 3,959,546 | 1,761,346 | ||||||
Microport Scientific Corp. | 945,403 | 1,142,350 | ||||||
Noah Holdings, Ltd. — SP ADR1** | 20,810 | 1,085,242 | ||||||
Pacific Basin Shipping, Ltd.** | 6,000,000 | 1,644,234 | ||||||
Sichuan Swellfun Co., Ltd. — A | 240,976 | 2,008,830 | ||||||
Silergy Corp. | 58,000 | 1,409,646 | ||||||
Times China Holdings, Ltd. | 760,000 | 1,127,562 | ||||||
Number Shares | Value (Note A) | |||||||
Wisdom Education International Holdings Co., Ltd. | 3,022,000 | $ | 2,638,511 | |||||
Wuxi Biologics Cayman, Inc.2** | 406,328 | 4,523,905 | ||||||
Xiabuxiabu Catering Management China Holdings Co., Ltd.2 | 1,090,842 | 2,383,123 | ||||||
|
| |||||||
| 65,861,021 | ||||||||
|
| |||||||
India — 17.1% |
| |||||||
Balkrishna Industries, Ltd. | 72,566 | 1,103,079 | ||||||
Bharat Financial Inclusion, Ltd.** | 145,248 | 2,451,716 | ||||||
Britannia Industries, Ltd. | 39,105 | 3,546,503 | ||||||
Crompton Greaves Consumer Electricals, Ltd. | 356,958 | 1,178,485 | ||||||
Dixon Technologies India, Ltd. | 25,471 | 1,089,269 | ||||||
Edelweiss Financial Services, Ltd. | 524,941 | 2,256,369 | ||||||
Eris Lifesciences, Ltd.2** | 117,775 | 1,177,578 | ||||||
Escorts, Ltd. | 224,634 | 2,857,801 | ||||||
India Grid Trust2,3 | 2,995,461 | 4,239,070 | ||||||
Jindal Steel & Power, Ltd.** | 815,286 | 2,654,157 | ||||||
Jubilant Foodworks, Ltd. | 102,268 | 2,069,466 | ||||||
L&T Technology Services, Ltd.2 | 91,555 | 1,627,719 | ||||||
Larsen & Toubro Infotech, Ltd.2 | 68,811 | 1,678,621 | ||||||
Oberoi Realty, Ltd. | 209,600 | 1,460,301 | ||||||
Page Industries, Ltd. | 8,145 | 3,306,532 | ||||||
Phoenix Mills, Ltd. | 147,742 | 1,437,420 | ||||||
Quess Corp., Ltd.2** | 179,265 | 2,985,613 | ||||||
Sterlite Technologies, Ltd. | 282,080 | 1,133,837 | ||||||
|
| |||||||
| 38,253,536 | ||||||||
|
| |||||||
Taiwan — 9.4% |
| |||||||
Airtac International Group | 108,000 | 1,535,595 | ||||||
ASPEED Technology, Inc. | 84,553 | 2,215,847 | ||||||
Chroma ATE, Inc. | 368,000 | 1,979,500 | ||||||
Cub Elecparts, Inc. | 137,000 | 1,752,464 | ||||||
Ennoconn Corp. | 79,000 | 1,146,580 | ||||||
Formosa Sumco Technology Corp. | 454,828 | 2,140,736 | ||||||
Hiwin Technologies Corp. | 214,000 | 2,526,854 | ||||||
Macronix International** | 805,563 | 1,146,709 | ||||||
Nanya Technology Corp. | 378,000 | 1,031,523 | ||||||
Oriental Union Chemical Corp. | 1,126,000 | 1,215,061 | ||||||
TCI Co., Ltd. | 155,140 | 2,396,672 | ||||||
Wiwynn Corp. | 119,694 | 2,076,748 | ||||||
|
| |||||||
| 21,164,289 | ||||||||
|
| |||||||
South Korea — 8.1% |
| |||||||
Cafe24 Corp.** | 19,798 | 3,179,759 | ||||||
Notes to Financial Statements are an integral part of this Schedule.
7
Driehaus Emerging Markets Small Cap Growth Fund
Schedule of Investments
June 30, 2018 (unaudited)
Number Shares | Value (Note A) | |||||||
Dentium Co., Ltd. | 41,094 | $ | 3,292,682 | |||||
Douzone Bizon Co., Ltd. | 25,578 | 1,422,912 | ||||||
Kginicis Co., Ltd. | 53,249 | 1,039,180 | ||||||
Koh Young Technology, Inc. | 20,118 | 1,841,217 | ||||||
Medy-Tox, Inc. | 4,022 | 2,769,027 | ||||||
Modetour Network, Inc. | 23,714 | 578,753 | ||||||
SkC Kolon Pi, Inc. | 88,431 | 3,927,622 | ||||||
|
| |||||||
| 18,051,152 | ||||||||
|
| |||||||
Thailand — 4.2% |
| |||||||
Beauty Community PCL — NVDR | 2,337,248 | 860,683 | ||||||
IRPC PCL — NVDR | 14,837,945 | 2,597,648 | ||||||
Land & Houses PCL — NVDR | 11,099,579 | 3,785,851 | ||||||
TOA Paint Thailand PCL — NVDR | 1,923,300 | 2,206,019 | ||||||
|
| |||||||
| 9,450,201 | ||||||||
|
| |||||||
Cambodia — 0.6% |
| |||||||
NagaCorp, Ltd. | 1,452,276 | 1,321,664 | ||||||
Malaysia — 0.5% |
| |||||||
Malaysia Airports Holdings BHD | 563,800 | 1,228,231 | ||||||
Indonesia — 0.5% |
| |||||||
PT Bank Tabungan Pensiunan Nasional Syariah Tbk** | 10,366,700 | 1,146,631 | ||||||
|
| |||||||
Total FAR EAST | 156,476,725 | |||||||
|
| |||||||
| EUROPE — 5.3% |
| |||||||
Russia — 2.2% |
| |||||||
Evraz PLC | 269,441 | 1,807,842 | ||||||
Globaltrans Investment PLC — SP GDR | 192,943 | 1,968,019 | ||||||
TCS Group Holding PLC — GDR | 56,103 | 1,161,332 | ||||||
|
| |||||||
| 4,937,193 | ||||||||
|
| |||||||
Poland — 1.6% |
| |||||||
Dino Polska SA2** | 131,463 | 3,650,141 | ||||||
United Kingdom — 0.9% |
| |||||||
KAZ Minerals PLC** | 181,151 | 2,015,392 | ||||||
Turkey — 0.6% |
| |||||||
Tofas Turk Otomobil Fabrikasi AS | 228,863 | 1,198,656 | ||||||
|
| |||||||
Total EUROPE | 11,801,382 | |||||||
|
| |||||||
| NORTH AMERICA — 5.2% |
| |||||||
Mexico — 2.6% |
| |||||||
Alsea SAB de CV | 602,800 | 2,076,690 | ||||||
Banco del Bajio SA2 | 1,219,300 | 2,563,813 | ||||||
Grupo Aeroportuario del Centro Norte SAB de CV — ADR1 | 29,575 | 1,231,799 | ||||||
|
| |||||||
| 5,872,302 | ||||||||
|
| |||||||
Number Shares | Value (Note A) | |||||||
Canada — 1.8% | ||||||||
Gran Tierra Energy, | 831,040 | $ | 2,867,088 | |||||
Pan American Silver Corp.1 | 65,120 | 1,165,648 | ||||||
|
| |||||||
| 4,032,736 | ||||||||
|
| |||||||
United States — 0.8% | ||||||||
Diamond Offshore Drilling, Inc.1** | 79,803 | 1,664,691 | ||||||
|
| |||||||
Total NORTH AMERICA | 11,569,729 | |||||||
|
| |||||||
| SOUTH AMERICA — 4.1% |
| |||||||
Brazil — 4.1% |
| |||||||
Azul SA — ADR1** | 84,707 | 1,385,807 | ||||||
Iochpe Maxion SA | 31,614 | 170,479 | ||||||
Lojas Renner SA | 300,700 | 2,245,309 | ||||||
Magazine Luiza SA | 42,313 | 1,391,965 | ||||||
Metalurgica Gerdau SA — Pref. | 1,771,747 | 2,815,961 | ||||||
Rumo SA** | 328,600 | 1,186,970 | ||||||
|
| |||||||
Total SOUTH AMERICA | 9,196,491 | |||||||
|
| |||||||
| AFRICA — 3.9% |
| |||||||
South Africa — 3.3% |
| |||||||
Clicks Group, Ltd. | 226,002 | 3,237,920 | ||||||
Kumba Iron Ore, Ltd. | 91,736 | 1,971,212 | ||||||
Pick n Pay Stores, Ltd. | 421,429 | 2,297,391 | ||||||
|
| |||||||
| 7,506,523 | ||||||||
|
| |||||||
Kenya — 0.6% |
| |||||||
Safaricom PLC | 4,396,410 | 1,284,736 | ||||||
|
| |||||||
Total AFRICA | 8,791,259 | |||||||
|
| |||||||
| MIDDLE EAST — 2.5% |
| |||||||
United Arab Emirates — 1.5% |
| |||||||
NMC Health PLC | 70,691 | 3,341,804 | ||||||
Israel — 1.0% |
| |||||||
Frutarom Industries, Ltd. | 23,822 | 2,334,501 | ||||||
|
| |||||||
Total MIDDLE EAST | 5,676,305 | |||||||
|
| |||||||
Total EQUITY SECURITIES | 203,511,891 | |||||||
|
| |||||||
| ||||||||
| PURCHASED PUT OPTIONS — 0.6% |
| |||||||
iShares China Large-Cap Index ETF, Exercise Price $43.00, Notional Amount $43,000,000, Expiration Date July 13, 2018** | 10,000 | 760,000 | ||||||
iShares MSCI Emerging Markets Index ETF, Exercise Price $43.00, Notional Amount $43,000,000, Expiration Date July 13, 2018** | 10,000 | 500,000 | ||||||
Notes to Financial Statements are an integral part of this Schedule.
8
Driehaus Emerging Markets Small Cap Growth Fund
Schedule of Investments
June 30, 2018 (unaudited)
Number Shares | Value (Note A) | |||||||
iShares MSCI Mexico Index ETF, Exercise Price $44.00, Notional Amount $22,000,000, Expiration Date July 6, 2018** | 5,000 | $ | 100,000 | |||||
WisdomTree India Earnings ETF, Exercise Price $24.00, Notional Amount $12,000,000, Expiration Date July 20, 2018** | 5,000 | 75,000 | ||||||
|
| |||||||
Total PURCHASED PUT OPTIONS (Premiums paid $1,568,634) | 1,435,000 | |||||||
|
| |||||||
| ||||||||
TOTAL INVESTMENTS | 91.4 | % | $ | 204,946,891 | ||||
Other Assets In Excess Of Liabilities | 8.6 | % | 19,171,127 | |||||
|
|
|
| |||||
Net Assets | 100.0 | % | $ | 224,118,018 | ||||
| ||||||||
| WRITTEN PUT OPTIONS — (0.1%) |
| |||||||
iShares China Large-Cap Index ETF, Exercise Price $41.00, Notional Amount ($41,000,000), Expiration Date July 13, 2018** | (10,000 | ) | (190,000 | ) | ||||
iShares MSCI Emerging Markets Index ETF, Exercise Price $41.00, Notional Amount ($41,000,000), Expiration Date July 13, 2018** | (10,000 | ) | (100,000 | ) | ||||
Number Shares | Value (Note A) | |||||||
iShares MSCI Mexico Index ETF, Exercise Price $42.00, Notional Amount ($21,000,000), Expiration Date July 6, 2018** | (5,000 | ) | $ | (20,000 | ) | |||
|
| |||||||
Total WRITTEN PUT OPTIONS (Premiums received $325,301) | $ | (310,000 | ) | |||||
|
| |||||||
| ||||||||
| 1 | All or a portion of the security is pledged as collateral for derivatives transactions. |
| 2 | 144A — This security was purchased pursuant to Rule 144A of the Securities Act of 1933 and may not be resold subject to that rule except to qualified institutional buyers. At June 30, 2018, these securities amounted to $29,595,364 or 13.2% of net assets. These 144A securities have not been deemed illiquid, unless otherwise noted. |
| 3 | Pursuant to procedures adopted by Driehaus Mutual Funds’ (the “Trust”) Board of Trustees, this security has been determined to be illiquid by Driehaus Capital Management LLC, the Fund’s investment adviser. |
| ** | Non-income producing security |
ADR — American Depository Receipt
ETF — Exchange-Traded Fund
GDR — Global Depository Receipt
NVDR — Non-Voting Depository Receipt
SP ADR — Sponsored American Depository Receipt
SP GDR — Sponsored Global Depository Receipt
Regional Weightings(a)(b)
Asia/Far East Ex-Japan | 69.8% | |||
North America | 5.2% | |||
Eastern Europe | 4.4% | |||
South America | 4.1% | |||
Africa | 3.9% | |||
Middle East | 2.5% | |||
Western Europe | 0.9% |
Top Ten Holdings(a)
GDS Holdings, Ltd. — ADR | 2.2% | |||
Wuxi Biologics Cayman, Inc. | 2.0% | |||
India Grid Trust | 1.9% | |||
SKCKOLONPI, Inc. | 1.8% | |||
Land & Houses PCL — NVDR | 1.7% | |||
Dino Polska SA | 1.6% | |||
Hua Hong Semiconductor, Ltd. | 1.6% | |||
Britannia Industries, Ltd. | 1.6% | |||
NMC Health PLC | 1.5% | |||
Page Industries, Ltd. | 1.5% |
| (a) | All percentages are stated as a percent of net assets at June 30, 2018. |
| (b) | Excludes purchased options. |
Notes to Financial Statements are an integral part of this Schedule.
9
Driehaus Emerging Markets Small Cap Growth Fund
Schedule of Investments
June 30, 2018 (unaudited)
FORWARD FOREIGN CURRENCY CONTRACTS
| Currency Purchased | Currency Sold | Counterparty | Settlement Date | Unrealized Appreciation/ (Depreciation) | ||||||||||||||||
| INR 330,025,000 | USD 4,831,991 | GSC | 07/16/18 | $ | (25,052 | ) | ||||||||||||||
| USD 5,000,000 | INR 330,025,000 | GSC | 07/16/18 | 193,061 | ||||||||||||||||
|
| |||||||||||||||||||
| $ | 168,009 | |||||||||||||||||||
|
| |||||||||||||||||||
INR — Indian Rupee
GSC — Goldman Sachs & Co
USD — United States Dollar
Notes to Financial Statements are an integral part of this Schedule.
10
Driehaus Emerging Markets Small Cap Growth Fund
Schedule of Investments
June 30, 2018 (unaudited)
Industry | Percent of Net Assets | |||
Air Freight & Logistics | 1.3% | |||
Auto Components | 1.3% | |||
Automobiles | 0.5% | |||
Beverages | 0.9% | |||
Biotechnology | 1.2% | |||
Capital Markets | 1.5% | |||
Chemicals | 4.3% | |||
Commercial Banks | 2.2% | |||
Commercial Services & Supplies | 1.4% | |||
Communications Equipment | 0.5% | |||
Computers & Peripherals | 1.4% | |||
Construction Materials | 0.5% | |||
Consumer Finance | 1.1% | |||
Diversified Consumer Services | 1.2% | |||
Electric Utilities | 1.9% | |||
Electronic Equipment, Instruments & Components | 0.9% | |||
Energy Equipment & Services | 0.7% | |||
Food & Staples Retailing | 4.1% | |||
Food Products | 2.6% | |||
Health Care Equipment & Supplies | 2.0% | |||
Health Care Providers & Services | 1.5% | |||
Hotels, Restaurants & Leisure | 5.2% | |||
Household Durables | 1.0% | |||
Information Technology Services | 4.7% | |||
Industry | Percent of Net Assets | |||
Insurance | 1.1% | |||
Internet Software & Services | 2.3% | |||
Life Sciences Tools & Services | 3.1% | |||
Machinery | 4.4% | |||
Marine | 0.7% | |||
Media | 0.6% | |||
Metals & Mining | 7.4% | |||
Multiline Retail | 1.6% | |||
Oil, Gas & Consumable Fuels | 2.4% | |||
Other | 0.6% | |||
Paper & Forest Products | 1.2% | |||
Personal Products | 1.1% | |||
Pharmaceuticals | 0.5% | |||
Professional Services | 2.6% | |||
Real Estate Management & Development | 4.1% | |||
Road & Rail | 1.4% | |||
Semiconductors & Semiconductor Equipment | 6.0% | |||
Software | 1.1% | |||
Specialty Retail | 0.4% | |||
Textiles, Apparel & Luxury Goods | 2.8% | |||
Transportation Infrastructure | 1.5% | |||
Wireless Telecommunication Services | 0.6% | |||
Other Assets in Excess of Liabilities | 8.6% | |||
|
| |||
TOTAL | 100.0% | |||
|
| |||
Notes to Financial Statements are an integral part of this Schedule.
11
Driehaus Frontier Emerging Markets Fund
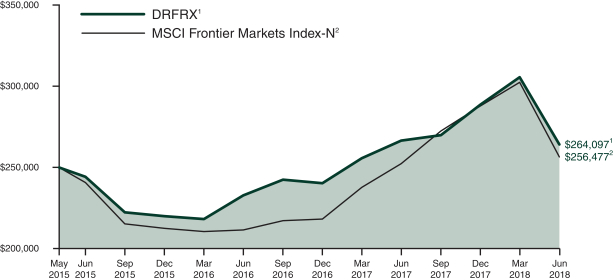
Performance Overview (unaudited)
The performance summarized below is historical and does not represent future results. Investment returns and principal value vary, and you may have a gain or loss when you sell shares. Performance data presented measures the change in the value of an investment in the Fund, assuming reinvestment of all dividends and capital gains. Average annual total return reflects annualized change.
The table does not reflect the deduction of taxes that a shareholder would pay on Fund distributions or the redemption of Fund shares. The graph compares the results of a $250,000 investment (minimum investment) in the Fund since May 4, 2015 (the date of the Fund’s inception), with all dividends and capital gains reinvested, with the indicated index (and dividends reinvested) for the same period.
| Average Annual Total Returns as of 6/30/18 | 1 Year | 3 Years | Since Inception (5/4/15 - 6/30/18) | |||||||||
Driehaus Frontier Emerging Markets Fund (DRFRX)1 | –0.91% | 2.64% | 1.75% | |||||||||
MSCI Frontier Markets Index-N2 | 1.69% | 2.15% | 0.81% | |||||||||
| 1 | The returns for the period reflect fee waivers and/or reimbursements without which performance would have been lower. |
| 2 | The Morgan Stanley Capital International Frontier Markets Index-Net (MSCI Frontier Markets Index-N) provides broad representation of the equity opportunity set in frontier markets while taking investability requirements into consideration within each market. Data is in U.S. dollars and is calculated with net dividend reinvestment. Source: Morgan Stanley Capital International Inc. |
12
Driehaus Frontier Emerging Markets Fund
Schedule of Investments
June 30, 2018 (unaudited)
| Number of Shares | Value (Note A) | |||||||
| EQUITY SECURITIES — 95.1% | ||||||||
| FAR EAST — 33.0% | ||||||||
Vietnam — 20.6% | ||||||||
Airports Corp. of Vietnam JSC | 450,600 | $ | 1,795,845 | |||||
Bank for Foreign Trade of Vietnam JSC | 6 | 15 | ||||||
Ho Chi Minh City Development Joint Stock Commercial Bank | 474,200 | 746,666 | ||||||
Mobile World Investment Corp. | 100,000 | 620,685 | ||||||
Nam Long Investment Corp. | 236,458 | 288,382 | ||||||
Refrigeration Electrical Engineering Corp. | 125,000 | 173,683 | ||||||
Saigon Securities, Inc. | 423,030 | 525,137 | ||||||
Viet Capital Securities JSC | 53,440 | 192,033 | ||||||
Vietjet Aviation JSC | 32,947 | 203,494 | ||||||
Vietnam Prosperity JSC | 175,845 | 219,821 | ||||||
Vincom Retail JSC** | 454,520 | 768,141 | ||||||
Vinhomes JSC1** | 80,000 | 391,663 | ||||||
|
| |||||||
| 5,925,565 | ||||||||
|
| |||||||
Bangladesh — 8.5% | ||||||||
Beximco Pharmaceuticals, Ltd. | 289,708 | 325,032 | ||||||
BRAC Bank, Ltd.** | 618,654 | 526,294 | ||||||
British American Tobacco Bangladesh Co., Ltd. | 17,112 | 706,745 | ||||||
Delta Brac Housing Finance Corp., Ltd. | 155,644 | 243,615 | ||||||
GrameenPhone, Ltd. | 44,215 | 205,451 | ||||||
Square Pharmaceuticals, Ltd. | 121,067 | 423,977 | ||||||
|
| |||||||
| 2,431,114 | ||||||||
|
| |||||||
Thailand — 1.4% | ||||||||
Beauty Community PCL — NVDR | 414,512 | 152,642 | ||||||
TOA Paint Thailand PCL — NVDR | 223,800 | 256,698 | ||||||
|
| |||||||
| 409,340 | ||||||||
|
| |||||||
Cambodia — 1.3% | ||||||||
NagaCorp, Ltd. | 402,000 | 365,846 | ||||||
Sri Lanka — 1.2% | ||||||||
Ceylon Cold Stores PLC | 56,423 | 353,579 | ||||||
|
| |||||||
Total FAR EAST | 9,485,444 | |||||||
|
| |||||||
| AFRICA — 21.3% | ||||||||
Egypt — 9.3% | ||||||||
Eastern Tobacco | 45,959 | 463,752 | ||||||
Edita Food Industries SAE | 232,452 | 240,378 | ||||||
Egyptian Financial Group- Hermes Holding Co.** | 198,008 | 254,787 | ||||||
ElSewdy Electric Co. | 35,200 | 392,749 | ||||||
Ezz Steel** | 171,104 | 280,710 | ||||||
| Number of Shares | Value (Note A) | |||||||
Ghabbour Auto** | 1,195,735 | $ | 372,957 | |||||
Ibnsina Pharma SAE** | 593,824 | 395,661 | ||||||
Sidi Kerir Petrochemicals Co. | 173,966 | 253,218 | ||||||
|
| |||||||
| 2,654,212 | ||||||||
|
| |||||||
Nigeria — 7.2% | ||||||||
Dangote Cement PLC | 651,669 | 412,814 | ||||||
Guaranty Trust Bank PLC | 9,563,602 | 1,071,441 | ||||||
Zenith Bank PLC | 8,299,845 | 573,986 | ||||||
|
| |||||||
| 2,058,241 | ||||||||
|
| |||||||
Kenya — 2.0% | ||||||||
Safaricom PLC | 1,953,461 | 570,848 | ||||||
Morocco — 1.7% | ||||||||
Societe d’Exploitation des Ports | 28,797 | 497,884 | ||||||
Ghana — 0.6% | ||||||||
FAN Milk, Ltd.** | 62,000 | 177,354 | ||||||
Botswana — 0.5% | ||||||||
Letshego Holdings, Ltd. | 819,580 | 145,148 | ||||||
|
| |||||||
Total AFRICA | 6,103,687 | |||||||
|
| |||||||
| MIDDLE EAST — 20.4% | ||||||||
Kuwait — 8.0% | ||||||||
Human Soft Holding Co. KSC | 32,538 | 376,377 | ||||||
Kuwait Finance House KSCP | 396,291 | 705,535 | ||||||
National Bank of Kuwait SAKP | 487,273 | 1,207,117 | ||||||
|
| |||||||
| 2,289,029 | ||||||||
|
| |||||||
Saudi Arabia — 6.5% | ||||||||
Mouwasat Medical Services Co. | 13,371 | 335,135 | ||||||
Samba Financial Group | 66,536 | 576,592 | ||||||
Saudi Co. For Hardware LLC | 5,333 | 163,814 | ||||||
United International Transportation Co. | 85,300 | 810,843 | ||||||
|
| |||||||
| 1,886,384 | ||||||||
|
| |||||||
Jordan — 2.8% | ||||||||
Al-Eqbal Investment Co. PLC** | 18,494 | 808,054 | ||||||
United Arab Emirates — 1.6% | ||||||||
NMC Health PLC | 9,787 | 462,665 | ||||||
Pakistan — 1.5% | ||||||||
Engro Polymer & Chemicals, Ltd. | 632,500 | 163,320 | ||||||
Pakistan Stock Exchange, Ltd. | 1,605,500 | 261,084 | ||||||
|
| |||||||
| 424,404 | ||||||||
|
| |||||||
Total MIDDLE EAST | 5,870,536 | |||||||
|
| |||||||
| EUROPE — 12.9% | ||||||||
Romania — 5.8% | ||||||||
Banca Transilvania | 716,669 | 430,685 | ||||||
Notes to Financial Statements are an integral part of this Schedule.
13
Driehaus Frontier Emerging Markets Fund
Schedule of Investments
June 30, 2018 (unaudited)
| Number of Shares | Value (Note A) | |||||||
BRD-Groupe Societe Generale SA | 78,224 | $ | 256,983 | |||||
Fondul Proprietatea SA | 3,616,304 | 800,474 | ||||||
Transgaz SA Medias | 2,353 | 193,253 | ||||||
|
| |||||||
| 1,681,395 | ||||||||
|
| |||||||
Georgia — 1.9% | ||||||||
Georgia Healthcare Group PLC1** | 51,988 | 172,557 | ||||||
TBC Bank Group PLC | 16,336 | 376,427 | ||||||
|
| |||||||
| 548,984 | ||||||||
|
| |||||||
Luxembourg — 1.6% | ||||||||
Globant SA** | 7,883 | 447,676 | ||||||
Ukraine — 1.5% | ||||||||
MHP SE — GDR | 32,609 | 433,700 | ||||||
Switzerland — 1.3% | ||||||||
Wizz Air Holdings PLC1** | 7,900 | 375,337 | ||||||
United Kingdom — 0.8% | ||||||||
KAZ Minerals PLC** | 20,137 | 224,034 | ||||||
|
| |||||||
Total EUROPE | 3,711,126 | |||||||
|
| |||||||
| SOUTH AMERICA — 7.5% | ||||||||
Argentina — 7.5% | ||||||||
Banco Macro SA — ADR | 4,729 | 278,018 | ||||||
Grupo Financiero Galicia SA — ADR | 28,206 | 930,234 | ||||||
Grupo Supervielle SA — SP ADR | 20,548 | 217,398 | ||||||
Holcim Argentina SA | 105,171 | 199,979 | ||||||
Telecom Argentina SA — SP ADR | 29,000 | 514,460 | ||||||
|
| |||||||
Total SOUTH AMERICA | 2,140,089 | |||||||
|
| |||||||
Total EQUITY SECURITIES (Cost $24,994,199) | 27,310,882 | |||||||
|
| |||||||
| ||||||||
| EQUITY CERTIFICATES — 0.3% | ||||||||
| FAR EAST — 0.3% | ||||||||
Vietnam — 0.3% | ||||||||
Nam Long Investment Corp.2 | 78,079 | 95,224 | ||||||
|
| |||||||
Total FAR EAST | 95,224 | |||||||
|
| |||||||
Total EQUITY | 95,224 | |||||||
|
| |||||||
| ||||||||
TOTAL INVESTMENTS | 95.4 | % | $ | 27,406,106 | ||||
Other Assets In Excess Of Liabilities | 4.6 | % | 1,332,494 | |||||
|
|
|
| |||||
Net Assets | 100.0 | % | $ | 28,738,600 | ||||
| ||||||||
| 1 | 144A — This security was purchased pursuant to Rule 144A of the Securities Act of 1933 and may not be resold subject to that rule except to qualified institutional buyers. At June 30, 2018, these securities amounted to $939,557 or 3.3% of net assets. These 144A securities have not been deemed illiquid. |
| 2 | Restricted security — Investments in securities not registered under the Securities Act of 1933, excluding 144A securities. At June 30, 2018, the value of this restricted security amounted to $95,224 or 0.3% of net assets. This security has not been deemed illiquid. |
| ** | Non-income producing security |
Additional information on each restricted security is as follows:
Security | Counter- Party | Acquisition Date(s) | Acquisition Cost | |||||||||
Nam Long Investment Corp. | MACQ | | 05/04/15 to 04/10/18 | | $ | 57,058 | ||||||
ADR — American Depository Receipt
GDR — Global Depository Receipt
MACQ — Macquarie Capital Group, Ltd.
NVDR — Non-Voting Depository Receipt
SP ADR — Sponsored American Depository Receipt
Notes to Financial Statements are an integral part of this Schedule.
14
Driehaus Frontier Emerging Markets Fund
Schedule of Investments
June 30, 2018 (unaudited)
Regional Weightings*
Asia/Far East Ex-Japan | 33.3% | |||
Africa | 21.3% | |||
Middle East | 20.4% | |||
Eastern Europe | 9.2% | |||
South America | 7.5% | |||
Western Europe | 3.7% |
Top Ten Holdings*
Airports Corp. of Vietnam JSC | 6.2% | |||
National Bank of Kuwait SAKP | 4.2% | |||
Guaranty Trust Bank PLC | 3.7% | |||
Grupo Financiero Galicia SA — ADR | 3.2% | |||
United International Transportation Co. | 2.8% | |||
Al-Eqbal Investment Co. PLC | 2.8% | |||
Fondul Proprietatea SA | 2.8% | |||
Vincom Retail JSC | 2.7% | |||
Ho Chi Minh City Development Joint Stock Commercial Bank | 2.6% | |||
British American Tobacco Bangladesh Co., Ltd. | 2.5% |
| * | All percentages are stated as a percent of net assets at June 30, 2018. |
Notes to Financial Statements are an integral part of this Schedule.
15
Driehaus Frontier Emerging Markets Fund
Schedule of Investments
June 30, 2018 (unaudited)
Industry | Percent of Net Assets | |||
Airlines | 2.0% | |||
Automobiles | 1.3% | |||
Beverages | 1.2% | |||
Capital Markets | 4.3% | |||
Chemicals | 2.3% | |||
Commercial Banks | 28.2% | |||
Construction Materials | 2.1% | |||
Consumer Finance | 1.3% | |||
Diversified Consumer Services | 1.3% | |||
Diversified Financial Services | 2.8% | |||
Diversified Telecommunication Services | 1.8% | |||
Electrical Equipment | 1.4% | |||
Food Products | 3.0% | |||
Health Care Providers & Services | 4.8% | |||
Industry | Percent of Net Assets | |||
Hotels, Restaurants & Leisure | 1.3% | |||
Industrial Conglomerates | 0.6% | |||
Metals & Mining | 1.8% | |||
Oil, Gas & Consumable Fuels | 0.7% | |||
Pharmaceuticals | 2.6% | |||
Real Estate Management & Development | 5.4% | |||
Road & Rail | 2.8% | |||
Software | 1.5% | |||
Specialty Retail | 3.3% | |||
Tobacco | 6.9% | |||
Transportation Infrastructure | 8.0% | |||
Wireless Telecommunication Services | 2.7% | |||
Other Assets in Excess of Liabilities | 4.6% | |||
|
| |||
TOTAL | 100.0% | |||
|
| |||
Notes to Financial Statements are an integral part of this Schedule.
16
Driehaus International Small Cap Growth Fund
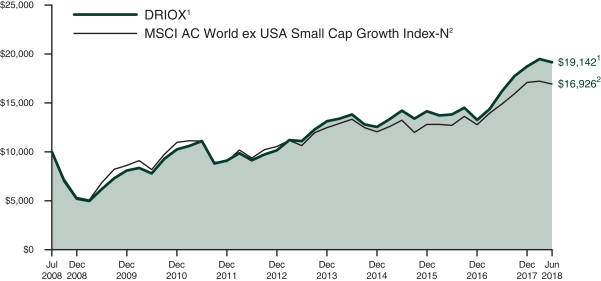
Performance Overview (unaudited)
The performance summarized below is historical and does not represent future results. Investment returns and principal value vary, and you may have a gain or loss when you sell shares. Performance data presented measures the change in the value of an investment in the Fund, assuming reinvestment of all dividends and capital gains. Average annual total return reflects annualized change.
The table does not reflect the deduction of taxes that a shareholder would pay on Fund distributions or the redemption of Fund shares. The graph compares the results of a $10,000 investment in the Fund over the last 10 fiscal year periods, with all dividends and capital gains reinvested, with the indicated index (and dividends reinvested) for the same period.
| Average Annual Total Returns as of 6/30/18 | 1 Year | 3 Years | 5 Years | 10 Years | ||||||||||||
Driehaus International Small Cap Growth Fund (DRIOX)1 | 18.20% | 10.49% | 11.56% | 6.71% | ||||||||||||
MSCI AC World ex USA Small Cap Growth Index-N2 | 13.67% | 8.57% | 9.73% | 5.40% | ||||||||||||
| 1 | The returns for the periods prior to January 1, 2010, reflect fee waivers and/or reimbursements without which performance would have been lower. |
| 2 | The Morgan Stanley Capital International All Country World ex USA Small Cap Growth Index-Net (MSCI AC World ex USA Small Cap Growth Index-N) is a market capitalization-weighted index designed to measure equity market performance in global developed markets and emerging markets, excluding the U.S., and is composed of stocks which are categorized as small capitalization growth stocks. Data is in U.S. dollars and is calculated with net dividend reinvestment. Source: Morgan Stanley Capital International Inc. |
17
Driehaus International Small Cap Growth Fund
Schedule of Investments
June 30, 2018 (unaudited)
| Number of Shares | Value (Note A) | |||||||
| EQUITY SECURITIES — 92.6% | ||||||||
| EUROPE — 48.2% | ||||||||
United Kingdom — 14.7% | ||||||||
Abcam PLC | 183,204 | $ | 3,225,388 | |||||
ASOS PLC** | 21,067 | 1,696,548 | ||||||
Aveva Group PLC | 154,844 | 5,488,980 | ||||||
Balfour Beatty PLC | 1,062,519 | 3,978,206 | ||||||
Burford Capital, Ltd. | 227,380 | 4,489,264 | ||||||
Cranswick PLC | 34,931 | 1,556,341 | ||||||
Croda International PLC | 98,132 | 6,219,050 | ||||||
Dechra Pharmaceuticals PLC | 77,863 | 2,858,772 | ||||||
IQE PLC** | 1,296,480 | 1,746,959 | ||||||
Oxford Biomedica PLC** | 179,069 | 2,329,939 | ||||||
Rentokil Initial PLC | 733,837 | 3,397,429 | ||||||
Spirax-Sarco Engineering PLC | 28,042 | 2,412,947 | ||||||
Stock Spirits Group PLC | 510,283 | 1,535,455 | ||||||
Vesuvius PLC | 595,037 | 4,696,090 | ||||||
|
| |||||||
| 45,631,368 | ||||||||
|
| |||||||
Germany — 9.4% | ||||||||
ADO Properties SA1 | 56,546 | 3,074,566 | ||||||
CANCOM SE | 24,737 | 2,527,691 | ||||||
Carl Zeiss Meditec AG | 56,017 | 3,823,608 | ||||||
MTU Aero Engines AG | 24,212 | 4,654,033 | ||||||
Norma Group SE | 15,744 | 1,080,170 | ||||||
Puma SE | 10,840 | 6,342,142 | ||||||
Scout24 AG1 | 61,121 | 3,243,379 | ||||||
STRATEC Biomedical AG | 17,972 | 1,404,079 | ||||||
TAG Immobilien AG | 143,839 | 3,162,976 | ||||||
|
| |||||||
| 29,312,644 | ||||||||
|
| |||||||
Italy — 3.9% | ||||||||
DiaSorin SpA | 40,615 | 4,633,936 | ||||||
Maire Tecnimont SpA | 497,676 | 2,237,569 | ||||||
Moncler SpA | 35,017 | 1,594,823 | ||||||
Prysmian SpA | 54,812 | 1,365,323 | ||||||
Retelit SpA | 1,232,232 | 2,335,501 | ||||||
|
| |||||||
| 12,167,152 | ||||||||
|
| |||||||
Netherlands — 2.7% | ||||||||
Aalberts Industries NV | 67,924 | 3,253,778 | ||||||
OCI NV** | 54,553 | 1,473,545 | ||||||
Rhi Magnesita NV | 59,548 | 3,615,066 | ||||||
|
| |||||||
| 8,342,389 | ||||||||
|
| |||||||
Sweden — 2.6% | ||||||||
Com Hem Holding AB | 207,677 | 3,375,976 | ||||||
Elekta AB — B | 355,842 | 4,688,013 | ||||||
|
| |||||||
| 8,063,989 | ||||||||
|
| |||||||
Switzerland — 2.5% | ||||||||
Bucher Industries AG | 2,344 | 786,777 | ||||||
Burckhardt Compression Holding AG | 10,764 | 3,832,562 | ||||||
Tecan Group AG | 12,706 | 3,092,140 | ||||||
|
| |||||||
| 7,711,479 | ||||||||
|
| |||||||
| Number of Shares | Value (Note A) | |||||||
Luxembourg — 2.2% | ||||||||
B&M European Value Retail SA | 299,171 | $ | 1,595,510 | |||||
Befesa SA1 | 40,043 | 2,155,741 | ||||||
Corestate Capital Holding SA | 57,402 | 3,066,812 | ||||||
|
| |||||||
| 6,818,063 | ||||||||
|
| |||||||
France — 2.2% | ||||||||
Maisons du Monde SA1 | 37,584 | 1,384,311 | ||||||
Teleperformance | 30,300 | 5,353,657 | ||||||
|
| |||||||
| 6,737,968 | ||||||||
|
| |||||||
Denmark — 2.0% | ||||||||
FLSmidth & Co., AS | 46,302 | 2,771,610 | ||||||
GN Store Nord AS | 34,963 | 1,593,624 | ||||||
Royal Unibrew AS | 22,007 | 1,754,020 | ||||||
|
| |||||||
| 6,119,254 | ||||||||
|
| |||||||
Norway — 1.9% | ||||||||
Petroleum Geo-Services ASA** | 832,049 | 3,901,595 | ||||||
Sbanken ASA1 | 204,391 | 2,148,222 | ||||||
|
| |||||||
| 6,049,817 | ||||||||
|
| |||||||
Spain — 1.9% | ||||||||
Fluidra SA | 202,576 | 3,245,720 | ||||||
Masmovil Ibercom SA** | 22,787 | 2,650,425 | ||||||
|
| |||||||
| 5,896,145 | ||||||||
|
| |||||||
Portugal — 1.0% | ||||||||
Mota-Engil SGPS SA | 903,464 | 3,033,316 | ||||||
Finland — 0.7% | ||||||||
Amer Sports OYJ | 74,585 | 2,353,455 | ||||||
Poland — 0.5% | ||||||||
Dino Polska SA1** | 52,839 | 1,467,103 | ||||||
|
| |||||||
Total EUROPE | 149,704,142 | |||||||
|
| |||||||
| FAR EAST — 25.2% | ||||||||
Japan — 13.9% | ||||||||
Arata Corp. | 40,468 | 2,448,951 | ||||||
Fuji Electric Co., Ltd. | 462,900 | 3,528,768 | ||||||
Ichikoh Industries, Ltd. | 483,234 | 5,783,183 | ||||||
Kose Corp. | 12,561 | 2,708,134 | ||||||
Kusuri no Aoki Holdings Co., Ltd. | 21,109 | 1,405,169 | ||||||
Minebea Mitsumi, Inc. | 115,910 | 1,961,932 | ||||||
Miura Co., Ltd. | 76,836 | 1,868,937 | ||||||
NET One Systems Co., Ltd. | 96,427 | 1,659,156 | ||||||
Nichias Corp. | 120,627 | 1,512,264 | ||||||
Nihon M&A Center, Inc. | 97,505 | 2,831,401 | ||||||
NOK Corp. | 70,577 | 1,366,726 | ||||||
PALTAC Corp. | 56,726 | 3,268,860 | ||||||
Ryohin Keikaku Co., Ltd. | 8,575 | 3,020,593 | ||||||
Shimadzu Corp. | 101,039 | 3,057,225 | ||||||
TechnoPro Holdings, Inc. | 64,989 | 3,997,427 | ||||||
Tokyo Tatemono Co., Ltd. | 207,832 | 2,855,191 | ||||||
|
| |||||||
| 43,273,917 | ||||||||
|
| |||||||
Notes to Financial Statements are an integral part of this Schedule.
18
Driehaus International Small Cap Growth Fund
Schedule of Investments
June 30, 2018 (unaudited)
| Number of Shares | Value (Note A) | |||||||
China — 5.0% | ||||||||
3SBio, Inc.1 | 559,971 | $ | 1,271,883 | |||||
CIMC Enric Holdings, Ltd. | 3,762,248 | 3,582,134 | ||||||
GDS Holdings, Ltd. — ADR** | 87,959 | 3,526,276 | ||||||
Goodbaby International Holdings, Ltd. | 3,378,233 | 2,045,300 | ||||||
Haier Electronics Group Co., Ltd. | 821,130 | 2,810,154 | ||||||
Li Ning Co., Ltd.** | 2,011,960 | 2,218,244 | ||||||
|
| |||||||
| 15,453,991 | ||||||||
|
| |||||||
South Korea — 3.0% |
| |||||||
CJ Logistics Corp.** | 21,057 | 3,174,137 | ||||||
Douzone Bizon Co., Ltd. | 12,896 | 717,409 | ||||||
Hotel Shilla Co., Ltd. | 36,136 | 4,004,303 | ||||||
Koh Young Technology, Inc. | 17,094 | 1,564,458 | ||||||
|
| |||||||
| 9,460,307 | ||||||||
|
| |||||||
Australia — 2.6% |
| |||||||
Bapcor, Ltd. | 975,930 | 4,730,653 | ||||||
NEXTDC, Ltd.** | 576,959 | 3,227,958 | ||||||
|
| |||||||
| 7,958,611 | ||||||||
|
| |||||||
Philippines — 0.7% |
| |||||||
Megawide Construction Corp. | 5,353,859 | 2,011,428 | ||||||
|
| |||||||
Total FAR EAST | 78,158,254 | |||||||
|
| |||||||
| NORTH AMERICA — 14.3% |
| |||||||
Canada — 14.3% |
| |||||||
ATS Automation Tooling Systems, Inc.** | 214,666 | 3,190,639 | ||||||
CAE, Inc. | 338,509 | 7,032,047 | ||||||
Canada Goose Holdings, Inc.** | 66,234 | 3,897,871 | ||||||
CES Energy Solutions Corp. | 719,519 | 2,457,415 | ||||||
Kelt Exploration, Ltd.** | 274,078 | 1,861,725 | ||||||
Kinaxis, Inc.** | 68,191 | 4,590,502 | ||||||
Kirkland Lake Gold, Ltd. | 152,990 | 3,239,829 | ||||||
Martinrea International, Inc. | 319,642 | 3,428,252 | ||||||
Methanex Corp. | 22,695 | 1,604,782 | ||||||
Parex Resources, Inc.** | 97,825 | 1,846,892 | ||||||
Parkland Fuel Corp. | 320,717 | 7,879,785 | ||||||
Russel Metals, Inc. | 75,899 | 1,551,292 | ||||||
Trican Well Service, Ltd.** | 784,615 | 1,784,505 | ||||||
|
| |||||||
Total NORTH AMERICA | 44,365,536 | |||||||
|
| |||||||
| Number of Shares | Value (Note A) | |||||||
| SOUTH AMERICA — 2.3% |
| |||||||
Brazil — 2.3% |
| |||||||
Cyrela Brazil Realty SA Empreendimentos e Participacoes | 854,708 | $ | 2,421,388 | |||||
Marcopolo SA — Pref. | 2,303,198 | 1,972,939 | ||||||
Rumo SA** | 736,839 | 2,661,613 | ||||||
|
| |||||||
Total SOUTH AMERICA | 7,055,940 | |||||||
|
| |||||||
| AFRICA — 1.8% |
| |||||||
South Africa — 1.8% |
| |||||||
Clicks Group, Ltd. | 206,218 | 2,954,476 | ||||||
Pick n Pay Stores, Ltd. | 464,276 | 2,530,968 | ||||||
|
| |||||||
Total AFRICA | 5,485,444 | |||||||
|
| |||||||
| MIDDLE EAST — 0.8% |
| |||||||
Israel — 0.8% |
| |||||||
Mellanox Technologies, Ltd.** | 30,983 | 2,611,867 | ||||||
|
| |||||||
Total MIDDLE EAST | 2,611,867 | |||||||
|
| |||||||
Total EQUITY SECURITIES | 287,381,183 | |||||||
|
| |||||||
| ||||||||
TOTAL INVESTMENTS | 92.6 | % | $ | 287,381,183 | ||||
Other Assets In Excess Of Liabilities | 7.4 | % | 23,059,808 | |||||
|
|
|
| |||||
Net Assets | 100.0 | % | $ | 310,440,991 | ||||
| ||||||||
| 1 | 144A — This security was purchased pursuant to Rule 144A of the Securities Act of 1933 and may not be resold subject to that rule except to qualified institutional buyers. At June 30, 2018, these securities amounted to $14,745,205 or 4.7% of net assets. These 144A securities have not been deemed illiquid. |
| ** | Non-income producing security |
ADR — American Depository Receipt
Notes to Financial Statements are an integral part of this Schedule.
19
Driehaus International Small Cap Growth Fund
Schedule of Investments
June 30, 2018 (unaudited)
Regional Weightings*
Western Europe | 47.7% | |||
North America | 14.3% | |||
Japan | 13.9% | |||
Asia/Far East Ex-Japan | 11.3% | |||
South America | 2.3% | |||
Africa | 1.8% | |||
Middle East | 0.8% | |||
Eastern Europe | 0.5% |
Top Ten Holdings*
Parkland Fuel Corp. | 2.5% | |||
CAE, Inc. | 2.3% | |||
Puma SE | 2.0% | |||
Croda International PLC | 2.0% | |||
Ichikoh Industries, Ltd. | 1.9% | |||
Aveva Group PLC | 1.8% | |||
Teleperformance | 1.7% | |||
Bapcor, Ltd. | 1.5% | |||
Vesuvius PLC | 1.5% | |||
Elekta AB — B | 1.5% |
| * | All percentages are stated as a percent of net assets at June 30, 2018. |
Notes to Financial Statements are an integral part of this Schedule.
20
Driehaus International Small Cap Growth Fund
Schedule of Investments
June 30, 2018 (unaudited)
Industry | Percent of Net Assets | |||
Aerospace & Defense | 3.8% | |||
Auto Components | 3.4% | |||
Beverages | 1.1% | |||
Biotechnology | 2.2% | |||
Building Products | 0.5% | |||
Capital Markets | 1.4% | |||
Chemicals | 3.0% | |||
Commercial Banks | 0.7% | |||
Commercial Services & Supplies | 1.8% | |||
Construction & Engineering | 4.5% | |||
Construction Materials | 1.2% | |||
Distributors | 3.4% | |||
Diversified Telecommunication Services | 2.7% | |||
Electrical Equipment | 1.6% | |||
Electronic Equipment, Instruments & Components | 1.0% | |||
Energy Equipment & Services | 2.6% | |||
Food & Staples Retailing | 2.7% | |||
Food Products | 0.5% | |||
Health Care Equipment & Supplies | 5.2% | |||
Household Durables | 1.7% | |||
Industry | Percent of Net Assets | |||
Internet & Catalog Retail | 0.5% | |||
Internet Software & Services | 2.1% | |||
Information Technology Services | 2.5% | |||
Leisure Equipment & Products | 1.4% | |||
Life Sciences Tools & Services | 1.0% | |||
Machinery | 10.3% | |||
Metals & Mining | 1.0% | |||
Multiline Retail | 1.5% | |||
Oil, Gas & Consumable Fuels | 3.7% | |||
Personal Products | 0.9% | |||
Pharmaceuticals | 0.9% | |||
Professional Services | 3.9% | |||
Real Estate Management & Development | 3.9% | |||
Road & Rail | 1.9% | |||
Semiconductors & Semiconductor Equipment | 1.9% | |||
Software | 3.5% | |||
Specialty Retail | 1.7% | |||
Textiles, Apparel & Luxury Goods | 4.5% | |||
Trading Companies & Distributors | 0.5% | |||
Other Assets in Excess of Liabilities | 7.4% | |||
|
| |||
TOTAL | 100.0% | |||
|
| |||
Notes to Financial Statements are an integral part of this Schedule.
21
Driehaus Micro Cap Growth Fund
Performance Overview (unaudited)
The performance summarized below is historical and does not represent future results. Investment returns and principal value vary, and you may have a gain or loss when you sell shares. Performance data presented measures the change in the value of an investment in the Fund, assuming reinvestment of all dividends and capital gains. Average annual total return reflects annualized change.
The table does not reflect the deduction of taxes that a shareholder would pay on Fund distributions or the redemption of Fund shares. The graph compares the results of a $10,000 investment in the Fund over the last 10 fiscal year periods (which includes performance of the Predecessor Limited Partnership), with all dividends and capital gains reinvested, with the indicated index (and dividends reinvested) for the same period.
| Fund Only | Including Predecessor Limited Partnership | |||||||||||||||||||
| Average Annual Total Returns as of 6/30/18 | 1 Year | 3 Years | Since Inception (11/18/13 - 6/30/18) | 5 Years | 10 Years | |||||||||||||||
Driehaus Micro Cap Growth Fund (DMCRX)1 | 39.27% | 14.61% | 17.05% | 19.25% | 13.54% | |||||||||||||||
Russell Microcap® Growth Index2 | 19.63% | 6.18% | 8.91% | 11.65% | 10.30% | |||||||||||||||
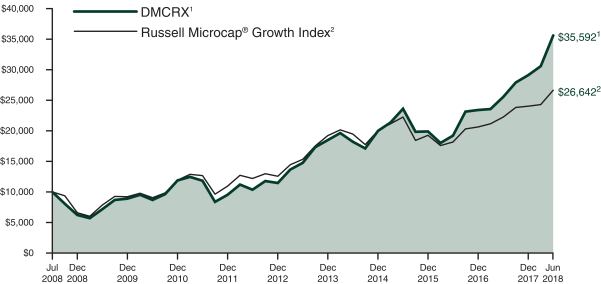
| 1 | The Driehaus Micro Cap Growth Fund (the “Fund”) performance shown above includes the performance of the Driehaus Micro Cap Fund, L.P. (the “Predecessor Limited Partnership”), one of the Fund’s predecessors, for the periods before the Fund’s registration statement became effective. The Predecessor Limited Partnership, which was established on July 1, 1996, was managed with substantially the same investment objective, policies and philosophies as are followed by the Fund. The Fund succeeded to the Predecessor Limited Partnership’s assets together with the assets of the Driehaus Institutional Micro Cap Fund, L.P. on November 18, 2013. The Predecessor Limited Partnership was not registered under the Investment Company Act of 1940, as amended (“1940 Act”), and thus was not subject to certain investment and operational restrictions that are imposed by the 1940 Act. If the Predecessor Limited Partnership had been registered under the 1940 Act, its performance may have been adversely affected. The Predecessor Limited Partnership’s performance has been restated to reflect estimated expenses of the Fund. The returns for periods prior to November 18, 2016, reflect fee waivers and/or reimbursements without which performance would have been lower. |
| 2 | The Russell Microcap® Growth Index is constructed to provide a comprehensive and unbiased barometer of the micro cap growth market. Based on ongoing empirical research of investment manager behavior, the methodology used to determine growth probability approximates the aggregate microcap growth manager's opportunity set. |
22
Driehaus Micro Cap Growth Fund
Schedule of Investments
June 30, 2018 (unaudited)
| Number of Shares | Value (Note A) | |||||||
| EQUITY SECURITIES — 99.6% |
| |||||||
| HEALTH CARE — 34.1% |
| |||||||
Biotechnology — 15.4% |
| |||||||
Adamas Pharmaceuticals, Inc.** | 66,082 | $ | 1,706,898 | |||||
Adverum Biotechnologies, Inc.** | 489,199 | 2,592,755 | ||||||
Arena Pharmaceuticals, Inc.** | 84,814 | 3,697,890 | ||||||
Argenx SE — ADR** | 40,833 | 3,383,422 | ||||||
Array BioPharma, Inc.** | 552,888 | 9,277,461 | ||||||
Atara Biotherapeutics, Inc.** | 78,208 | 2,874,144 | ||||||
Avrobio, Inc.** | 81,134 | 2,317,187 | ||||||
Blueprint Medicines Corp.** | 35,358 | 2,244,526 | ||||||
CareDx, Inc.** | 149,079 | 1,824,727 | ||||||
Clementia Pharmaceuticals, Inc.** | 158,744 | 2,089,071 | ||||||
CTI BioPharma Corp.** | 226,045 | 1,125,704 | ||||||
Deciphera Pharmaceuticals, Inc.** | 66,503 | 2,616,893 | ||||||
Global Blood Therapeutics, Inc.** | 90,179 | 4,076,091 | ||||||
Loxo Oncology, Inc.** | 58,789 | 10,198,716 | ||||||
Mirati Therapeutics, Inc.** | 113,987 | 5,619,559 | ||||||
Natera, Inc.** | 271,179 | 5,103,589 | ||||||
Ovid Therapeutics, Inc.** | 106,456 | 830,357 | ||||||
Sesen Bio, Inc.** | 878,001 | 1,712,102 | ||||||
TapImmune, Inc.** | 124,561 | 1,174,610 | ||||||
Vericel Corp.** | 314,894 | 3,054,472 | ||||||
|
| |||||||
| 67,520,174 | ||||||||
|
| |||||||
Health Care Equipment & Supplies — 11.9% |
| |||||||
AxoGen, Inc.** | 77,144 | 3,876,486 | ||||||
Cerus Corp.** | 510,791 | 3,406,976 | ||||||
CryoLife, Inc.** | 61,205 | 1,704,559 | ||||||
CryoPort, Inc.** | 94,413 | 1,489,837 | ||||||
Inogen, Inc.** | 48,015 | 8,946,635 | ||||||
IntriCon Corp.** | 65,395 | 2,635,419 | ||||||
iRhythm Technologies, Inc.** | 72,866 | 5,911,619 | ||||||
Neuronetics, Inc.** | 80,593 | 2,144,580 | ||||||
Nuvectra Corp.** | 117,911 | 2,420,713 | ||||||
OrthoPediatrics Corp.** | 162,002 | 4,315,733 | ||||||
Sientra, Inc.** | 240,543 | 4,692,994 | ||||||
Tactile Systems Technology, Inc.** | 204,432 | 10,630,464 | ||||||
|
| |||||||
| 52,176,015 | ||||||||
|
| |||||||
Pharmaceuticals — 3.2% | ||||||||
Aclaris Therapeutics, Inc.** | 75,127 | 1,500,286 | ||||||
Foamix Pharmaceuticals, | 227,869 | 1,141,624 | ||||||
Intersect ENT, Inc.** | 59,299 | 2,220,748 | ||||||
MyoKardia, Inc.** | 58,058 | 2,882,580 | ||||||
Optinose, Inc.** | 106,480 | 2,979,310 | ||||||
Tricida, Inc.** | 119,768 | 3,581,063 | ||||||
|
| |||||||
| 14,305,611 | ||||||||
|
| |||||||
| Number of Shares | Value (Note A) | |||||||
Health Care Technology — 2.3% |
| |||||||
Inspire Medical Systems, Inc.** | 83,684 | $ | 2,984,171 | |||||
Tabula Rasa HealthCare, Inc.** | 39,392 | 2,514,391 | ||||||
Teladoc, Inc.** | 77,587 | 4,503,925 | ||||||
|
| |||||||
| 10,002,487 | ||||||||
|
| |||||||
Life Sciences Tools & Services — 0.9% |
| |||||||
Codexis, Inc.** | 270,226 | 3,891,254 | ||||||
Health Care Providers & Services — 0.4% |
| |||||||
PetIQ, Inc.** | 59,674 | 1,602,844 | ||||||
|
| |||||||
Total HEALTH CARE | 149,498,385 | |||||||
|
| |||||||
| INFORMATION TECHNOLOGY — 19.2% |
| |||||||
Internet Software & Services — 7.6% |
| |||||||
Alteryx, Inc. — A** | 69,895 | 2,667,193 | ||||||
Bandwidth, Inc. — A** | 119,307 | 4,531,280 | ||||||
Cardlytics, Inc.** | 81,688 | 1,777,531 | ||||||
Five9, Inc.** | 91,642 | 3,168,064 | ||||||
Instructure, Inc.** | 103,790 | 4,416,265 | ||||||
Mimecast, Ltd.** | 167,323 | 6,895,381 | ||||||
Q2 Holdings, Inc.** | 50,764 | 2,896,086 | ||||||
QuinStreet, Inc.** | 427,551 | 5,429,898 | ||||||
ShotSpotter, Inc.** | 47,528 | 1,802,737 | ||||||
|
| |||||||
| 33,584,435 | ||||||||
|
| |||||||
Software — 7.2% |
| |||||||
Altair Engineering, Inc. — A** | 240,410 | 8,217,214 | ||||||
Asure Software, Inc.** | 158,057 | 2,521,009 | ||||||
Carbon Black, Inc.** | 81,622 | 2,122,172 | ||||||
Everbridge, Inc.** | 99,534 | 4,719,902 | ||||||
Smartsheet, Inc. — A** | 63,156 | 1,640,161 | ||||||
Talend SA — ADR** | 73,265 | 4,562,944 | ||||||
Upland Software, Inc.** | 139,325 | 4,788,600 | ||||||
Zscaler, Inc.** | 85,526 | 3,057,555 | ||||||
|
| |||||||
| 31,629,557 | ||||||||
|
| |||||||
Information Technology Services — 2.4% |
| |||||||
Everi Holdings, Inc.** | 389,400 | 2,803,680 | ||||||
I3 Verticals, Inc. — A** | 207,203 | 3,153,630 | ||||||
Virtusa Corp.** | 92,462 | 4,501,050 | ||||||
|
| |||||||
| 10,458,360 | ||||||||
|
| |||||||
Computers & Peripherals — 1.0% |
| |||||||
USA Technologies, Inc.** | 309,884 | 4,338,376 | ||||||
Semiconductors & Semiconductor Equipment — 0.5% |
| |||||||
Adesto Technologies Corp.** | 245,398 | 2,061,343 | ||||||
Communications Equipment — 0.5% |
| |||||||
RADCOM, Ltd.** | 103,348 | 2,041,123 | ||||||
|
| |||||||
Total INFORMATION TECHNOLOGY | 84,113,194 | |||||||
|
| |||||||
| CONSUMER DISCRETIONARY — 18.6% |
| |||||||
Hotels, Restaurants & Leisure — 6.2% |
| |||||||
BJ’s Restaurants, Inc. | 74,395 | 4,463,700 | ||||||
Notes to Financial Statements are an integral part of this Schedule.
23
Driehaus Micro Cap Growth Fund
Schedule of Investments
June 30, 2018 (unaudited)
| Number of Shares | Value (Note A) | |||||||
Carrols Restaurant Group, Inc.** | 190,444 | $ | 2,828,093 | |||||
Century Casinos, Inc.** | 294,632 | 2,578,030 | ||||||
Eldorado Resorts, Inc.** | 93,681 | 3,662,927 | ||||||
Golden Entertainment, Inc.** | 123,563 | 3,334,965 | ||||||
Monarch Casino & Resort, Inc.** | 50,432 | 2,221,530 | ||||||
Noodles & Co.** | 133,517 | 1,642,259 | ||||||
PlayAGS, Inc.** | 147,505 | 3,992,960 | ||||||
Wingstop, Inc. | 44,740 | 2,331,849 | ||||||
|
| |||||||
| 27,056,313 | ||||||||
|
| |||||||
Leisure Equipment & Products — 4.0% |
| |||||||
Callaway Golf Co. | 242,782 | 4,605,575 | ||||||
Malibu Boats, Inc. — A** | 172,709 | 7,243,415 | ||||||
MCBC Holdings, Inc.** | 193,193 | 5,592,937 | ||||||
|
| |||||||
| 17,441,927 | ||||||||
|
| |||||||
Textiles, Apparel & Luxury Goods — 3.1% |
| |||||||
Crocs, Inc.** | 278,406 | 4,902,730 | ||||||
G-III Apparel Group, Ltd.** | 79,006 | 3,507,866 | ||||||
Movado Group, Inc. | 107,979 | 5,215,386 | ||||||
|
| |||||||
| 13,625,982 | ||||||||
|
| |||||||
Specialty Retail — 1.8% |
| |||||||
Boot Barn Holdings, Inc.** | 197,161 | 4,091,091 | ||||||
Citi Trends, Inc. | 59,277 | 1,626,561 | ||||||
Zumiez, Inc.** | 83,063 | 2,080,728 | ||||||
|
| |||||||
| 7,798,380 | ||||||||
|
| |||||||
Household Durables — 1.4% |
| |||||||
Skyline Champion Corp. | 121,679 | 4,263,632 | ||||||
The Lovesac Co.** | 93,520 | 1,940,540 | ||||||
|
| |||||||
| 6,204,172 | ||||||||
|
| |||||||
Diversified Consumer Services — 1.2% |
| |||||||
Career Education Corp.** | 151,783 | 2,454,331 | ||||||
Chegg, Inc.** | 108,245 | 3,008,129 | ||||||
|
| |||||||
| 5,462,460 | ||||||||
|
| |||||||
Auto Components — 0.9% |
| |||||||
Stoneridge, Inc.** | 116,470 | 4,092,756 | ||||||
|
| |||||||
Total CONSUMER DISCRETIONARY | 81,681,990 | |||||||
|
| |||||||
| INDUSTRIALS — 11.3% |
| |||||||
Machinery — 2.8% |
| |||||||
Columbus McKinnon Corp. | 117,578 | 5,098,182 | ||||||
Kadant, Inc. | 29,040 | 2,792,196 | ||||||
Kornit Digital, Ltd.** | 146,352 | 2,605,066 | ||||||
Spartan Motors, Inc. | 124,384 | 1,878,198 | ||||||
|
| |||||||
| 12,373,642 | ||||||||
|
| |||||||
Road & Rail — 1.6% | ||||||||
Saia, Inc.** | 49,944 | 4,037,972 | ||||||
US Xpress Enterprises, Inc. — A** | 181,754 | 2,751,756 | ||||||
|
| |||||||
| 6,789,728 | ||||||||
|
| |||||||
| Number of Shares | Value (Note A) | |||||||
Construction & Engineering — 1.5% |
| |||||||
NV5 Global, Inc.** | 62,580 | $ | 4,336,794 | |||||
Sterling Construction Co., Inc.** | 165,461 | 2,155,957 | ||||||
|
| |||||||
| 6,492,751 | ||||||||
|
| |||||||
Electrical Equipment — 1.1% |
| |||||||
TPI Composites, Inc.** | 168,608 | 4,930,098 | ||||||
Aerospace & Defense — 1.0% |
| |||||||
Axon Enterprise, Inc.** | 72,733 | 4,595,271 | ||||||
Trading Companies & Distributors — 0.8% |
| |||||||
SiteOne Landscape Supply, Inc.** | 41,188 | 3,458,556 | ||||||
Commercial Services & Supplies — 0.8% |
| |||||||
Team, Inc.** | 145,205 | 3,354,236 | ||||||
Building Products — 0.6% |
| |||||||
PGT Innovations, Inc.** | 135,711 | 2,829,574 | ||||||
Air Freight & Logistics — 0.6% |
| |||||||
Echo Global Logistics, Inc.** | 91,797 | 2,685,062 | ||||||
Marine — 0.5% |
| |||||||
Seaspan Corp. | 193,461 | 1,969,433 | ||||||
|
| |||||||
Total INDUSTRIALS | 49,478,351 | |||||||
|
| |||||||
| CONSUMER STAPLES — 7.0% |
| |||||||
Food Products — 2.9% |
| |||||||
Calavo Growers, Inc. | 37,996 | 3,653,315 | ||||||
Freshpet, Inc.** | 193,193 | 5,303,148 | ||||||
Limoneira Co. | 152,138 | 3,744,116 | ||||||
|
| |||||||
| 12,700,579 | ||||||||
|
| |||||||
Beverages — 1.9% |
| |||||||
MGP Ingredients, Inc. | 57,614 | 5,116,699 | ||||||
Primo Water Corp.** | 172,776 | 3,021,852 | ||||||
|
| |||||||
| 8,138,551 | ||||||||
|
| |||||||
Personal Products — 1.2% |
| |||||||
Medifast, Inc. | 33,828 | 5,417,893 | ||||||
Food & Staples Retailing — 1.0% |
| |||||||
The Chefs’ Warehouse, Inc.** | 152,559 | 4,347,932 | ||||||
|
| |||||||
Total CONSUMER STAPLES | 30,604,955 | |||||||
|
| |||||||
| FINANCIALS — 6.7% |
| |||||||
Commercial Banks — 3.7% |
| |||||||
Live Oak Bancshares, Inc. | 194,279 | 5,954,651 | ||||||
Preferred Bank/Los Angeles CA | 60,141 | 3,696,266 | ||||||
TriState Capital Holdings, Inc.** | 110,329 | 2,879,587 | ||||||
Triumph Bancorp, Inc.** | 96,386 | 3,927,730 | ||||||
|
| |||||||
| 16,458,234 | ||||||||
|
| |||||||
Thrifts & Mortgage Finance — 1.5% |
| |||||||
Meta Financial Group, Inc. | 41,897 | 4,080,768 | ||||||
Sterling Bancorp, Inc. | 187,983 | 2,511,453 | ||||||
|
| |||||||
| 6,592,221 | ||||||||
|
| |||||||
Notes to Financial Statements are an integral part of this Schedule.
24
Driehaus Micro Cap Growth Fund
Schedule of Investments
June 30, 2018 (unaudited)
| Number of Shares | Value (Note A) | |||||||
Insurance — 1.5% |
| |||||||
Goosehead Insurance, Inc. — A** | 164,773 | $ | 4,112,734 | |||||
Kinsale Capital Group, Inc. | 45,156 | 2,477,258 | ||||||
|
| |||||||
| 6,589,992 | ||||||||
|
| |||||||
Total FINANCIALS | 29,640,447 | |||||||
|
| |||||||
| ENERGY — 1.9% |
| |||||||
Energy Equipment & Services — 1.2% |
| |||||||
Cactus, Inc. — A** | 88,294 | 2,983,454 | ||||||
Mammoth Energy Services, Inc.** | 64,925 | 2,204,853 | ||||||
|
| |||||||
| 5,188,307 | ||||||||
|
| |||||||
Oil, Gas & Consumable Fuels — 0.7% |
| |||||||
Penn Virginia Corp.** | 19,508 | 1,656,034 | ||||||
Scorpio Tankers, Inc. | 521,720 | 1,466,033 | ||||||
|
| |||||||
| 3,122,067 | ||||||||
|
| |||||||
Total ENERGY | 8,310,374 | |||||||
|
| |||||||
| Number of Shares | Value (Note A) | |||||||
| MATERIALS — 0.8% |
| |||||||
Chemicals — 0.8% |
| |||||||
KMG Chemicals, Inc. | 47,217 | $ | 3,483,670 | |||||
|
| |||||||
Total MATERIALS | 3,483,670 | |||||||
|
| |||||||
Total EQUITY SECURITIES | 436,811,366 | |||||||
|
| |||||||
| ||||||||
TOTAL INVESTMENTS | 99.6 | % | $ | 436,811,366 | ||||
Other Assets In Excess Of Liabilities | 0.4 | % | 1,539,359 | |||||
|
|
|
| |||||
Net Assets | 100.0 | % | $ | 438,350,725 | ||||
| ||||||||
| 1 | Pursuant to procedures adopted by Driehaus Mutual Funds’ (the “Trust”) Board of Trustees, this security has been determined to be illiquid by Driehaus Capital Management LLC, the Fund’s investment advisor. |
| ** | Non-income producing security |
ADR — American Depository Receipt
Top Ten Holdings*
Tactile Systems Technology, Inc. | 2.4% | |||
Loxo Oncology, Inc. | 2.3% | |||
Array BioPharma, Inc. | 2.1% | |||
Inogen, Inc. | 2.0% | |||
Altair Engineering, Inc. — A | 1.9% | |||
Malibu Boats, Inc. — A | 1.7% | |||
Mimecast, Ltd. | 1.6% | |||
Live Oak Bancshares, Inc. | 1.4% | |||
iRhythm Technologies, Inc. | 1.3% | |||
Mirati Therapeutics, Inc. | 1.3% |
| * | All percentages are stated as a percent of net assets at June 30, 2018. |
Notes to Financial Statements are an integral part of this Schedule.
25
Driehaus Micro Cap Growth Fund
Schedule of Investments
June 30, 2018 (unaudited)
Industry | Percent of Net Assets | |||
Aerospace & Defense | 1.0% | |||
Air Freight & Logistics | 0.6% | |||
Auto Components | 0.9% | |||
Beverages | 1.9% | |||
Biotechnology | 15.4% | |||
Building Products | 0.6% | |||
Chemicals | 0.8% | |||
Commercial Banks | 3.7% | |||
Commercial Services & Supplies | 0.8% | |||
Communications Equipment | 0.5% | |||
Computers & Pheripherals | 1.0% | |||
Construction & Engineering | 1.5% | |||
Diversified Consumer Services | 1.2% | |||
Electrical Equipment | 1.1% | |||
Energy Equipment & Services | 1.2% | |||
Food & Staples Retailing | 1.0% | |||
Food Products | 2.9% | |||
Health Care Equipment & Supplies | 11.9% | |||
Health Care Providers & Services | 0.4% | |||
Health Care Technology | 2.3% | |||
Hotels, Restaurants & Leisure | 6.2% | |||
Industry | Percent of Net Assets | |||
Household Durables | 1.4% | |||
Information Technology Services | 2.4% | |||
Insurance | 1.5% | |||
Internet Software & Services | 7.6% | |||
Leisure Equipment & Products | 4.0% | |||
Life Sciences Tools & Services | 0.9% | |||
Machinery | 2.8% | |||
Marine | 0.5% | |||
Oil, Gas & Consumable Fuels | 0.7% | |||
Personal Products | 1.2% | |||
Pharmaceuticals | 3.2% | |||
Road & Rail | 1.6% | |||
Semiconductors & Semiconductor Equipment | 0.5% | |||
Software | 7.2% | |||
Specialty Retail | 1.8% | |||
Textiles, Apparel & Luxury Goods | 3.1% | |||
Thrifts & Mortgage Finance | 1.5% | |||
Trading Companies & Distributors | 0.8% | |||
Other Assets in Excess of Liabilities | 0.4% | |||
|
| |||
TOTAL | 100.0% | |||
|
| |||
Notes to Financial Statements are an integral part of this Schedule.
26
Driehaus Small Cap Growth Fund
Performance Overview (unaudited)
The performance summarized below is historical and does not represent future results. Investment returns and principal value vary, and you may have a gain or loss when you sell shares. Performance data presented measures the change in the value of an investment in the Fund, assuming reinvestment of all dividends and capital gains. Average annual total return reflects annualized change.
The table does not reflect the deduction of taxes that a shareholder would pay on Fund distributions or the redemption of Fund shares. The graph compares the results of a $10,000 investment in the Fund over the last 10 fiscal year periods (which includes performance of the Predecessor Partnership), with all dividends and capital gains reinvested, with the indicated index (and dividends reinvested) for the same period.
| Fund Only | Including Predecessor Limited Partnership | |||||||||||||||||||
| Average Annual Total Returns as of 6/30/18 | Since Inception (8/21/17 - 6/30/18) | 1 Year | 3 Years | 5 Years | 10 Years | |||||||||||||||
Driehaus Small Cap Growth Fund Investor Class (DVSMX)1 | 42.48% | 37.75% | 15.51% | 18.19% | 11.11% | |||||||||||||||
Driehaus Small Cap Growth Fund Institutional Class (DNSMX)1 | 42.79% | 38.04% | 15.60% | 18.24% | 11.13% | |||||||||||||||
Russell 2000® Growth Index2 | 25.93% | 21.86% | 10.60% | 13.65% | 11.24% | |||||||||||||||
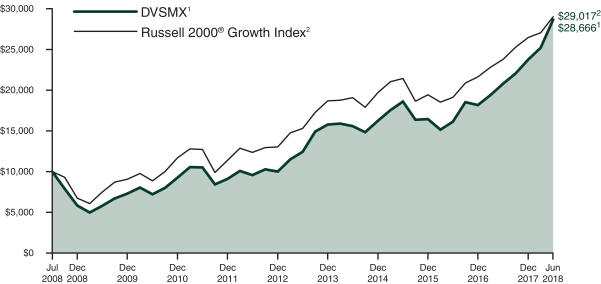
| 1 | The Driehaus Small Cap Growth Fund (“the Fund”) performance shown above includes the performance of the Driehaus Institutional Small Cap, L.P. (the “Predecessor Partnership”), one of the Fund’s predecessors, for the periods before the Fund’s registration statement became effective. The Predecessor Partnership was managed by the same investment team with substantially the same investment objective, policies and philosophies as are followed by the Fund. The Fund succeeded to the Predecessor Partnership’s assets together with the assets of the Driehaus Institutional Small Cap Recovery Fund, L.P., Driehaus Small Cap Recovery Fund, L.P. and Driehaus Small Cap Investors, L.P. (together, the “Limited Partnerships”) on August 21, 2017. The investment portfolios of the Limited Partnerships were identical and therefore had similar performance. The performance of the Predecessor Partnership is shown here because it has been in operation the longest. The Predecessor Partnership was not registered under the Investment Company Act of 1940, as amended (“1940 Act”), and thus was not subject to certain investment and operational restrictions that are imposed by the 1940 Act. If the Predecessor Partnership had been registered under the 1940 Act, its performance may have been adversely affected. The Predecessor Partnership’s performance has not been restated to reflect estimated expenses applicable to each class of shares of the Fund. The returns reflect fee waivers and/or reimbursements without which performance would have been lower. |
| 2 | The Russell 2000® Growth Index measures the performance of those Russell 2000® companies with higher price-to-book ratios and higher forecasted growth values. The performance data includes reinvested dividends. The Russell 2000® Index measures the performance of the 2,000 smallest companies in the Russell 3000® Index. |
27
Driehaus Small Cap Growth Fund
Schedule of Investments
June 30, 2018 (unaudited)
| Number of Shares | Value (Note A) | |||||||
| EQUITY SECURITIES — 99.6% |
| |||||||
| HEALTH CARE — 28.2% |
| |||||||
Biotechnology — 12.8% |
| |||||||
Adamas Pharmaceuticals, Inc.** | 9,824 | $ | 253,754 | |||||
Arena Pharmaceuticals, Inc.** | 12,028 | 524,421 | ||||||
Argenx SE — ADR** | 6,216 | 515,058 | ||||||
Array BioPharma, Inc.** | 78,037 | 1,309,461 | ||||||
Ascendis Pharma AS — ADR** | 7,735 | 514,532 | ||||||
Atara Biotherapeutics, Inc.** | 13,799 | 507,113 | ||||||
Autolus Therapeutics PLC** | 23,002 | 616,224 | ||||||
Blueprint Medicines Corp.** | 6,549 | 415,731 | ||||||
Deciphera Pharmaceuticals, Inc.** | 8,908 | 350,530 | ||||||
Exact Sciences Corp.** | 11,552 | 690,694 | ||||||
Global Blood Therapeutics, Inc.** | 12,630 | 570,876 | ||||||
Loxo Oncology, Inc.** | 10,526 | 1,826,050 | ||||||
Mirati Therapeutics, Inc.** | 12,865 | 634,244 | ||||||
Sage Therapeutics, Inc.** | 1,944 | 304,294 | ||||||
Sarepta Therapeutics, Inc.** | 12,572 | 1,661,767 | ||||||
|
| |||||||
| 10,694,749 | ||||||||
|
| |||||||
Health Care Equipment & Supplies — 9.6% |
| |||||||
AxoGen, Inc.** | 10,569 | 531,092 | ||||||
Inogen, Inc.** | 9,154 | 1,705,665 | ||||||
Insulet Corp.** | 18,112 | 1,552,198 | ||||||
Integra LifeSciences Holdings Corp.** | 6,353 | 409,197 | ||||||
iRhythm Technologies, Inc.** | 10,695 | 867,685 | ||||||
Penumbra, Inc.** | 3,472 | 479,657 | ||||||
Sientra, Inc.** | 35,700 | 696,507 | ||||||
Tactile Systems Technology, Inc.** | 33,615 | 1,747,980 | ||||||
|
| |||||||
| 7,989,981 | ||||||||
|
| |||||||
Pharmaceuticals — 2.5% |
| |||||||
Aclaris Therapeutics, Inc.** | 20,979 | 418,951 | ||||||
MyoKardia, Inc.** | 8,710 | 432,451 | ||||||
Optinose, Inc.** | 28,835 | 806,803 | ||||||
Tricida, Inc.** | 13,523 | 404,338 | ||||||
|
| |||||||
| 2,062,543 | ||||||||
|
| |||||||
Health Care Technology — 2.4% |
| |||||||
Inspire Medical Systems, Inc.** | 16,076 | 573,270 | ||||||
Medidata Solutions, Inc.** | 9,051 | 729,149 | ||||||
Teladoc, Inc.** | 11,508 | 668,039 | ||||||
|
| |||||||
| 1,970,458 | ||||||||
|
| |||||||
Health Care Providers & Services — 0.9% |
| |||||||
HealthEquity, Inc.** | 10,018 | 752,352 | ||||||
|
| |||||||
Total HEALTH CARE | 23,470,083 | |||||||
|
| |||||||
| CONSUMER DISCRETIONARY — 21.9% |
| |||||||
Hotels, Restaurants & Leisure — 6.0% |
| |||||||
BJ’s Restaurants, Inc. | 11,992 | 719,520 | ||||||
| Number of Shares | Value (Note A) | |||||||
Eldorado Resorts, Inc.** | 33,165 | $ | 1,296,751 | |||||
Planet Fitness, Inc. — A** | 14,517 | 637,877 | ||||||
PlayAGS, Inc.** | 17,123 | 463,520 | ||||||
Red Rock Resorts, Inc. — A | 25,021 | 838,203 | ||||||
Texas Roadhouse, Inc. | 9,039 | 592,145 | ||||||
Wingstop, Inc. | 8,937 | 465,796 | ||||||
|
| |||||||
| 5,013,812 | ||||||||
|
| |||||||
Diversified Consumer Services — 3.9% |
| |||||||
Bright Horizons Family Solutions, Inc.** | 3,781 | 387,628 | ||||||
Chegg, Inc.** | 16,072 | 446,641 | ||||||
Grand Canyon Education, Inc.** | 9,133 | 1,019,334 | ||||||
Weight Watchers International, Inc.** | 13,649 | 1,379,914 | ||||||
|
| |||||||
| 3,233,517 | ||||||||
|
| |||||||
Specialty Retail — 3.4% |
| |||||||
At Home Group, Inc.** | 23,137 | 905,814 | ||||||
Boot Barn Holdings, Inc.** | 33,669 | 698,632 | ||||||
Carvana Co.** | 16,738 | 696,301 | ||||||
Five Below, Inc.** | 5,240 | 512,000 | ||||||
|
| |||||||
| 2,812,747 | ||||||||
|
| |||||||
Textiles, Apparel & Luxury Goods — 2.3% |
| |||||||
Canada Goose Holdings, Inc.** | 21,164 | 1,245,501 | ||||||
G-III Apparel Group, Ltd.** | 16,026 | 711,554 | ||||||
|
| |||||||
| 1,957,055 | ||||||||
|
| |||||||
Leisure Equipment & Products — 2.2% |
| |||||||
Callaway Golf Co. | 30,274 | 574,298 | ||||||
Malibu Boats, Inc. — A** | 29,655 | 1,243,731 | ||||||
|
| |||||||
| 1,818,029 | ||||||||
|
| |||||||
Household Durables — 1.9% |
| |||||||
Roku, Inc.** | 28,395 | 1,210,195 | ||||||
SodaStream International, Ltd.** | 4,265 | 363,804 | ||||||
|
| |||||||
| 1,573,999 | ||||||||
|
| |||||||
Auto Components — 1.1% |
| |||||||
Visteon Corp.** | 7,298 | 943,194 | ||||||
Distributors — 1.1% |
| |||||||
Pool Corp. | 6,013 | 910,970 | ||||||
|
| |||||||
Total CONSUMER DISCRETIONARY | 18,263,323 | |||||||
|
| |||||||
| INFORMATION TECHNOLOGY — 21.9% |
| |||||||
Software — 9.7% |
| |||||||
Altair Engineering, Inc. — A** | 39,818 | 1,360,979 | ||||||
Carbon Black, Inc.** | 15,601 | 405,626 | ||||||
Everbridge, Inc.** | 18,890 | 895,764 | ||||||
Paylocity Holding Corp.** | 17,936 | 1,055,713 | ||||||
Proofpoint, Inc.** | 8,358 | 963,761 | ||||||
RingCentral, Inc. — A** | 16,765 | 1,179,418 | ||||||
Talend SA — ADR** | 13,592 | 846,510 | ||||||
Notes to Financial Statements are an integral part of this Schedule.
28
Driehaus Small Cap Growth Fund
Schedule of Investments
June 30, 2018 (unaudited)
| Number of Shares | Value (Note A) | |||||||
Upland Software, Inc.** | 20,579 | $ | 707,300 | |||||
Zscaler, Inc.** | 18,325 | 655,119 | ||||||
|
| |||||||
| 8,070,190 | ||||||||
|
| |||||||
Internet Software & Services — 8.4% |
| |||||||
Alteryx, Inc. — A** | 13,078 | 499,056 | ||||||
ANGI Homeservices, Inc. — A** | 41,355 | 636,040 | ||||||
Etsy, Inc.** | 14,273 | 602,178 | ||||||
Five9, Inc.** | 17,553 | 606,807 | ||||||
GTT Communications, Inc.** | 10,152 | 456,840 | ||||||
Instructure, Inc.** | 16,802 | 714,925 | ||||||
Mimecast, Ltd.** | 24,300 | 1,001,403 | ||||||
Nutanix, Inc. — A** | 23,242 | 1,198,590 | ||||||
Q2 Holdings, Inc.** | 12,650 | 721,682 | ||||||
Quotient Technology, Inc.** | 40,475 | 530,222 | ||||||
|
| |||||||
| 6,967,743 | ||||||||
|
| |||||||
Information Technology Services — 1.7% |
| |||||||
EPAM Systems, Inc.** | 11,224 | 1,395,480 | ||||||
Semiconductors & Semiconductor Equipment — 1.5% |
| |||||||
Monolithic Power Systems, Inc. | 4,474 | 598,040 | ||||||
Semtech Corp.** | 15,018 | 706,597 | ||||||
|
| |||||||
| 1,304,637 | ||||||||
|
| |||||||
Computers & Peripherals — 0.6% |
| |||||||
Pure Storage, Inc. — A** | 20,934 | 499,904 | ||||||
|
| |||||||
Total INFORMATION TECHNOLOGY | 18,237,954 | |||||||
|
| |||||||
| INDUSTRIALS — 15.2% |
| |||||||
Machinery — 5.7% |
| |||||||
Chart Industries, Inc.** | 7,119 | 439,100 | ||||||
Columbus McKinnon Corp. | 26,064 | 1,130,135 | ||||||
Federal Signal Corp. | 32,702 | 761,630 | ||||||
Gates Industrial Corp. PLC** | 38,485 | 626,151 | ||||||
Harsco Corp.** | 53,645 | 1,185,554 | ||||||
Kornit Digital, Ltd.** | 36,344 | 646,923 | ||||||
|
| |||||||
| 4,789,493 | ||||||||
|
| |||||||
Air Freight & Logistics — 1.8% |
| |||||||
BEST, Inc. — ADR** | 27,878 | 340,669 | ||||||
XPO Logistics, Inc.** | 11,700 | 1,172,106 | ||||||
|
| |||||||
| 1,512,775 | ||||||||
|
| |||||||
Aerospace & Defense — 1.5% |
| |||||||
AAR Corp. | 9,279 | 431,381 | ||||||
Axon Enterprise, Inc.** | 12,953 | 818,371 | ||||||
|
| |||||||
| 1,249,752 | ||||||||
|
| |||||||
Commercial Services & Supplies — 1.5% |
| |||||||
BrightView Holdings, Inc.** | 15,134 | 332,191 | ||||||
MSA Safety, Inc. | 9,108 | 877,465 | ||||||
|
| |||||||
| 1,209,656 | ||||||||
|
| |||||||
Road & Rail — 1.0% |
| |||||||
Saia, Inc.** | 10,070 | 814,160 | ||||||
| Number of Shares | Value (Note A) | |||||||
Electrical Equipment — 0.9% |
| |||||||
TPI Composites, Inc.** | 26,272 | $ | 768,193 | |||||
Trading Companies & Distributors — 0.7% |
| |||||||
SiteOne Landscape Supply, | 7,016 | 589,134 | ||||||
Building Products — 0.6% |
| |||||||
Gibraltar Industries, Inc.** | 14,161 | 531,037 | ||||||
Marine — 0.6% |
| |||||||
Seaspan Corp. | 46,343 | 471,772 | ||||||
Airlines — 0.5% |
| |||||||
SkyWest, Inc. | 7,431 | 385,669 | ||||||
Professional Services — 0.4% |
| |||||||
Korn/Ferry International | 5,391 | 333,865 | ||||||
|
| |||||||
Total INDUSTRIALS | 12,655,506 | |||||||
|
| |||||||
| FINANCIALS — 6.0% |
| |||||||
Commercial Banks — 2.5% |
| |||||||
Heritage Financial Corp. | 15,239 | 531,079 | ||||||
Live Oak Bancshares, Inc. | 31,118 | 953,767 | ||||||
Seacoast Banking Corp. of Florida** | 18,674 | 589,725 | ||||||
|
| |||||||
| 2,074,571 | ||||||||
|
| |||||||
Real Estate Investment Trust — 2.3% |
| |||||||
Rexford Industrial Realty, Inc. | 24,651 | 773,795 | ||||||
Ryman Hospitality Properties, Inc. | 13,381 | 1,112,630 | ||||||
|
| |||||||
| 1,886,425 | ||||||||
|
| |||||||
Consumer Finance — 1.2% |
| |||||||
Green Dot Corp. — A** | 13,927 | 1,022,103 | ||||||
|
| |||||||
Total FINANCIALS | 4,983,099 | |||||||
|
| |||||||
| ENERGY — 2.8% | ||||||||
Energy Equipment & Services — 1.8% |
| |||||||
Cactus, Inc. — A** | 12,252 | 413,995 | ||||||
Newpark Resources, Inc.** | 67,702 | 734,567 | ||||||
Oceaneering International, Inc. | 11,405 | 290,371 | ||||||
|
| |||||||
| 1,438,933 | ||||||||
|
| |||||||
Oil, Gas & Consumable Fuels — 1.0% |
| |||||||
Euronav NV | 46,370 | 426,604 | ||||||
Oasis Petroleum, Inc.** | 32,152 | 417,011 | ||||||
|
| |||||||
| 843,615 | ||||||||
|
| |||||||
Total ENERGY | 2,282,548 | |||||||
|
| |||||||
| MATERIALS — 2.5% | ||||||||
Chemicals — 1.8% |
| |||||||
Ingevity Corp.** | 11,737 | 949,054 | ||||||
Orion Engineered Carbons SA | 19,081 | 588,649 | ||||||
|
| |||||||
| 1,537,703 | ||||||||
|
| |||||||
Metals & Mining — 0.7% |
| |||||||
Carpenter Technology Corp. | 10,958 | 576,062 | ||||||
|
| |||||||
Total MATERIALS | 2,113,765 | |||||||
|
| |||||||
Notes to Financial Statements are an integral part of this Schedule.
29
Driehaus Small Cap Growth Fund
Schedule of Investments
June 30, 2018 (unaudited)
| Number of Shares | Value (Note A) | |||||||
| CONSUMER STAPLES — 1.1% |
| |||||||
Food Products — 0.6% |
| |||||||
Calavo Growers, Inc. | 5,722 | $ | 550,170 | |||||
Beverages — 0.5% |
| |||||||
MGP Ingredients, Inc. | 4,447 | 394,938 | ||||||
|
| |||||||
Total CONSUMER STAPLES | 945,108 | |||||||
|
| |||||||
Total EQUITY SECURITIES | 82,951,386 | |||||||
|
| |||||||
| ||||||||
TOTAL INVESTMENTS | 99.6 | % | $ | 82,951,386 | ||||
Other Assets In Excess Of Liabilities | 0.4 | % | 303,109 | |||||
|
|
|
| |||||
Net Assets | 100.0 | % | $ | 83,254,495 | ||||
| ||||||||
| ** | Non-income producing security |
ADR — American Depository Receipt
Top Ten Holdings*
Loxo Oncology, Inc. | 2.2% | |||
Tactile Systems Technology, Inc. | 2.1% | |||
Inogen, Inc. | 2.0% | |||
Sarepta Therapeutics, Inc. | 2.0% | |||
Insulet Corp. | 1.9% | |||
EPAM Systems, Inc. | 1.7% | |||
Weight Watchers International, Inc. | 1.7% | |||
Altair Engineering, Inc. — A | 1.6% | |||
Array BioPharma, Inc. | 1.6% | |||
Eldorado Resorts, Inc. | 1.6% |
| * | All percentages are stated as a percent of net assets at June 30, 2018. |
Notes to Financial Statements are an integral part of this Schedule.
30
Driehaus Small Cap Growth Fund
Schedule of Investments
June 30, 2018 (unaudited)
Industry | Percent of Net Assets | |||
Aerospace & Defense | 1.5% | |||
Air Freight & Logistics | 1.8% | |||
Airlines | 0.5% | |||
Auto Components | 1.1% | |||
Beverages | 0.5% | |||
Biotechnology | 12.8% | |||
Building Products | 0.6% | |||
Chemicals | 1.8% | |||
Commercial Banks | 2.5% | |||
Commercial Services & Supplies | 1.5% | |||
Computers & Peripherals | 0.6% | |||
Consumer Finance | 1.2% | |||
Distributors | 1.1% | |||
Diversified Consumer Services | 3.9% | |||
Electrical Equipment | 0.9% | |||
Energy Equipment & Services | 1.8% | |||
Food Products | 0.6% | |||
Health Care Equipment & Supplies | 9.6% | |||
Health Care Providers & Services | 0.9% | |||
Health Care Technology | 2.4% | |||
Industry | Percent of Net Assets | |||
Hotels, Restaurants & Leisure | 6.0% | |||
Household Durables | 1.9% | |||
Information Technology Services | 1.7% | |||
Internet Software & Services | 8.4% | |||
Leisure Equipment & Products | 2.2% | |||
Machinery | 5.7% | |||
Marine | 0.6% | |||
Metals & Mining | 0.7% | |||
Oil, Gas & Consumable Fuels | 1.0% | |||
Pharmaceuticals | 2.5% | |||
Professional Services | 0.4% | |||
Real Estate Investment Trust | 2.3% | |||
Road & Rail | 1.0% | |||
Semiconductors & Semiconductor Equipment | 1.5% | |||
Software | 9.7% | |||
Specialty Retail | 3.4% | |||
Textiles, Apparel & Luxury Goods | 2.3% | |||
Trading Companies & Distributors | 0.7% | |||
Other Assets in Excess of Liabilities | 0.4% | |||
|
| |||
TOTAL | 100.0% | |||
|
| |||
Notes to Financial Statements are an integral part of this Schedule.
31
Statements of Assets and Liabilities
June 30, 2018 (unaudited)
| Driehaus Emerging Markets Growth Fund | Driehaus Emerging Markets Small Cap Growth Fund | |||||||
ASSETS: | ||||||||
Investments, at cost | $ | 1,342,230,066 | $ | 190,535,779 | ||||
|
|
|
| |||||
Investments, at fair value | $ | 1,575,601,479 | $ | 204,946,891 | ||||
Foreign currency, at fair value* | 3,924,285 | 7,434,045 | ||||||
Cash | 80,584,836 | 15,688,964 | ||||||
Unrealized appreciation on forward foreign currency contracts | — | 193,061 | ||||||
Collateral held at custodian for the benefit of brokers | — | 511 | ||||||
Receivables: | ||||||||
Dividends | 7,387,544 | 422,134 | ||||||
Investment securities sold | 33,642,962 | 2,478,215 | ||||||
Fund shares sold | 2,396,655 | 52,770 | ||||||
Foreign taxes | 669,951 | 474,760 | ||||||
Prepaid expenses | 47,087 | 9,175 | ||||||
|
|
|
| |||||
| ||||||||
TOTAL ASSETS | 1,704,254,799 | 231,700,526 | ||||||
|
|
|
| |||||
| ||||||||
LIABILITIES: | ||||||||
Payables: | ||||||||
Investment securities purchased | 29,403,686 | 5,999,452 | ||||||
Fund shares redeemed | 2,576,381 | 750,139 | ||||||
Net unrealized depreciation on unsettled foreign currency transactions | 20,670 | — | ||||||
Due to affiliates | 1,814,778 | 292,881 | ||||||
Accrued foreign capital gains taxes | — | — | ||||||
Audit and tax fees | 43,481 | 49,795 | ||||||
Accrued expenses | 272,672 | 155,189 | ||||||
Unrealized depreciation on forward foreign currency contracts | — | 25,052 | ||||||
Written options outstanding, at fair value (premiums received $325,301) | — | 310,000 | ||||||
|
|
|
| |||||
| ||||||||
TOTAL LIABILITIES | 34,131,668 | �� | 7,582,508 | |||||
|
|
|
| |||||
| ||||||||
NET ASSETS | $ | 1,670,123,131 | $ | 224,118,018 | ||||
|
|
|
| |||||
| ||||||||
NET ASSETS CONSISTED OF THE FOLLOWING AT JUNE 30, 2018: | ||||||||
Paid-in capital | $ | 1,333,697,888 | $ | 244,682,059 | ||||
Accumulated net investment income (loss) | 6,226,136 | (309,139 | ) | |||||
Accumulated net realized gain (loss) | 96,863,171 | (34,775,027 | ) | |||||
Unrealized net foreign exchange gain (loss) | (35,477 | ) | (74,297 | ) | ||||
Unrealized net appreciation (depreciation) on forward foreign currency contracts | — | 168,009 | ||||||
Unrealized net appreciation (depreciation) on written options | — | 15,301 | ||||||
Unrealized net appreciation (depreciation) on purchased options | — | (133,634 | ) | |||||
Unrealized net appreciation (depreciation) on investments | 233,371,413 | 14,544,746 | ||||||
|
|
|
| |||||
NET ASSETS | $ | 1,670,123,131 | $ | 224,118,018 | ||||
|
|
|
| |||||
| ||||||||
NET ASSETS | $ | — | $ | 224,118,018 | ||||
SHARES OUTSTANDING (Unlimited shares authorized, no par value) | — | 16,920,399 | ||||||
NET ASSET VALUE | $ | — | $ | 13.25 | ||||
INVESTOR CLASS SHARES: | ||||||||
NET ASSETS | $ | 962,934,948 | $ | — | ||||
SHARES OUTSTANDING (Unlimited shares authorized, no par value) | 25,820,824 | — | ||||||
NET ASSET VALUE | $ | 37.29 | $ | — | ||||
INSTITUTIONAL CLASS SHARES: | ||||||||
NET ASSETS | $ | 707,188,183 | $ | — | ||||
SHARES OUTSTANDING (Unlimited shares authorized, no par value) | 18,953,367 | — | ||||||
NET ASSET VALUE | $ | 37.31 | $ | — | ||||
| * | The cost of foreign currency was $3,941,238, $7,503,790, $1,073,196, $4,997, $0 and $0, respectively. |
Notes to Financial Statements are an integral part of this Statement.
32
Statements of Assets and Liabilities
June 30, 2018 (unaudited)
| Driehaus Frontier Emerging Markets Fund | Driehaus International Small Cap Growth Fund | Driehaus Micro Cap Growth Fund | Driehaus Small Cap Growth Fund | |||||||||||
| $ | 25,051,257 | $ | 244,516,193 | $ | 311,798,183 | $ | 67,537,188 | |||||||
|
|
|
|
|
|
|
| |||||||
| $ | 27,406,106 | $ | 287,381,183 | $ | 436,811,366 | $ | 82,951,386 | |||||||
| 1,078,883 | 5,163 | — | — | |||||||||||
| 3,703,671 | 22,804,127 | 9,437,039 | 1,676,929 | |||||||||||
| — | — | — | — | |||||||||||
| — | — | — | — | |||||||||||
| 87,046 | 898,557 | 33,455 | 20,512 | |||||||||||
| 620,927 | 7,869,797 | 3,416,572 | 202,449 | |||||||||||
| — | 2,506 | 261,597 | 31,545 | |||||||||||
| — | — | — | — | |||||||||||
| 9,624 | — | 12,397 | 38,817 | |||||||||||
|
|
|
|
|
|
|
| |||||||
|
| |||||||||||||
| 32,906,257 | 318,961,333 | 449,972,426 | 84,921,638 | |||||||||||
|
|
|
|
|
|
|
| |||||||
|
| |||||||||||||
| — | 7,967,137 | 10,952,322 | 1,584,773 | |||||||||||
| 4,000,644 | 58,200 | 130,452 | — | |||||||||||
| | 1,422 | 14,012 | — | — | ||||||||||
| 14,457 | 389,394 | 450,228 | 28,775 | |||||||||||
| 65,352 | — | — | — | |||||||||||
| 23,225 | 29,674 | 24,045 | 30,330 | |||||||||||
| 62,557 | 61,925 | 64,654 | 23,265 | |||||||||||
| — | — | — | — | |||||||||||
| — | — | — | — | |||||||||||
|
|
|
|
|
|
|
| |||||||
|
| |||||||||||||
| 4,167,657 | 8,520,342 | 11,621,701 | 1,667,143 | |||||||||||
|
|
|
|
|
|
|
| |||||||
|
| |||||||||||||
| $ | 28,738,600 | $ | 310,440,991 | $ | 438,350,725 | $ | 83,254,495 | |||||||
|
|
|
|
|
|
|
| |||||||
|
| |||||||||||||
| $ | 22,867,794 | $ | 233,098,925 | $ | 272,510,911 | $ | 62,339,996 | |||||||
| 167,829 | (1,440,724 | ) | (2,676,053 | ) | (189,206 | ) | ||||||||
| 3,343,737 | 35,933,141 | 43,502,684 | 5,689,507 | |||||||||||
| 4,391 | (15,341 | ) | — | — | ||||||||||
| | — | — | — | — | ||||||||||
| — | — | — | — | |||||||||||
| — | — | — | — | |||||||||||
| 2,354,849 | 42,864,990 | 125,013,183 | 15,414,198 | |||||||||||
|
|
|
|
|
|
|
| |||||||
| $ | 28,738,600 | $ | 310,440,991 | $ | 438,350,725 | $ | 83,254,495 | |||||||
|
|
|
|
|
|
|
| |||||||
|
| |||||||||||||
| $ | 28,738,600 | $ | 310,440,991 | $ | 438,350,725 | $ | — | |||||||
| 2,892,311 | 26,665,176 | 24,829,399 | — | |||||||||||
| $ | 9.94 | $ | 11.64 | $ | 17.65 | $ | — | |||||||
| $ | — | $ | — | $ | — | $ | 2,062,499 | |||||||
| — | — | — | 147,188 | |||||||||||
| $ | — | $ | — | $ | — | $ | 14.01 | |||||||
| $ | — | $ | — | $ | — | $ | 81,191,996 | |||||||
| — | — | — | 5,781,668 | |||||||||||
| $ | — | $ | — | $ | — | $ | 14.04 | |||||||
Notes to Financial Statements are an integral part of this Statement.
33
For the Six Months Ended June 30, 2018 (unaudited)
| Driehaus Emerging Markets Growth Fund | Driehaus Emerging Markets Small Cap Growth Fund | |||||||
| INVESTMENT INCOME (LOSS): | ||||||||
Income: | ||||||||
Dividends* | $ | 18,579,791 | $ | 2,431,154 | ||||
|
|
|
| |||||
| ||||||||
Total income | 18,579,791 | 2,431,154 | ||||||
|
|
|
| |||||
| ||||||||
Expenses: | ||||||||
Investment advisory fee | 9,072,640 | 1,955,813 | ||||||
Administration fee | 460,057 | 127,629 | ||||||
Professional fees | 152,628 | 28,324 | ||||||
Audit and tax fees | 43,345 | 56,820 | ||||||
Federal and state registration fees | 39,882 | 16,334 | ||||||
Custodian fees | 206,660 | 634,882 | ||||||
Transfer agent fees | 185,695 | 34,122 | ||||||
Trustees’ fees | 114,405 | 38,084 | ||||||
Chief compliance officer fees | 10,000 | 10,000 | ||||||
Reports to shareholders | 59,703 | 14,838 | ||||||
Shareholder services fees (Investor Class) | 1,342,366 | — | ||||||
Miscellaneous | 47,503 | 18,858 | ||||||
|
|
|
| |||||
Total expenses | 11,734,884 | 2,935,704 | ||||||
|
|
|
| |||||
| ||||||||
Investment advisory fees waived | — | — | ||||||
Administration fees waived | — | — | ||||||
Transfer agent fees waived | — | — | ||||||
Fees paid indirectly | (49,988 | ) | (13,541 | ) | ||||
|
|
|
| |||||
Net expenses | 11,684,896 | 2,922,163 | ||||||
|
|
|
| |||||
| ||||||||
Net investment income (loss) | 6,894,895 | (491,009 | ) | |||||
|
|
|
| |||||
| ||||||||
| NET REALIZED AND UNREALIZED GAIN (LOSS) ON INVESTMENTS, WRITTEN OUTSTANDING OPTIONS AND FOREIGN CURRENCY TRANSACTIONS: | ||||||||
Net realized gain (loss) from security transactions | 79,439,020 | 14,440,323 | ||||||
Net realized foreign exchange gain (loss) | (2,449,081 | ) | (665,408 | ) | ||||
Net realized gain (loss) on forward foreign currency contracts | — | (282,021 | ) | |||||
Net realized gain (loss) on written options | — | (440,501 | ) | |||||
Net realized gain (loss) on purchased options | — | 1,550,433 | ||||||
Net realized gain (loss) on swap contracts | — | (593,215 | ) | |||||
Net change in unrealized foreign exchange gain (loss) | (176,823 | ) | (134,462 | ) | ||||
Net change in unrealized appreciation (depreciation) on swap contracts | — | 949,854 | ||||||
Net change in unrealized appreciation (depreciation) on forward foreign currency contracts | — | 168,009 | ||||||
Net change in unrealized appreciation (depreciation) on written options | — | 15,301 | ||||||
Net change in unrealized appreciation (depreciation) on purchased options | — | (128,426 | ) | |||||
Net change in unrealized appreciation (depreciation) on investments | (193,222,614 | ) | (31,308,568 | ) | ||||
|
|
|
| |||||
| ||||||||
Net realized and unrealized gain (loss) on investments, written options and foreign currency transactions | (116,409,498 | ) | (16,428,681 | ) | ||||
|
|
|
| |||||
| ||||||||
NET INCREASE (DECREASE) IN NET ASSETS RESULTING FROM OPERATIONS | $ | (109,514,603 | ) | $ | (16,919,690 | ) | ||
|
|
|
| |||||
| ||||||||
| * | Dividends are net of $1,970,772, $153,131, $91,793, $306,497, $0 and $794 non-reclaimable foreign taxes withheld, respectively. |
Notes to Financial Statements are an integral part of this Statement.
34
Statements of Operations
For the Six Months Ended June 30, 2018 (unaudited)
| Driehaus Frontier Emerging Markets Fund | Driehaus International Small Cap Growth Fund | Driehaus Micro Cap Growth Fund | Driehaus Small Cap Growth Fund | |||||||||||
| $ | 817,498 | $ | 2,619,948 | $ | 339,970 | $ | 56,751 | |||||||
|
|
|
|
|
|
|
| |||||||
|
| |||||||||||||
| 817,498 | 2,619,948 | 339,970 | 56,751 | |||||||||||
|
|
|
|
|
|
|
| |||||||
|
| |||||||||||||
| 342,713 | 2,494,837 | 2,339,076 | 155,463 | |||||||||||
| 50,882 | 147,646 | 143,356 | 38,788 | |||||||||||
| 10,960 | 33,868 | 36,757 | 11,385 | |||||||||||
| 32,897 | 29,486 | 23,645 | 27,430 | |||||||||||
| 10,551 | 12,365 | 14,219 | 26,506 | |||||||||||
| 62,562 | 26,954 | 13,625 | 6,079 | |||||||||||
| 19,002 | 25,567 | 28,166 | 39,236 | |||||||||||
| 27,390 | 42,228 | 42,539 | 27,320 | |||||||||||
| 10,000 | 10,000 | 10,000 | 10,000 | |||||||||||
| 6,612 | 9,910 | 16,971 | 6,257 | |||||||||||
| — | — | — | 713 | |||||||||||
| 15,148 | 19,977 | 20,580 | 9,783 | |||||||||||
|
|
|
|
|
|
|
| |||||||
| 588,717 | 2,852,838 | 2,688,934 | 358,960 | |||||||||||
|
|
|
|
|
|
|
| |||||||
|
| |||||||||||||
| (131,766 | ) | — | — | (80,202 | ) | |||||||||
| — | — | — | (2,057 | ) | ||||||||||
| — | — | — | (28,725 | ) | ||||||||||
| (204 | ) | (7,212 | ) | (16,200 | ) | (2,019 | ) | |||||||
|
|
|
|
|
|
|
| |||||||
| 456,747 | 2,845,626 | 2,672,734 | 245,957 | |||||||||||
|
|
|
|
|
|
|
| |||||||
|
| |||||||||||||
| 360,751 | (225,678 | ) | (2,332,764 | ) | (189,206 | ) | ||||||||
|
|
|
|
|
|
|
| |||||||
|
| |||||||||||||
| 3,548,417 | 26,105,227 | 38,640,913 | 3,760,568 | |||||||||||
| (116,342 | ) | (35,783 | ) | — | — | |||||||||
| — | — | — | — | |||||||||||
| — | — | — | — | |||||||||||
| — | — | — | — | |||||||||||
| — | — | — | — | |||||||||||
| 1,268 | (16,137 | ) | — | — | ||||||||||
| — |
| — | — | — | |||||||||
| — |
| — | — | — | |||||||||
| — |
| — | — | — | |||||||||
| — |
| — | — | — | |||||||||
| (7,556,371 | ) | (17,056,463 | ) | 39,864,280 | 6,379,015 | ||||||||
|
|
|
|
|
|
|
| |||||||
|
| |||||||||||||
| (4,123,028 | ) | 8,996,844 | 78,505,193 | 10,139,583 | |||||||||
|
|
|
|
|
|
|
| |||||||
|
| |||||||||||||
$ | (3,762,277 | ) | $ | 8,771,166 | $ | 76,172,429 | $ | 9,950,377 | ||||||
|
|
|
|
|
|
|
| |||||||
|
| |||||||||||||
Notes to Financial Statements are an integral part of this Statement.
35
Statements of Changes in Net Assets
| Driehaus Emerging Markets Growth Fund | Driehaus Emerging Markets Small Cap Growth Fund | |||||||||||||||
| For the six month period January 1, 2018 through June 30, 2018 (unaudited) | For the year ended December 31, 2017 | For the six month period January 1, 2018 through June 30, 2018 (unaudited) | For the year ended December 31, 2017 | |||||||||||||
INCREASE (DECREASE) IN NET ASSETS: | ||||||||||||||||
Operations: | ||||||||||||||||
Net investment income (loss) | $ | 6,894,895 | $ | 5,778,516 | $ | (491,009 | ) | $ | 389,221 | |||||||
Net realized gain (loss) on investments, written options and foreign currency transactions | 76,989,939 | 216,606,652 | 14,009,611 | 35,916,209 | ||||||||||||
Net change in unrealized gain (loss) on investments, written options and foreign currency transactions | (193,399,437 | ) | 322,194,791 | (30,438,292 | ) | 37,285,591 | ||||||||||
|
|
|
|
|
|
|
| |||||||||
| ||||||||||||||||
Net increase (decrease) in net assets resulting from operations | (109,514,603 | ) | 544,579,959 | (16,919,690 | ) | 73,591,021 | ||||||||||
|
|
|
|
|
|
|
| |||||||||
| ||||||||||||||||
Distributions to shareholders: | ||||||||||||||||
Net investment income | ||||||||||||||||
Fund | — | — | — | — | ||||||||||||
Investor Class Shares | — | (7,508,221 | ) | — | — | |||||||||||
Institutional Class Shares | — | (3,509,534 | ) | — | — | |||||||||||
Capital gains | ||||||||||||||||
Fund | — | — | — | — | ||||||||||||
Investor Class Shares | — | — | — | — | ||||||||||||
Institutional Class Shares | — | — | — | — | ||||||||||||
|
|
|
|
|
|
|
| |||||||||
Total distributions to shareholders | — | (11,017,755 | ) | — | — | |||||||||||
|
|
|
|
|
|
|
| |||||||||
| ||||||||||||||||
Capital share transactions: | ||||||||||||||||
Proceeds from shares sold: | ||||||||||||||||
Fund | — | — | 34,180,931 | 92,470,261 | ||||||||||||
Investor Class Shares | 163,625,452 | 271,797,882 | — | — | ||||||||||||
Institutional Class Shares | 312,328,195 | 491,937,774 | — | — | ||||||||||||
Reinvestment of distributions: | ||||||||||||||||
Fund | — | — | — | — | ||||||||||||
Investor Class Shares | — | 6,838,405 | — | — | ||||||||||||
Institutional Class Shares | — | 2,999,863 | — | — | ||||||||||||
Cost of shares redeemed: | ||||||||||||||||
Fund | — | — | (64,291,078 | ) | (156,312,117 | ) | ||||||||||
Investor Class Shares | (406,753,059 | ) | (844,792,483 | ) | — | — | ||||||||||
Institutional Class Shares | (69,115,883 | ) | (18,766,180 | ) | — | — | ||||||||||
Redemption fees: | ||||||||||||||||
Fund | — | — | 1,861 | 9,900 | ||||||||||||
Investor Class Shares | 33,806 | 44,733 | — | — | ||||||||||||
Institutional Class Shares | 18,617 | 5,674 | — | — | ||||||||||||
|
|
|
|
|
|
|
| |||||||||
Net increase (decrease) in net assets derived from capital share transactions | 137,128 | (89,934,332 | ) | (30,108,286 | ) | (63,831,956 | ) | |||||||||
|
|
|
|
|
|
|
| |||||||||
Total increase (decrease) in net assets | (109,377,475 | ) | 443,627,872 | (47,027,976 | ) | 9,759,065 | ||||||||||
|
|
|
|
|
|
|
| |||||||||
| ||||||||||||||||
NET ASSETS: | ||||||||||||||||
| ||||||||||||||||
Beginning of period | $ | 1,779,500,606 | $ | 1,335,872,734 | $ | 271,145,994 | $ | 261,386,929 | ||||||||
|
|
|
|
|
|
|
| |||||||||
End of period | $ | 1,670,123,131 | $ | 1,779,500,606 | $ | 224,118,018 | $ | 271,145,994 | ||||||||
|
|
|
|
|
|
|
| |||||||||
Accumulated net investment income (loss) | $ | 6,226,136 | $ | (668,759 | ) | $ | (309,139 | ) | $ | 181,870 | ||||||
|
|
|
|
|
|
|
| |||||||||
| ||||||||||||||||
| * | Fund commenced operations on August 21, 2017. |
Notes to Financial Statements are an integral part of this Statement.
36
Statements of Changes in Net Assets
| Driehaus Frontier Emerging Markets Fund | Driehaus International Small Cap Growth Fund | Driehaus Micro Cap Growth Fund | Driehaus Small Cap Growth Fund | |||||||||||||||||||||||||||
| For the six month period January 1, 2018 through June 30, 2018 (unaudited) | For the year ended December 31, 2017 | For the six month period January 1, 2018 through June 30, 2018 (unaudited) | For the year ended December 31, 2017 | For the six month period January 1, 2018 through June 30, 2018 (unaudited) | For the year ended December 31, 2017 | For the six month period January 1, 2018 through June 30, 2018 (unaudited) | For the period August 21, 2017 through December 31, 2017* | |||||||||||||||||||||||
| $ | 360,751 | $ | 904,665 | $ | (225,678 | ) | $ | (1,268,910 | ) | $ | (2,332,764 | ) | $ | (4,330,379 | ) | $ | (189,206 | ) | $ | (103,225 | ) | |||||||||
| 3,432,075 |
| 3,691,591 | 26,069,444 | 57,904,888 | 38,640,913 | 54,316,286 | 3,760,568 | 2,869,260 | |||||||||||||||||||||
| (7,555,103 | ) | 6,823,367 | (17,072,600 | ) | 41,013,409 | 39,864,280 | 15,229,939 | 6,379,015 | 4,026,863 | ||||||||||||||||||||
|
|
|
|
|
|
|
|
|
|
|
|
|
|
|
| |||||||||||||||
|
| |||||||||||||||||||||||||||||
| (3,762,277 | ) | 11,419,623 | 8,771,166 | 97,649,387 | 76,172,429 | 65,215,846 | 9,950,377 | 6,792,898 | |||||||||||||||||||||
|
|
|
|
|
|
|
|
|
|
|
|
|
|
|
| |||||||||||||||
|
| |||||||||||||||||||||||||||||
| — | (112,019 | ) | — | — | — | — | — | — | ||||||||||||||||||||||
| — | — | — | — | — | — | — | — | |||||||||||||||||||||||
| — | — | — | — | — | — | — | — | |||||||||||||||||||||||
| — | (2,313,790 | ) | — | (45,275,762 | ) | — | (26,974,093 | ) | — | — | ||||||||||||||||||||
| — | — | — | — | — | — | — | (22,468 | ) | ||||||||||||||||||||||
| — | — | — | — | — | — | — | (642,608 | ) | ||||||||||||||||||||||
|
|
|
|
|
|
|
|
|
|
|
|
|
|
|
| |||||||||||||||
| — |
| (2,425,809 | ) | — | (45,275,762 | ) | — | (26,974,093 | ) | — | (665,076 | ) | |||||||||||||||||
|
|
|
|
|
|
|
|
|
|
|
|
|
|
|
| |||||||||||||||
|
| |||||||||||||||||||||||||||||
| 1,294,425 | 3,010,067 | 61,658,083 | 31,966,198 | 75,810,896 | 62,642,640 | — | — | |||||||||||||||||||||||
| — | — | — | — | — | — | 918,174 | 1,270,517 | |||||||||||||||||||||||
| — | — | — | — | — | — | 33,184,496 | 36,880,432 | |||||||||||||||||||||||
| — | 2,425,416 | — | 40,876,829 | — | 25,135,678 | — | — | |||||||||||||||||||||||
| — | — | — | — | — | — | — | 22,468 | |||||||||||||||||||||||
| — | — | — | — | — | — | — | 642,608 | |||||||||||||||||||||||
| (14,886,345 | ) | (41,654,531 | ) | (85,351,154 | ) | (70,258,314 | ) | (36,167,867 | ) | (200,086,696 | ) | — | — | |||||||||||||||||
| — | — | — | — | — | — | (452,244 | ) | (68,562 | ) | |||||||||||||||||||||
| — | — | — | — | — | — | (321,470 | ) | (4,900,123 | ) | |||||||||||||||||||||
| 790 | 70 | 1,451 | 1,731 | 2,415 | 9,825 | — | — | |||||||||||||||||||||||
| — | — | — | — | — | — | — | — | |||||||||||||||||||||||
| — | — | — | — | — | — | — | — | |||||||||||||||||||||||
|
|
|
|
|
|
|
|
|
|
|
|
|
|
|
| |||||||||||||||
| (13,591,130 | ) | (36,218,978 | ) | (23,691,620 | ) | 2,586,444 | 39,645,444 | (112,298,553 | ) | 33,328,956 | 33,847,340 | ||||||||||||||||||
|
|
|
|
|
|
|
|
|
|
|
|
|
|
|
| |||||||||||||||
| (17,353,407 | ) | (27,225,164 | ) | (14,920,454 | ) | 54,960,069 | 115,817,873 | (74,056,800 | ) | 43,279,333 | 39,975,162 | ||||||||||||||||||
|
|
|
|
|
|
|
|
|
|
|
|
|
|
|
| |||||||||||||||
|
| |||||||||||||||||||||||||||||
|
| |||||||||||||||||||||||||||||
| $ | 46,092,007 | $ | 73,317,171 | $ | 325,361,445 | $ | 270,401,376 | $ | 322,532,852 | $ | 396,589,652 | $ | 39,975,162 | $ | — | |||||||||||||||
|
|
|
|
|
|
|
|
|
|
|
|
|
|
|
| |||||||||||||||
| $ | 28,738,600 | $ | 46,092,007 | $ | 310,440,991 | $ | 325,361,445 | $ | 438,350,725 | $ | 322,532,852 | $ | 83,254,495 | $ | 39,975,162 | |||||||||||||||
|
|
|
|
|
|
|
|
|
|
|
|
|
|
|
| |||||||||||||||
$ | 167,829 |
| $ | (192,922 | ) | $ | (1,440,724 | ) | $ | (1,215,046 | ) | $ | (2,676,053 | ) | $ | (343,289 | ) | $ | (189,206 | ) | $ | — | ||||||||
|
|
|
|
|
|
|
|
|
|
|
|
|
|
|
| |||||||||||||||
|
| |||||||||||||||||||||||||||||
Notes to Financial Statements are an integral part of this Statement.
37
Driehaus Emerging Markets Growth Fund — Investor Class
Financial Highlights
| For the six month period January 1, 2018 through June 30, 2018 (unaudited) | For the year ended December 31, 2017 | For the year ended December 31, 2016 | For the year ended December 31, 2015 | For the year ended December 31, 2014 | For the year ended December 31, 2013 | |||||||||||||||||||
Net asset value, beginning of period | $ | 39.64 | $ | 27.98 | $ | 26.52 | $ | 29.63 | $ | 32.53 | $ | 30.61 | ||||||||||||
|
|
|
|
|
|
|
|
|
|
|
| |||||||||||||
INCOME (LOSS) FROM INVESTMENT OPERATIONS: | ||||||||||||||||||||||||
Net investment income (loss) | 0.13 | ^ | 0.11 | ^ | 0.03 | 0.06 | 0.04 | 0.10 | ||||||||||||||||
Net realized and unrealized gain (loss) on investments and foreign currency transactions | (2.48 | ) | 11.78 | 1.54 | (3.17 | ) | (1.99 | ) | 2.62 | |||||||||||||||
|
|
|
|
|
|
|
|
|
|
|
| |||||||||||||
Total income (loss) from investment operations | (2.35 | ) | 11.89 | 1.57 | (3.11 | ) | (1.95 | ) | 2.72 | |||||||||||||||
|
|
|
|
|
|
|
|
|
|
|
| |||||||||||||
LESS DISTRIBUTIONS: | ||||||||||||||||||||||||
Dividends from net investment income | — | (0.23 | ) | (0.11 | ) | — | — | — | ||||||||||||||||
Distributions from capital gains | — | — | — | — | (0.95 | ) | (0.80 | ) | ||||||||||||||||
|
|
|
|
|
|
|
|
|
|
|
| |||||||||||||
Total distributions | — | (0.23 | ) | (0.11 | ) | — | (0.95 | ) | (0.80 | ) | ||||||||||||||
|
|
|
|
|
|
|
|
|
|
|
| |||||||||||||
Redemption fees added to paid-in capital | 0.00 | ~ | 0.00 | ~ | 0.00 | ~ | 0.00 | ~ | 0.00 | ~ | 0.00 | ~ | ||||||||||||
|
|
|
|
|
|
|
|
|
|
|
| |||||||||||||
Net asset value, end of period | $ | 37.29 | $ | 39.64 | $ | 27.98 | $ | 26.52 | $ | 29.63 | $ | 32.53 | ||||||||||||
|
|
|
|
|
|
|
|
|
|
|
| |||||||||||||
Total Return | (5.90 | )%** | 42.52 | % | 5.88 | % | (10.49 | )% | (5.96 | )% | 8.92 | % | ||||||||||||
RATIOS/SUPPLEMENTAL DATA | ||||||||||||||||||||||||
Net assets, end of period (in 000’s) | $ | 962,935 | $ | 1,266,365 | $ | 1,335,873 | $ | 1,362,421 | $ | 1,701,219 | $ | 1,634,866 | ||||||||||||
Ratio of expenses before reimbursements, waivers and fees paid indirectly to average net assets | 1.37 | %* | 1.54 | % | 1.65 | % | 1.65 | % | 1.65 | % | 1.66 | % | ||||||||||||
Ratio of net expenses to average net assets | 1.36 | %*# | 1.53 | %# | 1.63 | %# | 1.64 | %# | 1.63 | %# | 1.64 | %# | ||||||||||||
Ratio of net investment income (loss) to average net assets | 0.67 | %*# | 0.33 | %# | 0.11 | %# | 0.22 | %# | 0.11 | %# | 0.33 | %# | ||||||||||||
Portfolio turnover | 115 | %** | 176 | % | 232 | % | 257 | % | 289 | % | 264 | % | ||||||||||||
| * | Annualized |
| ** | Not Annualized |
| ^ | Net investment income (loss) per share has been calculated using the average shares method. |
| ~ | Amount represents less than $0.01 per share |
| # | Such ratios are net of fees paid indirectly (see Note B in the Notes to Financial Statements). |
Notes to Financial Statements are an integral part of this Schedule.
38
Driehaus Emerging Markets Growth Fund — Institutional Class
Financial Highlights
| For the six month period January 1, 2018 through June 30, 2018 (unaudited) | For the period July 17, 2017 through December 31, 2017 | |||||||
Net asset value, beginning of period | $ | 39.61 | $ | 34.85 | ||||
|
|
|
| |||||
INCOME (LOSS) FROM INVESTMENT OPERATIONS: | ||||||||
Net investment income (loss) | 0.18 | ^ | 0.12 | ^ | ||||
Net realized and unrealized gain (loss) on investments and foreign currency transactions | (2.48 | ) | 4.92 | |||||
|
|
|
| |||||
Total income (loss) from investment operations | (2.30 | ) | 5.04 | |||||
|
|
|
| |||||
LESS DISTRIBUTIONS: | ||||||||
Dividends from net investment income | — | (0.28 | ) | |||||
Distributions from capital gains | — | — | ||||||
|
|
|
| |||||
Total distributions | — | (0.28 | ) | |||||
|
|
|
| |||||
Redemption fees added to paid-in capital | 0.00 | ~ | 0.00 | ~ | ||||
|
|
|
| |||||
Net asset value, end of period | $ | 37.31 | $ | 39.61 | ||||
|
|
|
| |||||
Total Return | (5.81 | )%** | 14.47 | %** | ||||
RATIOS/SUPPLEMENTAL DATA | ||||||||
Net assets, end of period (in 000’s) | $ | 707,188 | $ | 513,135 | ||||
Ratio of expenses before reimbursements, waivers and fees paid indirectly to average net assets | 1.14 | %* | 1.17 | %* | ||||
Ratio of net expenses to average net assets | 1.13 | %*# | 1.16 | %*# | ||||
Ratio of net investment income (loss) to average net assets | 0.90 | %*# | 0.71 | %*# | ||||
Portfolio turnover | 115 | %** | 176 | %** | ||||
| * | Annualized |
| ** | Not Annualized |
| ^ | Net investment income (loss) per share has been calculated using the average shares method. |
| ~ | Amount represents less than $0.01 per share |
| # | Such ratios are net of fees paid indirectly (see Note B in the Notes to Financial Statements). |
Notes to Financial Statements are an integral part of this Schedule.
39
Driehaus Emerging Markets Small Cap Growth Fund
Financial Highlights
| For the six month period January 1, 2018 through June 30, 2018 (unaudited) | For the year ended December 31, 2017 | For the year ended December 31, 2016 | For the year ended December 31, 2015 | For the year ended December 31, 2014 | For the year ended December 31, 2013 | |||||||||||||||||||
Net asset value, beginning of period | $ | 14.21 | $ | 10.66 | $ | 11.85 | $ | 13.21 | $ | 12.49 | $ | 11.15 | ||||||||||||
|
|
|
|
|
|
|
|
|
|
|
| |||||||||||||
INCOME (LOSS) FROM INVESTMENT OPERATIONS: | ||||||||||||||||||||||||
Net investment income (loss) | (0.03 | ) | 0.02 | ^ | (0.03 | )^ | (0.05 | )^ | (0.02 | )^ | (0.00 | )^~ | ||||||||||||
Net realized and unrealized gain (loss) on investments | (0.93 | ) | 3.53 | (1.14 | ) | (1.31 | ) | 0.74 | 1.36 | |||||||||||||||
|
|
|
|
|
|
|
|
|
|
|
| |||||||||||||
Total income (loss) from investment operations | (0.96 | ) | 3.55 | (1.17 | ) | (1.36 | ) | 0.72 | 1.36 | |||||||||||||||
|
|
|
|
|
|
|
|
|
|
|
| |||||||||||||
LESS DISTRIBUTIONS: | ||||||||||||||||||||||||
Dividends from net investment income | — | — | (0.02 | ) | — | — | (0.02 | ) | ||||||||||||||||
Distributions from capital gains | — | — | — | — | — | — | ||||||||||||||||||
|
|
|
|
|
|
|
|
|
|
|
| |||||||||||||
Total distributions | — | — | (0.02 | ) | — | — | (0.02 | ) | ||||||||||||||||
|
|
|
|
|
|
|
|
|
|
|
| |||||||||||||
Redemption fees added to paid-in capital | 0.00 | ~ | 0.00 | ~ | 0.00 | ~ | 0.00 | ~ | 0.00 | ~ | 0.00 | ~ | ||||||||||||
|
|
|
|
|
|
|
|
|
|
|
| |||||||||||||
Net asset value, end of period | $ | 13.25 | $ | 14.21 | $ | 10.66 | $ | 11.85 | $ | 13.21 | $ | 12.49 | ||||||||||||
|
|
|
|
|
|
|
|
|
|
|
| |||||||||||||
Total Return | (6.76 | )%** | 33.30 | % | (9.97 | )% | (10.22 | )% | 5.77 | % | 12.11 | % | ||||||||||||
RATIOS/SUPPLEMENTAL DATA | ||||||||||||||||||||||||
Net assets, end of period (in 000’s) | $ | 224,118 | $ | 271,146 | $ | 261,387 | $ | 432,718 | $ | 510,175 | $ | 191,285 | ||||||||||||
Ratio of expenses before reimbursements and/or recapture, waivers and fees paid indirectly to average net assets | 2.25 | %* | 1.82 | % | 1.75 | % | 1.69 | %¥ | 1.73 | % | 1.85 | % | ||||||||||||
Ratio of net expenses to average net assets | 2.24 | %*# | 1.80 | %# | 1.73 | %# | 1.68 | %#¥ | 1.71 | %+# | 1.90 | %+# | ||||||||||||
Ratio of net investment income (loss) to average net assets | (0.38 | )%*# | 0.15 | %# | (0.26 | )%# | (0.39 | )%# | (0.14 | )%+# | (0.02 | )%+# | ||||||||||||
Portfolio turnover | 119 | %** | 243 | % | 240 | % | 306 | % | 265 | % | 223 | % | ||||||||||||
| * | Annualized |
| ** | Not annualized |
| ^ | Net investment income (loss) per share has been calculated using the average shares method. |
| ~ | Amount represents less than $0.01 per share |
| + | Such ratios are after administrative and transfer agent waivers and adviser expense reimbursements, when applicable. BNY Mellon Investment Servicing (US) Inc., the administrative agent and transfer agent, waived a portion of its fees beginning with the Fund’s commencement of operations, August 22, 2011. The Adviser contractually agreed to waive its investment advisory fee or absorb other operating expenses to the extent necessary to ensure that total annual Fund operating expenses (other than interest, taxes, brokerage commissions and other portfolio transaction expenses, capital expenditures, and extraordinary expenses) would not exceed the Fund’s operating expense cap of 2.00% of average daily net assets until August 21, 2014. |
| # | Such ratios are net of fees paid indirectly (see Note B in the Notes to Financial Statements). |
| ¥ | Ratio of expenses to average net assets includes interest expense of less than 0.005% for the year ended December 31, 2015. The interest expense is from utilizing the line of credit (see Note E in the Notes to Financial Statements). |
Notes to Financial Statements are an integral part of this Schedule.
40
Driehaus Frontier Emerging Markets Fund
Financial Highlights
| For the six month period January 1, 2017 through June 30, 2017 (unaudited) | For the year ended December 31, 2017 | For the year ended December 31, 2016 | For the period May 4, 2015 through December 31, 2015 | |||||||||||||
Net asset value, beginning of period | $ | 10.86 | $ | 9.56 | $ | 8.80 | $ | 10.00 | ||||||||
|
|
|
|
|
|
|
| |||||||||
INCOME (LOSS) FROM INVESTMENT OPERATIONS: | ||||||||||||||||
Net investment income (loss) | 0.09 | ^ | 0.15 | ^ | 0.12 | ^ | (0.01 | ) | ||||||||
Net realized and unrealized gain (loss) on investments | (1.01 | ) | 1.76 | 0.69 | (1.19 | ) | ||||||||||
|
|
|
|
|
|
|
| |||||||||
Total income (loss) from investment operations | (0.92 | ) | 1.91 | 0.81 | (1.20 | ) | ||||||||||
|
|
|
|
|
|
|
| |||||||||
LESS DISTRIBUTIONS: | ||||||||||||||||
Dividends from net investment income | — | (0.03 | ) | (0.05 | ) | — | ||||||||||
Distributions from capital gains | — | (0.58 | ) | — | — | |||||||||||
|
|
|
|
|
|
|
| |||||||||
Total distributions | — | (0.61 | ) | (0.05 | ) | — | ||||||||||
|
|
|
|
|
|
|
| |||||||||
Redemption fees added to paid-in capital | 0.00 | ~ | 0.00 | ~ | 0.00 | ~ | — | |||||||||
|
|
|
|
|
|
|
| |||||||||
Net asset value, end of period | $ | 9.94 | $ | 10.86 | $ | 9.56 | $ | 8.80 | ||||||||
|
|
|
|
|
|
|
| |||||||||
Total Return | (8.47 | )%** | 20.04 | % | 9.26 | % | (12.00 | )%** | ||||||||
RATIOS/SUPPLEMENTAL DATA | ||||||||||||||||
Net assets, end of period (in 000’s) | $ | 28,739 | $ | 46,092 | $ | 73,317 | $ | 19,570 | ||||||||
Ratio of expenses before reimbursements and waivers and fees recaptured, if any, to average net assets | 2.58 | %* | 2.33 | % | 2.50 | % | 3.89 | %* | ||||||||
Ratio of net expenses to average net assets | 2.00 | %*+# | 1.99 | %+# | 1.99 | %+# | 2.00 | %*+# | ||||||||
Ratio of net investment income (loss) to average net assets | 1.58 | %*+# | 1.44 | %+# | 1.31 | %+# | (0.22 | )%*+# | ||||||||
Portfolio turnover | 62 | %** | 105 | % | 90 | % | 66 | %** | ||||||||
| * | Annualized |
| ** | Not Annualized |
| ^ | Net investment income (loss) per share has been calculated using the average share method. |
| ~ | Amount represents less than $0.01 per share |
| + | Such ratios are after administrative and transfer agent waivers and adviser expense reimbursements, when applicable. BNY Mellon Investment Servicing (US) Inc., the administrative agent and transfer agent, waived a portion of its fees beginning with the Fund’s commencement of operations, May 4, 2015. The Adviser contractually agreed to waive its investment advisory fee or absorb other operating expenses to the extent necessary to ensure that total annual Fund operating expenses (other than interest, taxes, brokerage commissions and other portfolio transaction expenses, capital expenditures, and extraordinary expenses) would not exceed the Fund’s operating expense cap of 2.00% of average daily net assets until May 3, 2021. |
| # | Such ratios are net of fees paid indirectly (see Note B in the Notes to Financial Statements). |
Notes to Financial Statements are an integral part of this Schedule.
41
Driehaus International Small Cap Growth Fund
Financial Highlights
| For the six month period January 1, 2018 through June 30, 2018 (unaudited) | For the year ended December 31, 2017 | For the year ended December 31, 2016 | For the year ended December 31, 2015 | For the year ended December 31, 2014 | For the year ended December 31, 2013 | |||||||||||||||||||
Net asset value, beginning of period | $ | 11.39 | $ | 9.33 | $ | 10.08 | $ | 9.20 | $ | 10.84 | $ | 9.45 | ||||||||||||
|
|
|
|
|
|
|
|
|
|
|
| |||||||||||||
INCOME (LOSS) FROM INVESTMENT OPERATIONS: | ||||||||||||||||||||||||
Net investment income (loss) | (0.01 | ) | (0.04 | ) | (0.02 | ) | (0.02 | )^ | (0.04 | ) | (0.01 | )^ | ||||||||||||
Net realized and unrealized gain (loss) on investments and foreign currency transactions | 0.26 | 3.88 | (0.61 | ) | 1.17 | (0.42 | ) | 2.74 | ||||||||||||||||
|
|
|
|
|
|
|
|
|
|
|
| |||||||||||||
Total income (loss) from investment operations | 0.25 | 3.84 | (0.63 | ) | 1.15 | (0.46 | ) | 2.73 | ||||||||||||||||
|
|
|
|
|
|
|
|
|
|
|
| |||||||||||||
LESS DISTRIBUTIONS: | ||||||||||||||||||||||||
Dividends from net investment income | — | — | — | (0.03 | ) | (0.06 | ) | (0.13 | ) | |||||||||||||||
Distributions from capital gains | — | (1.78 | ) | (0.12 | ) | (0.24 | ) | (1.12 | ) | (1.21 | ) | |||||||||||||
|
|
|
|
|
|
|
|
|
|
|
| |||||||||||||
Total distributions | — | (1.78 | ) | (0.12 | ) | (0.27 | ) | (1.18 | ) | (1.34 | ) | |||||||||||||
|
|
|
|
|
|
|
|
|
|
|
| |||||||||||||
Redemption fees added to paid-in capital | 0.00 | ~ | 0.00 | ~ | 0.00 | ~ | 0.00 | ~ | 0.00 | ~ | 0.00 | ~ | ||||||||||||
|
|
|
|
|
|
|
|
|
|
|
| |||||||||||||
Net asset value, end of period | $ | 11.64 | $ | 11.39 | $ | 9.33 | $ | 10.08 | $ | 9.20 | $ | 10.84 | ||||||||||||
|
|
|
|
|
|
|
|
|
|
|
| |||||||||||||
Total Return | 2.20 | %** | 41.44 | % | (6.22 | )% | 12.58 | % | (4.32 | )% | 29.24 | % | ||||||||||||
RATIOS/SUPPLEMENTAL DATA | ||||||||||||||||||||||||
Net assets, end of period (in 000’s) | $ | 310,441 | $ | 325,361 | $ | 270,401 | $ | 341,249 | $ | 218,979 | $ | 270,671 | ||||||||||||
Ratio of expenses before reimbursements, waivers and fees paid indirectly to average net assets | 1.72 | %* | 1.73 | % | 1.72 | % | 1.71 | % | 1.74 | % | 1.73 | % | ||||||||||||
Ratio of net expenses to average net assets | 1.71 | %*# | 1.71 | %# | 1.70 | %# | 1.70 | %# | 1.72 | %# | 1.70 | %# | ||||||||||||
Ratio of net investment income (loss) to average net assets | (0.14 | )%*# | (0.44 | )%# | (0.15 | )%# | (0.19 | )%# | (0.40 | )%# | (0.11 | )%# | ||||||||||||
Portfolio turnover | 67 | %** | 143 | % | 151 | % | 251 | % | 277 | % | 320 | % | ||||||||||||
| * | Annualized |
| ** | Not annualized |
| ^ | Net investment income (loss) per share has been calculated using the average shares method. |
| ~ | Amount represents less than $0.01 per share |
| # | Such ratios are net of fees paid indirectly (see Note B in the Notes to Financial Statements). |
Notes to Financial Statements are an integral part of this Schedule.
42
Driehaus Micro Cap Growth Fund
Financial Highlights
| For the six month period January 1, 2018 through June 30, 2018 (unaudited) | For the year ended December 31, 2017 | For the year ended December 31, 2016 | For the year ended December 31, 2015 | For the year ended December 31, 2014 | For the period November 18, 2013 through December 31, 2013 | |||||||||||||||||||
Net asset value, beginning of period | $ | 14.44 | $ | 12.65 | $ | 10.74 | $ | 11.25 | $ | 10.74 | $ | 10.00 | ||||||||||||
|
|
|
|
|
|
|
|
|
|
|
| |||||||||||||
INCOME (LOSS) FROM INVESTMENT OPERATIONS: | ||||||||||||||||||||||||
Net investment income (loss) | (0.10 | )^ | (0.18 | )^ | (0.11 | )^ | (0.14 | )^ | (0.14 | ) | (0.02 | ) | ||||||||||||
Net realized and unrealized gain (loss) on investments | 3.31 | 3.26 | 2.02 | 0.08 | 1.01 | 0.76 | ||||||||||||||||||
|
|
|
|
|
|
|
|
|
|
|
| |||||||||||||
Total income (loss) from investment operations | 3.21 | 3.08 | 1.91 | (0.06 | ) | 0.87 | 0.74 | |||||||||||||||||
|
|
|
|
|
|
|
|
|
|
|
| |||||||||||||
LESS DISTRIBUTIONS: | ||||||||||||||||||||||||
Dividends from net investment income | — | — | — | — | — | — | ||||||||||||||||||
Distributions from capital gains | — | (1.29 | ) | — | (0.45 | ) | (0.36 | ) | — | |||||||||||||||
|
|
|
|
|
|
|
|
|
|
|
| |||||||||||||
Total distributions | — | (1.29 | ) | — | (0.45 | ) | (0.36 | ) | — | |||||||||||||||
|
|
|
|
|
|
|
|
|
|
|
| |||||||||||||
Redemption fees added to paid-in capital | 0.00 | ~ | 0.00 | ~ | 0.00 | ~ | 0.00 | ~ | 0.00 | ~ | — | |||||||||||||
|
|
|
|
|
|
|
|
|
|
|
| |||||||||||||
Net asset value, end of period | $ | 17.65 | $ | 14.44 | $ | 12.65 | $ | 10.74 | $ | 11.25 | $ | 10.74 | ||||||||||||
|
|
|
|
|
|
|
|
|
|
|
| |||||||||||||
Total Return | 22.23 | %** | 24.30 | % | 17.78 | % | (0.55 | )% | 8.21 | % | 7.40 | %** | ||||||||||||
RATIOS/SUPPLEMENTAL DATA | ||||||||||||||||||||||||
Net assets, end of period (in 000’s) | $ | 438,351 | $ | 322,533 | $ | 396,590 | $ | 282,178 | $ | 111,846 | $ | 74,677 | ||||||||||||
Ratio of expenses before reimbursements and waivers and fees recaptured, if any, to average net assets | 1.44 | %* | 1.45 | %¥ | 1.48 | % | 1.53 | % | 1.59 | % | 2.28 | %* | ||||||||||||
Ratio of net expenses to average net assets | 1.43 | %*# | 1.43 | %#¥ | 1.44 | %+# | 1.52 | %+# | 1.60 | %+# | 1.70 | %*+# | ||||||||||||
Ratio of net investment income (loss) to average net assets | (1.25 | )%*# | (1.33 | )%# | (1.00 | )%+# | (1.21 | )%+# | (1.39 | )%+# | (1.55 | )%*+# | ||||||||||||
Portfolio turnover | 75 | %** | 177 | % | 180 | % | 183 | % | 191 | % | 21 | %** | ||||||||||||
| * | Annualized |
| ** | Not Annualized |
| ^ | Net investment income (loss) per share has been calculated using the average shares method. |
| ~ | Amount represents less than $0.01 per share |
| + | Such ratios are after administrative and transfer agent waivers and adviser expense reimbursements, when applicable. BNY Mellon Investment Servicing (US) Inc., the administrative agent and transfer agent, waived a portion of its fees beginning with the Fund’s commencement of operations, November 18, 2013. The Adviser contractually agreed to waive its investment advisory fee or absorb other operating expenses to the extent necessary to ensure that total annual Fund operating expenses (other than interest, taxes, brokerage commissions and other portfolio transaction expenses, capital expenditures, and extraordinary expenses) would not exceed the Fund’s operating expense cap of 1.70% of average daily net assets until November 17, 2016. |
| # | Such ratios are net of fees paid indirectly (see Note B in the Notes to Financial Statements). |
| ¥ | Ratio of expenses to average net assets includes interest expense of less than 0.005% for the year ended December 31, 2017. The interest expense is from utilizing the line of credit (see Note E in the Notes to Financial Statements). |
Notes to Financial Statements are an integral part of this Schedule.
43
Driehaus Small Cap Growth Fund — Investor Class
Financial Highlights
| For the six month period January 1, 2018 through June 30, 2018 (unaudited) | For the period August 21, 2017 through December 31, 2017 | |||||||
Net asset value, beginning of period | $ | 11.62 | $ | 10.00 | ||||
|
|
|
| |||||
INCOME (LOSS) FROM INVESTMENT OPERATIONS: | ||||||||
Net investment income (loss) | (0.06 | )^ | (0.04 | )^ | ||||
Net realized and unrealized gain (loss) on investments and foreign currency transactions | 2.45 | 1.86 | ||||||
|
|
|
| |||||
Total income (loss) from investment operations | 2.39 | 1.82 | ||||||
|
|
|
| |||||
LESS DISTRIBUTIONS: | ||||||||
Dividends from net investment income | — | — | ||||||
Distributions from capital gains | — | (0.20 | ) | |||||
|
|
|
| |||||
Total distributions | — | (0.20 | ) | |||||
|
|
|
| |||||
Redemption fees added to paid-in capital | — | — | ||||||
|
|
|
| |||||
Net asset value, end of period | $ | 14.01 | $ | 11.62 | ||||
|
|
|
| |||||
Total Return | 20.57 | %** | 18.18 | %** | ||||
RATIOS/SUPPLEMENTAL DATA | ||||||||
Net assets, end of period (in 000’s) | $ | 2,062 | $ | 1,344 | ||||
Ratio of expenses before reimbursements, waivers and fees paid indirectly to average net assets | 5.29 | %* | 7.86 | %* | ||||
Ratio of net expenses to average net assets | 1.19 | %*+# | 1.20 | %*+ | ||||
Ratio of net investment income (loss) to average net assets | (0.97 | )%*+# | (0.94 | )%*+ | ||||
Portfolio turnover | 94 | %** | 66 | %** | ||||
| * | Annualized |
| ^ | Net investment loss per share has been calculated using the average share method. |
| ** | Not Annualized |
| ~ | Amount represents less than $0.01 per share |
| + | Such ratios are after administrative and transfer agent waivers and adviser expense reimbursements, when applicable. BNY Mellon Investment Servicing (US) Inc., the administrative agent and transfer agent, waived a portion of its fees beginning with the Fund’s commencement of operations, August 21, 2017. The Adviser contractually agreed to waive its investment advisory fee or absorb other operating expenses to the extent necessary to ensure that total annual Fund operating expenses (other than interest, taxes, brokerage commissions and other portfolio transaction expenses, capital expenditures, and extraordinary expenses) would not exceed the Fund’s operating expense cap of 1.20% of average daily net assets until August 20, 2020. |
| # | Such ratios are net of fees paid indirectly (see Note B in the Notes to Financial Statements). |
Notes to Financial Statements are an integral part of this Schedule.
44
Driehaus Small Cap Growth Fund — Institutional Class
Financial Highlights
| For the six month period January 1, 2018 through June 30, 2018 (unaudited) | For the period August 21, 2017 through December 31, 2017 | |||||||
Net asset value, beginning of period | $ | 11.63 | $ | 10.00 | ||||
|
|
|
| |||||
INCOME (LOSS) FROM INVESTMENT OPERATIONS: | ||||||||
Net investment income (loss) | (0.05 | )^ | (0.03 | )^ | ||||
Net realized and unrealized gain (loss) on investments and foreign currency transactions | 2.46 | 1.86 | ||||||
|
|
|
| |||||
Total income (loss) from investment operations | 2.41 | 1.83 | ||||||
|
|
|
| |||||
LESS DISTRIBUTIONS: | ||||||||
Dividends from net investment income | — | — | ||||||
Distributions from capital gains | — | (0.20 | ) | |||||
|
|
|
| |||||
Total distributions | — | (0.20 | ) | |||||
|
|
|
| |||||
Redemption fees added to paid-in capital | — | — | ||||||
|
|
|
| |||||
Net asset value, end of period | $ | 14.04 | $ | 11.63 | ||||
|
|
|
| |||||
Total Return | 20.72 | %** | 18.28 | %** | ||||
RATIOS/SUPPLEMENTAL DATA | ||||||||
Net assets, end of period (in 000’s) | $ | 81,192 | $ | 38,631 | ||||
Ratio of expenses before reimbursements, waivers and fees paid indirectly to average net assets | 1.27 | %* | 1.48 | %* | ||||
Ratio of net expenses to average net assets | 0.94 | %*+# | 0.95 | %*+ | ||||
Ratio of net investment income (loss) to average net assets | (0.72 | )%*+# | (0.69 | )%*+ | ||||
Portfolio turnover | 94 | %** | 66 | %** | ||||
| * | Annualized |
| ** | Not Annualized |
| ^ | Net investment loss per share has been calculated using the average share method. |
| ~ | Amount represents less than $0.01 per share |
| + | Such ratios are after administrative and transfer agent waivers and adviser expense reimbursements, when applicable. BNY Mellon Investment Servicing (US) Inc., the administrative agent and transfer agent, waived a portion of its fees beginning with the Fund’s commencement of operations, August 21, 2017. The Adviser contractually agreed to waive its investment advisory fee or absorb other operating expenses to the extent necessary to ensure that total annual Fund operating expenses (other than interest, taxes, brokerage commissions and other portfolio transaction expenses, capital expenditures, and extraordinary expenses) would not exceed the Fund’s operating expense cap of 0.95% of average daily net assets until August 20, 2020. |
| # | Such ratios are net of fees paid indirectly (see Note B in the Notes to Financial Statements). |
Notes to Financial Statements are an integral part of this Schedule.
45
Notes to Financial Statements (unaudited)
A. SUMMARY OF SIGNIFICANT ACCOUNTING POLICIES
Organization
The Driehaus Mutual Funds (the “Trust”) is an open-end registered management investment company under the Investment Company Act of 1940, as amended, organized as a Delaware statutory trust, with nine separate series currently in operation. The Trust was organized under an Agreement and Declaration of Trust dated May 31, 1996, as subsequently amended and restated as of June 6, 2013, and amended as of June 4, 2015, and may issue an unlimited number of full and fractional units of beneficial interest (shares) without par value. The six series (“Funds” or each a “Fund”) included in this report are as follows:
| Fund | Commencement of Operations | |||
Driehaus Emerging Markets Growth Fund | 12/31/97 | |||
Driehaus Emerging Markets Small Cap Growth Fund | 08/22/11 | |||
Driehaus Frontier Emerging Markets Fund | 05/04/15 | |||
Driehaus International Small Cap Growth Fund | 09/17/07 | |||
Driehaus Micro Cap Growth Fund* | 11/18/13 | |||
Driehaus Small Cap Growth Fund | 08/21/17 | |||
| * | On September 29, 2017, the Driehaus Micro Cap Growth Fund was closed to new investors. |
The Driehaus Emerging Markets Growth Fund and Driehaus Small Cap Growth Fund each offer two classes of shares, designated as Institutional Class and Investor Class. Each class of shares represents an interest in the same portfolio of investments of the respective Fund and voting privileges with respect to the Fund in general. Each class of shares has exclusive voting rights with respect to any matters involving only that class. The classes of each Fund pay pro rata the costs of management of that Fund’s portfolio, including the management fee. Each class of a Fund bears the cost of its own transfer agency and shareholder servicing arrangements, and any other class-specific expenses, which will result in differing expenses by class.
The investment objective of each Fund is to maximize capital appreciation.
Driehaus Emerging Markets Growth Fund seeks to achieve its objective by investing primarily in equity securities of emerging markets companies.
Driehaus Emerging Markets Small Cap Growth Fund seeks to achieve its objective by investing primarily in equity securities of small capitalization emerging markets companies.
Driehaus Frontier Emerging Markets Fund seeks to achieve its objective by investing primarily in equity securities of frontier emerging markets companies.
Driehaus International Small Cap Growth Fund seeks to achieve its objective by investing primarily in equity securities of smaller capitalization non-U.S. companies exhibiting strong growth characteristics.
Driehaus Micro Cap Growth Fund seeks to achieve its objective by investing primarily in equity securities of micro capitalization U.S. companies exhibiting strong growth characteristics.
Driehaus Small Cap Growth Fund seeks to achieve its objective by investing primarily in equity securities of U.S. small capitalization companies.
The Funds, which are investment companies within the scope of Financial Accounting Standards Board (“FASB”) Accounting Standards Update 2013-08, follow accounting and reporting guidance under FASB Accounting Standards Codification Topic 946, Financial Services-Investment Companies.
Securities Valuation and Transactions
Equity securities and exchange-traded options are valued at the last sale price as of the close of the primary exchange or other designated time. Equity certificates are valued at the last sale price of the underlying security as of the close of the primary exchange. Swaps, forward foreign currency contracts and other financial derivatives are valued daily, primarily by an independent pricing service using pricing models, and are generally classified as level 2. The pricing models use inputs that are observed from actively quoted markets such as issuer details, indices, spreads, interest rates, yield curves, dividends and exchange rates. If valuations are not available from the independent pricing service or values received are deemed not representative of market value, values will be obtained from a third party broker-dealer or counterparty.
46
Driehaus Mutual Funds
Notes to Financial Statements (unaudited) — (Continued)
Investments initially valued in currencies other than the U.S. dollar are converted to the U.S. dollar using exchange rates obtained from an independent pricing service. In addition, if quotations are not readily available, if the values have been materially affected by events occurring after the closing of a foreign market, or if there has been a movement in the U.S. market that exceeds a certain threshold, assets may be valued at fair value as determined in good faith by or under the direction of the Trust’s Board of Trustees. Events that may materially affect asset values that could cause a fair value determination include, but are not limited to: corporate announcements relating to a specific security; natural and other disasters which may impact an entire market or region; and political and other events which may be global or impact a particular country or region. The frequency with which these procedures are used cannot be predicted and may be utilized to a significant extent. To the extent utilized, securities would be considered level 2 in the hierarchy described below. Substantially all transfers between level 1 and level 2 relate to the use of these procedures.
Each Fund is subject to fair value accounting standards that define fair value, establish the framework for measuring fair value and provide a three-level hierarchy for fair valuation based upon the inputs to the valuation as of the measurement date. The three levels of the fair value hierarchy are as follows:
Level 1 — quoted prices in active markets for identical securities
Level 2 — significant observable inputs (including quoted prices for similar securities, interest rates, prepayment speeds, credit risk, etc.)
Level 3 — significant unobservable inputs (including the Funds’ own assumptions in determining the fair value of investments)
The inputs or methodology used for valuing securities are not necessarily an indication of the risk associated with investing in those securities.
The summary of the Funds’ investments that are measured at fair value by level within the fair value hierarchy as of June 30, 2018 is as follows:
Fund | Total Value at June 30, 2018 | Level 1 Quoted Price | Level 2 Significant Observable Inputs | Level 3 Significant Unobservable Inputs | ||||||||||||
Driehaus Emerging Markets Growth Fund | ||||||||||||||||
Equity Securities: | ||||||||||||||||
Africa | $ | 61,007,800 | $ | 61,007,800 | $ | — | $ | — | ||||||||
Europe | 238,923,901 | 228,829,196 | 10,094,705 | — | ||||||||||||
Far East | 1,070,404,266 | 1,070,404,266 | — | — | ||||||||||||
Middle East | 35,951,703 | 35,951,703 | — | — | ||||||||||||
North America | 63,798,088 | 63,798,088 | — | — | ||||||||||||
South America | 105,515,721 | 105,515,721 | — | — | ||||||||||||
|
|
|
|
|
|
|
| |||||||||
Total Investments | $ | 1,575,601,479 | $ | 1,565,506,774 | $ | 10,094,705 | $ | — | ||||||||
|
|
|
|
|
|
|
| |||||||||
47
Driehaus Mutual Funds
Notes to Financial Statements (unaudited) — (Continued)
Fund | Total Value at June 30, 2018 | Level 1 Quoted Price | Level 2 Significant Observable Inputs | Level 3 Significant Unobservable Inputs | ||||||||||||
Driehaus Emerging Markets Small Cap Growth Fund | ||||||||||||||||
Assets: | ||||||||||||||||
Equity Securities: | ||||||||||||||||
Africa | $ | 8,791,259 | $ | 8,791,259 | $ | — | $ | — | ||||||||
Europe | 11,801,382 | 11,801,382 | — | — | ||||||||||||
Far East | 156,476,725 | 156,476,725 | — | — | ||||||||||||
Middle East | 5,676,305 | 5,676,305 | — | — | ||||||||||||
North America | 11,569,729 | 11,569,729 | — | — | ||||||||||||
South America | 9,196,491 | 9,196,491 | — | — | ||||||||||||
Purchased Put Options | 1,435,000 | 1,435,000 | — | — | ||||||||||||
Forward Contracts | 193,061 | — | 193,061 | — | ||||||||||||
|
|
|
|
|
|
|
| |||||||||
Total Assets | $ | 205,139,952 | $ | 204,946,891 | $ | 193,061 | $ | — | ||||||||
|
|
|
|
|
|
|
| |||||||||
Liabilities: | ||||||||||||||||
Written Put Options . | $ | (310,000 | ) | $ | (310,000 | ) | $ | — | $ | — | ||||||
Forward Contracts | (25,052 | ) | — | (25,052 | ) | — | ||||||||||
|
|
|
|
|
|
|
| |||||||||
Total Liabilities | $ | (335,052 | ) | $ | (310,000 | ) | $ | (25,052 | ) | $ | — | |||||
|
|
|
|
|
|
|
| |||||||||
Driehaus Frontier Emerging Markets Fund | ||||||||||||||||
Equity Securities: | ||||||||||||||||
Africa | $ | 6,103,687 | $ | 6,103,687 | $ | — | $ | — | ||||||||
Europe | 3,711,126 | 3,711,126 | — | — | ||||||||||||
Far East | 9,485,444 | 9,485,444 | — | — | ||||||||||||
Middle East | 5,870,536 | 5,870,536 | — | — | ||||||||||||
South America | 2,140,089 | 2,140,089 | — | — | ||||||||||||
Equity Certificates* . | 95,224 | — | 95,224 | — | ||||||||||||
|
|
|
|
|
|
|
| |||||||||
Total Investments | $ | 27,406,106 | $ | 27,310,882 | $ | 95,224 | $ | — | ||||||||
|
|
|
|
|
|
|
| |||||||||
Driehaus International Small Cap Growth Fund | ||||||||||||||||
Investments in Securities* | $ | 287,381,183 | $ | 287,381,183 | $ | — | $ | — | ||||||||
|
|
|
|
|
|
|
| |||||||||
Driehaus Micro Cap Growth Fund | ||||||||||||||||
Investments in Securities* | $ | 436,811,366 | $ | 436,811,366 | $ | — | $ | — | ||||||||
|
|
|
|
|
|
|
| |||||||||
Driehaus Small Cap Growth Fund | ||||||||||||||||
Investments in Securities* | $ | 82,951,386 | $ | 82,951,386 | $ | — | $ | — | ||||||||
|
|
|
|
|
|
|
| |||||||||
| * | See Schedule of Investments for industry and/or country breakout. |
Transfers between levels, if any, are recognized as of the last day in the fiscal quarter of the period in which the event or change in circumstances that caused the reclassification occurred. The Funds used observable inputs in their valuation methodologies whenever they were available and deemed reliable.
48
Driehaus Mutual Funds
Notes to Financial Statements (unaudited) — (Continued)
When fair value pricing is employed, the prices of securities used by a Fund to calculate its net asset value may differ from closing prices for the same securities, which means that a Fund may value those securities higher or lower than another fund that does not employ fair value. In addition, the fair value price may differ materially from the value a Fund may ultimately realize.
For the period ended June 30, 2018, securities with end of period values of $498,727 held by Driehaus Frontier Emerging Markets Fund were transferred from level 2 to level 1, due to an increase in trading volume at the end of the quarter.
Securities transactions are accounted for on trade date. The cost of investments sold is determined by the use of the specific identification method for both financial reporting and income tax purposes. Interest income is recorded on an accrual basis. Dividend income, net of non-reclaimable foreign taxes withheld, is recorded on the ex-dividend date or as soon as the information is available. Income and expenses are accrued daily. The Funds’ investment income, expenses (other than class-specific expenses) and unrealized and realized gains and losses are allocated daily to each class of shares based upon the relative proportion of net assets of each class at the beginning of the day.
Options Contracts
The Funds are subject to equity and other risk exposures in the normal course of pursuing their investment objective. The Funds may use options contracts to hedge their portfolio or a portion thereof or speculatively for the purpose of profiting from a decline in the market value of a security. The Driehaus Emerging Markets Small Cap Growth Fund used both purchased and written options during the period January 1, 2018 through June 30, 2018 to hedge exposure to certain countries, sectors or currencies.
The Funds may write covered call and put options on futures, securities or currencies the Funds own or in which they may invest. Writing put options tends to increase a Fund’s exposure to the underlying instrument. Writing call options tends to decrease a Fund’s exposure to the underlying instrument. When a Fund writes a call or put option, an amount equal to the premium received is recorded as a liability and subsequently marked-to-market to reflect the current value of the option written. These liabilities are reflected as written options outstanding in the Schedule of Investments. Payments received or made, if any, from writing options with premiums to be determined on a future date are reflected as such in the Schedule of Investments. Premiums received from writing options that expire are treated as realized gains. Premiums received from writing options that are exercised or closed are added to the proceeds or offset against amounts paid on the underlying future, security or currency transaction to determine the realized gain or loss. A Fund, as a writer of an option, has no control over whether the underlying future, security or currency may be sold (call) or purchased (put) and, as a result, bears the market risk of an unfavorable change in the price of the future, security or currency underlying the written option. The risk exists that a Fund may not be able to enter into a closing transaction because of an illiquid market.
For the period January 1, 2018 through June 30, 2018, the average monthly volume of purchased and written options based on premium value for Driehaus Emerging Markets Small Cap Growth Fund were $1,166,533 and $310,677, respectively.
The Funds may also purchase put and call options. Purchasing call options tends to increase a Fund’s exposure to the underlying instrument. Purchasing put options tends to decrease a Fund’s exposure to the underlying instrument. A Fund pays a premium which is included in its Schedule of Investments as an investment and subsequently marked-to-market to reflect the current value of the option. Premiums paid for purchasing options that expire are treated as realized losses. Premiums paid for purchasing options that are exercised or closed are added to the amounts paid or offset against the proceeds on the underlying future, security or currency transaction to determine the realized gain or loss. When entering into purchased option contracts, a Fund bears the risk of securities prices moving unexpectedly, in which case, a Fund may not achieve the anticipated benefits of the purchased option contracts; however, the risk of loss is limited to the premium paid. As of June 30, 2018, Funds with outstanding options are as listed on the Schedules of Investments.
49
Driehaus Mutual Funds
Notes to Financial Statements (unaudited) — (Continued)
Swap Contracts
The Driehaus Emerging Markets Small Cap Growth Fund may engage in various swap transactions, including forward rate agreements and interest rate, primarily to manage risk, or as alternatives to direct investments. The Fund may also engage in credit default swaps, which involve the exchange of a periodic premium for protection against a defined credit event (such as payment default, refinancing or bankruptcy). The Fund engaged in credit default swaps during the period January 1, 2018 through June 30, 2018 to protect against credit events and interest rate swaps to hedge currency risks.
Under the terms of a credit default swap contract, one party acts as a guarantor receiving a periodic payment that is a fixed percentage applied to a notional amount. In return, the party agrees to purchase the notional amount of the underlying instrument, at par, if a credit event occurs during the term of the contract. The Fund may enter into credit default swaps in which the Fund acts as guarantor (a seller of protection), and may enter into credit default swaps in which the counterparty acts as guarantor (a buyer of protection). Premiums paid to or by the Fund are accrued daily and included in realized gain (loss) on swaps. The contracts are marked-to-market daily using fair value estimates provided by an independent pricing service. Changes in value are recorded as net change in unrealized appreciation (depreciation) on the statements of operations. Unrealized gains are reported as an asset and unrealized losses are reported as a liability on the statement of assets and liabilities. Gains or losses are realized upon termination of the contracts. The risk of loss under a swap contract may exceed the amount recorded as an asset or a liability. The notional amount of a swap contract is the reference amount pursuant to which the counterparties make payments. For swaps in which the referenced obligation is an index, in the event of default of any debt security included in the corresponding index, the Fund pays or receives the percentage of the corresponding index that the defaulted security comprises (1) multiplied by the notional value and (2) multiplied by the ratio of one minus the ratio of the market value of the defaulted debt security to its par value. The maximum exposure to loss of the notional value as a seller of credit default swaps outstanding at June 30, 2018, for the Driehaus Emerging Markets Small Cap Growth Fund was $0.
Interest rate swaps are agreements between two parties to exchange cash flows based on a notional principal amount. The Fund may elect to pay a fixed rate and receive a floating rate or receive a fixed rate and pay a floating rate on a notional principal amount. The net interest received or paid on interest rate swap agreements is accrued daily as interest income/expense. Interest rate swaps are marked-to-market daily using fair value estimates provided by an independent pricing service. Changes in value, including accrued interest, are recorded as net change in unrealized appreciation (depreciation) on the statement of operations. Unrealized gains are reported as an asset and unrealized losses are reported as a liability on the statement of assets and liabilities. Gains or losses are realized upon termination of the contracts. The risk of loss under a swap contract may exceed the amount recorded as an asset or a liability.
Risks associated with swap contracts include changes in the returns of underlying instruments, failure of the counterparties to perform under the contracts’ terms and the possible lack of liquidity with respect to the contracts. Credit default swaps can involve greater risks than if an investor had invested in the reference obligation directly since, in addition to general market risks, credit default swaps are subject to counterparty credit risk, leverage risk, hedging risk, correlation risk and liquidity risk. The Fund discloses swap contracts on a gross basis, with no netting of contracts held with the same counterparty. As of June 30, 2018, the Driehaus Emerging Markets Small Cap Growth Fund had no outstanding swap contracts.
Forward Foreign Currency Contracts
The Driehaus Emerging Markets Small Cap Growth Fund used forward foreign currency contracts during the period January 1, 2018 through June 30, 2018 to hedge foreign currency exposure in the portfolio. A forward foreign currency contract involves an obligation to purchase or sell a specific currency at a future date, which may be any fixed number of days from the date of the contract agreed upon by the parties, at a price set at the time of the contract. These contracts are principally traded in the inter-bank market conducted directly between currency traders (usually large commercial banks) and their customers.
The market value of a forward foreign currency contract fluctuates with changes in currency exchange rates. Outstanding forward foreign currency contracts are valued daily at current market rates and the resulting
50
Driehaus Mutual Funds
Notes to Financial Statements (unaudited) — (Continued)
change in market value is recorded as net change in unrealized appreciation or depreciation on the statement of operations. When a forward foreign currency contract is settled, the Fund records a realized gain or loss equal to the difference between the value at the time the forward foreign currency contract was opened and the value at the time it was settled. A forward foreign currency contract may involve market risk in excess of the unrealized gain or loss reflected on the Statements of Assets and Liabilities. In addition, the Fund could be exposed to credit risk if the counterparties are unable or unwilling to meet the terms of the contracts or market risk if the value of the foreign currency changes unfavorably. As of June 30, 2018, the Driehaus Emerging Markets Small Cap Growth Fund had outstanding forward foreign currency contracts as listed on the Schedule of Investments.
Foreign Currency Spot Contracts
The Funds enter into foreign currency spot contracts to facilitate transactions in foreign currency denominated securities. These spot contracts are typically open for 2 to 5 days, depending on the settlement terms of the underlying security transaction. On June 30, 2018, the Funds had foreign currency spot contracts outstanding under which they are obligated to exchange currencies at specified future dates. The net unrealized appreciation or depreciation on spot contracts is reflected as Net unrealized appreciation or depreciation on unsettled foreign currency transactions in the Statements of Assets and Liabilities.
Equity Certificates
The Funds may invest in equity certificates, which allow the Funds to participate in the appreciation (depreciation) of the underlying security without actually owning the underlying security. These derivative instruments are purchased pursuant to an agreement with a financial institution and are valued at a calculated market price based on the value of the underlying security in accordance with the agreement. These equity certificates are subject to the credit risk of the issuing financial institution. There is no off-balance sheet risk associated with equity certificates and the Funds’ potential loss is limited to the purchase price of the securities. The Funds are exposed to credit risk associated with the counterparty to the transaction, which is monitored by the Funds’ management on a periodic basis. A Fund’s equity certificates are not subject to any master netting agreement.
On June 30, 2018, Driehaus Frontier Emerging Markets Fund had unrealized appreciation (depreciation) of $38,166 as a result of its investments in these financial instruments. The aggregate market values of these certificates for Driehaus Frontier Emerging Markets Funds represented 0.3% of its total market value of investments at June 30, 2018.
Derivative Investment Holdings Categorized by Risk Exposure
Each Fund is subject to the FASB’s “Disclosures about Derivative Instruments and Hedging Activities” (the “Derivatives Statement”). The Derivatives Statement amends and expands disclosures about derivative instruments and hedging activities. The Derivatives Statement is intended to improve financial reporting about derivative instruments requiring enhanced disclosures to enable investors to better understand how and why the Funds use derivative instruments, how these derivative instruments are accounted for and their effects on the Funds’ financial position and results of operations.
The following table sets forth the fair value and the location in the Statement of Assets and Liabilities of the Driehaus Emerging Markets Small Cap Growth Fund’s derivative contracts by primary risk exposure as of June 30, 2018:
Risk exposure category | Asset derivatives | Fair value | Liability derivatives | Fair value | ||||||||
Equity contracts | Investments, at fair value | $ | 1,435,000 | Written Options outstanding, at fair value | $ | 310,000 | ||||||
Foreign currency contracts | Unrealized appreciation on forward foreign currency contracts | $ | 193,061 | Unrealized depreciation on forward foreign currency contracts | $ | 25,052 | ||||||
51
Driehaus Mutual Funds
Notes to Financial Statements (unaudited) — (Continued)
The following table sets forth the fair value and the location in the Statement of Assets and Liabilities of the Driehaus Frontier Emerging Markets Fund’s derivative contracts by primary risk exposure as of June 30, 2018:
Risk exposure category | Asset derivatives | Fair value | ||||
Equity contracts | Investments, at fair value | $ | 95,224 | |||
The following table sets forth the Driehaus Emerging Markets Small Cap Growth Fund’s net realized gain (loss) by primary risk exposure and by type of derivative contract for the period January 1, 2018 through June 30, 2018.
| Amount of realized gain (loss) on derivatives | ||||||||||||||||||||
Risk exposure category | Credit Default Swap Contracts | Interest Rate Swap Contracts | Purchased Options | Written Options | Forward Foreign Currency Contracts | |||||||||||||||
Credit contracts | $ | (1,073,421 | ) | $ | — | $ | — | $ | — | $ | — | |||||||||
Equity contracts | — | — | 1,550,433 | (440,501 | ) | — | ||||||||||||||
Foreign currency contracts | — | — | — | — | (282,021 | ) | ||||||||||||||
Interest contracts | — | 480,206 | — | — | — | |||||||||||||||
The following table sets forth the Driehaus Emerging Markets Small Cap Growth Fund’s change in net unrealized appreciation (depreciation) by primary risk exposure and by type of derivative contract for the period January 1, 2018 through June 30, 2018.
| Change in unrealized appreciation (depreciation) on derivatives | ||||||||||||||||||||
Risk exposure category | Credit Default Swap Contracts | Interest Rate Swap Contracts | Purchased Options | Written Options | Forward Foreign Currency Contracts | |||||||||||||||
Credit contracts | $ | 937,408 | $ | — | $ | — | $ | — | $ | — | ||||||||||
Equity contracts | — | — | (128,426 | ) | 15,301 | — | ||||||||||||||
Foreign currency contracts | — | — | — | — | 168,009 | |||||||||||||||
Interest rate contracts | — | 12,446 | — | — | — | |||||||||||||||
The following table sets forth the Driehaus Frontier Emerging Markets Fund’s change in net unrealized appreciation (depreciation) by primary risk exposure and by type of derivative contract for the period January 1, 2018 through June 30, 2018.
| Change in unrealized appreciation (depreciation) on derivatives | ||||
Risk exposure category | Equity Certificates | |||
Equity contracts | $ | 8,445 | ||
Disclosures about Offsetting Assets and Liabilities
The Driehaus Emerging Markets Small Cap Growth Fund is party to various agreements, including International Swaps and Derivatives Association Inc. master agreements and related Credit Support Annexes (“Master Netting Agreements” or “MNA”), which govern the terms of certain transactions with select counterparties. MNAs are designed to reduce counterparty risk associated with the relevant transactions by establishing credit protection mechanisms and providing standardization as a means of improving legal certainty. As MNAs are specific to the unique operations of different asset types, they allow the Fund to close out and net its total exposure to a counterparty in the event of default with respect to all of the transactions governed under a single agreement with that counterparty. MNAs can also help reduce counterparty risk by specifying collateral posting requirements at pre-arranged exposure levels. Securities and cash pledged as collateral are reflected as assets on the Statement of Assets and Liabilities as either a component of Investments at fair value or Collateral held at custodian for the benefit of brokers.
52
Driehaus Mutual Funds
Notes to Financial Statements (unaudited) — (Continued)
The Funds’ derivative contracts held at June 30, 2018, are not accounted for as hedging instruments under U.S. generally accepted accounting principles (“U.S. GAAP”). For financial reporting purposes, the Funds do not offset financial assets and financial liabilities that are subject to MNAs or similar arrangements on the Statements of Assets and Liabilities. The settlement of exchange-traded options is guaranteed by the exchange the option is traded on and is not subject to arrangements with particular counterparties. For that reason, these options are excluded from the below disclosure.
The following table presents the Driehaus Emerging Markets Small Cap Growth Fund’s financial and derivative assets subject to Master Netting Agreements by type, net of amounts available for offset under a MNA and net of the related collateral received by the Fund as of June 30, 2018:
Description | Gross Amounts Recognized in Statement of Assets and Liabilities | Derivatives Available for Offset | Collateral Received | Net Amount1 | ||||||||||||
Forward contracts | $ | 193,061 | $ | (25,052 | ) | $ | — | $ | 168,009 | |||||||
| 1 | Net amount represents the net amount receivable from the counterparty in the event of default. |
The following table presents the Driehaus Emerging Markets Small Cap Growth Fund’s financial and derivative liabilities subject to Master Netting Agreements by type, net of amounts available for offset under a MNA and net of the related collateral pledged by the Fund as of June 30, 2018:
Description | Gross Amounts Recognized in Statement of Assets and Liabilities | Derivatives Available for Offset | Collateral Pledged | Net Amount2 | ||||||||||||
Forward contracts | $ | 25,052 | $ | (25,052 | ) | $ | — | $ | — | |||||||
| 2 | Net amount represents the net amount payable to the counterparty in the event of default. |
Federal Income Taxes
No provision is made for Federal income taxes since each Fund has elected or will elect to be taxed as a “regulated investment company” under Subchapter M of the Internal Revenue Code (the “Code”) and has made and declared all the required distributions to its shareholders in amounts sufficient to relieve each Fund from all or substantially all Federal income and excise taxes under provisions of current Federal tax law.
Each Fund is subject to accounting standards that establish a minimum threshold for recognizing, and a system for measuring, the benefits of a tax position taken or expected to be taken in a tax return. Taxable years ending 2017, 2016, 2015 and 2014 remain open to Federal and state audit. As of June 30, 2018, management has evaluated the application of these standards to each Fund, and has determined that no provision for income tax is required in each Fund’s financial statements for uncertain tax provisions. The Funds recognize interest and penalties, if any, related to unrecognized tax benefits as income tax expense in the Statements of Operations. During the year, the Funds did not incur any interest or penalties. The Funds may be subject to foreign taxes on income, gains on investments or currency repatriation, a portion of which may be recoverable. Foreign taxes are provided for based on the Funds’ understanding of the tax rules and regulations that exist in the foreign markets in which they invest.
The amount of dividends and distributions from net investment income and net realized capital gains are determined in accordance with Federal income tax regulations, which may differ from U.S. GAAP.
For the year ended December 31, 2017, reclassifications were recorded to undistributed net investment income, undistributed net realized gain and paid-in capital for any permanent tax differences. These reclassifications relate primarily to foreign currency losses, sales of passive foreign investment companies, net operating losses and foreign capital gain taxes paid. Results of operations and net assets were not affected by these reclassifications.
53
Driehaus Mutual Funds
Notes to Financial Statements (unaudited) — (Continued)
Accumulated capital losses represent net capital loss carryovers that may be available for an unlimited period to offset future realized capital gains and thereby reduce future capital gains distributions. Capital loss carryover retains the character of the original loss. The following table shows the amounts of capital loss carryover, if any, by each of the applicable Funds as of December 31, 2017:
| Unlimited Period of Net Capital Loss Carryover | ||||||||||||
| Fund | Short-Term | Long-Term | Accumulated Capital Loss Carryover | |||||||||
Driehaus Emerging Markets Small Cap Growth Fund | $ | 48,263,562 | $ | — | $ | 48,263,562 | ||||||
During the year ended December 31, 2017, Driehaus Emerging Markets Growth Fund, Driehaus Emerging Markets Small Cap Growth Fund, Driehaus Frontier Emerging Markets Fund, Driehaus International Small Cap Growth Fund and Driehaus Micro Cap Growth Fund utilized $186,212,543, $37,701,882, $2,738,349, $2,120,671 and 13,972,775, respectively of capital loss carryforwards.
Pursuant to Federal income tax rules applicable to regulated investment companies, the Funds may elect to treat certain capital losses between November 1 and December 31 as occurring on the first day of the following tax year. For the year ended December 31, 2017, the following qualified late-year losses were deferred and recognized on January 1, 2018:
| Fund | Late-Year Ordinary Loss Deferral | Total Capital Loss Deferral | Total | |||||||||
Driehaus Emerging Markets Growth Fund | $ | 736,532 | $ | — | $ | 736,532 | ||||||
Driehaus Emerging Markets Small Cap Growth Fund | 143,085 | — | 143,085 | |||||||||
Driehaus Frontier Emerging Markets Fund | — | 3,787 | 3,787 | |||||||||
Distributions to Shareholders
The Funds had no distributions during the six months ended June 30, 2018.
The tax character of distributions paid during the fiscal year ended December 31, 2017 was as follows:
Distributions paid from: | Driehaus Emerging Markets Growth Fund | Driehaus Emerging Markets Small Cap Growth Fund | Driehaus Frontier Emerging Markets Fund | Driehaus International Small Cap Growth Fund | Driehaus Micro Cap Growth Fund | Driehaus Small Cap Growth Fund | ||||||||||||||||||
Ordinary income | $ | 11,017,755 | $ | — | $ | 112,002 | $ | 21,815,148 | $ | — | $ | 222,898 | ||||||||||||
Net long-term capital gain | — | — | 2,313,807 | 23,460,614 | 26,974,093 | 442,178 | ||||||||||||||||||
|
|
|
|
|
|
|
|
|
|
|
| |||||||||||||
Total distributions paid | $ | 11,017,755 | $ | — | $ | 2,425,809 | $ | 45,275,762 | $ | 26,974,093 | $ | 665,076 | ||||||||||||
|
|
|
|
|
|
|
|
|
|
|
| |||||||||||||
The tax character of distributions paid during the fiscal year ended December 31, 2016 was as follows:
Distributions paid from: | Driehaus Emerging Markets Growth Fund | Driehaus Emerging Markets Small Cap Growth Fund | Driehaus Frontier Emerging Markets Fund | Driehaus International Small Cap Growth Fund | Driehaus Micro Cap Growth Fund | |||||||||||||||
Ordinary income | $ | 5,290,378 | $ | 450,242 | $ | 420,026 | $ | — | $ | — | ||||||||||
Net long-term capital gain | — | — | — | 3,539,778 | — | |||||||||||||||
|
|
|
|
|
|
|
|
|
| |||||||||||
Total distributions paid | $ | 5,290,378 | $ | 450,242 | $ | 420,026 | $ | 3,539,778 | $ | — | ||||||||||
|
|
|
|
|
|
|
|
|
| |||||||||||
54
Driehaus Mutual Funds
Notes to Financial Statements (unaudited) — (Continued)
As of December 31, 2017, the components of net assets on a tax basis were as follows:
| Driehaus Emerging Markets Growth Fund | Driehaus Emerging Markets Small Cap Growth Fund | Driehaus Frontier Emerging Markets Fund | Driehaus International Small Cap Growth Fund | Driehaus Micro Cap Growth Fund | Driehaus Small Cap Growth Fund | |||||||||||||||||||
Undistributed ordinary income | $ | — | $ | — | $ | — | $ | 5,657,722 | $ | 1,997,501 | $ | 1,454,358 | ||||||||||||
Undistributed long-term capital gain | 24,671,838 | — | 52,410 | 4,334,508 | 5,040,181 | 715,323 | ||||||||||||||||||
|
|
|
|
|
|
|
|
|
|
|
| |||||||||||||
Accumulated earnings | $ | 24,671,838 | $ | — | $ | 52,410 | $ | 9,992,230 | $ | 7,037,682 | $ | 2,169,681 | ||||||||||||
Paid-in capital | 1,333,560,760 | 274,790,345 | 36,458,924 | 256,790,545 | 232,865,467 | 29,011,040 | ||||||||||||||||||
Accumulated capital and other losses | (668,759 | ) | (48,406,647 | ) | — | — | — | — | ||||||||||||||||
Unrealized appreciation (depreciation) on foreign currency | 141,346 | 40,219 | 3,123 | 796 | — | — | ||||||||||||||||||
Unrealized appreciation on investments | 421,795,421 | 44,712,965 | 9,577,550 | 58,577,874 | 82,629,703 | 8,794,441 | ||||||||||||||||||
Other temporary differences | — | 9,112 | — | — | — | — | ||||||||||||||||||
|
|
|
|
|
|
|
|
|
|
|
| |||||||||||||
Net assets | $ | 1,779,500,606 | $ | 271,145,994 | $ | 46,092,007 | $ | 325,361,445 | $ | 322,532,852 | $ | 39,975,162 | ||||||||||||
|
|
|
|
|
|
|
|
|
|
|
| |||||||||||||
The differences between book-basis and tax-basis unrealized appreciation are attributable primarily to the tax deferral of losses on wash sales and passive foreign investment company (PFIC) mark-to-market.
The aggregate cost of investments and the composition of unrealized appreciation and depreciation on investments and net unrealized appreciation and/or depreciation on derivatives for Federal income tax purposes as of June 30, 2018, were as follows:
| Fund | Basis | Gross Appreciation | Gross Depreciation | Net Appreciation | ||||||||||||
Driehaus Emerging Markets Growth Fund | $ | 1,347,028,672 | $ | 286,973,485 | $ | 58,400,678 | $ | 228,572,807 | ||||||||
Driehaus Emerging Markets Small Cap Growth Fund | $ | 191,670,920 | $ | 26,092,947 | $ | 12,816,976 | $ | 13,275,971 | ||||||||
Driehaus Frontier Emerging Markets Fund | $ | 25,384,927 | $ | 4,541,855 | $ | 2,520,676 | $ | 2,021,179 | ||||||||
Driehaus International Small Cap Growth Fund | $ | 245,859,772 | $ | 53,529,408 | $ | 12,007,997 | $ | 41,521,411 | ||||||||
Driehaus Micro Cap Growth Fund | $ | 314,317,383 | $ | 130,113,608 | $ | 7,619,625 | $ | 122,493,983 | ||||||||
Driehaus Small Cap Growth Fund | $ | 67,777,973 | $ | 15,978,283 | $ | 804,870 | $ | 15,173,413 | ||||||||
Foreign Currency Translation
Foreign currency and equity securities not denominated in U.S. dollars are translated into U.S. dollar values based upon the current rates of exchange on the date of the Funds’ valuations.
Net realized foreign exchange gains or losses which are reported by the Funds result from currency gains and losses on transaction hedges arising from changes in exchange rates between the trade and settlement dates on spot contracts underlying securities transactions and the difference between the amounts accrued for dividends, interest, and foreign taxes and the amounts actually received or paid in U.S. dollars for these items. Net unrealized foreign exchange gains and losses result from changes in the U.S. dollar value of assets and liabilities (other than investments in securities), which are denominated in foreign currencies, as a result of changes in exchange rates.
The Funds do not isolate that portion of the results of operations which results from fluctuations in foreign exchange rates on investments. These fluctuations are included with the net realized gain (loss) from security transactions and the net change in unrealized appreciation (depreciation) of investments.
55
Driehaus Mutual Funds
Notes to Financial Statements (unaudited) — (Continued)
Use of Estimates
The preparation of financial statements, in conformity with U.S. GAAP, requires management to make estimates and assumptions that affect the reported amount of assets and liabilities and disclosure of contingent assets and liabilities at the date of the financial statements and the reported amounts of net increases or decreases in net assets from operations during the reporting period. Actual results could differ from those estimates.
Indemnifications
Under the Trust’s organizational documents, the officers and Trustees are indemnified against certain liabilities arising out of the performance of their duties to the Trust. In addition, in the normal course of business, the Trust enters into contracts that provide general indemnifications to other parties. The Funds’ maximum exposure under these agreements is unknown as this would involve future claims that may be made against the Funds that have not yet occurred. However, the Funds have not had prior claims or losses pursuant to these contracts and expect the risk of loss to be remote.
B. INVESTMENT ADVISORY FEES, TRANSACTIONS WITH AFFILIATES, AND ADMINISTRATIVE FEES
Richard H. Driehaus is Chairman of Driehaus Capital Management LLC (“DCM” or the “Adviser”), a registered investment adviser, and of Driehaus Securities LLC (“DS LLC” or the “Distributor”), a registered broker-dealer.
DCM serves as the Funds’ investment adviser. In return for its services to the Funds, DCM receives monthly fees. Driehaus Micro Cap Growth Fund pays the Adviser a monthly fee computed and accrued daily at an annual rate of 1.25% of the Fund’s average daily net assets. Driehaus Small Cap Growth Fund pays the Adviser a monthly fee computed and accrued daily at an annual rate of 0.60% of the Fund’s average daily net assets. Driehaus Emerging Markets Small Cap Growth Fund, Driehaus Frontier Emerging Markets Fund and Driehaus International Small Cap Growth Fund each pay the Adviser a monthly fee computed and accrued daily at an annual rate of 1.50% of each Fund’s average daily net assets. Beginning July 2, 2018, the Driehaus International Small Cap Growth Fund will pay the Adviser a monthly fee computed and accrued daily at an annual rate of 1.00% of the Fund’s average daily net assets. The Driehaus Emerging Markets Growth Fund pays the Adviser a monthly fee computed and accrued daily at an annual rate of 1.05% on the first $1.5 billion and 0.75% in excess of $1.5 billion of the Fund`s average daily net assets.
DCM has entered into a contractual agreement to cap Driehaus Frontier Emerging Markets Fund’s annual operating expenses (other than interest, taxes, brokerage commissions, dividends and interest on short sales and other portfolio transaction expenses and extraordinary expenses such as litigation and other expenses not incurred in the ordinary course of the Fund`s business) at 2.00% of average daily net assets until May 3, 2021. DCM is entitled to reimbursement for previously waived fees and reimbursed expenses to the extent that the Fund’s expense ratio remains below the operating expense cap in place at the time of the waiver and the current operating expense cap. For the six months ended June 30, 2018, DCM waived fees for Driehaus Frontier Emerging Markets Fund totaling $131,766 under this agreement. The amount of potential recovery expiring May 3, 2021 was $753,981.
DCM has entered into a contractual agreement to cap Driehaus Small Cap Growth Fund’s annual operating expenses (other than interest, taxes, brokerage commissions, dividends and interest on short sales and other portfolio transaction expenses and extraordinary expenses such as litigation and other expenses not incurred in the ordinary course of the Fund`s business) at 1.20% of average daily net assets for the Investor Class and 0.95% of average daily net assets for the Institutional Class until August 20, 2020. For a period of three years subsequent to the Fund’s commencement of operations on August 21, 2017, DCM is entitled to reimbursement for previously waived fees and reimbursed expenses to the extent that each share class’s expense ratio remains below the respective operating expense cap in place at the time of the waiver and the current operating expense cap. For the six months ended June 30, 2018, DCM waived fees for Driehaus Small Cap Growth Fund totaling $80,202 under this agreement. The amount of potential recovery expiring August 20, 2020 was $147,375.
56
Driehaus Mutual Funds
Notes to Financial Statements (unaudited) — (Continued)
The amounts incurred and payable to DCM during the six months ended June 30, 2018 are as follows:
| Fund | Advisory Fees | Advisory Fees Payable (included in Due to affiliate) | ||||||
Driehaus Emerging Markets Growth Fund | $ | 9,072,640 | $ | 1,443,326 | ||||
Driehaus Emerging Markets Small Cap Growth Fund | $ | 1,955,813 | $ | 292,881 | ||||
Driehaus Frontier Emerging Markets Fund | $ | 342,713 | $ | 14,457 | ||||
Driehaus International Small Cap Growth Fund | $ | 2,494,837 | $ | 389,394 | ||||
Driehaus Micro Cap Growth Fund | $ | 2,339,076 | $ | 450,228 | ||||
Driehaus Small Cap Growth Fund | $ | 155,463 | $ | 28,534 | ||||
The Funds direct certain portfolio trades, subject to obtaining the best price and execution, to brokers who have agreed to pay a portion of the Funds’ operating expenses using part of the commissions generated. For the six months ended June 30, 2018, these arrangements reduced the expenses of Driehaus Emerging Markets Growth Fund, Driehaus Emerging Markets Small Cap Growth Fund, Driehaus Frontier Emerging Markets Fund, Driehaus International Small Cap Growth Fund, Driehaus Micro Cap Growth Fund and Driehaus Small Cap Growth Fund by $49,988 (0.4%), $13,541 (0.5%), $204 (0.0%), $7,212 (0.3%), $16,200 (0.6%) and $2,019 (0.6%), respectively.
Certain officers of the Trust are also officers of DCM and DS LLC. The Funds pay a portion of the Chief Compliance Officer’s salary and bonus. No other officers received compensation from the Funds. The Independent Trustees are compensated for their services to the Trust and such compensation is reflected as Trustees’ fees in the Statements of Operations.
BNY Mellon Investment Servicing (US) Inc. (“BNY Mellon”) serves as the Funds’ administrative and accounting agent. In compensation for these services, BNY Mellon earns the greater of a monthly minimum fee or a monthly fee based upon average daily net assets. BNY Mellon has agreed to waive a portion of its monthly fee for administrative services for the first two years of operations for Driehaus Small Cap Growth Fund. For the six months ended June 30, 2018, BNY Mellon waived $2,057 for Driehaus Small Cap Growth Fund. BNY Mellon also acts as the transfer agent and dividend disbursing agent for the Funds. For these services, BNY Mellon earns a monthly fee based on shareholder processing activity during the month. BNY Mellon has agreed to waive a portion of its monthly fee for transfer agent services for the first two years of operations for Driehaus Small Cap Growth Fund. For the six months ended June 30, 2018, BNY Mellon waived $28,725 for Driehaus Small Cap Growth Fund.
DS LLC is the Funds’ distributor. DS LLC does not earn any compensation from the Funds for these services. DS LLC has entered into a Fee Reimbursement Agreement (“Agreement”) with the Driehaus Emerging Markets Growth Fund and Driehaus Small Cap Growth Fund. Under these Agreements, the Funds reimburse DS LLC for certain fees paid by DS LLC to intermediaries who provide shareholder administrative and/or sub-transfer agency services to the Investor Class shares of the Driehaus Emerging Markets Growth Fund and Driehaus Small Cap Growth Fund. Currently, the amount to be reimbursed will not exceed 0.25% of the Investor Class’ average daily net assets held by such intermediaries.
The amounts incurred and payable to DS LLC during the six months ended June 30, 2018 are as follows:
| Fund | Shareholder Services Fees | Accrued Shareholder Services Fees (included in Due to affiliate) | ||||||
Driehaus Emerging Markets Growth Fund | $ | 1,342,366 | $ | 371,452 | ||||
Driehaus Small Cap Growth Fund | $ | 713 | $ | 241 | ||||
57
Driehaus Mutual Funds
Notes to Financial Statements (unaudited) — (Continued)
C. INVESTMENT TRANSACTIONS
The aggregate purchases and sales of investment securities, other than short-term obligations and options, for six months ended June 30, 2018 were as follows:
| Fund | Purchases | Sales | ||||||
Driehaus Emerging Markets Growth Fund | $ | 2,006,788,864 | $ | 1,963,325,705 | ||||
Driehaus Emerging Markets Small Cap Growth Fund | $ | 288,584,048 | $ | 324,880,114 | ||||
Driehaus Frontier Emerging Markets Fund | $ | 25,236,297 | $ | 34,927,473 | ||||
Driehaus International Small Cap Growth Fund | $ | 213,629,425 | $ | 251,971,045 | ||||
Driehaus Micro Cap Growth Fund | $ | 314,690,599 | $ | 278,339,002 | ||||
Driehaus Small Cap Growth Fund | $ | 81,638,317 | $ | 48,751,060 | ||||
D. CAPITAL SHARE TRANSACTIONS
For the six-month period ended June 30, 2018, and the year ended December 31, 2017, transactions in capital shares (authorized shares unlimited) were as follows:
| Driehaus Emerging Markets Growth Fund | Driehaus Emerging Markets Small Cap Growth Fund | Driehaus Frontier Emerging Markets Fund | ||||||||||||||||||||||
| June 30, 2018 | December 31, 2017 | June 30, 2018 | December 31, 2017 | June 30, 2018 | December 31, 2017 | |||||||||||||||||||
Fund | ||||||||||||||||||||||||
Shares issued | — | — | 2,404,650 | 7,441,081 | 116,888 | 293,210 | ||||||||||||||||||
Shares reinvested | — | — | — | — | — | 227,525 | ||||||||||||||||||
Shares redeemed | — | — | (4,569,560 | ) | (12,881,043 | ) | (1,469,775 | ) | (3,942,460 | ) | ||||||||||||||
|
|
|
|
|
|
|
|
|
|
|
| |||||||||||||
Net decrease | — | — | (2,164,910 | ) | (5,439,962 | ) | (1,352,887 | ) | (3,421,725 | ) | ||||||||||||||
|
|
|
|
|
|
|
|
|
|
|
| |||||||||||||
Investor Class | ||||||||||||||||||||||||
Shares issued | 4,043,596 | 53,291,270 | — | — | — | — | ||||||||||||||||||
Shares reinvested | — | 175,258 | — | — | — | — | ||||||||||||||||||
Shares redeemed | (10,172,819 | ) | (69,265,507 | ) | — | — | — | — | ||||||||||||||||
|
|
|
|
|
|
|
|
|
|
|
| |||||||||||||
Net decrease | (6,129,223 | ) | (15,798,979 | ) | — | — | — | — | ||||||||||||||||
|
|
|
|
|
|
|
|
|
|
|
| |||||||||||||
Institutional Class | ||||||||||||||||||||||||
Shares issued | 7,768,795 | 13,364,735 | — | — | — | — | ||||||||||||||||||
Shares reinvested | — | 76,939 | — | — | — | — | ||||||||||||||||||
Shares redeemed | (1,769,836 | ) | (487,266 | ) | — | — | — | — | ||||||||||||||||
|
|
|
|
|
|
|
|
|
|
|
| |||||||||||||
Net increase | 5,998,959 | 12,954,408 | — | — | — | — | ||||||||||||||||||
|
|
|
|
|
|
|
|
|
|
|
| |||||||||||||
Total net decrease | (130,264 | ) | (2,844,571 | ) | — | — | — | — | ||||||||||||||||
|
|
|
|
|
|
|
|
|
|
|
| |||||||||||||
58
Driehaus Mutual Funds
Notes to Financial Statements (unaudited) — (Continued)
| Driehaus International Small Cap Growth Fund | Driehaus Micro Cap Growth Fund | Driehaus Small Cap Growth Fund | ||||||||||||||||||||||
| June 30, 2018 | December 31, 2017 | June 30, 2018 | December 31, 2017 | June 30, 2018 | December 31, 2017 | |||||||||||||||||||
Fund | ||||||||||||||||||||||||
Shares issued | 5,267,633 | 2,719,395 | 4,806,897 | 4,641,406 | — | — | ||||||||||||||||||
Shares reinvested | — | 3,643,211 | — | 1,738,290 | — | — | ||||||||||||||||||
Shares redeemed | (7,172,904 | ) | (6,783,946 | ) | (2,311,967 | ) | (15,385,865 | ) | — | — | ||||||||||||||
|
|
|
|
|
|
|
|
|
|
|
| |||||||||||||
Net increase (decrease) | (1,905,271 | ) | (421,340 | ) | 2,494,930 | (9,006,169 | ) | — | — | |||||||||||||||
|
|
|
|
|
|
|
|
|
|
|
| |||||||||||||
Investor Class | ||||||||||||||||||||||||
Shares issued | — | — | — | 69,642 | 120,209 | |||||||||||||||||||
Shares reinvested | — | — | — | — | 1,942 | |||||||||||||||||||
Shares redeemed | — | — | — | (38,147 | ) | (6,458 | ) | |||||||||||||||||
|
|
|
|
|
|
|
|
|
|
|
| |||||||||||||
Net increase | — | — | — | 31,495 | 115,693 | |||||||||||||||||||
|
|
|
|
|
|
|
|
|
|
|
| |||||||||||||
Institutional Class | ||||||||||||||||||||||||
Shares issued | — | — | — | 2,485,585 | 3,684,462 | |||||||||||||||||||
Shares reinvested | — | — | — | — | 55,493 | |||||||||||||||||||
Shares redeemed | — | — | — | (26,041 | ) | (417,831 | ) | |||||||||||||||||
|
|
|
|
|
|
|
|
|
|
|
| |||||||||||||
Net increase | — | — | — | 2,459,544 | 3,322,124 | |||||||||||||||||||
|
|
|
|
|
|
|
|
|
|
|
| |||||||||||||
Total net increase | — | — | — | — | 2,491,039 | 3,437,817 | ||||||||||||||||||
|
|
|
|
|
|
|
|
|
|
|
| |||||||||||||
E. LINE OF CREDIT
The Funds, together with certain other funds in the Trust, obtained a committed line of credit in the amount of $50,000,000. This line of credit is available primarily to meet large, unexpected shareholder withdrawals subject to certain restrictions. Interest is charged at a rate per annum equal to the Federal Funds Rate in effect at the time of the borrowings plus 1.5%, or 1.75%, whichever is greater. There is a commitment fee of 0.10% of the excess of the $50,000,000 committed amount over the sum of the average daily balance of any loans, which is allocated amongst all funds that have access to the line. At June 30, 2018, the Funds had no outstanding borrowings under the line of credit.
F. FOREIGN INVESTMENT RISKS
To the extent a Fund invests in foreign securities, it may entail risks due to the potential for political and economic instability in the countries where the issuers of these securities are located. In addition, foreign exchange fluctuations could affect the value of positions held. These risks are generally intensified in emerging markets.
G. REDEMPTION FEES
The Funds may charge a redemption fee of 2.00% of the redemption amount for shares redeemed within 60 days of purchase. The redemption fees are recorded in paid-in capital and reflected in the Statements of Changes in Net Assets.
H. SUBSEQUENT EVENTS
Events or transactions that occurred after the date of this report through the date the report was issued have been evaluated for potential impact to the financial statements. There are no subsequent events that require recognition or disclosure in the financial statements.
59
As a mutual fund shareholder, you may incur two types of costs: (1) transaction costs, including sales charges; redemption fees; and exchange fees and (2) ongoing costs, including management fees; distribution (12b-1) fees; and other fund expenses. This example is intended to help you understand your ongoing costs (in dollars) of investing in each Fund and to compare these costs with the ongoing costs of investing in other mutual funds.
The example is based on an investment of $1,000 invested at the beginning of the period and held for the entire six months ended June 30, 2018.
Actual Expenses
The first line of the tables below (“Actual”) provides information about actual account values and actual expenses. You may use the information in this line, together with the amount you invested, to estimate the expenses that you paid over the period. Simply divide your account value by $1,000 (for example, an $8,600 account value divided by $1,000 = 8.6), then multiply the result by the number in the first line under the heading entitled “Expenses Paid During Period” to estimate the expenses you paid on your account during this period.
Hypothetical Example for Comparison Purposes
The second line of the tables below (“Hypothetical”) provides information about hypothetical account values and hypothetical expenses based on the Fund’s actual expense ratio and an assumed rate of return of 5% per year before expenses, which is not the Fund’s actual return. You may use this information to compare the ongoing costs of investing in the Funds versus other funds. To do so, compare this 5% hypothetical example with the 5% hypothetical examples that appear in the shareholder reports of the other funds.
Please note that the expenses shown in the table are meant to highlight your ongoing costs only and do not reflect any transactional costs, such as sales charges, redemption fees or exchange fees. Therefore, the second line of the table is useful in comparing ongoing costs only, and will not help you determine the relative total costs of owning different funds. In addition, if these transactional costs were included, your costs would have been higher.
Driehaus Emerging Markets Growth Fund — Investor Class
| Beginning Account Value January 1, 2018 | Ending Account Value June 30, 2018 | Expenses Paid During Six Months Ended June 30, 2018* | ||||||||||
Actual | $ | 1,000 | $ | 941.00 | $ | 6.55 | ||||||
Hypothetical (5% return before expenses) | $ | 1,000 | $ | 1,018.05 | $ | 6.80 | ||||||
Driehaus Emerging Markets Growth Fund — Institutional Class
| Beginning Account Value January 1, 2018 | Ending Account Value June 30, 2018 | Expenses Paid During Six Months Ended June 30, 2018* | ||||||||||
Actual | $ | 1,000 | $ | 941.90 | $ | 5.44 | ||||||
Hypothetical (5% return before expenses) | $ | 1,000 | $ | 1,019.19 | $ | 5.66 | ||||||
60
Fund Expense Examples (unaudited) — (Continued)
Driehaus Emerging Markets Small Cap Growth Fund
| Beginning Account Value January 1, 2018 | Ending Account Value June 30, 2018 | Expenses Paid During Six Months Ended June 30, 2018* | ||||||||||
Actual | $ | 1,000 | $ | 932.40 | $ | 10.73 | ||||||
Hypothetical (5% return before expenses) | $ | 1,000 | $ | 1,013.69 | $ | 11.18 | ||||||
Driehaus Frontier Emerging Markets Fund
| Beginning Account Value January��1, 2018 | Ending Account Value June 30, 2018 | Expenses Paid During Six Months Ended June 30, 2018* | ||||||||||
Actual | $ | 1,000 | $ | 915.30 | $ | 9.50 | ||||||
Hypothetical (5% return before expenses) | $ | 1,000 | $ | 1,014.88 | $ | 9.99 | ||||||
Driehaus International Small Cap Growth Fund
| Beginning Account Value January 1, 2018 | Ending Account Value June 30, 2018 | Expenses Paid During Six Months Ended June 30, 2018* | ||||||||||
Actual | $ | 1,000 | $ | 1,022.00 | $ | 8.57 | ||||||
Hypothetical (5% return before expenses) | $ | 1,000 | $ | 1,016.31 | $ | 8.55 | ||||||
Driehaus Micro Cap Growth Fund
| Beginning Account Value January 1, 2018 | Ending Account Value June 30, 2018 | Expenses Paid During Six Months Ended June 30, 2018* | ||||||||||
Actual | $ | 1,000 | $ | 1,222.30 | $ | 7.88 | ||||||
Hypothetical (5% return before expenses) | $ | 1,000 | $ | 1,017.70 | $ | 7.15 | ||||||
Driehaus Small Cap Growth Fund — Investor Class
| Beginning Account Value January 1, 2018 | Ending Account Value June 30, 2018 | Expenses Paid During Six Months Ended June 30, 2018* | ||||||||||
Actual | $ | 1,000 | $ | 1,205.70 | $ | 6.51 | ||||||
Hypothetical (5% return before expenses) | $ | 1,000 | $ | 1,018.89 | $ | 5.96 | ||||||
61
Fund Expense Examples (unaudited) — (Continued)
Driehaus Small Cap Growth Fund — Institutional Class
| Beginning Account Value January 1, 2018 | Ending Account Value June 30, 2018 | Expenses Paid During Six Months Ended June 30, 2018* | ||||||||||
Actual | $ | 1,000 | $ | 1,207.20 | $ | 5.14 | ||||||
Hypothetical (5% return before expenses) | $ | 1,000 | $ | 1,020.13 | $ | 4.71 | ||||||
| * | Expenses are equal to the Fund’s annualized expense ratios for the six-month period in the table below multiplied by the average account value over the period, multiplied by the number of days in the most recent fiscal half-year (181), then divided by 365 to reflect the half-year period. |
Driehaus Emerging Markets Growth Fund — Investor Class . | 1.36% | |||
Driehaus Emerging Markets Growth Fund — Institutional Class | 1.13% | |||
Driehaus Emerging Markets Small Cap Growth Fund | 2.24% | |||
Driehaus Frontier Emerging Markets Fund | 2.00% | |||
Driehaus International Small Cap Growth Fund | 1.71% | |||
Driehaus Micro Cap Growth Fund | 1.43% | |||
Driehaus Small Cap Growth Fund — Investor Class | 1.19% | |||
Driehaus Small Cap Growth Fund — Institutional Class | 0.94% |
62
Board Considerations in Connection with the Review of an Amendment to the Investment Advisory Agreement for Driehaus International Small Cap Growth Fund
The Board of Trustees of Driehaus Mutual Funds (the “Trust”), including a majority of the Trustees who are not “interested persons” (as defined in the Investment Company Act of 1940, as amended) (the “Independent Trustees”), approved an amendment to the investment advisory agreement (the “Agreement”) with Driehaus Capital Management LLC (the “Adviser”) for the Driehaus International Small Cap Growth Fund (the “Fund”) on June 4, 2018. As part of its consideration, the Board reviewed materials received from the Adviser. The Board also considered materials previously provided by legal counsel, and the Independent Trustees met with their independent legal counsel to review the proposal presented and the materials provided. After their consideration of the information received, the Independent Trustees presented their findings and their recommendation to approve the Agreement to the full Board.
In connection with the review process, the Board considered that, at its September 2017 meeting, the Board considered information regarding, among other things, the nature, extent and quality of services provided by the Adviser and the advisory fee rates, operating expenses and total expense ratio of the Fund, along with performance information for the Fund. The Board also compared the advisory fee rate and expense ratio of the Fund to fees and expense ratios of a peer group of funds based on data compiled from Lipper Analytical Services, Inc., an independent provider of mutual fund data that is a service of Broadridge Financial Solutions (“Lipper”). The Board noted that, pursuant to the Agreement, the advisory fee schedule would be reduced. The Board also noted that the Fund’s advisory fee of 1.00% would rank in the 21st percentile of the Lipper peer group (primary share class only) as of December 31, 2017 (1st percentile would be the highest advisory fee). The Board considered that the Fund’s expense ratio would be in the 59th percentile (1st percentile being the highest expense ratio) based on information the Adviser obtained from Lipper. The Board further considered the Fund’s asset size and the Adviser’s representation that the change in fees would not diminish the quality or quantity of services the Adviser provides to the Fund.
Based on all of the information considered, in particular the information received and considered at its September meeting, as supplemented at the June 2018 meeting, the Board determined that the terms of the Agreement are fair and reasonable and that the approval of the Agreement is in the best interests of the Fund. No single factor was determinative in the Board’s analysis.
63
DRH-SAR2018
Driehaus Mutual Funds
Trustees & Officers
Theodore J. Beck
Trustee
Francis J. Harmon
Trustee
Christopher J. Towle
Trustee
Dawn M. Vroegop
Trustee
Daniel F. Zemanek
Chairman of the Board
Stephen J. Kneeley
President & Trustee
Michelle L. Cahoon
Vice President & Treasurer
Janet L. McWilliams
Chief Legal Officer &
Assistant Vice President
Michael R. Shoemaker
Chief Compliance Officer &
Assistant Vice President
William H. Wallace, III
Secretary
Michael P. Kailus
Assistant Secretary & Anti-Money
Laundering Compliance Officer
Christine Mason
Assistant Secretary
Investment Adviser
Driehaus Capital Management LLC
25 East Erie Street
Chicago, IL 60611
Distributor
Driehaus Securities LLC
25 East Erie Street
Chicago, IL 60611
Administrator & Transfer Agent
UMB Fund Services, Inc.
235 W. Galena Street
Milwaukee, WI 53212
Custodian
The Northern Trust Company
50 South LaSalle Street
Chicago, IL 60603
Semi-Annual Report to Shareholders
June 30, 2018

Driehaus Active Income Fund
Driehaus Event Driven Fund
Driehaus Multi-Asset Growth Economies Fund
Distributed by:
Driehaus Securities LLC
This report has been prepared for the shareholders of the Funds and is not an offer to sell or buy any Fund securities. Such offer is only made by the Funds’ prospectus.
Performance Overview and Schedule of Investments: | ||||
| 1 | ||||
| 11 | ||||
| 15 | ||||
| 21 | ||||
| 22 | ||||
| 24 | ||||
| 26 | ||||
| 29 | ||||
| 49 | ||||
PROXY VOTING POLICIES AND PROCEDURES AND PROXY VOTING RECORD
A description of the Funds’ policies and procedures with respect to the voting of proxies relating to the Funds’ portfolio securities is available without charge, upon request, by calling 1-877-779-0079. This information is also available on the Funds’ website at http://www.driehaus.com.
Information regarding how the Funds voted proxies related to portfolio securities during the 12-month period ended June 30, 2018 is available without charge, upon request, by calling 1-877-779-0079. This information is also available on the Securities and Exchange Commission’s (“SEC”) website at http://www.sec.gov.
HOW TO OBTAIN QUARTERLY PORTFOLIO HOLDINGS
Each Fund files a complete schedule of portfolio holdings with the SEC for the first and third quarters of each fiscal year on Form N-Q. The Funds’ Form N-Q is available electronically on the SEC’s website at http://www.sec.gov; hard copies may be reviewed and copied at the SEC’s Public Reference Room in Washington, DC 20549. For more information on the Public Reference Room, call 1-800-SEC-0330. Each Fund’s complete schedule of portfolio holdings is also available on the Fund’s website at http://www.driehaus.com.
Performance Overview (unaudited)
The performance summarized below is historical and does not represent future results. Investment returns and principal value vary, and you may have a gain or loss when you sell shares. Performance data presented measures the change in the value of an investment in the Fund, assuming reinvestment of all dividends and capital gains. Average annual total return reflects annualized change.
The table does not reflect the deduction of taxes that a shareholder would pay on Fund distributions or the redemption of Fund shares. The graph compares the results of a $25,000 investment (minimum investment) in the Fund over the last 10 fiscal year periods (which includes performance of the Predecessor Fund), with all dividends and capital gains reinvested, with the indicated indices (and dividends reinvested) for the same period.
| Average Annual Total Returns as of 6/30/18 | 1 Year | 3 Years | 5 Years | 10 Years | ||||||||||||
Driehaus Active Income Fund (LCMAX)1 | 0.89% | 1.53% | 1.35% | 3.55% | ||||||||||||
FTSE 3-Month T-Bill Index2 | 1.33% | 0.64% | 0.39% | 0.31% | ||||||||||||
Bloomberg Barclays U.S. Aggregate Bond Index3 | –0.40% | 1.72% | 2.27% | 3.72% | ||||||||||||
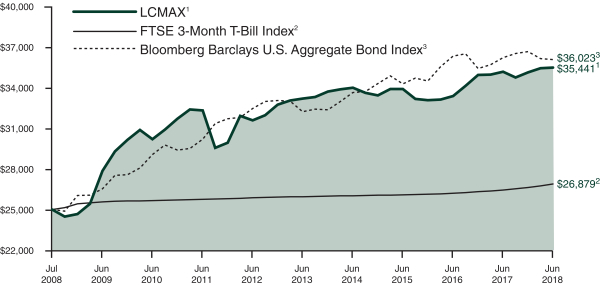
| 1 | The Driehaus Active Income Fund (the “Fund”) performance shown above includes the performance of the Lotsoff Capital Management Active Income Fund (the “Predecessor Fund”) for the periods before the Fund’s registration statement became effective. The Fund received the assets and liabilities of the Predecessor Fund on June 1, 2009 through a reorganization of the Predecessor Fund into the Fund. The Predecessor Fund was a nondiversified fund that was a series of another management investment company registered under the Investment Company Act of 1940, as amended. The Fund had no prior operating history prior to succeeding to the assets of the Predecessor Fund. The Fund has substantially similar investment objectives, strategies, and policies as the Predecessor Fund. Financial and performance information of the Fund includes the Predecessor Fund information. |
| 2 | The FTSE 3-Month T-Bill Index is designed to mirror the performance of the 3-month U.S. Treasury Bill. The FTSE 3-Month T-Bill Index is unmanaged and its returns reflect reinvestment of all distributions and changes in market prices. |
| 3 | The Bloomberg Barclays U.S. Aggregate Bond Index, an unmanaged index, represents securities that are SEC-registered, taxable and dollar denominated. This index covers the U.S. investment grade fixed rate bond market, with index components for government and corporate securities, mortgage pass-through securities and asset-backed securities. These major sectors are subdivided into more specific indices that are calculated and reported on a regular basis. |
1
Driehaus Active Income Fund
Schedule of Investments
June 30, 2018 (unaudited)
| Shares, Principal Amount, or Number of Contracts | Value | |||||||
| BANK LOANS — 33.82% |
| |||||||
Advertising — 2.26% |
| |||||||
Getty Images, Inc. | $ | 36,236,546 | $ | 35,083,500 | ||||
Auto Manufacturers — 1.16% |
| |||||||
Navistar, Inc. | 17,960,488 | 17,994,254 | ||||||
Commercial Services — 1.26% |
| |||||||
Syniverse Holdings, Inc. | 12,718,125 | 12,727,473 | ||||||
Syniverse Holdings, Inc. | 6,800,000 | 6,778,750 | ||||||
|
| |||||||
| 19,506,223 | ||||||||
|
| |||||||
Computers — 1.79% |
| |||||||
DynCorp International, Inc. | 9,123,890 | 9,163,852 | ||||||
McAfee LLC | 10,004,400 | 10,070,529 | ||||||
McAfee LLC | 8,400,000 | 8,563,800 | ||||||
|
| |||||||
| 27,798,181 | ||||||||
|
| |||||||
Distribution/Wholesale — 0.49% |
| |||||||
Fossil Group, Inc. | 7,650,000 | 7,659,562 | ||||||
Entertainment — 2.88% |
| |||||||
Golden Entertainment, Inc. | 9,326,566 | 9,320,784 | ||||||
Scientific Games International, Inc. | 35,521,723 | 35,333,103 | ||||||
|
| |||||||
| 44,653,887 | ||||||||
|
| |||||||
| Shares, Principal Amount, or Number of Contracts | Value | |||||||
Food — 2.81% |
| |||||||
Chobani LLC | $ | 29,452,607 | $ | 29,520,054 | ||||
SUPERVALU, Inc. | 8,810,326 | 8,829,048 | ||||||
SUPERVALU, Inc. | 5,286,196 | 5,297,429 | ||||||
|
| |||||||
| 43,646,531 | ||||||||
|
| |||||||
Healthcare — Services — 0.24% |
| |||||||
Heartland Dental LLC | 498,913 | 496,730 | ||||||
Heartland Dental LLC | 3,326,087 | 3,311,536 | ||||||
|
| |||||||
| 3,808,266 | ||||||||
|
| |||||||
Insurance — 3.78% |
| |||||||
Acrisure LLC | 14,131,662 | 14,122,900 | ||||||
Acrisure LLC | 2,550,000 | 2,546,832 | ||||||
Asurion LLC | 8,500,000 | 8,468,125 | ||||||
Asurion LLC | 26,993,049 | 27,431,686 | ||||||
Genworth Holdings, Inc. | 5,935,125 | 6,053,827 | ||||||
|
| |||||||
| 58,623,370 | ||||||||
|
| |||||||
Internet — 5.65% |
| |||||||
EIG Investors Corp. | 12,269,742 | 12,282,564 | ||||||
Hoya Midco LLC | 24,936,193 | 24,795,927 | ||||||
Notes to Financial Statements are an integral part of this Schedule.
2
Driehaus Active Income Fund
Schedule of Investments
June 30, 2018 (unaudited)
| Shares, Principal Amount, or Number of Contracts | Value | |||||||
ProQuest LLC | $ | 26,046,448 | $ | 26,230,987 | ||||
Uber Technologies, Inc. | 24,252,350 | 24,323,166 | ||||||
|
| |||||||
| 87,632,644 | ||||||||
|
| |||||||
Investment Companies — 0.44% |
| |||||||
Larchmont Resources LLC | 6,879,713 | 6,810,915 | ||||||
Leisure Time — 1.70% |
| |||||||
Equinox Holdings, Inc. | 19,750,750 | 19,755,688 | ||||||
Equinox Holdings, Inc. | 6,500,000 | 6,678,750 | ||||||
|
| |||||||
| 26,434,438 | ||||||||
|
| |||||||
Oil & Gas — 0.99% |
| |||||||
McDermott Technology Americas, Inc. | 15,261,750 | 15,357,975 | ||||||
Real Estate Investment Trusts — 3.17% |
| |||||||
QCP SNF West REIT LLC | 22,365,061 | 22,518,821 | ||||||
Uniti Group, Inc. | 27,877,480 | 26,686,832 | ||||||
|
| |||||||
| 49,205,653 | ||||||||
|
| |||||||
Retail — 0.32% |
| |||||||
Neiman Marcus Group Ltd. LLC | 5,561,914 | 4,943,151 | ||||||
Software — 2.94% |
| |||||||
Digicert Holdings, Inc. | 17,810,201 | 17,821,332 | ||||||
| Shares, Principal Amount, or Number of Contracts | Value | |||||||
Evergreen Skills Lux Sarl (Luxembourg) | $ | 29,327,493 | $ | 27,815,221 | ||||
|
| |||||||
| 45,636,553 | ||||||||
|
| |||||||
Telecommunications — 1.94% |
| |||||||
Avaya, Inc. | 23,402,400 | 23,466,406 | ||||||
Consolidated Communications, Inc. | 6,765,746 | 6,679,077 | ||||||
|
| |||||||
| 30,145,483 | ||||||||
|
| |||||||
Total BANK LOANS | 524,940,586 | |||||||
|
| |||||||
| CORPORATE BONDS — 47.68% |
| |||||||
Agriculture — 1.88% |
| |||||||
Adecoagro S.A. (Argentina) | 6,300,000 | 5,196,555 | ||||||
Vector Group Ltd. | 24,842,000 | 24,003,582 | ||||||
|
| |||||||
| 29,200,137 | ||||||||
|
| |||||||
Auto Parts & Equipment — 0.96% |
| |||||||
American Axle & Manufacturing, Inc. | 8,075,000 | 8,014,438 | ||||||
American Axle & Manufacturing, Inc. | 6,970,000 | 6,865,450 | ||||||
|
| |||||||
| 14,879,888 | ||||||||
|
| |||||||
Banks — 5.05% |
| |||||||
JPMorgan Chase & Co. | 19,813,000 | 19,961,597 | ||||||
Royal Bank of Scotland Group PLC (United Kingdom) | 13,910,000 | 13,301,438 | ||||||
State Street Corp. | 17,670,000 | 15,637,950 | ||||||
Notes to Financial Statements are an integral part of this Schedule.
3
Driehaus Active Income Fund
Schedule of Investments
June 30, 2018 (unaudited)
| Shares, Principal Amount, or Number of Contracts | Value | |||||||
USB Realty Corp. | $ | 32,510,000 | $ | 29,462,187 | ||||
|
| |||||||
| 78,363,172 | ||||||||
|
| |||||||
Building Materials — 1.05% |
| |||||||
Builders FirstSource, Inc. | 16,684,000 | 16,225,190 | ||||||
Chemicals — 0.97% |
| |||||||
Venator Finance Sarl / Venator Materials LLC (Luxembourg) | 15,725,000 | 15,017,375 | ||||||
Computers — 2.57% |
| |||||||
DynCorp International, Inc. | 38,420,751 | 39,957,581 | ||||||
Diversified Financial Services — 2.51% |
| |||||||
ILFC E-Capital Trust I | 39,539,000 | 36,968,965 | ||||||
ILFC E-Capital Trust I | 2,116,000 | 1,978,460 | ||||||
Rio Oil Finance Trust Series 2014-1 (Brazil) | 3,202 | 3,426 | ||||||
|
| |||||||
| 38,950,851 | ||||||||
|
| |||||||
Electric — 0.73% |
| |||||||
Capex S.A. (Argentina) | 12,720,000 | 11,360,232 | ||||||
Entertainment — 2.54% |
| |||||||
Codere Finance 2 Luxembourg S.A. (Luxembourg) | 5,000,000 | 8 | 5,527,853 | |||||
Codere Finance 2 Luxembourg S.A. (Luxembourg) | 26,375,000 | 24,122,311 | ||||||
Pinnacle Entertainment, Inc. | 9,448,000 | 9,808,441 | ||||||
|
| |||||||
| 39,458,605 | ||||||||
|
| |||||||
Food — 0.26% |
| |||||||
Chobani LLC / Chobani Finance Corp., Inc. | 4,250,000 | 4,080,000 | ||||||
Healthcare — Products — 1.84% |
| |||||||
Sotera Health Holdings LLC | 28,037,000 | 28,597,740 | ||||||
Healthcare — Services — 2.73% |
| |||||||
Kindred Healthcare, Inc. | 21,244,000 | 22,763,158 | ||||||
Kindred Healthcare, Inc. | 19,077,000 | 19,649,310 | ||||||
|
| |||||||
| 42,412,468 | ||||||||
|
| |||||||
| Shares, Principal Amount, or Number of Contracts | Value | |||||||
Holding Companies — Diversified — 1.62% |
| |||||||
HRG Group, Inc. | $ | 24,489,000 | $ | 25,162,448 | ||||
Insurance — 0.30% |
| |||||||
Acrisure LLC / Acrisure Finance, Inc. | 5,040,000 | 4,586,400 | ||||||
Internet — 1.28% |
| |||||||
EIG Investors Corp. | 18,060,000 | 19,893,090 | ||||||
Media — 4.90% |
| |||||||
Altice France S.A. (France) | 15,320,000 | 14,978,364 | ||||||
Altice France S.A. (France) | 17,000,000 | 17,060,350 | ||||||
Altice Luxembourg S.A. (Luxembourg) | 16,005,000 | 15,484,837 | ||||||
Sinclair Television Group, Inc. | 15,810,000 | 15,691,425 | ||||||
VTR Finance BV (Chile) | 6,800,000 | 6,831,960 | ||||||
VTR Finance BV (Chile) | 5,950,000 | 5,977,965 | ||||||
|
| |||||||
| 76,024,901 | ||||||||
|
| |||||||
Miscellaneous Manufacturing — 0.46% |
| |||||||
Amsted Industries, Inc. | 7,100,000 | 7,108,875 | ||||||
Oil & Gas — 4.30% |
| |||||||
Antero Resources Corp. | 21,350,000 | 21,243,250 | ||||||
Chesapeake Energy Corp. | 4,250,000 | 4,328,413 | ||||||
Continental Resources, Inc. | 15,129,000 | 14,817,070 | ||||||
Diamondback Energy, Inc. | 21,290,000 | 21,290,000 | ||||||
Transocean, Inc. (Cayman Islands) | 3,910,000 | 4,208,138 | ||||||
Transocean, Inc. (Cayman Islands) | 850,000 | 863,281 | ||||||
|
| |||||||
| 66,750,152 | ||||||||
|
| |||||||
Packaging & Containers — 0.83% |
| |||||||
Ardagh Packaging Finance PLC / Ardagh Holdings USA, Inc. (Ireland) | 13,260,000 | 12,911,925 | ||||||
Notes to Financial Statements are an integral part of this Schedule.
4
Driehaus Active Income Fund
Schedule of Investments
June 30, 2018 (unaudited)
| Shares, Principal Amount, or Number of Contracts | Value | |||||||
Pipelines — 0.98% |
| |||||||
Enbridge Energy Partners LP | $ | 8,200,000 | $ | 8,189,750 | ||||
Transportadora de Gas del Sur S.A. (Argentina) | 7,650,000 | 6,999,750 | ||||||
|
| |||||||
| 15,189,500 | ||||||||
|
| |||||||
Real Estate Investment Trusts — 1.79% |
| |||||||
ESH Hospitality, Inc. | 20,953,000 | 20,219,645 | ||||||
Uniti Group LP / Uniti Fiber Holdings, Inc. / CSL Capital LLC | 2,000,000 | 1,810,000 | ||||||
Uniti Group LP / Uniti Group Finance, Inc. / CSL Capital LLC | 6,000,000 | 5,730,000 | ||||||
|
| |||||||
| 27,759,645 | ||||||||
|
| |||||||
Retail — 0.56% |
| |||||||
Neiman Marcus Group Ltd. LLC | 13,215,000 | 8,738,419 | ||||||
Software — 1.12% |
| |||||||
BMC Software Finance, Inc. | 17,000,000 | 17,382,500 | ||||||
Telecommunications — 5.20% |
| |||||||
Comunicaciones Celulares S.A. Via Comcel Trust (Cayman Islands) | 11,900,000 | 12,195,120 | ||||||
Digicel Ltd. (Jamaica) | 32,300,000 | 26,809,000 | ||||||
Digicel Ltd. (Jamaica) | 13,180,000 | 10,939,400 | ||||||
HC2 Holdings, Inc. | 30,273,000 | 30,727,095 | ||||||
|
| |||||||
| 80,670,615 | ||||||||
|
| |||||||
Transportation — 1.25% |
| |||||||
XPO CNW, Inc. | 19,277,000 | 19,421,578 | ||||||
|
| |||||||
Total CORPORATE BONDS | 740,103,287 | |||||||
|
| |||||||
| Shares, Principal Amount, or Number of Contracts | Value | |||||||
| CONVERTIBLE CORPORATE BONDS — 3.10% |
| |||||||
Semiconductors — 1.00% |
| |||||||
Microchip Technology, Inc. | $ | 8,950,000 | $ | 15,616,148 | ||||
Software — 0.40% |
| |||||||
Avaya Holdings Corp. | 6,375,000 | 6,197,494 | ||||||
Telecommunications — 1.70% |
| |||||||
Ciena Corp. | 19,931,000 | 26,371,364 | ||||||
|
| |||||||
Total CONVERTIBLE CORPORATE BONDS | 48,185,006 | |||||||
|
| |||||||
| U.S. GOVERNMENT AND AGENCY SECURITIES — 0.43% |
| |||||||
United States Treasury Note | 7,047,000 | 6,675,384 | ||||||
|
| |||||||
Total U.S. GOVERNMENT AND AGENCY SECURITIES | 6,675,384 | |||||||
|
| |||||||
| COMMON STOCK — 4.00% |
| |||||||
Aerospace & Defense — 0.25% |
| |||||||
Rockwell Collins, Inc. | 28,375 | 3,821,545 | ||||||
Auto Manufacturers — 0.54% |
| |||||||
General Motors Co.3 | 212,341 | 8,366,235 | ||||||
Banks — 1.14% |
| |||||||
BB&T Corp. | 68,510 | 3,455,644 | ||||||
Huntington Bancshares, Inc. | 284,707 | 4,202,275 | ||||||
Kearny Financial Corp. | 268,600 | 3,612,670 | ||||||
KeyCorp | 172,025 | 3,361,369 | ||||||
M&T Bank Corp. | 18,270 | 3,108,641 | ||||||
|
| |||||||
| 17,740,599 | ||||||||
|
| |||||||
Healthcare — Services — 0.26% |
| |||||||
Aetna, Inc. | 21,988 | 4,034,798 | ||||||
Insurance — 0.25% |
| |||||||
XL Group Ltd. (Bermuda)9 | 69,200 | 3,871,740 | ||||||
Investment Companies — 0.14% |
| |||||||
Larchmont Resources LLC4 | 7,824 | 2,151,600 | ||||||
Media — 0.95% |
| |||||||
Altice NV, Class A (Netherlands)*9 | 806,805 | 3,288,274 | ||||||
Altice USA, Inc. | 672,337 | 11,470,069 | ||||||
Charter Communications, Inc., Class A* | — | 106 | ||||||
|
| |||||||
| 14,758,449 | ||||||||
|
| |||||||
Notes to Financial Statements are an integral part of this Schedule.
5
Driehaus Active Income Fund
Schedule of Investments
June 30, 2018 (unaudited)
| Shares, Principal Amount, or Number of Contracts | Value | |||||||
Savings & Loans — 0.20% |
| |||||||
Investors Bancorp, Inc. | 244,282 | $ | 3,124,367 | |||||
Software — 0.15% |
| |||||||
Avaya Holdings Corp.* | 117,164 | 2,352,653 | ||||||
Telecommunications — 0.12% |
| |||||||
AT&T, Inc. | 58,917 | 1,891,825 | ||||||
|
| |||||||
Total COMMON STOCK | 62,113,811 | |||||||
|
| |||||||
| CONVERTIBLE PREFERRED STOCK — 0.00% |
| |||||||
Auto Manufacturers — 0.00% |
| |||||||
General Motors Corp. Senior Convertible Preferred Escrow — B | 475,000 | — | ||||||
General Motors Corp. Senior Convertible Preferred | 11,790,650 | — | ||||||
|
| |||||||
| — | ||||||||
|
| |||||||
Total CONVERTIBLE PREFERRED STOCK | — | |||||||
|
| |||||||
| PREFERRED STOCKS — 2.42% |
| |||||||
Banks — 2.42% |
| |||||||
GMAC Capital Trust I | 1,428,511 | 37,569,839 | ||||||
|
| |||||||
Total PREFERRED STOCKS | 37,569,839 | |||||||
|
| |||||||
| PURCHASED PUT OPTIONS — 0.23% |
| |||||||
S&P 500 Index, | 41,830 | 3,530,631 | ||||||
|
| |||||||
Total PURCHASED PUT OPTIONS | 3,530,631 | |||||||
|
| |||||||
| ||||||||
TOTAL INVESTMENTS | 91.68 | % | 1,423,118,544 | |||||
Other Assets less Liabilities | 8.32 | % | 129,085,483 | |||||
|
|
|
| |||||
Net Assets | 100.00 | % | $ | 1,552,204,027 | ||||
| ||||||||
| Shares, Principal Amount, or Number of Contracts | Value | |||||||
| SECURITIES SOLD SHORT — (5.67)% |
| |||||||
| CORPORATE BONDS — (0.60)% |
| |||||||
Healthcare — Services — (0.11)% |
| |||||||
Hadrian Merger Sub, Inc. | $ | (1,700,000 | ) | $ | (1,661,750 | ) | ||
Pipelines — (0.13)% |
| |||||||
Enbridge Energy Partners LP | (1,800,000 | ) | (1,964,597 | ) | ||||
Telecommunications — (0.36)% |
| |||||||
Digicel Group Ltd. (Jamaica) | (5,950,000 | ) | (3,956,750 | ) | ||||
Digicel Group Ltd. (Jamaica) | (2,550,000 | ) | (1,683,000 | ) | ||||
|
| |||||||
| (5,639,750 | ) | |||||||
|
| |||||||
Total CORPORATE BONDS | (9,266,097 | ) | ||||||
|
| |||||||
| U.S. GOVERNMENT AND AGENCY SECURITIES — (1.77)% |
| |||||||
United States Treasury Bond | (16,000,000 | ) | (16,073,120 | ) | ||||
3.00%, 5/15/45 | (11,293,000 | ) | (11,342,407 | ) | ||||
|
| |||||||
| (27,415,527 | ) | |||||||
|
| |||||||
Total U.S. GOVERNMENT AND AGENCY SECURITIES | (27,415,527 | ) | ||||||
|
| |||||||
| COMMON STOCK — (3.30)% |
| |||||||
Aerospace & Defense — (0.08)% |
| |||||||
United Technologies Corp. | (10,620 | ) | (1,327,819 | ) | ||||
Media — (0.67)% |
| |||||||
Altice USA, Inc. | (612,000 | ) | (10,440,720 | ) | ||||
Charter Communications, Inc., Class A* | — | (107 | ) | |||||
|
| |||||||
| (10,440,827 | ) | |||||||
|
| |||||||
Pharmaceuticals — (0.08)% |
| |||||||
CVS Health Corp. | (18,421 | ) | (1,185,391 | ) | ||||
Semiconductors — (0.91)% |
| |||||||
Microchip Technology, Inc. | (155,441 | ) | (14,137,359 | ) | ||||
Notes to Financial Statements are an integral part of this Schedule.
6
Driehaus Active Income Fund
Schedule of Investments
June 30, 2018 (unaudited)
| Shares, Principal Amount, or Number of Contracts | Value | |||||||
Telecommunications — (1.56)% |
| |||||||
AT&T, Inc. | (58,917 | ) | $ | (1,891,825 | ) | |||
Ciena Corp.* | (840,823 | ) | (22,290,218 | ) | ||||
|
| |||||||
| (24,182,043 | ) | |||||||
|
| |||||||
Total COMMON STOCK | (51,273,439 | ) | ||||||
|
| |||||||
| ||||||||
TOTAL INVESTMENT SECURITIES SOLD SHORT | (5.67 | )% | $ | (87,955,063 | ) | |||
|
| |||||||
| ||||||||
| WRITTEN PUT OPTIONS — (0.06)% |
| |||||||
S&P 500 Index, | (41,830 | ) | $ | (923,933 | ) | |||
|
| |||||||
| ||||||||
TOTAL WRITTEN PUT OPTIONS | (0.06 | )% | $ | (923,933 | ) | |||
| ||||||||
| * | Non-income producing security. |
| US | LIBOR — U.S. Dollar London Interbank Offered Rate. |
| LIBOR | 3 Month — 3 Month U.S. Dollar London Interbank Offered Rate. |
| 1 | Security is exempt from registration under Rule 144A of the Securities Act of 1933, as amended. Unless otherwise indicated, this security has been determined to be liquid under procedures established by Driehaus Mutual Funds’ (the “Trust”) Board of Trustees and may be resold in transactions exempt from registration, normally to qualified institutional buyers. |
| 2 | Variable or Floating rate security. Rates disclosed as of June 30, 2018. |
| 3 | All or a portion of this security is pledged as collateral for short sales or derivatives transactions. |
| 4 | Pursuant to procedures adopted by the Trust’s Board of Trustees, this security has been determined to be illiquid by Driehaus Capital Management LLC (the “Adviser”), investment adviser to the Fund. |
| 5 | Security is in default. |
| 6 | Security valued at fair value as determined in good faith by the Adviser, in accordance with procedures established by, and under the general supervision of, the Trust’s Board of Trustees. |
| 7 | Bank loans in which the Fund invests pay interest at rates which are periodically predetermined by reference to a base lending rate plus a premium. These base lending rates are generally (i) the lending rate offered by one or more major European banks, such as the London Inter-Bank Offered Rate (“LIBOR”), (ii) the prime rate offered by one or more United States banks or (iii) the certificate of deposit rate. Certain bank loans are subject to a LIBOR floor that establishes a minimum LIBOR rate. The interest rate shown reflects the rate in effect at June 30, 2018. Bank loans generally are subject to mandatory and/or optional repayment. As a result, the actual remaining maturity may be substantially less than the stated maturities shown. |
| 8 | Foreign security, par value shown in local currency (Euro). |
| 9 | Foreign security denominated in U.S. dollars and traded in the U.S. |
| 10 | The coupon rate equals 155 basis points plus the highest of the LIBOR 3 Month, the Constant Maturity Treasury 10 year rate, and the Constant Maturity Treasury 30 year rate, with a maximum of 12.95%. |
| 11 | The coupon rate equals 155 basis points plus the highest of the LIBOR 3 Month, the Constant Maturity Treasury 10 year rate, and the Constant Maturity Treasury 30 year rate, with a maximum of 14.5%. |
Percentages are stated as a percent of net assets.
Security Type | Percent of Total Net Assets | |||
Bank Loans | 33.82 | % | ||
Corporate Bonds | 47.68 | % | ||
Convertible Corporate Bonds | 3.10 | % | ||
U.S. Government and Agency Securities | 0.43 | % | ||
Common Stock | 4.00 | % | ||
Convertible Preferred Stock | 0.00 | % | ||
Preferred Stocks | 2.42 | % | ||
Purchased Put Options | 0.23 | % | ||
|
| |||
Total Investments | 91.68 | % | ||
Other Assets less Liabilities | 8.32 | % | ||
|
| |||
Total Net Assets | 100.00 | % | ||
|
| |||
Percentages are stated as a percent of net assets.
Notes to Financial Statements are an integral part of this Schedule.
7
Driehaus Active Income Fund
Schedule of Investments
June 30, 2018 (unaudited)
SWAP CONTRACTS
Credit Default Swaps
| Counterparty | Reference Instrument | Currency | Notional Amount(4) | Buy/Sell Protection(1)(2) | Pay (Receive) Fixed Rate | Payment Frequency | Expiration Date | Implied Credit Spread(3) | Upfront Premium Paid (Received) | Unrealized Appreciation/ (Depreciation) | Value | |||||||||||||||||||||||||||||
Bank of America | Ally Financial, Inc. 7.50%, 9/15/20 | USD | 10,000,000 | Buy | 5.00 | % | Quarterly | 12/20/2018 | 0.19 | % | $ | (1,492,458 | ) | $ | 1,246,733 | $ | (245,725 | ) | ||||||||||||||||||||||
Credit Suisse | Hess Corp. 7.00%, 2/15/14 | USD | 20,000,000 | Buy | 1.00 | Quarterly | 9/20/2018 | 0.07 | 309,975 | (358,605 | ) | (48,630 | ) | |||||||||||||||||||||||||||
Goldman Sachs | SUPERVALU, Inc. 7.75%, 11/15/22 | USD | 1,050,000 | Buy | 5.00 | Quarterly | 6/20/2023 | 4.19 | 78,750 | (116,023 | ) | (37,273 | ) | |||||||||||||||||||||||||||
Goldman Sachs | SUPERVALU, Inc. 7.75%, 11/15/22 | USD | 6,290,000 | Buy | 5.00 | Quarterly | 6/20/2023 | 4.19 | 534,650 | (757,935 | ) | (223,285 | ) | |||||||||||||||||||||||||||
Goldman Sachs | The Markit iTraxx Europe Crossover IndexSeries 20 | EUR | 10,000,000 | Buy | 5.00 | Quarterly | 12/20/2018 | 0.70 | (2,134,040 | ) | 1,873,459 | (260,581 | ) | |||||||||||||||||||||||||||
Morgan Stanley | The Markit iTraxx Europe Crossover IndexSeries 20 | EUR | 10,000,000 | Buy | 5.00 | Quarterly | 12/20/2018 | 0.70 | (2,137,029 | ) | 1,876,448 | (260,581 | ) | |||||||||||||||||||||||||||
Morgan Stanley | The Markit iTraxx Europe Crossover IndexSeries 20 | EUR | 10,000,000 | Buy | 5.00 | Quarterly | 12/20/2018 | 0.70 | (2,252,200 | ) | 1,991,620 | (260,580 | ) | |||||||||||||||||||||||||||
|
|
|
|
|
| |||||||||||||||||||||||||||||||||||
TOTAL CREDIT DEFAULT SWAPS |
| $ | (7,092,352 | ) | $ | 5,755,697 | $ | (1,336,655 | ) | |||||||||||||||||||||||||||||||
|
|
|
|
|
| |||||||||||||||||||||||||||||||||||
| 1 | If the Fund is a buyer of protection and a credit event occurs, as defined under the terms of that particular swap agreement, the Fund will either (i) receive from the seller of protection an amount equal to the notional amount of the swap and deliver the referenced obligation or underlying investments comprising the referenced index or (ii) receive a net settlement amount in the form of cash or investments equal to the notional amount of the swap less the recovery value of the referenced obligation or underlying investments comprising the referenced index. |
| 2 | If the Fund is a seller of protection and a credit event occurs, as defined under the terms of that particular swap agreement, the Fund will either (i) pay to the buyer of protection an amount equal to the notional amount of the swap and take delivery of the referenced obligation or underlying investments comprising the referenced index or (ii) pay a net settlement amount in the form of cash or investments equal to the notional amount of the swap less the recovery value of the referenced obligation or underlying investments comprising the referenced index. |
| 3 | An implied credit spread is the spread in yield between a U.S. Treasury security and the referenced obligation or underlying investment that are identical in all respects except for the quality rating. Implied credit spreads, represented in absolute terms, utilized in determining the value of credit default swap agreements on corporate and sovereign issues as of period end serve as an indicator of the current status of the payment/performance risk and represent the likelihood of risk of default for the credit derivative. The implied credit spread of a particular referenced entity reflects the cost of buying/selling protection and may include upfront payments required to be made to enter into the agreement. Wider credit spreads, in comparison to narrower credit spreads, represent a deterioration of the referenced entity’s credit soundness and a greater likelihood of risk of default or other credit event occurring as defined under the terms of the agreement. A credit spread identified as “Defaulted” indicates a credit event has occurred for the referenced entity or obligation. |
| 4 | The maximum potential amount the Fund could be required to pay as a seller of credit protection or receive as a buyer of credit protection if a credit event occurs as defined under the terms of that particular swap agreement. |
EUR — Euro
USD — United States Dollar
Notes to Financial Statements are an integral part of this Schedule.
8
Driehaus Active Income Fund
Schedule of Investments
June 30, 2018 (unaudited)
Total Return Swaps
| Counterparty | Reference Instrument | Currency | Notional Amount | Pay/ Receive Total Return on Reference Instrument | Financing Rate3 | Payment Frequency | Termination Date | Upfront Premium Paid (Received) | Unrealized Appreciation/ (Depreciation) | Value | ||||||||||||||||||||||||
Goldman Sachs | Goldman Sachs Catch-Up Energy Index4 | USD | 1,852,625 | See Note 1 | 1-Month USD-LIBOR plus 0.40% | Monthly | 9/18/2018 | $ | — | $ | 226,317 | $ | 2,078,942 | |||||||||||||||||||||
Goldman Sachs | Goldman Sachs Stable Energy Index5 | USD | 3,872,839 | See Note 1 | 1-Month USD-LIBOR plus 0.40% | Monthly | 9/18/2018 | — | 136,544 |
| 4,009,383 |
| ||||||||||||||||||||||
Goldman Sachs | Egypt Treasury Bill 0.00%, 8/7/2018 | EGP | 233,187,500 | See Note 2 | 3-Month USD-LIBOR plus 0.75% | At Termination | 8/7/2018 | 12,333,229 | 485,736 | 12,818,965 | ||||||||||||||||||||||||
|
|
|
|
|
| |||||||||||||||||||||||||||||
TOTAL TOTAL RETURN SWAPS |
| $ | 12,333,229 | $ | 848,597 | $ | 18,907,290 | |||||||||||||||||||||||||||
|
|
|
|
|
| |||||||||||||||||||||||||||||
| 1 | The Fund pays the financing rate. The Fund receives payment from the counterparty if the value of the total return of the reference index has increased and makes payment if the value has decreased. |
| 2 | The Fund pays the financing rate. The Fund receives payment from the counterparty if the value of the total return of the reference treasury bill has increased and makes payment if the value has decreased. |
| 3 | Financing rate is based upon predetermined notional amounts. |
| 4 | The Goldman Sachs Catch-Up Energy Index is a customized index comprised of 4 U.S. energy equity securities. |
| 5 | The Goldman Sachs Stable Energy Index is a customized index comprised of 5 U.S. energy equity securities. |
EGP — Egyptian Pound
USD — United States Dollar
1-Month USD-LIBOR — 1 Month U.S. Dollar London Interbank Offered Rate.
3-Month USD-LIBOR — 3 Month U.S. Dollar London Interbank Offered Rate.
SWAPTIONS
| Interest Rate Swaptions | ||||||||||||||||||||||||||||||
| Counterparty | Floating Rate Index | Currency | Notional Amount | Pay/ Receive Fixed Rate | Exercise Rate | Expiration Date | Premium Paid/ (Received) | Market Value | ||||||||||||||||||||||
Morgan Stanley | 3-Month USD-LIBOR | USD | 61,000,000 | Pay | 2.95 | % | 8/2/2023 | $ | 315,000 | $ | 111,401 | |||||||||||||||||||
Morgan Stanley | 3-Month USD-LIBOR | USD | 46,000,000 | Pay | 2.97 | 8/2/2025 | 345,000 | 98,662 | ||||||||||||||||||||||
Morgan Stanley | 3-Month USD-LIBOR | USD | 33,000,000 | Pay | 3.00 | 8/2/2028 | 350,000 | 98,268 | ||||||||||||||||||||||
|
|
|
| |||||||||||||||||||||||||||
TOTAL INTEREST RATE SWAPTIONS |
| $ | 1,010,000 | $ | 308,331 | |||||||||||||||||||||||||
|
|
|
| |||||||||||||||||||||||||||
USD — United States Dollar
3-Month USD-LIBOR — 3 Month U.S. Dollar London Interbank Offered Rate.
FUTURES CONTRACTS
| Counterparty | Futures Contracts | Number of Contracts (Short) | Expiration Date | Notional Amount | Value at June 30, 2018 | Unrealized Appreciation/ (Depreciation) | ||||||||||||||
Goldman Sachs | U.S. 5 Year Treasury Note | (1,703 | ) | September 28, 2018 | $ | (193,898,511 | ) | $ | (193,490,092 | ) | $ | 408,419 | ||||||||
Goldman Sachs | U.S. 10 Year Treasury Note | (540 | ) | September 19, 2018 | (64,955,317 | ) | (64,901,250 | ) | 54,067 | |||||||||||
Goldman Sachs | U.S. Treasury Long Bond | (221 | ) | September 19, 2018 | (31,951,356 | ) | (32,045,000 | ) | (93,644 | ) | ||||||||||
|
|
|
|
|
| |||||||||||||||
TOTAL FUTURES CONTRACTS | $ | (290,805,184 | ) | $ | (290,436,342 | ) | $ | 368,842 | ||||||||||||
|
|
|
|
|
| |||||||||||||||
Notes to Financial Statements are an integral part of this Schedule.
9
Driehaus Active Income Fund
Schedule of Investments
June 30, 2018 (unaudited)
FORWARD FOREIGN CURRENCY CONTRACTS
| Counterparty | Currency Purchased | Currency Sold | Settlement Date | Unrealized Appreciation/ (Depreciation) | ||||||||||||||||||||
Goldman Sachs | USD | 20,895,904 | EUR | 17,400,000 | August 9, 2018 | $ | 511,832 | |||||||||||||||||
Goldman Sachs | EUR | 8,400,000 | USD | 9,951,791 | August 9, 2018 | (111,205 | ) | |||||||||||||||||
|
| |||||||||||||||||||||||
TOTAL FORWARD FOREIGN CURRENCY CONTRACTS |
| $ | 400,627 | |||||||||||||||||||||
|
| |||||||||||||||||||||||
EUR = Euro
USD = United States Dollar
Notes to Financial Statements are an integral part of this Schedule.
10
Performance Overview (unaudited)
The performance summarized below is historical and does not represent future results. Investment returns and principal value vary, and you may have a gain or loss when you sell shares. Performance data presented measures the change in the value of an investment in the Fund, assuming reinvestment of all dividends and capital gains.
The table does not reflect the deduction of taxes that a shareholder would pay on Fund distributions or the redemption of Fund shares. The graph compares the results of a $10,000 investment in the Fund since August 26, 2013 (the date of the Fund’s inception), with all dividends and capital gains reinvested, with the indicated indices (and dividends reinvested) for the same period.
| Average Annual Total Returns as of 6/30/18 | 1 Year | 3 Years | Since Inception (8/26/13 - 6/30/18) | |||||||||
Driehaus Event Driven Fund (DEVDX)1 | 2.40% | 2.71% | 3.18% | |||||||||
S&P 500 Index2 | 14.37% | 11.93% | 12.98% | |||||||||
FTSE 3-Month T-Bill Index3 | 1.33% | 0.64% | 0.41% | |||||||||
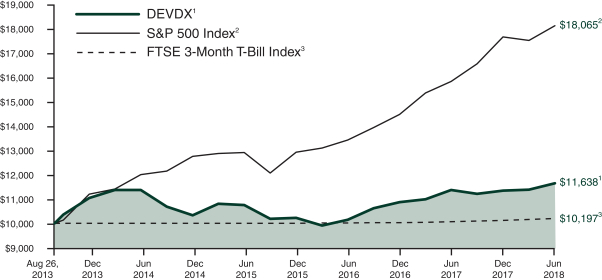
| 1 | The returns for the periods prior to March 1, 2014, reflect fee waivers and/or reimbursements without which performance would have been lower. |
| 2 | The S&P 500 Index consists of 500 stocks chosen for market size, liquidity and industry group. It is a market-weighted index, with each stock’s weight in the index proportionate to its market value. |
| 3 | The FTSE 3-Month T-Bill Index is designed to mirror the performance of the 3-month U.S. Treasury Bill. The FTSE 3-Month T-Bill Index is unmanaged and its returns reflect reinvestment of all distributions and changes in market prices. |
11
Driehaus Event Driven Fund
Schedule of Investments
June 30, 2018 (unaudited)
| Shares, Principal Amount, or Number of Contracts | Value | |||||||
| BANK LOANS — 6.58% |
| |||||||
Advertising — 3.77% |
| |||||||
Getty Images, Inc. | $ | 3,995,516 | $ | 3,868,379 | ||||
Distribution/Wholesale — 1.90% |
| |||||||
Fossil Group, Inc. | 1,942,500 | 1,944,928 | ||||||
Entertainment — 0.91% |
| |||||||
Golden Entertainment, Inc. | 920,000 | 934,950 | ||||||
|
| |||||||
Total BANK LOANS | 6,748,257 | |||||||
|
| |||||||
| CORPORATE BONDS — 14.47% |
| |||||||
Banks — 1.77% |
| |||||||
USB Realty Corp. | 2,000,000 | 1,812,500 | ||||||
Commercial Services — 1.34% |
| |||||||
Rent-A-Center, Inc. | 1,378,000 | 1,378,000 | ||||||
Diversified Financial Services — 1.47% |
| |||||||
Abe Investment Holdings, Inc./Getty Images, Inc. | 1,649,000 | 1,508,835 | ||||||
Telecommunications — 9.89% |
| |||||||
Consolidated Communications, Inc. | 5,427,000 | 5,060,678 | ||||||
HC2 Holdings, Inc. | 5,005,000 | 5,080,075 | ||||||
|
| |||||||
| 10,140,753 | ||||||||
|
| |||||||
Total CORPORATE BONDS | 14,840,088 | |||||||
|
| |||||||
| CONVERTIBLE CORPORATE BONDS — 0.30% |
| |||||||
Internet — 0.30% |
| |||||||
Wix.com Ltd. (Israel) | 310,000 | 305,766 | ||||||
|
| |||||||
Total CONVERTIBLE CORPORATE BONDS | 305,766 | |||||||
|
| |||||||
| COMMON STOCK — 70.34% |
| |||||||
Aerospace & Defense — 4.13% |
| |||||||
Rockwell Collins, Inc. | 31,488 | 4,240,804 | ||||||
| Shares, Principal Amount, or Number of Contracts | Value | |||||||
Biotechnology — 11.73% |
| |||||||
Adverum Biotechnologies, Inc.* | 251,395 | $ | 1,332,393 | |||||
Atara Biotherapeutics, Inc.* | 7,996 | 293,853 | ||||||
Avrobio, Inc.* | 25,763 | 735,791 | ||||||
Blueprint Medicines Corp.* | 8,893 | 564,528 | ||||||
Deciphera Pharmaceuticals, Inc.* | 9,402 | 369,969 | ||||||
Ideaya Biosciences, Inc. Private Equity5,7 | 1,544,998 | 963,615 | ||||||
Loxo Oncology, Inc.*4 | 33,799 | 5,863,451 | ||||||
Sesen Bio, Inc.* | 505,333 | 985,399 | ||||||
Sierra Oncology, Inc. (Canada)* | 313,224 | 927,143 | ||||||
|
| |||||||
| 12,036,142 | ||||||||
|
| |||||||
Building Materials — 2.06% |
| |||||||
Builders FirstSource, | 115,716 | 2,116,446 | ||||||
Chemicals — 3.35% |
| |||||||
Huntsman Corp. | 117,675 | 3,436,110 | ||||||
Commercial Services — 1.95% |
| |||||||
Quanta Services, Inc.* | 59,853 | 1,999,090 | ||||||
Computers — 2.56% |
| |||||||
Perspecta, Inc. | 127,876 | 2,627,852 | ||||||
Healthcare - Products — 2.35% |
| |||||||
Inspire Medical Systems, Inc.* | 28,878 | 1,029,790 | ||||||
Sientra, Inc.* | 70,600 | 1,377,406 | ||||||
|
| |||||||
| 2,407,196 | ||||||||
|
| |||||||
Healthcare — Services — 3.17% |
| |||||||
Natera, Inc.*4 | 148,041 | 2,786,132 | ||||||
Neuronetics, Inc.* | 17,545 | �� | 466,872 | |||||
|
| |||||||
| 3,253,004 | ||||||||
|
| |||||||
Insurance — 7.20% |
| |||||||
FGL Holdings (Bermuda)*4 | 879,778 | 7,381,337 | ||||||
Media — 0.65% |
| |||||||
Altice NV, Class A (Netherlands)* | 126,041 | 513,702 | ||||||
Altice USA, Inc. | 8,673 | 147,961 | ||||||
|
| |||||||
| 661,663 | ||||||||
|
| |||||||
Pharmaceuticals — 10.81% |
| |||||||
Aclaris Therapeutics, | 124,237 | 2,481,013 | ||||||
Array Biopharma, Inc.* | 261,559 | 4,388,960 | ||||||
Clementia Pharmaceuticals, Inc. (Canada)* | 159,516 | 2,099,231 | ||||||
Concert Pharmaceuticals, Inc.* | 26,115 | 439,515 | ||||||
Mirati Therapeutics, Inc.* | 33,977 | 1,675,066 | ||||||
|
| |||||||
| 11,083,785 | ||||||||
|
| |||||||
Notes to Financial Statements are an integral part of this Schedule.
12
Driehaus Event Driven Fund
Schedule of Investments
June 30, 2018 (unaudited)
| Shares, Principal Amount, or Number of Contracts | Value | |||||||
Savings & Loans — 8.09% |
| |||||||
OceanFirst Financial | 130,030 | $ | 3,895,699 | |||||
Oritani Financial Corp.4 | 123,499 | 2,000,684 | ||||||
Waterstone Financial, Inc. | 140,540 | 2,396,207 | ||||||
|
| |||||||
| 8,292,590 | ||||||||
|
| |||||||
Semiconductors — 2.23% |
| |||||||
Marvell Technology Group Ltd. (Bermuda) | 106,575 | 2,284,968 | ||||||
Software — 1.06% |
| |||||||
Avaya Holdings Corp.* | 54,236 | 1,089,059 | ||||||
Telecommunications — 0.81% |
| |||||||
HC2 Holdings, Inc.* | 142,775 | 835,234 | ||||||
Transportation — 8.19% |
| |||||||
Knight-Swift Transportation Holdings, Inc. | 88,715 | 3,389,800 | ||||||
XPO Logistics, Inc.*4 | 50,062 | 5,015,211 | ||||||
|
| |||||||
| 8,405,011 | ||||||||
|
| |||||||
Total COMMON STOCK | 72,150,291 | |||||||
|
| |||||||
| CONVERTIBLE PREFERRED STOCK — 0.00% |
| |||||||
Auto Manufacturers — 0.00% |
| |||||||
General Motors Corp. Senior Convertible Preferred Escrow — B | 25,000 | — | ||||||
General Motors Corp. Senior Convertible Preferred Escrow — C | 162,750 | — | ||||||
|
| |||||||
| — | ||||||||
|
| |||||||
Total CONVERTIBLE PREFERRED STOCK | — | |||||||
|
| |||||||
| PURCHASED CALL OPTIONS — 0.09% |
| |||||||
United Technologies Corp., Exercise Price: $135.00, Notional Amount $4,306,500, Expiration Date: January 18, 2019* | 319 | 98,890 | ||||||
|
| |||||||
Total PURCHASED CALL OPTIONS | 98,890 | |||||||
|
| |||||||
| ||||||||
TOTAL INVESTMENTS | 91.78 | % | 94,143,292 | |||||
Other Assets less Liabilities | 8.22 | % | 8,431,219 | |||||
|
|
|
| |||||
Net Assets | 100.00 | % | $ | 102,574,511 | ||||
| ||||||||
| Shares, Principal Amount, or Number of Contracts | Value | |||||||
| SECURITIES SOLD SHORT — (18.67)% |
| |||||||
| EXCHANGE-TRADED FUNDS — (18.67)% |
| |||||||
iShares Nasdaq Biotechnology ETF | (50,400 | ) | $ | (5,534,928 | ) | |||
SPDR S&P Biotech ETF | (111,138 | ) | (10,579,226 | ) | ||||
SPDR S&P Regional Banking ETF | (49,788 | ) | (3,037,068 | ) | ||||
|
| |||||||
| (19,151,222 | ) | |||||||
|
| |||||||
Total EXCHANGE-TRADED FUNDS | (19,151,222 | ) | ||||||
|
| |||||||
| ||||||||
TOTAL INVESTMENT SECURITIES SOLD SHORT | (18.67 | )% | $ | (19,151,222 | ) | |||
|
| |||||||
| ||||||||
| * | Non-income producing security. |
| US | LIBOR — U.S. Dollar London Interbank Offered Rate. |
| LIBOR | 3 Month — 3 Month U.S. Dollar London Interbank Offered Rate. |
| 1 | Security is exempt from registration under Rule 144A of the Securities Act of 1933, as amended. Unless otherwise indicated, this security has been determined to be liquid under procedures established by Driehaus Mutual Funds’ ( the “Trust”) Board of Trustees and may be resold in transactions exempt from registration, normally to qualified institutional buyers. |
| 2 | Variable or floating rate security. Rates disclosed as of June 30, 2018. |
| 3 | Bank loans in which the Fund invests pay interest at rates which are periodically predetermined by reference to a base lending rate plus a premium. These base lending rates are generally (i) the lending rate offered by one or more major European banks, such as the London Inter-Bank Offered Rate (“LIBOR”), (ii) the prime rate offered by one or more United States banks or (iii) the certificate of deposit rate. Certain bank loans are subject to a LIBOR floor that establishes a minimum LIBOR rate. The interest rate shown reflects the rate in effect at June 30, 2018. Bank loans generally are subject to mandatory and/or optional repayment. As a result, the actual remaining maturity may be substantially less than the stated maturities shown. |
| 4 | All or a portion of this security is pledged as collateral for short sales or derivatives transactions. |
| 5 | Pursuant to procedures adopted by the Trust’s Board of Trustees, this security has been determined to be illiquid by Driehaus Capital Management LLC (the “Adviser”), investment adviser to the Fund. |
| 6 | Security is in default. |
| 7 | Security valued at fair value as determined in good faith by the Adviser, in accordance with procedures established by, and under the general supervision of, the Trust’s Board of Trustees. |
Percentages are stated as a percent of net assets.
Notes to Financial Statements are an integral part of this Schedule.
13
Driehaus Event Driven Fund
Schedule of Investments
June 30, 2018 (unaudited)
Security Type | Percent of Total Net Assets | |||
Corporate Bonds | 14.5 | % | ||
Common Stock | 70.3 | % | ||
Convertible Preferred Stock | 0.0 | % | ||
Purchased Call Options | 0.1 | % | ||
Bank Loans | 6.6 | % | ||
Convertible Corporate Bonds | 0.3 | % | ||
|
| |||
Total Investments | 91.8 | % | ||
Other Assets less Liabilities | 8.2 | % | ||
|
| |||
Total Net Assets | 100.0 | % | ||
|
| |||
Percentages are stated as a percent of net assets.
FORWARD FOREIGN CURRENCY CONTRACTS
| Counterparty | Currency Purchased | Currency Sold | Settlement Date | Unrealized Appreciation/ (Depreciation) | ||||||||||||||||||||
Goldman Sachs | EUR | 1,085,000 | USD | 1,285,440 | August 9, 2018 | $ | (14,364 | ) | ||||||||||||||||
Goldman Sachs | USD | 1,993,517 | EUR | 1,660,000 | August 9, 2018 | 48,830 | ||||||||||||||||||
|
| |||||||||||||||||||||||
TOTAL FORWARD FOREIGN CURRENCY CONTRACTS |
| $ | 34,466 | |||||||||||||||||||||
|
| |||||||||||||||||||||||
EUR = Euro
USD = United States Dollar
Notes to Financial Statements are an integral part of this Schedule.
14
Driehaus Multi-Asset Growth Economies Fund
Performance Overview (unaudited)
The performance summarized below is historical and does not represent future results. Investment returns and principal value vary, and you may have a gain or loss when you sell shares. Performance data presented measures the change in the value of an investment in the Fund, assuming reinvestment of all dividends and capital gains.
The table does not reflect the deduction of taxes that a shareholder would pay on Fund distributions or the redemption of Fund shares. The graph compares the results of a $10,000 investment in the Fund since April 10, 2017 (the date of the Fund’s inception), with all dividends and capital gains reinvested, with the indicated indices (and dividends reinvested) for the same period.
| Cumulative Total Returns as of 6/30/18 | 1 Year | Since Inception (4/10/17 - 6/30/18) | ||||||
Driehaus Multi-Asset Growth Economies Fund (DMAGX)1 | 7.15% | 11.13% | ||||||
MSCI EM/JP Morgan GBI Blended Index2 | 2.96% | 6.50% | ||||||
MSCI Emerging Markets Index-N3 | 8.20% | 11.73% | ||||||
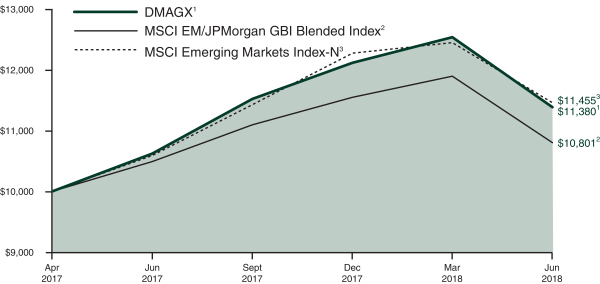
| 1 | The returns for the period reflect fee waivers and/or reimbursements without which performance would have been lower. |
| 2 | The MSCI EM/JPMorgan GBI Blended Index is an equally weighted benchmark comprised of 50 percent by the Morgan Stanley Capital International Emerging Markets Index-Net (MSCI EM) and 50 percent by the JPMorgan Global Bond Index Emerging Markets Global Diversified (JPMorgan GBI). The MSCI EM is a market capitalization-weighted index designed to measure equity market performance in emerging markets and the JPMorgan GBI tracks debt instruments in the emerging markets. Source: Morgan Stanley Capital International Inc. and JPMorgan. |
| 3 | The Morgan Stanley Capital International Emerging Markets Index-Net (MSCI Emerging Markets Index-N) is a market capitalization-weighted index designed to measure equity market performance in emerging markets. Data is in U.S. dollars and is calculated with net dividend reinvestment. Source: Morgan Stanley Capital International Inc. |
15
Driehaus Multi-Asset Growth Economies Fund
Schedule of Investments
June 30, 2018 (unaudited)
| Shares, Principal Amount, or Number of Contracts | Value | |||||||
| SOVEREIGN BONDS — 24.10% |
| |||||||
Egypt — 3.71% |
| |||||||
Egypt Treasury Bills | 10,000,000 | 5 | $ | 551,693 | ||||
Egypt Treasury Bills | 18,000,000 | 5 | 984,012 | |||||
|
| |||||||
| 1,535,705 | ||||||||
|
| |||||||
Malaysia — 1.19% |
| |||||||
Malaysia Government Bond | 2,050,000 | 5 | 491,409 | |||||
Mexico — 6.17% |
| |||||||
Mexican Bonos | 500,000 | 5 | 2,553,662 | |||||
Nigeria — 2.74% |
| |||||||
Nigeria Government International Bond | 1,200,000 | 5 | 1,133,712 | |||||
Peru — 2.42% |
| |||||||
Peruvian Government International Bond | 3,000,000 | 5 | 1,000,132 | |||||
Poland — 3.73% |
| |||||||
Republic of Poland Government Bond | 6,000,000 | 5 | 1,541,768 | |||||
South Africa — 1.87% |
| |||||||
Republic of South Africa Government Bond | 4,951,000 | 5 | 327,069 | |||||
Republic of South Africa Government International Bond | 500,000 | 5 | 445,410 | |||||
|
| |||||||
| 772,479 | ||||||||
|
| |||||||
Thailand — 2.27% |
| |||||||
Thailand Government Bond | 30,500,000 | 5 | 937,386 | |||||
|
| |||||||
Total SOVEREIGN BONDS | 9,966,253 | |||||||
|
| |||||||
| EQUITY SECURITIES — 68.62% |
| |||||||
Argentina — 0.54% |
| |||||||
Telecom Argentina SA ADR2,3 | 12,696 | 225,227 | ||||||
Brazil — 5.89% |
| |||||||
Ambev SA ADR2,3 | 118,428 | 548,322 | ||||||
Cyrela Brazil Realty SA Empreendimentos e Participacoes | 147,423 | 418,405 | ||||||
Gerdau SA — SP ADR2,3 | 45,904 | 162,500 | ||||||
Itau Unibanco Holding SA — SP ADR2,3 | 59,244 | 614,953 | ||||||
Localiza Rent a Car SA | 36,524 | 223,622 | ||||||
Vale SA — ADR2,3 | 36,436 | 467,109 | ||||||
|
| |||||||
| 2,434,911 | ||||||||
|
| |||||||
| Shares, Principal Amount, or Number of Contracts | Value | |||||||
China — 20.82% |
| |||||||
AIA Group, Ltd. | 84,720 | $ | 740,771 | |||||
Alibaba Group Holding, Ltd. — SP ADR*2,3 | 5,538 | 1,027,465 | ||||||
Baidu, Inc. ADR*2,3 | 1,222 | 296,946 | ||||||
China Overseas Land & Investment, Ltd. | 121,115 | 399,054 | ||||||
China Shenhua Energy Co., Ltd. | 127,000 | 301,410 | ||||||
CSPC Pharmaceutical Group, Ltd. | 99,273 | 299,884 | ||||||
Fanhua, Inc. — SP ADR2,3 | 11,525 | 328,463 | ||||||
GDS Holdings, Ltd. ADR*2,3 | 7,691 | 308,332 | ||||||
Guangzhou Baiyun International Airport Co., Ltd. | 81,800 | 161,617 | ||||||
Hangzhou Hikvision Digital Technology Co., Ltd. — A | 35,654 | 199,815 | ||||||
Huifu Payment, Ltd.*1 | 225,908 | 195,513 | ||||||
Industrial & Commercial Bank of China, Ltd. | 679,058 | 508,064 | ||||||
Ping An Insurance Group Co. of China, Ltd. — H | 51,739 | 476,134 | ||||||
Sands China, Ltd. | 74,610 | 398,936 | ||||||
Tencent Holdings, Ltd. | 45,573 | 2,287,479 | ||||||
Xiabuxiabu Catering Management China Holdings Co., Ltd.1 | 156,762 | 342,472 | ||||||
ZTO Express Cayman, Inc. — ADR2,3 | 16,946 | 338,920 | ||||||
|
| |||||||
| 8,611,275 | ||||||||
|
| |||||||
Cyprus — 1.16% |
| |||||||
TCS Group Holding PLC GDR3 | 23,181 | 479,847 | ||||||
Czech Republic — 0.52% |
| |||||||
Moneta Money Bank AS1 | 62,310 | 213,851 | ||||||
Egypt — 0.39% |
| |||||||
Commercial International Bank Egypt SAE — GDR3 | 32,956 | 163,132 | ||||||
France — 1.34% |
| |||||||
LVMH Moet Hennessy Louis Vuitton SE | 1,666 | 554,879 | ||||||
Greece — 0.49% |
| |||||||
OPAP SA | 17,768 | 200,857 | ||||||
Hungary — 0.64% |
| |||||||
OTP Bank PLC | 7,281 | 263,613 | ||||||
India — 7.44% |
| |||||||
Crompton Greaves Consumer Electricals, Ltd. | 93,326 | 308,113 | ||||||
HDFC Bank, Ltd. — ADR2,3 | 8,325 | 874,291 | ||||||
Housing Development Finance Corp., Ltd. | 15,683 | 436,762 | ||||||
Notes to Financial Statements are an integral part of this Schedule.
16
Driehaus Multi-Asset Growth Economies Fund
Schedule of Investments
June 30, 2018 (unaudited)
| Shares, Principal Amount, or Number of Contracts | Value | |||||||
ICICI Bank, Ltd. — SP ADR2,3 | 51,859 | $ | 416,428 | |||||
ITC, Ltd. | 27,185 | 105,621 | ||||||
Maruti Suzuki India, Ltd. | 1,709 | 220,141 | ||||||
Tata Consultancy Services, Ltd. | 26,516 | 715,098 | ||||||
|
| |||||||
| 3,076,454 | ||||||||
|
| |||||||
Indonesia — 1.02% |
| |||||||
PT Bank Central Asia Tbk | 281,697 | 422,152 | ||||||
Malaysia — 0.71% |
| |||||||
Public Bank BHD | 50,548 | 292,314 | ||||||
Mexico — 3.17% |
| |||||||
Grupo Financiero Banorte SAB de CV — O | 68,381 | 403,084 | ||||||
Prologis Property Mexico SA de CV | 302,711 | 558,315 | ||||||
Wal-Mart de Mexico SAB de CV | 133,256 | 351,318 | ||||||
|
| |||||||
| 1,312,717 | ||||||||
|
| |||||||
Philippines — 0.89% |
| |||||||
BDO Unibank, Inc. | 157,185 | 369,639 | ||||||
Russia — 3.02% |
| |||||||
Sberbank of Russia PJSC — SP ADR3 | 51,822 | 748,051 | ||||||
Yandex NV — A*2,3 | 13,938 | 500,374 | ||||||
|
| |||||||
| 1,248,425 | ||||||||
|
| |||||||
Saudi Arabia — 1.87% |
| |||||||
Al Rajhi Bank | 14,558 | 334,992 | ||||||
Bupa Arabia for Cooperative Insurance Co. | 8,848 | 212,094 | ||||||
United International Transportation Co. | 23,575 | 224,096 | ||||||
|
| |||||||
| 771,182 | ||||||||
|
| |||||||
South Africa — 0.85% |
| |||||||
Shoprite Holdings Ltd. | 21,918 | 352,494 | ||||||
South Korea — 7.30% |
| |||||||
Cafe24 Corp.* | 1,746 | 280,425 | ||||||
Koh Young Technology, Inc. | 4,279 | 391,618 | ||||||
Korea Investment Holdings Co., Ltd. | 4,714 | 355,718 | ||||||
Macquarie Korea Infrastructure Fund | 51,186 | 411,509 | ||||||
Samsung Electronics Co., Ltd. | 27,850 | 1,165,727 | ||||||
SK Hynix, Inc. | 5,364 | 412,467 | ||||||
|
| |||||||
| 3,017,464 | ||||||||
|
| |||||||
Taiwan — 6.92% |
| |||||||
Cathay Financial Holding Co., Ltd. | 307,022 | 541,771 | ||||||
Chipbond Technology Corp. | 189,000 | 392,400 | ||||||
| Shares, Principal Amount, or Number of Contracts | Value | |||||||
Hon Hai Precision Industry Co., Ltd. | 104,191 | $ | 284,327 | |||||
MediaTek, Inc. | 24,271 | 238,821 | ||||||
Taiwan Semiconductor Manufacturing Co., Ltd. | 143,175 | 1,016,691 | ||||||
Vanguard International Semiconductor Corp. | 169,000 | 386,907 | ||||||
|
| |||||||
| 2,860,917 | ||||||||
|
| |||||||
Thailand — 1.43% |
| |||||||
Advanced Info Service PCL | 64,100 | 357,938 | ||||||
Indorama Ventures PCL — NVDR | 141,600 | 234,006 | ||||||
|
| |||||||
| 591,944 | ||||||||
|
| |||||||
Turkey — 0.58% |
| |||||||
Turkcell Iletisim Hizmetleri AS | 91,061 | 241,236 | ||||||
United Arab Emirates — 0.98% |
| |||||||
Abu Dhabi Commercial Bank PJSC | 106,704 | 205,088 | ||||||
DP World, Ltd.3 | 8,738 | 200,974 | ||||||
|
| |||||||
| 406,062 | ||||||||
|
| |||||||
United Kingdom — 0.65% |
| |||||||
KAZ Minerals PLC* | 24,188 | 269,110 | ||||||
|
| |||||||
Total EQUITY SECURITIES | 28,379,702 | |||||||
|
| |||||||
| PURCHASED CALL OPTION — 0.00% |
| |||||||
OTC CLP vs USD | 500,000 | 232 | ||||||
|
| |||||||
Total PURCHASED CALL OPTION | 232 | |||||||
|
| |||||||
| PURCHASED PUT OPTION — 0.06% |
| |||||||
OTC EUR vs USD Exercise Price: $1.18, Notional Amount: $23,600 Expiration Date: July 12, 2018* Counterparty: Goldman Sachs | 2,000,000 | 24,833 | ||||||
|
| |||||||
Total PURCHASED PUT OPTIONS | 24,833 | |||||||
|
| |||||||
Notes to Financial Statements are an integral part of this Schedule.
17
Driehaus Multi-Asset Growth Economies Fund
Schedule of Investments
June 30, 2018 (unaudited)
| Shares, Principal Amount, or Number of Contracts | Value | |||||||
| EQUITY CERTIFICATES — 0.45% |
| |||||||
India — 0.45% |
| |||||||
ITC, Ltd.4 | 48,407 | $ | 188,075 | |||||
|
| |||||||
Total EQUITY CERTIFICATES | 188,075 | |||||||
|
| |||||||
| ||||||||
TOTAL INVESTMENTS | 93.23 | % | 38,559,095 | |||||
Other Assets less Liabilities | 6.77 | % | 2,798,975 | |||||
|
|
|
| |||||
Net Assets | 100.00 | % | $ | 41,358,070 | ||||
| ||||||||
| * | Non-income producing security. |
ADR — American Depository Receipt
CLP — Chilean Peso
CALY — Calyon Securities
EUR — Euro
GDR — Global Depository Receipt
NVDR — Non-Voting Depository Receipt
SP ADR — Sponsored American Depository Receipt
USD — United States Dollar
| 1 | Security is exempt from registration under Rule 144A of the Securities Act of 1933, as amended. Unless otherwise indicated, this security has been determined to be liquid under procedures established by Driehaus Mutual Funds’ (the “Trust”) Board of Trustees and may be resold in transactions exempt from registration, normally to qualified institutional buyers. |
| 2 | All or a portion of this security is pledged as collateral for short sales or derivatives transactions. |
| 3 | Foreign security denominated in U.S. dollars and traded on a U.S. exchange. |
| 4 | Restricted security — Investments in securities not registered under the Securities Act of 1933, excluding 144A securities. At June 30, 2018, the value of these restricted securities amounted to $188,075 or 0.45% of net assets. These restricted securities have not been deemed illiquid. |
| 5 | Foreign security, par value shown in local currency. |
Percentages are stated as a percent of net assets.
Security Type/Sector | Percent of Total Net Assets | |||
Sovereign Bonds | 24.10 | % | ||
Equity Securities | 68.62 | % | ||
Purchased Call Options | 0.00 | % | ||
Purchased Put Options | 0.06 | % | ||
Equity Certificates | 0.45 | % | ||
|
| |||
Total Investments | 93.23 | % | ||
Other Assets less Liabilities | 6.77 | % | ||
|
| |||
Total Net Assets | 100.00 | % | ||
|
| |||
Percentages are stated as a percent of net assets.
Regional Weightings(a)
Asia/Far East Ex-Japan | 50.44% | |||
Eastern Europe | 9.83% | |||
Africa | 9.56% | |||
North America | 9.40% | |||
South America | 8.85% | |||
Middle East | 4.01% | |||
Western Europe | 1.14% |
| (a) | All percentages are stated as a percent of net assets at June 30, 2018. |
Additional information on each restricted security is as follows:
Security | Counter- Party | Acquisition Date(s) | Acquisition Costs | |||||||||
ITC, Ltd. | CALY | 4/11/17 | $ | 205,716 | ||||||||
Notes to Financial Statements are an integral part of this Schedule.
18
Driehaus Multi-Asset Growth Economies Fund
Schedule of Investments
June 30, 2018 (unaudited)
SWAP CONTRACTS
| Credit Default Swaps | ||||||||||||||||||||||||||||||||||||||||
| Counterparty | Reference Instrument | Currency | Notional Amount(4) | Buy/Sell Protection(1)(2) | Pay (Receive) Fixed Rate | Payment Frequency | Expiration Date | Implied Credit Spread(3) | Upfront Premium Paid (Received) | Unrealized Appreciation/ (Depreciation) | Value | |||||||||||||||||||||||||||||
ICE Clear Credit LLC | The Markit CDX Emerging Markets IndexSeries 29 | USD | 8,000,000 | Buy | 1.00 | % | Quarterly | 6/20/2023 | 1.90 | % | $ | 316,368 | $ | (1,099 | ) | $ | 315,269 | |||||||||||||||||||||||
|
|
|
|
|
| |||||||||||||||||||||||||||||||||||
TOTAL CREDIT DEFAULT SWAPS |
| $ | 316,368 | $ | (1,099 | ) | $ | 315,269 | ||||||||||||||||||||||||||||||||
|
|
|
|
|
| |||||||||||||||||||||||||||||||||||
| 1 | If the Fund is a buyer of protection and a credit event occurs, as defined under the terms of that particular swap agreement, the Fund will either (i) receive from the seller of protection an amount equal to the notional amount of the swap and deliver the referenced obligation or underlying investments comprising the referenced index or (ii) receive a net settlement amount in the form of cash or investments equal to the notional amount of the swap less the recovery value of the referenced obligation or underlying investments comprising the referenced index. |
| 2 | If the Fund is a seller of protection and a credit event occurs, as defined under the terms of that particular swap agreement, the Fund will either (i) pay to the buyer of protection an amount equal to the notional amount of the swap and take delivery of the referenced obligation or underlying investments comprising the referenced index or (ii) pay a net settlement amount in the form of cash or investments equal to the notional amount of the swap less the recovery value of the referenced obligation or underlying investments comprising the referenced index. |
| 3 | An implied credit spread is the spread in yield between a U.S. Treasury security and the referenced obligation or underlying investment that are identical in all respects except for the quality rating. Implied credit spreads, represented in absolute terms, utilized in determining the value of credit default swap agreements on corporate and sovereign issues as of period end serve as an indicator of the current status of the payment/performance risk and represent the likelihood of risk of default for the credit derivative. The implied credit spread of a particular referenced entity reflects the cost of buying/selling protection and may include upfront payments required to be made to enter into the agreement. Wider credit spreads, in comparison to narrower credit spreads, represent a deterioration of the referenced entity’s credit soundness and a greater likelihood of risk of default or other credit event occurring as defined under the terms of the agreement. A credit spread identified as “Defaulted” indicates a credit event has occurred for the referenced entity or obligation. |
| 4 | The maximum potential amount the Fund could be required to pay as a seller of credit protection or receive as a buyer of credit protection if a credit event occurs as defined under the terms of that particular swap agreement. |
USD — United States Dollar
Notes to Financial Statements are an integral part of this Schedule.
19
Driehaus Multi-Asset Growth Economies Fund
Schedule of Investments
June 30, 2018 (unaudited)
SWAP CONTRACTS
| Interest Rate Swaps | ||||||||||||||||||||||||
| Counterparty | Notional Amount | Fixed Rate | Floating Rate Index | Payment Frequency | Expiration Date | Value/ Unrealized Appreciation/ (Depreciation) | ||||||||||||||||||
Chicago Mercantile Exchange | BRL | 15,131,123 | 9.41 | %1 | 1-Day BRL BZDIOVRA1 | Daily | 1/4/2021 | $ | 21,281 | |||||||||||||||
Morgan Stanley Capital Services LLC | CNY | 67,000,000 | 3.19 | %1 | 7-Day CNRR0071 | 7-Day | 6/20/2020 | 21,687 | ||||||||||||||||
Morgan Stanley Capital Services LLC | KRW | 3,400,000,000 | 2.26 | %1 | 3-Months KWCDC1 | Quarterly | 6/28/2028 | 12,593 | ||||||||||||||||
Chicago Mercantile Exchange | MXN | 29,000,000 | 8.26 | %2 | 28-Day MXN MXIBTIIE2 | 28 Days | 6/8/2028 | (21,820 | ) | |||||||||||||||
|
| |||||||||||||||||||||||
TOTAL INTEREST RATE SWAPS |
| $ | 33,741 | |||||||||||||||||||||
|
| |||||||||||||||||||||||
| 1 | Fund Pays the floating rate and receives the fixed rate. |
| 2 | Fund Pays the fixed rate and receives the floating rate. |
BRL — Brazilian Real
CNY — Chinese Yuan
KRW — South Korean won
MXN — Mexican Peso
BZDIOVRA — Brazil Interbank Deposit Rate
CNRR007 — CFETS China Fixing Repo Rates
KWCDC — KRW 3 Month Certificate of Deposit
MXIBTIIE — Mexico 28-day Interbank Interest Rate
FORWARD FOREIGN CURRENCY CONTRACTS
| Counterparty | Currency Purchased | Currency Sold | Settlement Date | Unrealized Appreciation/ (Depreciation) | ||||||||||||||||||||
Bank of America | ARS | 24,350,000 | USD | 1,000,000 | March 8, 2019 | $ | (302,440 | ) | ||||||||||||||||
Goldman Sachs | USD | 330,000 | ARS | 8,184,000 | March 8, 2019 | 95,551 | ||||||||||||||||||
Goldman Sachs | USD | 670,000 | ARS | 18,257,500 | March 8, 2019 | 146,974 | ||||||||||||||||||
Goldman Sachs | USD | 1,473,167 | MXN | 30,173,382 | July 23, 2018 | (40,243 | ) | |||||||||||||||||
Goldman Sachs | USD | 500,000 | MXN | 10,227,465 | July 23, 2018 | (12,981 | ) | |||||||||||||||||
Goldman Sachs | USD | 513,771 | MXN | 10,129,235 | July 23, 2018 | 5,718 | ||||||||||||||||||
Goldman Sachs | RUB | 31,765,000 | USD | 500,000 | September 28, 2018 | 1,158 | ||||||||||||||||||
|
| |||||||||||||||||||||||
TOTAL FORWARD FOREIGN CURRENCY CONTRACTS |
| $ | (106,263 | ) | ||||||||||||||||||||
|
| |||||||||||||||||||||||
ARS = Argentine Peso
MXN = Mexican Peso
RUB = Russian Ruble
USD = United States Dollar
Notes to Financial Statements are an integral part of this Schedule.
20
Statements of Assets and Liabilities
June 30, 2018 (unaudited)
Driehaus Active Income Fund | Driehaus Event Driven Fund | Driehaus Multi-Asset Growth Economies Fund | ||||||||||
ASSETS: |
| |||||||||||
Investment securities, at fair value (cost $1,430,731,291, $91,419,209 and $36,715,663, respectively) | $ | 1,419,587,913 | $ | 94,044,402 | $ | 38,534,030 | ||||||
Purchased options contracts, at fair value (premiums paid $3,144,154, $301,419 and $29,011, respectively) | 3,530,631 | 98,890 | 25,065 | |||||||||
Purchased swaptions contracts, at fair value (premiums paid $1,010,000, $0 and $0, respectively) | 308,331 | — | — | |||||||||
Foreign currency, at fair value (cost $0, $12 and $1,331, respectively) | — | 12 | 1,320 | |||||||||
Unrealized appreciation on forward foreign currency contracts | 511,832 | 48,830 | 249,401 | |||||||||
Unrealized appreciation on open swap contracts | 7,836,857 | — | 55,561 | |||||||||
Premiums paid on open swap contracts | 13,256,604 | — | 316,368 | |||||||||
Cash | 117,038,968 | 7,478,313 | 1,681,425 | |||||||||
Collateral held at custodian for the benefit of brokers | 109,753,687 | 23,033,437 | 275,721 | |||||||||
Receivable for investment securities sold | 6,393,322 | — | 652,718 | |||||||||
Receivable for fund shares sold | 1,593,651 | 101,125 | — | |||||||||
Receivable for interest and dividends | 16,197,097 | 234,335 | 268,161 | |||||||||
Receivable for variation margin on futures contracts | 33,008 | — | — | |||||||||
Receivable from custodian | — | — | 21,372 | |||||||||
Prepaid expenses | 25,148 | 24,713 | 14,478 | |||||||||
|
|
|
|
|
| |||||||
| ||||||||||||
TOTAL ASSETS | 1,696,067,049 | 125,064,057 | 42,095,620 | |||||||||
|
|
|
|
|
| |||||||
| ||||||||||||
LIABILITIES: |
| |||||||||||
Payable for investment securities sold short, at fair value (proceeds $83,900,378, $16,797,306 and $0, respectively) | 87,955,063 | 19,151,222 | — | |||||||||
Written options outstanding, at fair value (premiums received $849,151, $0 and $0, respectively) | 923,933 | — | — | |||||||||
Foreign currency due to custodian, at fair value (proceeds $272, $0 and $212, respectively) | 275 | — | 208 | |||||||||
Unrealized depreciation on open swap contracts | 1,232,563 | — | 22,919 | |||||||||
Unrealized depreciation on forward foreign currency contracts | 111,205 | 14,364 | 355,664 | |||||||||
Premiums received on open swap contracts | 8,015,727 | — | — | |||||||||
Due to custodian | — | 50,672 | — | |||||||||
Payable for investment securities purchased | 42,663,890 | 2,933,350 | 300,297 | |||||||||
Payable for fund shares redeemed | 1,482,326 | 169,666 | — | |||||||||
Payable to affiliate | 709,162 | 86,846 | 25,072 | |||||||||
Payable for interest and dividends on securities sold short | 324,989 | 19,880 | — | |||||||||
Payable for variation margin on futures contracts | — | — | — | |||||||||
Accrued shareholder services plan fees | 220,807 | 14,684 | — | |||||||||
Accrued administration and accounting fees | 54,366 | 3,643 | 909 | |||||||||
Accrued foreign capital gains taxes | — | — | 2,409 | |||||||||
Accrued expenses | 168,716 | 45,219 | 30,072 | |||||||||
|
|
|
|
|
| |||||||
| ||||||||||||
TOTAL LIABILITIES | 143,863,022 | 22,489,546 | 737,550 | |||||||||
|
|
|
|
|
| |||||||
| ||||||||||||
NET ASSETS | $ | 1,552,204,027 | $ | 102,574,511 | $ | 41,358,070 | ||||||
|
|
|
|
|
| |||||||
SHARES OUTSTANDING (Unlimited shares authorized, no par value) | 160,493,147 | 9,255,757 | 3,816,414 | |||||||||
|
|
|
|
|
| |||||||
NET ASSET VALUE, OFFERING AND REDEMPTION PRICE PER SHARE | $ | 9.67 | $ | 11.08 | $ | 10.84 | ||||||
|
|
|
|
|
| |||||||
| ||||||||||||
NET ASSETS CONSISTED OF THE FOLLOWING AT JUNE 30, 2018: |
| |||||||||||
Paid-in-capital | $ | 2,029,929,419 | $ | 106,102,220 | $ | 38,352,419 | ||||||
Undistributed net investment income (loss) | (2,940,882 | ) | 1,402,051 | 490,107 | ||||||||
Undistributed net realized gain (loss) on investments, options, swaptions, securities sold short, futures contracts, swap contracts, forward foreign currency contracts and foreign currency | (466,569,761 | ) | (5,032,974 | ) | 782,481 | |||||||
Net unrealized appreciation (depreciation) on: |
| |||||||||||
Investments | (11,143,378 | ) | 2,625,193 | 1,818,367 | ||||||||
Purchased options contracts | 386,477 | (202,529 | ) | (3,946 | ) | |||||||
Purchased swaptions contracts | (701,669 | ) | — | — | ||||||||
Securities sold short | (4,054,685 | ) | (2,353,916 | ) | — | |||||||
Written options contracts | (74,782 | ) | — | — | ||||||||
Futures contracts | 368,842 | — | — | |||||||||
Swap contracts | 6,604,294 | — | 32,642 | |||||||||
Forward foreign currency contracts | 400,627 | 34,466 | (106,263 | ) | ||||||||
Foreign currency | (3 | ) | — | (7 | ) | |||||||
Foreign currency translations | (472 | ) | — | (7,730 | ) | |||||||
|
|
|
|
|
| |||||||
NET ASSETS | $ | 1,552,204,027 | $ | 102,574,511 | $ | 41,358,070 | ||||||
|
|
|
|
|
| |||||||
| ||||||||||||
Notes to Financial Statements are an integral part of these Statements.
21
For the six months ended June 30, 2018 (unaudited)
Driehaus Active Income Fund | Driehaus Event Driven Fund | Driehaus Multi-Asset Growth Economies Fund | ||||||||||
INVESTMENT INCOME (LOSS): |
| |||||||||||
Interest income (net of $0, $0, and $7,270 of non-reclaimable foreign taxes withheld, respectively) | $ | 35,189,470 | $ | 1,150,314 | $ | 408,959 | ||||||
Dividend income (net of $0, $0, and $58,758 of non-reclaimable foreign taxes withheld, respectively) | 13,315,815 | 2,070,727 | 476,282 | |||||||||
|
|
|
|
|
| |||||||
| ||||||||||||
Total investment income | 48,505,285 | 3,221,041 | 885,241 | |||||||||
|
|
|
|
|
| |||||||
| ||||||||||||
Expenses: |
| |||||||||||
Investment advisory fees | 4,191,816 | 697,003 | 220,287 | |||||||||
Shareholder services plan fees | 1,132,471 | 132,655 | — | |||||||||
Administration and fund accounting fees | 342,075 | 51,561 | 23,534 | |||||||||
Transfer agent fees and expenses | 166,297 | 32,771 | 21,742 | |||||||||
Trustees’ fees | 64,800 | 20,640 | 17,727 | |||||||||
Custody fees | 52,927 | 9,465 | 12,478 | |||||||||
Federal and state registration fees | 46,648 | 15,858 | 25,108 | |||||||||
Legal fees | 43,339 | 14,237 | 14,509 | |||||||||
Reports to shareholders | 38,834 | 19,473 | 12,889 | |||||||||
Audit and tax fees | 29,524 | 29,524 | 24,328 | |||||||||
Chief compliance officer fees | 9,294 | 9,294 | 9,294 | |||||||||
Dividends on short positions | 1,362,772 | 220,375 | — | |||||||||
Interest on short positions | 630,661 | 15,116 | — | |||||||||
Interest expense | 127,766 | 72,578 | — | |||||||||
Miscellaneous | 89,019 | 25,850 | 32,341 | |||||||||
|
|
|
|
|
| |||||||
Total expenses | 8,328,243 | 1,366,400 | 414,237 | |||||||||
Fees paid indirectly | (10,000 | ) | (15,200 | ) | (950 | ) | ||||||
Fees waived by Adviser | — | — | (27,785 | ) | ||||||||
|
|
|
|
|
| |||||||
Net expenses | 8,318,243 | 1,351,200 | 385,502 | |||||||||
|
|
|
|
|
| |||||||
| ||||||||||||
Net investment income (loss) | 40,187,042 | 1,869,841 | 499,739 | |||||||||
|
|
|
|
|
| |||||||
| ||||||||||||
NET REALIZED AND UNREALIZED GAIN (LOSS) ON INVESTMENTS: |
| |||||||||||
Net realized gain (loss) on transactions from: |
| |||||||||||
Investments | 3,551,510 | 10,439,179 | 350,180 | |||||||||
Purchased options contracts | (151,991 | ) | 131,295 | 291,283 | ||||||||
Purchased swaptions contracts | 3,464,715 | — | — | |||||||||
Securities sold short | (17,605,191 | ) | (1,055,532 | ) | — | |||||||
Written options contracts | (384,800 | ) | (252,742 | ) | (131,389 | ) | ||||||
Futures contracts | 8,658,013 | — | — | |||||||||
Swap contracts | 1,445,011 | — | 339,048 | |||||||||
Forward foreign currency contracts | 152,491 | (308,493 | ) | (270,619 | ) | |||||||
Foreign currency | 66,166 | 60,686 | (2,450 | ) | ||||||||
|
|
|
|
|
| |||||||
| ||||||||||||
Net realized gain (loss) on investments | (804,076 | ) | 9,014,393 | 576,053 | ||||||||
|
|
|
|
|
| |||||||
| ||||||||||||
Change in net unrealized appreciation (depreciation) on: |
| |||||||||||
Investments | (41,934,368 | ) | (7,683,585 | ) | (3,424,963 | ) | ||||||
Purchased options contracts | 538,468 | (202,529 | ) | (21,267 | ) | |||||||
Purchased swaptions contracts | (499,543 | ) | — | — | ||||||||
Securities sold short | 15,293,391 | (842,311 | ) | — | ||||||||
Written options contracts | 2,345,181 | 683,374 | — | |||||||||
Futures contracts | (569,388 | ) | — | — | ||||||||
Swap contracts | 800,238 | — | (191,376 | ) | ||||||||
Forward foreign currency contracts | 645,649 | 238,379 | (125,616 | ) | ||||||||
Foreign currency | (1 | ) | — | 2,183 | ||||||||
Foreign currency translations | (2,360 | ) | (228 | ) | (10,880 | ) | ||||||
|
|
|
|
|
| |||||||
| ||||||||||||
Net change in net unrealized appreciation (depreciation) on investments | (23,382,733 | ) | (7,806,900 | ) | (3,771,919 | ) | ||||||
|
|
|
|
|
| |||||||
| ||||||||||||
Net realized and unrealized gain (loss) on investments | (24,186,809 | ) | 1,207,493 | (3,195,866 | ) | |||||||
|
|
|
|
|
| |||||||
| ||||||||||||
NET INCREASE (DECREASE) IN NET ASSETS RESULTING FROM OPERATIONS | $ | 16,000,233 | $ | 3,077,334 | $ | (2,696,127 | ) | |||||
|
|
|
|
|
| |||||||
| ||||||||||||
Notes to Financial Statements are an integral part of these Statements.
22
(This page intentionally left blank)
Statements of Changes in Net Assets
| Driehaus Active Income Fund | Driehaus Event Driven Fund | |||||||||||||||
Six Months June 30, 2018 (unaudited) | Year Ended December 31, | Six Months June 30, 2018 (unaudited) | Year Ended December 31, | |||||||||||||
Operations: | ||||||||||||||||
Net investment income (loss) | $ | 40,187,042 | $ | 69,974,396 | $ | 1,869,841 | $ | 316,090 | ||||||||
Net realized gain (loss) on investments | (804,076 | ) | (80,635,900 | ) | 9,014,393 | 17,590,679 | ||||||||||
Net change in unrealized appreciation (depreciation) on investments | (23,382,733 | ) | 17,210,449 | (7,806,900 | ) | (9,979,767 | ) | |||||||||
|
|
|
|
|
|
|
| |||||||||
| ||||||||||||||||
Net increase (decrease) in net assets resulting from operations | 16,000,233 | 6,548,945 | 3,077,334 | 7,927,002 | ||||||||||||
|
|
|
|
|
|
|
| |||||||||
| ||||||||||||||||
Distributions: | ||||||||||||||||
Net investment income | (45,011,949 | ) | (74,683,208 | ) | — | — | ||||||||||
Net capital gains | — | — | — | — | ||||||||||||
|
|
|
|
|
|
|
| |||||||||
Total distributions | (45,011,949 | ) | (74,683,208 | ) | — | — | ||||||||||
|
|
|
|
|
|
|
| |||||||||
| ||||||||||||||||
Capital share transactions: | ||||||||||||||||
Proceeds from shares sold | 304,068,725 | 533,408,414 | 18,279,593 | 66,521,757 | ||||||||||||
Reinvested distributions | 23,446,985 | 40,540,265 | — | — | ||||||||||||
Cost of shares redeemed | (280,570,226 | ) | (1,246,371,265 | ) | (84,430,165 | ) | (165,282,973 | ) | ||||||||
|
|
|
|
|
|
|
| |||||||||
Net increase (decrease) from capital transactions | 46,945,484 | (672,422,586 | ) | (66,150,572 | ) | (98,761,216 | ) | |||||||||
|
|
|
|
|
|
|
| |||||||||
Total increase (decrease) in net assets | 17,933,768 | (740,556,849 | ) | (63,073,238 | ) | (90,834,214 | ) | |||||||||
|
|
|
|
|
|
|
| |||||||||
| ||||||||||||||||
NET ASSETS: | ||||||||||||||||
| ||||||||||||||||
Beginning of period | $ | 1,534,270,259 | $ | 2,274,827,108 | $ | 165,647,749 | $ | 256,481,963 | ||||||||
|
|
|
|
|
|
|
| |||||||||
End of period | $ | 1,552,204,027 | $ | 1,534,270,259 | $ | 102,574,511 | $ | 165,647,749 | ||||||||
|
|
|
|
|
|
|
| |||||||||
Undistributed net investment income (loss) | $ | (2,940,882 | ) | $ | 1,884,025 | $ | 1,402,051 | $ | (467,790 | ) | ||||||
|
|
|
|
|
|
|
| |||||||||
| ||||||||||||||||
Capital share transactions in shares: | ||||||||||||||||
Shares sold | 30,748,411 | 53,202,812 | 1,674,756 | 6,332,559 | ||||||||||||
Reinvested distributions | 2,401,418 | 4,096,719 | — | — | ||||||||||||
Shares redeemed | (28,307,524 | ) | (125,133,149 | ) | (7,769,816 | ) | (15,782,409 | ) | ||||||||
|
|
|
|
|
|
|
| |||||||||
Net increase (decrease) | 4,842,305 | (67,833,618 | ) | (6,095,060 | ) | (9,449,850 | ) | |||||||||
|
|
|
|
|
|
|
| |||||||||
| ||||||||||||||||
| * | Fund commenced operations on April 10, 2017 |
Notes to Financial Statements are an integral part of these Statements.
24
Statements of Changes in Net Assets
| Driehaus Multi-Asset Growth Economies Fund | ||||||
Six Months June 30, 2018 (unaudited) | For the Period April 10, 2017* through December 31, 2017 | |||||
| $ | 499,739 | $ | 420,295 | |||
| | 576,053 | 1,779,638 | ||||
| | (3,771,919) | 3,050,200 | ||||
|
|
|
| |||
|
| |||||
| | (2,696,127) | 5,250,133 | ||||
|
|
|
| |||
|
| |||||
| — | (555,003) | |||||
| — | (1,463,728) | |||||
|
|
|
| |||
| — | (2,018,731) | |||||
|
|
|
| |||
|
| |||||
| 1,071,444 | 38,153,988 | |||||
| — | 2,018,731 | |||||
| (200,640) | (220,728) | |||||
|
|
|
| |||
| | 870,804 | 39,951,991 | ||||
|
|
|
| |||
| | (1,825,323) | 43,183,393 | ||||
|
|
|
| |||
|
| |||||
|
| |||||
| $ | 43,183,393 | $ | — | |||
|
|
|
| |||
| $ | 41,358,070 | $ | 43,183,393 | |||
|
|
|
| |||
| $ | 490,107 | $ | (9,632) | |||
|
|
|
| |||
|
| |||||
| 90,309 | 3,586,704 | |||||
| — | 177,393 | |||||
| (17,451) | (20,541) | |||||
|
|
|
| |||
| 72,858 | 3,743,556 | |||||
|
|
|
| |||
|
| |||||
Notes to Financial Statements are an integral part of these Statements.
25
Financial Highlights
| For the six month period January 1, 2018 through June 30, 2018 (unaudited) | For the year ended December 31, 2017 | For the year ended December 31, 2016 | For the year ended December 31, 2015 | For the year ended December 31, 2014 | For the year ended December 31, 2013 | |||||||||||||||||||
Net asset value, beginning of period | $ | 9.86 | $ | 10.18 | $ | 9.95 | $ | 10.42 | $ | 10.77 | $ | 10.67 | ||||||||||||
|
|
|
|
|
|
|
|
|
|
|
| |||||||||||||
INCOME FROM INVESTMENT OPERATIONS: | ||||||||||||||||||||||||
Net investment income1 | 0.26 | 0.35 | 0.32 | 0.38 | 0.27 | 0.30 | ||||||||||||||||||
Net realized and unrealized gain (loss) on investments | (0.16 | ) | (0.29 | ) | 0.23 | (0.49 | ) | (0.36 | ) | 0.02 | ||||||||||||||
|
|
|
|
|
|
|
|
|
|
|
| |||||||||||||
Total from investment operations | 0.10 | 0.06 | 0.55 | (0.11 | ) | (0.09 | ) | 0.32 | ||||||||||||||||
|
|
|
|
|
|
|
|
|
|
|
| |||||||||||||
LESS DISTRIBUTIONS TO SHAREHOLDERS FROM: | ||||||||||||||||||||||||
Net investment income | (0.29 | ) | (0.38 | ) | (0.32 | ) | (0.36 | ) | (0.26 | ) | (0.22 | ) | ||||||||||||
Net realized gain | — | — | — | — | — | — | ||||||||||||||||||
|
|
|
|
|
|
|
|
|
|
|
| |||||||||||||
Total distributions | (0.29 | ) | (0.38 | ) | (0.32 | ) | (0.36 | ) | (0.26 | ) | (0.22 | ) | ||||||||||||
|
|
|
|
|
|
|
|
|
|
|
| |||||||||||||
Net asset value, end of period | $ | 9.67 | $ | 9.86 | $ | 10.18 | $ | 9.95 | $ | 10.42 | $ | 10.77 | ||||||||||||
|
|
|
|
|
|
|
|
|
|
|
| |||||||||||||
Total Return | 1.00 | %4 | 0.59 | % | 5.63 | % | (1.07 | )% | (0.87 | )% | 2.99 | % | ||||||||||||
SUPPLEMENTAL DATA AND RATIOS: | ||||||||||||||||||||||||
Net assets, end of period (in 000’s) | $ | 1,552,204 | $ | 1,534,270 | $ | 2,274,827 | $ | 2,875,993 | $ | 3,982,787 | $ | 4,607,803 | ||||||||||||
Ratio of total expenses before reimbursements, waivers, recaptures and/or fees paid indirectly to average net assets | 1.09 | %3 | 1.18 | % | 1.38 | % | 1.05 | % | 1.05 | % | 1.14 | % | ||||||||||||
Ratio of total expenses net of reimbursements, waivers, recaptures and/or fees paid indirectly to average net assets | 1.09 | %2,3 | 1.17 | %2 | 1.38 | %2 | 1.05 | % | 1.05 | % | 1.14 | % | ||||||||||||
Ratio of expenses (excluding dividends and interest on short positions and interest expense) before reimbursements, waivers, recaptures and/or fees paid indirectly to average net assets | 0.81 | %3 | 0.81 | % | 0.80 | % | 0.78 | % | 0.77 | % | 0.79 | % | ||||||||||||
Ratio of expenses (excluding dividends and interest on short positions and interest expense) net of reimbursements, waivers, recaptures and/or fees paid indirectly to average net assets | 0.81 | %2,3 | 0.81 | %2 | 0.80 | %2 | 0.78 | % | 0.77 | % | 0.79 | % | ||||||||||||
Ratio of net investment income (including dividends and interest on short positions and interest expense) net of reimbursements, waivers, recaptures and/or fees paid indirectly to average net assets | 5.27 | %3 | 3.53 | % | 3.20 | % | 3.69 | % | 2.51 | % | 2.80 | % | ||||||||||||
Ratio of net investment income (excluding dividends and interest on short positions and interest expense) net of reimbursements, waivers, recaptures and/or fees paid indirectly to average net assets | 5.55 | %3 | 3.89 | % | 3.78 | % | 3.96 | % | 2.79 | % | 3.15 | % | ||||||||||||
Portfolio turnover rate | 31 | %4 | 89 | % | 115 | % | 76 | % | 43 | % | 48 | % | ||||||||||||
| 1 | Calculated based on average shares outstanding. |
| 2 | Such ratios are net of fees paid indirectly (see Note C in the Notes to Financial Statements). |
| 3 | Annualized. |
| 4 | Not annualized. |
Notes to Financial Statements are an integral part of this Schedule.
26
Driehaus Event Driven Fund
Financial Highlights
| For the six month period January 1, 2018 through June 30, 2018 (unaudited) | For the year ended December 31, 2017 | For the year ended December 31, 2016 | For the year ended December 31, 2015 | For the year ended December 31, 2014 | For the period August 26, 2013* through December 31, 2013 | |||||||||||||||||||
Net asset value, beginning of period | $ | 10.79 | $ | 10.34 | $ | 9.85 | $ | 10.01 | $ | 10.74 | $ | 10.00 | ||||||||||||
|
|
|
|
|
|
|
|
|
|
|
| |||||||||||||
INCOME FROM INVESTMENT OPERATIONS: | ||||||||||||||||||||||||
Net investment income (loss)1 | 0.15 | 0.02 | 0.02 | 0.05 | (0.02 | ) | (0.06 | ) | ||||||||||||||||
Net realized and unrealized gain (loss) on investments | 0.14 | 0.43 | 0.59 | (0.15 | ) | (0.67 | ) | 1.09 | ||||||||||||||||
|
|
|
|
|
|
|
|
|
|
|
| |||||||||||||
Total from investment operations | 0.29 | 0.45 | 0.61 | (0.10 | ) | (0.69 | ) | 1.03 | ||||||||||||||||
|
|
|
|
|
|
|
|
|
|
|
| |||||||||||||
LESS DISTRIBUTIONS TO SHAREHOLDERS FROM: | ||||||||||||||||||||||||
Net investment income | — | — | (0.09 | ) | (0.06 | ) | — | — | ||||||||||||||||
Net realized gain | — | — | — | — | (0.04 | ) | (0.29 | ) | ||||||||||||||||
Tax return of capital | — | — | (0.03 | ) | — | — | — | |||||||||||||||||
|
|
|
|
|
|
|
|
|
|
|
| |||||||||||||
Total Distributions | — | — | (0.12 | ) | (0.06 | ) | (0.04 | ) | (0.29 | ) | ||||||||||||||
|
|
|
|
|
|
|
|
|
|
|
| |||||||||||||
Net asset value, end of period | $ | 11.08 | $ | 10.79 | $ | 10.34 | $ | 9.85 | $ | 10.01 | $ | 10.74 | ||||||||||||
|
|
|
|
|
|
|
|
|
|
|
| |||||||||||||
Total Return | 2.69 | %3 | 4.35 | % | 6.25 | % | (1.08 | )% | (6.35 | )% | 10.35 | %3 | ||||||||||||
SUPPLEMENTAL DATA AND RATIOS: | ||||||||||||||||||||||||
Net assets, end of period (in 000’s) | $ | 102,575 | $ | 165,648 | $ | 256,482 | $ | 232,456 | $ | 166,300 | $ | 42,033 | ||||||||||||
Ratio of total expenses before reimbursements, waivers, recaptures and/or fees paid indirectly to average net assets | 1.96 | %4 | 1.77 | % | 2.03 | % | 1.86 | % | 1.80 | % | 3.03 | %4 | ||||||||||||
Ratio of total expenses net of reimbursements, waivers, recaptures and/or fees paid indirectly to average net assets | 1.94 | %2,4 | 1.76 | %2 | 2.01 | %2 | 1.86 | % | 1.80 | % | 3.00 | %4 | ||||||||||||
Ratio of expenses (excluding dividends and interest on short positions and interest expense) before reimbursements, waivers, recaptures and/or fees paid indirectly to average net assets | 1.52 | %4 | 1.46 | % | 1.44 | % | 1.43 | % | 1.35 | % | 2.03 | %4 | ||||||||||||
Ratio of expenses (excluding dividends and interest on short positions and interest expense) net of reimbursements, waivers, recaptures and/or fees paid indirectly to average net assets | 1.50 | %2,4 | 1.45 | %2 | 1.42 | %2 | 1.43 | % | 1.35 | % | 2.00 | %4 | ||||||||||||
Ratio of net investment income (including dividends and interest on short positions and interest expense) net of reimbursements, waivers, recaptures and/or fees paid indirectly to average net assets | 2.68 | %4 | 0.17 | % | 0.19 | % | 0.45 | % | (0.17 | )% | (1.75 | )%4 | ||||||||||||
Ratio of net investment income (excluding dividends and interest on short positions and interest expense) net of reimbursements, waivers, recaptures and/or fees paid indirectly to average net assets | 2.66 | %4 | 0.48 | % | 0.78 | % | 0.89 | % | 0.28 | % | (0.75 | )%4 | ||||||||||||
Portfolio turnover rate | 52 | %3 | 198 | % | 246 | % | 400 | % | 315 | % | 104 | %3 | ||||||||||||
| * | Fund commenced operations on August 26, 2013. |
| 1 | Calculated based on average shares outstanding. |
| 2 | Such ratios are net of fees paid indirectly (see Note C in the Notes to Financial Statements). |
| 3 | Not annualized. |
| 4 | Annualized. |
Notes to Financial Statements are an integral part of this Schedule.
27
Driehaus Multi-Asset Growth Economies Fund
Financial Highlights
| For the six month period January 1, 2018 through June 30, 2018 (unaudited) | For the period April 10, 2017* through December 31, 2017 | |||||||
Net asset value, beginning of period | $ | 11.54 | $ | 10.00 | ||||
|
|
|
| |||||
INCOME FROM INVESTMENT OPERATIONS: | ||||||||
Net investment income (loss)1 | 0.13 | 0.17 | ||||||
Net realized and unrealized gain (loss) on investments | (0.83 | ) | 1.94 | |||||
|
|
|
| |||||
Total from investment operations | (0.70 | ) | 2.11 | |||||
|
|
|
| |||||
LESS DISTRIBUTIONS TO SHAREHOLDERS FROM: | ||||||||
Net investment income | — | (0.16 | ) | |||||
Net realized gain | — | (0.41 | ) | |||||
|
|
|
| |||||
Total distributions | — | (0.57 | ) | |||||
|
|
|
| |||||
Redemption fees added to paid-in capital | 0.00 | 4 | 0.00 | 4 | ||||
|
|
|
| |||||
Net asset value, end of period | $ | 10.84 | $ | 11.54 | ||||
|
|
|
| |||||
Total Return | (6.07 | )%2 | 21.14 | %2 | ||||
SUPPLEMENTAL DATA AND RATIOS: | ||||||||
Net assets, end of period (in 000’s) | $ | 41,358 | $ | 43,183 | ||||
Ratio of total expenses before reimbursements, waivers, recaptures and/or fees paid indirectly to average net assets | 1.88 | %3 | 2.04 | %3 | ||||
Ratio of total expenses net of reimbursements, waivers, recaptures and/or fees paid indirectly to average net assets | 1.75 | %3,5 | 1.75 | %3,5 | ||||
Ratio of expenses (excluding dividends and interest on short positions and interest expense) before reimbursements, waivers, recaptures and/or fees paid indirectly to average net assets | 1.88 | %3 | 2.04 | %3 | ||||
Ratio of expenses (excluding dividends and interest on short positions and interest expense) net of reimbursements, waivers, recaptures and/or fees paid indirectly to average net assets | 1.75 | %3,5 | 1.75 | %3,5 | ||||
Ratio of net investment income (including dividends and interest on short positions and interest expense) net of reimbursements, waivers, recaptures and/or fees paid indirectly to average net assets | 2.14 | %3 | 2.12 | %3 | ||||
Ratio of net investment income (excluding dividends and interest on short positions and interest expense) net of reimbursements, waivers, recaptures and/or fees paid indirectly to average net assets | 2.14 | %3,5 | 2.12 | %3,5 | ||||
Portfolio turnover rate | 82 | %2 | 99 | %2 | ||||
| * | Fund commenced operations on April 10, 2017. |
| 1 | Calculated based on average shares outstanding. |
| 2 | Not annualized. |
| 3 | Annualized. |
| 4 | Amount represents less than $0.01 per share. |
| 5 | The Adviser contractually agreed to waive its investment advisory fee or absorb other operating expenses to the extent necessary to ensure that total annual Fund operating expenses (other than interest, taxes, brokerage commissions, dividends and interest on short sales, other investment-related expenses, acquired fund fees and expenses, and extraordinary expenses such as litigation and other expenses not incurred in the ordinary course of the Fund’s business) would not exceed the Fund’s operating expense cap of 1.75% of average daily net assets until April 9, 2020. |
Notes to Financial Statements are an integral part of this Schedule.
28
Notes to Financial Statements (unaudited)
A. ORGANIZATION AND SUMMARY OF SIGNIFICANT ACCOUNTING POLICIES
Organization
The Driehaus Mutual Funds (the “Trust”) is an open-end registered management investment company under the Investment Company Act of 1940, as amended, organized as a Delaware statutory trust, with nine separate series currently in operation. The Trust was organized under an Agreement and Declaration of Trust dated May 31, 1996, as subsequently amended and restated as of June 6, 2013 and amended as of June 4, 2015, and may issue an unlimited number of full and fractional units of beneficial interest (shares) without par value. The three series (“Funds” or each a “Fund”) included in this report are as follows: the Driehaus Active Income Fund (the “Active Income Fund”) commenced operations on June 1, 2009 following the receipt of the assets and liabilities of the Lotsoff Capital Management Active Income Fund (the “Acquired Fund”) pursuant to a plan of reorganization approved by the shareholders of the Acquired Fund. The reorganization was accomplished by a tax-free exchange of Acquired Fund shares for an equal number of shares of the Active Income Fund as of June 1, 2009. The Active Income Fund seeks to provide current income and capital appreciation. The Driehaus Event Driven Fund (the “Event Driven Fund”) commenced operations on August 26, 2013, following the receipt of the assets and liabilities of the Driehaus Credit Opportunities Fund, L.P. The Event Driven Fund seeks to provide positive returns over full market cycles. The Driehaus Multi-Asset Growth Economies Fund (the “Multi-Asset Growth Economies Fund”) commenced operations on April 10, 2017, after succeeding to the assets of the Driehaus Emerging Markets Dividend Growth Fund, L.P. The transaction was structured to be a tax-free exchange and the cost basis and holding period of the underlying securities were carried over to the Multi-Asset Growth Economies Fund. The Multi-Asset Growth Economies Fund seeks to maximize total return.
Significant Accounting Policies
The presentation of financial statements in conformity with U.S. generally accepted accounting principles (“U.S. GAAP”) requires management to make estimates and assumptions that affect the reported amounts of assets and liabilities at the date of the financial statements and the reported amounts of income and expenses. Actual results may differ from those estimates.
The Funds, which are investment companies within the scope of Financial Accounting Standards Board (“FASB”) Accounting Standards Update 2013-08, follow accounting and reporting guidance under FASB Accounting Standards Codification Topic 946, Financial Services-Investment Companies.
Securities Valuation
Investments in securities traded on a national securities exchange, including exchange-traded futures and options, are valued at the last reported sales or settlement price on the day of valuation and are generally classified as level 1. Exchange-traded securities for which no sale was reported are valued at the mean of the closing bid and ask prices from the exchange the security is primarily traded on and are generally classified as level 1. Equity certificates are valued at the last sale price of the underlying security as of the close of the primary exchange. Long-term fixed income securities are valued at the representative quoted bid price when held long or the representative quoted ask price if sold short or, if such prices are not available, at prices for securities of comparable maturity, quality and type or as determined by an independent pricing service. The pricing service provider may employ methodologies that utilize actual market transactions, broker-dealer supplied valuations or other techniques. Such techniques generally consider factors such as composite security prices, yields, maturities, call features, credit ratings and developments relating to specific securities, in arriving at valuations. Fixed income securities are generally classified as level 2. Short-term investments with remaining maturities of 60 days or less at the time of purchase are stated at amortized cost, which approximates fair value. If amortized cost does not approximate fair value, short-term securities are reported at fair value. These securities are generally classified as level 2. Swaps, forward foreign currency contracts and other financial derivatives are valued daily, primarily by an independent pricing service using pricing models and are generally classified as level 2. The pricing models use inputs that are observed from actively quoted markets such as issuer details, indices, spreads, interest rates, yield curves, dividends and exchange rates. If valuations are not available from the independent pricing service or values received are deemed not representative of market value, values will be obtained from a third party broker-dealer or counterparty. Investments initially
29
Driehaus Mutual Funds
Notes to Financial Statements (unaudited) — (Continued)
valued in currencies other than the U.S. dollar are converted to the U.S. dollar using exchange rates obtained from an independent pricing service. In addition, for Multi-Asset Growth Economies Fund, if quotations are not readily available, if the values have been materially affected by events occurring after the closing of a foreign market, or if there has been a movement in the U.S. market that exceeds a certain threshold, assets may be valued at fair value as determined in good faith by or under the direction of the Trust’s Board of Trustees. Events that may materially affect asset values that could cause a fair value determination include, but are not limited to: corporate announcements relating to a specific security; natural and other disasters which may impact an entire market or region; and political and other events which may be global or impact a particular country or region. The frequency with which these procedures are used cannot be predicted and may be utilized to a significant extent. To the extent utilized, securities would be considered level 2 in the hierarchy described below. Securities for which market quotations are not readily available are valued at fair value as determined in good faith in accordance with procedures established by or under the direction of the Trust’s Board of Trustees and are generally classified as level 3. Under these procedures, the Funds primarily employ a market-based approach, which may use related or comparable assets or liabilities, recent transactions, market multiples, book values and other relevant information for the investment to determine the fair value of the investment. It is possible that the estimated values may differ significantly from the values that would have been used had a ready market existed for the investments, and such differences could be material.
Each Fund is subject to fair value accounting standards that define fair value, establish the framework for measuring fair value and provide a three-level hierarchy for fair valuation based upon the inputs to the valuation as of the measurement date. The three levels of the fair value hierarchy are as follows:
Level 1 — quoted prices for active markets for identical securities
Level 2 — significant observable inputs (including quoted prices for similar securities, interest rates, prepayment speeds, credit risk, etc.)
Level 3 — significant unobservable inputs (including the Fund’s own assumptions in determining the fair value of investments).
The Funds adopted the FASB amendments to authoritative guidance which require the Funds to disclose details of transfers in and out of Level 1 and Level 2 measurements and Level 2 and Level 3 measurements and the reasons for the transfers. During the period ended June 30, 2018, there were no transfers between levels for the Active Income Fund, Event Driven Fund and Multi-Asset Growth Economies Fund. It is the Funds’ policy to recognize transfers into and out of all levels at the end of the reporting period.
The inputs or methodology used for valuing securities are not necessarily an indication of the risk associated with investing in those securities. The following is a summary of the inputs used to value the Active Income Fund’s investments as of June 30, 2018:
Assets | Level 1 | Level 2 | Level 3 | Total | ||||||||||||
Bank Loans | $ | — | $ | 524,940,586 | $ | — | $ | 524,940,586 | ||||||||
Common Stocks | ||||||||||||||||
Aerospace & Defense | 3,821,545 | — | — | 3,821,545 | ||||||||||||
Auto Manufacturers | 8,366,235 | — | — | 8,366,235 | ||||||||||||
Banks | 17,740,599 | — | — | 17,740,599 | ||||||||||||
Healthcare — Services | 4,034,798 | — | — | 4,034,798 | ||||||||||||
Insurance | 3,871,740 | — | — | 3,871,740 | ||||||||||||
Investment Companies | — | 2,151,600 | — | 2,151,600 | ||||||||||||
Media | 14,758,449 | — | — | 14,758,449 | ||||||||||||
Savings & Loans | 3,124,367 | — | — | 3,124,367 | ||||||||||||
Software | 2,352,653 | — | — | 2,352,653 | ||||||||||||
Telecommunications | 1,891,825 | — | — | 1,891,825 | ||||||||||||
Convertible Corporate Bonds | — | 48,185,006 | — | 48,185,006 | ||||||||||||
30
Driehaus Mutual Funds
Notes to Financial Statements (unaudited) — (Continued)
Assets | Level 1 | Level 2 | Level 3 | Total | ||||||||||||
Convertible Preferred Stocks | ||||||||||||||||
Auto Manufacturers | $ | — | $ | — | $ | 0 | $ | 0 | ||||||||
Corporate Bonds | — | 740,103,287 | — | 740,103,287 | ||||||||||||
Preferred Stocks | ||||||||||||||||
Banks | 37,569,839 | — | — | 37,569,839 | ||||||||||||
Purchased Put Options | — | 3,530,631 | — | 3,530,631 | ||||||||||||
U.S. Government and Agency Securities | — | 6,675,384 | — | 6,675,384 | ||||||||||||
|
|
|
|
|
|
|
| |||||||||
Total | $ | 97,532,050 | $ | 1,325,586,494 | $ | 0 | $ | 1,423,118,544 | ||||||||
|
|
|
|
|
|
|
| |||||||||
Liabilities | ||||||||||||||||
Common Stocks Sold Short | ||||||||||||||||
Aerospace & Defense | $ | (1,327,819 | ) | $ | — | $ | — | $ | (1,327,819 | ) | ||||||
Media | (10,440,827 | ) | — | — | (10,440,827 | ) | ||||||||||
Pharmaceuticals | (1,185,391 | ) | — | — | (1,185,391 | ) | ||||||||||
Semiconductors | (14,137,359 | ) | — | — | (14,137,359 | ) | ||||||||||
Telecommunications | (24,182,043 | ) | — | — | (24,182,043 | ) | ||||||||||
Corporate Bonds Sold Short | — | (9,266,097 | ) | — | (9,266,097 | ) | ||||||||||
U.S. Government and Agency Securities Sold Short | — | (27,415,527 | ) | — | (27,415,527 | ) | ||||||||||
Written Put Options | — | (923,933 | ) | — | (923,933 | ) | ||||||||||
|
|
|
|
|
|
|
| |||||||||
Total | $ | (51,273,439 | ) | $ | (37,605,557 | ) | $ | — | $ | (88,878,996 | ) | |||||
|
|
|
|
|
|
|
| |||||||||
Other Financial Instruments* | ||||||||||||||||
Credit Default Swaps — Assets | $ | — | $ | 7,911,635 | $ | — | $ | 7,911,635 | ||||||||
Credit Default Swaps — Liabilities | — | (9,248,290 | ) | — | (9,248,290 | ) | ||||||||||
Forward Foreign Currency Contracts — Assets | — | 511,832 | — | 511,832 | ||||||||||||
Forward Foreign Currency Contracts — Liabilities | — | (111,205 | ) | — | (111,205 | ) | ||||||||||
Futures Contracts | 368,842 | — | — | 368,842 | ||||||||||||
Interest Rate Swaptions — Assets | — | 308,331 | — | 308,331 | ||||||||||||
Total Return Swaps — Assets | — | 848,597 | — | 848,597 | ||||||||||||
|
|
|
|
|
|
|
| |||||||||
Total Other Financial Instruments | $ | 368,842 | $ | 220,900 | $ | — | $ | 589,742 | ||||||||
|
|
|
|
|
|
|
| |||||||||
| * | Other financial instruments are swap, forward foreign currency and futures contracts and interest rate swaptions, which are detailed in the Schedule of Investments. |
The following is a reconciliation of Level 3 assets for which significant unobservable inputs were used to determine fair value in the Active Income Fund:
| Investments, at Value | ||||
Balance as of December 31, 2017 | $ | 0 | ||
Realized gain (loss) | — | |||
Change in net unrealized appreciation (depreciation) | — | |||
Purchases | — | |||
Sales | — | |||
Transfers in and/or out of Level 3 | 0 | |||
|
| |||
Balance as of June 30, 2018 | $ | 0 | ||
|
| |||
31
Driehaus Mutual Funds
Notes to Financial Statements (unaudited) — (Continued)
As of June 30, 2018 and December 31, 2017, the Active Income Fund held Level 3 investments in General Motors Corp. senior convertible preferred stock, valued at fair value as determined in good faith in accordance with procedures established by or under the direction of the Trust’s Board of Trustees. As a part of the ongoing restructuring of General Motors, any value previously ascribed to these holdings has been transferred to the General Motors Co. Motors Liquidation Co. GUC Trust common stock, which is freely and actively traded, and therefore the senior convertible preferred stock was fair valued at $0.
The following is a summary of the inputs used to value the Event Driven Fund’s investments as of June 30, 2018:
Assets | Level 1 | Level 2 | Level 3 | Total | ||||||||||||
Bank Loans | $ | — | $ | 6,748,257 | $ | — | $ | 6,748,257 | ||||||||
Common Stocks | ||||||||||||||||
Aerospace & Defense | 4,240,804 | — | — | 4,240,804 | ||||||||||||
Biotechnology | 11,072,527 | — | 963,615 | 12,036,142 | ||||||||||||
Building Materials | 2,116,446 | — | — | 2,116,446 | ||||||||||||
Chemicals | 3,436,110 | — | — | 3,436,110 | ||||||||||||
Commercial Services | 1,999,090 | — | — | 1,999,090 | ||||||||||||
Computers | 2,627,852 | — | — | 2,627,852 | ||||||||||||
Healthcare — Products | 2,407,196 | — | — | 2,407,196 | ||||||||||||
Healthcare — Services | 3,253,004 | — | — | 3,253,004 | ||||||||||||
Insurance | 7,381,337 | — | — | 7,381,337 | ||||||||||||
Media | 661,663 | — | — | 661,663 | ||||||||||||
Pharmaceuticals | 11,083,785 | — | — | 11,083,785 | ||||||||||||
Savings & Loans | 8,292,590 | — | — | 8,292,590 | ||||||||||||
Semiconductors | 2,284,968 | — | — | 2,284,968 | ||||||||||||
Software | 1,089,059 | — | — | 1,089,059 | ||||||||||||
Telecommunications | 835,234 | — | — | 835,234 | ||||||||||||
Transportation | 8,405,011 | — | — | 8,405,011 | ||||||||||||
Convertible Preferred Stocks | ||||||||||||||||
Auto Manufacturers | — | — | 0 | 0 | ||||||||||||
Corporate Bonds | — | 14,840,088 | — | 14,840,088 | ||||||||||||
Convertible Corporate Bonds | — | 305,766 | — | 305,766 | ||||||||||||
Purchased Put Options | 98,890 | — | — | 98,890 | ||||||||||||
|
|
|
|
|
|
|
| |||||||||
Total | $ | 71,285,566 | $ | 21,894,111 | $ | 963,615 | $ | 94,143,292 | ||||||||
|
|
|
|
|
|
|
| |||||||||
Liabilities | ||||||||||||||||
Exchange-Traded Funds Sold Short | $ | (19,151,222 | ) | $ | — | $ | — | $ | (19,151,222 | ) | ||||||
|
|
|
|
|
|
|
| |||||||||
Total | $ | (19,151,222 | ) | $ | — | $ | — | $ | (19,151,222 | ) | ||||||
|
|
|
|
|
|
|
| |||||||||
Other Financial Instruments* | ||||||||||||||||
Forward Foreign Currency Contracts — Assets | $ | — | $ | 48,830 | $ | — | $ | 48,830 | ||||||||
Forward Foreign Currency Contracts — Liabilities | — | (14,364 | ) | — | (14,364 | ) | ||||||||||
|
|
|
|
|
|
|
| |||||||||
Total Other Financial Instruments | $ | — | $ | 34,466 | $ | — | $ | 34,466 | ||||||||
|
|
|
|
|
|
|
| |||||||||
| * | Other financial instruments are forward foreign currency contracts, which are detailed in the Schedule of Investments. |
32
Driehaus Mutual Funds
Notes to Financial Statements (unaudited) — (Continued)
The following is a reconciliation of Level 3 assets for which significant unobservable inputs were used to determine fair value in the Event Driven Fund:
| Investments, at Value | ||||
Balance as of December 31, 2017 | $ | 0 | ||
Realized gain (loss) | — | |||
Change in net unrealized appreciation (depreciation) | (1,036,385 | ) | ||
Purchases | 2,000,000 | |||
Sales | — | |||
Transfers in and/or out of Level 3 | — | |||
|
| |||
Balance as of June 30, 2018 | $ | 963,615 | ||
|
| |||
As of June 30, 2018, the Event Driven Fund held Level 3 investments in General Motors Corp. senior convertible preferred stock, which were valued in the same manner as described above for the Active Income Fund.
As of June 30, 2018, the Event Driven Fund also held a Level 3 investment in Ideaya Biosciences, Inc. private equity stock, valued at fair value as determined in good faith in accordance with procedures established by or under the direction of the Trust’s Board of Trustees. These procedures include the use of an independent third-party valuation service to obtain a monthly valuation for the security. The valuation service uses a market approach, including recent company transactions, comparable company performance and industry index performance. On a daily basis, the evaluated price received from the valuation service is adjusted to reflect the market movements of a biotechnology index. In addition, if there is any company specific information available that would impact the price of the security intra-month, that information will be considered and the price may be adjusted based on that information.
The following is a summary of the inputs used to value the Multi-Asset Growth Economies Fund’s investments as of June 30, 2018:
Assets | Level 1 | Level 2 | Level 3 | Total | ||||||||||||
Sovereign Bonds | ||||||||||||||||
Egypt | $ | — | $ | 1,535,705 | $ | — | $ | 1,535,705 | ||||||||
Malaysia | — | 491,409 | — | 491,409 | ||||||||||||
Mexico | — | 2,553,662 | — | 2,553,662 | ||||||||||||
Nigeria | — | 1,133,712 | — | 1,133,712 | ||||||||||||
Peru | — | 1,000,132 | — | 1,000,132 | ||||||||||||
Poland | — | 1,541,768 | — | 1,541,768 | ||||||||||||
South Africa | — | 772,479 | — | 772,479 | ||||||||||||
Thailand | — | 937,386 | — | 937,386 | ||||||||||||
Equity Securities | ||||||||||||||||
Argentina | 225,227 | — | — | 225,227 | ||||||||||||
Brazil | 2,434,911 | — | — | 2,434,911 | ||||||||||||
China | 8,611,275 | — | — | 8,611,275 | ||||||||||||
Cyprus | 479,847 | — | — | 479,847 | ||||||||||||
Czech Republic | 213,851 | — | — | 213,851 | ||||||||||||
Egypt | 163,132 | — | — | 163,132 | ||||||||||||
France | 554,879 | — | — | 554,879 | ||||||||||||
Greece | 200,857 | — | — | 200,857 | ||||||||||||
Hungary | 263,613 | — | — | 263,613 | ||||||||||||
33
Driehaus Mutual Funds
Notes to Financial Statements (unaudited) — (Continued)
Assets | Level 1 | Level 2 | Level 3 | Total | ||||||||||||
India | $ | 3,076,454 | $ | — | $ | — | $ | 3,076,454 | ||||||||
Indonesia | 422,152 | — | — | 422,152 | ||||||||||||
Malaysia | 292,314 | — | — | 292,314 | ||||||||||||
Mexico | 1,312,717 | — | — | 1,312,717 | ||||||||||||
Philippines | 369,639 | — | — | 369,639 | ||||||||||||
Russia | 1,248,425 | — | — | 1,248,425 | ||||||||||||
Saudi Arabia | 771,182 | — | — | 771,182 | ||||||||||||
South Africa | 352,494 | — | — | 352,494 | ||||||||||||
South Korea | 3,017,464 | — | — | 3,017,464 | ||||||||||||
Taiwan | 2,860,917 | — | — | 2,860,917 | ||||||||||||
Thailand | 591,944 | — | — | 591,944 | ||||||||||||
Turkey | 241,236 | — | — | 241,236 | ||||||||||||
United Arab Emirates | 406,062 | — | — | 406,062 | ||||||||||||
United Kingdom | 269,110 | — | — | 269,110 | ||||||||||||
Purchased Call Options | — | 232 | — | 232 | ||||||||||||
Purchased Put Options | — | 24,833 | — | 24,833 | ||||||||||||
Equity Certificates** | — | 188,075 | — | 188,075 | ||||||||||||
|
|
|
|
|
|
|
| |||||||||
Total | $ | 28,379,702 | $ | 10,179,393 | $ | — | $ | 38,559,095 | ||||||||
|
|
|
|
|
|
|
| |||||||||
Other Financial Instruments* | ||||||||||||||||
Credit Default Swap — Asset | $ | — | $ | 316,368 | $ | — | $ | 316,368 | ||||||||
Credit Default Swap — Liabilities | — | (1,099 | ) | — | (1,099 | ) | ||||||||||
Interest Rate Swaps — Asset | — | 55,561 | — | 55,561 | ||||||||||||
Interest Rate Swaps — Liabilities | — | (21,820 | ) | — | (21,820 | ) | ||||||||||
Forward Foreign Currency Contracts — Assets | — | 249,401 | — | 249,401 | ||||||||||||
Forward Foreign Currency Contracts — Liabilities | — | (355,664 | ) | — | (355,664 | ) | ||||||||||
|
|
|
|
|
|
|
| |||||||||
Total Other Financial Instruments | $ | — | $ | 242,747 | $ | — | $ | 242,747 | ||||||||
|
|
|
|
|
|
|
| |||||||||
| * | Other financial instruments are swap and forward foreign currency contracts, which are detailed in the Schedule of Investments. |
| ** | See Schedule of Investments for industry and/or country breakout. |
Securities Sold Short
The Funds are engaged in selling securities short, which obligates them to replace a borrowed security by purchasing it at market price at the time of replacement. Each Fund incurs a loss if the price of the security increases between the date of the short sale and the date on which the Fund replaces the borrowed security. Each Fund realizes a gain if the price of the security declines between those dates. Gains are limited to the price at which the Fund sold the security short, while losses are potentially unlimited in size.
The Funds are required to establish a margin account with the broker lending the security sold short. While the short sale is outstanding, the broker retains the proceeds of the short sale and the Fund must maintain a deposit with the broker consisting of cash and securities having a value equal to a specified percentage of the value of the securities sold short. Such deposit is included in “Collateral held at custodian for the benefit of brokers” on the Statements of Assets and Liabilities. Each Fund is obligated to pay any dividends or interest due on securities sold short. Such dividends and interest are recorded as an expense to the Funds on the Statements of Operations.
34
Driehaus Mutual Funds
Notes to Financial Statements (unaudited) — (Continued)
Federal Income Taxes
The Funds’ policy is to comply with the requirements of Subchapter M of the Internal Revenue Code that are applicable to regulated investment companies and to distribute substantially all their taxable income to their shareholders. Therefore, no Federal income tax provision is required.
The FASB’s “Accounting for Uncertainty in Income Taxes” (“Tax Statement”) requires the evaluation of tax positions taken or expected to be taken in the course of preparing the Funds’ tax returns to determine whether the tax positions are “more-likely-than-not” of being sustained by the applicable tax authority. Tax positions not deemed to meet the more-likely-than-not threshold would be recorded as a tax benefit or expense in the current year. Management has evaluated the implications of the Tax Statement and all of the uncertain tax positions and has determined that no liability is required to be recorded in the financial statements as of June 30, 2018. The Funds file tax returns with the U.S. Internal Revenue Service and various states. Taxable years ending 2017, 2016, 2015, and 2014 remain subject to examination by taxing authorities.
For Federal income tax purposes, capital loss carryforwards represent net capital losses of a fund that may be carried forward and applied against future net realized gains. On December 22, 2010, the Regulated Investment Company Modernization Act of 2010 was enacted to modernize several of the Federal income and excise tax provisions related to regulated investment companies. Under pre-enactment law, capital losses could be carried forward for up to eight years, and were required to be carried forward as short-term capital losses, irrespective of the character of the original loss. New net capital losses (those earned in taxable years beginning after December 22, 2010) may be carried forward indefinitely and must retain the character of the original loss.
At June 30, 2018, gross unrealized appreciation and depreciation on investments, based on cost for Federal income tax purposes, were as follows:
| Active Income Fund | Event Driven Fund | Multi-Asset Growth Economies Fund | ||||||||||
Cost of investments | $ | 1,358,494,050 | $ | 75,452,067 | $ | 37,192,807 | ||||||
|
|
|
|
|
| |||||||
Gross unrealized appreciation | $ | 33,370,766 | $ | 8,934,100 | $ | 4,000,251 | ||||||
Gross unrealized depreciation | (52,384,391 | ) | (9,394,097 | ) | (2,316,250 | ) | ||||||
|
|
|
|
|
| |||||||
Net unrealized appreciation on investments | $ | (19,013,625 | ) | $ | (459,997 | ) | $ | 1,684,001 | ||||
|
|
|
|
|
| |||||||
The difference between cost amounts for financial statement and federal income tax purposes is due primarily to the tax deferral of losses on wash sales and timing differences in recognizing certain gains and losses on security transactions.
The amount of dividends and distributions from net investment income and net realized capital gains are determined in accordance with Federal income tax regulations, which may differ from U.S. GAAP.
The tax character of distributions paid were as follows:
Active Income Fund | ||||||||
Distributions paid from: | January 1, 2017 to December 31, 2017 | January 1, 2016 to December 31, 2016 | ||||||
Ordinary income | $ | 74,683,208 | $ | 79,985,655 | ||||
|
|
|
| |||||
Total distributions paid | $ | 74,683,208 | $ | 79,985,655 | ||||
|
|
|
| |||||
Event Driven Fund | ||||||||
Distributions paid from: | January 1, 2017 to December 31, 2017 | January 1, 2016 to December 31, 2016 | ||||||
Ordinary income | $ | — | $ | 2,312,787 | ||||
Taxable return of capital distribution | — | 736,638 | ||||||
|
|
|
| |||||
Total distributions paid | $ | — | $ | 3,049,425 | ||||
|
|
|
| |||||
35
Driehaus Mutual Funds
Notes to Financial Statements (unaudited) — (Continued)
Multi-Asset Growth Economies Fund | ||||
Distributions paid from: | April 10, 2017* to December 31, 2017 | |||
Ordinary income | $ | 1,804,830 | ||
Long term capital gains | 213,901 | |||
|
| |||
Total distributions paid | $ | 2,018,731 | ||
|
| |||
| * | The Fund commenced operations on April 10, 2017. |
As of December 31, 2017, the components of accumulated earnings (deficit) were as follows:
| Active Income Fund | Event Driven Fund | Multi-Asset Growth Economies Fund | ||||||||||
Undistributed ordinary income | $ | 7,443,059 | $ | — | $ | 233,413 | ||||||
Undistributed long-term capital gains | — | — | 29,969 | |||||||||
|
|
|
|
|
| |||||||
Accumulated earnings | 7,443,059 | — | 263,382 | |||||||||
Accumulated capital and other losses | (459,388,212 | ) | (13,470,650 | ) | — | |||||||
Unrealized appreciation (depreciation) on currency and foreign currency translations | 1,886 | 228 | 960 | |||||||||
Unrealized appreciation (depreciation) on swap and swaptions contracts | (202,126 | ) | — | 233,739 | ||||||||
Unrealized appreciation (depreciation) on investments, securities sold short, swap, forwards and futures | 3,431,717 | 6,865,379 | 5,203,697 | |||||||||
|
|
|
|
|
| |||||||
Total accumulated earnings (deficit) | $ | (448,713,676 | ) | $ | (6,605,043 | ) | $ | 5,701,778 | ||||
|
|
|
|
|
| |||||||
As of December 31, 2017, the Funds had net capital loss carryforwards to offset future net capital gains, if any, to the extent provided by Treasury regulations:
| Not Subject to Expiration | ||||||||
| Short-Term | Long-Term | |||||||
Active Income Fund | $ | 269,247,897 | $ | 178,404,662 | ||||
Event Driven Fund | 13,470,650 | — | ||||||
Multi-Asset Growth Economies Fund | — | — | ||||||
Post-October capital losses and late-year ordinary losses incurred after October 31 and within the taxable year are deemed to arise on the first business day of the Funds’ taxable year. As of December 31, 2017, the Funds had no post-October capital losses or late-year ordinary losses.
Foreign Currency Translation
The value of securities, currencies and other assets and liabilities not denominated in U.S. dollars are translated into U.S. dollar values based upon the current rates of exchange on the date of the Funds’ valuations.
Net realized foreign exchange gains or losses which are reported by the Funds result from currency gains and losses on transaction hedges arising from changes in exchange rates between the trade and settlement dates on forward contract transactions, and the difference between the amounts accrued for dividends, interest, and foreign taxes and the amounts actually received or paid in U.S. dollars for these items. Net unrealized foreign exchange gains and losses result from changes in the U.S. dollar value of assets and liabilities (other than investments in securities), which are denominated in foreign currencies, as a result of changes in exchange rates.
Net realized foreign exchange gains or losses on portfolio hedges result from the use of forward contracts to hedge portfolio positions denominated or quoted in a particular currency in order to reduce or limit exposure in that currency. The Active Income Fund, Event Driven Fund and Multi-Asset Growth Economies Fund held portfolio hedges as of June 30, 2018 as disclosed in the Schedule of Investments.
36
Driehaus Mutual Funds
Notes to Financial Statements (unaudited) — (Continued)
The Funds do not isolate that portion of the results of operations which results from fluctuations in foreign exchange rates on investments. These fluctuations are included with the net realized gain (loss) on investments and the net change in unrealized appreciation (depreciation) on investments.
Indemnifications
Under the Trust’s organizational documents, the officers and Trustees are indemnified against certain liabilities arising out of the performance of their duties to the Trust. In addition, in the normal course of business, the Trust enters into contracts that provide general indemnifications to other parties. A Fund’s maximum exposure under these agreements is unknown as this would involve future claims that may be made against a Fund that have not yet occurred. However, the Funds have not had prior claims or losses pursuant to these contracts and expect the risk of loss to be remote.
Securities Transactions and Income
The Trust records security transactions based on trade date. Dividend income is recognized on the ex-dividend date, and interest income is recognized on an accrual basis. Discounts and premiums on securities purchased are accreted and amortized over the lives of the respective securities using the effective yield method. Withholding taxes on foreign dividends and interest have been provided for in accordance with the Trust’s understanding of the applicable country’s tax rules and rates.
Pursuant to the terms of certain of the senior unsecured loan agreements, the Funds may have unfunded loan commitments, which are callable on demand. Each Fund will have available with its custodian, cash and/or liquid securities having an aggregate value at least equal to the amount of the unfunded senior loan commitments. At June 30, 2018, the Funds had no unfunded senior loan commitments.
With respect to the senior loans held in each Fund’s portfolio, the Funds may: 1) invest in assignments; 2) act as a participant in primary lending syndicates; or 3) invest in participations. If a Fund purchases a participation of a senior loan interest, the Fund would typically enter into a contractual agreement with the lender or other third party selling the participation, rather than directly with the borrower. As such, the Fund not only assumes the credit risk of the borrower, but also that of the selling participant or other persons interpositioned between the Fund and the borrower. At June 30, 2018, the Funds had no such outstanding senior loan participation commitments.
B. INVESTMENTS IN DERIVATIVES
Each Fund uses derivative instruments such as swaps, futures, options, swaptions and forward foreign currency contracts in connection with their respective investment strategies. During the period January 1, 2018 through June 30, 2018, the Active Income Fund primarily utilized: 1) credit default swaps as alternatives to direct investments to manage exposure to specific sectors/markets/industries and/or credit events and manage volatility; 2) total return swaps to gain exposure to certain sectors and manage volatility; 3) futures to hedge their interest rate and/or commodity risk and manage volatility; 4) options to hedge downside risk and manage volatility; and 5) forward foreign currency contracts to manage currency risk in portfolio holdings. During the period January 1, 2018 through June 30, 2018, the Event Driven Fund primarily utilized: 1) options to both hedge exposure and provide exposure to certain market segments or specific securities; and 2) forward foreign currency contracts to manage currency risk in portfolio holdings. During the period January 1, 2018 through June 30, 2018, the Multi-Asset Growth Economies Fund primarily utilized: 1) interest rate swaps to hedge against interest rate fluctuation and enable the parties involved to exchange fixed and floating cash flows; 2) credit default swaps as alternatives to direct investments to manage exposure to specific sectors/markets/industries and/or credit events and manage volatility; 3) options to both hedge exposure and provide exposure to certain market segments or specific securities; and 4) forward foreign currency contracts to manage currency risk in portfolio holdings. Detail regarding each derivative type is included below.
Swap Contracts
The Funds are subject to credit risk, volatility risk and interest rate risk exposure in the normal course of pursuing their investment objectives. The Funds engage in various swap transactions, including forward rate agreements and interest rate, currency, volatility, index and total return swaps, primarily to manage duration and yield curve risk, or as alternatives to direct investments.
37
Driehaus Mutual Funds
Notes to Financial Statements (unaudited) — (Continued)
Interest rate swaps are agreements between two parties to exchange cash flows based on a notional principal amount. The Funds may elect to pay a fixed rate and receive a floating rate or receive a fixed rate and pay a floating rate on a notional principal amount. The net interest received or paid on interest rate swap agreements is accrued daily as interest income/expense. Interest rate swaps are marked-to-market daily using fair value estimates provided by an independent pricing service. Changes in value, including accrued interest, are recorded as changes in net unrealized appreciation (depreciation). Unrealized appreciation is reported as an asset and unrealized depreciation is reported as a liability on the statements of assets and liabilities. Gains or losses are realized upon termination of the contracts. The risk of loss under a swap contract may exceed the amount recorded as an asset or a liability.
Total return swap contracts are arrangements to exchange a market linked return for a periodic payment, both based on a notional principal amount, to hedge sector exposure and to manage exposure to specific sectors or industries and/or to gain exposure to specific markets/countries and to specific sectors/industries. To the extent that the total return of the security, index or other financial measure underlying the transaction exceeds or falls short of the offsetting interest rate obligation, the Fund will receive a payment from or make a payment to the counterparty. Total return swap contracts are marked to market daily based upon quotations from market makers and the change, if any, is recorded as a change in net unrealized appreciation (depreciation) on the statement of operations. Payments received or made are recorded as realized gains or losses. Gains or losses are realized upon termination of the contracts. Each Fund’s maximum risk of loss from counterparty risk is the fair value of the contract.
Volatility swaps are forward contracts on the future realized volatility of an underlying instrument. Volatility swaps are generally used to speculate on future volatility levels, trade the spread between realized and implied volatility or hedge volatility exposure of other positions. Changes in value are recorded as changes in net unrealized appreciation (depreciation). Unrealized gains are reported as an asset and unrealized losses are reported as a liability on the statement of operations. Gains or losses are realized upon termination of the contracts. The risk of loss under a volatility swap contract is dependent upon the volatility of the underlying instrument.
Under the terms of a credit default swap contract, one party acts as a guarantor receiving a periodic payment that is a fixed percentage applied to a notional amount. In return, the party agrees to purchase the notional amount of the underlying instrument, at par, if a credit event occurs during the term of the contract. Each Fund may enter into credit default swaps in which the Fund acts as guarantor (a seller of protection), and may enter into credit default swaps in which the counterparty acts as guarantor (a buyer of protection). Premiums paid to or by the Funds are accrued daily and included in realized gain (loss) on swaps. The contracts are marked-to-market daily using fair value estimates provided by an independent pricing service. Changes in value are recorded as unrealized appreciation (depreciation) on the statement of operations. Unrealized gains are reported as an asset and unrealized losses are reported as a liability. Gains or losses are realized upon termination of the contracts. The risk of loss under a swap contract may exceed the amount recorded as an asset or a liability. The notional amount of a swap contract is the reference amount pursuant to which the counterparties make payments. For swaps in which the referenced obligation is an index, in the event of default of any debt security included in the corresponding index, the Fund pays or receives the percentage of the corresponding index that the defaulted security comprises (1) multiplied by the notional value and (2) multiplied by the ratio of one minus the ratio of the market value of the defaulted debt security to its par value. The maximum exposure to loss of the notional value as a seller of credit default swaps outstanding at June 30, 2018 for the Active Income Fund, Event Driven Fund and Multi-Asset Growth Economies Fund was $0, $0 and $0, respectively.
Risks associated with swap contracts include changes in the returns of underlying instruments and/or interest rates, failure of the counterparties to perform under the contracts’ terms and the possible lack of liquidity with respect to the contracts. Credit default swaps can involve greater risks than if an investor had invested in the reference obligation directly since, in addition to general market risks, credit default swaps are subject to counterparty credit risk, leverage risk, hedging risk, correlation risk and liquidity risk. The Funds disclose swap contracts on a gross basis, with no netting of contracts held with the same counterparty. As of June 30, 2018, the Active Income Fund and Multi-Asset Growth Economies Fund had outstanding swap contracts as listed on the Schedule of Investments and the required collateral is included in the Statements of Assets and Liabilities. The Event Driven Fund had no outstanding swap contracts at June 30, 2018.
38
Driehaus Mutual Funds
Notes to Financial Statements (unaudited) — (Continued)
Futures Contracts
The Funds may enter into futures contracts to produce incremental earnings, hedge existing positions or protect against market changes in the value of equities or interest rates. Upon entering into a futures contract with a broker, a Fund is required to deposit in a segregated account a specified amount of cash or U.S. government securities. Futures contracts are valued daily and unrealized gains or losses are recorded in a “variation margin” account. Daily, the Fund receives from or pays to the broker a specified amount of cash based upon changes in the variation margin account. When a contract is closed, the Fund recognizes a realized gain or loss. Futures contracts have market risks, including the risk that the change in the value of the contract may not correlate with changes in the value of the underlying securities. With futures contracts, there is minimal counterparty credit risk to the Funds since futures contracts are exchange-traded and the exchange’s clearinghouse, as counterparty to all exchange-traded futures contracts, guarantees the futures contract against default. As of June 30, 2018, the Active Income Fund had outstanding futures contracts as listed in the Schedule of Investments and the required collateral is included in the Statements of Assets and Liabilities. The Event Driven Fund and Multi-Asset Growth Economies Fund had no outstanding futures contracts at June 30, 2018.
Options Contracts
The Funds may use options contracts to hedge downside risk, produce incremental earnings or protect against market changes in the value of equities or interest rates. The Funds may write covered call and put options on futures, swaps, securities or currencies the Funds own or in which they may invest. Writing put options tends to increase a Fund’s exposure to the underlying instrument. Writing call options tends to decrease a Fund’s exposure to the underlying instrument. When a Fund writes a call or put option, an amount equal to the premium received is recorded as a liability and subsequently marked to market to reflect the current value of the option written. These liabilities are reflected as written options outstanding in the Schedule of Investments. Premiums received from writing options that expire are treated as realized gains. Premiums received from writing options that are exercised or closed are added to the proceeds or offset against amounts paid on the underlying future, swap, security or currency transaction to determine the realized gain or loss. A Fund, as a writer of an option, has no control over whether the underlying future, swap, security or currency may be sold (call) or purchased (put) and, as a result, bears the market risk of an unfavorable change in the price of the future, swap, security or currency underlying the written option. The risk exists that a Fund may not be able to enter into a closing transaction because of an illiquid market. In addition, to the extent a Fund purchases an over-the-counter (“OTC”) option, it is subject to credit risk that the counterparty to the trade does not perform under the contract’s terms. The Funds are not subject to credit risk on OTC options written as the counterparty has already performed its obligation by paying the premium at the inception of the contract.
The Funds may also purchase put and call options. Purchasing call options tends to increase a Fund’s exposure to the underlying instrument. Purchasing put options tends to decrease a Fund’s exposure to the underlying instrument. A Fund pays a premium, which is included in its Schedule of Investments as an investment and subsequently marked-to-market to reflect the current value of the option. Premiums paid for purchasing options that expire are treated as realized losses. The risk associated with purchasing put and call options is limited to the premium paid. Premiums paid for purchasing options that are exercised or closed are added to the amounts paid or offset against the proceeds on the underlying future, swap, security or currency transaction to determine the realized gain or loss. When entering into purchased option contracts, a Fund bears the risk of securities prices moving unexpectedly, in which case, a Fund may not achieve the anticipated benefits of the purchased option contracts; however, the risk of loss is limited to the premium paid. As of June 30, 2018, the Funds had outstanding options as listed on the Schedule of Investments and the required collateral is included in the Statements of Assets and Liabilities.
Swaptions
An option on a swap contract, also called a “swaption,” is an option that gives the buyer the right, but not the obligation, to enter into a swap on a future date in exchange for paying a market-based “premium.” A call or receiver swaption gives the owner the right to receive the total return of a specified asset, reference rate, or
39
Driehaus Mutual Funds
Notes to Financial Statements (unaudited) — (Continued)
index swap. A put or payer swaption gives the owner the right to pay the total return of a specified asset, reference rate, or index swap. Swaptions also include options that allow an existing swap to be terminated or extended by one of the counterparties. As of June 30, 2018, the Active Income Fund had outstanding swaptions as listed on the Schedule of Investments and the required collateral is included in the Statements of Assets and Liabilities. The Event Driven Fund and Multi-Asset Growth Economies Fund had no outstanding swaptions at June 30, 2018.
Forward Foreign Currency Contracts
The Funds use forward foreign currency contracts to manage foreign currency, to produce incremental earnings or to hedge existing positions. A forward foreign currency contract involves an obligation to purchase or sell a specific currency at a future date, which may be any fixed number of days from the date of the contract agreed upon by the parties, at a price set at the time of the contract. These contracts are principally traded in the inter-bank market conducted directly between currency traders (usually large commercial banks) and their customers.
The market value of a forward foreign currency contract fluctuates with changes in currency exchange rates. Outstanding forward foreign currency contracts are valued daily at current market rates and the resulting change in market value is recorded as change in net unrealized appreciation or depreciation on the statement of operations. When a forward foreign currency contract is settled, the Fund records a realized gain or loss equal to the difference between the value at the time the forward foreign currency contract was opened and the value at the time it was settled. A forward foreign currency contract may involve market risk in excess of the unrealized appreciation (depreciation) reflected on the Statements of Assets and Liabilities. In addition, the Funds could be exposed to credit risk if the counterparties are unable or unwilling to meet the terms of the contracts or market risk if the value of the foreign currency changes unfavorably. As of June 30, 2018, the Funds had forward foreign currency contracts as listed in the Schedule of Investments.
Equity Certificates
The Funds may invest in equity certificates, which allow the Funds to participate in the appreciation (depreciation) of the underlying security without actually owning the underlying security. These derivative instruments are purchased pursuant to an agreement with a financial institution and are valued at a calculated market price based on the value of the underlying security in accordance with the agreement. These equity certificates are subject to the credit risk of the issuing financial institution. There is no off-balance sheet risk associated with equity certificates and the Funds’ potential loss is limited to the purchase price of the securities. The Funds are exposed to credit risk associated with the counterparty to the transaction, which is monitored by the Funds’ management on a periodic basis. A Fund’s equity certificates are not subject to any master netting agreement.
On June 30, 2018, Multi-Asset Growth Economies Fund had unrealized appreciation (depreciation) of $(17,641) as a result of its investments in these financial instruments. The aggregate market values of these certificates for Multi-Asset Growth Economies Fund represented 0.49 % of its total market value of investments at June 30, 2018.
Derivative Investment Holdings Categorized by Risk Exposure
Each Fund is subject to the FASB’s “Disclosures about Derivative Instruments and Hedging Activities” (the “Derivatives Statement”). The Derivatives Statement amends and expands disclosures about derivative instruments and hedging activities. The Derivatives Statement is intended to improve financial reporting about derivative instruments by requiring enhanced disclosures to enable investors to better understand how and why the Fund uses derivative instruments, how these derivative instruments are accounted for and their effects on the Funds’ financial position and results of operations.
40
Driehaus Mutual Funds
Notes to Financial Statements (unaudited) — (Continued)
The following table sets forth the fair value and the location in the Statement of Assets and Liabilities of the Active Income Fund’s derivative contracts by primary risk exposure as of June 30, 2018:
Asset derivatives | ||||||
Risk exposure category | Statement of Assets and Liabilities location | Fair Value | ||||
Credit contracts | Unrealized appreciation on open swap contracts | $ | 6,988,260 | |||
Currency contracts | Unrealized appreciation on forward foreign currency contracts | 511,832 | ||||
Equity contracts | Purchased options, at fair value | 3,530,631 | ||||
Equity contracts | Unrealized appreciation on open swap contracts | 362,861 | ||||
Interest rate contracts | Unrealized appreciation on open swap contracts | 485,736 | ||||
Interest rate contracts | Purchased swaptions, at fair value | 308,331 | ||||
Interest rate contracts | N/A* | 368,842 | ||||
Total | $ | 12,556,493 | ||||
Liability derivatives | ||||||
Risk exposure category | Statement of Assets and Liabilities location | Fair Value | ||||
Credit contracts | Unrealized depreciation on open swap contracts | $ | 1,232,563 | |||
Currency contracts | Unrealized depreciation on forward foreign currency contracts | 111,205 | ||||
Equity contracts | Written options, at fair value | 923,933 | ||||
Total | $ | 2,267,701 | ||||
| * | Includes cumulative appreciation/depreciation of futures contracts as shown in the Schedule of Investments. Only current day’s variation margin is reported in the Statement of Assets and Liabilities. |
The following table sets forth the fair value and the location in the Statement of Assets and Liabilities of the Event Driven Fund’s derivative contracts by primary risk exposure as of June 30, 2018:
Asset derivatives | ||||||
Risk exposure category | Statement of Assets and Liabilities location | Fair Value | ||||
Currency contracts | Unrealized appreciation on forward foreign currency contracts | $ | 48,830 | |||
Equity contracts | Purchased options, at fair value | 98,890 | ||||
Total | $ | 147,720 | ||||
Liability derivatives | ||||||
Risk exposure category | Statement of Assets and Liabilities location | Fair Value | ||||
Currency contracts | Unrealized depreciation on forward foreign currency contracts | $ | 14,364 | |||
Total | $ | 14,364 | ||||
41
Driehaus Mutual Funds
Notes to Financial Statements (unaudited) — (Continued)
The following table sets forth the fair value and the location in the Statement of Assets and Liabilities of the Multi-Asset Growth Economies Fund’s derivative contracts by primary risk exposure as of June 30, 2018:
Asset derivatives | ||||||
Risk exposure category | Statement of Assets and Liabilities location | Fair Value | ||||
Interest rate contracts | Unrealized appreciation on open swap contracts | $ | 55,561 | |||
Currency contracts | Unrealized appreciation on forward foreign currency contracts | 249,401 | ||||
Currency contracts | Purchased options, at fair value | 25,065 | ||||
Total | $ | 330,027 | ||||
Liability derivatives | ||||||
Risk exposure category | Statement of Assets and Liabilities location | Fair Value | ||||
Credit contracts | Unrealized depreciation on open swap contracts | $ | 1,099 | |||
Interest rate contracts | Unrealized depreciation on open swap contracts | 21,820 | ||||
Currency contracts | Unrealized depreciation on forward foreign currency contracts | 355,664 | ||||
Total | $ | 378,583 | ||||
The following table sets forth the Active Income Fund’s net realized gain/loss by primary risk exposure and by type of derivative contract for the period January 1, 2018 through June 30, 2018:
Amount of net realized gain (loss) on derivatives | ||||||||||||||||||||
| Risk exposure category | ||||||||||||||||||||
Derivative | Credit contracts | Currency contracts | Equity contracts | Interest rate contracts | Total | |||||||||||||||
Purchased options contracts | $ | — | $ | — | $ | (151,991 | ) | $ | — | $ | (151,991 | ) | ||||||||
Written options contracts | — | — | (384,800 | ) | — | (384,800 | ) | |||||||||||||
Purchased swaptions contracts | — | — | — | 3,464,715 | 3,464,715 | |||||||||||||||
Forward foreign currency contracts | — | 152,491 | — | — | 152,491 | |||||||||||||||
Futures contracts | — | — | — | 8,658,013 | 8,658,013 | |||||||||||||||
Swap contracts | (2,201,909 | ) | — | 2,644,218 | 1,002,702 | 1,445,011 | ||||||||||||||
|
|
|
|
|
|
|
|
|
| |||||||||||
Total | $ | (2,201,909 | ) | $ | 152,491 | $ | 2,107,427 | $ | 13,125,430 | $ | 13,183,439 | |||||||||
|
|
|
|
|
|
|
|
|
| |||||||||||
The following table sets forth the Event Driven Fund’s net realized gain/loss by primary risk exposure and by type of derivative contract for the period January 1, 2018 through June 30, 2018:
Amount of net realized gain (loss) on derivatives | ||||||||||||
| Risk exposure category | ||||||||||||
Derivative | Currency contracts | Equity contracts | Total | |||||||||
Purchased options contracts | $ | — | $ | 131,295 | $ | 131,295 | ||||||
Written options contracts | — | (252,742 | ) | (252,742 | ) | |||||||
Forward foreign currency contracts | (308,493 | ) | — | (308,493 | ) | |||||||
|
|
|
|
|
| |||||||
Total | $ | (308,493 | ) | $ | (121,447 | ) | $ | (429,940 | ) | |||
|
|
|
|
|
| |||||||
42
Driehaus Mutual Funds
Notes to Financial Statements (unaudited) — (Continued)
The following table sets forth the Multi-Asset Growth Economies Fund’s net realized gain/loss by primary risk exposure and by type of derivative contract for the period January 1, 2018 through June 30, 2018:
Amount of net realized gain (loss) on derivatives | ||||||||||||||||||||
| Risk exposure category | ||||||||||||||||||||
Derivative | Credit contracts | Currency contracts | Equity contracts | Interest rate contracts | Total | |||||||||||||||
Purchased options contracts | $ | — | $ | 17,745 | $ | 273,538 | $ | — | $ | 291,283 | ||||||||||
Written options contracts | — | — | (131,389 | ) | — | (131,389 | ) | |||||||||||||
Forward foreign currency contracts | — | (270,619 | ) | — | — | (270,619 | ) | |||||||||||||
Swap contracts | (18,729 | ) | — | — | 357,777 | 339,048 | ||||||||||||||
|
|
|
|
|
|
|
|
|
| |||||||||||
Total | $ | (18,729 | ) | $ | (252,874 | ) | $ | 142,149 | $ | 357,777 | $ | 228,323 | ||||||||
|
|
|
|
|
|
|
|
|
| |||||||||||
The following table sets forth the Active Income Fund’s change in net unrealized appreciation/depreciation by primary risk exposure and by type of derivative contract for the period January 1, 2018 through June 30, 2018:
Change in net unrealized appreciation (depreciation) on derivatives | ||||||||||||||||||||
| Risk exposure category | ||||||||||||||||||||
Derivative | Credit contracts | Equity contracts | Currency contracts | Interest rate contracts | Total | |||||||||||||||
Purchased options contracts | $ | — | $ | 538,468 | $ | — | $ | — | $ | 538,468 | ||||||||||
Purchased swaptions contracts | — | — | — | (499,543 | ) | (499,543 | ) | |||||||||||||
Written options contracts | — | 2,345,181 | — | — | 2,345,181 | |||||||||||||||
Futures contracts | — | — | — | (569,388 | ) | (569,388 | ) | |||||||||||||
Swap contracts | 1,093,737 | (717,235 | ) | — | 423,736 | 800,238 | ||||||||||||||
Forward foreign currency contracts | — | — | 645,649 | — | 645,649 | |||||||||||||||
|
|
|
|
|
|
|
|
|
| |||||||||||
Total | $ | 1,093,737 | $ | 2,166,414 | $ | 645,649 | $ | (645,195 | ) | $ | 3,260,605 | |||||||||
|
|
|
|
|
|
|
|
|
| |||||||||||
The gross notional amount and/or the number of contracts for the Active Income Fund as of June 30, 2018 are included on the Schedule of Investments. The quarterly average values of derivative investments for the period January 1, 2018 through June 30, 2018 is set forth in the table below:
Quarterly Derivative Averages | ||||||
Derivative | Quarterly Average | $ Amount / Number | ||||
Purchased options contracts | number of contracts | 9,266 | ||||
Written options contracts | number of contracts | (10,226 | ) | |||
Futures contracts — Short | number of contracts | (3,006 | ) | |||
Swap contracts | gross notional amount | 191,874,054 | ||||
Purchased swaptions contracts | gross notional amount | $ | 136,995,000 | |||
Forward foreign currency contracts — Long | fair value | $ | 2,708,475 | |||
Forward foreign currency contracts — Short | fair value | $ | (14,760,197 | ) | ||
The following table sets forth the Event Driven Fund’s change in net unrealized appreciation/depreciation by primary risk exposure and by type of derivative contract for the period January 1, 2018 through June 30, 2018:
Change in net unrealized appreciation (depreciation) on derivatives | ||||||||||||
| Risk exposure category | ||||||||||||
Derivative | Equity contracts | Currency contracts | Total | |||||||||
Purchased options contracts | $ | (202,529 | ) | $ | — | $ | (202,529 | ) | ||||
Written options contracts | 683,374 | — | 683,374 | |||||||||
Forward foreign currency contracts | — | 238,379 | 238,379 | |||||||||
|
|
|
|
|
| |||||||
Total | $ | 480,845 | $ | 238,379 | $ | 719,224 | ||||||
|
|
|
|
|
| |||||||
43
Driehaus Mutual Funds
Notes to Financial Statements (unaudited) — (Continued)
The gross notional amount and/or the number of contracts for the Event Driven Fund as of June 30, 2018 are included on the Schedule of Investments. The quarterly average values of derivative investments for the period January 1, 2018 through June 30, 2018 is set forth in the table below:
Quarterly Derivative Averages | ||||||
Derivative | Quarterly Average | $ Amount / Number | ||||
Purchased options contracts | number of contracts | 489 | ||||
Written options contracts | number of contracts | (175 | ) | |||
Swap contracts | gross notional amount | $ | (24,378 | ) | ||
Forward foreign currency contracts — Long | fair value | $ | 2,937,706 | |||
Forward foreign currency contracts — Short | fair value | $ | (7,118,193 | ) | ||
The following table sets forth Multi-Asset Growth Economies Fund’s change in net unrealized appreciation/depreciation by primary risk exposure and by type of derivative contract for the period January 1, 2018 through June 30, 2018:
Change in net unrealized appreciation (depreciation) on derivatives | ||||||||||||||||||||
| Risk exposure category | ||||||||||||||||||||
Derivative | Credit contracts | Equity contracts | Currency contracts | Interest rate contracts | Total | |||||||||||||||
Purchased options contracts | $ | — | $ | — | $ | 21,267 | $ | — | $ | 21,267 | ||||||||||
Equity Certificates | — | (102,330 | ) | — | — | (102,330 | ) | |||||||||||||
Forward foreign currency contracts | — | — | (125,616 | ) | — | (125,616 | ) | |||||||||||||
Swap contracts | 8,622 | — | — | (199,998 | ) | (191,376 | ) | |||||||||||||
|
|
|
|
|
|
|
|
|
| |||||||||||
Total | $ | 8,622 | $ | (102,330 | ) | $ | (104,349 | ) | $ | (199,998 | ) | $ | (398,055 | ) | ||||||
|
|
|
|
|
|
|
|
|
| |||||||||||
The gross notional amount and/or the number of contracts for the Multi-Asset Growth Economies Fund as of June 30, 2018 are included on the Schedule of Investments. The quarterly average values of derivative investments for the period January 1, 2018 through June 30, 2018 is set forth in the table below:
Quarterly Derivative Averages | ||||||
Derivative | Quarterly Average | $ Amount / Number | ||||
Purchased options contracts | number of contracts | 1,900,340 | ||||
Written options contracts | number of contracts | (340 | ) | |||
Swap contracts | gross notional amount | 2,631,035,170 | ||||
Forward foreign currency contracts — Long | fair value | $ | 2,543,011 | |||
Forward foreign currency contracts — Short | fair value | $ | (2,542,154 | ) | ||
Disclosures about Offsetting Assets and Liabilities
The Funds are party to various agreements, including International Swaps and Derivatives Association Agreements and related Credit Support Annexes (“Master Netting Agreements” or “MNA”), which govern the terms of certain transactions with select counterparties. MNAs are designed to reduce counterparty risk associated with the relevant transactions by establishing credit protection mechanisms and providing standardization as a means of improving legal certainty. As MNAs are specific to the unique operations of different asset types, they allow each Fund to close out and net its total exposure to a counterparty in the event of default with respect to all of the transactions governed under a single agreement with that counterparty. MNAs can also help reduce counterparty risk by specifying collateral posting requirements at pre-arranged exposure levels. Securities and cash pledged as collateral are reflected as assets in the Statement of Assets and Liabilities as either a component of Investment securities at fair value or Collateral held at custodian for the benefit of brokers.
The Funds’ derivative contracts held at June 30, 2018, are not accounted for as hedging instruments under U.S. GAAP. For financial reporting purposes, the Funds do not offset financial assets and financial liabilities that are subject to MNAs or similar arrangements on the Statements of Assets and Liabilities. The settlement of futures contracts and exchange-traded purchased options is guaranteed by the clearinghouse or exchange the instrument is traded on and is not subject to arrangements with particular counterparties. For that reason, these instruments are excluded from the below disclosure.
44
Driehaus Mutual Funds
Notes to Financial Statements (unaudited) — (Continued)
The following table presents the Active Income Fund’s financial and derivative assets subject to Master Netting Agreements by type, net of amounts available for offset under a MNA and net of the related collateral received by the Active Income Fund as of June 30, 2018:
Description | Gross Amounts Recognized in Statement of Assets and Liabilities | Derivatives Available for Offset | Collateral Received | Net Amount1 | ||||||||||||
Unrealized appreciation on open swap contracts | $ | 7,836,857 | $ | (873,958 | ) | $ | — | $ | 6,962,899 | |||||||
Unrealized appreciation on forward foreign currency contracts | 511,832 | (111,205 | ) | — | 400,627 | |||||||||||
The following table presents the Active Income Fund’s financial and derivative liabilities subject to Master Netting Agreements by type, net of amounts available for offset under a MNA and net of the related collateral pledged by the Active Income Fund as of June 30, 2018:
Description | Gross Amounts Recognized in Statement of Assets and Liabilities | Derivatives Available for Offset | Collateral Pledged | Net Amount2 | ||||||||||||
Unrealized depreciation on open swap contracts | $ | 1,232,563 | $ | (873,958 | ) | $ | (358,605 | ) | $ | — | ||||||
Unrealized depreciation on forward foreign currency contracts | 111,205 | (111,205 | ) | — | — | |||||||||||
| 1 | Net amount represents the net amount receivable from the counterparty in the event of default. |
| 2 | Net amount represents the net amount payable to the counterparty in the event of default. |
The following table presents the Event Driven Fund’s financial and derivative assets subject to Master Netting Agreements by type, net of amounts available for offset under a MNA and net of the related collateral received by the Event Driven Fund as of June 30, 2018:
Description | Gross Amounts Recognized in Statement of Assets and Liabilities | Derivatives Available for Offset | Collateral Pledged | Net Amount1 | ||||||||||||
Unrealized appreciation on forward foreign currency contracts | $ | 48,830 | $ | (14,364 | ) | $ | — | $ | 34,466 | |||||||
| 1 | Net amount represents the net amount receivable to the counterparty in the event of default. |
The following table presents the Event Driven Fund’s financial and derivative liabilities subject to Master Netting Agreements by type, net of amounts available for offset under a MNA and net of the related collateral pledged by the Event Driven Fund as of June 30, 2018:
Description | Gross Amounts Recognized in Statement of Assets and Liabilities | Derivatives Available for Offset | Collateral Pledged | Net Amount2 | ||||||||||||
Unrealized depreciation on forward foreign currency contracts | $ | 14,364 | $ | (14,364 | ) | $ | — | $ | — | |||||||
| 2 | Net amount represents the net amount payable to the counterparty in the event of default. |
45
Driehaus Mutual Funds
Notes to Financial Statements (unaudited) — (Continued)
The following table presents the Multi-Asset Growth Economies Fund’s financial and derivative assets subject to Master Netting Agreements by type, net of amounts available for offset under a MNA and net of the related collateral received by the Multi-Asset Growth Economies Fund as of June 30, 2018:
Description | Gross Amounts Recognized in Statement of Assets and Liabilities | Derivatives Available for Offset | Collateral Received | Net Amount1 | ||||||||||||
Unrealized appreciation on open swap contracts | $ | 34,280 | $ | — | $ | — | $ | 34,280 | ||||||||
Unrealized appreciation on forward foreign currency contracts | 249,401 | (53,224 | ) | — | 196,177 | |||||||||||
The following table presents the Multi-Asset Growth Economies Fund’s financial and derivative liabilities subject to Master Netting Agreements by type, net of amounts available for offset under a MNA and net of the related collateral pledged by the Multi-Asset Growth Economies Fund as of June 30, 2018:
Description | Gross Amounts Recognized in Statement of Assets and Liabilities | Derivatives Available for Offset | Collateral Pledged | Net Amount2 | ||||||||||||
Unrealized depreciation on forward foreign currency contracts | $ | 355,664 | $ | (53,224 | ) | $ | (302,440 | ) | $ | — | ||||||
| 1 | Net amount represents the net amount receivable from the counterparty in the event of default. |
| 2 | Net amount represents the net amount payable to the counterparty in the event of default. |
C. INVESTMENT ADVISORY FEES, TRANSACTIONS WITH AFFILIATES, AND ADMINISTRATIVE FEES
Richard H. Driehaus, is the Chairman of the Board of Driehaus Capital Management LLC (“DCM” or the “Adviser”), a registered investment adviser, and of Driehaus Securities LLC (“DS LLC” or the “Distributor”), a registered broker-dealer. As of June 30, 2018, Richard H. Driehaus controls the Driehaus Multi-Asset Growth Economies Fund due to his power to vote a majority of the shares of the Fund.
DCM serves as the Funds’ investment adviser. In return for its services to the Funds, the Funds pay the Adviser an annual management fee on a monthly basis of 0.55%, 1.00% and 1.00% of average daily net assets, respectively, for the Active Income Fund and Event Driven Fund and Multi-Asset Growth Economies Fund.
DCM entered into a written agreement to cap the Multi-Asset Growth Economies Fund’s annual ordinary operating expenses (other than interest, taxes, brokerage commissions, dividends and interest on short sales, other investment-related expenses and extraordinary expenses such as litigation and other expenses not incurred in the ordinary course of the Fund’s business) at 1.75% of average daily net assets until at least April 9, 2020. For this same time period, DCM is entitled to reimbursement for previously waived fees and reimbursed expenses to the extent that the Multi-Asset Growth Economies Fund’s expense ratio remains below the operating expense cap in place at the time of the waiver and the current operating expense cap. For the six months ended June 30, 2018, DCM Waived fees for Multi-Asset Growth Economies Fund totaling $27,785 under this agreement. The amount of potential recovery expiring April 9, 2020 was $86,126.
The Active Income Fund incurred $4,191,816 for investment advisory fees during the period January 1, 2018 through June 30, 2018, of which $709,868 was payable to DCM at June 30, 2018. The Event Driven Fund incurred $697,003 for investment advisory fees during the period January 1, 2018 through June 30, 2018, and $87,551 was payable to DCM at June 30, 2018. The Multi-Asset Growth Economies Fund incurred $220,287 for investment advisory fees during the period January 1, 2018 through June 30, 2018, and $25,778 was payable to DCM at June 30, 2018.
The Funds direct certain portfolio trades, subject to obtaining the best price and execution, to brokers who have agreed to pay a portion of the Funds’ operating expenses using part of the commissions generated. For the six months ended June 30, 2018, these arrangements reduced the expenses of Driehaus Active Income Fund, Driehaus Event Driven Fund and Multi-Asset Growth Economies Fund by $10,000 (0.1%), $15,200 (1.1%) and $950 (0.2%), respectively.
46
Driehaus Mutual Funds
Notes to Financial Statements (unaudited) — (Continued)
The Funds are permitted to purchase or sell securities from or to certain affiliated funds under specified conditions outlined in procedures adopted by the Board. The procedures have been designed to ensure that any purchase or sale of securities by a Fund from or to another fund or portfolio that is or could be considered an affiliate by virtue of having a common investment adviser (or affiliated investment advisers), common trustees and/or common officers complies with Rule 17a-7 of the 1940 Act. Further, as defined under these procedures, each transaction is affected at the current market price to minimize trading costs, where permissible. For the six months ended June 30, 2018, the Funds engaged in purchases and sales of securities, pursuant to Rule 17a-7 of the 1940 Act, as follows:
Fund | Purchases | Sales | Net Realized Gain (Loss) | |||||||||
Active Income Fund | $ | 1,426,250 | $ | — | $ | — | ||||||
Event Driven Fund | — | 1,426,250 | (273 | ) | ||||||||
Multi-Asset Growth Economies Fund | — | — | — | |||||||||
DS LLC is the Funds’ distributor. DS LLC does not earn any compensation from the Funds for these services. DS LLC has entered into a Fee Reimbursement Agreement (“Agreement”) with the Active Income Fund and Event Driven Fund. Under these Agreements, the Funds reimburse DS LLC for certain fees paid by DS LLC to intermediaries who provide shareholder administrative and/or sub-transfer agency services to the Funds. Currently, the amount to be reimbursed will not exceed 0.25% of the average daily net assets held by such intermediaries. The amounts incurred and payable to DS LLC during the period January 1, 2018 through June 30, 2018 are as follows:
| Fund | Shareholder services plan fees | Accrued shareholder services plan fees | ||||||
Active Income Fund | $ | 1,132,471 | $ | 220,807 | ||||
Event Driven Fund | 132,655 | 14,684 | ||||||
Certain officers of the Trust are also officers of DCM and DS LLC. The Funds pay a portion of the Chief Compliance Officer’s salary. No other officers received compensation from the Funds during the period January 1, 2018 through June 30, 2018. The Independent Trustees are compensated for their services to the Trust and such compensation is reflected as Trustees’ fees in the Statements of Operations.
UMB Fund Services, Inc. (“UMBFS”), an affiliate of UMB Financial Corporation, serves as the Funds’ administrative and accounting agent. In compensation for these services, UMBFS earns the larger of a monthly minimum fee or a monthly fee based upon each Fund’s average daily net assets. UMBFS also acts as the transfer agent and dividend disbursing agent for the Funds. For these services, UMBFS earns a monthly fee based in part on shareholder processing activity during the month.
D. INVESTMENT TRANSACTIONS
Purchases and sales of investment securities (excluding swaps, options, futures, forwards, short-term securities and U.S. government obligations) for the Active Income Fund, Event Driven Fund and Multi-Asset Growth Economies Fund for the period January 1, 2018 through June 30, 2018 were as follows:
Active Income Fund | Event Driven Fund | Multi-Asset Growth | ||||||||||||||
Purchases | $ | 433,825,873 | Purchases | $ | 65,104,729 | Purchases | $ | 35,397,017 | ||||||||
Sales | $ | 431,235,601 | Sales | $ | 123,095,551 | Sales | $ | 31,733,417 | ||||||||
The aggregate purchases and sales of U.S. government obligations for the Active Income Fund, Event Driven Fund and Multi-Asset Growth Economies Fund for the period January 1, 2018 through June 30, 2018, were as follows:
Active Income Fund | Event Driven Fund | Multi-Asset Growth | ||||||||||||||
Purchases | $ | — | Purchases | $ | — | Purchases | $ | — | ||||||||
Sales | $ | — | Sales | $ | — | Sales | $ | — | ||||||||
47
Driehaus Mutual Funds
Notes to Financial Statements (unaudited) — (Continued)
E. RESTRICTED SECURITIES
Restricted securities are securities that are not registered for sale under the Securities Act of 1933 or applicable foreign law and that may be resold only in transactions exempt from applicable registration. Restricted securities include Rule 144A securities which may be sold normally to qualified institutional buyers. At June 30, 2018, the Funds held restricted securities as denoted on the Schedule of Investments.
F. LINE OF CREDIT
The Funds, together with certain other funds in the Trust, obtained a committed line of credit in the amount of $50,000,000. The line of credit is available primarily to meet large, unexpected shareholder withdrawals subject to certain restrictions. Interest is charged at a rate per annum equal to the Federal Funds Rate in effect at the time of the borrowings plus 1.5%, or 1.75%, whichever is greater. There is a commitment fee of 0.10% of the excess of the $50,000,000 committed amount over the sum of the average daily balance of any loans, which is allocated amongst all funds that have access to the line. At June 30, 2018, the Funds had no outstanding borrowings under the line of credit.
G. REDEMPTION FEES
The Multi-Asset Growth Economies Fund may charge a redemption fee of 2.00% of the redemption amount for shares redeemed within 60 days of purchase. The redemption fees are recorded in paid-in capital and reflected in the Statements of Changes in Net Assets.
H. SUBSEQUENT EVENTS
Events or transactions that occurred after the date of this report through the date the report was issued have been evaluated for potential impact to the financial statements. There are no subsequent events that require recognition or disclosure in the financial statements.
48
As a mutual fund shareholder, you may incur two types of costs: (1) transaction costs, including sales charges; redemption fees; and exchange fees and (2) ongoing costs, including management fees; distribution (12b-1) and/or service fees; and other fund expenses. This example is intended to help you understand your ongoing costs (in dollars) of investing in the Fund and to compare these costs with the ongoing costs of investing in other mutual funds.
The example is based on an investment of $1,000 invested at the beginning of the period and held for the entire six month period ended June 30, 2018.
Actual Expenses
The first line of the table below (“Actual”) provides information about actual account values and actual expenses. You may use the information in this line, together with the amount you invested, to estimate the expense that you paid over the period. Simply divide your account value by $1,000 (for example, an $8,600 account value divided by $1,000 = 8.6), then multiply the result by the number in the first line under the heading entitled “Expenses Paid During Period” to estimate the expenses you paid on your account during this period.
Hypothetical Example for Comparison Purposes
The second line of the tables below (“Hypothetical”) provides information about hypothetical account values and hypothetical expenses based on the Fund’s actual expense ratio and an assumed rate of return of 5% per year before expenses, which is not the Fund’s actual return. You may use this information to compare the ongoing costs of investing in the Fund versus other funds. To do so, compare this 5% hypothetical example with the 5% hypothetical examples that appear in the shareholder reports of the other funds.
Please note that the expenses shown in the table are meant to highlight your ongoing costs only and do not reflect any transactional costs, such as sales charges, redemption fees or exchange fees. Therefore, the second line of the table is useful in comparing ongoing costs only, and will not help you determine the relative total costs of owning different funds. In addition, if these transactional costs were included, your costs would have been higher.
Driehaus Active Income Fund
Beginning Account Value January 1, 2018 | Ending Account Value June 30, 2018 | Expenses Paid During Six Months Ended June 30, 2018* | ||||||||||
Actual | $ | 1,000.00 | $ | 1,010.00 | $ | 5.43 | ||||||
Hypothetical Example, assuming a 5% return before expenses | $ | 1,000.00 | $ | 1,019.39 | $ | 5.46 | ||||||
Driehaus Event Driven Fund
Beginning Account Value January 1, 2018 | Ending Account Value June 30, 2018 | Expenses Paid During Six Months Ended June 30, 2018* | ||||||||||
Actual | $ | 1,000.00 | $ | 1,026.90 | $ | 9.75 | ||||||
Hypothetical Example, assuming a 5% return before expenses | $ | 1,000.00 | $ | 1,015.17 | $ | 9.69 | ||||||
49
Fund Expense Examples — (Continued)
Driehaus Multi-Asset Growth Economies Fund
Beginning Account Value January 1, 2018 | Ending Account Value June 30, 2018 | Expenses Paid During Six Months Ended June 30, 2018* | ||||||||||
Actual | $ | 1,000.00 | $ | 939.30 | $ | 8.41 | ||||||
Hypothetical Example, assuming a 5% return before expenses | $ | 1,000.00 | $ | 1,016.12 | $ | 8.75 | ||||||
| * Expenses | are equal to the Funds’ annualized expense ratios for the six-month period in the table below multiplied by the average account value over the period, multiplied by the number of days in the most recent fiscal half-year (181), then divided by 365 to reflect the half-year period. |
Driehaus Active Income Fund | 1.09% | |||
Driehaus Event Driven Fund | 1.94% | |||
Driehaus Multi-Asset Growth Economies Fund | 1.75% |
50
| Item 2. | Code of Ethics. |
Not applicable.
| Item 3. | Audit Committee Financial Expert. |
Not applicable.
| Item 4. | Principal Accountant Fees and Services. |
Not applicable.
| Item 5. | Audit Committee of Listed Registrants. |
Not applicable.
| Item 6. | Investments. |
| (a) | Schedule of Investments in securities of unaffiliated issuers as of the close of the reporting period is included as part of the report to shareholders filed under Item 1 of this form. |
| (b) | Not applicable. |
| Item 7. | Disclosure of Proxy Voting Policies and Procedures for Closed-End Management Investment Companies. |
Not applicable.
| Item 8. | Portfolio Managers of Closed-End Management Investment Companies. |
Not applicable.
| Item 9. | Purchases of Equity Securities by Closed-End Management Investment Company and Affiliated Purchasers. |
Not applicable.
| Item 10. | Submission of Matters to a Vote of Security Holders. |
There have been no material changes to the procedures by which the shareholders may recommend nominees to the registrant’s board of directors, where those changes were implemented after the registrant last provided disclosure in response to the requirements of Item 407(c)(2)(iv) of Regulation S-K (17 CFR 229.407) (as required by Item 22(b)(15) of Schedule 14A (17 CFR 240.14a-101)), or this Item.
| Item 11. | Controls and Procedures. |
| (a) | The registrant’s principal executive and principal financial officers, or persons performing similar functions, have concluded that the registrant’s disclosure controls and procedures (as defined in Rule 30a-3(c) under the Investment Company Act of 1940, as amended (the “1940 Act”) (17 CFR 270.30a-3(c))) are effective, as of a date within 90 days of the filing date of the report that includes the disclosure required by this paragraph, based on their evaluation of these controls and procedures required by Rule 30a-3(b) under the 1940 Act (17 CFR 270.30a-3(b)) and Rules 13a-15(b) or 15d-15(b) under the Securities Exchange Act of 1934, as amended (17 CFR 240.13a-15(b) or 240.15d-15(b)). |
| (b) | There were no changes in the registrant’s internal control over financial reporting (as defined in Rule 30a-3(d) under the 1940 Act (17 CFR 270.30a-3(d))) that occurred during the registrant’s last fiscal quarter that has materially affected, or is reasonably likely to materially affect, the registrant’s internal control over financial reporting. |
| Item 12. | Disclosure of Securities Lending Activities for Closed-End Management Investment Companies. |
Not applicable.
| Item 13. | Exhibits. |
| (a)(1) | Not applicable. | |
| (a)(2) | Certifications pursuant to Rule 30a-2(a) under the 1940 Act and Section 302 of the Sarbanes-Oxley Act of 2002 are attached hereto. | |
| (a)(3) | Not applicable. | |
| (a)(4) | Not applicable. | |
| (b) | Certifications pursuant to Rule 30a-2(b) under the 1940 Act and Section 906 of the Sarbanes-Oxley Act of 2002 are attached hereto. | |
SIGNATURES
Pursuant to the requirements of the Securities Exchange Act of 1934 and the Investment Company Act of 1940, the registrant has duly caused this report to be signed on its behalf by the undersigned, thereunto duly authorized.
| (Registrant) | Driehaus Mutual Funds |
| By (Signature and Title)* | /s/ Stephen J. Kneeley | |
Stephen J. Kneeley, President (principal executive officer) |
| Date | August 29, 2018 | |
Pursuant to the requirements of the Securities Exchange Act of 1934 and the Investment Company Act of 1940, this report has been signed below by the following persons on behalf of the registrant and in the capacities and on the dates indicated.
| By (Signature and Title)* | /s/ Stephen J. Kneeley |
Stephen J. Kneeley, President (principal executive officer) |
| Date | August 29, 2018 | |
| By (Signature and Title)* | /s/ Michelle L. Cahoon |
Michelle L. Cahoon, Vice President and Treasurer (principal financial officer) |
| Date | August 29, 2018 | |
| * | Print the name and title of each signing officer under his or her signature. |