UNITED STATES
SECURITIES AND EXCHANGE COMMISSION
Washington, D.C. 20549
FORM N-CSR
CERTIFIED SHAREHOLDER REPORT OF REGISTERED MANAGEMENT INVESTMENT COMPANIES
Investment Company Act file number 811-07655
Driehaus Mutual Funds
(Exact name of registrant as specified in charter)
25 East Erie Street
Chicago, IL 60611
(Address of principal executive offices) (Zip code)
Janet L. McWilliams
Driehaus Capital Management LLC
25 East Erie Street
Chicago, IL 60611
(Name and address of agent for service)
Registrant's telephone number, including area code: 312-587-3800
Date of fiscal year end: December 31
Date of reporting period: December 31, 2020
Item 1. Reports to Stockholders.
| (a) | The Reports to Shareholders are attached herewith. |
 |  |  |
| Howard Schwab Lead Portfolio Manager | Chad Cleaver Portfolio Manager | Rich Thies Portfolio Manager |
| Average Annual Total Returns as of 12/31/20 | 1 Year | 3 Years | 5 Years | 10 Years |
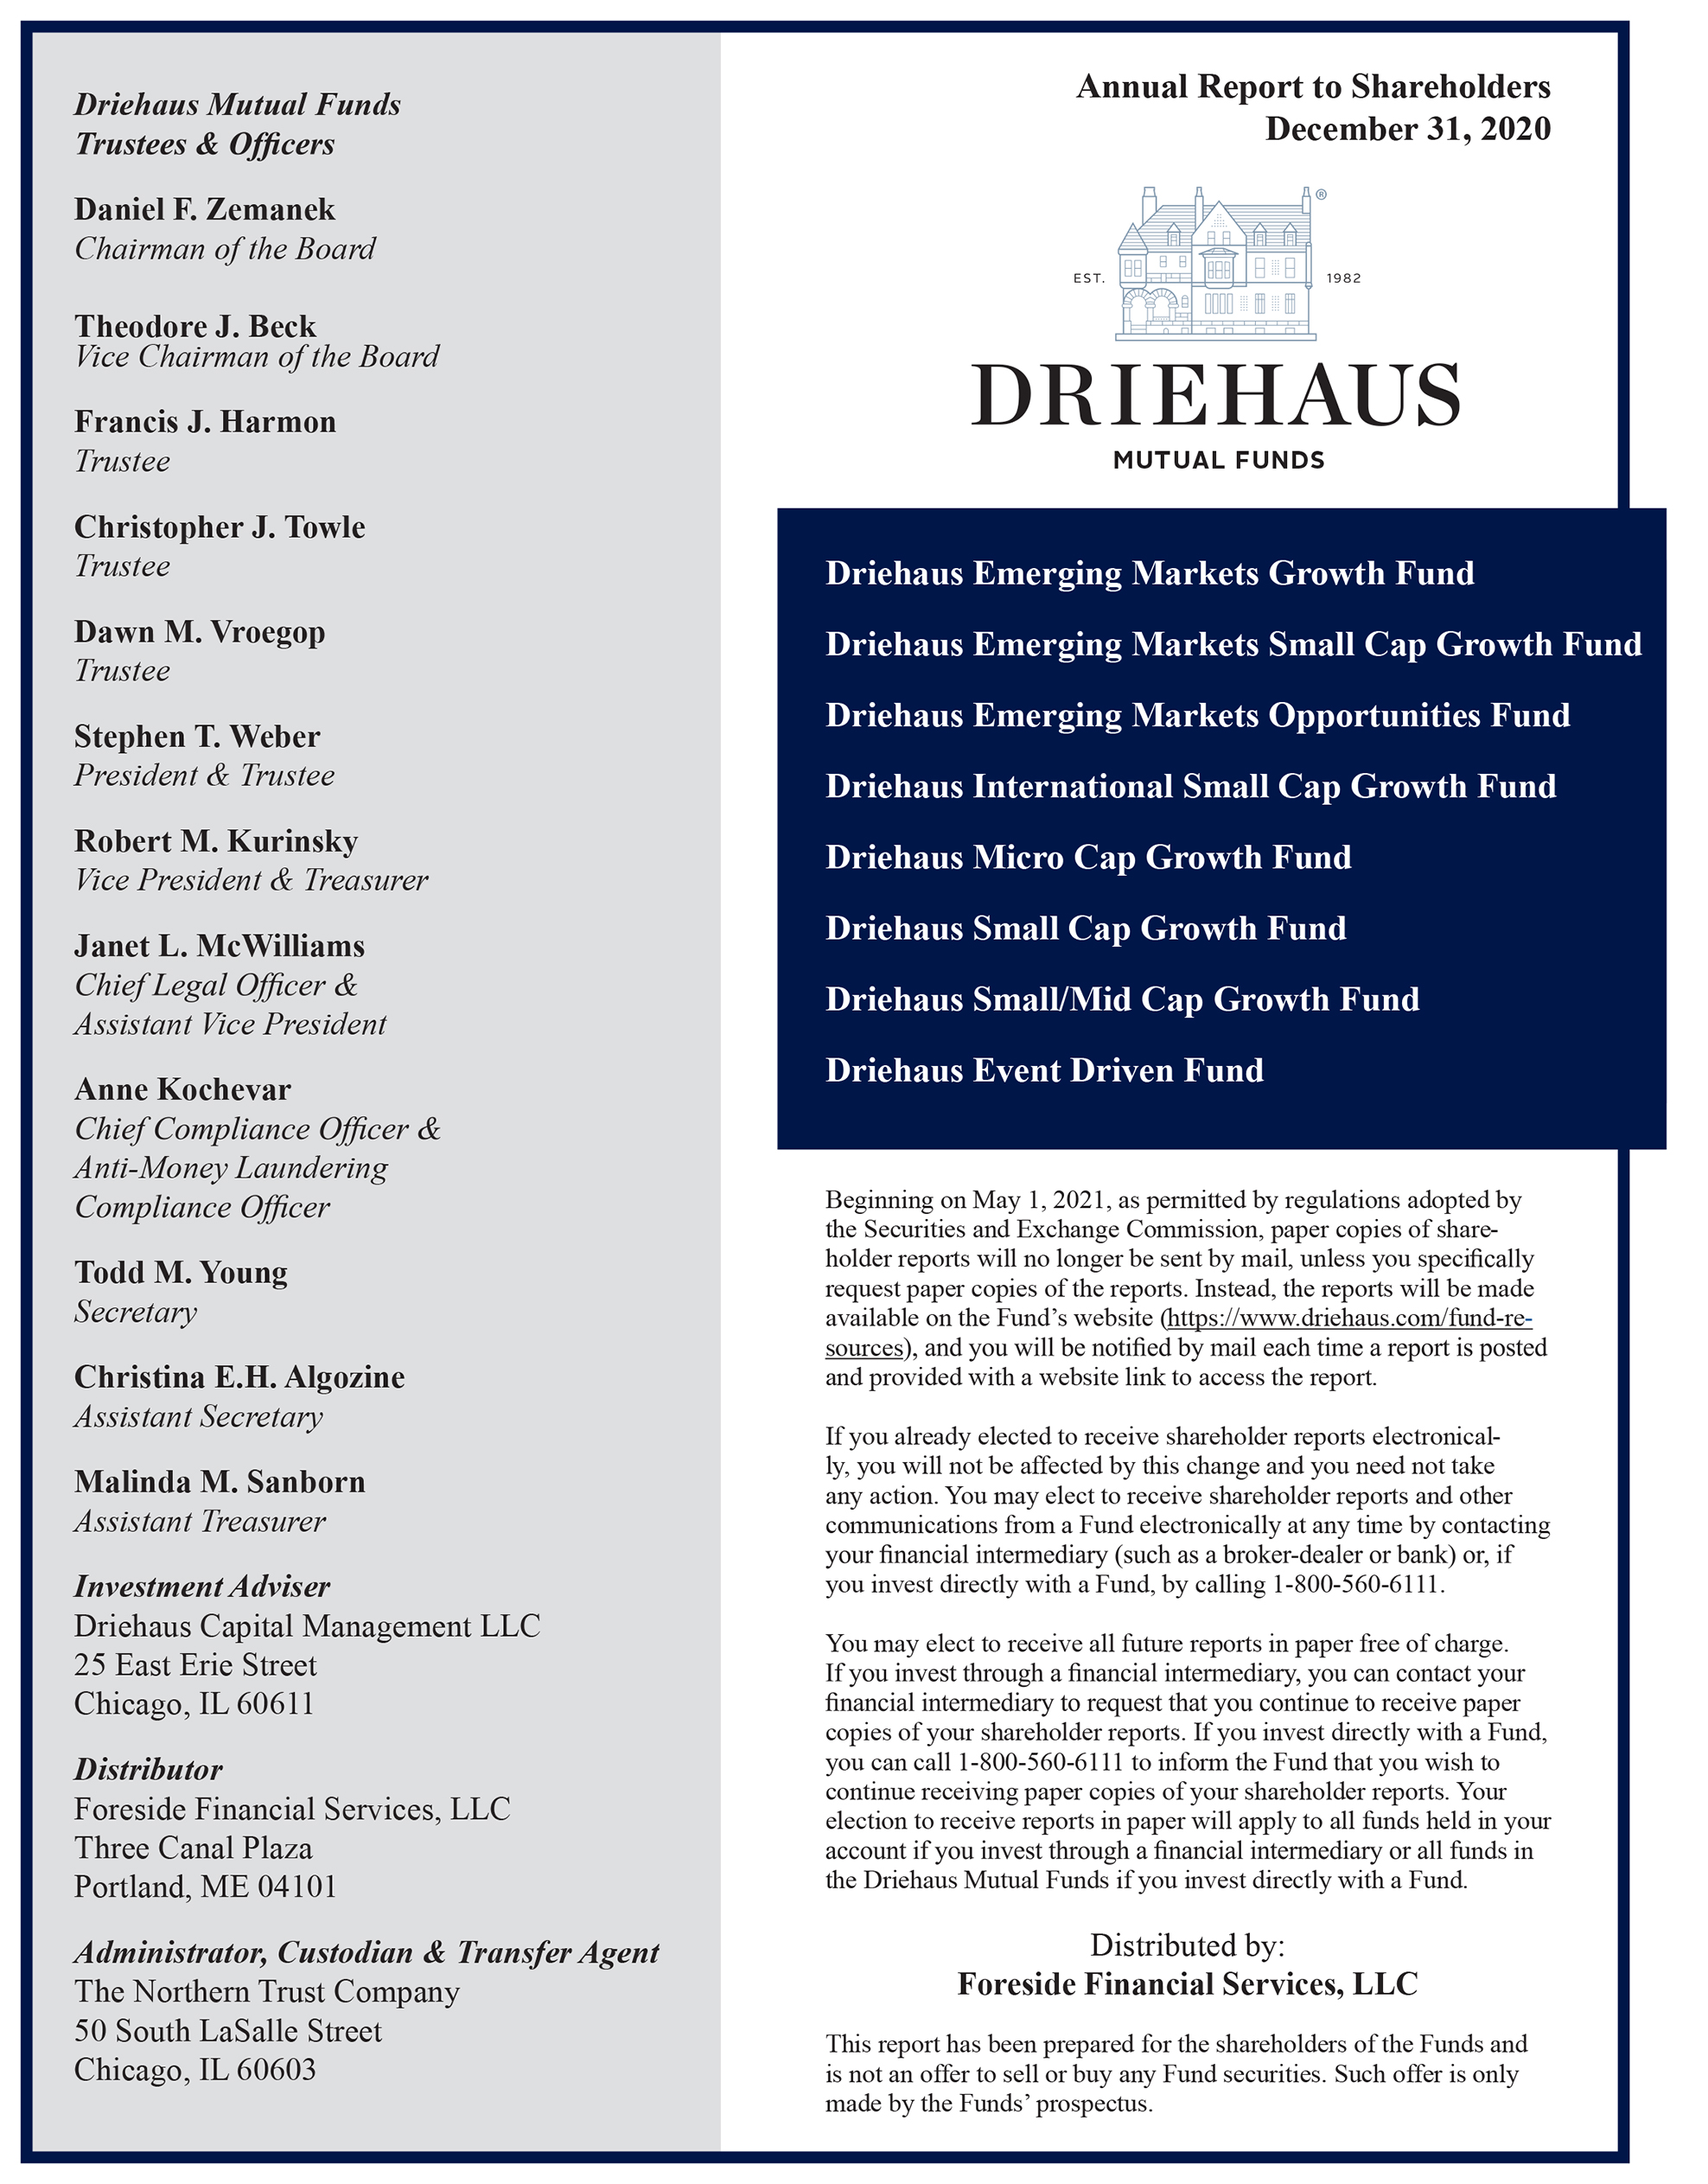
| Driehaus Emerging Markets Growth Fund Investor Class (DREGX) | 27.31% | 10.15% | 15.06% | 6.50% |
| Driehaus Emerging Markets Growth Fund Institutional Class (DIEMX)1 | 27.60% | 10.39% | 15.22% | 6.58% |
| MSCI Emerging Markets Index-N2 | 18.31% | 6.17% | 12.81% | 3.63% |
| MSCI Emerging Markets Growth Index-N3 | 31.33% | 10.33% | 16.23% | 6.21% |
| 1 | The returns for the periods prior to July 17, 2017 (institutional share class inception date) include the performance of the investor share class. |
| 2 | The Morgan Stanley Capital International Emerging Markets Index-Net (MSCI Emerging Markets Index-N) is a market capitalization-weighted index designed to measure equity market performance in emerging markets. Data is in U.S. dollars and is calculated with net dividend reinvestment. Source: Morgan Stanley Capital International Inc. |
| 3 | The Morgan Stanley Capital International Emerging Markets Growth Index-Net (MSCI Emerging Markets Growth Index-N) is a subset of the MSCI Emerging Markets Index and includes only the MSCI Emerging Markets Index stocks which are categorized as growth stocks. Data is in U.S. dollars and is calculated with net dividend reinvestment. Source: Morgan Stanley Capital International Inc. |
| Shares, Principal Amount, or Number of Contracts | Value | |
| COMMON STOCKS — 95.18% | ||
| FAR EAST — 71.13% | ||
| China — 36.83% | ||
| AIA Group Ltd. | 1,987,570 | $24,356,062 |
| Airtac International Group | 582,203 | 18,648,398 |
| Alibaba Group Holding Ltd. * | 563,450 | 16,905,426 |
| Alibaba Group Holding Ltd. - SP ADR 1,* | 324,156 | 75,440,826 |
| Alibaba Health Information Technology Ltd. * | 2,333,940 | 6,894,237 |
| China Feihe Ltd. 2 | 2,908,076 | 6,812,125 |
| China International Capital Corp. Ltd. - H 2,* | 4,618,303 | 12,510,157 |
| China Mengniu Dairy Co. Ltd. * | 3,097,397 | 18,698,370 |
| China Merchants Bank Co. Ltd. - H | 1,775,368 | 11,221,360 |
| China Resources Cement Holdings Ltd. | 6,863,977 | 7,667,517 |
| China Tourism Group Duty Free Corp. Ltd. - A | 317,800 | 13,725,590 |
| Contemporary Amperex Technology Co. Ltd. - A | 393,400 | 21,120,932 |
| Country Garden Services Holdings Co. Ltd. | 2,924,158 | 19,783,693 |
| Dada Nexus Ltd. - ADR 1,* | 192,237 | 7,016,651 |
| East Money Information Co. Ltd. - A | 6,390,163 | 30,290,690 |
| Foshan Haitian Flavouring & Food Co. Ltd. - A | 576,603 | 17,681,269 |
| Galaxy Entertainment Group Ltd. | 3,158,002 | 24,543,160 |
| GDS Holdings Ltd. - ADR 1,* | 177,930 | 16,661,365 |
| Hong Kong Exchanges & Clearing Ltd. | 484,272 | 26,548,459 |
| Huazhu Group Ltd. - ADR 1 | 341,308 | 15,369,099 |
| Innovent Biologics, Inc. 2,* | 1,431,780 | 15,153,603 |
| JD Health International, Inc. 2,* | 9,738 | 188,418 |
| JD.com, Inc. - A * | 362,972 | 16,012,541 |
| KE Holdings, Inc. 1,* | 335,628 | 20,654,547 |
| Kweichow Moutai Co. Ltd. - A | 150,186 | 45,883,915 |
| Li Ning Co. Ltd. | 3,968,878 | 27,287,012 |
| Meituan Dianping - B * | 291,288 | 11,069,203 |
| New Oriental Education & Technology Group, Inc. - SP ADR 1,* | 78,630 | 14,610,240 |
| Offcn Education Technology Co. Ltd. - A | 721,264 | 3,874,431 |
| Ping An Insurance Group Co. of China Ltd. - H | 1,802,908 | 22,093,178 |
| Sany Heavy Industry Co. Ltd. - A | 3,132,606 | 16,755,644 |
| Silergy Corp. | 184,834 | 15,853,439 |
| Techtronic Industries Co. Ltd. | 1,321,924 | 18,859,173 |
| Shares, Principal Amount, or Number of Contracts | Value | |
| Tencent Holdings Ltd. | 2,179,894 | $158,589,893 |
| Tencent Music Entertainment Group - ADR 1,* | 761,473 | 14,650,741 |
| Wuxi Biologics Cayman, Inc. 2,* | 1,056,916 | 14,015,049 |
| Xinyi Solar Holdings Ltd. | 5,833,471 | 15,237,478 |
| Zai Lab Ltd. - ADR 1,* | 134,415 | 18,191,726 |
| 840,875,617 | ||
| India — 12.53% | ||
| Apollo Hospitals Enterprise Ltd. | 718,510 | 23,726,293 |
| Asian Paints Ltd. | 549,653 | 20,796,054 |
| Bajaj Finance Ltd. | 176,834 | 12,815,156 |
| Divi's Laboratories Ltd. | 343,331 | 18,052,395 |
| HDFC Bank Ltd. - ADR 1,* | 690,465 | 49,893,001 |
| HDFC Life Insurance Co. Ltd. 2,* | 1,912,138 | 17,703,649 |
| Hindustan Unilever Ltd. | 552,008 | 18,096,691 |
| ICICI Bank Ltd. - SP ADR 1,* | 1,880,730 | 27,947,648 |
| Maruti Suzuki India Ltd. | 166,908 | 17,473,972 |
| Reliance Industries Ltd. | 1,232,623 | 33,491,312 |
| Tata Consultancy Services Ltd. | 924,609 | 36,225,742 |
| Titan Co. Ltd. | 457,192 | 9,805,843 |
| 286,027,756 | ||
| Taiwan — 9.68% | ||
| Globalwafers Co. Ltd. | 476,000 | 11,994,021 |
| Hon Hai Precision Industry Co. Ltd. | 4,220,964 | 13,820,510 |
| MediaTek, Inc. | 936,698 | 24,902,606 |
| Merida Industry Co. Ltd. | 673,859 | 5,659,859 |
| Taiwan Semiconductor Manufacturing Co. Ltd. - SP ADR 1 | 1,359,533 | 148,243,478 |
| Unimicron Technology Corp. | 5,238,850 | 16,295,661 |
| 220,916,135 | ||
| South Korea — 9.67% | ||
| Kakao Corp. | 57,595 | 20,666,269 |
| Kia Motors Corp. | 316,419 | 18,231,042 |
| LG Chem Ltd. | 14,901 | 11,330,972 |
| LG Household & Health Care Ltd. | 17,733 | 26,466,945 |
| Macquarie Korea Infrastructure Fund | 1,000,206 | 9,813,485 |
| Samsung Electronics Co. Ltd. | 1,575,064 | 117,618,724 |
| Samsung SDI Co. Ltd. | 28,796 | 16,688,659 |
| 220,816,096 | ||
| Indonesia — 1.36% | ||
| Bank Central Asia Tbk PT | 12,914,360 | 31,130,450 |
| Japan — 0.56% | ||
| Keyence Corp. | 22,699 | 12,768,574 |
| Shares, Principal Amount, or Number of Contracts | Value | |
| Singapore — 0.50% | ||
| Sea Ltd. - ADR 1,* | 57,544 | $11,454,133 |
| Total FAR EAST (Cost $962,542,500) | 1,623,988,761 | |
| NORTH AMERICA — 9.06% | ||
| United States — 7.94% | ||
| Advanced Micro Devices, Inc. * | 302,237 | 27,718,155 |
| Cummins, Inc. | 70,460 | 16,001,466 |
| EPAM System, Inc. * | 84,675 | 30,343,286 |
| Micron Technology, Inc. 1,* | 240,739 | 18,098,758 |
| Newmont Corp. 1 | 369,805 | 22,147,622 |
| NIKE, Inc. - B | 249,191 | 35,253,051 |
| Unity Software, Inc. * | 39,964 | 6,133,275 |
| Visa, Inc. - A 1 | 117,183 | 25,631,438 |
| 181,327,051 | ||
| Mexico — 1.12% | ||
| Cemex SAB de CV - SP ADR 1,* | 1,981,647 | 10,245,115 |
| Grupo Financiero Banorte SAB de CV - O * | 2,780,852 | 15,323,019 |
| 25,568,134 | ||
| Total NORTH AMERICA (Cost $174,858,616) | 206,895,185 | |
| EUROPE — 8.06% | ||
| Russia — 2.39% | ||
| Sberbank of Russia PJSC - SP ADR 1 | 2,221,757 | 32,259,912 |
| Yandex NV - A 1,* | 322,009 | 22,405,386 |
| 54,665,298 | ||
| Germany — 1.75% | ||
| Delivery Hero SE 2,* | 93,487 | 14,620,341 |
| Infineon Technologies AG | 662,880 | 25,314,474 |
| 39,934,815 | ||
| France — 1.19% | ||
| L'Oreal SA | 71,525 | 27,157,245 |
| Hungary — 0.80% | ||
| OTP Bank NYRT * | 405,546 | 18,275,758 |
| Poland — 0.68% | ||
| CD Projekt SA * | 95,582 | 7,048,254 |
| Dino Polska SA 2,* | 108,427 | 8,408,901 |
| 15,457,155 | ||
| Netherlands — 0.64% | ||
| ASML Holding NV | 30,155 | 14,645,288 |
| Switzerland — 0.61% | ||
| Dufry AG * | 222,166 | 13,995,354 |
| Total EUROPE (Cost $148,800,396) | 184,130,913 | |
| Shares, Principal Amount, or Number of Contracts | Value | ||
| SOUTH AMERICA — 6.06% | |||
| Brazil — 4.62% | |||
| B3 SA - Brasil Bolsa Balcao | 2,514,679 | $30,107,708 | |
| Localiza Rent a Car SA * | 929,423 | 12,386,772 | |
| Multiplan Empreendimentos Imobiliarios SA * | 2,876,750 | 13,078,645 | |
| Pagseguro Digital Ltd. - A 1,* | 349,788 | 19,895,941 | |
| Raia Drogasil SA | 2,664,428 | 12,808,110 | |
| WEG SA | 1,179,133 | 17,221,045 | |
| 105,498,221 | |||
| Argentina — 1.44% | |||
| MercadoLibre, Inc. 1,* | 19,585 | 32,809,184 | |
| Total SOUTH AMERICA (Cost $103,806,527) | 138,307,405 | ||
| AFRICA — 0.87% | |||
| South Africa — 0.44% | |||
| Impala Platinum Holdings Ltd. | 732,109 | 10,058,714 | |
| Egypt — 0.43% | |||
| Commercial International Bank Egypt SAE | 2,639,116 | 9,930,660 | |
| Total AFRICA (Cost $19,590,785) | 19,989,374 | ||
| Total COMMON STOCKS (Cost $1,409,598,824) | 2,173,311,638 | ||
| PREFERRED STOCKS — 0.36% | |||
| SOUTH AMERICA — 0.36% | |||
| Brazil — 0.36% | |||
| Azul SA * | 1,079,129 | 8,149,498 | |
| Total SOUTH AMERICA (Cost $6,902,490) | 8,149,498 | ||
| Total PREFERRED STOCKS (Cost $6,902,490) | 8,149,498 | ||
| SHORT TERM INVESTMENTS — 4.26% | |||
| Northern Institutional U.S. Government Select Portfolio (Shares Class), 0.02%3 (Cost $97,180,178) | 97,180,178 | 97,180,178 | |
| TOTAL INVESTMENTS (Cost $1,513,681,492) | 99.80% | $2,278,641,314 | |
| Other Assets In Excess of Liabilities | 0.20% | 4,620,028 | |
| Net Assets | 100.00% | $2,283,261,342 | |
| ADR | American Depositary Receipt |
| PJSC | Public Joint Stock Company |
| SP ADR | Sponsored American Depositary Receipt |
| 1 | Foreign security denominated and traded in U.S. dollars. |
| 2 | Security is exempt from registration under Rule 144A of the Securities Act of 1933, as amended. The total value of these securities is $89,412,243, which represents 4% of Net Assets (see Note F in the Notes to Financial Statements). |
| 3 | 7 day current yield as of December 31, 2020, is disclosed. |
| * | Non-income producing security. |
| Security Type | Percent of Total Net Assets | |
| Common Stocks | 95.18% | |
| Preferred Stocks | 0.36% | |
| Short Term Investments | 4.26% | |
| Total Investments | 99.80% | |
| Other Assets In Excess of Liabilities | 0.20% | |
| Total Net Assets | 100.00% |
| Regional Weightings | Percent of Total Net Assets | |
| Far East | 71.13% | |
| North America | 13.32% | |
| Europe | 8.06% | |
| South America | 6.42% | |
| Africa | 0.87% |
| Industry | Percent of Net Assets | |
| Airlines | 0.36 | |
| Automobiles | 1.57 | |
| Banks | 8.56 | |
| Beverages | 2.01 | |
| Biotechnology | 1.46 | |
| Capital Markets | 4.79 | |
| Chemicals | 1.41 | |
| Commercial Services & Supplies | 0.87 | |
| Construction Materials | 0.79 | |
| Consumer Finance | 0.56 | |
| Diversified Consumer Services | 0.81 | |
| Electrical Equipment | 1.69 | |
| Electronic Equipment, Instruments & Components | 2.61 | |
| Entertainment | 1.45 | |
| Food & Staples Retailing | 0.93 | |
| Food Products | 1.89 | |
| Health Care Providers & Services | 1.04 | |
| Health Care Technology | 0.30 | |
| Hotels, Restaurants & Leisure | 1.74 | |
| Household Products | 0.79 | |
| Insurance | 2.82 |
| Industry | Percent of Net Assets | |
| Interactive Media & Services | 8.83 | |
| Internet & Direct Marketing Retail | 7.62 | |
| IT Services | 5.64 | |
| Leisure Products | 0.25 | |
| Life Sciences Tools & Services | 1.40 | |
| Machinery | 3.08 | |
| Metals & Mining | 1.41 | |
| Money Market Fund | 4.26 | |
| Oil, Gas & Consumable Fuels | 1.47 | |
| Personal Products | 2.35 | |
| Real Estate Management & Development | 1.47 | |
| Road & Rail | 0.54 | |
| Semiconductors & Semiconductor Equipment | 13.22 | |
| Software | 0.27 | |
| Specialty Retail | 1.21 | |
| Technology Hardware, Storage & Peripherals | 5.15 | |
| Textiles, Apparel & Luxury Goods | 3.18 | |
| Other Assets In Excess of Liabilities | 0.20 | |
| TOTAL | 100.00 |
| | |
| Chad Cleaver, CFA Lead Portfolio Manager | Howard Schwab Portfolio Manager | Rich Thies Portfolio Manager |
| Fund Only | Including Predecessor Limited Partnership | |||||
| Average Annual Total Returns as of 12/31/20 | 1 Year | 3 Years | 5 Years | Since Inception (8/22/11 - 12/31/20) | 10 Years | |
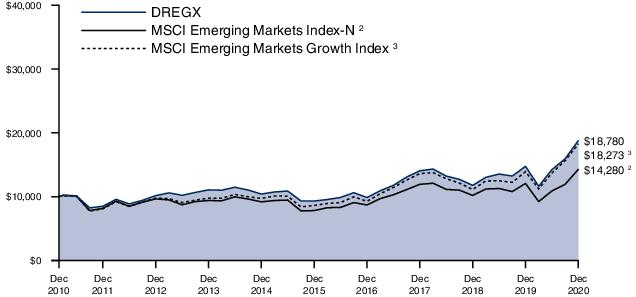
| Driehaus Emerging Markets Small Cap Growth Fund (DRESX)1 | 33.56% | 10.72% | 10.25% | 7.50% | 6.71% | |
| MSCI Emerging Markets Small Cap Index-N2 | 19.29% | 2.69% | 8.19% | 4.31% | 2.29% | |
| MSCI Emerging Markets Small Cap Growth Index-N3 | 25.56% | 4.02% | 7.14% | 4.19% | 2.10% | |
| 1 | The Driehaus Emerging Markets Small Cap Growth Fund (the “Fund”) performance shown above includes the performance of the Driehaus Emerging Markets Small Cap Growth Fund, L.P. (the “Predecessor Limited Partnership”), the Fund’s predecessor, for the periods before the Fund’s registration statement became effective. The Predecessor Limited Partnership, which was established on December 1, 2008, was managed with substantially the same investment objective, policies and philosophies as are followed by the Fund. The Fund succeeded to the Predecessor Limited Partnership’s assets on August 22, 2011. The Predecessor Limited Partnership was not registered under the Investment Company Act of 1940, as amended (“1940 Act”), and thus was not subject to certain investment and operational restrictions that are imposed by the 1940 Act. If the Predecessor Limited Partnership had been registered under the 1940 Act, its performance may have been adversely affected. The Predecessor Limited Partnership’s performance has been restated to reflect estimated expenses of the Fund. The returns for the periods prior to August 21, 2014, reflect fee waivers and/or reimbursements without which performance would have been lower. |
| 2 | The Morgan Stanley Capital International Emerging Markets Small Cap Index-Net (MSCI Emerging Markets Small Cap Index-N) is a market capitalization-weighted index designed to measure equity market performance of small cap stocks in emerging markets. Data is in U.S. dollars and is calculated with net dividend reinvestment. Source: Morgan Stanley Capital International Inc. |
| 3 | The Morgan Stanley Capital International Emerging Markets Small Cap Growth Index-Net (MSCI Emerging Markets Small Cap Growth Index-N) is a market capitalization-weighted index designed to measure equity market performance of small cap growth stocks in emerging markets. Data is in U.S. dollars and is calculated with net dividend reinvestment. Source: Morgan Stanley Capital International Inc. |
| Shares, Principal Amount, or Number of Contracts | Value | |
| COMMON STOCKS — 92.95% | ||
| FAR EAST — 74.95% | ||
| China — 25.87% | ||
| Airtac International Group | 22,000 | $704,676 |
| Bilibili, Inc. - SP ADR 1,* | 11,843 | 1,015,182 |
| Bosideng International Holdings Ltd. | 898,000 | 457,546 |
| Changzhou Xingyu Automotive Lighting Systems Co. Ltd. - A | 28,200 | 864,568 |
| China Meidong Auto Holdings Ltd. | 132,000 | 536,347 |
| China Resources Cement Holdings Ltd. | 348,794 | 389,626 |
| Dada Nexus Ltd. - ADR 1,* | 17,212 | 628,238 |
| Daqo New Energy Corp. - ADR 1,* | 13,951 | 800,229 |
| GDS Holdings Ltd. - ADR 1,* | 6,985 | 654,075 |
| Gotion High-tech Co. Ltd. - A * | 120,900 | 723,204 |
| Hainan Meilan International Airport Co. Ltd. - H * | 186,000 | 986,088 |
| Hygeia Healthcare Holdings Co. Ltd. 2,* | 70,400 | 443,153 |
| Innovent Biologics, Inc. 2,* | 52,000 | 550,355 |
| Jiangsu Hengli Hydraulic Co. Ltd. - A | 95,021 | 1,641,850 |
| Kingdee International Software Group Co. Ltd. * | 211,000 | 860,064 |
| Lee & Man Paper Manufacturing Ltd. | 483,000 | 395,623 |
| Li Ning Co. Ltd. | 181,971 | 1,251,095 |
| Ming Yang Smart Energy Group Ltd. - A | 222,300 | 645,166 |
| Minth Group Ltd. | 174,000 | 917,981 |
| Nine Dragons Paper Holdings Ltd. | 591,000 | 838,574 |
| Niu Technologies - SP ADR 1,* | 11,516 | 323,024 |
| Pharmaron Beijing Co. Ltd. - H 2 | 59,500 | 1,005,424 |
| Proya Cosmetics Co. Ltd. - A | 37,500 | 1,020,673 |
| Shanghai Putailai New Energy Technology Co. Ltd. - A | 24,021 | 412,814 |
| Shenzhen SC New Energy Technology Corp. - A | 24,744 | 550,892 |
| Silergy Corp. | 9,000 | 771,941 |
| Sunac Services Holdings Ltd. 2,* | 349,000 | 772,509 |
| Weihai Guangwei Composites Co. Ltd. - A | 35,600 | 484,752 |
| Xiabuxiabu Catering Management China Holdings Co. Ltd. 2,* | 177,500 | 404,801 |
| Zhejiang Dingli Machinery Co. Ltd. - A | 46,557 | 720,374 |
| Zhou Hei Ya International Holdings Co. Ltd. 2,* | 553,500 | 588,310 |
| Shares, Principal Amount, or Number of Contracts | Value | |
| Zoomlion Heavy Industry Science and Technology Co. Ltd. - H | 711,400 | $853,410 |
| 23,212,564 | ||
| India — 19.56% | ||
| Affle India Ltd. * | 8,654 | 447,934 |
| Amber Enterprises India Ltd. | 35,320 | 1,137,317 |
| Angel Broking Ltd. | 138,910 | 642,673 |
| Apollo Hospitals Enterprise Ltd. | 19,689 | 650,161 |
| Ashok Leyland Ltd. | 641,387 | 837,861 |
| AU Small Finance Bank Ltd. 2,* | 54,216 | 632,628 |
| Azure Power Global Ltd. 1,* | 11,396 | 464,615 |
| Burger King India Ltd. * | 833,500 | 2,001,974 |
| Crompton Greaves Consumer Electricals Ltd. | 132,316 | 689,128 |
| Dabur India Ltd. | 53,549 | 391,353 |
| Dixon Technologies India Ltd. | 5,806 | 1,068,632 |
| Dr Lal PathLabs Ltd. 2 | 13,591 | 428,791 |
| Gujarat Gas Ltd. | 170,042 | 875,955 |
| Indraprastha Gas Ltd. | 61,034 | 419,618 |
| Info Edge India Ltd. | 20,120 | 1,310,144 |
| JK Cement Ltd. | 14,162 | 371,516 |
| Jubilant Foodworks Ltd. | 12,648 | 483,149 |
| Mindtree Ltd. | 33,078 | 751,648 |
| Navin Fluorine International Ltd. | 20,981 | 750,081 |
| PI Industries Ltd. | 35,369 | 1,062,534 |
| Route Mobile Ltd. * | 27,434 | 412,481 |
| SRF Ltd. | 8,708 | 664,283 |
| Syngene International Ltd. 2,* | 121,230 | 1,061,193 |
| 17,555,669 | ||
| Taiwan — 13.39% | ||
| Accton Technology Corp. | 85,000 | 955,940 |
| Advanced Ceramic X Corp. | 38,000 | 689,729 |
| Alchip Technologies Ltd. | 24,000 | 530,429 |
| Andes Technology Corp. | 69,000 | 820,201 |
| ASPEED Technology, Inc. | 14,000 | 854,509 |
| Century Iron & Steel Industrial Co. Ltd. | 187,000 | 712,115 |
| Eclat Textile Co. Ltd. | 71,000 | 1,067,603 |
| Macronix International | 592,643 | 892,191 |
| Makalot Industrial Co. Ltd. | 109,000 | 742,882 |
| Nien Made Enterprise Co. Ltd. | 31,000 | 359,670 |
| Parade Technologies Ltd. | 29,455 | 1,163,608 |
| Sinbon Electronics Co. Ltd. | 105,000 | 807,175 |
| Unimicron Technology Corp. | 138,000 | 429,255 |
| Universal Vision Biotechnology Co. Ltd. | 48,000 | 408,285 |
| Voltronic Power Technology Corp. | 14,550 | 579,970 |
| Shares, Principal Amount, or Number of Contracts | Value | |
| Win Semiconductors Corp. | 81,000 | $997,437 |
| 12,010,999 | ||
| South Korea — 8.15% | ||
| Doosan Fuel Cell Co. Ltd. * | 7,868 | 388,446 |
| Douzone Bizon Co. Ltd. | 5,436 | 520,825 |
| Hugel, Inc. * | 1,836 | 317,638 |
| LEENO Industrial, Inc. | 10,531 | 1,309,681 |
| NHN KCP Corp. * | 17,444 | 1,101,016 |
| NICE Information Service Co. Ltd. | 42,137 | 963,803 |
| Tesna, Inc. * | 21,784 | 1,128,221 |
| Tokai Carbon Korea Co. Ltd. | 6,141 | 708,976 |
| WONIK IPS Co. Ltd. * | 21,408 | 873,595 |
| 7,312,201 | ||
| Vietnam — 4.12% | ||
| Asia Commercial Bank JSC * | 955,000 | 1,278,850 |
| FPT Corp. | 478,754 | 1,470,951 |
| Military Commercial Joint Stock Bank * | 926,180 | 950,556 |
| 3,700,357 | ||
| Indonesia — 1.72% | ||
| Ace Hardware Indonesia Tbk PT | 6,677,400 | 816,135 |
| Bank BTPN Syariah Tbk PT | 2,718,700 | 726,174 |
| 1,542,309 | ||
| Kazakhstan — 1.17% | ||
| Kaspi.KZ JSC 2,* | 7,381 | 398,943 |
| NAC Kazatomprom JSC - GDR | 35,965 | 647,370 |
| 1,046,313 | ||
| Thailand — 0.97% | ||
| Sri Trang Gloves Thailand PCL - NVDR | 344,200 | 873,138 |
| Total FAR EAST (Cost $46,462,852) | 67,253,550 | |
| SOUTH AMERICA — 7.80% | ||
| Brazil — 7.35% | ||
| Banco Inter SA * | 42,200 | 800,360 |
| Construtora Tenda SA | 67,400 | 393,035 |
| Cyrela Brazil Realty SA Empreendimentos e Participacoes | 186,600 | 1,064,145 |
| Grupo SBF SA * | 147,600 | 843,563 |
| Locaweb Servicos de Internet SA 2,* | 77,800 | 1,210,313 |
| LOG Commercial Properties e Participacoes SA | 78,800 | 522,065 |
| Pet Center Comercio e Participacoes SA * | 269,000 | 986,917 |
| TOTVS SA | 72,700 | 402,778 |
| Shares, Principal Amount, or Number of Contracts | Value | |
| Via Varejo SA * | 118,700 | $369,797 |
| 6,592,973 | ||
| Argentina — 0.45% | ||
| Globant SA 1,* | 1,870 | 406,931 |
| Total SOUTH AMERICA (Cost $5,961,021) | 6,999,904 | |
| EUROPE — 5.02% | ||
| Russia — 2.40% | ||
| Detsky Mir PJSC 1 | 637,079 | 1,167,277 |
| RusHydro PJSC 1 | 93,529,457 | 989,108 |
| 2,156,385 | ||
| Poland — 1.51% | ||
| CD Projekt SA * | 4,279 | 315,535 |
| Dino Polska SA 2,* | 13,383 | 1,037,900 |
| 1,353,435 | ||
| United Kingdom — 1.11% | ||
| Ceres Power Holdings PLC * | 54,893 | 990,873 |
| Total EUROPE (Cost $2,829,526) | 4,500,693 | |
| NORTH AMERICA — 4.33% | ||
| Canada — 2.18% | ||
| B2Gold Corp. | 143,429 | 803,401 |
| Ballard Power Systems, Inc. * | 28,151 | 658,733 |
| MAG Silver Corp. * | 24,198 | 496,543 |
| 1,958,677 | ||
| Mexico — 2.15% | ||
| Grupo Aeroportuario del Centro Norte SAB de CV - ADR 1,* | 14,620 | 755,562 |
| Qualitas Controladora SAB de CV | 217,300 | 1,167,225 |
| 1,922,787 | ||
| Total NORTH AMERICA (Cost $3,071,945) | 3,881,464 | |
| AFRICA — 0.85% | ||
| South Africa — 0.85% | ||
| Impala Platinum Holdings Ltd. | 55,651 | 764,609 |
| Total AFRICA (Cost $682,432) | 764,609 | |
| Total COMMON STOCKS (Cost $59,007,776) | 83,400,220 | |
| PREFERRED STOCKS — 2.98% | ||
| SOUTH AMERICA — 2.98% | ||
| Brazil — 2.98% | ||
| Azul SA - ADR 1,* | 26,834 | 612,352 |
| Bradespar SA, 3.24%3 | 31,600 | 388,804 |
| Shares, Principal Amount, or Number of Contracts | Value | ||
| Metalurgica Gerdau SA, 2.23%3 | 477,200 | $1,031,707 | |
| Randon SA Implementos e Participacoes * | 205,700 | 639,954 | |
| 2,672,817 | |||
| Total SOUTH AMERICA (Cost $1,578,350) | 2,672,817 | ||
| Total PREFERRED STOCKS (Cost $1,578,350) | 2,672,817 | ||
| SHORT TERM INVESTMENTS — 5.95% | |||
| Northern Institutional U.S. Government Select Portfolio (Shares Class), 0.02%4 (Cost $5,338,694) | 5,338,694 | 5,338,694 | |
| TOTAL INVESTMENTS (Cost $65,924,820) | 101.88% | $91,411,731 | |
| Liabilities in Excess of Other Assets | (1.88)% | (1,682,485) | |
| Net Assets | 100.00% | $89,729,246 | |
| ADR | American Depositary Receipt |
| GDR | Global Depositary Receipt |
| NVDR | Non-Voting Depositary Receipt |
| PCL | Public Company Limited |
| PJSC | Public Joint Stock Company |
| PLC | Public Limited Company |
| SP ADR | Sponsored American Depositary Receipt |
| 1 | Foreign security denominated and traded in U.S. dollars. |
| 2 | Security is exempt from registration under Rule 144A of the Securities Act of 1933, as amended. The total value of these securities is $8,534,320, which represents 10% of Net Assets (see Note F in the Notes to Financial Statements). |
| 3 | Current yield is disclosed. Dividends are calculated based on a percentage of the issuer’s net income. |
| 4 | 7 day current yield as of December 31, 2020, is disclosed. |
| * | Non-income producing security. |
| Security Type | Percent of Total Net Assets | |
| Common Stocks | 92.95% | |
| Preferred Stocks | 2.98% | |
| Short Term Investments | 5.95% | |
| Total Investments | 101.88% | |
| Liabilities In Excess of Other Assets | (1.88)% | |
| Total Net Assets | 100.00% |
| Regional Weightings | Percent of Total Net Assets | |
| Far East | 74.95% | |
| South America | 10.78% | |
| North America | 10.28% | |
| Europe | 5.02% | |
| Africa | 0.85% |
| Industry | Percent of Net Assets | |
| Airlines | 0.68 | |
| Auto Components | 1.98 | |
| Automobiles | 0.36 | |
| Banks | 4.88 | |
| Biotechnology | 0.96 | |
| Capital Markets | 0.72 | |
| Chemicals | 3.75 | |
| Communications Equipment | 1.84 | |
| Construction Materials | 0.84 | |
| Consumer Finance | 0.45 | |
| Electric Utilities | 1.10 | |
| Electrical Equipment | 4.45 | |
| Electronic Equipment, Instruments & Components | 1.38 | |
| Entertainment | 1.48 | |
| Food & Staples Retailing | 1.16 | |
| Food Products | 0.66 | |
| Gas Utilities | 1.45 | |
| Health Care Equipment & Supplies | 0.97 | |
| Health Care Providers & Services | 2.15 | |
| Hotels, Restaurants & Leisure | 3.22 | |
| Household Durables | 5.26 | |
| Independent Power and Renewable Electricity Producers | 0.52 |
| Industry | Percent of Net Assets | |
| Insurance | 1.30 | |
| Interactive Media & Services | 1.46 | |
| Internet & Direct Marketing Retail | 0.70 | |
| IT Services | 6.24 | |
| Life Sciences Tools & Services | 2.30 | |
| Machinery | 6.01 | |
| Media | 0.50 | |
| Metals & Mining | 4.68 | |
| Money Market Fund | 5.95 | |
| Oil, Gas & Consumable Fuels | 0.72 | |
| Paper & Forest Products | 1.38 | |
| Personal Products | 1.58 | |
| Professional Services | 1.08 | |
| Real Estate Management & Development | 1.44 | |
| Semiconductors & Semiconductor Equipment | 12.69 | |
| Software | 2.45 | |
| Specialty Retail | 5.26 | |
| Textiles, Apparel & Luxury Goods | 3.93 | |
| Transportation Infrastructure | 1.95 | |
| Liabilities In Excess of Other Assets | (1.88) | |
| TOTAL | 100.00 |
| |
| Richard Thies Lead Portfolio Manager | Chad Cleaver Portfolio Manager |
|  |
| Howard Schwab Portfolio Manager | Jonathan Mershimer Assistant Portfolio Manager |
| Average Annual Total Returns as of 12/31/20 | 1 Year | 3 Years | Since Inception (4/10/17 - 12/31/20) |
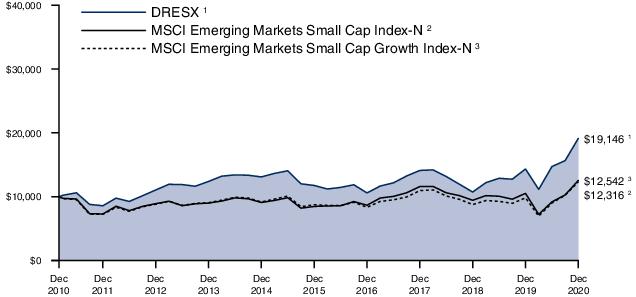
| Driehaus Emerging Markets Opportunities Fund (DMAGX)1 | 30.09% | 11.17% | 14.64% |
| MSCI Emerging Markets Index-N2 | 18.31% | 6.17% | 10.86% |
| MSCI EM/JP Morgan GBI Blended Index3 | 10.59% | 4.81% | 7.93% |
| 1 | Prior to January 29, 2020, the Driehaus Emerging Markets Opportunities Fund was known as the Driehaus Multi-Asset Growth Economies Fund. The returns for the period reflect fee waivers and/or reimbursements without which performance would have been lower. |
| 2 | The Morgan Stanley Capital International Emerging Markets Index-Net (MSCI Emerging Markets Index-N) is a market capitalization-weighted index designed to measure equity market performance in emerging markets. Data is in U.S. dollars and is calculated with net dividend reinvestment. Source: Morgan Stanley Capital International Inc. |
| 3 | The MSCI EM/JPMorgan GBI Blended Index is an equally weighted benchmark comprised of 50 percent by the Morgan Stanley Capital International Emerging Markets Index-Net (MSCI EM) and 50 percent by the JPMorgan Global Bond Index Emerging Markets Global Diversified (JPMorgan GBI). The MSCI EM is a market capitalization-weighted index designed to measure equity market performance in emerging markets and the JPMorgan GBI tracks debt instruments in the emerging markets. Source: Morgan Stanley Capital International Inc. and JPMorgan. |
| Shares, Principal Amount, or Number of Contracts | Value | |
| SOVEREIGN BONDS — 17.37% | ||
| Brazil — 2.13% | ||
| Brazil Notas do Tesouro Nacional Series F 10.00%, 1/1/311 | 1,500,000 | $350,435 |
| Brazilian Government International Bond 4.62%, 1/13/282 | 500,000 | 560,005 |
| Brazilian Government International Bond 4.50%, 5/30/292 | 200,000 | 222,524 |
| 1,132,964 | ||
| China — 3.02% | ||
| China Government Bond 3.20%, 3/16/241 | 1,200,000 | 185,149 |
| China Government Bond 3.54%, 8/16/281 | 2,500,000 | 395,133 |
| China Government Bond 2.68%, 5/21/301 | 7,000,000 | 1,027,244 |
| 1,607,526 | ||
| Egypt — 2.07% | ||
| Egypt Government Bond 17.00%, 4/3/221 | 6,500,000 | 429,913 |
| Egypt Government International Bond 8.70%, 3/1/492 | 580,000 | 672,437 |
| 1,102,350 | ||
| Indonesia — 1.83% | ||
| Indonesia Treasury Bond 8.38%, 9/15/261 | 3,400,000,000 | 277,471 |
| Indonesia Treasury Bond 7.00%, 9/15/301 | 9,000,000,000 | 694,697 |
| 972,168 | ||
| Malaysia — 0.72% | ||
| Malaysia Government Bond 3.89%, 8/15/291 | 1,400,000 | 383,057 |
| Mexico — 2.42% | ||
| Banco Mercantil del Norte SA 8.37%, 10/14/302,3,4 | 300,000 | 358,128 |
| Mexican Bonos 8.50%, 11/18/381 | 10,000,000 | 623,523 |
| Mexico Government International Bond 4.50%, 4/22/292 | 260,000 | 305,240 |
| 1,286,891 | ||
| Netherlands — 1.05% | ||
| Petrobras Global Finance BV 5.09%, 1/15/302 | 500,000 | 558,750 |
| Saudi Arabia — 0.79% | ||
| Saudi Government International Bond 2.75%, 2/3/322 | 400,000 | 423,142 |
| Shares, Principal Amount, or Number of Contracts | Value | |
| South Africa — 1.69% | ||
| Republic of South Africa Government Bond 8.50%, 1/31/371 | 15,900,000 | $897,025 |
| Turkey — 1.18% | ||
| Turkey Government Bond 10.60%, 2/11/261 | 2,500,000 | 315,149 |
| Turkey Government International Bond 5.95%, 1/15/312 | 300,000 | 312,750 |
| 627,899 | ||
| United Arab Emirates — 0.47% | ||
| Abu Dhabi Government International Bond 1.70%, 3/2/312 | 250,000 | 250,438 |
| Total SOVEREIGN BONDS (Cost $8,605,296) | 9,242,210 | |
| COMMON STOCKS — 76.05% | ||
| Argentina — 1.47% | ||
| Globant SA*,2,5 | 1,188 | 258,521 |
| MercadoLibre, Inc.*,2 | 311 | 520,993 |
| 779,514 | ||
| Brazil — 3.29% | ||
| LOG Commercial Properties e Participacoes SA | 108,578 | 719,350 |
| Magazine Luiza SA | 40 | 192 |
| Pagseguro Digital Ltd. - A*,2,5 | 6,724 | 382,461 |
| Pet Center Comercio e Participacoes SA* | 103,212 | 378,668 |
| WEG SA | 18,388 | 268,554 |
| 1,749,225 | ||
| Canada — 1.19% | ||
| Ballard Power Systems, Inc.*,2 | 11,626 | 272,049 |
| Wheaton Precious Metals Corp.2 | 8,696 | 362,971 |
| 635,020 | ||
| China — 25.57% | ||
| AIA Group Ltd. | 23,856 | 292,336 |
| Alibaba Group Holding Ltd.* | 28,500 | 855,097 |
| Alibaba Group Holding Ltd. - SP ADR*,2,5 | 2,174 | 505,955 |
| Alibaba Health Information Technology Ltd.* | 58,000 | 171,326 |
| Bilibili, Inc. - SP ADR*,2,5 | 3,315 | 284,162 |
| China International Capital Corp. Ltd. - H*,6 | 193,600 | 524,428 |
| China Merchants Bank Co. Ltd. - H | 37,700 | 238,286 |
| China Resources Beer Holdings Co. Ltd. | 27,810 | 256,130 |
| China Tourism Group Duty Free Corp. Ltd. - A | 4,937 | 213,226 |
| Shares, Principal Amount, or Number of Contracts | Value | |
| Contemporary Amperex Technology Co. Ltd. - A | 9,195 | $493,663 |
| East Money Information Co. Ltd. - A | 108,354 | 513,620 |
| Galaxy Entertainment Group Ltd. | 55,466 | 431,067 |
| Gotion High-tech Co. Ltd. - A* | 35,200 | 210,561 |
| Hong Kong Exchanges & Clearing Ltd. | 8,002 | 438,681 |
| JD Health International, Inc.*,6 | 172 | 3,328 |
| JD.com, Inc. - ADR*,2,5 | 5,677 | 499,008 |
| KE Holdings, Inc.*,2 | 5,451 | 335,454 |
| Li Ning Co. Ltd. | 66,684 | 458,469 |
| Luxshare Precision Industry Co. Ltd. - A | 37,196 | 319,190 |
| Meituan Dianping - B* | 7,363 | 279,801 |
| Ping An Healthcare and Technology Co. Ltd.*,6 | 27,058 | 328,084 |
| Ping An Insurance Group Co. of China Ltd. - H | 29,959 | 367,123 |
| Sany Heavy Industry Co. Ltd. - A | 80,450 | 430,310 |
| Tencent Holdings Ltd. | 33,261 | 2,419,777 |
| Tencent Music Entertainment Group - ADR*,2 | 26,522 | 510,283 |
| Wuxi Biologics Cayman, Inc.*,6 | 42,186 | 559,400 |
| Xinyi Solar Holdings Ltd. | 202,631 | 529,288 |
| Zai Lab Ltd. - ADR*,2 | 1,664 | 225,206 |
| Zhangzhou Pientzehuang Pharmaceutical Co. Ltd. - A | 13,569 | 555,039 |
| Zhou Hei Ya International Holdings Co. Ltd.*,6 | 337,923 | 359,175 |
| 13,607,473 | ||
| France — 1.22% | ||
| L'Oreal SA | 1,716 | 651,546 |
| India — 9.02% | ||
| Apollo Hospitals Enterprise Ltd. | 7,102 | 234,519 |
| Asian Paints Ltd. | 8,053 | 304,684 |
| Azure Power Global Ltd.*,2 | 6,618 | 269,816 |
| Divi's Laboratories Ltd. | 9,628 | 506,241 |
| HDFC Bank Ltd. - ADR*,2,5 | 9,704 | 701,211 |
| HDFC Life Insurance Co. Ltd.*,6 | 29,849 | 276,359 |
| Hindustan Unilever Ltd. | 17,763 | 582,331 |
| ICICI Bank Ltd. - SP ADR*,2,5 | 45,220 | 671,969 |
| Power Grid Corp. of India Ltd. | 125,867 | 327,038 |
| Reliance Industries Ltd. | 19,031 | 517,087 |
| Tech Mahindra Ltd. | 30,614 | 407,754 |
| 4,799,009 | ||
| Indonesia — 0.76% | ||
| Bank Central Asia Tbk PT | 167,449 | 403,641 |
| Japan — 0.43% | ||
| FANUC Corp. | 936 | 231,051 |
| Shares, Principal Amount, or Number of Contracts | Value | |
| Kazakhstan — 0.65% | ||
| Kaspi.KZ JSC*,2,6 | 6,419 | $346,947 |
| Mexico — 1.41% | ||
| Cemex SAB de CV - SP ADR*,2 | 48,075 | 248,548 |
| Grupo Aeroportuario del Sureste SAB de CV - ADR*,2,5 | 1,953 | 322,108 |
| Wal-Mart de Mexico SAB de CV | 64,835 | 182,129 |
| 752,785 | ||
| Netherlands — 0.59% | ||
| ASML Holding NV | 648 | 314,712 |
| Poland — 1.17% | ||
| CD Projekt SA* | 2,597 | 191,504 |
| Dino Polska SA*,6 | 5,559 | 431,120 |
| 622,624 | ||
| Russia — 2.15% | ||
| LUKOIL PJSC - SP ADR2 | 3,184 | 217,149 |
| Sberbank of Russia PJSC - SP ADR2 | 14,548 | 211,237 |
| X5 Retail Group NV - GDR2 | 7,944 | 286,937 |
| Yandex NV - A*,2,5 | 6,131 | 426,595 |
| 1,141,918 | ||
| Singapore — 0.60% | ||
| Sea Ltd. - ADR*,2,5 | 1,604 | 319,276 |
| South Africa — 1.82% | ||
| Anglo American Platinum Ltd. | 4,952 | 486,320 |
| Naspers Ltd. - N | 2,344 | 481,617 |
| 967,937 | ||
| South Korea — 10.36% | ||
| Hankook Tire & Technology Co. Ltd. | 8,945 | 324,974 |
| Kakao Corp. | 727 | 260,863 |
| KB Financial Group, Inc. | 6,445 | 255,976 |
| Kia Motors Corp. | 6,498 | 374,394 |
| LEENO Industrial, Inc. | 2,805 | 348,842 |
| LG Chem Ltd. | 434 | 330,021 |
| Macquarie Korea Infrastructure Fund | 44,563 | 437,228 |
| NICE Information Service Co. Ltd. | 15,539 | 355,425 |
| Samsung Electronics Co. Ltd. | 26,619 | 1,987,788 |
| Samsung SDI Co. Ltd. | 779 | 451,468 |
| SK Hynix, Inc. | 3,533 | 385,904 |
| 5,512,883 | ||
| Sweden — 1.19% | ||
| Spotify Technology SA*,2,5 | 2,020 | 635,613 |
| Taiwan — 11.45% | ||
| Accton Technology Corp. | 39,705 | 446,536 |
| Century Iron & Steel Industrial Co. Ltd. | 40,000 | 152,324 |
| Chailease Holding Co. Ltd. | 63,286 | 378,392 |
| Shares, Principal Amount, or Number of Contracts | Value | ||
| Hon Hai Precision Industry Co. Ltd. | 121,103 | $396,522 | |
| Kindom Development Co. Ltd. | 372,000 | 445,505 | |
| Macronix International | 199,357 | 300,121 | |
| MediaTek, Inc. | 14,648 | 389,425 | |
| Parade Technologies Ltd. | 7,050 | 278,507 | |
| Sinbon Electronics Co. Ltd. | 25,746 | 197,919 | |
| Taiwan Semiconductor Manufacturing Co. Ltd. | 148,445 | 2,800,052 | |
| Yageo Corp. | 16,694 | 307,762 | |
| 6,093,065 | |||
| United States — 1.71% | |||
| Advanced Micro Devices, Inc.*,2,5 | 6,163 | 565,209 | |
| Facebook, Inc. - A*,2,5 | 684 | 186,841 | |
| NVIDIA Corp.2,5 | 306 | 159,793 | |
| 911,843 | |||
| Total COMMON STOCKS (Cost $27,390,704) | 40,476,082 | ||
| PREFERRED STOCKS — 1.10% | |||
| Brazil — 1.10% | |||
| Azul SA - ADR*,2 | 9,387 | 214,211 | |
| Gerdau SA - SP ADR 1.70%2,5,7 | 79,977 | 373,493 | |
| 587,704 | |||
| Total PREFERRED STOCKS (Cost $451,648) | 587,704 | ||
| SHORT TERM INVESTMENTS — 10.16% | |||
| Northern Institutional U.S. Government Select Portfolio (Shares Class), 0.02%8 (Cost $5,405,735) | 5,405,735 | 5,405,735 | |
| TOTAL INVESTMENTS (Cost $41,853,383) | 104.68% | $55,711,731 | |
| Liabilities in Excess of Other Assets | (4.68)% | (2,490,273) | |
| Net Assets | 100.00% | $53,221,458 | |
| ADR | American Depositary Receipt |
| GDR | Global Depositary Receipt |
| PJSC | Public Joint Stock Company |
| SP ADR | Sponsored American Depositary Receipt |
| * | Non-income producing security. |
| 1 | Foreign security, principal amount shown in local currency. |
| 2 | Foreign security denominated and traded in U.S. dollars. |
| 3 | Perpetual security. Maturity date shown is the next call date or final legal maturity date, whichever comes first. |
| 4 | Variable rate security. Rates disclosed as of December 31, 2020. |
| 5 | All or a portion of this security is pledged as collateral for short sales or derivatives transactions. |
| 6 | Security is exempt from registration under Rule 144A of the Securities Act of 1933, as amended. The total value of these securities is $2,828,841, which represents 5% of Net Assets (see Note F in the Notes to Financial Statements). |
| 7 | Current yield is disclosed. Dividends are calculated based on a percentage of the issuer’s net income. |
| 8 | 7 day current yield as of December 31, 2020, is disclosed. |
| Security Type | Percent of Total Net Assets | |
| Sovereign Bonds | 17.37% | |
| Common Stocks | 76.05% | |
| Preferred Stocks | 1.10% | |
| Short Term Investments | 10.16% | |
| Total Investments | 104.68% | |
| Liabilities In Excess of Other Assets | (4.68)% | |
| Total Net Assets | 100.00% |
| Regional Weightings | Percent of Total Net Assets | |
| Far East | 64.41% | |
| North America | 16.89% | |
| South America | 7.99% | |
| Europe | 7.37% | |
| Africa | 5.58% | |
| Middle East | 2.44% |
| Industry | Percent of Net Assets | |
| Airlines | 0.40 | |
| Auto Components | 0.61 | |
| Automobiles | 0.70 | |
| Banks | 4.67 | |
| Beverages | 0.48 | |
| Biotechnology | 0.42 | |
| Capital Markets | 3.59 | |
| Chemicals | 1.19 | |
| Communications Equipment | 0.84 | |
| Construction Materials | 0.47 | |
| Consumer Finance | 0.65 | |
| Diversified Financial Services | 0.71 | |
| Electric Utilities | 0.62 | |
| Electrical Equipment | 2.35 | |
| Electronic Equipment, Instruments & Components | 3.15 | |
| Entertainment | 3.64 | |
| Food & Staples Retailing | 1.69 | |
| Food Products | 0.67 | |
| Health Care Providers & Services | 0.44 | |
| Health Care Technology | 0.94 | |
| Hotels, Restaurants & Leisure | 0.81 | |
| Household Products | 1.09 | |
| Independent Power and Renewable Electricity Producers | 0.51 |
| Industry | Percent of Net Assets | |
| Insurance | 1.76 | |
| Interactive Media & Services | 6.19 | |
| Internet & Direct Marketing Retail | 5.93 | |
| IT Services | 1.98 | |
| Life Sciences Tools & Services | 2.00 | |
| Machinery | 1.24 | |
| Metals & Mining | 2.58 | |
| Money Market Fund | 10.16 | |
| Multiline Retail | 0.00 | |
| Oil, Gas & Consumable Fuels | 1.38 | |
| Personal Products | 1.22 | |
| Pharmaceuticals | 1.04 | |
| Professional Services | 0.67 | |
| Real Estate Management & Development | 2.82 | |
| Semiconductors & Semiconductor Equipment | 11.40 | |
| Sovereign Bonds | 17.37 | |
| Specialty Retail | 1.11 | |
| Technology Hardware, Storage & Peripherals | 3.73 | |
| Textiles, Apparel & Luxury Goods | 0.86 | |
| Transportation Infrastructure | 0.60 | |
| Liabilities In Excess of Other Assets | (4.68) | |
| TOTAL | 100.00 |
 |  |  |
| Daniel Burr Portfolio Manager | David Mouser Portfolio Manager | Ryan Carpenter Assistant Portfolio Manager |
| Average Annual Total Returns as of 12/31/20 | 1 Year | 3 Years | 5 Years | 10 Years |
| Driehaus International Small Cap Growth Fund (DRIOX) | 29.71% | 12.01% | 13.26% | 9.89% |
| MSCI AC World ex USA Small Cap Growth Index-N1 | 23.69% | 8.00% | 10.92% | 6.97% |
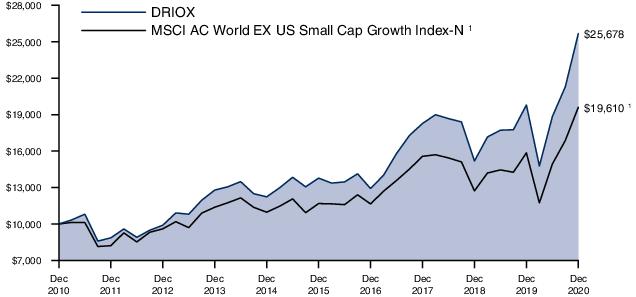
| 1 | The Morgan Stanley Capital International All Country World ex USA Small Cap Growth Index-Net (MSCI AC World ex USA Small Cap Growth Index-N) is a market capitalization-weighted index designed to measure equity market performance in global developed markets and emerging markets, excluding the U.S., and is composed of stocks which are categorized as small capitalization growth stocks. Data is in U.S. dollars and is calculated with net dividend reinvestment. Source: Morgan Stanley Capital International Inc. |
| Shares, Principal Amount, or Number of Contracts | Value | |
| COMMON STOCKS — 97.86% | ||
| EUROPE — 61.60% | ||
| United Kingdom — 20.89% | ||
| 888 Holdings PLC | 545,200 | $2,128,577 |
| ASOS PLC * | 29,038 | 1,899,304 |
| Aston Martin Lagonda Global Holdings PLC 1,* | 66,295 | 1,821,328 |
| B&M European Value Retail SA | 310,235 | 2,189,960 |
| Bellway PLC | 51,438 | 2,078,590 |
| Codemasters Group Holdings PLC * | 184,200 | 1,647,384 |
| Conduit Holdings Ltd. * | 371,526 | 2,557,837 |
| ConvaTec Group PLC 1 | 1,043,373 | 2,842,211 |
| Cranswick PLC | 32,216 | 1,550,749 |
| Electrocomponents PLC | 333,300 | 3,967,633 |
| Endava PLC - SP ADR 2,* | 40,312 | 3,093,946 |
| Fevertree Drinks PLC | 110,389 | 3,814,682 |
| Halfords Group PLC * | 810,800 | 2,960,413 |
| JD Sports Fashion PLC * | 104,965 | 1,234,441 |
| Kingfisher PLC * | 468,814 | 1,733,543 |
| LivaNova PLC 2,* | 42,952 | 2,843,852 |
| OSB Group PLC * | 598,600 | 3,467,528 |
| Pets at Home Group PLC | 314,400 | 1,789,419 |
| Provident Financial PLC * | 443,300 | 1,861,073 |
| Serco Group PLC * | 1,155,168 | 1,887,732 |
| Spirax-Sarco Engineering PLC | 15,146 | 2,339,438 |
| Stock Spirits Group PLC | 529,050 | 1,938,915 |
| The Weir Group PLC * | 214,310 | 5,830,606 |
| Vesuvius PLC | 389,201 | 2,855,427 |
| 60,334,588 | ||
| Germany — 8.55% | ||
| Duerr AG | 80,124 | 3,276,265 |
| DWS Group GmbH & Co. KGaA 1 | 64,781 | 2,754,062 |
| flatexDEGIRO AG * | 52,534 | 4,065,570 |
| Hornbach Holding AG & Co. KGaA | 13,894 | 1,335,823 |
| Puma SE * | 13,056 | 1,469,151 |
| Scout24 AG 1 | 29,125 | 2,379,916 |
| SMA Solar Technology AG * | 45,400 | 3,119,740 |
| TAG Immobilien AG * | 84,133 | 2,684,850 |
| VERBIO Vereinigte BioEnergie AG | 96,600 | 3,622,950 |
| 24,708,327 | ||
| Sweden — 5.09% | ||
| BHG Group AB * | 106,841 | 2,332,443 |
| Boozt AB 1,* | 90,307 | 2,072,842 |
| Elekta AB - B | 244,600 | 3,276,914 |
| Kindred Group PLC * | 188,600 | 1,845,327 |
| Mekonomen AB * | 231,106 | 2,558,239 |
| Shares, Principal Amount, or Number of Contracts | Value | |
| Tele2 AB - B | 197,629 | $2,614,235 |
| 14,700,000 | ||
| Netherlands — 4.61% | ||
| Alfen Beheer BV 1,* | 18,198 | 1,836,329 |
| Argenx SE * | 9,923 | 2,933,629 |
| BE Semiconductor Industries NV | 41,692 | 2,525,260 |
| Corbion NV | 38,100 | 2,148,046 |
| OCI NV * | 202,231 | 3,883,713 |
| 13,326,977 | ||
| Finland — 4.35% | ||
| Konecranes OYJ | 79,897 | 2,824,530 |
| Metso Outotec OYJ | 745,552 | 7,491,135 |
| Tokmanni Group Corp. | 113,967 | 2,255,983 |
| 12,571,648 | ||
| Switzerland — 4.30% | ||
| Bachem Holding AG | 5,054 | 2,260,231 |
| Comet Holding AG | 12,394 | 2,785,116 |
| Flughafen Zurich AG * | 11,600 | 2,046,721 |
| Softwareone Holding AG * | 127,995 | 3,787,101 |
| Tecan Group AG | 3,165 | 1,552,377 |
| 12,431,546 | ||
| France — 3.87% | ||
| Coface SA * | 368,148 | 3,692,431 |
| Maisons du Monde SA 1,* | 83,100 | 1,517,711 |
| McPhy Energy SA * | 40,569 | 1,702,425 |
| Virbac SA * | 14,706 | 4,275,809 |
| 11,188,376 | ||
| Denmark — 2.30% | ||
| Ascendis Pharma A/S - ADR 2,* | 9,343 | 1,558,226 |
| Netcompany Group A/S 1,* | 27,742 | 2,844,869 |
| Royal Unibrew A/S | 19,202 | 2,223,571 |
| 6,626,666 | ||
| Ireland — 1.62% | ||
| James Hardie Industries PLC * | 158,730 | 4,677,092 |
| Austria — 1.52% | ||
| AT&S Austria Technologie & Systemtechnik AG | 41,528 | 1,320,282 |
| BAWAG Group AG 1,* | 65,643 | 3,053,247 |
| 4,373,529 | ||
| Belgium — 1.45% | ||
| Bekaert SA | 84,300 | 2,797,075 |
| bpost SA * | 133,200 | 1,381,525 |
| 4,178,600 | ||
| Luxembourg — 1.30% | ||
| Befesa SA 1 | 59,686 | 3,764,607 |
| Norway — 1.20% | ||
| Nordic Semiconductor ASA * | 216,300 | 3,474,968 |
| Shares, Principal Amount, or Number of Contracts | Value | |
| Italy — 0.55% | ||
| FinecoBank Banca Fineco SpA * | 95,396 | $1,573,273 |
| Total EUROPE (Cost $127,726,092) | 177,930,197 | |
| FAR EAST — 23.99% | ||
| Japan — 16.39% | ||
| ASKUL Corp. | 102,825 | 3,836,925 |
| Capcom Co. Ltd. | 26,500 | 1,718,596 |
| CKD Corp. | 81,049 | 1,737,248 |
| Freee KK * | 21,300 | 2,083,006 |
| Fujitec Co. Ltd. | 103,250 | 2,230,824 |
| Hennge KK * | 38,300 | 3,085,313 |
| Ibiden Co. Ltd. | 74,500 | 3,482,664 |
| Iwatani Corp. | 23,700 | 1,460,135 |
| Lasertec Corp. | 15,206 | 1,784,773 |
| MINEBEA MITSUMI, Inc. | 106,254 | 2,113,900 |
| Nabtesco Corp. | 69,227 | 3,038,561 |
| Nichias Corp. | 77,530 | 1,846,484 |
| NSK Ltd. | 301,700 | 2,625,577 |
| Sugi Holdings Co. Ltd. | 32,978 | 2,202,896 |
| Takeuchi Manufacturing Co. Ltd. | 137,800 | 3,254,109 |
| TechnoPro Holdings, Inc. | 28,387 | 2,358,276 |
| THK Co. Ltd. | 83,423 | 2,697,970 |
| Tokai Carbon Co. Ltd. | 174,400 | 2,183,437 |
| Tokyo Tatemono Co. Ltd. | 163,355 | 2,242,773 |
| Tokyotokeiba Co. Ltd. | 29,900 | 1,357,165 |
| 47,340,632 | ||
| South Korea — 3.22% | ||
| Douzone Bizon Co. Ltd. | 20,068 | 1,922,721 |
| Hankook Tire & Technology Co. Ltd. | 84,600 | 3,073,541 |
| NHN KCP Corp. * | 45,582 | 2,876,984 |
| Pearl Abyss Corp. * | 5,938 | 1,423,851 |
| 9,297,097 | ||
| Australia — 1.84% | ||
| Bigtincan Holdings Ltd. * | 1,981,505 | 1,680,405 |
| Megaport Ltd. * | 110,754 | 1,216,748 |
| NEXTDC Ltd. * | 257,437 | 2,427,301 |
| 5,324,454 | ||
| Taiwan — 1.66% | ||
| Giant Manufacturing Co. Ltd. | 317,589 | 3,108,299 |
| Hiwin Technologies Corp. | 122,446 | 1,675,584 |
| 4,783,883 | ||
| China — 0.88% | ||
| Li Ning Co. Ltd. | 369,934 | 2,543,387 |
| Total FAR EAST (Cost $47,710,367) | 69,289,453 | |
| Shares, Principal Amount, or Number of Contracts | Value | |
| NORTH AMERICA — 10.32% | ||
| Canada — 9.92% | ||
| Altus Group Ltd. | 34,100 | $1,316,422 |
| AutoCanada, Inc. | 71,100 | 1,318,777 |
| Boardwalk REIT | 71,870 | 1,905,015 |
| Canada Goose Holdings, Inc. 2,* | 40,700 | 1,211,639 |
| Empire Co. Ltd. - A | 58,990 | 1,612,273 |
| Intertape Polymer Group, Inc. | 182,600 | 3,462,930 |
| K92 Mining, Inc. * | 276,200 | 1,651,255 |
| Methanex Corp. | 63,151 | 2,901,801 |
| Parkland Corp. | 119,882 | 3,803,939 |
| Ritchie Bros Auctioneers, Inc. | 40,800 | 2,836,031 |
| Sleep Country Canada Holdings, Inc. 1 | 96,600 | 2,008,800 |
| Xebec Adsorption, Inc. * | 661,118 | 4,622,004 |
| 28,650,886 | ||
| Mexico — 0.40% | ||
| Grupo Cementos de Chihuahua SAB de CV | 190,586 | 1,154,271 |
| Total NORTH AMERICA (Cost $23,590,278) | 29,805,157 | |
| SOUTH AMERICA — 1.36% | ||
| Brazil — 1.36% | ||
| Cyrela Brazil Realty SA Empreendimentos e Participacoes | 480,000 | 2,737,350 |
| Rumo SA * | 327,893 | 1,212,664 |
| 3,950,014 | ||
| Total SOUTH AMERICA (Cost $4,066,133) | 3,950,014 | |
| MIDDLE EAST — 0.59% | ||
| Israel — 0.59% | ||
| Kornit Digital Ltd. 2,* | 19,104 | 1,702,740 |
| Total MIDDLE EAST (Cost $900,469) | 1,702,740 | |
| Total COMMON STOCKS (Cost $203,993,339) | 282,677,561 | |
| PREFERRED STOCKS — 0.34% | ||
| EUROPE — 0.34% | ||
| Germany — 0.34% | ||
| Jungheinrich AG, 1.24%3 | 21,864 | 977,172 |
| Total EUROPE (Cost $369,742) | 977,172 | |
| Total PREFERRED STOCKS (Cost $369,742) | 977,172 | |
| Shares, Principal Amount, or Number of Contracts | Value | ||
| SHORT TERM INVESTMENTS — 2.08% | |||
| Northern Institutional U.S. Government Select Portfolio (Shares Class), 0.02%4 (Cost $6,012,281) | 6,012,281 | $6,012,281 | |
| TOTAL INVESTMENTS (Cost $210,375,362) | 100.28% | $289,667,014 | |
| Liabilities in Excess of Other Assets | (0.28)% | (812,499) | |
| Net Assets | 100.00% | $288,854,515 | |
| ADR | American Depositary Receipt |
| PLC | Public Limited Company |
| REIT | Real Estate Investment Trust |
| SP ADR | Sponsored American Depositary Receipt |
| 1 | Security is exempt from registration under Rule 144A of the Securities Act of 1933, as amended. The total value of these securities is $26,895,922, which represents 9% of Net Assets (see Note F in the Notes to Financial Statements). |
| 2 | Foreign security denominated and traded in U.S. dollars. |
| 3 | Current yield is disclosed. Dividends are calculated based on a percentage of the issuer’s net income. |
| 4 | 7 day current yield as of December 31, 2020, is disclosed. |
| * | Non-income producing security. |
| Security Type | Percent of Total Net Assets | |
| Common Stocks | 97.86% | |
| Preferred Stocks | 0.34% | |
| Short Term Investments | 2.08% | |
| Total Investments | 100.28% | |
| Liabilities In Excess of Other Assets | (0.28)% | |
| Total Net Assets | 100.00% |
| Regional Weightings | Percent of Total Net Assets | |
| Europe | 61.94% | |
| Far East | 23.99% | |
| North America | 12.40% | |
| South America | 1.36% | |
| Middle East | 0.59% |
| Industry | Percent of Net Assets | |
| Air Freight & Logistics | 0.48 | |
| Auto Components | 1.06 | |
| Automobiles | 0.63 | |
| Banks | 1.61 | |
| Beverages | 2.76 | |
| Biotechnology | 1.56 | |
| Building Products | 0.64 | |
| Capital Markets | 2.36 | |
| Chemicals | 3.84 | |
| Commercial Services & Supplies | 2.93 | |
| Construction Materials | 2.02 | |
| Consumer Finance | 0.64 | |
| Containers & Packaging | 1.20 | |
| Electrical Equipment | 0.64 | |
| Electronic Equipment, Instruments & Components | 3.94 | |
| Entertainment | 1.65 | |
| Food & Staples Retailing | 1.32 | |
| Food Products | 0.54 | |
| Health Care Equipment & Supplies | 3.09 | |
| Hotels, Restaurants & Leisure | 1.85 | |
| Household Durables | 1.66 | |
| Insurance | 2.17 | |
| Interactive Media & Services | 0.82 | |
| Internet & Direct Marketing Retail | 3.52 |
| Industry | Percent of Net Assets | |
| IT Services | 4.40 | |
| Leisure Products | 1.08 | |
| Life Sciences Tools & Services | 1.32 | |
| Machinery | 18.34 | |
| Metals & Mining | 1.54 | |
| Money Market Fund | 2.08 | |
| Multiline Retail | 1.54 | |
| Oil, Gas & Consumable Fuels | 3.08 | |
| Pharmaceuticals | 1.48 | |
| Professional Services | 0.82 | |
| Real Estate Management & Development | 2.83 | |
| Road & Rail | 0.42 | |
| Semiconductors & Semiconductor Equipment | 3.77 | |
| Software | 2.96 | |
| Specialty Retail | 5.70 | |
| Textiles, Apparel & Luxury Goods | 1.81 | |
| Thrifts & Mortgage Finance | 1.20 | |
| Trading Companies & Distributors | 1.37 | |
| Transportation Infrastructure | 0.71 | |
| Wireless Telecommunication Services | 0.90 | |
| Liabilities In Excess of Other Assets | (0.28) | |
| TOTAL | 100.00 |
 |  | |
| Jeff James Lead Portfolio Manager | Michael Buck Portfolio Manager | |
 | ||
| Prakash Vijayan Assistant Portfolio Manager |
| Fund Only | Including Predecessor Limited Partnership | |||||
| Average Annual Total Returns as of 12/31/20 | 1 Year | 3 Years | 5 Years | Since Inception (11/18/13 - 12/31/20) | 10 Years | |
| Driehaus Micro Cap Growth Fund (DMCRX)1 | 85.60% | 37.18% | 30.46% | 23.01% | 20.24% | |
| Russell Microcap® Growth Index2 | 40.13% | 14.04% | 13.08% | 10.11% | 11.57% | |
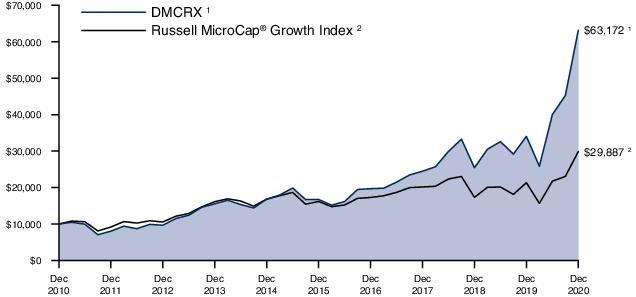
| 1 | The Driehaus Micro Cap Growth Fund (the “Fund”) performance shown above includes the performance of the Driehaus Micro Cap Fund, L.P. (the “Predecessor Limited Partnership”), one of the Fund’s predecessors, for the periods before the Fund’s registration statement became effective. The Predecessor Limited Partnership, which was established on July 1, 1996, was managed with substantially the same investment objective, policies and philosophies as are followed by the Fund. The Fund succeeded to the Predecessor Limited Partnership’s assets together with the assets of the Driehaus Institutional Micro Cap Fund, L.P. on November 18, 2013. The Predecessor Limited Partnership was not registered under the Investment Company Act of 1940, as amended (“1940 Act”), and thus was not subject to certain investment and operational restrictions that are imposed by the 1940 Act. If the Predecessor Limited Partnership had been registered under the 1940 Act, its performance may have been adversely affected. The Predecessor Limited Partnership’s performance has been restated to reflect estimated expenses of the Fund. The returns for periods prior to November 18, 2016, reflect fee waivers and/or reimbursements without which performance would have been lower. |
| 2 | The Russell Microcap® Growth Index measures the performance of the microcap growth segment of the U.S. equity market. It includes those Russell Microcap companies that are considered more growth oriented relative to the overall market as defined by FTSE Russell's leading style methodology. The Russell Microcap® Growth Index is constructed to provide a comprehensive and unbiased barometer for the microcap growth segment of the market. Data is calculated with net dividend reinvestment. Source: FTSE Russell. |
| Shares, Principal Amount, or Number of Contracts | Value | |
| COMMON STOCKS — 99.40% | ||
| HEALTH CARE — 30.94% | ||
| Biotechnology — 15.80% | ||
| Aeglea BioTherapeutics, Inc.* | 33,863 | $266,502 |
| Apellis Pharmaceuticals, Inc.* | 39,710 | 2,271,412 |
| Applied Therapeutics, Inc.* | 54,255 | 1,194,153 |
| Aziyo Biologics, Inc. - A* | 46,008 | 627,089 |
| Black Diamond Therapeutics, Inc.* | 38,785 | 1,243,059 |
| Celldex Therapeutics, Inc.* | 48,023 | 841,363 |
| Cogent Biosciences, Inc.* | 69,159 | 776,656 |
| Crinetics Pharmaceuticals, Inc.* | 108,654 | 1,533,108 |
| Cytokinetics, Inc.* | 201,385 | 4,184,780 |
| Gamida Cell Ltd.1,* | 146,631 | 1,230,234 |
| Immunovant, Inc.* | 69,127 | 3,192,976 |
| Kura Oncology, Inc.* | 36,975 | 1,207,603 |
| Merus NV1,* | 78,061 | 1,368,409 |
| Mirati Therapeutics, Inc.* | 8,189 | 1,798,632 |
| Mirum Pharmaceuticals, Inc.* | 55,172 | 963,303 |
| Natera, Inc.* | 63,419 | 6,311,459 |
| Olema Pharmaceuticals, Inc.* | 25,870 | 1,243,830 |
| PMV Pharmaceuticals, Inc.* | 32,430 | 1,994,769 |
| Relay Therapeutics, Inc.* | 60,921 | 2,531,877 |
| SpringWorks Therapeutics, Inc.* | 77,316 | 5,606,956 |
| Trillium Therapeutics, Inc.1,* | 127,672 | 1,878,055 |
| Turning Point Therapeutics, Inc.* | 26,411 | 3,218,180 |
| Twist Bioscience Corp.* | 33,503 | 4,733,639 |
| Xenon Pharmaceuticals, Inc.1,* | 47,081 | 724,106 |
| Y-mAbs Therapeutics, Inc.* | 38,343 | 1,898,362 |
| 52,840,512 | ||
| Health Care Equipment & Supplies — 5.88% | ||
| Alphatec Holdings, Inc.* | 240,096 | 3,486,194 |
| Axonics Modulation Technologies, Inc.* | 58,020 | 2,896,358 |
| CryoPort, Inc.* | 44,075 | 1,934,011 |
| GenMark Diagnostics, Inc.* | 95,570 | 1,395,322 |
| Inari Medical, Inc.* | 14,315 | 1,249,556 |
| OrthoPediatrics Corp.* | 49,247 | 2,031,439 |
| Pulmonx Corp.* | 34,192 | 2,359,932 |
| SeaSpine Holdings Corp.* | 99,640 | 1,738,718 |
| SI-BONE, Inc.* | 85,325 | 2,551,218 |
| 19,642,748 | ||
| Health Care Providers & Services — 3.05% | ||
| AdaptHealth Corp.* | 79,240 | 2,976,254 |
| Castle Biosciences, Inc.* | 55,344 | 3,716,350 |
| Fulgent Genetics, Inc.* | 35,075 | 1,827,407 |
| Owens & Minor, Inc. | 62,133 | 1,680,698 |
| 10,200,709 | ||
| Shares, Principal Amount, or Number of Contracts | Value | |
| Health Care Technology — 2.62% | ||
| Inspire Medical Systems, Inc.* | 23,970 | $4,508,517 |
| Phreesia, Inc.* | 45,271 | 2,456,405 |
| Schrodinger, Inc.* | 22,799 | 1,805,225 |
| 8,770,147 | ||
| Life Sciences Tools & Services — 2.14% | ||
| NeoGenomics, Inc.* | 52,535 | 2,828,484 |
| Personalis, Inc.* | 41,332 | 1,513,165 |
| Quanterix Corp.* | 60,618 | 2,818,737 |
| 7,160,386 | ||
| Pharmaceuticals — 1.45% | ||
| Ocular Therapeutix, Inc.* | 117,516 | 2,432,581 |
| Odonate Therapeutics, Inc.* | 79,208 | 1,520,793 |
| Revance Therapeutics, Inc.* | 31,693 | 898,180 |
| 4,851,554 | ||
| Total HEALTH CARE (Cost $53,359,284) | 103,466,056 | |
| CONSUMER DISCRETIONARY — 19.61% | ||
| Hotels, Restaurants & Leisure — 3.97% | ||
| Bally's Corp. | 87,585 | 4,399,395 |
| Everi Holdings, Inc.* | 181,804 | 2,510,713 |
| GAN Ltd.1,* | 143,928 | 2,918,860 |
| NEOGAMES SA1,* | 90,910 | 3,453,671 |
| 13,282,639 | ||
| Specialty Retail — 3.76% | ||
| At Home Group, Inc.* | 64,180 | 992,223 |
| Boot Barn Holdings, Inc.* | 46,311 | 2,008,045 |
| GrowGeneration Corp.* | 178,913 | 7,195,881 |
| MarineMax, Inc.* | 26,206 | 917,996 |
| OneWater Marine, Inc. - A* | 50,668 | 1,473,932 |
| 12,588,077 | ||
| Household Durables — 3.64% | ||
| Century Communities, Inc.* | 36,656 | 1,604,800 |
| LGI Homes, Inc.* | 11,629 | 1,230,929 |
| Purple Innovation, Inc.* | 123,730 | 4,075,666 |
| Skyline Champion Corp.* | 37,638 | 1,164,520 |
| The Lovesac Co.* | 74,041 | 3,190,427 |
| VOXX International Corp.* | 71,706 | 914,968 |
| 12,181,310 | ||
| Internet & Direct Marketing Retail — 3.24% | ||
| CarParts.com, Inc.* | 219,426 | 2,718,688 |
| Liquidity Services, Inc.* | 61,636 | 980,629 |
| Magnite, Inc.* | 231,940 | 7,122,877 |
| 10,822,194 | ||
| Auto Components — 2.30% | ||
| Fox Factory Holding Corp.* | 26,804 | 2,833,451 |
| Modine Manufacturing Co.* | 79,969 | 1,004,411 |
| Shares, Principal Amount, or Number of Contracts | Value | |
| XPEL, Inc.* | 74,810 | $3,857,203 |
| 7,695,065 | ||
| Leisure Products — 1.32% | ||
| Malibu Boats, Inc. - A* | 39,088 | 2,440,655 |
| Vista Outdoor, Inc.* | 82,565 | 1,961,744 |
| 4,402,399 | ||
| Textiles, Apparel & Luxury Goods — 1.05% | ||
| Crocs, Inc.* | 55,909 | 3,503,258 |
| Diversified Consumer Services — 0.33% | ||
| Aspen Group, Inc.* | 98,051 | 1,091,308 |
| Total CONSUMER DISCRETIONARY (Cost $33,363,581) | 65,566,250 | |
| INFORMATION TECHNOLOGY — 17.00% | ||
| Software — 7.88% | ||
| Avaya Holdings Corp.* | 141,668 | 2,712,942 |
| ChannelAdvisor Corp.* | 231,456 | 3,698,667 |
| Digital Turbine, Inc.* | 80,608 | 4,559,189 |
| Docebo, Inc.1,* | 43,690 | 2,843,782 |
| Domo, Inc. - B* | 71,673 | 4,570,587 |
| Five9, Inc.* | 9,623 | 1,678,251 |
| fuboTV, Inc.* | 87,122 | 2,439,416 |
| PubMatic, Inc. - A* | 87,997 | 2,460,396 |
| Veritone, Inc.* | 48,334 | 1,375,102 |
| 26,338,332 | ||
| Semiconductors & Semiconductor Equipment — 4.10% | ||
| Camtek Ltd.1,* | 50,127 | 1,098,283 |
| FormFactor, Inc.* | 42,888 | 1,845,042 |
| SiTime Corp.* | 72,558 | 8,121,417 |
| Ultra Clean Holdings, Inc.* | 84,736 | 2,639,526 |
| 13,704,268 | ||
| Communications Equipment — 2.22% | ||
| Calix, Inc.* | 160,995 | 4,791,211 |
| Cambium Networks Corp.* | 105,463 | 2,645,012 |
| 7,436,223 | ||
| IT Services — 1.89% | ||
| Endava PLC - SP ADR1,* | 46,712 | 3,585,146 |
| Grid Dynamics Holdings, Inc.* | 121,858 | 1,535,411 |
| Repay Holdings Corp.* | 43,903 | 1,196,357 |
| 6,316,914 | ||
| Electronic Equipment, Instruments & Components — 0.91% | ||
| nLight, Inc.* | 93,212 | 3,043,372 |
| Total INFORMATION TECHNOLOGY (Cost $32,933,063) | 56,839,109 | |
| FINANCIALS — 9.73% | ||
| Insurance — 4.30% | ||
| BRP Group, Inc. - A* | 123,504 | 3,701,415 |
| Shares, Principal Amount, or Number of Contracts | Value | |
| Goosehead Insurance, Inc. - A | 28,212 | $3,519,729 |
| James River Group Holdings Ltd. | 48,162 | 2,367,162 |
| Kinsale Capital Group, Inc. | 7,026 | 1,406,114 |
| Midwest Holding, Inc.* | 16,679 | 894,828 |
| Palomar Holdings, Inc.* | 18,041 | 1,602,763 |
| Trean Insurance Group, Inc.* | 68,381 | 895,791 |
| 14,387,802 | ||
| Banks — 2.36% | ||
| Live Oak Bancshares, Inc. | 77,357 | 3,671,363 |
| Silvergate Capital Corp. - A* | 23,880 | 1,774,523 |
| Triumph Bancorp, Inc.* | 50,217 | 2,438,035 |
| 7,883,921 | ||
| Thrifts & Mortgage Finance — 1.37% | ||
| Meta Financial Group, Inc. | 41,643 | 1,522,468 |
| NMI Holdings, Inc. - A* | 135,616 | 3,071,702 |
| 4,594,170 | ||
| Capital Markets — 1.23% | ||
| Cowen, Inc. - A | 64,532 | 1,677,187 |
| Open Lending Corp. - A* | 69,593 | 2,432,971 |
| 4,110,158 | ||
| Asset Management — 0.47% | ||
| CF Finance Acquisition Corp. II - A* | 143,443 | 1,580,742 |
| Total FINANCIALS (Cost $18,170,604) | 32,556,793 | |
| INDUSTRIALS — 9.69% | ||
| Electrical Equipment — 3.86% | ||
| Bloom Energy Corp. - A* | 115,847 | 3,320,175 |
| Plug Power, Inc.* | 123,258 | 4,179,679 |
| TPI Composites, Inc.* | 64,090 | 3,382,670 |
| Vicor Corp.* | 21,939 | 2,023,215 |
| 12,905,739 | ||
| Machinery — 3.74% | ||
| Chart Industries, Inc.* | 40,693 | 4,793,228 |
| Hydrofarm Holdings Group, Inc.* | 58,284 | 3,064,573 |
| Terex Corp. | 56,040 | 1,955,236 |
| The Shyft Group, Inc. | 95,226 | 2,702,514 |
| 12,515,551 | ||
| Commercial Services & Supplies — 0.84% | ||
| Montrose Environmental Group, Inc.* | 90,624 | 2,805,719 |
| Professional Services — 0.83% | ||
| Upwork, Inc.* | 80,264 | 2,770,713 |
| Construction & Engineering — 0.42% | ||
| Ameresco, Inc. - A* | 26,763 | 1,398,099 |
| Total INDUSTRIALS (Cost $14,945,428) | 32,395,821 | |
| Shares, Principal Amount, or Number of Contracts | Value | |
| CONSUMER STAPLES — 5.12% | ||
| Food Products — 2.45% | ||
| Freshpet, Inc.* | 16,674 | $2,367,541 |
| Laird Superfood, Inc.* | 27,868 | 1,318,714 |
| SunOpta, Inc.1,* | 182,762 | 2,132,833 |
| Village Farms International, Inc.1,* | 233,168 | 2,364,323 |
| 8,183,411 | ||
| Beverages — 1.90% | ||
| Celsius Holdings, Inc.* | 126,153 | 6,346,757 |
| Tobacco — 0.77% | ||
| Turning Point Brands, Inc. | 58,325 | 2,598,962 |
| Total CONSUMER STAPLES (Cost $8,321,721) | 17,129,130 | |
| COMMUNICATION SERVICES — 2.13% | ||
| Diversified Telecommunication Services — 1.11% | ||
| Bandwidth, Inc. - A* | 24,183 | 3,716,202 |
| Media — 1.02% | ||
| Cardlytics, Inc.* | 23,782 | 3,395,356 |
| Total COMMUNICATION SERVICES (Cost $2,591,834) | 7,111,558 | |
| MATERIALS — 1.83% | ||
| Metals & Mining — 1.15% | ||
| Arconic Corp.* | 76,874 | 2,290,845 |
| Warrior Met Coal, Inc. | 73,358 | 1,563,993 |
| 3,854,838 | ||
| Construction Materials — 0.68% | ||
| Forterra, Inc.* | 132,537 | 2,278,973 |
| Total MATERIALS (Cost $5,138,171) | 6,133,811 | |
| UTILITIES — 1.32% | ||
| Independent Power and Renewable Electricity Producers — 1.32% | ||
| Sunnova Energy International, Inc.* | 97,585 | 4,404,011 |
| Total UTILITIES (Cost $1,378,788) | 4,404,011 | |
| ENERGY — 1.25% | ||
| Energy Equipment & Services — 0.71% | ||
| Aspen Aerogels, Inc.* | 92,266 | 1,539,920 |
| DMC Global, Inc. | 19,663 | 850,425 |
| 2,390,345 | ||
| Oil, Gas & Consumable Fuels — 0.54% | ||
| Matador Resources Co.* | 148,821 | 1,794,781 |
| Total ENERGY (Cost $3,940,842) | 4,185,126 | |
| Shares, Principal Amount, or Number of Contracts | Value | ||
| REAL ESTATE — 0.78% | |||
| Real Estate Management & Development — 0.78% | |||
| eXp World Holdings, Inc.* | 41,406 | $2,613,547 | |
| Total REAL ESTATE (Cost $1,909,237) | 2,613,547 | ||
| Total COMMON STOCKS (Cost $176,052,553) | 332,401,212 | ||
| SHORT TERM INVESTMENTS — 0.62% | |||
| Northern Institutional U.S. Government Select Portfolio (Shares Class), 0.02%2 (Cost $2,068,996) | 2,068,996 | 2,068,996 | |
| TOTAL INVESTMENTS (Cost $178,121,549) | 100.02% | $334,470,208 | |
| Liabilities In Excess of Other Assets | (0.02)% | (79,244) | |
| Net Assets | 100.00% | $334,390,964 | |
| PLC | Public Limited Company |
| SP ADR | Sponsored American Depositary Receipt |
| 1 | Foreign security denominated and traded in U.S. dollars. |
| 2 | 7 day current yield as of December 31, 2020, is disclosed. |
| * | Non-income producing security. |
| Security Type | Percent of Total Net Assets | |
| Common Stocks | 99.40% | |
| Short Term Investments | 0.62% | |
| Total Investments | 100.02% | |
| Liabilities In Excess of Other Assets | (0.02)% | |
| Total Net Assets | 100.00% |
| Industry | Percent of Net Assets | |
| Asset Management | 0.47 | |
| Auto Components | 2.30 | |
| Banks | 2.36 | |
| Beverages | 1.90 | |
| Biotechnology | 15.80 | |
| Capital Markets | 1.23 | |
| Commercial Services & Supplies | 0.84 | |
| Communications Equipment | 2.22 | |
| Construction & Engineering | 0.42 | |
| Construction Materials | 0.68 | |
| Diversified Consumer Services | 0.33 | |
| Diversified Telecommunication Services | 1.11 | |
| Electrical Equipment | 3.86 | |
| Electronic Equipment, Instruments & Components | 0.91 | |
| Energy Equipment & Services | 0.71 | |
| Food Products | 2.45 | |
| Health Care Equipment & Supplies | 5.88 | |
| Health Care Providers & Services | 3.05 | |
| Health Care Technology | 2.62 | |
| Hotels, Restaurants & Leisure | 3.97 | |
| Household Durables | 3.64 | |
| Independent Power and Renewable Electricity Producers | 1.32 |
| Industry | Percent of Net Assets | |
| Insurance | 4.30 | |
| Internet & Direct Marketing Retail | 3.24 | |
| IT Services | 1.89 | |
| Leisure Products | 1.32 | |
| Life Sciences Tools & Services | 2.14 | |
| Machinery | 3.74 | |
| Media | 1.02 | |
| Metals & Mining | 1.15 | |
| Money Market Fund | 0.62 | |
| Oil, Gas & Consumable Fuels | 0.54 | |
| Pharmaceuticals | 1.45 | |
| Professional Services | 0.83 | |
| Real Estate Management & Development | 0.78 | |
| Semiconductors & Semiconductor Equipment | 4.10 | |
| Software | 7.88 | |
| Specialty Retail | 3.76 | |
| Textiles, Apparel & Luxury Goods | 1.05 | |
| Thrifts & Mortgage Finance | 1.37 | |
| Tobacco | 0.77 | |
| Liabilities In Excess of Other Assets | (0.02) | |
| TOTAL | 100.00 |
| | |
| Jeff James Lead Portfolio Manager | Michael Buck Portfolio Manager | |
| ||
| Prakash Vijayan Assistant Portfolio Manager |
| Fund Only | Including Predecessor Limited Partnership | |||||
| Average Annual Total Returns as of 12/31/20 | 1 Year | 3 Years | Since Inception (8/21/17 - 12/31/20) | 5 Years | 10 Years | |
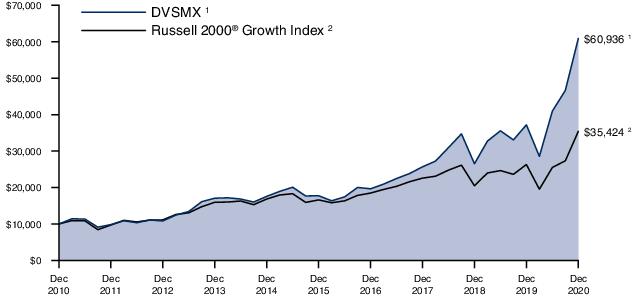
| Driehaus Small Cap Growth Fund Investor Class (DVSMX)1 | 63.77% | 33.39% | 35.87% | 27.98% | 19.81% | |
| Driehaus Small Cap Growth Fund Institutional Class (DNSMX)1 | 64.39% | 33.79% | 36.26% | 28.23% | 19.93% | |
| Russell 2000® Growth Index2 | 34.63% | 16.20% | 19.11% | 16.36% | 13.48% | |
| 1 | The Driehaus Small Cap Growth Fund (“the Fund”) performance shown above includes the performance of the Driehaus Institutional Small Cap, L.P. (the “Predecessor Partnership”), one of the Fund’s predecessors, for the periods before the Fund’s registration statement became effective. The Predecessor Partnership was managed by the same investment team with substantially the same investment objective, policies and philosophies as are followed by the Fund. The Fund succeeded to the Predecessor Partnership’s assets together with the assets of the Driehaus Institutional Small Cap Recovery Fund, L.P., Driehaus Small Cap Recovery Fund, L.P. and Driehaus Small Cap Investors, L.P. (together, the “Limited Partnerships”) on August 21, 2017. The investment portfolios of the Limited Partnerships were identical and therefore had similar performance. The performance of the Predecessor Partnership is shown here because it has been in operation the longest. The Predecessor Partnership was not registered under the Investment Company Act of 1940, as amended (“1940 Act”), and thus was not subject to certain investment and operational restrictions that are imposed by the 1940 Act. If the Predecessor Partnership had been registered under the 1940 Act, its performance may have been adversely affected. The Predecessor Partnership’s performance has not been restated to reflect estimated expenses applicable to each class of shares of the Fund. The returns reflect fee waivers and/or reimbursements without which performance would have been lower. |
| 2 | The Russell 2000® Growth Index measures the performance of the small cap growth segment of the US Equity universe. It includes those Russell 2000® companies with higher price-value ratio and higher forecasted growth values. The Russell 2000® Index is constructed to provide a comprehensive and unbiased barometer for the small cap growth segment of the market. Data is calculated with net dividend reinvestment. Source: FTSE Russell. |
| Shares, Principal Amount, or Number of Contracts | Value | |
| COMMON STOCKS — 99.25% | ||
| HEALTH CARE — 24.98% | ||
| Biotechnology — 17.20% | ||
| Apellis Pharmaceuticals, Inc.* | 38,148 | $2,182,066 |
| Argenx SE - ADR1,* | 5,881 | 1,729,543 |
| Ascendis Pharma A/S - ADR1,* | 17,580 | 2,931,992 |
| Black Diamond Therapeutics, Inc.* | 47,327 | 1,516,830 |
| Blueprint Medicines Corp.* | 30,217 | 3,388,836 |
| Cytokinetics, Inc.* | 161,495 | 3,355,866 |
| Halozyme Therapeutics, Inc.* | 92,790 | 3,963,061 |
| Immunovant, Inc.* | 58,826 | 2,717,173 |
| Invitae Corp.* | 158,989 | 6,647,330 |
| Mirati Therapeutics, Inc.* | 8,946 | 1,964,900 |
| Natera, Inc.* | 77,087 | 7,671,698 |
| Olema Pharmaceuticals, Inc.* | 31,676 | 1,522,982 |
| Relay Therapeutics, Inc.* | 73,963 | 3,073,902 |
| SpringWorks Therapeutics, Inc.* | 95,059 | 6,893,679 |
| Trillium Therapeutics, Inc.1,* | 116,065 | 1,707,316 |
| Turning Point Therapeutics, Inc.* | 32,376 | 3,945,016 |
| Twist Bioscience Corp.* | 26,141 | 3,693,462 |
| Zentalis Pharmaceuticals, Inc.* | 42,365 | 2,200,438 |
| 61,106,090 | ||
| Health Care Technology — 2.03% | ||
| Inspire Medical Systems, Inc.* | 28,622 | 5,383,512 |
| Schrodinger, Inc.* | 23,050 | 1,825,099 |
| 7,208,611 | ||
| Life Sciences Tools & Services — 2.00% | ||
| Maravai LifeSciences Holdings, Inc. - A* | 75,673 | 2,122,628 |
| NeoGenomics, Inc.* | 43,071 | 2,318,943 |
| Repligen Corp.* | 13,967 | 2,676,496 |
| 7,118,067 | ||
| Health Care Equipment & Supplies — 1.68% | ||
| AtriCure, Inc.* | 29,792 | 1,658,520 |
| Inari Medical, Inc.* | 17,085 | 1,491,350 |
| SI-BONE, Inc.* | 93,883 | 2,807,102 |
| 5,956,972 | ||
| Health Care Providers & Services — 1.55% | ||
| AdaptHealth Corp.* | 83,174 | 3,124,015 |
| Guardant Health, Inc.* | 18,570 | 2,393,302 |
| 5,517,317 | ||
| Pharmaceuticals — 0.52% | ||
| Intra-Cellular Therapies, Inc.* | 58,235 | 1,851,873 |
| Total HEALTH CARE (Cost $46,544,908) | 88,758,930 | |
| Shares, Principal Amount, or Number of Contracts | Value | |
| INFORMATION TECHNOLOGY — 20.64% | ||
| Software — 11.42% | ||
| Avaya Holdings Corp.* | 124,864 | $2,391,146 |
| C3.ai, Inc. - A* | 36,451 | 5,057,576 |
| ChannelAdvisor Corp.* | 157,851 | 2,522,459 |
| Docebo, Inc.1,* | 38,527 | 2,507,722 |
| Elastic NV* | 30,294 | 4,426,862 |
| Five9, Inc.* | 28,648 | 4,996,211 |
| fuboTV, Inc.* | 67,041 | 1,877,148 |
| PubMatic, Inc. - A* | 65,774 | 1,839,041 |
| Q2 Holdings, Inc.* | 26,848 | 3,397,078 |
| RingCentral, Inc. - A* | 9,950 | 3,770,752 |
| Sprout Social, Inc. - A* | 65,074 | 2,955,010 |
| Unity Software, Inc.* | 10,670 | 1,637,525 |
| Zscaler, Inc.* | 15,992 | 3,193,762 |
| 40,572,292 | ||
| Semiconductors & Semiconductor Equipment — 6.01% | ||
| Lattice Semiconductor Corp.* | 91,408 | 4,188,315 |
| SiTime Corp.* | 64,206 | 7,186,578 |
| SunPower Corp.* | 103,331 | 2,649,407 |
| Synaptics, Inc.* | 45,656 | 4,401,238 |
| Ultra Clean Holdings, Inc.* | 93,227 | 2,904,021 |
| 21,329,559 | ||
| IT Services — 1.46% | ||
| Endava PLC - SP ADR1,* | 33,662 | 2,583,559 |
| LiveRamp Holdings, Inc.* | 35,744 | 2,616,103 |
| 5,199,662 | ||
| Communications Equipment — 1.07% | ||
| Calix, Inc.* | 127,949 | 3,807,762 |
| Electronic Equipment, Instruments & Components — 0.68% | ||
| nLight, Inc.* | 74,175 | 2,421,814 |
| Total INFORMATION TECHNOLOGY (Cost $46,626,868) | 73,331,089 | |
| CONSUMER DISCRETIONARY — 18.75% | ||
| Textiles, Apparel & Luxury Goods — 3.58% | ||
| Crocs, Inc.* | 77,061 | 4,828,642 |
| Deckers Outdoor Corp.* | 14,797 | 4,243,484 |
| Tapestry, Inc. | 117,048 | 3,637,852 |
| 12,709,978 | ||
| Hotels, Restaurants & Leisure — 3.18% | ||
| Brinker International, Inc. | 74,882 | 4,236,075 |
| Caesars Entertainment, Inc.* | 53,015 | 3,937,424 |
| Churchill Downs, Inc. | 15,992 | 3,115,081 |
| 11,288,580 | ||
| Auto Components — 2.95% | ||
| Fox Factory Holding Corp.* | 27,690 | 2,927,110 |
| Gentherm, Inc.* | 44,100 | 2,876,202 |
| Shares, Principal Amount, or Number of Contracts | Value | |
| Visteon Corp.* | 37,383 | $4,692,314 |
| 10,495,626 | ||
| Specialty Retail — 2.68% | ||
| GrowGeneration Corp.* | 100,664 | 4,048,706 |
| Lithia Motors, Inc. - A | 13,742 | 4,021,871 |
| National Vision Holdings, Inc.* | 32,171 | 1,457,025 |
| 9,527,602 | ||
| Leisure Products — 2.45% | ||
| BRP, Inc.1 | 44,570 | 2,940,729 |
| Rush Street Interactive, Inc.* | 114,579 | 2,480,635 |
| YETI Holdings, Inc.* | 47,751 | 3,269,511 |
| 8,690,875 | ||
| Household Durables — 1.76% | ||
| LGI Homes, Inc.* | 17,226 | 1,823,372 |
| Purple Innovation, Inc.* | 75,885 | 2,499,652 |
| TopBuild Corp.* | 10,419 | 1,917,930 |
| 6,240,954 | ||
| Internet & Direct Marketing Retail — 1.28% | ||
| Fiverr International Ltd.1,* | 9,031 | 1,761,948 |
| Magnite, Inc.* | 90,495 | 2,779,102 |
| 4,541,050 | ||
| Diversified Consumer Services — 0.87% | ||
| Chegg, Inc.* | 34,459 | 3,112,681 |
| Total CONSUMER DISCRETIONARY (Cost $40,671,067) | 66,607,346 | |
| INDUSTRIALS — 16.32% | ||
| Electrical Equipment — 4.66% | ||
| Array Technologies, Inc.* | 50,496 | 2,178,397 |
| Bloom Energy Corp. - A* | 90,302 | 2,588,055 |
| Generac Holdings, Inc.* | 17,001 | 3,866,197 |
| Plug Power, Inc.* | 147,946 | 5,016,849 |
| Vicor Corp.* | 31,534 | 2,908,066 |
| 16,557,564 | ||
| Machinery — 4.32% | ||
| Altra Industrial Motion Corp. | 39,067 | 2,165,484 |
| Chart Industries, Inc.* | 42,011 | 4,948,476 |
| Hydrofarm Holdings Group, Inc.* | 51,788 | 2,723,013 |
| Kornit Digital Ltd.1,* | 21,809 | 1,943,836 |
| The Shyft Group, Inc. | 125,648 | 3,565,890 |
| 15,346,699 | ||
| Professional Services — 2.02% | ||
| ASGN, Inc.* | 17,644 | 1,473,803 |
| Exponent, Inc. | 18,300 | 1,647,549 |
| Upwork, Inc.* | 117,832 | 4,067,561 |
| 7,188,913 | ||
| Shares, Principal Amount, or Number of Contracts | Value | |
| Building Products — 1.71% | ||
| Advanced Drainage Systems, Inc. | 23,570 | $1,969,980 |
| Builders FirstSource, Inc.* | 46,536 | 1,899,134 |
| Trex Co., Inc.* | 26,244 | 2,197,148 |
| 6,066,262 | ||
| Aerospace & Defense — 1.19% | ||
| Axon Enterprise, Inc.* | 17,432 | 2,135,943 |
| Kratos Defense & Security Solutions, Inc.* | 76,097 | 2,087,341 |
| 4,223,284 | ||
| Trading Companies & Distributors — 0.92% | ||
| Applied Industrial Technologies, Inc. | 20,266 | 1,580,546 |
| H&E Equipment Services, Inc. | 56,351 | 1,679,823 |
| 3,260,369 | ||
| Airlines — 0.92% | ||
| Alaska Air Group, Inc. | 62,638 | 3,257,176 |
| Road & Rail — 0.58% | ||
| Saia, Inc.* | 11,454 | 2,070,883 |
| Total INDUSTRIALS (Cost $35,333,585) | 57,971,150 | |
| FINANCIALS — 7.52% | ||
| Insurance — 2.99% | ||
| BRP Group, Inc. - A* | 62,149 | 1,862,606 |
| Goosehead Insurance, Inc. - A | 13,157 | 1,641,467 |
| James River Group Holdings Ltd.1 | 29,876 | 1,468,405 |
| Kinsale Capital Group, Inc. | 19,193 | 3,841,095 |
| Palomar Holdings, Inc.* | 20,266 | 1,800,432 |
| 10,614,005 | ||
| Capital Markets — 2.19% | ||
| Cohen & Steers, Inc. | 36,374 | 2,702,588 |
| Open Lending Corp. - A* | 59,501 | 2,080,155 |
| PJT Partners, Inc. - A | 39,909 | 3,003,152 |
| 7,785,895 | ||
| Banks — 1.50% | ||
| Triumph Bancorp, Inc.* | 61,076 | 2,965,240 |
| Western Alliance Bancorp | 39,235 | 2,352,138 |
| 5,317,378 | ||
| Thrifts & Mortgage Finance — 0.84% | ||
| NMI Holdings, Inc. - A* | 132,114 | 2,992,382 |
| Total FINANCIALS (Cost $20,056,789) | 26,709,660 | |
| COMMUNICATION SERVICES — 3.77% | ||
| Entertainment — 1.50% | ||
| Roku, Inc.* | 16,031 | 5,322,613 |
| Shares, Principal Amount, or Number of Contracts | Value | |
| Diversified Telecommunication Services — 1.18% | ||
| Bandwidth, Inc. - A* | 27,208 | $4,181,053 |
| Media — 1.09% | ||
| Cardlytics, Inc.* | 27,208 | 3,884,486 |
| Total COMMUNICATION SERVICES (Cost $8,556,443) | 13,388,152 | |
| ENERGY — 1.72% | ||
| Oil, Gas & Consumable Fuels — 1.05% | ||
| Cimarex Energy Co. | 42,667 | 1,600,439 |
| Clean Energy Fuels Corp.* | 272,090 | 2,138,628 |
| 3,739,067 | ||
| Energy Equipment & Services — 0.67% | ||
| Cactus, Inc. - A | 91,736 | 2,391,557 |
| Total ENERGY (Cost $5,456,947) | 6,130,624 | |
| MATERIALS — 1.71% | ||
| Chemicals — 1.25% | ||
| The Scotts Miracle-Gro Co. | 7,790 | 1,551,300 |
| Tronox Holdings PLC - A1 | 196,301 | 2,869,921 |
| 4,421,221 | ||
| Metals & Mining — 0.46% | ||
| MP Materials Corp.* | 51,100 | 1,643,887 |
| Total MATERIALS (Cost $4,134,279) | 6,065,108 | |
| CONSUMER STAPLES — 1.67% | ||
| Food Products — 0.96% | ||
| Freshpet, Inc.* | 24,020 | 3,410,600 |
| Beverages — 0.71% | ||
| Celsius Holdings, Inc.* | 50,020 | 2,516,506 |
| Total CONSUMER STAPLES (Cost $2,700,549) | 5,927,106 | |
| UTILITIES — 1.45% | ||
| Independent Power and Renewable Electricity Producers — 1.45% | ||
| Sunnova Energy International, Inc.* | 113,911 | 5,140,803 |
| Total UTILITIES (Cost $2,400,232) | 5,140,803 | |
| REAL ESTATE — 0.72% | ||
| Real Estate Management & Development — 0.72% | ||
| Redfin Corp.* | 37,203 | 2,553,242 |
| Total REAL ESTATE (Cost $819,299) | 2,553,242 | |
| Total COMMON STOCKS (Cost $213,300,966) | 352,583,210 | |
| Shares, Principal Amount, or Number of Contracts | Value | ||
| SHORT TERM INVESTMENTS — 1.18% | |||
| Northern Institutional U.S. Government Select Portfolio (Shares Class), 0.02%2 (Cost $4,179,137) | 4,179,137 | $4,179,137 | |
| TOTAL INVESTMENTS (Cost $217,480,103) | 100.43% | $356,762,347 | |
| Liabilities In Excess of Other Assets | (0.43)% | (1,519,321) | |
| Net Assets | 100.00% | $355,243,026 | |
| ADR | American Depositary Receipt |
| PLC | Public Limited Company |
| SP ADR | Sponsored American Depositary Receipt |
| 1 | Foreign security denominated and traded in U.S. dollars. |
| 2 | 7 day current yield as of December 31, 2020, is disclosed. |
| * | Non-income producing security. |
| Security Type | Percent of Total Net Assets | |
| Common Stocks | 99.25% | |
| Short Term Investments | 1.18% | |
| Total Investments | 100.43% | |
| Liabilities In Excess of Other Assets | (0.43)% | |
| Total Net Assets | 100.00% |
| Industry | Percent of Net Assets | |
| Aerospace & Defense | 1.19 | |
| Airlines | 0.92 | |
| Auto Components | 2.95 | |
| Banks | 1.50 | |
| Beverages | 0.71 | |
| Biotechnology | 17.20 | |
| Building Products | 1.71 | |
| Capital Markets | 2.19 | |
| Chemicals | 1.25 | |
| Communications Equipment | 1.07 | |
| Diversified Consumer Services | 0.87 | |
| Diversified Telecommunication Services | 1.18 | |
| Electrical Equipment | 4.66 | |
| Electronic Equipment, Instruments & Components | 0.68 | |
| Energy Equipment & Services | 0.67 | |
| Entertainment | 1.50 | |
| Food Products | 0.96 | |
| Health Care Equipment & Supplies | 1.68 | |
| Health Care Providers & Services | 1.55 | |
| Health Care Technology | 2.03 | |
| Hotels, Restaurants & Leisure | 3.18 | |
| Household Durables | 1.76 | |
| Independent Power and Renewable Electricity Producers | 1.45 |
| Industry | Percent of Net Assets | |
| Insurance | 2.99 | |
| Internet & Direct Marketing Retail | 1.28 | |
| IT Services | 1.46 | |
| Leisure Products | 2.45 | |
| Life Sciences Tools & Services | 2.00 | |
| Machinery | 4.32 | |
| Media | 1.09 | |
| Metals & Mining | 0.46 | |
| Money Market Fund | 1.18 | |
| Oil, Gas & Consumable Fuels | 1.05 | |
| Pharmaceuticals | 0.52 | |
| Professional Services | 2.02 | |
| Real Estate Management & Development | 0.72 | |
| Road & Rail | 0.58 | |
| Semiconductors & Semiconductor Equipment | 6.01 | |
| Software | 11.42 | |
| Specialty Retail | 2.68 | |
| Textiles, Apparel & Luxury Goods | 3.58 | |
| Thrifts & Mortgage Finance | 0.84 | |
| Trading Companies & Distributors | 0.92 | |
| Liabilities In Excess of Other Assets | (0.43) | |
| TOTAL | 100.00 |
| |
| Jeff James Lead Portfolio Manager | Michael Buck Portfolio Manager |
| |
| Prakash Vijayan Assistant Portfolio Manager |
| Average Annual Total Returns as of 12/31/20 | Since Inception (5/1/20 - 12/31/20) |
| Driehaus Small/Mid Cap Growth Fund (DSMDX)1 | 74.23% |
| Russell 2500® Growth Index2 | 57.67% |
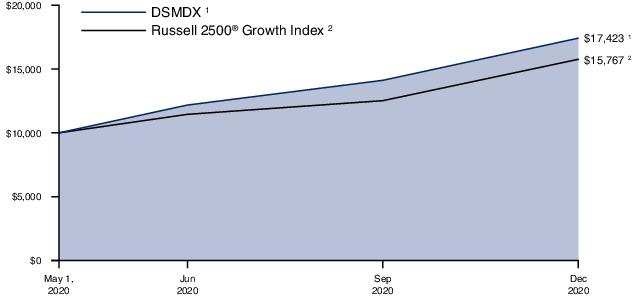
| 1 | The returns for the period reflect fee waivers and/or reimbursements without which performance would have been lower. |
| 2 | The Russell 2500® Growth Index measures the performance of the small to midcap growth segment of the US Equity universe. It measures the performance of those Russell 2500® Index companies with higher growth earning potential as defined by FTSE Russell’s leading style methodology. The Russell 2500® Growth Index is constructed to provide a comprehensive and unbiased barometer for the small to midcap growth segment of the market. Data is calculated with net dividend reinvestment. Source: FTSE Russell. |
| Shares, Principal Amount, or Number of Contracts | Value | |
| COMMON STOCKS — 100.30% | ||
| INFORMATION TECHNOLOGY — 26.52% | ||
| Software — 13.48% | ||
| Avalara, Inc.* | 654 | $107,838 |
| C3.ai, Inc. - A* | 1,788 | 248,085 |
| Coupa Software, Inc.* | 362 | 122,686 |
| DocuSign, Inc.* | 358 | 79,583 |
| Elastic NV* | 1,572 | 229,716 |
| Five9, Inc.* | 1,677 | 292,469 |
| Palantir Technologies, Inc. - A* | 3,130 | 73,712 |
| RingCentral, Inc. - A* | 892 | 338,041 |
| Sprout Social, Inc. - A* | 2,570 | 116,704 |
| Unity Software, Inc.* | 745 | 114,335 |
| Zscaler, Inc.* | 1,392 | 277,996 |
| 2,001,165 | ||
| Semiconductors & Semiconductor Equipment — 7.37% | ||
| Enphase Energy, Inc.* | 879 | 154,238 |
| Lattice Semiconductor Corp.* | 3,036 | 139,110 |
| MKS Instruments, Inc. | 968 | 145,636 |
| Monolithic Power Systems, Inc. | 466 | 170,663 |
| Qorvo, Inc.* | 1,241 | 206,341 |
| Synaptics, Inc.* | 2,111 | 203,500 |
| Teradyne, Inc. | 617 | 73,972 |
| 1,093,460 | ||
| IT Services — 4.64% | ||
| Endava PLC - SP ADR1,* | 1,420 | 108,985 |
| EPAM System, Inc.* | 250 | 89,587 |
| LiveRamp Holdings, Inc.* | 1,266 | 92,659 |
| MongoDB, Inc.* | 918 | 329,599 |
| Snowflake, Inc. - A* | 243 | 68,380 |
| 689,210 | ||
| Electronic Equipment, Instruments & Components — 1.03% | ||
| Trimble, Inc.* | 2,288 | 152,770 |
| Total INFORMATION TECHNOLOGY (Cost $2,807,776) | 3,936,605 | |
| HEALTH CARE — 20.99% | ||
| Biotechnology — 14.56% | ||
| Alnylam Pharmaceuticals, Inc.* | 803 | 104,366 |
| Argenx SE - ADR1,* | 310 | 91,168 |
| Ascendis Pharma A/S - ADR1,* | 1,160 | 193,465 |
| Blueprint Medicines Corp.* | 1,872 | 209,945 |
| Exact Sciences Corp.* | 1,118 | 148,124 |
| Halozyme Therapeutics, Inc.* | 3,273 | 139,790 |
| Invitae Corp.* | 7,160 | 299,360 |
| Mirati Therapeutics, Inc.* | 310 | 68,088 |
| Moderna, Inc.* | 445 | 46,489 |
| Natera, Inc.* | 2,633 | 262,036 |
| Relay Therapeutics, Inc.* | 2,435 | 101,199 |
| Shares, Principal Amount, or Number of Contracts | Value | |
| Sarepta Therapeutics, Inc.* | 478 | $81,494 |
| Seagen, Inc.* | 859 | 150,445 |
| SpringWorks Therapeutics, Inc.* | 2,449 | 177,601 |
| Turning Point Therapeutics, Inc.* | 724 | 88,219 |
| 2,161,789 | ||
| Health Care Equipment & Supplies — 2.71% | ||
| DexCom, Inc.* | 155 | 57,306 |
| Insulet Corp.* | 546 | 139,574 |
| Intuitive Surgical, Inc.* | 157 | 128,442 |
| Tandem Diabetes Care, Inc.* | 812 | 77,692 |
| 403,014 | ||
| Life Sciences Tools & Services — 2.42% | ||
| Bio-Techne Corp. | 224 | 71,131 |
| Maravai LifeSciences Holdings, Inc. - A* | 2,870 | 80,504 |
| Medpace Holdings, Inc.* | 676 | 94,099 |
| Repligen Corp.* | 589 | 112,870 |
| 358,604 | ||
| Health Care Providers & Services — 0.77% | ||
| Guardant Health, Inc.* | 884 | 113,930 |
| Health Care Technology — 0.53% | ||
| Schrodinger, Inc.* | 987 | 78,151 |
| Total HEALTH CARE (Cost $2,600,056) | 3,115,488 | |
| INDUSTRIALS — 18.64% | ||
| Electrical Equipment — 4.20% | ||
| Array Technologies, Inc.* | 2,153 | 92,880 |
| Generac Holdings, Inc.* | 892 | 202,850 |
| Plug Power, Inc.* | 5,234 | 177,485 |
| Sunrun, Inc.* | 774 | 53,700 |
| Vicor Corp.* | 1,046 | 96,462 |
| 623,377 | ||
| Machinery — 3.31% | ||
| AGCO Corp. | 1,242 | 128,038 |
| Chart Industries, Inc.* | 1,173 | 138,168 |
| Graco, Inc. | 1,632 | 118,075 |
| The Toro Co. | 1,131 | 107,264 |
| 491,545 | ||
| Building Products — 1.90% | ||
| Carrier Global Corp. | 2,718 | 102,523 |
| Fortune Brands Home & Security, Inc. | 993 | 85,120 |
| Trex Co., Inc.* | 1,134 | 94,938 |
| 282,581 | ||
| Professional Services — 1.69% | ||
| ASGN, Inc.* | 772 | 64,485 |
| Clarivate PLC1,* | 6,267 | 186,193 |
| 250,678 | ||
| Shares, Principal Amount, or Number of Contracts | Value | |
| Trading Companies & Distributors — 1.68% | ||
| Applied Industrial Technologies, Inc. | 871 | $67,929 |
| United Rentals, Inc.* | 781 | 181,122 |
| 249,051 | ||
| Road & Rail — 1.36% | ||
| Kansas City Southern | 425 | 86,755 |
| Old Dominion Freight Line, Inc. | 593 | 115,742 |
| 202,497 | ||
| Air Freight & Logistics — 1.30% | ||
| XPO Logistics, Inc.* | 1,614 | 192,389 |
| Commercial Services & Supplies — 1.14% | ||
| IAA, Inc.* | 1,146 | 74,467 |
| Ritchie Bros Auctioneers, Inc.1 | 1,359 | 94,519 |
| 168,986 | ||
| Airlines — 0.97% | ||
| Alaska Air Group, Inc. | 2,770 | 144,040 |
| Aerospace & Defense — 0.63% | ||
| Axon Enterprise, Inc.* | 763 | 93,490 |
| Industrial Conglomerates — 0.46% | ||
| Carlisle Cos., Inc. | 441 | 68,875 |
| Total INDUSTRIALS (Cost $2,224,347) | 2,767,509 | |
| CONSUMER DISCRETIONARY — 17.94% | ||
| Hotels, Restaurants & Leisure — 3.98% | ||
| Brinker International, Inc. | 2,732 | 154,549 |
| Caesars Entertainment, Inc.* | 2,179 | 161,834 |
| Chipotle Mexican Grill, Inc.* | 52 | 72,109 |
| Churchill Downs, Inc. | 699 | 136,158 |
| Planet Fitness, Inc. - A* | 853 | 66,219 |
| 590,869 | ||
| Textiles, Apparel & Luxury Goods — 3.86% | ||
| Crocs, Inc.* | 3,317 | 207,843 |
| Deckers Outdoor Corp.* | 664 | 190,422 |
| Lululemon Athletica, Inc.1,* | 180 | 62,645 |
| Tapestry, Inc. | 3,634 | 112,945 |
| 573,855 | ||
| Specialty Retail — 3.68% | ||
| Carvana Co.* | 394 | 94,379 |
| Five Below, Inc.* | 641 | 112,162 |
| Floor & Decor Holdings, Inc. - A* | 910 | 84,493 |
| Lithia Motors, Inc. - A | 651 | 190,528 |
| National Vision Holdings, Inc.* | 1,423 | 64,448 |
| 546,010 | ||
| Leisure Products — 2.36% | ||
| BRP, Inc.1 | 1,948 | 128,529 |
| Peloton Interactive, Inc. - A* | 789 | 119,707 |
| Shares, Principal Amount, or Number of Contracts | Value | |
| YETI Holdings, Inc.* | 1,498 | $102,568 |
| 350,804 | ||
| Auto Components — 1.93% | ||
| Fox Factory Holding Corp.* | 1,069 | 113,004 |
| Visteon Corp.* | 1,382 | 173,469 |
| 286,473 | ||
| Diversified Consumer Services — 1.03% | ||
| Chegg, Inc.* | 1,690 | 152,658 |
| Household Durables — 0.55% | ||
| D.R. Horton, Inc. | 1,178 | 81,188 |
| Internet & Direct Marketing Retail — 0.55% | ||
| Chewy, Inc - A* | 903 | 81,171 |
| Total CONSUMER DISCRETIONARY (Cost $1,940,379) | 2,663,028 | |
| COMMUNICATION SERVICES — 7.67% | ||
| Interactive Media & Services — 3.48% | ||
| Pinterest, Inc. - A* | 1,159 | 76,378 |
| Snap, Inc. - A* | 5,163 | 258,511 |
| Zillow Group, Inc. - A* | 1,335 | 181,480 |
| 516,369 | ||
| Entertainment — 3.07% | ||
| Roku, Inc.* | 1,372 | 455,532 |
| Diversified Telecommunication Services — 1.12% | ||
| Bandwidth, Inc. - A* | 1,082 | 166,271 |
| Total COMMUNICATION SERVICES (Cost $712,842) | 1,138,172 | |
| FINANCIALS — 4.77% | ||
| Capital Markets — 1.93% | ||
| Cohen & Steers, Inc. | 1,612 | 119,771 |
| MarketAxess Holdings, Inc. | 118 | 67,326 |
| MSCI, Inc. | 224 | 100,023 |
| 287,120 | ||
| Banks — 1.48% | ||
| SVB Financial Group* | 296 | 114,798 |
| Western Alliance Bancorp | 1,741 | 104,373 |
| 219,171 | ||
| Insurance — 1.36% | ||
| Kinsale Capital Group, Inc. | 1,011 | 202,331 |
| Total FINANCIALS (Cost $585,607) | 708,622 | |
| MATERIALS — 1.80% | ||
| Chemicals — 1.80% | ||
| FMC Corp. | 1,144 | 131,480 |
| Shares, Principal Amount, or Number of Contracts | Value | ||
| The Scotts Miracle-Gro Co. | 685 | $136,411 | |
| 267,891 | |||
| Total MATERIALS (Cost $224,703) | 267,891 | ||
| UTILITIES — 0.98% | |||
| Independent Power and Renewable Electricity Producers — 0.98% | |||
| Sunnova Energy International, Inc.* | 3,232 | 145,860 | |
| Total UTILITIES (Cost $101,830) | 145,860 | ||
| CONSUMER STAPLES — 0.53% | |||
| Beverages — 0.53% | |||
| The Boston Beer Co., Inc. - A* | 79 | 78,549 | |
| Total CONSUMER STAPLES (Cost $73,885) | 78,549 | ||
| ENERGY — 0.46% | |||
| Energy Equipment & Services — 0.46% | |||
| Cactus, Inc. - A | 2,645 | 68,955 | |
| Total ENERGY (Cost $72,957) | 68,955 | ||
| Total COMMON STOCKS (Cost $11,344,382) | 14,890,679 | ||
| TOTAL INVESTMENTS (Cost $11,344,382) | 100.30% | $14,890,679 | |
| Liabilities In Excess of Other Assets | (0.30)% | (45,193) | |
| Net Assets | 100.00% | $14,845,486 | |
| ADR | American Depositary Receipt |
| MSCI | Morgan Stanley Capital International |
| PLC | Public Limited Company |
| SP ADR | Sponsored American Depositary Receipt |
| 1 | Foreign security denominated and traded in U.S. dollars. |
| * | Non-income producing security. |
| Security Type | Percent of Total Net Assets | |
| Common Stocks | 100.30% | |
| Total Investments | 100.30% | |
| Liabilities In Excess of Other Assets | (0.30)% | |
| Total Net Assets | 100.00% |
| Industry | Percent of Net Assets | |
| Aerospace & Defense | 0.63 | |
| Air Freight & Logistics | 1.30 | |
| Airlines | 0.97 | |
| Auto Components | 1.93 | |
| Banks | 1.48 | |
| Beverages | 0.53 | |
| Biotechnology | 14.56 | |
| Building Products | 1.90 | |
| Capital Markets | 1.93 | |
| Chemicals | 1.80 | |
| Commercial Services & Supplies | 1.14 | |
| Diversified Consumer Services | 1.03 | |
| Diversified Telecommunication Services | 1.12 | |
| Electrical Equipment | 4.20 | |
| Electronic Equipment, Instruments & Components | 1.03 | |
| Energy Equipment & Services | 0.46 | |
| Entertainment | 3.07 | |
| Health Care Equipment & Supplies | 2.71 | |
| Health Care Providers & Services | 0.77 | |
| Health Care Technology | 0.53 | |
| Hotels, Restaurants & Leisure | 3.98 |
| Industry | Percent of Net Assets | |
| Household Durables | 0.55 | |
| Independent Power and Renewable Electricity Producers | 0.98 | |
| Industrial Conglomerates | 0.46 | |
| Insurance | 1.36 | |
| Interactive Media & Services | 3.48 | |
| Internet & Direct Marketing Retail | 0.55 | |
| IT Services | 4.64 | |
| Leisure Products | 2.36 | |
| Life Sciences Tools & Services | 2.42 | |
| Machinery | 3.31 | |
| Professional Services | 1.69 | |
| Road & Rail | 1.36 | |
| Semiconductors & Semiconductor Equipment | 7.37 | |
| Software | 13.48 | |
| Specialty Retail | 3.68 | |
| Textiles, Apparel & Luxury Goods | 3.86 | |
| Trading Companies & Distributors | 1.68 | |
| Liabilities In Excess of Other Assets | (0.30) | |
| TOTAL | 100.00 |
 |  |  |
| Michael Caldwell Portfolio Manager | Tom McCauley Portfolio Manager | Yoav Sharon Portfolio Manager |
| Average Annual Total Returns as of 12/31/20 | 1 Year | 3 Years | 5 Years | Since Inception (8/26/13 - 12/31/20) |
| Driehaus Event Driven Fund (DEVDX)1 | 24.84% | 12.69% | 9.67% | 6.80% |
| S&P 500 Index2 | 18.40% | 14.18% | 15.22% | 14.00% |
| FTSE 3-Month T-Bill Index3 | 0.58% | 1.56% | 1.16% | 0.80% |
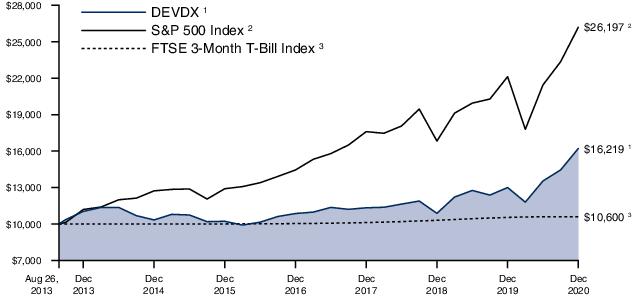
| 1 | The returns for the periods prior to March 1, 2014, reflect fee waivers and/or reimbursements without which performance would have been lower. |
| 2 | The S&P 500 Index consists of 500 stocks chosen for market size, liquidity and industry group. It is a market-weighted index, with each stock’s weight in the index proportionate to its market value. |
| 3 | The FTSE 3-Month T-Bill Index is designed to mirror the performance of the 3-month U.S. Treasury Bill. The FTSE 3-Month T-Bill Index is unmanaged and its returns reflect reinvestment of all distributions and changes in market prices. |
| Shares, Principal Amount, or Number of Contracts | Value | |
| CONVERTIBLE CORPORATE BONDS — 1.97% | ||
| Healthcare - Services — 1.62% | ||
| Progenity, Inc. 7.25%, 12/1/251 | $1,400,000 | $2,301,295 |
| Pharmaceuticals — 0.35% | ||
| Cytokinetics, Inc. 4.00%, 11/15/262 | 229,000 | 492,052 |
| Total CONVERTIBLE CORPORATE BONDS (Cost $1,629,000) | 2,793,347 | |
| CORPORATE BONDS — 13.74% | ||
| Banks — 4.41% | ||
| JPMorgan Chase & Co. 3.69%, (3-Month USD Libor + 347 basis points), 4/30/212,3,4 | 3,773,000 | 3,765,282 |
| USB Realty Corp. 1.38%, (3-Month USD Libor + 115 basis points), 1/15/221,2,3,4 | 3,348,000 | 2,502,630 |
| 6,267,912 | ||
| Diversified Financial Services — 1.03% | ||
| ILFC E-Capital Trust I 3.23%, 12/21/651,2,4,5 | 2,189,000 | 1,466,630 |
| Entertainment — 2.31% | ||
| Cinemark USA, Inc. 4.88%, 6/1/23 | 3,450,000 | 3,277,500 |
| Lodging — 1.23% | ||
| Arrow Bidco LLC 9.50%, 3/15/241,2 | 1,985,000 | 1,741,838 |
| Oil & Gas — 1.32% | ||
| Transocean Pontus Ltd. (Cayman Islands) 6.12%, 8/1/251 | 1,977,300 | 1,878,415 |
| Telecommunications — 2.79% | ||
| Cincinnati Bell, Inc. 7.00%, 7/15/241,2 | 1,674,000 | 1,740,960 |
| Consolidated Communications, Inc. 6.50%, 10/1/281,2 | 1,724,000 | 1,844,680 |
| HC2 Holdings, Inc. 11.50%, 12/1/211,2 | 383,500 | 381,582 |
| 3,967,222 | ||
| Trucking & Leasing — 0.65% | ||
| Fortress Transportation and Infrastructure Investors LLC 9.75%, 8/1/271 | 800,000 | 917,000 |
| Total CORPORATE BONDS (Cost $19,285,520) | 19,516,517 | |
| COMMON STOCKS — 53.89% | ||
| Auto Manufacturers — 0.02% | ||
| Navistar International Corp.* | 577 | 25,365 |
| Shares, Principal Amount, or Number of Contracts | Value | |
| Banks — 5.16% | ||
| Eastern Bankshares, Inc.* | 228,385 | $3,724,959 |
| HarborOne Bancorp, Inc. | 192,787 | 2,093,667 |
| Kearny Financial Corp./MD | 143,220 | 1,512,403 |
| 7,331,029 | ||
| Biotechnology — 9.86% | ||
| Argenx SE - ADR*,2,6 | 4,335 | 1,274,880 |
| Ascendis Pharma A/S - ADR*,2,6 | 9,653 | 1,609,927 |
| Black Diamond Therapeutics, Inc.* | 28,947 | 927,751 |
| Crinetics Pharmaceuticals, Inc.* | 93,261 | 1,315,913 |
| Essa Pharma, Inc.*,6 | 12,482 | 148,910 |
| Gamida Cell Ltd.*,6 | 205,628 | 1,725,219 |
| Orchard Therapeutics PLC*,6 | 100,065 | 432,281 |
| Relay Therapeutics, Inc.* | 86,576 | 3,598,099 |
| SpringWorks Therapeutics, Inc.* | 30,231 | 2,192,352 |
| Trillium Therapeutics, Inc.*,6 | 53,433 | 786,000 |
| 14,011,332 | ||
| Electric — 1.67% | ||
| Vistra Corp. | 120,375 | 2,366,573 |
| Entertainment — 0.15% | ||
| Golden Entertainment, Inc.* | 10,975 | 218,293 |
| Healthcare - Products — 1.72% | ||
| Alphatec Holdings, Inc.* | 57,772 | 838,849 |
| SeaSpine Holdings Corp.* | 91,750 | 1,601,038 |
| 2,439,887 | ||
| Healthcare - Services — 4.56% | ||
| Invitae Corp.* | 148,368 | 6,203,266 |
| Progenity, Inc.* | 51,023 | 270,932 |
| 6,474,198 | ||
| Holding Companies - Diversified — 7.51% | ||
| BCTG Acquisition Corp.* | 69,240 | 792,106 |
| ION Acquisition Corp. 1 Ltd.*,6 | 35,130 | 424,370 |
| L&F Acquisition Corp./IL* | 130,500 | 1,353,285 |
| Montes Archimedes Acquisition Corp. - A* | 234,400 | 2,383,848 |
| Senior Connect Acquisition Corp. I* | 125,839 | 1,294,883 |
| Sustainable Opportunities Acquisition Corp. - A* | 100,200 | 1,078,152 |
| Tekkorp Digital Acquisition Corp. - A* | 119,100 | 1,200,516 |
| Thayer Ventures Acquisition Corp.* | 71,467 | 746,830 |
| TS Innovation Acquisitions Corp.* | 132,060 | 1,391,913 |
| 10,665,903 | ||
| Internet — 1.95% | ||
| IAC/InterActiveCorp* | 14,667 | 2,777,196 |
| Shares, Principal Amount, or Number of Contracts | Value | |
| Pharmaceuticals — 9.96% | ||
| AdaptHealth Corp.*,2 | 159,900 | $6,005,844 |
| Bausch Health Cos., Inc.* | 84,655 | 1,760,824 |
| Cytokinetics, Inc.*,2 | 193,646 | 4,023,964 |
| Merus NV*,6 | 19,476 | 341,414 |
| Odonate Therapeutics, Inc.*,2 | 104,911 | 2,014,291 |
| 14,146,337 | ||
| Real Estate (REIT's) — 2.55% | ||
| Equity Commonwealth | 39,646 | 1,081,543 |
| MGM Growth Properties LLC - A | 81,306 | 2,544,878 |
| 3,626,421 | ||
| Retail — 0.90% | ||
| Tiffany & Co. | 9,682 | 1,272,699 |
| Savings & Loans — 2.02% | ||
| Waterstone Financial, Inc. | 152,797 | 2,875,640 |
| Software — 5.29% | ||
| Porch Group, Inc.* | 115,593 | 1,649,512 |
| Skillz, Inc.*,2 | 147,238 | 2,944,760 |
| Slack Technologies, Inc. - A* | 69,169 | 2,921,699 |
| 7,515,971 | ||
| Telecommunications — 0.53% | ||
| HC2 Holdings, Inc.*,2 | 229,654 | 748,672 |
| Transportation — 0.04% | ||
| XPO Logistics, Inc.* | 462 | 55,070 |
| Total COMMON STOCKS (Cost $56,731,185) | 76,550,586 | |
| CONVERTIBLE PREFERRED STOCKS — 0.00% | ||
| Auto Manufacturers — 0.00% | ||
| General Motors Corp. Senior Convertible Preferred Escrow - B*,^ | 25,000 | — |
| General Motors Corp. Senior Convertible Preferred Escrow - C*,^ | 162,750 | — |
| Total CONVERTIBLE PREFERRED STOCKS (Cost $0) | 0 | |
| MASTER LIMITED PARTNERSHIPS — 1.02% | ||
| Trucking & Leasing — 1.02% | ||
| Fortress Transportation and Infrastructure Investors LLC | 61,924 | 1,452,737 |
| Total MASTER LIMITED PARTNERSHIPS (Cost $1,152,924) | 1,452,737 | |
| Shares, Principal Amount, or Number of Contracts | Value | ||
| PREFERRED STOCKS — 0.87% | |||
| Banks — 0.87% | |||
| GMAC Capital Trust I 6.01%, (3-Month USD Libor + 579 basis points), 2/15/404 | 45,678 | $1,241,528 | |
| Total PREFERRED STOCKS (Cost $945,618) | 1,241,528 | ||
| PRIVATE PREFERRED STOCKS — 2.08% | |||
| Biotechnology — 2.08% | |||
| Elevation Oncology, Inc., Series A Shares*,^ | 1,550,000 | 2,960,500 | |
| Total PRIVATE PREFERRED STOCKS (Cost $1,550,000) | 2,960,500 | ||
| WARRANTS — 0.46% | |||
| Montes Archimedes Acquisition Corp., Exp 1/24/25, Strike $11.50* | 117,200 | 168,768 | |
| Skillz, Inc., Exp 2/26/27, Strike $11.50*,2 | 30,352 | 219,141 | |
| Sustainable Opportunities Acquisition Corp., Exp 6/26/25, Strike $11.50* | 50,100 | 112,725 | |
| Tekkorp Digital Acquisition Corp., Exp 1/24/25, Strike $11.50* | 59,550 | 144,111 | |
| X4 Pharmaceuticals, Inc., Exp 4/12/24, Strike $13.20* | 5,547 | 3,606 | |
| Total WARRANTS (Cost $0) | 648,351 | ||
| SHORT TERM INVESTMENTS — 23.83% | |||
| Northern Institutional Treasury Portfolio (Premier Class), 0.01%7 (Cost $33,855,341) | 33,855,341 | 33,855,341 | |
| TOTAL INVESTMENTS (Cost $115,149,588) | 97.86% | $139,018,907 | |
| Other Assets In Excess of Liabilities | 2.14% | 3,045,217 | |
| Net Assets | 100.00% | $142,064,124 | |
| INVESTMENT SECURITIES SOLD SHORT AND WRITTEN CALL OPTIONS — (14.66)% | |||
| WRITTEN CALL OPTIONS — (0.11)% | |||
| Software — (0.11)% | |||
| Skillz, Inc., Strike Price $20.00, Expires 01/15/21, notional $1,058,000 | (529) | (100,510) | |
| Shares, Principal Amount, or Number of Contracts | Value | |
| Skillz, Inc., Strike Price $22.50, Expires 01/15/21, notional $1,190,250 | (529) | $(62,157) |
| (162,667) | ||
| Total WRITTEN CALL OPTIONS (Proceeds $376,509) | (162,667) | |
| COMMON STOCKS — (1.61)% | ||
| Diversified Financial Services — (0.07)% | ||
| AerCap Holdings NV*,6 | (2,277) | (103,786) |
| Internet — (0.67)% | ||
| ANGI Homeservices, Inc. - A* | (71,872) | (948,351) |
| Software — (0.84)% | ||
| salesforce.com, Inc.* | (5,364) | (1,193,651) |
| Telecommunications — (0.03)% | ||
| Cincinnati Bell, Inc.* | (3,000) | (45,840) |
| Total COMMON STOCKS (Proceeds $2,387,972) | (2,291,628) | |
| EXCHANGE-TRADED FUNDS — (12.94)% | ||
| iShares Nasdaq Biotechnology ETF | (28,860) | (4,372,001) |
| SPDR S&P Biotech ETF | (99,493) | (14,006,625) |
| Total EXCHANGE-TRADED FUNDS (Proceeds $12,308,892) | (18,378,626) | |
| TOTAL INVESTMENT SECURITIES SOLD SHORT AND WRITTEN CALL OPTIONS (Proceeds $15,073,373) | (14.66)% | $(20,832,921) |
| ADR | American Depositary Receipt |
| LIBOR | London Interbank Offered Rate |
| PLC | Public Limited Company |
| USD LIBOR | U.S. Dollar London Interbank Offered Rate. |
| * | Non-income producing security. |
| ^ | Security valued at fair value as determined in good faith by the Adviser, in accordance with procedures established by, and under the general supervision of, the Trust’s Board of Trustees. The security is valued using significant unobservable inputs. |
| 1 | Security is exempt from registration under Rule 144A of the Securities Act of 1933, as amended. The total value of these securities is $14,775,030, which represents 10% of Net Assets (see Note F in the Notes to Financial Statements). |
| 2 | All or a portion of this security is pledged as collateral for short sales or derivatives transactions. |
| 3 | Perpetual security. Maturity date shown is the next call date or final legal maturity date, whichever comes first. |
| 4 | Variable rate security. Rates disclosed as of December 31, 2020. |
| 5 | The coupon rate equals 155 basis points plus the highest of the LIBOR 3 Month, the Constant Maturity Treasury 10 year rate, and the Constant Maturity Treasury 30 year rate, with a maximum of 12.95%. |
| 6 | Foreign security denominated and traded in U.S. dollars. |
| 7 | 7 day current yield as of December 31, 2020, is disclosed. |
| Security Type | Percent of Total Net Assets | |
| Convertible Corporate Bonds | 1.97% | |
| Corporate Bonds | 13.74% | |
| Common Stocks | 53.89% | |
| Convertible Preferred Stocks | 0.00% | |
| Master Limited Partnerships | 1.02% | |
| Preferred Stocks | 0.87% | |
| Private Preferred Stocks | 2.08% | |
| Warrants | 0.46% | |
| Short Term Investments | 23.83% | |
| Total Investments | 97.86% | |
| Other Assets In Excess of Liabilities | 2.14% | |
| Total Net Assets | 100.00% |
| Driehaus Emerging Markets Growth Fund | Driehaus Emerging Markets Small Cap Growth Fund | ||
| ASSETS: | |||
| Investments, at cost | $1,416,501,314 | $60,586,126 | |
| Investments securities, at fair value | $2,181,461,136 | $86,073,037 | |
| Short-term securities, at fair value1 | $97,180,178 | $5,338,694 | |
| Warrant securities, at fair value2 | — | — | |
| Foreign currency, at fair value3 | 9,327,040 | 836,672 | |
| Cash | — | — | |
| Receivable for investment securities sold | 21,631,091 | 682,552 | |
| Receivable for foreign taxes | — | 47,948 | |
| Receivable for fund shares sold | 1,179,593 | 7,459 | |
| Receivable for interest and dividends | 3,311,481 | 108,526 | |
| Prepaid expenses | 234,977 | 29,052 | |
| TOTAL ASSETS | 2,314,325,496 | 93,123,940 | |
| LIABILITIES: | |||
| Payable for investment securities sold short, proceeds | — | — | |
| Payable for investment securities sold short, at fair value | — | — | |
| Written options, at fair value4 | — | — | |
| Cash overdraft | — | — | |
| Payable for fund shares redeemed | 9,091,715 | 57,030 | |
| Payable for investment securities purchased | 13,291,971 | 3,153,104 | |
| Payable to affiliate | 1,790,707 | 80,544 | |
| Accrued shareholder services plan fees | 340,189 | — | |
| Accrued administration and accounting fees | 335,077 | 19,993 | |
| Accrued foreign capital gains taxes | 5,927,699 | — | |
| Accrued expenses | 286,796 | 84,023 | |
| TOTAL LIABILITIES | 31,064,154 | 3,394,694 | |
| NET ASSETS | $2,283,261,342 | $89,729,246 | |
| NET ASSETS CONSISTED OF THE FOLLOWING AT DECEMBER 31, 2020: | |||
| Paid-in-capital | $1,412,454,012 | $105,553,998 | |
| Total distributable earnings (deficit) | 870,807,330 | (15,824,752) | |
| NET ASSETS | $2,283,261,342 | $89,729,246 | |
| NET ASSETS | $— | $89,729,246 | |
| SHARES OUTSTANDING (Unlimited shares authorized, no par value) | — | 4,702,711 | |
| NET ASSET VALUE | $— | $19.08 | |
| INVESTOR CLASS SHARES | |||
| NET ASSETS | $951,998,334 | $— | |
| SHARES OUTSTANDING (Unlimited shares authorized, no par value) | 19,391,604 | — | |
| NET ASSET VALUE | $49.09 | $— | |
| INSTITUTIONAL CLASS SHARES | |||
| NET ASSETS | $1,331,263,008 | $— | |
| SHARES OUTSTANDING (Unlimited shares authorized, no par value) | 27,090,377 | — | |
| NET ASSET VALUE | $49.14 | $— | |
| 1 | The cost of short-term securities was $97,180,178, $5,338,694, $5,405,735, $6,012,281, $2,068,996, $4,179,137, $0 and $33,855,341, respectively. |
| 2 | The cost of warrants was $0, $0, $0, $0, $0, $0, $0 and $0, respectively. |
| 3 | The cost of foreign currency was $9,273,258, $836,651, $6, $0, $0, $0, $0 and $0, respectively. |
| 4 | The proceeds of written options was $0, $0, $0, $0, $0, $0, $0 and $376,509, respectively. |
| Driehaus Emerging Markets Opportunities Fund | Driehaus International Small Cap Growth Fund | Driehaus Micro Cap Growth Fund | Driehaus Small Cap Growth Fund | Driehaus Small/Mid Cap Growth Fund | Driehaus Event Driven Fund | |||||
| $36,447,648 | $204,363,081 | $176,052,553 | $213,300,966 | $11,344,382 | $81,294,247 | |||||
| $50,305,996 | $283,654,733 | $332,401,212 | $352,583,210 | $14,890,679 | $104,515,215 | |||||
| $5,405,735 | $6,012,281 | $2,068,996 | $4,179,137 | $— | $33,855,341 | |||||
| — | — | — | — | — | 648,351 | |||||
| 6 | — | — | — | — | — | |||||
| 354,496 | — | — | — | — | 23,308,432 | |||||
| 1,906 | — | 1,871,519 | 3,124,043 | 93,237 | 221,988 | |||||
| — | — | — | — | — | — | |||||
| 23 | 113,191 | 3,914 | 634,031 | — | 1,844,721 | |||||
| 245,736 | 554,525 | 9,411 | 15,351 | 2,193 | 330,422 | |||||
| 57,494 | 30,811 | 83,991 | 63,692 | 24,439 | 59,743 | |||||
| 56,371,392 | 290,365,541 | 336,439,043 | 360,599,464 | 15,010,548 | 164,784,213 | |||||
| — | — | — | — | — | 14,696,864 | |||||
| — | — | — | — | — | 20,670,254 | |||||
| — | — | — | — | — | 162,667 | |||||
| — | — | — | — | 63,002 | — | |||||
| — | 9,474 | 67,170 | 57,058 | 53,195 | 63,705 | |||||
| 2,986,890 | 1,144,407 | 1,522,736 | 5,012,571 | — | 1,594,551 | |||||
| 36,282 | 237,728 | 350,116 | 173,621 | 7,547 | 117,090 | |||||
| — | — | — | 3,926 | — | — | |||||
| 4,522 | 40,984 | 43,662 | 42,257 | 11,204 | 1,691 | |||||
| 58,616 | — | — | — | — | — | |||||
| 63,624 | 78,433 | 64,395 | 67,005 | 30,114 | 110,131 | |||||
| 3,149,934 | 1,511,026 | 2,048,079 | 5,356,438 | 165,062 | 22,720,089 | |||||
| $53,221,458 | $288,854,515 | $334,390,964 | $355,243,026 | $14,845,486 | $142,064,124 | |||||
| $38,217,798 | $189,656,945 | $154,024,210 | $203,197,014 | $11,298,500 | $119,392,644 | |||||
| 15,003,660 | 99,197,570 | 180,366,754 | 152,046,012 | 3,546,986 | 22,671,480 | |||||
| $53,221,458 | $288,854,515 | $334,390,964 | $355,243,026 | $14,845,486 | $142,064,124 | |||||
| $53,221,458 | $288,854,515 | $334,390,964 | $— | $14,845,486 | $142,064,124 | |||||
| 3,508,387 | 22,941,336 | 16,724,185 | — | 863,488 | 10,195,646 | |||||
| $15.17 | $12.59 | $19.99 | $— | $17.19 | $13.93 | |||||
| $— | $— | $— | $28,087,764 | $— | $— | |||||
| — | — | — | 1,189,219 | — | — | |||||
| $— | $— | $— | $23.62 | $— | $— | |||||
| $— | $— | $— | $327,155,262 | $— | $— | |||||
| — | — | — | 13,699,337 | — | — | |||||
| $— | $— | $— | $23.88 | $— | $— | |||||
| Driehaus Emerging Markets Growth Fund | Driehaus Emerging Markets Small Cap Growth Fund | ||
| INVESTMENT INCOME: | |||
| Interest income | $13,430 | $— | |
| Dividend income1 | 20,919,245 | 1,001,445 | |
| Total investment income | 20,932,675 | 1,001,445 | |
| Expenses: | |||
| Investment advisory fees | 18,239,478 | 732,472 | |
| Shareholder services fees | 1,820,859 | — | |
| Administration fees | 838,131 | 78,196 | |
| Transfer agent fees | 421,149 | 35,665 | |
| Trustees fees | 419,742 | 14,398 | |
| Custody fees | 371,657 | 39,366 | |
| Reports to shareholders | 152,334 | 8,309 | |
| Professional fees | 577,866 | 24,322 | |
| Audit and tax fees | 85,019 | 102,330 | |
| Federal and state registration fees | 50,000 | 22,500 | |
| Chief compliance officer fees | 17,343 | 17,343 | |
| Dividends and interest on short positions | — | — | |
| Interest expense | — | — | |
| Miscellaneous | 204,255 | 22,378 | |
| Total expenses | 23,197,833 | 1,097,279 | |
| Investment advisory fees recoupment (reimbursement) | — | (171,531) | |
| Administration fees waived | — | — | |
| Transfer agent fees waived | — | — | |
| Fees paid indirectly | (135,342) | (2,321) | |
| Net expenses | 23,062,491 | 923,427 | |
| Net investment income (loss) | (2,129,816) | 78,018 | |
| NET REALIZED AND UNREALIZED GAIN (LOSS) ON INVESTMENT TRANSACTIONS: | |||
| Net realized gain (loss) on transactions from: | |||
| Investments2 | 174,331,353 | 5,549,180 | |
| Warrants | — | — | |
| Securities sold short | — | — | |
| Swaps contracts | — | — | |
| Forward foreign currency contracts | — | — | |
| Foreign currency | (1,637,222) | (238,326) | |
| Net realized gain (loss) on investment transactions | 172,694,131 | 5,310,854 | |
| Change in net unrealized appreciation (depreciation) on: | |||
| Investments3 | 311,159,363 | 14,671,872 | |
| Written options contracts | — | — | |
| Warrants | — | — | |
| Securities sold short | — | — | |
| Swap contracts | — | — | |
| Foreign currency | 38,748 | 51,445 | |
| Foreign currency translations | — | — | |
| Net change in unrealized appreciation (depreciation) on investment transactions | 311,198,111 | 14,723,317 | |
| Net realized and unrealized gain (loss) on investment transactions | 483,892,242 | 20,034,171 | |
| NET INCREASE (DECREASE) IN NET ASSETS FROM OPERATIONS | $481,762,426 | $20,112,189 | |
| 1 | Net of $3,277,964, $100,836, $46,521, $423,141, $0, $1,897, $141, and $0 of non-reclaimable foreign taxes withheld, respectively. |
| 2 | Net realized gain (loss) from security transactions are net of $19,553, $0, $0, $0, $0, $0, $0 and $0 foreign capital gains tax withheld, respectively. |
| 3 | Net unrealized gain (loss) from security transactions are net of $(5,927,699), $(755,551), $(58,616), $0, $0, $0, $0 and $0 foreign capital gains tax withheld, respectively. |
| Driehaus Emerging Markets Opportunities Fund | Driehaus International Small Cap Growth Fund | Driehaus Micro Cap Growth Fund | Driehaus Small Cap Growth Fund | Driehaus Small/Mid Cap Growth Fund* | Driehaus Event Driven Fund | |||||
| $497,786 | $— | $— | $— | $— | $1,907,853 | |||||
| 400,685 | 3,060,850 | 273,253 | 358,966 | 10,532 | 380,563 | |||||
| 898,471 | 3,060,850 | 273,253 | 358,966 | 10,532 | 2,288,416 | |||||
| 327,473 | 2,460,180 | 3,227,705 | 1,369,876 | 29,232 | 1,018,776 | |||||
| — | — | — | 29,370 | — | 120,299 | |||||
| 46,755 | 181,366 | 172,699 | 167,224 | 13,143 | 65,101 | |||||
| 19,236 | 58,661 | 63,405 | 100,961 | 4,223 | 77,726 | |||||
| 6,052 | 58,475 | 59,656 | 31,457 | 709 | 17,401 | |||||
| 30,166 | 41,400 | 44,418 | 35,019 | 22,147 | 20,840 | |||||
| 8,548 | 12,836 | 15,096 | 20,564 | 160 | 21,419 | |||||
| 16,007 | 64,848 | 66,863 | 44,141 | 2,063 | 28,898 | |||||
| 66,625 | 72,468 | 34,760 | 34,779 | 28,782 | 55,279 | |||||
| 31,189 | 24,001 | 22,500 | 37,000 | 12,000 | 32,794 | |||||
| 8,305 | 17,343 | 17,343 | 18,217 | 11,752 | 8,305 | |||||
| — | — | — | — | — | 134,913 | |||||
| — | — | 1,036 | — | — | — | |||||
| 32,237 | 44,831 | 41,141 | 40,360 | 2,295 | 24,403 | |||||
| 592,593 | 3,036,409 | 3,766,622 | 1,928,968 | 126,506 | 1,626,154 | |||||
| (230,617) | — | — | (8,650) | (73,297) | — | |||||
| — | — | — | — | (3,750) | — | |||||
| — | — | — | — | (3,000) | — | |||||
| (1,350) | (14,845) | (65,779) | (33,114) | (60) | (25,355) | |||||
| 360,626 | 3,021,564 | 3,700,843 | 1,887,204 | 46,399 | 1,600,799 | |||||
| 537,845 | 39,286 | (3,427,590) | (1,528,238) | (35,867) | 687,617 | |||||
| 2,311,256 | 31,577,214 | 82,788,200 | 34,651,531 | 238,674 | 9,627,540 | |||||
| — | — | — | — | — | 348,556 | |||||
| — | — | — | — | — | 76,099 | |||||
| 107,987 | — | — | — | — | — | |||||
| 30,199 | — | — | — | — | — | |||||
| (92,648) | (39,625) | — | — | — | — | |||||
| 2,356,794 | 31,537,589 | 82,788,200 | 34,651,531 | 238,674 | 10,052,195 | |||||
| 7,020,977 | 35,373,906 | 81,270,382 | 105,766,133 | 3,546,297 | 20,364,254 | |||||
| — | — | — | — | — | 213,841 | |||||
| — | — | — | — | — | 548,233 | |||||
| — | — | — | — | — | (3,498,846) | |||||
| (26,132) | — | — | — | — | — | |||||
| (382) | 33,104 | — | — | — | — | |||||
| (3,618) | — | — | — | — | — | |||||
| 6,990,845 | 35,407,010 | 81,270,382 | 105,766,133 | 3,546,297 | 17,627,482 | |||||
| 9,347,639 | 66,944,599 | 164,058,582 | 140,417,664 | 3,784,971 | 27,679,677 | |||||
| $9,885,484 | $66,983,885 | $160,630,992 | $138,889,426 | $3,749,104 | $28,367,294 | |||||
| * | For the period from May 1, 2020 (commencement of operations) through December 31, 2020. |
| Driehaus Emerging Markets Growth Fund | Driehaus Emerging Markets Small Cap Growth Fund | ||||||
| For the year ended December 31, 2020 | For the year ended December 31, 2019 | For the year ended December 31, 2020 | For the year ended December 31, 2019 | ||||
| INCREASE (DECREASE) IN NET ASSETS: | |||||||
| Operations: | |||||||
| Net investment income (loss) | $(2,129,816) | $15,788,913 | $78,018 | $344,582 | |||
| Net realized gain (loss) on investment transactions | 172,694,131 | 71,686,094 | 5,310,854 | 9,961,191 | |||
| Net change in unrealized appreciation (depreciation) on investment transactions | 311,198,111 | 281,848,637 | 14,723,317 | 10,273,967 | |||
| Net increase (decrease) in net assets resulting from operations | 481,762,426 | 369,323,644 | 20,112,189 | 20,579,740 | |||
| Distributions from distributable earnings to shareholders: | |||||||
| Fund | — | — | (556,757) | (255,325) | |||
| Investor Class Shares | (23,489,434) | (7,060,076) | — | — | |||
| Institutional Class Shares | (32,004,050) | (9,417,880) | — | — | |||
| Total distributions to shareholders | (55,493,484) | (16,477,956) | (556,757) | (255,325) | |||
| Capital share transactions: | |||||||
| Proceeds from shares sold: | |||||||
| Fund | — | — | 42,887,654 | 10,428,657 | |||
| Investor Class | 122,400,329 | 102,153,849 | — | — | |||
| Institutional Class | 339,486,012 | 247,854,903 | — | — | |||
| Reinvestment of distributions: | |||||||
| Fund | — | — | 466,065 | 209,523 | |||
| Investor Class | 22,539,510 | 6,761,528 | — | — | |||
| Institutional Class | 28,589,713 | 6,842,565 | — | — | |||
| Cost of shares redeemed: | |||||||
| Fund | — | — | (35,591,556) | (58,228,599) | |||
| Investor Class | (238,017,663) | (215,941,727) | — | — | |||
| Institutional Class | (209,828,617) | (154,953,413) | — | — | |||
| Redemption fees: | |||||||
| Fund | — | — | 4,205 | 20,320 | |||
| Investor Class | 28,875 | 53,415 | — | — | |||
| Institutional Fund | 29,249 | 46,979 | — | — | |||
| Net increase (decrease) from capital transactions | 65,227,408 | (7,181,901) | 7,766,368 | (47,570,099) | |||
| Total increase (decrease) in net assets | 491,496,350 | 345,663,787 | 27,321,800 | (27,245,684) | |||
| NET ASSETS: | |||||||
| Beginning of period | $1,791,764,992 | $1,446,101,205 | $62,407,446 | $89,653,130 | |||
| End of period | $2,283,261,342 | $1,791,764,992 | $89,729,246 | $62,407,446 | |||
| Driehaus Emerging Markets Opportunities Fund | Driehaus International Small Cap Growth Fund | Driehaus Micro Cap Growth Fund | ||||||||
| For the year ended through December 31, 2020 | For the year ended December 31, 2019 | For the year ended December 31, 2020 | For the year ended December 31, 2019 | For the year ended December 31, 2020 | For the year ended December 31, 2019 | |||||
| $537,845 | $947,357 | $39,286 | $1,632,146 | $(3,427,590) | $(3,317,303) | |||||
| 2,356,794 | 333,334 | 31,537,589 | 18,156,966 | 82,788,200 | 50,822,845 | |||||
| 6,990,845 | 5,614,238 | 35,407,010 | 46,116,055 | 81,270,382 | 21,885,605 | |||||
| 9,885,484 | 6,894,929 | 66,983,885 | 65,905,167 | 160,630,992 | 69,391,147 | |||||
| (1,123,080) | (443,723) | (22,403,111) | (1,976,543) | (58,749,898) | (33,768,834) | |||||
| — | — | — | — | — | — | |||||
| — | — | — | — | — | — | |||||
| (1,123,080) | (443,723) | (22,403,111) | (1,976,543) | (58,749,898) | (33,768,834) | |||||
| 26,003,271 | 10,925,869 | 41,526,419 | 44,599,170 | 41,498,846 | 68,729,193 | |||||
| — | — | — | — | — | — | |||||
| — | — | — | — | — | — | |||||
| 1,122,838 | 443,412 | 19,610,183 | 1,754,974 | 40,290,822 | 29,366,777 | |||||
| — | — | — | — | — | — | |||||
| — | — | — | — | — | — | |||||
| (21,710,112) | (10,414,503) | (85,092,052) | (60,484,970) | (118,404,606) | (129,214,201) | |||||
| — | — | — | — | — | — | |||||
| — | — | — | — | — | — | |||||
| — | — | 500 | 406 | 4,638 | 9,243 | |||||
| — | — | — | — | — | — | |||||
| — | — | — | — | — | — | |||||
| 5,415,997 | 954,778 | (23,954,950) | (14,130,420) | (36,610,300) | (31,108,988) | |||||
| 14,178,401 | 7,405,984 | 20,625,824 | 49,798,204 | 65,270,794 | 4,513,325 | |||||
| $39,043,057 | $31,637,073 | $268,228,691 | $218,430,487 | $269,120,170 | $264,606,845 | |||||
| $53,221,458 | $39,043,057 | $288,854,515 | $268,228,691 | $334,390,964 | $269,120,170 | |||||
| Driehaus Small Cap Growth Fund | Driehaus Small/Mid Cap Growth Fund | ||||
| For the year ended December 31, 2020 | For the year ended December 31, 2019 | For the period May 1, 2020* through December 31, 2020 | |||
| INCREASE (DECREASE) IN NET ASSETS: | |||||
| Operations: | |||||
| Net investment income (loss) | $(1,528,238) | $(1,140,258) | $(35,867) | ||
| Net realized gain (loss) on investment transactions | 34,651,531 | 21,736,831 | 238,674 | ||
| Net change in unrealized appreciation (depreciation) on investment transactions | 105,766,133 | 30,538,084 | 3,546,297 | ||
| Net increase (decrease) in net assets resulting from operations | 138,889,426 | 51,134,657 | 3,749,104 | ||
| Distributions from distributable earnings to shareholders: | |||||
| Fund | — | — | (202,118) | ||
| Investor Class Shares | (1,620,573) | (640,385) | — | ||
| Institutional Class Shares | (19,908,410) | (9,268,936) | — | ||
| Total distributions to shareholders | (21,528,983) | (9,909,321) | (202,118) | ||
| Capital share transactions: | |||||
| Proceeds from shares sold: | |||||
| Fund | — | — | 17,928,182 | ||
| Investor Class | 13,330,751 | 7,758,179 | — | ||
| Institutional Class | 112,711,149 | 57,398,808 | — | ||
| Reinvestment of distributions: | |||||
| Fund | — | — | 202,118 | ||
| Investor Class | 1,619,229 | 640,385 | — | ||
| Institutional Class | 19,739,575 | 9,197,963 | — | ||
| Cost of shares redeemed: | |||||
| Fund | — | — | (6,831,800) | ||
| Investor Class | (4,531,942) | (7,175,856) | — | ||
| Institutional Class | (77,715,811) | (67,276,279) | — | ||
| Redemption fees: | |||||
| Fund | — | — | — | ||
| Investor Class | 3,223 | 1,112 | — | ||
| Institutional Fund | 6,224 | 17,340 | — | ||
| Net increase (decrease) from capital transactions | 65,162,398 | 561,652 | 11,298,500 | ||
| Total increase (decrease) in net assets | 182,522,841 | 41,786,988 | 14,845,486 | ||
| NET ASSETS: | |||||
| Beginning of period | $172,720,185 | $130,933,197 | $— | ||
| End of period | $355,243,026 | $172,720,185 | $14,845,486 | ||
| * | For the period from May 1, 2020 (commencement of operations) through December 31, 2020. |
| Driehaus Event Driven Fund | ||
| For the year ended December 31, 2020 | For the year ended December 31, 2019 | |
| $687,617 | $1,448,301 | |
| 10,052,195 | 4,699,382 | |
| 17,627,482 | 4,010,666 | |
| 28,367,294 | 10,158,349 | |
| (4,729,352) | (2,262,269) | |
| — | — | |
| — | — | |
| (4,729,352) | (2,262,269) | |
| 75,163,713 | 36,050,717 | |
| — | — | |
| — | — | |
| 4,489,499 | 2,071,307 | |
| — | — | |
| — | — | |
| (30,682,059) | (28,238,483) | |
| — | — | |
| — | — | |
| — | — | |
| — | — | |
| — | — | |
| 48,971,153 | 9,883,541 | |
| 72,609,095 | 17,779,621 | |
| $69,455,029 | $51,675,408 | |
| $142,064,124 | $69,455,029 | |
| For the year ended December 31, 2020 | For the year ended December 31, 2019 | For the year ended December 31, 2018 | For the year ended December 31, 2017 | For the year ended December 31, 2016 | |||||
| Net asset value, beginning of period | $ 39.53 | $ 31.80 | $ 39.64 | $ 27.98 | $ 26.52 | ||||
| INCOME (LOSS) FROM INVESTMENT OPERATIONS: | |||||||||
| Net investment income (loss) | (0.09)1 | 0.301 | 0.261 | 0.111 | 0.03 | ||||
| Net realized and unrealized gain (loss) on investments | 10.87 | 7.76 | (6.73) | 11.78 | 1.54 | ||||
| Total income (loss) from investment operations | 10.78 | 8.06 | (6.47) | 11.89 | 1.57 | ||||
| LESS DISTRIBUTIONS: | |||||||||
| Net investment income | — | (0.33) | (0.16) | (0.23) | (0.11) | ||||
| Net realized gain | (1.22) | — | (1.21) | — | — | ||||
| Total distributions | (1.22) | (0.33) | (1.37) | (0.23) | (0.11) | ||||
| Redemption fees added to paid-in capital | 0.002 | 0.002 | 0.002 | 0.002 | 0.002 | ||||
| Net asset value, end of period | $ 49.09 | $ 39.53 | $ 31.80 | $ 39.64 | $ 27.98 | ||||
| Total Return | 27.31% | 25.34% | (16.26)% | 42.52% | 5.88% | ||||
| RATIOS/SUPPLEMENTAL DATA: | |||||||||
| Net assets, end of period (000’s) | $ 951,998 | $ 863,535 | $ 791,656 | $ 1,266,365 | $ 1,335,873 | ||||
| Ratio of total expenses before reimbursements, waivers, recoupments and/or fees paid indirectly to average net assets | 1.39% | 1.41% | 1.38% | 1.54% | 1.65% | ||||
| Ratio of total expenses net of reimbursements, waivers, recoupments and/or fees paid indirectly to average net assets3 | 1.38% | 1.40% | 1.37% | 1.53% | 1.63% | ||||
| Ratio of net investment income (loss) (including interest expense) net of reimbursements, waivers, recoupments and/or fees paid indirectly to average net assets3 | (0.24)% | 0.85% | 0.69% | 0.33% | 0.11% | ||||
| Portfolio turnover | 203% | 167% | 218% | 176% | 232% |
| 1 | Net investment income (loss) per share has been calculated using the average shares method. |
| 2 | Amount represents less than $0.01 per share. |
| 3 | Such ratios are net of fees paid indirectly (see Note C in the Notes to Financial Statements). The ratio for the Fund includes the effect of fees paid indirectly which impacted the ratio by 0.02%, 0.01%, 0.01%, 0.01%, and 0.01% for the years 2016, 2017, 2018, 2019, and 2020. |
| For the year ended December 31, 2020 | For the year ended December 31, 2019 | For the year ended December 31, 2018 | For the period July 17, 2017 through December 31, 2017 | ||||
| Net asset value, beginning of period | $ 39.48 | $ 31.76 | $ 39.61 | $ 34.85 | |||
| INCOME (LOSS) FROM INVESTMENT OPERATIONS: | |||||||
| Net investment income (loss) | (0.01)1 | 0.381 | 0.32 | 0.121 | |||
| Net realized and unrealized gain (loss) on investments | 10.89 | 7.75 | (6.71) | 4.92 | |||
| Total income (loss) from investment operations | 10.88 | 8.13 | (6.39) | 5.04 | |||
| LESS DISTRIBUTIONS: | |||||||
| Net investment income | — | (0.41) | (0.25) | (0.28) | |||
| Net realized gain | (1.22) | — | (1.21) | — | |||
| Total distributions | (1.22) | (0.41) | (1.46) | (0.28) | |||
| Redemption fees added to paid-in capital | 0.002 | 0.002 | 0.002 | 0.002 | |||
| Net asset value, end of period | $ 49.14 | $ 39.48 | $ 31.76 | $ 39.61 | |||
| Total Return | 27.60% | 25.60% | (16.08)% | 14.47%3 | |||
| RATIOS/SUPPLEMENTAL DATA: | |||||||
| Net assets, end of period (000’s) | $ 1,331,263 | $ 928,230 | $ 654,445 | $ 513,135 | |||
| Ratio of total expenses before reimbursements, waivers, recoupments and/or fees paid indirectly to average net assets | 1.17% | 1.20% | 1.17% | 1.17%4 | |||
| Ratio of total expenses net of reimbursements, waivers, recoupments and/or fees paid indirectly to average net assets5 | 1.16% | 1.19% | 1.16% | 1.16%4 | |||
| Ratio of net investment income (loss) (including interest expense) net of reimbursements, waivers, recoupments and/or fees paid indirectly to average net assets5 | (0.02)% | 1.07% | 0.89% | 0.71%4 | |||
| Portfolio turnover | 203% | 167% | 218% | 176%3 |
| 1 | Net investment income (loss) per share has been calculated using the average shares method. |
| 2 | Amount represents less than $0.01 per share. |
| 3 | Not annualized. |
| 4 | Annualized. |
| 5 | Such ratios are net of fees paid indirectly (see Note C in the Notes to Financial Statements). The ratio for the Fund includes the effect of fees paid indirectly which impacted the ratio by 0.01% for the years 2017, 2018, 2019, and 2020. |
| For the year ended December 31, 2020 | For the year ended December 31, 2019 | For the year ended December 31, 2018 | For the year ended December 31, 2017 | For the year ended December 31, 2016 | |||||
| Net asset value, beginning of period | $ 14.38 | $ 10.80 | $ 14.21 | $ 10.66 | $ 11.85 | ||||
| INCOME (LOSS) FROM INVESTMENT OPERATIONS: | |||||||||
| Net investment income (loss) | 0.02 | 0.06 | (0.04)1 | 0.021 | (0.03)1 | ||||
| Net realized and unrealized gain (loss) on investments | 4.80 | 3.58 | (3.37) | 3.53 | (1.14) | ||||
| Total income (loss) from investment operations | 4.82 | 3.64 | (3.41) | 3.55 | (1.17) | ||||
| LESS DISTRIBUTIONS: | |||||||||
| Net investment income | (0.12) | (0.06) | — | — | (0.02) | ||||
| Total distributions | (0.12) | (0.06) | — | — | (0.02) | ||||
| Redemption fees added to paid-in capital | — | 0.002 | 0.002 | 0.002 | 0.002 | ||||
| Net asset value, end of period | $ 19.08 | $ 14.38 | $ 10.80 | $ 14.21 | $ 10.66 | ||||
| Total Return | 33.56% | 33.71% | (24.00)% | 33.30% | (9.97)% | ||||
| RATIOS/SUPPLEMENTAL DATA: | |||||||||
| Net assets, end of period (000’s) | $ 89,729 | $ 62,407 | $ 89,653 | $ 271,146 | $ 261,387 | ||||
| Ratio of total expenses before reimbursements, waivers, recoupments and/or fees paid indirectly to average net assets | 1.72% | 1.80%3 | 2.27%3 | 1.82% | 1.75% | ||||
| Ratio of total expenses net of reimbursements, waivers, recoupments and/or fees paid indirectly to average net assets4 | 1.45%5 | 1.45%3,5 | 2.26%3 | 1.80% | 1.73% | ||||
| Ratio of net investment income (loss) (including interest expense) net of reimbursements, waivers, recoupments and/or fees paid indirectly to average net assets4 | 0.12%5 | 0.52%5 | (0.30)% | 0.15% | (0.26)% | ||||
| Portfolio turnover | 248% | 220% | 207% | 243% | 240% |
| 1 | Net investment income (loss) per share has been calculated using the average shares method. |
| 2 | Amount represents less than $0.01 per share. |
| 3 | Ratio of expenses to average net assets includes interest expense of 0.01% for the year ended December 31, 2019, and less than 0.005% for the year ended December 31, 2018. The interest expense is from utilizing the line of credit (see Note G in the Notes to Financial Statements). |
| 4 | Such ratios are net of fees paid indirectly (see Note C in the Notes to Financial Statements). The ratio for the Fund includes the effect of fees paid indirectly which impacted the ratio by 0.02%, 0.02%, 0.02%, 0.01%, and 0.00% for the years 2016, 2017, 2018, 2019, and 2020. |
| 5 | Such ratios are after prior administrative and transfer agent waivers and adviser expense reimbursements, when applicable. BNY Mellon Investment Servicing (US) Inc., the administrative agent and transfer agent, waived a portion of its fees beginning with the Fund’s commencement of operations, August 22, 2011. Effective December 31, 2020, the Adviser contractually agreed to waive its investment advisory fee or absorb other operating expenses to the extent necessary to ensure that total annual Fund operating expenses (other than interest, taxes, brokerage commissions, dividends and interest on short sales, other investment-related expenses, acquired fund fees and expenses, and extraordinary expenses such as litigation and other expenses not incurred in the ordinary course of the Fund’s business) would not exceed the Fund’s operating expense cap of 1.24% of average daily net assets until April 30, 2023. From November 1, 2018, to December 31, 2020, the annual operating expense limitation was 1.45%. |
| For the year ended December 31, 2020 | For the year ended December 31, 2019 | For the year ended December 31, 2018 | For the period April 10, 2017* through December 31, 2017 | ||||
| Net asset value, beginning of period | $ 11.94 | $ 9.93 | $ 11.54 | $ 10.00 | |||
| INCOME (LOSS) FROM INVESTMENT OPERATIONS: | |||||||
| Net investment income (loss) | 0.16 | 0.29 | 0.24 | 0.17 | |||
| Net realized and unrealized gain (loss) on investments | 3.43 | 1.86 | (1.77) | 1.94 | |||
| Total income (loss) from investment operations | 3.59 | 2.15 | (1.53) | 2.11 | |||
| LESS DISTRIBUTIONS: | |||||||
| Net investment income | (0.11) | (0.14) | — | (0.16) | |||
| Net realized gain | (0.25) | — | (0.08) | (0.41) | |||
| Total distributions | (0.36) | (0.14) | (0.08) | (0.57) | |||
| Redemption fees added to paid-in capital | — | — | — | 0.001 | |||
| Net asset value, end of period | $ 15.17 | $ 11.94 | $ 9.93 | $ 11.54 | |||
| Total Return | 30.09% | 21.64% | (13.22)% | 21.14%2 | |||
| RATIOS/SUPPLEMENTAL DATA: | |||||||
| Net assets, end of period (000’s) | $ 53,221 | $ 39,043 | $ 31,637 | $ 43,183 | |||
| Ratio of total expenses before reimbursements, waivers, recoupments and/or fees paid indirectly to average net assets | 1.62% | 1.89% | 2.05% | 2.04%3 | |||
| Ratio of total expenses net of reimbursements, waivers, recoupments and/or fees paid indirectly to average net assets4 | 0.99%5 | 1.23%5 | 1.75%5 | 1.75%3,5 | |||
| Ratio of net investment income (loss) (including interest expense) net of reimbursements, waivers, recoupments and/or fees paid indirectly to average net assets4 | 1.47% | 2.67% | 2.19% | 2.12%3 | |||
| Portfolio turnover | 135% | 155% | 169% | 99%2 |
| * | Fund commenced operations on May 1, 2020. |
| 1 | Amount represents less than $0.01 per share. |
| 2 | Not annualized. |
| 3 | Annualized. |
| 4 | Such ratios are net of fees paid indirectly (see Note C in the Notes to Financial Statements). The expense ratio impacts of fees paid indirectly were 0.00% for the years 2018, 2019, and 2020. |
| 5 | Effective May 1, 2019, the Adviser contractually agreed to waive its investment advisory fee or absorb other operating expenses to the extent necessary to ensure that total annual Fund operating expenses (other than interest, taxes, brokerage commissions, dividends and interest on short sales, other investment-related expenses, acquired fund fees and expenses, and extraordinary expenses such as litigation and other expenses not incurred in the ordinary course of the Fund’s business) would not exceed the Fund’s operating expense cap of 0.99% of average daily net assets until April 30, 2022. Prior to May 1, 2019, the annual operating expense limitation was 1.75%. |
| For the year ended December 31, 2020 | For the year ended December 31, 2019 | For the year ended December 31, 2018 | For the year ended December 31, 2017 | For the year ended December 31, 2016 | |||||
| Net asset value, beginning of period | $ 10.52 | $ 8.13 | $ 11.39 | $ 9.33 | $ 10.08 | ||||
| INCOME (LOSS) FROM INVESTMENT OPERATIONS: | |||||||||
| Net investment income (loss) | 0.01 | 0.06 | (0.02)1 | (0.04) | (0.02) | ||||
| Net realized and unrealized gain (loss) on investments | 3.10 | 2.41 | (1.92) | 3.88 | (0.61) | ||||
| Total income (loss) from investment operations | 3.11 | 2.47 | (1.94) | 3.84 | (0.63) | ||||
| LESS DISTRIBUTIONS: | |||||||||
| Net investment income | (0.08) | (0.01) | — | — | — | ||||
| Net realized gain | (0.96) | (0.07) | (1.32) | (1.78) | (0.12) | ||||
| Total distributions | (1.04) | (0.08) | (1.32) | (1.78) | (0.12) | ||||
| Redemption fees added to paid-in capital | 0.002 | 0.002 | 0.002 | 0.002 | 0.002 | ||||
| Net asset value, end of period | $ 12.59 | $ 10.52 | $ 8.13 | $ 11.39 | $ 9.33 | ||||
| Total Return | 29.71% | 30.41% | (16.92)% | 41.44% | (6.22)% | ||||
| RATIOS/SUPPLEMENTAL DATA: | |||||||||
| Net assets, end of period (000’s) | $ 288,855 | $ 268,229 | $ 218,430 | $ 325,361 | $ 270,401 | ||||
| Ratio of total expenses before reimbursements, waivers, recoupments and/or fees paid indirectly to average net assets | 1.23% | 1.24% | 1.50% | 1.73% | 1.72% | ||||
| Ratio of total expenses net of reimbursements, waivers, recoupments and/or fees paid indirectly to average net assets3 | 1.23% | 1.24% | 1.49% | 1.71% | 1.70% | ||||
| Ratio of net investment income (loss) (including interest expense) net of reimbursements, waivers, recoupments and/or fees paid indirectly to average net assets3 | 0.02% | 0.65% | (0.21)% | (0.44)% | (0.15)% | ||||
| Portfolio turnover | 104% | 96% | 118% | 143% | 151% |
| 1 | Net investment income (loss) per share has been calculated using the average shares method. |
| 2 | Amount represents less than $0.01 per share. |
| 3 | Such ratios are net of fees paid indirectly (see Note C in the Notes to Financial Statements). The ratio for the Fund includes the effect of fees paid indirectly which impacted the ratio by 0.02%, 0.02%, 0.01%, 0.00%, and 0.00% for the years 2016, 2017, 2018, 2019, and 2020. |
| For the year ended December 31, 2020 | For the year ended December 31, 2019 | For the year ended December 31, 2018 | For the year ended December 31, 2017 | For the year ended December 31, 2016 | |||||
| Net asset value, beginning of period | $ 12.95 | $ 11.11 | $ 14.44 | $ 12.65 | $ 10.74 | ||||
| INCOME (LOSS) FROM INVESTMENT OPERATIONS: | |||||||||
| Net investment income (loss) | (0.20) | (0.16) | (0.19) | (0.18)1 | (0.11)1 | ||||
| Net realized and unrealized gain (loss) on investments | 11.20 | 3.90 | 0.55 | 3.26 | 2.02 | ||||
| Total income (loss) from investment operations | 11.00 | 3.74 | 0.36 | 3.08 | 1.91 | ||||
| LESS DISTRIBUTIONS: | |||||||||
| Net investment income | — | (0.02) | — | — | — | ||||
| Net realized gain | (3.96) | (1.88) | (3.69) | (1.29) | — | ||||
| Total distributions | (3.96) | (1.90) | (3.69) | (1.29) | — | ||||
| Redemption fees added to paid-in capital | 0.002 | 0.002 | 0.002 | 0.002 | 0.002 | ||||
| Net asset value, end of period | $ 19.99 | $ 12.95 | $ 11.11 | $ 14.44 | $ 12.65 | ||||
| Total Return | 85.60% | 33.89% | 3.88% | 24.30% | 17.78% | ||||
| RATIOS/SUPPLEMENTAL DATA: | |||||||||
| Net assets, end of period (000’s) | $ 334,391 | $ 269,120 | $ 264,607 | $ 322,533 | $ 396,590 | ||||
| Ratio of total expenses before reimbursements, waivers, recoupments and/or fees paid indirectly to average net assets | 1.46% | 1.48% | 1.44%3 | 1.45%3 | 1.48% | ||||
| Ratio of total expenses net of reimbursements, waivers, recoupments and/or fees paid indirectly to average net assets4 | 1.43% | 1.43% | 1.42%3 | 1.43%3 | 1.44%5 | ||||
| Ratio of net investment income (loss) (including interest expense) net of reimbursements, waivers, recoupments and/or fees paid indirectly to average net assets4 | (1.33)% | (1.32)% | (1.19)% | (1.33)% | (1.00)%5 | ||||
| Portfolio turnover | 141% | 165% | 156% | 177% | 180% |
| 1 | Net investment income (loss) per share has been calculated using the average shares method. |
| 2 | Amount represents less than $0.01 per share. |
| 3 | Ratio of expenses to average net assets includes interest expense of less than 0.005% for the years ended December 31, 2018 and 2017. The interest expense is from utilizing the line of credit (see Note G in the Notes to Financial Statements). |
| 4 | Such ratios are net of fees paid indirectly (see Note C in the Notes to Financial Statements). The ratio for the Fund includes the effect of fees paid indirectly which impacted the ratio by 0.04%, 0.02%, 0.02%, 0.05%, and 0.03% for the years 2016, 2017, 2018, 2019, and 2020. |
| 5 | Such ratios are after administrative and transfer agent waivers and adviser expense reimbursements, when applicable. BNY Mellon Investment Servicing (US) Inc., the prior administrative agent and transfer agent, waived a portion of its fees beginning with the Fund’s commencement of operations, November 18, 2013. The Adviser contractually agreed to waive its investment advisory fee or absorb other operating expenses to the extent necessary to ensure that total annual Fund operating expenses (other than interest, taxes, brokerage commissions and other portfolio transaction expenses, capital expenditures, and extraordinary expenses) would not exceed the Fund’s operating expense cap of 1.70% of average daily net assets until November 17, 2016. |
| For the year ended December 31, 2020 | For the year ended December 31, 2019 | For the year ended December 31, 2018 | For the period August 21, 2017 through December 31, 2017 | ||||
| Net asset value, beginning of period | $ 15.37 | $ 11.66 | $ 11.62 | $ 10.00 | |||
| INCOME (LOSS) FROM INVESTMENT OPERATIONS: | |||||||
| Net investment income (loss) | (0.18)1 | (0.13) | (0.12)1 | (0.04)1 | |||
| Net realized and unrealized gain (loss) on investments | 9.98 | 4.81 | 0.48 | 1.86 | |||
| Total income (loss) from investment operations | 9.80 | 4.68 | 0.36 | 1.82 | |||
| LESS DISTRIBUTIONS: | |||||||
| Net investment income | — | — | — | — | |||
| Net realized gain | (1.55) | (0.97) | (0.33) | (0.20) | |||
| Total distributions | (1.55) | (0.97) | (0.33) | (0.20) | |||
| Redemption fees added to paid-in capital | — | 0.002 | 0.01 | — | |||
| Net asset value, end of period | $ 23.62 | $ 15.37 | $ 11.66 | $ 11.62 | |||
| Total Return | 63.77% | 40.25% | 3.33% | 18.18%3 | |||
| RATIOS/SUPPLEMENTAL DATA: | |||||||
| Net assets, end of period (000’s) | $ 28,088 | $ 10,899 | $ 7,538 | $ 1,344 | |||
| Ratio of total expenses before reimbursements, waivers, recoupments and/or fees paid indirectly to average net assets | 1.35% | 1.59% | 2.57% | 7.86%4 | |||
| Ratio of total expenses net of reimbursements, waivers, recoupments and/or fees paid indirectly to average net assets5 | 1.20%6 | 1.17%6 | 1.18%6 | 1.20%4,6 | |||
| Ratio of net investment income (loss) (including interest expense) net of reimbursements, waivers, recoupments and/or fees paid indirectly to average net assets5 | (1.04)%4,6 | (0.95)%4,6 | (0.87)%4,6 | (0.94)%4,6 | |||
| Portfolio turnover | 164% | 206% | 193% | 66%3 |
| 1 | Net investment income (loss) loss per share has been calculated using the average share method. |
| 2 | Amount represents less than $0.01 per share. |
| 3 | Not annualized. |
| 4 | Annualized. |
| 5 | Such ratios are net of fees paid indirectly (see Note C in the Notes to Financial Statements). The ratio for the Fund includes the effect of fees paid indirectly which impacted the ratio by 0.00%, 0.02%, 0.03%, and 0.02% for the years 2017, 2018, 2019, and 2020. |
| 6 | Such ratios are after administrative and transfer agent waivers and adviser expense reimbursements, when applicable. BNY Mellon Investment Servicing (US) Inc., the prior administrative agent and transfer agent, waived a portion of its fees beginning with the Fund’s commencement of operations, August 21, 2017. The Adviser contractually agree to waive its investment advisory fee or absorb other operating expenses to the extent necessary to ensure that total annual operating expenses for the Investor Class (other than interest, taxes, brokerage commissions and other portfolio transaction expenses, capital expenditures, and extraordinary expenses) would not exceed the Investor Class’s operating expense cap of 1.20% of average daily net assets until April 30, 2021. |
| For the year ended December 31, 2020 | For the year ended December 31, 2019 | For the year ended December 31, 2018 | For the period August 21, 2017 through December 31, 2017 | ||||
| Net asset value, beginning of period | $ 15.47 | $ 11.70 | $ 11.63 | $ 10.00 | |||
| INCOME (LOSS) FROM INVESTMENT OPERATIONS: | |||||||
| Net investment income (loss) | (0.11)1 | (0.10) | (0.08)1 | (0.03)1 | |||
| Net realized and unrealized gain (loss) on investments | 10.07 | 4.84 | 0.39 | 1.86 | |||
| Total income (loss) from investment operations | 9.96 | 4.74 | 0.39 | 1.83 | |||
| LESS DISTRIBUTIONS: | |||||||
| Net investment income | — | — | — | — | |||
| Net realized gain | (1.55) | (0.97) | (0.33) | (0.20) | |||
| Total distributions | (1.55) | (0.97) | (0.33) | (0.20) | |||
| Redemption fees added to paid-in capital | — | 0.002 | 0.01 | — | |||
| Net asset value, end of period | $ 23.88 | $ 15.47 | $ 11.70 | $ 11.63 | |||
| Total Return | 64.39% | 40.62% | 3.59% | 18.28%3 | |||
| RATIOS/SUPPLEMENTAL DATA: | |||||||
| Net assets, end of period (000’s) | $ 327,155 | $ 161,821 | $ 123,395 | $ 38,631 | |||
| Ratio of total expenses before reimbursements, waivers, recoupments and/or fees paid indirectly to average net assets | 0.80% | 0.89% | 1.04% | 1.48%4 | |||
| Ratio of total expenses net of reimbursements, waivers, recoupments and/or fees paid indirectly to average net assets5 | 0.81%6 | 0.92%6 | 0.93%6 | 0.95%4,6 | |||
| Ratio of net investment income (loss) (including interest expense) net of reimbursements, waivers, recoupments and/or fees paid indirectly to average net assets5 | (0.64)%6 | (0.70)%6 | (0.62)%6 | (0.69)%4,6 | |||
| Portfolio turnover | 164% | 206% | 193% | 66%3 |
| 1 | Net investment income (loss) loss per share has been calculated using the average share method. |
| 2 | Amount represents less than $0.01 per share. |
| 3 | Not annualized. |
| 4 | Annualized. |
| 5 | Such ratios are net of fees paid indirectly (see Note C in the Notes to Financial Statements). The ratio for the Fund includes the effect of fees paid indirectly which impacted the ratio by 0.00%, 0.02%, 0.03%, and 0.01% for the years 2017, 2018, 2019, and 2020. |
| 6 | Such ratios are after administrative and transfer agent waivers and adviser expense reimbursements and recoupments, when applicable. BNY Mellon Investment Servicing (US) Inc., the prior administrative agent and transfer agent, waived a portion of its fees beginning with the Fund’s commencement of operations, August 21, 2017. The Adviser contractually agreed to waive its investment advisory fee or absorb other operating expenses to the extent necessary to ensure that total annual operating expenses for the Institutional Class (other than interest, taxes, brokerage commissions and other portfolio transaction expenses, capital expenditures, and extraordinary expenses) would not exceed the Institutional Class’s operating expense cap of 0.95% of average daily net assets until April 30, 2021. |
| For the period May 1, 2020* through December 31, 2020 | |
| Net asset value, beginning of period | $ 10.00 |
| INCOME (LOSS) FROM INVESTMENT OPERATIONS: | |
| Net investment income (loss) | (0.04) |
| Net realized and unrealized gain (loss) on investments | 7.47 |
| Total income (loss) from investment operations | 7.43 |
| LESS DISTRIBUTIONS: | |
| Net investment income | — |
| Net realized gain | (0.24) |
| Total distributions | (0.24) |
| Net asset value, end of period | $ 17.19 |
| Total Return | 74.23%1 |
| RATIOS/SUPPLEMENTAL DATA: | |
| Net assets, end of period (000’s) | $ 14,845 |
| Ratio of total expenses before reimbursements, waivers, recoupments and/or fees paid indirectly to average net assets | 2.58%2 |
| Ratio of total expenses net of reimbursements, waivers, recoupments and/or fees paid indirectly to average net assets3 | 0.95%2,4 |
| Ratio of net investment income (loss) (including interest expense) net of reimbursements, waivers, recoupments and/or fees paid indirectly to average net assets3 | (0.73)%2,4 |
| Portfolio turnover | 96%1 |
| * | Fund commenced operations on May 1, 2020. |
| 1 | Not annualized. |
| 2 | Annualized. |
| 3 | Such ratios are net of fees paid indirectly (see Note C in the Notes to Financial Statements). The ratio for the Fund includes the effect of fees paid indirectly which impacted the ratio by 0.00%. |
| 4 | Such ratios are after administrative and transfer agent waivers and adviser expense reimbursements, when applicable. BNY Mellon Investment Servicing (US) Inc., the prior administrative agent and transfer agent, and The Northern Trust Company, the current administrative agent and transfer agent, waived a portion of its fees beginning with the Fund’s commencement of operations, May 1, 2020. The Adviser contractually agreed to waive its investment advisory fee or absorb other operating expenses to the extent necessary to ensure that total annual Fund operating expenses (other than interest, taxes, brokerage commissions and other portfolio transaction expenses, capital expenditures, and extraordinary expenses) would not exceed the Fund’s operating expense cap of 0.95% of average daily net assets until May 1, 2023. |
| For the year ended December 31, 2020 | For the year ended December 31, 2019 | For the year ended December 31, 2018 | For the year ended December 31, 2017 | For the year ended December 31, 2016 | |||||
| Net asset value, beginning of period | $ 11.55 | $ 9.99 | $ 10.79 | $ 10.34 | $ 9.85 | ||||
| INCOME (LOSS) FROM INVESTMENT OPERATIONS: | |||||||||
| Net investment income (loss) | 0.12 | 0.26 | 0.25 | 0.02 | 0.02 | ||||
| Net realized and unrealized gain (loss) on investments | 2.74 | 1.69 | (0.69) | 0.43 | 0.59 | ||||
| Total income (loss) from investment operations | 2.86 | 1.95 | (0.44) | 0.45 | 0.61 | ||||
| LESS DISTRIBUTIONS: | |||||||||
| Net investment income | (0.17) | (0.39) | (0.36) | — | (0.09) | ||||
| Net realized gain | (0.31) | — | — | — | — | ||||
| Tax return of capital | — | — | — | — | (0.03) | ||||
| Total distributions | (0.48) | (0.39) | (0.36) | — | (0.12) | ||||
| Net asset value, end of period | $ 13.93 | $ 11.55 | $ 9.99 | $ 10.79 | $ 10.34 | ||||
| Total Return | 24.84% | 19.53% | (4.03)% | 4.35% | 6.25% | ||||
| RATIOS/SUPPLEMENTAL DATA: | |||||||||
| Net assets, end of period (000’s) | $ 142,064 | $ 69,455 | $ 51,675 | $ 165,648 | $ 256,482 | ||||
| Ratio of total expenses before reimbursements, waivers, recoupments and/or fees paid indirectly to average net assets | 1.59% | 1.93% | 1.90% | 1.77% | 2.03% | ||||
| Ratio of total expenses net of reimbursements, waivers, recoupments and/or fees paid indirectly to average net assets1,2 | 1.57% | 1.90% | 1.88% | 1.76% | 2.01% | ||||
| Ratio of net investment income (loss) (including dividends and interest on short positions and interest expense) net of reimbursements, waivers, recoupments and/or fees paid indirectly to average net assets1,2 | 0.67% | 2.63% | 2.57% | 0.48% | 0.78% | ||||
| Portfolio turnover | 136% | 111% | 101% | 198% | 246% |
| 1 | The ratio for the fund includes the effect of dividends and interest on short positions, and interest expense which increased the expense ratios by 0.59%, 0.31%, 0.31%, 0.30%, and 0.13% for the years 2016, 2017, 2018, 2019, and 2020. |
| 2 | Such ratios are net of fees paid indirectly (see Note C in the Notes to Financial Statements). The ratio for the fund includes the effect of fees paid indirectly which impacted the expense ratios by 0.02%, 0.01%, 0.02%, 0.03%, and 0.02% for the years 2016, 2017, 2018, 2019, and 2020. |
| Fund | Commencement of Operations |
| Emerging Markets Growth Fund | 12/31/97 |
| Emerging Markets Small Cap Growth Fund | 08/22/11 |
| Emerging Markets Opportunities Fund | 04/10/17 |
| International Small Cap Growth Fund | 09/17/07 |
| Micro Cap Growth Fund | 11/18/13 |
| Small Cap Growth Fund | 08/21/17 |
| Small/Mid Cap Growth Fund | 05/01/20 |
| Event Driven Fund | 08/26/13 |
| Assets* | Total Value at December 31, 2020 | Level 1 Quoted Price | Level 2 Significant Observable Inputs | Level 3 Significant Unobservable Inputs | ||||
| Common Stocks | ||||||||
| Africa | $19,989,374 | $19,989,374 | $— | $— | ||||
| Europe | ||||||||
| France | 27,157,245 | 27,157,245 | — | — | ||||
| Germany | 39,934,815 | — | 39,934,815 | — | ||||
| Hungary | 18,275,758 | — | 18,275,758 | — | ||||
| Netherlands | 14,645,288 | 14,645,288 | — | — | ||||
| Poland | 15,457,155 | — | 15,457,155 | — | ||||
| Russia | 54,665,298 | 54,665,298 | — | — | ||||
| Switzerland | 13,995,354 | — | 13,995,354 | — | ||||
| Far East | ||||||||
| China | 840,875,617 | 840,875,617 | — | — | ||||
| India | 286,027,756 | 286,027,756 | — | — | ||||
| Indonesia | 31,130,450 | — | 31,130,450 | — | ||||
| Japan | 12,768,574 | — | 12,768,574 | — | ||||
| Singapore | 11,454,133 | 11,454,133 | — | — | ||||
| South Korea | 220,816,096 | — | 220,816,096 | — | ||||
| Taiwan | 220,916,135 | 220,916,135 | — | — | ||||
| North America | 206,895,185 | 206,895,185 | — | — | ||||
| South America | ||||||||
| Argentina | 32,809,184 | 32,809,184 | — | — | ||||
| Brazil | 105,498,221 | 19,895,941 | 85,602,280 | — | ||||
| Preferred Stocks | ||||||||
| South America | ||||||||
| Brazil | 8,149,498 | — | 8,149,498 | — | ||||
| Short Term Investments | 97,180,178 | 97,180,178 | — | — | ||||
| Total | $2,278,641,314 | $1,832,511,334 | $446,129,980 | $— |
| Assets* | Total Value at December 31, 2020 | Level 1 Quoted Price | Level 2 Significant Observable Inputs | Level 3 Significant Unobservable Inputs | ||||
| Common Stocks | ||||||||
| Africa | $764,609 | $764,609 | $— | $— | ||||
| Europe | ||||||||
| Poland | 1,353,435 | — | 1,353,435 | — | ||||
| Russia | 2,156,385 | 2,156,385 | — | — | ||||
| United Kingdom | 990,873 | 990,873 | — | — | ||||
| Far East | ||||||||
| China | 23,212,564 | 23,212,564 | — | — |
| Assets* | Total Value at December 31, 2020 | Level 1 Quoted Price | Level 2 Significant Observable Inputs | Level 3 Significant Unobservable Inputs | ||||
| India | $17,555,669 | $17,555,669 | $— | $— | ||||
| Indonesia | 1,542,309 | — | 1,542,309 | — | ||||
| Kazakhstan | 1,046,313 | 1,046,313 | — | — | ||||
| South Korea | 7,312,201 | — | 7,312,201 | — | ||||
| Taiwan | 12,010,999 | 12,010,999 | — | — | ||||
| Thailand | 873,138 | 873,138 | — | — | ||||
| Vietnam | 3,700,357 | — | 3,700,357 | — | ||||
| North America | 3,881,464 | 3,881,464 | — | — | ||||
| South America | ||||||||
| Argentina | 406,931 | 406,931 | — | — | ||||
| Brazil | 6,592,973 | — | 6,592,973 | — | ||||
| Preferred Stocks | ||||||||
| South America | ||||||||
| Brazil | 2,672,817 | 612,352 | 2,060,465 | — | ||||
| Short Term Investments | 5,338,694 | 5,338,694 | — | — | ||||
| Total | $91,411,731 | $68,849,991 | $22,561,740 | $— |
| Assets* | Total Value at December 31, 2020 | Level 1 Quoted Price | Level 2 Significant Observable Inputs | Level 3 Significant Unobservable Inputs | ||||
| Common Stocks | ||||||||
| Argentina | $779,514 | $779,514 | $— | $— | ||||
| Brazil | 1,749,225 | 382,461 | 1,366,764 | — | ||||
| Canada | 635,020 | 635,020 | — | — | ||||
| China | 13,607,473 | 13,607,473 | — | — | ||||
| France | 651,546 | 651,546 | — | — | ||||
| India | 4,799,009 | 4,799,009 | — | — | ||||
| Indonesia | 403,641 | — | 403,641 | — | ||||
| Japan | 231,051 | — | 231,051 | — | ||||
| Kazakhstan | 346,947 | 346,947 | — | — | ||||
| Mexico | 752,785 | 752,785 | — | — | ||||
| Netherlands | 314,712 | 314,712 | — | — | ||||
| Poland | 622,624 | — | 622,624 | — | ||||
| Russia | 1,141,918 | 1,141,918 | — | — | ||||
| Singapore | 319,276 | 319,276 | — | — | ||||
| South Africa | 967,937 | 967,937 | — | — | ||||
| South Korea | 5,512,883 | — | 5,512,883 | — | ||||
| Sweden | 635,613 | 635,613 | — | — | ||||
| Taiwan | 6,093,065 | 6,093,065 | — | — | ||||
| United States | 911,843 | 911,843 | — | — | ||||
| Preferred Stocks | 587,704 | 587,704 | — | — | ||||
| Short Term Investments | 5,405,735 | 5,405,735 | — | — |
| Assets* | Total Value at December 31, 2020 | Level 1 Quoted Price | Level 2 Significant Observable Inputs | Level 3 Significant Unobservable Inputs | ||||
| Sovereign Bonds | $9,242,210 | $— | $9,242,210 | $— | ||||
| Total | $55,711,731 | $38,332,558 | $17,379,173 | $— |
| Assets* | Total Value at December 31, 2020 | Level 1 Quoted Price | Level 2 Significant Observable Inputs | Level 3 Significant Unobservable Inputs | ||||
| Common Stocks | ||||||||
| Europe | ||||||||
| Austria | $4,373,529 | $— | $4,373,529 | $— | ||||
| Belgium | 4,178,600 | 4,178,600 | — | — | ||||
| Denmark | 6,626,666 | 1,558,226 | 5,068,440 | — | ||||
| Finland | 12,571,648 | — | 12,571,648 | — | ||||
| France | 11,188,376 | 11,188,376 | — | — | ||||
| Germany | 24,708,327 | 7,712,835 | 16,995,492 | — | ||||
| Ireland | 4,677,092 | 4,677,092 | — | — | ||||
| Italy | 1,573,273 | — | 1,573,273 | — | ||||
| Luxembourg | 3,764,607 | — | 3,764,607 | — | ||||
| Netherlands | 13,326,977 | 13,326,977 | — | — | ||||
| Norway | 3,474,968 | — | 3,474,968 | — | ||||
| Sweden | 14,700,000 | — | 14,700,000 | — | ||||
| Switzerland | 12,431,546 | — | 12,431,546 | — | ||||
| United Kingdom | 60,334,588 | 60,334,588 | — | — | ||||
| Far East | ||||||||
| Australia | 5,324,454 | 5,324,454 | — | — | ||||
| China | 2,543,387 | 2,543,387 | — | — | ||||
| Japan | 47,340,632 | — | 47,340,632 | — | ||||
| South Korea | 9,297,097 | — | 9,297,097 | — | ||||
| Taiwan | 4,783,883 | 4,783,883 | — | — | ||||
| Middle East | 1,702,740 | 1,702,740 | — | — | ||||
| North America | 29,805,157 | 29,805,157 | — | — | ||||
| South America | 3,950,014 | — | 3,950,014 | — | ||||
| Preferred Stocks | ||||||||
| Europe | 977,172 | — | 977,172 | — | ||||
| Short Term Investments | 6,012,281 | 6,012,281 | — | — | ||||
| Total | $289,667,014 | $153,148,596 | $136,518,418 | $— |
| Assets* | Total Value at December 31, 2020 | Level 1 Quoted Price | Level 2 Significant Observable Inputs | Level 3 Significant Unobservable Inputs | ||||
| Common Stocks | $332,401,212 | $332,401,212 | $— | $— |
| Assets* | Total Value at December 31, 2020 | Level 1 Quoted Price | Level 2 Significant Observable Inputs | Level 3 Significant Unobservable Inputs | ||||
| Short Term Investments | $2,068,996 | $2,068,996 | $— | $— | ||||
| Total | $334,470,208 | $334,470,208 | $— | $— |
| Assets* | Total Value at December 31, 2020 | Level 1 Quoted Price | Level 2 Significant Observable Inputs | Level 3 Significant Unobservable Inputs | ||||
| Common Stocks | $352,583,210 | $352,583,210 | $— | $— | ||||
| Short Term Investments | 4,179,137 | 4,179,137 | — | — | ||||
| Total | $356,762,347 | $356,762,347 | $— | $— |
| Assets* | Total Value at December 31, 2020 | Level 1 Quoted Price | Level 2 Significant Observable Inputs | Level 3 Significant Unobservable Inputs | ||||
| Common Stocks | $14,890,679 | $14,890,679 | $— | $— | ||||
| Total | $14,890,679 | $14,890,679 | $— | $— |
| Assets* | Total Value at December 31, 2020 | Level 1 Quoted Price | Level 2 Significant Observable Inputs | Level 3 Significant Unobservable Inputs | ||||
| Common Stocks | $76,550,586 | $76,550,586 | $— | $— | ||||
| Convertible Corporate Bonds | 2,793,347 | — | 2,793,347 | — | ||||
| Convertible Preferred Stocks | 0 | — | — | 0 | ||||
| Corporate Bonds | 19,516,517 | — | 19,516,517 | — | ||||
| Master Limited Partnerships | 1,452,737 | 1,452,737 | — | — | ||||
| Preferred Stocks | 1,241,528 | — | 1,241,528 | — | ||||
| Private Preferred Stocks | 2,960,500 | — | — | 2,960,500 | ||||
| Short Term Investments | 33,855,341 | 33,855,341 | — | — | ||||
| Warrants | 648,351 | 644,745 | 3,606 | — | ||||
| Total | $139,018,907 | $112,503,409 | $23,554,998 | $2,960,500 |
| Liabilities* | ||||||||
| Common Stocks Sold Short | $(2,291,628) | $(2,291,628) | $— | $— | ||||
| Exchange-Traded Funds Sold Short | (18,378,626) | (18,378,626) | — | — | ||||
| Written Options | (162,667) | (162,667) | — | — | ||||
| Total | $(20,832,921) | $(20,832,921) | $— | $— |
| * | See Schedule of Investments for industry breakout. |
| Investments, at Value | |
| Balance as of December 31, 2019 | $412,500 |
| Realized gain (loss) | — |
| Change in net unrealized appreciation (depreciation) | 1,549,728 |
| Purchases | 1,001,878 |
| Sales | — |
| Transfers in and/or out of Level 3 | (3,606) |
| Balance as of December 31, 2020 | $2,960,500 |
| Financial Assets | Fair Value at December 31, 2020 | Valuation Technique(s) | Unobservable Inputs | Price/Range | ||||
| Convertible Preferred Stocks | $0 | Cash available in relation to claim | Estimated recovery | — | ||||
| Private Preferred Stocks | $2,960,500 | Market approach | Transaction price | $1.91 |
| Emerging Markets Growth Fund | Emerging Markets Small Cap Growth Fund | Emerging Markets Opportunities Fund | International Small Cap Growth Fund | ||||
| Paid-in capital | $— | $— | $— | $— | |||
| Total distributable earnings (deficit) | — | — | — | — |
| Micro Cap Growth Fund | Small Cap Growth Fund | Small/Mid Cap Growth Fund | Event Driven Fund | ||||
| Paid-in capital | $— | $95 | $— | $— | |||
| Total distributable earnings (deficit) | — | (95) | — | — |
| Not Subject to Expiration | ||||
| Fund | Short-Term | Long-Term | ||
| Emerging Markets Growth Fund | $— | $— | ||
| Emerging Markets Small Cap Growth Fund | (40,064,535) | — | ||
| Emerging Markets Opportunities Fund | — | — | ||
| International Small Cap Growth Fund | — | — | ||
| Micro Cap Growth Fund | — | — | ||
| Small Cap Growth Fund | — | — | ||
| Small/Mid Cap Growth Fund | — | — | ||
| Event Driven Fund | — | — | ||
| Fund | Year | Ordinary Income | Long-Term Capital Gain | Return of Capital | Total Distributions | |||||
| Emerging Markets Growth Fund | 2020 | $16,886,001 | $38,607,483 | $— | $55,493,484 | |||||
| 2019 | 15,701,188 | 776,768 | — | 16,477,956 | ||||||
| Emerging Markets Small Cap Growth Fund | 2020 | 556,757 | — | — | 556,757 | |||||
| 2019 | 255,325 | — | — | 255,325 | ||||||
| Emerging Markets Opportunities Fund | 2020 | 379,497 | 743,583 | — | 1,123,080 | |||||
| 2019 | 443,723 | — | — | 443,723 | ||||||
| International Small Cap Growth Fund | 2020 | 3,163,154 | 19,239,957 | — | 22,403,111 | |||||
| 2019 | 343,991 | 1,632,552 | — | 1,976,543 | ||||||
| Micro Cap Growth Fund | 2020 | 10,322,938 | 48,426,960 | — | 58,749,898 | |||||
| 2019 | — | 33,768,834 | — | 33,768,834 | ||||||
| Small Cap Growth Fund | 2020 | 2,296,873 | 19,232,110 | — | 21,528,983 | |||||
| 2019 | — | 9,909,321 | — | 9,909,321 | ||||||
| Small/Mid Cap Growth Fund | 2020 | 202,118 | — | — | 202,118 | |||||
| Event Driven Fund | 2020 | 2,341,243 | 2,388,109 | — | 4,729,352 | |||||
| 2019 | 2,262,269 | — | — | 2,262,269 |
| Emerging Markets Growth Fund | Emerging Markets Small Cap Growth Fund | Emerging Markets Opportunities Fund | International Small Cap Growth Fund | ||||
| Undistributed ordinary income | $81,648,785 | $49,512 | $866,309 | $14,658,561 | |||
| Undistributed long-term capital gain | 43,094,847 | — | 422,136 | 5,877,643 | |||
| Accumulated earnings | 124,743,632 | 49,512 | 1,288,445 | 20,536,204 | |||
| Paid-in capital | 1,412,454,012 | 105,553,998 | 38,217,798 | 189,656,945 | |||
| Accumulated capital and other losses | — | (40,064,535) | — | — | |||
| Unrealized appreciation (depreciation) on investments, securities, sold short, options and futures contracts | 746,063,698 | 24,190,271 | 13,715,215 | 78,661,366 | |||
| Net assets | $2,283,261,342 | $89,729,246 | $53,221,458 | $288,854,515 |
| Micro Cap Growth Fund | Small Cap Growth Fund | Small/Mid Cap Growth Fund | Event Driven Fund | ||||
| Undistributed ordinary income | $17,444,131 | $10,719,716 | $49,767 | $1,178,844 | |||
| Undistributed long-term capital gain | 12,077,255 | 5,136,799 | — | 4,433,042 | |||
| Accumulated earnings | 29,521,386 | 15,856,515 | 49,767 | 5,611,886 | |||
| Paid-in capital | 154,024,211 | 203,197,014 | 11,298,500 | 119,392,644 | |||
| Accumulated capital and other losses | — | — | — | — | |||
| Unrealized appreciation (depreciation) on investments, securities, sold short, options and futures contracts | 150,845,367 | 136,189,497 | 3,497,219 | 17,059,594 | |||
| Net assets | $334,390,964 | $355,243,026 | $14,845,486 | $142,064,124 |
| Fund | Basis | Gross Appreciation | Gross Depreciation | Net Appreciation/ Depreciation | ||||
| Emerging Markets Growth Fund | $1,526,719,817 | $756,297,592 | $(4,376,095) | $751,921,497 | ||||
| Emerging Markets Small Cap Growth Fund | 66,485,623 | 25,177,967 | (251,859) | 24,926,108 | ||||
| Emerging Markets Opportunities Fund | 41,937,367 | 13,929,386 | (155,022) | 13,774,364 | ||||
| International Small Cap Growth Fund | 211,033,936 | 79,484,673 | (851,595) | 78,633,078 | ||||
| Micro Cap Growth Fund | 183,624,841 | 154,057,609 | (3,212,242) | 150,845,367 | ||||
| Small Cap Growth Fund | 220,572,850 | 137,456,434 | (1,266,937) | 136,189,497 | ||||
| Small/Mid Cap Growth Fund | 11,393,460 | 3,531,570 | (34,351) | 3,497,219 | ||||
| Event Driven Fund | 101,126,391 | 25,511,173 | (8,451,578) | 17,059,595 |
| Asset derivatives | ||||
| Risk exposure category | Statements of Assets and Liabilities location | Fair Value | ||
| Equity contracts | Warrant securities, at fair value | $648,351 | ||
| Total | $648,351 | |||
| Liabilities derivatives | ||||
| Risk exposure category | Statements of Assets and Liabilities location | Fair Value | ||
| Equity contracts | Written Options outstanding, at fair value | $162,667 | ||
| Total | $162,667 | |||
| Amount of net realized gain (loss) on derivatives | ||||||
| Risk exposure category | ||||||
| Derivative | Currency contracts | Interest rate contracts | Total | |||
| Forward foreign currency contracts | $30,199 | $— | $30,199 | |||
| Swap contracts | — | 107,987 | 107,987 | |||
| Total | $30,199 | $107,987 | $138,186 | |||
| Amount of net realized gain (loss) on derivatives | ||||
| Risk exposure category | ||||
| Derivative | Equity contracts | Total | ||
| Warrant contracts | $348,556 | $348,556 | ||
| Total | $348,556 | $348,556 | ||
| Change in net unrealized appreciation (depreciation) on derivatives | ||||
| Risk exposure category | ||||
| Derivative | Interest rate contracts | Total | ||
| Swap contracts | $(26,132) | $(26,132) | ||
| Total | $(26,132) | $(26,132) | ||
| Quarterly Derivative Averages | ||||
| Derivative | Quarterly Average | $ Amount/ Number | ||
| Swap contracts | gross notional amount | $14,911,277 | ||
| Forward foreign currency contracts - Long | gross notional amount | $732,644 | ||
| Forward foreign currency contracts - Short | gross notional amount | $736,335 | ||
| Change in net unrealized appreciation (depreciation) on derivatives | ||||
| Risk exposure category | ||||
| Derivative | Equity contracts | Total | ||
| Warrant contracts | $548,233 | $548,233 | ||
| Written options contracts | 213,841 | 213,841 | ||
| Total | $762,074 | $762,074 | ||
| Quarterly Derivative Averages | ||||
| Derivative | Quarterly Average | $ Amount/ Number | ||
| Written options contracts | number of contracts | (212) | ||
| Warrant contracts | number of contracts | 167,376 | ||
| Year Ended December 31 | Emerging Markets Small Cap Growth Fund | Emerging Markets Opportunities Fund | Small Cap Growth Fund* | Small/Mid Cap Growth Fund | ||||
| 2021 | $— | $119,889 | $34,463 | $— | ||||
| 2022 | 227,780 | 234,125 | 31,856 | — | ||||
| 2023 | 171,531 | 230,617 | 18,154 | 73,297 | ||||
| Total | $399,311 | $584,631 | $84,473 | $73,297 |
| *Amount of fees available for recoupment for the Small Cap Growth Fund is for the Investor Class. All fees have been recouped by the Institutional Class as of December 31, 2020. |
| Fund | Purchases | Sales | Net Realized Gain (Loss) | |||
| Event Driven Fund | $1,386,307 | $— | $— |
| Fund | Shareholder services plan fees | Accrued shareholder services plan fees | ||
| Emerging Markets Growth Fund | $ 1,820,859 | $ 340,189 | ||
| Small Cap Growth Fund | 29,370 | 3,926 | ||
| Event Driven Fund | 120,299 | — |
| Fund | Purchases | Sales | ||
| Emerging Markets Growth Fund | 3,495,322,912 | 3,516,198,886 | ||
| Emerging Markets Small Cap Growth Fund | 154,927,417 | 149,613,640 | ||
| Emerging Markets Opportunities Fund | 50,784,264 | 46,820,141 | ||
| International Small Cap Growth Fund | 246,191,156 | 278,597,825 | ||
| Micro Cap Growth Fund | 361,302,198 | 458,127,057 | ||
| Small Cap Growth Fund | 411,125,942 | 371,153,881 | ||
| Small/Mid Cap Growth Fund | 18,221,234 | 7,114,532 | ||
| Event Driven Fund | 126,233,339 | 118,962,666 |
| Emerging Markets Growth Fund | Emerging Markets Small Cap Growth Fund | Emerging Markets Opportunities Fund | |||||||||
| 2020 | 2019 | 2020 | 2019 | 2020 | 2019 | ||||||
| Fund | |||||||||||
| Shares issued | — | — | 2,543,003 | 874,262 | 1,794,696 | 920,608 | |||||
| Shares reinvested | — | — | 24,896 | 14,891 | 75,459 | 37,514 | |||||
| Shares redeemed | — | — | (2,203,816) | (4,849,550) | (1,630,784) | (873,645) | |||||
| Net increase (decrease) | — | — | 364,083 | (3,960,397) | 239,371 | 84,477 | |||||
| Investor Class | |||||||||||
| Shares issued | 3,204,978 | 2,872,532 | — | — | — | — | |||||
| Shares reinvested | 465,885 | 172,532 | — | — | — | — | |||||
| Shares redeemed | (6,122,971) | (6,094,234) | — | — | — | — | |||||
| Net increase (decrease) | (2,452,108) | (3,049,170) | — | — | — | — | |||||
| Institutional Class | |||||||||||
| Shares issued | 8,365,858 | 7,006,838 | — | — | — | — | |||||
| Shares reinvested | 590,331 | 174,824 | — | — | — | — | |||||
| Shares redeemed | (5,376,101) | (4,277,922) | — | — | — | — | |||||
| Net increase (decrease) | 3,580,088 | 2,903,740 | — | — | — | — | |||||
| Total net increase (decrease) | 1,127,980 | (145,430) | — | — | — | — | |||||
| International Small Cap Growth Fund | Micro Cap Growth Fund | Small Cap Growth Fund | |||||||||
| 2020 | 2019 | 2020 | 2019 | 2020 | 2019 | ||||||
| Fund | |||||||||||
| Shares issued | 3,883,897 | 4,710,527 | 3,395,804 | 5,178,977 | — | — | |||||
| Shares reinvested | 1,581,466 | 169,235 | 2,060,912 | 2,292,488 | — | — | |||||
| Shares redeemed | (8,019,361) | (6,242,924) | (9,518,280) | (10,513,427) | — | — | |||||
| Net increase (decrease) | (2,553,998) | (1,363,162) | (4,061,564) | (3,041,962) | — | — | |||||
| Investor Class | |||||||||||
| Shares issued | — | — | — | — | 692,425 | 526,045 | |||||
| Shares reinvested | — | — | — | — | 68,699 | 42,020 | |||||
| Shares redeemed | — | — | — | — | (281,205) | (505,115) | |||||
| Net increase (decrease) | — | — | — | — | 479,919 | 62,950 | |||||
| Institutional Class | |||||||||||
| Shares issued | — | — | — | — | 6,900,456 | 3,970,530 | |||||
| Shares reinvested | — | — | — | — | 828,350 | 599,613 | |||||
| Shares redeemed | — | — | — | — | (4,491,029) | (4,651,842) | |||||
| Net increase (decrease) | — | — | — | — | 3,237,777 | (81,699) | |||||
| Total net increase (decrease) | — | — | — | — | 3,717,696 | (18,749) | |||||
| Small/Mid Cap Growth Fund | Event Driven Fund | ||||
| 2020 | 2020 | 2019 | |||
| Fund | |||||
| Shares issued | 1,246,622 | 6,365,985 | 3,126,556 | ||
| Shares reinvested | 11,603 | 325,090 | 181,217 | ||
| Shares redeemed | (394,737) | (2,509,836) | (2,468,451) | ||
| Net increase (decrease) | 863,488 | 4,181,239 | 839,322 | ||
| Investor Class | |||||
| Shares issued | — | — | — | ||
| Shares reinvested | — | — | — | ||
| Shares redeemed | — | — | — | ||
| Net increase (decrease) | — | — | — | ||
| Institutional Class | |||||
| Shares issued | — | — | — | ||
| Shares reinvested | — | — | — | ||
| Shares redeemed | — | — | — | ||
| Net increase (decrease) | — | — | — | ||
| Total net increase (decrease) | — | — | — | ||
| Individual fund constituting the Driehaus Mutual Funds | Statement of operations | Statement of changes in net assets | Financial highlights | |||
| Driehaus Emerging Markets Growth FundDriehaus Emerging Markets Small Cap Growth FundDriehaus International Small Cap Growth FundDriehaus Micro Cap Growth FundDriehaus Event Driven Fund | For the year ended December 31, 2020 | For each of the two years in the period ended December 31, 2020 | For each of the five years in the period ended December 31, 2020 | |||
| Driehaus Emerging Markets Opportunities Fund | For the year ended December 31, 2020 | For each of the two years in the period ended December 31, 2020 | For each of the three years in the period ended December 31, 2020 and the period from April 10, 2017 (commencement of operations) through December 31, 2017 | |||
| Driehaus Small Cap Growth Fund | For the year ended December 31, 2020 | For each of the two years in the period ended December 31, 2020 | For each of the three years in the period ended December 31, 2020 and the period from August 21, 2017 (commencement of operations) through December 31, 2017 | |||
| Driehaus Small/Mid Cap Growth Fund | For the period May 1, 2020 (commencement of operations) through December 31, 2020 | |||||

| Name, Address and Year of Birth | Position(s) Held with the Trust | Term of Office and Length of Time Served | Principal Occupation(s) During the Past 5 Years | Other Directorships Held by Trustee During the Past 5 Years | |||||
| Interested Trustee:* | |||||||||
| Stephen T. Weber Driehaus Capital Management LLC 25 East Erie Street Chicago, IL 60611 YOB: 1963 | Trustee and President | Since Dec. 2020 Since Feb. 2020 | President and Head of Distribution of the Adviser since February 2020; Director of Sales and Relationship Management of the Adviser from 2006 through February 2020; President and Chief Executive Officer of Driehaus Securities LLC from 2018 through 2019. | None. | |||||
| Independent Trustees: | |||||||||
| Daniel F. Zemanek c/o Driehaus Capital Management LLC 25 East Erie Street Chicago, IL 60611 YOB: 1942 | Trustee and Chair | Since 1996 Since 2014 | Retired; President of Ludan, Inc. (real estate development services specializing in senior housing) from April 2008 to December 2014. | None. | |||||
| Theodore J. Beck c/o Driehaus Capital Management LLC 25 East Erie Street Chicago, IL 60611 YOB: 1952 | Trustee and Vice Chair | Since 2012 Since June 2020 | Retired; President and Chief Executive Officer, National Endowment for Financial Education, 2005 to July 2018. | None. | |||||
| Francis J. Harmon c/o Driehaus Capital Management LLC 25 East Erie Street Chicago, IL 60611 YOB: 1942 | Trustee | Since 1998 | Retired; Consultant, Great Lakes Advisors, Inc. from January 2020 to December 2020; Relationship Manager, Great Lakes Advisors, Inc. through December 2019. | None. | |||||
| Dawn M. Vroegop c/o Driehaus Capital Management LLC 25 East Erie Street Chicago, IL 60611 YOB: 1966 | Trustee | Since 2012 | Private Investor. | Independent Trustee, Brighthouse Funds Trust I since December 2000 and Brighthouse Funds Trust II since May 2009 | |||||
| Christopher J. Towle, CFA c/o Driehaus Capital Management LLC 25 East Erie Street Chicago, IL 60611 YOB: 1957 | Trustee | Since 2016 | Retired; Partner, Portfolio Manager, Director of High Yield and Convertible Securities, Lord Abbett & Co. 1987 to 2014. | Independent Trustee, Brighthouse Funds Trust I and Brighthouse Funds Trust II, each from April 2018 to August 2019. | |||||
| Name, Address and Year of Birth | Position(s) Held with the Trust | Length of Time Served | Principal Occupation(s) During Past 5 Years | |||
| Stephen T. Weber 25 East Erie Street Chicago, IL 60611 YOB: 1970 | President | Since Feb. 2020 | President and Head of Distribution of the Adviser since February 2020; Director of Sales and Relationship Management of the Adviser from 2006 through February 2020; President and Chief Executive Officer of Driehaus Securities LLC from 2018 through 2019. | |||
| Robert M. Kurinsky 25 East Erie Street Chicago, IL 60611 YOB: 1972 | Vice President and Treasurer | Since 2019 | Chief Operating Officer of the Adviser since February 2020, Chief Financial Officer and Treasurer of the Adviser since January 2019; Treasurer and Chief Financial Officer of Driehaus Securities LLC from January 2019 through December 2019; Treasurer, Secretary and Chief Legal Officer of the Keeley Funds, Inc. through December 2018; President and Chief Operating Officer of Keeley-Teton Advisors, LLC from March 2017 to December 2018; Treasurer and Secretary of Joley Corp. and Keeley Holdings, Inc. through February 2017; Secretary, Treasurer, Chief Financial Officer and General Counsel of Keeley Asset Management Corp. through February 2017; Secretary, Treasurer, Chief Financial Officer and General Counsel of Keeley Investment Corp. through February 2017. | |||
| Janet L. McWilliams 25 East Erie Street Chicago, IL 60611 YOB: 1970 | Assistant Vice President and Chief Legal Officer | Since 2007 Since 2012 | General Counsel and Secretary of the Adviser and Driehaus Securities LLC since 2012; General Counsel and Secretary of Driehaus Securities LLC through December 2019. | |||
| Anne S. Kochevar 25 East Erie Street Chicago, IL 60611 YOB: 1963 | Chief Compliance Officer and Anti-Money Laundering Compliance Officer | Since 2019 | Chief Compliance Officer of the Adviser since July 2019; Anti-Money Laundering Compliance Officer of Driehaus Securities LLC from July 2019 to December 2019; Chief Compliance Officer of Confluence Investment Management from January 2018 to June 2019; and Chief Compliance Officer of Henderson Global Investors U.S. from November 2014 to January 2018. | |||
| Todd M. Young 333 South Wabash Avenue Chicago, IL 60604 YOB: 1983 | Secretary | Since August 2020 | Senior Consultant of the Northern Trust Company since July 2019; Associate Director and Fund Accounting and Regulatory Policies Manager of UBS Asset Management (Americas) Inc. from December 2017 to July 2019; Senior Accountant of William Blair & Company from May 2015 to December 2017. | |||
| Malinda M. Sanborn 25 East Erie Street Chicago, IL 60611 YOB: 1965 | Assistant Treasurer | Since August 2020 | Director of Fund Administration of the Advisor since August 2014. | |||
| Christina E. Algozine 25 East Erie Street Chicago, IL 60611 YOB: 1985 | Assistant Secretary | Since 2019 | Assistant Secretary of the Adviser since January 2019; Assistant Secretary of Driehaus Securities LLC from January 2019 to December 2019; Senior Attorney, Aegon USA Investment Management, LLC from December 2014 to January 2019; Head of Corporate Strategy and Support, Aegon USA Investment Management, LLC from April 2015 to January 2017. |
| Emerging Markets Growth Fund — Investor Class | ||||||
| Beginning Account Value July 1, 2020 | Ending Account Value December 31, 2020 | Expenses Paid During Six Months Ended December 31, 2020* | ||||
| Actual | $1,000.00 | $1,319.10 | $7.58 | |||
| Hypothetical Example, assuming a 5% return before expenses | $1,000.00 | $1,018.60 | $6.60 | |||
| Emerging Markets Growth Fund — Institutional Class | ||||||
| Beginning Account Value July 1, 2020 | Ending Account Value December 31, 2020 | Expenses Paid During Six Months Ended December 31, 2020* | ||||
| Actual | $1,000.00 | $1,320.10 | $6.59 | |||
| Hypothetical Example, assuming a 5% return before expenses | $1,000.00 | $1,019.46 | $5.74 | |||
| Emerging Markets Small Cap Growth Fund | ||||||
| Beginning Account Value July 1, 2020 | Ending Account Value December 31, 2020 | Expenses Paid During Six Months Ended December 31, 2020* | ||||
| Actual | $1,000.00 | $1,301.20 | $8.39 | |||
| Hypothetical Example, assuming a 5% return before expenses | $1,000.00 | $1,017.85 | $7.35 | |||
| Emerging Markets Opportunities Fund | ||||||
| Beginning Account Value July 1, 2020 | Ending Account Value December 31, 2020 | Expenses Paid During Six Months Ended December 31, 2020* | ||||
| Actual | $1,000.00 | $1,282.40 | $5.74 | |||
| Hypothetical Example, assuming a 5% return before expenses | $1,000.00 | $1,020.11 | $5.08 | |||
| International Small Cap Growth Fund | ||||||
| Beginning Account Value July 1, 2020 | Ending Account Value December 31, 2020 | Expenses Paid During Six Months Ended December 31, 2020* | ||||
| Actual | $1,000.00 | $1,363.20 | $7.19 | |||
| Hypothetical Example, assuming a 5% return before expenses | $1,000.00 | $1,019.05 | $6.14 | |||
| Micro Cap Growth Fund | ||||||
| Beginning Account Value July 1, 2020 | Ending Account Value December 31, 2020 | Expenses Paid During Six Months Ended December 31, 2020* | ||||
| Actual | $1,000.00 | $1,579.20 | $9.14 | |||
| Hypothetical Example, assuming a 5% return before expenses | $1,000.00 | $1,018.05 | $7.15 | |||
| Small Cap Growth Fund — Investor Class | ||||||
| Beginning Account Value July 1, 2020 | Ending Account Value December 31, 2020 | Expenses Paid During Six Months Ended December 31, 2020* | ||||
| Actual | $1,000.00 | $1,487.70 | $7.69 | |||
| Hypothetical Example, assuming a 5% return before expenses | $1,000.00 | $1,018.95 | $6.24 | |||
| Small Cap Growth Fund — Institutional Class | ||||||
| Beginning Account Value July 1, 2020 | Ending Account Value December 31, 2020 | Expenses Paid During Six Months Ended December 31, 2020* | ||||
| Actual | $1,000.00 | $1,490.70 | $4.95 | |||
| Hypothetical Example, assuming a 5% return before expenses | $1,000.00 | $1,021.17 | $4.01 | |||
| Small/Mid Cap Growth Fund | ||||||
| Beginning Account Value July 1, 2020 | Ending Account Value December 31, 2020 | Expenses Paid During Six Months Ended December 31, 2020* | ||||
| Actual | $1,000.00 | $1,430.50 | $5.80 | |||
| Hypothetical Example, assuming a 5% return before expenses | $1,000.00 | $1,020.36 | $4.82 | |||
| Event Driven Fund | ||||||
| Beginning Account Value July 1, 2020 | Ending Account Value December 31, 2020 | Expenses Paid During Six Months Ended December 31, 2020* | ||||
| Actual | $1,000.00 | $1,197.80 | $8.67 | |||
| Hypothetical Example, assuming a 5% return before expenses | $1,000.00 | $1,017.24 | $7.96 | |||
| Emerging Markets Growth Fund – Investor Class | 1.30% |
| Emerging Markets Growth Fund – Institutional Class | 1.13% |
| Emerging Markets Small Cap Growth Fund | 1.45% |
| Emerging Markets Opportunities Fund | 1.00% |
| International Small Cap Growth Fund | 1.21% |
| Micro Cap Growth Fund | 1.41% |
| Small Cap Growth Fund – Investor Class | 1.23% |
| Small Cap Growth Fund – Institutional Class | 0.79% |
| Small/Mid Cap Growth Fund | 0.95% |
| Event Driven Fund | 1.57% |
| Emerging Markets Growth Fund | Emerging Markets Small Cap Growth Fund | Emerging Markets Opportunities Fund | International Small Cap Growth Fund | |||
| $38,607,483 | $— | $743,583 | $19,239,957 |
| Micro Cap Growth Fund | Small Cap Growth Fund | Small/Mid Cap Growth Fund | Event Driven Fund | |||
| $48,426,960 | $19,232,110 | $— | $2,388,109 |
| Emerging Markets Growth Fund | Emerging Markets Small Cap Growth Fund | Emerging Markets Opportunities Fund | International Small Cap Growth Fund | |||
| —% | 63.85% | 69.62% | 100.00% |
| Micro Cap Growth Fund | Small Cap Growth Fund | Small/Mid Cap Growth Fund | Event Driven Fund | |||
| —% | —% | —% | 18.30% |
| Emerging Markets Growth Fund | Emerging Markets Small Cap Growth Fund | Emerging Markets Opportunities Fund | International Small Cap Growth Fund | |||
| 84.46% | —% | —% | 76.91% |
| Micro Cap Growth Fund | Small Cap Growth Fund | Small/Mid Cap Growth Fund | Event Driven Fund | |||
| 2.46% | 10.71% | 3.45% | —% |
| Emerging Markets Growth Fund | Emerging Markets Small Cap Growth Fund | Emerging Markets Opportunities Fund | International Small Cap Growth Fund | |||
| —% | —% | 0.20% | —% |
| Micro Cap Growth Fund | Small Cap Growth Fund | Small/Mid Cap Growth Fund | Event Driven Fund | |||
| —% | —% | —% | 11.55% |
| (b) | Not applicable. |
Item 2. Code of Ethics.
| (a) | The registrant, as of the end of the period covered by this report, has adopted a code of ethics that applies to the registrant’s principal executive officer, principal financial officer, principal accounting officer or controller, or persons performing similar functions, regardless of whether these individuals are employed by the registrant or a third party. |
| (b) | No response required. |
| (c) | There have been no amendments, during the period covered by this report, to a provision of the code of ethics that applies to the registrant’s principal executive officer, principal financial officer, principal accounting officer or controller, or persons performing similar functions, regardless of whether these individuals are employed by the registrant or a third party, and that relates to any element of the code of ethics description. |
| (d) | The registrant has not granted any waivers, including an implicit waiver, from a provision of the code of ethics that applies to the registrant’s principal executive officer, principal financial officer, principal accounting officer or controller, or persons performing similar functions, regardless of whether these individuals are employed by the registrant or a third party, that relates to one or more of the items set forth in paragraph (b) of this item. |
| (e) | Not applicable. |
| (f) | The registrant’s Code of Ethics for Principal Executive and Financial Officers was filed as Exhibit 12(a)(1) to the registrant’s Certified Shareholder Report on Form N-CSR, Accession Number 0001193125-12-093739, on March 2, 2012, and is incorporated herein by reference. |
Item 3. Audit Committee Financial Expert.
The registrant’s Board of Trustees has designated Christopher J. Towle as an audit committee financial expert. Christopher J. Towle is “independent,” as defined by this Item 3. Mr. Towle is a CFA charterholder and his relevant experience includes prior audit committee experience, experience reviewing financial statements, performing company specific financial analysis and creating financial models, as well as coursework in accounting.
Item 4. Principal Accountant Fees and Services.
| (a) | Audit Fees |
For the fiscal years ended December 31, 2020 and 2019, Ernst & Young LLP, the registrant’s principal accountant (“E&Y”), billed the registrant $249,000 and $376,800, respectively, for professional services rendered for the audit of the registrant’s annual financial statements or services that are normally provided in connection with statutory and regulatory filings.
| (b) | Audit-Related Fees |
For the fiscal years ended December 31, 2020 and 2019, E&Y billed the registrant $0 and $0, respectively, for assurance and related services that are reasonably related to the performance of the audit of the registrant’s financial statements and that are not reported above.
For engagements that Driehaus Capital Management LLC, the registrant’s investment adviser (“DCM”), or Driehaus Securities LLC, the registrant’s distributor (“DS”), entered into with E&Y for fiscal years 2020 and 2019, E&Y provided no audit-related services to DCM or DS that were for engagements directly related to the registrant’s operations and financial reporting.
| (c) | Tax Fees |
For the fiscal years ended December 31, 2020 and 2019, E&Y billed the registrant $95,750 and $113,375 respectively, for professional services rendered for tax compliance, tax advice, and tax planning. Such services consisted of review of the registrant’s income tax returns and tax distribution requirements and analysis related to foreign tax liabilities and passive foreign investment company status. The Audit Committee pre-approved all tax services that E&Y provided to the registrant.
For fiscal years 2020 and 2019, E&Y provided no tax services to DCM or DS that were for engagements directly related to the registrant’s operations and financial reporting.
| (d) | All Other Fees |
For the fiscal years ended December 31, 2020 and 2019, E&Y billed the registrant $0 and $0, respectively, for products and services provided, other than the services reported above.
For fiscal years 2020 and 2019, E&Y provided no other services to DCM or DS that were for engagements directly related to the registrant’s operations and financial reporting.
| (e)(1) | Audit Committee Pre-Approval Policies and Procedures |
Pursuant to registrant’s Audit Committee Charter (the “Charter”), the Audit Committee is responsible for pre-approving any engagement of the principal accountant to provide non-prohibited services to the registrant, including the fees and other compensation to be paid to the principal accountant, to the extent required by Rule 2-01(c)(7) of Regulation S-X. The Chairperson of the Audit Committee may grant pre-approval for such engagements of $5,000 or less. All such delegated pre-approvals will be presented to the Audit Committee no later than the next Audit Committee meeting.
Pursuant to the Charter, the Audit Committee is also responsible for pre-approving any engagement of the principal accountant, including the fees and other compensation to be paid to the principal accountant, to provide non-audit services to the registrant’s investment adviser (or any entity controlling, controlled by, or under common control with the adviser that provides ongoing services to the registrant), if the engagement relates directly to the operations and financial reporting of the registrant, to the extent required by Rule 2-01(c)(7) of Regulation S-X. The Chairperson of the Audit Committee may grant pre-approval for engagements of $5,000 or less. All such delegated pre-approvals will be presented to the Audit Committee no later than the next Audit Committee meeting.
| (e)(2) | The percentage of services described in each of paragraphs (b) through (d) of this Item that were approved by the Audit Committee pursuant to paragraph (c)(7)(i)(C) of Rule 2-01 of Regulation S-X is 0%. |
| (f) | Not applicable. |
| (g) | Non-Audit Fees |
For the fiscal years ended December 31, 2020 and 2019, E&Y billed the registrant $95,750 and $113,375, respectively, in aggregate non-audit fees. For the fiscal years ended December 31, 2020 and 2019, E&Y billed DCM or DS $0 and $0, respectively, in aggregate non-audit fees.
(h) Not applicable.
Item 5. Audit Committee of Listed Registrants.
Not applicable.
Item 6. Investments.
| (a) | Schedule of Investments in securities of unaffiliated issuers as of the close of the reporting period is included as part of the report to shareholders filed under Item 1 of this form. |
| (b) | Not applicable. |
Item 7. Disclosure of Proxy Voting Policies and Procedures for Closed-End Management Investment Companies.
Not applicable.
Item 8. Portfolio Managers of Closed-End Management Investment Companies.
Not applicable.
Item 9. Purchases of Equity Securities by Closed-End Management Investment Companies and Affiliated Purchasers.
Not applicable.
Item 10. Submission of Matters to a Vote of Security Holders.
There have been no material changes to the procedures by which the shareholders may recommend nominees to the registrant’s board of directors, where those changes were implemented after the registrant last provided disclosure in response to the requirements of Item 407(c)(2)(iv) of Regulation S-K (17 CFR 229.407) (as required by Item 22(b)(15) of Schedule 14A (17 CFR 240.14a-101)), or this Item.
Item 11. Controls and Procedures.
| (a) | The registrant’s principal executive and principal financial officers, or persons performing similar functions, have concluded that the registrant’s disclosure controls and procedures (as defined in Rule 30a-3(c) under the Investment Company Act of 1940, as amended (the “1940 Act”) (17 CFR 270.30a-3(c))) are effective, as of a date within 90 days of the filing date of the report that includes the disclosure required by this paragraph, based on their evaluation of these controls and procedures required by Rule 30a-3(b) under the 1940 Act (17 CFR 270.30a-3(b)) and Rules 13a-15(b) or 15d-15(b) under the Securities Exchange Act of 1934, as amended (17 CFR 240.13a-15(b) or 240.15d-15(b)). |
| (b) | There were no changes in the registrant’s internal control over financial reporting (as defined in Rule 30a-3(d) under the 1940 Act (17 CFR 270.30a-3(d))) that occurred during the period covered by this report that has materially affected, or is reasonably likely to materially affect, the registrant’s internal control over financial reporting. |
Item 12. Disclosure of Securities Lending Activities for Closed-End Management Investment Companies.
Not applicable.
Item 13. Exhibits.
| (a)(2) | Certifications pursuant to Rule 30a-2(a) under the 1940 Act and Section 906 of the Sarbanes- Oxley Act of 2002 are attached hereto. |
| (a)(3) | Not applicable. |
| (a)(4) | Not applicable. |
| (b) | Certifications pursuant to Rule 30a-2(b) under the 1940 Act and Section 1350 of Chapter 63 of Title 18 of the United States Code (18 U.S.C. 1350) are attached hereto. |
SIGNATURES
Pursuant to the requirements of the Securities Exchange Act of 1934 and the Investment Company Act of 1940, the registrant has duly caused this report to be signed on its behalf by the undersigned, thereunto duly authorized.
| (Registrant) | Driehaus Mutual Funds | |
| By (Signature and Title) | /s/ Stephen T. Weber | |
| Stephen T. Weber, President | ||
| (principal executive officer) | ||
| Date | March 3, 2021 |
Pursuant to the requirements of the Securities Exchange Act of 1934 and the Investment Company Act of 1940, this report has been signed below by the following persons on behalf of the registrant and in the capacities and on the dates indicated.
| By (Signature and Title) | /s/ Stephen T. Weber | |
| Stephen T. Weber, President | ||
| (principal executive officer) | ||
| Date | March 3, 2021 | |
| By (Signature and Title) | /s/ Robert M. Kurinsky | |
| Robert M. Kurinsky, Vice President and Treasurer | ||
| (principal financial officer) | ||
| Date | March 3, 2021 |
.