UNITED STATES
SECURITIES AND EXCHANGE COMMISSION
Washington, D.C. 20549
FORM N-CSR
CERTIFIED SHAREHOLDER REPORT OF REGISTERED MANAGEMENT INVESTMENT COMPANIES
Investment Company Act file number 811-07655
| Driehaus Mutual Funds | ||
| (Exact name of registrant as specified in charter) |
25 East Erie Street
| Chicago, IL 60611 | ||
| (Address of principal executive offices) (Zip code) |
Janet L. McWilliams
Driehaus Capital Management LLC
25 East Erie Street
| Chicago, IL 60611 | ||
| (Name and address of agent for service) |
Registrant's telephone number, including area code: 312-587-3800
Date of fiscal year end: December 31
Date of reporting period: June 30, 2021
Form N-CSR is to be used by management investment companies to file reports with the Commission not later than 10 days after the transmission to stockholders of any report that is required to be transmitted to stockholders under Rule 30e-1 under the Investment Company Act of 1940 (17 CFR 270.30e-1). The Commission may use the information provided on Form N-CSR in its regulatory, disclosure review, inspection, and policymaking roles.
A registrant is required to disclose the information specified by Form N-CSR, and the Commission will make this information public. A registrant is not required to respond to the collection of information contained in Form N-CSR unless the Form displays a currently valid Office of Management and Budget ("OMB") control number. Please direct comments concerning the accuracy of the information collection burden estimate and any suggestions for reducing the burden to Secretary, Securities and Exchange Commission, 450 Fifth Street, NW, Washington, DC 20549-0609. The OMB has reviewed this collection of information under the clearance requirements of 44 U.S.C. § 3507.
Item 1. Reports to Stockholders.
a. The Report to Shareholders is attached herewith.

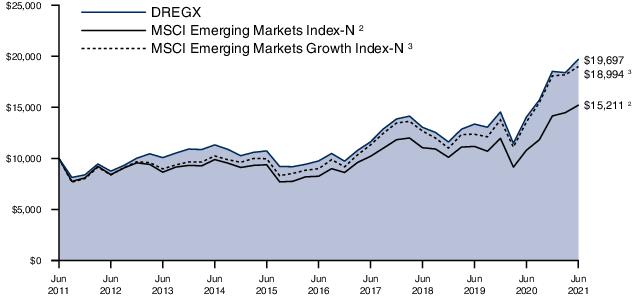
| Average Annual Total Returns as of 6/30/21 | 1 Year | 3 Years | 5 Years | 10 Years |
| Driehaus Emerging Markets Growth Fund Investor Class (DREGX) | 40.24% | 14.72% | 15.11% | 7.01% |
| Driehaus Emerging Markets Growth Fund Institutional Class (DIEMX)1 | 40.49% | 14.98% | 15.29% | 7.10% |
| MSCI Emerging Markets Index-N2 | 40.90% | 11.27% | 13.03% | 4.28% |
| MSCI Emerging Markets Growth Index-N3 | 40.08% | 14.44% | 16.14% | 6.63% |
| 1 | The returns for the periods prior to July 17, 2017 (institutional share class inception date) include the performance of the investor share class. |
| 2 | The Morgan Stanley Capital International Emerging Markets Index-Net (MSCI Emerging Markets Index-N) is a market capitalization-weighted index designed to measure equity market performance in emerging markets. Data is in U.S. dollars and is calculated with net dividend reinvestment. Source: Morgan Stanley Capital International Inc. |
| 3 | The Morgan Stanley Capital International Emerging Markets Growth Index-Net (MSCI Emerging Markets Growth Index-N) is a subset of the MSCI Emerging Markets Index and includes only the MSCI Emerging Markets Index stocks which are categorized as growth stocks. Data is in U.S. dollars and is calculated with net dividend reinvestment. Source: Morgan Stanley Capital International Inc. |
| Shares, Principal Amount, or Number of Contracts | Value | |
| COMMON STOCKS — 94.29% | ||
| FAR EAST — 68.43% | ||
| China — 32.65% | ||
| AIA Group Ltd. | 3,610,658 | $44,875,713 |
| Airtac International Group | 491,992 | 18,982,195 |
| Alibaba Group Holding Ltd. * | 1,072,793 | 30,397,391 |
| Alibaba Group Holding Ltd. - SP ADR 1,* | 197,202 | 44,721,470 |
| Aluminum Corp. of China Ltd. - H * | 28,193,662 | 16,812,418 |
| BeiGene Ltd. - ADR 1,* | 63,233 | 21,700,933 |
| Beijing Oriental Yuhong Waterproof Technology Co. Ltd. - A | 1,334,751 | 11,427,532 |
| Bilibili, Inc. - SP ADR 1,* | 225,631 | 27,490,881 |
| China Mengniu Dairy Co. Ltd. * | 3,054,492 | 18,470,229 |
| China Merchants Bank Co. Ltd. - H | 4,947,483 | 42,215,106 |
| China Resources Beer Holdings Co. Ltd. | 1,394,000 | 12,522,893 |
| China Tourism Group Duty Free Corp. Ltd. - A | 376,603 | 17,491,207 |
| Contemporary Amperex Technology Co. Ltd. - A | 448,092 | 37,087,589 |
| Country Garden Services Holdings Co. Ltd. | 1,785,901 | 19,298,210 |
| East Money Information Co. Ltd. - A | 3,857,790 | 19,577,174 |
| Galaxy Entertainment Group Ltd. * | 2,011,001 | 16,097,229 |
| Huazhu Group Ltd. - ADR 1,* | 350,189 | 18,493,481 |
| I-Mab - SP ADR 1,* | 167,001 | 14,019,734 |
| JD.com, Inc. - ADR 1,* | 417,988 | 33,359,622 |
| Kweichow Moutai Co. Ltd. - A | 81,032 | 25,792,742 |
| Li Ning Co. Ltd. | 2,327,086 | 28,413,090 |
| Meituan - B 2,* | 1,005,495 | 41,492,549 |
| NetEase, Inc. | 990,770 | 22,445,867 |
| NIO, Inc. - ADR 1,* | 427,956 | 22,767,259 |
| Ping An Insurance Group Co. of China Ltd. - H | 1,403,001 | 13,742,156 |
| Silergy Corp. | 120,609 | 16,405,854 |
| Techtronic Industries Co. Ltd. | 848,386 | 14,816,679 |
| Tencent Holdings Ltd. | 1,824,644 | 137,242,520 |
| WuXi AppTec Co. Ltd. - H 2 | 938,600 | 21,916,745 |
| Wuxi Biologics Cayman, Inc. 2,* | 878,140 | 16,094,087 |
| Zai Lab Ltd. - ADR 1,* | 103,031 | 18,235,457 |
| 844,406,012 | ||
| India — 12.16% | ||
| Apollo Hospitals Enterprise Ltd. | 494,947 | 24,103,779 |
| Asian Paints Ltd. | 477,284 | 19,216,572 |
| Azure Power Global Ltd. 1,* | 259,899 | 6,996,481 |
| HDFC Bank Ltd. - ADR 1 | 361,681 | 26,446,115 |
| Shares, Principal Amount, or Number of Contracts | Value | |
| HDFC Life Insurance Co. Ltd. 2 | 1,936,736 | $17,882,173 |
| Hindalco Industries Ltd. | 3,746,359 | 18,751,956 |
| Hindustan Unilever Ltd. | 230,345 | 7,658,437 |
| Housing Development Finance Corp. Ltd. | 709,499 | 23,626,899 |
| ICICI Bank Ltd. - SP ADR 1,* | 2,765,009 | 47,281,654 |
| Indraprastha Gas Ltd. | 2,119,382 | 15,903,206 |
| Motherson Sumi Systems Ltd. * | 4,247,258 | 13,833,730 |
| Reliance Industries Ltd. | 1,399,455 | 39,738,459 |
| SBI Cards & Payment Services Ltd. * | 1,485,263 | 19,390,545 |
| Tata Consultancy Services Ltd. | 747,970 | 33,667,707 |
| 314,497,713 | ||
| Taiwan — 10.78% | ||
| Chailease Holding Co. Ltd. | 2,807,790 | 20,406,549 |
| Delta Electronics, Inc. | 3,757,640 | 40,863,703 |
| Hon Hai Precision Industry Co. Ltd. | 2,791,640 | 11,221,666 |
| MediaTek, Inc. | 527,543 | 18,214,316 |
| Merida Industry Co. Ltd. | 580,807 | 6,524,633 |
| Taiwan Semiconductor Manufacturing Co. Ltd. - SP ADR 1 | 1,312,904 | 157,758,545 |
| Unimicron Technology Corp. | 5,156,412 | 23,873,563 |
| 278,862,975 | ||
| South Korea — 9.31% | ||
| Kakao Corp. | 172,450 | 24,960,574 |
| KB Financial Group, Inc. | 373,952 | 18,529,078 |
| Kia Corp. | 246,477 | 19,610,477 |
| LG Chem Ltd. | 17,468 | 13,184,567 |
| Macquarie Korea Infrastructure Fund | 1,000,206 | 11,146,459 |
| Mando Corp. * | 244,693 | 14,449,305 |
| Samsung Electronics Co. Ltd. | 1,936,146 | 138,744,379 |
| 240,624,839 | ||
| Singapore — 1.08% | ||
| Sea Ltd. - ADR 1,* | 102,123 | 28,042,976 |
| Indonesia — 1.05% | ||
| Bank Central Asia Tbk PT | 13,080,460 | 27,175,783 |
| Japan — 0.95% | ||
| FANUC Corp. | 101,884 | 24,573,399 |
| Malaysia — 0.45% | ||
| Lynas Rare Earths Ltd. * | 2,684,349 | 11,494,958 |
| Total FAR EAST (Cost $1,142,412,989) | 1,769,678,655 | |
| EUROPE — 9.53% | ||
| Russia — 4.76% | ||
| LUKOIL PJSC - SP ADR 1 | 421,702 | 39,058,039 |
| Ozon Holdings PLC - ADR 1,* | 213,246 | 12,500,481 |
| Polyus PJSC 1 | 92,435 | 17,922,992 |
| Shares, Principal Amount, or Number of Contracts | Value | |
| Sberbank of Russia PJSC - SP ADR 1 | 1,628,011 | $27,033,123 |
| Yandex NV - A 1,* | 376,791 | 26,657,963 |
| 123,172,598 | ||
| Netherlands — 1.71% | ||
| ASML Holding NV | 64,525 | 44,330,200 |
| France — 1.23% | ||
| L'Oreal SA | 71,525 | 31,871,890 |
| Hungary — 1.14% | ||
| OTP Bank NYRT * | 545,387 | 29,360,823 |
| Switzerland — 0.35% | ||
| Dufry AG * | 151,785 | 8,989,806 |
| Greece — 0.34% | ||
| OPAP SA | 578,534 | 8,719,019 |
| Total EUROPE (Cost $201,632,510) | 246,444,336 | |
| NORTH AMERICA — 8.29% | ||
| United States — 6.19% | ||
| EPAM System, Inc. * | 71,810 | 36,692,038 |
| LyondellBasell Industries NV - A | 132,396 | 13,619,577 |
| NVIDIA Corp. | 57,538 | 46,036,154 |
| ROBLOX Corp. - A * | 255,724 | 23,010,045 |
| Visa, Inc. - A | 174,238 | 40,740,329 |
| 160,098,143 | ||
| Mexico — 2.10% | ||
| Cemex SAB de CV - SP ADR 1,* | 1,480,468 | 12,435,931 |
| Grupo Financiero Banorte SAB de CV - O | 4,595,473 | 29,591,397 |
| Grupo Televisa SAB - SP ADR 1 | 861,128 | 12,296,908 |
| 54,324,236 | ||
| Total NORTH AMERICA (Cost $177,737,765) | 214,422,379 | |
| SOUTH AMERICA — 6.75% | ||
| Brazil — 6.32% | ||
| Banco BTG Pactual SA * | 1,370,077 | 33,548,128 |
| Equatorial Energia SA | 2,669,096 | 13,351,383 |
| Hapvida Participacoes e Investimentos SA 2 | 3,379,900 | 10,498,905 |
| Iguatemi Empresa de Shopping Centers SA | 1,239,527 | 10,090,564 |
| Locaweb Servicos de Internet SA 2,* | 2,405,456 | 13,067,558 |
| Natura & Co. Holding SA * | 1,789,698 | 20,326,519 |
| Pagseguro Digital Ltd. - A 1,* | 414,482 | 23,177,833 |
| Petro Rio SA * | 5,253,583 | 20,660,277 |
| Vale SA - SP ADR 1 | 823,087 | 18,774,615 |
| 163,495,782 | ||
| Shares, Principal Amount, or Number of Contracts | Value | ||
| Uruguay — 0.43% | |||
| Globant SA 1,* | 50,359 | $11,037,686 | |
| Total SOUTH AMERICA (Cost $145,818,592) | 174,533,468 | ||
| AFRICA — 0.84% | |||
| South Africa — 0.84% | |||
| Capitec Bank Holdings Ltd. | 183,463 | 21,667,134 | |
| Total AFRICA (Cost $18,052,840) | 21,667,134 | ||
| MIDDLE EAST — 0.45% | |||
| Saudi Arabia — 0.45% | |||
| Saudi Arabian Oil Co. 2 | 1,234,437 | 11,552,482 | |
| Total MIDDLE EAST (Cost $11,711,202) | 11,552,482 | ||
| Total COMMON STOCKS (Cost $1,697,365,898) | 2,438,298,454 | ||
| SHORT TERM INVESTMENTS — 4.86% | |||
| Northern Institutional U.S. Government Select Portfolio (Shares Class), 0.03% 3 (Cost $125,687,870) | 125,687,870 | 125,687,870 | |
| TOTAL INVESTMENTS (Cost $1,823,053,768) | 99.15% | $2,563,986,324 | |
| Other Assets In Excess of Liabilities | 0.85% | 21,921,736 | |
| Net Assets | 100.00% | $2,585,908,060 | |
| ADR | American Depositary Receipt |
| PJSC | Public Joint Stock Company |
| PLC | Public Limited Company |
| SP ADR | Sponsored American Depositary Receipt |
| 1 | Foreign security denominated and/or traded in U.S. dollars. |
| 2 | Security is exempt from registration under Rule 144A of the Securities Act of 1933, as amended. The total value of these securities is $132,504,499, which represents 5% of Net Assets (see Note F in the Notes to Financial Statements). |
| 3 | 7 day current yield as of June 30, 2021, is disclosed. |
| * | Non-income producing security. |
| Security Type | Percent of Total Net Assets | |
| Common Stocks | 94.29% | |
| Short Term Investments | 4.86% | |
| Total Investments | 99.15% | |
| Other Assets In Excess of Liabilities | 0.85% | |
| Total Net Assets | 100.00% |
| Regional Weightings | Percent of Total Net Assets | |
| Far East | 68.43% | |
| North America | 13.15% | |
| Europe | 9.53% | |
| South America | 6.75% | |
| Africa | 0.84% | |
| Middle East | 0.45% |
| Industry | Percent of Net Assets | |
| Auto Components | 1.09 | |
| Automobiles | 1.64 | |
| Banks | 10.42 | |
| Beverages | 1.48 | |
| Biotechnology | 2.09 | |
| Capital Markets | 2.49 | |
| Chemicals | 1.78 | |
| Commercial Services & Supplies | 0.75 | |
| Construction Materials | 0.92 | |
| Consumer Finance | 0.75 | |
| Diversified Financial Services | 0.79 | |
| Electric Utilities | 0.52 | |
| Electrical Equipment | 1.43 | |
| Electronic Equipment, Instruments & Components | 2.93 | |
| Entertainment | 3.90 | |
| Food Products | 0.71 | |
| Gas Utilities | 0.62 | |
| Health Care Providers & Services | 1.33 | |
| Hotels, Restaurants & Leisure | 1.68 | |
| Household Products | 0.30 | |
| Independent Power and Renewable Electricity Producers | 0.27 |
| Industry | Percent of Net Assets | |
| Insurance | 2.96 | |
| Interactive Media & Services | 7.30 | |
| Internet & Direct Marketing Retail | 6.28 | |
| IT Services | 6.12 | |
| Leisure Products | 0.25 | |
| Life Sciences Tools & Services | 1.47 | |
| Machinery | 2.25 | |
| Media | 0.48 | |
| Metals & Mining | 3.24 | |
| Money Market Fund | 4.86 | |
| Oil, Gas & Consumable Fuels | 4.30 | |
| Personal Products | 2.02 | |
| Real Estate Management & Development | 0.39 | |
| Semiconductors & Semiconductor Equipment | 10.93 | |
| Specialty Retail | 1.03 | |
| Technology Hardware, Storage & Peripherals | 5.37 | |
| Textiles, Apparel & Luxury Goods | 1.10 | |
| Thrifts & Mortgage Finance | 0.91 | |
| Other Assets In Excess of Liabilities | 0.85 | |
| TOTAL | 100.00 |
| Fund Only | Including Predecessor Limited Partnership | |||||
| Average Annual Total Returns as of 6/30/21 | 1 Year | 3 Years | 5 Years | Since Inception (8/22/11 - 6/30/21) | 10 Years | |
| Driehaus Emerging Markets Small Cap Growth Fund (DRESX)1 | 51.47% | 19.22% | 14.25% | 8.77% | 7.71% | |
| MSCI Emerging Markets Small Cap Index-N2 | 63.75% | 12.31% | 11.86% | 6.01% | 4.55% | |
| MSCI Emerging Markets Small Cap Growth Index-N3 | 64.20% | 13.52% | 11.46% | 5.92% | 4.48% | |

| 1 | The Driehaus Emerging Markets Small Cap Growth Fund (the “Fund”) performance shown above includes the performance of the Driehaus Emerging Markets Small Cap Growth Fund, L.P. (the “Predecessor Limited Partnership”), the Fund’s predecessor, for the periods before the Fund’s registration statement became effective. The Predecessor Limited Partnership, which was established on December 1, 2008, was managed with substantially the same investment objective, policies and philosophies as are followed by the Fund. The Fund succeeded to the Predecessor Limited Partnership’s assets on August 22, 2011. The Predecessor Limited Partnership was not registered under the Investment Company Act of 1940, as amended (“1940 Act”), and thus was not subject to certain investment and operational restrictions that are imposed by the 1940 Act. If the Predecessor Limited Partnership had been registered under the 1940 Act, its performance may have been adversely affected. The Predecessor Limited Partnership’s performance has been restated to reflect estimated expenses of the Fund. The returns for the periods prior to August 21, 2014, reflect fee waivers and/or reimbursements without which performance would have been lower. |
| 2 | The Morgan Stanley Capital International Emerging Markets Small Cap Index-Net (MSCI Emerging Markets Small Cap Index-N) is a market capitalization-weighted index designed to measure equity market performance of small cap stocks in emerging markets. Data is in U.S. dollars and is calculated with net dividend reinvestment. Source: Morgan Stanley Capital International Inc. |
| 3 | The Morgan Stanley Capital International Emerging Markets Small Cap Growth Index-Net (MSCI Emerging Markets Small Cap Growth Index-N) is a market capitalization-weighted index designed to measure equity market performance of small cap growth stocks in emerging markets. Data is in U.S. dollars and is calculated with net dividend reinvestment. Source: Morgan Stanley Capital International Inc. |
| Shares, Principal Amount, or Number of Contracts | Value | |
| COMMON STOCKS — 95.30% | ||
| FAR EAST — 77.11% | ||
| China — 23.54% | ||
| Airtac International Group | 49,000 | $1,890,534 |
| Akeso, Inc. 1,* | 156,000 | 1,258,761 |
| A-Living Smart City Services Co. Ltd. 1 | 102,000 | 507,747 |
| Aluminum Corp. of China Ltd. - H * | 2,286,000 | 1,363,185 |
| Amoy Diagnostics Co. Ltd. - A | 106,063 | 1,708,446 |
| Centre Testing International Group Co. Ltd. - A | 189,500 | 934,970 |
| Changzhou Xingyu Automotive Lighting Systems Co. Ltd. - A | 16,800 | 586,880 |
| Estun Automation Co. Ltd. - A * | 368,078 | 2,224,492 |
| Gotion High-tech Co. Ltd. - A * | 95,000 | 640,445 |
| Hygeia Healthcare Holdings Co. Ltd. 1 | 153,200 | 2,012,596 |
| Innovent Biologics, Inc. 1,* | 90,500 | 1,055,443 |
| Jiumaojiu International Holdings Ltd. 1 | 147,000 | 601,117 |
| Keshun Waterproof Technologies Co. Ltd. - A | 196,300 | 955,153 |
| Li Ning Co. Ltd. | 86,549 | 1,056,740 |
| Niu Technologies - SP ADR 2,* | 14,241 | 464,969 |
| Pharmaron Beijing Co. Ltd. - H 1 | 44,800 | 1,194,390 |
| Proya Cosmetics Co. Ltd. - A | 37,300 | 1,135,547 |
| Silergy Corp. | 17,000 | 2,312,427 |
| Sunac Services Holdings Ltd. 1 | 231,000 | 858,332 |
| Xinyi Energy Holdings Ltd. | 2,076,000 | 1,237,958 |
| Yantai Jereh Oilfield Services Group Co. Ltd. - A | 141,700 | 980,274 |
| Zhou Hei Ya International Holdings Co. Ltd. 1,* | 421,500 | 505,411 |
| 25,485,817 | ||
| India — 23.53% | ||
| ABB Power Products & Systems India Ltd. | 20,117 | 511,613 |
| Apollo Hospitals Enterprise Ltd. | 11,963 | 582,595 |
| Ashok Leyland Ltd. * | 331,255 | 546,372 |
| AU Small Finance Bank Ltd. 1,* | 38,321 | 534,035 |
| Azure Power Global Ltd. 2,* | 24,803 | 667,697 |
| Burger King India Ltd. * | 256,553 | 548,622 |
| Crompton Greaves Consumer Electricals Ltd. | 190,577 | 1,114,284 |
| Dixon Technologies India Ltd. * | 23,975 | 1,426,001 |
| Dr Lal PathLabs Ltd. 1 | 19,267 | 848,248 |
| Godrej Properties Ltd. * | 27,087 | 509,380 |
| Gujarat Gas Ltd. | 62,853 | 558,726 |
| ICICI Lombard General Insurance Co. Ltd. 1 | 47,769 | 1,007,050 |
| Shares, Principal Amount, or Number of Contracts | Value | |
| IndiaMart InterMesh Ltd. 1,* | 8,603 | $809,276 |
| Indigo Paints Ltd. * | 14,562 | 492,234 |
| Indraprastha Gas Ltd. | 188,586 | 1,415,093 |
| Info Edge India Ltd. | 14,310 | 946,379 |
| JK Cement Ltd. * | 20,562 | 788,814 |
| Jubilant Foodworks Ltd. * | 18,119 | 750,843 |
| Jubilant Ingrevia Ltd. * | 84,636 | 596,027 |
| Kaveri Seed Co. Ltd. | 112,261 | 1,102,674 |
| Max Healthcare Institute Ltd. * | 389,770 | 1,334,541 |
| Mindtree Ltd. | 19,850 | 694,470 |
| Oberoi Realty Ltd. * | 115,832 | 981,292 |
| Polycab India Ltd. * | 22,325 | 593,206 |
| Radico Khaitan Ltd. | 121,578 | 1,241,623 |
| Relaxo Footwears Ltd. * | 75,678 | 1,172,841 |
| SRF Ltd. | 14,536 | 1,422,838 |
| Supreme Industries Ltd. | 28,044 | 816,589 |
| Syngene International Ltd. 1,* | 62,704 | 492,066 |
| Varun Beverages Ltd. | 97,987 | 961,810 |
| 25,467,239 | ||
| Taiwan — 11.62% | ||
| Accton Technology Corp. | 141,000 | 1,672,517 |
| ASPEED Technology, Inc. | 10,000 | 721,400 |
| Chroma ATE, Inc. | 73,000 | 501,732 |
| Eclat Textile Co. Ltd. | 71,000 | 1,671,638 |
| Macronix International | 342,643 | 562,002 |
| Makalot Industrial Co. Ltd. | 134,000 | 1,317,757 |
| Nien Made Enterprise Co. Ltd. | 36,000 | 534,266 |
| Realtek Semiconductor Corp. | 29,300 | 531,054 |
| Sinbon Electronics Co. Ltd. | 212,000 | 2,084,809 |
| Voltronic Power Technology Corp. | 33,550 | 1,619,551 |
| Wiwynn Corp. | 38,000 | 1,359,749 |
| 12,576,475 | ||
| South Korea — 6.30% | ||
| LEENO Industrial, Inc. | 10,344 | 1,612,016 |
| Mando Corp. * | 11,741 | 693,315 |
| NHN KCP Corp. * | 11,774 | 607,441 |
| NICE Information Service Co. Ltd. | 47,905 | 1,067,722 |
| Park Systems Corp. | 8,657 | 1,003,955 |
| Tokai Carbon Korea Co. Ltd. | 7,177 | 1,284,805 |
| WONIK IPS Co. Ltd. | 12,459 | 548,743 |
| 6,817,997 | ||
| Vietnam — 5.96% | ||
| Asia Commercial Bank JSC * | 656,375 | 1,089,367 |
| Dat Xanh Real Estate Services JSC * | 1,077,000 | 1,497,393 |
| FPT Corp. | 550,567 | 2,252,407 |
| Military Commercial Joint Stock Bank * | 586,435 | 1,104,534 |
| Shares, Principal Amount, or Number of Contracts | Value | |
| SSI Securities Corp. | 211,200 | $504,692 |
| 6,448,393 | ||
| Kazakhstan — 2.18% | ||
| Kaspi.KZ JSC 1,2 | 14,595 | 1,387,255 |
| NAC Kazatomprom JSC - GDR 2,* | 33,446 | 969,934 |
| 2,357,189 | ||
| Thailand — 1.50% | ||
| Chularat Hospital PCL - NVDR | 7,618,000 | 946,010 |
| Sri Trang Gloves Thailand PCL - NVDR | 520,600 | 678,161 |
| 1,624,171 | ||
| Indonesia — 0.88% | ||
| Merdeka Copper Gold Tbk PT * | 4,728,600 | 958,764 |
| Turkey — 0.63% | ||
| Coca-Cola Icecek A/S | 76,023 | 678,874 |
| Malaysia — 0.54% | ||
| Lynas Rare Earths Ltd. * | 136,297 | 583,653 |
| Pakistan — 0.43% | ||
| Lucky Cement Ltd. * | 85,176 | 466,652 |
| Total FAR EAST (Cost $61,531,277) | 83,465,224 | |
| SOUTH AMERICA — 9.27% | ||
| Brazil — 8.79% | ||
| Banco Inter SA * | 74,700 | 1,172,960 |
| Blau Farmaceutica SA * | 55,200 | 542,145 |
| Locaweb Servicos de Internet SA 1,* | 147,500 | 801,289 |
| Meliuz SA | 160,800 | 1,600,306 |
| Orizon Valorizacao de Residuos SA * | 282,700 | 1,675,579 |
| Pet Center Comercio e Participacoes SA | 216,600 | 1,110,914 |
| TOTVS SA | 190,100 | 1,434,025 |
| Vamos Locacao de Caminhoes Maquinas e Equipamentos SA * | 102,800 | 1,172,306 |
| 9,509,524 | ||
| Uruguay — 0.48% | ||
| Globant SA 2,* | 2,377 | 520,991 |
| Total SOUTH AMERICA (Cost $6,054,251) | 10,030,515 | |
| EUROPE — 4.73% | ||
| Russia — 2.01% | ||
| Detsky Mir PJSC 2 | 511,526 | 1,058,710 |
| RusHydro PJSC 2 | 93,529,457 | 1,113,078 |
| 2,171,788 | ||
| United Kingdom — 1.82% | ||
| Ceres Power Holdings PLC * | 38,683 | 565,603 |
| Shares, Principal Amount, or Number of Contracts | Value | ||
| TCS Group Holding PLC - GDR REG S 2 | 16,039 | $1,403,412 | |
| 1,969,015 | |||
| Poland — 0.90% | |||
| Dino Polska SA 1,* | 13,316 | 977,485 | |
| Total EUROPE (Cost $3,303,945) | 5,118,288 | ||
| NORTH AMERICA — 4.19% | |||
| Mexico — 1.99% | |||
| Grupo Cementos de Chihuahua SAB de CV | 137,000 | 1,101,484 | |
| Grupo Traxion SAB de CV 1,* | 561,800 | 1,046,717 | |
| 2,148,201 | |||
| Canada — 1.31% | |||
| Ivanhoe Mines Ltd. - A * | 132,558 | 957,078 | |
| MAG Silver Corp. 2,* | 22,089 | 462,102 | |
| 1,419,180 | |||
| United States — 0.89% | |||
| Parade Technologies Ltd. | 19,455 | 967,077 | |
| Total NORTH AMERICA (Cost $3,970,584) | 4,534,458 | ||
| Total COMMON STOCKS (Cost $74,860,057) | 103,148,485 | ||
| SHORT TERM INVESTMENTS — 3.48% | |||
| Northern Institutional U.S. Government Select Portfolio (Shares Class), 0.03% 3 (Cost $3,768,138) | 3,768,138 | 3,768,138 | |
| TOTAL INVESTMENTS (Cost $78,628,195) | 98.78% | $106,916,623 | |
| Other Assets In Excess of Liabilities | 1.22% | 1,325,640 | |
| Net Assets | 100.00% | $108,242,263 | |
| GDR | Global Depositary Receipt |
| JSC | Joint Stock Company |
| NVDR | Non-Voting Depositary Receipt |
| PCL | Public Company Limited |
| PJSC | Public Joint Stock Company |
| PLC | Public Limited Company |
| SP ADR | Sponsored American Depositary Receipt |
| 1 | Security is exempt from registration under Rule 144A of the Securities Act of 1933, as amended. The total value of these securities is $15,897,218, which represents 15% of Net Assets (see Note F in the Notes to Financial Statements). |
| 2 | Foreign security denominated and/or traded in U.S. dollars. |
| 3 | 7 day current yield as of June 30, 2021, is disclosed. |
| * | Non-income producing security. |
| Security Type | Percent of Total Net Assets | |
| Common Stocks | 95.30% | |
| Short Term Investments | 3.48% | |
| Total Investments | 98.78% | |
| Other Assets In Excess of Liabilities | 1.22% | |
| Total Net Assets | 100.00% |
| Regional Weightings | Percent of Total Net Assets | |
| Far East | 77.11% | |
| South America | 9.27% | |
| North America | 7.67% | |
| Europe | 4.73% |
| Industry | Percent of Net Assets | |
| Auto Components | 1.18 | |
| Automobiles | 0.43 | |
| Banks | 4.90 | |
| Beverages | 2.67 | |
| Biotechnology | 4.21 | |
| Capital Markets | 0.47 | |
| Chemicals | 2.52 | |
| Commercial Services & Supplies | 2.02 | |
| Communications Equipment | 1.54 | |
| Construction Materials | 3.06 | |
| Consumer Finance | 1.28 | |
| Electric Utilities | 1.03 | |
| Electrical Equipment | 3.63 | |
| Electronic Equipment, Instruments & Components | 3.32 | |
| Energy Equipment & Services | 0.91 | |
| Food & Staples Retailing | 0.90 | |
| Food Products | 1.49 | |
| Gas Utilities | 1.83 | |
| Health Care Equipment & Supplies | 0.63 | |
| Health Care Providers & Services | 5.28 | |
| Hotels, Restaurants & Leisure | 1.76 | |
| Household Durables | 2.84 | |
| Independent Power and Renewable Electricity Producers | 1.76 |
| Industry | Percent of Net Assets | |
| Insurance | 0.93 | |
| Interactive Media & Services | 2.35 | |
| IT Services | 4.50 | |
| Life Sciences Tools & Services | 2.10 | |
| Machinery | 4.31 | |
| Metals & Mining | 3.99 | |
| Money Market Fund | 3.48 | |
| Oil, Gas & Consumable Fuels | 0.90 | |
| Personal Products | 1.05 | |
| Professional Services | 1.84 | |
| Real Estate Management & Development | 3.55 | |
| Road & Rail | 2.05 | |
| Semiconductors & Semiconductor Equipment | 7.90 | |
| Software | 1.33 | |
| Specialty Retail | 2.01 | |
| Technology Hardware, Storage & Peripherals | 1.26 | |
| Textiles, Apparel & Luxury Goods | 4.82 | |
| Trading Companies & Distributors | 0.75 | |
| Other Assets In Excess of Liabilities | 1.22 | |
| TOTAL | 100.00 |
| Average Annual Total Returns as of 6/30/21 | 1 Year | 3 Years | Since Inception (4/10/17 - 6/30/21) |
| Driehaus Emerging Markets Opportunities Fund (DMAGX)1 | 37.11% | 16.07% | 14.62% |
| MSCI Emerging Markets Index-N2 | 40.90% | 11.27% | 11.41% |
| MSCI EM/JP Morgan GBI Blended Index3 | 22.81% | 7.88% | 7.48% |

| 1 | Prior to January 29, 2020, the Driehaus Emerging Markets Opportunities Fund was known as the Driehaus Multi-Asset Growth Economies Fund. The returns for the period reflect fee waivers and/or reimbursements without which performance would have been lower. |
| 2 | The Morgan Stanley Capital International Emerging Markets Index-Net (MSCI Emerging Markets Index-N) is a market capitalization-weighted index designed to measure equity market performance in emerging markets. Data is in U.S. dollars and is calculated with net dividend reinvestment. Source: Morgan Stanley Capital International Inc. |
| 3 | The MSCI EM/JPMorgan GBI Blended Index is an equally weighted benchmark comprised of 50 percent by the Morgan Stanley Capital International Emerging Markets Index-Net (MSCI EM) and 50 percent by the JPMorgan Global Bond Index Emerging Markets Global Diversified (JPMorgan GBI). The MSCI EM is a market capitalization-weighted index designed to measure equity market performance in emerging markets and the JPMorgan GBI tracks debt instruments in the emerging markets. Source: Morgan Stanley Capital International Inc. and JPMorgan. |
| Shares, Principal Amount, or Number of Contracts | Value | |
| SOVEREIGN BONDS — 13.75% | ||
| Brazil — 0.80% | ||
| Brazil Notas do Tesouro Nacional Serie F 10.00%, 1/1/31 1 | 2,500,000 | $529,900 |
| China — 4.01% | ||
| China Government Bond 3.20%, 3/16/24 1 | 1,200,000 | 187,823 |
| China Government Bond 3.54%, 8/16/28 1 | 2,500,000 | 400,061 |
| China Government Bond 2.68%, 5/21/30 1 | 7,000,000 | 1,043,527 |
| China Government Bond 3.27%, 11/19/30 1 | 6,500,000 | 1,019,552 |
| 2,650,963 | ||
| Egypt — 1.53% | ||
| Egypt Government Bond 17.00%, 4/3/22 1 | 6,500,000 | 425,683 |
| Egypt Government International Bond 6.59%, 2/21/28 2 | 550,000 | 583,000 |
| 1,008,683 | ||
| Indonesia — 1.37% | ||
| Indonesia Treasury Bond 8.37%, 9/15/26 1 | 3,400,000,000 | 263,976 |
| Indonesia Treasury Bond 7.00%, 9/15/30 1 | 9,000,000,000 | 642,972 |
| 906,948 | ||
| Malaysia — 0.54% | ||
| Malaysia Government Bond 3.89%, 8/15/29 1 | 1,400,000 | 354,611 |
| Mexico — 2.79% | ||
| Banco Mercantil del Norte SA 8.37%, (U.S. Treasury Yield Curve Rate CMT 10Y + 776 basis points), 10/14/30 2,3,4 | 300,000 | 362,520 |
| Mexican Bonos 8.50%, 11/18/38 1 | 11,000,000 | 610,280 |
| Mexico Government International Bond 4.50%, 4/22/29 2 | 260,000 | 293,784 |
| Petroleos Mexicanos 6.50%, 3/13/27 2 | 550,000 | 580,525 |
| 1,847,109 | ||
| Nigeria — 0.48% | ||
| Nigeria Government International Bond 7.14%, 2/23/30 2 | 300,000 | 317,440 |
| Saudi Arabia — 0.62% | ||
| Saudi Government International Bond 2.75%, 2/3/32 2 | 400,000 | 411,225 |
| Shares, Principal Amount, or Number of Contracts | Value | |
| South Africa — 0.45% | ||
| Republic of South Africa Government Bond 8.50%, 1/31/37 1 | 4,900,000 | $295,414 |
| Turkey — 0.44% | ||
| Turkey Government International Bond 5.95%, 1/15/31 2 | 300,000 | 293,707 |
| Ukraine — 0.72% | ||
| Ukraine Government International Bond 7.38%, 9/25/32 2 | 450,000 | 474,359 |
| Total SOVEREIGN BONDS (Cost $8,774,594) | 9,090,359 | |
| COMMON STOCKS — 82.12% | ||
| Brazil — 3.46% | ||
| Iguatemi Empresa de Shopping Centers SA | 63,384 | 515,988 |
| Locaweb Servicos de Internet SA 5,* | 109,965 | 597,381 |
| LOG Commercial Properties e Participacoes SA | 78,722 | 495,554 |
| Pagseguro Digital Ltd. - A 2,6,* | 12,173 | 680,714 |
| 2,289,637 | ||
| China — 30.16% | ||
| AIA Group Ltd. | 54,220 | 673,883 |
| Akeso, Inc. 5,* | 82,122 | 662,641 |
| Alibaba Group Holding Ltd. * | 36,950 | 1,046,971 |
| Alibaba Group Holding Ltd. - SP ADR 2,6,* | 3,575 | 810,738 |
| BeiGene Ltd. - ADR 2,6,* | 1,079 | 370,302 |
| Bilibili, Inc. - SP ADR 2,6,* | 4,637 | 564,972 |
| Burning Rock Biotech Ltd. - ADR 2,6,* | 7,669 | 225,929 |
| China Merchants Bank Co. Ltd. - H | 79,049 | 674,497 |
| China Resources Beer Holdings Co. Ltd. | 75,810 | 681,033 |
| Contemporary Amperex Technology Co. Ltd. - A | 6,955 | 575,650 |
| East Money Information Co. Ltd. - A | 165,322 | 838,962 |
| Galaxy Entertainment Group Ltd. * | 79,299 | 634,756 |
| GDS Holdings Ltd. - ADR 2,6,* | 5,295 | 415,604 |
| Huazhu Group Ltd. - ADR 2,6,* | 9,411 | 496,995 |
| I-Mab - SP ADR 2,6,* | 3,408 | 286,102 |
| JD Health International, Inc. 5,* | 172 | 2,466 |
| JD.com, Inc. - ADR 2,6,* | 8,097 | 646,221 |
| KE Holdings, Inc. - ADR 2,6,* | 12,532 | 597,526 |
| Kingdee International Software Group Co. Ltd. * | 148,359 | 503,492 |
| Shares, Principal Amount, or Number of Contracts | Value | |
| Kweichow Moutai Co. Ltd. - A | 1,000 | $318,303 |
| Li Ning Co. Ltd. | 66,684 | 814,194 |
| Meituan - B 5,* | 19,720 | 813,761 |
| NIO, Inc. - ADR 2,6,* | 13,807 | 734,532 |
| Sangfor Technologies, Inc. - A | 9,700 | 389,534 |
| Tencent Holdings Ltd. | 40,961 | 3,080,925 |
| Will Semiconductor Co. Ltd. Shanghai - A | 18,200 | 906,979 |
| Wuxi Biologics Cayman, Inc. 5,* | 42,186 | 773,163 |
| Zai Lab Ltd. - ADR 2,6,* | 2,463 | 435,926 |
| Zhangzhou Pientzehuang Pharmaceutical Co. Ltd. - A | 8,047 | 558,307 |
| Zhou Hei Ya International Holdings Co. Ltd. 5,* | 337,923 | 405,196 |
| 19,939,560 | ||
| Czech Republic — 0.84% | ||
| Komercni banka A/S * | 15,709 | 552,932 |
| France — 1.51% | ||
| L'Oreal SA | 2,236 | 996,372 |
| India — 8.43% | ||
| Apollo Hospitals Enterprise Ltd. | 7,102 | 345,865 |
| Asian Paints Ltd. | 8,053 | 324,233 |
| HDFC Bank Ltd. - ADR 2,6 | 7,021 | 513,376 |
| HDFC Life Insurance Co. Ltd. 5 | 29,849 | 275,600 |
| Hindustan Unilever Ltd. | 8,576 | 285,132 |
| Housing Development Finance Corp. Ltd. | 10,109 | 336,638 |
| ICICI Bank Ltd. - SP ADR 2,6,* | 45,220 | 773,262 |
| Indraprastha Gas Ltd. | 54,398 | 408,186 |
| Power Grid Corp. of India Ltd. | 125,867 | 393,536 |
| Reliance Industries Ltd. | 30,467 | 865,131 |
| SBI Cards & Payment Services Ltd. * | 46,590 | 608,246 |
| Tech Mahindra Ltd. | 30,041 | 442,734 |
| 5,571,939 | ||
| Indonesia — 0.83% | ||
| Bank Central Asia Tbk PT | 262,549 | 545,468 |
| Japan — 1.22% | ||
| FANUC Corp. | 2,091 | 504,328 |
| Tokyo Electron Ltd. | 700 | 302,948 |
| 807,276 | ||
| Kazakhstan — 1.42% | ||
| Kaspi.KZ JSC 2,5 | 6,419 | 610,126 |
| NAC Kazatomprom JSC - GDR 2,* | 11,303 | 327,787 |
| 937,913 | ||
| Shares, Principal Amount, or Number of Contracts | Value | |
| Mexico — 1.10% | ||
| Cemex SAB de CV - SP ADR 2,6,* | 31,636 | $265,743 |
| Grupo Financiero Banorte SAB de CV - O | 71,791 | 462,280 |
| 728,023 | ||
| Netherlands — 0.91% | ||
| ASML Holding NV | 876 | 601,833 |
| Russia — 3.03% | ||
| LUKOIL PJSC - SP ADR 2 | 10,906 | 1,010,114 |
| Ozon Holdings PLC - ADR 2,6,* | 5,004 | 293,334 |
| Sberbank of Russia PJSC - SP ADR 2 | 41,924 | 696,148 |
| 1,999,596 | ||
| Saudi Arabia — 0.83% | ||
| Saudi Arabian Oil Co. 5 | 58,622 | 548,614 |
| Singapore — 0.86% | ||
| Sea Ltd. - ADR 2,6,* | 2,072 | 568,971 |
| South Africa — 0.98% | ||
| Naspers Ltd. - N | 3,094 | 649,608 |
| South Korea — 10.98% | ||
| Hankook Tire & Technology Co. Ltd. | 8,945 | 410,653 |
| Kakao Corp. | 4,380 | 633,965 |
| KB Financial Group, Inc. | 7,279 | 360,670 |
| Kia Corp. | 6,212 | 494,246 |
| LEENO Industrial, Inc. | 4,257 | 663,414 |
| Macquarie Korea Infrastructure Fund | 44,563 | 496,617 |
| Mando Corp. * | 8,775 | 518,170 |
| NICE Information Service Co. Ltd. | 12,650 | 281,947 |
| Samsung Electronics Co. Ltd. | 40,739 | 2,919,360 |
| Samsung SDI Co. Ltd. | 779 | 482,833 |
| 7,261,875 | ||
| Taiwan — 9.99% | ||
| Accton Technology Corp. | 25,631 | 304,030 |
| Chailease Holding Co. Ltd. | 94,286 | 685,255 |
| Delta Electronics, Inc. | 35,986 | 391,342 |
| Hon Hai Precision Industry Co. Ltd. | 121,103 | 486,802 |
| MediaTek, Inc. | 9,603 | 331,560 |
| Sinbon Electronics Co. Ltd. | 40,136 | 394,698 |
| Taiwan Semiconductor Manufacturing Co. Ltd. | 168,625 | 3,600,965 |
| Unimicron Technology Corp. | 89,135 | 412,684 |
| 6,607,336 | ||
| United States — 4.98% | ||
| Freeport-McMoRan, Inc. | 9,316 | 345,717 |
| Liberty Media Corp.-Liberty Formula One - C 6,* | 8,903 | 429,214 |
| Shares, Principal Amount, or Number of Contracts | Value | ||
| NVIDIA Corp. 6 | 1,760 | $1,408,176 | |
| ROBLOX Corp. - A 6,* | 6,648 | 598,187 | |
| Visa, Inc. - A 6 | 2,188 | 511,598 | |
| 3,292,892 | |||
| Uruguay — 0.59% | |||
| Globant SA 2,6,* | 1,777 | 389,483 | |
| Total COMMON STOCKS (Cost $39,712,957) | 54,289,328 | ||
| PREFERRED STOCKS — 0.64% | |||
| Brazil — 0.64% | |||
| Gerdau SA - SP ADR 5.31% 2,6,7 | 72,111 | 425,455 | |
| Total PREFERRED STOCKS (Cost $216,283) | 425,455 | ||
| SHORT TERM INVESTMENTS — 2.54% | |||
| Northern Institutional U.S. Government Select Portfolio (Shares Class), 0.03% 8 (Cost $1,679,093) | 1,679,093 | 1,679,093 | |
| TOTAL INVESTMENTS (Cost $50,382,927) | 99.05% | $65,484,235 | |
| Other Assets in Excess of Liabilities | 0.95% | 629,529 | |
| Net Assets | 100.00% | $66,113,764 | |
| ADR | American Depositary Receipt |
| GDR | Global Depositary Receipt |
| JSC | Joint Stock Company |
| PJSC | Public Joint Stock Company |
| PLC | Public Limited Company |
| SP ADR | Sponsored American Depositary Receipt |
| 1 | Foreign security, principal amount shown in local currency. |
| 2 | Foreign security denominated and/or traded in U.S. dollars. |
| 3 | Perpetual security. Maturity date shown is the next call date or final legal maturity date, whichever comes first. |
| 4 | Variable rate security. Rates disclosed as of June 30, 2021. |
| 5 | Security is exempt from registration under Rule 144A of the Securities Act of 1933, as amended. The total value of these securities is $4,688,948, which represents 7% of Net Assets (see Note F in the Notes to Financial Statements). |
| 6 | All or a portion of this security is pledged as collateral for short sales or derivatives transactions. |
| 7 | Current yield is disclosed. Dividends are calculated based on a percentage of the issuer’s net income. |
| 8 | 7 day current yield as of June 30, 2021, is disclosed. |
| * | Non-income producing security. |
| Security Type | Percent of Total Net Assets | |
| Sovereign Bonds | 13.75% | |
| Common Stocks | 82.12% | |
| Preferred Stocks | 0.64% | |
| Short Term Investments | 2.54% | |
| Total Investments | 99.05% | |
| Other Assets In Excess of Liabilities | 0.95% | |
| Total Net Assets | 100.00% |
| Regional Weightings | Percent of Total Net Assets | |
| Far East | 69.81% | |
| North America | 11.41% | |
| Europe | 7.01% | |
| South America | 5.49% | |
| Africa | 3.44% | |
| Middle East | 1.89% |
| Industry | Percent of Net Assets | |
| Auto Components | 1.40 | |
| Automobiles | 1.86 | |
| Banks | 6.93 | |
| Beverages | 1.51 | |
| Biotechnology | 2.99 | |
| Capital Markets | 2.02 | |
| Chemicals | 0.49 | |
| Communications Equipment | 0.46 | |
| Construction Materials | 0.40 | |
| Consumer Finance | 1.84 | |
| Diversified Financial Services | 1.04 | |
| Electric Utilities | 0.59 | |
| Electrical Equipment | 0.87 | |
| Electronic Equipment, Instruments & Components | 3.27 | |
| Entertainment | 3.28 | |
| Food Products | 0.61 | |
| Gas Utilities | 0.62 | |
| Health Care Providers & Services | 0.52 | |
| Hotels, Restaurants & Leisure | 1.71 | |
| Household Products | 0.43 | |
| Insurance | 1.44 |
| Industry | Percent of Net Assets | |
| Interactive Media & Services | 5.62 | |
| Internet & Direct Marketing Retail | 6.45 | |
| IT Services | 4.59 | |
| Life Sciences Tools & Services | 1.17 | |
| Machinery | 0.76 | |
| Metals & Mining | 1.16 | |
| Money Market Fund | 2.54 | |
| Oil, Gas & Consumable Fuels | 4.17 | |
| Personal Products | 1.51 | |
| Pharmaceuticals | 0.85 | |
| Professional Services | 0.43 | |
| Real Estate Management & Development | 2.44 | |
| Semiconductors & Semiconductor Equipment | 11.82 | |
| Software | 1.35 | |
| Sovereign Bonds | 13.75 | |
| Technology Hardware, Storage & Peripherals | 4.42 | |
| Textiles, Apparel & Luxury Goods | 1.23 | |
| Thrifts & Mortgage Finance | 0.51 | |
| Other Assets In Excess of Liabilities | 0.95 | |
| TOTAL | 100.00 |
| Average Annual Total Returns as of 6/30/21 | 1 Year | 3 Years | 5 Years | 10 Years |
| Driehaus International Small Cap Growth Fund | 53.97% | 15.81% | 16.59% | 10.38% |
| MSCI AC World ex USA Small Cap Growth Index-N1 | 44.91% | 11.91% | 13.29% | 7.89% |
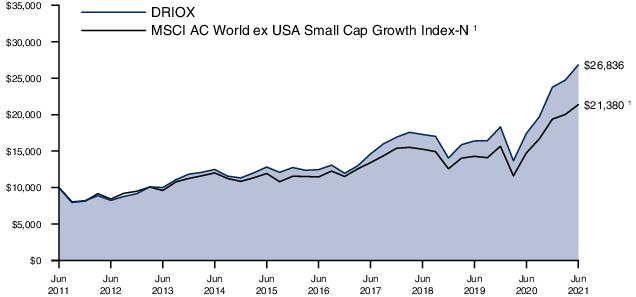
| 1 | The Morgan Stanley Capital International All Country World ex USA Small Cap Growth Index-Net (MSCI AC World ex USA Small Cap Growth Index-N) is a market capitalization-weighted index designed to measure equity market performance in global developed markets and emerging markets, excluding the U.S., and is composed of stocks which are categorized as small capitalization growth stocks. Data is in U.S. dollars and is calculated with net dividend reinvestment. Source: Morgan Stanley Capital International Inc. |
| Shares, Principal Amount, or Number of Contracts | Value | |
| COMMON STOCKS — 97.29% | ||
| EUROPE — 67.92% | ||
| United Kingdom — 23.30% | ||
| 888 Holdings PLC | 392,282 | $2,082,667 |
| Abcam PLC * | 174,500 | 3,333,539 |
| Aston Martin Lagonda Global Holdings PLC 1,* | 81,204 | 2,108,986 |
| B&M European Value Retail SA | 302,810 | 2,401,004 |
| Bellway PLC | 50,207 | 2,250,224 |
| Conduit Holdings Ltd. * | 362,634 | 2,633,566 |
| ConvaTec Group PLC 1 | 1,311,907 | 4,366,315 |
| Cranswick PLC | 57,213 | 3,141,967 |
| easyJet PLC * | 108,050 | 1,337,418 |
| Electrocomponents PLC | 295,456 | 4,205,568 |
| Endava PLC - SP ADR 2,* | 31,636 | 3,586,890 |
| Fevertree Drinks PLC | 80,124 | 2,851,799 |
| Halfords Group PLC * | 590,912 | 3,524,666 |
| IMI PLC | 137,137 | 3,262,868 |
| LivaNova PLC 2,* | 41,924 | 3,526,228 |
| OSB Group PLC | 624,033 | 4,005,364 |
| Pets at Home Group PLC | 255,925 | 1,614,336 |
| Serco Group PLC | 1,104,097 | 2,072,543 |
| Spirax-Sarco Engineering PLC | 12,440 | 2,342,904 |
| Stock Spirits Group PLC | 516,389 | 1,867,949 |
| Synthomer PLC | 559,092 | 3,801,995 |
| The Restaurant Group PLC * | 1,324,991 | 2,349,727 |
| The Weir Group PLC * | 162,330 | 4,156,441 |
| Vesuvius PLC | 379,886 | 2,774,621 |
| Watches of Switzerland Group PLC 1,* | 247,594 | 2,863,273 |
| WH Smith PLC * | 82,118 | 1,827,157 |
| 74,290,015 | ||
| Germany — 12.74% | ||
| About You Holding AG * | 22,171 | 670,376 |
| Befesa SA 1 | 65,480 | 5,031,261 |
| DWS Group GmbH & Co. KGaA 1 | 46,344 | 2,100,281 |
| flatexDEGIRO AG * | 13,795 | 1,856,568 |
| hGears AG * | 33,449 | 987,588 |
| Hornbach Holding AG & Co. KGaA | 34,783 | 3,963,543 |
| HUGO BOSS AG | 46,273 | 2,517,354 |
| Ibu-Tec Advanced Materials AG * | 25,383 | 1,643,345 |
| PVA TePla AG * | 54,906 | 1,611,344 |
| Scout24 AG 1 | 35,455 | 2,989,940 |
| SGL Carbon SE * | 202,729 | 1,944,722 |
| SUESS MicroTec SE * | 125,451 | 4,120,473 |
| TAG Immobilien AG | 67,868 | 2,153,497 |
| VERBIO Vereinigte BioEnergie AG | 58,803 | 2,978,680 |
| Shares, Principal Amount, or Number of Contracts | Value | |
| zooplus AG * | 18,740 | $6,070,766 |
| 40,639,738 | ||
| Netherlands — 4.86% | ||
| Accell Group NV * | 48,183 | 2,588,125 |
| Corbion NV | 37,188 | 2,125,412 |
| Meltwater Holding BV * | 404,775 | 2,157,587 |
| Merus NV 2,* | 90,188 | 1,900,261 |
| OCI NV * | 276,940 | 6,738,391 |
| 15,509,776 | ||
| Denmark — 4.55% | ||
| ISS A/S * | 150,412 | 3,530,500 |
| Matas A/S | 247,500 | 4,483,317 |
| Netcompany Group A/S 1 | 24,930 | 2,832,390 |
| Royal Unibrew A/S | 28,698 | 3,655,405 |
| 14,501,612 | ||
| Switzerland — 3.66% | ||
| Bachem Holding AG - B | 2,830 | 1,676,131 |
| Belimo Holding AG | 3,611 | 1,650,854 |
| Flughafen Zurich AG * | 16,105 | 2,663,134 |
| Montana Aerospace AG 1,* | 75,115 | 3,162,096 |
| Tecan Group AG | 5,089 | 2,521,262 |
| 11,673,477 | ||
| France — 3.56% | ||
| Coface SA | 360,509 | 4,368,780 |
| Maisons du Monde SA 1,* | 95,069 | 2,356,017 |
| Virbac SA | 13,475 | 4,617,637 |
| 11,342,434 | ||
| Sweden — 3.48% | ||
| BHG Group AB * | 83,051 | 1,606,074 |
| Boozt AB 1,* | 88,145 | 1,936,325 |
| Elekta AB - B | 238,746 | 3,459,238 |
| Kindred Group PLC | 99,145 | 1,554,118 |
| Mekonomen AB * | 154,322 | 2,549,763 |
| 11,105,518 | ||
| Austria — 3.13% | ||
| AT&S Austria Technologie & Systemtechnik AG | 124,155 | 5,373,413 |
| BAWAG Group AG 1,* | 86,814 | 4,619,934 |
| 9,993,347 | ||
| Finland — 2.36% | ||
| Metso Outotec OYJ | 509,070 | 5,913,158 |
| Tokmanni Group Corp. | 58,336 | 1,613,089 |
| 7,526,247 | ||
| Ireland — 1.56% | ||
| Glanbia PLC | 84,124 | 1,368,571 |
| James Hardie Industries PLC | 106,518 | 3,616,311 |
| 4,984,882 | ||
| Shares, Principal Amount, or Number of Contracts | Value | |
| Spain — 1.44% | ||
| Almirall SA | 262,172 | $4,572,905 |
| Norway — 0.94% | ||
| Nordic Semiconductor ASA * | 77,207 | 1,956,594 |
| SmartCraft ASA * | 429,481 | 1,052,734 |
| 3,009,328 | ||
| Iceland — 0.71% | ||
| Ossur HF * | 307,852 | 2,270,385 |
| Belgium — 0.68% | ||
| Bekaert SA | 48,608 | 2,165,996 |
| Italy — 0.51% | ||
| FinecoBank Banca Fineco SpA * | 93,113 | 1,623,009 |
| Poland — 0.44% | ||
| CCC SA * | 47,534 | 1,400,589 |
| Total EUROPE (Cost $161,840,571) | 216,609,258 | |
| FAR EAST — 15.72% | ||
| Japan — 12.61% | ||
| Asics Corp. | 130,200 | 3,295,579 |
| ASKUL Corp. | 200,650 | 3,128,186 |
| Capcom Co. Ltd. | 44,900 | 1,313,515 |
| Fujitec Co. Ltd. | 139,950 | 3,103,981 |
| Iwatani Corp. | 23,100 | 1,384,815 |
| MINEBEA MITSUMI, Inc. | 80,354 | 2,125,752 |
| MISUMI Group, Inc. | 107,300 | 3,631,559 |
| Nichias Corp. | 66,830 | 1,681,352 |
| NSK Ltd. | 225,800 | 1,908,513 |
| Pola Orbis Holdings, Inc. | 143,600 | 3,792,451 |
| Raccoon Holdings, Inc. | 86,000 | 1,777,362 |
| Sugi Holdings Co. Ltd. | 12,583 | 917,434 |
| Takeuchi Manufacturing Co. Ltd. | 98,100 | 2,443,339 |
| THK Co. Ltd. | 111,823 | 3,336,723 |
| Tokai Carbon Co. Ltd. | 170,200 | 2,347,058 |
| ZOZO, Inc. | 118,100 | 4,013,029 |
| 40,200,648 | ||
| Taiwan — 1.11% | ||
| Giant Manufacturing Co. Ltd. | 309,589 | 3,538,954 |
| Australia — 0.93% | ||
| NEXTDC Ltd. * | 334,925 | 2,978,959 |
| China — 0.69% | ||
| Burning Rock Biotech Ltd. - ADR 2,* | 19,130 | 563,570 |
| Genetron Holdings Ltd. - ADR 2,* | 81,384 | 1,639,074 |
| 2,202,644 | ||
| Shares, Principal Amount, or Number of Contracts | Value | |
| South Korea — 0.38% | ||
| Douzone Bizon Co. Ltd. | 16,269 | $1,199,065 |
| Total FAR EAST (Cost $42,370,895) | 50,120,270 | |
| NORTH AMERICA — 9.87% | ||
| Canada — 9.17% | ||
| Altus Group Ltd. | 46,753 | 2,166,796 |
| AutoCanada, Inc. * | 63,688 | 2,565,811 |
| Boardwalk REIT | 70,150 | 2,313,433 |
| Docebo, Inc. * | 60,125 | 3,558,220 |
| Intertape Polymer Group, Inc. | 178,230 | 4,132,244 |
| K92 Mining, Inc. * | 380,081 | 2,747,278 |
| Kinaxis, Inc. * | 32,465 | 4,270,787 |
| Methanex Corp. | 61,639 | 2,043,197 |
| Parkland Corp. | 73,675 | 2,380,946 |
| Sleep Country Canada Holdings, Inc. 1 | 128,645 | 3,079,136 |
| 29,257,848 | ||
| Mexico — 0.47% | ||
| Grupo Cementos de Chihuahua SAB de CV | 185,986 | 1,495,333 |
| United States — 0.23% | ||
| MaxCyte, Inc. * | 59,052 | 735,180 |
| Total NORTH AMERICA (Cost $25,068,756) | 31,488,361 | |
| SOUTH AMERICA — 2.52% | ||
| Brazil — 2.52% | ||
| Cyrela Brazil Realty SA Empreendimentos e Participacoes | 468,500 | 2,228,620 |
| Embraer SA * | 482,300 | 1,829,788 |
| Iochpe Maxion SA * | 788,900 | 2,539,364 |
| Meliuz SA | 144,900 | 1,442,067 |
| 8,039,839 | ||
| Total SOUTH AMERICA (Cost $6,768,288) | 8,039,839 | |
| MIDDLE EAST — 1.26% | ||
| Israel — 1.26% | ||
| Kornit Digital Ltd. 2,* | 32,214 | 4,005,166 |
| Total MIDDLE EAST (Cost $2,232,453) | 4,005,166 | |
| Total COMMON STOCKS (Cost $238,280,963) | 310,262,894 | |
| Shares, Principal Amount, or Number of Contracts | Value | ||
| PREFERRED STOCKS — 0.80% | |||
| SOUTH AMERICA — 0.80% | |||
| Brazil — 0.80% | |||
| Azul SA * | 290,700 | $2,555,270 | |
| Total SOUTH AMERICA (Cost $2,756,173) | 2,555,270 | ||
| Total PREFERRED STOCKS (Cost $2,756,173) | 2,555,270 | ||
| SHORT TERM INVESTMENTS — 1.53% | |||
| Northern Institutional U.S. Government Select Portfolio (Shares Class), 0.03% 3 (Cost $4,876,996) | 4,876,996 | 4,876,996 | |
| TOTAL INVESTMENTS (Cost $245,914,132) | 99.62% | $317,695,160 | |
| Other Assets In Excess of Liabilities | 0.38% | 1,202,862 | |
| Net Assets | 100.00% | $318,898,022 | |
| ADR | American Depositary Receipt |
| PLC | Public Limited Company |
| REIT | Real Estate Investment Trust |
| SP ADR | Sponsored American Depositary Receipt |
| 1 | Security is exempt from registration under Rule 144A of the Securities Act of 1933, as amended. The total value of these securities is $37,445,954, which represents 12% of Net Assets (see Note F in the Notes to Financial Statements). |
| 2 | Foreign security denominated and/or traded in U.S. dollars. |
| 3 | 7 day current yield as of June 30, 2021, is disclosed. |
| * | Non-income producing security. |
| Security Type | Percent of Total Net Assets | |
| Common Stocks | 97.29% | |
| Preferred Stocks | 0.80% | |
| Short Term Investments | 1.53% | |
| Total Investments | 99.62% | |
| Other Assets In Excess of Liabilities | 0.38% | |
| Total Net Assets | 100.00% |
| Regional Weightings | Percent of Total Net Assets | |
| Europe | 67.92% | |
| Far East | 15.72% | |
| North America | 11.40% | |
| South America | 3.32% | |
| Middle East | 1.26% |
| Industry | Percent of Net Assets | |
| Aerospace & Defense | 1.56 | |
| Airlines | 1.22 | |
| Auto Components | 0.31 | |
| Automobiles | 0.66 | |
| Banks | 1.96 | |
| Beverages | 2.63 | |
| Biotechnology | 2.56 | |
| Building Products | 1.05 | |
| Capital Markets | 1.24 | |
| Chemicals | 5.86 | |
| Commercial Services & Supplies | 3.34 | |
| Construction Materials | 1.60 | |
| Containers & Packaging | 1.30 | |
| Electrical Equipment | 0.61 | |
| Electronic Equipment, Instruments & Components | 1.68 | |
| Entertainment | 0.41 | |
| Food & Staples Retailing | 0.29 | |
| Food Products | 1.41 | |
| Health Care Equipment & Supplies | 4.27 | |
| Hotels, Restaurants & Leisure | 1.88 | |
| Household Durables | 1.41 | |
| Insurance | 2.20 | |
| Interactive Media & Services | 1.39 | |
| Internet & Direct Marketing Retail | 6.02 |
| Industry | Percent of Net Assets | |
| IT Services | 2.05 | |
| Leisure Products | 1.92 | |
| Life Sciences Tools & Services | 1.32 | |
| Machinery | 13.03 | |
| Metals & Mining | 1.54 | |
| Money Market Fund | 1.53 | |
| Multiline Retail | 1.26 | |
| Oil, Gas & Consumable Fuels | 2.11 | |
| Personal Products | 1.19 | |
| Pharmaceuticals | 2.89 | |
| Professional Services | 0.68 | |
| Real Estate Investment Trusts (REITs) | 0.72 | |
| Real Estate Management & Development | 1.36 | |
| Semiconductors & Semiconductor Equipment | 2.40 | |
| Software | 4.06 | |
| Specialty Retail | 9.03 | |
| Textiles, Apparel & Luxury Goods | 2.26 | |
| Thrifts & Mortgage Finance | 1.26 | |
| Trading Companies & Distributors | 1.32 | |
| Transportation Infrastructure | 0.83 | |
| Other Assets In Excess of Liabilities | 0.38 | |
| TOTAL | 100.00 |
| Fund Only | Including Predecessor Limited Partnership | |||||
| Average Annual Total Returns as of 6/30/21 | 1 Year | 3 Years | 5 Years | Since Inception (11/18/13 - 6/30/21) | 10 Years | |
| Driehaus Micro Cap Growth Fund (DMCRX)1 | 90.94% | 36.68% | 36.44% | 24.42% | 22.61% | |
| Russell Microcap® Growth Index2 | 65.78% | 17.29% | 18.82% | 12.14% | 13.01% | |
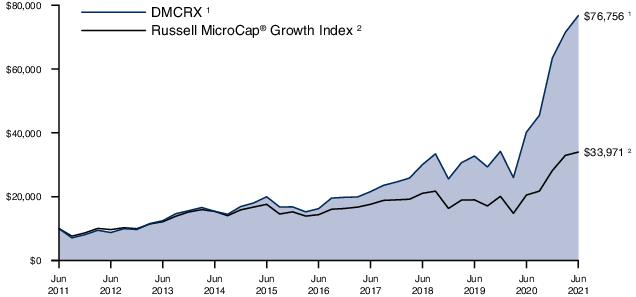
| 1 | The Driehaus Micro Cap Growth Fund (the “Fund”) performance shown above includes the performance of the Driehaus Micro Cap Fund, L.P. (the “Predecessor Limited Partnership”), one of the Fund’s predecessors, for the periods before the Fund’s registration statement became effective. The Predecessor Limited Partnership, which was established on July 1, 1996, was managed with substantially the same investment objective, policies and philosophies as are followed by the Fund. The Fund succeeded to the Predecessor Limited Partnership’s assets together with the assets of the Driehaus Institutional Micro Cap Fund, L.P. on November 18, 2013. The Predecessor Limited Partnership was not registered under the Investment Company Act of 1940, as amended (“1940 Act”), and thus was not subject to certain investment and operational restrictions that are imposed by the 1940 Act. If the Predecessor Limited Partnership had been registered under the 1940 Act, its performance may have been adversely affected. The Predecessor Limited Partnership’s performance has been restated to reflect estimated expenses of the Fund. The returns for periods prior to November 18, 2016, reflect fee waivers and/or reimbursements without which performance would have been lower. |
| 2 | The Russell Microcap® Growth Index measures the performance of the microcap growth segment of the U.S. equity market. It includes those Russell Microcap companies that are considered more growth oriented relative to the overall market as defined by FTSE Russell's leading style methodology. The Russell Microcap® Growth Index is constructed to provide a comprehensive and unbiased barometer for the microcap growth segment of the market. Data is calculated with net dividend reinvestment. Source: FTSE Russell. |
| Shares, Principal Amount, or Number of Contracts | Value | |
| COMMON STOCKS — 99.90% | ||
| HEALTH CARE — 25.71% | ||
| Biotechnology — 15.30% | ||
| Apellis Pharmaceuticals, Inc. * | 38,213 | $2,415,062 |
| Applied Therapeutics, Inc. * | 71,332 | 1,482,279 |
| Ardelyx, Inc. * | 297,951 | 2,258,469 |
| Avid Bioservices, Inc. * | 182,730 | 4,687,024 |
| Biomea Fusion, Inc. * | 64,761 | 1,010,919 |
| C4 Therapeutics, Inc. * | 14,924 | 564,724 |
| Celldex Therapeutics, Inc. * | 81,912 | 2,739,137 |
| Centessa Pharmaceuticals PLC - ADR 1,* | 78,615 | 1,746,039 |
| Crinetics Pharmaceuticals, Inc. * | 198,244 | 3,736,899 |
| Cytokinetics, Inc. * | 193,816 | 3,835,619 |
| Day One Biopharmaceuticals, Inc. * | 64,160 | 1,460,923 |
| Elevation Oncology, Inc. * | 47,710 | 647,425 |
| Essa Pharma, Inc. 1,* | 51,349 | 1,467,041 |
| Gamida Cell Ltd. 1,* | 141,116 | 904,554 |
| Intellia Therapeutics, Inc. * | 25,859 | 4,186,831 |
| Merus NV 1,* | 80,747 | 1,701,339 |
| Mirum Pharmaceuticals, Inc. * | 32,878 | 568,461 |
| Morphic Holding, Inc. * | 27,501 | 1,578,282 |
| Natera, Inc. * | 51,673 | 5,866,436 |
| ProQR Therapeutics NV 1,* | 265,622 | 1,790,292 |
| Relay Therapeutics, Inc. * | 153,080 | 5,601,197 |
| SpringWorks Therapeutics, Inc. * | 82,848 | 6,827,504 |
| VectivBio Holding AG 1,* | 67,249 | 784,123 |
| Xenon Pharmaceuticals, Inc. 1,* | 98,784 | 1,839,358 |
| 59,699,937 | ||
| Health Care Equipment & Supplies — 5.47% | ||
| Alphatec Holdings, Inc. * | 231,074 | 3,540,054 |
| Axogen, Inc. * | 45,764 | 988,960 |
| Axonics, Inc. * | 55,812 | 3,539,039 |
| CryoPort, Inc. * | 73,441 | 4,634,127 |
| SeaSpine Holdings Corp. * | 139,521 | 2,861,576 |
| SI-BONE, Inc. * | 82,114 | 2,584,128 |
| Sientra, Inc. * | 220,837 | 1,757,862 |
| Treace Medical Concepts, Inc. * | 46,428 | 1,451,339 |
| 21,357,085 | ||
| Health Care Technology — 1.72% | ||
| Inspire Medical Systems, Inc. * | 11,256 | 2,175,334 |
| OptimizeRx Corp. * | 17,908 | 1,108,505 |
| Phreesia, Inc. * | 56,059 | 3,436,417 |
| 6,720,256 | ||
| Health Care Providers & Services — 1.67% | ||
| Castle Biosciences, Inc. * | 53,260 | 3,905,556 |
| Cross Country Healthcare, Inc. * | 84,799 | 1,400,032 |
| Shares, Principal Amount, or Number of Contracts | Value | |
| RadNet, Inc. * | 35,412 | $1,193,030 |
| 6,498,618 | ||
| Life Sciences Tools & Services — 1.06% | ||
| NeoGenomics, Inc. * | 45,620 | 2,060,656 |
| Quanterix Corp. * | 35,014 | 2,053,921 |
| 4,114,577 | ||
| Pharmaceuticals — 0.49% | ||
| EyePoint Pharmaceuticals, Inc. * | 111,734 | 1,004,489 |
| Revance Therapeutics, Inc. * | 30,496 | 903,901 |
| 1,908,390 | ||
| Total HEALTH CARE (Cost $67,795,121) | 100,298,863 | |
| CONSUMER DISCRETIONARY — 21.21% | ||
| Hotels, Restaurants & Leisure — 5.27% | ||
| Bally's Corp. * | 95,581 | 5,171,888 |
| Everi Holdings, Inc. * | 271,778 | 6,778,144 |
| Full House Resorts, Inc. * | 234,778 | 2,333,693 |
| GAN Ltd. 1,* | 61,577 | 1,012,326 |
| Lindblad Expeditions Holdings, Inc. * | 121,117 | 1,939,083 |
| NEOGAMES SA 1,* | 53,826 | 3,308,684 |
| 20,543,818 | ||
| Specialty Retail — 4.10% | ||
| Abercrombie & Fitch Co. - A * | 61,167 | 2,839,984 |
| Boot Barn Holdings, Inc. * | 84,649 | 7,114,748 |
| GrowGeneration Corp. * | 125,477 | 6,035,444 |
| 15,990,176 | ||
| Internet & Direct Marketing Retail — 3.56% | ||
| 1stdibs.com, Inc. * | 58,989 | 2,053,407 |
| CarParts.com, Inc. * | 147,100 | 2,994,956 |
| Liquidity Services, Inc. * | 82,382 | 2,096,622 |
| PubMatic, Inc. - A * | 133,520 | 5,216,626 |
| RumbleON, Inc. - B * | 38,079 | 1,541,057 |
| 13,902,668 | ||
| Household Durables — 3.04% | ||
| Skyline Champion Corp. * | 77,343 | 4,122,382 |
| The Lovesac Co. * | 81,948 | 6,538,631 |
| VOXX International Corp. * | 85,286 | 1,194,857 |
| 11,855,870 | ||
| Auto Components — 2.73% | ||
| Fox Factory Holding Corp. * | 21,928 | 3,413,313 |
| Modine Manufacturing Co. * | 119,782 | 1,987,183 |
| XPEL, Inc. * | 62,494 | 5,241,372 |
| 10,641,868 | ||
| Leisure Products — 1.98% | ||
| Malibu Boats, Inc. - A * | 26,904 | 1,972,870 |
| Shares, Principal Amount, or Number of Contracts | Value | |
| Vista Outdoor, Inc. * | 124,450 | $5,759,546 |
| 7,732,416 | ||
| Distributors — 0.53% | ||
| Funko, Inc. - A * | 97,469 | 2,074,140 |
| Total CONSUMER DISCRETIONARY (Cost $45,278,336) | 82,740,956 | |
| INFORMATION TECHNOLOGY — 16.66% | ||
| Semiconductors & Semiconductor Equipment — 6.28% | ||
| Axcelis Technologies, Inc. * | 63,678 | 2,573,865 |
| AXT, Inc. * | 170,682 | 1,874,088 |
| Camtek Ltd. 1,* | 72,367 | 2,728,960 |
| Impinj, Inc. * | 63,005 | 3,250,428 |
| SiTime Corp. * | 36,333 | 4,599,394 |
| SkyWater Technology, Inc. * | 104,996 | 3,008,135 |
| Ultra Clean Holdings, Inc. * | 120,110 | 6,452,309 |
| 24,487,179 | ||
| Communications Equipment — 5.27% | ||
| Aviat Networks, Inc. * | 85,021 | 2,786,138 |
| Calix, Inc. * | 166,747 | 7,920,483 |
| Cambium Networks Corp. * | 101,892 | 4,926,478 |
| Clearfield, Inc. * | 50,972 | 1,908,901 |
| Sierra Wireless, Inc. 1,* | 159,434 | 3,027,652 |
| 20,569,652 | ||
| Software — 3.10% | ||
| Avaya Holdings Corp. * | 109,078 | 2,934,198 |
| ChannelAdvisor Corp. * | 222,756 | 5,459,750 |
| Docebo, Inc. 1,* | 62,699 | 3,701,122 |
| 12,095,070 | ||
| IT Services — 2.01% | ||
| Endava PLC - SP ADR 1,* | 35,615 | 4,038,029 |
| Grid Dynamics Holdings, Inc. * | 117,278 | 1,762,688 |
| Integral Ad Science Holding Corp. * | 99,369 | 2,045,014 |
| 7,845,731 | ||
| Total INFORMATION TECHNOLOGY (Cost $41,781,078) | 64,997,632 | |
| INDUSTRIALS — 11.76% | ||
| Machinery — 4.18% | ||
| Agrify Corp. * | 117,113 | 1,393,645 |
| Chart Industries, Inc. * | 23,167 | 3,389,796 |
| Energy Recovery, Inc. * | 29,496 | 671,919 |
| Hydrofarm Holdings Group, Inc. * | 57,984 | 3,427,434 |
| Terex Corp. | 80,094 | 3,814,076 |
| The Shyft Group, Inc. | 96,213 | 3,599,328 |
| 16,296,198 | ||
| Shares, Principal Amount, or Number of Contracts | Value | |
| Airlines — 1.21% | ||
| Spirit Airlines, Inc. * | 73,005 | $2,222,272 |
| Sun Country Airlines Holdings, Inc. * | 67,170 | 2,485,962 |
| 4,708,234 | ||
| Electrical Equipment — 1.19% | ||
| Stem, Inc. * | 56,672 | 2,040,759 |
| Vicor Corp. * | 24,573 | 2,598,349 |
| 4,639,108 | ||
| Aerospace & Defense — 1.10% | ||
| Embraer SA - SP ADR 1,* | 282,359 | 4,274,915 |
| Commercial Services & Supplies — 1.05% | ||
| Montrose Environmental Group, Inc. * | 76,648 | 4,112,931 |
| Trading Companies & Distributors — 0.94% | ||
| Karat Packaging, Inc. * | 98,369 | 2,003,777 |
| Titan Machinery, Inc. * | 53,497 | 1,655,197 |
| 3,658,974 | ||
| Marine — 0.93% | ||
| Star Bulk Carriers Corp. 1 | 158,366 | 3,634,499 |
| Road & Rail — 0.78% | ||
| HyreCar, Inc. * | 145,315 | 3,039,990 |
| Construction & Engineering — 0.38% | ||
| NV5 Global, Inc. * | 15,884 | 1,501,197 |
| Total INDUSTRIALS (Cost $29,480,702) | 45,866,046 | |
| FINANCIALS — 7.38% | ||
| Banks — 2.62% | ||
| Live Oak Bancshares, Inc. | 65,914 | 3,888,926 |
| Silvergate Capital Corp. - A * | 22,483 | 2,547,773 |
| Triumph Bancorp, Inc. * | 50,756 | 3,768,633 |
| 10,205,332 | ||
| Capital Markets — 1.92% | ||
| Cowen, Inc. - A | 78,954 | 3,241,062 |
| Open Lending Corp. - A * | 98,934 | 4,263,066 |
| 7,504,128 | ||
| Insurance — 1.49% | ||
| BRP Group, Inc. - A * | 73,907 | 1,969,622 |
| Goosehead Insurance, Inc. - A | 11,745 | 1,495,138 |
| Midwest Holding, Inc. * | 15,323 | 599,436 |
| Trean Insurance Group, Inc. * | 117,049 | 1,765,099 |
| 5,829,295 | ||
| Thrifts & Mortgage Finance — 0.86% | ||
| Meta Financial Group, Inc. | 66,411 | 3,362,389 |
| Holding Companies - Diversified — 0.49% | ||
| CM Life Sciences III, Inc. 2,* | 173,706 | 1,902,081 |
| Total FINANCIALS (Cost $15,156,544) | 28,803,225 | |
| Shares, Principal Amount, or Number of Contracts | Value | |
| ENERGY — 6.82% | ||
| Oil, Gas & Consumable Fuels — 4.97% | ||
| Bonanza Creek Energy, Inc. | 96,126 | $4,524,651 |
| Callon Petroleum Co. * | 35,315 | 2,037,322 |
| Energy Fuels, Inc. * | 198,604 | 1,201,554 |
| Green Plains, Inc. * | 140,982 | 4,739,815 |
| Matador Resources Co. | 191,051 | 6,879,747 |
| 19,383,089 | ||
| Energy Equipment & Services — 1.85% | ||
| Aspen Aerogels, Inc. * | 126,093 | 3,772,702 |
| DMC Global, Inc. * | 29,517 | 1,659,151 |
| Oceaneering International, Inc. * | 114,647 | 1,785,054 |
| 7,216,907 | ||
| Total ENERGY (Cost $18,045,619) | 26,599,996 | |
| CONSUMER STAPLES — 6.00% | ||
| Beverages — 2.82% | ||
| Celsius Holdings, Inc. * | 115,009 | 8,751,035 |
| The Duckhorn Portfolio, Inc. * | 101,647 | 2,242,333 |
| 10,993,368 | ||
| Personal Products — 1.43% | ||
| BellRing Brands, Inc. - A * | 79,076 | 2,478,242 |
| The Beauty Health Co. * | 185,198 | 3,111,326 |
| 5,589,568 | ||
| Food Products — 1.00% | ||
| SunOpta, Inc. 1,* | 318,243 | 3,895,294 |
| Tobacco — 0.75% | ||
| Turning Point Brands, Inc. | 64,113 | 2,934,452 |
| Total CONSUMER STAPLES (Cost $13,696,884) | 23,412,682 | |
| COMMUNICATION SERVICES — 3.07% | ||
| Media — 1.57% | ||
| Cardlytics, Inc. * | 17,164 | 2,178,627 |
| Perion Network Ltd. 1,* | 184,986 | 3,962,400 |
| 6,141,027 | ||
| Interactive Media & Services — 1.35% | ||
| Eventbrite, Inc. - A * | 128,550 | 2,442,450 |
| fuboTV, Inc. * | 87,247 | 2,801,501 |
| 5,243,951 | ||
| Entertainment — 0.15% | ||
| Motorsport Games, Inc. - A * | 41,175 | 576,450 |
| Total COMMUNICATION SERVICES (Cost $8,433,444) | 11,961,428 | |
| Shares, Principal Amount, or Number of Contracts | Value | ||
| MATERIALS — 1.29% | |||
| Metals & Mining — 0.72% | |||
| Gatos Silver, Inc. * | 78,396 | $1,371,146 | |
| Kaiser Aluminum Corp. | 11,635 | 1,436,806 | |
| 2,807,952 | |||
| Containers & Packaging — 0.57% | |||
| Ranpak Holdings Corp. * | 89,212 | 2,232,977 | |
| Total MATERIALS (Cost $4,772,667) | 5,040,929 | ||
| Total COMMON STOCKS (Cost $244,440,395) | 389,721,757 | ||
| SHORT TERM INVESTMENTS — 0.42% | |||
| Northern Institutional U.S. Government Select Portfolio (Shares Class), 0.03% 3 (Cost $1,648,787) | 1,648,787 | 1,648,787 | |
| TOTAL INVESTMENTS (Cost $246,089,182) | 100.32% | $391,370,544 | |
| Liabilities In Excess of Other Assets | (0.32)% | (1,254,568) | |
| Net Assets | 100.00% | $390,115,976 | |
| ADR | American Depositary Receipt |
| PLC | Public Limited Company |
| SP ADR | Sponsored American Depositary Receipt |
| 1 | Foreign security denominated and/or traded in U.S. dollars. |
| 2 | Special Purpose Acquisition Company (SPAC). |
| 3 | 7 day current yield as of June 30, 2021, is disclosed. |
| * | Non-income producing security. |
| Security Type | Percent of Total Net Assets | |
| Common Stocks | 99.90% | |
| Short Term Investments | 0.42% | |
| Total Investments | 100.32% | |
| Liabilities In Excess of Other Assets | (0.32)% | |
| Total Net Assets | 100.00% |
| Industry | Percent of Net Assets | |
| Aerospace & Defense | 1.10 | |
| Airlines | 1.21 | |
| Auto Components | 2.73 | |
| Banks | 2.62 | |
| Beverages | 2.82 | |
| Biotechnology | 15.30 | |
| Capital Markets | 1.92 | |
| Commercial Services & Supplies | 1.05 | |
| Communications Equipment | 5.27 | |
| Construction & Engineering | 0.38 | |
| Containers & Packaging | 0.57 | |
| Distributors | 0.53 | |
| Electrical Equipment | 1.19 | |
| Energy Equipment & Services | 1.85 | |
| Entertainment | 0.15 | |
| Food Products | 1.00 | |
| Health Care Equipment & Supplies | 5.47 | |
| Health Care Providers & Services | 1.67 | |
| Health Care Technology | 1.72 | |
| Holding Companies - Diversified | 0.49 | |
| Hotels, Restaurants & Leisure | 5.27 | |
| Household Durables | 3.04 | |
| Insurance | 1.49 |
| Industry | Percent of Net Assets | |
| Interactive Media & Services | 1.35 | |
| Internet & Direct Marketing Retail | 3.56 | |
| IT Services | 2.01 | |
| Leisure Products | 1.98 | |
| Life Sciences Tools & Services | 1.06 | |
| Machinery | 4.18 | |
| Marine | 0.93 | |
| Media | 1.57 | |
| Metals & Mining | 0.72 | |
| Money Market Fund | 0.42 | |
| Oil, Gas & Consumable Fuels | 4.97 | |
| Personal Products | 1.43 | |
| Pharmaceuticals | 0.49 | |
| Road & Rail | 0.78 | |
| Semiconductors & Semiconductor Equipment | 6.28 | |
| Software | 3.10 | |
| Specialty Retail | 4.10 | |
| Thrifts & Mortgage Finance | 0.86 | |
| Tobacco | 0.75 | |
| Trading Companies & Distributors | 0.94 | |
| Liabilities In Excess of Other Assets | (0.32) | |
| TOTAL | 100.00 |
| Fund Only | Including Predecessor Limited Partnership | |||||
| Average Annual Total Returns as of 6/30/21 | 1 Year | 3 Years | Since Inception (8/21/17 - 6/30/21) | 5 Years | 10 Years | |
| Driehaus Small Cap Growth Fund Investor Class (DVSMX)1 | 70.43% | 31.14% | 35.31% | 31.99% | 19.91% | |
| Driehaus Small Cap Growth Fund Institutional Class (DNSMX)1 | 70.98% | 31.52% | 35.69% | 32.28% | 20.04% | |
| Russell 2000® Growth Index2 | 51.36% | 15.94% | 19.09% | 18.76% | 13.52% | |

| 1 | The Driehaus Small Cap Growth Fund (“the Fund”) performance shown above includes the performance of the Driehaus Institutional Small Cap, L.P. (the “Predecessor Partnership”), one of the Fund’s predecessors, for the periods before the Fund’s registration statement became effective. The Predecessor Partnership was managed by the same investment team with substantially the same investment objective, policies and philosophies as are followed by the Fund. The Fund succeeded to the Predecessor Partnership’s assets together with the assets of the Driehaus Institutional Small Cap Recovery Fund, L.P., Driehaus Small Cap Recovery Fund, L.P. and Driehaus Small Cap Investors, L.P. (together, the “Limited Partnerships”) on August 21, 2017. The investment portfolios of the Limited Partnerships were identical and therefore had similar performance. The performance of the Predecessor Partnership is shown here because it has been in operation the longest. The Predecessor Partnership was not registered under the Investment Company Act of 1940, as amended (“1940 Act”), and thus was not subject to certain investment and operational restrictions that are imposed by the 1940 Act. If the Predecessor Partnership had been registered under the 1940 Act, its performance may have been adversely affected. The Predecessor Partnership’s performance has not been restated to reflect estimated expenses applicable to each class of shares of the Fund. The returns reflect fee waivers and/or reimbursements without which performance would have been lower. |
| 2 | The Russell 2000® Growth Index measures the performance of the small cap growth segment of the US Equity universe. It includes those Russell 2000® companies with higher price-value ratio and higher forecasted growth values. The Russell 2000® Index is constructed to provide a comprehensive and unbiased barometer for the small cap growth segment of the market. Data is calculated with net dividend reinvestment. Source: FTSE Russell. |
| Shares, Principal Amount, or Number of Contracts | Value | |
| COMMON STOCKS — 99.27% | ||
| HEALTH CARE — 21.71% | ||
| Biotechnology — 12.76% | ||
| Argenx SE - ADR 1,* | 9,922 | $2,987,217 |
| Blueprint Medicines Corp. * | 25,950 | 2,282,562 |
| C4 Therapeutics, Inc. * | 18,664 | 706,246 |
| CareDx, Inc. * | 39,804 | 3,642,862 |
| Centessa Pharmaceuticals PLC - ADR 1,* | 97,513 | 2,165,764 |
| Cytokinetics, Inc. * | 181,903 | 3,599,860 |
| Halozyme Therapeutics, Inc. * | 130,694 | 5,934,815 |
| Intellia Therapeutics, Inc. * | 27,547 | 4,460,135 |
| Invitae Corp. * | 109,473 | 3,692,524 |
| Mirati Therapeutics, Inc. * | 14,180 | 2,290,495 |
| Morphic Holding, Inc. * | 43,947 | 2,522,118 |
| Natera, Inc. * | 86,868 | 9,862,124 |
| Relay Therapeutics, Inc. * | 166,605 | 6,096,077 |
| SpringWorks Therapeutics, Inc. * | 107,093 | 8,825,534 |
| 59,068,333 | ||
| Life Sciences Tools & Services — 3.10% | ||
| Maravai LifeSciences Holdings, Inc. - A * | 84,405 | 3,522,221 |
| Medpace Holdings, Inc. * | 23,799 | 4,203,617 |
| NeoGenomics, Inc. * | 45,894 | 2,073,032 |
| Olink Holding AB - ADR 1,* | 61,975 | 2,133,179 |
| Repligen Corp. * | 12,155 | 2,426,381 |
| 14,358,430 | ||
| Health Care Equipment & Supplies — 2.58% | ||
| AtriCure, Inc. * | 53,452 | 4,240,347 |
| Shockwave Medical, Inc. * | 22,947 | 4,353,734 |
| SI-BONE, Inc. * | 105,801 | 3,329,558 |
| 11,923,639 | ||
| Health Care Providers & Services — 2.13% | ||
| AMN Healthcare Services, Inc. * | 61,123 | 5,927,709 |
| Guardant Health, Inc. * | 15,427 | 1,915,879 |
| Owens & Minor, Inc. | 47,300 | 2,002,209 |
| 9,845,797 | ||
| Pharmaceuticals — 0.59% | ||
| Intra-Cellular Therapies, Inc. * | 66,902 | 2,730,940 |
| Health Care Technology — 0.55% | ||
| Inspire Medical Systems, Inc. * | 13,237 | 2,558,183 |
| Total HEALTH CARE (Cost $69,884,998) | 100,485,322 | |
| INFORMATION TECHNOLOGY — 19.95% | ||
| Software — 10.02% | ||
| Avaya Holdings Corp. * | 112,262 | 3,019,848 |
| ChannelAdvisor Corp. * | 177,888 | 4,360,035 |
| Docebo, Inc. 1,* | 79,478 | 4,691,586 |
| Shares, Principal Amount, or Number of Contracts | Value | |
| DoubleVerify Holdings, Inc. * | 120,810 | $5,115,095 |
| Five9, Inc. * | 28,535 | 5,233,034 |
| Monday.com Ltd. 1,* | 33,839 | 7,566,062 |
| Sprinklr, Inc. - A * | 131,415 | 2,705,835 |
| Sprout Social, Inc. - A * | 39,475 | 3,529,855 |
| Teradata Corp. * | 122,003 | 6,096,490 |
| Zscaler, Inc. * | 18,689 | 4,037,945 |
| 46,355,785 | ||
| Semiconductors & Semiconductor Equipment — 6.16% | ||
| Ambarella, Inc. * | 50,486 | 5,383,322 |
| Axcelis Technologies, Inc. * | 66,324 | 2,680,816 |
| Lattice Semiconductor Corp. * | 81,437 | 4,575,131 |
| SiTime Corp. * | 26,840 | 3,397,676 |
| Synaptics, Inc. * | 38,640 | 6,011,611 |
| Ultra Clean Holdings, Inc. * | 120,316 | 6,463,375 |
| 28,511,931 | ||
| Communications Equipment — 2.70% | ||
| Calix, Inc. * | 153,170 | 7,275,575 |
| Cambium Networks Corp. * | 108,454 | 5,243,751 |
| 12,519,326 | ||
| IT Services — 1.07% | ||
| Endava PLC - SP ADR 1,* | 43,696 | 4,954,252 |
| Total INFORMATION TECHNOLOGY (Cost $64,549,537) | 92,341,294 | |
| INDUSTRIALS — 19.70% | ||
| Machinery — 6.88% | ||
| Chart Industries, Inc. * | 30,315 | 4,435,691 |
| Evoqua Water Technologies Corp. * | 85,697 | 2,894,845 |
| Gates Industrial Corp. PLC * | 250,827 | 4,532,444 |
| Hydrofarm Holdings Group, Inc. * | 46,380 | 2,741,522 |
| John Bean Technologies Corp. | 17,328 | 2,471,319 |
| Kornit Digital Ltd. 1,* | 49,490 | 6,153,092 |
| Terex Corp. | 69,433 | 3,306,399 |
| The Shyft Group, Inc. | 141,582 | 5,296,582 |
| 31,831,894 | ||
| Electrical Equipment — 2.18% | ||
| Generac Holdings, Inc. * | 13,481 | 5,596,637 |
| Vicor Corp. * | 42,578 | 4,502,198 |
| 10,098,835 | ||
| Airlines — 1.90% | ||
| Alaska Air Group, Inc. * | 37,982 | 2,290,695 |
| Allegiant Travel Co. * | 16,992 | 3,296,448 |
| Sun Country Airlines Holdings, Inc. * | 87,127 | 3,224,570 |
| 8,811,713 | ||
| Shares, Principal Amount, or Number of Contracts | Value | |
| Professional Services — 1.86% | ||
| Korn Ferry | 33,652 | $2,441,453 |
| Upwork, Inc. * | 106,064 | 6,182,470 |
| 8,623,923 | ||
| Trading Companies & Distributors — 1.76% | ||
| GMS, Inc. * | 39,140 | 1,884,200 |
| H&E Equipment Services, Inc. | 79,934 | 2,659,404 |
| Herc Holdings, Inc. * | 32,025 | 3,589,042 |
| 8,132,646 | ||
| Marine — 1.59% | ||
| Star Bulk Carriers Corp. 1 | 147,523 | 3,385,653 |
| ZIM Integrated Shipping Services Ltd. 1,* | 88,349 | 3,969,520 |
| 7,355,173 | ||
| Building Products — 1.03% | ||
| Advanced Drainage Systems, Inc. | 20,819 | 2,426,871 |
| Trex Co., Inc. * | 23,038 | 2,354,714 |
| 4,781,585 | ||
| Road & Rail — 0.94% | ||
| Avis Budget Group, Inc. * | 28,623 | 2,229,445 |
| Saia, Inc. * | 10,112 | 2,118,363 |
| 4,347,808 | ||
| Aerospace & Defense — 0.84% | ||
| Axon Enterprise, Inc. * | 21,837 | 3,860,782 |
| Commercial Services & Supplies — 0.72% | ||
| ACV Auctions, Inc. - A * | 76,627 | 1,963,950 |
| Legalzoom.com, Inc. * | 36,486 | 1,380,995 |
| 3,344,945 | ||
| Total INDUSTRIALS (Cost $65,711,475) | 91,189,304 | |
| CONSUMER DISCRETIONARY — 19.56% | ||
| Specialty Retail — 4.30% | ||
| American Eagle Outfitters, Inc. | 84,466 | 3,170,009 |
| Boot Barn Holdings, Inc. * | 54,843 | 4,609,554 |
| GrowGeneration Corp. * | 120,023 | 5,773,106 |
| Lithia Motors, Inc. - A | 18,537 | 6,370,055 |
| 19,922,724 | ||
| Hotels, Restaurants & Leisure — 3.32% | ||
| Bally's Corp. * | 37,469 | 2,027,448 |
| Caesars Entertainment, Inc. * | 71,700 | 7,438,875 |
| SeaWorld Entertainment, Inc. * | 71,946 | 3,592,983 |
| Six Flags Entertainment Corp. * | 52,927 | 2,290,681 |
| 15,349,987 | ||
| Textiles, Apparel & Luxury Goods — 2.88% | ||
| Crocs, Inc. * | 86,868 | 10,121,859 |
| Deckers Outdoor Corp. * | 8,356 | 3,209,289 |
| 13,331,148 | ||
| Shares, Principal Amount, or Number of Contracts | Value | |
| Internet & Direct Marketing Retail — 2.44% | ||
| PubMatic, Inc. - A * | 143,626 | $5,611,468 |
| Revolve Group, Inc. * | 82,329 | 5,672,468 |
| 11,283,936 | ||
| Auto Components — 2.39% | ||
| Fox Factory Holding Corp. * | 25,061 | 3,900,995 |
| Gentherm, Inc. * | 43,430 | 3,085,702 |
| Visteon Corp. * | 33,797 | 4,087,409 |
| 11,074,106 | ||
| Leisure Products — 2.23% | ||
| Callaway Golf Co. * | 146,175 | 4,930,482 |
| Hayward Holdings, Inc. * | 114,589 | 2,981,606 |
| Latham Group, Inc. * | 74,929 | 2,394,731 |
| 10,306,819 | ||
| Household Durables — 2.00% | ||
| Skyline Champion Corp. * | 66,825 | 3,561,772 |
| Vizio Holding Corp. - A * | 210,067 | 5,673,910 |
| 9,235,682 | ||
| Total CONSUMER DISCRETIONARY (Cost $63,833,317) | 90,504,402 | |
| MATERIALS — 5.70% | ||
| Metals & Mining — 2.99% | ||
| Arconic Corp. * | 84,146 | 2,997,281 |
| Cleveland-Cliffs, Inc. * | 238,724 | 5,146,889 |
| MP Materials Corp. * | 155,041 | 5,714,811 |
| 13,858,981 | ||
| Chemicals — 1.40% | ||
| Ingevity Corp. * | 36,904 | 3,002,510 |
| Tronox Holdings PLC - A 1 | 154,288 | 3,456,051 |
| 6,458,561 | ||
| Construction Materials — 1.31% | ||
| Summit Materials, Inc. - A * | 174,383 | 6,077,248 |
| Total MATERIALS (Cost $21,506,115) | 26,394,790 | |
| ENERGY — 3.52% | ||
| Oil, Gas & Consumable Fuels — 2.55% | ||
| Magnolia Oil & Gas Corp. - A * | 312,209 | 4,879,827 |
| PDC Energy, Inc. | 99,269 | 4,545,527 |
| SM Energy Co. | 97,072 | 2,390,883 |
| 11,816,237 | ||
| Energy Equipment & Services — 0.97% | ||
| Cactus, Inc. - A | 90,624 | 3,327,713 |
| Core Laboratories NV 1 | 29,189 | 1,136,912 |
| 4,464,625 | ||
| Total ENERGY (Cost $13,962,503) | 16,280,862 | |
| Shares, Principal Amount, or Number of Contracts | Value | |
| CONSUMER STAPLES — 3.18% | ||
| Beverages — 2.64% | ||
| Celsius Holdings, Inc. * | 125,714 | $9,565,578 |
| The Duckhorn Portfolio, Inc. * | 120,445 | 2,657,017 |
| 12,222,595 | ||
| Food Products — 0.54% | ||
| Freshpet, Inc. * | 15,298 | 2,492,962 |
| Total CONSUMER STAPLES (Cost $8,983,036) | 14,715,557 | |
| FINANCIALS — 3.14% | ||
| Banks — 1.74% | ||
| Live Oak Bancshares, Inc. | 42,784 | 2,524,256 |
| Silvergate Capital Corp. - A * | 11,671 | 1,322,558 |
| Triumph Bancorp, Inc. * | 56,873 | 4,222,820 |
| 8,069,634 | ||
| Capital Markets — 1.08% | ||
| Open Lending Corp. - A * | 116,286 | 5,010,764 |
| Holding Companies - Diversified — 0.32% | ||
| CM Life Sciences, Inc. - A 2,* | 104,759 | 1,467,673 |
| Total FINANCIALS (Cost $10,937,580) | 14,548,071 | |
| COMMUNICATION SERVICES — 2.81% | ||
| Entertainment — 1.27% | ||
| Roku, Inc. * | 12,796 | 5,876,563 |
| Interactive Media & Services — 0.96% | ||
| Eventbrite, Inc. - A * | 105,405 | 2,002,695 |
| ZipRecruiter, Inc. - A * | 98,280 | 2,455,034 |
| 4,457,729 | ||
| Media — 0.58% | ||
| Cardlytics, Inc. * | 21,046 | 2,671,369 |
| Total COMMUNICATION SERVICES (Cost $8,614,361) | 13,005,661 | |
| Total COMMON STOCKS (Cost $327,982,922) | 459,465,263 | |
| Shares, Principal Amount, or Number of Contracts | Value | ||
| SHORT TERM INVESTMENTS — 1.65% | |||
| Northern Institutional U.S. Government Select Portfolio (Shares Class), 0.03% 3 (Cost $7,646,504) | 7,646,504 | $7,646,504 | |
| TOTAL INVESTMENTS (Cost $335,629,426) | 100.92% | $467,111,767 | |
| Liabilities In Excess of Other Assets | (0.92)% | (4,276,878) | |
| Net Assets | 100.00% | $462,834,889 | |
| ADR | American Depositary Receipt |
| PLC | Public Limited Company |
| SP ADR | Sponsored American Depositary Receipt |
| 1 | Foreign security denominated and/or traded in U.S. dollars. |
| 2 | Special Purpose Acquisition Company (SPAC). |
| 3 | 7 day current yield as of June 30, 2021, is disclosed. |
| * | Non-income producing security. |
| Security Type | Percent of Total Net Assets | |
| Common Stocks | 99.27% | |
| Short Term Investments | 1.65% | |
| Total Investments | 100.92% | |
| Liabilities In Excess of Other Assets | (0.92)% | |
| Total Net Assets | 100.00% |
| Industry | Percent of Net Assets | |
| Aerospace & Defense | 0.84 | |
| Airlines | 1.90 | |
| Auto Components | 2.39 | |
| Banks | 1.74 | |
| Beverages | 2.64 | |
| Biotechnology | 12.76 | |
| Building Products | 1.03 | |
| Capital Markets | 1.08 | |
| Chemicals | 1.40 | |
| Commercial Services & Supplies | 0.72 | |
| Communications Equipment | 2.70 | |
| Construction Materials | 1.31 | |
| Electrical Equipment | 2.18 | |
| Energy Equipment & Services | 0.97 | |
| Entertainment | 1.27 | |
| Food Products | 0.54 | |
| Health Care Equipment & Supplies | 2.58 | |
| Health Care Providers & Services | 2.13 | |
| Health Care Technology | 0.55 | |
| Holding Companies - Diversified | 0.32 | |
| Hotels, Restaurants & Leisure | 3.32 | |
| Household Durables | 2.00 |
| Industry | Percent of Net Assets | |
| Interactive Media & Services | 0.96 | |
| Internet & Direct Marketing Retail | 2.44 | |
| IT Services | 1.07 | |
| Leisure Products | 2.23 | |
| Life Sciences Tools & Services | 3.10 | |
| Machinery | 6.88 | |
| Marine | 1.59 | |
| Media | 0.58 | |
| Metals & Mining | 2.99 | |
| Money Market Fund | 1.65 | |
| Oil, Gas & Consumable Fuels | 2.55 | |
| Pharmaceuticals | 0.59 | |
| Professional Services | 1.86 | |
| Road & Rail | 0.94 | |
| Semiconductors & Semiconductor Equipment | 6.16 | |
| Software | 10.02 | |
| Specialty Retail | 4.30 | |
| Textiles, Apparel & Luxury Goods | 2.88 | |
| Trading Companies & Distributors | 1.76 | |
| Liabilities In Excess of Other Assets | (0.92) | |
| TOTAL | 100.00 |
| Average Annual Total Returns as of 6/30/21 | 1 Year | Since Inception (5/1/20 - 6/30/21) |
| Driehaus Small/Mid Cap Growth Fund 1 | 61.94% | 78.96% |
| Russell 2500® Growth Index2 | 49.63% | 58.63% |
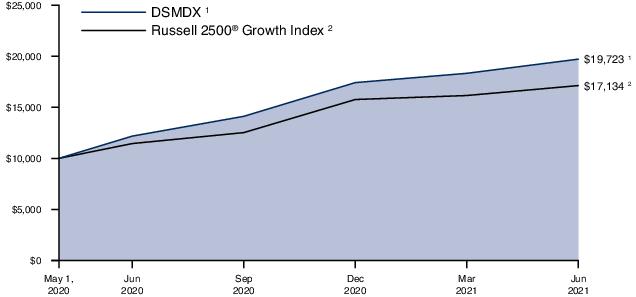
| 1 | The returns for the period reflect fee waivers and/or reimbursements without which performance would have been lower. |
| 2 | The Russell 2500® Growth Index measures the performance of the small to midcap growth segment of the US Equity universe. It measures the performance of those Russell 2500® Index companies with higher growth earning potential as defined by FTSE Russell’s leading style methodology. The Russell 2500® Growth Index is constructed to provide a comprehensive and unbiased barometer for the small to midcap growth segment of the market. Data is calculated with net dividend reinvestment. Source: FTSE Russell. |
| Shares, Principal Amount, or Number of Contracts | Value | |
| COMMON STOCKS — 98.46% | ||
| INFORMATION TECHNOLOGY — 22.90% | ||
| Software — 11.60% | ||
| Avaya Holdings Corp. * | 4,709 | $126,672 |
| Confluent, Inc. - A * | 4,207 | 199,832 |
| DoubleVerify Holdings, Inc. * | 6,405 | 271,188 |
| Five9, Inc. * | 2,548 | 467,278 |
| HubSpot, Inc. * | 705 | 410,818 |
| Monday.com Ltd. 1,* | 1,960 | 438,236 |
| Sprout Social, Inc. - A * | 1,857 | 166,053 |
| Teradata Corp. * | 6,739 | 336,748 |
| Zscaler, Inc. * | 1,870 | 404,032 |
| 2,820,857 | ||
| Semiconductors & Semiconductor Equipment — 6.71% | ||
| Ambarella, Inc. * | 2,608 | 278,091 |
| Enphase Energy, Inc. * | 1,415 | 259,837 |
| Lattice Semiconductor Corp. * | 3,680 | 206,742 |
| MKS Instruments, Inc. | 994 | 176,882 |
| Qorvo, Inc. * | 809 | 158,281 |
| SiTime Corp. * | 1,315 | 166,466 |
| Synaptics, Inc. * | 1,697 | 264,019 |
| Ultra Clean Holdings, Inc. * | 2,271 | 121,998 |
| 1,632,316 | ||
| IT Services — 2.18% | ||
| Endava PLC - SP ADR 1,* | 1,833 | 207,825 |
| EPAM System, Inc. * | 255 | 130,295 |
| MongoDB, Inc. * | 533 | 192,690 |
| 530,810 | ||
| Communications Equipment — 1.51% | ||
| Calix, Inc. * | 7,729 | 367,128 |
| Electronic Equipment, Instruments & Components — 0.90% | ||
| Trimble, Inc. * | 2,673 | 218,732 |
| Total INFORMATION TECHNOLOGY (Cost $4,287,670) | 5,569,843 | |
| HEALTH CARE — 22.78% | ||
| Biotechnology — 12.29% | ||
| Alnylam Pharmaceuticals, Inc. * | 834 | 141,380 |
| Argenx SE - ADR 1,* | 630 | 189,674 |
| Ascendis Pharma A/S - ADR 1,* | 512 | 67,354 |
| Blueprint Medicines Corp. * | 1,261 | 110,918 |
| CareDx, Inc. * | 2,077 | 190,087 |
| Exact Sciences Corp. * | 976 | 121,326 |
| Halozyme Therapeutics, Inc. * | 5,942 | 269,826 |
| Intellia Therapeutics, Inc. * | 1,457 | 235,903 |
| Invitae Corp. * | 5,747 | 193,846 |
| Mirati Therapeutics, Inc. * | 676 | 109,194 |
| Moderna, Inc. * | 967 | 227,226 |
| Natera, Inc. * | 3,824 | 434,139 |
| Shares, Principal Amount, or Number of Contracts | Value | |
| Relay Therapeutics, Inc. * | 7,070 | $258,691 |
| SpringWorks Therapeutics, Inc. * | 5,331 | 439,328 |
| 2,988,892 | ||
| Life Sciences Tools & Services — 4.57% | ||
| Bio-Techne Corp. | 677 | 304,826 |
| Maravai LifeSciences Holdings, Inc. - A * | 4,167 | 173,889 |
| Medpace Holdings, Inc. * | 1,473 | 260,176 |
| NeoGenomics, Inc. * | 2,152 | 97,206 |
| Olink Holding AB - ADR 1,* | 4,300 | 148,006 |
| Repligen Corp. * | 635 | 126,758 |
| 1,110,861 | ||
| Health Care Equipment & Supplies — 3.71% | ||
| AtriCure, Inc. * | 2,925 | 232,040 |
| Globus Medical, Inc. - A * | 2,542 | 197,081 |
| Insulet Corp. * | 891 | 244,589 |
| Shockwave Medical, Inc. * | 1,211 | 229,763 |
| 903,473 | ||
| Health Care Providers & Services — 2.21% | ||
| AMN Healthcare Services, Inc. * | 3,497 | 339,139 |
| Guardant Health, Inc. * | 860 | 106,804 |
| LifeStance Health Group, Inc. * | 3,298 | 91,882 |
| 537,825 | ||
| Total HEALTH CARE (Cost $4,688,451) | 5,541,051 | |
| CONSUMER DISCRETIONARY — 19.99% | ||
| Specialty Retail — 5.26% | ||
| American Eagle Outfitters, Inc. | 3,656 | 137,210 |
| Five Below, Inc. * | 656 | 126,785 |
| GrowGeneration Corp. * | 2,540 | 122,174 |
| Lithia Motors, Inc. - A | 947 | 325,427 |
| RH * | 288 | 195,552 |
| The Gap, Inc. | 4,189 | 140,960 |
| Ulta Beauty, Inc. * | 670 | 231,666 |
| 1,279,774 | ||
| Textiles, Apparel & Luxury Goods — 3.43% | ||
| Crocs, Inc. * | 4,817 | 561,277 |
| Deckers Outdoor Corp. * | 417 | 160,157 |
| Under Armour, Inc. - A * | 5,390 | 113,998 |
| 835,432 | ||
| Hotels, Restaurants & Leisure — 2.99% | ||
| Caesars Entertainment, Inc. * | 3,796 | 393,835 |
| SeaWorld Entertainment, Inc. * | 4,138 | 206,652 |
| Vail Resorts, Inc. * | 398 | 125,975 |
| 726,462 | ||
| Auto Components — 1.78% | ||
| Fox Factory Holding Corp. * | 821 | 127,797 |
| Shares, Principal Amount, or Number of Contracts | Value | |
| Gentherm, Inc. * | 2,786 | $197,945 |
| Visteon Corp. * | 880 | 106,427 |
| 432,169 | ||
| Leisure Products — 1.58% | ||
| Callaway Golf Co. * | 7,670 | 258,709 |
| Latham Group, Inc. * | 3,960 | 126,562 |
| 385,271 | ||
| Internet & Direct Marketing Retail — 1.54% | ||
| PubMatic, Inc. - A * | 6,261 | 244,617 |
| Revolve Group, Inc. * | 1,885 | 129,877 |
| 374,494 | ||
| Distributors — 1.24% | ||
| LKQ Corp. * | 2,969 | 146,134 |
| Pool Corp. | 337 | 154,568 |
| 300,702 | ||
| Household Durables — 1.15% | ||
| Vizio Holding Corp. - A * | 10,373 | 280,175 |
| Automobiles — 1.02% | ||
| Harley-Davidson, Inc. | 5,427 | 248,665 |
| Total CONSUMER DISCRETIONARY (Cost $3,984,081) | 4,863,144 | |
| INDUSTRIALS — 17.08% | ||
| Machinery — 5.12% | ||
| Chart Industries, Inc. * | 1,194 | 174,706 |
| Gates Industrial Corp. PLC * | 12,545 | 226,688 |
| Kornit Digital Ltd. 1,* | 2,326 | 289,192 |
| Nordson Corp. | 524 | 115,023 |
| Terex Corp. | 2,970 | 141,431 |
| The Middleby Corp. * | 1,029 | 178,285 |
| The Toro Co. | 1,102 | 121,088 |
| 1,246,413 | ||
| Electrical Equipment — 3.08% | ||
| Acuity Brands, Inc. | 992 | 185,534 |
| Generac Holdings, Inc. * | 739 | 306,796 |
| Vicor Corp. * | 2,427 | 256,631 |
| 748,961 | ||
| Professional Services — 1.84% | ||
| Clarivate PLC 1,* | 5,915 | 162,840 |
| Upwork, Inc. * | 4,876 | 284,222 |
| 447,062 | ||
| Aerospace & Defense — 1.65% | ||
| Axon Enterprise, Inc. * | 1,208 | 213,574 |
| HEICO Corp. | 1,342 | 187,102 |
| 400,676 | ||
| Airlines — 1.38% | ||
| Alaska Air Group, Inc. * | 1,992 | 120,137 |
| Shares, Principal Amount, or Number of Contracts | Value | |
| Allegiant Travel Co. * | 1,117 | $216,698 |
| 336,835 | ||
| Air Freight & Logistics — 1.01% | ||
| XPO Logistics, Inc. * | 1,759 | 246,066 |
| Road & Rail — 0.97% | ||
| Avis Budget Group, Inc. * | 1,497 | 116,601 |
| Old Dominion Freight Line, Inc. | 467 | 118,525 |
| 235,126 | ||
| Commercial Services & Supplies — 0.88% | ||
| ACV Auctions, Inc. - A * | 4,008 | 102,725 |
| Legalzoom.com, Inc. * | 2,918 | 110,446 |
| 213,171 | ||
| Building Products — 0.65% | ||
| Trex Co., Inc. * | 1,538 | 157,199 |
| Trading Companies & Distributors — 0.50% | ||
| United Rentals, Inc. * | 384 | 122,500 |
| Total INDUSTRIALS (Cost $3,393,716) | 4,154,009 | |
| MATERIALS — 5.18% | ||
| Metals & Mining — 2.07% | ||
| Arconic Corp. * | 4,381 | 156,051 |
| Cleveland-Cliffs, Inc. * | 10,305 | 222,176 |
| MP Materials Corp. * | 3,412 | 125,766 |
| 503,993 | ||
| Chemicals — 2.05% | ||
| Albemarle Corp. | 1,418 | 238,876 |
| CF Industries Holdings, Inc. | 2,348 | 120,805 |
| Tronox Holdings PLC - A 1 | 6,244 | 139,866 |
| 499,547 | ||
| Construction Materials — 1.06% | ||
| Summit Materials, Inc. - A * | 7,382 | 257,263 |
| Total MATERIALS (Cost $1,133,597) | 1,260,803 | |
| COMMUNICATION SERVICES — 4.18% | ||
| Entertainment — 2.25% | ||
| Roku, Inc. * | 1,192 | 547,426 |
| Interactive Media & Services — 1.93% | ||
| Eventbrite, Inc. - A * | 4,851 | 92,169 |
| Snap, Inc. - A * | 3,629 | 247,280 |
| ZipRecruiter, Inc. - A * | 5,173 | 129,222 |
| 468,671 | ||
| Total COMMUNICATION SERVICES (Cost $653,087) | 1,016,097 | |
| Shares, Principal Amount, or Number of Contracts | Value | ||
| ENERGY — 3.15% | |||
| Oil, Gas & Consumable Fuels — 2.86% | |||
| Diamondback Energy, Inc. | 2,128 | $199,798 | |
| Magnolia Oil & Gas Corp. - A * | 16,157 | 252,534 | |
| PDC Energy, Inc. | 5,336 | 244,335 | |
| 696,667 | |||
| Energy Equipment & Services — 0.29% | |||
| ChampionX Corp. * | 2,749 | 70,512 | |
| Total ENERGY (Cost $652,317) | 767,179 | ||
| CONSUMER STAPLES — 1.64% | |||
| Beverages — 1.11% | |||
| Celsius Holdings, Inc. * | 3,530 | 268,598 | |
| Food Products — 0.53% | |||
| Oatly Group AB - ADR 1,* | 5,281 | 129,173 | |
| Total CONSUMER STAPLES (Cost $347,711) | 397,771 | ||
| FINANCIALS — 1.56% | |||
| Banks — 1.56% | |||
| Signature Bank | 856 | 210,276 | |
| SVB Financial Group * | 304 | 169,155 | |
| 379,431 | |||
| Total FINANCIALS (Cost $251,793) | 379,431 | ||
| Total COMMON STOCKS (Cost $19,392,423) | 23,949,328 | ||
| SHORT TERM INVESTMENTS — 1.89% | |||
| Northern Institutional Funds - U.S. Government Portfolio (Shares Class), 0.00% 2 (Cost $459,314) | 459,314 | 459,314 | |
| TOTAL INVESTMENTS (Cost $19,851,737) | 100.35% | $24,408,642 | |
| Liabilities In Excess of Other Assets | (0.35)% | (85,895) | |
| Net Assets | 100.00% | $24,322,747 | |
| ADR | American Depositary Receipt |
| PLC | Public Limited Company |
| SP ADR | Sponsored American Depositary Receipt |
| 1 | Foreign security denominated and/or traded in U.S. dollars. |
| 2 | 7 day current yield as of June 30, 2021, is disclosed. |
| * | Non-income producing security. |
| Security Type | Percent of Total Net Assets | |
| Common Stocks | 98.46% | |
| Short Term Investments | 1.89% | |
| Total Investments | 100.35% | |
| Liabilities In Excess of Other Assets | (0.35)% | |
| Total Net Assets | 100.00% |
| Industry | Percent of Net Assets | |
| Aerospace & Defense | 1.65 | |
| Air Freight & Logistics | 1.01 | |
| Airlines | 1.38 | |
| Auto Components | 1.78 | |
| Automobiles | 1.02 | |
| Banks | 1.56 | |
| Beverages | 1.11 | |
| Biotechnology | 12.29 | |
| Building Products | 0.65 | |
| Chemicals | 2.05 | |
| Commercial Services & Supplies | 0.88 | |
| Communications Equipment | 1.51 | |
| Construction Materials | 1.06 | |
| Distributors | 1.24 | |
| Electrical Equipment | 3.08 | |
| Electronic Equipment, Instruments & Components | 0.90 | |
| Energy Equipment & Services | 0.29 | |
| Entertainment | 2.25 | |
| Food Products | 0.53 | |
| Health Care Equipment & Supplies | 3.71 | |
| Health Care Providers & Services | 2.21 |
| Industry | Percent of Net Assets | |
| Hotels, Restaurants & Leisure | 2.99 | |
| Household Durables | 1.15 | |
| Interactive Media & Services | 1.93 | |
| Internet & Direct Marketing Retail | 1.54 | |
| IT Services | 2.18 | |
| Leisure Products | 1.58 | |
| Life Sciences Tools & Services | 4.57 | |
| Machinery | 5.12 | |
| Metals & Mining | 2.07 | |
| Money Market Fund | 1.89 | |
| Oil, Gas & Consumable Fuels | 2.86 | |
| Professional Services | 1.84 | |
| Road & Rail | 0.97 | |
| Semiconductors & Semiconductor Equipment | 6.71 | |
| Software | 11.60 | |
| Specialty Retail | 5.26 | |
| Textiles, Apparel & Luxury Goods | 3.43 | |
| Trading Companies & Distributors | 0.50 | |
| Liabilities In Excess of Other Assets | (0.35) | |
| TOTAL | 100.00 |
| Average Annual Total Returns as of 6/30/21 | 1 Year | 3 Years | 5 Years | Since Inception (8/26/13 - 6/30/21) |
| Driehaus Event Driven Fund (DEVDX)1 | 27.09% | 13.93% | 11.14% | 7.16% |
| S&P 500 Index2 | 40.79% | 18.67% | 17.65% | 15.12% |
| FTSE 3-Month T-Bill Index3 | 0.08% | 1.31% | 1.14% | 0.75% |

| 1 | The returns for the periods prior to March 1, 2014, reflect fee waivers and/or reimbursements without which performance would have been lower. |
| 2 | The S&P 500 Index consists of 500 stocks chosen for market size, liquidity and industry group. It is a market-weighted index, with each stock’s weight in the index proportionate to its market value. |
| 3 | The FTSE 3-Month T-Bill Index is designed to mirror the performance of the 3-month U.S. Treasury Bill. The FTSE 3-Month T-Bill Index is unmanaged and its returns reflect reinvestment of all distributions and changes in market prices. |
| Shares, Principal Amount, or Number of Contracts | Value | |
| CONVERTIBLE CORPORATE BONDS — 0.80% | ||
| Healthcare - Products — 0.55% | ||
| Progenity, Inc. 7.25%, 12/1/25 1 | $1,073,000 | $1,054,222 |
| Pharmaceuticals — 0.25% | ||
| Cytokinetics, Inc. 4.00%, 11/15/26 2 | 229,000 | 473,183 |
| Total CONVERTIBLE CORPORATE BONDS (Cost $1,347,805) | 1,527,405 | |
| CORPORATE BONDS — 10.59% | ||
| Banks — 1.99% | ||
| JPMorgan Chase & Co. 3.66%, (3-Month USD Libor + 347 basis points), 4/29/49 2,3,4 | 3,773,000 | 3,782,432 |
| Diversified Financial Services — 0.96% | ||
| ILFC E-Capital Trust I 3.66%, 12/21/65 1,2,3,4,5 | 2,189,000 | 1,816,870 |
| Lodging — 1.82% | ||
| Arrow Bidco LLC 9.50%, 3/15/24 1,2 | 3,410,000 | 3,460,298 |
| Oil & Gas — 0.98% | ||
| Transocean Pontus Ltd. (Cayman Islands) 6.12%, 8/1/25 1 | 1,837,875 | 1,859,406 |
| Retail — 1.24% | ||
| Guitar Center, Inc. 8.50%, 1/15/26 1,2 | 2,200,000 | 2,354,000 |
| Telecommunications — 0.90% | ||
| Cincinnati Bell, Inc. 7.00%, 7/15/24 1,2 | 1,674,000 | 1,717,943 |
| Trucking & Leasing — 2.70% | ||
| Fortress Transportation and Infrastructure Investors LLC 9.75%, 8/1/27 1,2 | 4,437,000 | 5,130,281 |
| Total CORPORATE BONDS (Cost $18,854,245) | 20,121,230 | |
| COMMON STOCKS — 64.03% | ||
| Banks — 6.49% | ||
| Eastern Bankshares, Inc. 2 | 262,717 | 5,404,089 |
| HarborOne Bancorp, Inc. 2 | 249,225 | 3,573,886 |
| Kearny Financial Corp./MD 2 | 280,555 | 3,352,632 |
| 12,330,607 | ||
| Biotechnology — 12.27% | ||
| Alexion Pharmaceuticals, Inc. 2,* | 23,569 | 4,329,861 |
| Ascendis Pharma A/S - ADR 2,6,* | 13,514 | 1,777,767 |
| Crinetics Pharmaceuticals, Inc. * | 179,547 | 3,384,461 |
| Elevation Oncology, Inc. * | 366,813 | 4,977,658 |
| Relay Therapeutics, Inc. 2,* | 159,345 | 5,830,433 |
| Shares, Principal Amount, or Number of Contracts | Value | |
| SpringWorks Therapeutics, Inc. * | 30,231 | $2,491,337 |
| Trillium Therapeutics, Inc. * | 53,433 | 518,300 |
| 23,309,817 | ||
| Computers — 0.25% | ||
| iCAD, Inc. * | 27,444 | 475,056 |
| Entertainment — 3.10% | ||
| Golden Entertainment, Inc. 2,* | 131,700 | 5,900,160 |
| Healthcare - Products — 1.97% | ||
| Alphatec Holdings, Inc. * | 57,772 | 885,067 |
| Avita Medical, Inc. * | 29,601 | 607,413 |
| Itamar Medical Ltd. - SP ADR 6,* | 15,477 | 364,483 |
| SeaSpine Holdings Corp. * | 91,750 | 1,881,792 |
| 3,738,755 | ||
| Healthcare - Services — 2.51% | ||
| Invitae Corp. * | 141,171 | 4,761,698 |
| Holding Companies - Diversified — 18.53% | ||
| BCTG Acquisition Corp. 7,* | 69,240 | 787,259 |
| Class Acceleration Corp. - A 7,* | 89,160 | 863,960 |
| CM Life Sciences II, Inc. - A 7,* | 124,795 | 1,531,235 |
| CM Life Sciences III, Inc. - A 7,* | 133,400 | 1,375,354 |
| CM Life Sciences, Inc. - A 7,* | 24,852 | 348,177 |
| Corazon Capital V838 Monoceros Corp. - A 7,* | 189,734 | 1,840,420 |
| EJF Acquisition Corp. 7,* | 37,150 | 370,757 |
| EJF Acquisition Corp. - A 7,* | 292,972 | 2,827,180 |
| Empower Ltd. - A 7,* | 269,715 | 2,699,847 |
| Jack Creek Investment Corp. 7,* | 37,000 | 371,850 |
| Jack Creek Investment Corp. - A 7,* | 265,994 | 2,569,502 |
| L&F Acquisition Corp. - A 7,* | 185,742 | 1,853,705 |
| Landcadia Holdings III, Inc. - A 7,* | 296,630 | 3,678,212 |
| Live Oak Mobility Acquisition Corp. - A 7,* | 65,151 | 638,480 |
| Longview Acquisition Corp. II - A 7,* | 257,100 | 2,519,580 |
| Montes Archimedes Acquisition Corp. - A 7,* | 234,400 | 2,318,216 |
| Senior Connect Acquisition Corp. I - A 7,* | 190,710 | 1,855,608 |
| Soaring Eagle Acquisition Corp. - A 7,* | 227,200 | 2,262,912 |
| Tekkorp Digital Acquisition Corp. - A 7,* | 189,734 | 1,849,906 |
| Thayer Ventures Acquisition Corp. - A 7,* | 71,467 | 718,243 |
| Tishman Speyer Innovation Corp. 7,* | 38,709 | 389,025 |
| Tishman Speyer Innovation Corp. II - A 7,* | 89,480 | 883,168 |
| Shares, Principal Amount, or Number of Contracts | Value | |
| Z-Work Acquisition Corp. - A 7,* | 67,660 | $653,596 |
| 35,206,192 | ||
| Media — 1.51% | ||
| Altice USA, Inc. - A 2,* | 81,395 | 2,778,825 |
| WideOpenWest, Inc. * | 4,590 | 95,059 |
| 2,873,884 | ||
| Pharmaceuticals — 3.05% | ||
| Curaleaf Holdings, Inc. * | 133,228 | 1,877,822 |
| Cytokinetics, Inc. 2,* | 177,646 | 3,515,615 |
| Merus NV * | 19,476 | 410,359 |
| 5,803,796 | ||
| Real Estate (REIT's) — 3.96% | ||
| Equity Commonwealth 2 | 152,840 | 4,004,408 |
| MGM Growth Properties LLC - A 2 | 96,306 | 3,526,726 |
| 7,531,134 | ||
| Savings & Loans — 1.84% | ||
| Berkshire Hills Bancorp, Inc. | 127,683 | 3,499,791 |
| Software — 2.21% | ||
| Slack Technologies, Inc. - A 2,* | 94,648 | 4,192,906 |
| Telecommunications — 4.17% | ||
| HC2 Holdings, Inc. 2,* | 285,575 | 1,136,588 |
| Telephone and Data Systems, Inc. | 131,854 | 2,987,812 |
| T-Mobile US, Inc. 2,* | 26,294 | 3,808,160 |
| 7,932,560 | ||
| Transportation — 2.17% | ||
| XPO Logistics, Inc. 2,* | 29,442 | 4,118,641 |
| Total COMMON STOCKS (Cost $103,344,054) | 121,674,997 | |
| PRIVATE INVESTMENT IN PUBLIC EQUITY (PIPES) — 1.34% | ||
| Holding Companies - Diversified — 1.34% | ||
| CM Life Sciences, Inc. - A * | 938,670 | |
| CM Life Sciences II, Inc. * | 1,614,732 | |
| Total PRIVATE INVESTMENT IN PUBLIC EQUITY (PIPES) (Cost $1,986,000) | 2,553,402 | |
| MASTER LIMITED PARTNERSHIPS — 1.09% | ||
| Trucking & Leasing — 1.09% | ||
| Fortress Transportation and Infrastructure Investors LLC | 61,924 | 2,077,550 |
| Total MASTER LIMITED PARTNERSHIPS (Cost $1,152,924) | 2,077,550 | |
| Shares, Principal Amount, or Number of Contracts | Value | |
| PREFERRED STOCKS — 1.78% | ||
| Retail — 1.43% | ||
| Qurate Retail, Inc. 8.00%, 3/15/31 * | 25,000 | $2,706,250 |
| Telecommunications — 0.35% | ||
| Telephone and Data Systems, Inc. * | 22,999 | 669,961 |
| Total PREFERRED STOCKS (Cost $3,073,651) | 3,376,211 | |
| WARRANTS — 0.70% | ||
| Class Acceleration Corp., Exp 3/31/2028, Strike $11.50 * | 44,580 | 35,218 |
| CM Life Sciences II, Inc., Exp 12/31/2027, Strike $11.50 * | 22,690 | 119,576 |
| CM Life Sciences III, Inc., Exp 12/21/2028, Strike $11.50 * | 26,680 | 68,834 |
| Corazon Capital V838 Monoceros Corp., Exp 12/31/2028, Strike $11.50 * | 53,713 | 54,787 |
| Deep Lake Capital Acquisition Corp., Exp 12/31/2027, Strike $11.50 * | 10,795 | 9,825 |
| EJF Acquisition Corp., Exp 12/31/2027, Strike $11.50 * | 97,657 | 80,079 |
| Jack Creek Investment Corp., Exp 12/31/2027, Strike $11.50 * | 132,997 | 107,767 |
| L&F Acquisition Corp., Exp 5/23/2027, Strike $11.50 * | 65,250 | 54,151 |
| Latch, Inc., Exp 12/31/2026, Strike $11.50 * | 44,020 | 154,070 |
| Live Oak Mobility Acquisition Corp., Exp 3/4/2028, Strike $11.50 * | 13,030 | 19,806 |
| Longview Acquisition Corp. II, Exp 5/10/2026, Strike $11.50 * | 45,820 | 62,773 |
| Montes Archimedes Acquisition Corp., Exp 12/31/2025, Strike $11.50 * | 117,200 | 180,488 |
| Senior Connect Acquisition Corp., Exp 12/31/2027, Strike $11.50 * | 62,919 | 53,513 |
| Soaring Eagle Acquisition Corp., Exp 12/31/2027, Strike $11.50 * | 45,440 | 149,952 |
| Taboola.com Ltd., Exp 10/5/2027, Strike $11.50 * | 7,026 | 21,781 |
| Tekkorp Digital Acquisition Corp., Exp 01/24/2025, Strike $11.50 * | 59,550 | 62,528 |
| Thayer Ventures Acquisition Corp., Exp 1/1/2030, Strike $11.50 * | 35,733 | 46,453 |
| Shares, Principal Amount, or Number of Contracts | Value | ||
| Tishman Speyer Innovation Corp., Exp 12/31/2027, Strike $11.50 * | 17,896 | $22,549 | |
| X4 Pharmaceuticals, Inc., Exp 04/12/2024, Strike $13.20 * | 5,547 | 1,109 | |
| Z-Work Acquisition Corp., Exp 12/31/2027, Strike $11.50 * | 22,553 | 20,298 | |
| Total WARRANTS (Cost $0) | 1,325,557 | ||
| SHORT TERM INVESTMENTS — 18.33% | |||
| Northern Institutional Treasury Portfolio (Premier Class), 0.01% 8 (Cost $34,824,320) | 34,824,320 | 34,824,320 | |
| TOTAL INVESTMENTS (Cost $164,582,999) | 98.66% | $187,480,672 | |
| Other Assets In Excess of Liabilities | 1.34% | 2,553,757 | |
| Net Assets | 100.00% | $190,034,429 | |
| INVESTMENT SECURITIES SOLD SHORT — (18.73)% | |||
| COMMON STOCKS — (2.55)% | |||
| Pharmaceuticals — (1.58)% | |||
| AstraZeneca PLC - SP ADR | (50,045) | (2,997,695) | |
| Software — (0.94)% | |||
| salesforce.com, Inc. * | (7,332) | (1,790,988) | |
| Telecommunications — (0.03)% | |||
| Cincinnati Bell, Inc. * | (3,000) | (46,260) | |
| Total COMMON STOCKS (Proceeds $4,384,162) | (4,834,943) | ||
| EXCHANGE-TRADED FUNDS — (16.18)% | |||
| ARK Genomic Revolution ETF * | (35,461) | (3,280,142) | |
| iShares Biotechnology ETF | (28,860) | (4,722,939) | |
| SPDR S&P Biotech ETF | (130,614) | (17,685,136) | |
| Shares, Principal Amount, or Number of Contracts | Value | |
| SPDR S&P Regional Banking ETF | (77,320) | $(5,066,780) |
| Total EXCHANGE-TRADED FUNDS (Proceeds $29,649,362) | (30,754,997) | |
| TOTAL INVESTMENT SECURITIES SOLD SHORT (Proceeds $34,033,524) | (18.73)% | $(35,589,940) |
| ADR | American Depositary Receipt |
| LIBOR | London Interbank Offered Rate |
| PLC | Public Limited Company |
| SP ADR | Sponsored American Depositary Receipt |
| USD LIBOR | U.S. Dollar London Interbank Offered Rate. |
| 1 | Security is exempt from registration under Rule 144A of the Securities Act of 1933, as amended. The total value of these securities is $17,393,020, which represents 9% of Net Assets (see Note F in the Notes to Financial Statements). |
| 2 | All or a portion of this security is pledged as collateral for short sales or derivatives transactions. |
| 3 | Perpetual security. Maturity date shown is the next call date or final legal maturity date, whichever comes first. |
| 4 | Variable rate security. Rates disclosed as of June 30, 2021. |
| 5 | The coupon rate equals 155 basis points plus the highest of the LIBOR 3 Month, the Constant Maturity Treasury 10 year rate, and the Constant Maturity Treasury 30 year rate, with a maximum of 12.95%. |
| 6 | Foreign security denominated and/or traded in U.S. dollars. |
| 7 | Special Purpose Acquisition Company (SPAC). |
| 8 | 7 day current yield as of June 30, 2021, is disclosed. |
| * | Non-income producing security. |
| Security Type | Percent of Total Net Assets | |
| Convertible Corporate Bonds | 0.80% | |
| Corporate Bonds | 10.59% | |
| Common Stocks | 64.03% | |
| Private Investment in Public Equity (PIPES) | 1.34% | |
| Master Limited Partnerships | 1.09% | |
| Preferred Stocks | 1.78% | |
| Warrants | 0.70% | |
| Short Term Investments | 18.33% | |
| Total Investments | 98.66% | |
| Other Assets In Excess of Liabilities | 1.34% | |
| Total Net Assets | 100.00% |
| Driehaus Emerging Markets Growth Fund | Driehaus Emerging Markets Small Cap Growth Fund | ||
| ASSETS: | |||
| Investments, at cost | $1,697,365,898 | $74,860,057 | |
| Investments securities, at fair value | $2,438,298,454 | $103,148,485 | |
| Short-term securities, at fair value1 | $125,687,870 | $3,768,138 | |
| Warrant securities, at fair value2 | — | — | |
| Foreign currency, at fair value3 | 9,494,158 | 975,229 | |
| Cash | — | — | |
| Receivable for investment securities sold | 16,459,709 | 817,874 | |
| Receivable for foreign taxes | — | — | |
| Receivable for fund shares sold | 955,794 | 26,608 | |
| Receivable for interest and dividends | 3,849,321 | 871,111 | |
| Prepaid expenses | 171,385 | 46,694 | |
| TOTAL ASSETS | 2,594,916,691 | 109,654,139 | |
| LIABILITIES: | |||
| Payable for investment securities sold short, proceeds | — | — | |
| Payable for investment securities sold short, at fair value | — | — | |
| Payable for fund shares redeemed | 579,812 | 30,504 | |
| Payable for investment securities purchased | — | 523,336 | |
| Payable to affiliate | 1,944,530 | 94,962 | |
| Accrued shareholder services plan fees | 285,883 | — | |
| Accrued administration and accounting fees | 474,733 | 27,452 | |
| Accrued foreign capital gains taxes | 5,390,473 | 661,297 | |
| Accrued expenses | 333,200 | 74,325 | |
| TOTAL LIABILITIES | 9,008,631 | 1,411,876 | |
| NET ASSETS | $2,585,908,060 | $108,242,263 | |
| NET ASSETS CONSISTED OF THE FOLLOWING AT JUNE 30, 2021: | |||
| Paid-in-capital | $1,565,880,690 | $108,980,170 | |
| Total distributable earnings (deficit) | 1,020,027,370 | (737,907) | |
| NET ASSETS | $2,585,908,060 | $108,242,263 | |
| NET ASSETS | $— | $108,242,263 | |
| SHARES OUTSTANDING (Unlimited shares authorized, no par value) | — | 4,875,833 | |
| NET ASSET VALUE | $— | $22.20 | |
| INVESTOR CLASS SHARES | |||
| NET ASSETS | $1,002,748,742 | $— | |
| SHARES OUTSTANDING (Unlimited shares authorized, no par value) | 19,207,417 | — | |
| NET ASSET VALUE | $52.21 | $— | |
| INSTITUTIONAL CLASS SHARES | |||
| NET ASSETS | $1,583,159,318 | $— | |
| SHARES OUTSTANDING (Unlimited shares authorized, no par value) | 30,264,439 | — | |
| NET ASSET VALUE | $52.31 | $— | |
| 1 | The cost of short-term securities was $125,687,870, $3,768,138, $1,679,093, $4,876,996, $1,648,787, $7,646,504, $459,314 and $34,824,320, respectively. |
| 2 | The cost of warrants was $0, $0, $0, $0, $0, $0, $0 and $0, respectively. |
| 3 | The cost of foreign currency was $9,413,529, $974,660, $32,892, $0, $0, $0, $0 and $0, respectively. |
| Driehaus Emerging Markets Opportunities Fund | Driehaus International Small Cap Growth Fund | Driehaus Micro Cap Growth Fund | Driehaus Small Cap Growth Fund | Driehaus Small/Mid Cap Growth Fund | Driehaus Event Driven Fund | |||||
| $48,703,834 | $241,037,136 | $244,440,395 | $327,982,922 | $19,392,423 | $129,758,679 | |||||
| $63,805,142 | $312,818,164 | $389,721,757 | $459,465,263 | $23,949,328 | $151,939,458 | |||||
| $1,679,093 | $4,876,996 | $1,648,787 | $7,646,504 | $459,314 | $34,824,320 | |||||
| — | — | — | — | — | 716,894 | |||||
| 32,885 | — | — | — | — | — | |||||
| 339,054 | — | — | — | — | 40,201,009 | |||||
| 1,414,572 | 1,709,192 | 3,295,870 | 5,523,071 | 315,572 | 100,848 | |||||
| — | — | — | — | — | — | |||||
| — | 464 | 660 | 457,170 | 45,991 | 184,608 | |||||
| 115,057 | 802,080 | 6,929 | 284 | 954 | 576,050 | |||||
| 53,774 | 20,826 | 78,839 | 95,287 | 35,386 | 100,896 | |||||
| 67,439,577 | 320,227,722 | 394,752,842 | 473,187,579 | 24,806,545 | 228,644,083 | |||||
| — | — | — | — | — | 34,033,524 | |||||
| — | — | — | — | — | 35,589,940 | |||||
| — | 14,590 | 25,282 | 264,646 | — | 27,660 | |||||
| 1,216,194 | 897,924 | 4,074,765 | 9,693,882 | 431,185 | 2,751,238 | |||||
| 48,595 | 272,760 | 390,135 | 211,516 | 11,467 | 153,152 | |||||
| — | — | — | — | — | 10,124 | |||||
| 13,709 | 62,782 | 70,023 | 71,687 | 16,742 | 26,656 | |||||
| — | — | — | — | — | — | |||||
| 47,315 | 81,644 | 76,661 | 110,959 | 24,404 | 50,884 | |||||
| 1,325,813 | 1,329,700 | 4,636,866 | 10,352,690 | 483,798 | 38,609,654 | |||||
| $66,113,764 | $318,898,022 | $390,115,976 | $462,834,889 | $24,322,747 | $190,034,429 | |||||
| $47,258,157 | $183,046,311 | $140,340,713 | $257,252,355 | $18,571,179 | $158,223,344 | |||||
| 18,855,607 | 135,851,711 | 249,775,263 | 205,582,534 | 5,751,568 | 31,811,085 | |||||
| $66,113,764 | $318,898,022 | $390,115,976 | $462,834,889 | $24,322,747 | $190,034,429 | |||||
| $66,113,764 | $318,898,022 | $390,115,976 | $— | $24,322,747 | $190,034,429 | |||||
| 4,075,345 | 22,426,201 | 16,129,788 | — | 1,247,975 | 12,862,337 | |||||
| $16.22 | $14.22 | $24.19 | $— | $19.49 | $14.77 | |||||
| $— | $— | $— | $58,166,445 | $— | $— | |||||
| — | — | — | 2,147,990 | — | — | |||||
| $— | $— | $— | $27.08 | $— | $— | |||||
| $— | $— | $— | $404,668,444 | $— | $— | |||||
| — | — | — | 14,764,323 | — | — | |||||
| $— | $— | $— | $27.41 | $— | $— | |||||
| Driehaus Emerging Markets Growth Fund | Driehaus Emerging Markets Small Cap Growth Fund | ||
| INVESTMENT INCOME: | |||
| Interest income | $140,407 | $5,522 | |
| Dividend income1 | 12,578,270 | 473,560 | |
| Total investment income | 12,718,677 | 479,082 | |
| Expenses: | |||
| Investment advisory fees | 11,395,746 | 536,702 | |
| Shareholder services fees | 1,037,568 | — | |
| Administration fees | 425,927 | 16,995 | |
| Transfer agent fees | 133,977 | 5,340 | |
| Trustees fees | 244,465 | 9,553 | |
| Custody fees | 177,591 | 19,581 | |
| Reports to shareholders | 57,791 | 3,959 | |
| Professional fees | 219,206 | 10,744 | |
| Audit and tax fees | 35,692 | 36,354 | |
| Federal and state registration fees | 35,507 | 9,674 | |
| Dividends and interest on short positions | — | — | |
| Miscellaneous | 142,570 | 14,150 | |
| Total expenses | 13,906,040 | 663,052 | |
| Investment advisory fees recoupment (reimbursement) | — | (52,847) | |
| Fees paid indirectly | (87,787) | (5,195) | |
| Net expenses | 13,818,253 | 605,010 | |
| Net investment income (loss) | (1,099,576) | (125,928) | |
| NET REALIZED AND UNREALIZED GAIN (LOSS) ON INVESTMENT TRANSACTIONS: | |||
| Net realized gain (loss) on transactions from: | |||
| Investments2 | 174,843,763 | 12,377,695 | |
| Warrants | — | — | |
| Securities sold short | — | — | |
| Written option contracts | — | — | |
| Swap contracts | — | — | |
| Forward foreign currency contracts | 122,502 | 12 | |
| Foreign currency | (1,267,106) | (58,788) | |
| Net realized gain (loss) on investment transactions | 173,699,159 | 12,318,919 | |
| Change in net unrealized appreciation (depreciation) on: | |||
| Investments3 | (23,490,039) | 2,895,771 | |
| Warrants | — | — | |
| Securities sold short | — | — | |
| Written options contracts | — | — | |
| Forward foreign currency contracts | — | — | |
| Foreign currency | 22,873 | (1,917) | |
| Foreign currency translations | 87,623 | — | |
| Net change in unrealized appreciation (depreciation) on investment transactions | (23,379,543) | 2,893,854 | |
| Net realized and unrealized gain (loss) on investment transactions | 150,319,616 | 15,212,773 | |
| NET INCREASE (DECREASE) IN NET ASSETS FROM OPERATIONS | $149,220,040 | $15,086,845 | |
| 1 | Net of $2,131,451, $50,758, $41,463, $243,554, $0, $717, $85, and $0 of non-reclaimable foreign taxes withheld, respectively. |
| 2 | Net realized gain (loss) from security transactions are net of $1,716,687, $0, $0, $0, $0, $0, $0 and $0 foreign capital gains tax withheld, respectively. |
| 3 | Net unrealized gain (loss) from security transactions are net of $537,226, $94,254, $0, $0, $0, $0, $0 and $0 foreign capital gains tax withheld, respectively. |
| Driehaus Emerging Markets Opportunities Fund | Driehaus International Small Cap Growth Fund | Driehaus Micro Cap Growth Fund | Driehaus Small Cap Growth Fund | Driehaus Small/Mid Cap Growth Fund | Driehaus Event Driven Fund | |||||
| $248,867 | $16,819 | $18,410 | $20,149 | $961 | $833,900 | |||||
| 238,282 | 2,491,643 | 175,643 | 357,867 | 29,356 | 424,214 | |||||
| 487,149 | 2,508,462 | 194,053 | 378,016 | 30,317 | 1,258,114 | |||||
| 277,665 | 1,524,070 | 2,345,588 | 1,219,471 | 60,117 | 826,594 | |||||
| — | — | — | 24,612 | — | 109,931 | |||||
| 10,746 | 55,495 | 65,456 | 70,834 | 3,479 | 31,283 | |||||
| 3,377 | 16,648 | 20,609 | 22,276 | 1,088 | 12,301 | |||||
| 5,874 | 30,134 | 38,693 | 40,174 | 1,820 | 15,940 | |||||
| 8,399 | 23,011 | 16,469 | 17,521 | 16,146 | 3,047 | |||||
| 2,123 | 5,177 | 6,451 | 9,875 | 1,689 | 7,540 | |||||
| 7,810 | 25,171 | 32,589 | 34,701 | 2,257 | 14,725 | |||||
| 35,964 | 29,348 | 17,025 | 17,018 | 15,968 | 24,501 | |||||
| 9,229 | 9,311 | 12,270 | 20,581 | 12,464 | 11,639 | |||||
| — | — | — | — | — | 72,416 | |||||
| 16,677 | 26,035 | 27,069 | 26,260 | 13,736 | 28,491 | |||||
| 377,864 | 1,744,400 | 2,582,219 | 1,503,323 | 128,764 | 1,158,408 | |||||
| (70,932) | — | — | 81,561 | (33,189) | — | |||||
| (1,500) | (3,059) | (31,081) | (33,020) | (390) | (45,537) | |||||
| 305,432 | 1,741,341 | 2,551,138 | 1,551,864 | 95,185 | 1,112,871 | |||||
| 181,717 | 767,121 | (2,357,085) | (1,173,848) | (64,868) | 145,243 | |||||
| 2,452,446 | 43,459,636 | 82,832,891 | 62,510,275 | 1,258,842 | 10,477,739 | |||||
| — | — | — | — | — | — | |||||
| — | — | — | — | — | (4,960,924) | |||||
| — | — | — | — | — | 246,039 | |||||
| (2,639) | — | — | — | — | — | |||||
| 6,386 | 7,303 | — | — | — | — | |||||
| (14,645) | (53,916) | — | — | — | 21 | |||||
| 2,441,548 | 43,413,023 | 82,832,891 | 62,510,275 | 1,258,842 | 5,762,875 | |||||
| 1,226,544 | (7,510,624) | (11,067,297) | (7,799,903) | 1,010,608 | (1,040,189) | |||||
| — | — | — | — | — | 68,543 | |||||
| — | — | — | — | — | 4,416,974 | |||||
| — | — | — | — | — | (213,841) | |||||
| 14 | — | — | — | — | — | |||||
| (80) | (15,379) | — | — | — | — | |||||
| 2,204 | — | — | — | — | — | |||||
| 1,228,682 | (7,526,003) | (11,067,297) | (7,799,903) | 1,010,608 | 3,231,487 | |||||
| 3,670,230 | 35,887,020 | 71,765,594 | 54,710,372 | 2,269,450 | 8,994,362 | |||||
| $3,851,947 | $36,654,141 | $69,408,509 | $53,536,524 | $2,204,582 | $9,139,605 | |||||
| Driehaus Emerging Markets Growth Fund | Driehaus Emerging Markets Small Cap Growth Fund | ||||||
| For the six months ended June 30, 2021 (unaudited) | For the year ended December 31, 2020 | For the six months ended June 30, 2021 (unaudited) | For the year ended December 31, 2020 | ||||
| INCREASE (DECREASE) IN NET ASSETS: | |||||||
| Operations: | |||||||
| Net investment income (loss) | $(1,099,576) | $(2,129,816) | $(125,928) | $78,018 | |||
| Net realized gain (loss) on investment transactions | 173,699,159 | 172,694,131 | 12,318,919 | 5,310,854 | |||
| Net change in unrealized appreciation (depreciation) on investment transactions | (23,379,543) | 311,198,111 | 2,893,854 | 14,723,317 | |||
| Net increase (decrease) in net assets resulting from operations | 149,220,040 | 481,762,426 | 15,086,845 | 20,112,189 | |||
| Distributions from distributable earnings to shareholders: | |||||||
| Fund | — | — | — | (556,757) | |||
| Investor Class Shares | — | (23,489,434) | — | — | |||
| Institutional Class Shares | — | (32,004,050) | — | — | |||
| Total distributions to shareholders | — | (55,493,484) | — | (556,757) | |||
| Capital share transactions: | |||||||
| Proceeds from shares sold: | |||||||
| Fund | — | — | 11,879,597 | 42,887,654 | |||
| Investor Class | 77,013,958 | 122,400,329 | — | — | |||
| Institutional Class | 257,346,794 | 339,486,012 | — | — | |||
| Reinvestment of distributions: | |||||||
| Fund | — | — | — | 466,065 | |||
| Investor Class | — | 22,539,510 | — | — | |||
| Institutional Class | — | 28,589,713 | — | — | |||
| Cost of shares redeemed: | |||||||
| Fund | — | — | (8,454,319) | (35,591,556) | |||
| Investor Class | (86,682,599) | (238,017,663) | — | — | |||
| Institutional Class | (94,257,601) | (209,828,617) | — | — | |||
| Redemption fees: | |||||||
| Fund | — | — | 894 | 4,205 | |||
| Investor Class | 1,946 | 28,875 | — | — | |||
| Institutional Fund | 4,180 | 29,249 | — | — | |||
| Net increase (decrease) from capital transactions | 153,426,678 | 65,227,408 | 3,426,172 | 7,766,368 | |||
| Total increase (decrease) in net assets | 302,646,718 | 491,496,350 | 18,513,017 | 27,321,800 | |||
| NET ASSETS: | |||||||
| Beginning of period | $2,283,261,342 | $1,791,764,992 | $89,729,246 | $62,407,446 | |||
| End of period | $2,585,908,060 | $2,283,261,342 | $108,242,263 | $89,729,246 | |||
| Driehaus Emerging Markets Opportunities Fund | Driehaus International Small Cap Growth Fund | Driehaus Micro Cap Growth Fund | ||||||||
| For the six months ended June 30, 2021 (unaudited) | For the year ended December 31, 2020 | For the six months ended June 30, 2021 (unaudited) | For the year ended December 31, 2020 | For the six months ended June 30, 2021 (unaudited) | For the year ended December 31, 2020 | |||||
| $181,717 | $537,845 | $767,121 | $39,286 | $(2,357,085) | $(3,427,590) | |||||
| 2,441,548 | 2,356,794 | 43,413,023 | 31,537,589 | 82,832,891 | 82,788,200 | |||||
| 1,228,682 | 6,990,845 | (7,526,003) | 35,407,010 | (11,067,297) | 81,270,382 | |||||
| 3,851,947 | 9,885,484 | 36,654,141 | 66,983,885 | 69,408,509 | 160,630,992 | |||||
| — | (1,123,080) | — | (22,403,111) | — | (58,749,898) | |||||
| — | — | — | — | — | — | |||||
| — | — | — | — | — | — | |||||
| — | (1,123,080) | — | (22,403,111) | — | (58,749,898) | |||||
| 10,543,631 | 26,003,271 | 30,166,797 | 41,526,419 | 3,029,195 | 41,498,846 | |||||
| — | — | — | — | — | — | |||||
| — | — | — | — | — | — | |||||
| — | 1,122,838 | — | 19,610,183 | — | 40,290,822 | |||||
| — | — | — | — | — | — | |||||
| — | — | — | — | — | — | |||||
| (1,503,272) | (21,710,112) | (36,778,467) | (85,092,052) | (16,712,692) | (118,404,606) | |||||
| — | — | — | — | — | — | |||||
| — | — | — | — | — | — | |||||
| — | — | 1,036 | 500 | — | 4,638 | |||||
| — | — | — | — | — | — | |||||
| — | — | — | — | — | — | |||||
| 9,040,359 | 5,415,997 | (6,610,634) | (23,954,950) | (13,683,497) | (36,610,300) | |||||
| 12,892,306 | 14,178,401 | 30,043,507 | 20,625,824 | 55,725,012 | 65,270,794 | |||||
| $53,221,458 | $39,043,057 | $288,854,515 | $268,228,691 | $334,390,964 | $269,120,170 | |||||
| $66,113,764 | $53,221,458 | $318,898,022 | $288,854,515 | $390,115,976 | $334,390,964 | |||||
| Driehaus Small Cap Growth Fund | Driehaus Small/Mid Cap Growth Fund | ||||||
| For the six months ended June 30, 2021 (unaudited) | For the year ended December 31, 2020 | For the six months ended June 30, 2021 (unaudited) | For the period May 1, 2020* through December 31, 2020 | ||||
| INCREASE (DECREASE) IN NET ASSETS: | |||||||
| Operations: | |||||||
| Net investment income (loss) | $(1,173,848) | $(1,528,238) | $(64,868) | $(35,867) | |||
| Net realized gain (loss) on investment transactions | 62,510,275 | 34,651,531 | 1,258,842 | 238,674 | |||
| Net change in unrealized appreciation (depreciation) on investment transactions | (7,799,903) | 105,766,133 | 1,010,608 | 3,546,297 | |||
| Net increase (decrease) in net assets resulting from operations | 53,536,524 | 138,889,426 | 2,204,582 | 3,749,104 | |||
| Distributions from distributable earnings to shareholders: | |||||||
| Fund | — | — | — | (202,118) | |||
| Investor Class Shares | — | (1,620,573) | — | — | |||
| Institutional Class Shares | — | (19,908,410) | — | — | |||
| Total distributions to shareholders | — | (21,528,983) | — | (202,118) | |||
| Capital share transactions: | |||||||
| Proceeds from shares sold: | |||||||
| Fund | — | — | 8,541,128 | 17,928,182 | |||
| Investor Class | 39,507,444 | 13,330,751 | — | — | |||
| Institutional Class | 79,708,366 | 112,711,149 | — | — | |||
| Reinvestment of distributions: | |||||||
| Fund | — | — | — | 202,118 | |||
| Investor Class | — | 1,619,229 | — | — | |||
| Institutional Class | — | 19,739,575 | — | — | |||
| Cost of shares redeemed: | |||||||
| Fund | — | — | (1,268,449) | (6,831,800) | |||
| Investor Class | (13,867,119) | (4,531,942) | — | — | |||
| Institutional Class | (51,336,824) | (77,715,811) | — | — | |||
| Redemption fees: | |||||||
| Fund | — | — | — | — | |||
| Investor Class | 44,212 | 3,223 | — | — | |||
| Institutional Fund | (740) | 6,224 | — | — | |||
| Net increase (decrease) from capital transactions | 54,055,339 | 65,162,398 | 7,272,679 | 11,298,500 | |||
| Total increase (decrease) in net assets | 107,591,863 | 182,522,841 | 9,477,261 | 14,845,486 | |||
| NET ASSETS: | |||||||
| Beginning of period | $355,243,026 | $172,720,185 | $14,845,486 | $— | |||
| End of period | $462,834,889 | $355,243,026 | $24,322,747 | $14,845,486 | |||
| * | For the period from May 1, 2020 (commencement of operations) through December 31, 2020. |
| Driehaus Event Driven Fund | ||
| For the six months ended June 30, 2021 (unaudited) | For the year ended December 31, 2020 | |
| $145,243 | $687,617 | |
| 5,762,875 | 10,052,195 | |
| 3,231,487 | 17,627,482 | |
| 9,139,605 | 28,367,294 | |
| — | (4,729,352) | |
| — | — | |
| — | — | |
| — | (4,729,352) | |
| 76,525,180 | 75,163,713 | |
| — | — | |
| — | — | |
| — | 4,489,499 | |
| — | — | |
| — | — | |
| (37,694,480) | (30,682,059) | |
| — | — | |
| — | — | |
| — | — | |
| — | — | |
| — | — | |
| 38,830,700 | 48,971,153 | |
| 47,970,305 | 72,609,095 | |
| $142,064,124 | $69,455,029 | |
| $190,034,429 | $142,064,124 | |
| For the six month period January 1, 2021 through June 30, 2021 (unaudited) | For the year ended December 31, 2020 | For the year ended December 31, 2019 | For the year ended December 31, 2018 | For the year ended December 31, 2017 | For the year ended December 31, 2016 | ||||||
| Net asset value, beginning of period | $ 49.09 | $ 39.53 | $ 31.80 | $ 39.64 | $ 27.98 | $ 26.52 | |||||
| INCOME (LOSS) FROM INVESTMENT OPERATIONS: | |||||||||||
| Net investment income (loss) | (0.06)1 | (0.09)1 | 0.301 | 0.261 | 0.111 | 0.03 | |||||
| Net realized and unrealized gain (loss) on investments | 3.18 | 10.87 | 7.76 | (6.73) | 11.78 | 1.54 | |||||
| Total income (loss) from investment operations | 3.12 | 10.78 | 8.06 | (6.47) | 11.89 | 1.57 | |||||
| LESS DISTRIBUTIONS: | |||||||||||
| Net investment income | — | — | (0.33) | (0.16) | (0.23) | (0.11) | |||||
| Net realized gain | — | (1.22) | — | (1.21) | — | — | |||||
| Total distributions | — | (1.22) | (0.33) | (1.37) | (0.23) | (0.11) | |||||
| Redemption fees added to paid-in capital | 0.002 | 0.002 | 0.002 | 0.002 | 0.002 | 0.002 | |||||
| Net asset value, end of period | $ 52.21 | $ 49.09 | $ 39.53 | $ 31.80 | $ 39.64 | $ 27.98 | |||||
| Total Return | 6.34%3 | 27.31% | 25.34% | (16.26)% | 42.52% | 5.88% | |||||
| RATIOS/SUPPLEMENTAL DATA: | |||||||||||
| Net assets, end of period (000’s) | $ 1,002,749 | $ 951,998 | $ 863,535 | $ 791,656 | $ 1,266,365 | $ 1,335,873 | |||||
| Ratio of total expenses before reimbursements, waivers, recoupments and/or fees paid indirectly to average net assets | 1.27%4 | 1.39% | 1.41% | 1.38% | 1.54% | 1.65% | |||||
| Ratio of total expenses net of reimbursements, waivers, recoupments and/or fees paid indirectly to average net assets5 | 1.26%4 | 1.38% | 1.40% | 1.37% | 1.53% | 1.63% | |||||
| Ratio of net investment income (loss) (including interest expense) net of reimbursements, waivers, recoupments and/or fees paid indirectly to average net assets5 | (0.22)%4 | (0.24)% | 0.85% | 0.69% | 0.33% | 0.11% | |||||
| Portfolio turnover | 83%3 | 203% | 167% | 218% | 176% | 232% |
| 1 | Net investment income (loss) per share has been calculated using the average shares method. |
| 2 | Amount represents less than $0.01 per share. |
| 3 | Not annualized. |
| 4 | Annualized. |
| 5 | Such ratios are net of fees paid indirectly (see Note C in the Notes to Financial Statements). The ratio for the Fund includes the effect of fees paid indirectly which impacted the ratio by 0.02%, 0.01%, 0.01%, 0.01%, 0.01%, and 0.01% for the years 2016, 2017, 2018, 2019, 2020 and for the six month period June 30, 2021. |
| For the six month period January 1, 2021 through June 30, 2021 (unaudited) | For the year ended December 31, 2020 | For the year ended December 31, 2019 | For the year ended December 31, 2018 | For the period July 17, 2017 through December 31, 2017 | |||||
| Net asset value, beginning of period | $ 49.14 | $ 39.48 | $ 31.76 | $ 39.61 | $ 34.85 | ||||
| INCOME (LOSS) FROM INVESTMENT OPERATIONS: | |||||||||
| Net investment income (loss) | (0.01)1 | (0.01)1 | 0.381 | 0.32 | 0.121 | ||||
| Net realized and unrealized gain (loss) on investments | 3.18 | 10.89 | 7.75 | (6.71) | 4.92 | ||||
| Total income (loss) from investment operations | 3.17 | 10.88 | 8.13 | (6.39) | 5.04 | ||||
| LESS DISTRIBUTIONS: | |||||||||
| Net investment income | — | — | (0.41) | (0.25) | (0.28) | ||||
| Net realized gain | — | (1.22) | — | (1.21) | — | ||||
| Total distributions | — | (1.22) | (0.41) | (1.46) | (0.28) | ||||
| Redemption fees added to paid-in capital | 0.002 | 0.002 | 0.002 | 0.002 | 0.002 | ||||
| Net asset value, end of period | $ 52.31 | $ 49.14 | $ 39.48 | $ 31.76 | $ 39.61 | ||||
| Total Return | 6.43%3 | 27.60% | 25.60% | (16.08)% | 14.47%3 | ||||
| RATIOS/SUPPLEMENTAL DATA: | |||||||||
| Net assets, end of period (000’s) | $ 1,583,159 | $ 1,331,263 | $ 928,230 | $ 654,445 | $ 513,135 | ||||
| Ratio of total expenses before reimbursements, waivers, recoupments and/or fees paid indirectly to average net assets | 1.06%4 | 1.17% | 1.20% | 1.17% | 1.17%4 | ||||
| Ratio of total expenses net of reimbursements, waivers, recoupments and/or fees paid indirectly to average net assets5 | 1.05%4 | 1.16% | 1.19% | 1.16% | 1.16%4 | ||||
| Ratio of net investment income (loss) (including interest expense) net of reimbursements, waivers, recoupments and/or fees paid indirectly to average net assets5 | (0.01)%4 | (0.02)% | 1.07% | 0.89% | 0.71%4 | ||||
| Portfolio turnover | 83%3 | 203% | 167% | 218% | 176%3 |
| 1 | Net investment income (loss) per share has been calculated using the average shares method. |
| 2 | Amount represents less than $0.01 per share. |
| 3 | Not annualized. |
| 4 | Annualized. |
| 5 | Such ratios are net of fees paid indirectly (see Note C in the Notes to Financial Statements). The ratio for the Fund includes the effect of fees paid indirectly which impacted the ratio by 0.01% for the years 2017, 2018, 2019, 2020 and for the six month period June 30, 2021. |
| For the six month period January 1, 2021 through June 30, 2021 (unaudited) | For the year ended December 31, 2020 | For the year ended December 31, 2019 | For the year ended December 31, 2018 | For the year ended December 31, 2017 | For the year ended December 31, 2016 | ||||||
| Net asset value, beginning of period | $ 19.08 | $ 14.38 | $ 10.80 | $ 14.21 | $ 10.66 | $ 11.85 | |||||
| INCOME (LOSS) FROM INVESTMENT OPERATIONS: | |||||||||||
| Net investment income (loss) | (0.02) | 0.02 | 0.06 | (0.04)1 | 0.021 | (0.03)1 | |||||
| Net realized and unrealized gain (loss) on investments | 3.14 | 4.80 | 3.58 | (3.37) | 3.53 | (1.14) | |||||
| Total income (loss) from investment operations | 3.12 | 4.82 | 3.64 | (3.41) | 3.55 | (1.17) | |||||
| LESS DISTRIBUTIONS: | |||||||||||
| Net investment income | — | (0.12) | (0.06) | — | — | (0.02) | |||||
| Total distributions | — | (0.12) | (0.06) | — | — | (0.02) | |||||
| Redemption fees added to paid-in capital | 0.002 | 0.00 | 0.002 | 0.002 | 0.002 | 0.002 | |||||
| Net asset value, end of period | $ 22.20 | $ 19.08 | $ 14.38 | $ 10.80 | $ 14.21 | $ 10.66 | |||||
| Total Return | 16.35%3 | 33.56% | 33.71% | (24.00)% | 33.30% | (9.97)% | |||||
| RATIOS/SUPPLEMENTAL DATA: | |||||||||||
| Net assets, end of period (000’s) | $ 108,242 | $ 89,729 | $ 62,407 | $ 89,653 | $ 271,146 | $ 261,387 | |||||
| Ratio of total expenses before reimbursements, waivers, recoupments and/or fees paid indirectly to average net assets | 1.36%4 | 1.72% | 1.80%5 | 2.27%5 | 1.82% | 1.75% | |||||
| Ratio of total expenses net of reimbursements, waivers, recoupments and/or fees paid indirectly to average net assets6 | 1.24%4,7 | 1.45%7 | 1.45%5,7 | 2.26%5 | 1.80% | 1.73% | |||||
| Ratio of net investment income (loss) (including interest expense) net of reimbursements, waivers, recoupments and/or fees paid indirectly to average net assets6 | (0.26)%4,7 | 0.12%7 | 0.52%7 | (0.30)% | 0.15% | (0.26)% | |||||
| Portfolio turnover | 86%3 | 248% | 220% | 207% | 243% | 240% |
| 1 | Net investment income (loss) per share has been calculated using the average shares method. |
| 2 | Amount represents less than $0.01 per share. |
| 3 | Not annualized. |
| 4 | Annualized. |
| 5 | Ratio of expenses to average net assets includes interest expense of 0.01% for the year ended December 31, 2019, and less than 0.005% for the year ended December 31, 2018. The interest expense is from utilizing the line of credit (see Note G in the Notes to Financial Statements). |
| 6 | Such ratios are net of fees paid indirectly (see Note C in the Notes to Financial Statements). The ratio for the Fund includes the effect of fees paid indirectly which impacted the ratio by 0.02%, 0.02%, 0.02%, 0.01%, 0.00%, 0.01% for the years 2016, 2017, 2018, 2019, 2020 and for the six month period for 2021. |
| 7 | Such ratios are after prior administrative and transfer agent waivers and adviser expense reimbursements, when applicable. BNY Mellon Investment Servicing (US) Inc., the administrative agent and transfer agent, waived a portion of its fees beginning with the Fund’s commencement of operations, August 22, 2011. Effective December 31, 2020, the Adviser contractually agreed to waive its investment advisory fee or absorb other operating expenses to the extent necessary to ensure that total annual Fund operating expenses (other than interest, taxes, brokerage commissions, dividends and interest on short sales, other investment-related expenses, acquired fund fees and expenses, and extraordinary expenses such as litigation and other expenses not incurred in the ordinary course of the Fund’s business) would not exceed the Fund’s operating expense cap of 1.24% of average daily net assets until April 30, 2023. From November 1, 2018, to December 31, 2020, the annual operating expense limitation was 1.45%. |
| For the six month period January 1, 2021 through June 30, 2021 (unaudited) | For the year ended December 31, 2020 | For the year ended December 31, 2019 | For the year ended December 31, 2018 | For the period April 10, 2017* through December 31, 2017 | |||||
| Net asset value, beginning of period | $ 15.17 | $ 11.94 | $ 9.93 | $ 11.54 | $ 10.00 | ||||
| INCOME (LOSS) FROM INVESTMENT OPERATIONS: | |||||||||
| Net investment income (loss) | — | 0.16 | 0.29 | 0.24 | 0.17 | ||||
| Net realized and unrealized gain (loss) on investments | 1.05 | 3.43 | 1.86 | (1.77) | 1.94 | ||||
| Total income (loss) from investment operations | 1.05 | 3.59 | 2.15 | (1.53) | 2.11 | ||||
| LESS DISTRIBUTIONS: | |||||||||
| Net investment income | — | (0.11) | (0.14) | — | (0.16) | ||||
| Net realized gain | — | (0.25) | — | (0.08) | (0.41) | ||||
| Total distributions | — | (0.36) | (0.14) | (0.08) | (0.57) | ||||
| Redemption fees added to paid-in capital | 0.001 | 0.001 | 0.001 | 0.001 | 0.001 | ||||
| Net asset value, end of period | $ 16.22 | $ 15.17 | $ 11.94 | $ 9.93 | $ 11.54 | ||||
| Total Return | 6.87%2 | 30.09% | 21.64% | (13.22)% | 21.14%2 | ||||
| RATIOS/SUPPLEMENTAL DATA: | |||||||||
| Net assets, end of period (000’s) | $ 66,114 | $ 53,221 | $ 39,043 | $ 31,637 | $ 43,183 | ||||
| Ratio of total expenses before reimbursements, waivers, recoupments and/or fees paid indirectly to average net assets | 1.22%3 | 1.62% | 1.89% | 2.05% | 2.04%3 | ||||
| Ratio of total expenses net of reimbursements, waivers, recoupments and/or fees paid indirectly to average net assets4 | 0.99%3 | 0.99%5 | 1.23%5 | 1.75%5 | 1.75%3,5 | ||||
| Ratio of net investment income (loss) (including interest expense) net of reimbursements, waivers, recoupments and/or fees paid indirectly to average net assets4 | 0.59%3 | 1.47% | 2.67% | 2.19% | 2.12%3 | ||||
| Portfolio turnover | 51%2 | 135% | 155% | 169% | 99%2 |
| * | Fund commenced operations on May 1, 2020. |
| 1 | Amount represents less than $0.01 per share. |
| 2 | Not annualized. |
| 3 | Annualized. |
| 4 | Such ratios are net of fees paid indirectly (see Note C in the Notes to Financial Statements). The expense ratio impacts of fees paid indirectly were 0.00% for the years 2018, 2019, 2020 and for the six month period June 30, 2021. |
| 5 | Effective May 1, 2019, the Adviser contractually agreed to waive its investment advisory fee or absorb other operating expenses to the extent necessary to ensure that total annual Fund operating expenses (other than interest, taxes, brokerage commissions, dividends and interest on short sales, other investment-related expenses, acquired fund fees and expenses, and extraordinary expenses such as litigation and other expenses not incurred in the ordinary course of the Fund’s business) would not exceed the Fund’s operating expense cap of 0.99% of average daily net assets until April 30, 2022. Prior to May 1, 2019, the annual operating expense limitation was 1.75%. |
| For the six month period January 1, 2021 through June 30, 2021 (unaudited) | For the year ended December 31, 2020 | For the year ended December 31, 2019 | For the year ended December 31, 2018 | For the year ended December 31, 2017 | For the year ended December 31, 2016 | ||||||
| Net asset value, beginning of period | $ 12.59 | $ 10.52 | $ 8.13 | $ 11.39 | $ 9.33 | $ 10.08 | |||||
| INCOME (LOSS) FROM INVESTMENT OPERATIONS: | |||||||||||
| Net investment income (loss) | 0.03 | 0.01 | 0.06 | (0.02)1 | (0.04) | (0.02) | |||||
| Net realized and unrealized gain (loss) on investments | 1.60 | 3.10 | 2.41 | (1.92) | 3.88 | (0.61) | |||||
| Total income (loss) from investment operations | 1.63 | 3.11 | 2.47 | (1.94) | 3.84 | (0.63) | |||||
| LESS DISTRIBUTIONS: | |||||||||||
| Net investment income | — | (0.08) | (0.01) | — | — | — | |||||
| Net realized gain | — | (0.96) | (0.07) | (1.32) | (1.78) | (0.12) | |||||
| Total distributions | — | (1.04) | (0.08) | (1.32) | (1.78) | (0.12) | |||||
| Redemption fees added to paid-in capital | 0.002 | 0.002 | 0.002 | 0.002 | 0.002 | 0.002 | |||||
| Net asset value, end of period | $ 14.22 | $ 12.59 | $ 10.52 | $ 8.13 | $ 11.39 | $ 9.33 | |||||
| Total Return | 12.95%3 | 29.71% | 30.41% | (16.92)% | 41.44% | (6.22)% | |||||
| RATIOS/SUPPLEMENTAL DATA: | |||||||||||
| Net assets, end of period (000’s) | $ 318,898 | $ 288,855 | $ 268,229 | $ 218,430 | $ 325,361 | $ 270,401 | |||||
| Ratio of total expenses before reimbursements, waivers, recoupments and/or fees paid indirectly to average net assets | 1.14%4 | 1.23% | 1.24% | 1.50% | 1.73% | 1.72% | |||||
| Ratio of total expenses net of reimbursements, waivers, recoupments and/or fees paid indirectly to average net assets5 | 1.14%4 | 1.23% | 1.24% | 1.49% | 1.71% | 1.70% | |||||
| Ratio of net investment income (loss) (including interest expense) net of reimbursements, waivers, recoupments and/or fees paid indirectly to average net assets5 | 0.50%4 | 0.02% | 0.65% | (0.21)% | (0.44)% | (0.15)% | |||||
| Portfolio turnover | 49%3 | 104% | 96% | 118% | 143% | 151% |
| 1 | Net investment income (loss) per share has been calculated using the average shares method. |
| 2 | Amount represents less than $0.01 per share. |
| 3 | Not annualized. |
| 4 | Annualized. |
| 5 | Such ratios are net of fees paid indirectly (see Note C in the Notes to Financial Statements). The ratio for the Fund includes the effect of fees paid indirectly which impacted the ratio by 0.02%, 0.02%, 0.01%, 0.00%, 0.00% and 0.00% for the years 2016, 2017, 2018, 2019, 2020 and the six month period for 2021. |
| For the six month period January 1, 2021 through June 30, 2021 (unaudited) | For the year ended December 31, 2020 | For the year ended December 31, 2019 | For the year ended December 31, 2018 | For the year ended December 31, 2017 | For the year ended December 31, 2016 | ||||||
| Net asset value, beginning of period | $ 19.99 | $ 12.95 | $ 11.11 | $ 14.44 | $ 12.65 | $ 10.74 | |||||
| INCOME (LOSS) FROM INVESTMENT OPERATIONS: | |||||||||||
| Net investment income (loss) | (0.14) | (0.20) | (0.16) | (0.19) | (0.18)1 | (0.11)1 | |||||
| Net realized and unrealized gain (loss) on investments | 4.34 | 11.20 | 3.90 | 0.55 | 3.26 | 2.02 | |||||
| Total income (loss) from investment operations | 4.20 | 11.00 | 3.74 | 0.36 | 3.08 | 1.91 | |||||
| LESS DISTRIBUTIONS: | |||||||||||
| Net investment income | — | — | (0.02) | — | — | — | |||||
| Net realized gain | — | (3.96) | (1.88) | (3.69) | (1.29) | — | |||||
| Total distributions | — | (3.96) | (1.90) | (3.69) | (1.29) | — | |||||
| Redemption fees added to paid-in capital | 0.002 | 0.002 | 0.002 | 0.002 | 0.002 | 0.002 | |||||
| Net asset value, end of period | $ 24.19 | $ 19.99 | $ 12.95 | $ 11.11 | $ 14.44 | $ 12.65 | |||||
| Total Return | 21.01%3 | 85.60% | 33.89% | 3.88% | 24.30% | 17.78% | |||||
| RATIOS/SUPPLEMENTAL DATA: | |||||||||||
| Net assets, end of period (000’s) | $ 390,116 | $ 334,391 | $ 269,120 | $ 264,607 | $ 322,533 | $ 396,590 | |||||
| Ratio of total expenses before reimbursements, waivers, recoupments and/or fees paid indirectly to average net assets | 1.37%4 | 1.46% | 1.48% | 1.44%5 | 1.45%5 | 1.48% | |||||
| Ratio of total expenses net of reimbursements, waivers, recoupments and/or fees paid indirectly to average net assets6 | 1.36%4 | 1.43% | 1.43% | 1.42%5 | 1.43%5 | 1.44%7 | |||||
| Ratio of net investment income (loss) (including interest expense) net of reimbursements, waivers, recoupments and/or fees paid indirectly to average net assets6 | (1.26)%4 | (1.33)% | (1.32)% | (1.19)% | (1.33)% | (1.00)%7 | |||||
| Portfolio turnover | 64%3 | 141% | 165% | 156% | 177% | 180% |
| 1 | Net investment income (loss) per share has been calculated using the average shares method. |
| 2 | Amount represents less than $0.01 per share. |
| 3 | Not annualized. |
| 4 | Annualized. |
| 5 | Ratio of expenses to average net assets includes interest expense of less than 0.005% for the years ended December 31, 2018 and 2017. The interest expense is from utilizing the line of credit (see Note G in the Notes to Financial Statements). |
| 6 | Such ratios are net of fees paid indirectly (see Note C in the Notes to Financial Statements). The ratio for the Fund includes the effect of fees paid indirectly which impacted the ratio by 0.04%, 0.02%, 0.02%, 0.05%, 0.03%, and 0.01% for the years 2016, 2017, 2018, 2019, 2020, and for the six month period June 30, 2021. |
| 7 | Such ratios are after administrative and transfer agent waivers and adviser expense reimbursements, when applicable. BNY Mellon Investment Servicing (US) Inc., the prior administrative agent and transfer agent, waived a portion of its fees beginning with the Fund’s commencement of operations, November 18, 2013. The Adviser contractually agreed to waive its investment advisory fee or absorb other operating expenses to the extent necessary to ensure that total annual Fund operating expenses (other than interest, taxes, brokerage commissions and other portfolio transaction expenses, capital expenditures, and extraordinary expenses) would not exceed the Fund’s operating expense cap of 1.70% of average daily net assets until November 17, 2016. |
| For the six month period January 1, 2021 through June 30, 2021 (unaudited) | For the year ended December 31, 2020 | For the year ended December 31, 2019 | For the year ended December 31, 2018 | For the period August 21, 2017 through December 31, 2017 | |||||
| Net asset value, beginning of period | $ 23.62 | $ 15.37 | $ 11.66 | $ 11.62 | $ 10.00 | ||||
| INCOME (LOSS) FROM INVESTMENT OPERATIONS: | |||||||||
| Net investment income (loss) | (0.13) | (0.18)1 | (0.13) | (0.12)1 | (0.04)1 | ||||
| Net realized and unrealized gain (loss) on investments | 3.59 | 9.98 | 4.81 | 0.48 | 1.86 | ||||
| Total income (loss) from investment operations | 3.46 | 9.80 | 4.68 | 0.36 | 1.82 | ||||
| LESS DISTRIBUTIONS: | |||||||||
| Net investment income | — | — | — | — | — | ||||
| Net realized gain | — | (1.55) | (0.97) | (0.33) | (0.20) | ||||
| Total distributions | — | (1.55) | (0.97) | (0.33) | (0.20) | ||||
| Redemption fees added to paid-in capital | 0.002 | 0.00 | 0.002 | 0.01 | 0.00 | ||||
| Net asset value, end of period | $ 27.08 | $ 23.62 | $ 15.37 | $ 11.66 | $ 11.62 | ||||
| Total Return | 14.65%3 | 63.77% | 40.25% | 3.33% | 18.18%3 | ||||
| RATIOS/SUPPLEMENTAL DATA: | |||||||||
| Net assets, end of period (000’s) | $ 58,166 | $ 28,088 | $ 10,899 | $ 7,538 | $ 1,344 | ||||
| Ratio of total expenses before reimbursements, waivers, recoupments and/or fees paid indirectly to average net assets | 0.87%4 | 1.35% | 1.59% | 2.57% | 7.86%4 | ||||
| Ratio of total expenses net of reimbursements, waivers, recoupments and/or fees paid indirectly to average net assets5 | 1.20%4,6 | 1.20%6 | 1.17%6 | 1.18%6 | 1.20%4,6 | ||||
| Ratio of net investment income (loss) (including interest expense) net of reimbursements, waivers, recoupments and/or fees paid indirectly to average net assets5 | (1.01)%4,6 | (1.04)%6 | (0.95)%6 | (0.87)%6 | (0.94)%4,6 | ||||
| Portfolio turnover | 83%3 | 164% | 206% | 193% | 66%3 |
| 1 | Net investment income (loss) loss per share has been calculated using the average share method. |
| 2 | Amount represents less than $0.01 per share. |
| 3 | Not annualized. |
| 4 | Annualized. |
| 5 | Such ratios are net of fees paid indirectly (see Note C in the Notes to Financial Statements). The ratio for the Fund includes the effect of fees paid indirectly which impacted the ratio by 0.00%, 0.02%, 0.03%, 0.02%, and 0.02% for the years 2017, 2018, 2019, 2020, and for the the six month period June 30, 2021. |
| 6 | Such ratios are after administrative and transfer agent waivers and adviser expense reimbursements and recoupments, when applicable. BNY Mellon Investment Servicing (US) Inc., the prior administrative agent and transfer agent, waived a portion of its fees beginning with the Fund’s commencement of operations, August 21, 2017. The Adviser contractually agree to waive its investment advisory fee or absorb other operating expenses to the extent necessary to ensure that total annual operating expenses for the Investor Class (other than interest, taxes, brokerage commissions and other portfolio transaction expenses, capital expenditures, and extraordinary expenses) would not exceed the Investor Class’s operating expense cap of 1.20% of average daily net assets until April 30, 2023. |
| For the six month period January 1, 2021 through June 30, 2021 (unaudited) | For the year ended December 31, 2020 | For the year ended December 31, 2019 | For the year ended December 31, 2018 | For the period August 21, 2017 through December 31, 2017 | |||||
| Net asset value, beginning of period | $ 23.88 | $ 15.47 | $ 11.70 | $ 11.63 | $ 10.00 | ||||
| INCOME (LOSS) FROM INVESTMENT OPERATIONS: | |||||||||
| Net investment income (loss) | (0.07) | (0.11)1 | (0.10) | (0.08)1 | (0.03)1 | ||||
| Net realized and unrealized gain (loss) on investments | 3.60 | 10.07 | 4.84 | 0.39 | 1.86 | ||||
| Total income (loss) from investment operations | 3.53 | 9.96 | 4.74 | 0.39 | 1.83 | ||||
| LESS DISTRIBUTIONS: | |||||||||
| Net investment income | — | — | — | — | — | ||||
| Net realized gain | — | (1.55) | (0.97) | (0.33) | (0.20) | ||||
| Total distributions | — | (1.55) | (0.97) | (0.33) | (0.20) | ||||
| Redemption fees added to paid-in capital | 0.002 | — | 0.002 | 0.01 | — | ||||
| Net asset value, end of period | $ 27.41 | $ 23.88 | $ 15.47 | $ 11.70 | $ 11.63 | ||||
| Total Return | 14.78%3 | 64.39% | 40.62% | 3.59% | 18.28%3 | ||||
| RATIOS/SUPPLEMENTAL DATA: | |||||||||
| Net assets, end of period (000’s) | $ 404,669 | $ 327,155 | $ 161,821 | $ 123,395 | $ 38,631 | ||||
| Ratio of total expenses before reimbursements, waivers, recoupments and/or fees paid indirectly to average net assets | 0.72%4 | 0.80% | 0.89% | 1.04% | 1.48%4 | ||||
| Ratio of total expenses net of reimbursements, waivers, recoupments and/or fees paid indirectly to average net assets5 | 0.71%4,6 | 0.81%6 | 0.92%6 | 0.93%6 | 0.95%4,6 | ||||
| Ratio of net investment income (loss) (including interest expense) net of reimbursements, waivers, recoupments and/or fees paid indirectly to average net assets5 | (0.52)%4,6 | (0.64)%6 | (0.70)%6 | (0.62)%6 | (0.69)%4,6 | ||||
| Portfolio turnover | 83%3 | 164% | 206% | 193% | 66%3 |
| 1 | Net investment income (loss) loss per share has been calculated using the average share method. |
| 2 | Amount represents less than $0.01 per share. |
| 3 | Not annualized. |
| 4 | Annualized. |
| 5 | Such ratios are net of fees paid indirectly (see Note C in the Notes to Financial Statements). The ratio for the Fund includes the effect of fees paid indirectly which impacted the ratio by 0.00%, 0.02%, 0.03%, 0.01%, and 0.02% for the years 2017, 2018, 2019, 2020, and for the six month period June 30, 2021. |
| 6 | Such ratios are after administrative and transfer agent waivers and adviser expense reimbursements and recoupments, when applicable. BNY Mellon Investment Servicing (US) Inc., the prior administrative agent and transfer agent, waived a portion of its fees beginning with the Fund’s commencement of operations, August 21, 2017. The Adviser contractually agreed to waive its investment advisory fee or absorb other operating expenses to the extent necessary to ensure that total annual operating expenses for the Institutional Class (other than interest, taxes, brokerage commissions and other portfolio transaction expenses, capital expenditures, and extraordinary expenses) would not exceed the Institutional Class’s operating expense cap of 0.95% of average daily net assets until April 30, 2023. |
| For the six month period January 1, 2021 through June 30, 2021 (unaudited) | For the period May 1, 2020* through December 31, 2020 | ||
| Net asset value, beginning of period | $ 17.19 | $ 10.00 | |
| INCOME (LOSS) FROM INVESTMENT OPERATIONS: | |||
| Net investment income (loss) | (0.05) | (0.04) | |
| Net realized and unrealized gain (loss) on investments | 2.35 | 7.47 | |
| Total income (loss) from investment operations | 2.30 | 7.43 | |
| LESS DISTRIBUTIONS: | |||
| Net investment income | — | — | |
| Net realized gain | — | (0.24) | |
| Total distributions | — | (0.24) | |
| Net asset value, end of period | $ 19.49 | $ 17.19 | |
| Total Return1 | 13.37% | 74.23% | |
| RATIOS/SUPPLEMENTAL DATA: | |||
| Net assets, end of period (000’s) | $ 24,323 | $ 14,845 | |
| Ratio of total expenses before reimbursements, waivers, recoupments and/or fees paid indirectly to average net assets2 | 1.28% | 2.58% | |
| Ratio of total expenses net of reimbursements, waivers, recoupments and/or fees paid indirectly to average net assets2,3 | 0.95% | 0.95%4 | |
| Ratio of net investment income (loss) (including interest expense) net of reimbursements, waivers, recoupments and/or fees paid indirectly to average net assets2,3 | (0.65)% | (0.73)%4 | |
| Portfolio turnover1 | 99% | 96% |
| * | Fund commenced operations on May 1, 2020. |
| 1 | Not annualized. |
| 2 | Annualized. |
| 3 | Such ratios are net of fees paid indirectly (see Note C in the Notes to Financial Statements). The ratio for the Fund includes the effect of fees paid indirectly which impacted the ratio by 0.00% for the periods 2020 and for the six month period June 30, 2021. |
| 4 | Such ratios are after administrative and transfer agent waivers and adviser expense reimbursements, when applicable. BNY Mellon Investment Servicing (US) Inc., the prior administrative agent and transfer agent, and The Northern Trust Company, the current administrative agent and transfer agent, waived a portion of its fees beginning with the Fund’s commencement of operations, May 1, 2020. The Adviser contractually agreed to waive its investment advisory fee or absorb other operating expenses to the extent necessary to ensure that total annual Fund operating expenses (other than interest, taxes, brokerage commissions and other portfolio transaction expenses, capital expenditures, and extraordinary expenses) would not exceed the Fund’s operating expense cap of 0.95% of average daily net assets until May 1, 2023. |
| For the six month period January 1, 2021 through June 30, 2021 (unaudited) | For the year ended December 31, 2020 | For the year ended December 31, 2019 | For the year ended December 31, 2018 | For the year ended December 31, 2017 | For the year ended December 31, 2016 | ||||||
| Net asset value, beginning of period | $ 13.93 | $ 11.55 | $ 9.99 | $ 10.79 | $ 10.34 | $ 9.85 | |||||
| INCOME (LOSS) FROM INVESTMENT OPERATIONS: | |||||||||||
| Net investment income (loss) | 0.04 | 0.12 | 0.26 | 0.25 | 0.02 | 0.02 | |||||
| Net realized and unrealized gain (loss) on investments | 0.80 | 2.74 | 1.69 | (0.69) | 0.43 | 0.59 | |||||
| Total income (loss) from investment operations | 0.84 | 2.86 | 1.95 | (0.44) | 0.45 | 0.61 | |||||
| LESS DISTRIBUTIONS: | |||||||||||
| Net investment income | — | (0.17) | (0.39) | (0.36) | — | (0.09) | |||||
| Net realized gain | — | (0.31) | — | — | — | — | |||||
| Tax return of capital | — | — | — | — | — | (0.03) | |||||
| Total distributions | — | (0.48) | (0.39) | (0.36) | — | (0.12) | |||||
| Net asset value, end of period | $ 14.77 | $ 13.93 | $ 11.55 | $ 9.99 | $ 10.79 | $ 10.34 | |||||
| Total Return | 6.11%1 | 24.84% | 19.53% | (4.03)% | 4.35% | 6.25% | |||||
| RATIOS/SUPPLEMENTAL DATA: | |||||||||||
| Net assets, end of period (000’s) | $ 190,034 | $ 142,064 | $ 69,455 | $ 51,675 | $ 165,648 | $ 256,482 | |||||
| Ratio of total expenses before reimbursements, waivers, recoupments and/or fees paid indirectly to average net assets | 1.40%2 | 1.59% | 1.93% | 1.90% | 1.77% | 2.03% | |||||
| Ratio of total expenses net of reimbursements, waivers, recoupments and/or fees paid indirectly to average net assets3,4 | 1.34%2 | 1.57% | 1.90% | 1.88% | 1.76% | 2.01% | |||||
| Ratio of net investment income (loss) (including dividends and interest on short positions and interest expense) net of reimbursements, waivers, recoupments and/or fees paid indirectly to average net assets3,4 | 0.18%2 | 0.67% | 2.63% | 2.57% | 0.48% | 0.78% | |||||
| Portfolio turnover | 61%1 | 136% | 111% | 101% | 198% | 246% |
| 1 | Not annualized. |
| 2 | Annualized. |
| 3 | The ratio for the fund includes the effect of dividends and interest on short positions, and interest expense which increased the expense ratios by 0.59%, 0.31%, 0.31%, 0.30%, and 0.09% for the years 2017, 2018, 2019, 2020, and for the six month period June 30, 2021. |
| 4 | Such ratios are net of fees paid indirectly (see Note C in the Notes to Financial Statements). The ratio for the fund includes the effect of fees paid indirectly which impacted the expense ratios by 0.02%, 0.01%, 0.02%, 0.03%, and 0.06% for the years 2017, 2018, 2019, 2020, and for the six month period June 30, 2021. |
| Fund | Commencement of Operations |
| Emerging Markets Growth Fund | 12/31/97 |
| Emerging Markets Small Cap Growth Fund | 08/22/11 |
| Emerging Markets Opportunities Fund | 04/10/17 |
| International Small Cap Growth Fund | 09/17/07 |
| Micro Cap Growth Fund | 11/18/13 |
| Small Cap Growth Fund | 08/21/17 |
| Small/Mid Cap Growth Fund | 05/01/20 |
| Event Driven Fund | 08/26/13 |
| Assets | Total Value at June 30, 2021 | Level 1 Quoted Price | Level 2 Significant Observable Inputs | Level 3 Significant Unobservable Inputs | ||||
| Common Stocks | ||||||||
| Africa | $21,667,134 | $21,667,134 | $— | $— | ||||
| Europe | 246,444,336 | 246,444,336 | — | — | ||||
| Far East | 1,769,678,655 | 1,769,678,655 | — | — | ||||
| Middle East | 11,552,482 | 11,552,482 | — | — | ||||
| North America | 214,422,379 | 214,422,379 | — | — | ||||
| South America | 174,533,468 | 174,533,468 | — | — | ||||
| Short Term Investments | 125,687,870 | 125,687,870 | — | — | ||||
| Total | $2,563,986,324 | $2,563,986,324 | $— | $— |
| Assets | Total Value at June 30, 2021 | Level 1 Quoted Price | Level 2 Significant Observable Inputs | Level 3 Significant Unobservable Inputs | ||||
| Common Stocks | ||||||||
| Europe | $5,118,288 | $5,118,288 | $— | $— | ||||
| Far East | ||||||||
| China | 25,485,817 | 25,485,817 | — | — | ||||
| India | 25,467,239 | 25,467,239 | — | — | ||||
| Indonesia | 958,764 | 958,764 | — | — | ||||
| Kazakhstan | 2,357,189 | 2,357,189 | — | — | ||||
| Malaysia | 583,653 | 583,653 | — | — | ||||
| Pakistan | 466,652 | 466,652 | — | — | ||||
| South Korea | 6,817,997 | 6,817,997 | — | — | ||||
| Taiwan | 12,576,475 | 12,576,475 | — | — | ||||
| Thailand | 1,624,171 | 1,624,171 | — | — | ||||
| Turkey | 678,874 | 678,874 | — | — | ||||
| Vietnam | 6,448,393 | 1,609,226 | 4,839,167 | — | ||||
| North America | 4,534,458 | 4,534,458 | — | — | ||||
| South America | 10,030,515 | 10,030,515 | — | — | ||||
| Short Term Investments | 3,768,138 | 3,768,138 | — | — | ||||
| Total | $106,916,623 | $102,077,456 | $4,839,167 | $— |
| Assets | Total Value at June 30, 2021 | Level 1 Quoted Price | Level 2 Significant Observable Inputs | Level 3 Significant Unobservable Inputs | ||||
| Common Stocks | ||||||||
| Africa | $649,608 | $649,608 | $— | $— | ||||
| Europe | 4,150,733 | 4,150,733 | — | — | ||||
| Far East | 42,240,338 | 42,240,338 | — | — | ||||
| Middle East | 548,614 | 548,614 | — | — | ||||
| North America | 4,020,915 | 4,020,915 | — | — | ||||
| South America | 2,679,120 | 2,679,120 | — | — | ||||
| Preferred Stocks | ||||||||
| South America | 425,455 | 425,455 | — | — | ||||
| Short Term Investments | 1,679,093 | 1,679,093 | — | — | ||||
| Sovereign Bonds | 9,090,359 | — | 9,090,359 | — | ||||
| Total | $65,484,235 | $56,393,876 | $9,090,359 | $— |
| Assets | Total Value at June 30, 2021 | Level 1 Quoted Price | Level 2 Significant Observable Inputs | Level 3 Significant Unobservable Inputs | ||||
| Common Stocks | ||||||||
| Europe | $216,609,258 | $216,609,258 | $— | $— | ||||
| Far East | 50,120,270 | 50,120,270 | — | — | ||||
| Middle East | 4,005,166 | 4,005,166 | — | — | ||||
| North America | 31,488,361 | 31,488,361 | — | — | ||||
| South America | 8,039,839 | 8,039,839 | — | — | ||||
| Preferred Stocks | ||||||||
| South America | 2,555,270 | 2,555,270 | — | — | ||||
| Short Term Investments | 4,876,996 | 4,876,996 | — | — | ||||
| Total | $317,695,160 | $317,695,160 | $— | $— |
| Assets* | Total Value at June 30, 2021 | Level 1 Quoted Price | Level 2 Significant Observable Inputs | Level 3 Significant Unobservable Inputs | ||||
| Common Stocks | $389,721,757 | $389,721,757 | $— | $— | ||||
| Short Term Investments | 1,648,787 | 1,648,787 | — | — | ||||
| Total | $391,370,544 | $391,370,544 | $— | $— |
| * See Schedule of Investments for industry breakout. |
| Assets* | Total Value at June 30, 2021 | Level 1 Quoted Price | Level 2 Significant Observable Inputs | Level 3 Significant Unobservable Inputs | ||||
| Common Stocks | $459,465,263 | $459,465,263 | $— | $— | ||||
| Short Term Investments | 7,646,504 | 7,646,504 | — | — | ||||
| Total | $467,111,767 | $467,111,767 | $— | $— |
| * See Schedule of Investments for industry breakout. |
| Assets* | Total Value at June 30, 2021 | Level 1 Quoted Price | Level 2 Significant Observable Inputs | Level 3 Significant Unobservable Inputs | ||||
| Common Stocks | $23,949,328 | $23,949,328 | $— | $— | ||||
| Short Term Investments | 459,314 | 459,314 | — | — | ||||
| Total | $24,408,642 | $24,408,642 | $— | $— |
| * See Schedule of Investments for industry breakout. |
| Assets* | Total Value at June 30, 2021 | Level 1 Quoted Price | Level 2 Significant Observable Inputs | Level 3 Significant Unobservable Inputs | ||||
| Common Stocks | $121,674,997 | $118,194,221 | $3,480,776 | |||||
| Convertible Corporate Bonds | 1,527,405 | — | 1,527,405 | $— | ||||
| Corporate Bonds | 20,121,230 | — | 20,121,230 | — | ||||
| Master Limited Partnerships | 2,077,550 | 2,077,550 | — | — | ||||
| Preferred Stocks | 3,376,211 | 3,376,211 | — | — | ||||
| Private Investment In Public Equity (PIPES) | 2,553,402 | 2,553,402 | — | — | ||||
| Short Term Investments | 34,824,320 | 34,824,320 | — | — | ||||
| Warrants | 1,325,557 | 1,239,371 | 86,186 | — | ||||
| Total | $187,480,672 | $162,265,075 | $25,215,597 | $— |
| Liabilities* | ||||||||
| Common Stocks Sold Short | $(4,834,943) | $(4,834,943) | $— | $— | ||||
| Exchange-Traded Funds Sold Short | (30,754,997) | (30,754,997) | — | — | ||||
| Total | $(35,589,940) | $(35,589,940) | $— | $— |
| * See Schedule of Investments for industry breakout. |
| Investments, at Value | |
| Balance as of December 31, 2020 | $2,960,500 |
| Realized gain (loss) | — |
| Change in net unrealized appreciation (depreciation) | 357,592 |
| Purchases | 1,316,000 |
| Sales | — |
| Transfers in and/or out of Level 3 | (4,634,092) |
| Balance as of June 30, 2021 | $— |
| Emerging Markets Growth Fund | Emerging Markets Small Cap Growth Fund | Emerging Markets Opportunities Fund | International Small Cap Growth Fund | ||||
| Paid-in capital | $— | $— | $— | $— | |||
| Total distributable earnings (deficit) | — | — | — | — |
| Micro Cap Growth Fund | Small Cap Growth Fund | Small/Mid Cap Growth Fund | Event Driven Fund | ||||
| Paid-in capital | $— | $95 | $— | $— | |||
| Total distributable earnings (deficit) | — | (95) | — | — |
| Not Subject to Expiration | ||||
| Fund | Short-Term | Long-Term | ||
| Emerging Markets Growth Fund | $— | $— | ||
| Emerging Markets Small Cap Growth Fund | (40,064,535) | — | ||
| Emerging Markets Opportunities Fund | — | — | ||
| International Small Cap Growth Fund | — | — | ||
| Micro Cap Growth Fund | — | — | ||
| Small Cap Growth Fund | — | — | ||
| Small/Mid Cap Growth Fund | — | — | ||
| Event Driven Fund | — | — | ||
| Fund | Year | Ordinary Income | Long-Term Capital Gain | Return of Capital | Total Distributions | |||||
| Emerging Markets Growth Fund | 2020 | $16,886,001 | $38,607,483 | $— | $55,493,484 | |||||
| 2019 | 15,701,188 | 776,768 | — | 16,477,956 | ||||||
| Emerging Markets Small Cap Growth Fund | 2020 | 556,757 | — | — | 556,757 | |||||
| 2019 | 255,325 | — | — | 255,325 | ||||||
| Emerging Markets Opportunities Fund | 2020 | 379,497 | 743,583 | — | 1,123,080 | |||||
| 2019 | 443,723 | — | — | 443,723 | ||||||
| International Small Cap Growth Fund | 2020 | 3,163,154 | 19,239,957 | — | 22,403,111 | |||||
| 2019 | 343,991 | 1,632,552 | — | 1,976,543 | ||||||
| Micro Cap Growth Fund | 2020 | 10,322,938 | 48,426,960 | — | 58,749,898 | |||||
| 2019 | — | 33,768,834 | — | 33,768,834 | ||||||
| Small Cap Growth Fund | 2020 | 2,296,873 | 19,232,110 | — | 21,528,983 | |||||
| 2019 | — | 9,909,321 | — | 9,909,321 | ||||||
| Small/Mid Cap Growth Fund | 2020 | 202,118 | — | — | 202,118 | |||||
| Event Driven Fund | 2020 | 2,341,243 | 2,388,109 | — | 4,729,352 | |||||
| 2019 | 2,262,269 | — | — | 2,262,269 |
| Emerging Markets Growth Fund | Emerging Markets Small Cap Growth Fund | Emerging Markets Opportunities Fund | International Small Cap Growth Fund | ||||
| Undistributed ordinary income | $81,648,785 | $49,512 | $866,309 | $14,658,561 | |||
| Undistributed long-term capital gain | 43,094,847 | — | 422,136 | 5,877,643 | |||
| Accumulated earnings | 124,743,632 | 49,512 | 1,288,445 | 20,536,204 | |||
| Paid-in capital | 1,412,454,012 | 105,553,998 | 38,217,798 | 189,656,945 | |||
| Accumulated capital and other losses | — | (40,064,535) | — | — | |||
| Unrealized appreciation (depreciation) on investments, securities, sold short, options and futures contracts | 746,063,698 | 24,190,271 | 13,715,215 | 78,661,366 | |||
| Net assets | $2,283,261,342 | $89,729,246 | $53,221,458 | $288,854,515 |
| Micro Cap Growth Fund | Small Cap Growth Fund | Small/Mid Cap Growth Fund | Event Driven Fund | ||||
| Undistributed ordinary income | $17,444,131 | $10,719,716 | $49,767 | $1,178,844 | |||
| Undistributed long-term capital gain | 12,077,255 | 5,136,799 | — | 4,433,042 | |||
| Accumulated earnings | 29,521,386 | 15,856,515 | 49,767 | 5,611,886 | |||
| Paid-in capital | 154,024,211 | 203,197,014 | 11,298,500 | 119,392,644 | |||
| Accumulated capital and other losses | — | — | — | — | |||
| Unrealized appreciation (depreciation) on investments, securities, sold short, options and futures contracts | 150,845,367 | 136,189,497 | 3,497,219 | 17,059,594 | |||
| Net assets | $334,390,964 | $355,243,026 | $14,845,486 | $142,064,124 |
| Fund | Basis | Gross Appreciation | Gross Depreciation | Net Appreciation/ Depreciation | ||||
| Emerging Markets Growth Fund | $1,836,092,093 | $755,609,147 | $(27,714,916) | $727,894,231 | ||||
| Emerging Markets Small Cap Growth Fund | 79,188,998 | 28,496,223 | (768,598) | 27,727,625 | ||||
| Emerging Markets Opportunities Fund | 50,466,890 | 15,442,275 | (424,930) | 15,017,345 | ||||
| International Small Cap Growth Fund | 246,547,532 | 74,396,647 | (3,249,019) | 71,147,628 | ||||
| Micro Cap Growth Fund | 251,555,291 | 146,110,741 | (6,295,488) | 139,815,253 | ||||
| Small Cap Growth Fund | 338,694,068 | 131,338,501 | (2,920,802) | 128,417,699 | ||||
| Small/Mid Cap Growth Fund | 19,899,944 | 4,748,896 | (240,198) | 4,508,698 | ||||
| Event Driven Fund | 131,585,319 | 4,013,222 | (26,390,323) | (22,377,101) |
| Asset derivatives | ||||
| Risk exposure category | Statements of Assets and Liabilities location | Fair Value | ||
| Equity contracts | Warrant securities, at fair value | $1,325,557 | ||
| Total | $1,325,557 | |||
| Amount of net realized gain (loss) on derivatives | ||||
| Risk exposure category | ||||
| Derivative | Currency contracts | Total | ||
| Forward foreign currency contracts | $12 | $12 | ||
| Total | $12 | $12 | ||
| Amount of net realized gain (loss) on derivatives | ||||||
| Risk exposure category | ||||||
| Derivative | Currency contracts | Interest rate contracts | Total | |||
| Forward foreign currency contracts | $6,386 | $— | $6,386 | |||
| Swap contracts | — | (2,639) | (2,639) | |||
| Total | $6,386 | $(2,639) | $3,747 | |||
| Amount of net realized gain (loss) on derivatives | ||||
| Risk exposure category | ||||
| Derivative | Equity contracts | Total | ||
| Written options contracts | $246,039 | $246,039 | ||
| Total | $246,039 | $246,039 | ||
| Change in net unrealized appreciation (depreciation) on derivatives | ||||
| Risk exposure category | ||||
| Derivative | Interest rate contracts | Total | ||
| Swap contracts | $14 | $14 | ||
| Total | $14 | $14 | ||
| Quarterly Derivative Averages | ||||
| Derivative | Quarterly Average | $ Amount/ Number | ||
| Swap contracts | gross notional amount | $108,992 | ||
| Change in net unrealized appreciation (depreciation) on derivatives | ||||
| Risk exposure category | ||||
| Derivative | Equity contracts | Total | ||
| Written options contracts | $(213,841) | $(213,841) | ||
| Warrant contracts | 68,543 | 68,543 | ||
| Total | $(145,298) | $(145,298) | ||
| Quarterly Derivative Averages | ||||
| Derivative | Quarterly Average | $ Amount/ Number | ||
| Written options contracts | number of contracts | (353) | ||
| Warrant contracts | number of contracts | 600,672 | ||
| Period ended June 30 | Emerging Markets Small Cap Growth Fund | Emerging Markets Opportunities Fund | Small Cap Growth Fund | Small/Mid Cap Growth Fund | ||||
| 2022 | $227,780 | $234,125 | $— | $— | ||||
| 2023 | 171,531 | 230,617 | 2,912 | 73,297 | ||||
| 2024 | 52,847 | 70,932 | — | 33,189 | ||||
| Total | $452,158 | $535,674 | $2,912 | $106,486 |
| Fund | Shareholder services plan fees | Accrued shareholder services plan fees | ||
| Emerging Markets Growth Fund | $ 1,037,568 | $ 285,883 | ||
| Small Cap Growth Fund | 24,612 | — | ||
| Event Driven Fund | 109,931 | 10,124 |
| Fund | Purchases | Sales | ||
| Emerging Markets Growth Fund | 2,024,956,197 | 1,920,680,878 | ||
| Emerging Markets Small Cap Growth Fund | 81,621,264 | 80,205,047 | ||
| Emerging Markets Opportunities Fund | 39,272,082 | 29,484,150 | ||
| International Small Cap Growth Fund | 144,561,911 | 151,342,031 | ||
| Micro Cap Growth Fund | 234,890,049 | 249,208,047 | ||
| Small Cap Growth Fund | 386,148,518 | 333,977,430 | ||
| Small/Mid Cap Growth Fund | 26,739,203 | 19,950,038 | ||
| Event Driven Fund | 122,115,208 | 98,785,301 |
| Emerging Markets Growth Fund | Emerging Markets Small Cap Growth Fund | Emerging Markets Opportunities Fund | |||||||||
| June 30, 2021 | December 31, 2020 | June 30, 2021 | December 31, 2020 | June 30, 2021 | December 31, 2020 | ||||||
| Fund | |||||||||||
| Shares issued | — | — | 594,067 | 2,543,003 | 663,621 | 1,794,696 | |||||
| Shares reinvested | — | — | — | 24,896 | — | 75,459 | |||||
| Shares redeemed | — | — | (420,945) | (2,203,816) | (96,663) | (1,630,784) | |||||
| Net increase (decrease) | — | — | 173,122 | 364,083 | 566,958 | 239,371 | |||||
| Investor Class | |||||||||||
| Shares issued | 1,509,169 | 3,204,978 | — | — | — | — | |||||
| Shares reinvested | — | 465,885 | — | — | — | — | |||||
| Shares redeemed | (1,693,356) | (6,122,971) | — | — | — | — | |||||
| Net increase (decrease) | (184,187) | (2,452,108) | — | — | — | — | |||||
| Institutional Class | |||||||||||
| Shares issued | 5,008,833 | 8,365,858 | — | — | — | — | |||||
| Shares reinvested | — | 590,331 | — | — | — | — | |||||
| Shares redeemed | (1,834,771) | (5,376,101) | — | — | — | — | |||||
| Net increase (decrease) | 3,174,062 | 3,580,088 | — | — | — | — | |||||
| Total net increase (decrease) | 2,989,875 | 1,127,980 | — | — | — | — | |||||
| International Small Cap Growth Fund | Micro Cap Growth Fund | Small Cap Growth Fund | |||||||||
| June 30, 2021 | December 31, 2020 | June 30, 2021 | December 31, 2020 | June 30, 2021 | December 31, 2020 | ||||||
| Fund | |||||||||||
| Shares issued | 2,175,304 | 3,883,897 | 132,054 | 3,395,804 | — | — | |||||
| Shares reinvested | — | 1,581,466 | — | 2,060,912 | — | — | |||||
| Shares redeemed | (2,690,439) | (8,019,361) | (726,451) | (9,518,280) | — | — | |||||
| Net increase (decrease) | (515,135) | (2,553,998) | (594,397) | (4,061,564) | — | — | |||||
| Investor Class | |||||||||||
| Shares issued | — | — | — | — | 1,489,888 | 692,425 | |||||
| Shares reinvested | — | — | — | — | — | 68,699 | |||||
| Shares redeemed | — | — | — | — | (531,117) | (281,205) | |||||
| Net increase (decrease) | — | — | — | — | 958,771 | 479,919 | |||||
| Institutional Class | |||||||||||
| Shares issued | — | — | — | — | 3,007,445 | 6,900,456 | |||||
| Shares reinvested | — | — | — | — | — | 828,350 | |||||
| Shares redeemed | — | — | — | — | (1,942,459) | (4,491,029) | |||||
| Net increase (decrease) | — | — | — | — | 1,064,986 | 3,237,777 | |||||
| Total net increase (decrease) | — | — | — | — | 2,023,757 | 3,717,696 | |||||
| Small/Mid Cap Growth Fund | Event Driven Fund | ||||||
| June 30, 2021 | December 31, 2020 | June 30, 2021 | December 31, 2020 | ||||
| Fund | |||||||
| Shares issued | 453,605 | 1,246,622 | 4,918,812 | 6,365,985 | |||
| Shares reinvested | — | 11,603 | — | 325,090 | |||
| Shares redeemed | (69,118) | (394,737) | (2,252,121) | (2,509,836) | |||
| Net increase (decrease) | 384,487 | 863,488 | 2,666,691 | 4,181,239 | |||
| Investor Class | |||||||
| Shares issued | — | — | — | — | |||
| Shares reinvested | — | — | — | — | |||
| Shares redeemed | — | — | — | — | |||
| Net increase (decrease) | — | — | — | — | |||
| Institutional Class | |||||||
| Shares issued | — | — | — | — | |||
| Shares reinvested | — | — | — | — | |||
| Shares redeemed | — | — | — | — | |||
| Net increase (decrease) | — | — | — | — | |||
| Total net increase (decrease) | — | — | — | — | |||
| Emerging Markets Growth Fund — Investor Class | ||||||
| Beginning Account Value January 1, 2021 | Ending Account Value June 30, 2021 | Expenses Paid During Six Months Ended June 30, 2021* | ||||
| Actual | $1,000.00 | $1,063.20 | $6.50 | |||
| Hypothetical Example, assuming a 5% return before expenses | $1,000.00 | $1,018.50 | $6.36 | |||
| Emerging Markets Growth Fund — Institutional Class | ||||||
| Beginning Account Value January 1, 2021 | Ending Account Value June 30, 2021 | Expenses Paid During Six Months Ended June 30, 2021* | ||||
| Actual | $1,000.00 | $1,064.30 | $5.43 | |||
| Hypothetical Example, assuming a 5% return before expenses | $1,000.00 | $1,019.54 | $5.31 | |||
| Emerging Markets Small Cap Growth Fund | ||||||
| Beginning Account Value January 1, 2021 | Ending Account Value June 30, 2021 | Expenses Paid During Six Months Ended June 30, 2021* | ||||
| Actual | $1,000.00 | $1,164.00 | $6.65 | |||
| Hypothetical Example, assuming a 5% return before expenses | $1,000.00 | $1,018.65 | $6.21 | |||
| Emerging Markets Opportunities Fund | ||||||
| Beginning Account Value January 1, 2021 | Ending Account Value June 30, 2021 | Expenses Paid During Six Months Ended June 30, 2021* | ||||
| Actual | $1,000.00 | $1,069.20 | $5.09 | |||
| Hypothetical Example, assuming a 5% return before expenses | $1,000.00 | $1,019.89 | $4.96 | |||
| International Small Cap Growth Fund | ||||||
| Beginning Account Value January 1, 2021 | Ending Account Value June 30, 2021 | Expenses Paid During Six Months Ended June 30, 2021* | ||||
| Actual | $1,000.00 | $1,129.50 | $6.02 | |||
| Hypothetical Example, assuming a 5% return before expenses | $1,000.00 | $1,019.14 | $5.71 | |||
| Micro Cap Growth Fund | ||||||
| Beginning Account Value January 1, 2021 | Ending Account Value June 30, 2021 | Expenses Paid During Six Months Ended June 30, 2021* | ||||
| Actual | $1,000.00 | $1,209.10 | $7.50 | |||
| Hypothetical Example, assuming a 5% return before expenses | $1,000.00 | $1,018.00 | $6.85 | |||
| Small Cap Growth Fund — Investor Class | ||||||
| Beginning Account Value January 1, 2021 | Ending Account Value June 30, 2021 | Expenses Paid During Six Months Ended June 30, 2021* | ||||
| Actual | $1,000.00 | $1,145.60 | $6.38 | |||
| Hypothetical Example, assuming a 5% return before expenses | $1,000.00 | $1,018.84 | $6.01 | |||
| Small Cap Growth Fund — Institutional Class | ||||||
| Beginning Account Value January 1, 2021 | Ending Account Value June 30, 2021 | Expenses Paid During Six Months Ended June 30, 2021* | ||||
| Actual | $1,000.00 | $1,147.00 | $3.83 | |||
| Hypothetical Example, assuming a 5% return before expenses | $1,000.00 | $1,021.22 | $3.61 | |||
| Small/Mid Cap Growth Fund | ||||||
| Beginning Account Value January 1, 2021 | Ending Account Value June 30, 2021 | Expenses Paid During Six Months Ended June 30, 2021* | ||||
| Actual | $1,000.00 | $1,132.00 | $5.02 | |||
| Hypothetical Example, assuming a 5% return before expenses | $1,000.00 | $1,020.08 | $4.76 | |||
| Event Driven Fund | ||||||
| Beginning Account Value January 1, 2021 | Ending Account Value June 30, 2021 | Expenses Paid During Six Months Ended June 30, 2021* | ||||
| Actual | $1,000.00 | $1,061.10 | $7.15 | |||
| Hypothetical Example, assuming a 5% return before expenses | $1,000.00 | $1,017.85 | $7.00 | |||
| Emerging Markets Growth Fund – Investor Class | 1.27% |
| Emerging Markets Growth Fund – Institutional Class | 1.06% |
| Emerging Markets Small Cap Growth Fund | 1.24% |
| Emerging Markets Opportunities Fund | 0.99% |
| International Small Cap Growth Fund | 1.14% |
| Micro Cap Growth Fund | 1.37% |
| Small Cap Growth Fund – Investor Class | 1.20% |
| Small Cap Growth Fund – Institutional Class | 0.72% |
| Small/Mid Cap Growth Fund | 0.95% |
| Event Driven Fund | 1.40% |
| Emerging Markets Growth Fund | Emerging Markets Small Cap Growth Fund | Emerging Markets Opportunities Fund | International Small Cap Growth Fund | |||
| $38,607,483 | $— | $743,583 | $19,239,957 |
| Micro Cap Growth Fund | Small Cap Growth Fund | Small/Mid Cap Growth Fund | Event Driven Fund | |||
| $48,426,960 | $19,232,110 | $— | $2,388,109 |
| Emerging Markets Growth Fund | Emerging Markets Small Cap Growth Fund | Emerging Markets Opportunities Fund | International Small Cap Growth Fund | |||
| —% | 63.85% | 69.62% | 100.00% |
| Micro Cap Growth Fund | Small Cap Growth Fund | Small/Mid Cap Growth Fund | Event Driven Fund | |||
| —% | —% | —% | 18.30% |
| Emerging Markets Growth Fund | Emerging Markets Small Cap Growth Fund | Emerging Markets Opportunities Fund | International Small Cap Growth Fund | |||
| 84.46% | —% | —% | 76.91% |
| Micro Cap Growth Fund | Small Cap Growth Fund | Small/Mid Cap Growth Fund | Event Driven Fund | |||
| 2.46% | 10.71% | 3.45% | —% |
| Emerging Markets Growth Fund | Emerging Markets Small Cap Growth Fund | Emerging Markets Opportunities Fund | International Small Cap Growth Fund | |||
| —% | —% | 0.20% | —% |
| Micro Cap Growth Fund | Small Cap Growth Fund | Small/Mid Cap Growth Fund | Event Driven Fund | |||
| —% | —% | —% | 11.55% |
| • | the program supported each Fund’s ability to honor redemption requests timely; |
| • | the program supported the Adviser’s management of each Fund’s liquidity profile, including during periods of market volatility and net redemptions; |
| • | no material liquidity issues were identified during the period; |
| • | there were no material changes to the program during the period; |
| • | the implementation of the program was effective to manage each Fund’s liquidity risk; and |
| • | the program operated adequately during the period. |
b. Not applicable.
Item 2. Code of Ethics.
Not applicable.
Item 3. Audit Committee Financial Expert.
Not applicable.
Item 4. Principal Accountant Fees and Services.
Not applicable.
Item 5. Audit Committee of Listed Registrants.
Not applicable.
Item 6. Investments.
| (a) | Schedule of Investments in securities of unaffiliated issuers as of the close of the reporting period is included as part of the report to shareholders filed under Item 1 of this form. |
| (b) | Not applicable. |
Item 7. Disclosure of Proxy Voting Policies and Procedures for Closed-End Management Investment Companies.
Not applicable.
Item 8. Portfolio Managers of Closed-End Management Investment Companies.
Not applicable.
Item 9. Purchases of Equity Securities by Closed-End Management Investment Companies and Affiliated Purchasers.
Not applicable.
Item 10. Submission of Matters to a Vote of Security Holders.
There have been no material changes to the procedures by which the shareholders may recommend nominees to the registrant’s board of directors, where those changes were implemented after the registrant last provided disclosure in response to the requirements of Item 407(c)(2)(iv) of Regulation S-K (17 CFR 229.407) (as required by Item 22(b)(15) of Schedule 14A (17 CFR 240.14a-101)), or this Item.
Item 11. Controls and Procedures.
| (a) | The registrant’s principal executive and principal financial officers, or persons performing similar functions, have concluded that the registrant’s disclosure controls and procedures (as defined in Rule 30a-3(c) under the Investment Company Act of 1940, as amended (the “1940 Act”) (17 CFR 270.30a-3(c))) are effective, as of a date within 90 days of the filing date of the report that includes the disclosure required by this paragraph, based on their evaluation of these controls and procedures required by Rule 30a-3(b) under the 1940 Act (17 CFR 270.30a-3(b)) and Rules 13a-15(b) or 15d-15(b) under the Securities Exchange Act of 1934, as amended (17 CFR 240.13a-15(b) or 240.15d-15(b)). |
| (b) | There were no changes in the registrant’s internal control over financial reporting (as defined in Rule 30a-3(d) under the 1940 Act (17 CFR 270.30a-3(d))) that occurred during the period covered by this report that has materially affected, or is reasonably likely to materially affect, the registrant’s internal control over financial reporting. |
Item 12. Disclosure of Securities Lending Activities for Closed-End Management Investment Companies.
Not applicable.
Item 13. Exhibits.
| (a)(1) | Not applicable. |
| (a)(2) | Certifications pursuant to Rule 30a-2(a) under the 1940 Act and Section 302 of the Sarbanes-Oxley Act of 2002 are attached hereto. |
| (a)(3) | Not applicable. |
| (a)(4) | Not applicable. |
| (b) | Certifications pursuant to Rule 30a-2(b) under the 1940 Act and Section 906 of the Sarbanes- Oxley Act of 2002 are attached hereto. |
SIGNATURES
Pursuant to the requirements of the Securities Exchange Act of 1934 and the Investment Company Act of 1940, the registrant has duly caused this report to be signed on its behalf by the undersigned, thereunto duly authorized.
| (Registrant) | Driehaus Mutual Funds |
| By (Signature and Title)* | /s/ Stephen T. Weber |
| Stephen T. Weber, President |
| (principal executive officer) |
| Date | September 2, 2021 |
Pursuant to the requirements of the Securities Exchange Act of 1934 and the Investment Company Act of 1940, this report has been signed below by the following persons on behalf of the registrant and in the capacities and on the dates indicated.
| By (Signature and Title)* | /s/ Stephen T. Weber |
| Stephen T. Weber, President |
| (principal executive officer) |
| Date | September 2, 2021 |
| By (Signature and Title)* | /s/ Robert M. Kurinsky |
| Robert M. Kurinsky, Vice President and Treasurer |
| (principal financial officer) |
| Date | September 2, 2021 |
| * | Print the name and title of each signing officer under his or her signature. |