UNITED STATES
SECURITIES AND EXCHANGE COMMISSION
Washington, D.C. 20549
FORM N-CSR
CERTIFIED SHAREHOLDER REPORT
OF
REGISTERED MANAGEMENT INVESTMENT COMPANIES
Investment Company Act file number: 811-7803
Name of Registrant: Vanguard Treasury Fund
Address of Registrant: | P.O. Box 2600 |
| Valley Forge, PA 19482 |
|
|
Name and address of agent for service: | Heidi Stam, Esquire |
| P.O. Box 876 |
| Valley Forge, PA 19482 |
|
|
|
|
Registrant’s telephone number, including area code: (610) 669-1000
Date of fiscal year end: August 31
Date of reporting period: September 1, 2006–August 31, 2007
Item 1: Reports to Shareholders |
|
|

|

> | The returns of Vanguard’s four money market funds for the fiscal year ended August 31, 2007, ranged from 4.9% to 5.4%. |
> | The federal funds rate stood at 5.25% throughout the period, providing for the highest money market returns since the late 1990s. |
> | The funds’ ten-year average returns are significantly ahead of those for their respective peer groups. |
Contents |
|
|
|
Your Fund’s Total Returns | 1 |
Chairman’s Letter | 2 |
Advisor’s Report | 7 |
Prime Money Market Fund | 9 |
Federal Money Market Fund | 25 |
Treasury Money Market Fund | 35 |
Admiral Treasury Money Market Fund | 44 |
About Your Fund’s Expenses | 55 |
Trustees Approve Advisory Arrangement | 57 |
Glossary | 58 |
Please note: The opinions expressed in this report are just that—informed opinions. They should not be considered promises or advice. Also, please keep in mind that the information and opinions cover the period through the date on the cover of this report. Of course, the risks of investing in your fund are spelled out in the prospectus.
Your Fund’s Total Returns
Fiscal Year Ended August 31, 2007 |
|
|
|
|
|
|
|
|
|
|
|
| Average | SEC 7-Day |
| Ticker | Vanguard | Competing | Annualized Yield2 |
Vanguard Money Market Fund | Symbol | Fund | Fund1 | 8/31/2007 |
Prime |
|
|
|
|
Investor Shares | VMMXX | 5.2% | 4.6% | 5.11% |
Institutional Shares3 | VMRXX | 5.4 | 5.1 | 5.27 |
Federal | VMFXX | 5.2 | 4.6 | 5.03 |
Treasury | VMPXX | 4.9 | 4.3 | 4.54 |
Admiral Treasury4 | VUSXX | 5.0 | 4.3 | 4.64 |
1 Peer groups are: for the Prime Money Market Fund Investor Shares, the Average Money Market Fund; for the Prime Money Market Fund Institutional Shares, the Average Institutional Money Market Fund; for the Federal Money Market Fund, the Average Government Money Market Fund; for the Treasury and Admiral Treasury Money Market Funds, the iMoneyNet Money Fund Report’s Average 100% Treasury Fund. For the Prime and Federal Money Market Funds, peer-group returns are derived from data provided by Lipper Inc.; for the Treasury and Admiral Treasury Money Market Funds, data provided by iMoneyNet, Inc.
2 SEC 7-day annualized yield as of August 31, 2007. The yield of a money market fund more closely reflects the current earnings of the fund than its total return.
3 This class of shares carries low expenses and is available for a minimum initial investment is $5 million.
4 Minimum initial investment is $50,000.
1

Chairman’s Letter
Dear Shareholder,
A year ago we reported that the federal funds rate had increased seven times over 12 months; by contrast, throughout the most recent fiscal year for Vanguard’s money market funds, the rate was flat. Consequently, yields were at their highest level in a decade, boosting income.
For the year ended August 31, 2007, total returns ranged from 4.9% for the Treasury Money Market Fund to 5.4% for the Prime Money Market Fund’s Institutional Shares. Each of the funds earned a return that exceeded the average result for its mutual fund peers.
The funds enjoy two interwoven competitive advantages: lower costs and high credit standards. Because the funds carry very low expense ratios, their managers don’t need to reach as far along the risk spectrum to seek to generate competitive yields. That was an advantage during the past 12 months, when markets became more volatile in reaction to increasing defaults on sub-prime mortgages, loans with weaker underwriting standards.
The table on page 4 illustrates this advantage by comparing the expense ratios of the funds and their peer groups. The table on page 5 shows the changes in yields over the year for each fund.
2
Bond markets rebounded as investors sought safety
Toward the end of the fiscal year, as investors sought refuge from the rough and tumble of stock and corporate bond markets, U.S. Treasury bond prices rose and yields fell. The declines in yield were most pronounced among Treasury securities with the shortest maturities.
Falling short-term yields helped restore the yield curve—which illustrates the relationship between short- and long-term bond yields—to its typical, upward-sloping pattern. At the start of the period, the curve had been mildly inverted. The broad taxable bond market returned 5.3% for the year. Lacking the boost from the late-summer rally in Treasuries, tax-exempt municipal securities returned less.
For the U.S. stock market, a nervous finish to the year
U.S. stocks produced a solid return for the fiscal year, despite a midsummer pullback. The market retreated as problems with low-quality mortgage loans rippled through investment portfolios. Financial stocks, which account for a big share of the U.S. market’s value, were the hardest hit as investment banking and consumer lending businesses throttled back.
The broad U.S. stock market returned 15.6% for the year, after hitting a high-water mark in July. Large-capitalization stocks bested small-caps, and growth-oriented stocks outperformed their value-oriented counterparts during the fiscal period, which ended amid a growing aversion to risk. Though not immune from the
Market Barometer |
|
|
| |
|
| Average Annual Total Returns | ||
|
| Periods Ended August 31, 2007 | ||
| One Year | Three Years | Five Years | |
Bonds |
|
|
| |
Lehman U.S. Aggregate Bond Index (Broad taxable market) | 5.3% | 3.7% | 4.3% | |
Lehman Municipal Bond Index | 2.3 | 3.5 | 4.2 | |
Citigroup 3-Month Treasury Bill Index | 5.1 | 3.9 | 2.8 | |
|
|
|
| |
Stocks |
|
|
| |
Russell 1000 Index (Large-caps) | 15.3% | 12.8% | 12.5% | |
Russell 2000 Index (Small-caps) | 11.4 | 14.5 | 16.6 | |
Dow Jones Wilshire 5000 Index (Entire market) | 15.6 | 13.4 | 13.3 | |
MSCI All Country World Index ex USA (International) | 23.0 | 25.2 | 22.0 | |
|
|
|
| |
CPI |
|
|
| |
Consumer Price Index | 2.0% | 3.1% | 2.8% | |
3
turmoil in U.S. credit markets, international stocks handily outperformed U.S. stocks for the full 12 months.
Funds’ competitive advantage shone during liquidity crunch
Yields on the funds did not change appreciably during the fiscal year. Despite much speculation as to whether the Federal Reserve Board would raise or lower short-term rates, the Fed stood pat, leaving the federal funds rate at 5.25% for the full period.
The year was far from uneventful, however. During the spring and summer of 2007, subprime mortgage loans increasingly fell into default, triggering downgrades of investment securities backed by pools of these loans. Many money market funds had invested in (and continue to invest in) these mortgage-backed pools, which can boost fund yields but can create liquidity problems should the securities be downgraded—as many have been.
Vanguard’s money market funds don’t invest in these securities. Our fund managers are focused first and foremost on liquidity and credit quality, and the subprime mortgage securities never passed these tests. And, as I noted earlier, our funds also offer lower expense ratios than most competitors, removing the need to reach for higher yields from securities backed by less-solid assets.
Each fund met its mandate to generate superior relative returns, provide liquidity, and preserve principal (the share price of
Expense Ratios1 |
|
|
Your fund compared with its peer group |
|
|
| Fund | Peer Group |
| Expense | Expense |
Money Market Fund | Ratio | Ratio |
Prime |
|
|
Investor Shares | 0.24% | 0.91% |
Institutional Shares | 0.08 | 0.44 |
Federal | 0.24 | 0.81 |
Treasury | 0.24 | 0.76 |
Admiral Treasury | 0.10 | 0.76 |
1 Fund expense ratios reflect the fiscal year ended August 31, 2007. Peer groups are: for the Prime Money Market Fund Investor Shares, the Average Money Market Fund; for the Prime Money Market Fund Institutional Shares, the Average Institutional Money Market Fund; for the Federal Money Market Fund, the Average Government Money Market Fund; for the Treasury and Admiral Treasury Money Market Funds, the Average U.S. Treasury Money Market Fund. Peer-group expense ratios are derived from data provided by Lipper Inc. and capture information through year-end 2006.
4
each held steady at $1, as is expected but not guaranteed). The variation in the funds’ returns primarily reflects incremental differences in risk exposure and cost within this group of low-risk, low-cost portfolios.
The funds have demonstrated excellent long-term performance
Over the long term, the cost advantage offered by the Vanguard Money Market Funds has become increasingly apparent. The funds also benefit from the investment-management skills of our Fixed Income Group, whose portfolio managers demonstrated their expertise over the past year by shunning mortgage-backed securities that managers around the globe selected for their portfolios. The table on page 6 shows the average annual returns for the funds and their peer groups for the ten years ended August 31, 2007.
If you hold shares of a mutual fund whose expense ratio is one-half the average for its peer group, it stands to reason that you’ll keep a greater portion of the return on your investment. A competing argument from some quarters is: “You get what you pay for.” In the money market world, however, years of empirical evidence have shown no benefit to paying a higher price. Money market fund managers are fishing in the same shallow pond of short-term debt. A fund with higher costs must by definition take on more risk to cover those costs and produce a high-enough return to attract investors.
Changes in Yields |
|
|
|
|
|
| SEC 7-Day Annualized Yield | |
| August 31, | August 31, |
Money Market Fund | 2007 | 2006 |
Prime |
|
|
Investor Shares | 5.11% | 5.11% |
Institutional Shares | 5.27 | 5.31 |
Federal | 5.03 | 5.05 |
Treasury | 4.54 | 4.75 |
Admiral Treasury | 4.64 | 4.92 |
5
Vanguard’s lower expense ratio means its managers can seek to produce a competitive return without reaching for lower-quality securities and the higher yields they offer. Money market funds are meant to be safe, liquid investments. That’s why our managers focus on these two attributes when selecting securities for our portfolios. The summer’s market turmoil was a good reminder of the importance of careful credit selection.
Thank you for entrusting your assets to Vanguard.
Sincerely,

John J. Brennan
Chairman and Chief Executive Officer
September 14, 2007
Total Returns |
|
|
Ten Years Ended August 31, 2007 |
|
|
| Average Annual Total Return | |
|
| Average |
| Vanguard | Competing |
Money Market Fund | Fund | Fund1 |
Prime |
|
|
Investor Shares | 3.8% | 3.2% |
Institutional Shares | 4.0 | 3.6 |
Federal | 3.7 | 3.2 |
Treasury | 3.5 | 3.1 |
Admiral Treasury | 3.7 | 3.1 |
Investment returns will fluctuate. The figures shown represent past performance, which is not a guarantee of future results that may be achieved by the funds. Current performance may be lower or higher than the performance data cited. For performance data current to the most recent month-end, visit our website at www.vanguard.com/performance.
1 Peer groups are: for the Prime Money Market Fund Investor Shares, the Average Money Market Fund; for the Prime Money Market Fund Institutional Shares, the Average Institutional Money Market Fund; for the Federal Money Market Fund, the Average Government Money Market Fund; for the Treasury and Admiral Treasury Money Market Funds, the iMoneyNet Money Fund Report’s Average 100% Treasury Fund. For the Prime and Federal Money Market Funds, peer-group returns are derived from data provided by Lipper Inc.; for the Treasury and Admiral Treasury Money Market Funds, data provided by iMoneyNet, Inc.
6
Advisor’s Report
During the past 12 months, the Vanguard Money Market Funds posted returns ranging from 4.9% to 5.4%. All of the funds outpaced their peer groups’ average returns for the year ended August 31, 2007.
The investment environment
Throughout the year, the Federal Reserve Board left its target for the federal funds rate unchanged at 5.25%. As the Fed explained in August, its goal was to address concerns that inflation “will fail to moderate as expected,” but to do so without jeopardizing the economic expansion.
The Fed’s stance kept the yields on money market securities at attractive levels for most of the period. In July and August, however, this benign investment environment turned treacherous. Problems with subprime mortgage loans and related securities reverberated through the fixed income markets, including the very short-term securities that make up the money markets. This turbulent period helped showcase the strengths of the Vanguard money market funds’ investment approach.
The management of the funds
Over the years, we have used the opportunity of these shareholder reports to remind you that we emphasize safety and liquidity over everything else. We believe that we can achieve superior returns while investing in high-quality assets because our low expense ratio gives us a significant advantage over our competitors.
As the subprime crisis unfolded, the press scrutinized a host of securities with large subprime mortgage exposure, such as collateralized debt obligations, structured investment vehicles, and extendible commercial paper. While we passed the test by not owning any of the securities in question, our funds were not immune to their impact.
Asset-backed securities with strong credentials—even those without any subprime exposure—underperformed in this period, as investors demonstrated a strong preference for bank certificates of deposit and corporate commercial paper. Although asset-backed securities represented a small portion of the Prime Money Market Fund’s assets and posed no risk to the portfolio, we chose to take the conservative approach and liquidate the holding. This action had no impact on the fund’s performance.
In the Federal Money Market Fund, we increased our holdings in floating-rate agency securities, which offer superior returns to agency discount notes. We also extended the portfolio’s duration, increasing its investment in longer-maturity assets. We made similar shifts in the Treasury and Admiral Treasury Money Market Funds. These moves reflected our assessment that signs of slowing economic growth might cause the Fed to lower its short-term rate target, reducing the yields available from new securities.
7
In time, conditions in the money markets and the broader fixed income markets will improve. As always, we will scrutinize our investment outlook and take the appropriate course of action. True to our mandate, we’ll take the conservative path and look to our low expense ratios to help win the day for us.
David R. Glocke, Principal
Vanguard Fixed Income Group
September 20, 2007
8
Prime Money Market Fund
Fund Profile
As of August 31, 2007
Financial Attributes |
|
|
|
Yield |
|
Investor Shares | 5.11% |
Institutional Shares | 5.27% |
Average Weighted Maturity | 48 days |
Average Quality1 | Aa1 |
Expense Ratio |
|
Investor Shares | 0.24% |
Institutional Shares | 0.08% |
Distribution by Credit Quality1 (% of portfolio) |
|
|
|
Aaa | 36.9% |
Aa | 60.0 |
A | 3.1 |
Sector Diversification (% of portfolio) |
|
|
|
Banker’s Acceptances | 2.5% |
Finance |
|
Commercial Paper | 16.6 |
Certificates of Deposit | 47.3 |
Treasury/Agency | 23.5 |
Other | 10.1 |
1 Moody’s Investors Service.
See page 58 for a glossary of investment terms.
9
Prime Money Market Fund
Performance Summary
Investment returns will fluctuate. All of the returns in this report represent past performance, which is not a guarantee of future results that may be achieved by the fund. (Current performance may be lower or higher than the performance data cited. For performance data current to the most recent month-end, visit our website at www.vanguard.com/performance.) The returns shown do not reflect taxes that a shareholder would pay on fund distributions. An investment in a money market fund is not insured or guaranteed by the Federal Deposit Insurance Corporation or any other government agency. Although the fund seeks to preserve the value of your investment at $1 per share, it is possible to lose money by investing in the fund. The annualized yield shown reflects the current earnings of the fund more closely than do the average annual returns.
|
| Average Annual Total Returns | Final Value | |
|
| Periods Ended August 31, 2007 | of a $10,000 | |
| One Year | Five Years | Ten Years | Investment |
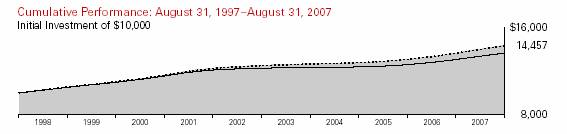
Prime Money Market Fund Investor Shares1 | 5.23% | 2.76% | 3.76% | $14,457 |
Citigroup 3-Month Treasury Index | 5.05 | 2.78 | 3.66 | 14,323 |
Average Money Market Fund2 | 4.55 | 2.16 | 3.16 | 13,646 |
|
|
|
| Final Value |
|
|
|
| of a $5,000,000 |
| One Year | Five Years | Ten Years | Investment |
Prime Money Market Fund Institutional Shares | 5.39% | 2.96% | 3.95% | $7,367,550 |
Citigroup 3-Month Treasury Index | 5.05 | 2.78 | 3.66 | 7,161,595 |
Average Institutional Money Market Fund2 | 5.05 | 2.61 | 3.61 | 7,131,123 |
1 Total returns do not include the account service fee that may be applicable to certain accounts with balances below $10,000.
2 Returns for Average Money Market Fund and Average Institutional Money Market Fund are derived from data provided by Lipper Inc.
10
Prime Money Market Fund
Fiscal-Year Total Returns (%): August 31, 1997–August 31, 2007 | ||
|
|
|
| Prime Money Market Fund | Average |
Fiscal Year | Investor Shares | Fund1 |
1998 | 5.5% | 4.9% |
1999 | 5.0 | 4.4 |
2000 | 5.9 | 5.3 |
2001 | 5.4 | 4.8 |
2002 | 2.1 | 1.4 |
2003 | 1.1 | 0.6 |
2004 | 0.8 | 0.4 |
2005 | 2.3 | 1.7 |
2006 | 4.4 | 3.7 |
2007 | 5.2 | 4.6 |
SEC 7-Day Annualized Yield (8/31/2007): 5.11% |
|
|
Average Annual Total Returns: Periods Ended June 30, 2007
This table presents average annual total returns through the latest calendar quarter—rather than through the end of the fiscal period. Securities and Exchange Commission rules require that we provide this information.
| Inception Date | One Year | Five Years | Ten Years |
Prime Money Market Fund |
|
|
|
|
Investor Shares2 | 6/4/1975 | 5.22% | 2.63% | 3.76% |
Institutional Shares | 10/3/1989 | 5.39 | 2.84 | 3.96 |
1 Returns for Average Money Market Fund are derived from data provided by Lipper Inc.
2 Total returns do not include the account service fee that may be applicable to certain accounts with balances below $10,000. Note: See Financial Highlights tables on pages 21 and 22 for dividend information.
11
Prime Money Market Fund
Financial Statements
Statement of Net Assets
As of August 31, 2007
The fund provides a complete list of its holdings four times in each fiscal year, at the quarter-ends. For the second and fourth fiscal quarters, the lists appear in the fund’s semiannual and annual reports to shareholders. For the first and third fiscal quarters, the fund files the lists with the Securities and Exchange Commission on Form N-Q. Shareholders can look up the fund’s Forms N-Q on the SEC’s website at www.sec.gov. Forms N-Q may also be reviewed and copied at the SEC’s Public Reference Room (see the back cover of this report for further information).
|
|
|
| Face | Market |
|
|
| Maturity | Amount | Value• |
|
| Yield1 | Date | ($000) | ($000) |
U.S. Government and Agency Obligations (23.7%) |
|
|
| ||
2,3 | Federal Farm Credit Bank | 5.220% | 10/9/07 | 74,000 | 73,992 |
2,3 | Federal Home Loan Bank | 5.200% | 9/19/07 | 295,000 | 294,937 |
2,3 | Federal Home Loan Bank | 5.210% | 9/24/07 | 378,000 | 377,884 |
2,3 | Federal Home Loan Bank | 5.190% | 10/5/07 | 910,000 | 909,408 |
2,3 | Federal Home Loan Bank | 5.200% | 10/24/07 | 195,000 | 194,914 |
2,3 | Federal Home Loan Bank | 5.438% | 11/19/07 | 2,770,000 | 2,770,000 |
2,3 | Federal Home Loan Bank | 5.438% | 12/5/07 | 1,917,000 | 1,916,867 |
2 | Federal Home Loan Bank | 5.187% | 10/17/07 | 200,000 | 198,686 |
2 | Federal Home Loan Bank | 5.137% | 1/25/08 | 46,869 | 45,916 |
2 | Federal Home Loan Bank | 5.135% | 2/6/08 | 148,000 | 144,749 |
2,3 | Federal Home Loan Mortgage Corp. | 5.190% | 9/26/07 | 4,245,000 | 4,242,288 |
2,3 | Federal Home Loan Mortgage Corp. | 5.200% | 10/1/07 | 3,425,000 | 3,423,568 |
2 | Federal Home Loan Mortgage Corp. | 5.133% | 1/28/08 | 145,406 | 142,391 |
2 | Federal Home Loan Mortgage Corp. | 4.964% | 7/21/08 | 183,002 | 175,195 |
2 | Federal Home Loan Mortgage Corp. | 4.896% | 8/18/08 | 322,635 | 307,903 |
2,3 | Federal National Mortgage Assn. | 5.190% | 9/26/07 | 737,000 | 736,529 |
2,3 | Federal National Mortgage Assn. | 5.190% | 10/9/07 | 2,700,000 | 2,698,225 |
2 | Federal National Mortgage Assn. | 5.195% | 10/1/07 | 60,763 | 60,502 |
2 | Federal National Mortgage Assn. | 5.181% | 10/9/07 | 97,297 | 96,769 |
2 | Federal National Mortgage Assn. | 5.124%–5.135% | 1/30/08 | 504,546 | 493,962 |
2 | Federal National Mortgage Assn. | 4.929% | 7/18/08 | 295,000 | 282,611 |
2 | Federal National Mortgage Assn. | 4.933%–4.943% | 7/25/08 | 345,012 | 330,204 |
| U.S. Treasury Bill | 5.020% | 9/6/07 | 940,000 | 939,347 |
| U.S. Treasury Bill | 4.510% | 9/17/07 | 475,400 | 474,449 |
| U.S. Treasury Bill | 4.654% | 11/29/07 | 1,000,000 | 988,628 |
Total U.S. Government and Agency Obligations (Cost $22,319,924) |
| 22,319,924 | |||
Commercial Paper (16.7%) |
|
|
|
| |
Bank Holding Company (0.2%) |
|
|
|
| |
| State Street Corp. | 5.322% | 9/20/07 | 196,000 | 195,457 |
|
|
|
|
|
|
Finance—Auto (0.5%) |
|
|
|
| |
| Toyota Motor Credit Corp. | 5.302% | 10/1/07 | 74,000 | 73,681 |
| Toyota Motor Credit Corp. | 5.309% | 10/12/07 | 98,400 | 97,821 |
| Toyota Motor Credit Corp. | 5.309% | 10/17/07 | 159,000 | 157,935 |
| Toyota Motor Credit Corp. | 5.310% | 10/18/07 | 159,000 | 157,912 |
|
|
|
|
| 487,349 |
12
Prime Money Market Fund
|
|
|
| Face | Market | |
|
|
| Maturity | Amount | Value• | |
|
| Yield1 | Date | ($000) | ($000) | |
Finance—Other (3.4%) |
|
|
|
| ||
| American Express Credit Corp. | 5.290% | 9/4/07 | 98,000 | 97,957 | |
| General Electric Capital Corp. | 5.309% | 9/10/07 | 675,000 | 674,116 | |
| General Electric Capital Corp. | 5.310% | 9/11/07 | 675,000 | 674,018 | |
| General Electric Capital Corp. | 5.308% | 10/15/07 | 742,000 | 737,311 | |
| General Electric Capital Corp. | 5.298% | 11/13/07 | 500,000 | 494,768 | |
| General Electric Capital Corp. | 5.317% | 11/21/07 | 500,000 | 494,173 | |
|
|
|
|
| 3,172,343 | |
Foreign Banks (8.5%) |
|
|
|
| ||
| Abbey National NA LLC | 5.309% | 10/17/07 | 400,000 | 397,322 | |
4 | Australia & New Zealand Banking Group, Ltd. | 5.319% | 10/22/07 | 240,000 | 238,217 | |
4 | Australia & New Zealand Banking Group, Ltd. | 5.319% | 10/29/07 | 117,000 | 116,011 | |
| CBA (Delaware) Finance Inc. | 5.319% | 9/4/07 | 14,618 | 14,612 | |
| CBA (Delaware) Finance Inc. | 5.310% | 9/6/07 | 183,000 | 182,867 | |
| CBA (Delaware) Finance Inc. | 5.297% | 9/12/07 | 100,000 | 99,840 | |
| CBA (Delaware) Finance Inc. | 5.318% | 9/17/07 | 416,000 | 415,030 | |
| CBA (Delaware) Finance Inc. | 5.297% | 9/20/07 | 120,000 | 119,668 | |
| CBA (Delaware) Finance Inc. | 5.298% | 9/24/07 | 153,000 | 152,487 | |
| CBA (Delaware) Finance Inc. | 5.297% | 9/26/07 | 229,500 | 228,663 | |
| CBA (Delaware) Finance Inc. | 5.317% | 10/2/07 | 98,000 | 97,555 | |
| CBA (Delaware) Finance Inc. | 5.317% | 10/22/07 | 40,000 | 39,703 | |
| CBA (Delaware) Finance Inc. | 5.318% | 10/23/07 | 40,000 | 39,697 | |
4 | Danske Corp. | 5.309% | 9/4/07 | 225,000 | 224,902 | |
4 | Danske Corp. | 5.311% | 10/12/07 | 400,000 | 397,645 | |
4 | Danske Corp. | 5.308% | 10/15/07 | 657,000 | 652,853 | |
| Dexia Delaware LLC | 5.316% | 9/6/07 | 20,770 | 20,755 | |
| HBOS Treasury Services PLC | 5.317% | 9/14/07 | 100,000 | 99,811 | |
| HBOS Treasury Services PLC | 5.324% | 10/23/07 | 158,000 | 156,802 | |
| HBOS Treasury Services PLC | 5.324% | 10/24/07 | 79,000 | 78,389 | |
| HBOS Treasury Services PLC | 5.331% | 11/2/07 | 188,650 | 186,941 | |
| Nordea North America Inc. | 5.307% | 10/29/07 | 155,700 | 154,387 | |
| Nordea North America Inc. | 5.300% | 10/30/07 | 196,500 | 194,816 | |
| Nordea North America Inc. | 5.311% | 11/1/07 | 200,000 | 198,224 | |
| Nordea North America Inc. | 5.376% | 11/6/07 | 125,000 | 123,784 | |
| Societe Generale N.A. Inc. | 5.319% | 10/22/07 | 200,000 | 198,514 | |
| Svenska Handelsbanken, Inc. | 5.309% | 10/17/07 | 198,000 | 196,692 | |
| UBS Finance (Delaware), LLC | 5.309%–5.310% | 10/10/07 | 645,000 | 641,386 | |
| UBS Finance (Delaware), LLC | 5.308%–5.311% | 10/15/07 | 690,500 | 686,137 | |
4 | Westpac Banking Corp. | 5.309% | 9/4/07 | 72,571 | 72,539 | |
4 | Westpac Banking Corp. | 5.310%–5.319% | 10/11/07 | 412,371 | 410,001 | |
4 | Westpac Banking Corp. | 5.310% | 10/12/07 | 150,000 | 149,117 | |
4 | Westpac Banking Corp. | 5.321% | 10/19/07 | 350,000 | 347,583 | |
4 | Westpac Banking Corp. | 5.305% | 11/2/07 | 157,000 | 155,602 | |
4 | Westpac Banking Corp. | 5.328% | 11/5/07 | 85,000 | 84,194 | |
4 | Westpac Banking Corp. | 5.310% | 11/9/07 | 192,000 | 190,097 | |
4 | Westpac Banking Corp. | 5.313% | 11/13/07 | 289,000 | 285,970 | |
|
|
|
|
| 8,048,813 | |
Foreign Industrial (3.1%) |
|
|
|
| ||
4 | Astrazeneca PLC | 5.341% | 9/19/07 | 494,500 | 493,197 | |
4 | Nestle Capital Corp. | 5.357% | 1/22/08 | 98,000 | 95,960 | |
4 | Nestle Capital Corp. | 5.338% | 2/20/08 | 492,000 | 479,777 | |
4 | Nestle Capital Corp. | 5.339% | 2/21/08 | 490,000 | 477,755 | |
4 | Nestle Capital Corp. | 5.353% | 2/28/08 | 492,000 | 479,183 | |
4 | Procter & Gamble |
|
|
|
| |
| International Funding SCA | 5.302%–5.305% | 9/7/07 | 82,250 | 82,178 | |
13
Prime Money Market Fund
|
|
|
| Face | Market | |
|
|
| Maturity | Amount | Value• | |
|
| Yield1 | Date | ($000) | ($000) | |
4 | Procter & Gamble International Funding SCA | 5.307% | 9/10/07 | 74,500 | 74,403 | |
4 | Procter & Gamble International Funding SCA | 5.305% | 9/14/07 | 48,000 | 47,909 | |
4 | Procter & Gamble International Funding SCA | 5.294% | 10/4/07 | 49,000 | 48,764 | |
4 | Procter & Gamble International Funding SCA | 5.289% | 10/11/07 | 87,000 | 86,494 | |
4 | Procter & Gamble International Funding SCA | 5.297% | 10/22/07 | 50,000 | 49,630 | |
4 | Procter & Gamble International Funding SCA | 5.300% | 10/25/07 | 84,500 | 83,836 | |
4 | Procter & Gamble International Funding SCA | 5.300% | 10/26/07 | 94,926 | 94,168 | |
4 | Procter & Gamble International Funding SCA | 5.298% | 10/30/07 | 44,800 | 44,416 | |
4 | Procter & Gamble International Funding SCA | 5.308% | 10/31/07 | 97,000 | 96,153 | |
4 | Procter & Gamble International Funding SCA | 5.312% | 11/5/07 | 163,000 | 161,458 | |
|
|
|
|
| 2,895,281 | |
Industrial (1.0%) |
|
|
|
| ||
4 | IBM International Group Capital LLC | 5.297% | 10/15/07 | 25,000 | 24,840 | |
4 | Wal-Mart Stores, Inc. | 5.300% | 11/6/07 | 45,000 | 44,569 | |
4 | Wal-Mart Stores, Inc. | 5.296%–5.301% | 11/13/07 | 564,000 | 558,038 | |
4 | Wal-Mart Stores, Inc. | 5.301% | 11/14/07 | 17,587 | 17,398 | |
4 | Wal-Mart Stores, Inc. | 5.301% | 11/19/07 | 150,000 | 148,285 | |
4 | Wal-Mart Stores, Inc. | 5.301% | 11/20/07 | 115,000 | 113,669 | |
|
|
|
|
| 906,799 | |
Insurance (0.0%) |
|
|
|
| ||
| Metlife Funding Inc. | 5.296% | 9/17/07 | 16,521 | 16,482 | |
| Metlife Funding Inc. | 5.299% | 10/23/07 | 26,468 | 26,268 | |
|
|
|
|
| 42,750 | |
Total Commercial Paper (Cost $15,748,792) |
|
|
| 15,748,792 | ||
Certificates of Deposit (30.9%) |
|
|
|
| ||
Certificates of Deposit—U.S. Banks (3.7%) |
|
|
|
| ||
| Branch Banking & Trust Co. | 5.295% | 9/21/07 | 245,000 | 245,000 | |
| Branch Banking & Trust Co. | 5.305% | 10/22/07 | 245,000 | 245,000 | |
| Branch Banking & Trust Co. | 5.315% | 11/19/07 | 295,000 | 295,000 | |
| Citibank, N.A. | 5.330% | 11/5/07 | 24,000 | 24,000 | |
| HSBC Bank USA | 5.370% | 11/13/07 | 493,000 | 493,000 | |
| HSBC Bank USA | 5.500% | 11/13/07 | 400,000 | 400,000 | |
| State Street Bank & Trust | 5.400% | 2/25/08 | 250,000 | 250,000 | |
| State Street Bank & Trust | 5.400% | 2/26/08 | 200,000 | 200,000 | |
| State Street Bank & Trust | 5.400% | 2/28/08 | 493,000 | 493,000 | |
| Wachovia Bank NA | 5.320% | 10/29/07 | 885,000 | 885,000 | |
|
|
|
|
| 3,530,000 | |
Yankee Certificates of Deposit—U.S. Branches (27.2%) |
|
|
| |||
| Abbey National Treasury Services PLC |
|
|
|
| |
| (Stamford Branch) | 5.300% | 10/16/07 | 495,000 | 495,000 | |
| Banco Bilbao Vizcaya Argentaria, SA |
|
|
|
| |
| (New York Branch) | 5.320% | 9/20/07 | 750,000 | 750,000 | |
| Banco Bilbao Vizcaya Argentaria, SA |
|
|
|
| |
| (New York Branch) | 5.310% | 10/22/07 | 475,000 | 475,000 | |
| Banco Bilbao Vizcaya Argentaria, SA |
|
|
|
| |
| (New York Branch) | 5.310% | 10/22/07 | 1,000,000 | 1,000,000 | |
| Bank of Montreal (Chicago Branch) | 5.300% | 9/14/07 | 500,000 | 500,000 | |
| Bank of Montreal (Chicago Branch) | 5.290% | 11/9/07 | 350,000 | 350,000 | |
| Bank of Nova Scotia (Portland Branch) | 5.310% | 10/23/07 | 400,000 | 400,000 | |
| Bank of Nova Scotia (Portland Branch) | 5.320% | 11/1/07 | 688,000 | 688,000 | |
| Bank of Nova Scotia (Portland Branch) | 5.480% | 11/29/07 | 700,000 | 700,000 | |
| Barclays Bank PLC (New York Branch) | 5.310% | 9/4/07 | 500,000 | 500,000 | |
| Barclays Bank PLC (New York Branch) | 5.315% | 9/5/07 | 400,000 | 400,000 | |
| Barclays Bank PLC (New York Branch) | 5.325% | 10/17/07 | 300,000 | 300,000 | |
14
Prime Money Market Fund
|
|
| Face | Market |
|
| Maturity | Amount | Value• |
| Yield1 | Date | ($000) | ($000) |
Barclays Bank PLC (New York Branch) | 5.330% | 11/1/07 | 500,000 | 500,000 |
BNP Paribas (New York Branch) | 5.270% | 9/26/07 | 330,000 | 330,000 |
BNP Paribas (New York Branch) | 5.195% | 10/9/07 | 250,000 | 250,000 |
BNP Paribas (New York Branch) | 5.310% | 10/12/07 | 200,000 | 200,000 |
BNP Paribas (New York Branch) | 5.320% | 10/19/07 | 987,000 | 987,000 |
BNP Paribas (New York Branch) | 5.290% | 10/23/07 | 300,000 | 300,000 |
Calyon (New York Branch) | 5.310% | 10/31/07 | 300,000 | 300,000 |
Canadian Imperial Bank of Commerce |
|
|
|
|
(New York Branch) | 5.300% | 9/4/07 | 300,000 | 300,000 |
Canadian Imperial Bank of Commerce |
|
|
|
|
(New York Branch) | 5.310% | 10/19/07 | 200,000 | 200,000 |
Canadian Imperial Bank of Commerce |
|
|
|
|
(New York Branch) | 5.360% | 11/8/07 | 495,000 | 495,000 |
Credit Suisse (New York Branch) | 5.310% | 10/12/07 | 300,000 | 300,000 |
Credit Suisse (New York Branch) | 5.300% | 10/29/07 | 498,000 | 498,000 |
Credit Suisse (New York Branch) | 5.305% | 11/1/07 | 225,000 | 225,002 |
Deutsche Bank AG (New York Branch) | 5.310% | 10/9/07 | 500,000 | 500,000 |
Fortis Bank NV-SA (New York Branch) | 5.300% | 9/4/07 | 498,000 | 498,000 |
Fortis Bank NV-SA (New York Branch) | 5.310% | 9/10/07 | 500,000 | 500,000 |
Fortis Bank NV-SA (New York Branch) | 5.320% | 9/14/07 | 561,000 | 561,000 |
Fortis Bank NV-SA (New York Branch) | 5.330% | 11/1/07 | 250,000 | 250,000 |
Fortis Bank NV-SA (New York Branch) | 5.300% | 2/11/08 | 200,000 | 200,000 |
HBOS Treasury Services PLC (New York Branch) | 5.315% | 9/4/07 | 100,000 | 100,000 |
HBOS Treasury Services PLC (New York Branch) | 5.320% | 10/18/07 | 198,000 | 198,003 |
Lloyds TSB Bank PLC (New York Branch) | 5.290% | 9/4/07 | 890,000 | 890,000 |
Lloyds TSB Bank PLC (New York Branch) | 5.300% | 9/24/07 | 500,000 | 500,000 |
Nordea Bank Finland PLC (New York Branch) | 5.295% | 10/17/07 | 197,000 | 197,000 |
Nordea Bank Finland PLC (New York Branch) | 5.350% | 11/9/07 | 500,000 | 500,000 |
Nordea Bank Finland PLC (New York Branch) | 5.500% | 11/19/07 | 500,000 | 500,000 |
Rabobank Nederland (New York Branch) | 5.270% | 9/4/07 | 137,000 | 137,000 |
Rabobank Nederland (New York Branch) | 5.300% | 9/4/07 | 1,200,000 | 1,200,000 |
Rabobank Nederland (New York Branch) | 5.240% | 9/6/07 | 100,000 | 100,000 |
Rabobank Nederland (New York Branch) | 5.300% | 9/7/07 | 650,000 | 650,000 |
Rabobank Nederland (New York Branch) | 5.310% | 9/17/07 | 975,000 | 975,000 |
Royal Bank of Canada (New York Branch) | 5.300% | 9/4/07 | 740,000 | 740,000 |
Royal Bank of Scotland PLC (New York Branch) | 5.310% | 9/5/07 | 400,000 | 400,000 |
Royal Bank of Scotland PLC (New York Branch) | 5.290% | 10/18/07 | 1,000,000 | 1,000,000 |
Societe Generale (New York Branch) | 5.260% | 9/24/07 | 100,000 | 99,999 |
Societe Generale (New York Branch) | 5.330% | 11/1/07 | 300,000 | 300,000 |
Svenska Handelsbanken, AB (New York Branch) | 5.310% | 11/1/07 | 200,000 | 200,000 |
Svenska Handelsbanken, AB (New York Branch) | 5.440% | 3/4/08 | 750,000 | 750,000 |
Toronto Dominion (New York Branch) | 5.300% | 9/4/07 | 400,000 | 400,000 |
Toronto Dominion (New York Branch) | 5.330% | 11/5/07 | 490,000 | 490,000 |
Toronto Dominion (New York Branch) | 5.500% | 11/15/07 | 500,000 | 500,000 |
UBS AG (Stamford Branch) | 5.380% | 11/6/07 | 518,000 | 518,000 |
Westpac Banking Corp. (New York Branch) | 5.310% | 11/1/07 | 280,000 | 280,000 |
|
|
|
| 25,577,004 |
Total Certificates of Deposit (Cost $29,107,004) |
|
|
| 29,107,004 |
Eurodollar Certificates of Deposit (16.9%) |
|
|
|
|
ABN–AMRO Bank NV | 5.320% | 10/16/07 | 800,000 | 800,000 |
ABN–AMRO Bank NV | 5.315% | 10/19/07 | 886,000 | 886,000 |
ABN–AMRO Bank NV | 5.290% | 10/22/07 | 295,000 | 295,000 |
Bank of Nova Scotia | 5.300% | 11/1/07 | 200,000 | 200,000 |
Barclays Bank PLC | 5.310% | 10/12/07 | 395,000 | 395,000 |
Barclays Bank PLC | 5.320% | 10/18/07 | 600,000 | 600,000 |
15
Prime Money Market Fund
|
|
| Face | Market |
|
| Maturity | Amount | Value• |
| Yield1 | Date | ($000) | ($000) |
BNP Paribas | 5.270% | 9/4/07 | 25,000 | 25,000 |
Credit Agricole S.A. | 5.280% | 9/28/07 | 500,000 | 500,000 |
Credit Agricole S.A. | 5.310% | 11/13/07 | 589,000 | 589,000 |
Credit Agricole S.A. | 5.310% | 11/19/07 | 489,000 | 489,000 |
Deutsche Bank AG | 5.280% | 9/28/07 | 300,000 | 300,000 |
Deutsche Bank AG | 5.320% | 10/17/07 | 240,000 | 240,003 |
Deutsche Bank AG | 5.295% | 10/23/07 | 550,000 | 550,000 |
Deutsche Bank AG | 5.300% | 10/29/07 | 125,000 | 125,000 |
Deutsche Bank AG | 5.305% | 11/13/07 | 460,000 | 460,005 |
HBOS Treasury Services PLC | 5.320% | 9/7/07 | 690,000 | 690,000 |
HBOS Treasury Services PLC | 5.320% | 9/14/07 | 1,000,000 | 1,000,000 |
HSBC Bank PLC | 5.330% | 1/30/08 | 197,000 | 196,992 |
ING Bank N.V. | 5.320% | 9/7/07 | 225,000 | 225,000 |
ING Bank N.V. | 5.330% | 10/11/07 | 684,000 | 684,000 |
ING Bank N.V. | 5.320% | 10/24/07 | 280,000 | 280,000 |
ING Bank N.V. | 5.320% | 11/2/07 | 500,000 | 500,000 |
ING Bank N.V. | 5.330% | 11/6/07 | 300,000 | 300,000 |
KBC Bank N.V. | 5.380% | 11/13/07 | 889,000 | 889,000 |
Landesbank Hessen-Thuringen | 5.315% | 9/13/07 | 490,000 | 490,000 |
National Australia Bank | 5.290% | 9/4/07 | 300,000 | 300,000 |
National Australia Bank | 5.300% | 9/24/07 | 500,000 | 500,000 |
National Australia Bank | 5.310% | 11/1/07 | 500,000 | 500,000 |
Royal Bank of Scotland PLC | 5.300% | 10/31/07 | 225,000 | 225,000 |
Royal Bank of Scotland PLC | 5.480% | 11/30/07 | 750,000 | 750,000 |
Societe Generale | 5.320% | 9/14/07 | 994,000 | 994,000 |
Societe Generale | 5.310% | 10/12/07 | 610,000 | 610,000 |
Societe Generale | 5.320% | 10/18/07 | 319,000 | 319,000 |
Total Eurodollar Certificates of Deposit (Cost $15,907,000) |
|
| 15,907,000 | |
Other Notes (2.6%) |
|
|
|
|
Bank of America, N.A. | 5.270% | 9/24/07 | 200,000 | 200,000 |
Bank of America, N.A. | 5.310% | 10/12/07 | 244,000 | 244,000 |
Bank of America, N.A. | 5.300% | 11/1/07 | 1,000,000 | 1,000,000 |
Bank of America, N.A. | 5.325% | 11/19/07 | 970,000 | 970,000 |
Total Other Notes (Cost $2,414,000) |
|
|
| 2,414,000 |
Repurchase Agreements (10.3%) |
|
|
|
|
Barclays Capital Inc. |
|
|
|
|
(Dated 8/31/07, Repurchase Value $1,877,105,000, |
|
|
|
|
collateralized by Federal Farm Credit Bank |
|
|
|
|
Discount Note, 9/25/07, Federal Farm Credit Bank |
|
|
|
|
2.625%–5.125%, 9/17/07–10/19/15, Federal Home |
|
|
|
|
Loan Bank Discount Note, 9/19/07–11/21/07, |
|
|
|
|
Federal Home Loan Bank 3.250%–5.500%, |
|
|
|
|
12/17/07–7/15/36, Federal Home Loan Mortgage |
|
|
|
|
Corp. Discount Note, 11/19/07–8/18/08, Federal |
|
|
|
|
Home Loan Mortgage Corp. 3.625%–6.750%, |
|
|
|
|
2/15/08–9/15/29, Federal National Mortgage Assn. |
|
|
|
|
Discount Note, 12/3/07–2/27/08, Federal National |
|
|
|
|
Mortgage Assn. 2.500%–6.625%, 4/10/08–7/15/37) | 5.300% | 9/4/07 | 1,876,000 | 1,876,000 |
BNP Paribas Securities Corp. |
|
|
|
|
(Dated 8/31/07, Repurchase Value $252,144,000, |
|
|
|
|
collateralized by U.S. Treasury Note 2.375%, 4/15/11) | 5.150% | 9/4/07 | 252,000 | 252,000 |
16
Prime Money Market Fund
|
|
|
| Face | Market |
|
|
| Maturity | Amount | Value• |
|
| Yield1 | Date | ($000) | ($000) |
BNP Paribas Securities Corp. |
|
|
|
| |
| (Dated 8/31/07, Repurchase Value $393,231,000, |
|
|
|
|
| collateralized by Federal Farm Credit Bank 5.200%, |
|
|
|
|
| 2/14/11, Federal Home Loan Bank 4.375%–5.500%, |
|
|
|
|
| 1/16/09–7/15/36, Federal Home Loan Mortgage |
|
|
|
|
| Corp. Discount Note, 11/5/07 Federal Home |
|
|
|
|
| Loan Mortgage Corp. 4.500%–5.125%, |
|
|
|
|
| 10/15/08–1/15/14, Federal National Mortgage |
|
|
|
|
| Assn. 4.375%–7.125%, 9/15/09–1/15/30) | 5.300% | 9/4/07 | 393,000 | 393,000 |
Citigroup Global Markets, Inc. |
|
|
|
| |
| (Dated 8/31/07, Repurchase Value $402,237,000, |
|
|
|
|
| collateralized by Federal Farm Credit Bank |
|
|
|
|
| 4.850%–5.050%, 3/8/17–7/29/20, Federal Home |
|
|
|
|
| Loan Bank Discount Note, 9/21/07, Federal Home |
|
|
|
|
| Loan Bank 4.500%–7.625%, 8/14/09–7/15/36, |
|
|
|
|
| Federal Home Loan Mortgage Corp. 4.500%, |
|
|
|
|
| 1/15/15, Federal National Mortgage Assn. |
|
|
|
|
| 4.900–6.250%, 9/2/08–5/15/29) | 5.300% | 9/4/07 | 402,000 | 402,000 |
Citigroup Global Markets, Inc. |
|
|
|
| |
| (Dated 8/8/07, Repurchase Value $502,402,000, |
|
|
|
|
| collateralized by Federal Home Loan Bank |
|
|
|
|
| 3.500%–5.750%, 11/15/07–6/12/15, Federal |
|
|
|
|
| Home Loan Mortgage Corp. Discount Note, |
|
|
|
|
| 2/11/08, Federal Home Loan Mortgage Corp. |
|
|
|
|
| 4.125%–6.750%, 10/18/10–9/15/29, |
|
|
|
|
| Federal National Mortgage Assn. Discount Note, |
|
|
|
|
| 9/14/07, Federal National Mortgage Assn. |
|
|
|
|
| 4.375%–7.125%, 1/15/09–10/15/14) | 5.240% | 9/10/07 | 500,000 | 500,000 |
Credit Suisse Securities (USA), LLC |
|
|
|
| |
| (Dated 8/31/07, Repurchase Value $1,469,857,000, |
|
|
|
|
| collateralized by Federal Farm Credit Bank Discount |
|
|
|
|
| Note, 9/7/07, Federal Home Loan Bank Discount |
|
|
|
|
| Note, 9/13/07–2/6/08, Federal Home Loan |
|
|
|
|
| Mortgage Corp. Discount Note, 9/5/07–4/11/08, |
|
|
|
|
| Federal Home Loan Mortgage Corp. |
|
|
|
|
| 3.625%–5.500%, 9/17/07–4/18/16, Federal National |
|
|
|
|
| Mortgage Assn. Discount Note, 10/9/07–2/27/08, |
|
|
|
|
| Federal National Mortgage Assn. 4.125%–6.625%, |
|
|
|
|
| 4/10/08–9/11/28) | 5.250% | 9/4/07 | 1,469,000 | 1,469,000 |
Deutsche Bank Securities, Inc. |
|
|
|
| |
| (Dated 8/31/07, Repurchase Value $2,258,329,000, |
|
|
|
|
| collateralized by Federal Home Loan Bank Discount |
|
|
|
|
| Note, 11/23/07, Federal Home Loan Bank |
|
|
|
|
| 3.625%–5.375%, 1/15/08–8/15/24, Federal |
|
|
|
|
| Home Loan Mortgage Corp. 4.75%–5.625%, |
|
|
|
|
| 3/5/09–9/15/11, Federal National Mortgage Assn. |
|
|
|
|
| Discount Note, 9/28/07, Federal National Mortgage |
|
|
|
|
| Assn. 3.250%–7.250%, 8/15/08–5/15/11) | 5.300% | 9/4/07 | 2,257,000 | 2,257,000 |
UBS Securities LLC |
|
|
|
| |
| (Dated 8/31/07, Repurchase Value $248,140,000, |
|
|
|
|
| collateralized by Federal Home Loan Mortgage |
|
|
|
|
| Corp. 4.750%, 11/17/15) | 5.080% | 9/4/07 | 248,000 | 248,000 |
17
Prime Money Market Fund
|
|
|
| Face | Market |
|
|
| Maturity | Amount | Value• |
|
| Yield1 | Date | ($000) | ($000) |
UBS Securities LLC |
|
|
|
| |
| (Dated 8/31/07, Repurchase Value $1,753,413,000, |
|
|
|
|
| collateralized by Federal Home Loan Mortgage |
|
|
|
|
| Corp. 4.375%–5.250%, 11/16/07–4/18/16, |
|
|
|
|
| Federal National Mortgage Assn. 5.375%–7.125%, |
|
|
|
|
| 7/15/16–1/15/30) | 5.270% | 9/4/07 | 1,752,387 | 1,752,387 |
UBS Securities LLC |
|
|
|
| |
| (Dated 8/8/07, Repurchase Value $502,188,000, |
|
|
|
|
| collateralized by Federal Home Loan Mortgage |
|
|
|
|
| Corp. 4.750%–7.000%, 9/16/08–11/17/15) | 5.250% | 9/7/07 | 500,000 | 500,000 |
Total Repurchase Agreements (Cost $9,649,387) |
|
|
| 9,649,387 | |
Total Investments (101.1%) (Cost $95,146,107) |
|
|
| 95,146,107 | |
Other Assets and Liabilities (–1.1%) |
|
|
|
| |
| Other Assets—Note B |
|
|
| 1,129,637 |
| Payables for Investment Securities Purchased |
|
|
| (1,916,867) |
| Other Liabilities |
|
|
| (285,302) |
|
|
|
|
| (1,072,532) |
| Net Assets (100%) |
|
|
| 94,073,575 |
At August 31, 2007, net assets consisted of: |
|
| Amount |
| ($000) |
Paid-in Capital | 94,078,462 |
Undistributed Net Investment Income | — |
Accumulated Net Realized Losses | (4,887) |
Unrealized Appreciation | — |
Net Assets | 94,073,575 |
|
|
Investor Shares—Net Assets |
|
Applicable to 84,056,238,087 outstanding $.001 par value shares of |
|
beneficial interest (unlimited authorization) | 84,051,978 |
Net Asset Value Per Share—Investor Shares | $1.00 |
|
|
Institutional Shares—Net Assets |
|
Applicable to 10,022,230,228 outstanding $.001 par value shares of |
|
beneficial interest (unlimited authorization) | 10,021,597 |
Net Asset Value Per Share—Institutional Shares | $1.00 |
• | See Note A in Notes to Financial Statements. |
1 Represents annualized yield at date of purchase for discount securities, and coupon for coupon-bearing securities.
2 The issuer operates under a congressional charter; its securities are neither issued nor guaranteed by the U.S. government. If needed, access to additional funding from the U.S. Treasury (beyond the issuer’s line of credit) would require congressional action.
3 Adjustable-rate note.
4 Security exempt from registration under Section 4(2) of the Securities Act of 1933. Such securities may be sold in transactions exempt from registration only to dealers in that program or other “accredited investors.” At August 31, 2007, the aggregate value of these securities was $7,126,811,000, representing 7.6% of net assets.
18
Prime Money Market Fund
Statement of Operations
| Year Ended |
| August 31, 2007 |
| ($000) |
Investment Income |
|
Income |
|
Interest | 4,401,201 |
Total Income | 4,401,201 |
Expenses |
|
The Vanguard Group—Note B |
|
Investment Advisory Services | 6,619 |
Management and Administrative |
|
Investor Shares | 148,609 |
Institutional Shares | 4,178 |
Marketing and Distribution |
|
Investor Shares | 18,324 |
Institutional Shares | 2,082 |
Custodian Fees | 1,185 |
Auditing Fees | 31 |
Shareholders’ Reports |
|
Investor Shares | 856 |
Institutional Shares | 18 |
Trustees’ Fees and Expenses | 106 |
Total Expenses | 182,008 |
Net Investment Income | 4,219,193 |
Realized Net Gain (Loss) on Investment Securities Sold | (2,256) |
Change in Unrealized Appreciation (Depreciation) of Investment Securities | — |
Net Increase (Decrease) in Net Assets Resulting from Operations | 4,216,937 |
19
Prime Money Market Fund
Statement of Changes in Net Assets
| Year Ended August 31, | |
| 2007 | 2006 |
| ($000) | ($000) |
Increase (Decrease) in Net Assets |
|
|
Operations |
|
|
Net Investment Income | 4,219,193 | 2,571,798 |
Realized Net Gain (Loss) | (2,256) | (850) |
Change in Unrealized Appreciation (Depreciation) | — | — |
Net Increase (Decrease) in Net Assets Resulting from Operations | 4,216,937 | 2,570,948 |
Distributions |
|
|
Net Investment Income |
|
|
Investor Shares | (3,771,878) | (2,322,506) |
Institutional Shares | (447,315) | (249,292) |
Realized Capital Gain |
|
|
Investor Shares | — | — |
Institutional Shares | — | — |
Total Distributions | (4,219,193) | (2,571,798) |
Capital Share Transactions—Investor Shares (at $1.00) |
|
|
Issued | 96,242,797 | 77,995,216 |
Issued in Lieu of Cash Distributions | 3,654,662 | 2,258,557 |
Redeemed | (80,421,310) | (62,129,327) |
Net Increase (Decrease)—Investor Shares | 19,476,149 | 18,124,446 |
Capital Share Transactions—Institutional Shares (at $1.00) |
|
|
Issued | 15,512,668 | 7,088,080 |
Issued in Lieu of Cash Distributions | 419,628 | 235,871 |
Redeemed | (12,179,315) | (6,819,158) |
Net Increase (Decrease)—Institutional Shares | 3,752,981 | 504,793 |
Total Increase (Decrease) | 23,226,874 | 18,628,389 |
Net Assets |
|
|
Beginning of Period | 70,846,701 | 52,218,312 |
End of Period | 94,073,575 | 70,846,701 |
20
Prime Money Market Fund
Financial Highlights
Investor Shares |
|
|
|
|
|
|
|
|
|
|
|
|
|
|
|
|
|
| Year Ended August 31, | ||||
For a Share Outstanding Throughout Each Period | 2007 | 2006 | 2005 | 2004 | 2003 |
Net Asset Value, Beginning of Period | $1.00 | $1.00 | $1.00 | $1.00 | $1.00 |
Investment Operations |
|
|
|
|
|
Net Investment Income | .051 | .043 | .023 | .008 | .011 |
Net Realized and Unrealized Gain (Loss) |
|
|
|
|
|
on Investments | — | — | — | — | — |
Total from Investment Operations | .051 | .043 | .023 | .008 | .011 |
Distributions |
|
|
|
|
|
Dividends from Net Investment Income | (.051) | (.043) | (.023) | (.008) | (.011) |
Distributions from Realized Capital Gains | — | — | — | — | — |
Total Distributions | (.051) | (.043) | (.023) | (.008) | (.011) |
Net Asset Value, End of Period | $1.00 | $1.00 | $1.00 | $1.00 | $1.00 |
|
|
|
|
|
|
Total Return1 | 5.23% | 4.38% | 2.31% | 0.83% | 1.12% |
|
|
|
|
|
|
Ratios/Supplemental Data |
|
|
|
|
|
Net Assets, End of Period (Millions) | $84,052 | $64,578 | $46,454 | $43,884 | $47,341 |
Ratio of Total Expenses to |
|
|
|
|
|
Average Net Assets | 0.24% | 0.29% | 0.30% | 0.30% | 0.32% |
Ratio of Net Investment Income to |
|
|
|
|
|
Average Net Assets | 5.10% | 4.33% | 2.29% | 0.82% | 1.12% |
1 Total returns do not include the account service fee that may be applicable to certain accounts with balances below $10,000.
21
Prime Money Market Fund
Institutional Shares |
|
|
|
|
|
|
|
|
|
|
|
|
|
|
|
|
|
| Year Ended August 31, | ||||
For a Share Outstanding Throughout Each Period | 2007 | 2006 | 2005 | 2004 | 2003 |
Net Asset Value, Beginning of Period | $1.00 | $1.00 | $1.00 | $1.00 | $1.00 |
Investment Operations |
|
|
|
|
|
Net Investment Income | .053 | .045 | .025 | .010 | .013 |
Net Realized and Unrealized Gain (Loss) |
|
|
|
|
|
on Investments | — | — | — | — | — |
Total from Investment Operations | .053 | .045 | .025 | .010 | .013 |
Distributions |
|
|
|
|
|
Dividends from Net Investment Income | (.053) | (.045) | (.025) | (.010) | (.013) |
Distributions from Realized Capital Gains | — | — | — | — | — |
Total Distributions | (.053) | (.045) | (.025) | (.010) | (.013) |
Net Asset Value, End of Period | $1.00 | $1.00 | $1.00 | $1.00 | $1.00 |
|
|
|
|
|
|
Total Return | 5.39% | 4.58% | 2.52% | 1.05% | 1.33% |
|
|
|
|
|
|
Ratios/Supplemental Data |
|
|
|
|
|
Net Assets, End of Period (Millions) | $10,022 | $6,269 | $5,764 | $5,301 | $4,296 |
Ratio of Total Expenses to |
|
|
|
|
|
Average Net Assets | 0.08% | 0.09% | 0.09% | 0.09% | 0.10% |
Ratio of Net Investment Income to |
|
|
|
|
|
Average Net Assets | 5.26% | 4.53% | 2.51% | 1.05% | 1.32% |
See accompanying Notes, which are an integral part of the Financial Statements.
22
Prime Money Market Fund
Notes to Financial Statements
Vanguard Prime Money Market Fund is registered under the Investment Company Act of 1940 as an open-end investment company, or mutual fund. The fund invests in short-term debt instruments of companies primarily operating in specific industries, particularly financial services; the issuers’ abilities to meet their obligations may be affected by economic developments in such industries.
The fund offers two classes of shares, Investor Shares and Institutional Shares. Investor Shares are available to any investor who meets the fund’s minimum purchase requirements. Institutional Shares are designed for investors who meet certain administrative and service criteria and invest a minimum of $5 million.
A. The following significant accounting policies conform to generally accepted accounting principles for U.S. mutual funds. The fund consistently follows such policies in preparing its financial statements.
1. Security Valuation: Securities are valued at amortized cost, which approximates market value.
2. Repurchase Agreements: The fund may invest in repurchase agreements. Securities pledged as collateral for repurchase agreements are held by a custodian bank until the agreements mature. Each agreement requires that the market value of the collateral be sufficient to cover payments of interest and principal; however, in the event of default or bankruptcy by the other party to the agreement, retention of the collateral may be subject to legal proceedings.
3. Federal Income Taxes: The fund intends to continue to qualify as a regulated investment company and distribute all of its taxable income. Accordingly, no provision for federal income taxes is required in the financial statements.
4. Distributions: Dividends from net investment income are declared daily and paid on the first business day of the following month.
5. Other: Interest income is accrued daily. Premiums and discounts on debt securities purchased are amortized and accreted, respectively, to interest income over the lives of the respective securities. Security transactions are accounted for on the date the securities are bought or sold. Costs used to determine realized gains (losses) on the sale of investment securities are those of the specific securities sold.
Each class of shares has equal rights as to assets and earnings, except that each class separately bears certain class-specific expenses related to maintenance of shareholder accounts (included in Management and Administrative expenses) and shareholder reporting. Marketing and distribution expenses are allocated to each class of shares based on a method approved by the board of trustees. Income, other non-class-specific expenses, and gains and losses on investments are allocated to each class of shares based on its relative net assets.
B. The Vanguard Group furnishes at cost investment advisory, corporate management, administrative, marketing, and distribution services. The costs of such services are allocated to the fund under methods approved by the board of trustees. The fund has committed to provide up to 0.40% of its net assets in capital contributions to Vanguard. At August 31, 2007, the fund had contributed capital of $8,140,000 to Vanguard (included in Other Assets), representing 0.01% of the fund’s net assets and 8.14% of Vanguard’s capitalization. The fund’s trustees and officers are also directors and officers of Vanguard.
23
Prime Money Market Fund
C. In June 2006, the Financial Accounting Standards Board issued Interpretation No. 48 (“FIN 48”), “Accounting for Uncertainty in Income Taxes.” FIN 48 establishes the minimum threshold for recognizing, and a system for measuring, the benefits of tax-return positions in financial statements, and is effective for the fund’s fiscal year beginning September 1, 2007. Management has analyzed the fund’s tax positions taken on federal income tax returns for all open tax years (tax years ended August 31, 2004–2007) for purposes of implementing FIN 48, and has concluded that as of August 31, 2007, no provision for income tax would be required in the fund’s financial statements.
24
Federal Money Market Fund
Fund Profile
As of August 31, 2007
Financial Attributes |
|
|
|
Yield | 5.03% |
Average Weighted Maturity | 62 days |
Average Quality1 | Aaa |
Expense Ratio | 0.24% |
Distribution by Credit Quality1 (% of portfolio) |
|
|
|
Aaa | 100.0% |
Sector Diversification (% of portfolio) |
|
|
|
Treasury/Agency | 83.4% |
Other | 16.6 |
1 Moody’s Investors Service.
See page 58 for a glossary of investment terms.
25
Federal Money Market Fund
Performance Summary
Investment returns will fluctuate. All of the returns in this report represent past performance, which is not a guarantee of future results that may be achieved by the fund. (Current performance may be lower or higher than the performance data cited. For performance data current to the most recent month-end, visit our website at www.vanguard.com/performance.) The returns shown do not reflect taxes that a shareholder would pay on fund distributions. An investment in a money market fund is not insured or guaranteed by the Federal Deposit Insurance Corporation or any other government agency. Although the fund seeks to preserve the value of your investment at $1 per share, it is possible to lose money by investing in the fund. The annualized yield shown reflects the current earnings of the fund more closely than do the average annual returns.

| Average Annual Total Returns | Final Value | ||
| Periods Ended August 31, 2007 | of a $10,000 | ||
| One Year | Five Years | Ten Years | Investment |
Federal Money Market Fund1 | 5.17% | 2.72% | 3.71% | $14,401 |
Citigroup 3-Month Treasury Index | 5.05 | 2.78 | 3.66 | 14,323 |
Average Government Money Market Fund2 | 4.59 | 2.21 | 3.20 | 13,701 |
1 Total returns do not include the account service fee that may be applicable to certain accounts with balances below $10,000.
2 Returns for Average Government Money Market Fund are derived from data provided by Lipper Inc.
26
Federal Money Market Fund
Fiscal-Year Total Returns (%): August 31, 1997–August 31, 2007 |
|
|
| Federal Money | Average |
Fiscal Year | Market Fund | Fund1 |
1998 | 5.4% | 5.0% |
1999 | 4.9 | 4.4 |
2000 | 5.8 | 5.3 |
2001 | 5.4 | 4.8 |
2002 | 2.1 | 1.5 |
2003 | 1.1 | 0.7 |
2004 | 0.8 | 0.4 |
2005 | 2.3 | 1.7 |
2006 | 4.3 | 3.8 |
2007 | 5.2 | 4.6 |
SEC 7-Day Annualized Yield (8/31/2007): 5.03% |
|
|
Average Annual Total Returns: Periods Ended June 30, 2007
This table presents average annual total returns through the latest calendar quarter—rather than through the end of the fiscal period. Securities and Exchange Commission rules require that we provide this information.
| Inception Date | One Year | Five Years | Ten Years |
Federal Money Market Fund2 | 7/13/1981 | 5.16% | 2.60% | 3.72% |
1 Returns for Average Government Money Market Fund are derived from data provided by Lipper Inc.
2 Total returns do not include the account service fee that may be applicable to certain accounts with balances below $10,000.
Note: See Financial Highlights table on page 33 for dividend information.
27
Federal Money Market Fund
Financial Statements
Statement of Net Assets
As of August 31, 2007
The fund provides a complete list of its holdings four times in each fiscal year, at the quarter-ends. For the second and fourth fiscal quarters, the lists appear in the fund’s semiannual and annual reports to shareholders. For the first and third fiscal quarters, the fund files the lists with the Securities and Exchange Commission on Form N-Q. Shareholders can look up the fund’s Forms N-Q on the SEC’s website at www.sec.gov. Forms N-Q may also be reviewed and copied at the SEC’s Public Reference Room (see the back cover of this report for further information).
|
|
|
| Face | Market |
|
|
| Maturity | Amount | Value• |
|
| Yield1 | Date | ($000) | ($000) |
U.S. Government and Agency Obligations (83.7%) |
|
|
| ||
2,3 | Federal Farm Credit Bank | 5.220% | 10/9/07 | 75,000 | 74,992 |
2,3 | Federal Home Loan Bank | 5.210% | 9/17/07 | 350,000 | 349,894 |
2,3 | Federal Home Loan Bank | 5.200% | 9/19/07 | 150,000 | 149,968 |
2,3 | Federal Home Loan Bank | 5.210% | 9/19/07 | 150,000 | 149,954 |
2,3 | Federal Home Loan Bank | 5.210% | 9/24/07 | 75,000 | 74,977 |
2,3 | Federal Home Loan Bank | 5.200% | 10/24/07 | 300,000 | 299,868 |
2 | Federal Home Loan Bank | 5.178% | 10/31/07 | 181,797 | 180,246 |
2,3 | Federal Home Loan Bank | 5.438% | 11/19/07 | 70,000 | 70,000 |
2,3 | Federal Home Loan Bank | 5.438% | 12/5/07 | 70,000 | 69,995 |
2 | Federal Home Loan Bank | 5.135% | 1/30/08 | 29,776 | 29,150 |
2 | Federal Home Loan Bank | 5.134% | 2/6/08 | 47,000 | 45,968 |
2 | Federal Home Loan Bank | 4.955% | 2/20/08 | 31,681 | 30,949 |
2 | Federal Home Loan Bank | 5.024% | 2/22/08 | 37,900 | 37,002 |
2 | Federal Home Loan Bond | 5.155% | 9/12/07 | 100,000 | 99,843 |
2 | Federal Home Loan Bond | 5.098% | 2/11/08 | 87,000 | 85,042 |
2 | Federal Home Loan Mortgage Corp. | 5.213% | 9/4/07 | 290,000 | 289,876 |
2 | Federal Home Loan Mortgage Corp. | 5.127% | 9/18/07 | 102,418 | 102,182 |
2,3 | Federal Home Loan Mortgage Corp. | 5.190% | 9/26/07 | 535,000 | 534,658 |
2,3 | Federal Home Loan Mortgage Corp. | 5.200% | 10/1/07 | 500,000 | 499,791 |
2 | Federal Home Loan Mortgage Corp. | 5.194%–5.195% | 12/6/07 | 378,677 | 373,588 |
2 | Federal Home Loan Mortgage Corp. | 5.142% | 1/14/08 | 36,190 | 35,507 |
2 | Federal Home Loan Mortgage Corp. | 5.099%–5.138% | 1/22/08 | 68,300 | 66,944 |
2 | Federal Home Loan Mortgage Corp. | 5.098% | 1/28/08 | 28,400 | 27,815 |
2 | Federal Home Loan Mortgage Corp. | 4.938%–5.022% | 2/19/08 | 103,399 | 101,025 |
2 | Federal Home Loan Mortgage Corp. | 5.110% | 3/3/08 | 30,000 | 29,252 |
2 | Federal Home Loan Mortgage Corp. | 5.097% | 3/31/08 | 92,048 | 89,419 |
2 | Federal Home Loan Mortgage Corp. | 4.818% | 5/30/08 | 74,999 | 72,370 |
2 | Federal National Mortgage Assn. | 5.214% | 9/12/07 | 242,669 | 242,287 |
2 | Federal National Mortgage Assn. | 5.217% | 10/17/07 | 186,380 | 185,154 |
2 | Federal National Mortgage Assn. | 5.188% | 10/24/07 | 158,357 | 157,161 |
2 | Federal National Mortgage Assn. | 5.212% | 11/1/07 | 155,866 | 154,508 |
2 | Federal National Mortgage Assn. | 5.216% | 11/7/07 | 391,688 | 387,934 |
2 | Federal National Mortgage Assn. | 5.193% | 11/20/07 | 569,000 | 562,526 |
2 | Federal National Mortgage Assn. | 5.200% | 1/11/08 | 406,394 | 398,809 |
2 | Federal National Mortgage Assn. | 5.133% | 1/16/08 | 86,628 | 84,973 |
2 | Federal National Mortgage Assn. | 5.170% | 1/23/08 | 16,921 | 16,579 |
2 | Federal National Mortgage Assn. | 5.128%–5.137% | 2/6/08 | 96,615 | 94,493 |
2 | Federal National Mortgage Assn. | 4.939%–4.958% | 2/20/08 | 170,315 | 166,391 |
Total U.S. Government and Agency Obligations (Cost $6,421,090) |
| 6,421,090 | |||
28
Federal Money Market Fund
|
|
|
| Face | Market |
|
|
| Maturity | Amount | Value• |
|
| Yield1 | Date | ($000) | ($000) |
Repurchase Agreements (16.6%) |
|
|
|
| |
Barclays Capital Inc. |
|
|
|
| |
| (Dated 8/31/07, Repurchase Value $318,187,000 |
|
|
|
|
| collateralized by Federal Home Loan Bank Discount |
|
|
|
|
| Note, 10/31/07–11/28/07, Federal Home Loan Bank |
|
|
|
|
| 4.625%–5.125%, 7/30/08–2/18/11) | 5.300% | 9/4/07 | 318,000 | 318,000 |
BNP Paribas Securities Corp. |
|
|
|
| |
| (Dated 8/31/07, Repurchase Value $66,039,000, |
|
|
|
|
| collateralized by Federal Home Loan Bank 5.000%, |
|
|
|
|
| 2/20/09–9/14/12, Federal Home Loan Mortgage |
|
|
|
|
| Corp. 5.125%, 8/23/10) | 5.300% | 9/4/07 | 66,000 | 66,000 |
BNP Paribas Securities Corp. |
|
|
|
| |
| (Dated 8/31/07, Repurchase Value $1,486,000, |
|
|
|
|
| collateralized by U.S. Treasury Note |
|
|
|
|
| 2.375%, 4/15/11) | 5.150% | 9/4/07 | 1,485 | 1,485 |
Citigroup Global Markets, Inc. |
|
|
|
| |
| (Dated 8/31/07, Repurchase Value $41,024,000, |
|
|
|
|
| collateralized by Federal Home Loan Mortgage |
|
|
|
|
| Corp. 4.750%, 11/17/15) | 5.300% | 9/4/07 | 41,000 | 41,000 |
Credit Suisse Securities (USA), LLC |
|
|
|
| |
| (Dated 8/31/07, Repurchase Value $225,131,000, |
|
|
|
|
| collateralized by Federal Home Loan Mortgage |
|
|
|
|
| Corp. 5.125%–6.625%, 5/21/09–4/18/11, |
|
|
|
|
| Federal National Mortgage Assn. 4.875%–7.125%, |
|
|
|
|
| 4/15/09–1/15/30) | 5.250% | 9/4/07 | 225,000 | 225,000 |
Deutsche Bank Securities Inc. |
|
|
|
| |
| (Dated 8/31/07, Repurchase Value $353,208,000, |
|
|
|
|
| collateralized by Federal Home Loan Bank 5.250%, |
|
|
|
|
| 6/12/09, Federal Home Loan Mortgage Corp. |
|
|
|
|
| Discount Note, 9/13/07, Federal Home Loan |
|
|
|
|
| Mortgage Corp. 6.250%, 7/15/32, Federal National |
|
|
|
|
| Mortgage Assn. Discount Note, 1/15/30, |
|
|
|
|
| Federal National Mortgage Assn. 6.250%, 5/15/29) | 5.300% | 9/4/07 | 353,000 | 353,000 |
UBS Securities LLC |
|
|
|
| |
| (Dated 8/31/07, Repurchase Value $272,159,000, |
|
|
|
|
| collateralized by Federal Home Loan Mortgage |
|
|
|
|
| Corp. 3.625%–5.500%, 2/15/08–8/23/17, |
|
|
|
|
| Federal National Mortgage Assn. 6.000%, 5/15/11) | 5.270% | 9/4/07 | 272,000 | 272,000 |
Total Repurchase Agreements (Cost $1,276,485) |
|
|
| 1,276,485 | |
Total Investments (100.3%) (Cost $7,697,575) |
|
|
| 7,697,575 | |
Other Assets and Liabilities (–0.3%) |
|
|
|
| |
Other Assets—Note B |
|
|
| 67,532 | |
Liabilities |
|
|
| (92,759) | |
|
|
|
| (25,227) | |
Net Assets (100%) |
|
|
|
| |
Applicable to 7,672,373,938 outstanding $.001 par value shares of | |||||
beneficial interest (unlimited authorization) |
|
|
| 7,672,348 | |
Net Asset Value Per Share |
|
|
| $1.00 | |
29
Federal Money Market Fund
At August 31, 2007, net assets consisted of: |
|
|
| Amount | Per |
| ($000) | Share |
Paid-in Capital | 7,672,386 | $1.00 |
Undistributed Net Investment Income | — | — |
Accumulated Net Realized Losses | (38) | — |
Unrealized Appreciation | — | — |
Net Assets | 7,672,348 | $1.00 |
• | See Note A in Notes to Financial Statements. |
1 Represents annualized yield at date of purchase for discount securities, and coupon for coupon-bearing securities.
2 The issuer operates under a congressional charter; its securities are neither issued nor guaranteed by the U.S. government. If needed, access to additional funding from the U.S. Treasury (beyond the issuer’s line of credit) would require congressional action.
3 Adjustable-rate note.
30
Federal Money Market Fund
Statement of Operations
| Year Ended |
| August 31, 2007 |
| ($000) |
Investment Income |
|
Income |
|
Interest | 361,232 |
Total Income | 361,232 |
Expenses |
|
The Vanguard Group—Note B |
|
Investment Advisory Services | 557 |
Management and Administrative | 13,661 |
Marketing and Distribution | 1,721 |
Custodian Fees | 112 |
Auditing Fees | 23 |
Shareholders’ Reports | 91 |
Trustees’ Fees and Expenses | 10 |
Total Expenses | 16,175 |
Net Investment Income | 345,057 |
Realized Net Gain (Loss) on Investment Securities Sold | (21) |
Change in Unrealized Appreciation (Depreciation) of Investment Securities Sold | — |
Net Increase (Decrease) in Net Assets Resulting from Operations | 345,036 |
31
Federal Money Market Fund
Statement of Changes in Net Assets
| Year Ended August 31, | |
| 2007 | 2006 |
| ($000) | ($000) |
Increase (Decrease) in Net Assets |
|
|
Operations |
|
|
Net Investment Income | 345,057 | 248,836 |
Realized Net Gain (Loss) | (21) | 39 |
Change in Unrealized Appreciation (Depreciation) | — | — |
Net Increase (Decrease) in Net Assets Resulting from Operations | 345,036 | 248,875 |
Distributions |
|
|
Net Investment Income | (345,057) | (248,836) |
Realized Capital Gain | — | — |
Total Distributions | (345,057) | (248,836) |
Capital Share Transactions (at $1.00) |
|
|
Issued | 6,184,183 | 5,467,907 |
Issued in Lieu of Cash Distributions | 335,363 | 242,468 |
Redeemed | (5,206,858) | (4,857,418) |
Net Increase (Decrease) from Capital Share Transactions | 1,312,688 | 852,957 |
Total Increase (Decrease) | 1,312,667 | 852,996 |
Net Assets |
|
|
Beginning of Period | 6,359,681 | 5,506,685 |
End of Period | 7,672,348 | 6,359,681 |
32
Federal Money Market Fund
Financial Highlights
| Year Ended August 31, | ||||
For a Share Outstanding Throughout Each Period | 2007 | 2006 | 2005 | 2004 | 2003 |
Net Asset Value, Beginning of Period | $1.00 | $1.00 | $1.00 | $1.00 | $1.00 |
Investment Operations |
|
|
|
|
|
Net Investment Income | .051 | .042 | .022 | .008 | .011 |
Net Realized and Unrealized Gain (Loss) |
|
|
|
|
|
on Investments | — | — | — | — | — |
Total from Investment Operations | .051 | .042 | .022 | .008 | .011 |
Distributions |
|
|
|
|
|
Dividends from Net Investment Income | (.051) | (.042) | (.022) | (.008) | (.011) |
Distributions from Realized Capital Gains | — | — | — | — | — |
Total Distributions | (.051) | (.042) | (.022) | (.008) | (.011) |
Net Asset Value, End of Period | $1.00 | $1.00 | $1.00 | $1.00 | $1.00 |
|
|
|
|
|
|
Total Return1 | 5.17% | 4.31% | 2.26% | 0.82% | 1.11% |
|
|
|
|
|
|
Ratios/Supplemental Data |
|
|
|
|
|
Net Assets, End of Period (Millions) | $7,672 | $6,360 | $5,507 | $5,575 | $6,289 |
Ratio of Total Expenses to |
|
|
|
|
|
Average Net Assets | 0.24% | 0.29% | 0.30% | 0.30% | 0.32% |
Ratio of Net Investment Income to |
|
|
|
|
|
Average Net Assets | 5.05% | 4.25% | 2.23% | 0.81% | 1.11% |
1 Total returns do not include the account service fee that may be applicable to certain accounts with balances below $10,000. See accompanying Notes, which are an integral part of the Financial Statements.
33
Federal Money Market Fund
Notes to Financial Statements
Vanguard Federal Money Market Fund is registered under the Investment Company Act of 1940 as an open-end investment company, or mutual fund. The fund invests in short-term debt instruments issued by the U.S. government or its agencies and instrumentalities, and repurchase agreements collateralized by such instruments.
A. The following significant accounting policies conform to generally accepted accounting principles for U.S. mutual funds. The fund consistently follows such policies in preparing its financial statements.
1. Security Valuation: Securities are valued at amortized cost, which approximates market value.
2. Repurchase Agreements: The fund may invest in repurchase agreements. Securities pledged as collateral for repurchase agreements are held by a custodian bank until the agreements mature. Each agreement requires that the market value of the collateral be sufficient to cover payments of interest and principal; however, in the event of default or bankruptcy by the other party to the agreement, retention of the collateral may be subject to legal proceedings.
3. Federal Income Taxes: The fund intends to continue to qualify as a regulated investment company and distribute all of its taxable income. Accordingly, no provision for federal income taxes is required in the financial statements.
4. Distributions: Dividends from net investment income are declared daily and paid on the first business day of the following month.
5. Other: Interest income is accrued daily. Premiums and discounts on debt securities purchased are amortized and accreted, respectively, to interest income over the lives of the respective securities. Security transactions are accounted for on the date the securities are bought or sold. Costs used to determine realized gains (losses) on the sale of investment securities are those of the specific securities sold.
B. The Vanguard Group furnishes at cost investment advisory, corporate management, administrative, marketing, and distribution services. The costs of such services are allocated to the fund under methods approved by the board of trustees. The fund has committed to provide up to 0.40% of its net assets in capital contributions to Vanguard. At August 31, 2007, the fund had contributed capital of $642,000 to Vanguard (included in Other Assets), representing 0.01% of the fund’s net assets and 0.64% of Vanguard’s capitalization. The fund’s trustees and officers are also directors and officers of Vanguard.
C. In June 2006, the Financial Accounting Standards Board issued Interpretation No. 48 (“FIN 48”), “Accounting for Uncertainty in Income Taxes.” FIN 48 establishes the minimum threshold for recognizing, and a system for measuring, the benefits of tax-return positions in financial statements, and is effective for the fund’s fiscal year beginning September 1, 2007. Management has analyzed the fund’s tax positions taken on federal income tax returns for all open tax years (tax years ended August 31, 2004–2007) for purposes of implementing FIN 48, and has concluded that as of August 31, 2007, no provision for income tax would be required in the fund’s financial statements.
34
Treasury Money Market Fund
Fund Profile
As of August 31, 2007
Financial Attributes |
|
|
|
Yield | 4.54% |
Average Weighted Maturity | 74 days |
Average Quality1 | Aaa |
Expense Ratio | 0.24% |
Distribution by Credit Quality1 (% of portfolio) |
|
|
|
Aaa | 100.0% |
Sector Diversification (% of portfolio) |
|
|
|
Treasury | 100.0% |
1 Moody’s Investors Service.
See page 58 for a glossary of investment terms.
35
Treasury Money Market Fund
Performance Summary
Investment returns will fluctuate. All of the returns in this report represent past performance, which is not a guarantee of future results that may be achieved by the fund. (Current performance may be lower or higher than the performance data cited. For performance data current to the most recent month-end, visit our website at www.vanguard.com/performance.) The returns shown do not reflect taxes that a shareholder would pay on fund distributions. An investment in a money market fund is not insured or guaranteed by the Federal Deposit Insurance Corporation or any other government agency. Although the fund seeks to preserve the value of your investment at $1 per share, it is possible to lose money by investing in the fund. The annualized yield shown reflects the current earnings of the fund more closely than do the average annual returns.
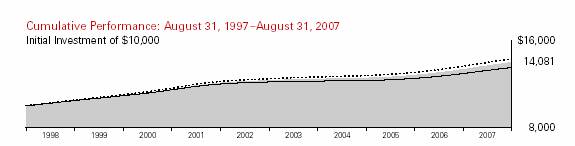
|
| Average Annual Total Returns | Final Value | |
|
| Periods Ended August 31, 2007 | of a $10,000 | |
| One Year | Five Years | Ten Years | Investment |
Treasury Money Market Fund1 | 4.88% | 2.55% | 3.48% | $14,081 |
Citigroup 3-Month Treasury Index | 5.05 | 2.78 | 3.66 | 14,323 |
iMoneyNet Money Fund Report’s |
|
|
|
|
Average 100% Treasury Fund | 4.34 | 2.10 | 3.07 | 13,526 |
1 Total returns do not include the account service fee that may be applicable to certain accounts with balances below $10,000.
36
Treasury Money Market Fund
Fiscal-Year Total Returns (%): August 31, 1997–August 31, 2007 |
|
|
| Treasury Money | Average |
Fiscal Year | Market Fund | Fund1 |
1998 | 5.1% | 4.8% |
1999 | 4.5 | 4.2 |
2000 | 5.4 | 5.0 |
2001 | 5.1 | 4.7 |
2002 | 2.0 | 1.6 |
2003 | 1.0 | 0.7 |
2004 | 0.7 | 0.4 |
2005 | 2.1 | 1.6 |
2006 | 4.1 | 3.5 |
2007 | 4.9 | 4.3 |
SEC 7-Day Annualized Yield (8/31/2007): 4.54% |
|
|
Average Annual Total Returns: Periods Ended June 30, 2007
This table presents average annual total returns through the latest calendar quarter—rather than through the end of the fiscal period. Securities and Exchange Commission rules require that we provide this information.
| Inception Date | One Year | Five Years | Ten Years |
Treasury Money Market Fund2 | 3/9/1983 | 4.88% | 2.44% | 3.49% |
1 Derived from iMoneyNet Money Fund Report’s Average 100% Treasury Fund.
2 Total returns do not include the account service fee that may be applicable to certain accounts with balances below $10,000. Note: See Financial Highlights table on page 42 for dividend information.
37
Treasury Money Market Fund
Financial Statements
Statement of Net Assets
As of August 31, 2007
The fund provides a complete list of its holdings four times in each fiscal year, at the quarter-ends. For the second and fourth fiscal quarters, the lists appear in the fund’s semiannual and annual reports to shareholders. For the first and third fiscal quarters, the fund files the lists with the Securities and Exchange Commission on Form N-Q. Shareholders can look up the fund’s Forms N-Q on the SEC’s website at www.sec.gov. Forms N-Q may also be reviewed and copied at the SEC’s Public Reference Room (see the back cover of this report for further information).
|
|
| Face | Market |
|
| Maturity | Amount | Value• |
| Yield1 | Date | ($000) | ($000) |
U.S Government Securities (99.8%) |
|
|
|
|
U.S. Treasury Bill | 3.002%–5.037% | 9/6/07 | 96,715 | 96,653 |
U.S. Treasury Bill | 3.711%–4.365% | 9/13/07 | 113,000 | 112,849 |
U.S. Treasury Bill | 4.269% | 9/17/07 | 3,270 | 3,264 |
U.S. Treasury Bill | 1.532%–4.647% | 9/20/07 | 58,930 | 58,845 |
U.S. Treasury Bill | 3.777%–4.972% | 9/27/07 | 378,883 | 377,591 |
U.S. Treasury Bill | 4.805%–4.868% | 10/4/07 | 480,000 | 477,905 |
U.S. Treasury Bill | 4.880%–4.890% | 10/11/07 | 530,000 | 527,157 |
U.S. Treasury Bill | 4.865%–4.900% | 10/18/07 | 253,694 | 252,091 |
U.S. Treasury Bill | 4.946%–4.956% | 10/25/07 | 879,000 | 872,576 |
U.S. Treasury Bill | 4.872%–4.890% | 11/1/07 | 293,000 | 290,609 |
U.S. Treasury Bill | 4.759%–4.845% | 11/8/07 | 172,669 | 171,111 |
U.S. Treasury Bill | 3.807%–4.707% | 11/15/07 | 510,789 | 505,946 |
U.S. Treasury Bill | 3.567%–4.911% | 11/23/07 | 387,346 | 383,720 |
U.S. Treasury Bill | 4.485%–4.657% | 11/29/07 | 600,000 | 593,280 |
U.S. Treasury Bill | 3.939%–3.960% | 1/3/08 | 70,000 | 69,063 |
U.S. Treasury Bill | 4.914% | 1/31/08 | 115,000 | 112,672 |
U.S. Treasury Bill | 4.662%–4.846% | 2/7/08 | 101,309 | 99,209 |
U.S. Treasury Bill | 3.925%–4.835% | 2/14/08 | 295,000 | 288,903 |
U.S. Treasury Bill | 3.978% | 2/21/08 | 225,000 | 220,783 |
U.S. Treasury Bill | 4.484%–4.652% | 2/28/08 | 375,000 | 366,636 |
Total U.S. Government Securities (Cost $5,880,863) |
|
| 5,880,863 | |
Other Assets and Liabilities (0.2%) |
|
|
|
|
Other Assets—Note B |
|
|
| 25,111 |
Liabilities |
|
|
| (14,604) |
|
|
|
| 10,507 |
Net Assets (100%) |
|
|
|
|
Applicable to 5,890,853,257 outstanding $.001 par value shares of |
|
| ||
beneficial interest (unlimited authorization) |
|
| 5,891,370 | |
Net Asset Value Per Share |
|
|
| $1.00 |
38
Treasury Money Market Fund
At August 31, 2007, net assets consisted of: |
|
|
| Amount | Per |
| ($000) | Share |
Paid-in Capital | 5,890,881 | $1.00 |
Undistributed Net Investment Income | — | — |
Accumulated Net Realized Gains | 489 | — |
Unrealized Appreciation | — | — |
Net Assets | 5,891,370 | $1.00 |
• | See Note A in Notes to Financial Statements. |
1 Represents annualized yield at date of purchase for discount securities, and coupon for coupon-bearing securities.
39
Treasury Money Market Fund
Statement of Operations
| Year Ended |
| August 31, 2007 |
| ($000) |
Investment Income |
|
Income |
|
Interest | 267,141 |
Total Income | 267,141 |
Expenses |
|
The Vanguard Group—Note B |
|
Investment Advisory Services | 440 |
Management and Administrative | 10,669 |
Marketing and Distribution | 1,362 |
Custodian Fees | 64 |
Auditing Fees | 17 |
Shareholders’ Reports | 84 |
Trustees’ Fees and Expenses | 8 |
Total Expenses | 12,644 |
Net Investment Income | 254,497 |
Realized Net Gain (Loss) on Investment Securities Sold | 732 |
Change in Unrealized Appreciation (Depreciation) of Investment Securities | — |
Net Increase (Decrease) in Net Assets Resulting from Operations | 255,229 |
40
Treasury Money Market Fund
Statement of Changes in Net Assets
| Year Ended August 31, | |
| 2007 | 2006 |
| ($000) | ($000) |
Increase (Decrease) in Net Assets |
|
|
Operations |
|
|
Net Investment Income | 254,497 | 198,121 |
Realized Net Gain (Loss) | 732 | (475) |
Change in Unrealized Appreciation (Depreciation) | — | — |
Net Increase (Decrease) in Net Assets Resulting from Operations | 255,229 | 197,646 |
Distributions |
|
|
Net Investment Income | (254,497) | (198,121) |
Realized Capital Gain | — | — |
Total Distributions | (254,497) | (198,121) |
Capital Share Transactions (at $1.00) |
|
|
Issued | 4,658,601 | 4,924,240 |
Issued in Lieu of Cash Distributions | 248,231 | 193,061 |
Redeemed | (4,239,110) | (4,451,544) |
Net Increase (Decrease) from Capital Share Transactions | 667,722 | 665,757 |
Total Increase (Decrease) | 668,454 | 665,282 |
Net Assets |
|
|
Beginning of Period | 5,222,916 | 4,557,634 |
End of Period | 5,891,370 | 5,222,916 |
41
Treasury Money Market Fund
Financial Highlights
| Year Ended August 31, | ||||
For a Share Outstanding Throughout Each Period | 2007 | 2006 | 2005 | 2004 | 2003 |
Net Asset Value, Beginning of Period | $1.00 | $1.00 | $1.00 | $1.00 | $1.00 |
Investment Operations |
|
|
|
|
|
Net Investment Income | .048 | .040 | .021 | .007 | .010 |
Net Realized and Unrealized Gain (Loss) |
|
|
|
|
|
on Investments | — | — | — | — | — |
Total from Investment Operations | .048 | .040 | .021 | .007 | .010 |
Distributions |
|
|
|
|
|
Dividends from Net Investment Income | (.048) | (.040) | (.021) | (.007) | (.010) |
Distributions from Realized Capital Gains | — | — | — | — | — |
Total Distributions | (.048) | (.040) | (.021) | (.007) | (.010) |
Net Asset Value, End of Period | $1.00 | $1.00 | $1.00 | $1.00 | $1.00 |
|
|
|
|
|
|
Total Return1 | 4.88% | 4.06% | 2.12% | 0.74% | 1.03% |
|
|
|
|
|
|
Ratios/Supplemental Data |
|
|
|
|
|
Net Assets, End of Period (Millions) | $5,891 | $5,223 | $4,558 | $4,628 | $4,959 |
Ratio of Total Expenses to |
|
|
|
|
|
Average Net Assets | 0.24% | 0.29% | 0.30% | 0.30% | 0.32% |
Ratio of Net Investment Income to |
|
|
|
|
|
Average Net Assets | 4.76% | 4.01% | 2.10% | 0.73% | 1.03% |
1 Total returns do not include the account service fee that may be applicable to certain accounts with balances below $10,000. See accompanying Notes, which are an integral part of the Financial Statements.
42
Treasury Money Market Fund
Notes to Financial Statements
Vanguard Treasury Money Market Fund is registered under the Investment Company Act of 1940 as an open-end investment company, or mutual fund. The fund invests in short-term debt instruments backed by the full faith and credit of the U.S. government.
A. The following significant accounting policies conform to generally accepted accounting principles for U.S. mutual funds. The fund consistently follows such policies in preparing its financial statements.
1. Security Valuation: Securities are valued at amortized cost, which approximates market value.
2. Federal Income Taxes: The fund intends to continue to qualify as a regulated investment company and distribute all of its taxable income. Accordingly, no provision for federal income taxes is required in the financial statements.
3. Distributions: Dividends from net investment income are declared daily and paid on the first business day of the following month.
4. Other: Interest income is accrued daily. Premiums and discounts on debt securities purchased are amortized and accreted, respectively, to interest income over the lives of the respective securities. Security transactions are accounted for on the date securities are bought or sold. Costs used to determine realized gains (losses) on the sale of investment securities are those of the specific securities sold.
B. The Vanguard Group furnishes at cost investment advisory, corporate management, administrative, marketing, and distribution services. The costs of such services are allocated to the fund under methods approved by the board of trustees. The fund has committed to provide up to 0.40% of its net assets in capital contributions to Vanguard. At August 31, 2007, the fund had contributed capital of $477,000 to Vanguard (included in Other Assets), representing 0.01% of the fund’s net assets and 0.48% of Vanguard’s capitalization. The fund’s trustees and officers are also directors and officers of Vanguard.
C. In June 2006, the Financial Accounting Standards Board issued Interpretation No. 48 (“FIN 48”), “Accounting for Uncertainty in Income Taxes.” FIN 48 establishes the minimum threshold for recognizing, and a system for measuring, the benefits of tax-return positions in financial statements, and is effective for the fund’s fiscal year beginning September 1, 2007. Management has analyzed the fund’s tax positions taken on federal income tax returns for all open tax years (tax years ended August 31, 2004–2007) for purposes of implementing FIN 48, and has concluded that as of August 31, 2007, no provision for income tax would be required in the fund’s financial statements.
43
Admiral Treasury Money Market Fund
Fund Profile
As of August 31, 2007
Financial Attributes |
|
|
|
Yield | 4.64% |
Average Weighted Maturity | 76 days |
Average Quality1 | Aaa |
Expense Ratio | 0.10% |
Distribution by Credit Quality1 (% of portfolio) |
|
|
|
Aaa | 100.0% |
Sector Diversification (% of portfolio) |
|
|
|
Treasury | 100.0% |
1 Moody’s Investors Service.
See page 58 for a glossary of investment terms.
44
Admiral Treasury Money Market Fund
Performance Summary
Investment returns will fluctuate. All of the returns in this report represent past performance, which is not a guarantee of future results that may be achieved by the fund. (Current performance may be lower or higher than the performance data cited. For performance data current to the most recent month-end, visit our website at www.vanguard.com/performance.) The returns shown do not reflect taxes that a shareholder would pay on fund distributions. An investment in a money market fund is not insured or guaranteed by the Federal Deposit Insurance Corporation or any other government agency. Although the fund seeks to preserve the value of your investment at $1 per share, it is possible to lose money by investing in the fund. The annualized yield shown reflects the current earnings of the fund more closely than do the average annual returns.

|
| Average Annual Total Returns | Final Value | |
|
| Periods Ended August 31, 2007 | of a $50,000 | |
| One Year | Five Years | Ten Years | Investment |
Admiral Treasury Money Market Fund | 5.02% | 2.72% | 3.65% | $71,586 |
Citigroup 3-Month Treasury Index | 5.05 | 2.78 | 3.66 | 71,616 |
iMoneyNet Money Fund Report’s |
|
|
|
|
Average 100% Treasury Fund | 4.34 | 2.10 | 3.07 | 67,628 |
45
Admiral Treasury Money Market Fund
Fiscal-Year Total Returns (%): August 31, 1997–August 31, 2007 | ||
| Admiral Treasury | Average |
Fiscal Year | Money Market Fund | Fund1 |
1998 | 5.3% | 4.8% |
1999 | 4.7 | 4.2 |
2000 | 5.5 | 5.0 |
2001 | 5.3 | 4.7 |
2002 | 2.1 | 1.6 |
2003 | 1.2 | 0.7 |
2004 | 0.9 | 0.4 |
2005 | 2.3 | 1.6 |
2006 | 4.2 | 3.5 |
2007 | 5.0 | 4.3 |
SEC 7-Day Annualized Yield (8/31/2007): 4.64% |
|
|
Average Annual Total Returns: Periods Ended June 30, 2007
This table presents average annual total returns through the latest calendar quarter—rather than through the end of the fiscal period. Securities and Exchange Commission rules require that we provide this information.
| Inception Date | One Year | Five Years | Ten Years |
Admiral Treasury Money Market Fund | 12/14/1992 | 5.03% | 2.61% | 3.66% |
1 Derived from iMoneyNet Money Fund Report’s Average 100% Treasury Fund.
Note: See Financial Highlights table on page 51 for dividend information.
46
Admiral Treasury Money Market Fund
Financial Statements
Statement of Net Assets
As of August 31, 2007
The fund provides a complete list of its holdings four times in each fiscal year, at the quarter-ends. For the second and fourth fiscal quarters, the lists appear in the fund’s semiannual and annual reports to shareholders. For the first and third fiscal quarters, the fund files the lists with the Securities and Exchange Commission on Form N-Q. Shareholders can look up the fund’s Forms N-Q on the SEC’s website at www.sec.gov. Forms N-Q may also be reviewed and copied at the SEC’s Public Reference Room (see the back cover of this report for further information).
|
|
| Face | Market |
|
| Maturity | Amount | Value• |
| Yield1 | Date | ($000) | ($000) |
U.S. Government Securities (100.0%) |
|
|
|
|
U.S. Treasury Bill | 5.020%–5.037% | 9/6/07 | 1,426,196 | 1,425,209 |
U.S. Treasury Bill | 3.711%–4.365% | 9/13/07 | 226,301 | 226,003 |
U.S. Treasury Bill | 4.269% | 9/17/07 | 19,139 | 19,103 |
U.S. Treasury Bill | 1.579%–5.038% | 9/20/07 | 635,678 | 634,387 |
U.S. Treasury Bill | 4.746%–4.972% | 9/27/07 | 515,000 | 513,232 |
U.S. Treasury Bill | 4.805%–4.868% | 10/4/07 | 1,520,000 | 1,513,374 |
U.S. Treasury Bill | 4.877%–4.890% | 10/11/07 | 1,321,324 | 1,314,233 |
U.S. Treasury Bill | 4.849%–4.900% | 10/18/07 | 1,135,267 | 1,128,095 |
U.S. Treasury Bill | 4.946%–4.956% | 10/25/07 | 1,906,000 | 1,892,089 |
U.S. Treasury Bill | 4.872%–4.890% | 11/1/07 | 1,357,000 | 1,345,921 |
U.S. Treasury Bill | 4.759%–4.845% | 11/8/07 | 626,739 | 621,086 |
U.S. Treasury Bill | 3.429%–4.707% | 11/15/07 | 2,234,879 | 2,214,193 |
U.S. Treasury Bill | 3.535%–4.911% | 11/23/07 | 1,422,204 | 1,408,744 |
U.S. Treasury Bill | 4.485%–4.657% | 11/29/07 | 1,350,000 | 1,334,950 |
U.S. Treasury Bill | 3.939%–3.960% | 1/3/08 | 330,000 | 325,577 |
U.S. Treasury Bill | 4.875%–4.914% | 1/31/08 | 685,000 | 671,179 |
U.S. Treasury Bill | 4.662%–4.846% | 2/7/08 | 420,000 | 411,303 |
U.S. Treasury Bill | 3.925%–4.835% | 2/14/08 | 855,000 | 836,882 |
U.S. Treasury Bill | 3.874%–3.978% | 2/21/08 | 1,055,000 | 1,035,362 |
U.S. Treasury Bill | 4.484%–4.678% | 2/28/08 | 1,210,000 | 1,183,007 |
Total U.S. Government Securities (Cost $20,053,929) |
|
| 20,053,929 | |
Other Assets and Liabilities (0.0%) |
|
|
|
|
Other Assets—Note B |
|
|
| 75,184 |
Liabilities |
|
|
| (65,164) |
|
|
|
| 10,020 |
Net Assets (100%) |
|
|
|
|
Applicable to 20,063,058,199 outstanding $.001 par value shares of |
|
| ||
beneficial interest (unlimited authorization) |
|
|
| 20,063,949 |
Net Asset Value Per Share |
|
|
| $1.00 |
47
Admiral Treasury Money Market Fund
At August 31, 2007, net assets consisted of: |
|
|
| Amount | Per |
| ($000) | Share |
Paid-in Capital | 20,063,060 | $1.00 |
Undistributed Net Investment Income | — | — |
Accumulated Net Realized Gains | 889 | — |
Unrealized Appreciation | — | — |
Net Assets | 20,063,949 | $1.00 |
• | See Note A in Notes to Financial Statements. |
1 Represents annualized yield at date of purchase for discount securities, and coupon for coupon-bearing securities.
48
Admiral Treasury Money Market Fund
Statement of Operations
| Year Ended |
| August 31, 2007 |
| ($000) |
Investment Income |
|
Income |
|
Interest | 864,440 |
Total Income | 864,440 |
Expenses |
|
The Vanguard Group—Note B |
|
Investment Advisory Services | 1,408 |
Management and Administrative | 10,660 |
Marketing and Distribution | 4,340 |
Custodian Fees | 240 |
Auditing Fees | 18 |
Shareholders’ Reports | 64 |
Trustees’ Fees and Expenses | 19 |
Total Expenses | 16,749 |
Net Investment Income | 847,691 |
Realized Net Gain (Loss) on Investment Securities Sold | 2,478 |
Change in Unrealized Appreciation (Depreciation) of Investment Securities | — |
Net Increase (Decrease) in Net Assets Resulting from Operations | 850,169 |
49
Admiral Treasury Money Market Fund
Statement of Changes in Net Assets
| Year Ended August 31, | |
| 2007 | 2006 |
| ($000) | ($000) |
Increase (Decrease) in Net Assets |
|
|
Operations |
|
|
Net Investment Income | 847,691 | 622,279 |
Realized Net Gain (Loss) | 2,478 | (587) |
Change in Unrealized Appreciation (Depreciation) | — | — |
Net Increase (Decrease) in Net Assets Resulting from Operations | 850,169 | 621,692 |
Distributions |
|
|
Net Investment Income | (847,691) | (622,279) |
Realized Capital Gain | — | — |
Total Distributions | (847,691) | (622,279) |
Capital Share Transactions (at $1.00) |
|
|
Issued | 17,590,283 | 16,807,460 |
Issued in Lieu of Cash Distributions | 808,325 | 592,915 |
Redeemed | (14,319,509) | (15,254,987) |
Net Increase (Decrease) from Capital Share Transactions | 4,079,099 | 2,145,388 |
Total Increase (Decrease) | 4,081,577 | 2,144,801 |
Net Assets |
|
|
Beginning of Period | 15,982,372 | 13,837,571 |
End of Period | 20,063,949 | 15,982,372 |
50
Admiral Treasury Money Market Fund
Financial Highlights
| Year Ended August 31, | ||||
For a Share Outstanding Throughout Each Period | 2007 | 2006 | 2005 | 2004 | 2003 |
Net Asset Value, Beginning of Period | $1.00 | $1.00 | $1.00 | $1.00 | $1.00 |
Investment Operations |
|
|
|
|
|
Net Investment Income | .049 | .041 | .023 | .009 | .012 |
Net Realized and Unrealized Gain (Loss) |
|
|
|
|
|
on Investments | — | — | — | — | — |
Total from Investment Operations | .049 | .041 | .023 | .009 | .012 |
Distributions |
|
|
|
|
|
Dividends from Net Investment Income | (.049) | (.041) | (.023) | (.009) | (.012) |
Distributions from Realized Capital Gains | — | — | — | — | — |
Total Distributions | (.049) | (.041) | (.023) | (.009) | (.012) |
Net Asset Value, End of Period | $1.00 | $1.00 | $1.00 | $1.00 | $1.00 |
|
|
|
|
|
|
Total Return | 5.02% | 4.22% | 2.29% | 0.91% | 1.20% |
|
|
|
|
|
|
Ratios/Supplemental Data |
|
|
|
|
|
Net Assets, End of Period (Millions) | $20,064 | $15,982 | $13,838 | $13,270 | $13,129 |
Ratio of Total Expenses to |
|
|
|
|
|
Average Net Assets | 0.10% | 0.13% | 0.13% | 0.13% | 0.14% |
Ratio of Net Investment Income to |
|
|
|
|
|
Average Net Assets | 4.90% | 4.15% | 2.27% | 0.91% | 1.18% |
See accompanying Notes, which are an integral part of the Financial Statements.
51
Admiral Treasury Money Market Fund
Notes to Financial Statements
Vanguard Admiral Treasury Money Market Fund is registered under the Investment Company Act of 1940 as an open-end investment company, or mutual fund. The fund invests in short-term debt instruments backed by the full faith and credit of the U.S. government.
A. The following significant accounting policies conform to generally accepted accounting principles for U.S. mutual funds. The fund consistently follows such policies in preparing its financial statements.
1. Security Valuation: Securities are valued at amortized cost, which approximates market value.
2. Federal Income Taxes: The fund intends to continue to qualify as a regulated investment company and distribute all of its taxable income. Accordingly, no provision for federal income taxes is required in the financial statements.
3. Distributions: Dividends from net investment income are declared daily and paid on the first
business day of the following month.
4. Other: Interest income is accrued daily. Premiums and discounts on debt securities purchased are amortized and accreted, respectively, to interest income over the lives of the respective securities. Security transactions are accounted for on the date securities are bought or sold. Costs used to determine realized gains (losses) on the sale of investment securities are those of the specific securities sold.
B. The Vanguard Group furnishes at cost investment advisory, corporate management, administrative, marketing, and distribution services. The costs of such services are allocated to the fund under methods approved by the board of trustees. The fund has committed to provide up to 0.40% of its net assets in capital contributions to Vanguard. At August 31, 2007, the fund had contributed capital of $1,591,000 to Vanguard (included in Other Assets), representing 0.01% of the fund’s net assets and 1.59% of Vanguard’s capitalization. The fund’s trustees and officers are also directors and officers of Vanguard.
C. In June 2006, the Financial Accounting Standards Board issued Interpretation No. 48 (“FIN 48”), “Accounting for Uncertainty in Income Taxes.” FIN 48 establishes the minimum threshold for recognizing, and a system for measuring, the benefits of tax-return positions in financial statements, and is effective for the fund’s fiscal year beginning September 1, 2007. Management has analyzed the fund’s tax positions taken on federal income tax returns for all open tax years (tax years ended August 31, 2004–2007) for purposes of implementing FIN 48, and has concluded that as of August 31, 2007, no provision for income tax would be required in the fund’s financial statements.
52
Report of Independent Registered Public Accounting Firm
To the Trustees of Vanguard Money Market Reserves, Vanguard Treasury Funds and Vanguard Admiral Funds and the Shareholders of Vanguard Prime Money Market Fund, Vanguard Federal Money Market Fund, Vanguard Treasury Money Market Fund and Vanguard Admiral Treasury Money Market Fund:
In our opinion, the accompanying statements of net assets and the related statements of operations and of changes in net assets and the financial highlights present fairly, in all material respects, the financial position of Vanguard Prime Money Market Fund, Vanguard Federal Money Market Fund, Vanguard Treasury Money Market Fund and Vanguard Admiral Treasury Money Market Fund (the “Funds”) at August 31, 2007, the results of each of their operations for the year then ended, the changes in each of their net assets for each of the two years in the period then ended and the financial highlights for each of the five years in the period then ended, in conformity with accounting principles generally accepted in the United States of America. These financial statements and financial highlights (hereafter referred to as “financial statements”) are the responsibility of the Funds’ management; our responsibility is to express an opinion on these financial statements based on our audits. We conducted our audits of these financial statements in accordance with the standards of the Public Company Accounting Oversight Board (United States). Those standards require that we plan and perform the audit to obtain reasonable assurance about whether the financial statements are free of material misstatement. An audit includes examining, on a test basis, evidence supporting the amounts and disclosures in the financial statements, assessing the accounting principles used and significant estimates made by management, and evaluating the overall financial statement presentation. We believe that our audits, which included confirmation of securities at August 31, 2007 by correspondence with the custodians and brokers, provide a reasonable basis for our opinion.
PricewaterhouseCoopers LLP
Philadelphia, Pennsylvania
October 10, 2007
53
Special 2007 tax information (unaudited) for Vanguard Prime Money Market Fund
This information for the fiscal year ended August 31, 2007, is included pursuant to provisions of the Internal Revenue Code.
For non-resident alien shareholders, 74.06% of income dividends are interest related dividends.
Special 2007 tax information (unaudited) for Vanguard Federal Money Market Fund
This information for the fiscal year ended August 31, 2007, is included pursuant to provisions of the Internal Revenue Code.
For non-resident alien shareholders, 100% of income dividends are interest related dividends.
Special 2007 tax information (unaudited) for Vanguard Treasury Money Market Fund
This information for the fiscal year ended August 31, 2007, is included pursuant to provisions of the Internal Revenue Code.
For non-resident alien shareholders, 100% of income dividends are interest related dividends.
Special 2007 tax information (unaudited) for Vanguard Admiral Treasury Money Market Fund
This information for the fiscal year ended August 31, 2007, is included pursuant to provisions of the Internal Revenue Code.
For non-resident alien shareholders, 100.0% of income dividends are interest related dividends.
54
About Your Fund’s Expenses
As a shareholder of the fund, you incur ongoing costs, which include costs for portfolio management, administrative services, and shareholder reports (like this one), among others. Operating expenses, which are deducted from a fund’s gross income, directly reduce the investment return of the fund.
A fund’s expenses are expressed as a percentage of its average net assets. This figure is known as the expense ratio. The following examples are intended to help you understand the ongoing costs (in dollars) of investing in your fund and to compare these costs with those of other mutual funds. The examples are based on an investment of $1,000 made at the beginning of the period shown and held for the entire period.
The table on page 56 illustrates your fund’s costs in two ways:
• Based on actual fund return. This section helps you to estimate the actual expenses that you paid over the period. The “Ending Account Value” shown is derived from the fund’s actual return, and the third column shows the dollar amount that would have been paid by an investor who started with $1,000 in the fund. You may use the information here, together with the amount you invested, to estimate the expenses that you paid over the period.
To do so, simply divide your account value by $1,000 (for example, an $8,600 account value divided by $1,000 = 8.6), then multiply the result by the number given for your fund under the heading “Expenses Paid During Period.”
• Based on hypothetical 5% yearly return. This section is intended to help you compare your fund’s costs with those of other mutual funds. It assumes that the fund had a yearly return of 5% before expenses, but that the expense ratio is unchanged. In this case—because the return used is not the fund’s actual return—the results do not apply to your investment. The example is useful in making comparisons because the Securities and Exchange Commission requires all mutual funds to calculate expenses based on a 5% return. You can assess your fund’s costs by comparing this hypothetical example with the hypothetical examples that appear in shareholder reports of other funds.
Note that the expenses shown in the table on page 56 are meant to highlight and help you compare ongoing costs only and do not reflect any transactional costs incurred by the fund for buying and selling securities. Further, the expenses do not include the account service fee described in the prospectus (the fee does not apply to the Prime Money Market Fund’s Institutional Shares or the Admiral Treasury Money Market Fund). If such a fee were applied to your account, your costs would be higher. Your fund does not charge transaction fees, such as purchase or redemption fees, nor does it carry a “sales load.”
The calculations assume no shares were bought or sold during the period. Your actual costs may have been higher or lower, depending on the amount of your investment and the timing of any purchases or redemptions.
You can find more information about the fund’s expenses, including annual expense ratios, in the Financial Statements section of this report. For additional information on operating expenses and other shareholder costs, please refer to your fund’s current prospectus.
55
Six Months Ended August 31, 2007 |
|
|
|
| Beginning | Ending | Expenses |
| Account Value | Account Value | Paid During |
Money Market Fund | 2/28/2007 | 8/31/2007 | Period1 |
Based on Actual Fund Return |
|
|
|
Prime |
|
|
|
Investor Shares | $1,000.00 | $1,026.04 | $1.12 |
Institutional Shares | 1,000.00 | 1,026.76 | 0.41 |
Federal | 1,000.00 | 1,025.77 | 1.12 |
Treasury | 1,000.00 | 1,024.19 | 1.12 |
Admiral Treasury | 1,000.00 | 1,024.85 | 0.46 |
Based on Hypothetical 5% Yearly Return |
|
|
|
Prime |
|
|
|
Investor Shares | $1,000.00 | $1,024.10 | $1.12 |
Institutional Shares | 1,000.00 | 1,024.80 | 0.41 |
Federal | 1,000.00 | 1,024.10 | 1.12 |
Treasury | 1,000.00 | 1,024.10 | 1.12 |
Admiral Treasury | 1,000.00 | 1,024.75 | 0.46 |
1 The calculations are based on expenses incurred in the most recent six-month period. The funds’ annualized six-month expense ratios for that period are: for the Prime Money Market Fund, 0.22% for Investor Shares and 0.08% for Institutional Shares; for the Federal Money Market Fund, 0.22%; for the Treasury Money Market Fund, 0.22%; and for the Admiral Treasury Money Market Fund, 0.09%. The dollar amounts shown as “Expenses Paid” are equal to the annualized expense ratio multiplied by the average account value over the period, multiplied by the number of days in the most recent six-month period, then divided by the number of days in the most recent 12-month period.
56
Trustees Approve Advisory Arrangement
The board of trustees of Vanguard Prime Money Market Fund, Federal Money Market Fund, Treasury Money Market Fund, and Admiral Treasury Money Market Fund has renewed the funds’ investment advisory arrangement with The Vanguard Group, Inc. Vanguard—through its Fixed Income Group—serves as the investment advisor for the funds. The board determined that continuing the funds’ internalized management structure was in the best interests of the funds and their shareholders.
The board based its decision upon an evaluation of the advisor’s investment staff, portfolio management process, and performance. The trustees considered the factors discussed below, among others. However, no single factor determined whether the board approved the arrangement. Rather, it was the totality of the circumstances that drove the board’s decision.
Nature, extent, and quality of services
The board considered the quality of the funds’ investment management over both the short and long term, and took into account the organizational depth and stability of the advisor. Vanguard has been managing investments for more than two decades. George U. Sauter, Vanguard managing director and chief investment officer, has been in the investment management business since 1985. Robert F. Auwaerter, principal in charge of the Fixed Income Group, has been in the investment management business since 1978. The Fixed Income Group adheres to a sound, disciplined investment management process; the team has considerable experience, stability, and depth.
The board concluded that Vanguard’s experience, stability, depth, and performance, among other factors, warranted continuation of the advisory arrangement.
Investment performance
The board considered the short- and long-term performance of the funds, including any periods of outperformance or underperformance of relevant benchmarks and peer groups. The board concluded that the funds have performed in line with expectations, and that their results have been consistent with their investment strategies. Information about the funds’ most recent performance can be found in the Performance Summary sections of this report.
Cost
The board concluded that the funds’ expense ratios were far below the average expense ratios charged by funds in their respective peer groups. The board noted that the funds’ advisory expense ratios were also well below their peer-group averages. Information about the funds’ expense ratios appears in the About Your Fund’s Expenses section of this report as well as in the Financial Statements sections.
The board does not conduct a profitability analysis of Vanguard because of Vanguard’s unique “at-cost” structure. Unlike most other mutual fund management companies, Vanguard is owned by the funds it oversees, and produces “profits” only in the form of reduced expenses for fund shareholders.
The benefit of economies of scale
The board of trustees concluded that the funds’ low-cost arrangement with Vanguard ensures that the funds will realize economies of scale as they grow, with the cost to shareholders declining as fund assets increase.
The board will consider whether to renew the advisory arrangement again after a one-year
period.
57
Glossary
Average Quality. An indicator of credit risk, this figure is the average of the ratings assigned to a fund’s fixed income holdings by credit-rating agencies. The agencies make their judgment after appraising an issuer’s ability to meet its obligations. Quality is graded on a scale, with Aaa or AAA indicating the most creditworthy bond issuers. U.S. Treasury securities are considered to have the highest credit quality.
Average Weighted Maturity. The average length of time until fixed income securities held by a fund reach maturity and are repaid. The figure reflects the proportion of fund assets represented by each security.
Expense Ratio. The percentage of a fund’s average net assets used to pay its annual administrative and advisory expenses. These expenses directly reduce returns to investors.
Inception Date. The date on which the assets of a fund (or one of its share classes) are first invested in accordance with the fund’s investment objective. For funds with a subscription period, the inception date is the day after that period ends. Investment performance is measured from the inception date.
Yield. A snapshot of a fund’s interest income. The yield is expressed as a percentage of the fund’s net asset value. For money market funds, yield is based on income earned over the past seven days and is annualized, or projected forward for the coming year.
58
This page intentionally left blank.
The People Who Govern Your Fund
The trustees of your mutual fund are there to see that the fund is operated and managed in your best interests since, as a shareholder, you are a part owner of the fund. Your fund’s trustees also serve on the board of directors of The Vanguard Group, Inc., which is owned by the Vanguard funds and provides services to them on an at-cost basis.
A majority of Vanguard’s board members are independent, meaning that they have no affiliation with Vanguard or the funds they oversee, apart from the sizable personal investments they have made as private individuals.
Our independent board members bring distinguished backgrounds in business, academia, and public service to their task of working with Vanguard officers to establish the policies and oversee the activities of the funds. Among board members’ responsibilities are selecting investment advisors for the funds; monitoring fund operations, performance, and costs; reviewing contracts; nominating and selecting new trustees/directors; and electing Vanguard officers.
Each trustee serves a fund until its termination; or until the trustee’s retirement, resignation, or death; or otherwise as specified in the fund’s organizational documents. Any trustee may be removed at a shareholders’ meeting by a vote representing two-thirds of the net asset value of all shares of the fund together with shares of other Vanguard funds organized within the same trust. The table on these two pages shows information for each trustee and executive officer of the fund. The mailing address of the trustees and officers is P.O. Box 876, Valley Forge, PA 19482.
Chairman of the Board, Chief Executive Officer, and Trustee | |
|
|
John J. Brennan1 |
|
Born 1954 | Principal Occupation(s) During the Past Five Years: Chairman of the Board, Chief Executive |
Trustee since May 1987; | Officer, and Director/Trustee of The Vanguard Group, Inc., and of each of the investment |
Chairman of the Board and | companies served by The Vanguard Group. |
Chief Executive Officer |
|
147 Vanguard Funds Overseen |
|
|
|
Independent Trustees |
|
|
|
Charles D. Ellis |
|
Born 1937 | Principal Occupation(s) During the Past Five Years: Applecore Partners (pro bono ventures |
Trustee since January 2001 | in education); Senior Advisor to Greenwich Associates (international business strategy |
147 Vanguard Funds Overseen | consulting); Successor Trustee of Yale University; Overseer of the Stern School of Business |
| at New York University; Trustee of the Whitehead Institute for Biomedical Research. |
|
|
Rajiv L. Gupta |
|
Born 1945 | Principal Occupation(s) During the Past Five Years: Chairman, President, and |
Trustee since December 20012 | Chief Executive Officer of Rohm and Haas Co. (chemicals); Board Member of |
147 Vanguard Funds Overseen | the American Chemistry Council; Director of Tyco International, Ltd. (diversified |
| manufacturing and services) since 2005; Trustee of Drexel University and of the |
| Chemical Heritage Foundation. |
|
|
Amy Gutmann |
|
Born 1949 | Principal Occupation(s) During the Past Five Years: President of the University of |
Trustee since June 2006 | Pennsylvania since 2004; Professor in the School of Arts and Sciences, Annenberg School |
147 Vanguard Funds Overseen | for Communication, and Graduate School of Education of the University of Pennsylvania |
| since 2004; Provost (2001–2004) and Laurance S. Rockefeller Professor of Politics and |
| the University Center for Human Values (1990–2004), Princeton University; Director of |
| Carnegie Corporation of New York since 2005 and of Schuylkill River Development |
| Corporation and Greater Philadelphia Chamber of Commerce since 2004. |
JoAnn Heffernan Heisen |
|
Born 1950 | Principal Occupation(s) During the Past Five Years: Corporate Vice President and |
Trustee since July 1998 | Chief Global Diversity Officer since 2006, Vice President and Chief Information |
147 Vanguard Funds Overseen | Officer (1997–2005), and Member of the Executive Committee of Johnson & |
| Johnson (pharmaceuticals/consumer products); Director of the University Medical |
| Center at Princeton and Women’s Research and Education Institute. |
|
|
André F. Perold |
|
Born 1952 | Principal Occupation(s) During the Past Five Years: George Gund Professor of Finance |
Trustee since December 2004 | and Banking, Harvard Business School; Senior Associate Dean, Director of Faculty |
147 Vanguard Funds Overseen | Recruiting, and Chair of Finance Faculty, Harvard Business School; Director and Chairman |
| of UNX, Inc. (equities trading firm) since 2003; Chair of the Investment Committee of |
| HighVista Strategies LLC (private investment firm) since 2005. |
|
|
Alfred M. Rankin, Jr. |
|
Born 1941 | Principal Occupation(s) During the Past Five Years: Chairman, President, Chief Executive |
Trustee since January 1993 | Officer, and Director of NACCO Industries, Inc. (forklift trucks/housewares/lignite); Director |
147 Vanguard Funds Overseen | of Goodrich Corporation (industrial products/aircraft systems and services). |
|
|
|
|
J. Lawrence Wilson |
|
Born 1936 | Principal Occupation(s) During the Past Five Years: Retired Chairman and Chief Executive |
Trustee since April 1985 | Officer of Rohm and Haas Co. (chemicals); Director of Cummins Inc. (diesel engines) and |
147 Vanguard Funds Overseen | AmerisourceBergen Corp. (pharmaceutical distribution); Trustee of Vanderbilt University |
| and of Culver Educational Foundation. |
|
|
Executive Officers1 |
|
|
|
Thomas J. Higgins |
|
Born 1957 | Principal Occupation(s) During the Past Five Years: Principal of The Vanguard Group, Inc.; |
Treasurer since July 1998 | Treasurer of each of the investment companies served by The Vanguard Group. |
147 Vanguard Funds Overseen |
|
|
|
|
|
Heidi Stam |
|
Born 1956 | Principal Occupation(s) During the Past Five Years: Managing Director of The Vanguard |
Secretary since July 2005 | Group, Inc., since 2006; General Counsel of The Vanguard Group since 2005; Secretary of |
147 Vanguard Funds Overseen | The Vanguard Group, and of each of the investment companies served by The Vanguard |
| Group, since 2005; Principal of The Vanguard Group (1997–2006). |
Vanguard Senior Management Team |
|
| |
|
|
|
|
R. Gregory Barton | Kathleen C. Gubanich | F. William McNabb, III | Ralph K. Packard |
Mortimer J. Buckley | Paul A. Heller | Michael S. Miller | George U. Sauter |
Founder |
|
John C. Bogle |
Chairman and Chief Executive Officer, 1974–1996 |
1 Officers of the funds are “interested persons” as defined in the Investment Company Act of 1940.
2 December 2002 for Vanguard Equity Income Fund, Vanguard Growth Equity Fund, the Vanguard Municipal Bond Funds, and the Vanguard State Tax-Exempt Funds.
More information about the trustees is in the Statement of Additional Information, available from The Vanguard Group.
|
|
| P.O. Box 2600 |
| Valley Forge, PA 19482-2600 |

Connect with Vanguard® > www.vanguard.com |
Fund Information > 800-662-7447 | Vanguard, Admiral, Connect with Vanguard, and the ship |
| logo are trademarks of The Vanguard Group, Inc. |
Direct Investor Account Services > 800-662-2739 |
|
|
|
Institutional Investor Services > 800-523-1036 | All other marks are the exclusive property of their |
| respective owners. |
Text Telephone for People |
|
With Hearing Impairment > 800-952-3335 |
|
| All comparative mutual fund data are from Lipper Inc. |
| or Morningstar, Inc., unless otherwise noted. |
|
|
|
|
| You can obtain a free copy of Vanguard’s proxy voting |
This material may be used in conjunction | guidelines by visiting our website, www.vanguard.com, |
with the offering of shares of any Vanguard | and searching for “proxy voting guidelines,” or by calling |
fund only if preceded or accompanied by | Vanguard at 800-662-2739. They are also available from |
the fund’s current prospectus. | the SEC’s website, www.sec.gov. In addition, you may |
| obtain a free report on how your fund voted the proxies for |
| securities it owned during the 12 months ended June 30. |
| To get the report, visit either www.vanguard.com |
| or www.sec.gov. |
|
|
|
|
| You can review and copy information about your fund |
| at the SEC’s Public Reference Room in Washington, D.C. |
| To find out more about this public service, call the SEC |
| at 202-551-8090. Information about your fund is also |
| available on the SEC’s website, and you can receive |
| copies of this information, for a fee, by sending a |
| request in either of two ways: via e-mail addressed to |
| publicinfo@sec.gov or via regular mail addressed to the |
| Public Reference Section, Securities and Exchange |
| Commission, Washington, DC 20549-0102. |
|
|
|
|
|
|
|
|
|
|
| © 2007 The Vanguard Group, Inc. |
| All rights reserved. |
| Vanguard Marketing Corporation, Distributor. |
|
|
| Q300 102007 |
Item 2: Code of Ethics. The Registrant has adopted a code of ethics that applies to the Registrant’s principal executive officer, principal financial officer, principal accounting officer or controller or persons performing similar functions. The Code of Ethics was amended during the reporting period covered by this report to make certain technical, non-material changes.
Item 3: Audit Committee Financial Expert. The following members of the Audit Committee have been determined by the Registrant’s Board of Trustees to be Audit Committee Financial Experts serving on its Audit Committee, and to be independent: Charles D. Ellis, Rajiv L. Gupta, JoAnn Heffernan Heisen, André F. Perold, Alfred M. Rankin, Jr., and J. Lawrence Wilson.
Item 4: Principal Accountant Fees and Services.
(a) Audit Fees.
Audit Fees of the Registrant
Fiscal Year Ended August 31, 2007: $17,000
Fiscal Year Ended August 31, 2006: $16,000
Aggregate Audit Fees of Registered Investment Companies in the Vanguard Group.
Fiscal Year Ended August 31, 2007: $2,835,320
Fiscal Year Ended August 31, 2006: $2,347,620
(b) Audit-Related Fees.
Fiscal Year Ended August 31, 2007: $630,400
Fiscal Year Ended August 31, 2006: $530,000
Includes fees billed in connection with assurance and related services provided to the Registrant, The Vanguard Group, Inc., Vanguard Marketing Corporation, and other registered investment companies in the Vanguard Group.
(c) Tax Fees.
Fiscal Year Ended August 31, 2007: $215,900
Fiscal Year Ended August 31, 2006: $101,300
Includes fees billed in connection with tax compliance, planning and advice services provided to the Registrant, The Vanguard Group, Inc., Vanguard Marketing Corporation, and other registered investment companies in the Vanguard Group and related to income and excise taxes.
(d) All Other Fees.
Fiscal Year Ended August 31, 2007: $0
Fiscal Year Ended August 31, 2006: $0
Includes fees billed for services related to risk management and privacy matters. Services were provided to the Registrant, The Vanguard Group, Inc., Vanguard Marketing Corporation, and other registered investment companies in the Vanguard Group.
(e) (1) Pre-Approval Policies. The policy of the Registrant’s Audit Committee is to consider and, if appropriate, approve before the principal accountant is engaged for such services, all specific audit and non-audit services provided to: (1) the Registrant; (2) The Vanguard Group, Inc.; (3) other entities controlled by The Vanguard Group, Inc. that provide ongoing services to the Registrant; and (4) other registered investment companies in the Vanguard Group. In making a determination, the Audit Committee considers whether the services are consistent with maintaining the principal accountant’s independence.
In the event of a contingency situation in which the principal accountant is needed to provide services in between scheduled Audit Committee meetings, the Chairman of the Audit Committee would be called on to consider and, if appropriate, pre-approve audit or permitted non-audit services in an amount sufficient to complete services through the next Audit Committee meeting, and to determine if such services would be consistent with maintaining the accountant’s independence. At the next scheduled Audit Committee meeting, services and fees would be presented to the Audit Committee for formal consideration, and, if appropriate, approval by the entire Audit Committee. The Audit Committee would again consider whether such services and fees are consistent with maintaining the principal accountant’s independence.
The Registrant’s Audit Committee is informed at least annually of all audit and non-audit services provided by the principal accountant to the Vanguard complex, whether such services are provided to: (1) the Registrant; (2) The Vanguard Group, Inc.; (3) other entities controlled by The Vanguard Group, Inc. that provide ongoing services to the Registrant; or (4) other registered investment companies in the Vanguard Group.
(2) No percentage of the principal accountant’s fees or services were approved pursuant to the waiver provision of paragraph (c)(7)(i)(C) of Rule 2-01 of Regulation S-X.
(f) For the most recent fiscal year, over 50% of the hours worked under the principal accountant’s engagement were not performed by persons other than full-time, permanent employees of the principal accountant.
(g) Aggregate Non-Audit Fees.
Fiscal Year Ended August 31, 2007: $215,900
Fiscal Year Ended August 31, 2006: $101,300
Includes fees billed for non-audit services provided to the Registrant, The Vanguard Group, Inc., Vanguard Marketing Corporation, and other registered investment companies in the Vanguard Group.
(h) For the most recent fiscal year, the Audit Committee has determined that the provision of all non-audit services was consistent with maintaining the principal accountant’s independence.
Item 5: Not Applicable.
Item 6: Not Applicable.
Item 7: Not Applicable.
Item 8: Not Applicable.
Item 9: Not Applicable.
Item 10: Not Applicable.
Item 11: Controls and Procedures.
(a) Disclosure Controls and Procedures. The Principal Executive and Financial Officers concluded that the Registrant's Disclosure Controls and Procedures are effective based on their evaluation of the Disclosure Controls and Procedures as of a date within 90 days of the filing date of this report.
(b) Internal Control Over Financial Reporting. There were no significant changes in Registrant’s Internal Control Over Financial Reporting or in other factors that could significantly affect this control subsequent to the date of the evaluation, including any corrective actions with regard to significant deficiencies and material weaknesses.
Item 12: Exhibits.
| (a) | Code of Ethics. |
| (b) | Certifications. |
Pursuant to the requirements of the Securities Exchange Act of 1934 and the Investment Company Act of 1940, the registrant has duly caused this report to be signed on its behalf by the undersigned, thereunto duly authorized.
| VANGUARD TREASURY FUND |
|
|
BY: | (signature) |
| (HEIDI STAM) |
| JOHN J. BRENNAN* |
| CHIEF EXECUTIVE OFFICER |
Date: October 18, 2007
Pursuant to the requirements of the Securities Exchange Act of 1934 and the Investment Company Act of 1940, this report has been signed below by the following persons on behalf of the registrant and in the capacities and on the dates indicated.
| VANGUARD TREASURY FUND |
|
|
BY: | (signature) |
| (HEIDI STAM) |
| JOHN J. BRENNAN* |
| CHIEF EXECUTIVE OFFICER |
Date: October 18, 2007
| VANGUARD TREASURY FUND |
|
|
BY: | (signature) |
| (HEIDI STAM) |
| THOMAS J. HIGGINS* |
| TREASURER |
Date: October 18, 2007
*By Power of Attorney. See File Number 333-145624, filed on August 22, 2007. Incorporated by Reference.