UNITED STATES
SECURITIES AND EXCHANGE COMMISSION
Washington, D.C. 20549
FORM N-CSR
CERTIFIED SHAREHOLDER REPORT
OF
REGISTERED MANAGEMENT INVESTMENT COMPANIES
| Investment Company Act file number: | 811-07803 | |
Name of Registrant: | Vanguard Scottsdale Funds | |
Address of Registrant: | P.O. Box 2600 | |
| Valley Forge, PA 19482 | ||
Name and address of agent for service: | Heidi Stam, Esquire P.O. Box 876 Valley Forge, PA 19482 | |
Registrant’s telephone number, including area code: | (610) 669-1000 | |
Date of fiscal year end: | August 31 | |
Date of reporting period: | September 1, 2013 – August 31, 2014 | |
Item 1: Reports to Shareholders | ||
Annual Report | August 31, 2014
Vanguard Explorer Value™ Fund
The mission continues
On May 1, 1975, Vanguard began operations, a fledgling company based on the simple but revolutionary idea that a mutual fund company should be managed solely in the interest of its investors.
Four decades later, that revolutionary spirit continues to animate the enterprise. Vanguard remains on a mission to give investors the best chance of investment success.
As we mark our 40th anniversary, we thank you for entrusting your assets to Vanguard and giving us the opportunity to help you reach your financial goals in the decades to come.
| Contents | |
| Your Fund’s Total Returns. | 1 |
| Chairman’s Letter. | 2 |
| Advisors’ Report. | 9 |
| Fund Profile. | 13 |
| Performance Summary. | 14 |
| Financial Statements. | 16 |
| Your Fund’s After-Tax Returns. | 28 |
| About Your Fund’s Expenses. | 29 |
| Glossary. | 31 |
Please note: The opinions expressed in this report are just that—informed opinions. They should not be considered promises or advice.
Also, please keep in mind that the information and opinions cover the period through the date on the front of this report. Of course, the risks of investing in your fund are spelled out in the prospectus.
See the Glossary for definitions of investment terms used in this report.
About the cover: Since our founding, Vanguard has drawn inspiration from the enterprise and valor demonstrated by British naval hero Horatio Nelson and his command at the Battle of the Nile in 1798. The photograph displays a replica of a merchant ship from the same era as Nelson’s flagship, the HMS Vanguard.
Your Fund’s Total Returns
| Fiscal Year Ended August 31, 2014 | |
| Total | |
| Returns | |
| Vanguard Explorer Value Fund | 20.34% |
| Russell 2500 Value Index | 22.61 |
| Small-Cap Value Funds Average | 19.06 |
Small-Cap Value Funds Average: Derived from data provided by Lipper, a Thomson Reuters Company.
| |
| Your Fund’s Performance at a Glance | ||||
| August 31, 2013, Through August 31, 2014 | ||||
| Distributions Per Share | ||||
| Starting | Ending | |||
| Share | Share | Income | Capital | |
| Price | Price | Dividends | Gains | |
| Vanguard Explorer Value Fund | $29.39 | $32.97 | $0.168 | $2.042 |
1

Chairman’s Letter
Dear Shareholder,
Vanguard Explorer Value Fund returned 20.34% for the 12 months ended August 31, 2014. In a reversal from a year ago, smaller-capitalization stocks underperformed large-cap stocks, and the fund was affected by this trend.
The fund’s return lagged that of its benchmark index, the Russell 2500 Value Index, by about two percentage points, but beat the average return for small-cap value funds by about one percentage point.
Nine of the fund’s ten sectors recorded double-digit gains for the fiscal year. The fund’s holdings in consumer discretionary, industrials, and materials underperformed their counterparts in the Russell 2500 Value Index. Financials, information technology, and energy, on the other hand, outperformed their benchmark counterparts.
If you hold shares of the fund in a taxable account, you may wish to review the information on the fund’s after-tax returns that appears later in this report.
Stocks cleared hurdles en route to new highs
Despite an assortment of challenges, the broad U.S. stock market recorded an impressive return of about 25% for the 12 months ended August 31. U.S. stocks registered positive results in 10 of those 12 months, and a July swoon was followed by an August flurry of record highs.
2
Investors applauded mostly solid corporate earnings, generally upbeat economic news, and the Federal Reserve’s continued accommodative policies. Still, turmoil in the Middle East and Ukraine, economic worries in Europe and China, and uncertainty about the Fed’s next moves pressured stocks at different times.
International stocks returned about 18%. Emerging markets, after sliding earlier in the period, rebounded to lead the way. The developed markets of the Pacific region and Europe trailed but still notched double-digit returns.
Defying analysts’ expectations, bond prices rose over the year
The broad U.S. taxable bond market returned 5.66% for the period, rallying from the drubbing it took a year ago when investors fretted over the future of the Fed’s bond-buying program.
The Fed began reducing its purchases in January and has consistently cut them further since, with the goal of ending the program in October. Interest rates have not risen as forecast, however. The yield of the 10-year U.S. Treasury note ended August at 2.34%, down from 2.76% a year earlier. (Bond prices and yields move in opposite directions.)
| Market Barometer | |||
| Average Annual Total Returns | |||
| Periods Ended August 31, 2014 | |||
| One | Three | Five | |
| Year | Years | Years | |
| Stocks | |||
| Russell 1000 Index (Large-caps) | 25.36% | 20.80% | 17.24% |
| Russell 2000 Index (Small-caps) | 17.68 | 19.00 | 17.03 |
| Russell 3000 Index (Broad U.S. market) | 24.74 | 20.65 | 17.22 |
| FTSE All-World ex US Index (International) | 18.04 | 9.48 | 8.44 |
| Bonds | |||
| Barclays U.S. Aggregate Bond Index (Broad taxable market) | 5.66% | 2.91% | 4.48% |
| Barclays Municipal Bond Index (Broad tax-exempt market) | 10.14 | 4.88 | 5.39 |
| Citigroup Three-Month U.S. Treasury Bill Index | 0.04 | 0.04 | 0.07 |
| CPI | |||
| Consumer Price Index | 1.70% | 1.64% | 1.96% |
3
Municipal bonds returned 10.14% as investors searched for tax-exempt income amid a limited supply of new issues. International bond markets (as measured by the Barclays Global Aggregate Index ex USD) returned 6.52%.
Following such a strong advance for bonds, it’s worth remembering that the current low yields imply lower future returns: As yields drop, the scope for further declines—and increases in prices—diminishes.
The Fed’s target of 0%–0.25% for short-term interest rates continued to restrict returns for money market funds and savings accounts.
Despite its robust returns, the fund trailed its benchmark
Reflecting the multiyear bull market, the Explorer Value Fund posted its fourth straight double-digit gain for its fiscal year. Nine of ten sectors represented in the fund rose at least 11%, and six returned at least 20%.
The fund’s three advisors, Frontier Capital Management, Sterling Capital Management, and Cardinal Capital Management, use distinct but complementary approaches in finding undervalued companies that they believe can outperform the market. Although its 12-month performance was well above long-term market averages, the fund did not beat
| Expense Ratios | ||
| Your Fund Compared With Its Peer Group | ||
| Peer Group | ||
| Fund | Average | |
| Explorer Value Fund | 0.66% | 1.36% |
| The fund expense ratio shown is from the prospectus dated December 20, 2013, and represents estimated costs for the current fiscal year. For the fiscal year ended August 31, 2014, the fund’s expense ratio was 0.57%. The peer-group expense ratio is derived from data provided by Lipper, a Thomson Reuters Company, and captures information through year-end 2013. | ||
| Peer group: Small-Cap Value Funds. | ||
4
its target index. Its record over a longer period, however, remains superior, as discussed below.
Among sectors, consumer discretionary was the most notable underperformer. The advisors’ selections in this area, including media companies and apparel retailers, returned only about half of the index’s return for the sector.
The fund’s industrial portfolio also disappointed, with air freight, construction machinery, and commercial services stocks proving the most problematic. And the smallest sector, telecommunication services, recorded an outright loss for the fund as several holdings performed particularly poorly.
Better relative performance came from financial companies, which make up about a third of the advisors’ holdings. This sector was the top contributor, and its returns were in line with the fund’s overall result. Real estate investment trusts (REITs) were among the sector’s standouts. A decline in interest rates in 2014 helped REITs rebound from their decline during the last part of 2013. REITs rely heavily on the markets to raise cash to finance growth, and less expensive capital can help their profit margins.
In terms of absolute returns, information technology was a standout. Selections among semiconductor and application software firms were especially profitable.
| Total Returns | |
| Inception Through August 31, 2014 | |
| Average | |
| Annual Return | |
| Explorer Value Fund (Returns since inception: 3/30/2010) | 16.40% |
| Russell 2500 Value Index | 15.14 |
| Small-Cap Value Funds Average | 13.86 |
Small-Cap Value Funds Average: Derived from data provided by Lipper, a Thomson Reuters Company. | |
| |
| The figures shown represent past performance, which is not a guarantee of future results. (Current performance may be lower or higher than the performance data cited. For performance data current to the most recent month-end, visit our website at vanguard.com/performance.) Note, too, that both investment returns and principal value can fluctuate widely, so an investor’s shares, when sold, could be worth more or less than their original cost. | |
5
Energy stocks also outperformed, thanks to companies that explore for and produce oil and gas.
For more about the advisors’ strategies and the fund’s positioning during the 12 months, see the Advisors’ Report that follows this letter.
| Small-cap stocks versus large-caps: A case for diversification |
| At times, particularly over the past dozen years, small-capitalization stocks have outpaced their |
| large-cap counterparts. This performance edge may appear compelling, but before making any |
| drastic decisions to tilt your portfolio heavily toward small-caps, consider two points. |
| First, there’s no guarantee that small caps’ performance advantage will persist. As shown in |
| the chart below, these stocks had an extended period of underperformance in the 1990s, and |
| that could happen again. |
| Second, investing in small companies’ stocks involves additional risks. These firms generally |
| have less business diversification, fewer financial resources, and less management depth than |
| larger enterprises. As a result, their stocks can be highly volatile. |
| Investors with a heavy allocation to only one segment of the market can end up with greater |
| volatility and less diversification. A better alternative can be a market-cap-weighted equity |
| portfolio of stocks of all capitalizations that offers more diversification over the long term. |
| Small-cap performance relative to large-caps |
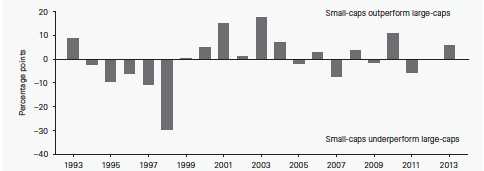
| Chart compares the annual returns of the Russell 2000 Index, a small-cap benchmark, with those of the Russell 1000 Index, a large-cap benchmark. Source: Vanguard. |
6
Booming markets are welcome but they call for caution
Since its inception on March 30, 2010, the Explorer Value Fund’s average annual return has exceeded, by more than a percentage point, that of its benchmark index. The period was characterized by a strong U.S. stock market performance—we’ve seen a rising tide that lifted all boats across the market waterfront.
In this very favorable environment, your fund generated returns well above historical market norms even though large-company stocks outdistanced small-caps during the period. Small-cap stocks’ underperformance stands in contrast to 2013 and most years of the previous decade, when it was large-cap stocks that lagged. The switch in performance leadership is a good reminder that the two groups take turns outperforming each other. (For more on the performance of small- and large-cap stocks, please see the box on page 6.)
Meanwhile, growth companies—typically defined as those poised to register above-average profits—outgained value stocks during the fiscal year. (Value companies tend to be more-established firms that grow more slowly.) Over longer periods, of course, the performance of growth and value stocks, like large- and small-cap stocks, tends to converge. That’s why Vanguard counsels that a broadly diversified portfolio spanning all corners of the market gives the best chance for long-term success.
| A note on expense ratios |
| The Expense Ratios table in each shareholder report’s Chairman’s Letter displays fund expense |
| ratios from the most recent prospectus. These figures include the funds’ actual operating |
| expenses. For some funds, the figures also include “acquired fund fees and expenses,” |
| which result from the funds’ holdings in business development companies (BDCs). |
| Although the Securities and Exchange Commission requires that BDC costs be included in a |
| fund’s expense ratio, these fees are not incurred by the fund. They have no impact on a fund’s |
| total return or on its tracking error relative to an index. A footnote to the Expense Ratios table |
| reports the fund’s actual expenses for the fiscal year, a more relevant tally of the operating |
| costs incurred by shareholders. |
7
History also teaches that bull markets eventually give back some of their gains as buyers and sellers change positions on the prospects of various companies and sectors. Regardless of whether small-cap value stocks are outperforming, or whether the overall market is rising or falling, Vanguard Explorer Value Fund can play a useful role in a diversified and well-balanced portfolio by giving you low-cost exposure to smaller companies that may be undervalued.
High costs don’t equal strong fund performance
The old adage “you get what you pay for” doesn’t apply to mutual funds. In fact, the reverse is true: Research suggests that higher costs are consistent with weaker returns. (See, for example, Shopping for Alpha: You Get What You Don’t Pay For at vanguard.com/research.)
Wouldn’t paying the highest fees allow you to purchase the services of the greatest talents, and therefore get you the best returns? As it turns out, the data don’t really support that argument. The explanation is simple: Every dollar paid for management fees is a dollar less earning potential return. Keeping expenses down can help narrow the gap between what the markets return and what investors actually earn.
That’s why Vanguard seeks to minimize costs on all our funds. Indexing, of course, is the purest expression of low-cost investing. In our actively managed funds, which are run by some of the most prominent advisory firms in the investment industry, we work to keep fees low. It’s a strategy that reflects decades of experience and research, boiled down to one tenet: The less you pay, the more you keep.
As always, thank you for investing with Vanguard.
Sincerely,

F. William McNabb III
Chairman and Chief Executive Officer
September 15, 2014
8
Advisors’ Report
For the fiscal year ended August 31, 2014, Vanguard Explorer Value Fund returned 20.34%. Your fund is managed by three independent advisors, a strategy that enhances the fund’s diversification by providing exposure to distinct, yet complementary, investment approaches. It is not uncommon for different advisors to have different views about individual securities or the broader investment environment.
The advisors, the amount and percentage of fund assets each manages, and brief descriptions of their investment strategies are presented in the table below. The advisors have also prepared a discussion of the investment environment that existed during the fiscal year and of how their portfolio positioning reflects this assessment. (Please note that the Frontier and Sterling discussions refer to industry sectors as defined by Russell classifications, rather than by the Global Industry Classification Standard used elsewhere in this report.) These comments were prepared on September 17, 2014.
Frontier Capital Management Co., LLC
Portfolio Managers:
Thomas W. Duncan, Jr.,
Senior Vice President
William A. Teichner, CFA,
Senior Vice President
Our portion of the Explorer Value Fund benefited primarily from strong stock selection in the technology, energy,
| Vanguard Explorer Value Fund Investment Advisors | ||||
| Fund Assets Managed | ||||
| Investment Advisor | % | $ Million | Investment Strategy | |
| Frontier Capital Management Co., | 33 | 107 | The advisor selects stocks by identifying companies it | |
| LLC | believes are underpriced relative to their long-term | |||
| value. These companies are generally inexpensive and | ||||
| have low price-to-book and price-to-earnings ratios. | ||||
| Sterling Capital Management LLC | 33 | 107 | The advisor searches for stocks of quality companies | |
| selling at large discounts compared with their | ||||
| underlying value. It defines quality stocks as those that | ||||
| generate considerable cash flow, reinvest in | ||||
| opportunities with attractive returns, and have a | ||||
| competitive advantage within their business sector. | ||||
| Cardinal Capital Management, | 32 | 104 | The advisor seeks stocks that are able to generate | |
| L.L.C. | excess cash flow and reinvest the cash to increase | |||
| shareholder value. | ||||
| Cash Investments | 2 | 5 | These short-term reserves are invested by Vanguard in | |
| equity index products to simulate investment in stocks. | ||||
| Each advisor may also maintain a modest cash | ||||
| position. | ||||
9
and financial services sectors. Our portfolio’s ten best contributing stocks were spread over five sectors and included three technology companies and two stocks each from energy, financial services, and producer durables, along with one materials and processing stock.
Our largest contributor was TriQuint Semiconductor, a supplier of semiconductors used in mobile devices, networks, and military systems. The company exceeded consensus earnings expectations in each of the past five quarters. Furthermore, in February, TriQuint announced that it planned to merge with RF Micro Devices, a similar enterprise, to become a leading provider of semiconductors for wireless applications. The companies expect to achieve $150 million in savings from manufacturing costs and operating expenses by the second year of the merger.
Our portfolio’s ten largest detractors were spread over six sectors and consisted of four technology holdings, two producer durables companies, and another four stocks from different sectors. The technology stocks were from three different industries within that sector.
The largest detractor during the period was NII Holdings, a U.S.-domiciled provider of wireless communication services to subscribers in Mexico and Brazil and two other Latin American countries. Despite promising new management at the helm, the firm’s financial results were worse than consensus expectations because of cellphone subscriber cancellations, lower revenue per subscriber, and currency depreciation. We sold the stock in February because we lost confidence that the company would be successfully turned around.
During the period, we bought 14 new stocks and sold 13 holdings. The purchases were spread across seven sectors; the sales, across six. The net effect was an increase in technology, materials and processing, and consumer discretionary stocks, and a reduction in producer durables, energy, and financial services holdings. As is typical for Frontier, the changes were related to company-specific reasons rather than top-down positioning.
Sterling Capital Management LLC
Portfolio Managers:
Eduardo A. Brea, CFA,
Managing Director
Timothy P. Beyer, CFA,
Managing Director
For the 12 months ended August 31, the benchmark 10-year U.S. Treasury started the fiscal year with a yield of 2.76%, which rose to nearly 3% by January. Confounding general expectations of a further rise, the Treasury yield fell back to 2.34% by the end of August. A rise in geopolitical tensions and weaker-than-expected economic activity in Europe (suppressing yields in those countries) kept the Treasury’s safe-haven status intact.
| 10 |
Stocks continued to rally as the relative valuation of equities continues to look better than that of fixed income. Mergers, acquisitions, spin-offs and other corporate activities have increased, encouraged by higher equity valuations and continued low borrowing costs for corporations and private equity sponsors.
Relative to the Russell 2500 Value Index, we saw underperformance equally in our sector and stock selections. We found businesses in the consumer discretionary sector, particularly in the “soft line” retail industry (primarily apparel and accessories) to be very attractively priced. Consumer spending has focused on autos, home furnishings, and electronics (“hard line” goods), while spending on apparel and shoes has languished. We expect consumer spending to normalize, shifting back toward a better balance between soft-line and hard-line goods over time and provide earnings growth for many of our holdings. Nevertheless, this sector was our largest detractor from relative performance. Our holdings in Ascena Retail Group, Chico’s, Elizabeth Arden, Guess, and Regis all lagged the benchmark over the fiscal year. Our underweighting of energy and real estate investment trusts (REITs) and utility businesses also hurt us because of rising geopolitical risks and falling interest rates, respectively.
We benefited from strong stock selection in the financial sector despite our underweight in REITs. Two holdings in particular, E*Trade Financial and Ryman Hospitality, significantly outperformed the benchmark. We also overweighted the technology and producer durables sectors, both of which lagged in the fiscal year.
We remain focused on finding businesses that are well financed, generate cash, and have an opportunity to grow their intrinsic value at a competitive rate. We measure intrinsic value using a variety of tools (e.g., discounted cash flow, and private and public market comparisons) and buy when there is a significant discount between a company’s stock price and its intrinsic value. Given the very low interest rate environment, we remain underweight in yield-oriented equities (such as REITs and utilities). Our overweighting of retail, technology, and producer durable businesses reflects our bottom-up approach to stock selection.
Cardinal Capital Management, L.L.C.
Portfolio Managers:
Robert B. Kirkpatrick, CFA,
Managing Partner
Eugene Fox III, Managing Partner
Rachel D. Matthews, Partner
During the 12-month period, the strong performance of U.S. equities was consistent with a more optimistic view of the economy. Despite the U.S. federal government’s shutdown in the fall and poor weather in the winter, most measures of business activity and confidence were positive. Calendar-year 2014 is shaping up to be a year of moderate growth, but not of the rebound many economists had expected.
11
The performance of our portfolio, while strong on an absolute basis, lagged its benchmark’s sharp rise. The main detractors from relative performance were stock selection in the industrial, materials, and consumer discretionary sectors, and the drag from holding residual cash in a strong market. The stock price of Copa Holdings, a Panamanian airline listed in the United States, declined after the company reduced its flights to and from Venezuela. Although this action capped Copa’s exposure to the bolivar, Venezuela’s currency, it also reduced the company’s short-term profit growth. We added to our position because Copa’s industry-leading fundamentals remain attractive. Within materials, Silgan Holdings, a metal and plastics packaging processor, lagged the sector’s more cyclical components.
Contributors to relative performance included stock selection in information technology and financials, as well as the absence of investments in utilities. Specifically, shares of Skyworks Solutions rose after the company reported better-than-expected results through the period and raised its long-term profitability targets on broad-based demand for its radio frequency technology. The stock of the Howard Hughes Corp. also rose on momentum in the company’s real estate development activities as well as strong land sales and pricing.
Our outlook for the equity market remains cautiously optimistic: Valuations are attractive relative to bonds, though less compelling on an absolute basis. Five years into the economic recovery, stock prices have become more closely tied to economic growth, although rising interest rates could change that. High-quality stocks also tend to perform relatively well as growth normalizes. Merger-and-acquisition activity should remain strong as credit remains available and inexpensive and business conditions are favorable. The managements of our portfolio companies are actively deploying their free cash flow through share repurchases, dividends and opportunistic acquisitions, which should bode well for the future.
12
Explorer Value Fund
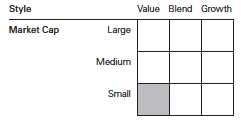
Fund Profile
As of August 31, 2014
| Portfolio Characteristics | |||
| DJ | |||
| U.S. | |||
| Russell | Total | ||
| 2500 | Market | ||
| Value | FA | ||
| Fund | Index | Index | |
| Number of Stocks | 174 | 1,678 | 3,709 |
| Median Market Cap | $2.6B | $3.6B | $48.0B |
| Price/Earnings Ratio | 22.4x | 22.5x | 20.7x |
| Price/Book Ratio | 1.8x | 1.7x | 2.7x |
| Return on Equity | 10.3% | 9.0% | 17.8% |
| Earnings Growth | |||
| Rate | 14.4% | 12.2% | 15.3% |
| Dividend Yield | 1.5% | 1.9% | 1.8% |
| Foreign Holdings | 0.8% | 0.0% | 0.0% |
| Turnover Rate | 36% | — | — |
| Ticker Symbol | VEVFX | — | — |
| Expense Ratio1 | 0.66% | — | — |
| 30-Day SEC Yield | 0.83% | — | — |
| Short-Term Reserves | 3.4% | — | — |
| Sector Diversification (% of equity exposure) | |||
| DJ | |||
| U.S. | |||
| Russell | Total | ||
| 2500 | Market | ||
| Value | FA | ||
| Fund | Index | Index | |
| Consumer Discretionary | 11.0% | 10.8% | 12.6% |
| Consumer Staples | 1.9 | 2.2 | 8.1 |
| Energy | 5.1 | 6.7 | 9.7 |
| Financials | 32.1 | 36.2 | 17.3 |
| Health Care | 4.2 | 5.7 | 13.3 |
| Industrials | 15.7 | 14.1 | 11.2 |
| Information Technology | 21.4 | 9.3 | 18.6 |
| Materials | 5.8 | 6.2 | 3.9 |
| Telecommunication | |||
| Services | 0.0 | 0.8 | 2.2 |
| Utilities | 2.8 | 8.0 | 3.1 |
| Volatility Measures | ||
| Russell | DJ | |
| 2500 | U.S. Total | |
| Value | Market | |
| Index | FA Index | |
| R-Squared | 0.98 | 0.93 |
| Beta | 1.01 | 1.18 |
| These measures show the degree and timing of the fund’s fluctuations compared with the indexes over 36 months. | ||
| Ten Largest Holdings (% of total net assets) | ||
| Endurance Specialty | ||
| Holdings Ltd. | Reinsurance | 1.7% |
| E*TRADE Financial | Investment Banking | |
| Corp. | & Brokerage | 1.6 |
| Skyworks Solutions Inc. | Semiconductors | 1.4 |
| Howard Hughes Corp. | Real Estate | |
| Development | 1.4 | |
| PacWest Bancorp | Regional Banks | 1.3 |
| Popular Inc. | Regional Banks | 1.2 |
| Aspen Insurance | Property & Casualty | |
| Holdings Ltd. | Insurance | 1.1 |
| KAR Auction Services | Diversified Support | |
| Inc. | Services | 1.1 |
| Crocs Inc. | Footwear | 1.1 |
| UTi Worldwide Inc. | Air Freight & | |
| Logistics | 1.1 | |
| Top Ten | 13.0% | |
| The holdings listed exclude any temporary cash investments and equity index products. | ||
Investment Focus
1 The expense ratio shown is from the prospectus dated December 20, 2013, and represents estimated costs for the current fiscal year. For the fiscal year ended August 31, 2014, the expense ratio was 0.57%.
13
Explorer Value Fund
Performance Summary
All of the returns in this report represent past performance, which is not a guarantee of future results that may be achieved by the fund. (Current performance may be lower or higher than the performance data cited. For performance data current to the most recent month-end, visit our website at vanguard.com/performance.) Note, too, that both investment returns and principal value can fluctuate widely, so an investor’s shares, when sold, could be worth more or less than their original cost. The returns shown do not reflect taxes that a shareholder would pay on fund distributions or on the sale of fund shares.
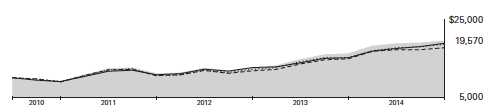
Cumulative Performance: March 30, 2010, Through August 31, 2014
Initial Investment of $10,000
| Average Annual Total Returns | |||
| Periods Ended August 31, 2014 | |||
| Since | Final Value | ||
| One | Inception | of a $10,000 | |
| Year | (3/30/2010) | Investment | |
| Explorer Value Fund | 20.34% | 16.40% | $19,570 |
| Russell 2500 Value Index | 22.61 | 15.14 | 18,652 |
| Small-Cap Value Funds Average | 19.06 | 13.86 | 17,756 |
| Dow Jones U.S. Total Stock Market | |||
| Float Adjusted Index | 24.68 | 15.49 | 18,908 |
Small-Cap Value Funds Average: Derived from data provided by Lipper, a Thomson Reuters Company.
"Since Inception" performance is calculated from the inception date for both the fund and its comparative standards.
See Financial Highlights for dividend and capital gains information.
14
Explorer Value Fund
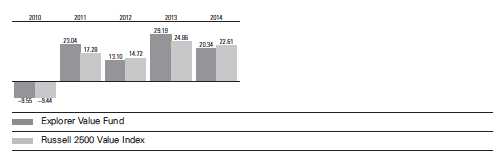
Fiscal-Year Total Returns (%): March 30, 2010, Through August 31, 2014
Average Annual Total Returns: Periods Ended June 30, 2014
This table presents returns through the latest calendar quarter—rather than through the end of the fiscal period.
Securities and Exchange Commission rules require that we provide this information.
| Inception | One | Since | |
| Date | Year | Inception | |
| Explorer Value Fund | 3/30/2010 | 25.96% | 17.60% |
15
Explorer Value Fund
Financial Statements
Statement of Net Assets
As of August 31, 2014
The fund reports a complete list of its holdings in regulatory filings four times in each fiscal year, at the quarter-ends. For the second and fourth fiscal quarters, the lists appear in the fund’s semiannual and annual reports to shareholders. For the first and third fiscal quarters, the fund files the lists with the Securities and Exchange Commission on Form N-Q. Shareholders can look up the fund’s Forms N-Q on the SEC’s website at sec.gov. Forms N-Q may also be reviewed and copied at the SEC’s Public Reference Room (see the back cover of this report for further information).
| Market | |||
| Value | |||
| Shares | ($000) | ||
| Common Stocks (95.5%)1 | |||
| Consumer Discretionary (10.5%) | |||
| * | Crocs Inc. | 225,203 | 3,479 |
| * | LIN Media LLC | 110,800 | 2,584 |
| Cinemark Holdings Inc. | 72,600 | 2,562 | |
| * | Ascena Retail Group Inc. | 141,450 | 2,460 |
| * | Modine Manufacturing Co. | 162,703 | 2,313 |
| MDC Partners Inc. Class A | 104,800 | 2,295 | |
| Six Flags | |||
| Entertainment Corp. | 60,500 | 2,207 | |
| Interpublic Group | |||
| of Cos. Inc. | 109,000 | 2,129 | |
| Chico’s FAS Inc. | 127,463 | 2,014 | |
| Kohl’s Corp. | 33,300 | 1,958 | |
| * | News Corp. Class B | 90,950 | 1,570 |
| Meredith Corp. | 33,550 | 1,563 | |
| * | American Public | ||
| Education Inc. | 51,100 | 1,551 | |
| Regis Corp. | 97,500 | 1,473 | |
| Guess? Inc. | 58,100 | 1,362 | |
| American Eagle | |||
| Outfitters Inc. | 51,937 | 731 | |
| International Speedway | |||
| Corp. Class A | 18,148 | 608 | |
| Universal Technical | |||
| Institute Inc. | 52,800 | 590 | |
| * | Quiksilver Inc. | 120,361 | 350 |
| 33,799 | |||
| Consumer Staples (1.8%) | |||
| * | Medifast Inc. | 63,100 | 2,120 |
| * | Elizabeth Arden Inc. | 123,500 | 2,112 |
| Lancaster Colony Corp. | 11,400 | 1,008 | |
| * | Central Garden and Pet Co. | ||
| Class A | 52,877 | 476 | |
| 5,716 | |||
| Market | |||
| Value | |||
| Shares | ($000) | ||
| Energy (4.8%) | |||
| * | Carrizo Oil & Gas Inc. | 41,049 | 2,575 |
| World Fuel Services Corp. | 57,000 | 2,530 | |
| * | Concho Resources Inc. | 15,100 | 2,145 |
| Comstock Resources Inc. | 78,801 | 1,921 | |
| * | Oasis Petroleum Inc. | 32,800 | 1,613 |
| * | Bonanza Creek Energy Inc. | 19,500 | 1,198 |
| * | Bill Barrett Corp. | 47,274 | 1,076 |
| *,^ | SandRidge Energy Inc. | 196,886 | 1,032 |
| * | Resolute Energy Corp. | 108,900 | 874 |
| * | Emerald Oil Inc. | 79,400 | 679 |
| 15,643 | |||
| Financials (30.8%) | |||
| Endurance Specialty | |||
| Holdings Ltd. | 95,153 | 5,526 | |
| * | E*TRADE Financial Corp. | 227,567 | 5,066 |
| * | Howard Hughes Corp. | 27,700 | 4,387 |
| PacWest Bancorp | 97,245 | 4,078 | |
| * | Popular Inc. | 125,454 | 3,884 |
| Aspen Insurance | |||
| Holdings Ltd. | 85,944 | 3,654 | |
| Willis Group Holdings plc | 77,700 | 3,261 | |
| Argo Group International | |||
| Holdings Ltd. | 57,090 | 3,005 | |
| * | American Capital Ltd. | 185,281 | 2,870 |
| Medical Properties | |||
| Trust Inc. | 202,500 | 2,853 | |
| Ryman Hospitality | |||
| Properties Inc. | 55,015 | 2,737 | |
| Leucadia National Corp. | 107,400 | 2,678 | |
| AG Mortgage Investment | |||
| Trust Inc. | 133,350 | 2,663 | |
| Starwood Property | |||
| Trust Inc. | 109,300 | 2,607 | |
| HCC Insurance Holdings Inc. | 51,632 | 2,589 | |
| Selective Insurance | |||
| Group Inc. | 106,166 | 2,545 | |
| * | Markel Corp. | 3,800 | 2,507 |
16
Explorer Value Fund
| Market | |||
| Value | |||
| Shares | ($000) | ||
| Pinnacle Financial | |||
| Partners Inc. | 67,488 | 2,420 | |
| * | Navigators Group Inc. | 36,085 | 2,318 |
| WSFS Financial Corp. | 30,696 | 2,290 | |
| Two Harbors | |||
| Investment Corp. | 200,500 | 2,149 | |
| Lincoln National Corp. | 36,600 | 2,015 | |
| Assured Guaranty Ltd. | 83,100 | 2,007 | |
| Renasant Corp. | 68,791 | 1,990 | |
| Hersha Hospitality Trust | |||
| Class A | 283,800 | 1,927 | |
| First Midwest Bancorp Inc. | 113,989 | 1,921 | |
| Flushing Financial Corp. | 99,259 | 1,916 | |
| First Horizon National Corp. | 143,563 | 1,746 | |
| Ares Capital Corp. | 99,900 | 1,713 | |
| * | Affiliated Managers | ||
| Group Inc. | 8,100 | 1,710 | |
| EPR Properties | 29,000 | 1,650 | |
| National Retail | |||
| Properties Inc. | 42,463 | 1,577 | |
| AmTrust Financial | |||
| Services Inc. | 34,870 | 1,535 | |
| Parkway Properties Inc. | 72,153 | 1,497 | |
| Washington Federal Inc. | 68,626 | 1,493 | |
| * | Enstar Group Ltd. | 10,350 | 1,469 |
| First Citizens BancShares | |||
| Inc. Class A | 6,350 | 1,459 | |
| * | Investment Technology | ||
| Group Inc. | 79,300 | 1,351 | |
| Nelnet Inc. Class A | 26,700 | 1,174 | |
| BGC Partners Inc. Class A | 135,300 | 1,024 | |
| Berkshire Hills Bancorp Inc. | 35,500 | 874 | |
| * | Bancorp Inc. | 84,700 | 822 |
| * | Starwood Waypoint | ||
| Residential Trust | 18,740 | 519 | |
| 99,476 | |||
| Health Care (3.9%) | |||
| * | Ligand Pharmaceuticals Inc. | 54,900 | 2,857 |
| * | VCA Inc. | 55,900 | 2,278 |
| * | Allscripts Healthcare | ||
| Solutions Inc. | 126,413 | 1,868 | |
| * | Laboratory Corp. | ||
| of America Holdings | 17,250 | 1,850 | |
| * | Globus Medical Inc. | 80,700 | 1,464 |
| * | Myriad Genetics Inc. | 28,895 | 1,045 |
| * | Merit Medical Systems Inc. | 55,397 | 693 |
| * | Symmetry Medical Inc. | 40,875 | 377 |
| 12,432 | |||
| Industrials (15.0%) | |||
| KAR Auction Services Inc. | 120,800 | 3,643 | |
| * | UTi Worldwide Inc. | 376,500 | 3,456 |
| Copa Holdings SA Class A | 26,400 | 3,247 | |
| * | Teledyne Technologies Inc. | 29,642 | 2,877 |
| * | Clean Harbors Inc. | 41,200 | 2,494 |
| Market | |||
| Value | |||
| Shares | ($000) | ||
| * | FTI Consulting Inc. | 63,730 | 2,364 |
| * | Hertz Global Holdings Inc. | 69,400 | 2,051 |
| Altra Industrial Motion Corp. | 60,709 | 2,019 | |
| * | Performant Financial Corp. | 190,101 | 1,829 |
| Babcock & Wilcox Co. | 57,200 | 1,662 | |
| * | Genesee & Wyoming Inc. | ||
| Class A | 15,900 | 1,563 | |
| * | Roadrunner Transportation | ||
| Systems Inc. | 61,700 | 1,554 | |
| Kaman Corp. | 37,000 | 1,504 | |
| Woodward Inc. | 27,800 | 1,452 | |
| * | Saia Inc. | 28,982 | 1,376 |
| Celadon Group Inc. | 58,346 | 1,222 | |
| HNI Corp. | 32,148 | 1,219 | |
| Harsco Corp. | 49,990 | 1,210 | |
| * | MRC Global Inc. | 47,804 | 1,186 |
| Elbit Systems Ltd. | 18,950 | 1,134 | |
| Timken Co. | 24,800 | 1,123 | |
| * | MasTec Inc. | 35,300 | 1,077 |
| Lennox International Inc. | 12,626 | 1,058 | |
| Primoris Services Corp. | 33,134 | 962 | |
| AGCO Corp. | 18,850 | 921 | |
| MSA Safety Inc. | 13,884 | 769 | |
| * | Wabash National Corp. | 47,964 | 678 |
| * | Hub Group Inc. Class A | 14,735 | 641 |
| Encore Wire Corp. | 12,689 | 539 | |
| * | WESCO International Inc. | 6,097 | 512 |
| Briggs & Stratton Corp. | 25,282 | 509 | |
| Civeo Corp. | 10,600 | 269 | |
| * | Furmanite Corp. | 29,487 | 268 |
| 48,388 | |||
| Information Technology (20.4%) | |||
| Skyworks Solutions Inc. | 78,100 | 4,425 | |
| Global Payments Inc. | 45,600 | 3,316 | |
| IAC/InterActiveCorp | 45,200 | 3,145 | |
| j2 Global Inc. | 54,800 | 2,929 | |
| InterDigital Inc. | 64,400 | 2,857 | |
| * | Atmel Corp. | 313,666 | 2,779 |
| * | MicroStrategy Inc. Class A | 19,655 | 2,731 |
| * | ACI Worldwide Inc. | 138,600 | 2,699 |
| * | Itron Inc. | 58,756 | 2,481 |
| * | Ingram Micro Inc. | 84,640 | 2,440 |
| Convergys Corp. | 125,100 | 2,402 | |
| * | Knowles Corp. | 68,200 | 2,245 |
| * | ON Semiconductor Corp. | 220,420 | 2,151 |
| * | II-VI Inc. | 152,400 | 2,128 |
| * | TriQuint Semiconductor Inc. | 97,785 | 2,021 |
| * | Kulicke & Soffa | ||
| Industries Inc. | 123,500 | 1,814 | |
| * | Advanced Energy | ||
| Industries Inc. | 91,992 | 1,771 | |
| * | Sykes Enterprises Inc. | 78,800 | 1,650 |
| Western Union Co. | 94,100 | 1,644 | |
| Jabil Circuit Inc. | 74,277 | 1,603 | |
| * | Progress Software Corp. | 66,700 | 1,545 |
17
Explorer Value Fund
| Market | |||
| Value | |||
| Shares | ($000) | ||
| DST Systems Inc. | 15,850 | 1,471 | |
| * | Fairchild Semiconductor | ||
| International Inc. Class A | 82,650 | 1,451 | |
| * | Orbotech Ltd. | 86,300 | 1,400 |
| * | Pericom Semiconductor | ||
| Corp. | 132,510 | 1,296 | |
| * | Insight Enterprises Inc. | 48,684 | 1,277 |
| * | NCR Corp. | 36,100 | 1,233 |
| * | Integrated Device | ||
| Technology Inc. | 74,832 | 1,231 | |
| * | Virtusa Corp. | 31,876 | 1,085 |
| * | QLogic Corp. | 92,017 | 833 |
| * | Ciber Inc. | 206,262 | 788 |
| * | Ultratech Inc. | 26,395 | 683 |
| * | Dice Holdings Inc. | 80,350 | 682 |
| Littelfuse Inc. | 6,235 | 573 | |
| * | NeuStar Inc. Class A | 19,300 | 569 |
| * | Entropic | ||
| Communications Inc. | 121,588 | 320 | |
| * | Semtech Corp. | 12,100 | 315 |
| 65,983 | |||
| Materials (5.6%) | |||
| Silgan Holdings Inc. | 67,100 | 3,378 | |
| Schnitzer Steel | |||
| Industries Inc. | 73,501 | 2,035 | |
| * | Rayonier Advanced | ||
| Materials Inc. | 60,300 | 2,003 | |
| FMC Corp. | 28,000 | 1,852 | |
| Eagle Materials Inc. | 16,464 | 1,678 | |
| TimkenSteel Corp. | 32,450 | 1,550 | |
| Albemarle Corp. | 18,300 | 1,164 | |
| Cabot Corp. | 20,958 | 1,148 | |
| * | Boise Cascade Co. | 28,565 | 859 |
| Cytec Industries Inc. | 7,055 | 727 | |
| PH Glatfelter Co. | 25,515 | 636 | |
| * | LSB Industries Inc. | 14,500 | 581 |
| * | Chemtura Corp. | 16,500 | 407 |
| * | Kraton Performance | ||
| Polymers Inc. | 2,300 | 47 | |
| 18,065 | |||
| Utilities (2.7%) | |||
| Westar Energy Inc. Class A | 62,076 | 2,292 | |
| Portland General Electric Co. | 58,475 | 2,016 | |
| WGL Holdings Inc. | 32,382 | 1,408 | |
| Unitil Corp. | 36,273 | 1,182 | |
| Southwest Gas Corp. | 20,007 | 1,045 | |
| Piedmont Natural Gas | |||
| Co. Inc. | 17,150 | 641 | |
| 8,584 | |||
| Total Common Stocks | |||
| (Cost $250,180) | 308,086 | ||
| Market | ||
| Value | ||
| Shares | ($000) | |
| Temporary Cash Investments (4.9%)1 | ||
| Money Market Fund (4.7%) | ||
| 2,3 Vanguard Market | ||
| Liquidity Fund, | ||
| 0.113% | 15,185,675 | 15,186 |
| Face | ||
| Amount | ||
| ($000) | ||
| U.S. Government and Agency Obligations (0.2%) | ||
| 4,5 Federal Home Loan | ||
| Bank Discount Notes, | ||
| 0.080%, 10/8/14 | 500 | 500 |
| Total Temporary Cash Investments | ||
| (Cost $15,686) | 15,686 | |
| Total Investments (100.4%) | ||
| (Cost $265,866) | 323,772 | |
| Other Assets and Liabilities (-0.4%) | ||
| Other Assets | 1,168 | |
| Liabilities3 | (2,322) | |
| (1,154) | ||
| Net Assets (100%) | ||
| Applicable to 9,785,899 outstanding | ||
| $.001 par value shares of beneficial | ||
| interest (unlimited authorization) | 322,618 | |
| Net Asset Value Per Share | $32.97 | |
18
Explorer Value Fund
| At August 31, 2014, net assets consisted of: | |
| Amount | |
| ($000) | |
| Paid-in Capital | 249,731 |
| Undistributed Net Investment Income | 1,064 |
| Accumulated Net Realized Gains | 13,819 |
| Unrealized Appreciation (Depreciation) | |
| Investment Securities | 57,906 |
| Futures Contracts | 98 |
| Net Assets | 322,618 |
See Note A in Notes to Financial Statements.
* Non-income-producing security.
^ Includes partial security positions on loan to broker-dealers. The total value of securities on loan is $210,000.
1 The fund invests a portion of its cash reserves in equity markets through the use of index futures contracts. After giving effect to futures investments, the fund’s effective common stock and temporary cash investment positions represent 96.9% and 3.5%, respectively, of net assets.
2 Affiliated money market fund available only to Vanguard funds and certain trusts and accounts managed by Vanguard. Rate shown is the
7-day yield.
3 Includes $240,000 of collateral received for securities on loan.
4 The issuer operates under a congressional charter; its securities are generally neither guaranteed by the U.S. Treasury nor backed by the full faith and credit of the U.S. government.
5 Securities with a value of $200,000 have been segregated as initial margin for open futures contracts.
See accompanying Notes, which are an integral part of the Financial Statements.
19
Explorer Value Fund
Statement of Operations
| Year Ended | |
| August 31, 2014 | |
| ($000) | |
| Investment Income | |
| Income | |
| Dividends | 3,752 |
| Interest1 | 25 |
| Securities Lending | 36 |
| Total Income | 3,813 |
| Expenses | |
| Investment Advisory Fees—Note B | |
| Basic Fee | 964 |
| Performance Adjustment | (61) |
| The Vanguard Group—Note C | |
| Management and Administrative | 549 |
| Marketing and Distribution | 41 |
| Custodian Fees | 17 |
| Auditing Fees | 43 |
| Shareholders’ Reports | 5 |
| Trustees’ Fees and Expenses | 1 |
| Total Expenses | 1,559 |
| Net Investment Income | 2,254 |
| Realized Net Gain (Loss) | |
| Investment Securities Sold | 19,196 |
| Futures Contracts | 1,222 |
| Realized Net Gain (Loss) | 20,418 |
| Change in Unrealized Appreciation (Depreciation) | |
| Investment Securities | 25,177 |
| Futures Contracts | 270 |
| Change in Unrealized Appreciation (Depreciation) | 25,447 |
| Net Increase (Decrease) in Net Assets Resulting from Operations | 48,119 |
| 1 Interest income from an affiliated company of the fund was $24,000. | |
See accompanying Notes, which are an integral part of the Financial Statements.
20
Explorer Value Fund
Statement of Changes in Net Assets
| Year Ended August 31, | ||
| 2014 | 2013 | |
| ($000) | ($000) | |
| Increase (Decrease) in Net Assets | ||
| Operations | ||
| Net Investment Income | 2,254 | 1,463 |
| Realized Net Gain (Loss) | 20,418 | 14,699 |
| Change in Unrealized Appreciation (Depreciation) | 25,447 | 22,412 |
| Net Increase (Decrease) in Net Assets Resulting from Operations | 48,119 | 38,574 |
| Distributions | ||
| Net Investment Income | (1,328) | (1,492) |
| Realized Capital Gain1 | (16,137) | (2,284) |
| Total Distributions | (17,465) | (3,776) |
| Capital Share Transactions | ||
| Issued | 132,062 | 104,200 |
| Issued in Lieu of Cash Distributions | 16,457 | 3,514 |
| Redeemed | (78,509) | (43,330) |
| Net Increase (Decrease) from Capital Share Transactions | 70,010 | 64,384 |
| Total Increase (Decrease) | 100,664 | 99,182 |
| Net Assets | ||
| Beginning of Period | 221,954 | 122,772 |
| End of Period2 | 322,618 | 221,954 |
| 1 Includes fiscal 2014 and 2013 short-term gain distributions totaling $5,516,000 and $530,000, respectively. Short-term gain distributions are treated as ordinary income dividends for tax purposes. 2 Net Assets—End of Period includes undistributed (overdistributed) net investment income of $1,064,000 and $369,000. | ||
See accompanying Notes, which are an integral part of the Financial Statements.
21
Explorer Value Fund
Financial Highlights
| March 16, | |||||
| 20101 to | |||||
| For a Share Outstanding | Year Ended August 31, | Aug. 31, | |||
| Throughout Each Period | 2014 | 2013 | 2012 | 2011 | 2010 |
| Net Asset Value, Beginning of Period | $29.39 | $23.44 | $21.94 | $18.09 | $20.00 |
| Investment Operations | |||||
| Net Investment Income | .251 | .255 | .232 | .190 | .044 |
| Net Realized and Unrealized Gain (Loss) | |||||
| on Investments | 5.539 | 6.429 | 2.476 | 3.991 | (1.954) |
| Total from Investment Operations | 5.790 | 6.684 | 2.708 | 4.181 | (1.910) |
| Distributions | |||||
| Dividends from Net Investment Income | (.168) | (. 290) | (.189) | (.135) | — |
| Distributions from Realized Capital Gains | (2.042) | (.444) | (1.019) | (.196) | — |
| Total Distributions | (2.210) | (.734) | (1.208) | (.331) | — |
| Net Asset Value, End of Period | $32.97 | $29.39 | $23.44 | $21.94 | $18.09 |
| Total Return2 | 20.34% | 29.19% | 13.10% | 23.04% | -9.55% |
| Ratios/Supplemental Data | |||||
| Net Assets, End of Period (Millions) | $323 | $222 | $123 | $116 | $75 |
| Ratio of Total Expenses to Average Net Assets3 | 0.57% | 0.60% | 0.59% | 0.57% | 0.56%4 |
| Ratio of Net Investment Income to | |||||
| Average Net Assets | 0.83% | 0.88% | 1.00% | 0.82% | 0.55%4 |
| Portfolio Turnover Rate | 36% | 46% | 38% | 41% | 16% |
| 1 Subscription period for the fund was March 16, 2010, to March 30, 2010, during which time all assets were held in money market instruments. Performance measurement began March 30, 2010, at a net asset value of $20.00. 2 Total returns do not include account service fees that may have applied in the periods shown. Fund prospectuses provide information about any applicable account service fees. 3 Includes performance-based investment advisory fee increases (decreases) of (0.02%), 0.04%, 0.03%, 0.01%, and 0.00%. 4 Annualized. | |||||
See accompanying Notes, which are an integral part of the Financial Statements.
22
Explorer Value Fund
Notes to Financial Statements
Vanguard Explorer Value Fund is registered under the Investment Company Act of 1940 as an open-end investment company, or mutual fund.
A. The following significant accounting policies conform to generally accepted accounting principles for U.S. investment companies. The fund consistently follows such policies in preparing its financial statements.
1. Security Valuation: Securities are valued as of the close of trading on the New York Stock Exchange (generally 4 p.m., Eastern time) on the valuation date. Equity securities are valued at the latest quoted sales prices or official closing prices taken from the primary market in which each security trades; such securities not traded on the valuation date are valued at the mean of the latest quoted bid and asked prices. Securities for which market quotations are not readily available, or whose values have been materially affected by events occurring before the fund’s pricing time but after the close of the securities’ primary markets, are valued by methods deemed by the board of trustees to represent fair value. Investments in Vanguard Market Liquidity Fund are valued at that fund’s net asset value. Temporary cash investments acquired over 60 days to maturity are valued using the latest bid prices or using valuations based on a matrix system (which considers such factors as security prices, yields, maturities, and ratings), both as furnished by independent pricing services. Other temporary cash investments are valued at amortized cost, which approximates market value.
2. Futures Contracts: The fund uses index futures contracts to a limited extent, with the objective of maintaining full exposure to the stock market while maintaining liquidity. The fund may purchase or sell futures contracts to achieve a desired level of investment, whether to accommodate portfolio turnover or cash flows from capital share transactions. The primary risks associated with the use of futures contracts are imperfect correlation between changes in market values of stocks held by the fund and the prices of futures contracts, and the possibility of an illiquid market. Counterparty risk involving futures is mitigated because a regulated clearinghouse is the counterparty instead of the clearing broker. To further mitigate counterparty risk, the fund trades futures contracts on an exchange, monitors the financial strength of its clearing brokers and clearinghouse, and has entered into clearing agreements with its clearing brokers. The clearinghouse imposes initial margin requirements to secure the fund’s performance and requires daily settlement of variation margin representing changes in the market value of each contract.
Futures contracts are valued at their quoted daily settlement prices. The aggregate settlement values of the contracts are not recorded in the Statement of Net Assets. Fluctuations in the value of the contracts are recorded in the Statement of Net Assets as an asset (liability) and in the Statement of Operations as unrealized appreciation (depreciation) until the contracts are closed, when they are recorded as realized futures gains (losses).
During the year ended August 31, 2014, the fund’s average investments in long and short futures contracts represented 3% and 0% of net assets, respectively, based on the average of aggregate settlement values at each quarter-end during the period.
3. Federal Income Taxes: The fund intends to continue to qualify as a regulated investment company and distribute all of its taxable income. Management has analyzed the fund’s tax positions taken for all open federal income tax years (August 31, 2011–2014), and has concluded that no provision for federal income tax is required in the fund’s financial statements.
4. Distributions: Distributions to shareholders are recorded on the ex-dividend date.
23
Explorer Value Fund
5. Securities Lending: To earn additional income, the fund lends its securities to qualified institutional borrowers. Security loans are required to be secured at all times by collateral in an amount at least equal to the market value of securities loaned. Daily market fluctuations could cause the value of loaned securities to be more or less than the value of the collateral received. When this occurs, the collateral is adjusted and settled on the next business day. The fund further mitigates its counterparty risk by entering into securities lending transactions only with a diverse group of prequalified counterparties, monitoring their financial strength, and entering into master securities lending agreements with its counterparties. The master securities lending agreements provide that, in the event of a counterparty’s default (including bankruptcy), the fund may terminate any loans with that borrower, determine the net amount owed, and sell or retain the collateral up to the net amount owed to the fund; however, such actions may be subject to legal proceedings. While collateral mitigates counterparty risk, in the absence of a default the fund may experience delays and costs in recovering the securities loaned. The fund invests cash collateral received in Vanguard Market Liquidity Fund, and records a liability in the Statement of Net Assets for the return of the collateral, during the period the securities are on loan. Securities lending income represents fees charged to borrowers plus income earned on invested cash collateral, less expenses associated with the loan.
6. Credit Facility: The fund and certain other funds managed by The Vanguard Group participate in a $2.89 billion committed credit facility provided by a syndicate of lenders pursuant to a credit agreement that may be renewed annually; each fund is individually liable for its borrowings, if any, under the credit facility. Borrowings may be utilized for temporary and emergency purposes, and are subject to the fund’s regulatory and contractual borrowing restrictions. The participating funds are charged administrative fees and an annual commitment fee of 0.06% of the undrawn amount of the facility; these fees are allocated to the funds based on a method approved by the fund’s board of trustees and included in Management and Administrative expenses on the fund’s Statement of Operations. Any borrowings under this facility bear interest at a rate equal to the higher of the federal funds rate or LIBOR reference rate plus an agreed-upon spread.
The fund had no borrowings outstanding at August 31, 2014, or at any time during the period then ended.
7. Other: Dividend income is recorded on the ex-dividend date. Interest income includes income distributions received from Vanguard Market Liquidity Fund and is accrued daily. Premiums and discounts on debt securities purchased are amortized and accreted, respectively, to interest income over the lives of the respective securities. Security transactions are accounted for on the date securities are bought or sold. Costs used to determine realized gains (losses) on the sale of investment securities are those of the specific securities sold.
B. Frontier Capital Management Co., LLC, Sterling Capital Management LLC, and Cardinal Capital Management, L.L.C., each provide investment advisory services to a portion of the fund for a fee calculated at an annual percentage rate of average net assets managed by the advisor. The basic fee of Frontier Capital Management Co., LLC, is subject to quarterly adjustments based on performance for the preceding three years relative to the Russell 2000 Value Index. The basic fee of Sterling Capital Management LLC is subject to quarterly adjustments based on performance for the preceding three years relative to the Russell 2500 Value Index. The basic fee of Cardinal Capital Management, L.L.C., is subject to quarterly adjustments based on performance for the preceding three years relative to the Russell Mid-Cap Value Custom Cap-Range Index.
24
Explorer Value Fund
The Vanguard Group manages the cash reserves of the fund on an at-cost basis.
For the year ended August 31, 2014, the aggregate investment advisory fee represented an effective annual basic rate of 0.35% of the fund’s average net assets, before a decrease of $61,000 (0.02%) based on performance.
C. The Vanguard Group furnishes at cost corporate management, administrative, marketing, and distribution services. The costs of such services are allocated to the fund based on methods approved by the board of trustees. The fund has committed to provide up to 0.40% of its net assets in capital contributions to Vanguard. At August 31, 2014, the fund had contributed capital of $33,000 to Vanguard (included in Other Assets), representing 0.01% of the fund’s net assets and 0.01% of Vanguard’s capitalization. The fund’s trustees and officers are also directors and officers of Vanguard.
D. Various inputs may be used to determine the value of the fund’s investments. These inputs are summarized in three broad levels for financial statement purposes. The inputs or methodologies used to value securities are not necessarily an indication of the risk associated with investing in those securities.
Level 1—Quoted prices in active markets for identical securities.
Level 2—Other significant observable inputs (including quoted prices for similar securities, interest rates, prepayment speeds, credit risk, etc.).
Level 3—Significant unobservable inputs (including the fund’s own assumptions used to determine the fair value of investments).
The following table summarizes the market value of the fund’s investments as of August 31, 2014, based on the inputs used to value them:
| Level 1 | Level 2 | Level 3 | |
| Investments | ($000) | ($000) | ($000) |
| Common Stocks | 308,086 | — | — |
| Temporary Cash Investments | 15,186 | 500 | — |
| Futures Contracts—Assets1 | 26 | — | — |
| Total | 323,298 | 500 | — |
| 1 Represents variation margin on the last day of the reporting period. | |||
E. At August 31, 2014, the aggregate settlement value of open futures contracts and the related unrealized appreciation (depreciation) were:
| ($000) | ||||
| Aggregate | ||||
| Number of | Settlement | Unrealized | ||
| Long (Short) | Value | Appreciation | ||
| Futures Contracts | Expiration | Contracts | Long (Short) | (Depreciation) |
| E-mini Russell 2000 Index | September 2014 | 37 | 4,342 | 98 |
Unrealized appreciation (depreciation) on open futures contracts is required to be treated as realized gain (loss) for tax purposes.
25
Explorer Value Fund
F. Distributions are determined on a tax basis and may differ from net investment income and realized capital gains for financial reporting purposes. Differences may be permanent or temporary. Permanent differences are reclassified among capital accounts in the financial statements to reflect their tax character. Temporary differences arise when certain items of income, expense, gain, or loss are recognized in different periods for financial statement and tax purposes. These differences will reverse at some time in the future. Differences in classification may also result from the treatment of short-term gains as ordinary income for tax purposes.
The fund used a tax accounting practice to treat a portion of the price of capital shares redeemed during the year as distributions from net investment income and realized capital gains. Accordingly, the fund has reclassified $231,000 from undistributed net investment income, and $2,334,000 from accumulated net realized gains, to paid-in capital.
For tax purposes, at August 31, 2014, the fund had $6,116,000 of ordinary income and $9,153,000 of long-term capital gains available for distribution.
At August 31, 2014, the cost of investment securities for tax purposes was $265,906,000. Net unrealized appreciation of investment securities for tax purposes was $57,866,000, consisting of unrealized gains of $62,551,000 on securities that had risen in value since their purchase and $4,685,000 in unrealized losses on securities that had fallen in value since their purchase.
G. During the year ended August 31, 2014, the fund purchased $151,308,000 of investment securities and sold $91,484,000 of investment securities, other than temporary cash investments.
H. Capital shares issued and redeemed were:
| Year Ended August 31, | ||
| 2014 | 2013 | |
| Shares | Shares | |
| (000) | (000) | |
| Issued | 4,163 | 3,776 |
| Issued in Lieu of Cash Distributions | 542 | 145 |
| Redeemed | (2,471) | (1,607) |
| Net Increase (Decrease) in Shares Outstanding | 2,234 | 2,314 |
I. Management has determined that no material events or transactions occurred subsequent to August 31, 2014, that would require recognition or disclosure in these financial statements.
26
Report of Independent Registered
Public Accounting Firm
To the Board of Trustees of Vanguard Scottsdale Funds and the Shareholders of Vanguard Explorer Value Fund:
In our opinion, the accompanying statement of net assets and the related statements of operations and of changes in net assets and the financial highlights present fairly, in all material respects, the financial position of Vanguard Explorer Value Fund (constituting a separate portfolio of Vanguard Scottsdale Funds, hereafter referred to as the “Fund”) at August 31, 2014, the results of its operations for the year then ended, the changes in its net assets for each of the two years in the period then ended, and the financial highlights for each of the periods indicated, in conformity with accounting principles generally accepted in the United States of America. These financial statements and financial highlights (hereafter referred to as “financial statements”) are the responsibility of the Fund’s management. Our responsibility is to express an opinion on these financial statements based on our audits. We conducted our audits of these financial statements in accordance with the standards of the Public Company Accounting Oversight Board (United States). Those standards require that we plan and perform the audit to obtain reasonable assurance about whether the financial statements are free of material misstatement. An audit includes examining, on a test basis, evidence supporting the amounts and disclosures in the financial statements, assessing the accounting principles used and significant estimates made by management, and evaluating the overall financial statement presentation. We believe that our audits, which included confirmation of securities at August 31, 2014 by correspondence with the custodian and broker and by agreement to the underlying ownership records of the transfer agent, provide a reasonable basis for our opinion.
/s/PricewaterhouseCoopers LLP
Philadelphia, Pennsylvania
October 10, 2014
| Special 2014 tax information (unaudited) for Vanguard Explorer Value Fund |
This information for the fiscal year ended August 31, 2014, is included pursuant to provisions of the Internal Revenue Code.
The fund distributed $12,227,000 as capital gain dividends (from net long-term capital gains) to shareholders during the fiscal year.
For nonresident alien shareholders, 100% of short-term capital gain dividends distributed by the fund in fiscal 2013 and 2014 are qualified short-term capital gains.
The fund distributed $1,678,000 of qualified dividend income to shareholders during the fiscal year.
For corporate shareholders, 20.9% of investment income (dividend income plus short-term gains, if any) qualifies for the dividends-received deduction.
27
Your Fund’s After-Tax Returns
This table presents returns for your fund both before and after taxes. The after-tax returns are shown in two ways: (1) assuming that an investor owned the fund during the entire period and paid taxes on the fund’s distributions, and (2) assuming that an investor paid taxes on the fund’s distributions and sold all shares at the end of each period.
Calculations are based on the highest individual federal income tax and capital gains tax rates in effect at the times of the distributions and the hypothetical sales. State and local taxes were not considered. After-tax returns reflect any qualified dividend income, using actual prior-year figures and estimates for 2014. (In the example, returns after the sale of fund shares may be higher than those assuming no sale. This occurs when the sale would have produced a capital loss. The calculation assumes that the investor received a tax deduction for the loss.)
Please note that your actual after-tax returns will depend on your tax situation and may differ from those shown. Also note that if you own the fund in a tax-deferred account, such as an individual retirement account or a 401(k) plan, this information does not apply to you. Such accounts are not subject to current taxes.
Finally, keep in mind that a fund’s performance—whether before or after taxes—does not guarantee future results.
| Average Annual Total Returns: Explorer Value Fund | ||
| Periods Ended August 31, 2014 | ||
| Since | ||
| One | Inception | |
| Year | (3/30/2010) | |
| Returns Before Taxes | 20.34% | 16.40% |
| Returns After Taxes on Distributions | 17.92 | 15.23 |
| Returns After Taxes on Distributions and Sale of Fund Shares | 12.44 | 12.81 |
About Your Fund’s Expenses
As a shareholder of the fund, you incur ongoing costs, which include costs for portfolio management, administrative services, and shareholder reports (like this one), among others. Operating expenses, which are deducted from a fund’s gross income, directly reduce the investment return of the fund.
A fund’s expenses are expressed as a percentage of its average net assets. This figure is known as the expense ratio. The following examples are intended to help you understand the ongoing costs (in dollars) of investing in your fund and to compare these costs with those of other mutual funds. The examples are based on an investment of $1,000 made at the beginning of the period shown and held for the entire period.
The accompanying table illustrates your fund’s costs in two ways:
• Based on actual fund return. This section helps you to estimate the actual expenses that you paid over the period. The ”Ending Account Value“ shown is derived from the fund‘s actual return, and the third column shows the dollar amount that would have been paid by an investor who started with $1,000 in the fund. You may use the information here, together with the amount you invested, to estimate the expenses that you paid over the period.
To do so, simply divide your account value by $1,000 (for example, an $8,600 account value divided by $1,000 = 8.6), then multiply the result by the number given for your fund under the heading ”Expenses Paid During Period.“
• Based on hypothetical 5% yearly return. This section is intended to help you compare your fund‘s costs with those of other mutual funds. It assumes that the fund had a yearly return of 5% before expenses, but that the expense ratio is unchanged. In this case—because the return used is not the fund’s actual return—the results do not apply to your investment. The example is useful in making comparisons because the Securities and Exchange Commission requires all mutual funds to calculate expenses based on a 5% return. You can assess your fund’s costs by comparing this hypothetical example with the hypothetical examples that appear in shareholder reports of other funds.
Note that the expenses shown in the table are meant to highlight and help you compare ongoing costs only and do not reflect transaction costs incurred by the fund for buying and selling securities. Further, the expenses do not include any purchase, redemption, or account service fees described in the fund prospectus. If such fees were applied to your account, your costs would be higher. Your fund does not carry a “sales load.”
The calculations assume no shares were bought or sold during the period. Your actual costs may have been higher or lower, depending on the amount of your investment and the timing of any purchases or redemptions.
You can find more information about the fund’s expenses, including annual expense ratios, in the Financial Statements section of this report. For additional information on operating expenses and other shareholder costs, please refer to your fund’s current prospectus.
29
| Six Months Ended August 31, 2014 | |||
| Beginning | Ending | Expenses | |
| Account Value | Account Value | Paid During | |
| Explorer Value Fund | 2/28/2014 | 8/31/2014 | Period |
| Based on Actual Fund Return | $1,000.00 | $1,037.12 | $2.93 |
| Based on Hypothetical 5% Yearly Return | 1,000.00 | 1,022.33 | 2.91 |
| The calculations are based on expenses incurred in the most recent six-month period. The fund’s annualized six-month expense ratio for that period is 0.57%. The dollar amounts shown as “Expenses Paid” are equal to the annualized expense ratio multiplied by the average account value over the period, multiplied by the number of days in the most recent six-month period, then divided by the number of days in the most recent 12-month period. | |||
30
Glossary
30-Day SEC Yield. A fund’s 30-day SEC yield is derived using a formula specified by the U.S. Securities and Exchange Commission. Under the formula, data related to the fund’s security holdings in the previous 30 days are used to calculate the fund’s hypothetical net income for that period, which is then annualized and divided by the fund’s estimated average net assets over the calculation period. For the purposes of this calculation, a security’s income is based on its current market yield to maturity (for bonds), its actual income (for asset-backed securities), or its projected dividend yield (for stocks). Because the SEC yield represents hypothetical annualized income, it will differ—at times significantly—from the fund’s actual experience. As a result, the fund’s income distributions may be higher or lower than implied by the SEC yield.
Beta. A measure of the magnitude of a fund’s past share-price fluctuations in relation to the ups and downs of a given market index. The index is assigned a beta of 1.00. Compared with a given index, a fund with a beta of 1.20 typically would have seen its share price rise or fall by 12% when the index rose or fell by 10%. For this report, beta is based on returns over the past 36 months for both the fund and the index. Note that a fund’s beta should be reviewed in conjunction with its R-squared (see definition). The lower the R-squared, the less correlation there is between the fund and the index, and the less reliable beta is as an indicator of volatility.
Dividend Yield. Dividend income earned by stocks, expressed as a percentage of the aggregate market value (or of net asset value, for a fund). The yield is determined by dividing the amount of the annual dividends by the aggregate value (or net asset value) at the end of the period. For a fund, the dividend yield is based solely on stock holdings and does not include any income produced by other investments.
Earnings Growth Rate. The average annual rate of growth in earnings over the past five years for the stocks now in a fund.
Equity Exposure. A measure that reflects a fund’s investments in stocks and stock futures. Any holdings in short-term reserves are excluded.
Expense Ratio. A fund’s total annual operating expenses expressed as a percentage of the fund’s average net assets. The expense ratio includes management and administrative expenses, but does not include the transaction costs of buying and selling portfolio securities.
Foreign Holdings. The percentage of a fund represented by securities or depositary receipts of companies based outside the United States.
Inception Date. The date on which the assets of a fund (or one of its share classes) are first invested in accordance with the fund’s investment objective. For funds with a subscription period, the inception date is the day after that period ends. Investment performance is measured from the inception date.
Median Market Cap. An indicator of the size of companies in which a fund invests; the midpoint of market capitalization (market price x shares outstanding) of a fund’s stocks, weighted by the proportion of the fund’s assets invested in each stock. Stocks representing half of the fund’s assets have market capitalizations above the median, and the rest are below it.
Price/Book Ratio. The share price of a stock divided by its net worth, or book value, per share. For a fund, the weighted average price/book ratio of the stocks it holds.
31
Price/Earnings Ratio. The ratio of a stock’s current price to its per-share earnings over the past year. For a fund, the weighted average P/E of the stocks it holds. P/E is an indicator of market expectations about corporate prospects; the higher the P/E, the greater the expectations for a company’s future growth.
R-Squared. A measure of how much of a fund’s past returns can be explained by the returns from the market in general, as measured by a given index. If a fund’s total returns were precisely synchronized with an index’s returns, its R-squared would be 1.00. If the fund’s returns bore no relationship to the index’s returns, its R-squared would be 0. For this report, R-squared is based on returns over the past 36 months for both the fund and the index.
Return on Equity. The annual average rate of return generated by a company during the past five years for each dollar of shareholder’s equity (net income divided by shareholder’s equity). For a fund, the weighted average return on equity for the companies whose stocks it holds.
Short-Term Reserves. The percentage of a fund invested in highly liquid, short-term securities that can be readily converted to cash.
Turnover Rate. An indication of the fund’s trading activity. Funds with high turnover rates incur higher transaction costs and may be more likely to distribute capital gains (which may be taxable to investors). The turnover rate excludes in-kind transactions, which have minimal impact on costs.
32
This page intentionally left blank.
This page intentionally left blank.
This page intentionally left blank.
The People Who Govern Your Fund
The trustees of your mutual fund are there to see that the fund is operated and managed in your best interests since, as a shareholder, you are a part owner of the fund. Your fund’s trustees also serve on the board of directors of The Vanguard Group, Inc., which is owned by the Vanguard funds and provides services to them on an at-cost basis.
A majority of Vanguard’s board members are independent, meaning that they have no affiliation with Vanguard or the funds they oversee, apart from the sizable personal investments they have made as private individuals. The independent board members have distinguished backgrounds in business, academia, and public service. Each of the trustees and executive officers oversees 177 Vanguard funds.
The following table provides information for each trustee and executive officer of the fund. More information about the trustees is in the Statement of Additional Information, which can be obtained, without charge, by contacting Vanguard at 800-662-7447, or online at vanguard.com.
| InterestedTrustee1 | and Delphi Automotive LLP (automotive components); |
| Senior Advisor at New Mountain Capital. | |
| F. William McNabb III | |
| Born 1957. Trustee Since July 2009. Chairman of the | Amy Gutmann |
| Board. Principal Occupation(s) During the Past Five | Born 1949. Trustee Since June 2006. Principal |
| Years: Chairman of the Board of The Vanguard Group, | Occupation(s) During the Past Five Years: President of |
| Inc., and of each of the investment companies served | the University of Pennsylvania; Christopher H. Browne |
| by The Vanguard Group, since January 2010; Director | Distinguished Professor of Political Science, School of |
| of The Vanguard Group since 2008; Chief Executive | Arts and Sciences, and Professor of Communication, |
| Officer and President of The Vanguard Group, and of | Annenberg School for Communication, with secondary |
| each of the investment companies served by The | faculty appointments in the Department of Philosophy, |
| Vanguard Group, since 2008; Director of Vanguard | School of Arts and Sciences, and at the Graduate |
| Marketing Corporation; Managing Director of The | School of Education, University of Pennsylvania; |
| Vanguard Group (1995–2008). | Trustee of the National Constitution Center; Chair |
| of the Presidential Commission for the Study of | |
| Independent Trustees | Bioethical Issues. |
| Emerson U. Fullwood | JoAnn Heffernan Heisen |
| Born 1948. Trustee Since January 2008. Principal | Born 1950. Trustee Since July 1998. Principal |
| Occupation(s) During the Past Five Years: Executive | Occupation(s) During the Past Five Years: Corporate |
| Chief Staff and Marketing Officer for North America | Vice President and Chief Global Diversity Officer |
| and Corporate Vice President (retired 2008) of Xerox | (retired 2008) and Member of the Executive |
| Corporation (document management products and | Committee (1997–2008) of Johnson & Johnson |
| services); Executive in Residence and 2009–2010 | (pharmaceuticals/medical devices/consumer |
| Distinguished Minett Professor at the Rochester | products); Director of Skytop Lodge Corporation |
| Institute of Technology; Director of SPX Corporation | (hotels), the University Medical Center at Princeton, |
| (multi-industry manufacturing), the United Way of | the Robert Wood Johnson Foundation, and the Center |
| Rochester, Amerigroup Corporation (managed health | for Talent Innovation; Member of the Advisory Board |
| care), the University of Rochester Medical Center, | of the Maxwell School of Citizenship and Public Affairs |
| Monroe Community College Foundation, and North | at Syracuse University. |
| Carolina A&T University. | |
| F. Joseph Loughrey | |
| Rajiv L. Gupta | Born 1949. Trustee Since October 2009. Principal |
| Born 1945. Trustee Since December 2001.2 | Occupation(s) During the Past Five Years: President |
| Principal Occupation(s) During the Past Five Years: | and Chief Operating Officer (retired 2009) of Cummins |
| Chairman and Chief Executive Officer (retired 2009) | Inc. (industrial machinery); Chairman of the Board |
| and President (2006–2008) of Rohm and Haas Co. | of Hillenbrand, Inc. (specialized consumer services), |
| (chemicals); Director of Tyco International, Ltd. | and of Oxfam America; Director of SKF AB (industrial |
| (diversified manufacturing and services), Hewlett- | machinery), Hyster-Yale Materials Handling, Inc. |
| Packard Co. (electronic computer manufacturing), | (forklift trucks), the Lumina Foundation for Education, |
| and the V Foundation for Cancer Research; Member | Executive Officers | |
| of the Advisory Council for the College of Arts and | ||
| Letters and of the Advisory Board to the Kellogg | Glenn Booraem | |
| Institute for International Studies, both at the | Born 1967. Controller Since July 2010. Principal | |
| University of Notre Dame. | Occupation(s) During the Past Five Years: Principal | |
| of The Vanguard Group, Inc.; Controller of each of | ||
| Mark Loughridge | the investment companies served by The Vanguard | |
| Born 1953. Trustee Since March 2012. Principal | Group; Assistant Controller of each of the investment | |
| Occupation(s) During the Past Five Years: Senior Vice | companies served by The Vanguard Group (2001–2010). | |
| President and Chief Financial Officer (retired 2013) | ||
| at IBM (information technology services); Fiduciary | Thomas J. Higgins | |
| Member of IBM’s Retirement Plan Committee (2004– | Born 1957. Chief Financial Officer Since September | |
| 2013); Member of the Council on Chicago Booth. | 2008. Principal Occupation(s) During the Past Five | |
| Years: Principal of The Vanguard Group, Inc.; Chief | ||
| Scott C. Malpass | Financial Officer of each of the investment companies | |
| Born 1962. Trustee Since March 2012. Principal | served by The Vanguard Group; Treasurer of each of | |
| Occupation(s) During the Past Five Years: Chief | the investment companies served by The Vanguard | |
| Investment Officer and Vice President at the University | Group (1998–2008). | |
| of Notre Dame; Assistant Professor of Finance at the | ||
| Mendoza College of Business at Notre Dame; Member | Kathryn J. Hyatt | |
| of the Notre Dame 403(b) Investment Committee; | Born 1955. Treasurer Since November 2008. Principal | |
| Board Member of TIFF Advisory Services, Inc. | Occupation(s) During the Past Five Years: Principal of | |
| (investment advisor); Member of the Investment | The Vanguard Group, Inc.; Treasurer of each of the | |
| Advisory Committees of the Financial Industry | investment companies served by The Vanguard | |
| Regulatory Authority (FINRA) and of Major League | Group; Assistant Treasurer of each of the investment | |
| Baseball. | companies served by The Vanguard Group (1988–2008). | |
| André F. Perold | Heidi Stam | |
| Born 1952. Trustee Since December 2004. Principal | Born 1956. Secretary Since July 2005. Principal | |
| Occupation(s) During the Past Five Years: George | Occupation(s) During the Past Five Years: Managing | |
| Gund Professor of Finance and Banking, Emeritus | Director of The Vanguard Group, Inc.; General Counsel | |
| at the Harvard Business School (retired 2011); | of The Vanguard Group; Secretary of The Vanguard | |
| Chief Investment Officer and Managing Partner of | Group and of each of the investment companies | |
| HighVista Strategies LLC (private investment firm); | served by The Vanguard Group; Director and Senior | |
| Director of Rand Merchant Bank; Overseer of the | Vice President of Vanguard Marketing Corporation. | |
| Museum of Fine Arts Boston. | ||
| Vanguard Senior ManagementTeam | ||
| Alfred M. Rankin, Jr. | ||
| Born 1941. Trustee Since January 1993. Principal | Mortimer J. Buckley | Chris D. McIsaac |
| Occupation(s) During the Past Five Years: Chairman, | Kathleen C. Gubanich | Michael S. Miller |
| President, and Chief Executive Officer of NACCO | Paul A. Heller | James M. Norris |
| Industries, Inc. (housewares/lignite), and of Hyster- | Martha G. King | Glenn W. Reed |
| Yale Materials Handling, Inc. (forklift trucks); Chairman | John T. Marcante | |
| of the Board of University Hospitals of Cleveland. | ||
| Chairman Emeritus and Senior Advisor | ||
| Peter F. Volanakis | ||
| Born 1955. Trustee Since July 2009. Principal | John J. Brennan | |
| Occupation(s) During the Past Five Years: President | Chairman, 1996–2009 | |
| and Chief Operating Officer (retired 2010) of Corning | Chief Executive Officer and President, 1996–2008 | |
| Incorporated (communications equipment); Trustee of | ||
| Colby-Sawyer College; Member of the Advisory Board | Founder | |
| of the Norris Cotton Cancer Center and of the Advisory | ||
| Board of the Parthenon Group (strategy consulting). | John C. Bogle | |
| Chairman and Chief Executive Officer, 1974–1996 | ||
1 Mr. McNabb is considered an “interested person,” as defined in the Investment Company Act of 1940, because he is an officer of the Vanguard funds.
2 December 2002 for Vanguard Equity Income Fund, the Vanguard Municipal Bond Funds, and the Vanguard State Tax-Exempt Funds.
 | |
| P.O. Box 2600 | |
| Valley Forge, PA 19482-2600 | |
| Connect with Vanguard® > vanguard.com | |
| Fund Information > 800-662-7447 | CFA® is a trademark owned by CFA Institute. |
| Direct Investor Account Services > 800-662-2739 | |
| Institutional Investor Services > 800-523-1036 | |
| Text Telephone for People | |
| With Hearing Impairment > 800-749-7273 | |
| This material may be used in conjunction | |
| with the offering of shares of any Vanguard | |
| fund only if preceded or accompanied by | |
| the fund’s current prospectus. | |
| All comparative mutual fund data are from Lipper, a | |
| Thomson Reuters Company, or Morningstar, Inc., unless | |
| otherwise noted. | |
| You can obtain a free copy of Vanguard’s proxy voting | |
| guidelines by visiting vanguard.com/proxyreporting or by | |
| calling Vanguard at 800-662-2739. The guidelines are | |
| also available from the SEC’s website, sec.gov. In | |
| addition, you may obtain a free report on how your fund | |
| voted the proxies for securities it owned during the 12 | |
| months ended June 30. To get the report, visit either | |
| vanguard.com/proxyreporting or sec.gov. | |
| You can review and copy information about your fund at | |
| the SEC’s Public Reference Room in Washington, D.C. To | |
| find out more about this public service, call the SEC at | |
| 202-551-8090. Information about your fund is also | |
| available on the SEC’s website, and you can receive | |
| copies of this information, for a fee, by sending a | |
| request in either of two ways: via e-mail addressed to | |
| publicinfo@sec.gov or via regular mail addressed to the | |
| Public Reference Section, Securities and Exchange | |
| Commission, Washington, DC 20549-1520. | |
| © 2014 The Vanguard Group, Inc. | |
| All rights reserved. | |
| Vanguard Marketing Corporation, Distributor. | |
| Q16900 102014 | |
Annual Report | August 31, 2014
Vanguard Russell 1000 Index Funds
Vanguard Russell 1000 Index Fund
Vanguard Russell 1000 Value Index Fund
Vanguard Russell 1000 Growth Index Fund
The mission continues
On May 1, 1975, Vanguard began operations, a fledgling company based on the simple but revolutionary idea that a mutual fund company should be managed solely in the interest of its investors.
Four decades later, that revolutionary spirit continues to animate the enterprise. Vanguard remains on a mission to give investors the best chance of investment success.
As we mark our 40th anniversary, we thank you for entrusting your assets to Vanguard and giving us the opportunity to help you reach your financial goals in the decades to come.
| Contents | |
| Your Fund’s Total Returns. | 1 |
| Chairman’s Letter. | 2 |
| Russell 1000 Index Fund. | 10 |
| Russell 1000 Value Index Fund. | 24 |
| Russell 1000 Growth Index Fund. | 39 |
| Your Fund’s After-Tax Returns. | 55 |
| About Your Fund’s Expenses. | 56 |
| Trustees Approve Advisory Arrangements. | 58 |
| Glossary. | 59 |
Please note: The opinions expressed in this report are just that—informed opinions. They should not be considered promises or advice. Also, please keep in mind that the information and opinions cover the period through the date on the front of this report. Of course, the risks of investing in your fund are spelled out in the prospectus.
See the Glossary for definitions of investment terms used in this report.
About the cover: Since our founding, Vanguard has drawn inspiration from the enterprise and valor demonstrated by British naval hero Horatio Nelson and his command at the Battle of the Nile in 1798. The photograph displays a replica of a merchant ship from the same era as Nelson’s flagship, the HMS Vanguard.
Your Fund’s Total Returns
| Fiscal Year Ended August 31, 2014 | |
| Total | |
| Returns | |
| Vanguard Russell 1000 Index Fund | |
| Institutional Shares | 25.24% |
| ETF Shares | |
| Market Price | 25.25 |
| Net Asset Value | 25.18 |
| Russell 1000 Index | 25.36 |
| Large-Cap Core Funds Average | 23.43 |
| Large-Cap Core Funds Average: Derived from data provided by Lipper, a Thomson Reuters Company. | |
| Vanguard Russell 1000 Value Index Fund | |
| Institutional Shares | 24.33% |
| ETF Shares | |
| Market Price | 24.28 |
| Net Asset Value | 24.27 |
| Russell 1000 Value Index | 24.43 |
| Large-Cap Value Funds Average | 22.67 |
| Large-Cap Value Funds Average: Derived from data provided by Lipper, a Thomson Reuters Company. | |
| Vanguard Russell 1000 Growth Index Fund | |
| Institutional Shares | 26.20% |
| ETF Shares | |
| Market Price | 26.18 |
| Net Asset Value | 26.15 |
| Russell 1000 Growth Index | 26.29 |
| Large-Cap Growth Funds Average | 25.10 |
| Large-Cap Growth Funds Average: Derived from data provided by Lipper, a Thomson Reuters Company. | |
Institutional Shares are available to certain institutional investors who meet specific administrative, service, and account-size criteria. The Vanguard ETF® Shares shown are traded on the Nasdaq exchange and are available only through brokers. The table provides ETF returns based on both the Nasdaq market price and the net asset value for a share. U.S. Pat. Nos. 6,879,964; 7,337,138; 7,720,749; 7,925,573;
8,090,646; and 8,417,623.
For the ETF Shares, the market price is determined by the midpoint of the bid-offer spread as of the closing time of the New York Stock Exchange (generally 4 p.m., Eastern time). The net asset value is also determined as of the NYSE closing time. For more information about how the ETF Shares' market prices have compared with their net asset value, visit vanguard.com, select your ETF, and then select the Price and Performance tab. The ETF premium/discount analysis there shows the percentages of days on which the ETF Shares' market price was above or below the NAV.
1

Chairman’s Letter
Dear Shareholder,
The three Vanguard Russell 1000 Index Funds generated impressive returns for the 12 months ended August 31, 2014, as the broad U.S. stock market advance entered its sixth year. Stocks of all sizes and styles contributed to the results, and the large-capitalization companies that make up the funds were among the leaders.
All three funds successfully tracked their target indexes and surpassed the average returns of their large-cap peer groups. The Russell 1000 Growth Index Fund led with a return of about 26%, while the Russell 1000 Value Index Fund returned about 24%. The Russell 1000 Index Fund, a blend of growth and value stocks, finished at about 25%.
For all three funds, gains were notable across the nine industry sectors. Most sectors surged more than 20%, and the rest still advanced by double digits. Technology holdings contributed most to returns for the Russell 1000 Index Fund and the Russell 1000 Growth Index Fund, and financial services companies led for the Russell 1000 Value Index Fund.
If you hold shares of your fund in a taxable account, you may wish to review the information on after-tax returns that appears later in this report.
2
Stocks cleared hurdles en route to new highs
Despite an assortment of challenges, the broad U.S. stock market recorded an impressive return of about 25% for the 12 months. U.S. stocks registered positive results in all but two months, and a late-July swoon was followed by an August flurry of record highs.
Investors applauded mostly solid corporate earnings, generally upbeat economic news, and the Federal Reserve’s continued accommodative policies. Still, turmoil in the Middle East and Ukraine, economic worries in Europe and China, and uncertainty about the Fed’s next moves pressured stocks at different times.
International stocks returned about 18%. Emerging markets, after sliding earlier in the period, rebounded to lead the way. The developed markets of the Pacific region and Europe trailed but still notched double-digit returns.
Defying analysts’ expectations, bond prices rose over the year
The broad U.S. taxable bond market returned 5.66%, rallying from the drubbing it took a year ago when investors fretted over the future of the Fed’s bond-buying program.
| Market Barometer | |||
| Average Annual Total Returns | |||
| Periods Ended August 31, 2014 | |||
| One | Three | Five | |
| Year | Years | Years | |
| Stocks | |||
| Russell 1000 Index (Large-caps) | 25.36% | 20.80% | 17.24% |
| Russell 2000 Index (Small-caps) | 17.68 | 19.00 | 17.03 |
| Russell 3000 Index (Broad U.S. market) | 24.74 | 20.65 | 17.22 |
| FTSE All-World ex US Index (International) | 18.04 | 9.48 | 8.44 |
| Bonds | |||
| Barclays U.S. Aggregate Bond Index (Broad taxable market) | 5.66% | 2.91% | 4.48% |
| Barclays Municipal Bond Index (Broad tax-exempt market) | 10.14 | 4.88 | 5.39 |
| Citigroup Three-Month U.S. Treasury Bill Index | 0.04 | 0.04 | 0.07 |
| CPI | |||
| Consumer Price Index | 1.70% | 1.64% | 1.96% |
3
The Fed began reducing its purchases in January and has consistently cut them further since, with the goal of ending the program in October. Interest rates have not risen as forecast, however. The yield of the 10-year U.S. Treasury note ended August at 2.34%, down from 2.76% a year earlier. (Bond prices and yields move in opposite directions.)
Municipal bonds returned 10.14% as investors searched for tax-exempt income amid a limited supply of new issues. International bond markets (as measured by the Barclays Global Aggregate Index ex USD) returned 6.52%.
Following such a strong advance for bonds, it’s worth remembering that the current low yields imply lower future returns: As yields drop, the scope for further declines—and increases in prices—diminishes.
The Fed’s target of 0%–0.25% for short-term interest rates continued to restrict returns for money market funds and savings accounts.
Technology stocks led the charge, but every sector played a part
The Vanguard Russell 1000 Index Funds represent the large-cap portion of the broad U.S. stock market. The Russell 1000
| Expense Ratios | |||
| Your Fund Compared With Its Peer Group | |||
| Institutional | ETF | Peer Group | |
| Shares | Shares | Average | |
| Russell 1000 Index Fund | 0.08% | 0.12% | 1.15% |
| Russell 1000 Value Index Fund | 0.08 | 0.15 | 1.14 |
| Russell 1000 Growth Index Fund | 0.08 | 0.15 | 1.22 |
| The fund expense ratios shown are from the prospectus dated December 20, 2013, and represent estimated costs for the current fiscal year. For the fiscal year ended August 31, 2014, the funds’ expense ratios were: for the Russell 1000 Index Fund, 0.08% for Institutional Shares and 0.12% for ETF Shares; for the Russell 1000 Value Index Fund, 0.08% for Institutional Shares and 0.12% for ETF Shares; and for the Russell 1000 Growth Index Fund, 0.08% for Institutional Shares and 0.12% for ETF Shares. Peer-group expense ratios are derived from data provided by Lipper, a Thomson Reuters Company, and capture information through year-end 2013. | |||
Peer groups: For the Russell 1000 Index Fund, Large-Cap Core Funds; for the Russell 1000 Value Index Fund, Large-Cap Value Funds; and for
the Russell 1000 Growth Index Fund, Large-Cap Growth Funds.
4
Index Fund alone represents more than 90% of the market’s total value, while the two other funds each focus on a subset of the broader group. Larger-cap stocks generally offer more stable returns, higher yields, and more predictable earnings than smaller stocks. On the flip side, less risk may mean less potential for reward.
Over the 12 months, large-caps performed as well as or better than their smaller counterparts as the market rally lifted the full spectrum of stocks. Large- and mid-caps both returned about 25%. Small-caps finished a few percentage points behind as concerns about their valuations spread after last year’s sharper gains. It’s good to keep in mind that market-cap leadership alternates over time; that’s one reason why Vanguard counsels staying broadly diversified. For more on the performance of small- and large-cap stocks, please see the box on page 6.
Among sectors, technology companies were large-cap leaders. In the two funds with heavy exposure to the sector, the Russell 1000 Index Fund and the Russell 1000 Growth Index Fund, tech stocks returned well over 30%. The Russell 1000 Value Index Fund had a far smaller stake in technology but still benefited from its return of 42%. As tech products and services become more accessible and affordable, they further extend their global reach. Also, consumers and corporations at the higher end of the market spent
| Total Returns | |
| Inception Through August 31, 2014 | |
| Average | |
| Annual Return | |
| Russell 1000 Index Fund Institutional Shares (Returns since inception: 10/15/2010) | 17.32% |
| Russell 1000 Index | 17.42 |
| Large-Cap Core Funds Average | 15.48 |
| Large-Cap Core Funds Average: Derived from data provided by Lipper, a Thomson Reuters Company. | |
| Russell 1000 Value Index Fund Institutional Shares (Returns since inception: 12/10/2010) | 16.32% |
| Russell 1000 Value Index | 16.42 |
| Large-Cap Value Funds Average | 14.65 |
| Large-Cap Value Funds Average: Derived from data provided by Lipper, a Thomson Reuters Company. | |
| Russell 1000 Growth Index Fund Institutional Shares (Returns since inception: 12/6/2010) | 16.25% |
| Russell 1000 Growth Index | 16.36 |
| Large-Cap Growth Funds Average | 14.38 |
| Large-Cap Growth Funds Average: Derived from data provided by Lipper, a Thomson Reuters Company. | |
The figures shown represent past performance, which is not a guarantee of future results. (Current performance may be lower or higher than the performance data cited. For performance data current to the most recent month-end, visit our website at vanguard.com/performance.) Note, too, that both investment returns and principal value can fluctuate widely, so an investor’s shares, when sold, could be worth more or less than their original cost.
5
more on technology, and updated or replaced equipment. Internet, software, hardware, semiconductor, electronics, and telecommunication stocks excelled over the period.
The health care sector also performed impressively for all three funds. Investors anticipated that an aging population and implementation of the Affordable Care Act would boost spending. Pharmaceutical
| Small-cap stocks versus large-caps: A case for diversification |
| At times, particularly over the past dozen years, small-capitalization stocks have outpaced their |
| large-cap counterparts. This performance edge may appear compelling, but before making any |
| drastic decisions to tilt your portfolio heavily toward small-caps, consider two points. |
| First, there’s no guarantee that small caps’ performance advantage will persist. As shown in |
| the chart below, these stocks had an extended period of underperformance in the 1990s, and |
| that could happen again. |
| Second, investing in small companies’ stocks involves additional risks. These firms generally |
| have less business diversification, fewer financial resources, and less management depth than |
| larger enterprises. As a result, their stocks can be highly volatile. |
| Investors with a heavy allocation to only one segment of the market can end up with greater |
| volatility and less diversification. A better alternative can be a market-cap-weighted equity |
| portfolio of stocks of all capitalizations that offers more diversification over the long term. |
| Small-cap performance relative to large-caps |
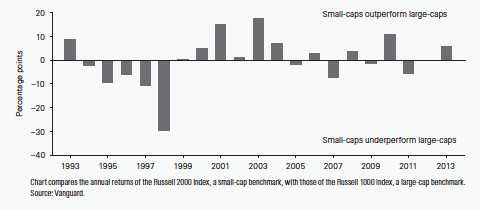
6
and biotechnology companies delivered most of the sector’s returns, helped by mergers and acquisitions, new drug development, and potential overseas sales. Health care services and medical equipment firms were also instrumental.
The financial services sector, by far the largest in the Russell 1000 Value Index Fund at close to 30% of holdings, was responsible for more than one-quarter of the fund’s result. The sector, in fact, returned 21% or more for all three funds The economic recovery and healthy investment environment bolstered all types of financial companies: banks, consumer finance and credit services firms, insurers, investment banks and brokerages, and real estate concerns.
As I mentioned earlier, every sector contributed in some way to the three funds’ performance. Manufacturing and production companies thrived as the nation’s economic engine rumbled ahead Entertainment and broadcasting firms shined behind revenue from advertising and subscriptions as well as receipts from resorts, movies, and theme parks. Oil companies––including integrated giants, refiners and marketers, and equipment and services firms––were key contributors as global demand for oil remained steady.
Over nearly four years, the funds have all tracked their indexes
Since debuting in September 2010, the three Vanguard Russell 1000 Index Funds have encountered occasional volatility while following generally prosperous paths. Most important, each has succeeded in tightly tracking its target index and has surpassed the average annual return of its peer group.
Vanguard Equity Investment Group, the fund’s advisor, is responsible for the index tracking achievements. The knowledge and skill of the group, whose sophisticated portfolio and management techniques reflect more than 30 years of indexing experience, have kept the funds on point. The group’s efforts have been aided by the funds’ low expenses, which let you pocket more of the returns.
High costs don���t equal strong fund performance
The adage “you get what you pay for” doesn’t apply to mutual funds. In fact, the reverse is true: Research suggests that higher costs are consistent with weaker returns. (See, for example, Shopping for Alpha: You Get What You Don’t Pay For at vanguard.com/research.)
7
Wouldn’t paying the highest fees allow you to purchase the services of the greatest talents, and therefore get you the best returns? As it turns out, the data don’t support that argument. The explanation is simple: Every dollar paid for management fees is a dollar less earning potential return. Keeping expenses down can help narrow the gap between what the markets return and what investors actually earn.
That’s why Vanguard always seeks to minimize costs. Indexing, of course, is the purest form of low-cost investing. And we negotiate low fees on our actively managed funds, which are run by world-class advisors. It’s a strategy that reflects decades of experience and research, boiled down to one tenet: The less you pay, the more you keep.
As always, thank you for entrusting your assets to Vanguard.
Sincerely,

F. William McNabb III
Chairman and Chief Executive Officer
September 17, 2014
| Your Fund’s Performance at a Glance | ||||
| August 31, 2013, Through August 31, 2014 | ||||
| Distributions Per Share | ||||
| Starting | Ending | Income | Capital | |
| Share Price | Share Price | Dividends | Gains | |
| Vanguard Russell 1000 Index Fund | ||||
| Institutional Shares | $146.04 | $179.58 | $3.005 | $0.000 |
| ETF Shares | 75.40 | 92.70 | 1.525 | 0.000 |
| Vanguard Russell 1000 Value Index Fund | ||||
| Institutional Shares | $144.13 | $175.38 | $3.460 | $0.000 |
| ETF Shares | 73.82 | 89.83 | 1.731 | 0.000 |
| Vanguard Russell 1000 Growth Index Fund | ||||
| Institutional Shares | $148.07 | $184.06 | $2.540 | $0.000 |
| ETF Shares | 77.02 | 95.74 | 1.286 | 0.000 |
Russell 1000 Index Fund
Fund Profile
As of August 31, 2014
| Share-Class Characteristics | ||
| Institutional | ETF | |
| Shares | Shares | |
| Ticker Symbol | VRNIX | VONE |
| Expense Ratio1 | 0.08% | 0.12% |
| 30-Day SEC Yield | 1.82% | 1.78% |
| Portfolio Characteristics | |||
| DJ | |||
| U.S. | |||
| Total | |||
| Russell | Market | ||
| 1000 | FA | ||
| Fund | Index | Index | |
| Number of Stocks | 1,033 | 1,032 | 3,709 |
| Median Market Cap | $58.6B | $58.6B | $48.0B |
| Price/Earnings Ratio | 20.2x | 20.2x | 20.7x |
| Price/Book Ratio | 2.7x | 2.7x | 2.7x |
| Return on Equity | 18.6% | 18.5% | 17.8% |
| Earnings Growth | |||
| Rate | 15.3% | 15.3% | 15.3% |
| Dividend Yield | 1.9% | 1.9% | 1.8% |
| Foreign Holdings | 0.0% | 0.0% | 0.0% |
| Turnover Rate | 7% | — | — |
| Short-Term Reserves | -0.2% | — | — |
| Sector Diversification (% of equity exposure) | |||
| DJ | |||
| U.S. | |||
| Total | |||
| Russell | Market | ||
| 1000 | FA | ||
| Fund | Index | Index | |
| Consumer Discretionary 13.9% | 14.0% | 14.1% | |
| Consumer Staples | 7.6 | 7.6 | 7.2 |
| Energy | 9.8 | 9.8 | 9.7 |
| Financial Services | 18.3 | 18.3 | 18.7 |
| Health Care | 13.2 | 13.1 | 13.2 |
| Materials & Processing | 4.3 | 4.3 | 4.5 |
| Producer Durables | 11.2 | 11.2 | 11.3 |
| Technology | 16.4 | 16.4 | 16.1 |
| Utilities | 5.3 | 5.3 | 5.2 |
| Volatility Measures | ||
| DJ | ||
| Russell | U.S. Total | |
| 1000 | Market | |
| Index | FA Index | |
| R-Squared | 1.00 | 1.00 |
| Beta | 1.00 | 0.97 |
| These measures show the degree and timing of the fund’s fluctuations compared with the indexes over 36 months. | ||
| Ten Largest Holdings (% of total net assets) | ||
| Apple Inc. | Computer | |
| Technology | 3.0% | |
| Exxon Mobil Corp. | Oil: Integrated | 2.1 |
| Microsoft Corp. | Computer Services | |
| Software & Systems | 1.8 | |
| Google Inc. | Computer Services | |
| Software & Systems | 1.6 | |
| Johnson & Johnson | Pharmaceuticals | 1.4 |
| General Electric Co. | Diversified | |
| Manufacturing | ||
| Operations | 1.3 | |
| Berkshire Hathaway Inc. Insurance: Multi-Line | 1.2 | |
| Chevron Corp. | Oil: Integrated | 1.2 |
| Wells Fargo & Co. | Banks: Diversified | 1.2 |
| JPMorgan Chase & Co. | Diversified Financial | |
| Services | 1.1 | |
| Top Ten | 15.9% | |
| The holdings listed exclude any temporary cash investments and equity index products. | ||
Investment Focus
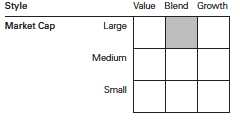
1 The expense ratios shown are from the prospectus dated December 20, 2013, and represent estimated costs for the current fiscal year. For the fiscal year ended August 31, 2014, the expense ratios were 0.08% for Institutional Shares and 0.12% for ETF Shares.
10
Russell 1000 Index Fund
Performance Summary
All of the returns in this report represent past performance, which is not a guarantee of future results that may be achieved by the fund. (Current performance may be lower or higher than the performance data cited. For performance data current to the most recent month-end, visit our website at vanguard.com/performance.) Note, too, that both investment returns and principal value can fluctuate widely, so an investor’s shares, when sold, could be worth more or less than their original cost. The returns shown do not reflect taxes that a shareholder would pay on fund distributions or on the sale of fund shares.
Cumulative Performance: September 20, 2010, Through August 31, 2014
Initial Investment of $10,000
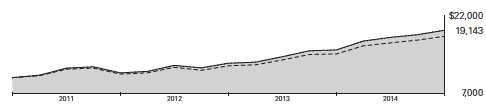
| Average Annual Total Returns | ||||
| Periods Ended August 31, 2014 | ||||
| Since | Final Value | |||
| One | Inception | of a $10,000 | ||
| Year | (9/20/2010) | Investment | ||
| Russell 1000 Index Fund*ETF Shares | ||||
| Net Asset Value | 25.18% | 17.89% | $19,143 | |
| Russell 1000 Index Fund*ETF Shares | ||||
| Market Price | 25.25 | 17.89 | 19,144 | |
| •••••••• | Russell 1000 Index | 25.36 | 18.04 | 19,236 |
| – – – – | Large-Cap Core Funds Average | 23.43 | 16.09 | 18,012 |
| Dow Jones U.S. Total Stock Market | ||||
| Float Adjusted Index | 24.68 | 17.95 | 19,178 | |
| Large-Cap Core Funds Average: Derived from data provided by Lipper, a Thomson Reuters Company. "Since Inception" performance is calculated from the ETF Shares’ inception date for both the fund and its comparative standards. | ||||
| Since | Final Value | ||
| One | Inception | of a $5,000,000 | |
| Year | (10/15/2010) | Investment | |
| Russell 1000 Index Fund Institutional Shares | 25.24% | 17.32% | $9,288,863 |
| Russell 1000 Index | 25.36 | 17.42 | 9,319,089 |
| Dow Jones U.S. Total Stock Market Float | |||
| Adjusted Index | 24.68 | 17.28 | 9,276,567 |
| "Since Inception" performance is calculated from the Institutional Shares’ inception date for both the fund and its comparative standards. | |||
See Financial Highlights for dividend and capital gains information.
11
Russell 1000 Index Fund
| Cumulative Returns of ETF Shares: September 20, 2010, Through August 31, 2014 | ||
| Since | ||
| One | Inception | |
| Year | (9/20/2010) | |
| Russell 1000 Index Fund ETF Shares Market Price | 25.25% | 91.44% |
| Russell 1000 Index Fund ETF Shares Net Asset | ||
| Value | 25.18 | 91.43 |
| Russell 1000 Index | 25.36 | 92.36 |
| "Since Inception" performance is calculated from the ETF Shares’ inception date for both the fund and its comparative standards. | ||
Fiscal-Year Total Returns (%): September 20, 2010, Through August 31, 2014
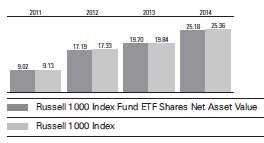
| Average Annual Total Returns: Periods Ended June 30, 2014 | |||
| This table presents returns through the latest calendar quarter—rather than through the end of the fiscal period. | |||
| Securities and Exchange Commission rules require that we provide this information. | |||
| Inception | One | Since | |
| Date | Year | Inception | |
| Institutional Shares | 10/15/2010 | 25.23% | 17.42% |
| ETF Shares | 9/20/2010 | ||
| Market Price | 25.33 | 18.02 | |
| Net Asset Value | 25.18 | 18.02 | |
12
Russell 1000 Index Fund
Financial Statements
Statement of Net Assets—Investments Summary
As of August 31, 2014
This Statement summarizes the fund’s holdings by asset type. Details are reported for each of the fund’s 50 largest individual holdings and for investments that, in total for any issuer, represent more than 1% of the fund’s net assets. The total value of smaller holdings is reported as a single amount within each category.
The fund reports a complete list of its holdings in regulatory filings four times in each fiscal year, at the quarter-ends. For the second and fourth fiscal quarters, the complete listing of the fund’s holdings is available electronically on vanguard.com and on the Securities and Exchange Commission’s website (sec.gov), or you can have it mailed to you without charge by calling 800-662-7447. For the first and third fiscal quarters, the fund files the lists with the SEC on Form N-Q. Shareholders can look up the fund’s Forms N-Q on the SEC’s website. Forms N-Q may also be reviewed and copied at the SEC’s Public Reference Room (see the back cover of this report for further information).
| Market | Percentage | ||
| Value | of Net | ||
| Shares | ($000) | Assets | |
| Common Stocks | |||
| Consumer Discretionary | |||
| Walt Disney Co. | 110,953 | 9,972 | 0.8% |
| Comcast Corp. Class A | 165,960 | 9,083 | 0.7% |
| Home Depot Inc. | 87,636 | 8,194 | 0.6% |
| * Amazon.com Inc. | 24,064 | 8,159 | 0.6% |
| Wal-Mart Stores Inc. | 102,100 | 7,709 | 0.6% |
| McDonald’s Corp. | 63,365 | 5,939 | 0.4% |
| Consumer Discretionary—Other † | 134,635 | 10.2% | |
| 183,691 | 13.9% | ||
| Consumer Staples | |||
| Procter & Gamble Co. | 173,329 | 14,405 | 1.1% |
| Coca-Cola Co. | 254,275 | 10,608 | 0.8% |
| PepsiCo Inc. | 97,121 | 8,983 | 0.7% |
| Philip Morris International Inc. | 100,819 | 8,628 | 0.7% |
| CVS Caremark Corp. | 74,967 | 5,956 | 0.4% |
| Altria Group Inc. | 127,256 | 5,482 | 0.4% |
| Consumer Staples—Other † | 45,896 | 3.5% | |
| 99,958 | 7.6% | ||
| Energy | |||
| Exxon Mobil Corp. | 275,070 | 27,359 | 2.0% |
| Chevron Corp. | 121,932 | 15,784 | 1.2% |
| Schlumberger Ltd. | 83,371 | 9,141 | 0.7% |
| ConocoPhillips | 78,687 | 6,391 | 0.5% |
| Occidental Petroleum Corp. | 50,341 | 5,222 | 0.4% |
| Energy—Other † | 64,723 | 4.9% | |
| 128,620 | 9.7% | ||
| Financial Services | |||
| * Berkshire Hathaway Inc. Class B | 117,244 | 16,092 | 1.2% |
| Wells Fargo & Co. | 305,834 | 15,732 | 1.2% |
| JPMorgan Chase & Co. | 242,390 | 14,410 | 1.1% |
| Bank of America Corp. | 673,425 | 10,835 | 0.8% |
13
Russell 1000 Index Fund
| Market | Percentage | ||
| Value• | of Net | ||
| Shares | ($000) | Assets | |
| Citigroup Inc. | 194,614 | 10,052 | 0.7% |
| Visa Inc. Class A | 32,118 | 6,826 | 0.5% |
| American Express Co. | 58,115 | 5,204 | 0.4% |
| Financial Services—Other † | 162,385 | 12.3% | |
| 241,536 | 18.2% | ||
| Health Care | |||
| Johnson & Johnson | 181,212 | 18,797 | 1.4% |
| Pfizer Inc. | 408,552 | 12,007 | 0.9% |
| Merck & Co. Inc. | 187,185 | 11,252 | 0.9% |
| * Gilead Sciences Inc. | 98,384 | 10,584 | 0.8% |
| Amgen Inc. | 48,511 | 6,762 | 0.5% |
| AbbVie Inc. | 101,879 | 5,632 | 0.4% |
| UnitedHealth Group Inc. | 62,833 | 5,446 | 0.4% |
| Bristol-Myers Squibb Co. | 106,158 | 5,377 | 0.4% |
| * Biogen Idec Inc. | 15,188 | 5,210 | 0.4% |
| Health Care—Other † | 92,085 | 7.0% | |
| 173,152 | 13.1% | ||
| Materials & Processing † | 56,525 | 4.3% | |
| Other | |||
| * Synchrony Financial | 3,500 | 90 | 0.0% |
| Producer Durables | |||
| General Electric Co. | 642,169 | 16,684 | 1.3% |
| United Technologies Corp. | 58,741 | 6,343 | 0.5% |
| Union Pacific Corp. | 58,009 | 6,107 | 0.5% |
| 3M Co. | 41,944 | 6,040 | 0.4% |
| Boeing Co. | 46,786 | 5,932 | 0.4% |
| Producer Durables—Other † | 106,165 | 8.0% | |
| 147,271 | 11.1% | ||
| Technology | |||
| Apple Inc. | 386,124 | 39,578 | 3.0% |
| Microsoft Corp. | 528,981 | 24,032 | 1.8% |
| International Business Machines Corp. | 60,664 | 11,666 | 0.9% |
| Intel Corp. | 318,853 | 11,134 | 0.8% |
| * Google Inc. Class A | 17,978 | 10,470 | 0.8% |
| * Google Inc. Class C | 18,194 | 10,400 | 0.8% |
| * Facebook Inc. Class A | 126,503 | 9,465 | 0.7% |
| Oracle Corp. | 210,361 | 8,736 | 0.7% |
| QUALCOMM Inc. | 108,174 | 8,232 | 0.6% |
| Cisco Systems Inc. | 328,131 | 8,200 | 0.6% |
| Technology—Other † | 73,949 | 5.6% | |
| 215,862 | 16.3% | ||
| Utilities | |||
| Verizon Communications Inc. | 265,258 | 13,215 | 1.0% |
| AT&T Inc. | 332,460 | 11,623 | 0.9% |
| Utilities—Other † | 44,548 | 3.3% | |
| 69,386 | 5.2% | ||
| Total Common Stocks (Cost $998,158) | 1,316,091 | 99.4%1 | |
14
Russell 1000 Index Fund
| Market | Percentage | |||
| Value | of Net | |||
| Coupon | Shares | ($000) | Assets | |
| Temporary Cash Investments | ||||
| Money Market Fund | ||||
| 2,3 Vanguard Market Liquidity Fund | 0.113% | 5,265,000 | 5,265 | 0.4% |
| 4U.S. Government and Agency Obligations † | 600 | 0.0% | ||
| Total Temporary Cash Investments (Cost $5,865) | 5,865 | 0.4%1 | ||
| 5Total Investments (Cost $1,004,023) | 1,321,956 | 99.8% | ||
| Other Assets and Liabilities | ||||
| Other Assets | 5,255 | 0.4% | ||
| Liabilities3 | (2,970) | (0.2%) | ||
| 2,285 | 0.2% | |||
| Net Assets | 1,324,241 | 100.0% | ||
| At August 31, 2014, net assets consisted of: | ||||
| Amount | ||||
| ($000) | ||||
| Paid-in Capital | 1,004,170 | |||
| Undistributed Net Investment Income | 4,576 | |||
| Accumulated Net Realized Losses | (2,587) | |||
| Unrealized Appreciation (Depreciation) | ||||
| Investment Securities | 317,933 | |||
| Futures Contracts | 149 | |||
| Net Assets | 1,324,241 | |||
| Institutional Shares—Net Assets | ||||
| Applicable to 5,257,735 outstanding $.001 par value shares of | ||||
| beneficial interest (unlimited authorization) | 944,162 | |||
| Net Asset Value Per Share—Institutional Shares | $179.58 | |||
| ETF Shares—Net Assets | ||||
| Applicable to 4,100,000 outstanding $.001 par value shares of | ||||
| beneficial interest (unlimited authorization) | 380,079 | |||
| Net Asset Value Per Share—ETF Shares | $92.70 | |||
See Note A in Notes to Financial Statements.
* Non-income-producing security.
† Represents the aggregate value, by category, of securities that are not among the 50 largest holdings and, in total for any issuer, represent 1% or less of net assets.
1 The fund invests a portion of its cash reserves in equity markets through the use of index futures contracts. After giving effect to futures investments, the fund’s effective common stock and temporary cash investment positions represent 100.0% and -0.2%, respectively, of net assets.
2 Affiliated money market fund available only to Vanguard funds and certain trusts and accounts managed by Vanguard. Rate shown is the 7-day yield.
3 Includes $264,000 of collateral received for securities on loan.
4 Securities with a value of $400,000 have been segregated as initial margin for open futures contracts.
5 The total value of securities on loan is $252,000.
See accompanying Notes, which are an integral part of the Financial Statements.
15
Russell 1000 Index Fund
Statement of Operations
| Year Ended | |
| August 31, 2014 | |
| ($000) | |
| Investment Income | |
| Income | |
| Dividends | 22,397 |
| Interest1 | 7 |
| Securities Lending | 30 |
| Total Income | 22,434 |
| Expenses | |
| The Vanguard Group—Note B | |
| Investment Advisory Services | 183 |
| Management and Administrative—Institutional Shares | 216 |
| Management and Administrative—ETF Shares | 182 |
| Marketing and Distribution—Institutional Shares | 196 |
| Marketing and Distribution—ETF Shares | 63 |
| Custodian Fees | 145 |
| Auditing Fees | 29 |
| Shareholders’ Reports—Institutional Shares | 1 |
| Shareholders’ Reports—ETF Shares | 7 |
| Trustees’ Fees and Expenses | 1 |
| Total Expenses | 1,023 |
| Net Investment Income | 21,411 |
| Realized Net Gain (Loss) | |
| Investment Securities Sold | 43,821 |
| Futures Contracts | 675 |
| Realized Net Gain (Loss) | 44,496 |
| Change in Unrealized Appreciation (Depreciation) | |
| Investment Securities | 182,527 |
| Futures Contracts | 220 |
| Change in Unrealized Appreciation (Depreciation) | 182,747 |
| Net Increase (Decrease) in Net Assets Resulting from Operations | 248,654 |
| 1 Interest income from an affiliated company of the fund was $6,000. | |
See accompanying Notes, which are an integral part of the Financial Statements.
16
Russell 1000 Index Fund
Statement of Changes in Net Assets
| Year Ended August 31, | ||
| 2014 | 2013 | |
| ($000) | ($000) | |
| Increase (Decrease) in Net Assets | ||
| Operations | ||
| Net Investment Income | 21,411 | 15,046 |
| Realized Net Gain (Loss) | 44,496 | 3,609 |
| Change in Unrealized Appreciation (Depreciation) | 182,747 | 103,141 |
| Net Increase (Decrease) in Net Assets Resulting from Operations | 248,654 | 121,796 |
| Distributions | ||
| Net Investment Income | ||
| Institutional Shares | (15,442) | (9,647) |
| ETF Shares | (4,868) | (3,789) |
| Realized Capital Gain | ||
| Institutional Shares | — | — |
| ETF Shares | — | — |
| Total Distributions | (20,310) | (13,436) |
| Capital Share Transactions | ||
| Institutional Shares | 96,033 | 263,546 |
| ETF Shares | 104,477 | 41,569 |
| Net Increase (Decrease) from Capital Share Transactions | 200,510 | 305,115 |
| Total Increase (Decrease) | 428,854 | 413,475 |
| Net Assets | ||
| Beginning of Period | 895,387 | 481,912 |
| End of Period1 | 1,324,241 | 895,387 |
| 1 Net Assets—End of Period includes undistributed (overdistributed) net investment income of $4,576,000 and $3,473,000. | ||
See accompanying Notes, which are an integral part of the Financial Statements.
17
Russell 1000 Index Fund
Financial Highlights
| Institutional Shares | ||||
| Oct. 15, | ||||
| 20101 to | ||||
| Year Ended August 31, | August 31, | |||
| For a Share Outstanding Throughout Each Period | 2014 | 2013 | 2012 | 2011 |
| Net Asset Value, Beginning of Period | $146.04 | $124.53 | $108.35 | $103.49 |
| Investment Operations | ||||
| Net Investment Income | 3.060 | 2.850 | 2.314 | 1.348 |
| Net Realized and Unrealized Gain (Loss) on Investments | 33.485 | 21.424 | 16.100 | 4.569 |
| Total from Investment Operations | 36.545 | 24.274 | 18.414 | 5.917 |
| Distributions | ||||
| Dividends from Net Investment Income | (3.005) | (2.764) | (2.234) | (1.057) |
| Distributions from Realized Capital Gains | — | — | — | — |
| Total Distributions | (3.005) | (2.764) | (2.234) | (1.057) |
| Net Asset Value, End of Period | $179.58 | $146.04 | $124.53 | $108.35 |
| Total Return | 25.24% | 19.73% | 17.25% | 5.67% |
| Ratios/Supplemental Data | ||||
| Net Assets, End of Period (Millions) | $944 | $677 | $334 | $178 |
| Ratio of Total Expenses to Average Net Assets | 0.08% | 0.08% | 0.08% | 0.08%2 |
| Ratio of Net Investment Income to Average Net Assets | 1.89% | 2.13% | 2.10% | 1.90%2 |
| Portfolio Turnover Rate 3 | 7% | 11% | 36% | 20% |
| 1 Inception. 2 Annualized. 3 Excludes the value of portfolio securities received or delivered as a result of in-kind purchases or redemptions of the fund’s capital shares, including ETF Creation Units. | ||||
See accompanying Notes, which are an integral part of the Financial Statements.
18
Russell 1000 Index Fund
Financial Highlights
| ETF Shares | ||||
| Sept. 20, | ||||
| 20101 to | ||||
| Year Ended August 31, | August 31, | |||
| For a Share Outstanding Throughout Each Period | 2014 | 2013 | 2012 | 2011 |
| Net Asset Value, Beginning of Period | $75.40 | $64.29 | $55.94 | $51.78 |
| Investment Operations | ||||
| Net Investment Income | 1.553 | 1.444 | 1.176 | .736 |
| Net Realized and Unrealized Gain (Loss) on Investments | 17.272 | 11.068 | 8.307 | 3.957 |
| Total from Investment Operations | 18.825 | 12.512 | 9.483 | 4.693 |
| Distributions | ||||
| Dividends from Net Investment Income | (1.525) | (1.402) | (1.133) | (.533) |
| Distributions from Realized Capital Gains | — | — | — | — |
| Total Distributions | (1.525) | (1.402) | (1.133) | (.533) |
| Net Asset Value, End of Period | $92.70 | $75.40 | $64.29 | $55.94 |
| Total Return | 25.18% | 19.70% | 17.19% | 9.02% |
| Ratios/Supplemental Data | ||||
| Net Assets, End of Period (Millions) | $380 | $219 | $148 | $14 |
| Ratio of Total Expenses to Average Net Assets | 0.12% | 0.12% | 0.12% | 0.12%2 |
| Ratio of Net Investment Income to Average Net Assets | 1.85% | 2.09% | 2.06% | 1.86%2 |
| Portfolio Turnover Rate 3 | 7% | 11% | 36% | 20% |
| 1 Inception. 2 Annualized. 3 Excludes the value of portfolio securities received or delivered as a result of in-kind purchases or redemptions of the fund’s capital shares, including ETF Creation Units. | ||||
See accompanying Notes, which are an integral part of the Financial Statements.
19
Russell 1000 Index Fund
Notes to Financial Statements
Vanguard Russell 1000 Index Fund is registered under the Investment Company Act of 1940 as an open-end investment company, or mutual fund. The fund offers two classes of shares: Institutional Shares and ETF Shares. Institutional Shares are designed for investors who meet certain administrative, service, and account-size criteria. ETF Shares are listed for trading on Nasdaq; they can be purchased and sold through a broker.
A. The following significant accounting policies conform to generally accepted accounting principles for U.S. investment companies. The fund consistently follows such policies in preparing its financial statements.
1. Security Valuation: Securities are valued as of the close of trading on the New York Stock Exchange (generally 4 p.m., Eastern time) on the valuation date. Equity securities are valued at the latest quoted sales prices or official closing prices taken from the primary market in which each security trades; such securities not traded on the valuation date are valued at the mean of the latest quoted bid and asked prices. Securities for which market quotations are not readily available, or whose values have been materially affected by events occurring before the fund’s pricing time but after the close of the securities’ primary markets, are valued by methods deemed by the board of trustees to represent fair value. Investments in Vanguard Market Liquidity Fund are valued at that fund’s net asset value. Temporary cash investments acquired over 60 days to maturity are valued using the latest bid prices or using valuations based on a matrix system (which considers such factors as security prices, yields, maturities, and ratings), both as furnished by independent pricing services. Other temporary cash investments are valued at amortized cost, which approximates market value.
2. Futures Contracts: The fund uses index futures contracts to a limited extent, with the objectives of maintaining full exposure to the stock market, enhancing returns, maintaining liquidity, and minimizing transaction costs. The fund may purchase futures contracts to immediately invest incoming cash in the market, or sell futures in response to cash outflows, thereby simulating a fully invested position in the underlying index while maintaining a cash balance for liquidity. The fund may seek to enhance returns by using futures contracts instead of the underlying securities when futures are believed to be priced more attractively than the underlying securities. The primary risks associated with the use of futures contracts are imperfect correlation between changes in market values of stocks held by the fund and the prices of futures contracts, and the possibility of an illiquid market. Counterparty risk involving futures is mitigated because a regulated clearinghouse is the counterparty instead of the clearing broker. To further mitigate counterparty risk, the fund trades futures contracts on an exchange, monitors the financial strength of its clearing brokers and clearinghouse, and has entered into clearing agreements with its clearing brokers. The clearinghouse imposes initial margin requirements to secure the fund’s performance and requires daily settlement of variation margin representing changes in the market value of each contract.
Futures contracts are valued at their quoted daily settlement prices. The aggregate settlement values of the contracts are not recorded in the Statement of Net Assets. Fluctuations in the value of the contracts are recorded in the Statement of Net Assets as an asset (liability) and in the Statement of Operations as unrealized appreciation (depreciation) until the contracts are closed, when they are recorded as realized futures gains (losses).
During the year ended August 31, 2014, the fund’s average investments in long and short futures contracts represented less than 1% and 0% of net assets, respectively, based on the average of aggregate settlement values at each quarter-end during the period.
20
Russell 1000 Index Fund
3. Federal Income Taxes: The fund intends to continue to qualify as a regulated investment company and distribute all of its taxable income. Management has analyzed the fund’s tax positions taken for all open federal income tax years (August 31, 2011–2014), and has concluded that no provision for federal income tax is required in the fund’s financial statements.
4. Distributions: Distributions to shareholders are recorded on the ex-dividend date.
5. Securities Lending: To earn additional income, the fund lends its securities to qualified institutional borrowers. Security loans are required to be secured at all times by collateral in an amount at least equal to the market value of securities loaned. Daily market fluctuations could cause the value of loaned securities to be more or less than the value of the collateral received. When this occurs, the collateral is adjusted and settled on the next business day. The fund further mitigates its counterparty risk by entering into securities lending transactions only with a diverse group of prequalified counterparties, monitoring their financial strength, and entering into master securities lending agreements with its counterparties. The master securities lending agreements provide that, in the event of a counterparty’s default (including bankruptcy), the fund may terminate any loans with that borrower, determine the net amount owed, and sell or retain the collateral up to the net amount owed to the fund; however, such actions may be subject to legal proceedings. While collateral mitigates counterparty risk, in the absence of a default the fund may experience delays and costs in recovering the securities loaned. The fund invests cash collateral received in Vanguard Market Liquidity Fund, and records a liability in the Statement of Net Assets for the return of the collateral, during the period the securities are on loan. Securities lending income represents fees charged to borrowers plus income earned on invested cash collateral, less expenses associated with the loan.
6. Credit Facility: The fund and certain other funds managed by The Vanguard Group participate in a $2.89 billion committed credit facility provided by a syndicate of lenders pursuant to a credit agreement that may be renewed annually; each fund is individually liable for its borrowings, if any, under the credit facility. Borrowings may be utilized for temporary and emergency purposes, and are subject to the fund’s regulatory and contractual borrowing restrictions. The participating funds are charged administrative fees and an annual commitment fee of 0.06% of the undrawn amount of the facility; these fees are allocated to the funds based on a method approved by the fund’s board of trustees and included in Management and Administrative expenses on the fund’s Statement of Operations. Any borrowings under this facility bear interest at a rate equal to the higher of the federal funds rate or LIBOR reference rate plus an agreed-upon spread.
The fund had no borrowings outstanding at August 31, 2014, or at any time during the period then ended.
7. Other: Dividend income is recorded on the ex-dividend date. Interest income includes income distributions received from Vanguard Market Liquidity Fund and is accrued daily. Premiums and discounts on debt securities purchased are amortized and accreted, respectively, to interest income over the lives of the respective securities. Security transactions are accounted for on the date securities are bought or sold. Costs used to determine realized gains (losses) on the sale of investment securities are those of the specific securities sold.
Each class of shares has equal rights as to assets and earnings, except that each class separately bears certain class-specific expenses related to maintenance of shareholder accounts (included in Management and Administrative expenses) and shareholder reporting. Marketing and distribution expenses are allocated to each class of shares based on a method approved by the board of trustees. Income, other non-class-specific expenses, and gains and losses on investments are allocated to each class of shares based on its relative net assets.
21
Russell 1000 Index Fund
B. The Vanguard Group furnishes at cost investment advisory, corporate management, administrative, marketing, and distribution services. The costs of such services are allocated to the fund based on methods approved by the board of trustees. The fund has committed to provide up to 0.40% of its net assets in capital contributions to Vanguard. At August 31, 2014, the fund had contributed capital of $126,000 to Vanguard (included in Other Assets), representing 0.01% of the fund’s net assets and 0.05% of Vanguard’s capitalization. The fund’s trustees and officers are also directors and officers of Vanguard.
C. Various inputs may be used to determine the value of the fund’s investments. These inputs are summarized in three broad levels for financial statement purposes. The inputs or methodologies used to value securities are not necessarily an indication of the risk associated with investing in those securities.
Level 1—Quoted prices in active markets for identical securities.
Level 2—Other significant observable inputs (including quoted prices for similar securities, interest rates, prepayment speeds, credit risk, etc.).
Level 3—Significant unobservable inputs (including the fund’s own assumptions used to determine the fair value of investments).
The following table summarizes the market value of the fund’s investments as of August 31, 2014, based on the inputs used to value them:
| Level 1 | Level 2 | Level 3 | |
| Investments | ($000) | ($000) | ($000) |
| Common Stocks | 1,316,091 | — | — |
| Temporary Cash Investments | 5,265 | 600 | — |
| Futures Contracts—Assets1 | 22 | — | — |
| Total | 1,321,378 | 600 | — |
| 1 Represents variation margin on the last day of the reporting period. | |||
D. At August 31, 2014, the aggregate settlement value of open futures contracts and the related unrealized appreciation (depreciation) were:
| ($000) | ||||
| Aggregate | ||||
| Number of | Settlement | Unrealized | ||
| Long (Short) | Value | Appreciation | ||
| Futures Contracts | Expiration | Contracts | Long (Short) | (Depreciation) |
| E-mini S&P 500 Index | September 2014 | 77 | 7,706 | 127 |
| E-mini S&P MidCap 400 Index | September 2014 | 6 | 862 | 22 |
| 149 |
Unrealized appreciation (depreciation) on open futures contracts is required to be treated as realized gain (loss) for tax purposes.
22
Russell 1000 Index Fund
E. Distributions are determined on a tax basis and may differ from net investment income and realized capital gains for financial reporting purposes. Differences may be permanent or temporary. Permanent differences are reclassified among capital accounts in the financial statements to reflect their tax character. Temporary differences arise when certain items of income, expense, gain, or loss are recognized in different periods for financial statement and tax purposes. These differences will reverse at some time in the future. Differences in classification may also result from the treatment of short-term gains as ordinary income for tax purposes.
During the year ended August 31, 2014, the fund realized $44,453,000 of net capital gains resulting from in-kind redemptions—in which shareholders exchanged fund shares for securities held by the fund rather than for cash. Because such gains are not taxable to the fund, and are not distributed to shareholders, they have been reclassified from accumulated net realized losses to paid-in capital.
For tax purposes, at August 31, 2014, the fund had $4,809,000 of ordinary income available for distribution. The fund had available capital losses totaling $2,437,000 that may be carried forward indefinitely to offset future net capital gains.
At August 31, 2014, the cost of investment securities for tax purposes was $1,004,063,000. Net unrealized appreciation of investment securities for tax purposes was $317,893,000, consisting of unrealized gains of $321,616,000 on securities that had risen in value since their purchase and $3,723,000 in unrealized losses on securities that had fallen in value since their purchase.
F. During the year ended August 31, 2014, the fund purchased $393,486,000 of investment securities and sold $196,675,000 of investment securities, other than temporary cash investments. Purchases and sales include $138,900,000 and $118,562,000, respectively, in connection with in-kind purchases and redemptions of the fund’s capital shares.
G. Capital share transactions for each class of shares were:
| Year Ended August 31, | |||||
| 2014 | 2013 | ||||
| Amount | Shares | Amount | Shares | ||
| ($000) | (000) | ($000) | (000) | ||
| Institutional Shares | |||||
| Issued | 215,100 | 1,353 | 298,339 | 2,195 | |
| Issued in Lieu of Cash Distributions | 14,324 | 87 | 8,779 | 66 | |
| Redeemed | (133,391) | (816) | (43,572) | (309) | |
| Net Increase (Decrease)—Institutional Shares | 96,033 | 624 | 263,546 | 1,952 | |
| ETF Shares | |||||
| Issued | 225,033 | 2,600 | 45,250 | 650 | |
| Issued in Lieu of Cash Distributions | — | — | — | — | |
| Redeemed | (120,556) | (1,400) | (3,681) | (50) | |
| Net Increase (Decrease)—ETF Shares | 104,477 | 1,200 | 41,569 | 600 | |
H. Management has determined that no material events or transactions occurred subsequent to August 31, 2014, that would require recognition or disclosure in these financial statements.
23
Russell 1000 Value Index Fund
Fund Profile
As of August 31, 2014
| Share-Class Characteristics | ||
| Institutional | ETF | |
| Shares | Shares | |
| Ticker Symbol | VRVIX | VONV |
| Expense Ratio1 | 0.08% | 0.15% |
| 30-Day SEC Yield | 2.29% | 2.25% |
| Portfolio Characteristics | |||
| DJ | |||
| U.S. | |||
| Russell | Total | ||
| 1000 | Market | ||
| Value | FA | ||
| Fund | Index | Index | |
| Number of Stocks | 691 | 690 | 3,709 |
| Median Market Cap | $57.8B | $57.8B | $48.0B |
| Price/Earnings Ratio | 18.0x | 18.0x | 20.7x |
| Price/Book Ratio | 1.8x | 1.8x | 2.7x |
| Return on Equity | 13.8% | 13.8% | 17.8% |
| Earnings Growth | |||
| Rate | 12.9% | 12.9% | 15.3% |
| Dividend Yield | 2.3% | 2.3% | 1.8% |
| Foreign Holdings | 0.0% | 0.0% | 0.0% |
| Turnover Rate | 16% | — | — |
| Short-Term Reserves | -0.2% | — | — |
| Sector Diversification (% of equity exposure) | |||
| DJ | |||
| U.S. | |||
| Russell | Total | ||
| 1000 | Market | ||
| Value | FA | ||
| Fund | Index | Index | |
| Consumer Discretionary | 7.5% | 7.5% | 14.1% |
| Consumer Staples | 5.8 | 5.8 | 7.2 |
| Energy | 13.6 | 13.6 | 9.7 |
| Financial Services | 29.1 | 29.1 | 18.7 |
| Health Care | 13.1 | 13.1 | 13.2 |
| Materials & Processing | 3.6 | 3.6 | 4.5 |
| Producer Durables | 10.2 | 10.2 | 11.3 |
| Technology | 8.8 | 8.8 | 16.1 |
| Utilities | 8.3 | 8.3 | 5.2 |
| Volatility Measures | ||
| Russell | DJ | |
| 1000 | U.S. Total | |
| Value | Market | |
| Index | FA Index | |
| R-Squared | 1.00 | 0.96 |
| Beta | 1.00 | 0.97 |
| These measures show the degree and timing of the fund’s fluctuations compared with the indexes over 36 months. | ||
| Ten Largest Holdings (% of total net assets) | ||
| Exxon Mobil Corp. | Oil: Integrated | 4.2% |
| General Electric Co. | Diversified | |
| Manufacturing | ||
| Operations | 2.6 | |
| Berkshire Hathaway Inc. Insurance: Multi-Line | 2.5 | |
| Johnson & Johnson | Pharmaceuticals | 2.4 |
| Chevron Corp. | Oil: Integrated | 2.4 |
| Wells Fargo & Co. | Banks: Diversified | 2.4 |
| JPMorgan Chase & Co. | Diversified Financial | |
| Services | 2.2 | |
| Procter & Gamble Co. | Personal Care | 2.1 |
| Pfizer Inc. | Pharmaceuticals | 1.8 |
| AT&T Inc. | Utilities: | |
| Telecommunications | 1.8 | |
| Top Ten | 24.4% | |
| The holdings listed exclude any temporary cash investments and equity index products. | ||
Investment Focus
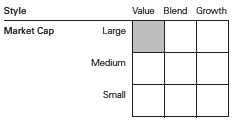
1 The expense ratios shown are from the prospectus dated December 20, 2013, and represent estimated costs for the current fiscal year. For the fiscal year ended August 31, 2014, the expense ratios were 0.08% for Institutional Shares and 0.12% for ETF Shares.
24
Russell 1000 Value Index Fund
Performance Summary
All of the returns in this report represent past performance, which is not a guarantee of future results that may be achieved by the fund. (Current performance may be lower or higher than the performance data cited. For performance data current to the most recent month-end, visit our website at vanguard.com/performance.) Note, too, that both investment returns and principal value can fluctuate widely, so an investor’s shares, when sold, could be worth more or less than their original cost. The returns shown do not reflect taxes that a shareholder would pay on fund distributions or on the sale of fund shares.
Cumulative Performance: September 20, 2010, Through August 31, 2014
Initial Investment of $10,000
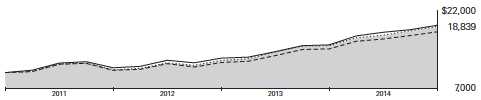
| Average Annual Total Returns | ||||
| Periods Ended August 31, 2014 | ||||
| Since | Final Value | |||
| One | Inception | of a $10,000 | ||
| Year | (9/20/2010) | Investment | ||
| Russell 1000 Value Index Fund*ETF | ||||
| Shares Net Asset Value | 24.27% | 17.41% | $18,839 | |
| Russell 1000 Value Index Fund*ETF | ||||
| Shares Market Price | 24.28 | 17.41 | 18,838 | |
| •••••••• | Russell 1000 Value Index | 24.43 | 17.59 | 18,950 |
| – – – – | Large-Cap Value Funds Average | 22.67 | 15.91 | 17,905 |
| Dow Jones U.S. Total Stock Market | ||||
| Float Adjusted Index | 24.68 | 17.95 | 19,178 | |
| Large-Cap Value Funds Average: Derived from data provided by Lipper, a Thomson Reuters Company. "Since Inception" performance is calculated from the ETF Shares’ inception date for both the fund and its comparative standards. | ||||
| Since | Final Value | ||
| One | Inception | of a $5,000,000 | |
| Year | (12/10/2010) | Investment | |
| Russell 1000 Value Index Fund Institutional | |||
| Shares | 24.33% | 16.32% | $8,778,430 |
| Russell 1000 Value Index | 24.43 | 16.42 | 8,805,811 |
| Dow Jones U.S. Total Stock Market Float | |||
| Adjusted Index | 24.68 | 16.05 | 8,703,657 |
| "Since Inception" performance is calculated from the Institutional Shares’ inception date for both the fund and its comparative standards. | |||
See Financial Highlights for dividend and capital gains information.
25
Russell 1000 Value Index Fund
| Cumulative Returns of ETF Shares: September 20, 2010, Through August 31, 2014 | ||
| Since | ||
| One | Inception | |
| Year | (9/20/2010) | |
| Russell 1000 Value Index Fund ETF Shares Market | ||
| Price | 24.28% | 88.38% |
| Russell 1000 Value Index Fund ETF Shares Net | ||
| Asset Value | 24.27 | 88.39 |
| Russell 1000 Value Index | 24.43 | 89.50 |
| "Since Inception" performance is calculated from the ETF Shares’ inception date for both the fund and its comparative standards. | ||
Fiscal-Year Total Returns (%): September 20, 2010, Through August 31, 2014
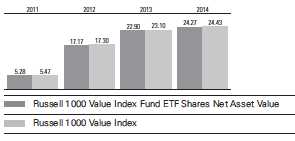
Average Annual Total Returns: Periods Ended June 30, 2014
This table presents returns through the latest calendar quarter—rather than through the end of the fiscal period.
Securities and Exchange Commission rules require that we provide this information.
| Inception | One | Since | |
| Date | Year | Inception | |
| Institutional Shares | 12/10/2010 | 23.71% | 16.55% |
| ETF Shares | 9/20/2010 | ||
| Market Price | 23.67 | 17.69 | |
| Net Asset Value | 23.65 | 17.68 |
26
Russell 1000 Value Index Fund
Financial Statements
Statement of Net Assets—Investments Summary
As of August 31, 2014
This Statement summarizes the fund’s holdings by asset type. Details are reported for each of the fund’s 50 largest individual holdings and for investments that, in total for any issuer, represent more than 1% of the fund’s net assets. The total value of smaller holdings is reported as a single amount within each category.
The fund reports a complete list of its holdings in regulatory filings four times in each fiscal year, at the quarter-ends. For the second and fourth fiscal quarters, the complete listing of the fund’s holdings is available electronically on vanguard.com and on the Securities and Exchange Commission’s website (sec.gov), or you can have it mailed to you without charge by calling 800-662-7447. For the first and third fiscal quarters, the fund files the lists with the SEC on Form N-Q. Shareholders can look up the fund’s Forms N-Q on the SEC’s website. Forms N-Q may also be reviewed and copied at the SEC’s Public Reference Room (see the back cover of this report for further information).
| Market | Percentage | ||
| Value | of Net | ||
| Shares | ($000) | Assets | |
| Common Stocks | |||
| Consumer Discretionary | |||
| Wal-Mart Stores Inc. | 211,702 | 15,984 | 1.1% |
| Time Warner Inc. | 130,561 | 10,057 | 0.7% |
| Ford Motor Co. | 574,792 | 10,007 | 0.7% |
| General Motors Co. | 237,538 | 8,266 | 0.5% |
| Consumer Discretionary—Other † | 67,864 | 4.5% | |
| 112,178 | 7.5% | ||
| Consumer Staples | |||
| Procter & Gamble Co. | 377,485 | 31,373 | 2.1% |
| CVS Caremark Corp. | 148,466 | 11,796 | 0.8% |
| Mondelez International Inc. Class A | 250,553 | 9,068 | 0.6% |
| Philip Morris International Inc. | 96,255 | 8,238 | 0.5% |
| Consumer Staples—Other † | 26,389 | 1.8% | |
| 86,864 | 5.8% | ||
| Energy | |||
| Exxon Mobil Corp. | 635,250 | 63,182 | 4.2% |
| Chevron Corp. | 281,465 | 36,436 | 2.4% |
| ConocoPhillips | 181,642 | 14,753 | 1.0% |
| Occidental Petroleum Corp. | 116,289 | 12,063 | 0.8% |
| Anadarko Petroleum Corp. | 69,414 | 7,822 | 0.5% |
| Apache Corp. | 56,917 | 5,796 | 0.4% |
| Energy—Other † | 64,479 | 4.3% | |
| 204,531 | 13.6% | ||
| Financial Services | |||
| * Berkshire Hathaway Inc. Class B | 270,570 | 37,136 | 2.5% |
| Wells Fargo & Co. | 706,456 | 36,340 | 2.4% |
| JPMorgan Chase & Co. | 559,898 | 33,286 | 2.2% |
| Bank of America Corp. | 1,555,487 | 25,028 | 1.7% |
| Citigroup Inc. | 449,342 | 23,209 | 1.5% |
| American International Group Inc. | 214,055 | 12,000 | 0.8% |
| Goldman Sachs Group Inc. | 66,154 | 11,849 | 0.8% |
27
Russell 1000 Value Index Fund
| Market | Percentage | ||
| Value | of Net | ||
| Shares | ($000) | Assets | |
| US Bancorp | 254,341 | 10,754 | 0.7% |
| Morgan Stanley | 227,252 | 7,797 | 0.5% |
| MetLife Inc. | 138,152 | 7,562 | 0.5% |
| Capital One Financial Corp. | 84,736 | 6,953 | 0.5% |
| PNC Financial Services Group Inc. | 78,898 | 6,687 | 0.5% |
| Bank of New York Mellon Corp. | 169,086 | 6,625 | 0.4% |
| Prudential Financial Inc. | 67,898 | 6,090 | 0.4% |
| Financial Services—Other † | 206,559 | 13.7% | |
| 437,875 | 29.1% | ||
| Health Care | |||
| Johnson & Johnson | 352,781 | 36,594 | 2.4% |
| Pfizer Inc. | 943,565 | 27,731 | 1.9% |
| Merck & Co. Inc. | 371,819 | 22,350 | 1.5% |
| UnitedHealth Group Inc. | 144,985 | 12,567 | 0.8% |
| Medtronic Inc. | 147,784 | 9,436 | 0.6% |
| Abbott Laboratories | 222,476 | 9,397 | 0.6% |
| Eli Lilly & Co. | 145,667 | 9,259 | 0.6% |
| Bristol-Myers Squibb Co. | 157,847 | 7,995 | 0.5% |
| Covidien plc | 66,611 | 5,784 | 0.4% |
| Health Care—Other † | 55,009 | 3.7% | |
| 196,122 | 13.0% | ||
| Materials & Processing | |||
| Dow Chemical Co. | 149,872 | 8,026 | 0.5% |
| Materials & Processing—Other † | 46,510 | 3.1% | |
| 54,536 | 3.6% | ||
| Producer Durables | |||
| General Electric Co. | 1,483,316 | 38,537 | 2.5% |
| United Technologies Corp. | 120,417 | 13,003 | 0.9% |
| Caterpillar Inc. | 72,855 | 7,946 | 0.5% |
| Producer Durables—Other † | 93,169 | 6.2% | |
| 152,655 | 10.1% | ||
| Technology | |||
| Intel Corp. | 673,771 | 23,528 | 1.6% |
| Microsoft Corp. | 431,318 | 19,595 | 1.3% |
| Cisco Systems Inc. | 757,759 | 18,936 | 1.3% |
| Hewlett-Packard Co. | 280,544 | 10,661 | 0.7% |
| EMC Corp. | 273,303 | 8,071 | 0.5% |
| Technology—Other † | 51,601 | 3.4% | |
| 132,392 | 8.8% | ||
| Utilities | |||
| AT&T Inc. | 767,807 | 26,843 | 1.8% |
| Duke Energy Corp. | 104,498 | 7,732 | 0.5% |
| NextEra Energy Inc. | 64,377 | 6,338 | 0.4% |
| Southern Co. | 131,617 | 5,844 | 0.4% |
| Utilities—Other † | 78,481 | 5.2% | |
| 125,238 | 8.3% | ||
| Total Common Stocks (Cost $1,216,387) | 1,502,391 | 99.8%1 |
28
Russell 1000 Value Index Fund
| Market | Percentage | |||
| Value | of Net | |||
| Coupon | Shares | ($000) | Assets | |
| Temporary Cash Investments | ||||
| Money Market Fund | ||||
| 2,3 Vanguard Market Liquidity Fund | 0.113% | 225,801 | 226 | 0.0% |
| 4U.S. Government and Agency Obligations † | 200 | 0.0% | ||
| Total Temporary Cash Investments (Cost $426) | 426 | 0.0%1 | ||
| 5Total Investments (Cost $1,216,813) | 1,502,817 | 99.8% | ||
| Other Assets and Liabilities | ||||
| Other Assets | 5,132 | 0.4% | ||
| Liabilities3 | (2,864) | (0.2%) | ||
| 2,268 | 0.2% | |||
| Net Assets | 1,505,085 | 100.0% | ||
| At August 31, 2014, net assets consisted of: | |
| Amount | |
| ($000) | |
| Paid-in Capital | 1,214,445 |
| Undistributed Net Investment Income | 6,673 |
| Accumulated Net Realized Losses | (2,110) |
| Unrealized Appreciation (Depreciation) | |
| Investment Securities | 286,004 |
| Futures Contracts | 73 |
| Net Assets | 1,505,085 |
| Institutional Shares—Net Assets | |
| Applicable to 6,968,319 outstanding $.001 par value shares of | |
| beneficial interest (unlimited authorization) | 1,222,110 |
| Net Asset Value Per Share—Institutional Shares | $175.38 |
| ETF Shares—Net Assets | |
| Applicable to 3,150,000 outstanding $.001 par value shares of | |
| beneficial interest (unlimited authorization) | 282,975 |
| Net Asset Value Per Share—ETF Shares | $89.83 |
See Note A in Notes to Financial Statements.
* Non-income-producing security.
† Represents the aggregate value, by category, of securities that are not among the 50 largest holdings and, in total for any issuer, represent 1% or less of net assets.
1 The fund invests a portion of its cash reserves in equity markets through the use of index futures contracts. After giving effect to futures investments, the fund’s effective common stock and temporary cash investment positions represent 100.0% and -0.2%, respectively, of net assets.
2 Affiliated money market fund available only to Vanguard funds and certain trusts and accounts managed by Vanguard. Rate shown is the 7-day yield.
3 Includes $226,000 of collateral received for securities on loan.
4 Securities with a value of $100,000 have been segregated as initial margin for open futures contracts.
5 The total value of securities on loan is $209,000.
See accompanying Notes, which are an integral part of the Financial Statements.
29
Russell 1000 Value Index Fund
Statement of Operations
| Year Ended | |
| August 31, 2014 | |
| ($000) | |
| Investment Income | |
| Income | |
| Dividends | 29,724 |
| Interest1 | 5 |
| Securities Lending | 41 |
| Total Income | 29,770 |
| Expenses | |
| The Vanguard Group—Note B | |
| Investment Advisory Services | 204 |
| Management and Administrative—Institutional Shares | 337 |
| Management and Administrative—ETF Shares | 141 |
| Marketing and Distribution—Institutional Shares | 241 |
| Marketing and Distribution—ETF Shares | 45 |
| Custodian Fees | 85 |
| Auditing Fees | 29 |
| Shareholders’ Reports—Institutional Shares | 6 |
| Shareholders’ Reports—ETF Shares | 6 |
| Trustees’ Fees and Expenses | 1 |
| Total Expenses | 1,095 |
| Net Investment Income | 28,675 |
| Realized Net Gain (Loss) | |
| Investment Securities Sold | 71,562 |
| Futures Contracts | 556 |
| Realized Net Gain (Loss) | 72,118 |
| Change in Unrealized Appreciation (Depreciation) | |
| Investment Securities | 164,907 |
| Futures Contracts | 73 |
| Change in Unrealized Appreciation (Depreciation) | 164,980 |
| Net Increase (Decrease) in Net Assets Resulting from Operations | 265,773 |
| 1 Interest income from an affiliated company of the fund was $4,000. | |
See accompanying Notes, which are an integral part of the Financial Statements.
30
Russell 1000 Value Index Fund
Statement of Changes in Net Assets
| Year Ended August 31, | ||
| 2014 | 2013 | |
| ($000) | ($000) | |
| Increase (Decrease) in Net Assets | ||
| Operations | ||
| Net Investment Income | 28,675 | 19,480 |
| Realized Net Gain (Loss) | 72,118 | 44,651 |
| Change in Unrealized Appreciation (Depreciation) | 164,980 | 92,562 |
| Net Increase (Decrease) in Net Assets Resulting from Operations | 265,773 | 156,693 |
| Distributions | ||
| Net Investment Income | ||
| Institutional Shares | (22,663) | (15,933) |
| ETF Shares | (3,927) | (2,071) |
| Realized Capital Gain | ||
| Institutional Shares | — | — |
| ETF Shares | — | — |
| Total Distributions | (26,590) | (18,004) |
| Capital Share Transactions | ||
| Institutional Shares | 224,692 | 134,199 |
| ETF Shares | 107,531 | 73,821 |
| Net Increase (Decrease) from Capital Share Transactions | 332,223 | 208,020 |
| Total Increase (Decrease) | 571,406 | 346,709 |
| Net Assets | ||
| Beginning of Period | 933,679 | 586,970 |
| End of Period1 | 1,505,085 | 933,679 |
| 1 Net Assets—End of Period includes undistributed (overdistributed) net investment income of $6,673,000 and $4,578,000. | ||
See accompanying Notes, which are an integral part of the Financial Statements.
31
Russell 1000 Value Index Fund
Financial Highlights
| Institutional Shares | ||||
| Dec. 10, | ||||
| 20101 to | ||||
| Year Ended August 31, | August 31, | |||
| For a Share Outstanding Throughout Each Period | 2014 | 2013 | 2012 | 2011 |
| Net Asset Value, Beginning of Period | $144.13 | $120.04 | $104.59 | $108.03 |
| Investment Operations | ||||
| Net Investment Income | 3.528 | 3.228 | 2.474 | 1.239 |
| Net Realized and Unrealized Gain (Loss) on Investments | 31.182 | 24.017 | 15.262 | (3.373) |
| Total from Investment Operations | 34.710 | 27.245 | 17.736 | (2.134) |
| Distributions | ||||
| Dividends from Net Investment Income | (3.460) | (3.155) | (2.286) | (1.306) |
| Distributions from Realized Capital Gains | — | — | — | — |
| Total Distributions | (3.460) | (3.155) | (2.286) | (1.306) |
| Net Asset Value, End of Period | $175.38 | $144.13 | $120.04 | $104.59 |
| Total Return | 24.33% | 23.00% | 17.23% | -2.06% |
| Ratios/Supplemental Data | ||||
| Net Assets, End of Period (Millions) | $1,222 | $797 | $541 | $164 |
| Ratio of Total Expenses to Average Net Assets | 0.08% | 0.08% | 0.08% | 0.08%2 |
| Ratio of Net Investment Income to Average Net Assets | 2.26% | 2.46% | 2.55% | 2.30%2 |
| Portfolio Turnover Rate 3 | 16% | 26% | 29% | 39% |
| 1 Inception. 2 Annualized. 3 Excludes the value of portfolio securities received or delivered as a result of in-kind purchases or redemptions of the fund’s capital shares, including ETF Creation Units. | ||||
See accompanying Notes, which are an integral part of the Financial Statements
32
Russell 1000 Value Index Fund
Financial Highlights
| ETF Shares | ||||
| Sept. 20, | ||||
| 20101 to | ||||
| Year Ended August 31, | August 31, | |||
| For a Share Outstanding Throughout Each Period | 2014 | 2013 | 2012 | 2011 |
| Net Asset Value, Beginning of Period | $73.82 | $61.49 | $53.57 | $51.46 |
| Investment Operations | ||||
| Net Investment Income | 1.774 | 1.610 | 1.228 | .876 |
| Net Realized and Unrealized Gain (Loss) on Investments | 15.967 | 12.290 | 7.833 | 1.886 |
| Total from Investment Operations | 17.741 | 13.900 | 9.061 | 2.762 |
| Distributions | ||||
| Dividends from Net Investment Income | (1.731) | (1.570) | (1.141) | (.652) |
| Distributions from Realized Capital Gains | — | — | — | — |
| Total Distributions | (1.731) | (1.570) | (1.141) | (.652) |
| Net Asset Value, End of Period | $89.83 | $73.82 | $61.49 | $53.57 |
| Total Return | 24.27% | 22.90% | 17.17% | 5.28% |
| Ratios/Supplemental Data | ||||
| Net Assets, End of Period (Millions) | $283 | $137 | $46 | $27 |
| Ratio of Total Expenses to Average Net Assets | 0.12% | 0.15% | 0.15% | 0.15%2 |
| Ratio of Net Investment Income to Average Net Assets | 2.22% | 2.39% | 2.48% | 2.23%2 |
| Portfolio Turnover Rate 3 | 16% | 26% | 29% | 39% |
| 1 Inception. 2 Annualized. 3 Excludes the value of portfolio securities received or delivered as a result of in-kind purchases or redemptions of the fund’s capital shares, including ETF Creation Units. | ||||
See accompanying Notes, which are an integral part of the Financial Statements.
33
Russell 1000 Value Index Fund
Notes to Financial Statements
Vanguard Russell 1000 Value Index Fund is registered under the Investment Company Act of 1940 as an open-end investment company, or mutual fund. The fund offers two classes of shares: Institutional Shares and ETF Shares. Institutional Shares are designed for investors who meet certain administrative, service, and account-size criteria. ETF Shares are listed for trading on Nasdaq; they can be purchased and sold through a broker.
A. The following significant accounting policies conform to generally accepted accounting principles for U.S. investment companies. The fund consistently follows such policies in preparing its financial statements.
1. Security Valuation: Securities are valued as of the close of trading on the New York Stock Exchange (generally 4 p.m., Eastern time) on the valuation date. Equity securities are valued at the latest quoted sales prices or official closing prices taken from the primary market in which each security trades; such securities not traded on the valuation date are valued at the mean of the latest quoted bid and asked prices. Securities for which market quotations are not readily available, or whose values have been materially affected by events occurring before the fund’s pricing time but after the close of the securities’ primary markets, are valued by methods deemed by the board of trustees to represent fair value. Investments in Vanguard Market Liquidity Fund are valued at that fund’s net asset value. Temporary cash investments acquired over 60 days to maturity are valued using the latest bid prices or using valuations based on a matrix system (which considers such factors as security prices, yields, maturities, and ratings), both as furnished by independent pricing services. Other temporary cash investments are valued at amortized cost, which approximates market value.
2. Futures Contracts: The fund uses index futures contracts to a limited extent, with the objectives of maintaining full exposure to the stock market, enhancing returns, maintaining liquidity, and minimizing transaction costs. The fund may purchase futures contracts to immediately invest incoming cash in the market, or sell futures in response to cash outflows, thereby simulating a fully invested position in the underlying index while maintaining a cash balance for liquidity. The fund may seek to enhance returns by using futures contracts instead of the underlying securities when futures are believed to be priced more attractively than the underlying securities. The primary risks associated with the use of futures contracts are imperfect correlation between changes in market values of stocks held by the fund and the prices of futures contracts, and the possibility of an illiquid market. Counterparty risk involving futures is mitigated because a regulated clearinghouse is the counterparty instead of the clearing broker. To further mitigate counterparty risk, the fund trades futures contracts on an exchange, monitors the financial strength of its clearing brokers and clearinghouse, and has entered into clearing agreements with its clearing brokers. The clearinghouse imposes initial margin requirements to secure the fund’s performance and requires daily settlement of variation margin representing changes in the market value of each contract.
Futures contracts are valued at their quoted daily settlement prices. The aggregate settlement values of the contracts are not recorded in the Statement of Net Assets. Fluctuations in the value of the contracts are recorded in the Statement of Net Assets as an asset (liability) and in the Statement of Operations as unrealized appreciation (depreciation) until the contracts are closed, when they are recorded as realized futures gains (losses).
During the year ended August 31, 2014, the fund’s average investments in long and short futures contracts represented less than 1% and 0% of net assets, respectively, based on the average of aggregate settlement values at each quarter-end during the period.
34
Russell 1000 Value Index Fund
3. Federal Income Taxes: The fund intends to continue to qualify as a regulated investment company and distribute all of its taxable income. Management has analyzed the fund’s tax positions taken for all open federal income tax years (August 31, 2011–2014), and has concluded that no provision for federal income tax is required in the fund’s financial statements.
4. Distributions: Distributions to shareholders are recorded on the ex-dividend date.
5. Securities Lending: To earn additional income, the fund lends its securities to qualified institutional borrowers. Security loans are required to be secured at all times by collateral in an amount at least equal to the market value of securities loaned. Daily market fluctuations could cause the value of loaned securities to be more or less than the value of the collateral received. When this occurs, the collateral is adjusted and settled on the next business day. The fund further mitigates its counterparty risk by entering into securities lending transactions only with a diverse group of prequalified counterparties, monitoring their financial strength, and entering into master securities lending agreements with its counterparties. The master securities lending agreements provide that, in the event of a counterparty’s default (including bankruptcy), the fund may terminate any loans with that borrower, determine the net amount owed, and sell or retain the collateral up to the net amount owed to the fund; however, such actions may be subject to legal proceedings. While collateral mitigates counterparty risk, in the absence of a default the fund may experience delays and costs in recovering the securities loaned. The fund invests cash collateral received in Vanguard Market Liquidity Fund, and records a liability in the Statement of Net Assets for the return of the collateral, during the period the securities are on loan. Securities lending income represents fees charged to borrowers plus income earned on invested cash collateral, less expenses associated with the loan.
6. Credit Facility: The fund and certain other funds managed by The Vanguard Group participate in a $2.89 billion committed credit facility provided by a syndicate of lenders pursuant to a credit agreement that may be renewed annually; each fund is individually liable for its borrowings, if any, under the credit facility. Borrowings may be utilized for temporary and emergency purposes, and are subject to the fund’s regulatory and contractual borrowing restrictions. The participating funds are charged administrative fees and an annual commitment fee of 0.06% of the undrawn amount of the facility; these fees are allocated to the funds based on a method approved by the fund’s board of trustees and included in Management and Administrative expenses on the fund’s Statement of Operations. Any borrowings under this facility bear interest at a rate equal to the higher of the federal funds rate or LIBOR reference rate plus an agreed-upon spread.
The fund had no borrowings outstanding at August 31, 2014, or at any time during the period then ended.
7. Other: Dividend income is recorded on the ex-dividend date. Interest income includes income distributions received from Vanguard Market Liquidity Fund and is accrued daily. Premiums and discounts on debt securities purchased are amortized and accreted, respectively, to interest income over the lives of the respective securities. Security transactions are accounted for on the date securities are bought or sold. Costs used to determine realized gains (losses) on the sale of investment securities are those of the specific securities sold.
Each class of shares has equal rights as to assets and earnings, except that each class separately bears certain class-specific expenses related to maintenance of shareholder accounts (included in Management and Administrative expenses) and shareholder reporting. Marketing and distribution
35
Russell 1000 Value Index Fund
expenses are allocated to each class of shares based on a method approved by the board of trustees. Income, other non-class-specific expenses, and gains and losses on investments are allocated to each class of shares based on its relative net assets.
B. The Vanguard Group furnishes at cost investment advisory, corporate management, administrative, marketing, and distribution services. The costs of such services are allocated to the fund based on methods approved by the board of trustees. The fund has committed to provide up to 0.40% of its net assets in capital contributions to Vanguard. At August 31, 2014, the fund had contributed capital of $144,000 to Vanguard (included in Other Assets), representing 0.01% of the fund’s net assets and 0.06% of Vanguard’s capitalization. The fund’s trustees and officers are also directors and officers of Vanguard.
C. Various inputs may be used to determine the value of the fund’s investments. These inputs are summarized in three broad levels for financial statement purposes. The inputs or methodologies used to value securities are not necessarily an indication of the risk associated with investing in those securities.
Level 1—Quoted prices in active markets for identical securities.
Level 2—Other significant observable inputs (including quoted prices for similar securities, interest rates, prepayment speeds, credit risk, etc.).
Level 3—Significant unobservable inputs (including the fund’s own assumptions used to determine the fair value of investments).
| The following table summarizes the market value of the fund’s investments as of August 31, 2014, | |||
| based on the inputs used to value them: | |||
| Level 1 | Level 2 | Level 3 | |
| Investments | ($000) | ($000) | ($000) |
| Common Stocks | 1,502,391 | — | — |
| Temporary Cash Investments | 226 | 200 | — |
| Futures Contracts—Assets1 | 8 | — | — |
| Total | 1,502,625 | 200 | — |
| 1 Represents variation margin on the last day of the reporting period. | |||
D. At August 31, 2014, the aggregate settlement value of open futures contracts and the related unrealized appreciation (depreciation) were:
| ($000) | ||||
| Aggregate | ||||
| Number of | Settlement | Unrealized | ||
| Long (Short) | Value | Appreciation | ||
| Futures Contracts | Expiration | Contracts | Long (Short) | (Depreciation) |
| E-mini S&P 500 Index | September 2014 | 32 | 3,202 | 73 |
Unrealized appreciation (depreciation) on open futures contracts is required to be treated as realized gain (loss) for tax purposes.
36
Russell 1000 Value Index Fund
E. Distributions are determined on a tax basis and may differ from net investment income and realized capital gains for financial reporting purposes. Differences may be permanent or temporary. Permanent differences are reclassified among capital accounts in the financial statements to reflect their tax character. Temporary differences arise when certain items of income, expense, gain, or loss are recognized in different periods for financial statement and tax purposes. These differences will reverse at some time in the future. Differences in classification may also result from the treatment of short-term gains as ordinary income for tax purposes.
Certain of the fund’s investments are in securities considered to be passive foreign investment companies, for which any unrealized appreciation and/or realized gains are required to be included in distributable net income for tax purposes. During the year ended August 31, 2014, the fund realized gains on the sale of passive foreign investment companies of $10,000, which have been included in current and prior periods’ taxable income; accordingly, such gains have been reclassified from accumulated net realized losses to undistributed net investment income. Passive foreign investment companies held at August 31, 2014, had unrealized appreciation of $90,000, of which $28,000 has been distributed and is reflected in the balance of undistributed net investment income.
During the year ended August 31, 2014, the fund realized $71,501,000 of net capital gains resulting from in-kind redemptions—in which shareholders exchanged fund shares for securities held by the fund rather than for cash. Because such gains are not taxable to the fund, and are not distributed to shareholders, they have been reclassified from accumulated net realized losses to paid-in capital.
For tax purposes, at August 31, 2014, the fund had $6,994,000 of ordinary income available for distribution. The fund had available capital losses totaling $1,826,000 that may be carried forward indefinitely to offset future net capital gains.
At August 31, 2014, the cost of investment securities for tax purposes was $1,217,115,000. Net unrealized appreciation of investment securities for tax purposes was $285,702,000, consisting of unrealized gains of $292,701,000 on securities that had risen in value since their purchase and $6,999,000 in unrealized losses on securities that had fallen in value since their purchase.
F. During the year ended August 31, 2014, the fund purchased $724,355,000 of investment securities and sold $390,724,000 of investment securities, other than temporary cash investments. Purchases and sales include $250,674,000 and $195,434,000, respectively, in connection with in-kind purchases and redemptions of the fund’s capital shares.
37
Russell 1000 Value Index Fund
| G. Capital share transactions for each class of shares were: | |||||
| Year Ended August 31, | |||||
| 2014 | 2013 | ||||
| Amount | Shares | Amount | Shares | ||
| ($000) | (000) | ($000) | (000) | ||
| Institutional Shares | |||||
| Issued | 364,022 | 2,304 | 274,140 | 2,054 | |
| Issued in Lieu of Cash Distributions | 21,267 | 132 | 15,713 | 120 | |
| Redeemed | (160,597) | (998) | (155,654) | (1,149) | |
| Net Increase (Decrease)—Institutional Shares | 224,692 | 1,438 | 134,199 | 1,025 | |
| ETF Shares | |||||
| Issued | 309,691 | 3,650 | 211,506 | 2,950 | |
| Issued in Lieu of Cash Distributions | — | — | — | — | |
| Redeemed | (202,160) | (2,350) | (137,685) | (1,850) | |
| Net Increase (Decrease) —ETF Shares | 107,531 | 1,300 | 73,821 | 1,100 | |
H. Management has determined that no material events or transactions occurred subsequent to August 31, 2014, that would require recognition or disclosure in these financial statements.
38
Russell 1000 Growth Index Fund
Fund Profile
As of August 31, 2014
| Share-Class Characteristics | ||
| Institutional | ETF | |
| Shares | Shares | |
| Ticker Symbol | VRGWX | VONG |
| Expense Ratio1 | 0.08% | 0.15% |
| 30-Day SEC Yield | 1.40% | 1.36% |
| Portfolio Characteristics | DJ | ||
| U.S. | |||
| Russell | Total | ||
| 1000 | Market | ||
| Growth | FA | ||
| Fund | Index | Index | |
| Number of Stocks | 676 | 675 | 3,709 |
| Median Market Cap | $58.6B | $58.6B | $48.0B |
| Price/Earnings Ratio | 23.1x | 23.1x | 20.7x |
| Price/Book Ratio | 5.2x | 5.2x | 2.7x |
| Return on Equity | 24.0% | 23.7% | 17.8% |
| Earnings Growth | |||
| Rate | 17.5% | 17.5% | 15.3% |
| Dividend Yield | 1.5% | 1.5% | 1.8% |
| Foreign Holdings | 0.0% | 0.0% | 0.0% |
| Turnover Rate | 18% | — | — |
| Short-Term Reserves | -0.1% | — | — |
| Sector Diversification (% of equity exposure) | |||
| DJ | |||
| U.S. | |||
| Russell | Total | ||
| 1000 | Market | ||
| Growth | FA | ||
| Fund | Index | Index | |
| Consumer Discretionary | 20.3% | 20.3% | 14.1% |
| Consumer Staples | 9.3 | 9.3 | 7.2 |
| Energy | 6.1 | 6.1 | 9.7 |
| Financial Services | 7.8 | 7.8 | 18.7 |
| Health Care | 13.2 | 13.2 | 13.2 |
| Materials & Processing | 5.0 | 5.0 | 4.5 |
| Producer Durables | 12.2 | 12.2 | 11.3 |
| Technology | 23.8 | 23.8 | 16.1 |
| Utilities | 2.3 | 2.3 | 5.2 |
Volatility Measures | DJ | |
| U.S. Total | |
| Russell 1000 | Market | |
| Growth Index | FA Index | |
| R-Squared | 1.00 | 0.96 |
| Beta | 1.00 | 0.98 |
| These measures show the degree and timing of the fund’s fluctuations compared with the indexes over 36 months. | ||
| Ten Largest Holdings (% of total net assets) | ||
| Apple Inc. | Computer | |
| Technology | 5.9% | |
| Google Inc. | Computer Services | |
| Software & Systems | 3.1 | |
| Microsoft Corp. | Computer Services | |
| Software & Systems | 2.3 | |
| Verizon Communications Utilities: | ||
| Inc. | Telecommunications | 2.0 |
| International Business | Computer | |
| Machines Corp. | Technology | 1.7 |
| Coca-Cola Co. | Beverage: Soft | |
| Drinks | 1.6 | |
| Gilead Sciences Inc. | Pharmaceuticals | 1.6 |
| Facebook Inc. | Computer Services | |
| Software & Systems | 1.4 | |
| Schlumberger Ltd. | Oil Well Equipment & | |
| Services | 1.4 | |
| PepsiCo Inc. | Beverage: Soft | |
| Drinks | 1.3 | |
| Top Ten | 22.3% | |
| The holdings listed exclude any temporary cash investments and equity index products. | ||
Investment Focus
1 The expense ratios shown are from the prospectus dated December 20, 2013, and represent estimated costs for the current fiscal year. For the fiscal year ended August 31, 2014, the expense ratios were 0.08% for Institutional Shares and 0.12% for ETF Shares.
39
Russell 1000 Growth Index Fund
Performance Summary
All of the returns in this report represent past performance, which is not a guarantee of future results that may be achieved by the fund. (Current performance may be lower or higher than the performance data cited. For performance data current to the most recent month-end, visit our website at vanguard.com/performance.) Note, too, that both investment returns and principal value can fluctuate widely, so an investor’s shares, when sold, could be worth more or less than their original cost. The returns shown do not reflect taxes that a shareholder would pay on fund distributions or on the sale of fund shares.
Cumulative Performance: September 20, 2010, Through August 31, 2014
Initial Investment of $10,000
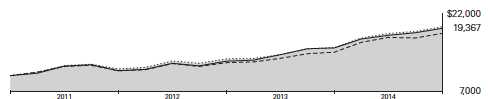
| Average Annual Total Returns | ||||
| Periods Ended August 31, 2014 | ||||
| Since | Final Value | |||
| One | Inception | of a $10,000 | ||
| Year | (9/20/2010) | Investment | ||
| Russell 1000 Growth Index | ||||
| Fund*ETF Shares Net Asset Value | 26.15% | 18.24% | $19,367 | |
| Russell 1000 Growth Index | ||||
| Fund*ETF Shares Market Price | 26.18 | 18.25 | 19,373 | |
| •••••••• | Russell 1000 Growth Index | 26.29 | 18.43 | 19,488 |
| – – – – | Large-Cap Growth Funds Average | 25.10 | 16.39 | 18,202 |
| Dow Jones U.S. Total Stock Market | ||||
| Float Adjusted Index | 24.68 | 17.95 | 19,178 | |
| Large-Cap Growth Funds Average: Derived from data provided by Lipper, a Thomson Reuters Company. "Since Inception" performance is calculated from the ETF Shares’ inception date for both the fund and its comparative standards. | ||||
| Since | Final Value | ||
| One | Inception | of a $5,000,000 | |
| Year | (12/6/2010) | Investment | |
| Russell 1000 Growth Index Fund Institutional | |||
| Shares | 26.20% | 16.25% | $8,774,402 |
| Russell 1000 Growth Index | 26.29 | 16.36 | 8,805,140 |
| Dow Jones U.S. Total Stock Market Float | |||
| Adjusted Index | 24.68 | 16.44 | 8,826,905 |
| "Since Inception" performance is calculated from the Institutional Shares’ inception date for both the fund and its comparative standards. | |||
See Financial Highlights for dividend and capital gains information.
40
Russell 1000 Growth Index Fund
| Cumulative Returns of ETF Shares: September 20, 2010, Through August 31, 2014 | ||
| Since | ||
| One | Inception | |
| Year | (9/20/2010) | |
| Russell 1000 Growth Index Fund ETF Shares | ||
| Market Price | 26.18% | 93.73% |
| Russell 1000 Growth Index Fund ETF Shares Net | ||
| Asset Value | 26.15 | 93.67 |
| Russell 1000 Growth Index | 26.29 | 94.88 |
| "Since Inception" performance is calculated from the ETF Shares’ inception date for both the fund and its comparative standards. | ||
Fiscal-Year Total Returns (%): September 20, 2010, Through August 31, 2014
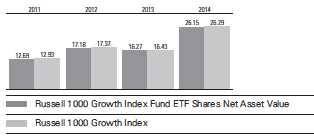
| Average Annual Total Returns: Periods Ended June 30, 2014 | |||
| This table presents returns through the latest calendar quarter—rather than through the end of the fiscal period. | |||
| Securities and Exchange Commission rules require that we provide this information. | |||
| Inception | One | Since | |
| Date | Year | Inception | |
| Institutional Shares | 12/6/2010 | 26.83% | 16.13% |
| ETF Shares | 9/20/2010 | ||
| Market Price | 26.75 | 18.21 | |
| Net Asset Value | 26.76 | 18.22 | |
41
Russell 1000 Growth Index Fund
Financial Statements
Statement of Net Assets—Investments Summary
As of August 31, 2014
This Statement summarizes the fund’s holdings by asset type. Details are reported for each of the fund’s 50 largest individual holdings and for investments that, in total for any issuer, represent more than 1% of the fund’s net assets. The total value of smaller holdings is reported as a single amount within each category.
The fund reports a complete list of its holdings in regulatory filings four times in each fiscal year, at the quarter-ends. For the second and fourth fiscal quarters, the complete listing of the fund’s holdings is available electronically on vanguard.com and on the Securities and Exchange Commission’s website (sec.gov), or you can have it mailed to you without charge by calling 800-662-7447. For the first and third fiscal quarters, the fund files the lists with the SEC on Form N-Q. Shareholders can look up the fund’s Forms N-Q on the SEC’s website. Forms N-Q may also be reviewed and copied at the SEC’s Public Reference Room (see the back cover of this report for further information).
| Market | Percentage | ||
| Value | of Net | ||
| Shares | ($000) | Assets | |
| Common Stocks | |||
| Consumer Discretionary | |||
| Walt Disney Co. | 244,592 | 21,984 | 1.3% |
| Comcast Corp. Class A | 399,407 | 21,860 | 1.2% |
| Home Depot Inc. | 230,428 | 21,545 | 1.2% |
| * Amazon.com Inc. | 63,304 | 21,463 | 1.2% |
| McDonald’s Corp. | 166,526 | 15,607 | 0.9% |
| * eBay Inc. | 213,882 | 11,870 | 0.7% |
| * Priceline Group Inc. | 8,691 | 10,814 | 0.6% |
| Starbucks Corp. | 127,099 | 9,890 | 0.6% |
| NIKE Inc. Class B | 117,905 | 9,261 | 0.5% |
| Lowe’s Cos. Inc. | 171,960 | 9,030 | 0.5% |
| Costco Wholesale Corp. | 69,972 | 8,472 | 0.5% |
| Twenty-First Century Fox Inc. Class A | 236,891 | 8,391 | 0.5% |
| Consumer Discretionary—Other † | 185,561 | 10.6% | |
| 355,748 | 20.3% | ||
| Consumer Staples | |||
| Coca-Cola Co. | 669,350 | 27,925 | 1.6% |
| PepsiCo Inc. | 255,469 | 23,628 | 1.3% |
| Altria Group Inc. | 317,154 | 13,663 | 0.8% |
| Philip Morris International Inc. | 155,825 | 13,336 | 0.8% |
| Colgate-Palmolive Co. | 138,187 | 8,945 | 0.5% |
| Consumer Staples—Other † | 76,321 | 4.3% | |
| 163,818 | 9.3% | ||
| Energy | |||
| Schlumberger Ltd. | 219,239 | 24,037 | 1.4% |
| EOG Resources Inc. | 92,279 | 10,140 | 0.6% |
| Halliburton Co. | 142,602 | 9,641 | 0.5% |
| Energy—Other † | 62,272 | 3.5% | |
| 106,090 | 6.0% |
42
Russell 1000 Growth Index Fund
| Market | Percentage | ||
| Value | of Net | ||
| Shares | ($000) | Assets | |
| Financial Services | |||
| Visa Inc. Class A | 84,487 | 17,955 | 1.0% |
| American Express Co. | 152,810 | 13,684 | 0.8% |
| MasterCard Inc. Class A | 169,722 | 12,867 | 0.7% |
| Financial Services—Other † | 92,202 | 5.3% | |
| 136,708 | 7.8% | ||
| Health Care | |||
| * Gilead Sciences Inc. | 258,904 | 27,853 | 1.6% |
| Amgen Inc. | 121,032 | 16,869 | 1.0% |
| AbbVie Inc. | 268,385 | 14,836 | 0.8% |
| * Biogen Idec Inc. | 40,037 | 13,734 | 0.8% |
| * Celgene Corp. | 134,823 | 12,811 | 0.7% |
| * Actavis plc | 42,786 | 9,712 | 0.5% |
| * Express Scripts Holding Co. | 113,103 | 8,362 | 0.5% |
| Allergan Inc. | 50,088 | 8,198 | 0.5% |
| Health Care—Other † | 119,683 | 6.8% | |
| 232,058 | 13.2% | ||
| Materials & Processing | |||
| Monsanto Co. | 88,507 | 10,236 | 0.6% |
| EI du Pont de Nemours & Co. | 146,377 | 9,677 | 0.6% |
| LyondellBasell Industries NV Class A | 74,453 | 8,514 | 0.5% |
| Materials & Processing—Other † | 58,700 | 3.3% | |
| 87,127 | 5.0% | ||
| Other † | 237 | 0.0% | |
| Producer Durables | |||
| Union Pacific Corp. | 152,620 | 16,066 | 0.9% |
| 3M Co. | 110,341 | 15,889 | 0.9% |
| Boeing Co. | 123,008 | 15,597 | 0.9% |
| Honeywell International Inc. | 131,905 | 12,561 | 0.7% |
| United Parcel Service Inc. Class B | 119,477 | 11,629 | 0.7% |
| Accenture plc Class A | 106,798 | 8,657 | 0.5% |
| Producer Durables—Other † | 132,999 | 7.6% | |
| 213,398 | 12.2% | ||
| Technology | |||
| Apple Inc. | 1,016,474 | 104,189 | 5.9% |
| Microsoft Corp. | 901,038 | 40,934 | 2.3% |
| International Business Machines Corp. | 159,391 | 30,651 | 1.8% |
| * Google Inc. Class A | 47,316 | 27,555 | 1.6% |
| * Google Inc. Class C | 47,876 | 27,366 | 1.6% |
| * Facebook Inc. Class A | 332,775 | 24,898 | 1.4% |
| Oracle Corp. | 553,584 | 22,990 | 1.3% |
| QUALCOMM Inc. | 284,545 | 21,654 | 1.2% |
| Texas Instruments Inc. | 182,167 | 8,777 | 0.5% |
| Technology—Other † | 109,118 | 6.2% | |
| 418,132 | 23.8% | ||
| Utilities | |||
| Verizon Communications Inc. | 698,155 | 34,782 | 2.0% |
| Utilities—Other † | 5,091 | 0.3% | |
| 39,873 | 2.3% | ||
| Total Common Stocks (Cost $1,335,631) | 1,753,189 | 99.9%1 | |
43
Russell 1000 Growth Index Fund
| Market | Percentage | |||
| Value | of Net | |||
| Coupon | Shares | ($000) | Assets | |
| Temporary Cash Investments | ||||
| Money Market Fund | ||||
| 2, 3 Vanguard Market Liquidity Fund | 0.113% | 456,002 | 456 | 0.0% |
| 4U.S. Government and Agency Obligations † | 200 | 0.0% | ||
| Total Temporary Cash Investments (Cost $656) | 656 | 0.0%1 | ||
| 5Total Investments (Cost $1,336,287) | 1,753,845 | 99.9% | ||
| Other Assets and Liabilities | ||||
| Other Assets | 4,503 | 0.3% | ||
| Liabilities3 | (3,533) | (0.2%) | ||
| 970 | 0.1% | |||
| Net Assets | 1,754,815 | 100.0% | ||
| At August 31, 2014, net assets consisted of: | |
| Amount | |
| ($000) | |
| Paid-in Capital | 1,357,080 |
| Undistributed Net Investment Income | 4,282 |
| Accumulated Net Realized Losses | (24,115) |
| Unrealized Appreciation (Depreciation) | |
| Investment Securities | 417,558 |
| Futures Contracts | 10 |
| Net Assets | 1,754,815 |
| Institutional Shares—Net Assets | |
| Applicable to 7,933,775 outstanding $.001 par value shares of | |
| beneficial interest (unlimited authorization) | 1,460,254 |
| Net Asset Value Per Share—Institutional Shares | $184.06 |
| ETF Shares—Net Assets | |
| Applicable to 3,076,711 outstanding $.001 par value shares of | |
| beneficial interest (unlimited authorization) | 294,561 |
| Net Asset Value Per Share—ETF Shares | $95.74 |
See Note A in Notes to Financial Statements.
* Non-income-producing security.
† Represents the aggregate value, by category, of securities that are not among the 50 largest holdings and, in total for any issuer, represent 1% or less of net assets.
1 The fund invests a portion of its cash reserves in equity markets through the use of index futures contracts. After giving effect to futures investments, the fund’s effective common stock and temporary cash investment positions represent 100.0% and 0.1%, respectively, of net assets.
2 Affiliated money market fund available only to Vanguard funds and certain trusts and accounts managed by Vanguard. Rate shown is the 7-day yield.
3 Includes $456,000 of collateral received for securities on loan.
4 Securities with a value of $100,000 have been segregated as initial margin for open futures contracts.
5 The total value of securities on loan is $442,000.
See accompanying Notes, which are an integral part of the Financial Statements.
44
Russell 1000 Growth Index Fund
Statement of Operations
| Year Ended | |
| August 31, 2014 | |
| ($000) | |
| Investment Income | |
| Income | |
| Dividends | 24,281 |
| Interest1 | 5 |
| Securities Lending | 53 |
| Total Income | 24,339 |
| Expenses | |
| The Vanguard Group—Note B | |
| Investment Advisory Services | 242 |
| Management and Administrative—Institutional Shares | 440 |
| Management and Administrative—ETF Shares | 167 |
| Marketing and Distribution—Institutional Shares | 288 |
| Marketing and Distribution—ETF Shares | 51 |
| Custodian Fees | 61 |
| Auditing Fees | 29 |
| Shareholders’ Reports—Institutional Shares | 2 |
| Shareholders’ Reports—ETF Shares | 9 |
| Trustees’ Fees and Expenses | 1 |
| Total Expenses | 1,290 |
| Net Investment Income | 23,049 |
| Realized Net Gain (Loss) | |
| Investment Securities Sold | 76,787 |
| Futures Contracts | 265 |
| Realized Net Gain (Loss) | 77,052 |
| Change in Unrealized Appreciation (Depreciation) | |
| Investment Securities | 234,677 |
| Futures Contracts | 3 |
| Change in Unrealized Appreciation (Depreciation) | 234,680 |
| Net Increase (Decrease) in Net Assets Resulting from Operations | 334,781 |
| 1 Interest income from an affiliated company of the fund was $4,000. |
See accompanying Notes, which are an integral part of the Financial Statements.
45
Russell 1000 Growth Index Fund
Statement of Changes in Net Assets
| Year Ended August 31, | ||
| 2014 | 2013 | |
| ($000) | ($000) | |
| Increase (Decrease) in Net Assets | ||
| Operations | ||
| Net Investment Income | 23,049 | 16,481 |
| Realized Net Gain (Loss) | 77,052 | 6,529 |
| Change in Unrealized Appreciation (Depreciation) | 234,680 | 117,234 |
| Net Increase (Decrease) in Net Assets Resulting from Operations | 334,781 | 140,244 |
| Distributions | ||
| Net Investment Income | ||
| Institutional Shares | (18,832) | (13,426) |
| ETF Shares | (3,358) | (1,906) |
| Realized Capital Gain | ||
| Institutional Shares | — | — |
| ETF Shares | — | — |
| Total Distributions | (22,190) | (15,332) |
| Capital Share Transactions | ||
| Institutional Shares | 204,387 | 306,975 |
| ETF Shares | 97,668 | 56,213 |
| Net Increase (Decrease) from Capital Share Transactions | 302,055 | 363,188 |
| Total Increase (Decrease) | 614,646 | 488,100 |
| Net Assets | ||
| Beginning of Period | 1,140,169 | 652,069 |
| End of Period1 | 1,754,815 | 1,140,169 |
| 1 Net Assets—End of Period includes undistributed (overdistributed) net investment income of $4,282,000 and $3,422,000. | ||
See accompanying Notes, which are an integral part of the Financial Statements.
46
Russell 1000 Growth Index Fund
Financial Highlights
| Institutional Shares | ||||
| Dec. 6, | ||||
| 20101 to | ||||
| Year Ended August 31, | August 31, | |||
| For a Share Outstanding Throughout Each Period | 2014 | 2013 | 2012 | 2011 |
| Net Asset Value, Beginning of Period | $148.07 | $129.59 | $112.09 | $110.81 |
| Investment Operations | ||||
| Net Investment Income | 2.544 | 2.446 | 1.812 | .879 |
| Net Realized and Unrealized Gain (Loss) on Investments | 35.986 | 18.488 | 17.342 | 1.278 |
| Total from Investment Operations | 38.530 | 20.934 | 19.154 | 2.157 |
| Distributions | ||||
| Dividends from Net Investment Income | (2.540) | (2.454) | (1.654) | (.877) |
| Distributions from Realized Capital Gains | — | — | — | — |
| Total Distributions | (2.540) | (2.454) | (1.654) | (.877) |
| Net Asset Value, End of Period | $184.06 | $148.07 | $129.59 | $112.09 |
| Total Return | 26.20% | 16.35% | 17.26% | 1.92% |
| Ratios/Supplemental Data | ||||
| Net Assets, End of Period (Millions) | $1,460 | $992 | $576 | $154 |
| Ratio of Total Expenses to Average Net Assets | 0.08% | 0.08% | 0.08% | 0.08%2 |
| Ratio of Net Investment Income to Average Net Assets | 1.55% | 1.80% | 1.66% | 1.54%2 |
| Portfolio Turnover Rate 3 | 18% | 29% | 25% | 30% |
| 1 Inception. 2 Annualized. 3 Excludes the value of portfolio securities received or delivered as a result of in-kind purchases or redemptions of the fund’s capital shares, including ETF Creation Units. | ||||
See accompanying Notes, which are an integral part of the Financial Statements.
47
Russell 1000 Growth Index Fund
Financial Highlights
| ETF Shares | ||||
| Sept. 20, | ||||
| 20101 to | ||||
| Year Ended August 31, | August 31, | |||
| For a Share Outstanding Throughout Each Period | 2014 | 2013 | 2012 | 2011 |
| Net Asset Value, Beginning of Period | $77.02 | $67.41 | $58.31 | $52.12 |
| Investment Operations | ||||
| Net Investment Income | 1.293 | 1.226 | .900 | .579 |
| Net Realized and Unrealized Gain (Loss) on Investments | 18.713 | 9.611 | 9.023 | 6.044 |
| Total from Investment Operations | 20.006 | 10.837 | 9.923 | 6.623 |
| Distributions | ||||
| Dividends from Net Investment Income | (1.286) | (1.227) | (. 823) | (. 433) |
| Distributions from Realized Capital Gains | — | — | — | — |
| Total Distributions | (1.286) | (1.227) | (. 823) | (. 433) |
| Net Asset Value, End of Period | $95.74 | $77.02 | $67.41 | $58.31 |
| Total Return | 26.15% | 16.27% | 17.18% | 12.69% |
| Ratios/Supplemental Data | ||||
| Net Assets, End of Period (Millions) | $295 | $148 | $76 | $52 |
| Ratio of Total Expenses to Average Net Assets | 0.12% | 0.15% | 0.15% | 0.15%2 |
| Ratio of Net Investment Income to Average Net Assets | 1.51% | 1.73% | 1.59% | 1.47%2 |
| Portfolio Turnover Rate 3 | 18% | 29% | 25% | 30% |
| 1 Inception. 2 Annualized. 3 Excludes the value of portfolio securities received or delivered as a result of in-kind purchases or redemptions of the fund’s capital shares, including ETF Creation Units. | ||||
See accompanying Notes, which are an integral part of the Financial Statements.
48
Russell 1000 Growth Index Fund
Notes to Financial Statements
Vanguard Russell 1000 Growth Index Fund is registered under the Investment Company Act of 1940 as an open-end investment company, or mutual fund. The fund offers two classes of shares: Institutional Shares and ETF Shares. Institutional Shares are designed for investors who meet certain administrative, service, and account-size criteria. ETF Shares are listed for trading on Nasdaq; they can be purchased and sold through a broker.
A. The following significant accounting policies conform to generally accepted accounting principles for U.S. investment companies. The fund consistently follows such policies in preparing its financial statements.
1. Security Valuation: Securities are valued as of the close of trading on the New York Stock Exchange (generally 4 p.m., Eastern time) on the valuation date. Equity securities are valued at the latest quoted sales prices or official closing prices taken from the primary market in which each security trades; such securities not traded on the valuation date are valued at the mean of the latest quoted bid and asked prices. Securities for which market quotations are not readily available, or whose values have been materially affected by events occurring before the fund’s pricing time but after the close of the securities’ primary markets, are valued by methods deemed by the board of trustees to represent fair value. Investments in Vanguard Market Liquidity Fund are valued at that fund’s net asset value. Temporary cash investments acquired over 60 days to maturity are valued using the latest bid prices or using valuations based on a matrix system (which considers such factors as security prices, yields, maturities, and ratings), both as furnished by independent pricing services. Other temporary cash investments are valued at amortized cost, which approximates market value.
2. Futures Contracts: The fund uses index futures contracts to a limited extent, with the objectives of maintaining full exposure to the stock market, enhancing returns, maintaining liquidity, and minimizing transaction costs. The fund may purchase futures contracts to immediately invest incoming cash in the market, or sell futures in response to cash outflows, thereby simulating a fully invested position in the underlying index while maintaining a cash balance for liquidity. The fund may seek to enhance returns by using futures contracts instead of the underlying securities when futures are believed to be priced more attractively than the underlying securities. The primary risks associated with the use of futures contracts are imperfect correlation between changes in market values of stocks held by the fund and the prices of futures contracts, and the possibility of an illiquid market. Counterparty risk involving futures is mitigated because a regulated clearinghouse is the counterparty instead of the clearing broker. To further mitigate counterparty risk, the fund trades futures contracts on an exchange, monitors the financial strength of its clearing brokers and clearinghouse, and has entered into clearing agreements with its clearing brokers. The clearinghouse imposes initial margin requirements to secure the fund’s performance and requires daily settlement of variation margin representing changes in the market value of each contract.
Futures contracts are valued at their quoted daily settlement prices. The aggregate settlement values of the contracts are not recorded in the Statement of Net Assets. Fluctuations in the value of the contracts are recorded in the Statement of Net Assets as an asset (liability) and in the Statement of Operations as unrealized appreciation (depreciation) until the contracts are closed, when they are recorded as realized futures gains (losses).
During the year ended August 31, 2014, the fund’s average investments in long and short futures contracts represented less than 1% and 0% of net assets, respectively, based on the average of aggregate settlement values at each quarter-end during the period.
49
Russell 1000 Growth Index Fund
3. Federal Income Taxes: The fund intends to continue to qualify as a regulated investment company and distribute all of its taxable income. Management has analyzed the fund’s tax positions taken for all open federal income tax years (August 31, 2011–2014), and has concluded that no provision for federal income tax is required in the fund’s financial statements.
4. Distributions: Distributions to shareholders are recorded on the ex-dividend date.
5. Securities Lending: To earn additional income, the fund lends its securities to qualified institutional borrowers. Security loans are required to be secured at all times by collateral in an amount at least equal to the market value of securities loaned. Daily market fluctuations could cause the value of loaned securities to be more or less than the value of the collateral received. When this occurs, the collateral is adjusted and settled on the next business day. The fund further mitigates its counterparty risk by entering into securities lending transactions only with a diverse group of prequalified counterparties, monitoring their financial strength, and entering into master securities lending agreements with its counterparties. The master securities lending agreements provide that, in the event of a counterparty’s default (including bankruptcy), the fund may terminate any loans with that borrower, determine the net amount owed, and sell or retain the collateral up to the net amount owed to the fund; however, such actions may be subject to legal proceedings. While collateral mitigates counterparty risk, in the absence of a default the fund may experience delays and costs in recovering the securities loaned. The fund invests cash collateral received in Vanguard Market Liquidity Fund, and records a liability in the Statement of Net Assets for the return of the collateral, during the period the securities are on loan. Securities lending income represents fees charged to borrowers plus income earned on invested cash collateral, less expenses associated with the loan.
6. Credit Facility: The fund and certain other funds managed by The Vanguard Group participate in a $2.89 billion committed credit facility provided by a syndicate of lenders pursuant to a credit agreement that may be renewed annually; each fund is individually liable for its borrowings, if any, under the credit facility. Borrowings may be utilized for temporary and emergency purposes, and are subject to the fund’s regulatory and contractual borrowing restrictions. The participating funds are charged administrative fees and an annual commitment fee of 0.06% of the undrawn amount of the facility; these fees are allocated to the funds based on a method approved by the fund’s board of trustees and included in Management and Administrative expenses on the fund’s Statement of Operations. Any borrowings under this facility bear interest at a rate equal to the higher of the federal funds rate or LIBOR reference rate plus an agreed-upon spread.
The fund had no borrowings outstanding at August 31, 2014, or at any time during the period then ended.
7. Other: Dividend income is recorded on the ex-dividend date. Interest income includes income distributions received from Vanguard Market Liquidity Fund and is accrued daily. Premiums and discounts on debt securities purchased are amortized and accreted, respectively, to interest income over the lives of the respective securities. Security transactions are accounted for on the date securities are bought or sold. Costs used to determine realized gains (losses) on the sale of investment securities are those of the specific securities sold.
Each class of shares has equal rights as to assets and earnings, except that each class separately bears certain class-specific expenses related to maintenance of shareholder accounts (included in Management and Administrative expenses) and shareholder reporting. Marketing and distribution expenses are allocated to each class of shares based on a method approved by the board of trustees. Income, other non-class-specific expenses, and gains and losses on investments are allocated to each class of shares based on its relative net assets.
50
Russell 1000 Growth Index Fund
B. The Vanguard Group furnishes at cost investment advisory, corporate management, administrative, marketing, and distribution services. The costs of such services are allocated to the fund based on methods approved by the board of trustees. The fund has committed to provide up to 0.40% of its net assets in capital contributions to Vanguard. At August 31, 2014, the fund had contributed capital of $167,000 to Vanguard (included in Other Assets), representing 0.01% of the fund’s net assets and 0.07% of Vanguard’s capitalization. The fund’s trustees and officers are also directors and officers of Vanguard.
C. Various inputs may be used to determine the value of the fund’s investments. These inputs are summarized in three broad levels for financial statement purposes. The inputs or methodologies used to value securities are not necessarily an indication of the risk associated with investing in those securities.
Level 1—Quoted prices in active markets for identical securities.
Level 2—Other significant observable inputs (including quoted prices for similar securities, interest rates, prepayment speeds, credit risk, etc.).
Level 3—Significant unobservable inputs (including the fund’s own assumptions used to determine the fair value of investments).
| The following table summarizes the market value of the fund’s investments as of August 31, 2014, based on the inputs used to value them: | |||
| Level 1 | Level 2 | Level 3 | |
| Investments | ($000) | ($000) | ($000) |
| Common Stocks | 1,753,189 | — | — |
| Temporary Cash Investments | 456 | 200 | — |
| Futures Contracts—Assets1 | 5 | — | — |
| Total | 1,753,650 | 200 | — |
| 1 Represents variation margin on the last day of the reporting period. | |||
| D. At August 31, 2014, the aggregate settlement value of open futures contracts and the related unrealized appreciation (depreciation) were: | ||||
| ($000) | ||||
| Aggregate | ||||
| Number of | Settlement | Unrealized | ||
| Long (Short) | Value | Appreciation | ||
| Futures Contracts | Expiration | Contracts | Long (Short) | (Depreciation) |
| E-mini S&P 500 Index | September 2014 | 20 | 2,001 | 10 |
Unrealized appreciation (depreciation) on open futures contracts is required to be treated as realized gain (loss) for tax purposes.
E. Distributions are determined on a tax basis and may differ from net investment income and realized capital gains for financial reporting purposes. Differences may be permanent or temporary. Permanent differences are reclassified among capital accounts in the financial statements to reflect their tax character. Temporary differences arise when certain items of income, expense, gain, or loss are recognized in different periods for financial statement and tax purposes. These differences will reverse at some time in the future. Differences in classification may also result from the treatment of short-term gains as ordinary income for tax purposes.
51
Russell 1000 Growth Index Fund
During the year ended August 31, 2014, the fund realized $74,485,000 of net capital gains resulting from in-kind redemptions—in which shareholders exchanged fund shares for securities held by the fund rather than for cash. Because such gains are not taxable to the fund, and are not distributed to shareholders, they have been reclassified from accumulated net realized losses to paid-in capital.
For tax purposes, at August 31, 2014, the fund had $4,549,000 of ordinary income available for distribution. The fund used capital loss carryforwards of $1,776,000 to offset taxable capital gains realized during the year ended August 31, 2014. At August 31, 2014, the fund had available capital losses totaling $23,780,000 that may be carried forward indefinitely to offset future net capital gains.
At August 31, 2014, the cost of investment securities for tax purposes was $1,336,624,000. Net unrealized appreciation of investment securities for tax purposes was $417,221,000, consisting of unrealized gains of $422,613,000 on securities that had risen in value since their purchase and $5,392,000 in unrealized losses on securities that had fallen in value since their purchase.
F. During the year ended August 31, 2014, the fund purchased $794,553,000 of investment securities and sold $492,244,000 of investment securities, other than temporary cash investments. Purchases and sales include $197,607,000 and $219,204,000, respectively, in connection with in-kind purchases and redemptions of the fund’s capital shares.
G. Capital share transactions for each class of shares were:
| Year Ended August 31, | |||||
| 2014 | 2013 | ||||
| Amount | Shares | Amount | Shares | ||
| ($000) | (000) | ($000) | (000) | ||
| Institutional Shares | |||||
| Issued | 442,008 | 2,640 | 461,871 | 3,371 | |
| Issued in Lieu of Cash Distributions | 17,909 | 107 | 13,026 | 96 | |
| Redeemed | (255,530) | (1,511) | (167,922) | (1,215) | |
| Net Increase (Decrease) —Institutional Shares | 204,387 | 1,236 | 306,975 | 2,252 | |
| ETF Shares | |||||
| Issued | 318,047 | 3,600 | 125,778 | 1,750 | |
| Issued in Lieu of Cash Distributions | — | — | — | — | |
| Redeemed | (220,379) | (2,450) | (69,565) | (950) | |
| Net Increase (Decrease)—ETF Shares | 97,668 | 1,150 | 56,213 | 800 | |
H. Management has determined that no material events or transactions occurred subsequent to August 31, 2014, that would require recognition or disclosure in these financial statements.
52
Report of Independent Registered
Public Accounting Firm
To the Board of Trustees of Vanguard Scottsdale Funds and the Shareholders of Vanguard Russell 1000 Index Fund, Vanguard Russell 1000 Value Index Fund and Vanguard Russell 1000 Growth Index Fund:
In our opinion, the accompanying statements of net assets—investments summary and the related statements of operations and of changes in net assets and the financial highlights present fairly, in all material respects, the financial position of Vanguard Russell 1000 Index Fund, Vanguard Russell 1000 Value Index Fund and Vanguard Russell 1000 Growth Index Fund (constituting separate portfolios of Vanguard Scottsdale Funds, hereafter referred to as the “Funds”) at August 31, 2014, and the results of each of their operations for the year then ended, the changes in each of their net assets for each of the two years in the period then ended, and the financial highlights for each of the periods indicated, in conformity with accounting principles generally accepted in the United States of America. These financial statements and financial highlights (hereafter referred to as “financial statements”) are the responsibility of the Funds’ management. Our responsibility is to express an opinion on these financial statements based on our audits. We conducted our audits of these financial statements in accordance with the standards of the Public Company Accounting Oversight Board (United States). Those standards require that we plan and perform the audit to obtain reasonable assurance about whether the financial statements are free of material misstatement. An audit includes examining, on a test basis, evidence supporting the amounts and disclosures in the financial statements, assessing the accounting principles used and significant estimates made by management, and evaluating the overall financial statement presentation. We believe that our audits, which included confirmation of securities at August 31, 2014 by correspondence with the custodian and broker and by agreement to the underlying ownership records of the transfer agent, provide a reasonable basis for our opinion.
/s/PricewaterhouseCoopers LLP
Philadelphia, Pennsylvania
October 15, 2014
53
| Special 2014 tax information (unaudited) for Vanguard Russell 1000 Index Funds |
This information for the fiscal year ended August 31, 2014, is included pursuant to provisions of the Internal Revenue Code.
The funds distributed qualified dividend income to shareholders during the fiscal year as follows:
| Fund | ($000) |
| Russell 1000 Index Fund | 20,310 |
| Russell 1000 Value Index Fund | 25,158 |
| Russell 1000 Growth Index Fund | 22,190 |
For corporate shareholders, the percentage of investment income (dividend income plus short-term gains, if any) that qualifies for the dividends-received deduction is as follows:
| Fund | Percentage |
| Russell 1000 Index Fund | 94.8% |
| Russell 1000 Value Index Fund | 91.8 |
| Russell 1000 Growth Index Fund | 97.8 |
54
Your Fund’s After-Tax Returns
This table presents returns for your fund both before and after taxes. The after-tax returns are shown in two ways: (1) assuming that an investor owned the fund during the entire period and paid taxes on the fund’s distributions, and (2) assuming that an investor paid taxes on the fund’s distributions and sold all shares at the end of each period.
Calculations are based on the highest individual federal income tax and capital gains tax rates in effect at the times of the distributions and the hypothetical sales. State and local taxes were not considered. After-tax returns reflect any qualified dividend income, using actual prior-year figures and estimates for 2014. (In the example, returns after the sale of fund shares may be higher than those assuming no sale. This occurs when the sale would have produced a capital loss. The calculation assumes that the investor received a tax deduction for the loss.)
The table shows returns for ETF Shares only; returns for other share classes will differ. Please note that your actual after-tax returns will depend on your tax situation and may differ from those shown. Also note that if you own the fund in a tax-deferred account, such as an individual retirement account or a 401(k) plan, this information does not apply to you. Such accounts are not subject to current taxes.
Finally, keep in mind that a fund’s performance—whether before or after taxes—does not guarantee future results.
| Average Annual Total Returns: Russell 1000 Index Funds | ||
| Periods Ended August 31, 2014 | ||
| Since | ||
| One | Inception | |
| Year | (9/20/2010) | |
| Russell 1000 Index Fund ETF Shares | ||
| Returns Before Taxes | 25.18% | 17.89% |
| Returns After Taxes on Distributions | 24.64 | 17.52 |
| Returns After Taxes on Distributions and Sale of Fund Shares | 14.62 | 14.33 |
| Since | ||
| One | Inception | |
| Year | (9/20/2010) | |
| Russell 1000 Value Index Fund ETF Shares | ||
| Returns Before Taxes | 24.27% | 17.41% |
| Returns After Taxes on Distributions | 23.64 | 16.99 |
| Returns After Taxes on Distributions and Sale of Fund Shares | 14.15 | 13.92 |
| Since | ||
| One | Inception | |
| Year | (9/20/2010) | |
| Russell 1000 Growth Index Fund ETF Shares | ||
| Returns Before Taxes | 26.15% | 18.24% |
| Returns After Taxes on Distributions | 25.71 | 17.94 |
| Returns After Taxes on Distributions and Sale of Fund Shares | 15.11 | 14.62 |
55
About Your Fund’s Expenses
As a shareholder of the fund, you incur ongoing costs, which include costs for portfolio management, administrative services, and shareholder reports (like this one), among others. Operating expenses, which are deducted from a fund’s gross income, directly reduce the investment return of the fund.
A fund’s expenses are expressed as a percentage of its average net assets. This figure is known as the expense ratio. The following examples are intended to help you understand the ongoing costs (in dollars) of investing in your fund and to compare these costs with those of other mutual funds. The examples are based on an investment of $1,000 made at the beginning of the period shown and held for the entire period.
The accompanying table illustrates your fund’s costs in two ways:
• Based on actual fund return. This section helps you to estimate the actual expenses that you paid over the period. The ”Ending Account Value“ shown is derived from the fund‘s actual return, and the third column shows the dollar amount that would have been paid by an investor who started with $1,000 in the fund. You may use the information here, together with the amount you invested, to estimate the expenses that you paid over the period.
To do so, simply divide your account value by $1,000 (for example, an $8,600 account value divided by $1,000 = 8.6), then multiply the result by the number given for your fund under the heading ”Expenses Paid During Period.“
• Based on hypothetical 5% yearly return. This section is intended to help you compare your fund‘s costs with those of other mutual funds. It assumes that the fund had a yearly return of 5% before expenses, but that the expense ratio is unchanged. In this case—because the return used is not the fund’s actual return—the results do not apply to your investment. The example is useful in making comparisons because the Securities and Exchange Commission requires all mutual funds to calculate expenses based on a 5% return. You can assess your fund’s costs by comparing this hypothetical example with the hypothetical examples that appear in shareholder reports of other funds.
Note that the expenses shown in the table are meant to highlight and help you compare ongoing costs only and do not reflect transaction costs incurred by the fund for buying and selling securities. Further, the expenses do not include any purchase, redemption, or account service fees described in the fund prospectus. If such fees were applied to your account, your costs would be higher. Your fund does not carry a “sales load.”
The calculations assume no shares were bought or sold during the period. Your actual costs may have been higher or lower, depending on the amount of your investment and the timing of any purchases or redemptions.
You can find more information about the fund’s expenses, including annual expense ratios, in the Financial Statements section of this report. For additional information on operating expenses and other shareholder costs, please refer to your fund’s current prospectus.
56
| Six Months Ended August 31, 2014 | |||
| Beginning | Ending | Expenses | |
| Account Value | Account Value | Paid During | |
| 2/28/2014 | 8/31/2014 | Period | |
| Based on Actual Fund Return | |||
| Russell 1000 Index Fund | |||
| Institutional Shares | $1,000.00 | $1,083.32 | $0.58 |
| ETF Shares | 1,000.00 | 1,083.10 | 0.79 |
| Russell 1000 Value Index Fund | |||
| Institutional Shares | $1,000.00 | $1,096.24 | $0.53 |
| ETF Shares | 1,000.00 | 1,095.93 | 0.69 |
| Russell 1000 Growth Index Fund | |||
| Institutional Shares | $1,000.00 | $1,071.43 | $0.52 |
| ETF Shares | 1,000.00 | 1,071.23 | 0.68 |
| Based on Hypothetical 5% Yearly Return | |||
| Russell 1000 Index Fund | |||
| Institutional Shares | $1,000.00 | $1,024.65 | $0.56 |
| ETF Shares | 1,000.00 | 1,024.45 | 0.77 |
| Russell 1000 Value Index Fund | |||
| Institutional Shares | $1,000.00 | $1,024.70 | $0.51 |
| ETF Shares | 1,000.00 | 1,024.55 | 0.66 |
| Russell 1000 Growth Index Fund | |||
| Institutional Shares | $1,000.00 | $1,024.70 | $0.51 |
| ETF Shares | 1,000.00 | 1,024.55 | 0.66 |
| The calculations are based on expenses incurred in the most recent six-month period. The funds’ annualized six-month expense ratios for that period are: for the Russell 1000 Index Fund, 0.11% for Institutional Shares and 0.15% for ETF Shares; for the Russell 1000 Value Index Fund, 0.10% for Institutional Shares and 0.13% for ETF Shares; and for the Russell 1000 Growth Index Fund, 0.10% for Institutional Shares and 0.13% for ETF Shares. The dollar amounts shown as ”Expenses Paid” are equal to the annualized expense ratio multiplied by the average account value over the period, multiplied by the number of days in the most recent six-month period, then divided by the number of days in the most recent 12-month period. | |||
57
Trustees Approve Advisory Arrangements
The board of trustees of Vanguard Russell 1000 Index Fund, Russell 1000 Value Index Fund, and Russell 1000 Growth Index Fund has renewed each fund’s investment advisory arrangement with The Vanguard Group, Inc. (Vanguard). Vanguard’s Equity Investment Group—through its Equity Index Group—serves as investment advisor for each fund. The board determined that continuing each fund’s internalized management structure was in the best interests of each fund and its shareholders.
The board based its decision upon an evaluation of the advisor’s investment staff, portfolio management process, and performance. The trustees considered the factors discussed below, among others. However, no single factor determined whether the board approved the arrangements. Rather, it was the totality of the circumstances that drove the board’s decision.
Nature, extent, and quality of services
The board considered the quality of investment management services provided to the funds since their inception in 2010, and took into account the organizational depth and stability of the advisor. The board noted that Vanguard has been managing investments for more than three decades. The Equity Index Group adheres to a sound, disciplined investment management process; the team has considerable experience, stability, and depth.
The board concluded that Vanguard’s experience, stability, depth, and performance, among other factors, warranted continuation of each advisory arrangement.
Investment performance
The board considered the funds’ performance since their inception, including any periods of outperformance or underperformance relative to a target index and peer group. The board concluded that the performance was such that each advisory arrangement should continue. Information about the funds’ most recent performance can be found in the Performance Summary pages of this report.
Cost
The board concluded that each fund’s expense ratio was well below the average expense ratios charged by funds in its peer group and that each fund’s advisory fee rate was also well below its peer group average. Information about the funds’ expenses appears in the About Your Fund’s Expenses section of this report as well as in the Financial Statements sections.
The board does not conduct a profitability analysis of Vanguard, because of Vanguard’s unique “at-cost” structure. Unlike most other mutual fund management companies, Vanguard is owned by the funds it oversees, and produces “profits” only in the form of reduced expenses for fund shareholders.
The benefit of economies of scale
The board concluded that each fund’s at-cost arrangement with Vanguard ensures that the funds will realize economies of scale as they grow, with the cost to shareholders declining as fund assets increase.
The board will consider whether to renew the advisory arrangements again after a one-year period.
58
Glossary
30-Day SEC Yield. A fund’s 30-day SEC yield is derived using a formula specified by the U.S. Securities and Exchange Commission. Under the formula, data related to the fund’s security holdings in the previous 30 days are used to calculate the fund’s hypothetical net income for that period, which is then annualized and divided by the fund’s estimated average net assets over the calculation period. For the purposes of this calculation, a security’s income is based on its current market yield to maturity (for bonds), its actual income (for asset-backed securities), or its projected dividend yield (for stocks). Because the SEC yield represents hypothetical annualized income, it will differ—at times significantly—from the fund’s actual experience. As a result, the fund’s income distributions may be higher or lower than implied by the SEC yield.
Beta. A measure of the magnitude of a fund’s past share-price fluctuations in relation to the ups and downs of a given market index. The index is assigned a beta of 1.00. Compared with a given index, a fund with a beta of 1.20 typically would have seen its share price rise or fall by 12% when the index rose or fell by 10%. For this report, beta is based on returns over the past 36 months for both the fund and the index. Note that a fund’s beta should be reviewed in conjunction with its R-squared (see definition). The lower the R-squared, the less correlation there is between the fund and the index, and the less reliable beta is as an indicator of volatility.
Dividend Yield. Dividend income earned by stocks, expressed as a percentage of the aggregate market value (or of net asset value, for a fund). The yield is determined by dividing the amount of the annual dividends by the aggregate value (or net asset value) at the end of the period. For a fund, the dividend yield is based solely on stock holdings and does not include any income produced by other investments.
Earnings Growth Rate. The average annual rate of growth in earnings over the past five years for the stocks now in a fund.
Equity Exposure. A measure that reflects a fund’s investments in stocks and stock futures. Any holdings in short-term reserves are excluded.
Expense Ratio. A fund’s total annual operating expenses expressed as a percentage of the fund’s average net assets. The expense ratio includes management and administrative expenses, but does not include the transaction costs of buying and selling portfolio securities.
Foreign Holdings. The percentage of a fund represented by securities or depositary receipts of companies based outside the United States.
Inception Date. The date on which the assets of a fund (or one of its share classes) are first invested in accordance with the fund’s investment objective. For funds with a subscription period, the inception date is the day after that period ends. Investment performance is measured from the inception date.
Median Market Cap. An indicator of the size of companies in which a fund invests; the midpoint of market capitalization (market price x shares outstanding) of a fund’s stocks, weighted by the proportion of the fund’s assets invested in each stock. Stocks representing half of the fund’s assets have market capitalizations above the median, and the rest are below it.
Price/Book Ratio. The share price of a stock divided by its net worth, or book value, per share. For a fund, the weighted average price/book ratio of the stocks it holds.
59
Price/Earnings Ratio. The ratio of a stock’s current price to its per-share earnings over the past year. For a fund, the weighted average P/E of the stocks it holds. P/E is an indicator of market expectations about corporate prospects; the higher the P/E, the greater the expectations for a company’s future growth.
R-Squared. A measure of how much of a fund’s past returns can be explained by the returns from the market in general, as measured by a given index. If a fund’s total returns were precisely synchronized with an index’s returns, its R-squared would be 1.00. If the fund’s returns bore no relationship to the index’s returns, its R-squared would be 0. For this report, R-squared is based on returns over the past 36 months for both the fund and the index.
Return on Equity. The annual average rate of return generated by a company during the past five years for each dollar of shareholder’s equity (net income divided by shareholder’s equity). For a fund, the weighted average return on equity for the companies whose stocks it holds.
Short-Term Reserves. The percentage of a fund invested in highly liquid, short-term securities that can be readily converted to cash.
Turnover Rate. An indication of the fund’s trading activity. Funds with high turnover rates incur higher transaction costs and may be more likely to distribute capital gains (which may be taxable to investors). The turnover rate excludes in-kind transactions, which have minimal impact on costs.
This page intentionally left blank.
This page intentionally left blank.
This page intentionally left blank.
The People Who Govern Your Fund
The trustees of your mutual fund are there to see that the fund is operated and managed in your best interests since, as a shareholder, you are a part owner of the fund. Your fund’s trustees also serve on the board of directors of The Vanguard Group, Inc., which is owned by the Vanguard funds and provides services to them on an at-cost basis.
A majority of Vanguard’s board members are independent, meaning that they have no affiliation with Vanguard or the funds they oversee, apart from the sizable personal investments they have made as private individuals. The independent board members have distinguished backgrounds in business, academia, and public service. Each of the trustees and executive officers oversees 177 Vanguard funds.
The following table provides information for each trustee and executive officer of the fund. More information about the trustees is in the Statement of Additional Information, which can be obtained, without charge, by contacting Vanguard at 800-662-7447, or online at vanguard.com.
| InterestedTrustee1 | and Delphi Automotive LLP (automotive components); |
| Senior Advisor at New Mountain Capital. | |
| F. William McNabb III | |
| Born 1957. Trustee Since July 2009. Chairman of the | Amy Gutmann |
| Board. Principal Occupation(s) During the Past Five | Born 1949. Trustee Since June 2006. Principal |
| Years: Chairman of the Board of The Vanguard Group, | Occupation(s) During the Past Five Years: President of |
| Inc., and of each of the investment companies served | the University of Pennsylvania; Christopher H. Browne |
| by The Vanguard Group, since January 2010; Director | Distinguished Professor of Political Science, School of |
| of The Vanguard Group since 2008; Chief Executive | Arts and Sciences, and Professor of Communication, |
| Officer and President of The Vanguard Group, and of | Annenberg School for Communication, with secondary |
| each of the investment companies served by The | faculty appointments in the Department of Philosophy, |
| Vanguard Group, since 2008; Director of Vanguard | School of Arts and Sciences, and at the Graduate |
| Marketing Corporation; Managing Director of The | School of Education, University of Pennsylvania; |
| Vanguard Group (1995–2008). | Trustee of the National Constitution Center; Chair |
| of the Presidential Commission for the Study of | |
| IndependentTrustees | Bioethical Issues. |
| Emerson U. Fullwood | JoAnn Heffernan Heisen |
| Born 1948. Trustee Since January 2008. Principal | Born 1950. Trustee Since July 1998. Principal |
| Occupation(s) During the Past Five Years: Executive | Occupation(s) During the Past Five Years: Corporate |
| Chief Staff and Marketing Officer for North America | Vice President and Chief Global Diversity Officer |
| and Corporate Vice President (retired 2008) of Xerox | (retired 2008) and Member of the Executive |
| Corporation (document management products and | Committee (1997–2008) of Johnson & Johnson |
| services); Executive in Residence and 2009–2010 | (pharmaceuticals/medical devices/consumer |
| Distinguished Minett Professor at the Rochester | products); Director of Skytop Lodge Corporation |
| Institute of Technology; Director of SPX Corporation | (hotels), the University Medical Center at Princeton, |
| (multi-industry manufacturing), the United Way of | the Robert Wood Johnson Foundation, and the Center |
| Rochester, Amerigroup Corporation (managed health | for Talent Innovation; Member of the Advisory Board |
| care), the University of Rochester Medical Center, | of the Maxwell School of Citizenship and Public Affairs |
| Monroe Community College Foundation, and North | at Syracuse University. |
| Carolina A&T University. | |
| F. Joseph Loughrey | |
| Rajiv L. Gupta | Born 1949. Trustee Since October 2009. Principal |
| Born 1945. Trustee Since December 2001.2 | Occupation(s) During the Past Five Years: President |
| Principal Occupation(s) During the Past Five Years: | and Chief Operating Officer (retired 2009) of Cummins |
| Chairman and Chief Executive Officer (retired 2009) | Inc. (industrial machinery); Chairman of the Board |
| and President (2006–2008) of Rohm and Haas Co. | of Hillenbrand, Inc. (specialized consumer services), |
| (chemicals); Director of Tyco International, Ltd. | and of Oxfam America; Director of SKF AB (industrial |
| (diversified manufacturing and services), Hewlett- | machinery), Hyster-Yale Materials Handling, Inc. |
| Packard Co. (electronic computer manufacturing), | (forklift trucks), the Lumina Foundation for Education, |
| and the V Foundation for Cancer Research; Member | Executive Officers | |
| of the Advisory Council for the College of Arts and | ||
| Letters and of the Advisory Board to the Kellogg | Glenn Booraem | |
| Institute for International Studies, both at the | Born 1967. Controller Since July 2010. Principal | |
| University of Notre Dame. | Occupation(s) During the Past Five Years: Principal | |
| of The Vanguard Group, Inc.; Controller of each of | ||
| Mark Loughridge | the investment companies served by The Vanguard | |
| Born 1953. Trustee Since March 2012. Principal | Group; Assistant Controller of each of the investment | |
| Occupation(s) During the Past Five Years: Senior Vice | companies served by The Vanguard Group (2001–2010). | |
| President and Chief Financial Officer (retired 2013) | ||
| at IBM (information technology services); Fiduciary | Thomas J. Higgins | |
| Member of IBM’s Retirement Plan Committee (2004– | Born 1957. Chief Financial Officer Since September | |
| 2013); Member of the Council on Chicago Booth. | 2008. Principal Occupation(s) During the Past Five | |
| Years: Principal of The Vanguard Group, Inc.; Chief | ||
| Scott C. Malpass | Financial Officer of each of the investment companies | |
| Born 1962. Trustee Since March 2012. Principal | served by The Vanguard Group; Treasurer of each of | |
| Occupation(s) During the Past Five Years: Chief | the investment companies served by The Vanguard | |
| Investment Officer and Vice President at the University | Group (1998–2008). | |
| of Notre Dame; Assistant Professor of Finance at the | ||
| Mendoza College of Business at Notre Dame; Member | Kathryn J. Hyatt | |
| of the Notre Dame 403(b) Investment Committee; | Born 1955. Treasurer Since November 2008. Principal | |
| Board Member of TIFF Advisory Services, Inc. | Occupation(s) During the Past Five Years: Principal of | |
| (investment advisor); Member of the Investment | The Vanguard Group, Inc.; Treasurer of each of the | |
| Advisory Committees of the Financial Industry | investment companies served by The Vanguard | |
| Regulatory Authority (FINRA) and of Major League | Group; Assistant Treasurer of each of the investment | |
| Baseball. | companies served by The Vanguard Group (1988–2008). | |
| André F. Perold | Heidi Stam | |
| Born 1952. Trustee Since December 2004. Principal | Born 1956. Secretary Since July 2005. Principal | |
| Occupation(s) During the Past Five Years: George | Occupation(s) During the Past Five Years: Managing | |
| Gund Professor of Finance and Banking, Emeritus | Director of The Vanguard Group, Inc.; General Counsel | |
| at the Harvard Business School (retired 2011); | of The Vanguard Group; Secretary of The Vanguard | |
| Chief Investment Officer and Managing Partner of | Group and of each of the investment companies | |
| HighVista Strategies LLC (private investment firm); | served by The Vanguard Group; Director and Senior | |
| Director of Rand Merchant Bank; Overseer of the | Vice President of Vanguard Marketing Corporation. | |
| Museum of Fine Arts Boston. | ||
| Vanguard Senior ManagementTeam | ||
| Alfred M. Rankin, Jr. | ||
| Born 1941. Trustee Since January 1993. Principal | Mortimer J. Buckley | Chris D. McIsaac |
| Occupation(s) During the Past Five Years: Chairman, | Kathleen C. Gubanich | Michael S. Miller |
| President, and Chief Executive Officer of NACCO | Paul A. Heller | James M. Norris |
| Industries, Inc. (housewares/lignite), and of Hyster- | Martha G. King | Glenn W. Reed |
| Yale Materials Handling, Inc. (forklift trucks); Chairman | John T. Marcante | |
| of the Board of University Hospitals of Cleveland. | ||
| Chairman Emeritus and Senior Advisor | ||
| Peter F. Volanakis | ||
| Born 1955. Trustee Since July 2009. Principal | John J. Brennan | |
| Occupation(s) During the Past Five Years: President | Chairman, 1996–2009 | |
| and Chief Operating Officer (retired 2010) of Corning | Chief Executive Officer and President, 1996–2008 | |
| Incorporated (communications equipment); Trustee of | ||
| Colby-Sawyer College; Member of the Advisory Board | Founder | |
| of the Norris Cotton Cancer Center and of the Advisory | ||
| Board of the Parthenon Group (strategy consulting). | John C. Bogle | |
| Chairman and Chief Executive Officer, 1974–1996 | ||
1 Mr. McNabb is considered an “interested person,” as defined in the Investment Company Act of 1940, because he is an officer of theVanguard funds.
2 December 2002 for Vanguard Equity Income Fund, the Vanguard Municipal Bond Funds, and the Vanguard State Tax-Exempt Funds.
 | |
| P.O. Box 2600 | |
| Valley Forge, PA 19482-2600 | |
| Connect with Vanguard® > vanguard.com | |
| Fund Information > 800-662-7447 | The Russell Indexes and Russell® are registered |
| Direct Investor Account Services > 800-662-2739 | trademarks of Russell Investments and have been |
| Institutional Investor Services > 800-523-1036 | licensed for use by The Vanguard Group, Inc. The |
| Text Telephone for People | products are not sponsored, endorsed, sold, or |
| With Hearing Impairment > 800-749-7273 | promoted by Russell Investments and Russell |
| Investments makes no representation regarding the | |
| This material may be used in conjunction | advisability of investing in the products. |
| with the offering of shares of any Vanguard | |
| fund only if preceded or accompanied by | |
| the fund’s current prospectus. | |
| All comparative mutual fund data are from Lipper, a | |
| Thomson Reuters Company, or Morningstar, Inc., unless | |
| otherwise noted. | |
| You can obtain a free copy of Vanguard’s proxy voting | |
| guidelines by visiting vanguard.com/proxyreporting or by | |
| calling Vanguard at 800-662-2739. The guidelines are | |
| also available from the SEC’s website, sec.gov. In | |
| addition, you may obtain a free report on how your fund | |
| voted the proxies for securities it owned during the 12 | |
| months ended June 30. To get the report, visit either | |
| vanguard.com/proxyreporting or sec.gov. | |
| You can review and copy information about your fund at | |
| the SEC’s Public Reference Room in Washington, D.C. To | |
| find out more about this public service, call the SEC at | |
| 202-551-8090. Information about your fund is also | |
| available on the SEC’s website, and you can receive | |
| copies of this information, for a fee, by sending a | |
| request in either of two ways: via e-mail addressed to | |
| publicinfo@sec.gov or via regular mail addressed to the | |
| Public Reference Section, Securities and Exchange | |
| Commission, Washington, DC 20549-1520. | |
| © 2014 The Vanguard Group, Inc. | |
| All rights reserved. | |
| Vanguard Marketing Corporation, Distributor. | |
| Q18480 102014 | |
Annual Report | August 31, 2014
Vanguard Russell 2000 Index Funds
Vanguard Russell 2000 Index Fund
Vanguard Russell 2000 Value Index Fund
Vanguard Russell 2000 Growth Index Fund
The mission continues
On May 1, 1975, Vanguard began operations, a fledgling company based on the simple but revolutionary idea that a mutual fund company should be managed solely in the interest of its investors.
Four decades later, that revolutionary spirit continues to animate the enterprise. Vanguard remains on a mission to give investors the best chance of investment success.
As we mark our 40th anniversary, we thank you for entrusting your assets to Vanguard and giving us the opportunity to help you reach your financial goals in the decades to come.
| Contents | |
| Your Fund’s Total Returns. | 1 |
| Chairman’s Letter. | 2 |
| Russell 2000 Index Fund. | 9 |
| Russell 2000 Value Index Fund. | 23 |
| Russell 2000 Growth Index Fund. | 37 |
| Your Fund’s After-Tax Returns. | 53 |
| About Your Fund’s Expenses. | 54 |
| Trustees Approve Advisory Arrangements. | 56 |
| Glossary. | 57 |
Please note: The opinions expressed in this report are just that—informed opinions. They should not be considered promises or advice.
Also, please keep in mind that the information and opinions cover the period through the date on the front of this report. Of course, the
risks of investing in your fund are spelled out in the prospectus.
See the Glossary for definitions of investment terms used in this report.
About the cover: Since our founding, Vanguard has drawn inspiration from the enterprise and valor demonstrated by British
naval hero Horatio Nelson and his command at the Battle of the Nile in 1798. The photograph displays a replica of a merchant
ship from the same era as Nelson’s flagship, the HMS Vanguard.
Your Fund’s Total Returns
| Fiscal Year Ended August 31, 2014 | |
| Total | |
| Returns | |
| Vanguard Russell 2000 Index Fund | |
| Institutional Shares | 17.78% |
| ETF Shares | |
| Market Price | 17.58 |
| Net Asset Value | 17.69 |
| Russell 2000 Index | 17.68 |
| Small-Cap Core Funds Average | 18.26 |
Small-Cap Core Funds Average: Derived from data provided by Lipper, a Thomson Reuters Company.
| |
| Vanguard Russell 2000 Value Index Fund | |
| Institutional Shares | 18.07% |
| ETF Shares | |
| Market Price | 17.73 |
| Net Asset Value | 17.92 |
| Russell 2000 Value Index | 18.10 |
| Small-Cap Value Funds Average | 19.06 |
Small-Cap Value Funds Average: Derived from data provided by Lipper, a Thomson Reuters Company.
| |
| Vanguard Russell 2000 Growth Index Fund | |
| Institutional Shares | 17.44% |
| ETF Shares | |
| Market Price | 17.19 |
| Net Asset Value | 17.30 |
| Russell 2000 Growth Index | 17.30 |
| Small-Cap Growth Funds Average | 14.11 |
| Small-Cap Growth Funds Average: Derived from data provided by Lipper, a Thomson Reuters Company. | |
Institutional Shares are available to certain institutional investors who meet specific administrative, service, and account-size criteria. The Vanguard ETF® Shares shown are traded on the Nasdaq exchange and are available only through brokers. The table provides ETF returns based on both the Nasdaq market price and the net asset value for a share. U.S. Pat. Nos. 6,879,964; 7,337,138; 7,720,749; 7,925,573; 8,090,646; and 8,417,623.
For the ETF Shares, the market price is determined by the midpoint of the bid-offer spread as of the closing time of the New York Stock Exchange (generally 4 p.m., Eastern time). The net asset value is also determined as of the NYSE closing time. For more information about how the ETF Shares' market prices have compared with their net asset value, visit vanguard.com, select your ETF, and then select the Price and Performance tab. The ETF premium/discount analysis there shows the percentages of days on which the ETF Shares' market price was above or below the NAV.
1

Chairman’s Letter
Dear Shareholder,
The three Vanguard Russell 2000 Index Funds delivered healthy returns for the fiscal year, although they lost momentum in the second half.
For the 12 months ended August 31, 2014, Vanguard Russell 2000 Value Index Fund led the trio with a return of 17.92%. (The returns cited in this letter are for ETF Shares based on net asset value.) Vanguard Russell 2000 Growth Index Fund returned 17.30%. Vanguard Russell 2000 Index Fund, which includes growth and value stocks, took the middle ground, returning 17.69%. In an unusually strong period for stocks of all sizes, small-capitalization stocks produced more modest returns than their mid- and large-cap counterparts.
Each fund closely tracked its target index. The Russell 2000 Growth Index Fund surpassed the average return of its peer group; the 2000 Index Fund and the 2000 Value Index Fund did not.
If you hold shares of the fund in a taxable account, you may wish to review the information on the fund’s after-tax returns that appears later in this report.
After clearing some hurdles, U.S. stocks reached new highs
Despite an assortment of challenges, the broad U.S. stock market recorded an impressive return of about 25% for the year ended August 31. U.S. stocks registered positive results in 10 of those 12 months, and a late-July swoon was followed by an August flurry of record highs.
Investors applauded mostly solid corporate earnings, generally upbeat economic news, and the Federal Reserve’s continued accommodative policies. Still, turmoil in the Middle East and Ukraine, economic worries in Europe and China, and uncertainty about the Fed’s next moves pressured the market at times.
International stocks returned about 18%. Emerging markets, after sliding earlier in the period, rebounded to lead the way. The developed markets of the Pacific region and Europe trailed but still notched double-digit returns.
Defying analysts’ expectations, bond prices rose over the year
The broad U.S. taxable bond market returned 5.66%, rallying from the drubbing it took a year ago when investors fretted over the future of the Fed’s bond-buying program.
The Fed began reducing its purchases in January and has consistently cut them further since, with the goal of ending the program in October. Interest rates have not risen as forecast, however. The yield of the 10-year U.S. Treasury note ended August at 2.34%, down from 2.76% a year earlier. (Bond prices and yields move in opposite directions.)
| Market Barometer | |||
| Average Annual Total Returns | |||
| Periods Ended August 31, 2014 | |||
| One | Three | Five | |
| Year | Years | Years | |
| Stocks | |||
| Russell 1000 Index (Large-caps) | 25.36% | 20.80% | 17.24% |
| Russell 2000 Index (Small-caps) | 17.68 | 19.00 | 17.03 |
| Russell 3000 Index (Broad U.S. market) | 24.74 | 20.65 | 17.22 |
| FTSE All-World ex US Index (International) | 18.04 | 9.48 | 8.44 |
| Bonds | |||
| Barclays U.S. Aggregate Bond Index (Broad taxable market) | 5.66% | 2.91% | 4.48% |
| Barclays Municipal Bond Index (Broad tax-exempt market) | 10.14 | 4.88 | 5.39 |
| Citigroup Three-Month U.S. Treasury Bill Index | 0.04 | 0.04 | 0.07 |
| CPI | |||
| Consumer Price Index | 1.70% | 1.64% | 1.96% |
3
Municipal bonds returned 10.14% as investors searched for tax-exempt income amid a limited supply of new issues. International bond markets (as measured by the Barclays Global Aggregate Index ex USD) returned 6.52%.
Following such a strong advance, it’s worth remembering that the current low yields imply lower future returns: As yields drop, the scope for further declines—and increases in prices—diminishes.
The Fed’s target of 0%–0.25% for short-term interest rates continued to restrict returns for money market funds and savings accounts.
The funds’ earlier gains offset their weakness
After posting exceptional results in the first half of the fiscal year, the Russell 2000 Index Funds retreated amid growing concerns over small-cap valuations but nonetheless ended on a strong footing.
In general, small companies tend to be more volatile and vulnerable to sharp swings in share price than large companies. This is true partly because they lack the balance-sheet heft and other resources available to larger firms. (See the text box on page 6 for more about the differences between small- and large-cap stocks.)
In the second half of the fiscal year, investors worried that some small-cap stocks with lofty valuations might fall short
| Expense Ratios | |||
| Your Fund Compared With Its Peer Group | |||
| Institutional | ETF | Peer Group | |
| Shares | Shares | Average | |
| Russell 2000 Index Fund | 0.08% | 0.15% | 1.32% |
| Russell 2000 Value Index Fund | 0.08 | 0.20 | 1.36 |
| Russell 2000 Growth Index Fund | 0.08 | 0.20 | 1.42 |
The fund expense ratios shown are from the prospectus dated July 8, 2014 (December 20, 2013, for the Russell 2000 Growth Index Fund), and represent estimated costs for the current fiscal year. For the fiscal year ended August 31, 2014, the funds’ expense ratios were: for the Russell 2000 Index Fund, 0.08% for Institutional Shares and 0.15% for ETF Shares; for the Russell 2000 Value Index Fund, 0.08% for Institutional Shares and 0.20% for ETF Shares; for the Russell 2000 Growth Index Fund, 0.08% for Institutional Shares and 0.20% for ETF Shares. Peer-group expense ratios are derived from data provided by Lipper, a Thomson Reuters Company, and capture information through year-end 2013.
Peer groups: For the Russell 2000 Index Fund, Small-Cap Core Funds; for the Russell 2000 Value Index Fund, Small-Cap Value Funds; and for the Russell 2000 Growth Fund, Small-Cap Growth Funds.
4
of their earnings projections. This shift in market sentiment took the heaviest toll on the 2000 Growth Index Fund, which turned in a negative return for the six months ended August 31. The returns of the 2000 Index and 2000 Value Index Funds also fell sharply, but to a lesser extent.
Despite this second-half weakness, all nine sectors that make up the funds posted positive, mostly double-digit returns for the year. Interestingly, the three funds’ results were rather similar—between 17% and 18%—because each held sizable stakes in some of the best-performing sectors.
The leader in the group, the 2000 Value Index Fund, benefited most from financial services, producer durables, and technology. Financial stocks, which represented close to 40% of the fund’s assets on average, rallied largely on the strength of real estate investment trusts (REITs) and banks. A drop in interest rates in 2014 helped REITs rebound from their decline during the last part of 2013. REITs rely heavily on the markets to raise cash to finance growth, and less expensive capital can help their profit margins. Banks continued to improve thanks to solid corporate earnings and lending activity.
Producer durables stocks got a boost from the U.S. economy’s gradual expansion. Gains were broad-based, led by aerospace parts manufacturers and commercial airlines. Companies that provide back-office support, including human resources and consulting services, also rose.
| Total Returns | |
| Inception Through August 31, 2014 | |
| Average | |
| Annual Return | |
| Russell 2000 Index Fund Institutional Shares (Returns since inception: 12/22/2010) | 12.88% |
| Russell 2000 Index | 12.84 |
| Small-Cap Core Funds Average | 12.33 |
| Small-Cap Core Funds Average: Derived from data provided by Lipper, a Thomson Reuters Company. | |
| Russell 2000 Value Index Fund Institutional Shares (Returns since inception: 7/13/2012) | 20.50% |
| Russell 2000 Value Index | 20.56 |
| Small-Cap Value Funds Average | 21.98 |
| Small-Cap Value Funds Average: Derived from data provided by Lipper, a Thomson Reuters Company. | |
| Russell 2000 Growth Index Fund Institutional Shares (Returns since inception: 5/25/2011) | 13.40% |
| Russell 2000 Growth Index | 13.35 |
| Small-Cap Growth Funds Average | 11.25 |
| Small-Cap Growth Funds Average: Derived from data provided by Lipper, a Thomson Reuters Company. | |
The figures shown represent past performance, which is not a guarantee of future results. (Current performance may be lower or higher than the performance data cited. For performance data current to the most recent month-end, visit our website at vanguard.com/performance.) Note, too, that both investment returns and principal value can fluctuate widely, so an investor’s shares, when sold, could be worth more or less than their original cost.
5
In technology, semiconductor manufacturers and measurement tool and instrument makers stood out. Computer services providers contributed as well.
The 2000 Index Fund also benefited most from the financial services, technology, and producer durable sectors, along with health care stocks. Pharmaceutical and
| Small-cap stocks versus large-caps: A case for diversification |
| At times, particularly over the past dozen years, small-capitalization stocks have outpaced their large-cap counterparts. This performance edge may appear compelling, but before making any drastic decisions to tilt your portfolio heavily toward small-caps, consider two points. |
| First, there’s no guarantee that small caps’ performance advantage will persist. As shown in the chart below, these stocks had an extended period of underperformance in the 1990s, and that could happen again. |
| Second, investing in small companies’ stocks involves additional risks. These firms generally have less business diversification, fewer financial resources, and less management depth than larger enterprises. As a result, their stocks can be highly volatile. |
| Investors with a heavy allocation to only one segment of the market can end up with greater volatility and less diversification. A better alternative can be a market-cap-weighted equity portfolio of stocks of all capitalizations that offers more diversification over the long term. |
| Small-cap performance relative to large-caps |
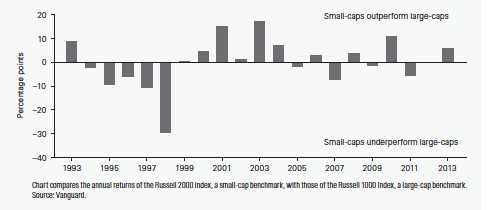
6
biotech companies had exceptional returns, buoyed by high-profile mergers and acquisitions and successful drug trials. Health care providers and medical and equipment makers all recorded solid gains.
The 2000 Growth Index Fund, which is heavily weighted in health care, technology, and producer durable stocks, posted strong returns as well. Its outsized holdings in consumer discretionary stocks did not deliver as much. Although consumer confidence has improved in recent months, many specialty retailers were hurt by the long, severe winter. Increased competition, along with consumers’ growing preference for online shopping and price comparison, also pushed down sales.
Building a successful long-term track record
Since their inception in 2010, the Russell 2000 Index Funds have successfully met their objective of closely tracking their target indexes, a tribute to the fund’s advisor, Vanguard Equity Investment Group. The skilled and experienced team has developed sophisticated trading and portfolio construction techniques to keep the funds close on the heels of their benchmarks. Helping in this effort were the funds’ low expenses, which allow you to keep more of their returns.
High costs don’t add up to strong fund performance
The adage “you get what you pay for” doesn’t apply to mutual funds. In fact, the reverse is true: Research suggests that higher costs are consistent with weaker returns. (See, for example, Shopping for Alpha: You Get What You Don’t Pay For at vanguard.com/research.)
Shouldn’t paying the highest fees allow you to purchase the services of the greatest talents and therefore get the best returns? As it turns out, the data don’t really support that argument. The explanation is simple: Every dollar paid for management fees is a dollar less earning potential return. Keeping expenses down can help narrow the gap between what the markets return and what investors actually earn.
That’s why Vanguard seeks to minimize costs on all our funds. Indexing, of course, is the purest expression of low-cost investing. In our actively managed funds, which are run by some of the most prominent advisory firms in the investment industry, we work to keep fees low. It’s a strategy that reflects decades of experience and research, boiled down to one tenet: The less you pay, the more you keep.
As always, thank you for investing with Vanguard.
Sincerely,

F. William McNabb III
Chairman and Chief Executive Officer
September 17, 2014
7
| Your Fund’s Performance at a Glance | ||||
| August 31, 2013, Through August 31, 2014 | ||||
| Distributions Per Share | ||||
| Starting | Ending | Income | Capital | |
| Share Price | Share Price | Dividends | Gains | |
| Vanguard Russell 2000 Index Fund | ||||
| Institutional Shares | $153.88 | $179.29 | $1.906 | $0.000 |
| ETF Shares | 80.46 | 93.72 | 0.957 | 0.000 |
| Vanguard Russell 2000 Value Index Fund | ||||
| Institutional Shares | $148.87 | $173.15 | $2.547 | $0.000 |
| ETF Shares | 75.48 | 87.76 | 1.223 | 0.000 |
| Vanguard Russell 2000 Growth Index Fund | ||||
| Institutional Shares | $162.99 | $190.26 | $1.134 | $0.000 |
| ETF Shares | 85.58 | 99.83 | 0.549 | 0.000 |
Russell 2000 Index Fund
Fund Profile
As of August 31, 2014
| Share-Class Characteristics | ||
| Institutional | ETF | |
| Shares | Shares | |
| Ticker Symbol | VRTIX | VTWO |
| Expense Ratio1 | 0.08% | 0.15% |
| 30-Day SEC Yield | 1.17% | 1.10% |
| Portfolio Characteristics | |||
| DJ | |||
| U.S. | |||
| Total | |||
| Russell | Market | ||
| 2000 | FA | ||
| Fund | Index | Index | |
| Number of Stocks | 1,989 | 1,957 | 3,709 |
| Median Market Cap | $1.7B | $1.7B | $48.0B |
| Price/Earnings Ratio | 33.9x | 33.6x | 20.7x |
| Price/Book Ratio | 2.2x | 2.2x | 2.7x |
| Return on Equity | 9.8% | 9.7% | 17.8% |
| Earnings Growth | |||
| Rate | 13.6% | 13.6% | 15.3% |
| Dividend Yield | 1.3% | 1.3% | 1.8% |
| Foreign Holdings | 0.0% | 0.0% | 0.0% |
| Turnover Rate | 16% | — | — |
| Short-Term Reserves | 0.0% | — | — |
| Sector Diversification (% of equity exposure) | |||
| DJ | |||
| U.S. | |||
| Total | |||
| Russell | Market | ||
| 2000 | FA | ||
| Fund | Index | Index | |
| Consumer Discretionary 13.8% | 13.8% | 14.1% | |
| Consumer Staples | 2.7 | 2.8 | 7.2 |
| Energy | 6.1 | 6.1 | 9.7 |
| Financial Services | 24.4 | 24.3 | 18.7 |
| Health Care | 13.6 | 13.6 | 13.2 |
| Materials & Processing | 6.8 | 6.9 | 4.5 |
| Other | 0.1 | 0.0 | 0.0 |
| Producer Durables | 13.7 | 13.7 | 11.3 |
| Technology | 14.5 | 14.5 | 16.1 |
| Utilities | 4.3 | 4.3 | 5.2 |
| Volatility Measures | ||
| DJ | ||
| Russell | U.S. Total | |
| 2000 | Market | |
| Index | FA Index | |
| R-Squared | 1.00 | 0.89 |
| Beta | 1.00 | 1.27 |
| These measures show the degree and timing of the fund’s fluctuations compared with the indexes over 36 months. | ||
| Ten Largest Holdings (% of total net assets) | ||
| InterMune Inc. | Biotechnology | 0.5% |
| Puma Biotechnology Inc. Biotechnology | 0.3 | |
| Isis Pharmaceuticals Inc. Pharmaceuticals | 0.3 | |
| WEX Inc. | Financial Data & | |
| Systems | 0.3 | |
| Kodiak Oil & Gas Corp. | Oil: Crude Producers | 0.3 |
| Prosperity Bancshares | ||
| Inc. | Banks: Diversified | 0.2 |
| Graphic Packaging | Containers & | |
| Holding Co. | Packaging | 0.2 |
| Ultimate Software Group Computer Services | ||
| Inc. | Software & Systems | 0.2 |
| Team Health Holdings | ||
| Inc. | Health Care Services | 0.2 |
| Brunswick Corp. | Recreational Vehicles | |
| & Boats | 0.2 | |
| Top Ten | 2.7% | |
| The holdings listed exclude any temporary cash investments and equity index products. | ||
Investment Focus
1 The expense ratios shown are from the prospectus dated July 8, 2014, and represent estimated costs for the current fiscal year. For the fiscal year ended August 31, 2014, the expense ratios were 0.08% for Institutional Shares and 0.15% for ETF Shares.
9
Russell 2000 Index Fund
Performance Summary
All of the returns in this report represent past performance, which is not a guarantee of future results that may be achieved by the fund. (Current performance may be lower or higher than the performance data cited. For performance data current to the most recent month-end, visit our website at vanguard.com/performance.) Note, too, that both investment returns and principal value can fluctuate widely, so an investor’s shares, when sold, could be worth more or less than their original cost. The returns shown do not reflect taxes that a shareholder would pay on fund distributions or on the sale of fund shares.
Cumulative Performance: September 20, 2010, Through August 31, 2014
Initial Investment of $10,000
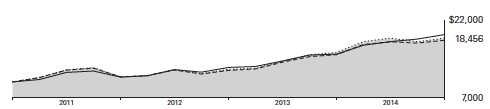
| Average Annual Total Returns | ||||
| Periods Ended August 31, 2014 | ||||
| Since | Final Value | |||
| One | Inception | of a $10,000 | ||
| Year | (9/20/2010) | Investment | ||
| Russell 2000 Index Fund*ETF Shares | ||||
| Net Asset Value | 17.69% | 16.80% | $18,456 | |
| Russell 2000 Index Fund*ETF Shares | ||||
| Market Price | 17.58 | 16.78 | 18,438 | |
| •••••••• | Russell 2000 Index | 17.68 | 16.86 | 18,488 |
| – – – – | Small-Cap Core Funds Average | 18.26 | 16.19 | 18,076 |
| Dow Jones U.S. Total Stock Market | ||||
| Float Adjusted Index | 24.68 | 17.95 | 19,178 | |
| Small-Cap Core Funds Average: Derived from data provided by Lipper, a Thomson Reuters Company. "Since Inception" performance is calculated from the ETF Shares’ inception date for both the fund and its comparative standards. | ||||
| Since | Final Value | ||
| One | Inception | of a $5,000,000 | |
| Year | (12/22/2010) | Investment | |
| Russell 2000 Index Fund Institutional Shares | 17.78% | 12.88% | $7,818,082 |
| Russell 2000 Index | 17.68 | 12.84 | 7,809,480 |
| Dow Jones U.S. Total Stock Market Float | |||
| Adjusted Index | 24.68 | 15.70 | 8,564,386 |
| "Since Inception" performance is calculated from the Institutional Shares’ inception date for both the fund and its comparative standards. | |||
See Financial Highlights for dividend and capital gains information.
10
Russell 2000 Index Fund
| Cumulative Returns of ETF Shares: September 20, 2010, Through August 31, 2014 | ||
| Since | ||
| One | Inception | |
| Year | (9/20/2010) | |
| Russell 2000 Index Fund ETF Shares Market Price | 17.58% | 84.38% |
| Russell 2000 Index Fund ETF Shares Net Asset | ||
| Value | 17.69 | 84.56 |
| Russell 2000 Index | 17.68 | 84.88 |
| "Since Inception" performance is calculated from the ETF Shares’ inception date for both the fund and its comparative standards. | ||
Fiscal-Year Total Returns (%): September 20, 2010, Through August 31, 2014
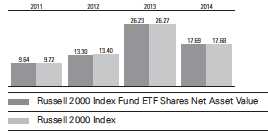
Average Annual Total Returns: Periods Ended June 30, 2014
This table presents returns through the latest calendar quarter—rather than through the end of the fiscal period.
Securities and Exchange Commission rules require that we provide this information.
| Inception | One | Since | |
| Date | Year | Inception | |
| Institutional Shares | 12/22/2010 | 23.75% | 13.99% |
| ETF Shares | 9/20/2010 | ||
| Market Price | 23.99 | 18.05 | |
| Net Asset Value | 23.65 | 18.06 |
11
Russell 2000 Index Fund
Financial Statements
Statement of Net Assets—Investments Summary
As of August 31, 2014
This Statement summarizes the fund’s holdings by asset type. Details are reported for each of the fund’s 50 largest individual holdings and for investments that, in total for any issuer, represent more than 1% of the fund’s net assets. The total value of smaller holdings is reported as a single amount within each category.
The fund reports a complete list of its holdings in regulatory filings four times in each fiscal year, at the quarter-ends. For the second and fourth fiscal quarters, the complete listing of the fund’s holdings is available electronically on vanguard.com and on the Securities and Exchange Commission’s website (sec.gov), or you can have it mailed to you without charge by calling 800-662-7447. For the first and third fiscal quarters, the fund files the lists with the SEC on Form N-Q. Shareholders can look up the fund’s Forms N-Q on the SEC’s website. Forms N-Q may also be reviewed and copied at the SEC’s Public Reference Room (see the back cover of this report for further information).
| Market | Percentage | ||
| Value | of Net | ||
| Shares | ($000) | Assets | |
| Common Stocks | |||
| Consumer Discretionary | |||
| Brunswick Corp. | 37,182 | 1,599 | 0.3% |
| * Tenneco Inc. | 24,413 | 1,564 | 0.2% |
| Dana Holding Corp. | 62,858 | 1,460 | 0.2% |
| Consumer Discretionary—Other † | 90,928 | 13.1% | |
| 95,551 | 13.8% | ||
| Consumer Staples | |||
| * TreeHouse Foods Inc. | 16,836 | 1,389 | 0.2% |
| * United Natural Foods Inc. | 19,899 | 1,279 | 0.2% |
| Consumer Staples—Other † | 16,336 | 2.3% | |
| 19,004 | 2.7% | ||
| Energy | |||
| * Kodiak Oil & Gas Corp. | 106,869 | 1,739 | 0.2% |
| SemGroup Corp. Class A | 17,086 | 1,499 | 0.2% |
| * Diamondback Energy Inc. | 16,769 | 1,448 | 0.2% |
| * Rosetta Resources Inc. | 24,635 | 1,232 | 0.2% |
| Energy—Other † | 36,071 | 5.2% | |
| 41,989 | 6.0% | ||
| Financial Services | |||
| * WEX Inc. | 15,538 | 1,766 | 0.3% |
| Prosperity Bancshares Inc. | 27,963 | 1,689 | 0.3% |
| RLJ Lodging Trust | 52,492 | 1,565 | 0.2% |
| CNO Financial Group Inc. | 87,358 | 1,559 | 0.2% |
| Highwoods Properties Inc. | 36,138 | 1,538 | 0.2% |
| LaSalle Hotel Properties | 41,726 | 1,525 | 0.2% |
| Investors Bancorp Inc. | 143,635 | 1,524 | 0.2% |
| * Stifel Financial Corp. | 26,255 | 1,257 | 0.2% |
| Financial Services—Other † | 155,832 | 22.4% | |
| 168,255 | 24.2% |
Russell 2000 Index Fund
| Market | Percentage | ||
| Value | of Net | ||
| Shares | ($000) | Assets | |
| Health Care | |||
| * InterMune Inc. | 43,417 | 3,189 | 0.5% |
| * Puma Biotechnology Inc. | 9,309 | 2,425 | 0.3% |
| * Isis Pharmaceuticals Inc. | 47,147 | 1,922 | 0.3% |
| * Team Health Holdings Inc. | 28,164 | 1,648 | 0.2% |
| * Pacira Pharmaceuticals Inc. | 14,296 | 1,548 | 0.2% |
| HealthSouth Corp. | 35,326 | 1,392 | 0.2% |
| STERIS Corp. | 23,693 | 1,334 | 0.2% |
| * DexCom Inc. | 30,041 | 1,328 | 0.2% |
| * PAREXEL International Corp. | 22,805 | 1,287 | 0.2% |
| * NPS Pharmaceuticals Inc. | 42,636 | 1,287 | 0.2% |
| Health Care—Other † | 76,850 | 11.1% | |
| 94,210 | 13.6% | ||
| Materials & Processing | |||
| * Graphic Packaging Holding Co. | 131,100 | 1,677 | 0.2% |
| US Silica Holdings Inc. | 21,557 | 1,548 | 0.2% |
| PolyOne Corp. | 37,744 | 1,480 | 0.2% |
| Belden Inc. | 17,483 | 1,277 | 0.2% |
| Materials & Processing—Other † | 41,286 | 6.0% | |
| 47,268 | 6.8% | ||
| 1Other † | 632 | 0.1% | |
| Producer Durables | |||
| * Esterline Technologies Corp. | 12,754 | 1,495 | 0.2% |
| * Teledyne Technologies Inc. | 15,046 | 1,461 | 0.2% |
| Woodward Inc. | 26,586 | 1,389 | 0.2% |
| Curtiss-Wright Corp. | 19,322 | 1,388 | 0.2% |
| HEICO Corp. | 26,663 | 1,381 | 0.2% |
| * Generac Holdings Inc. | 27,601 | 1,284 | 0.2% |
| CLARCOR Inc. | 20,216 | 1,278 | 0.2% |
| * Darling Ingredients Inc. | 65,876 | 1,270 | 0.2% |
| * Moog Inc. Class A | 17,839 | 1,265 | 0.2% |
| Producer Durables—Other † | 82,252 | 11.8% | |
| 94,463 | 13.6% | ||
| Technology | |||
| * Ultimate Software Group Inc. | 11,366 | 1,671 | 0.3% |
| * Aspen Technology Inc. | 36,920 | 1,517 | 0.2% |
| * Cognex Corp. | 34,820 | 1,462 | 0.2% |
| * RF Micro Devices Inc. | 114,742 | 1,431 | 0.2% |
| FEI Co. | 16,942 | 1,424 | 0.2% |
| * TriQuint Semiconductor Inc. | 68,702 | 1,420 | 0.2% |
| * Guidewire Software Inc. | 27,245 | 1,241 | 0.2% |
| * SS&C Technologies Holdings Inc. | 27,314 | 1,236 | 0.2% |
| Technology—Other † | 88,426 | 12.7% | |
| 99,828 | 14.4% | ||
| Utilities | |||
| Cleco Corp. | 24,204 | 1,366 | 0.2% |
| * Dynegy Inc. Class A | 40,236 | 1,315 | 0.2% |
| Utilities—Other † | 26,814 | 3.9% | |
| 29,495 | 4.3% | ||
| Total Common Stocks (Cost $596,444) | 690,695 | 99.5%2 | |
13
Russell 2000 Index Fund
| Market | Percentage | |||
| Value | of Net | |||
| Coupon | Shares | ($000) | Assets | |
| Temporary Cash Investments | ||||
| Money Market Fund | ||||
| 3,4 Vanguard Market Liquidity Fund | 0.113% | 6,730,759 | 6,731 | 1.0% |
| 5U.S. Government and Agency Obligations † | 300 | 0.0% | ||
| Total Temporary Cash Investments (Cost $7,031) | 7,031 | 1.0%2 | ||
| 6Total Investments (Cost $603,475) | 697,726 | 100.5% | ||
| Other Assets and Liabilities | ||||
| Other Assets | 11,403 | 1.6% | ||
| Liabilities4 | (14,635) | (2.1%) | ||
| (3,232) | (0.5%) | |||
| Net Assets | 694,494 | 100.0% | ||
| At August 31, 2014, net assets consisted of: | ||||
| Amount | ||||
| ($000) | ||||
| Paid-in Capital | 603,051 | |||
| Undistributed Net Investment Income | 4,873 | |||
| Accumulated Net Realized Losses | (7,760) | |||
| Unrealized Appreciation (Depreciation) | ||||
| Investment Securities | 94,251 | |||
| Futures Contracts | 79 | |||
| Net Assets | 694,494 | |||
| Institutional Shares—Net Assets | ||||
| Applicable to 1,782,596 outstanding $.001 par value shares of | ||||
| beneficial interest (unlimited authorization) | 319,607 | |||
| Net Asset Value Per Share—Institutional Shares | $179.29 | |||
| ETF Shares—Net Assets | ||||
| Applicable to 4,000,000 outstanding $.001 par value shares of | ||||
| beneficial interest (unlimited authorization) | 374,887 | |||
| Net Asset Value Per Share—ETF Shares | $93.72 | |||
See Note A in Notes to Financial Statements.
* Non-income-producing security.
† Represents the aggregate value, by category, of securities that are not among the 50 largest holdings and, in total for any issuer, represent
1% or less of net assets.
1 “Other” represents securities that are not classified by the fund’s benchmark index.
2 The fund invests a portion of its cash reserves in equity markets through the use of index futures contracts. After giving effect to futures investments, the fund’s effective common stock and temporary cash investment positions represent 100.0% and 0.5%, respectively, of net assets.
3 Affiliated money market fund available only to Vanguard funds and certain trusts and accounts managed by Vanguard. Rate shown is the
7-day yield.
4 Includes $3,852,000 of collateral received for securities on loan.
5 Securities with a value of $200,000 have been segregated as initial margin for open futures contracts.
6 The total value of securities on loan is $3,549,000.
See accompanying Notes, which are an integral part of the Financial Statements.
14
Russell 2000 Index Fund
Statement of Operations
| Year Ended | |
| August 31, 2014 | |
| ($000) | |
| Investment Income | |
| Income | |
| Dividends | 8,563 |
| Interest1 | 5 |
| Securities Lending | 537 |
| Total Income | 9,105 |
| Expenses | |
| The Vanguard Group—Note B | |
| Investment Advisory Services | 85 |
| Management and Administrative—Institutional Shares | — |
| Management and Administrative—ETF Shares | 229 |
| Marketing and Distribution—Institutional Shares | 75 |
| Marketing and Distribution—ETF Shares | 78 |
| Custodian Fees | 257 |
| Auditing Fees | 23 |
| Shareholders’ Reports—Institutional Shares | — |
| Shareholders’ Reports—ETF Shares | 22 |
| Total Expenses | 769 |
| Net Investment Income | 8,336 |
| Realized Net Gain (Loss) | |
| Investment Securities Sold | 83,124 |
| Futures Contracts | 309 |
| Realized Net Gain (Loss) | 83,433 |
| Change in Unrealized Appreciation (Depreciation) | |
| Investment Securities | 8,224 |
| Futures Contracts | 94 |
| Change in Unrealized Appreciation (Depreciation) | 8,318 |
| Net Increase (Decrease) in Net Assets Resulting from Operations | 100,087 |
| 1 Interest income from an affiliated company of the fund was $5,000. | |
See accompanying Notes, which are an integral part of the Financial Statements.
15
Russell 2000 Index Fund
Statement of Changes in Net Assets
| Year Ended August 31, | ||
| 2014 | 2013 | |
| ($000) | ($000) | |
| Increase (Decrease) in Net Assets | ||
| Operations | ||
| Net Investment Income | 8,336 | 7,639 |
| Realized Net Gain (Loss) | 83,433 | 16,107 |
| Change in Unrealized Appreciation (Depreciation) | 8,318 | 76,423 |
| Net Increase (Decrease) in Net Assets Resulting from Operations | 100,087 | 100,169 |
| Distributions | ||
| Net Investment Income | ||
| Institutional Shares | (3,461) | (3,588) |
| ETF Shares | (3,732) | (2,717) |
| Realized Capital Gain | ||
| Institutional Shares | — | — |
| ETF Shares | — | — |
| Total Distributions | (7,193) | (6,305) |
| Capital Share Transactions | ||
| Institutional Shares | (4,467) | 24,759 |
| ETF Shares | 70,573 | 66,096 |
| Net Increase (Decrease) from Capital Share Transactions | 66,106 | 90,855 |
| Total Increase (Decrease) | 159,000 | 184,719 |
| Net Assets | ||
| Beginning of Period | 535,494 | 350,775 |
| End of Period1 | 694,494 | 535,494 |
| 1 Net Assets—End of Period includes undistributed (overdistributed) net investment income of $4,873,000 and $3,608,000. | ||
See accompanying Notes, which are an integral part of the Financial Statements.
16
Russell 2000 Index Fund
Financial Highlights
| Institutional Shares | ||||
| Dec. 22, | ||||
| 20101 to | ||||
| Year Ended August 31, | Aug. 31, | |||
| For a Share Outstanding Throughout Each Period | 2014 | 2013 | 2012 | 2011 |
| Net Asset Value, Beginning of Period | $153.88 | $123.77 | $110.21 | $119.33 |
| Investment Operations | ||||
| Net Investment Income | 2.110 | 2.306 | 1.7332 | .652 |
| Net Realized and Unrealized Gain (Loss) on Investments | 25.206 | 29.858 | 12.899 | (9.340) |
| Total from Investment Operations | 27.316 | 32.164 | 14.632 | (8.688) |
| Distributions | ||||
| Dividends from Net Investment Income | (1.906) | (2.054) | (1.072) | (. 432) |
| Distributions from Realized Capital Gains | — | — | — | — |
| Total Distributions | (1.906) | (2.054) | (1.072) | (. 432) |
| Net Asset Value, End of Period | $179.29 | $153.88 | $123.77 | $110.21 |
| Total Return | 17.78% | 26.33% | 13.37% | -7.31% |
| Ratios/Supplemental Data | ||||
| Net Assets, End of Period (Millions) | $320 | $278 | $202 | $78 |
| Ratio of Total Expenses to Average Net Assets | 0.08% | 0.08% | 0.08% | 0.08%3 |
| Ratio of Net Investment Income to Average Net Assets | 1.30% | 1.78% | 1.52% | 1.21%3 |
| Portfolio Turnover Rate 4 | 16% | 32% | 35% | 34% |
1 Inception.
2 Calculated based on average shares outstanding.
3 Annualized.
4 Excludes the value of portfolio securities received or delivered as a result of in-kind purchases or redemptions of the fund’s capital shares, including ETF Creation Units.
See accompanying Notes, which are an integral part of the Financial Statements.
17
Russell 2000 Index Fund
Financial Highlights
| ETF Shares | ||||
| Sept. 20, | ||||
| 20101 to | ||||
| Year Ended August 31, | Aug. 31, | |||
| For a Share Outstanding Throughout Each Period | 2014 | 2013 | 2012 | 2011 |
| Net Asset Value, Beginning of Period | $80.46 | $64.74 | $57.66 | $52.78 |
| Investment Operations | ||||
| Net Investment Income | 1.054 | 1.161 | .8692 | .575 |
| Net Realized and Unrealized Gain (Loss) on Investments | 13.163 | 15.604 | 6.749 | 4.531 |
| Total from Investment Operations | 14.217 | 16.765 | 7.618 | 5.106 |
| Distributions | ||||
| Dividends from Net Investment Income | (.957) | (1.045) | (.538) | (.226) |
| Distributions from Realized Capital Gains | — | — | — | — |
| Total Distributions | (.957) | (1.045) | (.538) | (.226) |
| Net Asset Value, End of Period | $93.72 | $80.46 | $64.74 | $57.66 |
| Total Return | 17.69% | 26.23% | 13.30% | 9.64% |
| Ratios/Supplemental Data | ||||
| Net Assets, End of Period (Millions) | $375 | $257 | $149 | $29 |
| Ratio of Total Expenses to Average Net Assets | 0.15% | 0.15% | 0.15% | 0.15%3 |
| Ratio of Net Investment Income to Average Net Assets | 1.23% | 1.71% | 1.45% | 1.14%3 |
| Portfolio Turnover Rate 4 | 16% | 32% | 35% | 34% |
1 Inception.
2 Calculated based on average shares outstanding.
3 Annualized.
4 Excludes the value of portfolio securities received or delivered as a result of in-kind purchases or redemptions of the fund’s capital shares, including ETF Creation Units.
See accompanying Notes, which are an integral part of the Financial Statements.
18
Russell 2000 Index Fund
Notes to Financial Statements
Vanguard Russell 2000 Index Fund is registered under the Investment Company Act of 1940 as an open-end investment company, or mutual fund. The fund offers two classes of shares: Institutional Shares and ETF Shares. Institutional Shares are designed for investors who meet certain administrative, service, and account-size criteria. ETF Shares are listed for trading on Nasdaq; they can be purchased and sold through a broker.
A. The following significant accounting policies conform to generally accepted accounting principles for U.S. investment companies. The fund consistently follows such policies in preparing its financial statements.
1. Security Valuation: Securities are valued as of the close of trading on the New York Stock Exchange (generally 4 p.m., Eastern time) on the valuation date. Equity securities are valued at the latest quoted sales prices or official closing prices taken from the primary market in which each security trades; such securities not traded on the valuation date are valued at the mean of the latest quoted bid and asked prices. Securities for which market quotations are not readily available, or whose values have been materially affected by events occurring before the fund’s pricing time but after the close of the securities’ primary markets, are valued by methods deemed by the board of trustees to represent fair value. Investments in Vanguard Market Liquidity Fund are valued at that fund’s net asset value. Temporary cash investments acquired over 60 days to maturity are valued using the latest bid prices or using valuations based on a matrix system (which considers such factors as security prices, yields, maturities, and ratings), both as furnished by independent pricing services. Other temporary cash investments are valued at amortized cost, which approximates market value.
2. Futures Contracts: The fund uses index futures contracts to a limited extent, with the objectives of maintaining full exposure to the stock market, enhancing returns, maintaining liquidity, and minimizing transaction costs. The fund may purchase futures contracts to immediately invest incoming cash in the market, or sell futures in response to cash outflows, thereby simulating a fully invested position in the underlying index while maintaining a cash balance for liquidity. The fund may seek to enhance returns by using futures contracts instead of the underlying securities when futures are believed to be priced more attractively than the underlying securities. The primary risks associated with the use of futures contracts are imperfect correlation between changes in market values of stocks held by the fund and the prices of futures contracts, and the possibility of an illiquid market. Counterparty risk involving futures is mitigated because a regulated clearinghouse is the counterparty instead of the clearing broker. To further mitigate counterparty risk, the fund trades futures contracts on an exchange, monitors the financial strength of its clearing brokers and clearinghouse, and has entered into clearing agreements with its clearing brokers. The clearinghouse imposes initial margin requirements to secure the fund’s performance and requires daily settlement of variation margin representing changes in the market value of each contract.
Futures contracts are valued at their quoted daily settlement prices. The aggregate settlement values of the contracts are not recorded in the Statement of Net Assets. Fluctuations in the value of the contracts are recorded in the Statement of Net Assets as an asset (liability) and in the Statement of Operations as unrealized appreciation (depreciation) until the contracts are closed, when they are recorded as realized futures gains (losses).
During the year ended August 31, 2014, the fund’s average investments in long and short futures contracts represented less than 1% and 0% of net assets, respectively, based on the average of aggregate settlement values at each quarter-end during the period.
19
Russell 2000 Index Fund
3. Federal Income Taxes: The fund intends to continue to qualify as a regulated investment company and distribute all of its taxable income. Management has analyzed the fund’s tax positions taken for all open federal income tax years (August 31, 2011–2014), and has concluded that no provision for federal income tax is required in the fund’s financial statements.
4. Distributions: Distributions to shareholders are recorded on the ex-dividend date.
5. Securities Lending: To earn additional income, the fund lends its securities to qualified institutional borrowers. Security loans are required to be secured at all times by collateral in an amount at least equal to the market value of securities loaned. Daily market fluctuations could cause the value of loaned securities to be more or less than the value of the collateral received. When this occurs, the collateral is adjusted and settled on the next business day. The fund further mitigates its counterparty risk by entering into securities lending transactions only with a diverse group of prequalified counterparties, monitoring their financial strength, and entering into master securities lending agreements with its counterparties. The master securities lending agreements provide that, in the event of a counterparty’s default (including bankruptcy), the fund may terminate any loans with that borrower, determine the net amount owed, and sell or retain the collateral up to the net amount owed to the fund; however, such actions may be subject to legal proceedings. While collateral mitigates counterparty risk, in the absence of a default the fund may experience delays and costs in recovering the securities loaned. The fund invests cash collateral received in Vanguard Market Liquidity Fund, and records a liability in the Statement of Net Assets for the return of the collateral, during the period the securities are on loan. Securities lending income represents fees charged to borrowers plus income earned on invested cash collateral, less expenses associated with the loan.
6. Credit Facility: The fund and certain other funds managed by The Vanguard Group participate in a $2.89 billion committed credit facility provided by a syndicate of lenders pursuant to a credit agreement that may be renewed annually; each fund is individually liable for its borrowings, if any, under the credit facility. Borrowings may be utilized for temporary and emergency purposes, and are subject to the fund’s regulatory and contractual borrowing restrictions. The participating funds are charged administrative fees and an annual commitment fee of 0.06% of the undrawn amount of the facility; these fees are allocated to the funds based on a method approved by the fund’s board of trustees and included in Management and Administrative expenses on the fund’s Statement of Operations. Any borrowings under this facility bear interest at a rate equal to the higher of the federal funds rate or LIBOR reference rate plus an agreed-upon spread.
The fund had no borrowings outstanding at August 31, 2014, or at any time during the period then ended.
7. Other: Dividend income is recorded on the ex-dividend date. Interest income includes income distributions received from Vanguard Market Liquidity Fund and is accrued daily. Premiums and discounts on debt securities purchased are amortized and accreted, respectively, to interest income over the lives of the respective securities. Security transactions are accounted for on the date securities are bought or sold. Costs used to determine realized gains (losses) on the sale of investment securities are those of the specific securities sold.
Each class of shares has equal rights as to assets and earnings, except that each class separately bears certain class-specific expenses related to maintenance of shareholder accounts (included in Management and Administrative expenses) and shareholder reporting. Marketing and distribution expenses are allocated to each class of shares based on a method approved by the board of trustees. Income, other non-class-specific expenses, and gains and losses on investments are allocated to each class of shares based on its relative net assets.
20
Russell 2000 Index Fund
B. The Vanguard Group furnishes at cost investment advisory, corporate management, administrative, marketing, and distribution services. The costs of such services are allocated to the fund based on methods approved by the board of trustees. The fund has committed to provide up to 0.40% of its net assets in capital contributions to Vanguard. At August 31, 2014, the fund had contributed capital of $67,000 to Vanguard (included in Other Assets), representing 0.01% of the fund’s net assets and 0.03% of Vanguard’s capitalization. The fund’s trustees and officers are also directors and officers of Vanguard.
C. Various inputs may be used to determine the value of the fund’s investments. These inputs are summarized in three broad levels for financial statement purposes. The inputs or methodologies used to value securities are not necessarily an indication of the risk associated with investing in those securities.
Level 1—Quoted prices in active markets for identical securities.
Level 2—Other significant observable inputs (including quoted prices for similar securities, interest rates, prepayment speeds, credit risk, etc.).
Level 3—Significant unobservable inputs (including the fund’s own assumptions used to determine the fair value of investments).
The following table summarizes the market value of the fund’s investments as of August 31, 2014, based on the inputs used to value them:
| Level 1 | Level 2 | Level 3 | |
| Investments | ($000) | ($000) | ($000) |
| Common Stocks | 690,605 | — | 90 |
| Temporary Cash Investments | 6,731 | 300 | — |
| Futures Contracts—Assets1 | 19 | — | — |
| Total | 697,355 | 300 | 90 |
| 1 Represents variation margin on the last day of the reporting period. | |||
D. At August 31, 2014, the aggregate settlement value of open futures contracts and the related unrealized appreciation (depreciation) were:
| ($000) | ||||
| Aggregate | ||||
| Number of | Settlement | Unrealized | ||
| Long (Short) | Value | Appreciation | ||
| Futures Contracts | Expiration | Contracts | Long (Short) | (Depreciation) |
| E-mini Russell 2000 Index | September 2014 | 30 | 3,520 | 79 |
Unrealized appreciation (depreciation) on open futures contracts is required to be treated as realized gain (loss) for tax purposes.
E. Distributions are determined on a tax basis and may differ from net investment income and realized capital gains for financial reporting purposes. Differences may be permanent or temporary. Permanent differences are reclassified among capital accounts in the financial statements to reflect their tax character. Temporary differences arise when certain items of income, expense, gain, or loss are recognized in different periods for financial statement and tax purposes. These differences will reverse at some time in the future. Differences in classification may also result from the treatment of short-term gains as ordinary income for tax purposes.
21
Russell 2000 Index Fund
Certain of the fund’s investments are in securities considered to be passive foreign investment companies, for which any unrealized appreciation and/or realized gains are required to be included in distributable net income for tax purposes. During the year ended August 31, 2014, the fund realized gains on the sale of passive foreign investment companies of $122,000, which have been included in current and prior periods’ taxable income; accordingly, such gains have been reclassified from accumulated net realized losses to undistributed net investment income. Passive foreign investment companies held at August 31, 2014, had unrealized appreciation of $123,000, of which all has been distributed and is reflected in the balance of undistributed net investment income.
During the year ended August 31, 2014, the fund realized $86,359,000 of net capital gains resulting from in-kind redemptions—in which shareholders exchanged fund shares for securities held by the fund rather than for cash. Because such gains are not taxable to the fund, and are not distributed to shareholders, they have been reclassified from accumulated net realized losses to paid-in capital.
For tax purposes, at August 31, 2014, the fund had $5,114,000 of ordinary income available for distribution. The fund had available capital losses totaling $7,677,000 that may be carried forward indefinitely to offset future net capital gains.
At August 31, 2014, the cost of investment securities for tax purposes was $603,602,000. Net unrealized appreciation of investment securities for tax purposes was $94,124,000, consisting of unrealized gains of $121,654,000 on securities that had risen in value since their purchase and $27,530,000 in unrealized losses on securities that had fallen in value since their purchase.
F. During the year ended August 31, 2014, the fund purchased $489,937,000 of investment securities and sold $424,400,000 of investment securities, other than temporary cash investments. Purchases and sales include $356,247,000 and $323,229,000, respectively, in connection with in-kind purchases and redemptions of the fund’s capital shares.
G. Capital share transactions for each class of shares were:
| Year Ended August 31, | |||||
| 2014 | 2013 | ||||
| Amount | Shares | Amount | Shares | ||
| ($000) | (000) | ($000) | (000) | ||
| Institutional Shares | |||||
| Issued | 67,964 | 399 | 85,359 | 607 | |
| Issued in Lieu of Cash Distributions | 3,224 | 18 | 3,450 | 27 | |
| Redeemed | (75,655) | (441) | (64,050) | (458) | |
| Net Increase (Decrease) —Institutional Shares | (4,467) | (24) | 24,759 | 176 | |
| ETF Shares | |||||
| Issued | 401,320 | 4,400 | 104,908 | 1,400 | |
| Issued in Lieu of Cash Distributions | — | — | — | — | |
| Redeemed | (330,747) | (3,600) | (38,812) | (500) | |
| Net Increase (Decrease)—ETF Shares | 70,573 | 800 | 66,096 | 900 | |
H. Management has determined that no material events or transactions occurred subsequent to August 31, 2014, that would require recognition or disclosure in these financial statements.
22
Russell 2000 Value Index Fund
Fund Profile
As of August 31, 2014
| Share-Class Characteristics | ||
| Institutional | ETF | |
| Shares | Shares | |
| Ticker Symbol | VRTVX | VTWV |
| Expense Ratio1 | 0.08% | 0.20% |
| 30-Day SEC Yield | 1.86% | 1.74% |
| Portfolio Characteristics | |||
| DJ | |||
| U.S. | |||
| Russell | Total | ||
| 2000 | Market | ||
| Value | FA | ||
| Fund | Index | Index | |
| Number of Stocks | 1,317 | 1,311 | 3,709 |
| Median Market Cap | $1.5B | $1.5B | $48.0B |
| Price/Earnings Ratio | 27.0x | 26.7x | 20.7x |
| Price/Book Ratio | 1.5x | 1.5x | 2.7x |
| Return on Equity | 7.1% | 7.1% | 17.8% |
| Earnings Growth | |||
| Rate | 10.3% | 10.3% | 15.3% |
| Dividend Yield | 1.9% | 1.9% | 1.8% |
| Foreign Holdings | 0.0% | 0.0% | 0.0% |
| Turnover Rate | 36% | — | — |
| Short-Term Reserves | 0.0% | — | — |
| Sector Diversification (% of equity exposure) | |||
| DJ | |||
| U.S. | |||
| Russell | Total | ||
| 2000 | Market | ||
| Value | FA | ||
| Fund | Index | Index | |
| Consumer Discretionary 11.4% | 11.4% | 14.1% | |
| Consumer Staples | 2.2 | 2.2 | 7.2 |
| Energy | 6.3 | 6.2 | 9.7 |
| Financial Services | 39.1 | 39.1 | 18.7 |
| Health Care | 4.9 | 4.9 | 13.2 |
| Materials & Processing | 5.9 | 5.8 | 4.5 |
| Producer Durables | 13.9 | 14.0 | 11.3 |
| Technology | 9.2 | 9.2 | 16.1 |
| Utilities | 7.1 | 7.2 | 5.2 |
| Volatility Measures | ||
| Russell | DJ | |
| 2000 | U.S. Total | |
| Value | Market | |
| Index | FA Index | |
| R-Squared | 1.00 | 0.90 |
| Beta | 1.00 | 1.22 |
| These measures show the degree and timing of the fund’s fluctuations compared with the indexes over 36 months. | ||
| Ten Largest Holdings (% of total net assets) | ||
| Prosperity Bancshares | ||
| Inc. | Banks: Diversified | 0.5% |
| RLJ Lodging Trust | Real Estate | |
| Investment Trusts | ||
| (REITs) | 0.5 | |
| CNO Financial Group | ||
| Inc. | Insurance: Life | 0.4 |
| Highwoods Properties | Real Estate | |
| Inc. | Investment Trusts | |
| (REITs) | 0.4 | |
| LaSalle Hotel Properties | Real Estate | |
| Investment Trusts | ||
| (REITs) | 0.4 | |
| Esterline Technologies | ||
| Corp. | Aerospace | 0.4 |
| Cleco Corp. | Utilities: Electrical | 0.4 |
| Investors Bancorp Inc. | Banks: Diversified | 0.4 |
| Dynegy Inc. | Utilities: Electrical | 0.4 |
| Stifel Financial Corp. | Diversified Financial | |
| Services | 0.4 | |
| Top Ten | 4.2% | |
| The holdings listed exclude any temporary cash investments and equity index products. | ||
Investment Focus
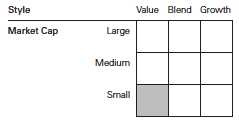
1 The expense ratios shown are from the prospectus dated July 8, 2014, and represent estimated costs for the current fiscal year. For the fiscal year ended August 31, 2014, the expense ratios were 0.08% for Institutional Shares and 0.20% for ETF Shares.
23
Russell 2000 Value Index Fund
Performance Summary
All of the returns in this report represent past performance, which is not a guarantee of future results that may be achieved by the fund. (Current performance may be lower or higher than the performance data cited. For performance data current to the most recent month-end, visit our website at vanguard.com/performance.) Note, too, that both investment returns and principal value can fluctuate widely, so an investor’s shares, when sold, could be worth more or less than their original cost. The returns shown do not reflect taxes that a shareholder would pay on fund distributions or on the sale of fund shares.
Cumulative Performance: September 20, 2010, Through August 31, 2014
Initial Investment of $10,000
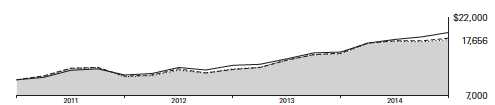
| Average Annual Total Returns | ||||
| Periods Ended August 31, 2014 | ||||
| Since | Final Value | |||
| One | Inception | of a $10,000 | ||
| Year | (9/20/2010) | Investment | ||
| Russell 2000 Value Index Fund*ETF | ||||
| Shares Net Asset Value | 17.92% | 15.50% | $17,656 | |
| Russell 2000 Value Index Fund*ETF | ||||
| Shares Market Price | 17.73 | 15.47 | 17,637 | |
| •••••••• | Russell 2000 Value Index | 18.10 | 15.70 | 17,776 |
| – – – – | Small-Cap Value Funds Average | 19.06 | 16.17 | 18,063 |
| Dow Jones U.S. Total Stock Market | ||||
| Float Adjusted Index | 24.68 | 17.95 | 19,178 | |
Small-Cap Value Funds Average: Derived from data provided by Lipper, a Thomson Reuters Company.
"Since Inception" performance is calculated from the ETF Shares’ inception date for both the fund and its comparative standards.
| Since | Final Value | ||
| One | Inception | of a $5,000,000 | |
| Year | (7/13/2012) | Investment | |
| Russell 2000 Value Index Fund Institutional | |||
| Shares | 18.07% | 20.50% | $7,441,996 |
| Russell 2000 Value Index | 18.10 | 20.56 | 7,450,636 |
| Dow Jones U.S. Total Stock Market Float | |||
| Adjusted Index | 24.68 | 22.98 | 7,772,562 |
| "Since Inception" performance is calculated from the Institutional Shares’ inception date for both the fund and its comparative standards. | |||
See Financial Highlights for dividend and capital gains information.
24
Russell 2000 Value Index Fund
| Cumulative Returns of ETF Shares: September 20, 2010, Through August 31, 2014 | ||
| Since | ||
| One | Inception | |
| Year | (9/20/2010) | |
| Russell 2000 Value Index Fund ETF Shares Market | ||
| Price | 17.73% | 76.37% |
| Russell 2000 Value Index Fund ETF Shares Net | ||
| Asset Value | 17.92 | 76.56 |
| Russell 2000 Value Index | 18.10 | 77.76 |
| "Since Inception" performance is calculated from the ETF Shares’ inception date for both the fund and its comparative standards. | ||
Fiscal-Year Total Returns (%): September 20, 2010, Through August 31, 2014
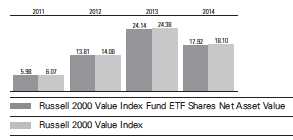
Average Annual Total Returns: Periods Ended June 30, 2014
This table presents returns through the latest calendar quarter—rather than through the end of the fiscal period.
Securities and Exchange Commission rules require that we provide this information.
| Inception | One | Since | |
| Date | Year | Inception | |
| Institutional Shares | 7/13/2012 | 22.51% | 23.70% |
| ETF Shares | 9/20/2010 | ||
| Market Price | 22.67 | 16.88 | |
| Net Asset Value | 22.36 | 16.87 |
25
Russell 2000 Value Index Fund
Financial Statements
Statement of Net Assets—Investments Summary
As of August 31, 2014
This Statement summarizes the fund’s holdings by asset type. Details are reported for each of the fund’s 50 largest individual holdings and for investments that, in total for any issuer, represent more than 1% of the fund’s net assets. The total value of smaller holdings is reported as a single amount within each category.
The fund reports a complete list of its holdings in regulatory filings four times in each fiscal year, at the quarter-ends. For the second and fourth fiscal quarters, the complete listing of the fund’s holdings is available electronically on vanguard.com and on the Securities and Exchange Commission’s website (sec.gov), or you can have it mailed to you without charge by calling 800-662-7447. For the first and third fiscal quarters, the fund files the lists with the SEC on Form N-Q. Shareholders can look up the fund’s Forms N-Q on the SEC’s website. Forms N-Q may also be reviewed and copied at the SEC’s Public Reference Room (see the back cover of this report for further information).
| Market | Percentage | ||
| Value | of Net | ||
| Shares | ($000) | Assets | |
| Common Stocks | |||
| Consumer Discretionary | |||
| * Office Depot Inc. | 93,795 | 480 | 0.3% |
| American Eagle Outfitters Inc. | 34,100 | 480 | 0.3% |
| * Time Inc. | 19,340 | 454 | 0.3% |
| Consumer Discretionary—Other † | 15,939 | 10.5% | |
| 17,353 | 11.4% | ||
| Consumer Staples † | 3,329 | 2.2% | |
| Energy | |||
| * Helix Energy Solutions Group Inc. | 18,512 | 506 | 0.4% |
| Exterran Holdings Inc. | 10,272 | 479 | 0.3% |
| * Rosetta Resources Inc. | 9,408 | 470 | 0.3% |
| Energy—Other † | 8,038 | 5.3% | |
| 9,493 | 6.3% | ||
| Financial Services | |||
| Prosperity Bancshares Inc. | 12,231 | 739 | 0.5% |
| RLJ Lodging Trust | 22,960 | 684 | 0.5% |
| CNO Financial Group Inc. | 38,211 | 682 | 0.4% |
| Highwoods Properties Inc. | 15,807 | 673 | 0.4% |
| LaSalle Hotel Properties | 18,253 | 667 | 0.4% |
| Investors Bancorp Inc. | 55,347 | 587 | 0.4% |
| * Stifel Financial Corp. | 11,485 | 550 | 0.4% |
| EPR Properties | 9,374 | 533 | 0.4% |
| First American Financial Corp. | 18,737 | 531 | 0.4% |
| Sunstone Hotel Investors Inc. | 35,809 | 522 | 0.3% |
| Umpqua Holdings Corp. | 29,222 | 510 | 0.3% |
| FirstMerit Corp. | 29,003 | 500 | 0.3% |
| Cousins Properties Inc. | 38,553 | 489 | 0.3% |
| Primerica Inc. | 9,581 | 482 | 0.3% |
| Hancock Holding Co. | 14,431 | 480 | 0.3% |
26
Russell 2000 Value Index Fund
| Market | Percentage | ||
| Value | of Net | ||
| Shares | ($000) | Assets | |
| Geo Group Inc. | 12,731 | 476 | 0.3% |
| CubeSmart | 25,311 | 471 | 0.3% |
| Webster Financial Corp. | 15,841 | 467 | 0.3% |
| DCT Industrial Trust Inc. | 57,713 | 459 | 0.3% |
| DiamondRock Hospitality Co. | 34,322 | 457 | 0.3% |
| Pebblebrook Hotel Trust | 11,194 | 434 | 0.3% |
| Medical Properties Trust Inc. | 30,212 | 426 | 0.3% |
| Healthcare Realty Trust Inc. | 16,844 | 420 | 0.3% |
| Colony Financial Inc. | 18,679 | 419 | 0.3% |
| Financial Services—Other † | 46,569 | 30.7% | |
| 59,227 | 39.0% | ||
| Health Care | |||
| * WellCare Health Plans Inc. | 7,109 | 468 | 0.3% |
| Health Care—Other † | 6,962 | 4.6% | |
| 7,430 | 4.9% | ||
| Materials & Processing | |||
| Axiall Corp. | 12,265 | 510 | 0.4% |
| Sensient Technologies Corp. | 8,172 | 459 | 0.3% |
| Materials & Processing—Other † | 7,906 | 5.2% | |
| 8,875 | 5.9% | ||
| Other † | 19 | 0.0% | |
| Producer Durables | |||
| * Esterline Technologies Corp. | 5,579 | 654 | 0.4% |
| * Moog Inc. Class A | 7,226 | 512 | 0.4% |
| EMCOR Group Inc. | 11,800 | 510 | 0.3% |
| * Teledyne Technologies Inc. | 5,087 | 494 | 0.3% |
| * JetBlue Airways Corp. | 37,414 | 458 | 0.3% |
| Bristow Group Inc. | 6,241 | 455 | 0.3% |
| Curtiss-Wright Corp. | 6,262 | 450 | 0.3% |
| * Darling Ingredients Inc. | 23,178 | 447 | 0.3% |
| Actuant Corp. Class A | 12,455 | 420 | 0.3% |
| Producer Durables—Other † | 16,734 | 11.0% | |
| 21,134 | 13.9% | ||
| Technology | |||
| * International Rectifier Corp. | 12,502 | 493 | 0.4% |
| Technology—Other † | 13,375 | 8.8% | |
| 13,868 | 9.2% | ||
| Utilities | |||
| Cleco Corp. | 10,586 | 597 | 0.4% |
| * Dynegy Inc. Class A | 17,600 | 575 | 0.4% |
| Piedmont Natural Gas Co. Inc. | 13,669 | 511 | 0.3% |
| IDACORP Inc. | 8,823 | 500 | 0.3% |
| Portland General Electric Co. | 13,712 | 473 | 0.3% |
| Southwest Gas Corp. | 8,157 | 426 | 0.3% |
| Black Hills Corp. | 7,827 | 421 | 0.3% |
| Utilities—Other † | 7,329 | 4.8% | |
| 10,832 | 7.1% | ||
| Total Common Stocks (Cost $145,271) | 151,560 | 99.9%1 | |
27
Russell 2000 Value Index Fund
| Market | Percentage | |||
| Value | of Net | |||
| Coupon | Shares | ($000) | Assets | |
| Temporary Cash Investments | ||||
| Money Market Fund | ||||
| 2,3 Vanguard Market Liquidity Fund | 0.113% | 349,000 | 349 | 0.2% |
| 4U.S. Government and Agency Obligations † | 100 | 0.1% | ||
| Total Temporary Cash Investments (Cost $449) | 449 | 0.3%1 | ||
| 5Total Investments (Cost $145,720) | 152,009 | 100.2% | ||
| Other Assets and Liabilities | ||||
| Other Assets | 512 | 0.3% | ||
| Liabilities3 | (759) | (0.5%) | ||
| (247) | (0.2%) | |||
| Net Assets | 151,762 | 100.0% | ||
| At August 31, 2014, net assets consisted of: | |
| Amount | |
| ($000) | |
| Paid-in Capital | 145,061 |
| Undistributed Net Investment Income | 1,634 |
| Accumulated Net Realized Losses | (1,224) |
| Unrealized Appreciation (Depreciation) | |
| Investment Securities | 6,289 |
| Futures Contracts | 2 |
| Net Assets | 151,762 |
| Institutional Shares—Net Assets | |
| Applicable to 471,024 outstanding $.001 par value shares of | |
| beneficial interest (unlimited authorization) | 81,557 |
| Net Asset Value Per Share—Institutional Shares | $173.15 |
| ETF Shares—Net Assets | |
| Applicable to 800,000 outstanding $.001 par value shares of | |
| beneficial interest (unlimited authorization) | 70,205 |
| Net Asset Value Per Share—ETF Shares | $87.76 |
See Note A in Notes to Financial Statements.
* Non-income-producing security.
† Represents the aggregate value, by category, of securities that are not among the 50 largest holdings and, in total for any issuer, represent 1% or less of net assets.
1 The fund invests a portion of its cash reserves in equity markets through the use of index futures contracts. After giving effect to futures investments, the fund’s effective common stock and temporary cash investment positions represent 100.0% and 0.2%, respectively, of net assets.
2 Affiliated money market fund available only to Vanguard funds and certain trusts and accounts managed by Vanguard. Rate shown is the 7-day yield.
3 Includes $349,000 of collateral received for securities on loan.
4 Securities with a value of $100,000 have been segregated as initial margin for open futures contracts.
5 The total value of securities on loan is $333,000.
See accompanying Notes, which are an integral part of the Financial Statements.
28
Russell 2000 Value Index Fund
Statement of Operations
| Year Ended | |
| August 31, 2014 | |
| ($000) | |
| Investment Income | |
| Income | |
| Dividends | 2,711 |
| Interest1 | 2 |
| Securities Lending | 57 |
| Total Income | 2,770 |
| Expenses | |
| The Vanguard Group—Note B | |
| Investment Advisory Services | 4 |
| Management and Administrative—Institutional Shares | — |
| Management and Administrative—ETF Shares | 74 |
| Marketing and Distribution—Institutional Shares | 16 |
| Marketing and Distribution—ETF Shares | 12 |
| Custodian Fees | 53 |
| Auditing Fees | 23 |
| Shareholders’ Reports—Institutional Shares | — |
| Shareholders’ Reports—ETF Shares | 4 |
| Total Expenses | 186 |
| Net Investment Income | 2,584 |
| Realized Net Gain (Loss) | |
| Investment Securities Sold | 18,142 |
| Futures Contracts | 47 |
| Realized Net Gain (Loss) | 18,189 |
| Change in Unrealized Appreciation (Depreciation) | |
| Investment Securities | (748) |
| Futures Contracts | 17 |
| Change in Unrealized Appreciation (Depreciation) | (731) |
| Net Increase (Decrease) in Net Assets Resulting from Operations | 20,042 |
| 1 Interest income from an affiliated company of the fund was $1,000. | |
See accompanying Notes, which are an integral part of the Financial Statements.
29
Russell 2000 Value Index Fund
Statement of Changes in Net Assets
| Year Ended August 31, | ||
| 2014 | 2013 | |
| ($000) | ($000) | |
| Increase (Decrease) in Net Assets | ||
| Operations | ||
| Net Investment Income | 2,584 | 1,390 |
| Realized Net Gain (Loss) | 18,189 | 3,680 |
| Change in Unrealized Appreciation (Depreciation) | (731) | 6,512 |
| Net Increase (Decrease) in Net Assets Resulting from Operations | 20,042 | 11,582 |
| Distributions | ||
| Net Investment Income | ||
| Institutional Shares | (1,206) | (115) |
| ETF Shares | (856) | (371) |
| Realized Capital Gain | ||
| Institutional Shares | — | — |
| ETF Shares | — | — |
| Total Distributions | (2,062) | (486) |
| Capital Share Transactions | ||
| Institutional Shares | 21,535 | 38,653 |
| ETF Shares | 16,354 | 21,687 |
| Net Increase (Decrease) from Capital Share Transactions | 37,889 | 60,340 |
| Total Increase (Decrease) | 55,869 | 71,436 |
| Net Assets | ||
| Beginning of Period | 95,893 | 24,457 |
| End of Period1 | 151,762 | 95,893 |
| 1 Net Assets—End of Period includes undistributed (overdistributed) net investment income of $1,634,000 and $1,077,000. | ||
See accompanying Notes, which are an integral part of the Financial Statements.
30
Russell 2000 Value Index Fund
Financial Highlights
| Institutional Shares | |||
| July 13, | |||
| Year Ended | 20121 to | ||
| August 31, | Aug. 31, | ||
| For a Share Outstanding Throughout Each Period | 2014 | 2013 | 2012 |
| Net Asset Value, Beginning of Period | $148.87 | $122.12 | $120.40 |
| Investment Operations | |||
| Net Investment Income | 2.724 | 3.360 | . 276 2 |
| Net Realized and Unrealized Gain (Loss) on Investments | 24.103 | 25.888 | 1.444 |
| Total from Investment Operations | 26.827 | 29.248 | 1.720 |
| Distributions | |||
| Dividends from Net Investment Income | (2.547) | (2.498) | — |
| Distributions from Realized Capital Gains | — | — | — |
| Total Distributions | (2.547) | (2.498) | — |
| Net Asset Value, End of Period | $173.15 | $148.87 | $122.12 |
| Total Return | 18.07% | 24.29% | 1.43% |
| Ratios/Supplemental Data | |||
| Net Assets, End of Period (Millions) | $82 | $51 | $6 |
| Ratio of Total Expenses to Average Net Assets | 0.08% | 0.08% | 0.08%3 |
| Ratio of Net Investment Income to Average Net Assets | 1.95% | 2.24% | 2.14%3 |
| Portfolio Turnover Rate 4 | 36% | 60% | 40% |
1 Inception.
2 Calculated based on average shares outstanding.
3 Annualized.
4 Excludes the value of portfolio securities received or delivered as a result of in-kind purchases or redemptions of the fund’s capital shares, including ETF Creation Units.
See accompanying Notes, which are an integral part of the Financial Statements.
31
Russell 2000 Value Index Fund
Financial Highlights
| ETF Shares | ||||
| Sept. 20, | ||||
| 20101 to | ||||
| Year Ended August 31, | Aug. 31, | |||
| For a Share Outstanding Throughout Each Period | 2014 | 2013 | 2012 | 2011 |
| Net Asset Value, Beginning of Period | $75.48 | $61.97 | $55.14 | $52.39 |
| Investment Operations | ||||
| Net Investment Income | 1.284 | 1.639 | 1.1262 | .9212 |
| Net Realized and Unrealized Gain (Loss) on Investments | 12.219 | 13.109 | 6.424 | 2.249 |
| Total from Investment Operations | 13.503 | 14.748 | 7.550 | 3.170 |
| Distributions | ||||
| Dividends from Net Investment Income | (1.223) | (1.238) | (.720) | (.420) |
| Distributions from Realized Capital Gains | — | — | — | — |
| Total Distributions | (1.223) | (1.238) | (.720) | (.420) |
| Net Asset Value, End of Period | $87.76 | $75.48 | $61.97 | $55.14 |
| Total Return | 17.92% | 24.14% | 13.81% | 5.98% |
| Ratios/Supplemental Data | ||||
| Net Assets, End of Period (Millions) | $70 | $45 | $19 | $17 |
| Ratio of Total Expenses to Average Net Assets | 0.20% | 0.20% | 0.20% | 0.20%3 |
| Ratio of Net Investment Income to Average Net Assets | 1.83% | 2.12% | 2.02% | 1.79%3 |
| Portfolio Turnover Rate 4 | 36% | 60% | 40% | 101% |
1 Inception.
2 Calculated based on average shares outstanding.
3 Annualized.
4 Excludes the value of portfolio securities received or delivered as a result of in-kind purchases or redemptions of the fund’s capital shares, including ETF Creation Units.
See accompanying Notes, which are an integral part of the Financial Statements.
32
Russell 2000 Value Index Fund
Notes to Financial Statements
Vanguard Russell 2000 Value Index Fund is registered under the Investment Company Act of 1940 as an open-end investment company, or mutual fund. The fund offers two classes of shares: Institutional Shares and ETF Shares. Institutional Shares are designed for investors who meet certain administrative, service, and account-size criteria. ETF Shares are listed for trading on Nasdaq; they can be purchased and sold through a broker.
A. The following significant accounting policies conform to generally accepted accounting principles for U.S. investment companies. The fund consistently follows such policies in preparing its financial statements.
1. Security Valuation: Securities are valued as of the close of trading on the New York Stock Exchange (generally 4 p.m., Eastern time) on the valuation date. Equity securities are valued at the latest quoted sales prices or official closing prices taken from the primary market in which each security trades; such securities not traded on the valuation date are valued at the mean of the latest quoted bid and asked prices. Securities for which market quotations are not readily available, or whose values have been materially affected by events occurring before the fund’s pricing time but after the close of the securities’ primary markets, are valued by methods deemed by the board of trustees to represent fair value. Investments in Vanguard Market Liquidity Fund are valued at that fund’s net asset value. Temporary cash investments acquired over 60 days to maturity are valued using the latest bid prices or using valuations based on a matrix system (which considers such factors as security prices, yields, maturities, and ratings), both as furnished by independent pricing services. Other temporary cash investments are valued at amortized cost, which approximates market value.
2. Futures Contracts: The fund uses index futures contracts to a limited extent, with the objectives of maintaining full exposure to the stock market, enhancing returns, maintaining liquidity, and minimizing transaction costs. The fund may purchase futures contracts to immediately invest incoming cash in the market, or sell futures in response to cash outflows, thereby simulating a fully invested position in the underlying index while maintaining a cash balance for liquidity. The fund may seek to enhance returns by using futures contracts instead of the underlying securities when futures are believed to be priced more attractively than the underlying securities. The primary risks associated with the use of futures contracts are imperfect correlation between changes in market values of stocks held by the fund and the prices of futures contracts, and the possibility of an illiquid market. Counterparty risk involving futures is mitigated because a regulated clearinghouse is the counterparty instead of the clearing broker. To further mitigate counterparty risk, the fund trades futures contracts on an exchange, monitors the financial strength of its clearing brokers and clearinghouse, and has entered into clearing agreements with its clearing brokers. The clearinghouse imposes initial margin requirements to secure the fund’s performance and requires daily settlement of variation margin representing changes in the market value of each contract.
Futures contracts are valued at their quoted daily settlement prices. The aggregate settlement values of the contracts are not recorded in the Statement of Net Assets. Fluctuations in the value of the contracts are recorded in the Statement of Net Assets as an asset (liability) and in the Statement of Operations as unrealized appreciation (depreciation) until the contracts are closed, when they are recorded as realized futures gains (losses).
During the year ended August 31, 2014, the fund’s average investments in long and short futures contracts represented less than 1% and 0% of net assets, respectively, based on the average of aggregate settlement values at each quarter-end during the period.
33
Russell 2000 Value Index Fund
3. Federal Income Taxes: The fund intends to continue to qualify as a regulated investment company and distribute all of its taxable income. Management has analyzed the fund’s tax positions taken for all open federal income tax years (August 31, 2011–2014), and has concluded that no provision for federal income tax is required in the fund’s financial statements.
4. Distributions: Distributions to shareholders are recorded on the ex-dividend date.
5. Securities Lending: To earn additional income, the fund lends its securities to qualified institutional borrowers. Security loans are required to be secured at all times by collateral in an amount at least equal to the market value of securities loaned. Daily market fluctuations could cause the value of loaned securities to be more or less than the value of the collateral received. When this occurs, the collateral is adjusted and settled on the next business day. The fund further mitigates its counterparty risk by entering into securities lending transactions only with a diverse group of prequalified counterparties, monitoring their financial strength, and entering into master securities lending agreements with its counterparties. The master securities lending agreements provide that, in the event of a counterparty’s default (including bankruptcy), the fund may terminate any loans with that borrower, determine the net amount owed, and sell or retain the collateral up to the net amount owed to the fund; however, such actions may be subject to legal proceedings. While collateral mitigates counterparty risk, in the absence of a default the fund may experience delays and costs in recovering the securities loaned. The fund invests cash collateral received in Vanguard Market Liquidity Fund, and records a liability in the Statement of Net Assets for the return of the collateral, during the period the securities are on loan. Securities lending income represents fees charged to borrowers plus income earned on invested cash collateral, less expenses associated with the loan.
6. Credit Facility: The fund and certain other funds managed by The Vanguard Group participate in a $2.89 billion committed credit facility provided by a syndicate of lenders pursuant to a credit agreement that may be renewed annually; each fund is individually liable for its borrowings, if any, under the credit facility. Borrowings may be utilized for temporary and emergency purposes, and are subject to the fund’s regulatory and contractual borrowing restrictions. The participating funds are charged administrative fees and an annual commitment fee of 0.06% of the undrawn amount of the facility; these fees are allocated to the funds based on a method approved by the fund’s board of trustees and included in Management and Administrative expenses on the fund’s Statement of Operations. Any borrowings under this facility bear interest at a rate equal to the higher of the federal funds rate or LIBOR reference rate plus an agreed-upon spread.
The fund had no borrowings outstanding at August 31, 2014, or at any time during the period then ended.
7. Other: Dividend income is recorded on the ex-dividend date. Interest income includes income distributions received from Vanguard Market Liquidity Fund and is accrued daily. Premiums and discounts on debt securities purchased are amortized and accreted, respectively, to interest income over the lives of the respective securities. Security transactions are accounted for on the date securities are bought or sold. Costs used to determine realized gains (losses) on the sale of investment securities are those of the specific securities sold.
Each class of shares has equal rights as to assets and earnings, except that each class separately bears certain class-specific expenses related to maintenance of shareholder accounts (included in Management and Administrative expenses) and shareholder reporting. Marketing and distribution expenses are allocated to each class of shares based on a method approved by the board of trustees. Income, other non-class-specific expenses, and gains and losses on investments are allocated to each class of shares based on its relative net assets.
34
Russell 2000 Value Index Fund
B. The Vanguard Group furnishes at cost investment advisory, corporate management, administrative, marketing, and distribution services. The costs of such services are allocated to the fund based on methods approved by the board of trustees. The fund has committed to provide up to 0.40% of its net assets in capital contributions to Vanguard. At August 31, 2014, the fund had contributed capital of $16,000 to Vanguard (included in Other Assets), representing 0.01% of the fund’s net assets and 0.01% of Vanguard’s capitalization. The fund’s trustees and officers are also directors and officers of Vanguard.
C. Various inputs may be used to determine the value of the fund’s investments. These inputs are summarized in three broad levels for financial statement purposes. The inputs or methodologies used to value securities are not necessarily an indication of the risk associated with investing in those securities.
Level 1—Quoted prices in active markets for identical securities.
Level 2—Other significant observable inputs (including quoted prices for similar securities, interest rates, prepayment speeds, credit risk, etc.).
Level 3—Significant unobservable inputs (including the fund’s own assumptions used to determine the fair value of investments).
The following table summarizes the market value of the fund’s investments as of August 31, 2014, based on the inputs used to value them:
| Level 1 | Level 2 | Level 3 | |
| Investments | ($000) | ($000) | ($000) |
| Common Stocks | 151,541 | — | 19 |
| Temporary Cash Investments | 349 | 100 | — |
| Futures Contracts—Assets1 | 1 | — | — |
| Total | 151,891 | 100 | 19 |
| 1 Represents variation margin on the last day of the reporting period. | |||
D. At August 31, 2014, the aggregate settlement value of open futures contracts and the related unrealized appreciation (depreciation) were:
| ($000) | ||||
| Aggregate | ||||
| Number of | Settlement | Unrealized | ||
| Long (Short) | Value | Appreciation | ||
| Futures Contracts | Expiration | Contracts | Long (Short) | (Depreciation) |
| E-mini Russell 2000 Index | September 2014 | 1 | 117 | 2 |
Unrealized appreciation (depreciation) on open futures contracts is required to be treated as realized gain (loss) for tax purposes.
E. Distributions are determined on a tax basis and may differ from net investment income and realized capital gains for financial reporting purposes. Differences may be permanent or temporary. Permanent differences are reclassified among capital accounts in the financial statements to reflect their tax character. Temporary differences arise when certain items of income, expense, gain, or loss are recognized in different periods for financial statement and tax purposes. These differences will reverse at some time in the future. Differences in classification may also result from the treatment of short-term gains as ordinary income for tax purposes.
35
Russell 2000 Value Index Fund
Certain of the fund’s investments are in securities considered to be passive foreign investment companies, for which any unrealized appreciation and/or realized gains are required to be included in distributable net income for tax purposes. During the year ended August 31, 2014, the fund realized gains on the sale of passive foreign investment companies of $35,000, which have been included in current and prior periods’ taxable income; accordingly, such gains have been reclassified from accumulated net realized losses to undistributed net investment income.
During the year ended August 31, 2014, the fund realized $18,702,000 of net capital gains resulting from in-kind redemptions—in which shareholders exchanged fund shares for securities held by the fund rather than for cash. Because such gains are not taxable to the fund, and are not distributed to shareholders, they have been reclassified from accumulated net realized losses to paid-in capital.
For tax purposes, at August 31, 2014, the fund had $1,662,000 of ordinary income available for distribution. The fund had available capital losses totaling $1,215,000 that may be carried forward indefinitely to offset future net capital gains.
At August 31, 2014, the cost of investment securities for tax purposes was $145,743,000. Net unrealized appreciation of investment securities for tax purposes was $6,266,000, consisting of unrealized gains of $11,694,000 on securities that had risen in value since their purchase and $5,428,000 in unrealized losses on securities that had fallen in value since their purchase.
F. During the year ended August 31, 2014, the fund purchased $248,125,000 of investment securities and sold $208,908,000 of investment securities, other than temporary cash investments. Purchases and sales include $176,105,000 and $159,997,000, respectively, in connection with in-kind purchases and redemptions of the fund’s capital shares.
G. Capital share transactions for each class of shares were:
| Year Ended August 31, | |||||
| 2014 | 2013 | ||||
| Amount | Shares | Amount | Shares | ||
| ($000) | (000) | ($000) | (000) | ||
| Institutional Shares | |||||
| Issued | 40,000 | 240 | 59,105 | 426 | |
| Issued in Lieu of Cash Distributions | 1,206 | 7 | 115 | 1 | |
| Redeemed | (19,671) | (116) | (20,567) | (135) | |
| Net Increase (Decrease)—Institutional Shares | 21,535 | 131 | 38,653 | 292 | |
| ETF Shares | |||||
| Issued | 178,165 | 2,100 | 29,108 | 400 | |
| Issued in Lieu of Cash Distributions | — | — | — | — | |
| Redeemed | (161,811) | (1,900) | (7,421) | (100) | |
| Net Increase (Decrease)—ETF Shares | 16,354 | 200 | 21,687 | 300 | |
At August 31, 2014, one shareholder was the record or beneficial owner of 26% of the fund’s net assets. If the shareholder were to redeem its investment in the fund, the redemption might result in an increase in the fund’s expense ratio, cause the fund to incur higher transaction costs, or lead to the realization of taxable capital gains.
H. Management has determined that no material events or transactions occurred subsequent to August 31, 2014, that would require recognition or disclosure in these financial statements.
36
Russell 2000 Growth Index Fund
Fund Profile
As of August 31, 2014
| Share-Class Characteristics | ||
| Institutional | ETF | |
| Shares | Shares | |
| Ticker Symbol | VRTGX | VTWG |
| Expense Ratio1 | 0.08% | 0.20% |
| 30-Day SEC Yield | 0.48% | 0.36% |
| Portfolio Characteristics | |||
| DJ | |||
| U.S. | |||
| Russell | Total | ||
| 2000 | Market | ||
| Growth | FA | ||
| Fund | Index | Index | |
| Number of Stocks | 1,185 | 1,156 | 3,709 |
| Median Market Cap | $1.8B | $1.8B | $48.0B |
| Price/Earnings Ratio | 45.1x | 45.0x | 20.7x |
| Price/Book Ratio | 4.1x | 4.1x | 2.7x |
| Return on Equity | 13.1% | 13.0% | 17.8% |
| Earnings Growth | |||
| Rate | 17.2% | 17.2% | 15.3% |
| Dividend Yield | 0.6% | 0.6% | 1.8% |
| Foreign Holdings | 0.0% | 0.0% | 0.0% |
| Turnover Rate | 35% | — | — |
| Short-Term Reserves | -0.1% | — | — |
| Sector Diversification (% of equity exposure) | |||
| DJ | |||
| U.S. | |||
| Russell | Total | ||
| 2000 | Market | ||
| Growth | FA | ||
| Fund | Index | Index | |
| Consumer Discretionary 16.2% | 16.2% | 14.1% | |
| Consumer Staples | 3.3 | 3.5 | 7.2 |
| Energy | 5.9 | 5.9 | 9.7 |
| Financial Services | 9.7 | 9.6 | 18.7 |
| Health Care | 22.4 | 22.3 | 13.2 |
| Materials & Processing | 7.8 | 7.9 | 4.5 |
| Other | 0.1 | 0.0 | 0.0 |
| Producer Durables | 13.4 | 13.4 | 11.3 |
| Technology | 19.8 | 19.8 | 16.1 |
| Utilities | 1.4 | 1.4 | 5.2 |
| Volatility Measures | ||
| DJ | ||
| U.S. Total | ||
| Russell 2000 | Market | |
| Growth Index | FA Index | |
| R-Squared | 1.00 | 0.86 |
| Beta | 1.00 | 1.33 |
| These measures show the degree and timing of the fund’s fluctuations compared with the indexes over 36 months. | ||
| Ten Largest Holdings (% of total net assets) | ||
| InterMune Inc. | Biotechnology | 0.8% |
| Puma Biotechnology Inc. Biotechnology | 0.7 | |
| Isis Pharmaceuticals Inc. Pharmaceuticals | 0.6 | |
| WEX Inc. | Financial Data & | |
| Systems | 0.5 | |
| Kodiak Oil & Gas Corp. | Oil: Crude Producers | 0.5 |
| Graphic Packaging | Containers & | |
| Holding Co. | Packaging | 0.5 |
| Ultimate Software Group Computer Services | ||
| Inc. | Software & Systems | 0.5 |
| Team Health Holdings | ||
| Inc. | Health Care Services | 0.5 |
| Tenneco Inc. | Auto Parts | 0.5 |
| US Silica Holdings Inc. | Metals & Minerals: | |
| Diversified | 0.4 | |
| Top Ten | 5.5% | |
| The holdings listed exclude any temporary cash investments and equity index products. | ||
Investment Focus
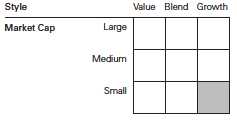
1 The expense ratios shown are from the prospectus dated December 20, 2013, and represent estimated costs for the current fiscal year. For the fiscal year ended August 31, 2014, the expense ratios were 0.08% for Institutional Shares and 0.20% for ETF Shares.
37
Russell 2000 Growth Index Fund
Performance Summary
All of the returns in this report represent past performance, which is not a guarantee of future results that may be achieved by the fund. (Current performance may be lower or higher than the performance data cited. For performance data current to the most recent month-end, visit our website at vanguard.com/performance.) Note, too, that both investment returns and principal value can fluctuate widely, so an investor’s shares, when sold, could be worth more or less than their original cost. The returns shown do not reflect taxes that a shareholder would pay on fund distributions or on the sale of fund shares.
Cumulative Performance: September 20, 2010, Through August 31, 2014
Initial Investment of $10,000
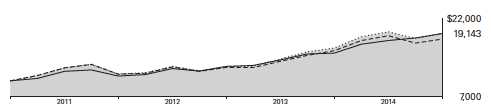
| Average Annual Total Returns | ||||
| Periods Ended August 31, 2014 | ||||
| Since | Final Value | |||
| One | Inception | of a $10,000 | ||
| Year | (9/20/2010) | Investment | ||
| Russell 2000 Growth Index | ||||
| Fund*ETF Shares Net Asset Value | 17.30% | 17.89% | $19,143 | |
| Russell 2000 Growth Index | ||||
| Fund*ETF Shares Market Price | 17.19 | 17.86 | 19,124 | |
| •••••••• | Russell 2000 Growth Index | 17.30 | 17.98 | 19,201 |
| – – – – | Small-Cap Growth Funds Average | 14.11 | 16.22 | 18,097 |
| Dow Jones U.S. Total Stock Market | ||||
| Float Adjusted Index | 24.68 | 17.95 | 19,178 | |
Small-Cap Growth Funds Average: Derived from data provided by Lipper, a Thomson Reuters Company.
"Since Inception" performance is calculated from the ETF Shares’ inception date for both the fund and its comparative standards.
| Since | Final Value | ||
| One | Inception | of a $5,000,000 | |
| Year | (5/25/2011) | Investment | |
| Russell 2000 Growth Index Fund Institutional | |||
| Shares | 17.44% | 13.40% | $7,540,953 |
| Russell 2000 Growth Index | 17.30 | 13.35 | 7,530,351 |
| Dow Jones U.S. Total Stock Market Float | |||
| Adjusted Index | 24.68 | 15.83 | 8,083,165 |
| "Since Inception" performance is calculated from the Institutional Shares’ inception date for both the fund and its comparative standards. | |||
See Financial Highlights for dividend and capital gains information.
38
Russell 2000 Growth Index Fund
| Cumulative Returns of ETF Shares: September 20, 2010, Through August 31, 2014 | ||
| Since | ||
| One | Inception | |
| Year | (9/20/2010) | |
| Russell 2000 Growth Index Fund ETF Shares | ||
| Market Price | 17.19% | 91.24% |
| Russell 2000 Growth Index Fund ETF Shares Net | ||
| Asset Value | 17.30 | 91.43 |
| Russell 2000 Growth Index | 17.30 | 92.01 |
| "Since Inception" performance is calculated from the ETF Shares’ inception date for both the fund and its comparative standards. | ||
Fiscal-Year Total Returns (%): September 20, 2010, Through August 31, 2014
Average Annual Total Returns: Periods Ended June 30, 2014
This table presents returns through the latest calendar quarter—rather than through the end of the fiscal period.
Securities and Exchange Commission rules require that we provide this information.
| Inception | One | Since | |
| Date | Year | Inception | |
| Institutional Shares | 5/25/2011 | 24.87% | 14.47% |
| ETF Shares | 9/20/2010 | ||
| Market Price | 24.84 | 19.01 | |
| Net Asset Value | 24.71 | 19.02 |
39
Russell 2000 Growth Index Fund
Financial Statements
Statement of Net Assets—Investments Summary
As of August 31, 2014
This Statement summarizes the fund’s holdings by asset type. Details are reported for each of the fund’s 50 largest individual holdings and for investments that, in total for any issuer, represent more than 1% of the fund’s net assets. The total value of smaller holdings is reported as a single amount within each category.
The fund reports a complete list of its holdings in regulatory filings four times in each fiscal year, at the quarter-ends. For the second and fourth fiscal quarters, the complete listing of the fund’s holdings is available electronically on vanguard.com and on the Securities and Exchange Commission’s website (sec.gov), or you can have it mailed to you without charge by calling 800-662-7447. For the first and third fiscal quarters, the fund files the lists with the SEC on Form N-Q. Shareholders can look up the fund’s Forms N-Q on the SEC’s website. Forms N-Q may also be reviewed and copied at the SEC’s Public Reference Room (see the back cover of this report for further information).
| Market | Percentage | ||
| Value | of Net | ||
| Shares | ($000) | Assets | |
| Common Stocks | |||
| Consumer Discretionary | |||
| * Tenneco Inc. | 19,079 | 1,223 | 0.5% |
| Vail Resorts Inc. | 11,327 | 900 | 0.3% |
| * Buffalo Wild Wings Inc. | 5,923 | 875 | 0.3% |
| Wolverine World Wide Inc. | 31,785 | 844 | 0.3% |
| * Restoration Hardware Holdings Inc. | 9,769 | 819 | 0.3% |
| Pool Corp. | 14,137 | 801 | 0.3% |
| Consumer Discretionary—Other † | 38,423 | 14.2% | |
| 43,885 | 16.2% | ||
| Consumer Staples | |||
| * United Natural Foods Inc. | 15,551 | 1,000 | 0.4% |
| Casey’s General Stores Inc. | 12,061 | 865 | 0.3% |
| Consumer Staples—Other † | 7,106 | 2.6% | |
| 8,971 | 3.3% | ||
| Energy | |||
| * Kodiak Oil & Gas Corp. | 83,521 | 1,359 | 0.5% |
| SemGroup Corp. Class A | 13,355 | 1,172 | 0.5% |
| * Diamondback Energy Inc. | 13,121 | 1,133 | 0.4% |
| * Carrizo Oil & Gas Inc. | 14,255 | 894 | 0.3% |
| Energy—Other † | 11,398 | 4.2% | |
| 15,956 | 5.9% | ||
| Financial Services | |||
| * WEX Inc. | 12,144 | 1,380 | 0.5% |
| * Portfolio Recovery Associates Inc. | 15,687 | 891 | 0.3% |
| * Euronet Worldwide Inc. | 15,969 | 851 | 0.3% |
| Bank of the Ozarks Inc. | 24,963 | 798 | 0.3% |
| Financial Services—Other † | 22,155 | 8.2% | |
| 26,075 | 9.6% |
40
Russell 2000 Growth Index Fund
| Market | Percentage | ||
| Value | of Net | ||
| Shares | ($000) | Assets | |
| Health Care | |||
| * InterMune Inc. | 30,333 | 2,228 | 0.8% |
| * Puma Biotechnology Inc. | 7,275 | 1,895 | 0.7% |
| * Isis Pharmaceuticals Inc. | 36,846 | 1,502 | 0.6% |
| * Team Health Holdings Inc. | 22,010 | 1,288 | 0.5% |
| * Pacira Pharmaceuticals Inc. | 11,174 | 1,210 | 0.4% |
| STERIS Corp. | 18,516 | 1,042 | 0.4% |
| * DexCom Inc. | 23,477 | 1,038 | 0.4% |
| * PAREXEL International Corp. | 17,823 | 1,006 | 0.4% |
| West Pharmaceutical Services Inc. | 22,145 | 962 | 0.4% |
| * NPS Pharmaceuticals Inc. | 31,021 | 936 | 0.3% |
| * Cepheid | 21,849 | 875 | 0.3% |
| HealthSouth Corp. | 20,982 | 826 | 0.3% |
| Health Care—Other † | 45,708 | 16.8% | |
| 60,516 | 22.3% | ||
| Materials & Processing | |||
| * Graphic Packaging Holding Co. | 102,457 | 1,310 | 0.5% |
| US Silica Holdings Inc. | 16,846 | 1,210 | 0.4% |
| PolyOne Corp. | 29,496 | 1,157 | 0.4% |
| Belden Inc. | 13,664 | 998 | 0.4% |
| * KapStone Paper and Packaging Corp. | 26,503 | 815 | 0.3% |
| Materials & Processing—Other † | 15,729 | 5.8% | |
| 21,219 | 7.8% | ||
| 1Other † | 382 | 0.2% | |
| Producer Durables | |||
| HEICO Corp. | 20,839 | 1,080 | 0.4% |
| * Generac Holdings Inc. | 21,570 | 1,003 | 0.4% |
| CLARCOR Inc. | 14,899 | 942 | 0.3% |
| MAXIMUS Inc. | 21,215 | 874 | 0.3% |
| Producer Durables—Other † | 32,443 | 12.0% | |
| 36,342 | 13.4% | ||
| Technology | |||
| * Ultimate Software Group Inc. | 8,883 | 1,306 | 0.5% |
| * Aspen Technology Inc. | 28,853 | 1,186 | 0.4% |
| * Cognex Corp. | 27,213 | 1,142 | 0.4% |
| * RF Micro Devices Inc. | 89,674 | 1,118 | 0.4% |
| FEI Co. | 13,242 | 1,113 | 0.4% |
| * TriQuint Semiconductor Inc. | 53,692 | 1,110 | 0.4% |
| * Guidewire Software Inc. | 21,292 | 970 | 0.4% |
| * SS&C Technologies Holdings Inc. | 21,347 | 966 | 0.4% |
| * Cavium Inc. | 16,557 | 930 | 0.4% |
| * Synaptics Inc. | 11,288 | 927 | 0.3% |
| * Tyler Technologies Inc. | 10,344 | 921 | 0.3% |
| * Verint Systems Inc. | 17,776 | 891 | 0.3% |
| * CommVault Systems Inc. | 14,788 | 815 | 0.3% |
| Technology—Other † | 40,147 | 14.8% | |
| 53,542 | 19.7% | ||
| Utilities † | 3,735 | 1.4% | |
| Total Common Stocks (Cost $245,402) | 270,623 | 99.8%2 | |
41
Russell 2000 Growth Index Fund
| Market | Percentage | |||
| Value | of Net | |||
| Coupon | Shares | ($000) | Assets | |
| Temporary Cash Investments | ||||
| Money Market Fund | ||||
| 3,4 Vanguard Market Liquidity Fund | 0.113% | 2,442,901 | 2,443 | 0.9% |
| 5U.S. Government and Agency Obligations † | 100 | 0.0% | ||
| Total Temporary Cash Investments (Cost $2,543) | 2,543 | 0.9%2 | ||
| 6Total Investments (Cost $247,945) | 273,166 | 100.7% | ||
| Other Assets and Liabilities | ||||
| Other Assets | 1,103 | 0.4% | ||
| Liabilities4 | (2,976) | (1.1%) | ||
| (1,873) | (0.7%) | |||
| Net Assets | 271,293 | 100.0% | ||
| At August 31, 2014, net assets consisted of: | ||||
| Amount | ||||
| ($000) | ||||
| Paid-in Capital | 252,127 | |||
| Undistributed Net Investment Income | 1,171 | |||
| Accumulated Net Realized Losses | (7,229) | |||
| Unrealized Appreciation (Depreciation) | ||||
| Investment Securities | 25,221 | |||
| Futures Contracts | 3 | |||
| Net Assets | 271,293 | |||
| Institutional Shares—Net Assets | ||||
| Applicable to 901,228 outstanding $.001 par value shares of | ||||
| beneficial interest (unlimited authorization) | 171,465 | |||
| Net Asset Value Per Share—Institutional Shares | $190.26 | |||
| ETF Shares—Net Assets | ||||
| Applicable to 1,000,000 outstanding $.001 par value shares of | ||||
| beneficial interest (unlimited authorization) | 99,828 | |||
| Net Asset Value Per Share—ETF Shares | $99.83 | |||
See Note A in Notes to Financial Statements.
* Non-income-producing security.
† Represents the aggregate value, by category, of securities that are not among the 50 largest holdings and, in total for any issuer, represent 1% or less of net assets.
1 “Other” represents securities that are not classified by the fund’s benchmark index.
2 The fund invests a portion of its cash reserves in equity markets through the use of index futures contracts. After giving effect to futures investments, the fund’s effective common stock and temporary cash investment positions represent 99.9% and 0.8%, respectively, of net assets.
3 Affiliated money market fund available only to Vanguard funds and certain trusts and accounts managed by Vanguard. Rate shown is the 7-day yield.
4 Includes $2,443,000 of collateral received for securities on loan.
5 Securities with a value of $100,000 have been segregated as initial margin for open futures contracts.
6 The total value of securities on loan is $2,246,000.
See accompanying Notes, which are an integral part of the Financial Statements.
42
Russell 2000 Growth Index Fund
Statement of Operations
| Year Ended | |
| August 31, 2014 | |
| ($000) | |
| Investment Income | |
| Income | |
| Dividends | 1,878 |
| Interest1 | 2 |
| Securities Lending | 274 |
| Total Income | 2,154 |
| Expenses | |
| The Vanguard Group—Note B | |
| Investment Advisory Services | 20 |
| Management and Administrative—Institutional Shares | — |
| Management and Administrative—ETF Shares | 126 |
| Marketing and Distribution—Institutional Shares | 40 |
| Marketing and Distribution—ETF Shares | 23 |
| Custodian Fees | 105 |
| Auditing Fees | 23 |
| Shareholders’ Reports—Institutional Shares | 1 |
| Shareholders’ Reports—ETF Shares | 7 |
| Total Expenses | 345 |
| Net Investment Income | 1,809 |
| Realized Net Gain (Loss) | |
| Investment Securities Sold | 56,520 |
| Futures Contracts | 199 |
| Realized Net Gain (Loss) | 56,719 |
| Change in Unrealized Appreciation (Depreciation) | |
| Investment Securities | (17,614) |
| Futures Contracts | 7 |
| Change in Unrealized Appreciation (Depreciation) | (17,607) |
| Net Increase (Decrease) in Net Assets Resulting from Operations | 40,921 |
| 1 Interest income from an affiliated company of the fund was $2,000. | |
See accompanying Notes, which are an integral part of the Financial Statements.
43
Russell 2000 Growth Index Fund
Statement of Changes in Net Assets
| Year Ended August 31, | ||
| 2014 | 2013 | |
| ($000) | ($000) | |
| Increase (Decrease) in Net Assets | ||
| Operations | ||
| Net Investment Income | 1,809 | 2,018 |
| Realized Net Gain (Loss) | 56,719 | 7,759 |
| Change in Unrealized Appreciation (Depreciation) | (17,607) | 38,170 |
| Net Increase (Decrease) in Net Assets Resulting from Operations | 40,921 | 47,947 |
| Distributions | ||
| Net Investment Income | ||
| Institutional Shares | (891) | (1,000) |
| ETF Shares | (659) | (393) |
| Realized Capital Gain | ||
| Institutional Shares | — | — |
| ETF Shares | — | — |
| Total Distributions | (1,550) | (1,393) |
| Capital Share Transactions | ||
| Institutional Shares | (38,746) | 62,677 |
| ETF Shares | 17,143 | 37,319 |
| Net Increase (Decrease) from Capital Share Transactions | (21,603) | 99,996 |
| Total Increase (Decrease) | 17,768 | 146,550 |
| Net Assets | ||
| Beginning of Period | 253,525 | 106,975 |
| End of Period1 | 271,293 | 253,525 |
| 1 Net Assets—End of Period includes undistributed (overdistributed) net investment income of $1,171,000 and $902,000. | ||
See accompanying Notes, which are an integral part of the Financial Statements.
44
Russell 2000 Growth Index Fund
Financial Highlights
| Institutional Shares | ||||
| May 25, | ||||
| 20111 to | ||||
| Year Ended August 31, | Aug. 31, | |||
| For a Share Outstanding Throughout Each Period | 2014 | 2013 | 2012 | 2011 |
| Net Asset Value, Beginning of Period | $162.99 | $128.23 | $114.21 | $128.54 |
| Investment Operations | ||||
| Net Investment Income | 1.412 | 1.412 | .8592 | .228 |
| Net Realized and Unrealized Gain (Loss) on Investments | 26.992 | 34.504 | 13.616 | (14.558) |
| Total from Investment Operations | 28.404 | 35.916 | 14.475 | (14.330) |
| Distributions | ||||
| Dividends from Net Investment Income | (1.134) | (1.156) | (.455) | — |
| Distributions from Realized Capital Gains | — | — | — | — |
| Total Distributions | (1.134) | (1.156) | (.455) | — |
| Net Asset Value, End of Period | $190.26 | $162.99 | $128.23 | $114.21 |
| Total Return | 17.44% | 28.23% | 12.72% | -11.15% |
| Ratios/Supplemental Data | ||||
| Net Assets, End of Period (Millions) | $171 | $185 | $87 | $22 |
| Ratio of Total Expenses to Average Net Assets | 0.08% | 0.08% | 0.08% | 0.08%3 |
| Ratio of Net Investment Income to Average Net Assets | 0.72% | 1.08% | 0.75% | 0.57%3 |
| Portfolio Turnover Rate 4 | 35% | 50% | 51% | 78% |
1 Inception.
2 Calculated based on average shares outstanding.
3 Annualized.
4 Excludes the value of portfolio securities received or delivered as a result of in-kind purchases or redemptions of the fund’s capital shares, including ETF Creation Units.
See accompanying Notes, which are an integral part of the Financial Statements.
45
Russell 2000 Growth Index Fund
Financial Highlights
| ETF Shares | ||||
| Sept. 20, | ||||
| 20101 to | ||||
| Year Ended August 31, | Aug. 31, | |||
| For a Share Outstanding Throughout Each Period | 2014 | 2013 | 2012 | 2011 |
| Net Asset Value, Beginning of Period | $85.58 | $67.37 | $60.02 | $53.17 |
| Investment Operations | ||||
| Net Investment Income | . 646 | . 699 | . 402 2 | .258 |
| Net Realized and Unrealized Gain (Loss) on Investments | 14.153 | 18.073 | 7.133 | 6.762 |
| Total from Investment Operations | 14.799 | 18.772 | 7.535 | 7.020 |
| Distributions | ||||
| Dividends from Net Investment Income | (. 549) | (. 562) | (.185) | (.170) |
| Distributions from Realized Capital Gains | — | — | — | — |
| Total Distributions | (. 549) | (. 562) | (.185) | (.170) |
| Net Asset Value, End of Period | $99.83 | $85.58 | $67.37 | $60.02 |
| Total Return | 17.30% | 28.07% | 12.58% | 13.18% |
| Ratios/Supplemental Data | ||||
| Net Assets, End of Period (Millions) | $100 | $68 | $20 | $12 |
| Ratio of Total Expenses to Average Net Assets | 0.20% | 0.20% | 0.20% | 0.20%3 |
| Ratio of Net Investment Income to Average Net Assets | 0.60% | 0.96% | 0.63% | 0.45%3 |
| Portfolio Turnover Rate 4 | 35% | 50% | 51% | 78% |
1 Inception.
2 Calculated based on average shares outstanding.
3 Annualized.
4 Excludes the value of portfolio securities received or delivered as a result of in-kind purchases or redemptions of the fund’s capital shares, including ETF Creation Units.
See accompanying Notes, which are an integral part of the Financial Statements.
46
Russell 2000 Growth Index Fund
Notes to Financial Statements
Vanguard Russell 2000 Growth Index Fund is registered under the Investment Company Act of 1940 as an open-end investment company, or mutual fund. The fund offers two classes of shares: Institutional Shares and ETF Shares. Institutional Shares are designed for investors who meet certain administrative, service, and account-size criteria. ETF Shares are listed for trading on Nasdaq; they can be purchased and sold through a broker.
A. The following significant accounting policies conform to generally accepted accounting principles for U.S. investment companies. The fund consistently follows such policies in preparing its financial statements.
1. Security Valuation: Securities are valued as of the close of trading on the New York Stock Exchange (generally 4 p.m., Eastern time) on the valuation date. Equity securities are valued at the latest quoted sales prices or official closing prices taken from the primary market in which each security trades; such securities not traded on the valuation date are valued at the mean of the latest quoted bid and asked prices. Securities for which market quotations are not readily available, or whose values have been materially affected by events occurring before the fund’s pricing time but after the close of the securities’ primary markets, are valued by methods deemed by the board of trustees to represent fair value. Investments in Vanguard Market Liquidity Fund are valued at that fund’s net asset value. Temporary cash investments acquired over 60 days to maturity are valued using the latest bid prices or using valuations based on a matrix system (which considers such factors as security prices, yields, maturities, and ratings), both as furnished by independent pricing services. Other temporary cash investments are valued at amortized cost, which approximates market value.
2. Futures Contracts: The fund uses index futures contracts to a limited extent, with the objectives of maintaining full exposure to the stock market, enhancing returns, maintaining liquidity, and minimizing transaction costs. The fund may purchase futures contracts to immediately invest incoming cash in the market, or sell futures in response to cash outflows, thereby simulating a fully invested position in the underlying index while maintaining a cash balance for liquidity. The fund may seek to enhance returns by using futures contracts instead of the underlying securities when futures are believed to be priced more attractively than the underlying securities. The primary risks associated with the use of futures contracts are imperfect correlation between changes in market values of stocks held by the fund and the prices of futures contracts, and the possibility of an illiquid market. Counterparty risk involving futures is mitigated because a regulated clearinghouse is the counterparty instead of the clearing broker. To further mitigate counterparty risk, the fund trades futures contracts on an exchange, monitors the financial strength of its clearing brokers and clearinghouse, and has entered into clearing agreements with its clearing brokers. The clearinghouse imposes initial margin requirements to secure the fund’s performance and requires daily settlement of variation margin representing changes in the market value of each contract.
Futures contracts are valued at their quoted daily settlement prices. The aggregate settlement values of the contracts are not recorded in the Statement of Net Assets. Fluctuations in the value of the contracts are recorded in the Statement of Net Assets as an asset (liability) and in the Statement of Operations as unrealized appreciation (depreciation) until the contracts are closed, when they are recorded as realized futures gains (losses).
During the year ended August 31, 2014, the fund’s average investments in long and short futures contracts represented less than 1% and 0% of net assets, respectively, based on the average of aggregate settlement values at each quarter-end during the period.
47
Russell 2000 Growth Index Fund
3. Federal Income Taxes: The fund intends to continue to qualify as a regulated investment company and distribute all of its taxable income. Management has analyzed the fund’s tax positions taken for all open federal income tax years (August 31, 2011–2014), and has concluded that no provision for federal income tax is required in the fund’s financial statements.
4. Distributions: Distributions to shareholders are recorded on the ex-dividend date.
5. Securities Lending: To earn additional income, the fund lends its securities to qualified institutional borrowers. Security loans are required to be secured at all times by collateral in an amount at least equal to the market value of securities loaned. Daily market fluctuations could cause the value of loaned securities to be more or less than the value of the collateral received. When this occurs, the collateral is adjusted and settled on the next business day. The fund further mitigates its counterparty risk by entering into securities lending transactions only with a diverse group of prequalified counterparties, monitoring their financial strength, and entering into master securities lending agreements with its counterparties. The master securities lending agreements provide that, in the event of a counterparty’s default (including bankruptcy), the fund may terminate any loans with that borrower, determine the net amount owed, and sell or retain the collateral up to the net amount owed to the fund; however, such actions may be subject to legal proceedings. While collateral mitigates counterparty risk, in the absence of a default the fund may experience delays and costs in recovering the securities loaned. The fund invests cash collateral received in Vanguard Market Liquidity Fund, and records a liability in the Statement of Net Assets for the return of the collateral, during the period the securities are on loan. Securities lending income represents fees charged to borrowers plus income earned on invested cash collateral, less expenses associated with the loan.
6. Credit Facility: The fund and certain other funds managed by The Vanguard Group participate in a $2.89 billion committed credit facility provided by a syndicate of lenders pursuant to a credit agreement that may be renewed annually; each fund is individually liable for its borrowings, if any, under the credit facility. Borrowings may be utilized for temporary and emergency purposes, and are subject to the fund’s regulatory and contractual borrowing restrictions. The participating funds are charged administrative fees and an annual commitment fee of 0.06% of the undrawn amount of the facility; these fees are allocated to the funds based on a method approved by the fund’s board of trustees and included in Management and Administrative expenses on the fund’s Statement of Operations. Any borrowings under this facility bear interest at a rate equal to the higher of the federal funds rate or LIBOR reference rate plus an agreed-upon spread.
The fund had no borrowings outstanding at August 31, 2014, or at any time during the period then ended.
7. Other: Dividend income is recorded on the ex-dividend date. Interest income includes income distributions received from Vanguard Market Liquidity Fund and is accrued daily. Premiums and discounts on debt securities purchased are amortized and accreted, respectively, to interest income over the lives of the respective securities. Security transactions are accounted for on the date securities are bought or sold. Costs used to determine realized gains (losses) on the sale of investment securities are those of the specific securities sold.
Each class of shares has equal rights as to assets and earnings, except that each class separately bears certain class-specific expenses related to maintenance of shareholder accounts (included in Management and Administrative expenses) and shareholder reporting. Marketing and distribution expenses are allocated to each class of shares based on a method approved by the board of trustees. Income, other non-class-specific expenses, and gains and losses on investments are allocated to each class of shares based on its relative net assets.
48
Russell 2000 Growth Index Fund
B. The Vanguard Group furnishes at cost investment advisory, corporate management, administrative, marketing, and distribution services. The costs of such services are allocated to the fund based on methods approved by the board of trustees. The fund has committed to provide up to 0.40% of its net assets in capital contributions to Vanguard. At August 31, 2014, the fund had contributed capital of $27,000 to Vanguard (included in Other Assets), representing 0.01% of the fund’s net assets and 0.01% of Vanguard’s capitalization. The fund’s trustees and officers are also directors and officers of Vanguard.
C. Various inputs may be used to determine the value of the fund’s investments. These inputs are summarized in three broad levels for financial statement purposes. The inputs or methodologies used to value securities are not necessarily an indication of the risk associated with investing in those securities.
Level 1—Quoted prices in active markets for identical securities.
Level 2—Other significant observable inputs (including quoted prices for similar securities, interest rates, prepayment speeds, credit risk, etc.).
Level 3—Significant unobservable inputs (including the fund’s own assumptions used to determine the fair value of investments).
The following table summarizes the market value of the fund’s investments as of August 31, 2014, based on the inputs used to value them:
| Level 1 | Level 2 | Level 3 | |
| Investments | ($000) | ($000) | ($000) |
| Common Stocks | 270,582 | — | 41 |
| Temporary Cash Investments | 2,443 | 100 | — |
| Futures Contracts—Assets1 | 1 | — | — |
| Total | 273,026 | 100 | 41 |
| 1 Represents variation margin on the last day of the reporting period. | |||
D. At August 31, 2014, the aggregate settlement value of open futures contracts and the related unrealized appreciation (depreciation) were:
| ($000) | ||||
| Aggregate | ||||
| Number of | Settlement | Unrealized | ||
| Long (Short) | Value | Appreciation | ||
| Futures Contracts | Expiration | Contracts | Long (Short) | (Depreciation) |
| E-mini Russell 2000 Index | September 2014 | 3 | 352 | 3 |
Unrealized appreciation (depreciation) on open futures contracts is required to be treated as realized gain (loss) for tax purposes.
E. Distributions are determined on a tax basis and may differ from net investment income and realized capital gains for financial reporting purposes. Differences may be permanent or temporary. Permanent differences are reclassified among capital accounts in the financial statements to reflect their tax character. Temporary differences arise when certain items of income, expense, gain, or loss are recognized in different periods for financial statement and tax purposes. These differences will reverse at some time in the future. Differences in classification may also result from the treatment of short-term gains as ordinary income for tax purposes.
49
Russell 2000 Growth Index Fund
Certain of the fund’s investments are in securities considered to be passive foreign investment companies, for which any unrealized appreciation and/or realized gains are required to be included in distributable net income for tax purposes. During the year ended August 31, 2014, the fund realized gains on the sale of passive foreign investment companies of $10,000, which have been included in current and prior periods’ taxable income; accordingly, such gains have been reclassified from accumulated net realized losses to undistributed net investment income. Passive foreign investment companies held at August 31, 2014, had unrealized appreciation of $17,000, of which all has been distributed and is reflected in the balance of undistributed net investment income.
During the year ended August 31, 2014, the fund realized $58,562,000 of net capital gains resulting from in-kind redemptions—in which shareholders exchanged fund shares for securities held by the fund rather than for cash. Because such gains are not taxable to the fund, and are not distributed to shareholders, they have been reclassified from accumulated net realized losses to paid-in capital.
For tax purposes, at August 31, 2014, the fund had $1,230,000 of ordinary income available for distribution. The fund had available capital losses totaling $7,226,000 that may be carried forward indefinitely to offset future net capital gains.
At August 31, 2014, the cost of investment securities for tax purposes was $247,963,000. Net unrealized appreciation of investment securities for tax purposes was $25,203,000, consisting of unrealized gains of $37,414,000 on securities that had risen in value since their purchase and $12,211,000 in unrealized losses on securities that had fallen in value since their purchase.
F. During the year ended August 31, 2014, the fund purchased $279,003,000 of investment securities and sold $300,054,000 of investment securities, other than temporary cash investments. Purchases and sales include $144,986,000 and $208,370,000, respectively, in connection with in-kind purchases and redemptions of the fund’s capital shares.
G. Capital share transactions for each class of shares were:
| Year Ended August 31, | |||||
| 2014 | 2013 | ||||
| Amount | Shares | Amount | Shares | ||
| ($000) | (000) | ($000) | (000) | ||
| Institutional Shares | |||||
| Issued | 60,834 | 329 | 102,692 | 721 | |
| Issued in Lieu of Cash Distributions | 891 | 5 | 1,000 | 8 | |
| Redeemed | (100,471) | (568) | (41,015) | (270) | |
| Net Increase (Decrease) —Institutional Shares | (38,746) | (234) | 62,677 | 459 | |
| ETF Shares | |||||
| Issued | 227,139 | 2,400 | 69,084 | 900 | |
| Issued in Lieu of Cash Distributions | — | — | — | — | |
| Redeemed | (209,996) | (2,200) | (31,765) | (400) | |
| Net Increase (Decrease)—ETF Shares | 17,143 | 200 | 37,319 | 500 | |
H. Management has determined that no material events or transactions occurred subsequent to August 31, 2014, that would require recognition or disclosure in these financial statements.
50
Report of Independent Registered
Public Accounting Firm
To the Board of Trustees of Vanguard Scottsdale Funds and the Shareholders of Vanguard Russell 2000 Index Fund, Vanguard Russell 2000 Value Index Fund and Vanguard Russell 2000 Growth Index Fund:
In our opinion, the accompanying statements of net assets - investments summary and the related statements of operations and of changes in net assets and the financial highlights present fairly, in all material respects, the financial position of Vanguard Russell 2000 Index Fund, Vanguard Russell 2000 Value Index Fund and Vanguard Russell 2000 Growth Index Fund (constituting separate portfolios of Vanguard Scottsdale Funds, hereafter referred to as the “Funds”) at August 31, 2014, the results of each of their operations for the year then ended, the changes in each of their net assets for each of the two years in the period then ended, and the financial highlights for each of the periods indicated, in conformity with accounting principles generally accepted in the United States of America. These financial statements and financial highlights (hereafter referred to as “financial statements”) are the responsibility of the Funds’ management. Our responsibility is to express an opinion on these financial statements based on our audits. We conducted our audits of these financial statements in accordance with the standards of the Public Company Accounting Oversight Board (United States). Those standards require that we plan and perform the audit to obtain reasonable assurance about whether the financial statements are free of material misstatement. An audit includes examining, on a test basis, evidence supporting the amounts and disclosures in the financial statements, assessing the accounting principles used and significant estimates made by management, and evaluating the overall financial statement presentation. We believe that our audits, which included confirmation of securities at August 31, 2014 by correspondence with the custodian and broker and by agreement to the underlying ownership records of the transfer agent, provide a reasonable basis for our opinion.
/s/PricewaterhouseCoopers LLP
Philadelphia, Pennsylvania
October 15, 2014
| Special 2014 tax information (unaudited) for Vanguard Russell 2000 Index Funds |
This information for the fiscal year ended August 31, 2014, is included pursuant to provisions of the Internal Revenue Code. |
| The funds distributed qualified dividend income to shareholders during the fiscal year as follows: |
| Fund | ($000) |
| Russell 2000 Index Fund | 4,411 |
| Russell 2000 Value Index Fund | 1,076 |
| Russell 2000 Growth Index Fund | 1,402 |
For corporate shareholders, the percentage of investment income (dividend income plus short-term gains, if any) that qualifies for the dividends-received deduction is as follows:
| Fund | Percentage |
| Russell 2000 Index Fund | 65.1% |
| Russell 2000 Value Index Fund | 57.4 |
| Russell 2000 Growth Index Fund | 83.2 |
Your Fund’s After-Tax Returns
This table presents returns for your fund both before and after taxes. The after-tax returns are shown in two ways: (1) assuming that an investor owned the fund during the entire period and paid taxes on the fund’s distributions, and (2) assuming that an investor paid taxes on the fund’s distributions and sold all shares at the end of each period.
Calculations are based on the highest individual federal income tax and capital gains tax rates in effect at the times of the distributions and the hypothetical sales. State and local taxes were not considered. After-tax returns reflect any qualified dividend income, using actual prior-year figures and estimates for 2014. (In the example, returns after the sale of fund shares may be higher than those assuming no sale. This occurs when the sale would have produced a capital loss. The calculation assumes that the investor received a tax deduction for the loss.)
The table shows returns for ETF Shares only; returns for other share classes will differ. Please note that your actual after-tax returns will depend on your tax situation and may differ from those shown. Also note that if you own the fund in a tax-deferred account, such as an individual retirement account or a 401(k) plan, this information does not apply to you. Such accounts are not subject to current taxes.
Finally, keep in mind that a fund’s performance—whether before or after taxes—does not guarantee future results.
| Average Annual Total Returns: Russell 2000 Index Funds | ||
| Periods Ended August 31, 2014 | ||
| Since | ||
| One | Inception | |
| Year | (9/20/2010) | |
| Russell 2000 Index Fund ETF Shares | ||
| Returns Before Taxes | 17.69% | 16.80% |
| Returns After Taxes on Distributions | 17.31 | 16.53 |
| Returns After Taxes on Distributions and Sale of Fund Shares | 10.15 | 13.37 |
| Since | ||
| One | Inception | |
| Year | (9/20/2010) | |
| Russell 2000 Value Index Fund ETF Shares | ||
| Returns Before Taxes | 17.92% | 15.50% |
| Returns After Taxes on Distributions | 17.38 | 15.12 |
| Returns After Taxes on Distributions and Sale of Fund Shares | 10.30 | 12.26 |
| Since | ||
| One | Inception | |
| Year | (9/20/2010) | |
| Russell 2000 Growth Index Fund ETF Shares | ||
| Returns Before Taxes | 17.30% | 17.89% |
| Returns After Taxes on Distributions | 17.14 | 17.78 |
| Returns After Taxes on Distributions and Sale of Fund Shares | 9.91 | 14.34 |
53
About Your Fund’s Expenses
As a shareholder of the fund, you incur ongoing costs, which include costs for portfolio management, administrative services, and shareholder reports (like this one), among others. Operating expenses, which are deducted from a fund’s gross income, directly reduce the investment return of the fund.
A fund’s expenses are expressed as a percentage of its average net assets. This figure is known as the expense ratio. The following examples are intended to help you understand the ongoing costs (in dollars) of investing in your fund and to compare these costs with those of other mutual funds. The examples are based on an investment of $1,000 made at the beginning of the period shown and held for the entire period.
The accompanying table illustrates your fund’s costs in two ways:
• Based on actual fund return. This section helps you to estimate the actual expenses that you paid over the period. The ”Ending Account Value“ shown is derived from the fund‘s actual return, and the third column shows the dollar amount that would have been paid by an investor who started with $1,000 in the fund. You may use the information here, together with the amount you invested, to estimate the expenses that you paid over the period.
To do so, simply divide your account value by $1,000 (for example, an $8,600 account value divided by $1,000 = 8.6), then multiply the result by the number given for your fund under the heading ”Expenses Paid During Period.“
• Based on hypothetical 5% yearly return. This section is intended to help you compare your fund‘s costs with those of other mutual funds. It assumes that the fund had a yearly return of 5% before expenses, but that the expense ratio is unchanged. In this case—because the return used is not the fund’s actual return—the results do not apply to your investment. The example is useful in making comparisons because the Securities and Exchange Commission requires all mutual funds to calculate expenses based on a 5% return. You can assess your fund’s costs by comparing this hypothetical example with the hypothetical examples that appear in shareholder reports of other funds.
Note that the expenses shown in the table are meant to highlight and help you compare ongoing costs only and do not reflect transaction costs incurred by the fund for buying and selling securities. Further, the expenses do not include any purchase, redemption, or account service fees described in the fund prospectus. If such fees were applied to your account, your costs would be higher. Your fund does not carry a “sales load.”
The calculations assume no shares were bought or sold during the period. Your actual costs may have been higher or lower, depending on the amount of your investment and the timing of any purchases or redemptions.
You can find more information about the fund’s expenses, including annual expense ratios, in the Financial Statements section of this report. For additional information on operating expenses and other shareholder costs, please refer to your fund’s current prospectus.
54
| Six Months Ended August 31, 2014 | |||
| Beginning | Ending | Expenses | |
| Account Value | Account Value | Paid During | |
| 2/28/2014 | 8/31/2014 | Period | |
| Based on Actual Fund Return | |||
| Russell 2000 Index Fund | |||
| Institutional Shares | $1,000.00 | $1,000.11 | $0.40 |
| ETF Shares | 1,000.00 | 999.79 | 0.76 |
| Russell 2000 Value Index Fund | |||
| Institutional Shares | $1,000.00 | $1,016.08 | $0.41 |
| ETF Shares | 1,000.00 | 1,015.51 | 1.02 |
| Russell 2000 Growth Index Fund | |||
| Institutional Shares | $1,000.00 | $984.94 | $0.40 |
| ETF Shares | 1,000.00 | 984.32 | 1.00 |
| Based on Hypothetical 5% Yearly Return | |||
| Russell 2000 Index Fund | |||
| Institutional Shares | $1,000.00 | $1,024.80 | $0.41 |
| ETF Shares | 1,000.00 | 1,024.45 | 0.77 |
| Russell 2000 Value Index Fund | |||
| Institutional Shares | $1,000.00 | $1,024.80 | $0.41 |
| ETF Shares | 1,000.00 | 1,024.20 | 1.02 |
| Russell 2000 Growth Index Fund | |||
| Institutional Shares | $1,000.00 | $1,024.80 | $0.41 |
| ETF Shares | 1,000.00 | 1,024.20 | 1.02 |
The calculations are based on expenses incurred in the most recent six-month period. The funds’ annualized six-month expense ratios for that period are: for the Russell 2000 Index Fund, 0.08% for Institutional Shares and 0.15% for ETF Shares; for the Russell 2000 Value Index Fund, 0.08% for Institutional Shares and 0.20% for ETF Shares; and for the Russell 2000 Growth Index Fund, 0.08% for Institutional Shares and 0.20% for ETF Shares. The dollar amounts shown as “Expenses Paid” are equal to the annualized expense ratio multiplied by the average account value over the period, multiplied by the number of days in the most recent six-month period, then divided by the number of days in the most recent 12-month period.
55
Trustees Approve Advisory Arrangements
The board of trustees of Vanguard Russell 2000 Index Fund, Russell 2000 Value Index Fund, and Russell 2000 Growth Index Fund has renewed each fund’s investment advisory arrangement with The Vanguard Group, Inc. (Vanguard). Vanguard’s Equity Investment Group—through its Equity Index Group—serves as investment advisor for each fund. The board determined that continuing each fund’s internalized management structure was in the best interests of each fund and its shareholders
The board based its decision upon an evaluation of the advisor’s investment staff, portfolio management process, and performance. The trustees considered the factors discussed below, among others. However, no single factor determined whether the board approved the arrangements. Rather, it was the totality of the circumstances that drove the board’s decision.
Nature, extent, and quality of services
The board considered the quality of each fund’s investment management services provided to the funds since their inception in 2010, and took into account the organizational depth and stability of the advisor. The board noted that Vanguard has been managing investments for more than three decades. The Equity Index Group adheres to a sound, disciplined investment management process; the team has considerable experience, stability, and depth.
The board concluded that Vanguard’s experience, stability, depth, and performance, among other factors, warranted continuation of each advisory arrangement.
Investment performance
The board considered the funds’ performance since their inception, including any periods of outperformance or underperformance relative to a target index and peer group. The board concluded that the performance was such that each advisory arrangement should continue. Information about the funds’ most recent performance can be found in the Performance Summary pages of this report.
Cost
The board concluded that each fund’s expense ratio was well below the average expense ratios charged by funds in its respective peer group and that each fund’s advisory fee rate was also well below its peer group average. Information about the funds’ expenses appears in the About Your Fund’s Expenses section of this report as well as in the Financial Statements sections.
The board does not conduct a profitability analysis of Vanguard, because of Vanguard’s unique “at-cost” structure. Unlike most other mutual fund management companies, Vanguard is owned by the funds it oversees, and produces “profits” only in the form of reduced expenses for fund shareholders.
The benefit of economies of scale
The board concluded that each fund’s at-cost arrangement with Vanguard ensures that the funds will realize economies of scale as they grow, with the cost to shareholders declining as fund assets increase.
The board will consider whether to renew the advisory arrangements again after a one-year period.
56
Glossary
30-Day SEC Yield. A fund’s 30-day SEC yield is derived using a formula specified by the U.S. Securities and Exchange Commission. Under the formula, data related to the fund’s security holdings in the previous 30 days are used to calculate the fund’s hypothetical net income for that period, which is then annualized and divided by the fund’s estimated average net assets over the calculation period. For the purposes of this calculation, a security’s income is based on its current market yield to maturity (for bonds), its actual income (for asset-backed securities), or its projected dividend yield (for stocks). Because the SEC yield represents hypothetical annualized income, it will differ—at times significantly—from the fund’s actual experience. As a result, the fund’s income distributions may be higher or lower than implied by the SEC yield.
Beta. A measure of the magnitude of a fund’s past share-price fluctuations in relation to the ups and downs of a given market index. The index is assigned a beta of 1.00. Compared with a given index, a fund with a beta of 1.20 typically would have seen its share price rise or fall by 12% when the index rose or fell by 10%. For this report, beta is based on returns over the past 36 months for both the fund and the index. Note that a fund’s beta should be reviewed in conjunction with its R-squared (see definition). The lower the R-squared, the less correlation there is between the fund and the index, and the less reliable beta is as an indicator of volatility.
Dividend Yield. Dividend income earned by stocks, expressed as a percentage of the aggregate market value (or of net asset value, for a fund). The yield is determined by dividing the amount of the annual dividends by the aggregate value (or net asset value) at the end of the period. For a fund, the dividend yield is based solely on stock holdings and does not include any income produced by other investments.
Earnings Growth Rate. The average annual rate of growth in earnings over the past five years for the stocks now in a fund.
Equity Exposure. A measure that reflects a fund’s investments in stocks and stock futures. Any holdings in short-term reserves are excluded.
Expense Ratio. A fund’s total annual operating expenses expressed as a percentage of the fund’s average net assets. The expense ratio includes management and administrative expenses, but does not include the transaction costs of buying and selling portfolio securities.
Foreign Holdings. The percentage of a fund represented by securities or depositary receipts of companies based outside the United States.
Inception Date. The date on which the assets of a fund (or one of its share classes) are first invested in accordance with the fund’s investment objective. For funds with a subscription period, the inception date is the day after that period ends. Investment performance is measured from the inception date.
Median Market Cap. An indicator of the size of companies in which a fund invests; the midpoint of market capitalization (market price x shares outstanding) of a fund’s stocks, weighted by the proportion of the fund’s assets invested in each stock. Stocks representing half of the fund’s assets have market capitalizations above the median, and the rest are below it.
Price/Book Ratio. The share price of a stock divided by its net worth, or book value, per share. For a fund, the weighted average price/book ratio of the stocks it holds.
57
Price/Earnings Ratio. The ratio of a stock’s current price to its per-share earnings over the past year. For a fund, the weighted average P/E of the stocks it holds. P/E is an indicator of market expectations about corporate prospects; the higher the P/E, the greater the expectations for a company’s future growth.
R-Squared. A measure of how much of a fund’s past returns can be explained by the returns from the market in general, as measured by a given index. If a fund’s total returns were precisely synchronized with an index’s returns, its R-squared would be 1.00. If the fund’s returns bore no relationship to the index’s returns, its R-squared would be 0. For this report, R-squared is based on returns over the past 36 months for both the fund and the index.
Return on Equity. The annual average rate of return generated by a company during the past five years for each dollar of shareholder’s equity (net income divided by shareholder’s equity). For a fund, the weighted average return on equity for the companies whose stocks it holds.
Short-Term Reserves. The percentage of a fund invested in highly liquid, short-term securities that can be readily converted to cash.
Turnover Rate. An indication of the fund’s trading activity. Funds with high turnover rates incur higher transaction costs and may be more likely to distribute capital gains (which may be taxable to investors). The turnover rate excludes in-kind transactions, which have minimal impact on costs.
58
This page intentionally left blank.
The People Who Govern Your Fund
The trustees of your mutual fund are there to see that the fund is operated and managed in your best interests since, as a shareholder, you are a part owner of the fund. Your fund’s trustees also serve on the board of directors of The Vanguard Group, Inc., which is owned by the Vanguard funds and provides services to them on an at-cost basis.
A majority of Vanguard’s board members are independent, meaning that they have no affiliation with Vanguard or the funds they oversee, apart from the sizable personal investments they have made as private individuals. The independent board members have distinguished backgrounds in business, academia, and public service. Each of the trustees and executive officers oversees 177 Vanguard funds.
The following table provides information for each trustee and executive officer of the fund. More information about the trustees is in the Statement of Additional Information, which can be obtained, without charge, by contacting Vanguard at 800-662-7447, or online at vanguard.com.
| InterestedTrustee1 | and Delphi Automotive LLP (automotive components); |
| Senior Advisor at New Mountain Capital. | |
| F. William McNabb III | |
| Born 1957. Trustee Since July 2009. Chairman of the | Amy Gutmann |
| Board. Principal Occupation(s) During the Past Five | Born 1949. Trustee Since June 2006. Principal |
| Years: Chairman of the Board of The Vanguard Group, | Occupation(s) During the Past Five Years: President of |
| Inc., and of each of the investment companies served | the University of Pennsylvania; Christopher H. Browne |
| by The Vanguard Group, since January 2010; Director | Distinguished Professor of Political Science, School of |
| of The Vanguard Group since 2008; Chief Executive | Arts and Sciences, and Professor of Communication, |
| Officer and President of The Vanguard Group, and of | Annenberg School for Communication, with secondary |
| each of the investment companies served by The | faculty appointments in the Department of Philosophy, |
| Vanguard Group, since 2008; Director of Vanguard | School of Arts and Sciences, and at the Graduate |
| Marketing Corporation; Managing Director of The | School of Education, University of Pennsylvania; |
| Vanguard Group (1995–2008). | Trustee of the National Constitution Center; Chair |
| of the Presidential Commission for the Study of | |
| IndependentTrustees | Bioethical Issues. |
| Emerson U. Fullwood | JoAnn Heffernan Heisen |
| Born 1948. Trustee Since January 2008. Principal | Born 1950. Trustee Since July 1998. Principal |
| Occupation(s) During the Past Five Years: Executive | Occupation(s) During the Past Five Years: Corporate |
| Chief Staff and Marketing Officer for North America | Vice President and Chief Global Diversity Officer |
| and Corporate Vice President (retired 2008) of Xerox | (retired 2008) and Member of the Executive |
| Corporation (document management products and | Committee (1997–2008) of Johnson & Johnson |
| services); Executive in Residence and 2009–2010 | (pharmaceuticals/medical devices/consumer |
| Distinguished Minett Professor at the Rochester | products); Director of Skytop Lodge Corporation |
| Institute of Technology; Director of SPX Corporation | (hotels), the University Medical Center at Princeton, |
| (multi-industry manufacturing), the United Way of | the Robert Wood Johnson Foundation, and the Center |
| Rochester, Amerigroup Corporation (managed health | for Talent Innovation; Member of the Advisory Board |
| care), the University of Rochester Medical Center, | of the Maxwell School of Citizenship and Public Affairs |
| Monroe Community College Foundation, and North | at Syracuse University. |
| Carolina A&T University. | |
| F. Joseph Loughrey | |
| Rajiv L. Gupta | Born 1949. Trustee Since October 2009. Principal |
| Born 1945. Trustee Since December 2001.2 | Occupation(s) During the Past Five Years: President |
| Principal Occupation(s) During the Past Five Years: | and Chief Operating Officer (retired 2009) of Cummins |
| Chairman and Chief Executive Officer (retired 2009) | Inc. (industrial machinery); Chairman of the Board |
| and President (2006–2008) of Rohm and Haas Co. | of Hillenbrand, Inc. (specialized consumer services), |
| (chemicals); Director of Tyco International, Ltd. | and of Oxfam America; Director of SKF AB (industrial |
| (diversified manufacturing and services), Hewlett- | machinery), Hyster-Yale Materials Handling, Inc. |
| Packard Co. (electronic computer manufacturing), | (forklift trucks), the Lumina Foundation for Education, |
| and the V Foundation for Cancer Research; Member | Executive Officers | |
| of the Advisory Council for the College of Arts and | ||
| Letters and of the Advisory Board to the Kellogg | Glenn Booraem | |
| Institute for International Studies, both at the | Born 1967. Controller Since July 2010. Principal | |
| University of Notre Dame. | Occupation(s) During the Past Five Years: Principal | |
| of The Vanguard Group, Inc.; Controller of each of | ||
| Mark Loughridge | the investment companies served by The Vanguard | |
| Born 1953. Trustee Since March 2012. Principal | Group; Assistant Controller of each of the investment | |
| Occupation(s) During the Past Five Years: Senior Vice | companies served by The Vanguard Group (2001–2010). | |
| President and Chief Financial Officer (retired 2013) | ||
| at IBM (information technology services); Fiduciary | Thomas J. Higgins | |
| Member of IBM’s Retirement Plan Committee (2004– | Born 1957. Chief Financial Officer Since September | |
| 2013); Member of the Council on Chicago Booth. | 2008. Principal Occupation(s) During the Past Five | |
| Years: Principal of The Vanguard Group, Inc.; Chief | ||
| Scott C. Malpass | Financial Officer of each of the investment companies | |
| Born 1962. Trustee Since March 2012. Principal | served by The Vanguard Group; Treasurer of each of | |
| Occupation(s) During the Past Five Years: Chief | the investment companies served by The Vanguard | |
| Investment Officer and Vice President at the University | Group (1998–2008). | |
| of Notre Dame; Assistant Professor of Finance at the | ||
| Mendoza College of Business at Notre Dame; Member | Kathryn J. Hyatt | |
| of the Notre Dame 403(b) Investment Committee; | Born 1955. Treasurer Since November 2008. Principal | |
| Board Member of TIFF Advisory Services, Inc. | Occupation(s) During the Past Five Years: Principal of | |
| (investment advisor); Member of the Investment | The Vanguard Group, Inc.; Treasurer of each of the | |
| Advisory Committees of the Financial Industry | investment companies served by The Vanguard | |
| Regulatory Authority (FINRA) and of Major League | Group; Assistant Treasurer of each of the investment | |
| Baseball. | companies served by The Vanguard Group (1988–2008). | |
| André F. Perold | Heidi Stam | |
| Born 1952. Trustee Since December 2004. Principal | Born 1956. Secretary Since July 2005. Principal | |
| Occupation(s) During the Past Five Years: George | Occupation(s) During the Past Five Years: Managing | |
| Gund Professor of Finance and Banking, Emeritus | Director of The Vanguard Group, Inc.; General Counsel | |
| at the Harvard Business School (retired 2011); | of The Vanguard Group; Secretary of The Vanguard | |
| Chief Investment Officer and Managing Partner of | Group and of each of the investment companies | |
| HighVista Strategies LLC (private investment firm); | served by The Vanguard Group; Director and Senior | |
| Director of Rand Merchant Bank; Overseer of the | Vice President of Vanguard Marketing Corporation. | |
| Museum of Fine Arts Boston. | ||
| Vanguard Senior ManagementTeam | ||
| Alfred M. Rankin, Jr. | ||
| Born 1941. Trustee Since January 1993. Principal | Mortimer J. Buckley | Chris D. McIsaac |
| Occupation(s) During the Past Five Years: Chairman, | Kathleen C. Gubanich | Michael S. Miller |
| President, and Chief Executive Officer of NACCO | Paul A. Heller | James M. Norris |
| Industries, Inc. (housewares/lignite), and of Hyster- | Martha G. King | Glenn W. Reed |
| Yale Materials Handling, Inc. (forklift trucks); Chairman | John T. Marcante | |
| of the Board of University Hospitals of Cleveland. | ||
| Chairman Emeritus and Senior Advisor | ||
| Peter F. Volanakis | ||
| Born 1955. Trustee Since July 2009. Principal | John J. Brennan | |
| Occupation(s) During the Past Five Years: President | Chairman, 1996–2009 | |
| and Chief Operating Officer (retired 2010) of Corning | Chief Executive Officer and President, 1996–2008 | |
| Incorporated (communications equipment); Trustee of | ||
| Colby-Sawyer College; Member of the Advisory Board | Founder | |
| of the Norris Cotton Cancer Center and of the Advisory | ||
| Board of the Parthenon Group (strategy consulting). | John C. Bogle | |
| Chairman and Chief Executive Officer, 1974–1996 | ||
1 Mr. McNabb is considered an “interested person,” as defined in the Investment Company Act of 1940, because he is an officer of the Vanguard funds.
2 December 2002 for Vanguard Equity Income Fund, the Vanguard Municipal Bond Funds, and the Vanguard State Tax-Exempt Funds.
 | |
| P.O. Box 2600 | |
| Valley Forge, PA 19482-2600 | |
| Connect with Vanguard® > vanguard.com | |
| Fund Information > 800-662-7447 | The Russell Indexes and Russell® are registered |
| Direct Investor Account Services > 800-662-2739 | trademarks of Russell Investments and have been |
| Institutional Investor Services > 800-523-1036 | licensed for use by The Vanguard Group, Inc. The |
| Text Telephone for People | products are not sponsored, endorsed, sold, or |
| With Hearing Impairment > 800-749-7273 | promoted by Russell Investments and Russell |
| Investments makes no representation regarding the | |
| This material may be used in conjunction | advisability of investing in the products. |
| with the offering of shares of any Vanguard | |
| fund only if preceded or accompanied by | |
| the fund’s current prospectus. | |
| All comparative mutual fund data are from Lipper, a | |
| Thomson Reuters Company, or Morningstar, Inc., unless | |
| otherwise noted. | |
| You can obtain a free copy of Vanguard’s proxy voting | |
| guidelines by visiting vanguard.com/proxyreporting or by | |
| calling Vanguard at 800-662-2739. The guidelines are | |
| also available from the SEC’s website, sec.gov. In | |
| addition, you may obtain a free report on how your fund | |
| voted the proxies for securities it owned during the 12 | |
| months ended June 30. To get the report, visit either | |
| vanguard.com/proxyreporting or sec.gov. | |
| You can review and copy information about your fund at | |
| the SEC’s Public Reference Room in Washington, D.C. To | |
| find out more about this public service, call the SEC at | |
| 202-551-8090. Information about your fund is also | |
| available on the SEC’s website, and you can receive | |
| copies of this information, for a fee, by sending a | |
| request in either of two ways: via e-mail addressed to | |
| publicinfo@sec.gov or via regular mail addressed to the | |
| Public Reference Section, Securities and Exchange | |
| Commission, Washington, DC 20549-1520. | |
| © 2014 The Vanguard Group, Inc. | |
| All rights reserved. | |
| Vanguard Marketing Corporation, Distributor. | |
| Q18510 102014 | |
Annual Report | August 31, 2014
Vanguard Russell 3000 Index Fund
The mission continues
On May 1, 1975, Vanguard began operations, a fledgling company based on the simple but revolutionary idea that a mutual fund company should be managed solely in the interest of its investors.
Four decades later, that revolutionary spirit continues to animate the enterprise. Vanguard remains on a mission to give investors the best chance of investment success.
As we mark our 40th anniversary, we thank you for entrusting your assets to Vanguard and giving us the opportunity to help you reach your financial goals in the decades to come.
| Contents | |
| Your Fund’s Total Returns. | 1 |
| Chairman’s Letter. | 2 |
| Fund Profile. | 8 |
| Performance Summary. | 9 |
| Financial Statements. | 11 |
| Your Fund’s After-Tax Returns. | 23 |
| About Your Fund’s Expenses. | 24 |
| Trustees Approve Advisory Arrangement. | 26 |
| Glossary. | 27 |
Please note: The opinions expressed in this report are just that—informed opinions. They should not be considered promises or advice. Also, please keep in mind that the information and opinions cover the period through the date on the front of this report. Of course, the risks of investing in your fund are spelled out in the prospectus.
See the Glossary for definitions of investment terms used in this report.
About the cover: Since our founding, Vanguard has drawn inspiration from the enterprise and valor demonstrated by British naval hero Horatio Nelson and his command at the Battle of the Nile in 1798. The photograph displays a replica of a merchant ship from the same era as Nelson’s flagship, the HMS Vanguard.
Your Fund’s Total Returns
| Fiscal Year Ended August 31, 2014 | |
| Total | |
| Returns | |
| Vanguard Russell 3000 Index Fund | |
| Institutional Shares | 24.66% |
| ETF Shares | |
| Market Price | 24.54 |
| Net Asset Value | 24.58 |
| Russell 3000 Index | 24.74 |
| Multi-Cap Core Funds Average | 22.50 |
| Multi-Cap Core Funds Average: Derived from data provided by Lipper, a Thomson Reuters Company. | |
Institutional Shares are available to certain institutional investors who meet specific administrative, service, and account-size criteria. The
Vanguard ETF® Shares shown are traded on the Nasdaq exchange and are available only through brokers. The table provides ETF returns
based on both the Nasdaq market price and the net asset value for a share. U.S. Pat. Nos. 6,879,964; 7,337,138; 7,720,749; 7,925,573;
8,090,646; and 8,417,623.
For the ETF Shares, the market price is determined by the midpoint of the bid-offer spread as of the closing time of the New York Stock
Exchange (generally 4 p.m., Eastern time). The net asset value is also determined as of the NYSE closing time. For more information about
how the ETF Shares' market prices have compared with their net asset value, visit vanguard.com, select your ETF, and then select the Price
and Performance tab. The ETF premium/discount analysis there shows the percentages of days on which the ETF Shares' market price was
above or below the NAV.
| Your Fund’s Performance at a Glance | ||||
| August 31, 2013, Through August 31, 2014 | ||||
| Distributions Per Share | ||||
| Starting | Ending | |||
| Share | Share | Income | Capital | |
| Price | Price | Dividends | Gains | |
| Vanguard Russell 3000 Index Fund | ||||
| Institutional Shares | $146.68 | $179.64 | $2.929 | $0.000 |
| ETF Shares | 75.79 | 92.82 | 1.459 | 0.000 |

Chairman’s Letter
Dear Shareholder,
The broad U.S. stock market notched another strong fiscal year, although momentum slowed later in the period. For the 12 months ended August 31, 2014, Vanguard Russell 3000 Index Fund returned more than 24%, in line with its target index and about 2 percentage points ahead of the average return of its peers.
Your fund seeks to track a benchmark that includes the Russell 1000 Index of large companies and the Russell 2000 Index of smaller companies, together representing nearly 100% of the U.S. stock market. Large companies outpaced smaller ones by more than 7 percentage points, in contrast to recent years when small-capitalization stocks outperformed. Because size and style leadership alternates over time, we counsel that broad diversification is the best course. For more on the performance of small-and large-cap stocks, please see the box on page 6.
If you invest in the fund through a taxable account, you may wish to review the information on the fund’s after-tax returns that appears later in this report.
Stocks cleared several hurdles to chart a series of new highs
Despite an assortment of challenges, the broad U.S. stock market recorded an impressive return of almost 25% for the 12 months ended August 31. U.S. stocks
registered positive results in all but two months, and a late-July swoon was followed by an August flurry of record highs.
Investors applauded mostly solid corporate earnings, generally upbeat economic news, and the Federal Reserve’s continued accommodative policies. Still, turmoil in the Middle East and Ukraine, economic worries in Europe and China, and uncertainty about the Fed’s next moves pressured stocks at various times.
International stocks returned about 18%. Emerging markets, after sliding earlier in the period, rebounded to lead the way.
The developed markets of the Pacific region and Europe trailed but still posted double-digit returns.
Defying analysts’ expectations, bond prices rose over the year
The broad U.S. taxable bond market returned 5.66%, rallying from the drubbing it took a year ago when investors fretted over the future of the Fed’s bond-buying program.
The Fed began reducing its purchases in January and has consistently cut them further since, with the goal of ending the program in October. Interest rates have not risen as forecast, however. The yield of the 10-year U.S. Treasury note ended
| Market Barometer | |||
| Average Annual Total Returns | |||
| Periods Ended August 31, 2014 | |||
| One | Three | Five | |
| Year | Years | Years | |
| Stocks | |||
| Russell 1000 Index (Large-caps) | 25.36% | 20.80% | 17.24% |
| Russell 2000 Index (Small-caps) | 17.68 | 19.00 | 17.03 |
| Russell 3000 Index (Broad U.S. market) | 24.74 | 20.65 | 17.22 |
| FTSE All-World ex US Index (International) | 18.04 | 9.48 | 8.44 |
| Bonds | |||
| Barclays U.S. Aggregate Bond Index (Broad taxable market) | 5.66% | 2.91% | 4.48% |
| Barclays Municipal Bond Index (Broad tax-exempt market) | 10.14 | 4.88 | 5.39 |
| Citigroup Three-Month U.S. Treasury Bill Index | 0.04 | 0.04 | 0.07 |
| CPI | |||
| Consumer Price Index | 1.70% | 1.64% | 1.96% |
3
August at 2.34%, down from 2.76% a year earlier. (Bond prices and yields move in opposite directions.)
Municipal bonds returned 10.14% as investors searched for tax-exempt income amid a limited supply of new issues. The Fed’s target of 0%–0.25% for short-term interest rates continued to restrict returns for money market funds and savings accounts.
International bond markets (as measured by the Barclays Global Aggregate Index ex USD) returned 6.52%, collectively outperforming the broad U.S. market.
Following such a strong advance for bonds globally, it’s worth remembering that the current low yields imply lower future returns: As yields drop, the scope for further declines—and increases in prices—diminishes.
As the stock rally lost steam, value stocks cut growth’s lead
Buoyed by an exceptionally strong first six months, the Russell 3000 Index Fund posted its best full-fiscal-year return since its 2010 inception. The fund earned two-thirds of its return during the period’s first half, when growth-oriented stocks outperformed their value counterparts by more than 4 percentage points. As the Fed shed more light on the anticipated end of its stimulative bond-buying, these groups swapped places—though growth stocks still finished ahead for the 12 months.
| Expense Ratios | |||
| Your Fund Compared With Its Peer Group | |||
| Institutional | ETF | Peer Group | |
| Shares | Shares | Average | |
| Russell 3000 Index Fund | 0.08% | 0.15% | 1.17% |
| The fund expense ratios shown are from the prospectus dated December 20, 2013, and represent estimated costs for the current fiscal year. For the fiscal year ended August 31, 2014, the fund’s expense ratios were 0.08% for Institutional Shares and 0.15% for ETF Shares. The peer-group expense ratio is derived from data provided by Lipper, a Thomson Reuters Company, and captures information through year-end 2013. | |||
| Peer group: Multi-Cap Core Funds. | |||
4
With all nine industry sectors posting double-digit gains, two typically growth-oriented ones—technology and health care—stood out, each returning more than 30%. Semiconductor firms and providers of computer software, systems, and technology were some of the best performers, benefiting in part from signs of a pickup in capital spending. In health care, drugmakers experienced a flurry of mergers and acquisitions; care facilities and managed-care providers were also sources of strength. In general, investors anticipated higher health care spending as baby boomers age and the Affordable Care Act expands the ranks of the insured.
Financial services, the fund’s largest sector and often home to many value companies, returned more than 21%. Overall, banks and other firms have come a long way since the financial crisis of 2008–2009. And as the housing market improved, real estate firms were some of the best performers within the group.
Together, technology, health care, and financial services contributed more than half of your fund’s total return. Utilities, which are classic value stocks and one of the smallest slices of the fund, brought up the rear with a still-impressive return of more than 17%.
| Total Returns | |
| Inception Through August 31, 2014 | |
| Average | |
| Annual Return | |
| Russell 3000 Index Fund Institutional Shares (Returns since inception: 11/1/2010) | 17.21% |
| Russell 3000 Index | 17.29 |
| Multi-Cap Core Funds Average | 14.94 |
| Multi-Cap Core Funds Average: Derived from data provided by Lipper, a Thomson Reuters Company. | |
The figures shown represent past performance, which is not a guarantee of future results. (Current performance may be lower or higher than the performance data cited. For performance data current to the most recent month-end, visit our website at vanguard.com/performance.) Note, too, that both investment returns and principal value can fluctuate widely, so an investor’s shares, when sold, could be worth more or less than their original cost.
5
Since inception, your fund has closely tracked its index
For any index fund, success is defined as closely tracking the performance of its target index, which, of course, incurs no expenses. Since it was launched in 2010, the Russell 3000 Index Fund has been successful.
| Small-cap stocks versus large-caps: A case for diversification |
| At times, particularly over the past dozen years, small-capitalization stocks have outpaced their |
| large-cap counterparts. This performance edge may appear compelling, but before making any |
| drastic decisions to tilt your portfolio heavily toward small-caps, consider two points. |
| First, there’s no guarantee that small caps’ performance advantage will persist. As shown in |
| the chart below, these stocks had an extended period of underperformance in the 1990s, and |
| that could happen again. |
| Second, investing in small companies’ stocks involves additional risks. These firms generally |
| have less business diversification, fewer financial resources, and less management depth than |
| larger enterprises. As a result, their stocks can be highly volatile. |
| Investors with a heavy allocation to only one segment of the market can end up with greater |
| volatility and less diversification. A better alternative can be an investment such as the Russell |
| 3000 Index Fund: a market-cap-weighted equity portfolio of stocks of all capitalizations that |
| offers more diversification over the long term. |
| Small-cap performance relative to large-caps |
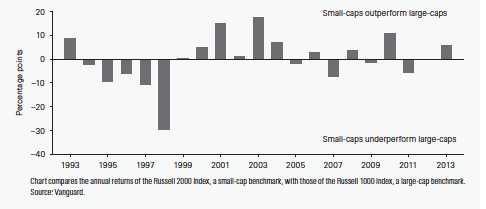
6
That’s no small accomplishment, especially for a new fund as it begins to build scale. Its close tracking is a testament to the experience, talent, and sophisticated systems of Vanguard Equity Investment Group, your fund’s advisor. And your fund’s average annual return since inception has exceeded its peer-group average by more than 2 percentage points.
High costs don’t equal strong fund performance
The adage “you get what you pay for” doesn’t apply to mutual funds. In fact, the reverse is true: Research suggests that higher costs are consistent with weaker returns. (See, for example, Shopping for Alpha: You Get What You Don’t Pay For at vanguard.com/research.)
Wouldn’t paying the highest fees allow you to purchase the services of the greatest talents, and therefore get you the best returns? As it turns out, the data don’t support that argument. The explanation is simple: Every dollar paid for management fees is a dollar less earning potential return. Keeping expenses down can help narrow the gap between what the markets return and what investors actually earn.
That’s why Vanguard always seeks to minimize costs. Indexing, of course, is the purest form of low-cost investing. And we negotiate low fees for our actively managed funds, which are run by world-class advisors. It’s a strategy that reflects decades of experience and research, boiled down to one tenet: The less you pay, the more you keep.
As always, thank you for entrusting your assets to Vanguard.
Sincerely,

F. William McNabb III
Chairman and Chief Executive Officer
September 17, 2014
7
Russell 3000 Index Fund
Fund Profile
As of August 31, 2014
| Share-Class Characteristics | ||
| Institutional | ETF | |
| Shares | Shares | |
| Ticker Symbol | VRTTX | VTHR |
| Expense Ratio1 | 0.08% | 0.15% |
| 30-Day SEC Yield | 1.71% | 1.64% |
| Portfolio Characteristics | |||
| DJ | |||
| U.S. | |||
| Total | |||
| Russell | Market | ||
| 3000 | FA | ||
| Fund | Index | Index | |
| Number of Stocks | 3,009 | 2,989 | 3,709 |
| Median Market Cap | $48.7B | $48.7B | $48.0B |
| Price/Earnings Ratio | 20.8x | 20.8x | 20.7x |
| Price/Book Ratio | 2.7x | 2.7x | 2.7x |
| Return on Equity | 18.0% | 17.9% | 17.8% |
| Earnings Growth | |||
| Rate | 15.2% | 15.2% | 15.3% |
| Dividend Yield | 1.8% | 1.8% | 1.8% |
| Foreign Holdings | 0.0% | 0.0% | 0.0% |
| Turnover Rate | 8% | — | — |
| Short-Term Reserves | -0.3% | — | — |
| Sector Diversification (% of equity exposure) | |||
| DJ | |||
| U.S. | |||
| Total | |||
| Russell | Market | ||
| 3000 | FA | ||
| Fund | Index | Index | |
| Consumer Discretionary 14.0% | 13.9% | 14.1% | |
| Consumer Staples | 7.2 | 7.2 | 7.2 |
| Energy | 9.5 | 9.5 | 9.7 |
| Financial Services | 18.8 | 18.8 | 18.7 |
| Health Care | 13.1 | 13.2 | 13.2 |
| Materials & Processing | 4.5 | 4.5 | 4.5 |
| Producer Durables | 11.4 | 11.4 | 11.3 |
| Technology | 16.3 | 16.3 | 16.1 |
| Utilities | 5.2 | 5.2 | 5.2 |
| Volatility Measures | ||
| DJ | ||
| Russell | U.S. Total | |
| 3000 | Market | |
| Index | FA Index | |
| R-Squared | 1.00 | 1.00 |
| Beta | 1.00 | 1.00 |
| These measures show the degree and timing of the fund’s fluctuations compared with the indexes over 36 months. | ||
| Ten Largest Holdings (% of total net assets) | ||
| Apple Inc. | Computer | |
| Technology | 2.8% | |
| Exxon Mobil Corp. | Oil: Integrated | 1.9 |
| Microsoft Corp. | Computer Services | |
| Software & Systems | 1.7 | |
| Google Inc. | Computer Services | |
| Software & Systems | 1.5 | |
| Johnson & Johnson | Pharmaceuticals | 1.3 |
| General Electric Co. | Diversified | |
| Manufacturing | ||
| Operations | 1.2 | |
| Berkshire Hathaway Inc. Insurance: Multi-Line | 1.1 | |
| Chevron Corp. | Oil: Integrated | 1.1 |
| Wells Fargo & Co. | Banks: Diversified | 1.1 |
| JPMorgan Chase & Co. | Diversified Financial | |
| Services | 1.0 | |
| Top Ten | 14.7% | |
| The holdings listed exclude any temporary cash investments and equity index products. | ||
Investment Focus
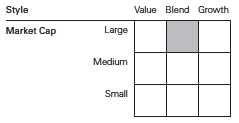
1 The expense ratios shown are from the prospectus dated December 20, 2013, and represent estimated costs for the current fiscal year. For the fiscal year ended August 31, 2014, the expense ratios were 0.08% for Institutional Shares and 0.15% for ETF Shares.
8
Russell 3000 Index Fund
Performance Summary
All of the returns in this report represent past performance, which is not a guarantee of future results that may be achieved by the fund. (Current performance may be lower or higher than the performance data cited. For performance data current to the most recent month-end, visit our website at vanguard.com/performance.) Note, too, that both investment returns and principal value can fluctuate widely, so an investor’s shares, when sold, could be worth more or less than their original cost. The returns shown do not reflect taxes that a shareholder would pay on fund distributions or on the sale of fund shares.
Cumulative Performance: September 20, 2010, Through August 31, 2014
Initial Investment of $10,000
| Average Annual Total Returns | ||||
| Periods Ended August 31, 2014 | ||||
| Since | Final Value | |||
| One | Inception | of a $10,000 | ||
| Year | (9/20/2010) | Investment | ||
| Russell 3000 Index Fund*ETF Shares | ||||
| Net Asset Value | 24.58% | 17.78% | $19,072 | |
| Russell 3000 Index Fund*ETF Shares | ||||
| Market Price | 24.54 | 17.77 | 19,066 | |
| •••••••• | Russell 3000 Index | 24.74 | 17.94 | 19,175 |
| – – – – | Multi-Cap Core Funds Average | 22.50 | 15.58 | 17,702 |
| Dow Jones U.S. Total Stock Market | ||||
| Float Adjusted Index | 24.68 | 17.95 | 19,178 | |
| Multi-Cap Core Funds Average: Derived from data provided by Lipper, a Thomson Reuters Company. "Since Inception" performance is calculated from the ETF Shares’ inception date for both the fund and its comparative standards. | ||||
| Since | Final Value | ||
| One | Inception | of a $5,000,000 | |
| Year | (11/1/2010) | Investment | |
| Russell 3000 Index Fund Institutional Shares | 24.66% | 17.21% | $9,185,241 |
| Russell 3000 Index | 24.74 | 17.29 | 9,209,323 |
| Dow Jones U.S. Total Stock Market Float | |||
| Adjusted Index | 24.68 | 17.29 | 9,208,855 |
| "Since Inception" performance is calculated from the Institutional Shares’ inception date for both the fund and its comparative standards. | |||
See Financial Highlights for dividend and capital gains information.
9
Russell 3000 Index Fund
| Cumulative Returns of ETF Shares: September 20, 2010, Through August 31, 2014 | ||
| Since | ||
| One | Inception | |
| Year | (9/20/2010) | |
| Russell 3000 Index Fund ETF Shares Market Price | 24.54% | 90.66% |
| Russell 3000 Index Fund ETF Shares Net Asset | ||
| Value | 24.58 | 90.72 |
| Russell 3000 Index | 24.74 | 91.75 |
| "Since Inception" performance is calculated from the ETF Shares’ inception date for both the fund and its comparative standards. | ||
Fiscal-Year Total Returns (%): September 20, 2010, Through August 31, 2014
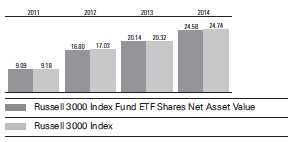
| Average Annual Total Returns: Periods Ended June 30, 2014 | |||
| This table presents returns through the latest calendar quarter—rather than through the end of the fiscal period. | |||
| Securities and Exchange Commission rules require that we provide this information. | |||
| Inception | One | Since | |
| Date | Year | Inception | |
| Institutional Shares | 11/1/2010 | 25.13% | 17.39% |
| ETF Shares | 9/20/2010 | ||
| Market Price | 24.97 | 17.98 | |
| Net Asset Value | 25.03 | 17.99 | |
10
Russell 3000 Index Fund
Financial Statements
Statement of Net Assets—Investments Summary
As of August 31, 2014
This Statement summarizes the fund’s holdings by asset type. Details are reported for each of the fund’s 50 largest individual holdings and for investments that, in total for any issuer, represent more than 1% of the fund’s net assets. The total value of smaller holdings is reported as a single amount within each category.
The fund reports a complete list of its holdings in regulatory filings four times in each fiscal year, at the quarter-ends. For the second and fourth fiscal quarters, the complete listing of the fund’s holdings is available electronically on vanguard.com and on the Securities and Exchange Commission’s website (sec.gov), or you can have it mailed to you without charge by calling 800-662-7447. For the first and third fiscal quarters, the fund files the lists with the SEC on Form N-Q. Shareholders can look up the fund’s Forms N-Q on the SEC’s website. Forms N-Q may also be reviewed and copied at the SEC’s Public Reference Room (see the back cover of this report for further information).
| Market | Percentage | ||
| Value• | of Net | ||
| Shares | ($000) | Assets | |
| Common Stocks | |||
| Consumer Discretionary | |||
| Walt Disney Co. | 55,605 | 4,998 | 0.7% |
| Comcast Corp. Class A | 83,170 | 4,552 | 0.6% |
| Home Depot Inc. | 43,912 | 4,106 | 0.6% |
| * Amazon.com Inc. | 12,063 | 4,090 | 0.6% |
| Wal-Mart Stores Inc. | 51,155 | 3,862 | 0.5% |
| McDonald’s Corp. | 31,736 | 2,974 | 0.4% |
| Consumer Discretionary—Other † | 75,113 | 10.4% | |
| 99,695 | 13.8% | ||
| Consumer Staples | |||
| Procter & Gamble Co. | 86,882 | 7,221 | 1.0% |
| Coca-Cola Co. | 127,485 | 5,319 | 0.8% |
| PepsiCo Inc. | 48,678 | 4,502 | 0.6% |
| Philip Morris International Inc. | 50,501 | 4,322 | 0.6% |
| CVS Caremark Corp. | 37,054 | 2,944 | 0.4% |
| Altria Group Inc. | 63,780 | 2,748 | 0.4% |
| Consumer Staples—Other † | 24,483 | 3.4% | |
| 51,539 | 7.2% | ||
| Energy | |||
| Exxon Mobil Corp. | 137,882 | 13,714 | 1.9% |
| Chevron Corp. | 61,122 | 7,912 | 1.1% |
| Schlumberger Ltd. | 41,758 | 4,578 | 0.6% |
| ConocoPhillips | 39,419 | 3,202 | 0.4% |
| Occidental Petroleum Corp. | 25,224 | 2,616 | 0.4% |
| Energy—Other † | 35,679 | 5.0% | |
| 67,701 | 9.4% | ||
| Financial Services | |||
| * Berkshire Hathaway Inc. Class B | 58,764 | 8,065 | 1.1% |
| Wells Fargo & Co. | 153,333 | 7,887 | 1.1% |
| JPMorgan Chase & Co. | 121,518 | 7,224 | 1.0% |
| Bank of America Corp. | 333,251 | 5,362 | 0.7% |
11
Russell 3000 Index Fund
| Market | Percentage | ||
| Value• | of Net | ||
| Shares | ($000) | Assets | |
| Citigroup Inc. | 97,536 | 5,038 | 0.7% |
| Visa Inc. Class A | 15,891 | 3,377 | 0.5% |
| American Express Co. | 29,127 | 2,608 | 0.4% |
| Financial Services—Other † | 94,727 | 13.1% | |
| 134,288 | 18.6% | ||
| Health Care | |||
| Johnson & Johnson | 90,836 | 9,422 | 1.3% |
| Pfizer Inc. | 204,805 | 6,019 | 0.8% |
| Merck & Co. Inc. | 93,830 | 5,640 | 0.8% |
| * Gilead Sciences Inc. | 49,308 | 5,305 | 0.7% |
| Amgen Inc. | 24,306 | 3,388 | 0.5% |
| AbbVie Inc. | 51,053 | 2,822 | 0.4% |
| UnitedHealth Group Inc. | 31,461 | 2,727 | 0.4% |
| Bristol-Myers Squibb Co. | 53,208 | 2,695 | 0.4% |
| * Biogen Idec Inc. | 7,617 | 2,613 | 0.3% |
| Health Care—Other † | 53,251 | 7.4% | |
| 93,882 | 13.0% | ||
| Materials & Processing † | 32,073 | 4.4% | |
| Other | |||
| * Synchrony Financial | 1,660 | 43 | 0.0% |
| Other—Other † | 24 | 0.0% | |
| 67 | 0.0% | ||
| Producer Durables | |||
| General Electric Co. | 321,966 | 8,365 | 1.2% |
| United Technologies Corp. | 29,435 | 3,178 | 0.5% |
| Union Pacific Corp. | 29,084 | 3,062 | 0.4% |
| 3M Co. | 21,008 | 3,025 | 0.4% |
| Boeing Co. | 23,414 | 2,969 | 0.4% |
| Producer Durables—Other † | 60,686 | 8.4% | |
| 81,285 | 11.3% | ||
| Technology | |||
| Apple Inc. | 193,598 | 19,844 | 2.7% |
| Microsoft Corp. | 265,221 | 12,049 | 1.7% |
| International Business Machines Corp. | 30,373 | 5,841 | 0.8% |
| Intel Corp. | 159,832 | 5,581 | 0.8% |
| * Google Inc. Class A | 9,013 | 5,249 | 0.7% |
| * Google Inc. Class C | 9,119 | 5,212 | 0.7% |
| * Facebook Inc. Class A | 63,397 | 4,743 | 0.7% |
| Oracle Corp. | 105,458 | 4,380 | 0.6% |
| QUALCOMM Inc. | 54,194 | 4,124 | 0.6% |
| Cisco Systems Inc. | 164,477 | 4,110 | 0.6% |
| Technology—Other † | 45,096 | 6.2% | |
| 116,229 | 16.1% | ||
| Utilities | |||
| Verizon Communications Inc. | 132,962 | 6,624 | 0.9% |
| AT&T Inc. | 166,654 | 5,826 | 0.8% |
| Utilities—Other † | 24,677 | 3.5% | |
| 37,127 | 5.2% | ||
| Total Common Stocks (Cost $570,295) | 713,886 | 99.0%1 | |
12
Russell 3000 Index Fund
| Market | Percentage | |||
| Value• | of Net | |||
| Coupon | Shares | ($000) | Assets | |
| Temporary Cash Investments | ||||
| Money Market Fund | ||||
| 2,3 Vanguard Market Liquidity Fund | 0.113% | 4,418,897 | 4,419 | 0.6% |
| 4U.S. Government and Agency Obligations † | 300 | 0.1% | ||
| Total Temporary Cash Investments (Cost $4,719) | 4,719 | 0.7%1 | ||
| 5Total Investments (Cost $575,014) | 718,605 | 99.7% | ||
| Other Assets and Liabilities | ||||
| Other Assets | 11,544 | 1.6% | ||
| Liabilities3 | (9,305) | (1.3%) | ||
| 2,239 | 0.3% | |||
| Net Assets | 720,844 | 100.0% | ||
| At August 31, 2014, net assets consisted of: | ||||
| Amount | ||||
| ($000) | ||||
| Paid-in Capital | 576,316 | |||
| Undistributed Net Investment Income | 2,382 | |||
| Accumulated Net Realized Losses | (1,543) | |||
| Unrealized Appreciation (Depreciation) | ||||
| Investment Securities | 143,591 | |||
| Futures Contracts | 98 | |||
| Net Assets | 720,844 | |||
| Institutional Shares—Net Assets | ||||
| Applicable to 3,341,032 outstanding $.001 par value shares of | ||||
| beneficial interest (unlimited authorization) | 600,180 | |||
| Net Asset Value Per Share—Institutional Shares | $179.64 | |||
| ETF Shares—Net Assets | ||||
| Applicable to 1,300,000 outstanding $.001 par value shares of | ||||
| beneficial interest (unlimited authorization) | 120,664 | |||
| Net Asset Value Per Share—ETF Shares | $92.82 | |||
• See Note A in Notes to Financial Statements.
* Non-income-producing security.
† Represents the aggregate value, by category, of securities that are not among the 50 largest holdings and, in total for any issuer, represent 1% or less of net assets.
1 The fund invests a portion of its cash reserves in equity markets through the use of index futures contracts. After giving effect to futures investments, the fund’s effective common stock and temporary cash investment positions represent 99.9% and -0.2%, respectively, of net assets.
2 Affiliated money market fund available only to Vanguard funds and certain trusts and accounts managed by Vanguard. Rate shown is the 7-day yield.
3 Includes $74,000 of collateral received for securities on loan.
4 Securities with a value of $300,000 have been segregated as initial margin for open futures contracts.
5 The total value of securities on loan is $66,000.
See accompanying Notes, which are an integral part of the Financial Statements.
13
Russell 3000 Index Fund
Statement of Operations
| Year Ended | |
| August 31, 2014 | |
| ($000) | |
| Investment Income | |
| Income | |
| Dividends | 11,732 |
| Interest1 | 3 |
| Securities Lending | 20 |
| Total Income | 11,755 |
| Expenses | |
| The Vanguard Group—Note B | |
| Investment Advisory Services | 78 |
| Management and Administrative—Institutional Shares | — |
| Management and Administrative—ETF Shares | 63 |
| Marketing and Distribution—Institutional Shares | 119 |
| Marketing and Distribution—ETF Shares | 22 |
| Custodian Fees | 241 |
| Auditing Fees | 29 |
| Shareholders’ Reports—Institutional Shares | — |
| Shareholders’ Reports—ETF Shares | 3 |
| Total Expenses | 555 |
| Net Investment Income | 11,200 |
| Realized Net Gain (Loss) | |
| Investment Securities Sold | 39,728 |
| Futures Contracts | 256 |
| Realized Net Gain (Loss) | 39,984 |
| Change in Unrealized Appreciation (Depreciation) | |
| Investment Securities | 80,954 |
| Futures Contracts | 103 |
| Change in Unrealized Appreciation (Depreciation) | 81,057 |
| Net Increase (Decrease) in Net Assets Resulting from Operations | 132,241 |
| 1 Interest income from an affiliated company of the fund was $3,000. | |
See accompanying Notes, which are an integral part of the Financial Statements.
14
Russell 3000 Index Fund
Statement of Changes in Net Assets
| Year Ended August 31, | ||
| 2014 | 2013 | |
| ($000) | ($000) | |
| Increase (Decrease) in Net Assets | ||
| Operations | ||
| Net Investment Income | 11,200 | 7,119 |
| Realized Net Gain (Loss) | 39,984 | 349 |
| Change in Unrealized Appreciation (Depreciation) | 81,057 | 54,814 |
| Net Increase (Decrease) in Net Assets Resulting from Operations | 132,241 | 62,282 |
| Distributions | ||
| Net Investment Income | ||
| Institutional Shares | (9,091) | (5,025) |
| ETF Shares | (1,568) | (898) |
| Realized Capital Gain | ||
| Institutional Shares | — | — |
| ETF Shares | — | — |
| Total Distributions | (10,659) | (5,923) |
| Capital Share Transactions | ||
| Institutional Shares | 71,356 | 250,923 |
| ETF Shares | 26,093 | 29,491 |
| Net Increase (Decrease) from Capital Share Transactions | 97,449 | 280,414 |
| Total Increase (Decrease) | 219,031 | 336,773 |
| Net Assets | ||
| Beginning of Period | 501,813 | 165,040 |
| End of Period1 | 720,844 | 501,813 |
| 1 Net Assets—End of Period includes undistributed (overdistributed) net investment income of $2,382,000 and $1,833,000. | ||
See accompanying Notes, which are an integral part of the Financial Statements.
15
Russell 3000 Index Fund
Financial Highlights
| Institutional Shares | ||||
| Nov. 1, | ||||
| 20101 to | ||||
| Year Ended August 31, | Aug. 31, | |||
| For a Share Outstanding Throughout Each Period | 2014 | 2013 | 2012 | 2011 |
| Net Asset Value, Beginning of Period | $146.68 | $124.40 | $108.32 | $104.44 |
| Investment Operations | ||||
| Net Investment Income | 2.986 | 2.630 | 2.087 | 1.494 |
| Net Realized and Unrealized Gain (Loss) on Investments | 32.903 | 22.226 | 15.972 | 3.650 |
| Total from Investment Operations | 35.889 | 24.856 | 18.059 | 5.144 |
| Distributions | ||||
| Dividends from Net Investment Income | (2.929) | (2.576) | (1.979) | (1.264) |
| Distributions from Realized Capital Gains | — | — | — | — |
| Total Distributions | (2.929) | (2.576) | (1.979) | (1.264) |
| Net Asset Value, End of Period | $179.64 | $146.68 | $124.40 | $108.32 |
| Total Return | 24.66% | 20.21% | 16.89% | 4.87% |
| Ratios/Supplemental Data | ||||
| Net Assets, End of Period (Millions) | $600 | $426 | $126 | $35 |
| Ratio of Total Expenses to Average Net Assets | 0.08% | 0.08% | 0.08% | 0.08%2 |
| Ratio of Net Investment Income to Average Net Assets | 1.84% | 2.10% | 2.06% | 1.78%2 |
| Portfolio Turnover Rate 3 | 8% | 16% | 20% | 32% |
| 1 Inception. 2 Annualized. 3 Excludes the value of portfolio securities received or delivered as a result of in-kind purchases or redemptions of the fund’s capital shares, including ETF Creation Units. | ||||
See accompanying Notes, which are an integral part of the Financial Statements.
16
Russell 3000 Index Fund
Financial Highlights
| ETF Shares | ||||
| Sept. 20, | ||||
| 20101 to | ||||
| Year Ended August 31, | Aug. 31, | |||
| For a Share Outstanding Throughout Each Period | 2014 | 2013 | 2012 | 2011 |
| Net Asset Value, Beginning of Period | $75.79 | $64.28 | $55.97 | $51.86 |
| Investment Operations | ||||
| Net Investment Income | 1.485 | 1.313 | 1.037 | .819 |
| Net Realized and Unrealized Gain (Loss) on Investments | 17.004 | 11.484 | 8.255 | 3.924 |
| Total from Investment Operations | 18.489 | 12.797 | 9.292 | 4.743 |
| Distributions | ||||
| Dividends from Net Investment Income | (1.459) | (1.287) | (. 982) | (. 633) |
| Distributions from Realized Capital Gains | — | — | — | — |
| Total Distributions | (1.459) | (1.287) | (. 982) | (. 633) |
| Net Asset Value, End of Period | $92.82 | $75.79 | $64.28 | $55.97 |
| Total Return | 24.58% | 20.14% | 16.80% | 9.09% |
| Ratios/Supplemental Data | ||||
| Net Assets, End of Period (Millions) | $121 | $76 | $39 | $22 |
| Ratio of Total Expenses to Average Net Assets | 0.15% | 0.15% | 0.15% | 0.15%2 |
| Ratio of Net Investment Income to Average Net Assets | 1.77% | 2.03% | 1.99% | 1.71%2 |
| Portfolio Turnover Rate 3 | 8% | 16% | 20% | 32% |
| 1 Inception. 2 Annualized. 3 Excludes the value of portfolio securities received or delivered as a result of in-kind purchases or redemptions of the fund’s capital shares, including ETF Creation Units. | ||||
See accompanying Notes, which are an integral part of the Financial Statements.
17
Russell 3000 Index Fund
Notes to Financial Statements
Vanguard Russell 3000 Index Fund is registered under the Investment Company Act of 1940 as an open-end investment company, or mutual fund. The fund offers two classes of shares: Institutional Shares and ETF Shares. Institutional Shares are designed for investors who meet certain administrative, service, and account-size criteria. ETF Shares are listed for trading on Nasdaq; they can be purchased and sold through a broker.
A. The following significant accounting policies conform to generally accepted accounting principles for U.S. investment companies. The fund consistently follows such policies in preparing its financial statements.
1. Security Valuation: Securities are valued as of the close of trading on the New York Stock Exchange (generally 4 p.m., Eastern time) on the valuation date. Equity securities are valued at the latest quoted sales prices or official closing prices taken from the primary market in which each security trades; such securities not traded on the valuation date are valued at the mean of the latest quoted bid and asked prices. Securities for which market quotations are not readily available, or whose values have been materially affected by events occurring before the fund’s pricing time but after the close of the securities’ primary markets, are valued by methods deemed by the board of trustees to represent fair value. Investments in Vanguard Market Liquidity Fund are valued at that fund’s net asset value. Temporary cash investments acquired over 60 days to maturity are valued using the latest bid prices or using valuations based on a matrix system (which considers such factors as security prices, yields, maturities, and ratings), both as furnished by independent pricing services. Other temporary cash investments are valued at amortized cost, which approximates market value.
2. Futures Contracts: The fund uses index futures contracts to a limited extent, with the objectives of maintaining full exposure to the stock market, enhancing returns, maintaining liquidity, and minimizing transaction costs. The fund may purchase futures contracts to immediately invest incoming cash in the market, or sell futures in response to cash outflows, thereby simulating a fully invested position in the underlying index while maintaining a cash balance for liquidity. The fund may seek to enhance returns by using futures contracts instead of the underlying securities when futures are believed to be priced more attractively than the underlying securities. The primary risks associated with the use of futures contracts are imperfect correlation between changes in market values of stocks held by the fund and the prices of futures contracts, and the possibility of an illiquid market. Counterparty risk involving futures is mitigated because a regulated clearinghouse is the counterparty instead of the clearing broker. To further mitigate counterparty risk, the fund trades futures contracts on an exchange, monitors the financial strength of its clearing brokers and clearinghouse, and has entered into clearing agreements with its clearing brokers. The clearinghouse imposes initial margin requirements to secure the fund’s performance and requires daily settlement of variation margin representing changes in the market value of each contract.
Futures contracts are valued at their quoted daily settlement prices. The aggregate settlement values of the contracts are not recorded in the Statement of Net Assets. Fluctuations in the value of the contracts are recorded in the Statement of Net Assets as an asset (liability) and in the Statement of Operations as unrealized appreciation (depreciation) until the contracts are closed, when they are recorded as realized futures gains (losses).
During the year ended August 31, 2014, the fund’s average investments in long and short futures contracts represented less than 1% and 0% of net assets, respectively, based on the average of aggregate settlement values at each quarter-end during the period.
18
Russell 3000 Index Fund
3. Federal Income Taxes: The fund intends to continue to qualify as a regulated investment company and distribute all of its taxable income. Management has analyzed the fund’s tax positions taken for all open federal income tax years (August 31, 2011–2014), and has concluded that no provision for federal income tax is required in the fund’s financial statements.
4. Distributions: Distributions to shareholders are recorded on the ex-dividend date.
5. Securities Lending: To earn additional income, the fund lends its securities to qualified institutional borrowers. Security loans are required to be secured at all times by collateral in an amount at least equal to the market value of securities loaned. Daily market fluctuations could cause the value of loaned securities to be more or less than the value of the collateral received. When this occurs, the collateral is adjusted and settled on the next business day. The fund further mitigates its counterparty risk by entering into securities lending transactions only with a diverse group of prequalified counter-parties, monitoring their financial strength, and entering into master securities lending agreements with its counterparties. The master securities lending agreements provide that, in the event of a counterparty’s default (including bankruptcy), the fund may terminate any loans with that borrower, determine the net amount owed, and sell or retain the collateral up to the net amount owed to the fund; however, such actions may be subject to legal proceedings. While collateral mitigates counter-party risk, in the absence of a default the fund may experience delays and costs in recovering the securities loaned. The fund invests cash collateral received in Vanguard Market Liquidity Fund, and records a liability in the Statement of Net Assets for the return of the collateral, during the period the securities are on loan. Securities lending income represents fees charged to borrowers plus income earned on invested cash collateral, less expenses associated with the loan.
6. Credit Facility: The fund and certain other funds managed by The Vanguard Group participate in a $2.89 billion committed credit facility provided by a syndicate of lenders pursuant to a credit agreement that may be renewed annually; each fund is individually liable for its borrowings, if any, under the credit facility. Borrowings may be utilized for temporary and emergency purposes, and are subject to the fund’s regulatory and contractual borrowing restrictions. The participating funds are charged administrative fees and an annual commitment fee of 0.06% of the undrawn amount of the facility; these fees are allocated to the funds based on a method approved by the fund’s board of trustees and included in Management and Administrative expenses on the fund’s Statement of Operations. Any borrowings under this facility bear interest at a rate equal to the higher of the federal funds rate or LIBOR reference rate plus an agreed-upon spread.
The fund had no borrowings outstanding at August 31, 2014, or at any time during the period then ended.
7. Other: Dividend income is recorded on the ex-dividend date. Interest income includes income distributions received from Vanguard Market Liquidity Fund and is accrued daily. Premiums and discounts on debt securities purchased are amortized and accreted, respectively, to interest income over the lives of the respective securities. Security transactions are accounted for on the date securities are bought or sold. Costs used to determine realized gains (losses) on the sale of investment securities are those of the specific securities sold.
Each class of shares has equal rights as to assets and earnings, except that each class separately bears certain class-specific expenses related to maintenance of shareholder accounts (included in Management and Administrative expenses) and shareholder reporting. Marketing and distribution expenses are allocated to each class of shares based on a method approved by the board of trustees. Income, other non-class-specific expenses, and gains and losses on investments are allocated to each class of shares based on its relative net assets.
19
Russell 3000 Index Fund
B. The Vanguard Group furnishes at cost investment advisory, corporate management, administrative, marketing, and distribution services. The costs of such services are allocated to the fund based on methods approved by the board of trustees. The fund has committed to provide up to 0.40% of its net assets in capital contributions to Vanguard. At August 31, 2014, the fund had contributed capital of $68,000 to Vanguard (included in Other Assets), representing 0.01% of the fund’s net assets and 0.03% of Vanguard’s capitalization. The fund’s trustees and officers are also directors and officers of Vanguard.
C. Various inputs may be used to determine the value of the fund’s investments. These inputs are summarized in three broad levels for financial statement purposes. The inputs or methodologies used to value securities are not necessarily an indication of the risk associated with investing in those securities.
Level 1—Quoted prices in active markets for identical securities.
Level 2—Other significant observable inputs (including quoted prices for similar securities, interest rates, prepayment speeds, credit risk, etc.).
Level 3—Significant unobservable inputs (including the fund’s own assumptions used to determine the fair value of investments).
| The following table summarizes the market value of the fund’s investments as of August 31, 2014, | |||
| based on the inputs used to value them: | |||
| Level 1 | Level 2 | Level 3 | |
| Investments | ($000) | ($000) | ($000) |
| Common Stocks | 713,879 | — | 7 |
| Temporary Cash Investments | 4,419 | 300 | — |
| Futures Contracts—Assets1 | 20 | — | — |
| Total | 718,318 | 300 | 7 |
| 1 Represents variation margin on the last day of the reporting period. | |||
| D. At August 31, 2014, the aggregate settlement value of open futures contracts and the related | ||||
| unrealized appreciation (depreciation) were: | ||||
| ($000) | ||||
| Aggregate | ||||
| Number of | Settlement | Unrealized | ||
| Long (Short) | Value | Appreciation | ||
| Futures Contracts | Expiration | Contracts | Long (Short) | (Depreciation) |
| E-mini S&P 500 Index | September 2014 | 49 | 4,904 | 94 |
| E-mini S&P MidCap 400 Index | September 2014 | 6 | 862 | 8 |
| E-mini Russell 2000 Index | September 2014 | 7 | 821 | (4) |
| 98 | ||||
Unrealized appreciation (depreciation) on open futures contracts is required to be treated as realized gain (loss) for tax purposes.
20
Russell 3000 Index Fund
E. Distributions are determined on a tax basis and may differ from net investment income and realized capital gains for financial reporting purposes. Differences may be permanent or temporary. Permanent differences are reclassified among capital accounts in the financial statements to reflect their tax character. Temporary differences arise when certain items of income, expense, gain, or loss are recognized in different periods for financial statement and tax purposes. These differences will reverse at some time in the future. Differences in classification may also result from the treatment of short-term gains as ordinary income for tax purposes.
During the year ended August 31, 2014, the fund realized $39,579,000 of net capital gains resulting from in-kind redemptions—in which shareholders exchanged fund shares for securities held by the fund rather than for cash. Because such gains are not taxable to the fund, and are not distributed to shareholders, they have been reclassified from accumulated net realized losses to paid-in capital.
For tax purposes, at August 31, 2014, the fund had $2,498,000 of ordinary income available for distribution. The fund had available capital losses totaling $1,359,000 that may be carried forward indefinitely to offset future net capital gains.
At August 31, 2014, the cost of investment securities for tax purposes was $575,128,000. Net unrealized appreciation of investment securities for tax purposes was $143,477,000, consisting of unrealized gains of $147,153,000 on securities that had risen in value since their purchase and $3,676,000 in unrealized losses on securities that had fallen in value since their purchase.
F. During the year ended August 31, 2014, the fund purchased $307,926,000 of investment securities and sold $215,766,000 of investment securities, other than temporary cash investments. Purchases and sales include $122,698,000 and $169,001,000, respectively, in connection with in-kind purchases and redemptions of the fund’s capital shares.
G. Capital share transactions for each class of shares were:
| Year Ended August 31, | ||||
| 2014 | 2013 | |||
| Amount | Shares | Amount | Shares | |
| ($000) | (000) | ($000) | (000) | |
| Institutional Shares | ||||
| Issued | 174,126 | 1,056 | 298,341 | 2,238 |
| Issued in Lieu of Cash Distributions | 8,632 | 52 | 5,025 | 37 |
| Redeemed | (111,402) | (671) | (52,443) | (387) |
| Net Increase (Decrease) —Institutional Shares | 71,356 | 437 | 250,923 | 1,888 |
| ETF Shares | ||||
| Issued | 201,240 | 2,300 | 29,491 | 400 |
| Issued in Lieu of Cash Distributions | — | — | — | — |
| Redeemed | (175,147) | (2,000) | — | — |
| Net Increase (Decrease)—ETF Shares | 26,093 | 300 | 29,491 | 400 |
H. Management has determined that no material events or transactions occurred subsequent to August 31, 2014, that would require recognition or disclosure in these financial statements.
21
Report of Independent Registered
Public Accounting Firm
To the Board of Trustees of Vanguard Scottsdale Funds and the Shareholders of Vanguard Russell 3000 Index Fund:
In our opinion, the accompanying statement of net assets—investments summary and the related statements of operations and of changes in net assets and the financial highlights present fairly, in all material respects, the financial position of Vanguard Russell 3000 Index Fund (constituting a separate portfolio of Vanguard Scottsdale Funds, hereafter referred to as the “Fund”) at August 31, 2014, the results of its operations for the year then ended, the changes in its net assets for each of the two years in the period then ended, and the financial highlights for each of the periods indicated, in conformity with accounting principles generally accepted in the United States of America. These financial statements and financial highlights (hereafter referred to as “financial statements”) are the responsibility of the Fund’s management. Our responsibility is to express an opinion on these financial statements based on our audits. We conducted our audits of these financial statements in accordance with the standards of the Public Company Accounting Oversight Board (United States). Those standards require that we plan and perform the audit to obtain reasonable assurance about whether the financial statements are free of material misstatement. An audit includes examining, on a test basis, evidence supporting the amounts and disclosures in the financial statements, assessing the accounting principles used and significant estimates made by management, and evaluating the overall financial statement presentation. We believe that our audits, which included confirmation of securities at August 31, 2014 by correspondence with the custodian and broker and by agreement to the underlying ownership records of the transfer agent, provide a reasonable basis for our opinion.
/s/PricewaterhouseCoopers LLP
Philadelphia, Pennsylvania
October 15, 2014
| Special 2014 tax information (unaudited) for Vanguard Russell 3000 Index Fund |
This information for the fiscal year ended August 31, 2014, is included pursuant to provisions of the Internal Revenue Code.
The fund distributed $10,659,000 of qualified dividend income to shareholders during the fiscal year.
For corporate shareholders, 93.1% of investment income (dividend income plus short-term gains, if any) qualifies for the dividends-received deduction.
22
Your Fund’s After-Tax Returns
This table presents returns for your fund both before and after taxes. The after-tax returns are shown in two ways: (1) assuming that an investor owned the fund during the entire period and paid taxes on the fund’s distributions, and (2) assuming that an investor paid taxes on the fund’s distributions and sold all shares at the end of each period.
Calculations are based on the highest individual federal income tax and capital gains tax rates in effect at the times of the distributions and the hypothetical sales. State and local taxes were not considered. After-tax returns reflect any qualified dividend income, using actual prior-year figures and estimates for 2014. (In the example, returns after the sale of fund shares may be higher than those assuming no sale. This occurs when the sale would have produced a capital loss. The calculation assumes that the investor received a tax deduction for the loss.)
The table shows returns for ETF Shares only; returns for other share classes will differ. Please note that your actual after-tax returns will depend on your tax situation and may differ from those shown. Also note that if you own the fund in a tax-deferred account, such as an individual retirement account or a 401(k) plan, this information does not apply to you. Such accounts are not subject to current taxes.
Finally, keep in mind that a fund’s performance—whether before or after taxes—does not guarantee future results.
| Average Annual Total Returns: Russell 3000 Index Funds ETF Shares | ||
| Periods Ended August 31, 2014 | ||
| Since | ||
| One | Inception | |
| Year | (9/20/2010) | |
| Returns Before Taxes | 24.58% | 17.78% |
| Returns After Taxes on Distributions | 24.08 | 17.43 |
| Returns After Taxes on Distributions and Sale of Fund Shares | 14.27 | 14.23 |
23
About Your Fund’s Expenses
As a shareholder of the fund, you incur ongoing costs, which include costs for portfolio management, administrative services, and shareholder reports (like this one), among others. Operating expenses, which are deducted from a fund’s gross income, directly reduce the investment return of the fund.
A fund’s expenses are expressed as a percentage of its average net assets. This figure is known as the expense ratio. The following examples are intended to help you understand the ongoing costs (in dollars) of investing in your fund and to compare these costs with those of other mutual funds. The examples are based on an investment of $1,000 made at the beginning of the period shown and held for the entire period.
The accompanying table illustrates your fund’s costs in two ways:
• Based on actual fund return. This section helps you to estimate the actual expenses that you paid over the period. The ”Ending Account Value“ shown is derived from the fund‘s actual return, and the third column shows the dollar amount that would have been paid by an investor who started with $1,000 in the fund. You may use the information here, together with the amount you invested, to estimate the expenses that you paid over the period.
To do so, simply divide your account value by $1,000 (for example, an $8,600 account value divided by $1,000 = 8.6), then multiply the result by the number given for your fund under the heading ”Expenses Paid During Period.“
• Based on hypothetical 5% yearly return. This section is intended to help you compare your fund‘s costs with those of other mutual funds. It assumes that the fund had a yearly return of 5% before expenses, but that the expense ratio is unchanged. In this case—because the return used is not the fund’s actual return—the results do not apply to your investment. The example is useful in making comparisons because the Securities and Exchange Commission requires all mutual funds to calculate expenses based on a 5% return. You can assess your fund’s costs by comparing this hypothetical example with the hypothetical examples that appear in shareholder reports of other funds.
Note that the expenses shown in the table are meant to highlight and help you compare ongoing costs only and do not reflect transaction costs incurred by the fund for buying and selling securities. Further, the expenses do not include any purchase, redemption, or account service fees described in the fund prospectus. If such fees were applied to your account, your costs would be higher. Your fund does not carry a “sales load.”
The calculations assume no shares were bought or sold during the period. Your actual costs may have been higher or lower, depending on the amount of your investment and the timing of any purchases or redemptions.
You can find more information about the fund’s expenses, including annual expense ratios, in the Financial Statements section of this report. For additional information on operating expenses and other shareholder costs, please refer to your fund’s current prospectus.
24
| Six Months Ended August 31, 2014 | |||
| Beginning | Ending | Expenses | |
| Account Value | Account Value | Paid During | |
| Russell 3000 Index Fund | 2/28/2014 | 8/31/2014 | Period |
| Based on Actual Fund Return | |||
| Institutional Shares | $1,000.00 | $1,076.62 | $0.42 |
| ETF Shares | 1,000.00 | 1,076.25 | 0.78 |
| Based on Hypothetical 5% Yearly Return | |||
| Institutional Shares | $1,000.00 | $1,024.80 | $0.41 |
| ETF Shares | 1,000.00 | 1,024.45 | 0.77 |
| The calculations are based on expenses incurred in the most recent six-month period. The fund’s annualized six-month expense ratios for that period are 0.08% for Institutional Shares and 0.15% for ETF Shares. The dollar amounts shown as ”Expenses Paid” are equal to the annualized expense ratio multiplied by the average account value over the period, multiplied by the number of days in the most recent six-month period, then divided by the number of days in the most recent 12-month period. | |||
25
Trustees Approve Advisory Arrangement
The board of trustees of Vanguard Russell 3000 Index Fund has renewed the fund’s investment advisory arrangement with The Vanguard Group, Inc. (Vanguard). Vanguard’s Equity Investment Group—through its Equity Index Group—serves as investment advisor to the fund. The board determined that continuing the fund’s internalized management structure was in the best interests of the fund and its shareholders.
The board based its decision upon an evaluation of the advisor’s investment staff, portfolio management process, and performance. The trustees considered the factors discussed below, among others. However, no single factor determined whether the board approved the arrangement. Rather, it was the totality of the circumstances that drove the board’s decision.
Nature, extent, and quality of services
The board considered the quality of the investment management services provided to the fund since its inception in 2010, and took into account the organizational depth and stability of the advisor. The board noted that Vanguard has been managing investments for more than three decades. The Equity Index Group adheres to a sound, disciplined investment management process; the team has considerable experience, stability, and depth.
The board concluded that Vanguard’s experience, stability, depth, and performance, among other factors, warranted continuation of the advisory arrangement.
Investment performance
The board considered the fund’s performance since its inception, including any periods of outperformance or underperformance relative to a target index and peer group. The board concluded that the performance was such that the advisory arrangement should continue. Information about the fund’s most recent performance can be found in the Performance Summary section of this report.
Cost
The board concluded that the fund’s expense ratio was well below the average expense ratio charged by funds in its peer group and that the fund’s advisory fee rate was also well below its peer-group average. Information about the fund’s expenses appears in the About Your Fund’s Expenses section of the report as well as in the Financial Statements section.
The board does not conduct a profitability analysis of Vanguard, because of Vanguard’s unique “at-cost” structure. Unlike most other mutual fund management companies, Vanguard is owned by the funds it oversees, and produces “profits” only in the form of reduced expenses for fund shareholders.
The benefit of economies of scale
The board concluded that the fund’s at-cost arrangement with Vanguard ensures that the fund will realize economies of scale as it grows, with the cost to shareholders declining as fund assets increase.
The board will consider whether to renew the advisory arrangement again after a one-year period.
26
Glossary
30-Day SEC Yield. A fund’s 30-day SEC yield is derived using a formula specified by the U.S. Securities and Exchange Commission. Under the formula, data related to the fund’s security holdings in the previous 30 days are used to calculate the fund’s hypothetical net income for that period, which is then annualized and divided by the fund’s estimated average net assets over the calculation period. For the purposes of this calculation, a security’s income is based on its current market yield to maturity (for bonds), its actual income (for asset-backed securities), or its projected dividend yield (for stocks). Because the SEC yield represents hypothetical annualized income, it will differ—at times significantly—from the fund’s actual experience. As a result, the fund’s income distributions may be higher or lower than implied by the SEC yield.
Beta. A measure of the magnitude of a fund’s past share-price fluctuations in relation to the ups and downs of a given market index. The index is assigned a beta of 1.00. Compared with a given index, a fund with a beta of 1.20 typically would have seen its share price rise or fall by 12% when the index rose or fell by 10%. For this report, beta is based on returns over the past 36 months for both the fund and the index. Note that a fund’s beta should be reviewed in conjunction with its R-squared (see definition). The lower the R-squared, the less correlation there is between the fund and the index, and the less reliable beta is as an indicator of volatility.
Dividend Yield. Dividend income earned by stocks, expressed as a percentage of the aggregate market value (or of net asset value, for a fund). The yield is determined by dividing the amount of the annual dividends by the aggregate value (or net asset value) at the end of the period. For a fund, the dividend yield is based solely on stock holdings and does not include any income produced by other investments.
Earnings Growth Rate. The average annual rate of growth in earnings over the past five years for the stocks now in a fund.
Equity Exposure. A measure that reflects a fund’s investments in stocks and stock futures. Any holdings in short-term reserves are excluded.
Expense Ratio. A fund’s total annual operating expenses expressed as a percentage of the fund’s average net assets. The expense ratio includes management and administrative expenses, but does not include the transaction costs of buying and selling portfolio securities.
Foreign Holdings. The percentage of a fund represented by securities or depositary receipts of companies based outside the United States.
Inception Date. The date on which the assets of a fund (or one of its share classes) are first invested in accordance with the fund’s investment objective. For funds with a subscription period, the inception date is the day after that period ends. Investment performance is measured from the inception date.
Median Market Cap. An indicator of the size of companies in which a fund invests; the midpoint of market capitalization (market price x shares outstanding) of a fund’s stocks, weighted by the proportion of the fund’s assets invested in each stock. Stocks representing half of the fund’s assets have market capitalizations above the median, and the rest are below it.
Price/Book Ratio. The share price of a stock divided by its net worth, or book value, per share. For a fund, the weighted average price/book ratio of the stocks it holds.
27
Price/Earnings Ratio. The ratio of a stock’s current price to its per-share earnings over the past year. For a fund, the weighted average P/E of the stocks it holds. P/E is an indicator of market expectations about corporate prospects; the higher the P/E, the greater the expectations for a company’s future growth.
R-Squared. A measure of how much of a fund’s past returns can be explained by the returns from the market in general, as measured by a given index. If a fund’s total returns were precisely synchronized with an index’s returns, its R-squared would be 1.00. If the fund’s returns bore no relationship to the index’s returns, its R-squared would be 0. For this report, R-squared is based on returns over the past 36 months for both the fund and the index.
Return on Equity. The annual average rate of return generated by a company during the past five years for each dollar of shareholder’s equity (net income divided by shareholder’s equity). For a fund, the weighted average return on equity for the companies whose stocks it holds.
Short-Term Reserves. The percentage of a fund invested in highly liquid, short-term securities that can be readily converted to cash.
Turnover Rate. An indication of the fund’s trading activity. Funds with high turnover rates incur higher transaction costs and may be more likely to distribute capital gains (which may be taxable to investors). The turnover rate excludes in-kind transactions, which have minimal impact on costs.
28
This page intentionally left blank.
This page intentionally left blank.
This page intentionally left blank.
The People Who Govern Your Fund
The trustees of your mutual fund are there to see that the fund is operated and managed in your best interests since, as a shareholder, you are a part owner of the fund. Your fund’s trustees also serve on the board of directors of The Vanguard Group, Inc., which is owned by the Vanguard funds and provides services to them on an at-cost basis.
A majority of Vanguard’s board members are independent, meaning that they have no affiliation with Vanguard or the funds they oversee, apart from the sizable personal investments they have made as private individuals. The independent board members have distinguished backgrounds in business, academia, and public service. Each of the trustees and executive officers oversees 177 Vanguard funds.
The following table provides information for each trustee and executive officer of the fund. More information about the trustees is in the Statement of Additional Information, which can be obtained, without charge, by contacting Vanguard at 800-662-7447, or online at vanguard.com.
| InterestedTrustee1 | and Delphi Automotive LLP (automotive components); |
| Senior Advisor at New Mountain Capital. | |
| F. William McNabb III | |
| Born 1957. Trustee Since July 2009. Chairman of the | Amy Gutmann |
| Board. Principal Occupation(s) During the Past Five | Born 1949. Trustee Since June 2006. Principal |
| Years: Chairman of the Board of The Vanguard Group, | Occupation(s) During the Past Five Years: President of |
| Inc., and of each of the investment companies served | the University of Pennsylvania; Christopher H. Browne |
| by The Vanguard Group, since January 2010; Director | Distinguished Professor of Political Science, School of |
| of The Vanguard Group since 2008; Chief Executive | Arts and Sciences, and Professor of Communication, |
| Officer and President of The Vanguard Group, and of | Annenberg School for Communication, with secondary |
| each of the investment companies served by The | faculty appointments in the Department of Philosophy, |
| Vanguard Group, since 2008; Director of Vanguard | School of Arts and Sciences, and at the Graduate |
| Marketing Corporation; Managing Director of The | School of Education, University of Pennsylvania; |
| Vanguard Group (1995–2008). | Trustee of the National Constitution Center; Chair |
| Bioethical Issues. | |
| IndependentTrustees | |
| JoAnn Heffernan Heisen | |
| Emerson U. Fullwood | Born 1950. Trustee Since July 1998. Principal |
| Born 1948. Trustee Since January 2008. Principal | Occupation(s) During the Past Five Years: Corporate |
| Occupation(s) During the Past Five Years: Executive | Vice President and Chief Global Diversity Officer |
| Chief Staff and Marketing Officer for North America | (retired 2008) and Member of the Executive |
| and Corporate Vice President (retired 2008) of Xerox | Committee (1997–2008) of Johnson & Johnson |
| Corporation (document management products and | (pharmaceuticals/medical devices/consumer |
| services); Executive in Residence and 2009–2010 | products); Director of Skytop Lodge Corporation |
| Distinguished Minett Professor at the Rochester | (hotels), the University Medical Center at Princeton, |
| Institute of Technology; Director of SPX Corporation | the Robert Wood Johnson Foundation, and the Center |
| (multi-industry manufacturing), the United Way of | for Talent Innovation; Member of the Advisory Board |
| Rochester, Amerigroup Corporation (managed health | of the Maxwell School of Citizenship and Public Affairs |
| care), the University of Rochester Medical Center, | at Syracuse University. |
| Monroe Community College Foundation, and North | |
| Carolina A&T University. | |
| F. Joseph Loughrey | |
| Rajiv L. Gupta | Born 1949. Trustee Since October 2009. Principal |
| Born 1945. Trustee Since December 2001.2 | Occupation(s) During the Past Five Years: President |
| Principal Occupation(s) During the Past Five Years: | and Chief Operating Officer (retired 2009) of Cummins |
| Chairman and Chief Executive Officer (retired 2009) | Inc. (industrial machinery); Chairman of the Board |
| and President (2006–2008) of Rohm and Haas Co. | of Hillenbrand, Inc. (specialized consumer services), |
| (chemicals); Director of Tyco International, Ltd. | and of Oxfam America; Director of SKF AB (industrial |
| (diversified manufacturing and services), Hewlett- | machinery), Hyster-Yale Materials Handling, Inc. |
| Packard Co. (electronic computer manufacturing), | (forklift trucks), the Lumina Foundation for Education, |
| and the V Foundation for Cancer Research; Member | Executive Officers | |
| of the Advisory Council for the College of Arts and | ||
| Letters and of the Advisory Board to the Kellogg | Glenn Booraem | |
| Institute for International Studies, both at the | Born 1967. Controller Since July 2010. Principal | |
| University of Notre Dame. | Occupation(s) During the Past Five Years: Principal | |
| of The Vanguard Group, Inc.; Controller of each of | ||
| Mark Loughridge | the investment companies served by The Vanguard | |
| Born 1953. Trustee Since March 2012. Principal | Group; Assistant Controller of each of the investment | |
| Occupation(s) During the Past Five Years: Senior Vice | companies served by The Vanguard Group (2001–2010). | |
| President and Chief Financial Officer (retired 2013) | ||
| at IBM (information technology services); Fiduciary | Thomas J. Higgins | |
| Member of IBM’s Retirement Plan Committee (2004– | Born 1957. Chief Financial Officer Since September | |
| 2013); Member of the Council on Chicago Booth. | 2008. Principal Occupation(s) During the Past Five | |
| Years: Principal of The Vanguard Group, Inc.; Chief | ||
| Scott C. Malpass | Financial Officer of each of the investment companies | |
| Born 1962. Trustee Since March 2012. Principal | served by The Vanguard Group; Treasurer of each of | |
| Occupation(s) During the Past Five Years: Chief | the investment companies served by The Vanguard | |
| Investment Officer and Vice President at the University | Group (1998–2008). | |
| of Notre Dame; Assistant Professor of Finance at the | ||
| Mendoza College of Business at Notre Dame; Member | Kathryn J. Hyatt | |
| of the Notre Dame 403(b) Investment Committee; | Born 1955. Treasurer Since November 2008. Principal | |
| Board Member of TIFF Advisory Services, Inc. | Occupation(s) During the Past Five Years: Principal of | |
| (investment advisor); Member of the Investment | The Vanguard Group, Inc.; Treasurer of each of the | |
| Advisory Committees of the Financial Industry | investment companies served by The Vanguard | |
| Regulatory Authority (FINRA) and of Major League | Group; Assistant Treasurer of each of the investment | |
| Baseball. | companies served by The Vanguard Group (1988–2008). | |
| André F. Perold | Heidi Stam | |
| Born 1952. Trustee Since December 2004. Principal | Born 1956. Secretary Since July 2005. Principal | |
| Occupation(s) During the Past Five Years: George | Occupation(s) During the Past Five Years: Managing | |
| Gund Professor of Finance and Banking, Emeritus | Director of The Vanguard Group, Inc.; General Counsel | |
| at the Harvard Business School (retired 2011); | of The Vanguard Group; Secretary of The Vanguard | |
| Chief Investment Officer and Managing Partner of | Group and of each of the investment companies | |
| HighVista Strategies LLC (private investment firm); | served by The Vanguard Group; Director and Senior | |
| Director of Rand Merchant Bank; Overseer of the | Vice President of Vanguard Marketing Corporation. | |
| Museum of Fine Arts Boston. | ||
| Vanguard Senior ManagementTeam | ||
| Alfred M. Rankin, Jr. | ||
| Born 1941. Trustee Since January 1993. Principal | Mortimer J. Buckley | Chris D. McIsaac |
| Occupation(s) During the Past Five Years: Chairman, | Kathleen C. Gubanich | Michael S. Miller |
| President, and Chief Executive Officer of NACCO | Paul A. Heller | James M. Norris |
| Industries, Inc. (housewares/lignite), and of Hyster- | Martha G. King | Glenn W. Reed |
| Yale Materials Handling, Inc. (forklift trucks); Chairman | John T. Marcante | |
| of the Board of University Hospitals of Cleveland. | ||
| Chairman Emeritus and Senior Advisor | ||
| Peter F. Volanakis | ||
| Born 1955. Trustee Since July 2009. Principal | John J. Brennan | |
| Occupation(s) During the Past Five Years: President | Chairman, 1996–2009 | |
| and Chief Operating Officer (retired 2010) of Corning | Chief Executive Officer and President, 1996–2008 | |
| Incorporated (communications equipment); Trustee of | ||
| Colby-Sawyer College; Member of the Advisory Board | Founder | |
| of the Norris Cotton Cancer Center and of the Advisory | ||
| Board of the Parthenon Group (strategy consulting). | John C. Bogle | |
| Chairman and Chief Executive Officer, 1974–1996 | ||
1 Mr. McNabb is considered an “interested person,” as defined in the Investment Company Act of 1940, because he is an officer of the Vanguard funds.
2 December 2002 for Vanguard Equity Income Fund, the Vanguard Municipal Bond Funds, and the Vanguard State Tax-Exempt Funds.
 | |
| P.O. Box 2600 | |
| Valley Forge, PA 19482-2600 | |
| Connect with Vanguard® > vanguard.com | |
| Fund Information > 800-662-7447 | The Russell Indexes and Russell® are registered |
| Direct Investor Account Services > 800-662-2739 | trademarks of Russell Investments and have been |
| Institutional Investor Services > 800-523-1036 | licensed for use by The Vanguard Group, Inc. The |
| Text Telephone for People | products are not sponsored, endorsed, sold, or |
| With Hearing Impairment > 800-749-7273 | promoted by Russell Investments and Russell |
| Investments makes no representation regarding the | |
| advisability of investing in the products. | |
| This material may be used in conjunction | |
| with the offering of shares of any Vanguard | |
| fund only if preceded or accompanied by | |
| the fund’s current prospectus. | |
| All comparative mutual fund data are from Lipper, a | |
| Thomson Reuters Company, or Morningstar, Inc., unless | |
| otherwise noted. | |
| You can obtain a free copy of Vanguard’s proxy voting | |
| guidelines by visiting vanguard.com/proxyreporting or by | |
| calling Vanguard at 800-662-2739. The guidelines are | |
| also available from the SEC’s website, sec.gov. In | |
| addition, you may obtain a free report on how your fund | |
| voted the proxies for securities it owned during the 12 | |
| months ended June 30. To get the report, visit either | |
| vanguard.com/proxyreporting or sec.gov. | |
| You can review and copy information about your fund at | |
| the SEC’s Public Reference Room in Washington, D.C. To | |
| find out more about this public service, call the SEC at | |
| 202-551-8090. Information about your fund is also | |
| available on the SEC’s website, and you can receive | |
| copies of this information, for a fee, by sending a | |
| request in either of two ways: via e-mail addressed to | |
| publicinfo@sec.gov or via regular mail addressed to the | |
| Public Reference Section, Securities and Exchange | |
| Commission, Washington, DC 20549-1520. | |
| © 2014 The Vanguard Group, Inc. | |
| All rights reserved. | |
| Vanguard Marketing Corporation, Distributor. | |
| Q18540 102014 | |
Annual Report | August 31, 2014
Vanguard Sector Bond Index Funds
Vanguard Short-Term Government Bond Index Fund
Vanguard Intermediate-Term Government Bond Index Fund
Vanguard Long-Term Government Bond Index Fund
Vanguard Short-Term Corporate Bond Index Fund
Vanguard Intermediate-Term Corporate Bond Index Fund
Vanguard Long-Term Corporate Bond Index Fund
Vanguard Mortgage-Backed Securities Index Fund
The mission continues
On May 1, 1975, Vanguard began operations, a fledgling company based on the simple but revolutionary idea that a mutual fund company should be managed solely in the interest of its investors.
Four decades later, that revolutionary spirit continues to animate the enterprise. Vanguard remains on a mission to give investors the best chance of investment success.
As we mark our 40th anniversary, we thank you for entrusting your assets to Vanguard and giving us the opportunity to help you reach your financial goals in the decades to come.
| Contents | |
| Your Fund’s Total Returns. | 1 |
| Chairman’s Letter. | 4 |
| Short-Term Government Bond Index Fund. | 11 |
| Intermediate-Term Government Bond Index Fund. | 27 |
| Long-Term Government Bond Index Fund. | 44 |
| Short-Term Corporate Bond Index Fund. | 59 |
| Intermediate-Term Corporate Bond Index Fund. | 108 |
| Long-Term Corporate Bond Index Fund. | 151 |
| Mortgage-Backed Securities Index Fund. | 191 |
| About Your Fund’s Expenses. | 212 |
| Trustees Approve Advisory Arrangements. | 215 |
| Glossary. | 216 |
Please note: The opinions expressed in this report are just that—informed opinions. They should not be considered promises or advice. Also, please keep in mind that the information and opinions cover the period through the date on the front of this report. Of course, the risks of investing in your fund are spelled out in the prospectus.
See the Glossary for definitions of investment terms used in this report.
About the cover: Since our founding, Vanguard has drawn inspiration from the enterprise and valor demonstrated by British naval hero Horatio Nelson and his command at the Battle of the Nile in 1798. The photograph displays a replica of a merchant ship from the same era as Nelson’s flagship, the HMS Vanguard.
Your Fund’s Total Returns
| Fiscal Year Ended August 31, 2014 | ||||
| 30-Day SEC | Income | Capital | Total | |
| Yield | Returns | Returns | Returns | |
| Vanguard Short-Term Government Bond Index Fund | ||||
| Admiral™ Shares | 0.37% | 0.32% | 0.38% | 0.70% |
| Institutional Shares | 0.40 | 0.37 | 0.35 | 0.72 |
| ETF Shares | 0.37 | |||
| Market Price | 0.70 | |||
| Net Asset Value | 0.70 | |||
| Barclays U.S. 1–3 Year Government Float | ||||
| Adjusted Index | 0.80 | |||
| Short U.S. Government Funds Average | 0.90 | |||
| Short U.S. Government Funds Average: Derived from data provided by Lipper, a Thomson Reuters Company. | ||||
| Vanguard Intermediate-Term Government Bond Index Fund | ||||
| Admiral Shares | 1.59% | 1.50% | 2.05% | 3.55% |
| Institutional Shares | 1.62 | 1.53 | 2.05 | 3.58 |
| ETF Shares | 1.59 | |||
| Market Price | 3.57 | |||
| Net Asset Value | 3.54 | |||
| Barclays U.S. 3–10 Year Government Float | ||||
| Adjusted Index | 3.54 | |||
| Intermediate U.S. Government Funds Average | 3.30 | |||
| Intermediate U.S. Government Funds Average: Derived from data provided by Lipper, a Thomson Reuters Company. | ||||
Admiral Shares carry lower expenses and are available to investors who meet certain account-balance requirements. Institutional Shares are available to certain institutional investors who meet specific administrative, service, and account-size criteria. The Vanguard ETF® Shares shown are traded on the Nasdaq exchange and are available only through brokers. The table provides ETF returns based on both the Nasdaq market price and the net asset value for a share. U.S. Pat. Nos. 6,879,964; 7,337,138; 7,720,749; 7,925,573; 8,090,646; and 8,417,623.
1
Your Fund’s Total Returns
| Fiscal Year Ended August 31, 2014 | ||||
| 30-Day SEC | Income | Capital | Total | |
| Yield | Returns | Returns | Returns | |
| Vanguard Long-Term Government Bond Index Fund | ||||
| Admiral Shares | 2.90% | 3.47% | 11.16% | 14.63% |
| Institutional Shares | 2.93 | 3.50 | 11.16 | 14.66 |
| ETF Shares | 2.90 | |||
| Market Price | 14.55 | |||
| Net Asset Value | 14.65 | |||
| Barclays U.S. Long Government Float Adjusted | ||||
| Index | 14.15 | |||
| General U.S. Government Funds Average | 4.38 | |||
| General U.S. Government Funds Average: Derived from data provided by Lipper, a Thomson Reuters Company. | ||||
| Vanguard Short-Term Corporate Bond Index Fund | ||||
| Admiral Shares | 1.40% | 1.85% | 1.62% | 3.47% |
| Institutional Shares | 1.43 | 1.88 | 1.67 | 3.55 |
| ETF Shares | 1.40 | |||
| Market Price | 3.23 | |||
| Net Asset Value | 3.50 | |||
| Barclays U.S. 1–5 Year Corporate Bond Index | 3.67 | |||
| Short-Intermediate Investment-Grade Debt Funds | ||||
| Average | 2.73 | |||
| Short-Intermediate Investment-Grade Debt Funds Average: Derived from data provided by Lipper, a Thomson Reuters Company. | ||||
| Vanguard Intermediate-Term Corporate Bond Index Fund | ||||
| Admiral Shares | 3.00% | 3.45% | 6.15% | 9.60% |
| Institutional Shares | 3.03 | 3.49 | 6.13 | 9.62 |
| ETF Shares | 3.00 | |||
| Market Price | 9.57 | |||
| Net Asset Value | 9.60 | |||
| Barclays U.S. 5–10 Year Corporate Bond Index | 9.51 | |||
| Core Bond Funds Average | 6.05 | |||
| Core Bond Funds Average: Derived from data provided by Lipper, a Thomson Reuters Company. | ||||
Admiral Shares carry lower expenses and are available to investors who meet certain account-balance requirements. Institutional Shares are available to certain institutional investors who meet specific administrative, service, and account-size criteria. The Vanguard ETF® Shares shown are traded on the Nasdaq exchange and are available only through brokers. The table provides ETF returns based on both the Nasdaq market price and the net asset value for a share. U.S. Pat. Nos. 6,879,964; 7,337,138; 7,720,749; 7,925,573; 8,090,646; and 8,417,623.
2
Your Fund’s Total Returns
| Fiscal Year Ended August 31, 2014 | ||||
| 30-Day SEC | Income | Capital | Total | |
| Yield | Returns | Returns | Returns | |
| Vanguard Long-Term Corporate Bond Index Fund | ||||
| Admiral Shares | 4.32% | 5.26% | 12.11% | 17.37% |
| Institutional Shares | 4.35 | 5.29 | 12.09 | 17.38 |
| ETF Shares | 4.32 | |||
| Market Price | 17.77 | |||
| Net Asset Value | 17.35 | |||
| Barclays U.S. 10+ Year Corporate Bond Index | 16.80 | |||
| Corporate Debt Funds BBB-Rated Average | 9.63 | |||
| Corporate Debt Funds BBB-Rated Average: Derived from data provided by Lipper, a Thomson Reuters Company. | ||||
| Vanguard Mortgage-Backed Securities Index Fund | ||||
| Admiral Shares | 1.40% | 1.78% | 3.44% | 5.22% |
| Institutional Shares (Inception: 10/31/2013) | 1.43 | 1.51 | 1.71 | 3.22 |
| ETF Shares | 1.40 | |||
| Market Price | 5.37 | |||
| Net Asset Value | 5.21 | |||
| Barclays U.S. MBS Float Adjusted Index | 5.15 | |||
| U.S. Mortgage Funds Average | 5.09 | |||
| U.S. Mortgage Funds Average: Derived from data provided by Lipper, a Thomson Reuters Company. | ||||
Admiral Shares carry lower expenses and are available to investors who meet certain account-balance requirements. Institutional Shares are available to certain institutional investors who meet specific administrative, service, and account-size criteria. The Vanguard ETF® Shares shown are traded on the Nasdaq exchange and are available only through brokers. The table provides ETF returns based on both the Nasdaq market price and the net asset value for a share. U.S. Pat. Nos. 6,879,964; 7,337,138; 7,720,749; 7,925,573; 8,090,646; and 8,417,623.
For the ETF Shares, the market price is determined by the midpoint of the bid-offer spread as of the closing time of the New York Stock Exchange (generally 4 p.m., Eastern time). The net asset value is also determined as of the NYSE closing time. For more information about how the ETF Shares' market prices have compared with their net asset value, visit vanguard.com, select your ETF, and then select the Price and Performance tab. The ETF premium/discount analysis there shows the percentages of days on which the ETF Shares' market price was above or below the NAV.
3

Chairman’s Letter
Dear Shareholder,
The 12-month period ended August 31, 2014, proved once again that financial markets rarely behave as expected. Interest rates moved higher across the board toward the end of 2013 as investors waited for the Federal Reserve to begin winding down its bond-buying program. Although the yields of some shorter-dated bonds kept drifting higher once the tapering began in January, a revival in investor demand for longer-dated bonds pushed their yields lower.
As bond yields and prices move in opposite directions, it was a good environment for bonds with maturities at the long end of the spectrum. The two long-term funds that are covered in the Vanguard Sector Bond Index Funds report returned 14.65% and 17.35% for the fiscal year. (The returns and yields cited in this letter are for the funds’ ETF Shares, based on net asset value.)
The other funds produced more modest results: 3.54% and 9.60% for the intermediate-term funds and 0.70% and 3.50% for the short-term funds. In each case, the corporate fund outpaced its government counterpart. Vanguard Mortgage-Backed Securities Index Fund returned 5.21%.
The funds generally performed in line with their benchmarks after taking expenses into account; the returns of the two long-term funds exceeded those of their benchmarks largely because of temporary security pricing differences.
4
The corporate bond funds and the long-term government fund saw their 30-day SEC yields fall, by between 23 and 85 basis points compared with a year earlier. (A basis point is one-hundredth of a percentage point.) The yields for the two other government funds and the mortgage fund rose, by between 12 and 45 basis points.
Solid gains for fixed income both at home and abroad
The broad U.S. taxable bond market returned 5.66% for the period, rallying from the drubbing it took a year ago. Municipal bonds fared even better, returning 10.14% as investors searched for tax-exempt income amid a limited supply of new issues.
International bond markets (as measured by the Barclays Global Aggregate Index ex USD) returned 6.52%. The European Central Bank continued its policy of monetary easing, which included taking the unprecedented move of lowering a key interest rate below zero, to –0.10%, in an effort to avert deflation and induce banks to lend and thus fuel economic growth. The central banks of Japan and China implemented monetary stimulus measures as well.
Following such a strong advance for bonds, it’s worth remembering that the current low yields imply lower future returns: As yields drop, the scope for further declines—and increases in prices—diminishes.
| Market Barometer | |||
| Average Annual Total Returns | |||
| Periods Ended August 31, 2014 | |||
| One | Three | Five | |
| Year | Years | Years | |
| Bonds | |||
| Barclays U.S. Aggregate Bond Index (Broad taxable | |||
| market) | 5.66% | 2.91% | 4.48% |
| Barclays Municipal Bond Index (Broad tax-exempt market) | 10.14 | 4.88 | 5.39 |
| Citigroup Three-Month U.S. Treasury Bill Index | 0.04 | 0.04 | 0.07 |
| Stocks | |||
| Russell 1000 Index (Large-caps) | 25.36% | 20.80% | 17.24% |
| Russell 2000 Index (Small-caps) | 17.68 | 19.00 | 17.03 |
| Russell 3000 Index (Broad U.S. market) | 24.74 | 20.65 | 17.22 |
| FTSE All-World ex US Index (International) | 18.04 | 9.48 | 8.44 |
| CPI | |||
| Consumer Price Index | 1.70% | 1.64% | 1.96% |
5
Stocks cleared hurdles en route to new highs
Despite an assortment of challenges, the broad U.S. stock market recorded an impressive return of about 25% for the 12 months ended August 31. U.S. stocks registered positive results in ten of those 12 months, and a July swoon was followed by an August flurry of record highs.
Investors applauded mostly solid corporate earnings, generally upbeat economic news, and the Federal Reserve’s continued accommodative policies. Still, turmoil in the Middle East and Ukraine, economic worries in Europe and China, and uncertainty about the Fed’s next moves pressured stocks at different times.
| Expense Ratios | ||||
| Your Fund Compared With Its Peer Group | ||||
| Admiral | Institutional | ETF | Peer Group | |
| Shares | Shares | Shares | Average | |
| Short-Term Government Bond Index | ||||
| Fund | 0.12% | 0.09% | 0.12% | 0.77% |
| Intermediate-Term Government Bond | ||||
| Index Fund | 0.12 | 0.09 | 0.12 | 0.97 |
| Long-Term Government Bond Index | ||||
| Fund | 0.12 | 0.09 | 0.12 | 1.13 |
| Short-Term Corporate Bond Index Fund | 0.12 | 0.09 | 0.12 | 0.83 |
| Intermediate-Term Corporate Bond | ||||
| Index Fund | 0.12 | 0.09 | 0.12 | 0.83 |
| Long-Term Corporate Bond Index Fund | 0.12 | 0.09 | 0.12 | 0.93 |
| Mortgage-Backed Securities Index | ||||
| Fund | 0.12 | 0.09 | 0.12 | 0.87 |
The fund expense ratios shown are from the prospectus dated December 20, 2013, and represent estimated costs for the current fiscal year. For the fiscal year ended August 31, 2014, the funds’ expense ratios were: for the Short-Term Government Bond Index Fund, 0.12% for Admiral Shares, 0.09% for Institutional Shares, and 0.12% for ETF Shares; for the Intermediate-Term Government Bond Index Fund, 0.12% for Admiral Shares, 0.09% for Institutional Shares, and 0.12% for ETF Shares; for the Long-Term Government Bond Index Fund, 0.12% for Admiral Shares, 0.09% for Institutional Shares, and 0.12% for ETF Shares; for the Short-Term Corporate Bond Index Fund, 0.12% for Admiral Shares, 0.09% for Institutional Shares, and 0.12% for ETF Shares; for the Intermediate-Term Corporate Bond Index Fund, 0.12% for Admiral Shares, 0.09% for Institutional Shares, and 0.12% for ETF Shares; for the Long-Term Corporate Bond Index Fund, 0.12% for Admiral Shares, 0.09% for Institutional Shares, and 0.12% for ETF Shares; and for the Mortgage-Backed Securities Index Fund, 0.12% for Admiral Shares, 0.09% for Institutional Shares (annualized for the period from inception through August 31, 2014), and 0.12% for ETF Shares. Peer-group expense ratios are derived from data provided by Lipper, a Thomson Reuters Company, and capture information through year-end 2013.
Peer groups: For the Short-Term Government Bond Index Fund, Short U.S. Government Funds; for the Intermediate-Term Government Bond Index Fund, Intermediate U.S. Government Funds; for the Long-Term Government Bond Index Fund, General U.S. Government Funds; for the Short-Term Corporate Bond Index Fund, Short-Intermediate Investment-Grade Debt Funds; for the Intermediate-Term Corporate Bond Index Fund, Core Bond Funds; for the Long-Term Corporate Bond Index Fund, Corporate BBB-Rated Debt Funds; for the Mortgage-Backed Securities Index Fund, U.S. Mortgage Funds.
6
International stocks returned about 18%. Emerging markets, after sliding earlier in the period, rebounded to lead the way. The developed markets of the Pacific region and Europe trailed but still notched double-digit returns.
Long-term bonds staged a strong rebound
The Federal Reserve purchased about $85 billion of Treasury and mortgage-backed securities each month throughout 2013, and many investors assumed that the Fed’s curtailing of its program would hurt bond prices. Prices did move lower, and yields higher, through the end of 2013
The arrival of 2014 brought a reversal of that trend, however. Yields at the long end of the curve began to ease back down amid reassurances from the Fed that interest rates would probably remain low even after its program ended. The fragility of growth both at home and abroad also made any imminent rise in rates seem less likely.
At the same time, demand for long-term bonds picked up. Some investors began to rebalance their portfolios out of equities and into bonds after the strong run-up in the stock market last year. There was more demand from international buyers who saw relative value in U.S. bonds. And heightened tensions in Eastern Europe and the Middle East drove more risk-averse investors to turn to bonds as a safe harbor for their assets.
Given that backdrop, the returns of the funds were relatively muted in the final four months of 2013. Among the government bond funds, the short-and intermediate-term funds stayed above water during that time, while the long-term fund posted a negative return. The corporate bond funds and the mortgage-backed securities fund held up a little better, returning between about 1% and 2%.
| Yields of U.S. Treasury Securities | ||
| August 31, | August 31, | |
| Maturity | 2013 | 2014 |
| 2 years | 0.40% | 0.50% |
| 3 years | 0.77 | 0.94 |
| 5 years | 1.61 | 1.63 |
| 10 years | 2.76 | 2.34 |
| 30 years | 3.72 | 3.08 |
| Source: Vanguard. | ||
7
As yields for longer-dated maturities trended lower in 2014, however, the long-term government and corporate bond funds ran far ahead of their shorter-term counterparts. Both funds returned more than 15% in the first eight months of 2014.
For the fiscal year, corporate bonds performed better than their government counterparts as investor appetite for those securities led to a tightening in their yield spreads versus government bonds.
| Market predictions about yields often miss the mark |
| U.S. bond yields have been below their historical long-term averages for some time now. |
| But history has shown that just because yields are low doesn’t mean that they have to |
| move higher. |
| At the end of 2010, the market believed yields were at such low levels that a significant |
| rise was in the offing. The dotted line in the chart below shows where the market expected |
| Treasury yields to be three years down the road (as indicated by the so-called forward yield |
| curve). For some maturities, those expectations implied that yields would more than double. |
| Bond yields rarely move as expected, however. The black line in the chart shows that Treasury |
| yields at the end of 2013 were well below market expectations, and in fact even lower than |
| where they had been three years earlier. |
| While the current low level of yields implies slim returns from bonds in the future, investors |
| should keep in mind that it remains just as hard today as it was in 2010 to say where yields |
| will head next. |
| The market’s forecast for 2013 yields versus where yields actually ended up |
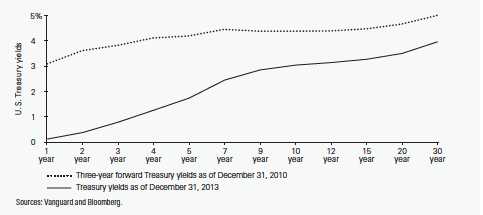
8
Agency mortgage-backed securities, given their slightly lower credit quality, continued to provide a small yield premium during the fiscal year over Treasuries with comparable maturities.
The funds’ track record has been relatively short but promising
The funds haven’t been around for a long time, only about five years, but so far they have behaved as expected. Since their inception on November 19, 2009, all seven funds have performed roughly in line with their target benchmarks. The range has been broad, with average annual returns since inception of 0.88% for the Short-Term Government Bond Fund and 9.79% for the Long-Term Corporate Bond Fund. With the exception of the Mortgage-Backed Securities Index Fund, the funds have come close to or outpaced their peer groups, some by wide margins.
High costs don’t equal strong fund performance
The old adage “You get what you pay for” doesn’t apply to mutual funds. In fact, the reverse is true: Research suggests that higher costs are consistent with weaker returns. (See, for example, Shopping for Alpha: You Get What You Don’t Pay For at vanguard.com/research.)
Wouldn’t paying the highest fees allow you to purchase the services of the greatest talents, and therefore get you the best returns? As it turns out, the data don’t really support that argument. The explanation is simple: Every dollar paid for management fees is a dollar less earning potential return. Keeping expenses down can help narrow the gap between what the markets return and what investors actually earn.
That’s why Vanguard seeks to minimize costs on all our funds. Indexing, of course, is the purest expression of low-cost investing. In our actively managed funds, which are run by some of the most prominent advisory firms in the investment industry, we work to keep fees low. It’s a strategy that reflects decades of experience and research, boiled down to one tenet: The less you pay, the more you keep.
As always, thank you for investing with Vanguard.
Sincerely,
F. William McNabb III
Chairman and Chief Executive Officer
September 15, 2014
9
| Your Fund’s Performance at a Glance | ||||
| August 31, 2013, Through August 31, 2014 | ||||
| Distributions Per Share | ||||
| Starting | Ending | Income | Capital | |
| Share Price | Share Price | Dividends | Gains | |
| Vanguard Short-Term Government Bond Index | ||||
| Fund | ||||
| Admiral Shares | $20.27 | $20.33 | $0.066 | $0.016 |
| Institutional Shares | 25.47 | 25.54 | 0.093 | 0.020 |
| ETF Shares | 60.75 | 60.95 | 0.177 | 0.048 |
| Vanguard Intermediate-Term Government | ||||
| Bond Index Fund | ||||
| Admiral Shares | $21.27 | $21.64 | $0.315 | $0.064 |
| Institutional Shares | 26.39 | 26.85 | 0.397 | 0.079 |
| ETF Shares | 62.96 | 64.14 | 0.843 | 0.189 |
| Vanguard Long-Term Government Bond Index | ||||
| Fund | ||||
| Admiral Shares | $22.32 | $24.81 | $0.712 | $0.000 |
| Institutional Shares | 28.32 | 31.48 | 0.911 | 0.000 |
| ETF Shares | 66.33 | 73.93 | 1.929 | 0.000 |
| Vanguard Short-Term Corporate Bond Index | ||||
| Fund | ||||
| Admiral Shares | $21.51 | $21.81 | $0.393 | $0.049 |
| Institutional Shares | 26.33 | 26.71 | 0.488 | 0.060 |
| ETF Shares | 78.97 | 80.21 | 1.321 | 0.180 |
| Vanguard Intermediate-Term Corporate Bond | ||||
| Index Fund | ||||
| Admiral Shares | $22.20 | $23.40 | $0.734 | $0.157 |
| Institutional Shares | 27.44 | 28.92 | 0.916 | 0.194 |
| ETF Shares | 82.31 | 86.98 | 2.496 | 0.582 |
| Vanguard Long-Term Corporate Bond Index | ||||
| Fund | ||||
| Admiral Shares | $22.04 | $24.71 | $1.065 | $0.000 |
| Institutional Shares | 27.37 | 30.68 | 1.329 | 0.000 |
| ETF Shares | 82.11 | 92.38 | 3.631 | 0.000 |
| Vanguard Mortgage-Backed Securities Index | ||||
| Fund | ||||
| Admiral Shares | $20.35 | $21.05 | $0.355 | $0.000 |
| Institutional Shares (Inception: 10/31/13) | 28.04 | 28.52 | 0.414 | 0.000 |
| ETF Shares | 50.85 | 52.65 | 0.828 | 0.000 |
10
Short-Term Government Bond Index Fund
Fund Profile
As of August 31, 2014
| Share-Class Characteristics | |||
| Admiral | Institutional | ETF | |
| Shares | Shares | Shares | |
| Ticker Symbol | VSBSX | VSBIX | VGSH |
| Expense Ratio1 | 0.12% | 0.09% | 0.12% |
| 30-Day SEC Yield | 0.37% | 0.40% | 0.37% |
| Financial Attributes | |||
| Barclays | |||
| 1–3 Year | |||
| Gov’t | Barclays | ||
| Float Adj | Aggregate | ||
| Fund | Index | FA Index | |
| Number of Bonds | 130 | 382 | 8,876 |
| Yield to Maturity | |||
| (before expenses) | 0.5% | 0.5% | 2.1% |
| Average Coupon | 1.3% | 1.5% | 3.3% |
| Average Duration | 1.9 years | 1.9 years | 5.6 years |
| Average Effective | |||
| Maturity | 2.0 years | 2.0 years | 7.7 years |
| Short-Term | |||
| Reserves | 1.1% | — | — |
| Sector Diversification (% of portfolio) | |
| Treasury/Agency | 100.0% |
| The agency and mortgage-backed securities sectors may include issues from government-sponsored enterprises; such issues are generally not backed by the full faith and credit of the U.S. government. | |
| Volatility Measures | ||
| Barclays | ||
| 1–3 Year | ||
| Gov’t | Barclays | |
| Float Adj | Aggregate | |
| Index | FA Index | |
| R-Squared | 0.96 | 0.50 |
| Beta | 1.00 | 0.11 |
| These measures show the degree and timing of the fund’s fluctuations compared with the indexes over 36 months. | ||
| Distribution by Effective Maturity | |
| (% of portfolio) | |
| Under 1 Year | 0.9% |
| 1 - 3 Years | 99.0 |
| 3 - 5 Years | 0.1 |
| Distribution by Credit Quality (% of portfolio) | |
| U.S. Government | 100.0% |
| Credit-quality ratings are obtained from Barclays and are from Moody's, Fitch, and S&P. When ratings from all three agencies are used, the median rating is shown. When ratings from two of the agencies are used, the lower rating for each issue is shown. For more information about these ratings, see the Glossary entry for Credit Quality. | |
Investment Focus
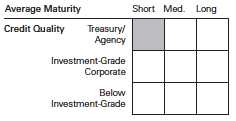
1 The expense ratios shown are from the prospectus dated December 20, 2013, and represent estimated costs for the current fiscal year. For the fiscal year ended August 31, 2014, the expense ratios were 0.12% for Admiral Shares, 0.09% for Institutional Shares, and 0.12% for ETF Shares.
11
Short-Term Government Bond Index Fund
Performance Summary
All of the returns in this report represent past performance, which is not a guarantee of future results that may be achieved by the fund. (Current performance may be lower or higher than the performance data cited. For performance data current to the most recent month-end, visit our website at vanguard.com/performance.) Note, too, that both investment returns and principal value can fluctuate widely, so an investor’s shares, when sold, could be worth more or less than their original cost. The returns shown do not reflect taxes that a shareholder would pay on fund distributions or on the sale of fund shares.
Cumulative Performance: November 19, 2009, Through August 31, 2014
Initial Investment of $10,000
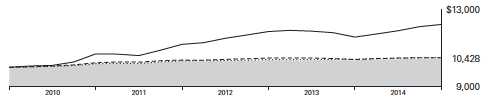
| Average Annual Total Returns | ||||
| Periods Ended August 31, 2014 | ||||
| Since | Final Value | |||
| One | Inception | of a $10,000 | ||
| Year | (11/19/2009) | Investment | ||
| Short-Term Government Bond Index | ||||
| Fund ETF Shares Net Asset Value | 0.70% | 0.88% | $10,428 | |
| Short-Term Government Bond Index | ||||
| Fund ETF Shares Market Price | 0.70 | 0.89 | 10,432 | |
| Barclays U.S. 1–3 Year Government | ||||
| •••••••• | Float Adjusted Index | 0.80 | 1.00 | 10,490 |
| – – – | Short U.S. Government Funds | |||
| Average | 0.90 | 1.01 | 10,493 | |
| Spliced Barclays U.S. Aggregate Float | ||||
| Adjusted Index | 5.64 | 4.27 | 12,212 | |
| For a benchmark description, see the Glossary. Short U.S. Government Funds Average: Derived from data provided by Lipper, a Thomson Reuters Company. "Since Inception" performance is calculated from the ETF Shares’ inception date for both the fund and its comparative standards. | ||||
See Financial Highlights for dividend and capital gains information.
12
Short-Term Government Bond Index Fund
| Average Annual Total Returns | |||
| Periods Ended August 31, 2014 | |||
| Since | Final Value | ||
| One | Inception | of a $10,000 | |
| Year | (12/28/2009) | Investment | |
| Short-Term Government Bond Index Fund | |||
| Admiral Shares | 0.70% | 1.00% | $10,477 |
| Barclays U.S. 1–3 Year Government Float | |||
| Adjusted Index | 0.80 | 1.12 | 10,534 |
| Spliced Barclays U.S. Aggregate Float | |||
| Adjusted Index | 5.64 | 4.60 | 12,339 |
| "Since Inception" performance is calculated from the Admiral Shares’ inception date for both the fund and its comparative standards. | |||
| Since | Final Value | ||
| One | Inception | of a $5,000,000 | |
| Year | (8/23/2010) | Investment | |
| Short-Term Government Bond Index Fund | |||
| Institutional Shares | 0.72% | 0.67% | $5,135,892 |
| Barclays U.S. 1–3 Year Government Float | |||
| Adjusted Index | 0.80 | 0.75 | 5,152,995 |
| Barclays U.S. Aggregate Float Adjusted | |||
| Index | 5.64 | 3.46 | 5,733,457 |
| "Since Inception" performance is calculated from the Institutional Shares’ inception date for both the fund and its comparative standards. | |||
| Cumulative Returns of ETF Shares: November 19, 2009, Through August 31, 2014 | ||
| Since | ||
| One | Inception | |
| Year | (11/19/2009) | |
| Short-Term Government Bond Index Fund ETF | ||
| Shares Market Price | 0.70% | 4.32% |
| Short-Term Government Bond Index Fund ETF | ||
| Shares Net Asset Value | 0.70 | 4.28 |
| Barclays U.S. 1–3 Year Government Float Adjusted | ||
| Index | 0.80 | 4.90 |
| "Since Inception" performance is calculated from the ETF Shares’ inception date for both the fund and its comparative standards. | ||
13
Short-Term Government Bond Index Fund
| Fiscal-Year Total Returns (%): November 19, 2009, Through August 31, 2014 | |||
| Barclays | |||
| 1–3 Year | |||
| Gov’t | |||
| Float Adj | |||
| ETF Shares Net Asset Value | Index | ||
| Fiscal Year | Total Returns | Total Returns | |
| 2010 | 1.69% | 1.83% | |
| 2011 | 1.39 | 1.53 | |
| 2012 | 0.40 | 0.50 | |
| 2013 | 0.04 | 0.16 | |
| 2014 | 0.70 | 0.80 | |
| Average Annual Total Returns: Periods Ended June 30, 2014 | |||||
| This table presents returns through the latest calendar quarter—rather than through the end of the fiscal period. Securities and Exchange Commission rules require that we provide this information. | |||||
| Since Inception | |||||
| Inception Date | One Year | Income | Capital | Total | |
| Admiral Shares | 12/28/2009 | 0.68% | 0.48% | 0.55% | 1.03% |
| Institutional Shares | 8/23/2010 | 0.69 | 0.48 | 0.20 | 0.68 |
| ETF Shares | 11/19/2009 | ||||
| Market Price | 0.60 | 0.90 | |||
| Net Asset Value | 0.67 | 0.90 | |||
14
Short-Term Government Bond Index Fund
Financial Statements
Statement of Net Assets
As of August 31, 2014
The fund reports a complete list of its holdings in regulatory filings four times in each fiscal year, at the quarter-ends. For the second and fourth fiscal quarters, the lists appear in the fund’s semiannual and annual reports to shareholders. For the first and third fiscal quarters, the fund files the lists with the Securities and Exchange Commission on Form N-Q. Shareholders can look up the fund’s Forms N-Q on the SEC’s website at sec.gov. Forms N-Q may also be reviewed and copied at the SEC’s Public Reference Room (see the back cover of this report for further information).
| Face | Market | |||
| Maturity | Amount | Value• | ||
| Coupon | Date | ($000) | ($000) | |
| U.S. Government and Agency Obligations (99.0%) | ||||
| U.S. Government Securities (89.0%) | ||||
| United States Treasury Note/Bond | 0.250% | 9/15/15 | 6,630 | 6,638 |
| United States Treasury Note/Bond | 0.250% | 9/30/15 | 5,600 | 5,607 |
| United States Treasury Note/Bond | 1.250% | 9/30/15 | 2,000 | 2,024 |
| United States Treasury Note/Bond | 0.250% | 10/15/15 | 14,055 | 14,068 |
| United States Treasury Note/Bond | 0.250% | 10/31/15 | 13,660 | 13,673 |
| United States Treasury Note/Bond | 1.250% | 10/31/15 | 750 | 759 |
| United States Treasury Note/Bond | 0.250% | 11/30/15 | 15,015 | 15,024 |
| United States Treasury Note/Bond | 1.375% | 11/30/15 | 15,145 | 15,365 |
| United States Treasury Note/Bond | 0.250% | 12/15/15 | 10,535 | 10,538 |
| United States Treasury Note/Bond | 0.250% | 12/31/15 | 16,245 | 16,250 |
| United States Treasury Note/Bond | 2.125% | 12/31/15 | 4,055 | 4,156 |
| United States Treasury Note/Bond | 0.375% | 1/31/16 | 9,815 | 9,830 |
| United States Treasury Note/Bond | 2.000% | 1/31/16 | 10,250 | 10,500 |
| United States Treasury Note/Bond | 0.375% | 2/15/16 | 11,300 | 11,314 |
| United States Treasury Note/Bond | 0.250% | 2/29/16 | 8,485 | 8,478 |
| United States Treasury Note/Bond | 2.125% | 2/29/16 | 3,390 | 3,482 |
| United States Treasury Note/Bond | 0.375% | 3/15/16 | 19,015 | 19,030 |
| United States Treasury Note/Bond | 0.375% | 3/31/16 | 7,820 | 7,825 |
| United States Treasury Note/Bond | 0.250% | 4/15/16 | 8,410 | 8,396 |
| United States Treasury Note/Bond | 0.375% | 4/30/16 | 6,805 | 6,805 |
| United States Treasury Note/Bond | 2.000% | 4/30/16 | 300 | 308 |
| United States Treasury Note/Bond | 0.250% | 5/15/16 | 10,030 | 10,005 |
| United States Treasury Note/Bond | 5.125% | 5/15/16 | 2,500 | 2,699 |
| United States Treasury Note/Bond | 7.250% | 5/15/16 | 850 | 948 |
| United States Treasury Note/Bond | 0.375% | 5/31/16 | 10,480 | 10,475 |
| United States Treasury Note/Bond | 1.750% | 5/31/16 | 28,605 | 29,262 |
| United States Treasury Note/Bond | 3.250% | 5/31/16 | 1,000 | 1,049 |
| United States Treasury Note/Bond | 0.500% | 6/15/16 | 4,675 | 4,681 |
| United States Treasury Note/Bond | 0.500% | 6/30/16 | 8,275 | 8,284 |
| United States Treasury Note/Bond | 1.500% | 6/30/16 | 4,798 | 4,889 |
| United States Treasury Note/Bond | 3.250% | 6/30/16 | 13,205 | 13,871 |
| United States Treasury Note/Bond | 0.625% | 7/15/16 | 6,500 | 6,519 |
| United States Treasury Note/Bond | 0.500% | 7/31/16 | 6,269 | 6,272 |
| United States Treasury Note/Bond | 1.500% | 7/31/16 | 4,386 | 4,470 |
| United States Treasury Note/Bond | 3.250% | 7/31/16 | 5,538 | 5,829 |
| United States Treasury Note/Bond | 0.625% | 8/15/16 | 6,750 | 6,767 |
| United States Treasury Note/Bond | 4.875% | 8/15/16 | 2,175 | 2,358 |

| Short-Term Government Bond Index Fund | ||||
| Face | Market | |||
| Maturity | Amount | Value• | ||
| Coupon | Date | ($000) | ($000) | |
| United States Treasury Note/Bond | 0.500% | 8/31/16 | 8,000 | 8,001 |
| United States Treasury Note/Bond | 1.000% | 8/31/16 | 7,700 | 7,775 |
| United States Treasury Note/Bond | 3.000% | 8/31/16 | 6,530 | 6,849 |
| United States Treasury Note/Bond | 0.875% | 9/15/16 | 6,100 | 6,141 |
| United States Treasury Note/Bond | 1.000% | 9/30/16 | 9,680 | 9,765 |
| United States Treasury Note/Bond | 3.000% | 9/30/16 | 4,010 | 4,212 |
| United States Treasury Note/Bond | 0.625% | 10/15/16 | 5,000 | 5,005 |
| United States Treasury Note/Bond | 1.000% | 10/31/16 | 8,753 | 8,825 |
| United States Treasury Note/Bond | 3.125% | 10/31/16 | 3,300 | 3,478 |
| United States Treasury Note/Bond | 0.625% | 11/15/16 | 11,700 | 11,702 |
| United States Treasury Note/Bond | 4.625% | 11/15/16 | 2,490 | 2,707 |
| United States Treasury Note/Bond | 0.875% | 11/30/16 | 5,575 | 5,604 |
| United States Treasury Note/Bond | 2.750% | 11/30/16 | 8,355 | 8,749 |
| United States Treasury Note/Bond | 0.625% | 12/15/16 | 4,745 | 4,742 |
| United States Treasury Note/Bond | 0.875% | 12/31/16 | 6,000 | 6,026 |
| United States Treasury Note/Bond | 3.250% | 12/31/16 | 7,660 | 8,115 |
| United States Treasury Note/Bond | 0.750% | 1/15/17 | 6,480 | 6,488 |
| United States Treasury Note/Bond | 0.875% | 1/31/17 | 8,000 | 8,031 |
| United States Treasury Note/Bond | 3.125% | 1/31/17 | 2,700 | 2,856 |
| United States Treasury Note/Bond | 0.625% | 2/15/17 | 6,410 | 6,394 |
| United States Treasury Note/Bond | 4.625% | 2/15/17 | 6,425 | 7,031 |
| United States Treasury Note/Bond | 0.875% | 2/28/17 | 15,855 | 15,904 |
| United States Treasury Note/Bond | 3.000% | 2/28/17 | 3,300 | 3,485 |
| United States Treasury Note/Bond | 0.750% | 3/15/17 | 5,110 | 5,110 |
| United States Treasury Note/Bond | 1.000% | 3/31/17 | 6,510 | 6,545 |
| United States Treasury Note/Bond | 3.250% | 3/31/17 | 6,425 | 6,827 |
| United States Treasury Note/Bond | 0.875% | 4/15/17 | 5,700 | 5,713 |
| United States Treasury Note/Bond | 0.875% | 4/30/17 | 6,695 | 6,703 |
| United States Treasury Note/Bond | 3.125% | 4/30/17 | 4,370 | 4,634 |
| United States Treasury Note/Bond | 0.875% | 5/15/17 | 5,995 | 6,001 |
| United States Treasury Note/Bond | 4.500% | 5/15/17 | 2,325 | 2,551 |
| United States Treasury Note/Bond | 0.625% | 5/31/17 | 820 | 815 |
| United States Treasury Note/Bond | 2.750% | 5/31/17 | 8,325 | 8,749 |
| United States Treasury Note/Bond | 0.875% | 6/15/17 | 7,500 | 7,500 |
| United States Treasury Note/Bond | 0.750% | 6/30/17 | 5,770 | 5,745 |
| United States Treasury Note/Bond | 2.500% | 6/30/17 | 18,045 | 18,840 |
| United States Treasury Note/Bond | 0.875% | 7/15/17 | 13,820 | 13,805 |
| United States Treasury Note/Bond | 2.375% | 7/31/17 | 6,550 | 6,818 |
| United States Treasury Note/Bond | 0.875% | 8/15/17 | 11,500 | 11,480 |
| United States Treasury Note/Bond | 0.625% | 8/31/17 | 8,000 | 7,915 |
| United States Treasury Note/Bond | 1.875% | 8/31/17 | 5,000 | 5,133 |
| 597,217 | ||||
| Agency Bonds and Notes (10.0%) | ||||
| 1 Federal Agricultural Mortgage Corp. | 2.125% | 9/15/15 | 50 | 51 |
| 1 Federal Agricultural Mortgage Corp. | 2.000% | 7/27/16 | 50 | 51 |
| 1 Federal Farm Credit Banks | 1.500% | 11/16/15 | 50 | 51 |
| 1 Federal Farm Credit Banks | 1.050% | 3/28/16 | 100 | 101 |
| 1 Federal Farm Credit Banks | 5.125% | 8/25/16 | 800 | 871 |
| 1 Federal Farm Credit Banks | 4.875% | 1/17/17 | 500 | 548 |
| 1 Federal Home Loan Banks | 0.500% | 11/20/15 | 4,675 | 4,688 |
| 1 Federal Home Loan Banks | 0.375% | 2/19/16 | 1,550 | 1,550 |
| 1 Federal Home Loan Banks | 3.125% | 3/11/16 | 425 | 442 |
| 1 Federal Home Loan Banks | 0.375% | 6/24/16 | 2,570 | 2,565 |
| 1 Federal Home Loan Banks | 0.500% | 9/28/16 | 1,400 | 1,394 |
| 1 Federal Home Loan Banks | 4.750% | 12/16/16 | 285 | 311 |
16
| Short-Term Government Bond Index Fund | |||||
| Face | Market | ||||
| Maturity | Amount | Value• | |||
| Coupon | Date | ($000) | ($000) | ||
| 1 | Federal Home Loan Banks | 0.625% | 12/28/16 | 600 | 599 |
| 1 | Federal Home Loan Banks | 4.875% | 5/17/17 | 600 | 663 |
| 1 | Federal Home Loan Banks | 0.875% | 5/24/17 | 1,100 | 1,098 |
| 1 | Federal Home Loan Banks | 1.000% | 6/21/17 | 2,205 | 2,207 |
| 2 | Federal Home Loan Mortgage Corp. | 1.750% | 9/10/15 | 4,980 | 5,056 |
| 2 | Federal Home Loan Mortgage Corp. | 4.750% | 11/17/15 | 1,300 | 1,370 |
| 2 | Federal Home Loan Mortgage Corp. | 0.500% | 5/13/16 | 2,620 | 2,621 |
| 2 | Federal Home Loan Mortgage Corp. | 2.500% | 5/27/16 | 980 | 1,014 |
| 2 | Federal Home Loan Mortgage Corp. | 5.500% | 7/18/16 | 250 | 273 |
| 2 | Federal Home Loan Mortgage Corp. | 2.000% | 8/25/16 | 1,525 | 1,567 |
| 2 | Federal Home Loan Mortgage Corp. | 0.875% | 10/14/16 | 3,530 | 3,544 |
| 2 | Federal Home Loan Mortgage Corp. | 5.000% | 2/16/17 | 600 | 661 |
| 2 | Federal Home Loan Mortgage Corp. | 0.875% | 2/22/17 | 1,250 | 1,251 |
| 2 | Federal Home Loan Mortgage Corp. | 1.000% | 3/8/17 | 2,040 | 2,047 |
| 2 | Federal Home Loan Mortgage Corp. | 5.000% | 4/18/17 | 200 | 221 |
| 2 | Federal Home Loan Mortgage Corp. | 1.250% | 5/12/17 | 2,500 | 2,520 |
| 2 | Federal Home Loan Mortgage Corp. | 1.000% | 6/29/17 | 375 | 375 |
| 2 | Federal Home Loan Mortgage Corp. | 1.000% | 7/28/17 | 550 | 550 |
| 2 | Federal National Mortgage Assn. | 0.500% | 9/28/15 | 4,535 | 4,548 |
| 2 | Federal National Mortgage Assn. | 4.375% | 10/15/15 | 2,350 | 2,458 |
| 2 | Federal National Mortgage Assn. | 1.625% | 10/26/15 | 75 | 76 |
| 2 | Federal National Mortgage Assn. | 0.375% | 12/21/15 | 300 | 300 |
| 2 | Federal National Mortgage Assn. | 5.000% | 3/15/16 | 25 | 27 |
| 2 | Federal National Mortgage Assn. | 0.500% | 3/30/16 | 2,785 | 2,789 |
| 2 | Federal National Mortgage Assn. | 2.375% | 4/11/16 | 800 | 824 |
| 2 | Federal National Mortgage Assn. | 0.375% | 7/5/16 | 3,230 | 3,222 |
| 2 | Federal National Mortgage Assn. | 0.625% | 8/26/16 | 3,000 | 3,001 |
| 2 | Federal National Mortgage Assn. | 1.250% | 9/28/16 | 1,840 | 1,862 |
| 2 | Federal National Mortgage Assn. | 1.375% | 11/15/16 | 575 | 584 |
| 2 | Federal National Mortgage Assn. | 5.000% | 2/13/17 | 880 | 969 |
| 2 | Federal National Mortgage Assn. | 0.750% | 4/20/17 | 1,100 | 1,095 |
| 2 | Federal National Mortgage Assn. | 1.125% | 4/27/17 | 700 | 703 |
| 2 | Federal National Mortgage Assn. | 5.000% | 5/11/17 | 555 | 614 |
| 2 | Federal National Mortgage Assn. | 0.000% | 6/1/17 | 500 | 486 |
| 2 | Federal National Mortgage Assn. | 5.375% | 6/12/17 | 1,230 | 1,378 |
| 2 | Federal National Mortgage Assn. | 0.875% | 8/28/17 | 1,050 | 1,044 |
| 2 | Federal National Mortgage Assn. | 1.000% | 9/27/17 | 500 | 498 |
| Private Export Funding Corp. | 1.375% | 2/15/17 | 250 | 253 | |
| 1 | Tennessee Valley Authority | 5.500% | 7/18/17 | 125 | 141 |
| 67,132 | |||||
| Total U.S. Government and Agency Obligations (Cost $663,810) | 664,349 | ||||
| Shares | |||||
| Temporary Cash Investment (1.1%) | |||||
| Money Market Fund (1.1%) | |||||
| 3 | Vanguard Market Liquidity Fund (Cost $7,308) | 0.113% | 7,308,038 | 7,308 | |
| Total Investments (100.1%) (Cost $671,118) | 671,657 | ||||
| Other Assets and Liabilities (-0.1%) | |||||
| Other Assets | 37,244 | ||||
| Liabilities | (37,960) | ||||
| (716) | |||||
| Net Assets (100%) | 670,941 | ||||
17
| Short-Term Government Bond Index Fund | |
| Amount | |
| ($000) | |
| Statement of Assets and Liabilities | |
| Assets | |
| Investments in Securities, at Value | |
| Unaffiliated Issuers | 664,349 |
| Affiliated Vanguard Funds | 7,308 |
| Total Investments in Securities | 671,657 |
| Receivables for Investment Securities Sold | 34,157 |
| Other Assets | 3,087 |
| Total Assets | 708,901 |
| Liabilities | |
| Payables for Investment Securities Purchased | 35,930 |
| Other Liabilities | 2,030 |
| Total Liabilities | 37,960 |
| Net Assets | 670,941 |
| At August 31, 2014, net assets consisted of: | |
| Amount | |
| ($000) | |
| Paid-in Capital | 669,908 |
| Undistributed Net Investment Income | 183 |
| Accumulated Net Realized Gains | 311 |
| Unrealized Appreciation (Depreciation) | 539 |
| Net Assets | 670,941 |
| Admiral Shares—Net Assets | |
| Applicable to 6,175,462 outstanding $.001 par value shares of | |
| beneficial interest (unlimited authorization) | 125,520 |
| Net Asset Value Per Share—Admiral Shares | $20.33 |
| Institutional Shares—Net Assets | |
| Applicable to 1,906,256 outstanding $.001 par value shares of | |
| beneficial interest (unlimited authorization) | 48,686 |
| Net Asset Value Per Share—Institutional Shares | $25.54 |
| ETF Shares—Net Assets | |
| Applicable to 8,150,000 outstanding $.001 par value shares of | |
| beneficial interest (unlimited authorization) | 496,735 |
| Net Asset Value Per Share—ETF Shares | $60.95 |
• See Note A in Notes to Financial Statements.
1 The issuer operates under a congressional charter; its securities are generally neither guaranteed by the U.S. Treasury nor backed by the full faith and credit of the U.S. government.
2 The issuer was placed under federal conservatorship in September 2008; since that time, its daily operations have been managed by the Federal Housing Finance Agency and it receives capital from the U.S. Treasury, as needed to maintain a positive net worth, in exchange for senior preferred stock.
3 Affiliated money market fund available only to Vanguard funds and certain trusts and accounts managed by Vanguard. Rate shown is the 7-day yield.
See accompanying Notes, which are an integral part of the Financial Statements.
18
Short-Term Government Bond Index Fund
Statement of Operations
| Year Ended | |
| August 31, 2014 | |
| ($000) | |
| Investment Income | |
| Income | |
| Interest1 | 2,332 |
| Total Income | 2,332 |
| Expenses | |
| The Vanguard Group—Note B | |
| Investment Advisory Services | 12 |
| Management and Administrative—Admiral Shares | 71 |
| Management and Administrative—Institutional Shares | 13 |
| Management and Administrative—ETF Shares | 322 |
| Marketing and Distribution—Admiral Shares | 16 |
| Marketing and Distribution—Institutional Shares | 5 |
| Marketing and Distribution—ETF Shares | 89 |
| Custodian Fees | 5 |
| Auditing Fees | 46 |
| Shareholders’ Reports—Admiral Shares | 2 |
| Shareholders’ Reports—Institutional Shares | — |
| Shareholders’ Reports—ETF Shares | 13 |
| Total Expenses | 594 |
| Net Investment Income | 1,738 |
| Realized Net Gain (Loss) on Investment Securities Sold | 556 |
| Change in Unrealized Appreciation (Depreciation) of Investment Securities | 977 |
| Net Increase (Decrease) in Net Assets Resulting from Operations | 3,271 |
| 1 Interest income from an affiliated company of the fund was $8,000. | |
See accompanying Notes, which are an integral part of the Financial Statements.
19
Short-Term Government Bond Index Fund
Statement of Changes in Net Assets
| Year Ended August 31, | ||
| 2014 | 2013 | |
| ($000) | ($000) | |
| Increase (Decrease) in Net Assets | ||
| Operations | ||
| Net Investment Income | 1,738 | 869 |
| Realized Net Gain (Loss) | 556 | 565 |
| Change in Unrealized Appreciation (Depreciation) | 977 | (1,328) |
| Net Increase (Decrease) in Net Assets Resulting from Operations | 3,271 | 106 |
| Distributions | ||
| Net Investment Income | ||
| Admiral Shares1 | (287) | (113) |
| Institutional Shares | (95) | (107) |
| ETF Shares | (1,173) | (651) |
| Realized Capital Gain 2 | ||
| Admiral Shares1 | (54) | (61) |
| Institutional Shares | (19) | (65) |
| ETF Shares | (307) | (389) |
| Total Distributions | (1,935) | (1,386) |
| Capital Share Transactions | ||
| Admiral Shares1 | 72,273 | 16,393 |
| Institutional Shares | 31,229 | (26,223) |
| ETF Shares | 188,874 | 124,806 |
| Net Increase (Decrease) from Capital Share Transactions | 292,376 | 114,976 |
| Total Increase (Decrease) | 293,712 | 113,696 |
| Net Assets | ||
| Beginning of Period | 377,229 | 263,533 |
| End of Period3 | 670,941 | 377,229 |
| 1 Signal Shares were renamed Admiral Shares in October 2013. The prior period’s distributions and capital share transactions are for the Signal class. 2 Includes fiscal 2014 and 2013 short-term gain distributions totaling $76,000 and $163,000, respectively. Short-term gain distributions are treated as ordinary income dividends for tax purposes. 3 Net Assets—End of Period includes undistributed (overdistributed) net investment income of $183,000 and ($1,000). | ||
See accompanying Notes, which are an integral part of the Financial Statements.
20
Short-Term Government Bond Index Fund
Financial Highlights
| Admiral Shares | |||||
| Dec. 28, | |||||
| 20091 to | |||||
| For a Share Outstanding | Year Ended August 31, | Aug. 31, | |||
| Throughout Each Period | 2014 | 2013 | 2012 | 2011 | 2010 |
| Net Asset Value, Beginning of Period | $20.27 | $20.35 | $20.39 | $20.25 | $19.92 |
| Investment Operations | |||||
| Net Investment Income | .068 | .053 | .089 | .134 | .101 |
| Net Realized and Unrealized Gain (Loss) | |||||
| on Investments | .074 | (.048) | (.007) | .149 | .329 |
| Total from Investment Operations | .142 | .005 | .082 | .283 | .430 |
| Distributions | |||||
| Dividends from Net Investment Income | (.066) | (.053) | (.087) | (.135) | (.100) |
| Distributions from Realized Capital Gains | (. 016) | (. 032) | (. 035) | (. 008) | — |
| Total Distributions | (.082) | (. 085) | (.122) | (.143) | (.100) |
| Net Asset Value, End of Period | $20.33 | $20.27 | $20.35 | $20.39 | $20.25 |
| Total Return2 | 0.70% | 0.02% | 0.40% | 1.40% | 2.16% |
| Ratios/Supplemental Data | |||||
| Net Assets, End of Period (Millions) | $126 | $53 | $37 | $11 | $6 |
| Ratio of Total Expenses to Average Net Assets | 0.12% | 0.12% | 0.12% | 0.14% | 0.15%3 |
| Ratio of Net Investment Income to | |||||
| Average Net Assets | 0.34% | 0.26% | 0.44% | 0.66% | 0.84%3 |
| Portfolio Turnover Rate 4 | 64% | 73% | 72% | 69% | 69% |
| Signal Shares were renamed Admiral Shares in October 2013. Prior periods’ Financial Highlights are for the Signal class. 1 Inception. 2 Total returns do not include transaction or account service fees that may have applied in the periods shown. Fund prospectuses provide information about any applicable transaction and account service fees. 3 Annualized. 4 Excludes the value of portfolio securities received or delivered as a result of in-kind purchases or redemptions of the fund’s capital shares, including ETF Creation Units. | |||||
See accompanying Notes, which are an integral part of the Financial Statements.
21
Short-Term Government Bond Index Fund
Financial Highlights
| Institutional Shares | |||||
| Aug. 23, | |||||
| 20101 to | |||||
| For a Share Outstanding | Year Ended August 31, | Aug. 31, | |||
| Throughout Each Period | 2014 | 2013 | 2012 | 2011 | 2010 |
| Net Asset Value, Beginning of Period | $25.47 | $25.57 | $25.62 | $25.45 | $25.46 |
| Investment Operations | |||||
| Net Investment Income | .095 | .075 | .121 | .183 | .005 |
| Net Realized and Unrealized Gain (Loss) | |||||
| on Investments | .088 | (.059) | (.007) | .180 | .003 |
| Total from Investment Operations | .183 | .016 | .114 | . 363 | .008 |
| Distributions | |||||
| Dividends from Net Investment Income | (.093) | (.075) | (.120) | (.183) | (. 018) |
| Distributions from Realized Capital Gains | (. 020) | (. 041) | (. 044) | (. 010) | — |
| Total Distributions | (.113) | (.116) | (.164) | (.193) | (. 018) |
| Net Asset Value, End of Period | $25.54 | $25.47 | $25.57 | $25.62 | $25.45 |
| Total Return2 | 0.72% | 0.06% | 0.45% | 1.43% | 0.03% |
| Ratios/Supplemental Data | |||||
| Net Assets, End of Period (Millions) | $49 | $17 | $44 | $33 | $8 |
| Ratio of Total Expenses to Average Net Assets | 0.09% | 0.09% | 0.09% | 0.09% | 0.09%3 |
| Ratio of Net Investment Income to | |||||
| Average Net Assets | 0.37% | 0.29% | 0.47% | 0.71% | 0.90%3 |
| Portfolio Turnover Rate 4 | 64% | 73% | 72% | 69% | 69% |
| 1 Inception. 2 Total returns do not include transaction fees that may have applied in the periods shown. Fund prospectuses provide information about any applicable transaction fees. 3 Annualized. 4 Excludes the value of portfolio securities received or delivered as a result of in-kind purchases or redemptions of the fund’s capital shares, including ETF Creation Units. | |||||
See accompanying Notes, which are an integral part of the Financial Statements.
22
Short-Term Government Bond Index Fund
Financial Highlights
| ETF Shares | |||||
| Nov. 19, | |||||
| 20091 to | |||||
| For a Share Outstanding | Year Ended August 31, | Aug. 31, | |||
| Throughout Each Period | 2014 | 2013 | 2012 | 2011 | 2010 |
| Net Asset Value, Beginning of Period | $60.75 | $60.98 | $61.11 | $60.70 | $60.04 |
| Investment Operations | |||||
| Net Investment Income | .198 | .158 | .270 | .405 | .349 |
| Net Realized and Unrealized Gain (Loss) | |||||
| on Investments | .227 | (.134) | (.028) | .434 | .660 |
| Total from Investment Operations | .425 | .024 | .242 | .839 | 1.009 |
| Distributions | |||||
| Dividends from Net Investment Income | (.177) | (.158) | (.267) | (.405) | (.349) |
| Distributions from Realized Capital Gains | (. 048) | (. 096) | (.105) | (. 024) | — |
| Total Distributions | (. 225) | (. 254) | (. 372) | (. 429) | (. 349) |
| Net Asset Value, End of Period | $60.95 | $60.75 | $60.98 | $61.11 | $60.70 |
| Total Return | 0.70% | 0.04% | 0.40% | 1.39% | 1.69% |
| Ratios/Supplemental Data | |||||
| Net Assets, End of Period (Millions) | $497 | $307 | $183 | $150 | $79 |
| Ratio of Total Expenses to Average Net Assets | 0.12% | 0.12% | 0.12% | 0.14% | 0.15%2 |
| Ratio of Net Investment Income to | |||||
| Average Net Assets | 0.34% | 0.26% | 0.44% | 0.66% | 0.84%2 |
| Portfolio Turnover Rate 3 | 64% | 73% | 72% | 69% | 69% |
| 1 Inception. 2 Annualized. 3 Excludes the value of portfolio securities received or delivered as a result of in-kind purchases or redemptions of the fund’s capital shares, including ETF Creation Units. | |||||
See accompanying Notes, which are an integral part of the Financial Statements.
23
Short-Term Government Bond Index Fund
Notes to Financial Statements
Vanguard Short-Term Government Bond Index Fund is registered under the Investment Company Act of 1940 as an open-end investment company, or mutual fund. The fund offers three classes of shares: Admiral Shares, Institutional Shares, and ETF Shares. Admiral Shares and Institutional Shares are designed for investors who meet certain administrative, service, and account-size criteria. ETF shares are listed for trading on Nasdaq; they can be purchased and sold through a broker. Effective in October 2013, Signal Shares were renamed Admiral Shares.
A. The following significant accounting policies conform to generally accepted accounting principles for U.S. investment companies. The fund consistently follows such policies in preparing its financial statements.
1. Security Valuation: Securities are valued as of the close of trading on the New York Stock Exchange (generally 4 p.m., Eastern time) on the valuation date. Bonds, and temporary cash investments acquired over 60 days to maturity, are valued using the latest bid prices or using valuations based on a matrix system (which considers such factors as security prices, yields, maturities, and ratings), both as furnished by independent pricing services. Investments in Vanguard Market Liquidity Fund are valued at that fund’s net asset value. Other temporary cash investments are valued at amortized cost, which approximates market value. Securities for which market quotations are not readily available, or whose values have been affected by events occurring before the fund’s pricing time but after the close of the securities’ primary markets, are valued by methods deemed by the board of trustees to represent fair value.
2. Federal Income Taxes: The fund intends to continue to qualify as a regulated investment company and distribute all of its taxable income. Management has analyzed the fund’s tax positions taken for all open federal income tax years (August 31, 2011–2014), and has concluded that no provision for federal income tax is required in the fund’s financial statements.
3. Distributions: Distributions to shareholders are recorded on the ex-dividend date.
4. Credit Facility: The fund and certain other funds managed by The Vanguard Group participate in a $2.89 billion committed credit facility provided by a syndicate of lenders pursuant to a credit agreement that may be renewed annually; each fund is individually liable for its borrowings, if any, under the credit facility. Borrowings may be utilized for temporary and emergency purposes, and are subject to the fund’s regulatory and contractual borrowing restrictions. The participating funds are charged administrative fees and an annual commitment fee of 0.06% of the undrawn amount of the facility; these fees are allocated to the funds based on a method approved by the fund’s board of trustees and included in Management and Administrative expenses on the fund’s Statement of Operations. Any borrowings under this facility bear interest at a rate equal to the higher of the federal funds rate or LIBOR reference rate plus an agreed-upon spread.
The fund had no borrowings outstanding at August 31, 2014, or at any time during the period then ended.
5. Other: Interest income includes income distributions received from Vanguard Market Liquidity Fund and is accrued daily. Premiums and discounts on debt securities purchased are amortized and accreted, respectively, to interest income over the lives of the respective securities. Security transactions are accounted for on the date securities are bought or sold. Costs used to determine realized gains (losses) on the sale of investment securities are those of the specific securities sold. Fees, if any, assessed on purchases of capital shares are credited to paid-in capital.
24
Short-Term Government Bond Index Fund
Each class of shares has equal rights as to assets and earnings, except that each class separately bears certain class-specific expenses related to maintenance of shareholder accounts (included in Management and Administrative expenses) and shareholder reporting. Marketing and distribution expenses are allocated to each class of shares based on a method approved by the board of trustees. Income, other non-class-specific expenses, and gains and losses on investments are allocated to each class of shares based on its relative net assets.
B. The Vanguard Group furnishes at cost investment advisory, corporate management, administrative, marketing, and distribution services. The costs of such services are allocated to the fund based on methods approved by the board of trustees. The fund has committed to provide up to 0.40% of its net assets in capital contributions to Vanguard. At August 31, 2014, the fund had contributed capital of $62,000 to Vanguard (included in Other Assets), representing 0.01% of the fund’s net assets and 0.02% of Vanguard’s capitalization. The fund’s trustees and officers are also directors and officers of Vanguard.
C. Various inputs may be used to determine the value of the fund’s investments. These inputs are summarized in three broad levels for financial statement purposes. The inputs or methodologies used to value securities are not necessarily an indication of the risk associated with investing in those securities.
Level 1—Quoted prices in active markets for identical securities.
Level 2—Other significant observable inputs (including quoted prices for similar securities, interest rates, prepayment speeds, credit risk, etc.).
Level 3—Significant unobservable inputs (including the fund’s own assumptions used to determine the fair value of investments).
| The following table summarizes the market value of the fund’s investments as of August 31, 2014, based on the inputs used to value them: | |||
| Level 1 | Level 2 | Level 3 | |
| Investments | ($000) | ($000) | ($000) |
| U.S. Government and Agency Obligations | — | 664,349 | — |
| Temporary Cash Investments | 7,308 | — | — |
| Total | 7,308 | 664,349 | — |
D. Distributions are determined on a tax basis and may differ from net investment income and realized capital gains for financial reporting purposes. Differences may be permanent or temporary. Permanent differences are reclassified among capital accounts in the financial statements to reflect their tax character. Temporary differences arise when certain items of income, expense, gain, or loss are recognized in different periods for financial statement and tax purposes. These differences will reverse at some time in the future. Differences in classification may also result from the treatment of short-term gains as ordinary income for tax purposes.
During the year ended August 31, 2014, the fund realized $110,000 of net capital gains resulting from in-kind redemptions—in which shareholders exchanged fund shares for securities held by the fund rather than for cash. Because such gains are not taxable to the fund, and are not distributed to shareholders, they have been reclassified from accumulated net realized gains to paid-in capital.
25
Short-Term Government Bond Index Fund
The fund used a tax accounting practice to treat a portion of the price of capital shares redeemed during the year as distributions from realized capital gains. Accordingly, the fund has reclassified $79,000 from accumulated net realized gains to paid-in capital.
For tax purposes, at August 31, 2014, the fund had short-term and long-term capital gains of $101,000 and $210,000, respectively, available for distribution. Short-term gain distributions are treated as ordinary income dividends for tax purposes.
At August 31, 2014, the cost of investment securities for tax purposes was $671,118,000. Net unrealized appreciation of investment securities for tax purposes was $539,000, consisting of unrealized gains of $641,000 on securities that had risen in value since their purchase and $102,000 in unrealized losses on securities that had fallen in value since their purchase.
E. During the year ended August 31, 2014, the fund purchased $695,043,000 of investment securities and sold $403,538,000 of investment securities, other than temporary cash investments. Purchases and sales include $272,162,000 and $84,625,000, respectively, in connection with in-kind purchases and redemptions of the fund’s capital shares.
| F. Capital share transactions for each class of shares were: | |||||
| Year Ended August 31, | |||||
| 2014 | 2013 | ||||
| Amount | Shares | Amount | Shares | ||
| ($000) | (000) | ($000) | (000) | ||
| Admiral Shares1 | |||||
| Issued 2 | 157,433 | 7,749 | 38,480 | 1,895 | |
| Issued in Lieu of Cash Distributions | 290 | 15 | 171 | 8 | |
| Redeemed | (85,450) | (4,206) | (22,258) | (1,096) | |
| Net Increase (Decrease) —Admiral Shares | 72,273 | 3,558 | 16,393 | 807 | |
| Institutional Shares | |||||
| Issued 2 | 35,085 | 1,374 | 2,001 | 78 | |
| Issued in Lieu of Cash Distributions | 114 | 4 | 166 | 7 | |
| Redeemed | (3,970) | (155) | (28,390) | (1,113) | |
| Net Increase (Decrease) —Institutional Shares | 31,229 | 1,223 | (26,223) | (1,028) | |
| ETF Shares | |||||
| Issued2 | 274,120 | 4,500 | 164,370 | 2,700 | |
| Issued in Lieu of Cash Distributions | — | — | — | — | |
| Redeemed | (85,246) | (1,400) | (39,564) | (650) | |
| Net Increase (Decrease)—ETF Shares | 188,874 | 3,100 | 124,806 | 2,050 | |
| 1 Signal Shares were renamed Admiral Shares in October 2013. The prior period’s capital share transactions are for the Signal class. 2 Includes purchase fees for fiscal 2014 and 2013 of $0 and $17,000, respectively (fund totals). | |||||
G. Management has determined that no material events or transactions occurred subsequent to August 31, 2014, that would require recognition or disclosure in these financial statements.
26
Intermediate-Term Government Bond Index Fund
Fund Profile
As of August 31, 2014
| Share-Class Characteristics | |||
| Admiral | Institutional | ETF | |
| Shares | Shares | Shares | |
| Ticker Symbol | VSIGX | VIIGX | VGIT |
| Expense Ratio1 | 0.12% | 0.09% | 0.12% |
| 30-Day SEC Yield | 1.59% | 1.62% | 1.59% |
| Financial Attributes | |||
| Barclays | |||
| 3–10 Year | |||
| Gov’t | Barclays | ||
| Float Adj | Aggregate | ||
| Fund | Index | FA Index | |
| Number of Bonds | 162 | 429 | 8,876 |
| Yield to Maturity | |||
| (before expenses) | 1.7% | 1.7% | 2.1% |
| Average Coupon | 2.3% | 2.1% | 3.3% |
| Average Duration | 5.2 years | 5.2 years | 5.6 years |
| Average Effective | |||
| Maturity | 5.6 years | 5.6 years | 7.7 years |
| Short-Term | |||
| Reserves | 0.7% | — | — |
| Sector Diversification (% of portfolio) | |
| Treasury/Agency | 100.0% |
| The agency and mortgage-backed securities sectors may include issues from government-sponsored enterprises; such issues are generally not backed by the full faith and credit of the U.S. government. | |
| Volatility Measures | ||
| Barclays | ||
| 3–10 Year | ||
| Gov’t | Barclays | |
| Float Adj | Aggregate | |
| Index | FA Index | |
| R-Squared | 0.99 | 0.86 |
| Beta | 1.02 | 1.04 |
| These measures show the degree and timing of the fund’s fluctuations compared with the indexes over 36 months. | ||
| Distribution by Effective Maturity | |
| (% of portfolio) | |
| Under 1 Year | 0.2% |
| 1 - 3 Years | 0.4 |
| 3 - 5 Years | 51.9 |
| 5 - 10 Years | 47.5 |
| Distribution by Credit Quality (% of portfolio) | |
| U.S. Government | 100.0% |
| Credit-quality ratings are obtained from Barclays and are from Moody's, Fitch, and S&P. When ratings from all three agencies are used, the median rating is shown. When ratings from two of the agencies are used, the lower rating for each issue is shown. For more information about these ratings, see the Glossary entry for Credit Quality. | |
Investment Focus
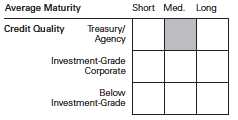
1 The expense ratios shown are from the prospectus dated December 20, 2013, and represent estimated costs for the current fiscal year. For the fiscal year ended August 31, 2014, the expense ratios were 0.12% for Admiral Shares, 0.09% for Institutional Shares, and 0.12% for ETF Shares.
27
Intermediate-Term Government Bond Index Fund
Performance Summary
All of the returns in this report represent past performance, which is not a guarantee of future results that may be achieved by the fund. (Current performance may be lower or higher than the performance data cited. For performance data current to the most recent month-end, visit our website at vanguard.com/performance.) Note, too, that both investment returns and principal value can fluctuate widely, so an investor’s shares, when sold, could be worth more or less than their original cost. The returns shown do not reflect taxes that a shareholder would pay on fund distributions or on the sale of fund shares.
Cumulative Performance: November 19, 2009, Through August 31, 2014
Initial Investment of $10,000
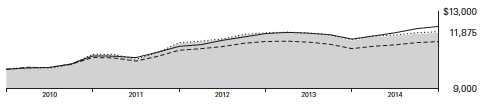
| Average Annual Total Returns | ||||
| Periods Ended August 31, 2014 | ||||
| Since | Final Value | |||
| One | Inception | of a $10,000 | ||
| Year | (11/19/2009) | Investment | ||
| Intermediate-Term Government Bond | ||||
| Index Fund ETF Shares Net Asset | ||||
| Value | 3.54% | 3.66% | $11,875 | |
| Intermediate-Term Government Bond | ||||
| Index Fund ETF Shares Market Price | 3.57 | 3.67 | 11,883 | |
| Barclays U.S. 3–10 Year Government | ||||
| •••••••• | Float Adjusted Index | 3.54 | 3.77 | 11,937 |
| – – –– | Intermediate U.S. Government Funds | |||
| Average | 3.30 | 2.84 | 11,431 | |
| Spliced Barclays U.S. Aggregate Float | ||||
| Adjusted Index | 5.64 | 4.27 | 12,212 | |
| For a benchmark description, see the Glossary. Intermediate U.S. Government Funds Average: Derived from data provided by Lipper, a Thomson Reuters Company. "Since Inception" performance is calculated from the ETF Shares’ inception date for both the fund and its comparative standards. | ||||
See Financial Highlights for dividend and capital gains information.
28
Intermediate-Term Government Bond Index Fund
| Average Annual Total Returns | |||
| Periods Ended August 31, 2014 | |||
| Since | Final Value | ||
| One | Inception | of a $10,000 | |
| Year | (8/4/2010) | Investment | |
| Intermediate-Term Government Bond Index | |||
| Fund Admiral Shares | 3.55% | 2.92% | $11,246 |
| Barclays U.S. 3–10 Year Government Float | |||
| Adjusted Index | 3.54 | 3.03 | 11,294 |
| Barclays U.S. Aggregate Float Adjusted Index | 5.64 | 3.69 | 11,589 |
| "Since Inception" performance is calculated from the Admiral Shares’ inception date for both the fund and its comparative standards. | |||
| Since | Final Value | ||
| One | Inception | of a $5,000,000 | |
| Year | (3/19/2010) | Investment | |
| Intermediate-Term Government Bond Index | |||
| Fund Institutional Shares | 3.58% | 3.98% | $5,947,705 |
| Barclays U.S. 3–10 Year Government Float | |||
| Adjusted Index | 3.54 | 4.06 | 5,969,808 |
| Barclays U.S. Aggregate Float Adjusted | |||
| Index | 5.64 | 4.31 | 6,032,971 |
| "Since Inception" performance is calculated from the Institutional Shares’ inception date for both the fund and its comparative standards. | |||
| Cumulative Returns of ETF Shares: November 19, 2009, Through August 31, 2014 | ||
| Since | ||
| One | Inception | |
| Year | (11/19/2009) | |
| Intermediate-Term Government Bond Index Fund | ||
| ETF Shares Market Price | 3.57% | 18.83% |
| Intermediate-Term Government Bond Index Fund | ||
| ETF Shares Net Asset Value | 3.54 | 18.75 |
| Barclays U.S. 3–10 Year Government Float Adjusted | ||
| Index | 3.54 | 19.37 |
| "Since Inception" performance is calculated from the ETF Shares’ inception date for both the fund and its comparative standards. | ||
29
Intermediate-Term Government Bond Index Fund
| Fiscal-Year Total Returns (%): November 19, 2009, Through August 31, 2014 | |||
| Barclays | |||
| 3–10 Year | |||
| Gov’t | |||
| Float Adj | |||
| ETF Shares Net Asset Value | Index | ||
| Fiscal Year | Total Returns | Total Returns | |
| 2010 | 7.65% | 7.76% | |
| 2011 | 5.30 | 5.53 | |
| 2012 | 4.50 | 4.51 | |
| 2013 | -3.18 | -2.99 | |
| 2014 | 3.54 | 3.54 | |
| Average Annual Total Returns: Periods Ended June 30, 2014 | |||||
| This table presents returns through the latest calendar quarter—rather than through the end of the fiscal period. | |||||
| Securities and Exchange Commission rules require that we provide this information. | |||||
| Since Inception | |||||
| Inception Date | One Year | Income | Capital | Total | |
| Admiral Shares | 8/4/2010 | 2.16% | 1.69% | 1.21% | 2.90% |
| Institutional Shares | 3/19/2010 | 2.18 | 1.79 | 2.20 | 3.99 |
| ETF Shares | 11/19/2009 | ||||
| Market Price | 2.25 | 3.68 | |||
| Net Asset Value | 2.15 | 3.66 | |||
30
Intermediate-Term Government Bond Index Fund
Financial Statements
Statement of Net Assets
As of August 31, 2014
The fund reports a complete list of its holdings in regulatory filings four times in each fiscal year, at the quarter-ends. For the second and fourth fiscal quarters, the lists appear in the fund’s semiannual and annual reports to shareholders. For the first and third fiscal quarters, the fund files the lists with the Securities and Exchange Commission on Form N-Q. Shareholders can look up the fund’s Forms N-Q on the SEC’s website at sec.gov. Forms N-Q may also be reviewed and copied at the SEC’s Public Reference Room (see the back cover of this report for further information).
| Face | Market | |||
| Maturity | Amount | Value• | ||
| Coupon | Date | ($000) | ($000) | |
| U.S. Government and Agency Obligations (99.3%) | ||||
| U.S. Government Securities (92.1%) | ||||
| United States Treasury Note/Bond | 1.875% | 8/31/17 | 1,941 | 1,993 |
| United States Treasury Note/Bond | 0.750% | 10/31/17 | 3,090 | 3,060 |
| United States Treasury Note/Bond | 1.875% | 10/31/17 | 2,560 | 2,624 |
| United States Treasury Note/Bond | 4.250% | 11/15/17 | 2,598 | 2,856 |
| United States Treasury Note/Bond | 0.625% | 11/30/17 | 5,705 | 5,618 |
| United States Treasury Note/Bond | 2.250% | 11/30/17 | 3,420 | 3,545 |
| United States Treasury Note/Bond | 0.750% | 12/31/17 | 3,015 | 2,977 |
| United States Treasury Note/Bond | 2.750% | 12/31/17 | 3,525 | 3,709 |
| United States Treasury Note/Bond | 0.875% | 1/31/18 | 3,045 | 3,014 |
| United States Treasury Note/Bond | 2.625% | 1/31/18 | 909 | 953 |
| United States Treasury Note/Bond | 3.500% | 2/15/18 | 2,701 | 2,912 |
| United States Treasury Note/Bond | 0.750% | 2/28/18 | 2,950 | 2,904 |
| United States Treasury Note/Bond | 2.750% | 2/28/18 | 8,706 | 9,166 |
| United States Treasury Note/Bond | 0.750% | 3/31/18 | 3,185 | 3,130 |
| United States Treasury Note/Bond | 0.625% | 4/30/18 | 4,975 | 4,861 |
| United States Treasury Note/Bond | 2.625% | 4/30/18 | 4,837 | 5,073 |
| United States Treasury Note/Bond | 3.875% | 5/15/18 | 1,100 | 1,204 |
| United States Treasury Note/Bond | 9.125% | 5/15/18 | 910 | 1,171 |
| United States Treasury Note/Bond | 1.000% | 5/31/18 | 4,337 | 4,289 |
| United States Treasury Note/Bond | 2.375% | 5/31/18 | 1,702 | 1,769 |
| United States Treasury Note/Bond | 1.375% | 6/30/18 | 7,750 | 7,761 |
| United States Treasury Note/Bond | 2.375% | 6/30/18 | 1,955 | 2,031 |
| United States Treasury Note/Bond | 1.375% | 7/31/18 | 3,525 | 3,527 |
| United States Treasury Note/Bond | 2.250% | 7/31/18 | 1,570 | 1,623 |
| United States Treasury Note/Bond | 4.000% | 8/15/18 | 592 | 653 |
| United States Treasury Note/Bond | 1.500% | 8/31/18 | 5,625 | 5,650 |
| United States Treasury Note/Bond | 1.375% | 9/30/18 | 6,456 | 6,446 |
| United States Treasury Note/Bond | 1.250% | 10/31/18 | 5,020 | 4,981 |
| United States Treasury Note/Bond | 1.750% | 10/31/18 | 2,145 | 2,172 |
| United States Treasury Note/Bond | 3.750% | 11/15/18 | 3,257 | 3,565 |
| United States Treasury Note/Bond | 9.000% | 11/15/18 | 1,233 | 1,618 |
| United States Treasury Note/Bond | 1.250% | 11/30/18 | 4,085 | 4,049 |
| United States Treasury Note/Bond | 1.375% | 11/30/18 | 1,670 | 1,664 |
| United States Treasury Note/Bond | 1.375% | 12/31/18 | 2,340 | 2,329 |
| United States Treasury Note/Bond | 1.500% | 12/31/18 | 5,925 | 5,927 |
| United States Treasury Note/Bond | 1.500% | 1/31/19 | 7,575 | 7,569 |
| United States Treasury Note/Bond | 2.750% | 2/15/19 | 10,007 | 10,534 |
31
| Intermediate-Term Government Bond Index Fund | ||||
| Face | Market | |||
| Maturity | Amount | Value• | ||
| Coupon | Date | ($000) | ($000) | |
| United States Treasury Note/Bond | 8.875% | 2/15/19 | 269 | 355 |
| United States Treasury Note/Bond | 1.375% | 2/28/19 | 4,650 | 4,617 |
| United States Treasury Note/Bond | 1.500% | 2/28/19 | 5,400 | 5,392 |
| United States Treasury Note/Bond | 1.500% | 3/31/19 | 2,340 | 2,334 |
| United States Treasury Note/Bond | 1.625% | 3/31/19 | 5,400 | 5,416 |
| United States Treasury Note/Bond | 1.250% | 4/30/19 | 528 | 520 |
| United States Treasury Note/Bond | 1.625% | 4/30/19 | 3,471 | 3,478 |
| United States Treasury Note/Bond | 3.125% | 5/15/19 | 3,958 | 4,234 |
| United States Treasury Note/Bond | 1.125% | 5/31/19 | 1,310 | 1,282 |
| United States Treasury Note/Bond | 1.500% | 5/31/19 | 10,350 | 10,303 |
| United States Treasury Note/Bond | 1.000% | 6/30/19 | 3,400 | 3,301 |
| United States Treasury Note/Bond | 1.625% | 6/30/19 | 4,750 | 4,754 |
| United States Treasury Note/Bond | 0.875% | 7/31/19 | 2,945 | 2,839 |
| United States Treasury Note/Bond | 1.625% | 7/31/19 | 6,850 | 6,851 |
| United States Treasury Note/Bond | 3.625% | 8/15/19 | 2,292 | 2,509 |
| United States Treasury Note/Bond | 8.125% | 8/15/19 | 4,893 | 6,417 |
| United States Treasury Note/Bond | 1.000% | 8/31/19 | 1,540 | 1,491 |
| United States Treasury Note/Bond | 1.625% | 8/31/19 | 4,850 | 4,849 |
| United States Treasury Note/Bond | 1.000% | 9/30/19 | 1,850 | 1,789 |
| United States Treasury Note/Bond | 1.250% | 10/31/19 | 450 | 440 |
| United States Treasury Note/Bond | 3.375% | 11/15/19 | 1,050 | 1,139 |
| United States Treasury Note/Bond | 1.000% | 11/30/19 | 1,980 | 1,909 |
| United States Treasury Note/Bond | 1.125% | 12/31/19 | 2,275 | 2,205 |
| United States Treasury Note/Bond | 1.375% | 1/31/20 | 2,552 | 2,503 |
| United States Treasury Note/Bond | 3.625% | 2/15/20 | 1,580 | 1,735 |
| United States Treasury Note/Bond | 8.500% | 2/15/20 | 360 | 487 |
| United States Treasury Note/Bond | 1.250% | 2/29/20 | 3,560 | 3,463 |
| United States Treasury Note/Bond | 1.125% | 3/31/20 | 1,050 | 1,013 |
| United States Treasury Note/Bond | 1.125% | 4/30/20 | 2,775 | 2,673 |
| United States Treasury Note/Bond | 3.500% | 5/15/20 | 5,719 | 6,252 |
| United States Treasury Note/Bond | 1.375% | 5/31/20 | 2,700 | 2,635 |
| United States Treasury Note/Bond | 1.875% | 6/30/20 | 2,450 | 2,456 |
| United States Treasury Note/Bond | 2.000% | 7/31/20 | 3,050 | 3,077 |
| United States Treasury Note/Bond | 2.625% | 8/15/20 | 8,649 | 9,021 |
| United States Treasury Note/Bond | 8.750% | 8/15/20 | 250 | 348 |
| United States Treasury Note/Bond | 2.125% | 8/31/20 | 2,550 | 2,586 |
| United States Treasury Note/Bond | 2.000% | 9/30/20 | 2,130 | 2,143 |
| United States Treasury Note/Bond | 1.750% | 10/31/20 | 5,800 | 5,743 |
| United States Treasury Note/Bond | 2.625% | 11/15/20 | 3,267 | 3,403 |
| United States Treasury Note/Bond | 2.000% | 11/30/20 | 5,675 | 5,698 |
| United States Treasury Note/Bond | 2.375% | 12/31/20 | 3,230 | 3,313 |
| United States Treasury Note/Bond | 2.125% | 1/31/21 | 4,522 | 4,566 |
| United States Treasury Note/Bond | 3.625% | 2/15/21 | 4,007 | 4,419 |
| United States Treasury Note/Bond | 7.875% | 2/15/21 | 716 | 977 |
| United States Treasury Note/Bond | 2.000% | 2/28/21 | 4,015 | 4,021 |
| United States Treasury Note/Bond | 2.250% | 3/31/21 | 2,375 | 2,414 |
| United States Treasury Note/Bond | 2.250% | 4/30/21 | 3,500 | 3,555 |
| United States Treasury Note/Bond | 3.125% | 5/15/21 | 3,042 | 3,261 |
| United States Treasury Note/Bond | 8.125% | 5/15/21 | 1,140 | 1,584 |
| United States Treasury Note/Bond | 2.000% | 5/31/21 | 8,000 | 7,990 |
| United States Treasury Note/Bond | 2.125% | 6/30/21 | 4,000 | 4,024 |
| United States Treasury Note/Bond | 2.250% | 7/31/21 | 3,825 | 3,878 |
| United States Treasury Note/Bond | 2.125% | 8/15/21 | 4,900 | 4,927 |
| United States Treasury Note/Bond | 8.125% | 8/15/21 | 1,775 | 2,487 |
| United States Treasury Note/Bond | 2.000% | 8/31/21 | 4,475 | 4,462 |
32
| Intermediate-Term Government Bond Index Fund | ||||
| Face | Market | |||
| Maturity | Amount | Value• | ||
| Coupon | Date | ($000) | ($000) | |
| United States Treasury Note/Bond | 2.000% | 11/15/21 | 2,743 | 2,730 |
| United States Treasury Note/Bond | 8.000% | 11/15/21 | 6,245 | 8,752 |
| United States Treasury Note/Bond | 2.000% | 2/15/22 | 6,595 | 6,553 |
| United States Treasury Note/Bond | 1.625% | 8/15/22 | 3,540 | 3,403 |
| United States Treasury Note/Bond | 7.250% | 8/15/22 | 350 | 482 |
| United States Treasury Note/Bond | 1.625% | 11/15/22 | 7,170 | 6,863 |
| United States Treasury Note/Bond | 7.625% | 11/15/22 | 575 | 814 |
| United States Treasury Note/Bond | 2.000% | 2/15/23 | 6,275 | 6,167 |
| United States Treasury Note/Bond | 7.125% | 2/15/23 | 1,590 | 2,200 |
| United States Treasury Note/Bond | 1.750% | 5/15/23 | 11,770 | 11,301 |
| United States Treasury Note/Bond | 2.500% | 8/15/23 | 7,295 | 7,434 |
| United States Treasury Note/Bond | 6.250% | 8/15/23 | 975 | 1,294 |
| United States Treasury Note/Bond | 2.750% | 11/15/23 | 6,545 | 6,797 |
| United States Treasury Note/Bond | 2.750% | 2/15/24 | 6,775 | 7,028 |
| United States Treasury Note/Bond | 2.500% | 5/15/24 | 9,880 | 10,022 |
| United States Treasury Note/Bond | 2.375% | 8/15/24 | 3,425 | 3,435 |
| 413,740 | ||||
| Agency Bonds and Notes (7.2%) | ||||
| 1 AID-Jordan | 1.945% | 6/23/19 | 200 | 201 |
| 1 AID-Jordan | 2.503% | 10/30/20 | 175 | 177 |
| 1 AID-Ukraine | 1.844% | 5/16/19 | 200 | 200 |
| 2 Federal Farm Credit Banks | 3.500% | 12/20/23 | 100 | 107 |
| 2 Federal Home Loan Banks | 5.000% | 11/17/17 | 1,350 | 1,512 |
| 2 Federal Home Loan Banks | 1.375% | 3/9/18 | 1,000 | 1,001 |
| 2 Federal Home Loan Banks | 1.875% | 3/8/19 | 1,000 | 1,009 |
| 2 Federal Home Loan Banks | 1.875% | 3/13/20 | 150 | 149 |
| 2 Federal Home Loan Banks | 4.125% | 3/13/20 | 1,005 | 1,120 |
| 2 Federal Home Loan Banks | 3.375% | 6/12/20 | 125 | 134 |
| 2 Federal Home Loan Banks | 5.250% | 12/11/20 | 250 | 297 |
| 2 Federal Home Loan Banks | 5.625% | 6/11/21 | 400 | 486 |
| 2 Federal Home Loan Banks | 2.125% | 3/10/23 | 250 | 242 |
| 3 Federal Home Loan Mortgage Corp. | 1.000% | 9/29/17 | 400 | 399 |
| 3 Federal Home Loan Mortgage Corp. | 5.125% | 11/17/17 | 625 | 703 |
| 3 Federal Home Loan Mortgage Corp. | 0.750% | 1/12/18 | 1,150 | 1,130 |
| 3 Federal Home Loan Mortgage Corp. | 0.875% | 3/7/18 | 2,070 | 2,037 |
| 3 Federal Home Loan Mortgage Corp. | 4.875% | 6/13/18 | 500 | 564 |
| 3 Federal Home Loan Mortgage Corp. | 3.750% | 3/27/19 | 440 | 481 |
| 3 Federal Home Loan Mortgage Corp. | 1.750% | 5/30/19 | 400 | 401 |
| 3 Federal Home Loan Mortgage Corp. | 1.250% | 8/1/19 | 450 | 439 |
| 3 Federal Home Loan Mortgage Corp. | 1.250% | 10/2/19 | 1,155 | 1,122 |
| 3 Federal Home Loan Mortgage Corp. | 1.375% | 5/1/20 | 1,065 | 1,032 |
| 3 Federal Home Loan Mortgage Corp. | 2.375% | 1/13/22 | 1,655 | 1,665 |
| 3 Federal National Mortgage Assn. | 1.000% | 9/27/17 | 500 | 498 |
| 3 Federal National Mortgage Assn. | 0.875% | 10/26/17 | 890 | 882 |
| 3 Federal National Mortgage Assn. | 0.875% | 12/20/17 | 900 | 890 |
| 3 Federal National Mortgage Assn. | 0.875% | 2/8/18 | 850 | 839 |
| 3 Federal National Mortgage Assn. | 0.875% | 5/21/18 | 3,720 | 3,649 |
| 3 Federal National Mortgage Assn. | 1.875% | 9/18/18 | 550 | 558 |
| 3 Federal National Mortgage Assn. | 1.625% | 11/27/18 | 970 | 972 |
| 3 Federal National Mortgage Assn. | 1.875% | 2/19/19 | 1,750 | 1,766 |
| 3 Federal National Mortgage Assn. | 1.750% | 6/20/19 | 800 | 800 |
| 3 Federal National Mortgage Assn. | 1.750% | 9/12/19 | 350 | 349 |
| 3 Federal National Mortgage Assn. | 0.000% | 10/9/19 | 1,150 | 1,018 |
| 2 Financing Corp. | 10.700% | 10/6/17 | 122 | 156 |
| 2 Financing Corp. | 9.800% | 11/30/17 | 350 | 441 |
33
| Intermediate-Term Government Bond Index Fund | |||||
| Face | Market | ||||
| Maturity | Amount | Value• | |||
| Coupon | Date | ($000) | ($000) | ||
| 2 | Financing Corp. | 9.800% | 4/6/18 | 200 | 258 |
| 2 | Financing Corp. | 10.350% | 8/3/18 | 250 | 332 |
| 2 | Financing Corp. | 9.700% | 4/5/19 | 50 | 68 |
| NCUA Guaranteed Notes | 3.000% | 6/12/19 | 180 | 190 | |
| Private Export Funding Corp. | 2.250% | 12/15/17 | 25 | 26 | |
| Private Export Funding Corp. | 1.875% | 7/15/18 | 50 | 51 | |
| Private Export Funding Corp. | 4.375% | 3/15/19 | 700 | 781 | |
| Private Export Funding Corp. | 1.450% | 8/15/19 | 100 | 98 | |
| Private Export Funding Corp. | 2.050% | 11/15/22 | 175 | 167 | |
| Private Export Funding Corp. | 3.550% | 1/15/24 | 75 | 80 | |
| Private Export Funding Corp. | 2.450% | 7/15/24 | 205 | 197 | |
| 1 | State of Israel | 5.500% | 9/18/23 | 125 | 154 |
| 2 | Tennessee Valley Authority | 1.750% | 10/15/18 | 125 | 126 |
| 2 | Tennessee Valley Authority | 3.875% | 2/15/21 | 225 | 248 |
| 2 | Tennessee Valley Authority | 1.875% | 8/15/22 | 125 | 120 |
| 32,322 | |||||
| Total U.S. Government and Agency Obligations (Cost $443,927) | 446,062 | ||||
| Shares | |||||
| Temporary Cash Investment (0.7%) | |||||
| Money Market Fund (0.7%) | |||||
| 4 | Vanguard Market Liquidity Fund (Cost $3,048) | 0.113% | 3,048,000 | 3,048 | |
| Total Investments (100.0%) (Cost $446,975) | 449,110 | ||||
| Other Assets and Liabilities (0.0%) | |||||
| Other Assets | 26,782 | ||||
| Liabilities | (26,931) | ||||
| (149) | |||||
| Net Assets (100%) | 448,961 | ||||
| Statement of Assets and Liabilities | |||||
| Assets | |||||
| Investments in Securities, at Value | 449,110 | ||||
| Unaffiliated Issuers | 446,062 | ||||
| Affiliated Vanguard Funds | 3,048 | ||||
| Total Investments in Securities | 449,110 | ||||
| Receivables for Investment Securities Sold | 23,320 | ||||
| Other Assets | 3,462 | ||||
| Total Assets | 475,892 | ||||
| Liabilities | |||||
| Payables for Investment Securities Purchased | 26,057 | ||||
| Other Liabilities | 874 | ||||
| Total Liabilities | 26,931 | ||||
| Net Assets | 448,961 | ||||
34
| Intermediate-Term Government Bond Index Fund | |
| At August 31, 2014, net assets consisted of: | |
| Amount | |
| ($000) | |
| Paid-in Capital | 446,889 |
| Undistributed Net Investment Income | 235 |
| Accumulated Net Realized Losses | (298) |
| Unrealized Appreciation (Depreciation) | 2,135 |
| Net Assets | 448,961 |
| Admiral Shares—Net Assets | |
| Applicable to 10,716,088 outstanding $.001 par value shares of | |
| beneficial interest (unlimited authorization) | 231,900 |
| Net Asset Value Per Share—Admiral Shares | $21.64 |
| Institutional Shares—Net Assets | |
| Applicable to 1,992,853 outstanding $.001 par value shares of | |
| beneficial interest (unlimited authorization) | 53,508 |
| Net Asset Value Per Share—Institutional Shares | $26.85 |
| ETF Shares—Net Assets | |
| Applicable to 2,550,000 outstanding $.001 par value shares of | |
| beneficial interest (unlimited authorization) | 163,553 |
| Net Asset Value Per Share—ETF Shares | $64.14 |
• See Note A in Notes to Financial Statements.
1 U.S. government guaranteed.
2 The issuer operates under a congressional charter; its securities are generally neither guaranteed by the U.S. Treasury nor backed by the full faith and credit of the U.S. government.
3 The issuer was placed under federal conservatorship in September 2008; since that time, its daily operations have been managed by the Federal Housing Finance Agency and it receives capital from the U.S. Treasury, as needed to maintain a positive net worth, in exchange for senior preferred stock.
4 Affiliated money market fund available only to Vanguard funds and certain trusts and accounts managed by Vanguard. Rate shown is the 7-day yield.
See accompanying Notes, which are an integral part of the Financial Statements.
35
Intermediate-Term Government Bond Index Fund
Statement of Operations
| Year Ended | |
| August 31, 2014 | |
| ($000) | |
| Investment Income | |
| Income | |
| Interest1 | 5,805 |
| Total Income | 5,805 |
| Expenses | |
| The Vanguard Group—Note B | |
| Investment Advisory Services | 9 |
| Management and Administrative—Admiral Shares | 140 |
| Management and Administrative—Institutional Shares | 26 |
| Management and Administrative—ETF Shares | 92 |
| Marketing and Distribution—Admiral Shares | 36 |
| Marketing and Distribution—Institutional Shares | 14 |
| Marketing and Distribution—ETF Shares | 31 |
| Custodian Fees | 6 |
| Auditing Fees | 46 |
| Shareholders’ Reports—Admiral Shares | 2 |
| Shareholders’ Reports—Institutional Shares | 1 |
| Shareholders’ Reports—ETF Shares | 10 |
| Total Expenses | 413 |
| Net Investment Income | 5,392 |
| Realized Net Gain (Loss) on Investment Securities Sold | 116 |
| Change in Unrealized Appreciation (Depreciation) of Investment Securities | 6,662 |
| Net Increase (Decrease) in Net Assets Resulting from Operations | 12,170 |
| 1 Interest income from an affiliated company of the fund was $2,000. | |
See accompanying Notes, which are an integral part of the Financial Statements.
36
Intermediate-Term Government Bond Index Fund
Statement of Changes in Net Assets
| Year Ended August 31, | ||
| 2014 | 2013 | |
| ($000) | ($000) | |
| Increase (Decrease) in Net Assets | ||
| Operations | ||
| Net Investment Income | 5,392 | 3,848 |
| Realized Net Gain (Loss) | 116 | 5,278 |
| Change in Unrealized Appreciation (Depreciation) | 6,662 | (17,798) |
| Net Increase (Decrease) in Net Assets Resulting from Operations | 12,170 | (8,672) |
| Distributions | ||
| Net Investment Income | ||
| Admiral Shares1 | (2,645) | (779) |
| Institutional Shares | (826) | (1,120) |
| ETF Shares | (1,690) | (1,948) |
| Realized Capital Gain 2 | ||
| Admiral Shares1 | (474) | (525) |
| Institutional Shares | (194) | (838) |
| ETF Shares | (359) | (1,224) |
| Total Distributions | (6,188) | (6,434) |
| Capital Share Transactions | ||
| Admiral Shares1 | 133,880 | 64,413 |
| Institutional Shares | (6,706) | (54,102) |
| ETF Shares | 38,270 | (2,923) |
| Net Increase (Decrease) from Capital Share Transactions | 165,444 | 7,388 |
| Total Increase (Decrease) | 171,426 | (7,718) |
| Net Assets | ||
| Beginning of Period | 277,535 | 285,253 |
| End of Period3 | 448,961 | 277,535 |
| 1 Signal Shares were renamed Admiral Shares in October 2013. The prior period’s distributions and capital share transactions are for the Signal class. 2 Includes fiscal 2014 and 2013 short-term gain distributions totaling $78,000 and $753,000, respectively. Short-term gain distributions are treated as ordinary income dividends for tax purposes. 3 Net Assets—End of Period includes undistributed (overdistributed) net investment income of $235,000 and $4,000. | ||
See accompanying Notes, which are an integral part of the Financial Statements.
37
Intermediate-Term Government Bond Index Fund
Financial Highlights
| Admiral Shares | |||||
| Aug. 4, | |||||
| 20101 to | |||||
| For a Share Outstanding | Year Ended August 31, | Aug. 31, | |||
| Throughout Each Period | 2014 | 2013 | 2012 | 2011 | 2010 |
| Net Asset Value, Beginning of Period | $21.27 | $22.50 | $21.94 | $21.49 | $21.11 |
| Investment Operations | |||||
| Net Investment Income | .317 | .292 | .369 | .441 | .033 |
| Net Realized and Unrealized Gain (Loss) | |||||
| on Investments | .432 | (1.000) | .602 | .658 | .385 |
| Total from Investment Operations | .749 | (.708) | .971 | 1.099 | .418 |
| Distributions | |||||
| Dividends from Net Investment Income | (.315) | (.292) | (.369) | (.441) | (.038) |
| Distributions from Realized Capital Gains | (.064) | (.230) | (.042) | (.208) | — |
| Total Distributions | (.379) | (.522) | (.411) | (.649) | (.038) |
| Net Asset Value, End of Period | $21.64 | $21.27 | $22.50 | $21.94 | $21.49 |
| Total Return 2 | 3.55% | -3.21% | 4.47% | 5.31% | 1.98% |
| Ratios/Supplemental Data | |||||
| Net Assets, End of Period (Millions) | $232 | $95 | $35 | $8 | $3 |
| Ratio of Total Expenses to Average Net Assets | 0.12% | 0.12% | 0.12% | 0.13% | 0.15%3 |
| Ratio of Net Investment Income to | |||||
| Average Net Assets | 1.50% | 1.32% | 1.67% | 2.10% | 2.29%3 |
| Portfolio Turnover Rate4 | 43% | 54% | 51% | 41% | 106% |
| Signal Shares were renamed Admiral Shares in October 2013. Prior periods’ Financial Highlights are for the Signal class. 1 Inception. 2 Total returns do not include transaction or account service fees that may have applied in the periods shown. Fund prospectuses provide information about any applicable transaction and account service fees. 3 Annualized. 4 Excludes the value of portfolio securities received or delivered as a result of in-kind purchases or redemptions of the fund’s capital shares, including ETF Creation Units. | |||||
See accompanying Notes, which are an integral part of the Financial Statements.
38
Intermediate-Term Government Bond Index Fund
Financial Highlights
| Institutional Shares | |||||
| March 19, | |||||
| 20101 to | |||||
| For a Share Outstanding | Year Ended August 31, | Aug. 31, | |||
| Throughout Each Period | 2014 | 2013 | 2012 | 2011 | 2010 |
| Net Asset Value, Beginning of Period | $26.39 | $27.91 | $27.21 | $26.65 | $25.01 |
| Investment Operations | |||||
| Net Investment Income | . 400 | . 368 | .466 | .557 | . 239 |
| Net Realized and Unrealized Gain (Loss) | |||||
| on Investments | .536 | (1.235) | .752 | .819 | 1.674 |
| Total from Investment Operations | .936 | (.867) | 1.218 | 1.376 | 1.913 |
| Distributions | |||||
| Dividends from Net Investment Income | (.397) | (.368) | (.465) | (.558) | (.273) |
| Distributions from Realized Capital Gains | (. 079) | (. 285) | (. 053) | (. 258) | — |
| Total Distributions | (. 476) | (. 653) | (. 518) | (.816) | (.273) |
| Net Asset Value, End of Period | $26.85 | $26.39 | $27.91 | $27.21 | $26.65 |
| Total Return2 | 3.58% | -3.17% | 4.52% | 5.36% | 7.69% |
| Ratios/Supplemental Data | |||||
| Net Assets, End of Period (Millions) | $54 | $59 | $117 | $118 | $73 |
| Ratio of Total Expenses to Average Net Assets | 0.09% | 0.09% | 0.09% | 0.09% | 0.09%3 |
| Ratio of Net Investment Income to | |||||
| Average Net Assets | 1.53% | 1.35% | 1.70% | 2.14% | 2.35%3 |
| Portfolio Turnover Rate 4 | 43% | 54% | 51% | 41% | 106% |
| 1 Inception. 2 Total returns do not include transaction fees that may have applied in the periods shown. Fund prospectuses provide information about any applicable transaction fees. 3 Annualized. 4 Excludes the value of portfolio securities received or delivered as a result of in-kind purchases or redemptions of the fund’s capital shares, including ETF Creation Units. | |||||
See accompanying Notes, which are an integral part of the Financial Statements.
39
Intermediate-Term Government Bond Index Fund
Financial Highlights
| ETF Shares | |||||
| Nov. 19, | |||||
| 20091 to | |||||
| For a Share Outstanding | Year Ended August 31, | Aug. 31, | |||
| Throughout Each Period | 2014 | 2013 | 2012 | 2011 | 2010 |
| Net Asset Value, Beginning of Period | $62.96 | $66.58 | $64.91 | $63.58 | $60.00 |
| Investment Operations | |||||
| Net Investment Income | .920 | .861 | 1.097 | 1.301 | .961 |
| Net Realized and Unrealized Gain (Loss) | |||||
| on Investments | 1.292 | (2.940) | 1.791 | 1.949 | 3.579 |
| Total from Investment Operations | 2.212 | (2.079) | 2.888 | 3.250 | 4.540 |
| Distributions | |||||
| Dividends from Net Investment Income | (.843) | (.861) | (1.094) | (1.304) | (.960) |
| Distributions from Realized Capital Gains | (.189) | (.680) | (.124) | (. 616) | — |
| Total Distributions | (1.032) | (1.541) | (1.218) | (1.920) | (.960) |
| Net Asset Value, End of Period | $64.14 | $62.96 | $66.58 | $64.91 | $63.58 |
| Total Return | 3.54% | -3.18% | 4.50% | 5.30% | 7.65% |
| Ratios/Supplemental Data | |||||
| Net Assets, End of Period (Millions) | $164 | $123 | $133 | $55 | $38 |
| Ratio of Total Expenses to Average Net Assets | 0.12% | 0.12% | 0.12% | 0.14% | 0.15%2 |
| Ratio of Net Investment Income to | |||||
| Average Net Assets | 1.50% | 1.32% | 1.67% | 2.09% | 2.29%2 |
| Portfolio Turnover Rate 3 | 43% | 54% | 51% | 41% | 106% |
| 1 Inception. 2 Annualized. 3 Excludes the value of portfolio securities received or delivered as a result of in-kind purchases or redemptions of the fund’s capital shares, including ETF Creation Units. | |||||
See accompanying Notes, which are an integral part of the Financial Statements.
40
Intermediate-Term Government Bond Index Fund
Notes to Financial Statements
Vanguard Intermediate-Term Government Bond Index Fund is registered under the Investment Company Act of 1940 as an open-end investment company, or mutual fund. The fund offers three classes of shares: Admiral Shares, Institutional Shares, and ETF Shares. Admiral Shares and Institutional Shares are designed for investors who meet certain administrative, service, and account-size criteria. ETF shares are listed for trading on Nasdaq; they can be purchased and sold through a broker. Effective in October 2013, Signal Shares were renamed Admiral Shares.
A. The following significant accounting policies conform to generally accepted accounting principles for U.S. investment companies. The fund consistently follows such policies in preparing its financial statements.
1. Security Valuation: Securities are valued as of the close of trading on the New York Stock Exchange (generally 4 p.m., Eastern time) on the valuation date. Bonds, and temporary cash investments acquired over 60 days to maturity, are valued using the latest bid prices or using valuations based on a matrix system (which considers such factors as security prices, yields, maturities, and ratings), both as furnished by independent pricing services. Investments in Vanguard Market Liquidity Fund are valued at that fund’s net asset value. Other temporary cash investments are valued at amortized cost, which approximates market value. Securities for which market quotations are not readily available, or whose values have been affected by events occurring before the fund’s pricing time but after the close of the securities’ primary markets, are valued by methods deemed by the board of trustees to represent fair value.
2. Federal Income Taxes: The fund intends to continue to qualify as a regulated investment company and distribute all of its taxable income. Management has analyzed the fund’s tax positions taken for all open federal income tax years (August 31, 2011–2014), and has concluded that no provision for federal income tax is required in the fund’s financial statements.
3. Distributions: Distributions to shareholders are recorded on the ex-dividend date.
4. Credit Facility: The fund and certain other funds managed by The Vanguard Group participate in a $2.89 billion committed credit facility provided by a syndicate of lenders pursuant to a credit agreement that may be renewed annually; each fund is individually liable for its borrowings, if any, under the credit facility. Borrowings may be utilized for temporary and emergency purposes, and are subject to the fund’s regulatory and contractual borrowing restrictions. The participating funds are charged administrative fees and an annual commitment fee of 0.06% of the undrawn amount of the facility; these fees are allocated to the funds based on a method approved by the fund’s board of trustees and included in Management and Administrative expenses on the fund’s Statement of Operations. Any borrowings under this facility bear interest at a rate equal to the higher of the federal funds rate or LIBOR reference rate plus an agreed-upon spread.
The fund had no borrowings outstanding at August 31, 2014, or at any time during the period then ended.
5. Other: Interest income includes income distributions received from Vanguard Market Liquidity Fund and is accrued daily. Premiums and discounts on debt securities purchased are amortized and accreted, respectively, to interest income over the lives of the respective securities. Security transactions are accounted for on the date securities are bought or sold. Costs used to determine realized gains (losses) on the sale of investment securities are those of the specific securities sold. Fees, if any, assessed on purchases of capital shares are credited to paid-in capital.
41
Intermediate-Term Government Bond Index Fund
Each class of shares has equal rights as to assets and earnings, except that each class separately bears certain class-specific expenses related to maintenance of shareholder accounts (included in Management and Administrative expenses) and shareholder reporting. Marketing and distribution expenses are allocated to each class of shares based on a method approved by the board of trustees. Income, other non-class-specific expenses, and gains and losses on investments are allocated to each class of shares based on its relative net assets.
B. The Vanguard Group furnishes at cost investment advisory, corporate management, administrative, marketing, and distribution services. The costs of such services are allocated to the fund based on methods approved by the board of trustees. The fund has committed to provide up to 0.40% of its net assets in capital contributions to Vanguard. At August 31, 2014, the fund had contributed capital of $43,000 to Vanguard (included in Other Assets), representing 0.01% of the fund’s net assets and 0.02% of Vanguard’s capitalization. The fund’s trustees and officers are also directors and officers of Vanguard.
C. Various inputs may be used to determine the value of the fund’s investments. These inputs are summarized in three broad levels for financial statement purposes. The inputs or methodologies used to value securities are not necessarily an indication of the risk associated with investing in those securities.
Level 1—Quoted prices in active markets for identical securities.
Level 2—Other significant observable inputs (including quoted prices for similar securities, interest rates, prepayment speeds, credit risk, etc.).
Level 3—Significant unobservable inputs (including the fund’s own assumptions used to determine the fair value of investments).
| The following table summarizes the market value of the fund’s investments as of August 31, 2014, | |||
| based on the inputs used to value them: | |||
| Level 1 | Level 2 | Level 3 | |
| Investments | ($000) | ($000) | ($000) |
| U.S. Government and Agency Obligations | — | 446,062 | — |
| Temporary Cash Investments | 3,048 | — | — |
| Total | 3,048 | 446,062 | — |
D. Distributions are determined on a tax basis and may differ from net investment income and realized capital gains for financial reporting purposes. Differences may be permanent or temporary. Permanent differences are reclassified among capital accounts in the financial statements to reflect their tax character. Temporary differences arise when certain items of income, expense, gain, or loss are recognized in different periods for financial statement and tax purposes. These differences will reverse at some time in the future. Differences in classification may also result from the treatment of short-term gains as ordinary income for tax purposes.
During the year ended August 31, 2014, the fund realized $290,000 of net capital gains resulting from in-kind redemptions—in which shareholders exchanged fund shares for securities held by the fund rather than for cash. Because such gains are not taxable to the fund, and are not distributed to shareholders, they have been reclassified from accumulated net realized losses to paid-in capital.
The fund had available capital losses totaling $302,000 that may be carried forward indefinitely to offset future net capital gains.
42
Intermediate-Term Government Bond Index Fund
At August 31, 2014, the cost of investment securities for tax purposes was $446,975,000. Net unrealized appreciation of investment securities for tax purposes was $2,135,000, consisting of unrealized gains of $3,236,000 on securities that had risen in value since their purchase and $1,101,000 in unrealized losses on securities that had fallen in value since their purchase.
E. During the year ended August 31, 2014, the fund purchased $339,143,000 of investment securities and sold $172,962,000 of investment securities, other than temporary cash investments. Purchases and sales include $56,741,000 and $18,913,000, respectively, in connection with in-kind purchases and redemptions of the fund’s capital shares.
| F. Capital share transactions for each class of shares were: | |||||
| Year Ended August 31, | |||||
| 2014 | 2013 | ||||
| Amount | Shares | Amount | Shares | ||
| ($000) | (000) | ($000) | (000) | ||
| Admiral Shares1 | |||||
| Issued 2 | 178,855 | 8,329 | 82,433 | 3,768 | |
| Issued in Lieu of Cash Distributions | 3,049 | 142 | 1,291 | 59 | |
| Redeemed | (48,024) | (2,237) | (19,311) | (882) | |
| Net Increase (Decrease) —Admiral Shares | 133,880 | 6,234 | 64,413 | 2,945 | |
| Institutional Shares | |||||
| Issued2 | 11,854 | 447 | 7,164 | 260 | |
| Issued in Lieu of Cash Distributions | 925 | 35 | 1,800 | 66 | |
| Redeemed | (19,485) | (741) | (63,066) | (2,285) | |
| Net Increase (Decrease)—Institutional Shares | (6,706) | (259) | (54,102) | (1,959) | |
| ETF Shares | |||||
| Issued 2 | 57,403 | 900 | 104,369 | 1,600 | |
| Issued in Lieu of Cash Distributions | — | — | — | — | |
| Redeemed | (19,133) | (300) | (107,292) | (1,650) | |
| Net Increase (Decrease)—ETF Shares | 38,270 | 600 | (2,923) | (50) | |
| 1 Signal Shares were renamed Admiral Shares in October 2013. The prior period’s capital share transactions are for the Signal class. 2 Includes purchase fees for fiscal 2014 and 2013 of $0 and $15,000, respectively (fund totals). | |||||
At August 31, 2014, one shareholder was the record or beneficial owner of 30% of the fund’s net assets. If the shareholder were to redeem its investment in the fund, the redemption might result in an increase in the fund’s expense ratio, cause the fund to incur higher transaction costs, or lead to the realization of taxable capital gains.
G. Management has determined that no material events or transactions occurred subsequent to August 31, 2014, that would require recognition or disclosure in these financial statements.
43
Long-Term Government Bond Index Fund
Fund Profile
As of August 31, 2014
| Share-Class Characteristics | |||
| Admiral | Institutional | ETF | |
| Shares | Shares | Shares | |
| Ticker Symbol | VLGSX | VLGIX | VGLT |
| Expense Ratio1 | 0.12% | 0.09% | 0.12% |
| 30-Day SEC Yield | 2.90% | 2.93% | 2.90% |
| Financial Attributes | |||
| Barclays | |||
| Long Gov | Barclays | ||
| Float Adj | Aggregate | ||
| Fund | Index | FA Index | |
| Number of Bonds | 66 | 90 | 8,876 |
| Yield to Maturity | |||
| (before expenses) | 3.0% | 3.0% | 2.1% |
| Average Coupon | 4.1% | 4.1% | 3.3% |
| Average Duration | 16.5 years | 16.5 years | 5.6 years |
| Average Effective | |||
| Maturity | 24.4 years | 24.4 years | 7.7 years |
| Short-Term | |||
| Reserves | 1.1% | — | — |
| Sector Diversification (% of portfolio) | |
| Treasury/Agency | 100.0% |
| The agency and mortgage-backed securities sectors may include issues from government-sponsored enterprises; such issues are generally not backed by the full faith and credit of the U.S. government. | |
| ||
| Volatility Measures | ||
| Barclays | ||
| Long Gov | Barclays | |
| Float Adj | Aggregate | |
| Index | FA Index | |
| R-Squared | 0.99 | 0.61 |
| Beta | 1.03 | 3.46 |
| These measures show the degree and timing of the fund’s fluctuations compared with the indexes over 36 months. | ||
| Distribution by Effective Maturity | |
| (% of portfolio) | |
| Under 1 Year | 0.3% |
| 10 - 20 Years | 20.7 |
| 20 - 30 Years | 78.7 |
| Over 30 Years | 0.3 |
| Distribution by Credit Quality (% of portfolio) | |
| U.S. Government | 100.0% |
| Credit-quality ratings are obtained from Barclays and are from Moody's, Fitch, and S&P. When ratings from all three agencies are used, the median rating is shown. When ratings from two of the agencies are used, the lower rating for each issue is shown. For more information about these ratings, see the Glossary entry for Credit Quality. | |
Investment Focus
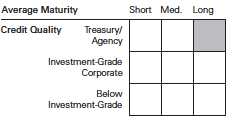
1 The expense ratios shown are from the prospectus dated December 20, 2013, and represent estimated costs for the current fiscal year. For the fiscal year ended August 31, 2014, the expense ratios were 0.12% for Admiral Shares, 0.09% for Institutional Shares, and 0.12% for ETF Shares.
44
Long-Term Government Bond Index Fund
Performance Summary
All of the returns in this report represent past performance, which is not a guarantee of future results that may be achieved by the fund. (Current performance may be lower or higher than the performance data cited. For performance data current to the most recent month-end, visit our website at vanguard.com/performance.) Note, too, that both investment returns and principal value can fluctuate widely, so an investor’s shares, when sold, could be worth more or less than their original cost. The returns shown do not reflect taxes that a shareholder would pay on fund distributions or on the sale of fund shares.
Cumulative Performance: November 19, 2009, Through August 31, 2014
Initial Investment of $10,000
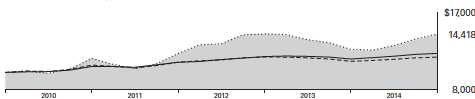
| Average Annual Total Returns | ||||
| Periods Ended August 31, 2014 | ||||
| Since | Final Value | |||
| One | Inception | of a $10,000 | ||
| Year | (11/19/2009) | Investment | ||
| Long-Term Government Bond Index | ||||
| Fund ETF Shares Net Asset Value | 14.65% | 7.95% | $14,418 | |
| Long-Term Government Bond Index | ||||
| Fund ETF Shares Market Price | 14.55 | 7.96 | 14,419 | |
| Barclays U.S. Long Government Float | ||||
| •••••••• | Adjusted Index | 14.15 | 8.04 | 14,474 |
| – – –– | General U.S. Government Funds | |||
| Average | 4.38 | 3.50 | 11,785 | |
| Spliced Barclays U.S. Aggregate Float | ||||
| Adjusted Index | 5.64 | 4.27 | 12,212 | |
| For a benchmark description, see the Glossary. General U.S. Government Funds Average: Derived from data provided by Lipper, a Thomson Reuters Company. "Since Inception" performance is calculated from the ETF Shares’ inception date for both the fund and its comparative standards. | ||||
See Financial Highlights for dividend and capital gains information.
45
Long-Term Government Bond Index Fund
| Average Annual Total Returns | |||
| Periods Ended August 31, 2014 | |||
| Since | Final Value | ||
| One | Inception | of a $10,000 | |
| Year | (3/1/2010) | Investment | |
| Long-Term Government Bond Index Fund | |||
| Admiral Shares | 14.63% | 8.79% | $14,611 |
| Barclays U.S. Long Government Float | |||
| Adjusted Index | 14.15 | 8.88 | 14,665 |
| Barclays U.S. Aggregate Float Adjusted Index | 5.64 | 4.32 | 12,096 |
| "Since Inception" performance is calculated from the Admiral Shares’ inception date for both the fund and its comparative standards. | |||
| Since | Final Value | ||
| One | Inception | of a $5,000,000 | |
| Year | (7/30/2010) | Investment | |
| Long-Term Government Bond Index Fund | |||
| Institutional Shares | 14.66% | 7.19% | $6,641,251 |
| Barclays U.S. Long Government Float | |||
| Adjusted Index | 14.15 | 7.21 | 6,645,503 |
| Barclays U.S. Aggregate Float Adjusted | |||
| Index | 5.64 | 3.65 | 5,789,479 |
| "Since Inception" performance is calculated from the Institutional Shares’ inception date for both the fund and its comparative standards. | |||
| Cumulative Returns of ETF Shares: November 19, 2009, Through August 31, 2014 | ||
| Since | ||
| One | Inception | |
| Year | (11/19/2009) | |
| Long-Term Government Bond Index Fund ETF | ||
| Shares Market Price | 14.55% | 44.19% |
| Long-Term Government Bond Index Fund ETF | ||
| Shares Net Asset Value | 14.65 | 44.18 |
| Barclays U.S. Long Government Float Adjusted | ||
| Index | 14.15 | 44.74 |
| "Since Inception" performance is calculated from the ETF Shares’ inception date for both the fund and its comparative standards. | ||
46
Long-Term Government Bond Index Fund
| Fiscal-Year Total Returns (%): November 19, 2009, Through August 31, 2014 | |||
| Barclays | |||
| Long Gov | |||
| Float Adj | |||
| ETF Shares Net Asset Value | Index | ||
| Fiscal Year | Total Returns | Total Returns | |
| 2010 | 16.21% | 16.12% | |
| 2011 | 4.63 | 5.11 | |
| 2012 | 19.06 | 18.68 | |
| 2013 | -13.13 | -12.46 | |
| 2014 | 14.65 | 14.15 | |
| Average Annual Total Returns: Periods Ended June 30, 2014 | |||||
| This table presents returns through the latest calendar quarter—rather than through the end of the fiscal period. | |||||
| Securities and Exchange Commission rules require that we provide this information. | |||||
| Since Inception | |||||
| Inception Date | One Year | Income | Capital | Total | |
| Admiral Shares | 3/1/2010 | 6.05% | 3.40% | 4.57% | 7.97% |
| Institutional Shares | 7/30/2010 | 6.03 | 3.34 | 2.89 | 6.23 |
| ETF Shares | 11/19/2009 | ||||
| Market Price | 6.05 | 7.16 | |||
| Net Asset Value | 6.03 | 7.16 | |||
47
Long-Term Government Bond Index Fund
Financial Statements
Statement of Net Assets
As of August 31, 2014
The fund reports a complete list of its holdings in regulatory filings four times in each fiscal year, at the quarter-ends. For the second and fourth fiscal quarters, the lists appear in the fund’s semiannual and annual reports to shareholders. For the first and third fiscal quarters, the fund files the lists with the Securities and Exchange Commission on Form N-Q. Shareholders can look up the fund’s Forms N-Q on the SEC’s website at sec.gov. Forms N-Q may also be reviewed and copied at the SEC’s Public Reference Room (see the back cover of this report for further information).
| Face | Market | |||
| Maturity | Amount | Value• | ||
| Coupon | Date | ($000) | ($000) | |
| U.S. Government and Agency Obligations (99.0%) | ||||
| U.S. Government Securities (92.6%) | ||||
| United States Treasury Note/Bond | 7.500% | 11/15/24 | 1,710 | 2,517 |
| United States Treasury Note/Bond | 7.625% | 2/15/25 | 1,115 | 1,663 |
| United States Treasury Note/Bond | 6.875% | 8/15/25 | 1,123 | 1,610 |
| United States Treasury Note/Bond | 6.000% | 2/15/26 | 2,456 | 3,331 |
| United States Treasury Note/Bond | 6.750% | 8/15/26 | 1,330 | 1,920 |
| United States Treasury Note/Bond | 6.500% | 11/15/26 | 1,424 | 2,025 |
| United States Treasury Note/Bond | 6.625% | 2/15/27 | 1,343 | 1,935 |
| United States Treasury Note/Bond | 6.375% | 8/15/27 | 783 | 1,114 |
| United States Treasury Note/Bond | 6.125% | 11/15/27 | 2,775 | 3,880 |
| United States Treasury Note/Bond | 5.500% | 8/15/28 | 1,908 | 2,549 |
| United States Treasury Note/Bond | 5.250% | 11/15/28 | 2,409 | 3,156 |
| United States Treasury Note/Bond | 5.250% | 2/15/29 | 1,980 | 2,596 |
| United States Treasury Note/Bond | 6.125% | 8/15/29 | 1,164 | 1,661 |
| United States Treasury Note/Bond | 6.250% | 5/15/30 | 2,262 | 3,292 |
| United States Treasury Note/Bond | 5.375% | 2/15/31 | 4,560 | 6,152 |
| United States Treasury Note/Bond | 4.500% | 2/15/36 | 4,155 | 5,242 |
| United States Treasury Note/Bond | 4.750% | 2/15/37 | 1,035 | 1,352 |
| United States Treasury Note/Bond | 5.000% | 5/15/37 | 1,526 | 2,059 |
| United States Treasury Note/Bond | 4.375% | 2/15/38 | 2,539 | 3,152 |
| United States Treasury Note/Bond | 4.500% | 5/15/38 | 2,216 | 2,802 |
| United States Treasury Note/Bond | 3.500% | 2/15/39 | 4,589 | 4,998 |
| United States Treasury Note/Bond | 4.250% | 5/15/39 | 3,351 | 4,101 |
| United States Treasury Note/Bond | 4.500% | 8/15/39 | 4,075 | 5,172 |
| United States Treasury Note/Bond | 4.375% | 11/15/39 | 4,812 | 6,004 |
| United States Treasury Note/Bond | 4.625% | 2/15/40 | 6,317 | 8,184 |
| United States Treasury Note/Bond | 4.375% | 5/15/40 | 6,413 | 8,022 |
| United States Treasury Note/Bond | 3.875% | 8/15/40 | 4,708 | 5,455 |
| United States Treasury Note/Bond | 4.250% | 11/15/40 | 5,247 | 6,448 |
| United States Treasury Note/Bond | 4.750% | 2/15/41 | 3,723 | 4,935 |
| United States Treasury Note/Bond | 4.375% | 5/15/41 | 3,459 | 4,342 |
| United States Treasury Note/Bond | 3.750% | 8/15/41 | 4,180 | 4,750 |
| United States Treasury Note/Bond | 3.125% | 11/15/41 | 5,670 | 5,762 |
| United States Treasury Note/Bond | 3.125% | 2/15/42 | 4,316 | 4,379 |
| United States Treasury Note/Bond | 3.000% | 5/15/42 | 3,275 | 3,241 |
| United States Treasury Note/Bond | 2.750% | 8/15/42 | 9,210 | 8,655 |
| United States Treasury Note/Bond | 2.750% | 11/15/42 | 8,755 | 8,215 |
| United States Treasury Note/Bond | 3.125% | 2/15/43 | 10,470 | 10,578 |
| 48 |
Long-Term Government Bond Index Fund
| Face | Market | ||||
| Maturity | Amount | Value• | |||
| Coupon | Date | ($000) | ($000) | ||
| United States Treasury Note/Bond | 2.875% | 5/15/43 | 13,010 | 12,502 | |
| United States Treasury Note/Bond | 3.625% | 8/15/43 | 13,515 | 14,968 | |
| United States Treasury Note/Bond | 3.750% | 11/15/43 | 12,198 | 13,814 | |
| United States Treasury Note/Bond | 3.625% | 2/15/44 | 14,790 | 16,387 | |
| United States Treasury Note/Bond | 3.375% | 5/15/44 | 7,870 | 8,332 | |
| United States Treasury Note/Bond | 3.125% | 8/15/44 | 4,400 | 4,441 | |
| 227,693 | |||||
| Agency Bonds and Notes (6.4%) | |||||
| 1 | AID-Israel | 5.500% | 9/18/33 | 150 | 193 |
| 2 | Federal Home Loan Banks | 5.500% | 7/15/36 | 710 | 939 |
| 3 | Federal Home Loan Mortgage Corp. | 6.750% | 9/15/29 | 313 | 456 |
| 3 | Federal Home Loan Mortgage Corp. | 6.750% | 3/15/31 | 1,255 | 1,839 |
| 3 | Federal Home Loan Mortgage Corp. | 6.250% | 7/15/32 | 1,369 | 1,942 |
| 3 | Federal National Mortgage Assn. | 6.250% | 5/15/29 | 700 | 961 |
| 3 | Federal National Mortgage Assn. | 7.125% | 1/15/30 | 730 | 1,093 |
| 3 | Federal National Mortgage Assn. | 7.250% | 5/15/30 | 1,165 | 1,769 |
| 3 | Federal National Mortgage Assn. | 6.625% | 11/15/30 | 1,320 | 1,908 |
| 3 | Federal National Mortgage Assn. | 5.625% | 7/15/37 | 275 | 374 |
| 2 | Tennessee Valley Authority | 6.750% | 11/1/25 | 530 | 720 |
| 2 | Tennessee Valley Authority | 7.125% | 5/1/30 | 150 | 219 |
| 2 | Tennessee Valley Authority | 4.700% | 7/15/33 | 100 | 116 |
| 2 | Tennessee Valley Authority | 4.650% | 6/15/35 | 75 | 86 |
| 2 | Tennessee Valley Authority | 5.880% | 4/1/36 | 670 | 897 |
| 2 | Tennessee Valley Authority | 6.150% | 1/15/38 | 165 | 229 |
| 2 | Tennessee Valley Authority | 5.500% | 6/15/38 | 150 | 192 |
| 2 | Tennessee Valley Authority | 5.250% | 9/15/39 | 622 | 781 |
| 2 | Tennessee Valley Authority | 3.500% | 12/15/42 | 250 | 240 |
| 2 | Tennessee Valley Authority | 4.875% | 1/15/48 | 245 | 287 |
| 2 | Tennessee Valley Authority | 5.375% | 4/1/56 | 215 | 272 |
| 2 | Tennessee Valley Authority | 4.625% | 9/15/60 | 250 | 280 |
| 15,793 | |||||
| Total U.S. Government and Agency Obligations (Cost $232,321) | 243,486 | ||||
| Shares | |||||
| Temporary Cash Investment (1.1%) | |||||
| Money Market Fund (1.1%) | |||||
| 4 | Vanguard Market Liquidity Fund (Cost $2,668) | 0.113% | 2,668,000 | 2,668 | |
| Total Investments (100.1%) (Cost $234,989) | 246,154 | ||||
| Other Assets and Liabilities (-0.1%) | |||||
| Other Assets | 5,003 | ||||
| Liabilities | (5,360) | ||||
| (357) | |||||
| Net Assets (100%) | 245,797 | ||||
49
Long-Term Government Bond Index Fund
| At August 31, 2014, net assets consisted of: | |
| Amount | |
| ($000) | |
| Paid-in Capital | 242,649 |
| Undistributed Net Investment Income | 268 |
| Accumulated Net Realized Losses | (8,285) |
| Unrealized Appreciation (Depreciation) | 11,165 |
| Net Assets | 245,797 |
| Admiral Shares—Net Assets | |
| Applicable to 1,770,546 outstanding $.001 par value shares of | |
| beneficial interest (unlimited authorization) | 43,927 |
| Net Asset Value Per Share—Admiral Shares | $24.81 |
| Institutional Shares—Net Assets | |
| Applicable to 3,006,821 outstanding $.001 par value shares of | |
| beneficial interest (unlimited authorization) | 94,666 |
| Net Asset Value Per Share—Institutional Shares | $31.48 |
| ETF Shares—Net Assets | |
| Applicable to 1,450,000 outstanding $.001 par value shares of | |
| beneficial interest (unlimited authorization) | 107,204 |
| Net Asset Value Per Share—ETF Shares | $73.93 |
• See Note A in Notes to Financial Statements.
1 U. S. government guaranteed.
2 The issuer operates under a congressional charter; its securities are generally neither guaranteed by the U.S. Treasury nor backed by the full faith and credit of the U.S. government.
3 The issuer was placed under federal conservatorship in September 2008; since that time, its daily operations have been managed by the Federal Housing Finance Agency and it receives capital from the U.S. Treasury, as needed to maintain a positive net worth, in exchange for senior preferred stock.
4 Affiliated money market fund available only to Vanguard funds and certain trusts and accounts managed by Vanguard. Rate shown is the 7-day yield.
See accompanying Notes, which are an integral part of the Financial Statements.
50
Long-Term Government Bond Index Fund
Statement of Operations
| Year Ended | |
| August 31, 2014 | |
| ($000) | |
| Investment Income | |
| Income | |
| Interest1 | 5,429 |
| Total Income | 5,429 |
| Expenses | |
| The Vanguard Group—Note B | |
| Investment Advisory Services | 4 |
| Management and Administrative—Admiral Shares | 12 |
| Management and Administrative—Institutional Shares | 24 |
| Management and Administrative—ETF Shares | 38 |
| Marketing and Distribution—Admiral Shares | 2 |
| Marketing and Distribution—Institutional Shares | 18 |
| Marketing and Distribution—ETF Shares | 19 |
| Custodian Fees | 6 |
| Auditing Fees | 46 |
| Shareholders’ Reports—Admiral Shares | 1 |
| Shareholders’ Reports—Institutional Shares | — |
| Shareholders’ Reports—ETF Shares | 6 |
| Total Expenses | 176 |
| Net Investment Income | 5,253 |
| Realized Net Gain (Loss) on Investment Securities Sold | (1,067) |
| Change in Unrealized Appreciation (Depreciation) of Investment Securities | 22,271 |
| Net Increase (Decrease) in Net Assets Resulting from Operations | 26,457 |
| 1 Interest income from an affiliated company of the fund was $1,000. | |
See accompanying Notes, which are an integral part of the Financial Statements.
51
Long-Term Government Bond Index Fund
Statement of Changes in Net Assets
| Year Ended August 31, | ||
| 2014 | 2013 | |
| ($000) | ($000) | |
| Increase (Decrease) in Net Assets | ||
| Operations | ||
| Net Investment Income | 5,253 | 6,610 |
| Realized Net Gain (Loss) | (1,067) | (2,529) |
| Change in Unrealized Appreciation (Depreciation) | 22,271 | (30,324) |
| Net Increase (Decrease) in Net Assets Resulting from Operations | 26,457 | (26,243) |
| Distributions | ||
| Net Investment Income | ||
| Admiral Shares1 | (541) | (156) |
| Institutional Shares | (2,376) | (2,707) |
| ETF Shares | (2,078) | (3,753) |
| Realized Capital Gain 2 | ||
| Admiral Shares1 | — | (10) |
| Institutional Shares | — | (198) |
| ETF Shares | — | (157) |
| Total Distributions | (4,995) | (6,981) |
| Capital Share Transactions | ||
| Admiral Shares1 | 35,290 | 1,704 |
| Institutional Shares | 48,422 | (31,020) |
| ETF Shares | 34,774 | 4,671 |
| Net Increase (Decrease) from Capital Share Transactions | 118,486 | (24,645) |
| Total Increase (Decrease) | 139,948 | (57,869) |
| Net Assets | ||
| Beginning of Period | 105,849 | 163,718 |
| End of Period3 | 245,797 | 105,849 |
| 1 Signal Shares were renamed Admiral Shares in October 2013. The prior period’s distributions and capital share transactions are for the Signal class. 2 Includes fiscal 2013 short-term gain distributions totaling $54,000. Short-term gain distributions are treated as ordinary income dividends for tax purposes. 3 Net Assets—End of Period includes undistributed (overdistributed) net investment income of $268,000 and $10,000. | ||
See accompanying Notes, which are an integral part of the Financial Statements.
52
Long-Term Government Bond Index Fund
Financial Highlights
| Admiral Shares | |||||
| March 1, | |||||
| 20101 to | |||||
| For a Share Outstanding | Year Ended August 31, | Aug. 31, | |||
| Throughout Each Period | 2014 | 2013 | 2012 | 2011 | 2010 |
| Net Asset Value, Beginning of Period | $22.32 | $26.48 | $22.91 | $22.75 | $19.66 |
| Investment Operations | |||||
| Net Investment Income | .711 | .693 | .746 | .780 | .364 |
| Net Realized and Unrealized Gain (Loss) | |||||
| on Investments | 2.491 | (4.112) | 3.567 | .182 | 3.084 |
| Total from Investment Operations | 3.202 | (3.419) | 4.313 | .962 | 3.448 |
| Distributions | |||||
| Dividends from Net Investment Income | (.712) | (.693) | (.743) | (.781) | (.358) |
| Distributions from Realized Capital Gains | — | (.048) | — | (.021) | — |
| Total Distributions | (.712) | (.741) | (.743) | (. 802) | (. 358) |
| Net Asset Value, End of Period | $24.81 | $22.32 | $26.48 | $22.91 | $22.75 |
| Total Return2 | 14.63% | -13.13% | 19.05% | 4.66% | 17.75% |
| Ratios/Supplemental Data | |||||
| Net Assets, End of Period (Millions) | $44 | $6 | $5 | $1 | $1 |
| Ratio of Total Expenses to Average Net Assets | 0.12% | 0.12% | 0.12% | 0.14% | 0.15%3 |
| Ratio of Net Investment Income to | |||||
| Average Net Assets | 3.17% | 2.80% | 2.99% | 3.68% | 3.75%3 |
| Portfolio Turnover Rate 4 | 23% | 54% | 46% | 40% | 70% |
| Signal Shares were renamed Admiral Shares in October 2013. Prior periods’ Financial Highlights are for the Signal class. 1 Inception. 2 Total returns do not include transaction or account service fees that may have applied in the periods shown. Fund prospectuses provide information about any applicable transaction and account service fees. 3 Annualized. 4 Excludes the value of portfolio securities received or delivered as a result of in-kind purchases or redemptions of the fund’s capital shares, including ETF Creation Units. | |||||
See accompanying Notes, which are an integral part of the Financial Statements.
53
Long-Term Government Bond Index Fund
Financial Highlights
| Institutional Shares | |||||
| July 30, | |||||
| 20101 to | |||||
| For a Share Outstanding | Year Ended August 31, | Aug. 31, | |||
| Throughout Each Period | 2014 | 2013 | 2012 | 2011 | 2010 |
| Net Asset Value, Beginning of Period | $28.32 | $33.60 | $29.06 | $28.87 | $27.07 |
| Investment Operations | |||||
| Net Investment Income | . 910 | . 890 | .956 | 1.003 | .070 |
| Net Realized and Unrealized Gain (Loss) | |||||
| on Investments | 3.161 | (5.219) | 4.537 | .218 | 1.799 |
| Total from Investment Operations | 4.071 | (4.329) | 5.493 | 1.221 | 1.869 |
| Distributions | |||||
| Dividends from Net Investment Income | (. 911) | (. 890) | (.953) | (1.004) | (.069) |
| Distributions from Realized Capital Gains | — | (.061) | — | (.027) | — |
| Total Distributions | (. 911) | (. 951) | (. 953) | (1.031) | (. 069) |
| Net Asset Value, End of Period | $31.48 | $28.32 | $33.60 | $29.06 | $28.87 |
| Total Return2 | 14.66% | -13.10% | 19.13% | 4.67% | 6.91% |
| Ratios/Supplemental Data | |||||
| Net Assets, End of Period (Millions) | $95 | $37 | $84 | $61 | $9 |
| Ratio of Total Expenses to Average Net Assets | 0.09% | 0.09% | 0.09% | 0.09% | 0.09%3 |
| Ratio of Net Investment Income to | |||||
| Average Net Assets | 3.20% | 2.83% | 3.02% | 3.73% | 3.81%3 |
| Portfolio Turnover Rate 4 | 23% | 54% | 46% | 40% | 70% |
| 1 Inception. 2 Total returns do not include transaction fees that may have applied in the periods shown. Fund prospectuses provide information about any applicable transaction fees. 3 Annualized. 4 Excludes the value of portfolio securities received or delivered as a result of in-kind purchases or redemptions of the fund’s capital shares, including ETF Creation Units. | |||||
See accompanying Notes, which are an integral part of the Financial Statements.
54
Long-Term Government Bond Index Fund
Financial Highlights
| ETF Shares | |||||
| Nov. 19, | |||||
| 20091 to | |||||
| For a Share Outstanding | Year Ended August 31, | Aug. 31, | |||
| Throughout Each Period | 2014 | 2013 | 2012 | 2011 | 2010 |
| Net Asset Value, Beginning of Period | $66.33 | $78.69 | $68.07 | $67.61 | $59.84 |
| Investment Operations | |||||
| Net Investment Income | 2.100 | 2.055 | 2.213 | 2.321 | 1.691 |
| Net Realized and Unrealized Gain (Loss) | |||||
| on Investments | 7.429 | (12.216) | 10.611 | .526 | 7.768 |
| Total from Investment Operations | 9.529 | (10.161) | 12.824 | 2.847 | 9.459 |
| Distributions | |||||
| Dividends from Net Investment Income | (1.929) | (2.056) | (2.204) | (2.324) | (1.689) |
| Distributions from Realized Capital Gains | — | (.143) | — | (.063) | — |
| Total Distributions | (1.929) | (2.199) | (2.204) | (2.387) | (1.689) |
| Net Asset Value, End of Period | $73.93 | $66.33 | $78.69 | $68.07 | $67.61 |
| Total Return | 14.65% | -13.13% | 19.06% | 4.63% | 16.21% |
| Ratios/Supplemental Data | |||||
| Net Assets, End of Period (Millions) | $107 | $63 | $75 | $34 | $78 |
| Ratio of Total Expenses to Average Net Assets | 0.12% | 0.12% | 0.12% | 0.14% | 0.15%2 |
| Ratio of Net Investment Income to | |||||
| Average Net Assets | 3.17% | 2.80% | 2.99% | 3.68% | 3.75%2 |
| Portfolio Turnover Rate 3 | 23% | 54% | 46% | 40% | 70% |
| 1 Inception. 2 Annualized. 3 Excludes the value of portfolio securities received or delivered as a result of in-kind purchases or redemptions of the fund’s capital shares, including ETF Creation Units. | |||||
See accompanying Notes, which are an integral part of the Financial Statements.
55
Long-Term Government Bond Index Fund
Notes to Financial Statements
Vanguard Long-Term Government Bond Index Fund is registered under the Investment Company Act of 1940 as an open-end investment company, or mutual fund The fund offers three classes of shares: Admiral Shares, Institutional Shares, and ETF Shares. Admiral Shares and Institutional Shares are designed for investors who meet certain administrative, service, and account-size criteria. ETF shares are listed for trading on Nasdaq; they can be purchased and sold through a broker. Effective in October 2013, Signal Shares were renamed Admiral Shares.
A. The following significant accounting policies conform to generally accepted accounting principles for U.S. investment companies. The fund consistently follows such policies in preparing its financial statements.
1. Security Valuation: Securities are valued as of the close of trading on the New York Stock Exchange (generally 4 p.m., Eastern time) on the valuation date. Bonds, and temporary cash investments acquired over 60 days to maturity, are valued using the latest bid prices or using valuations based on a matrix system (which considers such factors as security prices, yields, maturities, and ratings), both as furnished by independent pricing services. Investments in Vanguard Market Liquidity Fund are valued at that fund’s net asset value. Other temporary cash investments are valued at amortized cost, which approximates market value. Securities for which market quotations are not readily available, or whose values have been affected by events occurring before the fund’s pricing time but after the close of the securities’ primary markets, are valued by methods deemed by the board of trustees to represent fair value.
2. Federal Income Taxes: The fund intends to continue to qualify as a regulated investment company and distribute all of its taxable income. Management has analyzed the fund’s tax positions taken for all open federal income tax years (August 31, 2011–2014), and has concluded that no provision for federal income tax is required in the fund’s financial statements.
3. Distributions: Distributions to shareholders are recorded on the ex-dividend date.
4. Credit Facility: The fund and certain other funds managed by The Vanguard Group participate in a $2.89 billion committed credit facility provided by a syndicate of lenders pursuant to a credit agreement that may be renewed annually; each fund is individually liable for its borrowings, if any, under the credit facility. Borrowings may be utilized for temporary and emergency purposes, and are subject to the fund’s regulatory and contractual borrowing restrictions. The participating funds are charged administrative fees and an annual commitment fee of 0.06% of the undrawn amount of the facility; these fees are allocated to the funds based on a method approved by the fund’s board of trustees and included in Management and Administrative expenses on the fund’s Statement of Operations. Any borrowings under this facility bear interest at a rate equal to the higher of the federal funds rate or LIBOR reference rate plus an agreed-upon spread.
The fund had no borrowings outstanding at August 31, 2014, or at any time during the period then ended.
5. Other: Interest income includes income distributions received from Vanguard Market Liquidity Fund and is accrued daily. Premiums and discounts on debt securities purchased are amortized and accreted, respectively, to interest income over the lives of the respective securities. Security transactions are accounted for on the date securities are bought or sold. Costs used to determine realized gains (losses) on the sale of investment securities are those of the specific securities sold. Fees, if any, assessed on purchases of capital shares are credited to paid-in capital.
56
Long-Term Government Bond Index Fund
Each class of shares has equal rights as to assets and earnings, except that each class separately bears certain class-specific expenses related to maintenance of shareholder accounts (included in Management and Administrative expenses) and shareholder reporting. Marketing and distribution expenses are allocated to each class of shares based on a method approved by the board of trustees. Income, other non-class-specific expenses, and gains and losses on investments are allocated to each class of shares based on its relative net assets.
B. The Vanguard Group furnishes at cost investment advisory, corporate management, administrative, marketing, and distribution services. The costs of such services are allocated to the fund based on methods approved by the board of trustees. The fund has committed to provide up to 0.40% of its net assets in capital contributions to Vanguard. At August 31, 2014, the fund had contributed capital of $22,000 to Vanguard (included in Other Assets), representing 0.01% of the fund’s net assets and 0.01% of Vanguard’s capitalization. The fund’s trustees and officers are also directors and officers of Vanguard.
C. Various inputs may be used to determine the value of the fund’s investments. These inputs are
summarized in three broad levels for financial statement purposes. The inputs or methodologies
used to value securities are not necessarily an indication of the risk associated with investing in
those securities.
Level 1—Quoted prices in active markets for identical securities.
Level 2—Other significant observable inputs (including quoted prices for similar securities, interest rates, prepayment speeds, credit risk, etc.).
Level 3—Significant unobservable inputs (including the fund’s own assumptions used to determine the fair value of investments).
| The following table summarizes the market value of the fund’s investments as of August 31, 2014, based on the inputs used to value them: | |||
| Level 1 | Level 2 | Level 3 | |
| Investments | ($000) | ($000) | ($000) |
| U.S. Government and Agency Obligations | — | 243,486 | — |
| Temporary Cash Investments | 2,668 | — | — |
| Total | 2,668 | 243,486 | — |
D. Distributions are determined on a tax basis and may differ from net investment income and realized capital gains for financial reporting purposes. Differences may be permanent or temporary. Permanent differences are reclassified among capital accounts in the financial statements to reflect their tax character. Temporary differences arise when certain items of income, expense, gain, or loss are recognized in different periods for financial statement and tax purposes. These differences will reverse at some time in the future. Differences in classification may also result from the treatment of short-term gains as ordinary income for tax purposes.
During the year ended August 31, 2014, the fund realized $488,000 of net capital gains resulting from in-kind redemptions—in which shareholders exchanged fund shares for securities held by the fund rather than for cash. Because such gains are not taxable to the fund, and are not distributed to shareholders, they have been reclassified from accumulated net realized losses to paid-in capital.
57
Long-Term Government Bond Index Fund
For tax purposes, at August 31, 2014, the fund had available capital losses totaling $8,136,000 that may be carried forward indefinitely to offset future net capital gains.
At August 31, 2014, the cost of investment securities for tax purposes was $235,139,000. Net unrealized appreciation of investment securities for tax purposes was $11,015,000, consisting of unrealized gains of $11,468,000 on securities that had risen in value since their purchase and $453,000 in unrealized losses on securities that had fallen in value since their purchase.
E. During the year ended August 31, 2014, the fund purchased $192,573,000 of investment securities and sold $74,378,000 of investment securities, other than temporary cash investments. Purchases and sales include $70,188,000 and $35,896,000, respectively, in connection with in-kind purchases and redemptions of the fund’s capital shares.
F. Capital share transactions for each class of shares were:
| Year Ended August 31, | |||||
| 2014 | 2013 | ||||
| Amount | Shares | Amount | Shares | ||
| ($000) | (000) | ($000) | (000) | ||
| Admiral Shares1 | |||||
| Issued 2 | 48,250 | 2,064 | 3,088 | 128 | |
| Issued in Lieu of Cash Distributions | 499 | 22 | 166 | 7 | |
| Redeemed | (13,459) | (584) | (1,550) | (64) | |
| Net Increase (Decrease) —Admiral Shares | 35,290 | 1,502 | 1,704 | 71 | |
| Institutional Shares | |||||
| Issued 2 | 53,260 | 1,879 | 31,632 | 971 | |
| Issued in Lieu of Cash Distributions | 2,376 | 81 | 2,905 | 93 | |
| Redeemed | (7,214) | (254) | (65,557) | (2,255) | |
| Net Increase (Decrease) —Institutional Shares | 48,422 | 1,706 | (31,020) | (1,191) | |
| ETF Shares | |||||
| Issued2 | 71,314 | 1,050 | 231,737 | 3,150 | |
| Issued in Lieu of Cash Distributions | — | — | — | — | |
| Redeemed | (36,540) | (550) | (227,066) | (3,150) | |
| Net Increase (Decrease)—ETF Shares | 34,774 | 500 | 4,671 | — | |
| 1 Signal Shares were renamed Admiral Shares in October 2013. The prior period’s capital share transactions are for the Signal class. 2 Includes purchase fees for fiscal 2014 and 2013 of $0 and $24,000, respectively (fund totals). | |||||
G. Management has determined that no material events or transactions occurred subsequent to August 31, 2014, that would require recognition or disclosure in these financial statements.
58
Short-Term Corporate Bond Index Fund
Fund Profile
As of August 31, 2014
| Share-Class Characteristics | |||
| Admiral | Institutional | ETF | |
| Shares | Shares | Shares | |
| Ticker Symbol | VSCSX | VSTBX | VCSH |
| Expense Ratio1 | 0.12% | 0.09% | 0.12% |
| 30-Day SEC Yield | 1.40% | 1.43% | 1.40% |
| Financial Attributes | |||
| Barclays | |||
| 1–5 Year | Barclays | ||
| Corporate | Aggregate | ||
| Fund | Index | FA Index | |
| Number of Bonds | 1,797 | 1,969 | 8,876 |
| Yield to Maturity | |||
| (before expenses) | 1.6% | 1.6% | 2.1% |
| Average Coupon | 3.8% | 3.9% | 3.3% |
| Average Duration | 2.8 years | 2.8 years | 5.6 years |
| Average Effective | |||
| Maturity | 3.0 years | 3.0 years | 7.7 years |
| Short-Term | |||
| Reserves | 1.2% | — | — |
| Sector Diversification (% of portfolio) | |
| Finance | 43.3% |
| Industrial | 50.2 |
| Treasury/Agency | 1.0 |
| Utilities | 5.2 |
| Other | 0.3 |
| The agency and mortgage-backed securities sectors may include issues from government-sponsored enterprises; such issues are generally not backed by the full faith and credit of the U.S. government. | |
| Volatility Measures | ||
| Barclays | ||
| 1–5 Year | Barclays | |
| Corporate | Aggregate | |
| Index | FA Index | |
| R-Squared | 0.98 | 0.35 |
| Beta | 1.02 | 0.44 |
| These measures show the degree and timing of the fund’s fluctuations compared with the indexes over 36 months. | ||
| Distribution by Effective Maturity | |
| (% of portfolio) | |
| Under 1 Year | 0.8% |
| 1 - 3 Years | 46.2 |
| 3 - 5 Years | 52.9 |
| 5 - 10 Years | 0.1 |
| Distribution by Credit Quality (% of portfolio) | |
| U.S. Government | 1.0% |
| Aaa | 1.0 |
| Aa | 12.4 |
| A | 50.3 |
| Baa | 35.3 |
| Credit-quality ratings are obtained from Barclays and are from Moody's, Fitch, and S&P. When ratings from all three agencies are used, the median rating is shown. When ratings from two of the agencies are used, the lower rating for each issue is shown. For more information about these ratings, see the Glossary entry for Credit Quality. | |
Investment Focus
1 The expense ratios shown are from the prospectus dated December 20, 2013, and represent estimated costs for the current fiscal year. For the fiscal year ended August 31, 2014, the expense ratios were 0.12% for Admiral Shares, 0.09% for Institutional Shares, and 0.12% for ETF Shares.
59
Short-Term Corporate Bond Index Fund
Performance Summary
All of the returns in this report represent past performance, which is not a guarantee of future results that may be achieved by the fund. (Current performance may be lower or higher than the performance data cited. For performance data current to the most recent month-end, visit our website at vanguard.com/performance.) Note, too, that both investment returns and principal value can fluctuate widely, so an investor’s shares, when sold, could be worth more or less than their original cost. The returns shown do not reflect taxes that a shareholder would pay on fund distributions or on the sale of fund shares.
Cumulative Performance: November 19, 2009, Through August 31, 2014
Initial Investment of $10,000
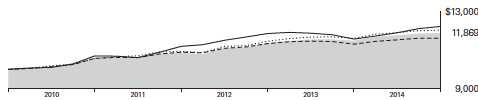
| Average Annual Total Returns | ||||
| Periods Ended August 31, 2014 | ||||
| Since | Final Value | |||
| One | Inception | of a $10,000 | ||
| Year | (11/19/2009) | Investment | ||
| Short-Term Corporate Bond Index | ||||
| Fund ETF Shares Net Asset Value | 3.50% | 3.65% | $11,869 | |
| Short-Term Corporate Bond Index | ||||
| Fund ETF Shares Market Price | 3.23 | 3.65 | 11,869 | |
| Barclays U.S. 1–5 Year Corporate | ||||
| •••••••• | Bond Index | 3.67 | 3.93 | 12,025 |
| – – –– | Short-Intermediate Investment-Grade | |||
| Debt Funds Average | 2.73 | 3.16 | 11,606 | |
| Spliced Barclays U.S. Aggregate Float | ||||
| Adjusted Index | 5.64 | 4.27 | 12,212 | |
| For a benchmark description, see the Glossary. Short-Intermediate Investment-Grade Debt Funds Average: Derived from data provided by Lipper, a Thomson Reuters Company. "Since Inception" performance is calculated from the ETF Shares’ inception date for both the fund and its comparative standards. | ||||
See Financial Highlights for dividend and capital gains information.
60
Short-Term Corporate Bond Index Fund
| Average Annual Total Returns | |||
| Periods Ended August 31, 2014 | |||
| Since | Final Value | ||
| One | Inception | of a $10,000 | |
| Year | (11/18/2010) | Investment | |
| Short-Term Corporate Bond Index Fund | |||
| Admiral Shares | 3.47% | 3.03% | $11,194 |
| Barclays U.S. 1–5 Year Corporate Bond Index | 3.67 | 3.25 | 11,286 |
| Barclays U.S. Aggregate Float Adjusted Index | 5.64 | 3.69 | 11,471 |
| "Since Inception" performance is calculated from the Admiral Shares’ inception date for both the fund and its comparative standards. | |||
| Since | Final Value | ||
| One | Inception | of a $5,000,000 | |
| Year | (11/19/2009) | Investment | |
| Short-Term Corporate Bond Index Fund | |||
| Institutional Shares | 3.55% | 3.70% | $5,947,329 |
| Barclays U.S. 1–5 Year Corporate Bond Index | 3.67 | 3.93 | 6,012,401 |
| Spliced Barclays U.S. Aggregate Float | |||
| Adjusted Index | 5.64 | 4.27 | 6,105,965 |
| "Since Inception" performance is calculated from the Institutional Shares’ inception date for both the fund and its comparative standards. | |||
| Cumulative Returns of ETF Shares: November 19, 2009, Through August 31, 2014 | ||
| Since | ||
| One | Inception | |
| Year | (11/19/2009) | |
| Short-Term Corporate Bond Index Fund ETF Shares | ||
| Market Price | 3.23% | 18.69% |
| Short-Term Corporate Bond Index Fund ETF Shares | ||
| Net Asset Value | 3.50 | 18.69 |
| Barclays U.S. 1–5 Year Corporate Bond Index | 3.67 | 20.25 |
| "Since Inception" performance is calculated from the ETF Shares’ inception date for both the fund and its comparative standards. | ||
| 61 |
Short-Term Corporate Bond Index Fund
| Fiscal-Year Total Returns (%): November 19, 2009, Through August 31, 2014 | |||
| Barclays | |||
| 1–5 Year | |||
| Corporate | |||
| ETF Shares Net Asset Value | Index | ||
| Fiscal Year | Total Returns | Total Returns | |
| 2010 | 5.34% | 5.61% | |
| 2011 | 2.94 | 3.45 | |
| 2012 | 4.68 | 4.81 | |
| 2013 | 1.03 | 1.29 | |
| 2014 | 3.50 | 3.67 | |
| Average Annual Total Returns: Periods Ended June 30, 2014 | |||||
| This table presents returns through the latest calendar quarter—rather than through the end of the fiscal period. | |||||
| Securities and Exchange Commission rules require that we provide this information. | |||||
| Since Inception | |||||
| Inception Date | One Year | Income | Capital | Total | |
| Admiral Shares | 11/18/2010 | 3.72% | 2.15% | 0.96% | 3.11% |
| Institutional Shares | 11/19/2009 | 3.75 | 2.21 | 1.57 | 3.78 |
| ETF Shares | 11/19/2009 | ||||
| Market Price | 3.50 | 3.75 | |||
| Net Asset Value | 3.72 | 3.74 | |||
62
Short-Term Corporate Bond Index Fund
Financial Statements
Statement of Net Assets
As of August 31, 2014
The fund reports a complete list of its holdings in regulatory filings four times in each fiscal year, at the quarter-ends. For the second and fourth fiscal quarters, the lists appear in the fund’s semiannual and annual reports to shareholders. For the first and third fiscal quarters, the fund files the lists with the Securities and Exchange Commission on Form N-Q. Shareholders can look up the fund’s Forms N-Q on the SEC’s website at sec.gov. Forms N-Q may also be reviewed and copied at the SEC’s Public Reference Room (see the back cover of this report for further information).
| Face | Market | |||
| Maturity | Amount | Value• | ||
| Coupon | Date | ($000) | ($000) | |
| U.S. Government and Agency Obligations (1.6%) | ||||
| U.S. Government Securities (1.6%) | ||||
| United States Treasury Note/Bond | 0.250% | 10/15/15 | 290 | 290 |
| United States Treasury Note/Bond | 0.500% | 7/31/16 | 93,100 | 93,144 |
| United States Treasury Note/Bond | 1.625% | 4/30/19 | 285 | 286 |
| United States Treasury Note/Bond | 1.625% | 7/31/19 | 2,060 | 2,060 |
| United States Treasury Note/Bond | 1.625% | 8/31/19 | 64,000 | 63,990 |
| Total U.S. Government and Agency Obligations (Cost $159,729) | 159,770 | |||
| Corporate Bonds (97.2%) | ||||
| Finance (42.6%) | ||||
| Banking (32.6%) | ||||
| Abbey National Treasury Services plc | 4.000% | 4/27/16 | 11,100 | 11,670 |
| Abbey National Treasury Services plc | 1.375% | 3/13/17 | 5,470 | 5,486 |
| Abbey National Treasury Services plc | 3.050% | 8/23/18 | 6,595 | 6,881 |
| American Express Bank FSB | 6.000% | 9/13/17 | 5,880 | 6,655 |
| American Express Centurion Bank | 0.875% | 11/13/15 | 6,400 | 6,423 |
| American Express Centurion Bank | 5.950% | 6/12/17 | 300 | 338 |
| American Express Centurion Bank | 6.000% | 9/13/17 | 4,299 | 4,863 |
| American Express Co. | 5.500% | 9/12/16 | 3,850 | 4,204 |
| American Express Co. | 6.150% | 8/28/17 | 8,433 | 9,590 |
| American Express Co. | 7.000% | 3/19/18 | 12,830 | 15,128 |
| American Express Co. | 1.550% | 5/22/18 | 7,250 | 7,190 |
| American Express Co. | 8.125% | 5/20/19 | 1,575 | 1,983 |
| 1 American Express Co. | 6.800% | 9/1/66 | 6,150 | 6,673 |
| American Express Credit Corp. | 2.750% | 9/15/15 | 9,857 | 10,087 |
| American Express Credit Corp. | 1.300% | 7/29/16 | 7,425 | 7,484 |
| American Express Credit Corp. | 2.800% | 9/19/16 | 11,925 | 12,378 |
| American Express Credit Corp. | 2.375% | 3/24/17 | 13,270 | 13,673 |
| American Express Credit Corp. | 1.125% | 6/5/17 | 13,000 | 12,951 |
| American Express Credit Corp. | 2.125% | 7/27/18 | 6,100 | 6,190 |
| American Express Credit Corp. | 2.125% | 3/18/19 | 6,275 | 6,295 |
| Associates Corp. of North America | 6.950% | 11/1/18 | 5,750 | 6,822 |
| Australia & New Zealand Banking Group Ltd. | 0.900% | 2/12/16 | 11,405 | 11,454 |
| Australia & New Zealand Banking Group Ltd. | 1.250% | 1/10/17 | 5,750 | 5,781 |
| Australia & New Zealand Banking Group Ltd. | 1.250% | 6/13/17 | 1,375 | 1,375 |
| Australia & New Zealand Banking Group Ltd. | 1.875% | 10/6/17 | 6,625 | 6,719 |
| Australia & New Zealand Banking Group Ltd. | 2.250% | 6/13/19 | 7,875 | 7,918 |
| Bancolombia SA | 4.250% | 1/12/16 | 2,000 | 2,095 |
63
| Short-Term Corporate Bond Index Fund | ||||
| Face | Market | |||
| Maturity | Amount | Value• | ||
| Coupon | Date | ($000) | ($000) | |
| Bank of America Corp. | 3.700% | 9/1/15 | 10,950 | 11,272 |
| Bank of America Corp. | 5.300% | 9/30/15 | 754 | 792 |
| Bank of America Corp. | 1.500% | 10/9/15 | 14,275 | 14,399 |
| Bank of America Corp. | 5.250% | 12/1/15 | 5,130 | 5,399 |
| Bank of America Corp. | 1.250% | 1/11/16 | 7,124 | 7,164 |
| Bank of America Corp. | 3.625% | 3/17/16 | 11,053 | 11,509 |
| Bank of America Corp. | 6.050% | 5/16/16 | 9,625 | 10,387 |
| Bank of America Corp. | 3.750% | 7/12/16 | 15,500 | 16,236 |
| Bank of America Corp. | 6.500% | 8/1/16 | 16,350 | 17,968 |
| Bank of America Corp. | 5.750% | 8/15/16 | 4,700 | 5,097 |
| Bank of America Corp. | 7.800% | 9/15/16 | 3,400 | 3,828 |
| Bank of America Corp. | 5.625% | 10/14/16 | 9,875 | 10,765 |
| Bank of America Corp. | 1.350% | 11/21/16 | 3,375 | 3,379 |
| Bank of America Corp. | 5.420% | 3/15/17 | 5,869 | 6,410 |
| Bank of America Corp. | 3.875% | 3/22/17 | 11,450 | 12,147 |
| Bank of America Corp. | 5.700% | 5/2/17 | 5,810 | 6,383 |
| Bank of America Corp. | 1.700% | 8/25/17 | 7,775 | 7,781 |
| Bank of America Corp. | 6.400% | 8/28/17 | 18,460 | 20,925 |
| Bank of America Corp. | 6.000% | 9/1/17 | 10,705 | 12,027 |
| Bank of America Corp. | 5.750% | 12/1/17 | 20,000 | 22,433 |
| Bank of America Corp. | 2.000% | 1/11/18 | 20,275 | 20,352 |
| Bank of America Corp. | 6.875% | 4/25/18 | 31,100 | 36,313 |
| Bank of America Corp. | 5.650% | 5/1/18 | 24,500 | 27,527 |
| Bank of America Corp. | 6.500% | 7/15/18 | 3,000 | 3,482 |
| Bank of America Corp. | 6.875% | 11/15/18 | 6,611 | 7,825 |
| Bank of America Corp. | 2.600% | 1/15/19 | 26,250 | 26,442 |
| Bank of America Corp. | 5.490% | 3/15/19 | 3,200 | 3,590 |
| Bank of America Corp. | 2.650% | 4/1/19 | 15,410 | 15,595 |
| Bank of America Corp. | 7.625% | 6/1/19 | 17,300 | 21,187 |
| Bank of America NA | 1.125% | 11/14/16 | 8,850 | 8,856 |
| Bank of America NA | 1.250% | 2/14/17 | 5,350 | 5,358 |
| Bank of America NA | 5.300% | 3/15/17 | 13,750 | 14,984 |
| Bank of America NA | 6.100% | 6/15/17 | 3,595 | 4,014 |
| Bank of Montreal | 0.800% | 11/6/15 | 7,415 | 7,446 |
| Bank of Montreal | 1.300% | 7/15/16 | 6,325 | 6,396 |
| Bank of Montreal | 2.500% | 1/11/17 | 9,824 | 10,151 |
| Bank of Montreal | 1.300% | 7/14/17 | 1,200 | 1,202 |
| Bank of Montreal | 1.400% | 9/11/17 | 5,035 | 5,051 |
| Bank of Montreal | 1.450% | 4/9/18 | 5,349 | 5,320 |
| Bank of Montreal | 2.375% | 1/25/19 | 7,400 | 7,526 |
| Bank of New York Mellon Corp. | 0.700% | 10/23/15 | 6,200 | 6,210 |
| Bank of New York Mellon Corp. | 2.500% | 1/15/16 | 1,875 | 1,922 |
| Bank of New York Mellon Corp. | 0.700% | 3/4/16 | 1,008 | 1,009 |
| Bank of New York Mellon Corp. | 2.300% | 7/28/16 | 11,440 | 11,784 |
| Bank of New York Mellon Corp. | 2.400% | 1/17/17 | 3,425 | 3,530 |
| Bank of New York Mellon Corp. | 1.969% | 6/20/17 | 1,550 | 1,584 |
| Bank of New York Mellon Corp. | 1.350% | 3/6/18 | 7,050 | 6,992 |
| Bank of New York Mellon Corp. | 2.100% | 8/1/18 | 1,500 | 1,522 |
| Bank of New York Mellon Corp. | 2.100% | 1/15/19 | 1,500 | 1,508 |
| Bank of New York Mellon Corp. | 2.200% | 3/4/19 | 2,525 | 2,544 |
| Bank of New York Mellon Corp. | 2.200% | 5/15/19 | 4,500 | 4,522 |
| Bank of New York Mellon Corp. | 5.450% | 5/15/19 | 7,075 | 8,109 |
| Bank of Nova Scotia | 2.050% | 10/7/15 | 6,800 | 6,919 |
| Bank of Nova Scotia | 0.750% | 10/9/15 | 9,550 | 9,588 |
| Bank of Nova Scotia | 0.950% | 3/15/16 | 3,890 | 3,910 |
64
| Short-Term Corporate Bond Index Fund | ||||
| Face | Market | |||
| Maturity | Amount | Value• | ||
| Coupon | Date | ($000) | ($000) | |
| Bank of Nova Scotia | 2.900% | 3/29/16 | 6,700 | 6,942 |
| Bank of Nova Scotia | 1.375% | 7/15/16 | 4,003 | 4,057 |
| Bank of Nova Scotia | 1.100% | 12/13/16 | 8,605 | 8,649 |
| Bank of Nova Scotia | 2.550% | 1/12/17 | 5,015 | 5,194 |
| Bank of Nova Scotia | 1.250% | 4/11/17 | 5,500 | 5,519 |
| Bank of Nova Scotia | 1.300% | 7/21/17 | 4,100 | 4,102 |
| Bank of Nova Scotia | 1.375% | 12/18/17 | 10,200 | 10,164 |
| Bank of Nova Scotia | 1.450% | 4/25/18 | 6,050 | 6,010 |
| Bank of Nova Scotia | 2.050% | 10/30/18 | 7,975 | 8,020 |
| Bank of Nova Scotia | 2.050% | 6/5/19 | 6,100 | 6,078 |
| Barclays Bank plc | 5.000% | 9/22/16 | 8,275 | 8,929 |
| Barclays Bank plc | 2.500% | 2/20/19 | 12,075 | 12,260 |
| Barclays Bank plc | 6.750% | 5/22/19 | 11,504 | 13,752 |
| BB&T Corp. | 5.200% | 12/23/15 | 5,315 | 5,616 |
| BB&T Corp. | 3.200% | 3/15/16 | 4,425 | 4,578 |
| BB&T Corp. | 3.950% | 4/29/16 | 2,100 | 2,209 |
| BB&T Corp. | 2.150% | 3/22/17 | 6,150 | 6,286 |
| BB&T Corp. | 4.900% | 6/30/17 | 2,575 | 2,816 |
| BB&T Corp. | 1.600% | 8/15/17 | 8,205 | 8,258 |
| BB&T Corp. | 1.450% | 1/12/18 | 2,870 | 2,855 |
| BB&T Corp. | 2.050% | 6/19/18 | 4,009 | 4,053 |
| BB&T Corp. | 2.250% | 2/1/19 | 3,650 | 3,685 |
| BB&T Corp. | 6.850% | 4/30/19 | 2,650 | 3,190 |
| BBVA US Senior SAU | 4.664% | 10/9/15 | 13,850 | 14,413 |
| Bear Stearns Cos. LLC | 5.300% | 10/30/15 | 4,700 | 4,950 |
| Bear Stearns Cos. LLC | 5.550% | 1/22/17 | 9,000 | 9,842 |
| Bear Stearns Cos. LLC | 6.400% | 10/2/17 | 14,286 | 16,284 |
| Bear Stearns Cos. LLC | 7.250% | 2/1/18 | 19,600 | 23,093 |
| Bear Stearns Cos. LLC | 4.650% | 7/2/18 | 500 | 548 |
| BNP Paribas SA | 3.600% | 2/23/16 | 11,750 | 12,206 |
| BNP Paribas SA | 1.250% | 12/12/16 | 5,525 | 5,544 |
| BNP Paribas SA | 2.375% | 9/14/17 | 15,936 | 16,293 |
| BNP Paribas SA | 2.700% | 8/20/18 | 11,299 | 11,560 |
| BNP Paribas SA | 2.400% | 12/12/18 | 8,200 | 8,290 |
| BNP Paribas SA | 2.450% | 3/17/19 | 6,775 | 6,854 |
| BPCE SA | 1.625% | 2/10/17 | 5,000 | 5,036 |
| BPCE SA | 1.613% | 7/25/17 | 4,800 | 4,811 |
| BPCE SA | 2.500% | 12/10/18 | 7,650 | 7,725 |
| BPCE SA | 2.500% | 7/15/19 | 7,925 | 7,951 |
| Branch Banking & Trust Co. | 1.450% | 10/3/16 | 3,900 | 3,945 |
| Branch Banking & Trust Co. | 1.050% | 12/1/16 | 1,675 | 1,678 |
| Branch Banking & Trust Co. | 1.000% | 4/3/17 | 3,000 | 2,988 |
| Branch Banking & Trust Co. | 1.350% | 10/1/17 | 5,000 | 4,986 |
| Branch Banking & Trust Co. | 2.300% | 10/15/18 | 9,125 | 9,268 |
| Canadian Imperial Bank of Commerce | 0.900% | 10/1/15 | 10,985 | 11,047 |
| Canadian Imperial Bank of Commerce | 2.350% | 12/11/15 | 8,020 | 8,217 |
| Canadian Imperial Bank of Commerce | 1.350% | 7/18/16 | 2,800 | 2,835 |
| Canadian Imperial Bank of Commerce | 1.550% | 1/23/18 | 1,400 | 1,402 |
| Capital One Bank USA NA | 1.150% | 11/21/16 | 4,200 | 4,205 |
| Capital One Bank USA NA | 1.300% | 6/5/17 | 2,550 | 2,547 |
| Capital One Bank USA NA | 2.150% | 11/21/18 | 2,700 | 2,707 |
| Capital One Bank USA NA | 2.250% | 2/13/19 | 12,750 | 12,781 |
| Capital One Bank USA NA | 2.300% | 6/5/19 | 4,850 | 4,843 |
| Capital One Bank USA NA | 8.800% | 7/15/19 | 1,777 | 2,285 |
| Capital One Financial Corp. | 1.000% | 11/6/15 | 4,500 | 4,508 |
65
| Short-Term Corporate Bond Index Fund | ||||
| Face | Market | |||
| Maturity | Amount | Value• | ||
| Coupon | Date | ($000) | ($000) | |
| Capital One Financial Corp. | 3.150% | 7/15/16 | 4,975 | 5,169 |
| Capital One Financial Corp. | 6.150% | 9/1/16 | 8,700 | 9,551 |
| Capital One Financial Corp. | 6.750% | 9/15/17 | 4,600 | 5,287 |
| Capital One Financial Corp. | 2.450% | 4/24/19 | 2,500 | 2,513 |
| Capital One NA | 1.500% | 3/22/18 | 1,775 | 1,754 |
| Citigroup Inc. | 4.587% | 12/15/15 | 12,707 | 13,328 |
| Citigroup Inc. | 5.300% | 1/7/16 | 5,392 | 5,710 |
| Citigroup Inc. | 1.250% | 1/15/16 | 11,946 | 12,007 |
| Citigroup Inc. | 1.300% | 4/1/16 | 7,655 | 7,694 |
| Citigroup Inc. | 3.953% | 6/15/16 | 12,565 | 13,208 |
| Citigroup Inc. | 1.700% | 7/25/16 | 11,875 | 12,013 |
| Citigroup Inc. | 5.850% | 8/2/16 | 1,600 | 1,740 |
| Citigroup Inc. | 1.300% | 11/15/16 | 4,875 | 4,882 |
| Citigroup Inc. | 4.450% | 1/10/17 | 13,850 | 14,865 |
| Citigroup Inc. | 5.500% | 2/15/17 | 7,499 | 8,182 |
| Citigroup Inc. | 1.350% | 3/10/17 | 5,600 | 5,591 |
| Citigroup Inc. | 1.550% | 8/14/17 | 5,725 | 5,711 |
| Citigroup Inc. | 6.000% | 8/15/17 | 9,151 | 10,279 |
| Citigroup Inc. | 6.125% | 11/21/17 | 22,632 | 25,702 |
| Citigroup Inc. | 1.750% | 5/1/18 | 9,815 | 9,769 |
| Citigroup Inc. | 6.125% | 5/15/18 | 16,244 | 18,625 |
| Citigroup Inc. | 2.500% | 9/26/18 | 8,750 | 8,864 |
| Citigroup Inc. | 2.550% | 4/8/19 | 11,500 | 11,604 |
| Citigroup Inc. | 8.500% | 5/22/19 | 16,833 | 21,332 |
| Citigroup Inc. | 2.500% | 7/29/19 | 10,550 | 10,578 |
| Comerica Bank | 5.750% | 11/21/16 | 4,875 | 5,361 |
| Comerica Bank | 5.200% | 8/22/17 | 1,675 | 1,845 |
| Comerica Inc. | 4.800% | 5/1/15 | 1,500 | 1,543 |
| Comerica Inc. | 3.000% | 9/16/15 | 3,375 | 3,457 |
| Comerica Inc. | 2.125% | 5/23/19 | 2,000 | 1,998 |
| Commonwealth Bank of Australia | 1.250% | 9/18/15 | 4,425 | 4,460 |
| Commonwealth Bank of Australia | 1.900% | 9/18/17 | 8,850 | 8,956 |
| Commonwealth Bank of Australia | 2.500% | 9/20/18 | 9,603 | 9,861 |
| Commonwealth Bank of Australia | 2.250% | 3/13/19 | 8,600 | 8,675 |
| Compass Bank | 6.400% | 10/1/17 | 1,730 | 1,911 |
| Cooperatieve Centrale Raiffeisen-Boerenleenbank | ||||
| BA | 2.125% | 10/13/15 | 7,625 | 7,621 |
| Cooperatieve Centrale Raiffeisen-Boerenleenbank | ||||
| BA | 3.375% | 1/19/17 | 13,700 | 14,437 |
| Cooperatieve Centrale Raiffeisen-Boerenleenbank | ||||
| BA | 1.700% | 3/19/18 | 14,300 | 14,352 |
| Cooperatieve Centrale Raiffeisen-Boerenleenbank | ||||
| BA | 2.250% | 1/14/19 | 11,000 | 11,170 |
| Corpbanca SA | 3.125% | 1/15/18 | 1,700 | 1,719 |
| Countrywide Financial Corp. | 6.250% | 5/15/16 | 5,941 | 6,436 |
| Credit Suisse | 1.375% | 5/26/17 | 15,225 | 15,225 |
| Credit Suisse | 6.000% | 2/15/18 | 10,275 | 11,611 |
| Credit Suisse | 2.300% | 5/28/19 | 17,975 | 18,014 |
| Credit Suisse | 5.300% | 8/13/19 | 7,895 | 8,987 |
| Credit Suisse USA Inc. | 5.375% | 3/2/16 | 4,725 | 5,044 |
| Credit Suisse USA Inc. | 5.850% | 8/16/16 | 2,600 | 2,844 |
| Deutsche Bank AG | 3.250% | 1/11/16 | 10,860 | 11,227 |
| Deutsche Bank AG | 1.400% | 2/13/17 | 5,775 | 5,783 |
| Deutsche Bank AG | 1.350% | 5/30/17 | 5,975 | 5,958 |
| Deutsche Bank AG | 6.000% | 9/1/17 | 17,965 | 20,263 |
66
| Short-Term Corporate Bond Index Fund | ||||
| Face | Market | |||
| Maturity | Amount | Value• | ||
| Coupon | Date | ($000) | ($000) | |
| Deutsche Bank AG | 2.500% | 2/13/19 | 14,960 | 15,194 |
| Discover Bank | 2.000% | 2/21/18 | 4,575 | 4,582 |
| Discover Financial Services | 6.450% | 6/12/17 | 2,175 | 2,453 |
| Fifth Third Bancorp | 3.625% | 1/25/16 | 8,736 | 9,091 |
| Fifth Third Bancorp | 5.450% | 1/15/17 | 2,255 | 2,461 |
| Fifth Third Bancorp | 4.500% | 6/1/18 | 1,875 | 2,040 |
| Fifth Third Bancorp | 2.300% | 3/1/19 | 3,000 | 3,009 |
| Fifth Third Bank | 0.900% | 2/26/16 | 1,250 | 1,254 |
| Fifth Third Bank | 1.150% | 11/18/16 | 7,975 | 8,010 |
| Fifth Third Bank | 1.350% | 6/1/17 | 5,000 | 5,003 |
| Fifth Third Bank | 1.450% | 2/28/18 | 2,500 | 2,483 |
| Fifth Third Bank | 2.375% | 4/25/19 | 4,850 | 4,900 |
| First Horizon National Corp. | 5.375% | 12/15/15 | 2,525 | 2,659 |
| Goldman Sachs Group Inc. | 1.600% | 11/23/15 | 13,925 | 14,056 |
| Goldman Sachs Group Inc. | 5.350% | 1/15/16 | 15,817 | 16,770 |
| Goldman Sachs Group Inc. | 3.625% | 2/7/16 | 24,675 | 25,619 |
| Goldman Sachs Group Inc. | 5.750% | 10/1/16 | 11,875 | 13,006 |
| Goldman Sachs Group Inc. | 5.625% | 1/15/17 | 13,300 | 14,552 |
| Goldman Sachs Group Inc. | 6.250% | 9/1/17 | 14,588 | 16,491 |
| Goldman Sachs Group Inc. | 5.950% | 1/18/18 | 18,209 | 20,535 |
| Goldman Sachs Group Inc. | 2.375% | 1/22/18 | 14,200 | 14,419 |
| Goldman Sachs Group Inc. | 6.150% | 4/1/18 | 26,735 | 30,453 |
| Goldman Sachs Group Inc. | 2.900% | 7/19/18 | 17,350 | 17,823 |
| Goldman Sachs Group Inc. | 2.625% | 1/31/19 | 15,500 | 15,688 |
| Goldman Sachs Group Inc. | 7.500% | 2/15/19 | 18,652 | 22,552 |
| HSBC USA Inc. | 1.300% | 6/23/17 | 4,000 | 4,017 |
| HSBC BANK USA NA | 6.000% | 8/9/17 | 4,050 | 4,561 |
| HSBC USA Inc. | 1.625% | 1/16/18 | 11,000 | 11,030 |
| HSBC USA Inc. | 2.625% | 9/24/18 | 925 | 954 |
| HSBC USA Inc. | 2.250% | 6/23/19 | 4,000 | 4,018 |
| Huntington Bancshares Inc. | 2.600% | 8/2/18 | 2,050 | 2,084 |
| Huntington National Bank | 1.350% | 8/2/16 | 1,500 | 1,510 |
| Huntington National Bank | 1.300% | 11/20/16 | 2,875 | 2,886 |
| Huntington National Bank | 1.375% | 4/24/17 | 1,000 | 1,002 |
| Huntington National Bank | 2.200% | 4/1/19 | 5,550 | 5,557 |
| Intesa Sanpaolo SPA | 3.125% | 1/15/16 | 9,775 | 10,010 |
| Intesa Sanpaolo SPA | 2.375% | 1/13/17 | 10,175 | 10,313 |
| Intesa Sanpaolo SPA | 3.875% | 1/16/18 | 8,300 | 8,702 |
| Intesa Sanpaolo SPA | 3.875% | 1/15/19 | 13,650 | 14,261 |
| JPMorgan Chase & Co. | 5.150% | 10/1/15 | 7,849 | 8,207 |
| JPMorgan Chase & Co. | 1.100% | 10/15/15 | 14,325 | 14,384 |
| JPMorgan Chase & Co. | 2.600% | 1/15/16 | 4,175 | 4,278 |
| JPMorgan Chase & Co. | 1.125% | 2/26/16 | 7,550 | 7,588 |
| JPMorgan Chase & Co. | 3.450% | 3/1/16 | 18,595 | 19,306 |
| JPMorgan Chase & Co. | 3.150% | 7/5/16 | 25,175 | 26,192 |
| JPMorgan Chase & Co. | 1.350% | 2/15/17 | 9,350 | 9,383 |
| JPMorgan Chase & Co. | 6.125% | 6/27/17 | 3,650 | 4,097 |
| JPMorgan Chase & Co. | 2.000% | 8/15/17 | 15,203 | 15,428 |
| JPMorgan Chase & Co. | 6.000% | 1/15/18 | 24,751 | 28,162 |
| JPMorgan Chase & Co. | 1.800% | 1/25/18 | 12,250 | 12,306 |
| JPMorgan Chase & Co. | 1.625% | 5/15/18 | 16,125 | 16,012 |
| JPMorgan Chase & Co. | 2.350% | 1/28/19 | 16,275 | 16,437 |
| JPMorgan Chase & Co. | 6.300% | 4/23/19 | 18,875 | 22,148 |
| JPMorgan Chase Bank NA | 6.000% | 7/5/17 | 3,200 | 3,598 |
| JPMorgan Chase Bank NA | 6.000% | 10/1/17 | 17,435 | 19,680 |
67
| Short-Term Corporate Bond Index Fund | ||||
| Face | Market | |||
| Maturity | Amount | Value• | ||
| Coupon | Date | ($000) | ($000) | |
| KeyBank NA | 4.950% | 9/15/15 | 1,000 | 1,043 |
| KeyBank NA | 5.450% | 3/3/16 | 4,500 | 4,805 |
| KeyBank NA | 1.100% | 11/25/16 | 1,000 | 1,003 |
| KeyBank NA | 1.650% | 2/1/18 | 4,950 | 4,958 |
| KeyCorp | 2.300% | 12/13/18 | 6,025 | 6,081 |
| Lloyds Bank plc | 4.875% | 1/21/16 | 7,500 | 7,920 |
| Lloyds Bank plc | 4.200% | 3/28/17 | 3,575 | 3,839 |
| Lloyds Bank plc | 2.300% | 11/27/18 | 4,500 | 4,553 |
| Manufacturers & Traders Trust Co. | 1.400% | 7/25/17 | 6,000 | 6,001 |
| Manufacturers & Traders Trust Co. | 6.625% | 12/4/17 | 3,915 | 4,520 |
| Manufacturers & Traders Trust Co. | 1.450% | 3/7/18 | 2,150 | 2,131 |
| Manufacturers & Traders Trust Co. | 2.300% | 1/30/19 | 7,750 | 7,808 |
| Manufacturers & Traders Trust Co. | 2.250% | 7/25/19 | 4,400 | 4,406 |
| 1 Manufacturers & Traders Trust Co. | 5.585% | 12/28/20 | 1,500 | 1,563 |
| Morgan Stanley | 5.375% | 10/15/15 | 13,550 | 14,243 |
| Morgan Stanley | 3.450% | 11/2/15 | 5,650 | 5,828 |
| Morgan Stanley | 1.750% | 2/25/16 | 12,431 | 12,573 |
| Morgan Stanley | 3.800% | 4/29/16 | 14,800 | 15,479 |
| Morgan Stanley | 5.750% | 10/18/16 | 9,575 | 10,475 |
| Morgan Stanley | 5.450% | 1/9/17 | 13,275 | 14,540 |
| Morgan Stanley | 4.750% | 3/22/17 | 10,575 | 11,444 |
| Morgan Stanley | 5.550% | 4/27/17 | 9,255 | 10,213 |
| Morgan Stanley | 6.250% | 8/28/17 | 8,625 | 9,758 |
| Morgan Stanley | 5.950% | 12/28/17 | 14,875 | 16,836 |
| Morgan Stanley | 6.625% | 4/1/18 | 23,100 | 26,749 |
| Morgan Stanley | 2.125% | 4/25/18 | 13,425 | 13,516 |
| Morgan Stanley | 2.500% | 1/24/19 | 11,300 | 11,393 |
| Morgan Stanley | 7.300% | 5/13/19 | 15,740 | 19,071 |
| Morgan Stanley | 2.375% | 7/23/19 | 14,750 | 14,720 |
| MUFG Union Bank NA | 5.950% | 5/11/16 | 3,550 | 3,837 |
| MUFG Union Bank NA | 1.500% | 9/26/16 | 5,250 | 5,297 |
| MUFG Union Bank NA | 2.125% | 6/16/17 | 5,925 | 6,030 |
| MUFG Union Bank NA | 2.625% | 9/26/18 | 7,950 | 8,155 |
| MUFG Union Bank NA | 2.250% | 5/6/19 | 2,700 | 2,711 |
| Murray Street Investment Trust I | 4.647% | 3/9/17 | 11,125 | 11,979 |
| National Australia Bank Ltd. | 0.900% | 1/20/16 | 4,025 | 4,056 |
| National Australia Bank Ltd. | 1.300% | 7/25/16 | 2,000 | 2,018 |
| National Australia Bank Ltd. | 2.750% | 3/9/17 | 6,750 | 7,008 |
| National Australia Bank Ltd. | 2.300% | 7/25/18 | 5,675 | 5,771 |
| National Bank of Canada | 1.450% | 11/7/17 | 6,650 | 6,645 |
| National City Bank | 5.800% | 6/7/17 | 500 | 559 |
| National City Corp. | 6.875% | 5/15/19 | 3,200 | 3,842 |
| PNC Bank NA | 0.800% | 1/28/16 | 5,050 | 5,066 |
| PNC Bank NA | 1.300% | 10/3/16 | 1,700 | 1,713 |
| PNC Bank NA | 1.150% | 11/1/16 | 8,250 | 8,297 |
| PNC Bank NA | 5.250% | 1/15/17 | 3,000 | 3,275 |
| PNC Bank NA | 1.125% | 1/27/17 | 2,500 | 2,501 |
| PNC Bank NA | 4.875% | 9/21/17 | 2,225 | 2,447 |
| PNC Bank NA | 6.000% | 12/7/17 | 3,340 | 3,801 |
| PNC Bank NA | 2.200% | 1/28/19 | 4,550 | 4,569 |
| PNC Bank NA | 2.250% | 7/2/19 | 5,825 | 5,840 |
| PNC Funding Corp. | 4.250% | 9/21/15 | 8,005 | 8,315 |
| PNC Funding Corp. | 5.250% | 11/15/15 | 5,900 | 6,215 |
| PNC Funding Corp. | 2.700% | 9/19/16 | 9,850 | 10,191 |
| PNC Funding Corp. | 5.625% | 2/1/17 | 1,950 | 2,138 |
68
| Short-Term Corporate Bond Index Fund | ||||
| Face | Market | |||
| Maturity | Amount | Value• | ||
| Coupon | Date | ($000) | ($000) | |
| PNC Funding Corp. | 6.700% | 6/10/19 | 3,925 | 4,726 |
| Regions Financial Corp. | 2.000% | 5/15/18 | 4,775 | 4,746 |
| Royal Bank of Canada | 0.800% | 10/30/15 | 5,164 | 5,187 |
| Royal Bank of Canada | 2.625% | 12/15/15 | 5,375 | 5,521 |
| Royal Bank of Canada | 0.850% | 3/8/16 | 8,100 | 8,130 |
| Royal Bank of Canada | 2.875% | 4/19/16 | 7,075 | 7,330 |
| Royal Bank of Canada | 2.300% | 7/20/16 | 7,625 | 7,849 |
| Royal Bank of Canada | 1.450% | 9/9/16 | 3,200 | 3,241 |
| Royal Bank of Canada | 1.200% | 1/23/17 | 10,400 | 10,450 |
| Royal Bank of Canada | 1.250% | 6/16/17 | 6,150 | 6,164 |
| Royal Bank of Canada | 1.500% | 1/16/18 | 8,800 | 8,833 |
| Royal Bank of Canada | 2.200% | 7/27/18 | 10,500 | 10,735 |
| Royal Bank of Canada | 2.150% | 3/15/19 | 6,700 | 6,780 |
| Royal Bank of Scotland Group plc | 2.550% | 9/18/15 | 11,100 | 11,297 |
| Royal Bank of Scotland Group plc | 1.875% | 3/31/17 | 5,800 | 5,835 |
| Royal Bank of Scotland plc | 3.950% | 9/21/15 | 7,954 | 8,203 |
| Royal Bank of Scotland plc | 4.375% | 3/16/16 | 8,400 | 8,825 |
| Santander Bank NA | 8.750% | 5/30/18 | 2,425 | 2,927 |
| Santander Holdings USA Inc. | 3.000% | 9/24/15 | 2,525 | 2,581 |
| Santander Holdings USA Inc. | 4.625% | 4/19/16 | 2,725 | 2,877 |
| Santander Holdings USA Inc. | 3.450% | 8/27/18 | 4,200 | 4,407 |
| Societe Generale SA | 2.750% | 10/12/17 | 9,250 | 9,544 |
| Societe Generale SA | 2.625% | 10/1/18 | 2,900 | 2,966 |
| State Street Bank & Trust Co. | 5.250% | 10/15/18 | 225 | 254 |
| State Street Corp. | 2.875% | 3/7/16 | 8,025 | 8,302 |
| State Street Corp. | 4.956% | 3/15/18 | 4,800 | 5,245 |
| State Street Corp. | 1.350% | 5/15/18 | 5,950 | 5,901 |
| Sumitomo Mitsui Banking Corp. | 1.350% | 7/18/15 | 3,950 | 3,976 |
| Sumitomo Mitsui Banking Corp. | 0.900% | 1/18/16 | 3,575 | 3,579 |
| Sumitomo Mitsui Banking Corp. | 1.450% | 7/19/16 | 4,050 | 4,074 |
| Sumitomo Mitsui Banking Corp. | 1.300% | 1/10/17 | 600 | 601 |
| Sumitomo Mitsui Banking Corp. | 1.350% | 7/11/17 | 4,000 | 3,998 |
| Sumitomo Mitsui Banking Corp. | 1.800% | 7/18/17 | 7,275 | 7,333 |
| Sumitomo Mitsui Banking Corp. | 1.500% | 1/18/18 | 4,400 | 4,364 |
| Sumitomo Mitsui Banking Corp. | 2.500% | 7/19/18 | 2,225 | 2,273 |
| Sumitomo Mitsui Banking Corp. | 2.450% | 1/10/19 | 8,175 | 8,304 |
| Sumitomo Mitsui Banking Corp. | 2.250% | 7/11/19 | 4,850 | 4,868 |
| SunTrust Bank | 1.350% | 2/15/17 | 4,775 | 4,794 |
| SunTrust Bank | 7.250% | 3/15/18 | 2,250 | 2,639 |
| SunTrust Banks Inc. | 3.600% | 4/15/16 | 8,975 | 9,338 |
| SunTrust Banks Inc. | 3.500% | 1/20/17 | 2,450 | 2,573 |
| SunTrust Banks Inc. | 6.000% | 9/11/17 | 1,600 | 1,807 |
| SunTrust Banks Inc. | 2.350% | 11/1/18 | 4,825 | 4,867 |
| SunTrust Banks Inc. | 2.500% | 5/1/19 | 3,600 | 3,638 |
| Svenska Handelsbanken AB | 3.125% | 7/12/16 | 7,825 | 8,159 |
| Svenska Handelsbanken AB | 2.875% | 4/4/17 | 5,475 | 5,707 |
| Svenska Handelsbanken AB | 1.625% | 3/21/18 | 6,550 | 6,529 |
| Svenska Handelsbanken AB | 2.500% | 1/25/19 | 8,175 | 8,388 |
| Svenska Handelsbanken AB | 2.250% | 6/17/19 | 8,050 | 8,102 |
| Synchrony Financial | 1.875% | 8/15/17 | 2,800 | 2,819 |
| Synchrony Financial | 3.000% | 8/15/19 | 3,600 | 3,648 |
| Toronto-Dominion Bank | 2.500% | 7/14/16 | 11,410 | 11,791 |
| Toronto-Dominion Bank | 2.375% | 10/19/16 | 12,760 | 13,183 |
| Toronto-Dominion Bank | 1.125% | 5/2/17 | 4,150 | 4,147 |
| Toronto-Dominion Bank | 1.400% | 4/30/18 | 9,844 | 9,773 |
69
| Short-Term Corporate Bond Index Fund | ||||
| Face | Market | |||
| Maturity | Amount | Value• | ||
| Coupon | Date | ($000) | ($000) | |
| Toronto-Dominion Bank | 2.625% | 9/10/18 | 8,525 | 8,785 |
| Toronto-Dominion Bank | 2.125% | 7/2/19 | 9,900 | 9,918 |
| UBS AG | 7.000% | 10/15/15 | 1,400 | 1,491 |
| UBS AG | 5.875% | 7/15/16 | 10,350 | 11,266 |
| UBS AG | 7.375% | 6/15/17 | 200 | 227 |
| UBS AG | 1.375% | 8/14/17 | 5,075 | 5,061 |
| UBS AG | 5.875% | 12/20/17 | 16,775 | 19,047 |
| UBS AG | 5.750% | 4/25/18 | 10,975 | 12,462 |
| UBS AG | 2.375% | 8/14/19 | 10,000 | 10,011 |
| US Bancorp | 3.442% | 2/1/16 | 3,475 | 3,601 |
| US Bancorp | 2.200% | 11/15/16 | 12,850 | 13,197 |
| US Bancorp | 1.650% | 5/15/17 | 9,225 | 9,334 |
| US Bancorp | 1.950% | 11/15/18 | 2,950 | 2,968 |
| US Bancorp | 2.200% | 4/25/19 | 7,500 | 7,549 |
| US Bank NA | 1.100% | 1/30/17 | 4,650 | 4,655 |
| 1 US Bank NA | 3.778% | 4/29/20 | 1,250 | 1,275 |
| Vesey Street Investment Trust I | 4.404% | 9/1/16 | 1,875 | 1,993 |
| Wachovia Bank NA | 5.600% | 3/15/16 | 2,323 | 2,493 |
| Wachovia Bank NA | 6.000% | 11/15/17 | 9,400 | 10,679 |
| Wachovia Corp. | 5.625% | 10/15/16 | 8,250 | 9,030 |
| Wachovia Corp. | 5.750% | 6/15/17 | 13,925 | 15,618 |
| Wachovia Corp. | 5.750% | 2/1/18 | 12,000 | 13,615 |
| Wells Fargo & Co. | 3.676% | 6/15/16 | 18,380 | 19,298 |
| Wells Fargo & Co. | 1.250% | 7/20/16 | 10,750 | 10,847 |
| Wells Fargo & Co. | 5.125% | 9/15/16 | 4,212 | 4,554 |
| Wells Fargo & Co. | 2.625% | 12/15/16 | 9,900 | 10,256 |
| Wells Fargo & Co. | 2.100% | 5/8/17 | 9,500 | 9,716 |
| Wells Fargo & Co. | 1.150% | 6/2/17 | 6,000 | 5,982 |
| Wells Fargo & Co. | 5.625% | 12/11/17 | 17,726 | 20,017 |
| Wells Fargo & Co. | 1.500% | 1/16/18 | 13,675 | 13,616 |
| Wells Fargo & Co. | 2.150% | 1/15/19 | 7,725 | 7,792 |
| Wells Fargo & Co. | 2.125% | 4/22/19 | 10,900 | 10,897 |
| Wells Fargo Bank NA | 5.750% | 5/16/16 | 4,150 | 4,500 |
| Westpac Banking Corp. | 1.125% | 9/25/15 | 5,100 | 5,137 |
| Westpac Banking Corp. | 3.000% | 12/9/15 | 3,350 | 3,445 |
| Westpac Banking Corp. | 0.950% | 1/12/16 | 6,410 | 6,439 |
| Westpac Banking Corp. | 1.050% | 11/25/16 | 9,032 | 9,053 |
| Westpac Banking Corp. | 1.200% | 5/19/17 | 8,300 | 8,297 |
| Westpac Banking Corp. | 2.000% | 8/14/17 | 7,264 | 7,395 |
| Westpac Banking Corp. | 1.600% | 1/12/18 | 5,250 | 5,259 |
| Westpac Banking Corp. | 2.250% | 7/30/18 | 7,600 | 7,726 |
| Westpac Banking Corp. | 2.250% | 1/17/19 | 8,525 | 8,611 |
| Zions Bancorporation | 4.500% | 3/27/17 | 2,225 | 2,356 |
| Brokerage (0.8%) | ||||
| Ameriprise Financial Inc. | 5.650% | 11/15/15 | 4,900 | 5,187 |
| 1 Ameriprise Financial Inc. | 7.518% | 6/1/66 | 2,200 | 2,398 |
| BlackRock Inc. | 6.250% | 9/15/17 | 5,150 | 5,883 |
| Charles Schwab Corp. | 0.850% | 12/4/15 | 1,200 | 1,204 |
| Charles Schwab Corp. | 2.200% | 7/25/18 | 2,175 | 2,209 |
| Eaton Vance Corp. | 6.500% | 10/2/17 | 409 | 466 |
| Franklin Resources Inc. | 1.375% | 9/15/17 | 3,050 | 3,049 |
| IntercontinentalExchange Group Inc. | 2.500% | 10/15/18 | 3,525 | 3,605 |
| Jefferies Group LLC | 3.875% | 11/9/15 | 1,900 | 1,958 |
| Jefferies Group LLC | 5.500% | 3/15/16 | 2,000 | 2,125 |
70
| Short-Term Corporate Bond Index Fund | ||||
| Face | Market | |||
| Maturity | Amount | Value• | ||
| Coupon | Date | ($000) | ($000) | |
| Jefferies Group LLC | 5.125% | 4/13/18 | 5,492 | 5,986 |
| Jefferies Group LLC | 8.500% | 7/15/19 | 4,305 | 5,322 |
| Lazard Group LLC | 6.850% | 6/15/17 | 2,600 | 2,950 |
| Legg Mason Inc. | 2.700% | 7/15/19 | 1,475 | 1,487 |
| Leucadia National Corp. | 8.125% | 9/15/15 | 1,969 | 2,104 |
| NASDAQ OMX Group Inc. | 5.250% | 1/16/18 | 500 | 551 |
| Nomura Holdings Inc. | 4.125% | 1/19/16 | 9,043 | 9,426 |
| Nomura Holdings Inc. | 2.000% | 9/13/16 | 8,325 | 8,422 |
| Nomura Holdings Inc. | 2.750% | 3/19/19 | 6,250 | 6,331 |
| NYSE Euronext | 2.000% | 10/5/17 | 3,850 | 3,907 |
| Raymond James Financial Inc. | 4.250% | 4/15/16 | 300 | 315 |
| Raymond James Financial Inc. | 8.600% | 8/15/19 | 2,000 | 2,522 |
| Finance Companies (2.9%) | ||||
| Air Lease Corp. | 4.500% | 1/15/16 | 1,000 | 1,038 |
| Air Lease Corp. | 5.625% | 4/1/17 | 11,025 | 11,948 |
| Air Lease Corp. | 3.375% | 1/15/19 | 5,125 | 5,227 |
| Ares Capital Corp. | 4.875% | 11/30/18 | 4,450 | 4,708 |
| FS Investment Corp. | 4.000% | 7/15/19 | 3,800 | 3,837 |
| Fifth Street Finance Corp. | 4.875% | 3/1/19 | 1,750 | 1,825 |
| GATX Corp. | 4.750% | 5/15/15 | 170 | 175 |
| GATX Corp. | 3.500% | 7/15/16 | 2,000 | 2,092 |
| GATX Corp. | 1.250% | 3/4/17 | 4,000 | 3,979 |
| GATX Corp. | 2.500% | 7/30/19 | 2,100 | 2,103 |
| 1 GE Capital Trust I | 6.375% | 11/15/67 | 5,975 | 6,632 |
| General Electric Capital Corp. | 4.375% | 9/21/15 | 3,580 | 3,730 |
| General Electric Capital Corp. | 2.250% | 11/9/15 | 9,725 | 9,920 |
| General Electric Capital Corp. | 1.000% | 12/11/15 | 9,661 | 9,728 |
| General Electric Capital Corp. | 1.000% | 1/8/16 | 10,950 | 11,008 |
| General Electric Capital Corp. | 5.000% | 1/8/16 | 10,578 | 11,201 |
| General Electric Capital Corp. | 2.950% | 5/9/16 | 10,475 | 10,890 |
| General Electric Capital Corp. | 1.500% | 7/12/16 | 6,775 | 6,868 |
| General Electric Capital Corp. | 3.350% | 10/17/16 | 7,750 | 8,157 |
| General Electric Capital Corp. | 5.375% | 10/20/16 | 2,000 | 2,185 |
| General Electric Capital Corp. | 2.900% | 1/9/17 | 10,400 | 10,841 |
| General Electric Capital Corp. | 5.400% | 2/15/17 | 6,630 | 7,290 |
| General Electric Capital Corp. | 2.450% | 3/15/17 | 3,500 | 3,614 |
| General Electric Capital Corp. | 2.300% | 4/27/17 | 16,615 | 17,079 |
| General Electric Capital Corp. | 1.250% | 5/15/17 | 5,000 | 5,014 |
| General Electric Capital Corp. | 5.625% | 9/15/17 | 19,040 | 21,404 |
| General Electric Capital Corp. | 1.600% | 11/20/17 | 6,100 | 6,139 |
| General Electric Capital Corp. | 1.625% | 4/2/18 | 4,625 | 4,637 |
| General Electric Capital Corp. | 5.625% | 5/1/18 | 21,625 | 24,613 |
| General Electric Capital Corp. | 2.300% | 1/14/19 | 10,025 | 10,216 |
| General Electric Capital Corp. | 6.000% | 8/7/19 | 13,751 | 16,204 |
| 1 General Electric Capital Corp. | 6.375% | 11/15/67 | 8,175 | 9,074 |
| 1 HSBC Finance Capital Trust IX | 5.911% | 11/30/35 | 8,300 | 8,570 |
| HSBC Finance Corp. | 5.500% | 1/19/16 | 9,987 | 10,611 |
| 2 International Lease Finance Corp. | 6.750% | 9/1/16 | 8,270 | 9,056 |
| 2 International Lease Finance Corp. | 7.125% | 9/1/18 | 7,750 | 8,893 |
| Prospect Capital Corp. | 5.000% | 7/15/19 | 1,000 | 1,045 |
71
| Short-Term Corporate Bond Index Fund | ||||
| Face | Market | |||
| Maturity | Amount | Value• | ||
| Coupon | Date | ($000) | ($000) | |
| Insurance (4.2%) | ||||
| ACE INA Holdings Inc. | 2.600% | 11/23/15 | 6,390 | 6,543 |
| ACE INA Holdings Inc. | 5.700% | 2/15/17 | 400 | 444 |
| ACE INA Holdings Inc. | 5.800% | 3/15/18 | 2,500 | 2,846 |
| ACE INA Holdings Inc. | 5.900% | 6/15/19 | 3,425 | 3,988 |
| Aegon NV | 4.625% | 12/1/15 | 3,275 | 3,430 |
| Aetna Inc. | 1.750% | 5/15/17 | 600 | 606 |
| Aetna Inc. | 1.500% | 11/15/17 | 3,410 | 3,416 |
| Aetna Inc. | 6.500% | 9/15/18 | 2,725 | 3,210 |
| Aetna Inc. | 2.200% | 3/15/19 | 5,000 | 5,013 |
| Aflac Inc. | 2.650% | 2/15/17 | 4,500 | 4,655 |
| Aflac Inc. | 8.500% | 5/15/19 | 3,425 | 4,367 |
| Allied World Assurance Co. Ltd. | 7.500% | 8/1/16 | 2,777 | 3,095 |
| 1 Allstate Corp. | 6.125% | 5/15/67 | 4,409 | 4,679 |
| American Financial Group Inc. | 9.875% | 6/15/19 | 2,015 | 2,626 |
| American International Group Inc. | 5.050% | 10/1/15 | 5,742 | 6,014 |
| American International Group Inc. | 5.600% | 10/18/16 | 3,725 | 4,071 |
| American International Group Inc. | 5.450% | 5/18/17 | 6,975 | 7,733 |
| American International Group Inc. | 5.850% | 1/16/18 | 14,875 | 16,875 |
| American International Group Inc. | 8.250% | 8/15/18 | 16,822 | 20,727 |
| American International Group Inc. | 2.300% | 7/16/19 | 5,700 | 5,728 |
| Aon Corp. | 3.500% | 9/30/15 | 4,275 | 4,406 |
| Aon Corp. | 3.125% | 5/27/16 | 2,220 | 2,304 |
| Assurant Inc. | 2.500% | 3/15/18 | 1,200 | 1,218 |
| AXIS Specialty Finance plc | 2.650% | 4/1/19 | 1,400 | 1,414 |
| Berkshire Hathaway Finance Corp. | 0.950% | 8/15/16 | 2,750 | 2,767 |
| Berkshire Hathaway Finance Corp. | 1.600% | 5/15/17 | 9,975 | 10,101 |
| Berkshire Hathaway Finance Corp. | 1.300% | 5/15/18 | 3,200 | 3,165 |
| Berkshire Hathaway Finance Corp. | 5.400% | 5/15/18 | 9,500 | 10,783 |
| Berkshire Hathaway Finance Corp. | 2.000% | 8/15/18 | 5,425 | 5,486 |
| Berkshire Hathaway Inc. | 0.800% | 2/11/16 | 1,825 | 1,831 |
| Berkshire Hathaway Inc. | 2.200% | 8/15/16 | 2,600 | 2,679 |
| Berkshire Hathaway Inc. | 1.900% | 1/31/17 | 9,000 | 9,189 |
| Berkshire Hathaway Inc. | 1.550% | 2/9/18 | 5,075 | 5,088 |
| Berkshire Hathaway Inc. | 2.100% | 8/14/19 | 2,000 | 2,006 |
| Chubb Corp. | 5.750% | 5/15/18 | 1,655 | 1,888 |
| 1 Chubb Corp. | 6.375% | 3/29/67 | 6,200 | 6,828 |
| Cigna Corp. | 2.750% | 11/15/16 | 9,473 | 9,831 |
| Cigna Corp. | 8.500% | 5/1/19 | 1,425 | 1,809 |
| CNA Financial Corp. | 6.500% | 8/15/16 | 2,800 | 3,091 |
| Coventry Health Care Inc. | 5.950% | 3/15/17 | 4,355 | 4,849 |
| Genworth Holdings Inc. | 8.625% | 12/15/16 | 3,175 | 3,682 |
| Genworth Holdings Inc. | 6.515% | 5/22/18 | 3,632 | 4,129 |
| Hartford Financial Services Group Inc. | 5.375% | 3/15/17 | 2,025 | 2,223 |
| Hartford Financial Services Group Inc. | 4.000% | 10/15/17 | 500 | 538 |
| Hartford Financial Services Group Inc. | 6.300% | 3/15/18 | 3,853 | 4,428 |
| Hartford Financial Services Group Inc. | 6.000% | 1/15/19 | 2,308 | 2,660 |
| Humana Inc. | 6.450% | 6/1/16 | 1,275 | 1,393 |
| Humana Inc. | 7.200% | 6/15/18 | 3,850 | 4,572 |
| Humana Inc. | 6.300% | 8/1/18 | 785 | 904 |
| Kemper Corp. | 6.000% | 11/30/15 | 200 | 212 |
| Kemper Corp. | 6.000% | 5/15/17 | 3,425 | 3,768 |
| 1 Lincoln National Corp. | 7.000% | 5/17/66 | 5,375 | 5,536 |
| 1 Lincoln National Corp. | 6.050% | 4/20/67 | 5,500 | 5,637 |
| Loews Corp. | 5.250% | 3/15/16 | 2,525 | 2,700 |
72
| Short-Term Corporate Bond Index Fund | ||||
| Face | Market | |||
| Maturity | Amount | Value• | ||
| Coupon | Date | ($000) | ($000) | |
| Manulife Financial Corp. | 3.400% | 9/17/15 | 6,125 | 6,304 |
| Marsh & McLennan Cos. Inc. | 2.300% | 4/1/17 | 1,450 | 1,481 |
| Marsh & McLennan Cos. Inc. | 2.550% | 10/15/18 | 1,150 | 1,176 |
| Marsh & McLennan Cos. Inc. | 9.250% | 4/15/19 | 3,100 | 4,012 |
| MetLife Inc. | 6.750% | 6/1/16 | 5,697 | 6,285 |
| MetLife Inc. | 1.756% | 12/15/17 | 6,075 | 6,132 |
| MetLife Inc. | 6.817% | 8/15/18 | 5,750 | 6,827 |
| MetLife Inc. | 7.717% | 2/15/19 | 5,870 | 7,260 |
| Principal Financial Group Inc. | 1.850% | 11/15/17 | 1,625 | 1,630 |
| Principal Financial Group Inc. | 8.875% | 5/15/19 | 2,075 | 2,661 |
| 1 Progressive Corp. | 6.700% | 6/15/67 | 4,117 | 4,524 |
| Prudential Financial Inc. | 4.750% | 9/17/15 | 5,243 | 5,463 |
| Prudential Financial Inc. | 5.500% | 3/15/16 | 1,725 | 1,846 |
| Prudential Financial Inc. | 3.000% | 5/12/16 | 4,200 | 4,354 |
| Prudential Financial Inc. | 6.000% | 12/1/17 | 5,601 | 6,355 |
| Prudential Financial Inc. | 2.300% | 8/15/18 | 1,875 | 1,906 |
| Prudential Financial Inc. | 7.375% | 6/15/19 | 4,375 | 5,381 |
| 1 Prudential Financial Inc. | 8.875% | 6/15/68 | 4,605 | 5,566 |
| Reinsurance Group of America Inc. | 5.625% | 3/15/17 | 1,500 | 1,637 |
| 1 Reinsurance Group of America Inc. | 6.750% | 12/15/65 | 2,900 | 2,976 |
| 1 StanCorp Financial Group Inc. | 6.900% | 6/1/67 | 1,495 | 1,555 |
| Torchmark Corp. | 6.375% | 6/15/16 | 1,500 | 1,638 |
| Torchmark Corp. | 9.250% | 6/15/19 | 1,000 | 1,296 |
| Transatlantic Holdings Inc. | 5.750% | 12/14/15 | 2,825 | 2,993 |
| Travelers Cos. Inc. | 5.500% | 12/1/15 | 1,840 | 1,952 |
| Travelers Cos. Inc. | 6.250% | 6/20/16 | 1,990 | 2,184 |
| Travelers Cos. Inc. | 5.750% | 12/15/17 | 2,200 | 2,493 |
| Travelers Cos. Inc. | 5.800% | 5/15/18 | 3,650 | 4,171 |
| Travelers Cos. Inc. | 5.900% | 6/2/19 | 2,415 | 2,820 |
| UnitedHealth Group Inc. | 0.850% | 10/15/15 | 6,250 | 6,272 |
| UnitedHealth Group Inc. | 5.375% | 3/15/16 | 2,600 | 2,786 |
| UnitedHealth Group Inc. | 1.875% | 11/15/16 | 2,625 | 2,687 |
| UnitedHealth Group Inc. | 1.400% | 10/15/17 | 5,100 | 5,107 |
| UnitedHealth Group Inc. | 6.000% | 2/15/18 | 8,234 | 9,435 |
| UnitedHealth Group Inc. | 1.625% | 3/15/19 | 1,150 | 1,132 |
| Unum Group | 7.125% | 9/30/16 | 1,445 | 1,621 |
| Voya Financial Inc. | 2.900% | 2/15/18 | 6,500 | 6,724 |
| WellPoint Inc. | 1.250% | 9/10/15 | 4,900 | 4,930 |
| WellPoint Inc. | 5.250% | 1/15/16 | 6,850 | 7,298 |
| WellPoint Inc. | 2.375% | 2/15/17 | 3,000 | 3,087 |
| WellPoint Inc. | 5.875% | 6/15/17 | 4,700 | 5,257 |
| WellPoint Inc. | 1.875% | 1/15/18 | 3,225 | 3,240 |
| WellPoint Inc. | 2.300% | 7/15/18 | 3,000 | 3,039 |
| WellPoint Inc. | 2.250% | 8/15/19 | 1,765 | 1,757 |
| Willis Group Holdings plc | 4.125% | 3/15/16 | 3,550 | 3,702 |
| Willis North America Inc. | 6.200% | 3/28/17 | 245 | 268 |
| XLIT Ltd. | 2.300% | 12/15/18 | 850 | 856 |
| Other Finance (0.1%) | ||||
| ORIX Corp. | 5.000% | 1/12/16 | 1,775 | 1,873 |
| ORIX Corp. | 3.750% | 3/9/17 | 1,950 | 2,057 |
| XTRA Finance Corp. | 5.150% | 4/1/17 | 1,600 | 1,752 |
73
| Short-Term Corporate Bond Index Fund | ||||
| Face | Market | |||
| Maturity | Amount | Value• | ||
| Coupon | Date | ($000) | ($000) | |
| Real Estate Investment Trusts (2.0%) | ||||
| 2 ARC Properties Operating Partnership LP/ | ||||
| Clark Acquisition LLC | 2.000% | 2/6/17 | 7,200 | 7,223 |
| 2 ARC Properties Operating Partnership LP/ | ||||
| Clark Acquisition LLC | 3.000% | 2/6/19 | 5,500 | 5,518 |
| Arden Realty LP | 5.250% | 3/1/15 | 3,925 | 3,973 |
| AvalonBay Communities Inc. | 5.750% | 9/15/16 | 500 | 549 |
| AvalonBay Communities Inc. | 5.700% | 3/15/17 | 1,335 | 1,481 |
| BioMed Realty LP | 3.850% | 4/15/16 | 1,960 | 2,044 |
| BioMed Realty LP | 2.625% | 5/1/19 | 2,000 | 2,006 |
| Boston Properties LP | 3.700% | 11/15/18 | 4,415 | 4,706 |
| Brandywine Operating Partnership LP | 5.700% | 5/1/17 | 5,900 | 6,466 |
| Brandywine Operating Partnership LP | 4.950% | 4/15/18 | 1,375 | 1,491 |
| DDR Corp. | 7.500% | 4/1/17 | 4,200 | 4,806 |
| Digital Realty Trust LP | 4.500% | 7/15/15 | 2,500 | 2,557 |
| Duke Realty LP | 5.950% | 2/15/17 | 5,700 | 6,294 |
| Duke Realty LP | 8.250% | 8/15/19 | 550 | 690 |
| ERP Operating LP | 5.125% | 3/15/16 | 5,425 | 5,785 |
| ERP Operating LP | 5.375% | 8/1/16 | 500 | 543 |
| ERP Operating LP | 5.750% | 6/15/17 | 3,725 | 4,169 |
| ERP Operating LP | 2.375% | 7/1/19 | 2,000 | 2,012 |
| 2 Essex Portfolio LP | 5.500% | 3/15/17 | 1,625 | 1,784 |
| Equity CommonWealth | 6.250% | 6/15/17 | 1,000 | 1,083 |
| Equity CommonWealth | 6.650% | 1/15/18 | 1,000 | 1,111 |
| HCP Inc. | 3.750% | 2/1/16 | 5,325 | 5,542 |
| HCP Inc. | 6.000% | 1/30/17 | 3,100 | 3,444 |
| HCP Inc. | 6.700% | 1/30/18 | 8,345 | 9,680 |
| HCP Inc. | 3.750% | 2/1/19 | 1,700 | 1,806 |
| Healthcare Realty Trust Inc. | 6.500% | 1/17/17 | 1,857 | 2,069 |
| Health Care REIT Inc. | 3.625% | 3/15/16 | 3,675 | 3,824 |
| Health Care REIT Inc. | 6.200% | 6/1/16 | 1,575 | 1,714 |
| Health Care REIT Inc. | 4.700% | 9/15/17 | 4,800 | 5,236 |
| Health Care REIT Inc. | 2.250% | 3/15/18 | 2,450 | 2,482 |
| Health Care REIT Inc. | 4.125% | 4/1/19 | 2,100 | 2,266 |
| Highwoods Realty LP | 5.850% | 3/15/17 | 1,300 | 1,437 |
| Hospitality Properties Trust | 5.625% | 3/15/17 | 975 | 1,067 |
| Hospitality Properties Trust | 6.700% | 1/15/18 | 3,925 | 4,406 |
| Kilroy Realty LP | 5.000% | 11/3/15 | 1,125 | 1,180 |
| Kilroy Realty LP | 4.800% | 7/15/18 | 2,325 | 2,533 |
| Kimco Realty Corp. | 5.783% | 3/15/16 | 1,100 | 1,181 |
| Kimco Realty Corp. | 5.700% | 5/1/17 | 2,100 | 2,329 |
| Kimco Realty Corp. | 4.300% | 2/1/18 | 3,075 | 3,325 |
| Liberty Property LP | 5.125% | 3/2/15 | 2,350 | 2,400 |
| Liberty Property LP | 5.500% | 12/15/16 | 113 | 123 |
| Liberty Property LP | 6.625% | 10/1/17 | 550 | 627 |
| Mack-Cali Realty LP | 2.500% | 12/15/17 | 1,000 | 1,017 |
| Mack-Cali Realty LP | 7.750% | 8/15/19 | 1,950 | 2,342 |
| ProLogis LP | 4.500% | 8/15/17 | 2,125 | 2,289 |
| ProLogis LP | 2.750% | 2/15/19 | 700 | 715 |
| Realty Income Corp. | 5.950% | 9/15/16 | 1,900 | 2,086 |
| Realty Income Corp. | 2.000% | 1/31/18 | 2,375 | 2,384 |
| Realty Income Corp. | 6.750% | 8/15/19 | 3,110 | 3,704 |
| Regency Centers LP | 5.250% | 8/1/15 | 1,750 | 1,822 |
| Regency Centers LP | 5.875% | 6/15/17 | 450 | 504 |
| Senior Housing Properties Trust | 4.300% | 1/15/16 | 845 | 871 |
74
| Short-Term Corporate Bond Index Fund | ||||
| Face | Market | |||
| Maturity | Amount | Value• | ||
| Coupon | Date | ($000) | ($000) | |
| Senior Housing Properties Trust | 3.250% | 5/1/19 | 3,975 | 4,045 |
| Simon Property Group LP | 5.750% | 12/1/15 | 2,100 | 2,208 |
| Simon Property Group LP | 6.100% | 5/1/16 | 550 | 592 |
| Simon Property Group LP | 5.250% | 12/1/16 | 3,250 | 3,531 |
| Simon Property Group LP | 2.800% | 1/30/17 | 3,225 | 3,351 |
| Simon Property Group LP | 5.875% | 3/1/17 | 86 | 95 |
| Simon Property Group LP | 2.150% | 9/15/17 | 4,525 | 4,638 |
| Simon Property Group LP | 6.125% | 5/30/18 | 8,775 | 10,161 |
| Simon Property Group LP | 2.200% | 2/1/19 | 5,700 | 5,774 |
| Simon Property Group LP | 10.350% | 4/1/19 | 2,800 | 3,759 |
| Tanger Properties LP | 6.150% | 11/15/15 | 2,000 | 2,127 |
| UDR Inc. | 4.250% | 6/1/18 | 1,000 | 1,079 |
| Ventas Realty LP | 1.550% | 9/26/16 | 2,630 | 2,657 |
| Ventas Realty LP / Ventas Capital Corp. | 3.125% | 11/30/15 | 4,575 | 4,711 |
| Ventas Realty LP / Ventas Capital Corp. | 2.000% | 2/15/18 | 4,025 | 4,050 |
| Ventas Realty LP / Ventas Capital Corp. | 4.000% | 4/30/19 | 3,275 | 3,519 |
| Vornado Realty LP | 2.500% | 6/30/19 | 1,825 | 1,838 |
| 4,213,740 | ||||
| Industrial (49.4%) | ||||
| Basic Industry (3.7%) | ||||
| Agrium Inc. | 6.750% | 1/15/19 | 3,352 | 3,976 |
| Air Products & Chemicals Inc. | 2.000% | 8/2/16 | 2,175 | 2,226 |
| Air Products & Chemicals Inc. | 1.200% | 10/15/17 | 1,625 | 1,626 |
| Air Products & Chemicals Inc. | 4.375% | 8/21/19 | 1,100 | 1,216 |
| Airgas Inc. | 3.250% | 10/1/15 | 950 | 974 |
| Airgas Inc. | 2.950% | 6/15/16 | 500 | 516 |
| Airgas Inc. | 1.650% | 2/15/18 | 1,850 | 1,838 |
| Allegheny Technologies Inc. | 9.375% | 6/1/19 | 1,900 | 2,360 |
| Barrick Gold Corp. | 6.950% | 4/1/19 | 8,184 | 9,806 |
| Barrick North America Finance LLC | 6.800% | 9/15/18 | 4,296 | 5,026 |
| BHP Billiton Finance USA Ltd. | 1.875% | 11/21/16 | 5,025 | 5,126 |
| BHP Billiton Finance USA Ltd. | 1.625% | 2/24/17 | 11,303 | 11,449 |
| BHP Billiton Finance USA Ltd. | 5.400% | 3/29/17 | 300 | 332 |
| BHP Billiton Finance USA Ltd. | 2.050% | 9/30/18 | 6,900 | 6,968 |
| BHP Billiton Finance USA Ltd. | 6.500% | 4/1/19 | 12,325 | 14,769 |
| Cabot Corp. | 2.550% | 1/15/18 | 1,125 | 1,154 |
| Celulosa Arauco y Constitucion SA | 5.625% | 4/20/15 | 3,300 | 3,386 |
| Celulosa Arauco y Constitucion SA | 7.250% | 7/29/19 | 2,315 | 2,736 |
| CF Industries Inc. | 6.875% | 5/1/18 | 7,425 | 8,669 |
| Cliffs Natural Resources Inc. | 4.200% | 1/15/18 | 3,350 | 3,369 |
| Domtar Corp. | 10.750% | 6/1/17 | 1,675 | 2,060 |
| Dow Chemical Co. | 2.500% | 2/15/16 | 4,260 | 4,364 |
| Dow Chemical Co. | 5.700% | 5/15/18 | 2,880 | 3,274 |
| Dow Chemical Co. | 8.550% | 5/15/19 | 12,900 | 16,422 |
| Eastman Chemical Co. | 3.000% | 12/15/15 | 250 | 257 |
| Eastman Chemical Co. | 2.400% | 6/1/17 | 10,050 | 10,294 |
| Ecolab Inc. | 3.000% | 12/8/16 | 6,050 | 6,311 |
| Ecolab Inc. | 1.450% | 12/8/17 | 2,800 | 2,797 |
| EI du Pont de Nemours & Co. | 4.750% | 3/15/15 | 375 | 384 |
| EI du Pont de Nemours & Co. | 1.950% | 1/15/16 | 3,175 | 3,236 |
| EI du Pont de Nemours & Co. | 2.750% | 4/1/16 | 5,400 | 5,586 |
| EI du Pont de Nemours & Co. | 5.250% | 12/15/16 | 2,752 | 3,034 |
| EI du Pont de Nemours & Co. | 6.000% | 7/15/18 | 9,001 | 10,453 |
| Freeport-McMoRan Copper & Gold Inc. | 2.150% | 3/1/17 | 5,500 | 5,603 |
| Freeport-McMoRan Copper & Gold Inc. | 2.375% | 3/15/18 | 10,295 | 10,436 |
75
| Short-Term Corporate Bond Index Fund | ||||
| Face | Market | |||
| Maturity | Amount | Value• | ||
| Coupon | Date | ($000) | ($000) | |
| Georgia-Pacific LLC | 7.700% | 6/15/15 | 750 | 792 |
| Glencore Canada Corp. | 6.000% | 10/15/15 | 1,925 | 2,032 |
| Glencore Canada Corp. | 5.500% | 6/15/17 | 900 | 986 |
| Goldcorp Inc. | 2.125% | 3/15/18 | 4,050 | 4,084 |
| International Paper Co. | 7.950% | 6/15/18 | 1,900 | 2,307 |
| Lubrizol Corp. | 8.875% | 2/1/19 | 3,088 | 3,940 |
| LyondellBasell Industries NV | 5.000% | 4/15/19 | 14,100 | 15,710 |
| Monsanto Co. | 2.750% | 4/15/16 | 3,437 | 3,549 |
| Monsanto Co. | 1.150% | 6/30/17 | 3,000 | 2,991 |
| Monsanto Co. | 5.125% | 4/15/18 | 1,400 | 1,566 |
| Monsanto Co. | 2.125% | 7/15/19 | 5,500 | 5,508 |
| Nucor Corp. | 5.750% | 12/1/17 | 3,450 | 3,898 |
| Nucor Corp. | 5.850% | 6/1/18 | 4,775 | 5,466 |
| Plains Exploration & Production Co. | 6.125% | 6/15/19 | 2,012 | 2,221 |
| Plum Creek Timberlands LP | 5.875% | 11/15/15 | 1,925 | 2,038 |
| Potash Corp. of Saskatchewan Inc. | 3.250% | 12/1/17 | 3,940 | 4,169 |
| Potash Corp. of Saskatchewan Inc. | 6.500% | 5/15/19 | 850 | 1,016 |
| PPG Industries Inc. | 6.650% | 3/15/18 | 3,172 | 3,689 |
| Praxair Inc. | 3.250% | 9/15/15 | 675 | 695 |
| Praxair Inc. | 0.750% | 2/21/16 | 3,600 | 3,614 |
| Praxair Inc. | 5.200% | 3/15/17 | 2,125 | 2,346 |
| Praxair Inc. | 1.050% | 11/7/17 | 1,675 | 1,665 |
| Praxair Inc. | 1.250% | 11/7/18 | 4,800 | 4,713 |
| Praxair Inc. | 4.500% | 8/15/19 | 4,675 | 5,206 |
| Rio Tinto Finance USA Ltd. | 1.875% | 11/2/15 | 4,825 | 4,898 |
| Rio Tinto Finance USA Ltd. | 2.500% | 5/20/16 | 917 | 942 |
| Rio Tinto Finance USA Ltd. | 2.250% | 9/20/16 | 3,400 | 3,492 |
| Rio Tinto Finance USA Ltd. | 6.500% | 7/15/18 | 14,185 | 16,658 |
| Rio Tinto Finance USA Ltd. | 9.000% | 5/1/19 | 10,310 | 13,414 |
| Rio Tinto Finance USA plc | 1.375% | 6/17/16 | 3,600 | 3,637 |
| Rio Tinto Finance USA plc | 2.000% | 3/22/17 | 4,525 | 4,617 |
| Rio Tinto Finance USA plc | 1.625% | 8/21/17 | 8,500 | 8,567 |
| Rio Tinto Finance USA plc | 2.250% | 12/14/18 | 4,300 | 4,367 |
| Rock-Tenn Co. | 4.450% | 3/1/19 | 5,000 | 5,436 |
| Rohm & Haas Co. | 6.000% | 9/15/17 | 1,756 | 1,984 |
| RPM International Inc. | 6.500% | 2/15/18 | 1,500 | 1,712 |
| Sherwin-Williams Co. | 1.350% | 12/15/17 | 6,200 | 6,191 |
| Teck Resources Ltd. | 3.150% | 1/15/17 | 5,600 | 5,835 |
| Teck Resources Ltd. | 3.850% | 8/15/17 | 1,900 | 2,011 |
| Teck Resources Ltd. | 2.500% | 2/1/18 | 3,341 | 3,394 |
| Teck Resources Ltd. | 3.000% | 3/1/19 | 2,171 | 2,219 |
| Vale Canada Ltd. | 5.700% | 10/15/15 | 2,505 | 2,636 |
| Vale Overseas Ltd. | 6.250% | 1/11/16 | 8,800 | 9,416 |
| Vale Overseas Ltd. | 6.250% | 1/23/17 | 7,150 | 7,950 |
| Capital Goods (4.4%) | ||||
| 3M Co. | 1.375% | 9/29/16 | 3,542 | 3,599 |
| 3M Co. | 1.000% | 6/26/17 | 5,445 | 5,437 |
| ABB Finance USA Inc. | 1.625% | 5/8/17 | 600 | 606 |
| Bemis Co. Inc. | 6.800% | 8/1/19 | 2,800 | 3,328 |
| Boeing Capital Corp. | 2.125% | 8/15/16 | 5,090 | 5,228 |
| Boeing Capital Corp. | 2.900% | 8/15/18 | 850 | 890 |
| Boeing Co. | 3.750% | 11/20/16 | 1,731 | 1,845 |
| Boeing Co. | 0.950% | 5/15/18 | 6,410 | 6,270 |
| Boeing Co. | 6.000% | 3/15/19 | 1,500 | 1,764 |
76
| Short-Term Corporate Bond Index Fund | ||||
| Face | Market | |||
| Maturity | Amount | Value• | ||
| Coupon | Date | ($000) | ($000) | |
| Caterpillar Financial Services Corp. | 0.700% | 11/6/15 | 600 | 602 |
| Caterpillar Financial Services Corp. | 2.650% | 4/1/16 | 3,200 | 3,301 |
| Caterpillar Financial Services Corp. | 2.050% | 8/1/16 | 9,175 | 9,408 |
| Caterpillar Financial Services Corp. | 1.350% | 9/6/16 | 3,150 | 3,186 |
| Caterpillar Financial Services Corp. | 1.000% | 11/25/16 | 3,000 | 3,008 |
| Caterpillar Financial Services Corp. | 1.000% | 3/3/17 | 5,600 | 5,593 |
| Caterpillar Financial Services Corp. | 1.625% | 6/1/17 | 2,449 | 2,485 |
| Caterpillar Financial Services Corp. | 1.250% | 8/18/17 | 3,600 | 3,604 |
| Caterpillar Financial Services Corp. | 1.250% | 11/6/17 | 9,457 | 9,426 |
| Caterpillar Financial Services Corp. | 1.300% | 3/1/18 | 2,250 | 2,233 |
| Caterpillar Financial Services Corp. | 5.450% | 4/15/18 | 1,000 | 1,132 |
| Caterpillar Financial Services Corp. | 2.450% | 9/6/18 | 2,200 | 2,258 |
| Caterpillar Financial Services Corp. | 7.050% | 10/1/18 | 4,000 | 4,821 |
| Caterpillar Financial Services Corp. | 7.150% | 2/15/19 | 4,372 | 5,333 |
| Caterpillar Financial Services Corp. | 2.100% | 6/9/19 | 1,950 | 1,953 |
| Caterpillar Inc. | 0.950% | 6/26/15 | 5,675 | 5,705 |
| Caterpillar Inc. | 5.700% | 8/15/16 | 3,075 | 3,368 |
| Caterpillar Inc. | 1.500% | 6/26/17 | 3,288 | 3,314 |
| Caterpillar Inc. | 7.900% | 12/15/18 | 5,225 | 6,524 |
| Cooper US Inc. | 2.375% | 1/15/16 | 550 | 563 |
| Cooper US Inc. | 6.100% | 7/1/17 | 1,800 | 2,027 |
| Crane Co. | 2.750% | 12/15/18 | 1,400 | 1,434 |
| CRH America Inc. | 4.125% | 1/15/16 | 1,250 | 1,304 |
| CRH America Inc. | 6.000% | 9/30/16 | 9,825 | 10,784 |
| Danaher Corp. | 2.300% | 6/23/16 | 3,100 | 3,188 |
| Danaher Corp. | 5.625% | 1/15/18 | 4,925 | 5,582 |
| Danaher Corp. | 5.400% | 3/1/19 | 5,725 | 6,551 |
| Dover Corp. | 4.875% | 10/15/15 | 175 | 184 |
| Dover Corp. | 5.450% | 3/15/18 | 900 | 1,015 |
| Eaton Corp. | 0.950% | 11/2/15 | 4,000 | 4,016 |
| Eaton Corp. | 5.300% | 3/15/17 | 2,300 | 2,520 |
| Eaton Corp. | 1.500% | 11/2/17 | 4,850 | 4,852 |
| Eaton Corp. | 5.600% | 5/15/18 | 2,925 | 3,321 |
| Eaton Corp. | 6.950% | 3/20/19 | 75 | 89 |
| Emerson Electric Co. | 5.125% | 12/1/16 | 375 | 411 |
| Emerson Electric Co. | 5.375% | 10/15/17 | 5,000 | 5,624 |
| Emerson Electric Co. | 5.250% | 10/15/18 | 2,950 | 3,355 |
| Emerson Electric Co. | 4.875% | 10/15/19 | 1,635 | 1,849 |
| Exelis Inc. | 4.250% | 10/1/16 | 1,100 | 1,164 |
| General Dynamics Corp. | 1.000% | 11/15/17 | 7,950 | 7,874 |
| General Electric Co. | 0.850% | 10/9/15 | 9,625 | 9,670 |
| General Electric Co. | 5.250% | 12/6/17 | 27,975 | 31,358 |
| Honeywell International Inc. | 5.400% | 3/15/16 | 3,200 | 3,439 |
| Honeywell International Inc. | 5.300% | 3/15/17 | 3,375 | 3,729 |
| Honeywell International Inc. | 5.300% | 3/1/18 | 7,850 | 8,866 |
| Honeywell International Inc. | 5.000% | 2/15/19 | 3,675 | 4,160 |
| Illinois Tool Works Inc. | 1.950% | 3/1/19 | 7,375 | 7,374 |
| Illinois Tool Works Inc. | 6.250% | 4/1/19 | 2,375 | 2,815 |
| Ingersoll-Rand Global Holding Co. Ltd. | 6.875% | 8/15/18 | 6,874 | 8,145 |
| Ingersoll-Rand Global Holding Co. Ltd. | 2.875% | 1/15/19 | 2,725 | 2,795 |
| John Deere Capital Corp. | 0.700% | 9/4/15 | 3,200 | 3,211 |
| John Deere Capital Corp. | 0.750% | 1/22/16 | 1,150 | 1,154 |
| John Deere Capital Corp. | 2.250% | 6/7/16 | 3,965 | 4,075 |
| John Deere Capital Corp. | 1.850% | 9/15/16 | 3,300 | 3,373 |
| John Deere Capital Corp. | 1.050% | 10/11/16 | 2,400 | 2,411 |
77
| Short-Term Corporate Bond Index Fund | ||||
| Face | Market | |||
| Maturity | Amount | Value• | ||
| Coupon | Date | ($000) | ($000) | |
| John Deere Capital Corp. | 1.050% | 12/15/16 | 1,500 | 1,506 |
| John Deere Capital Corp. | 2.000% | 1/13/17 | 4,510 | 4,620 |
| John Deere Capital Corp. | 1.400% | 3/15/17 | 2,000 | 2,022 |
| John Deere Capital Corp. | 5.500% | 4/13/17 | 1,675 | 1,860 |
| John Deere Capital Corp. | 1.125% | 6/12/17 | 4,000 | 3,997 |
| John Deere Capital Corp. | 2.800% | 9/18/17 | 3,625 | 3,788 |
| John Deere Capital Corp. | 1.200% | 10/10/17 | 5,600 | 5,579 |
| John Deere Capital Corp. | 1.300% | 3/12/18 | 2,525 | 2,503 |
| John Deere Capital Corp. | 5.350% | 4/3/18 | 2,325 | 2,622 |
| John Deere Capital Corp. | 5.750% | 9/10/18 | 1,980 | 2,284 |
| John Deere Capital Corp. | 1.950% | 12/13/18 | 6,000 | 6,024 |
| John Deere Capital Corp. | 1.950% | 3/4/19 | 5,300 | 5,300 |
| John Deere Capital Corp. | 2.250% | 4/17/19 | 3,958 | 4,013 |
| Joy Global Inc. | 6.000% | 11/15/16 | 1,185 | 1,305 |
| L-3 Communications Corp. | 3.950% | 11/15/16 | 4,425 | 4,666 |
| L-3 Communications Corp. | 1.500% | 5/28/17 | 1,200 | 1,194 |
| Lockheed Martin Corp. | 7.650% | 5/1/16 | 4,493 | 5,017 |
| Lockheed Martin Corp. | 2.125% | 9/15/16 | 4,325 | 4,433 |
| Martin Marietta Materials Inc. | 6.600% | 4/15/18 | 3,050 | 3,476 |
| Mohawk Industries Inc. | 6.125% | 1/15/16 | 4,974 | 5,324 |
| Northrop Grumman Corp. | 1.750% | 6/1/18 | 4,025 | 4,012 |
| Northrop Grumman Corp. | 5.050% | 8/1/19 | 1,175 | 1,321 |
| Owens Corning | 6.500% | 12/1/16 | 2,882 | 3,189 |
| Owens Corning | 9.000% | 6/15/19 | 375 | 466 |
| Pentair Finance SA | 1.350% | 12/1/15 | 1,500 | 1,510 |
| Pentair Finance SA | 1.875% | 9/15/17 | 2,770 | 2,790 |
| Precision Castparts Corp. | 0.700% | 12/20/15 | 3,225 | 3,231 |
| Precision Castparts Corp. | 1.250% | 1/15/18 | 8,940 | 8,866 |
| Raytheon Co. | 6.400% | 12/15/18 | 3,066 | 3,628 |
| Republic Services Inc. | 3.800% | 5/15/18 | 5,721 | 6,115 |
| Rockwell Automation Inc. | 5.650% | 12/1/17 | 500 | 562 |
| Rockwell Collins Inc. | 5.250% | 7/15/19 | 650 | 732 |
| Roper Industries Inc. | 1.850% | 11/15/17 | 3,825 | 3,857 |
| Roper Industries Inc. | 2.050% | 10/1/18 | 6,228 | 6,228 |
| 1 Stanley Black & Decker Inc. | 5.750% | 12/15/53 | 2,500 | 2,713 |
| Textron Inc. | 4.625% | 9/21/16 | 2,000 | 2,136 |
| Textron Inc. | 5.600% | 12/1/17 | 2,275 | 2,543 |
| Tyco International Finance SA | 8.500% | 1/15/19 | 2,000 | 2,449 |
| United Technologies Corp. | 1.800% | 6/1/17 | 12,750 | 12,999 |
| United Technologies Corp. | 5.375% | 12/15/17 | 3,860 | 4,360 |
| United Technologies Corp. | 6.125% | 2/1/19 | 5,325 | 6,272 |
| Waste Management Inc. | 2.600% | 9/1/16 | 5,021 | 5,181 |
| Waste Management Inc. | 6.100% | 3/15/18 | 4,850 | 5,567 |
| Waste Management Inc. | 7.375% | 3/11/19 | 2,300 | 2,805 |
| Xylem Inc. | 3.550% | 9/20/16 | 2,925 | 3,070 |
| Communication (7.4%) | ||||
| 21st Century Fox America Inc. | 7.250% | 5/18/18 | 500 | 596 |
| 21st Century Fox America Inc. | 8.250% | 8/10/18 | 3,275 | 4,028 |
| 21st Century Fox America Inc. | 6.900% | 3/1/19 | 5,825 | 6,962 |
| America Movil SAB de CV | 2.375% | 9/8/16 | 10,125 | 10,397 |
| America Movil SAB de CV | 5.625% | 11/15/17 | 3,525 | 3,956 |
| American Tower Corp. | 7.000% | 10/15/17 | 4,415 | 5,089 |
| American Tower Corp. | 4.500% | 1/15/18 | 6,590 | 7,109 |
| American Tower Corp. | 3.400% | 2/15/19 | 5,675 | 5,881 |
78
| Short-Term Corporate Bond Index Fund | ||||
| Face | Market | |||
| Maturity | Amount | Value• | ||
| Coupon | Date | ($000) | ($000) | |
| AT&T Inc. | 0.800% | 12/1/15 | 6,100 | 6,120 |
| AT&T Inc. | 0.900% | 2/12/16 | 8,194 | 8,220 |
| AT&T Inc. | 2.950% | 5/15/16 | 14,547 | 15,087 |
| AT&T Inc. | 2.400% | 8/15/16 | 9,200 | 9,476 |
| AT&T Inc. | 1.600% | 2/15/17 | 7,000 | 7,072 |
| AT&T Inc. | 1.700% | 6/1/17 | 7,161 | 7,251 |
| AT&T Inc. | 1.400% | 12/1/17 | 12,600 | 12,594 |
| AT&T Inc. | 5.500% | 2/1/18 | 17,315 | 19,545 |
| AT&T Inc. | 5.600% | 5/15/18 | 3,500 | 3,980 |
| AT&T Inc. | 2.375% | 11/27/18 | 8,550 | 8,714 |
| AT&T Inc. | 5.800% | 2/15/19 | 10,450 | 12,126 |
| AT&T Inc. | 2.300% | 3/11/19 | 11,525 | 11,643 |
| British Telecommunications plc | 1.625% | 6/28/16 | 2,800 | 2,834 |
| British Telecommunications plc | 1.250% | 2/14/17 | 3,050 | 3,049 |
| British Telecommunications plc | 5.950% | 1/15/18 | 6,240 | 7,102 |
| British Telecommunications plc | 2.350% | 2/14/19 | 4,925 | 4,979 |
| CBS Corp. | 1.950% | 7/1/17 | 2,225 | 2,258 |
| CBS Corp. | 4.625% | 5/15/18 | 1,025 | 1,121 |
| CBS Corp. | 2.300% | 8/15/19 | 1,050 | 1,045 |
| CC Holdings GS V LLC / Crown Castle GS III Corp. | 2.381% | 12/15/17 | 5,375 | 5,485 |
| Cellco Partnership / Verizon Wireless Capital LLC | 8.500% | 11/15/18 | 5,604 | 7,040 |
| Comcast Cable Communications LLC | 8.875% | 5/1/17 | 2,500 | 3,000 |
| Comcast Corp. | 5.900% | 3/15/16 | 8,650 | 9,331 |
| Comcast Corp. | 4.950% | 6/15/16 | 6,775 | 7,278 |
| Comcast Corp. | 6.500% | 1/15/17 | 6,399 | 7,220 |
| Comcast Corp. | 6.300% | 11/15/17 | 3,725 | 4,296 |
| Comcast Corp. | 5.875% | 2/15/18 | 7,050 | 8,074 |
| Comcast Corp. | 5.700% | 5/15/18 | 6,675 | 7,640 |
| Comcast Corp. | 5.700% | 7/1/19 | 4,415 | 5,153 |
| COX Communications Inc. | 5.500% | 10/1/15 | 2,825 | 2,969 |
| Deutsche Telekom International Finance BV | 5.750% | 3/23/16 | 9,350 | 10,046 |
| Deutsche Telekom International Finance BV | 6.750% | 8/20/18 | 2,900 | 3,416 |
| Deutsche Telekom International Finance BV | 6.000% | 7/8/19 | 3,225 | 3,771 |
| DIRECTV Holdings LLC / DIRECTV Financing | ||||
| Co. Inc. | 3.125% | 2/15/16 | 3,575 | 3,695 |
| DIRECTV Holdings LLC / DIRECTV Financing | ||||
| Co. Inc. | 3.500% | 3/1/16 | 8,475 | 8,808 |
| DIRECTV Holdings LLC / DIRECTV Financing | ||||
| Co. Inc. | 2.400% | 3/15/17 | 11,540 | 11,868 |
| DIRECTV Holdings LLC / DIRECTV Financing | ||||
| Co. Inc. | 1.750% | 1/15/18 | 4,700 | 4,704 |
| Discovery Communications LLC | 5.625% | 8/15/19 | 3,035 | 3,475 |
| Embarq Corp. | 7.082% | 6/1/16 | 11,000 | 12,100 |
| Graham Holdings Co. | 7.250% | 2/1/19 | 1,675 | 1,961 |
| Grupo Televisa SAB | 6.000% | 5/15/18 | 2,350 | 2,654 |
| Historic TW Inc. | 6.875% | 6/15/18 | 6,114 | 7,218 |
| Interpublic Group of Cos. Inc. | 2.250% | 11/15/17 | 1,800 | 1,825 |
| McGraw Hill Financial Inc. | 5.900% | 11/15/17 | 1,977 | 2,184 |
| Moody’s Corp. | 2.750% | 7/15/19 | 3,325 | 3,373 |
| NBCUniversal Media LLC | 2.875% | 4/1/16 | 6,151 | 6,360 |
| Nippon Telegraph & Telephone Corp. | 1.400% | 7/18/17 | 5,225 | 5,242 |
| Omnicom Group Inc. | 5.900% | 4/15/16 | 8,060 | 8,693 |
| Omnicom Group Inc. | 6.250% | 7/15/19 | 2,275 | 2,680 |
| Orange SA | 2.125% | 9/16/15 | 3,300 | 3,343 |
| Orange SA | 2.750% | 9/14/16 | 6,175 | 6,385 |
79
| Short-Term Corporate Bond Index Fund | ||||
| Face | Market | |||
| Maturity | Amount | Value• | ||
| Coupon | Date | ($000) | ($000) | |
| Orange SA | 2.750% | 2/6/19 | 6,200 | 6,355 |
| Orange SA | 5.375% | 7/8/19 | 7,030 | 7,988 |
| Qwest Corp. | 8.375% | 5/1/16 | 1,925 | 2,154 |
| Qwest Corp. | 6.500% | 6/1/17 | 2,250 | 2,515 |
| Reed Elsevier Capital Inc. | 8.625% | 1/15/19 | 850 | 1,068 |
| Rogers Communications Inc. | 6.800% | 8/15/18 | 8,175 | 9,662 |
| Scripps Networks Interactive Inc. | 2.700% | 12/15/16 | 2,325 | 2,413 |
| Telefonica Emisiones SAU | 3.992% | 2/16/16 | 11,200 | 11,649 |
| Telefonica Emisiones SAU | 6.421% | 6/20/16 | 9,150 | 9,988 |
| Telefonica Emisiones SAU | 6.221% | 7/3/17 | 2,250 | 2,528 |
| Telefonica Emisiones SAU | 3.192% | 4/27/18 | 8,300 | 8,668 |
| Telefonica Emisiones SAU | 5.877% | 7/15/19 | 1,550 | 1,791 |
| Thomson Reuters Corp. | 1.300% | 2/23/17 | 3,300 | 3,301 |
| Thomson Reuters Corp. | 6.500% | 7/15/18 | 8,850 | 10,337 |
| Time Warner Cable Inc. | 5.850% | 5/1/17 | 8,750 | 9,769 |
| Time Warner Cable Inc. | 6.750% | 7/1/18 | 13,771 | 16,172 |
| Time Warner Cable Inc. | 8.750% | 2/14/19 | 9,650 | 12,293 |
| Time Warner Cable Inc. | 8.250% | 4/1/19 | 10,550 | 13,281 |
| Time Warner Cos. Inc. | 7.250% | 10/15/17 | 468 | 549 |
| Time Warner Inc. | 5.875% | 11/15/16 | 6,250 | 6,897 |
| Time Warner Inc. | 2.100% | 6/1/19 | 3,650 | 3,620 |
| Verizon Communications Inc. | 5.550% | 2/15/16 | 5,890 | 6,302 |
| Verizon Communications Inc. | 3.000% | 4/1/16 | 9,250 | 9,570 |
| Verizon Communications Inc. | 2.500% | 9/15/16 | 12,424 | 12,809 |
| Verizon Communications Inc. | 2.000% | 11/1/16 | 7,475 | 7,620 |
| Verizon Communications Inc. | 1.350% | 6/9/17 | 11,900 | 11,886 |
| Verizon Communications Inc. | 1.100% | 11/1/17 | 3,950 | 3,911 |
| Verizon Communications Inc. | 5.500% | 2/15/18 | 4,750 | 5,377 |
| Verizon Communications Inc. | 6.100% | 4/15/18 | 5,400 | 6,223 |
| Verizon Communications Inc. | 3.650% | 9/14/18 | 24,818 | 26,473 |
| Verizon Communications Inc. | 8.750% | 11/1/18 | 6,830 | 8,613 |
| Verizon Communications Inc. | 6.350% | 4/1/19 | 13,075 | 15,373 |
| Verizon Communications Inc. | 2.550% | 6/17/19 | 3,750 | 3,806 |
| Viacom Inc. | 4.250% | 9/15/15 | 700 | 726 |
| Viacom Inc. | 6.250% | 4/30/16 | 3,050 | 3,317 |
| Viacom Inc. | 2.500% | 12/15/16 | 3,300 | 3,400 |
| Viacom Inc. | 3.500% | 4/1/17 | 2,775 | 2,932 |
| Viacom Inc. | 6.125% | 10/5/17 | 4,600 | 5,228 |
| Viacom Inc. | 2.500% | 9/1/18 | 4,655 | 4,742 |
| Viacom Inc. | 2.200% | 4/1/19 | 4,100 | 4,096 |
| Vodafone Group plc | 5.625% | 2/27/17 | 9,790 | 10,799 |
| Vodafone Group plc | 1.625% | 3/20/17 | 3,925 | 3,950 |
| Vodafone Group plc | 1.250% | 9/26/17 | 9,615 | 9,548 |
| Vodafone Group plc | 1.500% | 2/19/18 | 5,350 | 5,300 |
| Vodafone Group plc | 4.625% | 7/15/18 | 3,325 | 3,665 |
| Vodafone Group plc | 5.450% | 6/10/19 | 4,530 | 5,157 |
| Walt Disney Co. | 0.450% | 12/1/15 | 2,200 | 2,201 |
| Walt Disney Co. | 1.350% | 8/16/16 | 8,428 | 8,538 |
| Walt Disney Co. | 5.625% | 9/15/16 | 4,500 | 4,944 |
| Walt Disney Co. | 1.125% | 2/15/17 | 3,200 | 3,216 |
| Walt Disney Co. | 0.875% | 5/30/17 | 2,050 | 2,040 |
| Walt Disney Co. | 6.000% | 7/17/17 | 2,100 | 2,393 |
| Walt Disney Co. | 1.100% | 12/1/17 | 9,495 | 9,431 |
| Walt Disney Co. | 5.875% | 12/15/17 | 3,700 | 4,230 |
| Walt Disney Co. | 1.850% | 5/30/19 | 2,050 | 2,038 |
80
| Short-Term Corporate Bond Index Fund | ||||
| Face | Market | |||
| Maturity | Amount | Value• | ||
| Coupon | Date | ($000) | ($000) | |
| Consumer Cyclical (5.8%) | ||||
| Amazon.com Inc. | 0.650% | 11/27/15 | 6,500 | 6,513 |
| Amazon.com Inc. | 1.200% | 11/29/17 | 6,400 | 6,355 |
| American Honda Finance Corp. | 1.125% | 10/7/16 | 5,050 | 5,077 |
| American Honda Finance Corp. | 1.200% | 7/14/17 | 1,900 | 1,901 |
| American Honda Finance Corp. | 2.125% | 10/10/18 | 7,050 | 7,145 |
| AutoNation Inc. | 6.750% | 4/15/18 | 2,325 | 2,668 |
| AutoZone Inc. | 5.500% | 11/15/15 | 2,821 | 2,982 |
| AutoZone Inc. | 1.300% | 1/13/17 | 3,000 | 3,007 |
| AutoZone Inc. | 7.125% | 8/1/18 | 1,325 | 1,572 |
| Brinker International Inc. | 2.600% | 5/15/18 | 3,016 | 3,038 |
| Carnival Corp. | 1.200% | 2/5/16 | 1,425 | 1,433 |
| Carnival Corp. | 1.875% | 12/15/17 | 5,375 | 5,401 |
| Costco Wholesale Corp. | 0.650% | 12/7/15 | 4,400 | 4,416 |
| Costco Wholesale Corp. | 5.500% | 3/15/17 | 7,150 | 7,944 |
| Costco Wholesale Corp. | 1.125% | 12/15/17 | 8,000 | 7,939 |
| CVS Health Corp. | 6.125% | 8/15/16 | 1,055 | 1,162 |
| CVS Health Corp. | 1.200% | 12/5/16 | 1,650 | 1,658 |
| CVS Health Corp. | 5.750% | 6/1/17 | 6,914 | 7,739 |
| CVS Health Corp. | 2.250% | 12/5/18 | 11,350 | 11,478 |
| Darden Restaurants Inc. | 6.200% | 10/15/17 | 1,230 | 1,395 |
| Dollar General Corp. | 4.125% | 7/15/17 | 4,000 | 4,201 |
| Dollar General Corp. | 1.875% | 4/15/18 | 2,150 | 2,076 |
| eBay Inc. | 1.625% | 10/15/15 | 5,050 | 5,119 |
| eBay Inc. | 1.350% | 7/15/17 | 5,950 | 5,968 |
| eBay Inc. | 2.200% | 8/1/19 | 6,850 | 6,853 |
| Expedia Inc. | 7.456% | 8/15/18 | 3,925 | 4,629 |
| Ford Motor Co. | 6.500% | 8/1/18 | 50 | 58 |
| Ford Motor Credit Co. LLC | 5.625% | 9/15/15 | 2,500 | 2,624 |
| Ford Motor Credit Co. LLC | 2.500% | 1/15/16 | 3,600 | 3,676 |
| Ford Motor Credit Co. LLC | 4.207% | 4/15/16 | 6,750 | 7,093 |
| Ford Motor Credit Co. LLC | 1.700% | 5/9/16 | 4,412 | 4,458 |
| Ford Motor Credit Co. LLC | 3.984% | 6/15/16 | 8,570 | 9,005 |
| Ford Motor Credit Co. LLC | 8.000% | 12/15/16 | 11,325 | 12,978 |
| Ford Motor Credit Co. LLC | 4.250% | 2/3/17 | 4,075 | 4,347 |
| Ford Motor Credit Co. LLC | 3.000% | 6/12/17 | 10,550 | 10,939 |
| Ford Motor Credit Co. LLC | 6.625% | 8/15/17 | 8,512 | 9,719 |
| Ford Motor Credit Co. LLC | 1.724% | 12/6/17 | 5,200 | 5,192 |
| Ford Motor Credit Co. LLC | 2.375% | 1/16/18 | 10,493 | 10,675 |
| Ford Motor Credit Co. LLC | 5.000% | 5/15/18 | 15,300 | 16,869 |
| Ford Motor Credit Co. LLC | 2.875% | 10/1/18 | 9,125 | 9,396 |
| Ford Motor Credit Co. LLC | 2.375% | 3/12/19 | 10,600 | 10,597 |
| Home Depot Inc. | 5.400% | 3/1/16 | 17,243 | 18,474 |
| Home Depot Inc. | 2.250% | 9/10/18 | 8,915 | 9,121 |
| Home Depot Inc. | 2.000% | 6/15/19 | 3,200 | 3,207 |
| Hyatt Hotels Corp. | 3.875% | 8/15/16 | 400 | 420 |
| International Game Technology | 7.500% | 6/15/19 | 1,525 | 1,746 |
| Johnson Controls Inc. | 5.500% | 1/15/16 | 4,200 | 4,469 |
| Johnson Controls Inc. | 2.600% | 12/1/16 | 4,575 | 4,739 |
| Johnson Controls Inc. | 1.400% | 11/2/17 | 800 | 797 |
| Kohl’s Corp. | 6.250% | 12/15/17 | 3,500 | 3,992 |
| Lowe’s Cos. Inc. | 5.000% | 10/15/15 | 2,625 | 2,752 |
| Lowe’s Cos. Inc. | 2.125% | 4/15/16 | 3,350 | 3,420 |
| Lowe’s Cos. Inc. | 5.400% | 10/15/16 | 1,000 | 1,097 |
| Lowe’s Cos. Inc. | 1.625% | 4/15/17 | 8,125 | 8,215 |
81
| Short-Term Corporate Bond Index Fund | ||||
| Face | Market | |||
| Maturity | Amount | Value• | ||
| Coupon | Date | ($000) | ($000) | |
| Macy’s Retail Holdings Inc. | 5.900% | 12/1/16 | 4,008 | 4,432 |
| Macy’s Retail Holdings Inc. | 7.450% | 7/15/17 | 1,780 | 2,072 |
| Marriott International Inc. | 6.200% | 6/15/16 | 4,650 | 5,060 |
| Marriott International Inc. | 6.375% | 6/15/17 | 1,875 | 2,119 |
| Marriott International Inc. | 3.000% | 3/1/19 | 1,450 | 1,504 |
| MasterCard Inc. | 2.000% | 4/1/19 | 5,025 | 5,031 |
| McDonald’s Corp. | 5.300% | 3/15/17 | 4,500 | 4,979 |
| McDonald’s Corp. | 5.800% | 10/15/17 | 3,520 | 3,997 |
| McDonald’s Corp. | 5.350% | 3/1/18 | 6,615 | 7,475 |
| McDonald’s Corp. | 5.000% | 2/1/19 | 2,070 | 2,338 |
| McDonald’s Corp. | 1.875% | 5/29/19 | 2,000 | 2,011 |
| Nordstrom Inc. | 6.250% | 1/15/18 | 3,856 | 4,424 |
| PACCAR Financial Corp. | 0.700% | 11/16/15 | 1,000 | 1,003 |
| PACCAR Financial Corp. | 0.800% | 2/8/16 | 1,725 | 1,732 |
| PACCAR Financial Corp. | 0.750% | 5/16/16 | 3,000 | 3,006 |
| PACCAR Financial Corp. | 1.150% | 8/16/16 | 3,700 | 3,737 |
| PACCAR Financial Corp. | 1.600% | 3/15/17 | 1,925 | 1,950 |
| PACCAR Financial Corp. | 1.100% | 6/6/17 | 1,300 | 1,297 |
| QVC Inc. | 3.125% | 4/1/19 | 2,250 | 2,276 |
| Ralph Lauren Corp. | 2.125% | 9/26/18 | 1,475 | 1,494 |
| Staples Inc. | 2.750% | 1/12/18 | 2,925 | 2,958 |
| Starbucks Corp. | 0.875% | 12/5/16 | 3,025 | 3,030 |
| Starbucks Corp. | 6.250% | 8/15/17 | 3,675 | 4,190 |
| Starbucks Corp. | 2.000% | 12/5/18 | 3,025 | 3,044 |
| Starwood Hotels & Resorts Worldwide Inc. | 7.375% | 11/15/15 | 1,975 | 2,127 |
| Starwood Hotels & Resorts Worldwide Inc. | 6.750% | 5/15/18 | 1,300 | 1,519 |
| Target Corp. | 5.875% | 7/15/16 | 7,445 | 8,158 |
| Target Corp. | 5.375% | 5/1/17 | 2,928 | 3,256 |
| Target Corp. | 6.000% | 1/15/18 | 8,750 | 10,021 |
| Target Corp. | 2.300% | 6/26/19 | 4,825 | 4,875 |
| TJX Cos. Inc. | 6.950% | 4/15/19 | 4,100 | 4,964 |
| Toyota Motor Credit Corp. | 2.800% | 1/11/16 | 1,515 | 1,561 |
| Toyota Motor Credit Corp. | 0.800% | 5/17/16 | 200 | 201 |
| Toyota Motor Credit Corp. | 2.000% | 9/15/16 | 8,400 | 8,593 |
| Toyota Motor Credit Corp. | 2.050% | 1/12/17 | 4,525 | 4,634 |
| Toyota Motor Credit Corp. | 1.125% | 5/16/17 | 6,575 | 6,566 |
| Toyota Motor Credit Corp. | 1.750% | 5/22/17 | 11,125 | 11,296 |
| Toyota Motor Credit Corp. | 1.250% | 10/5/17 | 9,150 | 9,129 |
| Toyota Motor Credit Corp. | 1.375% | 1/10/18 | 5,044 | 5,028 |
| Toyota Motor Credit Corp. | 2.000% | 10/24/18 | 10,600 | 10,671 |
| Toyota Motor Credit Corp. | 2.100% | 1/17/19 | 10,000 | 10,099 |
| Toyota Motor Credit Corp. | 2.125% | 7/18/19 | 6,000 | 6,029 |
| Wal-Mart Stores Inc. | 2.250% | 7/8/15 | 3,725 | 3,788 |
| Wal-Mart Stores Inc. | 1.500% | 10/25/15 | 9,700 | 9,829 |
| Wal-Mart Stores Inc. | 0.600% | 4/11/16 | 2,650 | 2,654 |
| Wal-Mart Stores Inc. | 2.800% | 4/15/16 | 3,875 | 4,018 |
| Wal-Mart Stores Inc. | 5.375% | 4/5/17 | 8,825 | 9,812 |
| Wal-Mart Stores Inc. | 5.800% | 2/15/18 | 7,325 | 8,384 |
| Wal-Mart Stores Inc. | 1.125% | 4/11/18 | 11,775 | 11,653 |
| Wal-Mart Stores Inc. | 1.950% | 12/15/18 | 3,800 | 3,845 |
| Wal-Mart Stores Inc. | 4.125% | 2/1/19 | 250 | 275 |
| Walgreen Co. | 1.800% | 9/15/17 | 8,065 | 8,121 |
| Walgreen Co. | 5.250% | 1/15/19 | 5,450 | 6,109 |
| Western Union Co. | 2.375% | 12/10/15 | 150 | 153 |
| Western Union Co. | 5.930% | 10/1/16 | 4,450 | 4,869 |
82
| Short-Term Corporate Bond Index Fund | ||||
| Face | Market | |||
| Maturity | Amount | Value• | ||
| Coupon | Date | ($000) | ($000) | |
| Western Union Co. | 2.875% | 12/10/17 | 965 | 997 |
| Western Union Co. | 3.650% | 8/22/18 | 3,515 | 3,705 |
| Wyndham Worldwide Corp. | 6.000% | 12/1/16 | 1,688 | 1,859 |
| Wyndham Worldwide Corp. | 2.950% | 3/1/17 | 2,700 | 2,788 |
| Wyndham Worldwide Corp. | 2.500% | 3/1/18 | 3,665 | 3,709 |
| Yum! Brands Inc. | 6.250% | 4/15/16 | 2,714 | 2,946 |
| Yum! Brands Inc. | 6.250% | 3/15/18 | 368 | 422 |
| Consumer Noncyclical (12.7%) | ||||
| Abbott Laboratories | 5.125% | 4/1/19 | 675 | 766 |
| AbbVie Inc. | 1.200% | 11/6/15 | 23,105 | 23,233 |
| AbbVie Inc. | 1.750% | 11/6/17 | 22,000 | 22,078 |
| AbbVie Inc. | 2.000% | 11/6/18 | 3,825 | 3,819 |
| 2 Actavis Funding SCS | 1.300% | 6/15/17 | 3,450 | 3,426 |
| 2 Actavis Funding SCS | 2.450% | 6/15/19 | 3,800 | 3,793 |
| Actavis Inc. | 1.875% | 10/1/17 | 8,121 | 8,157 |
| Actavis Inc. | 6.125% | 8/15/19 | 750 | 878 |
| Allergan Inc. | 5.750% | 4/1/16 | 3,500 | 3,759 |
| Allergan Inc. | 1.350% | 3/15/18 | 2,025 | 1,969 |
| Altria Group Inc. | 4.125% | 9/11/15 | 10,163 | 10,542 |
| Altria Group Inc. | 9.700% | 11/10/18 | 7,614 | 9,905 |
| Altria Group Inc. | 9.250% | 8/6/19 | 5,918 | 7,782 |
| AmerisourceBergen Corp. | 1.150% | 5/15/17 | 3,750 | 3,740 |
| Amgen Inc. | 2.300% | 6/15/16 | 5,000 | 5,128 |
| Amgen Inc. | 2.500% | 11/15/16 | 7,350 | 7,593 |
| Amgen Inc. | 2.125% | 5/15/17 | 10,119 | 10,352 |
| Amgen Inc. | 1.250% | 5/22/17 | 4,275 | 4,277 |
| Amgen Inc. | 5.850% | 6/1/17 | 3,900 | 4,371 |
| Amgen Inc. | 6.150% | 6/1/18 | 2,500 | 2,878 |
| Amgen Inc. | 5.700% | 2/1/19 | 2,486 | 2,854 |
| Amgen Inc. | 2.200% | 5/22/19 | 13,500 | 13,487 |
| Anheuser-Busch Cos. LLC | 5.600% | 3/1/17 | 1,385 | 1,538 |
| Anheuser-Busch Cos. LLC | 5.500% | 1/15/18 | 6,667 | 7,538 |
| Anheuser-Busch Cos. LLC | 5.000% | 3/1/19 | 1,080 | 1,217 |
| Anheuser-Busch InBev Finance Inc. | 0.800% | 1/15/16 | 2,250 | 2,260 |
| Anheuser-Busch InBev Finance Inc. | 1.125% | 1/27/17 | 4,700 | 4,736 |
| Anheuser-Busch InBev Finance Inc. | 1.250% | 1/17/18 | 9,275 | 9,235 |
| Anheuser-Busch InBev Finance Inc. | 2.150% | 2/1/19 | 8,300 | 8,408 |
| Anheuser-Busch InBev Worldwide Inc. | 2.875% | 2/15/16 | 1,100 | 1,137 |
| Anheuser-Busch InBev Worldwide Inc. | 1.375% | 7/15/17 | 15,325 | 15,437 |
| Anheuser-Busch InBev Worldwide Inc. | 7.750% | 1/15/19 | 14,485 | 17,865 |
| Archer-Daniels-Midland Co. | 8.375% | 4/15/17 | 750 | 888 |
| Archer-Daniels-Midland Co. | 5.450% | 3/15/18 | 3,975 | 4,501 |
| AstraZeneca plc | 5.900% | 9/15/17 | 10,100 | 11,436 |
| Avon Products Inc. | 2.375% | 3/15/16 | 825 | 835 |
| Avon Products Inc. | 5.750% | 3/1/18 | 1,500 | 1,602 |
| Avon Products Inc. | 6.500% | 3/1/19 | 2,385 | 2,624 |
| Baxter International Inc. | 5.900% | 9/1/16 | 5,085 | 5,597 |
| Baxter International Inc. | 1.850% | 1/15/17 | 2,100 | 2,141 |
| Baxter International Inc. | 5.375% | 6/1/18 | 2,725 | 3,082 |
| Baxter International Inc. | 1.850% | 6/15/18 | 5,500 | 5,518 |
| Baxter International Inc. | 4.500% | 8/15/19 | 1,650 | 1,826 |
| Beam Suntory Inc. | 5.375% | 1/15/16 | 1,568 | 1,661 |
| Beam Suntory Inc. | 1.875% | 5/15/17 | 1,125 | 1,136 |
| Beam Suntory Inc. | 1.750% | 6/15/18 | 2,725 | 2,687 |
83
| Short-Term Corporate Bond Index Fund | ||||
| Face | Market | |||
| Maturity | Amount | Value• | ||
| Coupon | Date | ($000) | ($000) | |
| Becton Dickinson & Co. | 1.750% | 11/8/16 | 2,875 | 2,927 |
| Becton Dickinson & Co. | 5.000% | 5/15/19 | 2,850 | 3,234 |
| Biogen Idec Inc. | 6.875% | 3/1/18 | 2,825 | 3,308 |
| Boston Scientific Corp. | 6.250% | 11/15/15 | 4,000 | 4,258 |
| Boston Scientific Corp. | 6.400% | 6/15/16 | 2,375 | 2,594 |
| Boston Scientific Corp. | 5.125% | 1/12/17 | 1,650 | 1,789 |
| Boston Scientific Corp. | 2.650% | 10/1/18 | 7,800 | 7,942 |
| Bottling Group LLC | 5.500% | 4/1/16 | 1,625 | 1,751 |
| Bottling Group LLC | 5.125% | 1/15/19 | 8,535 | 9,643 |
| Bristol-Myers Squibb Co. | 0.875% | 8/1/17 | 2,600 | 2,577 |
| Bristol-Myers Squibb Co. | 1.750% | 3/1/19 | 2,700 | 2,686 |
| Brown-Forman Corp. | 2.500% | 1/15/16 | 725 | 744 |
| Brown-Forman Corp. | 1.000% | 1/15/18 | 2,150 | 2,115 |
| Bunge Ltd. Finance Corp. | 4.100% | 3/15/16 | 2,875 | 3,003 |
| Bunge Ltd. Finance Corp. | 3.200% | 6/15/17 | 2,500 | 2,598 |
| Bunge Ltd. Finance Corp. | 8.500% | 6/15/19 | 1,600 | 2,004 |
| Campbell Soup Co. | 3.050% | 7/15/17 | 2,295 | 2,404 |
| Campbell Soup Co. | 4.500% | 2/15/19 | 1,100 | 1,216 |
| Cardinal Health Inc. | 5.800% | 10/15/16 | 250 | 275 |
| Cardinal Health Inc. | 1.900% | 6/15/17 | 3,900 | 3,955 |
| Cardinal Health Inc. | 1.700% | 3/15/18 | 3,550 | 3,533 |
| CareFusion Corp. | 1.450% | 5/15/17 | 5,000 | 4,992 |
| CareFusion Corp. | 6.375% | 8/1/19 | 2,750 | 3,196 |
| Catholic Health Initiatives Colorado GO | 1.600% | 11/1/17 | 1,200 | 1,202 |
| Celgene Corp. | 2.450% | 10/15/15 | 4,625 | 4,703 |
| Celgene Corp. | 1.900% | 8/15/17 | 600 | 607 |
| Celgene Corp. | 2.300% | 8/15/18 | 3,575 | 3,628 |
| Celgene Corp. | 2.250% | 5/15/19 | 3,700 | 3,703 |
| Church & Dwight Co. Inc. | 3.350% | 12/15/15 | 350 | 362 |
| Clorox Co. | 5.950% | 10/15/17 | 6,950 | 7,875 |
| Coca-Cola Co. | 1.500% | 11/15/15 | 7,270 | 7,368 |
| Coca-Cola Co. | 1.800% | 9/1/16 | 11,525 | 11,767 |
| Coca-Cola Co. | 0.750% | 11/1/16 | 150 | 150 |
| Coca-Cola Co. | 5.350% | 11/15/17 | 5,050 | 5,691 |
| Coca-Cola Co. | 1.650% | 3/14/18 | 2,125 | 2,143 |
| Coca-Cola Co. | 1.150% | 4/1/18 | 8,800 | 8,720 |
| Coca-Cola Co. | 1.650% | 11/1/18 | 12,625 | 12,665 |
| Coca-Cola Co. | 4.875% | 3/15/19 | 2,800 | 3,169 |
| Coca-Cola Enterprises Inc. | 2.125% | 9/15/15 | 3,485 | 3,546 |
| Coca-Cola Enterprises Inc. | 2.000% | 8/19/16 | 500 | 511 |
| Coca-Cola Femsa SAB de CV | 2.375% | 11/26/18 | 8,600 | 8,717 |
| Coca-Cola HBC Finance BV | 5.500% | 9/17/15 | 1,250 | 1,306 |
| Colgate-Palmolive Co. | 1.300% | 1/15/17 | 2,506 | 2,520 |
| Colgate-Palmolive Co. | 2.625% | 5/1/17 | 625 | 652 |
| Colgate-Palmolive Co. | 0.900% | 5/1/18 | 2,950 | 2,896 |
| Colgate-Palmolive Co. | 1.500% | 11/1/18 | 1,925 | 1,921 |
| Colgate-Palmolive Co. | 1.750% | 3/15/19 | 5,950 | 5,952 |
| ConAgra Foods Inc. | 1.350% | 9/10/15 | 3,000 | 3,019 |
| ConAgra Foods Inc. | 1.300% | 1/25/16 | 7,285 | 7,333 |
| ConAgra Foods Inc. | 5.819% | 6/15/17 | 1,526 | 1,704 |
| ConAgra Foods Inc. | 1.900% | 1/25/18 | 8,450 | 8,449 |
| Covidien International Finance SA | 6.000% | 10/15/17 | 9,575 | 10,861 |
| CR Bard Inc. | 1.375% | 1/15/18 | 3,738 | 3,712 |
| Delhaize Group SA | 6.500% | 6/15/17 | 2,450 | 2,750 |
| Delhaize Group SA | 4.125% | 4/10/19 | 3,423 | 3,629 |
84
| Short-Term Corporate Bond Index Fund | ||||
| Face | Market | |||
| Maturity | Amount | Value• | ||
| Coupon | Date | ($000) | ($000) | |
| DENTSPLY International Inc. | 2.750% | 8/15/16 | 525 | 542 |
| Diageo Capital plc | 0.625% | 4/29/16 | 4,500 | 4,494 |
| Diageo Capital plc | 5.500% | 9/30/16 | 1,700 | 1,860 |
| Diageo Capital plc | 1.500% | 5/11/17 | 7,078 | 7,150 |
| Diageo Capital plc | 5.750% | 10/23/17 | 6,992 | 7,921 |
| Diageo Capital plc | 1.125% | 4/29/18 | 3,850 | 3,783 |
| Diageo Finance BV | 5.300% | 10/28/15 | 3,100 | 3,273 |
| Dr Pepper Snapple Group Inc. | 2.900% | 1/15/16 | 3,110 | 3,203 |
| Dr Pepper Snapple Group Inc. | 6.820% | 5/1/18 | 4,170 | 4,878 |
| Dr Pepper Snapple Group Inc. | 2.600% | 1/15/19 | 750 | 760 |
| Edwards Lifesciences Corp. | 2.875% | 10/15/18 | 3,300 | 3,370 |
| Eli Lilly & Co. | 5.200% | 3/15/17 | 6,400 | 7,079 |
| Eli Lilly & Co. | 1.950% | 3/15/19 | 3,250 | 3,261 |
| Express Scripts Holding Co. | 3.125% | 5/15/16 | 11,650 | 12,097 |
| Express Scripts Holding Co. | 2.650% | 2/15/17 | 8,600 | 8,890 |
| Express Scripts Holding Co. | 7.250% | 6/15/19 | 4,790 | 5,838 |
| Genentech Inc. | 4.750% | 7/15/15 | 6,186 | 6,421 |
| General Mills Inc. | 0.875% | 1/29/16 | 1,140 | 1,144 |
| General Mills Inc. | 5.700% | 2/15/17 | 6,325 | 7,017 |
| General Mills Inc. | 5.650% | 2/15/19 | 6,415 | 7,418 |
| Gilead Sciences Inc. | 3.050% | 12/1/16 | 5,690 | 5,951 |
| Gilead Sciences Inc. | 2.050% | 4/1/19 | 3,400 | 3,413 |
| GlaxoSmithKline Capital Inc. | 0.700% | 3/18/16 | 7,625 | 7,650 |
| GlaxoSmithKline Capital Inc. | 5.650% | 5/15/18 | 16,900 | 19,333 |
| GlaxoSmithKline Capital plc | 1.500% | 5/8/17 | 10,875 | 10,988 |
| Hasbro Inc. | 6.300% | 9/15/17 | 1,975 | 2,238 |
| Hershey Co. | 5.450% | 9/1/16 | 1,400 | 1,532 |
| Hershey Co. | 1.500% | 11/1/16 | 4,350 | 4,429 |
| Hillshire Brands Co. | 2.750% | 9/15/15 | 1,125 | 1,147 |
| Ingredion Inc. | 3.200% | 11/1/15 | 2,750 | 2,828 |
| Johnson & Johnson | 2.150% | 5/15/16 | 3,370 | 3,458 |
| Johnson & Johnson | 5.550% | 8/15/17 | 3,800 | 4,294 |
| Johnson & Johnson | 5.150% | 7/15/18 | 6,450 | 7,333 |
| Johnson & Johnson | 1.650% | 12/5/18 | 4,750 | 4,787 |
| Kellogg Co. | 4.450% | 5/30/16 | 5,375 | 5,711 |
| Kellogg Co. | 1.875% | 11/17/16 | 5,100 | 5,190 |
| Kellogg Co. | 1.750% | 5/17/17 | 2,775 | 2,811 |
| Kellogg Co. | 3.250% | 5/21/18 | 450 | 473 |
| Kimberly-Clark Corp. | 6.125% | 8/1/17 | 9,671 | 11,018 |
| Kimberly-Clark Corp. | 6.250% | 7/15/18 | 1,478 | 1,733 |
| Kimberly-Clark Corp. | 7.500% | 11/1/18 | 1,075 | 1,317 |
| Kimberly-Clark Corp. | 1.900% | 5/22/19 | 1,000 | 996 |
| Koninklijke Philips NV | 5.750% | 3/11/18 | 9,850 | 11,201 |
| Kraft Foods Group Inc. | 2.250% | 6/5/17 | 7,499 | 7,676 |
| Kraft Foods Group Inc. | 6.125% | 8/23/18 | 6,025 | 6,966 |
| Kroger Co. | 3.900% | 10/1/15 | 3,200 | 3,309 |
| Kroger Co. | 2.200% | 1/15/17 | 2,950 | 3,024 |
| Kroger Co. | 6.400% | 8/15/17 | 6,406 | 7,293 |
| Kroger Co. | 6.800% | 12/15/18 | 425 | 504 |
| Kroger Co. | 2.300% | 1/15/19 | 3,525 | 3,551 |
| Laboratory Corp. of America Holdings | 5.625% | 12/15/15 | 1,475 | 1,568 |
| Laboratory Corp. of America Holdings | 3.125% | 5/15/16 | 100 | 104 |
| Laboratory Corp. of America Holdings | 2.200% | 8/23/17 | 5,100 | 5,177 |
| Life Technologies Corp. | 3.500% | 1/15/16 | 700 | 724 |
| Lorillard Tobacco Co. | 3.500% | 8/4/16 | 5,465 | 5,695 |
85
| Short-Term Corporate Bond Index Fund | ||||
| Face | Market | |||
| Maturity | Amount | Value• | ||
| Coupon | Date | ($000) | ($000) | |
| Lorillard Tobacco Co. | 2.300% | 8/21/17 | 2,215 | 2,251 |
| Lorillard Tobacco Co. | 8.125% | 6/23/19 | 3,842 | 4,774 |
| Mattel Inc. | 2.500% | 11/1/16 | 1,655 | 1,706 |
| Mattel Inc. | 2.350% | 5/6/19 | 2,600 | 2,600 |
| McKesson Corp. | 0.950% | 12/4/15 | 900 | 903 |
| McKesson Corp. | 3.250% | 3/1/16 | 6,150 | 6,364 |
| McKesson Corp. | 5.700% | 3/1/17 | 1,900 | 2,113 |
| McKesson Corp. | 1.400% | 3/15/18 | 2,100 | 2,073 |
| McKesson Corp. | 7.500% | 2/15/19 | 4,200 | 5,148 |
| McKesson Corp. | 2.284% | 3/15/19 | 8,000 | 8,011 |
| Medco Health Solutions Inc. | 2.750% | 9/15/15 | 5,550 | 5,673 |
| Medco Health Solutions Inc. | 7.125% | 3/15/18 | 8,925 | 10,489 |
| Medtronic Inc. | 4.750% | 9/15/15 | 800 | 836 |
| Medtronic Inc. | 2.625% | 3/15/16 | 5,300 | 5,437 |
| Medtronic Inc. | 1.375% | 4/1/18 | 5,850 | 5,814 |
| Medtronic Inc. | 5.600% | 3/15/19 | 3,625 | 4,191 |
| Merck & Co. Inc. | 2.250% | 1/15/16 | 6,275 | 6,425 |
| Merck & Co. Inc. | 6.000% | 9/15/17 | 6,600 | 7,524 |
| Merck & Co. Inc. | 1.100% | 1/31/18 | 9,876 | 9,754 |
| Merck & Co. Inc. | 1.300% | 5/18/18 | 10,800 | 10,714 |
| Merck Sharp & Dohme Corp. | 5.000% | 6/30/19 | 4,125 | 4,685 |
| Molson Coors Brewing Co. | 2.000% | 5/1/17 | 1,100 | 1,119 |
| Mondelez International Inc. | 4.125% | 2/9/16 | 9,100 | 9,535 |
| Mondelez International Inc. | 6.500% | 8/11/17 | 8,657 | 9,873 |
| Mondelez International Inc. | 6.125% | 2/1/18 | 7,575 | 8,664 |
| Mondelez International Inc. | 6.125% | 8/23/18 | 1,800 | 2,082 |
| Mondelez International Inc. | 2.250% | 2/1/19 | 1,225 | 1,227 |
| Mylan Inc. | 1.800% | 6/24/16 | 3,550 | 3,599 |
| Mylan Inc. | 1.350% | 11/29/16 | 1,675 | 1,680 |
| Mylan Inc. | 2.600% | 6/24/18 | 6,225 | 6,349 |
| Mylan Inc. | 2.550% | 3/28/19 | 3,900 | 3,921 |
| Newell Rubbermaid Inc. | 2.000% | 6/15/15 | 375 | 379 |
| Newell Rubbermaid Inc. | 2.050% | 12/1/17 | 2,700 | 2,722 |
| Novartis Securities Investment Ltd. | 5.125% | 2/10/19 | 18,770 | 21,313 |
| PepsiAmericas Inc. | 5.000% | 5/15/17 | 750 | 827 |
| PepsiCo Inc. | 2.500% | 5/10/16 | 8,900 | 9,174 |
| PepsiCo Inc. | 0.950% | 2/22/17 | 1,300 | 1,298 |
| PepsiCo Inc. | 1.250% | 8/13/17 | 9,917 | 9,939 |
| PepsiCo Inc. | 5.000% | 6/1/18 | 11,306 | 12,687 |
| PepsiCo Inc. | 7.900% | 11/1/18 | 10,544 | 13,075 |
| PepsiCo Inc. | 2.250% | 1/7/19 | 3,275 | 3,336 |
| 2 Perrigo Co. plc | 1.300% | 11/8/16 | 1,500 | 1,498 |
| 2 Perrigo Co. plc | 2.300% | 11/8/18 | 3,800 | 3,793 |
| Pfizer Inc. | 0.900% | 1/15/17 | 3,450 | 3,449 |
| Pfizer Inc. | 1.100% | 5/15/17 | 5,000 | 5,015 |
| Pfizer Inc. | 1.500% | 6/15/18 | 7,807 | 7,795 |
| Pfizer Inc. | 6.200% | 3/15/19 | 19,829 | 23,361 |
| Pfizer Inc. | 2.100% | 5/15/19 | 9,400 | 9,466 |
| Pharmacia Corp. | 6.500% | 12/1/18 | 1,340 | 1,596 |
| Philip Morris International Inc. | 2.500% | 5/16/16 | 8,350 | 8,610 |
| Philip Morris International Inc. | 1.625% | 3/20/17 | 7,375 | 7,473 |
| Philip Morris International Inc. | 1.125% | 8/21/17 | 6,325 | 6,305 |
| Philip Morris International Inc. | 5.650% | 5/16/18 | 6,825 | 7,785 |
| Philip Morris International Inc. | 1.875% | 1/15/19 | 8,625 | 8,608 |
| Procter & Gamble Co. | 3.150% | 9/1/15 | 4,275 | 4,398 |
86
| Short-Term Corporate Bond Index Fund | ||||
| Face | Market | |||
| Maturity | Amount | Value• | ||
| Coupon | Date | ($000) | ($000) | |
| Procter & Gamble Co. | 1.800% | 11/15/15 | 5,050 | 5,135 |
| Procter & Gamble Co. | 4.850% | 12/15/15 | 5,531 | 5,846 |
| Procter & Gamble Co. | 1.450% | 8/15/16 | 7,608 | 7,719 |
| Procter & Gamble Co. | 1.600% | 11/15/18 | 3,600 | 3,604 |
| Procter & Gamble Co. | 4.700% | 2/15/19 | 7,235 | 8,150 |
| Quest Diagnostics Inc. | 5.450% | 11/1/15 | 1,140 | 1,200 |
| Quest Diagnostics Inc. | 3.200% | 4/1/16 | 2,100 | 2,172 |
| Quest Diagnostics Inc. | 6.400% | 7/1/17 | 1,725 | 1,950 |
| Quest Diagnostics Inc. | 2.700% | 4/1/19 | 2,000 | 2,020 |
| Reynolds American Inc. | 1.050% | 10/30/15 | 1,050 | 1,051 |
| Reynolds American Inc. | 6.750% | 6/15/17 | 4,850 | 5,517 |
| Reynolds American Inc. | 7.750% | 6/1/18 | 1,350 | 1,611 |
| Safeway Inc. | 6.350% | 8/15/17 | 1,313 | 1,421 |
| Safeway Inc. | 5.000% | 8/15/19 | 2,000 | 2,060 |
| Sanofi | 2.625% | 3/29/16 | 12,346 | 12,745 |
| Sanofi | 1.250% | 4/10/18 | 8,114 | 8,017 |
| St. Jude Medical Inc. | 2.500% | 1/15/16 | 6,787 | 6,955 |
| Stryker Corp. | 2.000% | 9/30/16 | 2,777 | 2,845 |
| Stryker Corp. | 1.300% | 4/1/18 | 4,050 | 4,008 |
| Sysco Corp. | 5.250% | 2/12/18 | 4,250 | 4,743 |
| Sysco Corp. | 5.375% | 3/17/19 | 150 | 171 |
| Teva Pharmaceutical Finance Co. BV | 2.400% | 11/10/16 | 5,555 | 5,706 |
| Thermo Fisher Scientific Inc. | 3.200% | 3/1/16 | 5,885 | 6,094 |
| Thermo Fisher Scientific Inc. | 2.250% | 8/15/16 | 8,975 | 9,188 |
| Thermo Fisher Scientific Inc. | 1.300% | 2/1/17 | 3,300 | 3,302 |
| Thermo Fisher Scientific Inc. | 1.850% | 1/15/18 | 1,600 | 1,610 |
| Thermo Fisher Scientific Inc. | 2.400% | 2/1/19 | 4,825 | 4,873 |
| Tyson Foods Inc. | 6.600% | 4/1/16 | 5,285 | 5,724 |
| Tyson Foods Inc. | 2.650% | 8/15/19 | 7,000 | 7,097 |
| Unilever Capital Corp. | 0.450% | 7/30/15 | 1,030 | 1,031 |
| Unilever Capital Corp. | 2.750% | 2/10/16 | 2,500 | 2,578 |
| Unilever Capital Corp. | 0.850% | 8/2/17 | 3,575 | 3,549 |
| Unilever Capital Corp. | 4.800% | 2/15/19 | 1,975 | 2,222 |
| Unilever Capital Corp. | 2.200% | 3/6/19 | 3,450 | 3,510 |
| UST LLC | 5.750% | 3/1/18 | 1,975 | 2,241 |
| Whirlpool Corp. | 1.350% | 3/1/17 | 2,150 | 2,148 |
| Whirlpool Corp. | 2.400% | 3/1/19 | 2,800 | 2,814 |
| Wyeth LLC | 5.500% | 2/15/16 | 5,325 | 5,703 |
| Wyeth LLC | 5.450% | 4/1/17 | 5,545 | 6,160 |
| Zimmer Holdings Inc. | 1.400% | 11/30/14 | 1,225 | 1,228 |
| Zoetis Inc. | 1.150% | 2/1/16 | 2,925 | 2,937 |
| Zoetis Inc. | 1.875% | 2/1/18 | 3,025 | 3,028 |
| Energy (8.2%) | ||||
| Anadarko Petroleum Corp. | 5.950% | 9/15/16 | 10,466 | 11,499 |
| Anadarko Petroleum Corp. | 6.375% | 9/15/17 | 11,950 | 13,634 |
| Anadarko Petroleum Corp. | 8.700% | 3/15/19 | 4,225 | 5,394 |
| Anadarko Petroleum Corp. | 6.950% | 6/15/19 | 700 | 848 |
| Apache Corp. | 5.625% | 1/15/17 | 3,500 | 3,864 |
| Apache Corp. | 1.750% | 4/15/17 | 3,850 | 3,904 |
| Apache Corp. | 6.900% | 9/15/18 | 1,775 | 2,113 |
| Baker Hughes Inc. | 7.500% | 11/15/18 | 825 | 1,010 |
| Boardwalk Pipelines LP | 5.500% | 2/1/17 | 2,200 | 2,388 |
| Boardwalk Pipelines LP | 5.750% | 9/15/19 | 2,000 | 2,202 |
| BP Capital Markets plc | 3.125% | 10/1/15 | 14,950 | 15,377 |
87
| Short-Term Corporate Bond Index Fund | ||||
| Face | Market | |||
| Maturity | Amount | Value• | ||
| Coupon | Date | ($000) | ($000) | |
| BP Capital Markets plc | 0.700% | 11/6/15 | 3,435 | 3,442 |
| BP Capital Markets plc | 3.200% | 3/11/16 | 10,130 | 10,543 |
| BP Capital Markets plc | 2.248% | 11/1/16 | 4,390 | 4,514 |
| BP Capital Markets plc | 1.846% | 5/5/17 | 8,007 | 8,148 |
| BP Capital Markets plc | 1.375% | 11/6/17 | 7,900 | 7,890 |
| BP Capital Markets plc | 1.375% | 5/10/18 | 9,050 | 8,954 |
| BP Capital Markets plc | 2.241% | 9/26/18 | 7,050 | 7,155 |
| BP Capital Markets plc | 4.750% | 3/10/19 | 4,150 | 4,636 |
| BP Capital Markets plc | 2.237% | 5/10/19 | 6,975 | 7,017 |
| Buckeye Partners LP | 6.050% | 1/15/18 | 2,525 | 2,837 |
| Buckeye Partners LP | 2.650% | 11/15/18 | 2,500 | 2,528 |
| Cameron International Corp. | 1.150% | 12/15/16 | 2,100 | 2,099 |
| Cameron International Corp. | 6.375% | 7/15/18 | 3,550 | 4,126 |
| Canadian Natural Resources Ltd. | 5.700% | 5/15/17 | 7,191 | 8,014 |
| Canadian Natural Resources Ltd. | 5.900% | 2/1/18 | 975 | 1,110 |
| CenterPoint Energy Resources Corp. | 6.150% | 5/1/16 | 1,600 | 1,741 |
| CenterPoint Energy Resources Corp. | 6.125% | 11/1/17 | 900 | 1,029 |
| CenterPoint Energy Resources Corp. | 6.000% | 5/15/18 | 4,000 | 4,582 |
| Chevron Corp. | 0.889% | 6/24/16 | 6,000 | 6,036 |
| Chevron Corp. | 1.104% | 12/5/17 | 8,075 | 8,019 |
| Chevron Corp. | 1.718% | 6/24/18 | 13,775 | 13,880 |
| Chevron Corp. | 4.950% | 3/3/19 | 8,825 | 10,004 |
| Colorado Interstate Gas Co. LLC | 6.800% | 11/15/15 | 3,426 | 3,669 |
| ConocoPhillips | 5.200% | 5/15/18 | 1,325 | 1,492 |
| ConocoPhillips | 6.650% | 7/15/18 | 2,000 | 2,366 |
| ConocoPhillips | 5.750% | 2/1/19 | 12,904 | 14,935 |
| ConocoPhillips Canada Funding Co. I | 5.625% | 10/15/16 | 9,050 | 9,950 |
| ConocoPhillips Co. | 1.050% | 12/15/17 | 6,900 | 6,839 |
| DCP Midstream Operating LP | 3.250% | 10/1/15 | 200 | 205 |
| DCP Midstream Operating LP | 2.500% | 12/1/17 | 6,755 | 6,917 |
| DCP Midstream Operating LP | 2.700% | 4/1/19 | 3,025 | 3,066 |
| Devon Energy Corp. | 2.400% | 7/15/16 | 2,075 | 2,131 |
| Devon Energy Corp. | 1.200% | 12/15/16 | 700 | 703 |
| Devon Energy Corp. | 1.875% | 5/15/17 | 6,595 | 6,694 |
| Devon Energy Corp. | 2.250% | 12/15/18 | 6,875 | 6,939 |
| Devon Energy Corp. | 6.300% | 1/15/19 | 4,065 | 4,756 |
| Diamond Offshore Drilling Inc. | 5.875% | 5/1/19 | 3,075 | 3,565 |
| El Paso Natural Gas Co. LLC | 5.950% | 4/15/17 | 4,050 | 4,497 |
| 2 Enable Midstream Partners LP | 2.400% | 5/15/19 | 3,700 | 3,690 |
| Enbridge Energy Partners LP | 5.875% | 12/15/16 | 1,729 | 1,908 |
| Enbridge Energy Partners LP | 6.500% | 4/15/18 | 4,766 | 5,517 |
| Enbridge Energy Partners LP | 9.875% | 3/1/19 | 1,325 | 1,736 |
| Enbridge Inc. | 5.600% | 4/1/17 | 2,653 | 2,938 |
| Encana Corp. | 5.900% | 12/1/17 | 2,700 | 3,058 |
| Encana Corp. | 6.500% | 5/15/19 | 2,600 | 3,079 |
| Energy Transfer Partners LP | 6.125% | 2/15/17 | 5,500 | 6,115 |
| Energy Transfer Partners LP | 6.700% | 7/1/18 | 8,025 | 9,361 |
| Energy Transfer Partners LP | 9.700% | 3/15/19 | 2,000 | 2,597 |
| Energy Transfer Partners LP | 9.000% | 4/15/19 | 1,425 | 1,810 |
| EnLink Midstream Partners LP | 2.700% | 4/1/19 | 2,250 | 2,281 |
| Ensco plc | 3.250% | 3/15/16 | 10,263 | 10,623 |
| Enterprise Products Operating LLC | 5.000% | 3/1/15 | 606 | 620 |
| Enterprise Products Operating LLC | 3.200% | 2/1/16 | 4,125 | 4,271 |
| Enterprise Products Operating LLC | 6.300% | 9/15/17 | 4,650 | 5,313 |
| Enterprise Products Operating LLC | 6.650% | 4/15/18 | 2,450 | 2,867 |
88
| Short-Term Corporate Bond Index Fund | ||||
| Face | Market | |||
| Maturity | Amount | Value• | ||
| Coupon | Date | ($000) | ($000) | |
| Enterprise Products Operating LLC | 6.500% | 1/31/19 | 6,100 | 7,220 |
| 1 Enterprise Products Operating LLC | 8.375% | 8/1/66 | 3,600 | 4,019 |
| 1 Enterprise Products Operating LLC | 7.034% | 1/15/68 | 6,265 | 7,079 |
| EOG Resources Inc. | 2.500% | 2/1/16 | 2,300 | 2,357 |
| EOG Resources Inc. | 5.875% | 9/15/17 | 1,700 | 1,921 |
| EOG Resources Inc. | 6.875% | 10/1/18 | 1,675 | 1,999 |
| EOG Resources Inc. | 5.625% | 6/1/19 | 6,627 | 7,662 |
| EQT Corp. | 6.500% | 4/1/18 | 2,750 | 3,160 |
| EQT Corp. | 8.125% | 6/1/19 | 4,025 | 4,994 |
| FMC Technologies Inc. | 2.000% | 10/1/17 | 2,240 | 2,264 |
| Halliburton Co. | 1.000% | 8/1/16 | 1,750 | 1,760 |
| Halliburton Co. | 2.000% | 8/1/18 | 1,750 | 1,772 |
| Halliburton Co. | 5.900% | 9/15/18 | 4,775 | 5,531 |
| Hess Corp. | 1.300% | 6/15/17 | 2,000 | 1,998 |
| Hess Corp. | 8.125% | 2/15/19 | 4,968 | 6,196 |
| Husky Energy Inc. | 6.150% | 6/15/19 | 510 | 592 |
| Kinder Morgan Energy Partners LP | 3.500% | 3/1/16 | 350 | 363 |
| Kinder Morgan Energy Partners LP | 6.000% | 2/1/17 | 3,750 | 4,154 |
| Kinder Morgan Energy Partners LP | 5.950% | 2/15/18 | 9,250 | 10,438 |
| Kinder Morgan Energy Partners LP | 2.650% | 2/1/19 | 525 | 529 |
| Kinder Morgan Energy Partners LP | 9.000% | 2/1/19 | 2,150 | 2,718 |
| Magellan Midstream Partners LP | 5.650% | 10/15/16 | 1,525 | 1,670 |
| Magellan Midstream Partners LP | 6.550% | 7/15/19 | 3,696 | 4,373 |
| Marathon Oil Corp. | 0.900% | 11/1/15 | 4,425 | 4,436 |
| Marathon Oil Corp. | 6.000% | 10/1/17 | 2,825 | 3,202 |
| Marathon Oil Corp. | 5.900% | 3/15/18 | 5,702 | 6,494 |
| Marathon Petroleum Corp. | 3.500% | 3/1/16 | 2,700 | 2,803 |
| Murphy Oil Corp. | 2.500% | 12/1/17 | 4,600 | 4,709 |
| Nabors Industries Inc. | 2.350% | 9/15/16 | 1,550 | 1,589 |
| Nabors Industries Inc. | 6.150% | 2/15/18 | 5,750 | 6,539 |
| Nabors Industries Inc. | 9.250% | 1/15/19 | 1,550 | 1,975 |
| National Oilwell Varco Inc. | 1.350% | 12/1/17 | 2,500 | 2,498 |
| Nisource Finance Corp. | 5.250% | 9/15/17 | 2,900 | 3,215 |
| Nisource Finance Corp. | 6.400% | 3/15/18 | 9,100 | 10,485 |
| Nisource Finance Corp. | 6.800% | 1/15/19 | 1,975 | 2,342 |
| Noble Holding International Ltd. | 3.050% | 3/1/16 | 4,150 | 4,277 |
| Noble Holding International Ltd. | 2.500% | 3/15/17 | 1,300 | 1,328 |
| Occidental Petroleum Corp. | 2.500% | 2/1/16 | 2,075 | 2,131 |
| Occidental Petroleum Corp. | 4.125% | 6/1/16 | 4,450 | 4,710 |
| Occidental Petroleum Corp. | 1.750% | 2/15/17 | 10,500 | 10,668 |
| Occidental Petroleum Corp. | 1.500% | 2/15/18 | 4,860 | 4,845 |
| ONEOK Partners LP | 3.250% | 2/1/16 | 4,750 | 4,909 |
| ONEOK Partners LP | 6.150% | 10/1/16 | 2,450 | 2,708 |
| ONEOK Partners LP | 2.000% | 10/1/17 | 3,425 | 3,467 |
| ONEOK Partners LP | 3.200% | 9/15/18 | 600 | 626 |
| ONEOK Partners LP | 8.625% | 3/1/19 | 4,075 | 5,121 |
| Panhandle Eastern Pipe Line Co. LP | 6.200% | 11/1/17 | 950 | 1,086 |
| Panhandle Eastern Pipe Line Co. LP | 7.000% | 6/15/18 | 2,575 | 2,987 |
| Petro-Canada | 6.050% | 5/15/18 | 3,025 | 3,482 |
| Phillips 66 | 2.950% | 5/1/17 | 13,425 | 14,026 |
| Pioneer Natural Resources Co. | 5.875% | 7/15/16 | 5,030 | 5,462 |
| Pioneer Natural Resources Co. | 6.650% | 3/15/17 | 1,050 | 1,184 |
| Pioneer Natural Resources Co. | 6.875% | 5/1/18 | 3,325 | 3,895 |
| Plains All American Pipeline LP / PAA Finance | ||||
| Corp. | 3.950% | 9/15/15 | 1,700 | 1,755 |
89
| Short-Term Corporate Bond Index Fund | ||||
| Face | Market | |||
| Maturity | Amount | Value• | ||
| Coupon | Date | ($000) | ($000) | |
| Plains All American Pipeline LP / PAA Finance | ||||
| Corp. | 6.125% | 1/15/17 | 1,800 | 2,005 |
| Plains All American Pipeline LP / PAA Finance | ||||
| Corp. | 6.500% | 5/1/18 | 3,100 | 3,603 |
| Plains All American Pipeline LP / PAA Finance | ||||
| Corp. | 8.750% | 5/1/19 | 890 | 1,138 |
| Pride International Inc. | 8.500% | 6/15/19 | 625 | 789 |
| Questar Corp. | 2.750% | 2/1/16 | 275 | 282 |
| Rowan Cos. Inc. | 5.000% | 9/1/17 | 1,700 | 1,847 |
| Rowan Cos. Inc. | 7.875% | 8/1/19 | 3,700 | 4,553 |
| Shell International Finance BV | 3.250% | 9/22/15 | 7,525 | 7,746 |
| Shell International Finance BV | 0.625% | 12/4/15 | 5,225 | 5,232 |
| Shell International Finance BV | 0.900% | 11/15/16 | 1,500 | 1,503 |
| Shell International Finance BV | 5.200% | 3/22/17 | 6,200 | 6,850 |
| Shell International Finance BV | 1.125% | 8/21/17 | 10,295 | 10,280 |
| Shell International Finance BV | 1.900% | 8/10/18 | 7,350 | 7,434 |
| Shell International Finance BV | 2.000% | 11/15/18 | 9,025 | 9,164 |
| 2 Southern Natural Gas Co. LLC | 5.900% | 4/1/17 | 2,858 | 3,174 |
| Southwestern Energy Co. | 7.500% | 2/1/18 | 3,406 | 4,036 |
| Spectra Energy Capital LLC | 6.200% | 4/15/18 | 1,300 | 1,485 |
| Spectra Energy Partners LP | 2.950% | 9/25/18 | 3,825 | 3,967 |
| Suncor Energy Inc. | 6.100% | 6/1/18 | 11,381 | 13,133 |
| Sunoco Inc. | 5.750% | 1/15/17 | 1,100 | 1,204 |
| Talisman Energy Inc. | 7.750% | 6/1/19 | 4,800 | 5,914 |
| Tennessee Gas Pipeline Co. LLC | 7.500% | 4/1/17 | 2,775 | 3,183 |
| Texas Gas Transmission LLC | 4.600% | 6/1/15 | 175 | 180 |
| Total Capital Canada Ltd. | 1.450% | 1/15/18 | 4,333 | 4,332 |
| Total Capital International SA | 0.750% | 1/25/16 | 5,835 | 5,850 |
| Total Capital International SA | 1.000% | 8/12/16 | 1,000 | 1,005 |
| Total Capital International SA | 1.500% | 2/17/17 | 9,075 | 9,173 |
| Total Capital International SA | 1.550% | 6/28/17 | 8,501 | 8,582 |
| Total Capital International SA | 2.125% | 1/10/19 | 5,334 | 5,398 |
| Total Capital International SA | 2.100% | 6/19/19 | 5,000 | 5,032 |
| Total Capital SA | 3.125% | 10/2/15 | 5,150 | 5,294 |
| Total Capital SA | 2.300% | 3/15/16 | 3,750 | 3,845 |
| Total Capital SA | 2.125% | 8/10/18 | 10,775 | 10,941 |
| TransCanada PipeLines Ltd. | 0.750% | 1/15/16 | 7,125 | 7,139 |
| TransCanada PipeLines Ltd. | 6.500% | 8/15/18 | 5,317 | 6,271 |
| TransCanada PipeLines Ltd. | 7.125% | 1/15/19 | 2,392 | 2,898 |
| 1 TransCanada PipeLines Ltd. | 6.350% | 5/15/67 | 5,625 | 5,850 |
| Transcontinental Gas Pipe Line Co. LLC | 6.050% | 6/15/18 | 1,375 | 1,570 |
| Transocean Inc. | 4.950% | 11/15/15 | 5,195 | 5,434 |
| Transocean Inc. | 5.050% | 12/15/16 | 8,250 | 8,899 |
| Transocean Inc. | 2.500% | 10/15/17 | 3,740 | 3,789 |
| Transocean Inc. | 6.000% | 3/15/18 | 9,814 | 10,925 |
| Valero Energy Corp. | 6.125% | 6/15/17 | 4,800 | 5,418 |
| Valero Energy Corp. | 9.375% | 3/15/19 | 4,598 | 5,969 |
| Weatherford International LLC | 6.350% | 6/15/17 | 5,500 | 6,207 |
| Weatherford International Ltd. | 5.500% | 2/15/16 | 1,705 | 1,812 |
| Weatherford International Ltd. | 6.000% | 3/15/18 | 2,125 | 2,410 |
| Weatherford International Ltd. | 9.625% | 3/1/19 | 6,247 | 8,109 |
| Western Gas Partners LP | 2.600% | 8/15/18 | 3,650 | 3,735 |
| Williams Partners LP/Williams Partners Finance | ||||
| Corp. | 7.250% | 2/1/17 | 3,125 | 3,543 |
| XTO Energy Inc. | 6.250% | 8/1/17 | 3,485 | 3,986 |
90
| Short-Term Corporate Bond Index Fund | ||||
| Face | Market | |||
| Maturity | Amount | Value• | ||
| Coupon | Date | ($000) | ($000) | |
| XTO Energy Inc. | 5.500% | 6/15/18 | 6,100 | 6,988 |
| XTO Energy Inc. | 6.500% | 12/15/18 | 625 | 746 |
| Other Industrial (0.1%) | ||||
| Cintas Corp. No 2 | 6.125% | 12/1/17 | 875 | 986 |
| URS Corp. | 3.850% | 4/1/17 | 2,500 | 2,594 |
| Yale University Connecticut GO | 2.086% | 4/15/19 | 1,400 | 1,413 |
| Technology (6.0%) | ||||
| Agilent Technologies Inc. | 6.500% | 11/1/17 | 1,725 | 1,973 |
| Altera Corp. | 1.750% | 5/15/17 | 5,575 | 5,623 |
| Altera Corp. | 2.500% | 11/15/18 | 4,500 | 4,568 |
| Amphenol Corp. | 2.550% | 1/30/19 | 5,375 | 5,442 |
| Analog Devices Inc. | 3.000% | 4/15/16 | 5,775 | 5,975 |
| Apple Inc. | 0.450% | 5/3/16 | 9,715 | 9,711 |
| Apple Inc. | 1.050% | 5/5/17 | 9,400 | 9,409 |
| Apple Inc. | 1.000% | 5/3/18 | 22,075 | 21,612 |
| Apple Inc. | 2.100% | 5/6/19 | 13,725 | 13,809 |
| Applied Materials Inc. | 2.650% | 6/15/16 | 3,800 | 3,914 |
| Arrow Electronics Inc. | 3.375% | 11/1/15 | 500 | 514 |
| Autodesk Inc. | 1.950% | 12/15/17 | 2,025 | 2,045 |
| Avnet Inc. | 6.625% | 9/15/16 | 1,600 | 1,769 |
| Baidu Inc. | 2.250% | 11/28/17 | 5,900 | 5,982 |
| Baidu Inc. | 3.250% | 8/6/18 | 4,400 | 4,565 |
| Baidu Inc. | 2.750% | 6/9/19 | 6,025 | 6,055 |
| Broadcom Corp. | 2.700% | 11/1/18 | 1,775 | 1,830 |
| CA Inc. | 2.875% | 8/15/18 | 1,850 | 1,886 |
| Cisco Systems Inc. | 5.500% | 2/22/16 | 20,675 | 22,172 |
| Cisco Systems Inc. | 1.100% | 3/3/17 | 6,750 | 6,773 |
| Cisco Systems Inc. | 3.150% | 3/14/17 | 3,750 | 3,958 |
| Cisco Systems Inc. | 4.950% | 2/15/19 | 15,025 | 16,935 |
| Cisco Systems Inc. | 2.125% | 3/1/19 | 12,700 | 12,789 |
| Computer Sciences Corp. | 2.500% | 9/15/15 | 1,000 | 1,017 |
| Computer Sciences Corp. | 6.500% | 3/15/18 | 5,450 | 6,240 |
| Corning Inc. | 1.450% | 11/15/17 | 2,850 | 2,855 |
| Corning Inc. | 6.625% | 5/15/19 | 275 | 329 |
| Dun & Bradstreet Corp. | 2.875% | 11/15/15 | 1,625 | 1,659 |
| Dun & Bradstreet Corp. | 3.250% | 12/1/17 | 2,100 | 2,176 |
| EMC Corp. | 1.875% | 6/1/18 | 15,700 | 15,758 |
| Equifax Inc. | 6.300% | 7/1/17 | 1,300 | 1,468 |
| Fidelity National Information Services Inc. | 1.450% | 6/5/17 | 2,300 | 2,297 |
| Fidelity National Information Services Inc. | 2.000% | 4/15/18 | 475 | 475 |
| Fiserv Inc. | 3.125% | 6/15/16 | 5,855 | 6,064 |
| Fiserv Inc. | 6.800% | 11/20/17 | 1,725 | 1,984 |
| Google Inc. | 2.125% | 5/19/16 | 7,450 | 7,649 |
| Harris Corp. | 5.950% | 12/1/17 | 1,675 | 1,899 |
| Harris Corp. | 6.375% | 6/15/19 | 1,425 | 1,642 |
| Hewlett-Packard Co. | 2.125% | 9/13/15 | 6,810 | 6,919 |
| Hewlett-Packard Co. | 2.200% | 12/1/15 | 2,130 | 2,171 |
| Hewlett-Packard Co. | 2.650% | 6/1/16 | 5,105 | 5,261 |
| Hewlett-Packard Co. | 3.000% | 9/15/16 | 7,622 | 7,916 |
| Hewlett-Packard Co. | 3.300% | 12/9/16 | 4,105 | 4,299 |
| Hewlett-Packard Co. | 5.400% | 3/1/17 | 3,125 | 3,450 |
| Hewlett-Packard Co. | 2.600% | 9/15/17 | 7,400 | 7,644 |
| Hewlett-Packard Co. | 5.500% | 3/1/18 | 6,200 | 7,002 |
91
| Short-Term Corporate Bond Index Fund | ||||
| Face | Market | |||
| Maturity | Amount | Value• | ||
| Coupon | Date | ($000) | ($000) | |
| Hewlett-Packard Co. | 2.750% | 1/14/19 | 11,600 | 11,868 |
| Intel Corp. | 1.950% | 10/1/16 | 9,950 | 10,194 |
| Intel Corp. | 1.350% | 12/15/17 | 18,300 | 18,297 |
| International Business Machines Corp. | 2.000% | 1/5/16 | 3,900 | 3,981 |
| International Business Machines Corp. | 0.450% | 5/6/16 | 6,825 | 6,811 |
| International Business Machines Corp. | 1.950% | 7/22/16 | 14,755 | 15,106 |
| International Business Machines Corp. | 1.250% | 2/6/17 | 6,225 | 6,265 |
| International Business Machines Corp. | 5.700% | 9/14/17 | 17,206 | 19,466 |
| International Business Machines Corp. | 1.250% | 2/8/18 | 10,675 | 10,649 |
| International Business Machines Corp. | 7.625% | 10/15/18 | 7,954 | 9,768 |
| International Business Machines Corp. | 1.950% | 2/12/19 | 2,000 | 2,007 |
| Intuit Inc. | 5.750% | 3/15/17 | 2,475 | 2,742 |
| Jabil Circuit Inc. | 7.750% | 7/15/16 | 3,450 | 3,864 |
| Jabil Circuit Inc. | 8.250% | 3/15/18 | 1,550 | 1,825 |
| Juniper Networks Inc. | 3.100% | 3/15/16 | 1,550 | 1,592 |
| KLA-Tencor Corp. | 6.900% | 5/1/18 | 4,475 | 5,232 |
| Lexmark International Inc. | 6.650% | 6/1/18 | 1,100 | 1,239 |
| Maxim Integrated Products Inc. | 2.500% | 11/15/18 | 3,285 | 3,325 |
| Microsoft Corp. | 1.625% | 9/25/15 | 6,875 | 6,969 |
| Microsoft Corp. | 2.500% | 2/8/16 | 5,327 | 5,490 |
| Microsoft Corp. | 0.875% | 11/15/17 | 3,100 | 3,074 |
| Microsoft Corp. | 1.000% | 5/1/18 | 2,083 | 2,058 |
| Microsoft Corp. | 1.625% | 12/6/18 | 8,250 | 8,248 |
| Microsoft Corp. | 4.200% | 6/1/19 | 6,725 | 7,442 |
| Motorola Solutions Inc. | 6.000% | 11/15/17 | 3,500 | 3,981 |
| National Semiconductor Corp. | 6.600% | 6/15/17 | 2,350 | 2,698 |
| NetApp Inc. | 2.000% | 12/15/17 | 4,455 | 4,498 |
| Oracle Corp. | 5.250% | 1/15/16 | 5,783 | 6,156 |
| Oracle Corp. | 1.200% | 10/15/17 | 14,300 | 14,250 |
| Oracle Corp. | 5.750% | 4/15/18 | 19,324 | 22,113 |
| Oracle Corp. | 2.375% | 1/15/19 | 12,800 | 13,036 |
| Oracle Corp. | 5.000% | 7/8/19 | 9,475 | 10,729 |
| Pitney Bowes Inc. | 4.750% | 1/15/16 | 3,750 | 3,941 |
| Pitney Bowes Inc. | 5.750% | 9/15/17 | 3,080 | 3,409 |
| Pitney Bowes Inc. | 5.600% | 3/15/18 | 725 | 805 |
| Pitney Bowes Inc. | 4.750% | 5/15/18 | 2,750 | 2,952 |
| 2 Seagate HDD Cayman | 3.750% | 11/15/18 | 8,375 | 8,542 |
| Symantec Corp. | 2.750% | 9/15/15 | 1,700 | 1,733 |
| Symantec Corp. | 2.750% | 6/15/17 | 3,675 | 3,768 |
| Tech Data Corp. | 3.750% | 9/21/17 | 1,700 | 1,782 |
| Texas Instruments Inc. | 2.375% | 5/16/16 | 5,600 | 5,773 |
| Texas Instruments Inc. | 1.000% | 5/1/18 | 5,150 | 5,049 |
| Texas Instruments Inc. | 1.650% | 8/3/19 | 4,334 | 4,261 |
| Total System Services Inc. | 2.375% | 6/1/18 | 3,125 | 3,118 |
| Tyco Electronics Group SA | 6.550% | 10/1/17 | 3,575 | 4,106 |
| Tyco Electronics Group SA | 2.375% | 12/17/18 | 775 | 782 |
| Tyco Electronics Group SA | 2.350% | 8/1/19 | 3,550 | 3,566 |
| Xerox Corp. | 6.400% | 3/15/16 | 3,500 | 3,789 |
| Xerox Corp. | 6.750% | 2/1/17 | 3,250 | 3,660 |
| Xerox Corp. | 2.950% | 3/15/17 | 4,650 | 4,838 |
| Xerox Corp. | 6.350% | 5/15/18 | 4,220 | 4,863 |
| Xerox Corp. | 2.750% | 3/15/19 | 4,500 | 4,577 |
| Xerox Corp. | 5.625% | 12/15/19 | 1,367 | 1,565 |
| Xilinx Inc. | 2.125% | 3/15/19 | 3,275 | 3,274 |
92
| Short-Term Corporate Bond Index Fund | ||||
| Face | Market | |||
| Maturity | Amount | Value• | ||
| Coupon | Date | ($000) | ($000) | |
| Transportation (1.1%) | ||||
| Burlington Northern Santa Fe LLC | 5.650% | 5/1/17 | 750 | 837 |
| Burlington Northern Santa Fe LLC | 5.750% | 3/15/18 | 5,400 | 6,152 |
| Canadian National Railway Co. | 5.800% | 6/1/16 | 700 | 763 |
| Canadian National Railway Co. | 1.450% | 12/15/16 | 1,200 | 1,216 |
| Canadian National Railway Co. | 5.850% | 11/15/17 | 1,000 | 1,139 |
| Canadian National Railway Co. | 5.550% | 5/15/18 | 2,190 | 2,490 |
| Canadian National Railway Co. | 5.550% | 3/1/19 | 3,225 | 3,726 |
| Canadian Pacific Railway Co. | 6.500% | 5/15/18 | 1,389 | 1,618 |
| Canadian Pacific Railway Co. | 7.250% | 5/15/19 | 2,880 | 3,523 |
| Con-way Inc. | 7.250% | 1/15/18 | 1,500 | 1,739 |
| 1 Continental Airlines 2009-1 Pass Through Trust | 9.000% | 1/8/18 | 746 | 838 |
| CSX Corp. | 5.600% | 5/1/17 | 1,795 | 1,993 |
| CSX Corp. | 7.900% | 5/1/17 | 500 | 583 |
| CSX Corp. | 6.250% | 3/15/18 | 6,750 | 7,798 |
| CSX Corp. | 7.375% | 2/1/19 | 1,200 | 1,462 |
| 1 Delta Air Lines 2010-2 Class A Pass Through Trust | 4.950% | 11/23/20 | 1,958 | 2,107 |
| FedEx Corp. | 8.000% | 1/15/19 | 4,100 | 5,099 |
| JB Hunt Transport Services Inc. | 3.375% | 9/15/15 | 300 | 308 |
| JB Hunt Transport Services Inc. | 2.400% | 3/15/19 | 2,500 | 2,521 |
| Norfolk Southern Corp. | 5.750% | 1/15/16 | 3,300 | 3,522 |
| Norfolk Southern Corp. | 7.700% | 5/15/17 | 800 | 935 |
| Norfolk Southern Corp. | 5.750% | 4/1/18 | 3,625 | 4,126 |
| Norfolk Southern Corp. | 5.900% | 6/15/19 | 4,700 | 5,480 |
| Ryder System Inc. | 7.200% | 9/1/15 | 325 | 346 |
| Ryder System Inc. | 3.600% | 3/1/16 | 3,850 | 4,011 |
| Ryder System Inc. | 5.850% | 11/1/16 | 100 | 110 |
| Ryder System Inc. | 2.500% | 3/1/17 | 4,350 | 4,476 |
| Ryder System Inc. | 3.500% | 6/1/17 | 2,325 | 2,452 |
| Ryder System Inc. | 2.500% | 3/1/18 | 1,075 | 1,105 |
| Ryder System Inc. | 2.450% | 11/15/18 | 4,925 | 5,005 |
| Ryder System Inc. | 2.350% | 2/26/19 | 500 | 502 |
| Ryder System Inc. | 2.550% | 6/1/19 | 250 | 253 |
| Ryder System Inc. | 2.450% | 9/3/19 | 1,200 | 1,204 |
| Southwest Airlines Co. | 5.750% | 12/15/16 | 1,640 | 1,800 |
| Southwest Airlines Co. | 5.125% | 3/1/17 | 1,600 | 1,737 |
| 1 UAL 2009-1 Pass Through Trust | 10.400% | 5/1/18 | 1,181 | 1,328 |
| 1 UAL 2009-2A Pass Through Trust | 9.750% | 7/15/18 | 3,400 | 3,859 |
| Union Pacific Corp. | 5.750% | 11/15/17 | 2,200 | 2,501 |
| Union Pacific Corp. | 5.700% | 8/15/18 | 1,825 | 2,102 |
| Union Pacific Corp. | 2.250% | 2/15/19 | 2,800 | 2,844 |
| United Parcel Service Inc. | 1.125% | 10/1/17 | 2,825 | 2,821 |
| United Parcel Service Inc. | 5.500% | 1/15/18 | 4,950 | 5,602 |
| United Parcel Service Inc. | 5.125% | 4/1/19 | 6,375 | 7,241 |
| 4,882,290 | ||||
| Utilities (5.2%) | ||||
| Electric (4.7%) | ||||
| Alabama Power Co. | 0.550% | 10/15/15 | 1,900 | 1,902 |
| Alabama Power Co. | 5.500% | 10/15/17 | 1,925 | 2,161 |
| Ameren Illinois Co. | 6.125% | 11/15/17 | 625 | 717 |
| American Electric Power Co. Inc. | 1.650% | 12/15/17 | 3,775 | 3,789 |
| Appalachian Power Co. | 5.000% | 6/1/17 | 200 | 219 |
| Arizona Public Service Co. | 8.750% | 3/1/19 | 5,325 | 6,830 |
| Avista Corp. | 5.950% | 6/1/18 | 1,450 | 1,658 |
| Baltimore Gas & Electric Co. | 5.900% | 10/1/16 | 2,250 | 2,476 |
93
| Short-Term Corporate Bond Index Fund | ||||
| Face | Market | |||
| Maturity | Amount | Value• | ||
| Coupon | Date | ($000) | ($000) | |
| Berkshire Hathaway Energy Co. | 1.100% | 5/15/17 | 5,700 | 5,675 |
| Berkshire Hathaway Energy Co. | 5.750% | 4/1/18 | 3,325 | 3,784 |
| Berkshire Hathaway Energy Co. | 2.000% | 11/15/18 | 1,725 | 1,727 |
| CenterPoint Energy Inc. | 6.500% | 5/1/18 | 4,328 | 5,023 |
| Cleco Power LLC | 6.650% | 6/15/18 | 817 | 947 |
| Cleveland Electric Illuminating Co. | 7.880% | 11/1/17 | 575 | 686 |
| CMS Energy Corp. | 4.250% | 9/30/15 | 1,500 | 1,555 |
| CMS Energy Corp. | 6.550% | 7/17/17 | 1,000 | 1,141 |
| CMS Energy Corp. | 5.050% | 2/15/18 | 1,000 | 1,107 |
| CMS Energy Corp. | 8.750% | 6/15/19 | 4,475 | 5,756 |
| Commonwealth Edison Co. | 5.950% | 8/15/16 | 700 | 770 |
| Commonwealth Edison Co. | 1.950% | 9/1/16 | 500 | 512 |
| Commonwealth Edison Co. | 6.150% | 9/15/17 | 1,475 | 1,682 |
| Commonwealth Edison Co. | 5.800% | 3/15/18 | 4,805 | 5,486 |
| Commonwealth Edison Co. | 2.150% | 1/15/19 | 7,375 | 7,442 |
| Connecticut Light & Power Co. | 5.650% | 5/1/18 | 2,750 | 3,131 |
| Consolidated Edison Co. of New York Inc. | 5.375% | 12/15/15 | 4,772 | 5,065 |
| Consolidated Edison Co. of New York Inc. | 5.500% | 9/15/16 | 5,563 | 6,075 |
| Consolidated Edison Co. of New York Inc. | 5.850% | 4/1/18 | 2,725 | 3,116 |
| Consolidated Edison Co. of New York Inc. | 7.125% | 12/1/18 | 3,575 | 4,308 |
| Consolidated Edison Co. of New York Inc. | 6.650% | 4/1/19 | 975 | 1,167 |
| Consumers Energy Co. | 5.500% | 8/15/16 | 640 | 697 |
| Consumers Energy Co. | 5.150% | 2/15/17 | 1,000 | 1,098 |
| Consumers Energy Co. | 5.650% | 9/15/18 | 2,000 | 2,293 |
| Consumers Energy Co. | 6.125% | 3/15/19 | 5,400 | 6,337 |
| Dayton Power & Light Co. | 1.875% | 9/15/16 | 1,975 | 2,009 |
| Dominion Resources Inc. | 2.250% | 9/1/15 | 1,825 | 1,855 |
| Dominion Resources Inc. | 1.950% | 8/15/16 | 6,180 | 6,297 |
| Dominion Resources Inc. | 1.250% | 3/15/17 | 400 | 400 |
| Dominion Resources Inc. | 1.400% | 9/15/17 | 4,625 | 4,607 |
| Dominion Resources Inc. | 6.000% | 11/30/17 | 2,100 | 2,387 |
| Dominion Resources Inc. | 6.400% | 6/15/18 | 2,025 | 2,352 |
| Dominion Resources Inc. | 8.875% | 1/15/19 | 3,450 | 4,401 |
| Dominion Resources Inc. | 5.200% | 8/15/19 | 2,650 | 3,025 |
| 1 Dominion Resources Inc. | 7.500% | 6/30/66 | 1,100 | 1,191 |
| DTE Electric Co. | 5.600% | 6/15/18 | 850 | 972 |
| DTE Energy Co. | 6.350% | 6/1/16 | 2,365 | 2,587 |
| Duke Energy Carolinas LLC | 5.300% | 10/1/15 | 3,800 | 4,000 |
| Duke Energy Carolinas LLC | 1.750% | 12/15/16 | 5,125 | 5,231 |
| Duke Energy Carolinas LLC | 5.100% | 4/15/18 | 1,550 | 1,738 |
| Duke Energy Carolinas LLC | 7.000% | 11/15/18 | 2,250 | 2,711 |
| Duke Energy Corp. | 2.150% | 11/15/16 | 3,500 | 3,599 |
| Duke Energy Corp. | 1.625% | 8/15/17 | 7,100 | 7,166 |
| Duke Energy Corp. | 2.100% | 6/15/18 | 3,350 | 3,379 |
| Duke Energy Corp. | 6.250% | 6/15/18 | 2,000 | 2,311 |
| Duke Energy Florida Inc. | 5.100% | 12/1/15 | 2,150 | 2,273 |
| Duke Energy Florida Inc. | 5.800% | 9/15/17 | 265 | 300 |
| Duke Energy Florida Inc. | 5.650% | 6/15/18 | 5,725 | 6,563 |
| Duke Energy Indiana Inc. | 6.050% | 6/15/16 | 1,000 | 1,091 |
| Duke Energy Ohio Inc. | 5.450% | 4/1/19 | 3,855 | 4,419 |
| Duke Energy Progress Inc. | 5.150% | 4/1/15 | 237 | 243 |
| Duke Energy Progress Inc. | 5.300% | 1/15/19 | 3,300 | 3,760 |
| Edison International | 3.750% | 9/15/17 | 4,625 | 4,920 |
| Entergy Corp. | 4.700% | 1/15/17 | 6,075 | 6,517 |
| Entergy Gulf States Louisiana LLC | 6.000% | 5/1/18 | 2,325 | 2,665 |
94
| Short-Term Corporate Bond Index Fund | ||||
| Face | Market | |||
| Maturity | Amount | Value• | ||
| Coupon | Date | ($000) | ($000) | |
| Entergy Louisiana LLC | 6.500% | 9/1/18 | 3,075 | 3,599 |
| Entergy Texas Inc. | 7.125% | 2/1/19 | 3,035 | 3,654 |
| Exelon Generation Co. LLC | 6.200% | 10/1/17 | 4,615 | 5,227 |
| Florida Power & Light Co. | 5.550% | 11/1/17 | 1,500 | 1,697 |
| Georgia Power Co. | 0.750% | 8/10/15 | 3,550 | 3,559 |
| Georgia Power Co. | 0.625% | 11/15/15 | 3,725 | 3,729 |
| Georgia Power Co. | 5.700% | 6/1/17 | 1,300 | 1,455 |
| Georgia Power Co. | 5.400% | 6/1/18 | 2,500 | 2,819 |
| Indiana Michigan Power Co. | 7.000% | 3/15/19 | 2,230 | 2,686 |
| 1 Integrys Energy Group Inc. | 6.110% | 12/1/66 | 2,700 | 2,768 |
| Jersey Central Power & Light Co. | 5.625% | 5/1/16 | 4,525 | 4,855 |
| Jersey Central Power & Light Co. | 5.650% | 6/1/17 | 1,000 | 1,106 |
| Kansas City Power & Light Co. | 6.375% | 3/1/18 | 586 | 682 |
| Kentucky Utilities Co. | 1.625% | 11/1/15 | 350 | 354 |
| LG&E & KU Energy LLC | 2.125% | 11/15/15 | 5,845 | 5,922 |
| Louisville Gas & Electric Co. | 1.625% | 11/15/15 | 1,200 | 1,215 |
| Metropolitan Edison Co. | 7.700% | 1/15/19 | 1,017 | 1,238 |
| MidAmerican Energy Co. | 5.950% | 7/15/17 | 3,539 | 3,999 |
| Mississippi Power Co. | 2.350% | 10/15/16 | 570 | 586 |
| National Rural Utilities Cooperative Finance Corp. | 1.900% | 11/1/15 | 1,350 | 1,372 |
| National Rural Utilities Cooperative Finance Corp. | 3.050% | 3/1/16 | 4,750 | 4,920 |
| National Rural Utilities Cooperative Finance Corp. | 5.450% | 4/10/17 | 2,700 | 2,993 |
| National Rural Utilities Cooperative Finance Corp. | 5.450% | 2/1/18 | 3,100 | 3,504 |
| National Rural Utilities Cooperative Finance Corp. | 10.375% | 11/1/18 | 7,614 | 10,156 |
| National Rural Utilities Cooperative Finance Corp. | 2.150% | 2/1/19 | 5,000 | 5,037 |
| Nevada Power Co. | 6.500% | 5/15/18 | 475 | 556 |
| Nevada Power Co. | 6.500% | 8/1/18 | 3,070 | 3,609 |
| Nevada Power Co. | 7.125% | 3/15/19 | 3,830 | 4,648 |
| NextEra Energy Capital Holdings Inc. | 2.600% | 9/1/15 | 560 | 571 |
| NextEra Energy Capital Holdings Inc. | 7.875% | 12/15/15 | 4,365 | 4,756 |
| NextEra Energy Capital Holdings Inc. | 6.000% | 3/1/19 | 4,100 | 4,744 |
| 1 NextEra Energy Capital Holdings Inc. | 6.350% | 10/1/66 | 2,800 | 2,800 |
| 1 NextEra Energy Capital Holdings Inc. | 6.650% | 6/15/67 | 3,075 | 3,144 |
| 1 NextEra Energy Capital Holdings Inc. | 7.300% | 9/1/67 | 675 | 744 |
| Northeast Utilities | 1.450% | 5/1/18 | 3,200 | 3,169 |
| Northern States Power Co. | 1.950% | 8/15/15 | 1,125 | 1,138 |
| Northern States Power Co. | 5.250% | 3/1/18 | 2,900 | 3,246 |
| NSTAR Electric Co. | 5.625% | 11/15/17 | 525 | 593 |
| Ohio Power Co. | 6.000% | 6/1/16 | 4,650 | 5,051 |
| Ohio Power Co. | 6.050% | 5/1/18 | 775 | 889 |
| Oncor Electric Delivery Co. LLC | 5.000% | 9/30/17 | 2,000 | 2,217 |
| Oncor Electric Delivery Co. LLC | 6.800% | 9/1/18 | 3,600 | 4,250 |
| 2 Oncor Electric Delivery Co. LLC | 2.150% | 6/1/19 | 2,250 | 2,246 |
| Pacific Gas & Electric Co. | 5.625% | 11/30/17 | 5,095 | 5,748 |
| Pacific Gas & Electric Co. | 8.250% | 10/15/18 | 6,090 | 7,555 |
| PacifiCorp | 5.650% | 7/15/18 | 4,125 | 4,717 |
| PacifiCorp | 5.500% | 1/15/19 | 5,500 | 6,310 |
| Peco Energy Co. | 1.200% | 10/15/16 | 3,225 | 3,248 |
| Peco Energy Co. | 5.350% | 3/1/18 | 2,700 | 3,036 |
| Pennsylvania Electric Co. | 6.050% | 9/1/17 | 3,275 | 3,685 |
| Pepco Holdings Inc. | 2.700% | 10/1/15 | 500 | 509 |
| PG&E Corp. | 2.400% | 3/1/19 | 1,975 | 1,994 |
| Portland General Electric Co. | 6.100% | 4/15/19 | 1,885 | 2,220 |
| PPL Capital Funding Inc. | 1.900% | 6/1/18 | 3,750 | 3,751 |
| Progress Energy Inc. | 5.625% | 1/15/16 | 154 | 164 |
95
| Short-Term Corporate Bond Index Fund | ||||
| Face | Market | |||
| Maturity | Amount | Value• | ||
| Coupon | Date | ($000) | ($000) | |
| PSEG Power LLC | 5.500% | 12/1/15 | 975 | 1,032 |
| PSEG Power LLC | 2.750% | 9/15/16 | 300 | 311 |
| PSEG Power LLC | 2.450% | 11/15/18 | 3,000 | 3,045 |
| Public Service Co. of Colorado | 5.125% | 6/1/19 | 3,525 | 4,024 |
| Public Service Co. of New Mexico | 7.950% | 5/15/18 | 1,265 | 1,519 |
| Public Service Electric & Gas Co. | 5.300% | 5/1/18 | 2,595 | 2,930 |
| Public Service Electric & Gas Co. | 2.300% | 9/15/18 | 1,600 | 1,636 |
| Public Service Electric & Gas Co. | 1.800% | 6/1/19 | 5,200 | 5,148 |
| San Diego Gas & Electric Co. | 5.300% | 11/15/15 | 300 | 317 |
| Sierra Pacific Power Co. | 6.000% | 5/15/16 | 5,150 | 5,605 |
| South Carolina Electric & Gas Co. | 5.250% | 11/1/18 | 2,225 | 2,522 |
| South Carolina Electric & Gas Co. | 6.500% | 11/1/18 | 2,325 | 2,757 |
| Southern California Edison Co. | 5.000% | 1/15/16 | 1,200 | 1,273 |
| Southern California Edison Co. | 1.125% | 5/1/17 | 2,500 | 2,499 |
| Southern California Edison Co. | 5.500% | 8/15/18 | 3,700 | 4,221 |
| Southern Co. | 2.375% | 9/15/15 | 3,700 | 3,767 |
| Southern Co. | 1.950% | 9/1/16 | 1,950 | 1,992 |
| Southern Co. | 1.300% | 8/15/17 | 2,350 | 2,352 |
| Southern Co. | 2.450% | 9/1/18 | 3,500 | 3,582 |
| Southern Co. | 2.150% | 9/1/19 | 1,200 | 1,199 |
| Southern Power Co. | 4.875% | 7/15/15 | 4,212 | 4,373 |
| Southwestern Electric Power Co. | 5.550% | 1/15/17 | 675 | 743 |
| Southwestern Electric Power Co. | 5.875% | 3/1/18 | 1,175 | 1,331 |
| Southwestern Electric Power Co. | 6.450% | 1/15/19 | 3,200 | 3,760 |
| Southwestern Public Service Co. | 8.750% | 12/1/18 | 155 | 196 |
| Tampa Electric Co. | 6.100% | 5/15/18 | 2,150 | 2,472 |
| TECO Finance Inc. | 4.000% | 3/15/16 | 725 | 760 |
| TECO Finance Inc. | 6.572% | 11/1/17 | 2,385 | 2,738 |
| TransAlta Corp. | 6.650% | 5/15/18 | 2,100 | 2,371 |
| Union Electric Co. | 6.400% | 6/15/17 | 4,215 | 4,795 |
| Union Electric Co. | 6.700% | 2/1/19 | 4,075 | 4,871 |
| Virginia Electric & Power Co. | 5.400% | 1/15/16 | 2,450 | 2,612 |
| Virginia Electric & Power Co. | 5.950% | 9/15/17 | 1,150 | 1,309 |
| Virginia Electric & Power Co. | 1.200% | 1/15/18 | 4,100 | 4,060 |
| Virginia Electric & Power Co. | 5.400% | 4/30/18 | 4,900 | 5,541 |
| Wisconsin Electric Power Co. | 1.700% | 6/15/18 | 2,250 | 2,254 |
| 1 Wisconsin Energy Corp. | 6.250% | 5/15/67 | 2,275 | 2,360 |
| Wisconsin Power & Light Co. | 5.000% | 7/15/19 | 1,725 | 1,954 |
| Xcel Energy Inc. | 0.750% | 5/9/16 | 2,750 | 2,751 |
| Natural Gas (0.4%) | ||||
| AGL Capital Corp. | 6.375% | 7/15/16 | 775 | 847 |
| AGL Capital Corp. | 5.250% | 8/15/19 | 2,825 | 3,190 |
| Atmos Energy Corp. | 6.350% | 6/15/17 | 2,300 | 2,622 |
| Atmos Energy Corp. | 8.500% | 3/15/19 | 1,775 | 2,254 |
| British Transco Finance Inc. | 6.625% | 6/1/18 | 1,735 | 2,023 |
| National Grid plc | 6.300% | 8/1/16 | 5,200 | 5,718 |
| 2 ONE Gas Inc. | 2.070% | 2/1/19 | 2,600 | 2,611 |
| Sempra Energy | 6.500% | 6/1/16 | 4,974 | 5,460 |
| Sempra Energy | 2.300% | 4/1/17 | 4,150 | 4,252 |
| Sempra Energy | 6.150% | 6/15/18 | 7,925 | 9,160 |
96
| Short-Term Corporate Bond Index Fund | ||||
| Face | Market | |||
| Maturity | Amount | Value• | ||
| Coupon | Date | ($000) | ($000) | |
| Other Utility (0.1%) | ||||
| American Water Capital Corp. | 6.085% | 10/15/17 | 3,000 | 3,383 |
| Veolia Environnement SA | 6.000% | 6/1/18 | 2,050 | 2,322 |
| 508,565 | ||||
| Total Corporate Bonds (Cost $9,508,164) | 9,604,595 | |||
| Taxable Municipal Bonds (0.0%) | ||||
| Dartmouth College New Hampshire GO | 4.750% | 6/1/19 | 1,440 | 1,626 |
| Stanford University California GO | 4.750% | 5/1/19 | 1,800 | 2,014 |
| Total Taxable Municipal Bonds (Cost $3,641) | 3,640 | |||
| Shares | ||||
| Temporary Cash Investment (1.2%) | ||||
| Money Market Fund (1.2%) | ||||
| 3 Vanguard Market Liquidity Fund (Cost $117,012) | 0.113% | 117,012,068 | 117,012 | |
| Total Investments (100.0%) (Cost $9,788,546) | 9,885,017 | |||
| Other Assets and Liabilities (0.0%) | ||||
| Other Assets | 99,578 | |||
| Liabilities | (100,039) | |||
| (461) | ||||
| Net Assets (100%) | 9,884,556 | |||
| At August 31, 2014, net assets consisted of: | ||||
| Amount | ||||
| ($000) | ||||
| Paid-in Capital | 9,761,590 | |||
| Undistributed Net Investment Income | 12,013 | |||
| Accumulated Net Realized Gains | 14,482 | |||
| Unrealized Appreciation (Depreciation) | 96,471 | |||
| Net Assets | 9,884,556 | |||
| Admiral Shares—Net Assets | ||||
| Applicable to 37,615,454 outstanding $.001 par value shares of | ||||
| beneficial interest (unlimited authorization) | 820,560 | |||
| Net Asset Value Per Share—Admiral Shares | $21.81 | |||
| Institutional Shares—Net Assets | ||||
| Applicable to 23,723,861 outstanding $.001 par value shares of | ||||
| beneficial interest (unlimited authorization) | 633,560 | |||
| Net Asset Value Per Share—Institutional Shares | $26.71 | |||
97
| Short-Term Corporate Bond Index Fund | |
| Amount | |
| ($000) | |
| ETF Shares—Net Assets | |
| Applicable to 105,101,511 outstanding $.001 par value shares of | |
| beneficial interest (unlimited authorization) | 8,430,436 |
| Net Asset Value Per Share—ETF Shares | $80.21 |
• See Note A in Notes to Financial Statements.
1 The average or expected maturity is shorter than the final maturity shown because of the possibility of interim principal payments and prepayments or the possibility of the issue being called.
2 Security exempt from registration under Rule 144A of the Securities Act of 1933. Such securities may be sold in transactions exempt from registration, normally to qualified institutional buyers. At August 31, 2014, the aggregate value of these securities was $65,247,000, representing 0.7% of net assets.
3 Affiliated money market fund available only to Vanguard funds and certain trusts and accounts managed by Vanguard. Rate shown is the 7-day yield.
GO—General Obligation Bond.
REIT—Real Estate Investment Trust.
See accompanying Notes, which are an integral part of the Financial Statements.
98
Short-Term Corporate Bond Index Fund
Statement of Operations
| Year Ended | |
| August 31, 2014 | |
| ($000) | |
| Investment Income | |
| Income | |
| Interest1 | 164,751 |
| Total Income | 164,751 |
| Expenses | |
| The Vanguard Group—Note B | |
| Investment Advisory Services | 209 |
| Management and Administrative—Admiral Shares | 446 |
| Management and Administrative—Institutional Shares | 258 |
| Management and Administrative—ETF Shares | 6,741 |
| Marketing and Distribution—Admiral Shares | 75 |
| Marketing and Distribution—Institutional Shares | 77 |
| Marketing and Distribution—ETF Shares | 1,779 |
| Custodian Fees | 83 |
| Auditing Fees | 46 |
| Shareholders’ Reports—Admiral Shares | 8 |
| Shareholders’ Reports—Institutional Shares | — |
| Shareholders’ Reports—ETF Shares | 339 |
| Trustees’ Fees and Expenses | 6 |
| Total Expenses | 10,067 |
| Net Investment Income | 154,684 |
| Realized Net Gain (Loss) | |
| Investment Securities Sold | 25,885 |
| Futures Contracts | (2,550) |
| Realized Net Gain (Loss) | 23,335 |
| Change in Unrealized Appreciation (Depreciation) of Investment Securities | 100,306 |
| Net Increase (Decrease) in Net Assets Resulting from Operations | 278,325 |
| 1 Interest income from an affiliated company of the fund was $76,000. | |
See accompanying Notes, which are an integral part of the Financial Statements.
99
Short-Term Corporate Bond Index Fund
Statement of Changes in Net Assets
| Year Ended August 31, | ||
| 2014 | 2013 | |
| ($000) | ($000) | |
| Increase (Decrease) in Net Assets | ||
| Operations | ||
| Net Investment Income | 154,684 | 106,577 |
| Realized Net Gain (Loss) | 23,335 | 19,513 |
| Change in Unrealized Appreciation (Depreciation) | 100,306 | (94,825) |
| Net Increase (Decrease) in Net Assets Resulting from Operations | 278,325 | 31,265 |
| Distributions | ||
| Net Investment Income | ||
| Admiral Shares1 | (8,666) | (886) |
| Institutional Shares | (7,383) | (3,583) |
| ETF Shares | (126,399) | (102,130) |
| Realized Capital Gain 2 | ||
| Admiral Shares1 | (608) | (46) |
| Institutional Shares | (736) | (235) |
| ETF Shares | (16,740) | (6,926) |
| Total Distributions | (160,532) | (113,806) |
| Capital Share Transactions | ||
| Admiral Shares1 | 742,084 | 51,421 |
| Institutional Shares | 367,790 | 101,926 |
| ETF Shares | 1,614,776 | 3,098,685 |
| Net Increase (Decrease) from Capital Share Transactions | 2,724,650 | 3,252,032 |
| Total Increase (Decrease) | 2,842,443 | 3,169,491 |
| Net Assets | ||
| Beginning of Period | 7,042,113 | 3,872,622 |
| End of Period3 | 9,884,556 | 7,042,113 |
| 1 Signal Shares were renamed Admiral Shares in October 2013. The prior period’s distributions and capital share transactions are for the Signal class. 2 Includes fiscal 2014 and 2013 short-term gain distributions totaling $3,918,000 and $2,033,000, respectively. Short-term gain distributions are treated as ordinary income dividends for tax purposes. 3 Net Assets—End of Period includes undistributed (overdistributed) net investment income of $12,013,000 and ($223,000). | ||
See accompanying Notes, which are an integral part of the Financial Statements.
100
Short-Term Corporate Bond Index Fund
Financial Highlights
| Admiral Shares | ||||
| Nov. 18, | ||||
| 20101 to | ||||
| For a Share Outstanding | Year Ended August 31, | Aug. 31, | ||
| Throughout Each Period | 2014 | 2013 | 2012 | 2011 |
| Net Asset Value, Beginning of Period | $21.51 | $21.73 | $21.26 | $21.21 |
| Investment Operations | ||||
| Net Investment Income | . 395 | . 414 | . 488 | .387 |
| Net Realized and Unrealized Gain (Loss) on Investments | .347 | (.189) | .494 | .091 |
| Total from Investment Operations | .742 | .225 | .982 | .478 |
| Distributions | ||||
| Dividends from Net Investment Income | (.393) | (.413) | (.487) | (.410) |
| Distributions from Realized Capital Gains | (. 049) | (. 032) | (. 025) | (. 018) |
| Total Distributions | (. 442) | (. 445) | (. 512) | (. 428) |
| Net Asset Value, End of Period | $21.81 | $21.51 | $21.73 | $21.26 |
| Total Return2 | 3.47% | 1.03% | 4.69% | 2.28% |
| Ratios/Supplemental Data | ||||
| Net Assets, End of Period (Millions) | $821 | $76 | $25 | $3 |
| Ratio of Total Expenses to Average Net Assets | 0.12% | 0.12% | 0.12% | 0.14%3 |
| Ratio of Net Investment Income to Average Net Assets | 1.82% | 1.92% | 2.33% | 2.39%3 |
| Portfolio Turnover Rate 4 | 56% | 61% | 65% | 63% |
| Signal Shares were renamed Admiral Shares in October 2013. Prior periods’ Financial Highlights are for the Signal class. 1 Inception. 2 Total returns do not include transaction or account service fees that may have applied in the periods shown. Fund prospectuses provide information about any applicable transaction and account service fees. 3 Annualized. 4 Excludes the value of portfolio securities received or delivered as a result of in-kind purchases or redemptions of the fund’s capital shares, including ETF Creation Units. | ||||
See accompanying Notes, which are an integral part of the Financial Statements.
101
Short-Term Corporate Bond Index Fund
Financial Highlights
| Institutional Shares | |||||
| Nov. 19, | |||||
| 20091 to | |||||
| For a Share Outstanding | Year Ended August 31, | Aug. 31, | |||
| Throughout Each Period | 2014 | 2013 | 2012 | 2011 | 2010 |
| Net Asset Value, Beginning of Period | $26.33 | $26.60 | $26.03 | $25.90 | $25.02 |
| Investment Operations | |||||
| Net Investment Income | . 491 | . 516 | . 605 | . 619 | . 453 |
| Net Realized and Unrealized Gain (Loss) | |||||
| on Investments | .437 | (.233) | .599 | .151 | .882 |
| Total from Investment Operations | .928 | .283 | 1.204 | .770 | 1.335 |
| Distributions | |||||
| Dividends from Net Investment Income | (. 488) | (. 514) | (. 603) | (. 618) | (.455) |
| Distributions from Realized Capital Gains | (. 060) | (. 039) | (. 031) | (. 022) | — |
| Total Distributions | (.548) | (. 553) | (. 634) | (. 640) | (. 455) |
| Net Asset Value, End of Period | $26.71 | $26.33 | $26.60 | $26.03 | $25.90 |
| Total Return2 | 3.55% | 1.06% | 4.70% | 3.01% | 5.39% |
| Ratios/Supplemental Data | |||||
| Net Assets, End of Period (Millions) | $634 | $262 | $161 | $125 | $134 |
| Ratio of Total Expenses to Average Net Assets | 0.09% | 0.09% | 0.09% | 0.09% | 0.09%3 |
| Ratio of Net Investment Income to | |||||
| Average Net Assets | 1.85% | 1.95% | 2.36% | 2.44% | 2.62%3 |
| Portfolio Turnover Rate 4 | 56% | 61% | 65% | 63% | 68% |
| 1 Inception. 2 Total returns do not include transaction fees that may have applied in the periods shown. Fund prospectuses provide information about any applicable transaction fees. 3 Annualized. 4 Excludes the value of portfolio securities received or delivered as a result of in-kind purchases or redemptions of the fund’s capital shares, including ETF Creation Units. | |||||
See accompanying Notes, which are an integral part of the Financial Statements.
102
Short-Term Corporate Bond Index Fund
Financial Highlights
| ETF Shares | |||||
| Nov. 19, | |||||
| 20091 to | |||||
| For a Share Outstanding | Year Ended August 31, | Aug. 31, | |||
| Throughout Each Period | 2014 | 2013 | 2012 | 2011 | 2010 |
| Net Asset Value, Beginning of Period | $78.97 | $79.78 | $78.06 | $77.68 | $75.05 |
| Investment Operations | |||||
| Net Investment Income | 1.436 | 1.523 | 1.793 | 1.815 | 1.334 |
| Net Realized and Unrealized Gain (Loss) | |||||
| on Investments | 1.305 | (.699) | 1.808 | .443 | 2.636 |
| Total from Investment Operations | 2.741 | .824 | 3.601 | 2.258 | 3.970 |
| Distributions | |||||
| Dividends from Net Investment Income | (1.321) | (1.517) | (1.789) | (1.813) | (1.340) |
| Distributions from Realized Capital Gains | (.180) | (.117) | (. 092) | (. 065) | — |
| Total Distributions | (1.501) | (1.634) | (1.881) | (1.878) | (1.340) |
| Net Asset Value, End of Period | $80.21 | $78.97 | $79.78 | $78.06 | $77.68 |
| Total Return | 3.50% | 1.03% | 4.68% | 2.94% | 5.34% |
| Ratios/Supplemental Data | |||||
| Net Assets, End of Period (Millions) | $8,430 | $6,705 | $3,686 | $1,905 | $707 |
| Ratio of Total Expenses to Average Net Assets | 0.12% | 0.12% | 0.12% | 0.14% | 0.15%2 |
| Ratio of Net Investment Income to | |||||
| Average Net Assets | 1.82% | 1.92% | 2.33% | 2.39% | 2.56%2 |
| Portfolio Turnover Rate 3 | 56% | 61% | 65% | 63% | 68% |
| 1 Inception. 2 Annualized. 3 Excludes the value of portfolio securities received or delivered as a result of in-kind purchases or redemptions of the fund’s capital shares, including ETF Creation Units. | |||||
See accompanying Notes, which are an integral part of the Financial Statements.
103
Short-Term Corporate Bond Index Fund
Notes to Financial Statements
Vanguard Short-Term Corporate Bond Index Fund is registered under the Investment Company Act of 1940 as an open-end investment company, or mutual fund. Certain of the fund’s investments are in corporate debt instruments; the issuers’ abilities to meet their obligations may be affected by economic developments in their respective industries. The fund offers three classes of shares: Admiral Shares, Institutional Shares, and ETF Shares. Admiral Shares and Institutional Shares are designed for investors who meet certain administrative, service, and account-size criteria.
ETF shares are listed for trading on Nasdaq; they can be purchased and sold through a broker. Effective in October 2013, Signal Shares were renamed Admiral Shares.
A. The following significant accounting policies conform to generally accepted accounting principles for U.S. investment companies. The fund consistently follows such policies in preparing its financial statements.
1. Security Valuation: Securities are valued as of the close of trading on the New York Stock Exchange (generally 4 p.m., Eastern time) on the valuation date. Bonds, and temporary cash investments acquired over 60 days to maturity, are valued using the latest bid prices or using valuations based on a matrix system (which considers such factors as security prices, yields, maturities, and ratings), both as furnished by independent pricing services. Investments in Vanguard Market Liquidity Fund are valued at that fund’s net asset value. Other temporary cash investments are valued at amortized cost, which approximates market value. Securities for which market quotations are not readily available, or whose values have been affected by events occurring before the fund’s pricing time but after the close of the securities’ primary markets, are valued by methods deemed by the board of trustees to represent fair value.
2. Futures Contracts: The fund uses futures contracts to invest in fixed income asset classes with greater efficiency and lower cost than is possible through direct investment, to add value when these instruments are attractively priced, or to adjust sensitivity to changes in interest rates. The primary risks associated with the use of futures contracts are imperfect correlation between changes in market values of bonds held by the fund and the prices of futures contracts, and the possibility of an illiquid market. Counterparty risk involving futures is mitigated because a regulated clearinghouse is the counterparty instead of the clearing broker. To further mitigate counterparty risk, the fund trades futures contracts on an exchange, monitors the financial strength of its clearing brokers and clearinghouse, and has entered into clearing agreements with its clearing brokers. The clearinghouse imposes initial margin requirements to secure the fund’s performance and requires daily settlement of variation margin representing changes in the market value of each contract.
Futures contracts are valued at their quoted daily settlement prices. The aggregate settlement values of the contracts are not recorded in the Statement of Net Assets. Fluctuations in the value of the contracts are recorded in the Statement of Net Assets as an asset (liability) and in the Statement of Operations as unrealized appreciation (depreciation) until the contracts are closed, when they are recorded as realized futures gains (losses).
During the year ended August 31, 2014, the fund’s average investments in long and short futures contracts each represented less than 1% of net assets, based on the average of aggregate settlement values at each quarter-end during the period. The fund had no open futures contracts at August 31, 2014.
3. Federal Income Taxes: The fund intends to continue to qualify as a regulated investment company and distribute all of its taxable income. Management has analyzed the fund’s tax positions taken for all open federal income tax years (August 31, 2011–2014), and has concluded that no provision for federal income tax is required in the fund’s financial statements.
104
Short-Term Corporate Bond Index Fund
4. Distributions: Distributions to shareholders are recorded on the ex-dividend date.
5. Credit Facility: The fund and certain other funds managed by The Vanguard Group participate in a $2.89 billion committed credit facility provided by a syndicate of lenders pursuant to a credit agreement that may be renewed annually; each fund is individually liable for its borrowings, if any, under the credit facility. Borrowings may be utilized for temporary and emergency purposes, and are subject to the fund’s regulatory and contractual borrowing restrictions. The participating funds are charged administrative fees and an annual commitment fee of 0.06% of the undrawn amount of the facility; these fees are allocated to the funds based on a method approved by the fund’s board of trustees and included in Management and Administrative expenses on the fund’s Statement of Operations. Any borrowings under this facility bear interest at a rate equal to the higher of the federal funds rate or LIBOR reference rate plus an agreed-upon spread.
The fund had no borrowings outstanding at August 31, 2014, or at any time during the period then ended.
6. Other: Interest income includes income distributions received from Vanguard Market Liquidity Fund and is accrued daily. Premiums and discounts on debt securities purchased are amortized and accreted, respectively, to interest income over the lives of the respective securities. Security transactions are accounted for on the date securities are bought or sold. Costs used to determine realized gains (losses) on the sale of investment securities are those of the specific securities sold. Fees assessed on purchases of capital shares were credited to paid-in capital.
Each class of shares has equal rights as to assets and earnings, except that each class separately bears certain class-specific expenses related to maintenance of shareholder accounts (included in Management and Administrative expenses) and shareholder reporting. Marketing and distribution expenses are allocated to each class of shares based on a method approved by the board of trustees. Income, other non-class-specific expenses, and gains and losses on investments are allocated to each class of shares based on its relative net assets.
B. The Vanguard Group furnishes at cost investment advisory, corporate management, administrative, marketing, and distribution services. The costs of such services are allocated to the fund based on methods approved by the board of trustees. The fund has committed to provide up to 0.40% of its net assets in capital contributions to Vanguard. At August 31, 2014, the fund had contributed capital of $969,000 to Vanguard (included in Other Assets), representing 0.01% of the fund’s net assets and 0.39% of Vanguard’s capitalization. The fund’s trustees and officers are also directors and officers of Vanguard.
C. Various inputs may be used to determine the value of the fund’s investments. These inputs are summarized in three broad levels for financial statement purposes. The inputs or methodologies used to value securities are not necessarily an indication of the risk associated with investing in those securities.
Level 1—Quoted prices in active markets for identical securities.
Level 2—Other significant observable inputs (including quoted prices for similar securities, interest rates, prepayment speeds, credit risk, etc.).
Level 3—Significant unobservable inputs (including the fund’s own assumptions used to determine the fair value of investments).
105
Short-Term Corporate Bond Index Fund
| The following table summarizes the market value of the fund’s investments as of August 31, 2014, based on the inputs used to value them: | |||
| Level 1 | Level 2 | Level 3 | |
| Investments | ($000) | ($000) | ($000) |
| U.S. Government and Agency Obligations | — | 159,770 | — |
| Corporate Bonds | — | 9,604,595 | — |
| Taxable Municipal Bonds | — | 3,640 | — |
| Temporary Cash Investments | 117,012 | — | — |
| Total | 117,012 | 9,768,005 | — |
D. Distributions are determined on a tax basis and may differ from net investment income and realized capital gains for financial reporting purposes. Differences may be permanent or temporary. Permanent differences are reclassified among capital accounts in the financial statements to reflect their tax character. Temporary differences arise when certain items of income, expense, gain, or loss are recognized in different periods for financial statement and tax purposes. These differences will reverse at some time in the future. Differences in classification may also result from the treatment of short-term gains as ordinary income for tax purposes.
During the year ended August 31, 2014, the fund realized $3,797,000 of net capital gains resulting from in-kind redemptions—in which shareholders exchanged fund shares for securities held by the fund rather than for cash. Because such gains are not taxable to the fund, and are not distributed to shareholders, they have been reclassified from accumulated net realized gains to paid-in capital.
The fund used a tax accounting practice to treat a portion of the price of capital shares redeemed during the year as distributions from realized capital gains. Accordingly, the fund has reclassified $1,434,000 from accumulated net realized gains to paid-in capital.
For tax purposes, at August 31, 2014, the fund had short-term and long-term capital gains of $3,180,000 and $12,831,000, respectively, available for distribution. Short-term gain distributions are treated as ordinary income dividends for tax purposes.
At August 31, 2014, the cost of investment securities for tax purposes was $9,790,075,000. Net unrealized appreciation of investment securities for tax purposes was $94,942,000, consisting of unrealized gains of $98,981,000 on securities that had risen in value since their purchase and $4,039,000 in unrealized losses on securities that had fallen in value since their purchase.
E. During the year ended August 31, 2014, the fund purchased $5,039,656,000 of investment securities and sold $2,416,294,000 of investment securities, other than U.S. government securities and temporary cash investments. Purchases and sales of U.S. government securities were $2,644,291,000 and $2,497,980,000, respectively. Total purchases and sales include $1,986,335,000 and $267,121,000, respectively, in connection with in-kind purchases and redemptions of the fund’s capital shares.
106
Short-Term Corporate Bond Index Fund
| F. Capital share transactions for each class of shares were: | |||||
| Year Ended August 31, | |||||
| 2014 | 2013 | ||||
| Amount | Shares | Amount | Shares | ||
| ($000) | (000) | ($000) | (000) | ||
| Admiral Shares1 | |||||
| Issued 2 | 953,911 | 43,819 | 60,095 | 2,764 | |
| Issued in Lieu of Cash Distributions | 8,037 | 369 | 674 | 31 | |
| Redeemed | (219,864) | (10,092) | (9,348) | (430) | |
| Net Increase (Decrease)—Admiral Shares | 742,084 | 34,096 | 51,421 | 2,365 | |
| Institutional Shares | |||||
| Issued 2 | 432,633 | 16,217 | 107,808 | 4,088 | |
| Issued in Lieu of Cash Distributions | 7,200 | 270 | 3,818 | 143 | |
| Redeemed | (72,043) | (2,701) | (9,700) | (363) | |
| Net Increase (Decrease)—Institutional Shares | 367,790 | 13,786 | 101,926 | 3,868 | |
| ETF Shares | |||||
| Issued 2 | 2,061,477 | 25,802 | 3,209,688 | 40,100 | |
| Issued in Lieu of Cash Distributions | — | — | — | — | |
| Redeemed | (446,701) | (5,600) | (111,003) | (1,400) | |
| Net Increase (Decrease)—ETF Shares | 1,614,776 | 20,202 | 3,098,685 | 38,700 | |
| 1 Signal Shares were renamed Admiral Shares in October 2013. The prior period’s capital share transactions are for the Signal class. 2 Includes purchase fees for fiscal 2014 and 2013 of $127,000 and $382,000, respectively (fund totals). | |||||
G. Management has determined that no material events or transactions occurred subsequent to August 31, 2014, that would require recognition or disclosure in these financial statements.
107
Intermediate-Term Corporate Bond Index Fund
Fund Profile
As of August 31, 2014
| Share-Class Characteristics | |||
| Admiral | Institutional | ETF | |
| Shares | Shares | Shares | |
| Ticker Symbol | VICSX | VICBX | VCIT |
| Expense Ratio1 | 0.12% | 0.09% | 0.12% |
| 30-Day SEC Yield | 3.00% | 3.03% | 3.00% |
| Financial Attributes | |||
| Barclays | |||
| 5–10 Year | Barclays | ||
| Corporate | Aggregate | ||
| Fund | Index | FA Index | |
| Number of Bonds | 1,474 | 1,627 | 8,876 |
| Yield to Maturity | |||
| (before expenses) | 3.1% | 3.1% | 2.1% |
| Average Coupon | 4.1% | 4.1% | 3.3% |
| Average Duration | 6.5 years | 6.5 years | 5.6 years |
| Average Effective | |||
| Maturity | 7.5 years | 7.4 years | 7.7 years |
| Short-Term | |||
| Reserves | 0.7% | — | — |
| Sector Diversification (% of portfolio) | |
| Finance | 31.5% |
| Industrial | 63.0 |
| Utilities | 5.5 |
| The agency and mortgage-backed securities sectors may include issues from government-sponsored enterprises; such issues are generally not backed by the full faith and credit of the U.S. government. | |
| Volatility Measures | ||
| Barclays | ||
| 5–10 Year | Barclays | |
| Corporate | Aggregate | |
| Index | FA Index | |
| R-Squared | 0.99 | 0.71 |
| Beta | 1.03 | 1.52 |
| These measures show the degree and timing of the fund’s fluctuations compared with the indexes over 36 months. | ||
| Distribution by Effective Maturity | |
| (% of portfolio) | |
| 1 - 3 Years | 0.8% |
| 3 - 5 Years | 0.5 |
| 5 - 10 Years | 98.7 |
| Distribution by Credit Quality (% of portfolio) | |
| Aaa | 0.7 |
| Aa | 8.3 |
| A | 40.7 |
| Baa | 50.2 |
| Less Than Baa | 0.1 |
| Credit-quality ratings are obtained from Barclays and are from Moody's, Fitch, and S&P. When ratings from all three agencies are used, the median rating is shown. When ratings from two of the agencies are used, the lower rating for each issue is shown. For more information about these ratings, see the Glossary entry for Credit Quality. | |
Investment Focus

1 The expense ratios shown are from the prospectus dated December 20, 2013, and represent estimated costs for the current fiscal year. For the fiscal year ended August 31, 2014, the expense ratios were 0.12% for Admiral Shares, 0.09% for Institutional Shares, and 0.12% for ETF Shares.
108
Intermediate-Term Corporate Bond Index Fund
Performance Summary
All of the returns in this report represent past performance, which is not a guarantee of future results that may be achieved by the fund. (Current performance may be lower or higher than the performance data cited. For performance data current to the most recent month-end, visit our website at vanguard.com/performance.) Note, too, that both investment returns and principal value can fluctuate widely, so an investor’s shares, when sold, could be worth more or less than their original cost. The returns shown do not reflect taxes that a shareholder would pay on fund distributions or on the sale of fund shares.
Cumulative Performance: November 19, 2009, Through August 31, 2014
Initial Investment of $10,000
| Average Annual Total Returns | ||||
| Periods Ended August 31, 2014 | ||||
| Since | Final Value | |||
| One | Inception | of a $10,000 | ||
| Year | (11/19/2009) | Investment | ||
| Intermediate-Term Corporate Bond | ||||
| Index Fund ETF Shares Net Asset | ||||
| Value | 9.60% | 7.29% | $13,998 | |
| Intermediate-Term Corporate Bond | ||||
| Index Fund ETF Shares Market Price | 9.57 | 7.31 | 14,010 | |
| Barclays U.S. 5–10 Year Corporate | ||||
| •••••••• | Bond Index | 9.51 | 7.42 | 14,079 |
| – – – – | Spliced Core Bond Funds Average | 6.05 | 4.90 | 12,572 |
| Spliced Barclays U.S. Aggregate Float | ||||
| Adjusted Index | 5.64 | 4.27 | 12,212 | |
| For a benchmark description, see the Glossary. Spliced Core Bond Funds Average: Derived from data provided by Lipper, a Thomson Reuters Company. "Since Inception" performance is calculated from the ETF Shares’ inception date for both the fund and its comparative standards. | ||||
Vanguard fund returns are adjusted to reflect the 0.25% fee on purchases of fund shares. The fee does not apply to the ETF Shares. The Fiscal-Year Total Returns table is not adjusted for fees.
See Financial Highlights for dividend and capital gains information.
109
Intermediate-Term Corporate Bond Index Fund
| Average Annual Total Returns | |||
| Periods Ended August 31, 2014 | |||
| Since | Final Value | ||
| One | Inception | of a $10,000 | |
| Year | (3/2/2010) | Investment | |
| Intermediate-Term Corporate Bond Index | |||
| Fund Admiral Shares | 9.33% | 7.17% | $13,657 |
| Barclays U.S. 5–10 Year Corporate Bond | |||
| Index | 9.51 | 7.30 | 13,732 |
| Barclays U.S. Aggregate Float Adjusted Index | 5.64 | 4.30 | 12,087 |
| "Since Inception" performance is calculated from the Admiral Shares’ inception date for both the fund and its comparative standards. | |||
| Since | Final Value | ||
| One | Inception | of a $5,000,000 | |
| Year | (11/19/2009) | Investment | |
| Intermediate-Term Corporate Bond Index | |||
| Fund Institutional Shares | 9.35% | 7.28% | $6,995,412 |
| Barclays U.S. 5–10 Year Corporate Bond | |||
| Index | 9.51 | 7.42 | 7,039,323 |
| Spliced Barclays U.S. Aggregate Float | |||
| Adjusted Index | 5.64 | 4.27 | 6,105,965 |
| "Since Inception" performance is calculated from the Institutional Shares’ inception date for both the fund and its comparative standards. | |||
| Cumulative Returns of ETF Shares: November 19, 2009, Through August 31, 2014 | ||
| Since | ||
| One | Inception | |
| Year | (11/19/2009) | |
| Intermediate-Term Corporate Bond Index Fund ETF | ||
| Shares Market Price | 9.57% | 40.10% |
| Intermediate-Term Corporate Bond Index Fund ETF | ||
| Shares Net Asset Value | 9.60 | 39.98 |
| Barclays U.S. 5–10 Year Corporate Bond Index | 9.51 | 40.79 |
| "Since Inception" performance is calculated from the ETF Shares’ inception date for both the fund and its comparative standards. | ||
Vanguard fund returns are adjusted to reflect the 0.25% fee on purchases of fund shares. The fee does not apply to the ETF Shares. The Fiscal-Year Total Returns table is not adjusted for fees.
110
Intermediate-Term Corporate Bond Index Fund
| Fiscal-Year Total Returns (%): November 19, 2009, Through August 31, 2014 | |||
| Barclays | |||
| 5–10 Year | |||
| Corporate | |||
| ETF Shares Net Asset Value | Index | ||
| Fiscal Year | Total Returns | Total Returns | |
| 2010 | 11.30% | 11.41% | |
| 2011 | 5.65 | 6.19 | |
| 2012 | 10.43 | 10.07 | |
| 2013 | -1.64 | -1.27 | |
| 2014 | 9.60 | 9.51 | |
| Average Annual Total Returns: Periods Ended June 30, 2014 | |||||
| This table presents returns through the latest calendar quarter—rather than through the end of the fiscal period. | |||||
| Securities and Exchange Commission rules require that we provide this information. | |||||
| Since Inception | |||||
| Inception Date | One Year | Income | Capital | Total | |
| Admiral Shares | 3/2/2010 | 7.94% | 3.80% | 3.43% | 7.23% |
| Fee-Adjusted Returns | 7.67 | 7.16 | |||
| Institutional Shares | 11/19/2009 | 7.97 | 3.86 | 3.47 | 7.33 |
| Fee-Adjusted Returns | 7.70 | 7.28 | |||
| ETF Shares | 11/19/2009 | ||||
| Market Price | 8.06 | 7.31 | |||
| Net Asset Value | 7.92 | 7.28 | |||
Vanguard fund returns are adjusted to reflect the 0.25% fee on purchases of fund shares. The fee does not apply to the ETF Shares. The Fiscal-Year Total Returns table is not adjusted for fees.
111
Intermediate-Term Corporate Bond Index Fund
Financial Statements
Statement of Net Assets
As of August 31, 2014
The fund reports a complete list of its holdings in regulatory filings four times in each fiscal year, at the quarter-ends. For the second and fourth fiscal quarters, the lists appear in the fund’s semiannual and annual reports to shareholders. For the first and third fiscal quarters, the fund files the lists with the Securities and Exchange Commission on Form N-Q. Shareholders can look up the fund’s Forms N-Q on the SEC’s website at sec.gov. Forms N-Q may also be reviewed and copied at the SEC’s Public Reference Room (see the back cover of this report for further information).
| Face | Market | |||
| Maturity | Amount | Value• | ||
| Coupon | Date | ($000) | ($000) | |
| U.S. Government and Agency Obligations (0.5%) | ||||
| U.S. Government Securities (0.5%) | ||||
| United States Treasury Note/Bond | 4.750% | 8/15/17 | 170 | 189 |
| United States Treasury Note/Bond | 1.625% | 7/31/19 | 50 | 50 |
| United States Treasury Note/Bond | 1.625% | 8/31/19 | 125 | 125 |
| United States Treasury Note/Bond | 2.250% | 7/31/21 | 5,575 | 5,652 |
| United States Treasury Note/Bond | 2.375% | 8/15/24 | 16,100 | 16,145 |
| Total U.S. Government and Agency Obligations (Cost $22,159) | 22,161 | |||
| Corporate Bonds (98.3%) | ||||
| Finance (30.9%) | ||||
| Banking (17.4%) | ||||
| Abbey National Treasury Services plc | 4.000% | 3/13/24 | 3,250 | 3,382 |
| American Express Co. | 2.650% | 12/2/22 | 6,013 | 5,885 |
| Bancolombia SA | 5.950% | 6/3/21 | 3,600 | 4,006 |
| Bank of America Corp. | 5.625% | 7/1/20 | 9,420 | 10,764 |
| Bank of America Corp. | 5.875% | 1/5/21 | 3,675 | 4,291 |
| Bank of America Corp. | 5.000% | 5/13/21 | 5,745 | 6,421 |
| Bank of America Corp. | 5.700% | 1/24/22 | 11,675 | 13,546 |
| Bank of America Corp. | 3.300% | 1/11/23 | 15,925 | 15,795 |
| Bank of America Corp. | 4.100% | 7/24/23 | 6,350 | 6,612 |
| Bank of America Corp. | 4.125% | 1/22/24 | 10,900 | 11,332 |
| Bank of America Corp. | 4.000% | 4/1/24 | 10,375 | 10,663 |
| Bank of America Corp. | 4.200% | 8/26/24 | 10,500 | 10,669 |
| Bank of Montreal | 2.550% | 11/6/22 | 4,400 | 4,297 |
| Bank of New York Mellon Corp. | 4.600% | 1/15/20 | 2,425 | 2,705 |
| Bank of New York Mellon Corp. | 4.150% | 2/1/21 | 650 | 713 |
| Bank of New York Mellon Corp. | 3.550% | 9/23/21 | 5,400 | 5,692 |
| Bank of New York Mellon Corp. | 3.650% | 2/4/24 | 2,550 | 2,663 |
| Bank of New York Mellon Corp. | 3.400% | 5/15/24 | 1,525 | 1,559 |
| Bank of Nova Scotia | 4.375% | 1/13/21 | 2,450 | 2,721 |
| Bank of Nova Scotia | 2.800% | 7/21/21 | 2,725 | 2,736 |
| Barclays Bank plc | 5.125% | 1/8/20 | 5,590 | 6,308 |
| Barclays Bank plc | 5.140% | 10/14/20 | 4,100 | 4,474 |
| Barclays Bank plc | 3.750% | 5/15/24 | 7,950 | 8,123 |
| BB&T Corp. | 5.250% | 11/1/19 | 1,650 | 1,871 |
| BB&T Corp. | 3.950% | 3/22/22 | 1,609 | 1,713 |
| BNP Paribas SA | 5.000% | 1/15/21 | 9,640 | 10,872 |
| BNP Paribas SA | 3.250% | 3/3/23 | 6,200 | 6,235 |
112
| Intermediate-Term Corporate Bond Index Fund | ||||
| Face | Market | |||
| Maturity | Amount | Value• | ||
| Coupon | Date | ($000) | ($000) | |
| BPCE SA | 4.000% | 4/15/24 | 5,750 | 5,962 |
| Branch Banking & Trust Co. | 2.850% | 4/1/21 | 2,000 | 2,017 |
| Capital One Bank USA NA | 3.375% | 2/15/23 | 5,055 | 5,056 |
| Capital One Financial Corp. | 4.750% | 7/15/21 | 5,554 | 6,148 |
| Capital One Financial Corp. | 3.500% | 6/15/23 | 3,265 | 3,296 |
| Capital One Financial Corp. | 3.750% | 4/24/24 | 1,700 | 1,735 |
| Capital One NA | 2.950% | 7/23/21 | 5,000 | 5,001 |
| Citigroup Inc. | 5.375% | 8/9/20 | 10,149 | 11,573 |
| Citigroup Inc. | 4.500% | 1/14/22 | 7,075 | 7,711 |
| Citigroup Inc. | 4.050% | 7/30/22 | 2,175 | 2,246 |
| Citigroup Inc. | 3.375% | 3/1/23 | 6,075 | 6,103 |
| Citigroup Inc. | 3.500% | 5/15/23 | 5,275 | 5,173 |
| Citigroup Inc. | 3.875% | 10/25/23 | 7,875 | 8,171 |
| Citigroup Inc. | 3.750% | 6/16/24 | 4,700 | 4,799 |
| Citigroup Inc. | 4.000% | 8/5/24 | 1,800 | 1,805 |
| City National Corp. | 5.250% | 9/15/20 | 1,050 | 1,181 |
| Cooperatieve Centrale Raiffeisen-Boerenleenbank | ||||
| BA | 4.500% | 1/11/21 | 5,290 | 5,871 |
| Cooperatieve Centrale Raiffeisen-Boerenleenbank | ||||
| BA | 3.875% | 2/8/22 | 9,400 | 10,045 |
| Cooperatieve Centrale Raiffeisen-Boerenleenbank | ||||
| BA | 3.950% | 11/9/22 | 5,325 | 5,481 |
| Cooperatieve Centrale Raiffeisen-Boerenleenbank | ||||
| BA | 4.625% | 12/1/23 | 8,625 | 9,186 |
| Credit Suisse | 5.400% | 1/14/20 | 4,725 | 5,310 |
| Credit Suisse | 4.375% | 8/5/20 | 4,160 | 4,545 |
| Deutsche Bank AG | 3.700% | 5/30/24 | 6,175 | 6,254 |
| 1 Deutsche Bank AG | 4.296% | 5/24/28 | 5,750 | 5,651 |
| Discover Bank | 7.000% | 4/15/20 | 3,475 | 4,164 |
| Discover Bank | 3.200% | 8/9/21 | 2,600 | 2,609 |
| Discover Bank | 4.200% | 8/8/23 | 3,550 | 3,738 |
| Discover Financial Services | 3.850% | 11/21/22 | 2,002 | 2,045 |
| Fifth Third Bancorp | 3.500% | 3/15/22 | 1,825 | 1,893 |
| Fifth Third Bancorp | 4.300% | 1/16/24 | 2,450 | 2,565 |
| First Niagara Financial Group Inc. | 6.750% | 3/19/20 | 1,100 | 1,269 |
| FirstMerit Corp. | 4.350% | 2/4/23 | 1,125 | 1,178 |
| Goldman Sachs Group Inc. | 5.375% | 3/15/20 | 10,154 | 11,467 |
| Goldman Sachs Group Inc. | 6.000% | 6/15/20 | 8,595 | 10,002 |
| Goldman Sachs Group Inc. | 5.250% | 7/27/21 | 13,675 | 15,394 |
| Goldman Sachs Group Inc. | 5.750% | 1/24/22 | 15,983 | 18,494 |
| Goldman Sachs Group Inc. | 3.625% | 1/22/23 | 8,900 | 9,030 |
| Goldman Sachs Group Inc. | 4.000% | 3/3/24 | 10,800 | 11,107 |
| Goldman Sachs Group Inc. | 3.850% | 7/8/24 | 7,000 | 7,113 |
| HSBC Bank USA NA | 4.875% | 8/24/20 | 4,255 | 4,749 |
| HSBC Holdings plc | 5.100% | 4/5/21 | 8,775 | 10,025 |
| HSBC Holdings plc | 4.875% | 1/14/22 | 3,175 | 3,578 |
| HSBC Holdings plc | 4.000% | 3/30/22 | 8,400 | 9,016 |
| HSBC Holdings plc | 4.250% | 3/14/24 | 8,075 | 8,400 |
| HSBC USA Inc. | 5.000% | 9/27/20 | 3,000 | 3,318 |
| HSBC USA Inc. | 3.500% | 6/23/24 | 2,600 | 2,649 |
| Huntington Bancshares Inc. | 7.000% | 12/15/20 | 675 | 807 |
| Intesa Sanpaolo SPA | 5.250% | 1/12/24 | 5,500 | 6,035 |
| JPMorgan Chase & Co. | 4.950% | 3/25/20 | 5,597 | 6,261 |
| JPMorgan Chase & Co. | 4.400% | 7/22/20 | 7,925 | 8,634 |
| JPMorgan Chase & Co. | 4.250% | 10/15/20 | 10,100 | 10,922 |
113
| Intermediate-Term Corporate Bond Index Fund | ||||
| Face | Market | |||
| Maturity | Amount | Value• | ||
| Coupon | Date | ($000) | ($000) | |
| JPMorgan Chase & Co. | 4.625% | 5/10/21 | 6,725 | 7,428 |
| JPMorgan Chase & Co. | 4.350% | 8/15/21 | 9,875 | 10,729 |
| JPMorgan Chase & Co. | 4.500% | 1/24/22 | 10,750 | 11,779 |
| JPMorgan Chase & Co. | 3.250% | 9/23/22 | 11,575 | 11,621 |
| JPMorgan Chase & Co. | 3.200% | 1/25/23 | 10,850 | 10,808 |
| JPMorgan Chase & Co. | 3.375% | 5/1/23 | 7,675 | 7,546 |
| JPMorgan Chase & Co. | 3.875% | 2/1/24 | 6,350 | 6,615 |
| JPMorgan Chase & Co. | 3.625% | 5/13/24 | 8,175 | 8,310 |
| KeyCorp | 5.100% | 3/24/21 | 3,300 | 3,745 |
| Lloyds Bank plc | 6.375% | 1/21/21 | 3,333 | 4,041 |
| Morgan Stanley | 5.625% | 9/23/19 | 12,065 | 13,788 |
| Morgan Stanley | 5.500% | 1/26/20 | 8,850 | 10,047 |
| Morgan Stanley | 5.500% | 7/24/20 | 6,586 | 7,521 |
| Morgan Stanley | 5.750% | 1/25/21 | 7,602 | 8,813 |
| Morgan Stanley | 5.500% | 7/28/21 | 7,425 | 8,528 |
| Morgan Stanley | 4.875% | 11/1/22 | 7,450 | 8,032 |
| Morgan Stanley | 3.750% | 2/25/23 | 7,875 | 8,080 |
| Morgan Stanley | 4.100% | 5/22/23 | 8,775 | 8,947 |
| Morgan Stanley | 3.875% | 4/29/24 | 11,850 | 12,120 |
| MUFG Americas Holdings Corp. | 3.500% | 6/18/22 | 1,950 | 2,020 |
| National Australia Bank Ltd. | 3.000% | 1/20/23 | 2,575 | 2,552 |
| Northern Trust Corp. | 3.450% | 11/4/20 | 2,125 | 2,256 |
| Northern Trust Corp. | 3.375% | 8/23/21 | 1,750 | 1,848 |
| Northern Trust Corp. | 2.375% | 8/2/22 | 1,475 | 1,431 |
| People’s United Bank | 4.000% | 7/15/24 | 1,000 | 1,013 |
| People’s United Financial Inc. | 3.650% | 12/6/22 | 2,150 | 2,186 |
| PNC Bank NA | 2.700% | 11/1/22 | 4,475 | 4,327 |
| PNC Bank NA | 2.950% | 1/30/23 | 2,675 | 2,629 |
| PNC Bank NA | 3.800% | 7/25/23 | 2,050 | 2,134 |
| PNC Financial Services Group Inc. | 2.854% | 11/9/22 | 1,350 | 1,333 |
| PNC Financial Services Group Inc. | 3.900% | 4/29/24 | 2,775 | 2,839 |
| PNC Funding Corp. | 5.125% | 2/8/20 | 4,227 | 4,812 |
| PNC Funding Corp. | 4.375% | 8/11/20 | 1,250 | 1,375 |
| PNC Funding Corp. | 3.300% | 3/8/22 | 5,427 | 5,575 |
| Royal Bank of Scotland Group plc | 6.400% | 10/21/19 | 4,836 | 5,693 |
| Royal Bank of Scotland plc | 5.625% | 8/24/20 | 4,138 | 4,733 |
| Royal Bank of Scotland plc | 6.125% | 1/11/21 | 2,900 | 3,427 |
| State Street Corp. | 4.375% | 3/7/21 | 2,675 | 2,981 |
| State Street Corp. | 3.100% | 5/15/23 | 3,550 | 3,533 |
| State Street Corp. | 3.700% | 11/20/23 | 3,235 | 3,399 |
| Sumitomo Mitsui Banking Corp. | 3.200% | 7/18/22 | 2,475 | 2,525 |
| Sumitomo Mitsui Banking Corp. | 3.000% | 1/18/23 | 775 | 778 |
| Sumitomo Mitsui Banking Corp. | 3.950% | 7/19/23 | 2,100 | 2,235 |
| Sumitomo Mitsui Banking Corp. | 3.950% | 1/10/24 | 3,075 | 3,300 |
| Sumitomo Mitsui Banking Corp. | 3.400% | 7/11/24 | 1,600 | 1,632 |
| SunTrust Bank | 2.750% | 5/1/23 | 1,975 | 1,908 |
| Synchrony Financial | 3.750% | 8/15/21 | 1,000 | 1,020 |
| Synchrony Financial | 4.250% | 8/15/24 | 4,800 | 4,928 |
| UBS AG | 4.875% | 8/4/20 | 6,952 | 7,813 |
| US Bancorp | 4.125% | 5/24/21 | 3,056 | 3,351 |
| US Bancorp | 3.000% | 3/15/22 | 3,350 | 3,404 |
| US Bancorp | 2.950% | 7/15/22 | 5,325 | 5,302 |
| US Bancorp | 3.700% | 1/30/24 | 2,350 | 2,462 |
| Wells Fargo & Co. | 3.000% | 1/22/21 | 4,950 | 5,064 |
| Wells Fargo & Co. | 4.600% | 4/1/21 | 9,222 | 10,299 |
114
| Intermediate-Term Corporate Bond Index Fund | ||||
| Face | Market | |||
| Maturity | Amount | Value• | ||
| Coupon | Date | ($000) | ($000) | |
| Wells Fargo & Co. | 3.500% | 3/8/22 | 8,500 | 8,846 |
| Wells Fargo & Co. | 3.450% | 2/13/23 | 7,525 | 7,567 |
| Wells Fargo & Co. | 4.125% | 8/15/23 | 5,000 | 5,261 |
| Wells Fargo & Co. | 4.480% | 1/16/24 | 2,500 | 2,685 |
| Westpac Banking Corp. | 4.875% | 11/19/19 | 6,488 | 7,311 |
| Zions Bancorporation | 4.500% | 6/13/23 | 800 | 838 |
| Brokerage (1.4%) | ||||
| Affiliated Managers Group Inc. | 4.250% | 2/15/24 | 1,125 | 1,173 |
| Ameriprise Financial Inc. | 5.300% | 3/15/20 | 1,475 | 1,686 |
| Ameriprise Financial Inc. | 4.000% | 10/15/23 | 4,375 | 4,652 |
| BlackRock Inc. | 5.000% | 12/10/19 | 4,950 | 5,656 |
| BlackRock Inc. | 4.250% | 5/24/21 | 1,700 | 1,879 |
| BlackRock Inc. | 3.375% | 6/1/22 | 2,375 | 2,467 |
| BlackRock Inc. | 3.500% | 3/18/24 | 3,525 | 3,605 |
| Charles Schwab Corp. | 4.450% | 7/22/20 | 2,350 | 2,609 |
| Charles Schwab Corp. | 3.225% | 9/1/22 | 575 | 586 |
| CME Group Inc. | 3.000% | 9/15/22 | 2,700 | 2,715 |
| Eaton Vance Corp. | 3.625% | 6/15/23 | 1,000 | 1,031 |
| Franklin Resources Inc. | 2.800% | 9/15/22 | 2,800 | 2,772 |
| IntercontinentalExchange Group Inc. | 4.000% | 10/15/23 | 2,975 | 3,163 |
| Invesco Finance plc | 3.125% | 11/30/22 | 2,900 | 2,911 |
| Invesco Finance plc | 4.000% | 1/30/24 | 3,700 | 3,916 |
| Jefferies Group LLC | 6.875% | 4/15/21 | 2,885 | 3,415 |
| Jefferies Group LLC | 5.125% | 1/20/23 | 1,900 | 2,050 |
| Lazard Group LLC | 4.250% | 11/14/20 | 1,575 | 1,658 |
| Legg Mason Inc. | 3.950% | 7/15/24 | 875 | 897 |
| Leucadia National Corp. | 5.500% | 10/18/23 | 2,450 | 2,588 |
| NASDAQ OMX Group Inc. | 5.550% | 1/15/20 | 2,100 | 2,339 |
| NASDAQ OMX Group Inc. | 4.250% | 6/1/24 | 1,750 | 1,789 |
| Nomura Holdings Inc. | 6.700% | 3/4/20 | 5,775 | 6,946 |
| TD Ameritrade Holding Corp. | 5.600% | 12/1/19 | 1,500 | 1,743 |
| Finance Companies (2.1%) | ||||
| Air Lease Corp. | 4.750% | 3/1/20 | 2,000 | 2,135 |
| Air Lease Corp. | 3.875% | 4/1/21 | 1,550 | 1,569 |
| Block Financial LLC | 5.500% | 11/1/22 | 1,850 | 2,038 |
| GATX Corp. | 4.750% | 6/15/22 | 1,275 | 1,387 |
| GATX Corp. | 3.900% | 3/30/23 | 725 | 749 |
| General Electric Capital Corp. | 2.100% | 12/11/19 | 2,215 | 2,224 |
| General Electric Capital Corp. | 5.500% | 1/8/20 | 6,425 | 7,421 |
| General Electric Capital Corp. | 5.550% | 5/4/20 | 4,951 | 5,752 |
| General Electric Capital Corp. | 4.375% | 9/16/20 | 8,100 | 8,902 |
| General Electric Capital Corp. | 4.625% | 1/7/21 | 7,538 | 8,428 |
| General Electric Capital Corp. | 5.300% | 2/11/21 | 7,900 | 9,074 |
| General Electric Capital Corp. | 4.650% | 10/17/21 | 10,975 | 12,282 |
| General Electric Capital Corp. | 3.150% | 9/7/22 | 6,450 | 6,535 |
| General Electric Capital Corp. | 3.100% | 1/9/23 | 8,625 | 8,661 |
| General Electric Capital Corp. | 3.450% | 5/15/24 | 4,600 | 4,717 |
| HSBC Finance Corp. | 6.676% | 1/15/21 | 11,222 | 13,464 |
| Prospect Capital Corp. | 5.875% | 3/15/23 | 825 | 868 |
115
| Intermediate-Term Corporate Bond Index Fund | |||||
| Face | Market | ||||
| Maturity | Amount | Value• | |||
| Coupon | Date | ($000) | ($000) | ||
| Insurance (5.3%) | |||||
| ACE INA Holdings Inc. | 2.700% | 3/13/23 | 2,722 | 2,652 | |
| ACE INA Holdings Inc. | 3.350% | 5/15/24 | 2,600 | 2,645 | |
| AEGON Funding Co. LLC | 5.750% | 12/15/20 | 1,520 | 1,767 | |
| Aetna Inc. | 3.950% | 9/1/20 | 4,735 | 5,103 | |
| Aetna Inc. | 4.125% | 6/1/21 | 300 | 326 | |
| Aetna Inc. | 2.750% | 11/15/22 | 3,900 | 3,826 | |
| Aflac Inc. | 4.000% | 2/15/22 | 2,300 | 2,473 | |
| Aflac Inc. | 3.625% | 6/15/23 | 4,300 | 4,428 | |
| Alleghany Corp. | 5.625% | 9/15/20 | 300 | 338 | |
| Alleghany Corp. | 4.950% | 6/27/22 | 2,725 | 3,004 | |
| Allied World Assurance Co. Ltd. | 5.500% | 11/15/20 | 375 | 423 | |
| Allstate Corp. | 3.150% | 6/15/23 | 2,625 | 2,648 | |
| 1 | Allstate Corp. | 5.750% | 8/15/53 | 2,825 | 3,016 |
| Alterra Finance LLC | 6.250% | 9/30/20 | 320 | 375 | |
| American International Group Inc. | 3.375% | 8/15/20 | 4,950 | 5,168 | |
| American International Group Inc. | 6.400% | 12/15/20 | 5,549 | 6,702 | |
| American International Group Inc. | 4.875% | 6/1/22 | 4,550 | 5,088 | |
| American International Group Inc. | 4.125% | 2/15/24 | 4,375 | 4,639 | |
| Aon Corp. | 5.000% | 9/30/20 | 1,725 | 1,938 | |
| Aon plc | 4.000% | 11/27/23 | 1,525 | 1,613 | |
| Aon plc | 3.500% | 6/14/24 | 2,200 | 2,208 | |
| Aspen Insurance Holdings Ltd. | 6.000% | 12/15/20 | 100 | 115 | |
| Aspen Insurance Holdings Ltd. | 4.650% | 11/15/23 | 1,950 | 2,042 | |
| Assurant Inc. | 4.000% | 3/15/23 | 1,800 | 1,828 | |
| Axis Specialty Finance LLC | 5.875% | 6/1/20 | 1,692 | 1,935 | |
| Berkshire Hathaway Finance Corp. | 2.900% | 10/15/20 | 2,425 | 2,496 | |
| Berkshire Hathaway Finance Corp. | 4.250% | 1/15/21 | 3,174 | 3,502 | |
| Berkshire Hathaway Finance Corp. | 3.000% | 5/15/22 | 4,350 | 4,412 | |
| Berkshire Hathaway Inc. | 3.750% | 8/15/21 | 2,375 | 2,560 | |
| Berkshire Hathaway Inc. | 3.000% | 2/11/23 | 1,975 | 1,986 | |
| Cigna Corp. | 5.125% | 6/15/20 | 822 | 926 | |
| Cigna Corp. | 4.500% | 3/15/21 | 2,924 | 3,218 | |
| Cigna Corp. | 4.000% | 2/15/22 | 2,425 | 2,580 | |
| CNA Financial Corp. | 7.350% | 11/15/19 | 1,764 | 2,160 | |
| CNA Financial Corp. | 5.875% | 8/15/20 | 2,202 | 2,553 | |
| CNA Financial Corp. | 3.950% | 5/15/24 | 2,400 | 2,483 | |
| Coventry Health Care Inc. | 5.450% | 6/15/21 | 3,200 | 3,720 | |
| Fidelity National Financial Inc. | 5.500% | 9/1/22 | 975 | 1,070 | |
| First American Financial Corp. | 4.300% | 2/1/23 | 725 | 741 | |
| Genworth Holdings Inc. | 7.700% | 6/15/20 | 1,250 | 1,513 | |
| Genworth Holdings Inc. | 7.200% | 2/15/21 | 3,500 | 4,174 | |
| Genworth Holdings Inc. | 7.625% | 9/24/21 | 3,125 | 3,860 | |
| Genworth Holdings Inc. | 4.900% | 8/15/23 | 1,850 | 1,961 | |
| Hanover Insurance Group Inc. | 6.375% | 6/15/21 | 725 | 846 | |
| Hartford Financial Services Group Inc. | 5.500% | 3/30/20 | 2,629 | 3,009 | |
| Hartford Financial Services Group Inc. | 5.125% | 4/15/22 | 2,600 | 2,973 | |
| HCC Insurance Holdings Inc. | 6.300% | 11/15/19 | 1,000 | 1,164 | |
| Humana Inc. | 3.150% | 12/1/22 | 1,833 | 1,830 | |
| Infinity Property & Casualty Corp. | 5.000% | 9/19/22 | 575 | 608 | |
| Lincoln National Corp. | 6.250% | 2/15/20 | 1,350 | 1,596 | |
| Lincoln National Corp. | 4.200% | 3/15/22 | 1,372 | 1,476 | |
| Lincoln National Corp. | 4.000% | 9/1/23 | 1,000 | 1,055 | |
| Loews Corp. | 2.625% | 5/15/23 | 2,050 | 1,968 | |
| Manulife Financial Corp. | 4.900% | 9/17/20 | 1,975 | 2,192 | |
| 116 | |||||
| Intermediate-Term Corporate Bond Index Fund | ||||
| Face | Market | |||
| Maturity | Amount | Value• | ||
| Coupon | Date | ($000) | ($000) | |
| Markel Corp. | 7.125% | 9/30/19 | 1,000 | 1,206 |
| Markel Corp. | 5.350% | 6/1/21 | 380 | 430 |
| Markel Corp. | 4.900% | 7/1/22 | 2,375 | 2,621 |
| Markel Corp. | 3.625% | 3/30/23 | 1,025 | 1,035 |
| Marsh & McLennan Cos. Inc. | 4.800% | 7/15/21 | 1,425 | 1,591 |
| Marsh & McLennan Cos. Inc. | 4.050% | 10/15/23 | 825 | 879 |
| Marsh & McLennan Cos. Inc. | 3.500% | 6/3/24 | 2,875 | 2,917 |
| MetLife Inc. | 4.750% | 2/8/21 | 5,400 | 6,072 |
| MetLife Inc. | 3.048% | 12/15/22 | 1,775 | 1,782 |
| MetLife Inc. | 4.368% | 9/15/23 | 3,000 | 3,263 |
| MetLife Inc. | 3.600% | 4/10/24 | 2,875 | 2,961 |
| Montpelier Re Holdings Ltd. | 4.700% | 10/15/22 | 675 | 707 |
| Navigators Group Inc. | 5.750% | 10/15/23 | 1,000 | 1,110 |
| OneBeacon US Holdings Inc. | 4.600% | 11/9/22 | 725 | 755 |
| PartnerRe Finance B LLC | 5.500% | 6/1/20 | 2,095 | 2,377 |
| Primerica Inc. | 4.750% | 7/15/22 | 750 | 824 |
| Principal Financial Group Inc. | 3.300% | 9/15/22 | 725 | 730 |
| Principal Financial Group Inc. | 3.125% | 5/15/23 | 2,008 | 1,984 |
| ProAssurance Corp. | 5.300% | 11/15/23 | 700 | 766 |
| Progressive Corp. | 3.750% | 8/23/21 | 2,763 | 2,966 |
| Protective Life Corp. | 7.375% | 10/15/19 | 1,400 | 1,729 |
| Prudential Financial Inc. | 5.375% | 6/21/20 | 3,224 | 3,691 |
| Prudential Financial Inc. | 4.500% | 11/15/20 | 1,600 | 1,758 |
| Prudential Financial Inc. | 4.500% | 11/16/21 | 2,680 | 2,949 |
| Prudential Financial Inc. | 3.500% | 5/15/24 | 3,000 | 3,039 |
| 1 Prudential Financial Inc. | 5.875% | 9/15/42 | 3,150 | 3,394 |
| 1 Prudential Financial Inc. | 5.625% | 6/15/43 | 4,925 | 5,270 |
| 1 Prudential Financial Inc. | 5.200% | 3/15/44 | 2,350 | 2,371 |
| Reinsurance Group of America Inc. | 6.450% | 11/15/19 | 1,600 | 1,883 |
| Reinsurance Group of America Inc. | 5.000% | 6/1/21 | 1,270 | 1,404 |
| Reinsurance Group of America Inc. | 4.700% | 9/15/23 | 900 | 977 |
| Torchmark Corp. | 3.800% | 9/15/22 | 700 | 722 |
| Travelers Cos. Inc. | 3.900% | 11/1/20 | 1,125 | 1,213 |
| Trinity Acquisition plc | 4.625% | 8/15/23 | 725 | 764 |
| UnitedHealth Group Inc. | 3.875% | 10/15/20 | 1,525 | 1,633 |
| UnitedHealth Group Inc. | 4.700% | 2/15/21 | 1,350 | 1,518 |
| UnitedHealth Group Inc. | 3.375% | 11/15/21 | 1,875 | 1,958 |
| UnitedHealth Group Inc. | 2.875% | 3/15/22 | 2,050 | 2,059 |
| UnitedHealth Group Inc. | 2.750% | 2/15/23 | 3,650 | 3,563 |
| UnitedHealth Group Inc. | 2.875% | 3/15/23 | 2,400 | 2,382 |
| Unum Group | 5.625% | 9/15/20 | 825 | 945 |
| Unum Group | 4.000% | 3/15/24 | 1,000 | 1,041 |
| Voya Financial Inc. | 5.500% | 7/15/22 | 2,600 | 2,975 |
| WellPoint Inc. | 4.350% | 8/15/20 | 4,425 | 4,821 |
| WellPoint Inc. | 3.700% | 8/15/21 | 1,705 | 1,790 |
| WellPoint Inc. | 3.125% | 5/15/22 | 2,700 | 2,702 |
| WellPoint Inc. | 3.300% | 1/15/23 | 3,800 | 3,802 |
| WellPoint Inc. | 3.500% | 8/15/24 | 1,443 | 1,446 |
| Willis Group Holdings plc | 5.750% | 3/15/21 | 2,015 | 2,287 |
| WR Berkley Corp. | 7.375% | 9/15/19 | 950 | 1,151 |
| WR Berkley Corp. | 5.375% | 9/15/20 | 1,450 | 1,631 |
| WR Berkley Corp. | 4.625% | 3/15/22 | 1,500 | 1,622 |
| XLIT Ltd. | 5.750% | 10/1/21 | 2,265 | 2,648 |
117
| Intermediate-Term Corporate Bond Index Fund | |||||
| Face | Market | ||||
| Maturity | Amount | Value• | |||
| Coupon | Date | ($000) | ($000) | ||
| Other Finance (0.0%) | |||||
| Jones Lang LaSalle Inc. | 4.400% | 11/15/22 | 925 | 953 | |
| Real Estate Investment Trusts (4.7%) | |||||
| Alexandria Real Estate Equities Inc. | 2.750% | 1/15/20 | 1,850 | 1,861 | |
| Alexandria Real Estate Equities Inc. | 4.600% | 4/1/22 | 1,825 | 1,951 | |
| Alexandria Real Estate Equities Inc. | 3.900% | 6/15/23 | 1,025 | 1,037 | |
| American Campus Communities Operating | |||||
| Partnership LP | 3.750% | 4/15/23 | 1,100 | 1,104 | |
| American Campus Communities Operating | |||||
| Partnership LP | 4.125% | 7/1/24 | 1,900 | 1,939 | |
| 2 | ARC Properties Operating Partnership LP/Clark | ||||
| Acquisition LLC | 4.600% | 2/6/24 | 1,550 | 1,601 | |
| AvalonBay Communities Inc. | 3.625% | 10/1/20 | 1,000 | 1,055 | |
| AvalonBay Communities Inc. | 3.950% | 1/15/21 | 1,000 | 1,072 | |
| AvalonBay Communities Inc. | 2.950% | 9/15/22 | 2,914 | 2,885 | |
| AvalonBay Communities Inc. | 2.850% | 3/15/23 | 600 | 584 | |
| AvalonBay Communities Inc. | 4.200% | 12/15/23 | 1,500 | 1,605 | |
| BioMed Realty LP | 4.250% | 7/15/22 | 3,000 | 3,113 | |
| Boston Properties LP | 5.875% | 10/15/19 | 1,759 | 2,047 | |
| Boston Properties LP | 5.625% | 11/15/20 | 3,910 | 4,522 | |
| Boston Properties LP | 4.125% | 5/15/21 | 2,675 | 2,876 | |
| Boston Properties LP | 3.850% | 2/1/23 | 4,255 | 4,440 | |
| Boston Properties LP | 3.125% | 9/1/23 | 1,475 | 1,445 | |
| Boston Properties LP | 3.800% | 2/1/24 | 2,175 | 2,237 | |
| Brandywine Operating Partnership LP | 3.950% | 2/15/23 | 625 | 634 | |
| Camden Property Trust | 4.625% | 6/15/21 | 2,100 | 2,303 | |
| Camden Property Trust | 2.950% | 12/15/22 | 2,425 | 2,365 | |
| CBL & Associates LP | 5.250% | 12/1/23 | 2,575 | 2,808 | |
| Corporate Office Properties LP | 3.700% | 6/15/21 | 300 | 302 | |
| Corporate Office Properties LP | 3.600% | 5/15/23 | 975 | 945 | |
| Corporate Office Properties LP | 5.250% | 2/15/24 | 2,250 | 2,421 | |
| CubeSmart LP | 4.800% | 7/15/22 | 575 | 624 | |
| CubeSmart LP | 4.375% | 12/15/23 | 1,150 | 1,200 | |
| DCT Industrial Operating Partnership LP | 4.500% | 10/15/23 | 700 | 723 | |
| DDR Corp. | 7.875% | 9/1/20 | 2,200 | 2,781 | |
| DDR Corp. | 3.500% | 1/15/21 | 1,650 | 1,679 | |
| DDR Corp. | 4.625% | 7/15/22 | 1,299 | 1,397 | |
| DDR Corp. | 3.375% | 5/15/23 | 1,100 | 1,068 | |
| Digital Realty Trust LP | 5.875% | 2/1/20 | 1,600 | 1,797 | |
| Digital Realty Trust LP | 5.250% | 3/15/21 | 2,160 | 2,368 | |
| Digital Realty Trust LP | 3.625% | 10/1/22 | 775 | 755 | |
| Duke Realty LP | 6.750% | 3/15/20 | 1,650 | 1,962 | |
| Duke Realty LP | 3.875% | 2/15/21 | 1,000 | 1,045 | |
| Duke Realty LP | 3.875% | 10/15/22 | 1,650 | 1,694 | |
| EPR Properties | 7.750% | 7/15/20 | 500 | 610 | |
| EPR Properties | 5.750% | 8/15/22 | 1,300 | 1,433 | |
| EPR Properties | 5.250% | 7/15/23 | 1,000 | 1,071 | |
| Equity Commonwealth | 5.875% | 9/15/20 | 800 | 871 | |
| Equity One Inc. | 3.750% | 11/15/22 | 1,100 | 1,107 | |
| ERP Operating LP | 4.750% | 7/15/20 | 2,700 | 3,004 | |
| ERP Operating LP | 4.625% | 12/15/21 | 2,650 | 2,938 | |
| ERP Operating LP | 3.000% | 4/15/23 | 2,375 | 2,342 | |
| Essex Portfolio LP | 3.625% | 8/15/22 | 800 | 821 | |
| 2 | Essex Portfolio LP | 3.375% | 1/15/23 | 1,996 | 2,001 |
| 118 | |||||
| Intermediate-Term Corporate Bond Index Fund | ||||
| Face | Market | |||
| Maturity | Amount | Value• | ||
| Coupon | Date | ($000) | ($000) | |
| Essex Portfolio LP | 3.250% | 5/1/23 | 1,075 | 1,063 |
| 2 Essex Portfolio LP | 3.875% | 5/1/24 | 1,400 | 1,440 |
| Excel Trust LP | 4.625% | 5/15/24 | 825 | 852 |
| Federal Realty Investment Trust | 3.000% | 8/1/22 | 575 | 574 |
| Federal Realty Investment Trust | 2.750% | 6/1/23 | 925 | 897 |
| HCP Inc. | 2.625% | 2/1/20 | 5,925 | 5,914 |
| HCP Inc. | 5.375% | 2/1/21 | 2,858 | 3,242 |
| HCP Inc. | 3.150% | 8/1/22 | 1,525 | 1,497 |
| HCP Inc. | 4.250% | 11/15/23 | 2,600 | 2,714 |
| HCP Inc. | 4.200% | 3/1/24 | 275 | 285 |
| Health Care REIT Inc. | 6.125% | 4/15/20 | 1,625 | 1,900 |
| Health Care REIT Inc. | 4.950% | 1/15/21 | 1,760 | 1,955 |
| Health Care REIT Inc. | 5.250% | 1/15/22 | 2,265 | 2,535 |
| Health Care REIT Inc. | 3.750% | 3/15/23 | 2,025 | 2,050 |
| Health Care REIT Inc. | 4.500% | 1/15/24 | 1,725 | 1,823 |
| Healthcare Realty Trust Inc. | 5.750% | 1/15/21 | 1,525 | 1,727 |
| Healthcare Realty Trust Inc. | 3.750% | 4/15/23 | 1,150 | 1,136 |
| Healthcare Trust of America Holdings LP | 3.375% | 7/15/21 | 1,025 | 1,030 |
| Healthcare Trust of America Holdings LP | 3.700% | 4/15/23 | 875 | 870 |
| Highwoods Realty LP | 3.200% | 6/15/21 | 1,400 | 1,391 |
| Highwoods Realty LP | 3.625% | 1/15/23 | 700 | 702 |
| Hospitality Properties Trust | 5.000% | 8/15/22 | 1,225 | 1,312 |
| Hospitality Properties Trust | 4.500% | 6/15/23 | 1,375 | 1,413 |
| Hospitality Properties Trust | 4.650% | 3/15/24 | 725 | 753 |
| Kilroy Realty LP | 3.800% | 1/15/23 | 2,000 | 2,035 |
| Kimco Realty Corp. | 6.875% | 10/1/19 | 950 | 1,142 |
| Kimco Realty Corp. | 3.200% | 5/1/21 | 2,300 | 2,333 |
| Kimco Realty Corp. | 3.125% | 6/1/23 | 1,100 | 1,075 |
| Lexington Realty Trust | 4.250% | 6/15/23 | 825 | 840 |
| Lexington Realty Trust | 4.400% | 6/15/24 | 1,200 | 1,222 |
| Liberty Property LP | 4.125% | 6/15/22 | 3,100 | 3,250 |
| Liberty Property LP | 3.375% | 6/15/23 | 1,225 | 1,201 |
| Liberty Property LP | 4.400% | 2/15/24 | 1,825 | 1,936 |
| Mack-Cali Realty LP | 4.500% | 4/18/22 | 980 | 997 |
| Mack-Cali Realty LP | 3.150% | 5/15/23 | 500 | 459 |
| Mid-America Apartments LP | 4.300% | 10/15/23 | 1,775 | 1,872 |
| Mid-America Apartments LP | 3.750% | 6/15/24 | 750 | 754 |
| National Retail Properties Inc. | 3.800% | 10/15/22 | 2,225 | 2,287 |
| National Retail Properties Inc. | 3.300% | 4/15/23 | 900 | 886 |
| National Retail Properties Inc. | 3.900% | 6/15/24 | 1,575 | 1,606 |
| Omega Healthcare Investors Inc. | 6.750% | 10/15/22 | 1,615 | 1,740 |
| Omega Healthcare Investors Inc. | 5.875% | 3/15/24 | 2,000 | 2,105 |
| 2 Omega Healthcare Investors Inc. | 4.950% | 4/1/24 | 1,850 | 1,910 |
| Piedmont Operating Partnership LP | 3.400% | 6/1/23 | 700 | 673 |
| Piedmont Operating Partnership LP | 4.450% | 3/15/24 | 2,675 | 2,765 |
| ProLogis LP | 6.875% | 3/15/20 | 3,150 | 3,769 |
| ProLogis LP | 3.350% | 2/1/21 | 1,500 | 1,527 |
| ProLogis LP | 4.250% | 8/15/23 | 1,950 | 2,055 |
| Realty Income Corp. | 5.750% | 1/15/21 | 450 | 518 |
| Realty Income Corp. | 3.250% | 10/15/22 | 2,020 | 2,017 |
| Realty Income Corp. | 4.650% | 8/1/23 | 1,525 | 1,649 |
| Regency Centers LP | 4.800% | 4/15/21 | 500 | 553 |
| Regency Centers LP | 3.750% | 6/15/24 | 650 | 660 |
| Retail Opportunity Investments Corp. | 5.000% | 12/15/23 | 750 | 809 |
| Senior Housing Properties Trust | 4.750% | 5/1/24 | 2,575 | 2,657 |
| Simon Property Group LP | 5.650% | 2/1/20 | 3,426 | 3,995 |
119
| Intermediate-Term Corporate Bond Index Fund | |||||
| Face | Market | ||||
| Maturity | Amount | Value• | |||
| Coupon | Date | ($000) | ($000) | ||
| Simon Property Group LP | 4.375% | 3/1/21 | 3,815 | 4,216 | |
| Simon Property Group LP | 4.125% | 12/1/21 | 4,450 | 4,830 | |
| Simon Property Group LP | 3.375% | 3/15/22 | 1,679 | 1,738 | |
| Simon Property Group LP | 2.750% | 2/1/23 | 1,000 | 973 | |
| Simon Property Group LP | 3.750% | 2/1/24 | 2,525 | 2,630 | |
| Tanger Properties LP | 3.875% | 12/1/23 | 1,750 | 1,800 | |
| UDR Inc. | 3.700% | 10/1/20 | 350 | 366 | |
| UDR Inc. | 4.625% | 1/10/22 | 1,700 | 1,855 | |
| UDR Inc. | 3.750% | 7/1/24 | 1,500 | 1,519 | |
| Ventas Realty LP | 3.750% | 5/1/24 | 2,800 | 2,808 | |
| Ventas Realty LP / Ventas Capital Corp. | 2.700% | 4/1/20 | 3,125 | 3,117 | |
| Ventas Realty LP / Ventas Capital Corp. | 4.750% | 6/1/21 | 2,695 | 2,973 | |
| Ventas Realty LP / Ventas Capital Corp. | 4.250% | 3/1/22 | 895 | 948 | |
| Ventas Realty LP / Ventas Capital Corp. | 3.250% | 8/15/22 | 950 | 936 | |
| Vornado Realty LP | 5.000% | 1/15/22 | 1,200 | 1,325 | |
| Washington REIT | 4.950% | 10/1/20 | 425 | 461 | |
| Washington REIT | 3.950% | 10/15/22 | 1,050 | 1,067 | |
| Weingarten Realty Investors | 3.375% | 10/15/22 | 600 | 601 | |
| Weingarten Realty Investors | 3.500% | 4/15/23 | 1,175 | 1,166 | |
| Weingarten Realty Investors | 4.450% | 1/15/24 | 725 | 765 | |
| WP Carey Inc. | 4.600% | 4/1/24 | 1,100 | 1,154 | |
| 1,408,467 | |||||
| Industrial (62.0%) | |||||
| Basic Industry (6.8%) | |||||
| Agrium Inc. | 3.150% | 10/1/22 | 1,905 | 1,891 | |
| Agrium Inc. | 3.500% | 6/1/23 | 3,825 | 3,850 | |
| Air Products & Chemicals Inc. | 3.000% | 11/3/21 | 1,650 | 1,684 | |
| Air Products & Chemicals Inc. | 2.750% | 2/3/23 | 1,400 | 1,373 | |
| Air Products & Chemicals Inc. | 3.350% | 7/31/24 | 1,475 | 1,494 | |
| Airgas Inc. | 2.900% | 11/15/22 | 1,050 | 1,034 | |
| Airgas Inc. | 3.650% | 7/15/24 | 1,750 | 1,786 | |
| Albemarle Corp. | 4.500% | 12/15/20 | 925 | 1,004 | |
| Allegheny Technologies Inc. | 5.950% | 1/15/21 | 2,465 | 2,721 | |
| Allegheny Technologies Inc. | 5.875% | 8/15/23 | 1,100 | 1,215 | |
| Barrick Gold Corp. | 3.850% | 4/1/22 | 6,325 | 6,390 | |
| Barrick Gold Corp. | 4.100% | 5/1/23 | 5,150 | 5,224 | |
| Barrick North America Finance LLC | 4.400% | 5/30/21 | 6,751 | 7,107 | |
| Barrick PD Australia Finance Pty Ltd. | 4.950% | 1/15/20 | 200 | 223 | |
| BHP Billiton Finance USA Ltd. | 3.250% | 11/21/21 | 5,350 | 5,555 | |
| BHP Billiton Finance USA Ltd. | 2.875% | 2/24/22 | 4,105 | 4,133 | |
| BHP Billiton Finance USA Ltd. | 3.850% | 9/30/23 | 3,525 | 3,758 | |
| Braskem Finance Ltd. | 6.450% | 2/3/24 | 2,675 | 2,881 | |
| Cabot Corp. | 3.700% | 7/15/22 | 1,000 | 1,017 | |
| Carpenter Technology Corp. | 5.200% | 7/15/21 | 200 | 218 | |
| Carpenter Technology Corp. | 4.450% | 3/1/23 | 1,500 | 1,558 | |
| Celulosa Arauco y Constitucion SA | 4.750% | 1/11/22 | 2,325 | 2,412 | |
| 2 | Celulosa Arauco y Constitucion SA | 4.500% | 8/1/24 | 2,600 | 2,590 |
| CF Industries Inc. | 7.125% | 5/1/20 | 3,990 | 4,868 | |
| CF Industries Inc. | 3.450% | 6/1/23 | 1,900 | 1,898 | |
| Cliffs Natural Resources Inc. | 5.900% | 3/15/20 | 1,775 | 1,781 | |
| Cliffs Natural Resources Inc. | 4.800% | 10/1/20 | 1,000 | 951 | |
| Cliffs Natural Resources Inc. | 4.875% | 4/1/21 | 2,150 | 2,043 | |
| Cytec Industries Inc. | 3.500% | 4/1/23 | 725 | 716 | |
| Dow Chemical Co. | 4.250% | 11/15/20 | 4,300 | 4,670 | |
| Dow Chemical Co. | 4.125% | 11/15/21 | 4,448 | 4,766 | |
| 120 | |||||
| Intermediate-Term Corporate Bond Index Fund | ||||
| Face | Market | |||
| Maturity | Amount | Value• | ||
| Coupon | Date | ($000) | ($000) | |
| Dow Chemical Co. | 3.000% | 11/15/22 | 6,818 | 6,719 |
| Eastman Chemical Co. | 5.500% | 11/15/19 | 2,196 | 2,510 |
| Eastman Chemical Co. | 4.500% | 1/15/21 | 500 | 542 |
| Eastman Chemical Co. | 3.600% | 8/15/22 | 2,600 | 2,674 |
| Ecolab Inc. | 4.350% | 12/8/21 | 4,625 | 5,076 |
| EI du Pont de Nemours & Co. | 4.625% | 1/15/20 | 3,575 | 4,001 |
| EI du Pont de Nemours & Co. | 3.625% | 1/15/21 | 3,325 | 3,559 |
| EI du Pont de Nemours & Co. | 4.250% | 4/1/21 | 950 | 1,051 |
| EI du Pont de Nemours & Co. | 2.800% | 2/15/23 | 4,400 | 4,340 |
| FMC Corp. | 3.950% | 2/1/22 | 2,350 | 2,466 |
| FMC Corp. | 4.100% | 2/1/24 | 1,650 | 1,735 |
| Freeport-McMoRan Copper & Gold Inc. | 3.100% | 3/15/20 | 4,067 | 4,120 |
| Freeport-McMoRan Copper & Gold Inc. | 3.550% | 3/1/22 | 9,425 | 9,466 |
| Freeport-McMoRan Copper & Gold Inc. | 3.875% | 3/15/23 | 7,605 | 7,717 |
| Georgia-Pacific LLC | 8.000% | 1/15/24 | 2,080 | 2,833 |
| Goldcorp Inc. | 3.625% | 6/9/21 | 2,000 | 2,054 |
| Goldcorp Inc. | 3.700% | 3/15/23 | 4,200 | 4,220 |
| International Paper Co. | 7.500% | 8/15/21 | 3,140 | 4,006 |
| International Paper Co. | 4.750% | 2/15/22 | 2,550 | 2,818 |
| International Paper Co. | 3.650% | 6/15/24 | 3,000 | 3,004 |
| Kinross Gold Corp. | 5.125% | 9/1/21 | 2,450 | 2,555 |
| 2 Kinross Gold Corp. | 5.950% | 3/15/24 | 1,300 | 1,355 |
| LYB International Finance BV | 4.000% | 7/15/23 | 3,000 | 3,174 |
| LyondellBasell Industries NV | 6.000% | 11/15/21 | 4,975 | 5,908 |
| LyondellBasell Industries NV | 5.750% | 4/15/24 | 2,525 | 2,986 |
| MeadWestvaco Corp. | 7.375% | 9/1/19 | 750 | 910 |
| Methanex Corp. | 3.250% | 12/15/19 | 1,025 | 1,050 |
| Monsanto Co. | 2.750% | 7/15/21 | 4,000 | 4,019 |
| Monsanto Co. | 3.375% | 7/15/24 | 2,500 | 2,549 |
| Mosaic Co. | 3.750% | 11/15/21 | 1,925 | 2,017 |
| Mosaic Co. | 4.250% | 11/15/23 | 3,250 | 3,455 |
| NewMarket Corp. | 4.100% | 12/15/22 | 1,050 | 1,065 |
| Newmont Mining Corp. | 5.125% | 10/1/19 | 2,806 | 3,115 |
| Newmont Mining Corp. | 3.500% | 3/15/22 | 5,757 | 5,658 |
| Nucor Corp. | 4.125% | 9/15/22 | 2,630 | 2,816 |
| Nucor Corp. | 4.000% | 8/1/23 | 975 | 1,021 |
| Packaging Corp. of America | 3.900% | 6/15/22 | 1,175 | 1,227 |
| Packaging Corp. of America | 4.500% | 11/1/23 | 3,805 | 4,106 |
| Plains Exploration & Production Co. | 6.500% | 11/15/20 | 5,138 | 5,690 |
| Plains Exploration & Production Co. | 6.625% | 5/1/21 | 1,298 | 1,438 |
| Plains Exploration & Production Co. | 6.750% | 2/1/22 | 3,464 | 3,932 |
| Plains Exploration & Production Co. | 6.875% | 2/15/23 | 2,759 | 3,204 |
| Plum Creek Timberlands LP | 4.700% | 3/15/21 | 1,750 | 1,919 |
| Potash Corp. of Saskatchewan Inc. | 4.875% | 3/30/20 | 3,475 | 3,932 |
| Potash Corp. of Saskatchewan Inc. | 3.625% | 3/15/24 | 2,575 | 2,670 |
| PPG Industries Inc. | 3.600% | 11/15/20 | 3,445 | 3,643 |
| Praxair Inc. | 4.050% | 3/15/21 | 1,775 | 1,937 |
| Praxair Inc. | 3.000% | 9/1/21 | 3,000 | 3,093 |
| Praxair Inc. | 2.450% | 2/15/22 | 3,400 | 3,347 |
| Praxair Inc. | 2.200% | 8/15/22 | 718 | 685 |
| Rayonier Inc. | 3.750% | 4/1/22 | 725 | 739 |
| Reliance Steel & Aluminum Co. | 4.500% | 4/15/23 | 1,675 | 1,743 |
| Rio Tinto Finance USA Ltd. | 3.500% | 11/2/20 | 4,925 | 5,176 |
| Rio Tinto Finance USA Ltd. | 4.125% | 5/20/21 | 3,379 | 3,676 |
| Rio Tinto Finance USA Ltd. | 3.750% | 9/20/21 | 4,750 | 5,054 |
121
| Intermediate-Term Corporate Bond Index Fund | |||||
| Face | Market | ||||
| Maturity | Amount | Value• | |||
| Coupon | Date | ($000) | ($000) | ||
| Rio Tinto Finance USA plc | 3.500% | 3/22/22 | 3,100 | 3,240 | |
| Rio Tinto Finance USA plc | 2.875% | 8/21/22 | 3,081 | 3,055 | |
| Rock-Tenn Co. | 3.500% | 3/1/20 | 1,350 | 1,402 | |
| Rock-Tenn Co. | 4.900% | 3/1/22 | 2,000 | 2,181 | |
| Rock-Tenn Co. | 4.000% | 3/1/23 | 2,120 | 2,198 | |
| RPM International Inc. | 6.125% | 10/15/19 | 750 | 865 | |
| RPM International Inc. | 3.450% | 11/15/22 | 1,775 | 1,750 | |
| Sigma-Aldrich Corp. | 3.375% | 11/1/20 | 240 | 251 | |
| Southern Copper Corp. | 5.375% | 4/16/20 | 1,050 | 1,168 | |
| Southern Copper Corp. | 3.500% | 11/8/22 | 950 | 942 | |
| Syngenta Finance NV | 3.125% | 3/28/22 | 1,700 | 1,734 | |
| Teck Resources Ltd. | 4.500% | 1/15/21 | 3,100 | 3,280 | |
| Teck Resources Ltd. | 4.750% | 1/15/22 | 1,275 | 1,356 | |
| Teck Resources Ltd. | 3.750% | 2/1/23 | 2,350 | 2,316 | |
| Vale Overseas Ltd. | 5.625% | 9/15/19 | 5,175 | 5,836 | |
| Vale Overseas Ltd. | 4.625% | 9/15/20 | 3,225 | 3,447 | |
| Vale Overseas Ltd. | 4.375% | 1/11/22 | 8,065 | 8,427 | |
| Valspar Corp. | 4.200% | 1/15/22 | 1,875 | 2,001 | |
| Westlake Chemical Corp. | 3.600% | 7/15/22 | 200 | 202 | |
| Weyerhaeuser Co. | 7.375% | 10/1/19 | 1,875 | 2,294 | |
| Weyerhaeuser Co. | 4.625% | 9/15/23 | 1,000 | 1,089 | |
| 2 | Yamana Gold Inc. | 4.950% | 7/15/24 | 1,735 | 1,768 |
| Capital Goods (5.3%) | |||||
| 3M Co. | 2.000% | 6/26/22 | 1,475 | 1,430 | |
| ABB Finance USA Inc. | 2.875% | 5/8/22 | 3,975 | 3,973 | |
| Acuity Brands Lighting Inc. | 6.000% | 12/15/19 | 1,125 | 1,269 | |
| Avery Dennison Corp. | 3.350% | 4/15/23 | 1,500 | 1,474 | |
| Bemis Co. Inc. | 4.500% | 10/15/21 | 2,625 | 2,857 | |
| Boeing Capital Corp. | 4.700% | 10/27/19 | 2,160 | 2,422 | |
| Boeing Co. | 4.875% | 2/15/20 | 3,800 | 4,317 | |
| Boeing Co. | 8.750% | 8/15/21 | 300 | 413 | |
| Boeing Co. | 7.950% | 8/15/24 | 1,115 | 1,569 | |
| Carlisle Cos. Inc. | 3.750% | 11/15/22 | 1,725 | 1,756 | |
| Caterpillar Financial Services Corp. | 2.850% | 6/1/22 | 1,800 | 1,807 | |
| Caterpillar Financial Services Corp. | 2.625% | 3/1/23 | 1,000 | 976 | |
| Caterpillar Financial Services Corp. | 3.750% | 11/24/23 | 2,200 | 2,315 | |
| Caterpillar Financial Services Corp. | 3.300% | 6/9/24 | 2,000 | 2,026 | |
| Caterpillar Inc. | 3.900% | 5/27/21 | 2,178 | 2,358 | |
| Caterpillar Inc. | 2.600% | 6/26/22 | 3,400 | 3,364 | |
| Caterpillar Inc. | 3.400% | 5/15/24 | 4,450 | 4,541 | |
| Cooper US Inc. | 3.875% | 12/15/20 | 100 | 106 | |
| Crane Co. | 4.450% | 12/15/23 | 2,100 | 2,246 | |
| CRH America Inc. | 5.750% | 1/15/21 | 1,884 | 2,196 | |
| Danaher Corp. | 3.900% | 6/23/21 | 2,650 | 2,887 | |
| Deere & Co. | 4.375% | 10/16/19 | 2,075 | 2,309 | |
| Deere & Co. | 2.600% | 6/8/22 | 3,650 | 3,601 | |
| Dover Corp. | 4.300% | 3/1/21 | 2,250 | 2,484 | |
| Eaton Corp. | 2.750% | 11/2/22 | 7,575 | 7,410 | |
| 2 | Embraer Overseas Ltd. | 5.696% | 9/16/23 | 3,861 | 4,144 |
| Embraer SA | 5.150% | 6/15/22 | 1,300 | 1,393 | |
| Emerson Electric Co. | 4.875% | 10/15/19 | 1,815 | 2,053 | |
| Emerson Electric Co. | 4.250% | 11/15/20 | 1,075 | 1,176 | |
| Emerson Electric Co. | 2.625% | 2/15/23 | 2,650 | 2,625 | |
| Exelis Inc. | 5.550% | 10/1/21 | 1,200 | 1,311 | |
| 122 | |||||
| Intermediate-Term Corporate Bond Index Fund | ||||
| Face | Market | |||
| Maturity | Amount | Value• | ||
| Coupon | Date | ($000) | ($000) | |
| Flowserve Corp. | 3.500% | 9/15/22 | 1,525 | 1,524 |
| Flowserve Corp. | 4.000% | 11/15/23 | 1,075 | 1,116 |
| General Dynamics Corp. | 3.875% | 7/15/21 | 1,800 | 1,951 |
| General Dynamics Corp. | 2.250% | 11/15/22 | 3,700 | 3,525 |
| General Electric Co. | 2.700% | 10/9/22 | 12,325 | 12,172 |
| General Electric Co. | 3.375% | 3/11/24 | 3,000 | 3,082 |
| Honeywell International Inc. | 4.250% | 3/1/21 | 3,867 | 4,314 |
| Honeywell International Inc. | 3.350% | 12/1/23 | 1,900 | 1,967 |
| IDEX Corp. | 4.200% | 12/15/21 | 600 | 633 |
| Illinois Tool Works Inc. | 3.375% | 9/15/21 | 977 | 1,030 |
| Illinois Tool Works Inc. | 3.500% | 3/1/24 | 2,500 | 2,612 |
| Ingersoll-Rand Global Holding Co. Ltd. | 4.250% | 6/15/23 | 1,800 | 1,922 |
| John Deere Capital Corp. | 1.700% | 1/15/20 | 2,025 | 1,976 |
| John Deere Capital Corp. | 2.800% | 3/4/21 | 3,700 | 3,748 |
| John Deere Capital Corp. | 3.900% | 7/12/21 | 2,700 | 2,929 |
| John Deere Capital Corp. | 3.150% | 10/15/21 | 2,550 | 2,637 |
| John Deere Capital Corp. | 2.750% | 3/15/22 | 1,500 | 1,503 |
| John Deere Capital Corp. | 2.800% | 1/27/23 | 1,000 | 993 |
| John Deere Capital Corp. | 3.350% | 6/12/24 | 800 | 814 |
| Joy Global Inc. | 5.125% | 10/15/21 | 1,450 | 1,612 |
| Kennametal Inc. | 2.650% | 11/1/19 | 2,850 | 2,883 |
| Kennametal Inc. | 3.875% | 2/15/22 | 350 | 357 |
| L-3 Communications Corp. | 5.200% | 10/15/19 | 2,875 | 3,185 |
| L-3 Communications Corp. | 4.750% | 7/15/20 | 3,600 | 3,910 |
| L-3 Communications Corp. | 4.950% | 2/15/21 | 3,500 | 3,822 |
| L-3 Communications Corp. | 3.950% | 5/28/24 | 1,550 | 1,551 |
| Lockheed Martin Corp. | 4.250% | 11/15/19 | 4,550 | 5,000 |
| Lockheed Martin Corp. | 3.350% | 9/15/21 | 4,150 | 4,340 |
| Mohawk Industries Inc. | 3.850% | 2/1/23 | 2,950 | 2,994 |
| Northrop Grumman Corp. | 3.500% | 3/15/21 | 1,225 | 1,283 |
| Northrop Grumman Corp. | 3.250% | 8/1/23 | 3,840 | 3,845 |
| Owens Corning | 4.200% | 12/15/22 | 3,275 | 3,376 |
| Parker Hannifin Corp. | 3.500% | 9/15/22 | 920 | 961 |
| Pentair Finance SA | 2.650% | 12/1/19 | 500 | 500 |
| Pentair Finance SA | 5.000% | 5/15/21 | 2,220 | 2,466 |
| Pentair Finance SA | 3.150% | 9/15/22 | 1,300 | 1,281 |
| Precision Castparts Corp. | 2.500% | 1/15/23 | 2,575 | 2,498 |
| Raytheon Co. | 4.400% | 2/15/20 | 1,325 | 1,465 |
| Raytheon Co. | 3.125% | 10/15/20 | 4,775 | 4,945 |
| Raytheon Co. | 2.500% | 12/15/22 | 3,500 | 3,387 |
| Republic Services Inc. | 5.500% | 9/15/19 | 1,825 | 2,090 |
| Republic Services Inc. | 5.000% | 3/1/20 | 3,442 | 3,864 |
| Republic Services Inc. | 5.250% | 11/15/21 | 3,958 | 4,549 |
| Republic Services Inc. | 3.550% | 6/1/22 | 2,608 | 2,715 |
| Republic Services Inc. | 4.750% | 5/15/23 | 1,670 | 1,867 |
| Rockwell Collins Inc. | 3.100% | 11/15/21 | 1,359 | 1,386 |
| Rockwell Collins Inc. | 3.700% | 12/15/23 | 900 | 945 |
| Roper Industries Inc. | 6.250% | 9/1/19 | 1,100 | 1,291 |
| Roper Industries Inc. | 3.125% | 11/15/22 | 2,247 | 2,225 |
| Snap-on Inc. | 6.125% | 9/1/21 | 1,410 | 1,657 |
| Sonoco Products Co. | 4.375% | 11/1/21 | 775 | 830 |
| Stanley Black & Decker Inc. | 3.400% | 12/1/21 | 1,275 | 1,331 |
| Stanley Black & Decker Inc. | 2.900% | 11/1/22 | 2,500 | 2,480 |
| Textron Inc. | 7.250% | 10/1/19 | 1,320 | 1,591 |
| Textron Inc. | 3.650% | 3/1/21 | 1,000 | 1,032 |
123
| Intermediate-Term Corporate Bond Index Fund | ||||
| Face | Market | |||
| Maturity | Amount | Value• | ||
| Coupon | Date | ($000) | ($000) | |
| Textron Inc. | 4.300% | 3/1/24 | 1,500 | 1,577 |
| Tyco International Finance SA / | ||||
| Tyco International Ltd. | 6.875% | 1/15/21 | 1,700 | 2,070 |
| United Technologies Corp. | 4.500% | 4/15/20 | 6,490 | 7,219 |
| United Technologies Corp. | 3.100% | 6/1/22 | 9,204 | 9,386 |
| Valmont Industries Inc. | 6.625% | 4/20/20 | 1,000 | 1,188 |
| Waste Management Inc. | 4.750% | 6/30/20 | 4,100 | 4,573 |
| Waste Management Inc. | 4.600% | 3/1/21 | 780 | 868 |
| Waste Management Inc. | 2.900% | 9/15/22 | 1,100 | 1,093 |
| Waste Management Inc. | 3.500% | 5/15/24 | 1,750 | 1,783 |
| Xylem Inc. | 4.875% | 10/1/21 | 1,850 | 2,042 |
| Communication (9.2%) | ||||
| 21st Century Fox America Inc. | 5.650% | 8/15/20 | 1,600 | 1,843 |
| 21st Century Fox America Inc. | 4.500% | 2/15/21 | 2,850 | 3,135 |
| 21st Century Fox America Inc. | 3.000% | 9/15/22 | 4,900 | 4,851 |
| 21st Century Fox America Inc. | 4.000% | 10/1/23 | 650 | 683 |
| America Movil SAB de CV | 5.000% | 10/16/19 | 2,625 | 2,953 |
| America Movil SAB de CV | 5.000% | 3/30/20 | 7,031 | 7,851 |
| America Movil SAB de CV | 3.125% | 7/16/22 | 6,862 | 6,858 |
| American Tower Corp. | 5.050% | 9/1/20 | 4,406 | 4,852 |
| American Tower Corp. | 3.450% | 9/15/21 | 1,800 | 1,805 |
| American Tower Corp. | 5.900% | 11/1/21 | 2,374 | 2,727 |
| American Tower Corp. | 4.700% | 3/15/22 | 2,750 | 2,949 |
| American Tower Corp. | 3.500% | 1/31/23 | 5,150 | 5,074 |
| AT&T Inc. | 4.450% | 5/15/21 | 4,305 | 4,771 |
| AT&T Inc. | 3.875% | 8/15/21 | 6,354 | 6,789 |
| AT&T Inc. | 3.000% | 2/15/22 | 5,000 | 5,036 |
| AT&T Inc. | 2.625% | 12/1/22 | 5,875 | 5,697 |
| AT&T Inc. | 3.900% | 3/11/24 | 4,200 | 4,386 |
| CBS Corp. | 5.750% | 4/15/20 | 2,815 | 3,246 |
| CBS Corp. | 4.300% | 2/15/21 | 1,700 | 1,840 |
| CBS Corp. | 3.375% | 3/1/22 | 767 | 778 |
| CC Holdings GS V LLC / Crown Castle GS III Corp. | 3.849% | 4/15/23 | 5,200 | 5,278 |
| Comcast Cable Communications Holdings Inc. | 9.455% | 11/15/22 | 2,888 | 4,201 |
| Comcast Corp. | 5.150% | 3/1/20 | 3,525 | 4,030 |
| Comcast Corp. | 3.125% | 7/15/22 | 3,175 | 3,249 |
| Comcast Corp. | 2.850% | 1/15/23 | 4,250 | 4,252 |
| Comcast Corp. | 3.600% | 3/1/24 | 6,675 | 6,918 |
| DIRECTV Holdings LLC / DIRECTV | ||||
| Financing Co. Inc. | 5.875% | 10/1/19 | 5,243 | 6,095 |
| DIRECTV Holdings LLC / DIRECTV | ||||
| Financing Co. Inc. | 5.200% | 3/15/20 | 4,215 | 4,764 |
| DIRECTV Holdings LLC / DIRECTV | ||||
| Financing Co. Inc. | 4.600% | 2/15/21 | 3,620 | 3,970 |
| DIRECTV Holdings LLC / DIRECTV | ||||
| Financing Co. Inc. | 5.000% | 3/1/21 | 3,450 | 3,867 |
| DIRECTV Holdings LLC / DIRECTV | ||||
| Financing Co. Inc. | 3.800% | 3/15/22 | 6,906 | 7,199 |
| DIRECTV Holdings LLC / DIRECTV | ||||
| Financing Co. Inc. | 4.450% | 4/1/24 | 4,975 | 5,339 |
| Discovery Communications LLC | 5.050% | 6/1/20 | 4,675 | 5,231 |
| Discovery Communications LLC | 4.375% | 6/15/21 | 2,700 | 2,936 |
| Discovery Communications LLC | 3.300% | 5/15/22 | 1,800 | 1,811 |
| Discovery Communications LLC | 3.250% | 4/1/23 | 1,800 | 1,781 |
124
| Intermediate-Term Corporate Bond Index Fund | ||||
| Face | Market | |||
| Maturity | Amount | Value• | ||
| Coupon | Date | ($000) | ($000) | |
| GTE Corp. | 8.750% | 11/1/21 | 1,175 | 1,568 |
| Historic TW Inc. | 9.150% | 2/1/23 | 1,795 | 2,507 |
| Interpublic Group of Cos. Inc. | 3.750% | 2/15/23 | 2,000 | 2,005 |
| Interpublic Group of Cos. Inc. | 4.200% | 4/15/24 | 2,925 | 3,020 |
| Moody’s Corp. | 5.500% | 9/1/20 | 2,100 | 2,388 |
| Moody’s Corp. | 4.500% | 9/1/22 | 1,771 | 1,894 |
| Moody’s Corp. | 4.875% | 2/15/24 | 3,700 | 4,055 |
| NBCUniversal Media LLC | 5.150% | 4/30/20 | 8,115 | 9,297 |
| NBCUniversal Media LLC | 4.375% | 4/1/21 | 5,326 | 5,886 |
| NBCUniversal Media LLC | 2.875% | 1/15/23 | 3,850 | 3,833 |
| Omnicom Group Inc. | 4.450% | 8/15/20 | 2,450 | 2,653 |
| Omnicom Group Inc. | 3.625% | 5/1/22 | 6,550 | 6,736 |
| Orange SA | 4.125% | 9/14/21 | 3,500 | 3,765 |
| Qwest Corp. | 6.750% | 12/1/21 | 4,040 | 4,712 |
| Reed Elsevier Capital Inc. | 3.125% | 10/15/22 | 4,231 | 4,193 |
| Rogers Communications Inc. | 3.000% | 3/15/23 | 1,450 | 1,408 |
| Rogers Communications Inc. | 4.100% | 10/1/23 | 3,175 | 3,321 |
| Telefonica Emisiones SAU | 5.134% | 4/27/20 | 4,582 | 5,104 |
| Telefonica Emisiones SAU | 5.462% | 2/16/21 | 6,145 | 6,975 |
| Telefonica Emisiones SAU | 4.570% | 4/27/23 | 2,625 | 2,814 |
| Telefonos de Mexico SAB de CV | 5.500% | 11/15/19 | 1,250 | 1,431 |
| Thomson Reuters Corp. | 4.700% | 10/15/19 | 2,225 | 2,463 |
| Thomson Reuters Corp. | 3.950% | 9/30/21 | 1,027 | 1,083 |
| Thomson Reuters Corp. | 4.300% | 11/23/23 | 1,800 | 1,906 |
| Time Warner Cable Inc. | 5.000% | 2/1/20 | 6,225 | 6,987 |
| Time Warner Cable Inc. | 4.125% | 2/15/21 | 3,025 | 3,265 |
| Time Warner Cable Inc. | 4.000% | 9/1/21 | 4,016 | 4,303 |
| Time Warner Cos. Inc. | 7.570% | 2/1/24 | 1,220 | 1,582 |
| Time Warner Entertainment Co. LP | 8.375% | 3/15/23 | 2,180 | 2,953 |
| Time Warner Inc. | 4.875% | 3/15/20 | 4,724 | 5,264 |
| Time Warner Inc. | 4.700% | 1/15/21 | 4,050 | 4,480 |
| Time Warner Inc. | 4.750% | 3/29/21 | 2,825 | 3,133 |
| Time Warner Inc. | 4.000% | 1/15/22 | 2,375 | 2,505 |
| Time Warner Inc. | 3.400% | 6/15/22 | 2,401 | 2,438 |
| Time Warner Inc. | 4.050% | 12/15/23 | 1,675 | 1,743 |
| Time Warner Inc. | 3.550% | 6/1/24 | 3,750 | 3,749 |
| 2 Verizon Communications Inc. | 2.625% | 2/21/20 | 11,826 | 11,840 |
| Verizon Communications Inc. | 4.500% | 9/15/20 | 14,405 | 15,804 |
| Verizon Communications Inc. | 3.450% | 3/15/21 | 3,475 | 3,596 |
| Verizon Communications Inc. | 4.600% | 4/1/21 | 5,400 | 5,979 |
| Verizon Communications Inc. | 3.500% | 11/1/21 | 6,468 | 6,716 |
| Verizon Communications Inc. | 2.450% | 11/1/22 | 6,740 | 6,415 |
| Verizon Communications Inc. | 5.150% | 9/15/23 | 39,350 | 44,558 |
| Verizon Communications Inc. | 4.150% | 3/15/24 | 6,525 | 6,886 |
| Viacom Inc. | 5.625% | 9/15/19 | 3,785 | 4,341 |
| Viacom Inc. | 4.500% | 3/1/21 | 1,655 | 1,806 |
| Viacom Inc. | 3.875% | 12/15/21 | 2,800 | 2,953 |
| Viacom Inc. | 3.125% | 6/15/22 | 1,250 | 1,243 |
| Viacom Inc. | 4.250% | 9/1/23 | 3,975 | 4,183 |
| Viacom Inc. | 3.875% | 4/1/24 | 2,200 | 2,246 |
| Vodafone Group plc | 4.375% | 3/16/21 | 2,000 | 2,189 |
| Vodafone Group plc | 2.500% | 9/26/22 | 2,500 | 2,369 |
| Vodafone Group plc | 2.950% | 2/19/23 | 6,188 | 5,979 |
| Walt Disney Co. | 3.750% | 6/1/21 | 1,275 | 1,382 |
| Walt Disney Co. | 2.750% | 8/16/21 | 3,325 | 3,396 |
125
| Intermediate-Term Corporate Bond Index Fund | ||||
| Face | Market | |||
| Maturity | Amount | Value• | ||
| Coupon | Date | ($000) | ($000) | |
| Walt Disney Co. | 2.550% | 2/15/22 | 1,600 | 1,598 |
| Walt Disney Co. | 2.350% | 12/1/22 | 3,350 | 3,258 |
| WPP Finance 2010 | 3.625% | 9/7/22 | 4,175 | 4,290 |
| Consumer Cyclical (6.3%) | ||||
| Advance Auto Parts Inc. | 5.750% | 5/1/20 | 1,200 | 1,371 |
| Advance Auto Parts Inc. | 4.500% | 1/15/22 | 1,600 | 1,707 |
| Advance Auto Parts Inc. | 4.500% | 12/1/23 | 1,200 | 1,273 |
| Amazon.com Inc. | 2.500% | 11/29/22 | 4,350 | 4,167 |
| AutoZone Inc. | 4.000% | 11/15/20 | 1,750 | 1,866 |
| AutoZone Inc. | 3.700% | 4/15/22 | 2,500 | 2,594 |
| AutoZone Inc. | 2.875% | 1/15/23 | 1,425 | 1,384 |
| Bed Bath & Beyond Inc. | 3.749% | 8/1/24 | 1,000 | 1,019 |
| BorgWarner Inc. | 4.625% | 9/15/20 | 75 | 82 |
| Brinker International Inc. | 3.875% | 5/15/23 | 2,500 | 2,466 |
| Carnival Corp. | 3.950% | 10/15/20 | 1,750 | 1,848 |
| Costco Wholesale Corp. | 1.700% | 12/15/19 | 4,375 | 4,322 |
| Cummins Inc. | 3.650% | 10/1/23 | 725 | 762 |
| CVS Health Corp. | 4.750% | 5/18/20 | 2,517 | 2,827 |
| CVS Health Corp. | 4.125% | 5/15/21 | 2,054 | 2,224 |
| CVS Health Corp. | 2.750% | 12/1/22 | 2,425 | 2,372 |
| CVS Health Corp. | 4.000% | 12/5/23 | 5,200 | 5,504 |
| Darden Restaurants Inc. | 3.350% | 11/1/22 | 935 | 887 |
| Delphi Corp. | 6.125% | 5/15/21 | 3,000 | 3,323 |
| Delphi Corp. | 5.000% | 2/15/23 | 2,000 | 2,150 |
| Delphi Corp. | 4.150% | 3/15/24 | 2,750 | 2,866 |
| Dollar General Corp. | 3.250% | 4/15/23 | 3,400 | 3,035 |
| eBay Inc. | 3.250% | 10/15/20 | 1,600 | 1,668 |
| eBay Inc. | 2.875% | 8/1/21 | 2,600 | 2,602 |
| eBay Inc. | 2.600% | 7/15/22 | 3,575 | 3,475 |
| eBay Inc. | 3.450% | 8/1/24 | 3,200 | 3,218 |
| Expedia Inc. | 5.950% | 8/15/20 | 3,800 | 4,306 |
| Family Dollar Stores Inc. | 5.000% | 2/1/21 | 1,065 | 1,116 |
| Ford Motor Credit Co. LLC | 8.125% | 1/15/20 | 4,925 | 6,250 |
| Ford Motor Credit Co. LLC | 5.750% | 2/1/21 | 4,750 | 5,505 |
| Ford Motor Credit Co. LLC | 5.875% | 8/2/21 | 6,777 | 7,933 |
| Ford Motor Credit Co. LLC | 4.250% | 9/20/22 | 5,425 | 5,789 |
| Ford Motor Credit Co. LLC | 4.375% | 8/6/23 | 3,725 | 3,969 |
| Gap Inc. | 5.950% | 4/12/21 | 4,772 | 5,504 |
| Home Depot Inc. | 3.950% | 9/15/20 | 1,000 | 1,096 |
| Home Depot Inc. | 4.400% | 4/1/21 | 3,463 | 3,890 |
| Home Depot Inc. | 2.700% | 4/1/23 | 6,550 | 6,450 |
| Home Depot Inc. | 3.750% | 2/15/24 | 2,875 | 3,041 |
| Host Hotels & Resorts LP | 6.000% | 10/1/21 | 1,500 | 1,742 |
| Host Hotels & Resorts LP | 5.250% | 3/15/22 | 1,647 | 1,832 |
| Host Hotels & Resorts LP | 4.750% | 3/1/23 | 2,884 | 3,093 |
| Host Hotels & Resorts LP | 3.750% | 10/15/23 | 2,700 | 2,710 |
| Hyatt Hotels Corp. | 5.375% | 8/15/21 | 800 | 906 |
| Hyatt Hotels Corp. | 3.375% | 7/15/23 | 975 | 961 |
| International Game Technology | 5.500% | 6/15/20 | 1,250 | 1,328 |
| International Game Technology | 5.350% | 10/15/23 | 1,500 | 1,577 |
| Johnson Controls Inc. | 5.000% | 3/30/20 | 725 | 810 |
| Johnson Controls Inc. | 4.250% | 3/1/21 | 2,434 | 2,628 |
| Johnson Controls Inc. | 3.750% | 12/1/21 | 2,496 | 2,623 |
| Johnson Controls Inc. | 3.625% | 7/2/24 | 1,200 | 1,219 |
126
| Intermediate-Term Corporate Bond Index Fund | ||||
| Face | Market | |||
| Maturity | Amount | Value• | ||
| Coupon | Date | ($000) | ($000) | |
| Kohl’s Corp. | 4.000% | 11/1/21 | 2,170 | 2,290 |
| Kohl’s Corp. | 3.250% | 2/1/23 | 1,975 | 1,936 |
| Lowe’s Cos. Inc. | 4.625% | 4/15/20 | 2,775 | 3,093 |
| Lowe’s Cos. Inc. | 3.800% | 11/15/21 | 3,249 | 3,507 |
| Lowe’s Cos. Inc. | 3.120% | 4/15/22 | 1,200 | 1,232 |
| Lowe’s Cos. Inc. | 3.875% | 9/15/23 | 3,425 | 3,648 |
| Macy’s Retail Holdings Inc. | 3.875% | 1/15/22 | 2,900 | 3,062 |
| Macy’s Retail Holdings Inc. | 2.875% | 2/15/23 | 2,121 | 2,065 |
| Macy’s Retail Holdings Inc. | 4.375% | 9/1/23 | 3,000 | 3,215 |
| Macy’s Retail Holdings Inc. | 3.625% | 6/1/24 | 2,360 | 2,376 |
| Marriott International Inc. | 3.375% | 10/15/20 | 3,200 | 3,324 |
| Marriott International Inc. | 3.250% | 9/15/22 | 400 | 402 |
| MasterCard Inc. | 3.375% | 4/1/24 | 4,575 | 4,670 |
| McDonald’s Corp. | 3.500% | 7/15/20 | 2,575 | 2,751 |
| McDonald’s Corp. | 3.625% | 5/20/21 | 750 | 806 |
| McDonald’s Corp. | 2.625% | 1/15/22 | 2,975 | 2,995 |
| McDonald’s Corp. | 3.250% | 6/10/24 | 1,550 | 1,570 |
| MDC Holdings Inc. | 5.625% | 2/1/20 | 400 | 430 |
| MDC Holdings Inc. | 5.500% | 1/15/24 | 1,100 | 1,130 |
| NIKE Inc. | 2.250% | 5/1/23 | 1,300 | 1,247 |
| Nordstrom Inc. | 4.750% | 5/1/20 | 1,600 | 1,777 |
| Nordstrom Inc. | 4.000% | 10/15/21 | 2,125 | 2,295 |
| NVR Inc. | 3.950% | 9/15/22 | 2,090 | 2,140 |
| O’Reilly Automotive Inc. | 4.875% | 1/14/21 | 1,235 | 1,365 |
| O’Reilly Automotive Inc. | 4.625% | 9/15/21 | 875 | 962 |
| O’Reilly Automotive Inc. | 3.800% | 9/1/22 | 1,200 | 1,249 |
| O’Reilly Automotive Inc. | 3.850% | 6/15/23 | 1,950 | 2,019 |
| QVC Inc. | 5.125% | 7/2/22 | 1,825 | 1,944 |
| QVC Inc. | 4.375% | 3/15/23 | 2,700 | 2,737 |
| QVC Inc. | 4.850% | 4/1/24 | 1,575 | 1,633 |
| Signet UK Finance plc | 4.700% | 6/15/24 | 1,300 | 1,335 |
| Staples Inc. | 4.375% | 1/12/23 | 1,625 | 1,627 |
| Starbucks Corp. | 3.850% | 10/1/23 | 4,150 | 4,410 |
| Starwood Hotels & Resorts Worldwide Inc. | 3.125% | 2/15/23 | 1,000 | 968 |
| Target Corp. | 3.875% | 7/15/20 | 2,500 | 2,697 |
| Target Corp. | 2.900% | 1/15/22 | 3,900 | 3,933 |
| Target Corp. | 3.500% | 7/1/24 | 4,150 | 4,239 |
| TJX Cos. Inc. | 2.750% | 6/15/21 | 1,975 | 1,989 |
| TJX Cos. Inc. | 2.500% | 5/15/23 | 2,625 | 2,536 |
| Toyota Motor Credit Corp. | 4.500% | 6/17/20 | 3,050 | 3,392 |
| Toyota Motor Credit Corp. | 4.250% | 1/11/21 | 1,875 | 2,066 |
| Toyota Motor Credit Corp. | 2.750% | 5/17/21 | 1,500 | 1,520 |
| Toyota Motor Credit Corp. | 3.400% | 9/15/21 | 4,200 | 4,394 |
| Toyota Motor Credit Corp. | 3.300% | 1/12/22 | 2,875 | 2,987 |
| Toyota Motor Credit Corp. | 2.625% | 1/10/23 | 1,354 | 1,330 |
| VF Corp. | 3.500% | 9/1/21 | 2,000 | 2,113 |
| Wal-Mart Stores Inc. | 3.625% | 7/8/20 | 4,808 | 5,165 |
| Wal-Mart Stores Inc. | 3.250% | 10/25/20 | 7,008 | 7,378 |
| Wal-Mart Stores Inc. | 4.250% | 4/15/21 | 2,400 | 2,674 |
| Wal-Mart Stores Inc. | 2.550% | 4/11/23 | 8,300 | 8,115 |
| Wal-Mart Stores Inc. | 3.300% | 4/22/24 | 5,050 | 5,170 |
| Walgreen Co. | 3.100% | 9/15/22 | 4,900 | 4,841 |
| Western Union Co. | 5.253% | 4/1/20 | 1,175 | 1,290 |
| Wyndham Worldwide Corp. | 4.250% | 3/1/22 | 1,375 | 1,417 |
| Wyndham Worldwide Corp. | 3.900% | 3/1/23 | 3,750 | 3,765 |
127
| Intermediate-Term Corporate Bond Index Fund | |||||
| Face | Market | ||||
| Maturity | Amount | Value• | |||
| Coupon | Date | ($000) | ($000) | ||
| Yum! Brands Inc. | 5.300% | 9/15/19 | 900 | 1,001 | |
| Yum! Brands Inc. | 3.875% | 11/1/20 | 1,850 | 1,954 | |
| Consumer Noncyclical (14.0%) | |||||
| Abbott Laboratories | 4.125% | 5/27/20 | 1,910 | 2,106 | |
| AbbVie Inc. | 2.900% | 11/6/22 | 10,354 | 10,188 | |
| 2 | Actavis Funding SCS | 3.850% | 6/15/24 | 5,225 | 5,296 |
| Actavis Inc. | 3.250% | 10/1/22 | 4,950 | 4,924 | |
| Allergan Inc. | 3.375% | 9/15/20 | 1,675 | 1,692 | |
| Allergan Inc. | 2.800% | 3/15/23 | 1,850 | 1,721 | |
| Altria Group Inc. | 4.750% | 5/5/21 | 6,474 | 7,219 | |
| Altria Group Inc. | 2.850% | 8/9/22 | 2,225 | 2,175 | |
| Altria Group Inc. | 2.950% | 5/2/23 | 3,650 | 3,524 | |
| Altria Group Inc. | 4.000% | 1/31/24 | 6,850 | 7,125 | |
| AmerisourceBergen Corp. | 4.875% | 11/15/19 | 1,970 | 2,213 | |
| AmerisourceBergen Corp. | 3.500% | 11/15/21 | 2,000 | 2,089 | |
| AmerisourceBergen Corp. | 3.400% | 5/15/24 | 1,700 | 1,711 | |
| Amgen Inc. | 4.500% | 3/15/20 | 1,100 | 1,215 | |
| Amgen Inc. | 3.450% | 10/1/20 | 3,392 | 3,543 | |
| Amgen Inc. | 4.100% | 6/15/21 | 3,375 | 3,643 | |
| Amgen Inc. | 3.875% | 11/15/21 | 6,700 | 7,138 | |
| Amgen Inc. | 3.625% | 5/15/22 | 2,025 | 2,112 | |
| Amgen Inc. | 3.625% | 5/22/24 | 6,550 | 6,658 | |
| Anheuser-Busch InBev Finance Inc. | 2.625% | 1/17/23 | 4,597 | 4,503 | |
| Anheuser-Busch InBev Finance Inc. | 3.700% | 2/1/24 | 6,650 | 6,983 | |
| Anheuser-Busch InBev Worldwide Inc. | 6.875% | 11/15/19 | 3,647 | 4,480 | |
| Anheuser-Busch InBev Worldwide Inc. | 5.375% | 1/15/20 | 8,850 | 10,210 | |
| Anheuser-Busch InBev Worldwide Inc. | 5.000% | 4/15/20 | 4,575 | 5,196 | |
| Anheuser-Busch InBev Worldwide Inc. | 4.375% | 2/15/21 | 1,950 | 2,166 | |
| Anheuser-Busch InBev Worldwide Inc. | 2.500% | 7/15/22 | 9,513 | 9,304 | |
| Archer-Daniels-Midland Co. | 4.479% | 3/1/21 | 2,925 | 3,254 | |
| AstraZeneca plc | 1.950% | 9/18/19 | 3,717 | 3,700 | |
| Avon Products Inc. | 4.600% | 3/15/20 | 2,261 | 2,321 | |
| Avon Products Inc. | 5.000% | 3/15/23 | 3,411 | 3,422 | |
| Baxter International Inc. | 4.250% | 3/15/20 | 1,525 | 1,678 | |
| Baxter International Inc. | 2.400% | 8/15/22 | 2,700 | 2,604 | |
| Baxter International Inc. | 3.200% | 6/15/23 | 3,575 | 3,585 | |
| Beam Suntory Inc. | 3.250% | 5/15/22 | 475 | 476 | |
| Beam Suntory Inc. | 3.250% | 6/15/23 | 1,050 | 1,051 | |
| Becton Dickinson & Co. | 3.250% | 11/12/20 | 3,460 | 3,622 | |
| Becton Dickinson & Co. | 3.125% | 11/8/21 | 4,750 | 4,921 | |
| Boston Scientific Corp. | 6.000% | 1/15/20 | 2,839 | 3,287 | |
| Boston Scientific Corp. | 4.125% | 10/1/23 | 1,875 | 1,960 | |
| Bristol-Myers Squibb Co. | 2.000% | 8/1/22 | 2,000 | 1,888 | |
| Bristol-Myers Squibb Co. | 7.150% | 6/15/23 | 900 | 1,182 | |
| Bristol-Myers Squibb Co. | 3.250% | 11/1/23 | 2,150 | 2,184 | |
| Brown-Forman Corp. | 2.250% | 1/15/23 | 1,400 | 1,329 | |
| Campbell Soup Co. | 4.250% | 4/15/21 | 1,600 | 1,739 | |
| Campbell Soup Co. | 2.500% | 8/2/22 | 1,675 | 1,590 | |
| Cardinal Health Inc. | 4.625% | 12/15/20 | 1,425 | 1,579 | |
| Cardinal Health Inc. | 3.200% | 6/15/22 | 1,200 | 1,206 | |
| Cardinal Health Inc. | 3.200% | 3/15/23 | 3,025 | 3,000 | |
| CareFusion Corp. | 3.300% | 3/1/23 | 2,150 | 2,121 | |
| Catholic Health Initiatives Colorado GO | 2.950% | 11/1/22 | 1,800 | 1,771 | |
| Celgene Corp. | 3.950% | 10/15/20 | 1,645 | 1,750 | |
| 128 | |||||
| Intermediate-Term Corporate Bond Index Fund | ||||
| Face | Market | |||
| Maturity | Amount | Value• | ||
| Coupon | Date | ($000) | ($000) | |
| Celgene Corp. | 3.250% | 8/15/22 | 5,220 | 5,296 |
| Celgene Corp. | 4.000% | 8/15/23 | 2,400 | 2,530 |
| Celgene Corp. | 3.625% | 5/15/24 | 3,150 | 3,210 |
| Church & Dwight Co. Inc. | 2.875% | 10/1/22 | 900 | 884 |
| Clorox Co. | 3.800% | 11/15/21 | 1,358 | 1,438 |
| Clorox Co. | 3.050% | 9/15/22 | 1,600 | 1,603 |
| Coca-Cola Co. | 2.450% | 11/1/20 | 2,800 | 2,830 |
| Coca-Cola Co. | 3.150% | 11/15/20 | 4,609 | 4,839 |
| Coca-Cola Co. | 3.300% | 9/1/21 | 3,975 | 4,187 |
| Coca-Cola Co. | 2.500% | 4/1/23 | 3,575 | 3,482 |
| Coca-Cola Co. | 3.200% | 11/1/23 | 6,275 | 6,398 |
| Coca-Cola Enterprises Inc. | 3.500% | 9/15/20 | 2,950 | 3,065 |
| Coca-Cola Enterprises Inc. | 3.250% | 8/19/21 | 425 | 438 |
| Coca-Cola Femsa SAB de CV | 4.625% | 2/15/20 | 1,875 | 2,056 |
| Coca-Cola Femsa SAB de CV | 3.875% | 11/26/23 | 4,500 | 4,689 |
| Coca-Cola Refreshments USA Inc. | 8.500% | 2/1/22 | 975 | 1,336 |
| Colgate-Palmolive Co. | 2.450% | 11/15/21 | 2,075 | 2,084 |
| Colgate-Palmolive Co. | 2.300% | 5/3/22 | 1,300 | 1,277 |
| Colgate-Palmolive Co. | 1.950% | 2/1/23 | 900 | 845 |
| Colgate-Palmolive Co. | 2.100% | 5/1/23 | 250 | 237 |
| Colgate-Palmolive Co. | 3.250% | 3/15/24 | 1,200 | 1,231 |
| ConAgra Foods Inc. | 3.250% | 9/15/22 | 1,925 | 1,912 |
| ConAgra Foods Inc. | 3.200% | 1/25/23 | 3,473 | 3,417 |
| Covidien International Finance SA | 4.200% | 6/15/20 | 1,875 | 2,051 |
| Covidien International Finance SA | 3.200% | 6/15/22 | 2,275 | 2,317 |
| Covidien International Finance SA | 2.950% | 6/15/23 | 4,175 | 4,113 |
| CR Bard Inc. | 4.400% | 1/15/21 | 2,445 | 2,680 |
| DENTSPLY International Inc. | 4.125% | 8/15/21 | 1,280 | 1,362 |
| Diageo Capital plc | 4.828% | 7/15/20 | 2,885 | 3,251 |
| Diageo Capital plc | 2.625% | 4/29/23 | 5,075 | 4,941 |
| Diageo Investment Corp. | 2.875% | 5/11/22 | 3,800 | 3,808 |
| Dignity Health California GO | 3.125% | 11/1/22 | 800 | 767 |
| Dr Pepper Snapple Group Inc. | 2.000% | 1/15/20 | 1,175 | 1,150 |
| Dr Pepper Snapple Group Inc. | 3.200% | 11/15/21 | 1,475 | 1,513 |
| Dr Pepper Snapple Group Inc. | 2.700% | 11/15/22 | 200 | 194 |
| Energizer Holdings Inc. | 4.700% | 5/19/21 | 1,725 | 1,792 |
| Energizer Holdings Inc. | 4.700% | 5/24/22 | 2,200 | 2,289 |
| Express Scripts Holding Co. | 4.750% | 11/15/21 | 2,650 | 2,948 |
| Express Scripts Holding Co. | 3.900% | 2/15/22 | 3,925 | 4,140 |
| Express Scripts Holding Co. | 3.500% | 6/15/24 | 2,600 | 2,612 |
| Flowers Foods Inc. | 4.375% | 4/1/22 | 1,350 | 1,439 |
| Fomento Economico Mexicano SAB de CV | 2.875% | 5/10/23 | 800 | 762 |
| General Mills Inc. | 3.150% | 12/15/21 | 4,175 | 4,309 |
| General Mills Inc. | 3.650% | 2/15/24 | 2,411 | 2,500 |
| Gilead Sciences Inc. | 4.500% | 4/1/21 | 3,625 | 4,033 |
| Gilead Sciences Inc. | 4.400% | 12/1/21 | 5,300 | 5,869 |
| Gilead Sciences Inc. | 3.700% | 4/1/24 | 7,475 | 7,792 |
| GlaxoSmithKline Capital Inc. | 2.800% | 3/18/23 | 4,125 | 4,047 |
| GlaxoSmithKline Capital plc | 2.850% | 5/8/22 | 8,625 | 8,576 |
| Hasbro Inc. | 3.150% | 5/15/21 | 1,125 | 1,140 |
| Hershey Co. | 4.125% | 12/1/20 | 2,325 | 2,559 |
| Hillshire Brands Co. | 4.100% | 9/15/20 | 54 | 56 |
| Hormel Foods Corp. | 4.125% | 4/15/21 | 100 | 110 |
| Ingredion Inc. | 4.625% | 11/1/20 | 375 | 406 |
| International Flavors & Fragrances Inc. | 3.200% | 5/1/23 | 975 | 964 |
129
| Intermediate-Term Corporate Bond Index Fund | ||||
| Face | Market | |||
| Maturity | Amount | Value• | ||
| Coupon | Date | ($000) | ($000) | |
| JM Smucker Co. | 3.500% | 10/15/21 | 2,200 | 2,295 |
| Johnson & Johnson | 3.550% | 5/15/21 | 4,250 | 4,616 |
| Johnson & Johnson | 6.730% | 11/15/23 | 50 | 65 |
| Johnson & Johnson | 3.375% | 12/5/23 | 2,050 | 2,159 |
| Kaiser Foundation Hospitals | 3.500% | 4/1/22 | 675 | 686 |
| Kellogg Co. | 4.150% | 11/15/19 | 800 | 874 |
| Kellogg Co. | 4.000% | 12/15/20 | 3,525 | 3,805 |
| Kellogg Co. | 3.125% | 5/17/22 | 800 | 818 |
| Kimberly-Clark Corp. | 3.625% | 8/1/20 | 300 | 321 |
| Kimberly-Clark Corp. | 3.875% | 3/1/21 | 1,075 | 1,172 |
| Kimberly-Clark Corp. | 2.400% | 3/1/22 | 1,200 | 1,184 |
| Kimberly-Clark Corp. | 2.400% | 6/1/23 | 2,275 | 2,182 |
| Koninklijke Philips NV | 3.750% | 3/15/22 | 4,662 | 4,934 |
| Kraft Foods Group Inc. | 5.375% | 2/10/20 | 3,179 | 3,613 |
| Kraft Foods Group Inc. | 3.500% | 6/6/22 | 7,577 | 7,788 |
| Kroger Co. | 6.150% | 1/15/20 | 1,989 | 2,327 |
| Kroger Co. | 3.300% | 1/15/21 | 2,525 | 2,598 |
| Kroger Co. | 3.400% | 4/15/22 | 1,168 | 1,191 |
| Kroger Co. | 3.850% | 8/1/23 | 2,650 | 2,749 |
| Kroger Co. | 4.000% | 2/1/24 | 2,925 | 3,060 |
| Laboratory Corp. of America Holdings | 4.625% | 11/15/20 | 1,350 | 1,464 |
| Laboratory Corp. of America Holdings | 3.750% | 8/23/22 | 950 | 969 |
| Laboratory Corp. of America Holdings | 4.000% | 11/1/23 | 1,300 | 1,349 |
| Life Technologies Corp. | 6.000% | 3/1/20 | 3,275 | 3,821 |
| Life Technologies Corp. | 5.000% | 1/15/21 | 2,083 | 2,339 |
| Lorillard Tobacco Co. | 6.875% | 5/1/20 | 3,100 | 3,680 |
| Lorillard Tobacco Co. | 3.750% | 5/20/23 | 3,225 | 3,208 |
| Mattel Inc. | 3.150% | 3/15/23 | 1,350 | 1,340 |
| McCormick & Co. Inc. | 3.900% | 7/15/21 | 275 | 299 |
| McCormick & Co. Inc. | 3.500% | 9/1/23 | 1,200 | 1,264 |
| McKesson Corp. | 4.750% | 3/1/21 | 1,800 | 2,023 |
| McKesson Corp. | 2.700% | 12/15/22 | 1,325 | 1,282 |
| McKesson Corp. | 2.850% | 3/15/23 | 1,250 | 1,218 |
| McKesson Corp. | 3.796% | 3/15/24 | 3,500 | 3,602 |
| Mead Johnson Nutrition Co. | 4.900% | 11/1/19 | 1,850 | 2,060 |
| Medco Health Solutions Inc. | 4.125% | 9/15/20 | 4,150 | 4,469 |
| Medtronic Inc. | 4.450% | 3/15/20 | 3,925 | 4,382 |
| Medtronic Inc. | 3.125% | 3/15/22 | 3,800 | 3,867 |
| Medtronic Inc. | 2.750% | 4/1/23 | 4,925 | 4,839 |
| Medtronic Inc. | 3.625% | 3/15/24 | 2,800 | 2,903 |
| Merck & Co. Inc. | 3.875% | 1/15/21 | 6,136 | 6,651 |
| Merck & Co. Inc. | 2.400% | 9/15/22 | 3,200 | 3,115 |
| Merck & Co. Inc. | 2.800% | 5/18/23 | 5,575 | 5,544 |
| Molson Coors Brewing Co. | 3.500% | 5/1/22 | 1,375 | 1,417 |
| Mondelez International Inc. | 5.375% | 2/10/20 | 6,301 | 7,212 |
| Mondelez International Inc. | 4.000% | 2/1/24 | 6,000 | 6,311 |
| Mylan Inc. | 4.200% | 11/29/23 | 3,050 | 3,192 |
| Newell Rubbermaid Inc. | 4.700% | 8/15/20 | 1,350 | 1,466 |
| Newell Rubbermaid Inc. | 4.000% | 6/15/22 | 1,125 | 1,182 |
| Novartis Capital Corp. | 4.400% | 4/24/20 | 5,625 | 6,274 |
| Novartis Capital Corp. | 2.400% | 9/21/22 | 5,410 | 5,273 |
| Novartis Capital Corp. | 3.400% | 5/6/24 | 4,825 | 4,968 |
| Partners Healthcare System Massachusetts GO | 3.443% | 7/1/21 | 225 | 235 |
| PepsiCo Inc. | 4.500% | 1/15/20 | 5,900 | 6,592 |
| PepsiCo Inc. | 3.125% | 11/1/20 | 1,945 | 2,035 |
130
| Intermediate-Term Corporate Bond Index Fund | ||||
| Face | Market | |||
| Maturity | Amount | Value• | ||
| Coupon | Date | ($000) | ($000) | |
| PepsiCo Inc. | 3.000% | 8/25/21 | 2,850 | 2,938 |
| PepsiCo Inc. | 2.750% | 3/5/22 | 3,965 | 3,972 |
| PepsiCo Inc. | 2.750% | 3/1/23 | 3,425 | 3,378 |
| PepsiCo Inc. | 3.600% | 3/1/24 | 4,925 | 5,137 |
| PerkinElmer Inc. | 5.000% | 11/15/21 | 3,150 | 3,443 |
| 2 Perrigo Co. plc | 4.000% | 11/15/23 | 2,500 | 2,569 |
| Pfizer Inc. | 3.000% | 6/15/23 | 3,650 | 3,691 |
| Pfizer Inc. | 3.400% | 5/15/24 | 2,500 | 2,551 |
| Philip Morris International Inc. | 4.500% | 3/26/20 | 2,886 | 3,201 |
| Philip Morris International Inc. | 4.125% | 5/17/21 | 2,970 | 3,254 |
| Philip Morris International Inc. | 2.900% | 11/15/21 | 2,350 | 2,392 |
| Philip Morris International Inc. | 2.500% | 8/22/22 | 1,775 | 1,734 |
| Philip Morris International Inc. | 2.625% | 3/6/23 | 2,500 | 2,439 |
| Philip Morris International Inc. | 3.600% | 11/15/23 | 2,175 | 2,259 |
| 1 Procter & Gamble - Esop | 9.360% | 1/1/21 | 1,214 | 1,537 |
| Procter & Gamble Co. | 2.300% | 2/6/22 | 5,555 | 5,486 |
| Procter & Gamble Co. | 3.100% | 8/15/23 | 3,000 | 3,089 |
| Quest Diagnostics Inc. | 4.750% | 1/30/20 | 1,275 | 1,386 |
| Quest Diagnostics Inc. | 4.700% | 4/1/21 | 1,075 | 1,177 |
| Quest Diagnostics Inc. | 4.250% | 4/1/24 | 1,875 | 1,934 |
| Reynolds American Inc. | 3.250% | 11/1/22 | 2,150 | 2,107 |
| Reynolds American Inc. | 4.850% | 9/15/23 | 2,650 | 2,873 |
| Safeway Inc. | 3.950% | 8/15/20 | 2,550 | 2,581 |
| Sanofi | 4.000% | 3/29/21 | 10,800 | 11,787 |
| St. Jude Medical Inc. | 3.250% | 4/15/23 | 4,425 | 4,437 |
| Stryker Corp. | 4.375% | 1/15/20 | 2,375 | 2,626 |
| Stryker Corp. | 3.375% | 5/15/24 | 1,925 | 1,944 |
| Sysco Corp. | 2.600% | 6/12/22 | 1,000 | 991 |
| Teva Pharmaceutical Finance Co. BV | 3.650% | 11/10/21 | 5,475 | 5,670 |
| Teva Pharmaceutical Finance Co. BV | 2.950% | 12/18/22 | 4,860 | 4,709 |
| Teva Pharmaceutical Finance IV BV | 3.650% | 11/10/21 | 400 | 412 |
| Teva Pharmaceutical Finance IV LLC | 2.250% | 3/18/20 | 4,480 | 4,395 |
| Thermo Fisher Scientific Inc. | 4.700% | 5/1/20 | 1,000 | 1,096 |
| Thermo Fisher Scientific Inc. | 4.500% | 3/1/21 | 2,725 | 2,998 |
| Thermo Fisher Scientific Inc. | 3.600% | 8/15/21 | 3,625 | 3,778 |
| Thermo Fisher Scientific Inc. | 3.150% | 1/15/23 | 860 | 856 |
| Thermo Fisher Scientific Inc. | 4.150% | 2/1/24 | 5,175 | 5,458 |
| Tupperware Brands Corp. | 4.750% | 6/1/21 | 2,200 | 2,370 |
| Tyson Foods Inc. | 4.500% | 6/15/22 | 3,825 | 4,134 |
| Tyson Foods Inc. | 3.950% | 8/15/24 | 7,100 | 7,251 |
| Unilever Capital Corp. | 4.250% | 2/10/21 | 4,813 | 5,352 |
| Whirlpool Corp. | 4.850% | 6/15/21 | 1,850 | 2,051 |
| Whirlpool Corp. | 4.700% | 6/1/22 | 348 | 381 |
| Whirlpool Corp. | 3.700% | 3/1/23 | 2,575 | 2,616 |
| Wyeth LLC | 6.450% | 2/1/24 | 3,575 | 4,555 |
| Zimmer Holdings Inc. | 4.625% | 11/30/19 | 1,675 | 1,853 |
| Zimmer Holdings Inc. | 3.375% | 11/30/21 | 2,000 | 2,068 |
| Zoetis Inc. | 3.250% | 2/1/23 | 4,125 | 4,124 |
| Energy (11.3%) | ||||
| Apache Corp. | 3.625% | 2/1/21 | 3,750 | 3,966 |
| Apache Corp. | 3.250% | 4/15/22 | 3,933 | 4,017 |
| Baker Hughes Inc. | 3.200% | 8/15/21 | 1,100 | 1,143 |
| Boardwalk Pipelines LP | 5.750% | 9/15/19 | 1,105 | 1,217 |
| Boardwalk Pipelines LP | 3.375% | 2/1/23 | 1,200 | 1,132 |
131
| Intermediate-Term Corporate Bond Index Fund | |||||
| Face | Market | ||||
| Maturity | Amount | Value• | |||
| Coupon | Date | ($000) | ($000) | ||
| BP Capital Markets plc | 4.500% | 10/1/20 | 4,865 | 5,375 | |
| BP Capital Markets plc | 4.742% | 3/11/21 | 6,795 | 7,622 | |
| BP Capital Markets plc | 3.561% | 11/1/21 | 4,386 | 4,603 | |
| BP Capital Markets plc | 3.245% | 5/6/22 | 5,404 | 5,511 | |
| BP Capital Markets plc | 2.500% | 11/6/22 | 4,025 | 3,882 | |
| BP Capital Markets plc | 2.750% | 5/10/23 | 8,350 | 8,102 | |
| BP Capital Markets plc | 3.994% | 9/26/23 | 2,775 | 2,946 | |
| BP Capital Markets plc | 3.814% | 2/10/24 | 2,400 | 2,511 | |
| Buckeye Partners LP | 4.875% | 2/1/21 | 2,283 | 2,485 | |
| Buckeye Partners LP | 4.150% | 7/1/23 | 2,871 | 2,969 | |
| Cameron International Corp. | 4.500% | 6/1/21 | 350 | 383 | |
| Cameron International Corp. | 3.600% | 4/30/22 | 1,150 | 1,186 | |
| Cameron International Corp. | 4.000% | 12/15/23 | 800 | 844 | |
| Cameron International Corp. | 3.700% | 6/15/24 | 1,300 | 1,334 | |
| Canadian Natural Resources Ltd. | 3.450% | 11/15/21 | 250 | 260 | |
| Canadian Natural Resources Ltd. | 3.800% | 4/15/24 | 2,925 | 3,024 | |
| Cenovus Energy Inc. | 5.700% | 10/15/19 | 5,500 | 6,376 | |
| Cenovus Energy Inc. | 3.000% | 8/15/22 | 2,225 | 2,214 | |
| CenterPoint Energy Resources Corp. | 4.500% | 1/15/21 | 2,550 | 2,832 | |
| Chevron Corp. | 2.427% | 6/24/20 | 2,925 | 2,974 | |
| Chevron Corp. | 2.355% | 12/5/22 | 6,250 | 6,090 | |
| Chevron Corp. | 3.191% | 6/24/23 | 10,325 | 10,619 | |
| ConocoPhillips | 6.000% | 1/15/20 | 1,880 | 2,231 | |
| ConocoPhillips Co. | 2.400% | 12/15/22 | 5,025 | 4,902 | |
| Continental Resources Inc. | 5.000% | 9/15/22 | 8,195 | 8,851 | |
| Continental Resources Inc. | 4.500% | 4/15/23 | 6,325 | 6,810 | |
| 2 | Continental Resources Inc. | 3.800% | 6/1/24 | 3,075 | 3,139 |
| Copano Energy LLC / Copano Energy | |||||
| Finance Corp. | 7.125% | 4/1/21 | 1,173 | 1,317 | |
| DCP Midstream Operating LP | 4.950% | 4/1/22 | 875 | 963 | |
| DCP Midstream Operating LP | 3.875% | 3/15/23 | 2,925 | 2,992 | |
| Devon Energy Corp. | 4.000% | 7/15/21 | 2,145 | 2,296 | |
| Devon Energy Corp. | 3.250% | 5/15/22 | 3,250 | 3,305 | |
| Diamond Offshore Drilling Inc. | 3.450% | 11/1/23 | 475 | 478 | |
| Dominion Gas Holdings LLC | 3.550% | 11/1/23 | 2,100 | 2,166 | |
| El Paso Natural Gas Co. LLC | 8.625% | 1/15/22 | 150 | 195 | |
| El Paso Pipeline Partners Operating Co. LLC | 6.500% | 4/1/20 | 3,200 | 3,725 | |
| El Paso Pipeline Partners Operating Co. LLC | 5.000% | 10/1/21 | 1,950 | 2,134 | |
| El Paso Pipeline Partners Operating Co. LLC | 4.300% | 5/1/24 | 2,035 | 2,085 | |
| 2 | Enable Midstream Partners LP | 3.900% | 5/15/24 | 1,950 | 1,979 |
| Enbridge Energy Partners LP | 5.200% | 3/15/20 | 1,700 | 1,909 | |
| Enbridge Energy Partners LP | 4.200% | 9/15/21 | 2,069 | 2,214 | |
| Enbridge Inc. | 4.000% | 10/1/23 | 1,550 | 1,625 | |
| Enbridge Inc. | 3.500% | 6/10/24 | 2,325 | 2,336 | |
| Encana Corp. | 3.900% | 11/15/21 | 2,100 | 2,228 | |
| Energy Transfer Partners LP | 4.150% | 10/1/20 | 1,795 | 1,898 | |
| Energy Transfer Partners LP | 4.650% | 6/1/21 | 3,850 | 4,163 | |
| Energy Transfer Partners LP | 5.200% | 2/1/22 | 5,425 | 5,991 | |
| Energy Transfer Partners LP | 3.600% | 2/1/23 | 3,325 | 3,298 | |
| Energy Transfer Partners LP | 7.600% | 2/1/24 | 930 | 1,179 | |
| EnLink Midstream Partners LP | 4.400% | 4/1/24 | 1,475 | 1,560 | |
| Ensco plc | 4.700% | 3/15/21 | 6,275 | 6,836 | |
| Enterprise Products Operating LLC | 5.250% | 1/31/20 | 1,350 | 1,537 | |
| Enterprise Products Operating LLC | 5.200% | 9/1/20 | 3,400 | 3,875 | |
| Enterprise Products Operating LLC | 4.050% | 2/15/22 | 2,675 | 2,870 | |
| 132 | |||||
| Intermediate-Term Corporate Bond Index Fund | ||||
| Face | Market | |||
| Maturity | Amount | Value• | ||
| Coupon | Date | ($000) | ($000) | |
| Enterprise Products Operating LLC | 3.350% | 3/15/23 | 4,150 | 4,183 |
| Enterprise Products Operating LLC | 3.900% | 2/15/24 | 4,625 | 4,828 |
| EOG Resources Inc. | 4.400% | 6/1/20 | 2,500 | 2,752 |
| EOG Resources Inc. | 4.100% | 2/1/21 | 4,840 | 5,286 |
| EOG Resources Inc. | 2.625% | 3/15/23 | 3,700 | 3,601 |
| EQT Corp. | 4.875% | 11/15/21 | 2,575 | 2,843 |
| FMC Technologies Inc. | 3.450% | 10/1/22 | 1,475 | 1,485 |
| Gulf South Pipeline Co. LP | 4.000% | 6/15/22 | 750 | 767 |
| Halliburton Co. | 6.150% | 9/15/19 | 2,575 | 3,070 |
| Halliburton Co. | 3.250% | 11/15/21 | 1,650 | 1,722 |
| Halliburton Co. | 3.500% | 8/1/23 | 3,975 | 4,135 |
| Hess Corp. | 3.500% | 7/15/24 | 1,000 | 1,011 |
| Husky Energy Inc. | 7.250% | 12/15/19 | 3,225 | 3,970 |
| Husky Energy Inc. | 3.950% | 4/15/22 | 325 | 346 |
| Husky Energy Inc. | 4.000% | 4/15/24 | 4,275 | 4,482 |
| Kerr-McGee Corp. | 6.950% | 7/1/24 | 2,287 | 2,926 |
| Kinder Morgan Energy Partners LP | 6.850% | 2/15/20 | 5,125 | 6,112 |
| Kinder Morgan Energy Partners LP | 3.500% | 3/1/21 | 3,100 | 3,135 |
| Kinder Morgan Energy Partners LP | 5.800% | 3/1/21 | 2,150 | 2,455 |
| Kinder Morgan Energy Partners LP | 4.150% | 3/1/22 | 850 | 879 |
| Kinder Morgan Energy Partners LP | 3.950% | 9/1/22 | 4,755 | 4,842 |
| Kinder Morgan Energy Partners LP | 3.450% | 2/15/23 | 1,000 | 977 |
| Kinder Morgan Energy Partners LP | 3.500% | 9/1/23 | 1,650 | 1,638 |
| Kinder Morgan Energy Partners LP | 4.150% | 2/1/24 | 2,500 | 2,538 |
| Magellan Midstream Partners LP | 4.250% | 2/1/21 | 900 | 987 |
| Marathon Oil Corp. | 2.800% | 11/1/22 | 2,950 | 2,884 |
| Marathon Petroleum Corp. | 5.125% | 3/1/21 | 3,150 | 3,569 |
| Murphy Oil Corp. | 3.700% | 12/1/22 | 3,600 | 3,614 |
| Nabors Industries Inc. | 5.000% | 9/15/20 | 900 | 1,006 |
| Nabors Industries Inc. | 4.625% | 9/15/21 | 925 | 1,012 |
| 2 Nabors Industries Inc. | 4.625% | 9/15/21 | 1,350 | 1,477 |
| Nabors Industries Inc. | 5.100% | 9/15/23 | 2,025 | 2,242 |
| National Oilwell Varco Inc. | 2.600% | 12/1/22 | 7,075 | 6,898 |
| Nisource Finance Corp. | 5.450% | 9/15/20 | 3,525 | 4,029 |
| Nisource Finance Corp. | 6.125% | 3/1/22 | 3,127 | 3,729 |
| Noble Energy Inc. | 4.150% | 12/15/21 | 3,786 | 4,065 |
| Noble Holding International Ltd. | 4.900% | 8/1/20 | 3,025 | 3,315 |
| Noble Holding International Ltd. | 3.950% | 3/15/22 | 1,500 | 1,547 |
| Occidental Petroleum Corp. | 4.100% | 2/1/21 | 6,565 | 7,141 |
| Occidental Petroleum Corp. | 3.125% | 2/15/22 | 3,100 | 3,160 |
| Occidental Petroleum Corp. | 2.700% | 2/15/23 | 3,195 | 3,137 |
| ONEOK Partners LP | 3.375% | 10/1/22 | 4,169 | 4,178 |
| ONEOK Partners LP | 5.000% | 9/15/23 | 1,450 | 1,608 |
| Petro-Canada | 9.250% | 10/15/21 | 2,575 | 3,570 |
| Phillips 66 | 4.300% | 4/1/22 | 7,025 | 7,594 |
| Pioneer Natural Resources Co. | 7.500% | 1/15/20 | 1,750 | 2,150 |
| Pioneer Natural Resources Co. | 3.950% | 7/15/22 | 2,890 | 3,033 |
| Plains All American Pipeline LP / | ||||
| PAA Finance Corp. | 5.750% | 1/15/20 | 1,700 | 1,969 |
| Plains All American Pipeline LP / | ||||
| PAA Finance Corp. | 5.000% | 2/1/21 | 2,334 | 2,630 |
| Plains All American Pipeline LP / | ||||
| PAA Finance Corp. | 3.650% | 6/1/22 | 2,600 | 2,693 |
| Plains All American Pipeline LP / | ||||
| PAA Finance Corp. | 2.850% | 1/31/23 | 1,400 | 1,358 |
133
| Intermediate-Term Corporate Bond Index Fund | ||||
| Face | Market | |||
| Maturity | Amount | Value• | ||
| Coupon | Date | ($000) | ($000) | |
| Plains All American Pipeline LP / | ||||
| PAA Finance Corp. | 3.850% | 10/15/23 | 2,750 | 2,843 |
| Pride International Inc. | 6.875% | 8/15/20 | 2,750 | 3,311 |
| Rowan Cos. Inc. | 4.875% | 6/1/22 | 2,650 | 2,844 |
| Rowan Cos. Inc. | 4.750% | 1/15/24 | 1,525 | 1,610 |
| Sasol Financing International plc | 4.500% | 11/14/22 | 2,800 | 2,875 |
| Schlumberger Investment SA | 3.650% | 12/1/23 | 4,823 | 5,077 |
| Shell International Finance BV | 4.300% | 9/22/19 | 6,800 | 7,538 |
| Shell International Finance BV | 4.375% | 3/25/20 | 4,855 | 5,424 |
| Shell International Finance BV | 2.375% | 8/21/22 | 3,600 | 3,496 |
| Shell International Finance BV | 2.250% | 1/6/23 | 3,456 | 3,305 |
| Shell International Finance BV | 3.400% | 8/12/23 | 4,950 | 5,111 |
| Southern Natural Gas Co. LLC / | ||||
| Southern Natural Issuing Corp. | 4.400% | 6/15/21 | 1,400 | 1,499 |
| Southwestern Energy Co. | 4.100% | 3/15/22 | 3,725 | 3,952 |
| Spectra Energy Capital LLC | 8.000% | 10/1/19 | 2,275 | 2,859 |
| Spectra Energy Capital LLC | 3.300% | 3/15/23 | 2,925 | 2,844 |
| Spectra Energy Partners LP | 4.600% | 6/15/21 | 850 | 935 |
| Spectra Energy Partners LP | 4.750% | 3/15/24 | 3,100 | 3,395 |
| Sunoco Logistics Partners Operations LP | 5.500% | 2/15/20 | 1,200 | 1,357 |
| Sunoco Logistics Partners Operations LP | 4.650% | 2/15/22 | 1,650 | 1,781 |
| Talisman Energy Inc. | 3.750% | 2/1/21 | 4,045 | 4,186 |
| TC Pipelines LP | 4.650% | 6/15/21 | 1,253 | 1,340 |
| Total Capital Canada Ltd. | 2.750% | 7/15/23 | 2,825 | 2,776 |
| Total Capital International SA | 2.750% | 6/19/21 | 3,000 | 3,055 |
| Total Capital International SA | 2.875% | 2/17/22 | 4,725 | 4,767 |
| Total Capital International SA | 2.700% | 1/25/23 | 5,350 | 5,250 |
| Total Capital International SA | 3.700% | 1/15/24 | 4,500 | 4,713 |
| Total Capital International SA | 3.750% | 4/10/24 | 4,850 | 5,088 |
| Total Capital SA | 4.450% | 6/24/20 | 4,125 | 4,588 |
| Total Capital SA | 4.125% | 1/28/21 | 3,100 | 3,394 |
| TransCanada PipeLines Ltd. | 3.800% | 10/1/20 | 4,467 | 4,807 |
| TransCanada PipeLines Ltd. | 2.500% | 8/1/22 | 5,661 | 5,481 |
| TransCanada PipeLines Ltd. | 3.750% | 10/16/23 | 2,100 | 2,205 |
| Transocean Inc. | 6.500% | 11/15/20 | 2,815 | 3,184 |
| Transocean Inc. | 6.375% | 12/15/21 | 5,065 | 5,721 |
| Transocean Inc. | 3.800% | 10/15/22 | 4,700 | 4,583 |
| Valero Energy Corp. | 6.125% | 2/1/20 | 1,740 | 2,049 |
| Weatherford International Ltd. | 5.125% | 9/15/20 | 2,975 | 3,311 |
| Weatherford International Ltd. | 4.500% | 4/15/22 | 3,150 | 3,365 |
| Western Gas Partners LP | 5.375% | 6/1/21 | 1,682 | 1,909 |
| Western Gas Partners LP | 4.000% | 7/1/22 | 2,325 | 2,437 |
| Williams Cos. Inc. | 7.875% | 9/1/21 | 1,063 | 1,313 |
| Williams Cos. Inc. | 3.700% | 1/15/23 | 4,803 | 4,608 |
| Williams Cos. Inc. | 4.550% | 6/24/24 | 5,000 | 5,046 |
| Williams Partners LP | 5.250% | 3/15/20 | 4,995 | 5,599 |
| Williams Partners LP | 4.125% | 11/15/20 | 2,057 | 2,189 |
| Williams Partners LP | 4.000% | 11/15/21 | 2,236 | 2,348 |
| Williams Partners LP | 3.350% | 8/15/22 | 3,275 | 3,272 |
| Williams Partners LP | 4.300% | 3/4/24 | 4,300 | 4,508 |
| Other Industrial (0.2%) | ||||
| Cintas Corp. No 2 | 4.300% | 6/1/21 | 700 | 764 |
| Cintas Corp. No 2 | 3.250% | 6/1/22 | 600 | 611 |
| Fluor Corp. | 3.375% | 9/15/21 | 1,580 | 1,639 |
134
| Intermediate-Term Corporate Bond Index Fund | ||||
| Face | Market | |||
| Maturity | Amount | Value• | ||
| Coupon | Date | ($000) | ($000) | |
| Howard Hughes Medical Institute | 3.500% | 9/1/23 | 4,225 | 4,413 |
| URS Corp. | 5.000% | 4/1/22 | 1,800 | 1,854 |
| Technology (6.8%) | ||||
| Adobe Systems Inc. | 4.750% | 2/1/20 | 2,175 | 2,415 |
| Agilent Technologies Inc. | 5.000% | 7/15/20 | 1,825 | 2,002 |
| Agilent Technologies Inc. | 3.200% | 10/1/22 | 2,700 | 2,654 |
| Agilent Technologies Inc. | 3.875% | 7/15/23 | 2,000 | 2,036 |
| Altera Corp. | 4.100% | 11/15/23 | 2,950 | 3,090 |
| Amphenol Corp. | 4.000% | 2/1/22 | 1,900 | 1,979 |
| Analog Devices Inc. | 2.875% | 6/1/23 | 1,550 | 1,510 |
| Apple Inc. | 2.850% | 5/6/21 | 11,825 | 12,039 |
| Apple Inc. | 2.400% | 5/3/23 | 19,825 | 19,021 |
| Apple Inc. | 3.450% | 5/6/24 | 8,825 | 9,057 |
| Applied Materials Inc. | 4.300% | 6/15/21 | 2,650 | 2,902 |
| Arrow Electronics Inc. | 6.000% | 4/1/20 | 1,500 | 1,689 |
| Arrow Electronics Inc. | 5.125% | 3/1/21 | 300 | 326 |
| Arrow Electronics Inc. | 4.500% | 3/1/23 | 1,266 | 1,322 |
| Autodesk Inc. | 3.600% | 12/15/22 | 850 | 856 |
| Avnet Inc. | 5.875% | 6/15/20 | 1,300 | 1,465 |
| Avnet Inc. | 4.875% | 12/1/22 | 1,050 | 1,122 |
| Baidu Inc. | 3.500% | 11/28/22 | 3,102 | 3,069 |
| Broadcom Corp. | 2.500% | 8/15/22 | 2,450 | 2,362 |
| Broadcom Corp. | 3.500% | 8/1/24 | 950 | 963 |
| Broadridge Financial Solutions Inc. | 3.950% | 9/1/20 | 1,150 | 1,208 |
| CA Inc. | 5.375% | 12/1/19 | 1,825 | 2,038 |
| CA Inc. | 4.500% | 8/15/23 | 900 | 950 |
| Cisco Systems Inc. | 4.450% | 1/15/20 | 10,210 | 11,333 |
| Cisco Systems Inc. | 2.900% | 3/4/21 | 1,700 | 1,742 |
| Cisco Systems Inc. | 3.625% | 3/4/24 | 3,150 | 3,287 |
| Computer Sciences Corp. | 4.450% | 9/15/22 | 1,500 | 1,586 |
| Corning Inc. | 4.250% | 8/15/20 | 2,675 | 2,921 |
| Corning Inc. | 3.700% | 11/15/23 | 1,300 | 1,357 |
| Dun & Bradstreet Corp. | 4.375% | 12/1/22 | 1,050 | 1,095 |
| EMC Corp. | 2.650% | 6/1/20 | 8,155 | 8,228 |
| EMC Corp. | 3.375% | 6/1/23 | 3,187 | 3,228 |
| Equifax Inc. | 3.300% | 12/15/22 | 1,250 | 1,243 |
| Fidelity National Information Services Inc. | 5.000% | 3/15/22 | 4,819 | 5,108 |
| Fidelity National Information Services Inc. | 3.500% | 4/15/23 | 4,675 | 4,670 |
| Fidelity National Information Services Inc. | 3.875% | 6/5/24 | 1,400 | 1,426 |
| Fiserv Inc. | 4.625% | 10/1/20 | 1,675 | 1,831 |
| Fiserv Inc. | 3.500% | 10/1/22 | 2,575 | 2,612 |
| Google Inc. | 3.625% | 5/19/21 | 5,070 | 5,445 |
| Google Inc. | 3.375% | 2/25/24 | 2,200 | 2,278 |
| Harris Corp. | 4.400% | 12/15/20 | 2,275 | 2,460 |
| Hewlett-Packard Co. | 3.750% | 12/1/20 | 3,350 | 3,509 |
| Hewlett-Packard Co. | 4.300% | 6/1/21 | 3,170 | 3,413 |
| Hewlett-Packard Co. | 4.375% | 9/15/21 | 4,125 | 4,465 |
| Hewlett-Packard Co. | 4.650% | 12/9/21 | 7,649 | 8,402 |
| Hewlett-Packard Co. | 4.050% | 9/15/22 | 2,800 | 2,948 |
| Intel Corp. | 3.300% | 10/1/21 | 9,262 | 9,676 |
| Intel Corp. | 2.700% | 12/15/22 | 4,175 | 4,107 |
| International Business Machines Corp. | 8.375% | 11/1/19 | 2,389 | 3,117 |
| International Business Machines Corp. | 1.625% | 5/15/20 | 6,600 | 6,369 |
| International Business Machines Corp. | 2.900% | 11/1/21 | 1,450 | 1,479 |
135
| Intermediate-Term Corporate Bond Index Fund | |||||
| Face | Market | ||||
| Maturity | Amount | Value• | |||
| Coupon | Date | ($000) | ($000) | ||
| International Business Machines Corp. | 1.875% | 8/1/22 | 2,850 | 2,662 | |
| International Business Machines Corp. | 3.375% | 8/1/23 | 4,525 | 4,649 | |
| International Business Machines Corp. | 3.625% | 2/12/24 | 7,725 | 8,014 | |
| Jabil Circuit Inc. | 5.625% | 12/15/20 | 1,675 | 1,817 | |
| Jabil Circuit Inc. | 4.700% | 9/15/22 | 1,125 | 1,138 | |
| Juniper Networks Inc. | 4.600% | 3/15/21 | 1,090 | 1,174 | |
| Juniper Networks Inc. | 4.500% | 3/15/24 | 1,175 | 1,235 | |
| Leidos Holdings Inc. | 4.450% | 12/1/20 | 1,400 | 1,423 | |
| Lender Processing Services Inc / | |||||
| Black Knight Lending Solutions Inc | 5.750% | 4/15/23 | 2,100 | 2,237 | |
| Lexmark International Inc. | 5.125% | 3/15/20 | 1,375 | 1,491 | |
| Maxim Integrated Products Inc. | 3.375% | 3/15/23 | 1,350 | 1,333 | |
| Microsoft Corp. | 3.000% | 10/1/20 | 3,545 | 3,713 | |
| Microsoft Corp. | 4.000% | 2/8/21 | 3,750 | 4,138 | |
| Microsoft Corp. | 2.125% | 11/15/22 | 1,875 | 1,802 | |
| Microsoft Corp. | 2.375% | 5/1/23 | 3,100 | 2,999 | |
| Microsoft Corp. | 3.625% | 12/15/23 | 4,275 | 4,528 | |
| Motorola Solutions Inc. | 3.750% | 5/15/22 | 3,050 | 3,047 | |
| Motorola Solutions Inc. | 3.500% | 3/1/23 | 1,820 | 1,779 | |
| NetApp Inc. | 3.375% | 6/15/21 | 2,400 | 2,443 | |
| Oracle Corp. | 2.250% | 10/8/19 | 6,750 | 6,795 | |
| Oracle Corp. | 3.875% | 7/15/20 | 3,125 | 3,383 | |
| Oracle Corp. | 2.800% | 7/8/21 | 5,850 | 5,911 | |
| Oracle Corp. | 2.500% | 10/15/22 | 10,900 | 10,607 | |
| Oracle Corp. | 3.625% | 7/15/23 | 1,750 | 1,829 | |
| Oracle Corp. | 3.400% | 7/8/24 | 8,625 | 8,782 | |
| Pitney Bowes Inc. | 4.625% | 3/15/24 | 1,625 | 1,689 | |
| Seagate HDD Cayman | 7.000% | 11/1/21 | 2,700 | 3,011 | |
| Seagate HDD Cayman | 4.750% | 6/1/23 | 4,500 | 4,601 | |
| Symantec Corp. | 4.200% | 9/15/20 | 4,175 | 4,337 | |
| Symantec Corp. | 3.950% | 6/15/22 | 600 | 617 | |
| Telefonaktiebolaget LM Ericsson | 4.125% | 5/15/22 | 2,975 | 3,121 | |
| Total System Services Inc. | 3.750% | 6/1/23 | 1,300 | 1,287 | |
| Tyco Electronics Group SA | 4.875% | 1/15/21 | 475 | 528 | |
| Tyco Electronics Group SA | 3.500% | 2/3/22 | 2,011 | 2,084 | |
| Tyco Electronics Group SA | 3.450% | 8/1/24 | 1,200 | 1,221 | |
| Verisk Analytics Inc. | 5.800% | 5/1/21 | 700 | 800 | |
| Verisk Analytics Inc. | 4.125% | 9/12/22 | 2,200 | 2,300 | |
| Xerox Corp. | 5.625% | 12/15/19 | 3,150 | 3,605 | |
| Xerox Corp. | 2.800% | 5/15/20 | 1,650 | 1,646 | |
| Xerox Corp. | 4.500% | 5/15/21 | 2,550 | 2,757 | |
| Xerox Corp. | 3.800% | 5/15/24 | 1,175 | 1,175 | |
| Xilinx Inc. | 3.000% | 3/15/21 | 2,025 | 2,052 | |
| Transportation (2.1%) | |||||
| 1 | American Airlines 2011-1 Class A Pass | ||||
| Through Trust | 5.250% | 7/31/22 | 920 | 1,006 | |
| 1 | American Airlines 2013-2 Class A Pass | ||||
| Through Trust | 4.950% | 7/15/24 | 4,673 | 5,035 | |
| Burlington Northern Santa Fe LLC | 4.700% | 10/1/19 | 1,760 | 1,975 | |
| Burlington Northern Santa Fe LLC | 3.600% | 9/1/20 | 1,000 | 1,051 | |
| Burlington Northern Santa Fe LLC | 3.450% | 9/15/21 | 2,775 | 2,896 | |
| Burlington Northern Santa Fe LLC | 3.050% | 3/15/22 | 2,525 | 2,553 | |
| Burlington Northern Santa Fe LLC | 3.050% | 9/1/22 | 3,050 | 3,056 | |
| Burlington Northern Santa Fe LLC | 3.000% | 3/15/23 | 1,333 | 1,316 | |
| 136 | |||||
| Intermediate-Term Corporate Bond Index Fund | ||||
| Face | Market | |||
| Maturity | Amount | Value• | ||
| Coupon | Date | ($000) | ($000) | |
| Burlington Northern Santa Fe LLC | 3.850% | 9/1/23 | 1,625 | 1,708 |
| Burlington Northern Santa Fe LLC | 3.750% | 4/1/24 | 1,900 | 1,972 |
| Burlington Northern Santa Fe LLC | 3.400% | 9/1/24 | 2,000 | 2,021 |
| Canadian National Railway Co. | 2.850% | 12/15/21 | 2,000 | 2,041 |
| Canadian National Railway Co. | 2.250% | 11/15/22 | 800 | 770 |
| Canadian Pacific Railway Co. | 4.450% | 3/15/23 | 1,900 | 2,099 |
| Canadian Pacific Railway Ltd. | 4.500% | 1/15/22 | 1,950 | 2,176 |
| 1 Continental Airlines 2007-1 Class A Pass | ||||
| Through Trust | 5.983% | 10/19/23 | 3,582 | 4,003 |
| 1 Continental Airlines 2009-2 Class A Pass | ||||
| Through Trust | 7.250% | 5/10/21 | 1,501 | 1,753 |
| 1 Continental Airlines 2010-1 Class A Pass | ||||
| Through Trust | 4.750% | 7/12/22 | 498 | 537 |
| 1 Continental Airlines 2012-1 Class A Pass | ||||
| Through Trust | 4.150% | 10/11/25 | 1,440 | 1,494 |
| CSX Corp. | 3.700% | 10/30/20 | 2,024 | 2,139 |
| CSX Corp. | 4.250% | 6/1/21 | 1,700 | 1,859 |
| CSX Corp. | 3.700% | 11/1/23 | 2,775 | 2,893 |
| CSX Corp. | 3.400% | 8/1/24 | 1,825 | 1,857 |
| 1 Delta Air Lines 2007-1 Class A Pass | ||||
| Through Trust | 6.821% | 2/10/24 | 1,689 | 1,985 |
| 1 Delta Air Lines 2009-1 Class A Pass | ||||
| Through Trust | 7.750% | 12/17/19 | 1,043 | 1,222 |
| 1 Delta Air Lines 2012-1 Class A Pass | ||||
| Through Trust | 4.750% | 11/7/21 | 2,444 | 2,639 |
| FedEx Corp. | 2.625% | 8/1/22 | 1,475 | 1,437 |
| FedEx Corp. | 2.700% | 4/15/23 | 300 | 290 |
| FedEx Corp. | 4.000% | 1/15/24 | 2,300 | 2,441 |
| JB Hunt Transport Services Inc. | 3.850% | 3/15/24 | 1,000 | 1,039 |
| Kansas City Southern de Mexico SA de CV | 2.350% | 5/15/20 | 2,850 | 2,752 |
| Kansas City Southern de Mexico SA de CV | 3.000% | 5/15/23 | 150 | 146 |
| Norfolk Southern Corp. | 3.250% | 12/1/21 | 2,601 | 2,682 |
| Norfolk Southern Corp. | 3.000% | 4/1/22 | 1,532 | 1,540 |
| Norfolk Southern Corp. | 2.903% | 2/15/23 | 3,589 | 3,518 |
| Norfolk Southern Corp. | 3.850% | 1/15/24 | 1,000 | 1,051 |
| Ryder System Inc. | 2.450% | 9/3/19 | 2,350 | 2,358 |
| 1 Southwest Airlines Co. 2007-1 Pass Through Trust | 6.150% | 2/1/24 | 1,064 | 1,232 |
| Union Pacific Corp. | 4.000% | 2/1/21 | 3,475 | 3,796 |
| Union Pacific Corp. | 4.163% | 7/15/22 | 3,166 | 3,482 |
| Union Pacific Corp. | 2.750% | 4/15/23 | 1,250 | 1,237 |
| Union Pacific Corp. | 3.646% | 2/15/24 | 2,250 | 2,355 |
| Union Pacific Corp. | 3.750% | 3/15/24 | 500 | 529 |
| United Parcel Service Inc. | 3.125% | 1/15/21 | 6,275 | 6,571 |
| United Parcel Service Inc. | 2.450% | 10/1/22 | 4,570 | 4,467 |
| United Parcel Service of America Inc. | 8.375% | 4/1/20 | 300 | 392 |
| 2,822,616 | ||||
| Utilities (5.4%) | ||||
| Electric (5.1%) | ||||
| Alabama Power Co. | 3.550% | 12/1/23 | 1,500 | 1,574 |
| Ameren Illinois Co. | 2.700% | 9/1/22 | 1,170 | 1,165 |
| American Electric Power Co. Inc. | 2.950% | 12/15/22 | 1,000 | 985 |
| Appalachian Power Co. | 7.950% | 1/15/20 | 1,825 | 2,317 |
| Appalachian Power Co. | 4.600% | 3/30/21 | 2,492 | 2,800 |
| Arizona Public Service Co. | 3.350% | 6/15/24 | 900 | 916 |
| Baltimore Gas & Electric Co. | 3.500% | 11/15/21 | 1,922 | 2,037 |
137
| Intermediate-Term Corporate Bond Index Fund | ||||
| Face | Market | |||
| Maturity | Amount | Value• | ||
| Coupon | Date | ($000) | ($000) | |
| Baltimore Gas & Electric Co. | 3.350% | 7/1/23 | 575 | 592 |
| Berkshire Hathaway Energy Co. | 3.750% | 11/15/23 | 2,525 | 2,630 |
| Black Hills Corp. | 4.250% | 11/30/23 | 1,000 | 1,067 |
| CenterPoint Energy Houston Electric LLC | 2.250% | 8/1/22 | 825 | 797 |
| CMS Energy Corp. | 6.250% | 2/1/20 | 2,600 | 3,079 |
| CMS Energy Corp. | 5.050% | 3/15/22 | 1,350 | 1,527 |
| Commonwealth Edison Co. | 4.000% | 8/1/20 | 2,125 | 2,306 |
| Commonwealth Edison Co. | 3.400% | 9/1/21 | 1,000 | 1,053 |
| Connecticut Light & Power Co. | 2.500% | 1/15/23 | 3,175 | 3,080 |
| Consolidated Edison Co. of New York Inc. | 4.450% | 6/15/20 | 750 | 834 |
| Constellation Energy Group Inc. | 5.150% | 12/1/20 | 2,150 | 2,411 |
| Consumers Energy Co. | 6.700% | 9/15/19 | 2,150 | 2,599 |
| Consumers Energy Co. | 2.850% | 5/15/22 | 1,684 | 1,696 |
| Consumers Energy Co. | 3.375% | 8/15/23 | 1,650 | 1,714 |
| Consumers Energy Co. | 3.125% | 8/31/24 | 1,000 | 1,008 |
| Delmarva Power & Light Co. | 3.500% | 11/15/23 | 1,975 | 2,050 |
| Dominion Resources Inc. | 4.450% | 3/15/21 | 2,544 | 2,802 |
| DTE Electric Co. | 3.900% | 6/1/21 | 2,275 | 2,471 |
| DTE Electric Co. | 2.650% | 6/15/22 | 1,800 | 1,790 |
| DTE Energy Co. | 3.500% | 6/1/24 | 1,900 | 1,931 |
| Duke Energy Carolinas LLC | 4.300% | 6/15/20 | 1,575 | 1,743 |
| Duke Energy Carolinas LLC | 3.900% | 6/15/21 | 1,775 | 1,943 |
| Duke Energy Corp. | 5.050% | 9/15/19 | 2,295 | 2,592 |
| Duke Energy Corp. | 3.550% | 9/15/21 | 2,050 | 2,159 |
| Duke Energy Corp. | 3.050% | 8/15/22 | 1,525 | 1,532 |
| Duke Energy Corp. | 3.950% | 10/15/23 | 3,325 | 3,531 |
| Duke Energy Corp. | 3.750% | 4/15/24 | 1,550 | 1,612 |
| Duke Energy Florida Inc. | 3.100% | 8/15/21 | 1,625 | 1,680 |
| Duke Energy Indiana Inc. | 3.750% | 7/15/20 | 2,100 | 2,250 |
| Duke Energy Ohio Inc. | 3.800% | 9/1/23 | 1,521 | 1,621 |
| Duke Energy Progress Inc. | 3.000% | 9/15/21 | 2,486 | 2,551 |
| Duke Energy Progress Inc. | 2.800% | 5/15/22 | 1,000 | 1,007 |
| Entergy Arkansas Inc. | 3.750% | 2/15/21 | 1,555 | 1,674 |
| Entergy Arkansas Inc. | 3.050% | 6/1/23 | 200 | 200 |
| Entergy Corp. | 5.125% | 9/15/20 | 2,650 | 2,949 |
| Entergy Gulf States Louisiana LLC | 3.950% | 10/1/20 | 1,785 | 1,933 |
| Entergy Louisiana LLC | 4.050% | 9/1/23 | 1,950 | 2,097 |
| Entergy Mississippi Inc. | 3.100% | 7/1/23 | 1,425 | 1,433 |
| Exelon Generation Co. LLC | 5.200% | 10/1/19 | 2,700 | 3,022 |
| Exelon Generation Co. LLC | 4.000% | 10/1/20 | 4,282 | 4,508 |
| Exelon Generation Co. LLC | 4.250% | 6/15/22 | 1,500 | 1,565 |
| FirstEnergy Solutions Corp. | 6.050% | 8/15/21 | 2,225 | 2,473 |
| Florida Power & Light Co. | 2.750% | 6/1/23 | 1,475 | 1,462 |
| Florida Power & Light Co. | 3.250% | 6/1/24 | 1,000 | 1,022 |
| Georgia Power Co. | 4.250% | 12/1/19 | 2,155 | 2,386 |
| Georgia Power Co. | 2.850% | 5/15/22 | 1,400 | 1,399 |
| Great Plains Energy Inc. | 4.850% | 6/1/21 | 2,300 | 2,544 |
| Indiana Michigan Power Co. | 3.200% | 3/15/23 | 1,625 | 1,646 |
| ITC Holdings Corp. | 4.050% | 7/1/23 | 1,425 | 1,497 |
| ITC Holdings Corp. | 3.650% | 6/15/24 | 1,275 | 1,288 |
| Kansas City Power & Light Co. | 3.150% | 3/15/23 | 1,775 | 1,792 |
| Kentucky Utilities Co. | 3.250% | 11/1/20 | 1,125 | 1,172 |
| LG&E & KU Energy LLC | 3.750% | 11/15/20 | 3,445 | 3,624 |
| LG&E & KU Energy LLC | 4.375% | 10/1/21 | 1,375 | 1,492 |
| National Rural Utilities Cooperative Finance Corp. | 2.350% | 6/15/20 | 2,000 | 2,002 |
138
| Intermediate-Term Corporate Bond Index Fund | ||||
| Face | Market | |||
| Maturity | Amount | Value• | ||
| Coupon | Date | ($000) | ($000) | |
| National Rural Utilities Cooperative Finance Corp. | 3.050% | 2/15/22 | 2,158 | 2,210 |
| National Rural Utilities Cooperative Finance Corp. | 3.400% | 11/15/23 | 875 | 902 |
| 1 National Rural Utilities Cooperative Finance Corp. | 4.750% | 4/30/43 | 1,675 | 1,658 |
| NextEra Energy Capital Holdings Inc. | 2.400% | 9/15/19 | 2,000 | 2,012 |
| NextEra Energy Capital Holdings Inc. | 2.700% | 9/15/19 | 800 | 815 |
| NextEra Energy Capital Holdings Inc. | 4.500% | 6/1/21 | 1,375 | 1,501 |
| NextEra Energy Capital Holdings Inc. | 3.625% | 6/15/23 | 925 | 948 |
| Northeast Utilities | 2.800% | 5/1/23 | 1,300 | 1,268 |
| Northern States Power Co. | 2.150% | 8/15/22 | 375 | 359 |
| Northern States Power Co. | 2.600% | 5/15/23 | 1,350 | 1,323 |
| NSTAR Electric Co. | 2.375% | 10/15/22 | 1,200 | 1,160 |
| NSTAR LLC | 4.500% | 11/15/19 | 1,862 | 2,055 |
| Ohio Power Co. | 5.375% | 10/1/21 | 1,100 | 1,293 |
| Oncor Electric Delivery Co. LLC | 7.000% | 9/1/22 | 3,700 | 4,765 |
| Pacific Gas & Electric Co. | 3.500% | 10/1/20 | 2,436 | 2,560 |
| Pacific Gas & Electric Co. | 4.250% | 5/15/21 | 2,025 | 2,218 |
| Pacific Gas & Electric Co. | 3.250% | 9/15/21 | 500 | 516 |
| Pacific Gas & Electric Co. | 2.450% | 8/15/22 | 2,900 | 2,811 |
| Pacific Gas & Electric Co. | 3.250% | 6/15/23 | 1,300 | 1,309 |
| Pacific Gas & Electric Co. | 3.850% | 11/15/23 | 2,600 | 2,727 |
| Pacific Gas & Electric Co. | 3.750% | 2/15/24 | 950 | 984 |
| PacifiCorp | 3.850% | 6/15/21 | 3,500 | 3,785 |
| PacifiCorp | 2.950% | 2/1/22 | 2,820 | 2,882 |
| PacifiCorp | 3.600% | 4/1/24 | 1,650 | 1,717 |
| Peco Energy Co. | 2.375% | 9/15/22 | 1,129 | 1,100 |
| Pennsylvania Electric Co. | 5.200% | 4/1/20 | 650 | 725 |
| Potomac Electric Power Co. | 3.600% | 3/15/24 | 1,500 | 1,561 |
| PPL Capital Funding Inc. | 3.400% | 6/1/23 | 2,950 | 2,974 |
| PPL Capital Funding Inc. | 3.950% | 3/15/24 | 1,100 | 1,145 |
| PPL Electric Utilities Corp. | 3.000% | 9/15/21 | 4,150 | 4,279 |
| Progress Energy Inc. | 4.875% | 12/1/19 | 1,200 | 1,348 |
| Progress Energy Inc. | 4.400% | 1/15/21 | 2,347 | 2,599 |
| Progress Energy Inc. | 3.150% | 4/1/22 | 275 | 279 |
| PSEG Power LLC | 5.125% | 4/15/20 | 1,125 | 1,254 |
| PSEG Power LLC | 4.150% | 9/15/21 | 1,011 | 1,079 |
| PSEG Power LLC | 4.300% | 11/15/23 | 825 | 871 |
| Public Service Co. of Colorado | 3.200% | 11/15/20 | 675 | 706 |
| Public Service Co. of Colorado | 2.250% | 9/15/22 | 1,535 | 1,479 |
| Public Service Co. of Colorado | 2.500% | 3/15/23 | 400 | 388 |
| Public Service Co. of New Hampshire | 3.500% | 11/1/23 | 700 | 732 |
| Public Service Co. of Oklahoma | 5.150% | 12/1/19 | 472 | 535 |
| Public Service Co. of Oklahoma | 4.400% | 2/1/21 | 500 | 553 |
| Public Service Electric & Gas Co. | 3.500% | 8/15/20 | 375 | 397 |
| Public Service Electric & Gas Co. | 2.375% | 5/15/23 | 2,950 | 2,833 |
| Public Service Electric & Gas Co. | 3.150% | 8/15/24 | 1,250 | 1,264 |
| Puget Energy Inc. | 6.500% | 12/15/20 | 2,050 | 2,455 |
| Puget Energy Inc. | 6.000% | 9/1/21 | 2,875 | 3,379 |
| Puget Energy Inc. | 5.625% | 7/15/22 | 1,800 | 2,099 |
| San Diego Gas & Electric Co. | 3.000% | 8/15/21 | 1,133 | 1,165 |
| San Diego Gas & Electric Co. | 3.600% | 9/1/23 | 1,100 | 1,167 |
| SCANA Corp. | 4.750% | 5/15/21 | 2,650 | 2,915 |
| SCANA Corp. | 4.125% | 2/1/22 | 725 | 762 |
| Sierra Pacific Power Co. | 3.375% | 8/15/23 | 750 | 775 |
| Southern California Edison Co. | 3.875% | 6/1/21 | 2,700 | 2,946 |
| Southern California Edison Co. | 3.500% | 10/1/23 | 1,000 | 1,046 |
139
| Intermediate-Term Corporate Bond Index Fund | ||||
| Face | Market | |||
| Maturity | Amount | Value• | ||
| Coupon | Date | ($000) | ($000) | |
| Southern Co. | 2.150% | 9/1/19 | 1,225 | 1,224 |
| Southwestern Electric Power Co. | 3.550% | 2/15/22 | 1,075 | 1,115 |
| Tampa Electric Co. | 5.400% | 5/15/21 | 1,000 | 1,169 |
| Tampa Electric Co. | 2.600% | 9/15/22 | 475 | 464 |
| TECO Finance Inc. | 5.150% | 3/15/20 | 1,950 | 2,194 |
| TransAlta Corp. | 4.500% | 11/15/22 | 2,069 | 2,105 |
| Tucson Electric Power Co. | 5.150% | 11/15/21 | 600 | 679 |
| UIL Holdings Corp. | 4.625% | 10/1/20 | 1,150 | 1,232 |
| Union Electric Co. | 3.500% | 4/15/24 | 1,200 | 1,245 |
| Virginia Electric & Power Co. | 2.950% | 1/15/22 | 2,000 | 2,043 |
| Virginia Electric & Power Co. | 3.450% | 9/1/22 | 1,315 | 1,392 |
| Virginia Electric & Power Co. | 2.750% | 3/15/23 | 2,600 | 2,582 |
| Virginia Electric and Power Co. | 3.450% | 2/15/24 | 600 | 618 |
| Wisconsin Electric Power Co. | 2.950% | 9/15/21 | 1,425 | 1,463 |
| Wisconsin Power & Light Co. | 2.250% | 11/15/22 | 875 | 845 |
| Xcel Energy Inc. | 4.700% | 5/15/20 | 1,700 | 1,891 |
| Natural Gas (0.3%) | ||||
| AGL Capital Corp. | 3.500% | 9/15/21 | 2,100 | 2,201 |
| National Fuel Gas Co. | 4.900% | 12/1/21 | 1,475 | 1,603 |
| National Fuel Gas Co. | 3.750% | 3/1/23 | 2,075 | 2,075 |
| 2 ONE Gas Inc. | 3.610% | 2/1/24 | 1,000 | 1,049 |
| Sempra Energy | 2.875% | 10/1/22 | 2,500 | 2,484 |
| Sempra Energy | 4.050% | 12/1/23 | 2,700 | 2,884 |
| Sempra Energy | 3.550% | 6/15/24 | 1,000 | 1,017 |
| 244,794 | ||||
| Total Corporate Bonds (Cost $4,375,612) | 4,475,877 | |||
| Taxable Municipal Bonds (0.0%) | ||||
| Cornell University New York GO | 5.450% | 2/1/19 | 750 | 864 |
| George Washington University District of | ||||
| Columbia GO | 3.485% | 9/15/22 | 950 | 966 |
| Total Taxable Municipal Bonds (Cost $1,839) | 1,830 | |||
| Shares | ||||
| Temporary Cash Investment (0.7%) | ||||
| Money Market Fund (0.7%) | ||||
| 3 Vanguard Market Liquidity Fund (Cost $31,544) | 0.113% | 31,543,722 | 31,544 | |
| Total Investments (99.5%) (Cost $4,431,154) | 4,531,412 | |||
| Other Assets and Liabilities (0.5%) | ||||
| Other Assets | 76,280 | |||
| Liabilities | (52,400) | |||
| 23,880 | ||||
| Net Assets (100%) | 4,555,292 | |||
140
| Intermediate-Term Corporate Bond Index Fund | |
| At August 31, 2014, net assets consisted of: | |
| Amount | |
| ($000) | |
| Paid-in Capital | 4,438,018 |
| Undistributed Net Investment Income | 10,446 |
| Accumulated Net Realized Gains | 6,570 |
| Unrealized Appreciation (Depreciation) | 100,258 |
| Net Assets | 4,555,292 |
| Admiral Shares—Net Assets | |
| Applicable to 10,204,078 outstanding $.001 par value shares of | |
| beneficial interest (unlimited authorization) | 238,820 |
| Net Asset Value Per Share—Admiral Shares | $23.40 |
| Institutional Shares—Net Assets | |
| Applicable to 10,604,342 outstanding $.001 par value shares of | |
| beneficial interest (unlimited authorization) | 306,711 |
| Net Asset Value Per Share—Institutional Shares | $28.92 |
| ETF Shares—Net Assets | |
| Applicable to 46,100,118 outstanding $.001 par value shares of | |
| beneficial interest (unlimited authorization) | 4,009,761 |
| Net Asset Value Per Share—ETF Shares | $86.98 |
• See Note A in Notes to Financial Statements.
1 The average or expected maturity is shorter than the final maturity shown because of the possibility of interim principal payments and prepayments or the possibility of the issue being called.
2 Security exempt from registration under Rule 144A of the Securities Act of 1933. Such securities may be sold in transactions exempt from registration, normally to qualified institutional buyers. At August 31, 2014, the aggregate value of these securities was $44,158,000, representing 1.0% of net assets.
3 Affiliated money market fund available only to Vanguard funds and certain trusts and accounts managed by Vanguard. Rate shown is the 7-day yield.
GO—General Obligation Bond.
REIT—Real Estate Investment Trust.
See accompanying Notes, which are an integral part of the Financial Statements.
141
| Intermediate-Term Corporate Bond Index Fund | |
| Statement of Operations | |
| Year Ended | |
| August 31, 2014 | |
| ($000) | |
| Investment Income | |
| Income | |
| Interest1 | 129,586 |
| Total Income | 129,586 |
| Expenses | |
| The Vanguard Group—Note B | |
| Investment Advisory Services | 96 |
| Management and Administrative—Admiral Shares | 121 |
| Management and Administrative—Institutional Shares | 180 |
| Management and Administrative—ETF Shares | 2,897 |
| Marketing and Distribution—Admiral Shares | 22 |
| Marketing and Distribution—Institutional Shares | 50 |
| Marketing and Distribution—ETF Shares | 816 |
| Custodian Fees | 52 |
| Auditing Fees | 46 |
| Shareholders’ Reports—Admiral Shares | 3 |
| Shareholders’ Reports—Institutional Shares | — |
| Shareholders’ Reports—ETF Shares | 249 |
| Trustees’ Fees and Expenses | 3 |
| Total Expenses | 4,535 |
| Net Investment Income | 125,051 |
| Realized Net Gain (Loss) | |
| Investment Securities Sold | 11,685 |
| Futures Contracts | (1,271) |
| Realized Net Gain (Loss) | 10,414 |
| Change in Unrealized Appreciation (Depreciation) of Investment Securities | 213,672 |
| Net Increase (Decrease) in Net Assets Resulting from Operations | 349,137 |
| 1 Interest income from an affiliated company of the fund was $28,000. | |
See accompanying Notes, which are an integral part of the Financial Statements.
142
| Intermediate-Term Corporate Bond Index Fund | ||
| Statement of Changes in Net Assets | ||
| Year Ended August 31, | ||
| 2014 | 2013 | |
| ($000) | ($000) | |
| Increase (Decrease) in Net Assets | ||
| Operations | ||
| Net Investment Income | 125,051 | 111,974 |
| Realized Net Gain (Loss) | 10,414 | 70,295 |
| Change in Unrealized Appreciation (Depreciation) | 213,672 | (256,154) |
| Net Increase (Decrease) in Net Assets Resulting from Operations | 349,137 | (73,885) |
| Distributions | ||
| Net Investment Income | ||
| Admiral Shares1 | (4,240) | (1,717) |
| Institutional Shares | (8,841) | (6,146) |
| ETF Shares | (101,451) | (104,040) |
| Realized Capital Gain 2 | ||
| Admiral Shares1 | (567) | (264) |
| Institutional Shares | (1,674) | (984) |
| ETF Shares | (22,349) | (16,426) |
| Total Distributions | (139,122) | (129,577) |
| Capital Share Transactions | ||
| Admiral Shares1 | 176,951 | 7,708 |
| Institutional Shares | 129,002 | (10,832) |
| ETF Shares | 658,982 | 599,923 |
| Net Increase (Decrease) from Capital Share Transactions | 964,935 | 596,799 |
| Total Increase (Decrease) | 1,174,950 | 393,337 |
| Net Assets | ||
| Beginning of Period | 3,380,342 | 2,987,005 |
| End of Period3 | 4,555,292 | 3,380,342 |
1 Signal Shares were renamed Admiral Shares in October 2013. The prior period’s distributions and capital share transactions are for the Signal class.
2 Includes fiscal 2014 and 2013 short-term gain distributions totaling $5,450,000 and $11,000,000, respectively. Short-term gain distributions are treated as ordinary income dividends for tax purposes.
3 Net Assets—End of Period includes undistributed (overdistributed) net investment income of $10,446,000 and ($73,000).
See accompanying Notes, which are an integral part of the Financial Statements.
143
Intermediate-Term Corporate Bond Index Fund
Financial Highlights
| Admiral Shares | |||||
| March 2, | |||||
| 20101 to | |||||
| For a Share Outstanding | Year Ended August 31, | Aug. 31, | |||
| Throughout Each Period | 2014 | 2013 | 2012 | 2011 | 2010 |
| Net Asset Value, Beginning of Period | $22.20 | $23.40 | $21.98 | $21.76 | $20.43 |
| Investment Operations | |||||
| Net Investment Income | .736 | .732 | . 800 | .876 | . 441 |
| Net Realized and Unrealized Gain (Loss) | |||||
| on Investments 2 | 1.355 | (1.085) | 1.437 | .312 | 1.345 |
| Total from Investment Operations | 2.091 | (.353) | 2.237 | 1.188 | 1.786 |
| Distributions | |||||
| Dividends from Net Investment Income | (.734) | (.731) | (.800) | (.875) | (.456) |
| Distributions from Realized Capital Gains | (.157) | (.116) | (. 017) | (. 093) | — |
| Total Distributions | (.891) | (. 847) | (.817) | (.968) | (.456) |
| Net Asset Value, End of Period | $23.40 | $22.20 | $23.40 | $21.98 | $21.76 |
| Total Return3 | 9.60% | -1.62% | 10.41% | 5.65% | 8.86% |
| Ratios/Supplemental Data | |||||
| Net Assets, End of Period (Millions) | $239 | $55 | $51 | $7 | $2 |
| Ratio of Total Expenses to Average Net Assets | 0.12% | 0.12% | 0.12% | 0.14% | 0.15%4 |
| Ratio of Net Investment Income to | |||||
| Average Net Assets | 3.25% | 3.16% | 3.62% | 4.15% | 4.60%4 |
| Portfolio Turnover Rate 5 | 65% | 73% | 69% | 80% | 61% |
Signal Shares were renamed Admiral Shares in October 2013. Prior periods’ Financial Highlights are for the Signal class.
1 Inception.
2 Includes increases from purchase fees of $.01, $.00, $.01, $.02, and $.00
3 Total returns do not include transaction or account service fees that may have applied in the periods shown. Fund prospectuses provide information about any applicable transaction and account service fees.
4 Annualized.
5 Excludes the value of portfolio securities received or delivered as a result of in-kind purchases or redemptions of the fund’s capital shares, including ETF Creation Units.
See accompanying Notes, which are an integral part of the Financial Statements.
144
Intermediate-Term Corporate Bond Index Fund
Financial Highlights
| Institutional Shares | |||||
| Nov. 19, | |||||
| 20091 to | |||||
| For a Share Outstanding | Year Ended August 31, | Aug. 31, | |||
| Throughout Each Period | 2014 | 2013 | 2012 | 2011 | 2010 |
| Net Asset Value, Beginning of Period | $27.44 | $28.93 | $27.17 | $26.90 | $24.97 |
| Investment Operations | |||||
| Net Investment Income | .919 | .913 | .999 | 1.098 | .850 |
| Net Realized and Unrealized Gain (Loss) | |||||
| on Investments 2 | 1.671 | (1.347) | 1.780 | .383 | 1.933 |
| Total from Investment Operations | 2.590 | (.434) | 2.779 | 1.481 | 2.783 |
| Distributions | |||||
| Dividends from Net Investment Income | (. 916) | (. 913) | (. 998) | (1.097) | (.853) |
| Distributions from Realized Capital Gains | (.194) | (.143) | (. 021) | (.114) | — |
| Total Distributions | (1.110) | (1.056) | (1.019) | (1.211) | (.853) |
| Net Asset Value, End of Period | $28.92 | $27.44 | $28.93 | $27.17 | $26.90 |
| Total Return3 | 9.62% | -1.61% | 10.46% | 5.70% | 11.38% |
| Ratios/Supplemental Data | |||||
| Net Assets, End of Period (Millions) | $307 | $164 | $185 | $82 | $12 |
| Ratio of Total Expenses to Average Net Assets | 0.09% | 0.09% | 0.09% | 0.09% | 0.09%4 |
| Ratio of Net Investment Income to | |||||
| Average Net Assets | 3.28% | 3.19% | 3.65% | 4.20% | 4.66%4 |
| Portfolio Turnover Rate 5 | 65% | 73% | 69% | 80% | 61% |
| 1 Inception. 2 Includes increases from purchase fees of $.01, $.00, $.01, $.02, and $.00. 3 Total returns do not include transaction fees that may have applied in the periods shown. Fund prospectuses provide information about any applicable transaction fees. 4 Annualized. 5 Excludes the value of portfolio securities received or delivered as a result of in-kind purchases or redemptions of the fund’s capital shares, including ETF Creation Units. | |||||
See accompanying Notes, which are an integral part of the Financial Statements.
145
Intermediate-Term Corporate Bond Index Fund
Financial Highlights
| ETF Shares | |||||
| Nov. 19, | |||||
| 20091 to | |||||
| For a Share Outstanding | Year Ended August 31, | Aug. 31, | |||
| Throughout Each Period | 2014 | 2013 | 2012 | 2011 | 2010 |
| Net Asset Value, Beginning of Period | $82.31 | $86.78 | $81.49 | $80.67 | $74.90 |
| Investment Operations | |||||
| Net Investment Income | 2.724 | 2.715 | 2.966 | 3.249 | 2.519 |
| Net Realized and Unrealized Gain (Loss) | |||||
| on Investments 2 | 5.024 | (4.042) | 5.350 | 1.162 | 5.778 |
| Total from Investment Operations | 7.748 | (1.327) | 8.316 | 4.411 | 8.297 |
| Distributions | |||||
| Dividends from Net Investment Income | (2.496) | (2.713) | (2.963) | (3.248) | (2.527) |
| Distributions from Realized Capital Gains | (. 582) | (. 430) | (. 063) | (. 343) | — |
| Total Distributions | (3.078) | (3.143) | (3.026) | (3.591) | (2.527) |
| Net Asset Value, End of Period | $86.98 | $82.31 | $86.78 | $81.49 | $80.67 |
| Total Return | 9.60% | -1.64% | 10.43% | 5.65% | 11.30% |
| Ratios/Supplemental Data | |||||
| Net Assets, End of Period (Millions) | $4,010 | $3,161 | $2,751 | $725 | $274 |
| Ratio of Total Expenses to Average Net Assets | 0.12% | 0.12% | 0.12% | 0.14% | 0.15%3 |
| Ratio of Net Investment Income to | |||||
| Average Net Assets | 3.25% | 3.16% | 3.62% | 4.15% | 4.60%3 |
| Portfolio Turnover Rate 4 | 65% | 73% | 69% | 80% | 61% |
| 1 Inception. 2 Includes increases from purchase fees of $.02, $.00, $.03, $.06, and $.01. 3 Annualized. 4 Excludes the value of portfolio securities received or delivered as a result of in-kind purchases or redemptions of the fund’s capital shares, including ETF Creation Units. | |||||
See accompanying Notes, which are an integral part of the Financial Statements.
146
Intermediate-Term Corporate Bond Index Fund
Notes to Financial Statements
Vanguard Intermediate-Term Corporate Bond Index Fund is registered under the Investment Company Act of 1940 as an open-end investment company, or mutual fund. Certain of the fund’s investments are in corporate debt instruments; the issuers’ abilities to meet their obligations may be affected by economic developments in their respective industries. The fund offers three classes of shares: Admiral Shares, Institutional Shares, and ETF Shares. Admiral Shares and Institutional Shares are designed for investors who meet certain administrative, service, and account-size criteria. ETF shares are listed for trading on Nasdaq; they can be purchased and sold through a broker. Effective in October 2013, Signal Shares were renamed Admiral Shares.
A. The following significant accounting policies conform to generally accepted accounting principles for U.S. investment companies. The fund consistently follows such policies in preparing its financial statements.
1. Security Valuation: Securities are valued as of the close of trading on the New York Stock Exchange (generally 4 p.m., Eastern time) on the valuation date. Bonds, and temporary cash investments acquired over 60 days to maturity, are valued using the latest bid prices or using valuations based on a matrix system (which considers such factors as security prices, yields, maturities, and ratings), both as furnished by independent pricing services. Investments in Vanguard Market Liquidity Fund are valued at that fund’s net asset value. Other temporary cash investments are valued at amortized cost, which approximates market value. Securities for which market quotations are not readily available, or whose values have been affected by events occurring before the fund’s pricing time but after the close of the securities’ primary markets, are valued by methods deemed by the board of trustees to represent fair value.
2. Futures Contracts: The fund uses futures contracts to invest in fixed income asset classes with greater efficiency and lower cost than is possible through direct investment, to add value when these instruments are attractively priced, or to adjust sensitivity to changes in interest rates. The primary risks associated with the use of futures contracts are imperfect correlation between changes in market values of bonds held by the fund and the prices of futures contracts, and the possibility of an illiquid market. Counterparty risk involving futures is mitigated because a regulated clearinghouse is the counterparty instead of the clearing broker. To further mitigate counterparty risk, the fund trades futures contracts on an exchange, monitors the financial strength of its clearing brokers and clearinghouse, and has entered into clearing agreements with its clearing brokers. The clearinghouse imposes initial margin requirements to secure the fund’s performance and requires daily settlement of variation margin representing changes in the market value of each contract.
Futures contracts are valued at their quoted daily settlement prices. The aggregate settlement values of the contracts are not recorded in the Statement of Net Assets. Fluctuations in the value of the contracts are recorded in the Statement of Net Assets as an asset (liability) and in the Statement of Operations as unrealized appreciation (depreciation) until the contracts are closed, when they are recorded as realized futures gains (losses).
During the year ended August 31, 2014, the fund’s average investments in long and short futures contracts each represented less than 1% of net assets, based on the average of aggregate settlement values at each quarter-end during the period. The fund had no open futures contracts at August 31, 2014.
147
Intermediate-Term Corporate Bond Index Fund
3. Federal Income Taxes: The fund intends to continue to qualify as a regulated investment company and distribute all of its taxable income. Management has analyzed the fund’s tax positions taken for all open federal income tax years (August 31, 2011–2014), and has concluded that no provision for federal income tax is required in the fund’s financial statements.
4. Distributions: Distributions to shareholders are recorded on the ex-dividend date.
5. Credit Facility: The fund and certain other funds managed by The Vanguard Group participate in a $2.89 billion committed credit facility provided by a syndicate of lenders pursuant to a credit agreement that may be renewed annually; each fund is individually liable for its borrowings, if any, under the credit facility. Borrowings may be utilized for temporary and emergency purposes, and are subject to the fund’s regulatory and contractual borrowing restrictions. The participating funds are charged administrative fees and an annual commitment fee of 0.06% of the undrawn amount of the facility; these fees are allocated to the funds based on a method approved by the fund’s board of trustees and included in Management and Administrative expenses on the fund’s Statement of Operations. Any borrowings under this facility bear interest at a rate equal to the higher of the federal funds rate or LIBOR reference rate plus an agreed-upon spread.
The fund had no borrowings outstanding at August 31, 2014, or at any time during the period then ended.
6. Other: Interest income includes income distributions received from Vanguard Market Liquidity Fund and is accrued daily. Premiums and discounts on debt securities purchased are amortized and accreted, respectively, to interest income over the lives of the respective securities. Security transactions are accounted for on the date securities are bought or sold. Costs used to determine realized gains (losses) on the sale of investment securities are those of the specific securities sold. Fees assessed on purchases of capital shares are credited to paid-in capital.
Each class of shares has equal rights as to assets and earnings, except that each class separately bears certain class-specific expenses related to maintenance of shareholder accounts (included in Management and Administrative expenses) and shareholder reporting. Marketing and distribution expenses are allocated to each class of shares based on a method approved by the board of trustees. Income, other non-class-specific expenses, and gains and losses on investments are allocated to each class of shares based on its relative net assets.
B. The Vanguard Group furnishes at cost investment advisory, corporate management, administrative, marketing, and distribution services. The costs of such services are allocated to the fund based on methods approved by the board of trustees. The fund has committed to provide up to 0.40% of its net assets in capital contributions to Vanguard. At August 31, 2014, the fund had contributed capital of $441,000 to Vanguard (included in Other Assets), representing 0.01% of the fund’s net assets and 0.18% of Vanguard’s capitalization. The fund’s trustees and officers are also directors and officers of Vanguard.
C. Various inputs may be used to determine the value of the fund’s investments. These inputs are summarized in three broad levels for financial statement purposes. The inputs or methodologies used to value securities are not necessarily an indication of the risk associated with investing in those securities.
148
Intermediate-Term Corporate Bond Index Fund
Level 1—Quoted prices in active markets for identical securities.
Level 2—Other significant observable inputs (including quoted prices for similar securities, interest rates, prepayment speeds, credit risk, etc.).
Level 3—Significant unobservable inputs (including the fund’s own assumptions used to determine the fair value of investments).
| The following table summarizes the market value of the fund’s investments as of August 31, 2014, based on the inputs used to value them: | |||
| Level 1 | Level 2 | Level 3 | |
| Investments | ($000) | ($000) | ($000) |
| U.S. Government and Agency Obligations | — | 22,161 | — |
| Corporate Bonds | — | 4,475,877 | — |
| Taxable Municipal Bonds | — | 1,830 | — |
| Temporary Cash Investments | 31,544 | — | — |
| Total | 31,544 | 4,499,868 | — |
D. Distributions are determined on a tax basis and may differ from net investment income and realized capital gains for financial reporting purposes. Differences may be permanent or temporary. Permanent differences are reclassified among capital accounts in the financial statements to reflect their tax character. Temporary differences arise when certain items of income, expense, gain, or loss are recognized in different periods for financial statement and tax purposes. These differences will reverse at some time in the future. Differences in classification may also result from the treatment of short-term gains as ordinary income for tax purposes.
During the year ended August 31, 2014, the fund realized $1,572,000 of net capital gains resulting from in-kind redemptions—in which shareholders exchanged fund shares for securities held by the fund rather than for cash. Because such gains are not taxable to the fund, and are not distributed to shareholders, they have been reclassified from accumulated net realized gains to paid-in capital.
The fund used a tax accounting practice to treat a portion of the price of capital shares redeemed during the year as distributions from realized capital gains. Accordingly, the fund has reclassified $1,197,000 from accumulated net realized gains to paid-in capital.
For tax purposes, at August 31, 2014, the fund had $7,706,000 of long-term capital gains available for distribution.
At August 31, 2014, the cost of investment securities for tax purposes was $4,432,257,000. Net unrealized appreciation of investment securities for tax purposes was $99,155,000, consisting of unrealized gains of $107,916,000 on securities that had risen in value since their purchase and $8,761,000 in unrealized losses on securities that had fallen in value since their purchase.
E. During the year ended August 31, 2014, the fund purchased $2,196,999,000 of investment securities and sold $1,255,784,000 of investment securities, other than U.S. government securities and temporary cash investments. Purchases and sales of U.S. government securities were $1,498,533,000 and $1,480,005,000, respectively. Total purchases and sales include $902,509,000 and $240,344,000, respectively, in connection with in-kind purchases and redemptions of the fund’s capital shares.
149
Intermediate-Term Corporate Bond Index Fund
| F. Capital share transactions for each class of shares were: | |||||
| Year Ended August 31, | |||||
| 2014 | 2013 | ||||
| Amount | Shares | Amount | Shares | ||
| ($000) | (000) | ($000) | (000) | ||
| Admiral Shares1 | |||||
| Issued 2 | 209,876 | 9,151 | 29,059 | 1,246 | |
| Issued in Lieu of Cash Distributions | 4,244 | 185 | 1,849 | 79 | |
| Redeemed | (37,169) | (1,624) | (23,200) | (1,000) | |
| Net Increase (Decrease)—Admiral Shares | 176,951 | 7,712 | 7,708 | 325 | |
| Institutional Shares | |||||
| Issued 2 | 168,157 | 6,007 | 18,952 | 656 | |
| Issued in Lieu of Cash Distributions | 9,054 | 321 | 5,903 | 205 | |
| Redeemed | (48,209) | (1,712) | (35,687) | (1,285) | |
| Net Increase (Decrease) —Institutional Shares | 129,002 | 4,616 | (10,832) | (424) | |
| ETF Shares | |||||
| Issued 2 | 902,718 | 10,600 | 1,435,939 | 16,400 | |
| Issued in Lieu of Cash Distributions | — | — | — | — | |
| Redeemed | (243,736) | (2,900) | (836,016) | (9,700) | |
| Net Increase (Decrease)—ETF Shares | 658,982 | 7,700 | 599,923 | 6,700 | |
| 1 Signal Shares were renamed Admiral Shares in October 2013. Prior periods’ capital share transactions are for the Signal class. 2 Includes purchase fees for fiscal 2014 and 2013 of $980,000 and $235,000, respectively (fund totals). | |||||
G. Management has determined that no material events or transactions occurred subsequent to August 31, 2014, that would require recognition or disclosure in these financial statements.
150
Long-Term Corporate Bond Index Fund
Fund Profile
As of August 31, 2014
| Share-Class Characteristics | |||
| Admiral | Institutional | ETF | |
| Shares | Shares | Shares | |
| Ticker Symbol | VLTCX | VLCIX | VCLT |
| Expense Ratio1 | 0.12% | 0.09% | 0.12% |
| 30-Day SEC Yield | 4.32% | 4.35% | 4.32% |
| Financial Attributes | |||
| Barclays | |||
| 10+ Year | Barclays | ||
| Corporate | Aggregate | ||
| Fund | Index | FA Index | |
| Number of Bonds | 1,348 | 1,496 | 8,876 |
| Yield to Maturity | |||
| (before expenses) | 4.4% | 4.4% | 2.1% |
| Average Coupon | 5.8% | 5.8% | 3.3% |
| Average Duration | 13.9 years | 13.9 years | 5.6 years |
| Average Effective | |||
| Maturity | 24.1 years | 24.0 years | 7.7 years |
| Short-Term | |||
| Reserves | 0.3% | — | — |
| Sector Diversification (% of portfolio) | |
| Finance | 18.8% |
| Industrial | 67.6 |
| Treasury/Agency | 0.2 |
| Utilities | 13.3 |
| Other | 0.1 |
| The agency and mortgage-backed securities sectors may include issues from government-sponsored enterprises; such issues are generally not backed by the full faith and credit of the U.S. government. | |
| Volatility Measures | ||
| Barclays | ||
| 10+ Year | Barclays | |
| Corporate | Aggregate | |
| Index | FA Index | |
| R-Squared | 0.99 | 0.76 |
| Beta | 1.03 | 2.88 |
| These measures show the degree and timing of the fund’s fluctuations compared with the indexes over 36 months. | ||
| Distribution by Effective Maturity | |
| (% of portfolio) | |
| Under 1 Year | 0.3% |
| 5 - 10 Years | 0.7 |
| 10 - 20 Years | 20.7 |
| 20 - 30 Years | 76.0 |
| Over 30 Years | 2.3 |
| Distribution by Credit Quality (% of portfolio) | |
| U.S. Government | 0.2% |
| Aaa | 1.3 |
| Aa | 6.5 |
| A | 44.9 |
| Baa | 47.1 |
| Credit-quality ratings are obtained from Barclays and are from Moody's, Fitch, and S&P. When ratings from all three agencies are used, the median rating is shown. When ratings from two of the agencies are used, the lower rating for each issue is shown. For more information about these ratings, see the Glossary entry for Credit Quality. | |
Investment Focus
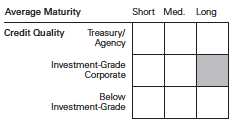
1 The expense ratios shown are from the prospectus dated December 20, 2013, and represent estimated costs for the current fiscal year. For the fiscal year ended August 31, 2014, the expense ratios were 0.12% for Admiral Shares, 0.09% for Institutional Shares, and 0.12% for ETF Shares.
151
Long-Term Corporate Bond Index Fund
Performance Summary
All of the returns in this report represent past performance, which is not a guarantee of future results that may be achieved by the fund. (Current performance may be lower or higher than the performance data cited. For performance data current to the most recent month-end, visit our website at vanguard.com/performance.) Note, too, that both investment returns and principal value can fluctuate widely, so an investor’s shares, when sold, could be worth more or less than their original cost. The returns shown do not reflect taxes that a shareholder would pay on fund distributions or on the sale of fund shares.
Cumulative Performance: November 19, 2009, Through August 31, 2014
Initial Investment of $10,000
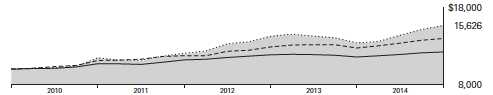
| Average Annual Total Returns | ||||
| Periods Ended August 31, 2014 | ||||
| Since | Final Value | |||
| One | Inception | of a $10,000 | ||
| Year | (11/19/2009) | Investment | ||
| Long-Term Corporate Bond Index | ||||
| Fund ETF Shares Net Asset Value | 17.35% | 9.79% | $15,626 | |
| Long-Term Corporate Bond Index | ||||
| Fund ETF Shares Market Price | 17.77 | 9.78 | 15,624 | |
| Barclays U.S. 10+ Year Corporate | ||||
| •••••••• | Bond Index | 16.80 | 9.79 | 15,625 |
| – – –– | Corporate Debt Funds BBB-Rated | |||
| Average | 9.63 | 7.21 | 13,950 | |
| Spliced Barclays U.S. Aggregate Float | ||||
| Adjusted Index | 5.64 | 4.27 | 12,212 | |
| For a benchmark description, see the Glossary. Corporate Debt Funds BBB-Rated Average: Derived from data provided by Lipper, a Thomson Reuters Company. "Since Inception" performance is calculated from the ETF Shares’ inception date for both the fund and its comparative standards. | ||||
Vanguard fund returns are adjusted to reflect the 1.00% fee on purchases of fund shares. The fee does not apply to the ETF Shares. The Fiscal-Year Total Returns table is not adjusted for fees.
See Financial Highlights for dividend and capital gains information.
152
Long-Term Corporate Bond Index Fund
| Average Annual Total Returns | |||
| Periods Ended August 31, 2014 | |||
| Since | Final Value | ||
| One | Inception | of a $10,000 | |
| Year | (1/19/2010) | Investment | |
| Long-Term Corporate Bond Index Fund | |||
| Admiral Shares | 16.20% | 9.68% | $15,318 |
| Barclays U.S. 10+ Year Corporate Bond Index | 16.80 | 9.95 | 15,490 |
| Barclays U.S. Aggregate Float Adjusted Index | 5.64 | 4.39 | 12,190 |
| "Since Inception" performance is calculated from the Admiral Shares’ inception date for both the fund and its comparative standards. | |||
| Since | Final Value | ||
| One | Inception | of a $5,000,000 | |
| Year | (11/19/2009) | Investment | |
| Long-Term Corporate Bond Index Fund | |||
| Institutional Shares | 16.20% | 9.61% | $7,752,400 |
| Barclays U.S. 10+ Year Corporate Bond | |||
| Index | 16.80 | 9.79 | 7,812,726 |
| Spliced Barclays U.S. Aggregate Float | |||
| Adjusted Index | 5.64 | 4.27 | 6,105,965 |
| "Since Inception" performance is calculated from the Institutional Shares’ inception date for both the fund and its comparative standards. | |||
| Cumulative Returns of ETF Shares: November 19, 2009, Through August 31, 2014 | ||
| Since | ||
| One | Inception | |
| Year | (11/19/2009) | |
| Long-Term Corporate Bond Index Fund ETF Shares | ||
| Market Price | 17.77% | 56.24% |
| Long-Term Corporate Bond Index Fund ETF Shares | ||
| Net Asset Value | 17.35 | 56.26 |
| Barclays U.S. 10+ Year Corporate Bond Index | 16.80 | 56.25 |
| "Since Inception" performance is calculated from the ETF Shares’ inception date for both the fund and its comparative standards. | ||
Vanguard fund returns are adjusted to reflect the 1.00% fee on purchases of fund shares. The fee does not apply to the ETF Shares. The Fiscal-Year Total Returns table is not adjusted for fees.
153
Long-Term Corporate Bond Index Fund
| Fiscal-Year Total Returns (%): November 19, 2009, Through August 31, 2014 | |||
| Barclays | |||
| 10+ Year | |||
| Corporate | |||
| ETF Shares Net Asset Value | Index | ||
| Fiscal Year | Total Returns | Total Returns | |
| 2010 | 14.54% | 14.46% | |
| 2011 | 4.19 | 5.18 | |
| 2012 | 19.40 | 18.33 | |
| 2013 | -6.55 | -6.09 | |
| 2014 | 17.35 | 16.80 | |
| Average Annual Total Returns: Periods Ended June 30, 2014 | |||||
| This table presents returns through the latest calendar quarter—rather than through the end of the fiscal period. Securities and Exchange Commission rules require that we provide this information. | |||||
| Since Inception | |||||
| Inception Date | One Year | Income | Capital | Total | |
| Admiral Shares | 1/19/2010 | 13.15% | 5.24% | 4.27% | 9.51% |
| Fee-Adjusted Returns | 12.02 | 9.26 | |||
| Institutional Shares | 11/19/2009 | 13.18 | 5.25 | 4.19 | 9.44 |
| Fee-Adjusted Returns | 12.05 | 9.20 | |||
| ETF Shares | 11/19/2009 | ||||
| Market Price | 13.41 | 9.40 | |||
| Net Asset Value | 13.15 | 9.39 | |||
Vanguard fund returns are adjusted to reflect the 1.00% fee on purchases of fund shares. The fee does not apply to the ETF Shares. The Fiscal-Year Total Returns table is not adjusted for fees.
154
Long-Term Corporate Bond Index Fund
Financial Statements
Statement of Net Assets
As of August 31, 2014
The fund reports a complete list of its holdings in regulatory filings four times in each fiscal year, at the quarter-ends. For the second and fourth fiscal quarters, the lists appear in the fund’s semiannual and annual reports to shareholders. For the first and third fiscal quarters, the fund files the lists with the Securities and Exchange Commission on Form N-Q. Shareholders can look up the fund’s Forms N-Q on the SEC’s website at sec.gov. Forms N-Q may also be reviewed and copied at the SEC’s Public Reference Room (see the back cover of this report for further information).
| Face | Market | |||
| Maturity | Amount | Value• | ||
| Coupon | Date | ($000) | ($000) | |
| U.S. Government and Agency Obligations (0.7%) | ||||
| U.S. Government Securities (0.7%) | ||||
| United States Treasury Note/Bond | 2.375% | 8/15/24 | 4,810 | 4,824 |
| United States Treasury Note/Bond | 3.375% | 5/15/44 | 3,115 | 3,298 |
| Total U.S. Government and Agency Obligations (Cost $8,101) | 8,122 | |||
| Corporate Bonds (97.8%) | ||||
| Finance (18.6%) | ||||
| Banking (9.4%) | ||||
| American Express Co. | 4.050% | 12/3/42 | 942 | 928 |
| Bank of America Corp. | 6.220% | 9/15/26 | 400 | 464 |
| Bank of America Corp. | 6.750% | 6/1/28 | 640 | 789 |
| Bank of America Corp. | 6.110% | 1/29/37 | 2,425 | 2,868 |
| Bank of America Corp. | 7.750% | 5/14/38 | 2,078 | 2,898 |
| Bank of America Corp. | 5.875% | 2/7/42 | 1,415 | 1,727 |
| Bank of America Corp. | 5.000% | 1/21/44 | 1,725 | 1,873 |
| Bank of America Corp. | 4.875% | 4/1/44 | 1,325 | 1,419 |
| Bank of America NA | 6.000% | 10/15/36 | 1,000 | 1,242 |
| Bank of New York Mellon Corp. | 3.950% | 11/18/25 | 350 | 371 |
| Bank One Capital III | 8.750% | 9/1/30 | 200 | 279 |
| Bank One Corp. | 7.625% | 10/15/26 | 1,170 | 1,558 |
| Citigroup Inc. | 5.500% | 9/13/25 | 1,075 | 1,203 |
| Citigroup Inc. | 6.625% | 1/15/28 | 200 | 250 |
| Citigroup Inc. | 6.625% | 6/15/32 | 1,010 | 1,233 |
| Citigroup Inc. | 5.875% | 2/22/33 | 1,255 | 1,424 |
| Citigroup Inc. | 6.000% | 10/31/33 | 1,095 | 1,259 |
| Citigroup Inc. | 5.850% | 12/11/34 | 516 | 606 |
| Citigroup Inc. | 6.125% | 8/25/36 | 1,610 | 1,892 |
| Citigroup Inc. | 6.875% | 3/5/38 | 1,789 | 2,423 |
| Citigroup Inc. | 8.125% | 7/15/39 | 2,350 | 3,583 |
| Citigroup Inc. | 5.875% | 1/30/42 | 1,155 | 1,414 |
| Citigroup Inc. | 6.675% | 9/13/43 | 1,250 | 1,594 |
| Citigroup Inc. | 5.300% | 5/6/44 | 875 | 939 |
| Comerica Inc. | 3.800% | 7/22/26 | 250 | 252 |
| Cooperatieve Centrale Raiffeisen-Boerenleenbank | ||||
| BA | 5.250% | 5/24/41 | 1,510 | 1,753 |
| Cooperatieve Centrale Raiffeisen-Boerenleenbank | ||||
| BA | 5.750% | 12/1/43 | 1,250 | 1,485 |
| Credit Suisse USA Inc. | 7.125% | 7/15/32 | 600 | 837 |
155
| Long-Term Corporate Bond Index Fund | |||||
| Face | Market | ||||
| Maturity | Amount | Value• | |||
| Coupon | Date | ($000) | ($000) | ||
| Discover Bank | 4.250% | 3/13/26 | 550 | 576 | |
| Fifth Third Bancorp | 8.250% | 3/1/38 | 957 | 1,435 | |
| Goldman Sachs Capital I | 6.345% | 2/15/34 | 1,930 | 2,229 | |
| Goldman Sachs Group Inc. | 5.950% | 1/15/27 | 1,735 | 2,005 | |
| Goldman Sachs Group Inc. | 6.125% | 2/15/33 | 2,465 | 3,037 | |
| Goldman Sachs Group Inc. | 6.450% | 5/1/36 | 1,595 | 1,901 | |
| Goldman Sachs Group Inc. | 6.750% | 10/1/37 | 5,080 | 6,271 | |
| Goldman Sachs Group Inc. | 6.250% | 2/1/41 | 2,580 | 3,235 | |
| Goldman Sachs Group Inc. | 4.800% | 7/8/44 | 400 | 416 | |
| HSBC Bank plc | 7.650% | 5/1/25 | 625 | 810 | |
| HSBC Bank USA NA | 5.875% | 11/1/34 | 1,775 | 2,195 | |
| HSBC Bank USA NA | 5.625% | 8/15/35 | 900 | 1,081 | |
| HSBC Bank USA NA | 7.000% | 1/15/39 | 925 | 1,299 | |
| HSBC Holdings plc | 7.625% | 5/17/32 | 845 | 1,136 | |
| HSBC Holdings plc | 6.500% | 5/2/36 | 1,200 | 1,511 | |
| HSBC Holdings plc | 6.500% | 9/15/37 | 2,160 | 2,740 | |
| HSBC Holdings plc | 6.800% | 6/1/38 | 1,205 | 1,590 | |
| HSBC Holdings plc | 6.100% | 1/14/42 | 710 | 924 | |
| HSBC Holdings plc | 5.250% | 3/14/44 | 1,200 | 1,320 | |
| JPMorgan Chase & Co. | 6.400% | 5/15/38 | 2,295 | 2,973 | |
| JPMorgan Chase & Co. | 5.500% | 10/15/40 | 1,935 | 2,286 | |
| JPMorgan Chase & Co. | 5.600% | 7/15/41 | 2,080 | 2,504 | |
| JPMorgan Chase & Co. | 5.400% | 1/6/42 | 1,105 | 1,293 | |
| JPMorgan Chase & Co. | 5.625% | 8/16/43 | 1,400 | 1,633 | |
| JPMorgan Chase & Co. | 4.850% | 2/1/44 | 750 | 822 | |
| KeyBank NA | 6.950% | 2/1/28 | 450 | 579 | |
| Morgan Stanley | 5.000% | 11/24/25 | 1,625 | 1,741 | |
| Morgan Stanley | 6.250% | 8/9/26 | 300 | 369 | |
| Morgan Stanley | 7.250% | 4/1/32 | 1,130 | 1,540 | |
| Morgan Stanley | 6.375% | 7/24/42 | 2,061 | 2,686 | |
| Northern Trust Corp. | 3.950% | 10/30/25 | 485 | 509 | |
| PNC Bank NA | 4.200% | 11/1/25 | 975 | 1,037 | |
| UBS AG | 7.750% | 9/1/26 | 125 | 165 | |
| Wachovia Bank NA | 6.600% | 1/15/38 | 1,525 | 2,103 | |
| Wachovia Corp. | 6.605% | 10/1/25 | 565 | 693 | |
| Wachovia Corp. | 7.500% | 4/15/35 | 345 | 479 | |
| Wachovia Corp. | 5.500% | 8/1/35 | 1,064 | 1,229 | |
| Wachovia Corp. | 6.550% | 10/15/35 | 25 | 32 | |
| Wells Fargo & Co. | 4.100% | 6/3/26 | 2,350 | 2,404 | |
| Wells Fargo & Co. | 5.375% | 2/7/35 | 1,185 | 1,385 | |
| Wells Fargo & Co. | 5.375% | 11/2/43 | 2,375 | 2,701 | |
| Wells Fargo & Co. | 5.606% | 1/15/44 | 2,240 | 2,649 | |
| Wells Fargo Bank NA | 5.950% | 8/26/36 | 725 | 922 | |
| 1 | Wells Fargo Capital X | 5.950% | 12/1/86 | 920 | 941 |
| Brokerage (0.3%) | |||||
| CME Group Inc. | 5.300% | 9/15/43 | 625 | 731 | |
| Invesco Finance plc | 5.375% | 11/30/43 | 900 | 1,052 | |
| Jefferies Group LLC | 6.450% | 6/8/27 | 400 | 455 | |
| Jefferies Group LLC | 6.250% | 1/15/36 | 435 | 470 | |
| Jefferies Group LLC | 6.500% | 1/20/43 | 400 | 447 | |
| Legg Mason Inc. | 5.625% | 1/15/44 | 475 | 530 | |
| Leucadia National Corp. | 6.625% | 10/23/43 | 250 | 276 | |
| 156 | |||||
| Long-Term Corporate Bond Index Fund | ||||
| Face | Market | |||
| Maturity | Amount | Value• | ||
| Coupon | Date | ($000) | ($000) | |
| Finance Companies (2.0%) | ||||
| GATX Corp. | 5.200% | 3/15/44 | 300 | 330 |
| General Electric Capital Corp. | 5.550% | 1/5/26 | 175 | 205 |
| General Electric Capital Corp. | 6.750% | 3/15/32 | 4,930 | 6,648 |
| General Electric Capital Corp. | 6.150% | 8/7/37 | 2,485 | 3,154 |
| General Electric Capital Corp. | 5.875% | 1/14/38 | 6,090 | 7,565 |
| General Electric Capital Corp. | 6.875% | 1/10/39 | 4,060 | 5,627 |
| Insurance (6.5%) | ||||
| ACE Capital Trust II | 9.700% | 4/1/30 | 240 | 353 |
| ACE INA Holdings Inc. | 4.150% | 3/13/43 | 875 | 885 |
| Aetna Inc. | 6.625% | 6/15/36 | 580 | 760 |
| Aetna Inc. | 6.750% | 12/15/37 | 1,065 | 1,431 |
| Aetna Inc. | 4.500% | 5/15/42 | 455 | 470 |
| Aetna Inc. | 4.125% | 11/15/42 | 700 | 681 |
| Aetna Inc. | 4.750% | 3/15/44 | 625 | 675 |
| Aflac Inc. | 6.900% | 12/17/39 | 145 | 198 |
| Aflac Inc. | 6.450% | 8/15/40 | 850 | 1,110 |
| AIG Life Holdings Inc. | 8.500% | 7/1/30 | 235 | 310 |
| Allstate Corp. | 5.350% | 6/1/33 | 190 | 223 |
| Allstate Corp. | 5.550% | 5/9/35 | 315 | 381 |
| Allstate Corp. | 5.950% | 4/1/36 | 395 | 501 |
| Allstate Corp. | 4.500% | 6/15/43 | 630 | 672 |
| 1 Allstate Corp. | 6.500% | 5/15/67 | 525 | 575 |
| American International Group Inc. | 6.250% | 5/1/36 | 1,335 | 1,706 |
| American International Group Inc. | 4.500% | 7/16/44 | 1,200 | 1,240 |
| 1 American International Group Inc. | 8.175% | 5/15/68 | 2,765 | 3,791 |
| 1 American International Group Inc. | 6.250% | 3/15/87 | 1,135 | 1,271 |
| Aon Corp. | 8.205% | 1/1/27 | 550 | 714 |
| Aon Corp. | 6.250% | 9/30/40 | 385 | 493 |
| Aon plc | 4.450% | 5/24/43 | 350 | 351 |
| Aon plc | 4.600% | 6/14/44 | 500 | 520 |
| Arch Capital Group Ltd. | 7.350% | 5/1/34 | 250 | 348 |
| Arch Capital Group US Inc. | 5.144% | 11/1/43 | 350 | 387 |
| Assurant Inc. | 6.750% | 2/15/34 | 500 | 609 |
| AXA SA | 8.600% | 12/15/30 | 1,110 | 1,498 |
| AXIS Specialty Finance plc | 5.150% | 4/1/45 | 425 | 454 |
| Berkshire Hathaway Finance Corp. | 5.750% | 1/15/40 | 655 | 812 |
| Berkshire Hathaway Finance Corp. | 4.400% | 5/15/42 | 1,170 | 1,214 |
| Berkshire Hathaway Finance Corp. | 4.300% | 5/15/43 | 575 | 589 |
| Berkshire Hathaway Inc. | 4.500% | 2/11/43 | 630 | 666 |
| Chubb Corp. | 6.000% | 5/11/37 | 600 | 773 |
| Chubb Corp. | 6.500% | 5/15/38 | 275 | 377 |
| Cigna Corp. | 7.875% | 5/15/27 | 565 | 745 |
| Cigna Corp. | 5.875% | 3/15/41 | 525 | 648 |
| Cigna Corp. | 5.375% | 2/15/42 | 875 | 1,014 |
| Cincinnati Financial Corp. | 6.920% | 5/15/28 | 300 | 375 |
| Cincinnati Financial Corp. | 6.125% | 11/1/34 | 394 | 477 |
| Endurance Specialty Holdings Ltd. | 7.000% | 7/15/34 | 420 | 514 |
| Everest Reinsurance Holdings Inc. | 4.868% | 6/1/44 | 500 | 503 |
| Genworth Holdings Inc. | 6.500% | 6/15/34 | 735 | 865 |
| Hartford Financial Services Group Inc. | 5.950% | 10/15/36 | 788 | 981 |
| Hartford Financial Services Group Inc. | 6.625% | 3/30/40 | 291 | 389 |
| Hartford Financial Services Group Inc. | 6.100% | 10/1/41 | 280 | 357 |
| Humana Inc. | 8.150% | 6/15/38 | 145 | 213 |
157
| Long-Term Corporate Bond Index Fund | |||||
| Face | Market | ||||
| Maturity | Amount | Value• | |||
| Coupon | Date | ($000) | ($000) | ||
| Humana Inc. | 4.625% | 12/1/42 | 605 | 617 | |
| Lincoln National Corp. | 6.150% | 4/7/36 | 800 | 1,009 | |
| Lincoln National Corp. | 7.000% | 6/15/40 | 395 | 551 | |
| Loews Corp. | 6.000% | 2/1/35 | 690 | 846 | |
| Loews Corp. | 4.125% | 5/15/43 | 100 | 97 | |
| Markel Corp. | 5.000% | 3/30/43 | 325 | 345 | |
| Marsh & McLennan Cos. Inc. | 5.875% | 8/1/33 | 115 | 140 | |
| MetLife Inc. | 6.500% | 12/15/32 | 550 | 728 | |
| MetLife Inc. | 6.375% | 6/15/34 | 640 | 842 | |
| MetLife Inc. | 5.700% | 6/15/35 | 1,020 | 1,253 | |
| MetLife Inc. | 5.875% | 2/6/41 | 695 | 877 | |
| MetLife Inc. | 4.125% | 8/13/42 | 1,225 | 1,210 | |
| MetLife Inc. | 4.875% | 11/13/43 | 585 | 645 | |
| 1 | MetLife Inc. | 6.400% | 12/15/66 | 895 | 1,008 |
| 1 | MetLife Inc. | 10.750% | 8/1/69 | 460 | 743 |
| Munich Re America Corp. | 7.450% | 12/15/26 | 350 | 464 | |
| 1 | Nationwide Financial Services Inc. | 6.750% | 5/15/67 | 365 | 383 |
| Principal Financial Group Inc. | 6.050% | 10/15/36 | 490 | 613 | |
| Principal Financial Group Inc. | 4.625% | 9/15/42 | 75 | 80 | |
| Principal Financial Group Inc. | 4.350% | 5/15/43 | 350 | 354 | |
| Progressive Corp. | 6.625% | 3/1/29 | 538 | 713 | |
| Progressive Corp. | 6.250% | 12/1/32 | 305 | 402 | |
| Progressive Corp. | 4.350% | 4/25/44 | 650 | 673 | |
| Protective Life Corp. | 8.450% | 10/15/39 | 390 | 595 | |
| Prudential Financial Inc. | 5.750% | 7/15/33 | 550 | 659 | |
| Prudential Financial Inc. | 5.400% | 6/13/35 | 545 | 625 | |
| Prudential Financial Inc. | 5.900% | 3/17/36 | 640 | 770 | |
| Prudential Financial Inc. | 5.700% | 12/14/36 | 275 | 329 | |
| Prudential Financial Inc. | 6.625% | 12/1/37 | 1,085 | 1,430 | |
| Prudential Financial Inc. | 6.625% | 6/21/40 | 500 | 663 | |
| Prudential Financial Inc. | 5.100% | 8/15/43 | 1,375 | 1,526 | |
| Prudential Financial Inc. | 4.600% | 5/15/44 | 650 | 676 | |
| Swiss Re Solutions Holding Corp. | 7.000% | 2/15/26 | 370 | 466 | |
| Transatlantic Holdings Inc. | 8.000% | 11/30/39 | 280 | 401 | |
| Travelers Cos. Inc. | 6.750% | 6/20/36 | 555 | 766 | |
| Travelers Cos. Inc. | 6.250% | 6/15/37 | 845 | 1,104 | |
| Travelers Cos. Inc. | 5.350% | 11/1/40 | 676 | 808 | |
| Travelers Cos. Inc. | 4.600% | 8/1/43 | 150 | 162 | |
| Trinity Acquisition plc | 6.125% | 8/15/43 | 275 | 312 | |
| UnitedHealth Group Inc. | 5.800% | 3/15/36 | 685 | 858 | |
| UnitedHealth Group Inc. | 6.500% | 6/15/37 | 515 | 692 | |
| UnitedHealth Group Inc. | 6.625% | 11/15/37 | 755 | 1,022 | |
| UnitedHealth Group Inc. | 6.875% | 2/15/38 | 785 | 1,087 | |
| UnitedHealth Group Inc. | 5.700% | 10/15/40 | 10 | 12 | |
| UnitedHealth Group Inc. | 5.950% | 2/15/41 | 585 | 745 | |
| UnitedHealth Group Inc. | 4.625% | 11/15/41 | 863 | 925 | |
| UnitedHealth Group Inc. | 4.375% | 3/15/42 | 305 | 313 | |
| UnitedHealth Group Inc. | 3.950% | 10/15/42 | 1,025 | 988 | |
| UnitedHealth Group Inc. | 4.250% | 3/15/43 | 650 | 657 | |
| Unum Group | 5.750% | 8/15/42 | 300 | 361 | |
| Validus Holdings Ltd. | 8.875% | 1/26/40 | 285 | 411 | |
| Voya Financial Inc. | 5.700% | 7/15/43 | 350 | 417 | |
| WellPoint Inc. | 5.950% | 12/15/34 | 666 | 806 | |
| WellPoint Inc. | 5.850% | 1/15/36 | 945 | 1,135 | |
| WellPoint Inc. | 6.375% | 6/15/37 | 695 | 883 | |
| 158 | |||||
| Long-Term Corporate Bond Index Fund | ||||
| Face | Market | |||
| Maturity | Amount | Value• | ||
| Coupon | Date | ($000) | ($000) | |
| WellPoint Inc. | 4.625% | 5/15/42 | 1,285 | 1,308 |
| WellPoint Inc. | 4.650% | 1/15/43 | 1,150 | 1,181 |
| XLIT Ltd. | 6.375% | 11/15/24 | 405 | 492 |
| XLIT Ltd. | 6.250% | 5/15/27 | 280 | 337 |
| XLIT Ltd. | 5.250% | 12/15/43 | 725 | 816 |
| Real Estate Investment Trusts (0.4%) | ||||
| Alexandria Real Estate Equities Inc. | 4.500% | 7/30/29 | 350 | 361 |
| ERP Operating LP | 4.500% | 7/1/44 | 525 | 535 |
| HCP Inc. | 6.750% | 2/1/41 | 365 | 486 |
| Health Care REIT Inc. | 6.500% | 3/15/41 | 575 | 739 |
| Health Care REIT Inc. | 5.125% | 3/15/43 | 225 | 245 |
| Kilroy Realty LP | 4.250% | 8/15/29 | 475 | 481 |
| Realty Income Corp. | 5.875% | 3/15/35 | 385 | 452 |
| Simon Property Group LP | 6.750% | 2/1/40 | 420 | 582 |
| Simon Property Group LP | 4.750% | 3/15/42 | 465 | 509 |
| Ventas Realty LP | 5.700% | 9/30/43 | 250 | 297 |
| 217,576 | ||||
| Industrial (66.2%) | ||||
| Basic Industry (6.0%) | ||||
| Agrium Inc. | 7.125% | 5/23/36 | 430 | 578 |
| Agrium Inc. | 6.125% | 1/15/41 | 450 | 549 |
| Agrium Inc. | 4.900% | 6/1/43 | 800 | 851 |
| Barrick Gold Corp. | 5.250% | 4/1/42 | 815 | 821 |
| Barrick North America Finance LLC | 7.500% | 9/15/38 | 265 | 327 |
| Barrick North America Finance LLC | 5.700% | 5/30/41 | 1,425 | 1,505 |
| Barrick North America Finance LLC | 5.750% | 5/1/43 | 850 | 918 |
| Barrick PD Australia Finance Pty Ltd. | 5.950% | 10/15/39 | 820 | 899 |
| BHP Billiton Finance USA Ltd. | 6.420% | 3/1/26 | 300 | 374 |
| BHP Billiton Finance USA Ltd. | 4.125% | 2/24/42 | 1,005 | 1,015 |
| BHP Billiton Finance USA Ltd. | 5.000% | 9/30/43 | 2,875 | 3,308 |
| CF Industries Inc. | 5.150% | 3/15/34 | 700 | 767 |
| CF Industries Inc. | 4.950% | 6/1/43 | 825 | 848 |
| CF Industries Inc. | 5.375% | 3/15/44 | 650 | 717 |
| Domtar Corp. | 6.250% | 9/1/42 | 225 | 248 |
| Domtar Corp. | 6.750% | 2/15/44 | 175 | 206 |
| Dow Chemical Co. | 7.375% | 11/1/29 | 485 | 662 |
| Dow Chemical Co. | 9.400% | 5/15/39 | 770 | 1,294 |
| Dow Chemical Co. | 5.250% | 11/15/41 | 505 | 558 |
| Dow Chemical Co. | 4.375% | 11/15/42 | 1,650 | 1,632 |
| Eastman Chemical Co. | 4.800% | 9/1/42 | 480 | 504 |
| Eastman Chemical Co. | 4.650% | 10/15/44 | 550 | 558 |
| Ecolab Inc. | 5.500% | 12/8/41 | 695 | 819 |
| EI du Pont de Nemours & Co. | 6.500% | 1/15/28 | 450 | 582 |
| EI du Pont de Nemours & Co. | 4.900% | 1/15/41 | 810 | 905 |
| EI du Pont de Nemours & Co. | 4.150% | 2/15/43 | 725 | 726 |
| Freeport-McMoRan Inc. | 5.450% | 3/15/43 | 2,005 | 2,173 |
| Georgia-Pacific LLC | 7.375% | 12/1/25 | 402 | 532 |
| Georgia-Pacific LLC | 7.250% | 6/1/28 | 305 | 407 |
| Georgia-Pacific LLC | 7.750% | 11/15/29 | 540 | 762 |
| Georgia-Pacific LLC | 8.875% | 5/15/31 | 365 | 558 |
| Glencore Canada Corp. | 6.200% | 6/15/35 | 175 | 195 |
| Goldcorp Inc. | 5.450% | 6/9/44 | 500 | 536 |
| International Paper Co. | 8.700% | 6/15/38 | 275 | 421 |
| International Paper Co. | 7.300% | 11/15/39 | 585 | 803 |
159
| Long-Term Corporate Bond Index Fund | ||||
| Face | Market | |||
| Maturity | Amount | Value• | ||
| Coupon | Date | ($000) | ($000) | |
| International Paper Co. | 6.000% | 11/15/41 | 590 | 708 |
| International Paper Co. | 4.800% | 6/15/44 | 850 | 883 |
| Kinross Gold Corp. | 6.875% | 9/1/41 | 260 | 270 |
| Lubrizol Corp. | 6.500% | 10/1/34 | 240 | 322 |
| LYB International Finance BV | 5.250% | 7/15/43 | 625 | 705 |
| LYB International Finance BV | 4.875% | 3/15/44 | 1,325 | 1,429 |
| Monsanto Co. | 5.500% | 8/15/25 | 360 | 432 |
| Monsanto Co. | 4.200% | 7/15/34 | 1,200 | 1,246 |
| Monsanto Co. | 5.875% | 4/15/38 | 230 | 286 |
| Monsanto Co. | 3.600% | 7/15/42 | 895 | 812 |
| Monsanto Co. | 4.400% | 7/15/44 | 600 | 621 |
| Monsanto Co. | 4.700% | 7/15/64 | 720 | 751 |
| Mosaic Co. | 5.450% | 11/15/33 | 500 | 571 |
| Mosaic Co. | 4.875% | 11/15/41 | 145 | 151 |
| Mosaic Co. | 5.625% | 11/15/43 | 700 | 811 |
| Newmont Mining Corp. | 5.875% | 4/1/35 | 230 | 242 |
| Newmont Mining Corp. | 6.250% | 10/1/39 | 940 | 1,019 |
| Newmont Mining Corp. | 4.875% | 3/15/42 | 1,260 | 1,169 |
| Nucor Corp. | 6.400% | 12/1/37 | 480 | 602 |
| Nucor Corp. | 5.200% | 8/1/43 | 575 | 631 |
| Placer Dome Inc. | 6.450% | 10/15/35 | 50 | 57 |
| Potash Corp. of Saskatchewan Inc. | 5.875% | 12/1/36 | 460 | 569 |
| Potash Corp. of Saskatchewan Inc. | 5.625% | 12/1/40 | 635 | 777 |
| PPG Industries Inc. | 7.700% | 3/15/38 | 270 | 395 |
| PPG Industries Inc. | 5.500% | 11/15/40 | 160 | 193 |
| Praxair Inc. | 3.550% | 11/7/42 | 400 | 373 |
| Reliance Steel & Aluminum Co. | 6.850% | 11/15/36 | 35 | 41 |
| Rio Tinto Alcan Inc. | 7.250% | 3/15/31 | 480 | 641 |
| Rio Tinto Alcan Inc. | 6.125% | 12/15/33 | 669 | 833 |
| Rio Tinto Alcan Inc. | 5.750% | 6/1/35 | 535 | 622 |
| Rio Tinto Finance USA Ltd. | 7.125% | 7/15/28 | 665 | 883 |
| Rio Tinto Finance USA Ltd. | 5.200% | 11/2/40 | 420 | 474 |
| Rio Tinto Finance USA plc | 4.750% | 3/22/42 | 290 | 309 |
| Rio Tinto Finance USA plc | 4.125% | 8/21/42 | 1,150 | 1,114 |
| Rohm & Haas Co. | 7.850% | 7/15/29 | 735 | 1,032 |
| Southern Copper Corp. | 7.500% | 7/27/35 | 1,495 | 1,824 |
| Southern Copper Corp. | 6.750% | 4/16/40 | 990 | 1,131 |
| Southern Copper Corp. | 5.250% | 11/8/42 | 620 | 606 |
| Syngenta Finance NV | 4.375% | 3/28/42 | 225 | 233 |
| Teck Resources Ltd. | 6.125% | 10/1/35 | 1,280 | 1,402 |
| Teck Resources Ltd. | 6.000% | 8/15/40 | 570 | 611 |
| Teck Resources Ltd. | 6.250% | 7/15/41 | 485 | 536 |
| Teck Resources Ltd. | 5.200% | 3/1/42 | 788 | 773 |
| Teck Resources Ltd. | 5.400% | 2/1/43 | 375 | 381 |
| Vale Canada Ltd. | 7.200% | 9/15/32 | 660 | 762 |
| Vale Overseas Ltd. | 8.250% | 1/17/34 | 745 | 979 |
| Vale Overseas Ltd. | 6.875% | 11/21/36 | 2,360 | 2,774 |
| Vale Overseas Ltd. | 6.875% | 11/10/39 | 1,730 | 2,066 |
| Vale SA | 5.625% | 9/11/42 | 1,410 | 1,454 |
| Westvaco Corp. | 8.200% | 1/15/30 | 250 | 334 |
| Westvaco Corp. | 7.950% | 2/15/31 | 500 | 657 |
| Weyerhaeuser Co. | 8.500% | 1/15/25 | 250 | 341 |
| Weyerhaeuser Co. | 6.950% | 10/1/27 | 200 | 253 |
| Weyerhaeuser Co. | 7.375% | 3/15/32 | 955 | 1,317 |
| Weyerhaeuser Co. | 6.875% | 12/15/33 | 725 | 972 |
| Worthington Industries Inc. | 4.550% | 4/15/26 | 200 | 210 |
160
| Long-Term Corporate Bond Index Fund | ||||
| Face | Market | |||
| Maturity | Amount | Value• | ||
| Coupon | Date | ($000) | ($000) | |
| Capital Goods (4.3%) | ||||
| 3M Co. | 6.375% | 2/15/28 | 550 | 734 |
| 3M Co. | 5.700% | 3/15/37 | 585 | 752 |
| ABB Finance USA Inc. | 4.375% | 5/8/42 | 550 | 581 |
| Boeing Co. | 6.125% | 2/15/33 | 380 | 500 |
| Boeing Co. | 6.875% | 3/15/39 | 270 | 392 |
| Boeing Co. | 5.875% | 2/15/40 | 1,050 | 1,364 |
| Caterpillar Inc. | 5.300% | 9/15/35 | 350 | 419 |
| Caterpillar Inc. | 6.050% | 8/15/36 | 990 | 1,266 |
| Caterpillar Inc. | 3.803% | 8/15/42 | 1,605 | 1,546 |
| Caterpillar Inc. | 4.300% | 5/15/44 | 700 | 727 |
| Caterpillar Inc. | 4.750% | 5/15/64 | 450 | 483 |
| Deere & Co. | 5.375% | 10/16/29 | 695 | 838 |
| Deere & Co. | 8.100% | 5/15/30 | 300 | 447 |
| Deere & Co. | 3.900% | 6/9/42 | 1,635 | 1,615 |
| Dover Corp. | 6.600% | 3/15/38 | 500 | 693 |
| Dover Corp. | 5.375% | 3/1/41 | 680 | 828 |
| Eaton Corp. | 4.000% | 11/2/32 | 625 | 638 |
| Eaton Corp. | 4.150% | 11/2/42 | 1,100 | 1,096 |
| Emerson Electric Co. | 6.000% | 8/15/32 | 160 | 207 |
| Emerson Electric Co. | 6.125% | 4/15/39 | 140 | 186 |
| Emerson Electric Co. | 5.250% | 11/15/39 | 335 | 402 |
| General Dynamics Corp. | 3.600% | 11/15/42 | 400 | 381 |
| General Electric Co. | 4.125% | 10/9/42 | 1,650 | 1,690 |
| General Electric Co. | 4.500% | 3/11/44 | 2,400 | 2,610 |
| Honeywell International Inc. | 5.700% | 3/15/37 | 915 | 1,149 |
| Honeywell International Inc. | 5.375% | 3/1/41 | 740 | 904 |
| Illinois Tool Works Inc. | 4.875% | 9/15/41 | 639 | 711 |
| Illinois Tool Works Inc. | 3.900% | 9/1/42 | 1,156 | 1,127 |
| Ingersoll-Rand Global Holding Co. Ltd. | 5.750% | 6/15/43 | 475 | 575 |
| Legrand France SA | 8.500% | 2/15/25 | 385 | 541 |
| Lockheed Martin Corp. | 6.150% | 9/1/36 | 985 | 1,265 |
| Lockheed Martin Corp. | 5.500% | 11/15/39 | 525 | 639 |
| Lockheed Martin Corp. | 5.720% | 6/1/40 | 635 | 790 |
| Lockheed Martin Corp. | 4.850% | 9/15/41 | 805 | 893 |
| Lockheed Martin Corp. | 4.070% | 12/15/42 | 450 | 447 |
| Northrop Grumman Corp. | 5.050% | 11/15/40 | 540 | 605 |
| Northrop Grumman Corp. | 4.750% | 6/1/43 | 1,000 | 1,072 |
| Northrop Grumman Systems Corp. | 7.750% | 2/15/31 | 560 | 794 |
| Owens Corning | 7.000% | 12/1/36 | 590 | 732 |
| Parker Hannifin Corp. | 6.250% | 5/15/38 | 140 | 186 |
| Precision Castparts Corp. | 3.900% | 1/15/43 | 475 | 472 |
| Raytheon Co. | 7.200% | 8/15/27 | 455 | 615 |
| Raytheon Co. | 4.875% | 10/15/40 | 275 | 309 |
| Raytheon Co. | 4.700% | 12/15/41 | 710 | 778 |
| Republic Services Inc. | 6.200% | 3/1/40 | 750 | 946 |
| Republic Services Inc. | 5.700% | 5/15/41 | 730 | 878 |
| Rockwell Automation Inc. | 6.700% | 1/15/28 | 135 | 176 |
| Rockwell Automation Inc. | 6.250% | 12/1/37 | 330 | 433 |
| Rockwell Collins Inc. | 4.800% | 12/15/43 | 250 | 279 |
| Sonoco Products Co. | 5.750% | 11/1/40 | 595 | 697 |
| Stanley Black & Decker Inc. | 5.200% | 9/1/40 | 315 | 367 |
| United Technologies Corp. | 6.700% | 8/1/28 | 400 | 536 |
| United Technologies Corp. | 7.500% | 9/15/29 | 855 | 1,239 |
| United Technologies Corp. | 5.400% | 5/1/35 | 500 | 608 |
161
| Long-Term Corporate Bond Index Fund | ||||
| Face | Market | |||
| Maturity | Amount | Value• | ||
| Coupon | Date | ($000) | ($000) | |
| United Technologies Corp. | 6.125% | 7/15/38 | 1,040 | 1,356 |
| United Technologies Corp. | 5.700% | 4/15/40 | 1,405 | 1,764 |
| United Technologies Corp. | 4.500% | 6/1/42 | 3,750 | 4,041 |
| Waste Management Inc. | 7.100% | 8/1/26 | 415 | 555 |
| Waste Management Inc. | 7.000% | 7/15/28 | 646 | 859 |
| Waste Management Inc. | 7.750% | 5/15/32 | 350 | 505 |
| Waste Management Inc. | 6.125% | 11/30/39 | 655 | 845 |
| Communication (16.6%) | ||||
| 21st Century Fox America Inc. | 6.550% | 3/15/33 | 335 | 425 |
| 21st Century Fox America Inc. | 6.200% | 12/15/34 | 715 | 888 |
| 21st Century Fox America Inc. | 6.400% | 12/15/35 | 1,265 | 1,612 |
| 21st Century Fox America Inc. | 6.150% | 3/1/37 | 975 | 1,190 |
| 21st Century Fox America Inc. | 6.650% | 11/15/37 | 1,395 | 1,788 |
| 21st Century Fox America Inc. | 6.900% | 8/15/39 | 810 | 1,074 |
| 21st Century Fox America Inc. | 6.150% | 2/15/41 | 1,775 | 2,196 |
| 21st Century Fox America Inc. | 5.400% | 10/1/43 | 600 | 691 |
| 21st Century Fox America Inc. | 7.750% | 12/1/45 | 985 | 1,470 |
| America Movil SAB de CV | 6.375% | 3/1/35 | 1,055 | 1,312 |
| America Movil SAB de CV | 6.125% | 11/15/37 | 800 | 976 |
| America Movil SAB de CV | 6.125% | 3/30/40 | 1,925 | 2,355 |
| America Movil SAB de CV | 4.375% | 7/16/42 | 575 | 565 |
| Ameritech Capital Funding Corp. | 6.550% | 1/15/28 | 385 | 464 |
| AT&T Corp. | 8.000% | 11/15/31 | 1,105 | 1,652 |
| AT&T Inc. | 6.150% | 9/15/34 | 867 | 1,065 |
| AT&T Inc. | 6.500% | 9/1/37 | 837 | 1,058 |
| AT&T Inc. | 6.300% | 1/15/38 | 2,185 | 2,702 |
| AT&T Inc. | 6.400% | 5/15/38 | 660 | 828 |
| AT&T Inc. | 6.550% | 2/15/39 | 1,605 | 2,055 |
| AT&T Inc. | 5.350% | 9/1/40 | 2,940 | 3,276 |
| AT&T Inc. | 5.550% | 8/15/41 | 2,206 | 2,516 |
| AT&T Inc. | 4.300% | 12/15/42 | 1,713 | 1,671 |
| AT&T Inc. | 4.800% | 6/15/44 | 1,645 | 1,719 |
| AT&T Inc. | 4.350% | 6/15/45 | 3,289 | 3,206 |
| AT&T Mobility LLC | 7.125% | 12/15/31 | 560 | 762 |
| Bellsouth Capital Funding Corp. | 7.875% | 2/15/30 | 323 | 443 |
| Bellsouth Capital Funding Corp. | 7.120% | 7/15/97 | 200 | 233 |
| BellSouth Corp. | 6.875% | 10/15/31 | 498 | 624 |
| BellSouth Corp. | 6.550% | 6/15/34 | 245 | 303 |
| BellSouth Telecommunications LLC | 6.375% | 6/1/28 | 165 | 197 |
| British Telecommunications plc | 9.625% | 12/15/30 | 2,602 | 4,210 |
| CBS Corp. | 7.875% | 7/30/30 | 436 | 601 |
| CBS Corp. | 5.500% | 5/15/33 | 735 | 818 |
| CBS Corp. | 5.900% | 10/15/40 | 500 | 590 |
| CBS Corp. | 4.850% | 7/1/42 | 495 | 499 |
| Comcast Corp. | 3.375% | 2/15/25 | 950 | 961 |
| Comcast Corp. | 4.250% | 1/15/33 | 1,380 | 1,435 |
| Comcast Corp. | 7.050% | 3/15/33 | 1,035 | 1,428 |
| Comcast Corp. | 4.200% | 8/15/34 | 950 | 976 |
| Comcast Corp. | 5.650% | 6/15/35 | 1,035 | 1,256 |
| Comcast Corp. | 6.500% | 11/15/35 | 760 | 1,005 |
| Comcast Corp. | 6.450% | 3/15/37 | 1,285 | 1,687 |
| Comcast Corp. | 6.950% | 8/15/37 | 1,450 | 2,001 |
| Comcast Corp. | 6.400% | 5/15/38 | 1,255 | 1,644 |
| Comcast Corp. | 6.550% | 7/1/39 | 1,111 | 1,486 |
162
| Long-Term Corporate Bond Index Fund | ||||
| Face | Market | |||
| Maturity | Amount | Value• | ||
| Coupon | Date | ($000) | ($000) | |
| Comcast Corp. | 6.400% | 3/1/40 | 950 | 1,250 |
| Comcast Corp. | 4.650% | 7/15/42 | 1,700 | 1,824 |
| Comcast Corp. | 4.500% | 1/15/43 | 600 | 628 |
| Comcast Corp. | 4.750% | 3/1/44 | 825 | 903 |
| Deutsche Telekom International Finance BV | 8.750% | 6/15/30 | 3,070 | 4,602 |
| Deutsche Telekom International Finance BV | 9.250% | 6/1/32 | 590 | 949 |
| DIRECTV Holdings LLC / DIRECTV Financing | ||||
| Co. Inc. | 6.000% | 8/15/40 | 1,160 | 1,377 |
| DIRECTV Holdings LLC / DIRECTV Financing | ||||
| Co. Inc. | 6.375% | 3/1/41 | 680 | 845 |
| DIRECTV Holdings LLC / DIRECTV Financing | ||||
| Co. Inc. | 5.150% | 3/15/42 | 1,835 | 1,979 |
| Discovery Communications LLC | 6.350% | 6/1/40 | 960 | 1,183 |
| Discovery Communications LLC | 4.950% | 5/15/42 | 500 | 525 |
| Discovery Communications LLC | 4.875% | 4/1/43 | 650 | 679 |
| Embarq Corp. | 7.995% | 6/1/36 | 1,955 | 2,208 |
| Grupo Televisa SAB | 6.625% | 3/18/25 | 510 | 628 |
| Grupo Televisa SAB | 8.500% | 3/11/32 | 540 | 770 |
| Grupo Televisa SAB | 6.625% | 1/15/40 | 500 | 613 |
| Grupo Televisa SAB | 5.000% | 5/13/45 | 600 | 621 |
| GTE Corp. | 6.940% | 4/15/28 | 1,180 | 1,470 |
| Historic TW Inc. | 6.625% | 5/15/29 | 1,540 | 1,958 |
| Koninklijke KPN NV | 8.375% | 10/1/30 | 500 | 719 |
| McGraw Hill Financial Inc. | 6.550% | 11/15/37 | 400 | 425 |
| Moody’s Corp. | 5.250% | 7/15/44 | 450 | 480 |
| NBCUniversal Media LLC | 6.400% | 4/30/40 | 990 | 1,309 |
| NBCUniversal Media LLC | 5.950% | 4/1/41 | 1,245 | 1,566 |
| NBCUniversal Media LLC | 4.450% | 1/15/43 | 750 | 785 |
| New Cingular Wireless Services Inc. | 8.750% | 3/1/31 | 795 | 1,207 |
| Orange SA | 9.000% | 3/1/31 | 2,125 | 3,244 |
| Orange SA | 5.375% | 1/13/42 | 1,035 | 1,158 |
| Orange SA | 5.500% | 2/6/44 | 860 | 984 |
| Pacific Bell Telephone Co. | 7.125% | 3/15/26 | 630 | 820 |
| Qwest Corp. | 7.200% | 11/10/26 | 30 | 30 |
| Qwest Corp. | 6.875% | 9/15/33 | 1,495 | 1,510 |
| Qwest Corp. | 7.125% | 11/15/43 | 85 | 86 |
| Rogers Communications Inc. | 7.500% | 8/15/38 | 225 | 309 |
| Rogers Communications Inc. | 4.500% | 3/15/43 | 825 | 825 |
| Rogers Communications Inc. | 5.450% | 10/1/43 | 350 | 393 |
| Rogers Communications Inc. | 5.000% | 3/15/44 | 800 | 859 |
| TCI Communications Inc. | 7.875% | 2/15/26 | 390 | 544 |
| TCI Communications Inc. | 7.125% | 2/15/28 | 220 | 294 |
| Telefonica Emisiones SAU | 7.045% | 6/20/36 | 2,490 | 3,246 |
| Telefonica Europe BV | 8.250% | 9/15/30 | 935 | 1,302 |
| Thomson Reuters Corp. | 5.500% | 8/15/35 | 200 | 223 |
| Thomson Reuters Corp. | 5.850% | 4/15/40 | 890 | 1,029 |
| Thomson Reuters Corp. | 4.500% | 5/23/43 | 300 | 293 |
| Thomson Reuters Corp. | 5.650% | 11/23/43 | 700 | 799 |
| Time Warner Cable Inc. | 6.550% | 5/1/37 | 1,425 | 1,832 |
| Time Warner Cable Inc. | 7.300% | 7/1/38 | 1,300 | 1,804 |
| Time Warner Cable Inc. | 6.750% | 6/15/39 | 1,520 | 1,992 |
| Time Warner Cable Inc. | 5.875% | 11/15/40 | 960 | 1,162 |
| Time Warner Cable Inc. | 5.500% | 9/1/41 | 1,536 | 1,774 |
| Time Warner Cable Inc. | 4.500% | 9/15/42 | 1,275 | 1,297 |
| Time Warner Cos. Inc. | 6.950% | 1/15/28 | 85 | 109 |
163
| Long-Term Corporate Bond Index Fund | |||||
| Face | Market | ||||
| Maturity | Amount | Value• | |||
| Coupon | Date | ($000) | ($000) | ||
| Time Warner Entertainment Co. LP | 8.375% | 7/15/33 | 1,050 | 1,577 | |
| Time Warner Inc. | 7.625% | 4/15/31 | 1,810 | 2,508 | |
| Time Warner Inc. | 7.700% | 5/1/32 | 1,655 | 2,328 | |
| Time Warner Inc. | 6.500% | 11/15/36 | 840 | 1,051 | |
| Time Warner Inc. | 6.200% | 3/15/40 | 475 | 575 | |
| Time Warner Inc. | 6.100% | 7/15/40 | 985 | 1,181 | |
| Time Warner Inc. | 6.250% | 3/29/41 | 685 | 840 | |
| Time Warner Inc. | 5.375% | 10/15/41 | 1,000 | 1,107 | |
| Time Warner Inc. | 4.900% | 6/15/42 | 855 | 892 | |
| Time Warner Inc. | 5.350% | 12/15/43 | 375 | 415 | |
| Time Warner Inc. | 4.650% | 6/1/44 | 1,025 | 1,038 | |
| Verizon Communications Inc. | 7.750% | 12/1/30 | 1,300 | 1,826 | |
| Verizon Communications Inc. | 6.400% | 9/15/33 | 4,625 | 5,842 | |
| Verizon Communications Inc. | 5.050% | 3/15/34 | 1,100 | 1,203 | |
| Verizon Communications Inc. | 5.850% | 9/15/35 | 1,425 | 1,692 | |
| Verizon Communications Inc. | 6.250% | 4/1/37 | 120 | 149 | |
| Verizon Communications Inc. | 6.400% | 2/15/38 | 2,350 | 2,944 | |
| Verizon Communications Inc. | 6.900% | 4/15/38 | 1,340 | 1,767 | |
| Verizon Communications Inc. | 7.350% | 4/1/39 | 450 | 626 | |
| Verizon Communications Inc. | 6.000% | 4/1/41 | 1,040 | 1,256 | |
| Verizon Communications Inc. | 4.750% | 11/1/41 | 1,205 | 1,236 | |
| Verizon Communications Inc. | 3.850% | 11/1/42 | 1,295 | 1,176 | |
| Verizon Communications Inc. | 6.550% | 9/15/43 | 10,487 | 13,539 | |
| 2 | Verizon Communications Inc. | 4.862% | 8/21/46 | 4,433 | 4,640 |
| 2 | Verizon Communications Inc. | 5.012% | 8/21/54 | 5,400 | 5,670 |
| Verizon Florida LLC | 6.860% | 2/1/28 | 250 | 300 | |
| Verizon Maryland LLC | 5.125% | 6/15/33 | 895 | 937 | |
| Verizon New England Inc. | 7.875% | 11/15/29 | 50 | 65 | |
| Verizon New York Inc. | 7.375% | 4/1/32 | 1,062 | 1,349 | |
| Viacom Inc. | 6.875% | 4/30/36 | 1,025 | 1,319 | |
| Viacom Inc. | 4.375% | 3/15/43 | 1,270 | 1,196 | |
| Viacom Inc. | 5.850% | 9/1/43 | 1,775 | 2,061 | |
| Viacom Inc. | 5.250% | 4/1/44 | 300 | 324 | |
| Vodafone Group plc | 7.875% | 2/15/30 | 935 | 1,321 | |
| Vodafone Group plc | 6.250% | 11/30/32 | 365 | 452 | |
| Vodafone Group plc | 6.150% | 2/27/37 | 1,485 | 1,800 | |
| Vodafone Group plc | 4.375% | 2/19/43 | 1,300 | 1,268 | |
| Walt Disney Co. | 7.000% | 3/1/32 | 885 | 1,246 | |
| Walt Disney Co. | 4.125% | 12/1/41 | 385 | 392 | |
| Walt Disney Co. | 3.700% | 12/1/42 | 850 | 807 | |
| Walt Disney Co. | 4.125% | 6/1/44 | 125 | 128 | |
| WPP Finance 2010 | 5.125% | 9/7/42 | 275 | 288 | |
| WPP Finance 2010 | 5.625% | 11/15/43 | 400 | 448 | |
| Consumer Cyclical (6.0%) | |||||
| Bed Bath & Beyond Inc. | 4.915% | 8/1/34 | 300 | 314 | |
| Bed Bath & Beyond Inc. | 5.165% | 8/1/44 | 675 | 703 | |
| Cummins Inc. | 7.125% | 3/1/28 | 725 | 978 | |
| Cummins Inc. | 4.875% | 10/1/43 | 175 | 199 | |
| CVS Health Corp. | 6.125% | 9/15/39 | 880 | 1,136 | |
| CVS Health Corp. | 5.750% | 5/15/41 | 1,014 | 1,244 | |
| CVS Health Corp. | 5.300% | 12/5/43 | 950 | 1,109 | |
| Daimler Finance North America LLC | 8.500% | 1/18/31 | 1,460 | 2,243 | |
| Darden Restaurants Inc. | 6.800% | 10/15/37 | 100 | 114 | |
| eBay Inc. | 4.000% | 7/15/42 | 650 | 596 | |
| 164 | |||||
| Long-Term Corporate Bond Index Fund | ||||
| Face | Market | |||
| Maturity | Amount | Value• | ||
| Coupon | Date | ($000) | ($000) | |
| Ford Motor Co. | 6.625% | 10/1/28 | 1,075 | 1,339 |
| Ford Motor Co. | 6.375% | 2/1/29 | 475 | 576 |
| Ford Motor Co. | 7.450% | 7/16/31 | 2,160 | 2,944 |
| Ford Motor Co. | 4.750% | 1/15/43 | 1,675 | 1,755 |
| Ford Motor Co. | 7.400% | 11/1/46 | 645 | 908 |
| Home Depot Inc. | 5.875% | 12/16/36 | 2,250 | 2,860 |
| Home Depot Inc. | 5.400% | 9/15/40 | 955 | 1,144 |
| Home Depot Inc. | 5.950% | 4/1/41 | 1,065 | 1,373 |
| Home Depot Inc. | 4.200% | 4/1/43 | 1,375 | 1,405 |
| Home Depot Inc. | 4.875% | 2/15/44 | 900 | 1,015 |
| Home Depot Inc. | 4.400% | 3/15/45 | 475 | 500 |
| Johnson Controls Inc. | 6.000% | 1/15/36 | 340 | 408 |
| Johnson Controls Inc. | 5.700% | 3/1/41 | 720 | 844 |
| Johnson Controls Inc. | 5.250% | 12/1/41 | 280 | 308 |
| Johnson Controls Inc. | 4.625% | 7/2/44 | 200 | 205 |
| Johnson Controls Inc. | 4.950% | 7/2/64 | 300 | 310 |
| Kohl’s Corp. | 6.000% | 1/15/33 | 345 | 389 |
| Kohl’s Corp. | 6.875% | 12/15/37 | 215 | 271 |
| Lowe’s Cos. Inc. | 6.875% | 2/15/28 | 60 | 78 |
| Lowe’s Cos. Inc. | 6.500% | 3/15/29 | 830 | 1,053 |
| Lowe’s Cos. Inc. | 5.500% | 10/15/35 | 570 | 680 |
| Lowe’s Cos. Inc. | 6.650% | 9/15/37 | 330 | 445 |
| Lowe’s Cos. Inc. | 5.800% | 4/15/40 | 455 | 563 |
| Lowe’s Cos. Inc. | 5.125% | 11/15/41 | 455 | 521 |
| Lowe’s Cos. Inc. | 4.650% | 4/15/42 | 460 | 497 |
| Lowe’s Cos. Inc. | 5.000% | 9/15/43 | 950 | 1,080 |
| Macy’s Retail Holdings Inc. | 6.900% | 4/1/29 | 735 | 945 |
| Macy’s Retail Holdings Inc. | 6.900% | 1/15/32 | 225 | 292 |
| Macy’s Retail Holdings Inc. | 6.700% | 7/15/34 | 40 | 52 |
| Macy’s Retail Holdings Inc. | 6.375% | 3/15/37 | 960 | 1,224 |
| Macy’s Retail Holdings Inc. | 5.125% | 1/15/42 | 705 | 766 |
| McDonald’s Corp. | 6.300% | 10/15/37 | 735 | 968 |
| McDonald’s Corp. | 6.300% | 3/1/38 | 750 | 990 |
| McDonald’s Corp. | 5.700% | 2/1/39 | 200 | 248 |
| McDonald’s Corp. | 3.700% | 2/15/42 | 595 | 563 |
| McDonald’s Corp. | 3.625% | 5/1/43 | 925 | 861 |
| MDC Holdings Inc. | 6.000% | 1/15/43 | 500 | 469 |
| NIKE Inc. | 3.625% | 5/1/43 | 225 | 217 |
| Nordstrom Inc. | 6.950% | 3/15/28 | 30 | 40 |
| Nordstrom Inc. | 5.000% | 1/15/44 | 929 | 1,047 |
| QVC Inc. | 5.950% | 3/15/43 | 350 | 382 |
| Target Corp. | 6.350% | 11/1/32 | 585 | 756 |
| Target Corp. | 6.500% | 10/15/37 | 1,587 | 2,103 |
| Target Corp. | 7.000% | 1/15/38 | 605 | 843 |
| Target Corp. | 4.000% | 7/1/42 | 852 | 825 |
| VF Corp. | 6.450% | 11/1/37 | 635 | 840 |
| Wal-Mart Stores Inc. | 5.875% | 4/5/27 | 505 | 641 |
| Wal-Mart Stores Inc. | 7.550% | 2/15/30 | 1,300 | 1,888 |
| Wal-Mart Stores Inc. | 5.250% | 9/1/35 | 1,840 | 2,196 |
| Wal-Mart Stores Inc. | 6.500% | 8/15/37 | 2,500 | 3,413 |
| Wal-Mart Stores Inc. | 6.200% | 4/15/38 | 2,360 | 3,091 |
| Wal-Mart Stores Inc. | 5.625% | 4/1/40 | 1,672 | 2,067 |
| Wal-Mart Stores Inc. | 5.625% | 4/15/41 | 2,665 | 3,344 |
| Wal-Mart Stores Inc. | 4.000% | 4/11/43 | 1,700 | 1,691 |
| Wal-Mart Stores Inc. | 4.750% | 10/2/43 | 1,350 | 1,508 |
165
| Long-Term Corporate Bond Index Fund | |||||
| Face | Market | ||||
| Maturity | Amount | Value• | |||
| Coupon | Date | ($000) | ($000) | ||
| Wal-Mart Stores Inc. | 4.300% | 4/22/44 | 950 | 992 | |
| Walgreen Co. | 4.400% | 9/15/42 | 750 | 733 | |
| Western Union Co. | 6.200% | 11/17/36 | 500 | 525 | |
| Western Union Co. | 6.200% | 6/21/40 | 170 | 177 | |
| Yum! Brands Inc. | 6.875% | 11/15/37 | 710 | 941 | |
| Yum! Brands Inc. | 5.350% | 11/1/43 | 250 | 282 | |
| Consumer Noncyclical (13.3%) | |||||
| Abbott Laboratories | 6.150% | 11/30/37 | 350 | 463 | |
| Abbott Laboratories | 6.000% | 4/1/39 | 445 | 577 | |
| Abbott Laboratories | 5.300% | 5/27/40 | 590 | 712 | |
| AbbVie Inc. | 4.400% | 11/6/42 | 2,090 | 2,099 | |
| 2 | Actavis Funding SCS | 4.850% | 6/15/44 | 1,550 | 1,598 |
| Actavis Inc. | 4.625% | 10/1/42 | 740 | 741 | |
| Ahold Finance USA LLC | 6.875% | 5/1/29 | 515 | 660 | |
| Altria Group Inc. | 9.950% | 11/10/38 | 593 | 1,006 | |
| Altria Group Inc. | 10.200% | 2/6/39 | 816 | 1,410 | |
| Altria Group Inc. | 4.250% | 8/9/42 | 525 | 495 | |
| Altria Group Inc. | 4.500% | 5/2/43 | 625 | 611 | |
| Altria Group Inc. | 5.375% | 1/31/44 | 1,925 | 2,140 | |
| Amgen Inc. | 6.375% | 6/1/37 | 1,195 | 1,507 | |
| Amgen Inc. | 6.900% | 6/1/38 | 765 | 1,039 | |
| Amgen Inc. | 6.400% | 2/1/39 | 1,335 | 1,717 | |
| Amgen Inc. | 5.750% | 3/15/40 | 800 | 956 | |
| Amgen Inc. | 4.950% | 10/1/41 | 835 | 896 | |
| Amgen Inc. | 5.150% | 11/15/41 | 2,792 | 3,097 | |
| Amgen Inc. | 5.650% | 6/15/42 | 1,020 | 1,208 | |
| Anheuser-Busch Cos. LLC | 6.800% | 8/20/32 | 65 | 88 | |
| Anheuser-Busch Cos. LLC | 5.950% | 1/15/33 | 20 | 25 | |
| Anheuser-Busch Cos. LLC | 5.750% | 4/1/36 | 225 | 281 | |
| Anheuser-Busch Cos. LLC | 6.450% | 9/1/37 | 680 | 926 | |
| Anheuser-Busch InBev Finance Inc. | 4.000% | 1/17/43 | 1,285 | 1,276 | |
| Anheuser-Busch InBev Finance Inc. | 4.625% | 2/1/44 | 725 | 792 | |
| Anheuser-Busch InBev Worldwide Inc. | 8.200% | 1/15/39 | 1,655 | 2,616 | |
| Anheuser-Busch InBev Worldwide Inc. | 8.000% | 11/15/39 | 805 | 1,252 | |
| Anheuser-Busch InBev Worldwide Inc. | 6.375% | 1/15/40 | 860 | 1,158 | |
| Anheuser-Busch InBev Worldwide Inc. | 3.750% | 7/15/42 | 785 | 747 | |
| Archer-Daniels-Midland Co. | 5.935% | 10/1/32 | 495 | 626 | |
| Archer-Daniels-Midland Co. | 5.375% | 9/15/35 | 510 | 614 | |
| Archer-Daniels-Midland Co. | 5.765% | 3/1/41 | 510 | 637 | |
| Archer-Daniels-Midland Co. | 4.535% | 3/26/42 | 540 | 583 | |
| Archer-Daniels-Midland Co. | 4.016% | 4/16/43 | 125 | 124 | |
| 1 | Ascension Health Alliance | 4.847% | 11/15/53 | 475 | 541 |
| AstraZeneca plc | 6.450% | 9/15/37 | 2,250 | 2,990 | |
| AstraZeneca plc | 4.000% | 9/18/42 | 950 | 918 | |
| Avon Products Inc. | 6.950% | 3/15/43 | 750 | 779 | |
| Baxter International Inc. | 6.250% | 12/1/37 | 230 | 301 | |
| Baxter International Inc. | 3.650% | 8/15/42 | 850 | 781 | |
| Becton Dickinson & Co. | 6.000% | 5/15/39 | 430 | 552 | |
| Becton Dickinson & Co. | 5.000% | 11/12/40 | 540 | 614 | |
| Boston Scientific Corp. | 7.375% | 1/15/40 | 630 | 892 | |
| Bristol-Myers Squibb Co. | 5.875% | 11/15/36 | 1,005 | 1,268 | |
| Bristol-Myers Squibb Co. | 6.125% | 5/1/38 | 510 | 661 | |
| Bristol-Myers Squibb Co. | 3.250% | 8/1/42 | 975 | 841 | |
| Bristol-Myers Squibb Co. | 4.500% | 3/1/44 | 525 | 557 | |
| 166 | |||||
| Long-Term Corporate Bond Index Fund | ||||
| Face | Market | |||
| Maturity | Amount | Value• | ||
| Coupon | Date | ($000) | ($000) | |
| Brown-Forman Corp. | 3.750% | 1/15/43 | 275 | 265 |
| Campbell Soup Co. | 3.800% | 8/2/42 | 500 | 443 |
| Cardinal Health Inc. | 4.600% | 3/15/43 | 425 | 445 |
| 1 Catholic Health Initiatives Colorado GO | 4.350% | 11/1/42 | 675 | 665 |
| Celgene Corp. | 5.700% | 10/15/40 | 610 | 723 |
| Celgene Corp. | 5.250% | 8/15/43 | 100 | 112 |
| Celgene Corp. | 4.625% | 5/15/44 | 825 | 858 |
| Coca-Cola Femsa SAB de CV | 5.250% | 11/26/43 | 675 | 777 |
| ConAgra Foods Inc. | 7.125% | 10/1/26 | 510 | 656 |
| ConAgra Foods Inc. | 7.000% | 10/1/28 | 375 | 487 |
| ConAgra Foods Inc. | 8.250% | 9/15/30 | 495 | 714 |
| ConAgra Foods Inc. | 6.625% | 8/15/39 | 200 | 254 |
| ConAgra Foods Inc. | 4.650% | 1/25/43 | 548 | 557 |
| Covidien International Finance SA | 6.550% | 10/15/37 | 635 | 852 |
| Delhaize America LLC | 9.000% | 4/15/31 | 220 | 298 |
| Delhaize Group SA | 5.700% | 10/1/40 | 997 | 1,100 |
| Diageo Capital plc | 5.875% | 9/30/36 | 770 | 960 |
| Diageo Capital plc | 3.875% | 4/29/43 | 375 | 363 |
| Diageo Investment Corp. | 7.450% | 4/15/35 | 235 | 341 |
| Diageo Investment Corp. | 4.250% | 5/11/42 | 785 | 800 |
| Dignity Health California GO | 4.500% | 11/1/42 | 275 | 265 |
| Dr Pepper Snapple Group Inc. | 7.450% | 5/1/38 | 330 | 471 |
| Eli Lilly & Co. | 7.125% | 6/1/25 | 360 | 482 |
| Eli Lilly & Co. | 5.500% | 3/15/27 | 500 | 606 |
| Eli Lilly & Co. | 5.550% | 3/15/37 | 1,230 | 1,501 |
| Eli Lilly & Co. | 5.950% | 11/15/37 | 665 | 858 |
| Eli Lilly & Co. | 4.650% | 6/15/44 | 600 | 653 |
| Estee Lauder Cos. Inc. | 6.000% | 5/15/37 | 415 | 515 |
| Estee Lauder Cos. Inc. | 3.700% | 8/15/42 | 600 | 563 |
| Express Scripts Holding Co. | 6.125% | 11/15/41 | 1,170 | 1,475 |
| Fomento Economico Mexicano SAB de CV | 4.375% | 5/10/43 | 575 | 554 |
| Genentech Inc. | 5.250% | 7/15/35 | 845 | 1,001 |
| General Mills Inc. | 5.400% | 6/15/40 | 115 | 134 |
| General Mills Inc. | 4.150% | 2/15/43 | 575 | 575 |
| Gilead Sciences Inc. | 5.650% | 12/1/41 | 775 | 947 |
| Gilead Sciences Inc. | 4.800% | 4/1/44 | 1,950 | 2,146 |
| GlaxoSmithKline Capital Inc. | 5.375% | 4/15/34 | 405 | 491 |
| GlaxoSmithKline Capital Inc. | 6.375% | 5/15/38 | 3,020 | 3,993 |
| GlaxoSmithKline Capital Inc. | 4.200% | 3/18/43 | 500 | 506 |
| Hasbro Inc. | 6.350% | 3/15/40 | 360 | 441 |
| Hasbro Inc. | 5.100% | 5/15/44 | 400 | 428 |
| Hershey Co. | 7.200% | 8/15/27 | 250 | 341 |
| Ingredion Inc. | 6.625% | 4/15/37 | 475 | 607 |
| Johnson & Johnson | 6.950% | 9/1/29 | 440 | 626 |
| Johnson & Johnson | 4.950% | 5/15/33 | 300 | 360 |
| Johnson & Johnson | 4.375% | 12/5/33 | 1,200 | 1,331 |
| Johnson & Johnson | 5.950% | 8/15/37 | 1,305 | 1,744 |
| Johnson & Johnson | 4.500% | 9/1/40 | 195 | 216 |
| Johnson & Johnson | 4.850% | 5/15/41 | 95 | 111 |
| Johnson & Johnson | 4.500% | 12/5/43 | 450 | 500 |
| Kaiser Foundation Hospitals | 4.875% | 4/1/42 | 620 | 698 |
| Kellogg Co. | 7.450% | 4/1/31 | 965 | 1,277 |
| Kimberly-Clark Corp. | 6.625% | 8/1/37 | 400 | 549 |
| Kimberly-Clark Corp. | 5.300% | 3/1/41 | 485 | 591 |
| Kimberly-Clark Corp. | 3.700% | 6/1/43 | 225 | 217 |
167
| Long-Term Corporate Bond Index Fund | |||||
| Face | Market | ||||
| Maturity | Amount | Value• | |||
| Coupon | Date | ($000) | ($000) | ||
| Koninklijke Philips NV | 6.875% | 3/11/38 | 870 | 1,182 | |
| Koninklijke Philips NV | 5.000% | 3/15/42 | 1,000 | 1,124 | |
| Kraft Foods Group Inc. | 6.875% | 1/26/39 | 1,225 | 1,631 | |
| Kraft Foods Group Inc. | 6.500% | 2/9/40 | 900 | 1,156 | |
| Kraft Foods Group Inc. | 5.000% | 6/4/42 | 900 | 980 | |
| Kroger Co. | 7.500% | 4/1/31 | 380 | 515 | |
| Kroger Co. | 6.900% | 4/15/38 | 855 | 1,142 | |
| Kroger Co. | 5.000% | 4/15/42 | 400 | 435 | |
| Kroger Co. | 5.150% | 8/1/43 | 850 | 944 | |
| Lorillard Tobacco Co. | 8.125% | 5/1/40 | 40 | 55 | |
| Lorillard Tobacco Co. | 7.000% | 8/4/41 | 535 | 675 | |
| Mattel Inc. | 5.450% | 11/1/41 | 470 | 531 | |
| 1 | Mayo Clinic | 3.774% | 11/15/43 | 400 | 383 |
| 1 | Mayo Clinic | 4.000% | 11/15/47 | 225 | 225 |
| McKesson Corp. | 6.000% | 3/1/41 | 430 | 528 | |
| McKesson Corp. | 4.883% | 3/15/44 | 350 | 376 | |
| Mead Johnson Nutrition Co. | 4.600% | 6/1/44 | 700 | 725 | |
| Medtronic Inc. | 6.500% | 3/15/39 | 155 | 208 | |
| Medtronic Inc. | 5.550% | 3/15/40 | 480 | 587 | |
| Medtronic Inc. | 4.500% | 3/15/42 | 610 | 650 | |
| Medtronic Inc. | 4.000% | 4/1/43 | 500 | 496 | |
| Medtronic Inc. | 4.625% | 3/15/44 | 325 | 348 | |
| Memorial Sloan-Kettering Cancer Center | |||||
| New York GO | 5.000% | 7/1/42 | 400 | 459 | |
| Memorial Sloan-Kettering Cancer Center | |||||
| New York GO | 4.125% | 7/1/52 | 250 | 248 | |
| Merck & Co. Inc. | 6.500% | 12/1/33 | 1,315 | 1,789 | |
| Merck & Co. Inc. | 6.550% | 9/15/37 | 725 | 992 | |
| Merck & Co. Inc. | 3.600% | 9/15/42 | 900 | 842 | |
| Merck & Co. Inc. | 4.150% | 5/18/43 | 1,000 | 1,022 | |
| Merck Sharp & Dohme Corp. | 6.300% | 1/1/26 | 30 | 38 | |
| Merck Sharp & Dohme Corp. | 6.400% | 3/1/28 | 640 | 840 | |
| Merck Sharp & Dohme Corp. | 5.950% | 12/1/28 | 380 | 481 | |
| Merck Sharp & Dohme Corp. | 5.750% | 11/15/36 | 1,070 | 1,358 | |
| Merck Sharp & Dohme Corp. | 5.850% | 6/30/39 | 660 | 846 | |
| Molson Coors Brewing Co. | 5.000% | 5/1/42 | 775 | 846 | |
| Mondelez International Inc. | 6.500% | 11/1/31 | 730 | 935 | |
| Mondelez International Inc. | 6.875% | 2/1/38 | 730 | 978 | |
| Mondelez International Inc. | 6.875% | 1/26/39 | 215 | 290 | |
| Mondelez International Inc. | 6.500% | 2/9/40 | 1,365 | 1,793 | |
| Mylan Inc. | 5.400% | 11/29/43 | 1,000 | 1,103 | |
| Novant Health Inc. | 4.371% | 11/1/43 | 300 | 304 | |
| Novartis Capital Corp. | 3.700% | 9/21/42 | 300 | 288 | |
| Novartis Capital Corp. | 4.400% | 5/6/44 | 1,650 | 1,775 | |
| Pepsi Bottling Group Inc. | 7.000% | 3/1/29 | 685 | 930 | |
| PepsiCo Inc. | 5.500% | 1/15/40 | 750 | 904 | |
| PepsiCo Inc. | 4.875% | 11/1/40 | 870 | 973 | |
| PepsiCo Inc. | 4.000% | 3/5/42 | 600 | 588 | |
| PepsiCo Inc. | 3.600% | 8/13/42 | 1,275 | 1,177 | |
| 2 | Perrigo Co. plc | 5.300% | 11/15/43 | 575 | 637 |
| Pfizer Inc. | 7.200% | 3/15/39 | 1,730 | 2,492 | |
| Pfizer Inc. | 4.300% | 6/15/43 | 700 | 721 | |
| Pfizer Inc. | 4.400% | 5/15/44 | 800 | 838 | |
| Pharmacia Corp. | 6.600% | 12/1/28 | 355 | 471 | |
| Philip Morris International Inc. | 6.375% | 5/16/38 | 1,440 | 1,871 | |
| 168 | |||||
| Long-Term Corporate Bond Index Fund | ||||
| Face | Market | |||
| Maturity | Amount | Value• | ||
| Coupon | Date | ($000) | ($000) | |
| Philip Morris International Inc. | 4.375% | 11/15/41 | 745 | 756 |
| Philip Morris International Inc. | 4.500% | 3/20/42 | 755 | 784 |
| Philip Morris International Inc. | 3.875% | 8/21/42 | 975 | 923 |
| Philip Morris International Inc. | 4.125% | 3/4/43 | 875 | 857 |
| Philip Morris International Inc. | 4.875% | 11/15/43 | 500 | 550 |
| Procter & Gamble Co. | 5.800% | 8/15/34 | 650 | 838 |
| 3 Procter & Gamble Co. | 5.550% | 3/5/37 | 1,815 | 2,273 |
| Quest Diagnostics Inc. | 6.950% | 7/1/37 | 60 | 76 |
| Quest Diagnostics Inc. | 5.750% | 1/30/40 | 460 | 518 |
| Reynolds American Inc. | 7.250% | 6/15/37 | 375 | 480 |
| Reynolds American Inc. | 4.750% | 11/1/42 | 525 | 513 |
| Reynolds American Inc. | 6.150% | 9/15/43 | 750 | 876 |
| Safeway Inc. | 7.250% | 2/1/31 | 480 | 491 |
| St. Jude Medical Inc. | 4.750% | 4/15/43 | 875 | 929 |
| Stryker Corp. | 4.100% | 4/1/43 | 900 | 879 |
| Stryker Corp. | 4.375% | 5/15/44 | 400 | 403 |
| Sysco Corp. | 5.375% | 9/21/35 | 730 | 869 |
| Teva Pharmaceutical Finance Co. LLC | 6.150% | 2/1/36 | 975 | 1,196 |
| Thermo Fisher Scientific Inc. | 5.300% | 2/1/44 | 825 | 941 |
| Tyson Foods Inc. | 4.875% | 8/15/34 | 400 | 422 |
| Tyson Foods Inc. | 5.150% | 8/15/44 | 975 | 1,037 |
| Unilever Capital Corp. | 5.900% | 11/15/32 | 1,495 | 1,988 |
| Whirlpool Corp. | 5.150% | 3/1/43 | 475 | 519 |
| Wyeth LLC | 6.500% | 2/1/34 | 1,180 | 1,571 |
| Wyeth LLC | 6.000% | 2/15/36 | 900 | 1,135 |
| Wyeth LLC | 5.950% | 4/1/37 | 2,395 | 2,993 |
| Zimmer Holdings Inc. | 5.750% | 11/30/39 | 575 | 688 |
| Zoetis Inc. | 4.700% | 2/1/43 | 725 | 756 |
| Energy (12.8%) | ||||
| Alberta Energy Co. Ltd. | 7.375% | 11/1/31 | 680 | 912 |
| Anadarko Finance Co. | 7.500% | 5/1/31 | 942 | 1,310 |
| Anadarko Petroleum Corp. | 6.450% | 9/15/36 | 1,860 | 2,394 |
| Anadarko Petroleum Corp. | 7.950% | 6/15/39 | 155 | 233 |
| Anadarko Petroleum Corp. | 6.200% | 3/15/40 | 715 | 905 |
| Apache Corp. | 6.000% | 1/15/37 | 1,386 | 1,699 |
| Apache Corp. | 5.100% | 9/1/40 | 1,085 | 1,194 |
| Apache Corp. | 5.250% | 2/1/42 | 1,005 | 1,121 |
| Apache Corp. | 4.750% | 4/15/43 | 1,295 | 1,377 |
| Apache Corp. | 4.250% | 1/15/44 | 875 | 870 |
| Apache Finance Canada Corp. | 7.750% | 12/15/29 | 275 | 397 |
| Baker Hughes Inc. | 6.875% | 1/15/29 | 350 | 475 |
| Baker Hughes Inc. | 5.125% | 9/15/40 | 1,360 | 1,572 |
| Buckeye Partners LP | 5.850% | 11/15/43 | 275 | 312 |
| Burlington Resources Finance Co. | 7.200% | 8/15/31 | 915 | 1,299 |
| Burlington Resources Finance Co. | 7.400% | 12/1/31 | 55 | 80 |
| Cameron International Corp. | 7.000% | 7/15/38 | 400 | 536 |
| Cameron International Corp. | 5.950% | 6/1/41 | 255 | 309 |
| Cameron International Corp. | 5.125% | 12/15/43 | 375 | 411 |
| Canadian Natural Resources Ltd. | 7.200% | 1/15/32 | 728 | 987 |
| Canadian Natural Resources Ltd. | 6.450% | 6/30/33 | 350 | 449 |
| Canadian Natural Resources Ltd. | 5.850% | 2/1/35 | 200 | 239 |
| Canadian Natural Resources Ltd. | 6.500% | 2/15/37 | 455 | 587 |
| Canadian Natural Resources Ltd. | 6.250% | 3/15/38 | 555 | 707 |
| Canadian Natural Resources Ltd. | 6.750% | 2/1/39 | 525 | 701 |
169
| Long-Term Corporate Bond Index Fund | |||||
| Face | Market | ||||
| Maturity | Amount | Value• | |||
| Coupon | Date | ($000) | ($000) | ||
| Cenovus Energy Inc. | 6.750% | 11/15/39 | 1,422 | 1,898 | |
| Cenovus Energy Inc. | 4.450% | 9/15/42 | 450 | 457 | |
| CenterPoint Energy Resources Corp. | 6.625% | 11/1/37 | 230 | 309 | |
| CenterPoint Energy Resources Corp. | 5.850% | 1/15/41 | 254 | 322 | |
| Conoco Funding Co. | 7.250% | 10/15/31 | 515 | 746 | |
| ConocoPhillips | 5.900% | 10/15/32 | 765 | 977 | |
| ConocoPhillips | 5.900% | 5/15/38 | 1,085 | 1,392 | |
| ConocoPhillips | 6.500% | 2/1/39 | 3,055 | 4,149 | |
| ConocoPhillips Canada Funding Co. I | 5.950% | 10/15/36 | 575 | 737 | |
| ConocoPhillips Holding Co. | 6.950% | 4/15/29 | 560 | 771 | |
| 2 | Continental Resources Inc. | 4.900% | 6/1/44 | 600 | 634 |
| DCP Midstream LLC | 8.125% | 8/16/30 | 321 | 432 | |
| DCP Midstream Operating LP | 5.600% | 4/1/44 | 875 | 992 | |
| Devon Energy Corp. | 7.950% | 4/15/32 | 620 | 896 | |
| Devon Energy Corp. | 5.600% | 7/15/41 | 1,290 | 1,518 | |
| Devon Energy Corp. | 4.750% | 5/15/42 | 865 | 919 | |
| Devon Financing Corp. LLC | 7.875% | 9/30/31 | 895 | 1,276 | |
| Diamond Offshore Drilling Inc. | 5.700% | 10/15/39 | 575 | 655 | |
| Diamond Offshore Drilling Inc. | 4.875% | 11/1/43 | 675 | 690 | |
| Dominion Gas Holdings LLC | 4.800% | 11/1/43 | 350 | 383 | |
| El Paso Natural Gas Co. LLC | 8.375% | 6/15/32 | 250 | 342 | |
| El Paso Pipeline Partners Operating Co. LLC | 7.500% | 11/15/40 | 400 | 520 | |
| El Paso Pipeline Partners Operating Co. LLC | 4.700% | 11/1/42 | 610 | 574 | |
| 2 | Enable Midstream Partners LP | 5.000% | 5/15/44 | 525 | 542 |
| Enbridge Energy Partners LP | 7.500% | 4/15/38 | 400 | 541 | |
| Enbridge Energy Partners LP | 5.500% | 9/15/40 | 400 | 446 | |
| Enbridge Inc. | 4.500% | 6/10/44 | 450 | 454 | |
| Encana Corp. | 6.500% | 8/15/34 | 1,285 | 1,629 | |
| Encana Corp. | 6.625% | 8/15/37 | 1,160 | 1,500 | |
| Encana Corp. | 6.500% | 2/1/38 | 540 | 699 | |
| Encana Corp. | 5.150% | 11/15/41 | 340 | 377 | |
| Energy Transfer Partners LP | 8.250% | 11/15/29 | 214 | 303 | |
| Energy Transfer Partners LP | 6.625% | 10/15/36 | 735 | 887 | |
| Energy Transfer Partners LP | 7.500% | 7/1/38 | 555 | 717 | |
| Energy Transfer Partners LP | 6.050% | 6/1/41 | 1,231 | 1,398 | |
| Energy Transfer Partners LP | 6.500% | 2/1/42 | 1,030 | 1,233 | |
| Energy Transfer Partners LP | 5.150% | 2/1/43 | 475 | 482 | |
| Eni USA Inc. | 7.300% | 11/15/27 | 395 | 536 | |
| EnLink Midstream Partners LP | 5.600% | 4/1/44 | 200 | 227 | |
| Enterprise Products Operating LLC | 6.875% | 3/1/33 | 890 | 1,179 | |
| Enterprise Products Operating LLC | 6.650% | 10/15/34 | 360 | 473 | |
| Enterprise Products Operating LLC | 5.750% | 3/1/35 | 250 | 296 | |
| Enterprise Products Operating LLC | 7.550% | 4/15/38 | 390 | 550 | |
| Enterprise Products Operating LLC | 6.125% | 10/15/39 | 560 | 697 | |
| Enterprise Products Operating LLC | 6.450% | 9/1/40 | 510 | 659 | |
| Enterprise Products Operating LLC | 5.950% | 2/1/41 | 875 | 1,073 | |
| Enterprise Products Operating LLC | 5.700% | 2/15/42 | 670 | 797 | |
| Enterprise Products Operating LLC | 4.850% | 8/15/42 | 590 | 625 | |
| Enterprise Products Operating LLC | 4.450% | 2/15/43 | 1,000 | 996 | |
| Enterprise Products Operating LLC | 4.850% | 3/15/44 | 950 | 1,009 | |
| Enterprise Products Operating LLC | 5.100% | 2/15/45 | 875 | 964 | |
| Global Marine Inc. | 7.000% | 6/1/28 | 705 | 800 | |
| Halliburton Co. | 6.700% | 9/15/38 | 816 | 1,119 | |
| Halliburton Co. | 7.450% | 9/15/39 | 470 | 689 | |
| Halliburton Co. | 4.500% | 11/15/41 | 800 | 844 | |
| 170 | |||||
| Long-Term Corporate Bond Index Fund | ||||
| Face | Market | |||
| Maturity | Amount | Value• | ||
| Coupon | Date | ($000) | ($000) | |
| Halliburton Co. | 4.750% | 8/1/43 | 590 | 647 |
| Hess Corp. | 7.875% | 10/1/29 | 1,190 | 1,661 |
| Hess Corp. | 7.300% | 8/15/31 | 860 | 1,168 |
| Hess Corp. | 7.125% | 3/15/33 | 1,175 | 1,592 |
| Hess Corp. | 6.000% | 1/15/40 | 125 | 154 |
| Hess Corp. | 5.600% | 2/15/41 | 875 | 1,038 |
| Kerr-McGee Corp. | 7.875% | 9/15/31 | 390 | 554 |
| Kinder Morgan Energy Partners LP | 7.400% | 3/15/31 | 350 | 438 |
| Kinder Morgan Energy Partners LP | 7.750% | 3/15/32 | 300 | 388 |
| Kinder Morgan Energy Partners LP | 7.300% | 8/15/33 | 575 | 720 |
| Kinder Morgan Energy Partners LP | 5.800% | 3/15/35 | 925 | 1,023 |
| Kinder Morgan Energy Partners LP | 6.500% | 2/1/37 | 585 | 681 |
| Kinder Morgan Energy Partners LP | 6.950% | 1/15/38 | 445 | 547 |
| Kinder Morgan Energy Partners LP | 6.500% | 9/1/39 | 705 | 827 |
| Kinder Morgan Energy Partners LP | 6.550% | 9/15/40 | 800 | 941 |
| Kinder Morgan Energy Partners LP | 6.375% | 3/1/41 | 525 | 614 |
| Kinder Morgan Energy Partners LP | 5.625% | 9/1/41 | 540 | 577 |
| Kinder Morgan Energy Partners LP | 5.000% | 8/15/42 | 850 | 838 |
| Kinder Morgan Energy Partners LP | 5.000% | 3/1/43 | 950 | 931 |
| Kinder Morgan Energy Partners LP | 5.500% | 3/1/44 | 375 | 391 |
| Magellan Midstream Partners LP | 6.400% | 5/1/37 | 265 | 341 |
| Magellan Midstream Partners LP | 4.200% | 12/1/42 | 250 | 242 |
| Magellan Midstream Partners LP | 5.150% | 10/15/43 | 225 | 253 |
| Marathon Oil Corp. | 6.800% | 3/15/32 | 540 | 696 |
| Marathon Oil Corp. | 6.600% | 10/1/37 | 605 | 792 |
| Marathon Petroleum Corp. | 6.500% | 3/1/41 | 710 | 895 |
| Murphy Oil Corp. | 7.050% | 5/1/29 | 330 | 405 |
| Murphy Oil Corp. | 5.125% | 12/1/42 | 200 | 197 |
| National Oilwell Varco Inc. | 3.950% | 12/1/42 | 1,510 | 1,492 |
| Nisource Finance Corp. | 6.250% | 12/15/40 | 480 | 593 |
| Nisource Finance Corp. | 5.950% | 6/15/41 | 790 | 942 |
| Nisource Finance Corp. | 5.800% | 2/1/42 | 300 | 349 |
| Nisource Finance Corp. | 5.250% | 2/15/43 | 470 | 513 |
| Nisource Finance Corp. | 4.800% | 2/15/44 | 800 | 819 |
| Noble Energy Inc. | 8.000% | 4/1/27 | 245 | 331 |
| Noble Energy Inc. | 6.000% | 3/1/41 | 975 | 1,181 |
| Noble Energy Inc. | 5.250% | 11/15/43 | 1,250 | 1,397 |
| Noble Holding International Ltd. | 6.200% | 8/1/40 | 360 | 420 |
| Noble Holding International Ltd. | 6.050% | 3/1/41 | 850 | 983 |
| ONEOK Partners LP | 6.650% | 10/1/36 | 950 | 1,199 |
| ONEOK Partners LP | 6.850% | 10/15/37 | 185 | 238 |
| ONEOK Partners LP | 6.125% | 2/1/41 | 495 | 590 |
| ONEOK Partners LP | 6.200% | 9/15/43 | 350 | 425 |
| Petro-Canada | 7.875% | 6/15/26 | 270 | 370 |
| Petro-Canada | 7.000% | 11/15/28 | 145 | 192 |
| Petro-Canada | 5.350% | 7/15/33 | 345 | 399 |
| Petro-Canada | 5.950% | 5/15/35 | 795 | 961 |
| Petro-Canada | 6.800% | 5/15/38 | 1,360 | 1,834 |
| Phillips 66 | 5.875% | 5/1/42 | 1,426 | 1,752 |
| Pioneer Natural Resources Co. | 7.200% | 1/15/28 | 275 | 358 |
| Plains All American Pipeline LP / | ||||
| PAA Finance Corp. | 6.700% | 5/15/36 | 65 | 83 |
| Plains All American Pipeline LP / | ||||
| PAA Finance Corp. | 6.650% | 1/15/37 | 460 | 592 |
171
| Long-Term Corporate Bond Index Fund | ||||
| Face | Market | |||
| Maturity | Amount | Value• | ||
| Coupon | Date | ($000) | ($000) | |
| Plains All American Pipeline LP / | ||||
| PAA Finance Corp. | 5.150% | 6/1/42 | 745 | 815 |
| Plains All American Pipeline LP / | ||||
| PAA Finance Corp. | 4.300% | 1/31/43 | 575 | 559 |
| Plains All American Pipeline LP / | ||||
| PAA Finance Corp. | 4.700% | 6/15/44 | 575 | 593 |
| Pride International Inc. | 7.875% | 8/15/40 | 485 | 715 |
| Rowan Cos. Inc. | 5.400% | 12/1/42 | 300 | 300 |
| Rowan Cos. Inc. | 5.850% | 1/15/44 | 600 | 635 |
| Shell International Finance BV | 6.375% | 12/15/38 | 2,995 | 4,049 |
| Shell International Finance BV | 5.500% | 3/25/40 | 895 | 1,104 |
| Shell International Finance BV | 3.625% | 8/21/42 | 200 | 189 |
| Shell International Finance BV | 4.550% | 8/12/43 | 1,700 | 1,870 |
| Southern Natural Gas Co. LLC | 8.000% | 3/1/32 | 270 | 359 |
| Spectra Energy Capital LLC | 7.500% | 9/15/38 | 60 | 79 |
| Spectra Energy Partners LP | 5.950% | 9/25/43 | 200 | 243 |
| Suncor Energy Inc. | 7.150% | 2/1/32 | 515 | 711 |
| Suncor Energy Inc. | 5.950% | 12/1/34 | 525 | 640 |
| Suncor Energy Inc. | 6.500% | 6/15/38 | 1,190 | 1,541 |
| Suncor Energy Inc. | 6.850% | 6/1/39 | 720 | 964 |
| Sunoco Logistics Partners Operations LP | 4.950% | 1/15/43 | 600 | 604 |
| Sunoco Logistics Partners Operations LP | 5.300% | 4/1/44 | 750 | 795 |
| Talisman Energy Inc. | 7.250% | 10/15/27 | 235 | 299 |
| Talisman Energy Inc. | 5.850% | 2/1/37 | 820 | 929 |
| Talisman Energy Inc. | 6.250% | 2/1/38 | 900 | 1,061 |
| Tennessee Gas Pipeline Co. LLC | 7.000% | 3/15/27 | 210 | 265 |
| Tennessee Gas Pipeline Co. LLC | 7.000% | 10/15/28 | 65 | 84 |
| Tennessee Gas Pipeline Co. LLC | 7.625% | 4/1/37 | 235 | 316 |
| Texas Eastern Transmission LP | 7.000% | 7/15/32 | 405 | 539 |
| Tosco Corp. | 8.125% | 2/15/30 | 620 | 929 |
| TransCanada PipeLines Ltd. | 4.625% | 3/1/34 | 1,500 | 1,615 |
| TransCanada PipeLines Ltd. | 5.600% | 3/31/34 | 910 | 1,083 |
| TransCanada PipeLines Ltd. | 5.850% | 3/15/36 | 485 | 596 |
| TransCanada PipeLines Ltd. | 6.200% | 10/15/37 | 915 | 1,182 |
| TransCanada PipeLines Ltd. | 7.250% | 8/15/38 | 505 | 718 |
| TransCanada PipeLines Ltd. | 7.625% | 1/15/39 | 562 | 835 |
| TransCanada PipeLines Ltd. | 6.100% | 6/1/40 | 1,145 | 1,459 |
| TransCanada PipeLines Ltd. | 5.000% | 10/16/43 | 475 | 535 |
| Transcontinental Gas Pipe Line Co. LLC | 5.400% | 8/15/41 | 300 | 340 |
| Transcontinental Gas Pipe Line Co. LLC | 4.450% | 8/1/42 | 485 | 480 |
| Transocean Inc. | 7.500% | 4/15/31 | 925 | 1,094 |
| Transocean Inc. | 6.800% | 3/15/38 | 785 | 853 |
| Transocean Inc. | 7.350% | 12/15/41 | 405 | 485 |
| Valero Energy Corp. | 7.500% | 4/15/32 | 959 | 1,272 |
| Valero Energy Corp. | 6.625% | 6/15/37 | 890 | 1,122 |
| Valero Energy Corp. | 10.500% | 3/15/39 | 440 | 747 |
| Weatherford International LLC | 6.800% | 6/15/37 | 310 | 385 |
| Weatherford International Ltd. | 6.500% | 8/1/36 | 1,055 | 1,273 |
| Weatherford International Ltd. | 7.000% | 3/15/38 | 548 | 697 |
| Weatherford International Ltd. | 9.875% | 3/1/39 | 355 | 562 |
| Weatherford International Ltd. | 6.750% | 9/15/40 | 345 | 431 |
| Weatherford International Ltd. | 5.950% | 4/15/42 | 530 | 614 |
| Western Gas Partners LP | 5.450% | 4/1/44 | 425 | 478 |
| Williams Cos. Inc. | 7.500% | 1/15/31 | 287 | 342 |
| Williams Cos. Inc. | 8.750% | 3/15/32 | 576 | 748 |
172
| Long-Term Corporate Bond Index Fund | ||||
| Face | Market | |||
| Maturity | Amount | Value• | ||
| Coupon | Date | ($000) | ($000) | |
| Williams Cos. Inc. | 5.750% | 6/24/44 | 700 | 711 |
| Williams Partners LP | 3.900% | 1/15/25 | 740 | 748 |
| Williams Partners LP | 6.300% | 4/15/40 | 705 | 853 |
| Williams Partners LP | 5.800% | 11/15/43 | 625 | 720 |
| Williams Partners LP | 5.400% | 3/4/44 | 350 | 383 |
| Williams Partners LP | 4.900% | 1/15/45 | 600 | 611 |
| XTO Energy Inc. | 6.750% | 8/1/37 | 105 | 154 |
| Other Industrial (0.3%) | ||||
| California Institute of Technology GO | 4.700% | 11/1/11 | 310 | 318 |
| 1 Johns Hopkins University Maryland GO | 4.083% | 7/1/53 | 325 | 330 |
| Massachusetts Institute of Technology GO | 5.600% | 7/1/11 | 555 | 733 |
| Massachusetts Institute of Technology GO | 4.678% | 7/1/14 | 650 | 726 |
| 1 Northwestern University Illinois GO | 4.643% | 12/1/44 | 400 | 444 |
| President & Fellows of Harvard College | ||||
| Massachusetts GO | 3.619% | 10/1/37 | 700 | 684 |
| University of Pennsylvania GO | 4.674% | 9/1/12 | 275 | 287 |
| Technology (3.4%) | ||||
| Apple Inc. | 3.850% | 5/4/43 | 2,500 | 2,374 |
| Apple Inc. | 4.450% | 5/6/44 | 1,350 | 1,423 |
| Applied Materials Inc. | 5.850% | 6/15/41 | 900 | 1,104 |
| Broadcom Corp. | 4.500% | 8/1/34 | 250 | 260 |
| Cisco Systems Inc. | 5.900% | 2/15/39 | 2,310 | 2,889 |
| Cisco Systems Inc. | 5.500% | 1/15/40 | 1,925 | 2,306 |
| Corning Inc. | 7.250% | 8/15/36 | 35 | 45 |
| Corning Inc. | 4.700% | 3/15/37 | 400 | 429 |
| Corning Inc. | 5.750% | 8/15/40 | 440 | 537 |
| Corning Inc. | 4.750% | 3/15/42 | 1,280 | 1,400 |
| Harris Corp. | 6.150% | 12/15/40 | 400 | 489 |
| Hewlett-Packard Co. | 6.000% | 9/15/41 | 1,585 | 1,876 |
| HP Enterprise Services LLC | 7.450% | 10/15/29 | 260 | 326 |
| Intel Corp. | 4.000% | 12/15/32 | 545 | 549 |
| Intel Corp. | 4.800% | 10/1/41 | 1,430 | 1,553 |
| Intel Corp. | 4.250% | 12/15/42 | 700 | 702 |
| International Business Machines Corp. | 7.000% | 10/30/25 | 660 | 886 |
| International Business Machines Corp. | 6.220% | 8/1/27 | 670 | 859 |
| International Business Machines Corp. | 6.500% | 1/15/28 | 225 | 296 |
| International Business Machines Corp. | 5.875% | 11/29/32 | 455 | 580 |
| International Business Machines Corp. | 5.600% | 11/30/39 | 740 | 911 |
| International Business Machines Corp. | 4.000% | 6/20/42 | 1,609 | 1,585 |
| Juniper Networks Inc. | 5.950% | 3/15/41 | 320 | 362 |
| Leidos Holdings Inc. | 5.950% | 12/1/40 | 186 | 195 |
| Leidos Inc. | 5.500% | 7/1/33 | 465 | 446 |
| Microsoft Corp. | 5.200% | 6/1/39 | 1,055 | 1,234 |
| Microsoft Corp. | 4.500% | 10/1/40 | 600 | 643 |
| Microsoft Corp. | 5.300% | 2/8/41 | 1,145 | 1,361 |
| Microsoft Corp. | 3.500% | 11/15/42 | 1,130 | 1,036 |
| Microsoft Corp. | 3.750% | 5/1/43 | 225 | 215 |
| Microsoft Corp. | 4.875% | 12/15/43 | 250 | 283 |
| Motorola Solutions Inc. | 7.500% | 5/15/25 | 196 | 252 |
| Oracle Corp. | 4.300% | 7/8/34 | 1,850 | 1,933 |
| Oracle Corp. | 6.500% | 4/15/38 | 1,220 | 1,615 |
| Oracle Corp. | 6.125% | 7/8/39 | 940 | 1,205 |
| Oracle Corp. | 5.375% | 7/15/40 | 2,241 | 2,637 |
173
| Long-Term Corporate Bond Index Fund | |||||
| Face | Market | ||||
| Maturity | Amount | Value• | |||
| Coupon | Date | ($000) | ($000) | ||
| Oracle Corp. | 4.500% | 7/8/44 | 1,200 | 1,271 | |
| 2 | Seagate HDD Cayman | 4.750% | 1/1/25 | 1,125 | 1,139 |
| Tyco Electronics Group SA | 7.125% | 10/1/37 | 370 | 502 | |
| Xerox Corp. | 6.750% | 12/15/39 | 310 | 386 | |
| Transportation (3.5%) | |||||
| 1 | American Airlines 2013-1 Class A Pass | ||||
| Through Trust | 4.000% | 1/15/27 | 650 | 664 | |
| 1 | BNSF Funding Trust I | 6.613% | 12/15/55 | 620 | 689 |
| Burlington Northern Santa Fe LLC | 3.400% | 9/1/24 | 400 | 404 | |
| Burlington Northern Santa Fe LLC | 7.000% | 12/15/25 | 85 | 111 | |
| Burlington Northern Santa Fe LLC | 7.950% | 8/15/30 | 50 | 71 | |
| Burlington Northern Santa Fe LLC | 6.200% | 8/15/36 | 320 | 411 | |
| Burlington Northern Santa Fe LLC | 6.150% | 5/1/37 | 675 | 864 | |
| Burlington Northern Santa Fe LLC | 5.750% | 5/1/40 | 1,160 | 1,409 | |
| Burlington Northern Santa Fe LLC | 5.050% | 3/1/41 | 605 | 673 | |
| Burlington Northern Santa Fe LLC | 5.400% | 6/1/41 | 920 | 1,075 | |
| Burlington Northern Santa Fe LLC | 4.950% | 9/15/41 | 200 | 220 | |
| Burlington Northern Santa Fe LLC | 4.400% | 3/15/42 | 1,050 | 1,061 | |
| Burlington Northern Santa Fe LLC | 4.375% | 9/1/42 | 550 | 557 | |
| Burlington Northern Santa Fe LLC | 4.450% | 3/15/43 | 510 | 523 | |
| Burlington Northern Santa Fe LLC | 5.150% | 9/1/43 | 200 | 225 | |
| Burlington Northern Santa Fe LLC | 4.900% | 4/1/44 | 900 | 982 | |
| Burlington Northern Santa Fe LLC | 4.550% | 9/1/44 | 675 | 701 | |
| Canadian National Railway Co. | 6.900% | 7/15/28 | 460 | 626 | |
| Canadian National Railway Co. | 6.250% | 8/1/34 | 495 | 648 | |
| Canadian National Railway Co. | 6.200% | 6/1/36 | 505 | 665 | |
| Canadian National Railway Co. | 6.375% | 11/15/37 | 430 | 586 | |
| Canadian National Railway Co. | 3.500% | 11/15/42 | 500 | 465 | |
| Canadian Pacific Railway Co. | 7.125% | 10/15/31 | 425 | 581 | |
| Canadian Pacific Railway Co. | 5.950% | 5/15/37 | 695 | 888 | |
| Canadian Pacific Railway Ltd. | 5.750% | 1/15/42 | 400 | 503 | |
| Con-way Inc. | 6.700% | 5/1/34 | 355 | 402 | |
| 1 | Continental Airlines 2012-2 Class A Pass | ||||
| Through Trust | 4.000% | 4/29/26 | 850 | 870 | |
| CSX Corp. | 6.000% | 10/1/36 | 671 | 833 | |
| CSX Corp. | 6.150% | 5/1/37 | 610 | 768 | |
| CSX Corp. | 6.220% | 4/30/40 | 415 | 535 | |
| CSX Corp. | 5.500% | 4/15/41 | 456 | 538 | |
| CSX Corp. | 4.750% | 5/30/42 | 390 | 419 | |
| CSX Corp. | 4.400% | 3/1/43 | 500 | 510 | |
| CSX Corp. | 4.100% | 3/15/44 | 950 | 927 | |
| CSX Corp. | 4.500% | 8/1/54 | 475 | 480 | |
| FedEx Corp. | 4.900% | 1/15/34 | 475 | 526 | |
| FedEx Corp. | 3.875% | 8/1/42 | 421 | 393 | |
| FedEx Corp. | 4.100% | 4/15/43 | 360 | 345 | |
| FedEx Corp. | 5.100% | 1/15/44 | 650 | 726 | |
| 1 | Hawaiian Airlines 2013-1 Class A Pass | ||||
| Through Certificates | 3.900% | 1/15/26 | 625 | 626 | |
| Kansas City Southern Railway Co. | 4.300% | 5/15/43 | 475 | 472 | |
| Norfolk Southern Corp. | 5.590% | 5/17/25 | 424 | 501 | |
| Norfolk Southern Corp. | 7.800% | 5/15/27 | 350 | 485 | |
| Norfolk Southern Corp. | 7.250% | 2/15/31 | 230 | 319 | |
| Norfolk Southern Corp. | 7.050% | 5/1/37 | 300 | 421 | |
| Norfolk Southern Corp. | 4.837% | 10/1/41 | 903 | 991 | |
| 174 | |||||
| Long-Term Corporate Bond Index Fund | ||||
| Face | Market | |||
| Maturity | Amount | Value• | ||
| Coupon | Date | ($000) | ($000) | |
| Norfolk Southern Corp. | 3.950% | 10/1/42 | 380 | 368 |
| Norfolk Southern Corp. | 4.800% | 8/15/43 | 225 | 247 |
| Norfolk Southern Corp. | 7.900% | 5/15/97 | 350 | 557 |
| Norfolk Southern Corp. | 6.000% | 3/15/05 | 502 | 624 |
| Norfolk Southern Corp. | 6.000% | 5/23/11 | 450 | 560 |
| Union Pacific Corp. | 3.250% | 1/15/25 | 100 | 101 |
| Union Pacific Corp. | 6.625% | 2/1/29 | 610 | 812 |
| Union Pacific Corp. | 4.750% | 9/15/41 | 450 | 501 |
| Union Pacific Corp. | 4.300% | 6/15/42 | 255 | 264 |
| Union Pacific Corp. | 4.250% | 4/15/43 | 425 | 436 |
| Union Pacific Corp. | 4.750% | 12/15/43 | 820 | 906 |
| Union Pacific Corp. | 4.821% | 2/1/44 | 392 | 436 |
| Union Pacific Corp. | 4.850% | 6/15/44 | 350 | 394 |
| Union Pacific Corp. | 4.150% | 1/15/45 | 200 | 202 |
| 1 United Airlines 2014-2 Class A Pass Through Trust | 3.750% | 9/3/26 | 450 | 451 |
| 1 United Airlines Pass Through Trust Series 2013-1 | 4.300% | 2/15/27 | 950 | 994 |
| 1 United Airlines Pass Through Trust Series 2014-1 | 4.000% | 10/11/27 | 675 | 692 |
| United Parcel Service Inc. | 6.200% | 1/15/38 | 1,475 | 1,959 |
| United Parcel Service Inc. | 4.875% | 11/15/40 | 720 | 832 |
| United Parcel Service Inc. | 3.625% | 10/1/42 | 175 | 165 |
| United Parcel Service of America Inc. | 8.375% | 4/1/30 | 225 | 337 |
| 1 US Airways 2012-1 Class A Pass Through Trust | 5.900% | 4/1/26 | 371 | 418 |
| 1 US Airways 2013-1 Class A Pass Through Trust | 3.950% | 5/15/27 | 450 | 460 |
| 1 US Airways Inc. 2012-2 Class A Pass | ||||
| Through Trust | 4.625% | 12/3/26 | 311 | 329 |
| 775,805 | ||||
| Utilities (13.0%) | ||||
| Electric (12.2%) | ||||
| AEP Texas Central Co. | 6.650% | 2/15/33 | 630 | 837 |
| Alabama Power Co. | 5.650% | 3/15/35 | 525 | 538 |
| Alabama Power Co. | 6.000% | 3/1/39 | 445 | 584 |
| Alabama Power Co. | 5.500% | 3/15/41 | 720 | 901 |
| Alabama Power Co. | 5.200% | 6/1/41 | 405 | 483 |
| Alabama Power Co. | 4.100% | 1/15/42 | 215 | 220 |
| Alabama Power Co. | 3.850% | 12/1/42 | 500 | 493 |
| Ameren Illinois Co. | 4.800% | 12/15/43 | 225 | 251 |
| Ameren Illinois Co. | 4.300% | 7/1/44 | 375 | 388 |
| Appalachian Power Co. | 5.800% | 10/1/35 | 450 | 550 |
| Appalachian Power Co. | 6.375% | 4/1/36 | 585 | 759 |
| Appalachian Power Co. | 6.700% | 8/15/37 | 500 | 669 |
| Appalachian Power Co. | 7.000% | 4/1/38 | 415 | 575 |
| Arizona Public Service Co. | 5.500% | 9/1/35 | 300 | 365 |
| Arizona Public Service Co. | 5.050% | 9/1/41 | 485 | 563 |
| Arizona Public Service Co. | 4.500% | 4/1/42 | 593 | 635 |
| Baltimore Gas & Electric Co. | 6.350% | 10/1/36 | 320 | 423 |
| Berkshire Hathaway Energy Co. | 8.480% | 9/15/28 | 483 | 715 |
| Berkshire Hathaway Energy Co. | 6.125% | 4/1/36 | 1,710 | 2,173 |
| Berkshire Hathaway Energy Co. | 5.950% | 5/15/37 | 941 | 1,175 |
| Berkshire Hathaway Energy Co. | 6.500% | 9/15/37 | 885 | 1,169 |
| Berkshire Hathaway Energy Co. | 5.150% | 11/15/43 | 320 | 373 |
| CenterPoint Energy Houston Electric LLC | 6.950% | 3/15/33 | 30 | 42 |
| CenterPoint Energy Houston Electric LLC | 3.550% | 8/1/42 | 975 | 915 |
| CenterPoint Energy Houston Electric LLC | 4.500% | 4/1/44 | 575 | 623 |
| Cleco Power LLC | 6.500% | 12/1/35 | 330 | 421 |
| Cleco Power LLC | 6.000% | 12/1/40 | 235 | 285 |
175
| Long-Term Corporate Bond Index Fund | ||||
| Face | Market | |||
| Maturity | Amount | Value• | ||
| Coupon | Date | ($000) | ($000) | |
| CMS Energy Corp. | 4.700% | 3/31/43 | 375 | 395 |
| CMS Energy Corp. | 4.875% | 3/1/44 | 250 | 270 |
| Commonwealth Edison Co. | 5.875% | 2/1/33 | 185 | 231 |
| Commonwealth Edison Co. | 5.900% | 3/15/36 | 585 | 738 |
| Commonwealth Edison Co. | 6.450% | 1/15/38 | 26 | 36 |
| Commonwealth Edison Co. | 3.800% | 10/1/42 | 620 | 599 |
| Commonwealth Edison Co. | 4.700% | 1/15/44 | 775 | 872 |
| Connecticut Light & Power Co. | 6.350% | 6/1/36 | 351 | 475 |
| Connecticut Light & Power Co. | 4.300% | 4/15/44 | 100 | 105 |
| Consolidated Edison Co. of New York Inc. | 5.300% | 3/1/35 | 590 | 690 |
| Consolidated Edison Co. of New York Inc. | 5.850% | 3/15/36 | 370 | 457 |
| Consolidated Edison Co. of New York Inc. | 6.200% | 6/15/36 | 741 | 961 |
| Consolidated Edison Co. of New York Inc. | 5.700% | 12/1/36 | 480 | 595 |
| Consolidated Edison Co. of New York Inc. | 6.300% | 8/15/37 | 725 | 944 |
| Consolidated Edison Co. of New York Inc. | 6.750% | 4/1/38 | 325 | 445 |
| Consolidated Edison Co. of New York Inc. | 5.500% | 12/1/39 | 780 | 938 |
| Consolidated Edison Co. of New York Inc. | 5.700% | 6/15/40 | 335 | 414 |
| Consolidated Edison Co. of New York Inc. | 4.450% | 3/15/44 | 1,175 | 1,236 |
| Consumers Energy Co. | 3.950% | 5/15/43 | 500 | 503 |
| Consumers Energy Co. | 4.350% | 8/31/64 | 225 | 230 |
| Delmarva Power & Light Co. | 4.000% | 6/1/42 | 660 | 661 |
| Dominion Resources Inc. | 6.300% | 3/15/33 | 640 | 809 |
| Dominion Resources Inc. | 5.250% | 8/1/33 | 248 | 285 |
| Dominion Resources Inc. | 5.950% | 6/15/35 | 285 | 353 |
| Dominion Resources Inc. | 7.000% | 6/15/38 | 755 | 1,042 |
| Dominion Resources Inc. | 4.900% | 8/1/41 | 450 | 492 |
| DTE Electric Co. | 3.375% | 3/1/25 | 525 | 538 |
| DTE Electric Co. | 6.625% | 6/1/36 | 100 | 139 |
| DTE Electric Co. | 3.950% | 6/15/42 | 550 | 547 |
| DTE Electric Co. | 4.000% | 4/1/43 | 300 | 301 |
| DTE Electric Co. | 4.300% | 7/1/44 | 225 | 236 |
| DTE Energy Co. | 6.375% | 4/15/33 | 345 | 444 |
| Duke Energy Carolinas LLC | 6.000% | 12/1/28 | 550 | 687 |
| Duke Energy Carolinas LLC | 6.450% | 10/15/32 | 450 | 594 |
| Duke Energy Carolinas LLC | 6.100% | 6/1/37 | 175 | 222 |
| Duke Energy Carolinas LLC | 6.000% | 1/15/38 | 780 | 1,012 |
| Duke Energy Carolinas LLC | 6.050% | 4/15/38 | 495 | 645 |
| Duke Energy Carolinas LLC | 5.300% | 2/15/40 | 660 | 796 |
| Duke Energy Carolinas LLC | 4.250% | 12/15/41 | 440 | 458 |
| Duke Energy Carolinas LLC | 4.000% | 9/30/42 | 435 | 436 |
| Duke Energy Florida Inc. | 6.350% | 9/15/37 | 295 | 402 |
| Duke Energy Florida Inc. | 6.400% | 6/15/38 | 690 | 942 |
| Duke Energy Florida Inc. | 5.650% | 4/1/40 | 445 | 562 |
| Duke Energy Florida Inc. | 3.850% | 11/15/42 | 730 | 726 |
| Duke Energy Indiana Inc. | 6.120% | 10/15/35 | 448 | 570 |
| Duke Energy Indiana Inc. | 6.350% | 8/15/38 | 480 | 656 |
| Duke Energy Indiana Inc. | 6.450% | 4/1/39 | 450 | 616 |
| Duke Energy Indiana Inc. | 4.200% | 3/15/42 | 450 | 461 |
| Duke Energy Indiana Inc. | 4.900% | 7/15/43 | 600 | 689 |
| Duke Energy Progress Inc. | 4.100% | 5/15/42 | 545 | 555 |
| Duke Energy Progress Inc. | 4.100% | 3/15/43 | 700 | 719 |
| El Paso Electric Co. | 6.000% | 5/15/35 | 55 | 67 |
| Entergy Gulf States Louisiana LLC | 5.590% | 10/1/24 | 535 | 638 |
| Entergy Louisiana LLC | 5.400% | 11/1/24 | 390 | 461 |
| Entergy Louisiana LLC | 4.440% | 1/15/26 | 110 | 121 |
176
| Long-Term Corporate Bond Index Fund | ||||
| Face | Market | |||
| Maturity | Amount | Value• | ||
| Coupon | Date | ($000) | ($000) | |
| Exelon Corp. | 5.625% | 6/15/35 | 550 | 636 |
| Exelon Generation Co. LLC | 6.250% | 10/1/39 | 1,140 | 1,357 |
| Exelon Generation Co. LLC | 5.750% | 10/1/41 | 345 | 390 |
| Exelon Generation Co. LLC | 5.600% | 6/15/42 | 888 | 981 |
| FirstEnergy Solutions Corp. | 6.800% | 8/15/39 | 295 | 328 |
| Florida Power & Light Co. | 5.625% | 4/1/34 | 500 | 620 |
| Florida Power & Light Co. | 4.950% | 6/1/35 | 465 | 542 |
| Florida Power & Light Co. | 5.650% | 2/1/37 | 625 | 793 |
| Florida Power & Light Co. | 5.850% | 5/1/37 | 345 | 444 |
| Florida Power & Light Co. | 5.950% | 2/1/38 | 710 | 925 |
| Florida Power & Light Co. | 5.960% | 4/1/39 | 760 | 1,009 |
| Florida Power & Light Co. | 5.690% | 3/1/40 | 555 | 705 |
| Florida Power & Light Co. | 5.250% | 2/1/41 | 885 | 1,076 |
| Florida Power & Light Co. | 4.125% | 2/1/42 | 405 | 417 |
| Florida Power & Light Co. | 4.050% | 6/1/42 | 445 | 450 |
| Florida Power & Light Co. | 3.800% | 12/15/42 | 425 | 416 |
| Georgia Power Co. | 5.650% | 3/1/37 | 545 | 661 |
| Georgia Power Co. | 5.950% | 2/1/39 | 365 | 460 |
| Georgia Power Co. | 5.400% | 6/1/40 | 175 | 209 |
| Georgia Power Co. | 4.750% | 9/1/40 | 230 | 254 |
| Georgia Power Co. | 4.300% | 3/15/42 | 1,080 | 1,115 |
| Indiana Michigan Power Co. | 6.050% | 3/15/37 | 330 | 413 |
| Interstate Power & Light Co. | 6.250% | 7/15/39 | 700 | 932 |
| ITC Holdings Corp. | 5.300% | 7/1/43 | 200 | 231 |
| Jersey Central Power & Light Co. | 6.150% | 6/1/37 | 325 | 387 |
| 1 John Sevier Combined Cycle Generation LLC | 4.626% | 1/15/42 | 705 | 779 |
| Kansas City Power & Light Co. | 6.050% | 11/15/35 | 30 | 37 |
| Kansas City Power & Light Co. | 5.300% | 10/1/41 | 335 | 386 |
| Kentucky Utilities Co. | 5.125% | 11/1/40 | 1,035 | 1,227 |
| Louisville Gas & Electric Co. | 5.125% | 11/15/40 | 545 | 645 |
| Louisville Gas & Electric Co. | 4.650% | 11/15/43 | 425 | 473 |
| MidAmerican Energy Co. | 6.750% | 12/30/31 | 350 | 480 |
| MidAmerican Energy Co. | 5.750% | 11/1/35 | 430 | 545 |
| MidAmerican Energy Co. | 5.800% | 10/15/36 | 815 | 1,046 |
| Midamerican Funding LLC | 6.927% | 3/1/29 | 350 | 460 |
| Mississippi Power Co. | 4.250% | 3/15/42 | 590 | 596 |
| 2 National Rural Utilities Cooperative Finance Corp. | 4.023% | 11/1/32 | 500 | 521 |
| National Rural Utilities Cooperative Finance Corp. | 4.023% | 11/1/32 | 311 | 324 |
| Nevada Power Co. | 6.650% | 4/1/36 | 350 | 476 |
| Nevada Power Co. | 6.750% | 7/1/37 | 390 | 544 |
| Nevada Power Co. | 5.375% | 9/15/40 | 175 | 212 |
| Nevada Power Co. | 5.450% | 5/15/41 | 491 | 596 |
| Northern States Power Co. | 6.250% | 6/1/36 | 400 | 542 |
| Northern States Power Co. | 6.200% | 7/1/37 | 36 | 49 |
| Northern States Power Co. | 5.350% | 11/1/39 | 175 | 213 |
| Northern States Power Co. | 4.850% | 8/15/40 | 270 | 312 |
| Northern States Power Co. | 3.400% | 8/15/42 | 450 | 411 |
| Northern States Power Co. | 4.125% | 5/15/44 | 750 | 782 |
| NSTAR Electric Co. | 5.500% | 3/15/40 | 640 | 807 |
| NSTAR Electric Co. | 4.400% | 3/1/44 | 125 | 134 |
| Oglethorpe Power Corp. | 5.950% | 11/1/39 | 280 | 353 |
| Oglethorpe Power Corp. | 5.375% | 11/1/40 | 445 | 518 |
| Oglethorpe Power Corp. | 4.550% | 6/1/44 | 450 | 465 |
| Ohio Edison Co. | 6.875% | 7/15/36 | 280 | 372 |
| Ohio Power Co. | 6.600% | 2/15/33 | 70 | 92 |
177
| Long-Term Corporate Bond Index Fund | ||||
| Face | Market | |||
| Maturity | Amount | Value• | ||
| Coupon | Date | ($000) | ($000) | |
| Ohio Power Co. | 5.850% | 10/1/35 | 301 | 376 |
| Oklahoma Gas & Electric Co. | 5.850% | 6/1/40 | 320 | 414 |
| Oklahoma Gas & Electric Co. | 5.250% | 5/15/41 | 30 | 36 |
| Oklahoma Gas & Electric Co. | 3.900% | 5/1/43 | 275 | 265 |
| Oklahoma Gas & Electric Co. | 4.550% | 3/15/44 | 275 | 298 |
| Oncor Electric Delivery Co. LLC | 7.000% | 5/1/32 | 575 | 811 |
| Oncor Electric Delivery Co. LLC | 7.250% | 1/15/33 | 40 | 58 |
| Oncor Electric Delivery Co. LLC | 7.500% | 9/1/38 | 120 | 179 |
| Oncor Electric Delivery Co. LLC | 5.250% | 9/30/40 | 445 | 538 |
| Oncor Electric Delivery Co. LLC | 4.550% | 12/1/41 | 645 | 712 |
| Oncor Electric Delivery Co. LLC | 5.300% | 6/1/42 | 360 | 435 |
| Pacific Gas & Electric Co. | 6.050% | 3/1/34 | 3,270 | 4,104 |
| Pacific Gas & Electric Co. | 5.800% | 3/1/37 | 795 | 973 |
| Pacific Gas & Electric Co. | 6.250% | 3/1/39 | 595 | 779 |
| Pacific Gas & Electric Co. | 5.400% | 1/15/40 | 1,025 | 1,205 |
| Pacific Gas & Electric Co. | 4.500% | 12/15/41 | 780 | 815 |
| Pacific Gas & Electric Co. | 4.450% | 4/15/42 | 1,270 | 1,319 |
| Pacific Gas & Electric Co. | 4.600% | 6/15/43 | 600 | 640 |
| Pacific Gas & Electric Co. | 4.750% | 2/15/44 | 350 | 378 |
| PacifiCorp | 7.700% | 11/15/31 | 120 | 178 |
| PacifiCorp | 5.250% | 6/15/35 | 45 | 54 |
| PacifiCorp | 6.100% | 8/1/36 | 785 | 1,038 |
| PacifiCorp | 5.750% | 4/1/37 | 535 | 680 |
| PacifiCorp | 6.250% | 10/15/37 | 425 | 566 |
| PacifiCorp | 6.000% | 1/15/39 | 530 | 693 |
| PacifiCorp | 4.100% | 2/1/42 | 485 | 499 |
| Peco Energy Co. | 5.950% | 10/1/36 | 520 | 680 |
| Pennsylvania Electric Co. | 6.150% | 10/1/38 | 405 | 491 |
| Potomac Electric Power Co. | 6.500% | 11/15/37 | 420 | 570 |
| Potomac Electric Power Co. | 7.900% | 12/15/38 | 45 | 71 |
| PPL Capital Funding Inc. | 5.000% | 3/15/44 | 600 | 660 |
| PPL Electric Utilities Corp. | 6.250% | 5/15/39 | 245 | 329 |
| PPL Electric Utilities Corp. | 5.200% | 7/15/41 | 240 | 291 |
| PPL Electric Utilities Corp. | 4.750% | 7/15/43 | 125 | 141 |
| PPL Electric Utilities Corp. | 4.125% | 6/15/44 | 500 | 516 |
| Progress Energy Inc. | 7.750% | 3/1/31 | 760 | 1,097 |
| Progress Energy Inc. | 7.000% | 10/30/31 | 745 | 1,005 |
| Progress Energy Inc. | 6.000% | 12/1/39 | 495 | 631 |
| PSEG Power LLC | 8.625% | 4/15/31 | 475 | 695 |
| Public Service Co. of Colorado | 6.250% | 9/1/37 | 320 | 432 |
| Public Service Co. of Colorado | 4.750% | 8/15/41 | 455 | 511 |
| Public Service Co. of Colorado | 3.600% | 9/15/42 | 325 | 310 |
| Public Service Co. of Colorado | 3.950% | 3/15/43 | 375 | 379 |
| Public Service Co. of Colorado | 4.300% | 3/15/44 | 500 | 528 |
| Public Service Co. of Oklahoma | 6.625% | 11/15/37 | 25 | 33 |
| Public Service Electric & Gas Co. | 5.700% | 12/1/36 | 750 | 960 |
| Public Service Electric & Gas Co. | 5.800% | 5/1/37 | 305 | 389 |
| Public Service Electric & Gas Co. | 5.375% | 11/1/39 | 455 | 557 |
| Public Service Electric & Gas Co. | 3.950% | 5/1/42 | 475 | 479 |
| Public Service Electric & Gas Co. | 3.650% | 9/1/42 | 425 | 405 |
| Public Service Electric & Gas Co. | 4.000% | 6/1/44 | 800 | 804 |
| Puget Sound Energy Inc. | 7.020% | 12/1/27 | 725 | 981 |
| Puget Sound Energy Inc. | 5.483% | 6/1/35 | 50 | 61 |
| Puget Sound Energy Inc. | 6.274% | 3/15/37 | 760 | 1,015 |
| Puget Sound Energy Inc. | 5.757% | 10/1/39 | 370 | 464 |
178
| Long-Term Corporate Bond Index Fund | ||||
| Face | Market | |||
| Maturity | Amount | Value• | ||
| Coupon | Date | ($000) | ($000) | |
| Puget Sound Energy Inc. | 5.795% | 3/15/40 | 340 | 433 |
| Puget Sound Energy Inc. | 5.764% | 7/15/40 | 40 | 51 |
| Puget Sound Energy Inc. | 5.638% | 4/15/41 | 265 | 333 |
| Puget Sound Energy Inc. | 4.434% | 11/15/41 | 485 | 526 |
| San Diego Gas & Electric Co. | 6.000% | 6/1/26 | 370 | 464 |
| San Diego Gas & Electric Co. | 5.350% | 5/15/35 | 540 | 657 |
| San Diego Gas & Electric Co. | 6.125% | 9/15/37 | 385 | 517 |
| San Diego Gas & Electric Co. | 6.000% | 6/1/39 | 505 | 669 |
| San Diego Gas & Electric Co. | 5.350% | 5/15/40 | 20 | 25 |
| San Diego Gas & Electric Co. | 4.500% | 8/15/40 | 415 | 451 |
| San Diego Gas & Electric Co. | 3.950% | 11/15/41 | 130 | 131 |
| San Diego Gas & Electric Co. | 4.300% | 4/1/42 | 60 | 64 |
| Scottish Power Ltd. | 5.810% | 3/15/25 | 600 | 700 |
| South Carolina Electric & Gas Co. | 6.625% | 2/1/32 | 450 | 617 |
| South Carolina Electric & Gas Co. | 5.300% | 5/15/33 | 30 | 36 |
| South Carolina Electric & Gas Co. | 6.050% | 1/15/38 | 915 | 1,173 |
| South Carolina Electric & Gas Co. | 5.450% | 2/1/41 | 685 | 833 |
| South Carolina Electric & Gas Co. | 4.350% | 2/1/42 | 355 | 370 |
| South Carolina Electric & Gas Co. | 4.600% | 6/15/43 | 475 | 516 |
| South Carolina Electric & Gas Co. | 4.500% | 6/1/64 | 275 | 286 |
| Southern California Edison Co. | 6.000% | 1/15/34 | 405 | 524 |
| Southern California Edison Co. | 5.750% | 4/1/35 | 826 | 1,053 |
| Southern California Edison Co. | 5.350% | 7/15/35 | 520 | 629 |
| Southern California Edison Co. | 5.550% | 1/15/36 | 620 | 764 |
| Southern California Edison Co. | 5.625% | 2/1/36 | 425 | 531 |
| Southern California Edison Co. | 5.550% | 1/15/37 | 520 | 649 |
| Southern California Edison Co. | 5.950% | 2/1/38 | 655 | 845 |
| Southern California Edison Co. | 6.050% | 3/15/39 | 875 | 1,147 |
| Southern California Edison Co. | 4.500% | 9/1/40 | 770 | 839 |
| Southern California Edison Co. | 3.900% | 12/1/41 | 545 | 544 |
| Southern California Edison Co. | 4.050% | 3/15/42 | 150 | 151 |
| Southern California Edison Co. | 3.900% | 3/15/43 | 125 | 124 |
| Southern California Edison Co. | 4.650% | 10/1/43 | 575 | 642 |
| Southern Power Co. | 5.150% | 9/15/41 | 640 | 732 |
| Southern Power Co. | 5.250% | 7/15/43 | 350 | 403 |
| Southwestern Electric Power Co. | 6.200% | 3/15/40 | 360 | 471 |
| Southwestern Public Service Co. | 4.500% | 8/15/41 | 400 | 440 |
| Tampa Electric Co. | 6.550% | 5/15/36 | 255 | 347 |
| Tampa Electric Co. | 6.150% | 5/15/37 | 340 | 440 |
| Tampa Electric Co. | 4.100% | 6/15/42 | 480 | 485 |
| Toledo Edison Co. | 6.150% | 5/15/37 | 320 | 397 |
| TransAlta Corp. | 6.500% | 3/15/40 | 375 | 400 |
| Union Electric Co. | 8.450% | 3/15/39 | 500 | 843 |
| Union Electric Co. | 3.900% | 9/15/42 | 455 | 446 |
| Virginia Electric & Power Co. | 6.000% | 1/15/36 | 485 | 627 |
| Virginia Electric & Power Co. | 6.000% | 5/15/37 | 300 | 387 |
| Virginia Electric & Power Co. | 6.350% | 11/30/37 | 452 | 612 |
| Virginia Electric & Power Co. | 8.875% | 11/15/38 | 570 | 972 |
| Virginia Electric & Power Co. | 4.000% | 1/15/43 | 485 | 486 |
| Virginia Electric & Power Co. | 4.650% | 8/15/43 | 750 | 827 |
| Virginia Electric and Power Co. | 4.450% | 2/15/44 | 400 | 432 |
| Westar Energy Inc. | 4.125% | 3/1/42 | 490 | 501 |
| Westar Energy Inc. | 4.100% | 4/1/43 | 250 | 253 |
| Westar Energy Inc. | 4.625% | 9/1/43 | 850 | 950 |
| Wisconsin Electric Power Co. | 5.625% | 5/15/33 | 455 | 568 |
179
| Long-Term Corporate Bond Index Fund | ||||
| Face | Market | |||
| Maturity | Amount | Value• | ||
| Coupon | Date | ($000) | ($000) | |
| Wisconsin Electric Power Co. | 5.700% | 12/1/36 | 190 | 242 |
| Wisconsin Electric Power Co. | 4.250% | 6/1/44 | 350 | 372 |
| Wisconsin Power & Light Co. | 6.375% | 8/15/37 | 349 | 478 |
| Wisconsin Public Service Corp. | 3.671% | 12/1/42 | 400 | 383 |
| Wisconsin Public Service Corp. | 4.752% | 11/1/44 | 250 | 286 |
| Xcel Energy Inc. | 6.500% | 7/1/36 | 330 | 440 |
| Xcel Energy Inc. | 4.800% | 9/15/41 | 325 | 363 |
| Natural Gas (0.6%) | ||||
| AGL Capital Corp. | 6.000% | 10/1/34 | 215 | 272 |
| AGL Capital Corp. | 5.875% | 3/15/41 | 780 | 983 |
| AGL Capital Corp. | 4.400% | 6/1/43 | 660 | 685 |
| Atmos Energy Corp. | 5.500% | 6/15/41 | 550 | 685 |
| Atmos Energy Corp. | 4.150% | 1/15/43 | 350 | 361 |
| KeySpan Corp. | 8.000% | 11/15/30 | 480 | 676 |
| KeySpan Corp. | 5.803% | 4/1/35 | 65 | 78 |
| Laclede Group Inc. | 4.700% | 8/15/44 | 275 | 283 |
| 2 ONE Gas Inc. | 4.658% | 2/1/44 | 450 | 503 |
| Piedmont Natural Gas Co. Inc. | 4.650% | 8/1/43 | 325 | 357 |
| Sempra Energy | 6.000% | 10/15/39 | 890 | 1,130 |
| Southern California Gas Co. | 5.750% | 11/15/35 | 325 | 415 |
| Southern California Gas Co. | 3.750% | 9/15/42 | 475 | 460 |
| Southern California Gas Co. | 4.450% | 3/15/44 | 225 | 244 |
| Other Utility (0.2%) | ||||
| American Water Capital Corp. | 3.400% | 3/1/25 | 250 | 253 |
| American Water Capital Corp. | 6.593% | 10/15/37 | 855 | 1,160 |
| American Water Capital Corp. | 4.300% | 12/1/42 | 325 | 332 |
| United Utilities plc | 6.875% | 8/15/28 | 445 | 540 |
| Veolia Environnement SA | 6.750% | 6/1/38 | 275 | 341 |
| 152,452 | ||||
| Total Corporate Bonds (Cost $1,092,629) | 1,145,833 | |||
| Taxable Municipal Bonds (0.2%) | ||||
| George Washington University District of | ||||
| Columbia GO | 4.300% | 9/15/44 | 225 | 232 |
| New York University Hospitals Center GO | 4.428% | 7/1/42 | 350 | 346 |
| New York University Hospitals Center Revenue | 5.750% | 7/1/43 | 350 | 419 |
| President & Fellows of Harvard College | ||||
| Massachusetts GO | 6.300% | 10/1/37 | 65 | 71 |
| President & Fellows of Harvard College | ||||
| Massachusetts GO | 4.875% | 10/15/40 | 275 | 324 |
| Princeton University New Jersey GO | 5.700% | 3/1/39 | 360 | 471 |
| Tufts University Massachusetts GO | 5.017% | 4/15/12 | 225 | 240 |
| University of Southern California GO | 5.250% | 10/1/11 | 265 | 338 |
| Total Taxable Municipal Bonds (Cost $2,310) | 2,441 | |||
| Shares | ||||
| Temporary Cash Investment (0.3%) | ||||
| Money Market Fund (0.3%) | ||||
| 4 Vanguard Market Liquidity Fund (Cost $2,905) | 0.113% | 2,905,000 | 2,905 | |
| Total Investments (99.0%) (Cost $1,105,945) | 1,159,301 | |||
180
| Long-Term Corporate Bond Index Fund | |
| Market | |
| Value• | |
| ($000) | |
| Other Assets and Liabilities (1.0%) | |
| Other Assets | 16,771 |
| Liabilities | (4,541) |
| 12,230 | |
| Net Assets (100%) | 1,171,531 |
| At August 31, 2014, net assets consisted of: | |
| Amount | |
| ($000) | |
| Paid-in Capital | 1,125,206 |
| Undistributed Net Investment Income | 3,177 |
| Accumulated Net Realized Losses | (10,199) |
| Unrealized Appreciation (Depreciation) | |
| Investment Securities | 53,356 |
| Futures Contracts | (9) |
| Net Assets | 1,171,531 |
| Admiral Shares—Net Assets | |
| Applicable to 1,779,179 outstanding $.001 par value shares of | |
| beneficial interest (unlimited authorization) | 43,962 |
| Net Asset Value Per Share—Admiral Shares | $24.71 |
| Institutional Shares—Net Assets | |
| Applicable to 8,147,874 outstanding $.001 par value shares of | |
| beneficial interest (unlimited authorization) | 249,961 |
| Net Asset Value Per Share—Institutional Shares | $30.68 |
| ETF Shares—Net Assets | |
| Applicable to 9,500,000 outstanding $.001 par value shares of | |
| beneficial interest (unlimited authorization) | 877,608 |
| Net Asset Value Per Share—ETF Shares | $92.38 |
• See Note A in Notes to Financial Statements.
1 The average or expected maturity is shorter than the final maturity shown because of the possibility of interim principal payments and prepayments or the possibility of the issue being called.
2 Security exempt from registration under Rule 144A of the Securities Act of 1933. Such securities may be sold in transactions exempt from registration, normally to qualified institutional buyers. At August 31, 2014, the aggregate value of these securities was $15,884,000, representing 1.4% of net assets.
3 Securities with a value of $125,000 have been segregated as initial margin for open futures contracts.
4 Affiliated money market fund available only to Vanguard funds and certain trusts and accounts managed by Vanguard. Rate shown is the 7-day yield.
GO—General Obligation Bond.
REIT—Real Estate Investment Trust.
See accompanying Notes, which are an integral part of the Financial Statements.
181
Long-Term Corporate Bond Index Fund
Statement of Operations
| Year Ended | |
| August 31, 2014 | |
| ($000) | |
| Investment Income | |
| Income | |
| Interest1 | 44,475 |
| Total Income | 44,475 |
| Expenses | |
| The Vanguard Group—Note B | |
| Investment Advisory Services | 24 |
| Management and Administrative—Admiral Shares | 22 |
| Management and Administrative—Institutional Shares | 120 |
| Management and Administrative—ETF Shares | 526 |
| Marketing and Distribution—Admiral Shares | 5 |
| Marketing and Distribution—Institutional Shares | 52 |
| Marketing and Distribution—ETF Shares | 164 |
| Custodian Fees | 23 |
| Auditing Fees | 46 |
| Shareholders’ Reports—Admiral Shares | 2 |
| Shareholders’ Reports—Institutional Shares | — |
| Shareholders’ Reports—ETF Shares | 74 |
| Trustees’ Fees and Expenses | 1 |
| Total Expenses | 1,059 |
| Net Investment Income | 43,416 |
| Realized Net Gain (Loss) | |
| Investment Securities Sold | (8,571) |
| Futures Contracts | (300) |
| Realized Net Gain (Loss) | (8,871) |
| Change in Unrealized Appreciation (Depreciation) | |
| Investment Securities | 118,107 |
| Futures Contracts | (9) |
| Change in Unrealized Appreciation (Depreciation) | 118,098 |
| Net Increase (Decrease) in Net Assets Resulting from Operations | 152,643 |
| 1 Interest income from an affiliated company of the fund was $4,000. | |
See accompanying Notes, which are an integral part of the Financial Statements.
182
Long-Term Corporate Bond Index Fund
Statement of Changes in Net Assets
| Year Ended August 31, | ||
| 2014 | 2013 | |
| ($000) | ($000) | |
| Increase (Decrease) in Net Assets | ||
| Operations | ||
| Net Investment Income | 43,416 | 53,884 |
| Realized Net Gain (Loss) | (8,871) | 26,186 |
| Change in Unrealized Appreciation (Depreciation) | 118,098 | (148,414) |
| Net Increase (Decrease) in Net Assets Resulting from Operations | 152,643 | (68,344) |
| Distributions | ||
| Net Investment Income | ||
| Admiral Shares1 | (1,332) | (769) |
| Institutional Shares | (9,963) | (9,371) |
| ETF Shares | (28,936) | (43,744) |
| Realized Capital Gain 2 | ||
| Admiral Shares1 | — | (38) |
| Institutional Shares | — | (527) |
| ETF Shares | — | (2,822) |
| Total Distributions | (40,231) | (57,271) |
| Capital Share Transactions | ||
| Admiral Shares1 | 22,307 | 5,594 |
| Institutional Shares | 19,116 | 67,132 |
| ETF Shares | 169,519 | (309,830) |
| Net Increase (Decrease) from Capital Share Transactions | 210,942 | (237,104) |
| Total Increase (Decrease) | 323,354 | (362,719) |
| Net Assets | ||
| Beginning of Period | 848,177 | 1,210,896 |
| End of Period3 | 1,171,531 | 848,177 |
1 Signal Shares were renamed Admiral Shares in October 2013. The prior period’s distributions and capital share transactions are for the Signal Class.
2 Includes fiscal 2013 short-term gain distributions totaling $2,936,000. Short-term gain distributions are treated as ordinary income dividends for tax purposes.
3 Net Assets—End of Period includes undistributed (overdistributed) net investment income of $3,177,000 and ($8,000).
See accompanying Notes, which are an integral part of the Financial Statements.
183
Long-Term Corporate Bond Index Fund
Financial Highlights
| Admiral Shares | |||||
| Jan. 19, | |||||
| 20101 to | |||||
| For a Share Outstanding | Year Ended August 31, | Aug. 31, | |||
| Throughout Each Period | 2014 | 2013 | 2012 | 2011 | 2010 |
| Net Asset Value, Beginning of Period | $22.04 | $24.74 | $21.69 | $22.00 | $20.12 |
| Investment Operations | |||||
| Net Investment Income | 1.066 | 1.078 | 1.068 | 1.100 | .680 |
| Net Realized and Unrealized Gain (Loss) | |||||
| on Investments 2 | 2.669 | (2.640) | 3.051 | (.246) | 1.936 |
| Total from Investment Operations | 3.735 | (1.562) | 4.119 | .854 | 2.616 |
| Distributions | |||||
| Dividends from Net Investment Income | (1.065) | (1.078) | (1.069) | (1.100) | (.736) |
| Distributions from Realized Capital Gains | — | (.060) | — | (.064) | — |
| Total Distributions | (1.065) | (1.138) | (1.069) | (1.164) | (.736) |
| Net Asset Value, End of Period | $24.71 | $22.04 | $24.74 | $21.69 | $22.00 |
| Total Return3 | 17.37% | -6.57% | 19.43% | 4.21% | 13.37% |
| Ratios/Supplemental Data | |||||
| Net Assets, End of Period (Millions) | $44 | $18 | $15 | $9 | $4 |
| Ratio of Total Expenses to Average Net Assets | 0.12% | 0.12% | 0.12% | 0.14% | 0.15%4 |
| Ratio of Net Investment Income to | |||||
| Average Net Assets | 4.63% | 4.47% | 4.73% | 5.36% | 5.65%4 |
| Portfolio Turnover Rate 5 | 54% | 57% | 71% | 110% | 41% |
Signal Shares were renamed Admiral Shares in October 2013. Prior periods’ Financial Highlights are for the Signal Class.
1 Inception.
2 Includes increases from purchase fees of $.01, $.01, $.01, $.04, and $.03.
3 Total returns do not include transaction or account service fees that may have applied in the periods shown. Fund prospectuses provide information about any applicable transaction and account service fees.
4 Annualized.
5 Excludes the value of portfolio securities received or delivered as a result of in-kind purchases or redemptions of the fund’s capital shares, including ETF Creation Units.
See accompanying Notes, which are an integral part of the Financial Statements.
184
Long-Term Corporate Bond Index Fund
Financial Highlights
| Institutional Shares | |||||
| Nov. 19, | |||||
| 20091 to | |||||
| For a Share Outstanding | Year Ended August 31, | Aug. 31, | |||
| Throughout Each Period | 2014 | 2013 | 2012 | 2011 | 2010 |
| Net Asset Value, Beginning of Period | $27.37 | $30.71 | $26.93 | $27.32 | $24.89 |
| Investment Operations | |||||
| Net Investment Income | 1.331 | 1.347 | 1.337 | 1.377 | 1.090 |
| Net Realized and Unrealized Gain (Loss) | |||||
| on Investments 2 | 3.308 | (3.265) | 3.780 | (.308) | 2.428 |
| Total from Investment Operations | 4.639 | (1.918) | 5.117 | 1.069 | 3.518 |
| Distributions | |||||
| Dividends from Net Investment Income | (1.329) | (1.347) | (1.337) | (1.379) | (1.088) |
| Distributions from Realized Capital Gains | — | (.075) | — | (.080) | — |
| Total Distributions | (1.329) | (1.422) | (1.337) | (1.459) | (1.088) |
| Net Asset Value, End of Period | $30.68 | $27.37 | $30.71 | $26.93 | $27.32 |
| Total Return3 | 17.38% | -6.50% | 19.44% | 4.25% | 14.61% |
| Ratios/Supplemental Data | |||||
| Net Assets, End of Period (Millions) | $250 | $206 | $164 | $15 | $7 |
| Ratio of Total Expenses to Average Net Assets | 0.09% | 0.09% | 0.09% | 0.09% | 0.09%4 |
| Ratio of Net Investment Income to | |||||
| Average Net Assets | 4.66% | 4.50% | 4.76% | 5.41% | 5.71%4 |
| Portfolio Turnover Rate 5 | 54% | 57% | 71% | 110% | 41% |
1 Inception.
2 Includes increases from purchase fees of $.02, $.01, $.00, $.04, and $.03.
3 Total returns do not include transaction fees that may have applied in the periods shown. Fund prospectuses provide information about any applicable transaction fees.
4 Annualized.
5 Excludes the value of portfolio securities received or delivered as a result of in-kind purchases or redemptions of the fund’s capital shares, including ETF Creation Units.
See accompanying Notes, which are an integral part of the Financial Statements.
185
Long-Term Corporate Bond Index Fund
Financial Highlights
| ETF Shares | |||||
| Nov. 19, | |||||
| 20091 to | |||||
| For a Share Outstanding | Year Ended August 31, | Aug. 31, | |||
| Throughout Each Period | 2014 | 2013 | 2012 | 2011 | 2010 |
| Net Asset Value, Beginning of Period | $82.11 | $92.15 | $80.80 | $81.96 | $74.67 |
| Investment Operations | |||||
| Net Investment Income | 3.964 | 4.018 | 3.980 | 4.091 | 3.236 |
| Net Realized and Unrealized Gain (Loss) | |||||
| on Investments 2 | 9.937 | (9.816) | 11.351 | (.917) | 7.286 |
| Total from Investment Operations | 13.901 | (5.798) | 15.331 | 3.174 | 10.522 |
| Distributions | |||||
| Dividends from Net Investment Income | (3.631) | (4.018) | (3.981) | (4.095) | (3.232) |
| Distributions from Realized Capital Gains | — | (.224) | — | (.239) | — |
| Total Distributions | (3.631) | (4.242) | (3.981) | (4.334) | (3.232) |
| Net Asset Value, End of Period | $92.38 | $82.11 | $92.15 | $80.80 | $81.96 |
| Total Return | 17.35% | -6.55% | 19.40% | 4.19% | 14.54% |
| Ratios/Supplemental Data | |||||
| Net Assets, End of Period (Millions) | $878 | $624 | $1,032 | $275 | $66 |
| Ratio of Total Expenses to Average Net Assets | 0.12% | 0.12% | 0.12% | 0.14% | 0.15%3 |
| Ratio of Net Investment Income to | |||||
| Average Net Assets | 4.63% | 4.47% | 4.73% | 5.36% | 5.65%3 |
| Portfolio Turnover Rate 4 | 54% | 57% | 71% | 110% | 41% |
| 1 Inception. 2 Includes increases from purchase fees of $.05, $.07, $.02, $.07, and $.10. 3 Annualized. 4 Excludes the value of portfolio securities received or delivered as a result of in-kind purchases or redemptions of the fund’s capital shares, including ETF Creation Units. | |||||
See accompanying Notes, which are an integral part of the Financial Statements.
186
Long-Term Corporate Bond Index Fund
Notes to Financial Statements
Vanguard Long-Term Corporate Bond Index Fund is registered under the Investment Company Act of 1940 as an open-end investment company, or mutual fund. Certain of the fund’s investments are in corporate debt instruments; the issuers’ abilities to meet their obligations may be affected by economic developments in their respective industries. The fund offers three classes of shares: Admiral Shares, Institutional Shares, and ETF Shares. Admiral Shares and Institutional Shares are designed for investors who meet certain administrative, service, and account-size criteria. ETF shares are listed for trading on Nasdaq; they can be purchased and sold through a broker. Effective in October 2013, Signal Shares were renamed Admiral Shares.
A. The following significant accounting policies conform to generally accepted accounting principles for U.S. investment companies. The fund consistently follows such policies in preparing its financial statements.
1. Security Valuation: Securities are valued as of the close of trading on the New York Stock Exchange (generally 4 p.m., Eastern time) on the valuation date. Bonds, and temporary cash investments acquired over 60 days to maturity, are valued using the latest bid prices or using valuations based on a matrix system (which considers such factors as security prices, yields, maturities, and ratings), both as furnished by independent pricing services. Investments in Vanguard Market Liquidity Fund are valued at that fund’s net asset value. Other temporary cash investments are valued at amortized cost, which approximates market value. Securities for which market quotations are not readily available, or whose values have been affected by events occurring before the fund’s pricing time but after the close of the securities’ primary markets, are valued by methods deemed by the board of trustees to represent fair value.
2. Futures Contracts: The fund uses futures contracts to invest in fixed income asset classes with greater efficiency and lower cost than is possible through direct investment, to add value when these instruments are attractively priced, or to adjust sensitivity to changes in interest rates. The primary risks associated with the use of futures contracts are imperfect correlation between changes in market values of bonds held by the fund and the prices of futures contracts, and the possibility of an illiquid market. Counterparty risk involving futures is mitigated because a regulated clearinghouse is the counterparty instead of the clearing broker. To further mitigate counterparty risk, the fund trades futures contracts on an exchange, monitors the financial strength of its clearing brokers and clearinghouse, and has entered into clearing agreements with its clearing brokers. The clearinghouse imposes initial margin requirements to secure the fund’s performance and requires daily settlement of variation margin representing changes in the market value of each contract.
Futures contracts are valued at their quoted daily settlement prices. The aggregate settlement values of the contracts are not recorded in the Statement of Net Assets. Fluctuations in the value of the contracts are recorded in the Statement of Net Assets as an asset (liability) and in the Statement of Operations as unrealized appreciation (depreciation) until the contracts are closed, when they are recorded as realized futures gains (losses).
During the year ended August 31, 2014, the fund’s average investments in long and short futures contracts each represented less than 1% of net assets, based on the average of aggregate settlement values at each quarter-end during the period.
3. Federal Income Taxes: The fund intends to continue to qualify as a regulated investment company and distribute all of its taxable income. Management has analyzed the fund’s tax positions taken for all open federal income tax years (August 31, 2011–2014), and has concluded that no provision for federal income tax is required in the fund’s financial statements.
187
Long-Term Corporate Bond Index Fund
4. Distributions: Distributions to shareholders are recorded on the ex-dividend date.
5. Credit Facility: The fund and certain other funds managed by The Vanguard Group participate in a $2.89 billion committed credit facility provided by a syndicate of lenders pursuant to a credit agreement that may be renewed annually; each fund is individually liable for its borrowings, if any, under the credit facility. Borrowings may be utilized for temporary and emergency purposes, and are subject to the fund’s regulatory and contractual borrowing restrictions. The participating funds are charged administrative fees and an annual commitment fee of 0.06% of the undrawn amount of the facility; these fees are allocated to the funds based on a method approved by the fund’s board of trustees and included in Management and Administrative expenses on the fund’s Statement of Operations. Any borrowings under this facility bear interest at a rate equal to the higher of the federal funds rate or LIBOR reference rate plus an agreed-upon spread.
The fund had no borrowings outstanding at August 31, 2014, or at any time during the period then ended.
6. Other: Interest income includes income distributions received from Vanguard Market Liquidity Fund and is accrued daily. Premiums and discounts on debt securities purchased are amortized and accreted, respectively, to interest income over the lives of the respective securities. Security transactions are accounted for on the date securities are bought or sold. Costs used to determine realized gains (losses) on the sale of investment securities are those of the specific securities sold. Fees assessed on purchases of capital shares are credited to paid-in capital.
Each class of shares has equal rights as to assets and earnings, except that each class separately bears certain class-specific expenses related to maintenance of shareholder accounts (included in Management and Administrative expenses) and shareholder reporting. Marketing and distribution expenses are allocated to each class of shares based on a method approved by the board of trustees. Income, other non-class-specific expenses, and gains and losses on investments are allocated to each class of shares based on its relative net assets.
B. The Vanguard Group furnishes at cost investment advisory, corporate management, administrative, marketing, and distribution services. The costs of such services are allocated to the fund based on methods approved by the board of trustees. The fund has committed to provide up to 0.40% of its net assets in capital contributions to Vanguard. At August 31, 2014, the fund had contributed capital of $112,000 to Vanguard (included in Other Assets), representing 0.01% of the fund’s net assets and 0.04% of Vanguard’s capitalization. The fund’s trustees and officers are also directors and officers of Vanguard.
C. Various inputs may be used to determine the value of the fund’s investments. These inputs are summarized in three broad levels for financial statement purposes. The inputs or methodologies used to value securities are not necessarily an indication of the risk associated with investing in those securities.
Level 1—Quoted prices in active markets for identical securities.
Level 2—Other significant observable inputs (including quoted prices for similar securities, interest rates, prepayment speeds, credit risk, etc.).
Level 3—Significant unobservable inputs (including the fund’s own assumptions used to determine the fair value of investments).
188
Long-Term Corporate Bond Index Fund
The following table summarizes the market value of the fund’s investments as of August 31, 2014, based on the inputs used to value them:
| |||
| Level 1 | Level 2 | Level 3 | |
| Investments | ($000) | ($000) | ($000) |
| U.S. Government and Agency Obligations | — | 8,122 | — |
| Corporate Bonds | — | 1,145,833 | — |
| Taxable Municipal Bonds | — | 2,441 | — |
| Temporary Cash Investments | 2,905 | — | — |
| Futures Contracts—Assets1 | 8 | — | — |
| Futures Contracts—Liabilities1 | (3) | — | — |
| Total | 2,910 | 1,156,396 | — |
| 1 Represents variation margin on the last day of the reporting period. | |||
D. At August 31, 2014, the aggregate settlement value of open futures contracts and the related unrealized appreciation (depreciation) were:
| ($000) | ||||
| Aggregate | ||||
| Number of | Settlement | Unrealized | ||
| Long (Short) | Value | Appreciation | ||
| Futures Contracts | Expiration | Contracts | Long (Short) | (Depreciation) |
| Ultra Long U.S. Treasury Bond | December 2014 | (10) | (1,555) | (9) |
Unrealized appreciation (depreciation) on open futures contracts is required to be treated as realized gain (loss) for tax purposes.
E. Distributions are determined on a tax basis and may differ from net investment income and realized capital gains for financial reporting purposes. Differences may be permanent or temporary. Permanent differences are reclassified among capital accounts in the financial statements to reflect their tax character. Temporary differences arise when certain items of income, expense, gain, or loss are recognized in different periods for financial statement and tax purposes. These differences will reverse at some time in the future. Differences in classification may also result from the treatment of short-term gains as ordinary income for tax purposes.
During the year ended August 31, 2014, the fund realized $1,149,000 of net capital losses resulting from in-kind redemptions—in which shareholders exchanged fund shares for securities held by the fund rather than for cash. Because such losses are not taxable to the fund, and are not distributed to shareholders, they have been reclassified from accumulated net realized losses to paid-in capital.
For tax purposes, at August 31, 2014, the fund had available capital losses totaling $9,634,000 that may be carried forward indefinitely to offset future capital gains.
At August 31, 2014, the cost of investment securities for tax purposes was $1,106,519,000. Net unrealized appreciation of investment securities for tax purposes was $52,782,000, consisting of unrealized gains of $56,818,000 on securities that had risen in value since their purchase and $4,036,000 in unrealized losses on securities that had fallen in value since their purchase.
189
Long-Term Corporate Bond Index Fund
F. During the year ended August 31, 2014, the fund purchased $586,331,000 of investment securities and sold $385,586,000 of investment securities, other than U.S. government securities and temporary cash investments. Purchases and sales of U.S. government securities were $283,519,000 and $277,658,000, respectively. Total purchases and sales include $314,642,000 and $166,141,000, respectively, in connection with in-kind purchases and redemptions of the fund’s capital shares.
G. Capital share transactions for each class of shares were:
| Year Ended August 31, | |||||
| 2014 | 2013 | ||||
| Amount | Shares | Amount | Shares | ||
| ($000) | (000) | ($000) | (000) | ||
| Admiral Shares1 | |||||
| Issued 2 | 35,859 | 1,523 | 5,284 | 219 | |
| Issued in Lieu of Cash Distributions | 1,164 | 49 | 805 | 34 | |
| Redeemed | (14,716) | (619) | (495) | (21) | |
| Net Increase (Decrease)—Admiral Shares | 22,307 | 953 | 5,594 | 232 | |
| Institutional Shares | |||||
| Issued 2 | 30,914 | 1,045 | 59,510 | 1,928 | |
| Issued in Lieu of Cash Distributions | 9,963 | 345 | 9,898 | 335 | |
| Redeemed | (21,761) | (769) | (2,276) | (79) | |
| Net Increase (Decrease) —Institutional Shares | 19,116 | 621 | 67,132 | 2,184 | |
| ETF Shares | |||||
| Issued 2 | 348,514 | 4,000 | 309,262 | 3,400 | |
| Issued in Lieu of Cash Distributions | — | — | — | — | |
| Redeemed | (178,995) | (2,100) | (619,092) | (7,000) | |
| Net Increase (Decrease) —ETF Shares | 169,519 | 1,900 | (309,830) | (3,600) | |
| 1 Signal Shares were renamed Admiral Shares in October 2013. The prior period’s capital share transactions are for the Signal class. 2 Includes purchase fees for fiscal 2014 and 2013 of $672,000 and $647,000, respectively (fund totals). | |||||
H. Management has determined that no material events or transactions occurred subsequent to August 31, 2014, that would require recognition or disclosure in these financial statements.
190
Mortgage-Backed Securities Index Fund
Fund Profile
As of August 31, 2014
| Share-Class Characteristics | |||
| Admiral | Institutional | ETF | |
| Shares | Shares | Shares | |
| Ticker Symbol | VMBSX | VMBIX | VMBS |
| Expense Ratio1 | 0.12% | 0.09% | 0.12% |
| 30-Day SEC Yield | 1.40% | 1.43% | 1.40% |
| Financial Attributes | |||
| Barclays | |||
| MBS | Barclays | ||
| Float Adj | Aggregate | ||
| Fund | Index | FA Index | |
| Number of Bonds | 4372 | 432 | 8,876 |
| Yield to Maturity | |||
| (before expenses) | 2.7% | 2.7% | 2.1% |
| Average Coupon | 4.0% | 4.0% | 3.3% |
| Average Duration | 4.4 years | 4.6 years | 5.6 years |
| Average Effective | |||
| Maturity | 6.5 years | 6.6 years | 7.7 years |
| Short-Term | |||
| Reserves | 0.9% | — | — |
| Sector Diversification (% of portfolio) | |
| Government Mortgage-Backed | 100.0% |
| The agency and mortgage-backed securities sectors may include issues from government-sponsored enterprises; such issues are generally not backed by the full faith and credit of the U.S. government. | |
| Volatility Measures | ||
| Barclays | ||
| MBS | Barclays | |
| Float Adj | Aggregate | |
| Index | FA Index | |
| R-Squared | 0.99 | 0.78 |
| Beta | 1.06 | 0.71 |
| These measures show the degree and timing of the fund’s fluctuations compared with the indexes over 36 months. | ||
| Distribution by Effective Maturity | |
| (% of portfolio) | |
| Under 1 Year | 1.7% |
| 1 - 3 Years | 2.7 |
| 3 - 5 Years | 18.8 |
| 5 - 10 Years | 76.8 |
| Distribution by Credit Quality (% of portfolio) | |
| U.S. Government | 98.2% |
| Aaa | 1.8 |
| Credit-quality ratings are obtained from Barclays and are from Moody's, Fitch, and S&P. When ratings from all three agencies are used, the median rating is shown. When ratings from two of the agencies are used, the lower rating for each issue is shown. For more information about these ratings, see the Glossary entry for Credit Quality. | |
| Distribution by Coupon (% of portfolio) | |
| Below 5% | 91.6% |
| 5% - 6% | 7.4 |
| Above 6% | 1.0 |
1 The expense ratios shown are from the prospectus dated December 20, 2013, and represent estimated costs for the current fiscal year. For the fiscal year ended August 31, 2014, the expense ratios were 0.12% for Admiral Shares, 0.09% for Institutional Shares (annualized), and 0.12% for ETF Shares.
2 Issues are mortgage pools grouped by coupon.
191
Mortgage-Backed Securities Index Fund
Investment Focus
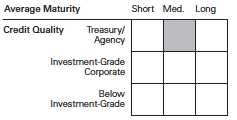
192
Mortgage-Backed Securities Index Fund
Performance Summary
All of the returns in this report represent past performance, which is not a guarantee of future results that may be achieved by the fund. (Current performance may be lower or higher than the performance data cited. For performance data current to the most recent month-end, visit our website at vanguard.com/performance.) Note, too, that both investment returns and principal value can fluctuate widely, so an investor’s shares, when sold, could be worth more or less than their original cost. The returns shown do not reflect taxes that a shareholder would pay on fund distributions or on the sale of fund shares.
Cumulative Performance: November 19, 2009, Through August 31, 2014
Initial Investment of $10,000
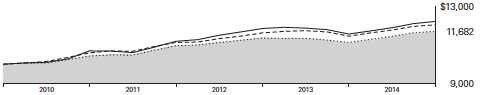
| Average Annual Total Returns | ||||
| Periods Ended August 31, 2014 | ||||
| Since | Final Value | |||
| One | Inception | of a $10,000 | ||
| Year | (11/19/2009) | Investment | ||
| Mortgage-Backed Securities Index | ||||
| Fund ETF Shares Net Asset Value | 5.21% | 3.31% | $11,682 | |
| Mortgage-Backed Securities Index | ||||
| Fund ETF Shares Market Price | 5.37 | 3.31 | 11,684 | |
| Barclays U.S. MBS Float Adjusted | ||||
| •••••••• | Index | 5.15 | 3.33 | 11,695 |
| – – – – | U.S. Mortgage Funds Average | 5.09 | 3.95 | 12,032 |
| Spliced Barclays U.S. Aggregate Float | ||||
| Adjusted Index | 5.64 | 4.27 | 12,212 | |
| For a benchmark description, see the Glossary. U.S. Mortgage Funds Average: Derived from data provided by Lipper, a Thomson Reuters Company. "Since Inception" performance is calculated from the ETF Shares’ inception date for both the fund and its comparative standards. | ||||
See Financial Highlights for dividend and capital gains information.
193
Mortgage-Backed Securities Index Fund
| Average Annual Total Returns | |||
| Periods Ended August 31, 2014 | |||
| Since | Final Value | ||
| One | Inception | of a $10,000 | |
| Year | (12/3/2009) | Investment | |
| Mortgage-Backed Securities Index Fund | |||
| Admiral Shares | 5.22% | 3.29% | $11,660 |
| Barclays U.S. MBS Float Adjusted Index | 5.15 | 3.34 | 11,684 |
| Spliced Barclays U.S. Aggregate Float | |||
| Adjusted Index | 5.64 | 4.28 | 12,197 |
| "Since Inception" performance is calculated from the Admiral Shares’ inception date for both the fund and its comparative standards. | |||
| Since | Final Value | |
| Inception | of a $5,000,000 | |
| (10/31/2013) | Investment | |
| Mortgage-Backed Securities Index Fund | ||
| Institutional Shares | 3.22% | $5,160,868 |
| Barclays U.S. MBS Float Adjusted Index | 3.18 | 5,158,885 |
| Barclays U.S. Aggregate Float Adjusted | ||
| Index | 3.88 | 5,193,989 |
| "Since Inception" performance is calculated from the Institutional Shares’ inception date for both the fund and its comparative standards. | ||
| Cumulative Returns of ETF Shares: November 19, 2009, Through August 31, 2014 | ||
| Since | ||
| One | Inception | |
| Year | (11/19/2009) | |
| Mortgage-Backed Securities Index Fund ETF Shares | ||
| Market Price | 5.37% | 16.84% |
| Mortgage-Backed Securities Index Fund ETF Shares | ||
| Net Asset Value | 5.21 | 16.82 |
| Barclays U.S. MBS Float Adjusted Index | 5.15 | 16.95 |
| "Since Inception" performance is calculated from the ETF Shares’ inception date for both the fund and its comparative standards. | ||
194
Mortgage-Backed Securities Index Fund
| Fiscal-Year Total Returns (%): November 19, 2009, Through August 31, 2014 | |||
| Barclays | |||
| MBS | |||
| Float Adj | |||
| ETF Shares Net Asset Value | Index | ||
| Fiscal Year | Total Returns | Total Returns | |
| 2010 | 4.39% | 4.23% | |
| 2011 | 5.14 | 5.11 | |
| 2012 | 3.62 | 3.62 | |
| 2013 | -2.36 | -2.03 | |
| 2014 | 5.21 | 5.15 | |
| Average Annual Total Returns: Periods Ended June 30, 2014 | |||||
| This table presents returns through the latest calendar quarter—rather than through the end of the fiscal period. | |||||
| Securities and Exchange Commission rules require that we provide this information. | |||||
| Since Inception | |||||
| Inception Date | One Year | Income | Capital | Total | |
| Admiral Shares | 12/3/2009 | 4.51% | 1.70% | 1.64% | 3.34% |
| Institutional Shares | 10/31/2013 | — | 1.25 | 1.64 | 2.89 |
| ETF Shares | 11/19/2009 | ||||
| Market Price | 4.62 | 3.36 | |||
| Net Asset Value | 4.52 | 3.36 | |||
195
Mortgage-Backed Securities Index Fund
Financial Statements
Statement of Net Assets
As of August 31, 2014
The fund reports a complete list of its holdings in regulatory filings four times in each fiscal year, at the quarter-ends. For the second and fourth fiscal quarters, the lists appear in the fund’s semiannual and annual reports to shareholders. For the first and third fiscal quarters, the fund files the lists with the Securities and Exchange Commission on Form N-Q. Shareholders can look up the fund’s Forms N-Q on the SEC’s website at sec.gov. Forms N-Q may also be reviewed and copied at the SEC’s Public Reference Room (see the back cover of this report for further information).
| Face | Market | ||||
| Maturity | Amount | Value• | |||
| Coupon | Date | ($000) | ($000) | ||
| U.S. Government and Agency Obligations (99.1%) | |||||
| Conventional Mortgage-Backed Securities (97.2%) | |||||
| 1,2 | Fannie Mae Pool | 2.000% | 10/1/28 | 2,432 | 2,403 |
| 1,2,3 Fannie Mae Pool | 2.500% | 11/1/27–1/1/43 | 23,406 | 23,482 | |
| 1,2,3 Fannie Mae Pool | 3.000% | 10/1/26–10/1/44 | 71,149 | 71,554 | |
| 1,2,3 Fannie Mae Pool | 3.500% | 10/1/21–9/1/44 | 90,947 | 78,599 | |
| 1,2,3 Fannie Mae Pool | 4.000% | 7/1/18–9/1/44 | 72,711 | 76,790 | |
| 1,2,3 Fannie Mae Pool | 4.500% | 4/1/15–9/1/44 | 56,359 | 58,392 | |
| 1,2,3 Fannie Mae Pool | 5.000% | 12/1/14–9/1/44 | 38,040 | 36,356 | |
| 1,2,3 Fannie Mae Pool | 5.500% | 12/1/16–9/1/44 | 26,153 | 25,996 | |
| 1,2,3 Fannie Mae Pool | 6.000% | 3/1/18–9/1/44 | 16,325 | 18,453 | |
| 1,2 | Fannie Mae Pool | 6.500% | 4/1/16–10/1/39 | 5,756 | 6,519 |
| 1,2 | Fannie Mae Pool | 7.000% | 12/1/22–10/1/37 | 537 | 610 |
| 1,2 | Fannie Mae Pool | 7.500% | 11/1/22 | 14 | 16 |
| 1,2 | Freddie Mac Gold Pool | 2.000% | 8/1/28 | 904 | 893 |
| 1,2,3 Freddie Mac Gold Pool | 2.500% | 6/1/28–2/1/43 | 18,967 | 19,166 | |
| 1,2,3 Freddie Mac Gold Pool | 3.000% | 1/1/27–9/1/44 | 39,315 | 39,886 | |
| 1,2,3 Freddie Mac Gold Pool | 3.500% | 7/1/25–9/1/44 | 41,721 | 43,248 | |
| 1,2,3 Freddie Mac Gold Pool | 4.000% | 7/1/18–9/1/44 | 45,856 | 47,234 | |
| 1,2,3 Freddie Mac Gold Pool | 4.500% | 1/1/18–9/1/44 | 36,431 | 35,165 | |
| 1,2,3 Freddie Mac Gold Pool | 5.000% | 9/1/15–9/1/44 | 22,297 | 24,515 | |
| 1,2,3 Freddie Mac Gold Pool | 5.500% | 4/1/21–9/1/44 | 21,760 | 20,186 | |
| 1,2,3 Freddie Mac Gold Pool | 6.000% | 6/1/17–9/1/44 | 11,071 | 12,507 | |
| 1,2 | Freddie Mac Gold Pool | 6.500% | 10/1/28–9/1/39 | 3,048 | 3,446 |
| 1,2 | Freddie Mac Gold Pool | 7.000% | 7/1/28–12/1/38 | 652 | 737 |
| 1,2 | Freddie Mac Gold Pool | 8.000% | 11/1/22 | 2 | 2 |
| 1,3 | Ginnie Mae I Pool | 3.000% | 1/15/26–9/1/44 | 16,479 | 8,211 |
| 1,3 | Ginnie Mae I Pool | 3.500% | 2/15/26–9/1/44 | 8,120 | 8,461 |
| 1,3 | Ginnie Mae I Pool | 4.000% | 7/15/24–9/1/44 | 22,371 | 15,338 |
| 1,3 | Ginnie Mae I Pool | 4.500% | 9/15/18–9/1/44 | 21,778 | 20,990 |
| 1,3 | Ginnie Mae I Pool | 5.000% | 1/15/18–9/1/44 | 14,893 | 12,934 |
| 1,3 | Ginnie Mae I Pool | 5.500% | 10/15/32–9/1/44 | 6,321 | 7,046 |
| 1 | Ginnie Mae I Pool | 6.000% | 4/15/28–5/15/41 | 2,863 | 3,242 |
| 1 | Ginnie Mae I Pool | 6.500% | 5/15/24–1/15/39 | 392 | 454 |
| 1 | Ginnie Mae I Pool | 7.000% | 10/15/27 | 10 | 11 |
| 1 | Ginnie Mae II Pool | 2.500% | 2/20/28–6/20/28 | 1,926 | 1,975 |
| 1,3 | Ginnie Mae II Pool | 3.000% | 10/20/26–9/1/44 | 62,259 | 32,784 |
| 1,3 | Ginnie Mae II Pool | 3.500% | 12/20/25–9/1/44 | 57,393 | 56,971 |
| 1,3 | Ginnie Mae II Pool | 4.000% | 9/20/25–9/1/44 | 46,456 | 47,012 |
196
| Mortgage-Backed Securities Index Fund | |||||
| Face | Market | ||||
| Maturity | Amount | Value• | |||
| Coupon | Date | ($000) | ($000) | ||
| 1,3 | Ginnie Mae II Pool | 4.500% | 4/20/18–9/1/44 | 35,104 | 37,124 |
| 1,3 | Ginnie Mae II Pool | 5.000% | 6/20/33–9/1/44 | 18,699 | 20,661 |
| 1 | Ginnie Mae II Pool | 5.500% | 12/20/33–3/20/42 | 5,880 | 6,547 |
| 1 | Ginnie Mae II Pool | 6.000% | 3/20/31–9/20/41 | 3,266 | 3,724 |
| 1 | Ginnie Mae II Pool | 6.500% | 10/20/28–9/20/40 | 980 | 1,116 |
| 1 | Ginnie Mae II Pool | 7.000% | 4/20/38–11/20/38 | 186 | 209 |
| 930,965 | |||||
| Nonconventional Mortgage-Backed Securities (1.9%) | |||||
| 1,2,4 Fannie Mae Pool | 1.924% | 9/1/37 | 33 | 36 | |
| 1,2 | Fannie Mae Pool | 2.198% | 6/1/43 | 621 | 635 |
| 1,2 | Fannie Mae Pool | 2.201% | 9/1/42 | 682 | 705 |
| 1,2 | Fannie Mae Pool | 2.207% | 12/1/41 | 348 | 361 |
| 1,2 | Fannie Mae Pool | 2.230% | 10/1/42 | 478 | 494 |
| 1,2 | Fannie Mae Pool | 2.266% | 7/1/43 | 729 | 732 |
| 1,2 | Fannie Mae Pool | 2.403% | 5/1/42 | 386 | 388 |
| 1,2 | Fannie Mae Pool | 2.408% | 7/1/42 | 512 | 527 |
| 1,2 | Fannie Mae Pool | 2.450% | 5/1/43 | 483 | 497 |
| 1,2 | Fannie Mae Pool | 2.454% | 10/1/42 | 432 | 444 |
| 1,2 | Fannie Mae Pool | 2.500% | 10/1/40 | 223 | 235 |
| 1,2 | Fannie Mae Pool | 2.512% | 12/1/40 | 638 | 674 |
| 1,2 | Fannie Mae Pool | 2.609% | 12/1/41 | 111 | 114 |
| 1,2 | Fannie Mae Pool | 2.623% | 11/1/41 | 105 | 109 |
| 1,2 | Fannie Mae Pool | 2.675% | 1/1/42 | 119 | 123 |
| 1,2 | Fannie Mae Pool | 2.784% | 3/1/42 | 652 | 672 |
| 1,2 | Fannie Mae Pool | 2.809% | 11/1/41 | 291 | 303 |
| 1,2 | Fannie Mae Pool | 2.817% | 3/1/41 | 572 | 597 |
| 1,2 | Fannie Mae Pool | 2.885% | 5/1/42 | 128 | 134 |
| 1,2 | Fannie Mae Pool | 2.959% | 12/1/40 | 168 | 177 |
| 1,2 | Fannie Mae Pool | 2.996% | 3/1/42 | 267 | 279 |
| 1,2 | Fannie Mae Pool | 3.011% | 9/1/43 | 458 | 478 |
| 1,2 | Fannie Mae Pool | 3.046% | 3/1/41 | 511 | 539 |
| 1,2 | Fannie Mae Pool | 3.068% | 2/1/42 | 438 | 456 |
| 1,2 | Fannie Mae Pool | 3.124% | 2/1/41 | 15 | 15 |
| 1,2 | Fannie Mae Pool | 3.150% | 2/1/41 | 166 | 175 |
| 1,2 | Fannie Mae Pool | 3.171% | 12/1/40 | 30 | 32 |
| 1,2 | Fannie Mae Pool | 3.219% | 12/1/40 | 25 | 26 |
| 1,2 | Fannie Mae Pool | 3.249% | 10/1/40–11/1/40 | 58 | 60 |
| 1,2 | Fannie Mae Pool | 3.284% | 1/1/40 | 7 | 7 |
| 1,2 | Fannie Mae Pool | 3.296% | 5/1/41 | 197 | 208 |
| 1,2 | Fannie Mae Pool | 3.330% | 8/1/42 | 287 | 298 |
| 1,2,4 Fannie Mae Pool | 3.472% | 10/1/39 | 54 | 56 | |
| 1,2 | Fannie Mae Pool | 3.486% | 5/1/40 | 9 | 9 |
| 1,2 | Fannie Mae Pool | 3.547% | 7/1/41 | 362 | 372 |
| 1,2,4 Fannie Mae Pool | 3.562% | 11/1/39 | 56 | 58 | |
| 1,2 | Fannie Mae Pool | 3.580% | 8/1/39 | 63 | 67 |
| 1,2 | Fannie Mae Pool | 3.608% | 4/1/41 | 159 | 168 |
| 1,2 | Fannie Mae Pool | 3.733% | 6/1/41 | 245 | 257 |
| 1,2 | Fannie Mae Pool | 3.814% | 9/1/40 | 495 | 526 |
| 1,2,4 Fannie Mae Pool | 5.149% | 11/1/39 | 58 | 62 | |
| 1,2 | Fannie Mae Pool | 5.176% | 3/1/38 | 49 | 51 |
| 1,2,4 Fannie Mae Pool | 5.262% | 8/1/39 | 166 | 177 | |
| 1,2 | Fannie Mae Pool | 5.659% | 4/1/37 | 32 | 34 |
| 1,2 | Fannie Mae Pool | 6.136% | 10/1/37 | 253 | 266 |
| 1,2,4 Freddie Mac Non Gold Pool | 2.278% | 10/1/37 | 21 | 22 | |
| 1,2,4 Freddie Mac Non Gold Pool | 2.320% | 2/1/37 | 26 | 27 | |
197
| Mortgage-Backed Securities Index Fund | |||||
| Face | Market | ||||
| Maturity | Amount | Value• | |||
| Coupon | Date | ($000) | ($000) | ||
| 1,2 | Freddie Mac Non Gold Pool | 2.570% | 2/1/42 | 197 | 206 |
| 1,2 | Freddie Mac Non Gold Pool | 2.712% | 12/1/40 | 90 | 93 |
| 1,2 | Freddie Mac Non Gold Pool | 2.785% | 1/1/41 | 271 | 277 |
| 1,2 | Freddie Mac Non Gold Pool | 2.880% | 2/1/41 | 28 | 30 |
| 1,2 | Freddie Mac Non Gold Pool | 2.950% | 2/1/41 | 398 | 417 |
| 1,2 | Freddie Mac Non Gold Pool | 3.067% | 6/1/41 | 312 | 325 |
| 1,2 | Freddie Mac Non Gold Pool | 3.116% | 1/1/41 | 209 | 221 |
| 1,2 | Freddie Mac Non Gold Pool | 3.358% | 5/1/40 | 5 | 5 |
| 1,2 | Freddie Mac Non Gold Pool | 3.422% | 3/1/42 | 285 | 296 |
| 1,2 | Freddie Mac Non Gold Pool | 3.592% | 6/1/40 | 89 | 95 |
| 1,2 | Freddie Mac Non Gold Pool | 3.627% | 6/1/40 | 232 | 242 |
| 1,2 | Freddie Mac Non Gold Pool | 3.683% | 9/1/40 | 212 | 219 |
| 1,2 | Freddie Mac Non Gold Pool | 4.066% | 12/1/39 | 48 | 50 |
| 1,2 | Freddie Mac Non Gold Pool | 5.299% | 3/1/38 | 203 | 215 |
| 1,4 | Ginnie Mae II Pool | 2.000% | 4/20/41–12/20/42 | 70 | 71 |
| 1,4 | Ginnie Mae II Pool | 2.125% | 5/20/41 | 18 | 18 |
| 1 | Ginnie Mae II Pool | 2.500% | 11/20/40–1/20/42 | 850 | 893 |
| 1 | Ginnie Mae II Pool | 3.000% | 11/20/40–11/20/41 | 1,055 | 1,108 |
| 1 | Ginnie Mae II Pool | 3.500% | 7/20/41–8/20/41 | 403 | 424 |
| 17,887 | |||||
| Total U.S. Government and Agency Obligations (Cost $944,272) | 948,852 | ||||
| Shares | |||||
| Temporary Cash Investment (39.4%) | |||||
| Money Market Fund (39.4%) | |||||
| 5 | Vanguard Market Liquidity Fund (Cost $377,142) | 0.113% | 377,142,000 | 377,142 | |
| Total Investments (138.5%) (Cost $1,321,414) | 1,325,994 | ||||
| Other Assets and Liabilities (-38.5%) | |||||
| Other Assets | 43,602 | ||||
| Liabilities | (412,490) | ||||
| (368,888) | |||||
| Net Assets (100%) | 957,106 | ||||
| Amount | |||||
| ($000) | |||||
| Statement of Assets and Liabilities | |||||
| Assets | |||||
| Investments in Securities, at Value | |||||
| Unaffiliated Issuers | 948,852 | ||||
| Affiliated Vanguard Funds | 377,142 | ||||
| Total Investments in Securities | 1,325,994 | ||||
| Receivables for Investment Securities Sold | 40,441 | ||||
| Other Assets | 3,161 | ||||
| Total Assets | 1,369,596 | ||||
| Liabilities | |||||
| Payables for Investment Securities Purchased | 410,693 | ||||
| Other Liabilities | 1,797 | ||||
| Total Liabilities | 412,490 | ||||
| Net Assets | 957,106 | ||||
198
| Mortgage-Backed Securities Index Fund | |
| At August 31, 2014, net assets consisted of: | |
| Amount | |
| ($000) | |
| Paid-in Capital | 950,851 |
| Undistributed Net Investment Income | 638 |
| Accumulated Net Realized Gains | 1,037 |
| Unrealized Appreciation (Depreciation) | 4,580 |
| Net Assets | 957,106 |
| Admiral Shares—Net Assets | |
| Applicable to 14,510,527 outstanding $.001 par value shares of | |
| beneficial interest (unlimited authorization) | 305,376 |
| Net Asset Value Per Share—Admiral Shares | $21.05 |
| Institutional Shares—Net Assets | |
| Applicable to 3,835,149 outstanding $.001 par value shares of | |
| beneficial interest (unlimited authorization) | 109,363 |
| Net Asset Value Per Share—Institutional Shares | $28.52 |
| ETF Shares—Net Assets | |
| Applicable to 10,301,190 outstanding $.001 par value shares of | |
| beneficial interest (unlimited authorization) | 542,367 |
| Net Asset Value Per Share—ETF Shares | $52.65 |
• See Note A in Notes to Financial Statements.
1 The average or expected maturity is shorter than the final maturity shown because of the possibility of interim principal payments and prepayments or the possibility of the issue being called.
2 The issuer was placed under federal conservatorship in September 2008; since that time, its daily operations have been managed by the Federal Housing Finance Agency and it receives capital from the U.S. Treasury, as needed to maintain a positive net worth, in exchange for senior preferred stock.
3 Includes securities purchased on a when-issued or delayed-delivery basis for which the fund has not taken delivery as of August 31, 2014.
4 Adjustable-rate security.
5 Affiliated money market fund available only to Vanguard funds and certain trusts and accounts managed by Vanguard. Rate shown is the 7-day yield.
See accompanying Notes, which are an integral part of the Financial Statements.
199
Mortgage-Backed Securities Index Fund
Statement of Operations
| Year Ended | |
| August 31, 2014 | |
| ($000) | |
| Investment Income | |
| Income | |
| Interest1 | 14,524 |
| Total Income | 14,524 |
| Expenses | |
| The Vanguard Group—Note B | |
| Investment Advisory Services | 20 |
| Management and Administrative—Admiral Shares | 207 |
| Management and Administrative—Institutional Shares | 42 |
| Management and Administrative—ETF Shares | 288 |
| Marketing and Distribution—Admiral Shares | 73 |
| Marketing and Distribution—Institutional Shares | 16 |
| Marketing and Distribution—ETF Shares | 102 |
| Custodian Fees | 108 |
| Auditing Fees | 40 |
| Shareholders’ Reports—Admiral Shares | 4 |
| Shareholders’ Reports—Institutional Shares | — |
| Shareholders’ Reports—ETF Shares | 21 |
| Trustees’ Fees and Expenses | 1 |
| Total Expenses | 922 |
| Net Investment Income | 13,602 |
| Realized Net Gain (Loss) on Investment Securities Sold | 6,824 |
| Change in Unrealized Appreciation (Depreciation) of Investment Securities | 18,334 |
| Net Increase (Decrease) in Net Assets Resulting from Operations | 38,760 |
| 1 Interest income from an affiliated company of the fund was $253,000. | |
See accompanying Notes, which are an integral part of the Financial Statements.
200
Mortgage-Backed Securities Index Fund
Statement of Changes in Net Assets
| Year Ended August 31, | ||
| 2014 | 2013 | |
| ($000) | ($000) | |
| Increase (Decrease) in Net Assets | ||
| Operations | ||
| Net Investment Income | 13,602 | 4,019 |
| Realized Net Gain (Loss) | 6,824 | (4,358) |
| Change in Unrealized Appreciation (Depreciation) | 18,334 | (17,819) |
| Net Increase (Decrease) in Net Assets Resulting from Operations | 38,760 | (18,158) |
| Distributions | ||
| Net Investment Income | ||
| Admiral Shares1 | (4,949) | (1,833) |
| Institutional Shares | (1,465) | (26) |
| ETF Shares | (6,562) | (2,167) |
| Realized Capital Gain 2 | ||
| Admiral Shares1 | — | (1,465) |
| Institutional Shares | — | (73) |
| ETF Shares | — | (1,423) |
| Total Distributions | (12,976) | (6,987) |
| Capital Share Transactions | ||
| Admiral Shares1 | 541 | 96,081 |
| Institutional Shares | 107,128 | (14,605) |
| ETF Shares | 111,427 | 182,530 |
| Net Increase (Decrease) from Capital Share Transactions | 219,096 | 264,006 |
| Total Increase (Decrease) | 244,880 | 238,861 |
| Net Assets | ||
| Beginning of Period | 712,226 | 473,365 |
| End of Period3 | 957,106 | 712,226 |
| 1 Signal Shares were renamed Admiral Shares in October 2013. The prior period’s distributions and capital share transactions are for the Signal class. 2 Includes fiscal 2013 short-term gain distributions totaling $2,874,000. Short-term gain distributions are treated as ordinary income dividends for tax purposes. 3 Net Assets—End of Period includes undistributed (overdistributed) net investment income of $638,000 and $12,000. | ||
See accompanying Notes, which are an integral part of the Financial Statements.
201
Mortgage-Backed Securities Index Fund
Financial Highlights
| Admiral Shares | |||||
| Dec. 3, | |||||
| 20091 to | |||||
| For a Share Outstanding | Year Ended August 31, | Aug. 31, | |||
| Throughout Each Period | 2014 | 2013 | 2012 | 2011 | 2010 |
| Net Asset Value, Beginning of Period | $20.35 | $21.06 | $20.76 | $20.52 | $20.04 |
| Investment Operations | |||||
| Net Investment Income | .356 | .118 | .344 | .456 | .332 |
| Net Realized and Unrealized Gain (Loss) | |||||
| on Investments | .699 | (.608) | .399 | .569 | .487 |
| Total from Investment Operations | 1.055 | (.490) | .743 | 1.025 | .819 |
| Distributions | |||||
| Dividends from Net Investment Income | (. 355) | (.118) | (. 342) | (. 456) | (. 339) |
| Distributions from Realized Capital Gains | — | (.102) | (.101) | (.329) | — |
| Total Distributions | (. 355) | (. 220) | (. 443) | (.785) | (. 339) |
| Net Asset Value, End of Period | $21.05 | $20.35 | $21.06 | $20.76 | $20.52 |
| Total Return2 | 5.22% | -2.35% | 3.63% | 5.16% | 4.13% |
| Ratios/Supplemental Data | |||||
| Net Assets, End of Period (Millions) | $305 | $295 | $211 | $15 | $6 |
| Ratio of Total Expenses to Average Net Assets | 0.12% | 0.12% | 0.12% | 0.15% | 0.15%3 |
| Ratio of Net Investment Income to | |||||
| Average Net Assets | 1.72% | 0.57% | 1.57% | 2.30% | 2.12%3 |
| Portfolio Turnover Rate 4 | 514% | 840% | 529% | 344% | 402% |
| Signal Shares were renamed Admiral Shares in October 2013. Prior periods’ Financial Highlights are for the Signal class. 1 Inception. 2 Total Returns do not include transaction fees or account service fees that may have applied in the periods shown. Fund prospectuses provide information about any applicable transaction and account service fees. 3 Annualized. 4 Includes 294%, 371%, 231%, 187%, and 166% attributable to mortgage-dollar-roll activity. | |||||
See accompanying Notes, which are an integral part of the Financial Statements.
202
Mortgage-Backed Securities Index Fund
Financial Highlights
| Institutional Shares | |||
| Oct. 31, | Sept. 1, | May 9, | |
| 20133 to | 2012 to | 20121 to | |
| Aug. 31, | Jan. 22, | Aug. 31, | |
| For a Share Outstanding Throughout Each Period | 2014 | 20132 | 2012 |
| Net Asset Value, Beginning of Period | $28.04 | $28.34 | $28.10 |
| Investment Operations | |||
| Net Investment Income | . 390 | . 042 | .137 |
| Net Realized and Unrealized Gain (Loss) on Investments | .504 | (.146) | .218 |
| Total from Investment Operations | .894 | (.104) | .355 |
| Distributions | |||
| Dividends from Net Investment Income | (. 414) | (. 049) | (.115) |
| Distributions from Realized Capital Gains | — | (.137) | — |
| Total Distributions | (. 414) | (.186) | (.115) |
| Net Asset Value, End of Period | $28.52 | $28.052 | $28.34 |
| Total Return4 | 3.22% | -0.37% | 1.27% |
| Ratios/Supplemental Data | |||
| Net Assets, End of Period (Millions) | $109 | $0 | $15 |
| Ratio of Total Expenses to Average Net Assets | 0.09%5 | 0.09%5 | 0.09%5 |
| Ratio of Net Investment Income to Average Net Assets | 1.75%5 | 0.35%5 | 1.60%5 |
| Portfolio Turnover Rate 6 | 514% | 840% | 529% |
| 1 Commencement of operations. 2 Net asset value as of January 22, 2013, at which date all shares were redeemed. 3 Recommencement of operations. 4 Total Returns do not include transaction fees that may have applied in the periods shown. Fund prospectuses provide information about any applicable transaction fees. 5 Annualized. 6 Includes 294%, 371%, and 231% attributable to mortgage-dollar-roll activity. | |||
See accompanying Notes, which are an integral part of the Financial Statements.
203
Mortgage-Backed Securities Index Fund
Financial Highlights
| ETF Shares | |||||
| Nov. 19, | |||||
| 20091 to | |||||
| For a Share Outstanding | Year Ended August 31, | Aug. 31, | |||
| Throughout Each Period | 2014 | 2013 | 2012 | 2011 | 2010 |
| Net Asset Value, Beginning of Period | $50.85 | $52.63 | $51.90 | $51.31 | $49.98 |
| Investment Operations | |||||
| Net Investment Income | .887 | . 292 | .875 | 1.142 | .836 |
| Net Realized and Unrealized Gain (Loss) | |||||
| on Investments 2 | 1.741 | (1.524) | .976 | 1.412 | 1.338 |
| Total from Investment Operations | 2.628 | (1.232) | 1.851 | 2.554 | 2.174 |
| Distributions | |||||
| Dividends from Net Investment Income | (. 828) | (. 294) | (. 868) | (1.142) | (. 844) |
| Distributions from Realized Capital Gains | — | (.254) | (.253) | (.822) | — |
| Total Distributions | (.828) | (.548) | (1.121) | (1.964) | (.844) |
| Net Asset Value, End of Period | $52.65 | $50.85 | $52.63 | $51.90 | $51.31 |
| Total Return | 5.21% | -2.36% | 3.62% | 5.14% | 4.39% |
| Ratios/Supplemental Data | |||||
| Net Assets, End of Period (Millions) | $542 | $417 | $247 | $73 | $31 |
| Ratio of Total Expenses to Average Net Assets | 0.12% | 0.12% | 0.12% | 0.15% | 0.15%3 |
| Ratio of Net Investment Income to | |||||
| Average Net Assets | 1.72% | 0.57% | 1.57% | 2.30% | 2.12%3 |
| Portfolio Turnover Rate 4 | 514% | 840% | 529% | 344% | 402% |
| 1 Inception. 2 Includes increases from purchase fees of $.01, $.01, $.02, $.00, and $.00. 3 Annualized. 4 Includes 294%, 371%, 231%, 187%, and 166% attributable to mortgage-dollar-roll activity. | |||||
See accompanying Notes, which are an integral part of the Financial Statements.
204
Mortgage-Backed Securities Index Fund
Notes to Financial Statements
Vanguard Mortgage-Backed Securities Index Fund is registered under the Investment Company Act of 1940 as an open-end investment company, or mutual fund. The fund offers three classes of shares: Admiral Shares, Institutional Shares, and ETF Shares. Admiral Shares and Institutional Shares are designed for investors who meet certain administrative, service, and account-size criteria. ETF shares are listed for trading on Nasdaq; they can be purchased and sold through a broker. Effective in October, 2013, Signal Shares were renamed Admiral Shares. Institutional Shares were first issued on May 9, 2012, and on January 22, 2013, all outstanding shares were redeemed. Institutional Shares recommenced operations on October 31, 2013.
A. The following significant accounting policies conform to generally accepted accounting principles for U.S. investment companies. The fund consistently follows such policies in preparing its financial statements.
1. Security Valuation: Securities are valued as of the close of trading on the New York Stock Exchange (generally 4 p.m., Eastern time) on the valuation date. Bonds, and temporary cash investments acquired over 60 days to maturity, are valued using the latest bid prices or using valuations based on a matrix system (which considers such factors as security prices, yields, maturities, and ratings), both as furnished by independent pricing services. Structured debt securities, including mortgages and asset-backed securities, are valued using the latest bid prices or using valuations based on a matrix system that considers such factors as issuer, tranche, nominal or option-adjusted spreads, weighted average coupon, weighted average maturity, credit enhancements, and collateral. Investments in Vanguard Market Liquidity Fund are valued at that fund’s net asset value. Other temporary cash investments are valued at amortized cost, which approximates market value. Securities for which market quotations are not readily available, or whose values have been affected by events occurring before the fund’s pricing time but after the close of the securities’ primary markets, are valued by methods deemed by the board of trustees to represent fair value.
2. To Be Announced (TBA) Transactions: A TBA transaction is an agreement to buy or sell mortgage-backed securities with agreed-upon characteristics (face amount, coupon, maturity) for settlement at a future date. The fund may be a seller of TBA transactions to reduce its exposure to the mortgage-backed securities market or in order to sell mortgage-backed securities it owns under delayed-delivery arrangements. When the fund is a buyer of TBA transactions, it maintains cash or short-term investments in an amount sufficient to meet the purchase price at the settlement date of the TBA transaction. The primary risk associated with TBA transactions is that a counterparty may default on its obligations. The fund mitigates its counterparty risk by, among other things, performing a credit analysis of counterparties, allocating transactions among numerous counterparties, and monitoring its exposure to each counterparty. The fund may also enter into a Master Securities Forward Transaction Agreement (MSFTA) with certain counterparties and require them to transfer collateral as security for their performance. Under an MSFTA, upon a counterparty default (including bankruptcy), the fund may terminate any TBA transactions with that counterparty, determine the net amount owed by either party in accordance with its master netting arrangements, and sell or retain any collateral held up to the net amount owed to the fund under the master netting arrangements.
At August 31, 2014, counterparties had deposited in segregated accounts securities with a value of $61,000 in connection with TBA transactions.
205
Mortgage-Backed Securities Index Fund
3. Mortgage Dollar Rolls: The fund enters into mortgage-dollar-roll transactions, in which the fund sells mortgage-backed securities to a dealer and simultaneously agrees to purchase similar securities in the future at a predetermined price. The proceeds of the securities sold in mortgage-dollar-roll transactions are typically invested in high-quality short-term fixed income securities. The fund forgoes principal and interest paid on the securities sold, and is compensated by interest earned on the proceeds of the sale and by a lower price on the securities to be repurchased. The fund has also entered into mortgage-dollar-roll transactions in which the fund buys mortgage-backed securities from a dealer pursuant to a TBA transaction and simultaneously agrees to sell similar securities in the future at a predetermined price. The securities bought in mortgage-dollar-roll transactions are used to cover an open TBA sell position. The fund continues to earn interest on mortgage-backed security pools already held and receives a lower price on the securities to be sold in the future.
The fund accounts for mortgage-dollar-roll transactions as purchases and sales; as such, these transactions may increase the fund’s portfolio turnover rate. Amounts to be received or paid in connection with open mortgage dollar rolls are included in Receivables for Investment Securities Sold or Payables for Investment Securities Purchased in the Statement of Assets and Liabilities.
4. Federal Income Taxes: The fund intends to continue to qualify as a regulated investment company and distribute all of its taxable income. Management has analyzed the fund’s tax positions taken for all open federal income tax years (August 31, 2011–2014), and has concluded that no provision for federal income tax is required in the fund’s financial statements.
5. Distributions: Distributions to shareholders are recorded on the ex-dividend date.
6. Credit Facility: The fund and certain other funds managed by The Vanguard Group participate in a $2.89 billion committed credit facility provided by a syndicate of lenders pursuant to a credit agreement that may be renewed annually; each fund is individually liable for its borrowings, if any, under the credit facility. Borrowings may be utilized for temporary and emergency purposes, and are subject to the fund’s regulatory and contractual borrowing restrictions. The participating funds are charged administrative fees and an annual commitment fee of 0.06% of the undrawn amount of the facility; these fees are allocated to the funds based on a method approved by the fund’s board of trustees and included in Management and Administrative expenses on the fund’s Statement of Operations. Any borrowings under this facility bear interest at a rate equal to the higher of the federal funds rate or LIBOR reference rate plus an agreed-upon spread.
The fund had no borrowings outstanding at August 31, 2014, or at any time during the period then ended.
7. Other: Interest income includes income distributions received from Vanguard Market Liquidity Fund and is accrued daily. Premiums and discounts on debt securities purchased are amortized and accreted, respectively, to interest income over the lives of the respective securities. Security transactions are accounted for on the date securities are bought or sold. Costs used to determine realized gains (losses) on the sale of investment securities are those of the specific securities sold. Fees, if any, assessed on purchases of capital shares are credited to paid-in capital.
Each class of shares has equal rights as to assets and earnings, except that each class separately bears certain class-specific expenses related to maintenance of shareholder accounts (included in Management and Administrative expenses) and shareholder reporting. Marketing and distribution expenses are allocated to each class of shares based on a method approved by the board of trustees. Income, other non-class-specific expenses, and gains and losses on investments are allocated to each class of shares based on its relative net assets.
206
Mortgage-Backed Securities Index Fund
B. The Vanguard Group furnishes at cost investment advisory, corporate management, administrative, marketing, and distribution services. The costs of such services are allocated to the fund based on methods approved by the board of trustees. The fund has committed to provide up to 0.40% of its net assets in capital contributions to Vanguard. At August 31, 2014, the fund had contributed capital of $86,000 to Vanguard (included in Other Assets), representing 0.01% of the fund’s net assets and 0.03% of Vanguard’s capitalization. The fund’s trustees and officers are also directors and officers of Vanguard.
C. Various inputs may be used to determine the value of the fund’s investments. These inputs are summarized in three broad levels for financial statement purposes. The inputs or methodologies used to value securities are not necessarily an indication of the risk associated with investing in those securities.
Level 1—Quoted prices in active markets for identical securities.
Level 2—Other significant observable inputs (including quoted prices for similar securities, interest rates, prepayment speeds, credit risk, etc.).
Level 3—Significant unobservable inputs (including the fund’s own assumptions used to determine the fair value of investments).
The following table summarizes the market value of the fund’s investments as of August 31, 2014, based on the inputs used to value them:
| |||
| Level 1 | Level 2 | Level 3 | |
| Investments | ($000) | ($000) | ($000) |
| U.S. Government and Agency Obligations | — | 948,852 | — |
| Temporary Cash Investments | 377,142 | — | — |
| Total | 377,142 | 948,852 | — |
D. Distributions are determined on a tax basis and may differ from net investment income and realized capital gains for financial reporting purposes. Differences may be permanent or temporary. Permanent differences are reclassified among capital accounts in the financial statements to reflect their tax character. Temporary differences arise when certain items of income, expense, gain, or loss are recognized in different periods for financial statement and tax purposes. These differences will reverse at some time in the future. Differences in classification may also result from the treatment of short-term gains as ordinary income for tax purposes.
The fund used a tax accounting practice to treat a portion of the price of capital shares redeemed during the year as distributions from realized capital gains. Accordingly, the fund has reclassified $20,000 from accumulated net realized gains to paid-in capital.
For tax purposes, at August 31, 2014, the fund had short-term capital gains of $1,129,000 available for distribution. Short-term gain distributions are treated as ordinary income for tax purposes.
At August 31, 2014, the cost of investment securities for tax purposes was $1,321,505,000. Net unrealized appreciation of investment securities for tax purposes was $4,489,000, consisting of unrealized gains of $6,761,000 on securities that had risen in value since their purchase and $2,272,000 in unrealized losses on securities that had fallen in value since their purchase.
207
Mortgage-Backed Securities Index Fund
E. During the year ended August 31, 2014, the fund purchased $4,300,158,000 of investment securities and sold $4,079,842,000 of investment securities, other than temporary cash investments.
| F. Capital share transactions for each class of shares were: | |||||
| Year Ended August 31, | |||||
| 2014 | 2013 | ||||
| Amount | Shares | Amount | Shares | ||
| ($000) | (000) | ($000) | (000) | ||
| Admiral Shares1 | |||||
| Issued 2 | 96,130 | 4,624 | 258,637 | 12,391 | |
| Issued in Lieu of Cash Distributions | 1,516 | 73 | 1,174 | 56 | |
| Redeemed | (97,105) | (4,689) | (163,730) | (7,971) | |
| Net Increase (Decrease)—Admiral Shares | 541 | 8 | 96,081 | 4,476 | |
| Institutional Shares | |||||
| Issued 2 | 107,508 | 3,848 | 1,571 | 55 | |
| Issued in Lieu of Cash Distributions | 1,465 | 52 | 99 | 4 | |
| Redeemed | (1,845) | (65) | (16,275) | (580) | |
| Net Increase (Decrease) —Institutional Shares | 107,128 | 3,835 | (14,605) | (521) | |
| ETF Shares | |||||
| Issued2 | 265,705 | 5,100 | 377,501 | 7,300 | |
| Issued in Lieu of Cash Distributions | — | — | — | — | |
| Redeemed | (154,278) | (3,000) | (194,971) | (3,800) | |
| Net Increase (Decrease)—ETF Shares | 111,427 | 2,100 | 182,530 | 3,500 | |
| 1 Signal Shares were renamed Admiral Shares in October 2013. The prior period’s capital share transactions are for the Signal Class. 2 Includes purchase fees for fiscal 2014 and 2013 of $132,000 and $218,000, respectively (fund totals). | |||||
G. Management has determined that no material events or transactions occurred subsequent to August 31, 2014, that would require recognition or disclosure in these financial statements.
208
Report of Independent Registered
Public Accounting Firm
To the Board of Trustees of Vanguard Scottsdale Funds and the Shareholders of Vanguard Short-Term Government Bond Index Fund, Vanguard Intermediate-Term Government Bond Index Fund, Vanguard Long-Term Government Bond Index Fund, Vanguard Short-Term Corporate Bond Index Fund, Vanguard Intermediate-Term Corporate Bond Index Fund, Vanguard Long-Term Corporate Bond Index Fund and Vanguard Mortgage-Backed Securities Index Fund:
In our opinion, the accompanying statements of net assets, the statements of assets and liabilities and the related statements of operations and of changes in net assets and the financial highlights present fairly, in all material respects, the financial position of Vanguard Short-Term Government Bond Index Fund, Vanguard Intermediate-Term Government Bond Index Fund, Vanguard Long-Term Government Bond Index Fund, Vanguard Short-Term Corporate Bond Index Fund, Vanguard Intermediate-Term Corporate Bond Index Fund, Vanguard Long-Term Corporate Bond Index Fund and Vanguard Mortgage-Backed Securities Index Fund (constituting separate portfolios of Vanguard Scottsdale Funds, hereafter referred to as the “Funds”) at August 31, 2014, the results of each of their operations for the year then ended, the changes in each of their net assets for each of the two years in the period then ended, and financial highlights for each of the periods indicated, in conformity with accounting principles generally accepted in the United States of America. These financial statements and financial highlights (hereafter referred to as “financial statements”) are the responsibility of the Funds’ management. Our responsibility is to express an opinion on these financial statements based on our audits. We conducted our audits of these financial statements in accordance with the standards of the Public Company Accounting Oversight Board (United States). Those standards require that we plan and perform the audit to obtain reasonable assurance about whether the financial statements are free of material misstatement. An audit includes examining, on a test basis, evidence supporting the amounts and disclosures in the financial statements, assessing the accounting principles used and significant estimates made by management, and evaluating the overall financial statement presentation. We believe that our audits, which included confirmation of securities at August 31, 2014 by correspondence with the custodian and brokers and by agreement to the underlying ownership records of the transfer agent, provide a reasonable basis for our opinion.
/s/PricewaterhouseCoopers LLP
Philadelphia, Pennsylvania
October 10, 2014
| Special 2014 tax information (unaudited) for Vanguard Short-Term Government Bond Index Fund |
This information for the fiscal year ended August 31, 2014, is included pursuant to provisions of the Internal Revenue Code.
The fund distributed $358,000 as capital gain dividends (from net long-term capital gains) to shareholders during the fiscal year.
For nonresident alien shareholders, 100% of short-term capital gain dividends distributed by the fund are qualified short-term capital gains.
For nonresident alien shareholders, 100% of income dividends are interest-related dividends.
209
|
| Special 2014 tax information (unaudited) for Vanguard Intermediate-Term Government Bond Index Fund |
This information for the fiscal year ended August 31, 2014, is included pursuant to provisions of the Internal Revenue Code.
The fund distributed $950,000 as capital gain dividends (from net long-term capital gains) to shareholders during the fiscal year.
For nonresident alien shareholders, 100% of short-term capital gain dividends distributed by the fund are qualified short-term capital gains.
For nonresident alien shareholders, 100% of income dividends are interest-related dividends.
|
| Special 2014 tax information (unaudited) for Vanguard Long-Term Government Bond Index Fund |
This information for the fiscal year ended August 31, 2014, is included pursuant to provisions of the Internal Revenue Code.
For nonresident alien shareholders, 100% of income dividends are interest-related dividends.
|
| Special 2014 tax information (unaudited) for Vanguard Short-Term Corporate Bond Index Fund |
This information for the fiscal year ended August 31, 2014, is included pursuant to provisions of the Internal Revenue Code.
The fund distributed $15,352,000 as capital gain dividends (from net long-term capital gains) to shareholders during the fiscal year.
For nonresident alien shareholders, 100% of short-term capital gain dividends distributed by the fund are qualified short-term capital gains.
For nonresident alien shareholders, 80.7% of income dividends are interest-related dividends.
|
| Special 2014 tax information (unaudited) for Vanguard Intermediate-Term Corporate Bond Index Fund |
This information for the fiscal year ended August 31, 2014, is included pursuant to provisions of the Internal Revenue Code.
The fund distributed $20,336,000 as capital gain dividends (from net long-term capital gains) to shareholders during the fiscal year.
For nonresident alien shareholders, 100% of short-term capital gain dividends distributed by the fund are qualified short-term capital gains.
For nonresident alien shareholders, 85.0% of income dividends are interest-related dividends.
210
| Special 2014 tax information (unaudited) for Vanguard Long-Term Corporate Bond Index Fund |
This information for the fiscal year ended August 31, 2014, is included pursuant to provisions of the Internal Revenue Code.
For nonresident alien shareholders, 85.1% of income dividends are interest-related dividends.
|
Special 2014 tax information (unaudited) for Vanguard Mortgage-Backed Securities Index Fund |
This information for the fiscal year ended August 31, 2014, is included pursuant to provisions of the Internal Revenue Code.
For nonresident alien shareholders, 99.1% of income dividends are interest-related dividends.
211
About Your Fund’s Expenses
As a shareholder of the fund, you incur ongoing costs, which include costs for portfolio management, administrative services, and shareholder reports (like this one), among others. Operating expenses, which are deducted from a fund’s gross income, directly reduce the investment return of the fund.
A fund’s expenses are expressed as a percentage of its average net assets. This figure is known as the expense ratio. The following examples are intended to help you understand the ongoing costs (in dollars) of investing in your fund and to compare these costs with those of other mutual funds. The examples are based on an investment of $1,000 made at the beginning of the period shown and held for the entire period.
The accompanying table illustrates your fund’s costs in two ways:
• Based on actual fund return. This section helps you to estimate the actual expenses that you paid over the period. The ”Ending Account Value“ shown is derived from the fund‘s actual return, and the third column shows the dollar amount that would have been paid by an investor who started with $1,000 in the fund. You may use the information here, together with the amount you invested, to estimate the expenses that you paid over the period.
To do so, simply divide your account value by $1,000 (for example, an $8,600 account value divided by $1,000 = 8.6), then multiply the result by the number given for your fund under the heading ”Expenses Paid During Period.“
• Based on hypothetical 5% yearly return. This section is intended to help you compare your fund‘s costs with those of other mutual funds. It assumes that the fund had a yearly return of 5% before expenses, but that the expense ratio is unchanged. In this case—because the return used is not the fund’s actual return—the results do not apply to your investment. The example is useful in making comparisons because the Securities and Exchange Commission requires all mutual funds to calculate expenses based on a 5% return. You can assess your fund’s costs by comparing this hypothetical example with the hypothetical examples that appear in shareholder reports of other funds.
Note that the expenses shown in the table are meant to highlight and help you compare ongoing costs only and do not reflect transaction costs incurred by the fund for buying and selling securities. Further, the expenses do not include any purchase, redemption, or account service fees described in the fund prospectus. If such fees were applied to your account, your costs would be higher. Your fund does not carry a “sales load.”
The calculations assume no shares were bought or sold during the period. Your actual costs may have been higher or lower, depending on the amount of your investment and the timing of any purchases or redemptions.
You can find more information about the fund’s expenses, including annual expense ratios, in the Financial Statements section of this report. For additional information on operating expenses and other shareholder costs, please refer to your fund’s current prospectus.
212
| Six Months Ended August 31, 2014 | |||
| Beginning | Ending | Expenses | |
| Account Value | Account Value | Paid During | |
| 2/28/2014 | 8/31/2014 | Period | |
| Based on Actual Fund Return | |||
| Short-Term Government Bond Index Fund | |||
| Admiral Shares | $1,000.00 | $1,001.77 | $0.61 |
| Institutional Shares | 1,000.00 | 1,002.00 | 0.45 |
| ETF Shares | 1,000.00 | 1,001.76 | 0.61 |
| Intermediate-Term Government Bond Index Fund | |||
| Admiral Shares | $1,000.00 | $1,013.74 | $0.61 |
| Institutional Shares | 1,000.00 | 1,013.82 | 0.46 |
| ETF Shares | 1,000.00 | 1,013.55 | 0.61 |
| Long-Term Government Bond Index Fund | |||
| Admiral Shares | $1,000.00 | $1,102.15 | $0.64 |
| Institutional Shares | 1,000.00 | 1,102.46 | 0.48 |
| ETF Shares | 1,000.00 | 1,102.24 | 0.64 |
| Short-Term Corporate Bond Index Fund | |||
| Admiral Shares | $1,000.00 | $1,009.58 | $0.61 |
| Institutional Shares | 1,000.00 | 1,010.01 | 0.46 |
| ETF Shares | 1,000.00 | 1,009.62 | 0.61 |
| Intermediate-Term Corporate Bond Index Fund | |||
| Admiral Shares | $1,000.00 | $1,040.52 | $0.62 |
| Institutional Shares | 1,000.00 | 1,040.37 | 0.46 |
| ETF Shares | 1,000.00 | 1,040.43 | 0.62 |
| Long-Term Corporate Bond Index Fund | |||
| Admiral Shares | $1,000.00 | $1,088.94 | $0.63 |
| Institutional Shares | 1,000.00 | 1,088.85 | 0.47 |
| ETF Shares | 1,000.00 | 1,088.64 | 0.63 |
| Mortgage-Backed Securities Index Fund | |||
| Admiral Shares | $1,000.00 | $1,022.44 | $0.61 |
| Institutional Shares | 1,000.00 | 1,022.45 | 0.46 |
| ETF Shares | 1,000.00 | 1,022.19 | 0.61 |
213
| Six Months Ended August 31, 2014 | |||
| Beginning | Ending | Expenses | |
| Account Value | Account Value | Paid During | |
| 2/28/2014 | 8/31/2014 | Period | |
| Based on Hypothetical 5% Yearly Return | |||
| Short-Term Government Bond Index Fund | |||
| Admiral Shares | $1,000.00 | $1,024.60 | $0.61 |
| Institutional Shares | 1,000.00 | 1,024.75 | 0.46 |
| ETF Shares | 1,000.00 | 1,024.60 | 0.61 |
| Intermediate-Term Government Bond Index Fund | |||
| Admiral Shares | $1,000.00 | $1,024.60 | $0.61 |
| Institutional Shares | 1,000.00 | 1,024.75 | 0.46 |
| ETF Shares | 1,000.00 | 1,024.60 | 0.61 |
| Long-Term Government Bond Index Fund | |||
| Admiral Shares | $1,000.00 | $1,024.60 | $0.61 |
| Institutional Shares | 1,000.00 | 1,024.75 | 0.46 |
| ETF Shares | 1,000.00 | 1,024.60 | 0.61 |
| Short-Term Corporate Bond Index Fund | |||
| Admiral Shares | $1,000.00 | $1,024.60 | $0.61 |
| Institutional Shares | 1,000.00 | 1,024.75 | 0.46 |
| ETF Shares | 1,000.00 | 1,024.60 | 0.61 |
| Intermediate-Term Corporate Bond Index Fund | |||
| Admiral Shares | $1,000.00 | $1,024.60 | $0.61 |
| Institutional Shares | 1,000.00 | 1,024.75 | 0.46 |
| ETF Shares | 1,000.00 | 1,024.60 | 0.61 |
| Long-Term Corporate Bond Index Fund | |||
| Admiral Shares | $1,000.00 | $1,024.60 | $0.61 |
| Institutional Shares | 1,000.00 | 1,024.75 | 0.46 |
| ETF Shares | 1,000.00 | 1,024.60 | 0.61 |
| Mortgage-Backed Securities Index Fund | |||
| Admiral Shares | $1,000.00 | $1,024.60 | $0.61 |
| Institutional Shares | 1,000.00 | 1,024.75 | 0.46 |
| ETF Shares | 1,000.00 | 1,024.60 | 0.61 |
| The calculations are based on expenses incurred in the most recent six-month period. The funds’ annualized six-month expense ratios for that period are: for the Short-Term Government Bond Index Fund, 0.12% for Admiral Shares, 0.09% for Institutional Shares, and 0.12% for ETF Shares; for the Intermediate-Term Government Bond Index Fund, 0.12% for Admiral Shares, 0.09% for Institutional Shares, and 0.12% for ETF Shares; for the Long-Term Government Bond Index Fund, 0.12% for Admiral Shares, 0.09% for Institutional Shares, and 0.12% for ETF Shares; for the Short-Term Corporate Bond Index Fund, 0.12% for Admiral Shares, 0.09% for Institutional Shares, and 0.12% for ETF Shares; for the Intermediate-Term Corporate Bond Index Fund, 0.12% for Admiral Shares, 0.09% for Institutional Shares, and 0.12% for ETF Shares; for the Long-Term Corporate Bond Index Fund, 0.12% for Admiral Shares, 0.09% for Institutional Shares, and 0.12% for ETF Shares; for the Mortgage-Backed Securities Index Fund, 0.12% for Admiral Shares, 0.09% for Institutional Shares, and 0.12% for ETF Shares. The dollar amounts shown as ”Expenses Paid” are equal to the annualized expense ratio multiplied by the average account value over the period, multiplied by the number of days in the most recent six-month period, then divided by the number of days in the most recent 12-month period. | |||
214
Trustees Approve Advisory Arrangements
The board of trustees of Vanguard Short-Term Government Bond Index Fund, Intermediate-Term Government Bond Index Fund, Long-Term Government Bond Index Fund, Short-Term Corporate Bond Index Fund, Intermediate-Term Corporate Bond Index Fund, Long-Term Corporate Bond Index Fund, and Mortgage-Backed Securities Index Fund has renewed each fund’s investment advisory arrangement with The Vanguard Group, Inc. (Vanguard). Vanguard—through its Fixed Income Group—serves as the investment advisor for each fund. The board determined that continuing each fund’s internalized management structure was in the best interests of each fund and its shareholders.
The board based its decision upon an evaluation of the advisor’s investment staff, portfolio management process, and performance. The trustees considered the factors discussed below, among others. However, no single factor determined whether the board approved the arrangements. Rather, it was the totality of the circumstances that drove the board’s decision.
Nature, extent, and quality of services
The board considered the quality of each fund’s investment management services provided to the funds since their inception in 2009, and took into account the organizational depth and stability of the advisor. The board noted that Vanguard has been managing investments for more than three decades. The Fixed Income Group adheres to a sound, disciplined investment management process; the team has considerable experience, stability, and depth.
The board concluded that Vanguard’s experience, stability, depth, and performance, among other factors, warranted continuation of each advisory arrangement.
Investment performance
The board considered the funds’ performance since their inception, including any periods of outperformance or underperformance relative to a target index and peer group. The board concluded that the performance was such that each advisory arrangement should continue. Information about the funds’ most recent performance can be found in the Performance Summary pages of this report.
Cost
The board concluded that each fund’s expense ratio was well below the average expense ratio charged by funds in its respective peer group and that each fund’s advisory fee rate was also well below its peer-group average. Information about the funds’ expenses appears in the About Your Fund’s Expenses section of this report as well as in the Financial Statements sections.
The board does not conduct a profitability analysis of Vanguard, because of Vanguard’s unique “at-cost” structure. Unlike most other mutual fund management companies, Vanguard is owned by the funds it oversees, and produces “profits” only in the form of reduced expenses for fund shareholders.
The benefit of economies of scale
The board concluded that each fund’s at-cost arrangement with Vanguard ensures that the funds will realize economies of scale as they grow, with the cost to shareholders declining as fund assets increase.
The board will consider whether to renew the advisory arrangements again after a one-year period.
215
Glossary
30-Day SEC Yield. A fund’s 30-day SEC yield is derived using a formula specified by the U.S. Securities and Exchange Commission. Under the formula, data related to the fund’s security holdings in the previous 30 days are used to calculate the fund’s hypothetical net income for that period, which is then annualized and divided by the fund’s estimated average net assets over the calculation period. For the purposes of this calculation, a security’s income is based on its current market yield to maturity (for bonds), its actual income (for asset-backed securities), or its projected dividend yield (for stocks). Because the SEC yield represents hypothetical annualized income, it will differ—at times significantly—from the fund’s actual experience. As a result, the fund’s income distributions may be higher or lower than implied by the SEC yield.
Average Coupon. The average interest rate paid on the fixed income securities held by a fund. It is expressed as a percentage of face value.
Average Duration. An estimate of how much the value of the bonds held by a fund will fluctuate in response to a change in interest rates. To see how the value could change, multiply the average duration by the change in rates. If interest rates rise by 1 percentage point, the value of the bonds in a fund with an average duration of five years would decline by about 5%. If rates decrease by a percentage point, the value would rise by 5%.
Average Effective Maturity. The average length of time until fixed income securities held by a fund reach maturity and are repaid, taking into consideration the possibility that the issuer may call the bond before its maturity date. The figure reflects the proportion of fund assets represented by each security; it also reflects any futures contracts held. In general, the longer the average effective maturity, the more a fund’s share price will fluctuate in response to changes in market interest rates.
Beta. A measure of the magnitude of a fund’s past share-price fluctuations in relation to the ups and downs of a given market index. The index is assigned a beta of 1.00. Compared with a given index, a fund with a beta of 1.20 typically would have seen its share price rise or fall by 12% when the index rose or fell by 10%. For this report, beta is based on returns over the past 36 months for both the fund and the index. Note that a fund’s beta should be reviewed in conjunction with its R-squared (see definition). The lower the R-squared, the less correlation there is between the fund and the index, and the less reliable beta is as an indicator of volatility.
Credit Quality. Credit-quality ratings are measured on a scale that generally ranges from AAA (highest) to D (lowest). “Not Rated” is used to classify securities for which a rating is not available. U.S. Treasury, U.S. Agency, and U.S. Agency mortgage-backed securities appear under “U.S. Government.” Credit-quality ratings are obtained from Barclays using ratings generally derived from Moody’s, Fitch, and S&P. When ratings from all three agencies are used, the median rating is shown. When ratings from two of the agencies are used, the lower rating is shown.
Expense Ratio. A fund’s total annual operating expenses expressed as a percentage of the fund’s average net assets. The expense ratio includes management and administrative expenses, but does not include the transaction costs of buying and selling portfolio securities.
Inception Date. The date on which the assets of a fund (or one of its share classes) are first invested in accordance with the fund’s investment objective. For funds with a subscription period, the inception date is the day after that period ends. Investment performance is measured from the inception date.
216
R-Squared. A measure of how much of a fund’s past returns can be explained by the returns from the market in general, as measured by a given index. If a fund’s total returns were precisely synchronized with an index’s returns, its R-squared would be 1.00. If the fund’s returns bore no relationship to the index’s returns, its R-squared would be 0. For this report, R-squared is based on returns over the past 36 months for both the fund and the index.
Short-Term Reserves. The percentage of a fund invested in highly liquid, short-term securities that can be readily converted to cash.
Yield to Maturity. The rate of return an investor would receive if the fixed income securities held by a fund were held to their maturity dates.
Benchmark Information
Spliced Barclays U.S. Aggregate Float Adjusted Index: Barclays U.S. Aggregate Bond Index through December 31, 2009; Barclays U.S. Aggregate Float Adjusted Index thereafter.
Spliced Core Bond Funds Average: Intermediate Investment-Grade Debt Funds Average through August 31, 2013; Core Bond Funds Average thereafter.
The Vanguard funds are not sponsored, endorsed, issued, sold, or promoted by Barclays Capital Inc. or any of its affiliates (“Barclays”). Barclays makes no representation or warranty, express or implied, to the owners or purchasers of the funds or any member of the public regarding the advisability of investing in securities generally or in the funds particularly or the ability of the Barclays indexes to track general bond market performance. Barclays has not passed on the legality or suitability of the funds with respect to any person or entity. Barclays’ only relationship to Vanguard and the funds is the licensing of the Barclays indexes, which are determined, composed, and calculated by Barclays without regard to Vanguard or the funds or any owners or purchasers of the funds. Barclays has no obligation to take the needs of Vanguard, the funds, or the owners of the funds into consideration in determining, composing, or calculating the Barclays indexes. Barclays is not responsible for and has not participated in the determination of the timing of, prices at, or quantities of the funds to be issued. Barclays has no obligation or liability in connection with the administration, marketing, or trading of the funds.
Barclays shall have no liability to third parties for the quality, accuracy, and/or completeness of the indexes or any data included therein or for interruptions in the delivery of the indexes. Barclays makes no warranty, express or implied, as to results to be obtained by owners of the funds or any other person or entity from the use of the indexes or any data included therein in connection with the rights licensed hereunder or for any other use. Barclays reserves the right to change the methods of calculation or publication, or to cease the calculation or publication of the Barclays U.S. 1–3 Year Government Float Adjusted Index, Barclays U.S. 3–10 Year Government Float Adjusted Index, Barclays U.S. Long Government Float Adjusted Index, Barclays U.S. 1–5 Year Corporate Bond Index, Barclays U.S. 5–10 Year Corporate Bond Index, Barclays U.S. 10+ Year Corporate Bond Index, or Barclays U.S. MBS Float Adjusted Index, and Barclays shall not be liable for any miscalculation of or any incorrect, delayed, or interrupted publication with respect to any of the Barclays indexes. Barclays makes no express or implied warranties, and hereby expressly disclaims all warranties of merchantability or fitness for a particular purpose or use with respect to the indexes or any data included therein. Barclays shall not be liable for any damages, including, without limitation, any indirect or consequential damages resulting from the use of the indexes or any data included therein.
218
This page intentionally left blank.
This page intentionally left blank.
This page intentionally left blank.
This page intentionally left blank.
This page intentionally left blank.
The People Who Govern Your Fund
The trustees of your mutual fund are there to see that the fund is operated and managed in your best interests since, as a shareholder, you are a part owner of the fund. Your fund’s trustees also serve on the board of directors of The Vanguard Group, Inc., which is owned by the Vanguard funds and provides services to them on an at-cost basis.
A majority of Vanguard’s board members are independent, meaning that they have no affiliation with Vanguard or the funds they oversee, apart from the sizable personal investments they have made as private individuals. The independent board members have distinguished backgrounds in business, academia, and public service. Each of the trustees and executive officers oversees 177 Vanguard funds.
The following table provides information for each trustee and executive officer of the fund. More information about the trustees is in the Statement of Additional Information, which can be obtained, without charge, by contacting Vanguard at 800-662-7447, or online at vanguard.com.
| InterestedTrustee1 | and Delphi Automotive LLP (automotive components); |
| Senior Advisor at New Mountain Capital. | |
| F. William McNabb III | |
| Born 1957. Trustee Since July 2009. Chairman of the | Amy Gutmann |
| Board. Principal Occupation(s) During the Past Five | Born 1949. Trustee Since June 2006. Principal |
| Years: Chairman of the Board of The Vanguard Group, | Occupation(s) During the Past Five Years: President of |
| Inc., and of each of the investment companies served | the University of Pennsylvania; Christopher H. Browne |
| by The Vanguard Group, since January 2010; Director | Distinguished Professor of Political Science, School of |
| of The Vanguard Group since 2008; Chief Executive | Arts and Sciences, and Professor of Communication, |
| Officer and President of The Vanguard Group, and of | Annenberg School for Communication, with secondary |
| each of the investment companies served by The | faculty appointments in the Department of Philosophy, |
| Vanguard Group, since 2008; Director of Vanguard | School of Arts and Sciences, and at the Graduate |
| Marketing Corporation; Managing Director of The | School of Education, University of Pennsylvania; |
| Vanguard Group (1995–2008). | Trustee of the National Constitution Center; Chair |
| of the Presidential Commission for the Study of | |
| IndependentTrustees | Bioethical Issues. |
| Emerson U. Fullwood | JoAnn Heffernan Heisen |
| Born 1948. Trustee Since January 2008. Principal | Born 1950. Trustee Since July 1998. Principal |
| Occupation(s) During the Past Five Years: Executive | Occupation(s) During the Past Five Years: Corporate |
| Chief Staff and Marketing Officer for North America | Vice President and Chief Global Diversity Officer |
| and Corporate Vice President (retired 2008) of Xerox | (retired 2008) and Member of the Executive |
| Corporation (document management products and | Committee (1997–2008) of Johnson & Johnson |
| services); Executive in Residence and 2009–2010 | (pharmaceuticals/medical devices/consumer |
| Distinguished Minett Professor at the Rochester | products); Director of Skytop Lodge Corporation |
| Institute of Technology; Director of SPX Corporation | (hotels), the University Medical Center at Princeton, |
| (multi-industry manufacturing), the United Way of | the Robert Wood Johnson Foundation, and the Center |
| Rochester, Amerigroup Corporation (managed health | for Talent Innovation; Member of the Advisory Board |
| care), the University of Rochester Medical Center, | of the Maxwell School of Citizenship and Public Affairs |
| Monroe Community College Foundation, and North | at Syracuse University. |
| Carolina A&T University. | |
| F. Joseph Loughrey | |
| Rajiv L. Gupta | Born 1949. Trustee Since October 2009. Principal |
| Born 1945. Trustee Since December 2001.2 | Occupation(s) During the Past Five Years: President |
| Principal Occupation(s) During the Past Five Years: | and Chief Operating Officer (retired 2009) of Cummins |
| Chairman and Chief Executive Officer (retired 2009) | Inc. (industrial machinery); Chairman of the Board |
| and President (2006–2008) of Rohm and Haas Co. | of Hillenbrand, Inc. (specialized consumer services), |
| (chemicals); Director of Tyco International, Ltd. | and of Oxfam America; Director of SKF AB (industrial |
| (diversified manufacturing and services), Hewlett- | machinery), Hyster-Yale Materials Handling, Inc. |
| Packard Co. (electronic computer manufacturing), | (forklift trucks), the Lumina Foundation for Education, |
| and the V Foundation for Cancer Research; Member | Executive Officers | |
| of the Advisory Council for the College of Arts and | ||
| Letters and of the Advisory Board to the Kellogg | Glenn Booraem | |
| Institute for International Studies, both at the | Born 1967. Controller Since July 2010. Principal | |
| University of Notre Dame. | Occupation(s) During the Past Five Years: Principal | |
| of The Vanguard Group, Inc.; Controller of each of | ||
| Mark Loughridge | the investment companies served by The Vanguard | |
| Born 1953. Trustee Since March 2012. Principal | Group; Assistant Controller of each of the investment | |
| Occupation(s) During the Past Five Years: Senior Vice | companies served by The Vanguard Group (2001–2010). | |
| President and Chief Financial Officer (retired 2013) | ||
| at IBM (information technology services); Fiduciary | Thomas J. Higgins | |
| Member of IBM’s Retirement Plan Committee (2004– | Born 1957. Chief Financial Officer Since September | |
| 2013); Member of the Council on Chicago Booth. | 2008. Principal Occupation(s) During the Past Five | |
| Years: Principal of The Vanguard Group, Inc.; Chief | ||
| Scott C. Malpass | Financial Officer of each of the investment companies | |
| Born 1962. Trustee Since March 2012. Principal | served by The Vanguard Group; Treasurer of each of | |
| Occupation(s) During the Past Five Years: Chief | the investment companies served by The Vanguard | |
| Investment Officer and Vice President at the University | Group (1998–2008). | |
| of Notre Dame; Assistant Professor of Finance at the | ||
| Mendoza College of Business at Notre Dame; Member | Kathryn J. Hyatt | |
| of the Notre Dame 403(b) Investment Committee; | Born 1955. Treasurer Since November 2008. Principal | |
| Board Member of TIFF Advisory Services, Inc. | Occupation(s) During the Past Five Years: Principal of | |
| (investment advisor); Member of the Investment | The Vanguard Group, Inc.; Treasurer of each of the | |
| Advisory Committees of the Financial Industry | investment companies served by The Vanguard | |
| Regulatory Authority (FINRA) and of Major League | Group; Assistant Treasurer of each of the investment | |
| Baseball. | companies served by The Vanguard Group (1988–2008). | |
| André F. Perold | Heidi Stam | |
| Born 1952. Trustee Since December 2004. Principal | Born 1956. Secretary Since July 2005. Principal | |
| Occupation(s) During the Past Five Years: George | Occupation(s) During the Past Five Years: Managing | |
| Gund Professor of Finance and Banking, Emeritus | Director of The Vanguard Group, Inc.; General Counsel | |
| at the Harvard Business School (retired 2011); | of The Vanguard Group; Secretary of The Vanguard | |
| Chief Investment Officer and Managing Partner of | Group and of each of the investment companies | |
| HighVista Strategies LLC (private investment firm); | served by The Vanguard Group; Director and Senior | |
| Director of Rand Merchant Bank; Overseer of the | Vice President of Vanguard Marketing Corporation. | |
| Museum of Fine Arts Boston. | ||
| Vanguard Senior ManagementTeam | ||
| Alfred M. Rankin, Jr. | ||
| Born 1941. Trustee Since January 1993. Principal | Mortimer J. Buckley | Chris D. McIsaac |
| Occupation(s) During the Past Five Years: Chairman, | Kathleen C. Gubanich | Michael S. Miller |
| President, and Chief Executive Officer of NACCO | Paul A. Heller | James M. Norris |
| Industries, Inc. (housewares/lignite), and of Hyster- | Martha G. King | Glenn W. Reed |
| Yale Materials Handling, Inc. (forklift trucks); Chairman | John T. Marcante | |
| of the Board of University Hospitals of Cleveland. | ||
| Chairman Emeritus and Senior Advisor | ||
| Peter F. Volanakis | ||
| Born 1955. Trustee Since July 2009. Principal | John J. Brennan | |
| Occupation(s) During the Past Five Years: President | Chairman, 1996–2009 | |
| and Chief Operating Officer (retired 2010) of Corning | Chief Executive Officer and President, 1996–2008 | |
| Incorporated (communications equipment); Trustee of | ||
| Colby-Sawyer College; Member of the Advisory Board | Founder | |
| of the Norris Cotton Cancer Center and of the Advisory | ||
| Board of the Parthenon Group (strategy consulting). | John C. Bogle | |
| Chairman and Chief Executive Officer, 1974–1996 | ||
1 Mr. McNabb is considered an “interested person,” as defined in the Investment Company Act of 1940, because he is an officer of the Vanguard funds.
2 December 2002 for Vanguard Equity Income Fund, the Vanguard Municipal Bond Funds, and the Vanguard State Tax-Exempt Funds.
 | |
| P.O. Box 2600 | |
| Valley Forge, PA 19482-2600 | |
| Connect with Vanguard® > vanguard.com | |
| Fund Information > 800-662-7447 | |
| Direct Investor Account Services > 800-662-2739 | |
| Institutional Investor Services > 800-523-1036 | |
| Text Telephone for People | |
| With Hearing Impairment > 800-749-7273 | |
| This material may be used in conjunction | |
| with the offering of shares of any Vanguard | |
| fund only if preceded or accompanied by | |
| the fund’s current prospectus. | |
| All comparative mutual fund data are from Lipper, a | |
| Thomson Reuters Company, or Morningstar, Inc., unless | |
| otherwise noted. | |
| You can obtain a free copy of Vanguard’s proxy voting | |
| guidelines by visiting vanguard.com/proxyreporting or by | |
| calling Vanguard at 800-662-2739. The guidelines are | |
| also available from the SEC’s website, sec.gov. In | |
| addition, you may obtain a free report on how your fund | |
| voted the proxies for securities it owned during the 12 | |
| months ended June 30. To get the report, visit either | |
| vanguard.com/proxyreporting or sec.gov. | |
| You can review and copy information about your fund at | |
| the SEC’s Public Reference Room in Washington, D.C. To | |
| find out more about this public service, call the SEC at | |
| 202-551-8090. Information about your fund is also | |
| available on the SEC’s website, and you can receive | |
| copies of this information, for a fee, by sending a | |
| request in either of two ways: via e-mail addressed to | |
| publicinfo@sec.gov or via regular mail addressed to the | |
| Public Reference Section, Securities and Exchange | |
| Commission, Washington, DC 20549-1520. | |
| © 2014 The Vanguard Group, Inc. | |
| All rights reserved. | |
| Vanguard Marketing Corporation, Distributor. | |
| Q16420 102014 | |
Item 2: Code of Ethics. The Registrant has adopted a code of ethics that applies to the Registrant’s principal executive officer, principal financial officer, principal accounting officer or controller or persons performing similar functions. The Code of Ethics was amended during the reporting period covered by this report to make certain technical, non-material changes.
Item 3: Audit Committee Financial Expert. The following members of the Audit Committee have been determined by the Registrant’s Board of Trustees to be Audit Committee Financial Experts serving on its Audit Committee, and to be independent: Rajiv L. Gupta, Amy Gutmann, JoAnn Heffernan Heisen, F. Joseph Loughrey, Mark Loughridge, Scott C. Malpass, André F. Perold, and Alfred M. Rankin, Jr.
Item 4: Principal Accountant Fees and Services.
(a) Audit Fees.
Audit Fees of the Registrant
Fiscal Year Ended August 31, 2014: $544,000 Fiscal Year Ended August 31, 2013: $510,000
Aggregate Audit Fees of Registered Investment Companies in the Vanguard Group.
Fiscal Year Ended August 31, 2014: $6,605,127
Fiscal Year Ended August 31, 2013: $5,714,113
Includes fees billed in connection with audits of the Registrant, other registered investment companies in the Vanguard complex, The Vanguard Group, Inc. and Vanguard Marketing Corporation.
(b) Audit-Related Fees.
Fiscal Year Ended August 31, 2014: $2,176,479
Fiscal Year Ended August 31, 2013: $1,552,950
Includes fees billed in connection with assurance and related services provided to the Registrant, other registered investment companies in the Vanguard complex, The Vanguard Group, Inc., and Vanguard Marketing Corporation.
(c) Tax Fees.
Fiscal Year Ended August 31, 2014: $316,869
Fiscal Year Ended August 31, 2013: $110,000
Includes fees billed in connection with tax compliance, planning, and advice services provided to the Registrant, other registered investment companies in the Vanguard complex, The Vanguard Group, Inc., and Vanguard Marketing Corporation.
(d) All Other Fees.
Fiscal Year Ended August 31, 2014: $198,163
Fiscal Year Ended August 31, 2013: $132,000
Includes fees billed for services related to tax reported information provided to the Registrant, other registered investment companies in the Vanguard complex, The Vanguard Group, Inc., and Vanguard Marketing Corporation.
(e) (1) Pre-Approval Policies. The policy of the Registrant’s Audit Committee is to consider and, if appropriate, approve before the principal accountant is engaged for such services, all specific audit and non-audit services provided to: the Registrant, other registered investment companies in the Vanguard complex, The Vanguard Group, Inc., and entities controlled by The Vanguard Group, Inc. that provide ongoing services to the Registrant. In making a determination, the Audit Committee considers whether the services are consistent with maintaining the principal accountant’s independence.
In the event of a contingency situation in which the principal accountant is needed to provide services in between scheduled Audit Committee meetings, the Chairman of the Audit Committee would be called on to consider and, if appropriate, pre-approve audit or permitted non-audit services in an amount sufficient to complete services through the next Audit Committee meeting, and to determine if such services would be consistent with maintaining the accountant’s independence. At the next scheduled Audit Committee meeting, services and fees would be presented to the Audit Committee for formal consideration, and, if appropriate, approval by the entire Audit Committee. The Audit Committee would again consider whether such services and fees are consistent with maintaining the principal accountant’s independence.
The Registrant’s Audit Committee is informed at least annually of all audit and non-audit services provided by the principal accountant to the Vanguard complex, whether such services are provided to: the Registrant, other registered investment companies in the Vanguard complex, The Vanguard Group, Inc., or other entities controlled by The Vanguard Group, Inc. that provide ongoing services to the Registrant.
(2) No percentage of the principal accountant’s fees or services were approved pursuant to the waiver provision of paragraph (c)(7)(i)(C) of Rule 2-01 of Regulation S-X.
(f) For the most recent fiscal year, over 50% of the hours worked under the principal accountant’s engagement were not performed by persons other than full-time, permanent employees of the principal accountant.
(g) Aggregate Non-Audit Fees.
Fiscal Year Ended August 31, 2014: $515,032
Fiscal Year Ended August 31, 2013: $242,000
Includes fees billed for non-audit services provided to the Registrant, other registered investment companies in the Vanguard complex, The Vanguard Group, Inc., and Vanguard Marketing Corporation.
(h) For the most recent fiscal year, the Audit Committee has determined that the provision of all non-audit services was consistent with maintaining the principal accountant’s independence.
Item 5: Audit Committee of Listed Registrants.
The Registrant is a listed issuer as defined in rule 10A-3 under the Securities Exchange Act of 1934 (“Exchange Act”). The Registrant has a separately-designated standing audit committee established in accordance with Section 3(a)(58)(A) of the Exchange Act. The Registrant’s audit committee members are: Emerson U. Fullwood, Rajiv L. Gupta, Amy Gutmann, JoAnn Heffernan Heisen, F. Joseph Loughrey, Mark Loughridge, Scott C. Malpass, André F. Perold, Alfred M. Rankin, Jr., and Peter F. Volanakis.
Item 6: Investments.
| Vanguard® Russell 1000 Index Fund | ||
| Schedule of Investments | ||
| August 31, 2014 | ||
| Market | ||
| Value | ||
| Shares | ($000) | |
| Common Stocks (99.4%)1 | ||
| Consumer Discretionary (13.9%) | ||
| Walt Disney Co. | 110,953 | 9,972 |
| Comcast Corp. Class A | 165,960 | 9,083 |
| Home Depot Inc. | 87,636 | 8,194 |
| * Amazon.com Inc. | 24,064 | 8,159 |
| Wal-Mart Stores Inc. | 102,100 | 7,709 |
| McDonald's Corp. | 63,365 | 5,939 |
| * eBay Inc. | 81,208 | 4,507 |
| Time Warner Inc. | 56,532 | 4,355 |
| Ford Motor Co. | 248,756 | 4,331 |
| Twenty-First Century Fox Inc. Class A | 122,028 | 4,322 |
| * Priceline Group Inc. | 3,306 | 4,114 |
| Starbucks Corp. | 48,265 | 3,755 |
| General Motors Co. | 102,749 | 3,576 |
| NIKE Inc. Class B | 44,734 | 3,514 |
| Lowe's Cos. Inc. | 65,274 | 3,428 |
| Costco Wholesale Corp. | 28,259 | 3,422 |
| TJX Cos. Inc. | 44,877 | 2,675 |
| Time Warner Cable Inc. | 17,896 | 2,647 |
| * DIRECTV | 30,048 | 2,598 |
| Target Corp. | 40,601 | 2,439 |
| Viacom Inc. Class B | 27,610 | 2,241 |
| Johnson Controls Inc. | 42,541 | 2,076 |
| Yum! Brands Inc. | 28,274 | 2,048 |
| CBS Corp. Class B | 33,602 | 1,992 |
| * Netflix Inc. | 3,834 | 1,831 |
| * Tesla Motors Inc. | 6,090 | 1,642 |
| Las Vegas Sands Corp. | 24,129 | 1,605 |
| Macy's Inc. | 23,191 | 1,445 |
| VF Corp. | 22,152 | 1,420 |
| * Chipotle Mexican Grill Inc. Class A | 1,985 | 1,347 |
| * Dollar General Corp. | 19,935 | 1,276 |
| Omnicom Group Inc. | 16,588 | 1,194 |
| * AutoZone Inc. | 2,097 | 1,130 |
| Estee Lauder Cos. Inc. Class A | 14,645 | 1,125 |
| * O'Reilly Automotive Inc. | 6,825 | 1,065 |
| * Michael Kors Holdings Ltd. | 13,109 | 1,050 |
| Starwood Hotels & Resorts Worldwide Inc. | 12,339 | 1,043 |
| Carnival Corp. | 27,304 | 1,034 |
| Ross Stores Inc. | 13,604 | 1,026 |
| Wynn Resorts Ltd. | 5,197 | 1,002 |
| L Brands Inc. | 15,569 | 994 |
| Marriott International Inc. Class A | 14,270 | 990 |
| * Liberty Interactive Corp. Class A | 31,499 | 930 |
| BorgWarner Inc. | 14,718 | 915 |
| Harley-Davidson Inc. | 14,081 | 895 |
| * DISH Network Corp. Class A | 13,689 | 887 |
| Genuine Parts Co. | 9,888 | 868 |
| * Hertz Global Holdings Inc. | 28,681 | 848 |
| Nielsen NV | 18,006 | 846 |
| * Bed Bath & Beyond Inc. | 13,065 | 840 |
| * Charter Communications Inc. Class A | 5,127 | 804 |
| Kohl's Corp. | 13,437 | 790 |
| Gap Inc. | 16,883 | 779 |
| * Under Armour Inc. Class A | 11,125 | 760 |
| Whirlpool Corp. | 4,964 | 760 |
| Mattel Inc. | 21,644 | 746 |
| * CarMax Inc. | 14,065 | 737 |
| Tiffany & Co. | 7,220 | 729 |
| * Dollar Tree Inc. | 13,274 | 712 |
| * TripAdvisor Inc. | 7,104 | 704 |
| * TRW Automotive Holdings Corp. | 7,168 | 690 |
1
| Vanguard® Russell 1000 Index Fund | ||
| Schedule of Investments | ||
| August 31, 2014 | ||
| Market | ||
| Value | ||
| Shares | ($000) | |
| Royal Caribbean Cruises Ltd. | 10,658 | 680 |
| Wyndham Worldwide Corp. | 8,191 | 663 |
| Hanesbrands Inc. | 6,362 | 653 |
| * Discovery Communications Inc. Class A | 14,766 | 646 |
| Advance Auto Parts Inc. | 4,719 | 644 |
| Ralph Lauren Corp. Class A | 3,791 | 641 |
| * Sirius XM Holdings Inc. | 176,045 | 639 |
| * Discovery Communications Inc. | 14,766 | 634 |
| PVH Corp. | 5,303 | 619 |
| Nordstrom Inc. | 8,884 | 615 |
| Polaris Industries Inc. | 4,198 | 610 |
| Signet Jewelers Ltd. | 5,168 | 609 |
| Tractor Supply Co. | 8,925 | 598 |
| Newell Rubbermaid Inc. | 17,650 | 592 |
| * Liberty Media Corp. | 12,204 | 592 |
| H&R Block Inc. | 17,616 | 591 |
| Best Buy Co. Inc. | 18,437 | 588 |
| * MGM Resorts International | 23,972 | 587 |
| * Mohawk Industries Inc. | 3,984 | 582 |
| * News Corp. Class A | 31,699 | 559 |
| Expedia Inc. | 6,498 | 558 |
| * LKQ Corp. | 19,355 | 550 |
| Scripps Networks Interactive Inc. Class A | 6,806 | 542 |
| Interpublic Group of Cos. Inc. | 27,368 | 534 |
| Foot Locker Inc. | 9,339 | 524 |
| Lear Corp. | 5,177 | 524 |
| Harman International Industries Inc. | 4,425 | 509 |
| * Jarden Corp. | 8,327 | 498 |
| Coach Inc. | 13,452 | 495 |
| Gannett Co. Inc. | 14,650 | 495 |
| Family Dollar Stores Inc. | 6,133 | 490 |
| Staples Inc. | 41,213 | 481 |
| PulteGroup Inc. | 24,111 | 463 |
| Fortune Brands Home & Security Inc. | 10,690 | 462 |
| * Avis Budget Group Inc. | 6,773 | 457 |
| Garmin Ltd. | 8,358 | 454 |
| PetSmart Inc. | 6,315 | 452 |
| Lennar Corp. Class A | 11,459 | 449 |
| DR Horton Inc. | 20,593 | 446 |
| Goodyear Tire & Rubber Co. | 15,865 | 412 |
| Darden Restaurants Inc. | 8,537 | 404 |
| * Toll Brothers Inc. | 11,308 | 402 |
| * Ulta Salon Cosmetics & Fragrance Inc. | 4,083 | 397 |
| Williams-Sonoma Inc. | 6,008 | 395 |
| Hasbro Inc. | 7,395 | 389 |
| * WABCO Holdings Inc. | 3,618 | 373 |
| * Pandora Media Inc. | 13,160 | 356 |
| * NVR Inc. | 292 | 343 |
| * Visteon Corp. | 3,142 | 318 |
| Leggett & Platt Inc. | 8,955 | 314 |
| GameStop Corp. Class A | 7,284 | 307 |
| Service Corp. International | 13,770 | 305 |
| Dunkin' Brands Group Inc. | 6,940 | 302 |
| * Fossil Group Inc. | 2,953 | 299 |
| * Liberty Media Corp. Class A | 5,999 | 295 |
| Carter's Inc. | 3,516 | 291 |
| * Sally Beauty Holdings Inc. | 10,279 | 287 |
| Dick's Sporting Goods Inc. | 6,269 | 283 |
| Gentex Corp. | 9,425 | 279 |
| * Urban Outfitters Inc. | 6,908 | 275 |
| Domino's Pizza Inc. | 3,619 | 273 |
| KAR Auction Services Inc. | 8,931 | 269 |
| * Madison Square Garden Co. Class A | 4,019 | 269 |
| Lamar Advertising Co. Class A | 5,060 | 266 |
2
| Vanguard® Russell 1000 Index Fund | ||
| Schedule of Investments | ||
| August 31, 2014 | ||
| Market | ||
| Value | ||
| Shares | ($000) | |
| CBS Outdoor Americas Inc. | 7,685 | 264 |
| International Game Technology | 15,657 | 264 |
| * Kate Spade & Co. | 8,083 | 261 |
| Cinemark Holdings Inc. | 7,379 | 260 |
| * AutoNation Inc. | 4,676 | 254 |
| * Panera Bread Co. Class A | 1,637 | 245 |
| Avon Products Inc. | 17,362 | 244 |
| * AMC Networks Inc. Class A | 3,834 | 240 |
| Cablevision Systems Corp. Class A | 12,615 | 233 |
| Tupperware Brands Corp. | 3,182 | 233 |
| * Tempur Sealy International Inc. | 3,937 | 230 |
| * Hilton Worldwide Holdings Inc. | 8,641 | 219 |
| Burger King Worldwide Inc. | 6,781 | 217 |
| * JC Penney Co. Inc. | 19,509 | 211 |
| Graham Holdings Co. Class B | 288 | 207 |
| * Deckers Outdoor Corp. | 2,230 | 206 |
| * Live Nation Entertainment Inc. | 9,233 | 203 |
| Brinker International Inc. | 4,119 | 201 |
| * HomeAway Inc. | 5,985 | 199 |
| * Bally Technologies Inc. | 2,496 | 198 |
| Abercrombie & Fitch Co. | 4,635 | 194 |
| * Norwegian Cruise Line Holdings Ltd. | 5,799 | 193 |
| * Cabela's Inc. | 3,151 | 192 |
| Dillard's Inc. Class A | 1,628 | 186 |
| * Starz | 5,905 | 185 |
| * Liberty Ventures Class A | 4,749 | 181 |
| DeVry Education Group Inc. | 4,100 | 176 |
| Big Lots Inc. | 3,757 | 174 |
| Six Flags Entertainment Corp. | 4,749 | 173 |
| CST Brands Inc. | 4,928 | 172 |
| * Apollo Education Group Inc. | 6,158 | 171 |
| * Liberty TripAdvisor Holdings Inc. Class A | 4,749 | 170 |
| John Wiley & Sons Inc. Class A | 2,786 | 167 |
| Lions Gate Entertainment Corp. | 5,127 | 166 |
| * Murphy USA Inc. | 2,990 | 163 |
| * Hyatt Hotels Corp. Class A | 2,664 | 163 |
| Thor Industries Inc. | 2,912 | 156 |
| Chico's FAS Inc. | 9,809 | 155 |
| DSW Inc. Class A | 4,836 | 150 |
| Wendy's Co. | 17,660 | 144 |
| * Ascena Retail Group Inc. | 8,169 | 142 |
| Penske Automotive Group Inc. | 2,724 | 131 |
| AMERCO | 457 | 127 |
| Choice Hotels International Inc. | 2,237 | 121 |
| Nu Skin Enterprises Inc. Class A | 2,505 | 112 |
| Regal Entertainment Group Class A | 5,280 | 111 |
| * DreamWorks Animation SKG Inc. Class A | 4,789 | 105 |
| Aaron's Inc. | 4,072 | 104 |
| Coty Inc. Class A | 4,496 | 77 |
| Aramark | 2,582 | 67 |
| * Sears Holdings Corp. | 1,632 | 57 |
| SeaWorld Entertainment Inc. | 2,389 | 50 |
| * Taylor Morrison Home Corp. Class A | 2,006 | 40 |
| * zulily Inc. Class A | 799 | 26 |
| Clear Channel Outdoor Holdings Inc. Class A | 2,528 | 18 |
| 183,691 | ||
| Consumer Staples (7.6%) | ||
| Procter & Gamble Co. | 173,329 | 14,405 |
| Coca-Cola Co. | 254,275 | 10,608 |
| PepsiCo Inc. | 97,121 | 8,983 |
| Philip Morris International Inc. | 100,819 | 8,628 |
| CVS Caremark Corp. | 74,967 | 5,956 |
| Altria Group Inc. | 127,256 | 5,482 |
| Mondelez International Inc. Class A | 108,337 | 3,921 |
3
| Vanguard® Russell 1000 Index Fund | ||
| Schedule of Investments | ||
| August 31, 2014 | ||
| Market | ||
| Value | ||
| Shares | ($000) | |
| Colgate-Palmolive Co. | 58,685 | 3,799 |
| Walgreen Co. | 61,151 | 3,701 |
| Kimberly-Clark Corp. | 24,206 | 2,614 |
| Kraft Foods Group Inc. | 38,141 | 2,247 |
| General Mills Inc. | 39,395 | 2,103 |
| Archer-Daniels-Midland Co. | 41,951 | 2,092 |
| Kroger Co. | 32,698 | 1,667 |
| Sysco Corp. | 37,476 | 1,418 |
| Lorillard Inc. | 23,274 | 1,389 |
| Mead Johnson Nutrition Co. | 12,986 | 1,241 |
| Keurig Green Mountain Inc. | 9,138 | 1,218 |
| Reynolds American Inc. | 19,799 | 1,158 |
| Kellogg Co. | 16,511 | 1,073 |
| Whole Foods Market Inc. | 23,634 | 925 |
| Brown-Forman Corp. Class B | 9,866 | 914 |
| * Constellation Brands Inc. Class A | 10,332 | 900 |
| Hershey Co. | 9,593 | 877 |
| ConAgra Foods Inc. | 26,951 | 868 |
| * Monster Beverage Corp. | 9,233 | 816 |
| Bunge Ltd. | 9,434 | 799 |
| Dr Pepper Snapple Group Inc. | 12,538 | 789 |
| Coca-Cola Enterprises Inc. | 16,039 | 766 |
| Clorox Co. | 8,323 | 737 |
| Tyson Foods Inc. Class A | 18,552 | 706 |
| JM Smucker Co. | 6,671 | 684 |
| Molson Coors Brewing Co. Class B | 8,720 | 645 |
| Church & Dwight Co. Inc. | 8,748 | 597 |
| McCormick & Co. Inc. | 8,430 | 588 |
| Safeway Inc. | 14,676 | 510 |
| Campbell Soup Co. | 11,185 | 501 |
| Energizer Holdings Inc. | 3,929 | 477 |
| Hormel Foods Corp. | 8,717 | 442 |
| * WhiteWave Foods Co. Class A | 11,120 | 389 |
| * Rite Aid Corp. | 62,297 | 388 |
| Ingredion Inc. | 4,753 | 379 |
| * Hain Celestial Group Inc. | 3,199 | 315 |
| ^ Herbalife Ltd. | 5,154 | 263 |
| GNC Holdings Inc. Class A | 5,789 | 220 |
| Flowers Foods Inc. | 10,887 | 213 |
| * Sprouts Farmers Market Inc. | 6,275 | 194 |
| * Pilgrim's Pride Corp. | 4,041 | 121 |
| Spectrum Brands Holdings Inc. | 1,358 | 118 |
| Pinnacle Foods Inc. | 3,529 | 114 |
| 99,958 | ||
| Energy (9.7%) | ||
| Exxon Mobil Corp. | 275,070 | 27,359 |
| Chevron Corp. | 121,932 | 15,784 |
| Schlumberger Ltd. | 83,371 | 9,141 |
| ConocoPhillips | 78,687 | 6,391 |
| Occidental Petroleum Corp. | 50,341 | 5,222 |
| EOG Resources Inc. | 35,033 | 3,849 |
| Halliburton Co. | 54,102 | 3,658 |
| Anadarko Petroleum Corp. | 32,352 | 3,646 |
| Phillips 66 | 36,328 | 3,161 |
| Williams Cos. Inc. | 47,887 | 2,846 |
| Apache Corp. | 24,725 | 2,518 |
| National Oilwell Varco Inc. | 27,540 | 2,380 |
| Devon Energy Corp. | 26,127 | 1,971 |
| Baker Hughes Inc. | 27,993 | 1,936 |
| Pioneer Natural Resources Co. | 9,169 | 1,913 |
| Valero Energy Corp. | 34,219 | 1,853 |
| Marathon Oil Corp. | 43,367 | 1,808 |
| Hess Corp. | 17,857 | 1,805 |
| Spectra Energy Corp. | 42,994 | 1,791 |
4
| Vanguard® Russell 1000 Index Fund | |||
| Schedule of Investments | |||
| August 31, 2014 | |||
| Market | |||
| Value | |||
| Shares | ($000) | ||
| Kinder Morgan Inc. | 42,112 | 1,695 | |
| Noble Energy Inc. | 23,131 | 1,669 | |
| Marathon Petroleum Corp. | 16,115 | 1,467 | |
| * | Cheniere Energy Inc. | 15,235 | 1,223 |
| * | Concho Resources Inc. | 7,286 | 1,035 |
| * | Cameron International Corp. | 13,163 | 978 |
| EQT Corp. | 9,777 | 969 | |
| ONEOK Inc. | 13,320 | 935 | |
| * | Southwestern Energy Co. | 22,680 | 934 |
| * | FMC Technologies Inc. | 15,073 | 932 |
| Chesapeake Energy Corp. | 33,760 | 918 | |
| Cabot Oil & Gas Corp. | 26,784 | 898 | |
| Seadrill Ltd. | 22,543 | 840 | |
| Range Resources Corp. | 10,542 | 829 | |
| Cimarex Energy Co. | 5,582 | 810 | |
| Murphy Oil Corp. | 11,522 | 720 | |
| * | Whiting Petroleum Corp. | 7,616 | 706 |
| Helmerich & Payne Inc. | 6,179 | 649 | |
| HollyFrontier Corp. | 12,665 | 634 | |
| CONSOL Energy Inc. | 14,815 | 597 | |
| Tesoro Corp. | 8,296 | 537 | |
| Nabors Industries Ltd. | 19,028 | 518 | |
| Oceaneering International Inc. | 6,912 | 481 | |
| * | Continental Resources Inc. | 2,854 | 460 |
| QEP Resources Inc. | 11,439 | 407 | |
| * | Newfield Exploration Co. | 8,795 | 394 |
| Denbury Resources Inc. | 22,323 | 384 | |
| SM Energy Co. | 4,270 | 380 | |
| Superior Energy Services Inc. | 9,973 | 357 | |
| * | WPX Energy Inc. | 13,043 | 347 |
| * | Dresser-Rand Group Inc. | 4,926 | 341 |
| Targa Resources Corp. | 2,412 | 337 | |
| * | First Solar Inc. | 4,726 | 329 |
| * | Gulfport Energy Corp. | 5,558 | 325 |
| Patterson-UTI Energy Inc. | 9,318 | 322 | |
| * | Oasis Petroleum Inc. | 6,432 | 316 |
| * | Dril-Quip Inc. | 2,675 | 271 |
| * | Ultra Petroleum Corp. | 9,701 | 257 |
| Rowan Cos. plc Class A | 7,872 | 239 | |
| * | NOW Inc. | 6,908 | 228 |
| * | Unit Corp. | 3,205 | 211 |
| Golar LNG Ltd. | 3,330 | 210 | |
| World Fuel Services Corp. | 4,665 | 207 | |
| * | Atwood Oceanics Inc. | 4,134 | 204 |
| * | Oil States International Inc. | 3,044 | 197 |
| * | Antero Resources Corp. | 3,394 | 196 |
| * | Cobalt International Energy Inc. | 12,582 | 193 |
| * | SolarCity Corp. | 2,792 | 192 |
| *,^ | SandRidge Energy Inc. | 31,287 | 164 |
| * | Athlon Energy Inc. | 3,274 | 152 |
| PBF Energy Inc. Class A | 4,496 | 128 | |
| Peabody Energy Corp. | 7,715 | 123 | |
| * | Laredo Petroleum Inc. | 5,006 | 118 |
| * | SunPower Corp. Class A | 2,921 | 112 |
| * | Rice Energy Inc. | 3,264 | 96 |
| RPC Inc. | 4,090 | 93 | |
| * | Kosmos Energy Ltd. | 6,821 | 68 |
| Diamond Offshore Drilling Inc. | 1,344 | 59 | |
| * | Seventy Seven Energy Inc. | 2 | 56 |
| CVR Energy Inc. | 1,042 | 52 | |
| Frank's International NV | 2,281 | 46 | |
| * | EP Energy Corp. Class A | 2,226 | 43 |
| 128,620 | |||
5
| Vanguard® Russell 1000 Index Fund | ||
| Schedule of Investments | ||
| August 31, 2014 | ||
| Market | ||
| Value | ||
| Shares | ($000) | |
| Financial Services (18.2%) | ||
| * Berkshire Hathaway Inc. Class B | 117,244 | 16,092 |
| Wells Fargo & Co. | 305,834 | 15,732 |
| JPMorgan Chase & Co. | 242,390 | 14,410 |
| Bank of America Corp. | 673,425 | 10,835 |
| Citigroup Inc. | 194,614 | 10,052 |
| Visa Inc. Class A | 32,118 | 6,826 |
| American Express Co. | 58,115 | 5,204 |
| American International Group Inc. | 92,710 | 5,197 |
| Goldman Sachs Group Inc. | 28,699 | 5,140 |
| MasterCard Inc. Class A | 64,371 | 4,880 |
| US Bancorp | 110,052 | 4,653 |
| Simon Property Group Inc. | 19,910 | 3,385 |
| Morgan Stanley | 98,305 | 3,373 |
| MetLife Inc. | 59,952 | 3,282 |
| Capital One Financial Corp. | 36,653 | 3,008 |
| PNC Financial Services Group Inc. | 34,221 | 2,900 |
| Bank of New York Mellon Corp. | 73,114 | 2,865 |
| BlackRock Inc. | 8,169 | 2,700 |
| Prudential Financial Inc. | 29,537 | 2,649 |
| American Tower Corporation | 25,361 | 2,501 |
| ACE Ltd. | 21,687 | 2,306 |
| Travelers Cos. Inc. | 22,263 | 2,109 |
| Charles Schwab Corp. | 72,022 | 2,053 |
| State Street Corp. | 27,620 | 1,989 |
| Marsh & McLennan Cos. Inc. | 35,193 | 1,869 |
| Discover Financial Services | 29,878 | 1,864 |
| Aflac Inc. | 29,151 | 1,785 |
| BB&T Corp. | 45,986 | 1,717 |
| Allstate Corp. | 27,816 | 1,710 |
| Crown Castle International Corp. | 21,448 | 1,705 |
| Aon plc | 19,067 | 1,662 |
| Public Storage | 9,201 | 1,612 |
| CME Group Inc. | 20,429 | 1,564 |
| Equity Residential | 23,215 | 1,543 |
| Ameriprise Financial Inc. | 12,255 | 1,541 |
| Chubb Corp. | 15,664 | 1,440 |
| Franklin Resources Inc. | 25,468 | 1,439 |
| McGraw Hill Financial Inc. | 17,488 | 1,419 |
| Intercontinental Exchange Inc. | 7,474 | 1,413 |
| T. Rowe Price Group Inc. | 16,786 | 1,360 |
| Health Care REIT Inc. | 19,701 | 1,331 |
| Prologis Inc. | 32,105 | 1,314 |
| SunTrust Banks Inc. | 34,191 | 1,302 |
| AvalonBay Communities Inc. | 8,331 | 1,284 |
| HCP Inc. | 29,386 | 1,273 |
| Vornado Realty Trust | 12,013 | 1,272 |
| Ventas Inc. | 18,856 | 1,240 |
| Boston Properties Inc. | 9,881 | 1,200 |
| Weyerhaeuser Co. | 33,721 | 1,145 |
| Moody's Corp. | 12,180 | 1,140 |
| Invesco Ltd. | 27,623 | 1,128 |
| Fifth Third Bancorp | 54,560 | 1,113 |
| Host Hotels & Resorts Inc. | 48,487 | 1,106 |
| Hartford Financial Services Group Inc. | 28,712 | 1,064 |
| Fidelity National Information Services Inc. | 18,518 | 1,051 |
| Northern Trust Corp. | 15,149 | 1,051 |
| M&T Bank Corp. | 8,429 | 1,042 |
| * Fiserv Inc. | 16,017 | 1,033 |
| Principal Financial Group Inc. | 18,835 | 1,023 |
| Progressive Corp. | 37,780 | 945 |
| Lincoln National Corp. | 16,955 | 933 |
| * Alliance Data Systems Corp. | 3,468 | 918 |
| Loews Corp. | 20,807 | 910 |
6
| Vanguard® Russell 1000 Index Fund | ||
| Schedule of Investments | ||
| August 31, 2014 | ||
| Market | ||
| Value | ||
| Shares | ($000) | |
| General Growth Properties Inc. | 36,401 | 894 |
| Regions Financial Corp. | 88,037 | 894 |
| Thomson Reuters Corp. | 22,663 | 859 |
| Essex Property Trust Inc. | 4,030 | 780 |
| * FleetCor Technologies Inc. | 5,376 | 772 |
| KeyCorp | 56,390 | 767 |
| American Realty Capital Properties Inc. | 57,990 | 763 |
| * Affiliated Managers Group Inc. | 3,531 | 746 |
| SL Green Realty Corp. | 6,132 | 671 |
| Realty Income Corp. | 14,177 | 634 |
| Equifax Inc. | 7,892 | 622 |
| Kimco Realty Corp. | 26,422 | 621 |
| Western Union Co. | 34,409 | 601 |
| Unum Group | 16,558 | 601 |
| * Markel Corp. | 901 | 594 |
| CIT Group Inc. | 12,353 | 592 |
| XL Group plc Class A | 17,292 | 591 |
| Macerich Co. | 9,052 | 591 |
| Leucadia National Corp. | 23,618 | 589 |
| Comerica Inc. | 11,574 | 583 |
| Annaly Capital Management Inc. | 48,458 | 577 |
| * CBRE Group Inc. Class A | 18,076 | 574 |
| TD Ameritrade Holding Corp. | 17,175 | 569 |
| Digital Realty Trust Inc. | 8,687 | 567 |
| American Capital Agency Corp. | 22,763 | 538 |
| Federal Realty Investment Trust | 4,282 | 534 |
| Huntington Bancshares Inc. | 52,857 | 520 |
| Cincinnati Financial Corp. | 10,575 | 509 |
| * FNF Group | 17,793 | 504 |
| Everest Re Group Ltd. | 2,962 | 485 |
| Navient Corp. | 26,925 | 483 |
| UDR Inc. | 16,051 | 480 |
| * Arch Capital Group Ltd. | 8,552 | 475 |
| Arthur J Gallagher & Co. | 10,050 | 475 |
| Plum Creek Timber Co. Inc. | 11,420 | 464 |
| Torchmark Corp. | 8,482 | 463 |
| * Alleghany Corp. | 1,063 | 458 |
| New York Community Bancorp Inc. | 28,421 | 453 |
| * Genworth Financial Inc. Class A | 31,858 | 452 |
| Raymond James Financial Inc. | 8,054 | 440 |
| WP Carey Inc. | 6,434 | 439 |
| First Republic Bank | 8,856 | 433 |
| Lazard Ltd. Class A | 7,860 | 430 |
| * Ally Financial Inc. | 17,295 | 425 |
| * E*TRADE Financial Corp. | 18,575 | 413 |
| Camden Property Trust | 5,434 | 407 |
| * Howard Hughes Corp. | 2,553 | 404 |
| Duke Realty Corp. | 21,123 | 393 |
| * Signature Bank | 3,311 | 392 |
| Extra Space Storage Inc. | 7,428 | 391 |
| * Realogy Holdings Corp. | 9,420 | 384 |
| Jones Lang LaSalle Inc. | 2,831 | 378 |
| Reinsurance Group of America Inc. Class A | 4,431 | 368 |
| Alexandria Real Estate Equities Inc. | 4,631 | 366 |
| PartnerRe Ltd. | 3,262 | 364 |
| * SVB Financial Group | 3,252 | 362 |
| Voya Financial Inc. | 9,211 | 360 |
| DDR Corp. | 19,378 | 353 |
| Protective Life Corp. | 5,049 | 350 |
| FactSet Research Systems Inc. | 2,716 | 346 |
| Mid-America Apartment Communities Inc. | 4,770 | 345 |
| Zions Bancorporation | 11,767 | 343 |
| * MSCI Inc. Class A | 7,405 | 342 |
| Regency Centers Corp. | 5,944 | 340 |
7
| Vanguard® Russell 1000 Index Fund | ||
| Schedule of Investments | ||
| August 31, 2014 | ||
| Market | ||
| Value | ||
| Shares | ($000) | |
| Starwood Property Trust Inc. | 14,107 | 336 |
| Global Payments Inc. | 4,617 | 336 |
| Liberty Property Trust | 9,457 | 335 |
| Broadridge Financial Solutions Inc. | 7,861 | 334 |
| Total System Services Inc. | 10,624 | 334 |
| Kilroy Realty Corp. | 5,276 | 334 |
| Hudson City Bancorp Inc. | 33,721 | 333 |
| Axis Capital Holdings Ltd. | 6,861 | 331 |
| Legg Mason Inc. | 6,601 | 326 |
| NASDAQ OMX Group Inc. | 7,471 | 325 |
| Apartment Investment & Management Co. Class A | 9,434 | 323 |
| SEI Investments Co. | 8,450 | 320 |
| HCC Insurance Holdings Inc. | 6,357 | 319 |
| East West Bancorp Inc. | 9,107 | 317 |
| WR Berkley Corp. | 6,536 | 316 |
| Taubman Centers Inc. | 4,104 | 313 |
| Jack Henry & Associates Inc. | 5,373 | 311 |
| Assurant Inc. | 4,614 | 308 |
| Omega Healthcare Investors Inc. | 8,140 | 307 |
| Eaton Vance Corp. | 7,806 | 306 |
| Senior Housing Properties Trust | 13,007 | 303 |
| Spirit Realty Capital Inc. | 25,547 | 302 |
| CBOE Holdings Inc. | 5,654 | 300 |
| People's United Financial Inc. | 20,050 | 300 |
| Waddell & Reed Financial Inc. Class A | 5,442 | 297 |
| National Retail Properties Inc. | 7,941 | 295 |
| * Zillow Inc. Class A | 1,986 | 285 |
| American Financial Group Inc. | 4,663 | 280 |
| Hospitality Properties Trust | 9,501 | 280 |
| Rayonier Inc. | 8,149 | 279 |
| Assured Guaranty Ltd. | 11,540 | 279 |
| BioMed Realty Trust Inc. | 12,315 | 276 |
| Dun & Bradstreet Corp. | 2,347 | 275 |
| LPL Financial Holdings Inc. | 5,618 | 274 |
| PacWest Bancorp | 6,509 | 273 |
| RenaissanceRe Holdings Ltd. | 2,618 | 268 |
| Cullen/Frost Bankers Inc. | 3,410 | 268 |
| Corrections Corp. of America | 7,507 | 268 |
| Weingarten Realty Investors | 7,779 | 266 |
| Douglas Emmett Inc. | 9,257 | 264 |
| American Campus Communities Inc. | 6,668 | 263 |
| Old Republic International Corp. | 16,839 | 258 |
| White Mountains Insurance Group Ltd. | 402 | 255 |
| Brown & Brown Inc. | 7,796 | 254 |
| Two Harbors Investment Corp. | 23,578 | 253 |
| * Vantiv Inc. Class A | 8,015 | 251 |
| Equity Lifestyle Properties Inc. | 5,347 | 244 |
| Commerce Bancshares Inc. | 5,265 | 243 |
| Retail Properties of America Inc. | 15,198 | 240 |
| Home Properties Inc. | 3,733 | 240 |
| SLM Corp. | 26,904 | 238 |
| Allied World Assurance Co. Holdings AG | 6,317 | 234 |
| Validus Holdings Ltd. | 5,956 | 233 |
| City National Corp. | 3,066 | 233 |
| * Equity Commonwealth | 8,296 | 223 |
| * Forest City Enterprises Inc. Class A | 10,524 | 219 |
| NorthStar Realty Finance Corp. | 11,721 | 217 |
| * NorthStar Asset Management Group. Inc. | 11,721 | 217 |
| Chimera Investment Corp. | 65,182 | 216 |
| Synovus Financial Corp. | 8,830 | 213 |
| BankUnited Inc. | 6,566 | 207 |
| * Popular Inc. | 6,641 | 206 |
| Columbia Property Trust Inc. | 7,980 | 205 |
| CBL & Associates Properties Inc. | 10,750 | 204 |
8
| Vanguard® Russell 1000 Index Fund | ||
| Schedule of Investments | ||
| August 31, 2014 | ||
| Market | ||
| Value | ||
| Shares | ($000) | |
| Tanger Factory Outlet Centers Inc. | 5,747 | 201 |
| MFA Financial Inc. | 23,583 | 199 |
| Piedmont Office Realty Trust Inc. Class A | 10,090 | 197 |
| First Niagara Financial Group Inc. | 22,409 | 195 |
| Washington Prime Group Inc. | 9,905 | 193 |
| Post Properties Inc. | 3,504 | 193 |
| Healthcare Trust of America Inc. Class A | 15,170 | 189 |
| StanCorp Financial Group Inc. | 2,842 | 186 |
| First Horizon National Corp. | 15,167 | 184 |
| ProAssurance Corp. | 3,985 | 184 |
| Associated Banc-Corp | 10,088 | 183 |
| Federated Investors Inc. Class B | 5,953 | 183 |
| Hanover Insurance Group Inc. | 2,850 | 181 |
| Aspen Insurance Holdings Ltd. | 4,238 | 180 |
| Gaming and Leisure Properties Inc. | 5,317 | 177 |
| * CoreLogic Inc. | 6,142 | 174 |
| Endurance Specialty Holdings Ltd. | 2,884 | 167 |
| Bank of Hawaii Corp. | 2,874 | 167 |
| TCF Financial Corp. | 10,474 | 165 |
| Brandywine Realty Trust | 10,051 | 161 |
| American Homes 4 Rent Class A | 8,928 | 160 |
| Corporate Office Properties Trust | 5,493 | 156 |
| Fulton Financial Corp. | 12,344 | 142 |
| Erie Indemnity Co. Class A | 1,568 | 120 |
| BOK Financial Corp. | 1,770 | 119 |
| Santander Consumer USA Holdings Inc. | 5,621 | 105 |
| Artisan Partners Asset Management Inc. Class A | 1,805 | 100 |
| * MBIA Inc. | 9,046 | 94 |
| Mercury General Corp. | 1,783 | 91 |
| Morningstar Inc. | 1,277 | 88 |
| * FNFV Group | 5,844 | 88 |
| Interactive Brokers Group Inc. | 3,502 | 82 |
| Brixmor Property Group Inc. | 3,217 | 76 |
| * TFS Financial Corp. | 4,750 | 69 |
| CNA Financial Corp. | 1,663 | 64 |
| American National Insurance Co. | 500 | 57 |
| * Nationstar Mortgage Holdings Inc. | 1,455 | 51 |
| * Ocwen Financial Corp. | 1,357 | 38 |
| 241,536 | ||
| Health Care (13.1%) | ||
| Johnson & Johnson | 181,212 | 18,797 |
| Pfizer Inc. | 408,552 | 12,007 |
| Merck & Co. Inc. | 187,185 | 11,252 |
| * Gilead Sciences Inc. | 98,384 | 10,584 |
| Amgen Inc. | 48,511 | 6,762 |
| AbbVie Inc. | 101,879 | 5,632 |
| UnitedHealth Group Inc. | 62,833 | 5,446 |
| Bristol-Myers Squibb Co. | 106,158 | 5,377 |
| * Biogen Idec Inc. | 15,188 | 5,210 |
| * Celgene Corp. | 51,373 | 4,882 |
| Medtronic Inc. | 63,976 | 4,085 |
| Abbott Laboratories | 96,234 | 4,065 |
| Eli Lilly & Co. | 63,095 | 4,010 |
| * Actavis plc | 16,264 | 3,692 |
| * Express Scripts Holding Co. | 49,550 | 3,663 |
| Allergan Inc. | 19,117 | 3,129 |
| Thermo Fisher Scientific Inc. | 25,595 | 3,077 |
| McKesson Corp. | 14,841 | 2,894 |
| Baxter International Inc. | 34,825 | 2,611 |
| Covidien plc | 28,956 | 2,514 |
| * Alexion Pharmaceuticals Inc. | 12,749 | 2,158 |
| WellPoint Inc. | 17,965 | 2,093 |
| Aetna Inc. | 22,964 | 1,886 |
| Stryker Corp. | 21,561 | 1,796 |
9
| Vanguard® Russell 1000 Index Fund | ||
| Schedule of Investments | ||
| August 31, 2014 | ||
| Market | ||
| Value | ||
| Shares | ($000) | |
| * Regeneron Pharmaceuticals Inc. | 5,055 | 1,772 |
| Cigna Corp. | 17,270 | 1,634 |
| Cardinal Health Inc. | 21,842 | 1,610 |
| * Illumina Inc. | 8,206 | 1,472 |
| * HCA Holdings Inc. | 20,897 | 1,459 |
| Becton Dickinson and Co. | 12,407 | 1,454 |
| * Vertex Pharmaceuticals Inc. | 15,136 | 1,416 |
| Perrigo Co. plc | 8,639 | 1,285 |
| Humana Inc. | 9,943 | 1,280 |
| St. Jude Medical Inc. | 18,281 | 1,199 |
| * Mylan Inc./PA | 24,050 | 1,169 |
| Zoetis Inc. | 32,107 | 1,138 |
| AmerisourceBergen Corp. Class A | 14,539 | 1,125 |
| * Cerner Corp. | 19,171 | 1,105 |
| * Intuitive Surgical Inc. | 2,304 | 1,083 |
| * Boston Scientific Corp. | 84,880 | 1,076 |
| Zimmer Holdings Inc. | 10,821 | 1,075 |
| * DaVita HealthCare Partners Inc. | 11,468 | 856 |
| CR Bard Inc. | 4,930 | 732 |
| * Edwards Lifesciences Corp. | 6,770 | 672 |
| * BioMarin Pharmaceutical Inc. | 9,375 | 668 |
| * Henry Schein Inc. | 5,524 | 661 |
| Universal Health Services Inc. Class B | 5,723 | 655 |
| * Salix Pharmaceuticals Ltd. | 4,068 | 647 |
| * Jazz Pharmaceuticals plc | 3,891 | 634 |
| * Catamaran Corp. | 13,314 | 627 |
| * Endo International plc | 9,734 | 620 |
| * CareFusion Corp. | 13,329 | 612 |
| * Mallinckrodt plc | 7,301 | 595 |
| * Laboratory Corp. of America Holdings | 5,486 | 588 |
| Quest Diagnostics Inc. | 9,295 | 588 |
| * Hospira Inc. | 10,740 | 577 |
| * Varian Medical Systems Inc. | 6,626 | 563 |
| * Incyte Corp. | 9,264 | 502 |
| Cooper Cos. Inc. | 3,071 | 501 |
| * Pharmacyclics Inc. | 3,938 | 490 |
| ResMed Inc. | 8,933 | 474 |
| * Medivation Inc. | 4,911 | 448 |
| DENTSPLY International Inc. | 9,206 | 439 |
| * Alkermes plc | 9,309 | 416 |
| * IDEXX Laboratories Inc. | 3,329 | 413 |
| * Community Health Systems Inc. | 7,476 | 406 |
| Omnicare Inc. | 6,294 | 401 |
| * Tenet Healthcare Corp. | 6,348 | 388 |
| * Hologic Inc. | 15,250 | 379 |
| * United Therapeutics Corp. | 3,158 | 372 |
| * MEDNAX Inc. | 6,439 | 369 |
| * QIAGEN NV | 14,988 | 362 |
| * Brookdale Senior Living Inc. | 10,360 | 362 |
| * athenahealth Inc. | 2,420 | 350 |
| * Cubist Pharmaceuticals Inc. | 4,811 | 332 |
| PerkinElmer Inc. | 7,304 | 328 |
| * Covance Inc. | 3,697 | 307 |
| * Sirona Dental Systems Inc. | 3,697 | 301 |
| Teleflex Inc. | 2,746 | 301 |
| * Alnylam Pharmaceuticals Inc. | 4,244 | 296 |
| * Seattle Genetics Inc. | 6,581 | 290 |
| * Centene Corp. | 3,685 | 288 |
| * Align Technology Inc. | 5,211 | 284 |
| * Health Net Inc./CA | 5,115 | 241 |
| * Intercept Pharmaceuticals Inc. | 797 | 231 |
| * VCA Inc. | 5,596 | 228 |
| Techne Corp. | 2,385 | 228 |
| Patterson Cos. Inc. | 5,593 | 225 |
10
| Vanguard® Russell 1000 Index Fund | ||
| Schedule of Investments | ||
| August 31, 2014 | ||
| Market | ||
| Value | ||
| Shares | ($000) | |
| * LifePoint Hospitals Inc. | 2,865 | 214 |
| * Quintiles Transnational Holdings Inc. | 3,707 | 208 |
| * Alere Inc. | 5,381 | 191 |
| * Envision Healthcare Holdings Inc. | 5,212 | 191 |
| * Charles River Laboratories International Inc. | 3,102 | 183 |
| * Myriad Genetics Inc. | 4,732 | 171 |
| * Allscripts Healthcare Solutions Inc. | 11,309 | 167 |
| * Bio-Rad Laboratories Inc. Class A | 1,382 | 166 |
| Hill-Rom Holdings Inc. | 3,603 | 158 |
| * Bruker Corp. | 7,004 | 141 |
| * Veeva Systems Inc. Class A | 2,438 | 73 |
| * Premier Inc. Class A | 2,151 | 68 |
| 173,152 | ||
| Materials & Processing (4.3%) | ||
| Dow Chemical Co. | 77,188 | 4,133 |
| EI du Pont de Nemours & Co. | 58,884 | 3,893 |
| Monsanto Co. | 33,658 | 3,893 |
| LyondellBasell Industries NV Class A | 28,236 | 3,229 |
| Praxair Inc. | 18,834 | 2,478 |
| Freeport-McMoRan Inc. | 66,524 | 2,419 |
| Precision Castparts Corp. | 9,272 | 2,263 |
| Ecolab Inc. | 17,067 | 1,960 |
| PPG Industries Inc. | 8,854 | 1,823 |
| Air Products & Chemicals Inc. | 13,655 | 1,819 |
| International Paper Co. | 27,852 | 1,349 |
| Alcoa Inc. | 74,840 | 1,243 |
| Sherwin-Williams Co. | 5,520 | 1,204 |
| Nucor Corp. | 20,486 | 1,113 |
| Ingersoll-Rand plc | 17,347 | 1,044 |
| Mosaic Co. | 21,462 | 1,025 |
| Fastenal Co. | 19,096 | 865 |
| CF Industries Holdings Inc. | 3,337 | 860 |
| Eastman Chemical Co. | 9,671 | 798 |
| Sigma-Aldrich Corp. | 7,581 | 788 |
| Newmont Mining Corp. | 25,943 | 703 |
| Celanese Corp. Class A | 10,011 | 626 |
| Ball Corp. | 8,878 | 569 |
| FMC Corp. | 8,497 | 562 |
| Masco Corp. | 23,067 | 541 |
| Ashland Inc. | 5,033 | 540 |
| International Flavors & Fragrances Inc. | 5,303 | 539 |
| Airgas Inc. | 4,842 | 534 |
| Vulcan Materials Co. | 8,336 | 528 |
| Martin Marietta Materials Inc. | 3,929 | 515 |
| Sealed Air Corp. | 13,801 | 498 |
| * WR Grace & Co. | 4,890 | 484 |
| MeadWestvaco Corp. | 10,804 | 465 |
| Rock-Tenn Co. Class A | 9,292 | 457 |
| Valspar Corp. | 5,444 | 440 |
| Packaging Corp. of America | 6,345 | 431 |
| * Crown Holdings Inc. | 8,833 | 426 |
| RPM International Inc. | 8,539 | 402 |
| Rockwood Holdings Inc. | 4,648 | 376 |
| United States Steel Corp. | 9,356 | 362 |
| Huntsman Corp. | 12,879 | 346 |
| Reliance Steel & Aluminum Co. | 4,949 | 346 |
| Acuity Brands Inc. | 2,761 | 342 |
| Steel Dynamics Inc. | 14,399 | 335 |
| Eagle Materials Inc. | 3,251 | 331 |
| Royal Gold Inc. | 4,192 | 326 |
| Albemarle Corp. | 5,119 | 325 |
| * Owens-Illinois Inc. | 10,522 | 324 |
| Southern Copper Corp. | 9,300 | 305 |
| Allegheny Technologies Inc. | 7,063 | 298 |
11
| Vanguard® Russell 1000 Index Fund | ||
| Schedule of Investments | ||
| August 31, 2014 | ||
| Market | ||
| Value | ||
| Shares | ($000) | |
| Owens Corning | 7,659 | 276 |
| AptarGroup Inc. | 4,197 | 269 |
| Bemis Co. Inc. | 6,544 | 267 |
| Lennox International Inc. | 3,175 | 266 |
| Sonoco Products Co. | 6,449 | 265 |
| * Hexcel Corp. | 6,372 | 262 |
| Westlake Chemical Corp. | 2,621 | 255 |
| Valmont Industries Inc. | 1,763 | 248 |
| NewMarket Corp. | 586 | 238 |
| Cytec Industries Inc. | 2,300 | 237 |
| Timken Co. | 5,165 | 234 |
| Cabot Corp. | 4,143 | 227 |
| Compass Minerals International Inc. | 2,229 | 199 |
| Carpenter Technology Corp. | 3,434 | 188 |
| * USG Corp. | 5,948 | 172 |
| Scotts Miracle-Gro Co. Class A | 2,946 | 170 |
| * Armstrong World Industries Inc. | 2,922 | 169 |
| * MRC Global Inc. | 6,600 | 164 |
| Domtar Corp. | 4,287 | 160 |
| * Platform Specialty Products Corp. | 5,431 | 148 |
| Silgan Holdings Inc. | 2,866 | 144 |
| * Tahoe Resources Inc. | 5,420 | 139 |
| TimkenSteel Corp. | 2,582 | 123 |
| Greif Inc. Class A | 2,061 | 99 |
| * Rayonier Advanced Materials Inc. | 2,714 | 90 |
| * Veritiv Corp. | 529 | 24 |
| Cliffs Natural Resources Inc. | 1,128 | 17 |
| 56,525 | ||
| Other (0.0%) | ||
| * Synchrony Financial | 3,500 | 90 |
| Producer Durables (11.1%) | ||
| General Electric Co. | 642,169 | 16,684 |
| United Technologies Corp. | 58,741 | 6,343 |
| Union Pacific Corp. | 58,009 | 6,107 |
| 3M Co. | 41,944 | 6,040 |
| Boeing Co. | 46,786 | 5,932 |
| Honeywell International Inc. | 50,244 | 4,785 |
| United Parcel Service Inc. Class B | 45,350 | 4,414 |
| Caterpillar Inc. | 40,051 | 4,368 |
| Accenture plc Class A | 40,587 | 3,290 |
| Lockheed Martin Corp. | 17,395 | 3,027 |
| Danaher Corp. | 38,923 | 2,982 |
| Emerson Electric Co. | 45,005 | 2,881 |
| FedEx Corp. | 18,982 | 2,807 |
| Automatic Data Processing Inc. | 30,958 | 2,584 |
| General Dynamics Corp. | 19,569 | 2,412 |
| Delta Air Lines Inc. | 54,371 | 2,152 |
| Eaton Corp. plc | 30,577 | 2,135 |
| Norfolk Southern Corp. | 19,874 | 2,127 |
| CSX Corp. | 64,347 | 1,989 |
| Deere & Co. | 23,380 | 1,966 |
| Raytheon Co. | 20,059 | 1,932 |
| Illinois Tool Works Inc. | 21,875 | 1,930 |
| American Airlines Group Inc. | 46,199 | 1,798 |
| Northrop Grumman Corp. | 13,771 | 1,752 |
| Cummins Inc. | 11,816 | 1,715 |
| PACCAR Inc. | 22,755 | 1,429 |
| Southwest Airlines Co. | 44,376 | 1,420 |
| Waste Management Inc. | 29,917 | 1,405 |
| Tyco International Ltd. | 29,460 | 1,314 |
| Agilent Technologies Inc. | 21,398 | 1,223 |
| * United Continental Holdings Inc. | 23,897 | 1,138 |
| Parker-Hannifin Corp. | 9,619 | 1,111 |
12
| Vanguard® Russell 1000 Index Fund | ||
| Schedule of Investments | ||
| August 31, 2014 | ||
| Market | ||
| Value | ||
| Shares | ($000) | |
| Rockwell Automation Inc. | 8,894 | 1,037 |
| Xerox Corp. | 74,862 | 1,034 |
| Roper Industries Inc. | 6,426 | 967 |
| Dover Corp. | 10,683 | 939 |
| WW Grainger Inc. | 3,721 | 916 |
| Stanley Black & Decker Inc. | 10,006 | 916 |
| Paychex Inc. | 20,929 | 872 |
| Pentair plc | 12,362 | 841 |
| AMETEK Inc. | 15,762 | 834 |
| Kansas City Southern | 7,102 | 819 |
| Fluor Corp. | 10,265 | 758 |
| * United Rentals Inc. | 6,289 | 740 |
| * Verisk Analytics Inc. Class A | 10,692 | 686 |
| Textron Inc. | 17,920 | 681 |
| Rockwell Collins Inc. | 8,760 | 674 |
| Republic Services Inc. Class A | 17,091 | 672 |
| Flowserve Corp. | 8,794 | 667 |
| CH Robinson Worldwide Inc. | 9,510 | 649 |
| * Stericycle Inc. | 5,453 | 648 |
| TransDigm Group Inc. | 3,406 | 640 |
| * IHS Inc. Class A | 4,419 | 630 |
| L-3 Communications Holdings Inc. | 5,498 | 604 |
| Pall Corp. | 7,124 | 601 |
| * B/E Aerospace Inc. | 6,753 | 572 |
| * Waters Corp. | 5,491 | 568 |
| * Trimble Navigation Ltd. | 16,715 | 556 |
| Expeditors International of Washington Inc. | 12,578 | 519 |
| Wabtec Corp./DE | 6,205 | 517 |
| * Mettler-Toledo International Inc. | 1,862 | 504 |
| * Quanta Services Inc. | 13,578 | 493 |
| Trinity Industries Inc. | 9,858 | 477 |
| Snap-on Inc. | 3,792 | 474 |
| Hubbell Inc. Class B | 3,887 | 470 |
| * Jacobs Engineering Group Inc. | 8,563 | 462 |
| Towers Watson & Co. Class A | 4,184 | 459 |
| JB Hunt Transport Services Inc. | 5,853 | 442 |
| * Kirby Corp. | 3,681 | 439 |
| Robert Half International Inc. | 8,731 | 438 |
| Xylem Inc./NY | 11,680 | 435 |
| Cintas Corp. | 6,407 | 424 |
| ADT Corp. | 11,094 | 409 |
| Joy Global Inc. | 6,427 | 406 |
| Alaska Air Group Inc. | 8,735 | 405 |
| IDEX Corp. | 5,208 | 401 |
| Manpowergroup Inc. | 5,139 | 399 |
| Chicago Bridge & Iron Co. NV | 6,257 | 397 |
| Iron Mountain Inc. | 10,995 | 396 |
| Waste Connections Inc. | 8,028 | 394 |
| * Colfax Corp. | 6,140 | 391 |
| Donaldson Co. Inc. | 9,243 | 387 |
| Lincoln Electric Holdings Inc. | 5,135 | 365 |
| Pitney Bowes Inc. | 12,869 | 348 |
| Carlisle Cos. Inc. | 4,117 | 341 |
| Nordson Corp. | 4,093 | 332 |
| Huntington Ingalls Industries Inc. | 3,215 | 328 |
| * Genesee & Wyoming Inc. Class A | 3,335 | 328 |
| * Spirit Airlines Inc. | 4,644 | 327 |
| Allegion plc | 6,195 | 319 |
| * Middleby Corp. | 3,659 | 316 |
| Ryder System Inc. | 3,437 | 310 |
| * CoStar Group Inc. | 2,141 | 310 |
| FLIR Systems Inc. | 9,150 | 309 |
| Graco Inc. | 3,900 | 300 |
| * Spirit AeroSystems Holdings Inc. Class A | 7,755 | 297 |
13
| Vanguard® Russell 1000 Index Fund | ||
| Schedule of Investments | ||
| August 31, 2014 | ||
| Market | ||
| Value | ||
| Shares | ($000) | |
| Avery Dennison Corp. | 6,076 | 292 |
| AGCO Corp. | 5,943 | 290 |
| SPX Corp. | 2,782 | 289 |
| ITT Corp. | 5,887 | 282 |
| Oshkosh Corp. | 5,532 | 275 |
| MSC Industrial Direct Co. Inc. Class A | 3,041 | 274 |
| URS Corp. | 4,503 | 273 |
| * Old Dominion Freight Line Inc. | 3,993 | 266 |
| Copa Holdings SA Class A | 2,164 | 266 |
| Allison Transmission Holdings Inc. | 8,637 | 265 |
| Terex Corp. | 7,050 | 264 |
| Alliant Techsystems Inc. | 2,021 | 255 |
| * Zebra Technologies Corp. | 3,241 | 253 |
| Manitowoc Co. Inc. | 8,550 | 252 |
| Air Lease Corp. Class A | 6,547 | 248 |
| * Copart Inc. | 7,113 | 245 |
| * AECOM Technology Corp. | 6,436 | 244 |
| AO Smith Corp. | 4,941 | 242 |
| * WESCO International Inc. | 2,842 | 239 |
| * Clean Harbors Inc. | 3,913 | 237 |
| Triumph Group Inc. | 3,355 | 233 |
| Kennametal Inc. | 5,134 | 230 |
| Toro Co. | 3,705 | 228 |
| RR Donnelley & Sons Co. | 12,799 | 226 |
| Crane Co. | 3,191 | 222 |
| National Instruments Corp. | 6,457 | 214 |
| Regal-Beloit Corp. | 2,965 | 211 |
| Babcock & Wilcox Co. | 7,181 | 209 |
| Foster Wheeler AG | 6,366 | 208 |
| Lexmark International Inc. Class A | 4,081 | 206 |
| Exelis Inc. | 11,979 | 206 |
| Landstar System Inc. | 2,850 | 193 |
| GATX Corp. | 2,892 | 192 |
| * HD Supply Holdings Inc. | 6,789 | 189 |
| Con-way Inc. | 3,674 | 188 |
| * Genpact Ltd. | 10,692 | 186 |
| Teekay Corp. | 2,951 | 181 |
| Tidewater Inc. | 3,193 | 162 |
| Covanta Holding Corp. | 6,799 | 143 |
| * Navistar International Corp. | 3,475 | 131 |
| Rollins Inc. | 3,954 | 118 |
| Booz Allen Hamilton Holding Corp. Class A | 4,845 | 107 |
| KBR Inc. | 2,554 | 56 |
| 147,271 | ||
| Technology (16.3%) | ||
| Apple Inc. | 386,124 | 39,578 |
| Microsoft Corp. | 528,981 | 24,032 |
| International Business Machines Corp. | 60,664 | 11,666 |
| Intel Corp. | 318,853 | 11,134 |
| * Google Inc. Class A | 17,978 | 10,470 |
| * Google Inc. Class C | 18,194 | 10,400 |
| * Facebook Inc. Class A | 126,503 | 9,465 |
| Oracle Corp. | 210,361 | 8,736 |
| QUALCOMM Inc. | 108,174 | 8,232 |
| Cisco Systems Inc. | 328,131 | 8,200 |
| Hewlett-Packard Co. | 121,364 | 4,612 |
| EMC Corp./MA | 131,171 | 3,873 |
| Texas Instruments Inc. | 69,166 | 3,332 |
| * Yahoo! Inc. | 64,524 | 2,485 |
| * salesforce.com inc | 39,339 | 2,325 |
| * Adobe Systems Inc. | 31,938 | 2,296 |
| * Micron Technology Inc. | 68,614 | 2,237 |
| Applied Materials Inc. | 78,022 | 1,803 |
| * Cognizant Technology Solutions Corp. Class A | 38,902 | 1,779 |
14
| Vanguard® Russell 1000 Index Fund | |||
| Schedule of Investments | |||
| August 31, 2014 | |||
| Market | |||
| Value | |||
| Shares | ($000) | ||
| Corning Inc. | 83,853 | 1,749 | |
| * | Twitter Inc. | 30,637 | 1,524 |
| Intuit Inc. | 18,206 | 1,514 | |
| * | LinkedIn Corp. Class A | 6,690 | 1,510 |
| Western Digital Corp. | 14,315 | 1,475 | |
| SanDisk Corp. | 14,521 | 1,422 | |
| Broadcom Corp. Class A | 34,268 | 1,349 | |
| Avago Technologies Ltd. Class A | 16,084 | 1,320 | |
| Symantec Corp. | 44,410 | 1,078 | |
| Amphenol Corp. Class A | 10,100 | 1,040 | |
| Analog Devices Inc. | 20,122 | 1,029 | |
| * | SBA Communications Corp. Class A | 8,314 | 917 |
| NetApp Inc. | 21,143 | 891 | |
| Motorola Solutions Inc. | 14,401 | 855 | |
| KLA-Tencor Corp. | 10,706 | 818 | |
| * | Autodesk Inc. | 14,583 | 782 |
| * | Electronic Arts Inc. | 20,185 | 764 |
| Lam Research Corp. | 10,452 | 752 | |
| Activision Blizzard Inc. | 31,662 | 745 | |
| * | Citrix Systems Inc. | 10,582 | 744 |
| * | Red Hat Inc. | 12,147 | 740 |
| Xilinx Inc. | 17,104 | 723 | |
| Juniper Networks Inc. | 30,535 | 708 | |
| Altera Corp. | 19,975 | 706 | |
| * | Equinix Inc. | 3,215 | 702 |
| NVIDIA Corp. | 35,612 | 693 | |
| * | Akamai Technologies Inc. | 11,449 | 692 |
| Skyworks Solutions Inc. | 12,147 | 688 | |
| Linear Technology Corp. | 15,161 | 684 | |
| Microchip Technology Inc. | 12,841 | 627 | |
| * | F5 Networks Inc. | 4,864 | 604 |
| CA Inc. | 20,404 | 576 | |
| * | ServiceNow Inc. | 9,223 | 564 |
| Maxim Integrated Products Inc. | 18,034 | 557 | |
| Computer Sciences Corp. | 9,311 | 557 | |
| * | VMware Inc. Class A | 5,626 | 555 |
| * | Workday Inc. Class A | 6,001 | 547 |
| Harris Corp. | 6,911 | 493 | |
| * | ANSYS Inc. | 5,967 | 485 |
| Amdocs Ltd. | 10,296 | 485 | |
| * | Teradata Corp. | 10,058 | 459 |
| * | VeriSign Inc. | 7,798 | 445 |
| * | Gartner Inc. | 5,756 | 429 |
| * | Splunk Inc. | 7,578 | 409 |
| * | Synopsys Inc. | 9,851 | 403 |
| * | Arrow Electronics Inc. | 6,471 | 403 |
| Avnet Inc. | 8,863 | 395 | |
| * | Stratasys Ltd. | 3,201 | 384 |
| *,^ | 3D Systems Corp. | 7,107 | 380 |
| * | SunEdison Inc. | 17,102 | 377 |
| * | NCR Corp. | 10,762 | 368 |
| Marvell Technology Group Ltd. | 25,947 | 361 | |
| * | Cree Inc. | 7,823 | 356 |
| IAC/InterActiveCorp | 4,796 | 334 | |
| * | Cadence Design Systems Inc. | 18,627 | 329 |
| * | MICROS Systems Inc. | 4,772 | 324 |
| * | Concur Technologies Inc. | 3,043 | 305 |
| Brocade Communications Systems Inc. | 28,603 | 302 | |
| * | PTC Inc. | 7,577 | 293 |
| * | Ingram Micro Inc. | 9,985 | 288 |
| * | Palo Alto Networks Inc. | 3,383 | 288 |
| * | Nuance Communications Inc. | 16,869 | 287 |
| * | ON Semiconductor Corp. | 28,531 | 278 |
| Jabil Circuit Inc. | 12,866 | 278 | |
15
| Vanguard® Russell 1000 Index Fund | ||
| Schedule of Investments | ||
| August 31, 2014 | ||
| Market | ||
| Value | ||
| Shares | ($000) | |
| * Yelp Inc. Class A | 3,243 | 267 |
| Solera Holdings Inc. | 4,374 | 267 |
| Teradyne Inc. | 12,531 | 258 |
| * VeriFone Systems Inc. | 7,186 | 251 |
| * ARRIS Group Inc. | 8,032 | 246 |
| * Atmel Corp. | 27,145 | 241 |
| * Informatica Corp. | 7,043 | 240 |
| * NetSuite Inc. | 2,681 | 235 |
| * Fortinet Inc. | 8,648 | 223 |
| * AOL Inc. | 5,133 | 222 |
| * TIBCO Software Inc. | 10,431 | 217 |
| * Riverbed Technology Inc. | 10,365 | 195 |
| DST Systems Inc. | 2,006 | 186 |
| CDW Corp./DE | 5,618 | 186 |
| * Knowles Corp. | 5,541 | 182 |
| * SolarWinds Inc. | 4,203 | 180 |
| * JDS Uniphase Corp. | 14,706 | 170 |
| * Advanced Micro Devices Inc. | 39,594 | 165 |
| * Tech Data Corp. | 2,401 | 162 |
| * Tableau Software Inc. Class A | 2,448 | 160 |
| Leidos Holdings Inc. | 4,244 | 160 |
| Diebold Inc. | 4,135 | 157 |
| * IPG Photonics Corp. | 2,176 | 149 |
| * Dolby Laboratories Inc. Class A | 3,161 | 147 |
| * EchoStar Corp. Class A | 2,843 | 143 |
| * Freescale Semiconductor Ltd. | 6,754 | 142 |
| Vishay Intertechnology Inc. | 8,697 | 139 |
| * IMS Health Holdings Inc. | 4,775 | 133 |
| * Rovi Corp. | 5,685 | 132 |
| * Rackspace Hosting Inc. | 3,160 | 109 |
| * CommScope Holding Co. Inc. | 4,042 | 104 |
| * FireEye Inc. | 3,046 | 95 |
| * Zynga Inc. Class A | 21,173 | 61 |
| Sabre Corp. | 2,886 | 53 |
| * Groupon Inc. Class A | 7,049 | 48 |
| AVX Corp. | 3,099 | 43 |
| 215,862 | ||
| Utilities (5.2%) | ||
| Verizon Communications Inc. | 265,258 | 13,215 |
| AT&T Inc. | 332,460 | 11,623 |
| Duke Energy Corp. | 45,314 | 3,353 |
| NextEra Energy Inc. | 28,016 | 2,758 |
| Dominion Resources Inc./VA | 37,338 | 2,622 |
| Southern Co. | 57,164 | 2,538 |
| Exelon Corp. | 55,007 | 1,838 |
| American Electric Power Co. Inc. | 31,292 | 1,680 |
| Sempra Energy | 15,759 | 1,670 |
| CenturyLink Inc. | 36,770 | 1,507 |
| PPL Corp. | 40,539 | 1,404 |
| PG&E Corp. | 29,878 | 1,389 |
| Edison International | 20,804 | 1,230 |
| Public Service Enterprise Group Inc. | 32,298 | 1,208 |
| Consolidated Edison Inc. | 18,793 | 1,088 |
| Xcel Energy Inc. | 32,118 | 1,029 |
| Northeast Utilities | 20,340 | 933 |
| FirstEnergy Corp. | 26,953 | 923 |
| DTE Energy Co. | 11,430 | 894 |
| Entergy Corp. | 11,527 | 892 |
| NiSource Inc. | 20,149 | 799 |
| AES Corp./VA | 46,401 | 704 |
| CenterPoint Energy Inc. | 27,700 | 688 |
| NRG Energy Inc. | 21,630 | 666 |
| Wisconsin Energy Corp. | 14,369 | 651 |
| * Calpine Corp. | 27,131 | 645 |
16
| Vanguard® Russell 1000 Index Fund | |||||
| Schedule of Investments | |||||
| August 31, 2014 | |||||
| Market | |||||
| Value | |||||
| Shares | ($000) | ||||
| Ameren Corp. | 15,653 | 626 | |||
| American Water Works Co. Inc. | 11,543 | 584 | |||
| CMS Energy Corp. | 17,332 | 529 | |||
| * | Level 3 Communications Inc. | 11,525 | 518 | ||
| * | T-Mobile US Inc. | 17,033 | 512 | ||
| OGE Energy Corp. | 12,726 | 478 | |||
| SCANA Corp. | 9,098 | 473 | |||
| Pepco Holdings Inc. | 16,135 | 445 | |||
| Windstream Holdings Inc. | 38,668 | 437 | |||
| Frontier Communications Corp. | 63,645 | 433 | |||
| Alliant Energy Corp. | 7,158 | 419 | |||
| National Fuel Gas Co. | 5,424 | 415 | |||
| AGL Resources Inc. | 7,577 | 404 | |||
| Pinnacle West Capital Corp. | 7,072 | 403 | |||
| UGI Corp. | 7,459 | 395 | |||
| MDU Resources Group Inc. | 12,310 | 385 | |||
| Energen Corp. | 4,697 | 378 | |||
| ITC Holdings Corp. | 10,029 | 375 | |||
| * | tw telecom inc Class A | 8,932 | 367 | ||
| Integrys Energy Group Inc. | 5,148 | 350 | |||
| Atmos Energy Corp. | 6,371 | 322 | |||
| Westar Energy Inc. Class A | 8,178 | 302 | |||
| Aqua America Inc. | 11,209 | 280 | |||
| TECO Energy Inc. | 14,990 | 271 | |||
| Questar Corp. | 11,137 | 262 | |||
| * | Sprint Corp. | 46,465 | 261 | ||
| Great Plains Energy Inc. | 9,774 | 251 | |||
| Vectren Corp. | 5,280 | 218 | |||
| ^ | Hawaiian Electric Industries Inc. | 6,579 | 167 | ||
| Telephone & Data Systems Inc. | 5,472 | 144 | |||
| * | United States Cellular Corp. | 932 | 35 | ||
| 69,386 | |||||
| Total Common Stocks (Cost $998,158) | 1,316,091 | ||||
| Coupon | |||||
| Temporary Cash Investments (0.4%)1 | |||||
| Money Market Fund (0.4%) | |||||
| 2,3 | Vanguard Market Liquidity Fund | 0.113% | 5,265,000 | 5,265 | |
| Face | |||||
| Maturity | Amount | ||||
| Date | ($000) | ||||
| U.S. Government and Agency Obligations (0.0%) | |||||
| 4,5 | Federal Home Loan Bank Discount Notes | 0.100% | 2/4/15 | 600 | 600 |
| Total Temporary Cash Investments (Cost $5,865) | 5,865 | ||||
| Total Investments (99.8%) (Cost $1,004,023) | 1,321,956 | ||||
| Other Assets and Liabilities—Net (0.2%)3 | 2,285 | ||||
| Net Assets (100%) | 1,324,241 | ||||
* Non-income-producing security.
^ Includes partial security positions on loan to broker-dealers. The total value of securities on loan is $252,000.
1 The fund invests a portion of its cash reserves in equity markets through the use of index futures contracts. After giving effect to futures investments, the fund's effective common stock and temporary cash investment positions represent 100.0% and -0.2%, respectively, of net assets.
2 Affiliated money market fund available only to Vanguard funds and certain trusts and accounts managed by Vanguard. Rate shown is the 7-day yield.
3 Includes $264,000 of collateral received for securities on loan.
17
Vanguard® Russell 1000 Index Fund
Schedule of Investments
August 31, 2014
4 The issuer operates under a congressional charter; its securities are generally neither guaranteed by the U.S. Treasury nor backed by the full faith and credit of the U.S. government.
5 Securities with a value of $400,000 have been segregated as initial margin for open futures contracts.
REIT—Real Estate Investment Trust.
18
| Vanguard® Russell 1000 Value Index Fund | ||
| Schedule of Investments | ||
| August 31, 2014 | ||
| Market | ||
| Value | ||
| Shares | ($000) | |
| Common Stocks (99.8%)1 | ||
| Consumer Discretionary (7.5%) | ||
| Wal-Mart Stores Inc. | 211,702 | 15,984 |
| Time Warner Inc. | 130,561 | 10,057 |
| Ford Motor Co. | 574,792 | 10,007 |
| General Motors Co. | 237,538 | 8,266 |
| Target Corp. | 84,063 | 5,050 |
| Walt Disney Co. | 41,470 | 3,727 |
| Johnson Controls Inc. | 71,927 | 3,511 |
| Twenty-First Century Fox Inc. Class A | 73,924 | 2,618 |
| Carnival Corp. | 62,696 | 2,375 |
| Kohl's Corp. | 29,335 | 1,725 |
| * TRW Automotive Holdings Corp. | 16,481 | 1,587 |
| Whirlpool Corp. | 10,347 | 1,583 |
| Royal Caribbean Cruises Ltd. | 24,408 | 1,556 |
| L Brands Inc. | 23,296 | 1,487 |
| * Liberty Media Corp. | 28,188 | 1,366 |
| Starwood Hotels & Resorts Worldwide Inc. | 15,821 | 1,338 |
| * Mohawk Industries Inc. | 9,147 | 1,336 |
| * News Corp. Class A | 74,158 | 1,307 |
| * MGM Resorts International | 51,067 | 1,250 |
| Comcast Corp. Class A | 21,579 | 1,181 |
| Gannett Co. Inc. | 34,009 | 1,148 |
| * Bed Bath & Beyond Inc. | 17,671 | 1,136 |
| Mattel Inc. | 32,474 | 1,120 |
| Staples Inc. | 94,312 | 1,102 |
| * Liberty Interactive Corp. Class A | 36,806 | 1,087 |
| PulteGroup Inc. | 55,230 | 1,062 |
| Foot Locker Inc. | 18,708 | 1,050 |
| Garmin Ltd. | 17,930 | 974 |
| Lennar Corp. Class A | 24,776 | 971 |
| Best Buy Co. Inc. | 30,139 | 961 |
| * Toll Brothers Inc. | 26,745 | 952 |
| DR Horton Inc. | 43,211 | 937 |
| Darden Restaurants Inc. | 19,387 | 917 |
| * Jarden Corp. | 13,064 | 781 |
| Macy's Inc. | 12,431 | 774 |
| * Liberty Media Corp. Class A | 14,094 | 694 |
| * Dollar General Corp. | 10,809 | 692 |
| GameStop Corp. Class A | 15,779 | 666 |
| * Visteon Corp. | 6,460 | 654 |
| Comcast Corp. | 11,200 | 612 |
| Fortune Brands Home & Security Inc. | 14,109 | 610 |
| International Game Technology | 36,026 | 607 |
| * Madison Square Garden Co. Class A | 9,008 | 602 |
| CBS Outdoor Americas Inc. | 16,418 | 564 |
| Newell Rubbermaid Inc. | 16,353 | 548 |
| * DISH Network Corp. Class A | 8,306 | 538 |
| Avon Products Inc. | 37,515 | 527 |
| Dick's Sporting Goods Inc. | 11,646 | 525 |
| * CarMax Inc. | 9,998 | 524 |
| Nielsen NV | 10,351 | 486 |
| * JC Penney Co. Inc. | 44,538 | 481 |
| Costco Wholesale Corp. | 3,720 | 450 |
| CBS Corp. Class B | 7,257 | 430 |
| Signet Jewelers Ltd. | 3,649 | 430 |
| DeVry Education Group Inc. | 9,770 | 419 |
| * Apollo Education Group Inc. | 14,627 | 406 |
| * Cabela's Inc. | 6,455 | 394 |
| John Wiley & Sons Inc. Class A | 6,517 | 391 |
| Abercrombie & Fitch Co. | 9,028 | 377 |
| KAR Auction Services Inc. | 12,277 | 370 |
| Graham Holdings Co. Class B | 511 | 367 |
19
| Vanguard® Russell 1000 Value Index Fund | ||
| Schedule of Investments | ||
| August 31, 2014 | ||
| Market | ||
| Value | ||
| Shares | ($000) | |
| Ralph Lauren Corp. Class A | 2,133 | 361 |
| Leggett & Platt Inc. | 10,231 | 359 |
| * Hyatt Hotels Corp. Class A | 5,701 | 348 |
| DSW Inc. Class A | 11,045 | 342 |
| * Ascena Retail Group Inc. | 19,007 | 331 |
| Wendy's Co. | 40,412 | 329 |
| Big Lots Inc. | 6,364 | 295 |
| Marriott International Inc. Class A | 4,182 | 290 |
| Gentex Corp. | 8,942 | 264 |
| Choice Hotels International Inc. | 4,818 | 261 |
| Lear Corp. | 2,275 | 230 |
| * DreamWorks Animation SKG Inc. Class A | 10,484 | 229 |
| * Live Nation Entertainment Inc. | 10,369 | 228 |
| * Murphy USA Inc. | 3,879 | 211 |
| Chico's FAS Inc. | 12,606 | 199 |
| Aaron's Inc. | 7,680 | 197 |
| PVH Corp. | 1,587 | 185 |
| Regal Entertainment Group Class A | 8,504 | 179 |
| * Urban Outfitters Inc. | 4,337 | 173 |
| * Sally Beauty Holdings Inc. | 6,120 | 171 |
| Service Corp. International | 7,619 | 169 |
| Penske Automotive Group Inc. | 3,452 | 166 |
| AMERCO | 528 | 147 |
| Dillard's Inc. Class A | 1,167 | 133 |
| Genuine Parts Co. | 1,519 | 133 |
| Hasbro Inc. | 2,525 | 133 |
| * Taylor Morrison Home Corp. Class A | 4,757 | 94 |
| CST Brands Inc. | 2,098 | 73 |
| Family Dollar Stores Inc. | 793 | 63 |
| * Starz | 1,707 | 53 |
| Coty Inc. Class A | 2,558 | 44 |
| * Norwegian Cruise Line Holdings Ltd. | 1,043 | 35 |
| * HomeAway Inc. | 1,024 | 34 |
| * Sears Holdings Corp. | 843 | 29 |
| Clear Channel Outdoor Holdings Inc. Class A | 3,298 | 23 |
| Aramark | 772 | 20 |
| 112,178 | ||
| Consumer Staples (5.8%) | ||
| Procter & Gamble Co. | 377,485 | 31,373 |
| CVS Caremark Corp. | 148,466 | 11,796 |
| Mondelez International Inc. Class A | 250,553 | 9,068 |
| Philip Morris International Inc. | 96,255 | 8,238 |
| Archer-Daniels-Midland Co. | 87,107 | 4,343 |
| Walgreen Co. | 35,080 | 2,123 |
| Sysco Corp. | 54,153 | 2,049 |
| ConAgra Foods Inc. | 62,594 | 2,016 |
| Bunge Ltd. | 21,725 | 1,839 |
| JM Smucker Co. | 15,452 | 1,585 |
| Tyson Foods Inc. Class A | 40,250 | 1,532 |
| Molson Coors Brewing Co. Class B | 20,314 | 1,502 |
| Whole Foods Market Inc. | 31,096 | 1,217 |
| Safeway Inc. | 33,653 | 1,170 |
| Energizer Holdings Inc. | 9,085 | 1,104 |
| Kimberly-Clark Corp. | 9,486 | 1,024 |
| Colgate-Palmolive Co. | 14,154 | 916 |
| Ingredion Inc. | 9,578 | 764 |
| Altria Group Inc. | 15,644 | 674 |
| Reynolds American Inc. | 11,103 | 649 |
| Campbell Soup Co. | 8,471 | 380 |
| * Rite Aid Corp. | 47,099 | 293 |
| Clorox Co. | 3,135 | 278 |
| Pinnacle Foods Inc. | 8,014 | 259 |
| * Pilgrim's Pride Corp. | 8,014 | 239 |
| Kellogg Co. | 3,486 | 226 |
20
| Vanguard® Russell 1000 Value Index Fund | |||
| Schedule of Investments | |||
| August 31, 2014 | |||
| Market | |||
| Value | |||
| Shares | ($000) | ||
| * | Constellation Brands Inc. Class A | 1,678 | 146 |
| * | Hain Celestial Group Inc. | 616 | 61 |
| 86,864 | |||
| Energy (13.6%) | |||
| Exxon Mobil Corp. | 635,250 | 63,182 | |
| Chevron Corp. | 281,465 | 36,436 | |
| ConocoPhillips | 181,642 | 14,753 | |
| Occidental Petroleum Corp. | 116,289 | 12,063 | |
| Anadarko Petroleum Corp. | 69,414 | 7,822 | |
| Apache Corp. | 56,917 | 5,796 | |
| National Oilwell Varco Inc. | 57,963 | 5,010 | |
| Devon Energy Corp. | 60,238 | 4,543 | |
| Phillips 66 | 49,340 | 4,294 | |
| Marathon Oil Corp. | 99,780 | 4,160 | |
| Hess Corp. | 41,114 | 4,157 | |
| Spectra Energy Corp. | 99,027 | 4,125 | |
| Baker Hughes Inc. | 58,991 | 4,079 | |
| Valero Energy Corp. | 59,937 | 3,245 | |
| Kinder Morgan Inc. | 70,271 | 2,829 | |
| Murphy Oil Corp. | 26,428 | 1,651 | |
| Cimarex Energy Co. | 11,280 | 1,637 | |
| Chesapeake Energy Corp. | 60,101 | 1,635 | |
| * | Whiting Petroleum Corp. | 15,915 | 1,475 |
| Seadrill Ltd. | 37,023 | 1,379 | |
| CONSOL Energy Inc. | 33,817 | 1,362 | |
| HollyFrontier Corp. | 24,196 | 1,211 | |
| Noble Energy Inc. | 15,471 | 1,116 | |
| Nabors Industries Ltd. | 40,091 | 1,091 | |
| ONEOK Inc. | 14,286 | 1,003 | |
| * | Newfield Exploration Co. | 20,353 | 912 |
| Denbury Resources Inc. | 51,259 | 883 | |
| Marathon Petroleum Corp. | 9,671 | 880 | |
| QEP Resources Inc. | 23,432 | 833 | |
| * | Cameron International Corp. | 11,159 | 829 |
| * | WPX Energy Inc. | 30,505 | 812 |
| Superior Energy Services Inc. | 21,203 | 760 | |
| * | First Solar Inc. | 10,696 | 745 |
| Tesoro Corp. | 10,691 | 692 | |
| Peabody Energy Corp. | 41,093 | 653 | |
| Rowan Cos. plc Class A | 18,848 | 571 | |
| Golar LNG Ltd. | 7,572 | 477 | |
| Helmerich & Payne Inc. | 4,529 | 476 | |
| * | NOW Inc. | 14,252 | 471 |
| Diamond Offshore Drilling Inc. | 10,223 | 449 | |
| * | Unit Corp. | 6,754 | 444 |
| * | Oil States International Inc. | 6,836 | 441 |
| * | Ultra Petroleum Corp. | 16,304 | 433 |
| *,^ | SandRidge Energy Inc. | 71,661 | 376 |
| * | Atwood Oceanics Inc. | 7,369 | 364 |
| World Fuel Services Corp. | 8,160 | 362 | |
| Patterson-UTI Energy Inc. | 10,263 | 354 | |
| * | SunPower Corp. Class A | 6,066 | 232 |
| EQT Corp. | 2,202 | 218 | |
| PBF Energy Inc. Class A | 6,978 | 198 | |
| * | Gulfport Energy Corp. | 2,427 | 142 |
| * | Seventy Seven Energy, Inc. | 4,222 | 99 |
| * | EP Energy Corp. Class A | 4,899 | 95 |
| Frank's International NV | 4,423 | 89 | |
| * | Cobalt International Energy Inc. | 4,766 | 73 |
| CVR Energy Inc. | 1,342 | 67 | |
| * | Laredo Petroleum Inc. | 1,485 | 35 |
| * | Rice Energy Inc. | 422 | 12 |
| 204,531 | |||
21
| Vanguard® Russell 1000 Value Index Fund | ||
| Schedule of Investments | ||
| August 31, 2014 | ||
| Market | ||
| Value | ||
| Shares | ($000) | |
| Financial Services (29.1%) | ||
| * Berkshire Hathaway Inc. Class B | 270,570 | 37,136 |
| Wells Fargo & Co. | 706,456 | 36,340 |
| JPMorgan Chase & Co. | 559,898 | 33,286 |
| Bank of America Corp. | 1,555,487 | 25,028 |
| Citigroup Inc. | 449,342 | 23,209 |
| American International Group Inc. | 214,055 | 12,000 |
| Goldman Sachs Group Inc. | 66,154 | 11,849 |
| US Bancorp | 254,341 | 10,754 |
| Morgan Stanley | 227,252 | 7,797 |
| MetLife Inc. | 138,152 | 7,562 |
| Capital One Financial Corp. | 84,736 | 6,953 |
| PNC Financial Services Group Inc. | 78,898 | 6,687 |
| Bank of New York Mellon Corp. | 169,086 | 6,625 |
| Prudential Financial Inc. | 67,898 | 6,090 |
| ACE Ltd. | 50,025 | 5,319 |
| Travelers Cos. Inc. | 51,338 | 4,862 |
| State Street Corp. | 63,571 | 4,579 |
| Discover Financial Services | 68,845 | 4,294 |
| Aflac Inc. | 67,014 | 4,104 |
| BB&T Corp. | 106,089 | 3,960 |
| Charles Schwab Corp. | 138,587 | 3,951 |
| Allstate Corp. | 64,034 | 3,937 |
| BlackRock Inc. | 11,636 | 3,846 |
| CME Group Inc. | 47,114 | 3,607 |
| Equity Residential | 53,363 | 3,547 |
| Chubb Corp. | 36,095 | 3,319 |
| Prologis Inc. | 73,754 | 3,019 |
| SunTrust Banks Inc. | 78,633 | 2,994 |
| HCP Inc. | 68,145 | 2,953 |
| AvalonBay Communities Inc. | 19,111 | 2,945 |
| Fifth Third Bancorp | 125,541 | 2,562 |
| Host Hotels & Resorts Inc. | 111,742 | 2,550 |
| Hartford Financial Services Group Inc. | 66,430 | 2,461 |
| Boston Properties Inc. | 19,963 | 2,424 |
| Northern Trust Corp. | 34,908 | 2,421 |
| M&T Bank Corp. | 19,408 | 2,399 |
| Principal Financial Group Inc. | 43,835 | 2,380 |
| Weyerhaeuser Co. | 69,390 | 2,356 |
| Ameriprise Financial Inc. | 18,250 | 2,295 |
| Vornado Realty Trust | 21,457 | 2,272 |
| Invesco Ltd. | 54,235 | 2,215 |
| Progressive Corp. | 87,554 | 2,191 |
| Lincoln National Corp. | 39,044 | 2,149 |
| Fidelity National Information Services Inc. | 37,307 | 2,117 |
| Loews Corp. | 48,205 | 2,108 |
| Regions Financial Corp. | 204,027 | 2,071 |
| General Growth Properties Inc. | 83,771 | 2,058 |
| Thomson Reuters Corp. | 52,652 | 1,996 |
| Simon Property Group Inc. | 11,577 | 1,968 |
| Intercontinental Exchange Inc. | 9,719 | 1,837 |
| Essex Property Trust Inc. | 9,286 | 1,796 |
| KeyCorp | 130,918 | 1,782 |
| American Realty Capital Properties Inc. | 134,844 | 1,775 |
| Annaly Capital Management Inc. | 139,814 | 1,664 |
| SL Green Realty Corp. | 14,254 | 1,559 |
| Ventas Inc. | 23,109 | 1,520 |
| Realty Income Corp. | 33,067 | 1,479 |
| Health Care REIT Inc. | 21,436 | 1,449 |
| Kimco Realty Corp. | 60,633 | 1,424 |
| Marsh & McLennan Cos. Inc. | 26,709 | 1,418 |
| Unum Group | 38,364 | 1,391 |
| CIT Group Inc. | 28,879 | 1,385 |
| XL Group plc Class A | 40,496 | 1,384 |
22
| Vanguard® Russell 1000 Value Index Fund | ||
| Schedule of Investments | ||
| August 31, 2014 | ||
| Market | ||
| Value | ||
| Shares | ($000) | |
| * Markel Corp. | 2,093 | 1,381 |
| Macerich Co. | 20,898 | 1,364 |
| Comerica Inc. | 27,096 | 1,364 |
| Digital Realty Trust Inc. | 20,253 | 1,322 |
| American Capital Agency Corp. | 51,740 | 1,224 |
| Huntington Bancshares Inc. | 123,679 | 1,218 |
| Cincinnati Financial Corp. | 24,530 | 1,180 |
| Leucadia National Corp. | 46,146 | 1,150 |
| * FNF Group | 40,466 | 1,146 |
| Navient Corp. | 63,464 | 1,139 |
| Everest Re Group Ltd. | 6,842 | 1,121 |
| UDR Inc. | 37,391 | 1,119 |
| * Arch Capital Group Ltd. | 19,626 | 1,091 |
| Torchmark Corp. | 19,741 | 1,077 |
| * Alleghany Corp. | 2,472 | 1,066 |
| * Genworth Financial Inc. Class A | 73,375 | 1,041 |
| New York Community Bancorp Inc. | 64,569 | 1,030 |
| Raymond James Financial Inc. | 18,289 | 999 |
| WP Carey Inc. | 14,519 | 991 |
| First Republic Bank | 20,133 | 985 |
| * E*TRADE Financial Corp. | 43,219 | 962 |
| Camden Property Trust | 12,691 | 950 |
| Duke Realty Corp. | 49,033 | 912 |
| Aon plc | 10,349 | 902 |
| Zions Bancorporation | 30,028 | 875 |
| PartnerRe Ltd. | 7,595 | 848 |
| Alexandria Real Estate Equities Inc. | 10,611 | 839 |
| Protective Life Corp. | 11,895 | 826 |
| Voya Financial Inc. | 21,013 | 821 |
| DDR Corp. | 44,785 | 816 |
| Mid-America Apartment Communities Inc. | 10,891 | 788 |
| * SVB Financial Group | 6,929 | 771 |
| Starwood Property Trust Inc. | 32,312 | 771 |
| Regency Centers Corp. | 13,476 | 770 |
| Hudson City Bancorp Inc. | 77,985 | 770 |
| Kilroy Realty Corp. | 12,159 | 769 |
| Liberty Property Trust | 21,603 | 765 |
| NASDAQ OMX Group Inc. | 17,552 | 763 |
| Axis Capital Holdings Ltd. | 15,763 | 760 |
| HCC Insurance Holdings Inc. | 14,978 | 751 |
| East West Bancorp Inc. | 20,796 | 725 |
| WR Berkley Corp. | 14,868 | 719 |
| Assurant Inc. | 10,577 | 706 |
| Senior Housing Properties Trust | 29,759 | 694 |
| People's United Financial Inc. | 46,151 | 690 |
| Spirit Realty Capital Inc. | 58,231 | 688 |
| National Retail Properties Inc. | 18,052 | 670 |
| Equifax Inc. | 8,276 | 652 |
| Hospitality Properties Trust | 22,093 | 650 |
| Jones Lang LaSalle Inc. | 4,864 | 650 |
| BioMed Realty Trust Inc. | 28,410 | 638 |
| RenaissanceRe Holdings Ltd. | 6,127 | 627 |
| PacWest Bancorp | 14,866 | 623 |
| Weingarten Realty Investors | 17,945 | 614 |
| American Campus Communities Inc. | 15,458 | 611 |
| Corrections Corp. of America | 16,986 | 605 |
| Cullen/Frost Bankers Inc. | 7,698 | 605 |
| Assured Guaranty Ltd. | 24,994 | 604 |
| Reinsurance Group of America Inc. Class A | 7,250 | 602 |
| Douglas Emmett Inc. | 21,012 | 600 |
| Franklin Resources Inc. | 10,591 | 599 |
| Old Republic International Corp. | 38,777 | 595 |
| White Mountains Insurance Group Ltd. | 914 | 580 |
| Two Harbors Investment Corp. | 53,370 | 572 |
23
| Vanguard® Russell 1000 Value Index Fund | ||
| Schedule of Investments | ||
| August 31, 2014 | ||
| Market | ||
| Value | ||
| Shares | ($000) | |
| Rayonier Inc. | 16,251 | 557 |
| Retail Properties of America Inc. | 34,510 | 546 |
| Plum Creek Timber Co. Inc. | 13,380 | 544 |
| Commerce Bancshares Inc. | 11,779 | 543 |
| Brown & Brown Inc. | 16,612 | 542 |
| Home Properties Inc. | 8,399 | 539 |
| Validus Holdings Ltd. | 13,711 | 536 |
| Allied World Assurance Co. Holdings AG | 14,466 | 535 |
| American Financial Group Inc. | 8,759 | 525 |
| City National Corp. | 6,876 | 522 |
| * Forest City Enterprises Inc. Class A | 25,072 | 521 |
| * Equity Commonwealth | 19,136 | 514 |
| Synovus Financial Corp. | 20,647 | 499 |
| * Realogy Holdings Corp. | 12,112 | 494 |
| Chimera Investment Corp. | 149,047 | 493 |
| * Howard Hughes Corp. | 3,022 | 479 |
| * Popular Inc. | 15,416 | 477 |
| Legg Mason Inc. | 9,636 | 475 |
| BankUnited Inc. | 14,913 | 471 |
| Omega Healthcare Investors Inc. | 12,352 | 465 |
| CBL & Associates Properties Inc. | 24,318 | 462 |
| MFA Financial Inc. | 54,526 | 460 |
| Post Properties Inc. | 8,299 | 457 |
| Piedmont Office Realty Trust Inc. Class A | 23,426 | 457 |
| First Niagara Financial Group Inc. | 51,517 | 448 |
| Washington Prime Group Inc. | 22,745 | 444 |
| First Horizon National Corp. | 36,303 | 441 |
| Federal Realty Investment Trust | 3,520 | 439 |
| * MSCI Inc. Class A | 9,475 | 437 |
| NorthStar Realty Finance Corp. | 23,048 | 427 |
| StanCorp Financial Group Inc. | 6,507 | 426 |
| Aspen Insurance Holdings Ltd. | 10,016 | 426 |
| Brandywine Realty Trust | 26,511 | 425 |
| Associated Banc-Corp | 23,172 | 421 |
| Hanover Insurance Group Inc. | 6,443 | 409 |
| Dun & Bradstreet Corp. | 3,476 | 408 |
| * CoreLogic Inc. | 14,137 | 400 |
| Columbia Property Trust Inc. | 15,496 | 398 |
| ProAssurance Corp. | 8,575 | 396 |
| American Homes 4 Rent Class A | 22,112 | 395 |
| TCF Financial Corp. | 24,988 | 395 |
| * NorthStar Asset Management Group Inc. | 21,048 | 389 |
| Healthcare Trust of America Inc. Class A | 30,479 | 379 |
| Endurance Specialty Holdings Ltd. | 6,534 | 379 |
| Bank of Hawaii Corp. | 6,395 | 371 |
| SLM Corp. | 40,598 | 360 |
| Corporate Office Properties Trust | 12,665 | 359 |
| Gaming and Leisure Properties Inc. | 10,164 | 338 |
| Apartment Investment & Management Co. Class A | 9,667 | 331 |
| Fulton Financial Corp. | 27,245 | 314 |
| Public Storage | 1,657 | 290 |
| BOK Financial Corp. | 3,911 | 264 |
| Santander Consumer USA Holdings Inc. | 11,943 | 222 |
| * MBIA Inc. | 20,864 | 218 |
| Mercury General Corp. | 4,168 | 214 |
| * FNFV Group | 13,489 | 202 |
| Interactive Brokers Group Inc. | 8,614 | 202 |
| Tanger Factory Outlet Centers Inc. | 4,974 | 174 |
| Total System Services Inc. | 5,377 | 169 |
| Brixmor Property Group Inc. | 7,055 | 167 |
| TD Ameritrade Holding Corp. | 4,841 | 160 |
| Equity Lifestyle Properties Inc. | 3,372 | 154 |
| CNA Financial Corp. | 3,897 | 151 |
| * TFS Financial Corp. | 10,210 | 147 |
24
| Vanguard® Russell 1000 Value Index Fund | ||
| Schedule of Investments | ||
| August 31, 2014 | ||
| Market | ||
| Value | ||
| Shares | ($000) | |
| American National Insurance Co. | 967 | 110 |
| * Ally Financial Inc. | 4,145 | 102 |
| Federated Investors Inc. Class B | 3,229 | 99 |
| Arthur J Gallagher & Co. | 1,262 | 60 |
| * Signature Bank | 455 | 54 |
| Taubman Centers Inc. | 544 | 41 |
| SEI Investments Co. | 926 | 35 |
| * Nationstar Mortgage Holdings Inc. | 235 | 8 |
| 437,875 | ||
| Health Care (13.0%) | ||
| Johnson & Johnson | 352,781 | 36,594 |
| Pfizer Inc. | 943,565 | 27,731 |
| Merck & Co. Inc. | 371,819 | 22,350 |
| UnitedHealth Group Inc. | 144,985 | 12,567 |
| Medtronic Inc. | 147,784 | 9,436 |
| Abbott Laboratories | 222,476 | 9,397 |
| Eli Lilly & Co. | 145,667 | 9,259 |
| Bristol-Myers Squibb Co. | 157,847 | 7,995 |
| Covidien plc | 66,611 | 5,784 |
| WellPoint Inc. | 41,290 | 4,811 |
| Thermo Fisher Scientific Inc. | 35,218 | 4,234 |
| Cigna Corp. | 36,622 | 3,464 |
| Cardinal Health Inc. | 46,218 | 3,406 |
| * HCA Holdings Inc. | 43,764 | 3,056 |
| Aetna Inc. | 37,103 | 3,047 |
| Humana Inc. | 22,840 | 2,940 |
| Zimmer Holdings Inc. | 22,928 | 2,277 |
| Perrigo Co. plc | 15,308 | 2,277 |
| * Boston Scientific Corp. | 176,920 | 2,243 |
| Stryker Corp. | 20,175 | 1,681 |
| * CareFusion Corp. | 30,838 | 1,416 |
| Quest Diagnostics Inc. | 21,623 | 1,367 |
| * Hospira Inc. | 25,012 | 1,344 |
| * DaVita HealthCare Partners Inc. | 17,427 | 1,301 |
| Universal Health Services Inc. Class B | 10,125 | 1,159 |
| * Express Scripts Holding Co. | 15,535 | 1,148 |
| St. Jude Medical Inc. | 14,754 | 968 |
| Omnicare Inc. | 14,887 | 949 |
| * Community Health Systems Inc. | 16,855 | 915 |
| * QIAGEN NV | 34,394 | 831 |
| * Laboratory Corp. of America Holdings | 7,475 | 802 |
| Amgen Inc. | 5,740 | 800 |
| DENTSPLY International Inc. | 14,227 | 679 |
| Teleflex Inc. | 6,193 | 678 |
| PerkinElmer Inc. | 13,652 | 612 |
| * Hologic Inc. | 23,625 | 588 |
| * Health Net Inc. | 11,962 | 565 |
| * VCA Inc. | 12,694 | 517 |
| * LifePoint Hospitals Inc. | 6,702 | 501 |
| Patterson Cos. Inc. | 11,433 | 460 |
| * Alere Inc. | 12,315 | 437 |
| * Bio-Rad Laboratories Inc. Class A | 3,239 | 390 |
| * Mallinckrodt plc | 4,490 | 366 |
| Hill-Rom Holdings Inc. | 7,711 | 338 |
| Cooper Cos. Inc. | 1,845 | 301 |
| * MEDNAX Inc. | 4,983 | 285 |
| Techne Corp. | 2,878 | 275 |
| * Sirona Dental Systems Inc. | 3,231 | 263 |
| * Quintiles Transnational Holdings Inc. | 4,405 | 247 |
| * Charles River Laboratories International Inc. | 4,113 | 243 |
| * Allscripts Healthcare Solutions Inc. | 16,332 | 241 |
| * Intuitive Surgical Inc. | 413 | 194 |
| * Alkermes plc | 3,035 | 136 |
| * Alnylam Pharmaceuticals Inc. | 1,470 | 102 |
25
| Vanguard® Russell 1000 Value Index Fund | ||
| Schedule of Investments | ||
| August 31, 2014 | ||
| Market | ||
| Value | ||
| Shares | ($000) | |
| * Covance Inc. | 792 | 66 |
| * Myriad Genetics Inc. | 1,343 | 49 |
| * Cubist Pharmaceuticals Inc. | 573 | 40 |
| 196,122 | ||
| Materials & Processing (3.6%) | ||
| Dow Chemical Co. | 149,872 | 8,026 |
| Freeport-McMoRan Inc. | 153,313 | 5,576 |
| Air Products & Chemicals Inc. | 31,349 | 4,176 |
| Alcoa Inc. | 173,032 | 2,874 |
| International Paper Co. | 54,040 | 2,618 |
| Nucor Corp. | 47,141 | 2,561 |
| Mosaic Co. | 49,551 | 2,366 |
| Ingersoll-Rand plc | 36,592 | 2,203 |
| Newmont Mining Corp. | 73,756 | 1,998 |
| CF Industries Holdings Inc. | 7,716 | 1,988 |
| Celanese Corp. Class A | 21,289 | 1,331 |
| Ashland Inc. | 11,585 | 1,242 |
| Vulcan Materials Co. | 19,395 | 1,229 |
| MeadWestvaco Corp. | 25,046 | 1,077 |
| Rock-Tenn Co. Class A | 20,992 | 1,032 |
| Sigma-Aldrich Corp. | 9,394 | 977 |
| United States Steel Corp. | 21,808 | 843 |
| Steel Dynamics Inc. | 35,586 | 827 |
| Reliance Steel & Aluminum Co. | 11,671 | 816 |
| Rockwood Holdings Inc. | 10,006 | 810 |
| Royal Gold Inc. | 9,435 | 734 |
| Allegheny Technologies Inc. | 15,875 | 669 |
| Sonoco Products Co. | 15,504 | 638 |
| Owens Corning | 17,683 | 637 |
| Bemis Co. Inc. | 14,734 | 600 |
| Valmont Industries Inc. | 3,666 | 516 |
| Timken Co. | 11,099 | 503 |
| EI du Pont de Nemours & Co. | 7,505 | 496 |
| AptarGroup Inc. | 7,465 | 479 |
| Cabot Corp. | 8,655 | 474 |
| Cytec Industries Inc. | 4,600 | 474 |
| Albemarle Corp. | 6,842 | 435 |
| Carpenter Technology Corp. | 7,427 | 406 |
| Domtar Corp. | 9,686 | 361 |
| Cliffs Natural Resources Inc. | 22,613 | 341 |
| * Owens-Illinois Inc. | 9,630 | 296 |
| TimkenSteel Corp. | 5,549 | 265 |
| * Tahoe Resources Inc. | 10,054 | 258 |
| Huntsman Corp. | 8,760 | 236 |
| Greif Inc. Class A | 4,695 | 225 |
| * MRC Global Inc. | 8,186 | 203 |
| * Rayonier Advanced Materials Inc. | 5,414 | 180 |
| * WR Grace & Co. | 1,727 | 171 |
| Eastman Chemical Co. | 1,972 | 163 |
| Westlake Chemical Corp. | 1,090 | 106 |
| RPM International Inc. | 1,140 | 54 |
| * Veritiv Corp. | 1,032 | 46 |
| 54,536 | ||
| Producer Durables (10.1%) | ||
| General Electric Co. | 1,483,316 | 38,537 |
| United Technologies Corp. | 120,417 | 13,003 |
| Caterpillar Inc. | 72,855 | 7,946 |
| General Dynamics Corp. | 45,125 | 5,562 |
| Danaher Corp. | 68,615 | 5,257 |
| Eaton Corp. plc | 70,353 | 4,911 |
| Delta Air Lines Inc. | 118,692 | 4,698 |
| CSX Corp. | 148,281 | 4,583 |
| Raytheon Co. | 46,185 | 4,449 |
| Northrop Grumman Corp. | 31,677 | 4,030 |
26
| Vanguard® Russell 1000 Value Index Fund | ||
| Schedule of Investments | ||
| August 31, 2014 | ||
| Market | ||
| Value | ||
| Shares | ($000) | |
| Norfolk Southern Corp. | 36,029 | 3,855 |
| FedEx Corp. | 24,878 | 3,679 |
| Deere & Co. | 41,888 | 3,522 |
| Waste Management Inc. | 61,662 | 2,896 |
| Agilent Technologies Inc. | 42,163 | 2,410 |
| Xerox Corp. | 172,682 | 2,385 |
| Stanley Black & Decker Inc. | 20,607 | 1,886 |
| Pentair plc | 26,763 | 1,822 |
| Emerson Electric Co. | 26,352 | 1,687 |
| Textron Inc. | 41,009 | 1,558 |
| Republic Services Inc. Class A | 39,527 | 1,555 |
| L-3 Communications Holdings Inc. | 12,870 | 1,415 |
| Roper Industries Inc. | 8,162 | 1,229 |
| Parker-Hannifin Corp. | 10,382 | 1,199 |
| * Jacobs Engineering Group Inc. | 19,618 | 1,058 |
| Towers Watson & Co. Class A | 9,497 | 1,041 |
| ADT Corp. | 26,217 | 966 |
| Joy Global Inc. | 14,961 | 945 |
| Snap-on Inc. | 7,504 | 938 |
| Manpowergroup Inc. | 11,955 | 927 |
| Hubbell Inc. Class B | 7,274 | 879 |
| * Quanta Services Inc. | 24,072 | 875 |
| Carlisle Cos. Inc. | 9,550 | 792 |
| Ryder System Inc. | 7,936 | 717 |
| SPX Corp. | 6,457 | 672 |
| Fluor Corp. | 8,992 | 664 |
| AGCO Corp. | 13,602 | 664 |
| Oshkosh Corp. | 12,312 | 612 |
| URS Corp. | 10,032 | 608 |
| Terex Corp. | 16,008 | 599 |
| Alliant Techsystems Inc. | 4,641 | 585 |
| Dover Corp. | 6,386 | 561 |
| * WESCO International Inc. | 6,552 | 550 |
| Lincoln Electric Holdings Inc. | 7,728 | 549 |
| * AECOM Technology Corp. | 14,499 | 549 |
| Air Lease Corp. Class A | 13,962 | 529 |
| Kennametal Inc. | 11,602 | 520 |
| ITT Corp. | 10,364 | 496 |
| KBR Inc. | 22,138 | 488 |
| Exelis Inc. | 27,620 | 475 |
| Regal-Beloit Corp. | 6,656 | 473 |
| Babcock & Wilcox Co. | 16,131 | 469 |
| GATX Corp. | 7,023 | 465 |
| RR Donnelley & Sons Co. | 26,254 | 464 |
| Lexmark International Inc. Class A | 8,956 | 453 |
| Pitney Bowes Inc. | 16,004 | 433 |
| Avery Dennison Corp. | 8,981 | 432 |
| Con-way Inc. | 8,350 | 428 |
| Kansas City Southern | 3,668 | 423 |
| Triumph Group Inc. | 6,022 | 418 |
| * Genesee & Wyoming Inc. Class A | 4,102 | 403 |
| Tidewater Inc. | 7,551 | 384 |
| * Genpact Ltd. | 20,763 | 361 |
| Southwest Airlines Co. | 11,057 | 354 |
| Waste Connections Inc. | 7,124 | 350 |
| Tyco International Ltd. | 7,268 | 324 |
| Crane Co. | 4,560 | 317 |
| AO Smith Corp. | 5,944 | 292 |
| Xylem Inc. | 7,349 | 274 |
| PACCAR Inc. | 4,331 | 272 |
| * Navistar International Corp. | 7,047 | 266 |
| Trinity Industries Inc. | 5,218 | 252 |
| Paychex Inc. | 5,683 | 237 |
| Teekay Corp. | 3,690 | 226 |
27
| Vanguard® Russell 1000 Value Index Fund | ||
| Schedule of Investments | ||
| August 31, 2014 | ||
| Market | ||
| Value | ||
| Shares | ($000) | |
| FLIR Systems Inc. | 6,539 | 221 |
| Covanta Holding Corp. | 9,256 | 194 |
| Cintas Corp. | 2,918 | 193 |
| Rockwell Collins Inc. | 2,380 | 183 |
| * Clean Harbors Inc. | 2,340 | 142 |
| Copa Holdings SA Class A | 1,046 | 129 |
| Huntington Ingalls Industries Inc. | 1,109 | 113 |
| Iron Mountain Inc. | 3,090 | 111 |
| Donaldson Co. Inc. | 2,169 | 91 |
| Alaska Air Group Inc. | 1,477 | 68 |
| IDEX Corp. | 804 | 62 |
| * Spirit AeroSystems Holdings Inc. Class A | 1,117 | 43 |
| Booz Allen Hamilton Holding Corp. Class A | 109 | 2 |
| 152,655 | ||
| Technology (8.8%) | ||
| Intel Corp. | 673,771 | 23,528 |
| Microsoft Corp. | 431,318 | 19,595 |
| Cisco Systems Inc. | 757,759 | 18,936 |
| Hewlett-Packard Co. | 280,544 | 10,661 |
| EMC Corp. | 273,303 | 8,071 |
| * Yahoo! Inc. | 148,604 | 5,723 |
| Western Digital Corp. | 32,873 | 3,386 |
| Broadcom Corp. Class A | 79,012 | 3,111 |
| Corning Inc. | 148,357 | 3,095 |
| Symantec Corp. | 102,309 | 2,484 |
| SanDisk Corp. | 17,558 | 1,720 |
| Motorola Solutions Inc. | 25,886 | 1,538 |
| Applied Materials Inc. | 59,572 | 1,376 |
| NVIDIA Corp. | 69,419 | 1,350 |
| CA Inc. | 47,674 | 1,346 |
| NetApp Inc. | 31,673 | 1,335 |
| Analog Devices Inc. | 25,460 | 1,301 |
| Juniper Networks Inc. | 55,392 | 1,285 |
| Lam Research Corp. | 17,799 | 1,280 |
| Computer Sciences Corp. | 20,268 | 1,212 |
| Amdocs Ltd. | 23,757 | 1,119 |
| Altera Corp. | 29,426 | 1,040 |
| * Synopsys Inc. | 23,210 | 949 |
| * Arrow Electronics Inc. | 14,532 | 905 |
| Harris Corp. | 12,648 | 903 |
| * ANSYS Inc. | 10,391 | 845 |
| Marvell Technology Group Ltd. | 59,181 | 823 |
| * NCR Corp. | 22,138 | 756 |
| Avnet Inc. | 16,058 | 715 |
| Brocade Communications Systems Inc. | 64,161 | 677 |
| * Ingram Micro Inc. | 23,102 | 666 |
| * Nuance Communications Inc. | 39,149 | 666 |
| Jabil Circuit Inc. | 29,430 | 635 |
| * Micron Technology Inc. | 19,133 | 624 |
| * SunEdison Inc. | 26,561 | 585 |
| Activision Blizzard Inc. | 24,307 | 572 |
| Teradyne Inc. | 27,002 | 556 |
| * AOL Inc. | 12,118 | 524 |
| IAC/InterActiveCorp | 6,384 | 444 |
| * Electronic Arts Inc. | 11,206 | 424 |
| * Knowles Corp. | 12,492 | 411 |
| * JDS Uniphase Corp. | 33,781 | 390 |
| * Autodesk Inc. | 7,266 | 390 |
| * Stratasys Ltd. | 3,119 | 374 |
| Leidos Holdings Inc. | 9,791 | 369 |
| * Tech Data Corp. | 5,435 | 367 |
| * Cree Inc. | 8,036 | 366 |
| * Dolby Laboratories Inc. Class A | 7,058 | 329 |
| * Rovi Corp. | 13,901 | 321 |
28
| Vanguard® Russell 1000 Value Index Fund | ||
| Schedule of Investments | ||
| August 31, 2014 | ||
| Market | ||
| Value | ||
| Shares | ($000) | |
| Vishay Intertechnology Inc. | 19,441 | 311 |
| * ON Semiconductor Corp. | 31,410 | 307 |
| * Zynga Inc. Class A | 105,405 | 305 |
| * EchoStar Corp. Class A | 4,665 | 235 |
| * Teradata Corp. | 4,856 | 222 |
| * MICROS Systems Inc. | 2,751 | 187 |
| * Citrix Systems Inc. | 2,272 | 160 |
| KLA-Tencor Corp. | 2,037 | 156 |
| Maxim Integrated Products Inc. | 3,379 | 104 |
| AVX Corp. | 6,172 | 85 |
| DST Systems Inc. | 865 | 80 |
| * FireEye Inc. | 2,432 | 76 |
| * Informatica Corp. | 1,604 | 55 |
| * Freescale Semiconductor Ltd. | 1,485 | 31 |
| 132,392 | ||
| Utilities (8.3%) | ||
| AT&T Inc. | 767,807 | 26,843 |
| Duke Energy Corp. | 104,498 | 7,732 |
| NextEra Energy Inc. | 64,377 | 6,338 |
| Southern Co. | 131,617 | 5,844 |
| Dominion Resources Inc. | 80,662 | 5,664 |
| Exelon Corp. | 126,727 | 4,235 |
| American Electric Power Co. Inc. | 72,069 | 3,870 |
| Sempra Energy | 36,229 | 3,839 |
| PPL Corp. | 98,294 | 3,404 |
| CenturyLink Inc. | 79,632 | 3,264 |
| PG&E Corp. | 68,637 | 3,190 |
| Edison International | 48,135 | 2,847 |
| Public Service Enterprise Group Inc. | 74,722 | 2,794 |
| Consolidated Edison Inc. | 43,621 | 2,525 |
| Xcel Energy Inc. | 74,078 | 2,374 |
| FirstEnergy Corp. | 62,449 | 2,138 |
| Northeast Utilities | 46,461 | 2,132 |
| Entergy Corp. | 26,619 | 2,061 |
| DTE Energy Co. | 26,179 | 2,049 |
| NiSource Inc. | 46,818 | 1,857 |
| AES Corp. | 107,859 | 1,637 |
| CenterPoint Energy Inc. | 63,322 | 1,573 |
| NRG Energy Inc. | 50,121 | 1,543 |
| Wisconsin Energy Corp. | 33,596 | 1,523 |
| Ameren Corp. | 35,985 | 1,439 |
| American Water Works Co. Inc. | 26,738 | 1,353 |
| * Calpine Corp. | 54,410 | 1,293 |
| CMS Energy Corp. | 40,187 | 1,227 |
| * T-Mobile US Inc. | 39,641 | 1,192 |
| OGE Energy Corp. | 29,683 | 1,114 |
| SCANA Corp. | 20,667 | 1,074 |
| Frontier Communications Corp. | 149,883 | 1,019 |
| Pepco Holdings Inc. | 36,590 | 1,008 |
| Alliant Energy Corp. | 16,716 | 978 |
| AGL Resources Inc. | 17,889 | 954 |
| National Fuel Gas Co. | 12,285 | 939 |
| Pinnacle West Capital Corp. | 16,062 | 915 |
| UGI Corp. | 17,035 | 903 |
| MDU Resources Group Inc. | 28,233 | 884 |
| Energen Corp. | 10,714 | 862 |
| Integrys Energy Group Inc. | 11,813 | 802 |
| Atmos Energy Corp. | 15,016 | 759 |
| Westar Energy Inc. Class A | 19,369 | 715 |
| Aqua America Inc. | 25,897 | 648 |
| TECO Energy Inc. | 34,524 | 625 |
| * Sprint Corp. | 107,820 | 605 |
| Questar Corp. | 25,561 | 601 |
| Great Plains Energy Inc. | 22,411 | 575 |
29
| Vanguard® Russell 1000 Value Index Fund | |||||
| Schedule of Investments | |||||
| August 31, 2014 | |||||
| Market | |||||
| Value | |||||
| Shares | ($000) | ||||
| Vectren Corp. | 12,317 | 508 | |||
| ^ | Hawaiian Electric Industries Inc. | 15,171 | 385 | ||
| Telephone & Data Systems Inc. | 12,215 | 322 | |||
| Windstream Holdings Inc. | 6,925 | 78 | |||
| * | Level 3 Communications Inc. | 1,621 | 73 | ||
| * | United States Cellular Corp. | 1,701 | 64 | ||
| ITC Holdings Corp. | 1,290 | 48 | |||
| 125,238 | |||||
| Total Common Stocks (Cost $1,216,387) | 1,502,391 | ||||
| Coupon | |||||
| Temporary Cash Investments (0.0%)1 | |||||
| Money Market Fund (0.0%) | |||||
| 2,3 | Vanguard Market Liquidity Fund | 0.113% | 225,801 | 226 | |
| Face | |||||
| Maturity | Amount | ||||
| Date | ($000) | ||||
| U.S. Government and Agency Obligations (0.0%) | |||||
| 4,5 | Federal Home Loan Bank Discount Notes | 0.081% | 9/12/14 | 200 | 200 |
| Total Temporary Cash Investments (Cost $426) | 426 | ||||
| Total Investments (99.8%) (Cost $1,216,813) | 1,502,817 | ||||
| Other Assets and Liabilities—Net (0.2%)3 | 2,268 | ||||
| Net Assets (100%) | 1,505,085 | ||||
* Non-income-producing security.
^ Includes partial security positions on loan to broker-dealers. The total value of securities on loan is $209,000.
1 The fund invests a portion of its cash reserves in equity markets through the use of index futures contracts. After giving effect to futures investments, the fund's effective common stock and temporary cash investment positions represent 100.0% and 0. 2%, respectively, of net assets.
2 Affiliated money market fund available only to Vanguard funds and certain trusts and accounts managed by Vanguard. Rate shown is the 7-day yield.
3 Includes $226,000 of collateral received for securities on loan.
4 The issuer operates under a congressional charter; its securities are generally neither guaranteed by the U.S. Treasury nor backed by the full faith and credit of the U.S. government.
5 Securities with a value of $100,000 have been segregated as initial margin for open futures contracts.
REIT—Real Estate Investment Trust.
30
| Vanguard® Russell 1000 Growth Index Fund | ||
| Schedule of Investments | ||
| August 31, 2014 | ||
| Market | ||
| Value | ||
| Shares | ($000) | |
| Common Stocks (99.9%)1 | ||
| Consumer Discretionary (20.3%) | ||
| Walt Disney Co. | 244,592 | 21,984 |
| Comcast Corp. Class A | 399,407 | 21,860 |
| Home Depot Inc. | 230,428 | 21,545 |
| * Amazon.com Inc. | 63,304 | 21,463 |
| McDonald's Corp. | 166,526 | 15,607 |
| * eBay Inc. | 213,882 | 11,870 |
| * Priceline Group Inc. | 8,691 | 10,814 |
| Starbucks Corp. | 127,099 | 9,890 |
| NIKE Inc. Class B | 117,905 | 9,261 |
| Lowe's Cos. Inc. | 171,960 | 9,030 |
| Costco Wholesale Corp. | 69,972 | 8,472 |
| Twenty-First Century Fox Inc. Class A | 236,891 | 8,391 |
| TJX Cos. Inc. | 118,324 | 7,053 |
| Time Warner Cable Inc. | 46,889 | 6,936 |
| * DIRECTV | 78,754 | 6,808 |
| Viacom Inc. Class B | 72,315 | 5,868 |
| Yum! Brands Inc. | 74,191 | 5,374 |
| * Netflix Inc. | 10,087 | 4,818 |
| CBS Corp. Class B | 79,934 | 4,739 |
| * Tesla Motors Inc. | 16,017 | 4,320 |
| Las Vegas Sands Corp. | 63,251 | 4,207 |
| VF Corp. | 58,127 | 3,727 |
| * Chipotle Mexican Grill Inc. Class A | 5,249 | 3,562 |
| Omnicom Group Inc. | 43,472 | 3,130 |
| Estee Lauder Cos. Inc. Class A | 38,804 | 2,981 |
| * AutoZone Inc. | 5,526 | 2,978 |
| Macy's Inc. | 46,875 | 2,920 |
| * O'Reilly Automotive Inc. | 17,974 | 2,804 |
| * Michael Kors Holdings Ltd. | 34,630 | 2,775 |
| Ross Stores Inc. | 35,716 | 2,694 |
| Wynn Resorts Ltd. | 13,719 | 2,646 |
| * Dollar General Corp. | 39,721 | 2,542 |
| BorgWarner Inc. | 38,733 | 2,409 |
| Harley-Davidson Inc. | 36,653 | 2,330 |
| Marriott International Inc. Class A | 32,594 | 2,262 |
| * Hertz Global Holdings Inc. | 75,349 | 2,227 |
| Genuine Parts Co. | 24,289 | 2,131 |
| * Charter Communications Inc. Class A | 13,376 | 2,098 |
| Wal-Mart Stores Inc. | 27,388 | 2,068 |
| Gap Inc. | 44,791 | 2,067 |
| * Under Armour Inc. Class A | 29,395 | 2,009 |
| Tiffany & Co. | 18,914 | 1,909 |
| * Dollar Tree Inc. | 35,094 | 1,882 |
| * TripAdvisor Inc. | 18,668 | 1,850 |
| Wyndham Worldwide Corp. | 21,504 | 1,741 |
| Hanesbrands Inc. | 16,835 | 1,729 |
| Coach Inc. | 46,535 | 1,714 |
| * DISH Network Corp. Class A | 26,442 | 1,714 |
| Nielsen NV | 35,829 | 1,684 |
| * Discovery Communications Inc. Class A | 38,476 | 1,682 |
| Advance Auto Parts Inc. | 12,212 | 1,666 |
| * Discovery Communications Inc. | 38,476 | 1,653 |
| Nordstrom Inc. | 23,585 | 1,633 |
| Polaris Industries Inc. | 11,170 | 1,624 |
| * Sirius XM Holdings Inc. | 436,976 | 1,586 |
| Tractor Supply Co. | 23,435 | 1,569 |
| H&R Block Inc. | 46,431 | 1,557 |
| Expedia Inc. | 16,883 | 1,450 |
| Johnson Controls Inc. | 29,657 | 1,448 |
| * LKQ Corp. | 50,557 | 1,436 |
| Scripps Networks Interactive Inc. Class A | 18,000 | 1,435 |
31
| Vanguard® Russell 1000 Growth Index Fund | ||
| Schedule of Investments | ||
| August 31, 2014 | ||
| Market | ||
| Value | ||
| Shares | ($000) | |
| PVH Corp. | 12,258 | 1,431 |
| Interpublic Group of Cos. Inc. | 70,870 | 1,384 |
| * CarMax Inc. | 25,397 | 1,331 |
| Harman International Industries Inc. | 11,417 | 1,314 |
| Ralph Lauren Corp. Class A | 7,394 | 1,251 |
| Starwood Hotels & Resorts Worldwide Inc. | 14,536 | 1,229 |
| * Avis Budget Group Inc. | 18,015 | 1,216 |
| * Liberty Interactive Corp. Class A | 41,198 | 1,216 |
| Family Dollar Stores Inc. | 15,161 | 1,210 |
| Goodyear Tire & Rubber Co. | 46,408 | 1,205 |
| PetSmart Inc. | 16,670 | 1,193 |
| Lear Corp. | 11,086 | 1,121 |
| Signet Jewelers Ltd. | 9,387 | 1,106 |
| * Ulta Salon Cosmetics & Fragrance Inc. | 10,703 | 1,041 |
| Williams-Sonoma Inc. | 15,706 | 1,033 |
| * WABCO Holdings Inc. | 9,405 | 971 |
| * Pandora Media Inc. | 34,783 | 941 |
| * Bed Bath & Beyond Inc. | 14,604 | 938 |
| L Brands Inc. | 14,668 | 937 |
| Newell Rubbermaid Inc. | 27,487 | 921 |
| Hasbro Inc. | 16,210 | 854 |
| * NVR Inc. | 706 | 828 |
| * Fossil Group Inc. | 7,760 | 786 |
| Dunkin' Brands Group Inc. | 17,704 | 771 |
| Carter's Inc. | 9,192 | 761 |
| Domino's Pizza Inc. | 9,575 | 722 |
| Mattel Inc. | 20,813 | 718 |
| Lamar Advertising Co. Class A | 13,504 | 709 |
| * Kate Spade & Co. | 21,462 | 694 |
| Cinemark Holdings Inc. | 19,281 | 680 |
| * AutoNation Inc. | 12,520 | 679 |
| Target Corp. | 10,608 | 637 |
| * Panera Bread Co. Class A | 4,181 | 627 |
| Tupperware Brands Corp. | 8,529 | 625 |
| * AMC Networks Inc. Class A | 9,925 | 621 |
| Service Corp. International | 27,806 | 616 |
| * Tempur Sealy International Inc. | 10,409 | 609 |
| Cablevision Systems Corp. Class A | 32,740 | 606 |
| * Hilton Worldwide Holdings Inc. | 23,411 | 593 |
| * Sally Beauty Holdings Inc. | 20,703 | 577 |
| Burger King Worldwide Inc. | 17,808 | 571 |
| Brinker International Inc. | 11,227 | 549 |
| * Urban Outfitters Inc. | 13,459 | 536 |
| * Deckers Outdoor Corp. | 5,689 | 525 |
| * Bally Technologies Inc. | 6,562 | 520 |
| Fortune Brands Home & Security Inc. | 11,330 | 490 |
| * Liberty Ventures Class A | 12,343 | 470 |
| * HomeAway Inc. | 14,126 | 469 |
| * Norwegian Cruise Line Holdings Ltd. | 13,759 | 458 |
| Lions Gate Entertainment Corp. | 13,977 | 453 |
| Nu Skin Enterprises Inc. Class A | 10,102 | 452 |
| Best Buy Co. Inc. | 14,055 | 448 |
| * Liberty TripAdvisor Holdings Inc. Class A | 12,343 | 442 |
| Six Flags Entertainment Corp. | 12,001 | 438 |
| Gentex Corp. | 14,235 | 421 |
| * Starz | 13,374 | 418 |
| Thor Industries Inc. | 7,555 | 406 |
| Avon Products Inc. | 28,853 | 405 |
| Leggett & Platt Inc. | 11,187 | 393 |
| * Jarden Corp. | 6,413 | 383 |
| CST Brands Inc. | 10,536 | 367 |
| Dillard's Inc. Class A | 2,981 | 341 |
| KAR Auction Services Inc. | 9,228 | 278 |
| * Live Nation Entertainment Inc. | 11,988 | 263 |
32
| Vanguard® Russell 1000 Growth Index Fund | ||
| Schedule of Investments | ||
| August 31, 2014 | ||
| Market | ||
| Value | ||
| Shares | ($000) | |
| SeaWorld Entertainment Inc. | 11,132 | 231 |
| AMERCO | 746 | 207 |
| Foot Locker Inc. | 3,541 | 199 |
| * Murphy USA Inc. | 3,550 | 193 |
| Whirlpool Corp. | 1,220 | 187 |
| Aramark | 6,954 | 180 |
| Chico's FAS Inc. | 10,913 | 172 |
| Coty Inc. Class A | 9,070 | 156 |
| Penske Automotive Group Inc. | 3,092 | 148 |
| Big Lots Inc. | 2,916 | 135 |
| * MGM Resorts International | 5,178 | 127 |
| Dick's Sporting Goods Inc. | 2,664 | 120 |
| * Sears Holdings Corp. | 3,397 | 118 |
| Kohl's Corp. | 1,872 | 110 |
| DR Horton Inc. | 4,331 | 94 |
| Regal Entertainment Group Class A | 4,059 | 85 |
| Abercrombie & Fitch Co. | 1,889 | 79 |
| * zulily Inc. Class A | 2,234 | 73 |
| Lennar Corp. Class A | 1,774 | 69 |
| * Cabela's Inc. | 915 | 56 |
| CBS Outdoor Americas Inc. | 1,409 | 48 |
| GameStop Corp. Class A | 975 | 41 |
| Aaron's Inc. | 1,594 | 41 |
| * Hyatt Hotels Corp. Class A | 373 | 23 |
| Choice Hotels International Inc. | 235 | 13 |
| Clear Channel Outdoor Holdings Inc. Class A | 1,812 | 13 |
| 355,748 | ||
| Consumer Staples (9.3%) | ||
| Coca-Cola Co. | 669,350 | 27,925 |
| PepsiCo Inc. | 255,469 | 23,628 |
| Altria Group Inc. | 317,154 | 13,663 |
| Philip Morris International Inc. | 155,825 | 13,336 |
| Colgate-Palmolive Co. | 138,187 | 8,945 |
| Walgreen Co. | 121,135 | 7,331 |
| Kraft Foods Group Inc. | 100,124 | 5,897 |
| Kimberly-Clark Corp. | 52,574 | 5,678 |
| General Mills Inc. | 103,928 | 5,548 |
| Kroger Co. | 85,654 | 4,367 |
| Lorillard Inc. | 61,044 | 3,644 |
| Mead Johnson Nutrition Co. | 33,899 | 3,241 |
| Keurig Green Mountain Inc. | 23,912 | 3,188 |
| Kellogg Co. | 39,270 | 2,551 |
| Brown-Forman Corp. Class B | 25,934 | 2,403 |
| Hershey Co. | 25,238 | 2,307 |
| Reynolds American Inc. | 39,159 | 2,290 |
| CVS Caremark Corp. | 27,909 | 2,217 |
| * Constellation Brands Inc. Class A | 25,311 | 2,204 |
| Procter & Gamble Co. | 25,985 | 2,160 |
| * Monster Beverage Corp. | 24,043 | 2,126 |
| Dr Pepper Snapple Group Inc. | 33,138 | 2,085 |
| Coca-Cola Enterprises Inc. | 42,427 | 2,027 |
| Clorox Co. | 18,131 | 1,606 |
| Church & Dwight Co. Inc. | 23,102 | 1,576 |
| McCormick & Co. Inc. | 21,888 | 1,525 |
| Sysco Corp. | 36,711 | 1,389 |
| Hormel Foods Corp. | 22,255 | 1,128 |
| Whole Foods Market Inc. | 26,842 | 1,051 |
| * WhiteWave Foods Co. Class A | 29,441 | 1,031 |
| Campbell Soup Co. | 19,567 | 877 |
| * Hain Celestial Group Inc. | 7,895 | 777 |
| * Rite Aid Corp. | 110,753 | 689 |
| ^ Herbalife Ltd. | 12,826 | 654 |
| GNC Holdings Inc. Class A | 15,260 | 579 |
| Flowers Foods Inc. | 28,554 | 559 |
33
| Vanguard® Russell 1000 Growth Index Fund | ||
| Schedule of Investments | ||
| August 31, 2014 | ||
| Market | ||
| Value | ||
| Shares | ($000) | |
| Archer-Daniels-Midland Co. | 10,566 | 527 |
| * Sprouts Farmers Market Inc. | 16,035 | 496 |
| Spectrum Brands Holdings Inc. | 3,469 | 300 |
| Ingredion Inc. | 1,882 | 150 |
| Tyson Foods Inc. Class A | 2,676 | 102 |
| * Pilgrim's Pride Corp. | 1,366 | 41 |
| 163,818 | ||
| Energy (6.0%) | ||
| Schlumberger Ltd. | 219,239 | 24,037 |
| EOG Resources Inc. | 92,279 | 10,140 |
| Halliburton Co. | 142,602 | 9,641 |
| Williams Cos. Inc. | 126,191 | 7,501 |
| Pioneer Natural Resources Co. | 24,203 | 5,050 |
| Phillips 66 | 39,282 | 3,418 |
| * Cheniere Energy Inc. | 39,990 | 3,210 |
| Noble Energy Inc. | 43,165 | 3,114 |
| Marathon Petroleum Corp. | 31,486 | 2,866 |
| * Concho Resources Inc. | 19,004 | 2,699 |
| * FMC Technologies Inc. | 39,878 | 2,466 |
| * Southwestern Energy Co. | 59,173 | 2,437 |
| Cabot Oil & Gas Corp. | 70,469 | 2,364 |
| EQT Corp. | 23,125 | 2,291 |
| Range Resources Corp. | 27,611 | 2,170 |
| * Cameron International Corp. | 21,893 | 1,627 |
| ONEOK Inc. | 18,392 | 1,291 |
| Oceaneering International Inc. | 18,091 | 1,258 |
| Kinder Morgan Inc. | 30,452 | 1,226 |
| * Continental Resources Inc. | 7,197 | 1,161 |
| Valero Energy Corp. | 21,427 | 1,160 |
| Helmerich & Payne Inc. | 10,980 | 1,153 |
| SM Energy Co. | 11,288 | 1,005 |
| Targa Resources Corp. | 6,462 | 902 |
| * Dresser-Rand Group Inc. | 13,006 | 901 |
| * Oasis Petroleum Inc. | 17,211 | 847 |
| * Cobalt International Energy Inc. | 53,932 | 828 |
| Anadarko Petroleum Corp. | 6,354 | 716 |
| * Dril-Quip Inc. | 7,010 | 711 |
| * Gulfport Energy Corp. | 11,430 | 669 |
| Seadrill Ltd. | 17,848 | 665 |
| Tesoro Corp. | 9,583 | 620 |
| Chesapeake Energy Corp. | 19,782 | 538 |
| National Oilwell Varco Inc. | 5,957 | 515 |
| * Antero Resources Corp. | 8,726 | 505 |
| * SolarCity Corp. | 6,988 | 480 |
| Patterson-UTI Energy Inc. | 12,056 | 416 |
| Baker Hughes Inc. | 5,993 | 414 |
| * Athlon Energy Inc. | 8,367 | 389 |
| HollyFrontier Corp. | 5,938 | 297 |
| * Laredo Petroleum Inc. | 11,226 | 265 |
| Cimarex Energy Co. | 1,721 | 250 |
| RPC Inc. | 10,037 | 229 |
| * Rice Energy Inc. | 7,706 | 226 |
| * Ultra Petroleum Corp. | 7,477 | 198 |
| * Whiting Petroleum Corp. | 2,006 | 186 |
| * Kosmos Energy Ltd. | 16,941 | 170 |
| QEP Resources Inc. | 3,738 | 133 |
| Nabors Industries Ltd. | 4,810 | 131 |
| World Fuel Services Corp. | 2,683 | 119 |
| * Atwood Oceanics Inc. | 2,370 | 117 |
| PBF Energy Inc. Class A | 3,544 | 101 |
| Superior Energy Services Inc. | 1,740 | 62 |
| CVR Energy Inc. | 1,008 | 50 |
| * NOW Inc. | 1,487 | 49 |
| * Unit Corp. | 516 | 34 |
34
| Vanguard® Russell 1000 Growth Index Fund | ||
| Schedule of Investments | ||
| August 31, 2014 | ||
| Market | ||
| Value | ||
| Shares | ($000) | |
| * Seventy Seven Energy Inc. | 1,413 | 33 |
| * SunPower Corp. Class A | 680 | 26 |
| Frank's International NV | 621 | 13 |
| 106,090 | ||
| Financial Services (7.8%) | ||
| Visa Inc. Class A | 84,487 | 17,955 |
| American Express Co. | 152,810 | 13,684 |
| MasterCard Inc. Class A | 169,722 | 12,867 |
| Simon Property Group Inc. | 39,131 | 6,653 |
| American Tower Corporation | 66,551 | 6,562 |
| Crown Castle International Corp. | 56,277 | 4,475 |
| Public Storage | 22,264 | 3,900 |
| McGraw Hill Financial Inc. | 46,033 | 3,735 |
| T. Rowe Price Group Inc. | 44,290 | 3,587 |
| Aon plc | 38,584 | 3,363 |
| Marsh & McLennan Cos. Inc. | 62,573 | 3,323 |
| Franklin Resources Inc. | 54,924 | 3,104 |
| Moody's Corp. | 31,852 | 2,980 |
| * Fiserv Inc. | 42,051 | 2,711 |
| BlackRock Inc. | 8,164 | 2,698 |
| * Alliance Data Systems Corp. | 9,085 | 2,404 |
| * FleetCor Technologies Inc. | 14,049 | 2,019 |
| * Affiliated Managers Group Inc. | 9,330 | 1,970 |
| Health Care REIT Inc. | 27,634 | 1,867 |
| Western Union Co. | 91,519 | 1,599 |
| Intercontinental Exchange Inc. | 8,161 | 1,542 |
| Ventas Inc. | 23,254 | 1,530 |
| * CBRE Group Inc. Class A | 47,479 | 1,509 |
| Ameriprise Financial Inc. | 11,194 | 1,408 |
| TD Ameritrade Holding Corp. | 39,405 | 1,305 |
| Arthur J Gallagher & Co. | 24,997 | 1,181 |
| Lazard Ltd. Class A | 20,763 | 1,135 |
| Extra Space Storage Inc. | 19,571 | 1,031 |
| * Ally Financial Inc. | 40,806 | 1,004 |
| * Signature Bank | 7,869 | 932 |
| Federal Realty Investment Trust | 7,387 | 922 |
| FactSet Research Systems Inc. | 7,163 | 913 |
| Charles Schwab Corp. | 31,496 | 898 |
| Broadridge Financial Solutions Inc. | 20,652 | 879 |
| Equifax Inc. | 11,093 | 874 |
| Global Payments Inc. | 11,430 | 831 |
| Jack Henry & Associates Inc. | 14,162 | 819 |
| Eaton Vance Corp. | 20,722 | 811 |
| SEI Investments Co. | 21,301 | 807 |
| Waddell & Reed Financial Inc. Class A | 14,634 | 798 |
| CBOE Holdings Inc. | 14,648 | 777 |
| Taubman Centers Inc. | 10,118 | 771 |
| Vornado Realty Trust | 7,211 | 763 |
| * Zillow Inc. Class A | 5,273 | 756 |
| LPL Financial Holdings Inc. | 15,063 | 733 |
| Total System Services Inc. | 21,972 | 691 |
| * Vantiv Inc. Class A | 21,240 | 664 |
| Plum Creek Timber Co. Inc. | 14,573 | 592 |
| Apartment Investment & Management Co. Class A | 14,260 | 489 |
| * Howard Hughes Corp. | 3,083 | 488 |
| * Ocwen Financial Corp. | 17,443 | 487 |
| Equity Lifestyle Properties Inc. | 9,995 | 457 |
| Invesco Ltd. | 10,806 | 441 |
| * Realogy Holdings Corp. | 10,274 | 419 |
| * MSCI Inc. Class A | 8,857 | 409 |
| Boston Properties Inc. | 3,078 | 374 |
| Federated Investors Inc. Class B | 11,726 | 360 |
| Fidelity National Information Services Inc. | 5,848 | 332 |
| Legg Mason Inc. | 6,647 | 328 |
35
| Vanguard® Russell 1000 Growth Index Fund | ||
| Schedule of Investments | ||
| August 31, 2014 | ||
| Market | ||
| Value | ||
| Shares | ($000) | |
| Tanger Factory Outlet Centers Inc. | 9,227 | 322 |
| Weyerhaeuser Co. | 9,107 | 309 |
| Erie Indemnity Co. Class A | 4,037 | 309 |
| Reinsurance Group of America Inc. Class A | 3,137 | 260 |
| Jones Lang LaSalle Inc. | 1,941 | 259 |
| Omega Healthcare Investors Inc. | 6,728 | 253 |
| Artisan Partners Asset Management Inc. Class A | 4,546 | 252 |
| Dun & Bradstreet Corp. | 2,134 | 250 |
| Leucadia National Corp. | 9,915 | 247 |
| Morningstar Inc. | 3,276 | 225 |
| SLM Corp. | 23,465 | 208 |
| American Financial Group Inc. | 2,080 | 125 |
| NorthStar Realty Finance Corp. | 6,414 | 119 |
| * NorthStar Asset Management Group Inc. | 6,414 | 119 |
| * Nationstar Mortgage Holdings Inc. | 3,020 | 106 |
| Rayonier Inc. | 2,418 | 83 |
| * SVB Financial Group | 717 | 80 |
| Columbia Property Trust Inc. | 3,064 | 79 |
| Gaming and Leisure Properties Inc. | 2,298 | 77 |
| Healthcare Trust of America Inc. Class A | 4,648 | 58 |
| Brown & Brown Inc. | 1,082 | 35 |
| Santander Consumer USA Holdings Inc. | 925 | 17 |
| 136,708 | ||
| Health Care (13.2%) | ||
| * Gilead Sciences Inc. | 258,904 | 27,853 |
| Amgen Inc. | 121,032 | 16,869 |
| AbbVie Inc. | 268,385 | 14,836 |
| * Biogen Idec Inc. | 40,037 | 13,734 |
| * Celgene Corp. | 134,823 | 12,811 |
| * Actavis plc | 42,786 | 9,712 |
| * Express Scripts Holding Co. | 113,103 | 8,362 |
| Allergan Inc. | 50,088 | 8,198 |
| Johnson & Johnson | 74,974 | 7,777 |
| McKesson Corp. | 38,804 | 7,568 |
| Baxter International Inc. | 91,696 | 6,875 |
| * Alexion Pharmaceuticals Inc. | 33,428 | 5,659 |
| Bristol-Myers Squibb Co. | 99,566 | 5,043 |
| * Regeneron Pharmaceuticals Inc. | 13,259 | 4,648 |
| * Illumina Inc. | 23,553 | 4,224 |
| Merck & Co. Inc. | 69,102 | 4,154 |
| Becton Dickinson and Co. | 32,628 | 3,823 |
| * Vertex Pharmaceuticals Inc. | 39,939 | 3,737 |
| Thermo Fisher Scientific Inc. | 27,251 | 3,276 |
| * Mylan Inc. | 63,203 | 3,072 |
| Zoetis Inc. | 84,915 | 3,009 |
| AmerisourceBergen Corp. Class A | 38,022 | 2,943 |
| * Cerner Corp. | 49,986 | 2,882 |
| Stryker Corp. | 33,754 | 2,812 |
| * Intuitive Surgical Inc. | 5,586 | 2,626 |
| St. Jude Medical Inc. | 30,985 | 2,032 |
| CR Bard Inc. | 12,861 | 1,909 |
| * Edwards Lifesciences Corp. | 17,946 | 1,781 |
| * BioMarin Pharmaceutical Inc. | 24,834 | 1,769 |
| * Henry Schein Inc. | 14,310 | 1,713 |
| * Salix Pharmaceuticals Ltd. | 10,741 | 1,709 |
| * Catamaran Corp. | 35,120 | 1,655 |
| * Endo International plc | 25,441 | 1,621 |
| * Jazz Pharmaceuticals plc | 9,940 | 1,619 |
| * Varian Medical Systems Inc. | 17,365 | 1,476 |
| Aetna Inc. | 17,819 | 1,463 |
| * Incyte Corp. | 24,227 | 1,313 |
| * Pharmacyclics Inc. | 10,340 | 1,286 |
36
| Vanguard® Russell 1000 Growth Index Fund | ||
| Schedule of Investments | ||
| August 31, 2014 | ||
| Market | ||
| Value | ||
| Shares | ($000) | |
| ResMed Inc. | 23,870 | 1,266 |
| * Medivation Inc. | 13,080 | 1,194 |
| * Mallinckrodt plc | 13,725 | 1,118 |
| * IDEXX Laboratories Inc. | 8,769 | 1,087 |
| * Tenet Healthcare Corp. | 16,556 | 1,013 |
| * United Therapeutics Corp. | 8,268 | 974 |
| Cooper Cos. Inc. | 5,881 | 959 |
| * Brookdale Senior Living Inc. | 27,125 | 948 |
| * athenahealth Inc. | 6,476 | 935 |
| * Alkermes plc | 20,883 | 934 |
| * Cubist Pharmaceuticals Inc. | 12,198 | 842 |
| * DaVita HealthCare Partners Inc. | 10,559 | 789 |
| * Centene Corp. | 9,819 | 767 |
| * Seattle Genetics Inc. | 17,343 | 763 |
| * Align Technology Inc. | 13,931 | 759 |
| Perrigo Co. plc | 5,093 | 758 |
| * Covance Inc. | 8,850 | 734 |
| * Alnylam Pharmaceuticals Inc. | 9,700 | 676 |
| * MEDNAX Inc. | 11,320 | 648 |
| * Intercept Pharmaceuticals Inc. | 2,147 | 622 |
| * Laboratory Corp. of America Holdings | 5,689 | 610 |
| * Sirona Dental Systems Inc. | 6,172 | 503 |
| * Envision Healthcare Holdings Inc. | 13,309 | 487 |
| Universal Health Services Inc. Class B | 3,451 | 395 |
| * Myriad Genetics Inc. | 10,684 | 387 |
| * Bruker Corp. | 18,215 | 365 |
| * HCA Holdings Inc. | 5,102 | 356 |
| DENTSPLY International Inc. | 7,274 | 347 |
| * Hologic Inc. | 13,637 | 339 |
| Cardinal Health Inc. | 4,502 | 332 |
| Cigna Corp. | 3,424 | 324 |
| Techne Corp. | 3,042 | 291 |
| * Boston Scientific Corp. | 20,520 | 260 |
| * Quintiles Transnational Holdings Inc. | 4,420 | 248 |
| * Charles River Laboratories International Inc. | 3,741 | 221 |
| Zimmer Holdings Inc. | 2,065 | 205 |
| * Veeva Systems Inc. Class A | 6,257 | 188 |
| * Premier Inc. Class A | 5,366 | 169 |
| * Allscripts Healthcare Solutions Inc. | 10,936 | 162 |
| PerkinElmer Inc. | 3,496 | 157 |
| Patterson Cos. Inc. | 1,219 | 49 |
| Hill-Rom Holdings Inc. | 628 | 28 |
| 232,058 | ||
| Materials & Processing (5.0%) | ||
| Monsanto Co. | 88,507 | 10,236 |
| EI du Pont de Nemours & Co. | 146,377 | 9,677 |
| LyondellBasell Industries NV Class A | 74,453 | 8,514 |
| Praxair Inc. | 49,308 | 6,486 |
| Precision Castparts Corp. | 24,465 | 5,971 |
| Ecolab Inc. | 44,877 | 5,153 |
| PPG Industries Inc. | 23,397 | 4,817 |
| Sherwin-Williams Co. | 14,558 | 3,175 |
| Fastenal Co. | 49,867 | 2,258 |
| Eastman Chemical Co. | 23,040 | 1,900 |
| Dow Chemical Co. | 32,704 | 1,751 |
| Ball Corp. | 23,591 | 1,512 |
| FMC Corp. | 22,219 | 1,470 |
| Masco Corp. | 60,436 | 1,418 |
| International Flavors & Fragrances Inc. | 13,814 | 1,403 |
| Airgas Inc. | 12,515 | 1,381 |
| Martin Marietta Materials Inc. | 10,442 | 1,367 |
| Sealed Air Corp. | 36,283 | 1,310 |
| Valspar Corp. | 14,233 | 1,149 |
| Packaging Corp. of America | 16,780 | 1,141 |
37
| Vanguard® Russell 1000 Growth Index Fund | ||
| Schedule of Investments | ||
| August 31, 2014 | ||
| Market | ||
| Value | ||
| Shares | ($000) | |
| * Crown Holdings Inc. | 23,311 | 1,125 |
| * WR Grace & Co. | 11,160 | 1,105 |
| RPM International Inc. | 20,840 | 982 |
| Sigma-Aldrich Corp. | 9,166 | 953 |
| Acuity Brands Inc. | 7,357 | 911 |
| Eagle Materials Inc. | 8,582 | 875 |
| Southern Copper Corp. | 24,724 | 811 |
| Lennox International Inc. | 8,201 | 687 |
| * Hexcel Corp. | 16,546 | 682 |
| Huntsman Corp. | 24,317 | 654 |
| NewMarket Corp. | 1,509 | 614 |
| Westlake Chemical Corp. | 5,922 | 575 |
| International Paper Co. | 11,615 | 563 |
| * Owens-Illinois Inc. | 16,444 | 506 |
| Compass Minerals International Inc. | 5,482 | 488 |
| Scotts Miracle-Gro Co. Class A | 7,772 | 449 |
| * USG Corp. | 15,207 | 441 |
| * Armstrong World Industries Inc. | 7,483 | 432 |
| * Platform Specialty Products Corp. | 13,887 | 379 |
| Silgan Holdings Inc. | 7,479 | 377 |
| Albemarle Corp. | 5,237 | 333 |
| Ingersoll-Rand plc | 3,734 | 225 |
| * MRC Global Inc. | 7,603 | 189 |
| AptarGroup Inc. | 2,367 | 152 |
| Celanese Corp. Class A | 2,095 | 131 |
| Cytec Industries Inc. | 702 | 72 |
| * Tahoe Resources Inc. | 2,650 | 68 |
| Rockwood Holdings Inc. | 744 | 60 |
| Timken Co. | 863 | 39 |
| Cabot Corp. | 686 | 38 |
| Valmont Industries Inc. | 257 | 36 |
| Carpenter Technology Corp. | 526 | 29 |
| * Rayonier Advanced Materials Inc. | 804 | 27 |
| TimkenSteel Corp. | 431 | 21 |
| * Veritiv Corp. | 211 | 9 |
| 87,127 | ||
| Other (0.0%) | ||
| * Synchrony Financial | 9,199 | 237 |
| Producer Durables (12.2%) | ||
| Union Pacific Corp. | 152,620 | 16,066 |
| 3M Co. | 110,341 | 15,889 |
| Boeing Co. | 123,008 | 15,597 |
| Honeywell International Inc. | 131,905 | 12,561 |
| United Parcel Service Inc. Class B | 119,477 | 11,629 |
| Accenture plc Class A | 106,798 | 8,657 |
| Lockheed Martin Corp. | 45,765 | 7,963 |
| Automatic Data Processing Inc. | 81,452 | 6,800 |
| Emerson Electric Co. | 88,193 | 5,646 |
| Illinois Tool Works Inc. | 57,403 | 5,063 |
| American Airlines Group Inc. | 121,139 | 4,713 |
| Cummins Inc. | 30,974 | 4,495 |
| PACCAR Inc. | 54,844 | 3,445 |
| Southwest Airlines Co. | 104,120 | 3,333 |
| FedEx Corp. | 21,446 | 3,171 |
| Tyco International Ltd. | 69,581 | 3,105 |
| * United Continental Holdings Inc. | 63,283 | 3,013 |
| Rockwell Automation Inc. | 23,384 | 2,727 |
| WW Grainger Inc. | 9,861 | 2,428 |
| Caterpillar Inc. | 22,221 | 2,424 |
| AMETEK Inc. | 41,251 | 2,184 |
| Paychex Inc. | 49,302 | 2,053 |
| * United Rentals Inc. | 16,556 | 1,948 |
| United Technologies Corp. | 17,300 | 1,868 |
38
| Vanguard® Russell 1000 Growth Index Fund | ||
| Schedule of Investments | ||
| August 31, 2014 | ||
| Market | ||
| Value | ||
| Shares | ($000) | |
| Danaher Corp. | 24,212 | 1,855 |
| Dover Corp. | 20,855 | 1,833 |
| * Verisk Analytics Inc. Class A | 28,212 | 1,811 |
| Flowserve Corp. | 23,225 | 1,763 |
| * Stericycle Inc. | 14,358 | 1,706 |
| CH Robinson Worldwide Inc. | 24,971 | 1,705 |
| TransDigm Group Inc. | 8,914 | 1,676 |
| Kansas City Southern | 14,481 | 1,671 |
| * IHS Inc. Class A | 11,485 | 1,636 |
| Pall Corp. | 18,581 | 1,568 |
| Rockwell Collins Inc. | 20,209 | 1,556 |
| Parker-Hannifin Corp. | 13,265 | 1,532 |
| * B/E Aerospace Inc. | 17,652 | 1,496 |
| * Waters Corp. | 14,290 | 1,478 |
| * Trimble Navigation Ltd. | 44,210 | 1,470 |
| Expeditors International of Washington Inc. | 33,665 | 1,390 |
| Wabtec Corp. | 16,083 | 1,341 |
| * Mettler-Toledo International Inc. | 4,888 | 1,322 |
| Fluor Corp. | 16,646 | 1,230 |
| Norfolk Southern Corp. | 11,105 | 1,188 |
| Robert Half International Inc. | 23,237 | 1,167 |
| JB Hunt Transport Services Inc. | 15,404 | 1,164 |
| * Kirby Corp. | 9,659 | 1,152 |
| Roper Industries Inc. | 7,627 | 1,148 |
| Deere & Co. | 13,395 | 1,126 |
| Chicago Bridge & Iron Co. NV | 16,492 | 1,046 |
| * Colfax Corp. | 16,037 | 1,020 |
| Alaska Air Group Inc. | 21,032 | 975 |
| Trinity Industries Inc. | 20,078 | 971 |
| IDEX Corp. | 12,508 | 962 |
| Iron Mountain Inc. | 25,694 | 924 |
| Donaldson Co. Inc. | 22,042 | 923 |
| Cintas Corp. | 13,717 | 907 |
| Nordson Corp. | 10,972 | 889 |
| * Spirit Airlines Inc. | 12,375 | 871 |
| Xylem Inc. | 22,718 | 846 |
| Allegion plc | 16,442 | 846 |
| * Middleby Corp. | 9,749 | 841 |
| * CoStar Group Inc. | 5,510 | 798 |
| Graco Inc. | 10,177 | 782 |
| * Spirit AeroSystems Holdings Inc. Class A | 19,372 | 743 |
| Huntington Ingalls Industries Inc. | 7,125 | 728 |
| * Old Dominion Freight Line Inc. | 10,741 | 716 |
| MSC Industrial Direct Co. Inc. Class A | 7,944 | 716 |
| Allison Transmission Holdings Inc. | 23,085 | 708 |
| Manitowoc Co. Inc. | 23,153 | 681 |
| * Zebra Technologies Corp. | 8,312 | 649 |
| * Copart Inc. | 18,542 | 638 |
| Waste Connections Inc. | 12,939 | 635 |
| Toro Co. | 9,607 | 591 |
| National Instruments Corp. | 17,258 | 572 |
| FLIR Systems Inc. | 16,784 | 567 |
| Foster Wheeler AG | 17,183 | 561 |
| Copa Holdings SA Class A | 4,474 | 550 |
| Landstar System Inc. | 7,343 | 498 |
| * HD Supply Holdings Inc. | 17,350 | 482 |
| * Clean Harbors Inc. | 7,719 | 467 |
| Agilent Technologies Inc. | 7,921 | 453 |
| Pitney Bowes Inc. | 15,210 | 412 |
| * Genesee & Wyoming Inc. Class A | 3,952 | 389 |
| Waste Management Inc. | 7,917 | 372 |
| Rollins Inc. | 11,000 | 327 |
| Lincoln Electric Holdings Inc. | 4,407 | 313 |
| * Quanta Services Inc. | 8,494 | 309 |
39
| Vanguard® Russell 1000 Growth Index Fund | ||
| Schedule of Investments | ||
| August 31, 2014 | ||
| Market | ||
| Value | ||
| Shares | ($000) | |
| AO Smith Corp. | 5,926 | 291 |
| Avery Dennison Corp. | 5,916 | 285 |
| Delta Air Lines Inc. | 7,180 | 284 |
| Stanley Black & Decker Inc. | 2,940 | 269 |
| Booz Allen Hamilton Holding Corp. Class A | 11,411 | 253 |
| Teekay Corp. | 3,413 | 209 |
| Crane Co. | 2,838 | 197 |
| Hubbell Inc. Class B | 1,519 | 184 |
| Snap-on Inc. | 1,389 | 174 |
| ITT Corp. | 3,256 | 156 |
| Covanta Holding Corp. | 7,187 | 151 |
| Pentair plc | 2,180 | 148 |
| Triumph Group Inc. | 2,046 | 142 |
| * Navistar International Corp. | 1,850 | 70 |
| RR Donnelley & Sons Co. | 3,219 | 57 |
| * Genpact Ltd. | 2,784 | 48 |
| Air Lease Corp. Class A | 1,065 | 40 |
| 213,398 | ||
| Technology (23.8%) | ||
| Apple Inc. | 1,016,474 | 104,189 |
| Microsoft Corp. | 901,038 | 40,934 |
| International Business Machines Corp. | 159,391 | 30,651 |
| * Google Inc. Class A | 47,316 | 27,555 |
| * Google Inc. Class C | 47,876 | 27,366 |
| * Facebook Inc. Class A | 332,775 | 24,898 |
| Oracle Corp. | 553,584 | 22,990 |
| QUALCOMM Inc. | 284,545 | 21,654 |
| Texas Instruments Inc. | 182,167 | 8,777 |
| * salesforce.com inc | 103,294 | 6,104 |
| * Adobe Systems Inc. | 83,683 | 6,017 |
| * Micron Technology Inc. | 158,774 | 5,176 |
| * Cognizant Technology Solutions Corp. Class A | 102,984 | 4,709 |
| * Twitter Inc. | 80,975 | 4,029 |
| Intuit Inc. | 47,849 | 3,980 |
| * LinkedIn Corp. Class A | 17,608 | 3,975 |
| Avago Technologies Ltd. Class A | 42,036 | 3,451 |
| Applied Materials Inc. | 137,440 | 3,176 |
| Amphenol Corp. Class A | 26,446 | 2,724 |
| Intel Corp. | 71,147 | 2,484 |
| * SBA Communications Corp. Class A | 21,675 | 2,391 |
| KLA-Tencor Corp. | 25,697 | 1,964 |
| * Equinix Inc. | 8,971 | 1,958 |
| * Red Hat Inc. | 32,041 | 1,952 |
| Xilinx Inc. | 45,383 | 1,917 |
| * Akamai Technologies Inc. | 30,121 | 1,820 |
| Linear Technology Corp. | 39,885 | 1,799 |
| Skyworks Solutions Inc. | 31,707 | 1,797 |
| SanDisk Corp. | 18,266 | 1,789 |
| * Citrix Systems Inc. | 25,162 | 1,768 |
| Microchip Technology Inc. | 33,923 | 1,656 |
| * Autodesk Inc. | 30,348 | 1,628 |
| * F5 Networks Inc. | 12,904 | 1,603 |
| * Electronic Arts Inc. | 40,269 | 1,524 |
| * ServiceNow Inc. | 24,194 | 1,479 |
| * VMware Inc. Class A | 14,804 | 1,459 |
| * Workday Inc. Class A | 15,759 | 1,435 |
| Maxim Integrated Products Inc. | 44,202 | 1,365 |
| Activision Blizzard Inc. | 54,786 | 1,290 |
| Analog Devices Inc. | 24,050 | 1,229 |
| * VeriSign Inc. | 20,284 | 1,158 |
| * Gartner Inc. | 15,151 | 1,130 |
| * Splunk Inc. | 19,910 | 1,074 |
| Corning Inc. | 50,968 | 1,063 |
| EMC Corp. | 34,215 | 1,010 |
40
| Vanguard® Russell 1000 Growth Index Fund | |||
| Schedule of Investments | |||
| August 31, 2014 | |||
| Market | |||
| Value | |||
| Shares | ($000) | ||
| *,^ | 3D Systems Corp. | 18,608 | 996 |
| * | Teradata Corp. | 21,089 | 963 |
| NetApp Inc. | 20,378 | 859 | |
| * | Cadence Design Systems Inc. | 48,012 | 847 |
| * | Concur Technologies Inc. | 8,125 | 816 |
| * | PTC Inc. | 20,171 | 780 |
| * | Palo Alto Networks Inc. | 8,940 | 760 |
| * | Yelp Inc. Class A | 8,697 | 717 |
| Solera Holdings Inc. | 11,632 | 709 | |
| Altera Corp. | 19,485 | 689 | |
| * | Rackspace Hosting Inc. | 19,478 | 674 |
| * | VeriFone Systems Inc. | 19,101 | 667 |
| * | ARRIS Group Inc. | 21,540 | 659 |
| * | MICROS Systems Inc. | 9,564 | 650 |
| * | Atmel Corp. | 71,027 | 629 |
| * | NetSuite Inc. | 6,817 | 597 |
| * | Fortinet Inc. | 22,630 | 584 |
| * | Informatica Corp. | 17,079 | 582 |
| * | TIBCO Software Inc. | 27,131 | 565 |
| * | Stratasys Ltd. | 4,641 | 557 |
| * | Groupon Inc. Class A | 78,606 | 535 |
| * | Cree Inc. | 11,594 | 528 |
| Motorola Solutions Inc. | 8,695 | 516 | |
| Lam Research Corp. | 7,108 | 511 | |
| * | Riverbed Technology Inc. | 26,643 | 502 |
| * | SolarWinds Inc. | 11,146 | 477 |
| CDW Corp. | 14,196 | 469 | |
| * | Advanced Micro Devices Inc. | 107,409 | 448 |
| * | Tableau Software Inc. Class A | 6,240 | 409 |
| Diebold Inc. | 10,549 | 401 | |
| Juniper Networks Inc. | 16,791 | 389 | |
| * | IPG Photonics Corp. | 5,416 | 372 |
| DST Systems Inc. | 3,972 | 369 | |
| * | ON Semiconductor Corp. | 36,912 | 360 |
| * | FireEye Inc. | 11,370 | 354 |
| IAC/InterActiveCorp | 4,995 | 348 | |
| * | IMS Health Holdings Inc. | 12,202 | 340 |
| * | Freescale Semiconductor Ltd. | 15,873 | 334 |
| * | SunEdison Inc. | 13,989 | 308 |
| NVIDIA Corp. | 14,943 | 291 | |
| * | ANSYS Inc. | 3,434 | 279 |
| * | CommScope Holding Co. Inc. | 10,223 | 263 |
| Harris Corp. | 3,638 | 260 | |
| Avnet Inc. | 4,587 | 204 | |
| Sabre Corp. | 7,380 | 135 | |
| * | NCR Corp. | 2,576 | 88 |
| * | EchoStar Corp. Class A | 1,725 | 87 |
| Computer Sciences Corp. | 1,444 | 86 | |
| Teradyne Inc. | 3,490 | 72 | |
| 418,132 | |||
| Utilities (2.3%) | |||
| Verizon Communications Inc. | 698,155 | 34,782 | |
| * | Level 3 Communications Inc. | 28,278 | 1,271 |
| Windstream Holdings Inc. | 94,187 | 1,064 | |
| * | tw telecom inc Class A | 22,984 | 943 |
| ITC Holdings Corp. | 25,098 | 938 | |
| Dominion Resources Inc. | 5,791 | 407 | |
| CenturyLink Inc. | 5,705 | 234 | |
| * | Calpine Corp. | 9,836 | 234 |
| 39,873 | |||
| Total Common Stocks (Cost $1,335,631) | 1,753,189 | ||
41
| Vanguard® Russell 1000 Growth Index Fund | |||||
| Schedule of Investments | |||||
| August 31, 2014 | |||||
| Market | |||||
| Value | |||||
| Coupon | Shares | ($000) | |||
| Temporary Cash Investments (0.0%)1 | |||||
| Money Market Fund (0.0%) | |||||
| 2,3 | Vanguard Market Liquidity Fund | 0.113% | 456,002 | 456 | |
| Face | |||||
| Maturity | Amount | ||||
| Date | ($000) | ||||
| U.S. Government and Agency Obligations (0.0%) | |||||
| 4 | Federal Home Loan Bank Discount Notes | 0.095% | 10/15/14 | 100 | 100 |
| 5,6 | Freddie Mac Discount Notes | 0.077% | 10/20/14 | 100 | 100 |
| 200 | |||||
| Total Temporary Cash Investments (Cost $656) | 656 | ||||
| Total Investments (99.9%) (Cost $1,336,287) | 1,753,845 | ||||
| Other Assets and Liabilities—Net (0.1%)3 | 970 | ||||
| Net Assets (100%) | 1,754,815 | ||||
* Non-income-producing security.
^ Includes partial security positions on loan to broker-dealers. The total value of securities on loan is $442,000.
1 The fund invests a portion of its cash reserves in equity markets through the use of index futures contracts. After giving effect to futures investments, the fund's effective common stock and temporary cash investment positions represent 100.0% and 0.1%, respectively, of net assets.
2 Affiliated money market fund available only to Vanguard funds and certain trusts and accounts managed by Vanguard. Rate shown is the 7-day yield.
3 Includes $456,000 of collateral received for securities on loan.
4 The issuer operates under a congressional charter; its securities are generally neither guaranteed by the U.S. Treasury nor backed by the full faith and credit of the U.S. government.
5 The issuer was placed under federal conservatorship in September 2008; since that time, its daily operations have been managed by the Federal Housing Finance Agency and it receives capital from the U.S. Treasury, as needed to maintain a positive net worth, in exchange for senior preferred stock.
6 Securities with a value of $100,000 have been segregated as initial margin for open futures contracts.
REIT—Real Estate Investment Trust.
42
This page intentionally left blank.
43
© 2014 The Vanguard Group, Inc.
All rights reserved.
Vanguard Marketing Corporation, Distributor.
SNA18480 102014
Report of Independent Registered Public Accounting Firm
To the Board of Trustees of Vanguard Scottsdale Funds and the Shareholders of Vanguard Russell 1000 Index Fund, Vanguard Russell 1000 Value Index Fund and Vanguard Russell 1000 Growth Index Fund:
In our opinion, the accompanying statements of net assets – investments summary and the related statements of operations and of changes in net assets and the financial highlights (included in Item 1 of this Form N-CSR) and the schedules of investments (included in Item 6 of this Form N-CSR) present fairly, in all material respects, the financial position of Vanguard Russell 1000 Index Fund, Vanguard Russell 1000 Value Index Fund and Vanguard Russell 1000 Growth Index Fund (the "Funds") at August 31, 2014, the results of each of their operations for the year then ended, the changes in each of their net assets for each of the two years in the period then ended, and the financial highlights for each of the periods indicated, in conformity with accounting principles generally accepted in the United States of America. These financial statements, financial highlights, and schedules of investments (hereafter referred to as "financial statements") are the responsibility of the Funds’ management. Our responsibility is to express an opinion on these financial statements based on our audits. We conducted our audits of these financial statements in accordance with the standards of the Public Company Accounting Oversight Board (United States). Those standards require that we plan and perform the audit to obtain reasonable assurance about whether the financial statements are free of material misstatement. An audit includes examining, on a test basis, evidence supporting the amounts and disclosures in the financial statements, assessing the accounting principles used and significant estimates made by management, and evaluating the overall financial statement presentation. We believe that our audits, which included confirmation of securities at August 31, 2014 by correspondence with the custodian and broker and by agreement to the underlying ownership records of the transfer agent, provide a reasonable basis for our opinion.

October 15, 2014
PricewaterhouseCoopers LLP, Two Commerce Square, 2001 Market Street, Suite 1700, Philadelphia, PA 19103-7042
T: (267) 330-3000, F: (267) 330-3300, www.pwc.com/us
| Vanguard® Russell 2000 Index Fund | ||
| Schedule of Investments | ||
| August 31, 2014 | ||
| Market | ||
| Value | ||
| Shares | ($000) | |
| Common Stocks (99.5%)1 | ||
| Consumer Discretionary (13.8%) | ||
| Brunswick Corp. | 37,182 | 1,599 |
| * Tenneco Inc. | 24,413 | 1,564 |
| Dana Holding Corp. | 62,858 | 1,460 |
| Vail Resorts Inc. | 14,494 | 1,152 |
| * Buffalo Wild Wings Inc. | 7,578 | 1,120 |
| * Office Depot Inc. | 214,425 | 1,098 |
| American Eagle Outfitters Inc. | 77,956 | 1,098 |
| Wolverine World Wide Inc. | 40,669 | 1,080 |
| * Restoration Hardware Holdings Inc. | 12,502 | 1,049 |
| Men's Wearhouse Inc. | 19,230 | 1,039 |
| * Time Inc. | 44,215 | 1,038 |
| Pool Corp. | 18,090 | 1,025 |
| Sotheby's | 24,432 | 997 |
| Jack in the Box Inc. | 16,054 | 954 |
| * Skechers U.S.A. Inc. Class A | 15,676 | 915 |
| Cheesecake Factory Inc. | 20,026 | 900 |
| * Five Below Inc. | 21,761 | 883 |
| * TRI Pointe Homes Inc. | 58,791 | 870 |
| * Asbury Automotive Group Inc. | 12,294 | 857 |
| Hillenbrand Inc. | 25,183 | 842 |
| * Houghton Mifflin Harcourt Co. | 43,713 | 839 |
| * Grand Canyon Education Inc. | 18,706 | 809 |
| HSN Inc. | 13,308 | 806 |
| Lithia Motors Inc. Class A | 9,154 | 800 |
| Sinclair Broadcast Group Inc. Class A | 27,536 | 800 |
| * Steven Madden Ltd. | 23,368 | 794 |
| * Shutterfly Inc. | 15,448 | 788 |
| Cooper Tire & Rubber Co. | 25,454 | 785 |
| Group 1 Automotive Inc. | 9,708 | 778 |
| * ANN Inc. | 18,777 | 778 |
| Cracker Barrel Old Country Store Inc. | 7,651 | 768 |
| * Iconix Brand Group Inc. | 18,364 | 765 |
| * Genesco Inc. | 9,619 | 763 |
| * Life Time Fitness Inc. | 16,389 | 756 |
| Texas Roadhouse Inc. Class A | 27,951 | 743 |
| * Conversant Inc. | 26,865 | 740 |
| Ryland Group Inc. | 18,813 | 698 |
| * Gentherm Inc. | 14,144 | 691 |
| New York Times Co. Class A | 55,479 | 687 |
| * Marriott Vacations Worldwide Corp. | 11,357 | 677 |
| PriceSmart Inc. | 7,504 | 673 |
| Meredith Corp. | 14,402 | 671 |
| * Helen of Troy Ltd. | 11,465 | 668 |
| Monro Muffler Brake Inc. | 12,635 | 654 |
| * TiVo Inc. | 46,051 | 649 |
| * Meritage Homes Corp. | 15,683 | 647 |
| * Vistaprint NV | 13,346 | 644 |
| * G-III Apparel Group Ltd. | 7,681 | 634 |
| * Lumber Liquidators Holdings Inc. | 11,000 | 629 |
| Pier 1 Imports Inc. | 37,908 | 597 |
| * Pinnacle Entertainment Inc. | 23,896 | 597 |
| KB Home | 33,580 | 596 |
| Rent-A-Center Inc. | 21,171 | 590 |
| * Express Inc. | 33,782 | 586 |
| Guess? Inc. | 24,647 | 578 |
| Finish Line Inc. Class A | 19,349 | 573 |
| Nexstar Broadcasting Group Inc. Class A | 12,281 | 561 |
| Buckle Inc. | 11,307 | 556 |
| DineEquity Inc. | 6,674 | 555 |
| Matthews International Corp. Class A | 11,973 | 553 |
| * Crocs Inc. | 35,098 | 542 |
1
| Vanguard® Russell 2000 Index Fund | ||
| Schedule of Investments | ||
| August 31, 2014 | ||
| Market | ||
| Value | ||
| Shares | ($000) | |
| * Meritor Inc. | 39,235 | 535 |
| * Fiesta Restaurant Group Inc. | 10,740 | 527 |
| Brown Shoe Co. Inc. | 17,508 | 522 |
| * Bloomin' Brands Inc. | 30,952 | 515 |
| Churchill Downs Inc. | 5,385 | 507 |
| * Bright Horizons Family Solutions Inc. | 12,307 | 501 |
| * Conn's Inc. | 11,106 | 498 |
| * Belmond Ltd. Class A | 38,732 | 495 |
| * American Axle & Manufacturing Holdings Inc. | 27,127 | 491 |
| * Dorman Products Inc. | 10,867 | 487 |
| * Select Comfort Corp. | 21,763 | 487 |
| Papa John's International Inc. | 12,278 | 486 |
| * Standard Pacific Corp. | 58,048 | 486 |
| * Vitamin Shoppe Inc. | 12,344 | 484 |
| * Outerwall Inc. | 8,173 | 482 |
| * LifeLock Inc. | 32,275 | 478 |
| Children's Place Inc. | 8,839 | 475 |
| * Hibbett Sports Inc. | 10,383 | 472 |
| * Sonic Corp. | 21,792 | 460 |
| * Tumi Holdings Inc. | 20,309 | 457 |
| MDC Holdings Inc. | 15,656 | 454 |
| La-Z-Boy Inc. | 20,986 | 448 |
| * Krispy Kreme Doughnuts Inc. | 26,124 | 444 |
| * Shutterstock Inc. | 6,099 | 432 |
| Bob Evans Farms Inc. | 9,900 | 430 |
| Columbia Sportswear Co. | 5,611 | 427 |
| Drew Industries Inc. | 9,472 | 420 |
| * Burlington Stores Inc. | 11,491 | 410 |
| Sonic Automotive Inc. Class A | 15,982 | 395 |
| * Barnes & Noble Inc. | 16,446 | 392 |
| * Constant Contact Inc. | 12,585 | 392 |
| Sturm Ruger & Co. Inc. | 7,779 | 392 |
| Cato Corp. Class A | 10,993 | 381 |
| * Popeyes Louisiana Kitchen Inc. | 9,480 | 380 |
| MDC Partners Inc. Class A | 17,277 | 378 |
| International Speedway Corp. Class A | 11,164 | 374 |
| Scholastic Corp. | 10,639 | 373 |
| * Cooper-Standard Holding Inc. | 5,489 | 360 |
| Oxford Industries Inc. | 5,819 | 357 |
| National CineMedia Inc. | 24,394 | 356 |
| * Penn National Gaming Inc. | 31,517 | 356 |
| * Diamond Resorts International Inc. | 14,187 | 355 |
| * BJ's Restaurants Inc. | 9,497 | 354 |
| * La Quinta Holdings Inc. | 17,756 | 351 |
| * Universal Electronics Inc. | 6,381 | 349 |
| Interval Leisure Group Inc. | 15,924 | 344 |
| * Mattress Firm Holding Corp. | 5,922 | 339 |
| * Media General Inc. | 21,811 | 336 |
| * Multimedia Games Holding Co. Inc. | 11,875 | 330 |
| * Carmike Cinemas Inc. | 9,718 | 329 |
| * Boyd Gaming Corp. | 30,269 | 322 |
| * Tuesday Morning Corp. | 17,430 | 306 |
| * Red Robin Gourmet Burgers Inc. | 5,729 | 304 |
| Standard Motor Products Inc. | 7,940 | 299 |
| Capella Education Co. | 4,383 | 285 |
| * Tower International Inc. | 8,261 | 277 |
| * Caesars Entertainment Corp. | 20,560 | 276 |
| Weight Watchers International Inc. | 11,103 | 274 |
| Movado Group Inc. | 7,354 | 273 |
| * Winnebago Industries Inc. | 10,922 | 270 |
| * Zumiez Inc. | 8,313 | 269 |
| * Cumulus Media Inc. Class A | 58,083 | 267 |
| Regis Corp. | 17,501 | 264 |
| * Strayer Education Inc. | 4,349 | 264 |
2
| Vanguard® Russell 2000 Index Fund | ||
| Schedule of Investments | ||
| August 31, 2014 | ||
| Market | ||
| Value | ||
| Shares | ($000) | |
| * K12 Inc. | 13,789 | 260 |
| Ethan Allen Interiors Inc. | 10,122 | 255 |
| * Cavco Industries Inc. | 3,546 | 253 |
| * Move Inc. | 15,869 | 252 |
| * FTD Cos. Inc. | 7,593 | 251 |
| * Steiner Leisure Ltd. | 5,895 | 251 |
| * Smith & Wesson Holding Corp. | 22,035 | 244 |
| * Denny's Corp. | 34,922 | 239 |
| * Libbey Inc. | 8,611 | 238 |
| * Pep Boys-Manny Moe & Jack | 21,346 | 237 |
| * EW Scripps Co. Class A | 12,515 | 237 |
| * Francesca's Holdings Corp. | 16,927 | 237 |
| Callaway Golf Co. | 31,087 | 237 |
| * Lands' End Inc. | 6,608 | 228 |
| * HealthStream Inc. | 8,770 | 228 |
| * M/I Homes Inc. | 9,811 | 223 |
| Stage Stores Inc. | 12,708 | 222 |
| * American Public Education Inc. | 7,007 | 213 |
| * Beazer Homes USA Inc. | 11,198 | 211 |
| * Scientific Games Corp. Class A | 20,755 | 211 |
| Fred's Inc. Class A | 14,779 | 210 |
| New Media Investment Group Inc. | 12,037 | 210 |
| * Del Frisco's Restaurant Group Inc. | 9,475 | 210 |
| * Biglari Holdings Inc. | 577 | 207 |
| * Chegg Inc. | 29,537 | 204 |
| * Rentrak Corp. | 3,979 | 203 |
| Inter Parfums Inc. | 6,667 | 203 |
| AMC Entertainment Holdings Inc. | 8,443 | 200 |
| * Caesars Acquisition Co. Class A | 18,329 | 200 |
| * Gray Television Inc. | 19,869 | 197 |
| * Stamps.com Inc. | 5,860 | 197 |
| * Federal-Mogul Holdings Corp. | 11,555 | 197 |
| * Hovnanian Enterprises Inc. Class A | 46,817 | 197 |
| Nutrisystem Inc. | 11,990 | 196 |
| * American Woodmark Corp. | 4,938 | 194 |
| Arctic Cat Inc. | 5,171 | 191 |
| Superior Industries International Inc. | 9,734 | 189 |
| Haverty Furniture Cos. Inc. | 8,077 | 188 |
| * Motorcar Parts of America Inc. | 6,049 | 183 |
| World Wrestling Entertainment Inc. Class A | 12,568 | 183 |
| * MarineMax Inc. | 10,508 | 181 |
| Viad Corp. | 8,195 | 180 |
| * William Lyon Homes Class A | 7,036 | 180 |
| * Vera Bradley Inc. | 8,743 | 179 |
| * Journal Communications Inc. Class A | 17,972 | 178 |
| * Elizabeth Arden Inc. | 10,379 | 178 |
| * Chuy's Holdings Inc. | 6,591 | 173 |
| * LeapFrog Enterprises Inc. | 26,182 | 170 |
| * Orbitz Worldwide Inc. | 20,689 | 170 |
| Ruth's Hospitality Group Inc. | 15,010 | 167 |
| * Eastman Kodak Co. | 7,078 | 164 |
| * Vince Holding Corp. | 4,480 | 163 |
| ClubCorp Holdings Inc. | 8,743 | 162 |
| * Quiksilver Inc. | 54,460 | 158 |
| * RealD Inc. | 16,951 | 158 |
| * Ruby Tuesday Inc. | 25,528 | 158 |
| * Central Garden and Pet Co. Class A | 17,320 | 156 |
| * Revlon Inc. Class A | 4,554 | 155 |
| * Stoneridge Inc. | 11,926 | 149 |
| * Career Education Corp. | 27,001 | 148 |
| * Nautilus Inc. | 12,506 | 148 |
| * Blue Nile Inc. | 5,191 | 147 |
| * Container Store Group Inc. | 6,900 | 146 |
| * Citi Trends Inc. | 6,247 | 145 |
3
| Vanguard® Russell 2000 Index Fund | |||
| Schedule of Investments | |||
| August 31, 2014 | |||
| Market | |||
| Value | |||
| Shares | ($000) | ||
| * | Eros International plc | 8,904 | 145 |
| Stein Mart Inc. | 11,593 | 144 | |
| * | Christopher & Banks Corp. | 14,605 | 140 |
| * | Aeropostale Inc. | 33,334 | 140 |
| Harte-Hanks Inc. | 19,743 | 138 | |
| Shoe Carnival Inc. | 6,282 | 135 | |
| * | Angie's List Inc. | 17,490 | 134 |
| * | America's Car-Mart Inc. | 3,118 | 132 |
| Marcus Corp. | 7,205 | 131 | |
| * | Tile Shop Holdings Inc. | 11,248 | 130 |
| National Presto Industries Inc. | 1,937 | 127 | |
| Remy International Inc. | 5,725 | 127 | |
| * | XO Group Inc. | 10,792 | 126 |
| * | SFX Entertainment Inc. | 17,716 | 125 |
| Carriage Services Inc. Class A | 6,440 | 120 | |
| Entravision Communications Corp. Class A | 24,723 | 113 | |
| Marchex Inc. Class B | 13,168 | 113 | |
| * | Kirkland's Inc. | 6,268 | 112 |
| Strattec Security Corp. | 1,391 | 112 | |
| * | Bravo Brio Restaurant Group Inc. | 7,682 | 111 |
| * | Carrols Restaurant Group Inc. | 15,190 | 111 |
| * | McClatchy Co. Class A | 24,495 | 110 |
| * | LGI Homes Inc. | 5,734 | 110 |
| Destination Maternity Corp. | 5,593 | 108 | |
| * | Perry Ellis International Inc. | 4,979 | 100 |
| * | Jamba Inc. | 6,755 | 99 |
| Universal Technical Institute Inc. | 8,708 | 97 | |
| * | WCI Communities Inc. | 4,702 | 94 |
| * | Morgans Hotel Group Co. | 12,152 | 92 |
| * | Sequential Brands Group Inc. | 6,769 | 90 |
| * | Sears Hometown and Outlet Stores Inc. | 4,652 | 89 |
| * | Overstock.com Inc. | 5,031 | 89 |
| * | Entercom Communications Corp. Class A | 9,673 | 88 |
| AH Belo Corp. Class A | 7,635 | 88 | |
| Speedway Motorsports Inc. | 4,707 | 88 | |
| * | Lee Enterprises Inc. | 21,467 | 87 |
| CSS Industries Inc. | 3,425 | 87 | |
| * | Noodles & Co. Class A | 4,343 | 85 |
| * | Franklin Covey Co. | 4,392 | 84 |
| * | VOXX International Corp. Class A | 8,457 | 84 |
| * | Daily Journal Corp. | 436 | 83 |
| * | Bridgepoint Education Inc. | 6,417 | 81 |
| * | Central European Media Enterprises Ltd. Class A | 32,057 | 80 |
| *,^ | ITT Educational Services Inc. | 9,370 | 79 |
| * | 2U Inc. | 4,117 | 78 |
| * | Sizmek Inc. | 8,834 | 78 |
| Big 5 Sporting Goods Corp. | 7,591 | 77 | |
| * | Black Diamond Inc. | 9,118 | 77 |
| RG Barry Corp. | 4,028 | 76 | |
| * | West Marine Inc. | 6,862 | 75 |
| * | ValueVision Media Inc. Class A | 15,894 | 75 |
| * | Rosetta Stone Inc. | 8,512 | 74 |
| *,^ | Coupons.com Inc. | 4,837 | 74 |
| * | Potbelly Corp. | 5,990 | 72 |
| Lifetime Brands Inc. | 4,129 | 71 | |
| Weyco Group Inc. | 2,630 | 71 | |
| * | Isle of Capri Casinos Inc. | 8,560 | 71 |
| * | Destination XL Group Inc. | 14,026 | 70 |
| * | Malibu Boats Inc. Class A | 3,360 | 70 |
| Flexsteel Industries Inc. | 1,952 | 68 | |
| * | Zoe's Kitchen Inc. | 2,339 | 68 |
| * | Dex Media Inc. | 5,970 | 68 |
| * | Cenveo Inc. | 21,791 | 66 |
| Winmark Corp. | 904 | 65 | |
4
| Vanguard® Russell 2000 Index Fund | |||
| Schedule of Investments | |||
| August 31, 2014 | |||
| Market | |||
| Value | |||
| Shares | ($000) | ||
| * | Build-A-Bear Workshop Inc. | 4,944 | 64 |
| * | Systemax Inc. | 4,401 | 64 |
| * | Fox Factory Holding Corp. | 4,187 | 64 |
| Einstein Noah Restaurant Group Inc. | 4,456 | 63 | |
| * | Intrawest Resorts Holdings Inc. | 5,390 | 62 |
| * | QuinStreet Inc. | 12,739 | 61 |
| * | Nathan's Famous Inc. | 1,099 | 61 |
| * | Reading International Inc. Class A | 7,047 | 61 |
| * | Skullcandy Inc. | 7,305 | 61 |
| * | Speed Commerce Inc. | 18,339 | 60 |
| Bon-Ton Stores Inc. | 5,465 | 58 | |
| * | Fuel Systems Solutions Inc. | 5,681 | 58 |
| Escalade Inc. | 3,972 | 57 | |
| Collectors Universe Inc. | 2,764 | 56 | |
| Saga Communications Inc. Class A | 1,449 | 55 | |
| * | New Home Co. Inc. | 3,868 | 55 |
| * | 1-800-Flowers.com Inc. Class A | 10,415 | 54 |
| Johnson Outdoors Inc. Class A | 2,006 | 53 | |
| * | JAKKS Pacific Inc. | 7,771 | 53 |
| * | Liberty Tax Inc. | 1,530 | 52 |
| * | Norcraft Cos. Inc. | 3,109 | 52 |
| * | Martha Stewart Living Omnimedia Inc. Class A | 11,923 | 51 |
| * | Famous Dave's of America Inc. | 1,875 | 51 |
| * | Crown Media Holdings Inc. Class A | 14,000 | 48 |
| * | Gaiam Inc. Class A | 6,013 | 45 |
| * | Monarch Casino & Resort Inc. | 3,474 | 44 |
| bebe stores inc | 12,595 | 42 | |
| * | Hemisphere Media Group Inc. | 3,482 | 40 |
| * | New York & Co. Inc. | 11,641 | 40 |
| * | Pacific Sunwear of California Inc. | 18,668 | 39 |
| * | hhgregg Inc. | 5,174 | 37 |
| Marine Products Corp. | 4,373 | 35 | |
| Salem Communications Corp. Class A | 4,201 | 35 | |
| * | Tilly's Inc. Class A | 4,008 | 33 |
| * | Radio One Inc. | 9,269 | 28 |
| * | Empire Resorts Inc. | 6,049 | 27 |
| * | Care.com Inc. | 2,833 | 26 |
| * | Sportsman's Warehouse Holdings Inc. | 3,903 | 23 |
| * | ReachLocal Inc. | 4,213 | 22 |
| * | Ignite Restaurant Group Inc. | 2,885 | 21 |
| * | Papa Murphy's Holdings Inc. | 2,340 | 21 |
| *,^ | Education Management Corp. | 10,736 | 14 |
| * | Biglari Holdings Inc. Rights Expire 9/12/2014 | 585 | 13 |
| 95,551 | |||
| Consumer Staples (2.7%) | |||
| * | TreeHouse Foods Inc. | 16,836 | 1,389 |
| * | United Natural Foods Inc. | 19,899 | 1,279 |
| Casey's General Stores Inc. | 15,433 | 1,106 | |
| Sanderson Farms Inc. | 9,251 | 863 | |
| Andersons Inc. | 11,309 | 778 | |
| * | SUPERVALU Inc. | 81,292 | 776 |
| * | Boston Beer Co. Inc. Class A | 3,340 | 738 |
| Lancaster Colony Corp. | 7,418 | 656 | |
| * | Post Holdings Inc. | 17,626 | 652 |
| B&G Foods Inc. | 21,511 | 650 | |
| Vector Group Ltd. | 26,372 | 630 | |
| Dean Foods Co. | 37,482 | 606 | |
| * | Fresh Market Inc. | 17,170 | 573 |
| J&J Snack Foods Corp. | 5,973 | 566 | |
| Snyder's-Lance Inc. | 19,090 | 520 | |
| Cal-Maine Foods Inc. | 6,222 | 492 | |
| Universal Corp. | 9,312 | 491 | |
| Fresh Del Monte Produce Inc. | 14,486 | 463 | |
| Core-Mark Holding Co. Inc. | 9,235 | 445 | |
5
| Vanguard® Russell 2000 Index Fund | |||
| Schedule of Investments | |||
| August 31, 2014 | |||
| Market | |||
| Value | |||
| Shares | ($000) | ||
| WD-40 Co. | 6,006 | 413 | |
| * | Boulder Brands Inc. | 24,418 | 329 |
| *,^ | Seaboard Corp. | 113 | 328 |
| SpartanNash Co. | 15,125 | 325 | |
| * | Chiquita Brands International Inc. | 18,813 | 261 |
| * | Diamond Foods Inc. | 8,729 | 241 |
| * | Annie's Inc. | 6,818 | 217 |
| Tootsie Roll Industries Inc. | 7,543 | 213 | |
| Calavo Growers Inc. | 5,190 | 202 | |
| * | Pantry Inc. | 9,404 | 199 |
| Weis Markets Inc. | 4,417 | 190 | |
| * | USANA Health Sciences Inc. | 2,511 | 183 |
| * | Medifast Inc. | 5,267 | 177 |
| Coca-Cola Bottling Co. Consolidated | 1,867 | 139 | |
| * | Chefs' Warehouse Inc. | 7,016 | 133 |
| Ingles Markets Inc. Class A | 5,066 | 128 | |
| * | Omega Protein Corp. | 8,395 | 126 |
| PetMed Express Inc. | 8,095 | 114 | |
| Limoneira Co. | 4,498 | 109 | |
| John B Sanfilippo & Son Inc. | 3,305 | 102 | |
| * | Seneca Foods Corp. Class A | 3,273 | 99 |
| Orchids Paper Products Co. | 3,238 | 90 | |
| * | Nutraceutical International Corp. | 3,470 | 84 |
| * | National Beverage Corp. | 4,585 | 84 |
| * | Alliance One International Inc. | 35,349 | 78 |
| * | Natural Grocers by Vitamin Cottage Inc. | 3,978 | 73 |
| Nature's Sunshine Products Inc. | 4,408 | 72 | |
| * | Farmer Bros Co. | 2,998 | 70 |
| * | Inventure Foods Inc. | 5,672 | 69 |
| Roundy's Inc. | 15,747 | 59 | |
| Village Super Market Inc. Class A | 2,557 | 59 | |
| * | Craft Brew Alliance Inc. | 4,273 | 56 |
| * | 22nd Century Group Inc. | 16,480 | 50 |
| * | PhotoMedex Inc. | 5,657 | 46 |
| Alico Inc. | 1,166 | 46 | |
| * | Synutra International Inc. | 6,994 | 40 |
| Liberator Medical Holdings Inc. | 12,631 | 37 | |
| Female Health Co. | 8,791 | 34 | |
| * | Fairway Group Holdings Corp. | 6,580 | 30 |
| * | Lifeway Foods Inc. | 1,865 | 26 |
| 19,004 | |||
| Energy (6.0%) | |||
| * | Kodiak Oil & Gas Corp. | 106,869 | 1,739 |
| SemGroup Corp. Class A | 17,086 | 1,499 | |
| * | Diamondback Energy Inc. | 16,769 | 1,448 |
| * | Rosetta Resources Inc. | 24,635 | 1,232 |
| * | Helix Energy Solutions Group Inc. | 42,318 | 1,156 |
| * | Carrizo Oil & Gas Inc. | 18,241 | 1,144 |
| Exterran Holdings Inc. | 23,484 | 1,095 | |
| Western Refining Inc. | 21,329 | 992 | |
| * | GT Advanced Technologies Inc. | 54,692 | 974 |
| Civeo Corp. | 37,650 | 957 | |
| * | PDC Energy Inc. | 14,353 | 862 |
| CARBO Ceramics Inc. | 7,916 | 852 | |
| Delek US Holdings Inc. | 23,798 | 832 | |
| * | Forum Energy Technologies Inc. | 23,897 | 814 |
| * | Bonanza Creek Energy Inc. | 13,154 | 808 |
| * | Matador Resources Co. | 29,395 | 804 |
| * | Stone Energy Corp. | 22,521 | 792 |
| * | McDermott International Inc. | 95,253 | 686 |
| * | Sanchez Energy Corp. | 20,386 | 677 |
| * | SEACOR Holdings Inc. | 8,267 | 675 |
| * | SunCoke Energy Inc. | 27,980 | 672 |
| Green Plains Inc. | 15,001 | 670 | |
6
| Vanguard® Russell 2000 Index Fund | |||
| Schedule of Investments | |||
| August 31, 2014 | |||
| Market | |||
| Value | |||
| Shares | ($000) | ||
| * | Hornbeck Offshore Services Inc. | 14,536 | 635 |
| Energy XXI Bermuda Ltd. | 37,589 | 620 | |
| * | Flotek Industries Inc. | 21,569 | 600 |
| * | Halcon Resources Corp. | 104,559 | 575 |
| * | Magnum Hunter Resources Corp. | 79,702 | 551 |
| * | C&J Energy Services Inc. | 18,462 | 530 |
| Comstock Resources Inc. | 19,183 | 468 | |
| * | Parsley Energy Inc. Class A | 21,285 | 467 |
| * | Bill Barrett Corp. | 19,927 | 454 |
| * | Newpark Resources Inc. | 34,024 | 419 |
| * | Northern Oil and Gas Inc. | 24,476 | 412 |
| * | Penn Virginia Corp. | 26,305 | 395 |
| * | Pioneer Energy Services Corp. | 25,161 | 387 |
| * | Cloud Peak Energy Inc. | 24,431 | 384 |
| * | TETRA Technologies Inc. | 31,647 | 373 |
| * | Triangle Petroleum Corp. | 30,331 | 364 |
| * | Synergy Resources Corp. | 26,696 | 359 |
| * | Alpha Natural Resources Inc. | 88,761 | 351 |
| * | Key Energy Services Inc. | 52,665 | 332 |
| North Atlantic Drilling Ltd. | 28,662 | 314 | |
| * | Basic Energy Services Inc. | 12,911 | 313 |
| * | Goodrich Petroleum Corp. | 13,953 | 308 |
| * | Parker Drilling Co. | 48,574 | 305 |
| * | Matrix Service Co. | 10,590 | 299 |
| * | Rex Energy Corp. | 19,453 | 297 |
| EXCO Resources Inc. | 60,889 | 294 | |
| Tesco Corp. | 13,468 | 286 | |
| * | Solazyme Inc. | 30,463 | 286 |
| * | Approach Resources Inc. | 15,787 | 282 |
| * | Clean Energy Fuels Corp. | 28,141 | 281 |
| * | Clayton Williams Energy Inc. | 2,362 | 280 |
| * | Contango Oil & Gas Co. | 6,981 | 277 |
| * | REX American Resources Corp. | 2,522 | 269 |
| * | RSP Permian Inc. | 9,390 | 268 |
| Arch Coal Inc. | 85,120 | 260 | |
| * | Westmoreland Coal Co. | 6,006 | 252 |
| * | Resolute Energy Corp. | 31,245 | 251 |
| * | RigNet Inc. | 4,793 | 224 |
| * | Pacific Ethanol Inc. | 9,623 | 222 |
| * | Abraxas Petroleum Corp. | 36,990 | 219 |
| *,^ | FuelCell Energy Inc. | 85,532 | 217 |
| * | Hercules Offshore Inc. | 64,414 | 217 |
| * | Geospace Technologies Corp. | 5,268 | 217 |
| * | EnerNOC Inc. | 10,835 | 213 |
| W&T Offshore Inc. | 14,007 | 209 | |
| * | Era Group Inc. | 8,156 | 209 |
| * | Swift Energy Co. | 17,566 | 199 |
| * | Emerald Oil Inc. | 22,885 | 196 |
| * | Warren Resources Inc. | 29,490 | 190 |
| * | VAALCO Energy Inc. | 19,978 | 183 |
| * | ION Geophysical Corp. | 51,810 | 179 |
| * | Willbros Group Inc. | 16,044 | 175 |
| Alon USA Energy Inc. | 10,517 | 175 | |
| * | Callon Petroleum Co. | 16,217 | 174 |
| * | Gastar Exploration Inc. | 22,057 | 173 |
| *,^ | Capstone Turbine Corp. | 137,459 | 172 |
| Panhandle Oil and Gas Inc. Class A | 2,804 | 171 | |
| * | Renewable Energy Group Inc. | 13,848 | 168 |
| * | PetroQuest Energy Inc. | 23,446 | 156 |
| * | Natural Gas Services Group Inc. | 5,183 | 154 |
| ^ | Walter Energy Inc. | 27,068 | 151 |
| * | Vantage Drilling Co. | 84,203 | 150 |
| * | Ring Energy Inc. | 8,113 | 139 |
| Gulf Island Fabrication Inc. | 6,055 | 128 | |
7
| Vanguard® Russell 2000 Index Fund | |||
| Schedule of Investments | |||
| August 31, 2014 | |||
| Market | |||
| Value | |||
| Shares | ($000) | ||
| * | BPZ Resources Inc. | 47,554 | 116 |
| * | PowerSecure International Inc. | 9,735 | 108 |
| * | Midstates Petroleum Co. Inc. | 14,934 | 105 |
| * | Enphase Energy Inc. | 7,342 | 103 |
| * | Trecora Resources | 7,864 | 103 |
| * | TransAtlantic Petroleum Ltd. | 9,078 | 100 |
| * | Jones Energy Inc. | 4,724 | 91 |
| * | Harvest Natural Resources Inc. | 16,878 | 83 |
| * | Forest Oil Corp. | 49,674 | 81 |
| * | Nuverra Environmental Solutions Inc. | 5,975 | 81 |
| Evolution Petroleum Corp. | 7,881 | 79 | |
| * | FX Energy Inc. | 21,594 | 74 |
| Dawson Geophysical Co. | 3,233 | 73 | |
| * | Mitcham Industries Inc. | 5,163 | 68 |
| * | Quicksilver Resources Inc. | 50,359 | 67 |
| * | Ameresco Inc. Class A | 7,910 | 66 |
| * | American Eagle Energy Corp. | 12,199 | 64 |
| * | Miller Energy Resources Inc. | 12,335 | 64 |
| Adams Resources & Energy Inc. | 855 | 56 | |
| * | Apco Oil and Gas International Inc. | 3,697 | 53 |
| Hallador Energy Co. | 3,514 | 47 | |
| * | Isramco Inc. | 370 | 47 |
| *,^ | Amyris Inc. | 10,600 | 45 |
| * | Glori Energy Inc. | 4,887 | 32 |
| * | Profire Energy Inc. | 5,349 | 25 |
| * | Global Geophysical Services Inc. | 127 | — |
| 41,989 | |||
| Financial Services (24.2%) | |||
| * | WEX Inc. | 15,538 | 1,766 |
| Prosperity Bancshares Inc. | 27,963 | 1,689 | |
| RLJ Lodging Trust | 52,492 | 1,565 | |
| CNO Financial Group Inc. | 87,358 | 1,559 | |
| Highwoods Properties Inc. | 36,138 | 1,538 | |
| LaSalle Hotel Properties | 41,726 | 1,525 | |
| Investors Bancorp Inc. | 143,635 | 1,524 | |
| * | Stifel Financial Corp. | 26,255 | 1,257 |
| EPR Properties | 21,432 | 1,220 | |
| First American Financial Corp. | 42,839 | 1,214 | |
| Sunstone Hotel Investors Inc. | 82,222 | 1,198 | |
| * | Strategic Hotels & Resorts Inc. | 99,149 | 1,178 |
| Umpqua Holdings Corp. | 66,805 | 1,167 | |
| * | MGIC Investment Corp. | 135,740 | 1,144 |
| FirstMerit Corp. | 66,305 | 1,143 | |
| * | Portfolio Recovery Associates Inc. | 20,072 | 1,141 |
| Cousins Properties Inc. | 88,500 | 1,123 | |
| Radian Group Inc. | 76,585 | 1,115 | |
| Primerica Inc. | 21,901 | 1,102 | |
| Hancock Holding Co. | 32,995 | 1,097 | |
| Geo Group Inc. | 29,108 | 1,089 | |
| * | Euronet Worldwide Inc. | 20,435 | 1,089 |
| CubeSmart | 57,865 | 1,076 | |
| Webster Financial Corp. | 36,216 | 1,068 | |
| DCT Industrial Trust Inc. | 131,940 | 1,049 | |
| DiamondRock Hospitality Co. | 78,465 | 1,045 | |
| Sovran Self Storage Inc. | 13,225 | 1,022 | |
| Bank of the Ozarks Inc. | 31,940 | 1,020 | |
| Pebblebrook Hotel Trust | 25,621 | 993 | |
| Medical Properties Trust Inc. | 69,146 | 974 | |
| Colony Financial Inc. | 42,967 | 963 | |
| Healthcare Realty Trust Inc. | 38,508 | 961 | |
| * | Texas Capital Bancshares Inc. | 17,266 | 932 |
| United Bankshares Inc. | 27,698 | 913 | |
| Lexington Realty Trust | 82,455 | 897 | |
| MarketAxess Holdings Inc. | 15,123 | 891 | |
8
| Vanguard® Russell 2000 Index Fund | ||
| Schedule of Investments | ||
| August 31, 2014 | ||
| Market | ||
| Value | ||
| Shares | ($000) | |
| Washington Federal Inc. | 40,632 | 884 |
| Sun Communities Inc. | 16,448 | 882 |
| UMB Financial Corp. | 15,129 | 874 |
| Wintrust Financial Corp. | 18,693 | 871 |
| Invesco Mortgage Capital Inc. | 49,354 | 870 |
| Ryman Hospitality Properties Inc. | 17,419 | 867 |
| National Health Investors Inc. | 13,253 | 855 |
| PrivateBancorp Inc. | 28,769 | 849 |
| Cathay General Bancorp | 31,927 | 831 |
| FNB Corp. | 66,734 | 825 |
| Iberiabank Corp. | 12,598 | 822 |
| BancorpSouth Inc. | 38,507 | 815 |
| EastGroup Properties Inc. | 12,550 | 814 |
| Glacier Bancorp Inc. | 29,861 | 813 |
| Valley National Bancorp | 80,385 | 804 |
| First Industrial Realty Trust Inc. | 44,161 | 804 |
| Alexander & Baldwin Inc. | 19,539 | 799 |
| Susquehanna Bancshares Inc. | 75,235 | 776 |
| RLI Corp. | 17,234 | 770 |
| Hatteras Financial Corp. | 38,702 | 770 |
| MB Financial Inc. | 26,764 | 757 |
| First Financial Bankshares Inc. | 25,678 | 755 |
| Kennedy-Wilson Holdings Inc. | 28,847 | 753 |
| Mack-Cali Realty Corp. | 35,553 | 752 |
| Fair Isaac Corp. | 12,901 | 750 |
| American Realty Capital Healthcare Trust Inc. | 67,886 | 745 |
| Washington REIT | 26,718 | 742 |
| Chambers Street Properties | 95,036 | 740 |
| Financial Engines Inc. | 20,629 | 740 |
| American Equity Investment Life Holding Co. | 29,856 | 739 |
| Symetra Financial Corp. | 30,223 | 736 |
| Janus Capital Group Inc. | 59,949 | 728 |
| DuPont Fabros Technology Inc. | 25,569 | 720 |
| * Western Alliance Bancorp | 30,255 | 714 |
| New Residential Investment Corp. | 113,066 | 709 |
| Capitol Federal Financial Inc. | 57,391 | 709 |
| First Citizens BancShares Inc. Class A | 3,037 | 698 |
| Potlatch Corp. | 16,275 | 695 |
| EverBank Financial Corp. | 36,538 | 690 |
| Heartland Payment Systems Inc. | 14,369 | 686 |
| Evercore Partners Inc. Class A | 13,262 | 679 |
| Kemper Corp. | 18,632 | 677 |
| Platinum Underwriters Holdings Ltd. | 10,799 | 675 |
| New York REIT Inc. | 65,064 | 671 |
| * First Cash Financial Services Inc. | 11,610 | 671 |
| Advent Software Inc. | 20,637 | 667 |
| Acadia Realty Trust | 23,009 | 663 |
| PennyMac Mortgage Investment Trust | 29,669 | 660 |
| CVB Financial Corp. | 42,465 | 660 |
| Government Properties Income Trust | 27,316 | 656 |
| Glimcher Realty Trust | 58,180 | 653 |
| Home BancShares Inc. | 21,711 | 646 |
| Redwood Trust Inc. | 33,269 | 644 |
| Trustmark Corp. | 27,043 | 642 |
| PS Business Parks Inc. | 7,801 | 636 |
| Virtus Investment Partners Inc. | 2,834 | 634 |
| * Cardtronics Inc. | 17,836 | 633 |
| Home Loan Servicing Solutions Ltd. | 28,477 | 624 |
| Chesapeake Lodging Trust | 20,064 | 618 |
| CYS Investments Inc. | 64,975 | 613 |
| Empire State Realty Trust Inc. | 37,023 | 609 |
| Education Realty Trust Inc. | 55,833 | 608 |
| EVERTEC Inc. | 26,337 | 607 |
| ARMOUR Residential REIT Inc. | 143,202 | 606 |
9
| Vanguard® Russell 2000 Index Fund | ||
| Schedule of Investments | ||
| August 31, 2014 | ||
| Market | ||
| Value | ||
| Shares | ($000) | |
| Old National Bancorp | 46,140 | 604 |
| Hudson Pacific Properties Inc. | 22,148 | 595 |
| Parkway Properties Inc. | 28,539 | 592 |
| * Altisource Portfolio Solutions SA | 5,850 | 585 |
| Equity One Inc. | 24,636 | 581 |
| * Blackhawk Network Holdings Inc. Class B | 21,142 | 581 |
| Community Bank System Inc. | 16,313 | 576 |
| * Hilltop Holdings Inc. | 27,170 | 575 |
| International Bancshares Corp. | 21,806 | 575 |
| Retail Opportunity Investments Corp. | 36,120 | 572 |
| LTC Properties Inc. | 13,960 | 572 |
| South State Corp. | 9,673 | 566 |
| Altisource Residential Corp. | 22,902 | 562 |
| Pennsylvania REIT | 27,564 | 556 |
| Greenhill & Co. Inc. | 11,335 | 556 |
| Argo Group International Holdings Ltd. | 10,495 | 552 |
| * St. Joe Co. | 25,344 | 549 |
| Columbia Banking System Inc. | 21,091 | 549 |
| Hersha Hospitality Trust Class A | 80,449 | 546 |
| Selective Insurance Group Inc. | 22,542 | 540 |
| Sabra Health Care REIT Inc. | 18,951 | 540 |
| AmTrust Financial Services Inc. | 12,046 | 530 |
| BGC Partners Inc. Class A | 69,868 | 529 |
| Ramco-Gershenson Properties Trust | 31,069 | 527 |
| FelCor Lodging Trust Inc. | 49,797 | 515 |
| Pinnacle Financial Partners Inc. | 14,264 | 512 |
| * WisdomTree Investments Inc. | 43,236 | 511 |
| American Assets Trust Inc. | 14,566 | 511 |
| Westamerica Bancorporation | 10,546 | 510 |
| First Midwest Bancorp Inc. | 30,182 | 509 |
| Capstead Mortgage Corp. | 38,403 | 508 |
| * iStar Financial Inc. | 34,025 | 506 |
| Cash America International Inc. | 11,276 | 503 |
| Montpelier Re Holdings Ltd. | 15,701 | 494 |
| Horace Mann Educators Corp. | 16,332 | 487 |
| * Enstar Group Ltd. | 3,418 | 485 |
| Northwest Bancshares Inc. | 37,954 | 479 |
| National Penn Bancshares Inc. | 47,132 | 471 |
| BBCN Bancorp Inc. | 31,873 | 465 |
| * Ambac Financial Group Inc. | 19,159 | 464 |
| STAG Industrial Inc. | 19,582 | 459 |
| * Encore Capital Group Inc. | 10,306 | 457 |
| Astoria Financial Corp. | 34,728 | 454 |
| * BofI Holding Inc. | 5,694 | 438 |
| Franklin Street Properties Corp. | 36,073 | 438 |
| * Starwood Waypoint Residential Trust | 15,684 | 434 |
| Union Bankshares Corp. | 18,350 | 434 |
| * Harbinger Group Inc. | 33,343 | 432 |
| Associated Estates Realty Corp. | 23,085 | 427 |
| Sterling Bancorp | 33,519 | 425 |
| * Altisource Asset Management Corp. | 567 | 422 |
| American Capital Mortgage Investment Corp. | 20,507 | 422 |
| NBT Bancorp Inc. | 17,520 | 421 |
| ViewPoint Financial Group Inc. | 16,018 | 417 |
| Select Income REIT | 14,758 | 412 |
| Provident Financial Services Inc. | 24,168 | 411 |
| Park National Corp. | 5,131 | 399 |
| * Walter Investment Management Corp. | 15,094 | 398 |
| HFF Inc. Class A | 13,156 | 395 |
| Boston Private Financial Holdings Inc. | 32,081 | 389 |
| * Greenlight Capital Re Ltd. Class A | 11,359 | 389 |
| First Financial Bancorp | 23,140 | 384 |
| Investors Real Estate Trust | 45,014 | 384 |
| Banco Latinoamericano de Comercio Exterior SA | 11,913 | 383 |
10
| Vanguard® Russell 2000 Index Fund | ||
| Schedule of Investments | ||
| August 31, 2014 | ||
| Market | ||
| Value | ||
| Shares | ($000) | |
| Summit Hotel Properties Inc. | 34,306 | 376 |
| Chemical Financial Corp. | 13,113 | 372 |
| Nelnet Inc. Class A | 8,346 | 367 |
| Renasant Corp. | 12,623 | 365 |
| Inland Real Estate Corp. | 35,001 | 364 |
| Independent Bank Corp. | 9,583 | 353 |
| * Essent Group Ltd. | 16,706 | 352 |
| * Third Point Reinsurance Ltd. | 22,768 | 349 |
| * Piper Jaffray Cos. | 6,523 | 348 |
| * Credit Acceptance Corp. | 2,821 | 348 |
| CyrusOne Inc. | 13,158 | 343 |
| United Community Banks Inc. | 20,054 | 340 |
| * Kite Realty Group Trust | 13,184 | 339 |
| Cohen & Steers Inc. | 7,768 | 339 |
| National Bank Holdings Corp. Class A | 16,488 | 335 |
| First Commonwealth Financial Corp. | 37,707 | 334 |
| Alexander's Inc. | 842 | 334 |
| * Springleaf Holdings Inc. | 9,841 | 328 |
| WesBanco Inc. | 10,536 | 327 |
| Ashford Hospitality Trust Inc. | 28,087 | 326 |
| Excel Trust Inc. | 24,454 | 316 |
| Infinity Property & Casualty Corp. | 4,614 | 316 |
| First Potomac Realty Trust | 23,560 | 312 |
| Apollo Commercial Real Estate Finance Inc. | 18,499 | 311 |
| Banner Corp. | 7,850 | 309 |
| * Eagle Bancorp Inc. | 9,127 | 306 |
| First Merchants Corp. | 14,937 | 305 |
| S&T Bancorp Inc. | 11,916 | 297 |
| CoreSite Realty Corp. | 8,421 | 295 |
| Gramercy Property Trust Inc. | 47,157 | 292 |
| New York Mortgage Trust Inc. | 36,349 | 290 |
| Safety Insurance Group Inc. | 5,201 | 287 |
| OFG Bancorp | 18,049 | 287 |
| * Xoom Corp. | 12,396 | 283 |
| Wilshire Bancorp Inc. | 28,973 | 283 |
| AMERISAFE Inc. | 7,488 | 283 |
| Northfield Bancorp Inc. | 21,474 | 282 |
| * Forestar Group Inc. | 13,999 | 280 |
| Resource Capital Corp. | 51,805 | 279 |
| Stewart Information Services Corp. | 8,614 | 278 |
| Oritani Financial Corp. | 18,346 | 275 |
| Rexford Industrial Realty Inc. | 18,534 | 273 |
| Tompkins Financial Corp. | 5,957 | 273 |
| * Navigators Group Inc. | 4,202 | 270 |
| Employers Holdings Inc. | 12,579 | 269 |
| City Holding Co. | 6,298 | 269 |
| Terreno Realty Corp. | 13,292 | 269 |
| RAIT Financial Trust | 32,999 | 267 |
| National General Holdings Corp. | 14,231 | 267 |
| TrustCo Bank Corp. NY | 37,961 | 266 |
| Anworth Mortgage Asset Corp. | 51,301 | 266 |
| FXCM Inc. Class A | 18,264 | 265 |
| Western Asset Mortgage Capital Corp. | 17,354 | 264 |
| Hanmi Financial Corp. | 12,768 | 262 |
| WSFS Financial Corp. | 3,510 | 262 |
| United Financial Bancorp Inc. | 21,132 | 262 |
| Simmons First National Corp. Class A | 6,538 | 261 |
| Rouse Properties Inc. | 14,890 | 260 |
| ^ Southside Bancshares Inc. | 7,552 | 259 |
| Brookline Bancorp Inc. | 28,313 | 259 |
| Lakeland Financial Corp. | 6,631 | 258 |
| Silver Bay Realty Trust Corp. | 15,423 | 257 |
| Berkshire Hills Bancorp Inc. | 10,068 | 248 |
| * World Acceptance Corp. | 3,152 | 247 |
11
| Vanguard® Russell 2000 Index Fund | ||
| Schedule of Investments | ||
| August 31, 2014 | ||
| Market | ||
| Value | ||
| Shares | ($000) | |
| * Investment Technology Group Inc. | 14,434 | 246 |
| * American Residential Properties Inc. | 12,898 | 245 |
| Chatham Lodging Trust | 10,583 | 245 |
| Maiden Holdings Ltd. | 20,048 | 244 |
| Sandy Spring Bancorp Inc. | 10,048 | 243 |
| Monmouth Real Estate Investment Corp. | 22,428 | 243 |
| United Fire Group Inc. | 8,274 | 243 |
| * Capital Bank Financial Corp. | 9,718 | 238 |
| Flushing Financial Corp. | 12,132 | 234 |
| * Green Dot Corp. Class A | 12,243 | 231 |
| Ameris Bancorp | 10,087 | 231 |
| Aviv REIT Inc. | 7,888 | 231 |
| Cardinal Financial Corp. | 12,815 | 229 |
| AG Mortgage Investment Trust Inc. | 11,381 | 227 |
| National Western Life Insurance Co. Class A | 893 | 227 |
| Community Trust Bancorp Inc. | 6,267 | 223 |
| * Ezcorp Inc. Class A | 20,614 | 219 |
| * First BanCorp | 41,799 | 218 |
| Arlington Asset Investment Corp. Class A | 7,660 | 218 |
| Apollo Residential Mortgage Inc. | 12,854 | 217 |
| State Bank Financial Corp. | 12,882 | 216 |
| Universal Health Realty Income Trust | 4,864 | 215 |
| Campus Crest Communities Inc. | 25,949 | 213 |
| Urstadt Biddle Properties Inc. Class A | 10,001 | 213 |
| Cass Information Systems Inc. | 4,526 | 212 |
| * KCG Holdings Inc. Class A | 18,070 | 211 |
| Washington Trust Bancorp Inc. | 5,889 | 207 |
| * Global Cash Access Holdings Inc. | 26,397 | 206 |
| Cedar Realty Trust Inc. | 31,769 | 206 |
| Heritage Financial Corp. | 12,549 | 205 |
| Physicians Realty Trust | 13,771 | 204 |
| Dime Community Bancshares Inc. | 13,141 | 203 |
| GAMCO Investors Inc. | 2,577 | 202 |
| * PICO Holdings Inc. | 9,119 | 202 |
| * NMI Holdings Inc. Class A | 20,264 | 196 |
| First Interstate BancSystem Inc. | 7,344 | 195 |
| Saul Centers Inc. | 3,905 | 195 |
| Getty Realty Corp. | 10,256 | 192 |
| * First NBC Bank Holding Co. | 5,988 | 192 |
| Dynex Capital Inc. | 21,933 | 192 |
| * Cowen Group Inc. Class A | 46,346 | 190 |
| BancFirst Corp. | 2,967 | 189 |
| Agree Realty Corp. | 6,291 | 186 |
| Independent Bank Group Inc. | 3,668 | 186 |
| Westwood Holdings Group Inc. | 3,105 | 185 |
| * Customers Bancorp Inc. | 9,902 | 184 |
| AmREIT Inc. | 7,891 | 184 |
| 1st Source Corp. | 6,014 | 180 |
| ConnectOne Bancorp Inc. | 9,154 | 177 |
| Stock Yards Bancorp Inc. | 5,844 | 176 |
| * eHealth Inc. | 7,129 | 175 |
| First Busey Corp. | 30,347 | 174 |
| FBL Financial Group Inc. Class A | 3,719 | 174 |
| Towne Bank | 11,846 | 174 |
| Universal Insurance Holdings Inc. | 12,499 | 173 |
| Bryn Mawr Bank Corp. | 5,661 | 167 |
| CoBiz Financial Inc. | 14,373 | 166 |
| Ashford Hospitality Prime Inc. | 10,177 | 165 |
| * MoneyGram International Inc. | 11,699 | 164 |
| Lakeland Bancorp Inc. | 15,717 | 162 |
| * Safeguard Scientifics Inc. | 8,273 | 162 |
| * Beneficial Mutual Bancorp Inc. | 11,762 | 161 |
| Waterstone Financial Inc. | 13,796 | 158 |
| * Yadkin Financial Corp. | 8,153 | 153 |
12
| Vanguard® Russell 2000 Index Fund | ||
| Schedule of Investments | ||
| August 31, 2014 | ||
| Market | ||
| Value | ||
| Shares | ($000) | |
| Peoples Financial Services Corp. | 3,029 | 153 |
| * Tejon Ranch Co. | 5,425 | 153 |
| HCI Group Inc. | 3,615 | 152 |
| First Financial Corp. | 4,701 | 152 |
| Diamond Hill Investment Group Inc. | 1,137 | 149 |
| Heartland Financial USA Inc. | 6,207 | 148 |
| * CareTrust REIT Inc. | 8,438 | 147 |
| OneBeacon Insurance Group Ltd. Class A | 9,088 | 146 |
| Whitestone REIT | 9,580 | 146 |
| QTS Realty Trust Inc. Class A | 4,805 | 145 |
| Trico Bancshares | 6,465 | 144 |
| Ares Commercial Real Estate Corp. | 11,466 | 144 |
| GFI Group Inc. | 31,916 | 144 |
| Enterprise Financial Services Corp. | 8,246 | 144 |
| German American Bancorp Inc. | 5,305 | 144 |
| * Ladenburg Thalmann Financial Services Inc. | 40,014 | 143 |
| Centerstate Banks Inc. | 13,611 | 142 |
| Federal Agricultural Mortgage Corp. | 4,313 | 142 |
| * Flagstar Bancorp Inc. | 8,132 | 142 |
| MainSource Financial Group Inc. | 8,190 | 141 |
| BNC Bancorp | 8,292 | 141 |
| * Phoenix Cos. Inc. | 2,285 | 141 |
| First Bancorp | 7,898 | 140 |
| Federated National Holding Co. | 5,559 | 137 |
| Mercantile Bank Corp. | 7,228 | 137 |
| Clifton Bancorp Inc. | 10,618 | 133 |
| Financial Institutions Inc. | 5,554 | 133 |
| * Metro Bancorp Inc. | 5,686 | 132 |
| State Auto Financial Corp. | 6,075 | 132 |
| Great Southern Bancorp Inc. | 4,153 | 132 |
| Southwest Bancorp Inc. | 7,934 | 131 |
| RE/MAX Holdings Inc. | 4,267 | 129 |
| * Bancorp Inc. | 13,260 | 129 |
| * NewStar Financial Inc. | 10,999 | 127 |
| * Citizens Inc. Class A | 17,636 | 126 |
| * HomeTrust Bancshares Inc. | 8,332 | 126 |
| * INTL. FCStone Inc. | 6,529 | 125 |
| Bank of Marin Bancorp | 2,556 | 125 |
| Banc of California Inc. | 10,353 | 124 |
| Univest Corp. of Pennsylvania | 6,513 | 124 |
| Meadowbrook Insurance Group Inc. | 20,086 | 124 |
| Bank Mutual Corp. | 18,665 | 123 |
| * Ladder Capital Corp. Class A | 6,580 | 122 |
| Park Sterling Corp. | 17,907 | 122 |
| Gladstone Commercial Corp. | 6,688 | 122 |
| Hannon Armstrong Sustainable Infrastructure Capital Inc. | 8,394 | 122 |
| Central Pacific Financial Corp. | 6,865 | 121 |
| OmniAmerican Bancorp Inc. | 4,637 | 120 |
| First Community Bancshares Inc. | 7,138 | 116 |
| Bridge Bancorp Inc. | 4,670 | 116 |
| Arrow Financial Corp. | 4,297 | 114 |
| Talmer Bancorp Inc. Class A | 7,720 | 113 |
| * Preferred Bank | 4,703 | 113 |
| First of Long Island Corp. | 3,228 | 113 |
| Independent Bank Corp. | 9,193 | 112 |
| Fidelity & Guaranty Life | 4,935 | 111 |
| HomeStreet Inc. | 6,047 | 110 |
| Camden National Corp. | 2,975 | 109 |
| Stonegate Bank | 3,991 | 108 |
| First Defiance Financial Corp. | 3,873 | 108 |
| United Insurance Holdings Corp. | 6,670 | 108 |
| Crawford & Co. Class B | 11,939 | 108 |
| Moelis & Co. | 2,957 | 107 |
| One Liberty Properties Inc. | 4,931 | 107 |
13
| Vanguard® Russell 2000 Index Fund | |||
| Schedule of Investments | |||
| August 31, 2014 | |||
| Market | |||
| Value | |||
| Shares | ($000) | ||
| 1st United Bancorp Inc. | 12,080 | 105 | |
| Hudson Valley Holding Corp. | 5,906 | 105 | |
| Peoples Bancorp Inc. | 4,371 | 105 | |
| * | Pacific Premier Bancorp Inc. | 6,887 | 102 |
| Manning & Napier Inc. | 5,488 | 102 | |
| CorEnergy Infrastructure Trust Inc. | 12,686 | 101 | |
| * | NewBridge Bancorp | 13,482 | 101 |
| *,^ | FBR & Co. | 3,523 | 101 |
| Consolidated-Tomoka Land Co. | 1,717 | 100 | |
| First Connecticut Bancorp Inc. | 6,477 | 99 | |
| Oppenheimer Holdings Inc. Class A | 4,086 | 99 | |
| Citizens & Northern Corp. | 4,982 | 98 | |
| CNB Financial Corp. | 5,798 | 98 | |
| Peapack Gladstone Financial Corp. | 5,213 | 98 | |
| Pacific Continental Corp. | 7,208 | 97 | |
| Suffolk Bancorp | 4,642 | 97 | |
| Baldwin & Lyons Inc. | 3,734 | 97 | |
| * | Walker & Dunlop Inc. | 6,800 | 96 |
| Calamos Asset Management Inc. Class A | 7,477 | 96 | |
| * | Global Indemnity plc | 3,510 | 95 |
| Meta Financial Group Inc. | 2,496 | 95 | |
| United Community Financial Corp. | 20,682 | 95 | |
| West Bancorporation Inc. | 6,250 | 94 | |
| Penns Woods Bancorp Inc. | 2,021 | 92 | |
| CatchMark Timber Trust Inc. Class A | 7,626 | 92 | |
| Bank of Kentucky Financial Corp. | 2,479 | 91 | |
| * | Kearny Financial Corp. | 5,799 | 91 |
| Republic Bancorp Inc. Class A | 3,920 | 89 | |
| * | Marcus & Millichap Inc. | 2,914 | 88 |
| OceanFirst Financial Corp. | 5,375 | 88 | |
| Horizon Bancorp | 3,984 | 88 | |
| * | SWS Group Inc. | 11,716 | 88 |
| * | Bridge Capital Holdings | 3,888 | 87 |
| * | Meridian Bancorp Inc. | 8,145 | 86 |
| * | Franklin Financial Corp. | 4,329 | 86 |
| Sierra Bancorp | 4,927 | 86 | |
| * | TriState Capital Holdings Inc. | 8,856 | 84 |
| Fidelity Southern Corp. | 6,076 | 84 | |
| Fox Chase Bancorp Inc. | 4,928 | 84 | |
| RCS Capital Corp. Class A | 3,782 | 84 | |
| Charter Financial Corp. | 7,740 | 84 | |
| Guaranty Bancorp | 6,004 | 84 | |
| * | Tree.com Inc. | 2,608 | 83 |
| * | Stonegate Mortgage Corp. | 5,730 | 83 |
| National Bankshares Inc. | 2,836 | 82 | |
| BankFinancial Corp. | 7,479 | 81 | |
| Seacoast Banking Corp. of Florida | 7,683 | 81 | |
| * | PennyMac Financial Services Inc. Class A | 5,171 | 80 |
| UMH Properties Inc. | 7,749 | 79 | |
| Ames National Corp. | 3,310 | 76 | |
| Kansas City Life Insurance Co. | 1,620 | 75 | |
| National Interstate Corp. | 2,685 | 75 | |
| Armada Hoffler Properties Inc. | 7,680 | 74 | |
| * | Regional Management Corp. | 4,280 | 73 |
| * | AV Homes Inc. | 4,538 | 72 |
| First Business Financial Services Inc. | 1,582 | 72 | |
| Territorial Bancorp Inc. | 3,502 | 72 | |
| First Financial Northwest Inc. | 6,609 | 72 | |
| * | CU Bancorp | 3,800 | 71 |
| American National Bankshares Inc. | 3,180 | 70 | |
| Heritage Commerce Corp. | 8,426 | 70 | |
| Owens Realty Mortgage Inc. | 4,317 | 69 | |
| Merchants Bancshares Inc. | 2,261 | 67 | |
| * | Atlas Financial Holdings Inc. | 4,613 | 67 |
14
| Vanguard® Russell 2000 Index Fund | ||
| Schedule of Investments | ||
| August 31, 2014 | ||
| Market | ||
| Value | ||
| Shares | ($000) | |
| * JGWPT Holdings Inc. Class A | 4,900 | 66 |
| ESB Financial Corp. | 5,189 | 66 |
| MidWestOne Financial Group Inc. | 2,745 | 65 |
| First Bancorp Inc. | 3,860 | 65 |
| * Opus Bank | 2,056 | 65 |
| Northrim BanCorp Inc. | 2,630 | 64 |
| * Cascade Bancorp | 12,424 | 64 |
| MidSouth Bancorp Inc. | 3,328 | 64 |
| * Sun Bancorp Inc. | 3,271 | 61 |
| * Consumer Portfolio Services Inc. | 8,528 | 61 |
| Capital City Bank Group Inc. | 4,273 | 60 |
| Gain Capital Holdings Inc. | 9,283 | 59 |
| Heritage Oaks Bancorp | 8,179 | 58 |
| Enterprise Bancorp Inc. | 2,926 | 58 |
| EMC Insurance Group Inc. | 1,821 | 56 |
| * Information Services Group Inc. | 13,098 | 56 |
| * Republic First Bancorp Inc. | 12,404 | 55 |
| * Higher One Holdings Inc. | 14,222 | 55 |
| * BBX Capital Corp. | 2,920 | 55 |
| * Hallmark Financial Services Inc. | 5,698 | 54 |
| Nicholas Financial Inc. | 4,158 | 53 |
| Trade Street Residential Inc. | 7,445 | 52 |
| Old Line Bancshares Inc. | 3,358 | 50 |
| Century Bancorp Inc. Class A | 1,376 | 50 |
| Macatawa Bank Corp. | 9,607 | 49 |
| Donegal Group Inc. Class A | 2,972 | 47 |
| Pzena Investment Management Inc. Class A | 4,593 | 46 |
| Resource America Inc. Class A | 4,916 | 46 |
| * Square 1 Financial Inc. Class A | 2,398 | 46 |
| Independence Holding Co. | 3,190 | 44 |
| * UCP Inc. | 3,285 | 42 |
| * Heritage Insurance Holdings Inc. | 2,765 | 41 |
| NASB Financial Inc. | 1,687 | 41 |
| * CommunityOne Bancorp | 4,252 | 40 |
| Silvercrest Asset Management Group Inc. Class A | 2,343 | 38 |
| CIFC Corp. | 2,779 | 28 |
| Palmetto Bancshares Inc. | 1,805 | 25 |
| * Hampton Roads Bankshares Inc. | 13,627 | 23 |
| * Tiptree Financial Inc. Class A | 3,138 | 23 |
| ServisFirst Bancshares Inc. | 751 | 23 |
| * Tejon Ranch Co. Warrants Exp. 8/31/2016 | 782 | 2 |
| * Blackhawk Network Holdings Inc. | 27 | 1 |
| 168,255 | ||
| Health Care (13.6%) | ||
| * InterMune Inc. | 43,417 | 3,189 |
| * Puma Biotechnology Inc. | 9,309 | 2,425 |
| * Isis Pharmaceuticals Inc. | 47,147 | 1,922 |
| * Team Health Holdings Inc. | 28,164 | 1,648 |
| * Pacira Pharmaceuticals Inc. | 14,296 | 1,548 |
| HealthSouth Corp. | 35,326 | 1,392 |
| STERIS Corp. | 23,693 | 1,334 |
| * DexCom Inc. | 30,041 | 1,328 |
| * PAREXEL International Corp. | 22,805 | 1,287 |
| * NPS Pharmaceuticals Inc. | 42,636 | 1,287 |
| West Pharmaceutical Services Inc. | 28,335 | 1,231 |
| * WellCare Health Plans Inc. | 17,592 | 1,159 |
| * Cepheid | 27,959 | 1,119 |
| * Medidata Solutions Inc. | 21,691 | 1,010 |
| * Akorn Inc. | 25,282 | 987 |
| * Air Methods Corp. | 15,698 | 921 |
| * Amsurg Corp. | 16,945 | 911 |
| * Acadia Healthcare Co. Inc. | 17,116 | 877 |
| Owens & Minor Inc. | 25,299 | 870 |
| * HMS Holdings Corp. | 35,154 | 804 |
15
| Vanguard® Russell 2000 Index Fund | |||
| Schedule of Investments | |||
| August 31, 2014 | |||
| Market | |||
| Value | |||
| Shares | ($000) | ||
| * | Insulet Corp. | 22,221 | 802 |
| ^ | Theravance Inc. | 33,024 | 778 |
| * | ACADIA Pharmaceuticals Inc. | 31,594 | 758 |
| * | WebMD Health Corp. | 15,537 | 751 |
| * | Haemonetics Corp. | 20,873 | 745 |
| Chemed Corp. | 7,033 | 743 | |
| * | MWI Veterinary Supply Inc. | 5,157 | 733 |
| * | Nektar Therapeutics | 50,918 | 726 |
| * | Prestige Brands Holdings Inc. | 20,777 | 719 |
| *,^ | OPKO Health Inc. | 79,017 | 703 |
| * | Exact Sciences Corp. | 33,208 | 692 |
| * | Impax Laboratories Inc. | 28,093 | 692 |
| *,^ | MannKind Corp. | 91,441 | 674 |
| * | Medicines Co. | 26,073 | 668 |
| * | Keryx Biopharmaceuticals Inc. | 36,672 | 667 |
| * | NuVasive Inc. | 18,685 | 656 |
| ^ | PDL BioPharma Inc. | 64,395 | 650 |
| * | Ironwood Pharmaceuticals Inc. Class A | 47,918 | 620 |
| * | Synageva BioPharma Corp. | 8,581 | 619 |
| * | Neogen Corp. | 14,704 | 619 |
| * | Cyberonics Inc. | 10,759 | 617 |
| * | Magellan Health Inc. | 11,050 | 617 |
| * | Wright Medical Group Inc. | 20,012 | 597 |
| * | Molina Healthcare Inc. | 12,279 | 587 |
| * | Celldex Therapeutics Inc. | 35,830 | 570 |
| * | Thoratec Corp. | 22,775 | 569 |
| * | MedAssets Inc. | 24,454 | 562 |
| * | Dyax Corp. | 54,456 | 556 |
| * | HeartWare International Inc. | 6,812 | 552 |
| * | Acorda Therapeutics Inc. | 16,700 | 544 |
| Kindred Healthcare Inc. | 25,819 | 533 | |
| * | Integra LifeSciences Holdings Corp. | 9,991 | 499 |
| * | Neurocrine Biosciences Inc. | 30,419 | 496 |
| Cantel Medical Corp. | 13,551 | 494 | |
| * | Globus Medical Inc. | 26,376 | 478 |
| * | Spectranetics Corp. | 16,672 | 473 |
| * | Clovis Oncology Inc. | 9,896 | 471 |
| * | ExamWorks Group Inc. | 13,872 | 457 |
| * | Greatbatch Inc. | 9,977 | 455 |
| * | Achillion Pharmaceuticals Inc. | 38,878 | 450 |
| * | Novavax Inc. | 95,276 | 447 |
| Select Medical Holdings Corp. | 31,569 | 443 | |
| * | Masimo Corp. | 19,404 | 435 |
| * | Ligand Pharmaceuticals Inc. | 8,309 | 432 |
| CONMED Corp. | 10,914 | 431 | |
| Abaxis Inc. | 9,003 | 430 | |
| * | AVANIR Pharmaceuticals Inc. | 68,476 | 426 |
| * | ABIOMED Inc. | 16,009 | 417 |
| * | Omnicell Inc. | 14,677 | 413 |
| * | Portola Pharmaceuticals Inc. | 14,791 | 413 |
| * | ARIAD Pharmaceuticals Inc. | 66,098 | 411 |
| * | ImmunoGen Inc. | 34,410 | 407 |
| * | Lannett Co. Inc. | 10,314 | 406 |
| * | Halozyme Therapeutics Inc. | 42,237 | 401 |
| * | Sangamo BioSciences Inc. | 27,249 | 390 |
| * | Receptos Inc. | 7,419 | 379 |
| * | BioCryst Pharmaceuticals Inc. | 28,099 | 379 |
| * | Auxilium Pharmaceuticals Inc. | 20,152 | 375 |
| * | Sarepta Therapeutics Inc. | 16,312 | 374 |
| * | Arena Pharmaceuticals Inc. | 88,074 | 363 |
| * | Natus Medical Inc. | 12,888 | 362 |
| * | Aegerion Pharmaceuticals Inc. | 11,823 | 361 |
| Analogic Corp. | 4,977 | 359 | |
| * | Depomed Inc. | 23,254 | 357 |
16
| Vanguard® Russell 2000 Index Fund | |||
| Schedule of Investments | |||
| August 31, 2014 | |||
| Market | |||
| Value | |||
| Shares | ($000) | ||
| * | Endologix Inc. | 25,670 | 355 |
| * | Bluebird Bio Inc. | 8,715 | 349 |
| * | ICU Medical Inc. | 5,382 | 337 |
| * | IPC The Hospitalist Co. Inc. | 6,869 | 332 |
| Meridian Bioscience Inc. | 16,663 | 326 | |
| *,^ | Exelixis Inc. | 78,071 | 323 |
| * | NxStage Medical Inc. | 24,627 | 323 |
| * | Hanger Inc. | 14,120 | 316 |
| * | Cardiovascular Systems Inc. | 11,090 | 316 |
| Quality Systems Inc. | 19,979 | 313 | |
| * | Tornier NV | 14,259 | 308 |
| * | Anacor Pharmaceuticals Inc. | 13,209 | 308 |
| * | Arrowhead Research Corp. | 20,802 | 303 |
| * | Fluidigm Corp. | 11,091 | 302 |
| * | Emergent Biosolutions Inc. | 12,105 | 301 |
| * | PharMerica Corp. | 12,025 | 299 |
| * | Intrexon Corp. | 14,290 | 290 |
| * | Raptor Pharmaceutical Corp. | 26,065 | 287 |
| * | Bio-Reference Laboratories Inc. | 9,849 | 286 |
| * | Luminex Corp. | 15,037 | 283 |
| * | AMN Healthcare Services Inc. | 18,644 | 282 |
| * | PTC Therapeutics Inc. | 8,903 | 282 |
| Ensign Group Inc. | 8,013 | 280 | |
| * | Insmed Inc. | 19,946 | 278 |
| * | Theravance Biopharma Inc. | 9,434 | 277 |
| * | Chimerix Inc. | 10,809 | 276 |
| Computer Programs & Systems Inc. | 4,475 | 275 | |
| * | Merrimack Pharmaceuticals Inc. | 39,367 | 275 |
| * | Orexigen Therapeutics Inc. | 48,157 | 275 |
| * | Quidel Corp. | 11,427 | 270 |
| * | Cambrex Corp. | 12,281 | 269 |
| * | BioDelivery Sciences International Inc. | 16,808 | 269 |
| * | Horizon Pharma Inc. | 26,102 | 269 |
| * | Capital Senior Living Corp. | 11,637 | 266 |
| * | MiMedx Group Inc. | 37,331 | 263 |
| * | KYTHERA Biopharmaceuticals Inc. | 6,977 | 262 |
| * | Volcano Corp. | 20,541 | 256 |
| *,^ | Inovio Pharmaceuticals Inc. | 24,123 | 255 |
| * | Repligen Corp. | 13,336 | 254 |
| * | Affymetrix Inc. | 29,171 | 253 |
| * | Agios Pharmaceuticals Inc. | 5,443 | 252 |
| * | Orthofix International NV | 7,393 | 251 |
| * | Accuray Inc. | 30,781 | 251 |
| * | Zeltiq Aesthetics Inc. | 11,657 | 245 |
| * | Prothena Corp. plc | 10,668 | 244 |
| * | Sagent Pharmaceuticals Inc. | 8,774 | 244 |
| * | Anika Therapeutics Inc. | 5,783 | 243 |
| * | TherapeuticsMD Inc. | 43,320 | 240 |
| * | Gentiva Health Services Inc. | 13,116 | 237 |
| National Healthcare Corp. | 4,133 | 237 | |
| * | BioScrip Inc. | 27,438 | 232 |
| * | Amedisys Inc. | 10,954 | 229 |
| * | TESARO Inc. | 7,731 | 229 |
| * | Momenta Pharmaceuticals Inc. | 19,261 | 227 |
| * | Healthways Inc. | 12,598 | 220 |
| * | NewLink Genetics Corp. | 7,966 | 220 |
| * | Infinity Pharmaceuticals Inc. | 19,463 | 220 |
| * | Providence Service Corp. | 4,830 | 220 |
| * | Ophthotech Corp. | 5,564 | 217 |
| * | Merit Medical Systems Inc. | 17,230 | 216 |
| * | Spectrum Pharmaceuticals Inc. | 26,297 | 213 |
| * | Repros Therapeutics Inc. | 9,260 | 203 |
| * | Omeros Corp. | 13,599 | 203 |
| * | Array BioPharma Inc. | 50,515 | 200 |
17
| Vanguard® Russell 2000 Index Fund | |||
| Schedule of Investments | |||
| August 31, 2014 | |||
| Market | |||
| Value | |||
| Shares | ($000) | ||
| * | AMAG Pharmaceuticals Inc. | 8,788 | 199 |
| * | Genomic Health Inc. | 6,689 | 199 |
| Invacare Corp. | 12,895 | 198 | |
| Atrion Corp. | 615 | 197 | |
| * | Karyopharm Therapeutics Inc. | 5,430 | 195 |
| *,^ | Organovo Holdings Inc. | 25,059 | 195 |
| * | Cynosure Inc. Class A | 8,519 | 192 |
| * | Triple-S Management Corp. Class B | 9,923 | 190 |
| * | Albany Molecular Research Inc. | 9,444 | 187 |
| * | OraSure Technologies Inc. | 22,392 | 187 |
| * | Accelerate Diagnostics Inc. | 9,106 | 184 |
| * | CorVel Corp. | 4,446 | 182 |
| US Physical Therapy Inc. | 5,057 | 181 | |
| * | LDR Holding Corp. | 6,663 | 180 |
| * | GenMark Diagnostics Inc. | 16,685 | 179 |
| * | Acceleron Pharma Inc. | 6,597 | 177 |
| * | STAAR Surgical Co. | 15,394 | 177 |
| * | Epizyme Inc. | 5,135 | 177 |
| * | Vanda Pharmaceuticals Inc. | 13,583 | 176 |
| * | Enanta Pharmaceuticals Inc. | 4,146 | 174 |
| * | Sequenom Inc. | 46,673 | 173 |
| * | Relypsa Inc. | 6,781 | 171 |
| * | MacroGenics Inc. | 8,011 | 171 |
| * | AtriCure Inc. | 10,989 | 171 |
| * | Vascular Solutions Inc. | 6,867 | 164 |
| * | Rockwell Medical Inc. | 17,188 | 164 |
| * | Progenics Pharmaceuticals Inc. | 29,215 | 161 |
| * | Dynavax Technologies Corp. | 110,882 | 157 |
| * | Geron Corp. | 66,106 | 157 |
| * | VIVUS Inc. | 36,051 | 155 |
| * | Ultragenyx Pharmaceutical Inc. | 2,858 | 153 |
| * | Universal American Corp. | 17,585 | 150 |
| * | XOMA Corp. | 34,295 | 150 |
| * | Sunesis Pharmaceuticals Inc. | 19,838 | 149 |
| * | SciClone Pharmaceuticals Inc. | 20,648 | 142 |
| * | Insys Therapeutics Inc. | 4,004 | 141 |
| * | Surgical Care Affiliates Inc. | 4,747 | 141 |
| * | Hyperion Therapeutics Inc. | 5,460 | 141 |
| * | Synergy Pharmaceuticals Inc. | 36,159 | 141 |
| * | CTI BioPharma Corp. | 54,839 | 140 |
| * | AngioDynamics Inc. | 9,907 | 140 |
| Landauer Inc. | 3,829 | 139 | |
| * | Lexicon Pharmaceuticals Inc. | 91,635 | 139 |
| * | Symmetry Medical Inc. | 15,033 | 139 |
| * | Chindex International Inc. | 5,685 | 136 |
| * | Pacific Biosciences of California Inc. | 22,395 | 131 |
| * | Foundation Medicine Inc. | 5,602 | 130 |
| * | LHC Group Inc. | 4,961 | 128 |
| *,^ | Peregrine Pharmaceuticals Inc. | 73,875 | 122 |
| * | RTI Surgical Inc. | 22,749 | 121 |
| * | Galena Biopharma Inc. | 50,871 | 120 |
| * | Antares Pharma Inc. | 50,575 | 119 |
| * | XenoPort Inc. | 23,362 | 119 |
| * | Immunomedics Inc. | 35,461 | 118 |
| * | Pernix Therapeutics Holdings Inc. | 13,340 | 116 |
| * | Tetraphase Pharmaceuticals Inc. | 8,842 | 116 |
| * | Unilife Corp. | 44,904 | 115 |
| * | Aratana Therapeutics Inc. | 9,796 | 114 |
| CryoLife Inc. | 11,280 | 113 | |
| Phibro Animal Health Corp. Class A | 5,876 | 112 | |
| * | Retrophin Inc. | 8,204 | 112 |
| * | Neuralstem Inc. | 27,569 | 112 |
| * | Endocyte Inc. | 15,208 | 112 |
| * | SurModics Inc. | 5,451 | 111 |
18
| Vanguard® Russell 2000 Index Fund | |||
| Schedule of Investments | |||
| August 31, 2014 | |||
| Market | |||
| Value | |||
| Shares | ($000) | ||
| * | Cerus Corp. | 29,210 | 110 |
| * | ZIOPHARM Oncology Inc. | 33,963 | 110 |
| * | Supernus Pharmaceuticals Inc. | 11,743 | 106 |
| * | Synta Pharmaceuticals Corp. | 26,096 | 104 |
| * | OncoMed Pharmaceuticals Inc. | 5,068 | 103 |
| * | Osiris Therapeutics Inc. | 6,951 | 99 |
| * | Cross Country Healthcare Inc. | 12,426 | 99 |
| * | Durata Therapeutics Inc. | 6,230 | 98 |
| * | Intra-Cellular Therapies Inc. | 6,857 | 98 |
| * | Almost Family Inc. | 3,343 | 94 |
| * | Rigel Pharmaceuticals Inc. | 35,099 | 91 |
| * | Threshold Pharmaceuticals Inc. | 21,894 | 91 |
| POZEN Inc. | 10,910 | 91 | |
| * | Exactech Inc. | 3,780 | 90 |
| * | Cempra Inc. | 8,290 | 88 |
| * | RadNet Inc. | 13,111 | 88 |
| * | Heron Therapeutics Inc. | 9,322 | 88 |
| * | Dendreon Corp. | 64,145 | 87 |
| *,^ | Navidea Biopharmaceuticals Inc. | 60,440 | 86 |
| * | OvaScience Inc. | 6,199 | 84 |
| * | Northwest Biotherapeutics Inc. | 14,249 | 83 |
| * | Enzo Biochem Inc. | 13,703 | 82 |
| * | Five Star Quality Care Inc. | 17,505 | 81 |
| * | ANI Pharmaceuticals Inc. | 2,755 | 81 |
| * | Revance Therapeutics Inc. | 3,443 | 80 |
| * | Five Prime Therapeutics Inc. | 6,912 | 80 |
| * | Auspex Pharmaceuticals Inc. | 3,479 | 80 |
| * | TG Therapeutics Inc. | 9,414 | 80 |
| * | IGI Laboratories Inc. | 11,537 | 79 |
| * | Ampio Pharmaceuticals Inc. | 16,711 | 78 |
| * | Agenus Inc. | 24,954 | 78 |
| * | BioTelemetry Inc. | 10,583 | 77 |
| * | CytRx Corp. | 22,368 | 74 |
| * | Oxford Immunotec Global plc | 5,212 | 73 |
| * | Verastem Inc. | 8,412 | 73 |
| * | Akebia Therapeutics Inc. | 3,141 | 71 |
| * | Idera Pharmaceuticals Inc. | 24,140 | 70 |
| * | Derma Sciences Inc. | 8,230 | 70 |
| * | Skilled Healthcare Group Inc. | 9,407 | 70 |
| Utah Medical Products Inc. | 1,335 | 70 | |
| * | Ohr Pharmaceutical Inc. | 8,435 | 69 |
| * | AcelRx Pharmaceuticals Inc. | 9,661 | 69 |
| * | Aerie Pharmaceuticals Inc. | 4,215 | 69 |
| * | Merge Healthcare Inc. | 26,420 | 69 |
| * | Bio-Path Holdings Inc. | 29,423 | 68 |
| * | Xencor Inc. | 6,316 | 68 |
| * | Zogenix Inc. | 49,254 | 67 |
| * | Oncothyreon Inc. | 28,374 | 66 |
| * | BioTime Inc. | 20,871 | 65 |
| * | Pain Therapeutics Inc. | 15,250 | 64 |
| * | Versartis Inc. | 2,779 | 64 |
| * | NanoViricides Inc. | 16,073 | 63 |
| * | Castlight Health Inc. Class B | 5,195 | 62 |
| * | Mirati Therapeutics Inc. | 2,878 | 59 |
| * | Alimera Sciences Inc. | 9,393 | 59 |
| * | Corcept Therapeutics Inc. | 21,355 | 59 |
| * | Alliance HealthCare Services Inc. | 2,022 | 58 |
| * | Cytokinetics Inc. | 13,152 | 56 |
| * | Tandem Diabetes Care Inc. | 3,880 | 55 |
| * | Alder Biopharmaceuticals Inc. | 3,208 | 55 |
| * | NeoStem Inc. | 9,491 | 55 |
| * | ChemoCentryx Inc. | 9,949 | 51 |
| * | Stemline Therapeutics Inc. | 4,465 | 50 |
| * | K2M Group Holdings Inc. | 3,540 | 50 |
19
| Vanguard® Russell 2000 Index Fund | |||
| Schedule of Investments | |||
| August 31, 2014 | |||
| Market | |||
| Value | |||
| Shares | ($000) | ||
| * | National Research Corp. Class A | 3,582 | 50 |
| * | Vital Therapies Inc. | 2,076 | 50 |
| * | Kindred Biosciences Inc. | 4,546 | 50 |
| * | Actinium Pharmaceuticals Inc. | 7,943 | 49 |
| * | Sucampo Pharmaceuticals Inc. Class A | 7,123 | 49 |
| * | Addus HomeCare Corp. | 2,210 | 48 |
| * | BioSpecifics Technologies Corp. | 1,458 | 46 |
| * | TransEnterix Inc. | 11,494 | 45 |
| * | Galectin Therapeutics Inc. | 7,224 | 45 |
| * | Inogen Inc. | 2,189 | 45 |
| * | NanoString Technologies Inc. | 4,028 | 45 |
| * | Cellular Dynamics International Inc. | 3,896 | 45 |
| * | TriVascular Technologies Inc. | 2,981 | 43 |
| *,^ | Cytori Therapeutics Inc. | 25,552 | 36 |
| * | Applied Genetic Technologies Corp. | 1,943 | 33 |
| * | Esperion Therapeutics Inc. | 1,940 | 30 |
| * | Regulus Therapeutics Inc. | 4,237 | 29 |
| * | Veracyte Inc. | 2,133 | 27 |
| * | Flexion Therapeutics Inc. | 1,951 | 27 |
| * | Achaogen Inc. | 2,766 | 26 |
| * | Cara Therapeutics Inc. | 2,326 | 24 |
| * | Adamas Pharmaceuticals Inc. | 1,173 | 22 |
| * | Eleven Biotherapeutics Inc. | 1,962 | 22 |
| * | Genocea Biosciences Inc. | 1,679 | 22 |
| * | Dicerna Pharmaceuticals Inc. | 1,513 | 21 |
| * | National Research Corp. Class B | 386 | 15 |
| * | Egalet Corp. | 1,455 | 14 |
| * | Regado Biosciences Inc. | 6,193 | 7 |
| 94,210 | |||
| Materials & Processing (6.8%) | |||
| * | Graphic Packaging Holding Co. | 131,100 | 1,677 |
| US Silica Holdings Inc. | 21,557 | 1,548 | |
| PolyOne Corp. | 37,744 | 1,480 | |
| Belden Inc. | 17,483 | 1,277 | |
| Axiall Corp. | 28,040 | 1,166 | |
| Sensient Technologies Corp. | 19,834 | 1,113 | |
| * | KapStone Paper and Packaging Corp. | 33,913 | 1,042 |
| Watsco Inc. | 10,377 | 960 | |
| HB Fuller Co. | 20,087 | 945 | |
| * | Chemtura Corp. | 36,350 | 897 |
| * | Stillwater Mining Co. | 48,037 | 892 |
| * | Rexnord Corp. | 30,128 | 880 |
| * | Berry Plastics Group Inc. | 36,056 | 869 |
| Minerals Technologies Inc. | 13,827 | 866 | |
| Olin Corp. | 31,682 | 865 | |
| Worthington Industries Inc. | 20,635 | 834 | |
| Commercial Metals Co. | 47,213 | 816 | |
| * | Polypore International Inc. | 18,075 | 810 |
| * | Louisiana-Pacific Corp. | 56,591 | 808 |
| Tronox Ltd. Class A | 24,644 | 748 | |
| * | Masonite International Corp. | 11,802 | 675 |
| Mueller Industries Inc. | 22,730 | 665 | |
| Balchem Corp. | 12,197 | 627 | |
| * | AK Steel Holding Corp. | 54,819 | 599 |
| Mueller Water Products Inc. Class A | 63,885 | 590 | |
| Kaiser Aluminum Corp. | 7,230 | 582 | |
| RBC Bearings Inc. | 9,322 | 576 | |
| * | Clearwater Paper Corp. | 8,188 | 567 |
| * | Beacon Roofing Supply Inc. | 19,771 | 564 |
| Simpson Manufacturing Co. Inc. | 16,572 | 536 | |
| Globe Specialty Metals Inc. | 25,598 | 526 | |
| Schweitzer-Mauduit International Inc. | 12,214 | 523 | |
| * | Century Aluminum Co. | 20,619 | 515 |
| Innophos Holdings Inc. | 8,799 | 512 | |
20
| Vanguard® Russell 2000 Index Fund | |||
| Schedule of Investments | |||
| August 31, 2014 | |||
| Market | |||
| Value | |||
| Shares | ($000) | ||
| * | Trex Co. Inc. | 13,471 | 506 |
| * | Boise Cascade Co. | 15,801 | 475 |
| A Schulman Inc. | 11,710 | 455 | |
| Interface Inc. Class A | 26,654 | 454 | |
| * | Calgon Carbon Corp. | 21,362 | 454 |
| Hecla Mining Co. | 137,588 | 450 | |
| * | Resolute Forest Products Inc. | 26,151 | 450 |
| PH Glatfelter Co. | 17,269 | 431 | |
| Apogee Enterprises Inc. | 11,673 | 426 | |
| * | Cabot Microelectronics Corp. | 9,670 | 415 |
| Quaker Chemical Corp. | 5,304 | 414 | |
| Innospec Inc. | 9,779 | 412 | |
| * | Horsehead Holding Corp. | 20,334 | 411 |
| * | Ferro Corp. | 28,757 | 388 |
| * | Headwaters Inc. | 29,449 | 383 |
| Universal Forest Products Inc. | 8,040 | 381 | |
| Stepan Co. | 7,710 | 372 | |
| Neenah Paper Inc. | 6,641 | 363 | |
| * | RTI International Metals Inc. | 12,308 | 357 |
| * | Intrepid Potash Inc. | 22,361 | 343 |
| OM Group Inc. | 12,877 | 343 | |
| * | Coeur Mining Inc. | 41,512 | 329 |
| AAON Inc. | 16,937 | 316 | |
| * | LSB Industries Inc. | 7,751 | 310 |
| * | Nortek Inc. | 3,656 | 305 |
| Koppers Holdings Inc. | 8,201 | 304 | |
| Deltic Timber Corp. | 4,455 | 295 | |
| Schnitzer Steel Industries Inc. | 10,555 | 292 | |
| * | Taminco Corp. | 11,428 | 274 |
| Quanex Building Products Corp. | 15,030 | 271 | |
| Materion Corp. | 8,258 | 269 | |
| * | Kraton Performance Polymers Inc. | 13,143 | 267 |
| Haynes International Inc. | 4,972 | 246 | |
| Comfort Systems USA Inc. | 15,101 | 230 | |
| * | NCI Building Systems Inc. | 11,254 | 225 |
| Aceto Corp. | 11,521 | 221 | |
| Myers Industries Inc. | 11,075 | 218 | |
| LB Foster Co. Class A | 4,146 | 217 | |
| * | Rentech Inc. | 94,622 | 212 |
| NN Inc. | 7,117 | 208 | |
| Tredegar Corp. | 9,965 | 207 | |
| Griffon Corp. | 15,984 | 199 | |
| * | PGT Inc. | 18,942 | 198 |
| * | Gibraltar Industries Inc. | 12,369 | 197 |
| * | Unifi Inc. | 6,232 | 178 |
| Insteel Industries Inc. | 7,322 | 172 | |
| *,^ | Allied Nevada Gold Corp. | 41,795 | 160 |
| * | OMNOVA Solutions Inc. | 18,992 | 159 |
| Hawkins Inc. | 4,263 | 157 | |
| American Vanguard Corp. | 11,547 | 155 | |
| Wausau Paper Corp. | 16,925 | 154 | |
| * | US Concrete Inc. | 5,927 | 150 |
| Zep Inc. | 9,218 | 146 | |
| * | Landec Corp. | 10,864 | 143 |
| * | Northwest Pipe Co. | 3,811 | 141 |
| * | Senomyx Inc. | 17,053 | 139 |
| Kronos Worldwide Inc. | 8,398 | 133 | |
| Global Brass & Copper Holdings Inc. | 8,559 | 132 | |
| * | Molycorp Inc. | 73,003 | 131 |
| * | Patrick Industries Inc. | 3,056 | 127 |
| FutureFuel Corp. | 9,109 | 127 | |
| * | Builders FirstSource Inc. | 18,312 | 126 |
| Dynamic Materials Corp. | 5,591 | 112 | |
| * | Ply Gem Holdings Inc. | 8,561 | 101 |
21
| Vanguard® Russell 2000 Index Fund | |||
| Schedule of Investments | |||
| August 31, 2014 | |||
| Market | |||
| Value | |||
| Shares | ($000) | ||
| * | Stock Building Supply Holdings Inc. | 5,845 | 99 |
| Gold Resource Corp. | 15,153 | 94 | |
| Chase Corp. | 2,606 | 92 | |
| * | Universal Stainless & Alloy Products Inc. | 2,807 | 90 |
| Olympic Steel Inc. | 3,686 | 89 | |
| * | Continental Building Products Inc. | 4,697 | 75 |
| Ampco-Pittsburgh Corp. | 3,416 | 73 | |
| Noranda Aluminum Holding Corp. | 17,781 | 72 | |
| * | AEP Industries Inc. | 1,635 | 69 |
| LSI Industries Inc. | 8,708 | 61 | |
| Culp Inc. | 3,297 | 60 | |
| Oil-Dri Corp. of America | 1,953 | 58 | |
| * | Dixie Group Inc. | 6,004 | 58 |
| * | Handy & Harman Ltd. | 2,201 | 58 |
| KMG Chemicals Inc. | 3,312 | 56 | |
| * | Shiloh Industries Inc. | 3,328 | 56 |
| * | UFP Technologies Inc. | 2,254 | 53 |
| * | Installed Building Products Inc. | 3,698 | 49 |
| United States Lime & Minerals Inc. | 788 | 49 | |
| * | Marrone Bio Innovations Inc. | 4,540 | 26 |
| NL Industries Inc. | 2,728 | 24 | |
| Omega Flex Inc. | 1,175 | 21 | |
| 47,268 | |||
| Other (0.1%)2 | |||
| * | Catalent Inc. | 5,467 | 118 |
| *,^ | GoPro Inc. Class A | 2,086 | 108 |
| * | Memorial Resource Development Corp. | 2,205 | 65 |
| * | Leap Wireless International Inc CVR | 22,395 | 56 |
| * | Eclipse Resources Corp. | 3,000 | 55 |
| * | TerraForm Power Inc. Class A | 1,367 | 43 |
| * | Aspen Aerogels Inc. | 2,700 | 29 |
| * | Furiex Pharmaceuticals Inc. CVR | 2,795 | 27 |
| * | Otonomy Inc. | 688 | 14 |
| * | HealthEquity Inc. | 685 | 13 |
| * | Adeptus Health Inc. Class A | 420 | 12 |
| * | MobileIron Inc. | 1,025 | 12 |
| * | Kite Pharma Inc. | 417 | 12 |
| *,^ | El Pollo Loco Holdings Inc. | 349 | 11 |
| * | Imprivata Inc. | 700 | 10 |
| * | Ardelyx Inc. | 679 | 10 |
| * | Sage Therapeutics Inc. | 333 | 10 |
| * | Arista Networks Inc. | 100 | 8 |
| * | Avalanche Biotechnologies Inc. | 206 | 6 |
| * | Ocular Therapeutix Inc. | 210 | 4 |
| * | Chelsea Therapeutics International Ltd. CVR Exp. 12/31/2016 | 31,094 | 3 |
| * | Energy Transfer Partners LP | 55 | 3 |
| * | Cubist Pharmaceuticals, Inc. CVR | 13,664 | 2 |
| * | Omthera Pharmaceuticals Inc. CVR | 2,012 | 1 |
| 632 | |||
| Producer Durables (13.6%) | |||
| * | Esterline Technologies Corp. | 12,754 | 1,495 |
| * | Teledyne Technologies Inc. | 15,046 | 1,461 |
| Woodward Inc. | 26,586 | 1,389 | |
| Curtiss-Wright Corp. | 19,322 | 1,388 | |
| HEICO Corp. | 26,663 | 1,381 | |
| * | Generac Holdings Inc. | 27,601 | 1,284 |
| CLARCOR Inc. | 20,216 | 1,278 | |
| * | Darling Ingredients Inc. | 65,876 | 1,270 |
| * | Moog Inc. Class A | 17,839 | 1,265 |
| * | JetBlue Airways Corp. | 99,687 | 1,219 |
| EnerSys | 18,815 | 1,210 | |
22
| Vanguard® Russell 2000 Index Fund | ||
| Schedule of Investments | ||
| August 31, 2014 | ||
| Market | ||
| Value | ||
| Shares | ($000) | |
| Deluxe Corp. | 20,071 | 1,195 |
| EMCOR Group Inc. | 26,978 | 1,165 |
| MAXIMUS Inc. | 27,145 | 1,118 |
| Bristow Group Inc. | 14,270 | 1,041 |
| Actuant Corp. Class A | 28,476 | 961 |
| Corporate Executive Board Co. | 13,552 | 893 |
| Littelfuse Inc. | 9,027 | 830 |
| * Electronics For Imaging Inc. | 18,679 | 823 |
| * Chart Industries Inc. | 12,218 | 817 |
| Applied Industrial Technologies Inc. | 16,750 | 816 |
| * MasTec Inc. | 26,300 | 802 |
| Greenbrier Cos. Inc. | 11,062 | 791 |
| Harsco Corp. | 32,377 | 784 |
| Convergys Corp. | 40,688 | 781 |
| Healthcare Services Group Inc. | 28,176 | 770 |
| Barnes Group Inc. | 21,734 | 744 |
| Mobile Mini Inc. | 18,733 | 734 |
| * Advisory Board Co. | 14,676 | 728 |
| Franklin Electric Co. Inc. | 19,128 | 726 |
| Watts Water Technologies Inc. Class A | 11,424 | 723 |
| * Swift Transportation Co. | 34,098 | 722 |
| Herman Miller Inc. | 23,754 | 706 |
| HNI Corp. | 18,084 | 686 |
| * Proto Labs Inc. | 9,078 | 683 |
| Allegiant Travel Co. Class A | 5,533 | 680 |
| * Itron Inc. | 15,762 | 665 |
| Tetra Tech Inc. | 26,048 | 664 |
| Scorpio Tankers Inc. | 68,938 | 659 |
| MSA Safety Inc. | 11,841 | 656 |
| * XPO Logistics Inc. | 21,061 | 652 |
| * Orbital Sciences Corp. | 24,287 | 650 |
| * On Assignment Inc. | 21,785 | 644 |
| United Stationers Inc. | 15,794 | 642 |
| * Hub Group Inc. Class A | 14,745 | 641 |
| * EnPro Industries Inc. | 9,111 | 619 |
| * FTI Consulting Inc. | 16,380 | 608 |
| Knight Transportation Inc. | 23,948 | 607 |
| * Korn/Ferry International | 19,942 | 603 |
| TAL International Group Inc. | 13,631 | 602 |
| ABM Industries Inc. | 22,399 | 596 |
| * WageWorks Inc. | 14,074 | 581 |
| Forward Air Corp. | 12,510 | 579 |
| * TriMas Corp. | 18,134 | 575 |
| UniFirst Corp. | 5,915 | 573 |
| * Huron Consulting Group Inc. | 9,443 | 571 |
| * OSI Systems Inc. | 7,996 | 558 |
| Granite Construction Inc. | 15,679 | 553 |
| * PHH Corp. | 23,011 | 551 |
| * Measurement Specialties Inc. | 6,404 | 550 |
| Brink's Co. | 19,423 | 532 |
| Steelcase Inc. Class A | 33,147 | 520 |
| Tennant Co. | 7,387 | 515 |
| H&E Equipment Services Inc. | 12,543 | 513 |
| Brady Corp. Class A | 19,238 | 512 |
| Heartland Express Inc. | 21,797 | 511 |
| * Rush Enterprises Inc. Class A | 13,773 | 505 |
| CIRCOR International Inc. | 7,081 | 504 |
| Aircastle Ltd. | 25,913 | 495 |
| AZZ Inc. | 10,255 | 475 |
| * Saia Inc. | 9,890 | 469 |
| Matson Inc. | 17,230 | 465 |
| Ship Finance International Ltd. | 23,381 | 463 |
| * TrueBlue Inc. | 16,573 | 450 |
| G&K Services Inc. Class A | 7,999 | 447 |
23
| Vanguard® Russell 2000 Index Fund | |||
| Schedule of Investments | |||
| August 31, 2014 | |||
| Market | |||
| Value | |||
| Shares | ($000) | ||
| * | Tutor Perini Corp. | 14,944 | 447 |
| Kaman Corp. | 10,980 | 446 | |
| Werner Enterprises Inc. | 17,922 | 446 | |
| Primoris Services Corp. | 15,274 | 444 | |
| * | GenCorp Inc. | 23,979 | 442 |
| AAR Corp. | 15,866 | 439 | |
| Gulfmark Offshore Inc. | 10,802 | 434 | |
| MTS Systems Corp. | 6,071 | 432 | |
| * | Scorpio Bulkers Inc. | 54,028 | 431 |
| GasLog Ltd. | 16,886 | 427 | |
| * | Dycom Industries Inc. | 13,614 | 425 |
| Albany International Corp. | 11,286 | 424 | |
| General Cable Corp. | 19,508 | 419 | |
| * | DXP Enterprises Inc. | 5,193 | 416 |
| * | GrafTech International Ltd. | 47,128 | 411 |
| Lindsay Corp. | 5,156 | 401 | |
| * | FARO Technologies Inc. | 6,910 | 401 |
| * | Astronics Corp. | 6,293 | 395 |
| * | Wabash National Corp. | 27,634 | 391 |
| Raven Industries Inc. | 14,608 | 389 | |
| * | Wesco Aircraft Holdings Inc. | 21,030 | 386 |
| Exponent Inc. | 5,254 | 384 | |
| McGrath RentCorp | 10,373 | 384 | |
| ESCO Technologies Inc. | 10,647 | 383 | |
| Standex International Corp. | 5,122 | 382 | |
| Briggs & Stratton Corp. | 18,736 | 377 | |
| * | Aegion Corp. Class A | 15,228 | 376 |
| ArcBest Corp. | 10,424 | 374 | |
| *,^ | Plug Power Inc. | 66,999 | 374 |
| Federal Signal Corp. | 25,212 | 371 | |
| US Ecology Inc. | 8,642 | 369 | |
| Cubic Corp. | 8,260 | 369 | |
| Altra Industrial Motion Corp. | 10,853 | 361 | |
| * | ExlService Holdings Inc. | 13,101 | 357 |
| Sun Hydraulics Corp. | 8,923 | 357 | |
| Knoll Inc. | 19,419 | 355 | |
| * | ACCO Brands Corp. | 45,749 | 354 |
| Encore Wire Corp. | 8,304 | 353 | |
| * | Thermon Group Holdings Inc. | 12,806 | 348 |
| * | Ascent Capital Group Inc. Class A | 5,564 | 347 |
| John Bean Technologies Corp. | 11,685 | 339 | |
| * | Taser International Inc. | 21,599 | 338 |
| * | Atlas Air Worldwide Holdings Inc. | 10,117 | 338 |
| * | UTi Worldwide Inc. | 36,687 | 337 |
| * | Sykes Enterprises Inc. | 15,797 | 331 |
| * | Team Inc. | 8,198 | 327 |
| Nordic American Tankers Ltd. | 35,759 | 324 | |
| * | RPX Corp. | 21,257 | 323 |
| * | Navigant Consulting Inc. | 19,708 | 321 |
| * | Advanced Energy Industries Inc. | 16,512 | 318 |
| Hyster-Yale Materials Handling Inc. | 4,122 | 318 | |
| * | Blount International Inc. | 19,834 | 317 |
| Astec Industries Inc. | 7,568 | 314 | |
| Textainer Group Holdings Ltd. | 8,655 | 305 | |
| American Railcar Industries Inc. | 3,789 | 302 | |
| Badger Meter Inc. | 5,789 | 302 | |
| Navios Maritime Holdings Inc. | 31,817 | 301 | |
| * | YRC Worldwide Inc. | 12,537 | 291 |
| * | Hawaiian Holdings Inc. | 18,064 | 282 |
| * | Roadrunner Transportation Systems Inc. | 11,177 | 281 |
| * | Modine Manufacturing Co. | 19,113 | 272 |
| * | ICF International Inc. | 7,997 | 270 |
| Insperity Inc. | 9,091 | 268 | |
| Titan International Inc. | 17,665 | 256 | |
24
| Vanguard® Russell 2000 Index Fund | |||
| Schedule of Investments | |||
| August 31, 2014 | |||
| Market | |||
| Value | |||
| Shares | ($000) | ||
| * | Engility Holdings Inc. | 7,039 | 247 |
| * | Echo Global Logistics Inc. | 9,417 | 244 |
| Quad/Graphics Inc. | 10,838 | 243 | |
| * | Aerovironment Inc. | 7,637 | 241 |
| Multi-Color Corp. | 5,132 | 238 | |
| Resources Connection Inc. | 15,539 | 238 | |
| Gorman-Rupp Co. | 7,557 | 235 | |
| Kimball International Inc. Class B | 14,277 | 227 | |
| Kforce Inc. | 10,958 | 220 | |
| * | PHI Inc. | 5,049 | 216 |
| Park-Ohio Holdings Corp. | 3,675 | 213 | |
| * | Monster Worldwide Inc. | 36,494 | 211 |
| * | Republic Airways Holdings Inc. | 19,962 | 203 |
| Argan Inc. | 5,021 | 201 | |
| * | MYR Group Inc. | 8,544 | 200 |
| Columbus McKinnon Corp. | 7,959 | 199 | |
| * | Advanced Emissions Solutions Inc. | 9,082 | 198 |
| Powell Industries Inc. | 3,725 | 196 | |
| DHT Holdings Inc. | 27,834 | 195 | |
| * | Lydall Inc. | 6,823 | 189 |
| * | TeleTech Holdings Inc. | 7,034 | 189 |
| Marten Transport Ltd. | 9,537 | 189 | |
| Kadant Inc. | 4,695 | 186 | |
| SkyWest Inc. | 20,489 | 184 | |
| Kelly Services Inc. Class A | 10,969 | 183 | |
| * | Great Lakes Dredge & Dock Corp. | 23,987 | 183 |
| Douglas Dynamics Inc. | 8,930 | 178 | |
| * | Air Transport Services Group Inc. | 21,720 | 177 |
| Celadon Group Inc. | 8,388 | 176 | |
| Barrett Business Services Inc. | 2,878 | 170 | |
| Knightsbridge Tankers Ltd. | 13,892 | 170 | |
| Forrester Research Inc. | 4,378 | 170 | |
| * | TriNet Group Inc. | 6,306 | 169 |
| Heidrick & Struggles International Inc. | 7,299 | 158 | |
| Ennis Inc. | 10,955 | 158 | |
| * | GP Strategies Corp. | 6,146 | 155 |
| * | Quality Distribution Inc. | 10,987 | 154 |
| * | Liquidity Services Inc. | 9,854 | 150 |
| Alamo Group Inc. | 2,966 | 145 | |
| FreightCar America Inc. | 4,834 | 144 | |
| * | CBIZ Inc. | 16,677 | 143 |
| * | Furmanite Corp. | 15,661 | 142 |
| * | Mistras Group Inc. | 6,566 | 141 |
| * | Kratos Defense & Security Solutions Inc. | 18,407 | 139 |
| Safe Bulkers Inc. | 15,603 | 137 | |
| * | Ducommun Inc. | 4,360 | 135 |
| * | SP Plus Corp. | 6,164 | 133 |
| * | Dice Holdings Inc. | 15,561 | 132 |
| * | Maxwell Technologies Inc. | 12,646 | 130 |
| Graham Corp. | 4,192 | 128 | |
| * | CAI International Inc. | 6,574 | 127 |
| * | Power Solutions International Inc. | 1,798 | 123 |
| * | InnerWorkings Inc. | 14,058 | 122 |
| Ceco Environmental Corp. | 8,437 | 119 | |
| *,^ | ExOne Co. | 3,979 | 116 |
| Baltic Trading Ltd. | 19,728 | 116 | |
| Global Power Equipment Group Inc. | 6,862 | 116 | |
| * | Performant Financial Corp. | 11,938 | 115 |
| Navios Maritime Acquisition Corp. | 32,969 | 114 | |
| * | Orion Marine Group Inc. | 10,992 | 111 |
| * | CRA International Inc. | 4,109 | 111 |
| Twin Disc Inc. | 3,361 | 109 | |
| Teekay Tankers Ltd. Class A | 24,958 | 106 | |
| NACCO Industries Inc. Class A | 1,983 | 103 | |
25
| Vanguard® Russell 2000 Index Fund | |||
| Schedule of Investments | |||
| August 31, 2014 | |||
| Market | |||
| Value | |||
| Shares | ($000) | ||
| * | ServiceSource International Inc. | 26,550 | 101 |
| Electro Rent Corp. | 6,577 | 100 | |
| VSE Corp. | 1,668 | 99 | |
| Ardmore Shipping Corp. | 7,241 | 95 | |
| * | Layne Christensen Co. | 8,304 | 95 |
| * | CHC Group Ltd. | 13,451 | 93 |
| Houston Wire & Cable Co. | 7,121 | 93 | |
| * | Patriot Transportation Holding Inc. | 2,645 | 92 |
| Hurco Cos. Inc. | 2,609 | 86 | |
| Miller Industries Inc. | 4,540 | 86 | |
| CDI Corp. | 5,650 | 86 | |
| * | Titan Machinery Inc. | 6,952 | 86 |
| * | AM Castle & Co. | 8,117 | 80 |
| * | Commercial Vehicle Group Inc. | 9,804 | 79 |
| Mesa Laboratories Inc. | 1,075 | 77 | |
| * | Vishay Precision Group Inc. | 5,002 | 77 |
| * | Paylocity Holding Corp. | 3,357 | 76 |
| * | Manitex International Inc. | 5,604 | 76 |
| * | Accuride Corp. | 16,203 | 74 |
| * | Energy Recovery Inc. | 15,432 | 73 |
| * | PRGX Global Inc. | 11,667 | 73 |
| Spartan Motors Inc. | 13,787 | 72 | |
| * | Casella Waste Systems Inc. Class A | 15,619 | 70 |
| * | Sterling Construction Co. Inc. | 8,123 | 69 |
| * | Control4 Corp. | 4,583 | 68 |
| Hackett Group Inc. | 10,577 | 66 | |
| * | Xerium Technologies Inc. | 4,416 | 66 |
| Marlin Business Services Corp. | 3,336 | 66 | |
| Universal Truckload Services Inc. | 2,640 | 66 | |
| * | LMI Aerospace Inc. | 4,199 | 64 |
| * | CUI Global Inc. | 8,272 | 61 |
| Preformed Line Products Co. | 1,039 | 59 | |
| * | Vicor Corp. | 7,146 | 59 |
| * | Dorian LPG Ltd. | 2,936 | 58 |
| * | Heritage-Crystal Clean Inc. | 3,572 | 57 |
| * | Frontline Ltd. | 26,596 | 55 |
| * | Hill International Inc. | 12,061 | 53 |
| * | PAM Transportation Services Inc. | 1,290 | 47 |
| * | USA Truck Inc. | 2,512 | 47 |
| * | Global Sources Ltd. | 6,559 | 47 |
| International Shipholding Corp. | 2,258 | 46 | |
| * | Vertex Energy Inc. | 4,734 | 44 |
| * | General Finance Corp. | 4,440 | 39 |
| * | Erickson Inc. | 2,429 | 32 |
| * | Ultrapetrol Bahamas Ltd. | 8,646 | 29 |
| SIFCO Industries Inc. | 1,019 | 28 | |
| * | ARC Group Worldwide Inc. | 1,231 | 25 |
| *,^ | Quest Resource Holding Corp. | 5,108 | 20 |
| * | Corporate Resource Services Inc. | 7,044 | 13 |
| 94,463 | |||
| Technology (14.4%) | |||
| * | Ultimate Software Group Inc. | 11,366 | 1,671 |
| * | Aspen Technology Inc. | 36,920 | 1,517 |
| * | Cognex Corp. | 34,820 | 1,462 |
| * | RF Micro Devices Inc. | 114,742 | 1,431 |
| FEI Co. | 16,942 | 1,424 | |
| * | TriQuint Semiconductor Inc. | 68,702 | 1,420 |
| * | Guidewire Software Inc. | 27,245 | 1,241 |
| * | SS&C Technologies Holdings Inc. | 27,314 | 1,236 |
| * | Verint Systems Inc. | 23,939 | 1,200 |
| * | Cavium Inc. | 21,186 | 1,190 |
| * | Synaptics Inc. | 14,444 | 1,186 |
| * | Tyler Technologies Inc. | 13,235 | 1,179 |
| * | International Rectifier Corp. | 28,578 | 1,126 |
26
| Vanguard® Russell 2000 Index Fund | |||
| Schedule of Investments | |||
| August 31, 2014 | |||
| Market | |||
| Value | |||
| Shares | ($000) | ||
| * | CommVault Systems Inc. | 18,921 | 1,043 |
| * | Qlik Technologies Inc. | 35,944 | 1,015 |
| * | Microsemi Corp. | 38,081 | 1,014 |
| Anixter International Inc. | 10,891 | 972 | |
| * | Dealertrack Technologies Inc. | 21,485 | 962 |
| * | ViaSat Inc. | 16,589 | 945 |
| * | DigitalGlobe Inc. | 30,252 | 919 |
| * | Aruba Networks Inc. | 42,813 | 914 |
| * | Trulia Inc. | 14,807 | 913 |
| * | ACI Worldwide Inc. | 45,624 | 888 |
| * | Integrated Device Technology Inc. | 53,561 | 881 |
| * | Fairchild Semiconductor International Inc. Class A | 50,093 | 879 |
| * | Manhattan Associates Inc. | 30,388 | 878 |
| * | Ciena Corp. | 42,114 | 871 |
| Mentor Graphics Corp. | 38,832 | 847 | |
| Compuware Corp. | 88,088 | 824 | |
| Plantronics Inc. | 17,060 | 814 | |
| * | Cornerstone OnDemand Inc. | 21,311 | 798 |
| * | SYNNEX Corp. | 11,400 | 795 |
| * | Silicon Laboratories Inc. | 17,425 | 790 |
| * | Finisar Corp. | 38,802 | 788 |
| * | Take-Two Interactive Software Inc. | 33,441 | 786 |
| Science Applications International Corp. | 16,855 | 777 | |
| Intersil Corp. Class A | 51,634 | 777 | |
| * | Sanmina Corp. | 33,009 | 775 |
| Monolithic Power Systems Inc. | 15,480 | 740 | |
| *,^ | InvenSense Inc. | 28,500 | 737 |
| * | Polycom Inc. | 55,395 | 734 |
| Power Integrations Inc. | 12,198 | 729 | |
| MKS Instruments Inc. | 21,467 | 729 | |
| Blackbaud Inc. | 18,508 | 720 | |
| InterDigital Inc. | 16,220 | 720 | |
| * | Semtech Corp. | 26,956 | 702 |
| Cypress Semiconductor Corp. | 63,244 | 699 | |
| * | CACI International Inc. Class A | 9,419 | 679 |
| * | Entegris Inc. | 55,806 | 677 |
| * | NetScout Systems Inc. | 14,611 | 673 |
| * | Sapient Corp. | 45,955 | 667 |
| * | NeuStar Inc. Class A | 22,452 | 662 |
| * | Coherent Inc. | 9,998 | 645 |
| * | Demandware Inc. | 12,047 | 640 |
| Tessera Technologies Inc. | 21,437 | 634 | |
| * | Envestnet Inc. | 13,654 | 628 |
| * | Synchronoss Technologies Inc. | 14,148 | 625 |
| * | OmniVision Technologies Inc. | 22,486 | 610 |
| * | Cirrus Logic Inc. | 24,882 | 602 |
| * | Proofpoint Inc. | 14,833 | 592 |
| * | Acxiom Corp. | 30,857 | 572 |
| * | Veeco Instruments Inc. | 16,054 | 568 |
| * | Rambus Inc. | 45,612 | 566 |
| * | Universal Display Corp. | 16,259 | 565 |
| * | iGATE Corp. | 15,037 | 563 |
| * | Plexus Corp. | 13,603 | 560 |
| * | Syntel Inc. | 6,223 | 556 |
| * | Ubiquiti Networks Inc. | 11,918 | 541 |
| * | Spansion Inc. Class A | 24,209 | 540 |
| * | EPAM Systems Inc. | 14,278 | 538 |
| * | Benchmark Electronics Inc. | 21,618 | 532 |
| * | comScore Inc. | 13,897 | 532 |
| ADTRAN Inc. | 22,621 | 522 | |
| * | Infinera Corp. | 49,116 | 520 |
| * | PMC-Sierra Inc. | 69,516 | 513 |
| Methode Electronics Inc. | 15,206 | 513 | |
| * | MicroStrategy Inc. Class A | 3,637 | 505 |
27
| Vanguard® Russell 2000 Index Fund | |||
| Schedule of Investments | |||
| August 31, 2014 | |||
| Market | |||
| Value | |||
| Shares | ($000) | ||
| * | FleetMatics Group plc | 14,974 | 491 |
| NIC Inc. | 26,152 | 490 | |
| * | NETGEAR Inc. | 14,640 | 486 |
| * | Unisys Corp. | 20,493 | 480 |
| * | Progress Software Corp. | 20,596 | 477 |
| Monotype Imaging Holdings Inc. | 15,846 | 466 | |
| * | Cray Inc. | 16,316 | 460 |
| * | Bottomline Technologies de Inc. | 15,780 | 444 |
| * | ScanSource Inc. | 11,433 | 441 |
| * | Rogers Corp. | 7,266 | 437 |
| * | Insight Enterprises Inc. | 16,414 | 431 |
| * | LogMeIn Inc. | 9,737 | 412 |
| * | Ellie Mae Inc. | 11,271 | 403 |
| *,^ | Ambarella Inc. | 11,550 | 396 |
| * | Loral Space & Communications Inc. | 5,254 | 394 |
| * | Web.com Group Inc. | 20,761 | 393 |
| *,^ | iRobot Corp. | 11,823 | 383 |
| CSG Systems International Inc. | 13,671 | 379 | |
| * | Bankrate Inc. | 26,882 | 377 |
| * | Diodes Inc. | 14,614 | 372 |
| * | Sonus Networks Inc. | 98,558 | 372 |
| * | SPS Commerce Inc. | 6,497 | 363 |
| * | Ruckus Wireless Inc. | 25,998 | 362 |
| Acacia Research Corp. | 20,075 | 357 | |
| * | Amkor Technology Inc. | 34,217 | 356 |
| * | Virtusa Corp. | 10,428 | 355 |
| * | Lattice Semiconductor Corp. | 47,189 | 354 |
| * | Super Micro Computer Inc. | 13,838 | 339 |
| * | RealPage Inc. | 20,769 | 335 |
| * | QLogic Corp. | 34,966 | 316 |
| Pegasystems Inc. | 14,212 | 315 | |
| Brooks Automation Inc. | 26,787 | 304 | |
| * | Newport Corp. | 15,982 | 302 |
| * | Marketo Inc. | 10,281 | 301 |
| * | II-VI Inc. | 21,072 | 294 |
| * | Ultratech Inc. | 11,248 | 291 |
| * | Infoblox Inc. | 21,601 | 291 |
| * | ICG Group Inc. | 16,664 | 289 |
| * | Interactive Intelligence Group Inc. | 6,667 | 285 |
| * | LivePerson Inc. | 21,733 | 281 |
| ManTech International Corp. Class A | 9,604 | 278 | |
| * | CalAmp Corp. | 14,410 | 278 |
| * | BroadSoft Inc. | 11,461 | 273 |
| * | Rofin-Sinar Technologies Inc. | 11,242 | 269 |
| * | Applied Micro Circuits Corp. | 31,746 | 269 |
| * | Blucora Inc. | 16,942 | 264 |
| * | Imperva Inc. | 8,801 | 256 |
| *,^ | VirnetX Holding Corp. | 17,053 | 251 |
| * | Harmonic Inc. | 38,006 | 250 |
| * | AVG Technologies NV | 13,972 | 245 |
| * | PDF Solutions Inc. | 12,236 | 244 |
| * | PROS Holdings Inc. | 9,427 | 241 |
| * | Checkpoint Systems Inc. | 17,405 | 241 |
| CTS Corp. | 13,553 | 240 | |
| * | Perficient Inc. | 13,856 | 239 |
| * | Kofax Ltd. | 29,751 | 236 |
| Park Electrochemical Corp. | 8,372 | 236 | |
| Comtech Telecommunications Corp. | 6,146 | 234 | |
| * | RetailMeNot Inc. | 12,349 | 230 |
| * | Fabrinet | 14,078 | 228 |
| Micrel Inc. | 17,888 | 224 | |
| * | Ixia | 23,090 | 222 |
| * | Comverse Inc. | 8,986 | 222 |
| * | Photronics Inc. | 24,724 | 218 |
28
| Vanguard® Russell 2000 Index Fund | |||
| Schedule of Investments | |||
| August 31, 2014 | |||
| Market | |||
| Value | |||
| Shares | ($000) | ||
| * | Tangoe Inc. | 15,512 | 216 |
| * | Textura Corp. | 7,478 | 215 |
| * | Callidus Software Inc. | 18,429 | 212 |
| * | Extreme Networks Inc. | 38,692 | 206 |
| * | Xcerra Corp. | 19,394 | 203 |
| * | Digital River Inc. | 13,093 | 200 |
| Daktronics Inc. | 15,139 | 199 | |
| * | Qualys Inc. | 8,065 | 196 |
| * | Global Eagle Entertainment Inc. | 15,292 | 193 |
| ^ | Ebix Inc. | 12,277 | 190 |
| * | Inphi Corp. | 12,557 | 189 |
| Integrated Silicon Solution Inc. | 12,722 | 189 | |
| * | Glu Mobile Inc. | 36,044 | 186 |
| * | VASCO Data Security International Inc. | 12,527 | 185 |
| American Science & Engineering Inc. | 3,154 | 183 | |
| Epiq Systems Inc. | 12,478 | 182 | |
| * | Cvent Inc. | 7,195 | 181 |
| * | SciQuest Inc. | 11,117 | 178 |
| * | Calix Inc. | 16,771 | 176 |
| * | Emulex Corp. | 31,851 | 175 |
| * | TTM Technologies Inc. | 22,174 | 170 |
| EarthLink Holdings Corp. | 41,041 | 169 | |
| * | ShoreTel Inc. | 25,073 | 168 |
| * | Endurance International Group Holdings Inc. | 12,087 | 163 |
| * | DTS Inc. | 6,803 | 162 |
| * | Nanometrics Inc. | 9,581 | 160 |
| * | Exar Corp. | 16,030 | 160 |
| * | FormFactor Inc. | 22,594 | 159 |
| * | Silicon Image Inc. | 31,415 | 159 |
| * | GSI Group Inc. | 12,180 | 156 |
| * | KEYW Holding Corp. | 13,116 | 155 |
| * | Internap Network Services Corp. | 22,449 | 154 |
| * | Mercury Systems Inc. | 13,706 | 153 |
| * | RingCentral Inc. Class A | 11,238 | 151 |
| Black Box Corp. | 6,238 | 147 | |
| * | Bazaarvoice Inc. | 20,039 | 146 |
| * | Silver Spring Networks Inc. | 14,039 | 146 |
| Oplink Communications Inc. | 7,432 | 144 | |
| * | E2open Inc. | 9,297 | 140 |
| * | Peregrine Semiconductor Corp. | 11,154 | 139 |
| * | ARC Document Solutions Inc. | 17,069 | 139 |
| * | GrubHub Inc. | 3,582 | 138 |
| * | Silicon Graphics International Corp. | 13,853 | 136 |
| * | Violin Memory Inc. | 32,147 | 136 |
| * | ChannelAdvisor Corp. | 8,300 | 134 |
| * | NVE Corp. | 1,943 | 134 |
| * | Rudolph Technologies Inc. | 13,679 | 132 |
| * | CEVA Inc. | 8,414 | 128 |
| * | Jive Software Inc. | 18,090 | 126 |
| * | Applied Optoelectronics Inc. | 5,930 | 126 |
| Cohu Inc. | 10,123 | 124 | |
| * | Intralinks Holdings Inc. | 15,770 | 124 |
| * | Zendesk Inc. | 4,558 | 124 |
| * | Immersion Corp. | 11,689 | 122 |
| * | ePlus Inc. | 2,089 | 122 |
| * | Lionbridge Technologies Inc. | 26,080 | 121 |
| *,^ | Rocket Fuel Inc. | 7,358 | 120 |
| * | Ciber Inc. | 31,130 | 119 |
| IXYS Corp. | 9,803 | 118 | |
| * | Sparton Corp. | 4,061 | 117 |
| * | Rally Software Development Corp. | 9,970 | 115 |
| * | M/A-COM Technology Solutions Holdings Inc. | 4,825 | 114 |
| * | Luxoft Holding Inc. Class A | 3,146 | 113 |
| * | Quantum Corp. | 88,099 | 110 |
29
| Vanguard® Russell 2000 Index Fund | |||
| Schedule of Investments | |||
| August 31, 2014 | |||
| Market | |||
| Value | |||
| Shares | ($000) | ||
| * | Gigamon Inc. | 9,700 | 106 |
| * | Kopin Corp. | 26,452 | 105 |
| * | Ultra Clean Holdings Inc. | 10,840 | 105 |
| * | Seachange International Inc. | 13,718 | 104 |
| * | Nimble Storage Inc. | 3,714 | 100 |
| * | MaxLinear Inc. | 10,821 | 100 |
| * | Datalink Corp. | 8,014 | 99 |
| * | Entropic Communications Inc. | 37,519 | 99 |
| Bel Fuse Inc. Class B | 3,985 | 94 | |
| * | Unwired Planet Inc. | 43,724 | 92 |
| * | Kemet Corp. | 18,188 | 92 |
| * | Wix.com Ltd. | 5,561 | 92 |
| * | Zix Corp. | 23,760 | 91 |
| American Software Inc. Class A | 9,878 | 91 | |
| * | Pericom Semiconductor Corp. | 9,267 | 91 |
| * | Axcelis Technologies Inc. | 44,665 | 90 |
| * | Marin Software Inc. | 10,562 | 88 |
| * | Digi International Inc. | 10,514 | 88 |
| * | Dot Hill Systems Corp. | 24,057 | 88 |
| PC Connection Inc. | 3,834 | 87 | |
| * | Actuate Corp. | 19,394 | 86 |
| * | Procera Networks Inc. | 8,297 | 85 |
| * | Aeroflex Holding Corp. | 7,873 | 83 |
| Reis Inc. | 3,369 | 80 | |
| * | Alpha & Omega Semiconductor Ltd. | 8,666 | 80 |
| * | Barracuda Networks Inc. | 3,181 | 79 |
| * | KVH Industries Inc. | 6,273 | 78 |
| * | Vocera Communications Inc. | 8,832 | 78 |
| Computer Task Group Inc. | 6,037 | 77 | |
| * | Carbonite Inc. | 7,099 | 76 |
| * | Telenav Inc. | 10,922 | 75 |
| *,^ | QuickLogic Corp. | 22,110 | 75 |
| * | Sapiens International Corp. NV | 8,866 | 73 |
| * | Millennial Media Inc. | 30,224 | 72 |
| * | DSP Group Inc. | 8,005 | 72 |
| * | Agilysys Inc. | 5,750 | 72 |
| Electro Scientific Industries Inc. | 9,632 | 71 | |
| * | Model N Inc. | 7,727 | 71 |
| Tessco Technologies Inc. | 2,214 | 71 | |
| * | Brightcove Inc. | 11,716 | 71 |
| * | Benefitfocus Inc. | 2,146 | 71 |
| * | RealNetworks Inc. | 9,084 | 70 |
| * | GTT Communications Inc. | 5,647 | 69 |
| * | Intevac Inc. | 9,585 | 68 |
| Alliance Fiber Optic Products Inc. | 4,593 | 68 | |
| * | Oclaro Inc. | 37,537 | 66 |
| * | Rubicon Technology Inc. | 10,491 | 65 |
| * | Numerex Corp. Class A | 5,658 | 65 |
| * | Vitesse Semiconductor Corp. | 19,324 | 65 |
| * | TrueCar Inc. | 3,119 | 64 |
| * | ModusLink Global Solutions Inc. | 15,124 | 62 |
| * | Clearfield Inc. | 4,573 | 61 |
| Digimarc Corp. | 2,537 | 60 | |
| * | A10 Networks Inc. | 5,100 | 59 |
| * | Q2 Holdings Inc. | 3,967 | 59 |
| * | Cinedigm Corp. Class A | 30,684 | 57 |
| * | TeleCommunication Systems Inc. Class A | 19,232 | 57 |
| * | Cascade Microtech Inc. | 5,125 | 56 |
| * | Travelzoo Inc. | 3,202 | 55 |
| * | Varonis Systems Inc. | 2,287 | 54 |
| * | Amber Road Inc. | 3,577 | 54 |
| * | Guidance Software Inc. | 6,788 | 53 |
| * | TechTarget Inc. | 6,012 | 52 |
| * | Limelight Networks Inc. | 21,880 | 52 |
30
| Vanguard® Russell 2000 Index Fund | |||
| Schedule of Investments | |||
| August 31, 2014 | |||
| Market | |||
| Value | |||
| Shares | ($000) | ||
| QAD Inc. Class A | 2,383 | 49 | |
| *,^ | ParkerVision Inc. | 39,698 | 49 |
| * | OPOWER Inc. | 3,116 | 49 |
| * | Audience Inc. | 5,616 | 48 |
| * | Paycom Software Inc. | 2,613 | 47 |
| * | Everyday Health Inc. | 3,034 | 44 |
| * | Mavenir Systems Inc. | 3,873 | 43 |
| * | Tremor Video Inc. | 14,221 | 42 |
| * | Rightside Group Ltd. | 3,497 | 42 |
| * | Cyan Inc. | 11,023 | 42 |
| * | Park City Group Inc. | 3,826 | 40 |
| * | YuMe Inc. | 7,268 | 38 |
| * | Multi-Fineline Electronix Inc. | 3,550 | 36 |
| * | Borderfree Inc. | 2,397 | 34 |
| * | Demand Media Inc. | 3,498 | 31 |
| * | Vringo Inc. | 30,819 | 31 |
| * | Rubicon Project Inc. | 3,174 | 31 |
| * | Aerohive Networks Inc. | 3,821 | 30 |
| * | Five9 Inc. | 4,889 | 29 |
| *,^ | Revolution Lighting Technologies Inc. | 12,002 | 25 |
| * | Turtle Beach Corp. | 2,814 | 20 |
| * | Viasystems Group Inc. | 1,474 | 16 |
| * | Covisint Corp. | 3,112 | 15 |
| * | Avid Technology Inc. | 173 | 1 |
| 99,828 | |||
| Utilities (4.3%) | |||
| Cleco Corp. | 24,204 | 1,366 | |
| * | Dynegy Inc. Class A | 40,236 | 1,315 |
| Piedmont Natural Gas Co. Inc. | 31,253 | 1,169 | |
| IDACORP Inc. | 20,172 | 1,144 | |
| Portland General Electric Co. | 31,348 | 1,081 | |
| j2 Global Inc. | 19,068 | 1,019 | |
| Southwest Gas Corp. | 18,645 | 973 | |
| Black Hills Corp. | 17,895 | 961 | |
| WGL Holdings Inc. | 20,812 | 905 | |
| New Jersey Resources Corp. | 16,896 | 882 | |
| Laclede Group Inc. | 17,261 | 853 | |
| UIL Holdings Corp. | 22,667 | 844 | |
| PNM Resources Inc. | 31,937 | 837 | |
| ALLETE Inc. | 16,984 | 827 | |
| Avista Corp. | 24,125 | 783 | |
| ONE Gas Inc. | 20,840 | 780 | |
| South Jersey Industries Inc. | 13,224 | 766 | |
| NorthWestern Corp. | 15,691 | 758 | |
| Cogent Communications Holdings Inc. | 18,685 | 648 | |
| El Paso Electric Co. | 16,165 | 636 | |
| MGE Energy Inc. | 13,901 | 559 | |
| NRG Yield Inc. Class A | 9,581 | 521 | |
| Pattern Energy Group Inc. Class A | 15,825 | 510 | |
| American States Water Co. | 15,550 | 502 | |
| Northwest Natural Gas Co. | 10,882 | 495 | |
| California Water Service Group | 19,168 | 467 | |
| West Corp. | 15,438 | 458 | |
| Empire District Electric Co. | 17,324 | 448 | |
| * | Globalstar Inc. | 110,090 | 438 |
| Otter Tail Corp. | 14,624 | 417 | |
| Consolidated Communications Holdings Inc. | 16,154 | 394 | |
| * | Gogo Inc. | 22,407 | 379 |
| * | Cincinnati Bell Inc. | 83,833 | 308 |
| * | Iridium Communications Inc. | 32,379 | 304 |
| * | 8x8 Inc. | 35,511 | 276 |
| Chesapeake Utilities Corp. | 3,889 | 268 | |
| Shenandoah Telecommunications Co. | 9,663 | 267 | |
| * | Premiere Global Services Inc. | 19,346 | 255 |
31
| Vanguard® Russell 2000 Index Fund | |||||
| Schedule of Investments | |||||
| August 31, 2014 | |||||
| Market | |||||
| Value | |||||
| Shares | ($000) | ||||
| * | Vonage Holdings Corp. | 68,551 | 236 | ||
| * | inContact Inc. | 24,096 | 221 | ||
| Atlantic Tele-Network Inc. | 3,761 | 220 | |||
| Atlantic Power Corp. | 49,731 | 197 | |||
| Ormat Technologies Inc. | 7,112 | 196 | |||
| * | Intelsat SA | 10,972 | 192 | ||
| Unitil Corp. | 5,787 | 189 | |||
| SJW Corp. | 6,481 | 177 | |||
| * | General Communication Inc. Class A | 14,138 | 159 | ||
| Inteliquent Inc. | 13,009 | 159 | |||
| Connecticut Water Service Inc. | 4,364 | 144 | |||
| * | FairPoint Communications Inc. | 8,327 | 135 | ||
| Middlesex Water Co. | 6,411 | 132 | |||
| * | Pike Corp. | 11,011 | 131 | ||
| Spok Holdings Inc. | 8,686 | 128 | |||
| * | Hawaiian Telcom Holdco Inc. | 4,243 | 117 | ||
| IDT Corp. Class B | 7,106 | 112 | |||
| * | ORBCOMM Inc. | 17,782 | 111 | ||
| Lumos Networks Corp. | 7,541 | 110 | |||
| York Water Co. | 5,190 | 105 | |||
| * | Pendrell Corp. | 66,336 | 102 | ||
| Enventis Corp. | 5,492 | 98 | |||
| NTELOS Holdings Corp. | 6,928 | 91 | |||
| * | magicJack VocalTec Ltd. | 7,151 | 90 | ||
| Artesian Resources Corp. Class A | 3,066 | 65 | |||
| * | Boingo Wireless Inc. | 9,318 | 65 | ||
| 29,495 | |||||
| Total Common Stocks (Cost $596,444) | 690,695 | ||||
| Coupon | |||||
| Temporary Cash Investments (1.0%)1 | |||||
| Money Market Fund (1.0%) | |||||
| 3,4 | Vanguard Market Liquidity Fund | 0.113% | 6,730,759 | 6,731 | |
| Face | |||||
| Maturity | Amount | ||||
| Date | ($000) | ||||
| U.S. Government and Agency Obligations (0.0%) | |||||
| 5,6 | Fannie Mae Discount Notes | 0.075% | 10/15/14 | 300 | 300 |
| Total Temporary Cash Investments (Cost $7,031) | 7,031 | ||||
| Total Investments (100.5%) (Cost $603,475) | 697,726 | ||||
| Other Assets and Liabilities—Net (-0.5%)4 | (3,232) | ||||
| Net Assets (100%) | 694,494 | ||||
* Non-income-producing security.
^ Includes partial security positions on loan to broker-dealers. The total value of securities on loan is $3,549,000.
1 The fund invests a portion of its cash reserves in equity markets through the use of index futures contracts. After giving effect to futures investments, the fund's effective common stock and temporary cash investment positions represent 100.0% and 0.5%, respectively, of net assets.
2 “Other” represents securities that are not classified by the fund’s benchmark index.
3 Affiliated money market fund available only to Vanguard funds and certain trusts and accounts managed by Vanguard. Rate shown is the 7-day yield.
4 Includes $3,852,000 of collateral received for securities on loan.
5 The issuer was placed under federal conservatorship in September 2008; since that time, its daily operations have been managed by the Federal Housing Finance Agency and it receives capital from the U.S. Treasury, as needed to maintain a positive net worth, in exchange for senior preferred stock.
6 Securities with a value of $200,000 have been segregated as initial margin for open futures contracts.
REIT—Real Estate Investment Trust.
32
| Vanguard® Russell 2000 Value Index Fund | ||
| Schedule of Investments | ||
| August 31, 2014 | ||
| Market | ||
| Value | ||
| Shares | ($000) | |
| Common Stocks (99.9%)1 | ||
| Consumer Discretionary (11.4%) | ||
| * Office Depot Inc. | 93,795 | 480 |
| American Eagle Outfitters Inc. | 34,100 | 480 |
| * Time Inc. | 19,340 | 454 |
| * Houghton Mifflin Harcourt Co. | 19,119 | 367 |
| Brunswick Corp. | 8,131 | 350 |
| * TRI Pointe Homes Inc. | 23,316 | 345 |
| Dana Holding Corp. | 13,803 | 321 |
| * Life Time Fitness Inc. | 6,768 | 312 |
| Cooper Tire & Rubber Co. | 10,097 | 311 |
| Ryland Group Inc. | 8,229 | 305 |
| * Genesco Inc. | 3,837 | 304 |
| New York Times Co. Class A | 24,268 | 300 |
| * Marriott Vacations Worldwide Corp. | 4,968 | 296 |
| Meredith Corp. | 6,299 | 293 |
| * Meritage Homes Corp. | 6,859 | 283 |
| Group 1 Automotive Inc. | 3,465 | 278 |
| Rent-A-Center Inc. | 9,300 | 259 |
| Guess? Inc. | 10,780 | 253 |
| Matthews International Corp. Class A | 5,255 | 242 |
| * Express Inc. | 13,959 | 242 |
| * Iconix Brand Group Inc. | 5,291 | 220 |
| * Belmond Ltd. Class A | 16,996 | 217 |
| * Standard Pacific Corp. | 25,450 | 213 |
| Children's Place Inc. | 3,877 | 208 |
| * Crocs Inc. | 13,437 | 208 |
| MDC Holdings Inc. | 6,858 | 199 |
| Bob Evans Farms Inc. | 4,343 | 189 |
| Finish Line Inc. Class A | 6,364 | 189 |
| * TiVo Inc. | 13,273 | 187 |
| * Helen of Troy Ltd. | 3,121 | 182 |
| Sonic Automotive Inc. Class A | 7,100 | 175 |
| * Barnes & Noble Inc. | 7,290 | 174 |
| International Speedway Corp. Class A | 4,958 | 166 |
| Scholastic Corp. | 4,725 | 166 |
| * Penn National Gaming Inc. | 13,997 | 158 |
| * Cooper-Standard Holding Inc. | 2,300 | 151 |
| DineEquity Inc. | 1,802 | 150 |
| * Media General Inc. | 9,560 | 147 |
| Cato Corp. Class A | 4,150 | 144 |
| * Shutterfly Inc. | 2,684 | 137 |
| MDC Partners Inc. Class A | 5,697 | 125 |
| National CineMedia Inc. | 8,313 | 121 |
| Brown Shoe Co. Inc. | 4,020 | 120 |
| * BJ's Restaurants Inc. | 3,194 | 119 |
| Regis Corp. | 7,772 | 117 |
| Ethan Allen Interiors Inc. | 4,496 | 113 |
| * Meritor Inc. | 8,242 | 112 |
| * Steiner Leisure Ltd. | 2,618 | 111 |
| * Vitamin Shoppe Inc. | 2,724 | 107 |
| * Caesars Entertainment Corp. | 7,926 | 107 |
| * Skechers U.S.A. Inc. Class A | 1,810 | 106 |
| * Pep Boys-Manny Moe & Jack | 9,481 | 105 |
| * EW Scripps Co. Class A | 5,559 | 105 |
| Callaway Golf Co. | 13,808 | 105 |
| * Lands' End Inc. | 2,935 | 101 |
| * FTD Cos. Inc. | 3,036 | 101 |
| * M/I Homes Inc. | 4,358 | 99 |
| Stage Stores Inc. | 5,645 | 99 |
| Men's Wearhouse Inc. | 1,742 | 94 |
| New Media Investment Group Inc. | 5,346 | 93 |
| Fred's Inc. Class A | 6,563 | 93 |
33
| Vanguard® Russell 2000 Value Index Fund | ||
| Schedule of Investments | ||
| August 31, 2014 | ||
| Market | ||
| Value | ||
| Shares | ($000) | |
| * Biglari Holdings Inc. | 256 | 92 |
| * Chegg Inc. | 13,118 | 91 |
| * Caesars Acquisition Co. Class A | 8,141 | 89 |
| AMC Entertainment Holdings Inc. | 3,748 | 89 |
| * Federal-Mogul Holdings Corp. | 5,134 | 88 |
| * Hovnanian Enterprises Inc. Class A | 20,794 | 87 |
| Inter Parfums Inc. | 2,754 | 84 |
| Haverty Furniture Cos. Inc. | 3,588 | 83 |
| Superior Industries International Inc. | 4,204 | 82 |
| Viad Corp. | 3,640 | 80 |
| * Journal Communications Inc. Class A | 7,982 | 79 |
| * Elizabeth Arden Inc. | 4,610 | 79 |
| Churchill Downs Inc. | 835 | 79 |
| * MarineMax Inc. | 4,415 | 76 |
| * LeapFrog Enterprises Inc. | 11,630 | 75 |
| * Eastman Kodak Co. | 3,144 | 73 |
| * William Lyon Homes Class A | 2,744 | 70 |
| KB Home | 3,908 | 69 |
| * Ruby Tuesday Inc. | 10,942 | 67 |
| * K12 Inc. | 3,535 | 67 |
| Movado Group Inc. | 1,791 | 66 |
| * Career Education Corp. | 11,971 | 66 |
| * Citi Trends Inc. | 2,768 | 64 |
| * Central Garden and Pet Co. Class A | 6,928 | 62 |
| Stein Mart Inc. | 4,945 | 62 |
| * Sonic Corp. | 2,885 | 61 |
| Columbia Sportswear Co. | 796 | 61 |
| Harte-Hanks Inc. | 8,518 | 60 |
| * Aeropostale Inc. | 14,004 | 59 |
| Marcus Corp. | 3,202 | 58 |
| Shoe Carnival Inc. | 2,692 | 58 |
| National Presto Industries Inc. | 852 | 56 |
| * SFX Entertainment Inc. | 7,870 | 56 |
| Arctic Cat Inc. | 1,495 | 55 |
| Standard Motor Products Inc. | 1,423 | 54 |
| Remy International Inc. | 2,357 | 52 |
| * Beazer Homes USA Inc. | 2,737 | 52 |
| * Revlon Inc. Class A | 1,503 | 51 |
| * America's Car-Mart Inc. | 1,173 | 50 |
| * McClatchy Co. Class A | 10,881 | 49 |
| * Carrols Restaurant Group Inc. | 6,271 | 46 |
| * La Quinta Holdings Inc. | 2,297 | 45 |
| Carriage Services Inc. Class A | 2,388 | 44 |
| * Perry Ellis International Inc. | 2,163 | 43 |
| Universal Technical Institute Inc. | 3,860 | 43 |
| * WCI Communities Inc. | 2,089 | 42 |
| * Orbitz Worldwide Inc. | 5,027 | 41 |
| Destination Maternity Corp. | 2,105 | 41 |
| * Eros International plc | 2,491 | 40 |
| CSS Industries Inc. | 1,590 | 40 |
| * Entercom Communications Corp. Class A | 4,396 | 40 |
| * Sears Hometown and Outlet Stores Inc. | 2,068 | 40 |
| * Lee Enterprises Inc. | 9,545 | 39 |
| Speedway Motorsports Inc. | 2,074 | 39 |
| AH Belo Corp. Class A | 3,348 | 39 |
| * LGI Homes Inc. | 1,982 | 38 |
| * Bridgepoint Education Inc. | 2,913 | 37 |
| * Cumulus Media Inc. Class A | 7,821 | 36 |
| Interval Leisure Group Inc. | 1,627 | 35 |
| * Daily Journal Corp. | 183 | 35 |
| * Denny's Corp. | 5,086 | 35 |
| * Sizmek Inc. | 3,923 | 35 |
| * Black Diamond Inc. | 4,049 | 34 |
| * VOXX International Corp. Class A | 3,461 | 34 |
34
| Vanguard® Russell 2000 Value Index Fund | ||
| Schedule of Investments | ||
| August 31, 2014 | ||
| Market | ||
| Value | ||
| Shares | ($000) | |
| * West Marine Inc. | 3,115 | 34 |
| Big 5 Sporting Goods Corp. | 3,287 | 34 |
| * Rosetta Stone Inc. | 3,782 | 33 |
| * Scientific Games Corp. Class A | 3,260 | 33 |
| Weyco Group Inc. | 1,226 | 33 |
| * ITT Educational Services Inc. | 3,835 | 32 |
| * Isle of Capri Casinos Inc. | 3,857 | 32 |
| Lifetime Brands Inc. | 1,851 | 32 |
| RG Barry Corp. | 1,656 | 31 |
| * Central European Media Enterprises Ltd. Class A | 12,563 | 31 |
| Flexsteel Industries Inc. | 870 | 30 |
| * Dex Media Inc. | 2,648 | 30 |
| * Skullcandy Inc. | 3,585 | 30 |
| La-Z-Boy Inc. | 1,379 | 29 |
| * Boyd Gaming Corp. | 2,762 | 29 |
| * Systemax Inc. | 1,989 | 29 |
| * QuinStreet Inc. | 5,989 | 29 |
| * Intrawest Resorts Holdings Inc. | 2,393 | 28 |
| * Morgans Hotel Group Co. | 3,635 | 27 |
| Bon-Ton Stores Inc. | 2,601 | 27 |
| * Quiksilver Inc. | 9,288 | 27 |
| * Reading International Inc. Class A | 3,077 | 27 |
| Ruth's Hospitality Group Inc. | 2,310 | 26 |
| * Destination XL Group Inc. | 5,139 | 26 |
| * Tuesday Morning Corp. | 1,455 | 26 |
| * Fuel Systems Solutions Inc. | 2,517 | 25 |
| * Nautilus Inc. | 2,157 | 25 |
| * Zumiez Inc. | 765 | 25 |
| * ValueVision Media Inc. Class A | 5,159 | 24 |
| Johnson Outdoors Inc. Class A | 877 | 23 |
| * 1-800-Flowers.com Inc. Class A | 4,427 | 23 |
| * JAKKS Pacific Inc. | 3,324 | 23 |
| Cracker Barrel Old Country Store Inc. | 215 | 22 |
| * Monarch Casino & Resort Inc. | 1,693 | 22 |
| * New Home Co. Inc. | 1,496 | 21 |
| * 2U Inc. | 1,113 | 21 |
| Escalade Inc. | 1,393 | 20 |
| * Gaiam Inc. Class A | 2,672 | 20 |
| * Burlington Stores Inc. | 546 | 19 |
| Saga Communications Inc. Class A | 512 | 19 |
| * Kirkland's Inc. | 1,077 | 19 |
| * Cenveo Inc. | 6,188 | 19 |
| bebe stores inc | 5,584 | 18 |
| * Hemisphere Media Group Inc. | 1,489 | 17 |
| * Franklin Covey Co. | 868 | 17 |
| * Tilly's Inc. Class A | 1,887 | 15 |
| Salem Communications Corp. Class A | 1,802 | 15 |
| * Stoneridge Inc. | 1,007 | 13 |
| * Empire Resorts Inc. | 2,689 | 12 |
| Strattec Security Corp. | 132 | 11 |
| Weight Watchers International Inc. | 399 | 10 |
| * hhgregg Inc. | 1,328 | 9 |
| * Sequential Brands Group Inc. | 641 | 9 |
| * New York & Co. Inc. | 2,469 | 8 |
| * Build-A-Bear Workshop Inc. | 620 | 8 |
| * Stamps.com Inc. | 218 | 7 |
| * Libbey Inc. | 241 | 7 |
| * Sportsman's Warehouse Holdings Inc. | 1,090 | 7 |
| * Rentrak Corp. | 117 | 6 |
| * Speed Commerce Inc. | 1,773 | 6 |
| * Martha Stewart Living Omnimedia Inc. Class A | 1,320 | 6 |
| * Biglari Holdings Inc. Rights Exp. 9/12/2014 | 255 | 6 |
| * American Public Education Inc. | 175 | 5 |
| * ReachLocal Inc. | 923 | 5 |
35
| Vanguard® Russell 2000 Value Index Fund | |||
| Schedule of Investments | |||
| August 31, 2014 | |||
| Market | |||
| Value | |||
| Shares | ($000) | ||
| Einstein Noah Restaurant Group Inc. | 314 | 4 | |
| * | Education Management Corp. | 3,280 | 4 |
| * | Bravo Brio Restaurant Group Inc. | 260 | 4 |
| * | Crown Media Holdings Inc. Class A | 1,066 | 4 |
| Entravision Communications Corp. Class A | 557 | 3 | |
| * | Pacific Sunwear of California Inc. | 1,017 | 2 |
| 17,353 | |||
| Consumer Staples (2.2%) | |||
| * | SUPERVALU Inc. | 35,558 | 340 |
| * | TreeHouse Foods Inc. | 3,530 | 291 |
| * | Post Holdings Inc. | 7,709 | 285 |
| Dean Foods Co. | 16,486 | 267 | |
| Snyder's-Lance Inc. | 8,379 | 228 | |
| Universal Corp. | 4,088 | 216 | |
| Fresh Del Monte Produce Inc. | 6,350 | 203 | |
| Core-Mark Holding Co. Inc. | 3,670 | 177 | |
| SpartanNash Co. | 6,717 | 144 | |
| *,^ | Seaboard Corp. | 46 | 133 |
| * | Chiquita Brands International Inc. | 8,356 | 116 |
| Lancaster Colony Corp. | 1,229 | 109 | |
| Vector Group Ltd. | 4,393 | 105 | |
| * | Pantry Inc. | 4,105 | 87 |
| Weis Markets Inc. | 1,962 | 84 | |
| Ingles Markets Inc. Class A | 2,286 | 58 | |
| Sanderson Farms Inc. | 588 | 55 | |
| * | Omega Protein Corp. | 3,617 | 54 |
| John B Sanfilippo & Son Inc. | 1,473 | 45 | |
| * | Seneca Foods Corp. Class A | 1,453 | 44 |
| * | Nutraceutical International Corp. | 1,541 | 37 |
| * | Alliance One International Inc. | 15,700 | 35 |
| Nature's Sunshine Products Inc. | 1,934 | 32 | |
| Village Super Market Inc. Class A | 1,202 | 27 | |
| Roundy's Inc. | 6,991 | 26 | |
| Andersons Inc. | 375 | 26 | |
| * | PhotoMedex Inc. | 2,319 | 19 |
| Alico Inc. | 483 | 19 | |
| B&G Foods Inc. | 488 | 15 | |
| * | Boulder Brands Inc. | 824 | 11 |
| * | Chefs' Warehouse Inc. | 583 | 11 |
| Orchids Paper Products Co. | 272 | 8 | |
| Tootsie Roll Industries Inc. | 216 | 6 | |
| Coca-Cola Bottling Co. Consolidated | 70 | 5 | |
| * | Craft Brew Alliance Inc. | 359 | 5 |
| Female Health Co. | 1,146 | 4 | |
| * | Synutra International Inc. | 307 | 2 |
| 3,329 | |||
| Energy (6.3%) | |||
| * | Helix Energy Solutions Group Inc. | 18,512 | 506 |
| Exterran Holdings Inc. | 10,272 | 479 | |
| * | Rosetta Resources Inc. | 9,408 | 470 |
| Civeo Corp. | 16,468 | 418 | |
| * | PDC Energy Inc. | 5,826 | 350 |
| * | Stone Energy Corp. | 9,840 | 346 |
| * | McDermott International Inc. | 41,664 | 300 |
| * | SEACOR Holdings Inc. | 3,616 | 295 |
| * | Hornbeck Offshore Services Inc. | 6,359 | 278 |
| Energy XXI Bermuda Ltd. | 16,585 | 274 | |
| * | Halcon Resources Corp. | 45,735 | 252 |
| * | Forum Energy Technologies Inc. | 6,610 | 225 |
| Comstock Resources Inc. | 8,410 | 205 | |
| * | Bill Barrett Corp. | 8,733 | 199 |
| * | Newpark Resources Inc. | 14,911 | 184 |
| * | Northern Oil and Gas Inc. | 10,870 | 183 |
| Delek US Holdings Inc. | 5,063 | 177 | |
36
| Vanguard® Russell 2000 Value Index Fund | |||
| Schedule of Investments | |||
| August 31, 2014 | |||
| Market | |||
| Value | |||
| Shares | ($000) | ||
| * | Penn Virginia Corp. | 11,684 | 176 |
| * | Cloud Peak Energy Inc. | 10,851 | 170 |
| * | TETRA Technologies Inc. | 14,057 | 166 |
| * | Alpha Natural Resources Inc. | 39,419 | 156 |
| * | Matador Resources Co. | 5,679 | 155 |
| * | Key Energy Services Inc. | 23,393 | 147 |
| * | Parker Drilling Co. | 21,573 | 135 |
| * | Contango Oil & Gas Co. | 3,102 | 123 |
| Tesco Corp. | 5,629 | 119 | |
| * | Sanchez Energy Corp. | 3,533 | 117 |
| Arch Coal Inc. | 37,807 | 115 | |
| * | Resolute Energy Corp. | 13,878 | 111 |
| * | Westmoreland Coal Co. | 2,614 | 110 |
| North Atlantic Drilling Ltd. | 9,559 | 105 | |
| * | Hercules Offshore Inc. | 28,610 | 96 |
| * | Era Group Inc. | 3,623 | 93 |
| * | SunCoke Energy Inc. | 3,801 | 91 |
| * | Pacific Ethanol Inc. | 3,900 | 90 |
| * | Swift Energy Co. | 7,801 | 89 |
| * | Emerald Oil Inc. | 10,148 | 87 |
| * | Geospace Technologies Corp. | 2,098 | 86 |
| * | Warren Resources Inc. | 13,114 | 85 |
| * | RSP Permian Inc. | 2,951 | 84 |
| * | VAALCO Energy Inc. | 8,875 | 81 |
| EXCO Resources Inc. | 16,713 | 81 | |
| * | Callon Petroleum Co. | 7,206 | 77 |
| * | Renewable Energy Group Inc. | 6,152 | 75 |
| * | Approach Resources Inc. | 4,041 | 72 |
| * | Triangle Petroleum Corp. | 5,898 | 71 |
| * | EnerNOC Inc. | 3,453 | 68 |
| * | ION Geophysical Corp. | 19,285 | 67 |
| * | Natural Gas Services Group Inc. | 2,219 | 66 |
| * | Vantage Drilling Co. | 36,596 | 65 |
| W&T Offshore Inc. | 3,838 | 57 | |
| * | Clean Energy Fuels Corp. | 5,600 | 56 |
| Alon USA Energy Inc. | 3,353 | 56 | |
| Walter Energy Inc. | 8,734 | 49 | |
| * | Pioneer Energy Services Corp. | 3,151 | 48 |
| * | Midstates Petroleum Co. Inc. | 6,622 | 47 |
| Green Plains Inc. | 1,024 | 46 | |
| * | PowerSecure International Inc. | 3,983 | 44 |
| * | Harvest Natural Resources Inc. | 7,498 | 37 |
| * | Nuverra Environmental Solutions Inc. | 2,703 | 37 |
| Gulf Island Fabrication Inc. | 1,625 | 34 | |
| * | C&J Energy Services Inc. | 1,180 | 34 |
| Dawson Geophysical Co. | 1,436 | 33 | |
| * | Forest Oil Corp. | 19,057 | 31 |
| * | Ameresco Inc. Class A | 3,537 | 30 |
| * | Mitcham Industries Inc. | 2,256 | 30 |
| * | BPZ Resources Inc. | 11,705 | 29 |
| * | American Eagle Energy Corp. | 5,419 | 28 |
| * | Quicksilver Resources Inc. | 19,478 | 26 |
| * | Miller Energy Resources Inc. | 4,977 | 26 |
| Hallador Energy Co. | 1,769 | 24 | |
| * | REX American Resources Corp. | 222 | 24 |
| Adams Resources & Energy Inc. | 356 | 23 | |
| * | TransAtlantic Petroleum Ltd. | 1,951 | 21 |
| *,^ | Amyris Inc. | 4,820 | 20 |
| * | Apco Oil and Gas International Inc. | 1,354 | 19 |
| * | Gastar Exploration Inc. | 648 | 5 |
| * | PetroQuest Energy Inc. | 707 | 5 |
| * | Trecora Resources | 313 | 4 |
| * | Global Geophysical Services Inc. | 223 | — |
| 9,493 | |||
37
| Vanguard® Russell 2000 Value Index Fund | ||
| Schedule of Investments | ||
| August 31, 2014 | ||
| Market | ||
| Value | ||
| Shares | ($000) | |
| Financial Services (39.0%) | ||
| Prosperity Bancshares Inc. | 12,231 | 739 |
| RLJ Lodging Trust | 22,960 | 684 |
| CNO Financial Group Inc. | 38,211 | 682 |
| Highwoods Properties Inc. | 15,807 | 673 |
| LaSalle Hotel Properties | 18,253 | 667 |
| Investors Bancorp Inc. | 55,347 | 587 |
| * Stifel Financial Corp. | 11,485 | 550 |
| EPR Properties | 9,374 | 533 |
| First American Financial Corp. | 18,737 | 531 |
| Sunstone Hotel Investors Inc. | 35,809 | 522 |
| Umpqua Holdings Corp. | 29,222 | 510 |
| FirstMerit Corp. | 29,003 | 500 |
| Cousins Properties Inc. | 38,553 | 489 |
| Primerica Inc. | 9,581 | 482 |
| Hancock Holding Co. | 14,431 | 480 |
| Geo Group Inc. | 12,731 | 476 |
| CubeSmart | 25,311 | 471 |
| Webster Financial Corp. | 15,841 | 467 |
| DCT Industrial Trust Inc. | 57,713 | 459 |
| DiamondRock Hospitality Co. | 34,322 | 457 |
| Pebblebrook Hotel Trust | 11,194 | 434 |
| Medical Properties Trust Inc. | 30,212 | 426 |
| Healthcare Realty Trust Inc. | 16,844 | 420 |
| Colony Financial Inc. | 18,679 | 419 |
| United Bankshares Inc. | 12,114 | 399 |
| Lexington Realty Trust | 36,026 | 392 |
| Radian Group Inc. | 26,766 | 390 |
| Washington Federal Inc. | 17,773 | 387 |
| UMB Financial Corp. | 6,617 | 382 |
| Invesco Mortgage Capital Inc. | 21,590 | 380 |
| Wintrust Financial Corp. | 8,164 | 380 |
| PrivateBancorp Inc. | 12,562 | 371 |
| Cathay General Bancorp | 13,965 | 364 |
| FNB Corp. | 29,190 | 361 |
| Iberiabank Corp. | 5,511 | 360 |
| BancorpSouth Inc. | 16,843 | 357 |
| Glacier Bancorp Inc. | 13,060 | 355 |
| Valley National Bancorp | 35,161 | 352 |
| First Industrial Realty Trust Inc. | 19,318 | 352 |
| Alexander & Baldwin Inc. | 8,545 | 349 |
| Susquehanna Bancshares Inc. | 32,909 | 340 |
| RLI Corp. | 7,541 | 337 |
| Hatteras Financial Corp. | 16,927 | 337 |
| MB Financial Inc. | 11,676 | 330 |
| Mack-Cali Realty Corp. | 15,550 | 329 |
| American Realty Capital Healthcare Trust Inc. | 29,695 | 326 |
| Washington REIT | 11,686 | 325 |
| Chambers Street Properties | 41,570 | 324 |
| American Equity Investment Life Holding Co. | 13,037 | 323 |
| Symetra Financial Corp. | 13,220 | 322 |
| Janus Capital Group Inc. | 26,224 | 319 |
| New Residential Investment Corp. | 49,455 | 310 |
| Capitol Federal Financial Inc. | 25,102 | 310 |
| First Citizens BancShares Inc. Class A | 1,327 | 305 |
| Kennedy-Wilson Holdings Inc. | 11,614 | 303 |
| EverBank Financial Corp. | 15,981 | 302 |
| Kemper Corp. | 8,151 | 296 |
| Platinum Underwriters Holdings Ltd. | 4,724 | 295 |
| New York REIT Inc. | 28,414 | 293 |
| * MGIC Investment Corp. | 34,675 | 292 |
| Acadia Realty Trust | 10,063 | 290 |
| PennyMac Mortgage Investment Trust | 12,976 | 289 |
| CVB Financial Corp. | 18,574 | 289 |
38
| Vanguard® Russell 2000 Value Index Fund | ||
| Schedule of Investments | ||
| August 31, 2014 | ||
| Market | ||
| Value | ||
| Shares | ($000) | |
| Government Properties Income Trust | 11,835 | 284 |
| Redwood Trust Inc. | 14,553 | 282 |
| Trustmark Corp. | 11,829 | 281 |
| Home Loan Servicing Solutions Ltd. | 12,455 | 273 |
| Chesapeake Lodging Trust | 8,776 | 270 |
| CYS Investments Inc. | 28,580 | 269 |
| * Texas Capital Bancshares Inc. | 4,912 | 265 |
| ARMOUR Residential REIT Inc. | 62,635 | 265 |
| Education Realty Trust Inc. | 24,221 | 264 |
| Old National Bancorp | 20,105 | 263 |
| Hudson Pacific Properties Inc. | 9,662 | 259 |
| Parkway Properties Inc. | 12,482 | 259 |
| Equity One Inc. | 10,832 | 256 |
| Community Bank System Inc. | 7,172 | 253 |
| * Hilltop Holdings Inc. | 11,941 | 253 |
| International Bancshares Corp. | 9,584 | 253 |
| LTC Properties Inc. | 6,137 | 251 |
| South State Corp. | 4,250 | 249 |
| Retail Opportunity Investments Corp. | 15,674 | 248 |
| Altisource Residential Corp. | 10,067 | 247 |
| Pennsylvania REIT | 12,111 | 244 |
| Argo Group International Holdings Ltd. | 4,612 | 243 |
| Columbia Banking System Inc. | 9,267 | 241 |
| Hersha Hospitality Trust Class A | 35,350 | 240 |
| Selective Insurance Group Inc. | 9,903 | 237 |
| Ramco-Gershenson Properties Trust | 13,532 | 229 |
| FelCor Lodging Trust Inc. | 21,879 | 226 |
| Pinnacle Financial Partners Inc. | 6,265 | 225 |
| Westamerica Bancorporation | 4,631 | 224 |
| First Midwest Bancorp Inc. | 13,248 | 223 |
| Capstead Mortgage Corp. | 16,859 | 223 |
| * iStar Financial Inc. | 14,936 | 222 |
| Cash America International Inc. | 4,951 | 221 |
| Montpelier Re Holdings Ltd. | 6,888 | 217 |
| DuPont Fabros Technology Inc. | 7,642 | 215 |
| Horace Mann Educators Corp. | 7,165 | 214 |
| * Enstar Group Ltd. | 1,501 | 213 |
| Northwest Bancshares Inc. | 16,652 | 210 |
| National Penn Bancshares Inc. | 20,687 | 207 |
| BBCN Bancorp Inc. | 13,986 | 204 |
| STAG Industrial Inc. | 8,549 | 200 |
| Astoria Financial Corp. | 15,227 | 199 |
| Union Bankshares Corp. | 8,212 | 194 |
| Franklin Street Properties Corp. | 15,815 | 192 |
| * Starwood Waypoint Residential Trust | 6,852 | 190 |
| Associated Estates Realty Corp. | 10,112 | 187 |
| Sterling Bancorp | 14,646 | 186 |
| American Capital Mortgage Investment Corp. | 8,983 | 185 |
| Ryman Hospitality Properties Inc. | 3,706 | 184 |
| NBT Bancorp Inc. | 7,654 | 184 |
| Provident Financial Services Inc. | 10,733 | 183 |
| Select Income REIT | 6,466 | 180 |
| * Walter Investment Management Corp. | 6,704 | 177 |
| American Assets Trust Inc. | 5,036 | 176 |
| Park National Corp. | 2,262 | 176 |
| Boston Private Financial Holdings Inc. | 14,248 | 173 |
| * Greenlight Capital Re Ltd. Class A | 5,046 | 173 |
| First Financial Bancorp | 10,276 | 171 |
| BGC Partners Inc. Class A | 22,530 | 171 |
| Banco Latinoamericano de Comercio Exterior SA | 5,291 | 170 |
| * Ambac Financial Group Inc. | 6,974 | 169 |
| Investors Real Estate Trust | 19,623 | 167 |
| Summit Hotel Properties Inc. | 15,237 | 167 |
| ViewPoint Financial Group Inc. | 6,359 | 166 |
39
| Vanguard® Russell 2000 Value Index Fund | ||
| Schedule of Investments | ||
| August 31, 2014 | ||
| Market | ||
| Value | ||
| Shares | ($000) | |
| Nelnet Inc. Class A | 3,706 | 163 |
| Chemical Financial Corp. | 5,718 | 162 |
| Renasant Corp. | 5,607 | 162 |
| Inland Real Estate Corp. | 15,546 | 162 |
| Independent Bank Corp. | 4,255 | 157 |
| * Third Point Reinsurance Ltd. | 10,114 | 155 |
| * Piper Jaffray Cos. | 2,896 | 155 |
| United Community Banks Inc. | 8,907 | 151 |
| First Financial Bankshares Inc. | 5,132 | 151 |
| * Kite Realty Group Trust | 5,855 | 151 |
| CyrusOne Inc. | 5,762 | 150 |
| National Bank Holdings Corp. Class A | 7,322 | 149 |
| First Commonwealth Financial Corp. | 16,748 | 148 |
| * Western Alliance Bancorp | 6,261 | 148 |
| * Springleaf Holdings Inc. | 4,371 | 145 |
| WesBanco Inc. | 4,680 | 145 |
| Ashford Hospitality Trust Inc. | 12,474 | 145 |
| PS Business Parks Inc. | 1,721 | 140 |
| First Potomac Realty Trust | 10,463 | 139 |
| Apollo Commercial Real Estate Finance Inc. | 8,217 | 138 |
| Banner Corp. | 3,487 | 137 |
| Excel Trust Inc. | 10,589 | 137 |
| S&T Bancorp Inc. | 5,292 | 132 |
| First Merchants Corp. | 6,416 | 131 |
| Gramercy Property Trust Inc. | 20,946 | 130 |
| New York Mortgage Trust Inc. | 16,145 | 129 |
| Safety Insurance Group Inc. | 2,310 | 128 |
| OFG Bancorp | 8,015 | 127 |
| AMERISAFE Inc. | 3,326 | 125 |
| Northfield Bancorp Inc. | 9,539 | 125 |
| Resource Capital Corp. | 23,009 | 124 |
| Stewart Information Services Corp. | 3,826 | 123 |
| * Strategic Hotels & Resorts Inc. | 10,306 | 122 |
| Oritani Financial Corp. | 8,150 | 122 |
| Wilshire Bancorp Inc. | 12,511 | 122 |
| Tompkins Financial Corp. | 2,647 | 121 |
| * Navigators Group Inc. | 1,864 | 120 |
| City Holding Co. | 2,795 | 119 |
| Terreno Realty Corp. | 5,893 | 119 |
| Rexford Industrial Realty Inc. | 8,044 | 119 |
| RAIT Financial Trust | 14,656 | 119 |
| WSFS Financial Corp. | 1,587 | 118 |
| National General Holdings Corp. | 6,320 | 118 |
| TrustCo Bank Corp. NY | 16,858 | 118 |
| Anworth Mortgage Asset Corp. | 22,783 | 118 |
| FXCM Inc. Class A | 8,114 | 118 |
| Hanmi Financial Corp. | 5,671 | 117 |
| Simmons First National Corp. Class A | 2,905 | 116 |
| Rouse Properties Inc. | 6,614 | 116 |
| ^ Southside Bancshares Inc. | 3,354 | 115 |
| Brookline Bancorp Inc. | 12,575 | 115 |
| Lakeland Financial Corp. | 2,945 | 115 |
| Silver Bay Realty Trust Corp. | 6,850 | 114 |
| * Forestar Group Inc. | 5,658 | 113 |
| Western Asset Mortgage Capital Corp. | 7,430 | 113 |
| * Harbinger Group Inc. | 8,678 | 112 |
| Berkshire Hills Bancorp Inc. | 4,471 | 110 |
| * Investment Technology Group Inc. | 6,411 | 109 |
| * American Residential Properties Inc. | 5,730 | 109 |
| Chatham Lodging Trust | 4,700 | 109 |
| Sandy Spring Bancorp Inc. | 4,462 | 108 |
| Monmouth Real Estate Investment Corp. | 9,962 | 108 |
| United Fire Group Inc. | 3,618 | 106 |
| * Capital Bank Financial Corp. | 4,315 | 106 |
40
| Vanguard® Russell 2000 Value Index Fund | ||
| Schedule of Investments | ||
| August 31, 2014 | ||
| Market | ||
| Value | ||
| Shares | ($000) | |
| * Green Dot Corp. Class A | 5,544 | 105 |
| Flushing Financial Corp. | 5,388 | 104 |
| Ameris Bancorp | 4,480 | 103 |
| AG Mortgage Investment Trust Inc. | 5,054 | 101 |
| National Western Life Insurance Co. Class A | 396 | 101 |
| Community Trust Bancorp Inc. | 2,783 | 99 |
| United Financial Bancorp Inc. | 7,892 | 98 |
| Maiden Holdings Ltd. | 8,005 | 97 |
| * Ezcorp Inc. Class A | 9,156 | 97 |
| * First BanCorp | 18,565 | 97 |
| Arlington Asset Investment Corp. Class A | 3,402 | 97 |
| Cardinal Financial Corp. | 5,403 | 97 |
| Apollo Residential Mortgage Inc. | 5,707 | 96 |
| State Bank Financial Corp. | 5,720 | 96 |
| Campus Crest Communities Inc. | 11,526 | 95 |
| Aviv REIT Inc. | 3,220 | 94 |
| * KCG Holdings Inc. Class A | 7,900 | 92 |
| Washington Trust Bancorp Inc. | 2,615 | 92 |
| * Global Cash Access Holdings Inc. | 11,725 | 92 |
| Cedar Realty Trust Inc. | 14,109 | 91 |
| Physicians Realty Trust | 6,106 | 90 |
| Dime Community Bancshares Inc. | 5,837 | 90 |
| * PICO Holdings Inc. | 4,051 | 90 |
| Infinity Property & Casualty Corp. | 1,305 | 89 |
| Heritage Financial Corp. | 5,375 | 88 |
| * NMI Holdings Inc. Class A | 9,001 | 87 |
| First Interstate BancSystem Inc. | 3,224 | 85 |
| Getty Realty Corp. | 4,554 | 85 |
| * First NBC Bank Holding Co. | 2,660 | 85 |
| Dynex Capital Inc. | 9,742 | 85 |
| * Customers Bancorp Inc. | 4,551 | 85 |
| * Cowen Group Inc. Class A | 20,549 | 84 |
| AmREIT Inc. | 3,504 | 82 |
| FBL Financial Group Inc. Class A | 1,731 | 81 |
| BancFirst Corp. | 1,267 | 81 |
| 1st Source Corp. | 2,669 | 80 |
| Stock Yards Bancorp Inc. | 2,612 | 79 |
| Agree Realty Corp. | 2,665 | 79 |
| ConnectOne Bancorp Inc. | 4,030 | 78 |
| Towne Bank | 5,135 | 75 |
| First Busey Corp. | 12,910 | 74 |
| CoBiz Financial Inc. | 6,383 | 74 |
| Ashford Hospitality Prime Inc. | 4,520 | 73 |
| * MoneyGram International Inc. | 5,197 | 73 |
| * Safeguard Scientifics Inc. | 3,674 | 72 |
| * Beneficial Mutual Bancorp Inc. | 5,223 | 72 |
| Bryn Mawr Bank Corp. | 2,437 | 72 |
| Waterstone Financial Inc. | 6,128 | 70 |
| Lakeland Bancorp Inc. | 6,751 | 70 |
| * Yadkin Financial Corp. | 3,621 | 68 |
| Peoples Financial Services Corp. | 1,345 | 68 |
| AmTrust Financial Services Inc. | 1,510 | 66 |
| Heartland Financial USA Inc. | 2,774 | 66 |
| Centerstate Banks Inc. | 6,330 | 66 |
| First Financial Corp. | 2,043 | 66 |
| OneBeacon Insurance Group Ltd. Class A | 4,036 | 65 |
| * Encore Capital Group Inc. | 1,457 | 65 |
| Trico Bancshares | 2,872 | 64 |
| Ares Commercial Real Estate Corp. | 5,092 | 64 |
| German American Bancorp Inc. | 2,348 | 64 |
| * Tejon Ranch Co. | 2,247 | 63 |
| * Flagstar Bancorp Inc. | 3,610 | 63 |
| MainSource Financial Group Inc. | 3,638 | 63 |
| * Phoenix Cos. Inc. | 1,014 | 62 |
41
| Vanguard® Russell 2000 Value Index Fund | |||
| Schedule of Investments | |||
| August 31, 2014 | |||
| Market | |||
| Value | |||
| Shares | ($000) | ||
| First Bancorp | 3,507 | 62 | |
| GFI Group Inc. | 13,684 | 62 | |
| Enterprise Financial Services Corp. | 3,518 | 61 | |
| Federal Agricultural Mortgage Corp. | 1,855 | 61 | |
| Whitestone REIT | 3,991 | 61 | |
| Sovran Self Storage Inc. | 777 | 60 | |
| Clifton Bancorp Inc. | 4,716 | 59 | |
| BNC Bancorp | 3,489 | 59 | |
| Financial Institutions Inc. | 2,466 | 59 | |
| * | Metro Bancorp Inc. | 2,525 | 59 |
| State Auto Financial Corp. | 2,698 | 59 | |
| Banc of California Inc. | 4,870 | 59 | |
| Great Southern Bancorp Inc. | 1,844 | 58 | |
| Southwest Bancorp Inc. | 3,524 | 58 | |
| RE/MAX Holdings Inc. | 1,896 | 57 | |
| * | Bancorp Inc. | 5,891 | 57 |
| Mercantile Bank Corp. | 2,997 | 57 | |
| Gladstone Commercial Corp. | 3,091 | 56 | |
| Hannon Armstrong Sustainable Infrastructure Capital Inc. | 3,878 | 56 | |
| * | Citizens Inc. Class A | 7,832 | 56 |
| * | HomeTrust Bancshares Inc. | 3,712 | 56 |
| Home BancShares Inc. | 1,861 | 55 | |
| Univest Corp. of Pennsylvania | 2,893 | 55 | |
| * | NewStar Financial Inc. | 4,759 | 55 |
| Bank Mutual Corp. | 8,290 | 55 | |
| Park Sterling Corp. | 7,953 | 54 | |
| Meadowbrook Insurance Group Inc. | 8,709 | 54 | |
| Central Pacific Financial Corp. | 3,050 | 54 | |
| OmniAmerican Bancorp Inc. | 2,057 | 53 | |
| Bridge Bancorp Inc. | 2,071 | 51 | |
| Bank of Marin Bancorp | 1,052 | 51 | |
| Employers Holdings Inc. | 2,374 | 51 | |
| Arrow Financial Corp. | 1,908 | 51 | |
| * | Ladder Capital Corp. Class A | 2,714 | 50 |
| * | Preferred Bank | 2,088 | 50 |
| First of Long Island Corp. | 1,433 | 50 | |
| Independent Bank Corp. | 4,083 | 50 | |
| Camden National Corp. | 1,321 | 48 | |
| Stonegate Bank | 1,774 | 48 | |
| First Defiance Financial Corp. | 1,722 | 48 | |
| *,^ | FBR & Co. | 1,670 | 48 |
| First Community Bancshares Inc. | 2,914 | 48 | |
| One Liberty Properties Inc. | 2,185 | 47 | |
| Independent Bank Group Inc. | 932 | 47 | |
| HomeStreet Inc. | 2,587 | 47 | |
| * | Walker & Dunlop Inc. | 3,299 | 47 |
| Talmer Bancorp Inc. Class A | 3,188 | 47 | |
| Hudson Valley Holding Corp. | 2,623 | 47 | |
| Peoples Bancorp Inc. | 1,939 | 46 | |
| 1st United Bancorp Inc. | 5,260 | 46 | |
| * | Pacific Premier Bancorp Inc. | 3,067 | 46 |
| Fidelity & Guaranty Life | 2,006 | 45 | |
| Manning & Napier Inc. | 2,430 | 45 | |
| CorEnergy Infrastructure Trust Inc. | 5,634 | 45 | |
| * | NewBridge Bancorp | 5,988 | 45 |
| First Connecticut Bancorp Inc. | 2,876 | 44 | |
| Glimcher Realty Trust | 3,903 | 44 | |
| Oppenheimer Holdings Inc. Class A | 1,812 | 44 | |
| Citizens & Northern Corp. | 2,214 | 44 | |
| CNB Financial Corp. | 2,577 | 44 | |
| Pacific Continental Corp. | 3,203 | 43 | |
| West Bancorporation Inc. | 2,854 | 43 | |
| Suffolk Bancorp | 2,059 | 43 | |
| Baldwin & Lyons Inc. | 1,654 | 43 | |
42
| Vanguard® Russell 2000 Value Index Fund | ||
| Schedule of Investments | ||
| August 31, 2014 | ||
| Market | ||
| Value | ||
| Shares | ($000) | |
| Moelis & Co. | 1,147 | 42 |
| Meta Financial Group Inc. | 1,093 | 42 |
| United Community Financial Corp. | 9,008 | 41 |
| Bank of Kentucky Financial Corp. | 1,118 | 41 |
| * INTL. FCStone Inc. | 2,117 | 41 |
| Fidelity Southern Corp. | 2,923 | 41 |
| Peapack Gladstone Financial Corp. | 2,142 | 40 |
| Republic Bancorp Inc. Class A | 1,765 | 40 |
| * Global Indemnity plc | 1,455 | 39 |
| CatchMark Timber Trust Inc. Class A | 3,271 | 39 |
| OceanFirst Financial Corp. | 2,387 | 39 |
| Calamos Asset Management Inc. Class A | 3,039 | 39 |
| * Bridge Capital Holdings | 1,746 | 39 |
| * SWS Group Inc. | 5,214 | 39 |
| Penns Woods Bancorp Inc. | 838 | 38 |
| Sierra Bancorp | 2,161 | 38 |
| * TriState Capital Holdings Inc. | 3,934 | 37 |
| Fox Chase Bancorp Inc. | 2,160 | 37 |
| Charter Financial Corp. | 3,384 | 37 |
| Guaranty Bancorp | 2,626 | 37 |
| Horizon Bancorp | 1,637 | 36 |
| National Bankshares Inc. | 1,237 | 36 |
| BankFinancial Corp. | 3,316 | 36 |
| * Eagle Bancorp Inc. | 1,058 | 35 |
| * Kearny Financial Corp. | 2,246 | 35 |
| Urstadt Biddle Properties Inc. Class A | 1,613 | 34 |
| * Franklin Financial Corp. | 1,725 | 34 |
| * Altisource Asset Management Corp. | 46 | 34 |
| Ames National Corp. | 1,467 | 34 |
| Seacoast Banking Corp. of Florida | 3,205 | 34 |
| EastGroup Properties Inc. | 514 | 33 |
| Armada Hoffler Properties Inc. | 3,429 | 33 |
| Crawford & Co. Class B | 3,636 | 33 |
| Consolidated-Tomoka Land Co. | 556 | 33 |
| * CU Bancorp | 1,727 | 32 |
| * Regional Management Corp. | 1,900 | 32 |
| First Business Financial Services Inc. | 703 | 32 |
| Territorial Bancorp Inc. | 1,554 | 32 |
| * Stonegate Mortgage Corp. | 2,172 | 32 |
| Kansas City Life Insurance Co. | 676 | 31 |
| American National Bankshares Inc. | 1,407 | 31 |
| Heritage Commerce Corp. | 3,707 | 31 |
| Owens Realty Mortgage Inc. | 1,917 | 31 |
| * AV Homes Inc. | 1,883 | 30 |
| MidWestOne Financial Group Inc. | 1,240 | 29 |
| UMH Properties Inc. | 2,857 | 29 |
| Northrim BanCorp Inc. | 1,189 | 29 |
| * Opus Bank | 913 | 29 |
| ESB Financial Corp. | 2,285 | 29 |
| First Bancorp Inc. | 1,708 | 29 |
| * JGWPT Holdings Inc. Class A | 2,097 | 28 |
| First Financial Northwest Inc. | 2,608 | 28 |
| MidSouth Bancorp Inc. | 1,469 | 28 |
| Heritage Oaks Bancorp | 3,922 | 28 |
| * Cascade Bancorp | 5,383 | 28 |
| * Sun Bancorp Inc. | 1,480 | 28 |
| EMC Insurance Group Inc. | 896 | 27 |
| Merchants Bancshares Inc. | 918 | 27 |
| * BBX Capital Corp. | 1,439 | 27 |
| * Consumer Portfolio Services Inc. | 3,741 | 27 |
| National Interstate Corp. | 955 | 27 |
| Capital City Bank Group Inc. | 1,895 | 27 |
| Gain Capital Holdings Inc. | 4,124 | 26 |
| Enterprise Bancorp Inc. | 1,312 | 26 |
43
| Vanguard® Russell 2000 Value Index Fund | ||
| Schedule of Investments | ||
| August 31, 2014 | ||
| Market | ||
| Value | ||
| Shares | ($000) | |
| * Republic First Bancorp Inc. | 5,509 | 25 |
| Macatawa Bank Corp. | 4,717 | 24 |
| Nicholas Financial Inc. | 1,822 | 23 |
| Trade Street Residential Inc. | 3,306 | 23 |
| Donegal Group Inc. Class A | 1,472 | 23 |
| * Hallmark Financial Services Inc. | 2,417 | 23 |
| Resource America Inc. Class A | 2,420 | 23 |
| Old Line Bancshares Inc. | 1,494 | 22 |
| Century Bancorp Inc. Class A | 607 | 22 |
| HCI Group Inc. | 497 | 21 |
| Independence Holding Co. | 1,466 | 20 |
| * UCP Inc. | 1,392 | 18 |
| * Tree.com Inc. | 543 | 17 |
| * CommunityOne Bancorp | 1,828 | 17 |
| * St. Joe Co. | 788 | 17 |
| NASB Financial Inc. | 622 | 15 |
| * PennyMac Financial Services Inc. Class A | 975 | 15 |
| * Higher One Holdings Inc. | 3,801 | 15 |
| Sabra Health Care REIT Inc. | 505 | 14 |
| * Square 1 Financial Inc. Class A | 736 | 14 |
| Saul Centers Inc. | 227 | 11 |
| Palmetto Bancshares Inc. | 743 | 10 |
| * Tiptree Financial Inc. Class A | 1,395 | 10 |
| CIFC Corp. | 1,010 | 10 |
| Alexander's Inc. | 25 | 10 |
| * Hampton Roads Bankshares Inc. | 5,826 | 10 |
| ServisFirst Bancshares Inc. | 277 | 8 |
| Federated National Holding Co. | 187 | 5 |
| United Insurance Holdings Corp. | 258 | 4 |
| Universal Insurance Holdings Inc. | 299 | 4 |
| * CareTrust REIT Inc. | 161 | 3 |
| * Atlas Financial Holdings Inc. | 135 | 2 |
| * Tejon Ranch Co. Warrants Exp. 8/31/2016 | 22 | — |
| 59,227 | ||
| Health Care (4.9%) | ||
| * WellCare Health Plans Inc. | 7,109 | 468 |
| Owens & Minor Inc. | 11,065 | 381 |
| * Amsurg Corp. | 5,839 | 314 |
| * Haemonetics Corp. | 8,344 | 298 |
| * Magellan Health Inc. | 4,833 | 270 |
| * Impax Laboratories Inc. | 9,950 | 245 |
| Kindred Healthcare Inc. | 11,216 | 232 |
| * Greatbatch Inc. | 4,376 | 199 |
| CONMED Corp. | 4,780 | 189 |
| Analogic Corp. | 2,212 | 160 |
| * Achillion Pharmaceuticals Inc. | 13,637 | 158 |
| * ICU Medical Inc. | 2,391 | 150 |
| HealthSouth Corp. | 3,766 | 148 |
| * InterMune Inc. | 1,949 | 143 |
| * Wright Medical Group Inc. | 4,719 | 141 |
| * Nektar Therapeutics | 9,838 | 140 |
| * Hanger Inc. | 6,193 | 139 |
| * Tornier NV | 6,332 | 137 |
| * PharMerica Corp. | 5,340 | 133 |
| * Integra LifeSciences Holdings Corp. | 2,631 | 131 |
| * AMN Healthcare Services Inc. | 8,282 | 125 |
| * Orthofix International NV | 3,283 | 111 |
| * Emergent Biosolutions Inc. | 4,443 | 111 |
| National Healthcare Corp. | 1,833 | 105 |
| * BioScrip Inc. | 12,187 | 103 |
| * Amedisys Inc. | 4,865 | 102 |
| * Merit Medical Systems Inc. | 7,652 | 96 |
| Invacare Corp. | 5,726 | 88 |
| * Anacor Pharmaceuticals Inc. | 3,738 | 87 |
44
| Vanguard® Russell 2000 Value Index Fund | ||
| Schedule of Investments | ||
| August 31, 2014 | ||
| Market | ||
| Value | ||
| Shares | ($000) | |
| * Affymetrix Inc. | 9,716 | 84 |
| * Triple-S Management Corp. Class B | 4,351 | 83 |
| * Albany Molecular Research Inc. | 4,193 | 83 |
| * Prothena Corp. plc | 3,416 | 78 |
| * OraSure Technologies Inc. | 9,299 | 77 |
| * Spectrum Pharmaceuticals Inc. | 8,900 | 72 |
| * Geron Corp. | 27,949 | 66 |
| * Dynavax Technologies Corp. | 46,819 | 66 |
| * Universal American Corp. | 7,357 | 63 |
| * IPC The Hospitalist Co. Inc. | 1,297 | 63 |
| * AngioDynamics Inc. | 4,399 | 62 |
| * Symmetry Medical Inc. | 6,677 | 62 |
| * Rockwell Medical Inc. | 6,289 | 60 |
| * LHC Group Inc. | 2,198 | 57 |
| * Cynosure Inc. Class A | 2,493 | 56 |
| * RTI Surgical Inc. | 10,082 | 53 |
| * Progenics Pharmaceuticals Inc. | 9,490 | 52 |
| CryoLife Inc. | 4,825 | 48 |
| * NuVasive Inc. | 1,370 | 48 |
| * Healthways Inc. | 2,675 | 47 |
| * XenoPort Inc. | 9,065 | 46 |
| * Almost Family Inc. | 1,488 | 42 |
| * Exactech Inc. | 1,741 | 42 |
| * Cross Country Healthcare Inc. | 5,180 | 41 |
| * SurModics Inc. | 2,018 | 41 |
| * Rigel Pharmaceuticals Inc. | 15,588 | 40 |
| * NPS Pharmaceuticals Inc. | 1,306 | 39 |
| * OvaScience Inc. | 2,749 | 37 |
| * Five Star Quality Care Inc. | 7,662 | 36 |
| * BioCryst Pharmaceuticals Inc. | 2,571 | 35 |
| * Derma Sciences Inc. | 4,079 | 35 |
| * Verastem Inc. | 3,297 | 29 |
| * AMAG Pharmaceuticals Inc. | 1,265 | 29 |
| * Medicines Co. | 1,065 | 27 |
| * ACADIA Pharmaceuticals Inc. | 1,110 | 27 |
| * Cytokinetics Inc. | 6,160 | 26 |
| * ChemoCentryx Inc. | 4,871 | 25 |
| * SciClone Pharmaceuticals Inc. | 3,474 | 24 |
| * Celldex Therapeutics Inc. | 1,496 | 24 |
| * CytRx Corp. | 7,114 | 24 |
| * Sagent Pharmaceuticals Inc. | 777 | 22 |
| * Addus HomeCare Corp. | 970 | 21 |
| * AtriCure Inc. | 1,279 | 20 |
| Theravance Inc. | 807 | 19 |
| * TransEnterix Inc. | 4,640 | 18 |
| * Array BioPharma Inc. | 4,376 | 17 |
| * Alliance HealthCare Services Inc. | 606 | 17 |
| * Skilled Healthcare Group Inc. | 2,253 | 17 |
| * PTC Therapeutics Inc. | 507 | 16 |
| * MedAssets Inc. | 630 | 14 |
| * BioTelemetry Inc. | 1,918 | 14 |
| * NeoStem Inc. | 2,302 | 13 |
| * Hyperion Therapeutics Inc. | 495 | 13 |
| * Inovio Pharmaceuticals Inc. | 1,190 | 13 |
| Select Medical Holdings Corp. | 868 | 12 |
| * XOMA Corp. | 2,674 | 12 |
| * Revance Therapeutics Inc. | 465 | 11 |
| * Bio-Reference Laboratories Inc. | 307 | 9 |
| Ensign Group Inc. | 252 | 9 |
| * Navidea Biopharmaceuticals Inc. | 5,884 | 8 |
| * Unilife Corp. | 3,186 | 8 |
| * Agenus Inc. | 2,318 | 7 |
| * Merrimack Pharmaceuticals Inc. | 979 | 7 |
| * Theravance Biopharma Inc. | 231 | 7 |
45
| Vanguard® Russell 2000 Value Index Fund | ||
| Schedule of Investments | ||
| August 31, 2014 | ||
| Market | ||
| Value | ||
| Shares | ($000) | |
| * Chindex International Inc. | 267 | 6 |
| * Omeros Corp. | 405 | 6 |
| * Cytori Therapeutics Inc. | 3,871 | 5 |
| * Castlight Health Inc. Class B | 408 | 5 |
| * Osiris Therapeutics Inc. | 300 | 4 |
| * Lexicon Pharmaceuticals Inc. | 2,659 | 4 |
| * Peregrine Pharmaceuticals Inc. | 2,198 | 4 |
| * Surgical Care Affiliates Inc. | 119 | 4 |
| * National Research Corp. Class A | 217 | 3 |
| * Idera Pharmaceuticals Inc. | 943 | 3 |
| * Immunomedics Inc. | 770 | 3 |
| * RadNet Inc. | 332 | 2 |
| * Threshold Pharmaceuticals Inc. | 520 | 2 |
| * Cellular Dynamics International Inc. | 92 | 1 |
| * Adamas Pharmaceuticals Inc. | 40 | 1 |
| 7,430 | ||
| Materials & Processing (5.9%) | ||
| Axiall Corp. | 12,265 | 510 |
| Sensient Technologies Corp. | 8,172 | 459 |
| Olin Corp. | 13,858 | 378 |
| Commercial Metals Co. | 20,651 | 357 |
| * Louisiana-Pacific Corp. | 24,754 | 353 |
| Tronox Ltd. Class A | 10,780 | 327 |
| Minerals Technologies Inc. | 4,366 | 273 |
| * AK Steel Holding Corp. | 24,077 | 263 |
| * Masonite International Corp. | 4,494 | 257 |
| Kaiser Aluminum Corp. | 3,178 | 256 |
| * Century Aluminum Co. | 9,037 | 226 |
| Simpson Manufacturing Co. Inc. | 6,787 | 219 |
| Hecla Mining Co. | 60,309 | 197 |
| * Resolute Forest Products Inc. | 11,459 | 197 |
| Schweitzer-Mauduit International Inc. | 4,539 | 194 |
| * Beacon Roofing Supply Inc. | 6,787 | 194 |
| Universal Forest Products Inc. | 3,570 | 169 |
| * Berry Plastics Group Inc. | 6,949 | 168 |
| * Horsehead Holding Corp. | 7,784 | 157 |
| A Schulman Inc. | 3,983 | 155 |
| * Intrepid Potash Inc. | 9,931 | 152 |
| OM Group Inc. | 5,718 | 152 |
| * RTI International Metals Inc. | 5,132 | 149 |
| Innospec Inc. | 3,440 | 145 |
| * LSB Industries Inc. | 3,443 | 138 |
| Schnitzer Steel Industries Inc. | 4,679 | 130 |
| PH Glatfelter Co. | 4,803 | 120 |
| * Kraton Performance Polymers Inc. | 5,838 | 119 |
| Quanex Building Products Corp. | 6,222 | 112 |
| * Coeur Mining Inc. | 13,404 | 106 |
| Haynes International Inc. | 2,091 | 104 |
| Mueller Industries Inc. | 3,513 | 103 |
| LB Foster Co. Class A | 1,842 | 97 |
| Innophos Holdings Inc. | 1,641 | 95 |
| Tredegar Corp. | 4,426 | 92 |
| Stepan Co. | 1,852 | 89 |
| * Gibraltar Industries Inc. | 5,493 | 87 |
| Comfort Systems USA Inc. | 5,391 | 82 |
| Aceto Corp. | 4,262 | 82 |
| Neenah Paper Inc. | 1,430 | 78 |
| Apogee Enterprises Inc. | 2,121 | 77 |
| * Unifi Inc. | 2,611 | 74 |
| Materion Corp. | 2,228 | 73 |
| * Allied Nevada Gold Corp. | 18,563 | 71 |
| Griffon Corp. | 5,601 | 70 |
| American Vanguard Corp. | 5,121 | 69 |
| * Landec Corp. | 4,770 | 63 |
46
| Vanguard® Russell 2000 Value Index Fund | |||
| Schedule of Investments | |||
| August 31, 2014 | |||
| Market | |||
| Value | |||
| Shares | ($000) | ||
| * | Northwest Pipe Co. | 1,693 | 63 |
| Hawkins Inc. | 1,596 | 59 | |
| *,^ | Molycorp Inc. | 32,421 | 58 |
| Quaker Chemical Corp. | 720 | 56 | |
| Kronos Worldwide Inc. | 3,276 | 52 | |
| Dynamic Materials Corp. | 2,337 | 47 | |
| Zep Inc. | 2,804 | 45 | |
| FutureFuel Corp. | 3,130 | 44 | |
| * | Universal Stainless & Alloy Products Inc. | 1,256 | 40 |
| Noranda Aluminum Holding Corp. | 7,899 | 32 | |
| Olympic Steel Inc. | 1,336 | 32 | |
| Ampco-Pittsburgh Corp. | 1,479 | 31 | |
| * | Cabot Microelectronics Corp. | 700 | 30 |
| KMG Chemicals Inc. | 1,711 | 29 | |
| LSI Industries Inc. | 3,837 | 27 | |
| * | UFP Technologies Inc. | 1,106 | 26 |
| * | Stillwater Mining Co. | 1,344 | 25 |
| Culp Inc. | 1,354 | 25 | |
| Oil-Dri Corp. of America | 716 | 21 | |
| * | Taminco Corp. | 843 | 20 |
| * | Handy & Harman Ltd. | 761 | 20 |
| NL Industries Inc. | 1,256 | 11 | |
| * | Ply Gem Holdings Inc. | 577 | 7 |
| NN Inc. | 224 | 7 | |
| Global Brass & Copper Holdings Inc. | 405 | 6 | |
| * | Dixie Group Inc. | 607 | 6 |
| Insteel Industries Inc. | 209 | 5 | |
| Chase Corp. | 121 | 4 | |
| Wausau Paper Corp. | 456 | 4 | |
| * | AEP Industries Inc. | 83 | 3 |
| * | Shiloh Industries Inc. | 82 | 1 |
| United States Lime & Minerals Inc. | 20 | 1 | |
| 8,875 | |||
| Other (0.0%) | |||
| * | Leap Wireless International Inc CVR | 7,564 | 19 |
| Producer Durables (13.9%) | |||
| * | Esterline Technologies Corp. | 5,579 | 654 |
| * | Moog Inc. Class A | 7,226 | 512 |
| EMCOR Group Inc. | 11,800 | 510 | |
| * | Teledyne Technologies Inc. | 5,087 | 494 |
| * | JetBlue Airways Corp. | 37,414 | 458 |
| Bristow Group Inc. | 6,241 | 455 | |
| Curtiss-Wright Corp. | 6,262 | 450 | |
| * | Darling Ingredients Inc. | 23,178 | 447 |
| Actuant Corp. Class A | 12,455 | 420 | |
| EnerSys | 6,256 | 402 | |
| Convergys Corp. | 17,798 | 342 | |
| Barnes Group Inc. | 9,506 | 325 | |
| Watts Water Technologies Inc. Class A | 4,689 | 297 | |
| Mobile Mini Inc. | 7,546 | 296 | |
| * | Itron Inc. | 6,933 | 293 |
| Scorpio Tankers Inc. | 30,171 | 288 | |
| * | Orbital Sciences Corp. | 10,623 | 284 |
| United Stationers Inc. | 6,907 | 281 | |
| Tetra Tech Inc. | 10,674 | 272 | |
| * | FTI Consulting Inc. | 7,165 | 266 |
| ABM Industries Inc. | 9,847 | 262 | |
| Deluxe Corp. | 4,279 | 255 | |
| UniFirst Corp. | 2,603 | 252 | |
| Granite Construction Inc. | 6,887 | 243 | |
| * | PHH Corp. | 10,110 | 242 |
47
| Vanguard® Russell 2000 Value Index Fund | |||
| Schedule of Investments | |||
| August 31, 2014 | |||
| Market | |||
| Value | |||
| Shares | ($000) | ||
| Brink's Co. | 8,532 | 234 | |
| * | XPO Logistics Inc. | 7,443 | 231 |
| Applied Industrial Technologies Inc. | 4,688 | 228 | |
| * | Huron Consulting Group Inc. | 3,725 | 225 |
| Brady Corp. Class A | 8,446 | 225 | |
| Ship Finance International Ltd. | 10,387 | 206 | |
| Woodward Inc. | 3,871 | 202 | |
| * | Tutor Perini Corp. | 6,545 | 196 |
| G&K Services Inc. Class A | 3,495 | 195 | |
| AAR Corp. | 6,954 | 193 | |
| Gulfmark Offshore Inc. | 4,731 | 190 | |
| * | OSI Systems Inc. | 2,712 | 189 |
| * | Scorpio Bulkers Inc. | 23,681 | 189 |
| General Cable Corp. | 8,546 | 183 | |
| * | GrafTech International Ltd. | 20,644 | 180 |
| TAL International Group Inc. | 3,907 | 173 | |
| McGrath RentCorp | 4,608 | 170 | |
| ESCO Technologies Inc. | 4,729 | 170 | |
| Briggs & Stratton Corp. | 8,322 | 168 | |
| Albany International Corp. | 4,430 | 166 | |
| *,^ | Plug Power Inc. | 29,756 | 166 |
| Federal Signal Corp. | 11,198 | 165 | |
| * | ACCO Brands Corp. | 20,320 | 157 |
| Werner Enterprises Inc. | 6,303 | 157 | |
| Cubic Corp. | 3,459 | 154 | |
| * | Ascent Capital Group Inc. Class A | 2,473 | 154 |
| GasLog Ltd. | 6,089 | 154 | |
| Aircastle Ltd. | 7,962 | 152 | |
| * | Aegion Corp. Class A | 6,141 | 151 |
| * | Atlas Air Worldwide Holdings Inc. | 4,493 | 150 |
| * | UTi Worldwide Inc. | 16,295 | 150 |
| Nordic American Tankers Ltd. | 15,882 | 144 | |
| * | Wesco Aircraft Holdings Inc. | 7,836 | 144 |
| * | Navigant Consulting Inc. | 8,752 | 143 |
| Astec Industries Inc. | 3,362 | 140 | |
| Matson Inc. | 5,013 | 135 | |
| * | Sykes Enterprises Inc. | 6,391 | 134 |
| Navios Maritime Holdings Inc. | 14,132 | 134 | |
| * | Korn/Ferry International | 4,312 | 130 |
| * | RPX Corp. | 8,432 | 128 |
| * | ICF International Inc. | 3,552 | 120 |
| Titan International Inc. | 7,845 | 114 | |
| Quad/Graphics Inc. | 4,907 | 110 | |
| * | Engility Holdings Inc. | 3,126 | 110 |
| * | YRC Worldwide Inc. | 4,611 | 107 |
| Resources Connection Inc. | 6,901 | 106 | |
| Textainer Group Holdings Ltd. | 2,907 | 103 | |
| Kimball International Inc. Class B | 6,111 | 97 | |
| Kaman Corp. | 2,367 | 96 | |
| * | Monster Worldwide Inc. | 16,210 | 94 |
| * | ExlService Holdings Inc. | 3,352 | 91 |
| * | PHI Inc. | 2,124 | 91 |
| * | Republic Airways Holdings Inc. | 8,866 | 90 |
| * | MYR Group Inc. | 3,796 | 89 |
| Powell Industries Inc. | 1,655 | 87 | |
| DHT Holdings Inc. | 12,363 | 87 | |
| * | Modine Manufacturing Co. | 6,026 | 86 |
| SkyWest Inc. | 9,098 | 82 | |
| Kelly Services Inc. Class A | 4,872 | 81 | |
| * | Roadrunner Transportation Systems Inc. | 3,157 | 79 |
| Columbus McKinnon Corp. | 3,146 | 79 | |
| * | Air Transport Services Group Inc. | 9,307 | 76 |
| * | Great Lakes Dredge & Dock Corp. | 9,875 | 75 |
| Celadon Group Inc. | 3,510 | 74 | |
48
| Vanguard® Russell 2000 Value Index Fund | ||
| Schedule of Investments | ||
| August 31, 2014 | ||
| Market | ||
| Value | ||
| Shares | ($000) | |
| Knightsbridge Tankers Ltd. | 5,985 | 73 |
| Heidrick & Struggles International Inc. | 3,242 | 70 |
| Kadant Inc. | 1,715 | 68 |
| Ennis Inc. | 4,655 | 67 |
| * Liquidity Services Inc. | 4,303 | 66 |
| FreightCar America Inc. | 2,145 | 64 |
| Alamo Group Inc. | 1,270 | 62 |
| * CBIZ Inc. | 7,078 | 61 |
| Safe Bulkers Inc. | 6,930 | 61 |
| * Kratos Defense & Security Solutions Inc. | 7,960 | 60 |
| * CAI International Inc. | 2,869 | 56 |
| Argan Inc. | 1,355 | 54 |
| Multi-Color Corp. | 1,170 | 54 |
| Ceco Environmental Corp. | 3,749 | 53 |
| Littelfuse Inc. | 570 | 52 |
| * TriNet Group Inc. | 1,940 | 52 |
| * Quality Distribution Inc. | 3,680 | 52 |
| Baltic Trading Ltd. | 8,762 | 51 |
| Global Power Equipment Group Inc. | 3,048 | 51 |
| * InnerWorkings Inc. | 5,875 | 51 |
| Navios Maritime Acquisition Corp. | 14,646 | 51 |
| * Orion Marine Group Inc. | 4,882 | 49 |
| Marten Transport Ltd. | 2,476 | 49 |
| * Aerovironment Inc. | 1,539 | 49 |
| * CRA International Inc. | 1,786 | 48 |
| Standex International Corp. | 643 | 48 |
| Teekay Tankers Ltd. Class A | 11,084 | 47 |
| * ServiceSource International Inc. | 12,191 | 46 |
| NACCO Industries Inc. Class A | 866 | 45 |
| VSE Corp. | 738 | 44 |
| Ardmore Shipping Corp. | 3,215 | 42 |
| * CHC Group Ltd. | 5,976 | 41 |
| Houston Wire & Cable Co. | 3,164 | 41 |
| * Patriot Transportation Holding Inc. | 1,185 | 41 |
| Electro Rent Corp. | 2,711 | 41 |
| * TeleTech Holdings Inc. | 1,515 | 41 |
| * Layne Christensen Co. | 3,531 | 40 |
| * Dice Holdings Inc. | 4,680 | 40 |
| Hurco Cos. Inc. | 1,153 | 38 |
| CDI Corp. | 2,510 | 38 |
| Encore Wire Corp. | 884 | 38 |
| * Ducommun Inc. | 1,188 | 37 |
| * Rush Enterprises Inc. Class A | 1,004 | 37 |
| Miller Industries Inc. | 1,896 | 36 |
| * Vishay Precision Group Inc. | 2,265 | 35 |
| CLARCOR Inc. | 513 | 32 |
| Spartan Motors Inc. | 6,137 | 32 |
| * Titan Machinery Inc. | 2,599 | 32 |
| * AM Castle & Co. | 3,243 | 32 |
| * PRGX Global Inc. | 4,845 | 30 |
| * TriMas Corp. | 936 | 30 |
| Marlin Business Services Corp. | 1,487 | 29 |
| * LMI Aerospace Inc. | 1,861 | 28 |
| Lindsay Corp. | 358 | 28 |
| * Sterling Construction Co. Inc. | 3,115 | 27 |
| * Dorian LPG Ltd. | 1,305 | 26 |
| Preformed Line Products Co. | 423 | 24 |
| Franklin Electric Co. Inc. | 629 | 24 |
| HNI Corp. | 620 | 24 |
| * Paylocity Holding Corp. | 1,033 | 23 |
| * FARO Technologies Inc. | 402 | 23 |
| * Frontline Ltd. | 11,198 | 23 |
| Hackett Group Inc. | 3,592 | 23 |
| CIRCOR International Inc. | 316 | 23 |
49
| Vanguard® Russell 2000 Value Index Fund | ||
| Schedule of Investments | ||
| August 31, 2014 | ||
| Market | ||
| Value | ||
| Shares | ($000) | |
| * Energy Recovery Inc. | 4,470 | 21 |
| * USA Truck Inc. | 1,115 | 21 |
| * GP Strategies Corp. | 827 | 21 |
| * Dycom Industries Inc. | 664 | 21 |
| International Shipholding Corp. | 992 | 20 |
| * Vicor Corp. | 2,468 | 20 |
| * Global Sources Ltd. | 2,427 | 17 |
| * PAM Transportation Services Inc. | 467 | 17 |
| * Erickson Inc. | 1,077 | 14 |
| ArcBest Corp. | 369 | 13 |
| Twin Disc Inc. | 406 | 13 |
| * Advanced Energy Industries Inc. | 659 | 13 |
| * Ultrapetrol Bahamas Ltd. | 3,631 | 12 |
| * Lydall Inc. | 415 | 11 |
| Universal Truckload Services Inc. | 438 | 11 |
| SIFCO Industries Inc. | 362 | 10 |
| * CUI Global Inc. | 1,271 | 9 |
| American Railcar Industries Inc. | 110 | 9 |
| Douglas Dynamics Inc. | 334 | 7 |
| * Advanced Emissions Solutions Inc. | 198 | 4 |
| * Hill International Inc. | 886 | 4 |
| * SP Plus Corp. | 174 | 4 |
| * Casella Waste Systems Inc. Class A | 674 | 3 |
| * Performant Financial Corp. | 287 | 3 |
| * Heritage-Crystal Clean Inc. | 136 | 2 |
| * Accuride Corp. | 470 | 2 |
| 21,134 | ||
| Technology (9.2%) | ||
| * International Rectifier Corp. | 12,502 | 493 |
| * DigitalGlobe Inc. | 13,232 | 402 |
| * Fairchild Semiconductor International Inc. Class A | 21,911 | 385 |
| Mentor Graphics Corp. | 16,985 | 370 |
| Compuware Corp. | 38,531 | 360 |
| Intersil Corp. Class A | 22,587 | 340 |
| * Sanmina Corp. | 14,439 | 339 |
| MKS Instruments Inc. | 9,390 | 319 |
| * Take-Two Interactive Software Inc. | 13,498 | 317 |
| * SYNNEX Corp. | 4,448 | 310 |
| * CACI International Inc. Class A | 4,121 | 297 |
| * OmniVision Technologies Inc. | 9,880 | 268 |
| * Coherent Inc. | 4,080 | 263 |
| * Acxiom Corp. | 13,566 | 252 |
| * Veeco Instruments Inc. | 7,060 | 250 |
| Anixter International Inc. | 2,647 | 236 |
| * Benchmark Electronics Inc. | 9,497 | 234 |
| * NETGEAR Inc. | 6,424 | 213 |
| * Progress Software Corp. | 9,042 | 209 |
| * ScanSource Inc. | 5,010 | 193 |
| * Insight Enterprises Inc. | 7,197 | 189 |
| * Cirrus Logic Inc. | 7,643 | 185 |
| * Polycom Inc. | 13,361 | 177 |
| * Plexus Corp. | 3,951 | 163 |
| Acacia Research Corp. | 8,917 | 159 |
| * PMC-Sierra Inc. | 21,180 | 156 |
| * Bankrate Inc. | 10,817 | 152 |
| * Microsemi Corp. | 5,446 | 145 |
| * QLogic Corp. | 15,529 | 141 |
| * Rogers Corp. | 2,318 | 140 |
| * Entegris Inc. | 11,078 | 134 |
| * II-VI Inc. | 9,359 | 131 |
| * ICG Group Inc. | 7,332 | 127 |
| Brooks Automation Inc. | 11,054 | 125 |
| ManTech International Corp. Class A | 4,265 | 124 |
| * Rofin-Sinar Technologies Inc. | 4,992 | 120 |
50
| Vanguard® Russell 2000 Value Index Fund | ||
| Schedule of Investments | ||
| August 31, 2014 | ||
| Market | ||
| Value | ||
| Shares | ($000) | |
| * Blucora Inc. | 7,525 | 117 |
| Tessera Technologies Inc. | 3,951 | 117 |
| ADTRAN Inc. | 4,873 | 112 |
| * Silicon Laboratories Inc. | 2,415 | 109 |
| CTS Corp. | 6,020 | 107 |
| * Ultratech Inc. | 4,082 | 106 |
| Park Electrochemical Corp. | 3,718 | 105 |
| * Integrated Device Technology Inc. | 6,327 | 104 |
| Comtech Telecommunications Corp. | 2,729 | 104 |
| * Checkpoint Systems Inc. | 7,422 | 103 |
| * Fabrinet | 6,252 | 101 |
| CSG Systems International Inc. | 3,564 | 99 |
| * Photronics Inc. | 10,980 | 97 |
| * Harmonic Inc. | 14,566 | 96 |
| * Digital River Inc. | 5,815 | 89 |
| * Ixia | 9,076 | 87 |
| * Unisys Corp. | 3,604 | 84 |
| Ebix Inc. | 5,454 | 84 |
| Integrated Silicon Solution Inc. | 5,379 | 80 |
| * Calix Inc. | 7,386 | 78 |
| * Emulex Corp. | 14,146 | 78 |
| Epiq Systems Inc. | 5,239 | 76 |
| * Amkor Technology Inc. | 7,294 | 76 |
| EarthLink Holdings Corp. | 18,229 | 75 |
| * TTM Technologies Inc. | 9,639 | 74 |
| American Science & Engineering Inc. | 1,232 | 71 |
| * FormFactor Inc. | 9,893 | 70 |
| * GSI Group Inc. | 5,410 | 69 |
| * Dealertrack Technologies Inc. | 1,548 | 69 |
| * KEYW Holding Corp. | 5,825 | 69 |
| * Internap Network Services Corp. | 9,673 | 66 |
| * Mercury Systems Inc. | 5,922 | 66 |
| Black Box Corp. | 2,770 | 66 |
| Oplink Communications Inc. | 3,295 | 64 |
| * Peregrine Semiconductor Corp. | 4,947 | 62 |
| * Exar Corp. | 6,057 | 60 |
| * CEVA Inc. | 3,737 | 57 |
| Cohu Inc. | 4,497 | 55 |
| * Intralinks Holdings Inc. | 6,993 | 55 |
| * Xcerra Corp. | 5,150 | 54 |
| * Ciber Inc. | 13,826 | 53 |
| * Diodes Inc. | 2,057 | 52 |
| IXYS Corp. | 4,354 | 52 |
| * DTS Inc. | 2,180 | 52 |
| * ePlus Inc. | 878 | 51 |
| * Rudolph Technologies Inc. | 5,144 | 50 |
| * Kopin Corp. | 11,749 | 47 |
| * Seachange International Inc. | 5,853 | 44 |
| * Datalink Corp. | 3,508 | 43 |
| Plantronics Inc. | 894 | 43 |
| Bel Fuse Inc. Class B | 1,785 | 42 |
| * Kemet Corp. | 8,078 | 41 |
| * Axcelis Technologies Inc. | 19,804 | 40 |
| PC Connection Inc. | 1,719 | 39 |
| * Entropic Communications Inc. | 14,764 | 39 |
| * Pericom Semiconductor Corp. | 3,949 | 39 |
| * Bazaarvoice Inc. | 5,163 | 38 |
| * Digi International Inc. | 4,517 | 38 |
| * Perficient Inc. | 2,141 | 37 |
| * Actuate Corp. | 8,204 | 36 |
| * Alpha & Omega Semiconductor Ltd. | 3,850 | 36 |
| * DSP Group Inc. | 3,932 | 35 |
| * Infinera Corp. | 3,316 | 35 |
| * Ultra Clean Holdings Inc. | 3,587 | 35 |
51
| Vanguard® Russell 2000 Value Index Fund | ||
| Schedule of Investments | ||
| August 31, 2014 | ||
| Market | ||
| Value | ||
| Shares | ($000) | |
| * NVE Corp. | 501 | 35 |
| * Silicon Image Inc. | 6,780 | 34 |
| Computer Task Group Inc. | 2,683 | 34 |
| * Telenav Inc. | 4,851 | 33 |
| Reis Inc. | 1,382 | 33 |
| * Agilysys Inc. | 2,611 | 33 |
| Electro Scientific Industries Inc. | 4,359 | 32 |
| * Millennial Media Inc. | 13,423 | 32 |
| * Bottomline Technologies de Inc. | 1,129 | 32 |
| * Nanometrics Inc. | 1,901 | 32 |
| * Procera Networks Inc. | 3,081 | 32 |
| * Sapiens International Corp. NV | 3,812 | 31 |
| * RealNetworks Inc. | 4,079 | 31 |
| * Intevac Inc. | 4,257 | 30 |
| Tessco Technologies Inc. | 933 | 30 |
| * Oclaro Inc. | 16,672 | 29 |
| * Quantum Corp. | 23,167 | 29 |
| * Extreme Networks Inc. | 5,428 | 29 |
| * Trulia Inc. | 460 | 28 |
| * ModusLink Global Solutions Inc. | 6,584 | 27 |
| * Rubicon Technology Inc. | 4,239 | 26 |
| * Verint Systems Inc. | 527 | 26 |
| Daktronics Inc. | 1,984 | 26 |
| * TechTarget Inc. | 2,951 | 26 |
| * TeleCommunication Systems Inc. Class A | 8,556 | 25 |
| * Limelight Networks Inc. | 10,557 | 25 |
| * Cascade Microtech Inc. | 2,132 | 23 |
| * Audience Inc. | 2,494 | 21 |
| * Finisar Corp. | 1,049 | 21 |
| * Global Eagle Entertainment Inc. | 1,657 | 21 |
| * Paycom Software Inc. | 1,162 | 21 |
| * Cinedigm Corp. Class A | 10,535 | 20 |
| * Tremor Video Inc. | 6,318 | 19 |
| * Rightside Group Ltd. | 1,453 | 17 |
| * Infoblox Inc. | 1,295 | 17 |
| * YuMe Inc. | 3,228 | 17 |
| * NeuStar Inc. Class A | 550 | 16 |
| * Multi-Fineline Electronix Inc. | 1,505 | 15 |
| * Newport Corp. | 773 | 15 |
| * Demand Media Inc. | 1,454 | 13 |
| * Model N Inc. | 1,020 | 9 |
| * Viasystems Group Inc. | 864 | 9 |
| * KVH Industries Inc. | 639 | 8 |
| * Glu Mobile Inc. | 1,473 | 8 |
| * Aerohive Networks Inc. | 925 | 7 |
| * Covisint Corp. | 1,264 | 6 |
| * Numerex Corp. Class A | 461 | 5 |
| * Zendesk Inc. | 177 | 5 |
| * Silver Spring Networks Inc. | 380 | 4 |
| QAD Inc. Class A | 129 | 3 |
| * A10 Networks Inc. | 197 | 2 |
| * Q2 Holdings Inc. | 154 | 2 |
| * Amber Road Inc. | 138 | 2 |
| * QuickLogic Corp. | 580 | 2 |
| * Varonis Systems Inc. | 82 | 2 |
| * OPOWER Inc. | 120 | 2 |
| * Vringo Inc. | 1,742 | 2 |
| * Everyday Health Inc. | 117 | 2 |
| * Vitesse Semiconductor Corp. | 459 | 2 |
| * Borderfree Inc. | 92 | 1 |
| * Rubicon Project Inc. | 122 | 1 |
| * Five9 Inc. | 190 | 1 |
| * Revolution Lighting Technologies Inc. | 339 | 1 |
| 13,868 | ||
52
| Vanguard® Russell 2000 Value Index Fund | ||
| Schedule of Investments | ||
| August 31, 2014 | ||
| Market | ||
| Value | ||
| Shares | ($000) | |
| Utilities (7.1%) | ||
| Cleco Corp. | 10,586 | 597 |
| * Dynegy Inc. Class A | 17,600 | 575 |
| Piedmont Natural Gas Co. Inc. | 13,669 | 511 |
| IDACORP Inc. | 8,823 | 500 |
| Portland General Electric Co. | 13,712 | 473 |
| Southwest Gas Corp. | 8,157 | 426 |
| Black Hills Corp. | 7,827 | 421 |
| WGL Holdings Inc. | 9,103 | 396 |
| New Jersey Resources Corp. | 7,382 | 386 |
| Laclede Group Inc. | 7,557 | 374 |
| UIL Holdings Corp. | 9,915 | 369 |
| PNM Resources Inc. | 13,971 | 366 |
| ALLETE Inc. | 7,428 | 362 |
| Avista Corp. | 10,553 | 343 |
| ONE Gas Inc. | 9,115 | 341 |
| South Jersey Industries Inc. | 5,785 | 335 |
| NorthWestern Corp. | 6,863 | 331 |
| El Paso Electric Co. | 7,069 | 278 |
| MGE Energy Inc. | 6,108 | 246 |
| NRG Yield Inc. Class A | 4,171 | 227 |
| Northwest Natural Gas Co. | 4,773 | 217 |
| American States Water Co. | 6,349 | 205 |
| California Water Service Group | 8,405 | 205 |
| Empire District Electric Co. | 7,591 | 196 |
| * Globalstar Inc. | 48,231 | 192 |
| Otter Tail Corp. | 6,495 | 185 |
| * Iridium Communications Inc. | 14,355 | 135 |
| Chesapeake Utilities Corp. | 1,727 | 119 |
| * Vonage Holdings Corp. | 30,507 | 105 |
| * Cincinnati Bell Inc. | 28,445 | 104 |
| Atlantic Tele-Network Inc. | 1,672 | 98 |
| West Corp. | 3,250 | 96 |
| * Premiere Global Services Inc. | 7,319 | 96 |
| Atlantic Power Corp. | 21,490 | 85 |
| * 8x8 Inc. | 10,709 | 83 |
| Unitil Corp. | 2,473 | 81 |
| Consolidated Communications Holdings Inc. | 2,676 | 65 |
| Connecticut Water Service Inc. | 1,937 | 64 |
| * Intelsat SA | 3,616 | 63 |
| SJW Corp. | 2,233 | 61 |
| Middlesex Water Co. | 2,847 | 58 |
| * Pike Corp. | 4,883 | 58 |
| Spok Holdings Inc. | 3,858 | 57 |
| Ormat Technologies Inc. | 1,952 | 54 |
| * Hawaiian Telcom Holdco Inc. | 1,883 | 52 |
| * ORBCOMM Inc. | 7,650 | 48 |
| * Pendrell Corp. | 29,215 | 45 |
| Artesian Resources Corp. Class A | 1,380 | 29 |
| * Boingo Wireless Inc. | 3,693 | 26 |
| NTELOS Holdings Corp. | 1,690 | 22 |
| Shenandoah Telecommunications Co. | 635 | 18 |
| York Water Co. | 869 | 18 |
| * FairPoint Communications Inc. | 692 | 11 |
| * inContact Inc. | 1,048 | 10 |
| Lumos Networks Corp. | 520 | 8 |
| * magicJack VocalTec Ltd. | 225 | 3 |
| IDT Corp. Class B | 172 | 3 |
| 10,832 | ||
| Total Common Stocks (Cost $145,271) | 151,560 | |
53
| Vanguard® Russell 2000 Value Index Fund | ||||
| Schedule of Investments | ||||
| August 31, 2014 | ||||
| Market | ||||
| Value | ||||
| Coupon | Shares | ($000) | ||
| Temporary Cash Investments (0.3%)1 | ||||
| Money Market Fund (0.2%) | ||||
| 2,3 Vanguard Market Liquidity Fund | 0.113% | 349,000 | 349 | |
| Face | ||||
| Maturity | Amount | |||
| Date | ($000) | |||
| U.S. Government and Agency Obligations (0.1%) | ||||
| 4,5 Federal Home Loan Bank Discount Notes | 0.080% | 9/24/14 | 100 | 100 |
| Total Temporary Cash Investments (Cost $449) | 449 | |||
| Total Investments (100.2%) (Cost $145,720) | 152,009 | |||
| Other Assets and Liabilities—Net (-0.2%)3 | (247) | |||
| Net Assets (100%) | 151,762 | |||
* Non-income-producing security.
^ Includes partial security positions on loan to broker-dealers. The total value of securities on loan is $333,000.
1 The fund invests a portion of its cash reserves in equity markets through the use of index futures contracts. After giving effect to futures investments, the fund's effective common stock and temporary cash investment positions represent 100.0% and 0.2%, respectively, of net assets.
2 Affiliated money market fund available only to Vanguard funds and certain trusts and accounts managed by Vanguard. Rate shown is the 7-day yield.
3 Includes $349,000 of collateral received for securities on loan.
4 The issuer operates under a congressional charter; its securities are generally neither guaranteed by the U.S. Treasury nor backed by the full faith and credit of the U.S. government.
5 Securities with a value of $100,000 have been segregated as initial margin for open futures contracts.
REIT—Real Estate Investment Trust.
54
| Vanguard® Russell 2000 Growth Index Fund | ||
| Schedule of Investments | ||
| August 31, 2014 | ||
| Market | ||
| Value | ||
| Shares | ($000) | |
| Common Stocks (99.8%)1 | ||
| Consumer Discretionary (16.2%) | ||
| * Tenneco Inc. | 19,079 | 1,223 |
| Vail Resorts Inc. | 11,327 | 900 |
| * Buffalo Wild Wings Inc. | 5,923 | 875 |
| Wolverine World Wide Inc. | 31,785 | 844 |
| * Restoration Hardware Holdings Inc. | 9,769 | 819 |
| Pool Corp. | 14,137 | 801 |
| Sotheby's | 19,094 | 779 |
| Jack in the Box Inc. | 12,547 | 746 |
| Cheesecake Factory Inc. | 15,651 | 704 |
| * Five Below Inc. | 16,995 | 689 |
| * Asbury Automotive Group Inc. | 9,606 | 669 |
| Hillenbrand Inc. | 19,669 | 658 |
| Men's Wearhouse Inc. | 11,956 | 646 |
| * Grand Canyon Education Inc. | 14,608 | 632 |
| HSN Inc. | 10,394 | 630 |
| Sinclair Broadcast Group Inc. Class A | 21,520 | 625 |
| Lithia Motors Inc. Class A | 7,148 | 625 |
| Brunswick Corp. | 14,520 | 624 |
| * Steven Madden Ltd. | 18,252 | 620 |
| * ANN Inc. | 14,665 | 608 |
| Texas Roadhouse Inc. Class A | 21,978 | 584 |
| * Conversant Inc. | 21,127 | 582 |
| Dana Holding Corp. | 24,612 | 572 |
| Cracker Barrel Old Country Store Inc. | 5,639 | 566 |
| * Gentherm Inc. | 11,122 | 543 |
| PriceSmart Inc. | 5,905 | 529 |
| * Skechers U.S.A. Inc. Class A | 9,060 | 529 |
| Monro Muffler Brake Inc. | 9,935 | 514 |
| * Vistaprint NV | 10,424 | 503 |
| * G-III Apparel Group Ltd. | 6,030 | 498 |
| * Lumber Liquidators Holdings Inc. | 8,654 | 495 |
| Pier 1 Imports Inc. | 29,841 | 470 |
| * Pinnacle Entertainment Inc. | 18,812 | 470 |
| Nexstar Broadcasting Group Inc. Class A | 9,662 | 441 |
| Buckle Inc. | 8,831 | 434 |
| * Fiesta Restaurant Group Inc. | 8,389 | 412 |
| * Bloomin' Brands Inc. | 24,349 | 405 |
| * Bright Horizons Family Solutions Inc. | 9,698 | 394 |
| * Conn's Inc. | 8,759 | 393 |
| * American Axle & Manufacturing Holdings Inc. | 21,378 | 387 |
| Papa John's International Inc. | 9,676 | 383 |
| * Dorman Products Inc. | 8,518 | 382 |
| * Select Comfort Corp. | 16,997 | 380 |
| * Shutterfly Inc. | 7,424 | 379 |
| * Outerwall Inc. | 6,383 | 376 |
| * LifeLock Inc. | 25,208 | 374 |
| * Hibbett Sports Inc. | 8,180 | 372 |
| * Tumi Holdings Inc. | 15,862 | 357 |
| KB Home | 19,562 | 347 |
| * Krispy Kreme Doughnuts Inc. | 20,403 | 347 |
| * Shutterstock Inc. | 4,813 | 341 |
| Drew Industries Inc. | 7,478 | 332 |
| * Constant Contact Inc. | 9,948 | 310 |
| Sturm Ruger & Co. Inc. | 6,138 | 309 |
| La-Z-Boy Inc. | 14,139 | 302 |
| * Popeyes Louisiana Kitchen Inc. | 7,499 | 301 |
| * Burlington Stores Inc. | 8,007 | 286 |
| Oxford Industries Inc. | 4,602 | 282 |
| * Diamond Resorts International Inc. | 11,069 | 277 |
| * Universal Electronics Inc. | 4,979 | 272 |
| * Mattress Firm Holding Corp. | 4,690 | 269 |
55
| Vanguard® Russell 2000 Growth Index Fund | ||
| Schedule of Investments | ||
| August 31, 2014 | ||
| Market | ||
| Value | ||
| Shares | ($000) | |
| * Multimedia Games Holding Co. Inc. | 9,399 | 261 |
| * Carmike Cinemas Inc. | 7,620 | 258 |
| Churchill Downs Inc. | 2,734 | 257 |
| * Sonic Corp. | 11,936 | 252 |
| * Red Robin Gourmet Burgers Inc. | 4,534 | 241 |
| Capella Education Co. | 3,419 | 223 |
| Columbia Sportswear Co. | 2,902 | 221 |
| * Meritor Inc. | 16,136 | 220 |
| * Tower International Inc. | 6,446 | 216 |
| * Winnebago Industries Inc. | 8,522 | 211 |
| Interval Leisure Group Inc. | 9,568 | 207 |
| * Boyd Gaming Corp. | 19,411 | 207 |
| * Strayer Education Inc. | 3,393 | 206 |
| * Iconix Brand Group Inc. | 4,929 | 205 |
| * Cavco Industries Inc. | 2,767 | 198 |
| * Move Inc. | 12,382 | 197 |
| Brown Shoe Co. Inc. | 6,596 | 197 |
| ^ Weight Watchers International Inc. | 7,961 | 197 |
| * Helen of Troy Ltd. | 3,374 | 196 |
| * Tuesday Morning Corp. | 11,046 | 194 |
| * La Quinta Holdings Inc. | 9,824 | 194 |
| * Smith & Wesson Holding Corp. | 17,192 | 190 |
| * Vitamin Shoppe Inc. | 4,843 | 190 |
| * Francesca's Holdings Corp. | 13,209 | 185 |
| * HealthStream Inc. | 6,744 | 175 |
| * Libbey Inc. | 6,297 | 174 |
| * TiVo Inc. | 12,288 | 173 |
| DineEquity Inc. | 2,042 | 170 |
| * Zumiez Inc. | 5,145 | 166 |
| * Del Frisco's Restaurant Group Inc. | 7,394 | 164 |
| * American Public Education Inc. | 5,161 | 157 |
| * Gray Television Inc. | 15,505 | 154 |
| * American Woodmark Corp. | 3,852 | 151 |
| Nutrisystem Inc. | 9,007 | 147 |
| * Rentrak Corp. | 2,843 | 145 |
| * Motorcar Parts of America Inc. | 4,720 | 143 |
| * Cumulus Media Inc. Class A | 30,591 | 140 |
| * Vera Bradley Inc. | 6,823 | 140 |
| Standard Motor Products Inc. | 3,697 | 139 |
| * Stamps.com Inc. | 4,062 | 137 |
| World Wrestling Entertainment Inc. Class A | 9,304 | 135 |
| * Chuy's Holdings Inc. | 5,142 | 135 |
| ClubCorp Holdings Inc. | 6,854 | 127 |
| * Vince Holding Corp. | 3,496 | 127 |
| * Denny's Corp. | 18,310 | 125 |
| * RealD Inc. | 12,582 | 117 |
| * Container Store Group Inc. | 5,384 | 114 |
| Finish Line Inc. Class A | 3,775 | 112 |
| Group 1 Automotive Inc. | 1,394 | 112 |
| * Christopher & Banks Corp. | 11,398 | 109 |
| * Blue Nile Inc. | 3,790 | 108 |
| * Angie's List Inc. | 13,645 | 105 |
| * Scientific Games Corp. Class A | 10,133 | 103 |
| * Tile Shop Holdings Inc. | 8,776 | 101 |
| * XO Group Inc. | 8,421 | 99 |
| Movado Group Inc. | 2,594 | 96 |
| Marchex Inc. Class B | 10,277 | 88 |
| * K12 Inc. | 4,550 | 86 |
| * Stoneridge Inc. | 6,804 | 85 |
| Ruth's Hospitality Group Inc. | 7,215 | 80 |
| * Jamba Inc. | 5,379 | 79 |
| Entravision Communications Corp. Class A | 17,116 | 78 |
| * Bravo Brio Restaurant Group Inc. | 5,379 | 78 |
| * Quiksilver Inc. | 26,179 | 76 |
56
| Vanguard® Russell 2000 Growth Index Fund | ||||
| Schedule of Investments | ||||
| August 31, 2014 | ||||
| Market | ||||
| Value | ||||
| Shares | ($000) | |||
| MDC Partners Inc. Class A | 3,282 | 72 | ||
| * | Nautilus Inc. | 5,973 | 71 | |
| Strattec Security Corp. | 853 | 68 | ||
| * | Overstock.com Inc. | 3,846 | 68 | |
| * | BJ's Restaurants Inc. | 1,800 | 67 | |
| * | Beazer Homes USA Inc. | 3,553 | 67 | |
| * | Noodles & Co. Class A | 3,387 | 66 | |
| * | TRI Pointe Homes Inc. | 4,268 | 63 | |
| National CineMedia Inc. | 4,149 | 61 | ||
| * | Orbitz Worldwide Inc. | 7,313 | 60 | |
| *,^ | Coupons.com Inc. | 3,775 | 58 | |
| Cooper Tire & Rubber Co. | 1,847 | 57 | ||
| * | Potbelly Corp. | 4,675 | 57 | |
| * | Nathan's Famous Inc. | 1,011 | 56 | |
| Winmark Corp. | 776 | 56 | ||
| * | Sequential Brands Group Inc. | 4,157 | 56 | |
| * | Malibu Boats Inc. Class A | 2,636 | 55 | |
| * | Crocs Inc. | 3,506 | 54 | |
| * | Zoe's Kitchen Inc. | 1,826 | 53 | |
| * | Fox Factory Holding Corp. | 3,496 | 53 | |
| * | Genesco Inc. | 661 | 52 | |
| Arctic Cat Inc. | 1,413 | 52 | ||
| * | Kirkland's Inc. | 2,686 | 48 | |
| Cato Corp. Class A | 1,285 | 45 | ||
| Collectors Universe Inc. | 2,158 | 44 | ||
| Einstein Noah Restaurant Group Inc. | 2,929 | 42 | ||
| * | Eros International plc | 2,528 | 41 | |
| * | Liberty Tax Inc. | 1,192 | 40 | |
| * | Speed Commerce Inc. | 12,153 | 40 | |
| * | Famous Dave's of America Inc. | 1,464 | 40 | |
| * | Franklin Covey Co. | 2,057 | 39 | |
| * | Norcraft Cos. Inc. | 2,328 | 39 | |
| * | Build-A-Bear Workshop Inc. | 2,770 | 36 | |
| * | Life Time Fitness Inc. | 715 | 33 | |
| * | Crown Media Holdings Inc. Class A | 8,974 | 31 | |
| * | Martha Stewart Living Omnimedia Inc. Class A | 7,033 | 30 | |
| * | Revlon Inc. Class A | 852 | 29 | |
| * | Caesars Entertainment Corp. | 2,118 | 28 | |
| * | Pacific Sunwear of California Inc. | 13,340 | 28 | |
| Marine Products Corp. | 3,401 | 27 | ||
| * | Express Inc. | •1,555 | 1,555 | 27 |
| * | 2U Inc. | 1,256 | 24 | |
| * | Radio One Inc. | 7,231 | 22 | |
| * | Morgans Hotel Group Co. | 2,750 | 21 | |
| * | ValueVision Media Inc. Class A | 4,303 | 20 | |
| * | Cenveo Inc. | 6,468 | 20 | |
| * | FTD Cos. Inc. | 586 | 19 | |
| * | LGI Homes Inc. | 991 | 19 | |
| * | Care.com Inc. | 2,023 | 19 | |
| * | Ignite Restaurant Group Inc. | 2,427 | 18 | |
| * | William Lyon Homes Class A | 668 | 17 | |
| * | Cooper-Standard Holding Inc. | 245 | 16 | |
| * | Papa Murphy's Holdings Inc. | 1,828 | 16 | |
| * | America's Car-Mart Inc. | 370 | 16 | |
| Carriage Services Inc. Class A | 824 | 15 | ||
| * | Central Garden and Pet Co. Class A | 1,595 | 14 | |
| * | New York & Co. Inc. | 4,172 | 14 | |
| * | ReachLocal Inc. | 2,516 | 13 | |
| Destination Maternity Corp. | 591 | 11 | ||
| Inter Parfums Inc. | 365 | 11 | ||
| * | hhgregg Inc. | 1,426 | 10 | |
| * | Destination XL Group Inc. | 1,914 | 10 | |
| Escalade Inc. | 654 | 9 | ||
| Saga Communications Inc. Class A | 231 | 9 | ||
57
| Vanguard® Russell 2000 Growth Index Fund | ||
| Schedule of Investments | ||
| August 31, 2014 | ||
| Market | ||
| Value | ||
| Shares | ($000) | |
| Remy International Inc. | 327 | 7 |
| * Sportsman's Warehouse Holdings Inc. | 1,134 | 7 |
| * ITT Educational Services Inc. | 578 | 5 |
| RG Barry Corp. | 201 | 4 |
| * Education Management Corp. | 890 | 1 |
| 43,885 | ||
| Consumer Staples (3.3%) | ||
| * United Natural Foods Inc. | 15,551 | 1,000 |
| Casey's General Stores Inc. | 12,061 | 865 |
| Sanderson Farms Inc. | 6,235 | 582 |
| * Boston Beer Co. Inc. Class A | 2,610 | 577 |
| * TreeHouse Foods Inc. | 6,861 | 566 |
| Andersons Inc. | 8,169 | 562 |
| B&G Foods Inc. | 16,069 | 485 |
| * Fresh Market Inc. | 13,410 | 447 |
| J&J Snack Foods Corp. | 4,704 | 446 |
| Cal-Maine Foods Inc. | 4,908 | 388 |
| WD-40 Co. | 4,745 | 326 |
| Lancaster Colony Corp. | 3,673 | 325 |
| Vector Group Ltd. | 12,873 | 308 |
| * Boulder Brands Inc. | 17,604 | 237 |
| * Diamond Foods Inc. | 6,814 | 188 |
| * Annie's Inc. | 5,319 | 170 |
| Calavo Growers Inc. | 4,245 | 165 |
| Tootsie Roll Industries Inc. | 5,355 | 151 |
| * Medifast Inc. | 4,108 | 138 |
| * USANA Health Sciences Inc. | 1,882 | 137 |
| Coca-Cola Bottling Co. Consolidated | 1,334 | 99 |
| PetMed Express Inc. | 6,316 | 89 |
| Limoneira Co. | 3,616 | 88 |
| * Chefs' Warehouse Inc. | 4,602 | 87 |
| * National Beverage Corp. | 3,569 | 65 |
| * Inventure Foods Inc. | 4,856 | 59 |
| Orchids Paper Products Co. | 2,048 | 57 |
| * Farmer Bros Co. | 2,339 | 55 |
| * Natural Grocers by Vitamin Cottage Inc. | 2,918 | 54 |
| * 22nd Century Group Inc. | 12,858 | 39 |
| * Craft Brew Alliance Inc. | 2,807 | 37 |
| Core-Mark Holding Co. Inc. | 755 | 36 |
| Liberator Medical Holdings Inc. | 9,856 | 29 |
| * Synutra International Inc. | 5,085 | 29 |
| * Fairway Group Holdings Corp. | 5,791 | 26 |
| * Lifeway Foods Inc. | 1,576 | 22 |
| Female Health Co. | 4,795 | 18 |
| * Seaboard Corp. | 6 | 17 |
| Alico Inc. | 64 | 2 |
| 8,971 | ||
| Energy (5.9%) | ||
| * Kodiak Oil & Gas Corp. | 83,521 | 1,359 |
| SemGroup Corp. Class A | 13,355 | 1,172 |
| * Diamondback Energy Inc. | 13,121 | 1,133 |
| * Carrizo Oil & Gas Inc. | 14,255 | 894 |
| Western Refining Inc. | 16,671 | 776 |
| * GT Advanced Technologies Inc. | 42,716 | 761 |
| CARBO Ceramics Inc. | 6,186 | 666 |
| * Bonanza Creek Energy Inc. | 10,273 | 631 |
| * Flotek Industries Inc. | 16,959 | 471 |
| Green Plains Inc. | 9,911 | 443 |
| * Magnum Hunter Resources Corp. | 62,751 | 434 |
| * Parsley Energy Inc. Class A | 16,704 | 366 |
| * SunCoke Energy Inc. | 15,166 | 364 |
| * Matador Resources Co. | 13,108 | 359 |
| * C&J Energy Services Inc. | 12,454 | 357 |
| Delek US Holdings Inc. | 9,675 | 338 |
58
| Vanguard® Russell 2000 Growth Index Fund | |||
| Schedule of Investments | |||
| August 31, 2014 | |||
| Market | |||
| Value | |||
| Shares | ($000) | ||
| * | Sanchez Energy Corp. | 9,645 | 320 |
| * | Synergy Resources Corp. | 20,830 | 280 |
| * | Basic Energy Services Inc. | 10,094 | 244 |
| * | Goodrich Petroleum Corp. | 10,886 | 241 |
| * | Forum Energy Technologies Inc. | 6,898 | 235 |
| * | Matrix Service Co. | 8,266 | 233 |
| * | Rex Energy Corp. | 15,042 | 230 |
| * | Solazyme Inc. | 23,773 | 223 |
| * | Clayton Williams Energy Inc. | 1,844 | 218 |
| * | Pioneer Energy Services Corp. | 14,099 | 217 |
| *,^ | FuelCell Energy Inc. | 69,107 | 176 |
| * | RigNet Inc. | 3,739 | 175 |
| * | Abraxas Petroleum Corp. | 29,081 | 172 |
| * | REX American Resources Corp. | 1,574 | 168 |
| * | Triangle Petroleum Corp. | 13,301 | 159 |
| * | Willbros Group Inc. | 12,519 | 137 |
| Panhandle Oil and Gas Inc. Class A | 2,217 | 136 | |
| *,^ | Capstone Turbine Corp. | 102,885 | 129 |
| * | Gastar Exploration Inc. | 16,077 | 126 |
| * | Rosetta Resources Inc. | 2,441 | 122 |
| * | Clean Energy Fuels Corp. | 12,121 | 121 |
| * | PetroQuest Energy Inc. | 16,539 | 110 |
| * | Ring Energy Inc. | 6,348 | 109 |
| * | Approach Resources Inc. | 5,221 | 93 |
| EXCO Resources Inc. | 18,148 | 88 | |
| * | Enphase Energy Inc. | 5,719 | 81 |
| * | Trecora Resources | 5,390 | 71 |
| * | Jones Energy Inc. | 3,492 | 67 |
| W&T Offshore Inc. | 4,187 | 62 | |
| Evolution Petroleum Corp. | 6,139 | 62 | |
| North Atlantic Drilling Ltd. | 5,568 | 61 | |
| * | FX Energy Inc. | 17,532 | 60 |
| * | RSP Permian Inc. | 1,910 | 55 |
| * | PDC Energy Inc. | 807 | 48 |
| * | EnerNOC Inc. | 2,129 | 42 |
| * | BPZ Resources Inc. | 16,553 | 41 |
| * | TransAtlantic Petroleum Ltd. | 3,656 | 40 |
| * | Isramco Inc. | 307 | 39 |
| Alon USA Energy Inc. | 2,304 | 38 | |
| Gulf Island Fabrication Inc. | 1,680 | 35 | |
| Walter Energy Inc. | 5,251 | 29 | |
| * | Glori Energy Inc. | 3,812 | 25 |
| * | ION Geophysical Corp. | 6,548 | 23 |
| Tesco Corp. | 964 | 20 | |
| * | Profire Energy Inc. | 4,159 | 20 |
| * | Geospace Technologies Corp. | 422 | 17 |
| * | Pacific Ethanol Inc. | 439 | 10 |
| * | Quicksilver Resources Inc. | 5,068 | 7 |
| * | Forest Oil Corp. | 3,763 | 6 |
| * | Apco Oil and Gas International Inc. | 423 | 6 |
| * | Miller Energy Resources Inc. | 648 | 3 |
| Adams Resources & Energy Inc. | 37 | 2 | |
| 15,956 | |||
| Financial Services (9.6%) | |||
| * | WEX Inc. | 12,144 | 1,380 |
| * | Portfolio Recovery Associates Inc. | 15,687 | 891 |
| * | Euronet Worldwide Inc. | 15,969 | 851 |
| Bank of the Ozarks Inc. | 24,963 | 798 | |
| * | Strategic Hotels & Resorts Inc. | 59,355 | 705 |
| MarketAxess Holdings Inc. | 11,821 | 697 | |
| Sovran Self Storage Inc. | 8,971 | 693 | |
| Sun Communities Inc. | 12,855 | 689 | |
| National Health Investors Inc. | 10,351 | 668 | |
| Fair Isaac Corp. | 10,068 | 586 | |
59
| Vanguard® Russell 2000 Growth Index Fund | ||
| Schedule of Investments | ||
| August 31, 2014 | ||
| Market | ||
| Value | ||
| Shares | ($000) | |
| Financial Engines Inc. | 16,221 | 582 |
| EastGroup Properties Inc. | 8,961 | 581 |
| Potlatch Corp. | 12,797 | 546 |
| Heartland Payment Systems Inc. | 11,301 | 540 |
| Evercore Partners Inc. Class A | 10,428 | 534 |
| * First Cash Financial Services Inc. | 9,131 | 527 |
| Advent Software Inc. | 16,233 | 524 |
| Virtus Investment Partners Inc. | 2,230 | 499 |
| * Cardtronics Inc. | 13,930 | 495 |
| Empire State Realty Trust Inc. | 29,112 | 479 |
| EVERTEC Inc. | 20,726 | 477 |
| * Altisource Portfolio Solutions SA | 4,604 | 460 |
| Glimcher Realty Trust | 38,910 | 437 |
| Greenhill & Co. Inc. | 8,853 | 434 |
| Home BancShares Inc. | 13,801 | 411 |
| * St. Joe Co. | 18,560 | 402 |
| * WisdomTree Investments Inc. | 33,919 | 401 |
| Sabra Health Care REIT Inc. | 14,044 | 400 |
| * Blackhawk Network Holdings Inc. Class B | 14,540 | 399 |
| * MGIC Investment Corp. | 44,578 | 376 |
| Ryman Hospitality Properties Inc. | 7,054 | 351 |
| * BofI Holding Inc. | 4,446 | 342 |
| First Financial Bankshares Inc. | 11,156 | 328 |
| HFF Inc. Class A | 10,383 | 311 |
| * Western Alliance Bancorp | 12,777 | 302 |
| AmTrust Financial Services Inc. | 6,755 | 297 |
| * Essent Group Ltd. | 13,035 | 275 |
| * Credit Acceptance Corp. | 2,206 | 272 |
| * Altisource Asset Management Corp. | 361 | 269 |
| Cohen & Steers Inc. | 6,060 | 264 |
| * Texas Capital Bancshares Inc. | 4,756 | 257 |
| PS Business Parks Inc. | 3,069 | 250 |
| * Encore Capital Group Inc. | 5,488 | 244 |
| Alexander's Inc. | 613 | 243 |
| CoreSite Realty Corp. | 6,570 | 230 |
| * Xoom Corp. | 9,671 | 221 |
| * World Acceptance Corp. | 2,462 | 193 |
| DuPont Fabros Technology Inc. | 6,364 | 179 |
| * Eagle Bancorp Inc. | 5,264 | 177 |
| Radian Group Inc. | 12,011 | 175 |
| Cass Information Systems Inc. | 3,608 | 169 |
| Universal Health Realty Income Trust | 3,795 | 168 |
| GAMCO Investors Inc. | 2,017 | 158 |
| Investors Bancorp Inc. | 13,339 | 142 |
| Westwood Holdings Group Inc. | 2,342 | 140 |
| * Harbinger Group Inc. | 10,771 | 139 |
| * eHealth Inc. | 5,564 | 137 |
| Saul Centers Inc. | 2,639 | 132 |
| Universal Insurance Holdings Inc. | 9,227 | 128 |
| Employers Holdings Inc. | 5,644 | 121 |
| Diamond Hill Investment Group Inc. | 886 | 116 |
| QTS Realty Trust Inc. Class A | 3,751 | 113 |
| BGC Partners Inc. Class A | 14,938 | 113 |
| * Ladenburg Thalmann Financial Services Inc. | 31,226 | 112 |
| Urstadt Biddle Properties Inc. Class A | 4,971 | 106 |
| * CareTrust REIT Inc. | 5,802 | 101 |
| Federated National Holding Co. | 3,922 | 97 |
| Infinity Property & Casualty Corp. | 1,310 | 90 |
| American Assets Trust Inc. | 2,368 | 83 |
| HCI Group Inc. | 1,950 | 82 |
| United Insurance Holdings Corp. | 4,753 | 77 |
| * Marcus & Millichap Inc. | 2,506 | 76 |
| * Meridian Bancorp Inc. | 6,356 | 67 |
| RCS Capital Corp. Class A | 3,005 | 67 |
60
| Vanguard® Russell 2000 Growth Index Fund | |||
| Schedule of Investments | |||
| August 31, 2014 | |||
| Market | |||
| Value | |||
| Shares | ($000) | ||
| Independent Bank Group Inc. | 1,226 | 62 | |
| * | Blackhawk Network Holdings Inc. | 2,063 | 57 |
| * | Atlas Financial Holdings Inc. | 3,364 | 49 |
| Kennedy-Wilson Holdings Inc. | 1,751 | 46 | |
| * | Information Services Group Inc. | 10,216 | 43 |
| * | PennyMac Financial Services Inc. Class A | 2,477 | 38 |
| Pzena Investment Management Inc. Class A | 3,556 | 36 | |
| ViewPoint Financial Group Inc. | 1,325 | 35 | |
| United Financial Bancorp Inc. | 2,622 | 32 | |
| * | Heritage Insurance Holdings Inc. | 2,159 | 32 |
| * | Tree.com Inc. | 885 | 28 |
| Silvercrest Asset Management Group Inc. Class A | 1,762 | 28 | |
| * | INTL. FCStone Inc. | 1,111 | 21 |
| Consolidated-Tomoka Land Co. | 364 | 21 | |
| Crawford & Co. Class B | 2,363 | 21 | |
| * | Forestar Group Inc. | 984 | 20 |
| Maiden Holdings Ltd. | 1,579 | 19 | |
| * | Higher One Holdings Inc. | 3,954 | 15 |
| Aviv REIT Inc. | 501 | 15 | |
| National Interstate Corp. | 445 | 12 | |
| Moelis & Co. | 290 | 11 | |
| * | Square 1 Financial Inc. Class A | 541 | 10 |
| * | Stonegate Mortgage Corp. | 658 | 10 |
| Cardinal Financial Corp. | 511 | 9 | |
| * | Tejon Ranch Co. | 286 | 8 |
| UMH Properties Inc. | 703 | 7 | |
| * | Kearny Financial Corp. | 439 | 7 |
| ServisFirst Bancshares Inc. | 105 | 3 | |
| * | CommunityOne Bancorp | 235 | 2 |
| * | Tejon Ranch Co. Warrants Exp. 8/31/2016 | 617 | 1 |
| CIFC Corp. | 103 | 1 | |
| 26,075 | |||
| Health Care (22.3%) | |||
| * | InterMune Inc. | 30,333 | 2,228 |
| * | Puma Biotechnology Inc. | 7,275 | 1,895 |
| * | Isis Pharmaceuticals Inc. | 36,846 | 1,502 |
| * | Team Health Holdings Inc. | 22,010 | 1,288 |
| * | Pacira Pharmaceuticals Inc. | 11,174 | 1,210 |
| STERIS Corp. | 18,516 | 1,042 | |
| * | DexCom Inc. | 23,477 | 1,038 |
| * | PAREXEL International Corp. | 17,823 | 1,006 |
| West Pharmaceutical Services Inc. | 22,145 | 962 | |
| * | NPS Pharmaceuticals Inc. | 31,021 | 936 |
| * | Cepheid | 21,849 | 875 |
| HealthSouth Corp. | 20,982 | 826 | |
| * | Medidata Solutions Inc. | 16,953 | 789 |
| * | Akorn Inc. | 19,535 | 762 |
| * | Air Methods Corp. | 12,261 | 719 |
| * | Acadia Healthcare Co. Inc. | 13,394 | 686 |
| * | HMS Holdings Corp. | 27,456 | 628 |
| * | Insulet Corp. | 17,355 | 627 |
| * | WebMD Health Corp. | 12,217 | 591 |
| Chemed Corp. | 5,529 | 584 | |
| ^ | Theravance Inc. | 24,536 | 578 |
| * | MWI Veterinary Supply Inc. | 4,027 | 572 |
| * | Prestige Brands Holdings Inc. | 16,339 | 565 |
| *,^ | OPKO Health Inc. | 62,126 | 553 |
| * | ACADIA Pharmaceuticals Inc. | 22,727 | 545 |
| * | Exact Sciences Corp. | 25,936 | 541 |
| *,^ | MannKind Corp. | 71,895 | 530 |
| * | Keryx Biopharmaceuticals Inc. | 28,642 | 521 |
| ^ | PDL BioPharma Inc. | 50,671 | 511 |
| * | Ironwood Pharmaceuticals Inc. Class A | 37,674 | 487 |
| * | Neogen Corp. | 11,577 | 487 |
61
| Vanguard® Russell 2000 Growth Index Fund | ||
| Schedule of Investments | ||
| August 31, 2014 | ||
| Market | ||
| Value | ||
| Shares | ($000) | |
| * Synageva BioPharma Corp. | 6,751 | 487 |
| * Cyberonics Inc. | 8,465 | 486 |
| * Medicines Co. | 18,626 | 477 |
| * Molina Healthcare Inc. | 9,537 | 456 |
| * Thoratec Corp. | 17,907 | 448 |
| * HeartWare International Inc. | 5,361 | 435 |
| * Dyax Corp. | 42,531 | 434 |
| * NuVasive Inc. | 12,298 | 432 |
| * Acorda Therapeutics Inc. | 13,164 | 429 |
| * MedAssets Inc. | 18,145 | 417 |
| * Celldex Therapeutics Inc. | 25,355 | 403 |
| Cantel Medical Corp. | 10,688 | 390 |
| * Neurocrine Biosciences Inc. | 23,759 | 388 |
| * Globus Medical Inc. | 20,756 | 377 |
| * Spectranetics Corp. | 13,022 | 370 |
| * Clovis Oncology Inc. | 7,728 | 368 |
| * ExamWorks Group Inc. | 10,965 | 361 |
| * Novavax Inc. | 74,938 | 351 |
| * Masimo Corp. | 15,306 | 343 |
| * Ligand Pharmaceuticals Inc. | 6,564 | 342 |
| Abaxis Inc. | 7,038 | 336 |
| * AVANIR Pharmaceuticals Inc. | 53,747 | 334 |
| * ABIOMED Inc. | 12,651 | 330 |
| Select Medical Holdings Corp. | 23,368 | 328 |
| * Omnicell Inc. | 11,603 | 327 |
| * Portola Pharmaceuticals Inc. | 11,551 | 322 |
| * ImmunoGen Inc. | 27,209 | 322 |
| * Lannett Co. Inc. | 8,155 | 321 |
| * ARIAD Pharmaceuticals Inc. | 51,575 | 321 |
| * Nektar Therapeutics | 22,448 | 320 |
| * Halozyme Therapeutics Inc. | 32,557 | 309 |
| * Sangamo BioSciences Inc. | 21,262 | 304 |
| * Receptos Inc. | 5,845 | 299 |
| * Auxilium Pharmaceuticals Inc. | 15,932 | 296 |
| * Sarepta Therapeutics Inc. | 12,913 | 296 |
| * Arena Pharmaceuticals Inc. | 69,546 | 287 |
| * Natus Medical Inc. | 10,058 | 283 |
| * Aegerion Pharmaceuticals Inc. | 9,226 | 282 |
| * Endologix Inc. | 20,312 | 281 |
| * Depomed Inc. | 18,142 | 278 |
| * Bluebird Bio Inc. | 6,856 | 274 |
| Meridian Bioscience Inc. | 13,198 | 258 |
| * Exelixis Inc. | 60,920 | 252 |
| * NxStage Medical Inc. | 19,216 | 252 |
| * Cardiovascular Systems Inc. | 8,780 | 250 |
| Quality Systems Inc. | 15,592 | 244 |
| * Fluidigm Corp. | 8,781 | 239 |
| * Arrowhead Research Corp. | 16,231 | 236 |
| * BioCryst Pharmaceuticals Inc. | 17,409 | 235 |
| * Intrexon Corp. | 11,152 | 226 |
| * Luminex Corp. | 11,734 | 221 |
| * Orexigen Therapeutics Inc. | 38,377 | 219 |
| * Wright Medical Group Inc. | 7,324 | 219 |
| * Insmed Inc. | 15,509 | 216 |
| * Raptor Pharmaceutical Corp. | 19,593 | 216 |
| * Chimerix Inc. | 8,435 | 215 |
| Computer Programs & Systems Inc. | 3,493 | 215 |
| * Horizon Pharma Inc. | 20,648 | 213 |
| * Quidel Corp. | 8,919 | 210 |
| * Cambrex Corp. | 9,581 | 210 |
| * BioDelivery Sciences International Inc. | 13,094 | 210 |
| * Capital Senior Living Corp. | 9,080 | 208 |
| * Bio-Reference Laboratories Inc. | 7,147 | 208 |
| * MiMedx Group Inc. | 29,130 | 205 |
62
| Vanguard® Russell 2000 Growth Index Fund | |||
| Schedule of Investments | |||
| August 31, 2014 | |||
| Market | |||
| Value | |||
| Shares | ($000) | ||
| * | KYTHERA Biopharmaceuticals Inc. | 5,444 | 205 |
| * | Theravance Biopharma Inc. | 6,957 | 204 |
| Ensign Group Inc. | 5,803 | 203 | |
| * | Merrimack Pharmaceuticals Inc. | 28,999 | 202 |
| * | Volcano Corp. | 16,027 | 199 |
| * | Agios Pharmaceuticals Inc. | 4,247 | 196 |
| * | Accuray Inc. | 24,019 | 196 |
| * | PTC Therapeutics Inc. | 6,058 | 192 |
| * | Zeltiq Aesthetics Inc. | 9,097 | 191 |
| * | Repligen Corp. | 10,024 | 191 |
| * | Anika Therapeutics Inc. | 4,512 | 190 |
| * | TherapeuticsMD Inc. | 33,748 | 187 |
| * | TESARO Inc. | 6,031 | 178 |
| * | Gentiva Health Services Inc. | 9,851 | 178 |
| * | Momenta Pharmaceuticals Inc. | 15,030 | 177 |
| *,^ | Inovio Pharmaceuticals Inc. | 16,733 | 177 |
| * | NewLink Genetics Corp. | 6,328 | 175 |
| * | Infinity Pharmaceuticals Inc. | 15,187 | 172 |
| * | Ophthotech Corp. | 4,342 | 169 |
| * | Providence Service Corp. | 3,605 | 164 |
| * | Integra LifeSciences Holdings Corp. | 3,196 | 160 |
| * | Repros Therapeutics Inc. | 7,226 | 158 |
| * | Genomic Health Inc. | 5,221 | 155 |
| Atrion Corp. | 481 | 154 | |
| * | Karyopharm Therapeutics Inc. | 4,265 | 154 |
| * | Amsurg Corp. | 2,851 | 153 |
| * | Sagent Pharmaceuticals Inc. | 5,483 | 153 |
| *,^ | Organovo Holdings Inc. | 19,552 | 152 |
| * | IPC The Hospitalist Co. Inc. | 3,081 | 149 |
| * | Omeros Corp. | 9,900 | 148 |
| * | Accelerate Diagnostics Inc. | 7,104 | 144 |
| * | CorVel Corp. | 3,468 | 142 |
| * | LDR Holding Corp. | 5,199 | 141 |
| * | GenMark Diagnostics Inc. | 13,019 | 140 |
| * | Acceleron Pharma Inc. | 5,147 | 138 |
| * | STAAR Surgical Co. | 12,014 | 138 |
| * | Epizyme Inc. | 4,008 | 138 |
| * | Vanda Pharmaceuticals Inc. | 10,598 | 137 |
| US Physical Therapy Inc. | 3,820 | 136 | |
| * | Enanta Pharmaceuticals Inc. | 3,235 | 136 |
| * | Sequenom Inc. | 36,419 | 135 |
| * | Relypsa Inc. | 5,290 | 134 |
| * | MacroGenics Inc. | 6,252 | 134 |
| * | Vascular Solutions Inc. | 5,517 | 132 |
| * | Array BioPharma Inc. | 31,735 | 125 |
| * | VIVUS Inc. | 28,133 | 121 |
| * | Ultragenyx Pharmaceutical Inc. | 2,198 | 117 |
| * | Sunesis Pharmaceuticals Inc. | 15,481 | 116 |
| * | Synergy Pharmaceuticals Inc. | 29,318 | 114 |
| * | Surgical Care Affiliates Inc. | 3,726 | 111 |
| * | Insys Therapeutics Inc. | 3,126 | 110 |
| Landauer Inc. | 2,989 | 109 | |
| * | CTI BioPharma Corp. | 41,967 | 107 |
| * | Pacific Biosciences of California Inc. | 17,997 | 105 |
| * | AMAG Pharmaceuticals Inc. | 4,634 | 105 |
| * | Impax Laboratories Inc. | 4,253 | 105 |
| * | Foundation Medicine Inc. | 4,370 | 102 |
| * | AtriCure Inc. | 6,326 | 98 |
| * | Lexicon Pharmaceuticals Inc. | 64,281 | 98 |
| * | XOMA Corp. | 21,543 | 94 |
| * | Chindex International Inc. | 3,886 | 93 |
| * | Retrophin Inc. | 6,655 | 91 |
| * | Pernix Therapeutics Holdings Inc. | 10,408 | 90 |
| * | Tetraphase Pharmaceuticals Inc. | 6,898 | 90 |
63
| Vanguard® Russell 2000 Growth Index Fund | |||
| Schedule of Investments | |||
| August 31, 2014 | |||
| Market | |||
| Value | |||
| Shares | ($000) | ||
| * | Healthways Inc. | 5,133 | 90 |
| * | Aratana Therapeutics Inc. | 7,644 | 89 |
| * | Endocyte Inc. | 12,030 | 89 |
| Phibro Animal Health Corp. Class A | 4,586 | 88 | |
| * | Hyperion Therapeutics Inc. | 3,392 | 88 |
| * | Neuralstem Inc. | 21,511 | 88 |
| * | Galena Biopharma Inc. | 36,929 | 87 |
| * | Anacor Pharmaceuticals Inc. | 3,741 | 87 |
| * | Antares Pharma Inc. | 36,526 | 86 |
| * | Cerus Corp. | 22,690 | 85 |
| * | Peregrine Pharmaceuticals Inc. | 51,351 | 85 |
| * | Supernus Pharmaceuticals Inc. | 9,163 | 83 |
| * | ZIOPHARM Oncology Inc. | 25,401 | 82 |
| * | Synta Pharmaceuticals Corp. | 20,319 | 81 |
| * | Osiris Therapeutics Inc. | 5,649 | 81 |
| * | OncoMed Pharmaceuticals Inc. | 3,954 | 80 |
| * | Immunomedics Inc. | 23,776 | 79 |
| * | Durata Therapeutics Inc. | 4,863 | 77 |
| * | Intra-Cellular Therapies Inc. | 5,353 | 76 |
| * | Cempra Inc. | 7,153 | 76 |
| * | Achillion Pharmaceuticals Inc. | 6,329 | 73 |
| POZEN Inc. | 8,550 | 71 | |
| * | IGI Laboratories Inc. | 10,071 | 69 |
| * | Heron Therapeutics Inc. | 7,345 | 69 |
| * | WellCare Health Plans Inc. | 1,043 | 69 |
| * | Dendreon Corp. | 50,053 | 68 |
| * | Threshold Pharmaceuticals Inc. | 16,359 | 68 |
| * | SciClone Pharmaceuticals Inc. | 9,909 | 68 |
| * | Unilife Corp. | 26,570 | 68 |
| * | Auspex Pharmaceuticals Inc. | 2,928 | 67 |
| * | Northwest Biotherapeutics Inc. | 11,119 | 65 |
| * | RadNet Inc. | 9,647 | 64 |
| Utah Medical Products Inc. | 1,223 | 64 | |
| * | Enzo Biochem Inc. | 10,690 | 64 |
| * | ANI Pharmaceuticals Inc. | 2,151 | 63 |
| * | Five Prime Therapeutics Inc. | 5,395 | 63 |
| * | TG Therapeutics Inc. | 7,348 | 62 |
| * | Ampio Pharmaceuticals Inc. | 13,285 | 62 |
| * | Merge Healthcare Inc. | 22,884 | 59 |
| * | Oxford Immunotec Global plc | 4,068 | 57 |
| * | AcelRx Pharmaceuticals Inc. | 7,929 | 57 |
| * | Akebia Therapeutics Inc. | 2,452 | 55 |
| * | Ohr Pharmaceutical Inc. | 6,582 | 54 |
| * | Cynosure Inc. Class A | 2,401 | 54 |
| *,^ | Navidea Biopharmaceuticals Inc. | 37,750 | 54 |
| * | Aerie Pharmaceuticals Inc. | 3,288 | 54 |
| * | Bio-Path Holdings Inc. | 22,962 | 53 |
| * | Zogenix Inc. | 38,438 | 52 |
| * | Oncothyreon Inc. | 22,139 | 52 |
| * | Alimera Sciences Inc. | 8,205 | 52 |
| * | BioTime Inc. | 16,284 | 51 |
| * | Prothena Corp. plc | 2,202 | 50 |
| * | Pain Therapeutics Inc. | 11,904 | 50 |
| * | Haemonetics Corp. | 1,399 | 50 |
| * | Xencor Inc. | 4,667 | 50 |
| * | Versartis Inc. | 2,169 | 50 |
| * | Idera Pharmaceuticals Inc. | 17,183 | 50 |
| * | Affymetrix Inc. | 5,692 | 49 |
| * | NanoViricides Inc. | 12,545 | 49 |
| * | Agenus Inc. | 15,404 | 48 |
| * | Mirati Therapeutics Inc. | 2,245 | 46 |
| * | Corcept Therapeutics Inc. | 16,691 | 46 |
| * | Alder Biopharmaceuticals Inc. | 2,504 | 43 |
| * | Stemline Therapeutics Inc. | 3,615 | 41 |
64
| Vanguard® Russell 2000 Growth Index Fund | ||
| Schedule of Investments | ||
| August 31, 2014 | ||
| Market | ||
| Value | ||
| Shares | ($000) | |
| * Castlight Health Inc. Class B | 3,333 | 40 |
| * Spectrum Pharmaceuticals Inc. | 4,883 | 40 |
| * Revance Therapeutics Inc. | 1,681 | 39 |
| * K2M Group Holdings Inc. | 2,762 | 39 |
| * Vital Therapies Inc. | 1,620 | 39 |
| * Actinium Pharmaceuticals Inc. | 6,183 | 38 |
| * Sucampo Pharmaceuticals Inc. Class A | 5,550 | 38 |
| * Tandem Diabetes Care Inc. | 2,670 | 38 |
| * Kindred Biosciences Inc. | 3,284 | 36 |
| * BioTelemetry Inc. | 4,891 | 36 |
| * BioSpecifics Technologies Corp. | 1,139 | 36 |
| * Galectin Therapeutics Inc. | 5,637 | 35 |
| * NanoString Technologies Inc. | 3,144 | 35 |
| * TriVascular Technologies Inc. | 2,324 | 33 |
| * Inogen Inc. | 1,601 | 33 |
| * Cellular Dynamics International Inc. | 2,856 | 33 |
| * National Research Corp. Class A | 2,298 | 32 |
| * Applied Genetic Technologies Corp. | 1,768 | 30 |
| * Emergent Biosolutions Inc. | 1,198 | 30 |
| * Regulus Therapeutics Inc. | 4,295 | 30 |
| * Progenics Pharmaceuticals Inc. | 5,092 | 28 |
| * Veracyte Inc. | 2,035 | 26 |
| * Skilled Healthcare Group Inc. | 3,371 | 25 |
| * Esperion Therapeutics Inc. | 1,582 | 25 |
| * Cytori Therapeutics Inc. | 15,918 | 22 |
| * Achaogen Inc. | 2,158 | 21 |
| * NeoStem Inc. | 3,361 | 19 |
| * Flexion Therapeutics Inc. | 1,313 | 18 |
| * CytRx Corp. | 4,955 | 16 |
| * National Research Corp. Class B | 425 | 16 |
| * Cara Therapeutics Inc. | 1,567 | 16 |
| * Adamas Pharmaceuticals Inc. | 846 | 16 |
| * Rockwell Medical Inc. | 1,570 | 15 |
| * Eleven Biotherapeutics Inc. | 1,324 | 15 |
| * SurModics Inc. | 710 | 14 |
| * Genocea Biosciences Inc. | 1,128 | 14 |
| * XenoPort Inc. | 2,779 | 14 |
| * Dicerna Pharmaceuticals Inc. | 1,021 | 14 |
| * Alliance HealthCare Services Inc. | 445 | 13 |
| * Egalet Corp. | 1,284 | 12 |
| * OraSure Technologies Inc. | 1,136 | 9 |
| * Verastem Inc. | 761 | 7 |
| * Accretive Health Inc. | 681 | 6 |
| * Regado Biosciences Inc. | 4,834 | 5 |
| * Addus HomeCare Corp. | 173 | 4 |
| * TransEnterix Inc. | 818 | 3 |
| 60,516 | ||
| Materials & Processing (7.8%) | ||
| * Graphic Packaging Holding Co. | 102,457 | 1,310 |
| US Silica Holdings Inc. | 16,846 | 1,210 |
| PolyOne Corp. | 29,496 | 1,157 |
| Belden Inc. | 13,664 | 998 |
| * KapStone Paper and Packaging Corp. | 26,503 | 815 |
| Watsco Inc. | 8,095 | 749 |
| HB Fuller Co. | 15,699 | 738 |
| * Chemtura Corp. | 28,367 | 700 |
| * Rexnord Corp. | 23,530 | 687 |
| * Stillwater Mining Co. | 35,177 | 653 |
| Worthington Industries Inc. | 16,118 | 652 |
| * Polypore International Inc. | 14,117 | 633 |
| Balchem Corp. | 9,597 | 494 |
| Mueller Water Products Inc. Class A | 49,897 | 461 |
| RBC Bearings Inc. | 7,339 | 454 |
| * Clearwater Paper Corp. | 6,395 | 443 |
65
| Vanguard® Russell 2000 Growth Index Fund | ||
| Schedule of Investments | ||
| August 31, 2014 | ||
| Market | ||
| Value | ||
| Shares | ($000) | |
| Globe Specialty Metals Inc. | 20,175 | 414 |
| * Trex Co. Inc. | 10,521 | 396 |
| * Berry Plastics Group Inc. | 16,079 | 388 |
| * Boise Cascade Co. | 12,341 | 371 |
| Interface Inc. Class A | 21,017 | 358 |
| * Calgon Carbon Corp. | 16,851 | 358 |
| Mueller Industries Inc. | 11,705 | 342 |
| * Ferro Corp. | 22,461 | 303 |
| * Headwaters Inc. | 23,298 | 303 |
| * Cabot Microelectronics Corp. | 6,407 | 275 |
| AAON Inc. | 13,407 | 250 |
| * Nortek Inc. | 2,854 | 238 |
| Koppers Holdings Inc. | 6,399 | 237 |
| Innophos Holdings Inc. | 3,981 | 231 |
| Deltic Timber Corp. | 3,477 | 230 |
| Quaker Chemical Corp. | 2,874 | 224 |
| Apogee Enterprises Inc. | 5,382 | 197 |
| Minerals Technologies Inc. | 2,999 | 188 |
| * Taminco Corp. | 7,439 | 178 |
| * NCI Building Systems Inc. | 8,782 | 175 |
| Myers Industries Inc. | 8,642 | 170 |
| * Rentech Inc. | 71,244 | 160 |
| * PGT Inc. | 14,782 | 154 |
| NN Inc. | 5,161 | 151 |
| Neenah Paper Inc. | 2,669 | 146 |
| Stepan Co. | 2,760 | 133 |
| PH Glatfelter Co. | 5,039 | 126 |
| * OMNOVA Solutions Inc. | 14,818 | 124 |
| Insteel Industries Inc. | 5,192 | 122 |
| * US Concrete Inc. | 4,437 | 113 |
| Wausau Paper Corp. | 12,256 | 112 |
| * Senomyx Inc. | 13,304 | 108 |
| * Patrick Industries Inc. | 2,553 | 106 |
| * Builders FirstSource Inc. | 14,288 | 99 |
| * Beacon Roofing Supply Inc. | 3,347 | 95 |
| Global Brass & Copper Holdings Inc. | 5,964 | 92 |
| A Schulman Inc. | 2,138 | 83 |
| Materion Corp. | 2,533 | 83 |
| * Stock Building Supply Holdings Inc. | 4,563 | 78 |
| Gold Resource Corp. | 12,216 | 76 |
| * Masonite International Corp. | 1,226 | 70 |
| * Coeur Mining Inc. | 8,842 | 70 |
| Chase Corp. | 1,894 | 67 |
| Innospec Inc. | 1,584 | 67 |
| * Ply Gem Holdings Inc. | 5,652 | 67 |
| Schweitzer-Mauduit International Inc. | 1,448 | 62 |
| * Continental Building Products Inc. | 3,666 | 59 |
| Sensient Technologies Corp. | 898 | 50 |
| * AEP Industries Inc. | 1,140 | 48 |
| * Horsehead Holding Corp. | 2,189 | 44 |
| * Shiloh Industries Inc. | 2,452 | 41 |
| United States Lime & Minerals Inc. | 608 | 38 |
| * Installed Building Products Inc. | 2,681 | 36 |
| * Dixie Group Inc. | 3,617 | 35 |
| Comfort Systems USA Inc. | 2,238 | 34 |
| Griffon Corp. | 2,632 | 33 |
| Zep Inc. | 1,979 | 31 |
| Simpson Manufacturing Co. Inc. | 866 | 28 |
| Aceto Corp. | 1,348 | 26 |
| * Marrone Bio Innovations Inc. | 4,389 | 25 |
| Hawkins Inc. | 518 | 19 |
| Omega Flex Inc. | 985 | 17 |
| * RTI International Metals Inc. | 585 | 17 |
| FutureFuel Corp. | 1,211 | 17 |
66
| Vanguard® Russell 2000 Growth Index Fund | |||
| Schedule of Investments | |||
| August 31, 2014 | |||
| Market | |||
| Value | |||
| Shares | ($000) | ||
| Quanex Building Products Corp. | 798 | 14 | |
| Olympic Steel Inc. | 541 | 13 | |
| Kronos Worldwide Inc. | 798 | 13 | |
| Oil-Dri Corp. of America | 347 | 10 | |
| Haynes International Inc. | 206 | 10 | |
| Culp Inc. | 365 | 7 | |
| Dynamic Materials Corp. | 258 | 5 | |
| * | Handy & Harman Ltd. | 195 | 5 |
| 21,219 | |||
| Other (0.2%)2 | |||
| *,^ | GoPro Inc. Class A | 1,457 | 75 |
| * | Catalent Inc. | 2,397 | 52 |
| * | TerraForm Power Inc. Class A | 950 | 30 |
| * | Memorial Resource Development Corp. | 960 | 28 |
| * | Aspen Aerogels Inc. | 2,400 | 26 |
| * | Furiex Pharmaceuticals Inc. CVR | 2,460 | 24 |
| * | Eclipse Resources Corp. | 1,313 | 24 |
| * | Otonomy Inc. | 594 | 12 |
| * | HealthEquity Inc. | 593 | 12 |
| * | Leap Wireless International Inc. CVR | 4,245 | 11 |
| * | MobileIron Inc. | 900 | 10 |
| * | Adeptus Health Inc. Class A | 360 | 10 |
| * | Kite Pharma Inc. | 350 | 10 |
| *,^ | El Pollo Loco Holdings Inc. | 302 | 10 |
| * | Ardelyx Inc. | 599 | 9 |
| * | Imprivata Inc. | 600 | 9 |
| * | Sage Therapeutics Inc. | 292 | 8 |
| * | Arista Networks Inc. | 85 | 7 |
| * | Avalanche Biotechnologies Inc. | 178 | 5 |
| * | Chelsea Therapeutics International Ltd. CVR Exp. 12/31/2016 | 27,975 | 3 |
| * | Ocular Therapeutix Inc. | 180 | 3 |
| * | Cubist Pharmaceuticals, Inc. CVR | 13,027 | 2 |
| * | Omthera Pharmaceuticals Inc. CVR | 2,001 | 1 |
| * | Energy Transfer Partners LP | 20 | 1 |
| 382 | |||
| Producer Durables (13.4%) | |||
| HEICO Corp. | 20,839 | 1,080 | |
| * | Generac Holdings Inc. | 21,570 | 1,003 |
| CLARCOR Inc. | 14,899 | 942 | |
| MAXIMUS Inc. | 21,215 | 874 | |
| Woodward Inc. | 13,879 | 725 | |
| Corporate Executive Board Co. | 10,591 | 698 | |
| * | Electronics For Imaging Inc. | 14,598 | 643 |
| * | Chart Industries Inc. | 9,549 | 639 |
| * | MasTec Inc. | 20,493 | 625 |
| Greenbrier Cos. Inc. | 8,639 | 618 | |
| Harsco Corp. | 25,287 | 612 | |
| Healthcare Services Group Inc. | 22,007 | 601 | |
| * | Advisory Board Co. | 11,540 | 572 |
| * | Swift Transportation Co. | 26,810 | 568 |
| Littelfuse Inc. | 6,090 | 560 | |
| Herman Miller Inc. | 18,677 | 555 | |
| * | Proto Labs Inc. | 7,136 | 537 |
| Allegiant Travel Co. Class A | 4,353 | 535 | |
| Franklin Electric Co. Inc. | 13,928 | 529 | |
| MSA Safety Inc. | 9,311 | 515 | |
| * | On Assignment Inc. | 17,130 | 506 |
| * | Hub Group Inc. Class A | 11,596 | 504 |
| HNI Corp. | 13,132 | 498 | |
| * | EnPro Industries Inc. | 7,165 | 487 |
| Deluxe Corp. | 8,135 | 484 | |
| Knight Transportation Inc. | 18,853 | 478 | |
67
| Vanguard® Russell 2000 Growth Index Fund | ||
| Schedule of Investments | ||
| August 31, 2014 | ||
| Market | ||
| Value | ||
| Shares | ($000) | |
| * WageWorks Inc. | 11,082 | 457 |
| Forward Air Corp. | 9,849 | 456 |
| * Measurement Specialties Inc. | 5,046 | 433 |
| Steelcase Inc. Class A | 26,123 | 410 |
| Tennant Co. | 5,819 | 406 |
| Heartland Express Inc. | 17,192 | 403 |
| H&E Equipment Services Inc. | 9,797 | 401 |
| * TriMas Corp. | 12,620 | 400 |
| AZZ Inc. | 8,089 | 375 |
| * Saia Inc. | 7,805 | 371 |
| CIRCOR International Inc. | 5,021 | 357 |
| * TrueBlue Inc. | 13,067 | 355 |
| * GenCorp Inc. | 18,927 | 349 |
| Primoris Services Corp. | 11,907 | 346 |
| MTS Systems Corp. | 4,797 | 341 |
| * Rush Enterprises Inc. Class A | 8,994 | 330 |
| * DXP Enterprises Inc. | 4,055 | 325 |
| * Wabash National Corp. | 21,863 | 309 |
| * Astronics Corp. | 4,914 | 308 |
| Raven Industries Inc. | 11,533 | 307 |
| Exponent Inc. | 4,156 | 304 |
| * Dycom Industries Inc. | 9,589 | 299 |
| US Ecology Inc. | 6,827 | 292 |
| Altra Industrial Motion Corp. | 8,581 | 285 |
| Sun Hydraulics Corp. | 7,064 | 283 |
| Curtiss-Wright Corp. | 3,905 | 281 |
| Knoll Inc. | 15,155 | 277 |
| ArcBest Corp. | 7,580 | 272 |
| * FARO Technologies Inc. | 4,685 | 272 |
| * Thermon Group Holdings Inc. | 9,993 | 271 |
| Lindsay Corp. | 3,444 | 268 |
| John Bean Technologies Corp. | 9,117 | 265 |
| * Taser International Inc. | 16,853 | 264 |
| * Teledyne Technologies Inc. | 2,665 | 259 |
| * Team Inc. | 6,396 | 255 |
| Hyster-Yale Materials Handling Inc. | 3,261 | 251 |
| * Blount International Inc. | 15,475 | 247 |
| * Korn/Ferry International | 7,983 | 242 |
| Badger Meter Inc. | 4,518 | 235 |
| Applied Industrial Technologies Inc. | 4,744 | 231 |
| EnerSys | 3,509 | 226 |
| * Advanced Energy Industries Inc. | 11,704 | 225 |
| American Railcar Industries Inc. | 2,762 | 220 |
| * Hawaiian Holdings Inc. | 14,099 | 220 |
| Standex International Corp. | 2,867 | 214 |
| Insperity Inc. | 7,095 | 209 |
| Encore Wire Corp. | 4,925 | 209 |
| * Darling Ingredients Inc. | 10,145 | 196 |
| * Echo Global Logistics Inc. | 7,350 | 191 |
| Gorman-Rupp Co. | 5,896 | 183 |
| Kaman Corp. | 4,412 | 179 |
| Kforce Inc. | 8,551 | 172 |
| TAL International Group Inc. | 3,658 | 162 |
| Park-Ohio Holdings Corp. | 2,744 | 159 |
| * Advanced Emissions Solutions Inc. | 6,452 | 141 |
| * JetBlue Airways Corp. | 10,967 | 134 |
| Barrett Business Services Inc. | 2,245 | 133 |
| Forrester Research Inc. | 3,414 | 133 |
| * Lydall Inc. | 4,595 | 127 |
| Matson Inc. | 4,638 | 125 |
| Douglas Dynamics Inc. | 6,138 | 122 |
| * ExlService Holdings Inc. | 4,333 | 118 |
| Aircastle Ltd. | 6,026 | 115 |
| * Mistras Group Inc. | 5,122 | 110 |
68
| Vanguard® Russell 2000 Growth Index Fund | |||
| Schedule of Investments | |||
| August 31, 2014 | |||
| Market | |||
| Value | |||
| Shares | ($000) | ||
| * | Furmanite Corp. | 11,767 | 107 |
| * | Aerovironment Inc. | 3,255 | 103 |
| * | XPO Logistics Inc. | 3,236 | 100 |
| * | OSI Systems Inc. | 1,410 | 98 |
| * | SP Plus Corp. | 4,504 | 98 |
| Graham Corp. | 3,152 | 96 | |
| * | Maxwell Technologies Inc. | 9,364 | 96 |
| * | Power Solutions International Inc. | 1,403 | 96 |
| *,^ | ExOne Co. | 3,105 | 91 |
| Multi-Color Corp. | 1,828 | 85 | |
| * | Performant Financial Corp. | 8,813 | 85 |
| * | GP Strategies Corp. | 3,185 | 80 |
| * | Roadrunner Transportation Systems Inc. | 3,148 | 79 |
| * | TeleTech Holdings Inc. | 2,827 | 76 |
| * | Moog Inc. Class A | 1,031 | 73 |
| Werner Enterprises Inc. | 2,909 | 72 | |
| * | Commercial Vehicle Group Inc. | 8,278 | 66 |
| Mesa Laboratories Inc. | 916 | 65 | |
| GasLog Ltd. | 2,478 | 63 | |
| Argan Inc. | 1,540 | 62 | |
| * | Modine Manufacturing Co. | 4,324 | 62 |
| Marten Transport Ltd. | 3,089 | 61 | |
| Twin Disc Inc. | 1,870 | 61 | |
| * | Manitex International Inc. | 4,324 | 58 |
| Textainer Group Holdings Ltd. | 1,648 | 58 | |
| * | Xerium Technologies Inc. | 3,617 | 54 |
| * | Control4 Corp. | 3,576 | 53 |
| * | Accuride Corp. | 10,932 | 50 |
| * | Wesco Aircraft Holdings Inc. | 2,641 | 48 |
| * | Casella Waste Systems Inc. Class A | 10,532 | 47 |
| * | Huron Consulting Group Inc. | 751 | 45 |
| Mobile Mini Inc. | 1,152 | 45 | |
| * | Heritage-Crystal Clean Inc. | 2,630 | 42 |
| * | Ducommun Inc. | 1,308 | 41 |
| * | TriNet Group Inc. | 1,509 | 40 |
| * | YRC Worldwide Inc. | 1,663 | 39 |
| Albany International Corp. | 1,021 | 38 | |
| Watts Water Technologies Inc. Class A | 554 | 35 | |
| * | Vertex Energy Inc. | 3,677 | 34 |
| * | Dice Holdings Inc. | 3,902 | 33 |
| * | Hill International Inc. | 7,448 | 33 |
| * | Quality Distribution Inc. | 2,328 | 33 |
| Tetra Tech Inc. | 1,280 | 33 | |
| Universal Truckload Services Inc. | 1,284 | 32 | |
| * | CUI Global Inc. | 4,222 | 31 |
| * | General Finance Corp. | 3,464 | 30 |
| * | Aegion Corp. Class A | 1,093 | 27 |
| * | RPX Corp. | 1,774 | 27 |
| * | Sykes Enterprises Inc. | 1,098 | 23 |
| * | ARC Group Worldwide Inc. | 961 | 19 |
| Kadant Inc. | 483 | 19 | |
| * | Paylocity Holding Corp. | 805 | 18 |
| * | Energy Recovery Inc. | 3,817 | 18 |
| Columbus McKinnon Corp. | 683 | 17 | |
| Cubic Corp. | 364 | 16 | |
| * | Quest Resource Holding Corp. | 3,987 | 16 |
| Hackett Group Inc. | 2,310 | 15 | |
| * | Great Lakes Dredge & Dock Corp. | 1,571 | 12 |
| * | Titan Machinery Inc. | 856 | 11 |
| * | Corporate Resource Services Inc. | 5,494 | 10 |
| * | PHI Inc. | 235 | 10 |
| Celadon Group Inc. | 421 | 9 | |
| * | PAM Transportation Services Inc. | 190 | 7 |
| * | Vicor Corp. | 799 | 7 |
69
| Vanguard® Russell 2000 Growth Index Fund | |||
| Schedule of Investments | |||
| August 31, 2014 | |||
| Market | |||
| Value | |||
| Shares | ($000) | ||
| * | InnerWorkings Inc. | 646 | 6 |
| Electro Rent Corp. | 367 | 6 | |
| SIFCO Industries Inc. | 160 | 4 | |
| * | Global Sources Ltd. | 592 | 4 |
| Miller Industries Inc. | 205 | 4 | |
| Preformed Line Products Co. | 66 | 4 | |
| * | Sterling Construction Co. Inc. | 408 | 3 |
| 36,342 | |||
| Technology (19.7%) | |||
| * | Ultimate Software Group Inc. | 8,883 | 1,306 |
| * | Aspen Technology Inc. | 28,853 | 1,186 |
| * | Cognex Corp. | 27,213 | 1,142 |
| * | RF Micro Devices Inc. | 89,674 | 1,118 |
| FEI Co. | 13,242 | 1,113 | |
| * | TriQuint Semiconductor Inc. | 53,692 | 1,110 |
| * | Guidewire Software Inc. | 21,292 | 970 |
| * | SS&C Technologies Holdings Inc. | 21,347 | 966 |
| * | Cavium Inc. | 16,557 | 930 |
| * | Synaptics Inc. | 11,288 | 927 |
| * | Tyler Technologies Inc. | 10,344 | 921 |
| * | Verint Systems Inc. | 17,776 | 891 |
| * | CommVault Systems Inc. | 14,788 | 815 |
| * | Qlik Technologies Inc. | 28,090 | 793 |
| * | ViaSat Inc. | 12,964 | 738 |
| * | Aruba Networks Inc. | 33,439 | 714 |
| * | ACI Worldwide Inc. | 35,633 | 694 |
| * | Manhattan Associates Inc. | 23,750 | 686 |
| * | Ciena Corp. | 32,893 | 681 |
| * | Trulia Inc. | 10,761 | 663 |
| * | Dealertrack Technologies Inc. | 14,061 | 629 |
| * | Cornerstone OnDemand Inc. | 16,655 | 624 |
| Science Applications International Corp. | 13,163 | 607 | |
| * | Finisar Corp. | 28,648 | 582 |
| Monolithic Power Systems Inc. | 12,173 | 582 | |
| *,^ | InvenSense Inc. | 22,407 | 579 |
| Power Integrations Inc. | 9,591 | 573 | |
| InterDigital Inc. | 12,755 | 566 | |
| Plantronics Inc. | 11,833 | 565 | |
| Blackbaud Inc. | 14,456 | 562 | |
| * | Semtech Corp. | 21,196 | 552 |
| Cypress Semiconductor Corp. | 49,726 | 550 | |
| * | Microsemi Corp. | 20,300 | 541 |
| * | NetScout Systems Inc. | 11,494 | 530 |
| * | Sapient Corp. | 36,132 | 524 |
| * | Integrated Device Technology Inc. | 30,943 | 509 |
| * | Demandware Inc. | 9,472 | 503 |
| * | Envestnet Inc. | 10,742 | 494 |
| * | NeuStar Inc. Class A | 16,635 | 491 |
| * | Synchronoss Technologies Inc. | 11,056 | 488 |
| * | Proofpoint Inc. | 11,585 | 462 |
| * | Rambus Inc. | 35,880 | 445 |
| * | Universal Display Corp. | 12,698 | 441 |
| * | Syntel Inc. | 4,900 | 438 |
| * | iGATE Corp. | 11,617 | 435 |
| * | Silicon Laboratories Inc. | 9,438 | 428 |
| * | Spansion Inc. Class A | 19,070 | 425 |
| * | EPAM Systems Inc. | 11,245 | 423 |
| * | Ubiquiti Networks Inc. | 9,307 | 422 |
| * | comScore Inc. | 10,952 | 420 |
| Methode Electronics Inc. | 11,985 | 404 | |
| * | MicroStrategy Inc. Class A | 2,867 | 398 |
| * | FleetMatics Group plc | 11,816 | 388 |
| NIC Inc. | 20,425 | 383 | |
| Monotype Imaging Holdings Inc. | 12,510 | 368 | |
70
| Vanguard® Russell 2000 Growth Index Fund | |||
| Schedule of Investments | |||
| August 31, 2014 | |||
| Market | |||
| Value | |||
| Shares | ($000) | ||
| * | Cray Inc. | 12,870 | 363 |
| * | Infinera Corp. | 32,531 | 344 |
| Anixter International Inc. | 3,842 | 343 | |
| * | LogMeIn Inc. | 7,698 | 325 |
| * | Ellie Mae Inc. | 8,794 | 315 |
| * | Loral Space & Communications Inc. | 4,156 | 311 |
| * | Web.com Group Inc. | 16,353 | 310 |
| *,^ | Ambarella Inc. | 9,012 | 309 |
| *,^ | iRobot Corp. | 9,332 | 303 |
| * | Entegris Inc. | 24,382 | 296 |
| * | Bottomline Technologies de Inc. | 10,476 | 295 |
| * | Sonus Networks Inc. | 77,868 | 294 |
| Tessera Technologies Inc. | 9,787 | 289 | |
| * | SPS Commerce Inc. | 5,143 | 288 |
| * | Ruckus Wireless Inc. | 20,285 | 282 |
| * | Lattice Semiconductor Corp. | 37,329 | 280 |
| * | Virtusa Corp. | 8,136 | 277 |
| * | Super Micro Computer Inc. | 10,952 | 268 |
| * | RealPage Inc. | 16,450 | 265 |
| * | Polycom Inc. | 19,756 | 262 |
| Pegasystems Inc. | 11,089 | 246 | |
| * | Marketo Inc. | 8,022 | 235 |
| * | Interactive Intelligence Group Inc. | 5,319 | 228 |
| * | Unisys Corp. | 9,661 | 226 |
| * | LivePerson Inc. | 16,958 | 219 |
| * | CalAmp Corp. | 11,243 | 217 |
| * | BroadSoft Inc. | 8,943 | 213 |
| ADTRAN Inc. | 9,089 | 210 | |
| * | Newport Corp. | 11,112 | 210 |
| * | Applied Micro Circuits Corp. | 24,625 | 209 |
| * | Imperva Inc. | 6,919 | 201 |
| * | Diodes Inc. | 7,789 | 198 |
| *,^ | VirnetX Holding Corp. | 13,307 | 196 |
| * | Infoblox Inc. | 14,581 | 196 |
| * | AVG Technologies NV | 10,903 | 191 |
| * | PDF Solutions Inc. | 9,551 | 191 |
| * | PROS Holdings Inc. | 7,356 | 188 |
| * | Kofax Ltd. | 23,215 | 184 |
| * | RetailMeNot Inc. | 9,634 | 180 |
| Micrel Inc. | 13,958 | 175 | |
| * | Comverse Inc. | 7,012 | 173 |
| * | Tangoe Inc. | 12,104 | 169 |
| * | Textura Corp. | 5,834 | 168 |
| * | Callidus Software Inc. | 14,380 | 165 |
| * | Qualys Inc. | 6,293 | 153 |
| * | Plexus Corp. | 3,672 | 151 |
| * | Inphi Corp. | 9,798 | 147 |
| * | Amkor Technology Inc. | 13,885 | 144 |
| * | Cvent Inc. | 5,613 | 141 |
| * | Cirrus Logic Inc. | 5,766 | 139 |
| * | SciQuest Inc. | 8,554 | 137 |
| * | VASCO Data Security International Inc. | 9,213 | 136 |
| * | Glu Mobile Inc. | 25,539 | 132 |
| * | ShoreTel Inc. | 19,565 | 131 |
| * | Endurance International Group Holdings Inc. | 9,432 | 127 |
| * | PMC-Sierra Inc. | 17,032 | 126 |
| CSG Systems International Inc. | 4,404 | 122 | |
| * | Perficient Inc. | 7,052 | 121 |
| * | RingCentral Inc. Class A | 8,768 | 118 |
| * | Global Eagle Entertainment Inc. | 9,019 | 114 |
| * | Extreme Networks Inc. | 20,653 | 110 |
| Daktronics Inc. | 8,330 | 110 | |
| * | E2open Inc. | 7,254 | 110 |
| * | GrubHub Inc. | 2,795 | 107 |
71
| Vanguard® Russell 2000 Growth Index Fund | |||
| Schedule of Investments | |||
| August 31, 2014 | |||
| Market | |||
| Value | |||
| Shares | ($000) | ||
| * | Silver Spring Networks Inc. | 10,287 | 107 |
| * | Silicon Graphics International Corp. | 10,811 | 106 |
| * | Violin Memory Inc. | 25,083 | 106 |
| * | ChannelAdvisor Corp. | 6,478 | 105 |
| * | ARC Document Solutions Inc. | 12,858 | 104 |
| * | Applied Optoelectronics Inc. | 4,627 | 98 |
| * | Rogers Corp. | 1,598 | 96 |
| * | Immersion Corp. | 9,054 | 95 |
| * | Lionbridge Technologies Inc. | 20,225 | 94 |
| * | Rocket Fuel Inc. | 5,743 | 94 |
| * | Jive Software Inc. | 13,315 | 93 |
| * | Sparton Corp. | 3,169 | 91 |
| * | Rally Software Development Corp. | 7,778 | 90 |
| * | M/A-COM Technology Solutions Holdings Inc. | 3,764 | 89 |
| * | Luxoft Holding Inc. Class A | 2,453 | 88 |
| * | Zendesk Inc. | 3,246 | 88 |
| * | Gigamon Inc. | 7,569 | 82 |
| * | MaxLinear Inc. | 8,716 | 81 |
| * | Nimble Storage Inc. | 2,898 | 78 |
| * | Wix.com Ltd. | 4,339 | 71 |
| * | Zix Corp. | 18,541 | 71 |
| American Software Inc. Class A | 7,708 | 71 | |
| * | Nanometrics Inc. | 4,134 | 69 |
| * | Marin Software Inc. | 8,242 | 69 |
| * | SYNNEX Corp. | 982 | 69 |
| * | Dot Hill Systems Corp. | 18,770 | 68 |
| * | Unwired Planet Inc. | 31,592 | 66 |
| * | Aeroflex Holding Corp. | 6,185 | 65 |
| * | Silicon Image Inc. | 12,598 | 64 |
| * | Xcerra Corp. | 6,083 | 64 |
| * | Vocera Communications Inc. | 7,066 | 62 |
| * | Barracuda Networks Inc. | 2,481 | 62 |
| * | Brightcove Inc. | 10,041 | 61 |
| Alliance Fiber Optic Products Inc. | 4,073 | 60 | |
| * | Carbonite Inc. | 5,539 | 59 |
| *,^ | QuickLogic Corp. | 16,237 | 55 |
| * | Vitesse Semiconductor Corp. | 16,443 | 55 |
| * | GTT Communications Inc. | 4,407 | 54 |
| Digimarc Corp. | 2,162 | 52 | |
| * | Benefitfocus Inc. | 1,530 | 51 |
| * | TrueCar Inc. | 2,433 | 50 |
| * | Bazaarvoice Inc. | 6,567 | 48 |
| * | Clearfield Inc. | 3,567 | 48 |
| * | KVH Industries Inc. | 3,840 | 48 |
| * | Take-Two Interactive Software Inc. | 2,012 | 47 |
| * | Guidance Software Inc. | 5,829 | 46 |
| * | NVE Corp. | 635 | 44 |
| * | Numerex Corp. Class A | 3,765 | 43 |
| * | A10 Networks Inc. | 3,633 | 42 |
| * | Q2 Holdings Inc. | 2,827 | 42 |
| * | Ultratech Inc. | 1,606 | 42 |
| * | Mavenir Systems Inc. | 3,620 | 41 |
| * | Travelzoo Inc. | 2,308 | 39 |
| * | Model N Inc. | 4,241 | 39 |
| * | Amber Road Inc. | 2,552 | 38 |
| *,^ | ParkerVision Inc. | 29,601 | 37 |
| * | Varonis Systems Inc. | 1,523 | 36 |
| * | Coherent Inc. | 561 | 36 |
| QAD Inc. Class A | 1,743 | 36 | |
| * | DTS Inc. | 1,479 | 35 |
| * | Quantum Corp. | 27,931 | 35 |
| * | OPOWER Inc. | 2,220 | 35 |
| * | Cyan Inc. | 8,602 | 32 |
| * | Everyday Health Inc. | 2,161 | 31 |
72
| Vanguard® Russell 2000 Growth Index Fund | |||
| Schedule of Investments | |||
| August 31, 2014 | |||
| Market | |||
| Value | |||
| Shares | ($000) | ||
| * | Park City Group Inc. | 2,986 | 31 |
| * | Ultra Clean Holdings Inc. | 2,912 | 28 |
| * | Bankrate Inc. | 1,972 | 28 |
| * | Harmonic Inc. | 4,062 | 27 |
| * | Borderfree Inc. | 1,708 | 24 |
| * | Rubicon Project Inc. | 2,262 | 22 |
| * | Five9 Inc. | 3,485 | 20 |
| * | Ixia | 2,072 | 20 |
| * | Vringo Inc. | 19,293 | 20 |
| *,^ | Revolution Lighting Technologies Inc. | 9,300 | 19 |
| * | Exar Corp. | 1,717 | 17 |
| American Science & Engineering Inc. | 294 | 17 | |
| Brooks Automation Inc. | 1,484 | 17 | |
| * | Turtle Beach Corp. | 2,196 | 16 |
| * | Rudolph Technologies Inc. | 1,340 | 13 |
| * | Aerohive Networks Inc. | 1,393 | 11 |
| * | Cinedigm Corp. Class A | 5,434 | 10 |
| * | Procera Networks Inc. | 905 | 9 |
| Epiq Systems Inc. | 570 | 8 | |
| * | Sapiens International Corp. NV | 856 | 7 |
| * | Rubicon Technology Inc. | 946 | 6 |
| * | Entropic Communications Inc. | 1,862 | 5 |
| * | ePlus Inc. | 68 | 4 |
| Reis Inc. | 154 | 4 | |
| Tessco Technologies Inc. | 105 | 3 | |
| * | Cascade Microtech Inc. | 254 | 3 |
| * | Viasystems Group Inc. | 80 | 1 |
| * | Covisint Corp. | 121 | 1 |
| 53,542 | |||
| Utilities (1.4%) | |||
| j2 Global Inc. | 14,902 | 797 | |
| Cogent Communications Holdings Inc. | 14,696 | 509 | |
| Pattern Energy Group Inc. Class A | 12,467 | 402 | |
| * | Gogo Inc. | 17,726 | 300 |
| Consolidated Communications Holdings Inc. | 7,901 | 193 | |
| West Corp. | 6,336 | 188 | |
| Shenandoah Telecommunications Co. | 6,424 | 177 | |
| * | inContact Inc. | 17,155 | 157 |
| * | General Communication Inc. Class A | 11,238 | 126 |
| Inteliquent Inc. | 10,151 | 124 | |
| * | FairPoint Communications Inc. | 5,107 | 83 |
| IDT Corp. Class B | 4,918 | 77 | |
| Enventis Corp. | 4,271 | 76 | |
| Lumos Networks Corp. | 4,978 | 73 | |
| * | 8x8 Inc. | 8,894 | 69 |
| * | magicJack VocalTec Ltd. | 5,184 | 65 |
| Ormat Technologies Inc. | 2,120 | 58 | |
| * | Cincinnati Bell Inc. | 15,437 | 57 |
| York Water Co. | 2,523 | 51 | |
| * | Intelsat SA | 2,207 | 39 |
| NTELOS Holdings Corp. | 2,333 | 31 | |
| * | Premiere Global Services Inc. | 2,235 | 29 |
| American States Water Co. | 837 | 27 | |
| SJW Corp. | 985 | 27 | |
| 3,735 | |||
| Total Common Stocks (Cost $245,402) | 270,623 | ||
73
| Vanguard® Russell 2000 Growth Index Fund | ||||
| Schedule of Investments | ||||
| August 31, 2014 | ||||
| Market | ||||
| Value | ||||
| Coupon | Shares | ($000) | ||
| Temporary Cash Investments (0.9%)1 | ||||
| Money Market Fund (0.9%) | ||||
| 3,4 Vanguard Market Liquidity Fund | 0.113% | 2,442,901 | 2,443 | |
| Face | ||||
| Maturity | Amount | |||
| Date | ($000) | |||
| U.S. Government and Agency Obligations (0.0%) | ||||
| 5,6 Federal Home Loan Bank Discount Notes | 0.070% | 9/5/14 | 100 | 100 |
| Total Temporary Cash Investments (Cost $2,543) | 2,543 | |||
| Total Investments (100.7%) (Cost $247,945) | 273,166 | |||
| Other Assets and Liabilities—Net (-0.7%)4 | (1,873) | |||
| Net Assets (100%) | 271,293 | |||
* Non-income-producing security.
^ Includes partial security positions on loan to broker-dealers. The total value of securities on loan is $2,246,000.
1 The fund invests a portion of its cash reserves in equity markets through the use of index futures contracts. After giving effect to futures investments, the fund's effective common stock and temporary cash investment positions represent 99.9% and 0.8%, respectively, of net assets.
2 “Other” represents securities that are not classified by the fund’s benchmark index.
3 Affiliated money market fund available only to Vanguard funds and certain trusts and accounts managed by Vanguard. Rate shown is the 7-day yield.
4 Includes $2,443,000 of collateral received for securities on loan.
5 The issuer operates under a congressional charter; its securities are generally neither guaranteed by the U.S. Treasury nor backed by the full faith and credit of the U.S. government.
6 Securities with a value of $100,000 have been segregated as initial margin for open futures contracts.
REIT—Real Estate Investment Trust.
74
This page intentionally left blank.
© 2014 The Vanguard Group, Inc.
All rights reserved.
Vanguard Marketing Corporation, Distributor.
SNA18510 102014
Report of Independent Registered Public Accounting Firm
To the Board of Trustees of Vanguard Scottsdale Funds and the Shareholders of Vanguard Russell 2000 Index Fund, Vanguard Russell 2000 Value Index Fund and Vanguard Russell 2000 Growth Index Fund:
In our opinion, the accompanying statements of net assets – investments summary and the related statements of operations and of changes in net assets and the financial highlights (included in Item 1 of this Form N-CSR) and the schedules of investments (included in Item 6 of this Form N-CSR) present fairly, in all material respects, the financial position of Vanguard Russell 2000 Index Fund, Vanguard Russell 2000 Value Index Fund and Vanguard Russell 2000 Growth Index Fund (the "Funds") at August 31, 2014, the results of each of their operations for the year then ended, the changes in each of their net assets for each of the two years in the period then ended, and the financial highlights for each of the periods indicated, in conformity with accounting principles generally accepted in the United States of America. These financial statements, financial highlights, and schedules of investments (hereafter referred to as "financial statements") are the responsibility of the Funds’ management. Our responsibility is to express an opinion on these financial statements based on our audits. We conducted our audits of these financial statements in accordance with the standards of the Public Company Accounting Oversight Board (United States). Those standards require that we plan and perform the audit to obtain reasonable assurance about whether the financial statements are free of material misstatement. An audit includes examining, on a test basis, evidence supporting the amounts and disclosures in the financial statements, assessing the accounting principles used and significant estimates made by management, and evaluating the overall financial statement presentation. We believe that our audits, which included confirmation of securities at August 31, 2014 by correspondence with the custodian and broker and by agreement to the underlying ownership records of the transfer agent, provide a reasonable basis for our opinion.

October 15, 2014
PricewaterhouseCoopers LLP, Two Commerce Square, 2001 Market Street, Suite 1700, Philadelphia, PA 19103-7042
T: (267) 330-3000, F: (267) 330-3300, www.pwc.com/us
| Vanguard® Russell 3000 Index Fund | ||
| Schedule of Investments | ||
| August 31, 2014 | ||
| Market | ||
| Value | ||
| Shares | ($000) | |
| Common Stocks (99.0%)1 | ||
| Consumer Discretionary (13.8%) | ||
| Walt Disney Co. | 55,605 | 4,998 |
| Comcast Corp. Class A | 83,170 | 4,552 |
| Home Depot Inc. | 43,912 | 4,106 |
| * Amazon.com Inc. | 12,063 | 4,090 |
| Wal-Mart Stores Inc. | 51,155 | 3,862 |
| McDonald's Corp. | 31,736 | 2,974 |
| * eBay Inc. | 40,692 | 2,258 |
| Time Warner Inc. | 28,322 | 2,182 |
| Ford Motor Co. | 124,688 | 2,171 |
| Twenty-First Century Fox Inc. Class A | 61,142 | 2,166 |
| * Priceline Group Inc. | 1,656 | 2,061 |
| Starbucks Corp. | 24,171 | 1,881 |
| General Motors Co. | 51,492 | 1,792 |
| NIKE Inc. Class B | 22,427 | 1,762 |
| Lowe's Cos. Inc. | 32,710 | 1,718 |
| Costco Wholesale Corp. | 14,124 | 1,710 |
| TJX Cos. Inc. | 22,486 | 1,340 |
| Time Warner Cable Inc. | 8,946 | 1,323 |
| * DIRECTV | 15,019 | 1,298 |
| Target Corp. | 20,347 | 1,222 |
| Viacom Inc. Class B | 13,801 | 1,120 |
| Johnson Controls Inc. | 21,325 | 1,041 |
| Yum! Brands Inc. | 14,172 | 1,027 |
| CBS Corp. Class B | 16,811 | 997 |
| * Netflix Inc. | 1,925 | 919 |
| * Tesla Motors Inc. | 3,052 | 823 |
| Las Vegas Sands Corp. | 12,074 | 803 |
| Macy's Inc. | 11,617 | 724 |
| VF Corp. | 11,078 | 710 |
| * Chipotle Mexican Grill Inc. Class A | 999 | 678 |
| * Dollar General Corp. | 9,953 | 637 |
| Omnicom Group Inc. | 8,299 | 598 |
| Estee Lauder Cos. Inc. Class A | 7,364 | 566 |
| * AutoZone Inc. | 1,048 | 565 |
| * O'Reilly Automotive Inc. | 3,406 | 531 |
| * Michael Kors Holdings Ltd. | 6,560 | 526 |
| Starwood Hotels & Resorts Worldwide Inc. | 6,165 | 521 |
| Ross Stores Inc. | 6,820 | 514 |
| Carnival Corp. | 13,465 | 510 |
| Wynn Resorts Ltd. | 2,603 | 502 |
| L Brands Inc. | 7,804 | 498 |
| Marriott International Inc. Class A | 7,113 | 494 |
| * Liberty Interactive Corp. Class A | 15,759 | 465 |
| BorgWarner Inc. | 7,341 | 457 |
| Harley-Davidson Inc. | 7,012 | 446 |
| * DISH Network Corp. Class A | 6,848 | 444 |
| Genuine Parts Co. | 4,933 | 433 |
| Nielsen NV | 9,049 | 425 |
| * Hertz Global Holdings Inc. | 14,375 | 425 |
| * Bed Bath & Beyond Inc. | 6,556 | 421 |
| * Charter Communications Inc. Class A | 2,552 | 400 |
| Kohl's Corp. | 6,707 | 394 |
| Gap Inc. | 8,519 | 393 |
| Whirlpool Corp. | 2,502 | 383 |
| * Under Armour Inc. Class A | 5,565 | 380 |
| Mattel Inc. | 10,915 | 376 |
| * CarMax Inc. | 7,099 | 372 |
| Tiffany & Co. | 3,634 | 367 |
| * Dollar Tree Inc. | 6,659 | 357 |
| * TripAdvisor Inc. | 3,590 | 356 |
| * TRW Automotive Holdings Corp. | 3,569 | 344 |
1
| Vanguard® Russell 3000 Index Fund | ||
| Schedule of Investments | ||
| August 31, 2014 | ||
| Market | ||
| Value | ||
| Shares | ($000) | |
| Royal Caribbean Cruises Ltd. | 5,355 | 341 |
| Wyndham Worldwide Corp. | 4,108 | 333 |
| Hanesbrands Inc. | 3,214 | 330 |
| Coach Inc. | 8,845 | 326 |
| * Discovery Communications Inc. Class A | 7,404 | 324 |
| * Sirius XM Holdings Inc. | 89,017 | 323 |
| Ralph Lauren Corp. Class A | 1,907 | 323 |
| Advance Auto Parts Inc. | 2,355 | 321 |
| * Discovery Communications Inc. | 7,409 | 318 |
| PVH Corp. | 2,657 | 310 |
| Nordstrom Inc. | 4,479 | 310 |
| Polaris Industries Inc. | 2,128 | 309 |
| Signet Jewelers Ltd. | 2,601 | 307 |
| Tractor Supply Co. | 4,481 | 300 |
| Newell Rubbermaid Inc. | 8,942 | 300 |
| * Liberty Media Corp. | 6,133 | 297 |
| H&R Block Inc. | 8,863 | 297 |
| Best Buy Co. Inc. | 9,287 | 296 |
| * MGM Resorts International | 12,049 | 295 |
| * Mohawk Industries Inc. | 1,987 | 290 |
| * News Corp. Class A | 16,095 | 284 |
| Expedia Inc. | 3,275 | 281 |
| * LKQ Corp. | 9,780 | 278 |
| Scripps Networks Interactive Inc. Class A | 3,421 | 273 |
| Interpublic Group of Cos. Inc. | 13,718 | 268 |
| Lear Corp. | 2,636 | 267 |
| Foot Locker Inc. | 4,638 | 260 |
| Harman International Industries Inc. | 2,209 | 254 |
| * Jarden Corp. | 4,191 | 251 |
| Gannett Co. Inc. | 7,358 | 248 |
| Family Dollar Stores Inc. | 3,107 | 248 |
| Staples Inc. | 21,008 | 245 |
| PulteGroup Inc. | 12,320 | 237 |
| PetSmart Inc. | 3,228 | 231 |
| Fortune Brands Home & Security Inc. | 5,302 | 229 |
| DR Horton Inc. | 10,478 | 227 |
| Lennar Corp. Class A | 5,789 | 227 |
| * Avis Budget Group Inc. | 3,353 | 226 |
| Garmin Ltd. | 3,882 | 211 |
| Goodyear Tire & Rubber Co. | 7,882 | 205 |
| * Toll Brothers Inc. | 5,725 | 204 |
| * Ulta Salon Cosmetics & Fragrance Inc. | 2,056 | 200 |
| Williams-Sonoma Inc. | 3,030 | 199 |
| Darden Restaurants Inc. | 4,193 | 198 |
| Avon Products Inc. | 13,958 | 196 |
| Hasbro Inc. | 3,704 | 195 |
| * WABCO Holdings Inc. | 1,826 | 188 |
| * Pandora Media Inc. | 6,628 | 179 |
| * NVR Inc. | 145 | 170 |
| * Visteon Corp. | 1,579 | 160 |
| Leggett & Platt Inc. | 4,532 | 159 |
| GameStop Corp. Class A | 3,630 | 153 |
| * Liberty Media Corp. Class A | 3,055 | 150 |
| Service Corp. International | 6,763 | 150 |
| * Fossil Group Inc. | 1,476 | 150 |
| Dunkin' Brands Group Inc. | 3,406 | 148 |
| * Sally Beauty Holdings Inc. | 5,214 | 145 |
| Carter's Inc. | 1,744 | 144 |
| Dick's Sporting Goods Inc. | 3,158 | 142 |
| * Urban Outfitters Inc. | 3,473 | 138 |
| Domino's Pizza Inc. | 1,807 | 136 |
| Gentex Corp. | 4,610 | 136 |
| International Game Technology | 7,953 | 134 |
| KAR Auction Services Inc. | 4,441 | 134 |
2
| Vanguard® Russell 3000 Index Fund | ||
| Schedule of Investments | ||
| August 31, 2014 | ||
| Market | ||
| Value | ||
| Shares | ($000) | |
| Lamar Advertising Co. Class A | 2,538 | 133 |
| * Madison Square Garden Co. Class A | 1,985 | 133 |
| Cinemark Holdings Inc. | 3,725 | 131 |
| * Kate Spade & Co. | 4,010 | 130 |
| CBS Outdoor Americas Inc. | 3,764 | 129 |
| Brunswick Corp. | 2,937 | 126 |
| * Tenneco Inc. | 1,967 | 126 |
| * AutoNation Inc. | 2,316 | 126 |
| * AMC Networks Inc. Class A | 1,949 | 122 |
| Tupperware Brands Corp. | 1,628 | 119 |
| Dana Holding Corp. | 5,132 | 119 |
| Cablevision Systems Corp. Class A | 6,335 | 117 |
| * Panera Bread Co. Class A | 774 | 116 |
| * Tempur Sealy International Inc. | 1,973 | 115 |
| * Hilton Worldwide Holdings Inc. | 4,435 | 112 |
| Burger King Worldwide Inc. | 3,384 | 108 |
| Graham Holdings Co. Class B | 146 | 105 |
| * Deckers Outdoor Corp. | 1,137 | 105 |
| * Bally Technologies Inc. | 1,299 | 103 |
| * Live Nation Entertainment Inc. | 4,645 | 102 |
| * HomeAway Inc. | 3,066 | 102 |
| Brinker International Inc. | 2,070 | 101 |
| * Norwegian Cruise Line Holdings Ltd. | 2,979 | 99 |
| * Cabela's Inc. | 1,591 | 97 |
| Dillard's Inc. Class A | 846 | 97 |
| Abercrombie & Fitch Co. | 2,301 | 96 |
| * Liberty Ventures Class A | 2,399 | 91 |
| * Starz | 2,913 | 91 |
| Vail Resorts Inc. | 1,128 | 90 |
| * Buffalo Wild Wings Inc. | 591 | 87 |
| American Eagle Outfitters Inc. | 6,187 | 87 |
| * Office Depot Inc. | 16,999 | 87 |
| Nu Skin Enterprises Inc. Class A | 1,930 | 86 |
| * Liberty TripAdvisor Holdings Inc. Class A | 2,399 | 86 |
| John Wiley & Sons Inc. Class A | 1,431 | 86 |
| Big Lots Inc. | 1,846 | 86 |
| DeVry Education Group Inc. | 1,985 | 85 |
| * Apollo Education Group Inc. | 3,064 | 85 |
| Wolverine World Wide Inc. | 3,180 | 84 |
| Six Flags Entertainment Corp. | 2,308 | 84 |
| Pool Corp. | 1,469 | 83 |
| Lions Gate Entertainment Corp. | 2,555 | 83 |
| * Murphy USA Inc. | 1,519 | 83 |
| CST Brands Inc. | 2,366 | 82 |
| * Restoration Hardware Holdings Inc. | 975 | 82 |
| * Time Inc. | 3,482 | 82 |
| Sotheby's | 2,001 | 82 |
| Thor Industries Inc. | 1,520 | 82 |
| Men's Wearhouse Inc. | 1,502 | 81 |
| * Hyatt Hotels Corp. Class A | 1,310 | 80 |
| Jack in the Box Inc. | 1,327 | 79 |
| DSW Inc. Class A | 2,516 | 78 |
| Chico's FAS Inc. | 4,848 | 77 |
| Wendy's Co. | 9,159 | 75 |
| * Skechers U.S.A. Inc. Class A | 1,241 | 72 |
| Cheesecake Factory Inc. | 1,599 | 72 |
| * Ascena Retail Group Inc. | 4,104 | 71 |
| * Five Below Inc. | 1,731 | 70 |
| * TRI Pointe Homes Inc. | 4,710 | 70 |
| * Asbury Automotive Group Inc. | 998 | 70 |
| Hillenbrand Inc. | 2,059 | 69 |
| * Houghton Mifflin Harcourt Co. | 3,495 | 67 |
| HSN Inc. | 1,097 | 67 |
| * Steven Madden Ltd. | 1,939 | 66 |
3
| Vanguard® Russell 3000 Index Fund | ||
| Schedule of Investments | ||
| August 31, 2014 | ||
| Market | ||
| Value | ||
| Shares | ($000) | |
| AMERCO | 237 | 66 |
| Penske Automotive Group Inc. | 1,360 | 65 |
| * JC Penney Co. Inc. | 5,960 | 64 |
| Group 1 Automotive Inc. | 797 | 64 |
| * ANN Inc. | 1,539 | 64 |
| Cracker Barrel Old Country Store Inc. | 635 | 64 |
| Cooper Tire & Rubber Co. | 2,059 | 64 |
| Sinclair Broadcast Group Inc. Class A | 2,180 | 63 |
| * Shutterfly Inc. | 1,236 | 63 |
| * Grand Canyon Education Inc. | 1,451 | 63 |
| Choice Hotels International Inc. | 1,158 | 63 |
| Lithia Motors Inc. Class A | 713 | 62 |
| * Genesco Inc. | 779 | 62 |
| Texas Roadhouse Inc. Class A | 2,299 | 61 |
| * Conversant Inc. | 2,189 | 60 |
| * Iconix Brand Group Inc. | 1,417 | 59 |
| * Life Time Fitness Inc. | 1,258 | 58 |
| New York Times Co. Class A | 4,674 | 58 |
| Regal Entertainment Group Class A | 2,714 | 57 |
| * Gentherm Inc. | 1,167 | 57 |
| * Marriott Vacations Worldwide Corp. | 952 | 57 |
| Ryland Group Inc. | 1,522 | 56 |
| PriceSmart Inc. | 620 | 56 |
| Meredith Corp. | 1,173 | 55 |
| * Helen of Troy Ltd. | 935 | 54 |
| Aaron's Inc. | 2,110 | 54 |
| * Vistaprint NV | 1,113 | 54 |
| * DreamWorks Animation SKG Inc. Class A | 2,458 | 54 |
| Monro Muffler Brake Inc. | 1,029 | 53 |
| * Meritage Homes Corp. | 1,288 | 53 |
| * G-III Apparel Group Ltd. | 636 | 53 |
| * Lumber Liquidators Holdings Inc. | 912 | 52 |
| * TiVo Inc. | 3,701 | 52 |
| Pier 1 Imports Inc. | 3,215 | 51 |
| * Express Inc. | 2,898 | 50 |
| KB Home | 2,814 | 50 |
| Rent-A-Center Inc. | 1,792 | 50 |
| * Pinnacle Entertainment Inc. | 1,975 | 49 |
| Finish Line Inc. Class A | 1,646 | 49 |
| Matthews International Corp. Class A | 1,019 | 47 |
| Buckle Inc. | 947 | 47 |
| DineEquity Inc. | 557 | 46 |
| Guess? Inc. | 1,957 | 46 |
| * Crocs Inc. | 2,948 | 46 |
| SeaWorld Entertainment Inc. | 2,184 | 45 |
| * Meritor Inc. | 3,315 | 45 |
| * Fiesta Restaurant Group Inc. | 919 | 45 |
| Nexstar Broadcasting Group Inc. Class A | 979 | 45 |
| Brown Shoe Co. Inc. | 1,470 | 44 |
| Churchill Downs Inc. | 465 | 44 |
| * Conn's Inc. | 960 | 43 |
| * Bloomin' Brands Inc. | 2,540 | 42 |
| * Belmond Ltd. Class A | 3,305 | 42 |
| * Bright Horizons Family Solutions Inc. | 1,032 | 42 |
| * American Axle & Manufacturing Holdings Inc. | 2,303 | 42 |
| * Outerwall Inc. | 705 | 42 |
| Coty Inc. Class A | 2,414 | 42 |
| * LifeLock Inc. | 2,799 | 42 |
| * Vitamin Shoppe Inc. | 1,026 | 40 |
| * Hibbett Sports Inc. | 870 | 40 |
| MDC Holdings Inc. | 1,359 | 39 |
| * Krispy Kreme Doughnuts Inc. | 2,278 | 39 |
| La-Z-Boy Inc. | 1,810 | 39 |
| * Dorman Products Inc. | 859 | 39 |
4
| Vanguard® Russell 3000 Index Fund | ||
| Schedule of Investments | ||
| August 31, 2014 | ||
| Market | ||
| Value | ||
| Shares | ($000) | |
| * Tumi Holdings Inc. | 1,707 | 38 |
| Aramark | 1,457 | 38 |
| Papa John's International Inc. | 937 | 37 |
| Bob Evans Farms Inc. | 848 | 37 |
| * Shutterstock Inc. | 520 | 37 |
| * Select Comfort Corp. | 1,626 | 36 |
| Children's Place Inc. | 676 | 36 |
| * Standard Pacific Corp. | 4,335 | 36 |
| * Burlington Stores Inc. | 1,006 | 36 |
| Drew Industries Inc. | 801 | 36 |
| * Sonic Corp. | 1,641 | 35 |
| Sonic Automotive Inc. Class A | 1,396 | 35 |
| * Barnes & Noble Inc. | 1,444 | 34 |
| Sturm Ruger & Co. Inc. | 682 | 34 |
| Columbia Sportswear Co. | 449 | 34 |
| * Constant Contact Inc. | 1,088 | 34 |
| * Sears Holdings Corp. | 931 | 32 |
| * Cooper-Standard Holding Inc. | 488 | 32 |
| MDC Partners Inc. Class A | 1,437 | 32 |
| Oxford Industries Inc. | 496 | 30 |
| * Mattress Firm Holding Corp. | 519 | 30 |
| * Multimedia Games Holding Co. Inc. | 1,065 | 30 |
| * Media General Inc. | 1,889 | 29 |
| * Carmike Cinemas Inc. | 848 | 29 |
| * Penn National Gaming Inc. | 2,506 | 28 |
| * Popeyes Louisiana Kitchen Inc. | 697 | 28 |
| Cato Corp. Class A | 803 | 28 |
| * Boyd Gaming Corp. | 2,569 | 27 |
| International Speedway Corp. Class A | 813 | 27 |
| Scholastic Corp. | 772 | 27 |
| * BJ's Restaurants Inc. | 721 | 27 |
| * Universal Electronics Inc. | 474 | 26 |
| National CineMedia Inc. | 1,760 | 26 |
| * Diamond Resorts International Inc. | 1,023 | 26 |
| * La Quinta Holdings Inc. | 1,282 | 25 |
| Interval Leisure Group Inc. | 1,149 | 25 |
| Movado Group Inc. | 659 | 25 |
| * Red Robin Gourmet Burgers Inc. | 414 | 22 |
| * Tuesday Morning Corp. | 1,250 | 22 |
| Standard Motor Products Inc. | 578 | 22 |
| * Caesars Entertainment Corp. | 1,606 | 22 |
| Regis Corp. | 1,392 | 21 |
| Capella Education Co. | 322 | 21 |
| * HealthStream Inc. | 790 | 21 |
| * Winnebago Industries Inc. | 821 | 20 |
| * K12 Inc. | 1,064 | 20 |
| * Tower International Inc. | 595 | 20 |
| * Zumiez Inc. | 615 | 20 |
| * Cavco Industries Inc. | 275 | 20 |
| * Move Inc. | 1,214 | 19 |
| * Strayer Education Inc. | 316 | 19 |
| * Lands' End Inc. | 538 | 19 |
| * Steiner Leisure Ltd. | 434 | 18 |
| * Taylor Morrison Home Corp. Class A | 927 | 18 |
| * Denny's Corp. | 2,682 | 18 |
| * American Woodmark Corp. | 467 | 18 |
| Ethan Allen Interiors Inc. | 725 | 18 |
| * Cumulus Media Inc. Class A | 3,952 | 18 |
| * Smith & Wesson Holding Corp. | 1,631 | 18 |
| Callaway Golf Co. | 2,298 | 18 |
| * FTD Cos. Inc. | 528 | 18 |
| * EW Scripps Co. Class A | 914 | 17 |
| * Pep Boys-Manny Moe & Jack | 1,554 | 17 |
| * Libbey Inc. | 612 | 17 |
5
| Vanguard® Russell 3000 Index Fund | ||
| Schedule of Investments | ||
| August 31, 2014 | ||
| Market | ||
| Value | ||
| Shares | ($000) | |
| Stage Stores Inc. | 957 | 17 |
| * M/I Homes Inc. | 705 | 16 |
| * Rentrak Corp. | 306 | 16 |
| * American Public Education Inc. | 514 | 16 |
| * William Lyon Homes Class A | 607 | 16 |
| Fred's Inc. Class A | 1,072 | 15 |
| New Media Investment Group Inc. | 871 | 15 |
| * Del Frisco's Restaurant Group Inc. | 683 | 15 |
| * Career Education Corp. | 2,736 | 15 |
| * Federal-Mogul Holdings Corp. | 868 | 15 |
| * Biglari Holdings Inc. | 41 | 15 |
| * Chegg Inc. | 2,131 | 15 |
| Inter Parfums Inc. | 478 | 15 |
| * Caesars Acquisition Co. Class A | 1,323 | 14 |
| * Scientific Games Corp. Class A | 1,419 | 14 |
| AMC Entertainment Holdings Inc. | 603 | 14 |
| Arctic Cat Inc. | 385 | 14 |
| * Hovnanian Enterprises Inc. Class A | 3,370 | 14 |
| * Beazer Homes USA Inc. | 734 | 14 |
| Nutrisystem Inc. | 835 | 14 |
| Haverty Furniture Cos. Inc. | 576 | 13 |
| * Motorcar Parts of America Inc. | 437 | 13 |
| * Stamps.com Inc. | 392 | 13 |
| Superior Industries International Inc. | 678 | 13 |
| Viad Corp. | 593 | 13 |
| * Vera Bradley Inc. | 631 | 13 |
| * Journal Communications Inc. Class A | 1,288 | 13 |
| * zulily Inc. Class A | 387 | 13 |
| * Orbitz Worldwide Inc. | 1,525 | 13 |
| * Chuy's Holdings Inc. | 474 | 12 |
| * MarineMax Inc. | 718 | 12 |
| World Wrestling Entertainment Inc. Class A | 841 | 12 |
| * Vince Holding Corp. | 334 | 12 |
| * LeapFrog Enterprises Inc. | 1,864 | 12 |
| * Gray Television Inc. | 1,200 | 12 |
| * Eastman Kodak Co. | 511 | 12 |
| Ruth's Hospitality Group Inc. | 1,045 | 12 |
| ClubCorp Holdings Inc. | 605 | 11 |
| * Revlon Inc. Class A | 330 | 11 |
| * Carrols Restaurant Group Inc. | 1,535 | 11 |
| * Central Garden and Pet Co. Class A | 1,225 | 11 |
| * RealD Inc. | 1,182 | 11 |
| * Ruby Tuesday Inc. | 1,782 | 11 |
| * Nautilus Inc. | 907 | 11 |
| * LGI Homes Inc. | 551 | 11 |
| Marchex Inc. Class B | 1,226 | 11 |
| * Citi Trends Inc. | 452 | 11 |
| * Stoneridge Inc. | 832 | 10 |
| * Blue Nile Inc. | 361 | 10 |
| * Christopher & Banks Corp. | 1,062 | 10 |
| * SFX Entertainment Inc. | 1,430 | 10 |
| Stein Mart Inc. | 808 | 10 |
| * WCI Communities Inc. | 502 | 10 |
| * America's Car-Mart Inc. | 235 | 10 |
| Marcus Corp. | 541 | 10 |
| Shoe Carnival Inc. | 438 | 9 |
| * Eros International plc | 567 | 9 |
| National Presto Industries Inc. | 140 | 9 |
| * XO Group Inc. | 781 | 9 |
| Remy International Inc. | 409 | 9 |
| * 2U Inc. | 478 | 9 |
| Harte-Hanks Inc. | 1,255 | 9 |
| Clear Channel Outdoor Holdings Inc. Class A | 1,238 | 9 |
| Carriage Services Inc. Class A | 459 | 9 |
6
| Vanguard® Russell 3000 Index Fund | ||
| Schedule of Investments | ||
| August 31, 2014 | ||
| Market | ||
| Value | ||
| Shares | ($000) | |
| * Rosetta Stone Inc. | 974 | 9 |
| * Bravo Brio Restaurant Group Inc. | 572 | 8 |
| Strattec Security Corp. | 102 | 8 |
| * McClatchy Co. Class A | 1,776 | 8 |
| * Noodles & Co. Class A | 393 | 8 |
| Destination Maternity Corp. | 394 | 8 |
| Entravision Communications Corp. Class A | 1,608 | 7 |
| * Tile Shop Holdings Inc. | 627 | 7 |
| * Kirkland's Inc. | 406 | 7 |
| * Perry Ellis International Inc. | 360 | 7 |
| * Jamba Inc. | 488 | 7 |
| Universal Technical Institute Inc. | 626 | 7 |
| * Zoe's Kitchen Inc. | 239 | 7 |
| * Sequential Brands Group Inc. | 488 | 7 |
| * Potbelly Corp. | 537 | 7 |
| * Entercom Communications Corp. Class A | 698 | 6 |
| AH Belo Corp. Class A | 552 | 6 |
| Speedway Motorsports Inc. | 339 | 6 |
| * Container Store Group Inc. | 296 | 6 |
| CSS Industries Inc. | 247 | 6 |
| * Sizmek Inc. | 709 | 6 |
| * Lee Enterprises Inc. | 1,531 | 6 |
| * Morgans Hotel Group Co. | 818 | 6 |
| * Destination XL Group Inc. | 1,236 | 6 |
| * Intrawest Resorts Holdings Inc. | 516 | 6 |
| * Overstock.com Inc. | 327 | 6 |
| * Dex Media Inc. | 503 | 6 |
| * Black Diamond Inc. | 663 | 6 |
| RG Barry Corp. | 291 | 6 |
| * Bridgepoint Education Inc. | 436 | 6 |
| * West Marine Inc. | 498 | 5 |
| * VOXX International Corp. Class A | 546 | 5 |
| Saga Communications Inc. Class A | 142 | 5 |
| * ValueVision Media Inc. Class A | 1,147 | 5 |
| * Daily Journal Corp. | 28 | 5 |
| Lifetime Brands Inc. | 299 | 5 |
| Weyco Group Inc. | 190 | 5 |
| * Isle of Capri Casinos Inc. | 619 | 5 |
| * Franklin Covey Co. | 268 | 5 |
| Flexsteel Industries Inc. | 144 | 5 |
| * Malibu Boats Inc. Class A | 240 | 5 |
| Big 5 Sporting Goods Corp. | 488 | 5 |
| * Cenveo Inc. | 1,574 | 5 |
| Winmark Corp. | 66 | 5 |
| * Build-A-Bear Workshop Inc. | 357 | 5 |
| * Systemax Inc. | 318 | 5 |
| * Liberty Tax Inc. | 134 | 5 |
| * Nathan's Famous Inc. | 80 | 4 |
| * Reading International Inc. Class A | 510 | 4 |
| * Skullcandy Inc. | 527 | 4 |
| * Fox Factory Holding Corp. | 286 | 4 |
| * Speed Commerce Inc. | 1,313 | 4 |
| Bon-Ton Stores Inc. | 395 | 4 |
| * Fuel Systems Solutions Inc. | 410 | 4 |
| Escalade Inc. | 287 | 4 |
| Collectors Universe Inc. | 200 | 4 |
| * 1-800-Flowers.com Inc. Class A | 755 | 4 |
| Johnson Outdoors Inc. Class A | 145 | 4 |
| * Famous Dave's of America Inc. | 136 | 4 |
| * Norcraft Cos. Inc. | 215 | 4 |
| * Crown Media Holdings Inc. Class A | 1,017 | 4 |
| * New Home Co. Inc. | 245 | 4 |
| * Gaiam Inc. Class A | 437 | 3 |
| * Monarch Casino & Resort Inc. | 251 | 3 |
7
| Vanguard® Russell 3000 Index Fund | ||
| Schedule of Investments | ||
| August 31, 2014 | ||
| Market | ||
| Value | ||
| Shares | ($000) | |
| * Martha Stewart Living Omnimedia Inc. Class A | 710 | 3 |
| * Hemisphere Media Group Inc. | 253 | 3 |
| * New York & Co. Inc. | 843 | 3 |
| * Pacific Sunwear of California Inc. | 1,340 | 3 |
| Einstein Noah Restaurant Group Inc. | 185 | 3 |
| Marine Products Corp. | 309 | 3 |
| * Tilly's Inc. Class A | 289 | 2 |
| Salem Communications Corp. Class A | 274 | 2 |
| * hhgregg Inc. | 311 | 2 |
| * Radio One Inc. | 668 | 2 |
| * Empire Resorts Inc. | 437 | 2 |
| * Care.com Inc. | 192 | 2 |
| * Sportsman's Warehouse Holdings Inc. | 281 | 2 |
| * Papa Murphy's Holdings Inc. | 170 | 2 |
| * Quiksilver Inc. | 472 | 1 |
| Weight Watchers International Inc. | 55 | 1 |
| * Francesca's Holdings Corp. | 67 | 1 |
| * Biglari Holdings Inc Rights Exp. 09/12/2014 | 40 | 1 |
| * Elizabeth Arden Inc. | 37 | 1 |
| * Aeropostale Inc. | 134 | 1 |
| * Angie's List Inc. | 64 | 1 |
| * Coupons.com Inc. | 27 | — |
| * Sears Hometown and Outlet Stores Inc. | 20 | — |
| * ITT Educational Services Inc. | 38 | — |
| * Central European Media Enterprises Ltd. Class A | 118 | — |
| * QuinStreet Inc. | 54 | — |
| * JAKKS Pacific Inc. | 31 | — |
| bebe stores inc | 51 | — |
| * ReachLocal Inc. | 21 | — |
| * Ignite Restaurant Group Inc. | 11 | — |
| * Education Management Corp. | 39 | — |
| 99,695 | ||
| Consumer Staples (7.2%) | ||
| Procter & Gamble Co. | 86,882 | 7,221 |
| Coca-Cola Co. | 127,485 | 5,319 |
| PepsiCo Inc. | 48,678 | 4,502 |
| Philip Morris International Inc. | 50,501 | 4,322 |
| CVS Caremark Corp. | 37,054 | 2,944 |
| Altria Group Inc. | 63,780 | 2,748 |
| Mondelez International Inc. Class A | 54,310 | 1,965 |
| Colgate-Palmolive Co. | 29,391 | 1,902 |
| Walgreen Co. | 30,642 | 1,854 |
| Kimberly-Clark Corp. | 12,098 | 1,306 |
| Kraft Foods Group Inc. | 19,114 | 1,126 |
| General Mills Inc. | 19,730 | 1,053 |
| Archer-Daniels-Midland Co. | 21,014 | 1,048 |
| Kroger Co. | 16,361 | 834 |
| Sysco Corp. | 18,770 | 710 |
| Lorillard Inc. | 11,641 | 695 |
| Mead Johnson Nutrition Co. | 6,489 | 620 |
| Keurig Green Mountain Inc. | 4,541 | 605 |
| Reynolds American Inc. | 9,913 | 580 |
| Kellogg Co. | 8,246 | 536 |
| Whole Foods Market Inc. | 11,802 | 462 |
| Brown-Forman Corp. Class B | 4,940 | 458 |
| * Constellation Brands Inc. Class A | 5,152 | 449 |
| Hershey Co. | 4,801 | 439 |
| ConAgra Foods Inc. | 13,525 | 435 |
| * Monster Beverage Corp. | 4,603 | 407 |
| Bunge Ltd. | 4,735 | 401 |
| Dr Pepper Snapple Group Inc. | 6,318 | 397 |
| Coca-Cola Enterprises Inc. | 8,089 | 386 |
| Clorox Co. | 4,141 | 367 |
| JM Smucker Co. | 3,343 | 343 |
8
| Vanguard® Russell 3000 Index Fund | ||
| Schedule of Investments | ||
| August 31, 2014 | ||
| Market | ||
| Value | ||
| Shares | ($000) | |
| Tyson Foods Inc. Class A | 8,659 | 329 |
| Molson Coors Brewing Co. Class B | 4,386 | 324 |
| Church & Dwight Co. Inc. | 4,394 | 300 |
| McCormick & Co. Inc. | 4,220 | 294 |
| Safeway Inc. | 7,467 | 260 |
| Campbell Soup Co. | 5,638 | 253 |
| Energizer Holdings Inc. | 2,005 | 244 |
| Hormel Foods Corp. | 4,300 | 218 |
| * WhiteWave Foods Co. Class A | 5,597 | 196 |
| * Rite Aid Corp. | 30,977 | 193 |
| Ingredion Inc. | 2,360 | 188 |
| * Hain Celestial Group Inc. | 1,592 | 157 |
| Herbalife Ltd. | 2,583 | 132 |
| GNC Holdings Inc. Class A | 3,008 | 114 |
| * TreeHouse Foods Inc. | 1,370 | 113 |
| Flowers Foods Inc. | 5,611 | 110 |
| * United Natural Foods Inc. | 1,636 | 105 |
| * Sprouts Farmers Market Inc. | 3,222 | 100 |
| Casey's General Stores Inc. | 1,209 | 87 |
| Sanderson Farms Inc. | 735 | 69 |
| Andersons Inc. | 928 | 64 |
| * SUPERVALU Inc. | 6,568 | 63 |
| Spectrum Brands Holdings Inc. | 700 | 61 |
| * Boston Beer Co. Inc. Class A | 268 | 59 |
| * Pilgrim's Pride Corp. | 1,964 | 59 |
| Pinnacle Foods Inc. | 1,773 | 57 |
| Lancaster Colony Corp. | 604 | 53 |
| B&G Foods Inc. | 1,755 | 53 |
| * Post Holdings Inc. | 1,417 | 52 |
| Vector Group Ltd. | 2,139 | 51 |
| Dean Foods Co. | 3,138 | 51 |
| J&J Snack Foods Corp. | 507 | 48 |
| * Fresh Market Inc. | 1,393 | 46 |
| Snyder's-Lance Inc. | 1,625 | 44 |
| Universal Corp. | 792 | 42 |
| Cal-Maine Foods Inc. | 515 | 41 |
| Core-Mark Holding Co. Inc. | 793 | 38 |
| Fresh Del Monte Produce Inc. | 1,106 | 35 |
| * Seaboard Corp. | 11 | 32 |
| WD-40 Co. | 446 | 31 |
| * Boulder Brands Inc. | 2,181 | 29 |
| SpartanNash Co. | 1,338 | 29 |
| Calavo Growers Inc. | 515 | 20 |
| * Chiquita Brands International Inc. | 1,360 | 19 |
| * Annie's Inc. | 583 | 19 |
| * Diamond Foods Inc. | 649 | 18 |
| Tootsie Roll Industries Inc. | 589 | 17 |
| * Pantry Inc. | 686 | 14 |
| Weis Markets Inc. | 320 | 14 |
| * Medifast Inc. | 384 | 13 |
| * USANA Health Sciences Inc. | 174 | 13 |
| Coca-Cola Bottling Co. Consolidated | 135 | 10 |
| * Chefs' Warehouse Inc. | 483 | 9 |
| * Omega Protein Corp. | 581 | 9 |
| Ingles Markets Inc. Class A | 346 | 9 |
| PetMed Express Inc. | 588 | 8 |
| John B Sanfilippo & Son Inc. | 240 | 7 |
| * Seneca Foods Corp. Class A | 238 | 7 |
| Limoneira Co. | 290 | 7 |
| * National Beverage Corp. | 331 | 6 |
| * Nutraceutical International Corp. | 250 | 6 |
| * Alliance One International Inc. | 2,564 | 6 |
| Nature's Sunshine Products Inc. | 318 | 5 |
| * Natural Grocers by Vitamin Cottage Inc. | 278 | 5 |
9
| Vanguard® Russell 3000 Index Fund | ||
| Schedule of Investments | ||
| August 31, 2014 | ||
| Market | ||
| Value | ||
| Shares | ($000) | |
| * Inventure Foods Inc. | 411 | 5 |
| Orchids Paper Products Co. | 172 | 5 |
| Village Super Market Inc. Class A | 184 | 4 |
| * Craft Brew Alliance Inc. | 307 | 4 |
| * Farmer Bros Co. | 172 | 4 |
| * 22nd Century Group Inc. | 1,188 | 4 |
| Alico Inc. | 85 | 3 |
| * PhotoMedex Inc. | 388 | 3 |
| * Synutra International Inc. | 506 | 3 |
| Liberator Medical Holdings Inc. | 913 | 3 |
| * Lifeway Foods Inc. | 137 | 2 |
| Roundy's Inc. | 64 | — |
| Female Health Co. | 35 | — |
| * Fairway Group Holdings Corp. | 27 | — |
| 51,539 | ||
| Energy (9.4%) | ||
| Exxon Mobil Corp. | 137,882 | 13,714 |
| Chevron Corp. | 61,122 | 7,912 |
| Schlumberger Ltd. | 41,758 | 4,578 |
| ConocoPhillips | 39,419 | 3,202 |
| Occidental Petroleum Corp. | 25,224 | 2,616 |
| EOG Resources Inc. | 17,548 | 1,928 |
| Halliburton Co. | 27,116 | 1,833 |
| Anadarko Petroleum Corp. | 16,216 | 1,827 |
| Phillips 66 | 18,169 | 1,581 |
| Williams Cos. Inc. | 23,984 | 1,426 |
| Apache Corp. | 12,385 | 1,261 |
| National Oilwell Varco Inc. | 13,776 | 1,191 |
| Devon Energy Corp. | 13,097 | 988 |
| Baker Hughes Inc. | 13,999 | 968 |
| Pioneer Natural Resources Co. | 4,594 | 959 |
| Valero Energy Corp. | 17,134 | 928 |
| Marathon Oil Corp. | 21,708 | 905 |
| Hess Corp. | 8,923 | 902 |
| Spectra Energy Corp. | 21,534 | 897 |
| Kinder Morgan Inc. | 21,091 | 849 |
| Noble Energy Inc. | 11,583 | 836 |
| Marathon Petroleum Corp. | 8,074 | 735 |
| * Cheniere Energy Inc. | 7,639 | 613 |
| * Concho Resources Inc. | 3,619 | 514 |
| * Cameron International Corp. | 6,556 | 487 |
| EQT Corp. | 4,873 | 483 |
| ONEOK Inc. | 6,675 | 469 |
| * FMC Technologies Inc. | 7,552 | 467 |
| * Southwestern Energy Co. | 11,337 | 467 |
| Chesapeake Energy Corp. | 16,911 | 460 |
| Cabot Oil & Gas Corp. | 13,399 | 449 |
| Seadrill Ltd. | 11,345 | 423 |
| Range Resources Corp. | 5,268 | 414 |
| Cimarex Energy Co. | 2,801 | 407 |
| Murphy Oil Corp. | 5,783 | 361 |
| * Whiting Petroleum Corp. | 3,837 | 356 |
| Helmerich & Payne Inc. | 3,120 | 328 |
| HollyFrontier Corp. | 6,411 | 321 |
| CONSOL Energy Inc. | 7,434 | 299 |
| Tesoro Corp. | 4,189 | 271 |
| Nabors Industries Ltd. | 9,653 | 263 |
| Oceaneering International Inc. | 3,511 | 244 |
| * Continental Resources Inc. | 1,370 | 221 |
| QEP Resources Inc. | 5,765 | 205 |
| * Newfield Exploration Co. | 4,395 | 197 |
| Denbury Resources Inc. | 11,324 | 195 |
| SM Energy Co. | 2,163 | 193 |
| Superior Energy Services Inc. | 5,018 | 180 |
10
| Vanguard® Russell 3000 Index Fund | |||
| Schedule of Investments | |||
| August 31, 2014 | |||
| Market | |||
| Value | |||
| Shares | ($000) | ||
| * | Cobalt International Energy Inc. | 11,324 | 174 |
| Targa Resources Corp. | 1,226 | 171 | |
| * | WPX Energy Inc. | 6,402 | 170 |
| * | Dresser-Rand Group Inc. | 2,425 | 168 |
| * | Oasis Petroleum Inc. | 3,285 | 162 |
| Patterson-UTI Energy Inc. | 4,638 | 160 | |
| * | First Solar Inc. | 2,290 | 160 |
| * | Gulfport Energy Corp. | 2,707 | 158 |
| * | Kodiak Oil & Gas Corp. | 8,518 | 139 |
| * | Dril-Quip Inc. | 1,303 | 132 |
| * | Ultra Petroleum Corp. | 4,974 | 132 |
| Rowan Cos. plc Class A | 4,031 | 122 | |
| SemGroup Corp. Class A | 1,380 | 121 | |
| * | Diamondback Energy Inc. | 1,363 | 118 |
| * | NOW Inc. | 3,496 | 115 |
| * | Unit Corp. | 1,615 | 106 |
| Golar LNG Ltd. | 1,657 | 104 | |
| * | Rosetta Resources Inc. | 2,020 | 101 |
| * | Antero Resources Corp. | 1,741 | 101 |
| * | Atwood Oceanics Inc. | 2,026 | 100 |
| * | Oil States International Inc. | 1,547 | 100 |
| World Fuel Services Corp. | 2,249 | 100 | |
| * | SolarCity Corp. | 1,392 | 96 |
| Diamond Offshore Drilling Inc. | 2,144 | 94 | |
| * | Helix Energy Solutions Group Inc. | 3,324 | 91 |
| * | Carrizo Oil & Gas Inc. | 1,421 | 89 |
| Exterran Holdings Inc. | 1,821 | 85 | |
| *,^ | SandRidge Energy Inc. | 15,423 | 81 |
| Western Refining Inc. | 1,720 | 80 | |
| * | GT Advanced Technologies Inc. | 4,307 | 77 |
| Civeo Corp. | 2,974 | 76 | |
| * | Athlon Energy Inc. | 1,604 | 75 |
| * | PDC Energy Inc. | 1,151 | 69 |
| Delek US Holdings Inc. | 1,922 | 67 | |
| CARBO Ceramics Inc. | 620 | 67 | |
| * | Bonanza Creek Energy Inc. | 1,073 | 66 |
| * | Matador Resources Co. | 2,389 | 65 |
| * | Forum Energy Technologies Inc. | 1,898 | 65 |
| PBF Energy Inc. Class A | 2,222 | 63 | |
| * | Stone Energy Corp. | 1,774 | 62 |
| * | SunPower Corp. Class A | 1,539 | 59 |
| * | Laredo Petroleum Inc. | 2,459 | 58 |
| * | McDermott International Inc. | 7,706 | 55 |
| Green Plains Inc. | 1,238 | 55 | |
| * | SunCoke Energy Inc. | 2,301 | 55 |
| * | SEACOR Holdings Inc. | 664 | 54 |
| * | Sanchez Energy Corp. | 1,563 | 52 |
| * | Hornbeck Offshore Services Inc. | 1,186 | 52 |
| * | Flotek Industries Inc. | 1,805 | 50 |
| * | Rice Energy Inc. | 1,689 | 49 |
| * | Halcon Resources Corp. | 8,863 | 49 |
| Energy XXI Bermuda Ltd. | 2,932 | 48 | |
| RPC Inc. | 2,114 | 48 | |
| * | Magnum Hunter Resources Corp. | 6,779 | 47 |
| * | C&J Energy Services Inc. | 1,500 | 43 |
| Comstock Resources Inc. | 1,660 | 40 | |
| * | Bill Barrett Corp. | 1,661 | 38 |
| * | Parsley Energy Inc. Class A | 1,705 | 37 |
| * | Newpark Resources Inc. | 2,961 | 37 |
| * | Kosmos Energy Ltd. | 3,559 | 36 |
| * | Pioneer Energy Services Corp. | 2,224 | 34 |
| * | Northern Oil and Gas Inc. | 1,867 | 31 |
| * | Penn Virginia Corp. | 2,000 | 30 |
| * | Triangle Petroleum Corp. | 2,504 | 30 |
11
| Vanguard® Russell 3000 Index Fund | ||
| Schedule of Investments | ||
| August 31, 2014 | ||
| Market | ||
| Value | ||
| Shares | ($000) | |
| * Key Energy Services Inc. | 4,470 | 28 |
| * Cloud Peak Energy Inc. | 1,777 | 28 |
| * TETRA Technologies Inc. | 2,288 | 27 |
| * Rex Energy Corp. | 1,753 | 27 |
| * Basic Energy Services Inc. | 1,106 | 27 |
| * Synergy Resources Corp. | 1,969 | 26 |
| * Goodrich Petroleum Corp. | 1,171 | 26 |
| * Seventy Seven Energy Inc. | 1,087 | 26 |
| Tesco Corp. | 1,170 | 25 |
| * REX American Resources Corp. | 225 | 24 |
| * Approach Resources Inc. | 1,302 | 23 |
| * Contango Oil & Gas Co. | 580 | 23 |
| CVR Energy Inc. | 458 | 23 |
| North Atlantic Drilling Ltd. | 2,047 | 22 |
| * Resolute Energy Corp. | 2,724 | 22 |
| * Parker Drilling Co. | 3,481 | 22 |
| * Matrix Service Co. | 761 | 21 |
| * FuelCell Energy Inc. | 8,325 | 21 |
| * Abraxas Petroleum Corp. | 3,575 | 21 |
| * Solazyme Inc. | 2,246 | 21 |
| * Clayton Williams Energy Inc. | 172 | 20 |
| Frank's International NV | 1,009 | 20 |
| * Westmoreland Coal Co. | 480 | 20 |
| * Clean Energy Fuels Corp. | 1,992 | 20 |
| Peabody Energy Corp. | 1,243 | 20 |
| * EP Energy Corp. Class A | 1,009 | 20 |
| * RSP Permian Inc. | 660 | 19 |
| * RigNet Inc. | 345 | 16 |
| * VAALCO Energy Inc. | 1,700 | 16 |
| W&T Offshore Inc. | 1,014 | 15 |
| * EnerNOC Inc. | 767 | 15 |
| * Era Group Inc. | 587 | 15 |
| * Swift Energy Co. | 1,266 | 14 |
| * Emerald Oil Inc. | 1,656 | 14 |
| * Renewable Energy Group Inc. | 1,143 | 14 |
| * Pacific Ethanol Inc. | 587 | 14 |
| * Warren Resources Inc. | 2,098 | 14 |
| * Willbros Group Inc. | 1,168 | 13 |
| * Gastar Exploration Inc. | 1,623 | 13 |
| * Callon Petroleum Co. | 1,167 | 13 |
| Panhandle Oil and Gas Inc. Class A | 203 | 12 |
| Alon USA Energy Inc. | 678 | 11 |
| * Capstone Turbine Corp. | 8,901 | 11 |
| * PetroQuest Energy Inc. | 1,669 | 11 |
| * Natural Gas Services Group Inc. | 361 | 11 |
| * Vantage Drilling Co. | 5,871 | 10 |
| * Ring Energy Inc. | 538 | 9 |
| Gulf Island Fabrication Inc. | 421 | 9 |
| * BPZ Resources Inc. | 3,445 | 8 |
| * Trecora Resources | 582 | 8 |
| * TransAtlantic Petroleum Ltd. | 656 | 7 |
| * PowerSecure International Inc. | 633 | 7 |
| * Midstates Petroleum Co. Inc. | 967 | 7 |
| * Enphase Energy Inc. | 464 | 7 |
| * Jones Energy Inc. | 325 | 6 |
| * Harvest Natural Resources Inc. | 1,221 | 6 |
| * FX Energy Inc. | 1,559 | 5 |
| Dawson Geophysical Co. | 235 | 5 |
| Evolution Petroleum Corp. | 494 | 5 |
| * Mitcham Industries Inc. | 375 | 5 |
| * Ameresco Inc. Class A | 572 | 5 |
| * Miller Energy Resources Inc. | 897 | 5 |
| * American Eagle Energy Corp. | 880 | 5 |
| Adams Resources & Energy Inc. | 62 | 4 |
12
| Vanguard® Russell 3000 Index Fund | ||
| Schedule of Investments | ||
| August 31, 2014 | ||
| Market | ||
| Value | ||
| Shares | ($000) | |
| * Isramco Inc. | 28 | 4 |
| Hallador Energy Co. | 254 | 3 |
| * Amyris Inc. | 603 | 3 |
| * Glori Energy Inc. | 354 | 2 |
| * Profire Energy Inc. | 386 | 2 |
| * Alpha Natural Resources Inc. | 377 | 1 |
| EXCO Resources Inc. | 254 | 1 |
| * Geospace Technologies Corp. | 28 | 1 |
| Arch Coal Inc. | 350 | 1 |
| * Apco Oil and Gas International Inc. | 67 | 1 |
| * Hercules Offshore Inc. | 266 | 1 |
| * ION Geophysical Corp. | 209 | 1 |
| Walter Energy Inc. | 108 | 1 |
| * Nuverra Environmental Solutions Inc. | 27 | — |
| * Forest Oil Corp. | 198 | — |
| * Quicksilver Resources Inc. | 213 | — |
| 67,701 | ||
| Financial Services (18.6%) | ||
| * Berkshire Hathaway Inc. Class B | 58,764 | 8,065 |
| Wells Fargo & Co. | 153,333 | 7,887 |
| JPMorgan Chase & Co. | 121,518 | 7,224 |
| Bank of America Corp. | 333,251 | 5,362 |
| Citigroup Inc. | 97,536 | 5,038 |
| Visa Inc. Class A | 15,891 | 3,377 |
| American Express Co. | 29,127 | 2,608 |
| American International Group Inc. | 46,449 | 2,604 |
| Goldman Sachs Group Inc. | 14,358 | 2,572 |
| MasterCard Inc. Class A | 31,860 | 2,415 |
| US Bancorp | 55,156 | 2,332 |
| Simon Property Group Inc. | 9,975 | 1,696 |
| Morgan Stanley | 49,247 | 1,690 |
| MetLife Inc. | 30,042 | 1,645 |
| Capital One Financial Corp. | 18,352 | 1,506 |
| PNC Financial Services Group Inc. | 17,151 | 1,454 |
| Bank of New York Mellon Corp. | 36,615 | 1,435 |
| BlackRock Inc. | 4,094 | 1,353 |
| Prudential Financial Inc. | 14,771 | 1,325 |
| American Tower Corporation | 12,707 | 1,253 |
| ACE Ltd. | 10,844 | 1,153 |
| Travelers Cos. Inc. | 11,157 | 1,057 |
| Charles Schwab Corp. | 36,094 | 1,029 |
| State Street Corp. | 13,820 | 995 |
| Marsh & McLennan Cos. Inc. | 17,647 | 937 |
| Discover Financial Services | 14,971 | 934 |
| Aflac Inc. | 14,582 | 893 |
| BB&T Corp. | 23,069 | 861 |
| Allstate Corp. | 13,935 | 857 |
| Crown Castle International Corp. | 10,718 | 852 |
| Aon plc | 9,527 | 830 |
| Public Storage | 4,612 | 808 |
| CME Group Inc. | 10,237 | 784 |
| Equity Residential | 11,597 | 771 |
| Ameriprise Financial Inc. | 6,097 | 767 |
| Chubb Corp. | 7,850 | 722 |
| Franklin Resources Inc. | 12,739 | 720 |
| McGraw Hill Financial Inc. | 8,740 | 709 |
| Intercontinental Exchange Inc. | 3,698 | 699 |
| T. Rowe Price Group Inc. | 8,436 | 683 |
| Health Care REIT Inc. | 9,863 | 667 |
| Prologis Inc. | 16,044 | 657 |
| SunTrust Banks Inc. | 17,109 | 652 |
| AvalonBay Communities Inc. | 4,162 | 641 |
| HCP Inc. | 14,712 | 637 |
| Vornado Realty Trust | 6,018 | 637 |
13
| Vanguard® Russell 3000 Index Fund | ||
| Schedule of Investments | ||
| August 31, 2014 | ||
| Market | ||
| Value | ||
| Shares | ($000) | |
| Ventas Inc. | 9,451 | 622 |
| Boston Properties Inc. | 4,915 | 597 |
| Weyerhaeuser Co. | 16,895 | 574 |
| Moody's Corp. | 6,071 | 568 |
| Invesco Ltd. | 13,892 | 567 |
| Fifth Third Bancorp | 27,308 | 557 |
| Host Hotels & Resorts Inc. | 24,304 | 555 |
| Hartford Financial Services Group Inc. | 14,439 | 535 |
| Northern Trust Corp. | 7,594 | 527 |
| Fidelity National Information Services Inc. | 9,241 | 524 |
| M&T Bank Corp. | 4,223 | 522 |
| * Fiserv Inc. | 8,003 | 516 |
| Principal Financial Group Inc. | 9,448 | 513 |
| Progressive Corp. | 19,009 | 476 |
| Lincoln National Corp. | 8,469 | 466 |
| * Alliance Data Systems Corp. | 1,741 | 461 |
| Loews Corp. | 10,457 | 457 |
| Regions Financial Corp. | 44,276 | 449 |
| General Growth Properties Inc. | 18,205 | 447 |
| Thomson Reuters Corp. | 11,414 | 433 |
| Essex Property Trust Inc. | 2,012 | 389 |
| KeyCorp | 28,420 | 387 |
| American Realty Capital Properties Inc. | 29,211 | 384 |
| * FleetCor Technologies Inc. | 2,668 | 383 |
| * Affiliated Managers Group Inc. | 1,781 | 376 |
| Annaly Capital Management Inc. | 30,512 | 363 |
| SL Green Realty Corp. | 3,078 | 337 |
| Realty Income Corp. | 7,145 | 320 |
| Kimco Realty Corp. | 13,254 | 311 |
| Equifax Inc. | 3,942 | 310 |
| Western Union Co. | 17,406 | 304 |
| Unum Group | 8,323 | 302 |
| XL Group plc Class A | 8,778 | 300 |
| CIT Group Inc. | 6,251 | 300 |
| * Markel Corp. | 453 | 299 |
| Leucadia National Corp. | 11,914 | 297 |
| Macerich Co. | 4,548 | 297 |
| Comerica Inc. | 5,875 | 296 |
| TD Ameritrade Holding Corp. | 8,698 | 288 |
| * CBRE Group Inc. Class A | 9,061 | 288 |
| Digital Realty Trust Inc. | 4,376 | 286 |
| Federal Realty Investment Trust | 2,179 | 272 |
| American Capital Agency Corp. | 11,429 | 270 |
| Huntington Bancshares Inc. | 26,832 | 264 |
| Cincinnati Financial Corp. | 5,304 | 255 |
| * FNF Group | 8,869 | 251 |
| Navient Corp. | 13,731 | 246 |
| Everest Re Group Ltd. | 1,499 | 246 |
| UDR Inc. | 8,164 | 244 |
| * Arch Capital Group Ltd. | 4,356 | 242 |
| Arthur J Gallagher & Co. | 5,104 | 241 |
| Plum Creek Timber Co. Inc. | 5,755 | 234 |
| New York Community Bancorp Inc. | 14,407 | 230 |
| * Genworth Financial Inc. Class A | 16,153 | 229 |
| Torchmark Corp. | 4,187 | 228 |
| * Alleghany Corp. | 522 | 225 |
| Lazard Ltd. Class A | 3,975 | 217 |
| Raymond James Financial Inc. | 3,956 | 216 |
| WP Carey Inc. | 3,150 | 215 |
| First Republic Bank | 4,368 | 214 |
| * Ally Financial Inc. | 8,604 | 212 |
| * E*TRADE Financial Corp. | 9,231 | 205 |
| Camden Property Trust | 2,726 | 204 |
| * Howard Hughes Corp. | 1,278 | 202 |
14
| Vanguard® Russell 3000 Index Fund | ||
| Schedule of Investments | ||
| August 31, 2014 | ||
| Market | ||
| Value | ||
| Shares | ($000) | |
| Duke Realty Corp. | 10,458 | 195 |
| Extra Space Storage Inc. | 3,679 | 194 |
| * Realogy Holdings Corp. | 4,705 | 192 |
| Jones Lang LaSalle Inc. | 1,428 | 191 |
| * Signature Bank | 1,598 | 189 |
| Alexandria Real Estate Equities Inc. | 2,316 | 183 |
| * SVB Financial Group | 1,642 | 183 |
| Reinsurance Group of America Inc. Class A | 2,193 | 182 |
| Voya Financial Inc. | 4,643 | 182 |
| PartnerRe Ltd. | 1,611 | 180 |
| Protective Life Corp. | 2,555 | 177 |
| DDR Corp. | 9,700 | 177 |
| Mid-America Apartment Communities Inc. | 2,426 | 175 |
| Zions Bancorporation | 6,007 | 175 |
| * MSCI Inc. Class A | 3,789 | 175 |
| Regency Centers Corp. | 2,999 | 171 |
| FactSet Research Systems Inc. | 1,342 | 171 |
| Liberty Property Trust | 4,774 | 169 |
| Kilroy Realty Corp. | 2,669 | 169 |
| Total System Services Inc. | 5,342 | 168 |
| Starwood Property Trust Inc. | 7,011 | 167 |
| Global Payments Inc. | 2,275 | 165 |
| Hudson City Bancorp Inc. | 16,745 | 165 |
| Axis Capital Holdings Ltd. | 3,415 | 165 |
| Broadridge Financial Solutions Inc. | 3,856 | 164 |
| NASDAQ OMX Group Inc. | 3,738 | 163 |
| Legg Mason Inc. | 3,288 | 162 |
| East West Bancorp Inc. | 4,641 | 162 |
| HCC Insurance Holdings Inc. | 3,198 | 160 |
| SEI Investments Co. | 4,206 | 159 |
| Apartment Investment & Management Co. Class A | 4,627 | 159 |
| Jack Henry & Associates Inc. | 2,729 | 158 |
| WR Berkley Corp. | 3,258 | 158 |
| Taubman Centers Inc. | 2,027 | 154 |
| Assurant Inc. | 2,310 | 154 |
| Omega Healthcare Investors Inc. | 4,057 | 153 |
| Senior Housing Properties Trust | 6,474 | 151 |
| Spirit Realty Capital Inc. | 12,778 | 151 |
| Eaton Vance Corp. | 3,839 | 150 |
| Waddell & Reed Financial Inc. Class A | 2,745 | 150 |
| CBOE Holdings Inc. | 2,794 | 148 |
| National Retail Properties Inc. | 3,977 | 148 |
| People's United Financial Inc. | 9,865 | 147 |
| * Zillow Inc. Class A | 991 | 142 |
| * WEX Inc. | 1,247 | 142 |
| Hospitality Properties Trust | 4,815 | 142 |
| Dun & Bradstreet Corp. | 1,204 | 141 |
| Assured Guaranty Ltd. | 5,826 | 141 |
| BioMed Realty Trust Inc. | 6,249 | 140 |
| PacWest Bancorp | 3,305 | 139 |
| American Financial Group Inc. | 2,305 | 138 |
| Rayonier Inc. | 4,026 | 138 |
| LPL Financial Holdings Inc. | 2,783 | 136 |
| Prosperity Bancshares Inc. | 2,222 | 134 |
| Weingarten Realty Investors | 3,919 | 134 |
| American Campus Communities Inc. | 3,367 | 133 |
| Corrections Corp. of America | 3,730 | 133 |
| Cullen/Frost Bankers Inc. | 1,675 | 132 |
| Douglas Emmett Inc. | 4,589 | 131 |
| RenaissanceRe Holdings Ltd. | 1,279 | 131 |
| Old Republic International Corp. | 8,361 | 128 |
| Two Harbors Investment Corp. | 11,856 | 127 |
| RLJ Lodging Trust | 4,250 | 127 |
| White Mountains Insurance Group Ltd. | 199 | 126 |
15
| Vanguard® Russell 3000 Index Fund | ||
| Schedule of Investments | ||
| August 31, 2014 | ||
| Market | ||
| Value | ||
| Shares | ($000) | |
| Brown & Brown Inc. | 3,838 | 125 |
| * Vantiv Inc. Class A | 3,969 | 124 |
| Highwoods Properties Inc. | 2,915 | 124 |
| Equity Lifestyle Properties Inc. | 2,707 | 124 |
| LaSalle Hotel Properties | 3,380 | 124 |
| CNO Financial Group Inc. | 6,856 | 122 |
| Investors Bancorp Inc. | 11,501 | 122 |
| Commerce Bancshares Inc. | 2,627 | 121 |
| Retail Properties of America Inc. | 7,636 | 121 |
| SLM Corp. | 13,624 | 121 |
| Allied World Assurance Co. Holdings AG | 3,215 | 119 |
| Home Properties Inc. | 1,846 | 119 |
| City National Corp. | 1,524 | 116 |
| Validus Holdings Ltd. | 2,896 | 113 |
| * Equity Commonwealth | 4,184 | 112 |
| NorthStar Realty Finance Corp. | 6,063 | 112 |
| * NorthStar Asset Management Group Inc. | 6,020 | 111 |
| Synovus Financial Corp. | 4,581 | 111 |
| * Forest City Enterprises Inc. Class A | 5,221 | 109 |
| Chimera Investment Corp. | 32,334 | 107 |
| * Popular Inc. | 3,398 | 105 |
| Columbia Property Trust Inc. | 4,087 | 105 |
| BankUnited Inc. | 3,325 | 105 |
| Tanger Factory Outlet Centers Inc. | 2,940 | 103 |
| CBL & Associates Properties Inc. | 5,401 | 103 |
| First Niagara Financial Group Inc. | 11,726 | 102 |
| * Stifel Financial Corp. | 2,119 | 101 |
| MFA Financial Inc. | 12,009 | 101 |
| Washington Prime Group Inc. | 5,134 | 100 |
| EPR Properties | 1,726 | 98 |
| Sunstone Hotel Investors Inc. | 6,726 | 98 |
| Healthcare Trust of America Inc. Class A | 7,846 | 98 |
| * Strategic Hotels & Resorts Inc. | 8,165 | 97 |
| First American Financial Corp. | 3,383 | 96 |
| Piedmont Office Realty Trust Inc. Class A | 4,911 | 96 |
| Associated Banc-Corp | 5,245 | 95 |
| * Ocwen Financial Corp. | 3,367 | 94 |
| Post Properties Inc. | 1,701 | 94 |
| Gaming and Leisure Properties Inc. | 2,796 | 93 |
| * MGIC Investment Corp. | 11,034 | 93 |
| Umpqua Holdings Corp. | 5,284 | 92 |
| First Horizon National Corp. | 7,558 | 92 |
| StanCorp Financial Group Inc. | 1,394 | 91 |
| * Euronet Worldwide Inc. | 1,693 | 90 |
| Primerica Inc. | 1,786 | 90 |
| ProAssurance Corp. | 1,945 | 90 |
| * Portfolio Recovery Associates Inc. | 1,581 | 90 |
| Federated Investors Inc. Class B | 2,917 | 90 |
| FirstMerit Corp. | 5,176 | 89 |
| Aspen Insurance Holdings Ltd. | 2,085 | 89 |
| Hancock Holding Co. | 2,667 | 89 |
| CubeSmart | 4,750 | 88 |
| Radian Group Inc. | 6,052 | 88 |
| Hanover Insurance Group Inc. | 1,387 | 88 |
| TCF Financial Corp. | 5,547 | 88 |
| Endurance Specialty Holdings Ltd. | 1,475 | 86 |
| DCT Industrial Trust Inc. | 10,747 | 85 |
| * CoreLogic Inc. | 3,017 | 85 |
| Geo Group Inc. | 2,264 | 85 |
| Webster Financial Corp. | 2,846 | 84 |
| DiamondRock Hospitality Co. | 6,187 | 82 |
| Bank of Hawaii Corp. | 1,417 | 82 |
| Pebblebrook Hotel Trust | 2,114 | 82 |
| Sovran Self Storage Inc. | 1,043 | 81 |
16
| Vanguard® Russell 3000 Index Fund | ||
| Schedule of Investments | ||
| August 31, 2014 | ||
| Market | ||
| Value | ||
| Shares | ($000) | |
| Colony Financial Inc. | 3,563 | 80 |
| Bank of the Ozarks Inc. | 2,493 | 80 |
| Brandywine Realty Trust | 4,951 | 79 |
| Cousins Properties Inc. | 6,227 | 79 |
| American Homes 4 Rent Class A | 4,368 | 78 |
| Medical Properties Trust Inc. | 5,479 | 77 |
| Corporate Office Properties Trust | 2,713 | 77 |
| Healthcare Realty Trust Inc. | 3,043 | 76 |
| United Bankshares Inc. | 2,275 | 75 |
| * Texas Capital Bancshares Inc. | 1,369 | 74 |
| Washington Federal Inc. | 3,335 | 73 |
| UMB Financial Corp. | 1,248 | 72 |
| Fulton Financial Corp. | 6,246 | 72 |
| Lexington Realty Trust | 6,620 | 72 |
| MarketAxess Holdings Inc. | 1,204 | 71 |
| Wintrust Financial Corp. | 1,515 | 71 |
| Ryman Hospitality Properties Inc. | 1,416 | 70 |
| Invesco Mortgage Capital Inc. | 3,993 | 70 |
| National Health Investors Inc. | 1,075 | 69 |
| Sun Communities Inc. | 1,293 | 69 |
| Iberiabank Corp. | 1,057 | 69 |
| PrivateBancorp Inc. | 2,330 | 69 |
| FNB Corp. | 5,526 | 68 |
| Fair Isaac Corp. | 1,156 | 67 |
| Cathay General Bancorp | 2,538 | 66 |
| Alexander & Baldwin Inc. | 1,592 | 65 |
| BancorpSouth Inc. | 3,061 | 65 |
| Valley National Bancorp | 6,445 | 64 |
| Hatteras Financial Corp. | 3,205 | 64 |
| EastGroup Properties Inc. | 975 | 63 |
| Glacier Bancorp Inc. | 2,320 | 63 |
| First Industrial Realty Trust Inc. | 3,439 | 63 |
| Susquehanna Bancshares Inc. | 6,034 | 62 |
| Kennedy-Wilson Holdings Inc. | 2,376 | 62 |
| Erie Indemnity Co. Class A | 808 | 62 |
| American Equity Investment Life Holding Co. | 2,496 | 62 |
| RLI Corp. | 1,381 | 62 |
| MB Financial Inc. | 2,156 | 61 |
| Mack-Cali Realty Corp. | 2,849 | 60 |
| First Financial Bankshares Inc. | 2,044 | 60 |
| Washington REIT | 2,162 | 60 |
| American Realty Capital Healthcare Trust Inc. | 5,460 | 60 |
| Chambers Street Properties | 7,677 | 60 |
| Janus Capital Group Inc. | 4,859 | 59 |
| New York REIT Inc. | 5,658 | 58 |
| BOK Financial Corp. | 862 | 58 |
| Symetra Financial Corp. | 2,386 | 58 |
| New Residential Investment Corp. | 9,233 | 58 |
| DuPont Fabros Technology Inc. | 2,035 | 57 |
| * Western Alliance Bancorp | 2,417 | 57 |
| First Citizens BancShares Inc. Class A | 248 | 57 |
| EverBank Financial Corp. | 3,016 | 57 |
| Heartland Payment Systems Inc. | 1,191 | 57 |
| Financial Engines Inc. | 1,585 | 57 |
| Kemper Corp. | 1,563 | 57 |
| Potlatch Corp. | 1,328 | 57 |
| Platinum Underwriters Holdings Ltd. | 902 | 56 |
| * First Cash Financial Services Inc. | 956 | 55 |
| CVB Financial Corp. | 3,530 | 55 |
| Advent Software Inc. | 1,671 | 54 |
| Capitol Federal Financial Inc. | 4,362 | 54 |
| Glimcher Realty Trust | 4,777 | 54 |
| Home BancShares Inc. | 1,799 | 54 |
| Santander Consumer USA Holdings Inc. | 2,837 | 53 |
17
| Vanguard® Russell 3000 Index Fund | ||
| Schedule of Investments | ||
| August 31, 2014 | ||
| Market | ||
| Value | ||
| Shares | ($000) | |
| Evercore Partners Inc. Class A | 1,031 | 53 |
| Trustmark Corp. | 2,222 | 53 |
| Redwood Trust Inc. | 2,715 | 53 |
| Acadia Realty Trust | 1,816 | 52 |
| * Cardtronics Inc. | 1,472 | 52 |
| PS Business Parks Inc. | 640 | 52 |
| PennyMac Mortgage Investment Trust | 2,341 | 52 |
| Home Loan Servicing Solutions Ltd. | 2,366 | 52 |
| CYS Investments Inc. | 5,387 | 51 |
| Virtus Investment Partners Inc. | 226 | 51 |
| Artisan Partners Asset Management Inc. Class A | 907 | 50 |
| Government Properties Income Trust | 2,093 | 50 |
| EVERTEC Inc. | 2,165 | 50 |
| Chesapeake Lodging Trust | 1,616 | 50 |
| Parkway Properties Inc. | 2,399 | 50 |
| * MBIA Inc. | 4,725 | 49 |
| LTC Properties Inc. | 1,172 | 48 |
| Equity One Inc. | 2,011 | 47 |
| * Hilltop Holdings Inc. | 2,239 | 47 |
| * Altisource Portfolio Solutions SA | 473 | 47 |
| Community Bank System Inc. | 1,336 | 47 |
| International Bancshares Corp. | 1,787 | 47 |
| South State Corp. | 804 | 47 |
| Greenhill & Co. Inc. | 954 | 47 |
| Mercury General Corp. | 912 | 47 |
| Education Realty Trust Inc. | 4,277 | 47 |
| Pennsylvania REIT | 2,301 | 46 |
| ARMOUR Residential REIT Inc. | 10,949 | 46 |
| Hersha Hospitality Trust Class A | 6,809 | 46 |
| Altisource Residential Corp. | 1,881 | 46 |
| Old National Bancorp | 3,525 | 46 |
| Sabra Health Care REIT Inc. | 1,601 | 46 |
| Empire State Realty Trust Inc. | 2,759 | 45 |
| Hudson Pacific Properties Inc. | 1,688 | 45 |
| Selective Insurance Group Inc. | 1,882 | 45 |
| * FNFV Group | 3,003 | 45 |
| Columbia Banking System Inc. | 1,722 | 45 |
| BGC Partners Inc. Class A | 5,819 | 44 |
| Retail Opportunity Investments Corp. | 2,768 | 44 |
| First Midwest Bancorp Inc. | 2,568 | 43 |
| * iStar Financial Inc. | 2,902 | 43 |
| Capstead Mortgage Corp. | 3,261 | 43 |
| Cash America International Inc. | 963 | 43 |
| FelCor Lodging Trust Inc. | 4,150 | 43 |
| * St. Joe Co. | 1,973 | 43 |
| Pinnacle Financial Partners Inc. | 1,182 | 42 |
| STAG Industrial Inc. | 1,790 | 42 |
| Morningstar Inc. | 605 | 42 |
| Argo Group International Holdings Ltd. | 788 | 41 |
| * Blackhawk Network Holdings Inc. Class B | 1,492 | 41 |
| * WisdomTree Investments Inc. | 3,461 | 41 |
| Horace Mann Educators Corp. | 1,367 | 41 |
| Northwest Bancshares Inc. | 3,227 | 41 |
| American Assets Trust Inc. | 1,148 | 40 |
| National Penn Bancshares Inc. | 4,011 | 40 |
| AmTrust Financial Services Inc. | 907 | 40 |
| BBCN Bancorp Inc. | 2,713 | 40 |
| * Enstar Group Ltd. | 278 | 39 |
| Ramco-Gershenson Properties Trust | 2,302 | 39 |
| Brixmor Property Group Inc. | 1,647 | 39 |
| * Encore Capital Group Inc. | 877 | 39 |
| Interactive Brokers Group Inc. | 1,631 | 38 |
| Westamerica Bancorporation | 788 | 38 |
| Franklin Street Properties Corp. | 3,123 | 38 |
18
| Vanguard® Russell 3000 Index Fund | ||
| Schedule of Investments | ||
| August 31, 2014 | ||
| Market | ||
| Value | ||
| Shares | ($000) | |
| Montpelier Re Holdings Ltd. | 1,206 | 38 |
| * Starwood Waypoint Residential Trust | 1,363 | 38 |
| * Harbinger Group Inc. | 2,909 | 38 |
| Associated Estates Realty Corp. | 2,005 | 37 |
| Sterling Bancorp | 2,925 | 37 |
| NBT Bancorp Inc. | 1,534 | 37 |
| ViewPoint Financial Group Inc. | 1,401 | 37 |
| * Altisource Asset Management Corp. | 49 | 36 |
| CNA Financial Corp. | 928 | 36 |
| Provident Financial Services Inc. | 2,098 | 36 |
| Union Bankshares Corp. | 1,476 | 35 |
| Boston Private Financial Holdings Inc. | 2,821 | 34 |
| * Walter Investment Management Corp. | 1,292 | 34 |
| Astoria Financial Corp. | 2,582 | 34 |
| * BofI Holding Inc. | 437 | 34 |
| Banco Latinoamericano de Comercio Exterior SA | 1,042 | 33 |
| * TFS Financial Corp. | 2,307 | 33 |
| * Ambac Financial Group Inc. | 1,350 | 33 |
| Park National Corp. | 416 | 32 |
| Renasant Corp. | 1,110 | 32 |
| Inland Real Estate Corp. | 3,078 | 32 |
| Summit Hotel Properties Inc. | 2,911 | 32 |
| American Capital Mortgage Investment Corp. | 1,548 | 32 |
| Chemical Financial Corp. | 1,076 | 31 |
| Select Income REIT | 1,088 | 30 |
| Nelnet Inc. Class A | 671 | 30 |
| HFF Inc. Class A | 977 | 29 |
| Ashford Hospitality Trust Inc. | 2,482 | 29 |
| * Greenlight Capital Re Ltd. Class A | 836 | 29 |
| First Financial Bancorp | 1,691 | 28 |
| United Community Banks Inc. | 1,626 | 28 |
| National Bank Holdings Corp. Class A | 1,333 | 27 |
| Investors Real Estate Trust | 3,114 | 27 |
| CyrusOne Inc. | 1,004 | 26 |
| * Credit Acceptance Corp. | 208 | 26 |
| Independent Bank Corp. | 692 | 25 |
| * Essent Group Ltd. | 1,205 | 25 |
| First Commonwealth Financial Corp. | 2,864 | 25 |
| * Third Point Reinsurance Ltd. | 1,643 | 25 |
| * Piper Jaffray Cos. | 470 | 25 |
| * KCG Holdings Inc. Class A | 2,091 | 24 |
| Cohen & Steers Inc. | 560 | 24 |
| * Kite Realty Group Trust | 946 | 24 |
| American National Insurance Co. | 213 | 24 |
| Excel Trust Inc. | 1,873 | 24 |
| Alexander's Inc. | 61 | 24 |
| Gramercy Property Trust Inc. | 3,851 | 24 |
| * Springleaf Holdings Inc. | 708 | 24 |
| WesBanco Inc. | 755 | 23 |
| WSFS Financial Corp. | 311 | 23 |
| Infinity Property & Casualty Corp. | 336 | 23 |
| First Potomac Realty Trust | 1,716 | 23 |
| Apollo Commercial Real Estate Finance Inc. | 1,349 | 23 |
| Banner Corp. | 568 | 22 |
| Northfield Bancorp Inc. | 1,701 | 22 |
| FXCM Inc. Class A | 1,513 | 22 |
| * Nationstar Mortgage Holdings Inc. | 625 | 22 |
| * Eagle Bancorp Inc. | 649 | 22 |
| S&T Bancorp Inc. | 869 | 22 |
| * Green Dot Corp. Class A | 1,132 | 21 |
| OFG Bancorp | 1,341 | 21 |
| Monmouth Real Estate Investment Corp. | 1,969 | 21 |
| CoreSite Realty Corp. | 605 | 21 |
| New York Mortgage Trust Inc. | 2,647 | 21 |
19
| Vanguard® Russell 3000 Index Fund | ||
| Schedule of Investments | ||
| August 31, 2014 | ||
| Market | ||
| Value | ||
| Shares | ($000) | |
| First Merchants Corp. | 1,021 | 21 |
| Safety Insurance Group Inc. | 376 | 21 |
| Anworth Mortgage Asset Corp. | 3,976 | 21 |
| * Xoom Corp. | 894 | 20 |
| AMERISAFE Inc. | 540 | 20 |
| Oritani Financial Corp. | 1,357 | 20 |
| Stewart Information Services Corp. | 621 | 20 |
| Cass Information Systems Inc. | 426 | 20 |
| Resource Capital Corp. | 3,708 | 20 |
| * Forestar Group Inc. | 999 | 20 |
| * World Acceptance Corp. | 255 | 20 |
| City Holding Co. | 457 | 20 |
| * Navigators Group Inc. | 302 | 19 |
| Employers Holdings Inc. | 905 | 19 |
| TrustCo Bank Corp. NY | 2,753 | 19 |
| Tompkins Financial Corp. | 422 | 19 |
| Wilshire Bancorp Inc. | 1,977 | 19 |
| RAIT Financial Trust | 2,380 | 19 |
| Physicians Realty Trust | 1,300 | 19 |
| Simmons First National Corp. Class A | 482 | 19 |
| National General Holdings Corp. | 1,026 | 19 |
| Rouse Properties Inc. | 1,097 | 19 |
| United Financial Bancorp Inc. | 1,531 | 19 |
| Hanmi Financial Corp. | 922 | 19 |
| Terreno Realty Corp. | 935 | 19 |
| Southside Bancshares Inc. | 547 | 19 |
| Brookline Bancorp Inc. | 2,049 | 19 |
| Lakeland Financial Corp. | 479 | 19 |
| Silver Bay Realty Trust Corp. | 1,113 | 19 |
| * Investment Technology Group Inc. | 1,088 | 19 |
| Aviv REIT Inc. | 633 | 19 |
| Berkshire Hills Bancorp Inc. | 733 | 18 |
| Chatham Lodging Trust | 768 | 18 |
| * Customers Bancorp Inc. | 954 | 18 |
| Maiden Holdings Ltd. | 1,456 | 18 |
| * American Residential Properties Inc. | 932 | 18 |
| Western Asset Mortgage Capital Corp. | 1,163 | 18 |
| Sandy Spring Bancorp Inc. | 728 | 18 |
| United Fire Group Inc. | 599 | 18 |
| * Cowen Group Inc. Class A | 4,281 | 18 |
| Saul Centers Inc. | 350 | 17 |
| Flushing Financial Corp. | 900 | 17 |
| Universal Insurance Holdings Inc. | 1,250 | 17 |
| Ameris Bancorp | 744 | 17 |
| * Capital Bank Financial Corp. | 686 | 17 |
| * First BanCorp | 3,208 | 17 |
| Cardinal Financial Corp. | 932 | 17 |
| AG Mortgage Investment Trust Inc. | 815 | 16 |
| National Western Life Insurance Co. Class A | 64 | 16 |
| Community Trust Bancorp Inc. | 451 | 16 |
| Apollo Residential Mortgage Inc. | 936 | 16 |
| Arlington Asset Investment Corp. Class A | 554 | 16 |
| State Bank Financial Corp. | 932 | 16 |
| Campus Crest Communities Inc. | 1,887 | 16 |
| Urstadt Biddle Properties Inc. Class A | 727 | 16 |
| Universal Health Realty Income Trust | 347 | 15 |
| ConnectOne Bancorp Inc. | 782 | 15 |
| * Global Cash Access Holdings Inc. | 1,938 | 15 |
| Washington Trust Bancorp Inc. | 422 | 15 |
| * PICO Holdings Inc. | 664 | 15 |
| Dime Community Bancshares Inc. | 927 | 14 |
| * NMI Holdings Inc. Class A | 1,463 | 14 |
| * MoneyGram International Inc. | 1,005 | 14 |
| Ashford Hospitality Prime Inc. | 870 | 14 |
20
| Vanguard® Russell 3000 Index Fund | ||
| Schedule of Investments | ||
| August 31, 2014 | ||
| Market | ||
| Value | ||
| Shares | ($000) | |
| Getty Realty Corp. | 747 | 14 |
| * First NBC Bank Holding Co. | 433 | 14 |
| Heritage Financial Corp. | 843 | 14 |
| GAMCO Investors Inc. | 176 | 14 |
| Ares Commercial Real Estate Corp. | 1,093 | 14 |
| Independent Bank Group Inc. | 271 | 14 |
| Dynex Capital Inc. | 1,564 | 14 |
| Cedar Realty Trust Inc. | 2,115 | 14 |
| First Interstate BancSystem Inc. | 510 | 14 |
| Rexford Industrial Realty Inc. | 910 | 13 |
| AmREIT Inc. | 572 | 13 |
| 1st Source Corp. | 441 | 13 |
| * eHealth Inc. | 537 | 13 |
| BancFirst Corp. | 206 | 13 |
| * Beneficial Mutual Bancorp Inc. | 936 | 13 |
| Agree Realty Corp. | 434 | 13 |
| QTS Realty Trust Inc. Class A | 412 | 12 |
| Hannon Armstrong Sustainable Infrastructure Capital Inc. | 853 | 12 |
| Banc of California Inc. | 1,027 | 12 |
| Stock Yards Bancorp Inc. | 407 | 12 |
| First Busey Corp. | 2,117 | 12 |
| FBL Financial Group Inc. Class A | 259 | 12 |
| Westwood Holdings Group Inc. | 203 | 12 |
| HCI Group Inc. | 285 | 12 |
| * Safeguard Scientifics Inc. | 612 | 12 |
| CoBiz Financial Inc. | 1,037 | 12 |
| Bryn Mawr Bank Corp. | 402 | 12 |
| Waterstone Financial Inc. | 1,016 | 12 |
| * Tejon Ranch Co. | 406 | 11 |
| Lakeland Bancorp Inc. | 1,097 | 11 |
| Central Pacific Financial Corp. | 640 | 11 |
| Towne Bank | 767 | 11 |
| Peoples Financial Services Corp. | 219 | 11 |
| * Ladenburg Thalmann Financial Services Inc. | 3,011 | 11 |
| Diamond Hill Investment Group Inc. | 82 | 11 |
| First Financial Corp. | 328 | 11 |
| OneBeacon Insurance Group Ltd. Class A | 661 | 11 |
| Mercantile Bank Corp. | 556 | 11 |
| * Phoenix Cos. Inc. | 170 | 10 |
| Trico Bancshares | 467 | 10 |
| Heartland Financial USA Inc. | 430 | 10 |
| MainSource Financial Group Inc. | 596 | 10 |
| RE/MAX Holdings Inc. | 338 | 10 |
| * Stonegate Mortgage Corp. | 703 | 10 |
| First Bancorp | 574 | 10 |
| CatchMark Timber Trust Inc. Class A | 843 | 10 |
| * Flagstar Bancorp Inc. | 580 | 10 |
| RCS Capital Corp. Class A | 453 | 10 |
| German American Bancorp Inc. | 370 | 10 |
| Consolidated-Tomoka Land Co. | 171 | 10 |
| Federal Agricultural Mortgage Corp. | 302 | 10 |
| * Yadkin Financial Corp. | 529 | 10 |
| * CareTrust REIT Inc. | 568 | 10 |
| Clifton Bancorp Inc. | 782 | 10 |
| Enterprise Financial Services Corp. | 562 | 10 |
| Financial Institutions Inc. | 402 | 10 |
| Whitestone REIT | 633 | 10 |
| * Metro Bancorp Inc. | 412 | 10 |
| Great Southern Bancorp Inc. | 301 | 10 |
| Southwest Bancorp Inc. | 574 | 9 |
| State Auto Financial Corp. | 436 | 9 |
| * Bancorp Inc. | 959 | 9 |
| Univest Corp. of Pennsylvania | 487 | 9 |
| GFI Group Inc. | 2,029 | 9 |
21
| Vanguard® Russell 3000 Index Fund | |||
| Schedule of Investments | |||
| August 31, 2014 | |||
| Market | |||
| Value | |||
| Shares | ($000) | ||
| * | HomeTrust Bancshares Inc. | 607 | 9 |
| Centerstate Banks Inc. | 875 | 9 | |
| BNC Bancorp | 535 | 9 | |
| * | Citizens Inc. Class A | 1,270 | 9 |
| Meadowbrook Insurance Group Inc. | 1,457 | 9 | |
| * | Regional Management Corp. | 528 | 9 |
| Bank Mutual Corp. | 1,358 | 9 | |
| Park Sterling Corp. | 1,307 | 9 | |
| * | NewStar Financial Inc. | 767 | 9 |
| OmniAmerican Bancorp Inc. | 333 | 9 | |
| Hudson Valley Holding Corp. | 481 | 9 | |
| Bank of Marin Bancorp | 171 | 8 | |
| Gladstone Commercial Corp. | 455 | 8 | |
| Arrow Financial Corp. | 311 | 8 | |
| * | Preferred Bank | 340 | 8 |
| Camden National Corp. | 223 | 8 | |
| * | Ladder Capital Corp. Class A | 436 | 8 |
| Bridge Bancorp Inc. | 325 | 8 | |
| Federated National Holding Co. | 327 | 8 | |
| First Community Bancshares Inc. | 493 | 8 | |
| Independent Bank Corp. | 662 | 8 | |
| First of Long Island Corp. | 230 | 8 | |
| First Defiance Financial Corp. | 285 | 8 | |
| * | INTL. FCStone Inc. | 410 | 8 |
| Stonegate Bank | 288 | 8 | |
| Moelis & Co. | 214 | 8 | |
| United Insurance Holdings Corp. | 481 | 8 | |
| 1st United Bancorp Inc. | 875 | 8 | |
| First Connecticut Bancorp Inc. | 496 | 8 | |
| Peoples Bancorp Inc. | 314 | 8 | |
| Talmer Bancorp Inc. Class A | 512 | 8 | |
| Calamos Asset Management Inc. Class A | 579 | 7 | |
| One Liberty Properties Inc. | 342 | 7 | |
| Fidelity & Guaranty Life | 327 | 7 | |
| Manning & Napier Inc. | 397 | 7 | |
| Gain Capital Holdings Inc. | 1,166 | 7 | |
| CorEnergy Infrastructure Trust Inc. | 916 | 7 | |
| * | Pacific Premier Bancorp Inc. | 486 | 7 |
| Charter Financial Corp. | 664 | 7 | |
| * | Square 1 Financial Inc. Class A | 372 | 7 |
| Citizens & Northern Corp. | 360 | 7 | |
| CNB Financial Corp. | 419 | 7 | |
| Pacific Continental Corp. | 522 | 7 | |
| Suffolk Bancorp | 337 | 7 | |
| Oppenheimer Holdings Inc. Class A | 289 | 7 | |
| Baldwin & Lyons Inc. | 269 | 7 | |
| Crawford & Co. Class B | 767 | 7 | |
| HomeStreet Inc. | 376 | 7 | |
| * | Walker & Dunlop Inc. | 476 | 7 |
| BankFinancial Corp. | 618 | 7 | |
| *,^ | FBR & Co. | 233 | 7 |
| * | Global Indemnity plc | 246 | 7 |
| United Community Financial Corp. | 1,443 | 7 | |
| OceanFirst Financial Corp. | 402 | 7 | |
| Peapack Gladstone Financial Corp. | 351 | 7 | |
| Bank of Kentucky Financial Corp. | 179 | 7 | |
| Meta Financial Group Inc. | 173 | 7 | |
| * | Kearny Financial Corp. | 419 | 7 |
| Republic Bancorp Inc. Class A | 282 | 6 | |
| Penns Woods Bancorp Inc. | 140 | 6 | |
| * | SWS Group Inc. | 847 | 6 |
| Ames National Corp. | 274 | 6 | |
| * | Meridian Bancorp Inc. | 595 | 6 |
| * | Bridge Capital Holdings | 281 | 6 |
22
| Vanguard® Russell 3000 Index Fund | ||
| Schedule of Investments | ||
| August 31, 2014 | ||
| Market | ||
| Value | ||
| Shares | ($000) | |
| West Bancorporation Inc. | 417 | 6 |
| * Franklin Financial Corp. | 315 | 6 |
| * TriState Capital Holdings Inc. | 652 | 6 |
| Sierra Bancorp | 356 | 6 |
| * Marcus & Millichap Inc. | 201 | 6 |
| Fox Chase Bancorp Inc. | 356 | 6 |
| Territorial Bancorp Inc. | 294 | 6 |
| * Tree.com Inc. | 188 | 6 |
| Guaranty Bancorp | 430 | 6 |
| Fidelity Southern Corp. | 426 | 6 |
| National Bankshares Inc. | 202 | 6 |
| * PennyMac Financial Services Inc. Class A | 372 | 6 |
| Horizon Bancorp | 253 | 6 |
| * NewBridge Bancorp | 734 | 5 |
| National Interstate Corp. | 194 | 5 |
| Armada Hoffler Properties Inc. | 557 | 5 |
| UMH Properties Inc. | 522 | 5 |
| Kansas City Life Insurance Co. | 115 | 5 |
| First Business Financial Services Inc. | 114 | 5 |
| Capital City Bank Group Inc. | 367 | 5 |
| * CU Bancorp | 275 | 5 |
| American National Bankshares Inc. | 230 | 5 |
| Seacoast Banking Corp. of Florida | 485 | 5 |
| Heritage Commerce Corp. | 609 | 5 |
| Owens Realty Mortgage Inc. | 313 | 5 |
| Merchants Bancshares Inc. | 164 | 5 |
| * Atlas Financial Holdings Inc. | 333 | 5 |
| First Financial Northwest Inc. | 443 | 5 |
| ESB Financial Corp. | 375 | 5 |
| * Opus Bank | 149 | 5 |
| First Bancorp Inc. | 279 | 5 |
| MidWestOne Financial Group Inc. | 198 | 5 |
| * Cascade Bancorp | 907 | 5 |
| Northrim BanCorp Inc. | 190 | 5 |
| MidSouth Bancorp Inc. | 241 | 5 |
| Heritage Oaks Bancorp | 638 | 5 |
| * JGWPT Holdings Inc. Class A | 328 | 4 |
| * Sun Bancorp Inc. | 235 | 4 |
| * AV Homes Inc. | 274 | 4 |
| Enterprise Bancorp Inc. | 212 | 4 |
| EMC Insurance Group Inc. | 132 | 4 |
| * Information Services Group Inc. | 944 | 4 |
| * Republic First Bancorp Inc. | 894 | 4 |
| * Hallmark Financial Services Inc. | 416 | 4 |
| * BBX Capital Corp. | 209 | 4 |
| Nicholas Financial Inc. | 301 | 4 |
| Trade Street Residential Inc. | 537 | 4 |
| * Consumer Portfolio Services Inc. | 527 | 4 |
| Old Line Bancshares Inc. | 244 | 4 |
| Century Bancorp Inc. Class A | 100 | 4 |
| Macatawa Bank Corp. | 692 | 4 |
| Donegal Group Inc. Class A | 217 | 3 |
| Pzena Investment Management Inc. Class A | 331 | 3 |
| Resource America Inc. Class A | 354 | 3 |
| Independence Holding Co. | 231 | 3 |
| NASB Financial Inc. | 125 | 3 |
| * Heritage Insurance Holdings Inc. | 200 | 3 |
| * CommunityOne Bancorp | 306 | 3 |
| * UCP Inc. | 200 | 3 |
| Silvercrest Asset Management Group Inc. Class A | 143 | 2 |
| CIFC Corp. | 203 | 2 |
| ServisFirst Bancshares Inc. | 58 | 2 |
| * Tiptree Financial Inc. Class A | 227 | 2 |
| Palmetto Bancshares Inc. | 107 | 2 |
23
| Vanguard® Russell 3000 Index Fund | ||
| Schedule of Investments | ||
| August 31, 2014 | ||
| Market | ||
| Value | ||
| Shares | ($000) | |
| * Hampton Roads Bankshares Inc. | 795 | 1 |
| * Ezcorp Inc. Class A | 82 | 1 |
| * Higher One Holdings Inc. | 56 | — |
| * Tejon Ranch Co. Warrants Exp. 08/31/2016 | 64 | — |
| 134,288 | ||
| Health Care (13.0%) | ||
| Johnson & Johnson | 90,836 | 9,422 |
| Pfizer Inc. | 204,805 | 6,019 |
| Merck & Co. Inc. | 93,830 | 5,640 |
| * Gilead Sciences Inc. | 49,308 | 5,305 |
| Amgen Inc. | 24,306 | 3,388 |
| AbbVie Inc. | 51,053 | 2,822 |
| UnitedHealth Group Inc. | 31,461 | 2,727 |
| Bristol-Myers Squibb Co. | 53,208 | 2,695 |
| * Biogen Idec Inc. | 7,617 | 2,613 |
| * Celgene Corp. | 25,714 | 2,443 |
| Abbott Laboratories | 48,224 | 2,037 |
| Medtronic Inc. | 31,660 | 2,021 |
| Eli Lilly & Co. | 31,589 | 2,008 |
| * Actavis plc | 8,154 | 1,851 |
| * Express Scripts Holding Co. | 24,838 | 1,836 |
| Allergan Inc. | 9,430 | 1,543 |
| Thermo Fisher Scientific Inc. | 12,809 | 1,540 |
| McKesson Corp. | 7,404 | 1,444 |
| Baxter International Inc. | 17,422 | 1,306 |
| Covidien plc | 14,289 | 1,241 |
| * Alexion Pharmaceuticals Inc. | 6,351 | 1,075 |
| WellPoint Inc. | 8,981 | 1,046 |
| Aetna Inc. | 11,476 | 943 |
| Stryker Corp. | 10,794 | 899 |
| * Regeneron Pharmaceuticals Inc. | 2,533 | 888 |
| Cigna Corp. | 8,626 | 816 |
| Cardinal Health Inc. | 10,924 | 805 |
| * Illumina Inc. | 4,123 | 739 |
| Becton Dickinson and Co. | 6,203 | 727 |
| * HCA Holdings Inc. | 10,346 | 722 |
| * Vertex Pharmaceuticals Inc. | 7,584 | 710 |
| Humana Inc. | 4,970 | 640 |
| Perrigo Co. plc | 4,297 | 639 |
| St. Jude Medical Inc. | 9,126 | 599 |
| * Mylan Inc. | 12,000 | 583 |
| Zoetis Inc. | 16,087 | 570 |
| AmerisourceBergen Corp. Class A | 7,252 | 561 |
| * Cerner Corp. | 9,567 | 552 |
| * Intuitive Surgical Inc. | 1,155 | 543 |
| * Boston Scientific Corp. | 42,468 | 538 |
| Zimmer Holdings Inc. | 5,389 | 535 |
| * DaVita HealthCare Partners Inc. | 5,711 | 426 |
| CR Bard Inc. | 2,456 | 365 |
| * Edwards Lifesciences Corp. | 3,404 | 338 |
| * BioMarin Pharmaceutical Inc. | 4,707 | 335 |
| * Henry Schein Inc. | 2,754 | 330 |
| Universal Health Services Inc. Class B | 2,868 | 328 |
| * Salix Pharmaceuticals Ltd. | 2,047 | 326 |
| * Catamaran Corp. | 6,678 | 315 |
| * Endo International plc | 4,917 | 313 |
| * Jazz Pharmaceuticals plc | 1,920 | 313 |
| * CareFusion Corp. | 6,699 | 308 |
| * Mallinckrodt plc | 3,651 | 298 |
| Quest Diagnostics Inc. | 4,672 | 295 |
| * Laboratory Corp. of America Holdings | 2,742 | 294 |
| * Hospira Inc. | 5,404 | 290 |
| * Varian Medical Systems Inc. | 3,364 | 286 |
| * Incyte Corp. | 4,697 | 255 |
24
| Vanguard® Russell 3000 Index Fund | ||
| Schedule of Investments | ||
| August 31, 2014 | ||
| Market | ||
| Value | ||
| Shares | ($000) | |
| Cooper Cos. Inc. | 1,554 | 253 |
| * Pharmacyclics Inc. | 1,978 | 246 |
| ResMed Inc. | 4,560 | 242 |
| * InterMune Inc. | 3,138 | 230 |
| * Medivation Inc. | 2,432 | 222 |
| DENTSPLY International Inc. | 4,617 | 220 |
| * Alkermes plc | 4,588 | 205 |
| * IDEXX Laboratories Inc. | 1,640 | 203 |
| Omnicare Inc. | 3,183 | 203 |
| * Community Health Systems Inc. | 3,668 | 199 |
| * Tenet Healthcare Corp. | 3,171 | 194 |
| * Puma Biotechnology Inc. | 736 | 192 |
| * Hologic Inc. | 7,618 | 189 |
| * United Therapeutics Corp. | 1,556 | 183 |
| * QIAGEN NV | 7,571 | 183 |
| * MEDNAX Inc. | 3,174 | 182 |
| * Brookdale Senior Living Inc. | 5,198 | 182 |
| * athenahealth Inc. | 1,214 | 175 |
| * Cubist Pharmaceuticals Inc. | 2,465 | 170 |
| PerkinElmer Inc. | 3,664 | 164 |
| * Isis Pharmaceuticals Inc. | 3,849 | 157 |
| * Covance Inc. | 1,843 | 153 |
| * Sirona Dental Systems Inc. | 1,854 | 151 |
| * Alnylam Pharmaceuticals Inc. | 2,136 | 149 |
| * Centene Corp. | 1,869 | 146 |
| Teleflex Inc. | 1,316 | 144 |
| * Seattle Genetics Inc. | 3,262 | 144 |
| * Align Technology Inc. | 2,586 | 141 |
| * Team Health Holdings Inc. | 2,232 | 131 |
| * Pacira Pharmaceuticals Inc. | 1,163 | 126 |
| * Health Net Inc. | 2,601 | 123 |
| * VCA Inc. | 2,902 | 118 |
| * Intercept Pharmaceuticals Inc. | 408 | 118 |
| Techne Corp. | 1,207 | 115 |
| HealthSouth Corp. | 2,862 | 113 |
| STERIS Corp. | 1,951 | 110 |
| * LifePoint Hospitals Inc. | 1,464 | 110 |
| Patterson Cos. Inc. | 2,709 | 109 |
| * PAREXEL International Corp. | 1,875 | 106 |
| * DexCom Inc. | 2,379 | 105 |
| * Quintiles Transnational Holdings Inc. | 1,853 | 104 |
| * NPS Pharmaceuticals Inc. | 3,348 | 101 |
| West Pharmaceutical Services Inc. | 2,319 | 101 |
| * Envision Healthcare Holdings Inc. | 2,681 | 98 |
| * Alere Inc. | 2,700 | 96 |
| * WellCare Health Plans Inc. | 1,444 | 95 |
| * Charles River Laboratories International Inc. | 1,542 | 91 |
| * Cepheid | 2,235 | 89 |
| * Myriad Genetics Inc. | 2,347 | 85 |
| Hill-Rom Holdings Inc. | 1,887 | 83 |
| * Allscripts Healthcare Solutions Inc. | 5,572 | 82 |
| * Akorn Inc. | 2,055 | 80 |
| * Medidata Solutions Inc. | 1,683 | 78 |
| * Bio-Rad Laboratories Inc. Class A | 649 | 78 |
| * Amsurg Corp. | 1,380 | 74 |
| * Air Methods Corp. | 1,255 | 74 |
| * Acadia Healthcare Co. Inc. | 1,432 | 73 |
| Owens & Minor Inc. | 2,030 | 70 |
| * Bruker Corp. | 3,453 | 69 |
| * HMS Holdings Corp. | 2,884 | 66 |
| Theravance Inc. | 2,778 | 65 |
| * Insulet Corp. | 1,720 | 62 |
| * ACADIA Pharmaceuticals Inc. | 2,537 | 61 |
| Chemed Corp. | 575 | 61 |
25
| Vanguard® Russell 3000 Index Fund | |||
| Schedule of Investments | |||
| August 31, 2014 | |||
| Market | |||
| Value | |||
| Shares | ($000) | ||
| * | WebMD Health Corp. | 1,242 | 60 |
| * | Nektar Therapeutics | 4,197 | 60 |
| * | Haemonetics Corp. | 1,657 | 59 |
| * | MWI Veterinary Supply Inc. | 412 | 59 |
| * | Prestige Brands Holdings Inc. | 1,681 | 58 |
| * | Exact Sciences Corp. | 2,756 | 57 |
| * | Impax Laboratories Inc. | 2,259 | 56 |
| *,^ | OPKO Health Inc. | 6,196 | 55 |
| * | Keryx Biopharmaceuticals Inc. | 2,997 | 55 |
| * | MannKind Corp. | 7,292 | 54 |
| PDL BioPharma Inc. | 5,320 | 54 | |
| * | NuVasive Inc. | 1,517 | 53 |
| * | Medicines Co. | 2,071 | 53 |
| * | Cyberonics Inc. | 906 | 52 |
| * | Ironwood Pharmaceuticals Inc. Class A | 3,964 | 51 |
| * | Wright Medical Group Inc. | 1,674 | 50 |
| * | Magellan Health Inc. | 894 | 50 |
| * | Neogen Corp. | 1,182 | 50 |
| * | Synageva BioPharma Corp. | 684 | 49 |
| * | Celldex Therapeutics Inc. | 3,058 | 49 |
| * | MedAssets Inc. | 2,064 | 47 |
| * | Thoratec Corp. | 1,854 | 46 |
| * | Molina Healthcare Inc. | 960 | 46 |
| * | Dyax Corp. | 4,496 | 46 |
| * | Acorda Therapeutics Inc. | 1,387 | 45 |
| * | HeartWare International Inc. | 543 | 44 |
| * | Neurocrine Biosciences Inc. | 2,608 | 43 |
| Cantel Medical Corp. | 1,133 | 41 | |
| * | Globus Medical Inc. | 2,265 | 41 |
| Kindred Healthcare Inc. | 1,979 | 41 | |
| * | Spectranetics Corp. | 1,406 | 40 |
| * | Integra LifeSciences Holdings Corp. | 795 | 40 |
| * | Novavax Inc. | 8,170 | 38 |
| * | Greatbatch Inc. | 823 | 37 |
| * | Masimo Corp. | 1,668 | 37 |
| Select Medical Holdings Corp. | 2,659 | 37 | |
| Abaxis Inc. | 775 | 37 | |
| * | ExamWorks Group Inc. | 1,123 | 37 |
| * | Portola Pharmaceuticals Inc. | 1,300 | 36 |
| * | Omnicell Inc. | 1,282 | 36 |
| * | ImmunoGen Inc. | 2,996 | 35 |
| * | ABIOMED Inc. | 1,354 | 35 |
| * | Clovis Oncology Inc. | 729 | 35 |
| * | Sangamo BioSciences Inc. | 2,399 | 34 |
| * | AVANIR Pharmaceuticals Inc. | 5,482 | 34 |
| * | BioCryst Pharmaceuticals Inc. | 2,487 | 34 |
| * | Halozyme Therapeutics Inc. | 3,465 | 33 |
| * | Veeva Systems Inc. Class A | 1,095 | 33 |
| * | Ligand Pharmaceuticals Inc. | 629 | 33 |
| * | Achillion Pharmaceuticals Inc. | 2,823 | 33 |
| * | Auxilium Pharmaceuticals Inc. | 1,746 | 32 |
| Analogic Corp. | 442 | 32 | |
| CONMED Corp. | 806 | 32 | |
| * | Depomed Inc. | 2,058 | 32 |
| * | Aegerion Pharmaceuticals Inc. | 1,028 | 31 |
| * | Endologix Inc. | 2,268 | 31 |
| * | Receptos Inc. | 599 | 31 |
| * | ICU Medical Inc. | 482 | 30 |
| * | Lannett Co. Inc. | 761 | 30 |
| * | Premier Inc. Class A | 945 | 30 |
| * | IPC The Hospitalist Co. Inc. | 615 | 30 |
| * | Sarepta Therapeutics Inc. | 1,281 | 29 |
| * | Bluebird Bio Inc. | 726 | 29 |
| * | NxStage Medical Inc. | 2,199 | 29 |
26
| Vanguard® Russell 3000 Index Fund | ||
| Schedule of Investments | ||
| August 31, 2014 | ||
| Market | ||
| Value | ||
| Shares | ($000) | |
| * Cardiovascular Systems Inc. | 981 | 28 |
| * Hanger Inc. | 1,212 | 27 |
| * Emergent Biosolutions Inc. | 1,060 | 26 |
| * Natus Medical Inc. | 938 | 26 |
| * Fluidigm Corp. | 942 | 26 |
| * Anacor Pharmaceuticals Inc. | 1,097 | 26 |
| * Theravance Biopharma Inc. | 859 | 25 |
| * Raptor Pharmaceutical Corp. | 2,233 | 25 |
| Quality Systems Inc. | 1,561 | 24 |
| * BioDelivery Sciences International Inc. | 1,514 | 24 |
| Meridian Bioscience Inc. | 1,211 | 24 |
| * Exelixis Inc. | 5,679 | 24 |
| * Tornier NV | 1,051 | 23 |
| * Arrowhead Research Corp. | 1,500 | 22 |
| * PharMerica Corp. | 866 | 22 |
| * Sagent Pharmaceuticals Inc. | 773 | 21 |
| * BioScrip Inc. | 2,485 | 21 |
| * Horizon Pharma Inc. | 2,034 | 21 |
| * Intrexon Corp. | 1,030 | 21 |
| * PTC Therapeutics Inc. | 656 | 21 |
| * Bio-Reference Laboratories Inc. | 713 | 21 |
| * Luminex Corp. | 1,091 | 21 |
| * TherapeuticsMD Inc. | 3,686 | 20 |
| * AMN Healthcare Services Inc. | 1,345 | 20 |
| * Chimerix Inc. | 780 | 20 |
| Ensign Group Inc. | 568 | 20 |
| * Anika Therapeutics Inc. | 473 | 20 |
| * KYTHERA Biopharmaceuticals Inc. | 527 | 20 |
| Computer Programs & Systems Inc. | 322 | 20 |
| * Merrimack Pharmaceuticals Inc. | 2,822 | 20 |
| * Capital Senior Living Corp. | 850 | 19 |
| * Amedisys Inc. | 923 | 19 |
| * Cambrex Corp. | 876 | 19 |
| * Quidel Corp. | 813 | 19 |
| * Zeltiq Aesthetics Inc. | 897 | 19 |
| * TESARO Inc. | 637 | 19 |
| * Insmed Inc. | 1,344 | 19 |
| * MiMedx Group Inc. | 2,653 | 19 |
| * Orexigen Therapeutics Inc. | 3,257 | 19 |
| * Agios Pharmaceuticals Inc. | 401 | 19 |
| * Cynosure Inc. Class A | 822 | 19 |
| * Inovio Pharmaceuticals Inc. | 1,742 | 18 |
| * Affymetrix Inc. | 2,077 | 18 |
| National Healthcare Corp. | 314 | 18 |
| * Orthofix International NV | 530 | 18 |
| * Accuray Inc. | 2,165 | 18 |
| * Repligen Corp. | 918 | 17 |
| * Healthways Inc. | 993 | 17 |
| * GenMark Diagnostics Inc. | 1,587 | 17 |
| * Prothena Corp. plc | 726 | 17 |
| * Gentiva Health Services Inc. | 914 | 17 |
| * Ophthotech Corp. | 410 | 16 |
| * Infinity Pharmaceuticals Inc. | 1,399 | 16 |
| * Momenta Pharmaceuticals Inc. | 1,336 | 16 |
| * Merit Medical Systems Inc. | 1,242 | 16 |
| * Spectrum Pharmaceuticals Inc. | 1,848 | 15 |
| * NewLink Genetics Corp. | 535 | 15 |
| * Omeros Corp. | 989 | 15 |
| * Sunesis Pharmaceuticals Inc. | 1,951 | 15 |
| * Insys Therapeutics Inc. | 411 | 15 |
| * Genomic Health Inc. | 488 | 14 |
| Atrion Corp. | 45 | 14 |
| Invacare Corp. | 935 | 14 |
| * Array BioPharma Inc. | 3,616 | 14 |
27
| Vanguard® Russell 3000 Index Fund | ||
| Schedule of Investments | ||
| August 31, 2014 | ||
| Market | ||
| Value | ||
| Shares | ($000) | |
| * AMAG Pharmaceuticals Inc. | 630 | 14 |
| * Providence Service Corp. | 310 | 14 |
| * Organovo Holdings Inc. | 1,809 | 14 |
| * Karyopharm Therapeutics Inc. | 390 | 14 |
| * Repros Therapeutics Inc. | 639 | 14 |
| * Epizyme Inc. | 401 | 14 |
| * CorVel Corp. | 332 | 14 |
| * OraSure Technologies Inc. | 1,623 | 14 |
| * Albany Molecular Research Inc. | 679 | 13 |
| * Accelerate Diagnostics Inc. | 659 | 13 |
| * LDR Holding Corp. | 491 | 13 |
| * Triple-S Management Corp. Class B | 692 | 13 |
| * Acceleron Pharma Inc. | 486 | 13 |
| * Enanta Pharmaceuticals Inc. | 305 | 13 |
| * Hyperion Therapeutics Inc. | 491 | 13 |
| * Relypsa Inc. | 500 | 13 |
| US Physical Therapy Inc. | 352 | 13 |
| * Sequenom Inc. | 3,368 | 12 |
| * Tetraphase Pharmaceuticals Inc. | 951 | 12 |
| * STAAR Surgical Co. | 1,070 | 12 |
| * Vanda Pharmaceuticals Inc. | 948 | 12 |
| * Vascular Solutions Inc. | 481 | 11 |
| * Progenics Pharmaceuticals Inc. | 2,001 | 11 |
| * Supernus Pharmaceuticals Inc. | 1,214 | 11 |
| * Rockwell Medical Inc. | 1,145 | 11 |
| * AtriCure Inc. | 703 | 11 |
| * SciClone Pharmaceuticals Inc. | 1,583 | 11 |
| * Geron Corp. | 4,532 | 11 |
| * Pernix Therapeutics Holdings Inc. | 1,216 | 11 |
| * Lexicon Pharmaceuticals Inc. | 6,863 | 10 |
| * AngioDynamics Inc. | 720 | 10 |
| Landauer Inc. | 278 | 10 |
| * Ultragenyx Pharmaceutical Inc. | 189 | 10 |
| * Symmetry Medical Inc. | 1,089 | 10 |
| * MacroGenics Inc. | 470 | 10 |
| * XOMA Corp. | 2,253 | 10 |
| * CTI BioPharma Corp. | 3,793 | 10 |
| * Surgical Care Affiliates Inc. | 326 | 10 |
| * Foundation Medicine Inc. | 413 | 10 |
| * LHC Group Inc. | 373 | 10 |
| * Universal American Corp. | 1,121 | 10 |
| * Synergy Pharmaceuticals Inc. | 2,344 | 9 |
| * Pacific Biosciences of California Inc. | 1,505 | 9 |
| * Chindex International Inc. | 365 | 9 |
| * RTI Surgical Inc. | 1,643 | 9 |
| * Peregrine Pharmaceuticals Inc. | 5,160 | 9 |
| * Aratana Therapeutics Inc. | 722 | 8 |
| * OncoMed Pharmaceuticals Inc. | 406 | 8 |
| * Arena Pharmaceuticals Inc. | 1,993 | 8 |
| * SurModics Inc. | 400 | 8 |
| * Galena Biopharma Inc. | 3,447 | 8 |
| Phibro Animal Health Corp. Class A | 424 | 8 |
| * Neuralstem Inc. | 1,989 | 8 |
| * XenoPort Inc. | 1,586 | 8 |
| CryoLife Inc. | 799 | 8 |
| * Cerus Corp. | 2,112 | 8 |
| * Unilife Corp. | 3,001 | 8 |
| * ZIOPHARM Oncology Inc. | 2,351 | 8 |
| * Oxford Immunotec Global plc | 539 | 8 |
| * Retrophin Inc. | 542 | 7 |
| * Immunomedics Inc. | 2,141 | 7 |
| * Intra-Cellular Therapies Inc. | 495 | 7 |
| * Osiris Therapeutics Inc. | 482 | 7 |
| * Almost Family Inc. | 241 | 7 |
28
| Vanguard® Russell 3000 Index Fund | ||
| Schedule of Investments | ||
| August 31, 2014 | ||
| Market | ||
| Value | ||
| Shares | ($000) | |
| * Five Prime Therapeutics Inc. | 575 | 7 |
| * Cellular Dynamics International Inc. | 582 | 7 |
| POZEN Inc. | 788 | 7 |
| * Exactech Inc. | 273 | 7 |
| * Akebia Therapeutics Inc. | 285 | 6 |
| * RadNet Inc. | 946 | 6 |
| * Cross Country Healthcare Inc. | 790 | 6 |
| * Cempra Inc. | 576 | 6 |
| * Durata Therapeutics Inc. | 381 | 6 |
| * Northwest Biotherapeutics Inc. | 1,028 | 6 |
| * Enzo Biochem Inc. | 991 | 6 |
| * ANI Pharmaceuticals Inc. | 199 | 6 |
| * Five Star Quality Care Inc. | 1,255 | 6 |
| * IGI Laboratories Inc. | 831 | 6 |
| * Threshold Pharmaceuticals Inc. | 1,372 | 6 |
| * Agenus Inc. | 1,798 | 6 |
| * BioTelemetry Inc. | 764 | 6 |
| * Versartis Inc. | 237 | 5 |
| * Ampio Pharmaceuticals Inc. | 1,159 | 5 |
| * CytRx Corp. | 1,614 | 5 |
| * Auspex Pharmaceuticals Inc. | 231 | 5 |
| * Heron Therapeutics Inc. | 562 | 5 |
| * Idera Pharmaceuticals Inc. | 1,744 | 5 |
| Utah Medical Products Inc. | 96 | 5 |
| * Ohr Pharmaceutical Inc. | 608 | 5 |
| * Merge Healthcare Inc. | 1,901 | 5 |
| * Castlight Health Inc. Class B | 414 | 5 |
| * Bio-Path Holdings Inc. | 2,125 | 5 |
| * AcelRx Pharmaceuticals Inc. | 682 | 5 |
| * Oncothyreon Inc. | 2,047 | 5 |
| * Derma Sciences Inc. | 554 | 5 |
| * OvaScience Inc. | 345 | 5 |
| * Pain Therapeutics Inc. | 1,104 | 5 |
| * Revance Therapeutics Inc. | 197 | 5 |
| * Xencor Inc. | 427 | 5 |
| * NanoViricides Inc. | 1,159 | 5 |
| * TG Therapeutics Inc. | 522 | 4 |
| * Corcept Therapeutics Inc. | 1,556 | 4 |
| * Mirati Therapeutics Inc. | 208 | 4 |
| * Skilled Healthcare Group Inc. | 566 | 4 |
| * Alliance HealthCare Services Inc. | 146 | 4 |
| * Alimera Sciences Inc. | 630 | 4 |
| * Alder Biopharmaceuticals Inc. | 232 | 4 |
| * NeoStem Inc. | 684 | 4 |
| * National Research Corp. Class A | 264 | 4 |
| * Aerie Pharmaceuticals Inc. | 224 | 4 |
| * K2M Group Holdings Inc. | 255 | 4 |
| * Vital Therapies Inc. | 150 | 4 |
| * Addus HomeCare Corp. | 158 | 3 |
| * BioTime Inc. | 1,066 | 3 |
| * BioSpecifics Technologies Corp. | 105 | 3 |
| * TransEnterix Inc. | 830 | 3 |
| * NanoString Technologies Inc. | 291 | 3 |
| * TriVascular Technologies Inc. | 215 | 3 |
| * Inogen Inc. | 149 | 3 |
| * Sucampo Pharmaceuticals Inc. Class A | 399 | 3 |
| * Applied Genetic Technologies Corp. | 141 | 2 |
| * Actinium Pharmaceuticals Inc. | 349 | 2 |
| * Esperion Therapeutics Inc. | 118 | 2 |
| * Veracyte Inc. | 146 | 2 |
| * Flexion Therapeutics Inc. | 132 | 2 |
| * ARIAD Pharmaceuticals Inc. | 288 | 2 |
| * Cara Therapeutics Inc. | 158 | 2 |
| * Adamas Pharmaceuticals Inc. | 85 | 2 |
29
| Vanguard® Russell 3000 Index Fund | ||
| Schedule of Investments | ||
| August 31, 2014 | ||
| Market | ||
| Value | ||
| Shares | ($000) | |
| * Regulus Therapeutics Inc. | 230 | 2 |
| * Eleven Biotherapeutics Inc. | 133 | 1 |
| * Genocea Biosciences Inc. | 113 | 1 |
| * Dicerna Pharmaceuticals Inc. | 103 | 1 |
| * Achaogen Inc. | 127 | 1 |
| * Volcano Corp. | 76 | 1 |
| * Egalet Corp. | 97 | 1 |
| * National Research Corp. Class B | 23 | 1 |
| * Verastem Inc. | 85 | 1 |
| * Dynavax Technologies Corp. | 439 | 1 |
| * VIVUS Inc. | 145 | 1 |
| * Antares Pharma Inc. | 203 | — |
| * Endocyte Inc. | 64 | — |
| * Rigel Pharmaceuticals Inc. | 149 | — |
| * Synta Pharmaceuticals Corp. | 95 | — |
| * Dendreon Corp. | 267 | — |
| * Navidea Biopharmaceuticals Inc. | 249 | — |
| * Stemline Therapeutics Inc. | 29 | — |
| * Zogenix Inc. | 201 | — |
| * Tandem Diabetes Care Inc. | 18 | — |
| * Cytokinetics Inc. | 54 | — |
| * Accretive Health Inc. | 24 | — |
| * ChemoCentryx Inc. | 37 | — |
| * Kindred Biosciences Inc. | 14 | — |
| * Galectin Therapeutics Inc. | 24 | — |
| * Cytori Therapeutics Inc. | 103 | — |
| * Regado Biosciences Inc. | 27 | — |
| 93,882 | ||
| Materials & Processing (4.4%) | ||
| Dow Chemical Co. | 38,660 | 2,070 |
| EI du Pont de Nemours & Co. | 29,487 | 1,949 |
| Monsanto Co. | 16,830 | 1,946 |
| LyondellBasell Industries NV Class A | 14,158 | 1,619 |
| Praxair Inc. | 9,406 | 1,237 |
| Freeport-McMoRan Inc. | 33,351 | 1,213 |
| Precision Castparts Corp. | 4,648 | 1,134 |
| Ecolab Inc. | 8,559 | 983 |
| PPG Industries Inc. | 4,440 | 914 |
| Air Products & Chemicals Inc. | 6,816 | 908 |
| International Paper Co. | 13,909 | 674 |
| Alcoa Inc. | 37,639 | 625 |
| Sherwin-Williams Co. | 2,765 | 603 |
| Nucor Corp. | 10,226 | 555 |
| Ingersoll-Rand plc | 8,682 | 523 |
| Mosaic Co. | 10,744 | 513 |
| Newmont Mining Corp. | 16,013 | 434 |
| Fastenal Co. | 9,532 | 432 |
| CF Industries Holdings Inc. | 1,674 | 431 |
| Eastman Chemical Co. | 4,832 | 398 |
| Sigma-Aldrich Corp. | 3,823 | 398 |
| Celanese Corp. Class A | 5,036 | 315 |
| Ball Corp. | 4,510 | 289 |
| FMC Corp. | 4,308 | 285 |
| Masco Corp. | 11,559 | 271 |
| Ashland Inc. | 2,525 | 271 |
| Vulcan Materials Co. | 4,238 | 269 |
| International Flavors & Fragrances Inc. | 2,635 | 268 |
| Airgas Inc. | 2,408 | 266 |
| Martin Marietta Materials Inc. | 2,004 | 262 |
| Sealed Air Corp. | 7,007 | 253 |
| * WR Grace & Co. | 2,478 | 245 |
| MeadWestvaco Corp. | 5,459 | 235 |
| Rock-Tenn Co. Class A | 4,582 | 225 |
| Valspar Corp. | 2,709 | 219 |
30
| Vanguard® Russell 3000 Index Fund | ||
| Schedule of Investments | ||
| August 31, 2014 | ||
| Market | ||
| Value | ||
| Shares | ($000) | |
| * Crown Holdings Inc. | 4,468 | 216 |
| Packaging Corp. of America | 3,142 | 214 |
| RPM International Inc. | 4,273 | 201 |
| Rockwood Holdings Inc. | 2,306 | 187 |
| United States Steel Corp. | 4,619 | 179 |
| Reliance Steel & Aluminum Co. | 2,496 | 175 |
| Acuity Brands Inc. | 1,408 | 174 |
| Huntsman Corp. | 6,422 | 173 |
| Eagle Materials Inc. | 1,636 | 167 |
| * Owens-Illinois Inc. | 5,362 | 165 |
| Steel Dynamics Inc. | 7,075 | 164 |
| Albemarle Corp. | 2,569 | 163 |
| Royal Gold Inc. | 2,041 | 159 |
| Southern Copper Corp. | 4,770 | 156 |
| Allegheny Technologies Inc. | 3,454 | 146 |
| Owens Corning | 3,826 | 138 |
| AptarGroup Inc. | 2,142 | 137 |
| Lennox International Inc. | 1,613 | 135 |
| Bemis Co. Inc. | 3,313 | 135 |
| Sonoco Products Co. | 3,262 | 134 |
| * Graphic Packaging Holding Co. | 10,483 | 134 |
| Westlake Chemical Corp. | 1,328 | 129 |
| * Hexcel Corp. | 3,093 | 127 |
| US Silica Holdings Inc. | 1,759 | 126 |
| Valmont Industries Inc. | 864 | 122 |
| PolyOne Corp. | 3,062 | 120 |
| NewMarket Corp. | 292 | 119 |
| Timken Co. | 2,614 | 118 |
| Cytec Industries Inc. | 1,124 | 116 |
| Cabot Corp. | 2,083 | 114 |
| Belden Inc. | 1,371 | 100 |
| Compass Minerals International Inc. | 1,109 | 99 |
| Carpenter Technology Corp. | 1,756 | 96 |
| Axiall Corp. | 2,185 | 91 |
| Sensient Technologies Corp. | 1,573 | 88 |
| * KapStone Paper and Packaging Corp. | 2,787 | 86 |
| Scotts Miracle-Gro Co. Class A | 1,471 | 85 |
| * USG Corp. | 2,920 | 85 |
| * Armstrong World Industries Inc. | 1,433 | 83 |
| * MRC Global Inc. | 3,172 | 79 |
| Domtar Corp. | 2,097 | 78 |
| * Chemtura Corp. | 3,128 | 77 |
| HB Fuller Co. | 1,600 | 75 |
| Watsco Inc. | 804 | 74 |
| * Platform Specialty Products Corp. | 2,706 | 74 |
| Silgan Holdings Inc. | 1,416 | 71 |
| Minerals Technologies Inc. | 1,124 | 70 |
| Olin Corp. | 2,572 | 70 |
| * Stillwater Mining Co. | 3,763 | 70 |
| * Rexnord Corp. | 2,391 | 70 |
| * Tahoe Resources Inc. | 2,711 | 69 |
| Worthington Industries Inc. | 1,698 | 69 |
| * Berry Plastics Group Inc. | 2,846 | 69 |
| * Polypore International Inc. | 1,504 | 67 |
| Commercial Metals Co. | 3,755 | 65 |
| * Louisiana-Pacific Corp. | 4,507 | 64 |
| TimkenSteel Corp. | 1,321 | 63 |
| Tronox Ltd. Class A | 2,006 | 61 |
| * Masonite International Corp. | 971 | 56 |
| Mueller Industries Inc. | 1,853 | 54 |
| * AK Steel Holding Corp. | 4,631 | 51 |
| Balchem Corp. | 983 | 51 |
| Greif Inc. Class A | 1,038 | 50 |
| Mueller Water Products Inc. Class A | 5,304 | 49 |
31
| Vanguard® Russell 3000 Index Fund | ||
| Schedule of Investments | ||
| August 31, 2014 | ||
| Market | ||
| Value | ||
| Shares | ($000) | |
| * Clearwater Paper Corp. | 700 | 48 |
| RBC Bearings Inc. | 772 | 48 |
| * Beacon Roofing Supply Inc. | 1,638 | 47 |
| * Rayonier Advanced Materials Inc. | 1,403 | 47 |
| Globe Specialty Metals Inc. | 2,196 | 45 |
| Schweitzer-Mauduit International Inc. | 1,049 | 45 |
| Kaiser Aluminum Corp. | 555 | 45 |
| Simpson Manufacturing Co. Inc. | 1,377 | 45 |
| * Century Aluminum Co. | 1,771 | 44 |
| Innophos Holdings Inc. | 741 | 43 |
| * Boise Cascade Co. | 1,349 | 41 |
| A Schulman Inc. | 1,009 | 39 |
| Hecla Mining Co. | 11,561 | 38 |
| * Trex Co. Inc. | 1,004 | 38 |
| PH Glatfelter Co. | 1,501 | 37 |
| Apogee Enterprises Inc. | 1,014 | 37 |
| Quaker Chemical Corp. | 465 | 36 |
| * Horsehead Holding Corp. | 1,773 | 36 |
| Innospec Inc. | 835 | 35 |
| * Resolute Forest Products Inc. | 2,043 | 35 |
| Interface Inc. Class A | 2,055 | 35 |
| * Calgon Carbon Corp. | 1,582 | 34 |
| Universal Forest Products Inc. | 707 | 33 |
| Stepan Co. | 673 | 32 |
| Neenah Paper Inc. | 585 | 32 |
| * Cabot Microelectronics Corp. | 714 | 31 |
| * Intrepid Potash Inc. | 1,982 | 30 |
| * Ferro Corp. | 2,118 | 29 |
| * Headwaters Inc. | 2,133 | 28 |
| * RTI International Metals Inc. | 916 | 27 |
| OM Group Inc. | 935 | 25 |
| AAON Inc. | 1,210 | 23 |
| Koppers Holdings Inc. | 607 | 23 |
| * LSB Industries Inc. | 557 | 22 |
| Deltic Timber Corp. | 331 | 22 |
| * Nortek Inc. | 263 | 22 |
| Schnitzer Steel Industries Inc. | 761 | 21 |
| * Taminco Corp. | 843 | 20 |
| * Kraton Performance Polymers Inc. | 964 | 20 |
| Materion Corp. | 598 | 20 |
| Quanex Building Products Corp. | 1,079 | 19 |
| * NCI Building Systems Inc. | 912 | 18 |
| Haynes International Inc. | 360 | 18 |
| * PGT Inc. | 1,694 | 18 |
| Comfort Systems USA Inc. | 1,085 | 16 |
| Myers Industries Inc. | 826 | 16 |
| LB Foster Co. Class A | 296 | 16 |
| Aceto Corp. | 797 | 15 |
| Griffon Corp. | 1,193 | 15 |
| Tredegar Corp. | 714 | 15 |
| * Rentech Inc. | 6,604 | 15 |
| NN Inc. | 500 | 15 |
| * Gibraltar Industries Inc. | 896 | 14 |
| Wausau Paper Corp. | 1,448 | 13 |
| * Unifi Inc. | 435 | 12 |
| Insteel Industries Inc. | 526 | 12 |
| * OMNOVA Solutions Inc. | 1,374 | 12 |
| * Veritiv Corp. | 240 | 11 |
| * US Concrete Inc. | 413 | 10 |
| Zep Inc. | 659 | 10 |
| * Northwest Pipe Co. | 275 | 10 |
| Hawkins Inc. | 274 | 10 |
| * Senomyx Inc. | 1,231 | 10 |
| * Stock Building Supply Holdings Inc. | 586 | 10 |
32
| Vanguard® Russell 3000 Index Fund | ||
| Schedule of Investments | ||
| August 31, 2014 | ||
| Market | ||
| Value | ||
| Shares | ($000) | |
| * Landec Corp. | 757 | 10 |
| Global Brass & Copper Holdings Inc. | 631 | 10 |
| Kronos Worldwide Inc. | 607 | 10 |
| * Builders FirstSource Inc. | 1,306 | 9 |
| FutureFuel Corp. | 634 | 9 |
| * Patrick Industries Inc. | 195 | 8 |
| Dynamic Materials Corp. | 399 | 8 |
| Chase Corp. | 188 | 7 |
| * Universal Stainless & Alloy Products Inc. | 201 | 6 |
| Olympic Steel Inc. | 265 | 6 |
| * Continental Building Products Inc. | 390 | 6 |
| * AEP Industries Inc. | 128 | 5 |
| Ampco-Pittsburgh Corp. | 249 | 5 |
| LSI Industries Inc. | 632 | 4 |
| Culp Inc. | 237 | 4 |
| Oil-Dri Corp. of America | 141 | 4 |
| * Handy & Harman Ltd. | 160 | 4 |
| * Dixie Group Inc. | 434 | 4 |
| KMG Chemicals Inc. | 238 | 4 |
| Cliffs Natural Resources Inc. | 252 | 4 |
| * UFP Technologies Inc. | 162 | 4 |
| United States Lime & Minerals Inc. | 57 | 4 |
| * Installed Building Products Inc. | 249 | 3 |
| * Shiloh Industries Inc. | 178 | 3 |
| Noranda Aluminum Holding Corp. | 499 | 2 |
| NL Industries Inc. | 197 | 2 |
| Omega Flex Inc. | 91 | 2 |
| * Coeur Mining Inc. | 171 | 1 |
| * Allied Nevada Gold Corp. | 178 | 1 |
| American Vanguard Corp. | 47 | 1 |
| * Molycorp Inc. | 302 | 1 |
| * Ply Gem Holdings Inc. | 38 | — |
| Gold Resource Corp. | 62 | — |
| * Marrone Bio Innovations Inc. | 21 | — |
| 32,073 | ||
| Other (0.0%) | ||
| * Synchrony Financial | 1,660 | 43 |
| * Catalent Inc. | 463 | 10 |
| * Leap Wireless International Inc CVR | 1,738 | 4 |
| * TerraForm Power Inc. Class A | 100 | 3 |
| * Furiex Pharmaceuticals Inc. CVR | 213 | 2 |
| * Otonomy Inc. | 63 | 1 |
| * HealthEquity Inc. | 56 | 1 |
| * El Pollo Loco Holdings Inc. | 23 | 1 |
| * Sage Therapeutics Inc. | 21 | 1 |
| * Avalanche Biotechnologies Inc. | 19 | 1 |
| * Chelsea Therapeutics International Ltd. CVR Exp. 12/31/2016 | 2,322 | — |
| * Ocular Therapeutix Inc. | 10 | — |
| * Cubist Pharmaceuticals, Inc. CVR | 1,151 | — |
| * Omthera Pharmaceuticals Inc. CVR | 152 | — |
| 67 | ||
| Producer Durables (11.3%) | ||
| General Electric Co. | 321,966 | 8,365 |
| United Technologies Corp. | 29,435 | 3,178 |
| Union Pacific Corp. | 29,084 | 3,062 |
| 3M Co. | 21,008 | 3,025 |
| Boeing Co. | 23,414 | 2,969 |
| Honeywell International Inc. | 25,144 | 2,394 |
| United Parcel Service Inc. Class B | 22,728 | 2,212 |
| Caterpillar Inc. | 20,043 | 2,186 |
| Accenture plc Class A | 20,311 | 1,646 |
33
| Vanguard® Russell 3000 Index Fund | ||
| Schedule of Investments | ||
| August 31, 2014 | ||
| Market | ||
| Value | ||
| Shares | ($000) | |
| Lockheed Martin Corp. | 8,701 | 1,514 |
| Danaher Corp. | 19,508 | 1,495 |
| Emerson Electric Co. | 22,531 | 1,442 |
| FedEx Corp. | 9,489 | 1,403 |
| Automatic Data Processing Inc. | 15,480 | 1,292 |
| General Dynamics Corp. | 9,819 | 1,210 |
| Delta Air Lines Inc. | 27,225 | 1,078 |
| Eaton Corp. plc | 15,307 | 1,069 |
| Norfolk Southern Corp. | 9,942 | 1,064 |
| CSX Corp. | 32,248 | 997 |
| Deere & Co. | 11,681 | 982 |
| Raytheon Co. | 10,045 | 968 |
| Illinois Tool Works Inc. | 10,966 | 967 |
| American Airlines Group Inc. | 23,124 | 900 |
| Northrop Grumman Corp. | 6,876 | 875 |
| Cummins Inc. | 5,905 | 857 |
| PACCAR Inc. | 11,389 | 715 |
| Southwest Airlines Co. | 22,214 | 711 |
| Waste Management Inc. | 14,942 | 702 |
| Tyco International Ltd. | 14,811 | 661 |
| Agilent Technologies Inc. | 10,706 | 612 |
| * United Continental Holdings Inc. | 11,993 | 571 |
| Parker-Hannifin Corp. | 4,782 | 552 |
| Rockwell Automation Inc. | 4,446 | 518 |
| Xerox Corp. | 37,480 | 518 |
| Roper Industries Inc. | 3,205 | 483 |
| Dover Corp. | 5,346 | 470 |
| WW Grainger Inc. | 1,872 | 461 |
| Stanley Black & Decker Inc. | 5,011 | 459 |
| Paychex Inc. | 10,452 | 435 |
| Pentair plc | 6,216 | 423 |
| AMETEK Inc. | 7,882 | 417 |
| Kansas City Southern | 3,548 | 409 |
| Fluor Corp. | 5,120 | 378 |
| * United Rentals Inc. | 3,133 | 369 |
| * Verisk Analytics Inc. Class A | 5,365 | 344 |
| Textron Inc. | 8,995 | 342 |
| Republic Services Inc. Class A | 8,563 | 337 |
| Rockwell Collins Inc. | 4,369 | 336 |
| Flowserve Corp. | 4,428 | 336 |
| CH Robinson Worldwide Inc. | 4,789 | 327 |
| * Stericycle Inc. | 2,733 | 325 |
| TransDigm Group Inc. | 1,710 | 321 |
| * IHS Inc. Class A | 2,198 | 313 |
| L-3 Communications Holdings Inc. | 2,786 | 306 |
| Pall Corp. | 3,551 | 300 |
| * B/E Aerospace Inc. | 3,406 | 289 |
| * Waters Corp. | 2,744 | 284 |
| * Trimble Navigation Ltd. | 8,440 | 281 |
| Expeditors International of Washington Inc. | 6,397 | 264 |
| Wabtec Corp. | 3,126 | 261 |
| * Quanta Services Inc. | 6,931 | 252 |
| * Mettler-Toledo International Inc. | 929 | 251 |
| Trinity Industries Inc. | 5,036 | 244 |
| * Jacobs Engineering Group Inc. | 4,301 | 232 |
| Snap-on Inc. | 1,848 | 231 |
| Hubbell Inc. Class B | 1,884 | 228 |
| Towers Watson & Co. Class A | 2,075 | 227 |
| JB Hunt Transport Services Inc. | 2,993 | 226 |
| Robert Half International Inc. | 4,474 | 225 |
| Xylem Inc. | 5,979 | 223 |
| * Kirby Corp. | 1,810 | 216 |
| Cintas Corp. | 3,205 | 212 |
| ADT Corp. | 5,569 | 205 |
34
| Vanguard® Russell 3000 Index Fund | ||
| Schedule of Investments | ||
| August 31, 2014 | ||
| Market | ||
| Value | ||
| Shares | ($000) | |
| Joy Global Inc. | 3,224 | 204 |
| Alaska Air Group Inc. | 4,388 | 203 |
| Chicago Bridge & Iron Co. NV | 3,145 | 199 |
| Iron Mountain Inc. | 5,508 | 198 |
| IDEX Corp. | 2,564 | 197 |
| Manpowergroup Inc. | 2,526 | 196 |
| Waste Connections Inc. | 3,984 | 195 |
| * Colfax Corp. | 3,032 | 193 |
| Donaldson Co. Inc. | 4,598 | 192 |
| Lincoln Electric Holdings Inc. | 2,548 | 181 |
| Pitney Bowes Inc. | 6,544 | 177 |
| Carlisle Cos. Inc. | 2,074 | 172 |
| * Spirit Airlines Inc. | 2,374 | 167 |
| * Genesee & Wyoming Inc. Class A | 1,687 | 166 |
| Nordson Corp. | 2,039 | 165 |
| Huntington Ingalls Industries Inc. | 1,590 | 162 |
| Allegion plc | 3,138 | 161 |
| * Middleby Corp. | 1,810 | 156 |
| Ryder System Inc. | 1,723 | 156 |
| FLIR Systems Inc. | 4,531 | 153 |
| Graco Inc. | 1,955 | 150 |
| * CoStar Group Inc. | 1,034 | 150 |
| SPX Corp. | 1,421 | 148 |
| * Spirit AeroSystems Holdings Inc. Class A | 3,833 | 147 |
| Avery Dennison Corp. | 3,043 | 146 |
| AGCO Corp. | 2,974 | 145 |
| ITT Corp. | 3,004 | 144 |
| MSC Industrial Direct Co. Inc. Class A | 1,520 | 137 |
| * Old Dominion Freight Line Inc. | 2,028 | 135 |
| URS Corp. | 2,224 | 135 |
| Oshkosh Corp. | 2,706 | 134 |
| Terex Corp. | 3,579 | 134 |
| Allison Transmission Holdings Inc. | 4,303 | 132 |
| Alliant Techsystems Inc. | 1,034 | 130 |
| Copa Holdings SA Class A | 1,051 | 129 |
| * Zebra Technologies Corp. | 1,641 | 128 |
| Manitowoc Co. Inc. | 4,311 | 127 |
| Air Lease Corp. Class A | 3,284 | 124 |
| * Copart Inc. | 3,610 | 124 |
| * AECOM Technology Corp. | 3,193 | 121 |
| * WESCO International Inc. | 1,437 | 121 |
| * Esterline Technologies Corp. | 1,021 | 120 |
| * Clean Harbors Inc. | 1,975 | 120 |
| * Teledyne Technologies Inc. | 1,222 | 119 |
| Triumph Group Inc. | 1,693 | 117 |
| AO Smith Corp. | 2,390 | 117 |
| Kennametal Inc. | 2,572 | 115 |
| HEICO Corp. | 2,176 | 113 |
| RR Donnelley & Sons Co. | 6,376 | 113 |
| Curtiss-Wright Corp. | 1,555 | 112 |
| Woodward Inc. | 2,131 | 111 |
| Crane Co. | 1,591 | 111 |
| Toro Co. | 1,797 | 111 |
| KBR Inc. | 4,866 | 107 |
| Exelis Inc. | 6,198 | 107 |
| National Instruments Corp. | 3,189 | 106 |
| Regal-Beloit Corp. | 1,485 | 106 |
| * Generac Holdings Inc. | 2,255 | 105 |
| Foster Wheeler AG | 3,209 | 105 |
| CLARCOR Inc. | 1,651 | 104 |
| * Darling Ingredients Inc. | 5,368 | 104 |
| Babcock & Wilcox Co. | 3,470 | 101 |
| * Moog Inc. Class A | 1,416 | 100 |
| * JetBlue Airways Corp. | 8,151 | 100 |
35
| Vanguard® Russell 3000 Index Fund | ||
| Schedule of Investments | ||
| August 31, 2014 | ||
| Market | ||
| Value | ||
| Shares | ($000) | |
| Lexmark International Inc. Class A | 1,964 | 99 |
| Landstar System Inc. | 1,453 | 99 |
| GATX Corp. | 1,461 | 97 |
| Con-way Inc. | 1,885 | 97 |
| EnerSys | 1,500 | 96 |
| Deluxe Corp. | 1,593 | 95 |
| * Genpact Ltd. | 5,278 | 92 |
| * HD Supply Holdings Inc. | 3,303 | 92 |
| EMCOR Group Inc. | 2,106 | 91 |
| MAXIMUS Inc. | 2,139 | 88 |
| Teekay Corp. | 1,424 | 87 |
| Bristow Group Inc. | 1,139 | 83 |
| Tidewater Inc. | 1,569 | 80 |
| Actuant Corp. Class A | 2,328 | 79 |
| Covanta Holding Corp. | 3,392 | 71 |
| Corporate Executive Board Co. | 1,076 | 71 |
| * Navistar International Corp. | 1,805 | 68 |
| Applied Industrial Technologies Inc. | 1,354 | 66 |
| Littelfuse Inc. | 715 | 66 |
| * Electronics For Imaging Inc. | 1,488 | 66 |
| Greenbrier Cos. Inc. | 912 | 65 |
| Convergys Corp. | 3,388 | 65 |
| * Chart Industries Inc. | 963 | 64 |
| Harsco Corp. | 2,583 | 63 |
| Rollins Inc. | 2,071 | 62 |
| Healthcare Services Group Inc. | 2,226 | 61 |
| Barnes Group Inc. | 1,737 | 59 |
| Watts Water Technologies Inc. Class A | 939 | 59 |
| * MasTec Inc. | 1,936 | 59 |
| Franklin Electric Co. Inc. | 1,542 | 59 |
| Mobile Mini Inc. | 1,492 | 58 |
| * Swift Transportation Co. | 2,737 | 58 |
| * Advisory Board Co. | 1,156 | 57 |
| Scorpio Tankers Inc. | 5,992 | 57 |
| Herman Miller Inc. | 1,918 | 57 |
| HNI Corp. | 1,494 | 57 |
| * Itron Inc. | 1,309 | 55 |
| * Proto Labs Inc. | 729 | 55 |
| United Stationers Inc. | 1,333 | 54 |
| Tetra Tech Inc. | 2,123 | 54 |
| Allegiant Travel Co. Class A | 438 | 54 |
| Booz Allen Hamilton Holding Corp. Class A | 2,419 | 54 |
| * On Assignment Inc. | 1,814 | 54 |
| * Orbital Sciences Corp. | 1,986 | 53 |
| * XPO Logistics Inc. | 1,716 | 53 |
| * Hub Group Inc. Class A | 1,208 | 53 |
| MSA Safety Inc. | 928 | 51 |
| * EnPro Industries Inc. | 756 | 51 |
| * FTI Consulting Inc. | 1,342 | 50 |
| Knight Transportation Inc. | 1,963 | 50 |
| TAL International Group Inc. | 1,122 | 50 |
| * Korn/Ferry International | 1,620 | 49 |
| ABM Industries Inc. | 1,838 | 49 |
| * WageWorks Inc. | 1,154 | 48 |
| UniFirst Corp. | 488 | 47 |
| * TriMas Corp. | 1,491 | 47 |
| * Huron Consulting Group Inc. | 777 | 47 |
| Forward Air Corp. | 1,014 | 47 |
| * OSI Systems Inc. | 671 | 47 |
| Granite Construction Inc. | 1,313 | 46 |
| * PHH Corp. | 1,924 | 46 |
| Brink's Co. | 1,644 | 45 |
| Steelcase Inc. Class A | 2,848 | 45 |
| * Measurement Specialties Inc. | 516 | 44 |
36
| Vanguard® Russell 3000 Index Fund | |||
| Schedule of Investments | |||
| August 31, 2014 | |||
| Market | |||
| Value | |||
| Shares | ($000) | ||
| Heartland Express Inc. | 1,864 | 44 | |
| * | Rush Enterprises Inc. Class A | 1,182 | 43 |
| Tennant Co. | 620 | 43 | |
| CIRCOR International Inc. | 603 | 43 | |
| Brady Corp. Class A | 1,577 | 42 | |
| H&E Equipment Services Inc. | 1,026 | 42 | |
| AZZ Inc. | 879 | 41 | |
| * | Saia Inc. | 840 | 40 |
| Matson Inc. | 1,472 | 40 | |
| G&K Services Inc. Class A | 695 | 39 | |
| * | Tutor Perini Corp. | 1,295 | 39 |
| * | TrueBlue Inc. | 1,419 | 39 |
| AAR Corp. | 1,385 | 38 | |
| Kaman Corp. | 942 | 38 | |
| Ship Finance International Ltd. | 1,933 | 38 | |
| Aircastle Ltd. | 1,985 | 38 | |
| Gulfmark Offshore Inc. | 937 | 38 | |
| Primoris Services Corp. | 1,275 | 37 | |
| * | Scorpio Bulkers Inc. | 4,619 | 37 |
| Albany International Corp. | 979 | 37 | |
| * | Dycom Industries Inc. | 1,177 | 37 |
| * | GrafTech International Ltd. | 4,112 | 36 |
| * | FARO Technologies Inc. | 606 | 35 |
| * | Wabash National Corp. | 2,426 | 34 |
| * | Astronics Corp. | 540 | 34 |
| McGrath RentCorp | 904 | 33 | |
| Werner Enterprises Inc. | 1,336 | 33 | |
| MTS Systems Corp. | 463 | 33 | |
| ArcBest Corp. | 916 | 33 | |
| *,^ | Plug Power Inc. | 5,861 | 33 |
| * | GenCorp Inc. | 1,769 | 33 |
| Cubic Corp. | 725 | 32 | |
| Sun Hydraulics Corp. | 792 | 32 | |
| GasLog Ltd. | 1,244 | 31 | |
| General Cable Corp. | 1,455 | 31 | |
| * | DXP Enterprises Inc. | 382 | 31 |
| * | Taser International Inc. | 1,895 | 30 |
| Lindsay Corp. | 376 | 29 | |
| * | Advanced Energy Industries Inc. | 1,491 | 29 |
| Raven Industries Inc. | 1,073 | 29 | |
| * | Wesco Aircraft Holdings Inc. | 1,550 | 28 |
| Briggs & Stratton Corp. | 1,411 | 28 | |
| Exponent Inc. | 388 | 28 | |
| * | Aegion Corp. Class A | 1,144 | 28 |
| * | Thermon Group Holdings Inc. | 1,032 | 28 |
| ESCO Technologies Inc. | 771 | 28 | |
| Standex International Corp. | 370 | 28 | |
| Federal Signal Corp. | 1,857 | 27 | |
| US Ecology Inc. | 629 | 27 | |
| Altra Industrial Motion Corp. | 783 | 26 | |
| * | ExlService Holdings Inc. | 952 | 26 |
| Knoll Inc. | 1,409 | 26 | |
| * | Ascent Capital Group Inc. Class A | 412 | 26 |
| Encore Wire Corp. | 603 | 26 | |
| * | ACCO Brands Corp. | 3,280 | 25 |
| * | Atlas Air Worldwide Holdings Inc. | 757 | 25 |
| Astec Industries Inc. | 603 | 25 | |
| John Bean Technologies Corp. | 845 | 25 | |
| * | UTi Worldwide Inc. | 2,652 | 24 |
| * | Team Inc. | 605 | 24 |
| * | Navigant Consulting Inc. | 1,475 | 24 |
| * | Sykes Enterprises Inc. | 1,147 | 24 |
| Hyster-Yale Materials Handling Inc. | 310 | 24 | |
| * | Hawaiian Holdings Inc. | 1,525 | 24 |
37
| Vanguard® Russell 3000 Index Fund | ||
| Schedule of Investments | ||
| August 31, 2014 | ||
| Market | ||
| Value | ||
| Shares | ($000) | |
| Nordic American Tankers Ltd. | 2,607 | 24 |
| * RPX Corp. | 1,535 | 23 |
| * Blount International Inc. | 1,437 | 23 |
| Quad/Graphics Inc. | 1,020 | 23 |
| Titan International Inc. | 1,572 | 23 |
| American Railcar Industries Inc. | 276 | 22 |
| Textainer Group Holdings Ltd. | 621 | 22 |
| Badger Meter Inc. | 419 | 22 |
| Navios Maritime Holdings Inc. | 2,296 | 22 |
| * YRC Worldwide Inc. | 914 | 21 |
| * Echo Global Logistics Inc. | 815 | 21 |
| * Roadrunner Transportation Systems Inc. | 825 | 21 |
| * Modine Manufacturing Co. | 1,396 | 20 |
| * ICF International Inc. | 575 | 19 |
| Insperity Inc. | 658 | 19 |
| * Engility Holdings Inc. | 501 | 18 |
| Resources Connection Inc. | 1,131 | 17 |
| * Aerovironment Inc. | 541 | 17 |
| Gorman-Rupp Co. | 549 | 17 |
| Multi-Color Corp. | 357 | 17 |
| Argan Inc. | 409 | 16 |
| * Monster Worldwide Inc. | 2,806 | 16 |
| Kforce Inc. | 791 | 16 |
| * PHI Inc. | 368 | 16 |
| * TeleTech Holdings Inc. | 584 | 16 |
| Kimball International Inc. Class B | 947 | 15 |
| Park-Ohio Holdings Corp. | 252 | 15 |
| Powell Industries Inc. | 275 | 15 |
| * Republic Airways Holdings Inc. | 1,420 | 14 |
| * MYR Group Inc. | 613 | 14 |
| Columbus McKinnon Corp. | 570 | 14 |
| * Quality Distribution Inc. | 1,007 | 14 |
| DHT Holdings Inc. | 2,010 | 14 |
| * Lydall Inc. | 497 | 14 |
| * Advanced Emissions Solutions Inc. | 627 | 14 |
| SkyWest Inc. | 1,518 | 14 |
| Marten Transport Ltd. | 684 | 14 |
| * Great Lakes Dredge & Dock Corp. | 1,735 | 13 |
| Forrester Research Inc. | 339 | 13 |
| Kelly Services Inc. Class A | 786 | 13 |
| Kadant Inc. | 326 | 13 |
| Douglas Dynamics Inc. | 648 | 13 |
| * Air Transport Services Group Inc. | 1,514 | 12 |
| Celadon Group Inc. | 585 | 12 |
| * TriNet Group Inc. | 454 | 12 |
| Barrett Business Services Inc. | 205 | 12 |
| Heidrick & Struggles International Inc. | 526 | 11 |
| Ennis Inc. | 764 | 11 |
| * InnerWorkings Inc. | 1,269 | 11 |
| Knightsbridge Tankers Ltd. | 887 | 11 |
| * GP Strategies Corp. | 428 | 11 |
| * ExOne Co. | 368 | 11 |
| * Power Solutions International Inc. | 157 | 11 |
| FreightCar America Inc. | 350 | 10 |
| Alamo Group Inc. | 206 | 10 |
| * Mistras Group Inc. | 463 | 10 |
| * Furmanite Corp. | 1,091 | 10 |
| Safe Bulkers Inc. | 1,125 | 10 |
| * SP Plus Corp. | 451 | 10 |
| * CAI International Inc. | 501 | 10 |
| * Kratos Defense & Security Solutions Inc. | 1,282 | 10 |
| * Ducommun Inc. | 308 | 10 |
| * Dice Holdings Inc. | 1,117 | 9 |
| * CBIZ Inc. | 1,041 | 9 |
38
| Vanguard® Russell 3000 Index Fund | ||
| Schedule of Investments | ||
| August 31, 2014 | ||
| Market | ||
| Value | ||
| Shares | ($000) | |
| Graham Corp. | 292 | 9 |
| * Maxwell Technologies Inc. | 853 | 9 |
| Baltic Trading Ltd. | 1,426 | 8 |
| Global Power Equipment Group Inc. | 496 | 8 |
| Electro Rent Corp. | 549 | 8 |
| Navios Maritime Acquisition Corp. | 2,384 | 8 |
| * Orion Marine Group Inc. | 795 | 8 |
| * CRA International Inc. | 298 | 8 |
| Twin Disc Inc. | 244 | 8 |
| Teekay Tankers Ltd. Class A | 1,818 | 8 |
| VSE Corp. | 121 | 7 |
| NACCO Industries Inc. Class A | 137 | 7 |
| * CHC Group Ltd. | 1,021 | 7 |
| Ceco Environmental Corp. | 493 | 7 |
| Ardmore Shipping Corp. | 524 | 7 |
| Houston Wire & Cable Co. | 523 | 7 |
| * Paylocity Holding Corp. | 293 | 7 |
| * Performant Financial Corp. | 691 | 7 |
| * Patriot Transportation Holding Inc. | 191 | 7 |
| * Control4 Corp. | 439 | 7 |
| CDI Corp. | 412 | 6 |
| Hurco Cos. Inc. | 188 | 6 |
| Miller Industries Inc. | 328 | 6 |
| * Energy Recovery Inc. | 1,297 | 6 |
| * Commercial Vehicle Group Inc. | 698 | 6 |
| Mesa Laboratories Inc. | 78 | 6 |
| * Vishay Precision Group Inc. | 361 | 6 |
| * Manitex International Inc. | 402 | 5 |
| * Accuride Corp. | 1,172 | 5 |
| * PRGX Global Inc. | 845 | 5 |
| Spartan Motors Inc. | 997 | 5 |
| * Casella Waste Systems Inc. Class A | 1,129 | 5 |
| * AM Castle & Co. | 511 | 5 |
| Marlin Business Services Corp. | 242 | 5 |
| * Xerium Technologies Inc. | 318 | 5 |
| Hackett Group Inc. | 758 | 5 |
| * LMI Aerospace Inc. | 303 | 5 |
| * CUI Global Inc. | 596 | 4 |
| Preformed Line Products Co. | 76 | 4 |
| * Vicor Corp. | 517 | 4 |
| * Dorian LPG Ltd. | 212 | 4 |
| * Sterling Construction Co. Inc. | 485 | 4 |
| * Heritage-Crystal Clean Inc. | 258 | 4 |
| Universal Truckload Services Inc. | 156 | 4 |
| * PAM Transportation Services Inc. | 94 | 3 |
| * Frontline Ltd. | 1,678 | 3 |
| * USA Truck Inc. | 181 | 3 |
| * Global Sources Ltd. | 470 | 3 |
| International Shipholding Corp. | 164 | 3 |
| * Vertex Energy Inc. | 341 | 3 |
| * Hill International Inc. | 699 | 3 |
| * General Finance Corp. | 320 | 3 |
| SIFCO Industries Inc. | 74 | 2 |
| * ARC Group Worldwide Inc. | 90 | 2 |
| * Ultrapetrol Bahamas Ltd. | 515 | 2 |
| * Quest Resource Holding Corp. | 372 | 1 |
| * Liquidity Services Inc. | 94 | 1 |
| * Erickson Inc. | 88 | 1 |
| * Corporate Resource Services Inc. | 504 | 1 |
| * ServiceSource International Inc. | 121 | — |
| * Layne Christensen Co. | 29 | — |
| * Titan Machinery Inc. | 24 | — |
| 81,285 | ||
39
| Vanguard® Russell 3000 Index Fund | ||
| Schedule of Investments | ||
| August 31, 2014 | ||
| Market | ||
| Value | ||
| Shares | ($000) | |
| Technology (16.1%) | ||
| Apple Inc. | 193,598 | 19,844 |
| Microsoft Corp. | 265,221 | 12,049 |
| International Business Machines Corp. | 30,373 | 5,841 |
| Intel Corp. | 159,832 | 5,581 |
| * Google Inc. Class A | 9,013 | 5,249 |
| * Google Inc. Class C | 9,119 | 5,212 |
| * Facebook Inc. Class A | 63,397 | 4,743 |
| Oracle Corp. | 105,458 | 4,380 |
| QUALCOMM Inc. | 54,194 | 4,124 |
| Cisco Systems Inc. | 164,477 | 4,110 |
| Hewlett-Packard Co. | 60,848 | 2,312 |
| EMC Corp. | 65,734 | 1,941 |
| Texas Instruments Inc. | 34,656 | 1,670 |
| * Yahoo! Inc. | 32,326 | 1,245 |
| * salesforce.com inc | 19,715 | 1,165 |
| * Adobe Systems Inc. | 15,981 | 1,149 |
| * Micron Technology Inc. | 34,368 | 1,120 |
| Applied Materials Inc. | 39,088 | 903 |
| * Cognizant Technology Solutions Corp. Class A | 19,536 | 893 |
| Corning Inc. | 42,012 | 876 |
| * Twitter Inc. | 15,385 | 765 |
| Intuit Inc. | 9,115 | 758 |
| * LinkedIn Corp. Class A | 3,349 | 756 |
| Western Digital Corp. | 7,148 | 736 |
| SanDisk Corp. | 7,263 | 712 |
| Broadcom Corp. Class A | 17,175 | 676 |
| Avago Technologies Ltd. Class A | 8,022 | 659 |
| Symantec Corp. | 22,209 | 539 |
| Amphenol Corp. Class A | 5,045 | 520 |
| Analog Devices Inc. | 10,087 | 516 |
| * SBA Communications Corp. Class A | 4,137 | 456 |
| NetApp Inc. | 10,638 | 449 |
| Motorola Solutions Inc. | 7,210 | 428 |
| KLA-Tencor Corp. | 5,333 | 408 |
| * Autodesk Inc. | 7,317 | 393 |
| * Electronic Arts Inc. | 10,121 | 383 |
| Activision Blizzard Inc. | 15,949 | 375 |
| Lam Research Corp. | 5,220 | 375 |
| * Red Hat Inc. | 6,095 | 371 |
| * Citrix Systems Inc. | 5,277 | 371 |
| Xilinx Inc. | 8,638 | 365 |
| Altera Corp. | 10,094 | 357 |
| Juniper Networks Inc. | 15,256 | 354 |
| * Equinix Inc. | 1,619 | 353 |
| NVIDIA Corp. | 17,982 | 350 |
| * Akamai Technologies Inc. | 5,736 | 347 |
| Skyworks Solutions Inc. | 6,112 | 346 |
| Linear Technology Corp. | 7,624 | 344 |
| Microchip Technology Inc. | 6,470 | 316 |
| * F5 Networks Inc. | 2,448 | 304 |
| CA Inc. | 10,344 | 292 |
| * ServiceNow Inc. | 4,667 | 285 |
| Maxim Integrated Products Inc. | 9,147 | 283 |
| Computer Sciences Corp. | 4,688 | 280 |
| * VMware Inc. Class A | 2,832 | 279 |
| * Workday Inc. Class A | 3,034 | 276 |
| Harris Corp. | 3,463 | 247 |
| * ANSYS Inc. | 2,957 | 240 |
| Amdocs Ltd. | 5,087 | 240 |
| * Teradata Corp. | 5,054 | 231 |
| * Gartner Inc. | 2,940 | 219 |
| * VeriSign Inc. | 3,830 | 219 |
| * Splunk Inc. | 3,775 | 204 |
40
| Vanguard® Russell 3000 Index Fund | ||
| Schedule of Investments | ||
| August 31, 2014 | ||
| Market | ||
| Value | ||
| Shares | ($000) | |
| * Synopsys Inc. | 4,966 | 203 |
| * Arrow Electronics Inc. | 3,190 | 199 |
| Avnet Inc. | 4,420 | 197 |
| * Stratasys Ltd. | 1,600 | 192 |
| * SunEdison Inc. | 8,643 | 190 |
| * 3D Systems Corp. | 3,522 | 188 |
| * NCR Corp. | 5,359 | 183 |
| Marvell Technology Group Ltd. | 12,929 | 180 |
| * Cree Inc. | 3,871 | 176 |
| IAC/InterActiveCorp | 2,383 | 166 |
| * Cadence Design Systems Inc. | 9,315 | 164 |
| * MICROS Systems Inc. | 2,394 | 163 |
| * Concur Technologies Inc. | 1,550 | 156 |
| Brocade Communications Systems Inc. | 14,232 | 150 |
| * PTC Inc. | 3,818 | 148 |
| * Ingram Micro Inc. | 5,072 | 146 |
| * Nuance Communications Inc. | 8,319 | 142 |
| * Palo Alto Networks Inc. | 1,653 | 141 |
| Jabil Circuit Inc. | 6,509 | 140 |
| * Yelp Inc. Class A | 1,648 | 136 |
| * ON Semiconductor Corp. | 13,867 | 135 |
| Solera Holdings Inc. | 2,209 | 135 |
| * Ultimate Software Group Inc. | 900 | 132 |
| Teradyne Inc. | 6,198 | 128 |
| * Rackspace Hosting Inc. | 3,682 | 127 |
| * ARRIS Group Inc. | 4,089 | 125 |
| * Aspen Technology Inc. | 3,013 | 124 |
| * VeriFone Systems Inc. | 3,515 | 123 |
| * Informatica Corp. | 3,523 | 120 |
| * Cognex Corp. | 2,827 | 119 |
| * NetSuite Inc. | 1,350 | 118 |
| * Atmel Corp. | 13,242 | 117 |
| * RF Micro Devices Inc. | 9,324 | 116 |
| * Fortinet Inc. | 4,460 | 115 |
| FEI Co. | 1,362 | 114 |
| * TriQuint Semiconductor Inc. | 5,454 | 113 |
| * AOL Inc. | 2,563 | 111 |
| * Groupon Inc. Class A | 15,823 | 108 |
| * TIBCO Software Inc. | 5,101 | 106 |
| * Guidewire Software Inc. | 2,247 | 102 |
| * SS&C Technologies Holdings Inc. | 2,242 | 101 |
| * Verint Systems Inc. | 1,962 | 98 |
| * Cavium Inc. | 1,733 | 97 |
| * Riverbed Technology Inc. | 5,105 | 96 |
| * Synaptics Inc. | 1,145 | 94 |
| * Tyler Technologies Inc. | 1,054 | 94 |
| DST Systems Inc. | 1,003 | 93 |
| CDW Corp. | 2,707 | 89 |
| * Knowles Corp. | 2,708 | 89 |
| * FireEye Inc. | 2,862 | 89 |
| * International Rectifier Corp. | 2,260 | 89 |
| * SolarWinds Inc. | 2,056 | 88 |
| * JDS Uniphase Corp. | 7,307 | 84 |
| * CommVault Systems Inc. | 1,476 | 81 |
| * Tech Data Corp. | 1,196 | 81 |
| Leidos Holdings Inc. | 2,136 | 80 |
| * Advanced Micro Devices Inc. | 19,273 | 80 |
| * Qlik Technologies Inc. | 2,808 | 79 |
| * Microsemi Corp. | 2,952 | 79 |
| * ViaSat Inc. | 1,377 | 78 |
| * Tableau Software Inc. Class A | 1,191 | 78 |
| Diebold Inc. | 2,025 | 77 |
| Anixter International Inc. | 859 | 77 |
| * Dealertrack Technologies Inc. | 1,705 | 76 |
41
| Vanguard® Russell 3000 Index Fund | ||
| Schedule of Investments | ||
| August 31, 2014 | ||
| Market | ||
| Value | ||
| Shares | ($000) | |
| * Dolby Laboratories Inc. Class A | 1,595 | 74 |
| * ACI Worldwide Inc. | 3,795 | 74 |
| * Aruba Networks Inc. | 3,451 | 74 |
| * Take-Two Interactive Software Inc. | 3,125 | 73 |
| * DigitalGlobe Inc. | 2,402 | 73 |
| * Fairchild Semiconductor International Inc. Class A | 4,117 | 72 |
| * Trulia Inc. | 1,165 | 72 |
| * IPG Photonics Corp. | 1,042 | 72 |
| * Manhattan Associates Inc. | 2,477 | 72 |
| * Rovi Corp. | 3,092 | 72 |
| * EchoStar Corp. Class A | 1,417 | 71 |
| * Freescale Semiconductor Ltd. | 3,339 | 70 |
| * Integrated Device Technology Inc. | 4,257 | 70 |
| * Zynga Inc. Class A | 23,467 | 68 |
| Vishay Intertechnology Inc. | 4,240 | 68 |
| * Ciena Corp. | 3,263 | 68 |
| Mentor Graphics Corp. | 3,077 | 67 |
| * IMS Health Holdings Inc. | 2,391 | 67 |
| * SYNNEX Corp. | 953 | 66 |
| Plantronics Inc. | 1,392 | 66 |
| Compuware Corp. | 6,865 | 64 |
| Science Applications International Corp. | 1,367 | 63 |
| * Sanmina Corp. | 2,675 | 63 |
| * Silicon Laboratories Inc. | 1,384 | 63 |
| * Cornerstone OnDemand Inc. | 1,674 | 63 |
| Intersil Corp. Class A | 4,146 | 62 |
| * Finisar Corp. | 3,029 | 62 |
| Monolithic Power Systems Inc. | 1,273 | 61 |
| * InvenSense Inc. | 2,349 | 61 |
| InterDigital Inc. | 1,338 | 59 |
| * Polycom Inc. | 4,450 | 59 |
| MKS Instruments Inc. | 1,736 | 59 |
| Blackbaud Inc. | 1,503 | 58 |
| * Semtech Corp. | 2,235 | 58 |
| Cypress Semiconductor Corp. | 5,170 | 57 |
| Power Integrations Inc. | 953 | 57 |
| * Entegris Inc. | 4,589 | 56 |
| * NetScout Systems Inc. | 1,192 | 55 |
| * CACI International Inc. Class A | 759 | 55 |
| * Synchronoss Technologies Inc. | 1,199 | 53 |
| * CommScope Holding Co. Inc. | 2,053 | 53 |
| * NeuStar Inc. Class A | 1,790 | 53 |
| Tessera Technologies Inc. | 1,775 | 53 |
| * Sapient Corp. | 3,612 | 52 |
| * Coherent Inc. | 812 | 52 |
| * Envestnet Inc. | 1,117 | 51 |
| * Demandware Inc. | 966 | 51 |
| * Cirrus Logic Inc. | 2,102 | 51 |
| * OmniVision Technologies Inc. | 1,839 | 50 |
| * Proofpoint Inc. | 1,247 | 50 |
| * Plexus Corp. | 1,145 | 47 |
| * Universal Display Corp. | 1,352 | 47 |
| * Rambus Inc. | 3,765 | 47 |
| * Spansion Inc. Class A | 2,090 | 47 |
| * Syntel Inc. | 520 | 46 |
| * Veeco Instruments Inc. | 1,311 | 46 |
| * Acxiom Corp. | 2,482 | 46 |
| * Ubiquiti Networks Inc. | 1,014 | 46 |
| * Benchmark Electronics Inc. | 1,837 | 45 |
| * EPAM Systems Inc. | 1,181 | 44 |
| * PMC-Sierra Inc. | 5,986 | 44 |
| * iGATE Corp. | 1,165 | 44 |
| Methode Electronics Inc. | 1,259 | 42 |
| * MicroStrategy Inc. Class A | 305 | 42 |
42
| Vanguard® Russell 3000 Index Fund | ||
| Schedule of Investments | ||
| August 31, 2014 | ||
| Market | ||
| Value | ||
| Shares | ($000) | |
| NIC Inc. | 2,246 | 42 |
| * FleetMatics Group plc | 1,274 | 42 |
| * NETGEAR Inc. | 1,250 | 42 |
| * Unisys Corp. | 1,772 | 42 |
| * Progress Software Corp. | 1,778 | 41 |
| ADTRAN Inc. | 1,737 | 40 |
| * comScore Inc. | 1,045 | 40 |
| * Cray Inc. | 1,372 | 39 |
| Monotype Imaging Holdings Inc. | 1,316 | 39 |
| * Infinera Corp. | 3,622 | 38 |
| * Rogers Corp. | 629 | 38 |
| * ScanSource Inc. | 979 | 38 |
| * Bottomline Technologies de Inc. | 1,316 | 37 |
| * Ellie Mae Inc. | 989 | 35 |
| * Loral Space & Communications Inc. | 461 | 35 |
| * iRobot Corp. | 1,007 | 33 |
| * Diodes Inc. | 1,276 | 32 |
| * Bankrate Inc. | 2,303 | 32 |
| * LogMeIn Inc. | 752 | 32 |
| Acacia Research Corp. | 1,786 | 32 |
| * Insight Enterprises Inc. | 1,208 | 32 |
| * Lattice Semiconductor Corp. | 4,200 | 32 |
| * Ambarella Inc. | 852 | 29 |
| * Web.com Group Inc. | 1,530 | 29 |
| * Virtusa Corp. | 844 | 29 |
| * Super Micro Computer Inc. | 1,155 | 28 |
| CSG Systems International Inc. | 993 | 28 |
| * Sonus Networks Inc. | 7,264 | 27 |
| * Amkor Technology Inc. | 2,587 | 27 |
| * Ruckus Wireless Inc. | 1,916 | 27 |
| * SPS Commerce Inc. | 472 | 26 |
| * RealPage Inc. | 1,632 | 26 |
| * ICG Group Inc. | 1,469 | 26 |
| * Interactive Intelligence Group Inc. | 582 | 25 |
| * Applied Micro Circuits Corp. | 2,851 | 24 |
| Sabre Corp. | 1,307 | 24 |
| * Imperva Inc. | 811 | 24 |
| * QLogic Corp. | 2,605 | 24 |
| Pegasystems Inc. | 1,015 | 23 |
| Brooks Automation Inc. | 1,970 | 22 |
| * Marketo Inc. | 741 | 22 |
| * Newport Corp. | 1,140 | 22 |
| * Ultratech Inc. | 809 | 21 |
| * II-VI Inc. | 1,490 | 21 |
| * LivePerson Inc. | 1,609 | 21 |
| * PDF Solutions Inc. | 1,016 | 20 |
| ManTech International Corp. Class A | 696 | 20 |
| * Rofin-Sinar Technologies Inc. | 825 | 20 |
| * CalAmp Corp. | 1,023 | 20 |
| * Callidus Software Inc. | 1,709 | 20 |
| * BroadSoft Inc. | 810 | 19 |
| AVX Corp. | 1,383 | 19 |
| * Tangoe Inc. | 1,347 | 19 |
| * Blucora Inc. | 1,197 | 19 |
| * Harmonic Inc. | 2,801 | 18 |
| * Fabrinet | 1,131 | 18 |
| * AVG Technologies NV | 1,030 | 18 |
| * Global Eagle Entertainment Inc. | 1,424 | 18 |
| * PROS Holdings Inc. | 694 | 18 |
| * Inphi Corp. | 1,180 | 18 |
| CTS Corp. | 978 | 17 |
| Park Electrochemical Corp. | 607 | 17 |
| Micrel Inc. | 1,362 | 17 |
| Comtech Telecommunications Corp. | 448 | 17 |
43
| Vanguard® Russell 3000 Index Fund | ||
| Schedule of Investments | ||
| August 31, 2014 | ||
| Market | ||
| Value | ||
| Shares | ($000) | |
| * Kofax Ltd. | 2,146 | 17 |
| * Perficient Inc. | 977 | 17 |
| * RetailMeNot Inc. | 891 | 17 |
| * Checkpoint Systems Inc. | 1,199 | 17 |
| * Qualys Inc. | 679 | 17 |
| * Photronics Inc. | 1,828 | 16 |
| * Comverse Inc. | 647 | 16 |
| * Textura Corp. | 551 | 16 |
| * Ixia | 1,632 | 16 |
| * Digital River Inc. | 976 | 15 |
| * Xcerra Corp. | 1,389 | 15 |
| * Extreme Networks Inc. | 2,714 | 14 |
| * Glu Mobile Inc. | 2,774 | 14 |
| * Endurance International Group Holdings Inc. | 1,058 | 14 |
| Daktronics Inc. | 1,067 | 14 |
| Ebix Inc. | 907 | 14 |
| American Science & Engineering Inc. | 239 | 14 |
| Epiq Systems Inc. | 918 | 13 |
| * Cvent Inc. | 530 | 13 |
| * E2open Inc. | 855 | 13 |
| * Emulex Corp. | 2,354 | 13 |
| Integrated Silicon Solution Inc. | 868 | 13 |
| * ePlus Inc. | 214 | 13 |
| * VASCO Data Security International Inc. | 844 | 12 |
| EarthLink Holdings Corp. | 3,010 | 12 |
| * Calix Inc. | 1,170 | 12 |
| * DTS Inc. | 507 | 12 |
| * SciQuest Inc. | 746 | 12 |
| * TTM Technologies Inc. | 1,548 | 12 |
| * ShoreTel Inc. | 1,721 | 12 |
| * Silicon Image Inc. | 2,255 | 11 |
| * GSI Group Inc. | 885 | 11 |
| * Nanometrics Inc. | 674 | 11 |
| Black Box Corp. | 473 | 11 |
| * RingCentral Inc. Class A | 830 | 11 |
| * Exar Corp. | 1,117 | 11 |
| * FormFactor Inc. | 1,575 | 11 |
| * KEYW Holding Corp. | 929 | 11 |
| * Bazaarvoice Inc. | 1,483 | 11 |
| Oplink Communications Inc. | 555 | 11 |
| * Internap Network Services Corp. | 1,564 | 11 |
| * Mercury Systems Inc. | 943 | 11 |
| * Silver Spring Networks Inc. | 1,013 | 11 |
| * Luxoft Holding Inc. Class A | 286 | 10 |
| * GrubHub Inc. | 264 | 10 |
| * Violin Memory Inc. | 2,371 | 10 |
| * CEVA Inc. | 647 | 10 |
| * NVE Corp. | 142 | 10 |
| * ChannelAdvisor Corp. | 598 | 10 |
| * Silicon Graphics International Corp. | 988 | 10 |
| * Peregrine Semiconductor Corp. | 771 | 10 |
| * Wix.com Ltd. | 570 | 9 |
| * Applied Optoelectronics Inc. | 437 | 9 |
| * Rudolph Technologies Inc. | 953 | 9 |
| * Rally Software Development Corp. | 778 | 9 |
| * ARC Document Solutions Inc. | 1,101 | 9 |
| * Zendesk Inc. | 328 | 9 |
| Cohu Inc. | 723 | 9 |
| * Intralinks Holdings Inc. | 1,124 | 9 |
| * Sparton Corp. | 299 | 9 |
| * Immersion Corp. | 814 | 9 |
| IXYS Corp. | 707 | 8 |
| * Ciber Inc. | 2,181 | 8 |
| * Lionbridge Technologies Inc. | 1,697 | 8 |
44
| Vanguard® Russell 3000 Index Fund | ||
| Schedule of Investments | ||
| August 31, 2014 | ||
| Market | ||
| Value | ||
| Shares | ($000) | |
| * Quantum Corp. | 6,202 | 8 |
| * Kopin Corp. | 1,939 | 8 |
| * Barracuda Networks Inc. | 305 | 8 |
| * Model N Inc. | 798 | 7 |
| * Seachange International Inc. | 955 | 7 |
| * M/A-COM Technology Solutions Holdings Inc. | 306 | 7 |
| * Nimble Storage Inc. | 263 | 7 |
| * Ultra Clean Holdings Inc. | 734 | 7 |
| * Zix Corp. | 1,813 | 7 |
| * Datalink Corp. | 560 | 7 |
| * Q2 Holdings Inc. | 466 | 7 |
| Bel Fuse Inc. Class B | 288 | 7 |
| * A10 Networks Inc. | 573 | 7 |
| * Marin Software Inc. | 800 | 7 |
| * Kemet Corp. | 1,313 | 7 |
| * Pericom Semiconductor Corp. | 672 | 7 |
| * MaxLinear Inc. | 708 | 7 |
| American Software Inc. Class A | 701 | 6 |
| * Cyan Inc. | 1,700 | 6 |
| * Axcelis Technologies Inc. | 3,167 | 6 |
| * Amber Road Inc. | 423 | 6 |
| * Digi International Inc. | 757 | 6 |
| * Dot Hill Systems Corp. | 1,734 | 6 |
| PC Connection Inc. | 273 | 6 |
| * Actuate Corp. | 1,384 | 6 |
| * Unwired Planet Inc. | 2,890 | 6 |
| * Aeroflex Holding Corp. | 574 | 6 |
| * OPOWER Inc. | 386 | 6 |
| * YuMe Inc. | 1,122 | 6 |
| Computer Task Group Inc. | 453 | 6 |
| Reis Inc. | 244 | 6 |
| * KVH Industries Inc. | 452 | 6 |
| * Everyday Health Inc. | 376 | 5 |
| * QuickLogic Corp. | 1,594 | 5 |
| * DSP Group Inc. | 577 | 5 |
| * Agilysys Inc. | 415 | 5 |
| Electro Scientific Industries Inc. | 697 | 5 |
| Tessco Technologies Inc. | 160 | 5 |
| * Tremor Video Inc. | 1,706 | 5 |
| * RealNetworks Inc. | 655 | 5 |
| * GTT Communications Inc. | 407 | 5 |
| Alliance Fiber Optic Products Inc. | 336 | 5 |
| * Intevac Inc. | 691 | 5 |
| * Oclaro Inc. | 2,710 | 5 |
| * Brightcove Inc. | 775 | 5 |
| * Sapiens International Corp. NV | 570 | 5 |
| * Numerex Corp. Class A | 408 | 5 |
| * TrueCar Inc. | 226 | 5 |
| * Vitesse Semiconductor Corp. | 1,392 | 5 |
| * Alpha & Omega Semiconductor Ltd. | 504 | 5 |
| * ModusLink Global Solutions Inc. | 1,086 | 4 |
| * Clearfield Inc. | 330 | 4 |
| Digimarc Corp. | 183 | 4 |
| * TeleCommunication Systems Inc. Class A | 1,390 | 4 |
| * Cinedigm Corp. Class A | 2,214 | 4 |
| * Cascade Microtech Inc. | 370 | 4 |
| * Travelzoo Inc. | 232 | 4 |
| * Carbonite Inc. | 350 | 4 |
| * Limelight Networks Inc. | 1,556 | 4 |
| * Varonis Systems Inc. | 154 | 4 |
| * Telenav Inc. | 514 | 4 |
| QAD Inc. Class A | 171 | 4 |
| * Paycom Software Inc. | 188 | 3 |
| * TechTarget Inc. | 337 | 3 |
45
| Vanguard® Russell 3000 Index Fund | ||
| Schedule of Investments | ||
| August 31, 2014 | ||
| Market | ||
| Value | ||
| Shares | ($000) | |
| * Park City Group Inc. | 276 | 3 |
| * Audience Inc. | 295 | 3 |
| * Guidance Software Inc. | 293 | 2 |
| * Rubicon Project Inc. | 230 | 2 |
| * Five9 Inc. | 353 | 2 |
| * Demand Media Inc. | 211 | 2 |
| * Mavenir Systems Inc. | 160 | 2 |
| * Aerohive Networks Inc. | 193 | 2 |
| * Turtle Beach Corp. | 203 | 1 |
| * Procera Networks Inc. | 140 | 1 |
| * Infoblox Inc. | 97 | 1 |
| * VirnetX Holding Corp. | 72 | 1 |
| * Viasystems Group Inc. | 81 | 1 |
| * Rubicon Technology Inc. | 97 | 1 |
| * Rocket Fuel Inc. | 30 | 1 |
| * Jive Software Inc. | 70 | 1 |
| * Gigamon Inc. | 44 | — |
| * Entropic Communications Inc. | 150 | — |
| * Vocera Communications Inc. | 36 | — |
| * Benefitfocus Inc. | 9 | — |
| * Millennial Media Inc. | 117 | — |
| * ParkerVision Inc. | 159 | — |
| * Multi-Fineline Electronix Inc. | 16 | — |
| * Borderfree Inc. | 9 | — |
| * Vringo Inc. | 123 | — |
| * Rightside Group Ltd. | 10 | — |
| * Revolution Lighting Technologies Inc. | 53 | — |
| * Covisint Corp. | 11 | — |
| 116,229 | ||
| Utilities (5.2%) | ||
| Verizon Communications Inc. | 132,962 | 6,624 |
| AT&T Inc. | 166,654 | 5,826 |
| Duke Energy Corp. | 22,708 | 1,680 |
| NextEra Energy Inc. | 14,004 | 1,379 |
| Dominion Resources Inc. | 18,674 | 1,311 |
| Southern Co. | 28,623 | 1,271 |
| Exelon Corp. | 27,572 | 921 |
| American Electric Power Co. Inc. | 15,671 | 842 |
| Sempra Energy | 7,880 | 835 |
| CenturyLink Inc. | 18,390 | 754 |
| PPL Corp. | 20,284 | 702 |
| PG&E Corp. | 14,923 | 694 |
| Edison International | 10,462 | 619 |
| Public Service Enterprise Group Inc. | 16,245 | 607 |
| Consolidated Edison Inc. | 9,405 | 544 |
| Xcel Energy Inc. | 16,117 | 517 |
| FirstEnergy Corp. | 13,483 | 462 |
| Northeast Utilities | 10,014 | 460 |
| Entergy Corp. | 5,762 | 446 |
| DTE Energy Co. | 5,685 | 445 |
| NiSource Inc. | 10,127 | 402 |
| AES Corp. | 23,369 | 355 |
| CenterPoint Energy Inc. | 13,853 | 344 |
| NRG Energy Inc. | 10,881 | 335 |
| Wisconsin Energy Corp. | 7,278 | 330 |
| * Calpine Corp. | 13,674 | 325 |
| Ameren Corp. | 7,837 | 313 |
| American Water Works Co. Inc. | 5,791 | 293 |
| CMS Energy Corp. | 8,735 | 267 |
| * Level 3 Communications Inc. | 5,847 | 263 |
| * T-Mobile US Inc. | 8,612 | 259 |
| OGE Energy Corp. | 6,471 | 243 |
| SCANA Corp. | 4,602 | 239 |
| Pepco Holdings Inc. | 8,170 | 225 |
46
| Vanguard® Russell 3000 Index Fund | ||
| Schedule of Investments | ||
| August 31, 2014 | ||
| Market | ||
| Value | ||
| Shares | ($000) | |
| Windstream Holdings Inc. | 19,620 | 222 |
| Frontier Communications Corp. | 32,063 | 218 |
| Alliant Energy Corp. | 3,560 | 208 |
| National Fuel Gas Co. | 2,687 | 205 |
| AGL Resources Inc. | 3,799 | 203 |
| Pinnacle West Capital Corp. | 3,543 | 202 |
| UGI Corp. | 3,694 | 196 |
| MDU Resources Group Inc. | 6,089 | 191 |
| ITC Holdings Corp. | 5,091 | 190 |
| Energen Corp. | 2,327 | 187 |
| * tw telecom inc Class A | 4,411 | 181 |
| Integrys Energy Group Inc. | 2,585 | 175 |
| Atmos Energy Corp. | 3,251 | 164 |
| Westar Energy Inc. Class A | 4,204 | 155 |
| Aqua America Inc. | 5,634 | 141 |
| TECO Energy Inc. | 7,517 | 136 |
| Questar Corp. | 5,660 | 133 |
| * Sprint Corp. | 23,606 | 132 |
| Great Plains Energy Inc. | 4,980 | 128 |
| Cleco Corp. | 1,983 | 112 |
| Vectren Corp. | 2,711 | 112 |
| * Dynegy Inc. Class A | 3,149 | 103 |
| Piedmont Natural Gas Co. Inc. | 2,547 | 95 |
| IDACORP Inc. | 1,577 | 89 |
| Portland General Electric Co. | 2,573 | 89 |
| Hawaiian Electric Industries Inc. | 3,369 | 86 |
| j2 Global Inc. | 1,576 | 84 |
| Southwest Gas Corp. | 1,474 | 77 |
| Black Hills Corp. | 1,409 | 76 |
| Telephone & Data Systems Inc. | 2,761 | 73 |
| WGL Holdings Inc. | 1,661 | 72 |
| Laclede Group Inc. | 1,413 | 70 |
| New Jersey Resources Corp. | 1,333 | 70 |
| UIL Holdings Corp. | 1,832 | 68 |
| PNM Resources Inc. | 2,556 | 67 |
| ALLETE Inc. | 1,362 | 66 |
| Avista Corp. | 1,943 | 63 |
| ONE Gas Inc. | 1,664 | 62 |
| South Jersey Industries Inc. | 1,042 | 60 |
| NorthWestern Corp. | 1,228 | 59 |
| Cogent Communications Holdings Inc. | 1,553 | 54 |
| El Paso Electric Co. | 1,338 | 53 |
| MGE Energy Inc. | 1,170 | 47 |
| Pattern Energy Group Inc. Class A | 1,339 | 43 |
| American States Water Co. | 1,321 | 43 |
| Northwest Natural Gas Co. | 929 | 42 |
| California Water Service Group | 1,649 | 40 |
| West Corp. | 1,341 | 40 |
| Empire District Electric Co. | 1,495 | 39 |
| * Globalstar Inc. | 9,541 | 38 |
| Otter Tail Corp. | 1,276 | 36 |
| NRG Yield Inc. Class A | 659 | 36 |
| Consolidated Communications Holdings Inc. | 1,423 | 35 |
| * Gogo Inc. | 1,975 | 33 |
| * Iridium Communications Inc. | 2,626 | 25 |
| * Cincinnati Bell Inc. | 6,078 | 22 |
| * Vonage Holdings Corp. | 6,088 | 21 |
| * inContact Inc. | 2,287 | 21 |
| * 8x8 Inc. | 2,559 | 20 |
| Shenandoah Telecommunications Co. | 700 | 19 |
| Chesapeake Utilities Corp. | 280 | 19 |
| * Premiere Global Services Inc. | 1,405 | 18 |
| * Intelsat SA | 960 | 17 |
| Atlantic Tele-Network Inc. | 281 | 16 |
47
| Vanguard® Russell 3000 Index Fund | |||||
| Schedule of Investments | |||||
| August 31, 2014 | |||||
| Market | |||||
| Value | |||||
| Shares | ($000) | ||||
| Ormat Technologies Inc. | 515 | 14 | |||
| * | United States Cellular Corp. | 371 | 14 | ||
| Unitil Corp. | 402 | 13 | |||
| SJW Corp. | 450 | 12 | |||
| Inteliquent Inc. | 951 | 12 | |||
| Connecticut Water Service Inc. | 315 | 10 | |||
| * | General Communication Inc. Class A | 916 | 10 | ||
| * | FairPoint Communications Inc. | 606 | 10 | ||
| Middlesex Water Co. | 462 | 9 | |||
| Spok Holdings Inc. | 631 | 9 | |||
| * | Pike Corp. | 775 | 9 | ||
| * | Hawaiian Telcom Holdco Inc. | 301 | 8 | ||
| York Water Co. | 378 | 8 | |||
| * | ORBCOMM Inc. | 1,213 | 8 | ||
| * | Pendrell Corp. | 4,896 | 8 | ||
| Enventis Corp. | 397 | 7 | |||
| IDT Corp. Class B | 447 | 7 | |||
| * | magicJack VocalTec Ltd. | 543 | 7 | ||
| Lumos Networks Corp. | 447 | 7 | |||
| NTELOS Holdings Corp. | 444 | 6 | |||
| Artesian Resources Corp. Class A | 222 | 5 | |||
| * | Boingo Wireless Inc. | 539 | 4 | ||
| Atlantic Power Corp. | 200 | 1 | |||
| 37,127 | |||||
| Total Common Stocks (Cost $570,295) | 713,886 | ||||
| Coupon | |||||
| Temporary Cash Investments (0.7%)1 | |||||
| Money Market Fund (0.6%) | |||||
| 2,3 | Vanguard Market Liquidity Fund | 0.113% | 4,418,897 | 4,419 | |
| Face | |||||
| Maturity | Amount | ||||
| Date | ($000) | ||||
| U.S. Government and Agency Obligations (0.1%) | |||||
| 4,5 | Federal Home Loan Bank Discount Notes | 0.081% | 9/12/14 | 100 | 100 |
| 4,5 | Federal Home Loan Bank Discount Notes | 0.100% | 2/4/15 | 200 | 200 |
| 300 | |||||
| Total Temporary Cash Investments (Cost $4,719) | 4,719 | ||||
| Total Investments (99.7%) (Cost $575,014) | 718,605 | ||||
| Other Assets and Liabilities—Net (0.3%)3 | 2,239 | ||||
| Net Assets (100%) | 720,844 | ||||
Securities with a market value of less than $500 are displayed with a dash.
* Non-income-producing security.
^ Includes partial security positions on loan to broker-dealers. The total value of securities on loan is $66,000.
1 The fund invests a portion of its cash reserves in equity markets through the use of index futures contracts. After giving effect to futures investments, the fund's effective common stock and temporary cash investment positions represent 99.9% and -0.2%, respectively, of net assets.
2 Affiliated money market fund available only to Vanguard funds and certain trusts and accounts managed by Vanguard. Rate shown is the 7-day yield.
3 Includes $74,000 of collateral received for securities on loan.
4 The issuer operates under a congressional charter; its securities are generally neither guaranteed by the U.S. Treasury nor backed by the full faith and credit of the U.S. government.
5 Securities with a value of $300,000 have been segregated as initial margin for open futures contracts.
REIT—Real Estate Investment Trust.
48
This page intentionally left blank.
© 2014 The Vanguard Group, Inc.
All rights reserved.
Vanguard Marketing Corporation, Distributor.
SNA18540 102014
Report of Independent Registered Public Accounting Firm
To the Board of Trustees of Vanguard Scottsdale Funds and the Shareholders of Vanguard Russell 3000 Index Fund:
In our opinion, the accompanying statement of net assets – investments summary and the related statements of operations and of changes in net assets and the financial highlights (included in Item 1 of this Form N-CSR) and the schedule of investments (included in Item 6 of this Form N-CSR) present fairly, in all material respects, the financial position of Vanguard Russell 3000 Index Fund (the "Fund") at August 31, 2014, the results of its operations for the year then ended, the changes in its net assets for each of the two years in the period then ended, and the financial highlights for each of the periods indicated, in conformity with accounting principles generally accepted in the United States of America. These financial statements, financial highlights, and schedule of investments (hereafter referred to as "financial statements") are the responsibility of the Fund's management. Our responsibility is to express an opinion on these financial statements based on our audits. We conducted our audits of these financial statements in accordance with the standards of the Public Company Accounting Oversight Board (United States). Those standards require that we plan and perform the audit to obtain reasonable assurance about whether the financial statements are free of material misstatement. An audit includes examining, on a test basis, evidence supporting the amounts and disclosures in the financial statements, assessing the accounting principles used and significant estimates made by management, and evaluating the overall financial statement presentation. We believe that our audits, which included confirmation of securities at August 31, 2014 by correspondence with the custodian and broker and by agreement to the underlying ownership records of the transfer agent, provide a reasonable basis for our opinion.

October 15, 2014
PricewaterhouseCoopers LLP, Two Commerce Square, 2001 Market Street, Suite 1700, Philadelphia, PA 19103-7042
T: (267) 330-3000, F: (267) 330-3300, www.pwc.com/us
Item 7: Disclosure of Proxy Voting Policies and Procedures for Closed-End Management Investment Companies.
Not Applicable.
Item 8: Portfolio Managers of Closed-End Management Investment Companies.
Not Applicable.
Item 9: Purchase of Equity Securities by Closed-End Management Investment Company and Affiliated Purchasers.
Not Applicable.
Item 10: Submission of Matters to a Vote of Security Holders.
Not Applicable.
Item 11: Controls and Procedures.
(a) Disclosure Controls and Procedures. The Principal Executive and Financial Officers concluded that the Registrant’s Disclosure Controls and Procedures are effective based on their evaluation of the Disclosure Controls and Procedures as of a date within 90 days of the filing date of this report.
(b) Internal Control Over Financial Reporting. There were no significant changes in Registrant’s Internal Control Over Financial Reporting or in other factors that could significantly affect this control subsequent to the date of the evaluation, including any corrective actions with regard to significant deficiencies and material weaknesses.
Item 12: Exhibits.
(a) Code of Ethics.
(b) Certifications.
Pursuant to the requirements of the Securities Exchange Act of 1934 and the Investment Company Act of 1940, the registrant has duly caused this report to be signed on its behalf by the undersigned, thereunto duly authorized.
VANGUARD SCOTTSDALE FUNDS
| |
| BY: | /s/ F. WILLIAM MCNABB III* |
| F. WILLIAM MCNABB III | |
| CHIEF EXECUTIVE OFFICER | |
Date: October 22, 2014
Pursuant to the requirements of the Securities Exchange Act of 1934 and the Investment Company Act of 1940, this report has been signed below by the following persons on behalf of the registrant and in the capacities and on the dates indicated.
VANGUARD SCOTTSDALE FUNDS
| |
| BY: | /s/ F. WILLIAM MCNABB III* |
| F. WILLIAM MCNABB III | |
| CHIEF EXECUTIVE OFFICER | |
Date: October 22, 2014
| |
VANGUARD SCOTTSDALE FUNDS
| |
| BY: | /s/ THOMAS J. HIGGINS* |
| THOMAS J. HIGGINS | |
| CHIEF FINANCIAL OFFICER | |
| Date: October 22, 2014 | |
* By: /s/ Heidi Stam
Heidi Stam, pursuant to a Power of Attorney filed on April 22, 2014 see file Number 2-17620, Incorporated by Reference.