UNITED STATES
SECURITIES AND EXCHANGE COMMISSION
Washington, D.C. 20549
FORM N-CSR
CERTIFIED SHAREHOLDER REPORT
OF
REGISTERED MANAGEMENT INVESTMENT COMPANIES
Investment Company Act file number: 811-07803
Name of Registrant: Vanguard Scottsdale Funds
Address of Registrant:
P.O. Box 2600
Valley Forge, PA 19482
Name and address of agent for service:
Heidi Stam, Esquire
P.O. Box 876
Valley Forge, PA 19482
Registrant’s telephone number, including area code: (610) 669-1000
Date of fiscal year end: August 31
Date of reporting period: September 1, 2014 – August 31, 2015
Item 1: Reports to Shareholders
Annual Report | August 31, 2015
Vanguard Explorer Value™ Fund
Vanguard’s Principles for Investing Success
We want to give you the best chance of investment success. These principles, grounded in Vanguard’s research and experience, can put you on the right path
Goals. Create clear, appropriate investment goals.
Balance. Develop a suitable asset allocation using broadly diversified funds.
Cost. Minimize cost.
Discipline. Maintain perspective and long-term discipline.
A single theme unites these principles: Focus on the things you can control.
We believe there is no wiser course for any investor.
| Contents | |
| Your Fund’s Total Returns. | 1 |
| Chairman’s Letter. | 2 |
| Advisors’ Report. | 8 |
| Fund Profile. | 12 |
| Performance Summary. | 13 |
| Financial Statements. | 15 |
| Your Fund’s After-Tax Returns. | 27 |
| About Your Fund’s Expenses. | 28 |
| Glossary. | 30 |
Please note: The opinions expressed in this report are just that—informed opinions. They should not be considered promises or advice.
Also, please keep in mind that the information and opinions cover the period through the date on the front of this report. Of course, the risks of investing in your fund are spelled out in the prospectus.
See the Glossary for definitions of investment terms used in this report.
About the cover: Pictured is a sailing block on the Brilliant, a 1932 schooner docked in Mystic, Connecticut. A type of pulley, the sailing block helps coordinate the setting of the sails. At Vanguard, the intricate coordination of technology and people allows us to help millions of clients around the world reach their financial goals.
| Your Fund’s Total Returns | ||||
| Fiscal Year Ended August 31, 2015 | ||||
| Total | ||||
| Returns | ||||
| Vanguard Explorer Value Fund | -3.12% | |||
| Russell 2500 Value Index | -4.77 | |||
| Small-Cap Value Funds Average | -4.82 | |||
| Small-Cap Value Funds Average: Derived from data provided by Lipper, a Thomson Reuters Company. | ||||
| Your Fund’s Performance at a Glance | ||||
| August 31, 2014, Through August 31, 2015 | ||||
| Distributions Per Share | ||||
| Starting | Ending | |||
| Share | Share | Income | Capital | |
| Price | Price | Dividends | Gains | |
| Vanguard Explorer Value Fund | $32.97 | $30.09 | $0.272 | $1.583 |
1

Chairman’s Letter
Dear Shareholder,
Vanguard Explorer Value Fund returned –3.12% for the 12 months ended August 31, 2015. Smaller-capitalization stocks continued to underperform large-caps. Within the small-cap arena, growth stocks outpaced their value counterparts.
The fund’s return, although negative, bettered that of its benchmark, the Russell 2500 Value Index, and the average return of small-cap value funds by more than 1.5 percentage points.
Of the nine sectors represented in the fund, five lost ground and four gained. Holdings in energy, industrials, and materials were notable detractors; health care and financials did best. (The fund had minimal exposure to the small telecommunication services sector.)
If you hold shares of the fund in a taxable account, you may wish to review the information on the fund’s after-tax returns that appears later in this report.
August’s moody markets led to flat 12-month returns
U.S. stocks generally moved in opposite

Much of the decline came in August, when stocks tumbled over fears about the global impact of China’s economic deceleration. Greece’s debt crisis, the strong U.S. dollar, perceived high valuations, and speculation over when the Federal Reserve might raise short-term interest rates also played a part. (Shortly after the close of the reporting period, the Fed announced at its September meeting that it would leave rates unchanged for the time being.)
For U.S. investors, international stocks returned about –12%, a result that would have been better if not for the dollar’s strength against many foreign currencies. China’s troubles buffeted emerging markets, which produced lower returns than the developed markets of Europe and the Pacific region.
Bonds notched more muted results as the Fed weighed rate-hike timing
The broad U.S. taxable bond market returned 1.56%. Bond prices, which generally fell slightly, received support at various times of the year from global investors looking for higher yields than those available in many other developed markets and from investors seeking shelter from stock market volatility. The yield of the 10-year Treasury note ended August at 2.18%, down from 2.34% a year earlier.
| Market Barometer | |||
| Average Annual Total Returns | |||
| Periods Ended August 31, 2015 | |||
| One | Three | Five | |
| Year | Years | Years | |
| Stocks | |||
| Russell 1000 Index (Large-caps) | 0.40% | 14.68% | 16.07% |
| Russell 2000 Index (Small-caps) | 0.03 | 14.12 | 15.55 |
| Russell 3000 Index (Broad U.S. market) | 0.36 | 14.63 | 16.03 |
| FTSE All-World ex US Index (International) | -11.50 | 5.79 | 5.17 |
| Bonds | |||
| Barclays U.S. Aggregate Bond Index (Broad taxable market) | 1.56% | 1.53% | 2.98% |
| Barclays Municipal Bond Index (Broad tax-exempt market) | 2.52 | 2.83 | 3.96 |
| Citigroup Three-Month U.S. Treasury Bill Index | 0.02 | 0.03 | 0.05 |
| CPI | |||
| Consumer Price Index | 0.20% | 1.14% | 1.77% |
3
Limited by the dollar’s strength, international bond markets (as measured by the Barclays Global Aggregate Index ex USD) returned –11.97%. International bonds returned about 3% without this currency effect.
The Fed’s 0%–0.25% target for short-term interest rates continued to restrain returns for money market funds and savings accounts.
Energy stocks were the main drivers of the fund’s mostly negative returns
After double-digit gains in the previous four fiscal years, the Explorer Value Fund retreated a few percentage points during the period. Five of the fund’s nine sectors returned about –6% or worse; three rose at least 4%, and one soared 33%.
The fund’s three advisors—Frontier Capital Management, Cardinal Capital Management, and Sterling Capital Management—use distinct but complementary approaches to identify smaller companies that they anticipate will outperform over the long term. Although its 12-month performance was negative, the fund did better than its target index, thanks to superior selection among information technology and financial stocks.
Relative performance was also helped by an underweighted position in the small-cap energy sector, which plummeted –55%. In the last year, oil prices fell nearly 50%. They faced nearly constant pressure from the high output of some leading oil-producing countries and concerns about slower growth in China, the world’s
| Expense Ratios | ||
| Your Fund Compared With Its Peer Group | ||
| Peer Group | ||
| Fund | Average | |
| Explorer Value Fund | 0.66% | 1.35% |
The fund expense ratio shown is from the prospectus dated December 23, 2014, and represents estimated costs for the current fiscal year. For the fiscal year ended August 31, 2015, the fund’s expense ratio was 0.56%. The peer-group expense ratio is derived from data provided by Lipper, a Thomson Reuters Company, and captures information through year-end 2014.
Peer group: Small-Cap Value Funds.
4
largest oil importer. At the same time, burgeoning U.S. production of natural gas helped to drive down its price by about one-third.
In this challenging environment, companies in many energy segments have been slashing billions of dollars’ worth of spending and laying off workers. Much of the brunt of the lower prices has fallen on oil and gas exploration and production companies, which returned –63% for the fund.
Industrial and materials holdings also retreated (-15% and –19%) in the face of declining commodity prices. The fund trailed the index in both sectors.
Consumer discretionary stocks were notable underperformers as well. The advisors’ selections lagged, particularly among apparel retailers and education services, and returned –6% for the fund. In the index, the sector gained 3%.
The aforementioned losses were partially offset by substantial gains among the fund’s health care stocks. Led by companies focused on biotechnology and health care equipment and supplies, the advisors’ selections returned 33%, far ahead of the sector’s return for the index. Health care stocks have generally been on a marked upswing in the past few years. The aging population requires more health care of
| Total Returns | |
| Inception Through August 31, 2015 | |
| Average | |
| Annual Return | |
| Explorer Value Fund (Returns since inception: 3/30/2010) | 12.52% |
| Russell 2500 Value Index | 11.18 |
| Small-Cap Value Funds Average | 10.16 |
| Small-Cap Value Funds Average: Derived from data provided by Lipper, a Thomson Reuters Company. |
The figures shown represent past performance, which is not a guarantee of future results. (Current performance may be lower or higher than the performance data cited. For performance data current to the most recent month-end, visit our website at vanguard.com/performance.) Note, too, that both investment returns and principal value can fluctuate widely, so an investor’s shares, when sold, could be worth more or less than their original cost.
5
all types, and in the United States, the Affordable Care Act has expanded medical insurance coverage.
The fund’s largest sector, financials, returned 6%; insurance stocks (18%) did especially well on both an absolute and a relative basis. The advisors’ information technology picks were the best performers versus the index—software and IT service holdings both returned about 23%.
For more about the advisors’ strategies and the fund’s positioning during the 12 months, see the Advisors’ Report that follows this letter.
The fund has a solid history of beating its index and peers
As shown in the table on page 5, the Explorer Value Fund has outperformed its benchmark index and competing funds for the period since its inception in 2010. It was an unusual time from a historical perspective, as the U.S. stock market rebounded vigorously from the financial crisis and Great Recession.
After enjoying a run of double-digit gains for four straight fiscal years, perhaps it’s not surprising that the fund produced a modestly negative return for the past 12 months. Throughout their history, stocks have proven to be more volatile than more conservative investments, and small-company stocks are often more unsettled than large-caps.
Although small-caps and large-caps typically take turns outperforming each other, over the past five years they have posted similar average annual returns. This is also not surprising, because the ups and downs of the market and its segments tend to revert to similar long-term averages as time goes on. That’s why we think it’s smart to keep a core part of your portfolio invested across the entire market. Vanguard Explorer Value Fund, with its focus on smaller companies that may be undervalued, can be a useful supplement to a diversified and well-balanced portfolio.
| A note on expense ratios |
| The Expense Ratios table in each shareholder report’s Chairman’s Letter displays fund expense |
| ratios from the most recent prospectus. These figures include the funds’ actual operating |
| expenses. For some funds, the figures also include “acquired fund fees and expenses,” |
| which result from the funds’ holdings in business development companies (BDCs). |
| Although the Securities and Exchange Commission requires that BDC costs be included in a |
| fund’s expense ratio, these fees are not incurred by the fund. They have no impact on a fund’s |
| total return or on its tracking error relative to an index. A footnote to the Expense Ratios table |
| reports the fund’s actual expenses for the fiscal year, a more relevant tally of the operating |
| costs incurred by shareholders. |
6
When the markets are volatile, maintaining perspective is key
Volatility returned to the stock market with a vengeance in the final weeks of August as investors worried that a slowdown in China’s economic growth could affect world markets.
This turmoil may have evoked painful memories of previous financial setbacks—memories that had been receding after more than six years of strong U.S. stock performance. Inevitably, that sort of upheaval can lead some investors to make rash moves with their portfolios.
During periods of market adversity, however, it’s more important than ever to keep sight of one of Vanguard’s key principles: Maintain perspective and long-term discipline. Whether you’re investing for yourself or on behalf of clients, your success is affected greatly by how you reactor don’t react—when the markets turn turbulent. (You can read more in Vanguard’s Principles for Investing Success at vanguard.com/research.)
As I’ve written in the past, the best course for long-term investors generally is to ignore daily market moves and not make decisions based on emotion. This is also a good time to evaluate your portfolio and make sure your asset allocation is aligned with your time horizon, goals, and risk tolerance.
The markets are unpredictable and often confounding. Keeping our long-term plans clearly in focus can be crucial as we weather these periodic storms.
As always, thank you for investing with Vanguard.
Sincerely,

F. William McNabb III
Chairman and Chief Executive Officer
September 18, 2015
7
Advisors’ Report
For the fiscal year ended August 31, 2015, Vanguard Explorer Value Fund returned –3.12%. Your fund is managed by three independent advisors, a strategy that enhances the fund’s diversification by providing exposure to distinct yet complementary investment approaches. It is not uncommon for different advisors to have different views about individual securities or the broader investment environment.
The advisors, the amount and percentage of fund assets each manages, and brief descriptions of their investment strategies are presented in the table below. The advisors have also prepared a discussion of the investment environment that existed during the 12 months and of how their portfolio positioning reflects this assessment. (Please note that the Frontier and Sterling discussions refer to industry sectors as defined by Russell classifications, rather than by the Global Industry Classification Standard used elsewhere in this report.) These comments were prepared on September 15, 2015.
| Vanguard Explorer Value Fund Investment Advisors | |||
| Fund Assets Managed | |||
| Investment Advisor | % | $ Million | Investment Strategy |
| Frontier Capital Management Co., | 33 | 96 | The advisor selects stocks by identifying companies it |
| LLC | believes are underpriced relative to their long-term | ||
| value. These companies are generally inexpensive and | |||
| have low price-to-book and price-to-earnings ratios. | |||
| Cardinal Capital Management, | 32 | 94 | The advisor seeks stocks that are able to generate |
| L.L.C. | excess cash flow and reinvest the cash to increase | ||
| shareholder value. | |||
| Sterling Capital Management LLC | 31 | 92 | The advisor searches for stocks of quality companies |
| selling at large discounts compared with their | |||
| underlying value. It defines quality stocks as those that | |||
| generate considerable cash flow, reinvest in | |||
| opportunities with attractive returns, and have a | |||
| competitive advantage within their business sector. | |||
| Cash Investments | 4 | 9 | These short-term reserves are invested by Vanguard in |
| equity index products to simulate investment in stocks. | |||
| Each advisor may also maintain a modest cash | |||
| position. | |||
8
Frontier Capital Management Co., LLC
Portfolio Managers:
Thomas W. Duncan, Jr., Senior Vice President
William A. Teichner, CFA, Senior Vice President
Our performance was helped by holdings in financial services, utilities, and technology. Our ten best stocks were spread over four sectors and included six financials, two technology companies, and one each from health care and utilities. The financials included property and casualty insurance firms along with a bank and a brokerage company.
The top contributor was HCC Insurance Holdings, a specialty insurance company that underwrites property and casualty, professional liability, and niche medical insurance policies. Japan’s largest non-life insurance company, Tokio Marine Holdings, agreed to acquire HCC for $78 in cash per share, a 38% premium to its prior-day closing price.
The portfolio’s ten largest detractors came from three sectors and included six energy holdings and two positions each in producer durables and materials and processing.
Five of the energy companies are producers of oil and natural gas, and one is a coal provider. During the period, West Texas Intermediate benchmark oil prices fell from $95.96 per barrel to $49.20, a 49% decline. Contributing factors included OPEC’s decision to not reduce its output, increased U.S. shale production, and
diminished market expectations for demand related to weaker economic growth outside the United States. Natural gas and coal prices also dropped significantly, partly because those commodities could potentially be substituted for oil in some applications.
One of the worst performers was Comstock Resources, a producer of crude oil and natural gas. Hurt by lower prices, the company suspended its dividend to preserve cash and curtailed its drilling plans.
We bought 14 new stocks in seven sectors and sold 16 holdings in eight. The net effect was an increase in consumer discretionary and financial companies and a reduction in producer durables, energy, and health care.
Cardinal Capital Management, L.L.C.
Portfolio Managers:
Eugene Fox III, Managing Partner
Robert B. Kirkpatrick, CFA, Managing Partner
Rachel D. Matthews, Partner
Despite a deteriorating outlook for China and other developing countries, prospects for moderate U.S. economic growth remained intact as employment gains and higher wages lifted consumer confidence. The Federal Reserve has not yet increased short-term interest rates despite a low unemployment rate, because inflation has remained low and the strong dollar has dampened domestic growth prospects. Accordingly, the performance of the broad domestic equity market was defensive.
9
The health care and consumer sectors rose, but energy, materials, and industrials declined.
During this period, our portion of the portfolio focused on higher-quality companies and less commodity-sensitive businesses. The main contributor to relative performance was stock selection in the technology, health care, and energy sectors. Shares of Skyworks Solutions increased as the company raised its financial guidance because of increasing radio frequency content in mobile phones and other connected devices.
The stock of Ligand Pharmaceuticals appreciated after positive news about its partnered programs and the rapid growth of Promacta and Kyprolis, its main royalty-generating drugs. The value of our energy stocks did decline, but much less than the benchmark’s. Our investment in World Fuel Services, a logistics company that benefits from higher oil price volatility and volumes, helped most.
Stock selection in the financial sector detracted from relative performance. As the Federal Reserve signaled its desire to raise interest rates, prices declined for real estate-related stocks such as owner and developer Howard Hughes Corporation.
Despite international economic and currency effects on U.S. corporate earnings, our outlook for the domestic market is cautiously optimistic. Equity valuations are not excessive. More than five years into the current economic expansion, stock prices have become
more tied to this improvement, although the pace of interest rate normalization could change that. High-quality stocks tend to perform relatively well at times of moderate economic growth. And merger and acquisition activity should remain strong while credit is available and inexpensive and domestic business conditions are favorable. The companies we hold continue to deploy their free cash flow through share repurchases, dividends, and opportunistic acquisitions, which should bode well for the future.
Sterling Capital Management LLC
Portfolio Managers:
Eduardo A. Brea, CFA, Managing Director
Timothy P. Beyer, CFA, Managing Director
After fits and starts over the past few years, U.S. economic activity appears to be broadly accelerating despite very difficult economic and geopolitical conditions around the world. We expect the Federal Reserve to raise rates this year for the first time since June 2006. Although this pending increase has been widely forecast for many years, it will profoundly affect sector valuations.
Income-oriented stocks such as utilities, master limited partnerships, and real estate investment trusts will be challenged to produce positive total returns as interest rate yields rise. We are significantly underweighted in these areas. Falling unemployment rates and low gasoline prices should provide a strong boost to
10
consumer spending. We are significantly overweighted in many consumer retail businesses that are trading at depressed multiples. In financial services, rising rates will aid our overweighted positions in banking, insurance, and capital markets-oriented businesses.
We also have increasing exposure to chemical, industrial, steel, and energy companies that have been caught in the global commodity collapse triggered by a slowing Chinese economy and strong U.S. dollar. Finally, we believe stock selection—the bedrock of our value-added investment process over the long term—will continue to add value. Our largest sector overweighting is in consumer discretionary, and the largest underweighting is in utilities.
Our portfolio is built one stock at a time with well-financed, cash-generating businesses that have opportunities to grow their intrinsic value at a competitive rate. We measure intrinsic value using a variety of tools (including discounted cash flow, sum-of-parts evaluation, and private/public market comparisons) and buy these businesses when there is a significant discount between a company’s stock price and its intrinsic value. The portfolio is exceptionally well-positioned for higher interest rates and an accelerating economic environment. We believe these conditions are already occurring in the United States and will eventually gain hold internationally.
11
| Explorer Value Fund | |||
| Fund Profile | |||
| As of August 31, 2015 | |||
| Portfolio Characteristics | |||
| Russell | DJ | ||
| 2500 | U.S. Total | ||
| Value | Market | ||
| Fund | Index | FA Index | |
| Number of Stocks | 178 | 1,664 | 3,828 |
| Median Market Cap | $2.5B | $3.3B | $47.2B |
| Price/Earnings Ratio | 22.7x | 22.0x | 20.8x |
| Price/Book Ratio | 1.6x | 1.5x | 2.6x |
| Return on Equity | 10.7% | 8.9% | 17.1% |
| Earnings Growth | |||
| Rate | 6.4% | 8.4% | 10.2% |
| Dividend Yield | 1.7% | 2.3% | 2.1% |
| Foreign Holdings | 0.8% | 0.0% | 0.0% |
| Turnover Rate | 35% | — | — |
| Ticker Symbol | VEVFX | — | — |
| Expense Ratio1 | 0.66% | — | — |
| 30-Day SEC Yield | 1.00% | — | — |
| Short-Term Reserves | 3.4% | — | — |
| Sector Diversification (% of equity exposure) | |||
| DJ | |||
| U.S. | |||
| Russell | Total | ||
| 2500 | Market | ||
| Value | FA | ||
| Fund | Index | Index | |
| Consumer Discretionary | 12.6% | 9.2% | 13.5% |
| Consumer Staples | 2.0 | 2.8 | 8.4 |
| Energy | 3.4 | 6.3 | 6.6 |
| Financials | 34.7 | 39.2 | 18.2 |
| Health Care | 6.1 | 4.7 | 15.0 |
| Industrials | 16.1 | 13.6 | 10.7 |
| Information Technology | 15.4 | 9.3 | 19.1 |
| Materials | 6.8 | 5.7 | 3.3 |
| Telecommunication | |||
| Services | 0.1 | 0.9 | 2.2 |
| Utilities | 2.8 | 8.3 | 3.0 |
| Volatility Measures | ||
| Russell | DJ | |
| 2500 | U.S. Total | |
| Value | Market | |
| Index | FA Index | |
| R-Squared | 0.95 | 0.79 |
| Beta | 1.02 | 1.07 |
These measures show the degree and timing of the fund’s fluctuations compared with the indexes over 36 months.
| Ten Largest Holdings (% of total net assets) | ||
| Ligand Pharmaceuticals | ||
| Inc. | Biotechnology | 1.7% |
| Endurance Specialty | ||
| Holdings Ltd. | Reinsurance | 1.7 |
| American Capital Ltd. | Asset Management | |
| & Custody Banks | 1.3 | |
| PacWest Bancorp | Regional Banks | 1.3 |
| Popular Inc. | Regional Banks | 1.3 |
| Howard Hughes Corp. | Real Estate | |
| Development | 1.2 | |
| KAR Auction Services | Diversified Support | |
| Inc. | Services | 1.2 |
| Ascena Retail Group Inc. Apparel Retail | 1.2 | |
| Knowles Corp. | Electronic | |
| Components | 1.1 | |
| Willis Group Holdings plc Insurance Brokers | 1.1 | |
| Top Ten | 13.1% | |
The holdings listed exclude any temporary cash investments and equity index products.
Investment Focus

1 The expense ratio shown is from the prospectus dated December 23, 2014, and represents estimated costs for the current fiscal year. For the fiscal year ended August 31, 2015, the expense ratio was 0.56%.
12
Explorer Value Fund
Performance Summary
All of the returns in this report represent past performance, which is not a guarantee of future results that may be achieved by the fund. (Current performance may be lower or higher than the performance data cited. For performance data current to the most recent month-end, visit our website at vanguard.com/performance.) Note, too, that both investment returns and principal value can fluctuate widely, so an investor’s shares, when sold, could be worth more or less than their original cost. The returns shown do not reflect taxes that a shareholder would pay on fund distributions or on the sale of fund shares.
Cumulative Performance: March 30, 2010, Through August 31, 2015
Initial Investment of $10,000
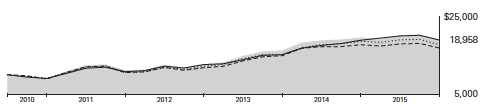
| Average Annual Total Returns | ||||
| Periods Ended August 31, 2015 | ||||
| Since | Final Value | |||
| One | Five | Inception | of a $10,000 | |
| Year | Years | (3/30/2010) | Investment | |
| Explorer Value Fund | -3.12% | 15.95% | 12.52% | $18,958 |
| Russell 2500 Value Index | -4.77 | 14.42 | 11.18 | 17,762 |
| Small-Cap Value Funds Average | -4.82 | 13.72 | 10.16 | 16,901 |
| Dow Jones U.S. Total Stock Market | ||||
| Float Adjusted Index | 0.29 | 16.01 | 12.53 | 18,963 |
Small-Cap Value Funds Average: Derived from data provided by Lipper, a Thomson Reuters Company.
"Since Inception" performance is calculated from the inception date for both the fund and its comparative standards.
See Financial Highlights for dividend and capital gains information.
13
Explorer Value Fund
Fiscal-Year Total Returns (%): March 30, 2010, Through August 31, 2015
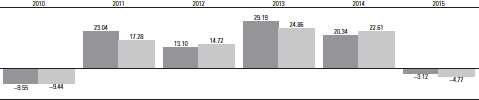
| Explorer Value Fund |
| Russell 2500 Value Index |
Average Annual Total Returns: Periods Ended June 30, 2015
This table presents returns through the latest calendar quarter—rather than through the end of the fiscal period.
Securities and Exchange Commission rules require that we provide this information.
| Inception | One | Five | Since | |
| Date | Year | Years | Inception | |
| Explorer Value Fund | 3/30/2010 | 2.29% | 17.64% | 14.52% |
14
Explorer Value Fund
Financial Statements
Statement of Net Assets
As of August 31, 2015
The fund reports a complete list of its holdings in regulatory filings four times in each fiscal year, at the quarter-ends. For the second and fourth fiscal quarters, the lists appear in the fund’s semiannual and annual reports to shareholders. For the first and third fiscal quarters, the fund files the lists with the Securities and Exchange Commission on Form N-Q. Shareholders can look up the fund’s Forms N-Q on the SEC’s website at sec.gov. Forms N-Q may also be reviewed and copied at the SEC’s Public Reference Room (see the back cover of this report for further information).
| Market | |||
| Value• | |||
| Shares | ($000) | ||
| Common Stocks (93.6%)1 | |||
| Consumer Discretionary (11.6%) | |||
| * | Ascena Retail Group Inc. | 285,881 | 3,451 |
| Chico’s FAS Inc. | 187,126 | 2,790 | |
| * | Crocs Inc. | 188,407 | 2,775 |
| Six Flags | |||
| Entertainment Corp. | 58,200 | 2,617 | |
| MDC Partners Inc. Class A | 128,525 | 2,524 | |
| Lithia Motors Inc. Class A | 21,700 | 2,313 | |
| * | News Corp. Class B | 138,755 | 1,919 |
| Interpublic Group of | |||
| Cos. Inc. | 101,150 | 1,910 | |
| Wendy’s Co. | 188,427 | 1,716 | |
| American Eagle | |||
| Outfitters Inc. | 91,686 | 1,560 | |
| * | Modine Manufacturing Co. | 161,821 | 1,437 |
| DSW Inc. Class A | 46,583 | 1,383 | |
| Guess? Inc. | 53,935 | 1,192 | |
| Gentex Corp. | 75,400 | 1,169 | |
| Kohl’s Corp. | 20,315 | 1,037 | |
| * | Regis Corp. | 90,525 | 981 |
| Meredith Corp. | 17,675 | 835 | |
| * | Career Education Corp. | 219,353 | 814 |
| * | LGI Homes Inc. | 28,750 | 749 |
| * | Skullcandy Inc. | 75,443 | 530 |
| * | Global Eagle | ||
| Entertainment Inc. | 17,263 | 203 | |
| 33,905 | |||
| Consumer Staples (1.8%) | |||
| Pinnacle Foods Inc. | 32,500 | 1,457 | |
| *,^ | Elizabeth Arden Inc. | 114,725 | 1,265 |
| * | Central Garden & Pet Co. | ||
| Class A | 99,029 | 1,253 | |
| * | Medifast Inc. | 40,800 | 1,133 |
| 5,108 | |||
| Energy (3.2%) | |||
| * | Concho Resources Inc. | 24,300 | 2,628 |
| World Fuel Services Corp. | 63,700 | 2,462 | |
| * | Carrizo Oil & Gas Inc. | 42,884 | 1,562 |
| Market | |||
| Value• | |||
| Shares | ($000) | ||
| Noble Corp. plc | 96,350 | 1,255 | |
| * | Bill Barrett Corp. | 136,443 | 746 |
| * | Cloud Peak Energy Inc. | 87,880 | 420 |
| Denbury Resources Inc. | 82,125 | 357 | |
| 9,430 | |||
| Financials (33.1%) | |||
| Endurance Specialty | |||
| Holdings Ltd. | 79,086 | 5,042 | |
| * | American Capital Ltd. | 281,756 | 3,919 |
| PacWest Bancorp | 89,345 | 3,810 | |
| * | Popular Inc. | 127,722 | 3,750 |
| * | Howard Hughes Corp. | 28,600 | 3,592 |
| Willis Group Holdings plc | 71,200 | 3,068 | |
| Selective Insurance | |||
| Group Inc. | 92,266 | 2,798 | |
| Argo Group International | |||
| Holdings Ltd. | 49,242 | 2,757 | |
| Leucadia National Corp. | 128,100 | 2,749 | |
| Starwood Property | |||
| Trust Inc. | 127,000 | 2,703 | |
| * | Navigators Group Inc. | 34,944 | 2,657 |
| Ryman Hospitality | |||
| Properties Inc. | 51,090 | 2,617 | |
| Columbia Banking | |||
| System Inc. | 85,600 | 2,595 | |
| * | Forest City Enterprises Inc. | ||
| Class A | 112,400 | 2,420 | |
| Assured Guaranty Ltd. | 94,575 | 2,389 | |
| WSFS Financial Corp. | 85,977 | 2,367 | |
| Medical Properties | |||
| Trust Inc. | 200,900 | 2,344 | |
| Aspen Insurance | |||
| Holdings Ltd. | 50,804 | 2,332 | |
| * | E*TRADE Financial Corp. | 83,450 | 2,194 |
| First Horizon National Corp. | 149,125 | 2,167 | |
| Renasant Corp. | 67,992 | 2,131 | |
| * | Enstar Group Ltd. | 14,525 | 2,122 |
| * | Markel Corp. | 2,475 | 2,039 |
| Hersha Hospitality Trust | |||
| Class A | 79,225 | 1,936 | |
15
| Explorer Value Fund | |||
| Market | |||
| Value• | |||
| Shares | ($000) | ||
| First Midwest Bancorp Inc. | 106,805 | 1,884 | |
| Gaming and Leisure | |||
| Properties Inc. | 60,200 | 1,863 | |
| Flushing Financial Corp. | 92,953 | 1,854 | |
| Two Harbors | |||
| Investment Corp. | 194,600 | 1,841 | |
| * | Affiliated Managers | ||
| Group Inc. | 9,600 | 1,790 | |
| Lincoln National Corp. | 33,925 | 1,723 | |
| BGC Partners Inc. Class A | 189,300 | 1,660 | |
| Washington Federal Inc. | 68,829 | 1,562 | |
| United Financial | |||
| Bancorp Inc. | 120,000 | 1,506 | |
| Starwood Waypoint | |||
| Residential Trust | 59,740 | 1,439 | |
| National Retail | |||
| Properties Inc. | 41,012 | 1,425 | |
| First Citizens BancShares | |||
| Inc. Class A | 5,925 | 1,405 | |
| Parkway Properties Inc. | 79,777 | 1,264 | |
| Great Western Bancorp Inc. | 40,200 | 1,012 | |
| HCC Insurance Holdings Inc. | 12,742 | 985 | |
| * | FNFV Group | 67,895 | 982 |
| Investment Technology | |||
| Group Inc. | 58,625 | 963 | |
| Campus Crest | |||
| Communities Inc. | 162,499 | 840 | |
| EPR Properties | 14,800 | 753 | |
| Ares Capital Corp. | 46,600 | 735 | |
| James River Group | |||
| Holdings Ltd. | 24,377 | 673 | |
| * | Bancorp Inc. | 78,650 | 577 |
| Berkshire Hills Bancorp Inc. | 18,850 | 527 | |
| Pinnacle Financial | |||
| Partners Inc. | 8,884 | 421 | |
| * | KCG Holdings Inc. Class A | 21,000 | 241 |
| 96,423 | |||
| Health Care (5.1%) | |||
| * | Ligand Pharmaceuticals Inc. | 54,850 | 5,043 |
| * | Allscripts Healthcare | ||
| Solutions Inc. | 206,200 | 2,839 | |
| * | Akorn Inc. | 47,900 | 1,906 |
| * | Laboratory Corp. of | ||
| America Holdings | 16,025 | 1,888 | |
| * | Myriad Genetics Inc. | 34,738 | 1,305 |
| * | Merit Medical Systems Inc. | 41,224 | 938 |
| * | Globus Medical Inc. | 34,900 | 852 |
| 14,771 | |||
| Industrials (15.3%) | |||
| KAR Auction Services Inc. | 95,400 | 3,534 | |
| * | FTI Consulting Inc. | 74,944 | 2,987 |
| BWX Technologies Inc. | 110,200 | 2,922 | |
| * | Teledyne Technologies Inc. | 23,142 | 2,266 |
| Market | |||
| Value• | |||
| Shares | ($000) | ||
| * | Roadrunner Transportation | ||
| Systems Inc. | 89,400 | 1,938 | |
| * | Clean Harbors Inc. | 38,700 | 1,901 |
| Tetra Tech Inc. | 71,700 | 1,863 | |
| * | Genesee & Wyoming Inc. | ||
| Class A | 27,200 | 1,860 | |
| EnPro Industries Inc. | 38,850 | 1,843 | |
| HNI Corp. | 33,714 | 1,576 | |
| * | Beacon Roofing Supply Inc. | 42,585 | 1,544 |
| * | Babcock & Wilcox | ||
| Enterprises Inc. | 77,500 | 1,430 | |
| * | UTi Worldwide Inc. | 198,075 | 1,410 |
| * | Hertz Global Holdings Inc. | 74,125 | 1,366 |
| Kaman Corp. | 34,000 | 1,320 | |
| Brady Corp. Class A | 48,058 | 1,055 | |
| Celadon Group Inc. | 54,336 | 1,037 | |
| * | Mistras Group Inc. | 69,975 | 1,024 |
| * | Saia Inc. | 26,642 | 1,000 |
| Elbit Systems Ltd. | 12,850 | 986 | |
| * | Jacobs Engineering | ||
| Group Inc. | 23,600 | 954 | |
| AGCO Corp. | 17,625 | 864 | |
| MSA Safety Inc. | 17,602 | 800 | |
| Encore Wire Corp. | 24,133 | 784 | |
| * | MRC Global Inc. | 57,935 | 753 |
| Harsco Corp. | 62,633 | 724 | |
| Briggs & Stratton Corp. | 36,192 | 723 | |
| * | WESCO International Inc. | 12,524 | 701 |
| Primoris Services Corp. | 34,934 | 642 | |
| Altra Industrial Motion Corp. | 23,904 | 598 | |
| CEB Inc. | 7,700 | 551 | |
| * | Furmanite Corp. | 82,724 | 519 |
| Timken Co. | 15,300 | 486 | |
| * | Performant Financial Corp. | 176,401 | 459 |
| Copa Holdings SA Class A | 4,600 | 236 | |
| 44,656 | |||
| Information Technology (14.3%) | |||
| *,^ | Knowles Corp. | 196,475 | 3,199 |
| * | ACI Worldwide Inc. | 114,000 | 2,432 |
| * | II-VI Inc. | 141,450 | 2,389 |
| j2 Global Inc. | 29,100 | 2,025 | |
| * | Itron Inc. | 64,874 | 1,946 |
| Jabil Circuit Inc. | 87,563 | 1,694 | |
| Western Union Co. | 87,375 | 1,611 | |
| * | ON Semiconductor Corp. | 166,798 | 1,594 |
| Convergys Corp. | 70,200 | 1,587 | |
| IAC/InterActiveCorp | 22,400 | 1,564 | |
| * | QLogic Corp. | 144,709 | 1,496 |
| Ingram Micro Inc. | 55,286 | 1,496 | |
| * | Anixter International Inc. | 23,500 | 1,496 |
| * | Insight Enterprises Inc. | 55,655 | 1,409 |
| * | Orbotech Ltd. | 80,200 | 1,336 |
| * | NCR Corp. | 50,350 | 1,263 |
| * | MicroStrategy Inc. Class A | 5,975 | 1,187 |
| DST Systems Inc. | 11,455 | 1,173 | |
16
| Explorer Value Fund | |||
| Market | |||
| Value• | |||
| Shares | ($000) | ||
| * | Fairchild Semiconductor | ||
| International Inc. Class A | 84,928 | 1,155 | |
| Global Payments Inc. | 9,700 | 1,081 | |
| * | DHI Group Inc. | 121,050 | 944 |
| InterDigital Inc. | 18,850 | 933 | |
| * | Virtusa Corp. | 15,287 | 809 |
| * | NETGEAR Inc. | 26,609 | 808 |
| * | Ciber Inc. | 219,334 | 750 |
| * | Semtech Corp. | 37,463 | 635 |
| Pericom | |||
| Semiconductor Corp. | 49,682 | 605 | |
| American Software Inc. | |||
| Class A | 62,700 | 574 | |
| Littelfuse Inc. | 6,063 | 544 | |
| * | Integrated Device | ||
| Technology Inc. | 26,009 | 494 | |
| * | Kulicke & Soffa | ||
| Industries Inc. | 45,275 | 478 | |
| * | Ultratech Inc. | 25,413 | 437 |
| * | Lattice Semiconductor Corp. | 76,972 | 322 |
| * | NeuStar Inc. Class A | 9,050 | 253 |
| 41,719 | |||
| Materials (6.6%) | |||
| Silgan Holdings Inc. | 52,800 | 2,765 | |
| * | Chemtura Corp. | 90,825 | 2,470 |
| Schnitzer Steel | |||
| Industries Inc. | 115,701 | 2,003 | |
| Compass Minerals | |||
| International Inc. | 20,200 | 1,636 | |
| FMC Corp. | 37,400 | 1,582 | |
| Eagle Materials Inc. | 17,582 | 1,439 | |
| * | Kraton Performance | ||
| Polymers Inc. | 63,556 | 1,342 | |
| * | Boise Cascade Co. | 34,127 | 1,107 |
| Cytec Industries Inc. | 13,622 | 1,011 | |
| Axiall Corp. | 35,850 | 906 | |
| PH Glatfelter Co. | 39,827 | 719 | |
| Cabot Corp. | 20,199 | 684 | |
| TimkenSteel Corp. | 30,575 | 546 | |
| * | LSB Industries Inc. | 20,305 | 486 |
| Albemarle Corp. | 10,300 | 466 | |
| 19,162 | |||
| Utilities (2.6%) | |||
| Portland General Electric Co. | 55,940 | 1,932 | |
| Westar Energy Inc. Class A | 48,504 | 1,773 | |
| Unitil Corp. | 35,443 | 1,276 | |
| Southwest Gas Corp. | 19,651 | 1,083 | |
| Piedmont Natural | |||
| Gas Co. Inc. | 22,319 | 861 | |
| MDU Resources Group Inc. | 36,621 | 656 | |
| 7,581 | |||
| Total Common Stocks | |||
| (Cost $244,240) | 272,755 | ||
| Market | ||
| Value• | ||
| Shares | ($000) | |
| Temporary Cash Investments (6.9%)1 | ||
| Money Market Fund (6.7%) | ||
| 2,3 Vanguard Market | ||
| Liquidity Fund, 0.168% | 19,338,402 | 19,338 |
| Face | ||
| Amount | ||
| ($000) | ||
| U.S. Government and Agency Obligations (0.2%) | ||
| 4,5 Federal Home Loan | ||
| Bank Discount | ||
| Notes, 0.100%, 10/23/15 | 600 | 600 |
| Total Temporary Cash Investments | ||
| (Cost $19,938) | 19,938 | |
| Total Investments (100.5%) | ||
| (Cost $264,178) | 292,693 | |
| Amount | ||
| ($000) | ||
| Other Assets and Liabilities (-0.5%) | ||
| Other Assets | ||
| Investment in Vanguard | 28 | |
| Receivables for Investment Securities Sold | 479 | |
| Receivables for Accrued Income | 259 | |
| Receivables for Capital Shares Issued | 298 | |
| Total Other Assets | 1,064 | |
| Liabilities | ||
| Payables for Investment | ||
| Securities Purchased | (420) | |
| Collateral for Securities on Loan | (1,008) | |
| Payables to Investment Advisor | (268) | |
| Payables for Capital Shares Redeemed | (409) | |
| Payables to Vanguard | (327) | |
| Other Liabilities | (52) | |
| Total Liabilities | (2,484) | |
| Net Assets (100%) | ||
| Applicable to 9,680,525 outstanding | ||
| $.001 par value shares of beneficial | ||
| interest (unlimited authorization) | 291,273 | |
| Net Asset Value Per Share | $30.09 | |
17
Explorer Value Fund
| At August 31, 2015, net assets consisted of: | |
| Amount | |
| ($000) | |
| Paid-in Capital | 248,098 |
| Undistributed Net Investment Income | 679 |
| Accumulated Net Realized Gains | 14,719 |
| Unrealized Appreciation (Depreciation) | |
| Investment Securities | 28,515 |
| Futures Contracts | (738) |
| Net Assets | 291,273 |
• See Note A in Notes to Financial Statements.
* Non-income-producing security.
^ Includes partial security positions on loan to broker-dealers. The total value of securities on loan is $949,000.
1 The fund invests a portion of its cash reserves in equity markets through the use of index futures contracts. After giving effect to futures investments, the fund’s effective common stock and temporary cash investment positions represent 96.7% and 3.8%, respectively, of net assets.
2 Affiliated money market fund available only to Vanguard funds and certain trusts and accounts managed by Vanguard. Rate shown is the 7-day yield.
3 Includes $1,008,000 of collateral received for securities on loan.
4 The issuer operates under a congressional charter; its securities are generally neither guaranteed by the U.S. Treasury nor backed by the full faith and credit of the U.S. government.
5 Securities with a value of $600,000 have been segregated as initial margin for open futures contracts.
See accompanying Notes, which are an integral part of the Financial Statements.
18
| Explorer Value Fund | |
| Statement of Operations | |
| Year Ended | |
| August 31, 2015 | |
| ($000) | |
| Investment Income | |
| Income | |
| Dividends | 4,031 |
| Interest1 | 25 |
| Securities Lending | 105 |
| Total Income | 4,161 |
| Expenses | |
| Investment Advisory Fees—Note B | |
| Basic Fee | 1,097 |
| Performance Adjustment | (64) |
| The Vanguard Group—Note C | |
| Management and Administrative | 589 |
| Marketing and Distribution | 55 |
| Custodian Fees | 15 |
| Auditing Fees | 44 |
| Shareholders’ Reports | 5 |
| Trustees’ Fees and Expenses | 1 |
| Total Expenses | 1,742 |
| Net Investment Income | 2,419 |
| Realized Net Gain (Loss) | |
| Investment Securities Sold | 16,925 |
| Futures Contracts | 994 |
| Realized Net Gain (Loss) | 17,919 |
| Change in Unrealized Appreciation (Depreciation) | |
| Investment Securities | (29,391) |
| Futures Contracts | (836) |
| Change in Unrealized Appreciation (Depreciation) | (30,227) |
| Net Increase (Decrease) in Net Assets Resulting from Operations | (9,889) |
| 1 Interest income from an affiliated company of the fund was $24,000. | |
See accompanying Notes, which are an integral part of the Financial Statements.
19
| Explorer Value Fund | ||
| Statement of Changes in Net Assets | ||
| Year Ended August 31, | ||
| 2015 | 2014 | |
| ($000) | ($000) | |
| Increase (Decrease) in Net Assets | ||
| Operations | ||
| Net Investment Income | 2,419 | 2,254 |
| Realized Net Gain (Loss) | 17,919 | 20,418 |
| Change in Unrealized Appreciation (Depreciation) | (30,227) | 25,447 |
| Net Increase (Decrease) in Net Assets Resulting from Operations | (9,889) | 48,119 |
| Distributions | ||
| Net Investment Income | (2,556) | (1,328) |
| Realized Capital Gain1 | (14,878) | (16,137) |
| Total Distributions | (17,434) | (17,465) |
| Capital Share Transactions | ||
| Issued | 53,864 | 132,062 |
| Issued in Lieu of Cash Distributions | 16,524 | 16,457 |
| Redeemed | (74,410) | (78,509) |
| Net Increase (Decrease) from Capital Share Transactions | (4,022) | 70,010 |
| Total Increase (Decrease) | (31,345) | 100,664 |
| Net Assets | ||
| Beginning of Period | 322,618 | 221,954 |
| End of Period2 | 291,273 | 322,618 |
1 Includes fiscal 2015 and 2014 short-term gain distributions totaling $4,803,000 and $5,516,000, respectively. Short-term gain distributions are treated as ordinary income dividends for tax purposes.
2 Net Assets—End of Period includes undistributed (overdistributed) net investment income of $679,000 and $1,064,000.
See accompanying Notes, which are an integral part of the Financial Statements.
20
| Explorer Value Fund | |||||
| Financial Highlights | |||||
| For a Share Outstanding | Year Ended August 31, | ||||
| Throughout Each Period | 2015 | 2014 | 2013 | 2012 | 2011 |
| Net Asset Value, Beginning of Period | $32.97 | $29.39 | $23.44 | $21.94 | $18.09 |
| Investment Operations | |||||
| Net Investment Income | .259 | .251 | .255 | .232 | .190 |
| Net Realized and Unrealized Gain (Loss) | |||||
| on Investments | (1.284) | 5.539 | 6.429 | 2.476 | 3.991 |
| Total from Investment Operations | (1.025) | 5.790 | 6.684 | 2.708 | 4.181 |
| Distributions | |||||
| Dividends from Net Investment Income | (.272) | (.168) | (. 290) | (.189) | (.135) |
| Distributions from Realized Capital Gains | (1.583) | (2.042) | (. 444) | (1.019) | (.196) |
| Total Distributions | (1.855) | (2.210) | (.734) | (1.208) | (.331) |
| Net Asset Value, End of Period | $30.09 | $32.97 | $29.39 | $23.44 | $21.94 |
| Total Return1 | -3.12% | 20.34% | 29.19% | 13.10% | 23.04% |
| Ratios/Supplemental Data | |||||
| Net Assets, End of Period (Millions) | $291 | $323 | $222 | $123 | $116 |
| Ratio of Total Expenses to Average Net Assets2 | 0.56% | 0.57% | 0.60% | 0.59% | 0.57% |
| Ratio of Net Investment Income to | |||||
| Average Net Assets | 0.78% | 0.83% | 0.88% | 1.00% | 0.82% |
| Portfolio Turnover Rate | 35% | 36% | 46% | 38% | 41% |
1 Total returns do not include account service fees that may have applied in the periods shown. Fund prospectuses provide information about any applicable account service fees.
2 Includes performance-based investment advisory fee increases (decreases) of (0.02%), (0.02%), 0.04%, 0.03%, and 0.01%.
See accompanying Notes, which are an integral part of the Financial Statements.
21
Explorer Value Fund
Notes to Financial Statements
Vanguard Explorer Value Fund is registered under the Investment Company Act of 1940 as an open-end investment company, or mutual fund.
A. The following significant accounting policies conform to generally accepted accounting principles for U.S. investment companies. The fund consistently follows such policies in preparing its financial statements.
1. Security Valuation: Securities are valued as of the close of trading on the New York Stock Exchange (generally 4 p.m., Eastern time) on the valuation date. Equity securities are valued at the latest quoted sales prices or official closing prices taken from the primary market in which each security trades; such securities not traded on the valuation date are valued at the mean of the latest quoted bid and asked prices. Securities for which market quotations are not readily available, or whose values have been materially affected by events occurring before the fund’s pricing time but after the close of the securities’ primary markets, are valued by methods deemed by the board of trustees to represent fair value. Investments in Vanguard Market Liquidity Fund are valued at that fund’s net asset value. Temporary cash investments acquired over 60 days to maturity are valued using the latest bid prices or using valuations based on a matrix system (which considers such factors as security prices, yields, maturities, and ratings), both as furnished by independent pricing services. Other temporary cash investments are valued at amortized cost, which approximates market value.
2. Futures Contracts: The fund uses index futures contracts to a limited extent, with the objective of maintaining full exposure to the stock market while maintaining liquidity. The fund may purchase or sell futures contracts to achieve a desired level of investment, whether to accommodate portfolio turnover or cash flows from capital share transactions. The primary risks associated with the use of futures contracts are imperfect correlation between changes in market values of stocks held by the fund and the prices of futures contracts, and the possibility of an illiquid market. Counterparty risk involving futures is mitigated because a regulated clearinghouse is the counterparty instead of the clearing broker. To further mitigate counterparty risk, the fund trades futures contracts on an exchange, monitors the financial strength of its clearing brokers and clearinghouse, and has entered into clearing agreements with its clearing brokers. The clearinghouse imposes initial margin requirements to secure the fund’s performance and requires daily settlement of variation margin representing changes in the market value of each contract.
Futures contracts are valued at their quoted daily settlement prices. The aggregate settlement values of the contracts are not recorded in the Statement of Net Assets. Fluctuations in the value of the contracts are recorded in the Statement of Net Assets as an asset (liability) and in the Statement of Operations as unrealized appreciation (depreciation) until the contracts are closed, when they are recorded as realized futures gains (losses).
During the year ended August 31, 2015, the fund’s average investments in long and short futures contracts represented 3% and 0% of net assets, respectively, based on the average of aggregate settlement values at each quarter-end during the period.
3. Federal Income Taxes: The fund intends to continue to qualify as a regulated investment company and distribute all of its taxable income. Management has analyzed the fund’s tax positions taken for all open federal income tax years (August 31, 2012–2015), and has concluded that no provision for federal income tax is required in the fund’s financial statements.
4. Distributions: Distributions to shareholders are recorded on the ex-dividend date.
22
Explorer Value Fund
5. Securities Lending: To earn additional income, the fund lends its securities to qualified institutional borrowers. Security loans are required to be secured at all times by collateral in an amount at least equal to the market value of securities loaned. Daily market fluctuations could cause the value of loaned securities to be more or less than the value of the collateral received. When this occurs, the collateral is adjusted and settled on the next business day. The fund further mitigates its counterparty risk by entering into securities lending transactions only with a diverse group of prequalified counter-parties, monitoring their financial strength, and entering into master securities lending agreements with its counterparties. The master securities lending agreements provide that, in the event of a counterparty’s default (including bankruptcy), the fund may terminate any loans with that borrower, determine the net amount owed, and sell or retain the collateral up to the net amount owed to the fund; however, such actions may be subject to legal proceedings. While collateral mitigates counter-party risk, in the absence of a default the fund may experience delays and costs in recovering the securities loaned. The fund invests cash collateral received in Vanguard Market Liquidity Fund, and records a liability in the Statement of Net Assets for the return of the collateral, during the period the securities are on loan. Securities lending income represents fees charged to borrowers plus income earned on invested cash collateral, less expenses associated with the loan.
6. Credit Facility: The fund and certain other funds managed by The Vanguard Group (“Vanguard”) participate in a $3 billion committed credit facility provided by a syndicate of lenders pursuant to a credit agreement that may be renewed annually; each fund is individually liable for its borrowings, if any, under the credit facility. Borrowings may be utilized for temporary and emergency purposes, and are subject to the fund’s regulatory and contractual borrowing restrictions. The participating funds are charged administrative fees and an annual commitment fee of 0.06% of the undrawn amount of the facility; these fees are allocated to the funds based on a method approved by the fund’s board of trustees and included in Management and Administrative expenses on the fund’s Statement of Operations. Any borrowings under this facility bear interest at a rate equal to the higher of the federal funds rate or LIBOR reference rate plus an agreed-upon spread.
The fund had no borrowings outstanding at August 31, 2015, or at any time during the period then ended.
7. Other: Dividend income is recorded on the ex-dividend date. Interest income includes income distributions received from Vanguard Market Liquidity Fund and is accrued daily. Premiums and discounts on debt securities purchased are amortized and accreted, respectively, to interest income over the lives of the respective securities. Security transactions are accounted for on the date securities are bought or sold. Costs used to determine realized gains (losses) on the sale of investment securities are those of the specific securities sold.
B. The investment advisory firms Frontier Capital Management Co., LLC, Cardinal Capital Management, L.L.C., and Sterling Capital Management LLC each provide investment advisory services to a portion of the fund for a fee calculated at an annual percentage rate of average net assets managed by the advisor. The basic fee of Frontier Capital Management Co., LLC, is subject to quarterly adjustments based on performance relative to the Russell 2000 Value Index for the preceding three years. The basic fee of Cardinal Capital Management, L.L.C., is subject to quarterly adjustments based on performance relative to the Russell Mid-Cap Value Custom Cap-Range Index for periods prior to March 1, 2015, and the new benchmark, Russell 3000 Value Custom Index, beginning March 1, 2015, for the preceding five years. The new benchmark will be fully phased in by February 2018. The basic fee of Sterling Capital Management LLC is subject to quarterly adjustments based on performance relative to the Russell 2500 Value Index for the preceding three years.
23
Explorer Value Fund
Vanguard manages the cash reserves of the fund as described below.
For the year ended August 31, 2015, the investment advisory fee represented an effective annual basic rate of 0.36% of the fund’s average net assets before a decrease of $64,000 (0.02%) based on performance.
C. In accordance with the terms of a Funds’ Service Agreement (the “FSA”) between Vanguard and the fund, Vanguard furnishes to the fund corporate management, administrative, marketing, distribution and cash management services at Vanguard’s cost of operations (as defined by the FSA). These costs of operations are allocated to the fund based on methods and guidelines approved by the board of trustees. Vanguard does not require reimbursement in the current period for certain costs of operations (such as deferred compensation/benefits and risk/insurance costs); the fund’s liability for these costs of operations is included in Payables to Vanguard on the Statement of Net Assets.
Upon the request of Vanguard, the fund may invest up to 0.40% of its net assets as capital in Vanguard. At August 31, 2015, the fund had contributed to Vanguard capital in the amount of $28,000, representing 0.01% of the fund’s net assets and 0.01% of Vanguard’s capitalization. The fund’s trustees and officers are also directors and employees, respectively, of Vanguard.
D. Various inputs may be used to determine the value of the fund’s investments. These inputs are summarized in three broad levels for financial statement purposes. The inputs or methodologies used to value securities are not necessarily an indication of the risk associated with investing in those securities.
Level 1—Quoted prices in active markets for identical securities.
Level 2—Other significant observable inputs (including quoted prices for similar securities, interest rates, prepayment speeds, credit risk, etc.).
Level 3—Significant unobservable inputs (including the fund’s own assumptions used to determine the fair value of investments).
The following table summarizes the market value of the fund’s investments as of August 31, 2015, based on the inputs used to value them:
| Level 1 | Level 2 | Level 3 | |
| Investments | ($000) | ($000) | ($000) |
| Common Stocks | 272,755 | — | — |
| Temporary Cash Investments | 19,338 | 600 | — |
| Futures Contracts—Liabilities1 | (51) | — | — |
| Total | 292,042 | 600 | — |
| 1 Represents variation margin on the last day of the reporting period. |
E. At August 31, 2015, the aggregate settlement value of open futures contracts and the related unrealized appreciation (depreciation) were:
| ($000) | ||||
| Aggregate | ||||
| Number of | Settlement | Unrealized | ||
| Long (Short) | Value | Appreciation | ||
| Futures Contracts | Expiration | Contracts | Long (Short) | (Depreciation) |
| E-mini Russell 2000 Index | September 2015 | 78 | 9,029 | (738) |
24
Explorer Value Fund
Unrealized appreciation (depreciation) on open futures contracts is required to be treated as realized gain (loss) for tax purposes.
F. Distributions are determined on a tax basis and may differ from net investment income and realized capital gains for financial reporting purposes. Differences may be permanent or temporary. Permanent differences are reclassified among capital accounts in the financial statements to reflect their tax character. Temporary differences arise when certain items of income, expense, gain, or loss are recognized in different periods for financial statement and tax purposes. These differences will reverse at some time in the future. Differences in classification may also result from the treatment of short-term gains as ordinary income for tax purposes.
The fund used a tax accounting practice to treat a portion of the price of capital shares redeemed during the year as distributions from net investment income and realized capital gains. Accordingly, the fund has reclassified $248,000 from undistributed net investment income, and $2,141,000 from accumulated net realized gains, to paid-in capital.
For tax purposes, at August 31, 2015, the fund had $1,246,000 of ordinary income and $13,726,000 of long-term capital gains available for distribution.
At August 31, 2015, the cost of investment securities for tax purposes was $264,178,000. Net unrealized appreciation of investment securities for tax purposes was $28,515,000, consisting of unrealized gains of $48,407,000 on securities that had risen in value since their purchase and $19,892,000 in unrealized losses on securities that had fallen in value since their purchase.
G. During the year ended August 31, 2015, the fund purchased $102,626,000 of investment securities and sold $124,959,000 of investment securities, other than temporary cash investments.
H. Capital shares issued and redeemed were:
| Year Ended August 31, | ||
| 2015 | 2014 | |
| Shares | Shares | |
| (000) | (000) | |
| Issued | 1,703 | 4,163 |
| Issued in Lieu of Cash Distributions | 548 | 542 |
| Redeemed | (2,356) | (2,471) |
| Net Increase (Decrease) in Shares Outstanding | (105) | 2,234 |
I. Management has determined that no material events or transactions occurred subsequent to August 31, 2015, that would require recognition or disclosure in these financial statements.
25
Report of Independent Registered Public Accounting Firm
To the Board of Trustees of Vanguard Scottsdale Funds and the Shareholders of Vanguard Explorer Value Fund: In our opinion, the accompanying statement of net assets and the related statements of operations and of changes in net assets and the financial highlights present fairly, in all material respects, the financial position of Vanguard Explorer Value Fund (constituting a separate portfolio of Vanguard Scottsdale Funds, hereafter referred to as the “Fund”) at August 31, 2015, the results of its operations for the year then ended, the changes in its net assets for each of the two years in the period then ended, and the financial highlights for each of the five years in the period then ended, in conformity with accounting principles generally accepted in the United States of America. These financial statements and financial highlights (hereafter referred to as “financial statements”) are the responsibility of the Fund’s management. Our responsibility is to express an opinion on these financial statements based on our audits. We conducted our audits of these financial statements in accordance with the standards of the Public Company Accounting Oversight Board (United States). Those standards require that we plan and perform the audit to obtain reasonable assurance about whether the financial statements are free of material misstatement. An audit includes examining, on a test basis, evidence supporting the amounts and disclosures in the financial statements, assessing the accounting principles used and significant estimates made by management, and evaluating the overall financial statement presentation. We believe that our audits, which included confirmation of securities at August 31, 2015 by correspondence with the custodian and brokers, by agreement to the underlying ownership records of the transfer agent and the application of alternative auditing procedures where securities purchased had not been received, provide a reasonable basis for our opinion.
/s/PricewaterhouseCoopers LLP
Philadelphia, Pennsylvania
October 12, 2015
| Special 2015 tax information (unaudited) for Vanguard Explorer Value Fund |
| This information for the fiscal year ended August 31, 2015, is included pursuant to provisions of the |
| Internal Revenue Code. |
| The fund distributed $12,188,000 as capital gain dividends (from net long-term capital gains) to |
| shareholders during the fiscal year. |
| For nonresident alien shareholders, 100% of short-term capital gain dividends distributed by the fund |
| are qualified short-term capital gains. |
| The fund distributed $2,457,000 of qualified dividend income to shareholders during the fiscal year. |
| For corporate shareholders, 94.5% of investment income (dividend income plus short-term gains, if |
| any) qualifies for the dividends-received deduction. |
26
Your Fund’s After-Tax Returns
This table presents returns for your fund both before and after taxes. The after-tax returns are shown in two ways: (1) assuming that an investor owned the fund during the entire period and paid taxes on the fund’s distributions, and (2) assuming that an investor paid taxes on the fund’s distributions and sold all shares at the end of each period.
Calculations are based on the highest individual federal income tax and capital gains tax rates in effect at the times of the distributions and the hypothetical sales. State and local taxes were not considered. After-tax returns reflect any qualified dividend income, using actual prior-year figures and estimates for 2015. (In the example, returns after the sale of fund shares may be higher than those assuming no sale. This occurs when the sale would have produced a capital loss. The calculation assumes that the investor received a tax deduction for the loss.)
Please note that your actual after-tax returns will depend on your tax situation and may differ from those shown. Also note that if you own the fund in a tax-deferred account, such as an individual retirement account or a 401(k) plan, this information does not apply to you. Such accounts are not subject to current taxes.
Finally, keep in mind that a fund’s performance—whether before or after taxes—does not guarantee future results.
| Average Annual Total Returns: Explorer Value Fund | |||
| Periods Ended August 31, 2015 | |||
| Since | |||
| One | Five | Inception | |
| Year | Years | (3/30/2010) | |
| Returns Before Taxes | -3.12% | 15.95% | 12.52% |
| Returns After Taxes on Distributions | -4.77 | 14.53 | 11.25 |
| Returns After Taxes on Distributions and Sale of Fund Shares | -0.97 | 12.53 | 9.74 |
27
About Your Fund’s Expenses
As a shareholder of the fund, you incur ongoing costs, which include costs for portfolio management, administrative services, and shareholder reports (like this one), among others. Operating expenses, which are deducted from a fund’s gross income, directly reduce the investment return of the fund.
A fund’s expenses are expressed as a percentage of its average net assets. This figure is known as the expense ratio. The following examples are intended to help you understand the ongoing costs (in dollars) of investing in your fund and to compare these costs with those of other mutual funds. The examples are based on an investment of $1,000 made at the beginning of the period shown and held for the entire period.
The accompanying table illustrates your fund’s costs in two ways:
• Based on actual fund return. This section helps you to estimate the actual expenses that you paid over the period. The ”Ending Account Value“ shown is derived from the fund‘s actual return, and the third column shows the dollar amount that would have been paid by an investor who started with $1,000 in the fund. You may use the information here, together with the amount you invested, to estimate the expenses that you paid over the period.
To do so, simply divide your account value by $1,000 (for example, an $8,600 account value divided by $1,000 = 8.6), then multiply the result by the number given for your fund under the heading ”Expenses Paid During Period.“
• Based on hypothetical 5% yearly return. This section is intended to help you compare your fund‘s costs with those of other mutual funds. It assumes that the fund had a yearly return of 5% before expenses, but that the expense ratio is unchanged. In this case—because the return used is not the fund’s actual return—the results do not apply to your investment. The example is useful in making comparisons because the Securities and Exchange Commission requires all mutual funds to calculate expenses based on a 5% return. You can assess your fund’s costs by comparing this hypothetical example with the hypothetical examples that appear in shareholder reports of other funds.
Note that the expenses shown in the table are meant to highlight and help you compare ongoing costs only and do not reflect transaction costs incurred by the fund for buying and selling securities. Further, the expenses do not include any purchase, redemption, or account service fees described in the fund prospectus. If such fees were applied to your account, your costs would be higher. Your fund does not carry a “sales load.”
The calculations assume no shares were bought or sold during the period. Your actual costs may have been higher or lower, depending on the amount of your investment and the timing of any purchases or redemptions.
You can find more information about the fund’s expenses, including annual expense ratios, in the Financial Statements section of this report. For additional information on operating expenses and other shareholder costs, please refer to your fund’s current prospectus.
28
| Six Months Ended August 31, 2015 | |||
| Beginning | Ending | Expenses | |
| Account Value | Account Value | Paid During | |
| Explorer Value Fund | 2/28/2015 | 8/31/2015 | Period |
| Based on Actual Fund Return | $1,000.00 | $942.08 | $2.79 |
| Based on Hypothetical 5% Yearly Return | 1,000.00 | 1,022.33 | 2.91 |
The calculations are based on expenses incurred in the most recent six-month period. The fund’s annualized six-month expense ratio for that period is 0.57%. The dollar amounts shown as “Expenses Paid” are equal to the annualized expense ratio multiplied by the average account value over the period, multiplied by the number of days in the most recent six-month period, then divided by the number of days in the most recent 12-month period (184/365).
29
Glossary
30-Day SEC Yield. A fund’s 30-day SEC yield is derived using a formula specified by the U.S. Securities and Exchange Commission. Under the formula, data related to the fund’s security holdings in the previous 30 days are used to calculate the fund’s hypothetical net income for that period, which is then annualized and divided by the fund’s estimated average net assets over the calculation period. For the purposes of this calculation, a security’s income is based on its current market yield to maturity (for bonds), its actual income (for asset-backed securities), or its projected dividend yield (for stocks). Because the SEC yield represents hypothetical annualized income, it will differ—at times significantly—from the fund’s actual experience. As a result, the fund’s income distributions may be higher or lower than implied by the SEC yield.
Beta. A measure of the magnitude of a fund’s past share-price fluctuations in relation to the ups and downs of a given market index. The index is assigned a beta of 1.00. Compared with a given index, a fund with a beta of 1.20 typically would have seen its share price rise or fall by 12% when the index rose or fell by 10%. For this report, beta is based on returns over the past 36 months for both the fund and the index. Note that a fund’s beta should be reviewed in conjunction with its R-squared (see definition). The lower the R-squared, the less correlation there is between the fund and the index, and the less reliable beta is as an indicator of volatility.
Dividend Yield. Dividend income earned by stocks, expressed as a percentage of the aggregate market value (or of net asset value, for a fund). The yield is determined by dividing the amount of the annual dividends by the aggregate value (or net asset value) at the end of the period. For a fund, the dividend yield is based solely on stock holdings and does not include any income produced by other investments.
Earnings Growth Rate. The average annual rate of growth in earnings over the past five years for the stocks now in a fund.
Equity Exposure. A measure that reflects a fund’s investments in stocks and stock futures. Any holdings in short-term reserves are excluded.
Expense Ratio. A fund’s total annual operating expenses expressed as a percentage of the fund’s average net assets. The expense ratio includes management and administrative expenses, but does not include the transaction costs of buying and selling portfolio securities.
Foreign Holdings. The percentage of a fund represented by securities or depositary receipts of companies based outside the United States.
Inception Date. The date on which the assets of a fund (or one of its share classes) are first invested in accordance with the fund’s investment objective. For funds with a subscription period, the inception date is the day after that period ends. Investment performance is measured from the inception date.
Median Market Cap. An indicator of the size of companies in which a fund invests; the midpoint of market capitalization (market price x shares outstanding) of a fund’s stocks, weighted by the proportion of the fund’s assets invested in each stock. Stocks representing half of the fund’s assets have market capitalizations above the median, and the rest are below it.
Price/Book Ratio. The share price of a stock divided by its net worth, or book value, per share. For a fund, the weighted average price/book ratio of the stocks it holds.
30
Price/Earnings Ratio. The ratio of a stock’s current price to its per-share earnings over the past year. For a fund, the weighted average P/E of the stocks it holds. P/E is an indicator of market expectations about corporate prospects; the higher the P/E, the greater the expectations for a company’s future growth.
R-Squared. A measure of how much of a fund’s past returns can be explained by the returns from the market in general, as measured by a given index. If a fund’s total returns were precisely synchronized with an index’s returns, its R-squared would be 1.00. If the fund’s returns bore no relationship to the index’s returns, its R-squared would be 0. For this report, R-squared is based on returns over the past 36 months for both the fund and the index.
Return on Equity. The annual average rate of return generated by a company during the past five years for each dollar of shareholder’s equity (net income divided by shareholder’s equity). For a fund, the weighted average return on equity for the companies whose stocks it holds.
Short-Term Reserves. The percentage of a fund invested in highly liquid, short-term securities that can be readily converted to cash.
Turnover Rate. An indication of the fund’s trading activity. Funds with high turnover rates incur higher transaction costs and may be more likely to distribute capital gains (which may be taxable to investors). The turnover rate excludes in-kind transactions, which have minimal impact on costs.
31
The People Who Govern Your Fund
The trustees of your mutual fund are there to see that the fund is operated and managed in your best interests since, as a shareholder, you are a part owner of the fund. Your fund’s trustees also serve on the board of directors of The Vanguard Group, Inc., which is owned by the Vanguard funds and provides services to them on an at-cost basis.
A majority of Vanguard’s board members are independent, meaning that they have no affiliation with Vanguard or the funds they oversee, apart from the sizable personal investments they have made as private individuals. The independent board members have distinguished backgrounds in business, academia, and public service. Each of the trustees and executive officers oversees 194 Vanguard funds.
The following table provides information for each trustee and executive officer of the fund. More information about the trustees is in the Statement of Additional Information, which can be obtained, without charge, by contacting Vanguard at 800-662-7447, or online at vanguard.com.
| InterestedTrustee1 | Rajiv L. Gupta |
| Born 1945. Trustee Since December 2001.2 Principal | |
| F. William McNabb III | Occupation(s) During the Past Five Years and Other |
| Born 1957. Trustee Since July 2009. Chairman of | Experience: Chairman and Chief Executive Officer |
| the Board. Principal Occupation(s) During the Past | (retired 2009) and President (2006–2008) of |
| Five Years and Other Experience: Chairman of the | Rohm and Haas Co. (chemicals); Director of Tyco |
| Board of The Vanguard Group, Inc., and of each of | International PLC (diversified manufacturing and |
| the investment companies served by The Vanguard | services), Hewlett-Packard Co. (electronic computer |
| Group, since January 2010; Director of The Vanguard | manufacturing), and Delphi Automotive PLC |
| Group since 2008; Chief Executive Officer and | (automotive components); Senior Advisor at New |
| President of The Vanguard Group, and of each of | Mountain Capital. |
| the investment companies served by The Vanguard | |
| Group, since 2008; Director of Vanguard Marketing | Amy Gutmann |
| Corporation; Managing Director of The Vanguard | Born 1949. Trustee Since June 2006. Principal |
| Group (1995–2008). | Occupation(s) During the Past Five Years and |
| Other Experience: President of the University of | |
| IndependentTrustees | Pennsylvania; Christopher H. Browne Distinguished |
| Professor of Political Science, School of Arts and | |
| Emerson U. Fullwood | Sciences, and Professor of Communication, Annenberg |
| Born 1948. Trustee Since January 2008. Principal | School for Communication, with secondary faculty |
| Occupation(s) During the Past Five Years and | appointments in the Department of Philosophy, School |
| Other Experience: Executive Chief Staff and | of Arts and Sciences, and at the Graduate School of |
| Marketing Officer for North America and Corporate | Education, University of Pennsylvania; Trustee of the |
| Vice President (retired 2008) of Xerox Corporation | National Constitution Center; Chair of the Presidential |
| (document management products and services); | Commission for the Study of Bioethical Issues. |
| Executive in Residence and 2009–2010 Distinguished | |
| Minett Professor at the Rochester Institute of | JoAnn Heffernan Heisen |
| Technology; Director of SPX Corporation (multi-industry | Born 1950. Trustee Since July 1998. Principal |
| manufacturing), the United Way of Rochester, | Occupation(s) During the Past Five Years and Other |
| Amerigroup Corporation (managed health care), the | Experience: Corporate Vice President and Chief |
| University of Rochester Medical Center, Monroe | Global Diversity Officer (retired 2008) and Member |
| Community College Foundation, and North Carolina | of the Executive Committee (1997–2008) of Johnson |
| A&T University. | & Johnson (pharmaceuticals/medical devices/ |
| consumer products); Director of Skytop Lodge | |
| Corporation (hotels), the University Medical Center | |
| at Princeton, the Robert Wood Johnson Foundation, | |
| and the Center for Talent Innovation; Member of | |
| the Advisory Board of the Institute for Women’s | |
| Leadership at Rutgers University. |
| F. Joseph Loughrey | Executive Officers | |
| Born 1949. Trustee Since October 2009. Principal | ||
| Occupation(s) During the Past Five Years and Other | Glenn Booraem | |
| Experience: President and Chief Operating Officer | Born 1967. Treasurer Since May 2015. Principal | |
| (retired 2009) of Cummins Inc. (industrial machinery); | Occupation(s) During the Past Five Years and | |
| Chairman of the Board of Hillenbrand, Inc. (specialized | Other Experience: Principal of The Vanguard Group, | |
| consumer services), and of Oxfam America; Director | Inc.; Treasurer of each of the investment companies | |
| of SKF AB (industrial machinery), Hyster-Yale Materials | served by The Vanguard Group; Controller of each of | |
| Handling, Inc. (forklift trucks), the Lumina Foundation | the investment companies served by The Vanguard | |
| for Education, and the V Foundation for Cancer | Group (2010–2015); Assistant Controller of each of | |
| Research; Member of the Advisory Council for the | the investment companies served by The Vanguard | |
| College of Arts and Letters and of the Advisory Board | Group (2001–2010). | |
| to the Kellogg Institute for International Studies, both | ||
| at the University of Notre Dame. | Thomas J. Higgins | |
| Born 1957. Chief Financial Officer Since September | ||
| Mark Loughridge | 2008. Principal Occupation(s) During the Past Five | |
| Born 1953. Trustee Since March 2012. Principal | Years and Other Experience: Principal of The Vanguard | |
| Occupation(s) During the Past Five Years and Other | Group, Inc.; Chief Financial Officer of each of the | |
| Experience: Senior Vice President and Chief Financial | investment companies served by The Vanguard Group; | |
| Officer (retired 2013) at IBM (information technology | Treasurer of each of the investment companies served | |
| services); Fiduciary Member of IBM’s Retirement Plan | by The Vanguard Group (1998–2008). | |
| Committee (2004–2013); Director of the Dow Chemical | ||
| Company; Member of the Council on Chicago Booth. | Peter Mahoney | |
| Born 1974. Controller Since May 2015. Principal | ||
| Scott C. Malpass | Occupation(s) During the Past Five Years and | |
| Born 1962. Trustee Since March 2012. Principal | Other Experience: Head of Global Fund Accounting | |
| Occupation(s) During the Past Five Years and Other | at The Vanguard Group, Inc.; Controller of each of the | |
| Experience: Chief Investment Officer and Vice | investment companies served by The Vanguard Group; | |
| President at the University of Notre Dame; Assistant | Head of International Fund Services at The Vanguard | |
| Professor of Finance at the Mendoza College of | Group (2008–2014). | |
| Business at Notre Dame; Member of the Notre Dame | ||
| 403(b) Investment Committee; Board Member of | Heidi Stam | |
| TIFF Advisory Services, Inc., and Catholic Investment | Born 1956. Secretary Since July 2005. Principal | |
| Services, Inc. (investment advisors); Member of | Occupation(s) During the Past Five Years and Other | |
| the Investment Advisory Committee of Major | Experience: Managing Director of The Vanguard | |
| League Baseball. | Group, Inc.; General Counsel of The Vanguard Group; | |
| Secretary of The Vanguard Group and of each of the | ||
| André F. Perold | investment companies served by The Vanguard Group; | |
| Born 1952. Trustee Since December 2004. Principal | Director and Senior Vice President of Vanguard | |
| Occupation(s) During the Past Five Years and Other | Marketing Corporation. | |
| Experience: George Gund Professor of Finance and | ||
| Banking, Emeritus at the Harvard Business School | Vanguard Senior ManagementTeam | |
| (retired 2011); Chief Investment Officer and Managing | Mortimer J. Buckley | Chris D. McIsaac |
| Partner of HighVista Strategies LLC (private investment | Kathleen C. Gubanich | James M. Norris |
| firm); Director of Rand Merchant Bank; Overseer of | Paul A. Heller | Thomas M. Rampulla |
| the Museum of Fine Arts Boston. | Martha G. King | Glenn W. Reed |
| John T. Marcante | Karin A. Risi | |
| Peter F. Volanakis | ||
| Born 1955. Trustee Since July 2009. Principal | Chairman Emeritus and Senior Advisor | |
| Occupation(s) During the Past Five Years and Other | ||
| Experience: President and Chief Operating Officer | John J. Brennan | |
| (retired 2010) of Corning Incorporated (communications | Chairman, 1996–2009 | |
| equipment); Trustee of Colby-Sawyer College; | Chief Executive Officer and President, 1996–2008 | |
| Member of the Advisory Board of the Norris Cotton | ||
| Cancer Center and of the Advisory Board of the | Founder | |
| Parthenon Group (strategy consulting). | ||
| John C. Bogle | ||
| Chairman and Chief Executive Officer, 1974–1996 | ||
1 Mr. McNabb is considered an “interested person,” as defined in the Investment Company Act of 1940, because he is an officer of the Vanguard funds.
2 December 2002 for Vanguard Equity Income Fund, the Vanguard Municipal Bond Funds, and the Vanguard State Tax-Exempt Funds.
 | |
| P.O. Box 2600 | |
| Valley Forge, PA 19482-2600 |
Connect with Vanguard® > vanguard.com
| Fund Information > 800-662-7447 | CFA® is a registered trademark owned by CFA Institute. |
| Direct Investor Account Services > 800-662-2739 | |
| Institutional Investor Services > 800-523-1036 | |
| Text Telephone for People | |
| Who Are Deaf or Hard of Hearing> 800-749-7273 | |
| This material may be used in conjunction | |
| with the offering of shares of any Vanguard | |
| fund only if preceded or accompanied by | |
| the fund’s current prospectus. | |
| All comparative mutual fund data are from Lipper, a | |
| Thomson Reuters Company, or Morningstar, Inc., unless | |
| otherwise noted. | |
| You can obtain a free copy of Vanguard’s proxy voting | |
| guidelines by visiting vanguard.com/proxyreporting or by | |
| calling Vanguard at 800-662-2739. The guidelines are | |
| also available from the SEC’s website, sec.gov. In | |
| addition, you may obtain a free report on how your fund | |
| voted the proxies for securities it owned during the 12 | |
| months ended June 30. To get the report, visit either | |
| vanguard.com/proxyreporting or sec.gov. | |
| You can review and copy information about your fund at | |
| the SEC’s Public Reference Room in Washington, D.C. To | |
| find out more about this public service, call the SEC at | |
| 202-551-8090. Information about your fund is also | |
| available on the SEC’s website, and you can receive | |
| copies of this information, for a fee, by sending a | |
| request in either of two ways: via email addressed to | |
| publicinfo@sec.gov or via regular mail addressed to the | |
| Public Reference Section, Securities and Exchange | |
| Commission, Washington, DC 20549-1520. | |
| © 2015 The Vanguard Group, Inc. | |
| All rights reserved. | |
| Vanguard Marketing Corporation, Distributor. | |
| Q16900 102015 | |
Annual Report | August 31, 2015
Vanguard Russell 1000 Index Funds
Vanguard Russell 1000 Index Fund
Vanguard Russell 1000 Value Index Fund
Vanguard Russell 1000 Growth Index Fund
Vanguard’s Principles for Investing Success
We want to give you the best chance of investment success. These principles, grounded in Vanguard’s research and experience, can put you on the right path.
Goals. Create clear, appropriate investment goals.
Balance. Develop a suitable asset allocation using broadly diversified funds.
Cost. Minimize cost.
Discipline. Maintain perspective and long-term discipline.
A single theme unites these principles: Focus on the things you can control.
We believe there is no wiser course for any investor.
| Contents | |
| Your Fund’s Total Returns. | 1 |
| Chairman’s Letter. | 2 |
| Russell 1000 Index Fund. | 9 |
| Russell 1000 Value Index Fund. | 24 |
| Russell 1000 Growth Index Fund. | 39 |
| Your Fund’s After-Tax Returns. | 56 |
| About Your Fund’s Expenses. | 57 |
| Trustees Approve Advisory Arrangements. | 59 |
| Glossary. | 60 |
Please note: The opinions expressed in this report are just that—informed opinions. They should not be considered promises or advice.
Also, please keep in mind that the information and opinions cover the period through the date on the front of this report. Of course, the risks of investing in your fund are spelled out in the prospectus.
See the Glossary for definitions of investment terms used in this report.
About the cover: Pictured is a sailing block on the Brilliant, a 1932 schooner docked in Mystic, Connecticut. A type of pulley, the sailing block helps coordinate the setting of the sails. At Vanguard, the intricate coordination of technology and people allows us to help millions of clients around the world reach their financial goals.
| Your Fund’s Total Returns | |
| Fiscal Year Ended August 31, 2015 | |
| Total | |
| Returns | |
| Vanguard Russell 1000 Index Fund | |
| ETF Shares | |
| Market Price | 0.32% |
| Net Asset Value | 0.29 |
| Institutional Shares | 0.33 |
| Russell 1000 Index | 0.40 |
| Large-Cap Core Funds Average | -1.07 |
| Large-Cap Core Funds Average: Derived from data provided by Lipper, a Thomson Reuters Company. | |
| Vanguard Russell 1000 Value Index Fund | |
| ETF Shares | |
| Market Price | -3.55% |
| Net Asset Value | -3.59 |
| Institutional Shares | -3.55 |
| Russell 1000 Value Index | -3.48 |
| Large-Cap Value Funds Average | -3.71 |
| Large-Cap Value Funds Average: Derived from data provided by Lipper, a Thomson Reuters Company. | |
| Vanguard Russell 1000 Growth Index Fund | |
| ETF Shares | |
| Market Price | 4.11% |
| Net Asset Value | 4.11 |
| Institutional Shares | 4.15 |
| Russell 1000 Growth Index | 4.26 |
| Large-Cap Growth Funds Average | 3.53 |
| Large-Cap Growth Funds Average: Derived from data provided by Lipper, a Thomson Reuters Company. | |
Institutional Shares are available to certain institutional investors who meet specific administrative, service, and account-size criteria. The Vanguard ETF® Shares shown are traded on the Nasdaq exchange and are available only through brokers. The table provides ETF returns based on both the Nasdaq market price and the net asset value for a share. U.S. Pat. Nos. 6,879,964; 7,337,138; 7,720,749; 7,925,573; 8,090,646; and 8,417,623.
For the ETF Shares, the market price is determined by the midpoint of the bid-offer spread as of the closing time of the New York Stock Exchange (generally 4 p.m., Eastern time). The net asset value is also determined as of the NYSE closing time. For more information about how the ETF Shares' market prices have compared with their net asset value, visit vanguard.com, select your ETF, and then select the Price and Performance tab. The ETF premium/discount analysis there shows the percentages of days on which the ETF Shares' market price was above or below the NAV.
1

Chairman’s Letter
Dear Shareholder,
Opposing forces tugged the broad U.S. stock market back and forth over the 12-month period ended August 31, 2015. After a fall in August, it ended the fiscal year clinging to slight gains. Growth stocks outpaced value, and large-, mid-, and small-capitalization stocks finished in close proximity to each other.
This uneven investment environment was mirrored in the performance of the Vanguard Russell 1000 Index Funds. All three closely tracked their target indexes and exceeded the average returns of their large-cap fund peers. Results ranged from 4.11% for the Growth Index Fund to –3.59% for the Value Index Fund. The Russell 1000 Index Fund, which includes both growth and value stocks, returned 0.29%. (All returns are for the net asset value of the funds’ ETF Shares.)
If you hold shares of your fund in a taxable account, you may wish to review the information on after-tax returns that appears later in this report.
August’s moody markets led to flat 12-month returns
U.S. stocks generally moved in opposite directions over the two halves of the fiscal year ended August 31. A first-half advance of about 6% was followed by a second-half retreat of about –5%. Ultimately, the ride ended about where it started, with the market returning less than 1%.
2
Much of the decline came in August, when stocks tumbled over fears about the global impact of China’s economic deceleration. Greece’s debt crisis, the strong U.S. dollar, perceived high valuations, and speculation about when the Federal Reserve might raise short-term interest rates also played a part. (Shortly after the close of the reporting period, the Fed anounced at its September meeting that it would leave rates unchanged for the time being.)
For U.S. investors, international stocks returned about –12%, a result that would have been less weak if not for the dollar’s strength against many foreign currencies. China’s troubles buffeted emerging markets, which produced lower returns than the developed markets of Europe and the Pacific region.
Bonds notched muted results as the Fed weighed rate-hike timing
The broad U.S. taxable bond market returned 1.56%. Bond prices received support from global investors looking for higher yields than those available in many other developed markets. Buyers seeking shelter from stock market volatility also helped. The yield of the 10-year Treasury note ended August at 2.18%, down from 2.34% a year earlier. (Bond prices and yields move in opposite directions.)
Limited by the dollar’s strength, international bond markets (as measured by the Barclays Global Aggregate Index ex USD) returned –11.97%. Without this currency effect, they returned about 3%.
| Market Barometer | |||
| Average Annual Total Returns | |||
| Periods Ended August 31, 2015 | |||
| One | Three | Five | |
| Year | Years | Years | |
| Stocks | |||
| Russell 1000 Index (Large-caps) | 0.40% | 14.68% | 16.07% |
| Russell 2000 Index (Small-caps) | 0.03 | 14.12 | 15.55 |
| Russell 3000 Index (Broad U.S. market) | 0.36 | 14.63 | 16.03 |
| FTSE All-World ex US Index (International) | -11.50 | 5.79 | 5.17 |
| Bonds | |||
| Barclays U.S. Aggregate Bond Index (Broad taxable market) | 1.56% | 1.53% | 2.98% |
| Barclays Municipal Bond Index (Broad tax-exempt market) | 2.52 | 2.83 | 3.96 |
| Citigroup Three-Month U.S. Treasury Bill Index | 0.02 | 0.03 | 0.05 |
| CPI | |||
| Consumer Price Index | 0.20% | 1.14% | 1.77% |
3
The Fed’s 0%–0.25% target for short-term interest rates continued to restrain money market fund and savings account returns.
Health care led the pack; energy brought up the rear
The Vanguard Russell 1000 Index Funds capture the large-cap segment of the broad U.S. stock market. Using a full replication strategy, the Russell 1000 Index Fund by itself holds all of the approximately 1,000 stocks represented in the index—encompassing more than 90% of the market.
Large-cap stocks generally include relatively mature companies. They have historically provided smoother returns, higher yields, and more predictable earnings than their small-cap counterparts. Small-caps, while inherently riskier, have greater potential for reward.
The Growth and Value Index Funds represent market segments within the broader fund. Growth stocks, which have mostly outperformed value over the past five years, clearly led again in the recent period. Although growth stocks are priced at a premium to the rest of the market, analysts and investors still judged them to be more attractively valued.
Health care stocks, traditionally a growth domain, generated returns of about 13% for all three funds. They were the top performers in the Russell 1000 Index Fund and the Value Index Fund and delivered the second-best showing in the Growth Index
| Expense Ratios | |||
| Your Fund Compared With Its Peer Group | |||
| ETF | Institutional | Peer Group | |
| Shares | Shares | Average | |
| Russell 1000 Index Fund | 0.12% | 0.08% | 1.12% |
| Russell 1000 Value Index Fund | 0.12 | 0.08 | 1.13 |
| Russell 1000 Growth Index Fund | 0.12 | 0.08 | 1.21 |
The fund expense ratios shown are from the prospectus dated December 23, 2014, and represent estimated costs for the current fiscal year. For the fiscal year ended August 31, 2015, the funds’ expense ratios were: for the Russell 1000 Index Fund, 0.12% for ETF Shares and 0.08% for Institutional Shares; for the Russell 1000 Value Index Fund, 0.12% for ETF Shares and 0.08% for Institutional Shares; and for the Russell 1000 Growth Index Fund, 0.12% for ETF Shares and 0.08% for Institutional Shares. Peer-group expense ratios are derived from data provided by Lipper, a Thomson Reuters Company, and capture information through year-end 2014.
Peer groups: For the Russell 1000 Index Fund, Large-Cap Core Funds; for the Russell 1000 Value Index Fund, Large-Cap Value Funds; and for the Russell 1000 Growth Index Fund, Large-Cap Growth Funds.
4
Fund. The trends favoring health care are familiar ones. The aging population requires more health care in all forms, health care is increasingly accessible worldwide, and the Affordable Care Act has provided insurance coverage for more people.
Pharmaceutical and biotechnology companies produced the bulk of the sector’s returns because of promising developments in the industry’s pipeline and merger-and-acquisition activity. Health care services and medical equipment companies also boosted results.
The consumer discretionary sector led the Growth Index Fund and was the Russell 1000 Index Fund’s second-best contributor. Returns from internet retailers were particularly robust. Many of the sector’s gains came from the housing market’s sustained rebound. Homebuild-ers, home improvement retailers, and companies that produce home appliances, equipment, and furnishings all excelled and offset some weakness in the media and auto industries.
Financial services stocks, which make up the largest portions of the Value Index Fund and the Russell 1000 Index Fund,
| Total Returns | |
| Inception Through August 31, 2015 | |
| Average | |
| Annual Return | |
| Russell 1000 Index Fund ETF Shares Net Asset Value (Returns since inception: 9/20/2010) | 14.10% |
| Russell 1000 Index | 14.24 |
| Large-Cap Core Funds Average | 12.39 |
| Large-Cap Core Funds Average: Derived from data provided by Lipper, a Thomson Reuters Company. | |
| Russell 1000 Value Index Fund ETF Shares Net Asset Value (Returns since inception: 9/20/2010) | 12.83% |
| Russell 1000 Value Index | 12.99 |
| Large-Cap Value Funds Average | 11.64 |
| Large-Cap Value Funds Average: Derived from data provided by Lipper, a Thomson Reuters Company. | |
| Russell 1000 Growth Index Fund ETF Shares Net Asset Value (Returns since inception: 9/20/2010) | 15.23% |
| Russell 1000 Growth Index | 15.41 |
| Large-Cap Growth Funds Average | 13.67 |
| Large-Cap Growth Funds Average: Derived from data provided by Lipper, a Thomson Reuters Company. | |
The figures shown represent past performance, which is not a guarantee of future results. (Current performance may be lower or higher than the performance data cited. For performance data current to the most recent month-end, visit our website at vanguard.com/performance.) Note, too, that both investment returns and principal value can fluctuate widely, so an investor’s shares, when sold, could be worth more or less than their original cost.
5
delivered single-digit returns for all three funds. Although the sector has benefited from the long bull market, it has also been restrained by a tougher regulatory environment and exceptionally low interest rates.
Traditional value-oriented sectors––energy, materials and processing, producer durables, and utilities––registered negative returns for all three funds. The energy sector was punished by the decline of oil and gas prices. This same commodity crunch put pressure on the prices of metals and mining and materials and processing companies.
The funds have been successful in tightly tracking their indexes
The three Vanguard Russell 1000 Index Funds launched in September 2010 as an extension of Vanguard’s indexing franchise. In the nearly five years since, they’ve met their primary goal of capturing virtually all of the returns of their target indexes. Reflecting the overall strength of the stock markets, all three funds also recorded double-digit average annual returns over the half-decade.
Vanguard’s Equity Index Group, the funds’ advisor, is responsible for this index tracking success. The group has kept the
| An indexing benefit that’s worth keeping in mind |
| As a Vanguard investor, you’re probably familiar with the cost and diversification benefits that |
| index funds typically offer. But there’s a lesser-known—yet important—advantage to indexing |
| as well: relative predictability. |
| Simply put, index funds help you capture the market’s return more predictably than actively |
| managed funds. |
| By definition, an index fund is built and managed to track the return of its designated broad |
| market or market segment. Some do so more closely than others. But what’s key is that you |
| know what to expect: whatever the market returns—good or bad—minus the fund’s costs. |
| Active managers, in contrast, seek to beat the market—and do so with varying degrees of |
| success at different times. |
| The relative predictability of indexing can help you stay on course with your investment goals, |
| by reducing the likelihood of particular surprises—such as being out of step with market |
| performance. The confidence of knowing that you’ll earn a market-like return can reduce |
| the temptation to trade based on emotions. |
| We recognize that some investors want the opportunity to outperform the market. That’s |
| why Vanguard also offers low-cost active funds managed by carefully selected, world-class |
| advisors, so you can choose an investment strategy that aligns with both your goals and your |
| risk appetite. |
6
funds on target with sophisticated portfolio and management techniques refined over the decades. Low expenses––which allow you to keep more of the funds’ returns––have helped in these efforts.
When the markets are volatile, maintaining perspective is key
Volatility returned to the stock market with a vengeance in the final weeks of August as investors worried that a slowdown in China’s economic growth could affect world markets.
This turmoil may have evoked painful memories of previous financial setbacks—memories that had been receding after more than six years of strong U.S. stock performance. Inevitably, that sort of upheaval can lead some investors to make rash moves with their portfolios.
During periods of market adversity, however, it’s more important than ever to keep sight of one of Vanguard’s key principles: Maintain perspective and long-term discipline. Whether you’re investing for yourself or on behalf of clients, your success is affected greatly by how you react––or don’t react––when the markets turn turbulent. (You can read more in Vanguard’s Principles for Investing Success at vanguard.com/research.)
As I’ve written in the past, the best course for long-term investors generally is to ignore daily market moves and not make decisions based on emotion. This is also a good time to evaluate your portfolio and make sure your asset allocation is aligned with your time horizon, goals, and risk tolerance.
The markets are unpredictable and often confounding. Keeping long-term plans clearly in focus can help you weather these periodic storms.
As always, thank you for entrusting your assets to Vanguard.
Sincerely,

F. William McNabb III
Chairman and Chief Executive Officer
September 17, 2015
7
| Your Fund’s Performance at a Glance | ||||
| August 31, 2014, Through August 31, 2015 | ||||
| Distributions Per Share | ||||
| Starting | Ending | Income | Capital | |
| Share Price | Share Price | Dividends | Gains | |
| Vanguard Russell 1000 Index Fund | ||||
| ETF Shares | $92.70 | $91.37 | $1.654 | $0.000 |
| Institutional Shares | 179.58 | 176.99 | 3.278 | 0.000 |
| Vanguard Russell 1000 Value Index Fund | ||||
| ETF Shares | $89.83 | $84.77 | $1.953 | $0.000 |
| Institutional Shares | 175.38 | 165.50 | 3.871 | 0.000 |
| Vanguard Russell 1000 Growth Index Fund | ||||
| ETF Shares | $95.74 | $98.24 | $1.447 | $0.000 |
| Institutional Shares | 184.06 | 188.88 | 2.844 | 0.000 |
8
Russell 1000 Index Fund
Fund Profile
As of August 31, 2015
| Share-Class Characteristics | ||
| ETF | Institutional | |
| Shares | Shares | |
| Ticker Symbol | VONE | VRNIX |
| Expense Ratio1 | 0.12% | 0.08% |
| 30-Day SEC Yield | 1.97% | 2.02% |
| Portfolio Characteristics | |||
| DJ | |||
| U.S. | |||
| Total | |||
| Russell | Market | ||
| 1000 | FA | ||
| Fund | Index | Index | |
| Number of Stocks | 1,032 | 1,031 | 3,828 |
| Median Market Cap | $56.6B | $56.6B | $47.2B |
| Price/Earnings Ratio | 20.3x | 20.3x | 20.8x |
| Price/Book Ratio | 2.6x | 2.7x | 2.6x |
| Return on Equity | 17.8% | 17.7% | 17.1% |
| Earnings Growth | |||
| Rate | 10.2% | 10.2% | 10.2% |
| Dividend Yield | 2.1% | 2.1% | 2.1% |
| Foreign Holdings | 0.0% | 0.0% | 0.0% |
| Turnover Rate | 4% | — | — |
| Short-Term Reserves | 0.1% | — | — |
| Sector Diversification (% of equity exposure) | |||
| DJ | |||
| U.S. | |||
| Total | |||
| Russell | Market | ||
| 1000 | FA | ||
| Fund | Index | Index | |
| Consumer Discretionary 14.7% | 14.7% | 14.9% | |
| Consumer Staples | 8.0 | 8.0 | 7.6 |
| Energy | 7.0 | 7.0 | 6.7 |
| Financial Services | 19.7 | 19.7 | 20.1 |
| Health Care | 14.7 | 14.7 | 14.8 |
| Materials & Processing | 3.7 | 3.7 | 3.9 |
| Producer Durables | 10.6 | 10.6 | 10.6 |
| Technology | 16.4 | 16.4 | 16.3 |
| Utilities | 5.2 | 5.2 | 5.1 |
| Volatility Measures | ||
| DJ | ||
| Russell | U.S. Total | |
| 1000 | Market | |
| Index | FA Index | |
| R-Squared | 1.00 | 1.00 |
| Beta | 1.00 | 0.99 |
These measures show the degree and timing of the fund’s fluctuations compared with the indexes over 36 months.
| Ten Largest Holdings (% of total net assets) | ||
| Apple Inc. | Computer | |
| Technology | 3.2% | |
| Google Inc. | Computer Services | |
| Software & Systems | 1.8 | |
| Microsoft Corp. | Computer Services | |
| Software & Systems | 1.8 | |
| Exxon Mobil Corp. | Oil: Integrated | 1.6 |
| Johnson & Johnson | Pharmaceuticals | 1.3 |
| General Electric Co. | Diversified | |
| Manufacturing | ||
| Operations | 1.2 | |
| Berkshire Hathaway Inc. Insurance: Multi-Line | 1.2 | |
| Wells Fargo & Co. | Banks: Diversified | 1.2 |
| JPMorgan Chase & Co. | Diversified Financial | |
| Services | 1.2 | |
| AT&T Inc. | Utilities: | |
| Telecommunications | 1.0 | |
| Top Ten | 15.5% | |
The holdings listed exclude any temporary cash investments and equity index products.
Investment Focus
1 The expense ratios shown are from the prospectus dated December 23, 2014, and represent estimated costs for the current fiscal year. For the fiscal year ended August 31, 2015, the expense ratios were 0.12% for ETF Shares and 0.08% for Institutional Shares.
9
Russell 1000 Index Fund
Performance Summary
All of the returns in this report represent past performance, which is not a guarantee of future results that may be achieved by the fund. (Current performance may be lower or higher than the performance data cited. For performance data current to the most recent month-end, visit our website at vanguard.com/performance.) Note, too, that both investment returns and principal value can fluctuate widely, so an investor’s shares, when sold, could be worth more or less than their original cost. The returns shown do not reflect taxes that a shareholder would pay on fund distributions or on the sale of fund shares.
Cumulative Performance: September 20, 2010, Through August 31, 2015
Initial Investment of $10,000
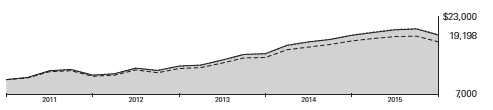
| Average Annual Total Returns | |||
| Periods Ended August 31, 2015 | |||
| Since | Final Value | ||
| One | Inception | of a $10,000 | |
| Year | (9/20/2010) | Investment | |
| Russell 1000 Index Fund*ETF Shares | |||
| Net Asset Value | 0.29% | 14.10% | $19,198 |
| Russell 1000 Index Fund*ETF Shares | |||
| Market Price | 0.32 | 14.11 | 19,205 |
| Russell 1000 Index | 0.40 | 14.24 | 19,312 |
| Large-Cap Core Funds Average | -1.07 | 12.39 | 17,820 |
| Dow Jones U.S. Total Stock Market | |||
| Float Adjusted Index | 0.29 | 14.14 | 19,234 |
Large-Cap Core Funds Average: Derived from data provided by Lipper, a Thomson Reuters Company.
"Since Inception" performance is calculated from the ETF Shares’ inception date for both the fund and its comparative standards.
| Since | Final Value | ||
| One | Inception | of a $5,000,000 | |
| Year | (10/15/2010) | Investment | |
| Russell 1000 Index Fund Institutional Shares | 0.33% | 13.62% | $9,319,389 |
| Russell 1000 Index | 0.40 | 13.71 | 9,355,955 |
| Dow Jones U.S. Total Stock Market Float | |||
| Adjusted Index | 0.29 | 13.58 | 9,303,719 |
"Since Inception" performance is calculated from the Institutional Shares’ inception date for both the fund and its comparative standards.
See Financial Highlights for dividend and capital gains information.
10
Russell 1000 Index Fund
| Cumulative Returns of ETF Shares: September 20, 2010, Through August 31, 2015 | ||
| Since | ||
| One | Inception | |
| Year | (9/20/2010) | |
| Russell 1000 Index Fund ETF Shares Market Price | 0.32% | 92.05% |
| Russell 1000 Index Fund ETF Shares Net Asset | ||
| Value | 0.29 | 91.98 |
| Russell 1000 Index | 0.40 | 93.12 |
"Since Inception" performance is calculated from the ETF Shares’ inception date for both the fund and its comparative standards.
Fiscal-Year Total Returns (%): September 20, 2010, Through August 31, 2015

| Russell 1000 Index Fund ETF Shares Net Asset Value |
| Russell 1000 Index |
Average Annual Total Returns: Periods Ended June 30, 2015
This table presents returns through the latest calendar quarter—rather than through the end of the fiscal period.
Securities and Exchange Commission rules require that we provide this information.
| Inception | One | Since | |
| Date | Year | Inception | |
| ETF Shares | 9/20/2010 | ||
| Market Price | 7.26% | 15.68% | |
| Net Asset Value | 7.24 | 15.67 | |
| Institutional Shares | 10/15/2010 | 7.30 | 15.19 |
11
Russell 1000 Index Fund
Financial Statements
Statement of Net Assets—Investments Summary
As of August 31, 2015
This Statement summarizes the fund’s holdings by asset type. Details are reported for each of the fund’s 50 largest individual holdings and for investments that, in total for any issuer, represent more than 1% of the fund’s net assets. The total value of smaller holdings is reported as a single amount within each category.
The fund reports a complete list of its holdings in regulatory filings four times in each fiscal year, at the quarter-ends. For the second and fourth fiscal quarters, the complete listing of the fund’s holdings is available electronically on vanguard.com and on the Securities and Exchange Commission’s website (sec.gov), or you can have it mailed to you without charge by calling 800-662-7447. For the first and third fiscal quarters, the fund files the lists with the SEC on Form N-Q. Shareholders can look up the fund’s Forms N-Q on the SEC’s website. Forms N-Q may also be reviewed and copied at the SEC’s Public Reference Room (see the back cover of this report for further information).
| Market | Percentage | ||
| Value• | of Net | ||
| Shares | ($000) | Assets | |
| Common Stocks | |||
| Consumer Discretionary | |||
| * Amazon.com Inc. | 33,535 | 17,200 | 1.0% |
| Walt Disney Co. | 149,244 | 15,205 | 0.9% |
| Home Depot Inc. | 114,279 | 13,309 | 0.7% |
| Comcast Corp. Class A | 220,329 | 12,411 | 0.7% |
| Wal-Mart Stores Inc. | 138,957 | 8,995 | 0.5% |
| McDonald’s Corp. | 84,488 | 8,028 | 0.5% |
| Starbucks Corp. | 132,178 | 7,231 | 0.4% |
| Consumer Discretionary—Other † | 176,167 | 10.0% | |
| 258,546 | 14.7% | ||
| Consumer Staples | |||
| Procter & Gamble Co. | 238,693 | 16,868 | 0.9% |
| Coca-Cola Co. | 345,658 | 13,591 | 0.8% |
| PepsiCo Inc. | 129,810 | 12,063 | 0.7% |
| Philip Morris International Inc. | 136,630 | 10,903 | 0.6% |
| CVS Health Corp. | 99,156 | 10,154 | 0.6% |
| Altria Group Inc. | 173,007 | 9,270 | 0.5% |
| Consumer Staples—Other † | 67,080 | 3.8% | |
| 139,929 | 7.9% | ||
| Energy | |||
| Exxon Mobil Corp. | 368,028 | 27,690 | 1.6% |
| Chevron Corp. | 165,763 | 13,425 | 0.8% |
| Schlumberger Ltd. | 111,708 | 8,643 | 0.5% |
| Energy—Other † | 73,339 | 4.1% | |
| 123,097 | 7.0% | ||
| Financial Services | |||
| * Berkshire Hathaway Inc. Class B | 163,622 | 21,932 | 1.2% |
| Wells Fargo & Co. | 410,007 | 21,866 | 1.2% |
| JPMorgan Chase & Co. | 326,640 | 20,938 | 1.2% |
| Bank of America Corp. | 925,719 | 15,126 | 0.9% |
| Citigroup Inc. | 267,492 | 14,306 | 0.8% |
12
| Russell 1000 Index Fund | |||
| Market | Percentage | ||
| Value• | of Net | ||
| Shares | ($000) | Assets | |
| Visa Inc. Class A | 172,385 | 12,291 | 0.7% |
| MasterCard Inc. Class A | 87,955 | 8,124 | 0.5% |
| * Synchrony Financial | 11,343 | 374 | 0.0% |
| Financial Services—Other † | 230,517 | 13.1% | |
| 345,474 | 19.6% | ||
| Health Care | |||
| Johnson & Johnson | 244,088 | 22,939 | 1.3% |
| Pfizer Inc. | 541,895 | 17,460 | 1.0% |
| Gilead Sciences Inc. | 129,293 | 13,585 | 0.8% |
| Merck & Co. Inc. | 249,086 | 13,413 | 0.7% |
| * Allergan plc | 34,603 | 10,510 | 0.6% |
| Amgen Inc. | 66,909 | 10,155 | 0.6% |
| UnitedHealth Group Inc. | 83,759 | 9,691 | 0.5% |
| AbbVie Inc. | 145,783 | 9,098 | 0.5% |
| Medtronic plc | 125,698 | 9,087 | 0.5% |
| Bristol-Myers Squibb Co. | 146,653 | 8,721 | 0.5% |
| * Celgene Corp. | 69,898 | 8,254 | 0.5% |
| Health Care—Other † | 125,481 | 7.1% | |
| 258,394 | 14.6% | ||
| Materials & Processing † | 65,800 | 3.7% | |
| 1Other † | 3 | 0.0% | |
| Producer Durables | |||
| General Electric Co. | 886,833 | 22,011 | 1.2% |
| Boeing Co. | 60,968 | 7,967 | 0.5% |
| 3M Co. | 55,848 | 7,938 | 0.4% |
| United Technologies Corp. | 78,375 | 7,180 | 0.4% |
| Producer Durables—Other † | 141,033 | 8.0% | |
| 186,129 | 10.5% | ||
| Technology | |||
| Apple Inc. | 507,092 | 57,180 | 3.2% |
| Microsoft Corp. | 712,005 | 30,986 | 1.7% |
| * Facebook Inc. Class A | 190,746 | 17,058 | 1.0% |
| * Google Inc. Class A | 25,365 | 16,432 | 0.9% |
| * Google Inc. Class C | 25,885 | 16,003 | 0.9% |
| Intel Corp. | 418,220 | 11,936 | 0.7% |
| International Business Machines Corp. | 79,812 | 11,803 | 0.7% |
| Cisco Systems Inc. | 448,353 | 11,603 | 0.6% |
| Oracle Corp. | 279,285 | 10,359 | 0.6% |
| QUALCOMM Inc. | 143,859 | 8,140 | 0.5% |
| Technology—Other † | 96,904 | 5.5% | |
| 288,404 | 16.3% | ||
| Utilities | |||
| AT&T Inc. | 535,721 | 17,786 | 1.0% |
| Verizon Communications Inc. | 358,837 | 16,510 | 1.0% |
| Utilities—Other † | 57,049 | 3.2% | |
| 91,345 | 5.2% | ||
| Total Common Stocks (Cost $1,599,797) | 1,757,121 | 99.5%2 | |
13
| Russell 1000 Index Fund | ||||
| Market | Percentage | |||
| Value• | of Net | |||
| Coupon | Shares | ($000) | Assets | |
| Temporary Cash Investments | ||||
| Money Market Fund | ||||
| 3,4 Vanguard Market Liquidity Fund | 0.168% | 8,225,187 | 8,225 | 0.5% |
| 5U.S. Government and Agency Obligations † | 500 | 0.0% | ||
| Total Temporary Cash Investments (Cost $8,725) | 8,725 | 0.5%2 | ||
| 6Total Investments (Cost $1,608,522) | 1,765,846 | 100.0% | ||
| Amount | ||||
| ($000) | ||||
| Other Assets and Liabilities (0.0%) | ||||
| Other Assets | ||||
| Investment in Vanguard | 165 | |||
| Receivables for Investment Securities Sold | 946 | |||
| Receivables for Accrued Income | 3,609 | |||
| Receivables for Capital Shares Issued | 140 | |||
| Other Assets | 1,076 | |||
| Total Other Assets | 5,936 | |||
| Liabilities | ||||
| Collateral for Securities on Loan | (2,407) | |||
| Payables for Capital Shares Redeemed | (1,691) | |||
| Payables to Vanguard | (386) | |||
| Other Liabilities | (2,332) | |||
| Total Liabilities | (6,816) | |||
| Net Assets | 1,764,966 | 100.0% | ||
| At August 31, 2015, net assets consisted of: | ||||
| Amount | ||||
| ($000) | ||||
| Paid-in Capital | 1,601,927 | |||
| Undistributed Net Investment Income | 6,693 | |||
| Accumulated Net Realized Losses | (585) | |||
| Unrealized Appreciation (Depreciation) | ||||
| Investment Securities | 157,324 | |||
| Futures Contracts | (393) | |||
| Net Assets | 1,764,966 | |||
| ETF Shares—Net Assets | ||||
| Applicable to 5,625,000 outstanding $.001 par value shares of | ||||
| beneficial interest (unlimited authorization) | 513,930 | |||
| Net Asset Value Per Share—ETF Shares | $91.37 | |||
14
| Russell 1000 Index Fund | |
| Amount | |
| ($000) | |
| Institutional Shares—Net Assets | |
| Applicable to 7,068,424 outstanding $.001 par value shares of | |
| beneficial interest (unlimited authorization) | 1,251,036 |
| Net Asset Value Per Share—Institutional Shares | $176.99 |
• See Note A in Notes to Financial Statements.
* Non-income-producing security.
† Represents the aggregate value, by category, of securities that are not among the 50 largest holdings and, in total for any issuer, represent 1% or less of net assets.
1 “Other” represents securities that are not classified by the fund’s benchmark index.
2 The fund invests a portion of its cash reserves in equity markets through the use of index futures contracts. After giving effect to futures investments, the fund’s effective common stock and temporary cash investment positions represent 99.9% and 0.1%, respectively, of net assets.
3 Affiliated money market fund available only to Vanguard funds and certain trusts and accounts managed by Vanguard. Rate shown is the 7-day yield.
4 Includes $2,407,000 of collateral received for securities on loan.
5 Securities with a value of $500,000 have been segregated as initial margin for open futures contracts.
6 The total value of securities on loan is $2,335,000.
See accompanying Notes, which are an integral part of the Financial Statements.
15
| Russell 1000 Index Fund | |
| Statement of Operations | |
| Year Ended | |
| August 31, 2015 | |
| ($000) | |
| Investment Income | |
| Income | |
| Dividends | 32,620 |
| Interest1 | 16 |
| Securities Lending | 37 |
| Total Income | 32,673 |
| Expenses | |
| The Vanguard Group—Note B | |
| Investment Advisory Services | 291 |
| Management and Administrative—ETF Shares | 330 |
| Management and Administrative—Institutional Shares | 375 |
| Marketing and Distribution—ETF Shares | 72 |
| Marketing and Distribution—Institutional Shares | 157 |
| Custodian Fees | 227 |
| Auditing Fees | 32 |
| Shareholders’ Reports—ETF Shares | 12 |
| Shareholders’ Reports—Institutional Shares | 3 |
| Trustees’ Fees and Expenses | 1 |
| Total Expenses | 1,500 |
| Net Investment Income | 31,173 |
| Realized Net Gain (Loss) | |
| Investment Securities Sold | 125,792 |
| Futures Contracts | 548 |
| Realized Net Gain (Loss) | 126,340 |
| Change in Unrealized Appreciation (Depreciation) | |
| Investment Securities | (160,609) |
| Futures Contracts | (542) |
| Change in Unrealized Appreciation (Depreciation) | (161,151) |
| Net Increase (Decrease) in Net Assets Resulting from Operations | (3,638) |
| 1 Interest income from an affiliated company of the fund was $14,000. | |
See accompanying Notes, which are an integral part of the Financial Statements.
16
| Russell 1000 Index Fund | ||
| Statement of Changes in Net Assets | ||
| Year Ended August 31, | ||
| 2015 | 2014 | |
| ($000) | ($000) | |
| Increase (Decrease) in Net Assets | ||
| Operations | ||
| Net Investment Income | 31,173 | 21,411 |
| Realized Net Gain (Loss) | 126,340 | 44,496 |
| Change in Unrealized Appreciation (Depreciation) | (161,151) | 182,747 |
| Net Increase (Decrease) in Net Assets Resulting from Operations | (3,638) | 248,654 |
| Distributions | ||
| Net Investment Income | ||
| ETF Shares | (8,056) | (4,868) |
| Institutional Shares | (21,001) | (15,442) |
| Realized Capital Gain | ||
| ETF Shares | — | — |
| Institutional Shares | — | — |
| Total Distributions | (29,057) | (20,310) |
| Capital Share Transactions | ||
| ETF Shares | 142,037 | 104,477 |
| Institutional Shares | 331,383 | 96,033 |
| Net Increase (Decrease) from Capital Share Transactions | 473,420 | 200,510 |
| Total Increase (Decrease) | 440,725 | 428,854 |
| Net Assets | ||
| Beginning of Period | 1,324,241 | 895,387 |
| End of Period1 | 1,764,966 | 1,324,241 |
1 Net Assets—End of Period includes undistributed (overdistributed) net investment income of $6,693,000 and $4,576,000.
See accompanying Notes, which are an integral part of the Financial Statements.
17
| Russell 1000 Index Fund | |||||
| Financial Highlights | |||||
| ETF Shares | |||||
| Sept. 20, | |||||
| 20101 to | |||||
| Year Ended August 31, | |||||
| For a Share Outstanding | August 31, | ||||
| Throughout Each Period | 2015 | 2014 | 2013 | 2012 | 2011 |
| Net Asset Value, Beginning of Period | $92.70 | $75.40 | $64.29 | $55.94 | $51.78 |
| Investment Operations | |||||
| Net Investment Income | 1.679 | 1.553 | 1.444 | 1.176 | .736 |
| Net Realized and Unrealized Gain (Loss) | |||||
| on Investments | (1.355) | 17.272 | 11.068 | 8.307 | 3.957 |
| Total from Investment Operations | .324 | 18.825 | 12.512 | 9.483 | 4.693 |
| Distributions | |||||
| Dividends from Net Investment Income | (1.654) | (1.525) | (1.402) | (1.133) | (.533) |
| Distributions from Realized Capital Gains | — | — | — | — | — |
| Total Distributions | (1.654) | (1.525) | (1.402) | (1.133) | (.533) |
| Net Asset Value, End of Period | $91.37 | $92.70 | $75.40 | $64.29 | $55.94 |
| Total Return | 0.29% | 25.18% | 19.70% | 17.19% | 9.02% |
| Ratios/Supplemental Data | |||||
| Net Assets, End of Period (Millions) | $514 | $380 | $219 | $148 | $14 |
| Ratio of Total Expenses to Average Net Assets | 0.12% | 0.12% | 0.12% | 0.12% | 0.12%2 |
| Ratio of Net Investment Income to | |||||
| Average Net Assets | 1.84% | 1.85% | 2.09% | 2.06% | 1.86%2 |
| Portfolio Turnover Rate 3 | 4% | 7% | 11% | 36% | 20% |
1 Inception.
2 Annualized.
3 Excludes the value of portfolio securities received or delivered as a result of in-kind purchases or redemptions of the fund’s capital shares, including ETF Creation Units.
See accompanying Notes, which are an integral part of the Financial Statements.
18
| Russell 1000 Index Fund | |||||
| Financial Highlights | |||||
| Institutional Shares | |||||
| Oct. 15, | |||||
| 20101 to | |||||
| Year Ended August 31, | |||||
| For a Share Outstanding | August 31, | ||||
| Throughout Each Period | 2015 | 2014 | 2013 | 2012 | 2011 |
| Net Asset Value, Beginning of Period | $179.58 | $146.04 | $124.53 | $108.35 | $103.49 |
| Investment Operations | |||||
| Net Investment Income | 3.329 | 3.060 | 2.850 | 2.314 | 1.348 |
| Net Realized and Unrealized Gain (Loss) | |||||
| on Investments | (2.641) | 33.485 | 21.424 | 16.100 | 4.569 |
| Total from Investment Operations | .688 | 36.545 | 24.274 | 18.414 | 5.917 |
| Distributions | |||||
| Dividends from Net Investment Income | (3.278) | (3.005) | (2.764) | (2.234) | (1.057) |
| Distributions from Realized Capital Gains | — | — | — | — | — |
| Total Distributions | (3.278) | (3.005) | (2.764) | (2.234) | (1.057) |
| Net Asset Value, End of Period | $176.99 | $179.58 | $146.04 | $124.53 | $108.35 |
| Total Return | 0.33% | 25.24% | 19.73% | 17.25% | 5.67% |
| Ratios/Supplemental Data | |||||
| Net Assets, End of Period (Millions) | $1,251 | $944 | $677 | $334 | $178 |
| Ratio of Total Expenses to Average Net Assets | 0.08% | 0.08% | 0.08% | 0.08% | 0.08%2 |
| Ratio of Net Investment Income to | |||||
| Average Net Assets | 1.88% | 1.89% | 2.13% | 2.10% | 1.90%2 |
| Portfolio Turnover Rate 3 | 4% | 7% | 11% | 36% | 20% |
1 Inception.
2 Annualized.
3 Excludes the value of portfolio securities received or delivered as a result of in-kind purchases or redemptions of the fund’s capital shares, including ETF Creation Units.
See accompanying Notes, which are an integral part of the Financial Statements.
19
Russell 1000 Index Fund
Notes to Financial Statements
Vanguard Russell 1000 Index Fund is registered under the Investment Company Act of 1940 as an open-end investment company, or mutual fund. The fund offers two classes of shares: ETF Shares and Institutional Shares. ETF Shares are listed for trading on Nasdaq; they can be purchased and sold through a broker. Institutional Shares are designed for investors who meet certain administrative, service, and account-size criteria.
A. The following significant accounting policies conform to generally accepted accounting principles for U.S. investment companies. The fund consistently follows such policies in preparing its financial statements.
1. Security Valuation: Securities are valued as of the close of trading on the New York Stock Exchange (generally 4 p.m., Eastern time) on the valuation date. Equity securities are valued at the latest quoted sales prices or official closing prices taken from the primary market in which each security trades; such securities not traded on the valuation date are valued at the mean of the latest quoted bid and asked prices. Securities for which market quotations are not readily available, or whose values have been materially affected by events occurring before the fund’s pricing time but after the close of the securities’ primary markets, are valued by methods deemed by the board of trustees to represent fair value. Investments in Vanguard Market Liquidity Fund are valued at that fund’s net asset value. Temporary cash investments acquired over 60 days to maturity are valued using the latest bid prices or using valuations based on a matrix system (which considers such factors as security prices, yields, maturities, and ratings), both as furnished by independent pricing services. Other temporary cash investments are valued at amortized cost, which approximates market value.
2. Futures Contracts: The fund uses index futures contracts to a limited extent, with the objectives of maintaining full exposure to the stock market, enhancing returns, maintaining liquidity, and minimizing transaction costs. The fund may purchase futures contracts to immediately invest incoming cash in the market, or sell futures in response to cash outflows, thereby simulating a fully invested position in the underlying index while maintaining a cash balance for liquidity. The fund may seek to enhance returns by using futures contracts instead of the underlying securities when futures are believed to be priced more attractively than the underlying securities. The primary risks associated with the use of futures contracts are imperfect correlation between changes in market values of stocks held by the fund and the prices of futures contracts, and the possibility of an illiquid market. Counterparty risk involving futures is mitigated because a regulated clearinghouse is the counterparty instead of the clearing broker. To further mitigate counterparty risk, the fund trades futures contracts on an exchange, monitors the financial strength of its clearing brokers and clearinghouse, and has entered into clearing agreements with its clearing brokers. The clearinghouse imposes initial margin requirements to secure the fund’s performance and requires daily settlement of variation margin representing changes in the market value of each contract.
Futures contracts are valued at their quoted daily settlement prices. The aggregate settlement values of the contracts are not recorded in the Statement of Net Assets. Fluctuations in the value of the contracts are recorded in the Statement of Net Assets as an asset (liability) and in the Statement of Operations as unrealized appreciation (depreciation) until the contracts are closed, when they are recorded as realized futures gains (losses).
During the year ended August 31, 2015, the fund’s average investments in long and short futures contracts represented less than 1% and 0% of net assets, respectively, based on the average of aggregate settlement values at each quarter-end during the period.
20
Russell 1000 Index Fund
3. Federal Income Taxes: The fund intends to continue to qualify as a regulated investment company and distribute all of its taxable income. Management has analyzed the fund’s tax positions taken for all open federal income tax years (August 31, 2012–2015), and has concluded that no provision for federal income tax is required in the fund’s financial statements.
4. Distributions: Distributions to shareholders are recorded on the ex-dividend date.
5. Securities Lending: To earn additional income, the fund lends its securities to qualified institutional borrowers. Security loans are required to be secured at all times by collateral in an amount at least equal to the market value of securities loaned. Daily market fluctuations could cause the value of loaned securities to be more or less than the value of the collateral received. When this occurs, the collateral is adjusted and settled on the next business day. The fund further mitigates its counterparty risk by entering into securities lending transactions only with a diverse group of prequalified counter-parties, monitoring their financial strength, and entering into master securities lending agreements with its counterparties. The master securities lending agreements provide that, in the event of a counterparty’s default (including bankruptcy), the fund may terminate any loans with that borrower, determine the net amount owed, and sell or retain the collateral up to the net amount owed to the fund; however, such actions may be subject to legal proceedings. While collateral mitigates counter-party risk, in the absence of a default the fund may experience delays and costs in recovering the securities loaned. The fund invests cash collateral received in Vanguard Market Liquidity Fund, and records a liability in the Statement of Net Assets for the return of the collateral, during the period the securities are on loan. Securities lending income represents fees charged to borrowers plus income earned on invested cash collateral, less expenses associated with the loan.
6. Credit Facility: The fund and certain other funds managed by The Vanguard Group (“Vanguard”) participate in a $3 billion committed credit facility provided by a syndicate of lenders pursuant to a credit agreement that may be renewed annually; each fund is individually liable for its borrowings, if any, under the credit facility. Borrowings may be utilized for temporary and emergency purposes, and are subject to the fund’s regulatory and contractual borrowing restrictions. The participating funds are charged administrative fees and an annual commitment fee of 0.06% of the undrawn amount of the facility; these fees are allocated to the funds based on a method approved by the fund’s board of trustees and included in Management and Administrative expenses on the fund’s Statement of Operations. Any borrowings under this facility bear interest at a rate equal to the higher of the federal funds rate or LIBOR reference rate plus an agreed-upon spread.
The fund had no borrowings outstanding at August 31, 2015, or at any time during the period then ended.
7. Other: Dividend income is recorded on the ex-dividend date. Interest income includes income distributions received from Vanguard Market Liquidity Fund and is accrued daily. Premiums and discounts on debt securities purchased are amortized and accreted, respectively, to interest income over the lives of the respective securities. Security transactions are accounted for on the date securities are bought or sold. Costs used to determine realized gains (losses) on the sale of investment securities are those of the specific securities sold.
Each class of shares has equal rights as to assets and earnings, except that each class separately bears certain class-specific expenses related to maintenance of shareholder accounts (included in Management and Administrative expenses) and shareholder reporting. Marketing and distribution expenses are allocated to each class of shares based on a method approved by the board of trustees. Income, other non-class-specific expenses, and gains and losses on investments are allocated to each class of shares based on its relative net assets.
21
Russell 1000 Index Fund
B. In accordance with the terms of a Funds’ Service Agreement (the “FSA”) between Vanguard and the fund, Vanguard furnishes to the fund investment advisory, corporate management, administrative, marketing, and distribution services at Vanguard’s cost of operations (as defined by the FSA). These costs of operations are allocated to the fund based on methods and guidelines approved by the board of trustees. Vanguard does not require reimbursement in the current period for certain costs of operations (such as deferred compensation/benefits and risk/insurance costs); the fund’s liability for these costs of operations is included in Payables to Vanguard on the Statement of Net Assets.
Upon the request of Vanguard, the fund may invest up to 0.40% of its net assets as capital in Vanguard. At August 31, 2015, the fund had contributed to Vanguard capital in the amount of $165,000, representing 0.01% of the fund’s net assets and 0.07% of Vanguard’s capitalization. The fund’s trustees and officers are also directors and employees, respectively, of Vanguard.
C. Various inputs may be used to determine the value of the fund’s investments. These inputs are summarized in three broad levels for financial statement purposes. The inputs or methodologies used to value securities are not necessarily an indication of the risk associated with investing in those securities.
Level 1—Quoted prices in active markets for identical securities.
Level 2—Other significant observable inputs (including quoted prices for similar securities, interest rates, prepayment speeds, credit risk, etc.).
Level 3—Significant unobservable inputs (including the fund’s own assumptions used to determine the fair value of investments).
The following table summarizes the market value of the fund’s investments as of August 31, 2015, based on the inputs used to value them:
| Level 1 | Level 2 | Level 3 | |
| Investments | ($000) | ($000) | ($000) |
| Common Stocks | 1,757,121 | — | — |
| Temporary Cash Investments | 8,225 | 500 | — |
| Futures Contracts—Liabilities1 | (75) | — | — |
| Total | 1,765,271 | 500 | — |
| 1 Represents variation margin on the last day of the reporting period. | |||
D. At August 31, 2015, the aggregate settlement value of open futures contracts and the related unrealized appreciation (depreciation) were:
| ($000) | ||||
| Aggregate | ||||
| Number of | Settlement | Unrealized | ||
| Long (Short) | Value | Appreciation | ||
| Futures Contracts | Expiration | Contracts | Long (Short) | (Depreciation) |
| S&P 500 Index | September 2015 | 13 | 6,400 | (346) |
| E-mini S&P 500 Index | September 2015 | 8 | 788 | (47) |
| (393) |
Unrealized appreciation (depreciation) on open futures contracts is required to be treated as realized gain (loss) for tax purposes.
22
Russell 1000 Index Fund
E. Distributions are determined on a tax basis and may differ from net investment income and realized capital gains for financial reporting purposes. Differences may be permanent or temporary. Permanent differences are reclassified among capital accounts in the financial statements to reflect their tax character. Temporary differences arise when certain items of income, expense, gain, or loss are recognized in different periods for financial statement and tax purposes. These differences will reverse at some time in the future. Differences in classification may also result from the treatment of short-term gains as ordinary income for tax purposes.
During the year ended August 31, 2015, the fund realized $124,337,000 of net capital gains resulting from in-kind redemptions—in which shareholders exchanged fund shares for securities held by the fund rather than for cash. Because such gains are not taxable to the fund, and are not distributed to shareholders, they have been reclassified from accumulated net realized losses to paid-in capital.
For tax purposes, at August 31, 2015, the fund had $7,042,000 of ordinary income available for distribution. The fund used capital loss carryforwards of $1,501,000 to offset taxable capital gains realized during the year ended August 31, 2015. At August 31, 2015 the fund had available capital losses totaling $936,000 that may be carried forward indefinitely to offset future net capital gains.
At August 31, 2015, the cost of investment securities for tax purposes was $1,608,564,000. Net unrealized appreciation of investment securities for tax purposes was $157,282,000, consisting of unrealized gains of $236,618,000 on securities that had risen in value since their purchase and $79,336,000 in unrealized losses on securities that had fallen in value since their purchase.
F. During the year ended August 31, 2015, the fund purchased $843,020,000 of investment securities and sold $366,503,000 of investment securities, other than temporary cash investments. Purchases and sales include $298,050,000 and $305,590,000, respectively, in connection with in-kind purchases and redemptions of the fund’s capital shares.
G. Capital share transactions for each class of shares were:
| Year Ended August 31, | ||||
| 2015 | 2014 | |||
| Amount | Shares | Amount | Shares | |
| ($000) | (000) | ($000) | (000) | |
| ETF Shares | ||||
| Issued | 495,727 | 5,225 | 225,033 | 2,600 |
| Issued in Lieu of Cash Distributions | — | — | — | — |
| Redeemed | (353,690) | (3,700) | (120,556) | (1,400) |
| Net Increase (Decrease)—ETF Shares | 142,037 | 1,525 | 104,477 | 1,200 |
| Institutional Shares | ||||
| Issued | 546,260 | 2,966 | 215,100 | 1,353 |
| Issued in Lieu of Cash Distributions | 19,253 | 105 | 14,324 | 87 |
| Redeemed | (234,130) | (1,260) | (133,391) | (816) |
| Net Increase (Decrease) —Institutional Shares | 331,383 | 1,811 | 96,033 | 624 |
H. Management has determined that no material events or transactions occurred subsequent to August 31, 2015, that would require recognition or disclosure in these financial statements.
23
Russell 1000 Value Index Fund
Fund Profile
As of August 31, 2015
| Share-Class Characteristics | ||
| ETF | Institutional | |
| Shares | Shares | |
| Ticker Symbol | VONV | VRVIX |
| Expense Ratio1 | 0.12% | 0.08% |
| 30-Day SEC Yield | 2.52% | 2.55% |
| Portfolio Characteristics | |||
| DJ | |||
| U.S. | |||
| Russell | Total | ||
| 1000 | Market | ||
| Value | FA | ||
| Fund | Index | Index | |
| Number of Stocks | 689 | 689 | 3,828 |
| Median Market Cap | $49.9B | $49.9B | $47.2B |
| Price/Earnings Ratio | 17.7x | 17.6x | 20.8x |
| Price/Book Ratio | 1.7x | 1.7x | 2.6x |
| Return on Equity | 12.9% | 12.9% | 17.1% |
| Earnings Growth | |||
| Rate | 5.1% | 5.1% | 10.2% |
| Dividend Yield | 2.7% | 2.7% | 2.1% |
| Foreign Holdings | 0.0% | 0.0% | 0.0% |
| Turnover Rate | 18% | — | — |
| Short-Term Reserves | 0.1% | — | — |
| Sector Diversification (% of equity exposure) | |||
| DJ | |||
| U.S. | |||
| Russell | Total | ||
| 1000 | Market | ||
| Value | FA | ||
| Fund | Index | Index | |
| Consumer Discretionary | 6.6% | 6.5% | 14.9% |
| Consumer Staples | 5.7 | 5.7 | 7.6 |
| Energy | 13.4 | 13.4 | 6.7 |
| Financial Services | 30.4 | 30.5 | 20.1 |
| Health Care | 11.9 | 11.9 | 14.8 |
| Materials & Processing | 3.3 | 3.3 | 3.9 |
| Producer Durables | 9.7 | 9.7 | 10.6 |
| Technology | 10.6 | 10.6 | 16.3 |
| Utilities | 8.4 | 8.4 | 5.1 |
| Volatility Measures | ||
| Russell | DJ | |
| 1000 | U.S. Total | |
| Value | Market | |
| Index | FA Index | |
| R-Squared | 1.00 | 0.94 |
| Beta | 1.00 | 0.98 |
These measures show the degree and timing of the fund’s fluctuations compared with the indexes over 36 months.
| Ten Largest Holdings (% of total net assets) | ||
| Exxon Mobil Corp. | Oil: Integrated | 3.2% |
| General Electric Co. | Diversified | |
| Manufacturing | ||
| Operations | 2.5 | |
| Wells Fargo & Co. | Banks: Diversified | 2.5 |
| JPMorgan Chase & Co. | Diversified Financial | |
| Services | 2.4 | |
| Berkshire Hathaway Inc. Insurance: Multi-Line | 2.4 | |
| Johnson & Johnson | Pharmaceuticals | 2.3 |
| Pfizer Inc. | Pharmaceuticals | 2.0 |
| Procter & Gamble Co. | Personal Care | 1.9 |
| AT&T Inc. | Utilities: | |
| Telecommunications | 1.8 | |
| Bank of America Corp. | Banks: Diversified | 1.7 |
| Top Ten | 22.7% | |
The holdings listed exclude any temporary cash investments and equity index products.
Investment Focus
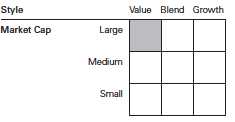
1 The expense ratios shown are from the prospectus dated December 23, 2014, and represent estimated costs for the current fiscal year. For the fiscal year ended August 31, 2015, the expense ratios were 0.12% for ETF Shares and 0.08% for Institutional Shares.
24
Russell 1000 Value Index Fund
Performance Summary
All of the returns in this report represent past performance, which is not a guarantee of future results that may be achieved by the fund. (Current performance may be lower or higher than the performance data cited. For performance data current to the most recent month-end, visit our website at vanguard.com/performance.) Note, too, that both investment returns and principal value can fluctuate widely, so an investor’s shares, when sold, could be worth more or less than their original cost. The returns shown do not reflect taxes that a shareholder would pay on fund distributions or on the sale of fund shares.
Cumulative Performance: September 20, 2010, Through August 31, 2015
Initial Investment of $10,000
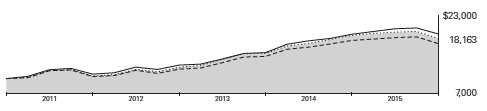
| Average Annual Total Returns | |||
| Periods Ended August 31, 2015 | |||
| Since | Final Value | ||
| One | Inception | of a $10,000 | |
| Year | (9/20/2010) | Investment | |
| Russell 1000 Value Index Fund*ETF | |||
| Shares Net Asset Value | -3.59% | 12.83% | $18,163 |
| Russell 1000 Value Index Fund*ETF | |||
| Shares Market Price | -3.55 | 12.83 | 18,168 |
| Russell 1000 Value Index | -3.48 | 12.99 | 18,290 |
| Large-Cap Value Funds Average | -3.71 | 11.64 | 17,240 |
| Dow Jones U.S. Total Stock Market | |||
| Float Adjusted Index | 0.29 | 14.14 | 19,234 |
Large-Cap Value Funds Average: Derived from data provided by Lipper, a Thomson Reuters Company.
"Since Inception" performance is calculated from the ETF Shares’ inception date for both the fund and its comparative standards.
| Since | Final Value | ||
| One | Inception | of a $5,000,000 | |
| Year | (12/10/2010) | Investment | |
| Russell 1000 Value Index Fund Institutional | |||
| Shares | -3.55% | 11.80% | $8,467,204 |
| Russell 1000 Value Index | -3.48 | 11.89 | 8,499,248 |
| Dow Jones U.S. Total Stock Market Float | |||
| Adjusted Index | 0.29 | 12.52 | 8,729,132 |
"Since Inception" performance is calculated from the Institutional Shares’ inception date for both the fund and its comparative standards.
See Financial Highlights for dividend and capital gains information.
25
Russell 1000 Value Index Fund
| Cumulative Returns of ETF Shares: September 20, 2010, Through August 31, 2015 | ||
| Since | ||
| One | Inception | |
| Year | (9/20/2010) | |
| Russell 1000 Value Index Fund ETF Shares Market | ||
| Price | -3.55% | 81.68% |
| Russell 1000 Value Index Fund ETF Shares Net | ||
| Asset Value | -3.59 | 81.63 |
| Russell 1000 Value Index | -3.48 | 82.90 |
"Since Inception" performance is calculated from the ETF Shares’ inception date for both the fund and its comparative standards.
Fiscal-Year Total Returns (%): September 20, 2010, Through August 31, 2015
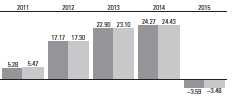
| Russell 1000 Value Index Fund ETF Shares Net Asset Value |
| Russell 1000 Value Index |
Average Annual Total Returns: Periods Ended June 30, 2015
This table presents returns through the latest calendar quarter—rather than through the end of the fiscal period.
Securities and Exchange Commission rules require that we provide this information.
| Inception | One | Since | |
| Date | Year | Inception | |
| ETF Shares | 9/20/2010 | ||
| Market Price | 4.06% | 14.69% | |
| Net Asset Value | 4.00 | 14.68 | |
| Institutional Shares | 12/10/2010 | 4.05 | 13.68 |
26
Russell 1000 Value Index Fund
Financial Statements
Statement of Net Assets—Investments Summary
As of August 31, 2015
This Statement summarizes the fund’s holdings by asset type. Details are reported for each of the fund’s 50 largest individual holdings and for investments that, in total for any issuer, represent more than 1% of the fund’s net assets. The total value of smaller holdings is reported as a single amount within each category.
The fund reports a complete list of its holdings in regulatory filings four times in each fiscal year, at the quarter-ends. For the second and fourth fiscal quarters, the complete listing of the fund’s holdings is available electronically on vanguard.com and on the Securities and Exchange Commission’s website (sec.gov), or you can have it mailed to you without charge by calling 800-662-7447. For the first and third fiscal quarters, the fund files the lists with the SEC on Form N-Q. Shareholders can look up the fund’s Forms N-Q on the SEC’s website. Forms N-Q may also be reviewed and copied at the SEC’s Public Reference Room (see the back cover of this report for further information).
| Market | Percentage | ||
| Value• | of Net | ||
| Shares | ($000) | Assets | |
| Common Stocks | |||
| Consumer Discretionary | |||
| Wal-Mart Stores Inc. | 270,992 | 17,541 | 1.0% |
| Ford Motor Co. | 669,900 | 9,292 | 0.6% |
| General Motors Co. | 275,826 | 8,120 | 0.5% |
| Target Corp. | 100,465 | 7,807 | 0.5% |
| Consumer Discretionary—Other † | 66,343 | 3.9% | |
| 109,103 | 6.5% | ||
| Consumer Staples | |||
| Procter & Gamble Co. | 465,446 | 32,893 | 2.0% |
| Mondelez International Inc. Class A | 279,060 | 11,821 | 0.7% |
| Walgreens Boots Alliance Inc. | 125,268 | 10,842 | 0.6% |
| Philip Morris International Inc. | 133,500 | 10,653 | 0.6% |
| Consumer Staples—Other † | 29,088 | 1.7% | |
| 95,297 | 5.6% | ||
| Energy | |||
| Exxon Mobil Corp. | 717,307 | 53,970 | 3.2% |
| Chevron Corp. | 322,691 | 26,135 | 1.5% |
| Schlumberger Ltd. | 191,561 | 14,821 | 0.9% |
| ConocoPhillips | 211,618 | 10,401 | 0.6% |
| Kinder Morgan Inc. | 306,337 | 9,928 | 0.6% |
| Occidental Petroleum Corp. | 131,845 | 9,626 | 0.6% |
| Phillips 66 | 92,974 | 7,351 | 0.4% |
| Energy—Other † | 93,137 | 5.5% | |
| 225,369 | 13.3% | ||
| Financial Services | |||
| Wells Fargo & Co. | 799,285 | 42,626 | 2.5% |
| JPMorgan Chase & Co. | 636,712 | 40,813 | 2.4% |
| * Berkshire Hathaway Inc. Class B | 298,388 | 39,996 | 2.4% |
| Bank of America Corp. | 1,801,747 | 29,441 | 1.7% |
| Citigroup Inc. | 520,562 | 27,840 | 1.7% |
| Goldman Sachs Group Inc. | 74,119 | 13,979 | 0.8% |
27
| Russell 1000 Value Index Fund | |||
| Market | Percentage | ||
| Value• | of Net | ||
| Shares | ($000) | Assets | |
| American International Group Inc. | 228,785 | 13,805 | 0.8% |
| US Bancorp | 287,428 | 12,173 | 0.7% |
| American Express Co. | 119,530 | 9,170 | 0.6% |
| Morgan Stanley | 263,083 | 9,063 | 0.5% |
| PNC Financial Services Group Inc. | 88,890 | 8,100 | 0.5% |
| MetLife Inc. | 160,764 | 8,054 | 0.5% |
| Capital One Financial Corp. | 93,761 | 7,290 | 0.4% |
| Bank of New York Mellon Corp. | 171,638 | 6,831 | 0.4% |
| * Synchrony Financial | 22,188 | 731 | 0.0% |
| Financial Services—Other † | 241,029 | 14.3% | |
| 510,941 | 30.2% | ||
| Health Care | |||
| Johnson & Johnson | 414,428 | 38,948 | 2.3% |
| Pfizer Inc. | 1,056,406 | 34,037 | 2.0% |
| Merck & Co. Inc. | 429,493 | 23,128 | 1.4% |
| Medtronic plc | 244,541 | 17,678 | 1.0% |
| Abbott Laboratories | 255,499 | 11,572 | 0.7% |
| * Allergan plc | 36,897 | 11,207 | 0.7% |
| Health Care—Other † | 63,149 | 3.7% | |
| 199,719 | 11.8% | ||
| Materials & Processing | |||
| Dow Chemical Co. | 171,916 | 7,523 | 0.4% |
| Materials & Processing—Other † | 48,396 | 2.9% | |
| 55,919 | 3.3% | ||
| Producer Durables | |||
| General Electric Co. | 1,728,617 | 42,904 | 2.5% |
| United Technologies Corp. | 138,733 | 12,709 | 0.8% |
| Danaher Corp. | 82,595 | 7,187 | 0.4% |
| Producer Durables—Other † | 99,152 | 5.9% | |
| 161,952 | 9.6% | ||
| Technology | |||
| Microsoft Corp. | 601,017 | 26,156 | 1.5% |
| Cisco Systems Inc. | 872,536 | 22,581 | 1.3% |
| Intel Corp. | 756,948 | 21,603 | 1.3% |
| QUALCOMM Inc. | 237,200 | 13,421 | 0.8% |
| International Business Machines Corp. | 69,375 | 10,260 | 0.6% |
| Hewlett-Packard Co. | 311,841 | 8,750 | 0.5% |
| Oracle Corp. | 217,525 | 8,068 | 0.5% |
| EMC Corp. | 305,915 | 7,608 | 0.5% |
| Technology—Other † | 58,453 | 3.5% | |
| 176,900 | 10.5% | ||
| Utilities | |||
| AT&T Inc. | 890,841 | 29,576 | 1.8% |
| Duke Energy Corp. | 118,683 | 8,416 | 0.5% |
| NextEra Energy Inc. | 76,284 | 7,507 | 0.4% |
| Utilities—Other † | 96,028 | 5.7% | |
| 141,527 | 8.4% | ||
| Total Common Stocks (Cost $1,638,276) | 1,676,727 | 99.2%1 | |
28
| Russell 1000 Value Index Fund | ||||
| Market | Percentage | |||
| Value• | of Net | |||
| Coupon | Shares | ($000) | Assets | |
| Temporary Cash Investments | ||||
| Money Market Fund | ||||
| 2,3 Vanguard Market Liquidity Fund | 0.168% | 8,467,901 | 8,468 | 0.5% |
| 4U.S. Government and Agency Obligations † | 600 | 0.1% | ||
| Total Temporary Cash Investments (Cost $9,068) | 9,068 | 0.6%1 | ||
| 5Total Investments (Cost $1,647,344) | 1,685,795 | 99.8% | ||
| Amount | ||||
| ($000) | ||||
| Other Assets and Liabilities | ||||
| Other Assets | ||||
| Investment in Vanguard | 157 | |||
| Receivables for Investment Securities Sold | 134 | |||
| Receivables for Accrued Income | 4,913 | |||
| Receivables for Capital Shares Issued | 1,495 | |||
| Total Other Assets | 6,699 | 0.4% | ||
| Liabilities | ||||
| Collateral for Securities on Loan | (1,215) | |||
| Payables for Capital Shares Redeemed | (343) | |||
| Payables to Vanguard | (402) | |||
| Other Liabilities | (652) | |||
| Total Liabilities | (2,612) | (0.2%) | ||
| Net Assets | 1,689,882 | 100.0% | ||
| At August 31, 2015, net assets consisted of: | ||||
| Amount | ||||
| ($000) | ||||
| Paid-in Capital | 1,650,891 | |||
| Undistributed Net Investment Income | 8,695 | |||
| Accumulated Net Realized Losses | (7,829) | |||
| Unrealized Appreciation (Depreciation) | ||||
| Investment Securities | 38,451 | |||
| Futures Contracts | (326) | |||
| Net Assets | 1,689,882 | |||
| ETF Shares—Net Assets | ||||
| Applicable to 4,800,000 outstanding $.001 par value shares of | ||||
| beneficial interest (unlimited authorization) | 406,888 | |||
| Net Asset Value Per Share—ETF Shares | $84.77 | |||
29
| Russell 1000 Value Index Fund | |
| Amount | |
| ($000) | |
| Institutional Shares—Net Assets | |
| Applicable to 7,752,093 outstanding $.001 par value shares of | |
| beneficial interest (unlimited authorization) | 1,282,994 |
| Net Asset Value Per Share— Institutional Shares | $165.50 |
• See Note A in Notes to Financial Statements.
* Non-income-producing security.
† Represents the aggregate value, by category, of securities that are not among the 50 largest holdings and, in total for any issuer, represent 1% or less of net assets.
1 The fund invests a portion of its cash reserves in equity markets through the use of index futures contracts. After giving effect to futures investments, the fund’s effective common stock and temporary cash investment positions represent 99.9% and -0.1%, respectively, of net assets.
2 Affiliated money market fund available only to Vanguard funds and certain trusts and accounts managed by Vanguard. Rate shown is the 7-day yield.
3 Includes $1,215,000 of collateral received for securities on loan.
4 Securities with a value of $600,000 have been segregated as initial margin for open futures contracts.
5 The total value of securities on loan is $1,159,000.
See accompanying Notes, which are an integral part of the Financial Statements.
30
| Russell 1000 Value Index Fund | |
| Statement of Operations | |
| Year Ended | |
| August 31, 2015 | |
| ($000) | |
| Investment Income | |
| Income | |
| Dividends | 38,356 |
| Interest1 | 8 |
| Securities Lending | 44 |
| Total Income | 38,408 |
| Expenses | |
| The Vanguard Group—Note B | |
| Investment Advisory Services | 282 |
| Management and Administrative—ETF Shares | 281 |
| Management and Administrative—Institutional Shares | 476 |
| Marketing and Distribution—ETF Shares | 48 |
| Marketing and Distribution—Institutional Shares | 184 |
| Custodian Fees | 109 |
| Auditing Fees | 32 |
| Shareholders’ Reports—ETF Shares | 10 |
| Shareholders’ Reports—Institutional Shares | — |
| Trustees’ Fees and Expenses | 1 |
| Total Expenses | 1,423 |
| Net Investment Income | 36,985 |
| Realized Net Gain (Loss) | |
| Investment Securities Sold | 142,305 |
| Futures Contracts | 141 |
| Realized Net Gain (Loss) | 142,446 |
| Change in Unrealized Appreciation (Depreciation) | |
| Investment Securities | (247,553) |
| Futures Contracts | (399) |
| Change in Unrealized Appreciation (Depreciation) | (247,952) |
| Net Increase (Decrease) in Net Assets Resulting from Operations | (68,521) |
| 1 Interest income from an affiliated company of the fund was $8,000. | |
See accompanying Notes, which are an integral part of the Financial Statements.
31
| Russell 1000 Value Index Fund | ||
| Statement of Changes in Net Assets | ||
| Year Ended August 31, | ||
| 2015 | 2014 | |
| ($000) | ($000) | |
| Increase (Decrease) in Net Assets | ||
| Operations | ||
| Net Investment Income | 36,985 | 28,675 |
| Realized Net Gain (Loss) | 142,446 | 72,118 |
| Change in Unrealized Appreciation (Depreciation) | (247,952) | 164,980 |
| Net Increase (Decrease) in Net Assets Resulting from Operations | (68,521) | 265,773 |
| Distributions | ||
| Net Investment Income | ||
| ETF Shares | (7,743) | (3,927) |
| Institutional Shares | (27,223) | (22,663) |
| Realized Capital Gain | ||
| ETF Shares | — | — |
| Institutional Shares | — | — |
| Total Distributions | (34,966) | (26,590) |
| Capital Share Transactions | ||
| ETF Shares | 151,113 | 107,531 |
| Institutional Shares | 137,171 | 224,692 |
| Net Increase (Decrease) from Capital Share Transactions | 288,284 | 332,223 |
| Total Increase (Decrease) | 184,797 | 571,406 |
| Net Assets | ||
| Beginning of Period | 1,505,085 | 933,679 |
| End of Period1 | 1,689,882 | 1,505,085 |
1 Net Assets—End of Period includes undistributed (overdistributed) net investment income of $8,695,000 and $6,673,000.
See accompanying Notes, which are an integral part of the Financial Statements.
32
| Russell 1000 Value Index Fund | |||||
| Financial Highlights | |||||
| ETF Shares | |||||
| Sept. 20, | |||||
| 20101 to | |||||
| Year Ended August 31, | |||||
| For a Share Outstanding | August 31, | ||||
| Throughout Each Period | 2015 | 2014 | 2013 | 2012 | 2011 |
| Net Asset Value, Beginning of Period | $89.83 | $73.82 | $61.49 | $53.57 | $51.46 |
| Investment Operations | |||||
| Net Investment Income | 1.990 | 1.774 | 1.610 | 1.228 | .876 |
| Net Realized and Unrealized Gain (Loss) | |||||
| on Investments | (5.097) | 15.967 | 12.290 | 7.833 | 1.886 |
| Total from Investment Operations | (3.107) | 17.741 | 13.900 | 9.061 | 2.762 |
| Distributions | |||||
| Dividends from Net Investment Income | (1.953) | (1.731) | (1.570) | (1.141) | (.652) |
| Distributions from Realized Capital Gains | — | — | — | — | — |
| Total Distributions | (1.953) | (1.731) | (1.570) | (1.141) | (.652) |
| Net Asset Value, End of Period | $84.77 | $89.83 | $73.82 | $61.49 | $53.57 |
| Total Return | -3.59% | 24.27% | 22.90% | 17.17% | 5.28% |
| Ratios/Supplemental Data | |||||
| Net Assets, End of Period (Millions) | $407 | $283 | $137 | $46 | $27 |
| Ratio of Total Expenses to Average Net Assets | 0.12% | 0.12% | 0.15% | 0.15% | 0.15%2 |
| Ratio of Net Investment Income to | |||||
| Average Net Assets | 2.26% | 2.22% | 2.39% | 2.48% | 2.23%2 |
| Portfolio Turnover Rate 3 | 18% | 16% | 26% | 29% | 39% |
1 Inception.
2 Annualized.
3 Excludes the value of portfolio securities received or delivered as a result of in-kind purchases or redemptions of the fund’s capital shares, including ETF Creation Units.
See accompanying Notes, which are an integral part of the Financial Statements.
33
| Russell 1000 Value Index Fund | |||||
| Financial Highlights | |||||
| Institutional Shares | |||||
| Dec. 10, | |||||
| 20101 to | |||||
| Year Ended August 31, | |||||
| For a Share Outstanding | August 31, | ||||
| Throughout Each Period | 2015 | 2014 | 2013 | 2012 | 2011 |
| Net Asset Value, Beginning of Period | $175.38 | $144.13 | $120.04 | $104.59 | $108.03 |
| Investment Operations | |||||
| Net Investment Income | 3.946 | 3.528 | 3.228 | 2.474 | 1.239 |
| Net Realized and Unrealized Gain (Loss) | |||||
| on Investments | (9.955) | 31.182 | 24.017 | 15.262 | (3.373) |
| Total from Investment Operations | (6.009) | 34.710 | 27.245 | 17.736 | (2.134) |
| Distributions | |||||
| Dividends from Net Investment Income | (3.871) | (3.460) | (3.155) | (2.286) | (1.306) |
| Distributions from Realized Capital Gains | — | — | — | — | — |
| Total Distributions | (3.871) | (3.460) | (3.155) | (2.286) | (1.306) |
| Net Asset Value, End of Period | $165.50 | $175.38 | $144.13 | $120.04 | $104.59 |
| Total Return | -3.55% | 24.33% | 23.00% | 17.23% | -2.06% |
| Ratios/Supplemental Data | |||||
| Net Assets, End of Period (Millions) | $1,283 | $1,222 | $797 | $541 | $164 |
| Ratio of Total Expenses to Average Net Assets | 0.08% | 0.08% | 0.08% | 0.08% | 0.08%2 |
| Ratio of Net Investment Income to | |||||
| Average Net Assets | 2.30% | 2.26% | 2.46% | 2.55% | 2.30%2 |
| Portfolio Turnover Rate 3 | 18% | 16% | 26% | 29% | 39% |
1 Inception.
2 Annualized.
3 Excludes the value of portfolio securities received or delivered as a result of in-kind purchases or redemptions of the fund’s capital shares, including ETF Creation Units.
See accompanying Notes, which are an integral part of the Financial Statements.
34
Russell 1000 Value Index Fund
Notes to Financial Statements
Vanguard Russell 1000 Value Index Fund is registered under the Investment Company Act of 1940 as an open-end investment company, or mutual fund. The fund offers two classes of shares: ETF Shares and Institutional Shares. ETF Shares are listed for trading on Nasdaq; they can be purchased and sold through a broker. Institutional Shares are designed for investors who meet certain administrative, service, and account-size criteria.
A. The following significant accounting policies conform to generally accepted accounting principles for U.S. investment companies. The fund consistently follows such policies in preparing its financial statements.
1. Security Valuation: Securities are valued as of the close of trading on the New York Stock Exchange (generally 4 p.m., Eastern time) on the valuation date. Equity securities are valued at the latest quoted sales prices or official closing prices taken from the primary market in which each security trades; such securities not traded on the valuation date are valued at the mean of the latest quoted bid and asked prices. Securities for which market quotations are not readily available, or whose values have been materially affected by events occurring before the fund’s pricing time but after the close of the securities’ primary markets, are valued by methods deemed by the board of trustees to represent fair value. Investments in Vanguard Market Liquidity Fund are valued at that fund’s net asset value. Temporary cash investments acquired over 60 days to maturity are valued using the latest bid prices or using valuations based on a matrix system (which considers such factors as security prices, yields, maturities, and ratings), both as furnished by independent pricing services. Other temporary cash investments are valued at amortized cost, which approximates market value.
2. Futures Contracts: The fund uses index futures contracts to a limited extent, with the objectives of maintaining full exposure to the stock market, enhancing returns, maintaining liquidity, and minimizing transaction costs. The fund may purchase futures contracts to immediately invest incoming cash in the market, or sell futures in response to cash outflows, thereby simulating a fully invested position in the underlying index while maintaining a cash balance for liquidity. The fund may seek to enhance returns by using futures contracts instead of the underlying securities when futures are believed to be priced more attractively than the underlying securities. The primary risks associated with the use of futures contracts are imperfect correlation between changes in market values of stocks held by the fund and the prices of futures contracts, and the possibility of an illiquid market. Counterparty risk involving futures is mitigated because a regulated clearinghouse is the counterparty instead of the clearing broker. To further mitigate counterparty risk, the fund trades futures contracts on an exchange, monitors the financial strength of its clearing brokers and clearinghouse, and has entered into clearing agreements with its clearing brokers. The clearinghouse imposes initial margin requirements to secure the fund’s performance and requires daily settlement of variation margin representing changes in the market value of each contract.
Futures contracts are valued at their quoted daily settlement prices. The aggregate settlement values of the contracts are not recorded in the Statement of Net Assets. Fluctuations in the value of the contracts are recorded in the Statement of Net Assets as an asset (liability) and in the Statement of Operations as unrealized appreciation (depreciation) until the contracts are closed, when they are recorded as realized futures gains (losses).
During the year ended August 31, 2015, the fund’s average investments in long and short futures contracts represented less than 1% and 0% of net assets, respectively, based on the average of aggregate settlement values at each quarter-end during the period.
35
Russell 1000 Value Index Fund
3. Federal Income Taxes: The fund intends to continue to qualify as a regulated investment company and distribute all of its taxable income. Management has analyzed the fund’s tax positions taken for all open federal income tax years (August 31, 2012–2015), and has concluded that no provision for federal income tax is required in the fund’s financial statements.
4. Distributions: Distributions to shareholders are recorded on the ex-dividend date.
5. Securities Lending: To earn additional income, the fund lends its securities to qualified institutional borrowers. Security loans are required to be secured at all times by collateral in an amount at least equal to the market value of securities loaned. Daily market fluctuations could cause the value of loaned securities to be more or less than the value of the collateral received. When this occurs, the collateral is adjusted and settled on the next business day. The fund further mitigates its counterparty risk by entering into securities lending transactions only with a diverse group of prequalified counter-parties, monitoring their financial strength, and entering into master securities lending agreements with its counterparties. The master securities lending agreements provide that, in the event of a counterparty’s default (including bankruptcy), the fund may terminate any loans with that borrower, determine the net amount owed, and sell or retain the collateral up to the net amount owed to the fund; however, such actions may be subject to legal proceedings. While collateral mitigates counter-party risk, in the absence of a default the fund may experience delays and costs in recovering the securities loaned. The fund invests cash collateral received in Vanguard Market Liquidity Fund, and records a liability in the Statement of Net Assets for the return of the collateral, during the period the securities are on loan. Securities lending income represents fees charged to borrowers plus income earned on invested cash collateral, less expenses associated with the loan.
6. Credit Facility: The fund and certain other funds managed by The Vanguard Group (“Vanguard”) participate in a $3 billion committed credit facility provided by a syndicate of lenders pursuant to a credit agreement that may be renewed annually; each fund is individually liable for its borrowings, if any, under the credit facility. Borrowings may be utilized for temporary and emergency purposes, and are subject to the fund’s regulatory and contractual borrowing restrictions. The participating funds are charged administrative fees and an annual commitment fee of 0.06% of the undrawn amount of the facility; these fees are allocated to the funds based on a method approved by the fund’s board of trustees and included in Management and Administrative expenses on the fund’s Statement of Operations. Any borrowings under this facility bear interest at a rate equal to the higher of the federal funds rate or LIBOR reference rate plus an agreed-upon spread.
The fund had no borrowings outstanding at August 31, 2015, or at any time during the period then ended.
7. Other: Dividend income is recorded on the ex-dividend date. Interest income includes income distributions received from Vanguard Market Liquidity Fund and is accrued daily. Premiums and discounts on debt securities purchased are amortized and accreted, respectively, to interest income over the lives of the respective securities. Security transactions are accounted for on the date securities are bought or sold. Costs used to determine realized gains (losses) on the sale of investment securities are those of the specific securities sold.
Each class of shares has equal rights as to assets and earnings, except that each class separately bears certain class-specific expenses related to maintenance of shareholder accounts (included in Management and Administrative expenses) and shareholder reporting. Marketing and distribution expenses are allocated to each class of shares based on a method approved by the board of trustees. Income, other non-class-specific expenses, and gains and losses on investments are allocated to each class of shares based on its relative net assets.
36
B. In accordance with the terms of a Funds’ Service Agreement (the “FSA”) between Vanguard and the fund, Vanguard furnishes to the fund investment advisory, corporate management, administrative, marketing, and distribution services at Vanguard’s cost of operations (as defined by the FSA). These costs of operations are allocated to the fund based on methods and guidelines approved by the board of trustees. Vanguard does not require reimbursement in the current period for certain costs of operations (such as deferred compensation/benefits and risk/insurance costs); the fund’s liability for these costs of operations is included in Payables to Vanguard on the Statement of Net Assets.
Upon the request of Vanguard, the fund may invest up to 0.40% of its net assets as capital in Vanguard. At August 31, 2015, the fund had contributed to Vanguard capital in the amount of $157,000, representing 0.01% of the fund’s net assets and 0.06% of Vanguard’s capitalization. The fund’s trustees and officers are also directors and employees, respectively, of Vanguard.
C. Various inputs may be used to determine the value of the fund’s investments. These inputs are summarized in three broad levels for financial statement purposes. The inputs or methodologies used to value securities are not necessarily an indication of the risk associated with investing in those securities.
Level 1—Quoted prices in active markets for identical securities.
Level 2—Other significant observable inputs (including quoted prices for similar securities, interest rates, prepayment speeds, credit risk, etc.).
Level 3—Significant unobservable inputs (including the fund’s own assumptions used to determine the fair value of investments).
The following table summarizes the market value of the fund’s investments as of August 31, 2015, based on the inputs used to value them:
| Level 1 | Level 2 | Level 3 | |
| Investments | ($000) | ($000) | ($000) |
| Common Stocks | 1,676,727 | — | — |
| Temporary Cash Investments | 8,468 | 600 | — |
| Futures Contracts—Liabilities1 | (120) | — | — |
| Total | 1,685,075 | 600 | — |
| 1 Represents variation margin on the last day of the reporting period. | |||
D. At August 31, 2015, the aggregate settlement value of open futures contracts and the related unrealized appreciation (depreciation) were:
| ($000) | ||||
| Aggregate | ||||
| Number of | Settlement | Unrealized | ||
| Long (Short) | Value | Appreciation | ||
| Futures Contracts | Expiration | Contracts | Long (Short) | (Depreciation) |
| E-mini S&P 500 Index | September 2015 | 112 | 11,028 | (300) |
| S&P 500 Index | September 2015 | 1 | 492 | (26) |
| (326) |
Unrealized appreciation (depreciation) on open futures contracts is required to be treated as realized gain (loss) for tax purposes.
37
Russell 1000 Value Index Fund
E. Distributions are determined on a tax basis and may differ from net investment income and realized capital gains for financial reporting purposes. Differences may be permanent or temporary. Permanent differences are reclassified among capital accounts in the financial statements to reflect their tax character. Temporary differences arise when certain items of income, expense, gain, or loss are recognized in different periods for financial statement and tax purposes. These differences will reverse at some time in the future. Differences in classification may also result from the treatment of short-term gains as ordinary income for tax purposes.
During the year ended August 31, 2015, the fund realized $148,162,000 of net capital gains resulting from in-kind redemptions—in which shareholders exchanged fund shares for securities held by the fund rather than for cash. Because such gains are not taxable to the fund, and are not distributed to shareholders, they have been reclassified from accumulated net realized losses to paid-in capital.
For tax purposes, at August 31, 2015, the fund had $9,071,000 of ordinary income available for distribution. The fund had available capital losses totaling $7,372,000 that may be carried forward indefinitely to offset future net capital gains.
At August 31, 2015, the cost of investment securities for tax purposes was $1,647,483,000. Net unrealized appreciation of investment securities for tax purposes was $38,312,000, consisting of unrealized gains of $144,163,000 on securities that had risen in value since their purchase and $105,851,000 in unrealized losses on securities that had fallen in value since their purchase.
F. During the year ended August 31, 2015, the fund purchased $983,157,000 of investment securities and sold $702,433,000 of investment securities, other than temporary cash investments. Purchases and sales include $387,617,000 and $415,807,000, respectively, in connection with in-kind purchases and redemptions of the fund’s capital shares.
G. Capital share transactions for each class of shares were:
| Year Ended August 31, | ||||
| 2015 | 2014 | |||
| Amount | Shares | Amount | Shares | |
| ($000) | (000) | ($000) | (000) | |
| ETF Shares | ||||
| Issued | 589,698 | 6,475 | 309,691 | 3,650 |
| Issued in Lieu of Cash Distributions | — | — | — | — |
| Redeemed | (438,585) | (4,825) | (202,160) | (2,350) |
| Net Increase (Decrease)—ETF Shares | 151,113 | 1,650 | 107,531 | 1,300 |
| Institutional Shares | ||||
| Issued | 406,222 | 2,305 | 364,022 | 2,304 |
| Issued in Lieu of Cash Distributions | 25,336 | 144 | 21,267 | 132 |
| Redeemed | (294,387) | (1,665) | (160,597) | (998) |
| Net Increase (Decrease) —Institutional Shares | 137,171 | 784 | 224,692 | 1,438 |
H. Management has determined that no material events or transactions occurred subsequent to August 31, 2015, that would require recognition or disclosure in these financial statements.
38
Russell 1000 Growth Index Fund
Fund Profile
As of August 31, 2015
| Share-Class Characteristics | ||
| ETF | Institutional | |
| Shares | Shares | |
| Ticker Symbol | VONG | VRGWX |
| Expense Ratio1 | 0.12% | 0.08% |
| 30-Day SEC Yield | 1.46% | 1.50% |
| Portfolio Characteristics | |||
| DJ | |||
| U.S. | |||
| Russell | Total | ||
| 1000 | Market | ||
| Growth | FA | ||
| Fund | Index | Index | |
| Number of Stocks | 645 | 643 | 3,828 |
| Median Market Cap | $61.8B | $61.8B | $47.2B |
| Price/Earnings Ratio | 23.5x | 23.6x | 20.8x |
| Price/Book Ratio | 5.4x | 5.4x | 2.6x |
| Return on Equity | 23.3% | 23.0% | 17.1% |
| Earnings Growth | |||
| Rate | 15.2% | 15.1% | 10.2% |
| Dividend Yield | 1.6% | 1.6% | 2.1% |
| Foreign Holdings | 0.0% | 0.0% | 0.0% |
| Turnover Rate | 20% | — | — |
| Short-Term Reserves | 0.1% | — | — |
| Sector Diversification (% of equity exposure) | |||
| DJ | |||
| U.S. | |||
| Russell | Total | ||
| 1000 | Market | ||
| Growth | FA | ||
| Fund | Index | Index | |
| Consumer Discretionary 22.6% | 22.6% | 14.9% | |
| Consumer Staples | 10.2 | 10.1 | 7.6 |
| Energy | 0.8 | 0.8 | 6.7 |
| Financial Services | 9.3 | 9.3 | 20.1 |
| Health Care | 17.4 | 17.5 | 14.8 |
| Materials & Processing | 4.1 | 4.1 | 3.9 |
| Producer Durables | 11.5 | 11.5 | 10.6 |
| Technology | 22.0 | 22.0 | 16.3 |
| Utilities | 2.1 | 2.1 | 5.1 |
| Volatility Measures | ||
| DJ | ||
| U.S. Total | ||
| Russell 1000 | Market | |
| �� | Growth Index | FA Index |
| R-Squared | 1.00 | 0.93 |
| Beta | 1.00 | 0.99 |
These measures show the degree and timing of the fund’s fluctuations compared with the indexes over 36 months.
| Ten Largest Holdings (% of total net assets) | ||
| Apple Inc. | Computer | |
| Technology | 6.4% | |
| Google Inc. | Computer Services | |
| Software & Systems | 3.6 | |
| Microsoft Corp. | Computer Services | |
| Software & Systems | 2.0 | |
| Amazon.com Inc. | Diversified Retail | 1.9 |
| Facebook Inc. | Computer Services | |
| Software & Systems | 1.9 | |
| Verizon Communications Utilities: | ||
| Inc. | Telecommunications | 1.7 |
| Walt Disney Co. | Entertainment | 1.7 |
| Gilead Sciences Inc. | Pharmaceuticals | 1.5 |
| Coca-Cola Co. | Beverage: Soft | |
| Drinks | 1.5 | |
| Home Depot Inc. | Specialty Retail | 1.5 |
| Top Ten | 23.7% | |
The holdings listed exclude any temporary cash investments and equity index products.
Investment Focus
1 The expense ratios shown are from the prospectus dated December 23, 2014, and represent estimated costs for the current fiscal year. For the fiscal year ended August 31, 2015, the expense ratios were 0.12% for ETF Shares and 0.08% for Institutional Shares.
39
Russell 1000 Growth Index Fund
Performance Summary
All of the returns in this report represent past performance, which is not a guarantee of future results that may be achieved by the fund. (Current performance may be lower or higher than the performance data cited. For performance data current to the most recent month-end, visit our website at vanguard.com/performance.) Note, too, that both investment returns and principal value can fluctuate widely, so an investor’s shares, when sold, could be worth more or less than their original cost. The returns shown do not reflect taxes that a shareholder would pay on fund distributions or on the sale of fund shares.
Cumulative Performance: September 20, 2010, Through August 31, 2015
Initial Investment of $10,000

| Average Annual Total Returns | |||
| Periods Ended August 31, 2015 | |||
| Since | Final Value | ||
| One | Inception | of a $10,000 | |
| Year | (9/20/2010) | Investment | |
| Russell 1000 Growth Index | |||
| Fund*ETF Shares Net Asset Value | 4.11% | 15.23% | $20,162 |
| Russell 1000 Growth Index | |||
| Fund*ETF Shares Market Price | 4.11 | 15.24 | 20,169 |
| Russell 1000 Growth Index | 4.26 | 15.41 | 20,318 |
| Large-Cap Growth Funds Average | 3.53 | 13.67 | 18,844 |
| Dow Jones U.S. Total Stock Market | |||
| Float Adjusted Index | 0.29 | 14.14 | 19,234 |
Large-Cap Growth Funds Average: Derived from data provided by Lipper, a Thomson Reuters Company.
"Since Inception" performance is calculated from the ETF Shares’ inception date for both the fund and its comparative standards.
| Since | Final Value | ||
| One | Inception | of a $5,000,000 | |
| Year | (12/6/2010) | Investment | |
| Russell 1000 Growth Index Fund Institutional | |||
| Shares | 4.15% | 13.59% | $9,138,975 |
| Russell 1000 Growth Index | 4.26 | 13.69 | 9,179,870 |
| Dow Jones U.S. Total Stock Market Float | |||
| Adjusted Index | 0.29 | 12.83 | 8,852,740 |
"Since Inception" performance is calculated from the Institutional Shares’ inception date for both the fund and its comparative standards.
See Financial Highlights for dividend and capital gains information.
40
Russell 1000 Growth Index Fund
| Cumulative Returns of ETF Shares: September 20, 2010, Through August 31, 2015 | ||
| Since | ||
| One | Inception | |
| Year | (9/20/2010) | |
| Russell 1000 Growth Index Fund ETF Shares | ||
| Market Price | 4.11% | 101.69% |
| Russell 1000 Growth Index Fund ETF Shares Net | ||
| Asset Value | 4.11 | 101.62 |
| Russell 1000 Growth Index | 4.26 | 103.18 |
"Since Inception" performance is calculated from the ETF Shares’ inception date for both the fund and its comparative standards.
Fiscal-Year Total Returns (%): September 20, 2010, Through August 31, 2015

| Russell 1000 Growth Index Fund ETF Shares Net Asset Value |
| Russell 1000 Growth Index |
Average Annual Total Returns: Periods Ended June 30, 2015
This table presents returns through the latest calendar quarter—rather than through the end of the fiscal period.
Securities and Exchange Commission rules require that we provide this information.
| Inception | One | Since | |
| Date | Year | Inception | |
| ETF Shares | 9/20/2010 | ||
| Market Price | 10.51% | 16.56% | |
| Net Asset Value | 10.43 | 16.54 | |
| Institutional Shares | 12/6/2010 | 10.48 | 14.87 |
41
Russell 1000 Growth Index Fund
Financial Statements
Statement of Net Assets—Investments Summary
As of August 31, 2015
This Statement summarizes the fund’s holdings by asset type. Details are reported for each of the fund’s 50 largest individual holdings and for investments that, in total for any issuer, represent more than 1% of the fund’s net assets. The total value of smaller holdings is reported as a single amount within each category.
The fund reports a complete list of its holdings in regulatory filings four times in each fiscal year, at the quarter-ends. For the second and fourth fiscal quarters, the complete listing of the fund’s holdings is available electronically on vanguard.com and on the Securities and Exchange Commission’s website (sec.gov), or you can have it mailed to you without charge by calling 800-662-7447. For the first and third fiscal quarters, the fund files the lists with the SEC on Form N-Q. Shareholders can look up the fund’s Forms N-Q on the SEC’s website. Forms N-Q may also be reviewed and copied at the SEC’s Public Reference Room (see the back cover of this report for further information).
| Market | Percentage | ||
| Value• | of Net | ||
| Shares | ($000) | Assets | |
| Common Stocks | |||
| Consumer Discretionary | |||
| * Amazon.com Inc. | 75,086 | 38,511 | 1.9% |
| Walt Disney Co. | 334,267 | 34,055 | 1.7% |
| Home Depot Inc. | 255,912 | 29,804 | 1.5% |
| Comcast Corp. Class A | 445,437 | 25,091 | 1.3% |
| McDonald’s Corp. | 188,872 | 17,947 | 0.9% |
| Starbucks Corp. | 295,585 | 16,171 | 0.8% |
| NIKE Inc. Class B | 133,632 | 14,933 | 0.7% |
| Lowe’s Cos. Inc. | 187,505 | 12,970 | 0.6% |
| * Priceline Group Inc. | 10,219 | 12,760 | 0.6% |
| Costco Wholesale Corp. | 86,726 | 12,146 | 0.6% |
| Time Warner Cable Inc. | 55,702 | 10,362 | 0.5% |
| * Netflix Inc. | 83,661 | 9,624 | 0.5% |
| TJX Cos. Inc. | 134,067 | 9,428 | 0.5% |
| Comcast Corp. Special Class A | 496 | 28 | 0.0% |
| Consumer Discretionary—Other † | 209,301 | 10.4% | |
| 453,131 | 22.5% | ||
| Consumer Staples | |||
| Coca-Cola Co. | 772,475 | 30,374 | 1.5% |
| PepsiCo Inc. | 290,773 | 27,022 | 1.3% |
| CVS Health Corp. | 206,110 | 21,106 | 1.1% |
| Altria Group Inc. | 364,548 | 19,532 | 1.0% |
| Philip Morris International Inc. | 152,050 | 12,134 | 0.6% |
| Colgate-Palmolive Co. | 156,362 | 9,821 | 0.5% |
| Consumer Staples—Other † | 83,916 | 4.2% | |
| 203,905 | 10.2% | ||
| Energy † | 16,380 | 0.8% | |
| Financial Services | |||
| Visa Inc. Class A | 385,599 | 27,493 | 1.4% |
| MasterCard Inc. Class A | 196,973 | 18,194 | 0.9% |
42
| Russell 1000 Growth Index Fund | |||
| Market | Percentage | ||
| Value• | of Net | ||
| Shares | ($000) | Assets | |
| Simon Property Group Inc. | 61,363 | 11,004 | 0.5% |
| Financial Services—Other † | 130,123 | 6.5% | |
| 186,814 | 9.3% | ||
| Health Care | |||
| Gilead Sciences Inc. | 289,512 | 30,419 | 1.5% |
| Amgen Inc. | 149,826 | 22,741 | 1.1% |
| UnitedHealth Group Inc. | 178,195 | 20,617 | 1.0% |
| AbbVie Inc. | 326,274 | 20,363 | 1.0% |
| Bristol-Myers Squibb Co. | 328,416 | 19,531 | 1.0% |
| * Celgene Corp. | 156,282 | 18,454 | 0.9% |
| Eli Lilly & Co. | 192,790 | 15,876 | 0.8% |
| * Biogen Inc. | 46,341 | 13,777 | 0.7% |
| * Allergan plc | 34,950 | 10,616 | 0.5% |
| * Express Scripts Holding Co. | 111,909 | 9,356 | 0.5% |
| McKesson Corp. | 45,659 | 9,021 | 0.4% |
| Health Care—Other † | 157,928 | 7.9% | |
| 348,699 | 17.3% | ||
| Materials & Processing | |||
| Monsanto Co. | 93,905 | 9,170 | 0.4% |
| Materials & Processing—Other † | 74,006 | 3.7% | |
| 83,176 | 4.1% | ||
| 1Other † | 7 | 0.0% | |
| Producer Durables | |||
| Boeing Co. | 136,259 | 17,806 | 0.9% |
| 3M Co. | 125,027 | 17,771 | 0.9% |
| Honeywell International Inc. | 154,035 | 15,291 | 0.8% |
| Union Pacific Corp. | 172,474 | 14,788 | 0.7% |
| United Parcel Service Inc. Class B | 138,229 | 13,498 | 0.7% |
| Accenture plc Class A | 123,774 | 11,668 | 0.6% |
| Producer Durables—Other † | 139,826 | 6.9% | |
| 230,648 | 11.5% | ||
| Technology | |||
| Apple Inc. | 1,135,984 | 128,094 | 6.4% |
| Microsoft Corp. | 903,503 | 39,320 | 2.0% |
| * Facebook Inc. Class A | 426,282 | 38,122 | 1.9% |
| * Google Inc. Class A | 56,790 | 36,790 | 1.8% |
| * Google Inc. Class C | 57,948 | 35,826 | 1.8% |
| International Business Machines Corp. | 99,284 | 14,683 | 0.7% |
| Oracle Corp. | 374,525 | 13,891 | 0.7% |
| Texas Instruments Inc. | 205,014 | 9,808 | 0.5% |
| * salesforce.com inc | 129,298 | 8,968 | 0.4% |
| Technology—Other † | 116,760 | 5.8% | |
| 442,262 | 22.0% | ||
| Utilities | |||
| Verizon Communications Inc. | 745,618 | 34,306 | 1.7% |
| Utilities—Other † | 7,691 | 0.4% | |
| 41,997 | 2.1% | ||
| Total Common Stocks (Cost $1,696,490) | 2,007,019 | 99.8%2 | |
43
| Russell 1000 Growth Index Fund | ||||
| Market | Percentage | |||
| Value• | of Net | |||
| Coupon | Shares | ($000) | Assets | |
| Temporary Cash Investments | ||||
| Money Market Fund | ||||
| 3,4 Vanguard Market Liquidity Fund | 0.168% | 11,860,223 | 11,860 | 0.6% |
| 5U.S. Government and Agency Obligations † | 400 | 0.0% | ||
| Total Temporary Cash Investments (Cost $12,260) | 12,260 | 0.6%2 | ||
| 6Total Investments (Cost $1,708,750) | 2,019,279 | 100.4% | ||
| Amount | ||||
| ($000) | ||||
| Other Assets and Liabilities | ||||
| Other Assets | ||||
| Investment in Vanguard | 190 | |||
| Receivables for Investment Securities Sold | 1,990 | |||
| Receivables for Accrued Income | 2,445 | |||
| Receivables for Capital Shares Issued | 660 | |||
| Total Other Assets | 5,285 | 0.2% | ||
| Liabilities | ||||
| Payables for Investment Securities Purchased | (124) | |||
| Collateral for Securities on Loan | (4,366) | |||
| Payables for Capital Shares Redeemed | (5,015) | |||
| Payables to Vanguard | (458) | |||
| Other Liabilities | (2,631) | |||
| Total Liabilities | (12,594) | (0.6%) | ||
| Net Assets | 2,011,970 | 100.0% | ||
| At August 31, 2015, net assets consisted of: | ||||
| Amount | ||||
| ($000) | ||||
| Paid-in Capital | 1,738,539 | |||
| Undistributed Net Investment Income | 5,181 | |||
| Accumulated Net Realized Losses | (42,083) | |||
| Unrealized Appreciation (Depreciation) | ||||
| Investment Securities | 310,529 | |||
| Futures Contracts | (196) | |||
| Net Assets | 2,011,970 | |||
| ETF Shares—Net Assets | ||||
| Applicable to 4,601,711 outstanding $.001 par value shares of | ||||
| beneficial interest (unlimited authorization) | 452,089 | |||
| Net Asset Value Per Share—ETF Shares | $98.24 | |||
44
| Russell 1000 Growth Index Fund | |
| Amount | |
| ($000) | |
| Institutional Shares—Net Assets | |
| Applicable to 8,258,474 outstanding $.001 par value shares of | |
| beneficial interest (unlimited authorization) | 1,559,881 |
| Net Asset Value Per Share—Institutional Shares | $188.88 |
• See Note A in Notes to Financial Statements.
* Non-income-producing security.
† Represents the aggregate value, by category, of securities that are not among the 50 largest holdings and, in total for any issuer, represent 1% or less of net assets.
1 “Other” represents securities that are not classified by the fund’s benchmark index.
2 The fund invests a portion of its cash reserves in equity markets through the use of index futures contracts. After giving effect to futures investments, the fund’s effective common stock and temporary cash investment positions represent 100.0% and 0.4%, respectively, of net assets.
3 Affiliated money market fund available only to Vanguard funds and certain trusts and accounts managed by Vanguard. Rate shown is the 7-day yield.
4 Includes $4,366,000 of collateral received for securities on loan.
5 Securities with a value of $400,000 have been segregated as initial margin for open futures contracts.
6 The total value of securities on loan is $4,241,000.
See accompanying Notes, which are an integral part of the Financial Statements.
45
| Russell 1000 Growth Index Fund | |
| Statement of Operations | |
| Year Ended | |
| August 31, 2015 | |
| ($000) | |
| Investment Income | |
| Income | |
| Dividends | 29,805 |
| Interest1 | 6 |
| Securities Lending | 55 |
| Total Income | 29,866 |
| Expenses | |
| The Vanguard Group—Note B | |
| Investment Advisory Services | 326 |
| Management and Administrative—ETF Shares | 298 |
| Management and Administrative—Institutional Shares | 593 |
| Marketing and Distribution—ETF Shares | 50 |
| Marketing and Distribution—Institutional Shares | 217 |
| Custodian Fees | 112 |
| Auditing Fees | 32 |
| Shareholders’ Reports—ETF Shares | 7 |
| Shareholders’ Reports—Institutional Shares | 4 |
| Trustees’ Fees and Expenses | 1 |
| Total Expenses | 1,640 |
| Net Investment Income | 28,226 |
| Realized Net Gain (Loss) | |
| Investment Securities Sold | 139,076 |
| Futures Contracts | 219 |
| Realized Net Gain (Loss) | 139,295 |
| Change in Unrealized Appreciation (Depreciation) | |
| Investment Securities | (107,029) |
| Futures Contracts | (206) |
| Change in Unrealized Appreciation (Depreciation) | (107,235) |
| Net Increase (Decrease) in Net Assets Resulting from Operations | 60,286 |
| 1 Interest income from an affiliated company of the fund was $6,000. | |
See accompanying Notes, which are an integral part of the Financial Statements.
46
| Russell 1000 Growth Index Fund | ||
| Statement of Changes in Net Assets | ||
| Year Ended August 31, | ||
| 2015 | 2014 | |
| ($000) | ($000) | |
| Increase (Decrease) in Net Assets | ||
| Operations | ||
| Net Investment Income | 28,226 | 23,049 |
| Realized Net Gain (Loss) | 139,295 | 77,052 |
| Change in Unrealized Appreciation (Depreciation) | (107,235) | 234,680 |
| Net Increase (Decrease) in Net Assets Resulting from Operations | 60,286 | 334,781 |
| Distributions | ||
| Net Investment Income | ||
| ETF Shares | (5,242) | (3,358) |
| Institutional Shares | (22,086) | (18,832) |
| Realized Capital Gain | ||
| ETF Shares | — | — |
| Institutional Shares | — | — |
| Total Distributions | (27,328) | (22,190) |
| Capital Share Transactions | ||
| ETF Shares | 156,308 | 97,668 |
| Institutional Shares | 67,889 | 204,387 |
| Net Increase (Decrease) from Capital Share Transactions | 224,197 | 302,055 |
| Total Increase (Decrease) | 257,155 | 614,646 |
| Net Assets | ||
| Beginning of Period | 1,754,815 | 1,140,169 |
| End of Period1 | 2,011,970 | 1,754,815 |
1 Net Assets—End of Period includes undistributed (overdistributed) net investment income of $5,181,000 and $4,282,000.
See accompanying Notes, which are an integral part of the Financial Statements.
47
| Russell 1000 Growth Index Fund | |||||
| Financial Highlights | |||||
| ETF Shares | |||||
| Sept. 20, | |||||
| 20101 to | |||||
| For a Share Outstanding | Year Ended August 31, | August 31, | |||
| Throughout Each Period | 2015 | 2014 | 2013 | 2012 | 2011 |
| Net Asset Value, Beginning of Period | $95.74 | $77.02 | $67.41 | $58.31 | $52.12 |
| Investment Operations | |||||
| Net Investment Income | 1.466 | 1.293 | 1.226 | .900 | .579 |
| Net Realized and Unrealized Gain (Loss) | |||||
| on Investments | 2.481 | 18.713 | 9.611 | 9.023 | 6.044 |
| Total from Investment Operations | 3.947 | 20.006 | 10.837 | 9.923 | 6.623 |
| Distributions | |||||
| Dividends from Net Investment Income | (1.447) | (1.286) | (1.227) | (.823) | (.433) |
| Distributions from Realized Capital Gains | — | — | — | — | — |
| Total Distributions | (1.447) | (1.286) | (1.227) | (.823) | (.433) |
| Net Asset Value, End of Period | $98.24 | $95.74 | $77.02 | $67.41 | $58.31 |
| Total Return | 4.11% | 26.15% | 16.27% | 17.18% | 12.69% |
| Ratios/Supplemental Data | |||||
| Net Assets, End of Period (Millions) | $452 | $295 | $148 | $76 | $52 |
| Ratio of Total Expenses to Average Net Assets | 0.12% | 0.12% | 0.15% | 0.15% | 0.15%2 |
| Ratio of Net Investment Income to | |||||
| Average Net Assets | 1.47% | 1.51% | 1.73% | 1.59% | 1.47%2 |
| Portfolio Turnover Rate 3 | 20% | 18% | 29% | 25% | 30% |
1 Inception.
2 Annualized.
3 Excludes the value of portfolio securities received or delivered as a result of in-kind purchases or redemptions of the fund’s capital shares, including ETF Creation Units.
See accompanying Notes, which are an integral part of the Financial Statements.
48
| Russell 1000 Growth Index Fund | |||||
| Financial Highlights | |||||
| Institutional Shares | |||||
| Dec. 6, | |||||
| 20101 to | |||||
| For a Share Outstanding | Year Ended August 31, | August 31, | |||
| Throughout Each Period | 2015 | 2014 | 2013 | 2012 | 2011 |
| Net Asset Value, Beginning of Period | $184.06 | $148.07 | $129.59 | $112.09 | $110.81 |
| Investment Operations | |||||
| Net Investment Income | 2.882 | 2.544 | 2.446 | 1.812 | .879 |
| Net Realized and Unrealized Gain (Loss) | |||||
| on Investments | 4.782 | 35.986 | 18.488 | 17.342 | 1.278 |
| Total from Investment Operations | 7.664 | 38.530 | 20.934 | 19.154 | 2.157 |
| Distributions | |||||
| Dividends from Net Investment Income | (2.844) | (2.540) | (2.454) | (1.654) | (.877) |
| Distributions from Realized Capital Gains | — | — | — | — | — |
| Total Distributions | (2.844) | (2.540) | (2.454) | (1.654) | (.877) |
| Net Asset Value, End of Period | $188.88 | $184.06 | $148.07 | $129.59 | $112.09 |
| Total Return | 4.15% | 26.20% | 16.35% | 17.26% | 1.92% |
| Ratios/Supplemental Data | |||||
| Net Assets, End of Period (Millions) | $1,560 | $1,460 | $992 | $576 | $154 |
| Ratio of Total Expenses to Average Net Assets | 0.08% | 0.08% | 0.08% | 0.08% | 0.08%2 |
| Ratio of Net Investment Income to | |||||
| Average Net Assets | 1.51% | 1.55% | 1.80% | 1.66% | 1.54%2 |
| Portfolio Turnover Rate 3 | 20% | 18% | 29% | 25% | 30% |
1 Inception.
2 Annualized.
3 Excludes the value of portfolio securities received or delivered as a result of in-kind purchases or redemptions of the fund’s capital shares, including ETF Creation Units.
See accompanying Notes, which are an integral part of the Financial Statements.
49
Russell 1000 Growth Index Fund
Notes to Financial Statements
Vanguard Russell 1000 Growth Index Fund is registered under the Investment Company Act of 1940 as an open-end investment company, or mutual fund. The fund offers two classes of shares: ETF Shares and Institutional Shares. ETF Shares are listed for trading on Nasdaq; they can be purchased and sold through a broker. Institutional Shares are designed for investors who meet certain administrative, service, and account-size criteria.
A. The following significant accounting policies conform to generally accepted accounting principles for U.S. investment companies. The fund consistently follows such policies in preparing its financial statements.
1. Security Valuation: Securities are valued as of the close of trading on the New York Stock Exchange (generally 4 p.m., Eastern time) on the valuation date. Equity securities are valued at the latest quoted sales prices or official closing prices taken from the primary market in which each security trades; such securities not traded on the valuation date are valued at the mean of the latest quoted bid and asked prices. Securities for which market quotations are not readily available, or whose values have been materially affected by events occurring before the fund’s pricing time but after the close of the securities’ primary markets, are valued by methods deemed by the board of trustees to represent fair value. Investments in Vanguard Market Liquidity Fund are valued at that fund’s net asset value. Temporary cash investments acquired over 60 days to maturity are valued using the latest bid prices or using valuations based on a matrix system (which considers such factors as security prices, yields, maturities, and ratings), both as furnished by independent pricing services. Other temporary cash investments are valued at amortized cost, which approximates market value.
2. Futures Contracts: The fund uses index futures contracts to a limited extent, with the objectives of maintaining full exposure to the stock market, enhancing returns, maintaining liquidity, and minimizing transaction costs. The fund may purchase futures contracts to immediately invest incoming cash in the market, or sell futures in response to cash outflows, thereby simulating a fully invested position in the underlying index while maintaining a cash balance for liquidity. The fund may seek to enhance returns by using futures contracts instead of the underlying securities when futures are believed to be priced more attractively than the underlying securities. The primary risks associated with the use of futures contracts are imperfect correlation between changes in market values of stocks held by the fund and the prices of futures contracts, and the possibility of an illiquid market. Counterparty risk involving futures is mitigated because a regulated clearinghouse is the counterparty instead of the clearing broker. To further mitigate counterparty risk, the fund trades futures contracts on an exchange, monitors the financial strength of its clearing brokers and clearinghouse, and has entered into clearing agreements with its clearing brokers. The clearinghouse imposes initial margin requirements to secure the fund’s performance and requires daily settlement of variation margin representing changes in the market value of each contract.
Futures contracts are valued at their quoted daily settlement prices. The aggregate settlement values of the contracts are not recorded in the Statement of Net Assets. Fluctuations in the value of the contracts are recorded in the Statement of Net Assets as an asset (liability) and in the Statement of Operations as unrealized appreciation (depreciation) until the contracts are closed, when they are recorded as realized futures gains (losses).
During the year ended August 31, 2015, the fund’s average investments in long and short futures contracts represented less than 1% and 0% of net assets, respectively, based on the average of aggregate settlement values at each quarter-end during the period.
50
Russell 1000 Growth Index Fund
3. Federal Income Taxes: The fund intends to continue to qualify as a regulated investment company and distribute all of its taxable income. Management has analyzed the fund’s tax positions taken for all open federal income tax years (August 31, 2012–2015), and has concluded that no provision for federal income tax is required in the fund’s financial statements.
4. Distributions: Distributions to shareholders are recorded on the ex-dividend date.
5. Securities Lending: To earn additional income, the fund lends its securities to qualified institutional borrowers. Security loans are required to be secured at all times by collateral in an amount at least equal to the market value of securities loaned. Daily market fluctuations could cause the value of loaned securities to be more or less than the value of the collateral received. When this occurs, the collateral is adjusted and settled on the next business day. The fund further mitigates its counterparty risk by entering into securities lending transactions only with a diverse group of prequalified counter-parties, monitoring their financial strength, and entering into master securities lending agreements with its counterparties. The master securities lending agreements provide that, in the event of a counterparty’s default (including bankruptcy), the fund may terminate any loans with that borrower, determine the net amount owed, and sell or retain the collateral up to the net amount owed to the fund; however, such actions may be subject to legal proceedings. While collateral mitigates counter-party risk, in the absence of a default the fund may experience delays and costs in recovering the securities loaned. The fund invests cash collateral received in Vanguard Market Liquidity Fund, and records a liability in the Statement of Net Assets for the return of the collateral, during the period the securities are on loan. Securities lending income represents fees charged to borrowers plus income earned on invested cash collateral, less expenses associated with the loan.
6. Credit Facility: The fund and certain other funds managed by The Vanguard Group (“Vanguard”) participate in a $3 billion committed credit facility provided by a syndicate of lenders pursuant to a credit agreement that may be renewed annually; each fund is individually liable for its borrowings, if any, under the credit facility. Borrowings may be utilized for temporary and emergency purposes, and are subject to the fund’s regulatory and contractual borrowing restrictions. The participating funds are charged administrative fees and an annual commitment fee of 0.06% of the undrawn amount of the facility; these fees are allocated to the funds based on a method approved by the fund’s board of trustees and included in Management and Administrative expenses on the fund’s Statement of Operations. Any borrowings under this facility bear interest at a rate equal to the higher of the federal funds rate or LIBOR reference rate plus an agreed-upon spread.
The fund had no borrowings outstanding at August 31, 2015, or at any time during the period then ended.
7. Other: Dividend income is recorded on the ex-dividend date. Interest income includes income distributions received from Vanguard Market Liquidity Fund and is accrued daily. Premiums and discounts on debt securities purchased are amortized and accreted, respectively, to interest income over the lives of the respective securities. Security transactions are accounted for on the date securities are bought or sold. Costs used to determine realized gains (losses) on the sale of investment securities are those of the specific securities sold.
Each class of shares has equal rights as to assets and earnings, except that each class separately bears certain class-specific expenses related to maintenance of shareholder accounts (included in Management and Administrative expenses) and shareholder reporting. Marketing and distribution expenses are allocated to each class of shares based on a method approved by the board of trustees. Income, other non-class-specific expenses, and gains and losses on investments are allocated to each class of shares based on its relative net assets.
51
Russell 1000 Growth Index Fund
B. In accordance with the terms of a Funds’ Service Agreement (the “FSA”) between Vanguard and the fund, Vanguard furnishes to the fund investment advisory, corporate management, administrative, marketing, and distribution services at Vanguard’s cost of operations (as defined by the FSA). These costs of operations are allocated to the fund based on methods and guidelines approved by the board of trustees. Vanguard does not require reimbursement in the current period for certain costs of operations (such as deferred compensation/benefits and risk/insurance costs); the fund’s liability for these costs of operations is included in Payables to Vanguard on the Statement of Net Assets.
Upon the request of Vanguard, the fund may invest up to 0.40% of its net assets as capital in Vanguard. At August 31, 2015, the fund had contributed to Vanguard capital in the amount of $190,000, representing 0.01% of the fund’s net assets and 0.08% of Vanguard’s capitalization. The fund’s trustees and officers are also directors and employees, respectively, of Vanguard.
C. Various inputs may be used to determine the value of the fund’s investments. These inputs are summarized in three broad levels for financial statement purposes. The inputs or methodologies used to value securities are not necessarily an indication of the risk associated with investing in those securities.
Level 1—Quoted prices in active markets for identical securities.
Level 2—Other significant observable inputs (including quoted prices for similar securities, interest rates, prepayment speeds, credit risk, etc.).
Level 3—Significant unobservable inputs (including the fund’s own assumptions used to determine the fair value of investments).
The following table summarizes the market value of the fund’s investments as of August 31, 2015, based on the inputs used to value them:
| Level 1 | Level 2 | Level 3 | |
| Investments | ($000) | ($000) | ($000) |
| Common Stocks | 2,007,019 | — | — |
| Temporary Cash Investments | 11,860 | 400 | — |
| Futures Contracts—Liabilities1 | (53) | — | — |
| Total | 2,018,826 | 400 | — |
| 1 Represents variation margin on the last day of the reporting period. | |||
D. At August 31, 2015, the aggregate settlement value of open futures contracts and the related unrealized appreciation (depreciation) were:
| ($000) | ||||
| Aggregate | ||||
| Number of | Settlement | Unrealized | ||
| Long (Short) | Value | Appreciation | ||
| Futures Contracts | Expiration | Contracts | Long (Short) | (Depreciation) |
| S&P 500 Index | September 2015 | 8 | 3,938 | (213) |
| E-mini S&P 500 Index | September 2015 | 12 | 1,182 | 17 |
| (196) |
Unrealized appreciation (depreciation) on open futures contracts is required to be treated as realized gain (loss) for tax purposes.
52
Russell 1000 Growth Index Fund
E. Distributions are determined on a tax basis and may differ from net investment income and realized capital gains for financial reporting purposes. Differences may be permanent or temporary. Permanent differences are reclassified among capital accounts in the financial statements to reflect their tax character. Temporary differences arise when certain items of income, expense, gain, or loss are recognized in different periods for financial statement and tax purposes. These differences will reverse at some time in the future. Differences in classification may also result from the treatment of short-term gains as ordinary income for tax purposes.
During the year ended August 31, 2015, the fund realized $157,262,000 of net capital gains resulting from in-kind redemptions—in which shareholders exchanged fund shares for securities held by the fund rather than for cash. Because such gains are not taxable to the fund, and are not distributed to shareholders, they have been reclassified from accumulated net realized losses to paid-in capital.
For tax purposes, at August 31, 2015, the fund had $5,597,000 of ordinary income available for distribution. The fund had available capital losses totaling $41,430,000 that may be carried forward indefinitely to offset future net capital gains.
At August 31, 2015, the cost of investment securities for tax purposes was $1,709,599,000. Net unrealized appreciation of investment securities for tax purposes was $309,680,000, consisting of unrealized gains of $355,850,000 on securities that had risen in value since their purchase and $46,170,000 in unrealized losses on securities that had fallen in value since their purchase.
F. During the year ended August 31, 2015, the fund purchased $1,004,954,000 of investment securities and sold $782,784,000 of investment securities, other than temporary cash investments. Purchases and sales include $327,834,000 and $409,553,000, respectively, in connection with in-kind purchases and redemptions of the fund’s capital shares.
G. Capital share transactions for each class of shares were:
| Year Ended August 31, | ||||
| 2015 | 2014 | |||
| Amount | Shares | Amount | Shares | |
| ($000) | (000) | ($000) | (000) | |
| ETF Shares | ||||
| Issued | 591,973 | 5,900 | 318,047 | 3,600 |
| Issued in Lieu of Cash Distributions | — | — | — | — |
| Redeemed | (435,665) | (4,375) | (220,379) | (2,450) |
| Net Increase (Decrease) —ETF Shares | 156,308 | 1,525 | 97,668 | 1,150 |
| Institutional Shares | ||||
| Issued | 431,791 | 2,235 | 442,008 | 2,640 |
| Issued in Lieu of Cash Distributions | 20,780 | 109 | 17,909 | 107 |
| Redeemed | (384,682) | (2,019) | (255,530) | (1,511) |
| Net Increase (Decrease) —Institutional Shares | 67,889 | 325 | 204,387 | 1,236 |
H. Management has determined that no material events or transactions occurred subsequent to August 31, 2015, that would require recognition or disclosure in these financial statements.
53
Report of Independent Registered Public Accounting Firm
To the Board of Trustees of Vanguard Scottsdale Funds and the Shareholders of Vanguard Russell 1000 Index Fund, Vanguard Russell 1000 Value Index Fund and Vanguard Russell 1000 Growth Index Fund: In our opinion, the accompanying statements of net assets—investments summary and the related statements of operations and of changes in net assets and the financial highlights present fairly, in all material respects, the financial position of Vanguard Russell 1000 Index Fund, Vanguard Russell 1000 Value Index Fund and Vanguard Russell 1000 Growth Index Fund (constituting separate portfolios of Vanguard Scottsdale Funds, hereafter referred to as the “Funds”) at August 31, 2015, the results of each of their operations for the year then ended, the changes in each of their net assets for each of the two years in the period then ended, and the financial highlights for each of the periods indicated, in conformity with accounting principles generally accepted in the United States of America. These financial statements and financial highlights (hereafter referred to as “financial statements”) are the responsibility of the Funds’ management. Our responsibility is to express an opinion on these financial statements based on our audits. We conducted our audits of these financial statements in accordance with the standards of the Public Company Accounting Oversight Board (United States). Those standards require that we plan and perform the audit to obtain reasonable assurance about whether the financial statements are free of material misstatement. An audit includes examining, on a test basis, evidence supporting the amounts and disclosures in the financial statements, assessing the accounting principles used and significant estimates made by management, and evaluating the overall financial statement presentation. We believe that our audits, which included confirmation of securities at August 31, 2015 by correspondence with the custodian and brokers, by agreement to the underlying ownership records of the transfer agent and the application of alternative auditing procedures where securities purchased had not been received, provide a reasonable basis for our opinion.
/s/PricewaterhouseCoopers LLP
Philadelphia, Pennsylvania
October 12, 2015
54
| Special 2015 tax information (unaudited) for Vanguard Russell 1000 Index Funds |
| This information for the fiscal year ended August 31, 2015, is included pursuant to provisions of the Internal Revenue Code. |
| The funds distributed qualified dividend income to shareholders during the fiscal year as follows: |
| Fund | ($000) |
| Russell 1000 Index Fund | 29,057 |
| Russell 1000 Value Index Fund | 33,706 |
| Russell 1000 Growth Index Fund | 27,328 |
For corporate shareholders, the percentage of investment income (dividend income plus short-term gains, if any) that qualifies for the dividends-received deduction is as follows:
| Fund | Percentage |
| Russell 1000 Index Fund | 94.6% |
| Russell 1000 Value Index Fund | 90.5 |
| Russell 1000 Growth Index Fund | 94.8 |
55
Your Fund’s After-Tax Returns
This table presents returns for your fund both before and after taxes. The after-tax returns are shown in two ways: (1) assuming that an investor owned the fund during the entire period and paid taxes on the fund’s distributions, and (2) assuming that an investor paid taxes on the fund’s distributions and sold all shares at the end of each period.
Calculations are based on the highest individual federal income tax and capital gains tax rates in effect at the times of the distributions and the hypothetical sales. State and local taxes were not considered. After-tax returns reflect any qualified dividend income, using actual prior-year figures and estimates for 2015. (In the example, returns after the sale of fund shares may be higher than those assuming no sale. This occurs when the sale would have produced a capital loss. The calculation assumes that the investor received a tax deduction for the loss.)
The table shows returns for ETF Shares only; returns for other share classes will differ. Please note that your actual after-tax returns will depend on your tax situation and may differ from those shown. Also note that if you own the fund in a tax-deferred account, such as an individual retirement account or a 401(k) plan, this information does not apply to you. Such accounts are not subject to current taxes.
Finally, keep in mind that a fund’s performance—whether before or after taxes—does not guarantee future results.
Average Annual Total Returns: Russell 1000 Index Funds
Periods Ended August 31, 2015
| Since | ||
| One | Inception | |
| Year | (9/20/2010) | |
| Russell 1000 Index Fund ETF Shares | ||
| Returns Before Taxes | 0.29% | 14.10% |
| Returns After Taxes on Distributions | -0.13 | 13.72 |
| Returns After Taxes on Distributions and Sale of Fund Shares | 0.52 | 11.34 |
| Since | ||
| One | Inception | |
| Year | (9/20/2010) | |
| Russell 1000 Value Index Fund ETF Shares | ||
| Returns Before Taxes | -3.59% | 12.83% |
| Returns After Taxes on Distributions | -4.09 | 12.38 |
| Returns After Taxes on Distributions and Sale of Fund Shares | -1.60 | 10.27 |
| Since | ||
| One | Inception | |
| Year | (9/20/2010) | |
| Russell 1000 Growth Index FundETF Shares | ||
| Returns Before Taxes | 4.11% | 15.23% |
| Returns After Taxes on Distributions | 3.75 | 14.92 |
| Returns After Taxes on Distributions and Sale of Fund Shares | 2.62 | 12.28 |
56
About Your Fund’s Expenses
As a shareholder of the fund, you incur ongoing costs, which include costs for portfolio management, administrative services, and shareholder reports (like this one), among others. Operating expenses, which are deducted from a fund’s gross income, directly reduce the investment return of the fund.
A fund’s expenses are expressed as a percentage of its average net assets. This figure is known as the expense ratio. The following examples are intended to help you understand the ongoing costs (in dollars) of investing in your fund and to compare these costs with those of other mutual funds. The examples are based on an investment of $1,000 made at the beginning of the period shown and held for the entire period.
The accompanying table illustrates your fund’s costs in two ways:
• Based on actual fund return. This section helps you to estimate the actual expenses that you paid over the period. The ”Ending Account Value“ shown is derived from the fund‘s actual return, and the third column shows the dollar amount that would have been paid by an investor who started with $1,000 in the fund. You may use the information here, together with the amount you invested, to estimate the expenses that you paid over the period.
To do so, simply divide your account value by $1,000 (for example, an $8,600 account value divided by $1,000 = 8.6), then multiply the result by the number given for your fund under the heading ”Expenses Paid During Period.“
• Based on hypothetical 5% yearly return. This section is intended to help you compare your fund‘s costs with those of other mutual funds. It assumes that the fund had a yearly return of 5% before expenses, but that the expense ratio is unchanged. In this case—because the return used is not the fund’s actual return—the results do not apply to your investment. The example is useful in making comparisons because the Securities and Exchange Commission requires all mutual funds to calculate expenses based on a 5% return. You can assess your fund’s costs by comparing this hypothetical example with the hypothetical examples that appear in shareholder reports of other funds.
Note that the expenses shown in the table are meant to highlight and help you compare ongoing costs only and do not reflect transaction costs incurred by the fund for buying and selling securities. Further, the expenses do not include any purchase, redemption, or account service fees described in the fund prospectus. If such fees were applied to your account, your costs would be higher. Your fund does not carry a “sales load.”
The calculations assume no shares were bought or sold during the period. Your actual costs may have been higher or lower, depending on the amount of your investment and the timing of any purchases or redemptions.
You can find more information about the fund’s expenses, including annual expense ratios, in the Financial Statements section of this report. For additional information on operating expenses and other shareholder costs, please refer to your fund’s current prospectus.
57
| Six Months Ended August 31, 2015 | |||
| Beginning | Ending | Expenses | |
| Account Value | Account Value | Paid During | |
| 2/28/2015 | 8/31/2015 | Period | |
| Based on Actual Fund Return | |||
| Russell 1000 Index Fund | |||
| ETF Shares | $1,000.00 | $946.55 | $0.74 |
| Institutional Shares | 1,000.00 | 946.75 | 0.54 |
| Russell 1000 Value Index Fund | |||
| ETF Shares | $1,000.00 | $932.24 | $0.68 |
| Institutional Shares | 1,000.00 | 932.40 | 0.54 |
| Russell 1000 Growth Index Fund | |||
| ETF Shares | $1,000.00 | $960.47 | $0.69 |
| Institutional Shares | 1,000.00 | 960.72 | 0.49 |
| Based on Hypothetical 5% Yearly Return | |||
| Russell 1000 Index Fund | |||
| ETF Shares | $1,000.00 | $1,024.45 | $0.77 |
| Institutional Shares | 1,000.00 | 1,024.65 | 0.56 |
| Russell 1000 Value Index Fund | |||
| ETF Shares | $1,000.00 | $1,024.50 | $0.71 |
| Institutional Shares | 1,000.00 | 1,024.65 | 0.56 |
| Russell 1000 Growth Index Fund | |||
| ETF Shares | $1,000.00 | $1,024.50 | $0.71 |
| Institutional Shares | 1,000.00 | 1,024.70 | 0.51 |
The calculations are based on expenses incurred in the most recent six-month period. The funds’ annualized six-month expense ratios for that period are: for the Russell 1000 Index Fund, 0.15% for ETF Shares and 0.11% for Institutional Shares; for the Russell 1000 Value Index Fund, 0.14% for ETF Shares and 0.11% for Institutional Shares; and for the Russell 1000 Growth Index Fund, 0.14% for ETF Shares and 0.10% for Institutional Shares. The dollar amounts shown as ”Expenses Paid” are equal to the annualized expense ratio multiplied by the average account value over the period, multiplied by the number of days in the most recent six-month period, then divided by the number of days in the most recent 12-month period (184/365).
58
Trustees Approve Advisory Arrangements
The board of trustees of Vanguard Russell 1000 Index Fund, Russell 1000 Value Index Fund, and Russell 1000 Growth Index Fund has renewed each fund’s investment advisory arrangement with The Vanguard Group, Inc. (Vanguard). Vanguard—through its Equity Index Group—serves as investment advisor for each fund. The board determined that continuing each fund’s internalized management structure was in the best interests of each fund and its shareholders.
The board based its decision upon an evaluation of the advisor’s investment staff, portfolio management process, and performance. The trustees considered the factors discussed below, among others. However, no single factor determined whether the board approved the arrangements. Rather, it was the totality of the circumstances that drove the board’s decision.
Nature, extent, and quality of services
The board reviewed the quality of investment management services provided to the funds since their inception in 2010 and took into account the organizational depth and stability of the advisor. The board considered that Vanguard has been managing investments for more than three decades. The Equity Index Group adheres to a sound, disciplined investment management process; the team has considerable experience, stability, and depth.
The board concluded that Vanguard’s experience, stability, depth, and performance, among other factors, warranted continuation of each advisory arrangement.
Investment performance
The board considered the funds’ performance since their inception, including any periods of outperformance or underperformance relative to a target index and peer group. The board concluded that the performance was such that each advisory arrangement should continue. Information about the funds’ most recent performance can be found in the Performance Summary pages of this report.
Cost
The board concluded that each fund’s expense ratio was well below the average expense ratios charged by funds in its respective peer group and that each fund’s advisory fee rate was also well below its peer group average. Information about the funds’ expenses appears in the About Your Fund’s Expenses section of this report as well as in the Financial Statements sections.
The board does not conduct a profitability analysis of Vanguard because of Vanguard’s unique “at-cost” structure. Unlike most other mutual fund management companies, Vanguard is owned by the funds it oversees and produces “profits” only in the form of reduced expenses for fund shareholders.
The benefit of economies of scale
The board concluded that each fund’s at-cost arrangement with Vanguard ensures that the funds will realize economies of scale as they grow, with the cost to shareholders declining as fund assets increase.
The board will consider whether to renew the advisory arrangements again after a one-year period.
59
Glossary
30-Day SEC Yield. A fund’s 30-day SEC yield is derived using a formula specified by the U.S. Securities and Exchange Commission. Under the formula, data related to the fund’s security holdings in the previous 30 days are used to calculate the fund’s hypothetical net income for that period, which is then annualized and divided by the fund’s estimated average net assets over the calculation period. For the purposes of this calculation, a security’s income is based on its current market yield to maturity (for bonds), its actual income (for asset-backed securities), or its projected dividend yield (for stocks). Because the SEC yield represents hypothetical annualized income, it will differ—at times significantly—from the fund’s actual experience. As a result, the fund’s income distributions may be higher or lower than implied by the SEC yield.
Beta. A measure of the magnitude of a fund’s past share-price fluctuations in relation to the ups and downs of a given market index. The index is assigned a beta of 1.00. Compared with a given index, a fund with a beta of 1.20 typically would have seen its share price rise or fall by 12% when the index rose or fell by 10%. For this report, beta is based on returns over the past 36 months for both the fund and the index. Note that a fund’s beta should be reviewed in conjunction with its R-squared (see definition). The lower the R-squared, the less correlation there is between the fund and the index, and the less reliable beta is as an indicator of volatility.
Dividend Yield. Dividend income earned by stocks, expressed as a percentage of the aggregate market value (or of net asset value, for a fund). The yield is determined by dividing the amount of the annual dividends by the aggregate value (or net asset value) at the end of the period. For a fund, the dividend yield is based solely on stock holdings and does not include any income produced by other investments.
Earnings Growth Rate. The average annual rate of growth in earnings over the past five years for the stocks now in a fund.
Equity Exposure. A measure that reflects a fund’s investments in stocks and stock futures. Any holdings in short-term reserves are excluded.
Expense Ratio. A fund’s total annual operating expenses expressed as a percentage of the fund’s average net assets. The expense ratio includes management and administrative expenses, but does not include the transaction costs of buying and selling portfolio securities.
Foreign Holdings. The percentage of a fund represented by securities or depositary receipts of companies based outside the United States.
Inception Date. The date on which the assets of a fund (or one of its share classes) are first invested in accordance with the fund’s investment objective. For funds with a subscription period, the inception date is the day after that period ends. Investment performance is measured from the inception date.
Median Market Cap. An indicator of the size of companies in which a fund invests; the midpoint of market capitalization (market price x shares outstanding) of a fund’s stocks, weighted by the proportion of the fund’s assets invested in each stock. Stocks representing half of the fund’s assets have market capitalizations above the median, and the rest are below it.
Price/Book Ratio. The share price of a stock divided by its net worth, or book value, per share. For a fund, the weighted average price/book ratio of the stocks it holds.
60
Price/Earnings Ratio. The ratio of a stock’s current price to its per-share earnings over the past year. For a fund, the weighted average P/E of the stocks it holds. P/E is an indicator of market expectations about corporate prospects; the higher the P/E, the greater the expectations for a company’s future growth.
R-Squared. A measure of how much of a fund’s past returns can be explained by the returns from the market in general, as measured by a given index. If a fund’s total returns were precisely synchronized with an index’s returns, its R-squared would be 1.00. If the fund’s returns bore no relationship to the index’s returns, its R-squared would be 0. For this report, R-squared is based on returns over the past 36 months for both the fund and the index.
Return on Equity. The annual average rate of return generated by a company during the past five years for each dollar of shareholder’s equity (net income divided by shareholder’s equity). For a fund, the weighted average return on equity for the companies whose stocks it holds.
Short-Term Reserves. The percentage of a fund invested in highly liquid, short-term securities that can be readily converted to cash.
Turnover Rate. An indication of the fund’s trading activity. Funds with high turnover rates incur higher transaction costs and may be more likely to distribute capital gains (which may be taxable to investors). The turnover rate excludes in-kind transactions, which have minimal impact on costs.
61
This page intentionally left blank.
This page intentionally left blank.
The People Who Govern Your Fund
The trustees of your mutual fund are there to see that the fund is operated and managed in your best interests since, as a shareholder, you are a part owner of the fund. Your fund’s trustees also serve on the board of directors of The Vanguard Group, Inc., which is owned by the Vanguard funds and provides services to them on an at-cost basis.
A majority of Vanguard’s board members are independent, meaning that they have no affiliation with Vanguard or the funds they oversee, apart from the sizable personal investments they have made as private individuals. The independent board members have distinguished backgrounds in business, academia, and public service. Each of the trustees and executive officers oversees 194 Vanguard funds.
The following table provides information for each trustee and executive officer of the fund. More information about the trustees is in the Statement of Additional Information, which can be obtained, without charge, by contacting Vanguard at 800-662-7447, or online at vanguard.com.
| InterestedTrustee1 | Rajiv L. Gupta |
| Born 1945. Trustee Since December 2001.2 Principal | |
| F. William McNabb III | Occupation(s) During the Past Five Years and Other |
| Born 1957. Trustee Since July 2009. Chairman of | Experience: Chairman and Chief Executive Officer |
| the Board. Principal Occupation(s) During the Past | (retired 2009) and President (2006–2008) of |
| Five Years and Other Experience: Chairman of the | Rohm and Haas Co. (chemicals); Director of Tyco |
| Board of The Vanguard Group, Inc., and of each of | International PLC (diversified manufacturing and |
| the investment companies served by The Vanguard | services), Hewlett-Packard Co. (electronic computer |
| Group, since January 2010; Director of The Vanguard | manufacturing), and Delphi Automotive PLC |
| Group since 2008; Chief Executive Officer and | (automotive components); Senior Advisor at New |
| President of The Vanguard Group, and of each of | Mountain Capital. |
| the investment companies served by The Vanguard | |
| Group, since 2008; Director of Vanguard Marketing | Amy Gutmann |
| Corporation; Managing Director of The Vanguard | Born 1949. Trustee Since June 2006. Principal |
| Group (1995–2008). | Occupation(s) During the Past Five Years and |
| Other Experience: President of the University of | |
| IndependentTrustees | Pennsylvania; Christopher H. Browne Distinguished |
| Professor of Political Science, School of Arts and | |
| Emerson U. Fullwood | Sciences, and Professor of Communication, Annenberg |
| Born 1948. Trustee Since January 2008. Principal | School for Communication, with secondary faculty |
| Occupation(s) During the Past Five Years and | appointments in the Department of Philosophy, School |
| Other Experience: Executive Chief Staff and | of Arts and Sciences, and at the Graduate School of |
| Marketing Officer for North America and Corporate | Education, University of Pennsylvania; Trustee of the |
| Vice President (retired 2008) of Xerox Corporation | National Constitution Center; Chair of the Presidential |
| (document management products and services); | Commission for the Study of Bioethical Issues. |
| Executive in Residence and 2009–2010 Distinguished | |
| Minett Professor at the Rochester Institute of | JoAnn Heffernan Heisen |
| Technology; Director of SPX Corporation (multi-industry | Born 1950. Trustee Since July 1998. Principal |
| manufacturing), the United Way of Rochester, | Occupation(s) During the Past Five Years and Other |
| Amerigroup Corporation (managed health care), the | Experience: Corporate Vice President and Chief |
| University of Rochester Medical Center, Monroe | Global Diversity Officer (retired 2008) and Member |
| Community College Foundation, and North Carolina | of the Executive Committee (1997–2008) of Johnson |
| A&T University. | & Johnson (pharmaceuticals/medical devices/ |
| consumer products); Director of Skytop Lodge | |
| Corporation (hotels), the University Medical Center | |
| at Princeton, the Robert Wood Johnson Foundation, | |
| and the Center for Talent Innovation; Member of | |
| the Advisory Board of the Institute for Women’s | |
| Leadership at Rutgers University. |
| F. Joseph Loughrey | Executive Officers | |
| Born 1949. Trustee Since October 2009. Principal | ||
| Occupation(s) During the Past Five Years and Other | Glenn Booraem | |
| Experience: President and Chief Operating Officer | Born 1967. Treasurer Since May 2015. Principal | |
| (retired 2009) of Cummins Inc. (industrial machinery); | Occupation(s) During the Past Five Years and | |
| Chairman of the Board of Hillenbrand, Inc. (specialized | Other Experience: Principal of The Vanguard Group, | |
| consumer services), and of Oxfam America; Director | Inc.; Treasurer of each of the investment companies | |
| of SKF AB (industrial machinery), Hyster-Yale Materials | served by The Vanguard Group; Controller of each of | |
| Handling, Inc. (forklift trucks), the Lumina Foundation | the investment companies served by The Vanguard | |
| for Education, and the V Foundation for Cancer | Group (2010–2015); Assistant Controller of each of | |
| Research; Member of the Advisory Council for the | the investment companies served by The Vanguard | |
| College of Arts and Letters and of the Advisory Board | Group (2001–2010). | |
| to the Kellogg Institute for International Studies, both | Thomas J. Higgins | |
| at the University of Notre Dame. | ||
| Born 1957. Chief Financial Officer Since September | ||
| Mark Loughridge | 2008. Principal Occupation(s) During the Past Five | |
| Born 1953. Trustee Since March 2012. Principal | Years and Other Experience: Principal of The Vanguard | |
| Occupation(s) During the Past Five Years and Other | Group, Inc.; Chief Financial Officer of each of the | |
| Experience: Senior Vice President and Chief Financial | investment companies served by The Vanguard Group; | |
| Officer (retired 2013) at IBM (information technology | Treasurer of each of the investment companies served | |
| services); Fiduciary Member of IBM’s Retirement Plan | by The Vanguard Group (1998–2008). | |
| Committee (2004–2013); Director of the Dow Chemical | ||
| Company; Member of the Council on Chicago Booth. | Peter Mahoney | |
| Born 1974. Controller Since May 2015. Principal | ||
| Scott C. Malpass | Occupation(s) During the Past Five Years and | |
| Born 1962. Trustee Since March 2012. Principal | Other Experience: Head of Global Fund Accounting | |
| Occupation(s) During the Past Five Years and Other | at The Vanguard Group, Inc.; Controller of each of the | |
| Experience: Chief Investment Officer and Vice | investment companies served by The Vanguard Group; | |
| President at the University of Notre Dame; Assistant | Head of International Fund Services at The Vanguard | |
| Professor of Finance at the Mendoza College of | Group (2008–2014). | |
| Business at Notre Dame; Member of the Notre Dame | ||
| 403(b) Investment Committee; Board Member of | Heidi Stam | |
| TIFF Advisory Services, Inc., and Catholic Investment | Born 1956. Secretary Since July 2005. Principal | |
| Services, Inc. (investment advisors); Member of | Occupation(s) During the Past Five Years and Other | |
| the Investment Advisory Committee of Major | Experience: Managing Director of The Vanguard | |
| League Baseball. | Group, Inc.; General Counsel of The Vanguard Group; | |
| Secretary of The Vanguard Group and of each of the | ||
| André F. Perold | investment companies served by The Vanguard Group; | |
| Born 1952. Trustee Since December 2004. Principal | Director and Senior Vice President of Vanguard | |
| Occupation(s) During the Past Five Years and Other | Marketing Corporation. | |
| Experience: George Gund Professor of Finance and | ||
| Banking, Emeritus at the Harvard Business School | Vanguard Senior Management Team | |
| (retired 2011); Chief Investment Officer and Managing | Mortimer J. Buckley | Chris D. McIsaac |
| Partner of HighVista Strategies LLC (private investment | Kathleen C. Gubanich | James M. Norris |
| firm); Director of Rand Merchant Bank; Overseer of | Paul A. Heller | Thomas M. Rampulla |
| the Museum of Fine Arts Boston. | Martha G. King | Glenn W. Reed |
| John T. Marcante | Karin A. Risi | |
| Peter F. Volanakis | ||
| Born 1955. Trustee Since July 2009. Principal | ||
| Occupation(s) During the Past Five Years and Other | Chairman Emeritus and Senior Advisor | |
| Experience: President and Chief Operating Officer | ||
| (retired 2010) of Corning Incorporated (communications | John J. Brennan | |
| equipment); Trustee of Colby-Sawyer College; | Chairman, 1996–2009 | |
| Member of the Advisory Board of the Norris Cotton | Chief Executive Officer and President, 1996–2008 | |
| Cancer Center and of the Advisory Board of the | ||
| Parthenon Group (strategy consulting). | Founder | |
| John C. Bogle | ||
| Chairman and Chief Executive Officer, 1974–1996 | ||
1 Mr. McNabb is considered an “interested person,” as defined in the Investment Company Act of 1940, because he is an officer of the Vanguard funds.
2 December 2002 for Vanguard Equity Income Fund, the Vanguard Municipal Bond Funds, and the Vanguard State Tax-Exempt Funds.
 | |
| P.O. Box 2600 | |
| Valley Forge, PA 19482-2600 |
Connect with Vanguard® > vanguard.com
| Fund Information > 800-662-7447 | The Russell Indexes and Russell® are registered |
| Direct Investor Account Services > 800-662-2739 | trademarks of Russell Investments and have been |
| licensed for use by The Vanguard Group, Inc. The | |
| Institutional Investor Services > 800-523-1036 | products are not sponsored, endorsed, sold, or |
| Text Telephone for People | promoted by Russell Investments and Russell |
| Who Are Deaf or Hard of Hearing> 800-749-7273 | Investments makes no representation regarding the |
| advisability of investing in the products. | |
| This material may be used in conjunction | |
| with the offering of shares of any Vanguard | |
| fund only if preceded or accompanied by | |
| the fund’s current prospectus. | |
| All comparative mutual fund data are from Lipper, a | |
| Thomson Reuters Company, or Morningstar, Inc., unless | |
| otherwise noted. | |
| You can obtain a free copy of Vanguard’s proxy voting | |
| guidelines by visiting vanguard.com/proxyreporting or by | |
| calling Vanguard at 800-662-2739. The guidelines are | |
| also available from the SEC’s website, sec.gov. In | |
| addition, you may obtain a free report on how your fund | |
| voted the proxies for securities it owned during the 12 | |
| months ended June 30. To get the report, visit either | |
| vanguard.com/proxyreporting or sec.gov. | |
| You can review and copy information about your fund at | |
| the SEC’s Public Reference Room in Washington, D.C. To | |
| find out more about this public service, call the SEC at | |
| 202-551-8090. Information about your fund is also | |
| available on the SEC’s website, and you can receive | |
| copies of this information, for a fee, by sending a | |
| request in either of two ways: via email addressed to | |
| publicinfo@sec.gov or via regular mail addressed to the | |
| Public Reference Section, Securities and Exchange | |
| Commission, Washington, DC 20549-1520. | |
| © 2015 The Vanguard Group, Inc. | |
| All rights reserved. | |
| Vanguard Marketing Corporation, Distributor. | |
| Q18480 102015 | |
Annual Report | August 31, 2015
Vanguard Russell 2000 Index Funds
Vanguard Russell 2000 Index Fund
Vanguard Russell 2000 Value Index Fund
Vanguard Russell 2000 Growth Index Fund
Vanguard’s Principles for Investing Success
We want to give you the best chance of investment success. These principles, grounded in Vanguard’s research and experience, can put you on the right path.
Goals. Create clear, appropriate investment goals.
Balance. Develop a suitable asset allocation using broadly diversified funds.
Cost. Minimize cost.
Discipline. Maintain perspective and long-term discipline.
A single theme unites these principles: Focus on the things you can control.
We believe there is no wiser course for any investor.
| Contents | |
| Your Fund’s Total Returns. | 1 |
| Chairman’s Letter. | 2 |
| Russell 2000 Index Fund. | 9 |
| Russell 2000 Value Index Fund. | 26 |
| Russell 2000 Growth Index Fund. | 43 |
| Your Fund’s After-Tax Returns. | 62 |
| About Your Fund’s Expenses. | 63 |
| Trustees Approve Advisory Arrangements. | 65 |
| Glossary. | 66 |
Please note: The opinions expressed in this report are just that—informed opinions. They should not be considered promises or advice.
Also, please keep in mind that the information and opinions cover the period through the date on the front of this report. Of course, the risks of investing in your fund are spelled out in the prospectus.
See the Glossary for definitions of investment terms used in this report.
About the cover: Pictured is a sailing block on the Brilliant, a 1932 schooner docked in Mystic, Connecticut. A type of pulley, the sailing block helps coordinate the setting of the sails. At Vanguard, the intricate coordination of technology and people allows us to help millions of clients around the world reach their financial goals.
| Your Fund’s Total Returns | |
| Fiscal Year Ended August 31, 2015 | |
| Total | |
| Returns | |
| Vanguard Russell 2000 Index Fund | |
| ETF Shares | |
| Market Price | 0.13% |
| Net Asset Value | 0.03 |
| Institutional Shares | 0.11 |
| Russell 2000 Index | 0.03 |
| Small-Cap Core Funds Average | -2.19 |
| Small-Cap Core Funds Average: Derived from data provided by Lipper, a Thomson Reuters Company. | |
| Vanguard Russell 2000 Value Index Fund | |
| ETF Shares | |
| Market Price | -5.03% |
| Net Asset Value | -5.10 |
| Institutional Shares | -4.97 |
| Russell 2000 Value Index | -4.95 |
| Small-Cap Value Funds Average | -4.82 |
| Small-Cap Value Funds Average: Derived from data provided by Lipper, a Thomson Reuters Company. | |
| Vanguard Russell 2000 Growth Index Fund | |
| ETF Shares | |
| Market Price | 5.25% |
| Net Asset Value | 5.17 |
| Institutional Shares | 5.29 |
| Russell 2000 Growth Index | 5.11 |
| Small-Cap Growth Funds Average | 4.10 |
| Small-Cap Growth Funds Average: Derived from data provided by Lipper, a Thomson Reuters Company. | |
Institutional Shares are available to certain institutional investors who meet specific administrative, service, and account-size criteria. The Vanguard ETF® Shares shown are traded on the Nasdaq exchange and are available only through brokers. The table provides ETF returns based on both the Nasdaq market price and the net asset value for a share. U.S. Pat. Nos. 6,879,964; 7,337,138; 7,720,749; 7,925,573; 8,090,646; and 8,417,623.
For the ETF Shares, the market price is determined by the midpoint of the bid-offer spread as of the closing time of the New York Stock Exchange (generally 4 p.m., Eastern time). The net asset value is also determined as of the NYSE closing time. For more information about how the ETF Shares' market prices have compared with their net asset value, visit vanguard.com, select your ETF, and then select the Price and Performance tab. The ETF premium/discount analysis there shows the percentages of days on which the ETF Shares' market price was above or below the NAV.
1

Chairman’s Letter
Dear Shareholder,
Opposing forces tugged the broad U.S. stock market back and forth during the fiscal year ended August 31, 2015; it finished the period clinging to slight gains. Growth stocks outpaced their value counterparts, and large-, mid-, and small-capitalization stocks were in close proximity to each other.
This investment environment was mirrored in the performance of the Vanguard Russell 2000 Index Funds. All three closely tracked their target small-cap indexes, and two exceeded the average returns of their fund peers. Results ranged from 5.17% for the Russell 2000 Growth Index Fund to –5.10% for the Russell 2000 Value Index Fund. The Russell 2000 Index Fund, which includes both growth and value stocks, returned 0.03%. (All returns are for the net asset value of the funds’ ETF Shares.)
If you hold shares of your fund in a taxable account, you may wish to review the information on after-tax returns that appears later in this report.
August’s moody markets led to flat 12-month returns
U.S. stocks generally moved in opposite directions over the two halves of the fiscal year ended August 31. A first-half advance of about 6% was followed by a second-half retreat of about –5%. Ultimately, the ride ended about where it started, with the market returning less than 1%.
2
Much of the decline came in August, when stocks tumbled over fears about the global impact of China’s economic deceleration. Greece’s debt crisis, the strong U.S. dollar, perceived high valuations, and speculation about when the Federal Reserve might raise short-term interest rates also played a part. (Shortly after the close of the reporting period, the Fed announced at its September meeting that it would leave rates unchanged for the time being.)
For U.S. investors, international stocks returned about –12%, a result that would have been better if not for the dollar’s strength against many foreign currencies. China’s troubles buffeted emerging markets, which produced lower returns than the developed markets of Europe and the Pacific region.
Bonds notched more muted results as the Fed weighed rate-hike timing
The broad U.S. taxable bond market returned 1.56%. Bond prices generally fell slightly but received some support from global investors looking for higher yields than those available in many other developed markets. Buyers seeking shelter from stock market volatility also helped. The yield of the 10-year Treasury note ended August at 2.18%, down from 2.34% a year earlier.
Limited by the dollar’s strength, international bond markets (as measured by the Barclays Global Aggregate Index ex USD) returned –11.97%. Without this currency effect, they returned about 3%.
| Market Barometer | |||
| Average Annual Total Returns | |||
| Periods Ended August 31, 2015 | |||
| One | Three | Five | |
| Year | Years | Years | |
| Stocks | |||
| Russell 1000 Index (Large-caps) | 0.40% | 14.68% | 16.07% |
| Russell 2000 Index (Small-caps) | 0.03 | 14.12 | 15.55 |
| Russell 3000 Index (Broad U.S. market) | 0.36 | 14.63 | 16.03 |
| FTSE All-World ex US Index (International) | -11.50 | 5.79 | 5.17 |
| Bonds | |||
| Barclays U.S. Aggregate Bond Index (Broad taxable market) | 1.56% | 1.53% | 2.98% |
| Barclays Municipal Bond Index (Broad tax-exempt market) | 2.52 | 2.83 | 3.96 |
| Citigroup Three-Month U.S. Treasury Bill Index | 0.02 | 0.03 | 0.05 |
| CPI | |||
| Consumer Price Index | 0.20% | 1.14% | 1.77% |
3
The Fed’s 0%–0.25% target for short-term interest rates continued to restrain money market fund and savings account returns.
Health care led the pack; energy brought up the rear
The Vanguard Russell 2000 Index Funds encompass the small-cap segment of the broad U.S. stock market. The Russell 2000 Index Fund by itself holds all of the nearly 2,000 stocks in the broad index.
The Growth and Value Index Funds represent market segments within the broader fund. Growth stocks, which have mostly outperformed value over the past five years, clearly led again in the recent period. They are typically priced at a premium to the rest of the market because of their perceived stronger growth prospects.
Health care stocks, traditionally a growth domain, generated returns of 25% to 26% for all three funds. The trends favoring the sector are familiar ones. The aging U.S. population requires more health care in all forms, health care is increasingly accessible worldwide, and the Affordable Care Act has provided insurance coverage for more people.
Pharmaceutical and biotechnology companies produced much of the sector’s returns because of promising developments in the industry’s pipeline
| Expense Ratios | |||
| Your Fund Compared With Its Peer Group | |||
| ETF | Institutional | Peer Group | |
| Shares | Shares | Average | |
| Russell 2000 Index Fund | 0.15% | 0.08% | 1.29% |
| Russell 2000 Value Index Fund | 0.20 | 0.08 | 1.35 |
| Russell 2000 Growth Index Fund | 0.20 | 0.08 | 1.39 |
The fund expense ratios shown are from the prospectus dated December 23, 2014, and represent estimated costs for the current fiscal year. For the fiscal year ended August 31, 2015, the funds’ expense ratios were: for the Russell 2000 Index Fund, 0.15% for ETF Shares and 0.08% for Institutional Shares; for the Russell 2000 Value Index Fund, 0.20% for ETF Shares and 0.08% for Institutional Shares; for the Russell 2000 Growth Index Fund, 0.20% for ETF Shares and 0.08% for Institutional Shares. Peer-group expense ratios are derived from data provided by Lipper, a Thomson Reuters Company, and capture information through year-end 2014.
Peer groups: For the Russell 2000 Index Fund, Small-Cap Core Funds; for the Russell 2000 Value Index Fund, Small-Cap Value Funds; and for the Russell 2000 Growth Fund, Small-Cap Growth Funds.
4
and merger-and-acquisition activity. Health care services and medical equipment companies also boosted results.
The consumer discretionary and consumer staples sectors contributed across the board as retail spending continued to grow. Returns from leisure-oriented companies, including restaurants, were particularly robust. Those gains offset some weakness in the media and auto industries.
Financial services stocks, which make up the largest portions of the Value Index Fund and the Russell 2000 Index Fund, delivered single-digit returns for all three funds. Although the sector has benefited from the long bull market, it has also been restrained by a tougher regulatory environment and exceptionally low interest rates.
The energy sector was the biggest drag on performance, returning –52% or lower for all three funds. During the past 12 months, oil prices fell nearly 50%. They were under nearly constant pressure from the high output levels of some leading oil-producing countries and concerns about slower growth in China—the world’s largest oil importer. At the same time, burgeoning U.S. production of natural gas helped to drive down that commodity’s price by about one-third.
| Total Returns | |
| Inception Through August 31, 2015 | |
| Average | |
| Annual Return | |
| Russell 2000 Index Fund ETF Shares Net Asset Value (Returns since inception: 9/20/2010) | 13.20% |
| Russell 2000 Index | 13.24 |
| Small-Cap Core Funds Average | 12.21 |
| Small-Cap Core Funds Average: Derived from data provided by Lipper, a Thomson Reuters Company. | |
| Russell 2000 Value Index Fund ETF Shares Net Asset Value (Returns since inception: 9/20/2010) | 11.00% |
| Russell 2000 Value Index | 11.19 |
| Small-Cap Value Funds Average | 11.58 |
| Small-Cap Value Funds Average: Derived from data provided by Lipper, a Thomson Reuters Company. | |
| Russell 2000 Growth Index Fund ETF Shares Net Asset Value (Returns since inception: 9/20/2010) | 15.20% |
| Russell 2000 Growth Index | 15.26 |
| Small-Cap Growth Funds Average | 13.66 |
| Small-Cap Growth Funds Average: Derived from data provided by Lipper, a Thomson Reuters Company. | |
The figures shown represent past performance, which is not a guarantee of future results. (Current performance may be lower or higher than the performance data cited. For performance data current to the most recent month-end, visit our website at vanguard.com/performance.) Note, too, that both investment returns and principal value can fluctuate widely, so an investor’s shares, when sold, could be worth more or less than their original cost.
5
Two other traditionally value-oriented sectors––materials and processing, and producer durables––also registered negative returns for all three funds because of declining commodity prices.
The funds have been successful in tightly tracking their indexes
The three Vanguard Russell 2000 Index Funds launched their ETF Shares on September 20, 2010, as an extension of Vanguard’s indexing franchise. (The funds’ Institutional Shares were created later.) In the nearly five years since, they’ve met their primary goal of capturing virtually all of the returns of their target indexes.
Reflecting the overall strength of the stock markets, all three funds also recorded double-digit average annual returns. And only the Value Index Fund failed to outdistance its peer-fund average.
Vanguard’s Equity Index Group, the funds’ advisor, is responsible for this index tracking success. The group has kept the funds on target with sophisticated portfolio and management techniques refined over several decades. Low expenses––which allow you to keep more of the funds’ returns––have helped in these efforts.
| An indexing benefit that’s worth keeping in mind |
| As a Vanguard investor, you’re probably familiar with the cost and diversification benefits that |
| index funds typically offer. But there’s a lesser-known—yet important—advantage to indexing |
| as well: relative predictability. |
| Simply put, index funds help you capture the market’s return more predictably than actively |
| managed funds. |
| By definition, an index fund is built and managed to track the return of its designated broad |
| market or market segment. Some do so more closely than others. But what’s key is that you |
| know what to expect: whatever the market returns—good or bad—minus the fund’s costs. |
| Active managers, in contrast, seek to beat the market—and do so with varying degrees of |
| success at different times. |
| The relative predictability of indexing can help you stay on course with your investment goals, |
| by reducing the likelihood of particular surprises—such as being out of step with market |
| performance. The confidence of knowing that you’ll earn a market-like return can reduce |
| the temptation to trade based on emotions. |
| We recognize that some investors want the opportunity to outperform the market. That’s |
| why Vanguard also offers low-cost active funds managed by carefully selected, world-class |
| advisors, so you can choose an investment strategy that aligns with both your goals and your |
| risk appetite. |
6
When the markets are volatile, maintaining perspective is key
Volatility returned to the stock market with a vengeance in the final weeks of August as investors worried that a slowdown in China’s economic growth could affect world markets.
This turmoil may have evoked painful memories of previous financial setbacks—memories that had been receding after more than six years of strong U.S. stock performance. Inevitably, that sort of upheaval can lead some investors to make rash moves with their portfolios.
During periods of market adversity, however, it’s more important than ever to keep sight of one of Vanguard’s key principles: Maintain perspective and long-term discipline. Whether you’re investing for yourself or on behalf of clients, your success is affected greatly by how you react––or don’t react––when the markets turn turbulent. (You can read more in Vanguard’s Principles for Investing Success at vanguard.com/research.)
As I’ve written in the past, the best course for long-term investors generally is to ignore daily market moves and not make decisions based on emotion. This is also a good time to evaluate your portfolio and make sure your asset allocation is aligned with your time horizon, goals, and risk tolerance.
The markets are unpredictable and often confounding. Keeping long-term plans clearly in focus can be crucial as we weather these periodic storms.
As always, thank you for entrusting your assets to Vanguard.
Sincerely,

F. William McNabb III
Chairman and Chief Executive Officer
September 17, 2015
7
| Your Fund’s Performance at a Glance | ||||
| August 31, 2014, Through August 31, 2015 | ||||
| Distributions Per Share | ||||
| Starting | Ending | Income | Capital | |
| Share Price | Share Price | Dividends | Gains | |
| Vanguard Russell 2000 Index Fund | ||||
| ETF Shares | $93.72 | $92.71 | $1.071 | $0.000 |
| Institutional Shares | 179.29 | 177.40 | 2.131 | 0.000 |
| Vanguard Russell 2000 Value Index Fund | ||||
| ETF Shares | $87.76 | $81.88 | $1.503 | $0.000 |
| Institutional Shares | 173.15 | 161.59 | 3.136 | 0.000 |
| Vanguard Russell 2000 Growth Index Fund | ||||
| ETF Shares | $99.83 | $104.34 | $0.641 | $0.000 |
| Institutional Shares | 190.26 | 198.85 | 1.453 | 0.000 |
8
Russell 2000 Index Fund
Fund Profile
As of August 31, 2015
| Share-Class Characteristics | ||
| ETF | Institutional | |
| Shares | Shares | |
| Ticker Symbol | VTWO | VRTIX |
| Expense Ratio1 | 0.15% | 0.08% |
| 30-Day SEC Yield | 1.22% | 1.36% |
| Portfolio Characteristics | |||
| DJ | |||
| U.S. | |||
| Total | |||
| Russell | Market | ||
| 2000 | FA | ||
| Fund | Index | Index | |
| Number of Stocks | 1,993 | 1,958 | 3,828 |
| Median Market Cap | $1.7B | $1.7B | $47.2B |
| Price/Earnings Ratio | 32.1x | 32.1x | 20.8x |
| Price/Book Ratio | 2.1x | 2.1x | 2.6x |
| Return on Equity | 10.6% | 10.6% | 17.1% |
| Earnings Growth | |||
| Rate | 10.3% | 10.2% | 10.2% |
| Dividend Yield | 1.5% | 1.5% | 2.1% |
| Foreign Holdings | 0.0% | 0.0% | 0.0% |
| Turnover Rate | 17% | — | — |
| Short-Term | |||
| Reserves | 0.0% | — | — |
| Volatility Measures | ||
| DJ | ||
| Russell | U.S. Total | |
| 2000 | Market | |
| Index | FA Index | |
| R-Squared | 1.00 | 0.72 |
| Beta | 1.00 | 1.16 |
These measures show the degree and timing of the fund’s fluctuations compared with the indexes over 36 months.
| Ten Largest Holdings (% of total net assets) | ||
| Anacor Pharmaceuticals | ||
| Inc. | Biotechnology | 0.3% |
| Tyler Technologies Inc. | Computer Services | |
| Software & Systems | 0.3 | |
| Manhattan Associates | Computer Services | |
| Inc. | Software & Systems | 0.2 |
| Ultragenyx | ||
| Pharmaceutical Inc. | Biotechnology | 0.2 |
| Team Health Holdings | ||
| Inc. | Health Care Services | 0.2 |
| First American Financial | Insurance: | |
| Corp. | Property-Casualty | 0.2 |
| CubeSmart | Real Estate | |
| Investment Trusts | ||
| (REITs) | 0.2 | |
| Casey's General Stores | Drug & Grocery Store | |
| Inc. | Chains | 0.2 |
| Investors Bancorp Inc. | Banks: Diversified | 0.2 |
| West Pharmaceutical | Medical & Dental | |
| Services Inc. | Instruments & | |
| Supplies | 0.2 | |
| Top Ten | 2.2% | |
The holdings listed exclude any temporary cash investments and equity index products.
Investment Focus
1 The expense ratios shown are from the prospectus dated December 23, 2014, and represent estimated costs for the current fiscal year. For the fiscal year ended August 31, 2015, the expense ratios were 0.15% for ETF Shares and 0.08% for Institutional Shares.
9
Russell 2000 Index Fund
| Sector Diversification (% of equity exposure) | |||
| DJ | |||
| U.S. | |||
| Total | |||
| Russell | Market | ||
| 2000 | FA | ||
| Fund | Index | Index | |
| Consumer Discretionary 15.3% | 15.3% | 14.9% | |
| Consumer Staples | 3.0 | 3.0 | 7.6 |
| Energy | 2.9 | 2.9 | 6.7 |
| Financial Services | 25.6 | 25.6 | 20.1 |
| Health Care | 16.5 | 16.5 | 14.8 |
| Materials & Processing | 5.8 | 5.8 | 3.9 |
| Producer Durables | 12.1 | 12.1 | 10.6 |
| Technology | 14.2 | 14.2 | 16.3 |
| Utilities | 4.6 | 4.6 | 5.1 |
10
Russell 2000 Index Fund
Performance Summary
All of the returns in this report represent past performance, which is not a guarantee of future results that may be achieved by the fund. (Current performance may be lower or higher than the performance data cited. For performance data current to the most recent month-end, visit our website at vanguard.com/performance.) Note, too, that both investment returns and principal value can fluctuate widely, so an investor’s shares, when sold, could be worth more or less than their original cost. The returns shown do not reflect taxes that a shareholder would pay on fund distributions or on the sale of fund shares.
Cumulative Performance: September 20, 2010, Through August 31, 2015
Initial Investment of $10,000
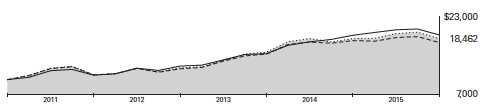
| Average Annual Total Returns | |||
| Periods Ended August 31, 2015 | |||
| Since | Final Value | ||
| One | Inception | of a $10,000 | |
| Year | (9/20/2010) | Investment | |
| Russell 2000 Index Fund*ETF Shares | |||
| Net Asset Value | 0.03% | 13.20% | $18,462 |
| Russell 2000 Index Fund*ETF Shares | |||
| Market Price | 0.13 | 13.20 | 18,461 |
| • Russell 2000 Index | 0.03 | 13.24 | 18,494 |
| Small-Cap Core Funds Average | -2.19 | 12.21 | 17,681 |
| Dow Jones U.S. Total Stock Market | |||
| Float Adjusted Index | 0.29 | 14.14 | 19,234 |
Small-Cap Core Funds Average: Derived from data provided by Lipper, a Thomson Reuters Company.
"Since Inception" performance is calculated from the ETF Shares’ inception date for both the fund and its comparative standards.
| Since | Final Value | ||
| One | Inception | of a $5,000,000 | |
| Year | (12/22/2010) | Investment | |
| Russell 2000 Index Fund Institutional Shares | 0.11% | 10.02% | $7,826,607 |
| Russell 2000 Index | 0.03 | 9.98 | 7,811,738 |
| Dow Jones U.S. Total Stock Market Float | |||
| Adjusted Index | 0.29 | 12.23 | 8,589,453 |
| "Since Inception" performance is calculated from the Institutional Shares’ inception date for both the fund and its comparative standards. | |||
See Financial Highlights for dividend and capital gains information.
11
Russell 2000 Index Fund
| Cumulative Returns of ETF Shares: September 20, 2010, Through August 31, 2015 | ||
| Since | ||
| One | Inception | |
| Year | (9/20/2010) | |
| Russell 2000 Index Fund ETF Shares Market Price | 0.13% | 84.61% |
| Russell 2000 Index Fund ETF Shares Net Asset | ||
| Value | 0.03 | 84.62 |
| Russell 2000 Index | 0.03 | 84.94 |
| "Since Inception" performance is calculated from the ETF Shares’ inception date for both the fund and its comparative standards. | ||
Fiscal-Year Total Returns (%): September 20, 2010, Through August 31, 2015

| Russell 2000 Index Fund ETF Shares Net Asset Value |
| Russell 2000 Index |
Average Annual Total Returns: Periods Ended June 30, 2015
This table presents returns through the latest calendar quarter—rather than through the end of the fiscal period.
Securities and Exchange Commission rules require that we provide this information.
| Inception | One | Since | |
| Date | Year | Inception | |
| ETF Shares | 9/20/2010 | ||
| Market Price | 6.58% | 15.55% | |
| Net Asset Value | 6.51 | 15.54 | |
| Institutional Shares | 12/22/2010 | 6.58 | 12.30 |
12
Russell 2000 Index Fund
Financial Statements
Statement of Net Assets—Investments Summary
As of August 31, 2015
This Statement summarizes the fund’s holdings by asset type. Details are reported for each of the fund’s 50 largest individual holdings and for investments that, in total for any issuer, represent more than 1% of the fund’s net assets. The total value of smaller holdings is reported as a single amount within each category.
The fund reports a complete list of its holdings in regulatory filings four times in each fiscal year, at the quarter-ends. For the second and fourth fiscal quarters, the complete listing of the fund’s holdings is available electronically on vanguard.com and on the Securities and Exchange Commission’s website (sec.gov), or you can have it mailed to you without charge by calling 800-662-7447. For the first and third fiscal quarters, the fund files the lists with the SEC on Form N-Q. Shareholders can look up the fund’s Forms N-Q on the SEC’s website. Forms N-Q may also be reviewed and copied at the SEC’s Public Reference Room (see the back cover of this report for further information).
| Market | Percentage | ||
| Value• | of Net | ||
| Shares | ($000) | Assets | |
| Common Stocks | |||
| Consumer Discretionary | |||
| * Burlington Stores Inc. | 46,744 | 2,482 | 0.2% |
| Vail Resorts Inc. | 22,531 | 2,431 | 0.2% |
| * Buffalo Wild Wings Inc. | 11,775 | 2,233 | 0.2% |
| American Eagle Outfitters Inc. | 121,139 | 2,062 | 0.2% |
| Consumer Discretionary—Other † | 155,269 | 14.4% | |
| 164,477 | 15.2% | ||
| Consumer Staples | |||
| Casey’s General Stores Inc. | 24,084 | 2,549 | 0.2% |
| * Post Holdings Inc. | 38,044 | 2,483 | 0.2% |
| * TreeHouse Foods Inc. | 26,578 | 2,109 | 0.2% |
| Consumer Staples—Other † | 25,451 | 2.4% | |
| 32,592 | 3.0% | ||
| Energy † | 31,016 | 2.9% | |
| Financial Services | |||
| First American Financial Corp. | 67,194 | 2,611 | 0.3% |
| CubeSmart | 103,115 | 2,608 | 0.2% |
| Investors Bancorp Inc. | 216,188 | 2,547 | 0.2% |
| * Strategic Hotels & Resorts Inc. | 170,664 | 2,302 | 0.2% |
| Umpqua Holdings Corp. | 136,721 | 2,285 | 0.2% |
| RLJ Lodging Trust | 81,938 | 2,257 | 0.2% |
| Prosperity Bancshares Inc. | 43,420 | 2,244 | 0.2% |
| * MGIC Investment Corp. | 210,538 | 2,223 | 0.2% |
| Highwoods Properties Inc. | 58,302 | 2,212 | 0.2% |
| LaSalle Hotel Properties | 70,025 | 2,203 | 0.2% |
| CNO Financial Group Inc. | 122,080 | 2,184 | 0.2% |
| Radian Group Inc. | 118,659 | 2,133 | 0.2% |
| MarketAxess Holdings Inc. | 23,136 | 2,092 | 0.2% |
| * Euronet Worldwide Inc. | 32,160 | 2,073 | 0.2% |
13
| Russell 2000 Index Fund | |||
| Market | Percentage | ||
| Value• | of Net | ||
| Shares | ($000) | Assets | |
| New Residential Investment Corp. | 142,835 | 2,023 | 0.2% |
| Financial Services—Other † | 240,956 | 22.3% | |
| 274,953 | 25.4% | ||
| Health Care | |||
| * Anacor Pharmaceuticals Inc. | 25,404 | 3,313 | 0.3% |
| * Ultragenyx Pharmaceutical Inc. | 23,825 | 2,659 | 0.3% |
| * Team Health Holdings Inc. | 44,643 | 2,622 | 0.3% |
| West Pharmaceutical Services Inc. | 44,600 | 2,491 | 0.2% |
| * ABIOMED Inc. | 25,873 | 2,481 | 0.2% |
| * WellCare Health Plans Inc. | 27,302 | 2,475 | 0.2% |
| * Neurocrine Biosciences Inc. | 52,950 | 2,456 | 0.2% |
| HealthSouth Corp. | 56,717 | 2,422 | 0.2% |
| STERIS Corp. | 37,023 | 2,371 | 0.2% |
| * Amsurg Corp. | 30,011 | 2,353 | 0.2% |
| * PAREXEL International Corp. | 34,199 | 2,248 | 0.2% |
| * Cepheid | 44,500 | 2,169 | 0.2% |
| * Thoratec Corp. | 33,598 | 2,111 | 0.2% |
| * Dyax Corp. | 90,302 | 2,079 | 0.2% |
| Health Care—Other † | 143,729 | 13.3% | |
| 177,979 | 16.4% | ||
| Materials & Processing | |||
| * Berry Plastics Group Inc. | 74,015 | 2,191 | 0.2% |
| Materials & Processing—Other † | 59,828 | 5.5% | |
| 62,019 | 5.7% | ||
| 1Other † | 522 | 0.1% | |
| Producer Durables | |||
| MAXIMUS Inc. | 40,846 | 2,473 | 0.2% |
| * Teledyne Technologies Inc. | 21,905 | 2,145 | 0.2% |
| Producer Durables—Other † | 125,700 | 11.6% | |
| 130,318 | 12.0% | ||
| Technology | |||
| * Tyler Technologies Inc. | 20,874 | 2,881 | 0.3% |
| * Manhattan Associates Inc. | 45,738 | 2,675 | 0.2% |
| * Guidewire Software Inc. | 43,493 | 2,432 | 0.2% |
| * Cavium Inc. | 34,285 | 2,332 | 0.2% |
| * Qlik Technologies Inc. | 56,617 | 2,144 | 0.2% |
| * EPAM Systems Inc. | 30,316 | 2,141 | 0.2% |
| * Dealertrack Technologies Inc. | 33,966 | 2,132 | 0.2% |
| * NetScout Systems Inc. | 57,048 | 2,085 | 0.2% |
| * Verint Systems Inc. | 38,035 | 2,028 | 0.2% |
| Technology—Other † | 131,508 | 12.2% | |
| 152,358 | 14.1% | ||
| Utilities | |||
| j2 Global Inc. | 29,883 | 2,079 | 0.2% |
| * Dynegy Inc. | 79,438 | 2,046 | 0.2% |
| Utilities—Other † | 45,486 | 4.2% | |
| 49,611 | 4.6% | ||
| Total Common Stocks (Cost $1,106,914) | 1,075,845 | 99.4%2 | |
14
| Russell 2000 Index Fund | ||||
| Market | Percentage | |||
| Value• | of Net | |||
| Coupon | Shares | ($000) | Assets | |
| Temporary Cash Investments | ||||
| Money Market Fund | ||||
| 3,4 Vanguard Market Liquidity Fund | 0.168% | 19,124,789 | 19,125 | 1.8% |
| 5U.S. Government and Agency Obligations † | 500 | 0.0% | ||
| Total Temporary Cash Investments (Cost $19,625) | 19,625 | 1.8%2 | ||
| 6Total Investments (Cost $1,126,539) | 1,095,470 | 101.2% | ||
| Amount | ||||
| ($000) | ||||
| Other Assets and Liabilities | ||||
| Other Assets | ||||
| Investment in Vanguard | 98 | |||
| Receivables for Investment Securities Sold | 495 | |||
| Receivables for Accrued Income | 799 | |||
| Receivables for Capital Shares Issued | 286 | |||
| Other Assets | 34 | |||
| Total Other Assets | 1,712 | 0.2% | ||
| Liabilities | ||||
| Payables for Investment Securities Purchased | (1,975) | |||
| Collateral for Securities on Loan | (12,418) | |||
| Payables for Capital Shares Redeemed | (101) | |||
| Payables to Vanguard | (228) | |||
| Other Liabilities | (54) | |||
| Total Liabilities | (14,776) | (1.4%) | ||
| Net Assets | 1,082,406 | 100.0% | ||
| At August 31, 2015, net assets consisted of: | ||||
| Amount | ||||
| ($000) | ||||
| Paid-in Capital | 1,129,852 | |||
| Undistributed Net Investment Income | 7,050 | |||
| Accumulated Net Realized Losses | (23,109) | |||
| Unrealized Appreciation (Depreciation) | ||||
| Investment Securities | (31,069) | |||
| Futures Contracts | (318) | |||
| Net Assets | 1,082,406 | |||
| ETF Shares—Net Assets | ||||
| Applicable to 5,975,000 outstanding $.001 par value shares of | ||||
| beneficial interest (unlimited authorization) | 553,928 | |||
| Net Asset Value Per Share—ETF Shares | $92.71 | |||
15
| Russell 2000 Index Fund | |
| Amount | |
| ($000) | |
| Institutional Shares—Net Assets | |
| Applicable to 2,979,056 outstanding $.001 par value shares of | |
| beneficial interest (unlimited authorization) | 528,478 |
| Net Asset Value Per Share—Institutional Shares | $177.40 |
• See Note A in Notes to Financial Statements.
* Non-income-producing security.
† Represents the aggregate value, by category, of securities that are not among the 50 largest holdings and, in total for any issuer, represent 1% or less of net assets.
1 “Other” represents securities that are not classified by the fund’s benchmark index.
2 The fund invests a portion of its cash reserves in equity markets through the use of index futures contracts. After giving effect to futures investments, the fund’s effective common stock and temporary cash investment positions represent 100.0% and 1.2%, respectively, of net assets.
3 Affiliated money market fund available only to Vanguard funds and certain trusts and accounts managed by Vanguard. Rate shown is the 7-day yield.
4 Includes $12,418,000 of collateral received for securities on loan.
5 Securities with a value of $400,000 have been segregated as initial margin for open futures contracts.
6 The total value of securities on loan is $11,434,000.
See accompanying Notes, which are an integral part of the Financial Statements.
16
| Russell 2000 Index Fund | |
| Statement of Operations | |
| Year Ended | |
| August 31, 2015 | |
| ($000) | |
| Investment Income | |
| Income | |
| Dividends | 11,245 |
| Interest1 | 10 |
| Securities Lending | 930 |
| Total Income | 12,185 |
| Expenses | |
| The Vanguard Group—Note B | |
| Investment Advisory Services | 144 |
| Management and Administrative—ETF Shares | 348 |
| Management and Administrative—Institutional Shares | 28 |
| Marketing and Distribution—ETF Shares | 80 |
| Marketing and Distribution—Institutional Shares | 54 |
| Custodian Fees | 314 |
| Auditing Fees | 25 |
| Shareholders’ Reports—ETF Shares | 29 |
| Shareholders’ Reports—Institutional Shares | — |
| Trustees’ Fees and Expenses | 1 |
| Total Expenses | 1,023 |
| Net Investment Income | 11,162 |
| Realized Net Gain (Loss) | |
| Investment Securities Sold | 98,760 |
| Futures Contracts | 470 |
| Realized Net Gain (Loss) | 99,230 |
| Change in Unrealized Appreciation (Depreciation) | |
| Investment Securities | (125,320) |
| Futures Contracts | (397) |
| Change in Unrealized Appreciation (Depreciation) | (125,717) |
| Net Increase (Decrease) in Net Assets Resulting from Operations | (15,325) |
| 1 Interest income from an affiliated company of the fund was $9,000. | |
See accompanying Notes, which are an integral part of the Financial Statements.
17
| Russell 2000 Index Fund | ||
| Statement of Changes in Net Assets | ||
| Year Ended August 31, | ||
| 2015 | 2014 | |
| ($000) | ($000) | |
| Increase (Decrease) in Net Assets | ||
| Operations | ||
| Net Investment Income | 11,162 | 8,336 |
| Realized Net Gain (Loss) | 99,230 | 83,433 |
| Change in Unrealized Appreciation (Depreciation) | (125,717) | 8,318 |
| Net Increase (Decrease) in Net Assets Resulting from Operations | (15,325) | 100,087 |
| Distributions | ||
| Net Investment Income | ||
| ETF Shares | (5,355) | (3,732) |
| Institutional Shares | (3,706) | (3,461) |
| Realized Capital Gain | ||
| ETF Shares | — | — |
| Institutional Shares | — | — |
| Total Distributions | (9,061) | (7,193) |
| Capital Share Transactions | ||
| ETF Shares | 188,644 | 70,573 |
| Institutional Shares | 223,654 | (4,467) |
| Net Increase (Decrease) from Capital Share Transactions | 412,298 | 66,106 |
| Total Increase (Decrease) | 387,912 | 159,000 |
| Net Assets | ||
| Beginning of Period | 694,494 | 535,494 |
| End of Period1 | 1,082,406 | 694,494 |
1 Net Assets—End of Period includes undistributed (overdistributed) net investment income of $7,050,000 and $4,873,000.
See accompanying Notes, which are an integral part of the Financial Statements.
18
| Russell 2000 Index Fund | |||||
| Financial Highlights | |||||
| ETF Shares | |||||
| Sept. 20, | |||||
| 20101 to | |||||
| For a Share Outstanding | Year Ended August 31, | Aug. 31, | |||
| Throughout Each Period | 2015 | 2014 | 2013 | 2012 | 2011 |
| Net Asset Value, Beginning of Period | $93.72 | $80.46 | $64.74 | $57.66 | $52.78 |
| Investment Operations | |||||
| Net Investment Income | 1.224 2 | 1.054 | 1.161 | .8692 | .575 |
| Net Realized and Unrealized Gain (Loss) | |||||
| on Investments | (1.163) | 13.163 | 15.604 | 6.749 | 4.531 |
| Total from Investment Operations | .061 | 14.217 | 16.765 | 7.618 | 5.106 |
| Distributions | |||||
| Dividends from Net Investment Income | (1.071) | (.957) | (1.045) | (. 538) | (.226) |
| Distributions from Realized Capital Gains | — | — | — | — | — |
| Total Distributions | (1.071) | (.957) | (1.045) | (. 538) | (.226) |
| Net Asset Value, End of Period | $92.71 | $93.72 | $80.46 | $64.74 | $57.66 |
| Total Return | 0.03% | 17.69% | 26.23% | 13.30% | 9.64% |
| Ratios/Supplemental Data | |||||
| Net Assets, End of Period (Millions) | $554 | $375 | $257 | $149 | $29 |
| Ratio of Total Expenses to Average Net Assets | 0.15% | 0.15% | 0.15% | 0.15% | 0.15%3 |
| Ratio of Net Investment Income to | |||||
| Average Net Assets | 1.28% | 1.23% | 1.71% | 1.45% | 1.14%3 |
| Portfolio Turnover Rate 4 | 17% | 16% | 32% | 35% | 34% |
1 Inception.
2 Calculated based on average shares outstanding.
3 Annualized.
4 Excludes the value of portfolio securities received or delivered as a result of in-kind purchases or redemptions of the fund’s capital shares, including ETF Creation Units.
See accompanying Notes, which are an integral part of the Financial Statements.
19
| Russell 2000 Index Fund | |||||
| Financial Highlights | |||||
| Institutional Shares | |||||
| Dec. 22, | |||||
| 20101 to | |||||
| For a Share Outstanding | Year Ended August 31, | Aug. 31, | |||
| Throughout Each Period | 2015 | 2014 | 2013 | 2012 | 2011 |
| Net Asset Value, Beginning of Period | $179.29 | $153.88 | $123.77 | $110.21 | $119.33 |
| Investment Operations | |||||
| Net Investment Income | 2.453 2 | 2.110 | 2.306 | 1.733 2 | .652 |
| Net Realized and Unrealized Gain (Loss) | |||||
| on Investments | (2.212) | 25.206 | 29.858 | 12.899 | (9.340) |
| Total from Investment Operations | .241 | 27.316 | 32.164 | 14.632 | (8.688) |
| Distributions | |||||
| Dividends from Net Investment Income | (2.131) | (1.906) | (2.054) | (1.072) | (. 432) |
| Distributions from Realized Capital Gains | — | — | — | — | — |
| Total Distributions | (2.131) | (1.906) | (2.054) | (1.072) | (. 432) |
| Net Asset Value, End of Period | $177.40 | $179.29 | $153.88 | $123.77 | $110.21 |
| Total Return | 0.11% | 17.78% | 26.33% | 13.37% | -7.31% |
| Ratios/Supplemental Data | |||||
| Net Assets, End of Period (Millions) | $528 | $320 | $278 | $202 | $78 |
| Ratio of Total Expenses to Average Net Assets | 0.08% | 0.08% | 0.08% | 0.08% | 0.08%3 |
| Ratio of Net Investment Income to | |||||
| Average Net Assets | 1.35% | 1.30% | 1.78% | 1.52% | 1.21%3 |
| Portfolio Turnover Rate 4 | 17% | 16% | 32% | 35% | 34% |
1 Inception.
2 Calculated based on average shares outstanding.
3 Annualized.
4 Excludes the value of portfolio securities received or delivered as a result of in-kind purchases or redemptions of the fund’s capital shares, including ETF Creation Units.
See accompanying Notes, which are an integral part of the Financial Statements.
20
Russell 2000 Index Fund
Notes to Financial Statements
Vanguard Russell 2000 Index Fund is registered under the Investment Company Act of 1940 as an open-end investment company, or mutual fund. The fund offers two classes of shares: ETF Shares and Institutional Shares. ETF Shares are listed for trading on Nasdaq; they can be purchased and sold through a broker. Institutional Shares are designed for investors who meet certain administrative, service, and account-size criteria.
A. The following significant accounting policies conform to generally accepted accounting principles for U.S. investment companies. The fund consistently follows such policies in preparing its financial statements.
1. Security Valuation: Securities are valued as of the close of trading on the New York Stock Exchange (generally 4 p.m., Eastern time) on the valuation date. Equity securities are valued at the latest quoted sales prices or official closing prices taken from the primary market in which each security trades; such securities not traded on the valuation date are valued at the mean of the latest quoted bid and asked prices. Securities for which market quotations are not readily available, or whose values have been materially affected by events occurring before the fund’s pricing time but after the close of the securities’ primary markets, are valued by methods deemed by the board of trustees to represent fair value. Investments in Vanguard Market Liquidity Fund are valued at that fund’s net asset value. Temporary cash investments acquired over 60 days to maturity are valued using the latest bid prices or using valuations based on a matrix system (which considers such factors as security prices, yields, maturities, and ratings), both as furnished by independent pricing services. Other temporary cash investments are valued at amortized cost, which approximates market value.
2. Futures Contracts: The fund uses index futures contracts to a limited extent, with the objectives of maintaining full exposure to the stock market, enhancing returns, maintaining liquidity, and minimizing transaction costs. The fund may purchase futures contracts to immediately invest incoming cash in the market, or sell futures in response to cash outflows, thereby simulating a fully invested position in the underlying index while maintaining a cash balance for liquidity. The fund may seek to enhance returns by using futures contracts instead of the underlying securities when futures are believed to be priced more attractively than the underlying securities. The primary risks associated with the use of futures contracts are imperfect correlation between changes in market values of stocks held by the fund and the prices of futures contracts, and the possibility of an illiquid market. Counterparty risk involving futures is mitigated because a regulated clearinghouse is the counterparty instead of the clearing broker. To further mitigate counterparty risk, the fund trades futures contracts on an exchange, monitors the financial strength of its clearing brokers and clearinghouse, and has entered into clearing agreements with its clearing brokers. The clearinghouse imposes initial margin requirements to secure the fund’s performance and requires daily settlement of variation margin representing changes in the market value of each contract.
Futures contracts are valued at their quoted daily settlement prices. The aggregate settlement values of the contracts are not recorded in the Statement of Net Assets. Fluctuations in the value of the contracts are recorded in the Statement of Net Assets as an asset (liability) and in the Statement of Operations as unrealized appreciation (depreciation) until the contracts are closed, when they are recorded as realized futures gains (losses).
During the year ended August 31, 2015, the fund’s average investments in long and short futures contracts represented less than 1% and 0% of net assets, respectively, based on the average of aggregate settlement values at each quarter-end during the period.
21
Russell 2000 Index Fund
3. Federal Income Taxes: The fund intends to continue to qualify as a regulated investment company and distribute all of its taxable income. Management has analyzed the fund’s tax positions taken for all open federal income tax years (August 31, 2012–2015), and has concluded that no provision for federal income tax is required in the fund’s financial statements.
4. Distributions: Distributions to shareholders are recorded on the ex-dividend date.
5. Securities Lending: To earn additional income, the fund lends its securities to qualified institutional borrowers. Security loans are required to be secured at all times by collateral in an amount at least equal to the market value of securities loaned. Daily market fluctuations could cause the value of loaned securities to be more or less than the value of the collateral received. When this occurs, the collateral is adjusted and settled on the next business day. The fund further mitigates its counterparty risk by entering into securities lending transactions only with a diverse group of prequalified counter-parties, monitoring their financial strength, and entering into master securities lending agreements with its counterparties. The master securities lending agreements provide that, in the event of a counterparty’s default (including bankruptcy), the fund may terminate any loans with that borrower, determine the net amount owed, and sell or retain the collateral up to the net amount owed to the fund; however, such actions may be subject to legal proceedings. While collateral mitigates counter-party risk, in the absence of a default the fund may experience delays and costs in recovering the securities loaned. The fund invests cash collateral received in Vanguard Market Liquidity Fund, and records a liability in the Statement of Net Assets for the return of the collateral, during the period the securities are on loan. Securities lending income represents fees charged to borrowers plus income earned on invested cash collateral, less expenses associated with the loan.
6. Credit Facility: The fund and certain other funds managed by The Vanguard Group (“Vanguard”) participate in a $3 billion committed credit facility provided by a syndicate of lenders pursuant to a credit agreement that may be renewed annually; each fund is individually liable for its borrowings, if any, under the credit facility. Borrowings may be utilized for temporary and emergency purposes, and are subject to the fund’s regulatory and contractual borrowing restrictions. The participating funds are charged administrative fees and an annual commitment fee of 0.06% of the undrawn amount of the facility; these fees are allocated to the funds based on a method approved by the fund’s board of trustees and included in Management and Administrative expenses on the fund’s Statement of Operations. Any borrowings under this facility bear interest at a rate equal to the higher of the federal funds rate or LIBOR reference rate plus an agreed-upon spread.
The fund had no borrowings outstanding at August 31, 2015, or at any time during the period then ended.
7. Other: Dividend income is recorded on the ex-dividend date. Interest income includes income distributions received from Vanguard Market Liquidity Fund and is accrued daily. Premiums and discounts on debt securities purchased are amortized and accreted, respectively, to interest income over the lives of the respective securities. Security transactions are accounted for on the date securities are bought or sold. Costs used to determine realized gains (losses) on the sale of investment securities are those of the specific securities sold.
Each class of shares has equal rights as to assets and earnings, except that each class separately bears certain class-specific expenses related to maintenance of shareholder accounts (included in Management and Administrative expenses) and shareholder reporting. Marketing and distribution expenses are allocated to each class of shares based on a method approved by the board of trustees. Income, other non-class-specific expenses, and gains and losses on investments are allocated to each class of shares based on its relative net assets.
22
Russell 2000 Index Fund
B. In accordance with the terms of a Funds’ Service Agreement (the “FSA”) between Vanguard and the fund, Vanguard furnishes to the fund investment advisory, corporate management, administrative, marketing, and distribution services at Vanguard’s cost of operations (as defined by the FSA). These costs of operations are allocated to the fund based on methods and guidelines approved by the board of trustees. Vanguard does not require reimbursement in the current period for certain costs of operations (such as deferred compensation/benefits and risk/insurance costs); the fund’s liability for these costs of operations is included in Payables to Vanguard on the Statement of Net Assets.
Upon the request of Vanguard, the fund may invest up to 0.40% of its net assets as capital in Vanguard. At August 31, 2015, the fund had contributed to Vanguard capital in the amount of $98,000, representing 0.01% of the fund’s net assets and 0.04% of Vanguard’s capitalization. The fund’s trustees and officers are also directors and employees, respectively, of Vanguard.
C. Various inputs may be used to determine the value of the fund’s investments. These inputs are summarized in three broad levels for financial statement purposes. The inputs or methodologies used to value securities are not necessarily an indication of the risk associated with investing in those securities.
Level 1—Quoted prices in active markets for identical securities.
Level 2—Other significant observable inputs (including quoted prices for similar securities, interest rates, prepayment speeds, credit risk, etc.).
Level 3—Significant unobservable inputs (including the fund’s own assumptions used to determine the fair value of investments).
The following table summarizes the market value of the fund’s investments as of August 31, 2015, based on the inputs used to value them:
| Level 1 | Level 2 | Level 3 | |
| Investments | ($000) | ($000) | ($000) |
| Common Stocks | 1,075,755 | — | 90 |
| Temporary Cash Investments | 19,125 | 500 | — |
| Futures Contracts—Assets1 | 8 | — | — |
| Futures Contracts—Liabilities1 | (54) | — | — |
| Total | 1,094,834 | 500 | 90 |
| 1 Represents variation margin on the last day of the reporting period. | |||
D. At August 31, 2015, the aggregate settlement value of open futures contracts and the related unrealized appreciation (depreciation) were:
| ($000) | ||||
| Aggregate | ||||
| Number of | Settlement | Unrealized | ||
| Long (Short) | Value | Appreciation | ||
| Futures Contracts | Expiration | Contracts | Long (Short) | (Depreciation) |
| E-mini Russell 2000 Index | September 2015 | 55 | 6,366 | (318) |
Unrealized appreciation (depreciation) on open futures contracts is required to be treated as realized gain (loss) for tax purposes.
23
Russell 2000 Index Fund
E. Distributions are determined on a tax basis and may differ from net investment income and realized capital gains for financial reporting purposes. Differences may be permanent or temporary. Permanent differences are reclassified among capital accounts in the financial statements to reflect their tax character. Temporary differences arise when certain items of income, expense, gain, or loss are recognized in different periods for financial statement and tax purposes. These differences will reverse at some time in the future. Differences in classification may also result from the treatment of short-term gains as ordinary income for tax purposes.
Certain of the fund’s investments are in securities considered to be passive foreign investment companies, for which any unrealized appreciation and/or realized gains are required to be included in distributable net income for tax purposes. During the year ended August 31, 2015, the fund realized gains on the sale of passive foreign investment companies of $76,000, which have been included in current and prior periods’ taxable income; accordingly, such gains have been reclassified from accumulated net realized losses to undistributed net investment income. Passive foreign investment companies held at August 31, 2015, had unrealized appreciation of $83,000, of which all has been distributed and is reflected in the balance of undistributed net investment income.
During the year ended August 31, 2015, the fund realized $114,503,000 of net capital gains resulting from in-kind redemptions—in which shareholders exchanged fund shares for securities held by the fund rather than for cash. Because such gains are not taxable to the fund, and are not distributed to shareholders, they have been reclassified from accumulated net realized losses to paid-in capital.
For tax purposes, at August 31, 2015, the fund had $7,326,000 of ordinary income available for distribution. The fund had available capital losses totaling $23,326,000 that may be carried forward indefinitely to offset future net capital gains.
At August 31, 2015, the cost of investment securities for tax purposes was $1,126,723,000. Net unrealized depreciation of investment securities for tax purposes was $31,253,000, consisting of unrealized gains of $82,736,000 on securities that had risen in value since their purchase and $113,989,000 in unrealized losses on securities that had fallen in value since their purchase.
F. During the year ended August 31, 2015, the fund purchased $881,590,000 of investment securities and sold $468,870,000 of investment securities, other than temporary cash investments. Purchases and sales include $443,254,000 and $324,807,000, respectively, in connection with in-kind purchases and redemptions of the fund’s capital shares.
24
Russell 2000 Index Fund
G. Capital share transactions for each class of shares were:
| Year Ended August 31, | ||||
| 2015 | 2014 | |||
| Amount | Shares | Amount | Shares | |
| ($000) | (000) | ($000) | (000) | |
| ETF Shares | ||||
| Issued | 647,425 | 6,700 | 401,320 | 4,400 |
| Issued in Lieu of Cash Distributions | — | — | — | — |
| Redeemed | (458,781) | (4,725) | (330,747) | (3,600) |
| Net Increase (Decrease)—ETF Shares | 188,644 | 1,975 | 70,573 | 800 |
| Institutional Shares | ||||
| Issued | 316,346 | 1,709 | 67,964 | 399 |
| Issued in Lieu of Cash Distributions | 3,416 | 19 | 3,224 | 18 |
| Redeemed | (96,108) | (532) | (75,655) | (441) |
| Net Increase (Decrease) —Institutional Shares | 223,654 | 1,196 | (4,467) | (24) |
At August 31, 2015, one shareholder was the record or beneficial owner of 26% of the fund’s net assets. If the shareholder were to redeem its investment in the fund, the redemption might result in an increase in the fund’s expense ratio, cause the fund to incur higher transaction costs, or lead to the realization of taxable capital gains.
H. Management has determined that no material events or transactions occurred subsequent to August 31, 2015, that would require recognition or disclosure in these financial statements.
25
Russell 2000 Value Index Fund
Fund Profile
As of August 31, 2015
| Share-Class Characteristics | ||
| ETF | Institutional | |
| Shares | Shares | |
| Ticker Symbol | VTWV | VRTVX |
| Expense Ratio1 | 0.20% | 0.08% |
| 30-Day SEC Yield | 1.93% | 2.13% |
| Portfolio Characteristics | |||
| DJ | |||
| U.S. | |||
| Russell | Total | ||
| 2000 | Market | ||
| Value | FA | ||
| Fund | Index | Index | |
| Number of Stocks | 1,324 | 1,310 | 3,828 |
| Median Market Cap | $1.5B | $1.5B | $47.2B |
| Price/Earnings Ratio | 23.3x | 23.2x | 20.8x |
| Price/Book Ratio | 1.4x | 1.4x | 2.6x |
| Return on Equity | 7.6% | 7.6% | 17.1% |
| Earnings Growth | |||
| Rate | 8.0% | 8.0% | 10.2% |
| Dividend Yield | 2.2% | 2.2% | 2.1% |
| Foreign Holdings | 0.0% | 0.0% | 0.0% |
| Turnover Rate | 28% | — | — |
| Short-Term | |||
| Reserves | 0.3% | — | — |
| Volatility Measures | ||
| Russell | DJ | |
| 2000 | U.S. Total | |
| Value | Market | |
| Index | FA Index | |
| R-Squared | 1.00 | 0.69 |
| Beta | 1.00 | 1.11 |
These measures show the degree and timing of the fund’s fluctuations compared with the indexes over 36 months.
| Ten Largest Holdings (% of total net assets) | ||
| First American Financial | Insurance: | |
| Corp. | Property-Casualty | 0.5% |
| Investors Bancorp Inc. | Banks: Diversified | 0.5 |
| Post Holdings Inc. | Foods | 0.5 |
| Strategic Hotels & | Real Estate | |
| Resorts Inc. | Investment Trusts | |
| (REITs) | 0.4 | |
| Umpqua Holdings Corp. | Banks: Diversified | 0.4 |
| Prosperity Bancshares | ||
| Inc. | Banks: Diversified | 0.4 |
| Highwoods Properties | Real Estate | |
| Inc. | Investment Trusts | |
| (REITs) | 0.4 | |
| LaSalle Hotel Properties | Real Estate | |
| Investment Trusts | ||
| (REITs) | 0.4 | |
| CNO Financial Group | ||
| Inc. | Insurance: Life | 0.4 |
| Radian Group Inc. | Insurance: | |
| Property-Casualty | 0.4 | |
| Top Ten | 4.3% | |
The holdings listed exclude any temporary cash investments and equity index products.
Investment Focus

1 The expense ratios shown are from the prospectus dated December 23, 2014, and represent estimated costs for the current fiscal year. For the fiscal year ended August 31, 2015, the expense ratios were 0.20% for ETF Shares and 0.08% for Institutional Shares.
26
Russell 2000 Value Index Fund
| Sector Diversification (% of equity exposure) | |||
| DJ | |||
| U.S. | |||
| Russell | Total | ||
| 2000 | Market | ||
| Value | FA | ||
| Fund | Index | Index | |
| Consumer Discretionary | 11.0% | 11.0% | 14.9% |
| Consumer Staples | 2.8 | 2.8 | 7.6 |
| Energy | 4.5 | 4.5 | 6.7 |
| Financial Services | 42.3 | 42.5 | 20.1 |
| Health Care | 4.6 | 4.4 | 14.8 |
| Materials & Processing | 4.4 | 4.4 | 3.9 |
| Producer Durables | 12.7 | 12.8 | 10.6 |
| Technology | 9.7 | 9.6 | 16.3 |
| Utilities | 8.0 | 8.0 | 5.1 |
27
Russell 2000 Value Index Fund
Performance Summary
All of the returns in this report represent past performance, which is not a guarantee of future results that may be achieved by the fund. (Current performance may be lower or higher than the performance data cited. For performance data current to the most recent month-end, visit our website at vanguard.com/performance.) Note, too, that both investment returns and principal value can fluctuate widely, so an investor’s shares, when sold, could be worth more or less than their original cost. The returns shown do not reflect taxes that a shareholder would pay on fund distributions or on the sale of fund shares.
Cumulative Performance: September 20, 2010, Through August 31, 2015
Initial Investment of $10,000
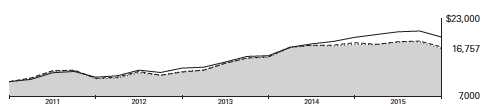
| Average Annual Total Returns | |||
| Periods Ended August 31, 2015 | |||
| Since | Final Value | ||
| One | Inception | of a $10,000 | |
| Year | (9/20/2010) | Investment | |
| Russell 2000 Value Index Fund*ETF | |||
| Shares Net Asset Value | -5.10% | 11.00% | $16,757 |
| Russell 2000 Value Index Fund*ETF | |||
| Shares Market Price | -5.03 | 10.99 | 16,750 |
| Russell 2000 Value Index | -4.95 | 11.19 | 16,896 |
| Small-Cap Value Funds Average | -4.82 | 11.58 | 17,192 |
| Dow Jones U.S. Total Stock Market | |||
| Float Adjusted Index | 0.29 | 14.14 | 19,234 |
Small-Cap Value Funds Average: Derived from data provided by Lipper, a Thomson Reuters Company.
"Since Inception" performance is calculated from the ETF Shares’ inception date for both the fund and its comparative standards.
| Since | Final Value | ||
| One | Inception | of a $5,000,000 | |
| Year | (7/13/2012) | Investment | |
| Russell 2000 Value Index Fund Institutional | |||
| Shares | -4.97% | 11.70% | $7,072,151 |
| Russell 2000 Value Index | -4.95 | 11.75 | 7,081,811 |
| Dow Jones U.S. Total Stock Market Float | |||
| Adjusted Index | 0.29 | 15.23 | 7,795,311 |
| "Since Inception" performance is calculated from the Institutional Shares’ inception date for both the fund and its comparative standards. | |||
See Financial Highlights for dividend and capital gains information.
28
| Russell 2000 Value Index Fund | ||
| Cumulative Returns of ETF Shares: September 20, 2010, Through August 31, 2015 | ||
| Since | ||
| One | Inception | |
| Year | (9/20/2010) | |
| Russell 2000 Value Index Fund ETF Shares Market | ||
| Price | -5.03% | 67.50% |
| Russell 2000 Value Index Fund ETF Shares Net | ||
| Asset Value | -5.10 | 67.57 |
| Russell 2000 Value Index | -4.95 | 68.96 |
| "Since Inception" performance is calculated from the ETF Shares’ inception date for both the fund and its comparative standards. | ||
Fiscal-Year Total Returns (%): September 20, 2010, Through August 31, 2015
| Russell 2000 Value Index Fund ETF Shares Net Asset Value |
| Russell 2000 Value Index |
Average Annual Total Returns: Periods Ended June 30, 2015
This table presents returns through the latest calendar quarter—rather than through the end of the fiscal period.
Securities and Exchange Commission rules require that we provide this information.
| Inception | One | Since | |
| Date | Year | Inception | |
| ETF Shares | 9/20/2010 | ||
| Market Price | 0.65% | 13.27% | |
| Net Asset Value | 0.65 | 13.27 | |
| Institutional Shares | 7/13/2012 | 0.78 | 15.43 |
29
Russell 2000 Value Index Fund
Financial Statements
Statement of Net Assets—Investments Summary
As of August 31, 2015
This Statement summarizes the fund’s holdings by asset type. Details are reported for each of the fund’s 50 largest individual holdings and for investments that, in total for any issuer, represent more than 1% of the fund’s net assets. The total value of smaller holdings is reported as a single amount within each category.
The fund reports a complete list of its holdings in regulatory filings four times in each fiscal year, at the quarter-ends. For the second and fourth fiscal quarters, the complete listing of the fund’s holdings is available electronically on vanguard.com and on the Securities and Exchange Commission’s website (sec.gov), or you can have it mailed to you without charge by calling 800-662-7447. For the first and third fiscal quarters, the fund files the lists with the SEC on Form N-Q. Shareholders can look up the fund’s Forms N-Q on the SEC’s website. Forms N-Q may also be reviewed and copied at the SEC’s Public Reference Room (see the back cover of this report for further information).
| Market | Percentage | ||
| Value• | of Net | ||
| Shares | ($000) | Assets | |
| Common Stocks | |||
| Consumer Discretionary | |||
| * Houghton Mifflin Harcourt Co. | 21,287 | 481 | 0.3% |
| Consumer Discretionary—Other † | 15,196 | 10.6% | |
| 15,677 | 10.9% | ||
| Consumer Staples | |||
| * Post Holdings Inc. | 10,244 | 669 | 0.5% |
| * TreeHouse Foods Inc. | 7,175 | 569 | 0.4% |
| Consumer Staples—Other † | 2,797 | 1.9% | |
| 4,035 | 2.8% | ||
| Energy † | 6,438 | 4.5% | |
| Financial Services | |||
| First American Financial Corp. | 18,123 | 704 | 0.5% |
| Investors Bancorp Inc. | 58,316 | 687 | 0.5% |
| * Strategic Hotels & Resorts Inc. | 46,056 | 621 | 0.4% |
| Umpqua Holdings Corp. | 36,891 | 616 | 0.4% |
| Prosperity Bancshares Inc. | 11,717 | 605 | 0.4% |
| Highwoods Properties Inc. | 15,731 | 597 | 0.4% |
| LaSalle Hotel Properties | 18,898 | 595 | 0.4% |
| CNO Financial Group Inc. | 32,955 | 590 | 0.4% |
| Radian Group Inc. | 32,031 | 576 | 0.4% |
| New Residential Investment Corp. | 38,506 | 545 | 0.4% |
| Webster Financial Corp. | 15,191 | 537 | 0.4% |
| * Stifel Financial Corp. | 11,356 | 529 | 0.4% |
| FirstMerit Corp. | 27,758 | 499 | 0.3% |
| PrivateBancorp Inc. | 13,159 | 498 | 0.3% |
| EPR Properties | 9,572 | 487 | 0.3% |
| Sunstone Hotel Investors Inc. | 34,771 | 481 | 0.3% |
| DCT Industrial Trust Inc. | 14,876 | 478 | 0.3% |
| Pebblebrook Hotel Trust | 11,972 | 456 | 0.3% |
30
| Russell 2000 Value Index Fund | |||
| Market | Percentage | ||
| Value• | of Net | ||
| Shares | ($000) | Assets | |
| Medical Properties Trust Inc. | 38,912 | 454 | 0.3% |
| United Bankshares Inc. | 11,571 | 433 | 0.3% |
| Sun Communities Inc. | 6,561 | 428 | 0.3% |
| MB Financial Inc. | 12,517 | 412 | 0.3% |
| Colony Capital Inc. Class A | 18,612 | 404 | 0.3% |
| Wintrust Financial Corp. | 7,901 | 403 | 0.3% |
| Cathay General Bancorp | 13,315 | 395 | 0.3% |
| Symetra Financial Corp. | 12,513 | 394 | 0.3% |
| DiamondRock Hospitality Co. | 33,443 | 393 | 0.3% |
| Financial Services—Other † | 46,956 | 32.6% | |
| 60,773 | 42.1% | ||
| Health Care | |||
| * Amsurg Corp. | 6,106 | 479 | 0.3% |
| * Medicines Co. | 9,943 | 408 | 0.3% |
| Health Care—Other † | 5,501 | 3.8% | |
| 6,388 | 4.4% | ||
| Materials & Processing † | 6,336 | 4.4% | |
| 1Other † | 42 | 0.0% | |
| Producer Durables | |||
| Curtiss-Wright Corp. | 7,488 | 492 | 0.4% |
| EMCOR Group Inc. | 10,445 | 481 | 0.3% |
| * Teledyne Technologies Inc. | 4,374 | 428 | 0.3% |
| * Esterline Technologies Corp. | 5,184 | 424 | 0.3% |
| Producer Durables—Other † | 16,416 | 11.4% | |
| 18,241 | 12.7% | ||
| Technology | |||
| Mentor Graphics Corp. | 16,663 | 431 | 0.3% |
| * Tech Data Corp. | 6,137 | 400 | 0.3% |
| * Dealertrack Technologies Inc. | 6,290 | 395 | 0.3% |
| Technology—Other † | 12,507 | 8.6% | |
| 13,733 | 9.5% | ||
| Utilities | |||
| * Dynegy Inc. | 21,448 | 552 | 0.4% |
| Cleco Corp. | 10,123 | 542 | 0.4% |
| Portland General Electric Co. | 14,767 | 510 | 0.4% |
| Piedmont Natural Gas Co. Inc. | 13,126 | 506 | 0.3% |
| IDACORP Inc. | 8,430 | 501 | 0.3% |
| WGL Holdings Inc. | 8,286 | 449 | 0.3% |
| Southwest Gas Corp. | 7,805 | 430 | 0.3% |
| UIL Holdings Corp. | 9,433 | 430 | 0.3% |
| NorthWestern Corp. | 7,838 | 405 | 0.3% |
| New Jersey Resources Corp. | 14,259 | 403 | 0.3% |
| ALLETE Inc. | 8,123 | 388 | 0.3% |
| Utilities—Other † | 6,374 | 4.4% | |
| 11,490 | 8.0% | ||
| Total Common Stocks (Cost $158,795) | 143,153 | 99.3%2 | |
31
| Russell 2000 Value Index Fund | ||||
| Market | Percentage | |||
| Value• | of Net | |||
| Coupon | Shares | ($000) | Assets | |
| Temporary Cash Investments | ||||
| Money Market Fund | ||||
| 3,4 Vanguard Market Liquidity Fund | 0.168% | 1,513,120 | 1,513 | 1.0% |
| 5U.S. Government and Agency Obligations † | 100 | 0.1% | ||
| Total Temporary Cash Investments (Cost $1,613) | 1,613 | 1.1%2 | ||
| 6Total Investments (Cost $160,408) | 144,766 | 100.4% | ||
| Amount | ||||
| ($000) | ||||
| Other Assets and Liabilities | ||||
| Other Assets | ||||
| Investment in Vanguard | 14 | |||
| Receivables for Investment Securities Sold | 90 | |||
| Receivables for Accrued Income | 150 | |||
| Receivables for Capital Shares Issued | 172 | |||
| Total Other Assets | 426 | 0.3% | ||
| Liabilities | ||||
| Payables for Investment Securities Purchased | (299) | |||
| Collateral for Securities on Loan | (543) | |||
| Payables for Capital Shares Redeemed | (2) | |||
| Payables to Vanguard | (33) | |||
| Other Liabilities | (73) | |||
| Total Liabilities | (950) | (0.7%) | ||
| Net Assets | 144,242 | 100.0% | ||
| At August 31, 2015, net assets consisted of: | ||||
| Amount | ||||
| ($000) | ||||
| Paid-in Capital | 166,355 | |||
| Undistributed Net Investment Income | 1,725 | |||
| Accumulated Net Realized Losses | (8,152) | |||
| Unrealized Appreciation (Depreciation) | ||||
| Investment Securities | (15,642) | |||
| Futures Contracts | (44) | |||
| Net Assets | 144,242 | |||
| ETF Shares—Net Assets | ||||
| Applicable to 900,000 outstanding $.001 par value shares of | ||||
| beneficial interest (unlimited authorization) | 73,694 | |||
| Net Asset Value Per Share—ETF Shares | $81.88 | |||
32
| Russell 2000 Value Index Fund | |
| Amount | |
| ($000) | |
| Institutional Shares—Net Assets | |
| Applicable to 436,580 outstanding $.001 par value shares of | |
| beneficial interest (unlimited authorization) | 70,548 |
| Net Asset Value Per Share—Institutional Shares | $161.59 |
• See Note A in Notes to Financial Statements.
* Non-income-producing security.
† Represents the aggregate value, by category, of securities that are not among the 50 largest holdings and, in total for any issuer, represent 1% or less of net assets.
1 “Other” represents securities that are not classified by the fund’s benchmark index.
2 The fund invests a portion of its cash reserves in equity markets through the use of index futures contracts. After giving effect to futures investments, the fund’s effective common stock and temporary cash investment positions represent 99.8% and 0.6%, respectively, of net assets.
3 Affiliated money market fund available only to Vanguard funds and certain trusts and accounts managed by Vanguard. Rate shown is the 7-day yield.
4 Includes $543,000 of collateral received for securities on loan.
5 Securities with a value of $100,000 have been segregated as initial margin for open futures contracts.
6 The total value of securities on loan is $484,000.
See accompanying Notes, which are an integral part of the Financial Statements.
33
| Russell 2000 Value Index Fund | |
| Statement of Operations | |
| Year Ended | |
| August 31, 2015 | |
| ($000) | |
| Investment Income | |
| Income | |
| Dividends | 3,050 |
| Interest1 | 2 |
| Securities Lending | 92 |
| Total Income | 3,144 |
| Expenses | |
| The Vanguard Group—Note B | |
| Investment Advisory Services | 19 |
| Management and Administrative—ETF Shares | 80 |
| Management and Administrative—Institutional Shares | 1 |
| Marketing and Distribution—ETF Shares | 14 |
| Marketing and Distribution—Institutional Shares | 13 |
| Custodian Fees | 62 |
| Auditing Fees | 25 |
| Shareholders’ Reports—ETF Shares | 4 |
| Shareholders’ Reports—Institutional Shares | — |
| Total Expenses | 218 |
| Net Investment Income | 2,926 |
| Realized Net Gain (Loss) | |
| Investment Securities Sold | 11,805 |
| Futures Contracts | 88 |
| Realized Net Gain (Loss) | 11,893 |
| Change in Unrealized Appreciation (Depreciation) | |
| Investment Securities | (21,931) |
| Futures Contracts | (46) |
| Change in Unrealized Appreciation (Depreciation) | (21,977) |
| Net Increase (Decrease) in Net Assets Resulting from Operations | (7,158) |
| 1 Interest income from an affiliated company of the fund was $1,000. | |
See accompanying Notes, which are an integral part of the Financial Statements.
34
| Russell 2000 Value Index Fund | ||
| Statement of Changes in Net Assets | ||
| Year Ended August 31, | ||
| 2015 | 2014 | |
| ($000) | ($000) | |
| Increase (Decrease) in Net Assets | ||
| Operations | ||
| Net Investment Income | 2,926 | 2,584 |
| Realized Net Gain (Loss) | 11,893 | 18,189 |
| Change in Unrealized Appreciation (Depreciation) | (21,977) | (731) |
| Net Increase (Decrease) in Net Assets Resulting from Operations | (7,158) | 20,042 |
| Distributions | ||
| Net Investment Income | ||
| ETF Shares | (1,353) | (856) |
| Institutional Shares | (1,497) | (1,206) |
| Realized Capital Gain | ||
| ETF Shares | — | — |
| Institutional Shares | — | — |
| Total Distributions | (2,850) | (2,062) |
| Capital Share Transactions | ||
| ETF Shares | 8,868 | 16,354 |
| Institutional Shares | (6,380) | 21,535 |
| Net Increase (Decrease) from Capital Share Transactions | 2,488 | 37,889 |
| Total Increase (Decrease) | (7,520) | 55,869 |
| Net Assets | ||
| Beginning of Period | 151,762 | 95,893 |
| End of Period1 | 144,242 | 151,762 |
1 Net Assets—End of Period includes undistributed (overdistributed) net investment income of $1,725,000 and $1,634,000.
See accompanying Notes, which are an integral part of the Financial Statements.
35
| Russell 2000 Value Index Fund | |||||
| Financial Highlights | |||||
| ETF Shares | |||||
| Sept. 20, | |||||
| 20101 to | |||||
| For a Share Outstanding | Year Ended August 31, | Aug. 31, | |||
| Throughout Each Period | 2015 | 2014 | 2013 | 2012 | 2011 |
| Net Asset Value, Beginning of Period | $87.76 | $75.48 | $61.97 | $55.14 | $52.39 |
| Investment Operations | |||||
| Net Investment Income | 1.530 | 1.284 | 1.639 | 1.1262 | .9212 |
| Net Realized and Unrealized Gain (Loss) | |||||
| on Investments | (5.907) | 12.219 | 13.109 | 6.424 | 2.249 |
| Total from Investment Operations | (4.377) | 13.503 | 14.748 | 7.550 | 3.170 |
| Distributions | |||||
| Dividends from Net Investment Income | (1.503) | (1.223) | (1.238) | (.720) | (. 420) |
| Distributions from Realized Capital Gains | — | — | — | — | — |
| Total Distributions | (1.503) | (1.223) | (1.238) | (.720) | (. 420) |
| Net Asset Value, End of Period | $81.88 | $87.76 | $75.48 | $61.97 | $55.14 |
| Total Return | -5.10% | 17.92% | 24.14% | 13.81% | 5.98% |
| Ratios/Supplemental Data | |||||
| Net Assets, End of Period (Millions) | $74 | $70 | $45 | $19 | $17 |
| Ratio of Total Expenses to Average Net Assets | 0.20% | 0.20% | 0.20% | 0.20% | 0.20%3 |
| Ratio of Net Investment Income to | |||||
| Average Net Assets | 1.80% | 1.83% | 2.12% | 2.02% | 1.79%3 |
| Portfolio Turnover Rate 4 | 28% | 36% | 60% | 40% | 101% |
1 Inception.
2 Calculated based on average shares outstanding.
3 Annualized.
4 Excludes the value of portfolio securities received or delivered as a result of in-kind purchases or redemptions of the fund’s capital shares, including ETF Creation Units.
See accompanying Notes, which are an integral part of the Financial Statements.
36
| Russell 2000 Value Index Fund | ||||
| Financial Highlights | ||||
| Institutional Shares | ||||
| July 13, | ||||
| 20121 to | ||||
| For a Share Outstanding | Year Ended August 31, | Aug. 31, | ||
| Throughout Each Period | 2015 | 2014 | 2013 | 2012 |
| Net Asset Value, Beginning of Period | $173.15 | $148.87 | $122.12 | $120.40 |
| Investment Operations | ||||
| Net Investment Income | 3.195 | 2.724 | 3.360 | . 276 2 |
| Net Realized and Unrealized Gain (Loss) on Investments | (11.619) | 24.103 | 25.888 | 1.444 |
| Total from Investment Operations | (8.424) | 26.827 | 29.248 | 1.720 |
| Distributions | ||||
| Dividends from Net Investment Income | (3.136) | (2.547) | (2.498) | — |
| Distributions from Realized Capital Gains | — | — | — | — |
| Total Distributions | (3.136) | (2.547) | (2.498) | — |
| Net Asset Value, End of Period | $161.59 | $173.15 | $148.87 | $122.12 |
| Total Return | -4.97% | 18.07% | 24.29% | 1.43% |
| Ratios/Supplemental Data | ||||
| Net Assets, End of Period (Millions) | $71 | $82 | $51 | $6 |
| Ratio of Total Expenses to Average Net Assets | 0.08% | 0.08% | 0.08% | 0.08%3 |
| Ratio of Net Investment Income to Average Net Assets | 1.92% | 1.95% | 2.24% | 2.14%3 |
| Portfolio Turnover Rate 4 | 28% | 36% | 60% | 40% |
1 Inception.
2 Calculated based on average shares outstanding.
3 Annualized.
4 Excludes the value of portfolio securities received or delivered as a result of in-kind purchases or redemptions of the fund’s capital shares, including ETF Creation Units.
See accompanying Notes, which are an integral part of the Financial Statements.
37
Russell 2000 Value Index Fund
Notes to Financial Statements
Vanguard Russell 2000 Value Index Fund is registered under the Investment Company Act of 1940 as an open-end investment company, or mutual fund. The fund offers two classes of shares: ETF Shares and Institutional Shares. ETF Shares are listed for trading on Nasdaq; they can be purchased and sold through a broker. Institutional Shares are designed for investors who meet certain administrative, service, and account-size criteria.
A. The following significant accounting policies conform to generally accepted accounting principles for U.S. investment companies. The fund consistently follows such policies in preparing its financial statements.
1. Security Valuation: Securities are valued as of the close of trading on the New York Stock Exchange (generally 4 p.m., Eastern time) on the valuation date. Equity securities are valued at the latest quoted sales prices or official closing prices taken from the primary market in which each security trades; such securities not traded on the valuation date are valued at the mean of the latest quoted bid and asked prices. Securities for which market quotations are not readily available, or whose values have been materially affected by events occurring before the fund’s pricing time but after the close of the securities’ primary markets, are valued by methods deemed by the board of trustees to represent fair value. Investments in Vanguard Market Liquidity Fund are valued at that fund’s net asset value. Temporary cash investments acquired over 60 days to maturity are valued using the latest bid prices or using valuations based on a matrix system (which considers such factors as security prices, yields, maturities, and ratings), both as furnished by independent pricing services. Other temporary cash investments are valued at amortized cost, which approximates market value.
2. Futures Contracts: The fund uses index futures contracts to a limited extent, with the objectives of maintaining full exposure to the stock market, enhancing returns, maintaining liquidity, and minimizing transaction costs. The fund may purchase futures contracts to immediately invest incoming cash in the market, or sell futures in response to cash outflows, thereby simulating a fully invested position in the underlying index while maintaining a cash balance for liquidity. The fund may seek to enhance returns by using futures contracts instead of the underlying securities when futures are believed to be priced more attractively than the underlying securities. The primary risks associated with the use of futures contracts are imperfect correlation between changes in market values of stocks held by the fund and the prices of futures contracts, and the possibility of an illiquid market. Counterparty risk involving futures is mitigated because a regulated clearinghouse is the counterparty instead of the clearing broker. To further mitigate counterparty risk, the fund trades futures contracts on an exchange, monitors the financial strength of its clearing brokers and clearinghouse, and has entered into clearing agreements with its clearing brokers. The clearinghouse imposes initial margin requirements to secure the fund’s performance and requires daily settlement of variation margin representing changes in the market value of each contract.
Futures contracts are valued at their quoted daily settlement prices. The aggregate settlement values of the contracts are not recorded in the Statement of Net Assets. Fluctuations in the value of the contracts are recorded in the Statement of Net Assets as an asset (liability) and in the Statement of Operations as unrealized appreciation (depreciation) until the contracts are closed, when they are recorded as realized futures gains (losses).
During the year ended August 31, 2015, the fund’s average investments in long and short futures contracts represented less than 1% and 0% of net assets, respectively, based on the average of aggregate settlement values at each quarter-end during the period.
38
Russell 2000 Value Index Fund
3. Federal Income Taxes: The fund intends to continue to qualify as a regulated investment company and distribute all of its taxable income. Management has analyzed the fund’s tax positions taken for all open federal income tax years (August 31, 2012–2015), and has concluded that no provision for federal income tax is required in the fund’s financial statements.
4. Distributions: Distributions to shareholders are recorded on the ex-dividend date.
5. Securities Lending: To earn additional income, the fund lends its securities to qualified institutional borrowers. Security loans are required to be secured at all times by collateral in an amount at least equal to the market value of securities loaned. Daily market fluctuations could cause the value of loaned securities to be more or less than the value of the collateral received. When this occurs, the collateral is adjusted and settled on the next business day. The fund further mitigates its counterparty risk by entering into securities lending transactions only with a diverse group of prequalified counter-parties, monitoring their financial strength, and entering into master securities lending agreements with its counterparties. The master securities lending agreements provide that, in the event of a counterparty’s default (including bankruptcy), the fund may terminate any loans with that borrower, determine the net amount owed, and sell or retain the collateral up to the net amount owed to the fund; however, such actions may be subject to legal proceedings. While collateral mitigates counter-party risk, in the absence of a default the fund may experience delays and costs in recovering the securities loaned. The fund invests cash collateral received in Vanguard Market Liquidity Fund, and records a liability in the Statement of Net Assets for the return of the collateral, during the period the securities are on loan. Securities lending income represents fees charged to borrowers plus income earned on invested cash collateral, less expenses associated with the loan.
6. Credit Facility: The fund and certain other funds managed by The Vanguard Group (“Vanguard”) participate in a $3 billion committed credit facility provided by a syndicate of lenders pursuant to a credit agreement that may be renewed annually; each fund is individually liable for its borrowings, if any, under the credit facility. Borrowings may be utilized for temporary and emergency purposes, and are subject to the fund’s regulatory and contractual borrowing restrictions. The participating funds are charged administrative fees and an annual commitment fee of 0.06% of the undrawn amount of the facility; these fees are allocated to the funds based on a method approved by the fund’s board of trustees and included in Management and Administrative expenses on the fund’s Statement of Operations. Any borrowings under this facility bear interest at a rate equal to the higher of the federal funds rate or LIBOR reference rate plus an agreed-upon spread.
The fund had no borrowings outstanding at August 31, 2015, or at any time during the period then ended.
7. Other: Dividend income is recorded on the ex-dividend date. Interest income includes income distributions received from Vanguard Market Liquidity Fund and is accrued daily. Premiums and discounts on debt securities purchased are amortized and accreted, respectively, to interest income over the lives of the respective securities. Security transactions are accounted for on the date securities are bought or sold. Costs used to determine realized gains (losses) on the sale of investment securities are those of the specific securities sold.
Each class of shares has equal rights as to assets and earnings, except that each class separately bears certain class-specific expenses related to maintenance of shareholder accounts (included in Management and Administrative expenses) and shareholder reporting. Marketing and distribution expenses are allocated to each class of shares based on a method approved by the board of trustees. Income, other non-class-specific expenses, and gains and losses on investments are allocated to each class of shares based on its relative net assets.
39
Russell 2000 Value Index Fund
B. In accordance with the terms of a Funds’ Service Agreement (the “FSA”) between Vanguard and the fund, Vanguard furnishes to the fund investment advisory, corporate management, administrative, marketing, and distribution services at Vanguard’s cost of operations (as defined by the FSA). These costs of operations are allocated to the fund based on methods and guidelines approved by the board of trustees. Vanguard does not require reimbursement in the current period for certain costs of operations (such as deferred compensation/benefits and risk/insurance costs); the fund’s liability for these costs of operations is included in Payables to Vanguard on the Statement of Net Assets.
Upon the request of Vanguard, the fund may invest up to 0.40% of its net assets as capital in Vanguard. At August 31, 2015, the fund had contributed to Vanguard capital in the amount of $14,000, representing 0.01% of the fund’s net assets and 0.01% of Vanguard’s capitalization. The fund’s trustees and officers are also directors and employees, respectively, of Vanguard.
C. Various inputs may be used to determine the value of the fund’s investments. These inputs are summarized in three broad levels for financial statement purposes. The inputs or methodologies used to value securities are not necessarily an indication of the risk associated with investing in those securities.
Level 1—Quoted prices in active markets for identical securities.
Level 2—Other significant observable inputs (including quoted prices for similar securities, interest rates, prepayment speeds, credit risk, etc.).
Level 3—Significant unobservable inputs (including the fund’s own assumptions used to determine the fair value of investments).
The following table summarizes the market value of the fund’s investments as of August 31, 2015, based on the inputs used to value them:
| Level 1 | Level 2 | Level 3 | |
| Investments | ($000) | ($000) | ($000) |
| Common Stocks | 143,134 | — | 19 |
| Temporary Cash Investments | 1,513 | 100 | — |
| Futures Contracts—Assets1 | 1 | — | — |
| Futures Contracts—Liabilities1 | (7) | — | — |
| Total | 144,641 | 100 | 19 |
| 1 Represents variation margin on the last day of the reporting period. | |||
D. At August 31, 2015, the aggregate settlement value of open futures contracts and the related unrealized appreciation (depreciation) were:
| ($000) | ||||
| Aggregate | ||||
| Number of | Settlement | Unrealized | ||
| Long (Short) | Value | Appreciation | ||
| Futures Contracts | Expiration | Contracts | Long (Short) | (Depreciation) |
| E-mini Russell 2000 Index | September 2015 | 7 | 810 | (44) |
Unrealized appreciation (depreciation) on open futures contracts is required to be treated as realized gain (loss) for tax purposes.
40
Russell 2000 Value Index Fund
E. Distributions are determined on a tax basis and may differ from net investment income and realized capital gains for financial reporting purposes. Differences may be permanent or temporary. Permanent differences are reclassified among capital accounts in the financial statements to reflect their tax character. Temporary differences arise when certain items of income, expense, gain, or loss are recognized in different periods for financial statement and tax purposes. These differences will reverse at some time in the future. Differences in classification may also result from the treatment of short-term gains as ordinary income for tax purposes.
Certain of the fund’s investments are in securities considered to be passive foreign investment companies, for which any unrealized appreciation and/or realized gains are required to be included in distributable net income for tax purposes. During the year ended August 31, 2015, the fund realized gains on the sale of passive foreign investment companies of $15,000, which have been included in current and prior periods’ taxable income; accordingly, such gains have been reclassified from accumulated net realized losses to undistributed net investment income.
During the year ended August 31, 2015, the fund realized $18,806,000 of net capital gains resulting from in-kind redemptions—in which shareholders exchanged fund shares for securities held by the fund rather than for cash. Because such gains are not taxable to the fund, and are not distributed to shareholders, they have been reclassified from accumulated net realized losses to paid-in capital.
For tax purposes, at August 31, 2015, the fund had $1,761,000 of ordinary income available for distribution. The fund had available capital losses totaling $8,192,000 that may be carried forward indefinitely to offset future net capital gains.
At August 31, 2015, the cost of investment securities for tax purposes was $160,420,000. Net unrealized depreciation of investment securities for tax purposes was $15,654,000, consisting of unrealized gains of $5,293,000 on securities that had risen in value since their purchase and $20,947,000 in unrealized losses on securities that had fallen in value since their purchase.
F. During the year ended August 31, 2015, the fund purchased $150,928,000 of investment securities and sold $148,852,000 of investment securities, other than temporary cash investments. Purchases and sales include $105,034,000 and $105,349,000, respectively, in connection with in-kind purchases and redemptions of the fund’s capital shares.
G. Capital share transactions for each class of shares were:
| Year Ended August 31, | ||||
| 2015 | 2014 | |||
| Amount | Shares | Amount | Shares | |
| ($000) | (000) | ($000) | (000) | |
| ETF Shares | ||||
| Issued | 175,714 | 2,000 | 178,165 | 2,100 |
| Issued in Lieu of Cash Distributions | — | — | — | — |
| Redeemed | (166,846) | (1,900) | (161,811) | (1,900) |
| Net Increase (Decrease)—ETF Shares | 8,868 | 100 | 16,354 | 200 |
| Institutional Shares | ||||
| Issued | 15,832 | 93 | 40,000 | 240 |
| Issued in Lieu of Cash Distributions | 1,497 | 9 | 1,206 | 7 |
| Redeemed | (23,709) | (136) | (19,671) | (116) |
| Net Increase (Decrease) —Institutional Shares | (6,380) | (34) | 21,535 | 131 |
41
Russell 2000 Value Index Fund
At August 31, 2015, one shareholder was the record or beneficial owner of 27% of the fund’s net assets. If the shareholder were to redeem its investment in the fund, the redemption might result in an increase in the fund’s expense ratio, cause the fund to incur higher transaction costs, or lead to the realization of taxable capital gains.
H. Management has determined that no material events or transactions occurred subsequent to August 31, 2015, that would require recognition or disclosure in these financial statements.
42
Russell 2000 Growth Index Fund
Fund Profile
As of August 31, 2015
| Share-Class Characteristics | ||
| ETF | Institutional | |
| Shares | Shares | |
| Ticker Symbol | VTWG | VRTGX |
| Expense Ratio1 | 0.20% | 0.08% |
| 30-Day SEC Yield | 0.43% | 0.62% |
| Portfolio Characteristics | |||
| DJ | |||
| U.S. | |||
| Russell | Total | ||
| 2000 | Market | ||
| Growth | FA | ||
| Fund | Index | Index | |
| Number of Stocks | 1,194 | 1,156 | 3,828 |
| Median Market Cap | $1.9B | $1.9B | $47.2B |
| Price/Earnings Ratio | 50.3x | 50.8x | 20.8x |
| Price/Book Ratio | 4.2x | 4.2x | 2.6x |
| Return on Equity | 14.4% | 14.4% | 17.1% |
| Earnings Growth | |||
| Rate | 12.7% | 12.7% | 10.2% |
| Dividend Yield | 0.7% | 0.7% | 2.1% |
| Foreign Holdings | 0.0% | 0.0% | 0.0% |
| Turnover Rate | 34% | — | — |
| Short-Term | |||
| Reserves | 0.1% | — | — |
| Volatility Measures | ||
| DJ | ||
| U.S. Total | ||
| Russell 2000 | Market | |
| Growth Index | FA Index | |
| R-Squared | 1.00 | 0.69 |
| Beta | 1.00 | 1.21 |
These measures show the degree and timing of the fund’s fluctuations compared with the indexes over 36 months.
| Ten Largest Holdings (% of total net assets) | ||
| Anacor Pharmaceuticals | ||
| Inc. | Biotechnology | 0.6% |
| Tyler Technologies Inc. | Computer Services | |
| Software & Systems | 0.5 | |
| Manhattan Associates | Computer Services | |
| Inc. | Software & Systems | 0.5 |
| Ultragenyx | ||
| Pharmaceutical Inc. | Biotechnology | 0.5 |
| Team Health Holdings | ||
| Inc. | Health Care Services | 0.5 |
| Casey's General Stores | Drug & Grocery Store | |
| Inc. | Chains | 0.5 |
| West Pharmaceutical | Medical & Dental | |
| Services Inc. | Instruments & | |
| Supplies | 0.5 | |
| ABIOMED Inc. | Medical & Dental | |
| Instruments & | ||
| Supplies | 0.5 | |
| WellCare Health Plans | Health Care | |
| Inc. | Management | |
| Services | 0.5 | |
| MAXIMUS Inc. | Back Office Support | |
| HR & Consulting | 0.5 | |
| Top Ten | 5.1% | |
The holdings listed exclude any temporary cash investments and equity index products.
1 The expense ratios shown are from the prospectus dated December 23, 2014, and represent estimated costs for the current fiscal year. For the fiscal year ended August 31, 2015, the expense ratios were 0.20% for ETF Shares and 0.08% for Institutional Shares.
43
Russell 2000 Growth Index Fund
Investment Focus

| Sector Diversification (% of equity exposure) | |||
| DJ | |||
| U.S. | |||
| Russell | Total | ||
| 2000 | Market | ||
| Growth | FA | ||
| Fund | Index | Index | |
| Consumer Discretionary 19.5% | 19.6% | 14.9% | |
| Consumer Staples | 3.2 | 3.2 | 7.6 |
| Energy | 1.3 | 1.3 | 6.7 |
| Financial Services | 9.2 | 9.1 | 20.1 |
| Health Care | 28.2 | 28.2 | 14.8 |
| Materials & Processing | 7.1 | 7.1 | 3.9 |
| Other | 0.1 | 0.0 | 0.0 |
| Producer Durables | 11.5 | 11.5 | 10.6 |
| Technology | 18.6 | 18.7 | 16.3 |
| Utilities | 1.3 | 1.3 | 5.1 |
44
Russell 2000 Growth Index Fund
Performance Summary
All of the returns in this report represent past performance, which is not a guarantee of future results that may be achieved by the fund. (Current performance may be lower or higher than the performance data cited. For performance data current to the most recent month-end, visit our website at vanguard.com/performance.) Note, too, that both investment returns and principal value can fluctuate widely, so an investor’s shares, when sold, could be worth more or less than their original cost. The returns shown do not reflect taxes that a shareholder would pay on fund distributions or on the sale of fund shares.
Cumulative Performance: September 20, 2010, Through August 31, 2015
Initial Investment of $10,000

| Average Annual Total Returns | |||
| Periods Ended August 31, 2015 | |||
| Since | Final Value | ||
| One | Inception | of a $10,000 | |
| Year | (9/20/2010) | Investment | |
| Russell 2000 Growth Index | |||
| Fund*ETF Shares Net Asset Value | 5.17% | 15.20% | $20,132 |
| Russell 2000 Growth Index | |||
| Fund*ETF Shares Market Price | 5.25 | 15.19 | 20,128 |
| Russell 2000 Growth Index | 5.11 | 15.26 | 20,182 |
| Small-Cap Growth Funds Average | 4.10 | 13.66 | 18,838 |
| Dow Jones U.S. Total Stock Market | |||
| Float Adjusted Index | 0.29 | 14.14 | 19,234 |
Small-Cap Growth Funds Average: Derived from data provided by Lipper, a Thomson Reuters Company.
"Since Inception" performance is calculated from the ETF Shares’ inception date for both the fund and its comparative standards.
| Since | Final Value | ||
| One | Inception | of a $5,000,000 | |
| Year | (5/25/2011) | Investment | |
| Russell 2000 Growth Index Fund Institutional | |||
| Shares | 5.29% | 11.44% | $7,939,862 |
| Russell 2000 Growth Index | 5.11 | 11.36 | 7,915,232 |
| Dow Jones U.S. Total Stock Market Float | |||
| Adjusted Index | 0.29 | 11.99 | 8,106,824 |
"Since Inception" performance is calculated from the Institutional Shares’ inception date for both the fund and its comparative standards.
See Financial Highlights for dividend and capital gains information.
45
| Russell 2000 Growth Index Fund | ||
| Cumulative Returns of ETF Shares: September 20, 2010, Through August 31, 2015 | ||
| Since | ||
| One | Inception | |
| Year | (9/20/2010) | |
| Russell 2000 Growth Index Fund ETF Shares | ||
| Market Price | 5.25% | 101.28% |
| Russell 2000 Growth Index Fund ETF Shares Net | ||
| Asset Value | 5.17 | 101.32 |
| Russell 2000 Growth Index | 5.11 | 101.82 |
| "Since Inception" performance is calculated from the ETF Shares’ inception date for both the fund and its comparative standards. | ||
Fiscal-Year Total Returns (%): September 20, 2010, Through August 31, 2015
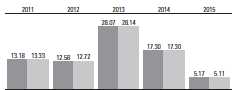
| Russell 2000 Growth Index Fund ETF Shares Net Asset Value |
| Russell 2000 Growth Index |
Average Annual Total Returns: Periods Ended June 30, 2015
This table presents returns through the latest calendar quarter—rather than through the end of the fiscal period.
Securities and Exchange Commission rules require that we provide this information.
| Inception | One | Since | |
| Date | Year | Inception | |
| ETF Shares | 9/20/2010 | ||
| Market Price | 12.54% | 17.63% | |
| Net Asset Value | 12.42 | 17.61 | |
| Institutional Shares | 5/25/2011 | 12.54 | 13.99 |
46
Russell 2000 Growth Index Fund
Financial Statements
Statement of Net Assets—Investments Summary
As of August 31, 2015
This Statement summarizes the fund’s holdings by asset type. Details are reported for each of the fund’s 50 largest individual holdings and for investments that, in total for any issuer, represent more than 1% of the fund’s net assets. The total value of smaller holdings is reported as a single amount within each category.
The fund reports a complete list of its holdings in regulatory filings four times in each fiscal year, at the quarter-ends. For the second and fourth fiscal quarters, the complete listing of the fund’s holdings is available electronically on vanguard.com and on the Securities and Exchange Commission’s website (sec.gov), or you can have it mailed to you without charge by calling 800-662-7447. For the first and third fiscal quarters, the fund files the lists with the SEC on Form N-Q. Shareholders can look up the fund’s Forms N-Q on the SEC’s website. Forms N-Q may also be reviewed and copied at the SEC’s Public Reference Room (see the back cover of this report for further information).
| Market | Percentage | ||
| Value• | of Net | ||
| Shares | ($000) | Assets | |
| Common Stocks | |||
| Consumer Discretionary | |||
| Vail Resorts Inc. | 13,825 | 1,492 | 0.5% |
| * Buffalo Wild Wings Inc. | 7,227 | 1,371 | 0.4% |
| * Burlington Stores Inc. | 25,706 | 1,365 | 0.4% |
| * Restoration Hardware Holdings Inc. | 12,708 | 1,175 | 0.4% |
| Pool Corp. | 16,570 | 1,155 | 0.4% |
| American Eagle Outfitters Inc. | 65,854 | 1,121 | 0.3% |
| Jack in the Box Inc. | 14,229 | 1,112 | 0.3% |
| * Tenneco Inc. | 23,360 | 1,099 | 0.3% |
| Wolverine World Wide Inc. | 39,303 | 1,059 | 0.3% |
| * G-III Apparel Group Ltd. | 15,130 | 1,049 | 0.3% |
| Consumer Discretionary—Other † | 53,153 | 15.8% | |
| 65,151 | 19.4% | ||
| Consumer Staples | |||
| Casey’s General Stores Inc. | 14,776 | 1,564 | 0.5% |
| Consumer Staples—Other † | 9,234 | 2.7% | |
| 10,798 | 3.2% | ||
| Energy | |||
| Western Refining Inc. | 27,070 | 1,165 | 0.3% |
| Energy—Other † | 3,294 | 1.0% | |
| 4,459 | 1.3% | ||
| Financial Services | |||
| MarketAxess Holdings Inc. | 14,200 | 1,284 | 0.4% |
| * Euronet Worldwide Inc. | 19,741 | 1,273 | 0.4% |
| CubeSmart | 49,626 | 1,255 | 0.4% |
| Bank of the Ozarks Inc. | 29,683 | 1,241 | 0.4% |
| Sovran Self Storage Inc. | 11,819 | 1,061 | 0.3% |
| Financial Services—Other † | 24,223 | 7.2% | |
| 30,337 | 9.1% |
47
| Russell 2000 Growth Index Fund | ||||
| Market | Percentage | |||
| Value• | of Net | |||
| Shares | ($000) | Assets | ||
| Health Care | ||||
| * | Anacor Pharmaceuticals Inc. | 15,578 | 2,032 | 0.6% |
| * | Ultragenyx Pharmaceutical Inc. | 14,617 | 1,632 | 0.5% |
| * | Team Health Holdings Inc. | 27,385 | 1,609 | 0.5% |
| West Pharmaceutical Services Inc. | 27,364 | 1,528 | 0.5% | |
| * | ABIOMED Inc. | 15,873 | 1,522 | 0.5% |
| * | WellCare Health Plans Inc. | 16,752 | 1,519 | 0.5% |
| * | Neurocrine Biosciences Inc. | 32,494 | 1,507 | 0.4% |
| HealthSouth Corp. | 34,802 | 1,486 | 0.4% | |
| STERIS Corp. | 22,719 | 1,455 | 0.4% | |
| * | PAREXEL International Corp. | 20,986 | 1,379 | 0.4% |
| * | Cepheid | 27,318 | 1,331 | 0.4% |
| * | Thoratec Corp. | 20,625 | 1,296 | 0.4% |
| * | Dyax Corp. | 55,446 | 1,276 | 0.4% |
| * | Impax Laboratories Inc. | 27,293 | 1,118 | 0.3% |
| * | Molina Healthcare Inc. | 14,950 | 1,115 | 0.3% |
| * | Novavax Inc. | 102,006 | 1,099 | 0.3% |
| Health Care—Other † | 71,695 | 21.4% | ||
| 94,599 | 28.2% | |||
| Materials & Processing | ||||
| PolyOne Corp. | 33,956 | 1,103 | 0.3% | |
| Materials & Processing—Other † | 22,490 | 6.7% | ||
| 23,593 | 7.0% | |||
| 1Other † | 388 | 0.1% | ||
| Producer Durables | ||||
| MAXIMUS Inc. | 25,063 | 1,518 | 0.4% | |
| Producer Durables—Other † | 36,811 | 11.0% | ||
| 38,329 | 11.4% | |||
| Technology | ||||
| * | Tyler Technologies Inc. | 12,803 | 1,767 | 0.5% |
| * | Manhattan Associates Inc. | 28,053 | 1,641 | 0.5% |
| * | Guidewire Software Inc. | 26,690 | 1,492 | 0.5% |
| * | Cavium Inc. | 21,041 | 1,431 | 0.4% |
| * | Qlik Technologies Inc. | 34,752 | 1,316 | 0.4% |
| * | EPAM Systems Inc. | 18,610 | 1,314 | 0.4% |
| * | Aspen Technology Inc. | 32,496 | 1,231 | 0.4% |
| FEI Co. | 15,817 | 1,194 | 0.4% | |
| * | Verint Systems Inc. | 22,068 | 1,177 | 0.4% |
| * | Microsemi Corp. | 36,235 | 1,151 | 0.3% |
| *,^ | Ambarella Inc. | 11,926 | 1,140 | 0.3% |
| * | Infinera Corp. | 50,677 | 1,106 | 0.3% |
| * | Integrated Device Technology Inc. | 56,280 | 1,069 | 0.3% |
| * | Ciena Corp. | 46,821 | 1,047 | 0.3% |
| Technology—Other † | 44,120 | 13.2% | ||
| 62,196 | 18.6% | |||
| Utilities | ||||
| j2 Global Inc. | 18,345 | 1,276 | 0.4% | |
| Utilities—Other † | 2,997 | 0.9% | ||
| 4,273 | 1.3% | |||
| Total Common Stocks (Cost $329,015) | 334,123 | 99.6%2 | ||
48
| Russell 2000 Growth Index Fund | ||||
| Market | Percentage | |||
| Value• | of Net | |||
| Coupon | Shares | ($000) | Assets | |
| Temporary Cash Investments | ||||
| Money Market Fund | ||||
| 3,4 Vanguard Market Liquidity Fund | 0.168% | 5,270,000 | 5,270 | 1.6% |
| 5U.S. Government and Agency Obligations † | 100 | 0.0% | ||
| Total Temporary Cash Investments (Cost $5,370) | 5,370 | 1.6%2 | ||
| Total Investments (Cost $334,385) | 339,493 | 101.2% | ||
| Amount | ||||
| ($000) | ||||
| Other Assets and Liabilities | ||||
| Other Assets | ||||
| Investment in Vanguard | 34 | |||
| Receivables for Investment Securities Sold | 117 | |||
| Receivables for Accrued Income | 164 | |||
| Receivables for Capital Shares Issued | 357 | |||
| Other Assets | 12 | |||
| Total Other Assets | 684 | 0.2% | ||
| Liabilities | ||||
| Payables for Investment Securities Purchased | (557) | |||
| Collateral for Securities on Loan | (3,846) | |||
| Payables for Capital Shares Redeemed | (76) | |||
| Payables to Vanguard | (82) | |||
| Other Liabilities | (12) | |||
| Total Liabilities | (4,573) | (1.4%) | ||
| Net Assets | 335,604 | 100.0% | ||
| At August 31, 2015, net assets consisted of: | ||||
| Amount | ||||
| ($000) | ||||
| Paid-in Capital | 349,471 | |||
| Undistributed Net Investment Income | 1,486 | |||
| Accumulated Net Realized Losses | (20,520) | |||
| Unrealized Appreciation (Depreciation) | ||||
| Investment Securities | 5,108 | |||
| Futures Contracts | 59 | |||
| Net Assets | 335,604 | |||
| ETF Shares—Net Assets | ||||
| Applicable to 1,425,000 outstanding $.001 par value shares of | ||||
| beneficial interest (unlimited authorization) | 148,681 | |||
| Net Asset Value Per Share—ETF Shares | $104.34 | |||
49
| Russell 2000 Growth Index Fund | |
| Amount | |
| ($000) | |
| Institutional Shares—Net Assets | |
| Applicable to 940,009 outstanding $.001 par value shares of | |
| beneficial interest (unlimited authorization) | 186,923 |
| Net Asset Value Per Share—Institutional Shares | $198.85 |
• See Note A in Notes to Financial Statements.
* Non-income-producing security.
^ Includes partial security positions on loan to broker-dealers. The total value of securities on loan is $3,546,000.
† Represents the aggregate value, by category, of securities that are not among the 50 largest holdings and, in total for any issuer, represent 1% or less of net assets.
1 “Other” represents securities that are not classified by the fund’s benchmark index.
2 The fund invests a portion of its cash reserves in equity markets through the use of index futures contracts. After giving effect to futures investments, the fund’s effective common stock and temporary cash investment positions represent 99.9% and 1.3%, respectively, of net assets.
3 Affiliated money market fund available only to Vanguard funds and certain trusts and accounts managed by Vanguard. Rate shown is the 7-day yield.
4 Includes $3,846,000 of collateral received for securities on loan.
5 Securities with a value of $100,000 have been segregated as initial margin for open futures contracts.
See accompanying Notes, which are an integral part of the Financial Statements.
50
| Russell 2000 Growth Index Fund | |
| Statement of Operations | |
| Year Ended | |
| August 31, 2015 | |
| ($000) | |
| Investment Income | |
| Income | |
| Dividends | 2,261 |
| Interest1 | 2 |
| Securities Lending | 463 |
| Total Income | 2,726 |
| Expenses | |
| The Vanguard Group—Note B | |
| Investment Advisory Services | 54 |
| Management and Administrative—ETF Shares | 164 |
| Management and Administrative—Institutional Shares | 22 |
| Marketing and Distribution—ETF Shares | 19 |
| Marketing and Distribution—Institutional Shares | 32 |
| Custodian Fees | 77 |
| Auditing Fees | 25 |
| Shareholders’ Reports—ETF Shares | 6 |
| Shareholders’ Reports—Institutional Shares | 1 |
| Total Expenses | 400 |
| Net Investment Income | 2,326 |
| Realized Net Gain (Loss) | |
| Investment Securities Sold | 30,618 |
| Futures Contracts | 77 |
| Realized Net Gain (Loss) | 30,695 |
| Change in Unrealized Appreciation (Depreciation) | |
| Investment Securities | (20,113) |
| Futures Contracts | 56 |
| Change in Unrealized Appreciation (Depreciation) | (20,057) |
| Net Increase (Decrease) in Net Assets Resulting from Operations | 12,964 |
| 1 Interest income from an affiliated company of the fund was $1,000. | |
See accompanying Notes, which are an integral part of the Financial Statements.
51
| Russell 2000 Growth Index Fund | ||
| Statement of Changes in Net Assets | ||
| Year Ended August 31, | ||
| 2015 | 2014 | |
| ($000) | ($000) | |
| Increase (Decrease) in Net Assets | ||
| Operations | ||
| Net Investment Income | 2,326 | 1,809 |
| Realized Net Gain (Loss) | 30,695 | 56,719 |
| Change in Unrealized Appreciation (Depreciation) | (20,057) | (17,607) |
| Net Increase (Decrease) in Net Assets Resulting from Operations | 12,964 | 40,921 |
| Distributions | ||
| Net Investment Income | ||
| ETF Shares | (705) | (659) |
| Institutional Shares | (1,350) | (891) |
| Realized Capital Gain | ||
| ETF Shares | — | — |
| Institutional Shares | — | — |
| Total Distributions | (2,055) | (1,550) |
| Capital Share Transactions | ||
| ETF Shares | 45,567 | 17,143 |
| Institutional Shares | 7,835 | (38,746) |
| Net Increase (Decrease) from Capital Share Transactions | 53,402 | (21,603) |
| Total Increase (Decrease) | 64,311 | 17,768 |
| Net Assets | ||
| Beginning of Period | 271,293 | 253,525 |
| End of Period1 | 335,604 | 271,293 |
1 Net Assets—End of Period includes undistributed (overdistributed) net investment income of $1,486,000 and $1,171,000.
See accompanying Notes, which are an integral part of the Financial Statements.
52
| Russell 2000 Growth Index Fund | |||||
| Financial Highlights | |||||
| ETF Shares | |||||
| Sept. 20, | |||||
| 20101 to | |||||
| Year Ended August 31, | |||||
| For a Share Outstanding | Aug. 31, | ||||
| Throughout Each Period | 2015 | 2014 | 2013 | 2012 | 2011 |
| Net Asset Value, Beginning of Period | $99.83 | $85.58 | $67.37 | $60.02 | $53.17 |
| Investment Operations | |||||
| Net Investment Income | . 680 | .646 | .699 | .4022 | .258 |
| Net Realized and Unrealized Gain (Loss) | |||||
| on Investments | 4.471 | 14.153 | 18.073 | 7.133 | 6.762 |
| Total from Investment Operations | 5.151 | 14.799 | 18.772 | 7.535 | 7.020 |
| Distributions | |||||
| Dividends from Net Investment Income | (.641) | (.549) | (. 562) | (.185) | (.170) |
| Distributions from Realized Capital Gains | — | — | — | — | — |
| Total Distributions | (.641) | (.549) | (. 562) | (.185) | (.170) |
| Net Asset Value, End of Period | $104.34 | $99.83 | $85.58 | $67.37 | $60.02 |
| Total Return | 5.17% | 17.30% | 28.07% | 12.58% | 13.18% |
| Ratios/Supplemental Data | |||||
| Net Assets, End of Period (Millions) | $149 | $100 | $68 | $20 | $12 |
| Ratio of Total Expenses to Average Net Assets | 0.20% | 0.20% | 0.20% | 0.20% | 0.20%3 |
| Ratio of Net Investment Income to | |||||
| Average Net Assets | 0.67% | 0.60% | 0.96% | 0.63% | 0.45%3 |
| Portfolio Turnover Rate 4 | 34% | 35% | 50% | 51% | 78% |
1 Inception.
2 Calculated based on average shares outstanding.
3 Annualized.
4 Excludes the value of portfolio securities received or delivered as a result of in-kind purchases or redemptions of the fund’s capital shares, including ETF Creation Units.
See accompanying Notes, which are an integral part of the Financial Statements.
53
| Russell 2000 Growth Index Fund | |||||
| Financial Highlights | |||||
| Institutional Shares | |||||
| May 25, | |||||
| 20111 to | |||||
| For a Share Outstanding | Year Ended August 31, | Aug. 31, | |||
| Throughout Each Period | 2015 | 2014 | 2013 | 2012 | 2011 |
| Net Asset Value, Beginning of Period | $190.26 | $162.99 | $128.23 | $114.21 | $128.54 |
| Investment Operations | |||||
| Net Investment Income | 1.478 | 1.412 | 1.412 | .8592 | .228 |
| Net Realized and Unrealized Gain (Loss) | |||||
| on Investments | 8.565 | 26.992 | 34.504 | 13.616 | (14.558) |
| Total from Investment Operations | 10.043 | 28.404 | 35.916 | 14.475 | (14.330) |
| Distributions | |||||
| Dividends from Net Investment Income | (1.453) | (1.134) | (1.156) | (.455) | — |
| Distributions from Realized Capital Gains | — | — | — | — | — |
| Total Distributions | (1.453) | (1.134) | (1.156) | (.455) | — |
| Net Asset Value, End of Period | $198.85 | $190.26 | $162.99 | $128.23 | $114.21 |
| Total Return | 5.29% | 17.44% | 28.23% | 12.72% | -11.15% |
| Ratios/Supplemental Data | |||||
| Net Assets, End of Period (Millions) | $187 | $171 | $185 | $87 | $22 |
| Ratio of Total Expenses to Average Net Assets | 0.08% | 0.08% | 0.08% | 0.08% | 0.08%3 |
| Ratio of Net Investment Income to | |||||
| Average Net Assets | 0.79% | 0.72% | 1.08% | 0.75% | 0.57%3 |
| Portfolio Turnover Rate 4 | 34% | 35% | 50% | 51% | 78% |
1 Inception.
2 Calculated based on average shares outstanding.
3 Annualized.
4 Excludes the value of portfolio securities received or delivered as a result of in-kind purchases or redemptions of the fund’s capital shares, including ETF Creation Units.
See accompanying Notes, which are an integral part of the Financial Statements.
54
Russell 2000 Growth Index Fund
Notes to Financial Statements
Vanguard Russell 2000 Growth Index Fund is registered under the Investment Company Act of 1940 as an open-end investment company, or mutual fund. The fund offers two classes of shares: ETF Shares and Institutional Shares. ETF Shares are listed for trading on Nasdaq; they can be purchased and sold through a broker. Institutional Shares are designed for investors who meet certain administrative, service, and account-size criteria.
A. The following significant accounting policies conform to generally accepted accounting principles for U.S. investment companies. The fund consistently follows such policies in preparing its financial statements.
1. Security Valuation: Securities are valued as of the close of trading on the New York Stock Exchange (generally 4 p.m., Eastern time) on the valuation date. Equity securities are valued at the latest quoted sales prices or official closing prices taken from the primary market in which each security trades; such securities not traded on the valuation date are valued at the mean of the latest quoted bid and asked prices. Securities for which market quotations are not readily available, or whose values have been materially affected by events occurring before the fund’s pricing time but after the close of the securities’ primary markets, are valued by methods deemed by the board of trustees to represent fair value. Investments in Vanguard Market Liquidity Fund are valued at that fund’s net asset value. Temporary cash investments acquired over 60 days to maturity are valued using the latest bid prices or using valuations based on a matrix system (which considers such factors as security prices, yields, maturities, and ratings), both as furnished by independent pricing services. Other temporary cash investments are valued at amortized cost, which approximates market value.
2. Futures Contracts: The fund uses index futures contracts to a limited extent, with the objectives of maintaining full exposure to the stock market, enhancing returns, maintaining liquidity, and minimizing transaction costs. The fund may purchase futures contracts to immediately invest incoming cash in the market, or sell futures in response to cash outflows, thereby simulating a fully invested position in the underlying index while maintaining a cash balance for liquidity. The fund may seek to enhance returns by using futures contracts instead of the underlying securities when futures are believed to be priced more attractively than the underlying securities. The primary risks associated with the use of futures contracts are imperfect correlation between changes in market values of stocks held by the fund and the prices of futures contracts, and the possibility of an illiquid market. Counterparty risk involving futures is mitigated because a regulated clearinghouse is the counterparty instead of the clearing broker. To further mitigate counterparty risk, the fund trades futures contracts on an exchange, monitors the financial strength of its clearing brokers and clearinghouse, and has entered into clearing agreements with its clearing brokers. The clearinghouse imposes initial margin requirements to secure the fund’s performance and requires daily settlement of variation margin representing changes in the market value of each contract.
Futures contracts are valued at their quoted daily settlement prices. The aggregate settlement values of the contracts are not recorded in the Statement of Net Assets. Fluctuations in the value of the contracts are recorded in the Statement of Net Assets as an asset (liability) and in the Statement of Operations as unrealized appreciation (depreciation) until the contracts are closed, when they are recorded as realized futures gains (losses).
During the year ended August 31, 2015, the fund’s average investments in long and short futures contracts represented less than 1% and 0% of net assets, respectively, based on the average of aggregate settlement values at each quarter-end during the period.
55
Russell 2000 Growth Index Fund
3. Federal Income Taxes: The fund intends to continue to qualify as a regulated investment company and distribute all of its taxable income. Management has analyzed the fund’s tax positions taken for all open federal income tax years (August 31, 2012–2015), and has concluded that no provision for federal income tax is required in the fund’s financial statements.
4. Distributions: Distributions to shareholders are recorded on the ex-dividend date.
5. Securities Lending: To earn additional income, the fund lends its securities to qualified institutional borrowers. Security loans are required to be secured at all times by collateral in an amount at least equal to the market value of securities loaned. Daily market fluctuations could cause the value of loaned securities to be more or less than the value of the collateral received. When this occurs, the collateral is adjusted and settled on the next business day. The fund further mitigates its counterparty risk by entering into securities lending transactions only with a diverse group of prequalified counter-parties, monitoring their financial strength, and entering into master securities lending agreements with its counterparties. The master securities lending agreements provide that, in the event of a counterparty’s default (including bankruptcy), the fund may terminate any loans with that borrower, determine the net amount owed, and sell or retain the collateral up to the net amount owed to the fund; however, such actions may be subject to legal proceedings. While collateral mitigates counter-party risk, in the absence of a default the fund may experience delays and costs in recovering the securities loaned. The fund invests cash collateral received in Vanguard Market Liquidity Fund, and records a liability in the Statement of Net Assets for the return of the collateral, during the period the securities are on loan. Securities lending income represents fees charged to borrowers plus income earned on invested cash collateral, less expenses associated with the loan.
6. Credit Facility: The fund and certain other funds managed by The Vanguard Group (“Vanguard”) participate in a $3 billion committed credit facility provided by a syndicate of lenders pursuant to a credit agreement that may be renewed annually; each fund is individually liable for its borrowings, if any, under the credit facility. Borrowings may be utilized for temporary and emergency purposes, and are subject to the fund’s regulatory and contractual borrowing restrictions. The participating funds are charged administrative fees and an annual commitment fee of 0.06% of the undrawn amount of the facility; these fees are allocated to the funds based on a method approved by the fund’s board of trustees and included in Management and Administrative expenses on the fund’s Statement of Operations. Any borrowings under this facility bear interest at a rate equal to the higher of the federal funds rate or LIBOR reference rate plus an agreed-upon spread.
The fund had no borrowings outstanding at August 31, 2015, or at any time during the period then ended.
7. Other: Dividend income is recorded on the ex-dividend date. Interest income includes income distributions received from Vanguard Market Liquidity Fund and is accrued daily. Premiums and discounts on debt securities purchased are amortized and accreted, respectively, to interest income over the lives of the respective securities. Security transactions are accounted for on the date securities are bought or sold. Costs used to determine realized gains (losses) on the sale of investment securities are those of the specific securities sold.
Each class of shares has equal rights as to assets and earnings, except that each class separately bears certain class-specific expenses related to maintenance of shareholder accounts (included in Management and Administrative expenses) and shareholder reporting. Marketing and distribution expenses are allocated to each class of shares based on a method approved by the board of trustees. Income, other non-class-specific expenses, and gains and losses on investments are allocated to each class of shares based on its relative net assets.
56
Russell 2000 Growth Index Fund
B. In accordance with the terms of a Funds’ Service Agreement (the “FSA”) between Vanguard and the fund, Vanguard furnishes to the fund investment advisory, corporate management, administrative, marketing, and distribution services at Vanguard’s cost of operations (as defined by the FSA). These costs of operations are allocated to the fund based on methods and guidelines approved by the board of trustees. Vanguard does not require reimbursement in the current period for certain costs of operations (such as deferred compensation/benefits and risk/insurance costs); the fund’s liability for these costs of operations is included in Payables to Vanguard on the Statement of Net Assets.
Upon the request of Vanguard, the fund may invest up to 0.40% of its net assets as capital in Vanguard. At August 31, 2015, the fund had contributed to Vanguard capital in the amount of $34,000, representing 0.01% of the fund’s net assets and 0.01% of Vanguard’s capitalization. The fund’s trustees and officers are also directors and employees, respectively, of Vanguard.
C. Various inputs may be used to determine the value of the fund’s investments. These inputs are summarized in three broad levels for financial statement purposes. The inputs or methodologies used to value securities are not necessarily an indication of the risk associated with investing in those securities.
Level 1—Quoted prices in active markets for identical securities.
Level 2—Other significant observable inputs (including quoted prices for similar securities, interest rates, prepayment speeds, credit risk, etc.).
Level 3—Significant unobservable inputs (including the fund’s own assumptions used to determine the fair value of investments).
The following table summarizes the market value of the fund’s investments as of August 31, 2015, based on the inputs used to value them:
| Level 1 | Level 2 | Level 3 | |
| Investments | ($000) | ($000) | ($000) |
| Common Stocks | 334,082 | — | 41 |
| Temporary Cash Investments | 5,270 | 100 | — |
| Futures Contracts—Assets1 | 3 | — | — |
| Futures Contracts—Liabilities1 | (12) | — | — |
| Total | 339,343 | 100 | 41 |
| 1 Represents variation margin on the last day of the reporting period. | |||
D. At August 31, 2015, the aggregate settlement value of open futures contracts and the related unrealized appreciation (depreciation) were:
| ($000) | ||||
| Aggregate | ||||
| Number of | Settlement | Unrealized | ||
| Long (Short) | Value | Appreciation | ||
| Futures Contracts | Expiration | Contracts | Long (Short) | (Depreciation) |
| E-mini Russell 2000 Index | September 2015 | 10 | 1,158 | 59 |
Unrealized appreciation (depreciation) on open futures contracts is required to be treated as realized gain (loss) for tax purposes.
57
Russell 2000 Growth Index Fund
E. Distributions are determined on a tax basis and may differ from net investment income and realized capital gains for financial reporting purposes. Differences may be permanent or temporary. Permanent differences are reclassified among capital accounts in the financial statements to reflect their tax character. Temporary differences arise when certain items of income, expense, gain, or loss are recognized in different periods for financial statement and tax purposes. These differences will reverse at some time in the future. Differences in classification may also result from the treatment of short-term gains as ordinary income for tax purposes.
Certain of the fund’s investments are in securities considered to be passive foreign investment companies, for which any unrealized appreciation and/or realized gains are required to be included in distributable net income for tax purposes. During the year ended August 31, 2015, the fund realized gains on the sale of passive foreign investment companies of $44,000, which have been included in current and prior periods’ taxable income; accordingly, such gains have been reclassified from accumulated net realized losses to undistributed net investment income.
During the year ended August 31, 2015, the fund realized $43,942,000 of net capital gains resulting from in-kind redemptions—in which shareholders exchanged fund shares for securities held by the fund rather than for cash. Because such gains are not taxable to the fund, and are not distributed to shareholders, they have been reclassified from accumulated net realized losses to paid-in capital.
For tax purposes, at August 31, 2015, the fund had $1,556,000 of ordinary income available for distribution. The fund had available capital losses totaling $20,440,000 that may be carried forward indefinitely to offset future net capital gains.
At August 31, 2015, the cost of investment securities for tax purposes was $334,406,000. Net unrealized appreciation of investment securities for tax purposes was $5,087,000, consisting of unrealized gains of $36,462,000 on securities that had risen in value since their purchase and $31,375,000 in unrealized losses on securities that had fallen in value since their purchase.
F. During the year ended August 31, 2015, the fund purchased $296,585,000 of investment securities and sold $243,312,000 of investment securities, other than temporary cash investments. Purchases and sales include $150,851,000 and $137,682,000, respectively, in connection with in-kind purchases and redemptions of the fund’s capital shares.
58
Russell 2000 Growth Index Fund
G. Capital share transactions for each class of shares were:
| Year Ended August 31, | ||||
| 2015 | 2014 | |||
| Amount | Shares | Amount | Shares | |
| ($000) | (000) | ($000) | (000) | |
| ETF Shares | ||||
| Issued | 224,830 | 2,100 | 227,139 | 2,400 |
| Issued in Lieu of Cash Distributions | — | — | — | — |
| Redeemed | (179,263) | (1,675) | (209,996) | (2,200) |
| Net Increase (Decrease)—ETF Shares | 45,567 | 425 | 17,143 | 200 |
| Institutional Shares | ||||
| Issued | 61,431 | 310 | 60,834 | 329 |
| Issued in Lieu of Cash Distributions | 1,350 | 7 | 891 | 5 |
| Redeemed | (54,946) | (278) | (100,471) | (568) |
| Net Increase (Decrease) —Institutional Shares | 7,835 | 39 | (38,746) | (234) |
H. Management has determined that no material events or transactions occurred subsequent to August 31, 2015, that would require recognition or disclosure in these financial statements.
59
Report of Independent Registered Public Accounting Firm
To the Board of Trustees of Vanguard Scottsdale Funds and the Shareholders of Vanguard Russell 2000 Index Fund, Vanguard Russell 2000 Value Index Fund and Vanguard Russell 2000 Growth Index Fund:
In our opinion, the accompanying statements of net assets—investments summary and the related statements of operations and of changes in net assets and the financial highlights present fairly, in all material respects, the financial position of Vanguard Russell 2000 Index Fund, Vanguard Russell 2000 Value Index Fund and Vanguard Russell 2000 Growth Index Fund (constituting separate portfolios of Vanguard Scottsdale Funds, hereafter referred to as the “Funds”) at August 31, 2015, the results of each of their operations for the year then ended, the changes in each of their net assets for each of the two years in the period then ended, and the financial highlights for each of the periods indicated, in conformity with accounting principles generally accepted in the United States of America. These financial statements and financial highlights (hereafter referred to as “financial statements”) are the responsibility of the Funds’ management. Our responsibility is to express an opinion on these financial statements based on our audits. We conducted our audits of these financial statements in accordance with the standards of the Public Company Accounting Oversight Board (United States). Those standards require that we plan and perform the audit to obtain reasonable assurance about whether the financial statements are free of material misstatement. An audit includes examining, on a test basis, evidence supporting the amounts and disclosures in the financial statements, assessing the accounting principles used and significant estimates made by management, and evaluating the overall financial statement presentation. We believe that our audits, which included confirmation of securities at August 31, 2015 by correspondence with the custodian and brokers, by agreement to the underlying ownership records of the transfer agent and the application of alternative auditing procedures where securities purchased had not been received, provide a reasonable basis for our opinion.
/s/PricewaterhouseCoopers LLP
Philadelphia, Pennsylvania
October 15, 2015
60
| Special 2015 tax information (unaudited) for Vanguard Russell 2000 Index Funds |
| This information for the fiscal year ended August 31, 2015, is included pursuant to provisions of the Internal Revenue Code. |
| The funds distributed qualified dividend income to shareholders during the fiscal year as follows: |
| Fund | ($000) |
| Russell 2000 Index Fund | 6,200 |
| Russell 2000 Value Index Fund | 1,740 |
| Russell 2000 Growth Index Fund | 1,685 |
For corporate shareholders, the percentage of investment income (dividend income plus short-term gains, if any) that qualifies for the dividends-received deduction is as follows:
| Fund | Percentage |
| Russell 2000 Index Fund | 64.9% |
| Russell 2000 Value Index Fund | 56.3 |
| Russell 2000 Growth Index Fund | 81.7 |
61
Your Fund’s After-Tax Returns
This table presents returns for your fund both before and after taxes. The after-tax returns are shown in two ways: (1) assuming that an investor owned the fund during the entire period and paid taxes on the fund’s distributions, and (2) assuming that an investor paid taxes on the fund’s distributions and sold all shares at the end of each period.
Calculations are based on the highest individual federal income tax and capital gains tax rates in effect at the times of the distributions and the hypothetical sales. State and local taxes were not considered. After-tax returns reflect any qualified dividend income, using actual prior-year figures and estimates for 2015. (In the example, returns after the sale of fund shares may be higher than those assuming no sale. This occurs when the sale would have produced a capital loss. The calculation assumes that the investor received a tax deduction for the loss.)
The table shows returns for ETF Shares only; returns for other share classes will differ. Please note that your actual after-tax returns will depend on your tax situation and may differ from those shown. Also note that if you own the fund in a tax-deferred account, such as an individual retirement account or a 401(k) plan, this information does not apply to you. Such accounts are not subject to current taxes.
Finally, keep in mind that a fund’s performance—whether before or after taxes—does not guarantee future results.
Average Annual Total Returns: Russell 2000 Index Funds
Periods Ended August 31, 2015
| Since | ||
| One | Inception | |
| Year | (9/20/2010) | |
| Russell 2000 Index Fund ETF Shares | ||
| Returns Before Taxes | 0.03% | 13.20% |
| Returns After Taxes on Distributions | -0.30 | 12.91 |
| Returns After Taxes on Distributions and Sale of Fund Shares | 0.18 | 10.52 |
| Since | ||
| One | Inception | |
| Year | (9/20/2010) | |
| Russell 2000 Value Index Fund ETF Shares | ||
| Returns Before Taxes | -5.10% | 11.00% |
| Returns After Taxes on Distributions | -5.60 | 10.59 |
| Returns After Taxes on Distributions and Sale of Fund Shares | -2.66 | 8.67 |
| Since | ||
| One | Inception | |
| Year | (9/20/2010) | |
| Russell 2000 Growth Index Fund ETF Shares | ||
| Returns Before Taxes | 5.17% | 15.20% |
| Returns After Taxes on Distributions | 4.99 | 15.07 |
| Returns After Taxes on Distributions and Sale of Fund Shares | 3.03 | 12.25 |
62
About Your Fund’s Expenses
As a shareholder of the fund, you incur ongoing costs, which include costs for portfolio management, administrative services, and shareholder reports (like this one), among others. Operating expenses, which are deducted from a fund’s gross income, directly reduce the investment return of the fund.
A fund’s expenses are expressed as a percentage of its average net assets. This figure is known as the expense ratio. The following examples are intended to help you understand the ongoing costs (in dollars) of investing in your fund and to compare these costs with those of other mutual funds. The examples are based on an investment of $1,000 made at the beginning of the period shown and held for the entire period.
The accompanying table illustrates your fund’s costs in two ways:
• Based on actual fund return. This section helps you to estimate the actual expenses that you paid over the period. The ”Ending Account Value“ shown is derived from the fund‘s actual return, and the third column shows the dollar amount that would have been paid by an investor who started with $1,000 in the fund. You may use the information here, together with the amount you invested, to estimate the expenses that you paid over the period.
To do so, simply divide your account value by $1,000 (for example, an $8,600 account value divided by $1,000 = 8.6), then multiply the result by the number given for your fund under the heading ”Expenses Paid During Period.“
• Based on hypothetical 5% yearly return. This section is intended to help you compare your fund‘s costs with those of other mutual funds. It assumes that the fund had a yearly return of 5% before expenses, but that the expense ratio is unchanged. In this case—because the return used is not the fund’s actual return—the results do not apply to your investment. The example is useful in making comparisons because the Securities and Exchange Commission requires all mutual funds to calculate expenses based on a 5% return. You can assess your fund’s costs by comparing this hypothetical example with the hypothetical examples that appear in shareholder reports of other funds.
Note that the expenses shown in the table are meant to highlight and help you compare ongoing costs only and do not reflect transaction costs incurred by the fund for buying and selling securities. Further, the expenses do not include any purchase, redemption, or account service fees described in the fund prospectus. If such fees were applied to your account, your costs would be higher. Your fund does not carry a “sales load.”
The calculations assume no shares were bought or sold during the period. Your actual costs may have been higher or lower, depending on the amount of your investment and the timing of any purchases or redemptions.
You can find more information about the fund’s expenses, including annual expense ratios, in the Financial Statements section of this report. For additional information on operating expenses and other shareholder costs, please refer to your fund’s current prospectus.
63
| Six Months Ended August 31, 2015 | |||
| Beginning | Ending | Expenses | |
| Account Value | Account Value | Paid During | |
| 2/28/2015 | 8/31/2015 | Period | |
| Based on Actual Fund Return | |||
| Russell 2000 Index Fund | |||
| ETF Shares | $1,000.00 | $946.41 | $0.78 |
| Institutional Shares | 1,000.00 | 946.74 | 0.39 |
| Russell 2000 Value Index Fund | |||
| ETF Shares | $1,000.00 | $928.24 | $0.97 |
| Institutional Shares | 1,000.00 | 928.84 | 0.39 |
| Russell 2000 Growth Index Fund | |||
| ETF Shares | $1,000.00 | $963.61 | $0.99 |
| Institutional Shares | 1,000.00 | 964.17 | 0.40 |
| Based on Hypothetical 5% Yearly Return | |||
| Russell 2000 Index Fund | |||
| ETF Shares | $1,000.00 | $1,024.40 | $0.82 |
| Institutional Shares | 1,000.00 | 1,024.80 | 0.41 |
| Russell 2000 Value Index Fund | |||
| ETF Shares | $1,000.00 | $1,024.20 | $1.02 |
| Institutional Shares | 1,000.00 | 1,024.80 | 0.41 |
| Russell 2000 Growth Index Fund | |||
| ETF Shares | $1,000.00 | $1,024.20 | $1.02 |
| Institutional Shares | 1,000.00 | 1,024.80 | 0.41 |
The calculations are based on expenses incurred in the most recent six-month period. The funds’ annualized six-month expense ratios for that period are: for the Russell 2000 Index Fund, 0.16% for ETF Shares and 0.08% for Institutional Shares; for the Russell 2000 Value Index Fund, 0.20% for ETF Shares and 0.08% for Institutional Shares; and for the Russell 2000 Growth Index Fund, 0.20% for ETF Shares and 0.08% for Institutional Shares. The dollar amounts shown as “Expenses Paid” are equal to the annualized expense ratio multiplied by the average account value over the period, multiplied by the number of days in the most recent six-month period, then divided by the number of days in the most recent 12-month period (184/365).
64
Trustees Approve Advisory Arrangements
The board of trustees of Vanguard Russell 2000 Index Fund, Russell 2000 Value Index Fund, and Russell 2000 Growth Index Fund has renewed each fund’s investment advisory arrangement with The Vanguard Group, Inc. (Vanguard). Vanguard—through its Equity Index Group—serves as investment advisor for each fund. The board determined that continuing each fund’s internalized management structure was in the best interests of each fund and its shareholders.
The board based its decision upon an evaluation of the advisor’s investment staff, portfolio management process, and performance. The trustees considered the factors discussed below, among others. However, no single factor determined whether the board approved the arrangements. Rather, it was the totality of the circumstances that drove the board’s decision.
Nature, extent, and quality of services
The board reviewed the quality of each fund’s investment management services provided to the funds since their inception in 2010 and took into account the organizational depth and stability of the advisor. The board considered that Vanguard has been managing investments for more than three decades. The Equity Index Group adheres to a sound, disciplined investment management process; the team has considerable experience, stability, and depth.
The board concluded that Vanguard’s experience, stability, depth, and performance, among other factors, warranted continuation of each advisory arrangement.
Investment performance
The board considered the funds’ performance since their inception, including any periods of outperformance or underperformance relative to a target index and peer group. The board concluded that the performance was such that each advisory arrangement should continue. Information about the funds’ most recent performance can be found in the Performance Summary pages of this report.
Cost
The board concluded that each fund’s expense ratio was well below the average expense ratios charged by funds in its respective peer group and that each fund’s advisory fee rate was also well below its peer group average. Information about the funds’ expenses appears in the About Your Fund’s Expenses section of this report as well as in the Financial Statements sections.
The board does not conduct a profitability analysis of Vanguard because of Vanguard’s unique “at-cost” structure. Unlike most other mutual fund management companies, Vanguard is owned by the funds it oversees and produces “profits” only in the form of reduced expenses for fund shareholders.
The benefit of economies of scale
The board concluded that each fund’s at-cost arrangement with Vanguard ensures that the funds will realize economies of scale as they grow, with the cost to shareholders declining as fund assets increase.
The board will consider whether to renew the advisory arrangements again after a one-year period.
65
Glossary
30-Day SEC Yield. A fund’s 30-day SEC yield is derived using a formula specified by the U.S. Securities and Exchange Commission. Under the formula, data related to the fund’s security holdings in the previous 30 days are used to calculate the fund’s hypothetical net income for that period, which is then annualized and divided by the fund’s estimated average net assets over the calculation period. For the purposes of this calculation, a security’s income is based on its current market yield to maturity (for bonds), its actual income (for asset-backed securities), or its projected dividend yield (for stocks). Because the SEC yield represents hypothetical annualized income, it will differ—at times significantly—from the fund’s actual experience. As a result, the fund’s income distributions may be higher or lower than implied by the SEC yield.
Beta. A measure of the magnitude of a fund’s past share-price fluctuations in relation to the ups and downs of a given market index. The index is assigned a beta of 1.00. Compared with a given index, a fund with a beta of 1.20 typically would have seen its share price rise or fall by 12% when the index rose or fell by 10%. For this report, beta is based on returns over the past 36 months for both the fund and the index. Note that a fund’s beta should be reviewed in conjunction with its R-squared (see definition). The lower the R-squared, the less correlation there is between the fund and the index, and the less reliable beta is as an indicator of volatility.
Dividend Yield. Dividend income earned by stocks, expressed as a percentage of the aggregate market value (or of net asset value, for a fund). The yield is determined by dividing the amount of the annual dividends by the aggregate value (or net asset value) at the end of the period. For a fund, the dividend yield is based solely on stock holdings and does not include any income produced by other investments.
Earnings Growth Rate. The average annual rate of growth in earnings over the past five years for the stocks now in a fund.
Equity Exposure. A measure that reflects a fund’s investments in stocks and stock futures. Any holdings in short-term reserves are excluded.
Expense Ratio. A fund’s total annual operating expenses expressed as a percentage of the fund’s average net assets. The expense ratio includes management and administrative expenses, but does not include the transaction costs of buying and selling portfolio securities.
Foreign Holdings. The percentage of a fund represented by securities or depositary receipts of companies based outside the United States.
Inception Date. The date on which the assets of a fund (or one of its share classes) are first invested in accordance with the fund’s investment objective. For funds with a subscription period, the inception date is the day after that period ends. Investment performance is measured from the inception date.
Median Market Cap. An indicator of the size of companies in which a fund invests; the midpoint of market capitalization (market price x shares outstanding) of a fund’s stocks, weighted by the proportion of the fund’s assets invested in each stock. Stocks representing half of the fund’s assets have market capitalizations above the median, and the rest are below it.
Price/Book Ratio. The share price of a stock divided by its net worth, or book value, per share. For a fund, the weighted average price/book ratio of the stocks it holds.
66
Price/Earnings Ratio. The ratio of a stock’s current price to its per-share earnings over the past year. For a fund, the weighted average P/E of the stocks it holds. P/E is an indicator of market expectations about corporate prospects; the higher the P/E, the greater the expectations for a company’s future growth.
R-Squared. A measure of how much of a fund’s past returns can be explained by the returns from the market in general, as measured by a given index. If a fund’s total returns were precisely synchronized with an index’s returns, its R-squared would be 1.00. If the fund’s returns bore no relationship to the index’s returns, its R-squared would be 0. For this report, R-squared is based on returns over the past 36 months for both the fund and the index.
Return on Equity. The annual average rate of return generated by a company during the past five years for each dollar of shareholder’s equity (net income divided by shareholder’s equity). For a fund, the weighted average return on equity for the companies whose stocks it holds.
Short-Term Reserves. The percentage of a fund invested in highly liquid, short-term securities that can be readily converted to cash.
Turnover Rate. An indication of the fund’s trading activity. Funds with high turnover rates incur higher transaction costs and may be more likely to distribute capital gains (which may be taxable to investors). The turnover rate excludes in-kind transactions, which have minimal impact on costs.
67
The People Who Govern Your Fund
The trustees of your mutual fund are there to see that the fund is operated and managed in your best interests since, as a shareholder, you are a part owner of the fund. Your fund’s trustees also serve on the board of directors of The Vanguard Group, Inc., which is owned by the Vanguard funds and provides services to them on an at-cost basis.
A majority of Vanguard’s board members are independent, meaning that they have no affiliation with Vanguard or the funds they oversee, apart from the sizable personal investments they have made as private individuals. The independent board members have distinguished backgrounds in business, academia, and public service. Each of the trustees and executive officers oversees 194 Vanguard funds.
The following table provides information for each trustee and executive officer of the fund. More information about the trustees is in the Statement of Additional Information, which can be obtained, without charge, by contacting Vanguard at 800-662-7447, or online at vanguard.com.
| InterestedTrustee1 | Rajiv L. Gupta |
| Born 1945. Trustee Since December 2001.2 Principal | |
| F. William McNabb III | Occupation(s) During the Past Five Years and Other |
| Born 1957. Trustee Since July 2009. Chairman of | Experience: Chairman and Chief Executive Officer |
| the Board. Principal Occupation(s) During the Past | (retired 2009) and President (2006–2008) of |
| Five Years and Other Experience: Chairman of the | Rohm and Haas Co. (chemicals); Director of Tyco |
| Board of The Vanguard Group, Inc., and of each of | International PLC (diversified manufacturing and |
| the investment companies served by The Vanguard | services), Hewlett-Packard Co. (electronic computer |
| Group, since January 2010; Director of The Vanguard | manufacturing), and Delphi Automotive PLC |
| Group since 2008; Chief Executive Officer and | (automotive components); Senior Advisor at New |
| President of The Vanguard Group, and of each of | Mountain Capital. |
| the investment companies served by The Vanguard | |
| Group, since 2008; Director of Vanguard Marketing | Amy Gutmann |
| Corporation; Managing Director of The Vanguard | Born 1949. Trustee Since June 2006. Principal |
| Group (1995–2008). | Occupation(s) During the Past Five Years and |
| Other Experience: President of the University of | |
| IndependentTrustees | Pennsylvania; Christopher H. Browne Distinguished |
| Professor of Political Science, School of Arts and | |
| Emerson U. Fullwood | Sciences, and Professor of Communication, Annenberg |
| Born 1948. Trustee Since January 2008. Principal | School for Communication, with secondary faculty |
| Occupation(s) During the Past Five Years and | appointments in the Department of Philosophy, School |
| Other Experience: Executive Chief Staff and | of Arts and Sciences, and at the Graduate School of |
| Marketing Officer for North America and Corporate | Education, University of Pennsylvania; Trustee of the |
| Vice President (retired 2008) of Xerox Corporation | National Constitution Center; Chair of the Presidential |
| (document management products and services); | Commission for the Study of Bioethical Issues. |
| Executive in Residence and 2009–2010 Distinguished | |
| Minett Professor at the Rochester Institute of | JoAnn Heffernan Heisen |
| Technology; Director of SPX Corporation (multi-industry | Born 1950. Trustee Since July 1998. Principal |
| manufacturing), the United Way of Rochester, | Occupation(s) During the Past Five Years and Other |
| Amerigroup Corporation (managed health care), the | Experience: Corporate Vice President and Chief |
| University of Rochester Medical Center, Monroe | Global Diversity Officer (retired 2008) and Member |
| Community College Foundation, and North Carolina | of the Executive Committee (1997–2008) of Johnson |
| A&T University. | & Johnson (pharmaceuticals/medical devices/ |
| consumer products); Director of Skytop Lodge | |
| Corporation (hotels), the University Medical Center | |
| at Princeton, the Robert Wood Johnson Foundation, | |
| and the Center for Talent Innovation; Member of | |
| the Advisory Board of the Institute for Women’s | |
| Leadership at Rutgers University. |
| F. Joseph Loughrey | Executive Officers | |
| Born 1949. Trustee Since October 2009. Principal | ||
| Occupation(s) During the Past Five Years and Other | Glenn Booraem | |
| Experience: President and Chief Operating Officer | Born 1967. Treasurer Since May 2015. Principal | |
| (retired 2009) of Cummins Inc. (industrial machinery); | Occupation(s) During the Past Five Years and | |
| Chairman of the Board of Hillenbrand, Inc. (specialized | Other Experience: Principal of The Vanguard Group, | |
| consumer services), and of Oxfam America; Director | Inc.; Treasurer of each of the investment companies | |
| of SKF AB (industrial machinery), Hyster-Yale Materials | served by The Vanguard Group; Controller of each of | |
| Handling, Inc. (forklift trucks), the Lumina Foundation | the investment companies served by The Vanguard | |
| for Education, and the V Foundation for Cancer | Group (2010–2015); Assistant Controller of each of | |
| Research; Member of the Advisory Council for the | the investment companies served by The Vanguard | |
| College of Arts and Letters and of the Advisory Board | Group (2001–2010). | |
| to the Kellogg Institute for International Studies, both | ||
| at the University of Notre Dame. | Thomas J. Higgins | |
| Born 1957. Chief Financial Officer Since September | ||
| Mark Loughridge | 2008. Principal Occupation(s) During the Past Five | |
| Born 1953. Trustee Since March 2012. Principal | Years and Other Experience: Principal of The Vanguard | |
| Occupation(s) During the Past Five Years and Other | Group, Inc.; Chief Financial Officer of each of the | |
| Experience: Senior Vice President and Chief Financial | investment companies served by The Vanguard Group; | |
| Officer (retired 2013) at IBM (information technology | Treasurer of each of the investment companies served | |
| services); Fiduciary Member of IBM’s Retirement Plan | by The Vanguard Group (1998–2008). | |
| Committee (2004–2013); Director of the Dow Chemical | ||
| Company; Member of the Council on Chicago Booth. | Peter Mahoney | |
| Born 1974. Controller Since May 2015. Principal | ||
| Scott C. Malpass | Occupation(s) During the Past Five Years and | |
| Born 1962. Trustee Since March 2012. Principal | Other Experience: Head of Global Fund Accounting | |
| Occupation(s) During the Past Five Years and Other | at The Vanguard Group, Inc.; Controller of each of the | |
| Experience: Chief Investment Officer and Vice | investment companies served by The Vanguard Group; | |
| President at the University of Notre Dame; Assistant | Head of International Fund Services at The Vanguard | |
| Professor of Finance at the Mendoza College of | Group (2008–2014). | |
| Business at Notre Dame; Member of the Notre Dame | ||
| 403(b) Investment Committee; Board Member of | Heidi Stam | |
| TIFF Advisory Services, Inc., and Catholic Investment | Born 1956. Secretary Since July 2005. Principal | |
| Services, Inc. (investment advisors); Member of | Occupation(s) During the Past Five Years and Other | |
| the Investment Advisory Committee of Major | Experience: Managing Director of The Vanguard | |
| League Baseball. | Group, Inc.; General Counsel of The Vanguard Group; | |
| Secretary of The Vanguard Group and of each of the | ||
| André F. Perold | investment companies served by The Vanguard Group; | |
| Born 1952. Trustee Since December 2004. Principal | Director and Senior Vice President of Vanguard | |
| Occupation(s) During the Past Five Years and Other | Marketing Corporation. | |
| Experience: George Gund Professor of Finance and | ||
| Banking, Emeritus at the Harvard Business School | Vanguard Senior ManagementTeam | |
| (retired 2011); Chief Investment Officer and Managing | Mortimer J. Buckley | Chris D. McIsaac |
| Partner of HighVista Strategies LLC (private investment | Kathleen C. Gubanich | James M. Norris |
| firm); Director of Rand Merchant Bank; Overseer of | Paul A. Heller | Thomas M. Rampulla |
| the Museum of Fine Arts Boston. | Martha G. King | Glenn W. Reed |
| John T. Marcante | Karin A. Risi | |
| Peter F. Volanakis | ||
| Born 1955. Trustee Since July 2009. Principal | ||
| Occupation(s) During the Past Five Years and Other | Chairman Emeritus and Senior Advisor | |
| Experience: President and Chief Operating Officer | ||
| (retired 2010) of Corning Incorporated (communications | John J. Brennan | |
| equipment); Trustee of Colby-Sawyer College; | Chairman, 1996–2009 | |
| Member of the Advisory Board of the Norris Cotton | Chief Executive Officer and President, 1996–2008 | |
| Cancer Center and of the Advisory Board of the | ||
| Parthenon Group (strategy consulting). | Founder | |
| John C. Bogle | ||
| Chairman and Chief Executive Officer, 1974–1996 | ||
1 Mr. McNabb is considered an “interested person,” as defined in the Investment Company Act of 1940, because he is an officer of the
Vanguard funds.
2 December 2002 for Vanguard Equity Income Fund, the Vanguard Municipal Bond Funds, and the Vanguard State Tax-Exempt Funds.
 | |
| P.O. Box 2600 | |
| Valley Forge, PA 19482-2600 |
Connect with Vanguard® > vanguard.com
| Fund Information > 800-662-7447 | The Russell Indexes and Russell® are registered |
| Direct Investor Account Services > 800-662-2739 | trademarks of Russell Investments and have been |
| licensed for use by The Vanguard Group, Inc. The | |
| Institutional Investor Services > 800-523-1036 | products are not sponsored, endorsed, sold, or |
| Text Telephone for People | promoted by Russell Investments and Russell |
| Who Are Deaf or Hard of Hearing> 800-749-7273 | Investments makes no representation regarding the |
| advisability of investing in the products. | |
| This material may be used in conjunction | |
| with the offering of shares of any Vanguard | |
| fund only if preceded or accompanied by | |
| the fund’s current prospectus. | |
| All comparative mutual fund data are from Lipper, a | |
| Thomson Reuters Company, or Morningstar, Inc., unless | |
| otherwise noted. | |
| You can obtain a free copy of Vanguard’s proxy voting | |
| guidelines by visiting vanguard.com/proxyreporting or by | |
| calling Vanguard at 800-662-2739. The guidelines are | |
| also available from the SEC’s website, sec.gov. In | |
| addition, you may obtain a free report on how your fund | |
| voted the proxies for securities it owned during the 12 | |
| months ended June 30. To get the report, visit either | |
| vanguard.com/proxyreporting or sec.gov. | |
| You can review and copy information about your fund at | |
| the SEC’s Public Reference Room in Washington, D.C. To | |
| find out more about this public service, call the SEC at | |
| 202-551-8090. Information about your fund is also | |
| available on the SEC’s website, and you can receive | |
| copies of this information, for a fee, by sending a | |
| request in either of two ways: via email addressed to | |
| publicinfo@sec.gov or via regular mail addressed to the | |
| Public Reference Section, Securities and Exchange | |
| Commission, Washington, DC 20549-1520. | |
| © 2015 The Vanguard Group, Inc. | |
| All rights reserved. | |
| Vanguard Marketing Corporation, Distributor. | |
| Q18510 102015 | |
Annual Report | August 31, 2015
Vanguard Russell 3000 Index Fund
Vanguard’s Principles for Investing Success
We want to give you the best chance of investment success. These principles, grounded in Vanguard’s research and experience, can put you on the right path.
Goals. Create clear, appropriate investment goals.
Balance. Develop a suitable asset allocation using broadly diversified funds.
Cost. Minimize cost.
Discipline. Maintain perspective and long-term discipline.
A single theme unites these principles: Focus on the things you can control.
We believe there is no wiser course for any investor.
| Contents | |
| Your Fund’s Total Returns. | 1 |
| Chairman’s Letter. | 2 |
| Fund Profile. | 8 |
| Performance Summary. | 10 |
| Financial Statements. | 12 |
| Your Fund’s After-Tax Returns. | 25 |
| About Your Fund’s Expenses. | 26 |
| Trustees Approve Advisory Arrangement. | 28 |
| Glossary. | 29 |
Please note: The opinions expressed in this report are just that—informed opinions. They should not be considered promises or advice.
Also, please keep in mind that the information and opinions cover the period through the date on the front of this report. Of course, the risks of investing in your fund are spelled out in the prospectus.
See the Glossary for definitions of investment terms used in this report.
About the cover: Pictured is a sailing block on the Brilliant, a 1932 schooner docked in Mystic, Connecticut. A type of pulley, the sailing block helps coordinate the setting of the sails. At Vanguard, the intricate coordination of technology and people allows us to help millions of clients around the world reach their financial goals.
| Your Fund’s Total Returns | |
| Fiscal Year Ended August 31, 2015 | |
| Total | |
| Returns | |
| Vanguard Russell 3000 Index Fund | |
| ETF Shares | |
| Market Price | 0.34% |
| Net Asset Value | 0.21 |
| Institutional Shares | 0.30 |
| Russell 3000 Index | 0.36 |
| Multi-Cap Core Funds Average | -1.59 |
| Multi-Cap Core Funds Average: Derived from data provided by Lipper, a Thomson Reuters Company. | |
Institutional Shares are available to certain institutional investors who meet specific administrative, service, and account-size criteria. The Vanguard ETF® Shares shown are traded on the Nasdaq exchange and are available only through brokers. The table provides ETF returns based on both the Nasdaq market price and the net asset value for a share. U.S. Pat. Nos. 6,879,964; 7,337,138; 7,720,749; 7,925,573; 8,090,646; and 8,417,623.
For the ETF Shares, the market price is determined by the midpoint of the bid-offer spread as of the closing time of the New York Stock Exchange (generally 4 p.m., Eastern time). The net asset value is also determined as of the NYSE closing time. For more information about how the ETF Shares' market prices have compared with their net asset value, visit vanguard.com, select your ETF, and then select the Price and Performance tab. The ETF premium/discount analysis there shows the percentages of days on which the ETF Shares' market price was above or below the NAV.
| Your Fund’s Performance at a Glance | ||||
| August 31, 2014, Through August 31, 2015 | ||||
| Distributions Per Share | ||||
| Starting | Ending | |||
| Share | Share | Income | Capital | |
| Price | Price | Dividends | Gains | |
| Vanguard Russell 3000 Index Fund | ||||
| ETF Shares | $92.82 | $91.43 | $1.643 | $0.000 |
| Institutional Shares | 179.64 | 176.98 | 3.289 | 0.000 |
1

Chairman’s Letter
Dear Shareholder,
After periods of seesawing, the broad U.S. stock market finished on nearly level ground for the 12 months ended August 31, 2015. Vanguard Russell 3000 Index Fund returned 0.21% for ETF Shares, based on net asset value, and a bit more for Institutional Shares.
Your fund closely tracked the return of its benchmark, which represents nearly 100% of the U.S. stock market. This index includes both growth- and value-oriented stocks of large companies (the Russell 1000 Index) and smaller ones (the Russell 2000 Index). Even with its modest result, your fund outpaced the average return of multi-capitalization core peer funds.
Unlike the previous fiscal year, when large-company stocks were several steps ahead of their smaller counterparts, returns didn’t differ much by company size. But the Russell 3000 Growth Index’s 4.30% return for the last 12 months was significantly ahead of the –3.60% return of the Russell 3000 Value Index; a year earlier, growth and value returns were more alike. As I’ve noted in the past, performance by size and leadership rotates over time. That’s why we recommend that you broadly diversify your portfolio.
If you invest in the fund through a taxable account, you may wish to review the information on the fund’s after-tax returns that appears later in this report.
2
August stock market anxiety led to disappointing returns
U.S. stocks rode a roller coaster to ultimately end the period about where they started, returning 0.36% for the 12 months. Several months of broad-market gains were nearly erased in August, when stocks tumbled over fears about the global impact of China’s economic deceleration. Greece’s debt crisis, the strong U.S. dollar, perceived high stock valuations, and speculation over when the Federal Reserve might begin to raise short-term interest rates also contributed to investor concerns. (Shortly after the close of the reporting period, the Fed announced at its September meeting that it would leave rates unchanged for the time being.)
For dollar-based investors, international stocks returned about –12%. Heightened fears about the slower growth in China, the world’s second-largest economy, cast doubt on the investment outlook for emerging markets in particular.
Bond results were muted as the Fed weighed a rate hike
The broad U.S. taxable bond market returned 1.56%, outpacing the broad U.S. stock market. Even as yields remained relatively low, bonds benefited at times from demand by investors seeking shelter from stock market volatility. The yield of the 10-year Treasury note, which dipped to 1.75% on January 31, ended the period at 2.18%, down from 2.34% a year earlier. (Bond prices and yields move in opposite directions.)
| Market Barometer | |||
| Average Annual Total Returns | |||
| Periods Ended August 31, 2015 | |||
| One | Three | Five | |
| Year | Years | Years | |
| Stocks | |||
| Russell 1000 Index (Large-caps) | 0.40% | 14.68% | 16.07% |
| Russell 2000 Index (Small-caps) | 0.03 | 14.12 | 15.55 |
| Russell 3000 Index (Broad U.S. market) | 0.36 | 14.63 | 16.03 |
| FTSE All-World ex US Index (International) | -11.50 | 5.79 | 5.17 |
| Bonds | |||
| Barclays U.S. Aggregate Bond Index (Broad taxable market) | 1.56% | 1.53% | 2.98% |
| Barclays Municipal Bond Index (Broad tax-exempt market) | 2.52 | 2.83 | 3.96 |
| Citigroup Three-Month U.S. Treasury Bill Index | 0.02 | 0.03 | 0.05 |
| CPI | |||
| Consumer Price Index | 0.20% | 1.14% | 1.77% |
3
The Fed’s 0%–0.25% target for short-term interest rates continued to restrain returns for money market funds and savings accounts. Since wrapping up its bond-buying program in October 2014, the Fed has been weighing when to raise rates for the first time in nearly a decade.
Limited by the dollar’s strength, international bond markets (as measured by the Barclays Global Aggregate Index ex USD) returned –11.97%. Without this currency effect, international bonds returned about 3%.
Health care stocks were robust, but the energy sector swooned
Returns for the nine industry groups in the Russell 3000 Index spanned a wide range, from about 14% for health care stocks to about –33% for energy stocks. Four sectors advanced, four declined, and technology was just above breakeven.
The trends favoring the growth-oriented health care sector are familiar. The aging global population requires more health care products and services, which are increasingly accessible worldwide. In the United States, the Affordable Care Act has meant that more people are insured. Health care providers had some of the best returns, but pharmaceutical and biotech-nology companies—the largest slice of the sector—contributed the most to its performance.
At the other end of the scale, many energy stocks struggled, especially crude oil producers. Oil prices fell about 50%,
| Expense Ratios | |||
| Your Fund Compared With Its Peer Group | |||
| ETF | Institutional | Peer Group | |
| Shares | Shares | Average | |
| Russell 3000 Index Fund | 0.15% | 0.08% | 1.21% |
The fund expense ratios shown are from the prospectus dated December 23, 2014, and represent estimated costs for the current fiscal year. For the fiscal year ended August 31, 2015, the fund’s expense ratios were 0.15% for ETF Shares and 0.08% for Institutional Shares. The peer-group expense ratio is derived from data provided by Lipper, a Thomson Reuters Company, and captures information through year-end 2014.
Peer group: Multi-Cap Core Funds.
4
in part because of high production levels from some leading oil-producing countries and concerns about the slower growth in China, the world’s largest oil importer. Natural gas prices also declined, though not as dramatically, amid burgeoning U.S. production.
In this challenging environment, companies in many energy segments have been slashing billions in spending and laying off workers. The decline in energy stocks was especially steep among smaller companies: In the Russell 2000 Value Index, for example, the energy sector lost about two-thirds of its value.
Financial services companies, the largest slice of the fund and its index (about one-fifth of assets), advanced modestly.
Returns in this value-oriented sector were boosted by a double-digit gain by the consumer finance and credit services segment. Consumer staples and consumer discretionary stocks, which together comprised another one-fifth of assets, also advanced; some consumers began to loosen their grip on their wallets as gas prices remained relatively low.
Larger companies that make up the bulk of the assets in the Russell 3000 Index edged ahead of smaller companies: The Russell 1000 Index returned 0.40%, while the Russell 2000 Index was flat at 0.03%. Sector return patterns were generally similar among both larger and smaller companies, but growth-oriented stocks outperformed more among smaller companies.
| Total Returns | |
| Inception Through August 31, 2015 | |
| Average | |
| Annual Return | |
| Russell 3000 Index Fund ETF Shares Net Asset Value (Returns since inception: 9/20/2010) | 13.99% |
| Russell 3000 Index | 14.15 |
| Multi-Cap Core Funds Average | 11.88 |
| Multi-Cap Core Funds Average: Derived from data provided by Lipper, a Thomson Reuters Company. |
The figures shown represent past performance, which is not a guarantee of future results. (Current performance may be lower or higher than the performance data cited. For performance data current to the most recent month-end, visit our website at vanguard.com/performance.) Note, too, that both investment returns and principal value can fluctuate widely, so an investor’s shares, when sold, could be worth more or less than their original cost.
5
The fund has met its objective of closely tracking its index
The hallmark of a successful index fund is its ability to closely track the return of its benchmark index over time, after allowing for normal operating expenses. Using sophisticated portfolio construction and trading strategies developed and refined over many years, your fund’s advisor, Vanguard Equity Index Group, has achieved that standard of success. Since their inception almost five years ago, the ETF Shares have had an average annual return of 13.99%, in line with the benchmark’s 14.15% return and more than two percentage points ahead of the average return of competing peer funds.
When the markets are volatile, maintaining perspective is key
As I noted earlier, volatility returned to the stock market with a vengeance in the final weeks of August. Stocks were unsettled as investors grew more worried that a slowdown in China’s growth could affect markets across the globe.
This turmoil may have evoked painful memories of previous financial setbacks—memories that had been receding after
An indexing benefit that’s worth keeping in mind
As a Vanguard investor, you’re probably familiar with the cost and diversification benefits that index funds typically offer. But there’s a lesser-known—yet important—advantage to indexing as well: relative predictability.
Simply put, index funds help you capture the market’s return more predictably than actively managed funds.
By definition, an index fund is built and managed to track the return of its designated broad market or market segment. Some do so more closely than others. But what’s key is that you know what to expect: whatever the market returns—good or bad—minus the fund’s costs. Active managers, in contrast, seek to beat the market—and do so with varying degrees of success at different times.
The relative predictability of indexing can help you stay on course with your investment goals, by reducing the likelihood of particular surprises—such as being out of step with market performance. The confidence of knowing that you’ll earn a market-like return can reduce the temptation to trade based on emotions.
We recognize that some investors want the opportunity to outperform the market. That’s why Vanguard also offers low-cost active funds managed by carefully selected, world-class advisors, so you can choose an investment strategy that aligns with both your goals and your risk appetite.
6
more than six years of strong U.S. stock performance. And inevitably, that sort of upheaval can lead some investors to make rash moves with their portfolios.
During periods of market adversity, however, it’s more important than ever to keep sight of one of Vanguard’s key principles: Maintain perspective and long-term discipline. Whether you’re investing for yourself or on behalf of clients, your success is affected greatly by how you react––or don’t react––when the markets turn turbulent. (You can read Vanguard’s Principles for Investing Success at vanguard.com/research.)
As I’ve written in the past, the best course for long-term investors generally is to ignore daily market moves and not make decisions based on emotion. This is also a good time to evaluate your portfolio and make sure your asset allocation is aligned with your time horizon, goals, and risk tolerance.
The markets are unpredictable and often confounding. Keeping long-term plans clearly in focus can help you weather these periodic storms.
As always, thank you for entrusting your assets to Vanguard.
Sincerely,

F. William McNabb III
Chairman and Chief Executive Officer
September 17, 2015
7
Russell 3000 Index Fund
Fund Profile
As of August 31, 2015
| Share-Class Characteristics | ||
| ETF | Institutional | |
| Shares | Shares | |
| Ticker Symbol | VTHR | VRTTX |
| Expense Ratio1 | 0.15% | 0.08% |
| 30-Day SEC Yield | 1.83% | 1.97% |
| Portfolio Characteristics | |||
| DJ | |||
| U.S. | |||
| Total | |||
| Russell | Market | ||
| 3000 | FA | ||
| Fund | Index | Index | |
| Number of Stocks | 3,023 | 2,989 | 3,828 |
| Median Market Cap | $47.2B | $47.2B | $47.2B |
| Price/Earnings Ratio | 20.8x | 20.9x | 20.8x |
| Price/Book Ratio | 2.6x | 2.6x | 2.6x |
| Return on Equity | 17.3% | 17.2% | 17.1% |
| Earnings Growth | |||
| Rate | 10.2% | 10.2% | 10.2% |
| Dividend Yield | 2.1% | 2.1% | 2.1% |
| Foreign Holdings | 0.0% | 0.0% | 0.0% |
| Turnover Rate | 4% | — | — |
| Short-Term | |||
| Reserves | 0.1% | — | — |
| Volatility Measures | ||
| DJ | ||
| Russell | U.S. Total | |
| 3000 | Market | |
| Index | FA Index | |
| R-Squared | 1.00 | 1.00 |
| Beta | 1.00 | 1.00 |
These measures show the degree and timing of the fund’s fluctuations compared with the indexes over 36 months.
| Ten Largest Holdings (% of total net assets) | ||
| Apple Inc. | Computer | |
| Technology | 3.0% | |
| Google Inc. | Computer Services | |
| Software & Systems | 1.7 | |
| Microsoft Corp. | Computer Services | |
| Software & Systems | 1.6 | |
| Exxon Mobil Corp. | Oil: Integrated | 1.4 |
| Johnson & Johnson | Pharmaceuticals | 1.2 |
| General Electric Co. | Diversified | |
| Manufacturing | ||
| Operations | 1.1 | |
| Berkshire Hathaway Inc. Insurance: Multi-Line | 1.1 | |
| Wells Fargo & Co. | Banks: Diversified | 1.1 |
| JPMorgan Chase & Co. | Diversified Financial | |
| Services | 1.1 | |
| AT&T Inc. | Utilities: | |
| Telecommunications | 0.9 | |
| Top Ten | 14.2% | |
The holdings listed exclude any temporary cash investments and equity index products.
Investment Focus
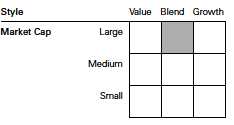
1 The expense ratios shown are from the prospectus dated December 23, 2014, and represent estimated costs for the current fiscal year. For the fiscal year ended August 31, 2015, the expense ratios were 0.15% for ETF Shares and 0.08% for Institutional Shares.
8
Russell 3000 Index Fund
| Sector Diversification (% of equity exposure) | |||
| DJ | |||
| U.S. | |||
| Total | |||
| Russell | Market | ||
| 3000 | FA | ||
| Fund | Index | Index | |
| Consumer Discretionary 14.7% | 14.8% | 14.9% | |
| Consumer Staples | 7.6 | 7.6 | 7.6 |
| Energy | 6.7 | 6.7 | 6.7 |
| Financial Services | 20.1 | 20.1 | 20.1 |
| Health Care | 14.9 | 14.9 | 14.8 |
| Materials & Processing | 3.9 | 3.9 | 3.9 |
| Producer Durables | 10.7 | 10.7 | 10.6 |
| Technology | 16.2 | 16.2 | 16.3 |
| Utilities | 5.2 | 5.1 | 5.1 |
9
Russell 3000 Index Fund
Performance Summary
All of the returns in this report represent past performance, which is not a guarantee of future results that may be achieved by the fund. (Current performance may be lower or higher than the performance data cited. For performance data current to the most recent month-end, visit our website at vanguard.com/performance.) Note, too, that both investment returns and principal value can fluctuate widely, so an investor’s shares, when sold, could be worth more or less than their original cost. The returns shown do not reflect taxes that a shareholder would pay on fund distributions or on the sale of fund shares.
Cumulative Performance: September 20, 2010, Through August 31, 2015
Initial Investment of $10,000
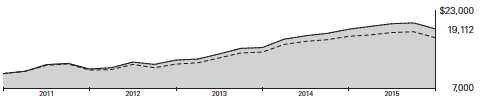
| Average Annual Total Returns | |||
| Periods Ended August 31, 2015 | |||
| Since | Final Value | ||
| One | Inception | of a $10,000 | |
| Year | (9/20/2010) | Investment | |
| Russell 3000 Index Fund*ETF Shares | |||
| Net Asset Value | 0.21% | 13.99% | $19,112 |
| Russell 3000 Index Fund*ETF Shares | |||
| Market Price | 0.34 | 14.02 | 19,131 |
| Russell 3000 Index | 0.36 | 14.15 | 19,243 |
| Multi-Cap Core Funds Average | -1.59 | 11.88 | 17,421 |
| Dow Jones U.S. Total Stock Market | |||
| Float Adjusted Index | 0.29 | 14.14 | 19,234 |
Multi-Cap Core Funds Average: Derived from data provided by Lipper, a Thomson Reuters Company.
"Since Inception" performance is calculated from the ETF Shares’ inception date for both the fund and its comparative standards.
| Since | Final Value | ||
| One | Inception | of a $5,000,000 | |
| Year | (11/1/2010) | Investment | |
| Russell 3000 Index Fund Institutional Shares | 0.30% | 13.49% | $9,212,394 |
| Russell 3000 Index | 0.36 | 13.56 | 9,242,064 |
| Dow Jones U.S. Total Stock Market Float | |||
| Adjusted Index | 0.29 | 13.55 | 9,235,808 |
"Since Inception" performance is calculated from the Institutional Shares’ inception date for both the fund and its comparative standards.
See Financial Highlights for dividend and capital gains information.
10
Russell 3000 Index Fund
| Cumulative Returns of ETF Shares: September 20, 2010, Through August 31, 2015 | ||
| Since | ||
| One | Inception | |
| Year | (9/20/2010) | |
| Russell 3000 Index Fund ETF Shares Market Price | 0.34% | 91.31% |
| Russell 3000 Index Fund ETF Shares Net Asset | ||
| Value | 0.21 | 91.12 |
| Russell 3000 Index | 0.36 | 92.43 |
"Since Inception" performance is calculated from the ETF Shares’ inception date for both the fund and its comparative standards.
Fiscal-Year Total Returns (%): September 20, 2010, Through August 31, 2015
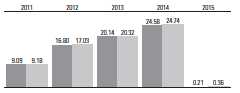
| Russell 3000 Index Fund ETF Shares Net Asset Value |
| Russell 3000 Index |
Average Annual Total Returns: Periods Ended June 30, 2015
This table presents returns through the latest calendar quarter—rather than through the end of the fiscal period.
Securities and Exchange Commission rules require that we provide this information.
| Inception | One | Since | |
| Date | Year | Inception | |
| ETF Shares | 9/20/2010 | ||
| Market Price | 7.28% | 15.66% | |
| Net Asset Value | 7.17 | 15.64 | |
| Institutional Shares | 11/1/2010 | 7.24 | 15.14 |
11
Russell 3000 Index Fund
Financial Statements
Statement of Net Assets—Investments Summary
As of August 31, 2015
This Statement summarizes the fund’s holdings by asset type. Details are reported for each of the fund’s 50 largest individual holdings and for investments that, in total for any issuer, represent more than 1% of the fund’s net assets. The total value of smaller holdings is reported as a single amount within each category.
The fund reports a complete list of its holdings in regulatory filings four times in each fiscal year, at the quarter-ends. For the second and fourth fiscal quarters, the complete listing of the fund’s holdings is available electronically on vanguard.com and on the Securities and Exchange Commission’s website (sec.gov), or you can have it mailed to you without charge by calling 800-662-7447. For the first and third fiscal quarters, the fund files the lists with the SEC on Form N-Q. Shareholders can look up the fund’s Forms N-Q on the SEC’s website. Forms N-Q may also be reviewed and copied at the SEC’s Public Reference Room (see the back cover of this report for further information).
| Market | Percentage | ||
| Value• | of Net | ||
| Shares | ($000) | Assets | |
| Common Stocks | |||
| Consumer Discretionary | |||
| * Amazon.com Inc. | 16,677 | 8,553 | 0.9% |
| Walt Disney Co. | 74,239 | 7,563 | 0.8% |
| Home Depot Inc. | 56,829 | 6,618 | 0.7% |
| Comcast Corp. Class A | 109,758 | 6,183 | 0.6% |
| Wal-Mart Stores Inc. | 69,109 | 4,473 | 0.5% |
| McDonald’s Corp. | 41,936 | 3,985 | 0.4% |
| Starbucks Corp. | 65,648 | 3,592 | 0.4% |
| Consumer Discretionary—Other † | 99,091 | 10.4% | |
| 140,058 | 14.7% | ||
| Consumer Staples | |||
| Procter & Gamble Co. | 118,698 | 8,388 | 0.9% |
| Coca-Cola Co. | 171,562 | 6,746 | 0.7% |
| PepsiCo Inc. | 64,579 | 6,001 | 0.6% |
| Philip Morris International Inc. | 67,777 | 5,409 | 0.6% |
| CVS Health Corp. | 49,245 | 5,043 | 0.5% |
| Altria Group Inc. | 86,039 | 4,610 | 0.5% |
| Consumer Staples—Other † | 35,743 | 3.7% | |
| 71,940 | 7.5% | ||
| Energy | |||
| Exxon Mobil Corp. | 182,925 | 13,763 | 1.4% |
| Chevron Corp. | 82,271 | 6,663 | 0.7% |
| Schlumberger Ltd. | 55,549 | 4,298 | 0.5% |
| Energy—Other † | 38,466 | 4.0% | |
| 63,190 | 6.6% | ||
| Financial Services | |||
| * Berkshire Hathaway Inc. Class B | 81,368 | 10,907 | 1.2% |
| Wells Fargo & Co. | 203,827 | 10,870 | 1.1% |
| JPMorgan Chase & Co. | 162,365 | 10,408 | 1.1% |
| Bank of America Corp. | 459,480 | 7,508 | 0.8% |
12
| Russell 3000 Index Fund | |||
| Market | Percentage | ||
| Value• | of Net | ||
| Shares | ($000) | Assets | |
| Citigroup Inc. | 132,747 | 7,099 | 0.8% |
| Visa Inc. Class A | 85,433 | 6,091 | 0.6% |
| MasterCard Inc. Class A | 43,632 | 4,030 | 0.4% |
| * Synchrony Financial | 5,466 | 180 | 0.0% |
| Financial Services—Other † | 134,039 | 14.0% | |
| 191,132 | 20.0% | ||
| Health Care | |||
| Johnson & Johnson | 121,321 | 11,402 | 1.2% |
| Pfizer Inc. | 269,409 | 8,680 | 0.9% |
| Gilead Sciences Inc. | 64,294 | 6,755 | 0.7% |
| Merck & Co. Inc. | 123,606 | 6,656 | 0.7% |
| * Allergan plc | 17,171 | 5,216 | 0.5% |
| Amgen Inc. | 33,265 | 5,049 | 0.5% |
| UnitedHealth Group Inc. | 41,647 | 4,819 | 0.5% |
| AbbVie Inc. | 76,565 | 4,778 | 0.5% |
| Medtronic plc | 62,348 | 4,507 | 0.5% |
| Bristol-Myers Squibb Co. | 72,933 | 4,337 | 0.5% |
| * Celgene Corp. | 34,702 | 4,098 | 0.4% |
| Health Care—Other † | 75,110 | 7.9% | |
| 141,407 | 14.8% | ||
| Materials & Processing † | 36,713 | 3.8% | |
| 1Other † | 38 | 0.0% | |
| Producer Durables | |||
| General Electric Co. | 440,835 | 10,942 | 1.1% |
| Boeing Co. | 30,254 | 3,954 | 0.4% |
| 3M Co. | 27,753 | 3,945 | 0.4% |
| United Technologies Corp. | 38,946 | 3,568 | 0.4% |
| Producer Durables—Other † | 79,193 | 8.3% | |
| 101,602 | 10.6% | ||
| Technology | |||
| Apple Inc. | 252,048 | 28,421 | 3.0% |
| Microsoft Corp. | 353,924 | 15,403 | 1.6% |
| * Facebook Inc. Class A | 94,675 | 8,467 | 0.9% |
| * Google Inc. Class A | 12,613 | 8,171 | 0.9% |
| * Google Inc. Class C | 12,870 | 7,957 | 0.8% |
| Intel Corp. | 207,552 | 5,924 | 0.6% |
| International Business Machines Corp. | 39,733 | 5,876 | 0.6% |
| Cisco Systems Inc. | 222,510 | 5,759 | 0.6% |
| Oracle Corp. | 138,623 | 5,142 | 0.5% |
| QUALCOMM Inc. | 71,325 | 4,036 | 0.4% |
| Technology—Other † | 58,987 | 6.2% | |
| 154,143 | 16.1% | ||
| Utilities | |||
| AT&T Inc. | 266,553 | 8,850 | 0.9% |
| Verizon Communications Inc. | 178,435 | 8,210 | 0.9% |
| Utilities—Other † | 31,961 | 3.3% | |
| 49,021 | 5.1% | ||
| Total Common Stocks (Cost $941,592) | 949,244 | 99.2%2 | |
13
| Russell 3000 Index Fund | ||||
| Market | Percentage | |||
| Value• | of Net | |||
| Coupon | Shares | ($000) | Assets | |
| Temporary Cash Investments | ||||
| Money Market Fund | ||||
| 3,4 Vanguard Market Liquidity Fund | 0.168% | 7,482,000 | 7,482 | 0.8% |
| 5U.S. Government and Agency Obligations † | 1,000 | 0.1% | ||
| Total Temporary Cash Investments (Cost $8,483) | 8,482 | 0.9%2 | ||
| 6Total Investments (Cost $950,075) | 957,726 | 100.1% | ||
| Amount | ||||
| ($000) | ||||
| Other Assets and Liabilities | ||||
| Other Assets | ||||
| Investment in Vanguard | 92 | |||
| Receivables for Investment Securities Sold | 770 | |||
| Receivables for Accrued Income | 1,873 | |||
| Receivables for Capital Shares Issued | 41 | |||
| Other Assets | 1,587 | |||
| Total Other Assets | 4,363 | 0.3% | ||
| Liabilities | ||||
| Payables for Investment Securities Purchased | (801) | |||
| Collateral for Securities on Loan | (244) | |||
| Payables for Capital Shares Redeemed | (1,707) | |||
| Payables to Vanguard | (182) | |||
| Other Liabilities | (2,336) | |||
| Total Liabilities | (5,270) | (0.4%) | ||
| Net Assets | 956,819 | 100.0% | ||
14
| Russell 3000 Index Fund | |
| At August 31, 2015, net assets consisted of: | |
| Amount | |
| ($000) | |
| Paid-in Capital | 947,749 |
| Undistributed Net Investment Income | 3,357 |
| Accumulated Net Realized Losses | (2,074) |
| Unrealized Appreciation (Depreciation) | |
| Investment Securities | 7,651 |
| Futures Contracts | 136 |
| Net Assets | 956,819 |
| ETF Shares—Net Assets | |
| Applicable to 1,850,000 outstanding $.001 par value shares of | |
| beneficial interest (unlimited authorization) | 169,151 |
| Net Asset Value Per Share—ETF Shares | $91.43 |
| Institutional Shares—Net Assets | |
| Applicable to 4,450,688 outstanding $.001 par value shares of | |
| beneficial interest (unlimited authorization) | 787,668 |
| Net Asset Value Per Share—Institutional Shares | $176.98 |
• See Note A in Notes to Financial Statements.
* Non-income-producing security.
† Represents the aggregate value, by category, of securities that are not among the 50 largest holdings and, in total for any issuer, represent 1% or less of net assets.
1 “Other” represents securities that are not classified by the fund’s benchmark index.
2 The fund invests a portion of its cash reserves in equity markets through the use of index futures contracts. After giving effect to futures investments, the fund’s effective common stock and temporary cash investment positions represent 100.0% and 0.1%, respectively, of net assets.
3 Affiliated money market fund available only to Vanguard funds and certain trusts and accounts managed by Vanguard. Rate shown is the 7-day yield.
4 Includes $244,000 of collateral received for securities on loan.
5 Securities with a value of $400,000 have been segregated as initial margin for open futures contracts.
6 The total value of securities on loan is $226,000.
See accompanying Notes, which are an integral part of the Financial Statements.
15
| Russell 3000 Index Fund | |
| Statement of Operations | |
| Year Ended | |
| August 31, 2015 | |
| ($000) | |
| Investment Income | |
| Income | |
| Dividends | 15,270 |
| Interest1 | 14 |
| Securities Lending | 29 |
| Total Income | 15,313 |
| Expenses | |
| The Vanguard Group—Note B | |
| Investment Advisory Services | 137 |
| Management and Administrative—ETF Shares | 100 |
| Management and Administrative—Institutional Shares | 29 |
| Marketing and Distribution—ETF Shares | 21 |
| Marketing and Distribution—Institutional Shares | 100 |
| Custodian Fees | 307 |
| Auditing Fees | 32 |
| Shareholders’ Reports—ETF Shares | 5 |
| Shareholders’ Reports—Institutional Shares | — |
| Total Expenses | 731 |
| Net Investment Income | 14,582 |
| Realized Net Gain (Loss) | |
| Investment Securities Sold | 113,753 |
| Futures Contracts | (253) |
| Realized Net Gain (Loss) | 113,500 |
| Change in Unrealized Appreciation (Depreciation) | |
| Investment Securities | (135,940) |
| Futures Contracts | 38 |
| Change in Unrealized Appreciation (Depreciation) | (135,902) |
| Net Increase (Decrease) in Net Assets Resulting from Operations | (7,820) |
| 1 Interest income from an affiliated company of the fund was $12,000. | |
See accompanying Notes, which are an integral part of the Financial Statements.
16
| Russell 3000 Index Fund | ||
| Statement of Changes in Net Assets | ||
| Year Ended August 31, | ||
| 2015 | 2014 | |
| ($000) | ($000) | |
| Increase (Decrease) in Net Assets | ||
| Operations | ||
| Net Investment Income | 14,582 | 11,200 |
| Realized Net Gain (Loss) | 113,500 | 39,984 |
| Change in Unrealized Appreciation (Depreciation) | (135,902) | 81,057 |
| Net Increase (Decrease) in Net Assets Resulting from Operations | (7,820) | 132,241 |
| Distributions | ||
| Net Investment Income | ||
| ETF Shares | (2,304) | (1,568) |
| Institutional Shares | (11,310) | (9,091) |
| Realized Capital Gain | ||
| ETF Shares | — | — |
| Institutional Shares | — | — |
| Total Distributions | (13,614) | (10,659) |
| Capital Share Transactions | ||
| ETF Shares | 53,219 | 26,093 |
| Institutional Shares | 204,190 | 71,356 |
| Net Increase (Decrease) from Capital Share Transactions | 257,409 | 97,449 |
| Total Increase (Decrease) | 235,975 | 219,031 |
| Net Assets | ||
| Beginning of Period | 720,844 | 501,813 |
| End of Period1 | 956,819 | 720,844 |
1 Net Assets—End of Period includes undistributed (overdistributed) net investment income of $3,357,000 and $2,382,000.
See accompanying Notes, which are an integral part of the Financial Statements.
17
| Russell 3000 Index Fund | |||||
| Financial Highlights | |||||
| ETF Shares | |||||
| Sept. 20, | |||||
| 20101 to | |||||
| Year Ended August 31, | |||||
| For a Share Outstanding | Aug. 31, | ||||
| Throughout Each Period | 2015 | 2014 | 2013 | 2012 | 2011 |
| Net Asset Value, Beginning of Period | $92.82 | $75.79 | $64.28 | $55.97 | $51.86 |
| Investment Operations | |||||
| Net Investment Income | 1.649 | 1.485 | 1.313 | 1.037 | .819 |
| Net Realized and Unrealized Gain (Loss) | |||||
| on Investments | (1.396) | 17.004 | 11.484 | 8.255 | 3.924 |
| Total from Investment Operations | .253 | 18.489 | 12.797 | 9.292 | 4.743 |
| Distributions | |||||
| Dividends from Net Investment Income | (1.643) | (1.459) | (1.287) | (. 982) | (. 633) |
| Distributions from Realized Capital Gains | — | — | — | — | — |
| Total Distributions | (1.643) | (1.459) | (1.287) | (. 982) | (. 633) |
| Net Asset Value, End of Period | $91.43 | $92.82 | $75.79 | $64.28 | $55.97 |
| Total Return | 0.21% | 24.58% | 20.14% | 16.80% | 9.09% |
| Ratios/Supplemental Data | |||||
| Net Assets, End of Period (Millions) | $169 | $121 | $76 | $39 | $22 |
| Ratio of Total Expenses to | |||||
| Average Net Assets | 0.15% | 0.15% | 0.15% | 0.15% | 0.15%2 |
| Ratio of Net Investment Income to | |||||
| Average Net Assets | 1.76% | 1.77% | 2.03% | 1.99% | 1.71%2 |
| Portfolio Turnover Rate 3 | 4% | 8% | 16% | 20% | 32% |
1 Inception.
2 Annualized.
3 Excludes the value of portfolio securities received or delivered as a result of in-kind purchases or redemptions of the fund’s capital shares, including ETF Creation Units.
See accompanying Notes, which are an integral part of the Financial Statements.
18
| Russell 3000 Index Fund | |||||
| Financial Highlights | |||||
| Institutional Shares | |||||
| Nov. 1, | |||||
| 20101 to | |||||
| Year Ended August 31, | |||||
| For a Share Outstanding | Aug. 31, | ||||
| Throughout Each Period | 2015 | 2014 | 2013 | 2012 | 2011 |
| Net Asset Value, Beginning of Period | $179.64 | $146.68 | $124.40 | $108.32 | $104.44 |
| Investment Operations | |||||
| Net Investment Income | 3.318 | 2.986 | 2.630 | 2.087 | 1.494 |
| Net Realized and Unrealized Gain (Loss) | |||||
| on Investments | (2.689) | 32.903 | 22.226 | 15.972 | 3.650 |
| Total from Investment Operations | .629 | 35.889 | 24.856 | 18.059 | 5.144 |
| Distributions | |||||
| Dividends from Net Investment Income | (3.289) | (2.929) | (2.576) | (1.979) | (1.264) |
| Distributions from Realized Capital Gains | — | — | — | — | — |
| Total Distributions | (3.289) | (2.929) | (2.576) | (1.979) | (1.264) |
| Net Asset Value, End of Period | $176.98 | $179.64 | $146.68 | $124.40 | $108.32 |
| Total Return | 0.30% | 24.66% | 20.21% | 16.89% | 4.87% |
| Ratios/Supplemental Data | |||||
| Net Assets, End of Period (Millions) | $788 | $600 | $426 | $126 | $35 |
| Ratio of Total Expenses to | |||||
| Average Net Assets | 0.08% | 0.08% | 0.08% | 0.08% | 0.08%2 |
| Ratio of Net Investment Income to | |||||
| Average Net Assets | 1.83% | 1.84% | 2.10% | 2.06% | 1.78%2 |
| Portfolio Turnover Rate 3 | 4% | 8% | 16% | 20% | 32% |
1 Inception.
2 Annualized.
3 Excludes the value of portfolio securities received or delivered as a result of in-kind purchases or redemptions of the fund’s capital shares, including ETF Creation Units.
See accompanying Notes, which are an integral part of the Financial Statements.
19
Russell 3000 Index Fund
Notes to Financial Statements
Vanguard Russell 3000 Index Fund is registered under the Investment Company Act of 1940 as an open-end investment company, or mutual fund. The fund offers two classes of shares: ETF Shares and Institutional Shares. ETF Shares are listed for trading on Nasdaq; they can be purchased and sold through a broker. Institutional Shares are designed for investors who meet certain administrative, service, and account-size criteria.
A. The following significant accounting policies conform to generally accepted accounting principles for U.S. investment companies. The fund consistently follows such policies in preparing its financial statements.
1. Security Valuation: Securities are valued as of the close of trading on the New York Stock Exchange (generally 4 p.m., Eastern time) on the valuation date. Equity securities are valued at the latest quoted sales prices or official closing prices taken from the primary market in which each security trades; such securities not traded on the valuation date are valued at the mean of the latest quoted bid and asked prices. Securities for which market quotations are not readily available, or whose values have been materially affected by events occurring before the fund’s pricing time but after the close of the securities’ primary markets, are valued by methods deemed by the board of trustees to represent fair value. Investments in Vanguard Market Liquidity Fund are valued at that fund’s net asset value. Temporary cash investments acquired over 60 days to maturity are valued using the latest bid prices or using valuations based on a matrix system (which considers such factors as security prices, yields, maturities, and ratings), both as furnished by independent pricing services. Other temporary cash investments are valued at amortized cost, which approximates market value.
2. Futures Contracts: The fund uses index futures contracts to a limited extent, with the objectives of maintaining full exposure to the stock market, enhancing returns, maintaining liquidity, and minimizing transaction costs. The fund may purchase futures contracts to immediately invest incoming cash in the market, or sell futures in response to cash outflows, thereby simulating a fully invested position in the underlying index while maintaining a cash balance for liquidity. The fund may seek to enhance returns by using futures contracts instead of the underlying securities when futures are believed to be priced more attractively than the underlying securities. The primary risks associated with the use of futures contracts are imperfect correlation between changes in market values of stocks held by the fund and the prices of futures contracts, and the possibility of an illiquid market. Counterparty risk involving futures is mitigated because a regulated clearinghouse is the counterparty instead of the clearing broker. To further mitigate counterparty risk, the fund trades futures contracts on an exchange, monitors the financial strength of its clearing brokers and clearinghouse, and has entered into clearing agreements with its clearing brokers. The clearinghouse imposes initial margin requirements to secure the fund’s performance and requires daily settlement of variation margin representing changes in the market value of each contract.
Futures contracts are valued at their quoted daily settlement prices. The aggregate settlement values of the contracts are not recorded in the Statement of Net Assets. Fluctuations in the value of the contracts are recorded in the Statement of Net Assets as an asset (liability) and in the Statement of Operations as unrealized appreciation (depreciation) until the contracts are closed, when they are recorded as realized futures gains (losses).
During the year ended August 31, 2015, the fund’s average investments in long and short futures contracts represented less than 1% and 0% of net assets, respectively, based on the average of aggregate settlement values at each quarter-end during the period.
20
Russell 3000 Index Fund
3. Federal Income Taxes: The fund intends to continue to qualify as a regulated investment company and distribute all of its taxable income. Management has analyzed the fund’s tax positions taken for all open federal income tax years (August 31, 2012–2015), and has concluded that no provision for federal income tax is required in the fund’s financial statements.
4. Distributions: Distributions to shareholders are recorded on the ex-dividend date.
5. Securities Lending: To earn additional income, the fund lends its securities to qualified institutional borrowers. Security loans are required to be secured at all times by collateral in an amount at least equal to the market value of securities loaned. Daily market fluctuations could cause the value of loaned securities to be more or less than the value of the collateral received. When this occurs, the collateral is adjusted and settled on the next business day. The fund further mitigates its counterparty risk by entering into securities lending transactions only with a diverse group of prequalified counter-parties, monitoring their financial strength, and entering into master securities lending agreements with its counterparties. The master securities lending agreements provide that, in the event of a counterparty’s default (including bankruptcy), the fund may terminate any loans with that borrower, determine the net amount owed, and sell or retain the collateral up to the net amount owed to the fund; however, such actions may be subject to legal proceedings. While collateral mitigates counter-party risk, in the absence of a default the fund may experience delays and costs in recovering the securities loaned. The fund invests cash collateral received in Vanguard Market Liquidity Fund, and records a liability in the Statement of Net Assets for the return of the collateral, during the period the securities are on loan. Securities lending income represents fees charged to borrowers plus income earned on invested cash collateral, less expenses associated with the loan.
6. Credit Facility: The fund and certain other funds managed by The Vanguard Group (“Vanguard”) participate in a $3 billion committed credit facility provided by a syndicate of lenders pursuant to a credit agreement that may be renewed annually; each fund is individually liable for its borrowings, if any, under the credit facility. Borrowings may be utilized for temporary and emergency purposes, and are subject to the fund’s regulatory and contractual borrowing restrictions. The participating funds are charged administrative fees and an annual commitment fee of 0.06% of the undrawn amount of the facility; these fees are allocated to the funds based on a method approved by the fund’s board of trustees and included in Management and Administrative expenses on the fund’s Statement of Operations. Any borrowings under this facility bear interest at a rate equal to the higher of the federal funds rate or LIBOR reference rate plus an agreed-upon spread.
The fund had no borrowings outstanding at August 31, 2015, or at any time during the period then ended.
7. Other: Dividend income is recorded on the ex-dividend date. Interest income includes income distributions received from Vanguard Market Liquidity Fund and is accrued daily. Premiums and discounts on debt securities purchased are amortized and accreted, respectively, to interest income over the lives of the respective securities. Security transactions are accounted for on the date securities are bought or sold. Costs used to determine realized gains (losses) on the sale of investment securities are those of the specific securities sold.
Each class of shares has equal rights as to assets and earnings, except that each class separately bears certain class-specific expenses related to maintenance of shareholder accounts (included in Management and Administrative expenses) and shareholder reporting. Marketing and distribution expenses are allocated to each class of shares based on a method approved by the board of trustees. Income, other non-class-specific expenses, and gains and losses on investments are allocated to each class of shares based on its relative net assets.
21
Russell 3000 Index Fund
B. In accordance with the terms of a Funds’ Service Agreement (the “FSA”) between Vanguard and the fund, Vanguard furnishes to the fund investment advisory, corporate management, administrative, marketing, and distribution services at Vanguard’s cost of operations (as defined by the FSA). These costs of operations are allocated to the fund based on methods and guidelines approved by the board of trustees. Vanguard does not require reimbursement in the current period for certain costs of operations (such as deferred compensation/benefits and risk/insurance costs); the fund’s liability for these costs of operations is included in Payables to Vanguard on the Statement of Net Assets.
Upon the request of Vanguard, the fund may invest up to 0.40% of its net assets as capital in Vanguard. At August 31, 2015, the fund had contributed to Vanguard capital in the amount of $92,000, representing 0.01% of the fund’s net assets and 0.04% of Vanguard’s capitalization. The fund’s trustees and officers are also directors and employees, respectively, of Vanguard.
C. Various inputs may be used to determine the value of the fund’s investments. These inputs are summarized in three broad levels for financial statement purposes. The inputs or methodologies used to value securities are not necessarily an indication of the risk associated with investing in those securities.
Level 1—Quoted prices in active markets for identical securities.
Level 2—Other significant observable inputs (including quoted prices for similar securities, interest rates, prepayment speeds, credit risk, etc.).
Level 3—Significant unobservable inputs (including the fund’s own assumptions used to determine the fair value of investments).
The following table summarizes the market value of the fund’s investments as of August 31, 2015, based on the inputs used to value them:
| Level 1 | Level 2 | Level 3 | |
| Investments | ($000) | ($000) | ($000) |
| Common Stocks | 949,238 | — | 6 |
| Temporary Cash Investments | 7,482 | 1,000 | — |
| Futures Contracts—Liabilities1 | (78) | — | — |
| Total | 956,642 | 1,000 | 6 |
| 1 Represents variation margin on the last day of the reporting period. |
D. At August 31, 2015, the aggregate settlement value of open futures contracts and the related unrealized appreciation (depreciation) were:
| ($000) | ||||
| Aggregate | ||||
| Number of | Settlement | Unrealized | ||
| Long (Short) | Value | Appreciation | ||
| Futures Contracts | Expiration | Contracts | Long (Short) | (Depreciation) |
| E-mini S&P 500 Index | September 2015 | 75 | 7,384 | 146 |
| E-mini Russell 2000 Index | September 2015 | 1 | 116 | (10) |
| 136 |
Unrealized appreciation (depreciation) on open futures contracts is required to be treated as realized gain (loss) for tax purposes.
22
Russell 3000 Index Fund
E. Distributions are determined on a tax basis and may differ from net investment income and realized capital gains for financial reporting purposes. Differences may be permanent or temporary. Permanent differences are reclassified among capital accounts in the financial statements to reflect their tax character. Temporary differences arise when certain items of income, expense, gain, or loss are recognized in different periods for financial statement and tax purposes. These differences will reverse at some time in the future. Differences in classification may also result from the treatment of short-term gains as ordinary income for tax purposes.
During the year ended August 31, 2015, the fund realized $114,024,000 of net capital gains resulting from in-kind redemptions—in which shareholders exchanged fund shares for securities held by the fund rather than for cash. Because such gains are not taxable to the fund, and are not distributed to shareholders, they have been reclassified from accumulated net realized losses to paid-in capital.
For tax purposes, at August 31, 2015, the fund had $3,523,000 of ordinary income available for distribution. The fund had available capital losses totaling $1,938,000 that may be carried forward indefinitely to offset future net capital gains.
At August 31, 2015, the cost of investment securities for tax purposes was $950,080,000. Net unrealized appreciation of investment securities for tax purposes was $7,646,000, consisting of unrealized gains of $62,366,000 on securities that had risen in value since their purchase and $54,720,000 in unrealized losses on securities that had fallen in value since their purchase.
F. During the year ended August 31, 2015, the fund purchased $641,812,000 of investment securities and sold $383,877,000 of investment securities, other than temporary cash investments. Purchases and sales include $316,668,000 and $353,065,000, respectively, in connection with in-kind purchases and redemptions of the fund’s capital shares.
G. Capital share transactions for each class of shares were:
| Year Ended August 31, | ||||
| 2015 | 2014 | |||
| Amount | Shares | Amount | Shares | |
| ($000) | (000) | ($000) | (000) | |
| ETF Shares | ||||
| Issued | 618,159 | 6,450 | 201,240 | 2,300 |
| Issued in Lieu of Cash Distributions | — | — | — | — |
| Redeemed | (564,940) | (5,900) | (175,147) | (2,000) |
| Net Increase (Decrease)—ETF Shares | 53,219 | 550 | 26,093 | 300 |
| Institutional Shares | ||||
| Issued | 325,512 | 1,765 | 174,126 | 1,056 |
| Issued in Lieu of Cash Distributions | 11,310 | 62 | 8,632 | 52 |
| Redeemed | (132,632) | (717) | (111,402) | (671) |
| Net Increase (Decrease) —Institutional Shares | 204,190 | 1,110 | 71,356 | 437 |
H. Management has determined that no material events or transactions occurred subsequent to August 31, 2015, that would require recognition or disclosure in these financial statements.
23
Report of Independent Registered Public Accounting Firm
To the Board of Trustees of Vanguard Scottsdale Funds and the Shareholders of Vanguard Russell 3000 Index Fund: In our opinion, the accompanying statement of net assets—investments summary and the related statements of operations and of changes in net assets and the financial highlights present fairly, in all material respects, the financial position of Vanguard Russell 3000 Index Fund (constituting a separate portfolio of Vanguard Scottsdale Funds, hereafter referred to as the “Fund”) at August 31, 2015, the results of its operations for the year then ended, the changes in its net assets for each of the two years in the period then ended, and the financial highlights for each of the periods indicated, in conformity with accounting principles generally accepted in the United States of America. These financial statements and financial highlights (hereafter referred to as “financial statements”) are the responsibility of the Fund’s management. Our responsibility is to express an opinion on these financial statements based on our audits. We conducted our audits of these financial statements in accordance with the standards of the Public Company Accounting Oversight Board (United States). Those standards require that we plan and perform the audit to obtain reasonable assurance about whether the financial statements are free of material misstatement. An audit includes examining, on a test basis, evidence supporting the amounts and disclosures in the financial statements, assessing the accounting principles used and significant estimates made by management, and evaluating the overall financial statement presentation. We believe that our audits, which included confirmation of securities at August 31, 2015 by correspondence with the custodian and brokers, by agreement to the underlying ownership records of the transfer agent and the application of alternative auditing procedures where securities purchased had not been received, provide a reasonable basis for our opinion.
/s/PricewaterhouseCoopers LLP
Philadelphia, Pennsylvania
October 15, 2015
| Special 2015 tax information (unaudited) for Vanguard Russell 3000 Index Fund |
| This information for the fiscal year ended August 31, 2015, is included pursuant to provisions of the |
| Internal Revenue Code. |
| The fund distributed $13,614,000 of qualified dividend income to shareholders during the fiscal year. |
| For corporate shareholders, 93.0% of investment income (dividend income plus short-term gains, |
| if any) qualifies for the dividends-received deduction. |
24
Your Fund’s After-Tax Returns
This table presents returns for your fund both before and after taxes. The after-tax returns are shown in two ways: (1) assuming that an investor owned the fund during the entire period and paid taxes on the fund’s distributions, and (2) assuming that an investor paid taxes on the fund’s distributions and sold all shares at the end of each period.
Calculations are based on the highest individual federal income tax and capital gains tax rates in effect at the times of the distributions and the hypothetical sales. State and local taxes were not considered. After-tax returns reflect any qualified dividend income, using actual prior-year figures and estimates for 2015. (In the example, returns after the sale of fund shares may be higher than those assuming no sale. This occurs when the sale would have produced a capital loss. The calculation assumes that the investor received a tax deduction for the loss.)
The table shows returns for ETF Shares only; returns for other share classes will differ. Please note that your actual after-tax returns will depend on your tax situation and may differ from those shown. Also note that if you own the fund in a tax-deferred account, such as an individual retirement account or a 401(k) plan, this information does not apply to you. Such accounts are not subject to current taxes.
Finally, keep in mind that a fund’s performance—whether before or after taxes—does not guarantee future results.
Average Annual Total Returns: Russell 3000 Index Fund ETF Shares
Periods Ended August 31, 2015
| Since | ||
| One | Inception | |
| Year | (9/20/2010) | |
| Returns Before Taxes | 0.21% | 13.99% |
| Returns After Taxes on Distributions | -0.20 | 13.63 |
| Returns After Taxes on Distributions and Sale of Fund Shares | 0.48 | 11.25 |
25
About Your Fund’s Expenses
As a shareholder of the fund, you incur ongoing costs, which include costs for portfolio management, administrative services, and shareholder reports (like this one), among others. Operating expenses, which are deducted from a fund’s gross income, directly reduce the investment return of the fund.
A fund’s expenses are expressed as a percentage of its average net assets. This figure is known as the expense ratio. The following examples are intended to help you understand the ongoing costs (in dollars) of investing in your fund and to compare these costs with those of other mutual funds. The examples are based on an investment of $1,000 made at the beginning of the period shown and held for the entire period.
The accompanying table illustrates your fund’s costs in two ways:
• Based on actual fund return. This section helps you to estimate the actual expenses that you paid over the period. The ”Ending Account Value“ shown is derived from the fund‘s actual return, and the third column shows the dollar amount that would have been paid by an investor who started with $1,000 in the fund. You may use the information here, together with the amount you invested, to estimate the expenses that you paid over the period.
To do so, simply divide your account value by $1,000 (for example, an $8,600 account value divided by $1,000 = 8.6), then multiply the result by the number given for your fund under the heading ”Expenses Paid During Period.“
• Based on hypothetical 5% yearly return. This section is intended to help you compare your fund‘s costs with those of other mutual funds. It assumes that the fund had a yearly return of 5% before expenses, but that the expense ratio is unchanged. In this case—because the return used is not the fund’s actual return—the results do not apply to your investment. The example is useful in making comparisons because the Securities and Exchange Commission requires all mutual funds to calculate expenses based on a 5% return. You can assess your fund’s costs by comparing this hypothetical example with the hypothetical examples that appear in shareholder reports of other funds.
Note that the expenses shown in the table are meant to highlight and help you compare ongoing costs only and do not reflect transaction costs incurred by the fund for buying and selling securities. Further, the expenses do not include any purchase, redemption, or account service fees described in the fund prospectus. If such fees were applied to your account, your costs would be higher. Your fund does not carry a “sales load.”
The calculations assume no shares were bought or sold during the period. Your actual costs may have been higher or lower, depending on the amount of your investment and the timing of any purchases or redemptions.
You can find more information about the fund’s expenses, including annual expense ratios, in the Financial Statements section of this report. For additional information on operating expenses and other shareholder costs, please refer to your fund’s current prospectus.
26
| Six Months Ended August 31, 2015 | |||
| Beginning | Ending | Expenses | |
| Account Value | Account Value | Paid During | |
| Russell 3000 Index Fund | 2/28/2015 | 8/31/2015 | Period |
| Based on Actual Fund Return | |||
| ETF Shares | $1,000.00 | $946.18 | $0.78 |
| Institutional Shares | 1,000.00 | 946.60 | 0.39 |
| Based on Hypothetical 5% Yearly Return | |||
| ETF Shares | $1,000.00 | $1,024.40 | $0.82 |
| Institutional Shares | 1,000.00 | 1,024.80 | 0.41 |
The calculations are based on expenses incurred in the most recent six-month period. The fund’s annualized six-month expense ratios for that period are 0.16% for ETF Shares and 0.08% for Institutional Shares. The dollar amounts shown as ”Expenses Paid” are equal to the annualized expense ratio multiplied by the average account value over the period, multiplied by the number of days in the most recent six-month period, then divided by the number of days in the most recent 12-month period (184/365).
27
Trustees Approve Advisory Arrangement
The board of trustees of Vanguard Russell 3000 Index Fund has renewed the fund’s investment advisory arrangement with The Vanguard Group, Inc. (Vanguard). Vanguard—through its Equity Index Group—serves as investment advisor to the fund. The board determined that continuing the fund’s internalized management structure was in the best interests of the fund and its shareholders.
The board based its decision upon an evaluation of the advisor’s investment staff, portfolio management process, and performance. The trustees considered the factors discussed below, among others. However, no single factor determined whether the board approved the arrangement. Rather, it was the totality of the circumstances that drove the board’s decision.
Nature, extent, and quality of services
The board reviewed the quality of the investment management services provided to the fund since its inception in 2010, and took into account the organizational depth and stability of the advisor. The board considered that Vanguard has been managing investments for more than three decades. The Equity Index Group adheres to a sound, disciplined investment management process; the team has considerable experience, stability, and depth.
The board concluded that Vanguard’s experience, stability, depth, and performance, among other factors, warranted continuation of the advisory arrangement.
Investment performance
The board considered the fund’s performance since its inception, including any periods of outperformance or underperformance relative to a target index and peer group. The board concluded that the performance was such that the advisory arrangement should continue. Information about the fund’s most recent performance can be found in the Performance Summary section of this report.
Cost
The board concluded that the fund’s expense ratio was well below the average expense ratio charged by funds in its peer group and that the fund’s advisory fee rate was also well below its peer-group average. Information about the fund’s expenses appears in the About Your Fund’s Expenses section of the report as well as in the Financial Statements section.
The board does not conduct a profitability analysis of Vanguard, because of Vanguard’s unique “at-cost” structure. Unlike most other mutual fund management companies, Vanguard is owned by the funds it oversees, and produces “profits” only in the form of reduced expenses for fund shareholders.
The benefit of economies of scale
The board concluded that the fund’s at-cost arrangement with Vanguard ensures that the fund will realize economies of scale as it grows, with the cost to shareholders declining as fund assets increase.
The board will consider whether to renew the advisory arrangement again after a one-year period.
28
Glossary
30-Day SEC Yield. A fund’s 30-day SEC yield is derived using a formula specified by the U.S. Securities and Exchange Commission. Under the formula, data related to the fund’s security holdings in the previous 30 days are used to calculate the fund’s hypothetical net income for that period, which is then annualized and divided by the fund’s estimated average net assets over the calculation period. For the purposes of this calculation, a security’s income is based on its current market yield to maturity (for bonds), its actual income (for asset-backed securities), or its projected dividend yield (for stocks). Because the SEC yield represents hypothetical annualized income, it will differ—at times significantly—from the fund’s actual experience. As a result, the fund’s income distributions may be higher or lower than implied by the SEC yield.
Beta. A measure of the magnitude of a fund’s past share-price fluctuations in relation to the ups and downs of a given market index. The index is assigned a beta of 1.00. Compared with a given index, a fund with a beta of 1.20 typically would have seen its share price rise or fall by 12% when the index rose or fell by 10%. For this report, beta is based on returns over the past 36 months for both the fund and the index. Note that a fund’s beta should be reviewed in conjunction with its R-squared (see definition). The lower the R-squared, the less correlation there is between the fund and the index, and the less reliable beta is as an indicator of volatility.
Dividend Yield. Dividend income earned by stocks, expressed as a percentage of the aggregate market value (or of net asset value, for a fund). The yield is determined by dividing the amount of the annual dividends by the aggregate value (or net asset value) at the end of the period. For a fund, the dividend yield is based solely on stock holdings and does not include any income produced by other investments.
Earnings Growth Rate. The average annual rate of growth in earnings over the past five years for the stocks now in a fund.
Equity Exposure. A measure that reflects a fund’s investments in stocks and stock futures. Any holdings in short-term reserves are excluded.
Expense Ratio. A fund’s total annual operating expenses expressed as a percentage of the fund’s average net assets. The expense ratio includes management and administrative expenses, but does not include the transaction costs of buying and selling portfolio securities.
Foreign Holdings. The percentage of a fund represented by securities or depositary receipts of companies based outside the United States.
Inception Date. The date on which the assets of a fund (or one of its share classes) are first invested in accordance with the fund’s investment objective. For funds with a subscription period, the inception date is the day after that period ends. Investment performance is measured from the inception date.
Median Market Cap. An indicator of the size of companies in which a fund invests; the midpoint of market capitalization (market price x shares outstanding) of a fund’s stocks, weighted by the proportion of the fund’s assets invested in each stock. Stocks representing half of the fund’s assets have market capitalizations above the median, and the rest are below it.
Price/Book Ratio. The share price of a stock divided by its net worth, or book value, per share. For a fund, the weighted average price/book ratio of the stocks it holds.
29
Price/Earnings Ratio. The ratio of a stock’s current price to its per-share earnings over the past year. For a fund, the weighted average P/E of the stocks it holds. P/E is an indicator of market expectations about corporate prospects; the higher the P/E, the greater the expectations for a company’s future growth.
R-Squared. A measure of how much of a fund’s past returns can be explained by the returns from the market in general, as measured by a given index. If a fund’s total returns were precisely synchronized with an index’s returns, its R-squared would be 1.00. If the fund’s returns bore no relationship to the index’s returns, its R-squared would be 0. For this report, R-squared is based on returns over the past 36 months for both the fund and the index.
Return on Equity. The annual average rate of return generated by a company during the past five years for each dollar of shareholder’s equity (net income divided by shareholder’s equity). For a fund, the weighted average return on equity for the companies whose stocks it holds.
Short-Term Reserves. The percentage of a fund invested in highly liquid, short-term securities that can be readily converted to cash.
Turnover Rate. An indication of the fund’s trading activity. Funds with high turnover rates incur higher transaction costs and may be more likely to distribute capital gains (which may be taxable to investors). The turnover rate excludes in-kind transactions, which have minimal impact on costs.
30
This page intentionally left blank.
The People Who Govern Your Fund
The trustees of your mutual fund are there to see that the fund is operated and managed in your best interests since, as a shareholder, you are a part owner of the fund. Your fund’s trustees also serve on the board of directors of The Vanguard Group, Inc., which is owned by the Vanguard funds and provides services to them on an at-cost basis.
A majority of Vanguard’s board members are independent, meaning that they have no affiliation with Vanguard or the funds they oversee, apart from the sizable personal investments they have made as private individuals. The independent board members have distinguished backgrounds in business, academia, and public service. Each of the trustees and executive officers oversees 194 Vanguard funds.
The following table provides information for each trustee and executive officer of the fund. More information about the trustees is in the Statement of Additional Information, which can be obtained, without charge, by contacting Vanguard at 800-662-7447, or online at vanguard.com.
| InterestedTrustee1 | Rajiv L. Gupta |
| Born 1945. Trustee Since December 2001.2 Principal | |
| F. William McNabb III | Occupation(s) During the Past Five Years and Other |
| Born 1957. Trustee Since July 2009. Chairman of | Experience: Chairman and Chief Executive Officer |
| the Board. Principal Occupation(s) During the Past | (retired 2009) and President (2006–2008) of |
| Five Years and Other Experience: Chairman of the | Rohm and Haas Co. (chemicals); Director of Tyco |
| Board of The Vanguard Group, Inc., and of each of | International PLC (diversified manufacturing and |
| the investment companies served by The Vanguard | services), Hewlett-Packard Co. (electronic computer |
| Group, since January 2010; Director of The Vanguard | manufacturing), and Delphi Automotive PLC |
| Group since 2008; Chief Executive Officer and | (automotive components); Senior Advisor at New |
| President of The Vanguard Group, and of each of | Mountain Capital. |
| the investment companies served by The Vanguard | |
| Group, since 2008; Director of Vanguard Marketing | Amy Gutmann |
| Corporation; Managing Director of The Vanguard | Born 1949. Trustee Since June 2006. Principal |
| Group (1995–2008). | Occupation(s) During the Past Five Years and |
| Other Experience: President of the University of | |
| IndependentTrustees | Pennsylvania; Christopher H. Browne Distinguished |
| Professor of Political Science, School of Arts and | |
| Emerson U. Fullwood | Sciences, and Professor of Communication, Annenberg |
| Born 1948. Trustee Since January 2008. Principal | School for Communication, with secondary faculty |
| Occupation(s) During the Past Five Years and | appointments in the Department of Philosophy, School |
| Other Experience: Executive Chief Staff and | of Arts and Sciences, and at the Graduate School of |
| Marketing Officer for North America and Corporate | Education, University of Pennsylvania; Trustee of the |
| Vice President (retired 2008) of Xerox Corporation | National Constitution Center; Chair of the Presidential |
| (document management products and services); | Commission for the Study of Bioethical Issues. |
| Executive in Residence and 2009–2010 Distinguished | |
| Minett Professor at the Rochester Institute of | JoAnn Heffernan Heisen |
| Technology; Director of SPX Corporation (multi-industry | Born 1950. Trustee Since July 1998. Principal |
| manufacturing), the United Way of Rochester, | Occupation(s) During the Past Five Years and Other |
| Amerigroup Corporation (managed health care), the | Experience: Corporate Vice President and Chief |
| University of Rochester Medical Center, Monroe | Global Diversity Officer (retired 2008) and Member |
| Community College Foundation, and North Carolina | of the Executive Committee (1997–2008) of Johnson |
| A&T University. | & Johnson (pharmaceuticals/medical devices/ |
| consumer products); Director of Skytop Lodge | |
| Corporation (hotels), the University Medical Center | |
| at Princeton, the Robert Wood Johnson Foundation, | |
| and the Center for Talent Innovation; Member of | |
| the Advisory Board of the Institute for Women’s | |
| Leadership at Rutgers University. |
| F. Joseph Loughrey | Executive Officers | |
| Born 1949. Trustee Since October 2009. Principal | ||
| Occupation(s) During the Past Five Years and Other | Glenn Booraem | |
| Experience: President and Chief Operating Officer | Born 1967. Treasurer Since May 2015. Principal | |
| (retired 2009) of Cummins Inc. (industrial machinery); | Occupation(s) During the Past Five Years and | |
| Chairman of the Board of Hillenbrand, Inc. (specialized | Other Experience: Principal of The Vanguard Group, | |
| consumer services), and of Oxfam America; Director | Inc.; Treasurer of each of the investment companies | |
| of SKF AB (industrial machinery), Hyster-Yale Materials | served by The Vanguard Group; Controller of each of | |
| Handling, Inc. (forklift trucks), the Lumina Foundation | the investment companies served by The Vanguard | |
| for Education, and the V Foundation for Cancer | Group (2010–2015); Assistant Controller of each of | |
| Research; Member of the Advisory Council for the | the investment companies served by The Vanguard | |
| College of Arts and Letters and of the Advisory Board | Group (2001–2010). | |
| to the Kellogg Institute for International Studies, both | ||
| at the University of Notre Dame. | Thomas J. Higgins | |
| Born 1957. Chief Financial Officer Since September | ||
| Mark Loughridge | 2008. Principal Occupation(s) During the Past Five | |
| Born 1953. Trustee Since March 2012. Principal | Years and Other Experience: Principal of The Vanguard | |
| Occupation(s) During the Past Five Years and Other | Group, Inc.; Chief Financial Officer of each of the | |
| Experience: Senior Vice President and Chief Financial | investment companies served by The Vanguard Group; | |
| Officer (retired 2013) at IBM (information technology | Treasurer of each of the investment companies served | |
| services); Fiduciary Member of IBM’s Retirement Plan | by The Vanguard Group (1998–2008). | |
| Committee (2004–2013); Director of the Dow Chemical | ||
| Company; Member of the Council on Chicago Booth. | Peter Mahoney | |
| Born 1974. Controller Since May 2015. Principal | ||
| Scott C. Malpass | Occupation(s) During the Past Five Years and | |
| Born 1962. Trustee Since March 2012. Principal | Other Experience: Head of Global Fund Accounting | |
| Occupation(s) During the Past Five Years and Other | at The Vanguard Group, Inc.; Controller of each of the | |
| Experience: Chief Investment Officer and Vice | investment companies served by The Vanguard Group; | |
| President at the University of Notre Dame; Assistant | Head of International Fund Services at The Vanguard | |
| Professor of Finance at the Mendoza College of | Group (2008–2014). | |
| Business at Notre Dame; Member of the Notre Dame | ||
| 403(b) Investment Committee; Board Member of | Heidi Stam | |
| TIFF Advisory Services, Inc., and Catholic Investment | Born 1956. Secretary Since July 2005. Principal | |
| Services, Inc. (investment advisors); Member of | Occupation(s) During the Past Five Years and Other | |
| the Investment Advisory Committee of Major | Experience: Managing Director of The Vanguard | |
| League Baseball. | Group, Inc.; General Counsel of The Vanguard Group; | |
| Secretary of The Vanguard Group and of each of the | ||
| André F. Perold | investment companies served by The Vanguard Group; | |
| Born 1952. Trustee Since December 2004. Principal | Director and Senior Vice President of Vanguard | |
| Occupation(s) During the Past Five Years and Other | Marketing Corporation. | |
| Experience: George Gund Professor of Finance and | ||
| Banking, Emeritus at the Harvard Business School | Vanguard Senior ManagementTeam | |
| (retired 2011); Chief Investment Officer and Managing | Mortimer J. Buckley | Chris D. McIsaac |
| Partner of HighVista Strategies LLC (private investment | Kathleen C. Gubanich | James M. Norris |
| firm); Director of Rand Merchant Bank; Overseer of | Paul A. Heller | Thomas M. Rampulla |
| the Museum of Fine Arts Boston. | Martha G. King | Glenn W. Reed |
| John T. Marcante | Karin A. Risi | |
| Peter F. Volanakis | ||
| Born 1955. Trustee Since July 2009. Principal | ||
| Occupation(s) During the Past Five Years and Other | Chairman Emeritus and Senior Advisor | |
| Experience: President and Chief Operating Officer | ||
| (retired 2010) of Corning Incorporated (communications | John J. Brennan | |
| equipment); Trustee of Colby-Sawyer College; | Chairman, 1996–2009 | |
| Member of the Advisory Board of the Norris Cotton | Chief Executive Officer and President, 1996–2008 | |
| Cancer Center and of the Advisory Board of the | ||
| Parthenon Group (strategy consulting). | Founder | |
| John C. Bogle | ||
| Chairman and Chief Executive Officer, 1974–1996 | ||
1 Mr. McNabb is considered an “interested person,” as defined in the Investment Company Act of 1940, because he is an officer of the Vanguard funds.
2 December 2002 for Vanguard Equity Income Fund, the Vanguard Municipal Bond Funds, and the Vanguard State Tax-Exempt Funds.
 | |
| P.O. Box 2600 | |
| Valley Forge, PA 19482-2600 |
Connect with Vanguard® > vanguard.com
| Fund Information > 800-662-7447 | The Russell Indexes and Russell® are registered |
| Direct Investor Account Services > 800-662-2739 | trademarks of Russell Investments and have been |
| licensed for use by The Vanguard Group, Inc. The | |
| Institutional Investor Services > 800-523-1036 | products are not sponsored, endorsed, sold, or |
| Text Telephone for People | promoted by Russell Investments and Russell |
| Who Are Deaf or Hard of Hearing> 800-749-7273 | Investments makes no representation regarding the |
| advisability of investing in the products. | |
| This material may be used in conjunction | |
| with the offering of shares of any Vanguard | |
| fund only if preceded or accompanied by | |
| the fund’s current prospectus. | |
| All comparative mutual fund data are from Lipper, a | |
| Thomson Reuters Company, or Morningstar, Inc., unless | |
| otherwise noted. | |
| You can obtain a free copy of Vanguard’s proxy voting | |
| guidelines by visiting vanguard.com/proxyreporting or by | |
| calling Vanguard at 800-662-2739. The guidelines are | |
| also available from the SEC’s website, sec.gov. In | |
| addition, you may obtain a free report on how your fund | |
| voted the proxies for securities it owned during the 12 | |
| months ended June 30. To get the report, visit either | |
| vanguard.com/proxyreporting or sec.gov. | |
| You can review and copy information about your fund at | |
| the SEC’s Public Reference Room in Washington, D.C. To | |
| find out more about this public service, call the SEC at | |
| 202-551-8090. Information about your fund is also | |
| available on the SEC’s website, and you can receive | |
| copies of this information, for a fee, by sending a | |
| request in either of two ways: via email addressed to | |
| publicinfo@sec.gov or via regular mail addressed to the | |
| Public Reference Section, Securities and Exchange | |
| Commission, Washington, DC 20549-1520. | |
| © 2015 The Vanguard Group, Inc. | |
| All rights reserved. | |
| Vanguard Marketing Corporation, Distributor. | |
| Q18540 102015 | |
Annual Report | August 31, 2015
Vanguard Sector Bond Index Funds
Vanguard Short-Term Government Bond Index Fund
Vanguard Intermediate-Term Government Bond Index Fund
Vanguard Long-Term Government Bond Index Fund
Vanguard Short-Term Corporate Bond Index Fund
Vanguard Intermediate-Term Corporate Bond Index Fund
Vanguard Long-Term Corporate Bond Index Fund
Vanguard Mortgage-Backed Securities Index Fund
Vanguard’s Principles for Investing Success
We want to give you the best chance of investment success. These principles, grounded in Vanguard’s research and experience, can put you on the right path.
Goals. Create clear, appropriate investment goals.
Balance. Develop a suitable asset allocation using broadly diversified funds.
Cost. Minimize cost.
Discipline. Maintain perspective and long-term discipline.
A single theme unites these principles: Focus on the things you can control.
We believe there is no wiser course for any investor.
| Contents | |
| Your Fund’s Total Returns. | 1 |
| Chairman’s Letter. | 4 |
| Short-Term Government Bond Index Fund. | 12 |
| Intermediate-Term Government Bond Index Fund. | 29 |
| Long-Term Government Bond Index Fund. | 46 |
| Short-Term Corporate Bond Index Fund. | 61 |
| Intermediate-Term Corporate Bond Index Fund. | 79 |
| Long-Term Corporate Bond Index Fund. | 97 |
| Mortgage-Backed Securities Index Fund. | 115 |
| About Your Fund’s Expenses. | 137 |
| Trustees Approve Advisory Arrangements. | 140 |
| Glossary. | 141 |
Please note: The opinions expressed in this report are just that—informed opinions. They should not be considered promises or advice.
Also, please keep in mind that the information and opinions cover the period through the date on the front of this report. Of course, the risks of investing in your fund are spelled out in the prospectus.
See the Glossary for definitions of investment terms used in this report.
About the cover: Pictured is a sailing block on the Brilliant, a 1932 schooner docked in Mystic, Connecticut. A type of pulley, the sailing block helps coordinate the setting of the sails. At Vanguard, the intricate coordination of technology and people allows us to help millions of clients around the world reach their financial goals.
| Your Fund’s Total Returns | ||||
| Fiscal Year Ended August 31, 2015 | ||||
| 30-Day SEC | Income | Capital | Total | |
| Yield | Returns | Returns | Returns | |
| Vanguard Short-Term Government Bond Index Fund | ||||
| ETF Shares | 0.60% | |||
| Market Price | 0.75% | |||
| Net Asset Value | 0.75 | |||
| Admiral™ Shares | 0.64 | 0.57% | 0.15% | 0.72 |
| Institutional Shares | 0.63 | 0.61 | 0.17 | 0.78 |
| Barclays U.S. 1–3 Year Government Float | ||||
| Adjusted Index | 0.84 | |||
| Short U.S. Government Funds Average | 0.36 | |||
| Short U.S. Government Funds Average: Derived from data provided by Lipper, a Thomson Reuters Company. | ||||
| Vanguard Intermediate-Term Government Bond Index Fund | ||||
| ETF Shares | 1.54% | |||
| Market Price | 2.67% | |||
| Net Asset Value | 2.67 | |||
| Admiral Shares | 1.58 | 1.65% | 1.02% | 2.67 |
| Institutional Shares | 1.57 | 1.68 | 1.01 | 2.69 |
| Barclays U.S. 3–10 Year Government Float | ||||
| Adjusted Index | 2.86 | |||
| Intermediate U.S. Government Funds Average | 1.55 | |||
Intermediate U.S. Government Funds Average: Derived from data provided by Lipper, a Thomson Reuters Company.
Admiral Shares carry lower expenses and are available to investors who meet certain account-balance requirements. Institutional Shares are available to certain institutional investors who meet specific administrative, service, and account-size criteria. The Vanguard ETF® Shares shown are traded on the Nasdaq exchange and are available only through brokers. The table provides ETF returns based on both the Nasdaq market price and the net asset value for a share. U.S. Pat. Nos. 6,879,964; 7,337,138; 7,720,749; 7,925,573; 8,090,646; and 8,417,623.
1
| Your Fund’s Total Returns | ||||
| Fiscal Year Ended August 31, 2015 | ||||
| 30-Day SEC | Income | Capital | Total | |
| Yield | Returns | Returns | Returns | |
| Vanguard Long-Term Government Bond Index Fund | ||||
| ETF Shares | 2.70% | |||
| Market Price | 4.51% | |||
| Net Asset Value | 4.44 | |||
| Admiral Shares | 2.74 | 2.79% | 1.61% | 4.40 |
| Institutional Shares | 2.73 | 2.82 | 1.65 | 4.47 |
| Barclays U.S. Long Government Float Adjusted | ||||
| Index | 5.05 | |||
| General U.S. Government Funds Average | 1.43 | |||
| General U.S. Government Funds Average: Derived from data provided by Lipper, a Thomson Reuters Company. | ||||
| Vanguard Short-Term Corporate Bond Index Fund | ||||
| ETF Shares | 1.98% | |||
| Market Price | 0.93% | |||
| Net Asset Value | 0.96 | |||
| Admiral Shares | 2.02 | 1.89% | -0.92% | 0.97 |
| Institutional Shares | 2.01 | 1.92 | -0.94 | 0.98 |
| Barclays U.S. 1–5 Year Corporate Bond Index | 1.03 | |||
| Short-Intermediate Investment-Grade Debt Funds | ||||
| Average | 0.33 | |||
| Short-Intermediate Investment-Grade Debt Funds Average: Derived from data provided by Lipper, a Thomson Reuters Company. | ||||
| Vanguard Intermediate-Term Corporate Bond Index Fund | ||||
| ETF Shares | 3.51% | |||
| Market Price | -0.07% | |||
| Net Asset Value | 0.32 | |||
| Admiral Shares | 3.54 | 3.17% | -2.80% | 0.37 |
| Institutional Shares | 3.54 | 3.20 | -2.83 | 0.37 |
| Barclays U.S. 5–10 Year Corporate Bond Index | 0.39 | |||
| Core Bond Funds Average | 0.53 | |||
| Core Bond Funds Average: Derived from data provided by Lipper, a Thomson Reuters Company. | ||||
Admiral Shares carry lower expenses and are available to investors who meet certain account-balance requirements. Institutional Shares are available to certain institutional investors who meet specific administrative, service, and account-size criteria. The Vanguard ETF® Shares shown are traded on the Nasdaq exchange and are available only through brokers. The table provides ETF returns based on both the Nasdaq market price and the net asset value for a share. U.S. Pat. Nos. 6,879,964; 7,337,138; 7,720,749; 7,925,573; 8,090,646; and 8,417,623.
2
| Your Fund’s Total Returns | ||||
| Fiscal Year Ended August 31, 2015 | ||||
| 30-Day SEC | Income | Capital | Total | |
| Yield | Returns | Returns | Returns | |
| Vanguard Long-Term Corporate Bond Index Fund | ||||
| ETF Shares | 4.84% | |||
| Market Price | -3.80% | |||
| Net Asset Value | -3.64 | |||
| Admiral Shares | 4.87 | 4.07% | -7.73% | -3.66 |
| Institutional Shares | 4.87 | 4.10 | -7.72 | -3.62 |
| Barclays U.S. 10+ Year Corporate Bond Index | -3.48 | |||
| Corporate Debt Funds BBB-Rated Average | -1.02 | |||
| Corporate Debt Funds BBB-Rated Average: Derived from data provided by Lipper, a Thomson Reuters Company. | ||||
| Vanguard Mortgage-Backed Securities Index Fund | ||||
| ETF Shares | 1.52% | |||
| Market Price | 2.47% | |||
| Net Asset Value | 2.49 | |||
| Admiral Shares | 1.56 | 1.42% | 1.02% | 2.44 |
| Institutional Shares | 1.55 | 1.45 | 1.04 | 2.49 |
| Barclays U.S. MBS Float Adjusted Index | 2.51 | |||
| U.S. Mortgage Funds Average | 2.28 | |||
| U.S. Mortgage Funds Average: Derived from data provided by Lipper, a Thomson Reuters Company. | ||||
Admiral Shares carry lower expenses and are available to investors who meet certain account-balance requirements. Institutional Shares are available to certain institutional investors who meet specific administrative, service, and account-size criteria. The Vanguard ETF® Shares shown are traded on the Nasdaq exchange and are available only through brokers. The table provides ETF returns based on both the Nasdaq market price and the net asset value for a share. U.S. Pat. Nos. 6,879,964; 7,337,138; 7,720,749; 7,925,573; 8,090,646; and 8,417,623.
For the ETF Shares, the market price is determined by the midpoint of the bid-offer spread as of the closing time of the New York Stock Exchange (generally 4 p.m., Eastern time). The net asset value is also determined as of the NYSE closing time. For more information about how the ETF Shares' market prices have compared with their net asset value, visit vanguard.com, select your ETF, and then select the Price and Performance tab. The ETF premium/discount analysis there shows the percentages of days on which the ETF Shares' market price was above or below the NAV.
3

Chairman’s Letter
Dear Shareholder,
The 12-month period ended August 31, 2015, was a volatile one for bonds. Uncertainty about when the Federal Reserve might begin raising interest rates weighed on sentiment at times, but a host of other factors contributed to the bumpy ride. They included the unsteady pace of growth at home and abroad, disinflationary pressures from the drop in the price of oil and other commodities, the strength of the U.S. dollar, and seemingly stretched stock market valuations.
Demand for the safety of U.S. Treasuries pushed their yields lower for the most part and sent their prices higher, as bond yields and prices move in opposite directions. Among the seven Vanguard Sector Bond Index Funds covered in this report, returns for the three government bond funds ranged from 0.75% for Vanguard Short-Term Government Bond Index Fund to 4.44% for Vanguard Long-Term Government Bond Index Fund. (Returns and yields cited in this letter are for the funds’ ETF Shares, based on net asset value, except where noted otherwise.) The holdings in Vanguard Mortgage-Backed Securities Index Fund also rose in value, contributing to its result of 2.49%.
In contrast, prices of investment-grade corporate bonds fell over the fiscal year as investors shied away from risk. Vanguard Short-Term Corporate Bond Index Fund,
4
which returned 0.96%, and Vanguard Intermediate-Term Corporate Bond Index Fund, which returned 0.32%, earned enough income to offset declines in the prices of their holdings. Their long-term counterpart did not, returning –3.64%.
All but one of the seven funds covered in this report generally performed in line with their benchmark indexes after taking expenses into account. The long-term government fund was the exception; it underperformed largely because of security pricing differences.
On August 31, the 30-day SEC yield was down 5 basis points for the intermediate-term government fund and down 20 basis points for the long-term government fund, compared with a year earlier. (A basis point is one-hundredth of a percentage point.) The yields for the five other funds rose by 12 to 58 basis points.
Results for bonds were muted both at home and abroad
The broad U.S. taxable bond market returned 1.56% for the 12 months, outpacing the broad U.S. stock market.
| Market Barometer | |||
| Average Annual Total Returns | |||
| Periods Ended August 31, 2015 | |||
| One | Three | Five | |
| Year | Years | Years | |
| Bonds | |||
| Barclays U.S. Aggregate Bond Index (Broad taxable market) | 1.56% | 1.53% | 2.98% |
| Barclays Municipal Bond Index (Broad tax-exempt market) | 2.52 | 2.83 | 3.96 |
| Citigroup Three-Month U.S. Treasury Bill Index | 0.02 | 0.03 | 0.05 |
| Stocks | |||
| Russell 1000 Index (Large-caps) | 0.40% | 14.68% | 16.07% |
| Russell 2000 Index (Small-caps) | 0.03 | 14.12 | 15.55 |
| Russell 3000 Index (Broad U.S. market) | 0.36 | 14.63 | 16.03 |
| FTSE All-World ex US Index (International) | -11.50 | 5.79 | 5.17 |
| CPI | |||
| Consumer Price Index | 0.20% | 1.14% | 1.77% |
5
The yield of the 10-year Treasury note slid from 2.34% at the start of the fiscal year to 1.75% on January 31 before retracing some of its steps to end the period at 2.18%. Longer-term Treasury yields also fell, while very short-term Treasury yields moved a little higher.
Municipal bonds resisted some of the downturns in the bond market better than their taxable counterparts, helping them return 2.52% for the period.
The Fed’s 0%–0.25% target for short-term interest rates continued to restrain returns for money market funds and savings accounts.
| Expense Ratios | ||||
| Your Fund Compared With Its Peer Group | ||||
| ETF | Admiral | Institutional | Peer Group | |
| Shares | Shares | Shares | Average | |
| Short-Term Government Bond Index | ||||
| Fund | 0.12% | 0.12% | 0.09% | 0.79% |
| Intermediate-Term Government Bond | ||||
| Index Fund | 0.12 | 0.12 | 0.09 | 0.97 |
| Long-Term Government Bond Index | ||||
| Fund | 0.12 | 0.12 | 0.09 | 1.09 |
| Short-Term Corporate Bond Index Fund | 0.12 | 0.12 | 0.09 | 0.82 |
| Intermediate-Term Corporate Bond | ||||
| Index Fund | 0.12 | 0.12 | 0.09 | 0.83 |
| Long-Term Corporate Bond Index Fund | 0.12 | 0.12 | 0.09 | 0.92 |
| Mortgage-Backed Securities Index | ||||
| Fund | 0.12 | 0.12 | 0.09 | 0.89 |
The fund expense ratios shown are from the prospectus dated December 23, 2014, and represent estimated costs for the current fiscal year. For the fiscal year ended August 31, 2015, the funds’ expense ratios were: for the Short-Term Government Bond Index Fund, 0.10% for ETF Shares, 0.10% for Admiral Shares, and 0.07% for Institutional Shares; for the Intermediate-Term Government Bond Index Fund, 0.10% for ETF Shares, 0.10% for Admiral Shares, and 0.07% for Institutional Shares; for the Long-Term Government Bond Index Fund, 0.10% for ETF Shares, 0.10% for Admiral Shares, and 0.07% for Institutional Shares; for the Short-Term Corporate Bond Index Fund, 0.10% for ETF Shares, 0.10% for Admiral Shares, and 0.07% for Institutional Shares; for the Intermediate-Term Corporate Bond Index Fund, 0.10% for ETF Shares, 0.10% for Admiral Shares, 0.07% for Institutional Shares; for the Long-Term Corporate Bond Index Fund, 0.10% for ETF Shares, 0.10% for Admiral Shares, and 0.07% for Institutional Shares; and for the Mortgage-Backed Securities Index Fund, 0.10% for ETF Shares, 0.10% for Admiral Shares, and 0.07% for Institutional Shares. Peer-group expense ratios are derived from data provided by Lipper, a Thomson Reuters Company, and capture information through year-end 2014.
Peer groups: For the Short-Term Government Bond Index Fund, Short U.S. Government Funds; for the Intermediate-Term Government Bond Index Fund, Intermediate U.S. Government Funds; for the Long-Term Government Bond Index Fund, General U.S. Government Funds; for the Short-Term Corporate Bond Index Fund, Short-Intermediate Investment-Grade Debt Funds; for the Intermediate-Term Corporate Bond Index Fund, Core Bond Funds; for the Long-Term Corporate Bond Index Fund, Corporate BBB-Rated Debt Funds; for the Mortgage-Backed Securities Index Fund, U.S. Mortgage Funds.
6
Limited by the dollar’s strength, international bond markets (as measured by the Barclays Global Aggregate Index ex USD) returned –11.97%. Without this currency effect, international bonds returned about 3%.
August stock market anxiety led to disappointing returns
U.S. stocks generally moved in opposite directions over the two halves of the fiscal year. Ultimately, the ride ended about where it started, with the market returning less than 1%. The broad stock market’s first-half advance of about 6% was followed by a second-half retreat of about –5%.
For U.S. investors, international stocks returned about –12%—a result that would have been a bit better if not for the dollar’s strength against many foreign currencies. China’s troubles buffeted emerging markets, which produced lower returns than the developed markets of Europe and the Pacific region.
Concerns boosted Treasuries but weighed on corporates
With the financial crisis in the rearview mirror and the economy showing more strength toward the end of 2014, the Fed ended its bond-buying program and seemed to edge closer to raising short-term interest rates from the near-zero levels they had been at since late 2008. (Shortly after the close of the reporting period, the Fed announced at its September meeting that it would leave rates unchanged for the time being.)
But amid severe winter weather and a West Coast port strike, growth ground almost to a halt. The oil price slide and the strong U.S. dollar helped push inflation even further below the Fed’s target of 2%.
International developments also muddied the picture, including flare-ups in the Greek debt crisis and repercussions from events in China—notably the
| Yields of U.S. Treasury Securities | ||
| August 31, | August 31, | |
| Maturity | 2014 | 2015 |
| 2 years | 0.50% | 0.72% |
| 3 years | 0.94 | 1.02 |
| 5 years | 1.63 | 1.51 |
| 10 years | 2.34 | 2.18 |
| 30 years | 3.08 | 2.91 |
| Source: Vanguard. |
7
surprise devaluation of China’s currency, the sharp correction in mainland China stock markets, and the downturn in manufacturing. Collectively, these concerns helped fuel demand for Treasuries. All three government bond index funds benefited from rising bond prices; for the
| Do you have the right ‘asset location’ for your bond fund? |
| Investors who want to maximize returns and minimize taxes should consider their “asset |
| location,” or how their investments are spread among different types of accounts. |
| Broadly speaking, accounts are either tax-advantaged (as in tax-free or tax-deferred) or they’re |
| taxable. IRAs and 401(k) plans, of course, are tax-advantaged. |
| As part of a series called IRA Insights (available at vanguard.com/research), analysts from |
| Vanguard’s Investment Strategy Group studied data from hundreds of thousands of Vanguard |
| accounts to determine how well investors were locating their assets. From a tax standpoint, |
| were people choosing the optimal account type for a particular investment? |
| The analysts noted that bonds are tax-inefficient, because their return is almost entirely income. |
| So investors are generally best served by holding them (and balanced funds, which include |
| bonds) in IRAs and other tax-advantaged accounts. Otherwise, income from the bonds will |
| drive up an investor’s annual tax liability, even if the income is automatically reinvested in a bond |
| or balanced fund. And unlike qualified stock dividends, which are taxed at a preferential rate, |
| bond income gets taxed at a higher “ordinary” income rate. |
| As you can see in results shown below from the study, there appears to be an opportunity for |
| some bond investors to improve their asset location. These investors may be paying more in |
| taxes than they need to. |
| Over half of investors with a choice own bonds in taxable accounts |
| 54% | Bonds/balanced holdings are in taxable accounts, |
| with stock holdings in IRAs | |
| 28% | Bonds/balanced holdings are in taxable accounts, |
| but no stock holdings are in IRAs | |
| 18% | All bonds/balanced funds are held in IRAs |
Notes: Based on an analysis of almost 700,000 Vanguard IRA® account owners who also have taxable investments at Vanguard and who own at least some bond investments. Data are as of December 31, 2014.
Source: Vanguard.
8
intermediate- and long-term government funds, those higher prices accounted for more than one-third of their Admiral and Institutional Share returns.
The Mortgage-Backed Securities Index Fund invests in bonds of pooled mortgages issued by government agencies. Those securities didn’t perform quite as well as their duration-equivalent government counterparts, but price increases contributed materially to their returns as well.
Corporate bonds were a different story. The increase in market volatility made investors less comfortable with the credit risk they had previously taken on in exchange for higher yields. In general, yields of lower-rated investment-grade corporate bonds widened more versus Treasuries than higher-rated corporates. By sector, the bonds of financial institutions held up fairly well, while debt issued by commodity-related companies—especially in the energy, metals, and mining segments—turned in some of the poorest performances.
Prices of the holdings in all three corporate funds declined. Those drops shaved almost 3 percentage points from results for Admiral and Institutional Shares of the intermediate-term corporate fund and close to 8 percentage points for those shares of the long-term corporate fund.
Compared with their peers, five of the seven funds outperformed; the intermediate- and long-term government funds did so by the widest margins. The intermediate- and long-term corporate funds lagged.
These bond funds have built a solid record since inception
For any index fund, success means closely tracking the performance of its target index, which, like all indexes, incurs no expenses. Since their launch on November 19, 2009, all seven funds covered in this report have produced returns in line with those of their benchmarks, thanks to the experience, talent, and index sampling techniques of their advisor, Vanguard Fixed Income Group.
Average annual returns from inception through the latest fiscal year ranged from 0.86% to 7.34% for the government bond index funds and from 3.18% to 7.34% for the corporate bond index funds. For the Mortgage-Backed Securities Index Fund, the average annual return was 3.16%.
When the markets are volatile, maintaining perspective is key
The volatility in the markets, particularly among stocks in the final weeks of August, may have evoked painful memories of previous financial setbacks. And inevitably, that can lead some investors to make rash moves with their portfolios.
9
During periods of market adversity, however, it’s more important than ever to keep sight of one of Vanguard’s key principles: Maintain perspective and long-term discipline. Whether you’re investing for yourself or on behalf of clients, your success is affected greatly by how you react—or don’t react—when the markets turn turbulent. (You can read Vanguard’s Principles for Investing Success at vanguard.com/research.)
As I’ve written in the past, the best course for long-term investors generally is to ignore daily market moves and not make decisions based on emotion. This is also a good time to evaluate your portfolio and make sure your asset allocation is aligned with your time horizon, goals, and risk tolerance.
The markets are unpredictable and often confounding. Keeping our long-term plans clearly in focus can be key as we weather these periodic storms.
As always, thank you for investing with Vanguard.
Sincerely,

F. William McNabb III
Chairman and Chief Executive Officer
September 18, 2015
10
| Your Fund’s Performance at a Glance | ||||
| August 31, 2014, Through August 31, 2015 | ||||
| Distributions Per Share | ||||
| Starting | Ending | Income | Capital | |
| Share Price | Share Price | Dividends | Gains | |
| Vanguard Short-Term Government Bond Index | ||||
| Fund | ||||
| ETF Shares | $60.95 | $61.03 | $0.340 | $0.033 |
| Admiral Shares | 20.33 | 20.35 | 0.116 | 0.011 |
| Institutional Shares | 25.54 | 25.57 | 0.155 | 0.014 |
| Vanguard Intermediate-Term Government | ||||
| Bond Index Fund | ||||
| ETF Shares | $64.14 | $64.80 | $1.043 | $0.000 |
| Admiral Shares | 21.64 | 21.86 | 0.355 | 0.000 |
| Institutional Shares | 26.85 | 27.12 | 0.448 | 0.000 |
| Vanguard Long-Term Government Bond Index | ||||
| Fund | ||||
| ETF Shares | $73.93 | $75.13 | $2.079 | $0.000 |
| Admiral Shares | 24.81 | 25.21 | 0.697 | 0.000 |
| Institutional Shares | 31.48 | 32.00 | 0.893 | 0.000 |
| Vanguard Short-Term Corporate Bond Index | ||||
| Fund | ||||
| ETF Shares | $80.21 | $79.33 | $1.492 | $0.149 |
| Admiral Shares | 21.81 | 21.57 | 0.410 | 0.040 |
| Institutional Shares | 26.71 | 26.41 | 0.510 | 0.050 |
| Vanguard Intermediate-Term Corporate Bond | ||||
| Index Fund | ||||
| ETF Shares | $86.98 | $84.39 | $2.754 | $0.130 |
| Admiral Shares | 23.40 | 22.71 | 0.746 | 0.035 |
| Institutional Shares | 28.92 | 28.06 | 0.932 | 0.043 |
| Vanguard Long-Term Corporate Bond Index | ||||
| Fund | ||||
| ETF Shares | $92.38 | $85.25 | $3.913 | $0.000 |
| Admiral Shares | 24.71 | 22.80 | 1.047 | 0.000 |
| Institutional Shares | 30.68 | 28.31 | 1.310 | 0.000 |
| Vanguard Mortgage-Backed Securities Index | ||||
| Fund | ||||
| ETF Shares | $52.65 | $53.05 | $0.741 | $0.161 |
| Admiral Shares | 21.05 | 21.20 | 0.297 | 0.065 |
| Institutional Shares | 28.52 | 28.73 | 0.410 | 0.087 |
11
Short-Term Government Bond Index Fund
Fund Profile
As of August 31, 2015
| Share-Class Characteristics | |||
| ETF | Admiral Institutional | ||
| Shares | Shares | Shares | |
| Ticker Symbol | VGSH | VSBSX | VSBIX |
| Expense Ratio1 | 0.12% | 0.12% | 0.09% |
| 30-Day SEC Yield | 0.60% | 0.64% | 0.63% |
| Financial Attributes | |||
| Barclays | |||
| 1–3 Year | |||
| Gov’t | Barclays | ||
| Float Adj | Aggregate | ||
| Fund | Index | FA Index | |
| Number of Bonds | 141 | 437 | 9,541 |
| Yield to Maturity | |||
| (before expenses) | 0.7% | 0.8% | 2.4% |
| Average Coupon | 1.5% | 1.5% | 3.2% |
| Average Duration | 1.8 years | 1.8 years | 5.7 years |
| Average Effective | |||
| Maturity | 1.9 years | 1.9 years | 7.9 years |
| Short-Term | |||
| Reserves | 1.4% | — | — |
| Sector Diversification (% of portfolio) | |
| Treasury/Agency | 98.8% |
| Other | 1.2 |
The agency and mortgage-backed securities sectors may include issues from government-sponsored enterprises; such issues are generally not backed by the full faith and credit of the U.S. government.
| Volatility Measures | ||
| Barclays | ||
| 1–3 Year | ||
| Gov’t | Barclays | |
| Float Adj | Aggregate | |
| Index | FA Index | |
| R-Squared | 0.98 | 0.58 |
| Beta | 1.01 | 0.14 |
These measures show the degree and timing of the fund’s fluctuations compared with the indexes over 36 months.
| Distribution by Effective Maturity | |
| (% of portfolio) | |
| Under 1 Year | 1.2% |
| 1 - 3 Years | 98.7 |
| 3 - 5 Years | 0.1 |
| Distribution by Credit Quality (% of portfolio) | |
| U.S. Government | 98.8% |
| Aaa | 1.2 |
Credit-quality ratings are obtained from Barclays and are from Moody's, Fitch, and S&P. When ratings from all three agencies are used, the median rating is shown. When ratings from two of the agencies are used, the lower rating for each issue is shown. "Not Rated" is used to classify securities for which a rating is not available. Not rated securities include a fund's investment in Vanguard Market Liquidity Fund or Vanguard Municipal Cash Management Fund, each of which invests in high-quality money market instruments and may serve as a cash management vehicle for the Vanguard funds, trusts, and accounts. For more information about these ratings, see the Glossary entry for Credit Quality.
Investment Focus

1 The expense ratios shown are from the prospectus dated December 23, 2014, and represent estimated costs for the current fiscal year. For the fiscal year ended August 31, 2015, the expense ratios were 0.10% for ETF Shares, 0.10% for Admiral Shares, and 0.07% for Institutional Shares.
12
Short-Term Government Bond Index Fund
Performance Summary
All of the returns in this report represent past performance, which is not a guarantee of future results that may be achieved by the fund. (Current performance may be lower or higher than the performance data cited. For performance data current to the most recent month-end, visit our website at vanguard.com/performance.) Note, too, that both investment returns and principal value can fluctuate widely, so an investor’s shares, when sold, could be worth more or less than their original cost. The returns shown do not reflect taxes that a shareholder would pay on fund distributions or on the sale of fund shares.
Cumulative Performance: November 19, 2009, Through August 31, 2015
Initial Investment of $10,000

| Average Annual Total Returns | ||||
| Periods Ended August 31, 2015 | ||||
| Since | Final Value | |||
| One | Five | Inception | of a $10,000 | |
| Year | Years | (11/19/2009) | Investment | |
| Short-Term Government Bond Index | ||||
| Fund ETF Shares Net Asset Value | 0.75% | 0.65% | 0.86% | $10,505 |
| Short-Term Government Bond Index | ||||
| Fund ETF Shares Market Price | 0.75 | 0.64 | 0.86 | 10,509 |
| Barclays U.S. 1–3 Year Government | ||||
| Float Adjusted Index | 0.84 | 0.76 | 0.98 | 10,578 |
| Short U.S. Government Funds | ||||
| Average | 0.36 | 0.58 | 0.90 | 10,531 |
| Spliced Barclays U.S. Aggregate Float | ||||
| Adjusted Index | 1.40 | 2.98 | 3.77 | 12,383 |
For a benchmark description, see the Glossary.
Short U.S. Government Funds Average: Derived from data provided by Lipper, a Thomson Reuters Company.
"Since Inception" performance is calculated from the ETF Shares’ inception date for both the fund and its comparative standards.
See Financial Highlights for dividend and capital gains information.
13
| Short-Term Government Bond Index Fund | ||||
| Average Annual Total Returns | ||||
| Periods Ended August 31, 2015 | ||||
| Since | Final Value | |||
| One | Five | Inception | of a $10,000 | |
| Year | Years | (12/28/2009) | Investment | |
| Short-Term Government Bond Index Fund | ||||
| Admiral Shares | 0.72% | 0.65% | 0.95% | $10,553 |
| Barclays U.S. 1–3 Year Government Float | ||||
| Adjusted Index | 0.84 | 0.76 | 1.07 | 10,623 |
| Spliced Barclays U.S. Aggregate Float | ||||
| Adjusted Index | 1.40 | 2.98 | 4.03 | 12,512 |
"Since Inception" performance is calculated from the Admiral Shares’ inception date for both the fund and its comparative standards.
| Since | Final Value | |||
| One | Five | Inception | of a $5,000,000 | |
| Year | Years | (8/23/2010) | Investment | |
| Short-Term Government Bond Index Fund | ||||
| Institutional Shares | 0.78% | 0.69% | 0.69% | $5,176,012 |
| Barclays U.S. 1–3 Year Government Float | ||||
| Adjusted Index | 0.84 | 0.76 | 0.77 | 5,196,482 |
| Barclays U.S. Aggregate Float Adjusted | ||||
| Index | 1.40 | 2.98 | 3.05 | 5,813,978 |
"Since Inception" performance is calculated from the Institutional Shares’ inception date for both the fund and its comparative standards.
| Cumulative Returns of ETF Shares: November 19, 2009, Through August 31, 2015 | |||
| Since | |||
| One | Five | Inception | |
| Year | Years | (11/19/2009) | |
| Short-Term Government Bond Index Fund ETF | |||
| Shares Market Price | 0.75% | 3.25% | 5.09% |
| Short-Term Government Bond Index Fund ETF | |||
| Shares Net Asset Value | 0.75 | 3.31 | 5.05 |
| Barclays U.S. 1–3 Year Government Float Adjusted | |||
| Index | 0.84 | 3.88 | 5.78 |
"Since Inception" performance is calculated from the ETF Shares’ inception date for both the fund and its comparative standards.
14
Short-Term Government Bond Index Fund
| Fiscal-Year Total Returns (%): November 19, 2009, Through August 31, 2015 | ||
| Barclays | ||
| 1–3 Year | ||
| Gov’t | ||
| Float Adj | ||
| ETF Shares Net Asset Value | Index | |
| Fiscal Year | Total Returns | Total Returns |
| 2010 | 1.69% | 1.83% |
| 2011 | 1.39 | 1.53 |
| 2012 | 0.40 | 0.50 |
| 2013 | 0.04 | 0.16 |
| 2014 | 0.70 | 0.80 |
| 2015 | 0.75 | 0.84 |
Average Annual Total Returns: Periods Ended June 30, 2015
This table presents returns through the latest calendar quarter—rather than through the end of the fiscal period.
Securities and Exchange Commission rules require that we provide this information.
| Since Inception | ||||||
| Inception Date | One Year | Five Years | Income | Capital | Total | |
| ETF Shares | 11/19/2009 | |||||
| Market Price | 0.84% | 0.72% | 0.89% | |||
| Net Asset Value | 0.80 | 0.73 | 0.88 | |||
| Admiral Shares | 12/28/2009 | 0.78 | 0.72 | 0.48% | 0.50% | 0.98 |
| Institutional Shares | 8/23/2010 | 0.82 | — | 0.50 | 0.21 | 0.71 |
15
Short-Term Government Bond Index Fund
Financial Statements
Statement of Net Assets
As of August 31, 2015
The fund reports a complete list of its holdings in regulatory filings four times in each fiscal year, at the quarter-ends. For the second and fourth fiscal quarters, the lists appear in the fund’s semiannual and annual reports to shareholders. For the first and third fiscal quarters, the fund files the lists with the Securities and Exchange Commission on Form N-Q. Shareholders can look up the fund’s Forms N-Q on the SEC’s website at sec.gov. Forms N-Q may also be reviewed and copied at the SEC’s Public Reference Room (see the back cover of this report for further information).
| Face | Market | |||
| Maturity | Amount | Value• | ||
| Coupon | Date | ($000) | ($000) | |
| U.S. Government and Agency Obligations (98.6%) | ||||
| U.S. Government Securities (88.7%) | ||||
| United States Treasury Note/Bond | 0.875% | 9/15/16 | 12,205 | 12,260 |
| United States Treasury Note/Bond | 0.500% | 9/30/16 | 3,910 | 3,912 |
| United States Treasury Note/Bond | 1.000% | 9/30/16 | 9,375 | 9,429 |
| United States Treasury Note/Bond | 3.000% | 9/30/16 | 6,730 | 6,912 |
| United States Treasury Note/Bond | 0.625% | 10/15/16 | 4,735 | 4,743 |
| United States Treasury Note/Bond | 0.375% | 10/31/16 | 12,435 | 12,417 |
| United States Treasury Note/Bond | 1.000% | 10/31/16 | 19,138 | 19,249 |
| United States Treasury Note/Bond | 3.125% | 10/31/16 | 6,145 | 6,330 |
| United States Treasury Note/Bond | 0.625% | 11/15/16 | 10,945 | 10,960 |
| United States Treasury Note/Bond | 4.625% | 11/15/16 | 4,690 | 4,921 |
| United States Treasury Note/Bond | 7.500% | 11/15/16 | 700 | 758 |
| United States Treasury Note/Bond | 0.500% | 11/30/16 | 10,680 | 10,677 |
| United States Treasury Note/Bond | 0.875% | 11/30/16 | 12,205 | 12,257 |
| United States Treasury Note/Bond | 2.750% | 11/30/16 | 10,665 | 10,960 |
| United States Treasury Note/Bond | 0.625% | 12/15/16 | 12,215 | 12,226 |
| United States Treasury Note/Bond | 0.625% | 12/31/16 | 6,341 | 6,347 |
| United States Treasury Note/Bond | 0.875% | 12/31/16 | 2,720 | 2,731 |
| United States Treasury Note/Bond | 3.250% | 12/31/16 | 11,010 | 11,399 |
| United States Treasury Note/Bond | 0.750% | 1/15/17 | 20,430 | 20,478 |
| United States Treasury Note/Bond | 0.500% | 1/31/17 | 8,825 | 8,815 |
| United States Treasury Note/Bond | 0.875% | 1/31/17 | 7,700 | 7,730 |
| United States Treasury Note/Bond | 3.125% | 1/31/17 | 6,790 | 7,032 |
| United States Treasury Note/Bond | 0.625% | 2/15/17 | 20,310 | 20,316 |
| United States Treasury Note/Bond | 4.625% | 2/15/17 | 12,060 | 12,761 |
| United States Treasury Note/Bond | 0.500% | 2/28/17 | 8,383 | 8,370 |
| United States Treasury Note/Bond | 0.875% | 2/28/17 | 17,714 | 17,780 |
| United States Treasury Note/Bond | 3.000% | 2/28/17 | 9,520 | 9,859 |
| United States Treasury Note/Bond | 0.750% | 3/15/17 | 10,130 | 10,149 |
| United States Treasury Note/Bond | 0.500% | 3/31/17 | 4,665 | 4,656 |
| United States Treasury Note/Bond | 1.000% | 3/31/17 | 6,085 | 6,119 |
| United States Treasury Note/Bond | 3.250% | 3/31/17 | 15,375 | 16,004 |
| United States Treasury Note/Bond | 0.875% | 4/15/17 | 6,685 | 6,709 |
| United States Treasury Note/Bond | 0.500% | 4/30/17 | 9,363 | 9,338 |
| United States Treasury Note/Bond | 0.875% | 4/30/17 | 5,405 | 5,423 |
| United States Treasury Note/Bond | 3.125% | 4/30/17 | 3,683 | 3,833 |
| United States Treasury Note/Bond | 0.875% | 5/15/17 | 8,530 | 8,558 |
| United States Treasury Note/Bond | 4.500% | 5/15/17 | 2,325 | 2,476 |
| United States Treasury Note/Bond | 8.750% | 5/15/17 | 2,330 | 2,647 |
16
| Short-Term Government Bond Index Fund | ||||
| Face | Market | |||
| Maturity | Amount | Value• | ||
| Coupon | Date | ($000) | ($000) | |
| United States Treasury Note/Bond | 0.625% | 5/31/17 | 21,894 | 21,870 |
| United States Treasury Note/Bond | 2.750% | 5/31/17 | 10,066 | 10,425 |
| United States Treasury Note/Bond | 0.875% | 6/15/17 | 9,940 | 9,970 |
| United States Treasury Note/Bond | 0.625% | 6/30/17 | 15,250 | 15,229 |
| United States Treasury Note/Bond | 0.750% | 6/30/17 | 11,425 | 11,432 |
| United States Treasury Note/Bond | 2.500% | 6/30/17 | 12,100 | 12,491 |
| United States Treasury Note/Bond | 0.875% | 7/15/17 | 13,820 | 13,859 |
| United States Treasury Note/Bond | 0.500% | 7/31/17 | 5,000 | 4,977 |
| United States Treasury Note/Bond | 0.625% | 7/31/17 | 11,870 | 11,852 |
| United States Treasury Note/Bond | 2.375% | 7/31/17 | 10,826 | 11,161 |
| United States Treasury Note/Bond | 0.875% | 8/15/17 | 17,265 | 17,303 |
| United States Treasury Note/Bond | 4.750% | 8/15/17 | 19,000 | 20,467 |
| United States Treasury Note/Bond | 0.625% | 8/31/17 | 5,955 | 5,942 |
| United States Treasury Note/Bond | 1.875% | 8/31/17 | 7,045 | 7,197 |
| United States Treasury Note/Bond | 1.000% | 9/15/17 | 5,895 | 5,922 |
| United States Treasury Note/Bond | 0.625% | 9/30/17 | 4,780 | 4,764 |
| United States Treasury Note/Bond | 1.875% | 9/30/17 | 6,115 | 6,249 |
| United States Treasury Note/Bond | 0.875% | 10/15/17 | 9,840 | 9,851 |
| United States Treasury Note/Bond | 0.750% | 10/31/17 | 6,500 | 6,489 |
| United States Treasury Note/Bond | 1.875% | 10/31/17 | 13,184 | 13,474 |
| United States Treasury Note/Bond | 0.875% | 11/15/17 | 11,310 | 11,315 |
| United States Treasury Note/Bond | 4.250% | 11/15/17 | 10,320 | 11,086 |
| United States Treasury Note/Bond | 0.625% | 11/30/17 | 6,955 | 6,917 |
| United States Treasury Note/Bond | 2.250% | 11/30/17 | 7,855 | 8,096 |
| United States Treasury Note/Bond | 1.000% | 12/15/17 | 7,395 | 7,416 |
| United States Treasury Note/Bond | 0.750% | 12/31/17 | 11,460 | 11,422 |
| United States Treasury Note/Bond | 0.875% | 1/15/18 | 6,550 | 6,544 |
| United States Treasury Note/Bond | 0.875% | 1/31/18 | 5,690 | 5,683 |
| United States Treasury Note/Bond | 2.625% | 1/31/18 | 6,480 | 6,744 |
| United States Treasury Note/Bond | 1.000% | 2/15/18 | 7,750 | 7,762 |
| United States Treasury Note/Bond | 3.500% | 2/15/18 | 9,850 | 10,461 |
| United States Treasury Note/Bond | 0.750% | 2/28/18 | 10,205 | 10,154 |
| United States Treasury Note/Bond | 2.750% | 2/28/18 | 6,745 | 7,042 |
| United States Treasury Note/Bond | 1.000% | 3/15/18 | 6,295 | 6,303 |
| United States Treasury Note/Bond | 0.750% | 3/31/18 | 7,545 | 7,500 |
| United States Treasury Note/Bond | 2.875% | 3/31/18 | 2,500 | 2,621 |
| United States Treasury Note/Bond | 0.750% | 4/15/18 | 11,220 | 11,153 |
| United States Treasury Note/Bond | 0.625% | 4/30/18 | 10,035 | 9,938 |
| United States Treasury Note/Bond | 2.625% | 4/30/18 | 1,800 | 1,877 |
| United States Treasury Note/Bond | 1.000% | 5/15/18 | 1,250 | 1,250 |
| United States Treasury Note/Bond | 3.875% | 5/15/18 | 2,500 | 2,692 |
| United States Treasury Note/Bond | 1.000% | 5/31/18 | 17,890 | 17,879 |
| United States Treasury Note/Bond | 1.125% | 6/15/18 | 8,970 | 8,992 |
| United States Treasury Note/Bond | 1.375% | 6/30/18 | 12,430 | 12,547 |
| United States Treasury Note/Bond | 2.375% | 6/30/18 | 4,370 | 4,531 |
| United States Treasury Note/Bond | 1.375% | 7/31/18 | 22,170 | 22,364 |
| United States Treasury Note/Bond | 2.250% | 7/31/18 | 6,000 | 6,203 |
| United States Treasury Note/Bond | 1.000% | 8/15/18 | 2,000 | 1,997 |
| United States Treasury Note/Bond | 1.500% | 8/31/18 | 22,000 | 22,261 |
| 819,215 | ||||
| Agency Bonds and Notes (9.9%) | ||||
| 1 Federal Farm Credit Banks | 4.875% | 1/17/17 | 500 | 529 |
| 1 Federal Farm Credit Banks | 1.125% | 9/22/17 | 750 | 754 |
| 1 Federal Farm Credit Banks | 1.000% | 9/25/17 | 200 | 201 |
| 1 Federal Farm Credit Banks | 1.125% | 12/18/17 | 225 | 226 |
| 1 Federal Farm Credit Banks | 1.110% | 2/20/18 | 200 | 200 |
17
| Short-Term Government Bond Index Fund | ||||
| Face | Market | |||
| Maturity | Amount | Value• | ||
| Coupon | Date | ($000) | ($000) | |
| 1 Federal Farm Credit Banks | 1.100% | 6/1/18 | 100 | 100 |
| 1 Federal Home Loan Banks | 0.500% | 9/28/16 | 2,650 | 2,651 |
| 1 Federal Home Loan Banks | 0.625% | 11/23/16 | 825 | 826 |
| 1 Federal Home Loan Banks | 4.750% | 12/16/16 | 285 | 300 |
| 1 Federal Home Loan Banks | 0.625% | 12/28/16 | 600 | 600 |
| 1 Federal Home Loan Banks | 0.875% | 3/10/17 | 125 | 125 |
| 1 Federal Home Loan Banks | 4.875% | 5/17/17 | 600 | 642 |
| 1 Federal Home Loan Banks | 0.875% | 5/24/17 | 6,470 | 6,484 |
| 1 Federal Home Loan Banks | 0.625% | 5/30/17 | 1,200 | 1,197 |
| 1 Federal Home Loan Banks | 1.000% | 6/21/17 | 2,205 | 2,215 |
| 1 Federal Home Loan Banks | 0.750% | 8/28/17 | 2,000 | 1,997 |
| 1 Federal Home Loan Banks | 5.000% | 11/17/17 | 2,010 | 2,189 |
| 1 Federal Home Loan Banks | 1.375% | 3/9/18 | 4,080 | 4,115 |
| 1 Federal Home Loan Banks | 1.125% | 4/25/18 | 2,500 | 2,505 |
| 2 Federal Home Loan Mortgage Corp. | 0.875% | 10/14/16 | 6,275 | 6,300 |
| 2 Federal Home Loan Mortgage Corp. | 0.500% | 1/27/17 | 1,250 | 1,247 |
| 2 Federal Home Loan Mortgage Corp. | 5.000% | 2/16/17 | 600 | 638 |
| 2 Federal Home Loan Mortgage Corp. | 0.875% | 2/22/17 | 2,010 | 2,016 |
| 2 Federal Home Loan Mortgage Corp. | 1.000% | 3/8/17 | 4,855 | 4,878 |
| 2 Federal Home Loan Mortgage Corp. | 5.000% | 4/18/17 | 200 | 214 |
| 2 Federal Home Loan Mortgage Corp. | 1.250% | 5/12/17 | 2,500 | 2,521 |
| 2 Federal Home Loan Mortgage Corp. | 1.000% | 6/29/17 | 265 | 266 |
| 2 Federal Home Loan Mortgage Corp. | 0.750% | 7/14/17 | 1,200 | 1,200 |
| 2 Federal Home Loan Mortgage Corp. | 1.000% | 7/28/17 | 657 | 660 |
| 2 Federal Home Loan Mortgage Corp. | 5.500% | 8/23/17 | 2,000 | 2,184 |
| 2 Federal Home Loan Mortgage Corp. | 1.000% | 9/29/17 | 400 | 401 |
| 2 Federal Home Loan Mortgage Corp. | 5.125% | 11/17/17 | 2,625 | 2,866 |
| 2 Federal Home Loan Mortgage Corp. | 0.750% | 1/12/18 | 1,150 | 1,145 |
| 2 Federal Home Loan Mortgage Corp. | 0.875% | 3/7/18 | 3,395 | 3,382 |
| 2 Federal Home Loan Mortgage Corp. | 4.875% | 6/13/18 | 500 | 552 |
| 2 Federal National Mortgage Assn. | 1.250% | 9/28/16 | 3,365 | 3,393 |
| 2 Federal National Mortgage Assn. | 1.375% | 11/15/16 | 1,335 | 1,348 |
| 2 Federal National Mortgage Assn. | 5.000% | 2/13/17 | 880 | 935 |
| 2 Federal National Mortgage Assn. | 0.750% | 4/20/17 | 2,025 | 2,026 |
| 2 Federal National Mortgage Assn. | 1.125% | 4/27/17 | 700 | 705 |
| 2 Federal National Mortgage Assn. | 5.000% | 5/11/17 | 555 | 595 |
| 2 Federal National Mortgage Assn. | 0.000% | 6/1/17 | 600 | 592 |
| 2 Federal National Mortgage Assn. | 5.375% | 6/12/17 | 3,050 | 3,299 |
| 2 Federal National Mortgage Assn. | 0.875% | 8/28/17 | 1,050 | 1,051 |
| 2 Federal National Mortgage Assn. | 1.000% | 9/27/17 | 4,500 | 4,514 |
| 2 Federal National Mortgage Assn. | 0.875% | 10/26/17 | 890 | 890 |
| 2 Federal National Mortgage Assn. | 0.875% | 12/20/17 | 900 | 899 |
| 2 Federal National Mortgage Assn. | 0.875% | 2/8/18 | 2,065 | 2,060 |
| 2 Federal National Mortgage Assn. | 0.875% | 5/21/18 | 6,280 | 6,247 |
| 2 Federal National Mortgage Assn. | 1.125% | 7/20/18 | 2,500 | 2,499 |
| 2 Federal National Mortgage Assn. | 1.125% | 10/19/18 | 1,200 | 1,197 |
| Private Export Funding Corp. | 1.375% | 2/15/17 | 250 | 252 |
| 1 Tennessee Valley Authority | 5.500% | 7/18/17 | 125 | 136 |
| 90,964 | ||||
| Total U.S. Government and Agency Obligations (Cost $909,676) | 910,179 | |||
18
| Short-Term Government Bond Index Fund | |||
| Market | |||
| Value• | |||
| Coupon | Shares | ($000) | |
| Temporary Cash Investment (1.4%) | |||
| Money Market Fund (1.4%) | |||
| 3 Vanguard Market Liquidity Fund (Cost $13,287) | 0.168% | 13,286,541 | 13,287 |
| Total Investments (100.0%) (Cost $922,963) | 923,466 | ||
| Other Assets and Liabilities (0.0%) | |||
| Other Assets | 52,920 | ||
| Liabilities | (53,310) | ||
| (390) | |||
| Net Assets (100%) | 923,076 | ||
| Amount | |||
| ($000) | |||
| Statement of Assets and Liabilities | |||
| Assets | |||
| Investments in Securities, at Value | |||
| Unaffiliated Issuers | 910,179 | ||
| Affiliated Vanguard Funds | 13,287 | ||
| Total Investments in Securities | 923,466 | ||
| Receivables for Investment Securities Sold | 47,694 | ||
| Receivables for Capital Shares Issued | 1,102 | ||
| Other Assets | 4,124 | ||
| Total Assets | 976,386 | ||
| Liabilities | |||
| Payables for Investment Securities Purchased | 52,150 | ||
| Other Liabilities | 1,160 | ||
| Total Liabilities | 53,310 | ||
| Net Assets | 923,076 | ||
19
| Short-Term Government Bond Index Fund | |
| At August 31, 2015, net assets consisted of: | |
| Amount | |
| ($000) | |
| Paid-in Capital | 921,905 |
| Undistributed Net Investment Income | 361 |
| Accumulated Net Realized Gains | 307 |
| Unrealized Appreciation (Depreciation) | 503 |
| Net Assets | 923,076 |
| ETF Shares—Net Assets | |
| Applicable to 10,400,000 outstanding $.001 par value shares of | |
| beneficial interest (unlimited authorization) | 634,748 |
| Net Asset Value Per Share—ETF Shares | $61.03 |
| Admiral Shares—Net Assets | |
| Applicable to 10,876,087 outstanding $.001 par value shares of | |
| beneficial interest (unlimited authorization) | 221,333 |
| Net Asset Value Per Share—Admiral Shares | $20.35 |
| Institutional Shares—Net Assets | |
| Applicable to 2,620,020 outstanding $.001 par value shares of | |
| beneficial interest (unlimited authorization) | 66,995 |
| Net Asset Value Per Share—Institutional Shares | $25.57 |
• See Note A in Notes to Financial Statements.
1 The issuer operates under a congressional charter; its securities are generally neither guaranteed by the U.S. Treasury nor backed by the full faith and credit of the U.S. government.
2 The issuer was placed under federal conservatorship in September 2008; since that time, its daily operations have been managed by the Federal Housing Finance Agency and it receives capital from the U.S. Treasury, as needed to maintain a positive net worth, in exchange for senior preferred stock.
3 Affiliated money market fund available only to Vanguard funds and certain trusts and accounts managed by Vanguard. Rate shown is the 7-day yield.
See accompanying Notes, which are an integral part of the Financial Statements.
20
| Short-Term Government Bond Index Fund | |
| Statement of Operations | |
| Year Ended | |
| August 31, 2015 | |
| ($000) | |
| Investment Income | |
| Income | |
| Interest1 | 5,423 |
| Total Income | 5,423 |
| Expenses | |
| The Vanguard Group—Note B | |
| Investment Advisory Services | 19 |
| Management and Administrative—ETF Shares | 386 |
| Management and Administrative—Admiral Shares | 127 |
| Management and Administrative—Institutional Shares | 31 |
| Marketing and Distribution—ETF Shares | 94 |
| Marketing and Distribution—Admiral Shares | 30 |
| Marketing and Distribution—Institutional Shares | 3 |
| Custodian Fees | 3 |
| Auditing Fees | 50 |
| Shareholders’ Reports—ETF Shares | 19 |
| Shareholders’ Reports—Admiral Shares | 3 |
| Shareholders’ Reports—Institutional Shares | — |
| Trustees’ Fees and Expenses | 1 |
| Total Expenses | 766 |
| Net Investment Income | 4,657 |
| Realized Net Gain (Loss) on Investment Securities Sold | 1,248 |
| Change in Unrealized Appreciation (Depreciation) of Investment Securities | (36) |
| Net Increase (Decrease) in Net Assets Resulting from Operations | 5,869 |
| 1 Interest income from an affiliated company of the fund was $13,000. | |
See accompanying Notes, which are an integral part of the Financial Statements.
21
| Short-Term Government Bond Index Fund | ||
| Statement of Changes in Net Assets | ||
| Year Ended August 31, | ||
| 2015 | 2014 | |
| ($000) | ($000) | |
| Increase (Decrease) in Net Assets | ||
| Operations | ||
| Net Investment Income | 4,657 | 1,738 |
| Realized Net Gain (Loss) | 1,248 | 556 |
| Change in Unrealized Appreciation (Depreciation) | (36) | 977 |
| Net Increase (Decrease) in Net Assets Resulting from Operations | 5,869 | 3,271 |
| Distributions | ||
| Net Investment Income | ||
| ETF Shares | (3,087) | (1,173) |
| Admiral Shares1 | (1,044) | (287) |
| Institutional Shares | (348) | (95) |
| Realized Capital Gain 2 | ||
| ETF Shares | (299) | (307) |
| Admiral Shares1 | (93) | (54) |
| Institutional Shares | (24) | (19) |
| Total Distributions | (4,895) | (1,935) |
| Capital Share Transactions | ||
| ETF Shares | 137,215 | 188,874 |
| Admiral Shares1 | 95,668 | 72,273 |
| Institutional Shares | 18,278 | 31,229 |
| Net Increase (Decrease) from Capital Share Transactions | 251,161 | 292,376 |
| Total Increase (Decrease) | 252,135 | 293,712 |
| Net Assets | ||
| Beginning of Period | 670,941 | 377,229 |
| End of Period3 | 923,076 | 670,941 |
1 Signal Shares were renamed Admiral Shares in October 2013.
2 Includes fiscal 2015 and 2014 short-term gain distributions totaling $149,000 and $76,000, respectively. Short-term gain distributions are treated as ordinary income dividends for tax purposes.
3 Net Assets—End of Period includes undistributed (overdistributed) net investment income of $361,000 and $183,000.
See accompanying Notes, which are an integral part of the Financial Statements.
22
| Short-Term Government Bond Index Fund | |||||
| Financial Highlights | |||||
| ETF Shares | |||||
| For a Share Outstanding | Year Ended August 31, | ||||
| Throughout Each Period | 2015 | 2014 | 2013 | 2012 | 2011 |
| Net Asset Value, Beginning of Period | $60.95 | $60.75 | $60.98 | $61.11 | $60.70 |
| Investment Operations | |||||
| Net Investment Income | . 351 | .198 | .158 | . 270 | .405 |
| Net Realized and Unrealized Gain (Loss) | |||||
| on Investments | .102 | .227 | (.134) | (.028) | .434 |
| Total from Investment Operations | .453 | .425 | . 024 | .242 | .839 |
| Distributions | |||||
| Dividends from Net Investment Income | (.340) | (.177) | (.158) | (. 267) | (.405) |
| Distributions from Realized Capital Gains | (.033) | (.048) | (. 096) | (.105) | (. 024) |
| Total Distributions | (.373) | (. 225) | (. 254) | (.372) | (. 429) |
| Net Asset Value, End of Period | $61.03 | $60.95 | $60.75 | $60.98 | $61.11 |
| Total Return | 0.75% | 0.70% | 0.04% | 0.40% | 1.39% |
| Ratios/Supplemental Data | |||||
| Net Assets, End of Period (Millions) | $635 | $497 | $307 | $183 | $150 |
| Ratio of Total Expenses to Average Net Assets | 0.10% | 0.12% | 0.12% | 0.12% | 0.14% |
| Ratio of Net Investment Income to | |||||
| Average Net Assets | 0.59% | 0.34% | 0.26% | 0.44% | 0.66% |
| Portfolio Turnover Rate1 | 64% | 64% | 73% | 72% | 69% |
1 Excludes the value of portfolio securities received or delivered as a result of in-kind purchases or redemptions of the fund’s capital shares, including ETF Creation Units.
See accompanying Notes, which are an integral part of the Financial Statements.
23
| Short-Term Government Bond Index Fund | |||||
| Financial Highlights | |||||
| Admiral Shares | |||||
| For a Share Outstanding | Year Ended August 31, | ||||
| Throughout Each Period | 2015 | 2014 | 2013 | 2012 | 2011 |
| Net Asset Value, Beginning of Period | $20.33 | $20.27 | $20.35 | $20.39 | $20.25 |
| Investment Operations | |||||
| Net Investment Income | .116 | .068 | .053 | .089 | .134 |
| Net Realized and Unrealized Gain (Loss) | |||||
| on Investments | .031 | .074 | (. 048) | (.007) | .149 |
| Total from Investment Operations | .147 | .142 | .005 | .082 | . 283 |
| Distributions | |||||
| Dividends from Net Investment Income | (.116) | (. 066) | (. 053) | (. 087) | (.135) |
| Distributions from Realized Capital Gains | (. 011) | (. 016) | (. 032) | (. 035) | (. 008) |
| Total Distributions | (.127) | (. 082) | (. 085) | (.122) | (.143) |
| Net Asset Value, End of Period | $20.35 | $20.33 | $20.27 | $20.35 | $20.39 |
| Total Return1 | 0.72% | 0.70% | 0.02% | 0.40% | 1.40% |
| Ratios/Supplemental Data | |||||
| Net Assets, End of Period (Millions) | $221 | $126 | $53 | $37 | $11 |
| Ratio of Total Expenses to Average Net Assets | 0.10% | 0.12% | 0.12% | 0.12% | 0.14% |
| Ratio of Net Investment Income to | |||||
| Average Net Assets | 0.59% | 0.34% | 0.26% | 0.44% | 0.66% |
| Portfolio Turnover Rate2 | 64% | 64% | 73% | 72% | 69% |
Signal Shares were renamed Admiral Shares in October 2013. Prior periods’ Financial Highlights are for the Signal class.
1 Total returns do not include transaction or account service fees that may have applied in the periods shown. Fund prospectuses provide information about any applicable transaction and account service fees.
2 Excludes the value of portfolio securities received or delivered as a result of in-kind purchases or redemptions of the fund’s capital shares, including ETF Creation Units.
See accompanying Notes, which are an integral part of the Financial Statements.
24
| Short-Term Government Bond Index Fund | |||||
| Financial Highlights | |||||
| Institutional Shares | |||||
| For a Share Outstanding | Year Ended August 31, | ||||
| Throughout Each Period | 2015 | 2014 | 2013 | 2012 | 2011 |
| Net Asset Value, Beginning of Period | $25.54 | $25.47 | $25.57 | $25.62 | $25.45 |
| Investment Operations | |||||
| Net Investment Income | .156 | . 095 | . 075 | .121 | .183 |
| Net Realized and Unrealized Gain (Loss) | |||||
| on Investments | .043 | . 088 | (. 059) | (. 007) | .180 |
| Total from Investment Operations | .199 | .183 | .016 | .114 | .363 |
| Distributions | |||||
| Dividends from Net Investment Income | (.155) | (. 093) | (. 075) | (.120) | (.183) |
| Distributions from Realized Capital Gains | (.014) | (. 020) | (. 041) | (.044) | (.010) |
| Total Distributions | (.169) | (.113) | (.116) | (.164) | (.193) |
| Net Asset Value, End of Period | $25.57 | $25.54 | $25.47 | $25.57 | $25.62 |
| Total Return1 | 0.78% | 0.72% | 0.06% | 0.45% | 1.43% |
| Ratios/Supplemental Data | |||||
| Net Assets, End of Period (Millions) | $67 | $49 | $17 | $44 | $33 |
| Ratio of Total Expenses to Average Net Assets | 0.07% | 0.09% | 0.09% | 0.09% | 0.09% |
| Ratio of Net Investment Income to | |||||
| Average Net Assets | 0.62% | 0.37% | 0.29% | 0.47% | 0.71% |
| Portfolio Turnover Rate2 | 64% | 64% | 73% | 72% | 69% |
1 Total returns do not include transaction fees that may have applied in the periods shown. Fund prospectuses provide information about any applicable transaction fees.
2 Excludes the value of portfolio securities received or delivered as a result of in-kind purchases or redemptions of the fund’s capital shares, including ETF Creation Units.
See accompanying Notes, which are an integral part of the Financial Statements.
25
Short-Term Government Bond Index Fund
Notes to Financial Statements
Vanguard Short-Term Government Bond Index Fund is registered under the Investment Company Act of 1940 as an open-end investment company, or mutual fund. The fund offers three classes of shares: ETF Shares, Admiral Shares, and Institutional Shares. ETF Shares are listed for trading on Nasdaq; they can be purchased and sold through a broker. Admiral Shares and Institutional Shares are designed for investors who meet certain administrative, service, and account-size criteria.
A. The following significant accounting policies conform to generally accepted accounting principles for U.S. investment companies. The fund consistently follows such policies in preparing its financial statements.
1. Security Valuation: Securities are valued as of the close of trading on the New York Stock Exchange (generally 4 p.m., Eastern time) on the valuation date. Bonds, and temporary cash investments acquired over 60 days to maturity, are valued using the latest bid prices or using valuations based on a matrix system (which considers such factors as security prices, yields, maturities, and ratings), both as furnished by independent pricing services. Investments in Vanguard Market Liquidity Fund are valued at that fund’s net asset value. Other temporary cash investments are valued at amortized cost, which approximates market value. Securities for which market quotations are not readily available, or whose values have been affected by events occurring before the fund’s pricing time but after the close of the securities’ primary markets, are valued by methods deemed by the board of trustees to represent fair value.
2. Federal Income Taxes: The fund intends to continue to qualify as a regulated investment company and distribute all of its taxable income. Management has analyzed the fund’s tax positions taken for all open federal income tax years (August 31, 2012–2015), and has concluded that no provision for federal income tax is required in the fund’s financial statements.
3. Distributions: Distributions to shareholders are recorded on the ex-dividend date.
4. Credit Facility: The fund and certain other funds managed by The Vanguard Group (“Vanguard”) participate in a $3 billion committed credit facility provided by a syndicate of lenders pursuant to a credit agreement that may be renewed annually; each fund is individually liable for its borrowings, if any, under the credit facility. Borrowings may be utilized for temporary and emergency purposes, and are subject to the fund’s regulatory and contractual borrowing restrictions. The participating funds are charged administrative fees and an annual commitment fee of 0.06% of the undrawn amount of the facility; these fees are allocated to the funds based on a method approved by the fund’s board of trustees and included in Management and Administrative expenses on the fund’s Statement of Operations. Any borrowings under this facility bear interest at a rate equal to the higher of the federal funds rate or LIBOR reference rate plus an agreed-upon spread.
The fund had no borrowings outstanding at August 31, 2015, or at any time during the period then ended.
5. Other: Interest income includes income distributions received from Vanguard Market Liquidity Fund and is accrued daily. Premiums and discounts on debt securities purchased are amortized and accreted, respectively, to interest income over the lives of the respective securities. Security transactions are accounted for on the date securities are bought or sold. Costs used to determine realized gains (losses) on the sale of investment securities are those of the specific securities sold.
Each class of shares has equal rights as to assets and earnings, except that each class separately bears certain class-specific expenses related to maintenance of shareholder accounts (included in Management and Administrative expenses) and shareholder reporting. Marketing and distribution
26
Short-Term Government Bond Index Fund
expenses are allocated to each class of shares based on a method approved by the board of trustees. Income, other non-class-specific expenses, and gains and losses on investments are allocated to each class of shares based on its relative net assets.
B. In accordance with the terms of a Funds’ Service Agreement (the “FSA”) between Vanguard and the fund, Vanguard furnishes to the fund investment advisory, corporate management, administrative, marketing, and distribution services at Vanguard’s cost of operations (as defined by the FSA). These costs of operations are allocated to the fund based on methods and guidelines approved by the board of trustees. Vanguard does not require reimbursement in the current period for certain costs of operations (such as deferred compensation/benefits and risk/insurance costs); the fund’s liability for these costs of operations is included in Payables to Vanguard on the Statement of Net Assets.
Upon the request of Vanguard, the fund may invest up to 0.40% of its net assets as capital in Vanguard. At August 31, 2015, the fund had contributed to Vanguard capital in the amount of $75,000, representing 0.01% of the fund’s net assets and 0.03% of Vanguard’s capitalization. The fund’s trustees and officers are also directors and employees, respectively, of Vanguard.
C. Various inputs may be used to determine the value of the fund’s investments. These inputs are summarized in three broad levels for financial statement purposes. The inputs or methodologies used to value securities are not necessarily an indication of the risk associated with investing in those securities.
Level 1—Quoted prices in active markets for identical securities.
Level 2—Other significant observable inputs (including quoted prices for similar securities, interest rates, prepayment speeds, credit risk, etc.).
Level 3—Significant unobservable inputs (including the fund’s own assumptions used to determine the fair value of investments).
The following table summarizes the market value of the fund’s investments as of August 31, 2015, based on the inputs used to value them:
| Level 1 | Level 2 | Level 3 | |
| Investments | ($000) | ($000) | ($000) |
| U.S. Government and Agency Obligations | — | 910,179 | — |
| Temporary Cash Investments | 13,287 | — | — |
| Total | 13,287 | 910,179 | — |
D. Distributions are determined on a tax basis and may differ from net investment income and realized capital gains for financial reporting purposes. Differences may be permanent or temporary. Permanent differences are reclassified among capital accounts in the financial statements to reflect their tax character. Temporary differences arise when certain items of income, expense, gain, or loss are recognized in different periods for financial statement and tax purposes. These differences will reverse at some time in the future. Differences in classification may also result from the treatment of short-term gains as ordinary income for tax purposes.
During the year ended August 31, 2015, the fund realized $661,000 of net capital gains resulting from in-kind redemptions—in which shareholders exchanged fund shares for securities held by the fund rather than for cash. Because such gains are not taxable to the fund, and are not distributed to shareholders, they have been reclassified from accumulated net realized gains to paid-in capital.
27
Short-Term Government Bond Index Fund
The fund used a tax accounting practice to treat a portion of the price of capital shares redeemed during the year as distributions from realized capital gains. Accordingly, the fund has reclassified $175,000 from accumulated net realized gains to paid-in capital.
For tax purposes, at August 31, 2015, the fund had $706,000 of ordinary income and $157,000 of long-term capital gains available for distribution.
At August 31, 2015, the cost of investment securities for tax purposes was $922,963,000. Net unrealized appreciation of investment securities for tax purposes was $503,000, consisting of unrealized gains of $872,000 on securities that had risen in value since their purchase and $369,000 in unrealized losses on securities that had fallen in value since their purchase.
E. During the year ended August 31, 2015, the fund purchased $987,933,000 of investment securities and sold $737,681,000 of investment securities, other than temporary cash investments. Purchases and sales include $375,110,000 and $238,961,000, respectively, in connection with in-kind purchases and redemptions of the fund’s capital shares.
F. Capital share transactions for each class of shares were:
| Year Ended August 31, | ||||
| 2015 | 2014 | |||
| Amount | Shares | Amount | Shares | |
| ($000) | (000) | ($000) | (000) | |
| ETF Shares | ||||
| Issued | 378,274 | 6,200 | 274,120 | 4,500 |
| Issued in Lieu of Cash Distributions | — | — | — | — |
| Redeemed | (241,059) | (3,950) | (85,246) | (1,400) |
| Net Increase (Decrease) —ETF Shares | 137,215 | 2,250 | 188,874 | 3,100 |
| Admiral Shares1 | ||||
| Issued | 176,583 | 8,677 | 157,433 | 7,749 |
| Issued in Lieu of Cash Distributions | 963 | 47 | 290 | 15 |
| Redeemed | (81,878) | (4,023) | (85,450) | (4,206) |
| Net Increase (Decrease) —Admiral Shares | 95,668 | 4,701 | 72,273 | 3,558 |
| Institutional Shares | ||||
| Issued | 29,714 | 1,162 | 35,085 | 1,374 |
| Issued in Lieu of Cash Distributions | 235 | 9 | 114 | 4 |
| Redeemed | (11,671) | (457) | (3,970) | (155) |
| Net Increase (Decrease) —Institutional Shares | 18,278 | 714 | 31,229 | 1,223 |
| 1 Signal Shares were renamed Admiral Shares in October 2013. | ||||
G. Management has determined that no material events or transactions occurred subsequent to August 31, 2015, that would require recognition or disclosure in these financial statements.
28
Intermediate-Term Government Bond Index Fund
Fund Profile
As of August 31, 2015
| Share-Class Characteristics | |||
| ETF | Admiral | Institutional | |
| Shares | Shares | Shares | |
| Ticker Symbol | VGIT | VSIGX | VIIGX |
| Expense Ratio1 | 0.12% | 0.12% | 0.09% |
| 30-Day SEC Yield | 1.54% | 1.58% | 1.57% |
| Financial Attributes | |||
| Barclays | |||
| 3–10 Year | |||
| Gov’t | Barclays | ||
| Float Adj | Aggregate | ||
| Fund | Index | FA Index | |
| Number of Bonds | 171 | 368 | 9,541 |
| Yield to Maturity | |||
| (before expenses) | 1.7% | 1.7% | 2.4% |
| Average Coupon | 2.2% | 2.1% | 3.2% |
| Average Duration | 5.2 years | 5.2 years | 5.7 years |
| Average Effective | |||
| Maturity | 5.6 years | 5.6 years | 7.9 years |
| Short-Term | |||
| Reserves | 0.8% | — | — |
| Sector Diversification (% of portfolio) | |
| Treasury/Agency | 99.5% |
| Other | 0.5 |
The agency and mortgage-backed securities sectors may include issues from government-sponsored enterprises; such issues are generally not backed by the full faith and credit of the U.S. government.
| Volatility Measures | ||
| Barclays | ||
| 3–10 Year | ||
| Gov’t | Barclays | |
| Float Adj | Aggregate | |
| Index | FA Index | |
| R-Squared | 0.99 | 0.89 |
| Beta | 1.03 | 1.06 |
These measures show the degree and timing of the fund’s fluctuations compared with the indexes over 36 months.
| Distribution by Effective Maturity | |
| (% of portfolio) | |
| Under 1 Year | 0.5% |
| 1 - 3 Years | 0.1 |
| 3 - 5 Years | 49.8 |
| 5 - 10 Years | 49.6 |
| Distribution by Credit Quality (% of portfolio) | |
| U.S. Government | 99.5% |
| Aaa | 0.5 |
Credit-quality ratings are obtained from Barclays and are from Moody's, Fitch, and S&P. When ratings from all three agencies are used, the median rating is shown. When ratings from two of the agencies are used, the lower rating for each issue is shown. "Not Rated" is used to classify securities for which a rating is not available. Not rated securities include a fund's investment in Vanguard Market Liquidity Fund or Vanguard Municipal Cash Management Fund, each of which invests in high-quality money market instruments and may serve as a cash management vehicle for the Vanguard funds, trusts, and accounts. For more information about these ratings, see the Glossary entry for Credit Quality.
Investment Focus
1 The expense ratios shown are from the prospectus dated December 23, 2014, and represent estimated costs for the current fiscal year. For the fiscal year ended August 31, 2015, the expense ratios were 0.10% for ETF Shares, 0.10% for Admiral Shares, and 0.07% for Institutional Shares.
29
Intermediate-Term Government Bond Index Fund
Performance Summary
All of the returns in this report represent past performance, which is not a guarantee of future results that may be achieved by the fund. (Current performance may be lower or higher than the performance data cited. For performance data current to the most recent month-end, visit our website at vanguard.com/performance.) Note, too, that both investment returns and principal value can fluctuate widely, so an investor’s shares, when sold, could be worth more or less than their original cost. The returns shown do not reflect taxes that a shareholder would pay on fund distributions or on the sale of fund shares.
Cumulative Performance: November 19, 2009, Through August 31, 2015
Initial Investment of $10,000
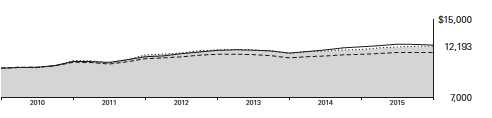
| Average Annual Total Returns | ||||
| Periods Ended August 31, 2015 | ||||
| Since | Final Value | |||
| One | Five | Inception | of a $10,000 | |
| Year | Years | (11/19/2009) | Investment | |
| Intermediate-Term Government Bond | ||||
| Index Fund ETF Shares Net Asset | ||||
| Value | 2.67% | 2.52% | 3.49% | $12,193 |
| Intermediate-Term Government Bond | ||||
| Index Fund ETF Shares Market Price | 2.67 | 2.52 | 3.50 | 12,200 |
| Barclays U.S. 3–10 Year Government | ||||
| Float Adjusted Index | 2.86 | 2.64 | 3.61 | 12,277 |
| Intermediate U.S. Government Funds | ||||
| Average | 1.55 | 1.82 | 2.61 | 11,608 |
| Spliced Barclays U.S. Aggregate Float | ||||
| Adjusted Index | 1.40 | 2.98 | 3.77 | 12,383 |
For a benchmark description, see the Glossary.
Intermediate U.S. Government Funds Average: Derived from data provided by Lipper, a Thomson Reuters Company.
"Since Inception" performance is calculated from the ETF Shares’ inception date for both the fund and its comparative standards.
See Financial Highlights for dividend and capital gains information.
30
| Intermediate-Term Government Bond Index Fund | ||||
| Average Annual Total Returns | ||||
| Periods Ended August 31, 2015 | ||||
| Since | Final Value | |||
| One | Five | Inception | of a $10,000 | |
| Year | Years | (8/4/2010) | Investment | |
| Intermediate-Term Government Bond Index | ||||
| Fund Admiral Shares | 2.67% | 2.51% | 2.87% | $11,546 |
| Barclays U.S. 3–10 Year Government Float | ||||
| Adjusted Index | 2.86 | 2.64 | 3.00 | 11,617 |
| Barclays U.S. Aggregate Float Adjusted Index | 1.40 | 2.98 | 3.23 | 11,751 |
"Since Inception" performance is calculated from the Admiral Shares’ inception date for both the fund and its comparative standards.
| Since | Final Value | |||
| One | Five | Inception | of a $5,000,000 | |
| Year | Years | (3/19/2010) | Investment | |
| Intermediate-Term Government Bond Index | ||||
| Fund Institutional Shares | 2.69% | 2.55% | 3.74% | $6,107,515 |
| Barclays U.S. 3–10 Year Government Float | ||||
| Adjusted Index | 2.86 | 2.64 | 3.84 | 6,140,259 |
| Barclays U.S. Aggregate Float Adjusted | ||||
| Index | 1.40 | 2.98 | 3.77 | 6,117,698 |
"Since Inception" performance is calculated from the Institutional Shares’ inception date for both the fund and its comparative standards.
Cumulative Returns of ETF Shares: November 19, 2009, Through August 31, 2015
| Since | |||
| One | Five | Inception | |
| Year | Years | (11/19/2009) | |
| Intermediate-Term Government Bond Index Fund | |||
| ETF Shares Market Price | 2.67% | 13.28% | 22.00% |
| Intermediate-Term Government Bond Index Fund | |||
| ETF Shares Net Asset Value | 2.67 | 13.26 | 21.93 |
| Barclays U.S. 3–10 Year Government Float Adjusted | |||
| Index | 2.86 | 13.94 | 22.77 |
"Since Inception" performance is calculated from the ETF Shares’ inception date for both the fund and its comparative standards.
31
Intermediate-Term Government Bond Index Fund
Fiscal-Year Total Returns (%): November 19, 2009, Through August 31, 2015
| Barclays | ||
| 3–10 Year | ||
| Gov’t | ||
| Float Adj | ||
| ETF Shares Net Asset Value | Index | |
| Fiscal Year | Total Returns | Total Returns |
| 2010 | 7.65% | 7.76% |
| 2011 | 5.30 | 5.53 |
| 2012 | 4.50 | 4.51 |
| 2013 | -3.18 | -2.99 |
| 2014 | 3.54 | 3.54 |
| 2015 | 2.67 | 2.86 |
Average Annual Total Returns: Periods Ended June 30, 2015
This table presents returns through the latest calendar quarter—rather than through the end of the fiscal period.
Securities and Exchange Commission rules require that we provide this information.
| Since Inception | ||||||
| Inception Date | One Year | Five Years | Income | Capital | Total | |
| ETF Shares | 11/19/2009 | |||||
| Market Price | 2.35% | 2.93% | 3.45% | |||
| Net Asset Value | 2.43 | 2.94 | 3.44 | |||
| Admiral Shares | 8/4/2010 | 2.43 | — | 1.68% | 1.12% | 2.80 |
| Institutional Shares | 3/19/2010 | 2.46 | 2.97 | 1.77 | 1.93 | 3.70 |
32
Intermediate-Term Government Bond Index Fund
Financial Statements
Statement of Net Assets
As of August 31, 2015
The fund reports a complete list of its holdings in regulatory filings four times in each fiscal year, at the quarter-ends. For the second and fourth fiscal quarters, the lists appear in the fund’s semiannual and annual reports to shareholders. For the first and third fiscal quarters, the fund files the lists with the Securities and Exchange Commission on Form N-Q. Shareholders can look up the fund’s Forms N-Q on the SEC’s website at sec.gov. Forms N-Q may also be reviewed and copied at the SEC’s Public Reference Room (see the back cover of this report for further information).
| Face | Market | |||
| Maturity | Amount | Value• | ||
| Coupon | Date | ($000) | ($000) | |
| U.S. Government and Agency Obligations (98.9%) | ||||
| U.S. Government Securities (94.4%) | ||||
| United States Treasury Note/Bond | 1.375% | 9/30/18 | 12,126 | 12,217 |
| United States Treasury Note/Bond | 1.250% | 10/31/18 | 6,710 | 6,731 |
| United States Treasury Note/Bond | 1.750% | 10/31/18 | 4,445 | 4,530 |
| United States Treasury Note/Bond | 3.750% | 11/15/18 | 4,607 | 4,985 |
| United States Treasury Note/Bond | 9.000% | 11/15/18 | 733 | 915 |
| United States Treasury Note/Bond | 1.250% | 11/30/18 | 6,035 | 6,048 |
| United States Treasury Note/Bond | 1.375% | 11/30/18 | 3,670 | 3,694 |
| United States Treasury Note/Bond | 1.375% | 12/31/18 | 4,220 | 4,242 |
| United States Treasury Note/Bond | 1.500% | 12/31/18 | 8,440 | 8,520 |
| United States Treasury Note/Bond | 1.250% | 1/31/19 | 5,250 | 5,253 |
| United States Treasury Note/Bond | 1.500% | 1/31/19 | 14,565 | 14,690 |
| United States Treasury Note/Bond | 2.750% | 2/15/19 | 19,197 | 20,172 |
| United States Treasury Note/Bond | 8.875% | 2/15/19 | 869 | 1,096 |
| United States Treasury Note/Bond | 1.375% | 2/28/19 | 4,650 | 4,669 |
| United States Treasury Note/Bond | 1.500% | 2/28/19 | 5,400 | 5,444 |
| United States Treasury Note/Bond | 1.500% | 3/31/19 | 2,340 | 2,358 |
| United States Treasury Note/Bond | 1.625% | 3/31/19 | 5,400 | 5,464 |
| United States Treasury Note/Bond | 1.250% | 4/30/19 | 28 | 28 |
| United States Treasury Note/Bond | 1.625% | 4/30/19 | 4,423 | 4,473 |
| United States Treasury Note/Bond | 3.125% | 5/15/19 | 7,958 | 8,477 |
| United States Treasury Note/Bond | 1.125% | 5/31/19 | 1,310 | 1,301 |
| United States Treasury Note/Bond | 1.500% | 5/31/19 | 10,350 | 10,415 |
| United States Treasury Note/Bond | 1.000% | 6/30/19 | 1,764 | 1,742 |
| United States Treasury Note/Bond | 1.625% | 6/30/19 | 14,030 | 14,175 |
| United States Treasury Note/Bond | 0.875% | 7/31/19 | 3,609 | 3,540 |
| United States Treasury Note/Bond | 1.625% | 7/31/19 | 9,810 | 9,905 |
| United States Treasury Note/Bond | 3.625% | 8/15/19 | 3,342 | 3,630 |
| United States Treasury Note/Bond | 8.125% | 8/15/19 | 2,692 | 3,395 |
| United States Treasury Note/Bond | 1.000% | 8/31/19 | 3,240 | 3,190 |
| United States Treasury Note/Bond | 1.625% | 8/31/19 | 7,283 | 7,351 |
| United States Treasury Note/Bond | 1.000% | 9/30/19 | 20,845 | 20,506 |
| United States Treasury Note/Bond | 1.750% | 9/30/19 | 18,350 | 18,597 |
| United States Treasury Note/Bond | 1.250% | 10/31/19 | 876 | 870 |
| United States Treasury Note/Bond | 1.500% | 10/31/19 | 9,750 | 9,776 |
| United States Treasury Note/Bond | 3.375% | 11/15/19 | 9,950 | 10,729 |
| United States Treasury Note/Bond | 1.000% | 11/30/19 | 7,855 | 7,708 |
| United States Treasury Note/Bond | 1.500% | 11/30/19 | 7,850 | 7,868 |
| United States Treasury Note/Bond | 1.125% | 12/31/19 | 3,275 | 3,228 |
33
| Intermediate-Term Government Bond Index Fund | ||||
| Face | Market | |||
| Maturity | Amount | Value• | ||
| Coupon | Date | ($000) | ($000) | |
| United States Treasury Note/Bond | 1.625% | 12/31/19 | 16,168 | 16,279 |
| United States Treasury Note/Bond | 1.250% | 1/31/20 | 7,800 | 7,726 |
| United States Treasury Note/Bond | 1.375% | 1/31/20 | 2,552 | 2,540 |
| United States Treasury Note/Bond | 3.625% | 2/15/20 | 5,780 | 6,309 |
| United States Treasury Note/Bond | 8.500% | 2/15/20 | 360 | 469 |
| United States Treasury Note/Bond | 1.250% | 2/29/20 | 5,560 | 5,497 |
| United States Treasury Note/Bond | 1.375% | 2/29/20 | 9,500 | 9,458 |
| United States Treasury Note/Bond | 1.125% | 3/31/20 | 1,050 | 1,032 |
| United States Treasury Note/Bond | 1.375% | 3/31/20 | 2,989 | 2,973 |
| United States Treasury Note/Bond | 1.125% | 4/30/20 | 2,775 | 2,725 |
| United States Treasury Note/Bond | 1.375% | 4/30/20 | 6,400 | 6,361 |
| United States Treasury Note/Bond | 3.500% | 5/15/20 | 21,639 | 23,546 |
| United States Treasury Note/Bond | 8.750% | 5/15/20 | 1,500 | 1,991 |
| United States Treasury Note/Bond | 1.375% | 5/31/20 | 2,700 | 2,680 |
| United States Treasury Note/Bond | 1.500% | 5/31/20 | 9,572 | 9,566 |
| United States Treasury Note/Bond | 1.625% | 6/30/20 | 8,000 | 8,031 |
| United States Treasury Note/Bond | 1.875% | 6/30/20 | 2,450 | 2,486 |
| United States Treasury Note/Bond | 1.625% | 7/31/20 | 16,800 | 16,858 |
| United States Treasury Note/Bond | 2.000% | 7/31/20 | 2,060 | 2,102 |
| United States Treasury Note/Bond | 2.625% | 8/15/20 | 24,215 | 25,396 |
| United States Treasury Note/Bond | 8.750% | 8/15/20 | 1,950 | 2,617 |
| United States Treasury Note/Bond | 1.375% | 8/31/20 | 7,000 | 6,942 |
| United States Treasury Note/Bond | 2.125% | 8/31/20 | 4,550 | 4,665 |
| United States Treasury Note/Bond | 2.000% | 9/30/20 | 2,130 | 2,170 |
| United States Treasury Note/Bond | 1.750% | 10/31/20 | 6,500 | 6,535 |
| United States Treasury Note/Bond | 2.625% | 11/15/20 | 29,097 | 30,488 |
| United States Treasury Note/Bond | 2.000% | 11/30/20 | 6,675 | 6,789 |
| United States Treasury Note/Bond | 2.375% | 12/31/20 | 5,230 | 5,417 |
| United States Treasury Note/Bond | 2.125% | 1/31/21 | 5,722 | 5,846 |
| United States Treasury Note/Bond | 3.625% | 2/15/21 | 5,457 | 6,004 |
| United States Treasury Note/Bond | 7.875% | 2/15/21 | 716 | 947 |
| United States Treasury Note/Bond | 2.000% | 2/28/21 | 5,015 | 5,088 |
| United States Treasury Note/Bond | 2.250% | 3/31/21 | 2,925 | 3,005 |
| United States Treasury Note/Bond | 2.250% | 4/30/21 | 3,500 | 3,592 |
| United States Treasury Note/Bond | 3.125% | 5/15/21 | 3,042 | 3,266 |
| United States Treasury Note/Bond | 8.125% | 5/15/21 | 1,340 | 1,804 |
| United States Treasury Note/Bond | 2.000% | 5/31/21 | 9,710 | 9,828 |
| United States Treasury Note/Bond | 2.125% | 6/30/21 | 4,950 | 5,041 |
| United States Treasury Note/Bond | 2.250% | 7/31/21 | 5,825 | 5,971 |
| United States Treasury Note/Bond | 2.125% | 8/15/21 | 7,250 | 7,379 |
| United States Treasury Note/Bond | 8.125% | 8/15/21 | 1,775 | 2,412 |
| United States Treasury Note/Bond | 2.000% | 8/31/21 | 5,425 | 5,479 |
| United States Treasury Note/Bond | 2.125% | 9/30/21 | 10,445 | 10,615 |
| United States Treasury Note/Bond | 2.000% | 10/31/21 | 8,775 | 8,852 |
| United States Treasury Note/Bond | 2.000% | 11/15/21 | 5,013 | 5,054 |
| United States Treasury Note/Bond | 8.000% | 11/15/21 | 7,115 | 9,701 |
| United States Treasury Note/Bond | 1.875% | 11/30/21 | 7,500 | 7,505 |
| United States Treasury Note/Bond | 2.125% | 12/31/21 | 8,850 | 8,981 |
| United States Treasury Note/Bond | 1.500% | 1/31/22 | 11,000 | 10,739 |
| United States Treasury Note/Bond | 2.000% | 2/15/22 | 15,390 | 15,505 |
| United States Treasury Note/Bond | 1.750% | 2/28/22 | 8,900 | 8,817 |
| United States Treasury Note/Bond | 1.750% | 3/31/22 | 8,206 | 8,124 |
| United States Treasury Note/Bond | 1.750% | 4/30/22 | 8,500 | 8,408 |
| United States Treasury Note/Bond | 1.750% | 5/15/22 | 5,000 | 4,945 |
| United States Treasury Note/Bond | 1.875% | 5/31/22 | 8,175 | 8,148 |
| United States Treasury Note/Bond | 2.125% | 6/30/22 | 8,900 | 9,017 |
34
| Intermediate-Term Government Bond Index Fund | ||||
| Face | Market | |||
| Maturity | Amount | Value• | ||
| Coupon | Date | ($000) | ($000) | |
| United States Treasury Note/Bond | 2.000% | 7/31/22 | 4,300 | 4,319 |
| United States Treasury Note/Bond | 1.625% | 8/15/22 | 2,740 | 2,681 |
| United States Treasury Note/Bond | 7.250% | 8/15/22 | 975 | 1,316 |
| United States Treasury Note/Bond | 1.875% | 8/31/22 | 4,882 | 4,861 |
| United States Treasury Note/Bond | 1.625% | 11/15/22 | 14,790 | 14,434 |
| United States Treasury Note/Bond | 7.625% | 11/15/22 | 575 | 797 |
| United States Treasury Note/Bond | 2.000% | 2/15/23 | 11,275 | 11,263 |
| United States Treasury Note/Bond | 7.125% | 2/15/23 | 1,590 | 2,162 |
| United States Treasury Note/Bond | 1.750% | 5/15/23 | 28,370 | 27,736 |
| United States Treasury Note/Bond | 2.500% | 8/15/23 | 8,295 | 8,556 |
| United States Treasury Note/Bond | 6.250% | 8/15/23 | 1,725 | 2,259 |
| United States Treasury Note/Bond | 2.750% | 11/15/23 | 7,545 | 7,925 |
| United States Treasury Note/Bond | 2.750% | 2/15/24 | 9,515 | 9,983 |
| United States Treasury Note/Bond | 2.500% | 5/15/24 | 20,135 | 20,692 |
| United States Treasury Note/Bond | 2.375% | 8/15/24 | 18,060 | 18,348 |
| United States Treasury Note/Bond | 2.250% | 11/15/24 | 19,316 | 19,394 |
| United States Treasury Note/Bond | 7.500% | 11/15/24 | 1,690 | 2,448 |
| United States Treasury Note/Bond | 2.000% | 2/15/25 | 16,673 | 16,363 |
| United States Treasury Note/Bond | 2.125% | 5/15/25 | 19,910 | 19,736 |
| United States Treasury Note/Bond | 2.000% | 8/15/25 | 7,000 | 6,867 |
| 873,793 | ||||
| Agency Bonds and Notes (4.5%) | ||||
| 1 AID-Israel | 5.500% | 9/18/23 | 125 | 152 |
| 1 AID-Israel | 5.500% | 4/26/24 | 500 | 613 |
| 1 AID-Jordan | 1.945% | 6/23/19 | 200 | 196 |
| 1 AID-Jordan | 2.503% | 10/30/20 | 175 | 181 |
| 1 AID-Jordan | 2.578% | 6/30/22 | 500 | 506 |
| 1 AID-Ukraine | 1.844% | 5/16/19 | 200 | 203 |
| 1 AID-Ukraine | 1.847% | 5/29/20 | 300 | 300 |
| 2 Federal Farm Credit Banks | 5.150% | 11/15/19 | 300 | 344 |
| 2 Federal Farm Credit Banks | 3.500% | 12/20/23 | 100 | 107 |
| 2 Federal Home Loan Banks | 1.875% | 3/8/19 | 1,070 | 1,089 |
| 2 Federal Home Loan Banks | 1.875% | 3/13/20 | 150 | 152 |
| 2 Federal Home Loan Banks | 4.125% | 3/13/20 | 2,100 | 2,327 |
| 2 Federal Home Loan Banks | 3.375% | 6/12/20 | 125 | 135 |
| 2 Federal Home Loan Banks | 3.125% | 12/11/20 | 1,000 | 1,066 |
| 2 Federal Home Loan Banks | 5.250% | 12/11/20 | 250 | 293 |
| 2 Federal Home Loan Banks | 5.625% | 6/11/21 | 400 | 479 |
| 2 Federal Home Loan Banks | 2.000% | 9/9/22 | 1,265 | 1,243 |
| 2 Federal Home Loan Banks | 2.125% | 3/10/23 | 650 | 637 |
| 2 Federal Home Loan Banks | 2.875% | 6/14/24 | 200 | 204 |
| 2 Federal Home Loan Banks | 2.875% | 9/13/24 | 1,000 | 1,016 |
| 3 Federal Home Loan Mortgage Corp. | 3.750% | 3/27/19 | 2,440 | 2,641 |
| 3 Federal Home Loan Mortgage Corp. | 1.750% | 5/30/19 | 400 | 405 |
| 3 Federal Home Loan Mortgage Corp. | 1.250% | 8/1/19 | 450 | 446 |
| 3 Federal Home Loan Mortgage Corp. | 1.250% | 10/2/19 | 2,690 | 2,665 |
| 3 Federal Home Loan Mortgage Corp. | 1.375% | 5/1/20 | 1,445 | 1,427 |
| 3 Federal Home Loan Mortgage Corp. | 2.375% | 1/13/22 | 3,400 | 3,453 |
| 3 Federal National Mortgage Assn. | 1.875% | 9/18/18 | 550 | 561 |
| 3 Federal National Mortgage Assn. | 1.625% | 11/27/18 | 1,350 | 1,366 |
| 3 Federal National Mortgage Assn. | 1.875% | 2/19/19 | 1,750 | 1,781 |
| 3 Federal National Mortgage Assn. | 1.750% | 6/20/19 | 800 | 809 |
| 3 Federal National Mortgage Assn. | 1.750% | 9/12/19 | 5,350 | 5,409 |
| 3 Federal National Mortgage Assn. | 0.000% | 10/9/19 | 1,150 | 1,058 |
| 3 Federal National Mortgage Assn. | 1.750% | 11/26/19 | 750 | 757 |
| 3 Federal National Mortgage Assn. | 1.625% | 1/21/20 | 1,170 | 1,172 |
35
| Intermediate-Term Government Bond Index Fund | |||||
| Face | Market | ||||
| Maturity | Amount | Value• | |||
| Coupon | Date | ($000) | ($000) | ||
| 3 | Federal National Mortgage Assn. | 1.500% | 6/22/20 | 1,200 | 1,189 |
| 3 | Federal National Mortgage Assn. | 2.625% | 9/6/24 | 1,495 | 1,506 |
| 2 | Financing Corp. | 10.700% | 10/6/17 | 142 | 170 |
| 2 | Financing Corp. | 9.800% | 11/30/17 | 385 | 459 |
| 2 | Financing Corp. | 9.800% | 4/6/18 | 200 | 243 |
| 2 | Financing Corp. | 10.350% | 8/3/18 | 250 | 314 |
| 2 | Financing Corp. | 9.700% | 4/5/19 | 50 | 64 |
| NCUA Guaranteed Notes | 3.000% | 6/12/19 | 180 | 191 | |
| Private Export Funding Corp. | 2.250% | 12/15/17 | 25 | 26 | |
| Private Export Funding Corp. | 1.875% | 7/15/18 | 50 | 51 | |
| Private Export Funding Corp. | 4.375% | 3/15/19 | 700 | 768 | |
| Private Export Funding Corp. | 1.450% | 8/15/19 | 125 | 124 | |
| Private Export Funding Corp. | 2.250% | 3/15/20 | 150 | 152 | |
| Private Export Funding Corp. | 2.300% | 9/15/20 | 75 | 76 | |
| Private Export Funding Corp. | 2.050% | 11/15/22 | 175 | 169 | |
| Private Export Funding Corp. | 3.550% | 1/15/24 | 75 | 80 | |
| Private Export Funding Corp. | 2.450% | 7/15/24 | 205 | 200 | |
| Private Export Funding Corp. | 3.250% | 6/15/25 | 75 | 76 | |
| 2 | Tennessee Valley Authority | 1.750% | 10/15/18 | 125 | 127 |
| 2 | Tennessee Valley Authority | 3.875% | 2/15/21 | 225 | 248 |
| 2 | Tennessee Valley Authority | 1.875% | 8/15/22 | 125 | 122 |
| 2 | Tennessee Valley Authority | 2.875% | 9/15/24 | 400 | 405 |
| 41,953 | |||||
| Total U.S. Government and Agency Obligations (Cost $910,975) | 915,746 | ||||
| Shares | |||||
| Temporary Cash Investment (0.8%) | |||||
| Money Market Fund (0.8%) | |||||
| 4 | Vanguard Market Liquidity Fund (Cost $7,229) | 0.168% | 7,228,556 | 7,229 | |
| Total Investments (99.7%) (Cost $918,204) | 922,975 | ||||
| Amount | |||||
| ($000) | |||||
| Other Assets and Liabilities (0.3%) | |||||
| Other Assets | |||||
| Investment in Vanguard | 78 | ||||
| Receivables for Investment Securities Sold | 18,109 | ||||
| Receivables for Accrued Income | 4,363 | ||||
| Receivables for Capital Shares Issued | 2,053 | ||||
| Other Assets | 574 | ||||
| Total Other Assets | 25,177 | ||||
| Liabilities | |||||
| Payables for Investment Securities Purchased | (21,562) | ||||
| Payables for Capital Shares Redeemed | (534) | ||||
| Payables for Distributions | (51) | ||||
| Payables to Vanguard | (174) | ||||
| Other Liabilities | (363) | ||||
| Total Liabilities | (22,684) | ||||
| Net Assets (100%) | 925,468 | ||||
36
| Intermediate-Term Government Bond Index Fund | |
| At August 31, 2015, net assets consisted of: | |
| Amount | |
| ($000) | |
| Paid-in Capital | 920,092 |
| Undistributed Net Investment Income | 565 |
| Accumulated Net Realized Gains | 40 |
| Unrealized Appreciation (Depreciation) | 4,771 |
| Net Assets | 925,468 |
| ETF Shares—Net Assets | |
| Applicable to 5,550,877 outstanding $.001 par value shares of | |
| beneficial interest (unlimited authorization) | 359,692 |
| Net Asset Value Per Share—ETF Shares | $64.80 |
| Admiral Shares—Net Assets | |
| Applicable to 16,387,059 outstanding $.001 par value shares of | |
| beneficial interest (unlimited authorization) | 358,229 |
| Net Asset Value Per Share—Admiral Shares | $21.86 |
| Institutional Shares—Net Assets | |
| Applicable to 7,651,598 outstanding $.001 par value shares of | |
| beneficial interest (unlimited authorization) | 207,547 |
| Net Asset Value Per Share—Institutional Shares | $27.12 |
• See Note A in Notes to Financial Statements.
1 U.S. government-guaranteed.
2 The issuer operates under a congressional charter; its securities are generally neither guaranteed by the U.S. Treasury nor backed by the full faith and credit of the U.S. government.
3 The issuer was placed under federal conservatorship in September 2008; since that time, its daily operations have been managed by the Federal Housing Finance Agency and it receives capital from the U.S. Treasury, as needed to maintain a positive net worth, in exchange for senior preferred stock.
4 Affiliated money market fund available only to Vanguard funds and certain trusts and accounts managed by Vanguard. Rate shown is the 7-day yield.
See accompanying Notes, which are an integral part of the Financial Statements.
37
| Intermediate-Term Government Bond Index Fund | |
| Statement of Operations | |
| Year Ended | |
| August 31, 2015 | |
| ($000) | |
| Investment Income | |
| Income | |
| Interest1 | 11,783 |
| Total Income | 11,783 |
| Expenses | |
| The Vanguard Group—Note B | |
| Investment Advisory Services | 16 |
| Management and Administrative—ETF Shares | 191 |
| Management and Administrative—Admiral Shares | 201 |
| Management and Administrative—Institutional Shares | 50 |
| Marketing and Distribution—ETF Shares | 34 |
| Marketing and Distribution—Admiral Shares | 48 |
| Marketing and Distribution—Institutional Shares | 11 |
| Custodian Fees | 5 |
| Auditing Fees | 50 |
| Shareholders’ Reports—ETF Shares | 16 |
| Shareholders’ Reports—Admiral Shares | 3 |
| Shareholders’ Reports—Institutional Shares | — |
| Total Expenses | 625 |
| Net Investment Income | 11,158 |
| Realized Net Gain (Loss) on Investment Securities Sold | 757 |
| Change in Unrealized Appreciation (Depreciation) of Investment Securities | 2,636 |
| Net Increase (Decrease) in Net Assets Resulting from Operations | 14,551 |
| 1 Interest income from an affiliated company of the fund was $5,000. | |
See accompanying Notes, which are an integral part of the Financial Statements.
38
| Intermediate-Term Government Bond Index Fund | ||
| Statement of Changes in Net Assets | ||
| Year Ended August 31, | ||
| 2015 | 2014 | |
| ($000) | ($000) | |
| Increase (Decrease) in Net Assets | ||
| Operations | ||
| Net Investment Income | 11,158 | 5,392 |
| Realized Net Gain (Loss) | 757 | 116 |
| Change in Unrealized Appreciation (Depreciation) | 2,636 | 6,662 |
| Net Increase (Decrease) in Net Assets Resulting from Operations | 14,551 | 12,170 |
| Distributions | ||
| Net Investment Income | ||
| ETF Shares | (4,277) | (1,690) |
| Admiral Shares1 | (4,736) | (2,645) |
| Institutional Shares | (1,815) | (826) |
| Realized Capital Gain 2 | ||
| ETF Shares | — | (359) |
| Admiral Shares1 | — | (474) |
| Institutional Shares | — | (194) |
| Total Distributions | (10,828) | (6,188) |
| Capital Share Transactions | ||
| ETF Shares | 195,097 | 38,270 |
| Admiral Shares1 | 123,954 | 133,880 |
| Institutional Shares | 153,733 | (6,706) |
| Net Increase (Decrease) from Capital Share Transactions | 472,784 | 165,444 |
| Total Increase (Decrease) | 476,507 | 171,426 |
| Net Assets | ||
| Beginning of Period | 448,961 | 277,535 |
| End of Period3 | 925,468 | 448,961 |
1 Signal Shares were renamed Admiral Shares in October 2013.
2 Includes fiscal 2014 short-term gain distributions totaling $78,000. Short-term gain distributions are treated as ordinary income dividends for tax purposes.
3 Net Assets—End of Period includes undistributed (overdistributed) net investment income of $565,000 and $235,000.
See accompanying Notes, which are an integral part of the Financial Statements.
39
| Intermediate-Term Government Bond Index Fund | |||||
| Financial Highlights | |||||
| ETF Shares | |||||
| For a Share Outstanding | Year Ended August 31, | ||||
| Throughout Each Period | 2015 | 2014 | 2013 | 2012 | 2011 |
| Net Asset Value, Beginning of Period | $64.14 | $62.96 | $66.58 | $64.91 | $63.58 |
| Investment Operations | |||||
| Net Investment Income | 1.054 | .920 | .861 | 1.097 | 1.301 |
| Net Realized and Unrealized Gain (Loss) | |||||
| on Investments | . 649 | 1.292 | (2.940) | 1.791 | 1.949 |
| Total from Investment Operations | 1.703 | 2.212 | (2.079) | 2.888 | 3.250 |
| Distributions | |||||
| Dividends from Net Investment Income | (1.043) | (. 843) | (. 861) | (1.094) | (1.304) |
| Distributions from Realized Capital Gains | — | (.189) | (.680) | (.124) | (.616) |
| Total Distributions | (1.043) | (1.032) | (1.541) | (1.218) | (1.920) |
| Net Asset Value, End of Period | $64.80 | $64.14 | $62.96 | $66.58 | $64.91 |
| Total Return | 2.67% | 3.54% | -3.18% | 4.50% | 5.30% |
| Ratios/Supplemental Data | |||||
| Net Assets, End of Period (Millions) | $360 | $164 | $123 | $133 | $55 |
| Ratio of Total Expenses to Average Net Assets | 0.10% | 0.12% | 0.12% | 0.12% | 0.14% |
| Ratio of Net Investment Income to | |||||
| Average Net Assets | 1.67% | 1.50% | 1.32% | 1.67% | 2.09% |
| Portfolio Turnover Rate1 | 35% | 43% | 54% | 51% | 41% |
1 Excludes the value of portfolio securities received or delivered as a result of in-kind purchases or redemptions of the fund’s capital shares, including ETF Creation Units.
See accompanying Notes, which are an integral part of the Financial Statements.
40
| Intermediate-Term Government Bond Index Fund | |||||
| Financial Highlights | |||||
| Admiral Shares | |||||
| For a Share Outstanding | Year Ended August 31, | ||||
| Throughout Each Period | 2015 | 2014 | 2013 | 2012 | 2011 |
| Net Asset Value, Beginning of Period | $21.64 | $21.27 | $22.50 | $21.94 | $21.49 |
| Investment Operations | |||||
| Net Investment Income | . 355 | . 317 | .292 | .369 | .441 |
| Net Realized and Unrealized Gain (Loss) | |||||
| on Investments | .220 | .432 | (1.000) | .602 | .658 |
| Total from Investment Operations | .575 | .749 | (.708) | .971 | 1.099 |
| Distributions | |||||
| Dividends from Net Investment Income | (. 355) | (. 315) | (. 292) | (. 369) | (. 441) |
| Distributions from Realized Capital Gains | — | (.064) | (. 230) | (. 042) | (. 208) |
| Total Distributions | (.355) | (.379) | (. 522) | (. 411) | (.649) |
| Net Asset Value, End of Period | $21.86 | $21.64 | $21.27 | $22.50 | $21.94 |
| Total Return1 | 2.67% | 3.55% | -3.21% | 4.47% | 5.31% |
| Ratios/Supplemental Data | |||||
| Net Assets, End of Period (Millions) | $358 | $232 | $95 | $35 | $8 |
| Ratio of Total Expenses to Average Net Assets | 0.10% | 0.12% | 0.12% | 0.12% | 0.13% |
| Ratio of Net Investment Income to | |||||
| Average Net Assets | 1.67% | 1.50% | 1.32% | 1.67% | 2.10% |
| Portfolio Turnover Rate2 | 35% | 43% | 54% | 51% | 41% |
Signal Shares were renamed Admiral Shares in October 2013. Prior periods’ Financial Highlights are for the Signal class.
1 Total returns do not include transaction or account service fees that may have applied in the periods shown. Fund prospectuses provide information about any applicable transaction and account service fees.
2 Excludes the value of portfolio securities received or delivered as a result of in-kind purchases or redemptions of the fund’s capital shares, including ETF Creation Units.
See accompanying Notes, which are an integral part of the Financial Statements.
41
| Intermediate-Term Government Bond Index Fund | |||||
| Financial Highlights | |||||
| Institutional Shares | |||||
| For a Share Outstanding | Year Ended August 31, | ||||
| Throughout Each Period | 2015 | 2014 | 2013 | 2012 | 2011 |
| Net Asset Value, Beginning of Period | $26.85 | $26.39 | $27.91 | $27.21 | $26.65 |
| Investment Operations | |||||
| Net Investment Income | . 447 | .400 | .368 | .466 | .557 |
| Net Realized and Unrealized Gain (Loss) | |||||
| on Investments | . 271 | .536 | (1.235) | .752 | . 819 |
| Total from Investment Operations | .718 | .936 | (.867) | 1.218 | 1.376 |
| Distributions | |||||
| Dividends from Net Investment Income | (.448) | (. 397) | (. 368) | (. 465) | (.558) |
| Distributions from Realized Capital Gains | — | (.079) | (. 285) | (. 053) | (. 258) |
| Total Distributions | (.448) | (.476) | (. 653) | (. 518) | (. 816) |
| Net Asset Value, End of Period | $27.12 | $26.85 | $26.39 | $27.91 | $27.21 |
| Total Return1 | 2.69% | 3.58% | -3.17% | 4.52% | 5.36% |
| Ratios/Supplemental Data | |||||
| Net Assets, End of Period (Millions) | $208 | $54 | $59 | $117 | $118 |
| Ratio of Total Expenses to Average Net Assets | 0.07% | 0.09% | 0.09% | 0.09% | 0.09% |
| Ratio of Net Investment Income to | |||||
| Average Net Assets | 1.70% | 1.53% | 1.35% | 1.70% | 2.14% |
| Portfolio Turnover Rate2 | 35% | 43% | 54% | 51% | 41% |
1 Total returns do not include transaction fees that may have applied in the periods shown. Fund prospectuses provide information about any applicable transaction fees.
2 Excludes the value of portfolio securities received or delivered as a result of in-kind purchases or redemptions of the fund’s capital shares, including ETF Creation Units.
See accompanying Notes, which are an integral part of the Financial Statements.
42
Intermediate-Term Government Bond Index Fund
Notes to Financial Statements
Vanguard Intermediate-Term Government Bond Index Fund is registered under the Investment Company Act of 1940 as an open-end investment company, or mutual fund. The fund offers three classes of shares: ETF Shares, Admiral Shares, and Institutional Shares. ETF Shares are listed for trading on Nasdaq; they can be purchased and sold through a broker. Admiral Shares and Institutional Shares are designed for investors who meet certain administrative, service, and account-size criteria.
A. The following significant accounting policies conform to generally accepted accounting principles for U.S. investment companies. The fund consistently follows such policies in preparing its financial statements.
1. Security Valuation: Securities are valued as of the close of trading on the New York Stock Exchange (generally 4 p.m., Eastern time) on the valuation date. Bonds, and temporary cash investments acquired over 60 days to maturity, are valued using the latest bid prices or using valuations based on a matrix system (which considers such factors as security prices, yields, maturities, and ratings), both as furnished by independent pricing services. Investments in Vanguard Market Liquidity Fund are valued at that fund’s net asset value. Other temporary cash investments are valued at amortized cost, which approximates market value. Securities for which market quotations are not readily available, or whose values have been affected by events occurring before the fund’s pricing time but after the close of the securities’ primary markets, are valued by methods deemed by the board of trustees to represent fair value.
2. Federal Income Taxes: The fund intends to continue to qualify as a regulated investment company and distribute all of its taxable income. Management has analyzed the fund’s tax positions taken for all open federal income tax years (August 31, 2012–2015), and has concluded that no provision for federal income tax is required in the fund’s financial statements.
3. Distributions: Distributions to shareholders are recorded on the ex-dividend date.
4. Credit Facility: The fund and certain other funds managed by The Vanguard Group (“Vanguard”) participate in a $3 billion committed credit facility provided by a syndicate of lenders pursuant to a credit agreement that may be renewed annually; each fund is individually liable for its borrowings, if any, under the credit facility. Borrowings may be utilized for temporary and emergency purposes, and are subject to the fund’s regulatory and contractual borrowing restrictions. The participating funds are charged administrative fees and an annual commitment fee of 0.06% of the undrawn amount of the facility; these fees are allocated to the funds based on a method approved by the fund’s board of trustees and included in Management and Administrative expenses on the fund’s Statement of Operations. Any borrowings under this facility bear interest at a rate equal to the higher of the federal funds rate or LIBOR reference rate plus an agreed-upon spread.
The fund had no borrowings outstanding at August 31, 2015, or at any time during the period then ended.
5. Other: Interest income includes income distributions received from Vanguard Market Liquidity Fund and is accrued daily. Premiums and discounts on debt securities purchased are amortized and accreted, respectively, to interest income over the lives of the respective securities. Security transactions are accounted for on the date securities are bought or sold. Costs used to determine realized gains (losses) on the sale of investment securities are those of the specific securities sold.
Each class of shares has equal rights as to assets and earnings, except that each class separately bears certain class-specific expenses related to maintenance of shareholder accounts (included in Management and Administrative expenses) and shareholder reporting. Marketing and distribution
43
Intermediate-Term Government Bond Index Fund
expenses are allocated to each class of shares based on a method approved by the board of trustees. Income, other non-class-specific expenses, and gains and losses on investments are allocated to each class of shares based on its relative net assets.
B. In accordance with the terms of a Funds’ Service Agreement (the “FSA”) between Vanguard and the fund, Vanguard furnishes to the fund investment advisory, corporate management, administrative, marketing, and distribution services at Vanguard’s cost of operations (as defined by the FSA). These costs of operations are allocated to the fund based on methods and guidelines approved by the board of trustees. Vanguard does not require reimbursement in the current period for certain costs of operations (such as deferred compensation/benefits and risk/insurance costs); the fund’s liability for these costs of operations is included in Payables to Vanguard on the Statement of Net Assets.
Upon the request of Vanguard, the fund may invest up to 0.40% of its net assets as capital in Vanguard. At August 31, 2015, the fund had contributed to Vanguard capital in the amount of $78,000, representing 0.01% of the fund’s net assets and 0.03% of Vanguard’s capitalization. The fund’s trustees and officers are also directors and employees, respectively, of Vanguard.
C. Various inputs may be used to determine the value of the fund’s investments. These inputs are summarized in three broad levels for financial statement purposes. The inputs or methodologies used to value securities are not necessarily an indication of the risk associated with investing in those securities.
Level 1—Quoted prices in active markets for identical securities.
Level 2—Other significant observable inputs (including quoted prices for similar securities, interest rates, prepayment speeds, credit risk, etc.).
Level 3—Significant unobservable inputs (including the fund’s own assumptions used to determine the fair value of investments).
The following table summarizes the market value of the fund’s investments as of August 31, 2015, based on the inputs used to value them:
| Level 1 | Level 2 | Level 3 | |
| Investments | ($000) | ($000) | ($000) |
| U.S. Government and Agency Obligations | — | 915,746 | — |
| Temporary Cash Investments | 7,229 | — | — |
| Total | 7,229 | 915,746 | — |
D. Distributions are determined on a tax basis and may differ from net investment income and realized capital gains for financial reporting purposes. Differences may be permanent or temporary. Permanent differences are reclassified among capital accounts in the financial statements to reflect their tax character. Temporary differences arise when certain items of income, expense, gain, or loss are recognized in different periods for financial statement and tax purposes. These differences will reverse at some time in the future. Differences in classification may also result from the treatment of short-term gains as ordinary income for tax purposes.
During the year ended August 31, 2015, the fund realized $377,000 of net capital gains resulting from in-kind redemptions—in which shareholders exchanged fund shares for securities held by the fund rather than for cash. Because such gains are not taxable to the fund, and are not distributed to shareholders, they have been reclassified from accumulated net realized gains to paid-in capital.
44
Intermediate-Term Government Bond Index Fund
The fund used a tax accounting practice to treat a portion of the price of capital shares redeemed during the year as distributions from realized capital gains. Accordingly, the fund has reclassified $42,000 from accumulated net realized gains to paid-in capital.
The fund used capital loss carryforwards of $302,000 to offset taxable capital gains realized during the year ended August 31, 2015, reducing the amount of capital gains that would otherwise be available to distribute to shareholders. For tax purposes, at August 31, 2015, the fund had $802,000 of ordinary income and $15,000 of long-term capital gains available for distribution.
At August 31, 2015, the cost of investment securities for tax purposes was $918,204,000. Net unrealized appreciation of investment securities for tax purposes was $4,771,000, consisting of unrealized gains of $6,274,000 on securities that had risen in value since their purchase and $1,503,000 in unrealized losses on securities that had fallen in value since their purchase.
E. During the year ended August 31, 2015, the fund purchased $724,962,000 of investment securities and sold $256,176,000 of investment securities, other than temporary cash investments. Purchases and sales include $215,226,000 and $22,280,000, respectively, in connection with in-kind purchases and redemptions of the fund’s capital shares.
F. Capital share transactions for each class of shares were:
| Year Ended August 31, | ||||
| 2015 | 2014 | |||
| Amount | Shares | Amount | Shares | |
| ($000) | (000) | ($000) | (000) | |
| ETF Shares | ||||
| Issued | 217,599 | 3,351 | 57,403 | 900 |
| Issued in Lieu of Cash Distributions | — | — | — | — |
| Redeemed | (22,502) | (350) | (19,133) | (300) |
| Net Increase (Decrease) —ETF Shares | 195,097 | 3,001 | 38,270 | 600 |
| Admiral Shares1 | ||||
| Issued | 202,742 | 9,279 | 178,855 | 8,329 |
| Issued in Lieu of Cash Distributions | 4,523 | 207 | 3,049 | 142 |
| Redeemed | (83,311) | (3,815) | (48,024) | (2,237) |
| Net Increase (Decrease) —Admiral Shares | 123,954 | 5,671 | 133,880 | 6,234 |
| Institutional Shares | ||||
| Issued | 155,729 | 5,732 | 11,854 | 447 |
| Issued in Lieu of Cash Distributions | 1,703 | 63 | 925 | 35 |
| Redeemed | (3,699) | (136) | (19,485) | (741) |
| Net Increase (Decrease) —Institutional Shares | 153,733 | 5,659 | (6,706) | (259) |
| 1 Signal Shares were renamed Admiral Shares in October 2013. | ||||
At August 31, 2015, one shareholder was the record or beneficial owner of 25% of the fund’s net assets. If the shareholder were to redeem its investment in the fund, the redemption might result in an increase in the fund’s expense ratio, cause the fund to incur higher transaction costs, or lead to the realization of taxable capital gains.
G. Management has determined that no material events or transactions occurred subsequent to August 31, 2015, that would require recognition or disclosure in these financial statements.
45
Long-Term Government Bond Index Fund
Fund Profile
As of August 31, 2015
| Share-Class Characteristics | |||
| ETF | Admiral | Institutional | |
| Shares | Shares | Shares | |
| Ticker Symbol | VGLT | VLGSX | VLGIX |
| Expense Ratio1 | 0.12% | 0.12% | 0.09% |
| 30-Day SEC Yield | 2.70% | 2.74% | 2.73% |
| Financial Attributes | |||
| Barclays | |||
| Long Gov | Barclays | ||
| Float Adj | Aggregate | ||
| Fund | Index | FA Index | |
| Number of Bonds | 69 | 90 | 9,541 |
| Yield to Maturity | |||
| (before expenses) | 2.8% | 2.9% | 2.4% |
| Average Coupon | 3.8% | 3.8% | 3.2% |
| Average Duration | 17.1 years | 17.1 years | 5.7 years |
| Average Effective | |||
| Maturity | 24.7 years | 24.7 years | 7.9 years |
| Short-Term | |||
| Reserves | 1.2% | — | — |
| Sector Diversification (% of portfolio) | |
| Treasury/Agency | 99.6% |
| Other | 0.4 |
The agency and mortgage-backed securities sectors may include issues from government-sponsored enterprises; such issues are generally not backed by the full faith and credit of the U.S. government.
| Volatility Measures | ||
| Barclays | ||
| Long Gov | Barclays | |
| Float Adj | Aggregate | |
| Index | FA Index | |
| R-Squared | 0.99 | 0.84 |
| Beta | 1.04 | 3.44 |
These measures show the degree and timing of the fund’s fluctuations compared with the indexes over 36 months.
| Distribution by Effective Maturity | |
| (% of portfolio) | |
| Under 1 Year | 0.4% |
| 5 - 10 Years | 0.6 |
| 10 - 20 Years | 14.9 |
| 20 - 30 Years | 83.8 |
| Over 30 Years | 0.3 |
| Distribution by Credit Quality (% of portfolio) | |
| U.S. Government | 99.6% |
| Aaa | 0.4 |
Credit-quality ratings are obtained from Barclays and are from Moody's, Fitch, and S&P. When ratings from all three agencies are used, the median rating is shown. When ratings from two of the agencies are used, the lower rating for each issue is shown. "Not Rated" is used to classify securities for which a rating is not available. Not rated securities include a fund's investment in Vanguard Market Liquidity Fund or Vanguard Municipal Cash Management Fund, each of which invests in high-quality money market instruments and may serve as a cash management vehicle for the Vanguard funds, trusts, and accounts. For more information about these ratings, see the Glossary entry for Credit Quality.
Investment Focus
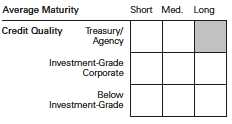
1 The expense ratios shown are from the prospectus dated December 23, 2014, and represent estimated costs for the current fiscal year. For the fiscal year ended August 31, 2015, the expense ratios were 0.10% for ETF Shares, 0.10% for Admiral Shares, and 0.07% for Institutional Shares.
46
Long-Term Government Bond Index Fund
Performance Summary
All of the returns in this report represent past performance, which is not a guarantee of future results that may be achieved by the fund. (Current performance may be lower or higher than the performance data cited. For performance data current to the most recent month-end, visit our website at vanguard.com/performance.) Note, too, that both investment returns and principal value can fluctuate widely, so an investor’s shares, when sold, could be worth more or less than their original cost. The returns shown do not reflect taxes that a shareholder would pay on fund distributions or on the sale of fund shares.
Cumulative Performance: November 19, 2009, Through August 31, 2015
Initial Investment of $10,000

| Average Annual Total Returns | ||||
| Periods Ended August 31, 2015 | ||||
| Since | Final Value | |||
| One | Five | Inception | of a $10,000 | |
| Year | Years | (11/19/2009) | Investment | |
| Long-Term Government Bond Index | ||||
| Fund ETF Shares Net Asset Value | 4.44% | 5.32% | 7.34% | $15,057 |
| Long-Term Government Bond Index | ||||
| Fund ETF Shares Market Price | 4.51 | 5.32 | 7.35 | 15,070 |
| Barclays U.S. Long Government Float | ||||
| Adjusted Index | 5.05 | 5.54 | 7.52 | 15,204 |
| General U.S. Government Funds | ||||
| Average | 1.43 | 1.96 | 3.14 | 11,954 |
| Spliced Barclays U.S. Aggregate Float | ||||
| Adjusted Index | 1.40 | 2.98 | 3.77 | 12,383 |
For a benchmark description, see the Glossary.
General U.S. Government Funds Average: Derived from data provided by Lipper, a Thomson Reuters Company.
"Since Inception" performance is calculated from the ETF Shares’ inception date for both the fund and its comparative standards.
See Financial Highlights for dividend and capital gains information.
47
| Long-Term Government Bond Index Fund | ||||
| Average Annual Total Returns | ||||
| Periods Ended August 31, 2015 | ||||
| Since | Final Value | |||
| One | Five | Inception | of a $10,000 | |
| Year | Years | (3/1/2010) | Investment | |
| Long-Term Government Bond Index Fund | ||||
| Admiral Shares | 4.40% | 5.31% | 7.98% | $15,254 |
| Barclays U.S. Long Government Float | ||||
| Adjusted Index | 5.05 | 5.54 | 8.17 | 15,405 |
| Barclays U.S. Aggregate Float Adjusted Index | 1.40 | 2.98 | 3.78 | 12,266 |
"Since Inception" performance is calculated from the Admiral Shares’ inception date for both the fund and its comparative standards.
| Since | Final Value | |||
| One | Five | Inception | of a $5,000,000 | |
| Year | Years | (7/30/2010) | Investment | |
| Long-Term Government Bond Index Fund | ||||
| Institutional Shares | 4.47% | 5.35% | 6.65% | $6,937,976 |
| Barclays U.S. Long Government Float | ||||
| Adjusted Index | 5.05 | 5.54 | 6.78 | 6,980,941 |
| Barclays U.S. Aggregate Float Adjusted | ||||
| Index | 1.40 | 2.98 | 3.21 | 5,870,787 |
"Since Inception" performance is calculated from the Institutional Shares’ inception date for both the fund and its comparative standards.
| Cumulative Returns of ETF Shares: November 19, 2009, Through August 31, 2015 | |||
| Since | |||
| One | Five | Inception | |
| Year | Years | (11/19/2009) | |
| Long-Term Government Bond Index Fund ETF | |||
| Shares Market Price | 4.51% | 29.60% | 50.70% |
| Long-Term Government Bond Index Fund ETF | |||
| Shares Net Asset Value | 4.44 | 29.58 | 50.57 |
| Barclays U.S. Long Government Float Adjusted | |||
| Index | 5.05 | 30.93 | 52.04 |
"Since Inception" performance is calculated from the ETF Shares’ inception date for both the fund and its comparative standards.
48
Long-Term Government Bond Index Fund
| Fiscal-Year Total Returns (%): November 19, 2009, Through August 31, 2015 | ||
| Barclays | ||
| Long Gov | ||
| Float Adj | ||
| ETF Shares Net Asset Value | Index | |
| Fiscal Year | Total Returns | Total Returns |
| 2010 | 16.21% | 16.12% |
| 2011 | 4.63 | 5.11 |
| 2012 | 19.06 | 18.68 |
| 2013 | -13.13 | -12.46 |
| 2014 | 14.65 | 14.15 |
| 2015 | 4.44 | 5.05 |
Average Annual Total Returns: Periods Ended June 30, 2015
This table presents returns through the latest calendar quarter—rather than through the end of the fiscal period.
Securities and Exchange Commission rules require that we provide this information.
| Since Inception | ||||||
| Inception Date | One Year | Five Years | Income | Capital | Total | |
| ETF Shares | 11/19/2009 | |||||
| Market Price | 5.89% | 6.02% | 6.93% | |||
| Net Asset Value | 5.89 | 6.02 | 6.93 | |||
| Admiral Shares | 3/1/2010 | 5.85 | 6.02 | 3.30% | 4.27% | 7.57 |
| Institutional Shares | 7/30/2010 | 5.92 | — | 3.25 | 2.92 | 6.17 |
49
Long-Term Government Bond Index Fund
Financial Statements
Statement of Net Assets
As of August 31, 2015
The fund reports a complete list of its holdings in regulatory filings four times in each fiscal year, at the quarter-ends. For the second and fourth fiscal quarters, the lists appear in the fund’s semiannual and annual reports to shareholders. For the first and third fiscal quarters, the fund files the lists with the Securities and Exchange Commission on Form N-Q. Shareholders can look up the fund’s Forms N-Q on the SEC’s website at sec.gov. Forms N-Q may also be reviewed and copied at the SEC’s Public Reference Room (see the back cover of this report for further information).
| Face | Market | |||
| Maturity | Amount | Value• | ||
| Coupon | Date | ($000) | ($000) | |
| U.S. Government and Agency Obligations (99.1%) | ||||
| U.S. Government Securities (93.8%) | ||||
| United States Treasury Note/Bond | 6.875% | 8/15/25 | 2,423 | 3,442 |
| United States Treasury Note/Bond | 6.000% | 2/15/26 | 5,726 | 7,738 |
| United States Treasury Note/Bond | 6.750% | 8/15/26 | 2,320 | 3,330 |
| United States Treasury Note/Bond | 6.500% | 11/15/26 | 1,424 | 2,016 |
| United States Treasury Note/Bond | 6.625% | 2/15/27 | 1,023 | 1,469 |
| United States Treasury Note/Bond | 6.375% | 8/15/27 | 1,858 | 2,640 |
| United States Treasury Note/Bond | 6.125% | 11/15/27 | 2,943 | 4,118 |
| United States Treasury Note/Bond | 5.500% | 8/15/28 | 5,218 | 7,005 |
| United States Treasury Note/Bond | 5.250% | 11/15/28 | 3,709 | 4,887 |
| United States Treasury Note/Bond | 5.250% | 2/15/29 | 4,460 | 5,882 |
| United States Treasury Note/Bond | 6.125% | 8/15/29 | 2,625 | 3,751 |
| United States Treasury Note/Bond | 6.250% | 5/15/30 | 3,482 | 5,082 |
| United States Treasury Note/Bond | 5.375% | 2/15/31 | 8,505 | 11,593 |
| United States Treasury Note/Bond | 4.500% | 2/15/36 | 6,330 | 8,152 |
| United States Treasury Note/Bond | 4.750% | 2/15/37 | 1,210 | 1,610 |
| United States Treasury Note/Bond | 5.000% | 5/15/37 | 1,301 | 1,791 |
| United States Treasury Note/Bond | 4.375% | 2/15/38 | 6,314 | 7,982 |
| United States Treasury Note/Bond | 4.500% | 5/15/38 | 4,566 | 5,874 |
| United States Treasury Note/Bond | 3.500% | 2/15/39 | 9,669 | 10,725 |
| United States Treasury Note/Bond | 4.250% | 5/15/39 | 7,531 | 9,333 |
| United States Treasury Note/Bond | 4.500% | 8/15/39 | 10,075 | 12,931 |
| United States Treasury Note/Bond | 4.375% | 11/15/39 | 8,747 | 11,039 |
| United States Treasury Note/Bond | 4.625% | 2/15/40 | 12,977 | 16,959 |
| United States Treasury Note/Bond | 4.375% | 5/15/40 | 9,918 | 12,523 |
| United States Treasury Note/Bond | 3.875% | 8/15/40 | 10,023 | 11,758 |
| United States Treasury Note/Bond | 4.250% | 11/15/40 | 8,187 | 10,170 |
| United States Treasury Note/Bond | 4.750% | 2/15/41 | 8,478 | 11,330 |
| United States Treasury Note/Bond | 4.375% | 5/15/41 | 2,534 | 3,217 |
| United States Treasury Note/Bond | 3.750% | 8/15/41 | 3,130 | 3,617 |
| United States Treasury Note/Bond | 3.125% | 11/15/41 | 5,905 | 6,124 |
| United States Treasury Note/Bond | 3.125% | 2/15/42 | 6,396 | 6,621 |
| United States Treasury Note/Bond | 3.000% | 5/15/42 | 8,095 | 8,166 |
| United States Treasury Note/Bond | 2.750% | 8/15/42 | 16,770 | 16,086 |
| United States Treasury Note/Bond | 2.750% | 11/15/42 | 21,644 | 20,731 |
| United States Treasury Note/Bond | 3.125% | 2/15/43 | 18,830 | 19,392 |
| United States Treasury Note/Bond | 2.875% | 5/15/43 | 22,775 | 22,341 |
| United States Treasury Note/Bond | 3.625% | 8/15/43 | 25,810 | 29,202 |
| United States Treasury Note/Bond | 3.750% | 11/15/43 | 19,287 | 22,319 |
50
| Long-Term Government Bond Index Fund | ||||
| Face | Market | |||
| Maturity | Amount | Value• | ||
| Coupon | Date | ($000) | ($000) | |
| United States Treasury Note/Bond | 3.625% | 2/15/44 | 26,305 | 29,741 |
| United States Treasury Note/Bond | 3.375% | 5/15/44 | 21,890 | 23,634 |
| United States Treasury Note/Bond | 3.125% | 8/15/44 | 31,925 | 32,883 |
| United States Treasury Note/Bond | 3.000% | 11/15/44 | 16,780 | 16,861 |
| United States Treasury Note/Bond | 2.500% | 2/15/45 | 19,350 | 17,521 |
| United States Treasury Note/Bond | 3.000% | 5/15/45 | 20,800 | 20,946 |
| United States Treasury Note/Bond | 2.875% | 8/15/45 | 7,650 | 7,527 |
| 502,059 | ||||
| Agency Bonds and Notes (5.3%) | ||||
| 1 AID-Israel | 5.500% | 9/18/33 | 150 | 197 |
| 2 Federal Home Loan Banks | 5.500% | 7/15/36 | 1,050 | 1,373 |
| 3 Federal Home Loan Mortgage Corp. | 6.750% | 9/15/29 | 913 | 1,304 |
| 3 Federal Home Loan Mortgage Corp. | 6.750% | 3/15/31 | 2,070 | 2,975 |
| 3 Federal Home Loan Mortgage Corp. | 6.250% | 7/15/32 | 2,334 | 3,250 |
| 3 Federal National Mortgage Assn. | 6.250% | 5/15/29 | 700 | 952 |
| 3 Federal National Mortgage Assn. | 7.125% | 1/15/30 | 730 | 1,072 |
| 3 Federal National Mortgage Assn. | 7.250% | 5/15/30 | 2,130 | 3,176 |
| 3 Federal National Mortgage Assn. | 6.625% | 11/15/30 | 2,955 | 4,207 |
| 3 Federal National Mortgage Assn. | 5.625% | 7/15/37 | 675 | 898 |
| 3 Federal National Mortgage Assn. | 6.210% | 8/6/38 | 300 | 425 |
| 2 Tennessee Valley Authority | 6.750% | 11/1/25 | 1,065 | 1,411 |
| 2 Tennessee Valley Authority | 7.125% | 5/1/30 | 650 | 931 |
| 2 Tennessee Valley Authority | 4.700% | 7/15/33 | 100 | 114 |
| 2 Tennessee Valley Authority | 4.650% | 6/15/35 | 575 | 654 |
| 2 Tennessee Valley Authority | 5.880% | 4/1/36 | 1,260 | 1,658 |
| 2 Tennessee Valley Authority | 6.150% | 1/15/38 | 165 | 225 |
| 2 Tennessee Valley Authority | 5.500% | 6/15/38 | 150 | 190 |
| 2 Tennessee Valley Authority | 5.250% | 9/15/39 | 1,352 | 1,660 |
| 2 Tennessee Valley Authority | 3.500% | 12/15/42 | 250 | 236 |
| 2 Tennessee Valley Authority | 4.875% | 1/15/48 | 245 | 282 |
| 2 Tennessee Valley Authority | 5.375% | 4/1/56 | 215 | 266 |
| 2 Tennessee Valley Authority | 4.625% | 9/15/60 | 850 | 925 |
| 28,381 | ||||
| Total U.S. Government and Agency Obligations (Cost $527,780) | 530,440 | |||
| Shares | ||||
| Temporary Cash Investment (1.2%) | ||||
| Money Market Fund (1.2%) | ||||
| 4 Vanguard Market Liquidity Fund (Cost $6,577) | 0.168% | 6,576,538 | 6,577 | |
| Total Investments (100.3%) (Cost $534,357) | 537,017 | |||
51
| Long-Term Government Bond Index Fund | |
| Amount | |
| ($000) | |
| Other Assets and Liabilities (-0.3%) | |
| Other Assets | |
| Investment in Vanguard | 46 |
| Receivables for Investment Securities Sold | 7,988 |
| Receivables for Accrued Income | 2,968 |
| Receivables for Capital Shares Issued | 450 |
| Total Other Assets | 11,452 |
| Liabilities | |
| Payables for Investment Securities Purchased | (9,473) |
| Payables for Capital Shares Redeemed | (3,236) |
| Payables for Distributions | (22) |
| Payables to Vanguard | (122) |
| Other Liabilities | (138) |
| Total Liabilities | (12,991) |
| Net Assets (100%) | 535,478 |
| At August 31, 2015, net assets consisted of: | |
| Amount | |
| ($000) | |
| Paid-in Capital | 541,778 |
| Undistributed Net Investment Income | 616 |
| Accumulated Net Realized Losses | (9,576) |
| Unrealized Appreciation (Depreciation) | 2,660 |
| Net Assets | 535,478 |
| ETF Shares—Net Assets | |
| Applicable to 3,352,307 outstanding $.001 par value shares of | |
| beneficial interest (unlimited authorization) | 251,850 |
| Net Asset Value Per Share—ETF Shares | $75.13 |
| Admiral Shares—Net Assets | |
| Applicable to 5,150,679 outstanding $.001 par value shares of | |
| beneficial interest (unlimited authorization) | 129,872 |
| Net Asset Value Per Share—Admiral Shares | $25.21 |
| Institutional Shares—Net Assets | |
| Applicable to 4,804,753 outstanding $.001 par value shares of | |
| beneficial interest (unlimited authorization) | 153,756 |
| Net Asset Value Per Share—Institutional Shares | $32.00 |
• See Note A in Notes to Financial Statements.
1 U.S. government-guaranteed.
2 The issuer operates under a congressional charter; its securities are generally neither guaranteed by the U.S. Treasury nor backed by the full faith and credit of the U.S. government.
3 The issuer was placed under federal conservatorship in September 2008; since that time, its daily operations have been managed by the Federal Housing Finance Agency and it receives capital from the U.S. Treasury, as needed to maintain a positive net worth, in exchange for senior preferred stock.
4 Affiliated money market fund available only to Vanguard funds and certain trusts and accounts managed by Vanguard. Rate shown is the 7-day yield.
See accompanying Notes, which are an integral part of the Financial Statements.
52
| Long-Term Government Bond Index Fund | |
| Statement of Operations | |
| Year Ended | |
| August 31, 2015 | |
| ($000) | |
| Investment Income | |
| Income | |
| Interest1 | 12,337 |
| Total Income | 12,337 |
| Expenses | |
| The Vanguard Group—Note B | |
| Investment Advisory Services | 10 |
| Management and Administrative—ETF Shares | 132 |
| Management and Administrative—Admiral Shares | 68 |
| Management and Administrative—Institutional Shares | 53 |
| Marketing and Distribution—ETF Shares | 25 |
| Marketing and Distribution—Admiral Shares | 15 |
| Marketing and Distribution—Institutional Shares | 16 |
| Custodian Fees | 4 |
| Auditing Fees | 50 |
| Shareholders’ Reports—ETF Shares | 14 |
| Shareholders’ Reports—Admiral Shares | 4 |
| Shareholders’ Reports—Institutional Shares | — |
| Total Expenses | 391 |
| Net Investment Income | 11,946 |
| Realized Net Gain (Loss) on Investment Securities Sold | 1,980 |
| Change in Unrealized Appreciation (Depreciation) of Investment Securities | (8,505) |
| Net Increase (Decrease) in Net Assets Resulting from Operations | 5,421 |
| 1 Interest income from an affiliated company of the fund was $3,000. | |
See accompanying Notes, which are an integral part of the Financial Statements.
53
| Long-Term Government Bond Index Fund | ||
| Statement of Changes in Net Assets | ||
| Year Ended August 31, | ||
| 2015 | 2014 | |
| ($000) | ($000) | |
| Increase (Decrease) in Net Assets | ||
| Operations | ||
| Net Investment Income | 11,946 | 5,253 |
| Realized Net Gain (Loss) | 1,980 | (1,067) |
| Change in Unrealized Appreciation (Depreciation) | (8,505) | 22,271 |
| Net Increase (Decrease) in Net Assets Resulting from Operations | 5,421 | 26,457 |
| Distributions | ||
| Net Investment Income | ||
| ETF Shares | (5,289) | (2,078) |
| Admiral Shares1 | (2,856) | (541) |
| Institutional Shares | (3,453) | (2,376) |
| Realized Capital Gain | ||
| ETF Shares | — | — |
| Admiral Shares1 | — | — |
| Institutional Shares | — | — |
| Total Distributions | (11,598) | (4,995) |
| Capital Share Transactions | ||
| ETF Shares | 148,580 | 34,774 |
| Admiral Shares1 | 89,912 | 35,290 |
| Institutional Shares | 57,366 | 48,422 |
| Net Increase (Decrease) from Capital Share Transactions | 295,858 | 118,486 |
| Total Increase (Decrease) | 289,681 | 139,948 |
| Net Assets | ||
| Beginning of Period | 245,797 | 105,849 |
| End of Period2 | 535,478 | 245,797 |
1 Signal Shares were renamed Admiral Shares in October 2013.
2 Net Assets—End of Period includes undistributed (overdistributed) net investment income of $616,000 and $268,000.
See accompanying Notes, which are an integral part of the Financial Statements.
54
| Long-Term Government Bond Index Fund | |||||
| Financial Highlights | |||||
| ETF Shares | |||||
| For a Share Outstanding | Year Ended August 31, | ||||
| Throughout Each Period | 2015 | 2014 | 2013 | 2012 | 2011 |
| Net Asset Value, Beginning of Period | $73.93 | $66.33 | $78.69 | $68.07 | $67.61 |
| Investment Operations | |||||
| Net Investment Income | 2.073 | 2.100 | 2.055 | 2.213 | 2.321 |
| Net Realized and Unrealized Gain (Loss) | |||||
| on Investments | 1.206 | 7.429 | (12.216) | 10.611 | .526 |
| Total from Investment Operations | 3.279 | 9.529 | (10.161) | 12.824 | 2.847 |
| Distributions | |||||
| Dividends from Net Investment Income | (2.079) | (1.929) | (2.056) | (2.204) | (2.324) |
| Distributions from Realized Capital Gains | — | — | (.143) | — | (.063) |
| Total Distributions | (2.079) | (1.929) | (2.199) | (2.204) | (2.387) |
| Net Asset Value, End of Period | $75.13 | $73.93 | $66.33 | $78.69 | $68.07 |
| Total Return | 4.44% | 14.65% | -13.13% | 19.06% | 4.63% |
| Ratios/Supplemental Data | |||||
| Net Assets, End of Period (Millions) | $252 | $107 | $63 | $75 | $34 |
| Ratio of Total Expenses to Average Net Assets | 0.10% | 0.12% | 0.12% | 0.12% | 0.14% |
| Ratio of Net Investment Income to | |||||
| Average Net Assets | 2.76% | 3.17% | 2.80% | 2.99% | 3.68% |
| Portfolio Turnover Rate1 | 24% | 23% | 54% | 46% | 40% |
1 Excludes the value of portfolio securities received or delivered as a result of in-kind purchases or redemptions of the fund’s capital shares, including ETF Creation Units.
See accompanying Notes, which are an integral part of the Financial Statements.
55
| Long-Term Government Bond Index Fund | |||||
| Financial Highlights | |||||
| Admiral Shares | |||||
| For a Share Outstanding | Year Ended August 31, | ||||
| Throughout Each Period | 2015 | 2014 | 2013 | 2012 | 2011 |
| Net Asset Value, Beginning of Period | $24.81 | $22.32 | $26.48 | $22.91 | $22.75 |
| Investment Operations | |||||
| Net Investment Income | . 698 | .711 | .693 | .746 | .780 |
| Net Realized and Unrealized Gain (Loss) | |||||
| on Investments | . 399 | 2.491 | (4.112) | 3.567 | .182 |
| Total from Investment Operations | 1.097 | 3.202 | (3.419) | 4.313 | .962 |
| Distributions | |||||
| Dividends from Net Investment Income | (.697) | (.712) | (. 693) | (.743) | (.781) |
| Distributions from Realized Capital Gains | — | — | (.048) | — | (.021) |
| Total Distributions | (.697) | (.712) | (.741) | (.743) | (. 802) |
| Net Asset Value, End of Period | $25.21 | $24.81 | $22.32 | $26.48 | $22.91 |
| Total Return1 | 4.40% | 14.63% | -13.13% | 19.05% | 4.66% |
| Ratios/Supplemental Data | |||||
| Net Assets, End of Period (Millions) | $130 | $44 | $6 | $5 | $1 |
| Ratio of Total Expenses to Average Net Assets | 0.10% | 0.12% | 0.12% | 0.12% | 0.14% |
| Ratio of Net Investment Income to | |||||
| Average Net Assets | 2.76% | 3.17% | 2.80% | 2.99% | 3.68% |
| Portfolio Turnover Rate2 | 24% | 23% | 54% | 46% | 40% |
Signal Shares were renamed Admiral Shares in October 2013. Prior periods’ Financial Highlights are for the Signal class.
1 Total returns do not include transaction or account service fees that may have applied in the periods shown. Fund prospectuses provide information about any applicable transaction or account service fees.
2 Excludes the value of portfolio securities received or delivered as a result of in-kind purchases or redemptions of the fund’s capital shares, including ETF Creation Units.
See accompanying Notes, which are an integral part of the Financial Statements.
56
| Long-Term Government Bond Index Fund | |||||
| Financial Highlights | |||||
| Institutional Shares | |||||
| For a Share Outstanding | Year Ended August 31, | ||||
| Throughout Each Period | 2015 | 2014 | 2013 | 2012 | 2011 |
| Net Asset Value, Beginning of Period | $31.48 | $28.32 | $33.60 | $29.06 | $28.87 |
| Investment Operations | |||||
| Net Investment Income | . 896 | . 910 | . 890 | . 956 | 1.003 |
| Net Realized and Unrealized Gain (Loss) | |||||
| on Investments | .517 | 3.161 | (5.219) | 4.537 | .218 |
| Total from Investment Operations | 1.413 | 4.071 | (4.329) | 5.493 | 1.221 |
| Distributions | |||||
| Dividends from Net Investment Income | (. 893) | (. 911) | (. 890) | (. 953) | (1.004) |
| Distributions from Realized Capital Gains | — | — | (.061) | — | (.027) |
| Total Distributions | (. 893) | (. 911) | (. 951) | (. 953) | (1.031) |
| Net Asset Value, End of Period | $32.00 | $31.48 | $28.32 | $33.60 | $29.06 |
| Total Return1 | 4.47% | 14.66% | -13.10% | 19.13% | 4.67% |
| Ratios/Supplemental Data | |||||
| Net Assets, End of Period (Millions) | $154 | $95 | $37 | $84 | $61 |
| Ratio of Total Expenses to Average Net Assets | 0.07% | 0.09% | 0.09% | 0.09% | 0.09% |
| Ratio of Net Investment Income to | |||||
| Average Net Assets | 2.79% | 3.20% | 2.83% | 3.02% | 3.73% |
| Portfolio Turnover Rate2 | 24% | 23% | 54% | 46% | 40% |
1 Total returns do not include transaction fees that may have applied in the periods shown. Fund prospectuses provide information about any applicable transaction fees.
2 Excludes the value of portfolio securities received or delivered as a result of in-kind purchases or redemptions of the fund’s capital shares, including ETF Creation Units.
See accompanying Notes, which are an integral part of the Financial Statements.
57
Long-Term Government Bond Index Fund
Notes to Financial Statements
Vanguard Long-Term Government Bond Index Fund is registered under the Investment Company Act of 1940 as an open-end investment company, or mutual fund. The fund offers three classes of shares: ETF Shares, Admiral Shares, and Institutional Shares. ETF Shares are listed for trading on Nasdaq; they can be purchased and sold through a broker. Admiral Shares and Institutional Shares are designed for investors who meet certain administrative, service, and account-size criteria.
A. The following significant accounting policies conform to generally accepted accounting principles for U.S. investment companies. The fund consistently follows such policies in preparing its financial statements.
1. Security Valuation: Securities are valued as of the close of trading on the New York Stock Exchange (generally 4 p.m., Eastern time) on the valuation date. Bonds, and temporary cash investments acquired over 60 days to maturity, are valued using the latest bid prices or using valuations based on a matrix system (which considers such factors as security prices, yields, maturities, and ratings), both as furnished by independent pricing services. Investments in Vanguard Market Liquidity Fund are valued at that fund’s net asset value. Other temporary cash investments are valued at amortized cost, which approximates market value. Securities for which market quotations are not readily available, or whose values have been affected by events occurring before the fund’s pricing time but after the close of the securities’ primary markets, are valued by methods deemed by the board of trustees to represent fair value.
2. Federal Income Taxes: The fund intends to continue to qualify as a regulated investment company and distribute all of its taxable income. Management has analyzed the fund’s tax positions taken for all open federal income tax years (August 31, 2012–2015), and has concluded that no provision for federal income tax is required in the fund’s financial statements.
3. Distributions: Distributions to shareholders are recorded on the ex-dividend date.
4. Credit Facility: The fund and certain other funds managed by The Vanguard Group (“Vanguard”) participate in a $3 billion committed credit facility provided by a syndicate of lenders pursuant to a credit agreement that may be renewed annually; each fund is individually liable for its borrowings, if any, under the credit facility. Borrowings may be utilized for temporary and emergency purposes, and are subject to the fund’s regulatory and contractual borrowing restrictions. The participating funds are charged administrative fees and an annual commitment fee of 0.06% of the undrawn amount of the facility; these fees are allocated to the funds based on a method approved by the fund’s board of trustees and included in Management and Administrative expenses on the fund’s Statement of Operations. Any borrowings under this facility bear interest at a rate equal to the higher of the federal funds rate or LIBOR reference rate plus an agreed-upon spread.
The fund had no borrowings outstanding at August 31, 2015, or at any time during the period then ended.
5. Other: Interest income includes income distributions received from Vanguard Market Liquidity Fund and is accrued daily. Premiums and discounts on debt securities purchased are amortized and accreted, respectively, to interest income over the lives of the respective securities. Security transactions are accounted for on the date securities are bought or sold. Costs used to determine realized gains (losses) on the sale of investment securities are those of the specific securities sold.
Each class of shares has equal rights as to assets and earnings, except that each class separately bears certain class-specific expenses related to maintenance of shareholder accounts (included in Management and Administrative expenses) and shareholder reporting. Marketing and distribution
58
Long-Term Government Bond Index Fund
expenses are allocated to each class of shares based on a method approved by the board of trustees. Income, other non-class-specific expenses, and gains and losses on investments are allocated to each class of shares based on its relative net assets.
B. In accordance with the terms of a Funds’ Service Agreement (the “FSA”) between Vanguard and the fund, Vanguard furnishes to the fund investment advisory, corporate management, administrative, marketing, and distribution services at Vanguard’s cost of operations (as defined by the FSA). These costs of operations are allocated to the fund based on methods and guidelines approved by the board of trustees. Vanguard does not require reimbursement in the current period for certain costs of operations (such as deferred compensation/benefits and risk/insurance costs); the fund’s liability for these costs of operations is included in Payables to Vanguard on the Statement of Net Assets.
Upon the request of Vanguard, the fund may invest up to 0.40% of its net assets as capital in Vanguard. At August 31, 2015, the fund had contributed to Vanguard capital in the amount of $46,000, representing 0.01% of the fund’s net assets and 0.02% of Vanguard’s capitalization. The fund’s trustees and officers are also directors and employees, respectively, of Vanguard.
C. Various inputs may be used to determine the value of the fund’s investments. These inputs are summarized in three broad levels for financial statement purposes. The inputs or methodologies used to value securities are not necessarily an indication of the risk associated with investing in those securities.
Level 1—Quoted prices in active markets for identical securities.
Level 2—Other significant observable inputs (including quoted prices for similar securities, interest rates, prepayment speeds, credit risk, etc.).
Level 3—Significant unobservable inputs (including the fund’s own assumptions used to determine the fair value of investments).
The following table summarizes the market value of the fund’s investments as of August 31, 2015, based on the inputs used to value them:
| Level 1 | Level 2 | Level 3 | |
| Investments | ($000) | ($000) | ($000) |
| U.S. Government and Agency Obligations | — | 530,440 | — |
| Temporary Cash Investments | 6,577 | — | — |
| Total | 6,577 | 530,440 | — |
D. Distributions are determined on a tax basis and may differ from net investment income and realized capital gains for financial reporting purposes. Differences may be permanent or temporary. Permanent differences are reclassified among capital accounts in the financial statements to reflect their tax character. Temporary differences arise when certain items of income, expense, gain, or loss are recognized in different periods for financial statement and tax purposes. These differences will reverse at some time in the future. Differences in classification may also result from the treatment of short-term gains as ordinary income for tax purposes.
During the year ended August 31, 2015, the fund realized $3,271,000 of net capital gains resulting from in-kind redemptions—in which shareholders exchanged fund shares for securities held by the fund rather than for cash. Because such gains are not taxable to the fund, and are not distributed to shareholders, they have been reclassified from accumulated net realized losses to paid-in capital.
59
Long-Term Government Bond Index Fund
For tax purposes, at August 31, 2015, the fund had $751,000 of ordinary income available for distribution. The fund had available capital losses totaling $9,563,000 that may be carried forward indefinitely to offset future net capital gains.
At August 31, 2015, the cost of investment securities for tax purposes was $534,371,000. Net unrealized appreciation of investment securities for tax purposes was $2,646,000, consisting of unrealized gains of $7,832,000 on securities that had risen in value since their purchase and $5,186,000 in unrealized losses on securities that had fallen in value since their purchase.
E. During the year ended August 31, 2015, the fund purchased $426,905,000 of investment securities and sold $131,501,000 of investment securities, other than temporary cash investments. Purchases and sales include $221,902,000 and $29,532,000, respectively, in connection with in-kind purchases and redemptions of the fund’s capital shares.
F. Capital share transactions for each class of shares were:
| Year Ended August 31, | ||||
| 2015 | 2014 | |||
| Amount | Shares | Amount | Shares | |
| ($000) | (000) | ($000) | (000) | |
| ETF Shares | ||||
| Issued | 178,492 | 2,302 | 71,314 | 1,050 |
| Issued in Lieu of Cash Distributions | — | — | — | — |
| Redeemed | (29,912) | (400) | (36,540) | (550) |
| Net Increase (Decrease)—ETF Shares | 148,580 | 1,902 | 34,774 | 500 |
| Admiral Shares1 | ||||
| Issued | 169,663 | 6,504 | 48,250 | 2,064 |
| Issued in Lieu of Cash Distributions | 2,686 | 104 | 499 | 22 |
| Redeemed | (82,437) | (3,228) | (13,459) | (584) |
| Net Increase (Decrease)—Admiral Shares | 89,912 | 3,380 | 35,290 | 1,502 |
| Institutional Shares | ||||
| Issued | 99,644 | 3,032 | 53,260 | 1,879 |
| Issued in Lieu of Cash Distributions | 3,404 | 104 | 2,376 | 81 |
| Redeemed | (45,682) | (1,338) | (7,214) | (254) |
| Net Increase (Decrease) —Institutional Shares | 57,366 | 1,798 | 48,422 | 1,706 |
| 1 Signal Shares were renamed Admiral Shares in October 2013. | ||||
G. Management has determined that no material events or transactions occurred subsequent to August 31, 2015, that would require recognition or disclosure in these financial statements.
60
Short-Term Corporate Bond Index Fund
Fund Profile
As of August 31, 2015
| Share-Class Characteristics | |||
| ETF | Admiral | Institutional | |
| Shares | Shares | Shares | |
| Ticker Symbol | VCSH | VSCSX | VSTBX |
| Expense Ratio1 | 0.12% | 0.12% | 0.09% |
| 30-Day SEC Yield | 1.98% | 2.02% | 2.01% |
| Financial Attributes | |||
| Barclays | |||
| 1–5 Year | Barclays | ||
| Corporate | Aggregate | ||
| Fund | Index | FA Index | |
| Number of Bonds | 1,882 | 2,032 | 9,541 |
| Yield to Maturity | |||
| (before expenses) | 2.2% | 2.2% | 2.4% |
| Average Coupon | 3.7% | 3.7% | 3.2% |
| Average Duration | 2.8 years | 2.8 years | 5.7 years |
| Average Effective | |||
| Maturity | 3.0 years | 3.0 years | 7.9 years |
| Short-Term | |||
| Reserves | 0.7% | — | — |
| Sector Diversification (% of portfolio) | |
| Finance | 43.2% |
| Industrial | 51.6 |
| Utilities | 5.1 |
| Other | 0.1 |
The agency and mortgage-backed securities sectors may include issues from government-sponsored enterprises; such issues are generally not backed by the full faith and credit of the U.S. government.
| Volatility Measures | ||
| Barclays | ||
| 1–5 Year | Barclays | |
| Corporate | Aggregate | |
| Index | FA Index | |
| R-Squared | 0.99 | 0.72 |
| Beta | 0.98 | 0.44 |
These measures show the degree and timing of the fund’s fluctuations compared with the indexes over 36 months.
| Distribution by Effective Maturity | |
| (% of portfolio) | |
| Under 1 Year | 0.3% |
| 1 - 3 Years | 54.2 |
| 3 - 5 Years | 45.4 |
| 5 - 10 Years | 0.1 |
| Distribution by Credit Quality (% of portfolio) | |
| Aaa | 1.0% |
| Aa | 11.1 |
| A | 50.9 |
| Baa | 37.0 |
Credit-quality ratings are obtained from Barclays and are from Moody's, Fitch, and S&P. When ratings from all three agencies are used, the median rating is shown. When ratings from two of the agencies are used, the lower rating for each issue is shown. "Not Rated" is used to classify securities for which a rating is not available. Not rated securities include a fund's investment in Vanguard Market Liquidity Fund or Vanguard Municipal Cash Management Fund, each of which invests in high-quality money market instruments and may serve as a cash management vehicle for the Vanguard funds, trusts, and accounts. For more information about these ratings, see the Glossary entry for Credit Quality.
Investment Focus
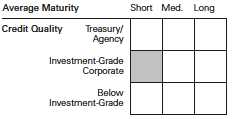
1 The expense ratios shown are from the prospectus dated December 23, 2014, and represent estimated costs for the current fiscal year. For the fiscal year ended August 31, 2015, the expense ratios were 0.10% for ETF Shares, 0.10% for Admiral Shares, and 0.07% for Institutional Shares.
61
Short-Term Corporate Bond Index Fund
Performance Summary
All of the returns in this report represent past performance, which is not a guarantee of future results that may be achieved by the fund. (Current performance may be lower or higher than the performance data cited. For performance data current to the most recent month-end, visit our website at vanguard.com/performance.) Note, too, that both investment returns and principal value can fluctuate widely, so an investor’s shares, when sold, could be worth more or less than their original cost. The returns shown do not reflect taxes that a shareholder would pay on fund distributions or on the sale of fund shares.
Cumulative Performance: November 19, 2009, Through August 31, 2015
Initial Investment of $10,000
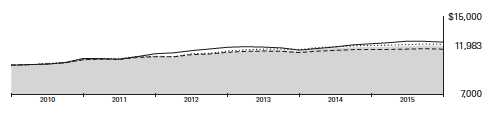
| Average Annual Total Returns | ||||
| Periods Ended August 31, 2015 | ||||
| Since | Final Value | |||
| One | Five | Inception | of a $10,000 | |
| Year | Years | (11/19/2009) | Investment | |
| Short-Term Corporate Bond Index | ||||
| Fund ETF Shares Net Asset Value | 0.96% | 2.61% | 3.18% | $11,983 |
| Short-Term Corporate Bond Index | ||||
| Fund ETF Shares Market Price | 0.93 | 2.57 | 3.17 | 11,980 |
| Barclays U.S. 1–5 Year Corporate | ||||
| Bond Index | 1.03 | 2.84 | 3.42 | 12,149 |
| Short-Intermediate Investment-Grade | ||||
| Debt Funds Average | 0.33 | 1.97 | 2.67 | 11,645 |
| Spliced Barclays U.S. Aggregate Float | ||||
| Adjusted Index | 1.40 | 2.98 | 3.77 | 12,383 |
For a benchmark description, see the Glossary.
Short-Intermediate Investment-Grade Debt Funds Average: Derived from data provided by Lipper, a Thomson Reuters Company.
"Since Inception" performance is calculated from the ETF Shares’ inception date for both the fund and its comparative standards.
See Financial Highlights for dividend and capital gains information.
62
| Short-Term Corporate Bond Index Fund | |||
| Average Annual Total Returns | |||
| Periods Ended August 31, 2015 | |||
| Since | Final Value | ||
| One | Inception | of a $10,000 | |
| Year | (11/18/2010) | Investment | |
| Short-Term Corporate Bond Index Fund | |||
| Admiral Shares | 0.97% | 2.59% | $11,302 |
| Barclays U.S. 1–5 Year Corporate Bond Index | 1.03 | 2.78 | 11,402 |
| Barclays U.S. Aggregate Float Adjusted Index | 1.40 | 3.21 | 11,632 |
"Since Inception" performance is calculated from the Admiral Shares’ inception date for both the fund and its comparative standards.
| Since | Final Value | |||
| One | Five | Inception | of a $5,000,000 | |
| Year | Years | (11/19/2009) | Investment | |
| Short-Term Corporate Bond Index Fund | ||||
| Institutional Shares | 0.98% | 2.65% | 3.22% | $6,005,663 |
| Barclays U.S. 1–5 Year Corporate Bond Index | 1.03 | 2.84 | 3.42 | 6,074,333 |
| Spliced Barclays U.S. Aggregate Float | ||||
| Adjusted Index | 1.40 | 2.98 | 3.77 | 6,191,718 |
"Since Inception" performance is calculated from the Institutional Shares’ inception date for both the fund and its comparative standards.
| Cumulative Returns of ETF Shares: November 19, 2009, Through August 31, 2015 | |||
| Since | |||
| One | Five | Inception | |
| Year | Years | (11/19/2009) | |
| Short-Term Corporate Bond Index Fund ETF Shares | |||
| Market Price | 0.93% | 13.52% | 19.80% |
| Short-Term Corporate Bond Index Fund ETF Shares | |||
| Net Asset Value | 0.96 | 13.76 | 19.83 |
| Barclays U.S. 1–5 Year Corporate Bond Index | 1.03 | 15.03 | 21.49 |
"Since Inception" performance is calculated from the ETF Shares’ inception date for both the fund and its comparative standards.
63
Short-Term Corporate Bond Index Fund
| Fiscal-Year Total Returns (%): November 19, 2009, Through August 31, 2015 | ||
| Barclays | ||
| 1–5 Year | ||
| Corporate | ||
| ETF Shares Net Asset Value | Index | |
| Fiscal Year | Total Returns | Total Returns |
| 2010 | 5.34% | 5.61% |
| 2011 | 2.94 | 3.45 |
| 2012 | 4.68 | 4.81 |
| 2013 | 1.03 | 1.29 |
| 2014 | 3.50 | 3.67 |
| 2015 | 0.96 | 1.03 |
Average Annual Total Returns: Periods Ended June 30, 2015
This table presents returns through the latest calendar quarter—rather than through the end of the fiscal period.
Securities and Exchange Commission rules require that we provide this information.
| Since Inception | ||||||
| Inception Date | One Year | Five Years | Income | Capital | Total | |
| ETF Shares | 11/19/2009 | |||||
| Market Price | 1.04% | 2.96% | 3.26% | |||
| Net Asset Value | 1.17 | 3.05 | 3.28 | |||
| Admiral Shares | 11/18/2010 | 1.16 | — | 2.09% | 0.60% | 2.69 |
| Institutional Shares | 11/19/2009 | 1.18 | 3.08 | 2.16 | 1.16 | 3.32 |
64
Short-Term Corporate Bond Index Fund
Financial Statements
Statement of Net Assets—Investments Summary
As of August 31, 2015
This Statement summarizes the fund’s holdings by asset type. Details are reported for each of the fund’s 50 largest individual holdings and for investments that, in total for any issuer, represent more than 1% of the fund’s net assets. The total value of smaller holdings is reported as a single amount within each category.
The fund reports a complete list of its holdings in regulatory filings four times in each fiscal year, at the quarter-ends. For the second and fourth fiscal quarters, the complete listing of the fund’s holdings is available electronically on vanguard.com and on the Securities and Exchange Commission’s website (sec.gov), or you can have it mailed to you without charge by calling 800-662-7447. For the first and third fiscal quarters, the fund files the lists with the SEC on Form N-Q. Shareholders can look up the fund’s Forms N-Q on the SEC’s website. Forms N-Q may also be reviewed and copied at the SEC’s Public Reference Room (see the back cover of this report for further information).
| Face | Market | Percentage | |||
| Maturity | Amount | Value• | of Net | ||
| Coupon | Date | ($000) | ($000) | Assets | |
| U.S. Government and Agency Obligations | |||||
| U.S. Government Securities (Cost $3,058) † | 3,058 | 0.0% | |||
| Corporate Bonds | |||||
| Finance | |||||
| Banking | |||||
| American Express Bank FSB | 6.000% | 9/13/17 | 6,880 | 7,442 | 0.1% |
| American Express Centurion | |||||
| Bank | 5.950%–6.000% | 6/12/17–9/13/17 | 5,054 | 5,473 | 0.0% |
| 1 American Express Co. | 1.550%–8.125% | 9/12/16–9/1/66 | 48,069 | 51,662 | 0.4% |
| American Express Credit | |||||
| Corp. | 1.125%–2.800% | 9/19/16–5/26/20 | 88,730 | 88,947 | 0.7% |
| Associates Corp. of North | |||||
| America | 6.950% | 11/1/18 | 7,956 | 9,056 | 0.1% |
| Bank of America Corp. | 6.875% | 4/25/18 | 45,410 | 50,778 | 0.4% |
| Bank of America Corp. | 2.600% | 1/15/19 | 38,257 | 38,525 | 0.3% |
| Bank of America Corp. | 5.625% | 7/1/20 | 26,430 | 29,624 | 0.2% |
| Bank of America Corp. | 5.650% | 5/1/18 | 26,140 | 28,448 | 0.2% |
| Bank of America Corp. | 5.750% | 12/1/17 | 21,180 | 22,891 | 0.2% |
| Bank of America Corp. | 2.000% | 1/11/18 | 22,610 | 22,597 | 0.2% |
| Bank of America Corp. | 7.625% | 6/1/19 | 19,100 | 22,546 | 0.2% |
| Bank of America Corp. | 1.350%–7.800% | 9/15/16–4/21/20 | 150,277 | 156,068 | 1.3% |
| Bank of America NA | 1.125%–6.100% | 11/14/16–3/26/18 | 45,325 | 46,293 | 0.4% |
| Bear Stearns Cos. LLC | 7.250% | 2/1/18 | 25,050 | 28,071 | 0.2% |
| Bear Stearns Cos. LLC | 4.650%–6.400% | 1/22/17–7/2/18 | 28,660 | 30,834 | 0.2% |
| BNP Paribas SA | 2.375% | 9/14/17 | 22,203 | 22,520 | 0.2% |
| Citigroup Inc. | 6.125% | 11/21/17 | 23,047 | 25,104 | 0.2% |
| Citigroup Inc. | 8.500% | 5/22/19 | 19,083 | 23,017 | 0.2% |
| Citigroup Inc. | 1.700% | 4/27/18 | 22,875 | 22,673 | 0.2% |
| Citigroup Inc. | 4.450% | 1/10/17 | 21,129 | 21,952 | 0.2% |
| Citigroup Inc. | 1.300%–6.125% | 11/15/16–8/9/20 | 165,197 | 168,443 | 1.4% |
| Credit Suisse | 1.375% | 5/26/17 | 22,680 | 22,582 | 0.2% |
| Deutsche Bank AG | 6.000% | 9/1/17 | 22,165 | 23,910 | 0.2% |
| Goldman Sachs Group Inc. | 6.150% | 4/1/18 | 28,275 | 31,145 | 0.3% |
65
| Short-Term Corporate Bond Index Fund | |||||
| Face | Market | Percentage | |||
| Maturity | Amount | Value• | of Net | ||
| Coupon | Date | ($000) | ($000) | Assets | |
| Goldman Sachs Group Inc. | 5.950% | 1/18/18 | 26,442 | 28,818 | 0.2% |
| Goldman Sachs Group Inc. | 2.625% | 1/31/19 | 22,222 | 22,432 | 0.2% |
| Goldman Sachs Group Inc. | 2.900% | 7/19/18 | 21,690 | 22,157 | 0.2% |
| Goldman Sachs Group Inc. | 7.500% | 2/15/19 | 18,802 | 21,903 | 0.2% |
| Goldman Sachs Group Inc. | 2.375% | 1/22/18 | 21,182 | 21,389 | 0.2% |
| Goldman Sachs Group Inc. | 2.550%–6.250% | 10/1/16–6/15/20 | 112,943 | 119,488 | 1.0% |
| JPMorgan Chase & Co. | 6.000% | 1/15/18 | 40,484 | 44,234 | 0.4% |
| JPMorgan Chase & Co. | 2.250% | 1/23/20 | 31,000 | 30,588 | 0.2% |
| JPMorgan Chase & Co. | 1.350% | 2/15/17 | 22,369 | 22,341 | 0.2% |
| JPMorgan Chase & Co. | 1.625%–6.300% | 6/27/17–7/22/20 | 146,558 | 150,865 | 1.2% |
| JPMorgan Chase Bank NA | 6.000% | 7/5/17–10/1/17 | 22,135 | 23,901 | 0.2% |
| Morgan Stanley | 5.625% | 9/23/19 | 29,237 | 32,558 | 0.3% |
| Morgan Stanley | 6.625% | 4/1/18 | 25,100 | 27,952 | 0.2% |
| Morgan Stanley | 5.450% | 1/9/17 | 22,475 | 23,645 | 0.2% |
| Morgan Stanley | 2.650% | 1/27/20 | 23,300 | 23,307 | 0.2% |
| Morgan Stanley | 1.875%–7.300% | 10/18/16–7/24/20 | 177,921 | 187,967 | 1.5% |
| Murray Street Investment | |||||
| Trust I | 4.647% | 3/9/17 | 12,138 | 12,646 | 0.1% |
| National City Bank | 5.800% | 6/7/17 | 735 | 783 | 0.0% |
| National City Corp. | 6.875% | 5/15/19 | 9,600 | 11,041 | 0.1% |
| PNC Bank NA | 1.125%–6.875% | 10/3/16–6/1/20 | 77,522 | 78,269 | 0.6% |
| PNC Financial Services | |||||
| Group Inc. | 1.850%–2.600% | 7/20/18–7/21/20 | 5,600 | 5,599 | 0.0% |
| PNC Funding Corp. | 2.700%–6.700% | 9/19/16–8/11/20 | 35,414 | 38,021 | 0.3% |
| Synchrony Financial | 1.875%–3.000% | 8/15/17–2/3/20 | 19,725 | 19,634 | 0.2% |
| UBS AG | 1.800% | 3/26/18 | 24,700 | 24,624 | 0.2% |
| Vesey Street Investment | |||||
| Trust I | 4.404% | 9/1/16 | 5,828 | 5,994 | 0.0% |
| Wachovia Bank NA | 6.000% | 11/15/17 | 9,790 | 10,687 | 0.1% |
| Wachovia Corp. | 5.750% | 2/1/18 | 22,200 | 24,252 | 0.2% |
| Wachovia Corp. | 5.625%–5.750% | 10/15/16–6/15/17 | 28,490 | 30,291 | 0.2% |
| Wells Fargo & Co. | 1.150%–5.625% | 9/15/16–7/22/20 | 134,367 | 136,250 | 1.1% |
| 2 Banking—Other † | 1,978,910 | 16.0% | |||
| Brokerage † | 117,480 | 1.0% | |||
| Finance Companies | |||||
| 1 GE Capital Trust I | 6.375% | 11/15/67 | 6,765 | 7,222 | 0.1% |
| General Electric Capital Corp. | 5.625% | 5/1/18 | 33,122 | 36,368 | 0.3% |
| General Electric Capital Corp. | 5.625% | 9/15/17 | 23,280 | 25,217 | 0.2% |
| 1 General Electric Capital | |||||
| Corp. | 1.250%–6.375% | 10/17/16–11/15/67 | 158,506 | 166,501 | 1.3% |
| 2 Finance Companies—Other † | 70,484 | 0.6% | |||
| Insurance † | 405,538 | 3.3% | |||
| Other Finance † | 5,793 | 0.0% | |||
| 2 Real Estate Investment Trusts † | 235,703 | 1.9% | |||
| 5,251,453 | 42.6% | ||||
| Industrial | |||||
| Basic Industry † | 411,637 | 3.3% | |||
| Capital Goods | |||||
| General Electric Co. | 5.250% | 12/6/17 | 33,118 | 35,799 | 0.3% |
| Capital Goods—Other † | 537,949 | 4.4% | |||
| Communication | |||||
| AT&T Inc. | 5.500% | 2/1/18 | 19,829 | 21,399 | 0.2% |
| AT&T Inc. | 1.400%–5.800% | 2/15/17–6/30/20 | 95,118 | 96,916 | 0.8% |
| DIRECTV Holdings LLC / | |||||
| DIRECTV Financing Co. | |||||
| Inc. | 1.750%–5.875% | 3/15/17–3/15/20 | 30,548 | 31,879 | 0.2% |
66
| Short-Term Corporate Bond Index Fund | |||||
| Face | Market | Percentage | |||
| Maturity | Amount | Value• | of Net | ||
| Coupon | Date | ($000) | ($000) | Assets | |
| Verizon Communications Inc. | 3.650% | 9/14/18 | 25,318 | 26,545 | 0.2% |
| Verizon Communications Inc. | 2.625% | 2/21/20 | 23,348 | 23,355 | 0.2% |
| Verizon Communications | |||||
| Inc. | 1.100%–6.350% | 9/15/16–6/17/19 | 70,246 | 74,062 | 0.6% |
| 2 Communication—Other † | 578,601 | 4.7% | |||
| Consumer Cyclical | |||||
| CVS Health Corp. | 2.800% | 7/20/20 | 23,350 | 23,586 | 0.2% |
| Ford Motor Co. | 6.500% | 8/1/18 | 150 | 168 | 0.0% |
| Ford Motor Credit Co. LLC | 1.461%–8.125% | 12/15/16–8/4/20 | 153,243 | 158,128 | 1.3% |
| 2 Consumer Cyclical—Other † | 667,434 | 5.4% | |||
| Consumer Noncyclical | |||||
| AbbVie Inc. | 1.750% | 11/6/17 | 26,630 | 26,604 | 0.2% |
| AbbVie Inc. | 1.800% | 5/14/18 | 25,250 | 25,095 | 0.2% |
| AbbVie Inc. | 2.500% | 5/14/20 | 24,929 | 24,669 | 0.2% |
| Actavis Funding SCS | 3.000% | 3/12/20 | 23,050 | 22,811 | 0.2% |
| Anheuser-Busch InBev Worldwide | |||||
| Inc. | 1.375% | 7/15/17 | 22,175 | 22,232 | 0.2% |
| Anheuser-Busch InBev Worldwide | |||||
| Inc. | 7.750% | 1/15/19 | 18,235 | 21,476 | 0.2% |
| 2 Medtronic Inc. | 2.500% | 3/15/20 | 22,963 | 23,014 | 0.2% |
| Novartis Securities Investment Ltd. 5.125% | 2/10/19 | 23,070 | 25,589 | 0.2% | |
| Pfizer Inc. | 6.200% | 3/15/19 | 19,182 | 21,855 | 0.2% |
| 2 Consumer Noncyclical—Other † | 1,414,120 | 11.4% | |||
| 2 Energy † | 1,077,676 | 8.7% | |||
| Other Industrial † | 3,739 | 0.0% | |||
| Technology | |||||
| Apple Inc. | 1.000% | 5/3/18 | 34,493 | 34,112 | 0.3% |
| Cisco Systems Inc. | 4.450% | 1/15/20 | 20,035 | 21,912 | 0.2% |
| Intel Corp. | 1.350% | 12/15/17 | 23,393 | 23,359 | 0.2% |
| International Business Machines | |||||
| Corp. | 5.700% | 9/14/17 | 19,941 | 21,683 | 0.1% |
| 2 Technology—Other † | 656,127 | 5.3% | |||
| Transportation † | 167,671 | 1.4% | |||
| 6,321,202 | 51.2% | ||||
| Utilities | |||||
| Electric † | 575,109 | 4.7% | |||
| Natural Gas † | 38,628 | 0.3% | |||
| Other Utility † | 3,278 | 0.0% | |||
| 617,015 | 5.0% | ||||
| Total Corporate Bonds (Cost $12,216,811) | 12,189,670 | 98.8% | |||
| Taxable Municipal Bonds (Cost $4,709) † | 4,742 | 0.0% | |||
| Shares | |||||
| Temporary Cash Investment | |||||
| Money Market Fund | |||||
| 3 Vanguard Market Liquidity Fund | |||||
| (Cost $80,364) | 0.168% | 80,364,000 | 80,364 | 0.7% | |
| Total Investments (Cost $12,304,942) | 12,277,834 | 99.5% | |||
67
| Short-Term Corporate Bond Index Fund | ||
| Percentage | ||
| Amount | of Net | |
| ($000) | Assets | |
| Other Assets and Liabilities | ||
| Other Assets | ||
| Investment in Vanguard | 1,109 | |
| Receivables for Investment Securities Sold | 146,678 | |
| Receivables for Accrued Income | 115,321 | |
| Receivables for Capital Shares Issued | 17,601 | |
| Other Assets | 3,266 | |
| Total Other Assets | 283,975 | 2.3% |
| Liabilities | ||
| Payables for Investment Securities Purchased | (195,522) | |
| Payables for Capital Shares Redeemed | (16,641) | |
| Payables for Distributions | (403) | |
| Payables to Vanguard | (2,901) | |
| Other Liabilities | (2,267) | |
| Total Liabilities | (217,734) | (1.8%) |
| Net Assets | 12,344,075 | 100.0% |
| At August 31, 2015, net assets consisted of: | ||
| Amount | ||
| ($000) | ||
| Paid-in Capital | 12,350,929 | |
| Undistributed Net Investment Income | 16,415 | |
| Accumulated Net Realized Gains | 3,839 | |
| Unrealized Appreciation (Depreciation) | (27,108) | |
| Net Assets | 12,344,075 | |
| ETF Shares—Net Assets | ||
| Applicable to 130,804,475 outstanding $.001 par value shares of | ||
| beneficial interest (unlimited authorization) | 10,376,960 | |
| Net Asset Value Per Share—ETF Shares | $79.33 | |
| Admiral Shares—Net Assets | ||
| Applicable to 56,662,624 outstanding $.001 par value shares of | ||
| beneficial interest (unlimited authorization) | 1,222,260 | |
| Net Asset Value Per Share—Admiral Shares | $21.57 | |
68
| Short-Term Corporate Bond Index Fund | |
| Amount | |
| ($000) | |
| Institutional Shares—Net Assets | |
| Applicable to 28,206,727 outstanding $.001 par value shares of | |
| beneficial interest (unlimited authorization) | 744,855 |
| Net Asset Value Per Share—Institutional Shares | $26.41 |
• See Note A in Notes to Financial Statements.
† Represents the aggregate value, by category, of securities that are not among the 50 largest holdings and, in total for any issuer, represent 1% or less of net assets.
1 The average or expected maturity is shorter than the final maturity shown because of the possibility of interim principal payments and prepayments or the possibility of the issue being called.
2 Certain of the fund’s securities are exempt from registration under Rule 144A of the Securities Act of 1933. Such securities may be sold in transactions exempt from registration, normally to qualified institutional buyers. At August 31, 2015, the aggregate value of these securities was $195,782,000, representing 1.6% of net assets.
3 Affiliated money market fund available only to Vanguard funds and certain trusts and accounts managed by Vanguard. Rate shown is the 7-day yield.
See accompanying Notes, which are an integral part of the Financial Statements.
69
| Short-Term Corporate Bond Index Fund | |
| Statement of Operations | |
| Year Ended | |
| August 31, 2015 | |
| ($000) | |
| Investment Income | |
| Income | |
| Interest1 | 226,740 |
| Total Income | 226,740 |
| Expenses | |
| The Vanguard Group—Note B | |
| Investment Advisory Services | 277 |
| Management and Administrative—ETF Shares | 7,224 |
| Management and Administrative—Admiral Shares | 793 |
| Management and Administrative—Institutional Shares | 361 |
| Marketing and Distribution—ETF Shares | 1,579 |
| Marketing and Distribution—Admiral Shares | 170 |
| Marketing and Distribution—Institutional Shares | 107 |
| Custodian Fees | 67 |
| Auditing Fees | 47 |
| Shareholders’ Reports—ETF Shares | 355 |
| Shareholders’ Reports—Admiral Shares | 11 |
| Shareholders’ Reports—Institutional Shares | — |
| Trustees’ Fees and Expenses | 7 |
| Total Expenses | 10,998 |
| Net Investment Income | 215,742 |
| Realized Net Gain (Loss) | |
| Investment Securities Sold | 17,026 |
| Futures Contracts | (4,068) |
| Realized Net Gain (Loss) | 12,958 |
| Change in Unrealized Appreciation (Depreciation) of Investment Securities | (123,579) |
| Net Increase (Decrease) in Net Assets Resulting from Operations | 105,121 |
| 1 Interest income from an affiliated company of the fund was $90,000. | |
See accompanying Notes, which are an integral part of the Financial Statements.
70
| Short-Term Corporate Bond Index Fund | ||
| Statement of Changes in Net Assets | ||
| Year Ended August 31, | ||
| 2015 | 2014 | |
| ($000) | ($000) | |
| Increase (Decrease) in Net Assets | ||
| Operations | ||
| Net Investment Income | 215,742 | 154,684 |
| Realized Net Gain (Loss) | 12,958 | 23,335 |
| Change in Unrealized Appreciation (Depreciation) | (123,579) | 100,306 |
| Net Increase (Decrease) in Net Assets Resulting from Operations | 105,121 | 278,325 |
| Distributions | ||
| Net Investment Income | ||
| ETF Shares | (178,240) | (126,399) |
| Admiral Shares1 | (19,430) | (8,666) |
| Institutional Shares | (13,670) | (7,383) |
| Realized Capital Gain 2 | ||
| ETF Shares | (17,076) | (16,740) |
| Admiral Shares1 | (1,706) | (608) |
| Institutional Shares | (1,287) | (736) |
| Total Distributions | (231,409) | (160,532) |
| Capital Share Transactions | ||
| ETF Shares | 2,052,107 | 1,614,776 |
| Admiral Shares1 | 414,035 | 742,084 |
| Institutional Shares | 119,665 | 367,790 |
| Net Increase (Decrease) from Capital Share Transactions | 2,585,807 | 2,724,650 |
| Total Increase (Decrease) | 2,459,519 | 2,842,443 |
| Net Assets | ||
| Beginning of Period | 9,884,556 | 7,042,113 |
| End of Period3 | 12,344,075 | 9,884,556 |
1 Signal Shares were renamed Admiral Shares in October 2013.
2 Includes fiscal 2015 and 2014 short-term gain distributions totaling $4,014,000 and $3,918,000, respectively. Short-term gain distributions are treated as ordinary income dividends for tax purposes.
3 Net Assets—End of Period includes undistributed (overdistributed) net investment income of $16,415,000 and $12,013,000.
See accompanying Notes, which are an integral part of the Financial Statements.
71
| Short-Term Corporate Bond Index Fund | |||||
| Financial Highlights | |||||
| ETF Shares | |||||
| For a Share Outstanding | Year Ended August 31, | ||||
| Throughout Each Period | 2015 | 2014 | 2013 | 2012 | 2011 |
| Net Asset Value, Beginning of Period | $80.21 | $78.97 | $79.78 | $78.06 | $77.68 |
| Investment Operations | |||||
| Net Investment Income | 1.504 | 1.436 | 1.523 | 1.793 | 1.815 |
| Net Realized and Unrealized Gain (Loss) | |||||
| on Investments | (.743) | 1.305 | (.699) | 1.808 | .443 |
| Total from Investment Operations | .761 | 2.741 | .824 | 3.601 | 2.258 |
| Distributions | |||||
| Dividends from Net Investment Income | (1.492) | (1.321) | (1.517) | (1.789) | (1.813) |
| Distributions from Realized Capital Gains | (.149) | (.180) | (.117) | (. 092) | (. 065) |
| Total Distributions | (1.641) | (1.501) | (1.634) | (1.881) | (1.878) |
| Net Asset Value, End of Period | $79.33 | $80.21 | $78.97 | $79.78 | $78.06 |
| Total Return | 0.96% | 3.50% | 1.03% | 4.68% | 2.94% |
| Ratios/Supplemental Data | |||||
| Net Assets, End of Period (Millions) | $10,377 | $8,430 | $6,705 | $3,686 | $1,905 |
| Ratio of Total Expenses to Average Net Assets | 0.10% | 0.12% | 0.12% | 0.12% | 0.14% |
| Ratio of Net Investment Income to | |||||
| Average Net Assets | 1.90% | 1.82% | 1.92% | 2.33% | 2.39% |
| Portfolio Turnover Rate1 | 62% | 56% | 61% | 65% | 63% |
1 Excludes the value of portfolio securities received or delivered as a result of in-kind purchases or redemptions of the fund’s capital shares, including ETF Creation Units.
See accompanying Notes, which are an integral part of the Financial Statements.
72
| Short-Term Corporate Bond Index Fund | |||||
| Financial Highlights | |||||
| Admiral Shares | |||||
| Nov. 18, | |||||
| 20101 to | |||||
| For a Share Outstanding | Year Ended August 31, | Aug. 31, | |||
| Throughout Each Period | 2015 | 2014 | 2013 | 2012 | 2011 |
| Net Asset Value, Beginning of Period | $21.81 | $21.51 | $21.73 | $21.26 | $21.21 |
| Investment Operations | |||||
| Net Investment Income | . 409 | .395 | .414 | .488 | .387 |
| Net Realized and Unrealized Gain (Loss) | |||||
| on Investments | (.199) | . 347 | (.189) | . 494 | .091 |
| Total from Investment Operations | .210 | .742 | .225 | .982 | .478 |
| Distributions | |||||
| Dividends from Net Investment Income | (.410) | (. 393) | (. 413) | (.487) | (.410) |
| Distributions from Realized Capital Gains | (.040) | (.049) | (. 032) | (. 025) | (. 018) |
| Total Distributions | (.450) | (.442) | (. 445) | (. 512) | (. 428) |
| Net Asset Value, End of Period | $21.57 | $21.81 | $21.51 | $21.73 | $21.26 |
| Total Return2 | 0.97% | 3.47% | 1.03% | 4.69% | 2.28% |
| Ratios/Supplemental Data | |||||
| Net Assets, End of Period (Millions) | $1,222 | $821 | $76 | $25 | $3 |
| Ratio of Total Expenses to Average Net Assets | 0.10% | 0.12% | 0.12% | 0.12% | 0.14%3 |
| Ratio of Net Investment Income to | |||||
| Average Net Assets | 1.90% | 1.82% | 1.92% | 2.33% | 2.39%3 |
| Portfolio Turnover Rate 4 | 62% | 56% | 61% | 65% | 63% |
Signal Shares were renamed Admiral Shares in October 2013. Prior periods’ Financial Highlights are for the Signal Class.
1 Inception.
2 Total returns do not include transaction or account service fees that may have applied in the periods shown. Fund prospectuses provide information about any applicable transaction and account service fees.
3 Annualized.
4 Excludes the value of portfolio securities received or delivered as a result of in-kind purchases or redemptions of the fund’s capital shares, including ETF Creation Units.
See accompanying Notes, which are an integral part of the Financial Statements.
73
| Short-Term Corporate Bond Index Fund | |||||
| Financial Highlights | |||||
| Institutional Shares | |||||
| For a Share Outstanding | Year Ended August 31, | ||||
| Throughout Each Period | 2015 | 2014 | 2013 | 2012 | 2011 |
| Net Asset Value, Beginning of Period | $26.71 | $26.33 | $26.60 | $26.03 | $25.90 |
| Investment Operations | |||||
| Net Investment Income | . 509 | . 491 | . 516 | .605 | .619 |
| Net Realized and Unrealized Gain (Loss) | |||||
| on Investments | (.249) | .437 | (. 233) | . 599 | .151 |
| Total from Investment Operations | .260 | .928 | .283 | 1.204 | .770 |
| Distributions | |||||
| Dividends from Net Investment Income | (.510) | (.488) | (.514) | (. 603) | (. 618) |
| Distributions from Realized Capital Gains | (. 050) | (. 060) | (. 039) | (. 031) | (. 022) |
| Total Distributions | (.560) | (.548) | (. 553) | (. 634) | (.640) |
| Net Asset Value, End of Period | $26.41 | $26.71 | $26.33 | $26.60 | $26.03 |
| Total Return1 | 0.98% | 3.55% | 1.06% | 4.70% | 3.01% |
| Ratios/Supplemental Data | |||||
| Net Assets, End of Period (Millions) | $745 | $634 | $262 | $161 | $125 |
| Ratio of Total Expenses to Average Net Assets | 0.07% | 0.09% | 0.09% | 0.09% | 0.09% |
| Ratio of Net Investment Income to | |||||
| Average Net Assets | 1.93% | 1.85% | 1.95% | 2.36% | 2.44% |
| Portfolio Turnover Rate2 | 62% | 56% | 61% | 65% | 63% |
1 Total returns do not include transaction fees that may have applied in the periods shown. Fund prospectuses provide information about any applicable transaction fees.
2 Excludes the value of portfolio securities received or delivered as a result of in-kind purchases or redemptions of the fund’s capital shares, including ETF Creation Units.
See accompanying Notes, which are an integral part of the Financial Statements.
74
Short-Term Corporate Bond Index Fund
Notes to Financial Statements
Vanguard Short-Term Corporate Bond Index Fund is registered under the Investment Company Act of 1940 as an open-end investment company, or mutual fund. Certain of the fund’s investments are in corporate debt instruments; the issuers’ abilities to meet their obligations may be affected by economic developments in their respective industries. The fund offers three classes of shares: ETF Shares, Admiral Shares, and Institutional Shares. ETF Shares are listed for trading on Nasdaq; they can be purchased and sold through a broker. Admiral Shares and Institutional Shares are designed for investors who meet certain administrative, service, and account-size criteria.
A. The following significant accounting policies conform to generally accepted accounting principles for U.S. investment companies. The fund consistently follows such policies in preparing its financial statements.
1. Security Valuation: Securities are valued as of the close of trading on the New York Stock Exchange (generally 4 p.m., Eastern time) on the valuation date. Bonds, and temporary cash investments acquired over 60 days to maturity, are valued using the latest bid prices or using valuations based on a matrix system (which considers such factors as security prices, yields, maturities, and ratings), both as furnished by independent pricing services. Investments in Vanguard Market Liquidity Fund are valued at that fund’s net asset value. Other temporary cash investments are valued at amortized cost, which approximates market value. Securities for which market quotations are not readily available, or whose values have been affected by events occurring before the fund’s pricing time but after the close of the securities’ primary markets, are valued by methods deemed by the board of trustees to represent fair value.
2. Futures Contracts: The fund uses futures contracts to invest in fixed income asset classes with greater efficiency and lower cost than is possible through direct investment, to add value when these instruments are attractively priced, or to adjust sensitivity to changes in interest rates. The primary risks associated with the use of futures contracts are imperfect correlation between changes in market values of bonds held by the fund and the prices of futures contracts, and the possibility of an illiquid market. Counterparty risk involving futures is mitigated because a regulated clearinghouse is the counterparty instead of the clearing broker. To further mitigate counterparty risk, the fund trades futures contracts on an exchange, monitors the financial strength of its clearing brokers and clearinghouse, and has entered into clearing agreements with its clearing brokers. The clearinghouse imposes initial margin requirements to secure the fund’s performance and requires daily settlement of variation margin representing changes in the market value of each contract.
Futures contracts are valued at their quoted daily settlement prices. The aggregate settlement values of the contracts are not recorded in the Statement of Net Assets. Fluctuations in the value of the contracts are recorded in the Statement of Net Assets as an asset (liability) and in the Statement of Operations as unrealized appreciation (depreciation) until the contracts are closed, when they are recorded as realized futures gains (losses).
During the year ended August 31, 2015, the fund’s average investments in long and short futures contracts represented less than 1% and 0%, respectively, of net assets, based on the average of aggregate settlement values at each quarter-end during the period. The fund had no open futures contracts at August 31, 2015.
3. Federal Income Taxes: The fund intends to continue to qualify as a regulated investment company and distribute all of its taxable income. Management has analyzed the fund’s tax positions taken for all open federal income tax years (August 31, 2012–2015), and has concluded that no provision for federal income tax is required in the fund’s financial statements.
75
Short-Term Corporate Bond Index Fund
4. Distributions: Distributions to shareholders are recorded on the ex-dividend date.
5. Credit Facility: The fund and certain other funds managed by The Vanguard Group (“Vanguard”) participate in a $3 billion committed credit facility provided by a syndicate of lenders pursuant to a credit agreement that may be renewed annually; each fund is individually liable for its borrowings, if any, under the credit facility. Borrowings may be utilized for temporary and emergency purposes, and are subject to the fund’s regulatory and contractual borrowing restrictions. The participating funds are charged administrative fees and an annual commitment fee of 0.06% of the undrawn amount of the facility; these fees are allocated to the funds based on a method approved by the fund’s board of trustees and included in Management and Administrative expenses on the fund’s Statement of Operations. Any borrowings under this facility bear interest at a rate equal to the higher of the federal funds rate or LIBOR reference rate plus an agreed-upon spread.
The fund had no borrowings outstanding at August 31, 2015, or at any time during the period then ended.
6. Other: Interest income includes income distributions received from Vanguard Market Liquidity Fund and is accrued daily. Premiums and discounts on debt securities purchased are amortized and accreted, respectively, to interest income over the lives of the respective securities. Security transactions are accounted for on the date securities are bought or sold. Costs used to determine realized gains (losses) on the sale of investment securities are those of the specific securities sold.
Each class of shares has equal rights as to assets and earnings, except that each class separately bears certain class-specific expenses related to maintenance of shareholder accounts (included in Management and Administrative expenses) and shareholder reporting. Marketing and distribution expenses are allocated to each class of shares based on a method approved by the board of trustees. Income, other non-class-specific expenses, and gains and losses on investments are allocated to each class of shares based on its relative net assets.
B. In accordance with the terms of a Funds’ Service Agreement (the “FSA”) between Vanguard and the fund, Vanguard furnishes to the fund investment advisory, corporate management, administrative, marketing, and distribution services at Vanguard’s cost of operations (as defined by the FSA). These costs of operations are allocated to the fund based on methods and guidelines approved by the board of trustees. Vanguard does not require reimbursement in the current period for certain costs of operations (such as deferred compensation/benefits and risk/insurance costs); the fund’s liability for these costs of operations is included in Payables to Vanguard on the Statement of Net Assets.
Upon the request of Vanguard, the fund may invest up to 0.40% of its net assets as capital in Vanguard. At August 31, 2015, the fund had contributed to Vanguard capital in the amount of $1,109,000, representing 0.01% of the fund’s net assets and 0.44% of Vanguard’s capitalization. The fund’s trustees and officers are also directors and employees, respectively, of Vanguard.
C. Various inputs may be used to determine the value of the fund’s investments. These inputs are summarized in three broad levels for financial statement purposes. The inputs or methodologies used to value securities are not necessarily an indication of the risk associated with investing in those securities.
76
Short-Term Corporate Bond Index Fund
Level 1—Quoted prices in active markets for identical securities.
Level 2—Other significant observable inputs (including quoted prices for similar securities, interest rates, prepayment speeds, credit risk, etc.).
Level 3—Significant unobservable inputs (including the fund’s own assumptions used to determine the fair value of investments).
The following table summarizes the market value of the fund’s investments as of August 31, 2015, based on the inputs used to value them:
| Level 1 | Level 2 | Level 3 | |
| Investments | ($000) | ($000) | ($000) |
| U.S. Government and Agency Obligations | — | 3,058 | — |
| Corporate Bonds | — | 12,189,670 | — |
| Taxable Municipal Bonds | — | 4,742 | — |
| Temporary Cash Investments | 80,364 | — | — |
| Futures Contracts—Assets1 | 65 | — | — |
| Total | 80,429 | 12,197,470 | — |
| 1 Represents variation margin on the last day of the reporting period for recently closed futures contracts. | |||
D. Distributions are determined on a tax basis and may differ from net investment income and realized capital gains for financial reporting purposes. Differences may be permanent or temporary. Permanent differences are reclassified among capital accounts in the financial statements to reflect their tax character. Temporary differences arise when certain items of income, expense, gain, or loss are recognized in different periods for financial statement and tax purposes. These differences will reverse at some time in the future. Differences in classification may also result from the treatment of short-term gains as ordinary income for tax purposes.
During the year ended August 31, 2015, the fund realized $2,082,000 of net capital gains resulting from in-kind redemptions—in which shareholders exchanged fund shares for securities held by the fund rather than for cash. Because such gains are not taxable to the fund, and are not distributed to shareholders, they have been reclassified from accumulated net realized gains to paid-in capital.
The fund used a tax accounting practice to treat a portion of the price of capital shares redeemed during the year as distributions from realized capital gains. Accordingly, the fund has reclassified $1,450,000 from accumulated net realized gains to paid-in capital.
For tax purposes, at August 31, 2015, the fund had $19,025,000 of ordinary income and $4,762,000 of long-term capital gains available for distribution.
At August 31, 2015, the cost of investment securities for tax purposes was $12,305,387,000. Net unrealized depreciation of investment securities for tax purposes was $27,553,000, consisting of unrealized gains of $27,822,000 on securities that had risen in value since their purchase and $55,375,000 in unrealized losses on securities that had fallen in value since their purchase.
77
Short-Term Corporate Bond Index Fund
E. During the year ended August 31, 2015, the fund purchased $6,342,719,000 of investment securities and sold $3,491,365,000 of investment securities, other than U.S. government securities and temporary cash investments. Purchases and sales of U.S. government securities were $3,709,343,000 and $3,865,939,000, respectively. Total purchases and sales include $2,379,415,000 and $382,886,000, respectively, in connection with in-kind purchases and redemptions of the fund’s capital shares.
F. Capital share transactions for each class of shares were:
| Year Ended August 31, | ||||
| 2015 | 2014 | |||
| Amount | Shares | Amount | Shares | |
| ($000) | (000) | ($000) | (000) | |
| ETF Shares | ||||
| Issued 2 | 2,442,985 | 30,603 | 2,061,477 | 25,802 |
| Issued in Lieu of Cash Distributions | — | — | — | — |
| Redeemed | (390,878) | (4,900) | (446,701) | (5,600) |
| Net Increase (Decrease) —ETF Shares | 2,052,107 | 25,703 | 1,614,776 | 20,202 |
| Admiral Shares1 | ||||
| Issued 2 | 875,488 | 40,286 | 953,911 | 43,819 |
| Issued in Lieu of Cash Distributions | 18,577 | 856 | 8,037 | 369 |
| Redeemed | (480,030) | (22,095) | (219,864) | (10,092) |
| Net Increase (Decrease) —Admiral Shares | 414,035 | 19,047 | 742,084 | 34,096 |
| Institutional Shares | ||||
| Issued 2 | 203,197 | 7,633 | 432,633 | 16,217 |
| Issued in Lieu of Cash Distributions | 12,940 | 487 | 7,200 | 270 |
| Redeemed | (96,472) | (3,637) | (72,043) | (2,701) |
| Net Increase (Decrease) —Institutional Shares | 119,665 | 4,483 | 367,790 | 13,786 |
1 Signal Shares were renamed Admiral Shares in October 2013.
2 Includes purchase fees for fiscal 2015 and 2014 of $0 and $127,000, respectively (fund totals).
G. Management has determined that no material events or transactions occurred subsequent to August 31, 2015, that would require recognition or disclosure in these financial statements.
78
Intermediate-Term Corporate Bond Index Fund
Fund Profile
As of August 31, 2015
| Share-Class Characteristics | |||
| ETF | Admiral | Institutional | |
| Shares | Shares | Shares | |
| Ticker Symbol | VCIT | VICSX | VICBX |
| Expense Ratio1 | 0.12% | 0.12% | 0.09% |
| 30-Day SEC Yield | 3.51% | 3.54% | 3.54% |
| Financial Attributes | |||
| Barclays | |||
| 5–10 Year | Barclays | ||
| Corporate | Aggregate | ||
| Fund | Index | FA Index | |
| Number of Bonds | 1,686 | 1,789 | 9,541 |
| Yield to Maturity | |||
| (before expenses) | 3.7% | 3.7% | 2.4% |
| Average Coupon | 3.9% | 3.9% | 3.2% |
| Average Duration | 6.4 years | 6.4 years | 5.7 years |
| Average Effective | |||
| Maturity | 7.4 years | 7.3 years | 7.9 years |
| Short-Term | |||
| Reserves | 0.1% | — | — |
| Sector Diversification (% of portfolio) | |
| Finance | 31.7% |
| Industrial | 62.7 |
| Utilities | 5.5 |
| Other | 0.1 |
The agency and mortgage-backed securities sectors may include issues from government-sponsored enterprises; such issues are generally not backed by the full faith and credit of the U.S. government.
| Volatility Measures | ||
| Barclays | ||
| 5–10 Year | Barclays | |
| Corporate | Aggregate | |
| Index | FA Index | |
| R-Squared | 0.99 | 0.91 |
| Beta | 1.01 | 1.44 |
These measures show the degree and timing of the fund’s fluctuations compared with the indexes over 36 months.
| Distribution by Effective Maturity | |
| (% of portfolio) | |
| Under 1 Year | 0.2% |
| 1 - 3 Years | 0.5 |
| 3 - 5 Years | 1.6 |
| 5 - 10 Years | 97.7 |
| Distribution by Credit Quality (% of portfolio) | |
| Aaa | 1.3% |
| Aa | 6.6 |
| A | 39.2 |
| Baa | 52.9 |
Credit-quality ratings are obtained from Barclays and are from Moody's, Fitch, and S&P. When ratings from all three agencies are used, the median rating is shown. When ratings from two of the agencies are used, the lower rating for each issue is shown. "Not Rated" is used to classify securities for which a rating is not available. Not rated securities include a fund's investment in Vanguard Market Liquidity Fund or Vanguard Municipal Cash Management Fund, each of which invests in high-quality money market instruments and may serve as a cash management vehicle for the Vanguard funds, trusts, and accounts. For more information about these ratings, see the Glossary entry for Credit Quality.
Investment Focus
1 The expense ratios shown are from the prospectus dated December 23, 2014, and represent estimated costs for the current fiscal year. For the fiscal year ended August 31, 2015, the expense ratios were 0.10% for ETF Shares, 0.10% for Admiral Shares, and 0.07% for Institutional Shares.
79
Intermediate-Term Corporate Bond Index Fund
Performance Summary
All of the returns in this report represent past performance, which is not a guarantee of future results that may be achieved by the fund. (Current performance may be lower or higher than the performance data cited. For performance data current to the most recent month-end, visit our website at vanguard.com/performance.) Note, too, that both investment returns and principal value can fluctuate widely, so an investor’s shares, when sold, could be worth more or less than their original cost. The returns shown do not reflect taxes that a shareholder would pay on fund distributions or on the sale of fund shares.
Cumulative Performance: November 19, 2009, Through August 31, 2015
Initial Investment of $10,000
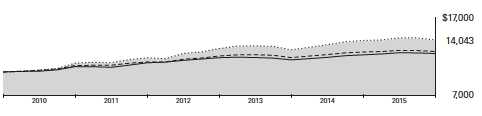
| Average Annual Total Returns | |||||
| Periods Ended August 31, 2015 | |||||
| Since | Final Value | ||||
| One | Five | Inception | of a $10,000 | ||
| Year | Years | (11/19/2009) | Investment | ||
| Intermediate-Term Corporate Bond | |||||
| Index Fund ETF Shares Net Asset | |||||
| Value | 0.32% | 4.76% | 6.05% | $14,043 | |
| Intermediate-Term Corporate Bond | |||||
| Index Fund ETF Shares Market Price | -0.07 | 4.60 | 5.99 | 14,000 | |
| Barclays U.S. 5–10 Year Corporate | |||||
| • | Bond Index | 0.39 | 4.87 | 6.17 | 14,134 |
| – | Spliced Core Bond Funds Average | 0.53 | 3.15 | 4.13 | 12,639 |
| Spliced Barclays U.S. Aggregate Float | |||||
| Adjusted Index | 1.40 | 2.98 | 3.77 | 12,383 | |
For a benchmark description, see the Glossary.
Spliced Core Bond Funds Average: Derived from data provided by Lipper, a Thomson Reuters Company.
"Since Inception" performance is calculated from the ETF Shares’ inception date for both the fund and its comparative standards.
Vanguard fund returns are adjusted to reflect the 0.25% fee on purchases of fund shares. The fee does not apply to the ETF Shares. The
Fiscal-Year Total Returns table is not adjusted for fees.
See Financial Highlights for dividend and capital gains information.
80
| Intermediate-Term Corporate Bond Index Fund | ||||
| Average Annual Total Returns | ||||
| Periods Ended August 31, 2015 | ||||
| Since | Final Value | |||
| One | Five | Inception | of a $10,000 | |
| Year | Years | (3/2/2010) | Investment | |
| Intermediate-Term Corporate Bond Index | ||||
| Fund Admiral Shares | 0.11% | 4.72% | 5.90% | $13,707 |
| Barclays U.S. 5–10 Year Corporate Bond | ||||
| Index | 0.39 | 4.87 | 6.01 | 13,786 |
| Barclays U.S. Aggregate Float Adjusted Index | 1.40 | 2.98 | 3.77 | 12,257 |
"Since Inception" performance is calculated from the Admiral Shares’ inception date for both the fund and its comparative standards.
| Since | Final Value | |||
| One | Five | Inception | of a $5,000,000 | |
| Year | Years | (11/19/2009) | Investment | |
| Intermediate-Term Corporate Bond Index | ||||
| Fund Institutional Shares | 0.12% | 4.74% | 6.05% | $7,021,572 |
| Barclays U.S. 5–10 Year Corporate Bond | ||||
| Index | 0.39 | 4.87 | 6.17 | 7,067,125 |
| Spliced Barclays U.S. Aggregate Float | ||||
| Adjusted Index | 1.40 | 2.98 | 3.77 | 6,191,718 |
"Since Inception" performance is calculated from the Institutional Shares’ inception date for both the fund and its comparative standards.
| Cumulative Returns of ETF Shares: November 19, 2009, Through August 31, 2015 | |||
| Since | |||
| One | Five | Inception | |
| Year | Years | (11/19/2009) | |
| Intermediate-Term Corporate Bond Index Fund ETF | |||
| Shares Market Price | -0.07% | 25.22% | 40.00% |
| Intermediate-Term Corporate Bond Index Fund ETF | |||
| Shares Net Asset Value | 0.32 | 26.17 | 40.43 |
| Barclays U.S. 5–10 Year Corporate Bond Index | 0.39 | 26.87 | 41.34 |
"Since Inception" performance is calculated from the ETF Shares’ inception date for both the fund and its comparative standards.
Vanguard fund returns are adjusted to reflect the 0.25% fee on purchases of fund shares. The fee does not apply to the ETF Shares. The Fiscal-Year Total Returns table is not adjusted for fees.
81
Intermediate-Term Corporate Bond Index Fund
| Fiscal-Year Total Returns (%): November 19, 2009, Through August 31, 2015 | ||
| Barclays | ||
| 5–10 Year | ||
| Corporate | ||
| ETF Shares Net Asset Value | Index | |
| Fiscal Year | Total Returns | Total Returns |
| 2010 | 11.30% | 11.41% |
| 2011 | 5.65 | 6.19 |
| 2012 | 10.43 | 10.07 |
| 2013 | -1.64 | -1.27 |
| 2014 | 9.60 | 9.51 |
| 2015 | 0.32 | 0.39 |
Average Annual Total Returns: Periods Ended June 30, 2015
This table presents returns through the latest calendar quarter—rather than through the end of the fiscal period.
Securities and Exchange Commission rules require that we provide this information.
| Since Inception | ||||||
| Inception Date | One Year | Five Years | Income | Capital | Total | |
| ETF Shares | 11/19/2009 | |||||
| Market Price | 1.88% | 5.67% | 6.32% | |||
| Net Asset Value | 1.79 | 5.75 | 6.28 | |||
| Admiral Shares | 3/2/2010 | 1.82 | 5.76 | 3.68% | 2.51% | 6.19 |
| Fee-Adjusted Returns | 1.57 | 5.70 | 6.14 | |||
| Institutional Shares | 11/19/2009 | 1.80 | 5.78 | 3.75 | 2.58 | 6.33 |
| Fee-Adjusted Returns | 1.55 | 5.73 | 6.28 | |||
Vanguard fund returns are adjusted to reflect the 0.25% fee on purchases of fund shares. The fee does not apply to the ETF Shares. The Fiscal-Year Total Returns table is not adjusted for fees.
82
Intermediate-Term Corporate Bond Index Fund
Financial Statements
Statement of Net Assets—Investments Summary
As of August 31, 2015
This Statement summarizes the fund’s holdings by asset type. Details are reported for each of the fund’s 50 largest individual holdings and for investments that, in total for any issuer, represent more than 1% of the fund’s net assets. The total value of smaller holdings is reported as a single amount within each category.
The fund reports a complete list of its holdings in regulatory filings four times in each fiscal year, at the quarter-ends. For the second and fourth fiscal quarters, the complete listing of the fund’s holdings is available electronically on vanguard.com and on the Securities and Exchange Commission’s website (sec.gov), or you can have it mailed to you without charge by calling 800-662-7447. For the first and third fiscal quarters, the fund files the lists with the SEC on Form N-Q. Shareholders can look up the fund’s Forms N-Q on the SEC’s website. Forms N-Q may also be reviewed and copied at the SEC’s Public Reference Room (see the back cover of this report for further information).
| Face | Market | Percentage | |||
| Maturity | Amount | Value• | of Net | ||
| Coupon | Date | ($000) | ($000) | Assets | |
| U.S. Government and Agency Obligations | |||||
| U.S. Government Securities (Cost $810)† | 809 | 0.0% | |||
| Corporate Bonds | |||||
| Finance | |||||
| Banking | |||||
| Bank of America Corp. | 3.300% | 1/11/23 | 18,925 | 18,627 | 0.3% |
| Bank of America Corp. | 4.200% | 8/26/24 | 14,862 | 14,736 | 0.2% |
| Bank of America Corp. | 4.125% | 1/22/24 | 12,550 | 12,964 | 0.2% |
| Bank of America Corp. | 4.000% | 4/1/24 | 12,625 | 12,925 | 0.2% |
| Bank of America Corp. | 5.700% | 1/24/22 | 11,175 | 12,616 | 0.2% |
| Bank of America Corp. | 3.875%–5.875% | 1/5/21–8/1/25 | 59,560 | 61,030 | 1.0% |
| BNP Paribas SA | 5.000% | 1/15/21 | 13,740 | 15,346 | 0.3% |
| Citigroup Inc. | 3.300%–5.375% | 8/9/20–6/10/25 | 75,199 | 76,600 | 1.2% |
| Cooperatieve Centrale | |||||
| Raiffeisen-Boerenleenbank BA | 3.875% | 2/8/22 | 14,488 | 15,143 | 0.2% |
| Credit Suisse | 3.000% | 10/29/21 | 15,700 | 15,637 | 0.3% |
| Credit Suisse | 3.625% | 9/9/24 | 12,950 | 12,852 | 0.2% |
| Goldman Sachs Group Inc. | 5.750% | 1/24/22 | 21,031 | 23,817 | 0.4% |
| Goldman Sachs Group Inc. | 5.250% | 7/27/21 | 16,870 | 18,723 | 0.3% |
| Goldman Sachs Group Inc. | 4.000% | 3/3/24 | 16,250 | 16,550 | 0.3% |
| Goldman Sachs Group Inc. | 3.500% | 1/23/25 | 15,675 | 15,313 | 0.3% |
| Goldman Sachs Group Inc. | 3.625%–3.850% | 1/22/23–5/22/25 | 26,949 | 27,036 | 0.4% |
| HSBC Bank plc | 7.650% | 5/1/25 | 250 | 313 | 0.0% |
| HSBC Holdings plc | 4.250% | 3/14/24 | 12,200 | 12,213 | 0.2% |
| HSBC Holdings plc | 4.000%–5.100% | 4/5/21–8/18/25 | 26,758 | 28,429 | 0.5% |
| HSBC USA Inc. | 3.500%–5.000% | 9/27/20–6/23/24 | 6,600 | 6,938 | 0.1% |
| JPMorgan Chase & Co. | 3.875% | 9/10/24 | 15,750 | 15,492 | 0.3% |
| JPMorgan Chase & Co. | 4.500% | 1/24/22 | 14,297 | 15,257 | 0.3% |
| JPMorgan Chase & Co. | 3.250% | 9/23/22 | 15,022 | 14,896 | 0.2% |
| JPMorgan Chase & Co. | 4.350% | 8/15/21 | 13,000 | 13,875 | 0.2% |
| JPMorgan Chase & Co. | 3.200% | 1/25/23 | 13,900 | 13,680 | 0.2% |
| JPMorgan Chase & Co. | 4.625% | 5/10/21 | 11,337 | 12,261 | 0.2% |
83
| Intermediate-Term Corporate Bond Index Fund | |||||
| Face | Market | Percentage | |||
| Maturity | Amount | Value• | of Net | ||
| Coupon | Date | ($000) | ($000) | Assets | |
| JPMorgan Chase & Co. | 3.125%–4.250% | 10/15/20–7/15/25 | 57,025 | 57,308 | 0.9% |
| Morgan Stanley | 3.875% | 4/29/24 | 15,000 | 15,221 | 0.3% |
| Morgan Stanley | 4.000% | 7/23/25 | 13,000 | 13,197 | 0.2% |
| Morgan Stanley | 3.700% | 10/23/24 | 12,993 | 12,948 | 0.2% |
| Morgan Stanley | 5.750% | 1/25/21 | 10,703 | 12,117 | 0.2% |
| Morgan Stanley | 3.750% | 2/25/23 | 11,950 | 12,102 | 0.2% |
| Morgan Stanley | 4.100%–5.500% | 7/28/21–5/22/23 | 30,475 | 32,267 | 0.5% |
| Synchrony Financial | 3.750%–4.500% | 8/15/21–7/23/25 | 16,033 | 15,826 | 0.3% |
| Wells Fargo & Co. | 3.500% | 3/8/22 | 12,135 | 12,445 | 0.2% |
| Wells Fargo & Co. | 3.000%–4.600% | 1/22/21–2/19/25 | 57,124 | 57,902 | 0.9% |
| 1 Banking—Other † | 387,606 | 6.3% | |||
| Brokerage † | 77,486 | 1.3% | |||
| Finance Companies | |||||
| General Electric Capital Corp. | 4.650% | 10/17/21 | 13,210 | 14,496 | 0.2% |
| 2 General Electric Capital Corp. | 3.100% | 1/9/23 | 13,544 | 13,531 | 0.2% |
| General Electric Capital Corp. | 4.625% | 1/7/21 | 11,125 | 12,212 | 0.2% |
| General Electric Capital | |||||
| Corp. | 3.150%–5.300% | 9/16/20–5/15/24 | 32,989 | 35,128 | 0.6% |
| HSBC Finance Corp. | 6.676% | 1/15/21 | 13,272 | 15,436 | 0.2% |
| Finance Companies—Other † | 16,658 | 0.3% | |||
| Insurance | |||||
| Berkshire Hathaway Finance | |||||
| Corp. | 2.900%–4.250% | 10/15/20–5/15/22 | 10,799 | 11,170 | 0.2% |
| Berkshire Hathaway Inc. | 3.000%–3.750% | 8/15/21–2/11/23 | 7,278 | 7,527 | 0.1% |
| Insurance—Other † | 293,534 | 4.8% | |||
| Other Finance † | 946 | 0.0% | |||
| Real Estate Investment Trusts † | 300,486 | 4.9% | |||
| 1,930,818 | 31.4% | ||||
| Industrial | |||||
| Basic Industry † | 343,920 | 5.6% | |||
| Capital Goods | |||||
| General Electric Co. | 2.700% | 10/9/22 | 17,100 | 16,716 | 0.2% |
| General Electric Co. | 3.375% | 3/11/24 | 3,533 | 3,580 | 0.1% |
| 1 Capital Goods—Other † | 264,841 | 4.3% | |||
| Communication | |||||
| AT&T Inc. | 3.400% | 5/15/25 | 20,050 | 19,005 | 0.3% |
| AT&T Inc. | 3.000% | 6/30/22 | 14,800 | 14,192 | 0.2% |
| AT&T Inc. | 2.625%–4.450% | 5/15/21–3/11/24 | 31,833 | 31,449 | 0.5% |
| 1 CCO Safari II LLC | 4.908% | 7/23/25 | 20,875 | 20,686 | 0.3% |
| 1 CCO Safari II LLC | 4.464% | 7/23/22 | 13,925 | 13,869 | 0.2% |
| DIRECTV Holdings LLC / | |||||
| DIRECTV Financing Co. | |||||
| Inc. | 3.800%–5.000% | 2/15/21–1/15/25 | 30,205 | 30,469 | 0.5% |
| GTE Corp. | 8.750% | 11/1/21 | 1,175 | 1,513 | 0.0% |
| Verizon Communications Inc. | 5.150% | 9/15/23 | 38,450 | 42,002 | 0.7% |
| Verizon Communications Inc. | 4.500% | 9/15/20 | 19,930 | 21,396 | 0.4% |
| Verizon Communications | |||||
| Inc. | 2.450%–4.600% | 3/15/21–11/1/24 | 52,218 | 52,216 | 0.9% |
| 1 Communication—Other † | 283,954 | 4.6% | |||
| Consumer Cyclical | |||||
| CVS Health Corp. | 3.875% | 7/20/25 | 13,000 | 13,290 | 0.2% |
| 1 Consumer Cyclical—Other † | 426,372 | 7.0% | |||
| Consumer Noncyclical | |||||
| AbbVie Inc. | 3.600% | 5/14/25 | 16,820 | 16,502 | 0.3% |
84
| Intermediate-Term Corporate Bond Index Fund | |||||
| Face | Market | Percentage | |||
| Maturity | Amount | Value• | of Net | ||
| Coupon | Date | ($000) | ($000) | Assets | |
| AbbVie Inc. | 2.900% | 11/6/22 | 14,054 | 13,554 | 0.2% |
| Actavis Funding SCS | 3.800% | 3/15/25 | 19,726 | 18,841 | 0.3% |
| Actavis Funding SCS | 3.450% | 3/15/22 | 12,514 | 12,132 | 0.2% |
| 1 Medtronic Inc. | 3.500% | 3/15/25 | 16,245 | 16,122 | 0.2% |
| Merck & Co. Inc. | 2.750% | 2/10/25 | 12,460 | 11,914 | 0.2% |
| Reynolds American Inc. | 4.450% | 6/12/25 | 12,160 | 12,456 | 0.2% |
| 1 Consumer Noncyclical—Other † | 805,657 | 13.1% | |||
| Energy | |||||
| BP Capital Markets plc | 2.500%–4.742% | 10/1/20–3/17/25 | 61,416 | 62,024 | 1.0% |
| Chevron Corp. | 3.191% | 6/24/23 | 12,725 | 12,739 | 0.2% |
| Shell International Finance BV | 3.250% | 5/11/25 | 13,400 | 13,141 | 0.2% |
| 1 Energy—Other † | 601,015 | 9.8% | |||
| Other Industrial † | 18,443 | 0.3% | |||
| Technology | |||||
| Apple Inc. | 2.400% | 5/3/23 | 27,200 | 25,955 | 0.4% |
| Apple Inc. | 3.450% | 5/6/24 | 12,100 | 12,277 | 0.2% |
| Apple Inc. | 2.150%–3.200% | 5/6/21–5/13/25 | 38,897 | 38,090 | 0.6% |
| Oracle Corp. | 2.500% | 10/15/22 | 14,493 | 13,928 | 0.3% |
| 1 Technology—Other † | 375,697 | 6.1% | |||
| Transportation | |||||
| Burlington Northern Santa Fe | |||||
| LLC | 3.000%–4.100% | 9/1/20–9/1/25 | 24,398 | 24,434 | 0.4% |
| Transportation—Other † | 111,950 | 1.8% | |||
| 3,816,341 | 62.0% | ||||
| Utilities | |||||
| Electric | |||||
| Berkshire Hathaway Energy | |||||
| Co. | 3.500%–3.750% | 11/15/23–2/1/25 | 5,800 | 5,836 | 0.1% |
| MidAmerican Energy Co. | 3.500% | 10/15/24 | 2,498 | 2,536 | 0.0% |
| PacifiCorp | 2.950%–3.850% | 6/15/21–4/1/24 | 9,570 | 9,854 | 0.2% |
| Sierra Pacific Power Co. | 3.375% | 8/15/23 | 750 | 761 | 0.0% |
| 1 Electric—Other † | 288,188 | 4.7% | |||
| Natural Gas † | 22,739 | 0.3% | |||
| Other Utility † | 3,796 | 0.1% | |||
| 333,710 | 5.4% | ||||
| Total Corporate Bonds (Cost $6,168,463) | 6,080,869 | 98.8% | |||
| Taxable Municipal Bonds (Cost $2,332) † | 2,337 | 0.1% | |||
| Shares | |||||
| Temporary Cash Investment | |||||
| Money Market Fund | |||||
| 3 Vanguard Market Liquidity Fund | |||||
| (Cost $7,785) | 0.168% | 7,785,428 | 7,785 | 0.1% | |
| Total Investments (Cost $6,179,390) | 6,091,800 | 99.0% | |||
85
| Intermediate-Term Corporate Bond Index Fund | ||
| Percentage | ||
| Amount | of Net | |
| ($000) | Assets | |
| Other Assets and Liabilities (1.0%) | ||
| Other Assets | ||
| Investment in Vanguard | 555 | |
| Receivables for Investment Securities Sold | 67,037 | |
| Receivables for Accrued Income | 65,467 | |
| Receivables for Capital Shares Issued | 1,849 | |
| Other Assets | 9 | |
| Total Other Assets | 134,917 | 2.2% |
| Liabilities | ||
| Payables for Investment Securities Purchased | (67,780) | |
| Payables for Capital Shares Redeemed | (1,134) | |
| Payables for Distributions | (576) | |
| Payables to Vanguard | (1,498) | |
| Other Liabilities | (1,471) | |
| Total Liabilities | (72,459) | (1.2%) |
| Net Assets | 6,154,258 | 100.0% |
| At August 31, 2015, net assets consisted of: | ||
| Amount | ||
| ($000) | ||
| Paid-in Capital | 6,235,165 | |
| Undistributed Net Investment Income | 15,315 | |
| Accumulated Net Realized Losses | (8,631) | |
| Unrealized Appreciation (Depreciation) | ||
| Investment Securities | (87,590) | |
| Futures Contracts | (1) | |
| Net Assets | 6,154,258 | |
| ETF Shares—Net Assets | ||
| Applicable to 63,905,918 outstanding $.001 par value shares of | ||
| beneficial interest (unlimited authorization) | 5,393,284 | |
| Net Asset Value Per Share—ETF Shares | $84.39 | |
| Admiral Shares—Net Assets | ||
| Applicable to 18,607,335 outstanding $.001 par value shares of | ||
| beneficial interest (unlimited authorization) | 422,518 | |
| Net Asset Value Per Share—Admiral Shares | $22.71 | |
86
| Intermediate-Term Corporate Bond Index Fund | |
| Amount | |
| ($000) | |
| Institutional Shares—Net Assets | |
| Applicable to 12,062,181 outstanding $.001 par value shares of | |
| beneficial interest (unlimited authorization) | 338,456 |
| Net Asset Value Per Share—Institutional Shares | $28.06 |
• See Note A in Notes to Financial Statements.
† Represents the aggregate value, by category, of securities that are not among the 50 largest holdings and, in total for any issuer, represent 1% or less of net assets.
1 Certain of the fund’s securities are exempt from registration under Rule 144A of the Securities Act of 1933. Such securities may be sold in transactions exempt from registration, normally to qualified institutional buyers. At August 31, 2015, the aggregate value of these securities was $143,482,000, representing 2.3% of net assets.
2 Securities with a value of $300,000 have been segregated as initial margin for open futures contracts.
3 Affiliated money market fund available only to Vanguard funds and certain trusts and accounts managed by Vanguard. Rate shown is the 7-day yield.
See accompanying Notes, which are an integral part of the Financial Statements.
87
| Intermediate-Term Corporate Bond Index Fund | |
| Statement of Operations | |
| Year Ended | |
| August 31, 2015 | |
| ($000) | |
| Investment Income | |
| Income | |
| Interest1 | 185,241 |
| Total Income | 185,241 |
| Expenses | |
| The Vanguard Group—Note B | |
| Investment Advisory Services | 134 |
| Management and Administrative—ETF Shares | 3,623 |
| Management and Administrative—Admiral Shares | 261 |
| Management and Administrative—Institutional Shares | 170 |
| Marketing and Distribution—ETF Shares | 774 |
| Marketing and Distribution—Admiral Shares | 53 |
| Marketing and Distribution—Institutional Shares | 38 |
| Custodian Fees | 42 |
| Auditing Fees | 47 |
| Shareholders’ Reports—ETF Shares | 234 |
| Shareholders’ Reports—Admiral Shares | 6 |
| Shareholders’ Reports—Institutional Shares | — |
| Trustees’ Fees and Expenses | 3 |
| Total Expenses | 5,385 |
| Net Investment Income | 179,856 |
| Realized Net Gain (Loss) | |
| Investment Securities Sold | 12,105 |
| Futures Contracts | (1,569) |
| Realized Net Gain (Loss) | 10,536 |
| Change in Unrealized Appreciation (Depreciation) | |
| Investment Securities | (187,848) |
| Futures Contracts | (1) |
| Change in Unrealized Appreciation (Depreciation) | (187,849) |
| Net Increase (Decrease) in Net Assets Resulting from Operations | 2,543 |
| 1 Interest income from an affiliated company of the fund was $35,000. | |
See accompanying Notes, which are an integral part of the Financial Statements.
88
| Intermediate-Term Corporate Bond Index Fund | ||
| Statement of Changes in Net Assets | ||
| Year Ended August 31, | ||
| 2015 | 2014 | |
| ($000) | ($000) | |
| Increase (Decrease) in Net Assets | ||
| Operations | ||
| Net Investment Income | 179,856 | 125,051 |
| Realized Net Gain (Loss) | 10,536 | 10,414 |
| Change in Unrealized Appreciation (Depreciation) | (187,849) | 213,672 |
| Net Increase (Decrease) in Net Assets Resulting from Operations | 2,543 | 349,137 |
| Distributions | ||
| Net Investment Income | ||
| ETF Shares | (153,363) | (101,451) |
| Admiral Shares1 | (11,087) | (4,240) |
| Institutional Shares | (10,537) | (8,841) |
| Realized Capital Gain 2 | ||
| ETF Shares | (6,812) | (22,349) |
| Admiral Shares1 | (446) | (567) |
| Institutional Shares | (461) | (1,674) |
| Total Distributions | (182,706) | (139,122) |
| Capital Share Transactions | ||
| ETF Shares | 1,541,965 | 658,982 |
| Admiral Shares1 | 195,685 | 176,951 |
| Institutional Shares | 41,479 | 129,002 |
| Net Increase (Decrease) from Capital Share Transactions | 1,779,129 | 964,935 |
| Total Increase (Decrease) | 1,598,966 | 1,174,950 |
| Net Assets | ||
| Beginning of Period | 4,555,292 | 3,380,342 |
| End of Period3 | 6,154,258 | 4,555,292 |
1 Signal Shares were renamed Admiral Shares in October 2013.
2 Includes fiscal 2015 and 2014 short-term gain distributions totaling $0 and $5,450,000, respectively. Short-term gain distributions are treated as ordinary income dividends for tax purposes.
3 Net Assets—End of Period includes undistributed (overdistributed) net investment income of $15,315,000 and $10,446,000.
See accompanying Notes, which are an integral part of the Financial Statements.
89
| Intermediate-Term Corporate Bond Index Fund | |||||
| Financial Highlights | |||||
| ETF Shares | |||||
| For a Share Outstanding | Year Ended August 31, | ||||
| Throughout Each Period | 2015 | 2014 | 2013 | 2012 | 2011 |
| Net Asset Value, Beginning of Period | $86.98 | $82.31 | $86.78 | $81.49 | $80.67 |
| Investment Operations | |||||
| Net Investment Income | 2.767 | 2.724 | 2.715 | 2.966 | 3.249 |
| Net Realized and Unrealized Gain (Loss) | |||||
| on Investments1 | (2.473) | 5.024 | (4.042) | 5.350 | 1.162 |
| Total from Investment Operations | .294 | 7.748 | (1.327) | 8.316 | 4.411 |
| Distributions | |||||
| Dividends from Net Investment Income | (2.754) | (2.496) | (2.713) | (2.963) | (3.248) |
| Distributions from Realized Capital Gains | (.130) | (. 582) | (. 430) | (. 063) | (. 343) |
| Total Distributions | (2.884) | (3.078) | (3.143) | (3.026) | (3.591) |
| Net Asset Value, End of Period | $84.39 | $86.98 | $82.31 | $86.78 | $81.49 |
| Total Return | 0.32% | 9.60% | -1.64% | 10.43% | 5.65% |
| Ratios/Supplemental Data | |||||
| Net Assets, End of Period (Millions) | $5,393 | $4,010 | $3,161 | $2,751 | $725 |
| Ratio of Total Expenses to Average Net Assets | 0.10% | 0.12% | 0.12% | 0.12% | 0.14% |
| Ratio of Net Investment Income to | |||||
| Average Net Assets | 3.25% | 3.25% | 3.16% | 3.62% | 4.15% |
| Portfolio Turnover Rate 2 | 56% | 65% | 73% | 69% | 80% |
1 Includes increases from purchase fees of $.02, $.02, $.00, $.03, and $.06.
2 Excludes the value of portfolio securities received or delivered as a result of in-kind purchases or redemptions of the fund’s capital shares, including ETF Creation Units.
See accompanying Notes, which are an integral part of the Financial Statements.
90
| Intermediate-Term Corporate Bond Index Fund | |||||
| Financial Highlights | |||||
| Admiral Shares | |||||
| For a Share Outstanding | Year Ended August 31, | ||||
| Throughout Each Period | 2015 | 2014 | 2013 | 2012 | 2011 |
| Net Asset Value, Beginning of Period | $23.40 | $22.20 | $23.40 | $21.98 | $21.76 |
| Investment Operations | |||||
| Net Investment Income | .745 | .736 | .732 | .800 | .876 |
| Net Realized and Unrealized Gain (Loss) | |||||
| on Investments1 | (. 654) | 1.355 | (1.085) | 1.437 | .312 |
| Total from Investment Operations | .091 | 2.091 | (.353) | 2.237 | 1.188 |
| Distributions | |||||
| Dividends from Net Investment Income | (.746) | (.734) | (.731) | (.800) | (.875) |
| Distributions from Realized Capital Gains | (.035) | (.157) | (.116) | (. 017) | (.093) |
| Total Distributions | (.781) | (. 891) | (. 847) | (.817) | (.968) |
| Net Asset Value, End of Period | $22.71 | $23.40 | $22.20 | $23.40 | $21.98 |
| Total Return2 | 0.37% | 9.60% | -1.62% | 10.41% | 5.65% |
| Ratios/Supplemental Data | |||||
| Net Assets, End of Period (Millions) | $423 | $239 | $55 | $51 | $7 |
| Ratio of Total Expenses to Average Net Assets | 0.10% | 0.12% | 0.12% | 0.12% | 0.14% |
| Ratio of Net Investment Income to | |||||
| Average Net Assets | 3.25% | 3.25% | 3.16% | 3.62% | 4.15% |
| Portfolio Turnover Rate 3 | 56% | 65% | 73% | 69% | 80% |
1 Includes increases from purchase fees of $.00, $.01, $.00, $.01, and $.02.
2 Total returns do not include transaction or account service fees that may have applied in the periods shown. Fund prospectuses provide information about any applicable transaction and account service fees.
3 Excludes the value of portfolio securities received or delivered as a result of in-kind purchases or redemptions of the fund’s capital shares, including ETF Creation Units.
See accompanying Notes, which are an integral part of the Financial Statements.
91
| Intermediate-Term Corporate Bond Index Fund | |||||
| Financial Highlights | |||||
| Institutional Shares | |||||
| For a Share Outstanding | Year Ended August 31, | ||||
| Throughout Each Period | 2015 | 2014 | 2013 | 2012 | 2011 |
| Net Asset Value, Beginning of Period | $28.92 | $27.44 | $28.93 | $27.17 | $26.90 |
| Investment Operations | |||||
| Net Investment Income | .931 | .919 | .913 | .999 | 1.098 |
| Net Realized and Unrealized Gain (Loss) | |||||
| on Investments1 | (. 816) | 1.671 | (1.347) | 1.780 | .383 |
| Total from Investment Operations | .115 | 2.590 | (.434) | 2.779 | 1.481 |
| Distributions | |||||
| Dividends from Net Investment Income | (. 932) | (. 916) | (. 913) | (. 998) | (1.097) |
| Distributions from Realized Capital Gains | (.043) | (.194) | (.143) | (. 021) | (.114) |
| Total Distributions | (.975) | (1.110) | (1.056) | (1.019) | (1.211) |
| Net Asset Value, End of Period | $28.06 | $28.92 | $27.44 | $28.93 | $27.17 |
| Total Return2 | 0.37% | 9.62% | -1.61% | 10.46% | 5.70% |
| Ratios/Supplemental Data | |||||
| Net Assets, End of Period (Millions) | $338 | $307 | $164 | $185 | $82 |
| Ratio of Total Expenses to Average Net Assets | 0.07% | 0.09% | 0.09% | 0.09% | 0.09% |
| Ratio of Net Investment Income to | |||||
| Average Net Assets | 3.28% | 3.28% | 3.19% | 3.65% | 4.20% |
| Portfolio Turnover Rate 3 | 56% | 65% | 73% | 69% | 80% |
1 Includes increases from purchase fees of $.01, $.01, $.00, $.01, and $.02.
2 Total returns do not include transaction fees that may have applied in the periods shown. Fund prospectuses provide information about any applicable transaction fees.
3 Excludes the value of portfolio securities received or delivered as a result of in-kind purchases or redemptions of the fund’s capital shares, including ETF Creation Units.
See accompanying Notes, which are an integral part of the Financial Statements.
92
Intermediate-Term Corporate Bond Index Fund
Notes to Financial Statements
Vanguard Intermediate-Term Corporate Bond Index Fund is registered under the Investment Company Act of 1940 as an open-end investment company, or mutual fund. Certain of the fund’s investments are in corporate debt instruments; the issuers’ abilities to meet their obligations may be affected by economic developments in their respective industries. The fund offers three classes of shares: ETF Shares, Admiral Shares, and Institutional Shares. ETF Shares are listed for trading on Nasdaq; they can be purchased and sold through a broker. Admiral Shares and Institutional Shares are designed for investors who meet certain administrative, service, and account-size criteria.
A. The following significant accounting policies conform to generally accepted accounting principles for U.S. investment companies. The fund consistently follows such policies in preparing its financial statements.
1. Security Valuation: Securities are valued as of the close of trading on the New York Stock Exchange (generally 4 p.m., Eastern time) on the valuation date. Bonds, and temporary cash investments acquired over 60 days to maturity, are valued using the latest bid prices or using valuations based on a matrix system (which considers such factors as security prices, yields, maturities, and ratings), both as furnished by independent pricing services. Investments in Vanguard Market Liquidity Fund are valued at that fund’s net asset value. Other temporary cash investments are valued at amortized cost, which approximates market value. Securities for which market quotations are not readily available, or whose values have been affected by events occurring before the fund’s pricing time but after the close of the securities’ primary markets, are valued by methods deemed by the board of trustees to represent fair value.
2. Futures Contracts: The fund uses futures contracts to invest in fixed income asset classes with greater efficiency and lower cost than is possible through direct investment, to add value when these instruments are attractively priced, or to adjust sensitivity to changes in interest rates. The primary risks associated with the use of futures contracts are imperfect correlation between changes in market values of bonds held by the fund and the prices of futures contracts, and the possibility of an illiquid market. Counterparty risk involving futures is mitigated because a regulated clearinghouse is the counterparty instead of the clearing broker. To further mitigate counterparty risk, the fund trades futures contracts on an exchange, monitors the financial strength of its clearing brokers and clearinghouse, and has entered into clearing agreements with its clearing brokers. The clearinghouse imposes initial margin requirements to secure the fund’s performance and requires daily settlement of variation margin representing changes in the market value of each contract.
Futures contracts are valued at their quoted daily settlement prices. The aggregate settlement values of the contracts are not recorded in the Statement of Net Assets. Fluctuations in the value of the contracts are recorded in the Statement of Net Assets as an asset (liability) and in the Statement of Operations as unrealized appreciation (depreciation) until the contracts are closed, when they are recorded as realized futures gains (losses).
During the year ended August 31, 2015, the fund’s average investments in long and short futures contracts each represented less than 1% of net assets, based on the average of aggregate settlement values at each quarter-end during the period.
3. Federal Income Taxes: The fund intends to continue to qualify as a regulated investment company and distribute all of its taxable income. Management has analyzed the fund’s tax positions taken for all open federal income tax years (August 31, 2012–2015), and has concluded that no provision for federal income tax is required in the fund’s financial statements.
4. Distributions: Distributions to shareholders are recorded on the ex-dividend date.
93
Intermediate-Term Corporate Bond Index Fund
5. Credit Facility: The fund and certain other funds managed by The Vanguard Group (“Vanguard”) participate in a $3 billion committed credit facility provided by a syndicate of lenders pursuant to a credit agreement that may be renewed annually; each fund is individually liable for its borrowings, if any, under the credit facility. Borrowings may be utilized for temporary and emergency purposes, and are subject to the fund’s regulatory and contractual borrowing restrictions. The participating funds are charged administrative fees and an annual commitment fee of 0.06% of the undrawn amount of the facility; these fees are allocated to the funds based on a method approved by the fund’s board of trustees and included in Management and Administrative expenses on the fund’s Statement of Operations. Any borrowings under this facility bear interest at a rate equal to the higher of the federal funds rate or LIBOR reference rate plus an agreed-upon spread.
The fund had no borrowings outstanding at August 31, 2015, or at any time during the period then ended.
6. Other: Interest income includes income distributions received from Vanguard Market Liquidity Fund and is accrued daily. Premiums and discounts on debt securities purchased are amortized and accreted, respectively, to interest income over the lives of the respective securities. Security transactions are accounted for on the date securities are bought or sold. Costs used to determine realized gains (losses) on the sale of investment securities are those of the specific securities sold. Fees assessed on capital share transactions are credited to paid-in capital.
Each class of shares has equal rights as to assets and earnings, except that each class separately bears certain class-specific expenses related to maintenance of shareholder accounts (included in Management and Administrative expenses) and shareholder reporting. Marketing and distribution expenses are allocated to each class of shares based on a method approved by the board of trustees. Income, other non-class-specific expenses, and gains and losses on investments are allocated to each class of shares based on its relative net assets.
B. In accordance with the terms of a Funds’ Service Agreement (the “FSA”) between Vanguard and the fund, Vanguard furnishes to the fund investment advisory, corporate management, administrative, marketing, and distribution services at Vanguard’s cost of operations (as defined by the FSA). These costs of operations are allocated to the fund based on methods and guidelines approved by the board of trustees. Vanguard does not require reimbursement in the current period for certain costs of operations (such as deferred compensation/benefits and risk/insurance costs); the fund’s liability for these costs of operations is included in Payables to Vanguard on the Statement of Net Assets.
Upon the request of Vanguard, the fund may invest up to 0.40% of its net assets as capital in Vanguard. At August 31, 2015, the fund had contributed to Vanguard capital in the amount of $555,000, representing 0.01% of the fund’s net assets and 0.22% of Vanguard’s capitalization. The fund’s trustees and officers are also directors and employees, respectively, of Vanguard.
C. Various inputs may be used to determine the value of the fund’s investments. These inputs are summarized in three broad levels for financial statement purposes. The inputs or methodologies used to value securities are not necessarily an indication of the risk associated with investing in those securities.
94
Intermediate-Term Corporate Bond Index Fund
Level 1—Quoted prices in active markets for identical securities.
Level 2—Other significant observable inputs (including quoted prices for similar securities, interest rates, prepayment speeds, credit risk, etc.).
Level 3—Significant unobservable inputs (including the fund’s own assumptions used to determine the fair value of investments).
The following table summarizes the market value of the fund’s investments as of August 31, 2015, based on the inputs used to value them:
| Level 1 | Level 2 | Level 3 | |
| Investments | ($000) | ($000) | ($000) |
| U.S. Government and Agency Obligations | — | 809 | — |
| Corporate Bonds | — | 6,080,869 | — |
| Taxable Municipal Bonds | — | 2,337 | — |
| Temporary Cash Investments | 7,785 | — | — |
| Futures Contracts—Assets1 | 14 | — | — |
| Futures Contracts—Liabilities1 | (1) | — | — |
| Total | 7,798 | 6,084,015 | — |
| 1 Represents variation margin on the last day of the reporting period. | |||
D. At August 31, 2015, the aggregate settlement value of open futures contracts and the related unrealized appreciation (depreciation) were:
| ($000) | ||||
| Aggregate | ||||
| Number of | Settlement | Unrealized | ||
| Long (Short) | Value | Appreciation | ||
| Futures Contracts | Expiration | Contracts | Long (Short) | (Depreciation) |
| 10-Year U.S. Treasury Note | December 2015 | 62 | 7,878 | (1) |
Unrealized appreciation (depreciation) on open futures contracts is required to be treated as realized gain (loss) for tax purposes.
E. Distributions are determined on a tax basis and may differ from net investment income and realized capital gains for financial reporting purposes. Differences may be permanent or temporary. Permanent differences are reclassified among capital accounts in the financial statements to reflect their tax character. Temporary differences arise when certain items of income, expense, gain, or loss are recognized in different periods for financial statement and tax purposes. These differences will reverse at some time in the future. Differences in classification may also result from the treatment of short-term gains as ordinary income for tax purposes.
During the year ended August 31, 2015, the fund realized $18,018,000 of net capital gains resulting from in-kind redemptions—in which shareholders exchanged fund shares for securities held by the fund rather than for cash. Because such gains are not taxable to the fund, and are not distributed to shareholders, they have been reclassified from accumulated net realized losses to paid-in capital.
For tax purposes, at August 31, 2015, the fund had $17,234,000 of ordinary income available for distribution. The fund had available capital losses totaling $7,066,000 that may be carried forward indefinitely to offset future net capital gains.
95
Intermediate-Term Corporate Bond Index Fund
At August 31, 2015, the cost of investment securities for tax purposes was $6,180,909,000. Net unrealized depreciation of investment securities for tax purposes was $89,109,000, consisting of unrealized gains of $29,260,000 on securities that had risen in value since their purchase and $118,369,000 in unrealized losses on securities that had fallen in value since their purchase.
F. During the year ended August 31, 2015, the fund purchased $3,620,863,000 of investment securities and sold $1,824,095,000 of investment securities, other than U.S. government securities and temporary cash investments. Purchases and sales of U.S. government securities were $1,830,967,000 and $1,853,145,000, respectively. Total purchases and sales include $1,395,709,000 and $618,493,000, respectively, in connection with in-kind purchases and redemptions of the fund’s capital shares.
G. Capital share transactions for each class of shares were:
| Year Ended August 31, | ||||
| 2015 | 2014 | |||
| Amount | Shares | Amount | Shares | |
| ($000) | (000) | ($000) | (000) | |
| ETF Shares | ||||
| Issued1 | 2,179,326 | 25,206 | 902,718 | 10,600 |
| Issued in Lieu of Cash Distributions | — | — | — | — |
| Redeemed | (637,361) | (7,400) | (243,736) | (2,900) |
| Net Increase (Decrease)—ETF Shares | 1,541,965 | 17,806 | 658,982 | 7,700 |
| Admiral Shares2 | ||||
| Issued1 | 301,432 | 12,952 | 209,876 | 9,151 |
| Issued in Lieu of Cash Distributions | 10,270 | 442 | 4,244 | 185 |
| Redeemed | (116,017) | (4,991) | (37,169) | (1,624) |
| Net Increase (Decrease)—Admiral Shares | 195,685 | 8,403 | 176,951 | 7,712 |
| Institutional Shares | ||||
| Issued1 | 185,789 | 6,461 | 168,157 | 6,007 |
| Issued in Lieu of Cash Distributions | 8,213 | 286 | 9,054 | 321 |
| Redeemed | (152,523) | (5,289) | (48,209) | (1,712) |
| Net Increase (Decrease)—Institutional Shares | 41,479 | 1,458 | 129,002 | 4,616 |
1 Includes purchase fees for fiscal 2015 and 2014 of $1,119,000 and $980,000, respectively (fund totals).
2 Signal Shares were renamed Admiral Shares in October 2013.
H. Management has determined that no material events or transactions occurred subsequent to August 31, 2015, that would require recognition or disclosure in these financial statements.
96
Long-Term Corporate Bond Index Fund
Fund Profile
As of August 31, 2015
| Share-Class Characteristics | |||
| ETF | Admiral Institutional | ||
| Shares | Shares | Shares | |
| Ticker Symbol | VCLT | VLTCX | VLCIX |
| Expense Ratio1 | 0.12% | 0.12% | 0.09% |
| 30-Day SEC Yield | 4.84% | 4.87% | 4.87% |
| Financial Attributes | |||
| Barclays | |||
| 10+ Year | Barclays | ||
| Corporate | Aggregate | ||
| Fund | Index | FA Index | |
| Number of Bonds | 1,630 | 1,733 | 9,541 |
| Yield to Maturity | |||
| (before expenses) | 5.0% | 5.0% | 2.4% |
| Average Coupon | 5.5% | 5.5% | 3.2% |
| Average Duration | 13.5 years | 13.5 years | 5.7 years |
| Average Effective | |||
| Maturity | 23.9 years | 23.8 years | 7.9 years |
| Short-Term | |||
| Reserves | 0.3% | — | — |
| Sector Diversification (% of portfolio) | |
| Finance | 19.6% |
| Industrial | 67.3 |
| Utilities | 12.9 |
| Other | 0.2 |
The agency and mortgage-backed securities sectors may include issues from government-sponsored enterprises; such issues are generally not backed by the full faith and credit of the U.S. government.
| Volatility Measures | ||
| Barclays | ||
| 10+ Year | Barclays | |
| Corporate | Aggregate | |
| Index | FA Index | |
| R-Squared | 0.99 | 0.87 |
| Beta | 1.00 | 2.66 |
These measures show the degree and timing of the fund’s fluctuations compared with the indexes over 36 months.
| Distribution by Effective Maturity (% of portfolio) | |
| Under 1 Year | 0.2% |
| 5 - 10 Years | 0.6 |
| 10 - 20 Years | 23.8 |
| 20 - 30 Years | 71.6 |
| Over 30 Years | 3.8 |
| Distribution by Credit Quality (% of portfolio) | |
| Aaa | 2.0% |
| Aa | 6.5 |
| A | 42.0 |
| Baa | 49.5 |
Credit-quality ratings are obtained from Barclays and are from Moody's, Fitch, and S&P. When ratings from all three agencies are used, the median rating is shown. When ratings from two of the agencies are used, the lower rating for each issue is shown. "Not Rated" is used to classify securities for which a rating is not available. Not rated securities include a fund's investment in Vanguard Market Liquidity Fund or Vanguard Municipal Cash Management Fund, each of which invests in high-quality money market instruments and may serve as a cash management vehicle for the Vanguard funds, trusts, and accounts. For more information about these ratings, see the Glossary entry for Credit Quality.
Investment Focus

1 The expense ratios shown are from the prospectus dated December 23, 2014, and represent estimated costs for the current fiscal year. For the fiscal year ended August 31, 2015, the expense ratios were 0.10% for ETF Shares, 0.10% for Admiral Shares, and 0.07% for Institutional Shares.
97
Long-Term Corporate Bond Index Fund
Performance Summary
All of the returns in this report represent past performance, which is not a guarantee of future results that may be achieved by the fund. (Current performance may be lower or higher than the performance data cited. For performance data current to the most recent month-end, visit our website at vanguard.com/performance.) Note, too, that both investment returns and principal value can fluctuate widely, so an investor’s shares, when sold, could be worth more or less than their original cost. The returns shown do not reflect taxes that a shareholder would pay on fund distributions or on the sale of fund shares.
Cumulative Performance: November 19, 2009, Through August 31, 2015
Initial Investment of $10,000
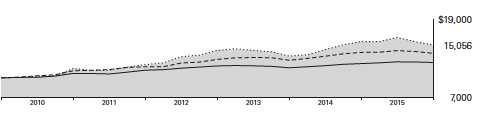
| Average Annual Total Returns | ||||
| Periods Ended August 31, 2015 | ||||
| Since | Final Value | |||
| One | Five | Inception | of a $10,000 | |
| Year | Years | (11/19/2009) | Investment | |
| Long-Term Corporate Bond Index | ||||
| Fund ETF Shares Net Asset Value | -3.64% | 5.62% | 7.34% | $15,056 |
| Long-Term Corporate Bond Index | ||||
| Fund ETF Shares Market Price | -3.80 | 5.39 | 7.30 | 15,030 |
| Barclays U.S. 10+ Year Corporate | ||||
| Bond Index | -3.48 | 5.67 | 7.37 | 15,082 |
| Corporate Debt Funds BBB-Rated | ||||
| Average | -1.02 | 4.46 | 5.74 | 13,807 |
| Spliced Barclays U.S. Aggregate Float | ||||
| Adjusted Index | 1.40 | 2.98 | 3.77 | 12,383 |
For a benchmark description, see the Glossary.
Corporate Debt Funds BBB-Rated Average: Derived from data provided by Lipper, a Thomson Reuters Company.
"Since Inception" performance is calculated from the ETF Shares’ inception date for both the fund and its comparative standards.
Vanguard fund returns are adjusted to reflect the 1.00% fee on purchases of fund shares. The fee does not apply to the ETF Shares. The
Fiscal-Year Total Returns table is not adjusted for fees.
See Financial Highlights for dividend and capital gains information.
98
| Long-Term Corporate Bond Index Fund | ||||
| Average Annual Total Returns | ||||
| Periods Ended August 31, 2015 | ||||
| Since | Final Value | |||
| One | Five | Inception | of a $10,000 | |
| Year | Years | (1/19/2010) | Investment | |
| Long-Term Corporate Bond Index Fund | ||||
| Admiral Shares | -4.62% | 5.42% | 7.18% | $14,758 |
| Barclays U.S. 10+ Year Corporate Bond Index | -3.48 | 5.67 | 7.43 | 14,951 |
| Barclays U.S. Aggregate Float Adjusted Index | 1.40 | 2.98 | 3.85 | 12,361 |
"Since Inception" performance is calculated from the Admiral Shares’ inception date for both the fund and its comparative standards.
| Since | Final Value | |||
| One | Five | Inception | of a $5,000,000 | |
| Year | Years | (11/19/2009) | Investment | |
| Long-Term Corporate Bond Index Fund | ||||
| Institutional Shares | -4.58% | 5.45% | 7.20% | $7,471,801 |
| Barclays U.S. 10+ Year Corporate Bond | ||||
| Index | -3.48 | 5.67 | 7.37 | 7,540,756 |
| Spliced Barclays U.S. Aggregate Float | ||||
| Adjusted Index | 1.40 | 2.98 | 3.77 | 6,191,718 |
"Since Inception" performance is calculated from the Institutional Shares’ inception date for both the fund and its comparative standards.
Cumulative Returns of ETF Shares: November 19, 2009, Through August 31, 2015
| |||
| Since | |||
| One | Five | Inception | |
| Year | Years | (11/19/2009) | |
| Long-Term Corporate Bond Index Fund ETF Shares | |||
| Market Price | -3.80% | 30.03% | 50.30% |
| Long-Term Corporate Bond Index Fund ETF Shares | |||
| Net Asset Value | -3.64 | 31.45 | 50.56 |
| Barclays U.S. 10+ Year Corporate Bond Index | -3.48 | 31.76 | 50.82 |
"Since Inception" performance is calculated from the ETF Shares’ inception date for both the fund and its comparative standards.
Vanguard fund returns are adjusted to reflect the 1.00% fee on purchases of fund shares. The fee does not apply to the ETF Shares. The Fiscal-Year Total Returns table is not adjusted for fees.
99
Long-Term Corporate Bond Index Fund
| Fiscal-Year Total Returns (%): November 19, 2009, Through August 31, 2015 | ||
| Barclays | ||
| 10+ Year | ||
| Corporate | ||
| ETF Shares Net Asset Value | Index | |
| Fiscal Year | Total Returns | Total Returns |
| 2010 | 14.54% | 14.46% |
| 2011 | 4.19 | 5.18 |
| 2012 | 19.40 | 18.33 |
| 2013 | -6.55 | -6.09 |
| 2014 | 17.35 | 16.80 |
| 2015 | -3.64 | -3.48 |
Average Annual Total Returns: Periods Ended June 30, 2015
This table presents returns through the latest calendar quarter—rather than through the end of the fiscal period.
Securities and Exchange Commission rules require that we provide this information.
| Since Inception | ||||||
| Inception Date | One Year | Five Years | Income | Capital | Total | |
| ETF Shares | 11/19/2009 | |||||
| Market Price | -1.24% | 6.75% | 7.42% | |||
| Net Asset Value | -0.42 | 7.01 | 7.57 | |||
| Admiral Shares | 1/19/2010 | -0.43 | 7.02 | 5.03% | 2.58% | 7.61 |
| Fee-Adjusted Returns | -1.43 | 6.80 | 7.42 | |||
| Institutional Shares | 11/19/2009 | -0.40 | 7.05 | 5.06 | 2.56 | 7.62 |
| Fee-Adjusted Returns | -1.40 | 6.84 | 7.42 | |||
Vanguard fund returns are adjusted to reflect the 1.00% fee on purchases of fund shares. The fee does not apply to the ETF Shares. The Fiscal-Year Total Returns table is not adjusted for fees.
100
Long-Term Corporate Bond Index Fund
Financial Statements
Statement of Net Assets—Investments Summary
As of August 31, 2015
This Statement summarizes the fund’s holdings by asset type. Details are reported for each of the fund’s 50 largest individual holdings and for investments that, in total for any issuer, represent more than 1% of the fund’s net assets. The total value of smaller holdings is reported as a single amount within each category.
The fund reports a complete list of its holdings in regulatory filings four times in each fiscal year, at the quarter-ends. For the second and fourth fiscal quarters, the complete listing of the fund’s holdings is available electronically on vanguard.com and on the Securities and Exchange Commission’s website (sec.gov), or you can have it mailed to you without charge by calling 800-662-7447. For the first and third fiscal quarters, the fund files the lists with the SEC on Form N-Q. Shareholders can look up the fund’s Forms N-Q on the SEC’s website. Forms N-Q may also be reviewed and copied at the SEC’s Public Reference Room (see the back cover of this report for further information).
| Face | Market | Percentage | |||
| Maturity | Amount | Value• | of Net | ||
| Coupon | Date | ($000) | ($000) | Assets | |
| U.S. Government and Agency Obligations | |||||
| U.S. Government Securities (Cost $ 2,090) † | 2,077 | 0.2% | |||
| Corporate Bonds | |||||
| Finance | |||||
| Banking | |||||
| Bank of America Corp. | 6.110% | 1/29/37 | 2,795 | 3,162 | 0.2% |
| Bank of America Corp. | 7.750% | 5/14/38 | 2,053 | 2,758 | 0.2% |
| Bank of America Corp. | 5.000% | 1/21/44 | 2,470 | 2,608 | 0.2% |
| Bank of America Corp. | 4.250%–6.750% | 9/15/26–4/21/45 | 6,555 | 6,897 | 0.5% |
| Bank of America NA | 6.000% | 10/15/36 | 1,075 | 1,279 | 0.1% |
| Bank One Capital III | 8.750% | 9/1/30 | 220 | 315 | 0.0% |
| Bank One Corp. | 7.625%–8.000% | 10/15/26–4/29/27 | 1,045 | 1,349 | 0.1% |
| Citigroup Inc. | 8.125% | 7/15/39 | 2,375 | 3,418 | 0.3% |
| Citigroup Inc. | 4.300%–6.675% | 9/13/25–7/30/45 | 12,593 | 13,805 | 1.0% |
| Goldman Sachs Capital I | 6.345% | 2/15/34 | 1,930 | 2,211 | 0.2% |
| Goldman Sachs Group Inc. | 6.750% | 10/1/37 | 5,397 | 6,389 | 0.5% |
| Goldman Sachs Group Inc. | 6.250% | 2/1/41 | 2,830 | 3,366 | 0.3% |
| Goldman Sachs Group Inc. | 6.125% | 2/15/33 | 2,415 | 2,871 | 0.2% |
| Goldman Sachs Group Inc. | 4.800% | 7/8/44 | 2,600 | 2,623 | 0.2% |
| Goldman Sachs Group Inc. | 5.150%–6.450% | 1/15/27–5/22/45 | 4,010 | 4,155 | 0.3% |
| HSBC Bank USA NA | 5.625%–7.000% | 11/1/34–1/15/39 | 3,300 | 3,923 | 0.3% |
| HSBC Holdings plc | 6.500% | 5/2/36 | 2,250 | 2,622 | 0.2% |
| HSBC Holdings plc | 5.250%–7.625% | 5/17/32–3/14/44 | 6,500 | 7,493 | 0.6% |
| JPMorgan Chase & Co. | 6.400% | 5/15/38 | 2,620 | 3,278 | 0.2% |
| JPMorgan Chase & Co. | 4.125%–5.625% | 12/15/26–6/1/45 | 10,852 | 11,548 | 0.9% |
| Morgan Stanley | 6.375% | 7/24/42 | 2,311 | 2,856 | 0.2% |
| Morgan Stanley | 4.300% | 1/27/45 | 2,900 | 2,719 | 0.2% |
| Morgan Stanley | 3.950%–7.250% | 11/24/25–4/1/32 | 7,401 | 7,754 | 0.6% |
| Wachovia Bank NA | 5.850% | 2/1/37 | 750 | 890 | 0.1% |
| Wachovia Corp. | 5.500%–7.574% | 10/1/25–10/15/35 | 2,574 | 3,222 | 0.2% |
| Wells Fargo & Co. | 4.100% | 6/3/26 | 2,805 | 2,809 | 0.2% |
| Wells Fargo & Co. | 5.606% | 1/15/44 | 2,440 | 2,713 | 0.2% |
| Wells Fargo & Co. | 3.900%–5.375% | 7/22/27–5/1/45 | 9,099 | 9,086 | 0.7% |
101
| Long-Term Corporate Bond Index Fund | |||||
| Face | Market | Percentage | |||
| Maturity | Amount | Value• | of Net | ||
| Coupon | Date | ($000) | ($000) | Assets | |
| Wells Fargo Bank NA | 5.950%–6.600% | 8/26/36–1/15/38 | 2,450 | 3,085 | 0.2% |
| 1 Wells Fargo Capital X | 5.950% | 12/1/86 | 920 | 919 | 0.1% |
| 2 Banking—Other † | 15,093 | 1.1% | |||
| Brokerage † | 3,807 | 0.3% | |||
| Finance Companies | |||||
| General Electric Capital Corp. | 5.875% | 1/14/38 | 6,503 | 7,844 | 0.6% |
| General Electric Capital Corp. | 6.750% | 3/15/32 | 5,037 | 6,589 | 0.5% |
| General Electric Capital Corp. | 6.875% | 1/10/39 | 4,325 | 5,766 | 0.4% |
| General Electric Capital Corp. | 6.150% | 8/7/37 | 2,130 | 2,622 | 0.2% |
| General Electric Capital | |||||
| Corp. | 5.550%–7.500% | 1/5/26–8/21/35 | 675 | 887 | 0.1% |
| Finance Companies—Other † | 597 | 0.0% | |||
| Insurance | |||||
| Berkshire Hathaway Finance | |||||
| Corp. | 4.300%–5.750% | 1/15/40–5/15/43 | 1,995 | 2,084 | 0.1% |
| Berkshire Hathaway Inc. | 4.500% | 2/11/43 | 1,030 | 1,012 | 0.1% |
| Insurance—Other † | 78,668 | 5.9% | |||
| 2 Real Estate Investment Trusts † | 8,733 | 0.7% | |||
| 255,825 | 19.2% | ||||
| Industrial | |||||
| Basic Industry | |||||
| Lubrizol Corp. | 6.500% | 10/1/34 | 240 | 302 | 0.0% |
| Basic Industry—Other † | 70,708 | 5.3% | |||
| Capital Goods | |||||
| General Electric Co. | 4.125%–4.500% | 10/9/42–3/11/44 | 4,830 | 4,748 | 0.3% |
| United Technologies Corp. | 4.500% | 6/1/42 | 3,430 | 3,465 | 0.3% |
| Capital Goods—Other † | 49,558 | 3.7% | |||
| Communication | |||||
| Alltel Corp. | 7.875% | 7/1/32 | 500 | 666 | 0.1% |
| America Movil SAB de CV | 6.125% | 3/30/40 | 2,425 | 2,728 | 0.2% |
| Ameritech Capital Funding Corp. | 6.550% | 1/15/28 | 385 | 437 | 0.0% |
| AT&T Corp. | 8.250% | 11/15/31 | 880 | 1,158 | 0.1% |
| AT&T Inc. | 5.350% | 9/1/40 | 3,630 | 3,555 | 0.3% |
| AT&T Inc. | 4.350% | 6/15/45 | 3,789 | 3,230 | 0.2% |
| AT&T Inc. | 4.750% | 5/15/46 | 3,100 | 2,802 | 0.2% |
| AT&T Inc. | 4.300%–6.550% | 9/15/34–6/15/44 | 13,788 | 13,887 | 1.0% |
| AT&T Mobility LLC | 7.125% | 12/15/31 | 422 | 519 | 0.0% |
| Bellsouth Capital Funding | |||||
| Corp. | 7.120%–7.875% | 2/15/30–7/15/97 | 798 | 942 | 0.1% |
| BellSouth Corp. | 6.000%–6.875% | 10/15/31–11/15/34 | 1,243 | 1,363 | 0.1% |
| BellSouth | |||||
| Telecommunications LLC | 6.375% | 6/1/28 | 372 | 410 | 0.0% |
| British Telecommunications plc | 9.625% | 12/15/30 | 2,727 | 3,971 | 0.3% |
| 2 CCO Safari II LLC | 6.484% | 10/23/45 | 4,550 | 4,611 | 0.3% |
| Comcast Corp. | 4.200%–7.050% | 1/15/33–8/15/45 | 17,741 | 20,131 | 1.5% |
| Deutsche Telekom | |||||
| International Finance BV | 8.750% | 6/15/30 | 3,639 | 5,126 | 0.4% |
| DIRECTV Holdings LLC / | |||||
| DIRECTV Financing Co. | |||||
| Inc. | 5.150%–6.375% | 3/15/40–3/15/42 | 4,530 | 4,567 | 0.3% |
| GTE Corp. | 6.940% | 4/15/28 | 810 | 950 | 0.1% |
| Historic TW Inc. | 6.625% | 5/15/29 | 590 | 701 | 0.1% |
| NBCUniversal Media LLC | 4.450%–6.400% | 4/30/40–1/15/43 | 3,285 | 3,721 | 0.3% |
| New Cingular Wireless | |||||
| Services Inc. | 8.750% | 3/1/31 | 970 | 1,338 | 0.1% |
102
| Long-Term Corporate Bond Index Fund | |||||
| Face | Market | Percentage | |||
| Maturity | Amount | Value• | of Net | ||
| Coupon | Date | ($000) | ($000) | Assets | |
| Orange SA | 9.000% | 3/1/31 | 2,550 | 3,543 | 0.3% |
| Pacific Bell Telephone Co. | 7.125% | 3/15/26 | 655 | 797 | 0.1% |
| TCI Communications Inc. | 7.125%–7.875% | 2/15/26–2/15/28 | 872 | 1,145 | 0.1% |
| Time Warner Cos. Inc. | 6.950% | 1/15/28 | 938 | 1,147 | 0.1% |
| Time Warner Inc. | 7.625% | 4/15/31 | 2,160 | 2,717 | 0.2% |
| Time Warner Inc. | 4.650%–7.700% | 5/1/32–7/15/45 | 8,350 | 9,231 | 0.7% |
| Verizon Communications Inc. | 6.550% | 9/15/43 | 6,190 | 7,309 | 0.5% |
| Verizon Communications Inc. | 5.012% | 8/21/54 | 6,209 | 5,675 | 0.4% |
| Verizon Communications Inc. | 4.672% | 3/15/55 | 5,800 | 5,017 | 0.4% |
| Verizon Communications Inc. | 4.522% | 9/15/48 | 5,328 | 4,697 | 0.4% |
| Verizon Communications Inc. | 4.862% | 8/21/46 | 4,803 | 4,502 | 0.3% |
| Verizon Communications Inc. | 4.272% | 1/15/36 | 3,240 | 2,901 | 0.2% |
| Verizon Communications Inc. | 4.400% | 11/1/34 | 3,045 | 2,799 | 0.2% |
| Verizon Communications | |||||
| Inc. | 3.850%–7.750% | 12/1/30–11/1/42 | 10,992 | 11,962 | 0.9% |
| Verizon Florida LLC | 6.860% | 2/1/28 | 975 | 944 | 0.1% |
| Verizon Maryland LLC | 5.125% | 6/15/33 | 695 | 684 | 0.1% |
| Verizon New England Inc. | 7.875% | 11/15/29 | 800 | 1,002 | 0.1% |
| Verizon New York Inc. | 7.375% | 4/1/32 | 437 | 504 | 0.0% |
| 2 Communication—Other † | 63,361 | 4.7% | |||
| Consumer Cyclical | |||||
| CVS Health Corp. | 4.875% | 7/20/35 | 3,225 | 3,334 | 0.3% |
| CVS Health Corp. | 5.125% | 7/20/45 | 3,050 | 3,240 | 0.2% |
| Home Depot Inc. | 5.875% | 12/16/36 | 2,260 | 2,730 | 0.2% |
| Wal-Mart Stores Inc. | 6.500% | 8/15/37 | 3,125 | 4,056 | 0.3% |
| Wal-Mart Stores Inc. | 5.250% | 9/1/35 | 2,840 | 3,243 | 0.2% |
| Wal-Mart Stores Inc. | 4.000%–7.550% | 4/5/27–4/22/44 | 12,212 | 14,044 | 1.1% |
| 2 Consumer Cyclical—Other † | 57,026 | 4.3% | |||
| Consumer Noncyclical | |||||
| AbbVie Inc. | 4.700% | 5/14/45 | 2,777 | 2,680 | 0.2% |
| AstraZeneca plc | 6.450% | 9/15/37 | 2,826 | 3,611 | 0.3% |
| GlaxoSmithKline Capital Inc. | 6.375% | 5/15/38 | 2,820 | 3,518 | 0.3% |
| 2 Medtronic Inc. | 4.625% | 3/15/45 | 4,280 | 4,364 | 0.3% |
| 2 Medtronic Inc. | 4.375% | 3/15/35 | 2,950 | 2,916 | 0.2% |
| Pfizer Inc. | 7.200% | 3/15/39 | 2,280 | 3,101 | 0.2% |
| 2 Consumer Noncyclical—Other † | 168,619 | 12.7% | |||
| Energy | |||||
| El Paso Natural Gas Co. LLC | 8.375% | 6/15/32 | 372 | 429 | 0.0% |
| Kinder Morgan Energy | |||||
| Partners LP | 4.700%–7.750% | 3/15/31–9/1/44 | 9,096 | 8,314 | 0.6% |
| Kinder Morgan Inc. | 5.300%–7.750% | 1/15/32–6/1/45 | 4,240 | 3,911 | 0.3% |
| Shell International Finance BV | 6.375% | 12/15/38 | 2,770 | 3,493 | 0.3% |
| Shell International Finance BV | 4.375% | 5/11/45 | 3,050 | 3,026 | 0.2% |
| Southern Natural Gas Co. LLC | 8.000% | 3/1/32 | 320 | 376 | 0.0% |
| Tennessee Gas Pipeline Co. | |||||
| LLC | 7.000%–7.625% | 3/15/27–4/1/37 | 1,610 | 1,829 | 0.2% |
| 2 Energy—Other † | 137,780 | 10.3% | |||
| Other Industrial † | 6,897 | 0.5% | |||
| Technology | |||||
| Apple Inc. | 3.850% | 5/4/43 | 3,250 | 2,954 | 0.2% |
| Oracle Corp. | 3.250%–6.500% | 5/15/30–5/15/55 | 13,594 | 14,026 | 1.0% |
| 2 Technology—Other † | 39,676 | 3.0% | |||
103
| Long-Term Corporate Bond Index Fund | ||||||
| Face | Market | Percentage | ||||
| Maturity | Amount | Value• | of Net | |||
| Coupon | Date | ($000) | ($000) | Assets | ||
| Transportation | ||||||
| 1 | BNSF Funding Trust I | 6.613% | 12/15/55 | 440 | 492 | 0.1% |
| Burlington Northern Santa | ||||||
| Fe LLC | 3.650%–7.950% | 9/1/25–9/1/45 | 10,575 | 10,953 | 0.8% | |
| 2 | Transportation—Other † | 35,183 | 2.6% | |||
| 881,352 | 66.0% | |||||
| Utilities | ||||||
| Electric | ||||||
| Berkshire Hathaway Energy | ||||||
| Co. | 4.500%–8.480% | 9/15/28–2/1/45 | 5,174 | 5,995 | 0.4% | |
| Duke Energy Carolinas LLC | 3.750%–6.450% | 12/1/28–6/1/45 | 5,325 | 6,054 | 0.5% | |
| Duke Energy Florida LLC | 3.850%–6.400% | 9/15/37–11/15/42 | 2,205 | 2,664 | 0.2% | |
| Duke Energy Indiana Inc. | 4.200%–6.450% | 10/15/35–7/15/43 | 1,858 | 2,174 | 0.2% | |
| Duke Energy Progress LLC | 4.100%–6.300% | 4/1/38–8/15/45 | 3,270 | 3,340 | 0.3% | |
| MidAmerican Energy Co. | 4.400%–6.750% | 12/30/31–10/15/44 | 2,015 | 2,370 | 0.2% | |
| MidAmerican Funding LLC | 6.927% | 3/1/29 | 200 | 262 | 0.0% | |
| Nevada Power Co. | 5.375%–6.750% | 4/1/36–5/15/41 | 1,196 | 1,482 | 0.1% | |
| Pacific Gas & Electric Co. | 6.050% | 3/1/34 | 3,145 | 3,755 | 0.3% | |
| PacifiCorp | 4.100%–7.700% | 11/15/31–2/1/42 | 3,745 | 4,552 | 0.3% | |
| Progress Energy Inc. | 6.000%–7.750% | 3/1/31–12/1/39 | 1,545 | 1,915 | 0.1% | |
| Sierra Pacific Power Co. | 6.750% | 7/1/37 | 285 | 374 | 0.0% | |
| 2 | Electric—Other † | 121,122 | 9.1% | |||
| Natural Gas † | 11,025 | 0.8% | ||||
| Other Utility † | 2,773 | 0.2% | ||||
| 169,857 | 12.7% | |||||
| Total Corporate Bonds (Cost $1,380,628) | 1,307,034 | 97.9% | ||||
| Taxable Municipal Bonds (Cost $3,183) † | 3,143 | 0.2% | ||||
| Shares | ||||||
| Temporary Cash Investment | ||||||
| Money Market Fund | ||||||
| 3 | Vanguard Market Liquidity Fund | |||||
| (Cost $3,805) | 0.168% | 3,804,996 | 3,805 | 0.3% | ||
| Total Investments (Cost $1,389,706) | 1,316,059 | 98.6% | ||||
| Amount | ||||||
| ($000) | ||||||
| Other Assets and Liabilities | ||||||
| Other Assets | ||||||
| Investment in Vanguard | 122 | |||||
| Receivables for Investment Securities Sold | 12,280 | |||||
| Receivables for Accrued Income | 19,310 | |||||
| Receivables for Capital Shares Issued | 108 | |||||
| Other Assets | 309 | |||||
| Total Other Assets | 32,129 | 2.4% | ||||
| Liabilities | ||||||
| Payables for Investment Securities Purchased | (12,404) | |||||
| Payables for Capital Shares Redeemed | (455) | |||||
| Payables for Distributions | (49) | |||||
| Payables to Vanguard | (420) | |||||
| Other Liabilities | (306) | |||||
| Total Liabilities | (13,634) | (1.0%) | ||||
| Net Assets | 1,334,554 | 100.0% | ||||
104
| Long-Term Corporate Bond Index Fund | |
| At August 31, 2015, net assets consisted of: | |
| Amount | |
| ($000) | |
| Paid-in Capital | 1,424,093 |
| Undistributed Net Investment Income | 3,769 |
| Accumulated Net Realized Losses | (19,661) |
| Unrealized Appreciation (Depreciation) | (73,647) |
| Net Assets | 1,334,554 |
| ETF Shares—Net Assets | |
| Applicable to 11,400,000 outstanding $.001 par value shares of | |
| beneficial interest (unlimited authorization) | 971,821 |
| Net Asset Value Per Share—ETF Shares | $85.25 |
| Admiral Shares—Net Assets | |
| Applicable to 2,916,602 outstanding $.001 par value shares of | |
| beneficial interest (unlimited authorization) | 66,504 |
| Net Asset Value Per Share—Admiral Shares | $22.80 |
| Institutional Shares—Net Assets | |
| Applicable to 10,465,572 outstanding $.001 par value shares of | |
| beneficial interest (unlimited authorization) | 296,229 |
| Net Asset Value Per Share—Institutional Shares | $28.31 |
• See Note A in Notes to Financial Statements.
† Represents the aggregate value, by category, of securities that are not among the 50 largest holdings and, in total for any issuer, represent 1% or less of net assets.
1 The average or expected maturity is shorter than the final maturity shown because of the possibility of interim principal payments and prepayments or the possibility of the issue being called.
2 Certain of the fund’s securities are exempt from registration under Rule 144A of the Securities Act of 1933. Such securities may be sold in transactions exempt from registration, normally to qualified institutional buyers. At August 31, 2015, the aggregate value of these securities was $27,093,000, representing 2.0% of net assets.
3 Affiliated money market fund available only to Vanguard funds and certain trusts and accounts managed by Vanguard. Rate shown is the 7-day yield.
See accompanying Notes, which are an integral part of the Financial Statements.
105
| Long-Term Corporate Bond Index Fund | |
| Statement of Operations | |
| Year Ended | |
| August 31, 2015 | |
| ($000) | |
| Investment Income | |
| Income | |
| Interest1 | 63,185 |
| Total Income | 63,185 |
| Expenses | |
| The Vanguard Group—Note B | |
| Investment Advisory Services | 36 |
| Management and Administrative—ETF Shares | 753 |
| Management and Administrative—Admiral Shares | 44 |
| Management and Administrative—Institutional Shares | 142 |
| Marketing and Distribution—ETF Shares | 180 |
| Marketing and Distribution—Admiral Shares | 7 |
| Marketing and Distribution—Institutional Shares | 40 |
| Custodian Fees | 23 |
| Auditing Fees | 47 |
| Shareholders’ Reports—ETF Shares | 38 |
| Shareholders’ Reports—Admiral Shares | 1 |
| Shareholders’ Reports—Institutional Shares | — |
| Trustees’ Fees and Expenses | 1 |
| Total Expenses | 1,312 |
| Net Investment Income | 61,873 |
| Realized Net Gain (Loss) | |
| Investment Securities Sold | 810 |
| Futures Contracts | (437) |
| Realized Net Gain (Loss) | 373 |
| Change in Unrealized Appreciation (Depreciation) | |
| Investment Securities | (127,003) |
| Futures Contracts | 9 |
| Change in Unrealized Appreciation (Depreciation) | (126,994) |
| Net Increase (Decrease) in Net Assets Resulting from Operations | (64,748) |
| 1 Interest income from an affiliated company of the fund was $8,000. | |
See accompanying Notes, which are an integral part of the Financial Statements.
106
| Long-Term Corporate Bond Index Fund | ||
| Statement of Changes in Net Assets | ||
| Year Ended August 31, | ||
| 2015 | 2014 | |
| ($000) | ($000) | |
| Increase (Decrease) in Net Assets | ||
| Operations | ||
| Net Investment Income | 61,873 | 43,416 |
| Realized Net Gain (Loss) | 373 | (8,871) |
| Change in Unrealized Appreciation (Depreciation) | (126,994) | 118,098 |
| Net Increase (Decrease) in Net Assets Resulting from Operations | (64,748) | 152,643 |
| Distributions | ||
| Net Investment Income | ||
| ETF Shares | (45,939) | (28,936) |
| Admiral Shares1 | (2,507) | (1,332) |
| Institutional Shares | (12,835) | (9,963) |
| Realized Capital Gain | ||
| ETF Shares | — | — |
| Admiral Shares1 | — | — |
| Institutional Shares | — | — |
| Total Distributions | (61,281) | (40,231) |
| Capital Share Transactions | ||
| ETF Shares | 190,279 | 169,519 |
| Admiral Shares1 | 28,156 | 22,307 |
| Institutional Shares | 70,617 | 19,116 |
| Net Increase (Decrease) from Capital Share Transactions | 289,052 | 210,942 |
| Total Increase (Decrease) | 163,023 | 323,354 |
| Net Assets | ||
| Beginning of Period | 1,171,531 | 848,177 |
| End of Period2 | 1,334,554 | 1,171,531 |
1 Signal Shares were renamed Admiral Shares in October 2013.
2 Net Assets—End of Period includes undistributed (overdistributed) net investment income of $3,769,000 and $3,177,000.
See accompanying Notes, which are an integral part of the Financial Statements.
107
| Long-Term Corporate Bond Index Fund | |||||
| Financial Highlights | |||||
| ETF Shares | |||||
| For a Share Outstanding | Year Ended August 31, | ||||
| Throughout Each Period | 2015 | 2014 | 2013 | 2012 | 2011 |
| Net Asset Value, Beginning of Period | $92.38 | $82.11 | $92.15 | $80.80 | $81.96 |
| Investment Operations | |||||
| Net Investment Income | 3.910 | 3.964 | 4.018 | 3.980 | 4.091 |
| Net Realized and Unrealized Gain (Loss) | |||||
| on Investments1 | (7.127) | 9.937 | (9.816) | 11.351 | (.917) |
| Total from Investment Operations | (3.217) | 13.901 | (5.798) | 15.331 | 3.174 |
| Distributions | |||||
| Dividends from Net Investment Income | (3.913) | (3.631) | (4.018) | (3.981) | (4.095) |
| Distributions from Realized Capital Gains | — | — | (.224) | — | (.239) |
| Total Distributions | (3.913) | (3.631) | (4.242) | (3.981) | (4.334) |
| Net Asset Value, End of Period | $85.25 | $92.38 | $82.11 | $92.15 | $80.80 |
| Total Return | -3.64% | 17.35% | -6.55% | 19.40% | 4.19% |
| Ratios/Supplemental Data | |||||
| Net Assets, End of Period (Millions) | $972 | $878 | $624 | $1,032 | $275 |
| Ratio of Total Expenses to Average Net Assets | 0.10% | 0.12% | 0.12% | 0.12% | 0.14% |
| Ratio of Net Investment Income to | |||||
| Average Net Assets | 4.37% | 4.63% | 4.47% | 4.73% | 5.36% |
| Portfolio Turnover Rate2 | 64% | 54% | 57% | 71% | 110% |
1 Includes increases from purchase fees of $.11, $.05, $.07, $.02, and $.07.
2 Excludes the value of portfolio securities received or delivered as a result of in-kind purchases or redemptions of the fund’s capital shares, including ETF Creation Units.
See accompanying Notes, which are an integral part of the Financial Statements.
108
| Long-Term Corporate Bond Index Fund | |||||
| Financial Highlights | |||||
| Admiral Shares | |||||
| For a Share Outstanding | Year Ended August 31, | ||||
| Throughout Each Period | 2015 | 2014 | 2013 | 2012 | 2011 |
| Net Asset Value, Beginning of Period | $24.71 | $22.04 | $24.74 | $21.69 | $22.00 |
| Investment Operations | |||||
| Net Investment Income | 1.048 | 1.066 | 1.078 | 1.068 | 1.100 |
| Net Realized and Unrealized Gain (Loss) | |||||
| on Investments1 | (1.911) | 2.669 | (2.640) | 3.051 | (.246) |
| Total from Investment Operations | (.863) | 3.735 | (1.562) | 4.119 | .854 |
| Distributions | |||||
| Dividends from Net Investment Income | (1.047) | (1.065) | (1.078) | (1.069) | (1.100) |
| Distributions from Realized Capital Gains | — | — | (.060) | — | (.064) |
| Total Distributions | (1.047) | (1.065) | (1.138) | (1.069) | (1.164) |
| Net Asset Value, End of Period | $22.80 | $24.71 | $22.04 | $24.74 | $21.69 |
| Total Return2 | -3.66% | 17.37% | -6.57% | 19.43% | 4.21% |
| Ratios/Supplemental Data | |||||
| Net Assets, End of Period (Millions) | $67 | $44 | $18 | $15 | $9 |
| Ratio of Total Expenses to Average Net Assets | 0.10% | 0.12% | 0.12% | 0.12% | 0.14% |
| Ratio of Net Investment Income to | |||||
| Average Net Assets | 4.37% | 4.63% | 4.47% | 4.73% | 5.36% |
| Portfolio Turnover Rate 3 | 64% | 54% | 57% | 71% | 110% |
Signal Shares were renamed Admiral Shares in October 2013. Prior periods’ Financial Highlights are for the Signal Class.
1 Includes increases from purchase fees of $.02, $.01, $.01, $.01, and $.04.
2 Total returns do not include transaction or account service fees that may have applied in the periods shown. Fund prospectuses provide information about any applicable transaction and account service fees.
3 Excludes the value of portfolio securities received or delivered as a result of in-kind purchases or redemptions of the fund’s capital shares, including ETF Creation Units.
See accompanying Notes, which are an integral part of the Financial Statements.
109
| Long-Term Corporate Bond Index Fund | |||||
| Financial Highlights | |||||
| Institutional Shares | |||||
| For a Share Outstanding | Year Ended August 31, | ||||
| Throughout Each Period | 2015 | 2014 | 2013 | 2012 | 2011 |
| Net Asset Value, Beginning of Period | $30.68 | $27.37 | $30.71 | $26.93 | $27.32 |
| Investment Operations | |||||
| Net Investment Income | 1.310 | 1.331 | 1.347 | 1.337 | 1.377 |
| Net Realized and Unrealized Gain (Loss) | |||||
| on Investments1 | (2.370) | 3.308 | (3.265) | 3.780 | (.308) |
| Total from Investment Operations | (1.060) | 4.639 | (1.918) | 5.117 | 1.069 |
| Distributions | |||||
| Dividends from Net Investment Income | (1.310) | (1.329) | (1.347) | (1.337) | (1.379) |
| Distributions from Realized Capital Gains | — | — | (.075) | — | (.080) |
| Total Distributions | (1.310) | (1.329) | (1.422) | (1.337) | (1.459) |
| Net Asset Value, End of Period | $28.31 | $30.68 | $27.37 | $30.71 | $26.93 |
| Total Return2 | -3.62% | 17.38% | -6.50% | 19.44% | 4.25% |
| Ratios/Supplemental Data | |||||
| Net Assets, End of Period (Millions) | $296 | $250 | $206 | $164 | $15 |
| Ratio of Total Expenses to Average Net Assets | 0.07% | 0.09% | 0.09% | 0.09% | 0.09% |
| Ratio of Net Investment Income to | |||||
| Average Net Assets | 4.40% | 4.66% | 4.50% | 4.76% | 5.41% |
| Portfolio Turnover Rate 3 | 64% | 54% | 57% | 71% | 110% |
1 Includes increases from purchase fees of $.03, $.02, $.01, $.00, and $.04.
2 Total returns do not include transaction fees that may have applied in the periods shown. Fund prospectuses provide information about any applicable transaction fees.
3 Excludes the value of portfolio securities received or delivered as a result of in-kind purchases or redemptions of the fund’s capital shares, including ETF Creation Units.
See accompanying Notes, which are an integral part of the Financial Statements.
110
Long-Term Corporate Bond Index Fund
Notes to Financial Statements
Vanguard Long-Term Corporate Bond Index Fund is registered under the Investment Company Act of 1940 as an open-end investment company, or mutual fund. Certain of the fund’s investments are in corporate debt instruments; the issuers’ abilities to meet their obligations may be affected by economic developments in their respective industries. The fund offers three classes of shares: ETF Shares, Admiral Shares, and Institutional Shares. ETF Shares are listed for trading on Nasdaq; they can be purchased and sold through a broker. Admiral Shares and Institutional Shares are designed for investors who meet certain administrative, service, and account-size criteria.
A. The following significant accounting policies conform to generally accepted accounting principles for U.S. investment companies. The fund consistently follows such policies in preparing its financial statements.
1. Security Valuation: Securities are valued as of the close of trading on the New York Stock Exchange (generally 4 p.m., Eastern time) on the valuation date. Bonds, and temporary cash investments acquired over 60 days to maturity, are valued using the latest bid prices or using valuations based on a matrix system (which considers such factors as security prices, yields, maturities, and ratings), both as furnished by independent pricing services. Investments in Vanguard Market Liquidity Fund are valued at that fund’s net asset value. Other temporary cash investments are valued at amortized cost, which approximates market value. Securities for which market quotations are not readily available, or whose values have been affected by events occurring before the fund’s pricing time but after the close of the securities’ primary markets, are valued by methods deemed by the board of trustees to represent fair value.
2. Futures Contracts: The fund uses futures contracts to invest in fixed income asset classes with greater efficiency and lower cost than is possible through direct investment, to add value when these instruments are attractively priced, or to adjust sensitivity to changes in interest rates. The primary risks associated with the use of futures contracts are imperfect correlation between changes in market values of bonds held by the fund and the prices of futures contracts, and the possibility of an illiquid market. Counterparty risk involving futures is mitigated because a regulated clearinghouse is the counterparty instead of the clearing broker. To further mitigate counterparty risk, the fund trades futures contracts on an exchange, monitors the financial strength of its clearing brokers and clearinghouse, and has entered into clearing agreements with its clearing brokers. The clearinghouse imposes initial margin requirements to secure the fund’s performance and requires daily settlement of variation margin representing changes in the market value of each contract.
Futures contracts are valued at their quoted daily settlement prices. The aggregate settlement values of the contracts are not recorded in the Statement of Net Assets. Fluctuations in the value of the contracts are recorded in the Statement of Net Assets as an asset (liability) and in the Statement of Operations as unrealized appreciation (depreciation) until the contracts are closed, when they are recorded as realized futures gains (losses).
During the year ended August 31, 2015, the fund’s average investments in long and short futures contracts each represented less than 1% of net assets, based on the average of aggregate settlement values at each quarter-end during the period. The fund had no open futures contracts at August 31, 2015.
3. Federal Income Taxes: The fund intends to continue to qualify as a regulated investment company and distribute all of its taxable income. Management has analyzed the fund’s tax positions taken for all open federal income tax years (August 31, 2012–2015), and has concluded that no provision for federal income tax is required in the fund’s financial statements.
4. Distributions: Distributions to shareholders are recorded on the ex-dividend date.
111
Long-Term Corporate Bond Index Fund
5. Credit Facility: The fund and certain other funds managed by The Vanguard Group (“Vanguard”) participate in a $3 billion committed credit facility provided by a syndicate of lenders pursuant to a credit agreement that may be renewed annually; each fund is individually liable for its borrowings, if any, under the credit facility. Borrowings may be utilized for temporary and emergency purposes, and are subject to the fund’s regulatory and contractual borrowing restrictions. The participating funds are charged administrative fees and an annual commitment fee of 0.06% of the undrawn amount of the facility; these fees are allocated to the funds based on a method approved by the fund’s board of trustees and included in Management and Administrative expenses on the fund’s Statement of Operations. Any borrowings under this facility bear interest at a rate equal to the higher of the federal funds rate or LIBOR reference rate plus an agreed-upon spread.
The fund had no borrowings outstanding at August 31, 2015, or at any time during the period then ended.
6. Other: Interest income includes income distributions received from Vanguard Market Liquidity Fund and is accrued daily. Premiums and discounts on debt securities purchased are amortized and accreted, respectively, to interest income over the lives of the respective securities. Security transactions are accounted for on the date securities are bought or sold. Costs used to determine realized gains (losses) on the sale of investment securities are those of the specific securities sold. Fees assessed on purchases of capital shares are credited to paid-in capital.
Each class of shares has equal rights as to assets and earnings, except that each class separately bears certain class-specific expenses related to maintenance of shareholder accounts (included in Management and Administrative expenses) and shareholder reporting. Marketing and distribution expenses are allocated to each class of shares based on a method approved by the board of trustees. Income, other non-class-specific expenses, and gains and losses on investments are allocated to each class of shares based on its relative net assets.
B. In accordance with the terms of a Funds’ Service Agreement (the “FSA”) between Vanguard and the fund, Vanguard furnishes to the fund investment advisory, corporate management, administrative, marketing, and distribution services at Vanguard’s cost of operations (as defined by the FSA). These costs of operations are allocated to the fund based on methods and guidelines approved by the board of trustees. Vanguard does not require reimbursement in the current period for certain costs of operations (such as deferred compensation/benefits and risk/insurance costs); the fund’s liability for these costs of operations is included in Payables to Vanguard on the Statement of Net Assets.
Upon the request of Vanguard, the fund may invest up to 0.40% of its net assets as capital in Vanguard. At August 31, 2015, the fund had contributed to Vanguard capital in the amount of $122,000, representing 0.01% of the fund’s net assets and 0.05% of Vanguard’s capitalization. The fund’s trustees and officers are also directors and employees, respectively, of Vanguard.
C. Various inputs may be used to determine the value of the fund’s investments. These inputs are summarized in three broad levels for financial statement purposes. The inputs or methodologies used to value securities are not necessarily an indication of the risk associated with investing in those securities.
Level 1—Quoted prices in active markets for identical securities.
Level 2—Other significant observable inputs (including quoted prices for similar securities, interest rates, prepayment speeds, credit risk, etc.).
Level 3—Significant unobservable inputs (including the fund’s own assumptions used to determine the fair value of investments).
112
Long-Term Corporate Bond Index Fund
The following table summarizes the market value of the fund’s investments as of August 31, 2015, based on the inputs used to value them:
| Level 1 | Level 2 | Level 3 | |
| Investments | ($000) | ($000) | ($000) |
| U.S. Government and Agency Obligations | — | 2,077 | — |
| Corporate Bonds | — | 1,307,034 | — |
| Taxable Municipal Bonds | — | 3,143 | — |
| Temporary Cash Investments | 3,805 | — | — |
| Futures Contracts—Assets1 | 14 | — | — |
| Total | 3,819 | 1,312,254 | — |
| 1 Represents variation margin on the last day of the reporting period for recently closed futures contracts. | |||
D. Distributions are determined on a tax basis and may differ from net investment income and realized capital gains for financial reporting purposes. Differences may be permanent or temporary. Permanent differences are reclassified among capital accounts in the financial statements to reflect their tax character. Temporary differences arise when certain items of income, expense, gain, or loss are recognized in different periods for financial statement and tax purposes. These differences will reverse at some time in the future. Differences in classification may also result from the treatment of short-term gains as ordinary income for tax purposes.
During the year ended August 31, 2015, the fund realized $9,835,000 of net capital gains resulting from in-kind redemptions—in which shareholders exchanged fund shares for securities held by the fund rather than for cash. Because such gains are not taxable to the fund, and are not distributed to shareholders, they have been reclassified from accumulated net realized losses to paid-in capital.
For tax purposes, at August 31, 2015, the fund had $4,216,000 of ordinary income available for distribution. The fund had available capital losses totaling $18,538,000 that may be carried forward indefinitely to offset future capital gains.
At August 31, 2015, the cost of investment securities for tax purposes was $1,390,829,000. Net unrealized depreciation of investment securities for tax purposes was $74,770,000, consisting of unrealized gains of $6,942,000 on securities that had risen in value since their purchase and $81,712,000 in unrealized losses on securities that had fallen in value since their purchase.
E. During the year ended August 31, 2015, the fund purchased $1,286,403,000 of investment securities and sold $1,000,122,000 of investment securities, other than U.S. government securities and temporary cash investments. Purchases and sales of U.S. government securities were $421,676,000 and $427,833,000, respectively. Total purchases and sales include $601,506,000 and $531,681,000, respectively, in connection with in-kind purchases and redemptions of the fund’s capital shares.
113
Long-Term Corporate Bond Index Fund
F. Capital share transactions for each class of shares were:
| Year Ended August 31, | ||||
| 2015 | 2014 | |||
| Amount | Shares | Amount | Shares | |
| ($000) | (000) | ($000) | (000) | |
| ETF Shares | ||||
| Issued1 | 754,420 | 8,200 | 348,514 | 4,000 |
| Issued in Lieu of Cash Distributions | — | — | — | — |
| Redeemed | (564,141) | (6,300) | (178,995) | (2,100) |
| Net Increase (Decrease)—ETF Shares | 190,279 | 1,900 | 169,519 | 1,900 |
| Admiral Shares2 | ||||
| Issued1 | 46,136 | 1,883 | 35,859 | 1,523 |
| Issued in Lieu of Cash Distributions | 2,027 | 84 | 1,164 | 49 |
| Redeemed | (20,007) | (830) | (14,716) | (619) |
| Net Increase (Decrease) —Admiral Shares | 28,156 | 1,137 | 22,307 | 953 |
| Institutional Shares | ||||
| Issued1 | 117,548 | 3,887 | 30,914 | 1,045 |
| Issued in Lieu of Cash Distributions | 12,835 | 427 | 9,963 | 345 |
| Redeemed | (59,766) | (1,996) | (21,761) | (769) |
| Net Increase (Decrease) —Institutional Shares | 70,617 | 2,318 | 19,116 | 621 |
1 Includes purchase fees for fiscal 2015 and 2014 of $1,672,000 and $672,000, respectively (fund totals).
2 Signal Shares were renamed Admiral Shares in October 2013.
G. Management has determined that no material events or transactions occurred subsequent to August 31, 2015, that would require recognition or disclosure in these financial statements.
114
Mortgage-Backed Securities Index Fund
Fund Profile
As of August 31, 2015
| Share-Class Characteristics | |||
| ETF | Admiral | Institutional | |
| Shares | Shares | Shares | |
| Ticker Symbol | VMBS | VMBSX | VMBIX |
| Expense Ratio1 | 0.12% | 0.12% | 0.09% |
| 30-Day SEC Yield | 1.52% | 1.56% | 1.55% |
| Financial Attributes | |||
| Barclays | |||
| MBS | Barclays | ||
| Float Adj | Aggregate | ||
| Fund | Index | FA Index | |
| Number of Bonds | 5002 | 381 | 9,541 |
| Yield to Maturity | |||
| (before expenses) | 2.6% | 2.7% | 2.4% |
| Average Coupon | 3.8% | 3.8% | 3.2% |
| Average Duration | 4.1 years | 4.2 years | 5.7 years |
| Average Effective | |||
| Maturity | 6.5 years | 6.5 years | 7.9 years |
| Short-Term | |||
| Reserves | 0.3% | — | — |
| Sector Diversification (% of portfolio) | |
| Government Mortgage-Backed | 98.1% |
| Treasury/Agency | 0.1 |
| Other | 1.8 |
The agency and mortgage-backed securities sectors may include issues from government-sponsored enterprises; such issues are generally not backed by the full faith and credit of the U.S. government.
| Volatility Measures | ||
| Barclays | ||
| MBS | Barclays | |
| Float Adj | Aggregate | |
| Index | FA Index | |
| R-Squared | 0.99 | 0.77 |
| Beta | 1.07 | 0.68 |
These measures show the degree and timing of the fund’s fluctuations compared with the indexes over 36 months.
| Distribution by Effective Maturity | |
| (% of portfolio) | |
| Under 1 Year | 1.8% |
| 1 - 3 Years | 2.0 |
| 3 - 5 Years | 21.1 |
| 5 - 10 Years | 72.2 |
| 10 - 20 Years | 2.9 |
| Distribution by Credit Quality (% of portfolio) | |
| U.S. Government | 98.2% |
| Aaa | 1.8 |
Credit-quality ratings are obtained from Barclays and are from Moody's, Fitch, and S&P. When ratings from all three agencies are used, the median rating is shown. When ratings from two of the agencies are used, the lower rating for each issue is shown. "Not Rated" is used to classify securities for which a rating is not available. Not rated securities include a fund's investment in Vanguard Market Liquidity Fund or Vanguard Municipal Cash Management Fund, each of which invests in high-quality money market instruments and may serve as a cash management vehicle for the Vanguard funds, trusts, and accounts. For more information about these ratings, see the Glossary entry for Credit Quality.
| Distribution by Coupon (% of portfolio) | |
| 0 - 5.0 | 93.6% |
| More Than 5.0 - 5.5 | 3.5 |
| More Than 5.5 - 6.0 | 2.2 |
| More Than 6.0 - 6.5 | 0.6 |
| More Than 6.5 - 7.0 | 0.1 |
1 The expense ratios shown are from the prospectus dated December 23, 2014, and represent estimated costs for the current fiscal year. For the fiscal year ended August 31, 2015, the expense ratios were 0.10% for ETF Shares, 0.10% for Admiral Shares, and 0.07% for Institutional Shares.
2 Issues are mortgage pools grouped by coupon.
115
Mortgage-Backed Securities Index Fund
Investment Focus
116
Mortgage-Backed Securities Index Fund
Performance Summary
All of the returns in this report represent past performance, which is not a guarantee of future results that may be achieved by the fund. (Current performance may be lower or higher than the performance data cited. For performance data current to the most recent month-end, visit our website at vanguard.com/performance.) Note, too, that both investment returns and principal value can fluctuate widely, so an investor’s shares, when sold, could be worth more or less than their original cost. The returns shown do not reflect taxes that a shareholder would pay on fund distributions or on the sale of fund shares.
Cumulative Performance: November 19, 2009, Through August 31, 2015
Initial Investment of $10,000
| Average Annual Total Returns | ||||
| Periods Ended August 31, 2015 | ||||
| Since | Final Value | |||
| One | Five | Inception | of a $10,000 | |
| Year | Years | (11/19/2009) | Investment | |
| Mortgage-Backed Securities Index | ||||
| Fund ETF Shares Net Asset Value | 2.49% | 2.78% | 3.16% | $11,973 |
| Mortgage-Backed Securities Index | ||||
| Fund ETF Shares Market Price | 2.47 | 2.74 | 3.16 | 11,973 |
| Barclays U.S. MBS Float Adjusted | ||||
| Index | 2.51 | 2.84 | 3.19 | 11,989 |
| U.S. Mortgage Funds Average | 2.28 | 3.05 | 3.66 | 12,306 |
| Spliced Barclays U.S. Aggregate Float | ||||
| Adjusted Index | 1.40 | 2.98 | 3.77 | 12,383 |
For a benchmark description, see the Glossary.
U.S. Mortgage Funds Average: Derived from data provided by Lipper, a Thomson Reuters Company.
"Since Inception" performance is calculated from the ETF Shares’ inception date for both the fund and its comparative standards.
See Financial Highlights for dividend and capital gains information.
117
| Mortgage-Backed Securities Index Fund | ||||
| Average Annual Total Returns | ||||
| Periods Ended August 31, 2015 | ||||
| Since | Final Value | |||
| One | Five | Inception | of a $10,000 | |
| Year | Years | (12/3/2009) | Investment | |
| Mortgage-Backed Securities Index Fund | ||||
| Admiral Shares | 2.44% | 2.78% | 3.14% | $11,945 |
| Barclays U.S. MBS Float Adjusted Index | 2.51 | 2.84 | 3.19 | 11,977 |
| Spliced Barclays U.S. Aggregate Float | ||||
| Adjusted Index | 1.40 | 2.98 | 3.77 | 12,369 |
"Since Inception" performance is calculated from the Admiral Shares’ inception date for both the fund and its comparative standards.
| Since | Final Value | ||
| One | Inception | of a $5,000,000 | |
| Year | (10/31/2013) | Investment | |
| Mortgage-Backed Securities Index Fund | |||
| Institutional Shares | 2.49% | 3.12% | $5,289,414 |
| Barclays U.S. MBS Float Adjusted Index | 2.51 | 3.11 | 5,288,409 |
| Barclays U.S. Aggregate Float Adjusted | |||
| Index | 1.40 | 2.88 | 5,266,934 |
"Since Inception" performance is calculated from the Institutional Shares’ inception date for both the fund and its comparative standards.
| Cumulative Returns of ETF Shares: November 19, 2009, Through August 31, 2015 | |||
| Since | |||
| One | Five | Inception | |
| Year | Years | (11/19/2009) | |
| Mortgage-Backed Securities Index Fund ETF Shares | |||
| Market Price | 2.47% | 14.47% | 19.73% |
| Mortgage-Backed Securities Index Fund ETF Shares | |||
| Net Asset Value | 2.49 | 14.69 | 19.73 |
| Barclays U.S. MBS Float Adjusted Index | 2.51 | 15.02 | 19.89 |
"Since Inception" performance is calculated from the ETF Shares’ inception date for both the fund and its comparative standards.
118
Mortgage-Backed Securities Index Fund
| Fiscal-Year Total Returns (%): November 19, 2009, Through August 31, 2015 | ||
| Barclays | ||
| MBS | ||
| Float Adj | ||
| ETF Shares Net Asset Value | Index | |
| Fiscal Year | Total Returns | Total Returns |
| 2010 | 4.39% | 4.23% |
| 2011 | 5.14 | 5.11 |
| 2012 | 3.62 | 3.62 |
| 2013 | -2.36 | -2.03 |
| 2014 | 5.21 | 5.15 |
| 2015 | 2.49 | 2.51 |
Average Annual Total Returns: Periods Ended June 30, 2015
This table presents returns through the latest calendar quarter—rather than through the end of the fiscal period.
Securities and Exchange Commission rules require that we provide this information.
| Since Inception | ||||||
| Inception Date | One Year | Five Years | Income | Capital | Total | |
| ETF Shares | 11/19/2009 | |||||
| Market Price | 2.07% | 2.78% | 3.13% | |||
| Net Asset Value | 2.16 | 2.79 | 3.15 | |||
| Admiral Shares | 12/3/2009 | 2.16 | 2.80 | 1.64% | 1.48% | 3.12 |
| Institutional Shares | 10/31/2013 | 2.21 | — | 1.63 | 1.44 | 3.07 |
119
Mortgage-Backed Securities Index Fund
Financial Statements
Statement of Net Assets
As of August 31, 2015
The fund reports a complete list of its holdings in regulatory filings four times in each fiscal year, at the quarter-ends. For the second and fourth fiscal quarters, the lists appear in the fund’s semiannual and annual reports to shareholders. For the first and third fiscal quarters, the fund files the lists with the Securities and Exchange Commission on Form N-Q. Shareholders can look up the fund’s Forms N-Q on the SEC’s website at sec.gov. Forms N-Q may also be reviewed and copied at the SEC’s Public Reference Room (see the back cover of this report for further information).
| Face | Market | ||||
| Maturity | Amount | Value• | |||
| Coupon | Date | ($000) | ($000) | ||
| U.S. Government and Agency Obligations (99.7%) | |||||
| Conventional Mortgage-Backed Securities (98.4%) | |||||
| 1,2 | Fannie Mae Pool | 2.000% | 10/1/28 | 2,198 | 2,171 |
| 1,2,3 Fannie Mae Pool | 2.500% | 11/1/26–1/1/43 | 52,186 | 52,989 | |
| 1,2,3 Fannie Mae Pool | 3.000% | 11/1/25–9/1/45 | 157,987 | 161,157 | |
| 1,2,3 Fannie Mae Pool | 3.500% | 10/1/21–9/1/45 | 194,757 | 202,903 | |
| 1,2,3 Fannie Mae Pool | 4.000% | 7/1/18–9/1/45 | 149,616 | 159,450 | |
| 1,2,3 Fannie Mae Pool | 4.500% | 2/1/18–9/1/45 | 87,917 | 95,306 | |
| 1,2,3 Fannie Mae Pool | 5.000% | 1/1/17–9/1/45 | 50,030 | 55,141 | |
| 1,2,3 Fannie Mae Pool | 5.500% | 12/1/16–9/1/45 | 37,039 | 41,545 | |
| 1,2 | Fannie Mae Pool | 6.000% | 3/1/18–5/1/41 | 25,015 | 28,360 |
| 1,2 | Fannie Mae Pool | 6.500% | 4/1/16–10/1/39 | 8,433 | 9,758 |
| 1,2 | Fannie Mae Pool | 7.000% | 12/1/22–10/1/37 | 1,281 | 1,504 |
| 1,2 | Fannie Mae Pool | 7.500% | 11/1/22 | 11 | 13 |
| 1,2 | Freddie Mac Gold Pool | 2.000% | 1/1/28–1/1/29 | 3,529 | 3,486 |
| 1,2,3 Freddie Mac Gold Pool | 2.500% | 4/1/27–2/1/43 | 40,365 | 40,934 | |
| 1,2,3 Freddie Mac Gold Pool | 3.000% | 10/1/26–9/1/45 | 93,008 | 94,682 | |
| 1,2,3 Freddie Mac Gold Pool | 3.500% | 9/1/25–9/1/45 | 118,014 | 122,701 | |
| 1,2,3 Freddie Mac Gold Pool | 4.000% | 7/1/18–9/1/45 | 88,869 | 94,525 | |
| 1,2,3 Freddie Mac Gold Pool | 4.500% | 1/1/18–9/1/45 | 54,004 | 58,362 | |
| 1,2,3 Freddie Mac Gold Pool | 5.000% | 9/1/15–9/1/45 | 30,909 | 33,906 | |
| 1,2 | Freddie Mac Gold Pool | 5.500% | 4/1/21–7/1/40 | 25,260 | 28,257 |
| 1,2 | Freddie Mac Gold Pool | 6.000% | 6/1/17–5/1/40 | 16,007 | 18,126 |
| 1,2 | Freddie Mac Gold Pool | 6.500% | 10/1/28–9/1/39 | 3,805 | 4,392 |
| 1,2 | Freddie Mac Gold Pool | 7.000% | 7/1/28–12/1/38 | 512 | 592 |
| 1,2 | Freddie Mac Gold Pool | 8.000% | 11/1/22 | 2 | 2 |
| 1,3 | Ginnie Mae I Pool | 3.000% | 1/15/26–9/1/45 | 15,163 | 15,403 |
| 1,3 | Ginnie Mae I Pool | 3.500% | 2/15/26–9/1/45 | 15,962 | 16,663 |
| 1,3 | Ginnie Mae I Pool | 4.000% | 7/15/24–9/1/45 | 25,698 | 27,351 |
| 1,3 | Ginnie Mae I Pool | 4.500% | 9/15/18–9/1/45 | 28,793 | 31,435 |
| 1,3 | Ginnie Mae I Pool | 5.000% | 1/15/18–9/1/45 | 18,151 | 20,110 |
| 1 | Ginnie Mae I Pool | 5.500% | 10/15/32–2/15/40 | 7,832 | 8,815 |
| 1 | Ginnie Mae I Pool | 6.000% | 4/15/28–5/15/41 | 3,673 | 4,148 |
| 1 | Ginnie Mae I Pool | 6.500% | 5/15/24–1/15/39 | 328 | 384 |
| 1 | Ginnie Mae I Pool | 7.000% | 10/15/27 | 8 | 10 |
| 1 | Ginnie Mae II Pool | 2.500% | 6/20/27–1/20/43 | 4,169 | 4,245 |
| 1,3 | Ginnie Mae II Pool | 3.000% | 10/20/26–9/1/45 | 84,603 | 86,212 |
| 1,3 | Ginnie Mae II Pool | 3.500% | 12/20/25–10/1/45 | 147,854 | 154,386 |
| 1,3 | Ginnie Mae II Pool | 4.000% | 9/20/25–10/1/45 | 90,166 | 96,083 |
| 1,3 | Ginnie Mae II Pool | 4.500% | 4/20/18–9/1/45 | 56,679 | 61,066 |
120
| Mortgage-Backed Securities Index Fund | |||||
| Face | Market | ||||
| Maturity | Amount | Value• | |||
| Coupon | Date | ($000) | ($000) | ||
| 1 | Ginnie Mae II Pool | 5.000% | 6/20/33–9/1/45 | 28,421 | 31,334 |
| 1,3 | Ginnie Mae II Pool | 5.500% | 12/20/33–9/1/45 | 10,388 | 11,573 |
| 1 | Ginnie Mae II Pool | 6.000% | 3/20/31–9/20/41 | 6,589 | 7,433 |
| 1 | Ginnie Mae II Pool | 6.500% | 10/20/28–9/20/40 | 814 | 930 |
| 1 | Ginnie Mae II Pool | 7.000% | 4/20/38–11/20/38 | 150 | 173 |
| 1,888,016 | |||||
| Nonconventional Mortgage-Backed Securities (1.3%) | |||||
| 1,2,4 Fannie Mae Pool | 1.839% | 9/1/37 | 33 | 36 | |
| 1,2,4 Fannie Mae Pool | 2.095% | 12/1/41 | 260 | 268 | |
| 1,2 | Fannie Mae Pool | 2.113% | 3/1/43 | 747 | 766 |
| 1,2 | Fannie Mae Pool | 2.188% | 6/1/42 | 2,600 | 2,727 |
| 1,2 | Fannie Mae Pool | 2.195% | 6/1/43 | 508 | 524 |
| 1,2,4 Fannie Mae Pool | 2.202% | 10/1/39 | 38 | 39 | |
| 1,2 | Fannie Mae Pool | 2.217% | 9/1/42 | 543 | 570 |
| 1,2 | Fannie Mae Pool | 2.232% | 10/1/42 | 393 | 406 |
| 1,2 | Fannie Mae Pool | 2.266% | 7/1/43 | 1,329 | 1,344 |
| 1,2,4 Fannie Mae Pool | 2.305% | 11/1/39 | 46 | 47 | |
| 1,2 | Fannie Mae Pool | 2.396% | 7/1/42 | 626 | 649 |
| 1,2,4 Fannie Mae Pool | 2.402% | 1/1/40 | 5 | 6 | |
| 1,2 | Fannie Mae Pool | 2.409% | 5/1/42 | 300 | 314 |
| 1,2 | Fannie Mae Pool | 2.431% | 5/1/43 | 1,505 | 1,539 |
| 1,2 | Fannie Mae Pool | 2.448% | 10/1/42 | 722 | 748 |
| 1,2,4 Fannie Mae Pool | 2.507% | 10/1/40 | 159 | 169 | |
| 1,2,4 Fannie Mae Pool | 2.513% | 12/1/40 | 459 | 486 | |
| 1,2,4 Fannie Mae Pool | 2.520% | 5/1/40 | 7 | 8 | |
| 1,2,4 Fannie Mae Pool | 2.545% | 5/1/42 | 91 | 94 | |
| 1,2 | Fannie Mae Pool | 2.601% | 12/1/41 | 279 | 295 |
| 1,2 | Fannie Mae Pool | 2.635% | 11/1/41 | 81 | 85 |
| 1,2 | Fannie Mae Pool | 2.708% | 1/1/42 | 469 | 494 |
| 1,2 | Fannie Mae Pool | 2.730% | 12/1/43 | 1,196 | 1,239 |
| 1,2 | Fannie Mae Pool | 2.742% | 3/1/42 | 534 | 563 |
| 1,2 | Fannie Mae Pool | 2.761% | 3/1/41 | 440 | 470 |
| 1,2 | Fannie Mae Pool | 2.795% | 11/1/41 | 213 | 229 |
| 1,2 | Fannie Mae Pool | 2.905% | 12/1/40 | 127 | 134 |
| 1,2,4 Fannie Mae Pool | 2.928% | 3/1/42 | 210 | 218 | |
| 1,2 | Fannie Mae Pool | 2.968% | 9/1/43 | 838 | 885 |
| 1,2,4 Fannie Mae Pool | 3.029% | 3/1/41 | 362 | 381 | |
| 1,2,4 Fannie Mae Pool | 3.060% | 2/1/42 | 294 | 306 | |
| 1,2,4 Fannie Mae Pool | 3.082% | 2/1/41 | 10 | 10 | |
| 1,2 | Fannie Mae Pool | 3.144% | 2/1/41 | 96 | 102 |
| 1,2 | Fannie Mae Pool | 3.233% | 12/1/40 | 17 | 18 |
| 1,2 | Fannie Mae Pool | 3.234% | 12/1/40 | 19 | 20 |
| 1,2 | Fannie Mae Pool | 3.245% | 5/1/41 | 123 | 130 |
| 1,2,4 Fannie Mae Pool | 3.276% | 10/1/40 | 20 | 21 | |
| 1,2 | Fannie Mae Pool | 3.321% | 11/1/40 | 19 | 20 |
| 1,2 | Fannie Mae Pool | 3.347% | 8/1/42 | 229 | 237 |
| 1,2 | Fannie Mae Pool | 3.547% | 7/1/41 | 332 | 356 |
| 1,2 | Fannie Mae Pool | 3.580% | 8/1/39 | 42 | 45 |
| 1,2 | Fannie Mae Pool | 3.613% | 4/1/41 | 128 | 136 |
| 1,2 | Fannie Mae Pool | 3.746% | 6/1/41 | 194 | 208 |
| 1,2 | Fannie Mae Pool | 3.815% | 9/1/40 | 392 | 418 |
| 1,2 | Fannie Mae Pool | 4.239% | 12/1/39 | 429 | 440 |
| 1,2,4 Fannie Mae Pool | 4.535% | 8/1/39 | 111 | 116 | |
| 1,2 | Fannie Mae Pool | 4.899% | 3/1/38 | 30 | 31 |
| 1,2,4 Fannie Mae Pool | 5.074% | 11/1/39 | 43 | 45 | |
| 1,2 | Fannie Mae Pool | 5.567% | 4/1/37 | 19 | 20 |
121
| Mortgage-Backed Securities Index Fund | |||||
| Face | Market | ||||
| Maturity | Amount | Value• | |||
| Coupon | Date | ($000) | ($000) | ||
| 1,2 | Fannie Mae Pool | 6.094% | 10/1/37 | 182 | 188 |
| 1,2,4 Freddie Mac Non Gold Pool | 2.175% | 10/1/37 | 18 | 19 | |
| 1,2,4 Freddie Mac Non Gold Pool | 2.276% | 2/1/37 | 24 | 25 | |
| 1,2,4 Freddie Mac Non Gold Pool | 2.575% | 5/1/40 | 3 | 3 | |
| 1,2 | Freddie Mac Non Gold Pool | 2.581% | 11/1/43 | 680 | 703 |
| 1,2 | Freddie Mac Non Gold Pool | 2.586% | 2/1/42 | 145 | 152 |
| 1,2,4 Freddie Mac Non Gold Pool | 2.631% | 6/1/40 | 49 | 51 | |
| 1,2,4 Freddie Mac Non Gold Pool | 2.736% | 6/1/37 | 462 | 481 | |
| 1,2 | Freddie Mac Non Gold Pool | 2.743% | 12/1/40 | 68 | 71 |
| 1,2 | Freddie Mac Non Gold Pool | 2.784% | 1/1/41 | 211 | 223 |
| 1,2 | Freddie Mac Non Gold Pool | 2.833% | 2/1/41 | 18 | 20 |
| 1,2 | Freddie Mac Non Gold Pool | 2.931% | 2/1/41 | 268 | 286 |
| 1,2 | Freddie Mac Non Gold Pool | 3.082% | 6/1/41 | 217 | 232 |
| 1,2 | Freddie Mac Non Gold Pool | 3.121% | 1/1/41 | 159 | 169 |
| 1,2 | Freddie Mac Non Gold Pool | 3.420% | 3/1/42 | 219 | 234 |
| 1,2 | Freddie Mac Non Gold Pool | 3.578% | 6/1/40 | 156 | 167 |
| 1,2 | Freddie Mac Non Gold Pool | 3.671% | 9/1/40 | 160 | 171 |
| 1,2 | Freddie Mac Non Gold Pool | 4.046% | 12/1/39 | 36 | 38 |
| 1,2 | Freddie Mac Non Gold Pool | 5.230% | 3/1/38 | 142 | 152 |
| 1,4 | Ginnie Mae II Pool | 1.750% | 4/20/41 | 12 | 13 |
| 1 | Ginnie Mae II Pool | 2.000% | 12/20/42 | 37 | 38 |
| 1,4 | Ginnie Mae II Pool | 2.250% | 5/20/41 | 16 | 16 |
| 1 | Ginnie Mae II Pool | 2.500% | 11/20/40–1/20/42 | 2,033 | 2,084 |
| 1 | Ginnie Mae II Pool | 3.000% | 11/20/40–11/20/41 | 733 | 758 |
| 1 | Ginnie Mae II Pool | 3.500% | 7/20/41–8/20/41 | 276 | 289 |
| 24,995 | |||||
| Total U.S. Government and Agency Obligations (Cost $1,912,208) | 1,913,011 | ||||
| Shares | |||||
| Temporary Cash Investment (27.5%) | |||||
| Money Market Fund (27.5%) | |||||
| 5 | Vanguard Market Liquidity Fund | ||||
| (Cost $528,168) | 0.168% | 528,168,000 | 528,168 | ||
| Total Investments (127.2%) (Cost $2,440,376) | 2,441,179 | ||||
| Other Assets and Liabilities (-27.2%) | |||||
| Other Assets | 107,029 | ||||
| Liabilities | (629,512) | ||||
| (522,483) | |||||
| Net Assets (100%) | 1,918,696 | ||||
122
| Mortgage-Backed Securities Index Fund | |
| Amount | |
| ($000) | |
| Statement of Assets and Liabilities | |
| Assets | |
| Investments in Securities, at Value | |
| Unaffiliated Issuers | 1,913,011 |
| Affiliated Vanguard Funds | 528,168 |
| Total Investments in Securities | 2,441,179 |
| Receivables for Investment Securities Sold | 98,128 |
| Other Assets | 8,901 |
| Total Assets | 2,548,208 |
| Liabilities | |
| Payables for Investment Securities Purchased | 569,139 |
| Other Liabilities | 60,373 |
| Total Liabilities | 629,512 |
| Net Assets | 1,918,696 |
| At August 31, 2015, net assets consisted of: | |
| Amount | |
| ($000) | |
| Paid-in Capital | 1,910,582 |
| Undistributed Net Investment Income | 1,870 |
| Accumulated Net Realized Gains | 5,441 |
| Unrealized Appreciation (Depreciation) | 803 |
| Net Assets | 1,918,696 |
| ETF Shares—Net Assets | |
| Applicable to 27,351,190 outstanding $.001 par value shares of | |
| beneficial interest (unlimited authorization) | 1,450,856 |
| Net Asset Value Per Share—ETF Shares | $53.05 |
| Admiral Shares—Net Assets | |
| Applicable to 20,012,045 outstanding $.001 par value shares of | |
| beneficial interest (unlimited authorization) | 424,298 |
| Net Asset Value Per Share—Admiral Shares | $21.20 |
123
| Mortgage-Backed Securities Index Fund | |
| Amount | |
| ($000) | |
| Institutional Shares—Net Assets | |
| Applicable to 1,515,625 outstanding $.001 par value shares of | |
| beneficial interest (unlimited authorization) | 43,542 |
| Net Asset Value Per Share—Institutional Shares | $28.73 |
• See Note A in Notes to Financial Statements.
1 The average or expected maturity is shorter than the final maturity shown because of the possibility of interim principal payments and prepayments or the possibility of the issue being called.
2 The issuer was placed under federal conservatorship in September 2008; since that time, its daily operations have been managed by the Federal Housing Finance Agency and it receives capital from the U.S. Treasury, as needed to maintain a positive net worth, in exchange for senior preferred stock.
3 Includes securities purchased on a when-issued or delayed-delivery basis for which the fund has not taken delivery as of August 31, 2015.
4 Adjustable-rate security.
5 Affiliated money market fund available only to Vanguard funds and certain trusts and accounts managed by Vanguard. Rate shown is the 7-day yield.
See accompanying Notes, which are an integral part of the Financial Statements.
124
| Mortgage-Backed Securities Index Fund | |
| Statement of Operations | |
| Year Ended | |
| August 31, 2015 | |
| ($000) | |
| Investment Income | |
| Income | |
| Interest1 | 22,214 |
| Total Income | 22,214 |
| Expenses | |
| The Vanguard Group—Note B | |
| Investment Advisory Services | 33 |
| Management and Administrative—ETF Shares | 727 |
| Management and Administrative—Admiral Shares | 267 |
| Management and Administrative—Institutional Shares | 15 |
| Marketing and Distribution—ETF Shares | 126 |
| Marketing and Distribution—Admiral Shares | 70 |
| Marketing and Distribution—Institutional Shares | 10 |
| Custodian Fees | 86 |
| Auditing Fees | 41 |
| Shareholders’ Reports—ETF Shares | 39 |
| Shareholders’ Reports—Admiral Shares | 9 |
| Shareholders’ Reports—Institutional Shares | — |
| Trustees’ Fees and Expenses | 1 |
| Total Expenses | 1,424 |
| Net Investment Income | 20,790 |
| Realized Net Gain (Loss) on Investment Securities Sold | 9,480 |
| Change in Unrealized Appreciation (Depreciation) of Investment Securities | (3,777) |
| Net Increase (Decrease) in Net Assets Resulting from Operations | 26,493 |
| 1 Interest income from an affiliated company of the fund was $669,000. | |
See accompanying Notes, which are an integral part of the Financial Statements.
125
| Mortgage-Backed Securities Index Fund | ||
| Statement of Changes in Net Assets | ||
| Year Ended August 31, | ||
| 2015 | 2014 | |
| ($000) | ($000) | |
| Increase (Decrease) in Net Assets | ||
| Operations | ||
| Net Investment Income | 20,790 | 13,602 |
| Realized Net Gain (Loss) | 9,480 | 6,824 |
| Change in Unrealized Appreciation (Depreciation) | (3,777) | 18,334 |
| Net Increase (Decrease) in Net Assets Resulting from Operations | 26,493 | 38,760 |
| Distributions | ||
| Net Investment Income | ||
| ETF Shares | (13,405) | (6,562) |
| Admiral Shares1 | (5,589) | (4,949) |
| Institutional Shares | (564) | (1,465) |
| Realized Capital Gain 2 | ||
| ETF Shares | (2,480) | — |
| Admiral Shares1 | (1,200) | — |
| Institutional Shares | (113) | — |
| Total Distributions | (23,351) | (12,976) |
| Capital Share Transactions | ||
| ETF Shares | 907,275 | 111,427 |
| Admiral Shares1 | 116,880 | 541 |
| Institutional Shares | (65,707) | 107,128 |
| Net Increase (Decrease) from Capital Share Transactions | 958,448 | 219,096 |
| Total Increase (Decrease) | 961,590 | 244,880 |
| Net Assets | ||
| Beginning of Period | 957,106 | 712,226 |
| End of Period3 | 1,918,696 | 957,106 |
1 Signal Shares were renamed Admiral Shares in October 2013,
2 Includes fiscal 2015 short-term gain distributions totaling $3,749,000. Short-term gain distributions are treated as ordinary income dividends for tax purposes.
3 Net Assets—End of Period includes undistributed (overdistributed) net investment income of $1,870,000 and $638,000.
See accompanying Notes, which are an integral part of the Financial Statements.
126
| Mortgage-Backed Securities Index Fund | |||||
| Financial Highlights | |||||
| ETF Shares | |||||
| For a Share Outstanding | Year Ended August 31, | ||||
| Throughout Each Period | 2015 | 2014 | 2013 | 2012 | 2011 |
| Net Asset Value, Beginning of Period | $52.65 | $50.85 | $52.63 | $51.90 | $51.31 |
| Investment Operations | |||||
| Net Investment Income | .748 | .887 | .292 | .875 | 1.142 |
| Net Realized and Unrealized Gain (Loss) | |||||
| on Investments1 | .554 | 1.741 | (1.524) | .976 | 1.412 |
| Total from Investment Operations | 1.302 | 2.628 | (1.232) | 1.851 | 2.554 |
| Distributions | |||||
| Dividends from Net Investment Income | (.741) | (. 828) | (. 294) | (.868) | (1.142) |
| Distributions from Realized Capital Gains | (.161) | — | (.254) | (. 253) | (. 822) |
| Total Distributions | (. 902) | (. 828) | (. 548) | (1.121) | (1.964) |
| Net Asset Value, End of Period | $53.05 | $52.65 | $50.85 | $52.63 | $51.90 |
| Total Return | 2.49% | 5.21% | -2.36% | 3.62% | 5.14% |
| Ratios/Supplemental Data | |||||
| Net Assets, End of Period (Millions) | $1,451 | $542 | $417 | $247 | $73 |
| Ratio of Total Expenses to Average Net Assets | 0.10% | 0.12% | 0.12% | 0.12% | 0.15% |
| Ratio of Net Investment Income to | |||||
| Average Net Assets | 1.43% | 1.72% | 0.57% | 1.57% | 2.30% |
| Portfolio Turnover Rate 2 | 713% | 514% | 840% | 529% | 344% |
1 Includes increases from purchase fees of $.01, $.01, $.01, $.02, and $.00.
2 Includes 331%, 294%, 371%, 231%, and 187% attributable to mortgage-dollar-roll activity.
See accompanying Notes, which are an integral part of the Financial Statements.
127
| Mortgage-Backed Securities Index Fund | |||||
| Financial Highlights | |||||
| Admiral Shares | |||||
| For a Share Outstanding | Year Ended August 31, | ||||
| Throughout Each Period | 2015 | 2014 | 2013 | 2012 | 2011 |
| Net Asset Value, Beginning of Period | $21.05 | $20.35 | $21.06 | $20.76 | $20.52 |
| Investment Operations | |||||
| Net Investment Income | .298 | .356 | .118 | .344 | .456 |
| Net Realized and Unrealized Gain (Loss) | |||||
| on Investments | .214 | .699 | (.608) | .399 | .569 |
| Total from Investment Operations | .512 | 1.055 | (.490) | .743 | 1.025 |
| Distributions | |||||
| Dividends from Net Investment Income | (.297) | (. 355) | (.118) | (. 342) | (. 456) |
| Distributions from Realized Capital Gains | (. 065) | — | (.102) | (.101) | (. 329) |
| Total Distributions | (. 362) | (. 355) | (. 220) | (. 443) | (.785) |
| Net Asset Value, End of Period | $21.20 | $21.05 | $20.35 | $21.06 | $20.76 |
| Total Return1 | 2.44% | 5.22% | -2.35% | 3.63% | 5.16% |
| Ratios/Supplemental Data | |||||
| Net Assets, End of Period (Millions) | $424 | $305 | $295 | $211 | $15 |
| Ratio of Total Expenses to Average Net Assets | 0.10% | 0.12% | 0.12% | 0.12% | 0.15% |
| Ratio of Net Investment Income to | |||||
| Average Net Assets | 1.43% | 1.72% | 0.57% | 1.57% | 2.30% |
| Portfolio Turnover Rate 2 | 713% | 514% | 840% | 529% | 344% |
Signal Shares were renamed Admiral Shares in October 2013. Prior periods’ Financial Highlights are for the Signal class.
1 Total returns do not include transaction or account service fees that may have applied in the periods shown. Fund prospectuses provide information about any applicable transaction and account service fees.
2 Includes 331%, 294%, 371%, 231%, and 187% attributable to mortgage-dollar-roll activity.
See accompanying Notes, which are an integral part of the Financial Statements.
128
| Mortgage-Backed Securities Index Fund | ||||
| Financial Highlights | ||||
| Institutional Shares | ||||
| Oct. 31, | Sept. 1, | May 9, | ||
| Year Ended | 20133 to | 2012, to | 20121 to | |
| August 31, | Aug. 31, | Jan. 22, | Aug. 31, | |
| For a Share Outstanding Throughout Each Period | 2015 | 2014 | 20132 | 2012 |
| Net Asset Value, Beginning of Period | $28.52 | $28.04 | $28.34 | $28.10 |
| Investment Operations | ||||
| Net Investment Income | . 412 | .390 | .042 | .137 |
| Net Realized and Unrealized Gain (Loss) on Investments | .295 | .504 | (.146) | . 218 |
| Total from Investment Operations | .707 | .894 | (.104) | .355 |
| Distributions | ||||
| Dividends from Net Investment Income | (.410) | (.414) | (.049) | (.115) |
| Distributions from Realized Capital Gains | (.087) | — | (.137) | — |
| Total Distributions | (.497) | (.414) | (.186) | (.115) |
| Net Asset Value, End of Period | $28.73 | $28.52 | $28.052 | $28.34 |
| Total Return4 | 2.49% | 3.22% | -0.37% | 1.27% |
| Ratios/Supplemental Data | ||||
| Net Assets, End of Period (Millions) | $44 | $109 | $0 | $15 |
| Ratio of Total Expenses to Average Net Assets | 0.07% | 0.09%5 | 0.09%5 | 0.09%5 |
| Ratio of Net Investment Income to Average Net Assets | 1.46% | 1.75%5 | 0.35%5 | 1.60%5 |
| Portfolio Turnover Rate 6 | 713% | 514% | 840% | 529% |
1 Commencement of operations.
2 Net asset value as of January 22, 2013, at which date all shares were redeemed.
3 Recommencement of operations.
4 Total returns do not include transaction fees that may have applied in the periods shown. Fund prospectuses provide information about any applicable transaction fees.
5 Annualized.
6 Includes 331%, 294%, 371%, and 231% attributable to mortgage-dollar-roll activity.
See accompanying Notes, which are an integral part of the Financial Statements.
129
Mortgage-Backed Securities Index Fund
Notes to Financial Statements
Vanguard Mortgage-Backed Securities Index Fund is registered under the Investment Company Act of 1940 as an open-end investment company, or mutual fund. The fund offers three classes of shares: ETF Shares, Admiral Shares, and Institutional Shares. ETF Shares are listed for trading on Nasdaq; they can be purchased and sold through a broker. Admiral Shares and Institutional Shares are designed for investors who meet certain administrative, service, and account-size criteria.
A. The following significant accounting policies conform to generally accepted accounting principles for U.S. investment companies. The fund consistently follows such policies in preparing its financial statements.
1. Security Valuation: Securities are valued as of the close of trading on the New York Stock Exchange (generally 4 p.m., Eastern time) on the valuation date. Bonds, and temporary cash investments acquired over 60 days to maturity, are valued using the latest bid prices or using valuations based on a matrix system (which considers such factors as security prices, yields, maturities, and ratings), both as furnished by independent pricing services. Structured debt securities, including mortgages and asset-backed securities, are valued using the latest bid prices or using valuations based on a matrix system that considers such factors as issuer, tranche, nominal or option-adjusted spreads, weighted average coupon, weighted average maturity, credit enhancements, and collateral. Investments in Vanguard Market Liquidity Fund are valued at that fund’s net asset value. Other temporary cash investments are valued at amortized cost, which approximates market value. Securities for which market quotations are not readily available, or whose values have been affected by events occurring before the fund’s pricing time but after the close of the securities’ primary markets, are valued by methods deemed by the board of trustees to represent fair value.
2. To Be Announced (TBA) Transactions: A TBA transaction is an agreement to buy or sell mortgage-backed securities with agreed-upon characteristics (face amount, coupon, maturity) for settlement at a future date. The fund may be a seller of TBA transactions to reduce its exposure to the mortgage-backed securities market or in order to sell mortgage-backed securities it owns under delayed-delivery arrangements. When the fund is a buyer of TBA transactions, it maintains cash or short-term investments in an amount sufficient to meet the purchase price at the settlement date of the TBA transaction. The primary risk associated with TBA transactions is that a counterparty may default on its obligations. The fund mitigates its counterparty risk by, among other things, performing a credit analysis of counterparties, allocating transactions among numerous counterparties, and monitoring its exposure to each counterparty. The fund may also enter into a Master Securities Forward Transaction Agreement (MSFTA) with certain counterparties and require them to transfer collateral as security for their performance. Under an MSFTA, upon a counterparty default (including bankruptcy), the fund may terminate any TBA transactions with that counterparty, determine the net amount owed by either party in accordance with its master netting arrangements, and sell or retain any collateral held up to the net amount owed to the fund under the master netting arrangements.
At August 31, 2015, counterparties had deposited in segregated accounts securities and cash with a value of $468,000 in connection with TBA transactions.
3. Mortgage Dollar Rolls: The fund enters into mortgage-dollar-roll transactions, in which the fund sells mortgage-backed securities to a dealer and simultaneously agrees to purchase similar securities in the future at a predetermined price. The proceeds of the securities sold in mortgage-dollar-roll transactions are typically invested in high-quality short-term fixed income securities. The fund forgoes principal and interest paid on the securities sold, and is compensated by interest earned on the proceeds of the sale and by a lower price on the securities to be repurchased. The fund has also
130
Mortgage-Backed Securities Index Fund
entered into mortgage-dollar-roll transactions in which the fund buys mortgage-backed securities from a dealer pursuant to a TBA transaction and simultaneously agrees to sell similar securities in the future at a predetermined price. The securities bought in mortgage-dollar-roll transactions are used to cover an open TBA sell position. The fund continues to earn interest on mortgage-backed security pools already held and receives a lower price on the securities to be sold in the future. The fund accounts for mortgage-dollar-roll transactions as purchases and sales; as such, these transactions may increase the fund’s portfolio turnover rate. Amounts to be received or paid in connection with open mortgage dollar rolls are included in Receivables for Investment Securities Sold or Payables for Investment Securities Purchased in the Statement of Assets and Liabilities.
4. Federal Income Taxes: The fund intends to continue to qualify as a regulated investment company and distribute all of its taxable income. Management has analyzed the fund’s tax positions taken for all open federal income tax years (August 31, 2012–2015), and has concluded that no provision for federal income tax is required in the fund’s financial statements.
5. Distributions: Distributions to shareholders are recorded on the ex-dividend date.
6. Credit Facility: The fund and certain other funds managed by The Vanguard Group (“Vanguard”) participate in a $3 billion committed credit facility provided by a syndicate of lenders pursuant to a credit agreement that may be renewed annually; each fund is individually liable for its borrowings, if any, under the credit facility. Borrowings may be utilized for temporary and emergency purposes, and are subject to the fund’s regulatory and contractual borrowing restrictions. The participating funds are charged administrative fees and an annual commitment fee of 0.06% of the undrawn amount of the facility; these fees are allocated to the funds based on a method approved by the fund’s board of trustees and included in Management and Administrative expenses on the fund’s Statement of Operations. Any borrowings under this facility bear interest at a rate equal to the higher of the federal funds rate or LIBOR reference rate plus an agreed-upon spread.
The fund had no borrowings outstanding at August 31, 2015, or at any time during the period then ended.
7. Other: Interest income includes income distributions received from Vanguard Market Liquidity Fund and is accrued daily. Premiums and discounts on debt securities purchased are amortized and accreted, respectively, to interest income over the lives of the respective securities. Security transactions are accounted for on the date securities are bought or sold. Costs used to determine realized gains (losses) on the sale of investment securities are those of the specific securities sold. Fees, if any, assessed on capital share transactions are credited to paid-in capital.
Each class of shares has equal rights as to assets and earnings, except that each class separately bears certain class-specific expenses related to maintenance of shareholder accounts (included in Management and Administrative expenses) and shareholder reporting. Marketing and distribution expenses are allocated to each class of shares based on a method approved by the board of trustees. Income, other non-class-specific expenses, and gains and losses on investments are allocated to each class of shares based on its relative net assets.
B. In accordance with the terms of a Funds’ Service Agreement (the “FSA”) between Vanguard and the fund, Vanguard furnishes to the fund investment advisory, corporate management, administrative, marketing, and distribution services at Vanguard’s cost of operations (as defined by the FSA). These costs of operations are allocated to the fund based on methods and guidelines approved by the board of trustees. Vanguard does not require reimbursement in the current period
131
Mortgage-Backed Securities Index Fund
for certain costs of operations (such as deferred compensation/benefits and risk/insurance costs); the fund’s liability for these costs of operations is included in Payables to Vanguard on the Statement of Net Assets.
Upon the request of Vanguard, the fund may invest up to 0.40% of its net assets as capital in Vanguard. At August 31, 2015, the fund had contributed to Vanguard capital in the amount of $173,000, representing 0.01% of the fund’s net assets and 0.07% of Vanguard’s capitalization. The fund’s trustees and officers are also directors and employees, respectively, of Vanguard.
C. Various inputs may be used to determine the value of the fund’s investments. These inputs are summarized in three broad levels for financial statement purposes. The inputs or methodologies used to value securities are not necessarily an indication of the risk associated with investing in those securities.
Level 1—Quoted prices in active markets for identical securities.
Level 2—Other significant observable inputs (including quoted prices for similar securities, interest rates, prepayment speeds, credit risk, etc.).
Level 3—Significant unobservable inputs (including the fund’s own assumptions used to determine the fair value of investments).
The following table summarizes the market value of the fund’s investments as of August 31, 2015, based on the inputs used to value them:
| Level 1 | Level 2 | Level 3 | |
| Investments | ($000) | ($000) | ($000) |
| U.S. Government and Agency Obligations | — | 1,913,011 | — |
| Temporary Cash Investments | 528,168 | — | — |
| Total | 528,168 | 1,913,011 | — |
D. Distributions are determined on a tax basis and may differ from net investment income and realized capital gains for financial reporting purposes. Differences may be permanent or temporary. Permanent differences are reclassified among capital accounts in the financial statements to reflect their tax character. Temporary differences arise when certain items of income, expense, gain, or loss are recognized in different periods for financial statement and tax purposes. These differences will reverse at some time in the future. Differences in classification may also result from the treatment of short-term gains as ordinary income for tax purposes.
The fund used a tax accounting practice to treat a portion of the price of capital shares redeemed during the year as distributions from realized capital gains. Accordingly, the fund has reclassified $1,283,000 from accumulated net realized gains to paid-in capital.
For tax purposes, at August 31, 2015, the fund had $7,918,000 of ordinary income and $37,000 of long-term capital gains available for distribution.
At August 31, 2015, the cost of investment securities for tax purposes was $2,440,422,000. Net unrealized appreciation of investment securities for tax purposes was $757,000, consisting of unrealized gains of $6,501,000 on securities that had risen in value since their purchase and $5,744,000 in unrealized losses on securities that had fallen in value since their purchase.
E. During the year ended August 31, 2015, the fund purchased $11,226,413,000 of investment securities and sold $10,255,727,000 of investment securities, other than temporary cash investments.
132
Mortgage-Backed Securities Index Fund
F. Capital share transactions for each class of shares were:
| Year Ended August 31, | ||||
| 2015 | 2014 | |||
| Amount | Shares | Amount | Shares | |
| ($000) | (000) | ($000) | (000) | |
| ETF Shares | ||||
| Issued1 | 1,164,548 | 21,900 | 265,705 | 5,100 |
| Issued in Lieu of Cash Distributions | — | — | — | — |
| Redeemed | (257,273) | (4,850) | (154,278) | (3,000) |
| Net Increase (Decrease)—ETF Shares | 907,275 | 17,050 | 111,427 | 2,100 |
| Admiral Shares2 | ||||
| Issued1 | 224,100 | 10,552 | 96,130 | 4,624 |
| Issued in Lieu of Cash Distributions | 2,844 | 134 | 1,516 | 73 |
| Redeemed | (110,064) | (5,184) | (97,105) | (4,689) |
| Net Increase (Decrease)—Admiral Shares | 116,880 | 5,502 | 541 | 8 |
| Institutional Shares | ||||
| Issued1 | 7,488 | 259 | 107,508 | 3,848 |
| Issued in Lieu of Cash Distributions | 677 | 24 | 1,465 | 52 |
| Redeemed | (73,872) | (2,603) | (1,845) | (65) |
| Net Increase (Decrease)—Institutional Shares | (65,707) | (2,320) | 107,128 | 3,835 |
1 Includes purchase fees for fiscal 2015 and 2014 of $579,000 and $132,000, respectively (fund totals).
2 Signal Shares were renamed Admiral Shares in October 2013.
G. Management has determined that no material events or transactions occurred subsequent to August 31, 2015, that would require recognition or disclosure in these financial statements.
133
Report of Independent Registered Public Accounting Firm
To the Board of Trustees of Vanguard Scottsdale Funds and the Shareholders of Vanguard Short-Term Government Bond Index Fund, Vanguard Intermediate-Term Government Bond Index Fund, Vanguard Long-Term Government Bond Index Fund, Vanguard Short-Term Corporate Bond Index Fund, Vanguard Intermediate-Term Corporate Bond Index Fund, Vanguard Long-Term Corporate Bond Index Fund and Vanguard Mortgage-Backed Securities Index Fund: In our opinion, the accompanying statements of net assets, the statements of net assets—investments summary, the statements of assets and liabilities and the related statements of operations and of changes in net assets and the financial highlights present fairly, in all material respects, the financial position of Vanguard Short-Term Government Bond Index Fund, Vanguard Intermediate-Term Government Bond Index Fund, Vanguard Long-Term Government Bond Index Fund, Vanguard Short-Term Corporate Bond Index Fund, Vanguard Intermediate-Term Corporate Bond Index Fund, Vanguard Long-Term Corporate Bond Index Fund and Vanguard Mortgage-Backed Securities Index Fund (constituting separate portfolios of Vanguard Scottsdale Funds, hereafter referred to as the “Funds”) at August 31, 2015, the results of each of their operations for the year then ended, the changes in each of their net assets for each of the two years in the period then ended, and the financial highlights for each of the periods indicated, in conformity with accounting principles generally accepted in the United States of America. These financial statements and financial highlights (hereafter referred to as “financial statements”) are the responsibility of the Funds’ management. Our responsibility is to express an opinion on these financial statements based on our audits. We conducted our audits of these financial statements in accordance with the standards of the Public Company Accounting Oversight Board (United States). Those standards require that we plan and perform the audit to obtain reasonable assurance about whether the financial statements are free of material misstatement. An audit includes examining, on a test basis, evidence supporting the amounts and disclosures in the financial statements, assessing the accounting principles used and significant estimates made by management, and evaluating the overall financial statement presentation. We believe that our audits, which included confirmation of securities at August 31, 2015 by correspondence with the custodian and brokers, by agreement to the underlying ownership records of the transfer agent and the application of alternative auditing procedures where securities purchased had not been received, provide a reasonable basis for our opinion.
/s/PricewaterhouseCoopers LLP
Philadelphia, Pennsylvania
October 12, 2015
| Special 2015 tax information (unaudited) for Vanguard Short-Term Government Bond Index Fund |
| This information for the fiscal year ended August 31, 2015, is included pursuant to provisions of the Internal Revenue Code. |
| The fund distributed $358,000 as capital gain dividends (from net long-term capital gains) to shareholders during the fiscal year. |
| For nonresident alien shareholders, 100% of short-term capital gain dividends distributed by the fund are qualified short-term capital gains. |
| For nonresident alien shareholders, 99.9% of income dividends are interest-related dividends. |
134
| Special 2015 tax information (unaudited) for Vanguard Intermediate-Term Government Bond Index Fund |
| This information for the fiscal year ended August 31, 2015, is included pursuant to provisions of the Internal Revenue Code. |
| The fund distributed $17,000 as capital gain dividends (from net long-term capital gains) to shareholders during the fiscal year. |
| For nonresident alien shareholders, 100% of income dividends are interest-related dividends. |
| Special 2015 tax information (unaudited) for Vanguard Long-Term Government Bond Index Fund |
| This information for the fiscal year ended August 31, 2015, is included pursuant to provisions of the Internal Revenue Code. |
| For nonresident alien shareholders, 100% of income dividends are interest-related dividends. |
| Special 2015 tax information (unaudited) for Vanguard Short-Term Corporate Bond Index Fund |
| This information for the fiscal year ended August 31, 2015, is included pursuant to provisions of the Internal Revenue Code. |
| The fund distributed $17,505,000 as capital gain dividends (from net long-term capital gains) to shareholders during the fiscal year. |
| For nonresident alien shareholders, 100% of short-term capital gain dividends distributed by the fund are qualified short-term capital gains. |
| For nonresident alien shareholders, 80.1% of income dividends are interest-related dividends. |
| Special 2015 tax information (unaudited) for Vanguard Intermediate-Term Corporate Bond Index Fund |
| This information for the fiscal year ended August 31, 2015, is included pursuant to provisions of the Internal Revenue Code. |
| The fund distributed $7,719,000 as capital gain dividends (20% rate gain distributions) to shareholders during the fiscal year. |
| For nonresident alien shareholders, 86.2% of income dividends are interest-related dividends. |
135
| Special 2015 tax information (unaudited) for Vanguard Long-Term Corporate Bond Index Fund |
| This information for the fiscal year ended August 31, 2015, is included pursuant to provisions of the Internal Revenue Code. |
| For nonresident alien shareholders, 86.5% of income dividends are interest-related dividends. |
| Special 2015 tax information (unaudited) for Vanguard Mortgage-Backed Securities Index Fund |
| This information for the fiscal year ended August 31, 2015, is included pursuant to provisions of the Internal Revenue Code. |
| The fund distributed $56,000 as capital gain dividends (from net long-term capital gains) to shareholders during the fiscal year. |
| For nonresident alien shareholders, 100% of short-term capital gain dividends distributed by the fund are qualified short-term capital gains. |
| For nonresident alien shareholders, 99.4% of income dividends are interest-related dividends. |
136
About Your Fund’s Expenses
As a shareholder of the fund, you incur ongoing costs, which include costs for portfolio management, administrative services, and shareholder reports (like this one), among others. Operating expenses, which are deducted from a fund’s gross income, directly reduce the investment return of the fund.
A fund’s expenses are expressed as a percentage of its average net assets. This figure is known as the expense ratio. The following examples are intended to help you understand the ongoing costs (in dollars) of investing in your fund and to compare these costs with those of other mutual funds. The examples are based on an investment of $1,000 made at the beginning of the period shown and held for the entire period.
The accompanying table illustrates your fund’s costs in two ways:
• Based on actual fund return. This section helps you to estimate the actual expenses that you paid over the period. The ”Ending Account Value“ shown is derived from the fund‘s actual return, and the third column shows the dollar amount that would have been paid by an investor who started with $1,000 in the fund. You may use the information here, together with the amount you invested, to estimate the expenses that you paid over the period.
To do so, simply divide your account value by $1,000 (for example, an $8,600 account value divided by $1,000 = 8.6), then multiply the result by the number given for your fund under the heading ”Expenses Paid During Period.“
• Based on hypothetical 5% yearly return. This section is intended to help you compare your fund‘s costs with those of other mutual funds. It assumes that the fund had a yearly return of 5% before expenses, but that the expense ratio is unchanged. In this case—because the return used is not the fund’s actual return—the results do not apply to your investment. The example is useful in making comparisons because the Securities and Exchange Commission requires all mutual funds to calculate expenses based on a 5% return. You can assess your fund’s costs by comparing this hypothetical example with the hypothetical examples that appear in shareholder reports of other funds.
Note that the expenses shown in the table are meant to highlight and help you compare ongoing costs only and do not reflect transaction costs incurred by the fund for buying and selling securities. Further, the expenses do not include any purchase, redemption, or account service fees described in the fund prospectus. If such fees were applied to your account, your costs would be higher. Your fund does not carry a “sales load.”
The calculations assume no shares were bought or sold during the period. Your actual costs may have been higher or lower, depending on the amount of your investment and the timing of any purchases or redemptions.
You can find more information about the fund’s expenses, including annual expense ratios, in the Financial Statements section of this report. For additional information on operating expenses and other shareholder costs, please refer to your fund’s current prospectus.
137
| Six Months Ended August 31, 2015 | |||
| Beginning | Ending | Expenses | |
| Account Value | Account Value | Paid During | |
| 2/28/2015 | 8/31/2015 | Period | |
| Based on Actual Fund Return | |||
| Short-Term Government Bond Index Fund | |||
| ETF Shares | $1,000.00 | $1,003.61 | $0.96 |
| Admiral Shares | 1,000.00 | 1,003.59 | 0.91 |
| Institutional Shares | 1,000.00 | 1,003.64 | 0.61 |
| Intermediate-Term Government Bond Index Fund | |||
| ETF Shares | $1,000.00 | $1,005.42 | $0.45 |
| Admiral Shares | 1,000.00 | 1,005.26 | 0.40 |
| Institutional Shares | 1,000.00 | 1,005.53 | 0.30 |
| Long-Term Government Bond Index Fund | |||
| ETF Shares | $1,000.00 | $956.51 | $0.84 |
| Admiral Shares | 1,000.00 | 956.29 | 0.79 |
| Institutional Shares | 1,000.00 | 956.60 | 0.59 |
| Short-Term Corporate Bond Index Fund | |||
| ETF Shares | $1,000.00 | $1,001.35 | $0.40 |
| Admiral Shares | 1,000.00 | 1,001.41 | 0.40 |
| Institutional Shares | 1,000.00 | 1,001.56 | 0.30 |
| Intermediate-Term Corporate Bond Index Fund | |||
| ETF Shares | $1,000.00 | $980.17 | $0.45 |
| Admiral Shares | 1,000.00 | 980.52 | 0.40 |
| Institutional Shares | 1,000.00 | 980.59 | 0.25 |
| Long-Term Corporate Bond Index Fund | |||
| ETF Shares | $1,000.00 | $925.07 | $0.39 |
| Admiral Shares | 1,000.00 | 924.97 | 0.39 |
| Institutional Shares | 1,000.00 | 925.45 | 0.24 |
| Mortgage-Backed Securities Index Fund | |||
| ETF Shares | $1,000.00 | $1,003.14 | $0.61 |
| Admiral Shares | 1,000.00 | 1,003.06 | 0.61 |
| Institutional Shares | 1,000.00 | 1,003.19 | 0.45 |
138
| Six Months Ended August 31, 2015 | |||
| Beginning | Ending | Expenses | |
| Account Value | Account Value | Paid During | |
| 2/28/2015 | 8/31/2015 | Period | |
| Based on Hypothetical 5% Yearly Return | |||
| Short-Term Government Bond Index Fund | |||
| ETF Shares | $1,000.00 | $1,024.25 | $0.97 |
| Admiral Shares | 1,000.00 | 1,024.30 | 0.92 |
| Institutional Shares | 1,000.00 | 1,024.60 | 0.61 |
| Intermediate-Term Government Bond Index Fund | |||
| ETF Shares | $1,000.00 | $1,024.75 | $0.46 |
| Admiral Shares | 1,000.00 | 1,024.80 | 0.41 |
| Institutional Shares | 1,000.00 | 1,024.90 | 0.31 |
| Long-Term Government Bond Index Fund | |||
| ETF Shares | $1,000.00 | $1,024.35 | $0.87 |
| Admiral Shares | 1,000.00 | 1,024.40 | 0.82 |
| Institutional Shares | 1,000.00 | 1,024.60 | 0.61 |
| Short-Term Corporate Bond Index Fund | |||
| ETF Shares | $1,000.00 | $1,024.80 | $0.41 |
| Admiral Shares | 1,000.00 | 1,024.80 | 0.41 |
| Institutional Shares | 1,000.00 | 1,024.90 | 0.31 |
| Intermediate-Term Corporate Bond Index Fund | |||
| ETF Shares | $1,000.00 | $1,024.75 | $0.46 |
| Admiral Shares | 1,000.00 | 1,024.80 | 0.41 |
| Institutional Shares | 1,000.00 | 1,024.95 | 0.26 |
| Long-Term Corporate Bond Index Fund | |||
| ETF Shares | $1,000.00 | $1,024.80 | $0.41 |
| Admiral Shares | 1,000.00 | 1,024.80 | 0.41 |
| Institutional Shares | 1,000.00 | 1,024.95 | 0.26 |
| Mortgage-Backed Securities Index Fund | |||
| ETF Shares | $1,000.00 | $1,024.60 | $0.61 |
| Admiral Shares | 1,000.00 | 1,024.60 | 0.61 |
| Institutional Shares | 1,000.00 | 1,024.75 | 0.46 |
The calculations are based on expenses incurred in the most recent six-month period. The funds’ annualized six-month expense ratios for that period are: for the Short-Term Government Bond Index Fund, 0.19% for ETF Shares, 0.18% for Admiral Shares, and 0.12% for Institutional Shares; for the Intermediate-Term Government Bond Index Fund, 0.09% for ETF Shares, 0.08% for Admiral Shares, and 0.06% for Institutional Shares; for the Long-Term Government Bond Index Fund, 0.17% for ETF Shares, 0.16% for Admiral Shares, and 0.12% for Institutional Shares; for the Short-Term Corporate Bond Index Fund, 0.08% for ETF Shares, 0.08% for Admiral Shares, and 0.06% for Institutional Shares; for the Intermediate-Term Corporate Bond Index Fund, 0.09% for ETF Shares, 0.08% for Admiral Shares, and 0.05% for Institutional Shares; for the Long-Term Corporate Bond Index Fund, 0.08% for ETF Shares, 0.08% for Admiral Shares, and 0.05% for Institutional Shares; for the Mortgage-Backed Securities Index Fund, 0.12% for ETF Shares, 0.12% for Admiral Shares, and 0.09% for Institutional Shares. The dollar amounts shown as ”Expenses Paid” are equal to the annualized expense ratio multiplied by the average account value over the period, multiplied by the number of days in the most recent six-month period, then divided by the number of days in the most recent 12-month period (184/365).
139
Trustees Approve Advisory Arrangements
The board of trustees of Vanguard Short-Term Government Bond Index Fund, Intermediate-Term Government Bond Index Fund, Long-Term Government Bond Index Fund, Short-Term Corporate Bond Index Fund, Intermediate-Term Corporate Bond Index Fund, Long-Term Corporate Bond Index Fund, and Mortgage-Backed Securities Index Fund has renewed each fund’s investment advisory arrangement with The Vanguard Group, Inc. (Vanguard). Vanguard—through its Fixed Income Group—serves as the investment advisor for each fund. The board determined that continuing each fund’s internalized management structure was in the best interests of each fund and its shareholders.
The board based its decision upon an evaluation of the advisor’s investment staff, portfolio management process, and performance. The trustees considered the factors discussed below, among others. However, no single factor determined whether the board approved the arrangements. Rather, it was the totality of the circumstances that drove the board’s decision.
Nature, extent, and quality of services
The board reviewed the quality of each fund’s investment management services provided to the funds since their inception in 2009, and took into account the organizational depth and stability of the advisor. The board considered that Vanguard has been managing investments for more than three decades. The Fixed Income Group adheres to a sound, disciplined investment management process; the team has considerable experience, stability, and depth.
The board concluded that Vanguard’s experience, stability, depth, and performance, among other factors, warranted continuation of each advisory arrangement.
Investment performance
The board considered the funds’ performance since their inception, including any periods of outperformance or underperformance relative to a target index and peer group. The board concluded that the performance was such that each advisory arrangement should continue. Information about the funds’ most recent performance can be found in the Performance Summary pages of this report.
Cost
The board concluded that each fund’s expense ratio was well below the average expense ratio charged by funds in its respective peer group and that each fund’s advisory fee rate was also well below its peer-group average. Information about the funds’ expenses appears in the About Your Fund’s Expenses section of this report as well as in the Financial Statements sections.
The board does not conduct a profitability analysis of Vanguard, because of Vanguard’s unique “at-cost” structure. Unlike most other mutual fund management companies, Vanguard is owned by the funds it oversees, and produces “profits” only in the form of reduced expenses for fund shareholders.
The benefit of economies of scale
The board concluded that each fund’s at-cost arrangement with Vanguard ensures that the funds will realize economies of scale as they grow, with the cost to shareholders declining as fund assets increase.
The board will consider whether to renew the advisory arrangements again after a one-year period.
140
Glossary
30-Day SEC Yield. A fund’s 30-day SEC yield is derived using a formula specified by the U.S. Securities and Exchange Commission. Under the formula, data related to the fund’s security holdings in the previous 30 days are used to calculate the fund’s hypothetical net income for that period, which is then annualized and divided by the fund’s estimated average net assets over the calculation period. For the purposes of this calculation, a security’s income is based on its current market yield to maturity (for bonds), its actual income (for asset-backed securities), or its projected dividend yield (for stocks). Because the SEC yield represents hypothetical annualized income, it will differ—at times significantly—from the fund’s actual experience. As a result, the fund’s income distributions may be higher or lower than implied by the SEC yield.
Average Coupon. The average interest rate paid on the fixed income securities held by a fund. It is expressed as a percentage of face value.
Average Duration. An estimate of how much the value of the bonds held by a fund will fluctuate in response to a change in interest rates. To see how the value could change, multiply the average duration by the change in rates. If interest rates rise by 1 percentage point, the value of the bonds in a fund with an average duration of five years would decline by about 5%. If rates decrease by a percentage point, the value would rise by 5%.
Average Effective Maturity. The average length of time until fixed income securities held by a fund reach maturity and are repaid, taking into consideration the possibility that the issuer may call the bond before its maturity date. The figure reflects the proportion of fund assets represented by each security; it also reflects any futures contracts held. In general, the longer the average effective maturity, the more a fund’s share price will fluctuate in response to changes in market interest rates.
Beta. A measure of the magnitude of a fund’s past share-price fluctuations in relation to the ups and downs of a given market index. The index is assigned a beta of 1.00. Compared with a given index, a fund with a beta of 1.20 typically would have seen its share price rise or fall by 12% when the index rose or fell by 10%. For this report, beta is based on returns over the past 36 months for both the fund and the index. Note that a fund’s beta should be reviewed in conjunction with its R-squared (see definition). The lower the R-squared, the less correlation there is between the fund and the index, and the less reliable beta is as an indicator of volatility.
Credit Quality. Credit-quality ratings are measured on a scale that generally ranges from AAA (highest) to D (lowest). U.S. Treasury, U.S. Agency, and U.S. Agency mortgage-backed securities appear under “U.S. Government.” Credit-quality ratings are obtained from Barclays and are from Moody’s, Fitch, and S&P. When ratings from all three agencies are used, the median rating is shown. When ratings from two of the agencies are used, the lower rating for each issue is shown. “Not Rated” is used to classify securities for which a rating is not available. Not rated securities include a fund’s investment in Vanguard Market Liquidity Fund or Vanguard Municipal Cash Management Fund, each of which invests in high-quality money market instruments and may serve as a cash management vehicle for the Vanguard funds, trusts, and accounts.
Expense Ratio. A fund’s total annual operating expenses expressed as a percentage of the fund’s average net assets. The expense ratio includes management and administrative expenses, but does not include the transaction costs of buying and selling portfolio securities.
141
Inception Date. The date on which the assets of a fund (or one of its share classes) are first invested in accordance with the fund’s investment objective. For funds with a subscription period, the inception date is the day after that period ends. Investment performance is measured from the inception date.
R-Squared. A measure of how much of a fund’s past returns can be explained by the returns from the market in general, as measured by a given index. If a fund’s total returns were precisely synchronized with an index’s returns, its R-squared would be 1.00. If the fund’s returns bore no relationship to the index’s returns, its R-squared would be 0. For this report, R-squared is based on returns over the past 36 months for both the fund and the index.
Short-Term Reserves. The percentage of a fund invested in highly liquid, short-term securities that can be readily converted to cash.
Yield to Maturity. The rate of return an investor would receive if the fixed income securities held by a fund were held to their maturity dates.
Benchmark Information
Spliced Barclays U.S. Aggregate Float Adjusted Index: Barclays U.S. Aggregate Bond Index through December 31, 2009; Barclays U.S. Aggregate Float Adjusted Index thereafter.
Spliced Core Bond Funds Average: Intermediate Investment-Grade Debt Funds Average through August 31, 2013; Core Bond Funds Average thereafter.
142
The Vanguard funds are not sponsored, endorsed, issued, sold, or promoted by Barclays Capital Inc. or any of its affiliates (“Barclays”). Barclays makes no representation or warranty, express or implied, to the owners or purchasers of the funds or any member of the public regarding the advisability of investing in securities generally or in the funds particularly or the ability of the Barclays indexes to track general bond market performance. Barclays has not passed on the legality or suitability of the funds with respect to any person or entity. Barclays’ only relationship to Vanguard and the funds is the licensing of the Barclays indexes, which are determined, composed, and calculated by Barclays without regard to Vanguard or the funds or any owners or purchasers of the funds. Barclays has no obligation to take the needs of Vanguard, the funds, or the owners of the funds into consideration in determining, composing, or calculating the Barclays indexes. Barclays is not responsible for and has not participated in the determination of the timing of, prices at, or quantities of the funds to be issued. Barclays has no obligation or liability in connection with the administration, marketing, or trading of the funds.
Barclays shall have no liability to third parties for the quality, accuracy, and/or completeness of the indexes or any data included therein or for interruptions in the delivery of the indexes. Barclays makes no warranty, express or implied, as to results to be obtained by owners of the funds or any other person or entity from the use of the indexes or any data included therein in connection with the rights licensed hereunder or for any other use. Barclays reserves the right to change the methods of calculation or publication, or to cease the calculation or publication of the Barclays U.S. 1–3 Year Government Float Adjusted Index, Barclays U.S. 3–10 Year Government Float Adjusted Index, Barclays U.S. Long Government Float Adjusted Index, Barclays U.S. 1–5 Year Corporate Bond Index, Barclays U.S. 5–10 Year Corporate Bond Index, Barclays U.S. 10+ Year Corporate Bond Index, or Barclays U.S. MBS Float Adjusted Index, and Barclays shall not be liable for any miscalculation of or any incorrect, delayed, or interrupted publication with respect to any of the Barclays indexes. Barclays makes no express or implied warranties, and hereby expressly disclaims all warranties of merchantability or fitness for a particular purpose or use with respect to the indexes or any data included therein. Barclays shall not be liable for any damages, including, without limitation, any indirect or consequential damages resulting from the use of the indexes or any data included therein.
143
The People Who Govern Your Fund
The trustees of your mutual fund are there to see that the fund is operated and managed in your best interests since, as a shareholder, you are a part owner of the fund. Your fund’s trustees also serve on the board of directors of The Vanguard Group, Inc., which is owned by the Vanguard funds and provides services to them on an at-cost basis.
A majority of Vanguard’s board members are independent, meaning that they have no affiliation with Vanguard or the funds they oversee, apart from the sizable personal investments they have made as private individuals. The independent board members have distinguished backgrounds in business, academia, and public service. Each of the trustees and executive officers oversees 194 Vanguard funds.
The following table provides information for each trustee and executive officer of the fund. More information about the trustees is in the Statement of Additional Information, which can be obtained, without charge, by contacting Vanguard at 800-662-7447, or online at vanguard.com.
| InterestedTrustee1 | Rajiv L. Gupta |
| Born 1945. Trustee Since December 2001.2 Principal | |
| F. William McNabb III | Occupation(s) During the Past Five Years and Other |
| Born 1957. Trustee Since July 2009. Chairman of | Experience: Chairman and Chief Executive Officer |
| the Board. Principal Occupation(s) During the Past | (retired 2009) and President (2006–2008) of |
| Five Years and Other Experience: Chairman of the | Rohm and Haas Co. (chemicals); Director of Tyco |
| Board of The Vanguard Group, Inc., and of each of | International PLC (diversified manufacturing and |
| the investment companies served by The Vanguard | services), Hewlett-Packard Co. (electronic computer |
| Group, since January 2010; Director of The Vanguard | manufacturing), and Delphi Automotive PLC |
| Group since 2008; Chief Executive Officer and | (automotive components); Senior Advisor at New |
| President of The Vanguard Group, and of each of | Mountain Capital. |
| the investment companies served by The Vanguard | |
| Group, since 2008; Director of Vanguard Marketing | Amy Gutmann |
| Corporation; Managing Director of The Vanguard | Born 1949. Trustee Since June 2006. Principal |
| Group (1995–2008). | Occupation(s) During the Past Five Years and |
| Other Experience: President of the University of | |
| IndependentTrustees | Pennsylvania; Christopher H. Browne Distinguished |
| Professor of Political Science, School of Arts and | |
| Emerson U. Fullwood | Sciences, and Professor of Communication, Annenberg |
| Born 1948. Trustee Since January 2008. Principal | School for Communication, with secondary faculty |
| Occupation(s) During the Past Five Years and | appointments in the Department of Philosophy, School |
| Other Experience: Executive Chief Staff and | of Arts and Sciences, and at the Graduate School of |
| Marketing Officer for North America and Corporate | Education, University of Pennsylvania; Trustee of the |
| Vice President (retired 2008) of Xerox Corporation | National Constitution Center; Chair of the Presidential |
| (document management products and services); | Commission for the Study of Bioethical Issues. |
| Executive in Residence and 2009–2010 Distinguished | |
| Minett Professor at the Rochester Institute of | JoAnn Heffernan Heisen |
| Technology; Director of SPX Corporation (multi-industry | Born 1950. Trustee Since July 1998. Principal |
| manufacturing), the United Way of Rochester, | Occupation(s) During the Past Five Years and Other |
| Amerigroup Corporation (managed health care), the | Experience: Corporate Vice President and Chief |
| University of Rochester Medical Center, Monroe | Global Diversity Officer (retired 2008) and Member |
| Community College Foundation, and North Carolina | of the Executive Committee (1997–2008) of Johnson |
| A&T University. | & Johnson (pharmaceuticals/medical devices/ |
| consumer products); Director of Skytop Lodge | |
| Corporation (hotels), the University Medical Center | |
| at Princeton, the Robert Wood Johnson Foundation, | |
| and the Center for Talent Innovation; Member of | |
| the Advisory Board of the Institute for Women’s | |
| Leadership at Rutgers University. |
| F. Joseph Loughrey | Executive Officers | |
| Born 1949. Trustee Since October 2009. Principal | ||
| Occupation(s) During the Past Five Years and Other | Glenn Booraem | |
| Experience: President and Chief Operating Officer | Born 1967. Treasurer Since May 2015. Principal | |
| (retired 2009) of Cummins Inc. (industrial machinery); | Occupation(s) During the Past Five Years and | |
| Chairman of the Board of Hillenbrand, Inc. (specialized | Other Experience: Principal of The Vanguard Group, | |
| consumer services), and of Oxfam America; Director | Inc.; Treasurer of each of the investment companies | |
| of SKF AB (industrial machinery), Hyster-Yale Materials | served by The Vanguard Group; Controller of each of | |
| Handling, Inc. (forklift trucks), the Lumina Foundation | the investment companies served by The Vanguard | |
| for Education, and the V Foundation for Cancer | Group (2010–2015); Assistant Controller of each of | |
| Research; Member of the Advisory Council for the | the investment companies served by The Vanguard | |
| College of Arts and Letters and of the Advisory Board | Group (2001–2010). | |
| to the Kellogg Institute for International Studies, both | ||
| at the University of Notre Dame. | Thomas J. Higgins | |
| Born 1957. Chief Financial Officer Since September | ||
| Mark Loughridge | 2008. Principal Occupation(s) During the Past Five | |
| Born 1953. Trustee Since March 2012. Principal | Years and Other Experience: Principal of The Vanguard | |
| Occupation(s) During the Past Five Years and Other | Group, Inc.; Chief Financial Officer of each of the | |
| Experience: Senior Vice President and Chief Financial | investment companies served by The Vanguard Group; | |
| Officer (retired 2013) at IBM (information technology | Treasurer of each of the investment companies served | |
| services); Fiduciary Member of IBM’s Retirement Plan | by The Vanguard Group (1998–2008). | |
| Committee (2004–2013); Director of the Dow Chemical | ||
| Company; Member of the Council on Chicago Booth. | Peter Mahoney | |
| Born 1974. Controller Since May 2015. Principal | ||
| Scott C. Malpass | Occupation(s) During the Past Five Years and | |
| Born 1962. Trustee Since March 2012. Principal | Other Experience: Head of Global Fund Accounting | |
| Occupation(s) During the Past Five Years and Other | at The Vanguard Group, Inc.; Controller of each of the | |
| Experience: Chief Investment Officer and Vice | investment companies served by The Vanguard Group; | |
| President at the University of Notre Dame; Assistant | Head of International Fund Services at The Vanguard | |
| Professor of Finance at the Mendoza College of | Group (2008–2014). | |
| Business at Notre Dame; Member of the Notre Dame | ||
| 403(b) Investment Committee; Board Member of | Heidi Stam | |
| TIFF Advisory Services, Inc., and Catholic Investment | Born 1956. Secretary Since July 2005. Principal | |
| Services, Inc. (investment advisors); Member of | Occupation(s) During the Past Five Years and Other | |
| the Investment Advisory Committee of Major | Experience: Managing Director of The Vanguard | |
| League Baseball. | Group, Inc.; General Counsel of The Vanguard Group; | |
| Secretary of The Vanguard Group and of each of the | ||
| André F. Perold | investment companies served by The Vanguard Group; | |
| Born 1952. Trustee Since December 2004. Principal | Director and Senior Vice President of Vanguard | |
| Occupation(s) During the Past Five Years and Other | Marketing Corporation. | |
| Experience: George Gund Professor of Finance and | ||
| Banking, Emeritus at the Harvard Business School | Vanguard Senior ManagementTeam | |
| (retired 2011); Chief Investment Officer and Managing | Mortimer J. Buckley | Chris D. McIsaac |
| Partner of HighVista Strategies LLC (private investment | Kathleen C. Gubanich | James M. Norris |
| firm); Director of Rand Merchant Bank; Overseer of | Paul A. Heller | Thomas M. Rampulla |
| the Museum of Fine Arts Boston. | Martha G. King | Glenn W. Reed |
| Peter F. Volanakis | John T. Marcante | Karin A. Risi |
| Born 1955. Trustee Since July 2009. Principal | ||
| Occupation(s) During the Past Five Years and Other | Chairman Emeritus and Senior Advisor | |
| Experience: President and Chief Operating Officer | ||
| (retired 2010) of Corning Incorporated (communications | John J. Brennan | |
| equipment); Trustee of Colby-Sawyer College; | Chairman, 1996–2009 | |
| Member of the Advisory Board of the Norris Cotton | Chief Executive Officer and President, 1996–2008 | |
| Cancer Center and of the Advisory Board of the | ||
| Parthenon Group (strategy consulting). | Founder | |
| John C. Bogle | ||
| Chairman and Chief Executive Officer, 1974–1996 | ||
1 Mr. McNabb is considered an “interested person,” as defined in the Investment Company Act of 1940, because he is an officer of the Vanguard funds.
2 December 2002 for Vanguard Equity Income Fund, the Vanguard Municipal Bond Funds, and the Vanguard State Tax-Exempt Funds.
| P.O. Box 2600 | |
| Valley Forge, PA 19482-2600 |
Connect with Vanguard® > vanguard.com
| Fund Information > 800-662-7447 | |
| Direct Investor Account Services > 800-662-2739 | |
| Institutional Investor Services > 800-523-1036 | |
| Text Telephone for People | |
| Who Are Deaf or Hard of Hearing> 800-749-7273 | |
| This material may be used in conjunction | |
| with the offering of shares of any Vanguard | |
| fund only if preceded or accompanied by | |
| the fund’s current prospectus. | |
| All comparative mutual fund data are from Lipper, a | |
| Thomson Reuters Company, or Morningstar, Inc., unless | |
| otherwise noted. | |
| You can obtain a free copy of Vanguard’s proxy voting | |
| guidelines by visiting vanguard.com/proxyreporting or by | |
| calling Vanguard at 800-662-2739. The guidelines are | |
| also available from the SEC’s website, sec.gov. In | |
| addition, you may obtain a free report on how your fund | |
| voted the proxies for securities it owned during the 12 | |
| months ended June 30. To get the report, visit either | |
| vanguard.com/proxyreporting or sec.gov. | |
| You can review and copy information about your fund at | |
| the SEC’s Public Reference Room in Washington, D.C. To | |
| find out more about this public service, call the SEC at | |
| 202-551-8090. Information about your fund is also | |
| available on the SEC’s website, and you can receive | |
| copies of this information, for a fee, by sending a | |
| request in either of two ways: via email addressed to | |
| publicinfo@sec.gov or via regular mail addressed to the | |
| Public Reference Section, Securities and Exchange | |
| Commission, Washington, DC 20549-1520. | |
| © 2015 The Vanguard Group, Inc. | |
| All rights reserved. | |
| Vanguard Marketing Corporation, Distributor. | |
| Q16420 102015 | |
Item 2: Code of Ethics. The Registrant has adopted a code of ethics that applies to the Registrant’s principal executive officer, principal financial officer, principal accounting officer or controller or persons performing similar functions. The Code of Ethics was amended during the reporting period covered by this report to make certain technical, non-material changes.
Item 3: Audit Committee Financial Expert. The following members of the Audit Committee have been determined by the Registrant’s Board of Trustees to be Audit Committee Financial Experts serving on its Audit Committee, and to be independent: Rajiv L. Gupta, Amy Gutmann, JoAnn Heffernan Heisen, F. Joseph Loughrey, Mark Loughridge, Scott C. Malpass, and André F. Perold.
Item 4: Principal Accountant Fees and Services.
(a) Audit Fees.
Audit Fees of the Registrant
Fiscal Year Ended August 31, 2015: $579,000
Fiscal Year Ended August 31, 2014: $544,000
Aggregate Audit Fees of Registered Investment Companies in the Vanguard Group.
Fiscal Year Ended August 31, 2015: $7,000,200
Fiscal Year Ended August 31, 2014: $6,605,127
Includes fees billed in connection with audits of the Registrant, other registered investment companies in the Vanguard complex, The Vanguard Group, Inc. and Vanguard Marketing Corporation.
(b) Audit-Related Fees.
Fiscal Year Ended August 31, 2015: $2,899,096
Fiscal Year Ended August 31, 2014: $2,176,479
Includes fees billed in connection with assurance and related services provided to the Registrant, other registered investment companies in the Vanguard complex, The Vanguard Group, Inc., and Vanguard Marketing Corporation.
(c) Tax Fees.
Fiscal Year Ended August 31, 2015: $353,389
Fiscal Year Ended August 31, 2014: $316,869
Includes fees billed in connection with tax compliance, planning, and advice services provided to the Registrant, other registered investment companies in the Vanguard complex, The Vanguard Group, Inc., and Vanguard Marketing Corporation.
(d) All Other Fees.
Fiscal Year Ended August 31, 2015: $202,313
Fiscal Year Ended August 31, 2014: $198,163
Includes fees billed for services related to tax reported information provided to the Registrant, other registered investment companies in the Vanguard complex, The Vanguard Group, Inc., and Vanguard Marketing Corporation.
(e) (1) Pre-Approval Policies. The policy of the Registrant’s Audit Committee is to consider and, if appropriate, approve before the principal accountant is engaged for such services, all specific audit and non-audit services provided to: the Registrant, other registered investment companies in the Vanguard complex, The Vanguard Group, Inc., and entities controlled by The Vanguard Group, Inc. that provide ongoing services to the Registrant. In making a determination, the Audit Committee considers whether the services are consistent with maintaining the principal accountant’s independence.
In the event of a contingency situation in which the principal accountant is needed to provide services in between scheduled Audit Committee meetings, the Chairman of the Audit Committee would be called on to consider and, if appropriate, pre-approve audit or permitted non-audit services in an amount sufficient to complete services through the next Audit Committee meeting, and to determine if such services would be consistent with maintaining the accountant’s independence. At the next scheduled Audit Committee meeting, services and fees would be presented to the Audit Committee for formal consideration, and, if appropriate, approval by the entire Audit Committee. The Audit Committee would again consider whether such services and fees are consistent with maintaining the principal accountant’s independence.
The Registrant’s Audit Committee is informed at least annually of all audit and non-audit services provided by the principal accountant to the Vanguard complex, whether such services are provided to: the Registrant, other registered investment companies in the Vanguard complex, The Vanguard Group, Inc., or other entities controlled by The Vanguard Group, Inc. that provide ongoing services to the Registrant.
(2) No percentage of the principal accountant’s fees or services were approved pursuant to the waiver provision of paragraph (c)(7)(i)(C) of Rule 2-01 of Regulation S-X.
(f) For the most recent fiscal year, over 50% of the hours worked under the principal accountant’s engagement were not performed by persons other than full-time, permanent employees of the principal accountant.
(g) Aggregate Non-Audit Fees.
Fiscal Year Ended August 31, 2015: $555,702
Fiscal Year Ended August 31, 2014: $515,032
Includes fees billed for non-audit services provided to the Registrant, other registered investment companies in the Vanguard complex, The Vanguard Group, Inc., and Vanguard Marketing Corporation.
(h) For the most recent fiscal year, the Audit Committee has determined that the provision of all non-audit services was consistent with maintaining the principal accountant’s independence.
Item 5: Audit Committee of Listed Registrants.
The Registrant is a listed issuer as defined in rule 10A-3 under the Securities Exchange Act of 1934 (“Exchange Act”). The Registrant has a separately-designated standing audit committee established in accordance with Section 3(a)(58)(A) of the Exchange Act. The Registrant’s audit committee members are: Emerson U. Fullwood, Rajiv L. Gupta, Amy Gutmann, JoAnn Heffernan Heisen, F. Joseph Loughrey, Mark Loughridge, Scott C. Malpass, André F. Perold, and Peter F. Volanakis.
Item 6: Investments.
| Vanguard® Russell 1000 Index Fund | |||
| Schedule of Investments | |||
| August 31, 2015 | |||
| Market | |||
| Value | |||
| Shares | ($000) | ||
| Common Stocks (99.5%)1 | |||
| Consumer Discretionary (14.7%) | |||
| * | Amazon.com Inc. | 33,535 | 17,200 |
| Walt Disney Co. | 149,244 | 15,205 | |
| Home Depot Inc. | 114,279 | 13,309 | |
| Comcast Corp. Class A | 220,329 | 12,411 | |
| Wal-Mart Stores Inc. | 138,957 | 8,995 | |
| McDonald's Corp. | 84,488 | 8,028 | |
| Starbucks Corp. | 132,178 | 7,231 | |
| NIKE Inc. Class B | 59,712 | 6,673 | |
| Lowe's Cos. Inc. | 83,960 | 5,808 | |
| * | Priceline Group Inc. | 4,577 | 5,715 |
| Costco Wholesale Corp. | 38,634 | 5,411 | |
| Time Warner Inc. | 72,669 | 5,167 | |
| Ford Motor Co. | 344,299 | 4,775 | |
| Time Warner Cable Inc. | 24,971 | 4,645 | |
| Target Corp. | 56,447 | 4,386 | |
| * | Netflix Inc. | 37,546 | 4,319 |
| TJX Cos. Inc. | 60,150 | 4,230 | |
| Twenty-First Century Fox Inc. Class A | 153,391 | 4,201 | |
| General Motors Co. | 141,865 | 4,176 | |
| Yum! Brands Inc. | 38,325 | 3,057 | |
| * | eBay Inc. | 107,608 | 2,917 |
| Johnson Controls Inc. | 58,144 | 2,392 | |
| *,^ | Tesla Motors Inc. | 8,672 | 2,160 |
| * | O'Reilly Automotive Inc. | 8,991 | 2,158 |
| VF Corp. | 29,695 | 2,151 | |
| Dollar General Corp. | 26,702 | 1,989 | |
| CBS Corp. Class B | 43,778 | 1,981 | |
| * | AutoZone Inc. | 2,744 | 1,965 |
| * | Chipotle Mexican Grill Inc. Class A | 2,732 | 1,940 |
| Delphi Automotive plc | 25,360 | 1,915 | |
| Carnival Corp. | 37,266 | 1,835 | |
| L Brands Inc. | 21,699 | 1,821 | |
| Ross Stores Inc. | 36,347 | 1,767 | |
| Macy's Inc. | 29,989 | 1,758 | |
| * | Dollar Tree Inc. | 20,227 | 1,543 |
| * | Under Armour Inc. Class A | 15,668 | 1,497 |
| Las Vegas Sands Corp. | 32,101 | 1,484 | |
| Estee Lauder Cos. Inc. Class A | 18,414 | 1,469 | |
| * | Nielsen Holdings plc | 32,281 | 1,460 |
| Omnicom Group Inc. | 21,440 | 1,436 | |
| Royal Caribbean Cruises Ltd. | 15,092 | 1,330 | |
| Marriott International Inc. Class A | 18,462 | 1,305 | |
| Viacom Inc. Class B | 30,443 | 1,241 | |
| * | Charter Communications Inc. Class A | 6,627 | 1,204 |
| Whirlpool Corp. | 6,955 | 1,169 | |
| Advance Auto Parts Inc. | 6,506 | 1,140 | |
| * | DISH Network Corp. Class A | 19,078 | 1,131 |
| Hilton Worldwide Holdings Inc. | 45,530 | 1,130 | |
| * | Liberty Interactive Corp. QVC Group Class A | 41,498 | 1,122 |
| * | CarMax Inc. | 18,370 | 1,121 |
| Genuine Parts Co. | 13,386 | 1,118 | |
| Starwood Hotels & Resorts Worldwide Inc. | 15,074 | 1,077 | |
| * | Mohawk Industries Inc. | 5,465 | 1,076 |
| Hanesbrands Inc. | 35,285 | 1,062 | |
| Harley-Davidson Inc. | 18,339 | 1,028 | |
| Tractor Supply Co. | 12,004 | 1,024 | |
| Expedia Inc. | 8,722 | 1,003 | |
| Newell Rubbermaid Inc. | 23,598 | 994 | |
| Best Buy Co. Inc. | 26,661 | 980 | |
| Signet Jewelers Ltd. | 6,973 | 962 | |
| * | Jarden Corp. | 18,567 | 953 |
1
| Vanguard® Russell 1000 Index Fund | ||
| Schedule of Investments | ||
| August 31, 2015 | ||
| Market | ||
| Value | ||
| Shares | ($000) | |
| * Bed Bath & Beyond Inc. | 15,028 | 933 |
| Kohl's Corp. | 17,794 | 908 |
| Nordstrom Inc. | 12,368 | 901 |
| * Ulta Salon Cosmetics & Fragrance Inc. | 5,660 | 895 |
| DR Horton Inc. | 28,835 | 876 |
| Foot Locker Inc. | 12,321 | 872 |
| BorgWarner Inc. | 19,910 | 869 |
| PVH Corp. | 7,214 | 858 |
| H&R Block Inc. | 24,179 | 823 |
| Tiffany & Co. | 9,967 | 820 |
| Wyndham Worldwide Corp. | 10,565 | 808 |
| * LKQ Corp. | 26,756 | 802 |
| Staples Inc. | 56,249 | 799 |
| Lennar Corp. Class A | 15,685 | 798 |
| * MGM Resorts International | 39,031 | 797 |
| * Sirius XM Holdings Inc. | 201,432 | 768 |
| Polaris Industries Inc. | 5,891 | 765 |
| * Michael Kors Holdings Ltd. | 17,465 | 759 |
| Darden Restaurants Inc. | 10,917 | 742 |
| Hasbro Inc. | 9,841 | 734 |
| Coach Inc. | 24,223 | 733 |
| Goodyear Tire & Rubber Co. | 23,614 | 703 |
| Lear Corp. | 6,781 | 697 |
| Mattel Inc. | 29,693 | 696 |
| * TripAdvisor Inc. | 9,854 | 689 |
| Gap Inc. | 20,910 | 686 |
| Interpublic Group of Cos. Inc. | 35,995 | 680 |
| Fortune Brands Home & Security Inc. | 14,088 | 674 |
| * Norwegian Cruise Line Holdings Ltd. | 11,605 | 668 |
| PulteGroup Inc. | 31,981 | 662 |
| * Hertz Global Holdings Inc. | 35,661 | 657 |
| * Liberty Media Corp. | 17,585 | 637 |
| Williams-Sonoma Inc. | 8,325 | 633 |
| * lululemon athletica Inc. | 9,828 | 629 |
| Harman International Industries Inc. | 6,317 | 617 |
| * Discovery Communications Inc. | 24,058 | 610 |
| Ralph Lauren Corp. Class A | 5,478 | 609 |
| * News Corp. Class A | 44,009 | 600 |
| * Toll Brothers Inc. | 15,238 | 563 |
| * WABCO Holdings Inc. | 4,749 | 548 |
| Wynn Resorts Ltd. | 7,200 | 540 |
| * NVR Inc. | 352 | 535 |
| Aramark | 17,004 | 533 |
| Leggett & Platt Inc. | 11,934 | 530 |
| Service Corp. International | 17,730 | 526 |
| Domino's Pizza Inc. | 4,790 | 507 |
| * Skechers U.S.A. Inc. Class A | 3,597 | 506 |
| * Liberty Ventures Class A | 12,381 | 492 |
| * TEGNA Inc. | 19,950 | 475 |
| KAR Auction Services Inc. | 12,511 | 463 |
| Carter's Inc. | 4,587 | 451 |
| Cablevision Systems Corp. Class A | 17,785 | 448 |
| Scripps Networks Interactive Inc. Class A | 8,039 | 427 |
| Dunkin' Brands Group Inc. | 8,381 | 420 |
| * Avis Budget Group Inc. | 9,312 | 411 |
| Brunswick Corp. | 8,221 | 409 |
| Dick's Sporting Goods Inc. | 8,088 | 405 |
| * Panera Bread Co. Class A | 2,271 | 405 |
| Gentex Corp. | 25,845 | 401 |
| * Visteon Corp. | 4,001 | 399 |
| GameStop Corp. Class A | 9,328 | 396 |
| * Tempur Sealy International Inc. | 5,418 | 396 |
| Garmin Ltd. | 10,409 | 391 |
| Lamar Advertising Co. Class A | 7,164 | 382 |
2
| Vanguard® Russell 1000 Index Fund | ||
| Schedule of Investments | ||
| August 31, 2015 | ||
| Market | ||
| Value | ||
| Shares | ($000) | |
| * Office Depot Inc. | 48,044 | 381 |
| * AMC Networks Inc. Class A | 5,210 | 377 |
| * AutoNation Inc. | 6,279 | 376 |
| * Madison Square Garden Co. Class A | 5,300 | 373 |
| * Discovery Communications Inc. Class A | 13,696 | 364 |
| Cinemark Holdings Inc. | 10,230 | 364 |
| * Sally Beauty Holdings Inc. | 13,879 | 363 |
| * Liberty Media Corp. Class A | 9,739 | 363 |
| * GoPro Inc. Class A | 7,701 | 359 |
| * Live Nation Entertainment Inc. | 13,630 | 336 |
| * Pandora Media Inc. | 18,534 | 332 |
| * ServiceMaster Global Holdings Inc. | 8,857 | 312 |
| * Liberty Broadband Corp. | 5,779 | 309 |
| Lions Gate Entertainment Corp. | 8,174 | 300 |
| Brinker International Inc. | 5,499 | 292 |
| Outfront Media Inc. | 12,903 | 292 |
| * Starz | 7,632 | 287 |
| Tribune Media Co. Class A | 7,082 | 283 |
| Six Flags Entertainment Corp. | 6,127 | 276 |
| * Urban Outfitters Inc. | 8,642 | 267 |
| * Vista Outdoor Inc. | 5,424 | 254 |
| * HomeAway Inc. | 8,418 | 242 |
| CST Brands Inc. | 6,831 | 237 |
| * JC Penney Co. Inc. | 25,714 | 234 |
| AMERCO | 619 | 232 |
| * Fossil Group Inc. | 3,713 | 229 |
| Nu Skin Enterprises Inc. Class A | 4,987 | 228 |
| Tupperware Brands Corp. | 4,250 | 218 |
| Coty Inc. Class A | 7,124 | 216 |
| * Kate Spade & Co. | 11,254 | 213 |
| Thor Industries Inc. | 3,870 | 211 |
| John Wiley & Sons Inc. Class A | 4,050 | 209 |
| Aaron's Inc. | 5,454 | 205 |
| * Cabela's Inc. | 4,521 | 203 |
| * Murphy USA Inc. | 3,944 | 202 |
| Avon Products Inc. | 38,235 | 198 |
| Graham Holdings Co. Class B | 298 | 197 |
| Dillard's Inc. Class A | 2,070 | 191 |
| DSW Inc. Class A | 6,328 | 188 |
| Penske Automotive Group Inc. | 3,683 | 186 |
| Wendy's Co. | 18,946 | 173 |
| Choice Hotels International Inc. | 2,984 | 152 |
| * Hyatt Hotels Corp. Class A | 2,905 | 149 |
| * Michaels Cos. Inc. | 5,438 | 143 |
| International Game Technology plc | 8,041 | 137 |
| Regal Entertainment Group Class A | 6,984 | 133 |
| * Liberty Broadband Corp. Class A | 2,389 | 130 |
| * Gannett Co. Inc. | 9,775 | 128 |
| * Cable One Inc. | 298 | 124 |
| Extended Stay America Inc. | 5,104 | 96 |
| Viacom Inc. Class A | 879 | 38 |
| Lennar Corp. Class B | 827 | 35 |
| * Sears Holdings Corp. | 1,040 | 28 |
| * Clear Channel Outdoor Holdings Inc. Class A | 3,359 | 27 |
| Comcast Corp. Special Class A | 392 | 22 |
| Twenty-First Century Fox Inc. | 495 | 14 |
| * News Corp. Class B | 126 | 2 |
| 258,546 | ||
| Consumer Staples (7.9%) | ||
| Procter & Gamble Co. | 238,693 | 16,868 |
| Coca-Cola Co. | 345,658 | 13,591 |
| PepsiCo Inc. | 129,810 | 12,063 |
| Philip Morris International Inc. | 136,630 | 10,903 |
| CVS Health Corp. | 99,156 | 10,154 |
3
| Vanguard® Russell 1000 Index Fund | ||
| Schedule of Investments | ||
| August 31, 2015 | ||
| Market | ||
| Value | ||
| Shares | ($000) | |
| Altria Group Inc. | 173,007 | 9,270 |
| Walgreens Boots Alliance Inc. | 75,774 | 6,558 |
| Mondelez International Inc. Class A | 143,255 | 6,068 |
| Colgate-Palmolive Co. | 79,850 | 5,015 |
| Kraft Heinz Co. | 52,320 | 3,802 |
| Kimberly-Clark Corp. | 31,970 | 3,406 |
| Reynolds American Inc. | 36,616 | 3,067 |
| General Mills Inc. | 52,857 | 3,000 |
| Kroger Co. | 86,838 | 2,996 |
| Archer-Daniels-Midland Co. | 54,449 | 2,450 |
| Sysco Corp. | 52,069 | 2,076 |
| Constellation Brands Inc. Class A | 14,351 | 1,837 |
| * Monster Beverage Corp. | 13,129 | 1,818 |
| ConAgra Foods Inc. | 37,517 | 1,564 |
| Kellogg Co. | 21,933 | 1,454 |
| Mead Johnson Nutrition Co. | 17,749 | 1,390 |
| Dr Pepper Snapple Group Inc. | 16,881 | 1,295 |
| Clorox Co. | 11,502 | 1,279 |
| JM Smucker Co. | 10,540 | 1,241 |
| Hershey Co. | 12,787 | 1,145 |
| Tyson Foods Inc. Class A | 25,841 | 1,093 |
| Brown-Forman Corp. Class B | 11,136 | 1,092 |
| Coca-Cola Enterprises Inc. | 20,865 | 1,074 |
| Whole Foods Market Inc. | 31,494 | 1,032 |
| Church & Dwight Co. Inc. | 11,518 | 994 |
| Bunge Ltd. | 12,615 | 914 |
| McCormick & Co. Inc. | 11,196 | 888 |
| Molson Coors Brewing Co. Class B | 12,106 | 824 |
| Campbell Soup Co. | 15,316 | 735 |
| Hormel Foods Corp. | 11,789 | 720 |
| * Rite Aid Corp. | 86,718 | 715 |
| * WhiteWave Foods Co. Class A | 15,351 | 708 |
| Keurig Green Mountain Inc. | 11,402 | 645 |
| Ingredion Inc. | 6,341 | 548 |
| * Hain Celestial Group Inc. | 8,936 | 544 |
| * Edgewell Personal Care Co. | 5,510 | 485 |
| Pinnacle Foods Inc. | 10,046 | 450 |
| * Herbalife Ltd. | 6,413 | 369 |
| GNC Holdings Inc. Class A | 7,697 | 360 |
| Flowers Foods Inc. | 15,324 | 356 |
| * Sprouts Farmers Market Inc. | 13,141 | 268 |
| Brown-Forman Corp. Class A | 2,333 | 253 |
| Energizer Holdings Inc. | 5,310 | 222 |
| Spectrum Brands Holdings Inc. | 2,197 | 216 |
| Pilgrim's Pride Corp. | 5,427 | 114 |
| 139,929 | ||
| Energy (7.0%) | ||
| Exxon Mobil Corp. | 368,028 | 27,690 |
| Chevron Corp. | 165,763 | 13,425 |
| Schlumberger Ltd. | 111,708 | 8,643 |
| ConocoPhillips | 108,711 | 5,343 |
| Kinder Morgan Inc. | 157,412 | 5,102 |
| Occidental Petroleum Corp. | 67,842 | 4,953 |
| EOG Resources Inc. | 48,561 | 3,803 |
| Phillips 66 | 47,912 | 3,788 |
| Anadarko Petroleum Corp. | 45,018 | 3,222 |
| Williams Cos. Inc. | 66,259 | 3,194 |
| Halliburton Co. | 75,415 | 2,968 |
| Valero Energy Corp. | 44,661 | 2,650 |
| Marathon Petroleum Corp. | 48,282 | 2,284 |
| Baker Hughes Inc. | 38,171 | 2,138 |
| Spectra Energy Corp. | 58,885 | 1,712 |
| Pioneer Natural Resources Co. | 13,169 | 1,621 |
| Devon Energy Corp. | 36,066 | 1,539 |
4
| Vanguard® Russell 1000 Index Fund | |||
| Schedule of Investments | |||
| August 31, 2015 | |||
| Market | |||
| Value | |||
| Shares | ($000) | ||
| Apache Corp. | 33,108 | 1,498 | |
| National Oilwell Varco Inc. | 34,010 | 1,440 | |
| Hess Corp. | 22,149 | 1,317 | |
| * | Cheniere Energy Inc. | 20,754 | 1,290 |
| Noble Energy Inc. | 37,622 | 1,257 | |
| * | Cameron International Corp. | 17,331 | 1,157 |
| * | Concho Resources Inc. | 10,529 | 1,139 |
| EQT Corp. | 13,373 | 1,041 | |
| Marathon Oil Corp. | 59,146 | 1,023 | |
| Tesoro Corp. | 11,058 | 1,017 | |
| Cimarex Energy Co. | 8,315 | 919 | |
| Cabot Oil & Gas Corp. | 36,316 | 860 | |
| HollyFrontier Corp. | 17,615 | 825 | |
| Columbia Pipeline Group Inc. | 27,966 | 709 | |
| * | FMC Technologies Inc. | 20,164 | 701 |
| * | Weatherford International plc | 67,959 | 690 |
| ONEOK Inc. | 18,299 | 659 | |
| Range Resources Corp. | 14,867 | 574 | |
| * | Southwestern Energy Co. | 33,758 | 548 |
| Helmerich & Payne Inc. | 8,507 | 502 | |
| Murphy Oil Corp. | 15,647 | 485 | |
| * | Newfield Exploration Co. | 14,354 | 478 |
| ^ | Chesapeake Energy Corp. | 51,494 | 402 |
| * | Diamondback Energy Inc. | 5,578 | 381 |
| Oceaneering International Inc. | 8,541 | 374 | |
| Ensco plc Class A | 20,610 | 373 | |
| Energen Corp. | 6,993 | 364 | |
| * | Whiting Petroleum Corp. | 17,898 | 346 |
| * | Gulfport Energy Corp. | 9,568 | 343 |
| Golar LNG Ltd. | 8,476 | 330 | |
| Nabors Industries Ltd. | 28,296 | 327 | |
| Targa Resources Corp. | 4,867 | 321 | |
| * | First Solar Inc. | 6,510 | 311 |
| CONSOL Energy Inc. | 19,718 | 300 | |
| Noble Corp. plc | 20,667 | 269 | |
| ^ | Seadrill Ltd. | 32,059 | 258 |
| * | Cobalt International Energy Inc. | 31,473 | 252 |
| World Fuel Services Corp. | 6,358 | 246 | |
| *,^ | SolarCity Corp. | 5,088 | 246 |
| * | Continental Resources Inc. | 7,415 | 238 |
| SM Energy Co. | 6,463 | 237 | |
| * | Dril-Quip Inc. | 3,421 | 236 |
| PBF Energy Inc. Class A | 7,431 | 222 | |
| QEP Resources Inc. | 15,067 | 212 | |
| Patterson-UTI Energy Inc. | 12,916 | 210 | |
| Superior Energy Services Inc. | 13,153 | 209 | |
| Rowan Cos. plc Class A | 10,535 | 189 | |
| * | Antero Resources Corp. | 5,991 | 155 |
| * | NOW Inc. | 9,048 | 154 |
| * | WPX Energy Inc. | 20,656 | 151 |
| * | Memorial Resource Development Corp. | 7,118 | 138 |
| Diamond Offshore Drilling Inc. | 5,726 | 136 | |
| Denbury Resources Inc. | 29,501 | 128 | |
| * | Rice Energy Inc. | 6,281 | 122 |
| TerraForm Power Inc. Class A | 5,382 | 121 | |
| * | SunPower Corp. Class A | 4,701 | 114 |
| *,^ | Laredo Petroleum Inc. | 10,692 | 109 |
| California Resources Corp. | 26,489 | 103 | |
| * | Kosmos Energy Ltd. | 13,487 | 94 |
| RPC Inc. | 4,866 | 57 | |
| CVR Energy Inc. | 1,264 | 51 | |
| Frank's International NV | 2,728 | 44 | |
| * | EP Energy Corp. Class A | 2,867 | 20 |
| 123,097 | |||
5
| Vanguard® Russell 1000 Index Fund | ||
| Schedule of Investments | ||
| August 31, 2015 | ||
| Market | ||
| Value | ||
| Shares | ($000) | |
| Financial Services (19.6%) | ||
| * Berkshire Hathaway Inc. Class B | 163,622 | 21,932 |
| Wells Fargo & Co. | 410,007 | 21,866 |
| JPMorgan Chase & Co. | 326,640 | 20,938 |
| Bank of America Corp. | 925,719 | 15,126 |
| Citigroup Inc. | 267,492 | 14,306 |
| Visa Inc. Class A | 172,385 | 12,291 |
| MasterCard Inc. Class A | 87,955 | 8,124 |
| Goldman Sachs Group Inc. | 37,956 | 7,159 |
| American International Group Inc. | 117,422 | 7,085 |
| US Bancorp | 147,501 | 6,247 |
| American Express Co. | 76,198 | 5,846 |
| Simon Property Group Inc. | 27,328 | 4,900 |
| Morgan Stanley | 135,211 | 4,658 |
| PNC Financial Services Group Inc. | 45,799 | 4,173 |
| MetLife Inc. | 82,689 | 4,143 |
| Bank of New York Mellon Corp. | 99,066 | 3,943 |
| Capital One Financial Corp. | 48,373 | 3,761 |
| * PayPal Holdings Inc. | 107,308 | 3,756 |
| American Tower Corporation | 37,152 | 3,425 |
| BlackRock Inc. | 11,092 | 3,355 |
| Prudential Financial Inc. | 40,132 | 3,239 |
| Charles Schwab Corp. | 101,343 | 3,079 |
| ACE Ltd. | 28,694 | 2,931 |
| Travelers Cos. Inc. | 28,014 | 2,789 |
| CME Group Inc. | 28,157 | 2,659 |
| State Street Corp. | 36,536 | 2,628 |
| Public Storage | 12,759 | 2,568 |
| Marsh & McLennan Cos. Inc. | 47,104 | 2,531 |
| BB&T Corp. | 68,121 | 2,515 |
| Crown Castle International Corp. | 29,284 | 2,442 |
| Chubb Corp. | 20,192 | 2,439 |
| McGraw Hill Financial Inc. | 24,046 | 2,332 |
| Aon plc | 24,769 | 2,314 |
| Equity Residential | 32,301 | 2,301 |
| Aflac Inc. | 38,105 | 2,233 |
| Intercontinental Exchange Inc. | 9,772 | 2,232 |
| Allstate Corp. | 35,910 | 2,093 |
| Discover Financial Services | 38,850 | 2,087 |
| Health Care REIT Inc. | 30,808 | 1,952 |
| AvalonBay Communities Inc. | 11,604 | 1,915 |
| SunTrust Banks Inc. | 45,949 | 1,855 |
| Ameriprise Financial Inc. | 15,989 | 1,802 |
| * Fiserv Inc. | 20,849 | 1,778 |
| Prologis Inc. | 46,020 | 1,749 |
| Fidelity National Information Services Inc. | 24,879 | 1,718 |
| Hartford Financial Services Group Inc. | 36,894 | 1,695 |
| T. Rowe Price Group Inc. | 22,919 | 1,647 |
| Moody's Corp. | 15,634 | 1,600 |
| Ventas Inc. | 29,060 | 1,599 |
| Progressive Corp. | 51,443 | 1,541 |
| Boston Properties Inc. | 13,482 | 1,529 |
| HCP Inc. | 40,503 | 1,501 |
| Vornado Realty Trust | 16,551 | 1,443 |
| Northern Trust Corp. | 20,551 | 1,435 |
| Fifth Third Bancorp | 71,069 | 1,416 |
| * Alliance Data Systems Corp. | 5,445 | 1,400 |
| M&T Bank Corp. | 11,703 | 1,384 |
| Franklin Resources Inc. | 34,060 | 1,382 |
| Equinix Inc. | 4,985 | 1,345 |
| Principal Financial Group Inc. | 25,826 | 1,300 |
| Invesco Ltd. | 37,782 | 1,289 |
| General Growth Properties Inc. | 50,574 | 1,284 |
| Weyerhaeuser Co. | 45,392 | 1,268 |
6
| Vanguard® Russell 1000 Index Fund | ||
| Schedule of Investments | ||
| August 31, 2015 | ||
| Market | ||
| Value | ||
| Shares | ($000) | |
| Essex Property Trust Inc. | 5,726 | 1,229 |
| * FleetCor Technologies Inc. | 8,101 | 1,208 |
| Host Hotels & Resorts Inc. | 66,470 | 1,179 |
| Lincoln National Corp. | 22,234 | 1,129 |
| Regions Financial Corp. | 117,455 | 1,126 |
| ^ Thomson Reuters Corp. | 28,966 | 1,124 |
| Macerich Co. | 13,928 | 1,061 |
| Equifax Inc. | 10,446 | 1,023 |
| KeyCorp | 74,371 | 1,022 |
| * Markel Corp. | 1,233 | 1,016 |
| XL Group plc Class A | 26,909 | 1,003 |
| Loews Corp. | 27,307 | 995 |
| * Ally Financial Inc. | 42,252 | 924 |
| Realty Income Corp. | 20,463 | 915 |
| SL Green Realty Corp. | 8,760 | 907 |
| FNF Group | 24,573 | 895 |
| * Affiliated Managers Group Inc. | 4,791 | 893 |
| Voya Financial Inc. | 20,153 | 868 |
| Annaly Capital Management Inc. | 83,090 | 836 |
| Kimco Realty Corp. | 36,262 | 836 |
| Western Union Co. | 45,258 | 835 |
| * CBRE Group Inc. Class A | 25,158 | 806 |
| Extra Space Storage Inc. | 10,791 | 793 |
| TD Ameritrade Holding Corp. | 23,423 | 784 |
| Huntington Bancshares Inc. | 70,988 | 775 |
| Federal Realty Investment Trust | 5,980 | 772 |
| Cincinnati Financial Corp. | 14,496 | 759 |
| Digital Realty Trust Inc. | 11,965 | 758 |
| First Republic Bank | 12,547 | 757 |
| * Arch Capital Group Ltd. | 10,916 | 745 |
| Unum Group | 21,875 | 734 |
| UDR Inc. | 22,709 | 734 |
| Everest Re Group Ltd. | 3,936 | 692 |
| Comerica Inc. | 15,701 | 691 |
| New York Community Bancorp Inc. | 39,012 | 689 |
| Citizens Financial Group Inc. | 27,402 | 680 |
| HCC Insurance Holdings Inc. | 8,677 | 670 |
| * E*TRADE Financial Corp. | 25,452 | 669 |
| Total System Services Inc. | 14,545 | 667 |
| * Alleghany Corp. | 1,416 | 665 |
| CIT Group Inc. | 15,293 | 664 |
| Torchmark Corp. | 11,140 | 651 |
| Global Payments Inc. | 5,803 | 646 |
| * VEREIT Inc. | 79,370 | 646 |
| Arthur J Gallagher & Co. | 14,749 | 645 |
| SEI Investments Co. | 12,245 | 619 |
| Leucadia National Corp. | 28,803 | 618 |
| Jones Lang LaSalle Inc. | 4,090 | 609 |
| MSCI Inc. Class A | 9,949 | 602 |
| Raymond James Financial Inc. | 11,231 | 595 |
| Plum Creek Timber Co. Inc. | 15,452 | 595 |
| American Capital Agency Corp. | 31,022 | 593 |
| * Signature Bank | 4,386 | 586 |
| FactSet Research Systems Inc. | 3,671 | 580 |
| PartnerRe Ltd. | 4,121 | 570 |
| * SVB Financial Group | 4,526 | 566 |
| * Vantiv Inc. Class A | 12,624 | 556 |
| Broadridge Financial Solutions Inc. | 10,517 | 555 |
| Camden Property Trust | 7,648 | 551 |
| Duke Realty Corp. | 30,288 | 547 |
| Lazard Ltd. Class A | 10,928 | 543 |
| Omega Healthcare Investors Inc. | 16,040 | 542 |
| Alexandria Real Estate Equities Inc. | 6,224 | 535 |
| Reinsurance Group of America Inc. Class A | 5,819 | 529 |
7
| Vanguard® Russell 1000 Index Fund | ||
| Schedule of Investments | ||
| August 31, 2015 | ||
| Market | ||
| Value | ||
| Shares | ($000) | |
| WP Carey Inc. | 9,165 | 527 |
| Mid-America Apartment Communities Inc. | 6,674 | 525 |
| Iron Mountain Inc. | 18,459 | 523 |
| * Realogy Holdings Corp. | 12,919 | 521 |
| Zions Bancorporation | 17,834 | 517 |
| East West Bancorp Inc. | 12,687 | 513 |
| NASDAQ OMX Group Inc. | 10,009 | 512 |
| Kilroy Realty Corp. | 7,788 | 505 |
| Apartment Investment & Management Co. | 13,742 | 495 |
| Jack Henry & Associates Inc. | 7,278 | 495 |
| Axis Capital Holdings Ltd. | 8,809 | 493 |
| Regency Centers Corp. | 8,272 | 491 |
| WR Berkley Corp. | 8,459 | 459 |
| CBOE Holdings Inc. | 7,256 | 459 |
| Assurant Inc. | 6,004 | 446 |
| Starwood Property Trust Inc. | 20,885 | 444 |
| Navient Corp. | 34,446 | 441 |
| * Howard Hughes Corp. | 3,492 | 439 |
| Hudson City Bancorp Inc. | 46,512 | 433 |
| NorthStar Realty Finance Corp. | 30,446 | 428 |
| American Financial Group Inc. | 6,150 | 425 |
| StanCorp Financial Group Inc. | 3,701 | 421 |
| RenaissanceRe Holdings Ltd. | 4,069 | 415 |
| People's United Financial Inc. | 26,650 | 413 |
| * Forest City Enterprises Inc. Class A | 19,155 | 412 |
| Equity LifeStyle Properties Inc. | 7,362 | 411 |
| National Retail Properties Inc. | 11,798 | 410 |
| DDR Corp. | 26,580 | 406 |
| Liberty Property Trust | 13,147 | 404 |
| PacWest Bancorp | 9,449 | 403 |
| Legg Mason Inc. | 8,610 | 382 |
| Old Republic International Corp. | 24,188 | 380 |
| White Mountains Insurance Group Ltd. | 523 | 376 |
| * Synchrony Financial | 11,343 | 374 |
| Home Properties Inc. | 5,015 | 372 |
| Spirit Realty Capital Inc. | 38,729 | 372 |
| Taubman Centers Inc. | 5,385 | 372 |
| City National Corp. | 4,225 | 371 |
| Synovus Financial Corp. | 11,689 | 356 |
| Douglas Emmett Inc. | 12,849 | 355 |
| Eaton Vance Corp. | 10,157 | 352 |
| Endurance Specialty Holdings Ltd. | 5,465 | 348 |
| Weingarten Realty Investors | 10,937 | 346 |
| Allied World Assurance Co. Holdings AG | 8,545 | 341 |
| Brixmor Property Group Inc. | 14,868 | 339 |
| Dun & Bradstreet Corp. | 3,193 | 338 |
| Assured Guaranty Ltd. | 13,264 | 335 |
| American Campus Communities Inc. | 9,707 | 332 |
| Hospitality Properties Trust | 12,899 | 332 |
| Validus Holdings Ltd. | 7,482 | 331 |
| Commerce Bancshares Inc. | 7,351 | 329 |
| Brown & Brown Inc. | 10,140 | 325 |
| BioMed Realty Trust Inc. | 17,466 | 323 |
| * WEX Inc. | 3,398 | 321 |
| BankUnited Inc. | 9,010 | 321 |
| * SLM Corp. | 37,376 | 317 |
| Senior Housing Properties Trust | 20,169 | 317 |
| Hanover Insurance Group Inc. | 3,909 | 308 |
| Cullen/Frost Bankers Inc. | 4,681 | 303 |
| LPL Financial Holdings Inc. | 7,519 | 302 |
| Two Harbors Investment Corp. | 31,461 | 298 |
| Corrections Corp. of America | 10,057 | 296 |
| * CoreLogic Inc. | 7,759 | 294 |
| * Equity Commonwealth | 11,370 | 292 |
8
| Vanguard® Russell 1000 Index Fund | |||
| Schedule of Investments | |||
| August 31, 2015 | |||
| Market | |||
| Value | |||
| Shares | ($000) | ||
| First Horizon National Corp. | 19,970 | 290 | |
| First Niagara Financial Group Inc. | 31,170 | 288 | |
| Waddell & Reed Financial Inc. Class A | 7,357 | 287 | |
| Apple Hospitality REIT Inc. | 15,890 | 281 | |
| NorthStar Asset Management Group Inc. | 16,682 | 280 | |
| Retail Properties of America Inc. | 20,307 | 277 | |
| Post Properties Inc. | 4,875 | 270 | |
| * | Popular Inc. | 9,079 | 267 |
| Healthcare Trust of America Inc. Class A | 11,034 | 265 | |
| Tanger Factory Outlet Centers Inc. | 8,275 | 262 | |
| Rayonier Inc. | 11,210 | 258 | |
| Federated Investors Inc. Class B | 8,281 | 257 | |
| Chimera Investment Corp. | 18,096 | 254 | |
| Paramount Group Inc. | 15,342 | 252 | |
| Associated Banc-Corp | 13,204 | 242 | |
| Aspen Insurance Holdings Ltd. | 5,226 | 240 | |
| Bank of Hawaii Corp. | 3,833 | 238 | |
| Gaming and Leisure Properties Inc. | 7,638 | 236 | |
| Columbia Property Trust Inc. | 11,042 | 236 | |
| TCF Financial Corp. | 14,893 | 231 | |
| MFA Financial Inc. | 32,473 | 231 | |
| * | Care Capital Properties Inc. | 7,261 | 231 |
| Piedmont Office Realty Trust Inc. Class A | 13,600 | 231 | |
| ProAssurance Corp. | 4,756 | 229 | |
| American Homes 4 Rent Class A | 14,268 | 228 | |
| * | Genworth Financial Inc. Class A | 42,612 | 221 |
| CBL & Associates Properties Inc. | 14,667 | 218 | |
| Communications Sales & Leasing Inc. | 10,597 | 213 | |
| * | Springleaf Holdings Inc. Class A | 4,452 | 199 |
| Interactive Brokers Group Inc. | 4,988 | 199 | |
| WP GLIMCHER Inc. | 16,304 | 197 | |
| * | Zillow Group Inc. | 7,822 | 193 |
| Brandywine Realty Trust | 15,786 | 191 | |
| AmTrust Financial Services Inc. | 3,275 | 190 | |
| Corporate Office Properties Trust | 8,313 | 175 | |
| Erie Indemnity Co. Class A | 2,102 | 172 | |
| * | Santander Consumer USA Holdings Inc. | 7,438 | 167 |
| BOK Financial Corp. | 2,504 | 158 | |
| Empire State Realty Trust Inc. | 9,516 | 154 | |
| * | Credit Acceptance Corp. | 727 | 148 |
| Morningstar Inc. | 1,700 | 136 | |
| Artisan Partners Asset Management Inc. Class A | 3,061 | 125 | |
| Mercury General Corp. | 2,317 | 118 | |
| TFS Financial Corp. | 6,433 | 110 | |
| *,^ | Zillow Group Inc. Class A | 3,911 | 99 |
| CNA Financial Corp. | 2,297 | 83 | |
| * | LendingClub Corp. | 5,588 | 70 |
| American National Insurance Co. | 612 | 61 | |
| 345,474 | |||
| Health Care (14.6%) | |||
| Johnson & Johnson | 244,088 | 22,939 | |
| Pfizer Inc. | 541,895 | 17,460 | |
| Gilead Sciences Inc. | 129,293 | 13,585 | |
| Merck & Co. Inc. | 249,086 | 13,413 | |
| * | Allergan plc | 34,603 | 10,510 |
| Amgen Inc. | 66,909 | 10,155 | |
| UnitedHealth Group Inc. | 83,759 | 9,691 | |
| AbbVie Inc. | 145,783 | 9,098 | |
| Medtronic plc | 125,698 | 9,087 | |
| Bristol-Myers Squibb Co. | 146,653 | 8,721 | |
| * | Celgene Corp. | 69,898 | 8,254 |
| Eli Lilly & Co. | 86,198 | 7,098 | |
| * | Biogen Inc. | 20,719 | 6,160 |
| Abbott Laboratories | 131,073 | 5,936 | |
9
| Vanguard® Russell 1000 Index Fund | ||
| Schedule of Investments | ||
| August 31, 2015 | ||
| Market | ||
| Value | ||
| Shares | ($000) | |
| * Express Scripts Holding Co. | 59,466 | 4,971 |
| Thermo Fisher Scientific Inc. | 35,206 | 4,414 |
| McKesson Corp. | 20,433 | 4,037 |
| * Regeneron Pharmaceuticals Inc. | 6,940 | 3,564 |
| Aetna Inc. | 30,914 | 3,540 |
| Anthem Inc. | 23,305 | 3,287 |
| * Alexion Pharmaceuticals Inc. | 18,966 | 3,266 |
| Cigna Corp. | 22,594 | 3,181 |
| Stryker Corp. | 29,911 | 2,951 |
| * Vertex Pharmaceuticals Inc. | 21,456 | 2,736 |
| Becton Dickinson and Co. | 18,553 | 2,616 |
| * Illumina Inc. | 12,765 | 2,523 |
| * HCA Holdings Inc. | 28,145 | 2,438 |
| Humana Inc. | 13,141 | 2,402 |
| Cardinal Health Inc. | 29,073 | 2,392 |
| Perrigo Co. plc | 12,824 | 2,346 |
| Zoetis Inc. | 43,861 | 1,968 |
| * Boston Scientific Corp. | 117,561 | 1,968 |
| AmerisourceBergen Corp. Class A | 19,324 | 1,933 |
| Baxter International Inc. | 47,741 | 1,836 |
| * Mylan NV | 36,856 | 1,828 |
| * BioMarin Pharmaceutical Inc. | 14,065 | 1,818 |
| St. Jude Medical Inc. | 24,642 | 1,745 |
| Baxalta Inc. | 47,741 | 1,678 |
| * Intuitive Surgical Inc. | 3,230 | 1,650 |
| * Cerner Corp. | 26,256 | 1,622 |
| * Incyte Corp. | 13,788 | 1,602 |
| Zimmer Biomet Holdings Inc. | 14,947 | 1,548 |
| * Endo International plc | 18,366 | 1,414 |
| * Hospira Inc. | 15,177 | 1,366 |
| * Edwards Lifesciences Corp. | 9,509 | 1,340 |
| CR Bard Inc. | 6,523 | 1,264 |
| * DaVita HealthCare Partners Inc. | 15,494 | 1,172 |
| Universal Health Services Inc. Class B | 8,045 | 1,103 |
| Agilent Technologies Inc. | 29,230 | 1,061 |
| * Laboratory Corp. of America Holdings | 8,827 | 1,040 |
| * Henry Schein Inc. | 7,339 | 1,004 |
| * Jazz Pharmaceuticals plc | 5,370 | 907 |
| * Mallinckrodt plc | 10,252 | 884 |
| Quest Diagnostics Inc. | 12,482 | 846 |
| * Hologic Inc. | 21,571 | 837 |
| * Alkermes plc | 13,117 | 781 |
| * Varian Medical Systems Inc. | 9,047 | 735 |
| * Alnylam Pharmaceuticals Inc. | 6,736 | 693 |
| Cooper Cos. Inc. | 4,241 | 689 |
| * Envision Healthcare Holdings Inc. | 16,267 | 667 |
| * MEDNAX Inc. | 8,264 | 666 |
| DENTSPLY International Inc. | 12,692 | 665 |
| * DexCom Inc. | 6,971 | 656 |
| ResMed Inc. | 12,420 | 645 |
| * Centene Corp. | 10,439 | 644 |
| * Medivation Inc. | 7,120 | 627 |
| * United Therapeutics Corp. | 4,139 | 623 |
| * IDEXX Laboratories Inc. | 8,224 | 588 |
| * Community Health Systems Inc. | 10,232 | 549 |
| * Isis Pharmaceuticals Inc. | 10,526 | 528 |
| * QIAGEN NV | 20,099 | 527 |
| * Quintiles Transnational Holdings Inc. | 6,848 | 510 |
| PerkinElmer Inc. | 10,352 | 504 |
| Teleflex Inc. | 3,603 | 471 |
| * Sirona Dental Systems Inc. | 4,867 | 464 |
| * athenahealth Inc. | 3,466 | 461 |
| * Brookdale Senior Living Inc. | 16,216 | 445 |
| * Health Net Inc. | 6,820 | 437 |
10
| Vanguard® Russell 1000 Index Fund | ||
| Schedule of Investments | ||
| August 31, 2015 | ||
| Market | ||
| Value | ||
| Shares | ($000) | |
| * Tenet Healthcare Corp. | 8,781 | 432 |
| * Bluebird Bio Inc. | 3,204 | 426 |
| * Align Technology Inc. | 7,103 | 402 |
| * VCA Inc. | 7,112 | 394 |
| * Alere Inc. | 7,396 | 384 |
| * Seattle Genetics Inc. | 8,504 | 342 |
| Patterson Cos. Inc. | 7,404 | 339 |
| * Acadia Healthcare Co. Inc. | 4,616 | 337 |
| Bio-Techne Corp. | 3,331 | 315 |
| * LifePoint Health Inc. | 3,824 | 299 |
| * OPKO Health Inc. | 26,708 | 289 |
| * Charles River Laboratories International Inc. | 4,161 | 287 |
| * Akorn Inc. | 6,696 | 266 |
| * Intercept Pharmaceuticals Inc. | 1,374 | 261 |
| Hill-Rom Holdings Inc. | 4,874 | 258 |
| * Bio-Rad Laboratories Inc. Class A | 1,805 | 252 |
| * Allscripts Healthcare Solutions Inc. | 15,950 | 220 |
| * Puma Biotechnology Inc. | 2,139 | 197 |
| * Agios Pharmaceuticals Inc. | 2,208 | 191 |
| * Intrexon Corp. | 3,953 | 176 |
| * Bruker Corp. | 9,354 | 172 |
| * Veeva Systems Inc. Class A | 6,064 | 157 |
| * Premier Inc. Class A | 3,308 | 118 |
| * VWR Corp. | 2,571 | 68 |
| * Juno Therapeutics Inc. | 871 | 32 |
| 258,394 | ||
| Materials & Processing (3.7%) | ||
| Dow Chemical Co. | 101,742 | 4,452 |
| EI du Pont de Nemours & Co. | 79,969 | 4,118 |
| Monsanto Co. | 42,044 | 4,106 |
| LyondellBasell Industries NV Class A | 33,839 | 2,889 |
| Precision Castparts Corp. | 12,159 | 2,800 |
| Praxair Inc. | 25,311 | 2,677 |
| Air Products & Chemicals Inc. | 18,846 | 2,630 |
| Ecolab Inc. | 23,205 | 2,533 |
| PPG Industries Inc. | 23,900 | 2,277 |
| Sherwin-Williams Co. | 7,202 | 1,842 |
| International Paper Co. | 36,890 | 1,591 |
| Sigma-Aldrich Corp. | 10,543 | 1,470 |
| WestRock Co. | 22,995 | 1,365 |
| Ingersoll-Rand plc | 23,284 | 1,287 |
| Mosaic Co. | 30,632 | 1,251 |
| Nucor Corp. | 28,004 | 1,212 |
| CF Industries Holdings Inc. | 20,624 | 1,183 |
| Vulcan Materials Co. | 11,704 | 1,096 |
| Alcoa Inc. | 114,783 | 1,085 |
| Martin Marietta Materials Inc. | 5,926 | 994 |
| Fastenal Co. | 25,783 | 994 |
| Freeport-McMoRan Inc. | 91,195 | 970 |
| Sealed Air Corp. | 18,477 | 951 |
| Eastman Chemical Co. | 12,970 | 940 |
| Celanese Corp. Class A | 13,805 | 837 |
| Masco Corp. | 30,618 | 803 |
| Ball Corp. | 12,057 | 795 |
| Newmont Mining Corp. | 46,436 | 793 |
| International Flavors & Fragrances Inc. | 7,102 | 778 |
| Acuity Brands Inc. | 3,820 | 744 |
| * WR Grace & Co. | 6,383 | 631 |
| Ashland Inc. | 5,938 | 623 |
| * Crown Holdings Inc. | 12,218 | 606 |
| Airgas Inc. | 5,925 | 572 |
| Packaging Corp. of America | 8,473 | 569 |
| RPM International Inc. | 12,213 | 535 |
| Valspar Corp. | 7,042 | 516 |
11
| Vanguard® Russell 1000 Index Fund | ||
| Schedule of Investments | ||
| August 31, 2015 | ||
| Market | ||
| Value | ||
| Shares | ($000) | |
| FMC Corp. | 11,771 | 498 |
| Cytec Industries Inc. | 6,294 | 467 |
| Owens Corning | 10,408 | 461 |
| Albemarle Corp. | 9,783 | 442 |
| Lennox International Inc. | 3,555 | 420 |
| Steel Dynamics Inc. | 21,221 | 413 |
| Graphic Packaging Holding Co. | 28,893 | 407 |
| Hexcel Corp. | 8,400 | 405 |
| Reliance Steel & Aluminum Co. | 6,534 | 380 |
| AptarGroup Inc. | 5,574 | 375 |
| Bemis Co. Inc. | 8,667 | 368 |
| Eagle Materials Inc. | 4,421 | 362 |
| Sonoco Products Co. | 8,787 | 345 |
| Huntsman Corp. | 18,042 | 298 |
| * Owens-Illinois Inc. | 14,224 | 297 |
| NewMarket Corp. | 758 | 290 |
| Royal Gold Inc. | 5,677 | 273 |
| Watsco Inc. | 2,221 | 272 |
| Southern Copper Corp. | 9,720 | 259 |
| * Axalta Coating Systems Ltd. | 8,672 | 253 |
| * USG Corp. | 7,918 | 242 |
| Scotts Miracle-Gro Co. Class A | 3,805 | 237 |
| Compass Minerals International Inc. | 2,875 | 233 |
| * Platform Specialty Products Corp. | 11,703 | 224 |
| Valmont Industries Inc. | 2,092 | 222 |
| Domtar Corp. | 5,456 | 219 |
| Timken Co. | 6,862 | 218 |
| United States Steel Corp. | 12,854 | 211 |
| Silgan Holdings Inc. | 3,720 | 195 |
| Westlake Chemical Corp. | 3,478 | 192 |
| Cabot Corp. | 5,427 | 184 |
| * Armstrong World Industries Inc. | 3,265 | 182 |
| Allegheny Technologies Inc. | 9,200 | 178 |
| Chemours Co. | 15,617 | 151 |
| Tahoe Resources Inc. | 13,335 | 112 |
| 65,800 | ||
| Other (0.0%) 2 | ||
| Restaurant Brands International LP | 78 | 3 |
| Producer Durables (10.5%) | ||
| General Electric Co. | 886,833 | 22,011 |
| Boeing Co. | 60,968 | 7,967 |
| 3M Co. | 55,848 | 7,938 |
| United Technologies Corp. | 78,375 | 7,180 |
| Honeywell International Inc. | 68,867 | 6,836 |
| Union Pacific Corp. | 77,225 | 6,621 |
| United Parcel Service Inc. Class B | 61,855 | 6,040 |
| Accenture plc Class A | 55,405 | 5,223 |
| Lockheed Martin Corp. | 23,939 | 4,816 |
| Danaher Corp. | 52,618 | 4,579 |
| Caterpillar Inc. | 53,316 | 4,075 |
| FedEx Corp. | 25,110 | 3,782 |
| General Dynamics Corp. | 25,633 | 3,641 |
| Automatic Data Processing Inc. | 41,567 | 3,214 |
| Delta Air Lines Inc. | 72,314 | 3,166 |
| Emerson Electric Co. | 59,247 | 2,827 |
| Northrop Grumman Corp. | 17,016 | 2,786 |
| Raytheon Co. | 27,051 | 2,774 |
| CSX Corp. | 87,625 | 2,399 |
| Deere & Co. | 29,334 | 2,399 |
| American Airlines Group Inc. | 60,780 | 2,369 |
| Eaton Corp. plc | 41,472 | 2,366 |
| Illinois Tool Works Inc. | 26,288 | 2,222 |
| Southwest Airlines Co. | 58,624 | 2,152 |
12
| Vanguard® Russell 1000 Index Fund | ||
| Schedule of Investments | ||
| August 31, 2015 | ||
| Market | ||
| Value | ||
| Shares | ($000) | |
| Norfolk Southern Corp. | 26,770 | 2,086 |
| Waste Management Inc. | 40,204 | 2,013 |
| Cummins Inc. | 15,953 | 1,942 |
| * United Continental Holdings Inc. | 33,511 | 1,909 |
| PACCAR Inc. | 31,117 | 1,835 |
| Roper Technologies Inc. | 8,850 | 1,435 |
| Stanley Black & Decker Inc. | 13,508 | 1,371 |
| Tyco International plc | 36,898 | 1,339 |
| Rockwell Automation Inc. | 11,863 | 1,327 |
| Parker-Hannifin Corp. | 12,202 | 1,314 |
| WW Grainger Inc. | 5,873 | 1,312 |
| Paychex Inc. | 28,457 | 1,271 |
| AMETEK Inc. | 21,176 | 1,140 |
| * Verisk Analytics Inc. Class A | 14,908 | 1,089 |
| * TransDigm Group Inc. | 4,677 | 1,075 |
| * Stericycle Inc. | 7,468 | 1,054 |
| Xerox Corp. | 96,746 | 984 |
| Rockwell Collins Inc. | 11,626 | 952 |
| Textron Inc. | 24,385 | 946 |
| Kansas City Southern | 9,752 | 904 |
| * Waters Corp. | 7,252 | 880 |
| Pentair plc | 15,825 | 875 |
| Republic Services Inc. Class A | 21,288 | 872 |
| Dover Corp. | 14,079 | 872 |
| CH Robinson Worldwide Inc. | 12,801 | 863 |
| Alaska Air Group Inc. | 11,400 | 853 |
| Snap-on Inc. | 5,174 | 827 |
| Expeditors International of Washington Inc. | 16,818 | 824 |
| Wabtec Corp. | 8,533 | 817 |
| L-3 Communications Holdings Inc. | 7,191 | 758 |
| * Mettler-Toledo International Inc. | 2,450 | 727 |
| Towers Watson & Co. Class A | 6,082 | 722 |
| Cintas Corp. | 8,430 | 716 |
| * IHS Inc. Class A | 6,011 | 697 |
| * Spirit AeroSystems Holdings Inc. Class A | 12,463 | 637 |
| Robert Half International Inc. | 12,306 | 628 |
| * JetBlue Airways Corp. | 27,454 | 613 |
| JB Hunt Transport Services Inc. | 8,373 | 609 |
| ManpowerGroup Inc. | 6,843 | 595 |
| Fluor Corp. | 12,869 | 587 |
| * United Rentals Inc. | 8,417 | 584 |
| Carlisle Cos. Inc. | 5,690 | 573 |
| * Middleby Corp. | 5,040 | 547 |
| Waste Connections Inc. | 11,391 | 542 |
| Flowserve Corp. | 11,769 | 531 |
| Xylem Inc. | 15,916 | 516 |
| * CoStar Group Inc. | 2,848 | 504 |
| Hubbell Inc. Class B | 5,068 | 500 |
| IDEX Corp. | 6,913 | 497 |
| Allegion plc | 8,323 | 496 |
| * HD Supply Holdings Inc. | 14,981 | 494 |
| ADT Corp. | 15,013 | 492 |
| Huntington Ingalls Industries Inc. | 4,285 | 482 |
| Macquarie Infrastructure Corp. | 6,105 | 481 |
| * Keysight Technologies Inc. | 14,818 | 475 |
| Avery Dennison Corp. | 7,986 | 464 |
| B/E Aerospace Inc. | 9,392 | 458 |
| Allison Transmission Holdings Inc. | 15,822 | 453 |
| * Jacobs Engineering Group Inc. | 11,024 | 445 |
| * Quanta Services Inc. | 18,130 | 439 |
| * Trimble Navigation Ltd. | 22,763 | 430 |
| AO Smith Corp. | 6,534 | 422 |
| * Old Dominion Freight Line Inc. | 5,995 | 399 |
| Orbital ATK Inc. | 5,226 | 396 |
13
| Vanguard® Russell 1000 Index Fund | ||
| Schedule of Investments | ||
| August 31, 2015 | ||
| Market | ||
| Value | ||
| Shares | ($000) | |
| Ryder System Inc. | 4,708 | 386 |
| Lincoln Electric Holdings Inc. | 6,550 | 384 |
| * Copart Inc. | 10,882 | 381 |
| Donaldson Co. Inc. | 12,018 | 376 |
| Chicago Bridge & Iron Co. NV | 8,485 | 376 |
| * Zebra Technologies Corp. | 4,510 | 374 |
| * AECOM | 13,269 | 365 |
| Graco Inc. | 5,276 | 364 |
| Nordson Corp. | 5,464 | 363 |
| Trinity Industries Inc. | 13,367 | 361 |
| FLIR Systems Inc. | 12,336 | 353 |
| Pitney Bowes Inc. | 17,436 | 345 |
| * Kirby Corp. | 4,851 | 342 |
| Toro Co. | 4,776 | 341 |
| * Colfax Corp. | 8,669 | 336 |
| AGCO Corp. | 6,744 | 331 |
| * Spirit Airlines Inc. | 6,429 | 330 |
| * Genpact Ltd. | 14,001 | 322 |
| * Genesee & Wyoming Inc. Class A | 4,606 | 315 |
| Air Lease Corp. Class A | 9,087 | 292 |
| ITT Corp. | 7,699 | 288 |
| MSC Industrial Direct Co. Inc. Class A | 4,200 | 284 |
| RR Donnelley & Sons Co. | 17,887 | 281 |
| National Instruments Corp. | 9,614 | 281 |
| Oshkosh Corp. | 6,644 | 279 |
| Regal Beloit Corp. | 3,824 | 255 |
| Landstar System Inc. | 3,809 | 252 |
| * Clean Harbors Inc. | 5,089 | 250 |
| BWX Technologies Inc. | 9,315 | 247 |
| Booz Allen Hamilton Holding Corp. Class A | 8,712 | 233 |
| Rollins Inc. | 8,051 | 225 |
| Triumph Group Inc. | 4,424 | 219 |
| Crane Co. | 4,150 | 218 |
| KBR Inc. | 12,435 | 217 |
| Terex Corp. | 9,285 | 217 |
| Kennametal Inc. | 7,039 | 215 |
| SPX Corp. | 3,649 | 214 |
| * WESCO International Inc. | 3,801 | 213 |
| Joy Global Inc. | 8,451 | 205 |
| GATX Corp. | 3,950 | 196 |
| Manitowoc Co. Inc. | 11,433 | 195 |
| Covanta Holding Corp. | 9,848 | 195 |
| Lexmark International Inc. Class A | 5,263 | 158 |
| Teekay Corp. | 3,915 | 144 |
| Copa Holdings SA Class A | 2,806 | 144 |
| * TopBuild Corp. | 3,398 | 108 |
| * Babcock & Wilcox Enterprises Inc. | 4,657 | 86 |
| 186,129 | ||
| Technology (16.3%) | ||
| Apple Inc. | 507,092 | 57,180 |
| Microsoft Corp. | 712,005 | 30,986 |
| * Facebook Inc. Class A | 190,746 | 17,058 |
| * Google Inc. Class A | 25,365 | 16,432 |
| * Google Inc. Class C | 25,885 | 16,003 |
| Intel Corp. | 418,220 | 11,936 |
| International Business Machines Corp. | 79,812 | 11,803 |
| Cisco Systems Inc. | 448,353 | 11,603 |
| Oracle Corp. | 279,285 | 10,359 |
| QUALCOMM Inc. | 143,859 | 8,140 |
| Hewlett-Packard Co. | 160,359 | 4,500 |
| Texas Instruments Inc. | 91,882 | 4,396 |
| EMC Corp. | 171,470 | 4,264 |
| * salesforce.com inc | 58,042 | 4,026 |
| * Adobe Systems Inc. | 44,301 | 3,481 |
14
| Vanguard® Russell 1000 Index Fund | ||
| Schedule of Investments | ||
| August 31, 2015 | ||
| Market | ||
| Value | ||
| Shares | ($000) | |
| * Cognizant Technology Solutions Corp. Class A | 54,012 | 3,400 |
| Avago Technologies Ltd. Class A | 22,519 | 2,837 |
| * Yahoo! Inc. | 83,153 | 2,681 |
| Broadcom Corp. Class A | 48,512 | 2,507 |
| Intuit Inc. | 24,252 | 2,080 |
| Corning Inc. | 112,049 | 1,928 |
| * Electronic Arts Inc. | 27,601 | 1,826 |
| Applied Materials Inc. | 107,953 | 1,736 |
| * LinkedIn Corp. Class A | 9,591 | 1,732 |
| Western Digital Corp. | 19,709 | 1,615 |
| * Micron Technology Inc. | 94,836 | 1,556 |
| Analog Devices Inc. | 27,534 | 1,538 |
| Skyworks Solutions Inc. | 16,801 | 1,468 |
| Amphenol Corp. Class A | 27,097 | 1,419 |
| * Twitter Inc. | 49,564 | 1,377 |
| * SBA Communications Corp. Class A | 11,388 | 1,346 |
| Altera Corp. | 26,420 | 1,283 |
| Activision Blizzard Inc. | 44,239 | 1,267 |
| Symantec Corp. | 59,699 | 1,223 |
| Motorola Solutions Inc. | 18,576 | 1,204 |
| * Red Hat Inc. | 16,086 | 1,162 |
| * Akamai Technologies Inc. | 15,680 | 1,118 |
| NVIDIA Corp. | 47,189 | 1,061 |
| * Palo Alto Networks Inc. | 6,395 | 1,050 |
| Lam Research Corp. | 13,953 | 1,015 |
| SanDisk Corp. | 18,308 | 999 |
| * ServiceNow Inc. | 13,526 | 960 |
| * Citrix Systems Inc. | 14,086 | 959 |
| Xilinx Inc. | 22,735 | 952 |
| * Autodesk Inc. | 19,975 | 934 |
| Juniper Networks Inc. | 34,655 | 891 |
| NetApp Inc. | 27,397 | 876 |
| Linear Technology Corp. | 21,068 | 849 |
| Maxim Integrated Products Inc. | 24,910 | 839 |
| Harris Corp. | 10,881 | 836 |
| Microchip Technology Inc. | 18,416 | 783 |
| Amdocs Ltd. | 13,600 | 778 |
| * F5 Networks Inc. | 6,255 | 759 |
| Computer Sciences Corp. | 12,193 | 756 |
| CA Inc. | 27,511 | 751 |
| * Qorvo Inc. | 13,161 | 731 |
| KLA-Tencor Corp. | 14,100 | 707 |
| CDK Global Inc. | 14,120 | 699 |
| * ANSYS Inc. | 7,779 | 689 |
| * Splunk Inc. | 11,028 | 683 |
| * Synopsys Inc. | 14,060 | 660 |
| * Workday Inc. Class A | 9,355 | 657 |
| * VeriSign Inc. | 9,136 | 630 |
| * Gartner Inc. | 7,271 | 622 |
| * VMware Inc. Class A | 7,127 | 564 |
| * Fortinet Inc. | 12,538 | 528 |
| * Cadence Design Systems Inc. | 25,708 | 515 |
| Avnet Inc. | 11,939 | 506 |
| SS&C Technologies Holdings Inc. | 7,205 | 488 |
| CDW Corp. | 12,140 | 483 |
| * Arrow Electronics Inc. | 8,392 | 469 |
| * FireEye Inc. | 12,157 | 459 |
| IAC/InterActiveCorp | 6,489 | 453 |
| Marvell Technology Group Ltd. | 39,796 | 448 |
| * Ultimate Software Group Inc. | 2,537 | 447 |
| * Tableau Software Inc. Class A | 4,326 | 407 |
| Brocade Communications Systems Inc. | 37,334 | 398 |
| * NCR Corp. | 14,888 | 374 |
| * Nuance Communications Inc. | 22,489 | 370 |
15
| Vanguard® Russell 1000 Index Fund | ||
| Schedule of Investments | ||
| August 31, 2015 | ||
| Market | ||
| Value | ||
| Shares | ($000) | |
| Ingram Micro Inc. | 13,399 | 363 |
| * ON Semiconductor Corp. | 37,784 | 361 |
| * Teradata Corp. | 12,267 | 359 |
| * IMS Health Holdings Inc. | 11,810 | 353 |
| * Freescale Semiconductor Ltd. | 9,809 | 350 |
| * PTC Inc. | 10,222 | 339 |
| Jabil Circuit Inc. | 17,412 | 337 |
| Teradyne Inc. | 18,419 | 332 |
| DST Systems Inc. | 3,173 | 325 |
| * Rackspace Hosting Inc. | 10,625 | 323 |
| * NetSuite Inc. | 3,538 | 314 |
| * VeriFone Systems Inc. | 10,041 | 314 |
| * ARRIS Group Inc. | 11,717 | 310 |
| Atmel Corp. | 36,190 | 296 |
| * CommScope Holding Co. Inc. | 9,029 | 292 |
| Cognex Corp. | 8,142 | 290 |
| Cypress Semiconductor Corp. | 28,344 | 283 |
| Solera Holdings Inc. | 5,757 | 277 |
| Sabre Corp. | 9,713 | 264 |
| * Cree Inc. | 9,477 | 258 |
| * IPG Photonics Corp. | 3,018 | 255 |
| * SunEdison Inc. | 23,966 | 249 |
| Leidos Holdings Inc. | 5,834 | 245 |
| * SolarWinds Inc. | 5,896 | 234 |
| * Arista Networks Inc. | 2,897 | 217 |
| * Groupon Inc. Class A | 42,716 | 192 |
| * Zynga Inc. Class A | 65,934 | 167 |
| * EchoStar Corp. Class A | 3,702 | 165 |
| * Yelp Inc. Class A | 5,631 | 137 |
| Dolby Laboratories Inc. Class A | 4,131 | 134 |
| * 3D Systems Corp. | 9,257 | 127 |
| * Viavi Solutions Inc. | 20,614 | 111 |
| King Digital Entertainment plc | 6,862 | 91 |
| * Lumentum Holdings Inc. | 4,118 | 81 |
| * Black Knight Financial Services Inc. Class A | 1,766 | 57 |
| * GoDaddy Inc. Class A | 2,018 | 51 |
| * Inovalon Holdings Inc. Class A | 2,122 | 46 |
| 288,404 | ||
| Utilities (5.2%) | ||
| AT&T Inc. | 535,721 | 17,786 |
| Verizon Communications Inc. | 358,837 | 16,510 |
| Duke Energy Corp. | 61,101 | 4,333 |
| NextEra Energy Inc. | 39,015 | 3,839 |
| Dominion Resources Inc. | 52,533 | 3,664 |
| Southern Co. | 80,380 | 3,489 |
| American Electric Power Co. Inc. | 43,532 | 2,363 |
| Exelon Corp. | 75,531 | 2,323 |
| PG&E Corp. | 42,131 | 2,089 |
| Sempra Energy | 21,778 | 2,066 |
| PPL Corp. | 58,620 | 1,817 |
| Public Service Enterprise Group Inc. | 44,362 | 1,786 |
| Edison International | 28,626 | 1,674 |
| Consolidated Edison Inc. | 25,674 | 1,615 |
| Xcel Energy Inc. | 44,492 | 1,501 |
| CenturyLink Inc. | 49,495 | 1,338 |
| WEC Energy Group Inc. | 27,815 | 1,325 |
| Eversource Energy | 27,879 | 1,317 |
| DTE Energy Co. | 15,767 | 1,231 |
| FirstEnergy Corp. | 37,009 | 1,183 |
| * Level 3 Communications Inc. | 25,411 | 1,137 |
| Entergy Corp. | 15,758 | 1,029 |
| * T-Mobile US Inc. | 24,097 | 955 |
| Ameren Corp. | 21,278 | 857 |
| American Water Works Co. Inc. | 15,779 | 820 |
16
| Vanguard® Russell 1000 Index Fund | |||||
| Schedule of Investments | |||||
| August 31, 2015 | |||||
| Market | |||||
| Value | |||||
| Shares | ($000) | ||||
| CMS Energy Corp. | 24,312 | 797 | |||
| AES Corp. | 59,873 | 718 | |||
| CenterPoint Energy Inc. | 37,762 | 703 | |||
| SCANA Corp. | 12,985 | 687 | |||
| AGL Resources Inc. | 10,539 | 643 | |||
| NRG Energy Inc. | 29,259 | 583 | |||
| Pinnacle West Capital Corp. | 9,722 | 579 | |||
| Alliant Energy Corp. | 9,813 | 556 | |||
| * | Calpine Corp. | 32,658 | 521 | ||
| Frontier Communications Corp. | 102,571 | 520 | |||
| UGI Corp. | 15,171 | 517 | |||
| Pepco Holdings Inc. | 22,273 | 512 | |||
| OGE Energy Corp. | 17,493 | 491 | |||
| Atmos Energy Corp. | 8,911 | 488 | |||
| NiSource Inc. | 27,866 | 468 | |||
| ITC Holdings Corp. | 13,531 | 442 | |||
| TECO Energy Inc. | 20,704 | 436 | |||
| Westar Energy Inc. Class A | 11,657 | 426 | |||
| National Fuel Gas Co. | 7,439 | 401 | |||
| Aqua America Inc. | 15,241 | 387 | |||
| * | Zayo Group Holdings Inc. | 12,316 | 344 | ||
| Great Plains Energy Inc. | 13,583 | 339 | |||
| * | Sprint Corp. | 62,564 | 317 | ||
| MDU Resources Group Inc. | 17,159 | 307 | |||
| Vectren Corp. | 7,285 | 293 | |||
| Questar Corp. | 15,063 | 291 | |||
| Hawaiian Electric Industries Inc. | 9,208 | 260 | |||
| Telephone & Data Systems Inc. | 8,095 | 230 | |||
| * | United States Cellular Corp. | 1,145 | 42 | ||
| 91,345 | |||||
| Total Common Stocks (Cost $1,599,797) | 1,757,121 | ||||
| Coupon | |||||
| Temporary Cash Investments (0.5%)1 | |||||
| Money Market Fund (0.5%) | |||||
| 3,4 | Vanguard Market Liquidity Fund | 0.168% | 8,225,187 | 8,225 | |
| Face | |||||
| Maturity | Amount | ||||
| Date | ($000) | ||||
| U.S. Government and Agency Obligations (0.0%) | |||||
| 5,6 | Federal Home Loan Bank Discount Notes | 0.091% | 9/11/15 | 100 | 100 |
| 5,6 | Federal Home Loan Bank Discount Notes | 0.100% | 10/23/15 | 300 | 300 |
| 5,6 | Federal Home Loan Bank Discount Notes | 0.150% | 11/13/15 | 100 | 100 |
| 500 | |||||
| Total Temporary Cash Investments (Cost $8,725) | 8,725 | ||||
| Total Investments (100.0%) (Cost $1,608,522) | 1,765,846 | ||||
| Other Assets and Liabilities—Net (0.0%)4 | (880) | ||||
| Net Assets (100%) | 1,764,966 | ||||
* Non-income-producing security.
^ Includes partial security positions on loan to broker-dealers. The total value of securities on loan is $2,335,000.
1 The fund invests a portion of its cash reserves in equity markets through the use of index futures contracts. After giving effect to futures investments, the fund's effective common stock and temporary cash investment positions represent 99.9% and 0.1%, respectively, of net assets.
2 “Other” represents securities that are not classified by the fund’s benchmark index.
17
Vanguard® Russell 1000 Index Fund
Schedule of Investments
August 31, 2015
3 Affiliated money market fund available only to Vanguard funds and certain trusts and accounts managed by Vanguard. Rate shown is the 7-day yield.
4 Includes $2,407,000 of collateral received for securities on loan.
5 The issuer operates under a congressional charter; its securities are generally neither guaranteed by the U.S. Treasury nor backed by the full faith and credit of the U.S. government.
6 Securities with a value of $500,000 have been segregated as initial margin for open futures contracts.
REIT—Real Estate Investment Trust.
18
| Vanguard® Russell 1000 Value Index Fund | ||
| Schedule of Investments | ||
| August 31, 2015 | ||
| Market | ||
| Value | ||
| Shares | ($000) | |
| Common Stocks (99.2%)1 | ||
| Consumer Discretionary (6.5%) | ||
| Wal-Mart Stores Inc. | 270,992 | 17,541 |
| Ford Motor Co. | 669,900 | 9,292 |
| General Motors Co. | 275,826 | 8,120 |
| Target Corp. | 100,465 | 7,807 |
| Time Warner Inc. | 68,723 | 4,886 |
| Johnson Controls Inc. | 88,077 | 3,623 |
| Carnival Corp. | 72,572 | 3,573 |
| Twenty-First Century Fox Inc. Class A | 96,116 | 2,633 |
| Royal Caribbean Cruises Ltd. | 29,526 | 2,603 |
| Whirlpool Corp. | 12,484 | 2,099 |
| Best Buy Co. Inc. | 52,163 | 1,916 |
| Kohl's Corp. | 34,633 | 1,767 |
| Comcast Corp. Class A | 30,254 | 1,704 |
| PVH Corp. | 14,285 | 1,700 |
| Staples Inc. | 109,815 | 1,560 |
| * MGM Resorts International | 71,511 | 1,461 |
| Goodyear Tire & Rubber Co. | 46,536 | 1,385 |
| Mattel Inc. | 58,368 | 1,368 |
| PulteGroup Inc. | 63,070 | 1,305 |
| * Liberty Interactive Corp. QVC Group Class A | 46,935 | 1,269 |
| Coach Inc. | 41,106 | 1,243 |
| * Liberty Media Corp. | 33,985 | 1,231 |
| Darden Restaurants Inc. | 17,560 | 1,194 |
| * News Corp. Class A | 87,121 | 1,187 |
| Ralph Lauren Corp. Class A | 9,662 | 1,074 |
| DR Horton Inc. | 32,937 | 1,000 |
| Newell Rubbermaid Inc. | 23,021 | 970 |
| Macy's Inc. | 16,303 | 956 |
| Lennar Corp. Class A | 17,976 | 915 |
| * TEGNA Inc. | 38,412 | 914 |
| Harley-Davidson Inc. | 16,157 | 906 |
| * Nielsen Holdings plc | 19,591 | 886 |
| Fortune Brands Home & Security Inc. | 17,699 | 847 |
| ^ GameStop Corp. Class A | 18,377 | 781 |
| Garmin Ltd. | 20,199 | 760 |
| Cablevision Systems Corp. Class A | 29,805 | 750 |
| * DISH Network Corp. Class A | 12,341 | 731 |
| * Toll Brothers Inc. | 19,590 | 724 |
| * Liberty Media Corp. Class A | 18,144 | 676 |
| Comcast Corp. Special Class A | 11,248 | 644 |
| * Mohawk Industries Inc. | 3,197 | 630 |
| * Office Depot Inc. | 78,339 | 621 |
| * Liberty Broadband Corp. | 11,445 | 613 |
| KAR Auction Services Inc. | 16,245 | 602 |
| Tribune Media Co. Class A | 14,004 | 559 |
| Outfront Media Inc. | 23,946 | 542 |
| * JC Penney Co. Inc. | 53,683 | 489 |
| * Vista Outdoor Inc. | 9,822 | 459 |
| John Wiley & Sons Inc. Class A | 8,156 | 421 |
| Graham Holdings Co. Class B | 624 | 413 |
| Tiffany & Co. | 4,985 | 410 |
| Gentex Corp. | 24,275 | 376 |
| Avon Products Inc. | 71,859 | 373 |
| Aaron's Inc. | 9,832 | 370 |
| * Murphy USA Inc. | 7,106 | 363 |
| Nu Skin Enterprises Inc. Class A | 7,643 | 349 |
| * Cabela's Inc. | 7,493 | 337 |
| DSW Inc. Class A | 11,340 | 337 |
| Lear Corp. | 3,235 | 333 |
| Wendy's Co. | 36,343 | 331 |
| Dillard's Inc. Class A | 3,503 | 324 |
19
| Vanguard® Russell 1000 Value Index Fund | |||
| Schedule of Investments | |||
| August 31, 2015 | |||
| Market | |||
| Value | |||
| Shares | ($000) | ||
| * | HomeAway Inc. | 10,721 | 308 |
| * | Hyatt Hotels Corp. Class A | 5,575 | 286 |
| Hasbro Inc. | 3,623 | 270 | |
| AMERCO | 668 | 250 | |
| * | Liberty Broadband Corp. Class A | 4,539 | 247 |
| * | Gannett Co. Inc. | 18,707 | 245 |
| * | Cable One Inc. | 574 | 238 |
| Dick's Sporting Goods Inc. | 4,719 | 237 | |
| Penske Automotive Group Inc. | 4,471 | 226 | |
| Foot Locker Inc. | 3,022 | 214 | |
| Brunswick Corp. | 4,023 | 200 | |
| Genuine Parts Co. | 2,068 | 173 | |
| Wynn Resorts Ltd. | 1,542 | 116 | |
| * | Discovery Communications Inc. | 4,072 | 103 |
| * | Norwegian Cruise Line Holdings Ltd. | 1,758 | 101 |
| H&R Block Inc. | 2,954 | 101 | |
| International Game Technology plc | 5,081 | 86 | |
| Aramark | 2,732 | 86 | |
| * | Fossil Group Inc. | 1,272 | 78 |
| CST Brands Inc. | 1,985 | 69 | |
| * | Discovery Communications Inc. Class A | 2,312 | 62 |
| *,^ | Sears Holdings Corp. | 2,028 | 54 |
| Lennar Corp. Class B | 974 | 42 | |
| * | Clear Channel Outdoor Holdings Inc. Class A | 3,662 | 30 |
| Tupperware Brands Corp. | 445 | 23 | |
| Twenty-First Century Fox Inc. | 136 | 4 | |
| * | News Corp. Class B | 104 | 1 |
| 109,103 | |||
| Consumer Staples (5.6%) | |||
| Procter & Gamble Co. | 465,446 | 32,893 | |
| Mondelez International Inc. Class A | 279,060 | 11,821 | |
| Walgreens Boots Alliance Inc. | 125,268 | 10,842 | |
| Philip Morris International Inc. | 133,500 | 10,653 | |
| Archer-Daniels-Midland Co. | 106,648 | 4,798 | |
| Sysco Corp. | 69,950 | 2,789 | |
| ConAgra Foods Inc. | 63,044 | 2,628 | |
| JM Smucker Co. | 20,458 | 2,408 | |
| Tyson Foods Inc. Class A | 47,795 | 2,021 | |
| Bunge Ltd. | 24,554 | 1,779 | |
| Molson Coors Brewing Co. Class B | 23,717 | 1,615 | |
| CVS Health Corp. | 14,170 | 1,451 | |
| Kimberly-Clark Corp. | 13,063 | 1,392 | |
| Colgate-Palmolive Co. | 19,247 | 1,209 | |
| Altria Group Inc. | 19,816 | 1,062 | |
| * | Edgewell Personal Care Co. | 10,870 | 957 |
| Ingredion Inc. | 10,702 | 924 | |
| Pinnacle Foods Inc. | 19,984 | 896 | |
| Campbell Soup Co. | 12,440 | 597 | |
| * | Rite Aid Corp. | 69,654 | 575 |
| Clorox Co. | 4,808 | 534 | |
| Energizer Holdings Inc. | 10,470 | 437 | |
| Kellogg Co. | 4,354 | 288 | |
| Pilgrim's Pride Corp. | 10,192 | 214 | |
| Whole Foods Market Inc. | 4,937 | 162 | |
| Brown-Forman Corp. Class B | 1,457 | 143 | |
| * | Herbalife Ltd. | 1,777 | 102 |
| Flowers Foods Inc. | 3,130 | 73 | |
| Brown-Forman Corp. Class A | 315 | 34 | |
| 95,297 | |||
| Energy (13.3%) | |||
| Exxon Mobil Corp. | 717,307 | 53,970 | |
| Chevron Corp. | 322,691 | 26,135 | |
| Schlumberger Ltd. | 191,561 | 14,821 | |
| ConocoPhillips | 211,618 | 10,401 | |
20
| Vanguard® Russell 1000 Value Index Fund | ||
| Schedule of Investments | ||
| August 31, 2015 | ||
| Market | ||
| Value | ||
| Shares | ($000) | |
| Kinder Morgan Inc. | 306,337 | 9,928 |
| Occidental Petroleum Corp. | 131,845 | 9,626 |
| Phillips 66 | 92,974 | 7,351 |
| EOG Resources Inc. | 86,088 | 6,742 |
| Anadarko Petroleum Corp. | 87,198 | 6,242 |
| Halliburton Co. | 146,100 | 5,749 |
| Valero Energy Corp. | 87,391 | 5,186 |
| Baker Hughes Inc. | 74,825 | 4,190 |
| Marathon Petroleum Corp. | 86,383 | 4,087 |
| Spectra Energy Corp. | 114,645 | 3,333 |
| Pioneer Natural Resources Co. | 25,535 | 3,142 |
| Devon Energy Corp. | 70,877 | 3,024 |
| Apache Corp. | 64,375 | 2,912 |
| National Oilwell Varco Inc. | 66,206 | 2,802 |
| Hess Corp. | 43,166 | 2,566 |
| * Cheniere Energy Inc. | 40,435 | 2,513 |
| Noble Energy Inc. | 73,255 | 2,447 |
| * Concho Resources Inc. | 20,504 | 2,218 |
| * Cameron International Corp. | 32,873 | 2,195 |
| EQT Corp. | 26,032 | 2,026 |
| Marathon Oil Corp. | 115,361 | 1,995 |
| Tesoro Corp. | 20,271 | 1,865 |
| Cimarex Energy Co. | 16,248 | 1,796 |
| Columbia Pipeline Group Inc. | 54,254 | 1,376 |
| * Weatherford International plc | 133,242 | 1,352 |
| HollyFrontier Corp. | 28,140 | 1,319 |
| * Southwestern Energy Co. | 66,653 | 1,082 |
| Range Resources Corp. | 26,756 | 1,033 |
| Helmerich & Payne Inc. | 16,440 | 970 |
| Murphy Oil Corp. | 30,156 | 935 |
| * Newfield Exploration Co. | 27,749 | 924 |
| ^ Chesapeake Energy Corp. | 99,771 | 779 |
| * Diamondback Energy Inc. | 10,898 | 744 |
| Ensco plc Class A | 40,360 | 731 |
| ONEOK Inc. | 19,391 | 698 |
| Energen Corp. | 13,289 | 691 |
| * Whiting Petroleum Corp. | 34,820 | 673 |
| Nabors Industries Ltd. | 57,037 | 658 |
| * Gulfport Energy Corp. | 18,257 | 654 |
| * First Solar Inc. | 13,042 | 624 |
| Oceaneering International Inc. | 14,143 | 620 |
| Golar LNG Ltd. | 15,680 | 611 |
| CONSOL Energy Inc. | 39,944 | 608 |
| Noble Corp. plc | 42,226 | 550 |
| ^ Seadrill Ltd. | 65,643 | 528 |
| * Cobalt International Energy Inc. | 64,383 | 516 |
| * FMC Technologies Inc. | 14,297 | 497 |
| PBF Energy Inc. Class A | 15,105 | 452 |
| * Dril-Quip Inc. | 6,426 | 443 |
| SM Energy Co. | 12,033 | 442 |
| QEP Resources Inc. | 31,324 | 440 |
| Superior Energy Services Inc. | 26,692 | 425 |
| World Fuel Services Corp. | 10,379 | 401 |
| Patterson-UTI Energy Inc. | 24,310 | 396 |
| Rowan Cos. plc Class A | 20,559 | 369 |
| * NOW Inc. | 18,386 | 314 |
| Targa Resources Corp. | 4,732 | 313 |
| * Continental Resources Inc. | 9,489 | 305 |
| * Antero Resources Corp. | 11,503 | 297 |
| * WPX Energy Inc. | 39,522 | 289 |
| Denbury Resources Inc. | 58,878 | 255 |
| Diamond Offshore Drilling Inc. | 10,521 | 249 |
| * Rice Energy Inc. | 12,099 | 235 |
| * SunPower Corp. Class A | 8,644 | 210 |
21
| Vanguard® Russell 1000 Value Index Fund | |||
| Schedule of Investments | |||
| August 31, 2015 | |||
| Market | |||
| Value | |||
| Shares | ($000) | ||
| *,^ | Laredo Petroleum Inc. | 20,381 | 208 |
| TerraForm Power Inc. Class A | 9,205 | 207 | |
| California Resources Corp. | 51,806 | 201 | |
| * | Kosmos Energy Ltd. | 26,013 | 182 |
| Frank's International NV | 6,505 | 106 | |
| RPC Inc. | 8,298 | 96 | |
| CVR Energy Inc. | 1,488 | 60 | |
| * | EP Energy Corp. Class A | 5,447 | 39 |
| 225,369 | |||
| Financial Services (30.2%) | |||
| Wells Fargo & Co. | 799,285 | 42,626 | |
| JPMorgan Chase & Co. | 636,712 | 40,813 | |
| * | Berkshire Hathaway Inc. Class B | 298,388 | 39,996 |
| Bank of America Corp. | 1,801,747 | 29,441 | |
| Citigroup Inc. | 520,562 | 27,840 | |
| Goldman Sachs Group Inc. | 74,119 | 13,979 | |
| American International Group Inc. | 228,785 | 13,805 | |
| US Bancorp | 287,428 | 12,173 | |
| American Express Co. | 119,530 | 9,170 | |
| Morgan Stanley | 263,083 | 9,063 | |
| PNC Financial Services Group Inc. | 88,890 | 8,100 | |
| MetLife Inc. | 160,764 | 8,054 | |
| Capital One Financial Corp. | 93,761 | 7,290 | |
| Bank of New York Mellon Corp. | 171,638 | 6,831 | |
| Prudential Financial Inc. | 77,760 | 6,275 | |
| ACE Ltd. | 56,103 | 5,731 | |
| Travelers Cos. Inc. | 54,735 | 5,449 | |
| CME Group Inc. | 55,122 | 5,206 | |
| State Street Corp. | 70,733 | 5,087 | |
| BB&T Corp. | 133,240 | 4,919 | |
| Chubb Corp. | 39,309 | 4,749 | |
| Equity Residential | 62,528 | 4,455 | |
| BlackRock Inc. | 14,706 | 4,448 | |
| Aflac Inc. | 74,571 | 4,370 | |
| Allstate Corp. | 70,367 | 4,101 | |
| Discover Financial Services | 76,120 | 4,090 | |
| AvalonBay Communities Inc. | 22,641 | 3,737 | |
| SunTrust Banks Inc. | 88,891 | 3,589 | |
| Prologis Inc. | 89,528 | 3,402 | |
| Hartford Financial Services Group Inc. | 71,764 | 3,298 | |
| Ventas Inc. | 57,005 | 3,136 | |
| Progressive Corp. | 100,153 | 3,001 | |
| HCP Inc. | 79,593 | 2,950 | |
| Vornado Realty Trust | 32,270 | 2,814 | |
| Intercontinental Exchange Inc. | 12,243 | 2,796 | |
| Northern Trust Corp. | 39,852 | 2,783 | |
| Fifth Third Bancorp | 138,282 | 2,755 | |
| M&T Bank Corp. | 22,769 | 2,692 | |
| Franklin Resources Inc. | 66,238 | 2,688 | |
| Principal Financial Group Inc. | 50,338 | 2,534 | |
| General Growth Properties Inc. | 98,622 | 2,503 | |
| Essex Property Trust Inc. | 11,160 | 2,395 | |
| Host Hotels & Resorts Inc. | 129,752 | 2,300 | |
| Weyerhaeuser Co. | 81,049 | 2,264 | |
| Lincoln National Corp. | 43,233 | 2,196 | |
| Regions Financial Corp. | 228,816 | 2,194 | |
| Invesco Ltd. | 64,328 | 2,194 | |
| Thomson Reuters Corp. | 56,304 | 2,186 | |
| Health Care REIT Inc. | 32,866 | 2,082 | |
| Macerich Co. | 27,036 | 2,060 | |
| KeyCorp | 144,829 | 1,990 | |
| Marsh & McLennan Cos. Inc. | 36,793 | 1,977 | |
| XL Group plc Class A | 52,411 | 1,954 | |
| Loews Corp. | 53,193 | 1,939 | |
22
| Vanguard® Russell 1000 Value Index Fund | ||
| Schedule of Investments | ||
| August 31, 2015 | ||
| Market | ||
| Value | ||
| Shares | ($000) | |
| Fidelity National Information Services Inc. | 27,597 | 1,906 |
| Realty Income Corp. | 39,701 | 1,774 |
| * Markel Corp. | 2,137 | 1,760 |
| SL Green Realty Corp. | 17,002 | 1,760 |
| FNF Group | 47,975 | 1,747 |
| Charles Schwab Corp. | 57,371 | 1,743 |
| Voya Financial Inc. | 39,248 | 1,691 |
| * Ally Financial Inc. | 76,457 | 1,671 |
| Annaly Capital Management Inc. | 162,640 | 1,636 |
| Kimco Realty Corp. | 70,608 | 1,627 |
| Huntington Bancshares Inc. | 138,763 | 1,514 |
| Cincinnati Financial Corp. | 28,314 | 1,482 |
| First Republic Bank | 24,378 | 1,470 |
| * Arch Capital Group Ltd. | 21,460 | 1,465 |
| UDR Inc. | 44,615 | 1,441 |
| Unum Group | 42,945 | 1,440 |
| New York Community Bancorp Inc. | 76,696 | 1,354 |
| Comerica Inc. | 30,662 | 1,349 |
| Everest Re Group Ltd. | 7,659 | 1,347 |
| Citizens Financial Group Inc. | 53,794 | 1,335 |
| * E*TRADE Financial Corp. | 49,940 | 1,313 |
| CIT Group Inc. | 30,055 | 1,306 |
| * Alleghany Corp. | 2,777 | 1,305 |
| HCC Insurance Holdings Inc. | 16,586 | 1,282 |
| Torchmark Corp. | 21,820 | 1,276 |
| * VEREIT Inc. | 156,511 | 1,274 |
| Raymond James Financial Inc. | 22,210 | 1,177 |
| American Capital Agency Corp. | 59,791 | 1,144 |
| PartnerRe Ltd. | 8,158 | 1,129 |
| Camden Property Trust | 14,783 | 1,065 |
| Duke Realty Corp. | 58,605 | 1,058 |
| Alexandria Real Estate Equities Inc. | 12,190 | 1,048 |
| Leucadia National Corp. | 48,208 | 1,035 |
| Reinsurance Group of America Inc. Class A | 11,379 | 1,034 |
| WP Carey Inc. | 17,720 | 1,018 |
| NASDAQ OMX Group Inc. | 19,757 | 1,011 |
| Mid-America Apartment Communities Inc. | 12,798 | 1,006 |
| Zions Bancorporation | 34,522 | 1,001 |
| East West Bancorp Inc. | 24,404 | 986 |
| Kilroy Realty Corp. | 14,957 | 970 |
| Axis Capital Holdings Ltd. | 17,223 | 964 |
| Apartment Investment & Management Co. | 26,581 | 958 |
| Regency Centers Corp. | 16,076 | 953 |
| WR Berkley Corp. | 16,619 | 902 |
| Assurant Inc. | 11,663 | 867 |
| Starwood Property Trust Inc. | 40,685 | 866 |
| Navient Corp. | 65,826 | 842 |
| Hudson City Bancorp Inc. | 90,403 | 841 |
| NorthStar Realty Finance Corp. | 59,252 | 832 |
| American Financial Group Inc. | 11,858 | 819 |
| People's United Financial Inc. | 52,814 | 819 |
| StanCorp Financial Group Inc. | 7,197 | 818 |
| RenaissanceRe Holdings Ltd. | 7,867 | 802 |
| * Forest City Enterprises Inc. Class A | 37,242 | 802 |
| National Retail Properties Inc. | 23,007 | 799 |
| DDR Corp. | 51,799 | 792 |
| Liberty Property Trust | 25,526 | 785 |
| Omega Healthcare Investors Inc. | 22,929 | 775 |
| PacWest Bancorp | 17,501 | 746 |
| Home Properties Inc. | 10,016 | 743 |
| White Mountains Insurance Group Ltd. | 1,032 | 742 |
| * Synchrony Financial | 22,188 | 731 |
| Spirit Realty Capital Inc. | 75,737 | 727 |
| City National Corp. | 8,244 | 724 |
23
| Vanguard® Russell 1000 Value Index Fund | ||
| Schedule of Investments | ||
| August 31, 2015 | ||
| Market | ||
| Value | ||
| Shares | ($000) | |
| Old Republic International Corp. | 44,940 | 706 |
| Synovus Financial Corp. | 22,975 | 699 |
| Plum Creek Timber Co. Inc. | 17,998 | 693 |
| Douglas Emmett Inc. | 25,061 | 692 |
| Brixmor Property Group Inc. | 29,902 | 682 |
| Weingarten Realty Investors | 21,323 | 675 |
| Endurance Specialty Holdings Ltd. | 10,476 | 668 |
| American Campus Communities Inc. | 19,408 | 665 |
| Hospitality Properties Trust | 25,814 | 664 |
| Assured Guaranty Ltd. | 26,031 | 658 |
| Allied World Assurance Co. Holdings AG | 16,361 | 653 |
| Validus Holdings Ltd. | 14,653 | 649 |
| BioMed Realty Trust Inc. | 35,019 | 648 |
| BankUnited Inc. | 17,960 | 640 |
| Brown & Brown Inc. | 19,949 | 640 |
| Commerce Bancshares Inc. | 14,227 | 637 |
| Senior Housing Properties Trust | 40,530 | 636 |
| * Realogy Holdings Corp. | 15,685 | 632 |
| Iron Mountain Inc. | 22,299 | 632 |
| Digital Realty Trust Inc. | 9,979 | 632 |
| Hanover Insurance Group Inc. | 7,681 | 606 |
| Two Harbors Investment Corp. | 63,504 | 601 |
| Cullen/Frost Bankers Inc. | 9,288 | 601 |
| Corrections Corp. of America | 20,294 | 596 |
| Ameriprise Financial Inc. | 5,261 | 593 |
| First Horizon National Corp. | 40,439 | 588 |
| * Equity Commonwealth | 22,520 | 579 |
| Apple Hospitality REIT Inc. | 32,410 | 574 |
| Arthur J Gallagher & Co. | 13,106 | 573 |
| First Niagara Financial Group Inc. | 61,701 | 571 |
| Retail Properties of America Inc. | 41,050 | 560 |
| * Popular Inc. | 18,005 | 529 |
| Paramount Group Inc. | 31,200 | 513 |
| * Howard Hughes Corp. | 4,046 | 508 |
| Legg Mason Inc. | 11,462 | 508 |
| Chimera Investment Corp. | 36,085 | 506 |
| Aspen Insurance Holdings Ltd. | 10,842 | 498 |
| Rayonier Inc. | 21,471 | 494 |
| Associated Banc-Corp | 26,677 | 490 |
| Dun & Bradstreet Corp. | 4,483 | 475 |
| Healthcare Trust of America Inc. Class A | 19,744 | 474 |
| Bank of Hawaii Corp. | 7,623 | 473 |
| American Homes 4 Rent Class A | 29,356 | 469 |
| ProAssurance Corp. | 9,682 | 467 |
| MFA Financial Inc. | 65,105 | 463 |
| TCF Financial Corp. | 29,702 | 461 |
| Piedmont Office Realty Trust Inc. Class A | 27,120 | 460 |
| * Genworth Financial Inc. Class A | 87,836 | 455 |
| * Care Capital Properties Inc. | 14,126 | 449 |
| Taubman Centers Inc. | 6,468 | 446 |
| Public Storage | 2,192 | 441 |
| CBL & Associates Properties Inc. | 29,427 | 438 |
| Communications Sales & Leasing Inc. | 21,262 | 427 |
| * SVB Financial Group | 3,346 | 418 |
| Columbia Property Trust Inc. | 19,419 | 415 |
| Gaming and Leisure Properties Inc. | 13,206 | 409 |
| Brandywine Realty Trust | 31,807 | 385 |
| * Springleaf Holdings Inc. Class A | 8,600 | 385 |
| WP GLIMCHER Inc. | 31,193 | 378 |
| Interactive Brokers Group Inc. | 9,288 | 371 |
| Post Properties Inc. | 6,382 | 353 |
| AmTrust Financial Services Inc. | 5,979 | 348 |
| Corporate Office Properties Trust | 15,564 | 327 |
| Jones Lang LaSalle Inc. | 2,158 | 321 |
24
| Vanguard® Russell 1000 Value Index Fund | |||
| Schedule of Investments | |||
| August 31, 2015 | |||
| Market | |||
| Value | |||
| Shares | ($000) | ||
| * | CoreLogic Inc. | 8,167 | 310 |
| * | Santander Consumer USA Holdings Inc. | 13,762 | 309 |
| BOK Financial Corp. | 4,651 | 294 | |
| Boston Properties Inc. | 2,414 | 274 | |
| TD Ameritrade Holding Corp. | 7,199 | 241 | |
| Mercury General Corp. | 4,408 | 224 | |
| TFS Financial Corp. | 10,811 | 186 | |
| Empire State Realty Trust Inc. | 9,725 | 158 | |
| CNA Financial Corp. | 4,337 | 156 | |
| * | Zillow Group Inc. | 5,840 | 144 |
| American National Insurance Co. | 1,278 | 127 | |
| * | Signature Bank | 728 | 97 |
| *,^ | Zillow Group Inc. Class A | 2,920 | 74 |
| * | SLM Corp. | 5,553 | 47 |
| Waddell & Reed Financial Inc. Class A | 862 | 34 | |
| 510,941 | |||
| Health Care (11.8%) | |||
| Johnson & Johnson | 414,428 | 38,948 | |
| Pfizer Inc. | 1,056,406 | 34,037 | |
| Merck & Co. Inc. | 429,493 | 23,128 | |
| Medtronic plc | 244,541 | 17,678 | |
| Abbott Laboratories | 255,499 | 11,572 | |
| * | Allergan plc | 36,897 | 11,207 |
| Thermo Fisher Scientific Inc. | 45,437 | 5,696 | |
| Aetna Inc. | 45,290 | 5,187 | |
| Anthem Inc. | 36,273 | 5,116 | |
| * | HCA Holdings Inc. | 50,877 | 4,407 |
| Perrigo Co. plc | 20,388 | 3,730 | |
| * | Boston Scientific Corp. | 212,832 | 3,563 |
| Zimmer Biomet Holdings Inc. | 27,362 | 2,834 | |
| Stryker Corp. | 28,420 | 2,804 | |
| Agilent Technologies Inc. | 56,898 | 2,066 | |
| Universal Health Services Inc. Class B | 12,973 | 1,779 | |
| * | Endo International plc | 22,759 | 1,752 |
| Quest Diagnostics Inc. | 24,669 | 1,673 | |
| * | DaVita HealthCare Partners Inc. | 21,446 | 1,622 |
| * | Express Scripts Holding Co. | 18,481 | 1,545 |
| St. Jude Medical Inc. | 21,241 | 1,504 | |
| * | Laboratory Corp. of America Holdings | 11,448 | 1,349 |
| Baxter International Inc. | 34,080 | 1,310 | |
| Baxalta Inc. | 33,780 | 1,187 | |
| * | Community Health Systems Inc. | 20,525 | 1,102 |
| * | Mallinckrodt plc | 12,061 | 1,040 |
| * | QIAGEN NV | 39,505 | 1,036 |
| UnitedHealth Group Inc. | 8,126 | 940 | |
| DENTSPLY International Inc. | 17,714 | 928 | |
| Teleflex Inc. | 7,070 | 925 | |
| PerkinElmer Inc. | 16,361 | 796 | |
| * | Health Net Inc. | 11,061 | 709 |
| * | Brookdale Senior Living Inc. | 24,921 | 683 |
| * | Hospira Inc. | 6,627 | 596 |
| * | Mylan NV | 11,142 | 553 |
| * | LifePoint Health Inc. | 6,906 | 540 |
| * | MEDNAX Inc. | 6,598 | 532 |
| * | Bio-Rad Laboratories Inc. Class A | 3,467 | 483 |
| Cardinal Health Inc. | 5,591 | 460 | |
| Cooper Cos. Inc. | 2,574 | 418 | |
| Bio-Techne Corp. | 3,876 | 366 | |
| Humana Inc. | 1,991 | 364 | |
| Patterson Cos. Inc. | 6,935 | 318 | |
| * | Allscripts Healthcare Solutions Inc. | 20,686 | 285 |
| * | Alkermes plc | 4,373 | 260 |
| * | Alere Inc. | 4,939 | 257 |
| * | Alnylam Pharmaceuticals Inc. | 2,361 | 243 |
25
| Vanguard® Russell 1000 Value Index Fund | ||
| Schedule of Investments | ||
| August 31, 2015 | ||
| Market | ||
| Value | ||
| Shares | ($000) | |
| * VWR Corp. | 2,286 | 60 |
| * Quintiles Transnational Holdings Inc. | 666 | 50 |
| * VCA Inc. | 754 | 42 |
| Hill-Rom Holdings Inc. | 743 | 39 |
| 199,719 | ||
| Materials & Processing (3.3%) | ||
| Dow Chemical Co. | 171,916 | 7,523 |
| Precision Castparts Corp. | 19,221 | 4,426 |
| EI du Pont de Nemours & Co. | 83,804 | 4,316 |
| Mosaic Co. | 59,534 | 2,431 |
| WestRock Co. | 40,421 | 2,399 |
| Nucor Corp. | 54,707 | 2,368 |
| Ingersoll-Rand plc | 42,045 | 2,325 |
| Alcoa Inc. | 223,553 | 2,113 |
| Freeport-McMoRan Inc. | 177,913 | 1,893 |
| Vulcan Materials Co. | 19,797 | 1,853 |
| Sigma-Aldrich Corp. | 12,642 | 1,762 |
| Martin Marietta Materials Inc. | 9,978 | 1,674 |
| Newmont Mining Corp. | 90,671 | 1,548 |
| Celanese Corp. Class A | 24,461 | 1,483 |
| Eastman Chemical Co. | 19,239 | 1,394 |
| Ashland Inc. | 10,616 | 1,114 |
| Air Products & Chemicals Inc. | 6,478 | 904 |
| Owens Corning | 20,184 | 894 |
| Praxair Inc. | 8,244 | 872 |
| Airgas Inc. | 8,990 | 868 |
| Albemarle Corp. | 19,170 | 867 |
| Cytec Industries Inc. | 11,126 | 826 |
| Reliance Steel & Aluminum Co. | 12,717 | 739 |
| Steel Dynamics Inc. | 36,872 | 718 |
| Sonoco Products Co. | 17,447 | 686 |
| * Crown Holdings Inc. | 13,467 | 668 |
| Bemis Co. Inc. | 15,022 | 637 |
| AptarGroup Inc. | 8,876 | 598 |
| * Owens-Illinois Inc. | 26,420 | 551 |
| Royal Gold Inc. | 10,696 | 515 |
| Domtar Corp. | 11,217 | 451 |
| United States Steel Corp. | 25,546 | 418 |
| Valmont Industries Inc. | 3,935 | 418 |
| Timken Co. | 13,167 | 418 |
| Cabot Corp. | 11,055 | 374 |
| Westlake Chemical Corp. | 6,650 | 367 |
| * Platform Specialty Products Corp. | 18,669 | 357 |
| Allegheny Technologies Inc. | 17,931 | 346 |
| Southern Copper Corp. | 12,676 | 338 |
| Graphic Packaging Holding Co. | 22,958 | 324 |
| FMC Corp. | 6,082 | 257 |
| Huntsman Corp. | 12,472 | 206 |
| Tahoe Resources Inc. | 22,990 | 192 |
| Chemours Co. | 16,180 | 157 |
| International Paper Co. | 3,471 | 150 |
| * Armstrong World Industries Inc. | 2,403 | 134 |
| Scotts Miracle-Gro Co. Class A | 760 | 47 |
| 55,919 | ||
| Producer Durables (9.6%) | ||
| General Electric Co. | 1,728,617 | 42,904 |
| United Technologies Corp. | 138,733 | 12,709 |
| Danaher Corp. | 82,595 | 7,187 |
| Caterpillar Inc. | 85,553 | 6,540 |
| Raytheon Co. | 52,465 | 5,381 |
| General Dynamics Corp. | 34,790 | 4,941 |
| FedEx Corp. | 31,142 | 4,690 |
| Eaton Corp. plc | 80,304 | 4,582 |
| Norfolk Southern Corp. | 52,481 | 4,089 |
26
| Vanguard® Russell 1000 Value Index Fund | ||
| Schedule of Investments | ||
| August 31, 2015 | ||
| Market | ||
| Value | ||
| Shares | ($000) | |
| Deere & Co. | 47,125 | 3,854 |
| Northrop Grumman Corp. | 23,096 | 3,782 |
| Waste Management Inc. | 71,648 | 3,587 |
| CSX Corp. | 126,304 | 3,458 |
| Lockheed Martin Corp. | 13,068 | 2,629 |
| Stanley Black & Decker Inc. | 23,846 | 2,421 |
| Xerox Corp. | 188,414 | 1,916 |
| Kansas City Southern | 19,100 | 1,771 |
| Roper Technologies Inc. | 10,650 | 1,726 |
| Dover Corp. | 27,558 | 1,707 |
| Emerson Electric Co. | 35,691 | 1,703 |
| Pentair plc | 30,707 | 1,698 |
| Republic Services Inc. Class A | 41,412 | 1,697 |
| L-3 Communications Holdings Inc. | 14,155 | 1,493 |
| Textron Inc. | 36,844 | 1,430 |
| Parker-Hannifin Corp. | 13,137 | 1,414 |
| Automatic Data Processing Inc. | 16,063 | 1,242 |
| Towers Watson & Co. Class A | 9,934 | 1,179 |
| ManpowerGroup Inc. | 13,268 | 1,153 |
| Fluor Corp. | 24,879 | 1,135 |
| Waste Connections Inc. | 21,146 | 1,006 |
| Xylem Inc. | 30,856 | 1,001 |
| Cummins Inc. | 7,959 | 969 |
| ADT Corp. | 29,232 | 958 |
| Macquarie Infrastructure Corp. | 11,805 | 929 |
| Carlisle Cos. Inc. | 8,689 | 875 |
| * Jacobs Engineering Group Inc. | 21,439 | 866 |
| Hubbell Inc. Class B | 8,580 | 847 |
| * Trimble Navigation Ltd. | 41,843 | 791 |
| Orbital ATK Inc. | 10,416 | 789 |
| * JetBlue Airways Corp. | 33,710 | 752 |
| Ryder System Inc. | 9,120 | 748 |
| ^ Chicago Bridge & Iron Co. NV | 16,763 | 742 |
| Trinity Industries Inc. | 26,683 | 720 |
| * Quanta Services Inc. | 28,312 | 686 |
| * Kirby Corp. | 9,706 | 685 |
| * Colfax Corp. | 17,371 | 674 |
| AGCO Corp. | 13,100 | 642 |
| * AECOM | 22,551 | 620 |
| ITT Corp. | 15,574 | 583 |
| Oshkosh Corp. | 13,704 | 576 |
| Flowserve Corp. | 12,549 | 566 |
| Air Lease Corp. Class A | 16,905 | 544 |
| Regal Beloit Corp. | 7,482 | 499 |
| National Instruments Corp. | 15,571 | 455 |
| KBR Inc. | 25,414 | 443 |
| * WESCO International Inc. | 7,883 | 441 |
| Terex Corp. | 18,499 | 432 |
| Kennametal Inc. | 13,981 | 426 |
| SPX Corp. | 7,219 | 424 |
| Crane Co. | 7,996 | 420 |
| Joy Global Inc. | 17,172 | 416 |
| Pitney Bowes Inc. | 20,521 | 407 |
| BWX Technologies Inc. | 15,273 | 405 |
| Triumph Group Inc. | 8,150 | 403 |
| Allison Transmission Holdings Inc. | 13,549 | 388 |
| GATX Corp. | 7,757 | 385 |
| Manitowoc Co. Inc. | 22,464 | 384 |
| MSC Industrial Direct Co. Inc. Class A | 5,443 | 368 |
| * Genesee & Wyoming Inc. Class A | 5,354 | 366 |
| Paychex Inc. | 7,476 | 334 |
| PACCAR Inc. | 5,613 | 331 |
| Tyco International plc | 9,016 | 327 |
| Lexmark International Inc. Class A | 10,048 | 301 |
27
| Vanguard® Russell 1000 Value Index Fund | |||
| Schedule of Investments | |||
| August 31, 2015 | |||
| Market | |||
| Value | |||
| Shares | ($000) | ||
| Copa Holdings SA Class A | 5,494 | 282 | |
| FLIR Systems Inc. | 9,245 | 265 | |
| RR Donnelley & Sons Co. | 16,282 | 256 | |
| * | IHS Inc. Class A | 1,634 | 190 |
| Teekay Corp. | 4,796 | 176 | |
| * | Clean Harbors Inc. | 3,200 | 157 |
| * | Keysight Technologies Inc. | 4,435 | 142 |
| * | Babcock & Wilcox Enterprises Inc. | 7,036 | 130 |
| * | Spirit AeroSystems Holdings Inc. Class A | 1,865 | 95 |
| IDEX Corp. | 1,312 | 94 | |
| Donaldson Co. Inc. | 2,396 | 75 | |
| Lincoln Electric Holdings Inc. | 965 | 57 | |
| Avery Dennison Corp. | 971 | 56 | |
| Booz Allen Hamilton Holding Corp. Class A | 1,304 | 35 | |
| 161,952 | |||
| Technology (10.5%) | |||
| Microsoft Corp. | 601,017 | 26,156 | |
| Cisco Systems Inc. | 872,536 | 22,581 | |
| Intel Corp. | 756,948 | 21,603 | |
| QUALCOMM Inc. | 237,200 | 13,421 | |
| International Business Machines Corp. | 69,375 | 10,260 | |
| Hewlett-Packard Co. | 311,841 | 8,750 | |
| Oracle Corp. | 217,525 | 8,068 | |
| EMC Corp. | 305,915 | 7,608 | |
| * | Yahoo! Inc. | 161,097 | 5,194 |
| Broadcom Corp. Class A | 88,062 | 4,550 | |
| Corning Inc. | 216,485 | 3,726 | |
| Western Digital Corp. | 38,403 | 3,147 | |
| * | Micron Technology Inc. | 170,068 | 2,791 |
| Activision Blizzard Inc. | 86,161 | 2,467 | |
| Symantec Corp. | 116,340 | 2,384 | |
| NVIDIA Corp. | 91,910 | 2,066 | |
| SanDisk Corp. | 35,530 | 1,938 | |
| Altera Corp. | 35,529 | 1,725 | |
| Amdocs Ltd. | 26,620 | 1,523 | |
| CA Inc. | 54,262 | 1,481 | |
| Computer Sciences Corp. | 23,871 | 1,480 | |
| Juniper Networks Inc. | 55,878 | 1,437 | |
| Xilinx Inc. | 34,224 | 1,434 | |
| Applied Materials Inc. | 86,378 | 1,389 | |
| Harris Corp. | 17,713 | 1,361 | |
| * | SBA Communications Corp. Class A | 11,429 | 1,351 |
| NetApp Inc. | 36,951 | 1,181 | |
| * | Synopsys Inc. | 24,841 | 1,166 |
| * | ANSYS Inc. | 12,368 | 1,096 |
| Maxim Integrated Products Inc. | 31,690 | 1,067 | |
| Avnet Inc. | 23,195 | 983 | |
| * | Arrow Electronics Inc. | 16,335 | 913 |
| Marvell Technology Group Ltd. | 76,449 | 862 | |
| Brocade Communications Systems Inc. | 71,914 | 766 | |
| * | NCR Corp. | 28,620 | 718 |
| * | Nuance Communications Inc. | 43,389 | 715 |
| Ingram Micro Inc. | 25,516 | 690 | |
| Teradyne Inc. | 36,316 | 655 | |
| Cypress Semiconductor Corp. | 57,667 | 577 | |
| Lam Research Corp. | 7,779 | 566 | |
| Jabil Circuit Inc. | 27,560 | 533 | |
| * | ARRIS Group Inc. | 19,795 | 523 |
| *,^ | Cree Inc. | 19,120 | 520 |
| * | Autodesk Inc. | 9,751 | 456 |
| Leidos Holdings Inc. | 10,756 | 453 | |
| * | EchoStar Corp. Class A | 7,295 | 325 |
| * | Zynga Inc. Class A | 126,737 | 321 |
| * | CommScope Holding Co. Inc. | 9,673 | 313 |
28
| Vanguard® Russell 1000 Value Index Fund | ||
| Schedule of Investments | ||
| August 31, 2015 | ||
| Market | ||
| Value | ||
| Shares | ($000) | |
| Dolby Laboratories Inc. Class A | 8,631 | 281 |
| Analog Devices Inc. | 4,311 | 241 |
| * Viavi Solutions Inc. | 38,561 | 207 |
| * Teradata Corp. | 6,071 | 177 |
| * 3D Systems Corp. | 11,678 | 160 |
| * Lumentum Holdings Inc. | 7,711 | 152 |
| DST Systems Inc. | 1,447 | 148 |
| SS&C Technologies Holdings Inc. | 1,226 | 83 |
| * Freescale Semiconductor Ltd. | 1,631 | 58 |
| * ON Semiconductor Corp. | 5,396 | 52 |
| * SunEdison Inc. | 3,532 | 37 |
| * Black Knight Financial Services Inc. Class A | 422 | 14 |
| 176,900 | ||
| Utilities (8.4%) | ||
| AT&T Inc. | 890,841 | 29,576 |
| Duke Energy Corp. | 118,683 | 8,416 |
| NextEra Energy Inc. | 76,284 | 7,507 |
| Southern Co. | 155,839 | 6,765 |
| Dominion Resources Inc. | 96,752 | 6,748 |
| American Electric Power Co. Inc. | 84,229 | 4,573 |
| Exelon Corp. | 147,900 | 4,549 |
| PG&E Corp. | 82,607 | 4,096 |
| Sempra Energy | 42,323 | 4,014 |
| PPL Corp. | 115,012 | 3,564 |
| Public Service Enterprise Group Inc. | 87,070 | 3,505 |
| Edison International | 55,649 | 3,254 |
| Consolidated Edison Inc. | 50,483 | 3,176 |
| Xcel Energy Inc. | 86,559 | 2,920 |
| CenturyLink Inc. | 96,238 | 2,602 |
| WEC Energy Group Inc. | 53,936 | 2,570 |
| Eversource Energy | 54,210 | 2,561 |
| DTE Energy Co. | 30,681 | 2,395 |
| Verizon Communications Inc. | 50,154 | 2,308 |
| FirstEnergy Corp. | 72,072 | 2,303 |
| Entergy Corp. | 30,655 | 2,003 |
| * Level 3 Communications Inc. | 43,545 | 1,948 |
| * T-Mobile US Inc. | 46,874 | 1,857 |
| Ameren Corp. | 41,539 | 1,674 |
| American Water Works Co. Inc. | 30,936 | 1,607 |
| CMS Energy Corp. | 47,505 | 1,557 |
| AES Corp. | 117,178 | 1,406 |
| CenterPoint Energy Inc. | 74,128 | 1,380 |
| SCANA Corp. | 24,775 | 1,310 |
| AGL Resources Inc. | 20,433 | 1,246 |
| NRG Energy Inc. | 57,916 | 1,154 |
| Pinnacle West Capital Corp. | 18,862 | 1,123 |
| Alliant Energy Corp. | 19,209 | 1,089 |
| Frontier Communications Corp. | 201,703 | 1,023 |
| UGI Corp. | 29,280 | 998 |
| Pepco Holdings Inc. | 42,865 | 985 |
| OGE Energy Corp. | 34,013 | 954 |
| Atmos Energy Corp. | 17,236 | 944 |
| NiSource Inc. | 54,854 | 921 |
| * Calpine Corp. | 56,064 | 894 |
| TECO Energy Inc. | 40,244 | 848 |
| Westar Energy Inc. Class A | 22,658 | 828 |
| National Fuel Gas Co. | 14,437 | 779 |
| Aqua America Inc. | 30,397 | 771 |
| Great Plains Energy Inc. | 26,602 | 663 |
| * Sprint Corp. | 129,076 | 653 |
| MDU Resources Group Inc. | 33,649 | 603 |
| Questar Corp. | 30,320 | 585 |
| Vectren Corp. | 14,377 | 578 |
| ITC Holdings Corp. | 17,070 | 558 |
29
| Vanguard® Russell 1000 Value Index Fund | |||||
| Schedule of Investments | |||||
| August 31, 2015 | |||||
| Market | |||||
| Value | |||||
| Shares | ($000) | ||||
| Hawaiian Electric Industries Inc. | 18,658 | 527 | |||
| Telephone & Data Systems Inc. | 16,016 | 456 | |||
| * | Zayo Group Holdings Inc. | 3,692 | 103 | ||
| * | United States Cellular Corp. | 2,721 | 100 | ||
| 141,527 | |||||
| Total Common Stocks (Cost $1,638,276) | 1,676,727 | ||||
| Coupon | |||||
| Temporary Cash Investments (0.6%)1 | |||||
| Money Market Fund (0.5%) | |||||
| 2,3 | Vanguard Market Liquidity Fund | 0.168% | 8,467,901 | 8,468 | |
| Face | |||||
| Maturity | Amount | ||||
| Date | ($000) | ||||
| U.S. Government and Agency Obligations (0.1%) | |||||
| 4,5 | Federal Home Loan Bank Discount Notes | 0.100% | 10/23/15 | 400 | 400 |
| 4,5 | Federal Home Loan Bank Discount Notes | 0.120% | 10/30/15 | 200 | 200 |
| 600 | |||||
| Total Temporary Cash Investments (Cost $9,068) | 9,068 | ||||
| Total Investments (99.8%) (Cost $1,647,344) | 1,685,795 | ||||
| Other Assets and Liabilities—Net (0.2%)3 | 4,087 | ||||
| Net Assets (100%) | 1,689,882 | ||||
* Non-income-producing security.
^ Includes partial security positions on loan to broker-dealers. The total value of securities on loan is $1,159,000.
1 The fund invests a portion of its cash reserves in equity markets through the use of index futures contracts. After giving effect to futures investments, the fund's effective common stock and temporary cash investment positions represent 99.9% and -0.1%, respectively, of net assets.
2 Affiliated money market fund available only to Vanguard funds and certain trusts and accounts managed by Vanguard. Rate shown is the 7-day yield.
3 Includes $1,215,000 of collateral received for securities on loan.
4 The issuer operates under a congressional charter; its securities are generally neither guaranteed by the U.S. Treasury nor backed by the full faith and credit of the U.S. government.
5 Securities with a value of $600,000 have been segregated as initial margin for open futures contracts.
REIT—Real Estate Investment Trust.
30
| Vanguard® Russell 1000 Growth Index Fund | |||
| Schedule of Investments | |||
| August 31, 2015 | |||
| Market | |||
| Value | |||
| Shares | ($000) | ||
| Common Stocks (99.8%)1 | |||
| Consumer Discretionary (22.5%) | |||
| * | Amazon.com Inc. | 75,086 | 38,511 |
| Walt Disney Co. | 334,267 | 34,055 | |
| Home Depot Inc. | 255,912 | 29,804 | |
| Comcast Corp. Class A | 445,437 | 25,091 | |
| McDonald's Corp. | 188,872 | 17,947 | |
| Starbucks Corp. | 295,585 | 16,171 | |
| NIKE Inc. Class B | 133,632 | 14,933 | |
| Lowe's Cos. Inc. | 187,505 | 12,970 | |
| * | Priceline Group Inc. | 10,219 | 12,760 |
| Costco Wholesale Corp. | 86,726 | 12,146 | |
| Time Warner Cable Inc. | 55,702 | 10,362 | |
| * | Netflix Inc. | 83,661 | 9,624 |
| TJX Cos. Inc. | 134,067 | 9,428 | |
| Yum! Brands Inc. | 85,356 | 6,809 | |
| * | eBay Inc. | 239,815 | 6,501 |
| Twenty-First Century Fox Inc. Class A | 232,739 | 6,375 | |
| Time Warner Inc. | 83,452 | 5,933 | |
| VF Corp. | 66,398 | 4,809 | |
| *,^ | Tesla Motors Inc. | 19,197 | 4,781 |
| * | O'Reilly Automotive Inc. | 19,861 | 4,768 |
| Dollar General Corp. | 59,707 | 4,448 | |
| * | AutoZone Inc. | 6,156 | 4,408 |
| CBS Corp. Class B | 96,756 | 4,377 | |
| * | Chipotle Mexican Grill Inc. Class A | 6,117 | 4,343 |
| Delphi Automotive plc | 56,950 | 4,301 | |
| L Brands Inc. | 48,726 | 4,088 | |
| Ross Stores Inc. | 81,880 | 3,981 | |
| * | Dollar Tree Inc. | 45,188 | 3,446 |
| * | Under Armour Inc. Class A | 35,269 | 3,369 |
| Las Vegas Sands Corp. | 71,775 | 3,318 | |
| Estee Lauder Cos. Inc. Class A | 41,143 | 3,282 | |
| Omnicom Group Inc. | 47,977 | 3,214 | |
| Marriott International Inc. Class A | 41,177 | 2,910 | |
| Macy's Inc. | 48,461 | 2,840 | |
| Viacom Inc. Class B | 68,025 | 2,773 | |
| *,^ | Charter Communications Inc. Class A | 14,762 | 2,681 |
| Hilton Worldwide Holdings Inc. | 102,348 | 2,541 | |
| Advance Auto Parts Inc. | 14,448 | 2,532 | |
| * | CarMax Inc. | 41,089 | 2,506 |
| Starwood Hotels & Resorts Worldwide Inc. | 33,586 | 2,400 | |
| Hanesbrands Inc. | 78,846 | 2,374 | |
| Genuine Parts Co. | 27,950 | 2,334 | |
| Tractor Supply Co. | 27,066 | 2,309 | |
| Expedia Inc. | 19,581 | 2,252 | |
| * | Nielsen Holdings plc | 49,777 | 2,251 |
| Signet Jewelers Ltd. | 15,778 | 2,177 | |
| * | Jarden Corp. | 41,572 | 2,134 |
| * | Bed Bath & Beyond Inc. | 33,626 | 2,089 |
| Nordstrom Inc. | 27,641 | 2,014 | |
| * | Ulta Salon Cosmetics & Fragrance Inc. | 12,663 | 2,002 |
| BorgWarner Inc. | 44,772 | 1,954 | |
| Wyndham Worldwide Corp. | 23,940 | 1,831 | |
| * | LKQ Corp. | 60,378 | 1,811 |
| H&R Block Inc. | 50,702 | 1,725 | |
| * | Sirius XM Holdings Inc. | 451,010 | 1,721 |
| Polaris Industries Inc. | 13,159 | 1,709 | |
| * | DISH Network Corp. Class A | 28,811 | 1,708 |
| * | Michael Kors Holdings Ltd. | 39,046 | 1,697 |
| Foot Locker Inc. | 23,909 | 1,693 | |
| * | Mohawk Industries Inc. | 8,552 | 1,684 |
| * | TripAdvisor Inc. | 22,000 | 1,538 |
31
| Vanguard® Russell 1000 Growth Index Fund | ||
| Schedule of Investments | ||
| August 31, 2015 | ||
| Market | ||
| Value | ||
| Shares | ($000) | |
| Gap Inc. | 46,810 | 1,536 |
| Interpublic Group of Cos. Inc. | 81,113 | 1,531 |
| * Hertz Global Holdings Inc. | 79,903 | 1,473 |
| * lululemon athletica Inc. | 22,004 | 1,408 |
| * Norwegian Cruise Line Holdings Ltd. | 24,017 | 1,383 |
| Harman International Industries Inc. | 14,077 | 1,376 |
| Tiffany & Co. | 16,715 | 1,375 |
| Williams-Sonoma Inc. | 18,020 | 1,370 |
| Hasbro Inc. | 17,899 | 1,335 |
| Harley-Davidson Inc. | 22,540 | 1,263 |
| * Discovery Communications Inc. | 49,094 | 1,245 |
| * WABCO Holdings Inc. | 10,757 | 1,240 |
| * NVR Inc. | 800 | 1,216 |
| Leggett & Platt Inc. | 27,288 | 1,212 |
| Lear Corp. | 11,618 | 1,194 |
| Service Corp. International | 40,090 | 1,189 |
| Domino's Pizza Inc. | 11,027 | 1,168 |
| Johnson Controls Inc. | 28,335 | 1,166 |
| * Skechers U.S.A. Inc. Class A | 8,086 | 1,138 |
| Newell Rubbermaid Inc. | 26,840 | 1,131 |
| * Liberty Ventures Class A | 28,208 | 1,121 |
| Aramark | 35,157 | 1,102 |
| * Liberty Interactive Corp. QVC Group Class A | 39,834 | 1,077 |
| Wynn Resorts Ltd. | 14,216 | 1,067 |
| Carter's Inc. | 10,343 | 1,017 |
| Scripps Networks Interactive Inc. Class A | 18,093 | 961 |
| Dunkin' Brands Group Inc. | 18,791 | 943 |
| * Avis Budget Group Inc. | 20,925 | 923 |
| * Panera Bread Co. Class A | 5,004 | 892 |
| * Tempur Sealy International Inc. | 12,067 | 881 |
| * AutoNation Inc. | 14,653 | 877 |
| * Madison Square Garden Co. Class A | 12,351 | 870 |
| * AMC Networks Inc. Class A | 11,802 | 854 |
| Lamar Advertising Co. Class A | 15,977 | 852 |
| Target Corp. | 10,686 | 830 |
| DR Horton Inc. | 27,311 | 829 |
| * Sally Beauty Holdings Inc. | 31,560 | 825 |
| Cinemark Holdings Inc. | 22,964 | 816 |
| * GoPro Inc. Class A | 17,275 | 805 |
| * Visteon Corp. | 7,902 | 788 |
| * Discovery Communications Inc. Class A | 28,480 | 758 |
| * Pandora Media Inc. | 41,716 | 748 |
| * ServiceMaster Global Holdings Inc. | 19,855 | 699 |
| * Live Nation Entertainment Inc. | 28,092 | 692 |
| Lions Gate Entertainment Corp. | 18,362 | 674 |
| Lennar Corp. Class A | 13,211 | 672 |
| Brunswick Corp. | 13,167 | 655 |
| Six Flags Entertainment Corp. | 14,372 | 646 |
| Brinker International Inc. | 12,039 | 640 |
| * Starz | 16,703 | 628 |
| Dick's Sporting Goods Inc. | 12,302 | 617 |
| * Urban Outfitters Inc. | 18,889 | 583 |
| Fortune Brands Home & Security Inc. | 11,356 | 543 |
| Thor Industries Inc. | 9,098 | 497 |
| Coty Inc. Class A | 16,110 | 488 |
| * Kate Spade & Co. | 24,909 | 472 |
| Tupperware Brands Corp. | 9,075 | 465 |
| Gentex Corp. | 28,321 | 439 |
| * Toll Brothers Inc. | 11,814 | 437 |
| CST Brands Inc. | 12,196 | 423 |
| * Fossil Group Inc. | 6,567 | 404 |
| Choice Hotels International Inc. | 6,854 | 350 |
| KAR Auction Services Inc. | 9,176 | 340 |
| Darden Restaurants Inc. | 4,825 | 328 |
32
| Vanguard® Russell 1000 Growth Index Fund | |||
| Schedule of Investments | |||
| August 31, 2015 | |||
| Market | |||
| Value | |||
| Shares | ($000) | ||
| * | Michaels Cos. Inc. | 12,105 | 317 |
| Regal Entertainment Group Class A | 16,009 | 304 | |
| AMERCO | 670 | 251 | |
| Coach Inc. | 7,426 | 225 | |
| Extended Stay America Inc. | 11,508 | 216 | |
| International Game Technology plc | 12,212 | 207 | |
| Whirlpool Corp. | 1,125 | 189 | |
| * | HomeAway Inc. | 5,780 | 166 |
| Penske Automotive Group Inc. | 3,109 | 157 | |
| * | Office Depot Inc. | 18,674 | 148 |
| Cablevision Systems Corp. Class A | 5,529 | 139 | |
| * | MGM Resorts International | 5,907 | 121 |
| Nu Skin Enterprises Inc. Class A | 2,335 | 107 | |
| Viacom Inc. Class A | 1,990 | 86 | |
| Aaron's Inc. | 2,203 | 83 | |
| * | Vista Outdoor Inc. | 1,601 | 75 |
| Ralph Lauren Corp. Class A | 618 | 69 | |
| Dillard's Inc. Class A | 497 | 46 | |
| * | Cabela's Inc. | 920 | 41 |
| * | Clear Channel Outdoor Holdings Inc. Class A | 4,555 | 37 |
| Lennar Corp. Class B | 734 | 31 | |
| Comcast Corp. Special Class A | 496 | 28 | |
| DSW Inc. Class A | 848 | 25 | |
| * | Murphy USA Inc. | 462 | 24 |
| Twenty-First Century Fox Inc. | 472 | 13 | |
| * | Sears Holdings Corp. | 207 | 6 |
| 453,131 | |||
| Consumer Staples (10.2%) | |||
| Coca-Cola Co. | 772,475 | 30,374 | |
| PepsiCo Inc. | 290,773 | 27,022 | |
| CVS Health Corp. | 206,110 | 21,106 | |
| Altria Group Inc. | 364,548 | 19,532 | |
| Philip Morris International Inc. | 152,050 | 12,134 | |
| Colgate-Palmolive Co. | 156,362 | 9,821 | |
| Kraft Heinz Co. | 116,750 | 8,483 | |
| Reynolds American Inc. | 81,501 | 6,826 | |
| General Mills Inc. | 117,673 | 6,679 | |
| Kroger Co. | 193,372 | 6,671 | |
| Kimberly-Clark Corp. | 56,983 | 6,070 | |
| Constellation Brands Inc. Class A | 32,181 | 4,119 | |
| * | Monster Beverage Corp. | 29,505 | 4,085 |
| Mead Johnson Nutrition Co. | 39,916 | 3,127 | |
| Kellogg Co. | 44,313 | 2,937 | |
| Dr Pepper Snapple Group Inc. | 37,843 | 2,904 | |
| Hershey Co. | 28,800 | 2,578 | |
| Coca-Cola Enterprises Inc. | 45,691 | 2,353 | |
| Clorox Co. | 20,554 | 2,285 | |
| Brown-Forman Corp. Class B | 23,284 | 2,284 | |
| Church & Dwight Co. Inc. | 25,930 | 2,237 | |
| Walgreens Boots Alliance Inc. | 25,687 | 2,223 | |
| Whole Foods Market Inc. | 64,977 | 2,129 | |
| McCormick & Co. Inc. | 25,337 | 2,009 | |
| Hormel Foods Corp. | 26,684 | 1,630 | |
| * | WhiteWave Foods Co. Class A | 34,432 | 1,589 |
| Sysco Corp. | 36,528 | 1,456 | |
| Keurig Green Mountain Inc. | 25,370 | 1,436 | |
| * | Hain Celestial Group Inc. | 20,309 | 1,236 |
| Campbell Soup Co. | 20,344 | 976 | |
| * | Rite Aid Corp. | 116,821 | 964 |
| GNC Holdings Inc. Class A | 17,346 | 812 | |
| Flowers Foods Inc. | 31,233 | 725 | |
| *,^ | Herbalife Ltd. | 12,531 | 721 |
| * | Sprouts Farmers Market Inc. | 29,565 | 602 |
| Brown-Forman Corp. Class A | 4,902 | 532 | |
33
| Vanguard® Russell 1000 Growth Index Fund | |||
| Schedule of Investments | |||
| August 31, 2015 | |||
| Market | |||
| Value | |||
| Shares | ($000) | ||
| Spectrum Brands Holdings Inc. | 4,951 | 487 | |
| ConAgra Foods Inc. | 11,194 | 467 | |
| Ingredion Inc. | 1,591 | 137 | |
| Tyson Foods Inc. Class A | 2,792 | 118 | |
| Pilgrim's Pride Corp. | 1,374 | 29 | |
| 203,905 | |||
| Energy (0.8%) | |||
| Williams Cos. Inc. | 147,797 | 7,124 | |
| Schlumberger Ltd. | 30,480 | 2,358 | |
| Cabot Oil & Gas Corp. | 81,709 | 1,934 | |
| * | FMC Technologies Inc. | 29,690 | 1,033 |
| EOG Resources Inc. | 9,441 | 739 | |
| ONEOK Inc. | 18,089 | 651 | |
| *,^ | SolarCity Corp. | 11,434 | 552 |
| Marathon Petroleum Corp. | 7,837 | 371 | |
| Targa Resources Corp. | 5,244 | 346 | |
| * | Memorial Resource Development Corp. | 15,994 | 310 |
| HollyFrontier Corp. | 5,569 | 261 | |
| * | Continental Resources Inc. | 5,348 | 172 |
| Oceaneering International Inc. | 3,241 | 142 | |
| Tesoro Corp. | 1,437 | 132 | |
| World Fuel Services Corp. | 2,296 | 89 | |
| Range Resources Corp. | 2,109 | 81 | |
| CVR Energy Inc. | 1,013 | 41 | |
| * | SunPower Corp. Class A | 684 | 17 |
| RPC Inc. | 1,296 | 15 | |
| TerraForm Power Inc. Class A | 514 | 12 | |
| 16,380 | |||
| Financial Services (9.3%) | |||
| Visa Inc. Class A | 385,599 | 27,493 | |
| MasterCard Inc. Class A | 196,973 | 18,194 | |
| Simon Property Group Inc. | 61,363 | 11,004 | |
| * | PayPal Holdings Inc. | 239,515 | 8,383 |
| American Tower Corporation | 83,508 | 7,699 | |
| Crown Castle International Corp. | 65,622 | 5,472 | |
| McGraw Hill Financial Inc. | 54,135 | 5,251 | |
| Public Storage | 26,005 | 5,234 | |
| Aon plc | 55,401 | 5,177 | |
| Charles Schwab Corp. | 159,195 | 4,836 | |
| * | Fiserv Inc. | 46,507 | 3,966 |
| T. Rowe Price Group Inc. | 51,165 | 3,678 | |
| Moody's Corp. | 34,839 | 3,564 | |
| Marsh & McLennan Cos. Inc. | 63,141 | 3,393 | |
| Ameriprise Financial Inc. | 29,797 | 3,357 | |
| * | Berkshire Hathaway Inc. Class B | 23,900 | 3,204 |
| * | Alliance Data Systems Corp. | 12,188 | 3,135 |
| Boston Properties Inc. | 27,481 | 3,116 | |
| Equinix Inc. | 11,187 | 3,018 | |
| * | FleetCor Technologies Inc. | 18,058 | 2,694 |
| American Express Co. | 33,049 | 2,535 | |
| BlackRock Inc. | 7,873 | 2,381 | |
| Equifax Inc. | 23,381 | 2,289 | |
| * | Affiliated Managers Group Inc. | 10,869 | 2,026 |
| Health Care REIT Inc. | 31,395 | 1,989 | |
| Western Union Co. | 101,287 | 1,868 | |
| * | CBRE Group Inc. Class A | 56,174 | 1,799 |
| Extra Space Storage Inc. | 24,205 | 1,779 | |
| Intercontinental Exchange Inc. | 7,775 | 1,776 | |
| Federal Realty Investment Trust | 13,540 | 1,748 | |
| Fidelity National Information Services Inc. | 24,049 | 1,661 | |
| Total System Services Inc. | 32,712 | 1,499 | |
| TD Ameritrade Holding Corp. | 44,656 | 1,494 | |
| Global Payments Inc. | 13,020 | 1,450 | |
| SEI Investments Co. | 27,551 | 1,394 | |
34
| Vanguard® Russell 1000 Growth Index Fund | |||
| Schedule of Investments | |||
| August 31, 2015 | |||
| Market | |||
| Value | |||
| Shares | ($000) | ||
| MSCI Inc. Class A | 22,235 | 1,346 | |
| FactSet Research Systems Inc. | 8,220 | 1,298 | |
| * | Vantiv Inc. Class A | 28,588 | 1,259 |
| Broadridge Financial Solutions Inc. | 23,579 | 1,245 | |
| * | Signature Bank | 9,235 | 1,233 |
| Lazard Ltd. Class A | 24,689 | 1,228 | |
| Jack Henry & Associates Inc. | 16,241 | 1,104 | |
| CBOE Holdings Inc. | 16,528 | 1,046 | |
| Digital Realty Trust Inc. | 15,525 | 983 | |
| Bank of New York Mellon Corp. | 24,245 | 965 | |
| Jones Lang LaSalle Inc. | 6,389 | 951 | |
| Equity LifeStyle Properties Inc. | 16,863 | 940 | |
| Arthur J Gallagher & Co. | 18,736 | 819 | |
| Eaton Vance Corp. | 23,259 | 806 | |
| * | SVB Financial Group | 6,235 | 780 |
| * | WEX Inc. | 7,849 | 742 |
| LPL Financial Holdings Inc. | 15,972 | 642 | |
| * | SLM Corp. | 75,545 | 641 |
| NorthStar Asset Management Group Inc. | 37,426 | 629 | |
| Waddell & Reed Financial Inc. Class A | 15,838 | 619 | |
| Tanger Factory Outlet Centers Inc. | 18,499 | 585 | |
| Federated Investors Inc. Class B | 18,104 | 561 | |
| Plum Creek Timber Co. Inc. | 13,874 | 534 | |
| Iron Mountain Inc. | 15,858 | 449 | |
| * | Howard Hughes Corp. | 3,300 | 414 |
| * | Realogy Holdings Corp. | 10,230 | 412 |
| Erie Indemnity Co. Class A | 4,660 | 382 | |
| Invesco Ltd. | 10,285 | 351 | |
| * | Credit Acceptance Corp. | 1,638 | 334 |
| Omega Healthcare Investors Inc. | 9,531 | 322 | |
| Morningstar Inc. | 3,795 | 303 | |
| Taubman Centers Inc. | 4,366 | 301 | |
| * | CoreLogic Inc. | 7,808 | 296 |
| Artisan Partners Asset Management Inc. Class A | 6,877 | 281 | |
| Legg Mason Inc. | 6,082 | 270 | |
| *,^ | Zillow Group Inc. | 10,015 | 247 |
| Weyerhaeuser Co. | 8,576 | 240 | |
| * | Markel Corp. | 277 | 228 |
| Dun & Bradstreet Corp. | 2,040 | 216 | |
| Post Properties Inc. | 3,546 | 196 | |
| Leucadia National Corp. | 8,500 | 182 | |
| Empire State Realty Trust Inc. | 10,115 | 164 | |
| * | LendingClub Corp. | 12,925 | 162 |
| * | Ally Financial Inc. | 6,782 | 148 |
| *,^ | Zillow Group Inc. Class A | 5,007 | 127 |
| Gaming and Leisure Properties Inc. | 2,332 | 72 | |
| Columbia Property Trust Inc. | 3,081 | 66 | |
| Healthcare Trust of America Inc. Class A | 2,349 | 56 | |
| Interactive Brokers Group Inc. | 965 | 38 | |
| AmTrust Financial Services Inc. | 415 | 24 | |
| * | Santander Consumer USA Holdings Inc. | 930 | 21 |
| 186,814 | |||
| Health Care (17.3%) | |||
| Gilead Sciences Inc. | 289,512 | 30,419 | |
| Amgen Inc. | 149,826 | 22,741 | |
| UnitedHealth Group Inc. | 178,195 | 20,617 | |
| AbbVie Inc. | 326,274 | 20,363 | |
| Bristol-Myers Squibb Co. | 328,416 | 19,531 | |
| * | Celgene Corp. | 156,282 | 18,454 |
| Eli Lilly & Co. | 192,790 | 15,876 | |
| * | Biogen Inc. | 46,341 | 13,777 |
| * | Allergan plc | 34,950 | 10,616 |
| * | Express Scripts Holding Co. | 111,909 | 9,356 |
| McKesson Corp. | 45,659 | 9,021 | |
35
| Vanguard® Russell 1000 Growth Index Fund | |||
| Schedule of Investments | |||
| August 31, 2015 | |||
| Market | |||
| Value | |||
| Shares | ($000) | ||
| * | Regeneron Pharmaceuticals Inc. | 15,471 | 7,944 |
| * | Alexion Pharmaceuticals Inc. | 42,604 | 7,336 |
| Cigna Corp. | 50,858 | 7,160 | |
| Johnson & Johnson | 70,310 | 6,608 | |
| * | Vertex Pharmaceuticals Inc. | 47,895 | 6,108 |
| Becton Dickinson and Co. | 41,144 | 5,802 | |
| * | Illumina Inc. | 28,323 | 5,597 |
| Humana Inc. | 27,434 | 5,015 | |
| Cardinal Health Inc. | 58,859 | 4,842 | |
| Zoetis Inc. | 98,553 | 4,422 | |
| AmerisourceBergen Corp. Class A | 43,158 | 4,318 | |
| * | BioMarin Pharmaceutical Inc. | 31,543 | 4,077 |
| * | Intuitive Surgical Inc. | 7,248 | 3,703 |
| * | Cerner Corp. | 58,813 | 3,632 |
| * | Incyte Corp. | 30,773 | 3,575 |
| * | Mylan NV | 70,194 | 3,481 |
| Merck & Co. Inc. | 63,203 | 3,403 | |
| Stryker Corp. | 33,850 | 3,339 | |
| Thermo Fisher Scientific Inc. | 26,416 | 3,312 | |
| * | Edwards Lifesciences Corp. | 21,250 | 2,994 |
| CR Bard Inc. | 14,642 | 2,837 | |
| Baxter International Inc. | 67,823 | 2,608 | |
| * | Hospira Inc. | 26,774 | 2,409 |
| Baxalta Inc. | 68,023 | 2,391 | |
| * | Henry Schein Inc. | 16,415 | 2,246 |
| St. Jude Medical Inc. | 31,367 | 2,221 | |
| * | Jazz Pharmaceuticals plc | 12,024 | 2,030 |
| Aetna Inc. | 16,833 | 1,928 | |
| * | Hologic Inc. | 48,292 | 1,874 |
| * | Varian Medical Systems Inc. | 19,561 | 1,589 |
| * | Envision Healthcare Holdings Inc. | 36,663 | 1,502 |
| * | DexCom Inc. | 15,684 | 1,476 |
| ResMed Inc. | 28,008 | 1,455 | |
| Anthem Inc. | 10,304 | 1,453 | |
| * | Centene Corp. | 23,348 | 1,441 |
| * | Alkermes plc | 24,023 | 1,431 |
| * | Medivation Inc. | 15,545 | 1,369 |
| * | United Therapeutics Corp. | 9,012 | 1,357 |
| * | IDEXX Laboratories Inc. | 18,482 | 1,321 |
| * | Alnylam Pharmaceuticals Inc. | 11,812 | 1,216 |
| * | Isis Pharmaceuticals Inc. | 23,674 | 1,188 |
| * | Endo International plc | 14,788 | 1,139 |
| * | Quintiles Transnational Holdings Inc. | 15,068 | 1,123 |
| * | Sirona Dental Systems Inc. | 11,137 | 1,062 |
| Cooper Cos. Inc. | 6,522 | 1,059 | |
| * | athenahealth Inc. | 7,738 | 1,029 |
| Perrigo Co. plc | 5,343 | 978 | |
| * | Bluebird Bio Inc. | 7,230 | 962 |
| * | Tenet Healthcare Corp. | 19,304 | 950 |
| * | Align Technology Inc. | 15,808 | 895 |
| * | MEDNAX Inc. | 10,751 | 866 |
| * | VCA Inc. | 15,034 | 833 |
| * | Mallinckrodt plc | 9,121 | 787 |
| * | Laboratory Corp. of America Holdings | 6,620 | 780 |
| * | DaVita HealthCare Partners Inc. | 10,138 | 767 |
| * | Seattle Genetics Inc. | 19,041 | 767 |
| * | Acadia Healthcare Co. Inc. | 10,461 | 764 |
| *,^ | OPKO Health Inc. | 59,473 | 643 |
| * | Charles River Laboratories International Inc. | 9,174 | 632 |
| * | Akorn Inc. | 15,109 | 601 |
| * | Intercept Pharmaceuticals Inc. | 3,081 | 585 |
| * | Alere Inc. | 10,534 | 547 |
| Hill-Rom Holdings Inc. | 10,055 | 531 | |
| * | Puma Biotechnology Inc. | 4,821 | 443 |
36
| Vanguard® Russell 1000 Growth Index Fund | ||
| Schedule of Investments | ||
| August 31, 2015 | ||
| Market | ||
| Value | ||
| Shares | ($000) | |
| Universal Health Services Inc. Class B | 3,168 | 434 |
| * Agios Pharmaceuticals Inc. | 4,980 | 430 |
| Patterson Cos. Inc. | 9,146 | 419 |
| * HCA Holdings Inc. | 4,814 | 417 |
| * Intrexon Corp. | 8,923 | 397 |
| * Bruker Corp. | 21,220 | 390 |
| DENTSPLY International Inc. | 6,835 | 358 |
| * Veeva Systems Inc. Class A | 13,735 | 356 |
| * Boston Scientific Corp. | 20,137 | 337 |
| Bio-Techne Corp. | 2,950 | 279 |
| * Premier Inc. Class A | 7,299 | 260 |
| * Brookdale Senior Living Inc. | 7,606 | 209 |
| Zimmer Biomet Holdings Inc. | 1,977 | 205 |
| PerkinElmer Inc. | 3,304 | 161 |
| * Health Net Inc. | 2,453 | 157 |
| * Allscripts Healthcare Solutions Inc. | 10,395 | 143 |
| * Juno Therapeutics Inc. | 2,344 | 85 |
| * VWR Corp. | 2,771 | 73 |
| * LifePoint Health Inc. | 837 | 65 |
| 348,699 | ||
| Materials & Processing (4.1%) | ||
| Monsanto Co. | 93,905 | 9,170 |
| LyondellBasell Industries NV Class A | 76,018 | 6,490 |
| Ecolab Inc. | 52,153 | 5,692 |
| PPG Industries Inc. | 53,455 | 5,094 |
| Praxair Inc. | 47,185 | 4,990 |
| Air Products & Chemicals Inc. | 34,767 | 4,851 |
| EI du Pont de Nemours & Co. | 82,330 | 4,240 |
| Sherwin-Williams Co. | 15,939 | 4,077 |
| International Paper Co. | 78,538 | 3,388 |
| CF Industries Holdings Inc. | 46,261 | 2,654 |
| Fastenal Co. | 58,187 | 2,243 |
| Sealed Air Corp. | 41,615 | 2,141 |
| Ball Corp. | 27,215 | 1,794 |
| Masco Corp. | 68,353 | 1,793 |
| International Flavors & Fragrances Inc. | 16,012 | 1,754 |
| Acuity Brands Inc. | 8,497 | 1,656 |
| * WR Grace & Co. | 14,521 | 1,437 |
| Dow Chemical Co. | 29,688 | 1,299 |
| Packaging Corp. of America | 19,299 | 1,295 |
| Sigma-Aldrich Corp. | 9,213 | 1,284 |
| Precision Castparts Corp. | 5,218 | 1,201 |
| Valspar Corp. | 16,012 | 1,174 |
| RPM International Inc. | 26,470 | 1,161 |
| Lennox International Inc. | 8,090 | 955 |
| Hexcel Corp. | 19,346 | 934 |
| Eagle Materials Inc. | 9,929 | 812 |
| FMC Corp. | 19,153 | 810 |
| NewMarket Corp. | 1,707 | 654 |
| Watsco Inc. | 5,017 | 614 |
| * Crown Holdings Inc. | 12,314 | 610 |
| * Axalta Coating Systems Ltd. | 19,518 | 570 |
| * USG Corp. | 17,967 | 548 |
| Compass Minerals International Inc. | 6,740 | 546 |
| Graphic Packaging Holding Co. | 36,580 | 516 |
| Eastman Chemical Co. | 7,115 | 516 |
| Scotts Miracle-Gro Co. Class A | 8,213 | 511 |
| Huntsman Corp. | 24,970 | 413 |
| Silgan Holdings Inc. | 7,819 | 409 |
| Vulcan Materials Co. | 3,350 | 314 |
| Martin Marietta Materials Inc. | 1,803 | 303 |
| Airgas Inc. | 2,881 | 278 |
| WestRock Co. | 4,683 | 278 |
| * Armstrong World Industries Inc. | 4,716 | 262 |
37
| Vanguard® Russell 1000 Growth Index Fund | ||
| Schedule of Investments | ||
| August 31, 2015 | ||
| Market | ||
| Value | ||
| Shares | ($000) | |
| Ingersoll-Rand plc | 3,553 | 196 |
| Southern Copper Corp. | 7,136 | 190 |
| Chemours Co. | 16,205 | 157 |
| AptarGroup Inc. | 2,180 | 147 |
| Ashland Inc. | 1,239 | 130 |
| Celanese Corp. Class A | 2,007 | 122 |
| Cytec Industries Inc. | 1,412 | 105 |
| Steel Dynamics Inc. | 5,173 | 101 |
| Bemis Co. Inc. | 2,048 | 87 |
| * Platform Specialty Products Corp. | 3,756 | 72 |
| Tahoe Resources Inc. | 4,766 | 40 |
| * Owens-Illinois Inc. | 1,894 | 39 |
| Royal Gold Inc. | 663 | 32 |
| Valmont Industries Inc. | 258 | 27 |
| Albemarle Corp. | 1 | — |
| 83,176 | ||
| Other (0.0%) 2 | ||
| Restaurant Brands International LP | 179 | 7 |
| Producer Durables (11.5%) | ||
| Boeing Co. | 136,259 | 17,806 |
| 3M Co. | 125,027 | 17,771 |
| Honeywell International Inc. | 154,035 | 15,291 |
| Union Pacific Corp. | 172,474 | 14,788 |
| United Parcel Service Inc. Class B | 138,229 | 13,498 |
| Accenture plc Class A | 123,774 | 11,668 |
| Lockheed Martin Corp. | 38,449 | 7,735 |
| Delta Air Lines Inc. | 161,118 | 7,054 |
| Automatic Data Processing Inc. | 74,088 | 5,728 |
| American Airlines Group Inc. | 136,249 | 5,311 |
| Illinois Tool Works Inc. | 58,845 | 4,974 |
| Southwest Airlines Co. | 131,398 | 4,822 |
| Emerson Electric Co. | 90,722 | 4,329 |
| * United Continental Holdings Inc. | 74,990 | 4,272 |
| PACCAR Inc. | 63,284 | 3,732 |
| Cummins Inc. | 26,546 | 3,232 |
| FedEx Corp. | 20,162 | 3,037 |
| Rockwell Automation Inc. | 26,514 | 2,965 |
| WW Grainger Inc. | 13,160 | 2,940 |
| Tyco International plc | 72,580 | 2,634 |
| AMETEK Inc. | 47,706 | 2,568 |
| Paychex Inc. | 55,906 | 2,497 |
| General Dynamics Corp. | 17,494 | 2,485 |
| * Verisk Analytics Inc. Class A | 33,475 | 2,446 |
| * TransDigm Group Inc. | 10,529 | 2,420 |
| * Stericycle Inc. | 16,937 | 2,390 |
| Rockwell Collins Inc. | 25,952 | 2,124 |
| * Waters Corp. | 16,231 | 1,970 |
| Danaher Corp. | 22,539 | 1,961 |
| CH Robinson Worldwide Inc. | 28,531 | 1,924 |
| Alaska Air Group Inc. | 25,580 | 1,915 |
| Northrop Grumman Corp. | 11,554 | 1,892 |
| Expeditors International of Washington Inc. | 37,575 | 1,840 |
| Wabtec Corp. | 19,196 | 1,838 |
| Snap-on Inc. | 11,421 | 1,825 |
| * Mettler-Toledo International Inc. | 5,492 | 1,629 |
| Cintas Corp. | 18,800 | 1,598 |
| Caterpillar Inc. | 20,555 | 1,571 |
| United Technologies Corp. | 16,013 | 1,467 |
| CSX Corp. | 50,128 | 1,373 |
| Robert Half International Inc. | 26,591 | 1,357 |
| * IHS Inc. Class A | 11,571 | 1,342 |
| JB Hunt Transport Services Inc. | 18,375 | 1,337 |
| * United Rentals Inc. | 19,249 | 1,335 |
38
| Vanguard® Russell 1000 Growth Index Fund | ||
| Schedule of Investments | ||
| August 31, 2015 | ||
| Market | ||
| Value | ||
| Shares | ($000) | |
| Parker-Hannifin Corp. | 12,363 | 1,331 |
| * Spirit AeroSystems Holdings Inc. Class A | 25,887 | 1,323 |
| * Middleby Corp. | 11,429 | 1,241 |
| Roper Technologies Inc. | 7,566 | 1,226 |
| * CoStar Group Inc. | 6,391 | 1,131 |
| Allegion plc | 18,755 | 1,118 |
| * HD Supply Holdings Inc. | 33,782 | 1,115 |
| Huntington Ingalls Industries Inc. | 9,468 | 1,066 |
| B/E Aerospace Inc. | 20,773 | 1,013 |
| IDEX Corp. | 14,003 | 1,006 |
| Avery Dennison Corp. | 16,969 | 986 |
| Deere & Co. | 11,904 | 974 |
| AO Smith Corp. | 14,878 | 960 |
| * Old Dominion Freight Line Inc. | 14,004 | 931 |
| * Keysight Technologies Inc. | 28,439 | 911 |
| * Copart Inc. | 25,355 | 888 |
| * Zebra Technologies Corp. | 10,068 | 834 |
| Lincoln Electric Holdings Inc. | 14,029 | 823 |
| Graco Inc. | 11,733 | 809 |
| Nordson Corp. | 12,032 | 800 |
| Toro Co. | 11,159 | 796 |
| Donaldson Co. Inc. | 24,528 | 768 |
| * Spirit Airlines Inc. | 14,562 | 746 |
| * Genpact Ltd. | 32,068 | 738 |
| Landstar System Inc. | 8,886 | 588 |
| Flowserve Corp. | 12,045 | 544 |
| Allison Transmission Holdings Inc. | 18,720 | 535 |
| Rollins Inc. | 19,005 | 531 |
| * JetBlue Airways Corp. | 22,521 | 503 |
| FLIR Systems Inc. | 16,972 | 486 |
| Booz Allen Hamilton Holding Corp. Class A | 18,189 | 486 |
| Textron Inc. | 12,147 | 471 |
| Covanta Holding Corp. | 22,070 | 437 |
| * Clean Harbors Inc. | 7,560 | 371 |
| Waste Management Inc. | 7,357 | 368 |
| RR Donnelley & Sons Co. | 21,182 | 333 |
| Pitney Bowes Inc. | 14,991 | 297 |
| Towers Watson & Co. Class A | 2,379 | 282 |
| Carlisle Cos. Inc. | 2,734 | 275 |
| * Genesee & Wyoming Inc. Class A | 3,973 | 272 |
| Stanley Black & Decker Inc. | 2,654 | 269 |
| * TopBuild Corp. | 7,443 | 236 |
| MSC Industrial Direct Co. Inc. Class A | 2,774 | 188 |
| * Quanta Services Inc. | 7,738 | 188 |
| Hubbell Inc. Class B | 1,427 | 141 |
| National Instruments Corp. | 4,716 | 138 |
| Teekay Corp. | 3,231 | 119 |
| BWX Technologies Inc. | 4,104 | 109 |
| * AECOM | 3,827 | 105 |
| * Trimble Navigation Ltd. | 2,564 | 48 |
| * Babcock & Wilcox Enterprises Inc. | 2,053 | 38 |
| Air Lease Corp. Class A | 1,070 | 34 |
| Regal Beloit Corp. | 459 | 31 |
| 230,648 | ||
| Technology (22.0%) | ||
| Apple Inc. | 1,135,984 | 128,094 |
| Microsoft Corp. | 903,503 | 39,320 |
| * Facebook Inc. Class A | 426,282 | 38,122 |
| * Google Inc. Class A | 56,790 | 36,790 |
| * Google Inc. Class C | 57,948 | 35,826 |
| International Business Machines Corp. | 99,284 | 14,683 |
| Oracle Corp. | 374,525 | 13,891 |
| Texas Instruments Inc. | 205,014 | 9,808 |
| * salesforce.com inc | 129,298 | 8,968 |
39
| Vanguard® Russell 1000 Growth Index Fund | ||
| Schedule of Investments | ||
| August 31, 2015 | ||
| Market | ||
| Value | ||
| Shares | ($000) | |
| * Adobe Systems Inc. | 98,725 | 7,757 |
| * Cognizant Technology Solutions Corp. Class A | 120,455 | 7,581 |
| Avago Technologies Ltd. Class A | 50,702 | 6,387 |
| Intuit Inc. | 54,142 | 4,643 |
| * Electronic Arts Inc. | 61,758 | 4,085 |
| * LinkedIn Corp. Class A | 21,592 | 3,900 |
| Skyworks Solutions Inc. | 37,508 | 3,276 |
| Amphenol Corp. Class A | 60,728 | 3,180 |
| Analog Devices Inc. | 56,383 | 3,150 |
| * Twitter Inc. | 111,731 | 3,105 |
| QUALCOMM Inc. | 48,754 | 2,759 |
| Motorola Solutions Inc. | 41,443 | 2,686 |
| * Red Hat Inc. | 36,043 | 2,603 |
| * Akamai Technologies Inc. | 35,116 | 2,504 |
| * Palo Alto Networks Inc. | 14,319 | 2,352 |
| Applied Materials Inc. | 143,666 | 2,311 |
| * ServiceNow Inc. | 30,277 | 2,148 |
| * Citrix Systems Inc. | 31,433 | 2,141 |
| Linear Technology Corp. | 47,337 | 1,907 |
| Intel Corp. | 65,156 | 1,860 |
| Microchip Technology Inc. | 40,945 | 1,740 |
| * F5 Networks Inc. | 14,228 | 1,727 |
| Lam Research Corp. | 22,282 | 1,621 |
| * Qorvo Inc. | 29,200 | 1,621 |
| KLA-Tencor Corp. | 31,441 | 1,576 |
| CDK Global Inc. | 31,693 | 1,570 |
| * Autodesk Inc. | 33,240 | 1,554 |
| * Splunk Inc. | 24,725 | 1,532 |
| * SBA Communications Corp. Class A | 12,505 | 1,478 |
| * Workday Inc. Class A | 20,875 | 1,467 |
| * VeriSign Inc. | 20,353 | 1,403 |
| * Gartner Inc. | 16,368 | 1,400 |
| * VMware Inc. Class A | 16,111 | 1,275 |
| * Fortinet Inc. | 28,490 | 1,201 |
| * Cadence Design Systems Inc. | 58,230 | 1,166 |
| CDW Corp. | 26,300 | 1,045 |
| * FireEye Inc. | 27,318 | 1,032 |
| IAC/InterActiveCorp | 14,745 | 1,029 |
| * Ultimate Software Group Inc. | 5,709 | 1,006 |
| SS&C Technologies Holdings Inc. | 14,332 | 971 |
| * Tableau Software Inc. Class A | 9,983 | 940 |
| Altera Corp. | 18,607 | 903 |
| * IMS Health Holdings Inc. | 26,922 | 804 |
| EMC Corp. | 31,796 | 791 |
| * PTC Inc. | 22,880 | 758 |
| * ON Semiconductor Corp. | 79,133 | 756 |
| * Rackspace Hosting Inc. | 23,815 | 724 |
| * NetSuite Inc. | 8,056 | 716 |
| * VeriFone Systems Inc. | 22,535 | 704 |
| * Freescale Semiconductor Ltd. | 19,666 | 703 |
| Atmel Corp. | 82,075 | 671 |
| Solera Holdings Inc. | 13,496 | 650 |
| Maxim Integrated Products Inc. | 18,850 | 635 |
| Sabre Corp. | 21,957 | 598 |
| Cognex Corp. | 16,793 | 597 |
| * Teradata Corp. | 20,298 | 593 |
| NetApp Inc. | 18,005 | 575 |
| * IPG Photonics Corp. | 6,748 | 570 |
| DST Systems Inc. | 5,497 | 563 |
| * SunEdison Inc. | 49,471 | 515 |
| * SolarWinds Inc. | 12,935 | 514 |
| * Arista Networks Inc. | 6,516 | 487 |
| Xilinx Inc. | 11,477 | 481 |
| * Groupon Inc. Class A | 100,323 | 451 |
40
| Vanguard® Russell 1000 Growth Index Fund | |||||
| Schedule of Investments | |||||
| August 31, 2015 | |||||
| Market | |||||
| Value | |||||
| Shares | ($000) | ||||
| Broadcom Corp. Class A | 7,774 | 402 | |||
| Juniper Networks Inc. | 13,424 | 345 | |||
| Harris Corp. | 4,158 | 319 | |||
| * | Yelp Inc. Class A | 12,579 | 305 | ||
| * | CommScope Holding Co. Inc. | 8,974 | 290 | ||
| * | ANSYS Inc. | 3,252 | 288 | ||
| * | Micron Technology Inc. | 16,374 | 269 | ||
| ^ | King Digital Entertainment plc | 15,494 | 207 | ||
| Jabil Circuit Inc. | 6,947 | 134 | |||
| * | ARRIS Group Inc. | 4,365 | 115 | ||
| * | GoDaddy Inc. Class A | 4,550 | 114 | ||
| * | Black Knight Financial Services Inc. Class A | 3,499 | 114 | ||
| * | 3D Systems Corp. | 7,877 | 108 | ||
| * | Inovalon Holdings Inc. Class A | 4,909 | 107 | ||
| * | Synopsys Inc. | 2,183 | 102 | ||
| Leidos Holdings Inc. | 1,106 | 47 | |||
| Ingram Micro Inc. | 1,687 | 46 | |||
| 442,262 | |||||
| Utilities (2.1%) | |||||
| Verizon Communications Inc. | 745,618 | 34,306 | |||
| AT&T Inc. | 175,881 | 5,839 | |||
| * | Zayo Group Holdings Inc. | 23,990 | 671 | ||
| Dominion Resources Inc. | 5,645 | 394 | |||
| ITC Holdings Corp. | 11,002 | 360 | |||
| * | Level 3 Communications Inc. | 6,627 | 296 | ||
| * | Calpine Corp. | 8,238 | 131 | ||
| 41,997 | |||||
| Total Common Stocks (Cost $1,696,490) | 2,007,019 | ||||
| Coupon | |||||
| Temporary Cash Investments (0.6%)1 | |||||
| Money Market Fund (0.6%) | |||||
| 3,4 | Vanguard Market Liquidity Fund | 0.168% | 11,860,223 | 11,860 | |
| Face | |||||
| Maturity | Amount | ||||
| Date | ($000) | ||||
| U.S. Government and Agency Obligations (0.0%) | |||||
| 5,6 | Federal Home Loan Bank Discount Notes | 0.093% | 10/2/15 | 100 | 100 |
| 4,5 | Federal Home Loan Bank Discount Notes | 0.090% | 10/14/15 | 200 | 200 |
| 5.6 | Federal Home Loan Bank Discount Notes | 0.140% | 12/4/15 | 100 | 100 |
| 400 | |||||
| Total Temporary Cash Investments (Cost $12,260) | 12,260 | ||||
| Total Investments (100.4%) (Cost $1,708,750) | 2,019,279 | ||||
| Other Assets and Liabilities—Net (-0.4%)4 | (7,309) | ||||
| Net Assets (100%) | 2,011,970 | ||||
* Non-income-producing security.
^ Includes partial security positions on loan to broker-dealers. The total value of securities on loan is $4,241,000.
1 The fund invests a portion of its cash reserves in equity markets through the use of index futures contracts. After giving effect to futures investments, the fund's effective common stock and temporary cash investment positions represent 100.0% and 0.4%, respectively, of net assets.
2 “Other” represents securities that are not classified by the fund’s benchmark index.
3 Affiliated money market fund available only to Vanguard funds and certain trusts and accounts managed by Vanguard. Rate shown is the 7-day yield.
4 Includes $4,366,000 of collateral received for securities on loan.
41
| Vanguard® Russell 1000 Growth Index Fund |
| Schedule of Investments |
| August 31, 2015 |
5 The issuer operates under a congressional charter; its securities are generally neither guaranteed by the U.S. Treasury nor backed by the full faith and credit of the U.S. government.
6 Securities with a value of $400,000 have been segregated as initial margin for open futures contracts.
REIT—Real Estate Investment Trust.
42
This page intentionally left blank.
43
© 2015 The Vanguard Group, Inc.
All rights reserved.
Vanguard Marketing Corporation, Distributor.
SNA18480 102015
Report of Independent Registered Public Accounting Firm
To the Board of Trustees of Vanguard Scottsdale Funds and the Shareholders of Vanguard Russell 1000 Index Fund, Vanguard Russell 1000 Value Index Fund and Vanguard Russell 1000 Growth Index Fund:
In our opinion, the accompanying statements of net assets – investments summary and the related statements of operations and of changes in net assets and the financial highlights (included in Item 1 of this Form N-CSR) and the schedules of investments (included in Item 6 of this Form N-CSR) present fairly, in all material respects, the financial position of Vanguard Russell 1000 Index Fund, Vanguard Russell 1000 Value Index Fund and Vanguard Russell 1000 Growth Index Fund (constituting separate portfolios of Vanguard Scottsdale Funds, hereafter referred to as the “Funds”) at August 31, 2015, the results of each of their operations for the year then ended, the changes in each of their net assets for each of the two years in the period then ended, and the financial highlights for each of the periods indicated, in conformity with accounting principles generally accepted in the United States of America. These financial statements, financial highlights, and schedules of investments (hereafter referred to as "financial statements") are the responsibility of the Funds’ management. Our responsibility is to express an opinion on these financial statements based on our audits. We conducted our audits of these financial statements in accordance with the standards of the Public Company Accounting Oversight Board (United States). Those standards require that we plan and perform the audit to obtain reasonable assurance about whether the financial statements are free of material misstatement. An audit includes examining, on a test basis, evidence supporting the amounts and disclosures in the financial statements, assessing the accounting principles used and significant estimates made by management, and evaluating the overall financial statement presentation. We believe that our audits, which included confirmation of securities at August 31, 2015 by correspondence with the custodian and brokers, by agreement to the underlying ownership records of the transfer agent and the application of alternative auditing procedures where securities purchased had not been received, provide a reasonable basis for our opinion.

October 12, 2015
PricewaterhouseCoopers LLP, Two Commerce Square, 2001 Market Street, Suite 1700, Philadelphia, PA 19103-7042
T: (267) 330-3000, F: (267) 330-3300, www.pwc.com/us
| Vanguard® Russell 2000 Index Fund | ||
| Schedule of Investments | ||
| August 31, 2015 | ||
| Market | ||
| Value | ||
| Shares | ($000) | |
| Common Stocks (99.4%)1 | ||
| Consumer Discretionary (15.2%) | ||
| * Burlington Stores Inc. | 46,744 | 2,482 |
| Vail Resorts Inc. | 22,531 | 2,431 |
| * Buffalo Wild Wings Inc. | 11,775 | 2,233 |
| American Eagle Outfitters Inc. | 121,139 | 2,062 |
| * Houghton Mifflin Harcourt Co. | 84,862 | 1,916 |
| * Restoration Hardware Holdings Inc. | 20,698 | 1,914 |
| Pool Corp. | 26,983 | 1,880 |
| Jack in the Box Inc. | 23,172 | 1,812 |
| * Tenneco Inc. | 38,037 | 1,790 |
| Dana Holding Corp. | 101,126 | 1,774 |
| Wolverine World Wide Inc. | 63,984 | 1,724 |
| Cracker Barrel Old Country Store Inc. | 11,891 | 1,714 |
| * G-III Apparel Group Ltd. | 24,724 | 1,714 |
| Men's Wearhouse Inc. | 29,954 | 1,691 |
| Cheesecake Factory Inc. | 30,228 | 1,640 |
| Big Lots Inc. | 33,432 | 1,604 |
| Bloomin' Brands Inc. | 76,848 | 1,591 |
| Texas Roadhouse Inc. Class A | 43,391 | 1,562 |
| Lithia Motors Inc. Class A | 14,117 | 1,505 |
| * Helen of Troy Ltd. | 17,665 | 1,504 |
| * Steven Madden Ltd. | 34,887 | 1,425 |
| * Cimpress NV | 20,335 | 1,423 |
| * Pinnacle Entertainment Inc. | 37,517 | 1,417 |
| * Bright Horizons Family Solutions Inc. | 23,172 | 1,416 |
| Time Inc. | 67,892 | 1,410 |
| * TRI Pointe Group Inc. | 100,201 | 1,391 |
| Cooper Tire & Rubber Co. | 35,685 | 1,377 |
| * Asbury Automotive Group Inc. | 16,891 | 1,361 |
| Sotheby's | 38,562 | 1,358 |
| Chico's FAS Inc. | 88,864 | 1,325 |
| * Five Below Inc. | 33,769 | 1,306 |
| * Deckers Outdoor Corp. | 20,189 | 1,300 |
| * Ascena Retail Group Inc. | 106,392 | 1,284 |
| Group 1 Automotive Inc. | 14,467 | 1,264 |
| Ryland Group Inc. | 29,005 | 1,254 |
| Monro Muffler Brake Inc. | 19,731 | 1,251 |
| HSN Inc. | 20,152 | 1,225 |
| Papa John's International Inc. | 17,946 | 1,207 |
| * Liberty TripAdvisor Holdings Inc. Class A | 46,364 | 1,176 |
| * IMAX Corp. | 37,441 | 1,174 |
| Marriott Vacations Worldwide Corp. | 16,025 | 1,138 |
| Churchill Downs Inc. | 8,339 | 1,108 |
| Sinclair Broadcast Group Inc. Class A | 41,075 | 1,100 |
| * La Quinta Holdings Inc. | 58,045 | 1,094 |
| Columbia Sportswear Co. | 17,788 | 1,092 |
| * Grand Canyon Education Inc. | 29,182 | 1,079 |
| Meredith Corp. | 22,778 | 1,076 |
| * Express Inc. | 52,382 | 1,069 |
| Hillenbrand Inc. | 39,009 | 1,052 |
| Matthews International Corp. Class A | 20,434 | 1,038 |
| New York Times Co. Class A | 85,240 | 1,037 |
| * Meritage Homes Corp. | 24,581 | 1,036 |
| DeVry Education Group Inc. | 39,500 | 1,033 |
| PriceSmart Inc. | 12,065 | 1,026 |
| * Gentherm Inc. | 22,258 | 1,015 |
| DineEquity Inc. | 10,513 | 1,004 |
| * American Axle & Manufacturing Holdings Inc. | 46,997 | 949 |
| * DreamWorks Animation SKG Inc. Class A | 47,081 | 939 |
| * Shutterfly Inc. | 23,299 | 905 |
| Caleres Inc. | 27,152 | 904 |
| Nexstar Broadcasting Group Inc. Class A | 19,398 | 902 |
1
| Vanguard® Russell 2000 Index Fund | ||
| Schedule of Investments | ||
| August 31, 2015 | ||
| Market | ||
| Value | ||
| Shares | ($000) | |
| * Penn National Gaming Inc. | 49,475 | 898 |
| * Genesco Inc. | 14,905 | 893 |
| Rent-A-Center Inc. | 32,872 | 884 |
| La-Z-Boy Inc. | 31,731 | 876 |
| Sonic Corp. | 32,235 | 870 |
| Travelport Worldwide Ltd. | 65,433 | 867 |
| * Fiesta Restaurant Group Inc. | 16,628 | 859 |
| Abercrombie & Fitch Co. | 43,196 | 858 |
| Guess? Inc. | 38,380 | 849 |
| * Dorman Products Inc. | 16,576 | 835 |
| Drew Industries Inc. | 14,959 | 827 |
| * Popeyes Louisiana Kitchen Inc. | 14,351 | 798 |
| * Boyd Gaming Corp. | 49,461 | 796 |
| * Orbitz Worldwide Inc. | 69,257 | 794 |
| * Select Comfort Corp. | 32,420 | 789 |
| * Standard Pacific Corp. | 90,685 | 766 |
| Children's Place Inc. | 12,781 | 766 |
| * Meritor Inc. | 60,531 | 766 |
| Oxford Industries Inc. | 9,080 | 764 |
| * Mattress Firm Holding Corp. | 12,708 | 764 |
| SeaWorld Entertainment Inc. | 42,383 | 754 |
| Finish Line Inc. Class A | 28,546 | 753 |
| KB Home | 50,593 | 741 |
| Buckle Inc. | 17,553 | 741 |
| Sturm Ruger & Co. Inc. | 11,588 | 729 |
| * Stamps.com Inc. | 8,841 | 728 |
| * zulily Inc. Class A | 40,673 | 722 |
| Scholastic Corp. | 16,530 | 714 |
| Outerwall Inc. | 11,438 | 705 |
| * Crocs Inc. | 47,721 | 703 |
| * Media General Inc. | 59,400 | 698 |
| MDC Holdings Inc. | 24,219 | 690 |
| * Red Robin Gourmet Burgers Inc. | 8,756 | 690 |
| * Krispy Kreme Doughnuts Inc. | 40,205 | 689 |
| * Tumi Holdings Inc. | 34,772 | 686 |
| * Belmond Ltd. Class A | 60,054 | 683 |
| * Vitamin Shoppe Inc. | 18,451 | 661 |
| * Diamond Resorts International Inc. | 25,819 | 656 |
| * Apollo Education Group Inc. | 58,482 | 650 |
| EW Scripps Co. Class A | 36,659 | 642 |
| Bob Evans Farms Inc. | 13,762 | 622 |
| ClubCorp Holdings Inc. | 27,429 | 617 |
| * Hibbett Sports Inc. | 15,485 | 612 |
| * Smith & Wesson Holding Corp. | 33,607 | 608 |
| * Denny's Corp. | 52,317 | 588 |
| * Eros International plc | 17,535 | 581 |
| * BJ's Restaurants Inc. | 13,405 | 576 |
| Cato Corp. Class A | 16,341 | 574 |
| Pier 1 Imports Inc. | 56,186 | 572 |
| International Speedway Corp. Class A | 17,409 | 559 |
| * TiVo Inc. | 60,584 | 551 |
| * American Woodmark Corp. | 8,024 | 532 |
| MDC Partners Inc. Class A | 27,010 | 530 |
| * 2U Inc. | 14,906 | 521 |
| Remy International Inc. | 17,776 | 521 |
| * Conn's Inc. | 17,010 | 508 |
| * Steiner Leisure Ltd. | 7,959 | 507 |
| Nutrisystem Inc. | 18,080 | 506 |
| National CineMedia Inc. | 38,102 | 501 |
| * LifeLock Inc. | 58,987 | 498 |
| Barnes & Noble Inc. | 31,660 | 494 |
| * Constant Contact Inc. | 19,751 | 489 |
| Interval Leisure Group Inc. | 24,261 | 487 |
| * Dave & Buster's Entertainment Inc. | 14,125 | 486 |
2
| Vanguard® Russell 2000 Index Fund | |||
| Schedule of Investments | |||
| August 31, 2015 | |||
| Market | |||
| Value | |||
| Shares | ($000) | ||
| * | Cooper-Standard Holding Inc. | 8,419 | 483 |
| Libbey Inc. | 13,541 | 477 | |
| Ethan Allen Interiors Inc. | 15,841 | 471 | |
| *,^ | Wayfair Inc. | 12,472 | 465 |
| * | Universal Electronics Inc. | 9,905 | 452 |
| * | Gray Television Inc. | 38,683 | 448 |
| Standard Motor Products Inc. | 12,376 | 438 | |
| Sonic Automotive Inc. Class A | 20,147 | 433 | |
| Callaway Golf Co. | 48,595 | 430 | |
| *,^ | Zoe's Kitchen Inc. | 12,055 | 416 |
| * | Iconix Brand Group Inc. | 29,830 | 414 |
| New Media Investment Group Inc. | 27,439 | 409 | |
| * | Taylor Morrison Home Corp. Class A | 20,345 | 406 |
| * | Pep Boys-Manny Moe & Jack | 33,339 | 403 |
| * | Shutterstock Inc. | 11,988 | 402 |
| * | Cavco Industries Inc. | 5,459 | 391 |
| * | HealthStream Inc. | 15,524 | 386 |
| AMC Entertainment Holdings Inc. | 13,147 | 381 | |
| * | M/I Homes Inc. | 15,245 | 381 |
| * | Biglari Holdings Inc. | 1,015 | 379 |
| World Wrestling Entertainment Inc. Class A | 18,688 | 375 | |
| Capella Education Co. | 7,632 | 372 | |
| * | Carmike Cinemas Inc. | 15,184 | 362 |
| * | Rentrak Corp. | 7,932 | 362 |
| * | Performance Sports Group Ltd. | 27,704 | 360 |
| * | Strayer Education Inc. | 6,860 | 358 |
| * | Chegg Inc. | 47,886 | 356 |
| * | Motorcar Parts of America Inc. | 11,137 | 355 |
| *,^ | Coupons.com Inc. | 37,412 | 349 |
| Winnebago Industries Inc. | 16,862 | 345 | |
| Ruth's Hospitality Group Inc. | 21,461 | 345 | |
| *,^ | Scientific Games Corp. Class A | 31,136 | 343 |
| Viad Corp. | 12,433 | 340 | |
| * | FTD Cos. Inc. | 11,349 | 339 |
| * | Beazer Homes USA Inc. | 20,179 | 337 |
| * | Central Garden & Pet Co. Class A | 25,853 | 327 |
| *,^ | Caesars Entertainment Corp. | 33,799 | 323 |
| Entravision Communications Corp. Class A | 39,931 | 321 | |
| * | Tower International Inc. | 13,002 | 318 |
| * | Zumiez Inc. | 13,545 | 316 |
| * | Chuy's Holdings Inc. | 10,138 | 311 |
| * | Nautilus Inc. | 19,581 | 299 |
| Fred's Inc. Class A | 22,724 | 298 | |
| * | Francesca's Holdings Corp. | 26,430 | 297 |
| Haverty Furniture Cos. Inc. | 12,547 | 290 | |
| Movado Group Inc. | 10,075 | 285 | |
| Superior Industries International Inc. | 14,634 | 279 | |
| * | Regis Corp. | 25,601 | 277 |
| * | K12 Inc. | 20,895 | 276 |
| * | William Lyon Homes Class A | 12,186 | 276 |
| * | Carrols Restaurant Group Inc. | 21,625 | 274 |
| Inter Parfums Inc. | 10,550 | 271 | |
| * | Party City Holdco Inc. | 15,616 | 265 |
| * | MarineMax Inc. | 16,018 | 261 |
| * | Barnes & Noble Education Inc. | 20,095 | 259 |
| * | Sequential Brands Group Inc. | 15,791 | 258 |
| *,^ | Lumber Liquidators Holdings Inc. | 17,077 | 258 |
| * | Isle of Capri Casinos Inc. | 13,961 | 258 |
| * | Lands' End Inc. | 9,971 | 254 |
| Citi Trends Inc. | 9,445 | 249 | |
| * | Ruby Tuesday Inc. | 37,684 | 248 |
| * | Blue Nile Inc. | 7,273 | 248 |
| * | XO Group Inc. | 16,633 | 244 |
| National Presto Industries Inc. | 2,963 | 243 | |
3
| Vanguard® Russell 2000 Index Fund | |||
| Schedule of Investments | |||
| August 31, 2015 | |||
| Market | |||
| Value | |||
| Shares | ($000) | ||
| Shoe Carnival Inc. | 9,377 | 243 | |
| * | Revlon Inc. Class A | 7,228 | 241 |
| Kirkland's Inc. | 10,661 | 238 | |
| * | WCI Communities Inc. | 9,453 | 236 |
| * | American Public Education Inc. | 10,694 | 235 |
| * | RealD Inc. | 24,772 | 233 |
| Carriage Services Inc. Class A | 9,921 | 228 | |
| * | LGI Homes Inc. | 8,540 | 222 |
| Marcus Corp. | 11,329 | 220 | |
| * | Tuesday Morning Corp. | 27,676 | 219 |
| Stage Stores Inc. | 20,120 | 216 | |
| * | Stoneridge Inc. | 17,495 | 214 |
| * | Del Frisco's Restaurant Group Inc. | 14,262 | 212 |
| * | Century Communities Inc. | 9,587 | 211 |
| Arctic Cat Inc. | 7,817 | 207 | |
| * | Caesars Acquisition Co. Class A | 27,879 | 198 |
| * | Tile Shop Holdings Inc. | 16,605 | 198 |
| Tribune Publishing Co. | 16,660 | 196 | |
| Stein Mart Inc. | 18,255 | 196 | |
| Bassett Furniture Industries Inc. | 6,650 | 193 | |
| * | Malibu Boats Inc. Class A | 11,034 | 191 |
| * | Perry Ellis International Inc. | 7,474 | 185 |
| * | America's Car-Mart Inc. | 5,155 | 185 |
| * | Shake Shack Inc. Class A | 3,653 | 182 |
| *,^ | Etsy Inc. | 12,719 | 182 |
| * | Habit Restaurants Inc. Class A | 7,139 | 178 |
| * | Federal-Mogul Holdings Corp. | 19,306 | 178 |
| *,^ | Elizabeth Arden Inc. | 15,646 | 173 |
| * | Entercom Communications Corp. Class A | 15,227 | 168 |
| * | Build-A-Bear Workshop Inc. | 8,536 | 167 |
| * | Eldorado Resorts Inc. | 17,573 | 166 |
| *,^ | Container Store Group Inc. | 9,739 | 165 |
| * | Boot Barn Holdings Inc. | 7,414 | 162 |
| * | Career Education Corp. | 43,026 | 160 |
| Hooker Furniture Corp. | 6,611 | 158 | |
| * | Fox Factory Holding Corp. | 10,451 | 157 |
| CSS Industries Inc. | 5,758 | 152 | |
| * | Eastman Kodak Co. | 10,802 | 152 |
| * | Vera Bradley Inc. | 13,597 | 147 |
| * | Angie's List Inc. | 27,372 | 145 |
| * | Potbelly Corp. | 13,556 | 143 |
| Speedway Motorsports Inc. | 7,334 | 142 | |
| * | Overstock.com Inc. | 7,179 | 141 |
| * | ZAGG Inc. | 18,963 | 139 |
| * | Sportsman's Warehouse Holdings Inc. | 10,701 | 138 |
| * | Cherokee Inc. | 5,392 | 138 |
| Strattec Security Corp. | 2,189 | 138 | |
| * | Hovnanian Enterprises Inc. Class A | 73,625 | 138 |
| Big 5 Sporting Goods Corp. | 11,612 | 134 | |
| Winmark Corp. | 1,346 | 133 | |
| * | Destination XL Group Inc. | 21,727 | 131 |
| * | 1-800-Flowers.com Inc. Class A | 15,661 | 131 |
| * | Franklin Covey Co. | 7,738 | 129 |
| Metaldyne Performance Group Inc. | 6,854 | 129 | |
| * | Cumulus Media Inc. Class A | 89,775 | 128 |
| * | Daily Journal Corp. | 655 | 128 |
| * | Reading International Inc. Class A | 9,848 | 126 |
| * | QuinStreet Inc. | 21,805 | 120 |
| * | Crown Media Holdings Inc. Class A | 22,237 | 119 |
| * | Bravo Brio Restaurant Group Inc. | 9,323 | 119 |
| * | Horizon Global Corp. | 11,229 | 117 |
| Harte-Hanks Inc. | 30,102 | 116 | |
| * | Jamba Inc. | 8,355 | 115 |
| * | JAKKS Pacific Inc. | 11,968 | 114 |
4
| Vanguard® Russell 2000 Index Fund | |||
| Schedule of Investments | |||
| August 31, 2015 | |||
| Market | |||
| Value | |||
| Shares | ($000) | ||
| * | El Pollo Loco Holdings Inc. | 8,649 | 113 |
| * | Martha Stewart Living Omnimedia Inc. Class A | 18,433 | 112 |
| Escalade Inc. | 6,172 | 110 | |
| * | Monarch Casino & Resort Inc. | 6,254 | 110 |
| Weyco Group Inc. | 4,033 | 109 | |
| Flexsteel Industries Inc. | 3,486 | 107 | |
| *,^ | Weight Watchers International Inc. | 17,320 | 106 |
| * | Bojangles' Inc. | 4,982 | 104 |
| * | Black Diamond Inc. | 13,601 | 101 |
| * | TubeMogul Inc. | 9,161 | 101 |
| Journal Media Group Inc. | 14,634 | 98 | |
| * | Intrawest Resorts Holdings Inc. | 10,860 | 98 |
| * | Noodles & Co. Class A | 8,172 | 97 |
| * | Central European Media Enterprises Ltd. Class A | 43,790 | 96 |
| * | Kona Grill Inc. | 5,243 | 96 |
| Lifetime Brands Inc. | 6,529 | 95 | |
| * | West Marine Inc. | 10,703 | 94 |
| * | Skullcandy Inc. | 13,247 | 93 |
| * | Sizmek Inc. | 14,006 | 92 |
| * | VOXX International Corp. Class A | 11,689 | 91 |
| Liberty Tax Inc. | 3,804 | 90 | |
| * | Vince Holding Corp. | 9,750 | 89 |
| * | Fenix Parts Inc. | 8,956 | 89 |
| * | EVINE Live Inc. | 31,571 | 85 |
| Marchex Inc. Class B | 21,322 | 85 | |
| * | Papa Murphy's Holdings Inc. | 5,622 | 83 |
| * | Bridgepoint Education Inc. | 10,260 | 83 |
| Superior Uniform Group Inc. | 4,875 | 83 | |
| Collectors Universe Inc. | 4,431 | 83 | |
| Johnson Outdoors Inc. Class A | 3,299 | 83 | |
| Saga Communications Inc. Class A | 2,361 | 82 | |
| * | Hemisphere Media Group Inc. Class A | 6,012 | 82 |
| * | Morgans Hotel Group Co. | 17,462 | 80 |
| * | New Home Co. Inc. | 5,330 | 79 |
| * | Care.com Inc. | 11,310 | 67 |
| * | Systemax Inc. | 6,568 | 60 |
| * | Tilly's Inc. Class A | 7,015 | 56 |
| Universal Technical Institute Inc. | 12,014 | 54 | |
| Marine Products Corp. | 7,046 | 49 | |
| * | Townsquare Media Inc. Class A | 4,194 | 48 |
| * | Cambium Learning Group Inc. | 8,582 | 45 |
| * | Empire Resorts Inc. | 9,633 | 41 |
| * | Christopher & Banks Corp. | 21,778 | 38 |
| * | Quiksilver Inc. | 74,592 | 32 |
| * | SFX Entertainment Inc. | 27,316 | 28 |
| bebe stores inc | 15,932 | 22 | |
| 164,477 | |||
| Consumer Staples (3.0%) | |||
| Casey's General Stores Inc. | 24,084 | 2,549 | |
| * | Post Holdings Inc. | 38,044 | 2,483 |
| * | TreeHouse Foods Inc. | 26,578 | 2,109 |
| * | United Natural Foods Inc. | 31,041 | 1,495 |
| * | SUPERVALU Inc. | 162,280 | 1,337 |
| Vector Group Ltd. | 50,646 | 1,207 | |
| * | Boston Beer Co. Inc. Class A | 5,635 | 1,156 |
| B&G Foods Inc. | 35,928 | 1,092 | |
| Lancaster Colony Corp. | 11,481 | 1,089 | |
| J&J Snack Foods Corp. | 9,230 | 1,052 | |
| Cal-Maine Foods Inc. | 19,413 | 1,031 | |
| Snyder's-Lance Inc. | 30,278 | 1,022 | |
| Dean Foods Co. | 58,491 | 963 | |
| Sanderson Farms Inc. | 13,893 | 959 | |
| * | Diplomat Pharmacy Inc. | 22,427 | 886 |
| Core-Mark Holding Co. Inc. | 14,316 | 860 | |
5
| Vanguard® Russell 2000 Index Fund | |||
| Schedule of Investments | |||
| August 31, 2015 | |||
| Market | |||
| Value | |||
| Shares | ($000) | ||
| Fresh Del Monte Produce Inc. | 20,658 | 818 | |
| WD-40 Co. | 9,030 | 756 | |
| Universal Corp. | 14,006 | 689 | |
| SpartanNash Co. | 23,315 | 660 | |
| Andersons Inc. | 17,722 | 627 | |
| * | Fresh Market Inc. | 26,781 | 577 |
| * | Seaboard Corp. | 161 | 535 |
| Calavo Growers Inc. | 9,162 | 534 | |
| * | USANA Health Sciences Inc. | 3,512 | 514 |
| * | Diamond Foods Inc. | 16,330 | 493 |
| Coca-Cola Bottling Co. Consolidated | 2,888 | 445 | |
| Ingles Markets Inc. Class A | 8,182 | 407 | |
| Tootsie Roll Industries Inc. | 11,393 | 354 | |
| Weis Markets Inc. | 6,764 | 275 | |
| * | Boulder Brands Inc. | 33,263 | 273 |
| John B Sanfilippo & Son Inc. | 5,181 | 268 | |
| * | Smart & Final Stores Inc. | 15,138 | 247 |
| * | Omega Protein Corp. | 13,407 | 229 |
| PetMed Express Inc. | 12,610 | 209 | |
| * | Medifast Inc. | 6,845 | 190 |
| * | National Beverage Corp. | 7,049 | 186 |
| * | Chefs' Warehouse Inc. | 11,601 | 176 |
| *,^ | Freshpet Inc. | 12,871 | 167 |
| Orchids Paper Products Co. | 5,875 | 147 | |
| * | Seneca Foods Corp. Class A | 4,821 | 142 |
| Limoneira Co. | 7,131 | 135 | |
| * | Natural Grocers by Vitamin Cottage Inc. | 5,377 | 131 |
| Natural Health Trends Corp. | 4,752 | 127 | |
| * | Nutraceutical International Corp. | 5,073 | 123 |
| Village Super Market Inc. Class A | 4,359 | 121 | |
| MGP Ingredients Inc. | 6,671 | 106 | |
| * | Farmer Bros Co. | 4,633 | 106 |
| * | Inventure Foods Inc. | 11,893 | 103 |
| Alico Inc. | 2,397 | 101 | |
| Nature's Sunshine Products Inc. | 6,127 | 75 | |
| * | Synutra International Inc. | 13,015 | 65 |
| * | Craft Brew Alliance Inc. | 6,191 | 51 |
| * | Castle Brands Inc. | 40,552 | 49 |
| * | Lifeway Foods Inc. | 2,883 | 41 |
| * | Arcadia Biosciences Inc. | 4,074 | 26 |
| * | Fairway Group Holdings Corp. | 10,501 | 24 |
| 32,592 | |||
| Energy (2.9%) | |||
| Western Refining Inc. | 44,094 | 1,897 | |
| SemGroup Corp. Class A | 27,214 | 1,497 | |
| * | PDC Energy Inc. | 24,827 | 1,395 |
| * | Carrizo Oil & Gas Inc. | 31,894 | 1,162 |
| Delek US Holdings Inc. | 35,558 | 1,094 | |
| * | Matador Resources Co. | 45,349 | 1,039 |
| * | Oasis Petroleum Inc. | 86,289 | 963 |
| Exterran Holdings Inc. | 43,027 | 960 | |
| * | Oil States International Inc. | 31,982 | 907 |
| * | Parsley Energy Inc. Class A | 51,736 | 890 |
| * | RSP Permian Inc. | 36,628 | 877 |
| *,^ | Ultra Petroleum Corp. | 94,964 | 809 |
| Atwood Oceanics Inc. | 40,073 | 766 | |
| * | McDermott International Inc. | 149,217 | 758 |
| * | SEACOR Holdings Inc. | 11,313 | 730 |
| * | Synergy Resources Corp. | 64,777 | 696 |
| * | Flotek Industries Inc. | 33,188 | 649 |
| * | Forum Energy Technologies Inc. | 36,941 | 581 |
| Green Plains Inc. | 23,525 | 500 | |
| * | Unit Corp. | 31,337 | 476 |
| SunCoke Energy Inc. | 40,746 | 468 | |
6
| Vanguard® Russell 2000 Index Fund | |||
| Schedule of Investments | |||
| August 31, 2015 | |||
| Market | |||
| Value | |||
| Shares | ($000) | ||
| ^ | Peabody Energy Corp. | 173,215 | 468 |
| * | Helix Energy Solutions Group Inc. | 66,353 | 461 |
| * | Hornbeck Offshore Services Inc. | 20,083 | 397 |
| * | Newpark Resources Inc. | 52,494 | 385 |
| * | TETRA Technologies Inc. | 48,725 | 375 |
| * | Callon Petroleum Co. | 40,207 | 369 |
| Alon USA Energy Inc. | 19,479 | 361 | |
| CARBO Ceramics Inc. | 11,948 | 328 | |
| * | Matrix Service Co. | 16,297 | 326 |
| *,^ | Halcon Resources Corp. | 223,165 | 257 |
| * | Parker Drilling Co. | 75,286 | 254 |
| *,^ | Clean Energy Fuels Corp. | 43,774 | 233 |
| *,^ | Northern Oil and Gas Inc. | 38,394 | 231 |
| * | Bonanza Creek Energy Inc. | 30,117 | 230 |
| * | Renewable Energy Group Inc. | 26,933 | 227 |
| * | RigNet Inc. | 7,560 | 218 |
| * | REX American Resources Corp. | 3,984 | 214 |
| *,^ | Sanchez Energy Corp. | 33,144 | 213 |
| * | Era Group Inc. | 12,496 | 211 |
| Tesco Corp. | 24,183 | 205 | |
| * | Stone Energy Corp. | 35,687 | 202 |
| * | Fairmount Santrol Holdings Inc. | 39,696 | 199 |
| * | Par Petroleum Corp. | 9,634 | 186 |
| * | C&J Energy Services Ltd. | 33,615 | 186 |
| * | Clayton Williams Energy Inc. | 3,567 | 181 |
| Panhandle Oil and Gas Inc. Class A | 10,010 | 176 | |
| * | Bill Barrett Corp. | 32,068 | 175 |
| * | Cloud Peak Energy Inc. | 36,253 | 173 |
| * | Natural Gas Services Group Inc. | 7,856 | 170 |
| * | Westmoreland Coal Co. | 11,011 | 167 |
| * | Trecora Resources | 12,768 | 165 |
| * | PowerSecure International Inc. | 13,477 | 162 |
| * | Green Brick Partners Inc. | 13,308 | 162 |
| * | EnerNOC Inc. | 17,165 | 160 |
| * | Vivint Solar Inc. | 12,705 | 158 |
| * | Ring Energy Inc. | 15,304 | 157 |
| * | Geospace Technologies Corp. | 8,256 | 146 |
| * | Pacific Ethanol Inc. | 19,967 | 141 |
| *,^ | SandRidge Energy Inc. | 259,214 | 138 |
| * | Civeo Corp. | 69,807 | 136 |
| * | Basic Energy Services Inc. | 25,921 | 135 |
| *,^ | Solazyme Inc. | 50,475 | 134 |
| * | Pioneer Energy Services Corp. | 38,976 | 129 |
| *,^ | FuelCell Energy Inc. | 154,197 | 127 |
| *,^ | Triangle Petroleum Corp. | 28,606 | 116 |
| * | Eclipse Resources Corp. | 28,532 | 110 |
| * | Abraxas Petroleum Corp. | 55,968 | 109 |
| ^ | Energy XXI Ltd. | 54,557 | 104 |
| * | Magnum Hunter Resources Corp. | 128,351 | 103 |
| *,^ | Rex Energy Corp. | 29,202 | 101 |
| * | Jones Energy Inc. Class A | 16,977 | 101 |
| * | Contango Oil & Gas Co. | 10,531 | 98 |
| * | Seventy Seven Energy Inc. | 33,735 | 97 |
| Evolution Petroleum Corp. | 14,510 | 85 | |
| EXCO Resources Inc. | 97,504 | 81 | |
| Nordic American Offshore Ltd. | 11,641 | 80 | |
| * | Enphase Energy Inc. | 16,922 | 78 |
| * | Gastar Exploration Inc. | 45,530 | 75 |
| * | Ameresco Inc. Class A | 13,100 | 74 |
| ^ | W&T Offshore Inc. | 20,547 | 73 |
| * | Isramco Inc. | 538 | 70 |
| * | Independence Contract Drilling Inc. | 9,614 | 67 |
| Adams Resources & Energy Inc. | 1,315 | 60 | |
| * | Key Energy Services Inc. | 81,617 | 58 |
7
| Vanguard® Russell 2000 Index Fund | |||
| Schedule of Investments | |||
| August 31, 2015 | |||
| Market | |||
| Value | |||
| Shares | ($000) | ||
| *,^ | Approach Resources Inc. | 22,169 | 57 |
| Hallador Energy Co. | 6,612 | 53 | |
| * | Penn Virginia Corp. | 39,993 | 49 |
| * | ION Geophysical Corp. | 89,828 | 47 |
| * | TransAtlantic Petroleum Ltd. | 15,082 | 46 |
| *,^ | Erin Energy Corp. | 9,470 | 38 |
| North Atlantic Drilling Ltd. | 37,667 | 33 | |
| * | Earthstone Energy Inc. | 650 | 11 |
| * | Global Geophysical Services Inc. | 127 | — |
| 31,016 | |||
| Financial Services (25.4%) | |||
| First American Financial Corp. | 67,194 | 2,611 | |
| CubeSmart | 103,115 | 2,608 | |
| Investors Bancorp Inc. | 216,188 | 2,547 | |
| * | Strategic Hotels & Resorts Inc. | 170,664 | 2,302 |
| Umpqua Holdings Corp. | 136,721 | 2,285 | |
| RLJ Lodging Trust | 81,938 | 2,257 | |
| Prosperity Bancshares Inc. | 43,420 | 2,244 | |
| * | MGIC Investment Corp. | 210,538 | 2,223 |
| Highwoods Properties Inc. | 58,302 | 2,212 | |
| LaSalle Hotel Properties | 70,025 | 2,203 | |
| CNO Financial Group Inc. | 122,080 | 2,184 | |
| Radian Group Inc. | 118,659 | 2,133 | |
| MarketAxess Holdings Inc. | 23,136 | 2,092 | |
| * | Euronet Worldwide Inc. | 32,160 | 2,073 |
| New Residential Investment Corp. | 142,835 | 2,023 | |
| Bank of the Ozarks Inc. | 48,344 | 2,021 | |
| Webster Financial Corp. | 56,274 | 1,991 | |
| Sovran Self Storage Inc. | 22,046 | 1,978 | |
| * | Stifel Financial Corp. | 42,080 | 1,961 |
| Sun Communities Inc. | 28,888 | 1,884 | |
| FirstMerit Corp. | 102,770 | 1,846 | |
| PrivateBancorp Inc. | 48,731 | 1,844 | |
| EPR Properties | 35,449 | 1,804 | |
| Sunstone Hotel Investors Inc. | 129,361 | 1,789 | |
| DCT Industrial Trust Inc. | 55,078 | 1,769 | |
| Pebblebrook Hotel Trust | 44,542 | 1,695 | |
| Medical Properties Trust Inc. | 144,511 | 1,686 | |
| Fair Isaac Corp. | 19,249 | 1,647 | |
| * | Western Alliance Bancorp | 53,308 | 1,627 |
| United Bankshares Inc. | 43,050 | 1,611 | |
| * | PRA Group Inc. | 29,954 | 1,596 |
| MB Financial Inc. | 46,569 | 1,534 | |
| * | Texas Capital Bancshares Inc. | 28,376 | 1,528 |
| Colony Capital Inc. Class A | 69,242 | 1,503 | |
| Wintrust Financial Corp. | 29,395 | 1,499 | |
| Cathay General Bancorp | 49,537 | 1,468 | |
| Symetra Financial Corp. | 46,555 | 1,465 | |
| DiamondRock Hospitality Co. | 124,418 | 1,463 | |
| IBERIABANK Corp. | 23,669 | 1,441 | |
| Healthcare Realty Trust Inc. | 62,232 | 1,425 | |
| BancorpSouth Inc. | 59,849 | 1,422 | |
| RLI Corp. | 26,773 | 1,395 | |
| GEO Group Inc. | 46,279 | 1,390 | |
| Ryman Hospitality Properties Inc. | 26,954 | 1,381 | |
| Kennedy-Wilson Holdings Inc. | 57,527 | 1,378 | |
| Valley National Bancorp | 144,140 | 1,364 | |
| FNB Corp. | 108,291 | 1,360 | |
| Hancock Holding Co. | 48,285 | 1,356 | |
| Janus Capital Group Inc. | 91,014 | 1,354 | |
| Primerica Inc. | 31,833 | 1,353 | |
| Heartland Payment Systems Inc. | 22,688 | 1,352 | |
| Home BancShares Inc. | 35,389 | 1,349 | |
| Washington Federal Inc. | 58,786 | 1,334 | |
8
| Vanguard® Russell 2000 Index Fund | ||
| Schedule of Investments | ||
| August 31, 2015 | ||
| Market | ||
| Value | ||
| Shares | ($000) | |
| Fulton Financial Corp. | 109,529 | 1,332 |
| First Industrial Realty Trust Inc. | 68,639 | 1,331 |
| * Blackhawk Network Holdings Inc. | 33,658 | 1,330 |
| WisdomTree Investments Inc. | 70,728 | 1,326 |
| Hudson Pacific Properties Inc. | 46,147 | 1,310 |
| CyrusOne Inc. | 41,080 | 1,301 |
| National Health Investors Inc. | 23,287 | 1,283 |
| Xenia Hotels & Resorts Inc. | 69,224 | 1,281 |
| Acadia Realty Trust | 42,639 | 1,260 |
| First Financial Bankshares Inc. | 39,762 | 1,238 |
| Cousins Properties Inc. | 134,269 | 1,231 |
| UMB Financial Corp. | 24,405 | 1,223 |
| American Equity Investment Life Holding Co. | 50,317 | 1,221 |
| Kite Realty Group Trust | 51,811 | 1,218 |
| Glacier Bancorp Inc. | 46,821 | 1,218 |
| EverBank Financial Corp. | 59,985 | 1,187 |
| Urban Edge Properties | 55,033 | 1,151 |
| First Citizens BancShares Inc. Class A | 4,777 | 1,133 |
| South State Corp. | 14,992 | 1,127 |
| Evercore Partners Inc. Class A | 21,458 | 1,124 |
| * BofI Holding Inc. | 9,516 | 1,102 |
| Columbia Banking System Inc. | 35,763 | 1,084 |
| EastGroup Properties Inc. | 20,025 | 1,081 |
| Selective Insurance Group Inc. | 35,302 | 1,070 |
| CVB Financial Corp. | 65,868 | 1,070 |
| Equity One Inc. | 45,514 | 1,070 |
| Chesapeake Lodging Trust | 36,977 | 1,069 |
| Pinnacle Financial Partners Inc. | 22,240 | 1,055 |
| Capitol Federal Financial Inc. | 87,196 | 1,051 |
| DuPont Fabros Technology Inc. | 39,141 | 1,046 |
| National Penn Bancshares Inc. | 86,847 | 1,043 |
| Financial Engines Inc. | 32,142 | 1,043 |
| Sterling Bancorp | 74,313 | 1,043 |
| Washington REIT | 42,241 | 1,039 |
| Invesco Mortgage Capital Inc. | 76,330 | 1,038 |
| Mack-Cali Realty Corp. | 55,250 | 1,035 |
| Lexington Realty Trust | 127,360 | 1,028 |
| Alexander & Baldwin Inc. | 30,284 | 1,025 |
| Old National Bancorp | 72,517 | 1,001 |
| BGC Partners Inc. Class A | 113,583 | 996 |
| Chambers Street Properties | 146,827 | 994 |
| Retail Opportunity Investments Corp. | 61,465 | 979 |
| * Hilltop Holdings Inc. | 47,205 | 975 |
| Hatteras Financial Corp. | 60,000 | 974 |
| Argo Group International Holdings Ltd. | 17,316 | 969 |
| Sabra Health Care REIT Inc. | 40,376 | 968 |
| New York REIT Inc. | 100,709 | 965 |
| Trustmark Corp. | 41,878 | 964 |
| * Cardtronics Inc. | 27,817 | 960 |
| Monogram Residential Trust Inc. | 103,221 | 956 |
| Kemper Corp. | 26,961 | 955 |
| * Essent Group Ltd. | 34,454 | 923 |
| Astoria Financial Corp. | 55,775 | 902 |
| Community Bank System Inc. | 25,273 | 901 |
| LTC Properties Inc. | 22,032 | 899 |
| American Assets Trust Inc. | 23,039 | 887 |
| PS Business Parks Inc. | 12,085 | 882 |
| Education Realty Trust Inc. | 29,974 | 877 |
| International Bancshares Corp. | 33,575 | 861 |
| First Midwest Bancorp Inc. | 48,331 | 853 |
| HFF Inc. Class A | 23,453 | 852 |
| ^ Pennsylvania REIT | 42,845 | 850 |
| Horace Mann Educators Corp. | 25,503 | 847 |
| LegacyTexas Financial Group Inc. | 29,510 | 836 |
9
| Vanguard® Russell 2000 Index Fund | ||
| Schedule of Investments | ||
| August 31, 2015 | ||
| Market | ||
| Value | ||
| Shares | ($000) | |
| Potlatch Corp. | 25,216 | 833 |
| Parkway Properties Inc. | 52,465 | 831 |
| * Enstar Group Ltd. | 5,634 | 823 |
| Simmons First National Corp. Class A | 18,505 | 812 |
| Northwest Bancshares Inc. | 62,931 | 808 |
| Gramercy Property Trust Inc. | 35,508 | 785 |
| Renasant Corp. | 24,916 | 781 |
| * Eagle Bancorp Inc. | 18,544 | 777 |
| Provident Financial Services Inc. | 40,679 | 770 |
| CYS Investments Inc. | 98,027 | 766 |
| Redwood Trust Inc. | 52,231 | 762 |
| Ramco-Gershenson Properties Trust | 49,063 | 760 |
| Hersha Hospitality Trust Class A | 30,424 | 744 |
| EVERTEC Inc. | 40,782 | 738 |
| CoreSite Realty Corp. | 15,082 | 734 |
| Independent Bank Corp. | 16,209 | 734 |
| WesBanco Inc. | 23,835 | 734 |
| * Third Point Reinsurance Ltd. | 52,322 | 732 |
| * St. Joe Co. | 41,670 | 727 |
| * First Cash Financial Services Inc. | 17,478 | 721 |
| Select Income REIT | 38,841 | 721 |
| * FNFV Group | 49,605 | 718 |
| BBCN Bancorp Inc. | 49,312 | 717 |
| FelCor Lodging Trust Inc. | 88,815 | 717 |
| Westamerica Bancorporation | 15,839 | 715 |
| NBT Bancorp Inc. | 27,307 | 707 |
| First Financial Bancorp | 38,239 | 705 |
| PennyMac Mortgage Investment Trust | 46,235 | 697 |
| QTS Realty Trust Inc. Class A | 17,316 | 696 |
| Government Properties Income Trust | 43,618 | 691 |
| STAG Industrial Inc. | 40,371 | 689 |
| Park National Corp. | 8,089 | 681 |
| Chemical Financial Corp. | 20,898 | 667 |
| Union Bankshares Corp. | 28,031 | 662 |
| * iStar Inc. | 53,013 | 661 |
| Kearny Financial Corp. | 58,056 | 659 |
| Summit Hotel Properties Inc. | 54,097 | 656 |
| * Encore Capital Group Inc. | 16,147 | 656 |
| S&T Bancorp Inc. | 21,675 | 649 |
| Great Western Bancorp Inc. | 25,618 | 645 |
| * Beneficial Bancorp Inc. | 51,468 | 640 |
| Greenhill & Co. Inc. | 18,154 | 637 |
| Physicians Realty Trust | 43,588 | 632 |
| * HRG Group Inc. | 49,046 | 632 |
| * MBIA Inc. | 89,586 | 629 |
| Capstead Mortgage Corp. | 59,479 | 620 |
| Boston Private Financial Holdings Inc. | 51,693 | 615 |
| United Community Banks Inc. | 31,291 | 612 |
| New Senior Investment Group Inc. | 53,733 | 612 |
| First Merchants Corp. | 23,432 | 610 |
| Apollo Commercial Real Estate Finance Inc. | 36,383 | 596 |
| ARMOUR Residential REIT Inc. | 27,397 | 585 |
| Franklin Street Properties Corp. | 56,136 | 584 |
| Banner Corp. | 13,015 | 578 |
| * FCB Financial Holdings Inc. Class A | 17,431 | 575 |
| Starwood Waypoint Residential Trust | 23,678 | 570 |
| Nelnet Inc. Class A | 14,735 | 555 |
| Infinity Property & Casualty Corp. | 7,148 | 552 |
| AMERISAFE Inc. | 11,807 | 552 |
| Talmer Bancorp Inc. Class A | 33,937 | 551 |
| Stewart Information Services Corp. | 14,226 | 551 |
| Terreno Realty Corp. | 26,803 | 545 |
| Ameris Bancorp | 19,991 | 545 |
| Chatham Lodging Trust | 23,741 | 545 |
10
| Vanguard® Russell 2000 Index Fund | |||
| Schedule of Investments | |||
| August 31, 2015 | |||
| Market | |||
| Value | |||
| Shares | ($000) | ||
| Altisource Residential Corp. | 35,460 | 541 | |
| Towne Bank | 28,330 | 520 | |
| ServisFirst Bancshares Inc. | 13,695 | 513 | |
| Investors Real Estate Trust | 76,655 | 513 | |
| Berkshire Hills Bancorp Inc. | 18,298 | 512 | |
| * | Navigators Group Inc. | 6,576 | 500 |
| * | Green Dot Corp. Class A | 28,197 | 499 |
| * | Ocwen Financial Corp. | 66,597 | 495 |
| * | Xoom Corp. | 19,914 | 494 |
| Tompkins Financial Corp. | 9,323 | 489 | |
| Universal Insurance Holdings Inc. | 19,854 | 489 | |
| Virtus Investment Partners Inc. | 4,244 | 488 | |
| First Commonwealth Financial Corp. | 55,146 | 488 | |
| Safety Insurance Group Inc. | 9,279 | 488 | |
| WSFS Financial Corp. | 17,603 | 485 | |
| American Capital Mortgage Investment Corp. | 31,720 | 484 | |
| Hanmi Financial Corp. | 19,894 | 482 | |
| Alexander's Inc. | 1,300 | 472 | |
| Cash America International Inc. | 17,034 | 470 | |
| Wilshire Bancorp Inc. | 43,748 | 467 | |
| Banco Latinoamericano de Comercio Exterior SA | 18,739 | 462 | |
| Brookline Bancorp Inc. | 43,694 | 461 | |
| STORE Capital Corp. | 22,717 | 458 | |
| * | Greenlight Capital Re Ltd. Class A | 17,943 | 458 |
| Inland Real Estate Corp. | 54,354 | 457 | |
| National General Holdings Corp. | 24,774 | 454 | |
| Maiden Holdings Ltd. | 31,509 | 452 | |
| * | Ambac Financial Group Inc. | 27,613 | 449 |
| City Holding Co. | 9,344 | 445 | |
| Cardinal Financial Corp. | 19,937 | 445 | |
| New York Mortgage Trust Inc. | 67,795 | 443 | |
| Rexford Industrial Realty Inc. | 34,312 | 443 | |
| State Bank Financial Corp. | 21,870 | 442 | |
| Employers Holdings Inc. | 19,770 | 436 | |
| Northfield Bancorp Inc. | 29,075 | 435 | |
| National Bank Holdings Corp. Class A | 21,435 | 432 | |
| * | Meridian Bancorp Inc. | 33,747 | 430 |
| * | Capital Bank Financial Corp. | 13,822 | 425 |
| Lakeland Financial Corp. | 10,316 | 424 | |
| United Fire Group Inc. | 12,678 | 421 | |
| Oritani Financial Corp. | 27,384 | 413 | |
| Southside Bancshares Inc. | 15,703 | 409 | |
| * | Customers Bancorp Inc. | 16,654 | 408 |
| *,^ | Nationstar Mortgage Holdings Inc. | 24,395 | 408 |
| * | Walker & Dunlop Inc. | 16,555 | 403 |
| Ashford Hospitality Trust Inc. | 51,908 | 402 | |
| Heartland Financial USA Inc. | 10,967 | 399 | |
| Sandy Spring Bancorp Inc. | 15,438 | 396 | |
| * | Piper Jaffray Cos. | 9,330 | 391 |
| CenterState Banks Inc. | 28,169 | 389 | |
| Ladder Capital Corp. | 24,891 | 388 | |
| * | LendingTree Inc. | 3,627 | 384 |
| Hannon Armstrong Sustainable Infrastructure Capital Inc. | 20,163 | 383 | |
| InfraREIT Inc. | 13,578 | 383 | |
| First Potomac Realty Trust | 36,405 | 383 | |
| United Financial Bancorp Inc. | 30,443 | 382 | |
| Cohen & Steers Inc. | 12,713 | 381 | |
| *,^ | Walter Investment Management Corp. | 23,081 | 379 |
| Flushing Financial Corp. | 18,294 | 365 | |
| Universal Health Realty Income Trust | 7,845 | 361 | |
| * | Cowen Group Inc. Class A | 68,155 | 361 |
| BNC Bancorp | 17,388 | 359 | |
| Diamond Hill Investment Group Inc. | 1,837 | 358 | |
| * | Marcus & Millichap Inc. | 8,424 | 358 |
11
| Vanguard® Russell 2000 Index Fund | ||
| Schedule of Investments | ||
| August 31, 2015 | ||
| Market | ||
| Value | ||
| Shares | ($000) | |
| Rouse Properties Inc. | 22,849 | 355 |
| ConnectOne Bancorp Inc. | 18,533 | 355 |
| Washington Trust Bancorp Inc. | 9,085 | 351 |
| TrustCo Bank Corp. NY | 58,962 | 349 |
| Silver Bay Realty Trust Corp. | 22,225 | 348 |
| Monmouth Real Estate Investment Corp. | 36,290 | 345 |
| Cass Information Systems Inc. | 7,151 | 345 |
| Investment Technology Group Inc. | 20,938 | 344 |
| Community Trust Bancorp Inc. | 9,704 | 341 |
| FBL Financial Group Inc. Class A | 5,961 | 340 |
| Western Asset Mortgage Capital Corp. | 26,186 | 335 |
| American Residential Properties Inc. | 19,710 | 334 |
| CareTrust REIT Inc. | 29,741 | 333 |
| TriCo Bancshares | 14,037 | 333 |
| Heritage Financial Corp. | 18,748 | 332 |
| Bryn Mawr Bank Corp. | 11,131 | 330 |
| Dime Community Bancshares Inc. | 19,355 | 330 |
| * First NBC Bank Holding Co. | 9,385 | 328 |
| ^ United Development Funding IV | 18,737 | 328 |
| Cedar Realty Trust Inc. | 52,263 | 327 |
| Anworth Mortgage Asset Corp. | 64,989 | 327 |
| Yadkin Financial Corp. | 15,646 | 326 |
| First Interstate BancSystem Inc. Class A | 12,194 | 325 |
| Stock Yards Bancorp Inc. | 9,179 | 323 |
| National Western Life Insurance Co. Class A | 1,389 | 316 |
| Agree Realty Corp. | 10,954 | 312 |
| Urstadt Biddle Properties Inc. Class A | 17,339 | 311 |
| * HomeStreet Inc. | 13,847 | 308 |
| 1st Source Corp. | 10,271 | 308 |
| Saul Centers Inc. | 6,121 | 302 |
| Moelis & Co. Class A | 10,977 | 299 |
| AG Mortgage Investment Trust Inc. | 17,805 | 294 |
| Central Pacific Financial Corp. | 14,177 | 294 |
| Enterprise Financial Services Corp. | 12,237 | 293 |
| RAIT Financial Trust | 56,155 | 291 |
| CoBiz Financial Inc. | 22,212 | 286 |
| First Busey Corp. | 44,382 | 284 |
| * First BanCorp | 70,614 | 283 |
| Virtu Financial Inc. Class A | 11,721 | 276 |
| Banc of California Inc. | 22,174 | 275 |
| Apollo Residential Mortgage Inc. | 19,676 | 275 |
| MainSource Financial Group Inc. | 13,195 | 273 |
| BancFirst Corp. | 4,465 | 270 |
| * Forestar Group Inc. | 20,853 | 270 |
| RE/MAX Holdings Inc. | 7,320 | 269 |
| Resource Capital Corp. | 81,620 | 264 |
| * Heritage Insurance Holdings Inc. | 15,041 | 264 |
| Westwood Holdings Group Inc. | 4,730 | 263 |
| Great Southern Bancorp Inc. | 6,520 | 263 |
| * Square 1 Financial Inc. Class A | 10,358 | 261 |
| * NMI Holdings Inc. Class A | 31,334 | 261 |
| Lakeland Bancorp Inc. | 23,464 | 260 |
| Independent Bank Group Inc. | 6,046 | 256 |
| * Flagstar Bancorp Inc. | 12,544 | 255 |
| OM Asset Management plc | 15,371 | 254 |
| Peoples Bancorp Inc. | 11,506 | 253 |
| Getty Realty Corp. | 15,974 | 252 |
| Blue Hills Bancorp Inc. | 17,702 | 250 |
| Bridge Bancorp Inc. | 9,388 | 247 |
| CatchMark Timber Trust Inc. Class A | 24,470 | 246 |
| * Pacific Premier Bancorp Inc. | 13,127 | 246 |
| * INTL. FCStone Inc. | 9,195 | 243 |
| OFG Bancorp | 28,059 | 242 |
| * KCG Holdings Inc. Class A | 20,678 | 238 |
12
| Vanguard® Russell 2000 Index Fund | |||
| Schedule of Investments | |||
| August 31, 2015 | |||
| Market | |||
| Value | |||
| Shares | ($000) | ||
| Arlington Asset Investment Corp. Class A | 14,228 | 237 | |
| German American Bancorp Inc. | 8,056 | 233 | |
| Opus Bank | 6,333 | 233 | |
| Ashford Hospitality Prime Inc. | 16,811 | 233 | |
| GAMCO Investors Inc. | 3,963 | 232 | |
| Univest Corp. of Pennsylvania | 11,931 | 231 | |
| Clifton Bancorp Inc. | 16,623 | 229 | |
| * | HomeTrust Bancshares Inc. | 12,574 | 229 |
| * | Seacoast Banking Corp. of Florida | 14,582 | 227 |
| Dynex Capital Inc. | 33,152 | 222 | |
| Preferred Bank | 7,240 | 222 | |
| First Financial Corp. | 6,744 | 222 | |
| * | CU Bancorp | 10,269 | 222 |
| * | Safeguard Scientifics Inc. | 12,602 | 221 |
| First Defiance Financial Corp. | 5,784 | 218 | |
| Financial Institutions Inc. | 8,789 | 218 | |
| * | Altisource Portfolio Solutions SA | 8,003 | 215 |
| Waterstone Financial Inc. | 16,679 | 215 | |
| Metro Bancorp Inc. | 7,469 | 214 | |
| Ares Commercial Real Estate Corp. | 17,078 | 214 | |
| Mercantile Bank Corp. | 10,460 | 212 | |
| * | Enova International Inc. | 16,251 | 211 |
| First Bancorp | 12,399 | 211 | |
| * | Everi Holdings Inc. | 40,763 | 211 |
| HCI Group Inc. | 5,276 | 210 | |
| Bank Mutual Corp. | 28,993 | 210 | |
| Stonegate Bank | 6,722 | 210 | |
| Peapack Gladstone Financial Corp. | 9,773 | 207 | |
| OneBeacon Insurance Group Ltd. Class A | 14,265 | 206 | |
| Campus Crest Communities Inc. | 39,663 | 205 | |
| Independent Bank Corp. | 14,570 | 205 | |
| Park Sterling Corp. | 28,306 | 204 | |
| * | Ezcorp Inc. Class A | 32,135 | 203 |
| * | Tejon Ranch Co. | 8,539 | 202 |
| State Auto Financial Corp. | 9,205 | 202 | |
| Suffolk Bancorp | 7,433 | 198 | |
| Southwest Bancorp Inc. | 11,873 | 198 | |
| First of Long Island Corp. | 7,676 | 196 | |
| Fidelity Southern Corp. | 10,108 | 195 | |
| Federated National Holding Co. | 8,892 | 195 | |
| *,^ | Citizens Inc. Class A | 30,643 | 193 |
| * | Anchor BanCorp Wisconsin Inc. | 4,692 | 192 |
| Whitestone REIT | 16,484 | 188 | |
| CorEnergy Infrastructure Trust Inc. | 36,575 | 188 | |
| Gladstone Commercial Corp. | 13,021 | 188 | |
| State National Cos. Inc. | 19,657 | 187 | |
| First Community Bancshares Inc. | 10,463 | 185 | |
| James River Group Holdings Ltd. | 6,712 | 185 | |
| West Bancorporation Inc. | 10,180 | 184 | |
| Arrow Financial Corp. | 6,649 | 183 | |
| Meta Financial Group Inc. | 4,180 | 182 | |
| Camden National Corp. | 4,535 | 181 | |
| NewBridge Bancorp | 21,661 | 181 | |
| National Storage Affiliates Trust | 13,872 | 180 | |
| * | PICO Holdings Inc. | 13,836 | 179 |
| Bank of Marin Bancorp | 3,629 | 174 | |
| * | Ladenburg Thalmann Financial Services Inc. | 66,645 | 174 |
| First Connecticut Bancorp Inc. | 10,106 | 172 | |
| Fidelity & Guaranty Life | 6,965 | 172 | |
| * | NewStar Financial Inc. | 14,942 | 170 |
| * | eHealth Inc. | 11,343 | 169 |
| Horizon Bancorp | 7,058 | 167 | |
| One Liberty Properties Inc. | 7,561 | 165 | |
| * | TriState Capital Holdings Inc. | 13,160 | 165 |
13
| Vanguard® Russell 2000 Index Fund | ||
| Schedule of Investments | ||
| August 31, 2015 | ||
| Market | ||
| Value | ||
| Shares | ($000) | |
| Peoples Financial Services Corp. | 4,584 | 164 |
| GAIN Capital Holdings Inc. | 19,681 | 163 |
| * World Acceptance Corp. | 4,317 | 162 |
| * MoneyGram International Inc. | 18,218 | 159 |
| * Bancorp Inc. | 21,438 | 157 |
| QCR Holdings Inc. | 7,237 | 157 |
| OceanFirst Financial Corp. | 8,486 | 156 |
| Armada Hoffler Properties Inc. | 15,608 | 156 |
| Republic Bancorp Inc. Class A | 6,176 | 154 |
| CNB Financial Corp. | 9,020 | 154 |
| Pacific Continental Corp. | 11,882 | 154 |
| Citizens & Northern Corp. | 7,666 | 153 |
| United Community Financial Corp. | 30,652 | 153 |
| Guaranty Bancorp | 9,409 | 151 |
| Federal Agricultural Mortgage Corp. | 6,375 | 151 |
| Consolidated-Tomoka Land Co. | 2,698 | 148 |
| NexPoint Residential Trust Inc. | 11,791 | 146 |
| * PennyMac Financial Services Inc. Class A | 8,376 | 144 |
| * Real Industry Inc. | 14,856 | 144 |
| Preferred Apartment Communities Inc. Class A | 14,054 | 144 |
| United Insurance Holdings Corp. | 10,656 | 140 |
| MidWestOne Financial Group Inc. | 4,755 | 139 |
| Baldwin & Lyons Inc. | 6,014 | 138 |
| Ames National Corp. | 5,780 | 137 |
| * Global Indemnity plc | 5,083 | 136 |
| BankFinancial Corp. | 11,090 | 136 |
| * FRP Holdings Inc. | 4,333 | 135 |
| National Bankshares Inc. | 4,238 | 135 |
| Heritage Commerce Corp. | 12,641 | 134 |
| Bluerock Residential Growth REIT Inc. Class A | 11,873 | 133 |
| Territorial Bancorp Inc. | 5,131 | 133 |
| Orchid Island Capital Inc. | 14,477 | 132 |
| UMH Properties Inc. | 14,016 | 131 |
| * Triumph Bancorp Inc. | 8,993 | 130 |
| Oppenheimer Holdings Inc. Class A | 6,518 | 130 |
| Easterly Government Properties Inc. | 8,207 | 129 |
| American National Bankshares Inc. | 5,345 | 126 |
| Charter Financial Corp. | 10,032 | 126 |
| National Interstate Corp. | 4,526 | 125 |
| Penns Woods Bancorp Inc. | 2,879 | 123 |
| Fox Chase Bancorp Inc. | 7,089 | 122 |
| Sierra Bancorp | 7,171 | 122 |
| First Bancorp Inc. | 6,509 | 121 |
| First Business Financial Services Inc. | 5,342 | 120 |
| Bar Harbor Bankshares | 3,564 | 118 |
| * Farmers Capital Bank Corp. | 4,467 | 116 |
| Calamos Asset Management Inc. Class A | 10,861 | 115 |
| * Sun Bancorp Inc. | 5,709 | 113 |
| Heritage Oaks Bancorp | 14,475 | 112 |
| Crawford & Co. Class B | 17,561 | 112 |
| * Old Second Bancorp Inc. | 17,783 | 111 |
| EMC Insurance Group Inc. | 4,838 | 111 |
| * AV Homes Inc. | 7,810 | 110 |
| Independence Realty Trust Inc. | 14,900 | 110 |
| * Regional Management Corp. | 6,549 | 108 |
| Tiptree Financial Inc. Class A | 17,951 | 107 |
| * Cascade Bancorp | 19,549 | 106 |
| Kansas City Life Insurance Co. | 2,257 | 104 |
| * BSB Bancorp Inc. | 4,985 | 104 |
| * Hallmark Financial Services Inc. | 8,910 | 102 |
| * Atlas Financial Holdings Inc. | 6,298 | 102 |
| Enterprise Bancorp Inc. | 4,635 | 101 |
| Capital City Bank Group Inc. | 6,697 | 100 |
| Hingham Institution for Savings | 833 | 97 |
14
| Vanguard® Russell 2000 Index Fund | |||
| Schedule of Investments | |||
| August 31, 2015 | |||
| Market | |||
| Value | |||
| Shares | ($000) | ||
| Access National Corp. | 4,700 | 96 | |
| Century Bancorp Inc. Class A | 2,254 | 94 | |
| * | Impac Mortgage Holdings Inc. | 5,273 | 93 |
| Merchants Bancshares Inc. | 3,148 | 91 | |
| *,^ | National Commerce Corp. | 3,862 | 89 |
| Trade Street Residential Inc. | 12,308 | 81 | |
| * | Green Bancorp Inc. | 6,686 | 80 |
| * | CommunityOne Bancorp | 7,419 | 78 |
| Pzena Investment Management Inc. Class A | 7,556 | 76 | |
| Resource America Inc. Class A | 9,912 | 75 | |
| * | Franklin Financial Network Inc. | 3,162 | 75 |
| Donegal Group Inc. Class A | 5,124 | 73 | |
| *,^ | On Deck Capital Inc. | 7,590 | 70 |
| * | Stonegate Mortgage Corp. | 9,687 | 70 |
| * | Bear State Financial Inc. | 7,734 | 67 |
| * | C1 Financial Inc. | 3,525 | 67 |
| *,^ | Trupanion Inc. | 9,479 | 66 |
| *,^ | RCS Capital Corp. Class A | 29,752 | 61 |
| Palmetto Bancshares Inc. | 2,770 | 53 | |
| Independence Holding Co. | 4,009 | 49 | |
| * | Ashford Inc. | 667 | 49 |
| * | JG Wentworth Co. Class A | 8,070 | 44 |
| * | Hampton Roads Bankshares Inc. | 21,716 | 40 |
| Great Ajax Corp. | 2,987 | 38 | |
| * | BBX Capital Corp. | 1,594 | 26 |
| Fifth Street Asset Management Inc. | 3,076 | 25 | |
| CIFC Corp. | 3,414 | 24 | |
| Medley Management Inc. Class A | 3,076 | 23 | |
| * | Altisource Asset Management Corp. | 533 | 21 |
| * | ZAIS Group Holdings Inc. | 1,898 | 13 |
| * | Tejon Ranch Co. Warrants Exp. 08/31/2016 | 782 | — |
| 274,953 | |||
| Health Care (16.4%) | |||
| * | Anacor Pharmaceuticals Inc. | 25,404 | 3,313 |
| * | Ultragenyx Pharmaceutical Inc. | 23,825 | 2,659 |
| * | Team Health Holdings Inc. | 44,643 | 2,622 |
| West Pharmaceutical Services Inc. | 44,600 | 2,491 | |
| * | ABIOMED Inc. | 25,873 | 2,481 |
| * | WellCare Health Plans Inc. | 27,302 | 2,475 |
| * | Neurocrine Biosciences Inc. | 52,950 | 2,456 |
| HealthSouth Corp. | 56,717 | 2,422 | |
| STERIS Corp. | 37,023 | 2,371 | |
| * | Amsurg Corp. | 30,011 | 2,353 |
| * | PAREXEL International Corp. | 34,199 | 2,248 |
| * | Cepheid | 44,500 | 2,169 |
| * | Thoratec Corp. | 33,598 | 2,111 |
| * | Dyax Corp. | 90,302 | 2,079 |
| * | Impax Laboratories Inc. | 44,448 | 1,821 |
| * | Molina Healthcare Inc. | 24,342 | 1,816 |
| * | ACADIA Pharmaceuticals Inc. | 49,406 | 1,810 |
| * | Novavax Inc. | 166,149 | 1,789 |
| * | Medicines Co. | 41,056 | 1,683 |
| * | Catalent Inc. | 51,839 | 1,648 |
| * | Medidata Solutions Inc. | 34,266 | 1,645 |
| *,^ | Myriad Genetics Inc. | 43,052 | 1,617 |
| * | NuVasive Inc. | 29,976 | 1,580 |
| * | Prestige Brands Holdings Inc. | 32,418 | 1,508 |
| Chemed Corp. | 10,586 | 1,443 | |
| * | Chimerix Inc. | 28,303 | 1,385 |
| * | Portola Pharmaceuticals Inc. Class A | 28,642 | 1,351 |
| * | Clovis Oncology Inc. | 17,251 | 1,343 |
| * | AMAG Pharmaceuticals Inc. | 21,309 | 1,333 |
| Owens & Minor Inc. | 39,117 | 1,330 | |
| * | Exact Sciences Corp. | 59,456 | 1,315 |
15
| Vanguard® Russell 2000 Index Fund | |||
| Schedule of Investments | |||
| August 31, 2015 | |||
| Market | |||
| Value | |||
| Shares | ($000) | ||
| * | Pacira Pharmaceuticals Inc. | 22,591 | 1,300 |
| * | Radius Health Inc. | 20,410 | 1,242 |
| * | KYTHERA Biopharmaceuticals Inc. | 15,999 | 1,195 |
| * | Neogen Corp. | 22,962 | 1,186 |
| * | Haemonetics Corp. | 32,038 | 1,157 |
| * | Halozyme Therapeutics Inc. | 65,749 | 1,148 |
| * | Prothena Corp. plc | 19,394 | 1,116 |
| * | Masimo Corp. | 27,111 | 1,102 |
| Cantel Medical Corp. | 21,294 | 1,057 | |
| * | Cyberonics Inc. | 16,138 | 1,054 |
| * | Integra LifeSciences Holdings Corp. | 17,519 | 1,051 |
| * | Insulet Corp. | 35,180 | 1,045 |
| * | Globus Medical Inc. | 42,545 | 1,039 |
| Kindred Healthcare Inc. | 51,732 | 1,039 | |
| * | Amicus Therapeutics Inc. | 71,847 | 1,033 |
| * | Depomed Inc. | 37,171 | 1,001 |
| * | Ligand Pharmaceuticals Inc. | 10,875 | 1,000 |
| * | ICU Medical Inc. | 8,762 | 995 |
| * | AMN Healthcare Services Inc. | 29,480 | 991 |
| * | ARIAD Pharmaceuticals Inc. | 103,784 | 980 |
| * | Tetraphase Pharmaceuticals Inc. | 22,397 | 972 |
| * | WebMD Health Corp. | 23,426 | 963 |
| *,^ | Kite Pharma Inc. | 17,877 | 951 |
| * | Magellan Health Inc. | 16,940 | 949 |
| * | Insmed Inc. | 38,125 | 932 |
| * | Cambrex Corp. | 19,410 | 928 |
| * | ExamWorks Group Inc. | 25,626 | 918 |
| * | Sarepta Therapeutics Inc. | 25,705 | 918 |
| * | HeartWare International Inc. | 10,698 | 916 |
| * | Air Methods Corp. | 24,342 | 912 |
| CONMED Corp. | 17,108 | 908 | |
| * | Halyard Health Inc. | 28,848 | 907 |
| * | Celldex Therapeutics Inc. | 61,048 | 906 |
| * | Nektar Therapeutics | 81,532 | 901 |
| * | Greatbatch Inc. | 15,818 | 899 |
| * | Ironwood Pharmaceuticals Inc. Class A | 78,068 | 859 |
| * | IPC Healthcare Inc. | 10,778 | 856 |
| * | Acorda Therapeutics Inc. | 26,526 | 848 |
| Select Medical Holdings Corp. | 65,094 | 840 | |
| * | Natus Medical Inc. | 20,435 | 831 |
| * | Exelixis Inc. | 139,269 | 829 |
| * | PTC Therapeutics Inc. | 21,013 | 802 |
| * | MedAssets Inc. | 37,420 | 790 |
| * | Lannett Co. Inc. | 16,443 | 788 |
| * | Omnicell Inc. | 22,489 | 764 |
| * | TESARO Inc. | 14,425 | 743 |
| Ensign Group Inc. | 15,777 | 741 | |
| * | Momenta Pharmaceuticals Inc. | 37,916 | 740 |
| * | Wright Medical Group Inc. | 31,863 | 735 |
| ^ | Theravance Inc. | 52,781 | 734 |
| * | FibroGen Inc. | 29,665 | 727 |
| * | ImmunoGen Inc. | 53,425 | 719 |
| * | Heron Therapeutics Inc. | 18,188 | 699 |
| * | Repligen Corp. | 20,365 | 694 |
| * | Merrimack Pharmaceuticals Inc. | 68,203 | 688 |
| * | NxStage Medical Inc. | 39,201 | 681 |
| * | Cempra Inc. | 19,726 | 679 |
| * | Amedisys Inc. | 17,496 | 676 |
| * | HealthEquity Inc. | 22,484 | 659 |
| Abaxis Inc. | 13,972 | 657 | |
| * | MiMedx Group Inc. | 67,339 | 654 |
| * | Ophthotech Corp. | 14,689 | 647 |
| * | Zeltiq Aesthetics Inc. | 19,972 | 644 |
| * | Dynavax Technologies Corp. | 22,649 | 642 |
16
| Vanguard® Russell 2000 Index Fund | |||
| Schedule of Investments | |||
| August 31, 2015 | |||
| Market | |||
| Value | |||
| Shares | ($000) | ||
| * | Emergent BioSolutions Inc. | 18,817 | 626 |
| * | Merit Medical Systems Inc. | 27,463 | 625 |
| Analogic Corp. | 7,704 | 621 | |
| * | PharMerica Corp. | 18,960 | 620 |
| *,^ | ZIOPHARM Oncology Inc. | 71,161 | 620 |
| * | Raptor Pharmaceutical Corp. | 49,902 | 605 |
| * | Retrophin Inc. | 21,694 | 595 |
| * | LDR Holding Corp. | 15,647 | 584 |
| * | NewLink Genetics Corp. | 12,996 | 584 |
| *,^ | MannKind Corp. | 153,171 | 581 |
| PDL BioPharma Inc. | 101,907 | 576 | |
| * | HMS Holdings Corp. | 54,886 | 574 |
| * | ZS Pharma Inc. | 11,146 | 570 |
| * | Alder Biopharmaceuticals Inc. | 14,353 | 556 |
| * | Endologix Inc. | 42,075 | 546 |
| * | Achillion Pharmaceuticals Inc. | 73,029 | 540 |
| * | MacroGenics Inc. | 19,661 | 518 |
| * | BioCryst Pharmaceuticals Inc. | 44,480 | 518 |
| * | Array BioPharma Inc. | 87,443 | 516 |
| Meridian Bioscience Inc. | 26,000 | 497 | |
| * | Tornier NV | 22,285 | 496 |
| * | Luminex Corp. | 26,859 | 489 |
| * | Surgical Care Affiliates Inc. | 13,340 | 488 |
| * | TherapeuticsMD Inc. | 79,186 | 485 |
| * | Inogen Inc. | 9,753 | 481 |
| * | Cardiovascular Systems Inc. | 19,656 | 473 |
| * | Insys Therapeutics Inc. | 14,464 | 469 |
| * | Nevro Corp. | 10,398 | 468 |
| * | Relypsa Inc. | 20,208 | 464 |
| * | Sage Therapeutics Inc. | 8,546 | 462 |
| * | PRA Health Sciences Inc. | 12,220 | 460 |
| * | Affymetrix Inc. | 48,265 | 450 |
| * | Spectranetics Corp. | 26,464 | 446 |
| * | Cynosure Inc. Class A | 13,738 | 435 |
| *,^ | Synergy Pharmaceuticals Inc. | 62,018 | 434 |
| * | Orthofix International NV | 11,536 | 432 |
| * | AtriCure Inc. | 17,587 | 430 |
| * | Atara Biotherapeutics Inc. | 10,479 | 425 |
| * | Eagle Pharmaceuticals Inc. | 5,362 | 421 |
| * | Sucampo Pharmaceuticals Inc. Class A | 15,585 | 419 |
| Quality Systems Inc. | 30,743 | 418 | |
| * | Arena Pharmaceuticals Inc. | 151,200 | 410 |
| *,^ | Keryx Biopharmaceuticals Inc. | 64,928 | 401 |
| * | Coherus Biosciences Inc. | 14,462 | 399 |
| * | Hanger Inc. | 22,117 | 397 |
| * | Esperion Therapeutics Inc. | 8,150 | 391 |
| * | Supernus Pharmaceuticals Inc. | 21,503 | 390 |
| * | Enanta Pharmaceuticals Inc. | 9,934 | 388 |
| * | Acceleron Pharma Inc. | 13,305 | 386 |
| * | Capital Senior Living Corp. | 18,449 | 384 |
| Phibro Animal Health Corp. Class A | 10,825 | 382 | |
| * | Providence Service Corp. | 8,477 | 380 |
| * | Adeptus Health Inc. Class A | 3,792 | 378 |
| National HealthCare Corp. | 6,255 | 378 | |
| * | Zafgen Inc. | 10,286 | 376 |
| * | Vascular Solutions Inc. | 10,802 | 373 |
| *,^ | Rockwell Medical Inc. | 30,706 | 368 |
| * | Quidel Corp. | 17,840 | 367 |
| * | Intra-Cellular Therapies Inc. | 13,524 | 362 |
| * | Epizyme Inc. | 17,892 | 358 |
| US Physical Therapy Inc. | 7,650 | 351 | |
| Invacare Corp. | 19,910 | 350 | |
| * | LHC Group Inc. | 8,065 | 349 |
| Atrion Corp. | 877 | 339 | |
17
| Vanguard® Russell 2000 Index Fund | |||
| Schedule of Investments | |||
| August 31, 2015 | |||
| Market | |||
| Value | |||
| Shares | ($000) | ||
| * | Accuray Inc. | 49,184 | 339 |
| * | Agenus Inc. | 47,372 | 337 |
| *,^ | Inovio Pharmaceuticals Inc. | 44,798 | 336 |
| * | Omeros Corp. | 23,617 | 333 |
| * | INC Research Holdings Inc. Class A | 8,039 | 330 |
| Computer Programs & Systems Inc. | 7,104 | 327 | |
| * | Sangamo BioSciences Inc. | 42,594 | 322 |
| * | Aratana Therapeutics Inc. | 18,139 | 320 |
| * | Progenics Pharmaceuticals Inc. | 43,451 | 318 |
| * | Anika Therapeutics Inc. | 8,909 | 315 |
| * | Triple-S Management Corp. Class B | 14,865 | 313 |
| * | Vanda Pharmaceuticals Inc. | 26,237 | 309 |
| * | Lexicon Pharmaceuticals Inc. | 25,753 | 307 |
| * | Albany Molecular Research Inc. | 15,378 | 307 |
| * | Genomic Health Inc. | 10,947 | 301 |
| * | Merge Healthcare Inc. | 42,418 | 301 |
| * | Xencor Inc. | 17,846 | 299 |
| * | Geron Corp. | 98,668 | 299 |
| * | Spectrum Pharmaceuticals Inc. | 41,088 | 299 |
| * | Revance Therapeutics Inc. | 9,826 | 297 |
| * | Zogenix Inc. | 15,240 | 293 |
| *,^ | Cerus Corp. | 58,109 | 288 |
| * | OvaScience Inc. | 14,468 | 281 |
| * | Cross Country Healthcare Inc. | 20,100 | 279 |
| * | Advaxis Inc. | 18,659 | 276 |
| * | Sagent Pharmaceuticals Inc. | 13,767 | 275 |
| * | Aegerion Pharmaceuticals Inc. | 15,442 | 273 |
| *,^ | Accelerate Diagnostics Inc. | 13,473 | 264 |
| * | GenMark Diagnostics Inc. | 25,543 | 264 |
| * | Infinity Pharmaceuticals Inc. | 29,927 | 264 |
| * | TG Therapeutics Inc. | 21,482 | 264 |
| * | Intersect ENT Inc. | 10,315 | 263 |
| * | La Jolla Pharmaceutical Co. | 7,232 | 257 |
| * | Amphastar Pharmaceuticals Inc. | 19,599 | 252 |
| * | Five Prime Therapeutics Inc. | 13,090 | 250 |
| * | Dermira Inc. | 9,602 | 247 |
| * | XenoPort Inc. | 35,949 | 243 |
| * | BioTelemetry Inc. | 16,922 | 242 |
| * | SciClone Pharmaceuticals Inc. | 30,281 | 238 |
| * | ANI Pharmaceuticals Inc. | 4,823 | 235 |
| * | K2M Group Holdings Inc. | 11,041 | 234 |
| * | Theravance Biopharma Inc. | 16,042 | 234 |
| * | Cara Therapeutics Inc. | 12,276 | 233 |
| * | Healthways Inc. | 18,998 | 232 |
| Landauer Inc. | 5,909 | 227 | |
| * | AngioDynamics Inc. | 15,309 | 226 |
| * | Sorrento Therapeutics Inc. | 17,763 | 225 |
| * | RTI Surgical Inc. | 35,139 | 224 |
| *,^ | Northwest Biotherapeutics Inc. | 29,096 | 224 |
| * | Pfenex Inc. | 10,151 | 222 |
| * | Universal American Corp. | 30,830 | 220 |
| * | Fluidigm Corp. | 18,027 | 220 |
| * | Spark Therapeutics Inc. | 4,967 | 217 |
| *,^ | Arrowhead Research Corp. | 36,319 | 215 |
| * | Flexion Therapeutics Inc. | 8,773 | 211 |
| * | Osiris Therapeutics Inc. | 11,715 | 211 |
| * | Press Ganey Holdings Inc. | 6,495 | 209 |
| * | Otonomy Inc. | 9,166 | 208 |
| * | NeoGenomics Inc. | 33,881 | 206 |
| * | OncoMed Pharmaceuticals Inc. | 10,408 | 204 |
| * | Lion Biotechnologies Inc. | 28,640 | 204 |
| * | Karyopharm Therapeutics Inc. | 14,502 | 201 |
| * | Paratek Pharmaceuticals Inc. | 7,711 | 200 |
| * | Aerie Pharmaceuticals Inc. | 12,617 | 199 |
18
| Vanguard® Russell 2000 Index Fund | |||
| Schedule of Investments | |||
| August 31, 2015 | |||
| Market | |||
| Value | |||
| Shares | ($000) | ||
| * | Oncothyreon Inc. | 58,634 | 199 |
| * | IGI Laboratories Inc. | 25,402 | 199 |
| * | BioDelivery Sciences International Inc. | 29,358 | 198 |
| * | Corcept Therapeutics Inc. | 39,361 | 197 |
| * | STAAR Surgical Co. | 24,352 | 195 |
| * | Ardelyx Inc. | 10,245 | 194 |
| * | Almost Family Inc. | 4,359 | 193 |
| * | SurModics Inc. | 8,255 | 188 |
| * | OraSure Technologies Inc. | 34,344 | 185 |
| * | Versartis Inc. | 14,255 | 185 |
| * | Ignyta Inc. | 13,274 | 182 |
| * | Pacific Biosciences of California Inc. | 36,431 | 181 |
| * | Oxford Immunotec Global plc | 12,581 | 181 |
| * | Curis Inc. | 68,725 | 180 |
| * | Orexigen Therapeutics Inc. | 64,261 | 178 |
| *,^ | Navidea Biopharmaceuticals Inc. | 94,266 | 177 |
| * | Civitas Solutions Inc. | 7,237 | 176 |
| * | Foundation Medicine Inc. | 7,412 | 174 |
| * | Antares Pharma Inc. | 95,491 | 172 |
| * | Catalyst Pharmaceuticals Inc. | 46,940 | 170 |
| * | Genesis Healthcare Inc. | 22,967 | 167 |
| * | Anthera Pharmaceuticals Inc. | 24,339 | 166 |
| * | InVivo Therapeutics Holdings Corp. | 16,888 | 165 |
| * | Ocular Therapeutix Inc. | 9,303 | 164 |
| * | Rigel Pharmaceuticals Inc. | 53,956 | 162 |
| * | Threshold Pharmaceuticals Inc. | 38,343 | 161 |
| * | Mirati Therapeutics Inc. | 6,221 | 161 |
| * | CTI BioPharma Corp. | 101,396 | 160 |
| *,^ | Sequenom Inc. | 74,489 | 160 |
| * | CorVel Corp. | 5,312 | 160 |
| * | Blueprint Medicines Corp. | 5,782 | 158 |
| * | POZEN Inc. | 18,042 | 157 |
| *,^ | Idera Pharmaceuticals Inc. | 51,898 | 157 |
| *,^ | Organovo Holdings Inc. | 57,196 | 156 |
| * | Genocea Biosciences Inc. | 13,338 | 155 |
| *,^ | Galena Biopharma Inc. | 97,887 | 155 |
| * | Cytokinetics Inc. | 22,197 | 154 |
| CryoLife Inc. | 15,682 | 153 | |
| * | BioSpecifics Technologies Corp. | 3,061 | 152 |
| * | Concert Pharmaceuticals Inc. | 9,644 | 150 |
| * | Regulus Therapeutics Inc. | 17,642 | 147 |
| *,^ | Cellular Biomedicine Group Inc. | 6,273 | 146 |
| * | Peregrine Pharmaceuticals Inc. | 126,465 | 145 |
| * | Foamix Pharmaceuticals Ltd. | 14,196 | 144 |
| * | Durect Corp. | 69,521 | 143 |
| * | Cutera Inc. | 9,279 | 136 |
| * | Pernix Therapeutics Holdings Inc. | 27,808 | 134 |
| * | Adamas Pharmaceuticals Inc. | 6,476 | 130 |
| * | RadNet Inc. | 20,728 | 127 |
| * | Assembly Biosciences Inc. | 9,087 | 125 |
| * | Avalanche Biotechnologies Inc. | 11,761 | 123 |
| * | Immunomedics Inc. | 56,949 | 123 |
| * | Tandem Diabetes Care Inc. | 10,664 | 122 |
| * | Exactech Inc. | 6,207 | 122 |
| * | Imprivata Inc. | 5,729 | 120 |
| * | Endocyte Inc. | 22,727 | 120 |
| Utah Medical Products Inc. | 2,241 | 120 | |
| * | Verastem Inc. | 19,496 | 119 |
| * | NanoString Technologies Inc. | 7,784 | 118 |
| * | Heska Corp. | 3,480 | 117 |
| * | Addus HomeCare Corp. | 4,074 | 117 |
| * | ChemoCentryx Inc. | 17,628 | 116 |
| * | Immune Design Corp. | 7,258 | 116 |
| * | Ocata Therapeutics Inc. | 26,799 | 113 |
19
| Vanguard® Russell 2000 Index Fund | |||
| Schedule of Investments | |||
| August 31, 2015 | |||
| Market | |||
| Value | |||
| Shares | ($000) | ||
| * | Trovagene Inc. | 19,029 | 113 |
| * | Castlight Health Inc. Class B | 21,278 | 113 |
| * | Synta Pharmaceuticals Corp. | 56,159 | 112 |
| * | AAC Holdings Inc. | 4,730 | 112 |
| * | Aduro Biotech Inc. | 5,322 | 103 |
| * | Loxo Oncology Inc. | 5,047 | 101 |
| * | BioScrip Inc. | 41,288 | 100 |
| LeMaitre Vascular Inc. | 7,558 | 100 | |
| * | Akebia Therapeutics Inc. | 14,257 | 99 |
| * | Sientra Inc. | 4,166 | 99 |
| * | Dicerna Pharmaceuticals Inc. | 9,034 | 99 |
| * | Nobilis Health Corp. | 19,033 | 99 |
| * | BioTime Inc. | 31,747 | 96 |
| * | CytRx Corp. | 38,937 | 96 |
| * | Trevena Inc. | 15,700 | 94 |
| * | Applied Genetic Technologies Corp. | 5,598 | 92 |
| * | Affimed NV | 9,009 | 91 |
| * | Harvard Bioscience Inc. | 20,563 | 90 |
| * | Bellicum Pharmaceuticals Inc. | 5,245 | 89 |
| * | Five Star Quality Care Inc. | 26,399 | 89 |
| * | Fibrocell Science Inc. | 15,801 | 89 |
| * | Stemline Therapeutics Inc. | 9,095 | 84 |
| *,^ | Unilife Corp. | 68,565 | 84 |
| * | Medgenics Inc. | 10,009 | 79 |
| National Research Corp. Class A | 6,033 | 77 | |
| * | Veracyte Inc. | 7,815 | 74 |
| * | Second Sight Medical Products Inc. | 7,650 | 73 |
| * | SeaSpine Holdings Corp. | 5,087 | 72 |
| * | VIVUS Inc. | 62,380 | 70 |
| * | Entellus Medical Inc. | 3,160 | 70 |
| * | TransEnterix Inc. | 25,986 | 69 |
| * | Corium International Inc. | 6,580 | 66 |
| *,^ | Tokai Pharmaceuticals Inc. | 5,527 | 65 |
| * | Proteon Therapeutics Inc. | 4,441 | 63 |
| * | T2 Biosystems Inc. | 5,203 | 62 |
| * | Alimera Sciences Inc. | 18,257 | 61 |
| * | Collegium Pharmaceutical Inc. | 3,942 | 60 |
| * | Vitae Pharmaceuticals Inc. | 7,493 | 58 |
| * | Agile Therapeutics Inc. | 6,230 | 55 |
| * | aTyr Pharma Inc. | 3,643 | 53 |
| * | CorMedix Inc. | 18,137 | 50 |
| * | Invitae Corp. | 4,844 | 49 |
| *,^ | XBiotech Inc. | 2,534 | 49 |
| * | Corindus Vascular Robotics Inc. | 13,843 | 48 |
| * | Alliance HealthCare Services Inc. | 3,161 | 45 |
| * | XOMA Corp. | 53,592 | 45 |
| * | Cidara Therapeutics Inc. | 3,086 | 44 |
| * | iRadimed Corp. | 1,812 | 43 |
| * | Flex Pharma Inc. | 3,436 | 41 |
| * | Carbylan Therapeutics Inc. | 7,537 | 41 |
| * | Calithera Biosciences Inc. | 6,870 | 40 |
| *,^ | Vital Therapies Inc. | 10,453 | 39 |
| * | Abeona Therapeutics Inc. | 6,726 | 31 |
| *,^ | Asterias Biotherapeutics Inc. | 5,236 | 25 |
| * | Tobira Therapeutics Inc. | 1,395 | 17 |
| 177,979 | |||
| Materials & Processing (5.7%) | |||
| * | Berry Plastics Group Inc. | 74,015 | 2,191 |
| Sensient Technologies Corp. | 28,970 | 1,887 | |
| PolyOne Corp. | 55,288 | 1,795 | |
| * | Louisiana-Pacific Corp. | 88,304 | 1,452 |
| Belden Inc. | 26,438 | 1,332 | |
| * | Rexnord Corp. | 63,115 | 1,265 |
| * | Masonite International Corp. | 18,712 | 1,236 |
20
| Vanguard® Russell 2000 Index Fund | ||
| Schedule of Investments | ||
| August 31, 2015 | ||
| Market | ||
| Value | ||
| Shares | ($000) | |
| Carpenter Technology Corp. | 31,245 | 1,219 |
| Minerals Technologies Inc. | 21,530 | 1,158 |
| KapStone Paper and Packaging Corp. | 52,789 | 1,150 |
| HB Fuller Co. | 31,255 | 1,133 |
| * Chemtura Corp. | 41,642 | 1,133 |
| Balchem Corp. | 19,273 | 1,128 |
| Commercial Metals Co. | 71,739 | 1,126 |
| Mueller Industries Inc. | 35,315 | 1,123 |
| * Beacon Roofing Supply Inc. | 30,762 | 1,115 |
| Axiall Corp. | 43,538 | 1,100 |
| Interface Inc. Class A | 40,960 | 993 |
| Olin Corp. | 48,050 | 959 |
| Apogee Enterprises Inc. | 18,097 | 944 |
| * Headwaters Inc. | 45,715 | 923 |
| Simpson Manufacturing Co. Inc. | 26,107 | 911 |
| * RBC Bearings Inc. | 14,502 | 897 |
| Mueller Water Products Inc. Class A | 99,727 | 893 |
| Kaiser Aluminum Corp. | 10,634 | 889 |
| * MRC Global Inc. | 63,847 | 829 |
| * Boise Cascade Co. | 24,506 | 795 |
| * Trex Co. Inc. | 19,886 | 772 |
| Worthington Industries Inc. | 29,803 | 763 |
| Universal Forest Products Inc. | 12,473 | 749 |
| Innospec Inc. | 15,027 | 738 |
| * Stillwater Mining Co. | 74,817 | 714 |
| Schweitzer-Mauduit International Inc. | 18,891 | 667 |
| US Silica Holdings Inc. | 33,116 | 666 |
| * Cabot Microelectronics Corp. | 15,324 | 665 |
| * Clearwater Paper Corp. | 11,823 | 663 |
| Quaker Chemical Corp. | 8,265 | 656 |
| Comfort Systems USA Inc. | 23,127 | 641 |
| OM Group Inc. | 18,812 | 630 |
| A Schulman Inc. | 18,182 | 624 |
| Neenah Paper Inc. | 10,372 | 599 |
| Advanced Drainage Systems Inc. | 20,943 | 595 |
| Innophos Holdings Inc. | 12,141 | 584 |
| * Ferro Corp. | 45,616 | 561 |
| Greif Inc. Class A | 19,113 | 560 |
| Globe Specialty Metals Inc. | 40,279 | 553 |
| Stepan Co. | 11,980 | 539 |
| AAON Inc. | 25,465 | 527 |
| Calgon Carbon Corp. | 32,360 | 526 |
| * Nortek Inc. | 6,010 | 492 |
| PH Glatfelter Co. | 26,932 | 486 |
| Hecla Mining Co. | 231,086 | 476 |
| * US Concrete Inc. | 9,102 | 471 |
| * Builders FirstSource Inc. | 31,321 | 464 |
| TimkenSteel Corp. | 24,760 | 442 |
| Deltic Timber Corp. | 6,763 | 420 |
| * Kraton Performance Polymers Inc. | 19,434 | 410 |
| Aceto Corp. | 18,061 | 405 |
| * PGT Inc. | 29,940 | 400 |
| NN Inc. | 16,495 | 399 |
| * Continental Building Products Inc. | 19,705 | 394 |
| Materion Corp. | 12,634 | 391 |
| Quanex Building Products Corp. | 21,132 | 379 |
| ^ Cliffs Natural Resources Inc. | 93,329 | 371 |
| * Summit Materials Inc. Class A | 15,606 | 366 |
| Griffon Corp. | 21,071 | 351 |
| * AK Steel Holding Corp. | 111,608 | 345 |
| * Installed Building Products Inc. | 12,376 | 331 |
| Tronox Ltd. Class A | 39,920 | 321 |
| * Gibraltar Industries Inc. | 19,389 | 318 |
| * Patrick Industries Inc. | 7,998 | 302 |
21
| Vanguard® Russell 2000 Index Fund | |||
| Schedule of Investments | |||
| August 31, 2015 | |||
| Market | |||
| Value | |||
| Shares | ($000) | ||
| * | LSB Industries Inc. | 12,390 | 296 |
| Haynes International Inc. | 7,629 | 292 | |
| *,^ | Horsehead Holding Corp. | 35,369 | 289 |
| * | Coeur Mining Inc. | 84,920 | 285 |
| Schnitzer Steel Industries Inc. | 16,178 | 280 | |
| * | Intrepid Potash Inc. | 34,626 | 274 |
| * | Unifi Inc. | 9,126 | 265 |
| Koppers Holdings Inc. | 12,585 | 262 | |
| Global Brass & Copper Holdings Inc. | 13,127 | 258 | |
| Hawkins Inc. | 6,665 | 254 | |
| American Vanguard Corp. | 17,929 | 240 | |
| Tredegar Corp. | 15,260 | 221 | |
| * | Landec Corp. | 16,512 | 220 |
| Myers Industries Inc. | 15,350 | 219 | |
| * | Trinseo SA | 6,953 | 203 |
| Insteel Industries Inc. | 11,585 | 201 | |
| Culp Inc. | 6,520 | 200 | |
| Wausau Paper Corp. | 25,264 | 197 | |
| * | Veritiv Corp. | 5,177 | 186 |
| * | OMNOVA Solutions Inc. | 29,459 | 185 |
| * | Ply Gem Holdings Inc. | 13,090 | 178 |
| * | Senomyx Inc. | 26,658 | 178 |
| * | Century Aluminum Co. | 31,188 | 175 |
| * | NCI Building Systems Inc. | 16,700 | 174 |
| Chase Corp. | 4,382 | 173 | |
| * | Stock Building Supply Holdings Inc. | 8,951 | 169 |
| Rayonier Advanced Materials Inc. | 24,483 | 167 | |
| FutureFuel Corp. | 14,723 | 148 | |
| * | AEP Industries Inc. | 2,355 | 128 |
| LSI Industries Inc. | 13,151 | 125 | |
| KMG Chemicals Inc. | 5,767 | 116 | |
| LB Foster Co. Class A | 6,145 | 110 | |
| * | Core Molding Technologies Inc. | 4,834 | 106 |
| Rentech Inc. | 13,678 | 96 | |
| * | Northwest Pipe Co. | 5,813 | 96 |
| Kronos Worldwide Inc. | 12,402 | 92 | |
| *,^ | Energy Fuels Inc. | 25,996 | 90 |
| * | Lawson Products Inc. | 3,763 | 88 |
| * | Uranium Energy Corp. | 62,599 | 78 |
| Olympic Steel Inc. | 5,954 | 77 | |
| Oil-Dri Corp. of America | 3,216 | 75 | |
| United States Lime & Minerals Inc. | 1,173 | 58 | |
| Omega Flex Inc. | 1,743 | 53 | |
| * | Ryerson Holding Corp. | 6,844 | 52 |
| * | Handy & Harman Ltd. | 1,669 | 42 |
| Valhi Inc. | 11,695 | 33 | |
| * | NL Industries Inc. | 3,447 | 13 |
| 62,019 | |||
| Other (0.1%)2 | |||
| * | Leap Wireless International Inc CVR | 22,127 | 56 |
| * | Milacron Holdings Corp. | 2,718 | 54 |
| *,^ | Fitbit Inc. | 1,380 | 48 |
| * | Sunrun Inc. | 3,900 | 46 |
| * | Chiasma Inc. | 1,371 | 35 |
| * | TransUnion | 1,167 | 30 |
| * | Furiex Pharmaceuticals Inc. CVR | 2,795 | 27 |
| * | Alarm.com Holdings Inc. | 1,400 | 24 |
| * | Global Blood Therapeutics Inc. | 480 | 24 |
| * | Univar Inc. | 970 | 22 |
| * | Blue Buffalo Pet Products Inc. | 778 | 20 |
| * | vTv Therapeutics Inc. Class A | 2,099 | 18 |
| * | ConforMIS Inc. | 980 | 16 |
| * | Planet Fitness Inc. Class A | 687 | 12 |
| * | Seres Therapeutics Inc. | 274 | 11 |
22
| Vanguard® Russell 2000 Index Fund | |||
| Schedule of Investments | |||
| August 31, 2015 | |||
| Market | |||
| Value | |||
| Shares | ($000) | ||
| * | Nivalis Therapeutics Inc. | 576 | 8 |
| * | Amplify Snack Brands Inc. | 585 | 8 |
| * | Appfolio Inc. | 480 | 8 |
| * | Teladoc Inc. | 280 | 7 |
| * | Fogo De Chao Inc. | 352 | 7 |
| * | Aimmune Therapeutics Inc. | 280 | 6 |
| * | Rapid7 Inc. | 280 | 6 |
| * | MINDBODY Inc. Class A | 419 | 6 |
| * | Neos Therapeutics Inc. | 216 | 6 |
| * | Ollie's Bargain Outlet Holdings Inc. | 313 | 6 |
| * | MCBC Holdings Inc. | 274 | 4 |
| * | Chelsea Therapeutics International Ltd. CVR Exp. 12/31/2016 | 31,094 | 3 |
| * | Cubist Pharmaceuticals, Inc. CVR | 13,664 | 2 |
| * | Omthera Pharmaceuticals Inc. CVR | 2,012 | 1 |
| * | Durata Therapeutics Inc CVR Exp. 12/31/2018 | 680 | 1 |
| * | Clinical Data CVR | 913 | — |
| * | Magnum Hunter Resources Corp. Warrants Exp. 04/15/2016 | 6,541 | — |
| * | Gerber Scientific Inc. CVR | 2,358 | — |
| 522 | |||
| Producer Durables (12.0%) | |||
| MAXIMUS Inc. | 40,846 | 2,473 | |
| * | Teledyne Technologies Inc. | 21,905 | 2,145 |
| Curtiss-Wright Corp. | 29,479 | 1,937 | |
| Woodward Inc. | 40,492 | 1,846 | |
| Deluxe Corp. | 30,951 | 1,795 | |
| EMCOR Group Inc. | 38,861 | 1,791 | |
| CLARCOR Inc. | 31,094 | 1,753 | |
| Allegiant Travel Co. Class A | 8,315 | 1,690 | |
| * | Esterline Technologies Corp. | 19,286 | 1,576 |
| *,^ | XPO Logistics Inc. | 44,337 | 1,556 |
| * | Moog Inc. Class A | 24,003 | 1,515 |
| * | Dycom Industries Inc. | 21,128 | 1,502 |
| CEB Inc. | 20,742 | 1,486 | |
| Healthcare Services Group Inc. | 44,313 | 1,482 | |
| EnerSys | 27,561 | 1,474 | |
| Convergys Corp. | 61,265 | 1,385 | |
| * | Generac Holdings Inc. | 42,866 | 1,325 |
| * | Darling Ingredients Inc. | 102,418 | 1,315 |
| Barnes Group Inc. | 33,962 | 1,312 | |
| HNI Corp. | 27,576 | 1,289 | |
| * | Advisory Board Co. | 26,304 | 1,279 |
| * | KLX Inc. | 32,698 | 1,278 |
| * | Electronics For Imaging Inc. | 29,062 | 1,272 |
| Con-way Inc. | 35,725 | 1,258 | |
| Littelfuse Inc. | 13,994 | 1,256 | |
| * | On Assignment Inc. | 32,065 | 1,154 |
| ABM Industries Inc. | 34,709 | 1,111 | |
| HEICO Corp. Class A | 24,744 | 1,081 | |
| Korn/Ferry International | 31,251 | 1,065 | |
| * | Swift Transportation Co. | 54,592 | 1,064 |
| Knight Transportation Inc. | 38,774 | 1,055 | |
| Applied Industrial Technologies Inc. | 24,895 | 1,054 | |
| * | Proto Labs Inc. | 14,438 | 1,052 |
| Scorpio Tankers Inc. | 110,853 | 1,049 | |
| * | Huron Consulting Group Inc. | 14,358 | 1,039 |
| * | FTI Consulting Inc. | 25,787 | 1,028 |
| Matson Inc. | 26,937 | 1,015 | |
| Herman Miller Inc. | 36,979 | 1,003 | |
| UniFirst Corp. | 9,210 | 998 | |
| * | WageWorks Inc. | 22,152 | 993 |
| Tetra Tech Inc. | 37,354 | 970 | |
| Mobile Mini Inc. | 28,411 | 966 | |
| Watts Water Technologies Inc. Class A | 17,463 | 958 | |
| Steelcase Inc. Class A | 51,628 | 910 | |
23
| Vanguard® Russell 2000 Index Fund | ||
| Schedule of Investments | ||
| August 31, 2015 | ||
| Market | ||
| Value | ||
| Shares | ($000) | |
| * OSI Systems Inc. | 12,280 | 897 |
| Franklin Electric Co. Inc. | 29,524 | 865 |
| Forward Air Corp. | 19,200 | 864 |
| Brink's Co. | 30,147 | 864 |
| * Hub Group Inc. Class A | 22,367 | 843 |
| Granite Construction Inc. | 24,391 | 841 |
| G&K Services Inc. Class A | 12,393 | 838 |
| MSA Safety Inc. | 18,159 | 826 |
| Essendant Inc. | 23,753 | 819 |
| AZZ Inc. | 15,972 | 808 |
| Aircastle Ltd. | 38,683 | 804 |
| Bristow Group Inc. | 21,624 | 801 |
| * Aerojet Rocketdyne Holdings Inc. | 38,805 | 798 |
| Actuant Corp. Class A | 36,920 | 792 |
| * TASER International Inc. | 33,133 | 775 |
| Nordic American Tankers Ltd. | 55,378 | 755 |
| * ExlService Holdings Inc. | 20,642 | 747 |
| Werner Enterprises Inc. | 27,501 | 729 |
| Knoll Inc. | 30,258 | 724 |
| * Itron Inc. | 23,836 | 715 |
| Exponent Inc. | 16,106 | 689 |
| * MasTec Inc. | 41,385 | 685 |
| Greenbrier Cos. Inc. | 16,365 | 682 |
| EnPro Industries Inc. | 14,148 | 671 |
| US Ecology Inc. | 13,427 | 671 |
| * Hawaiian Holdings Inc. | 29,572 | 670 |
| Kaman Corp. | 16,879 | 655 |
| Tennant Co. | 11,408 | 654 |
| Brady Corp. Class A | 29,615 | 650 |
| * Atlas Air Worldwide Holdings Inc. | 15,500 | 640 |
| Standex International Corp. | 7,930 | 635 |
| Heartland Express Inc. | 31,225 | 632 |
| * TrueBlue Inc. | 26,011 | 624 |
| Ship Finance International Ltd. | 36,946 | 621 |
| * Advanced Energy Industries Inc. | 25,429 | 617 |
| * Astronics Corp. | 11,876 | 614 |
| * Sykes Enterprises Inc. | 24,312 | 611 |
| HEICO Corp. | 11,950 | 608 |
| John Bean Technologies Corp. | 18,194 | 603 |
| ESCO Technologies Inc. | 16,273 | 588 |
| * Saia Inc. | 15,563 | 584 |
| Harsco Corp. | 49,707 | 575 |
| Cubic Corp. | 13,444 | 566 |
| * Navistar International Corp. | 31,702 | 566 |
| * Rush Enterprises Inc. Class A | 22,115 | 564 |
| ^ Lindsay Corp. | 7,331 | 559 |
| Albany International Corp. | 17,370 | 554 |
| Briggs & Stratton Corp. | 27,647 | 552 |
| Federal Signal Corp. | 39,037 | 552 |
| MTS Systems Corp. | 9,275 | 552 |
| * Team Inc. | 12,980 | 543 |
| * Wesco Aircraft Holdings Inc. | 38,419 | 539 |
| AAR Corp. | 21,991 | 535 |
| Insperity Inc. | 12,031 | 534 |
| Badger Meter Inc. | 8,894 | 518 |
| * ACCO Brands Corp. | 68,134 | 518 |
| Multi-Color Corp. | 7,850 | 517 |
| ^ Tidewater Inc. | 28,816 | 517 |
| * Virgin America Inc. | 15,740 | 514 |
| * TriMas Corp. | 28,076 | 512 |
| SkyWest Inc. | 32,129 | 511 |
| * Wabash National Corp. | 41,750 | 511 |
| * PHH Corp. | 30,459 | 493 |
| CIRCOR International Inc. | 10,630 | 481 |
24
| Vanguard® Russell 2000 Index Fund | |||
| Schedule of Investments | |||
| August 31, 2015 | |||
| Market | |||
| Value | |||
| Shares | ($000) | ||
| * | Chart Industries Inc. | 18,700 | 478 |
| * | Navigant Consulting Inc. | 29,903 | 472 |
| ArcBest Corp. | 16,122 | 466 | |
| * | RPX Corp. | 33,644 | 463 |
| Astec Industries Inc. | 11,611 | 459 | |
| *,^ | Thermon Group Holdings Inc. | 20,039 | 458 |
| Sun Hydraulics Corp. | 14,091 | 455 | |
| General Cable Corp. | 30,617 | 445 | |
| Primoris Services Corp. | 24,038 | 442 | |
| * | TriNet Group Inc. | 25,743 | 434 |
| * | Echo Global Logistics Inc. | 18,365 | 427 |
| * | Aegion Corp. Class A | 22,912 | 422 |
| Encore Wire Corp. | 12,957 | 421 | |
| Raven Industries Inc. | 23,204 | 420 | |
| * | FARO Technologies Inc. | 10,692 | 415 |
| * | ICF International Inc. | 12,134 | 415 |
| * | Monster Worldwide Inc. | 56,933 | 414 |
| Kforce Inc. | 15,421 | 413 | |
| Altra Industrial Motion Corp. | 16,501 | 413 | |
| McGrath RentCorp | 16,075 | 412 | |
| * | UTi Worldwide Inc. | 57,711 | 411 |
| * | Tutor Perini Corp. | 23,112 | 409 |
| DHT Holdings Inc. | 57,132 | 409 | |
| H&E Equipment Services Inc. | 19,160 | 397 | |
| * | Roadrunner Transportation Systems Inc. | 17,538 | 380 |
| TAL International Group Inc. | 20,723 | 380 | |
| * | MYR Group Inc. | 13,073 | 375 |
| Resources Connection Inc. | 23,405 | 367 | |
| GasLog Ltd. | 26,012 | 361 | |
| Hyster-Yale Materials Handling Inc. | 5,883 | 357 | |
| Teekay Tankers Ltd. Class A | 58,743 | 345 | |
| * | Scorpio Bulkers Inc. | 207,628 | 341 |
| * | YRC Worldwide Inc. | 19,998 | 334 |
| Celadon Group Inc. | 16,707 | 319 | |
| Argan Inc. | 8,118 | 318 | |
| * | Paylocity Holding Corp. | 9,526 | 315 |
| Alamo Group Inc. | 6,031 | 311 | |
| * | Engility Holdings Inc. | 11,054 | 307 |
| Kadant Inc. | 6,878 | 306 | |
| Douglas Dynamics Inc. | 13,700 | 304 | |
| * | Air Transport Services Group Inc. | 32,788 | 298 |
| * | Aerovironment Inc. | 12,292 | 296 |
| * | CBIZ Inc. | 30,234 | 295 |
| * | Lydall Inc. | 10,700 | 291 |
| Gorman-Rupp Co. | 12,015 | 290 | |
| TeleTech Holdings Inc. | 10,104 | 273 | |
| Marten Transport Ltd. | 14,563 | 270 | |
| Kelly Services Inc. Class A | 18,333 | 265 | |
| Ennis Inc. | 15,948 | 260 | |
| * | Modine Manufacturing Co. | 29,192 | 259 |
| Quad/Graphics Inc. | 17,533 | 253 | |
| Titan International Inc. | 27,020 | 248 | |
| ^ | American Railcar Industries Inc. | 5,936 | 246 |
| Textainer Group Holdings Ltd. | 13,933 | 245 | |
| Kimball International Inc. Class B | 21,707 | 237 | |
| * | Ascent Capital Group Inc. Class A | 8,365 | 235 |
| * | SP Plus Corp. | 10,225 | 235 |
| Columbus McKinnon Corp. | 12,321 | 234 | |
| * | DXP Enterprises Inc. | 7,692 | 229 |
| Heidrick & Struggles International Inc. | 11,358 | 221 | |
| * | DHI Group Inc. | 27,859 | 217 |
| Hackett Group Inc. | 15,140 | 213 | |
| * | Blount International Inc. | 30,388 | 209 |
| * | Great Lakes Dredge & Dock Corp. | 37,554 | 208 |
25
| Vanguard® Russell 2000 Index Fund | |||
| Schedule of Investments | |||
| August 31, 2015 | |||
| Market | |||
| Value | |||
| Shares | ($000) | ||
| Park-Ohio Holdings Corp. | 5,561 | 201 | |
| * | Dorian LPG Ltd. | 15,168 | 200 |
| Forrester Research Inc. | 6,231 | 197 | |
| * | PHI Inc. | 7,749 | 197 |
| Mesa Laboratories Inc. | 1,797 | 195 | |
| * | GP Strategies Corp. | 7,910 | 194 |
| *,^ | Plug Power Inc. | 108,706 | 186 |
| *,^ | Frontline Ltd. | 66,977 | 178 |
| * | InnerWorkings Inc. | 23,609 | 171 |
| Navios Maritime Acquisition Corp. | 49,658 | 171 | |
| * | ServiceSource International Inc. | 35,622 | 169 |
| * | Covenant Transportation Group Inc. Class A | 7,099 | 167 |
| FreightCar America Inc. | 7,714 | 166 | |
| Powell Industries Inc. | 5,568 | 163 | |
| * | Vectrus Inc. | 6,480 | 161 |
| Barrett Business Services Inc. | 4,450 | 159 | |
| * | Ducommun Inc. | 6,715 | 159 |
| Miller Industries Inc. | 7,231 | 157 | |
| * | Mistras Group Inc. | 10,618 | 155 |
| * | Casella Waste Systems Inc. Class A | 24,779 | 153 |
| ^ | Gulfmark Offshore Inc. | 16,050 | 145 |
| * | Furmanite Corp. | 23,112 | 145 |
| ^ | Navios Maritime Holdings Inc. | 50,327 | 141 |
| NACCO Industries Inc. Class A | 2,633 | 139 | |
| * | CAI International Inc. | 10,315 | 136 |
| * | CRA International Inc. | 5,877 | 134 |
| * | Kratos Defense & Security Solutions Inc. | 28,476 | 132 |
| CECO Environmental Corp. | 13,472 | 130 | |
| * | Golden Ocean Group Ltd. | 42,129 | 128 |
| * | Orion Marine Group Inc. | 17,758 | 128 |
| * | Titan Machinery Inc. | 10,960 | 127 |
| Hurco Cos. Inc. | 3,882 | 120 | |
| Ardmore Shipping Corp. | 10,594 | 119 | |
| * | USA Truck Inc. | 5,973 | 118 |
| * | Control4 Corp. | 12,883 | 116 |
| Graham Corp. | 6,232 | 115 | |
| * | Radiant Logistics Inc. | 18,430 | 111 |
| VSE Corp. | 2,651 | 110 | |
| Electro Rent Corp. | 10,203 | 109 | |
| * | Liquidity Services Inc. | 14,308 | 107 |
| Universal Truckload Services Inc. | 5,220 | 102 | |
| * | PFSweb Inc. | 7,516 | 98 |
| Eagle Bulk Shipping Inc. | 13,604 | 97 | |
| * | Republic Airways Holdings Inc. | 31,162 | 96 |
| * | Commercial Vehicle Group Inc. | 18,673 | 96 |
| * | Vicor Corp. | 9,765 | 95 |
| * | HC2 Holdings Inc. | 12,606 | 95 |
| * | TRC Cos. Inc. | 10,564 | 94 |
| *,^ | Power Solutions International Inc. | 2,976 | 94 |
| * | Hill International Inc. | 23,383 | 92 |
| * | Heritage-Crystal Clean Inc. | 7,548 | 90 |
| CDI Corp. | 8,705 | 89 | |
| * | Vishay Precision Group Inc. | 7,722 | 86 |
| * | Xerium Technologies Inc. | 6,723 | 82 |
| * | Patriot National Inc. | 4,946 | 80 |
| * | Accuride Corp. | 22,954 | 78 |
| Twin Disc Inc. | 5,481 | 77 | |
| ^ | Safe Bulkers Inc. | 22,426 | 75 |
| Marlin Business Services Corp. | 5,334 | 73 | |
| * | PAM Transportation Services Inc. | 1,784 | 69 |
| Allied Motion Technologies Inc. | 3,602 | 69 | |
| * | NV5 Holdings Inc. | 2,933 | 63 |
| * | Volt Information Sciences Inc. | 5,808 | 52 |
| Preformed Line Products Co. | 1,543 | 47 | |
26
| Vanguard® Russell 2000 Index Fund | |||
| Schedule of Investments | |||
| August 31, 2015 | |||
| Market | |||
| Value | |||
| Shares | ($000) | ||
| *,^ | ExOne Co. | 5,704 | 42 |
| * | Neff Corp. Class A | 6,322 | 42 |
| * | Blue Bird Corp. | 3,312 | 39 |
| *,^ | 6D Global Technologies Inc. | 11,250 | 27 |
| * | Ultrapetrol Bahamas Ltd. | 10,909 | 6 |
| 130,318 | |||
| Technology (14.1%) | |||
| * | Tyler Technologies Inc. | 20,874 | 2,881 |
| * | Manhattan Associates Inc. | 45,738 | 2,675 |
| * | Guidewire Software Inc. | 43,493 | 2,432 |
| * | Cavium Inc. | 34,285 | 2,332 |
| * | Qlik Technologies Inc. | 56,617 | 2,144 |
| * | EPAM Systems Inc. | 30,316 | 2,141 |
| * | Dealertrack Technologies Inc. | 33,966 | 2,132 |
| * | NetScout Systems Inc. | 57,048 | 2,085 |
| * | Verint Systems Inc. | 38,035 | 2,028 |
| * | Aspen Technology Inc. | 52,929 | 2,004 |
| FEI Co. | 25,762 | 1,944 | |
| * | Microsemi Corp. | 58,999 | 1,874 |
| *,^ | Ambarella Inc. | 19,420 | 1,857 |
| * | Infinera Corp. | 82,505 | 1,800 |
| * | Integrated Device Technology Inc. | 91,964 | 1,746 |
| * | Ciena Corp. | 76,507 | 1,711 |
| Blackbaud Inc. | 29,057 | 1,660 | |
| Mentor Graphics Corp. | 61,994 | 1,602 | |
| * | Synaptics Inc. | 22,832 | 1,600 |
| * | ViaSat Inc. | 26,480 | 1,556 |
| * | ACI Worldwide Inc. | 72,372 | 1,544 |
| * | Take-Two Interactive Software Inc. | 52,448 | 1,528 |
| * | Tech Data Corp. | 22,716 | 1,482 |
| SYNNEX Corp. | 17,822 | 1,411 | |
| Science Applications International Corp. | 28,539 | 1,392 | |
| * | Proofpoint Inc. | 24,437 | 1,377 |
| * | Ellie Mae Inc. | 18,228 | 1,320 |
| Diebold Inc. | 40,198 | 1,251 | |
| * | GrubHub Inc. | 46,608 | 1,233 |
| * | Cornerstone OnDemand Inc. | 33,436 | 1,195 |
| * | Entegris Inc. | 86,931 | 1,194 |
| * | Cirrus Logic Inc. | 39,308 | 1,186 |
| Monolithic Power Systems Inc. | 24,505 | 1,178 | |
| * | CACI International Inc. Class A | 14,988 | 1,175 |
| Plantronics Inc. | 21,768 | 1,157 | |
| * | Demandware Inc. | 20,697 | 1,155 |
| * | Silicon Laboratories Inc. | 26,476 | 1,151 |
| * | MicroStrategy Inc. Class A | 5,757 | 1,144 |
| * | Anixter International Inc. | 17,686 | 1,126 |
| MKS Instruments Inc. | 33,085 | 1,115 | |
| * | comScore Inc. | 21,331 | 1,114 |
| InterDigital Inc. | 22,358 | 1,106 | |
| Tessera Technologies Inc. | 32,616 | 1,068 | |
| * | Fleetmatics Group plc | 23,696 | 1,061 |
| * | DigitalGlobe Inc. | 44,948 | 1,036 |
| * | Acxiom Corp. | 48,459 | 1,016 |
| * | CommVault Systems Inc. | 28,039 | 1,005 |
| * | Finisar Corp. | 64,415 | 994 |
| * | Sanmina Corp. | 51,219 | 985 |
| * | Fairchild Semiconductor International Inc. Class A | 72,176 | 982 |
| * | Imperva Inc. | 16,453 | 980 |
| * | Virtusa Corp. | 18,379 | 973 |
| * | Synchronoss Technologies Inc. | 24,030 | 971 |
| *,^ | Stratasys Ltd. | 31,567 | 968 |
| * | Rambus Inc. | 71,581 | 961 |
| * | NeuStar Inc. Class A | 34,320 | 959 |
| * | LogMeIn Inc. | 15,265 | 952 |
27
| Vanguard® Russell 2000 Index Fund | |||
| Schedule of Investments | |||
| August 31, 2015 | |||
| Market | |||
| Value | |||
| Shares | ($000) | ||
| * | Universal Display Corp. | 24,929 | 918 |
| * | Polycom Inc. | 83,719 | 901 |
| *,^ | Knowles Corp. | 54,105 | 881 |
| * | Syntel Inc. | 19,454 | 865 |
| Intersil Corp. Class A | 81,719 | 861 | |
| * | Coherent Inc. | 14,773 | 861 |
| * | OmniVision Technologies Inc. | 36,020 | 861 |
| * | Progress Software Corp. | 31,364 | 850 |
| * | Nimble Storage Inc. | 31,428 | 838 |
| Vishay Intertechnology Inc. | 83,958 | 829 | |
| * | Plexus Corp. | 20,832 | 793 |
| NIC Inc. | 40,630 | 765 | |
| * | Paycom Software Inc. | 19,561 | 754 |
| Power Integrations Inc. | 18,243 | 716 | |
| *,^ | Advanced Micro Devices Inc. | 394,306 | 714 |
| * | Semtech Corp. | 41,154 | 698 |
| * | SPS Commerce Inc. | 10,246 | 697 |
| * | Luxoft Holding Inc. Class A | 11,376 | 695 |
| * | Benchmark Electronics Inc. | 32,482 | 694 |
| * | Zendesk Inc. | 33,314 | 689 |
| * | Envestnet Inc. | 21,957 | 686 |
| * | PMC-Sierra Inc. | 108,140 | 680 |
| * | ScanSource Inc. | 17,797 | 680 |
| * | Bottomline Technologies de Inc. | 25,369 | 678 |
| * | Infoblox Inc. | 35,123 | 676 |
| ^ | Ubiquiti Networks Inc. | 19,024 | 669 |
| * | Rogers Corp. | 11,564 | 644 |
| Methode Electronics Inc. | 23,785 | 632 | |
| CSG Systems International Inc. | 20,302 | 628 | |
| * | Super Micro Computer Inc. | 22,877 | 626 |
| * | Rovi Corp. | 55,176 | 611 |
| * | Insight Enterprises Inc. | 24,115 | 610 |
| * | Marketo Inc. | 21,569 | 604 |
| * | NETGEAR Inc. | 19,857 | 603 |
| * | RealPage Inc. | 32,714 | 602 |
| * | AVG Technologies NV | 25,484 | 589 |
| * | Web.com Group Inc. | 27,164 | 585 |
| * | Ixia | 37,636 | 582 |
| * | RingCentral Inc. Class A | 33,282 | 573 |
| * | Veeco Instruments Inc. | 24,788 | 572 |
| * | BroadSoft Inc. | 18,112 | 572 |
| * | QLogic Corp. | 54,259 | 561 |
| * | Inphi Corp. | 23,520 | 558 |
| * | Endurance International Group Holdings Inc. | 36,427 | 557 |
| * | HubSpot Inc. | 11,763 | 556 |
| Pegasystems Inc. | 22,334 | 547 | |
| * | II-VI Inc. | 32,199 | 544 |
| * | iRobot Corp. | 18,426 | 540 |
| EarthLink Holdings Corp. | 64,102 | 538 | |
| * | Cray Inc. | 25,305 | 536 |
| * | Callidus Software Inc. | 33,973 | 536 |
| * | Ruckus Wireless Inc. | 46,863 | 530 |
| Monotype Imaging Holdings Inc. | 24,576 | 521 | |
| ADTRAN Inc. | 30,844 | 494 | |
| * | InvenSense Inc. | 48,318 | 493 |
| ^ | Ebix Inc. | 16,619 | 472 |
| * | Diodes Inc. | 23,241 | 458 |
| * | Cvent Inc. | 14,347 | 452 |
| * | Qualys Inc. | 15,410 | 448 |
| * | Rofin-Sinar Technologies Inc. | 17,295 | 440 |
| * | Loral Space & Communications Inc. | 8,124 | 440 |
| Integrated Silicon Solution Inc. | 19,721 | 433 | |
| * | Fabrinet | 21,783 | 433 |
| * | M/A-COM Technology Solutions Holdings Inc. | 14,671 | 433 |
28
| Vanguard® Russell 2000 Index Fund | |||
| Schedule of Investments | |||
| August 31, 2015 | |||
| Market | |||
| Value | |||
| Shares | ($000) | ||
| Brooks Automation Inc. | 41,322 | 429 | |
| ManTech International Corp. Class A | 15,059 | 412 | |
| * | Bankrate Inc. | 41,775 | 412 |
| * | Unisys Corp. | 31,211 | 411 |
| * | Gigamon Inc. | 17,106 | 390 |
| CTS Corp. | 20,597 | 388 | |
| * | Newport Corp. | 24,879 | 381 |
| * | Photronics Inc. | 41,497 | 378 |
| * | Interactive Intelligence Group Inc. | 10,726 | 376 |
| AVX Corp. | 28,438 | 371 | |
| * | CalAmp Corp. | 22,183 | 369 |
| * | Dot Hill Systems Corp. | 37,948 | 367 |
| * | Perficient Inc. | 21,865 | 362 |
| * | Blucora Inc. | 25,547 | 357 |
| * | Actua Corp. | 24,945 | 355 |
| * | Glu Mobile Inc. | 75,229 | 345 |
| * | Global Eagle Entertainment Inc. | 29,109 | 343 |
| * | Mercury Systems Inc. | 21,424 | 339 |
| * | Amkor Technology Inc. | 61,515 | 332 |
| * | PROS Holdings Inc. | 15,004 | 332 |
| * | GTT Communications Inc. | 14,909 | 328 |
| * | LivePerson Inc. | 35,366 | 324 |
| * | Textura Corp. | 12,327 | 319 |
| * | MaxLinear Inc. | 31,772 | 316 |
| * | Q2 Holdings Inc. | 12,020 | 314 |
| * | Harmonic Inc. | 54,046 | 312 |
| *,^ | VASCO Data Security International Inc. | 18,195 | 304 |
| * | Lattice Semiconductor Corp. | 72,155 | 302 |
| Acacia Research Corp. | 31,532 | 300 | |
| * | ShoreTel Inc. | 39,785 | 296 |
| * | DTS Inc. | 11,103 | 295 |
| * | Ultratech Inc. | 16,867 | 290 |
| * | Applied Micro Circuits Corp. | 49,287 | 288 |
| * | Internap Corp. | 34,587 | 276 |
| * | GSI Group Inc. | 21,099 | 274 |
| Comtech Telecommunications Corp. | 10,098 | 269 | |
| * | ePlus Inc. | 3,534 | 268 |
| * | Comverse Inc. | 14,055 | 265 |
| * | Silver Spring Networks Inc. | 22,649 | 263 |
| *,^ | Pacific DataVision Inc. | 8,137 | 260 |
| Epiq Systems Inc. | 20,219 | 257 | |
| * | Globant SA | 9,359 | 255 |
| * | Intralinks Holdings Inc. | 24,749 | 253 |
| * | Rudolph Technologies Inc. | 19,487 | 249 |
| * | TTM Technologies Inc. | 36,379 | 248 |
| * | CEVA Inc. | 12,564 | 242 |
| * | FormFactor Inc. | 35,762 | 238 |
| * | Rubicon Project Inc. | 16,110 | 232 |
| * | Wix.com Ltd. | 11,540 | 228 |
| * | Axcelis Technologies Inc. | 69,627 | 227 |
| * | Calix Inc. | 27,655 | 221 |
| Park Electrochemical Corp. | 12,501 | 220 | |
| * | Sonus Networks Inc. | 31,033 | 218 |
| * | Applied Optoelectronics Inc. | 10,491 | 216 |
| * | RetailMeNot Inc. | 23,472 | 211 |
| * | Sigma Designs Inc. | 21,365 | 210 |
| * | Kimball Electronics Inc. | 17,892 | 210 |
| * | Lionbridge Technologies Inc. | 39,237 | 209 |
| * | Xcerra Corp. | 33,352 | 209 |
| Checkpoint Systems Inc. | 25,576 | 207 | |
| Daktronics Inc. | 23,730 | 206 | |
| * | Nanometrics Inc. | 14,747 | 205 |
| * | Immersion Corp. | 17,546 | 203 |
| * | PDF Solutions Inc. | 16,481 | 201 |
29
| Vanguard® Russell 2000 Index Fund | |||
| Schedule of Investments | |||
| August 31, 2015 | |||
| Market | |||
| Value | |||
| Shares | ($000) | ||
| * | Bazaarvoice Inc. | 37,841 | 196 |
| * | Extreme Networks Inc. | 62,528 | 188 |
| * | SciQuest Inc. | 16,973 | 186 |
| * | Vocera Communications Inc. | 15,733 | 185 |
| American Science & Engineering Inc. | 4,682 | 184 | |
| * | Tangoe Inc. | 24,421 | 183 |
| IXYS Corp. | 15,522 | 183 | |
| * | Benefitfocus Inc. | 4,957 | 182 |
| * | Yodlee Inc. | 11,180 | 181 |
| * | Digimarc Corp. | 4,662 | 178 |
| *,^ | TrueCar Inc. | 29,751 | 176 |
| *,^ | KEYW Holding Corp. | 20,611 | 173 |
| Sapiens International Corp. NV | 14,823 | 173 | |
| * | Avid Technology Inc. | 20,574 | 171 |
| Pericom Semiconductor Corp. | 13,630 | 166 | |
| * | Oclaro Inc. | 60,839 | 165 |
| * | ARC Document Solutions Inc. | 24,797 | 165 |
| Alliance Fiber Optic Products Inc. | 8,676 | 164 | |
| * | Ciber Inc. | 47,843 | 164 |
| QAD Inc. Class A | 6,344 | 160 | |
| NVE Corp. | 3,036 | 159 | |
| Cohu Inc. | 16,319 | 158 | |
| * | Digi International Inc. | 15,107 | 155 |
| * | Zix Corp. | 35,106 | 154 |
| * | Quantum Corp. | 129,343 | 151 |
| * | ChannelAdvisor Corp. | 13,199 | 150 |
| * | Exar Corp. | 24,880 | 147 |
| * | Sparton Corp. | 6,276 | 146 |
| Black Box Corp. | 9,372 | 144 | |
| * | OPOWER Inc. | 15,897 | 144 |
| American Software Inc. Class A | 15,624 | 143 | |
| * | Model N Inc. | 13,340 | 137 |
| PC Connection Inc. | 6,508 | 137 | |
| * | A10 Networks Inc. | 20,582 | 137 |
| * | Ultra Clean Holdings Inc. | 20,090 | 136 |
| Reis Inc. | 5,452 | 136 | |
| * | Mattson Technology Inc. | 47,325 | 133 |
| * | Cascade Microtech Inc. | 8,589 | 132 |
| * | Kopin Corp. | 42,405 | 131 |
| * | Everyday Health Inc. | 13,467 | 131 |
| * | Jive Software Inc. | 28,828 | 130 |
| * | NeoPhotonics Corp. | 17,803 | 129 |
| * | Seachange International Inc. | 21,340 | 129 |
| * | Barracuda Networks Inc. | 4,899 | 129 |
| * | Carbonite Inc. | 11,394 | 125 |
| * | Telenav Inc. | 17,641 | 125 |
| * | Clearfield Inc. | 7,013 | 119 |
| * | DSP Group Inc. | 13,555 | 119 |
| Bel Fuse Inc. Class B | 6,599 | 117 | |
| * | New Relic Inc. | 3,488 | 114 |
| * | Silicon Graphics International Corp. | 22,453 | 112 |
| * | TechTarget Inc. | 12,030 | 111 |
| * | Hortonworks Inc. | 4,531 | 108 |
| * | Varonis Systems Inc. | 5,416 | 107 |
| * | Brightcove Inc. | 19,955 | 106 |
| * | KVH Industries Inc. | 9,516 | 105 |
| * | TeleCommunication Systems Inc. Class A | 29,738 | 104 |
| *,^ | Box Inc. | 7,697 | 104 |
| * | Alpha & Omega Semiconductor Ltd. | 13,400 | 102 |
| *,^ | VirnetX Holding Corp. | 27,469 | 100 |
| * | Violin Memory Inc. | 56,016 | 99 |
| * | EMCORE Corp. | 14,148 | 99 |
| * | Rocket Fuel Inc. | 16,074 | 99 |
| * | Agilysys Inc. | 9,510 | 98 |
30
| Vanguard® Russell 2000 Index Fund | |||
| Schedule of Investments | |||
| August 31, 2015 | |||
| Market | |||
| Value | |||
| Shares | ($000) | ||
| * | Millennial Media Inc. | 72,311 | 97 |
| * | MobileIron Inc. | 23,023 | 95 |
| * | United Online Inc. | 8,627 | 94 |
| *,^ | Aerohive Networks Inc. | 14,483 | 90 |
| * | Multi-Fineline Electronix Inc. | 5,579 | 89 |
| * | Limelight Networks Inc. | 37,345 | 88 |
| * | Guidance Software Inc. | 11,378 | 81 |
| *,^ | Park City Group Inc. | 6,373 | 75 |
| *,^ | Digital Turbine Inc. | 27,869 | 73 |
| * | Datalink Corp. | 12,324 | 71 |
| ModusLink Global Solutions Inc. | 21,997 | 69 | |
| * | Marin Software Inc. | 17,973 | 64 |
| * | Workiva Inc. | 4,437 | 64 |
| * | Imation Corp. | 20,070 | 62 |
| * | Novatel Wireless Inc. | 22,201 | 62 |
| * | RealNetworks Inc. | 12,992 | 56 |
| * | Five9 Inc. | 13,763 | 54 |
| * | Amber Road Inc. | 10,359 | 52 |
| * | Travelzoo Inc. | 3,985 | 38 |
| * | Connecture Inc. | 3,463 | 25 |
| * | MaxPoint Interactive Inc. | 4,529 | 21 |
| * | Apigee Corp. | 2,780 | 18 |
| *,^ | Code Rebel Corp. | 540 | 8 |
| 152,358 | |||
| Utilities (4.6%) | |||
| j2 Global Inc. | 29,883 | 2,079 | |
| * | Dynegy Inc. | 79,438 | 2,046 |
| Cleco Corp. | 37,492 | 2,009 | |
| Portland General Electric Co. | 54,839 | 1,894 | |
| Piedmont Natural Gas Co. Inc. | 48,835 | 1,884 | |
| IDACORP Inc. | 31,210 | 1,853 | |
| WGL Holdings Inc. | 30,827 | 1,671 | |
| Southwest Gas Corp. | 29,038 | 1,600 | |
| UIL Holdings Corp. | 35,097 | 1,598 | |
| NorthWestern Corp. | 29,160 | 1,506 | |
| New Jersey Resources Corp. | 53,051 | 1,500 | |
| ALLETE Inc. | 30,221 | 1,444 | |
| Laclede Group Inc. | 26,853 | 1,422 | |
| ONE Gas Inc. | 32,603 | 1,401 | |
| PNM Resources Inc. | 49,377 | 1,265 | |
| Avista Corp. | 38,603 | 1,212 | |
| Black Hills Corp. | 27,785 | 1,105 | |
| South Jersey Industries Inc. | 42,416 | 1,022 | |
| El Paso Electric Co. | 25,039 | 886 | |
| American States Water Co. | 23,420 | 884 | |
| MGE Energy Inc. | 21,491 | 827 | |
| Ormat Technologies Inc. | 23,058 | 812 | |
| Cogent Communications Holdings Inc. | 28,546 | 793 | |
| West Corp. | 32,352 | 787 | |
| Pattern Energy Group Inc. Class A | 34,566 | 784 | |
| Northwest Natural Gas Co. | 16,944 | 745 | |
| * | Talen Energy Corp. | 51,728 | 737 |
| Abengoa Yield plc | 30,418 | 692 | |
| * | Vonage Holdings Corp. | 115,085 | 639 |
| NRG Yield Inc. | 38,919 | 625 | |
| California Water Service Group | 29,695 | 613 | |
| Consolidated Communications Holdings Inc. | 31,310 | 611 | |
| Otter Tail Corp. | 23,238 | 600 | |
| Empire District Electric Co. | 27,028 | 585 | |
| Shenandoah Telecommunications Co. | 15,079 | 583 | |
| * | Gogo Inc. | 34,825 | 553 |
| *,^ | Globalstar Inc. | 292,487 | 515 |
| Chesapeake Utilities Corp. | 9,485 | 467 | |
| Atlantic Tele-Network Inc. | 6,284 | 449 | |
31
| Vanguard® Russell 2000 Index Fund | |||||
| Schedule of Investments | |||||
| August 31, 2015 | |||||
| Market | |||||
| Value | |||||
| Shares | ($000) | ||||
| * | Cincinnati Bell Inc. | 130,722 | 448 | ||
| ^ | Windstream Holdings Inc. | 61,860 | 445 | ||
| * | 8x8 Inc. | 54,004 | 417 | ||
| Inteliquent Inc. | 20,829 | 382 | |||
| * | Iridium Communications Inc. | 50,122 | 373 | ||
| * | General Communication Inc. Class A | 21,924 | 369 | ||
| NRG Yield Inc. Class A | 21,482 | 338 | |||
| Unitil Corp. | 8,521 | 307 | |||
| * | Premiere Global Services Inc. | 28,435 | 307 | ||
| * | inContact Inc. | 37,722 | 285 | ||
| SJW Corp. | 9,658 | 278 | |||
| Connecticut Water Service Inc. | 6,803 | 236 | |||
| * | ORBCOMM Inc. | 37,804 | 230 | ||
| Middlesex Water Co. | 9,919 | 226 | |||
| Spok Holdings Inc. | 13,404 | 221 | |||
| * | FairPoint Communications Inc. | 12,770 | 209 | ||
| Atlantic Power Corp. | 76,668 | 180 | |||
| * | Boingo Wireless Inc. | 23,227 | 175 | ||
| Lumos Networks Corp. | 14,399 | 169 | |||
| York Water Co. | 7,943 | 169 | |||
| * | Intelsat SA | 17,295 | 167 | ||
| IDT Corp. Class B | 10,174 | 159 | |||
| * | Pendrell Corp. | 99,430 | 147 | ||
| * | Hawaiian Telcom Holdco Inc. | 6,554 | 144 | ||
| * | Straight Path Communications Inc. Class B | 5,729 | 130 | ||
| Artesian Resources Corp. Class A | 4,815 | 106 | |||
| * | NTELOS Holdings Corp. | 10,865 | 100 | ||
| Consolidated Water Co. Ltd. | 8,967 | 95 | |||
| Genie Energy Ltd. Class B | 7,233 | 77 | |||
| Spark Energy Inc. Class A | 1,528 | 24 | |||
| 49,611 | |||||
| Total Common Stocks (Cost $1,106,914) | 1,075,845 | ||||
| Coupon | |||||
| Temporary Cash Investments (1.8%)1 | |||||
| Money Market Fund (1.8%) | |||||
| 3,4 | Vanguard Market Liquidity Fund | 0.168% | 19,124,789 | 19,125 | |
| Face | |||||
| Maturity | Amount | ||||
| Date | ($000) | ||||
| U.S. Government and Agency Obligations (0.0%) | |||||
| 5,6 | Federal Home Loan Bank Discount Notes | 0.105% | 11/2/15 | 500 | 500 |
| Total Temporary Cash Investments (Cost $19,625) | 19,625 | ||||
| Total Investments (101.2%) (Cost $1,126,539) | 1,095,470 | ||||
| Other Assets and Liabilities—Net (-1.2%)4 | (13,064) | ||||
| Net Assets (100%) | 1,082,406 | ||||
* Non-income-producing security.
^ Includes partial security positions on loan to broker-dealers. The total value of securities on loan is $11,434,000.
1 The fund invests a portion of its cash reserves in equity markets through the use of index futures contracts. After giving effect to futures investments, the fund's effective common stock and temporary cash investment positions represent 100.0% and 1.2%, respectively, of net assets.
2 “Other” represents securities that are not classified by the fund’s benchmark index.
3 Affiliated money market fund available only to Vanguard funds and certain trusts and accounts managed by Vanguard. Rate shown is the 7-day yield.
4 Includes $12,418,000 of collateral received for securities on loan.
32
Vanguard® Russell 2000 Index Fund
Schedule of Investments
August 31, 2015
5 The issuer operates under a congressional charter; its securities are generally neither guaranteed by the U.S. Treasury nor backed by the full faith and credit of the U.S. government.
6 Securities with a value of $400,000 have been segregated as initial margin for open futures contracts. REIT—Real Estate Investment Trust.
33
| Vanguard® Russell 2000 Value Index Fund | |||
| Schedule of Investments | |||
| August 31, 2015 | |||
| Market | |||
| Value | |||
| Shares | ($000) | ||
| Common Stocks (99.3%)1 | |||
| Consumer Discretionary (10.9%) | |||
| * | Houghton Mifflin Harcourt Co. | 21,287 | 481 |
| Time Inc. | 18,249 | 379 | |
| * | TRI Pointe Group Inc. | 25,398 | 353 |
| Cooper Tire & Rubber Co. | 8,527 | 329 | |
| Meredith Corp. | 6,122 | 289 | |
| * | Ascena Retail Group Inc. | 23,341 | 282 |
| DeVry Education Group Inc. | 10,679 | 279 | |
| Group 1 Automotive Inc. | 3,066 | 268 | |
| Matthews International Corp. Class A | 5,211 | 265 | |
| * | Meritage Homes Corp. | 6,164 | 260 |
| *,^ | DreamWorks Animation SKG Inc. Class A | 12,630 | 252 |
| * | Genesco Inc. | 4,003 | 240 |
| * | Helen of Troy Ltd. | 2,804 | 239 |
| Rent-A-Center Inc. | 8,829 | 237 | |
| Abercrombie & Fitch Co. | 11,690 | 232 | |
| Guess? Inc. | 10,278 | 227 | |
| * | Liberty TripAdvisor Holdings Inc. Class A | 8,913 | 226 |
| * | Penn National Gaming Inc. | 12,350 | 224 |
| Dana Holding Corp. | 12,741 | 223 | |
| New York Times Co. Class A | 18,312 | 223 | |
| Caleres Inc. | 6,629 | 221 | |
| Ryland Group Inc. | 5,065 | 219 | |
| * | Standard Pacific Corp. | 24,310 | 205 |
| KB Home | 13,572 | 199 | |
| Scholastic Corp. | 4,426 | 191 | |
| * | Media General Inc. | 15,957 | 187 |
| * | Belmond Ltd. Class A | 16,082 | 183 |
| * | Apollo Education Group Inc. | 15,856 | 176 |
| * | Vitamin Shoppe Inc. | 4,634 | 166 |
| * | Eros International plc | 4,727 | 157 |
| Bob Evans Farms Inc. | 3,399 | 154 | |
| Children's Place Inc. | 2,522 | 151 | |
| * | Deckers Outdoor Corp. | 2,332 | 150 |
| International Speedway Corp. Class A | 4,623 | 148 | |
| Finish Line Inc. Class A | 5,570 | 147 | |
| La-Z-Boy Inc. | 5,296 | 146 | |
| Remy International Inc. | 4,805 | 141 | |
| * | Conn's Inc. | 4,598 | 137 |
| Barnes & Noble Inc. | 8,432 | 132 | |
| Marriott Vacations Worldwide Corp. | 1,844 | 131 | |
| Cato Corp. Class A | 3,654 | 128 | |
| Ethan Allen Interiors Inc. | 4,271 | 127 | |
| * | Cooper-Standard Holding Inc. | 2,122 | 122 |
| MDC Holdings Inc. | 4,270 | 122 | |
| Sonic Automotive Inc. Class A | 5,534 | 119 | |
| Standard Motor Products Inc. | 3,351 | 119 | |
| Callaway Golf Co. | 13,128 | 116 | |
| New Media Investment Group Inc. | 7,517 | 112 | |
| * | Iconix Brand Group Inc. | 7,928 | 110 |
| * | Pep Boys-Manny Moe & Jack | 9,029 | 109 |
| * | Taylor Morrison Home Corp. Class A | 5,464 | 109 |
| * | Biglari Holdings Inc. | 278 | 104 |
| MDC Partners Inc. Class A | 5,272 | 104 | |
| National CineMedia Inc. | 7,776 | 102 | |
| AMC Entertainment Holdings Inc. | 3,304 | 96 | |
| * | Carmike Cinemas Inc. | 3,902 | 93 |
| Viad Corp. | 3,369 | 92 | |
| * | Performance Sports Group Ltd. | 7,095 | 92 |
| * | FTD Cos. Inc. | 3,069 | 92 |
| * | Meritor Inc. | 7,237 | 92 |
| * | Beazer Homes USA Inc. | 5,434 | 91 |
34
| Vanguard® Russell 2000 Value Index Fund | ||
| Schedule of Investments | ||
| August 31, 2015 | ||
| Market | ||
| Value | ||
| Shares | ($000) | |
| Columbia Sportswear Co. | 1,460 | 90 |
| * Shutterfly Inc. | 2,305 | 90 |
| * Caesars Entertainment Corp. | 9,309 | 89 |
| * M/I Homes Inc. | 3,386 | 85 |
| Fred's Inc. Class A | 6,255 | 82 |
| * Central Garden & Pet Co. Class A | 6,283 | 79 |
| Haverty Furniture Cos. Inc. | 3,423 | 79 |
| Movado Group Inc. | 2,695 | 76 |
| Superior Industries International Inc. | 3,939 | 75 |
| * K12 Inc. | 5,677 | 75 |
| * Regis Corp. | 6,895 | 75 |
| * Burlington Stores Inc. | 1,318 | 70 |
| * Lumber Liquidators Holdings Inc. | 4,552 | 69 |
| * Barnes & Noble Education Inc. | 5,329 | 69 |
| * Ruby Tuesday Inc. | 10,438 | 69 |
| Travelport Worldwide Ltd. | 5,181 | 69 |
| National Presto Industries Inc. | 815 | 67 |
| Sonic Corp. | 2,439 | 66 |
| Citi Trends Inc. | 2,465 | 65 |
| Shoe Carnival Inc. | 2,512 | 65 |
| * WCI Communities Inc. | 2,595 | 65 |
| American Eagle Outfitters Inc. | 3,776 | 64 |
| * William Lyon Homes Class A | 2,808 | 64 |
| * American Public Education Inc. | 2,880 | 63 |
| EW Scripps Co. Class A | 3,575 | 63 |
| Marcus Corp. | 3,085 | 60 |
| * Chegg Inc. | 7,837 | 58 |
| * Lands' End Inc. | 2,279 | 58 |
| Stage Stores Inc. | 5,364 | 58 |
| * Strayer Education Inc. | 1,094 | 57 |
| * Caesars Acquisition Co. Class A | 7,769 | 55 |
| * Del Frisco's Restaurant Group Inc. | 3,706 | 55 |
| Stein Mart Inc. | 4,930 | 53 |
| * Century Communities Inc. | 2,359 | 52 |
| * Perry Ellis International Inc. | 2,055 | 51 |
| Carriage Services Inc. Class A | 2,217 | 51 |
| * Denny's Corp. | 4,338 | 49 |
| * Elizabeth Arden Inc. | 4,387 | 48 |
| * Entercom Communications Corp. Class A | 4,268 | 47 |
| * Revlon Inc. Class A | 1,409 | 47 |
| * Federal-Mogul Holdings Corp. | 5,097 | 47 |
| * LGI Homes Inc. | 1,758 | 46 |
| * Build-A-Bear Workshop Inc. | 2,231 | 44 |
| * Crocs Inc. | 2,949 | 43 |
| Inter Parfums Inc. | 1,686 | 43 |
| * Career Education Corp. | 11,409 | 42 |
| * America's Car-Mart Inc. | 1,179 | 42 |
| CSS Industries Inc. | 1,570 | 42 |
| Hooker Furniture Corp. | 1,692 | 40 |
| * Tower International Inc. | 1,586 | 39 |
| * Vera Bradley Inc. | 3,576 | 39 |
| Speedway Motorsports Inc. | 1,967 | 38 |
| * Hovnanian Enterprises Inc. Class A | 20,054 | 37 |
| Arctic Cat Inc. | 1,343 | 35 |
| Big 5 Sporting Goods Corp. | 3,072 | 35 |
| * Daily Journal Corp. | 181 | 35 |
| * Cumulus Media Inc. Class A | 23,969 | 34 |
| * MarineMax Inc. | 2,073 | 34 |
| * QuinStreet Inc. | 5,979 | 33 |
| Ruth's Hospitality Group Inc. | 1,971 | 32 |
| Strattec Security Corp. | 500 | 32 |
| Harte-Hanks Inc. | 8,105 | 31 |
| * Franklin Covey Co. | 1,849 | 31 |
| Flexsteel Industries Inc. | 970 | 30 |
35
| Vanguard® Russell 2000 Value Index Fund | ||
| Schedule of Investments | ||
| August 31, 2015 | ||
| Market | ||
| Value | ||
| Shares | ($000) | |
| * Horizon Global Corp. | 2,822 | 29 |
| Cracker Barrel Old Country Store Inc. | 203 | 29 |
| * Destination XL Group Inc. | 4,817 | 29 |
| * Express Inc. | 1,405 | 29 |
| * Monarch Casino & Resort Inc. | 1,614 | 28 |
| Weyco Group Inc. | 1,043 | 28 |
| * Reading International Inc. Class A | 2,160 | 28 |
| * JAKKS Pacific Inc. | 2,892 | 28 |
| * Intrawest Resorts Holdings Inc. | 3,033 | 27 |
| * Black Diamond Inc. | 3,618 | 27 |
| * West Marine Inc. | 3,022 | 26 |
| Bassett Furniture Industries Inc. | 912 | 26 |
| Lifetime Brands Inc. | 1,793 | 26 |
| Journal Media Group Inc. | 3,868 | 26 |
| * VOXX International Corp. Class A | 3,130 | 24 |
| * Sizmek Inc. | 3,616 | 24 |
| * Cavco Industries Inc. | 325 | 23 |
| * Sportsman's Warehouse Holdings Inc. | 1,798 | 23 |
| * Eldorado Resorts Inc. | 2,441 | 23 |
| Tribune Publishing Co. | 1,950 | 23 |
| * Bridgepoint Education Inc. | 2,836 | 23 |
| Escalade Inc. | 1,273 | 23 |
| * EVINE Live Inc. | 8,386 | 23 |
| * Hemisphere Media Group Inc. Class A | 1,639 | 22 |
| Marchex Inc. Class B | 5,473 | 22 |
| Johnson Outdoors Inc. Class A | 842 | 21 |
| * Universal Electronics Inc. | 440 | 20 |
| Saga Communications Inc. Class A | 572 | 20 |
| DineEquity Inc. | 190 | 18 |
| * New Home Co. Inc. | 1,213 | 18 |
| * Skullcandy Inc. | 2,456 | 17 |
| * Systemax Inc. | 1,883 | 17 |
| * Zumiez Inc. | 718 | 17 |
| * Care.com Inc. | 2,793 | 17 |
| Universal Technical Institute Inc. | 3,552 | 16 |
| Metaldyne Performance Group Inc. | 802 | 15 |
| * Tilly's Inc. Class A | 1,848 | 15 |
| * Sequential Brands Group Inc. | 877 | 14 |
| * Morgans Hotel Group Co. | 3,039 | 14 |
| * Townsquare Media Inc. Class A | 1,151 | 13 |
| * Kona Grill Inc. | 702 | 13 |
| * Cambium Learning Group Inc. | 2,184 | 11 |
| * Carrols Restaurant Group Inc. | 888 | 11 |
| * Christopher & Banks Corp. | 6,253 | 11 |
| * Tuesday Morning Corp. | 1,317 | 10 |
| Winnebago Industries Inc. | 408 | 8 |
| * Fenix Parts Inc. | 826 | 8 |
| * Noodles & Co. Class A | 638 | 8 |
| * Rentrak Corp. | 166 | 8 |
| * Central European Media Enterprises Ltd. Class A | 3,356 | 7 |
| Libbey Inc. | 208 | 7 |
| * Motorcar Parts of America Inc. | 224 | 7 |
| * Martha Stewart Living Omnimedia Inc. Class A | 1,081 | 7 |
| bebe stores inc | 4,744 | 6 |
| * Shake Shack Inc. Class A | 126 | 6 |
| Entravision Communications Corp. Class A | 622 | 5 |
| * SFX Entertainment Inc. | 4,238 | 4 |
| * Bravo Brio Restaurant Group Inc. | 300 | 4 |
| * Cherokee Inc. | 143 | 4 |
| * Isle of Capri Casinos Inc. | 189 | 3 |
| * Crown Media Holdings Inc. Class A | 647 | 3 |
| * Weight Watchers International Inc. | 446 | 3 |
| * Quiksilver Inc. | 6,189 | 3 |
| * ZAGG Inc. | 278 | 2 |
36
| Vanguard® Russell 2000 Value Index Fund | |||
| Schedule of Investments | |||
| August 31, 2015 | |||
| Market | |||
| Value | |||
| Shares | ($000) | ||
| * | Empire Resorts Inc. | 148 | 1 |
| 15,677 | |||
| Consumer Staples (2.8%) | |||
| * | Post Holdings Inc. | 10,244 | 669 |
| * | TreeHouse Foods Inc. | 7,175 | 569 |
| * | SUPERVALU Inc. | 43,620 | 359 |
| Snyder's-Lance Inc. | 8,131 | 275 | |
| Sanderson Farms Inc. | 3,734 | 258 | |
| Fresh Del Monte Produce Inc. | 5,537 | 219 | |
| Universal Corp. | 3,753 | 185 | |
| SpartanNash Co. | 6,245 | 177 | |
| Andersons Inc. | 4,714 | 167 | |
| Dean Foods Co. | 8,553 | 141 | |
| * | Seaboard Corp. | 39 | 129 |
| Core-Mark Holding Co. Inc. | 1,870 | 112 | |
| Lancaster Colony Corp. | 1,083 | 103 | |
| Ingles Markets Inc. Class A | 1,623 | 81 | |
| Weis Markets Inc. | 1,851 | 75 | |
| * | Smart & Final Stores Inc. | 4,082 | 66 |
| Tootsie Roll Industries Inc. | 2,017 | 63 | |
| * | Omega Protein Corp. | 3,650 | 62 |
| John B Sanfilippo & Son Inc. | 1,042 | 54 | |
| * | Seneca Foods Corp. Class A | 1,244 | 37 |
| * | Nutraceutical International Corp. | 1,409 | 34 |
| Village Super Market Inc. Class A | 1,203 | 33 | |
| * | United Natural Foods Inc. | 665 | 32 |
| Orchids Paper Products Co. | 1,127 | 28 | |
| Alico Inc. | 595 | 25 | |
| Nature's Sunshine Products Inc. | 1,778 | 22 | |
| B&G Foods Inc. | 463 | 14 | |
| * | Craft Brew Alliance Inc. | 1,145 | 9 |
| Coca-Cola Bottling Co. Consolidated | 60 | 9 | |
| * | Diamond Foods Inc. | 235 | 7 |
| * | Arcadia Biosciences Inc. | 862 | 6 |
| * | Fairway Group Holdings Corp. | 2,310 | 5 |
| * | Boulder Brands Inc. | 561 | 5 |
| * | National Beverage Corp. | 102 | 3 |
| * | Synutra International Inc. | 356 | 2 |
| 4,035 | |||
| Energy (4.5%) | |||
| * | PDC Energy Inc. | 6,673 | 375 |
| * | Carrizo Oil & Gas Inc. | 8,103 | 295 |
| * | Oasis Petroleum Inc. | 23,395 | 261 |
| Exterran Holdings Inc. | 11,631 | 260 | |
| * | Oil States International Inc. | 8,671 | 246 |
| * | RSP Permian Inc. | 9,863 | 236 |
| Atwood Oceanics Inc. | 10,865 | 208 | |
| * | McDermott International Inc. | 39,642 | 201 |
| * | SEACOR Holdings Inc. | 3,031 | 196 |
| * | Flotek Industries Inc. | 8,990 | 176 |
| * | Synergy Resources Corp. | 15,602 | 168 |
| * | Parsley Energy Inc. Class A | 9,048 | 156 |
| * | Forum Energy Technologies Inc. | 9,850 | 155 |
| Green Plains Inc. | 6,290 | 134 | |
| Delek US Holdings Inc. | 4,311 | 133 | |
| * | Unit Corp. | 8,471 | 129 |
| ^ | Peabody Energy Corp. | 46,686 | 126 |
| * | Helix Energy Solutions Group Inc. | 17,610 | 122 |
| * | Matador Resources Co. | 4,996 | 114 |
| *,^ | Ultra Petroleum Corp. | 13,209 | 113 |
| * | Hornbeck Offshore Services Inc. | 5,372 | 106 |
| * | Newpark Resources Inc. | 14,181 | 104 |
| * | TETRA Technologies Inc. | 13,377 | 103 |
| * | Callon Petroleum Co. | 11,070 | 102 |
37
| Vanguard® Russell 2000 Value Index Fund | |||
| Schedule of Investments | |||
| August 31, 2015 | |||
| Market | |||
| Value | |||
| Shares | ($000) | ||
| Alon USA Energy Inc. | 5,250 | 97 | |
| CARBO Ceramics Inc. | 3,299 | 90 | |
| * | Matrix Service Co. | 4,491 | 90 |
| *,^ | Halcon Resources Corp. | 61,719 | 71 |
| * | Parker Drilling Co. | 20,552 | 69 |
| * | Bonanza Creek Energy Inc. | 8,354 | 64 |
| *,^ | Clean Energy Fuels Corp. | 11,986 | 64 |
| *,^ | Northern Oil and Gas Inc. | 10,364 | 62 |
| * | Renewable Energy Group Inc. | 7,390 | 62 |
| * | REX American Resources Corp. | 1,111 | 60 |
| * | Era Group Inc. | 3,459 | 58 |
| *,^ | Sanchez Energy Corp. | 8,865 | 57 |
| Tesco Corp. | 6,543 | 56 | |
| * | Stone Energy Corp. | 9,428 | 53 |
| * | C&J Energy Services Ltd. | 9,288 | 51 |
| * | Clayton Williams Energy Inc. | 992 | 50 |
| * | Cloud Peak Energy Inc. | 10,257 | 49 |
| * | Natural Gas Services Group Inc. | 2,140 | 46 |
| * | Bill Barrett Corp. | 8,403 | 46 |
| * | Westmoreland Coal Co. | 2,984 | 45 |
| * | Green Brick Partners Inc. | 3,595 | 44 |
| * | EnerNOC Inc. | 4,551 | 42 |
| * | Ring Energy Inc. | 4,050 | 42 |
| * | SandRidge Energy Inc. | 72,769 | 39 |
| * | Geospace Technologies Corp. | 2,190 | 39 |
| * | Pacific Ethanol Inc. | 5,300 | 38 |
| * | Basic Energy Services Inc. | 7,166 | 37 |
| * | PowerSecure International Inc. | 3,093 | 37 |
| SunCoke Energy Inc. | 3,135 | 36 | |
| * | Pioneer Energy Services Corp. | 10,826 | 36 |
| * | Civeo Corp. | 17,623 | 34 |
| *,^ | Triangle Petroleum Corp. | 7,838 | 32 |
| * | Eclipse Resources Corp. | 8,075 | 31 |
| * | Abraxas Petroleum Corp. | 15,782 | 31 |
| ^ | Energy XXI Ltd. | 15,871 | 30 |
| * | Jones Energy Inc. Class A | 4,869 | 29 |
| * | Rex Energy Corp. | 8,084 | 28 |
| * | Contango Oil & Gas Co. | 2,927 | 27 |
| * | Seventy Seven Energy Inc. | 9,447 | 27 |
| Panhandle Oil and Gas Inc. Class A | 1,482 | 26 | |
| * | FuelCell Energy Inc. | 29,960 | 25 |
| * | Gastar Exploration Inc. | 13,638 | 22 |
| EXCO Resources Inc. | 26,536 | 22 | |
| Nordic American Offshore Ltd. | 3,183 | 22 | |
| W&T Offshore Inc. | 5,882 | 21 | |
| * | Independence Contract Drilling Inc. | 2,785 | 19 |
| * | Ameresco Inc. Class A | 3,371 | 19 |
| * | Vivint Solar Inc. | 1,319 | 16 |
| * | Key Energy Services Inc. | 22,362 | 16 |
| Adams Resources & Energy Inc. | 348 | 16 | |
| * | Approach Resources Inc. | 6,073 | 16 |
| * | Penn Virginia Corp. | 12,043 | 15 |
| * | TransAtlantic Petroleum Ltd. | 4,340 | 13 |
| Hallador Energy Co. | 1,359 | 11 | |
| * | ION Geophysical Corp. | 19,090 | 10 |
| North Atlantic Drilling Ltd. | 10,668 | 9 | |
| * | Erin Energy Corp. | 2,014 | 8 |
| * | Fairmount Santrol Holdings Inc. | 1,023 | 5 |
| * | Par Petroleum Corp. | 248 | 5 |
| * | Earthstone Energy Inc. | 219 | 4 |
| * | Global Geophysical Services Inc. | 223 | — |
| 6,438 | |||
| Financial Services (42.1%) | |||
| First American Financial Corp. | 18,123 | 704 | |
38
| Vanguard® Russell 2000 Value Index Fund | ||
| Schedule of Investments | ||
| August 31, 2015 | ||
| Market | ||
| Value | ||
| Shares | ($000) | |
| Investors Bancorp Inc. | 58,316 | 687 |
| * Strategic Hotels & Resorts Inc. | 46,056 | 621 |
| Umpqua Holdings Corp. | 36,891 | 616 |
| Prosperity Bancshares Inc. | 11,717 | 605 |
| Highwoods Properties Inc. | 15,731 | 597 |
| LaSalle Hotel Properties | 18,898 | 595 |
| CNO Financial Group Inc. | 32,955 | 590 |
| Radian Group Inc. | 32,031 | 576 |
| New Residential Investment Corp. | 38,506 | 545 |
| Webster Financial Corp. | 15,191 | 537 |
| * Stifel Financial Corp. | 11,356 | 529 |
| FirstMerit Corp. | 27,758 | 499 |
| PrivateBancorp Inc. | 13,159 | 498 |
| EPR Properties | 9,572 | 487 |
| Sunstone Hotel Investors Inc. | 34,771 | 481 |
| DCT Industrial Trust Inc. | 14,876 | 478 |
| Pebblebrook Hotel Trust | 11,972 | 456 |
| Medical Properties Trust Inc. | 38,912 | 454 |
| United Bankshares Inc. | 11,571 | 433 |
| Sun Communities Inc. | 6,561 | 428 |
| MB Financial Inc. | 12,517 | 412 |
| Colony Capital Inc. Class A | 18,612 | 404 |
| Wintrust Financial Corp. | 7,901 | 403 |
| Cathay General Bancorp | 13,315 | 395 |
| Symetra Financial Corp. | 12,513 | 394 |
| DiamondRock Hospitality Co. | 33,443 | 393 |
| IBERIABANK Corp. | 6,362 | 387 |
| RLJ Lodging Trust | 13,963 | 385 |
| Healthcare Realty Trust Inc. | 16,727 | 383 |
| BancorpSouth Inc. | 16,087 | 382 |
| * Texas Capital Bancshares Inc. | 7,085 | 382 |
| RLI Corp. | 7,196 | 375 |
| GEO Group Inc. | 12,439 | 374 |
| Valley National Bancorp | 38,744 | 367 |
| FNB Corp. | 29,108 | 366 |
| Hancock Holding Co. | 12,978 | 364 |
| Primerica Inc. | 8,556 | 364 |
| Fulton Financial Corp. | 29,577 | 360 |
| Washington Federal Inc. | 15,801 | 359 |
| First Industrial Realty Trust Inc. | 18,449 | 358 |
| Hudson Pacific Properties Inc. | 12,404 | 352 |
| Xenia Hotels & Resorts Inc. | 18,692 | 346 |
| Acadia Realty Trust | 11,461 | 339 |
| Kennedy-Wilson Holdings Inc. | 14,009 | 336 |
| Janus Capital Group Inc. | 22,409 | 333 |
| Cousins Properties Inc. | 36,091 | 331 |
| * MGIC Investment Corp. | 31,238 | 330 |
| UMB Financial Corp. | 6,559 | 329 |
| American Equity Investment Life Holding Co. | 13,549 | 329 |
| Kite Realty Group Trust | 13,926 | 327 |
| Glacier Bancorp Inc. | 12,585 | 327 |
| EverBank Financial Corp. | 16,123 | 319 |
| First Citizens BancShares Inc. Class A | 1,284 | 305 |
| Columbia Banking System Inc. | 9,612 | 291 |
| CVB Financial Corp. | 17,704 | 288 |
| Selective Insurance Group Inc. | 9,483 | 288 |
| Chesapeake Lodging Trust | 9,939 | 287 |
| South State Corp. | 3,812 | 286 |
| Capitol Federal Financial Inc. | 23,435 | 282 |
| National Penn Bancshares Inc. | 23,329 | 280 |
| Sterling Bancorp | 19,971 | 280 |
| Washington REIT | 11,354 | 279 |
| Invesco Mortgage Capital Inc. | 20,517 | 279 |
| Mack-Cali Realty Corp. | 14,848 | 278 |
39
| Vanguard® Russell 2000 Value Index Fund | ||
| Schedule of Investments | ||
| August 31, 2015 | ||
| Market | ||
| Value | ||
| Shares | ($000) | |
| Lexington Realty Trust | 34,234 | 276 |
| Alexander & Baldwin Inc. | 8,140 | 275 |
| Old National Bancorp | 19,491 | 269 |
| Chambers Street Properties | 39,466 | 267 |
| Retail Opportunity Investments Corp. | 16,551 | 264 |
| Pinnacle Financial Partners Inc. | 5,535 | 262 |
| Equity One Inc. | 11,160 | 262 |
| Hatteras Financial Corp. | 16,119 | 262 |
| Argo Group International Holdings Ltd. | 4,649 | 260 |
| New York REIT Inc. | 27,056 | 259 |
| Trustmark Corp. | 11,254 | 259 |
| Monogram Residential Trust Inc. | 27,986 | 259 |
| Kemper Corp. | 7,244 | 257 |
| Community Bank System Inc. | 6,786 | 242 |
| Astoria Financial Corp. | 14,943 | 242 |
| Education Realty Trust Inc. | 8,046 | 235 |
| EastGroup Properties Inc. | 4,305 | 232 |
| International Bancshares Corp. | 9,010 | 231 |
| National Health Investors Inc. | 4,155 | 229 |
| First Midwest Bancorp Inc. | 12,973 | 229 |
| Pennsylvania REIT | 11,503 | 228 |
| Horace Mann Educators Corp. | 6,845 | 227 |
| LTC Properties Inc. | 5,553 | 227 |
| LegacyTexas Financial Group Inc. | 7,919 | 224 |
| Parkway Properties Inc. | 14,079 | 223 |
| * Enstar Group Ltd. | 1,511 | 221 |
| Sabra Health Care REIT Inc. | 9,208 | 221 |
| Simmons First National Corp. Class A | 4,964 | 218 |
| Northwest Bancshares Inc. | 16,898 | 217 |
| * Western Alliance Bancorp | 6,971 | 213 |
| PS Business Parks Inc. | 2,901 | 212 |
| Gramercy Property Trust Inc. | 9,521 | 211 |
| Provident Financial Services Inc. | 10,900 | 206 |
| CYS Investments Inc. | 26,270 | 205 |
| Redwood Trust Inc. | 14,006 | 204 |
| Ramco-Gershenson Properties Trust | 13,150 | 204 |
| Hersha Hospitality Trust Class A | 8,151 | 199 |
| WesBanco Inc. | 6,397 | 197 |
| * St. Joe Co. | 11,286 | 197 |
| Independent Bank Corp. | 4,341 | 197 |
| Renasant Corp. | 6,212 | 195 |
| * FNFV Group | 13,450 | 195 |
| Select Income REIT | 10,414 | 193 |
| FelCor Lodging Trust Inc. | 23,835 | 192 |
| BBCN Bancorp Inc. | 13,205 | 192 |
| Westamerica Bancorporation | 4,245 | 192 |
| NBT Bancorp Inc. | 7,308 | 189 |
| First Financial Bancorp | 10,232 | 189 |
| PennyMac Mortgage Investment Trust | 12,396 | 187 |
| Government Properties Income Trust | 11,692 | 185 |
| STAG Industrial Inc. | 10,823 | 185 |
| * Third Point Reinsurance Ltd. | 13,029 | 182 |
| Park National Corp. | 2,164 | 182 |
| DuPont Fabros Technology Inc. | 6,793 | 182 |
| Union Bankshares Corp. | 7,576 | 179 |
| Chemical Financial Corp. | 5,590 | 179 |
| * iStar Inc. | 14,192 | 177 |
| Kearny Financial Corp. | 15,500 | 176 |
| Summit Hotel Properties Inc. | 14,474 | 176 |
| S&T Bancorp Inc. | 5,845 | 175 |
| Great Western Bancorp Inc. | 6,942 | 175 |
| Physicians Realty Trust | 11,807 | 171 |
| * Beneficial Bancorp Inc. | 13,706 | 171 |
| * MBIA Inc. | 24,122 | 169 |
40
| Vanguard® Russell 2000 Value Index Fund | ||
| Schedule of Investments | ||
| August 31, 2015 | ||
| Market | ||
| Value | ||
| Shares | ($000) | |
| * Hilltop Holdings Inc. | 8,126 | 168 |
| Capstead Mortgage Corp. | 15,889 | 166 |
| United Community Banks Inc. | 8,443 | 165 |
| First Merchants Corp. | 6,346 | 165 |
| New Senior Investment Group Inc. | 14,391 | 164 |
| Boston Private Financial Holdings Inc. | 13,774 | 164 |
| Apollo Commercial Real Estate Finance Inc. | 9,676 | 158 |
| Franklin Street Properties Corp. | 15,109 | 157 |
| Banner Corp. | 3,526 | 157 |
| ARMOUR Residential REIT Inc. | 7,296 | 156 |
| * FCB Financial Holdings Inc. Class A | 4,695 | 155 |
| Starwood Waypoint Residential Trust | 6,416 | 155 |
| CubeSmart | 6,026 | 152 |
| Talmer Bancorp Inc. Class A | 9,191 | 149 |
| Stewart Information Services Corp. | 3,854 | 149 |
| Infinity Property & Casualty Corp. | 1,928 | 149 |
| AMERISAFE Inc. | 3,186 | 149 |
| * Encore Capital Group Inc. | 3,659 | 149 |
| Nelnet Inc. Class A | 3,931 | 148 |
| Chatham Lodging Trust | 6,437 | 148 |
| Ameris Bancorp | 5,404 | 147 |
| Terreno Realty Corp. | 7,223 | 147 |
| Altisource Residential Corp. | 9,473 | 145 |
| First Financial Bankshares Inc. | 4,528 | 141 |
| Towne Bank | 7,647 | 140 |
| ServisFirst Bancshares Inc. | 3,743 | 140 |
| Berkshire Hills Bancorp Inc. | 4,959 | 139 |
| Investors Real Estate Trust | 20,597 | 138 |
| * Green Dot Corp. Class A | 7,711 | 136 |
| * Navigators Group Inc. | 1,781 | 135 |
| * Ocwen Financial Corp. | 18,057 | 134 |
| First Commonwealth Financial Corp. | 14,967 | 132 |
| Safety Insurance Group Inc. | 2,514 | 132 |
| Tompkins Financial Corp. | 2,517 | 132 |
| American Capital Mortgage Investment Corp. | 8,609 | 131 |
| WSFS Financial Corp. | 4,747 | 131 |
| Hanmi Financial Corp. | 5,367 | 130 |
| Cash America International Inc. | 4,617 | 127 |
| Virtus Investment Partners Inc. | 1,084 | 125 |
| Wilshire Bancorp Inc. | 11,667 | 125 |
| Brookline Bancorp Inc. | 11,777 | 124 |
| * Greenlight Capital Re Ltd. Class A | 4,869 | 124 |
| Banco Latinoamericano de Comercio Exterior SA | 4,975 | 123 |
| STORE Capital Corp. | 6,064 | 122 |
| City Holding Co. | 2,557 | 122 |
| State Bank Financial Corp. | 6,017 | 122 |
| New York Mortgage Trust Inc. | 18,390 | 120 |
| Rexford Industrial Realty Inc. | 9,304 | 120 |
| Northfield Bancorp Inc. | 7,884 | 118 |
| National Bank Holdings Corp. Class A | 5,771 | 116 |
| * Capital Bank Financial Corp. | 3,777 | 116 |
| Lakeland Financial Corp. | 2,792 | 115 |
| United Fire Group Inc. | 3,400 | 113 |
| Cardinal Financial Corp. | 5,059 | 113 |
| Oritani Financial Corp. | 7,400 | 112 |
| Southside Bancshares Inc. | 4,264 | 111 |
| * Nationstar Mortgage Holdings Inc. | 6,603 | 110 |
| * Customers Bancorp Inc. | 4,500 | 110 |
| National General Holdings Corp. | 5,978 | 110 |
| Ashford Hospitality Trust Inc. | 14,004 | 108 |
| Heartland Financial USA Inc. | 2,968 | 108 |
| * Ambac Financial Group Inc. | 6,618 | 108 |
| Maiden Holdings Ltd. | 7,474 | 107 |
| Sandy Spring Bancorp Inc. | 4,149 | 107 |
41
| Vanguard® Russell 2000 Value Index Fund | |||
| Schedule of Investments | |||
| August 31, 2015 | |||
| Market | |||
| Value | |||
| Shares | ($000) | ||
| CenterState Banks Inc. | 7,639 | 106 | |
| * | Piper Jaffray Cos. | 2,512 | 105 |
| Ladder Capital Corp. | 6,706 | 104 | |
| *,^ | Walter Investment Management Corp. | 6,346 | 104 |
| Hannon Armstrong Sustainable Infrastructure Capital Inc. | 5,466 | 104 | |
| First Potomac Realty Trust | 9,866 | 104 | |
| InfraREIT Inc. | 3,674 | 104 | |
| * | Meridian Bancorp Inc. | 7,887 | 100 |
| Flushing Financial Corp. | 4,943 | 99 | |
| ConnectOne Bancorp Inc. | 5,028 | 96 | |
| Washington Trust Bancorp Inc. | 2,491 | 96 | |
| Silver Bay Realty Trust Corp. | 6,110 | 96 | |
| Rouse Properties Inc. | 6,148 | 96 | |
| TrustCo Bank Corp. NY | 16,026 | 95 | |
| Monmouth Real Estate Investment Corp. | 9,950 | 95 | |
| * | HRG Group Inc. | 7,328 | 94 |
| * | Cowen Group Inc. Class A | 17,682 | 94 |
| Community Trust Bancorp Inc. | 2,629 | 92 | |
| FBL Financial Group Inc. Class A | 1,617 | 92 | |
| American Residential Properties Inc. | 5,410 | 92 | |
| TriCo Bancshares | 3,822 | 91 | |
| Heritage Financial Corp. | 5,081 | 90 | |
| Western Asset Mortgage Capital Corp. | 7,045 | 90 | |
| ^ | United Development Funding IV | 5,150 | 90 |
| * | First NBC Bank Holding Co. | 2,562 | 90 |
| Cedar Realty Trust Inc. | 14,286 | 89 | |
| Dime Community Bancshares Inc. | 5,231 | 89 | |
| Bryn Mawr Bank Corp. | 2,990 | 89 | |
| Anworth Mortgage Asset Corp. | 17,633 | 89 | |
| First Interstate BancSystem Inc. Class A | 3,305 | 88 | |
| Stock Yards Bancorp Inc. | 2,487 | 88 | |
| Yadkin Financial Corp. | 4,200 | 87 | |
| National Western Life Insurance Co. Class A | 374 | 85 | |
| United Financial Bancorp Inc. | 6,773 | 85 | |
| Inland Real Estate Corp. | 10,021 | 84 | |
| Agree Realty Corp. | 2,958 | 84 | |
| BNC Bancorp | 4,059 | 84 | |
| 1st Source Corp. | 2,750 | 82 | |
| Investment Technology Group Inc. | 4,899 | 80 | |
| Central Pacific Financial Corp. | 3,867 | 80 | |
| Enterprise Financial Services Corp. | 3,350 | 80 | |
| AG Mortgage Investment Trust Inc. | 4,776 | 79 | |
| CoBiz Financial Inc. | 6,098 | 79 | |
| RAIT Financial Trust | 15,121 | 78 | |
| First Busey Corp. | 12,156 | 78 | |
| * | First BanCorp | 19,167 | 77 |
| Banc of California Inc. | 6,086 | 75 | |
| MainSource Financial Group Inc. | 3,640 | 75 | |
| Apollo Residential Mortgage Inc. | 5,400 | 75 | |
| BancFirst Corp. | 1,224 | 74 | |
| Urstadt Biddle Properties Inc. Class A | 4,100 | 74 | |
| Resource Capital Corp. | 22,568 | 73 | |
| * | Forestar Group Inc. | 5,649 | 73 |
| RE/MAX Holdings Inc. | 1,978 | 73 | |
| Great Southern Bancorp Inc. | 1,762 | 71 | |
| Lakeland Bancorp Inc. | 6,365 | 70 | |
| * | Flagstar Bancorp Inc. | 3,457 | 70 |
| * | NMI Holdings Inc. Class A | 8,374 | 70 |
| Independent Bank Group Inc. | 1,631 | 69 | |
| Sovran Self Storage Inc. | 758 | 68 | |
| Peoples Bancorp Inc. | 3,094 | 68 | |
| * | Pacific Premier Bancorp Inc. | 3,615 | 68 |
| Getty Realty Corp. | 4,294 | 68 | |
| CatchMark Timber Trust Inc. Class A | 6,649 | 67 | |
42
| Vanguard® Russell 2000 Value Index Fund | |||
| Schedule of Investments | |||
| August 31, 2015 | |||
| Market | |||
| Value | |||
| Shares | ($000) | ||
| Home BancShares Inc. | 1,755 | 67 | |
| Blue Hills Bancorp Inc. | 4,713 | 67 | |
| Bridge Bancorp Inc. | 2,477 | 65 | |
| OFG Bancorp | 7,489 | 65 | |
| German American Bancorp Inc. | 2,227 | 65 | |
| Opus Bank | 1,751 | 64 | |
| Arlington Asset Investment Corp. Class A | 3,848 | 64 | |
| Ashford Hospitality Prime Inc. | 4,589 | 63 | |
| Clifton Bancorp Inc. | 4,563 | 63 | |
| Univest Corp. of Pennsylvania | 3,236 | 63 | |
| * | Seacoast Banking Corp. of Florida | 3,992 | 62 |
| * | HomeTrust Bancshares Inc. | 3,400 | 62 |
| Dynex Capital Inc. | 9,210 | 62 | |
| Potlatch Corp. | 1,860 | 61 | |
| First Financial Corp. | 1,857 | 61 | |
| * | CU Bancorp | 2,824 | 61 |
| * | Safeguard Scientifics Inc. | 3,480 | 61 |
| Preferred Bank | 1,962 | 60 | |
| Financial Institutions Inc. | 2,381 | 59 | |
| First Defiance Financial Corp. | 1,556 | 59 | |
| Waterstone Financial Inc. | 4,491 | 58 | |
| Stonegate Bank | 1,854 | 58 | |
| Mercantile Bank Corp. | 2,838 | 58 | |
| * | KCG Holdings Inc. Class A | 4,994 | 57 |
| * | Everi Holdings Inc. | 11,067 | 57 |
| Metro Bancorp Inc. | 1,992 | 57 | |
| Ares Commercial Real Estate Corp. | 4,556 | 57 | |
| * | HomeStreet Inc. | 2,554 | 57 |
| Bank Mutual Corp. | 7,837 | 57 | |
| First Bancorp | 3,317 | 56 | |
| Campus Crest Communities Inc. | 10,867 | 56 | |
| Peapack Gladstone Financial Corp. | 2,602 | 55 | |
| State Auto Financial Corp. | 2,519 | 55 | |
| OneBeacon Insurance Group Ltd. Class A | 3,817 | 55 | |
| * | Ezcorp Inc. Class A | 8,699 | 55 |
| * | Walker & Dunlop Inc. | 2,255 | 55 |
| Park Sterling Corp. | 7,563 | 55 | |
| Independent Bank Corp. | 3,860 | 54 | |
| Fidelity Southern Corp. | 2,805 | 54 | |
| * | Tejon Ranch Co. | 2,289 | 54 |
| Southwest Bancorp Inc. | 3,198 | 53 | |
| * | Anchor BanCorp Wisconsin Inc. | 1,292 | 53 |
| Suffolk Bancorp | 1,971 | 53 | |
| First of Long Island Corp. | 2,056 | 52 | |
| Federated National Holding Co. | 2,383 | 52 | |
| *,^ | Citizens Inc. Class A | 8,248 | 52 |
| * | Eagle Bancorp Inc. | 1,231 | 52 |
| Whitestone REIT | 4,487 | 51 | |
| CorEnergy Infrastructure Trust Inc. | 9,914 | 51 | |
| Arrow Financial Corp. | 1,846 | 51 | |
| Meta Financial Group Inc. | 1,166 | 51 | |
| NewBridge Bancorp | 6,029 | 50 | |
| HCI Group Inc. | 1,263 | 50 | |
| First Community Bancshares Inc. | 2,833 | 50 | |
| Gladstone Commercial Corp. | 3,484 | 50 | |
| James River Group Holdings Ltd. | 1,817 | 50 | |
| * | PICO Holdings Inc. | 3,866 | 50 |
| Camden National Corp. | 1,250 | 50 | |
| * | INTL. FCStone Inc. | 1,870 | 49 |
| West Bancorporation Inc. | 2,695 | 49 | |
| Bank of Marin Bancorp | 1,003 | 48 | |
| * | Square 1 Financial Inc. Class A | 1,867 | 47 |
| Employers Holdings Inc. | 2,122 | 47 | |
| Fidelity & Guaranty Life | 1,891 | 47 | |
43
| Vanguard® Russell 2000 Value Index Fund | ||
| Schedule of Investments | ||
| August 31, 2015 | ||
| Market | ||
| Value | ||
| Shares | ($000) | |
| * NewStar Financial Inc. | 4,059 | 46 |
| State National Cos. Inc. | 4,841 | 46 |
| One Liberty Properties Inc. | 2,105 | 46 |
| First Connecticut Bancorp Inc. | 2,694 | 46 |
| Peoples Financial Services Corp. | 1,268 | 45 |
| Horizon Bancorp | 1,901 | 45 |
| * TriState Capital Holdings Inc. | 3,575 | 45 |
| * MoneyGram International Inc. | 4,916 | 43 |
| Armada Hoffler Properties Inc. | 4,285 | 43 |
| QCR Holdings Inc. | 1,963 | 43 |
| Pacific Continental Corp. | 3,279 | 42 |
| Republic Bancorp Inc. Class A | 1,669 | 42 |
| Federal Agricultural Mortgage Corp. | 1,759 | 42 |
| * Bancorp Inc. | 5,665 | 42 |
| * Ladenburg Thalmann Financial Services Inc. | 15,828 | 41 |
| CNB Financial Corp. | 2,420 | 41 |
| United Community Financial Corp. | 8,258 | 41 |
| OceanFirst Financial Corp. | 2,234 | 41 |
| Citizens & Northern Corp. | 2,050 | 41 |
| Cass Information Systems Inc. | 841 | 41 |
| Guaranty Bancorp | 2,490 | 40 |
| NexPoint Residential Trust Inc. | 3,186 | 39 |
| Preferred Apartment Communities Inc. Class A | 3,736 | 38 |
| MidWestOne Financial Group Inc. | 1,307 | 38 |
| GAIN Capital Holdings Inc. | 4,602 | 38 |
| BankFinancial Corp. | 3,088 | 38 |
| United Insurance Holdings Corp. | 2,881 | 38 |
| * Global Indemnity plc | 1,395 | 37 |
| Heritage Commerce Corp. | 3,533 | 37 |
| Territorial Bancorp Inc. | 1,432 | 37 |
| National Bankshares Inc. | 1,168 | 37 |
| Ames National Corp. | 1,542 | 37 |
| Baldwin & Lyons Inc. | 1,578 | 36 |
| * Triumph Bancorp Inc. | 2,498 | 36 |
| * FRP Holdings Inc. | 1,157 | 36 |
| Bluerock Residential Growth REIT Inc. Class A | 3,168 | 36 |
| Charter Financial Corp. | 2,787 | 35 |
| Oppenheimer Holdings Inc. Class A | 1,741 | 35 |
| Orchid Island Capital Inc. | 3,819 | 35 |
| American National Bankshares Inc. | 1,466 | 35 |
| Penns Woods Bancorp Inc. | 804 | 34 |
| Fox Chase Bancorp Inc. | 1,962 | 34 |
| Sierra Bancorp | 1,984 | 34 |
| UMH Properties Inc. | 3,588 | 34 |
| Bar Harbor Bankshares | 1,004 | 33 |
| * PennyMac Financial Services Inc. Class A | 1,927 | 33 |
| First Bancorp Inc. | 1,778 | 33 |
| * Sun Bancorp Inc. | 1,646 | 33 |
| * Farmers Capital Bank Corp. | 1,260 | 33 |
| First Business Financial Services Inc. | 1,444 | 32 |
| Calamos Asset Management Inc. Class A | 2,994 | 32 |
| * Old Second Bancorp Inc. | 4,954 | 31 |
| Independence Realty Trust Inc. | 4,116 | 31 |
| Heritage Oaks Bancorp | 3,908 | 30 |
| EMC Insurance Group Inc. | 1,317 | 30 |
| Tiptree Financial Inc. Class A | 5,032 | 30 |
| * AV Homes Inc. | 2,062 | 29 |
| CyrusOne Inc. | 915 | 29 |
| Kansas City Life Insurance Co. | 620 | 29 |
| * BSB Bancorp Inc. | 1,361 | 28 |
| * Cascade Bancorp | 5,192 | 28 |
| Consolidated-Tomoka Land Co. | 511 | 28 |
| Enterprise Bancorp Inc. | 1,282 | 28 |
| * Regional Management Corp. | 1,663 | 27 |
44
| Vanguard® Russell 2000 Value Index Fund | |||
| Schedule of Investments | |||
| August 31, 2015 | |||
| Market | |||
| Value | |||
| Shares | ($000) | ||
| * | Hallmark Financial Services Inc. | 2,375 | 27 |
| Capital City Bank Group Inc. | 1,807 | 27 | |
| * | Heritage Insurance Holdings Inc. | 1,528 | 27 |
| American Assets Trust Inc. | 687 | 26 | |
| Hingham Institution for Savings | 222 | 26 | |
| National Interstate Corp. | 924 | 26 | |
| Access National Corp. | 1,222 | 25 | |
| Century Bancorp Inc. Class A | 578 | 24 | |
| Merchants Bancshares Inc. | 836 | 24 | |
| *,^ | National Commerce Corp. | 1,015 | 23 |
| * | CommunityOne Bancorp | 2,074 | 22 |
| * | Franklin Financial Network Inc. | 916 | 22 |
| Crawford & Co. Class B | 3,335 | 21 | |
| Trade Street Residential Inc. | 3,138 | 21 | |
| * | Green Bancorp Inc. | 1,711 | 20 |
| Donegal Group Inc. Class A | 1,419 | 20 | |
| * | Bear State Financial Inc. | 2,241 | 19 |
| * | C1 Financial Inc. | 1,000 | 19 |
| * | World Acceptance Corp. | 464 | 17 |
| Resource America Inc. Class A | 2,276 | 17 | |
| * | RCS Capital Corp. Class A | 8,277 | 17 |
| * | Atlas Financial Holdings Inc. | 946 | 15 |
| * | First Cash Financial Services Inc. | 365 | 15 |
| * | Stonegate Mortgage Corp. | 2,028 | 15 |
| Independence Holding Co. | 1,175 | 14 | |
| * | Real Industry Inc. | 1,486 | 14 |
| Palmetto Bancshares Inc. | 721 | 14 | |
| * | JG Wentworth Co. Class A | 2,303 | 12 |
| Saul Centers Inc. | 202 | 10 | |
| * | Hampton Roads Bankshares Inc. | 5,278 | 10 |
| Moelis & Co. Class A | 342 | 9 | |
| Great Ajax Corp. | 673 | 9 | |
| QTS Realty Trust Inc. Class A | 202 | 8 | |
| Alexander's Inc. | 20 | 7 | |
| * | Enova International Inc. | 538 | 7 |
| * | BBX Capital Corp. | 403 | 7 |
| CIFC Corp. | 811 | 6 | |
| National Storage Affiliates Trust | 228 | 3 | |
| * | Trupanion Inc. | 411 | 3 |
| * | Impac Mortgage Holdings Inc. | 125 | 2 |
| * | Altisource Asset Management Corp. | 26 | 1 |
| * | Tejon Ranch Co. Warrants Exp. 08/31/2016 | 22 | — |
| 60,773 | |||
| Health Care (4.4%) | |||
| * | Amsurg Corp. | 6,106 | 479 |
| * | Medicines Co. | 9,943 | 408 |
| Owens & Minor Inc. | 10,514 | 357 | |
| Kindred Healthcare Inc. | 13,905 | 279 | |
| * | Magellan Health Inc. | 4,553 | 255 |
| * | Halyard Health Inc. | 7,801 | 245 |
| CONMED Corp. | 4,595 | 244 | |
| * | Greatbatch Inc. | 4,242 | 241 |
| * | Merit Medical Systems Inc. | 7,381 | 168 |
| * | PharMerica Corp. | 5,105 | 167 |
| * | Haemonetics Corp. | 4,474 | 162 |
| * | Integra LifeSciences Holdings Corp. | 2,633 | 158 |
| PDL BioPharma Inc. | 27,579 | 156 | |
| Analogic Corp. | 1,901 | 153 | |
| * | Luminex Corp. | 6,740 | 123 |
| * | Orthofix International NV | 3,153 | 118 |
| * | Hanger Inc. | 5,828 | 104 |
| National HealthCare Corp. | 1,694 | 102 | |
| * | Wright Medical Group Inc. | 4,324 | 100 |
| * | ICU Medical Inc. | 847 | 96 |
45
| Vanguard® Russell 2000 Value Index Fund | ||
| Schedule of Investments | ||
| August 31, 2015 | ||
| Market | ||
| Value | ||
| Shares | ($000) | |
| Invacare Corp. | 5,327 | 94 |
| * IPC Healthcare Inc. | 1,157 | 92 |
| * LHC Group Inc. | 2,049 | 89 |
| * Affymetrix Inc. | 9,354 | 87 |
| * Triple-S Management Corp. Class B | 4,061 | 85 |
| * Healthways Inc. | 5,218 | 64 |
| * AngioDynamics Inc. | 4,239 | 63 |
| * Theravance Biopharma Inc. | 4,287 | 62 |
| * Tornier NV | 2,744 | 61 |
| * Spectrum Pharmaceuticals Inc. | 8,242 | 60 |
| * Universal American Corp. | 8,240 | 59 |
| * Quidel Corp. | 2,859 | 59 |
| * Almost Family Inc. | 1,207 | 53 |
| * Lexicon Pharmaceuticals Inc. | 4,190 | 50 |
| * Emergent BioSolutions Inc. | 1,499 | 50 |
| * OraSure Technologies Inc. | 8,732 | 47 |
| * Versartis Inc. | 3,471 | 45 |
| * Dermira Inc. | 1,668 | 43 |
| CryoLife Inc. | 4,285 | 42 |
| * SurModics Inc. | 1,764 | 40 |
| * ACADIA Pharmaceuticals Inc. | 1,031 | 38 |
| * Amedisys Inc. | 972 | 38 |
| * Adamas Pharmaceuticals Inc. | 1,747 | 35 |
| * Exactech Inc. | 1,713 | 34 |
| * Endocyte Inc. | 6,310 | 33 |
| * AtriCure Inc. | 1,172 | 29 |
| * Cross Country Healthcare Inc. | 2,059 | 29 |
| * Akebia Therapeutics Inc. | 4,098 | 28 |
| * Verastem Inc. | 4,645 | 28 |
| * BioScrip Inc. | 11,537 | 28 |
| * Addus HomeCare Corp. | 969 | 28 |
| * BioCryst Pharmaceuticals Inc. | 2,376 | 28 |
| * Arrowhead Research Corp. | 4,510 | 27 |
| * Loxo Oncology Inc. | 1,308 | 26 |
| * Array BioPharma Inc. | 4,362 | 26 |
| Theravance Inc. | 1,846 | 26 |
| * Harvard Bioscience Inc. | 5,623 | 25 |
| * Five Star Quality Care Inc. | 7,261 | 24 |
| * Amphastar Pharmaceuticals Inc. | 1,800 | 23 |
| * Celldex Therapeutics Inc. | 1,522 | 23 |
| * Genesis Healthcare Inc. | 3,111 | 23 |
| Meridian Bioscience Inc. | 1,129 | 22 |
| * Acorda Therapeutics Inc. | 633 | 20 |
| * Stemline Therapeutics Inc. | 2,190 | 20 |
| * Ignyta Inc. | 1,460 | 20 |
| * Cytokinetics Inc. | 2,815 | 19 |
| * Anika Therapeutics Inc. | 536 | 19 |
| * Agenus Inc. | 2,599 | 18 |
| * TransEnterix Inc. | 6,623 | 17 |
| LeMaitre Vascular Inc. | 1,275 | 17 |
| * Vanda Pharmaceuticals Inc. | 1,412 | 17 |
| Select Medical Holdings Corp. | 1,121 | 14 |
| Ensign Group Inc. | 291 | 14 |
| * MedAssets Inc. | 583 | 12 |
| * Cerus Corp. | 2,453 | 12 |
| * Cutera Inc. | 791 | 12 |
| * Tokai Pharmaceuticals Inc. | 947 | 11 |
| * SeaSpine Holdings Corp. | 788 | 11 |
| * Calithera Biosciences Inc. | 1,862 | 11 |
| * RTI Surgical Inc. | 1,667 | 11 |
| * Rockwell Medical Inc. | 887 | 11 |
| * Inovio Pharmaceuticals Inc. | 1,352 | 10 |
| * Rigel Pharmaceuticals Inc. | 3,303 | 10 |
| * Cynosure Inc. Class A | 305 | 10 |
46
| Vanguard® Russell 2000 Value Index Fund | |||
| Schedule of Investments | |||
| August 31, 2015 | |||
| Market | |||
| Value | |||
| Shares | ($000) | ||
| * | Navidea Biopharmaceuticals Inc. | 5,031 | 9 |
| * | Merrimack Pharmaceuticals Inc. | 899 | 9 |
| * | Aratana Therapeutics Inc. | 469 | 8 |
| * | Alliance HealthCare Services Inc. | 554 | 8 |
| * | Surgical Care Affiliates Inc. | 196 | 7 |
| * | Cardiovascular Systems Inc. | 272 | 7 |
| * | Omeros Corp. | 422 | 6 |
| * | Osiris Therapeutics Inc. | 324 | 6 |
| * | Geron Corp. | 1,461 | 4 |
| *,^ | Unilife Corp. | 3,118 | 4 |
| * | Ocata Therapeutics Inc. | 774 | 3 |
| National Research Corp. Class A | 239 | 3 | |
| * | Peregrine Pharmaceuticals Inc. | 2,462 | 3 |
| * | Oxford Immunotec Global plc | 176 | 2 |
| * | Idera Pharmaceuticals Inc. | 822 | 2 |
| * | Threshold Pharmaceuticals Inc. | 580 | 2 |
| * | Assembly Biosciences Inc. | 150 | 2 |
| * | Immunomedics Inc. | 915 | 2 |
| * | XOMA Corp. | 2,351 | 2 |
| * | Entellus Medical Inc. | 81 | 2 |
| 6,388 | |||
| Materials & Processing (4.4%) | |||
| Carpenter Technology Corp. | 8,449 | 330 | |
| Commercial Metals Co. | 19,283 | 303 | |
| Axiall Corp. | 11,702 | 296 | |
| * | Berry Plastics Group Inc. | 8,053 | 238 |
| * | Beacon Roofing Supply Inc. | 6,204 | 225 |
| * | MRC Global Inc. | 17,311 | 225 |
| Simpson Manufacturing Co. Inc. | 6,424 | 224 | |
| Universal Forest Products Inc. | 3,374 | 203 | |
| Innospec Inc. | 4,020 | 197 | |
| Sensient Technologies Corp. | 2,752 | 179 | |
| OM Group Inc. | 5,100 | 171 | |
| Kaiser Aluminum Corp. | 1,920 | 160 | |
| Worthington Industries Inc. | 6,214 | 159 | |
| Innophos Holdings Inc. | 3,269 | 157 | |
| Greif Inc. Class A | 5,177 | 152 | |
| Schweitzer-Mauduit International Inc. | 4,216 | 149 | |
| * | Stillwater Mining Co. | 13,547 | 129 |
| PH Glatfelter Co. | 7,156 | 129 | |
| Hecla Mining Co. | 61,356 | 126 | |
| TimkenSteel Corp. | 6,710 | 120 | |
| * | Kraton Performance Polymers Inc. | 5,165 | 109 |
| Materion Corp. | 3,320 | 103 | |
| ^ | Cliffs Natural Resources Inc. | 25,762 | 102 |
| Mueller Industries Inc. | 3,112 | 99 | |
| Quanex Building Products Corp. | 5,218 | 94 | |
| * | AK Steel Holding Corp. | 29,305 | 91 |
| * | Gibraltar Industries Inc. | 5,205 | 85 |
| Tronox Ltd. Class A | 10,535 | 85 | |
| Calgon Carbon Corp. | 4,784 | 78 | |
| Schnitzer Steel Industries Inc. | 4,444 | 77 | |
| * | Horsehead Holding Corp. | 9,333 | 76 |
| * | Coeur Mining Inc. | 22,410 | 75 |
| Haynes International Inc. | 1,954 | 75 | |
| Stepan Co. | 1,653 | 74 | |
| Neenah Paper Inc. | 1,273 | 74 | |
| * | Intrepid Potash Inc. | 9,233 | 73 |
| Griffon Corp. | 4,369 | 73 | |
| * | Unifi Inc. | 2,355 | 68 |
| American Vanguard Corp. | 4,301 | 57 | |
| Hawkins Inc. | 1,459 | 56 | |
| Olin Corp. | 2,645 | 53 | |
| Quaker Chemical Corp. | 643 | 51 | |
47
| Vanguard® Russell 2000 Value Index Fund | ||
| Schedule of Investments | ||
| August 31, 2015 | ||
| Market | ||
| Value | ||
| Shares | ($000) | |
| * LSB Industries Inc. | 2,092 | 50 |
| * Veritiv Corp. | 1,369 | 49 |
| Tredegar Corp. | 3,290 | 48 |
| * Landec Corp. | 3,559 | 47 |
| Rayonier Advanced Materials Inc. | 6,835 | 47 |
| * Century Aluminum Co. | 7,761 | 43 |
| FutureFuel Corp. | 4,103 | 41 |
| * Boise Cascade Co. | 1,077 | 35 |
| LSI Industries Inc. | 3,637 | 35 |
| * Louisiana-Pacific Corp. | 1,915 | 32 |
| LB Foster Co. Class A | 1,746 | 31 |
| * Cabot Microelectronics Corp. | 643 | 28 |
| * Northwest Pipe Co. | 1,605 | 27 |
| Kronos Worldwide Inc. | 3,445 | 26 |
| * OMNOVA Solutions Inc. | 3,221 | 20 |
| Minerals Technologies Inc. | 361 | 19 |
| Oil-Dri Corp. of America | 800 | 19 |
| A Schulman Inc. | 506 | 17 |
| Olympic Steel Inc. | 1,196 | 16 |
| United States Lime & Minerals Inc. | 308 | 15 |
| Aceto Corp. | 626 | 14 |
| * Ryerson Holding Corp. | 1,629 | 12 |
| * Energy Fuels Inc. | 3,213 | 11 |
| Comfort Systems USA Inc. | 376 | 10 |
| * Handy & Harman Ltd. | 374 | 9 |
| * Lawson Products Inc. | 277 | 7 |
| Global Brass & Copper Holdings Inc. | 318 | 6 |
| Chase Corp. | 135 | 5 |
| Valhi Inc. | 1,596 | 5 |
| * NL Industries Inc. | 1,059 | 4 |
| Wausau Paper Corp. | 523 | 4 |
| Insteel Industries Inc. | 217 | 4 |
| 6,336 | ||
| Other (0.0%)2 | ||
| * Leap Wireless International Inc CVR | 7,564 | 19 |
| * Milacron Holdings Corp. | 288 | 6 |
| * Sunrun Inc. | 450 | 5 |
| * TransUnion | 125 | 3 |
| * Univar Inc. | 110 | 2 |
| * Blue Buffalo Pet Products Inc. | 83 | 2 |
| * Evolent Health Inc. Class A | 117 | 2 |
| * Amplify Snack Brands Inc. | 68 | 1 |
| * Ollie's Bargain Outlet Holdings Inc. | 36 | 1 |
| * EndoChoice Holdings Inc. | 38 | 1 |
| * Magnum Hunter Resources Corp. Warrants Exp. 04/15/2016 | 1,575 | — |
| * Gerber Scientific Inc. CVR | 519 | — |
| 42 | ||
| Producer Durables (12.7%) | ||
| Curtiss-Wright Corp. | 7,488 | 492 |
| EMCOR Group Inc. | 10,445 | 481 |
| * Teledyne Technologies Inc. | 4,374 | 428 |
| * Esterline Technologies Corp. | 5,184 | 424 |
| Convergys Corp. | 16,467 | 372 |
| * Moog Inc. Class A | 5,871 | 370 |
| * Darling Ingredients Inc. | 27,529 | 353 |
| Barnes Group Inc. | 9,128 | 353 |
| * KLX Inc. | 8,836 | 345 |
| Con-way Inc. | 9,649 | 340 |
| ABM Industries Inc. | 9,329 | 299 |
| EnerSys | 5,415 | 289 |
| Scorpio Tankers Inc. | 29,797 | 282 |
| UniFirst Corp. | 2,474 | 268 |
| Tetra Tech Inc. | 10,030 | 261 |
| Watts Water Technologies Inc. Class A | 4,687 | 257 |
48
| Vanguard® Russell 2000 Value Index Fund | ||
| Schedule of Investments | ||
| August 31, 2015 | ||
| Market | ||
| Value | ||
| Shares | ($000) | |
| * FTI Consulting Inc. | 6,358 | 253 |
| * Huron Consulting Group Inc. | 3,381 | 245 |
| Mobile Mini Inc. | 6,911 | 235 |
| Granite Construction Inc. | 6,543 | 226 |
| Essendant Inc. | 6,376 | 220 |
| Deluxe Corp. | 3,752 | 218 |
| Aircastle Ltd. | 10,382 | 216 |
| Bristow Group Inc. | 5,805 | 215 |
| Actuant Corp. Class A | 9,902 | 212 |
| Nordic American Tankers Ltd. | 14,812 | 202 |
| * Itron Inc. | 6,391 | 192 |
| * MasTec Inc. | 11,221 | 186 |
| * OSI Systems Inc. | 2,442 | 178 |
| Brady Corp. Class A | 7,931 | 174 |
| * Atlas Air Worldwide Holdings Inc. | 4,158 | 172 |
| Applied Industrial Technologies Inc. | 4,015 | 170 |
| Ship Finance International Ltd. | 9,963 | 167 |
| * Sykes Enterprises Inc. | 6,554 | 165 |
| Kaman Corp. | 4,143 | 161 |
| ESCO Technologies Inc. | 4,384 | 158 |
| Woodward Inc. | 3,358 | 153 |
| * Rush Enterprises Inc. Class A | 5,954 | 152 |
| Cubic Corp. | 3,589 | 151 |
| Werner Enterprises Inc. | 5,684 | 151 |
| Briggs & Stratton Corp. | 7,501 | 150 |
| Federal Signal Corp. | 10,511 | 149 |
| * Navistar International Corp. | 8,068 | 144 |
| * Wesco Aircraft Holdings Inc. | 10,213 | 143 |
| AAR Corp. | 5,884 | 143 |
| Tidewater Inc. | 7,905 | 142 |
| * ACCO Brands Corp. | 18,445 | 140 |
| SkyWest Inc. | 8,678 | 138 |
| * PHH Corp. | 8,251 | 134 |
| * Chart Industries Inc. | 5,134 | 131 |
| Korn/Ferry International | 3,851 | 131 |
| Albany International Corp. | 4,043 | 129 |
| * TriMas Corp. | 7,057 | 129 |
| CIRCOR International Inc. | 2,836 | 128 |
| * Navigant Consulting Inc. | 8,100 | 128 |
| Astec Industries Inc. | 3,189 | 126 |
| * Aerojet Rocketdyne Holdings Inc. | 5,577 | 115 |
| * Aegion Corp. Class A | 6,156 | 113 |
| * ICF International Inc. | 3,280 | 112 |
| * Tutor Perini Corp. | 6,315 | 112 |
| DHT Holdings Inc. | 15,605 | 112 |
| * Monster Worldwide Inc. | 15,297 | 111 |
| McGrath RentCorp | 4,313 | 111 |
| * RPX Corp. | 7,979 | 110 |
| * UTi Worldwide Inc. | 15,261 | 109 |
| * Thermon Group Holdings Inc. | 4,658 | 107 |
| Raven Industries Inc. | 5,579 | 101 |
| TAL International Group Inc. | 5,514 | 101 |
| * MYR Group Inc. | 3,513 | 101 |
| GasLog Ltd. | 6,961 | 97 |
| Teekay Tankers Ltd. Class A | 15,818 | 93 |
| * Scorpio Bulkers Inc. | 55,907 | 92 |
| * FARO Technologies Inc. | 2,259 | 88 |
| ArcBest Corp. | 2,947 | 85 |
| * Engility Holdings Inc. | 3,017 | 84 |
| Alamo Group Inc. | 1,626 | 84 |
| Resources Connection Inc. | 5,145 | 81 |
| * Air Transport Services Group Inc. | 8,867 | 81 |
| * CBIZ Inc. | 8,225 | 80 |
| MSA Safety Inc. | 1,763 | 80 |
49
| Vanguard® Russell 2000 Value Index Fund | |||
| Schedule of Investments | |||
| August 31, 2015 | |||
| Market | |||
| Value | |||
| Shares | ($000) | ||
| * | Aerovironment Inc. | 3,314 | 80 |
| * | Advanced Energy Industries Inc. | 3,156 | 77 |
| * | XPO Logistics Inc. | 2,115 | 74 |
| * | YRC Worldwide Inc. | 4,425 | 74 |
| EnPro Industries Inc. | 1,542 | 73 | |
| Kelly Services Inc. Class A | 5,000 | 72 | |
| * | Modine Manufacturing Co. | 8,051 | 71 |
| Ennis Inc. | 4,335 | 71 | |
| Quad/Graphics Inc. | 4,827 | 70 | |
| Hyster-Yale Materials Handling Inc. | 1,143 | 69 | |
| Kadant Inc. | 1,544 | 69 | |
| Marten Transport Ltd. | 3,614 | 67 | |
| Textainer Group Holdings Ltd. | 3,721 | 65 | |
| Columbus McKinnon Corp. | 3,370 | 64 | |
| Douglas Dynamics Inc. | 2,842 | 63 | |
| * | Ascent Capital Group Inc. Class A | 2,233 | 63 |
| Titan International Inc. | 6,806 | 62 | |
| G&K Services Inc. Class A | 923 | 62 | |
| * | Roadrunner Transportation Systems Inc. | 2,851 | 62 |
| Gorman-Rupp Co. | 2,466 | 60 | |
| Heidrick & Struggles International Inc. | 2,922 | 57 | |
| * | Dorian LPG Ltd. | 4,208 | 55 |
| * | Lydall Inc. | 1,908 | 52 |
| * | Great Lakes Dredge & Dock Corp. | 9,258 | 51 |
| * | PHI Inc. | 1,971 | 50 |
| American Railcar Industries Inc. | 1,178 | 49 | |
| *,^ | Frontline Ltd. | 18,163 | 48 |
| Navios Maritime Acquisition Corp. | 13,785 | 48 | |
| Littelfuse Inc. | 515 | 46 | |
| Standex International Corp. | 571 | 46 | |
| Powell Industries Inc. | 1,530 | 45 | |
| * | Ducommun Inc. | 1,858 | 44 |
| * | DXP Enterprises Inc. | 1,475 | 44 |
| Kimball International Inc. Class B | 3,728 | 41 | |
| Gulfmark Offshore Inc. | 4,308 | 39 | |
| Navios Maritime Holdings Inc. | 13,676 | 38 | |
| Miller Industries Inc. | 1,766 | 38 | |
| * | CAI International Inc. | 2,898 | 38 |
| Primoris Services Corp. | 2,073 | 38 | |
| * | DHI Group Inc. | 4,785 | 37 |
| NACCO Industries Inc. Class A | 695 | 37 | |
| * | Kratos Defense & Security Solutions Inc. | 7,603 | 35 |
| * | CRA International Inc. | 1,540 | 35 |
| CECO Environmental Corp. | 3,606 | 35 | |
| * | Golden Ocean Group Ltd. | 11,231 | 34 |
| * | Casella Waste Systems Inc. Class A | 5,523 | 34 |
| Hurco Cos. Inc. | 1,098 | 34 | |
| Ardmore Shipping Corp. | 3,013 | 34 | |
| * | Titan Machinery Inc. | 2,901 | 34 |
| * | Orion Marine Group Inc. | 4,698 | 34 |
| TeleTech Holdings Inc. | 1,235 | 33 | |
| Graham Corp. | 1,703 | 31 | |
| * | Control4 Corp. | 3,501 | 31 |
| * | Liquidity Services Inc. | 4,048 | 30 |
| Electro Rent Corp. | 2,775 | 30 | |
| VSE Corp. | 699 | 29 | |
| Celadon Group Inc. | 1,447 | 28 | |
| * | InnerWorkings Inc. | 3,768 | 27 |
| CLARCOR Inc. | 480 | 27 | |
| Eagle Bulk Shipping Inc. | 3,735 | 27 | |
| * | Republic Airways Holdings Inc. | 8,545 | 26 |
| * | TRC Cos. Inc. | 2,875 | 26 |
| Encore Wire Corp. | 787 | 26 | |
| CDI Corp. | 2,400 | 25 | |
50
| Vanguard® Russell 2000 Value Index Fund | |||
| Schedule of Investments | |||
| August 31, 2015 | |||
| Market | |||
| Value | |||
| Shares | ($000) | ||
| * | Hill International Inc. | 6,149 | 24 |
| * | Vishay Precision Group Inc. | 2,117 | 24 |
| * | Heritage-Crystal Clean Inc. | 1,935 | 23 |
| Matson Inc. | 606 | 23 | |
| FreightCar America Inc. | 1,049 | 23 | |
| Lindsay Corp. | 295 | 22 | |
| Altra Industrial Motion Corp. | 884 | 22 | |
| ^ | Safe Bulkers Inc. | 6,369 | 21 |
| * | USA Truck Inc. | 1,045 | 21 |
| *,^ | Plug Power Inc. | 11,805 | 20 |
| * | Hub Group Inc. Class A | 528 | 20 |
| Marlin Business Services Corp. | 1,445 | 20 | |
| Twin Disc Inc. | 1,406 | 20 | |
| * | ServiceSource International Inc. | 4,107 | 19 |
| * | Mistras Group Inc. | 1,234 | 18 |
| Franklin Electric Co. Inc. | 579 | 17 | |
| * | ExlService Holdings Inc. | 408 | 15 |
| *,^ | ExOne Co. | 1,762 | 13 |
| Tennant Co. | 214 | 12 | |
| Preformed Line Products Co. | 403 | 12 | |
| General Cable Corp. | 698 | 10 | |
| Argan Inc. | 254 | 10 | |
| * | HC2 Holdings Inc. | 1,278 | 10 |
| Universal Truckload Services Inc. | 489 | 10 | |
| Exponent Inc. | 219 | 9 | |
| * | TriNet Group Inc. | 553 | 9 |
| * | Virgin America Inc. | 270 | 9 |
| * | Neff Corp. Class A | 1,108 | 7 |
| * | Furmanite Corp. | 953 | 6 |
| * | Volt Information Sciences Inc. | 586 | 5 |
| * | SP Plus Corp. | 194 | 4 |
| *,^ | 6D Global Technologies Inc. | 1,716 | 4 |
| * | Vicor Corp. | 329 | 3 |
| * | Covenant Transportation Group Inc. Class A | 107 | 2 |
| * | Vectrus Inc. | 101 | 2 |
| * | Ultrapetrol Bahamas Ltd. | 4,006 | 2 |
| * | Accuride Corp. | 543 | 2 |
| * | PFSweb Inc. | 140 | 2 |
| * | Radiant Logistics Inc. | 237 | 1 |
| 18,241 | |||
| Technology (9.5%) | |||
| Mentor Graphics Corp. | 16,663 | 431 | |
| * | Tech Data Corp. | 6,137 | 400 |
| * | Dealertrack Technologies Inc. | 6,290 | 395 |
| SYNNEX Corp. | 4,790 | 379 | |
| * | CACI International Inc. Class A | 4,028 | 316 |
| * | Anixter International Inc. | 4,753 | 303 |
| MKS Instruments Inc. | 8,893 | 300 | |
| * | DigitalGlobe Inc. | 12,081 | 279 |
| * | Acxiom Corp. | 13,003 | 273 |
| * | NetScout Systems Inc. | 7,352 | 269 |
| * | Finisar Corp. | 17,314 | 267 |
| * | Sanmina Corp. | 13,766 | 265 |
| * | Fairchild Semiconductor International Inc. Class A | 19,400 | 264 |
| * | Stratasys Ltd. | 8,468 | 260 |
| * | Polycom Inc. | 22,482 | 242 |
| * | Knowles Corp. | 14,516 | 236 |
| Intersil Corp. Class A | 21,965 | 231 | |
| * | OmniVision Technologies Inc. | 9,671 | 231 |
| * | Progress Software Corp. | 8,415 | 228 |
| Vishay Intertechnology Inc. | 22,764 | 225 | |
| * | Coherent Inc. | 3,617 | 211 |
| * | Take-Two Interactive Software Inc. | 6,844 | 199 |
| * | Benchmark Electronics Inc. | 8,693 | 186 |
51
| Vanguard® Russell 2000 Value Index Fund | |||
| Schedule of Investments | |||
| August 31, 2015 | |||
| Market | |||
| Value | |||
| Shares | ($000) | ||
| * | ScanSource Inc. | 4,745 | 181 |
| * | NeuStar Inc. Class A | 6,477 | 181 |
| * | Rovi Corp. | 14,860 | 164 |
| * | Insight Enterprises Inc. | 6,435 | 163 |
| * | NETGEAR Inc. | 5,346 | 162 |
| * | Veeco Instruments Inc. | 6,703 | 155 |
| * | QLogic Corp. | 14,501 | 150 |
| * | II-VI Inc. | 8,681 | 147 |
| * | Entegris Inc. | 9,806 | 135 |
| ADTRAN Inc. | 8,305 | 133 | |
| * | Plexus Corp. | 3,457 | 132 |
| * | Semtech Corp. | 7,387 | 125 |
| * | Diodes Inc. | 6,203 | 122 |
| * | iRobot Corp. | 4,067 | 119 |
| * | PMC-Sierra Inc. | 18,902 | 119 |
| * | Fabrinet | 5,962 | 118 |
| * | Rogers Corp. | 2,110 | 117 |
| Integrated Silicon Solution Inc. | 5,338 | 117 | |
| Brooks Automation Inc. | 11,138 | 116 | |
| Tessera Technologies Inc. | 3,431 | 112 | |
| ManTech International Corp. Class A | 4,071 | 111 | |
| * | Bankrate Inc. | 11,261 | 111 |
| *,^ | Advanced Micro Devices Inc. | 59,868 | 108 |
| * | Rofin-Sinar Technologies Inc. | 4,182 | 106 |
| CTS Corp. | 5,580 | 105 | |
| * | Photronics Inc. | 11,221 | 102 |
| AVX Corp. | 7,766 | 101 | |
| * | Actua Corp. | 6,819 | 97 |
| * | Blucora Inc. | 6,873 | 96 |
| * | Silicon Laboratories Inc. | 2,106 | 92 |
| * | Mercury Systems Inc. | 5,747 | 91 |
| * | Amkor Technology Inc. | 16,233 | 88 |
| Acacia Research Corp. | 8,591 | 82 | |
| * | Ultratech Inc. | 4,564 | 78 |
| * | GSI Group Inc. | 5,785 | 75 |
| Comtech Telecommunications Corp. | 2,732 | 73 | |
| * | Harmonic Inc. | 12,498 | 72 |
| * | Newport Corp. | 4,482 | 69 |
| * | TTM Technologies Inc. | 9,920 | 68 |
| * | ePlus Inc. | 881 | 67 |
| Power Integrations Inc. | 1,657 | 65 | |
| * | ShoreTel Inc. | 8,528 | 63 |
| * | ViaSat Inc. | 1,070 | 63 |
| * | Axcelis Technologies Inc. | 19,080 | 62 |
| * | Lattice Semiconductor Corp. | 14,783 | 62 |
| Park Electrochemical Corp. | 3,426 | 60 | |
| * | Calix Inc. | 7,465 | 60 |
| * | Sigma Designs Inc. | 5,950 | 59 |
| * | Sonus Networks Inc. | 8,310 | 58 |
| * | Applied Micro Circuits Corp. | 9,962 | 58 |
| * | Rudolph Technologies Inc. | 4,551 | 58 |
| * | Kimball Electronics Inc. | 4,906 | 58 |
| Checkpoint Systems Inc. | 7,071 | 57 | |
| * | Nanometrics Inc. | 4,031 | 56 |
| * | RetailMeNot Inc. | 6,090 | 55 |
| IXYS Corp. | 4,170 | 49 | |
| American Science & Engineering Inc. | 1,215 | 48 | |
| *,^ | KEYW Holding Corp. | 5,630 | 47 |
| * | Extreme Networks Inc. | 15,454 | 46 |
| Pericom Semiconductor Corp. | 3,761 | 46 | |
| * | Ciber Inc. | 13,249 | 45 |
| * | Oclaro Inc. | 16,433 | 45 |
| * | Glu Mobile Inc. | 9,708 | 45 |
| Daktronics Inc. | 5,078 | 44 | |
52
| Vanguard® Russell 2000 Value Index Fund | ||
| Schedule of Investments | ||
| August 31, 2015 | ||
| Market | ||
| Value | ||
| Shares | ($000) | |
| Epiq Systems Inc. | 3,386 | 43 |
| * Digi International Inc. | 4,189 | 43 |
| * Quantum Corp. | 36,204 | 42 |
| Cohu Inc. | 4,354 | 42 |
| * Unisys Corp. | 3,095 | 41 |
| Black Box Corp. | 2,582 | 40 |
| PC Connection Inc. | 1,781 | 37 |
| * Ultra Clean Holdings Inc. | 5,314 | 36 |
| * Kopin Corp. | 11,175 | 35 |
| * FormFactor Inc. | 5,158 | 34 |
| * CEVA Inc. | 1,773 | 34 |
| * NeoPhotonics Corp. | 4,693 | 34 |
| * Seachange International Inc. | 5,604 | 34 |
| * Telenav Inc. | 4,749 | 34 |
| * DSP Group Inc. | 3,757 | 33 |
| * Exar Corp. | 5,539 | 33 |
| * Xcerra Corp. | 5,180 | 32 |
| QAD Inc. Class A | 1,272 | 32 |
| * Perficient Inc. | 1,929 | 32 |
| * Intralinks Holdings Inc. | 3,106 | 32 |
| American Software Inc. Class A | 3,472 | 32 |
| InterDigital Inc. | 625 | 31 |
| Bel Fuse Inc. Class B | 1,740 | 31 |
| * Verint Systems Inc. | 567 | 30 |
| * TeleCommunication Systems Inc. Class A | 8,369 | 29 |
| * Bottomline Technologies de Inc. | 1,059 | 28 |
| * Alpha & Omega Semiconductor Ltd. | 3,682 | 28 |
| * Bazaarvoice Inc. | 5,364 | 28 |
| * Rocket Fuel Inc. | 4,437 | 27 |
| * Millennial Media Inc. | 20,071 | 27 |
| * United Online Inc. | 2,467 | 27 |
| * Agilysys Inc. | 2,556 | 26 |
| * Multi-Fineline Electronix Inc. | 1,527 | 24 |
| * Limelight Networks Inc. | 10,228 | 24 |
| NVE Corp. | 445 | 23 |
| * EMCORE Corp. | 3,252 | 23 |
| * Pacific DataVision Inc. | 688 | 22 |
| * SciQuest Inc. | 1,985 | 22 |
| * TechTarget Inc. | 2,359 | 22 |
| ModusLink Global Solutions Inc. | 6,288 | 20 |
| * Datalink Corp. | 3,229 | 19 |
| * Imation Corp. | 5,905 | 18 |
| * Vocera Communications Inc. | 1,501 | 18 |
| * RealNetworks Inc. | 3,863 | 17 |
| * Avid Technology Inc. | 1,993 | 17 |
| * Sparton Corp. | 692 | 16 |
| * Ixia | 1,039 | 16 |
| * Marin Software Inc. | 4,379 | 16 |
| Reis Inc. | 512 | 13 |
| Ubiquiti Networks Inc. | 319 | 11 |
| Sapiens International Corp. NV | 887 | 10 |
| * Applied Optoelectronics Inc. | 468 | 10 |
| * DTS Inc. | 350 | 9 |
| * Cascade Microtech Inc. | 457 | 7 |
| * KVH Industries Inc. | 527 | 6 |
| * Silver Spring Networks Inc. | 422 | 5 |
| * PDF Solutions Inc. | 341 | 4 |
| * Digimarc Corp. | 98 | 4 |
| * Everyday Health Inc. | 318 | 3 |
| * Novatel Wireless Inc. | 748 | 2 |
| * Brightcove Inc. | 339 | 2 |
| * Digital Turbine Inc. | 614 | 2 |
| * Park City Group Inc. | 122 | 1 |
53
| Vanguard® Russell 2000 Value Index Fund | ||
| Schedule of Investments | ||
| August 31, 2015 | ||
| Market | ||
| Value | ||
| Shares | ($000) | |
| * Amber Road Inc. | 154 | 1 |
| 13,733 | ||
| Utilities (8.0%) | ||
| * Dynegy Inc. | 21,448 | 552 |
| Cleco Corp. | 10,123 | 542 |
| Portland General Electric Co. | 14,767 | 510 |
| Piedmont Natural Gas Co. Inc. | 13,126 | 506 |
| IDACORP Inc. | 8,430 | 501 |
| WGL Holdings Inc. | 8,286 | 449 |
| Southwest Gas Corp. | 7,805 | 430 |
| UIL Holdings Corp. | 9,433 | 430 |
| NorthWestern Corp. | 7,838 | 405 |
| New Jersey Resources Corp. | 14,259 | 403 |
| ALLETE Inc. | 8,123 | 388 |
| Laclede Group Inc. | 7,217 | 382 |
| ONE Gas Inc. | 8,763 | 377 |
| PNM Resources Inc. | 13,272 | 340 |
| Avista Corp. | 10,376 | 326 |
| Black Hills Corp. | 7,468 | 297 |
| South Jersey Industries Inc. | 11,399 | 275 |
| El Paso Electric Co. | 6,716 | 238 |
| MGE Energy Inc. | 5,762 | 222 |
| American States Water Co. | 5,749 | 217 |
| Pattern Energy Group Inc. Class A | 9,274 | 210 |
| * Talen Energy Corp. | 14,025 | 200 |
| Northwest Natural Gas Co. | 4,534 | 199 |
| Abengoa Yield plc | 8,173 | 186 |
| West Corp. | 7,515 | 183 |
| NRG Yield Inc. | 10,442 | 168 |
| California Water Service Group | 7,939 | 164 |
| Otter Tail Corp. | 6,206 | 160 |
| Empire District Electric Co. | 7,320 | 158 |
| * Vonage Holdings Corp. | 27,849 | 155 |
| * Globalstar Inc. | 78,883 | 139 |
| Ormat Technologies Inc. | 3,654 | 129 |
| Chesapeake Utilities Corp. | 2,560 | 126 |
| Atlantic Tele-Network Inc. | 1,724 | 123 |
| * Cincinnati Bell Inc. | 35,254 | 121 |
| * Iridium Communications Inc. | 13,551 | 101 |
| NRG Yield Inc. Class A | 5,693 | 90 |
| Unitil Corp. | 2,346 | 84 |
| * Premiere Global Services Inc. | 7,807 | 84 |
| SJW Corp. | 2,663 | 77 |
| * 8x8 Inc. | 9,572 | 74 |
| Connecticut Water Service Inc. | 1,874 | 65 |
| Middlesex Water Co. | 2,712 | 62 |
| * ORBCOMM Inc. | 10,052 | 61 |
| Inteliquent Inc. | 3,293 | 60 |
| Spok Holdings Inc. | 3,654 | 60 |
| Consolidated Communications Holdings Inc. | 2,898 | 57 |
| Atlantic Power Corp. | 20,486 | 48 |
| York Water Co. | 1,974 | 42 |
| * Pendrell Corp. | 27,939 | 41 |
| * Hawaiian Telcom Holdco Inc. | 1,808 | 40 |
| IDT Corp. Class B | 2,394 | 37 |
| * Intelsat SA | 3,357 | 32 |
| Artesian Resources Corp. Class A | 1,316 | 29 |
| * NTELOS Holdings Corp. | 2,919 | 27 |
| Consolidated Water Co. Ltd. | 2,477 | 26 |
| Shenandoah Telecommunications Co. | 572 | 22 |
| * Boingo Wireless Inc. | 2,770 | 21 |
| Genie Energy Ltd. Class B | 1,617 | 17 |
| Windstream Holdings Inc. | 983 | 7 |
| * inContact Inc. | 923 | 7 |
54
| Vanguard® Russell 2000 Value Index Fund | ||||
| Schedule of Investments | ||||
| August 31, 2015 | ||||
| Market | ||||
| Value | ||||
| Shares | ($000) | |||
| Lumos Networks Corp. | 580 | 7 | ||
| Spark Energy Inc. Class A | 63 | 1 | ||
| 11,490 | ||||
| Total Common Stocks (Cost $158,795) | 143,153 | |||
| Coupon | ||||
| Temporary Cash Investments (1.1%)1 | ||||
| Money Market Fund (1.0%) | ||||
| 3,4 Vanguard Market Liquidity Fund | 0.168% | 1,513,120 | 1,513 | |
| Face | ||||
| Maturity | Amount | |||
| Date | ($000) | |||
| U.S. Government and Agency Obligations (0.1%) | ||||
| 5,6 Freddie Mac Discount Notes | 0.125% | 10/30/15 | 100 | 100 |
| Total Temporary Cash Investments (Cost $1,613) | 1,613 | |||
| Total Investments (100.4%) (Cost $160,408) | 144,766 | |||
| Other Assets and Liabilities—Net (-0.4%)4 | (524) | |||
| Net Assets (100%) | 144,242 | |||
* Non-income-producing security.
^ Includes partial security positions on loan to broker-dealers. The total value of securities on loan is $484,000.
1 The fund invests a portion of its cash reserves in equity markets through the use of index futures contracts. After giving effect to futures investments, the fund's effective common stock and temporary cash investment positions represent 99.8% and 0.6%, respectively, of net assets.
2 “Other” represents securities that are not classified by the fund’s benchmark index.
3 Affiliated money market fund available only to Vanguard funds and certain trusts and accounts managed by Vanguard. Rate shown is the 7-day yield.
4 Includes $543,000 of collateral received for securities on loan.
5 The issuer was placed under federal conservatorship in September 2008; since that time, its daily operations have been managed by the Federal Housing Finance Agency and it receives capital from the U.S. Treasury, as needed to maintain a positive net worth, in exchange for senior preferred stock.
6 Securities with a value of $100,000 have been segregated as initial margin for open futures contracts.
REIT—Real Estate Investment Trust.
55
| Vanguard® Russell 2000 Growth Index Fund | ||
| Schedule of Investments | ||
| August 31, 2015 | ||
| Market | ||
| Value | ||
| Shares | ($000) | |
| Common Stocks (99.6%)1 | ||
| Consumer Discretionary (19.4%) | ||
| Vail Resorts Inc. | 13,825 | 1,492 |
| * Buffalo Wild Wings Inc. | 7,227 | 1,371 |
| * Burlington Stores Inc. | 25,706 | 1,365 |
| * Restoration Hardware Holdings Inc. | 12,708 | 1,175 |
| Pool Corp. | 16,570 | 1,155 |
| American Eagle Outfitters Inc. | 65,854 | 1,121 |
| Jack in the Box Inc. | 14,229 | 1,112 |
| * Tenneco Inc. | 23,360 | 1,099 |
| Wolverine World Wide Inc. | 39,303 | 1,059 |
| * G-III Apparel Group Ltd. | 15,130 | 1,049 |
| Men's Wearhouse Inc. | 18,331 | 1,035 |
| Cheesecake Factory Inc. | 18,498 | 1,004 |
| Cracker Barrel Old Country Store Inc. | 6,818 | 983 |
| Big Lots Inc. | 20,459 | 982 |
| Bloomin' Brands Inc. | 47,029 | 973 |
| Texas Roadhouse Inc. Class A | 26,554 | 956 |
| Lithia Motors Inc. Class A | 8,638 | 921 |
| * Steven Madden Ltd. | 21,350 | 872 |
| * Cimpress NV | 12,444 | 871 |
| * Pinnacle Entertainment Inc. | 22,959 | 867 |
| * Bright Horizons Family Solutions Inc. | 14,181 | 867 |
| * Asbury Automotive Group Inc. | 10,336 | 833 |
| Sotheby's | 23,599 | 831 |
| Chico's FAS Inc. | 54,383 | 811 |
| * Five Below Inc. | 20,666 | 799 |
| Monro Muffler Brake Inc. | 12,074 | 765 |
| HSN Inc. | 12,332 | 750 |
| Papa John's International Inc. | 10,982 | 739 |
| * IMAX Corp. | 22,913 | 718 |
| Churchill Downs Inc. | 5,103 | 678 |
| Sinclair Broadcast Group Inc. Class A | 25,137 | 673 |
| * La Quinta Holdings Inc. | 35,522 | 670 |
| * Grand Canyon Education Inc. | 17,858 | 660 |
| Hillenbrand Inc. | 23,873 | 644 |
| PriceSmart Inc. | 7,383 | 628 |
| * Gentherm Inc. | 13,621 | 621 |
| * Express Inc. | 28,883 | 589 |
| * American Axle & Manufacturing Holdings Inc. | 28,761 | 581 |
| Dana Holding Corp. | 32,862 | 576 |
| DineEquity Inc. | 6,002 | 573 |
| Nexstar Broadcasting Group Inc. Class A | 11,871 | 552 |
| * Fiesta Restaurant Group Inc. | 10,175 | 525 |
| * Dorman Products Inc. | 10,144 | 511 |
| Drew Industries Inc. | 9,154 | 506 |
| * Popeyes Louisiana Kitchen Inc. | 8,782 | 488 |
| * Boyd Gaming Corp. | 30,269 | 487 |
| * Orbitz Worldwide Inc. | 42,384 | 486 |
| * Select Comfort Corp. | 19,840 | 483 |
| Oxford Industries Inc. | 5,556 | 468 |
| * Mattress Firm Holding Corp. | 7,776 | 467 |
| Columbia Sportswear Co. | 7,587 | 466 |
| SeaWorld Entertainment Inc. | 25,937 | 462 |
| * Deckers Outdoor Corp. | 7,077 | 456 |
| Buckle Inc. | 10,741 | 453 |
| Sturm Ruger & Co. Inc. | 7,091 | 446 |
| * Stamps.com Inc. | 5,408 | 445 |
| * zulily Inc. Class A | 24,851 | 441 |
| Outerwall Inc. | 6,999 | 431 |
| * Red Robin Gourmet Burgers Inc. | 5,358 | 422 |
| * Krispy Kreme Doughnuts Inc. | 24,604 | 422 |
| * Tumi Holdings Inc. | 21,279 | 420 |
56
| Vanguard® Russell 2000 Growth Index Fund | |||
| Schedule of Investments | |||
| August 31, 2015 | |||
| Market | |||
| Value | |||
| Shares | ($000) | ||
| * | Diamond Resorts International Inc. | 15,800 | 401 |
| Marriott Vacations Worldwide Corp. | 5,580 | 396 | |
| Sonic Corp. | 14,223 | 384 | |
| * | Helen of Troy Ltd. | 4,421 | 376 |
| Travelport Worldwide Ltd. | 28,351 | 376 | |
| ClubCorp Holdings Inc. | 16,665 | 375 | |
| * | Hibbett Sports Inc. | 9,445 | 373 |
| * | Smith & Wesson Holding Corp. | 20,388 | 369 |
| * | Shutterfly Inc. | 9,059 | 352 |
| * | BJ's Restaurants Inc. | 8,149 | 350 |
| Pier 1 Imports Inc. | 34,177 | 348 | |
| * | TiVo Inc. | 36,820 | 335 |
| * | Crocs Inc. | 22,534 | 332 |
| * | American Woodmark Corp. | 4,862 | 322 |
| * | 2U Inc. | 9,082 | 318 |
| * | Steiner Leisure Ltd. | 4,855 | 309 |
| Nutrisystem Inc. | 10,959 | 307 | |
| * | LifeLock Inc. | 35,800 | 302 |
| * | Constant Contact Inc. | 12,172 | 301 |
| Interval Leisure Group Inc. | 14,826 | 297 | |
| * | Dave & Buster's Entertainment Inc. | 8,634 | 297 |
| *,^ | Wayfair Inc. | 7,610 | 284 |
| * | Gray Television Inc. | 23,943 | 277 |
| Libbey Inc. | 7,744 | 273 | |
| Ryland Group Inc. | 6,175 | 267 | |
| * | Meritor Inc. | 20,643 | 261 |
| *,^ | Zoe's Kitchen Inc. | 7,315 | 253 |
| EW Scripps Co. Class A | 14,317 | 251 | |
| * | Denny's Corp. | 22,134 | 249 |
| * | Shutterstock Inc. | 7,410 | 248 |
| * | HealthStream Inc. | 9,531 | 237 |
| * | Universal Electronics Inc. | 4,999 | 228 |
| World Wrestling Entertainment Inc. Class A | 11,352 | 228 | |
| Capella Education Co. | 4,606 | 225 | |
| *,^ | Coupons.com Inc. | 23,006 | 215 |
| *,^ | Scientific Games Corp. Class A | 18,936 | 209 |
| La-Z-Boy Inc. | 7,546 | 208 | |
| * | Liberty TripAdvisor Holdings Inc. Class A | 8,198 | 208 |
| * | Rentrak Corp. | 4,382 | 200 |
| * | Motorcar Parts of America Inc. | 6,256 | 199 |
| Winnebago Industries Inc. | 9,404 | 193 | |
| * | Cavco Industries Inc. | 2,660 | 190 |
| * | Chuy's Holdings Inc. | 6,197 | 190 |
| Entravision Communications Corp. Class A | 23,123 | 186 | |
| * | Nautilus Inc. | 11,809 | 180 |
| * | Francesca's Holdings Corp. | 15,894 | 179 |
| Group 1 Automotive Inc. | 1,888 | 165 | |
| * | Party City Holdco Inc. | 9,667 | 164 |
| * | Zumiez Inc. | 6,787 | 158 |
| * | Blue Nile Inc. | 4,554 | 155 |
| MDC Holdings Inc. | 5,246 | 149 | |
| * | Isle of Capri Casinos Inc. | 8,073 | 149 |
| * | XO Group Inc. | 10,154 | 149 |
| Kirkland's Inc. | 6,662 | 149 | |
| * | Carrols Restaurant Group Inc. | 11,590 | 147 |
| * | RealD Inc. | 15,512 | 146 |
| * | Ascena Retail Group Inc. | 11,864 | 143 |
| Ruth's Hospitality Group Inc. | 8,893 | 143 | |
| * | Stoneridge Inc. | 10,747 | 131 |
| Finish Line Inc. Class A | 4,947 | 130 | |
| New York Times Co. Class A | 10,551 | 128 | |
| * | Sequential Brands Group Inc. | 7,724 | 126 |
| * | Tile Shop Holdings Inc. | 10,401 | 124 |
| Children's Place Inc. | 2,065 | 124 | |
57
| Vanguard® Russell 2000 Growth Index Fund | |||
| Schedule of Investments | |||
| August 31, 2015 | |||
| Market | |||
| Value | |||
| Shares | ($000) | ||
| * | Malibu Boats Inc. Class A | 6,849 | 118 |
| * | Tuesday Morning Corp. | 13,892 | 110 |
| *,^ | Etsy Inc. | 7,673 | 110 |
| * | Habit Restaurants Inc. Class A | 4,409 | 110 |
| * | Tower International Inc. | 4,478 | 109 |
| *,^ | Container Store Group Inc. | 6,063 | 102 |
| * | Boot Barn Holdings Inc. | 4,587 | 100 |
| * | Fox Factory Holding Corp. | 6,516 | 98 |
| * | Shake Shack Inc. Class A | 1,908 | 95 |
| * | Eastman Kodak Co. | 6,732 | 95 |
| Cooper Tire & Rubber Co. | 2,377 | 92 | |
| MDC Partners Inc. Class A | 4,667 | 92 | |
| * | Overstock.com Inc. | 4,612 | 91 |
| * | Angie's List Inc. | 16,840 | 89 |
| * | Potbelly Corp. | 8,393 | 89 |
| * | Strayer Education Inc. | 1,670 | 87 |
| * | Chegg Inc. | 11,512 | 86 |
| Winmark Corp. | 860 | 85 | |
| * | Houghton Mifflin Harcourt Co. | 3,750 | 85 |
| * | MarineMax Inc. | 5,047 | 82 |
| * | 1-800-Flowers.com Inc. Class A | 9,621 | 81 |
| * | ZAGG Inc. | 10,842 | 79 |
| National CineMedia Inc. | 5,884 | 77 | |
| * | Cherokee Inc. | 3,000 | 77 |
| *,^ | Jamba Inc. | 5,394 | 75 |
| Inter Parfums Inc. | 2,685 | 69 | |
| * | El Pollo Loco Holdings Inc. | 5,165 | 67 |
| Tribune Publishing Co. | 5,695 | 67 | |
| * | TubeMogul Inc. | 5,959 | 66 |
| * | Bravo Brio Restaurant Group Inc. | 5,040 | 64 |
| * | Bojangles' Inc. | 3,057 | 64 |
| Cato Corp. Class A | 1,757 | 62 | |
| Bassett Furniture Industries Inc. | 2,088 | 61 | |
| *,^ | Weight Watchers International Inc. | 9,386 | 58 |
| * | Crown Media Holdings Inc. Class A | 10,732 | 57 |
| * | Vince Holding Corp. | 6,041 | 55 |
| * | Martha Stewart Living Omnimedia Inc. Class A | 8,714 | 53 |
| * | Papa Murphy's Holdings Inc. | 3,558 | 53 |
| Liberty Tax Inc. | 2,197 | 52 | |
| Collectors Universe Inc. | 2,761 | 52 | |
| Arctic Cat Inc. | 1,925 | 51 | |
| Caleres Inc. | 1,444 | 48 | |
| * | Eldorado Resorts Inc. | 5,056 | 48 |
| * | TRI Pointe Group Inc. | 3,401 | 47 |
| Metaldyne Performance Group Inc. | 2,444 | 46 | |
| Superior Uniform Group Inc. | 2,714 | 46 | |
| * | Central European Media Enterprises Ltd. Class A | 19,858 | 44 |
| * | Meritage Homes Corp. | 974 | 41 |
| * | M/I Homes Inc. | 1,614 | 40 |
| * | Noodles & Co. Class A | 3,282 | 39 |
| * | Revlon Inc. Class A | 1,128 | 38 |
| * | Penn National Gaming Inc. | 2,036 | 37 |
| * | Sportsman's Warehouse Holdings Inc. | 2,692 | 35 |
| * | LGI Homes Inc. | 1,269 | 33 |
| * | Fenix Parts Inc. | 3,285 | 33 |
| Matthews International Corp. Class A | 622 | 32 | |
| Bob Evans Farms Inc. | 675 | 30 | |
| * | Kona Grill Inc. | 1,580 | 29 |
| * | Lands' End Inc. | 1,065 | 27 |
| Carriage Services Inc. Class A | 1,170 | 27 | |
| Marine Products Corp. | 3,814 | 27 | |
| * | Vitamin Shoppe Inc. | 659 | 24 |
| * | William Lyon Homes Class A | 1,039 | 24 |
| * | Central Garden & Pet Co. Class A | 1,835 | 23 |
58
| Vanguard® Russell 2000 Growth Index Fund | |||
| Schedule of Investments | |||
| August 31, 2015 | |||
| Market | |||
| Value | |||
| Shares | ($000) | ||
| * | Empire Resorts Inc. | 5,400 | 23 |
| * | America's Car-Mart Inc. | 596 | 21 |
| * | Cooper-Standard Holding Inc. | 362 | 21 |
| * | Skullcandy Inc. | 2,708 | 19 |
| * | Destination XL Group Inc. | 3,040 | 18 |
| Escalade Inc. | 1,009 | 18 | |
| * | Reading International Inc. Class A | 1,364 | 17 |
| * | Morgans Hotel Group Co. | 3,761 | 17 |
| AMC Entertainment Holdings Inc. | 563 | 16 | |
| * | Performance Sports Group Ltd. | 1,157 | 15 |
| * | Quiksilver Inc. | 33,365 | 14 |
| Strattec Security Corp. | 225 | 14 | |
| * | Carmike Cinemas Inc. | 469 | 11 |
| * | Century Communities Inc. | 438 | 10 |
| * | New Home Co. Inc. | 622 | 9 |
| Citi Trends Inc. | 326 | 9 | |
| * | Del Frisco's Restaurant Group Inc. | 573 | 8 |
| * | Franklin Covey Co. | 475 | 8 |
| * | SFX Entertainment Inc. | 7,594 | 8 |
| * | Build-A-Bear Workshop Inc. | 345 | 7 |
| Hooker Furniture Corp. | 277 | 7 | |
| * | JAKKS Pacific Inc. | 646 | 6 |
| * | Care.com Inc. | 939 | 6 |
| * | Horizon Global Corp. | 415 | 4 |
| Weyco Group Inc. | 134 | 4 | |
| * | Monarch Casino & Resort Inc. | 201 | 3 |
| * | VOXX International Corp. Class A | 445 | 3 |
| * | Black Diamond Inc. | 454 | 3 |
| Journal Media Group Inc. | 505 | 3 | |
| * | Hemisphere Media Group Inc. Class A | 212 | 3 |
| 65,151 | |||
| Consumer Staples (3.2%) | |||
| Casey's General Stores Inc. | 14,776 | 1,564 | |
| * | United Natural Foods Inc. | 17,496 | 842 |
| Vector Group Ltd. | 30,994 | 739 | |
| * | Boston Beer Co. Inc. Class A | 3,448 | 707 |
| J&J Snack Foods Corp. | 5,648 | 644 | |
| B&G Foods Inc. | 20,844 | 633 | |
| Cal-Maine Foods Inc. | 11,880 | 631 | |
| * | Diplomat Pharmacy Inc. | 13,724 | 542 |
| WD-40 Co. | 5,526 | 463 | |
| Lancaster Colony Corp. | 4,581 | 434 | |
| * | Fresh Market Inc. | 16,349 | 352 |
| Calavo Growers Inc. | 5,576 | 325 | |
| * | USANA Health Sciences Inc. | 2,140 | 314 |
| * | Diamond Foods Inc. | 9,442 | 285 |
| Core-Mark Holding Co. Inc. | 4,529 | 272 | |
| Dean Foods Co. | 16,410 | 270 | |
| Coca-Cola Bottling Co. Consolidated | 1,612 | 249 | |
| * | Boulder Brands Inc. | 19,424 | 159 |
| PetMed Express Inc. | 7,771 | 129 | |
| * | Medifast Inc. | 4,169 | 116 |
| * | National Beverage Corp. | 4,176 | 110 |
| * | Chefs' Warehouse Inc. | 7,231 | 109 |
| *,^ | Freshpet Inc. | 7,972 | 104 |
| * | Natural Grocers by Vitamin Cottage Inc. | 3,489 | 85 |
| Limoneira Co. | 4,429 | 84 | |
| Natural Health Trends Corp. | 3,024 | 81 | |
| Tootsie Roll Industries Inc. | 2,577 | 80 | |
| * | Farmer Bros Co. | 2,983 | 68 |
| Ingles Markets Inc. Class A | 1,367 | 68 | |
| * | Inventure Foods Inc. | 7,619 | 66 |
| MGP Ingredients Inc. | 3,946 | 63 | |
| John B Sanfilippo & Son Inc. | 782 | 40 | |
59
| Vanguard® Russell 2000 Growth Index Fund | |||
| Schedule of Investments | |||
| August 31, 2015 | |||
| Market | |||
| Value | |||
| Shares | ($000) | ||
| * | Synutra International Inc. | 6,758 | 34 |
| * | Castle Brands Inc. | 24,609 | 30 |
| * | Seaboard Corp. | 8 | 27 |
| * | Lifeway Foods Inc. | 1,832 | 26 |
| Orchids Paper Products Co. | 916 | 23 | |
| * | Craft Brew Alliance Inc. | 1,268 | 10 |
| * | Arcadia Biosciences Inc. | 1,113 | 7 |
| Alico Inc. | 168 | 7 | |
| * | Fairway Group Holdings Corp. | 2,524 | 6 |
| 10,798 | |||
| Energy (1.3%) | |||
| Western Refining Inc. | 27,070 | 1,165 | |
| SemGroup Corp. Class A | 16,654 | 916 | |
| * | Matador Resources Co. | 16,513 | 378 |
| Delek US Holdings Inc. | 12,034 | 370 | |
| *,^ | Ultra Petroleum Corp. | 28,084 | 239 |
| SunCoke Energy Inc. | 17,517 | 201 | |
| * | Parsley Energy Inc. Class A | 11,380 | 196 |
| * | RigNet Inc. | 4,630 | 133 |
| * | Fairmount Santrol Holdings Inc. | 22,183 | 111 |
| * | Par Petroleum Corp. | 5,589 | 108 |
| * | Trecora Resources | 7,751 | 100 |
| *,^ | Solazyme Inc. | 30,715 | 81 |
| * | Magnum Hunter Resources Corp. | 79,904 | 64 |
| * | Vivint Solar Inc. | 4,864 | 61 |
| Evolution Petroleum Corp. | 8,968 | 53 | |
| Panhandle Oil and Gas Inc. Class A | 2,835 | 50 | |
| *,^ | Enphase Energy Inc. | 10,717 | 49 |
| * | Isramco Inc. | 355 | 47 |
| * | Synergy Resources Corp. | 4,121 | 44 |
| * | Carrizo Oil & Gas Inc. | 1,007 | 37 |
| * | FuelCell Energy Inc. | 26,777 | 22 |
| * | PowerSecure International Inc. | 1,494 | 18 |
| Hallador Energy Co. | 1,035 | 8 | |
| * | ION Geophysical Corp. | 9,199 | 5 |
| * | Erin Energy Corp. | 696 | 3 |
| 4,459 | |||
| Financial Services (9.1%) | |||
| MarketAxess Holdings Inc. | 14,200 | 1,284 | |
| * | Euronet Worldwide Inc. | 19,741 | 1,273 |
| CubeSmart | 49,626 | 1,255 | |
| Bank of the Ozarks Inc. | 29,683 | 1,241 | |
| Sovran Self Storage Inc. | 11,819 | 1,061 | |
| Fair Isaac Corp. | 11,780 | 1,008 | |
| * | PRA Group Inc. | 18,331 | 977 |
| Ryman Hospitality Properties Inc. | 16,495 | 845 | |
| Heartland Payment Systems Inc. | 13,884 | 827 | |
| * | Blackhawk Network Holdings Inc. | 20,598 | 814 |
| WisdomTree Investments Inc. | 43,284 | 812 | |
| CyrusOne Inc. | 23,053 | 730 | |
| Urban Edge Properties | 33,679 | 704 | |
| Evercore Partners Inc. Class A | 13,132 | 688 | |
| * | BofI Holding Inc. | 5,823 | 675 |
| Home BancShares Inc. | 17,694 | 674 | |
| Financial Engines Inc. | 19,670 | 638 | |
| BGC Partners Inc. Class A | 69,511 | 610 | |
| * | MGIC Investment Corp. | 57,723 | 610 |
| * | Cardtronics Inc. | 17,023 | 587 |
| * | Essent Group Ltd. | 21,085 | 565 |
| HFF Inc. Class A | 14,352 | 521 | |
| * | Western Alliance Bancorp | 16,703 | 510 |
| RLJ Lodging Trust | 18,352 | 505 | |
| American Assets Trust Inc. | 12,548 | 483 | |
| EVERTEC Inc. | 24,957 | 452 | |
60
| Vanguard® Russell 2000 Growth Index Fund | ||
| Schedule of Investments | ||
| August 31, 2015 | ||
| Market | ||
| Value | ||
| Shares | ($000) | |
| CoreSite Realty Corp. | 9,229 | 449 |
| First Financial Bankshares Inc. | 14,113 | 439 |
| * First Cash Financial Services Inc. | 9,856 | 407 |
| QTS Realty Trust Inc. Class A | 10,067 | 405 |
| Greenhill & Co. Inc. | 11,110 | 390 |
| Potlatch Corp. | 11,234 | 371 |
| * Eagle Bancorp Inc. | 8,568 | 359 |
| * Xoom Corp. | 12,100 | 300 |
| Universal Insurance Holdings Inc. | 12,148 | 299 |
| Alexander's Inc. | 739 | 268 |
| National Health Investors Inc. | 4,859 | 268 |
| * LendingTree Inc. | 2,193 | 232 |
| Cohen & Steers Inc. | 7,648 | 229 |
| DuPont Fabros Technology Inc. | 8,387 | 224 |
| Diamond Hill Investment Group Inc. | 1,147 | 223 |
| * Marcus & Millichap Inc. | 5,128 | 218 |
| Universal Health Realty Income Trust | 4,716 | 217 |
| * Hilltop Holdings Inc. | 10,239 | 211 |
| CareTrust REIT Inc. | 18,258 | 205 |
| Sun Communities Inc. | 2,823 | 184 |
| * HRG Group Inc. | 13,467 | 173 |
| Virtu Financial Inc. Class A | 7,290 | 172 |
| Westwood Holdings Group Inc. | 2,957 | 164 |
| Employers Holdings Inc. | 7,393 | 163 |
| Moelis & Co. Class A | 5,966 | 163 |
| Saul Centers Inc. | 3,269 | 161 |
| OM Asset Management plc | 9,446 | 156 |
| GAMCO Investors Inc. | 2,423 | 142 |
| * Altisource Portfolio Solutions SA | 5,078 | 137 |
| EastGroup Properties Inc. | 2,466 | 133 |
| * Walker & Dunlop Inc. | 5,006 | 122 |
| Cass Information Systems Inc. | 2,484 | 120 |
| * Enova International Inc. | 8,772 | 114 |
| National Storage Affiliates Trust | 8,287 | 107 |
| * Heritage Insurance Holdings Inc. | 5,989 | 105 |
| * eHealth Inc. | 6,660 | 100 |
| Inland Real Estate Corp. | 10,794 | 91 |
| Sabra Health Care REIT Inc. | 3,740 | 90 |
| Easterly Government Properties Inc. | 5,312 | 83 |
| Kennedy-Wilson Holdings Inc. | 3,388 | 81 |
| Janus Capital Group Inc. | 4,804 | 71 |
| * Texas Capital Bancshares Inc. | 1,270 | 68 |
| * World Acceptance Corp. | 1,730 | 65 |
| * Encore Capital Group Inc. | 1,571 | 64 |
| * HomeStreet Inc. | 2,525 | 56 |
| * Real Industry Inc. | 5,767 | 56 |
| Equity One Inc. | 2,370 | 56 |
| PS Business Parks Inc. | 752 | 55 |
| * Square 1 Financial Inc. Class A | 2,131 | 54 |
| * Impac Mortgage Holdings Inc. | 2,868 | 51 |
| Pzena Investment Management Inc. Class A | 4,938 | 50 |
| Pinnacle Financial Partners Inc. | 978 | 46 |
| United Financial Bancorp Inc. | 3,378 | 42 |
| * INTL. FCStone Inc. | 1,508 | 40 |
| * On Deck Capital Inc. | 4,320 | 40 |
| * Meridian Bancorp Inc. | 2,963 | 38 |
| South State Corp. | 481 | 36 |
| * Trupanion Inc. | 5,131 | 36 |
| Maiden Holdings Ltd. | 2,418 | 35 |
| Renasant Corp. | 1,067 | 33 |
| LTC Properties Inc. | 789 | 32 |
| BNC Bancorp | 1,508 | 31 |
| * Third Point Reinsurance Ltd. | 2,185 | 31 |
| * Ambac Financial Group Inc. | 1,829 | 30 |
61
| Vanguard® Russell 2000 Growth Index Fund | ||
| Schedule of Investments | ||
| August 31, 2015 | ||
| Market | ||
| Value | ||
| Shares | ($000) | |
| * Ashford Inc. | 399 | 29 |
| * Atlas Financial Holdings Inc. | 1,756 | 28 |
| Consolidated-Tomoka Land Co. | 506 | 28 |
| Investment Technology Group Inc. | 1,658 | 27 |
| National General Holdings Corp. | 1,371 | 25 |
| Urstadt Biddle Properties Inc. Class A | 1,276 | 23 |
| Crawford & Co. Class B | 3,150 | 20 |
| National Interstate Corp. | 676 | 19 |
| Cardinal Financial Corp. | 798 | 18 |
| Fifth Street Asset Management Inc. | 2,150 | 18 |
| * KCG Holdings Inc. Class A | 1,505 | 17 |
| Virtus Investment Partners Inc. | 147 | 17 |
| Medley Management Inc. Class A | 2,216 | 16 |
| HCI Group Inc. | 394 | 16 |
| GAIN Capital Holdings Inc. | 1,803 | 15 |
| * Cowen Group Inc. Class A | 2,266 | 12 |
| * PennyMac Financial Services Inc. Class A | 655 | 11 |
| * Ladenburg Thalmann Financial Services Inc. | 4,125 | 11 |
| * Altisource Asset Management Corp. | 276 | 11 |
| * ZAIS Group Holdings Inc. | 1,401 | 9 |
| State National Cos. Inc. | 901 | 9 |
| Resource America Inc. Class A | 898 | 7 |
| * Stonegate Mortgage Corp. | 755 | 5 |
| * Regional Management Corp. | 325 | 5 |
| CIFC Corp. | 123 | 1 |
| * Tejon Ranch Co. Warrants Exp. 08/31/2016 | 617 | — |
| 30,337 | ||
| Health Care (28.2%) | ||
| * Anacor Pharmaceuticals Inc. | 15,578 | 2,032 |
| * Ultragenyx Pharmaceutical Inc. | 14,617 | 1,632 |
| * Team Health Holdings Inc. | 27,385 | 1,609 |
| West Pharmaceutical Services Inc. | 27,364 | 1,528 |
| * ABIOMED Inc. | 15,873 | 1,522 |
| * WellCare Health Plans Inc. | 16,752 | 1,519 |
| * Neurocrine Biosciences Inc. | 32,494 | 1,507 |
| HealthSouth Corp. | 34,802 | 1,486 |
| STERIS Corp. | 22,719 | 1,455 |
| * PAREXEL International Corp. | 20,986 | 1,379 |
| * Cepheid | 27,318 | 1,331 |
| * Thoratec Corp. | 20,625 | 1,296 |
| * Dyax Corp. | 55,446 | 1,276 |
| * Impax Laboratories Inc. | 27,293 | 1,118 |
| * Molina Healthcare Inc. | 14,950 | 1,115 |
| * Novavax Inc. | 102,006 | 1,099 |
| * ACADIA Pharmaceuticals Inc. | 27,907 | 1,022 |
| * Catalent Inc. | 31,724 | 1,008 |
| * Medidata Solutions Inc. | 20,970 | 1,007 |
| * Myriad Genetics Inc. | 26,347 | 990 |
| * NuVasive Inc. | 18,344 | 967 |
| * Prestige Brands Holdings Inc. | 19,839 | 923 |
| Chemed Corp. | 6,478 | 883 |
| * Chimerix Inc. | 17,321 | 848 |
| * Portola Pharmaceuticals Inc. Class A | 17,528 | 827 |
| * Clovis Oncology Inc. | 10,557 | 822 |
| * AMAG Pharmaceuticals Inc. | 13,081 | 818 |
| * Exact Sciences Corp. | 36,386 | 804 |
| * Pacira Pharmaceuticals Inc. | 13,825 | 796 |
| * Radius Health Inc. | 12,530 | 763 |
| * KYTHERA Biopharmaceuticals Inc. | 9,791 | 732 |
| * Neogen Corp. | 14,052 | 726 |
| * Halozyme Therapeutics Inc. | 40,237 | 703 |
| * Prothena Corp. plc | 11,868 | 683 |
| * Masimo Corp. | 16,591 | 674 |
| Cantel Medical Corp. | 13,031 | 647 |
62
| Vanguard® Russell 2000 Growth Index Fund | |||
| Schedule of Investments | |||
| August 31, 2015 | |||
| Market | |||
| Value | |||
| Shares | ($000) | ||
| * | Cyberonics Inc. | 9,876 | 645 |
| * | Insulet Corp. | 21,529 | 640 |
| * | Globus Medical Inc. | 26,036 | 636 |
| * | Amicus Therapeutics Inc. | 43,969 | 632 |
| * | Depomed Inc. | 22,747 | 613 |
| * | Ligand Pharmaceuticals Inc. | 6,654 | 612 |
| * | AMN Healthcare Services Inc. | 18,041 | 606 |
| * | ARIAD Pharmaceuticals Inc. | 63,514 | 600 |
| * | Tetraphase Pharmaceuticals Inc. | 13,706 | 595 |
| * | WebMD Health Corp. | 14,336 | 590 |
| *,^ | Kite Pharma Inc. | 10,940 | 582 |
| * | Insmed Inc. | 23,331 | 570 |
| * | Cambrex Corp. | 11,878 | 568 |
| * | ExamWorks Group Inc. | 15,682 | 562 |
| * | Sarepta Therapeutics Inc. | 15,730 | 562 |
| * | HeartWare International Inc. | 6,546 | 560 |
| * | Air Methods Corp. | 14,896 | 558 |
| * | Nektar Therapeutics | 49,896 | 551 |
| * | Ironwood Pharmaceuticals Inc. Class A | 47,776 | 526 |
| * | Natus Medical Inc. | 12,505 | 509 |
| * | Exelixis Inc. | 85,496 | 509 |
| * | Celldex Therapeutics Inc. | 33,923 | 503 |
| * | PTC Therapeutics Inc. | 12,840 | 490 |
| * | Lannett Co. Inc. | 10,062 | 482 |
| Select Medical Holdings Corp. | 37,367 | 482 | |
| * | Acorda Therapeutics Inc. | 14,805 | 473 |
| * | Omnicell Inc. | 13,750 | 467 |
| * | MedAssets Inc. | 21,572 | 456 |
| * | TESARO Inc. | 8,827 | 454 |
| * | Momenta Pharmaceuticals Inc. | 23,174 | 452 |
| * | FibroGen Inc. | 18,154 | 445 |
| * | ImmunoGen Inc. | 32,695 | 440 |
| * | Heron Therapeutics Inc. | 11,089 | 426 |
| * | Repligen Corp. | 12,462 | 425 |
| Ensign Group Inc. | 8,969 | 421 | |
| * | NxStage Medical Inc. | 23,990 | 417 |
| * | Cempra Inc. | 12,071 | 415 |
| * | HealthEquity Inc. | 13,759 | 403 |
| Abaxis Inc. | 8,550 | 402 | |
| * | MiMedx Group Inc. | 41,155 | 400 |
| * | Merrimack Pharmaceuticals Inc. | 39,401 | 398 |
| * | Ophthotech Corp. | 8,989 | 396 |
| * | Zeltiq Aesthetics Inc. | 12,222 | 394 |
| * | Dynavax Technologies Corp. | 13,904 | 394 |
| * | ICU Medical Inc. | 3,448 | 391 |
| ^ | Theravance Inc. | 28,134 | 391 |
| *,^ | ZIOPHARM Oncology Inc. | 43,509 | 379 |
| * | Raptor Pharmaceutical Corp. | 30,531 | 370 |
| * | Retrophin Inc. | 13,262 | 364 |
| * | LDR Holding Corp. | 9,606 | 358 |
| * | NewLink Genetics Corp. | 7,890 | 354 |
| *,^ | MannKind Corp. | 93,403 | 354 |
| * | ZS Pharma Inc. | 6,889 | 352 |
| * | HMS Holdings Corp. | 33,589 | 351 |
| * | Amsurg Corp. | 4,462 | 350 |
| * | Alder Biopharmaceuticals Inc. | 8,866 | 344 |
| * | Haemonetics Corp. | 9,371 | 338 |
| * | Endologix Inc. | 25,565 | 332 |
| * | Amedisys Inc. | 8,512 | 329 |
| * | Achillion Pharmaceuticals Inc. | 44,503 | 329 |
| * | IPC Healthcare Inc. | 3,977 | 316 |
| * | MacroGenics Inc. | 11,946 | 315 |
| * | TherapeuticsMD Inc. | 48,126 | 295 |
| * | Inogen Inc. | 5,958 | 294 |
63
| Vanguard® Russell 2000 Growth Index Fund | |||
| Schedule of Investments | |||
| August 31, 2015 | |||
| Market | |||
| Value | |||
| Shares | ($000) | ||
| * | Insys Therapeutics Inc. | 8,915 | 289 |
| * | Integra LifeSciences Holdings Corp. | 4,754 | 285 |
| * | Nevro Corp. | 6,298 | 284 |
| * | PRA Health Sciences Inc. | 7,533 | 283 |
| * | Relypsa Inc. | 12,338 | 283 |
| * | Sage Therapeutics Inc. | 5,220 | 282 |
| * | Surgical Care Affiliates Inc. | 7,712 | 282 |
| * | Cardiovascular Systems Inc. | 11,380 | 274 |
| * | Emergent BioSolutions Inc. | 8,106 | 270 |
| * | Spectranetics Corp. | 16,013 | 270 |
| * | Synergy Pharmaceuticals Inc. | 37,827 | 265 |
| * | Atara Biotherapeutics Inc. | 6,395 | 259 |
| * | BioCryst Pharmaceuticals Inc. | 22,046 | 257 |
| * | Array BioPharma Inc. | 43,456 | 256 |
| Quality Systems Inc. | 18,848 | 256 | |
| * | Eagle Pharmaceuticals Inc. | 3,238 | 254 |
| Meridian Bioscience Inc. | 13,204 | 253 | |
| * | Sucampo Pharmaceuticals Inc. Class A | 9,373 | 252 |
| * | Arena Pharmaceuticals Inc. | 91,517 | 248 |
| * | Coherus Biosciences Inc. | 8,928 | 246 |
| * | Cynosure Inc. Class A | 7,688 | 243 |
| *,^ | Keryx Biopharmaceuticals Inc. | 39,081 | 242 |
| * | Esperion Therapeutics Inc. | 4,977 | 239 |
| * | Acceleron Pharma Inc. | 8,204 | 238 |
| * | Enanta Pharmaceuticals Inc. | 6,044 | 236 |
| * | Supernus Pharmaceuticals Inc. | 12,948 | 235 |
| * | Adeptus Health Inc. Class A | 2,340 | 233 |
| Phibro Animal Health Corp. Class A | 6,595 | 233 | |
| * | Capital Senior Living Corp. | 11,119 | 232 |
| * | Providence Service Corp. | 5,160 | 231 |
| * | Zafgen Inc. | 6,213 | 227 |
| * | Vascular Solutions Inc. | 6,514 | 225 |
| * | Wright Medical Group Inc. | 9,695 | 224 |
| * | Intra-Cellular Therapies Inc. | 8,189 | 219 |
| * | Epizyme Inc. | 10,915 | 218 |
| US Physical Therapy Inc. | 4,678 | 215 | |
| * | Accuray Inc. | 30,340 | 209 |
| Atrion Corp. | 536 | 207 | |
| *,^ | Rockwell Medical Inc. | 16,911 | 202 |
| * | INC Research Holdings Inc. Class A | 4,886 | 200 |
| Computer Programs & Systems Inc. | 4,343 | 200 | |
| * | Sangamo BioSciences Inc. | 26,209 | 198 |
| * | AtriCure Inc. | 8,061 | 197 |
| * | Progenics Pharmaceuticals Inc. | 26,239 | 192 |
| * | Albany Molecular Research Inc. | 9,578 | 191 |
| * | Omeros Corp. | 13,433 | 189 |
| * | Genomic Health Inc. | 6,823 | 188 |
| * | Merge Healthcare Inc. | 26,470 | 188 |
| *,^ | Inovio Pharmaceuticals Inc. | 24,622 | 184 |
| * | Aratana Therapeutics Inc. | 10,311 | 182 |
| * | Revance Therapeutics Inc. | 6,000 | 182 |
| * | Zogenix Inc. | 9,356 | 180 |
| * | Xencor Inc. | 10,704 | 179 |
| * | Geron Corp. | 57,414 | 174 |
| * | OvaScience Inc. | 8,844 | 172 |
| * | Tornier NV | 7,654 | 170 |
| * | Aegerion Pharmaceuticals Inc. | 9,614 | 170 |
| * | Sagent Pharmaceuticals Inc. | 8,494 | 170 |
| * | Advaxis Inc. | 11,396 | 169 |
| * | Agenus Inc. | 23,545 | 167 |
| * | GenMark Diagnostics Inc. | 16,166 | 167 |
| * | Infinity Pharmaceuticals Inc. | 18,832 | 166 |
| * | TG Therapeutics Inc. | 13,305 | 163 |
| *,^ | Accelerate Diagnostics Inc. | 8,267 | 162 |
64
| Vanguard® Russell 2000 Growth Index Fund | |||
| Schedule of Investments | |||
| August 31, 2015 | |||
| Market | |||
| Value | |||
| Shares | ($000) | ||
| * | Intersect ENT Inc. | 6,288 | 160 |
| * | La Jolla Pharmaceutical Co. | 4,435 | 158 |
| * | Five Prime Therapeutics Inc. | 8,255 | 157 |
| * | Anika Therapeutics Inc. | 4,391 | 155 |
| * | Cerus Corp. | 30,987 | 154 |
| * | XenoPort Inc. | 22,535 | 152 |
| * | Vanda Pharmaceuticals Inc. | 12,826 | 151 |
| * | SciClone Pharmaceuticals Inc. | 19,030 | 150 |
| * | BioTelemetry Inc. | 10,394 | 149 |
| * | ANI Pharmaceuticals Inc. | 3,031 | 148 |
| * | K2M Group Holdings Inc. | 6,759 | 143 |
| * | Cara Therapeutics Inc. | 7,536 | 143 |
| Landauer Inc. | 3,675 | 141 | |
| *,^ | Northwest Biotherapeutics Inc. | 17,998 | 139 |
| * | Sorrento Therapeutics Inc. | 10,903 | 138 |
| * | Pfenex Inc. | 6,259 | 137 |
| * | Spark Therapeutics Inc. | 3,087 | 135 |
| * | Fluidigm Corp. | 11,042 | 135 |
| * | Flexion Therapeutics Inc. | 5,337 | 129 |
| * | Otonomy Inc. | 5,666 | 128 |
| * | OncoMed Pharmaceuticals Inc. | 6,487 | 127 |
| * | Press Ganey Holdings Inc. | 3,927 | 127 |
| * | NeoGenomics Inc. | 20,537 | 125 |
| * | IGI Laboratories Inc. | 15,941 | 125 |
| * | Aerie Pharmaceuticals Inc. | 7,868 | 124 |
| * | Lion Biotechnologies Inc. | 17,273 | 123 |
| * | Karyopharm Therapeutics Inc. | 8,859 | 123 |
| * | Oncothyreon Inc. | 35,994 | 122 |
| * | Paratek Pharmaceuticals Inc. | 4,677 | 122 |
| * | Osiris Therapeutics Inc. | 6,680 | 120 |
| * | Ardelyx Inc. | 6,327 | 120 |
| * | BioDelivery Sciences International Inc. | 17,754 | 120 |
| * | STAAR Surgical Co. | 14,903 | 119 |
| * | Corcept Therapeutics Inc. | 23,741 | 119 |
| * | RTI Surgical Inc. | 18,197 | 116 |
| * | Pacific Biosciences of California Inc. | 23,232 | 116 |
| * | Curis Inc. | 42,664 | 112 |
| * | Civitas Solutions Inc. | 4,507 | 109 |
| * | Orexigen Therapeutics Inc. | 39,250 | 109 |
| * | Foundation Medicine Inc. | 4,573 | 108 |
| * | Antares Pharma Inc. | 59,363 | 107 |
| * | Cross Country Healthcare Inc. | 7,658 | 106 |
| * | Oxford Immunotec Global plc | 7,400 | 106 |
| * | Catalyst Pharmaceuticals Inc. | 28,897 | 105 |
| * | Amphastar Pharmaceuticals Inc. | 8,080 | 104 |
| * | Anthera Pharmaceuticals Inc. | 15,175 | 104 |
| * | Ocular Therapeutix Inc. | 5,742 | 101 |
| * | CTI BioPharma Corp. | 63,113 | 100 |
| * | Medicines Co. | 2,431 | 100 |
| * | InVivo Therapeutics Holdings Corp. | 10,191 | 99 |
| * | CorVel Corp. | 3,305 | 99 |
| * | Blueprint Medicines Corp. | 3,624 | 99 |
| * | Mirati Therapeutics Inc. | 3,822 | 99 |
| *,^ | Galena Biopharma Inc. | 62,119 | 98 |
| * | Sequenom Inc. | 45,302 | 97 |
| * | Threshold Pharmaceuticals Inc. | 23,132 | 97 |
| * | POZEN Inc. | 11,122 | 97 |
| * | Genocea Biosciences Inc. | 8,188 | 95 |
| *,^ | Organovo Holdings Inc. | 34,806 | 95 |
| * | BioSpecifics Technologies Corp. | 1,897 | 94 |
| * | Quidel Corp. | 4,523 | 93 |
| *,^ | Idera Pharmaceuticals Inc. | 29,969 | 91 |
| * | Regulus Therapeutics Inc. | 10,853 | 90 |
| * | Concert Pharmaceuticals Inc. | 5,717 | 89 |
65
| Vanguard® Russell 2000 Growth Index Fund | |||
| Schedule of Investments | |||
| August 31, 2015 | |||
| Market | |||
| Value | |||
| Shares | ($000) | ||
| * | Durect Corp. | 43,224 | 89 |
| * | Foamix Pharmaceuticals Ltd. | 8,757 | 89 |
| *,^ | Cellular Biomedicine Group Inc. | 3,774 | 88 |
| * | Navidea Biopharmaceuticals Inc. | 44,248 | 83 |
| * | Peregrine Pharmaceuticals Inc. | 71,718 | 82 |
| * | RadNet Inc. | 13,191 | 81 |
| * | Pernix Therapeutics Holdings Inc. | 16,769 | 81 |
| * | Rigel Pharmaceuticals Inc. | 26,559 | 80 |
| * | Avalanche Biotechnologies Inc. | 7,497 | 78 |
| * | Affymetrix Inc. | 8,335 | 78 |
| Utah Medical Products Inc. | 1,454 | 78 | |
| * | NanoString Technologies Inc. | 5,092 | 77 |
| * | Tandem Diabetes Care Inc. | 6,574 | 75 |
| * | Lexicon Pharmaceuticals Inc. | 6,308 | 75 |
| * | Arrowhead Research Corp. | 12,633 | 75 |
| * | Immunomedics Inc. | 34,081 | 74 |
| * | AAC Holdings Inc. | 3,055 | 72 |
| * | Heska Corp. | 2,122 | 72 |
| * | ChemoCentryx Inc. | 10,827 | 71 |
| * | Assembly Biosciences Inc. | 5,180 | 71 |
| * | Imprivata Inc. | 3,377 | 71 |
| * | Immune Design Corp. | 4,379 | 70 |
| * | Castlight Health Inc. Class B | 12,962 | 69 |
| * | Synta Pharmaceuticals Corp. | 33,699 | 67 |
| * | Trovagene Inc. | 11,300 | 67 |
| * | Ignyta Inc. | 4,864 | 67 |
| * | Nobilis Health Corp. | 12,403 | 64 |
| * | Dicerna Pharmaceuticals Inc. | 5,870 | 64 |
| * | Aduro Biotech Inc. | 3,217 | 62 |
| * | CytRx Corp. | 25,284 | 62 |
| * | Trevena Inc. | 10,276 | 62 |
| * | BioTime Inc. | 20,348 | 61 |
| * | Ocata Therapeutics Inc. | 13,964 | 59 |
| * | Sientra Inc. | 2,479 | 59 |
| * | Affimed NV | 5,633 | 57 |
| * | Fibrocell Science Inc. | 9,853 | 56 |
| * | Bellicum Pharmaceuticals Inc. | 3,225 | 55 |
| * | Dermira Inc. | 2,093 | 54 |
| * | Cutera Inc. | 3,611 | 53 |
| * | Applied Genetic Technologies Corp. | 3,209 | 53 |
| * | Spectrum Pharmaceuticals Inc. | 6,888 | 50 |
| * | Medgenics Inc. | 6,218 | 49 |
| * | Genesis Healthcare Inc. | 6,652 | 48 |
| * | Veracyte Inc. | 5,049 | 48 |
| * | Cytokinetics Inc. | 6,628 | 46 |
| *,^ | Unilife Corp. | 37,594 | 46 |
| * | VIVUS Inc. | 39,824 | 45 |
| National Research Corp. Class A | 3,332 | 42 | |
| * | Second Sight Medical Products Inc. | 4,337 | 41 |
| * | Corium International Inc. | 4,040 | 40 |
| * | Vitae Pharmaceuticals Inc. | 5,181 | 40 |
| *,^ | Proteon Therapeutics Inc. | 2,782 | 39 |
| * | T2 Biosystems Inc. | 3,296 | 39 |
| * | Alimera Sciences Inc. | 11,371 | 38 |
| * | Entellus Medical Inc. | 1,691 | 38 |
| * | Collegium Pharmaceutical Inc. | 2,466 | 37 |
| * | CorMedix Inc. | 12,983 | 36 |
| * | Agile Therapeutics Inc. | 3,846 | 34 |
| Analogic Corp. | 405 | 33 | |
| * | aTyr Pharma Inc. | 2,234 | 32 |
| * | Invitae Corp. | 2,893 | 30 |
| * | Corindus Vascular Robotics Inc. | 8,322 | 29 |
| *,^ | XBiotech Inc. | 1,491 | 29 |
| * | Flex Pharma Inc. | 2,200 | 26 |
66
| Vanguard® Russell 2000 Growth Index Fund | |||
| Schedule of Investments | |||
| August 31, 2015 | |||
| Market | |||
| Value | |||
| Shares | ($000) | ||
| * | Cidara Therapeutics Inc. | 1,781 | 25 |
| * | iRadimed Corp. | 1,040 | 25 |
| * | Carbylan Therapeutics Inc. | 4,534 | 25 |
| * | XOMA Corp. | 29,025 | 24 |
| *,^ | Vital Therapies Inc. | 6,439 | 24 |
| * | SurModics Inc. | 1,005 | 23 |
| LeMaitre Vascular Inc. | 1,589 | 21 | |
| * | SeaSpine Holdings Corp. | 1,448 | 20 |
| * | Luminex Corp. | 1,080 | 20 |
| * | Asterias Biotherapeutics Inc. | 3,862 | 18 |
| * | Abeona Therapeutics Inc. | 3,820 | 18 |
| *,^ | Tokai Pharmaceuticals Inc. | 1,424 | 17 |
| * | LHC Group Inc. | 300 | 13 |
| * | Tobira Therapeutics Inc. | 889 | 11 |
| * | OraSure Technologies Inc. | 1,731 | 9 |
| * | Verastem Inc. | 1,514 | 9 |
| * | Versartis Inc. | 683 | 9 |
| * | Stemline Therapeutics Inc. | 957 | 9 |
| * | Alliance HealthCare Services Inc. | 550 | 8 |
| * | Addus HomeCare Corp. | 203 | 6 |
| * | TransEnterix Inc. | 2,193 | 6 |
| 94,599 | |||
| Materials & Processing (7.0%) | |||
| PolyOne Corp. | 33,956 | 1,103 | |
| * | Louisiana-Pacific Corp. | 49,717 | 817 |
| Belden Inc. | 16,179 | 815 | |
| * | Berry Plastics Group Inc. | 26,951 | 798 |
| * | Rexnord Corp. | 38,625 | 774 |
| * | Masonite International Corp. | 11,451 | 756 |
| Sensient Technologies Corp. | 11,435 | 745 | |
| KapStone Paper and Packaging Corp. | 32,306 | 704 | |
| * | Chemtura Corp. | 25,484 | 693 |
| HB Fuller Co. | 19,127 | 693 | |
| Balchem Corp. | 11,794 | 690 | |
| Minerals Technologies Inc. | 12,358 | 665 | |
| Interface Inc. Class A | 25,066 | 608 | |
| Apogee Enterprises Inc. | 11,075 | 578 | |
| * | Headwaters Inc. | 27,976 | 565 |
| * | RBC Bearings Inc. | 8,874 | 549 |
| Mueller Water Products Inc. Class A | 61,031 | 546 | |
| * | Trex Co. Inc. | 12,170 | 472 |
| Olin Corp. | 23,436 | 468 | |
| Mueller Industries Inc. | 14,588 | 464 | |
| * | Boise Cascade Co. | 12,567 | 408 |
| US Silica Holdings Inc. | 20,255 | 407 | |
| * | Clearwater Paper Corp. | 7,229 | 405 |
| Comfort Systems USA Inc. | 13,303 | 369 | |
| Advanced Drainage Systems Inc. | 12,764 | 363 | |
| * | Cabot Microelectronics Corp. | 7,924 | 344 |
| A Schulman Inc. | 9,967 | 342 | |
| * | Ferro Corp. | 27,653 | 340 |
| Globe Specialty Metals Inc. | 24,605 | 338 | |
| AAON Inc. | 15,526 | 321 | |
| * | Nortek Inc. | 3,649 | 299 |
| * | US Concrete Inc. | 5,524 | 286 |
| Quaker Chemical Corp. | 3,602 | 286 | |
| * | Builders FirstSource Inc. | 19,228 | 285 |
| Deltic Timber Corp. | 4,153 | 258 | |
| NN Inc. | 10,179 | 246 | |
| * | PGT Inc. | 18,009 | 241 |
| * | Continental Building Products Inc. | 11,879 | 237 |
| * | Summit Materials Inc. Class A | 9,653 | 226 |
| Aceto Corp. | 9,580 | 215 | |
| Neenah Paper Inc. | 3,508 | 203 | |
67
| Vanguard® Russell 2000 Growth Index Fund | |||
| Schedule of Investments | |||
| August 31, 2015 | |||
| Market | |||
| Value | |||
| Shares | ($000) | ||
| * | Installed Building Products Inc. | 7,493 | 200 |
| * | Patrick Industries Inc. | 4,889 | 185 |
| Kaiser Aluminum Corp. | 2,199 | 184 | |
| * | Beacon Roofing Supply Inc. | 4,701 | 170 |
| Koppers Holdings Inc. | 7,880 | 164 | |
| Stepan Co. | 3,627 | 163 | |
| Calgon Carbon Corp. | 9,310 | 151 | |
| Global Brass & Copper Holdings Inc. | 7,386 | 145 | |
| * | Stillwater Mining Co. | 14,907 | 142 |
| Myers Industries Inc. | 9,356 | 133 | |
| * | Trinseo SA | 4,396 | 128 |
| Culp Inc. | 3,962 | 122 | |
| Wausau Paper Corp. | 14,612 | 114 | |
| * | Ply Gem Holdings Inc. | 8,304 | 113 |
| Insteel Industries Inc. | 6,442 | 112 | |
| * | Senomyx Inc. | 16,370 | 109 |
| * | NCI Building Systems Inc. | 10,408 | 109 |
| Worthington Industries Inc. | 4,236 | 108 | |
| * | Stock Building Supply Holdings Inc. | 5,663 | 107 |
| Chase Corp. | 2,403 | 95 | |
| * | AEP Industries Inc. | 1,532 | 83 |
| KMG Chemicals Inc. | 3,730 | 75 | |
| Schweitzer-Mauduit International Inc. | 2,098 | 74 | |
| * | OMNOVA Solutions Inc. | 10,790 | 68 |
| * | LSB Industries Inc. | 2,794 | 67 |
| Rentech Inc. | 8,854 | 62 | |
| * | Core Molding Technologies Inc. | 2,840 | 62 |
| Griffon Corp. | 3,054 | 51 | |
| * | Uranium Energy Corp. | 36,671 | 46 |
| Simpson Manufacturing Co. Inc. | 1,283 | 45 | |
| * | Lawson Products Inc. | 1,533 | 36 |
| Omega Flex Inc. | 1,141 | 35 | |
| * | Energy Fuels Inc. | 9,655 | 34 |
| Tredegar Corp. | 2,029 | 29 | |
| * | Landec Corp. | 2,131 | 28 |
| Hawkins Inc. | 711 | 27 | |
| Quanex Building Products Corp. | 1,126 | 20 | |
| American Vanguard Corp. | 1,304 | 17 | |
| Haynes International Inc. | 328 | 13 | |
| Olympic Steel Inc. | 879 | 11 | |
| Valhi Inc. | 3,553 | 10 | |
| * | Unifi Inc. | 317 | 9 |
| * | Century Aluminum Co. | 1,129 | 6 |
| United States Lime & Minerals Inc. | 59 | 3 | |
| * | Handy & Harman Ltd. | 106 | 3 |
| * | Ryerson Holding Corp. | 335 | 3 |
| 23,593 | |||
| Other (0.1%)2 | |||
| *,^ | Fitbit Inc. | 1,200 | 41 |
| * | Chiasma Inc. | 1,200 | 31 |
| * | Milacron Holdings Corp. | 1,359 | 27 |
| * | Furiex Pharmaceuticals Inc. CVR | 2,460 | 24 |
| * | Sunrun Inc. | 1,900 | 22 |
| * | Global Blood Therapeutics Inc. | 420 | 21 |
| * | Alarm.com Holdings Inc. | 1,200 | 20 |
| * | vTv Therapeutics Inc. Class A | 1,799 | 16 |
| * | TransUnion | 575 | 15 |
| * | ConforMIS Inc. | 840 | 13 |
| * | Glaukos Corp. | 420 | 12 |
| * | Catabasis Pharmaceuticals Inc. | 1,055 | 12 |
| * | Univar Inc. | 480 | 11 |
| * | Planet Fitness Inc. Class A | 600 | 11 |
| * | Leap Wireless International Inc. CVR | 4,106 | 10 |
| * | Seres Therapeutics Inc. | 240 | 10 |
68
| Vanguard® Russell 2000 Growth Index Fund | ||
| Schedule of Investments | ||
| August 31, 2015 | ||
| Market | ||
| Value | ||
| Shares | ($000) | |
| * Blue Buffalo Pet Products Inc. | 383 | 10 |
| * Evolent Health Inc. Class A | 513 | 9 |
| * Nivalis Therapeutics Inc. | 480 | 7 |
| * Appfolio Inc. | 420 | 7 |
| * Wingstop Inc. | 240 | 6 |
| * Teladoc Inc. | 240 | 6 |
| * Fogo De Chao Inc. | 315 | 6 |
| * MINDBODY Inc. Class A | 363 | 5 |
| * Rapid7 Inc. | 240 | 5 |
| * Aimmune Therapeutics Inc. | 240 | 5 |
| * Neos Therapeutics Inc. | 180 | 5 |
| * Amplify Snack Brands Inc. | 285 | 4 |
| * MCBC Holdings Inc. | 240 | 4 |
| * EndoChoice Holdings Inc. | 188 | 3 |
| * Chelsea Therapeutics International Ltd. CVR Exp. 12/31/2016 | 27,975 | 3 |
| * Ollie's Bargain Outlet Holdings Inc. | 153 | 3 |
| * Cubist Pharmaceuticals, Inc. CVR | 13,027 | 2 |
| * Omthera Pharmaceuticals Inc. CVR | 2,001 | 1 |
| * Durata Therapeutics Inc. CVR Exp. 12/31/2018 | 534 | 1 |
| * Clinical Data CVR | 367 | — |
| * Magnum Hunter Resources Corp. Warrants Exp. 04/15/2016 | 1,888 | — |
| 388 | ||
| Producer Durables (11.4%) | ||
| MAXIMUS Inc. | 25,063 | 1,518 |
| Allegiant Travel Co. Class A | 5,107 | 1,038 |
| CLARCOR Inc. | 17,944 | 1,012 |
| * Dycom Industries Inc. | 12,929 | 919 |
| CEB Inc. | 12,693 | 909 |
| Healthcare Services Group Inc. | 27,118 | 907 |
| * Generac Holdings Inc. | 26,233 | 811 |
| HNI Corp. | 16,876 | 789 |
| * XPO Logistics Inc. | 22,357 | 785 |
| * Advisory Board Co. | 16,097 | 783 |
| Woodward Inc. | 17,098 | 780 |
| * Electronics For Imaging Inc. | 17,785 | 778 |
| * On Assignment Inc. | 19,623 | 706 |
| Littelfuse Inc. | 7,399 | 664 |
| HEICO Corp. Class A | 15,142 | 661 |
| * Swift Transportation Co. | 33,409 | 651 |
| Knight Transportation Inc. | 23,728 | 645 |
| * Proto Labs Inc. | 8,835 | 643 |
| Herman Miller Inc. | 22,630 | 614 |
| * WageWorks Inc. | 13,556 | 607 |
| Deluxe Corp. | 10,380 | 602 |
| Matson Inc. | 15,116 | 570 |
| Steelcase Inc. Class A | 31,595 | 557 |
| Forward Air Corp. | 11,749 | 529 |
| Brink's Co. | 18,449 | 529 |
| AZZ Inc. | 9,774 | 495 |
| Franklin Electric Co. Inc. | 16,749 | 491 |
| * TASER International Inc. | 20,277 | 475 |
| * Hub Group Inc. Class A | 12,497 | 471 |
| Knoll Inc. | 18,517 | 443 |
| * ExlService Holdings Inc. | 11,710 | 424 |
| Greenbrier Cos. Inc. | 10,012 | 418 |
| US Ecology Inc. | 8,216 | 410 |
| * Hawaiian Holdings Inc. | 18,097 | 410 |
| Exponent Inc. | 9,363 | 400 |
| Heartland Express Inc. | 19,109 | 387 |
| * TrueBlue Inc. | 15,900 | 382 |
| * Astronics Corp. | 7,267 | 375 |
| Tennant Co. | 6,499 | 373 |
| G&K Services Inc. Class A | 5,498 | 372 |
| HEICO Corp. | 7,297 | 371 |
69
| Vanguard® Russell 2000 Growth Index Fund | |||
| Schedule of Investments | |||
| August 31, 2015 | |||
| Market | |||
| Value | |||
| Shares | ($000) | ||
| John Bean Technologies Corp. | 11,087 | 367 | |
| * | Saia Inc. | 9,518 | 357 |
| Korn/Ferry International | 10,442 | 356 | |
| Harsco Corp. | 30,277 | 350 | |
| * | Teledyne Technologies Inc. | 3,445 | 337 |
| MTS Systems Corp. | 5,653 | 337 | |
| * | Team Inc. | 7,886 | 330 |
| Insperity Inc. | 7,349 | 326 | |
| MSA Safety Inc. | 7,133 | 324 | |
| Badger Meter Inc. | 5,486 | 320 | |
| Multi-Color Corp. | 4,783 | 315 | |
| * | Wabash National Corp. | 25,758 | 315 |
| * | Virgin America Inc. | 8,926 | 291 |
| Lindsay Corp. | 3,805 | 290 | |
| Standex International Corp. | 3,543 | 284 | |
| Sun Hydraulics Corp. | 8,593 | 277 | |
| * | Echo Global Logistics Inc. | 11,202 | 261 |
| Applied Industrial Technologies Inc. | 6,000 | 254 | |
| Kforce Inc. | 9,317 | 250 | |
| General Cable Corp. | 16,892 | 246 | |
| EnPro Industries Inc. | 5,159 | 245 | |
| H&E Equipment Services Inc. | 11,742 | 243 | |
| EnerSys | 4,516 | 241 | |
| * | TriNet Group Inc. | 14,312 | 241 |
| * | Aerojet Rocketdyne Holdings Inc. | 11,106 | 228 |
| * | Advanced Energy Industries Inc. | 8,338 | 202 |
| Altra Industrial Motion Corp. | 7,959 | 199 | |
| Encore Wire Corp. | 6,039 | 196 | |
| * | Paylocity Holding Corp. | 5,830 | 193 |
| Primoris Services Corp. | 10,152 | 187 | |
| Argan Inc. | 4,400 | 172 | |
| * | OSI Systems Inc. | 1,945 | 142 |
| * | SP Plus Corp. | 6,023 | 138 |
| Celadon Group Inc. | 7,186 | 137 | |
| Hackett Group Inc. | 9,186 | 129 | |
| * | Blount International Inc. | 18,656 | 129 |
| * | GP Strategies Corp. | 5,009 | 123 |
| Forrester Research Inc. | 3,855 | 122 | |
| Park-Ohio Holdings Corp. | 3,367 | 121 | |
| Mesa Laboratories Inc. | 1,110 | 120 | |
| Werner Enterprises Inc. | 4,033 | 107 | |
| * | Covenant Transportation Group Inc. Class A | 4,261 | 101 |
| Barrett Business Services Inc. | 2,751 | 98 | |
| * | Vectrus Inc. | 3,831 | 95 |
| ArcBest Corp. | 3,258 | 94 | |
| TeleTech Holdings Inc. | 3,446 | 93 | |
| * | Roadrunner Transportation Systems Inc. | 4,283 | 93 |
| * | Moog Inc. Class A | 1,345 | 85 |
| * | Furmanite Corp. | 12,358 | 78 |
| * | Huron Consulting Group Inc. | 1,049 | 76 |
| * | Radiant Logistics Inc. | 11,353 | 68 |
| *,^ | Plug Power Inc. | 39,774 | 68 |
| Curtiss-Wright Corp. | 1,021 | 67 | |
| * | ServiceSource International Inc. | 12,763 | 61 |
| Hyster-Yale Materials Handling Inc. | 989 | 60 | |
| * | Commercial Vehicle Group Inc. | 11,694 | 60 |
| Mobile Mini Inc. | 1,711 | 58 | |
| * | Lydall Inc. | 2,088 | 57 |
| * | FARO Technologies Inc. | 1,453 | 56 |
| * | Power Solutions International Inc. | 1,792 | 56 |
| * | Mistras Group Inc. | 3,685 | 54 |
| * | PFSweb Inc. | 4,132 | 54 |
| * | Xerium Technologies Inc. | 4,316 | 53 |
| * | Vicor Corp. | 5,359 | 52 |
70
| Vanguard® Russell 2000 Growth Index Fund | |||
| Schedule of Investments | |||
| August 31, 2015 | |||
| Market | |||
| Value | |||
| Shares | ($000) | ||
| * | Patriot National Inc. | 3,097 | 50 |
| * | FTI Consulting Inc. | 1,256 | 50 |
| Kimball International Inc. Class B | 4,478 | 49 | |
| FreightCar America Inc. | 2,248 | 48 | |
| * | PAM Transportation Services Inc. | 1,203 | 46 |
| * | DHI Group Inc. | 5,805 | 45 |
| Albany International Corp. | 1,417 | 45 | |
| * | DXP Enterprises Inc. | 1,511 | 45 |
| Douglas Dynamics Inc. | 2,017 | 45 | |
| * | Accuride Corp. | 12,885 | 44 |
| Allied Motion Technologies Inc. | 2,290 | 44 | |
| * | YRC Worldwide Inc. | 2,468 | 41 |
| * | NV5 Holdings Inc. | 1,872 | 40 |
| Resources Connection Inc. | 2,567 | 40 | |
| * | InnerWorkings Inc. | 5,435 | 39 |
| Universal Truckload Services Inc. | 2,006 | 39 | |
| Gorman-Rupp Co. | 1,589 | 38 | |
| American Railcar Industries Inc. | 905 | 38 | |
| * | Thermon Group Holdings Inc. | 1,612 | 37 |
| * | RPX Corp. | 2,617 | 36 |
| * | HC2 Holdings Inc. | 4,470 | 34 |
| Kaman Corp. | 822 | 32 | |
| Raven Industries Inc. | 1,703 | 31 | |
| Kadant Inc. | 659 | 29 | |
| * | USA Truck Inc. | 1,327 | 26 |
| * | Blue Bird Corp. | 1,880 | 22 |
| * | Volt Information Sciences Inc. | 2,240 | 20 |
| * | Navistar International Corp. | 1,113 | 20 |
| * | TriMas Corp. | 1,038 | 19 |
| Marten Transport Ltd. | 902 | 17 | |
| * | Casella Waste Systems Inc. Class A | 2,487 | 15 |
| * | Neff Corp. Class A | 1,575 | 10 |
| * | Great Lakes Dredge & Dock Corp. | 1,823 | 10 |
| Titan International Inc. | 973 | 9 | |
| *,^ | 6D Global Technologies Inc. | 3,539 | 9 |
| * | PHI Inc. | 275 | 7 |
| Heidrick & Struggles International Inc. | 345 | 7 | |
| Miller Industries Inc. | 245 | 5 | |
| * | Heritage-Crystal Clean Inc. | 389 | 5 |
| 38,329 | |||
| Technology (18.6%) | |||
| * | Tyler Technologies Inc. | 12,803 | 1,767 |
| * | Manhattan Associates Inc. | 28,053 | 1,641 |
| * | Guidewire Software Inc. | 26,690 | 1,492 |
| * | Cavium Inc. | 21,041 | 1,431 |
| * | Qlik Technologies Inc. | 34,752 | 1,316 |
| * | EPAM Systems Inc. | 18,610 | 1,314 |
| * | Aspen Technology Inc. | 32,496 | 1,231 |
| FEI Co. | 15,817 | 1,194 | |
| * | Verint Systems Inc. | 22,068 | 1,177 |
| * | Microsemi Corp. | 36,235 | 1,151 |
| *,^ | Ambarella Inc. | 11,926 | 1,140 |
| * | Infinera Corp. | 50,677 | 1,106 |
| * | Integrated Device Technology Inc. | 56,280 | 1,069 |
| * | Ciena Corp. | 46,821 | 1,047 |
| Blackbaud Inc. | 17,782 | 1,016 | |
| * | Synaptics Inc. | 13,972 | 979 |
| * | ACI Worldwide Inc. | 44,290 | 945 |
| Science Applications International Corp. | 17,465 | 852 | |
| * | Proofpoint Inc. | 14,954 | 843 |
| * | ViaSat Inc. | 13,790 | 810 |
| * | Ellie Mae Inc. | 11,155 | 808 |
| Diebold Inc. | 24,600 | 766 | |
| * | GrubHub Inc. | 28,523 | 754 |
71
| Vanguard® Russell 2000 Growth Index Fund | ||
| Schedule of Investments | ||
| August 31, 2015 | ||
| Market | ||
| Value | ||
| Shares | ($000) | |
| * Cornerstone OnDemand Inc. | 20,462 | 731 |
| * Cirrus Logic Inc. | 24,055 | 725 |
| Monolithic Power Systems Inc. | 14,996 | 721 |
| Plantronics Inc. | 13,363 | 710 |
| * Demandware Inc. | 12,666 | 707 |
| * MicroStrategy Inc. Class A | 3,522 | 700 |
| * comScore Inc. | 13,054 | 682 |
| * NetScout Systems Inc. | 18,154 | 664 |
| * Fleetmatics Group plc | 14,501 | 649 |
| * CommVault Systems Inc. | 17,159 | 615 |
| InterDigital Inc. | 12,273 | 607 |
| * Imperva Inc. | 10,068 | 600 |
| * Virtusa Corp. | 11,247 | 595 |
| * Synchronoss Technologies Inc. | 14,705 | 594 |
| * Rambus Inc. | 43,806 | 588 |
| * LogMeIn Inc. | 9,341 | 582 |
| * Universal Display Corp. | 15,256 | 562 |
| * Syntel Inc. | 11,905 | 529 |
| * Nimble Storage Inc. | 19,218 | 512 |
| * Silicon Laboratories Inc. | 11,471 | 499 |
| * Take-Two Interactive Software Inc. | 16,626 | 484 |
| NIC Inc. | 24,864 | 468 |
| * Paycom Software Inc. | 11,970 | 461 |
| * Entegris Inc. | 31,069 | 427 |
| * SPS Commerce Inc. | 6,270 | 426 |
| * Luxoft Holding Inc. Class A | 6,961 | 425 |
| * Zendesk Inc. | 20,387 | 422 |
| * Envestnet Inc. | 13,388 | 418 |
| * Infoblox Inc. | 21,494 | 414 |
| * Dealertrack Technologies Inc. | 6,464 | 406 |
| Tessera Technologies Inc. | 12,235 | 401 |
| Methode Electronics Inc. | 14,547 | 387 |
| CSG Systems International Inc. | 12,424 | 384 |
| ^ Ubiquiti Networks Inc. | 10,895 | 383 |
| * Super Micro Computer Inc. | 13,985 | 382 |
| * Marketo Inc. | 13,199 | 370 |
| * RealPage Inc. | 20,020 | 369 |
| * AVG Technologies NV | 15,538 | 359 |
| * Web.com Group Inc. | 16,623 | 358 |
| * Bottomline Technologies de Inc. | 13,126 | 351 |
| * RingCentral Inc. Class A | 20,326 | 350 |
| * BroadSoft Inc. | 11,054 | 349 |
| * Inphi Corp. | 14,511 | 344 |
| * Endurance International Group Holdings Inc. | 22,236 | 340 |
| * HubSpot Inc. | 7,132 | 337 |
| Pegasystems Inc. | 13,562 | 332 |
| * Callidus Software Inc. | 20,961 | 331 |
| * Cray Inc. | 15,486 | 328 |
| EarthLink Holdings Corp. | 39,097 | 328 |
| * Ruckus Wireless Inc. | 28,578 | 323 |
| Monotype Imaging Holdings Inc. | 15,187 | 322 |
| * Ixia | 20,627 | 319 |
| * InvenSense Inc. | 29,335 | 300 |
| Power Integrations Inc. | 7,404 | 291 |
| ^ Ebix Inc. | 10,150 | 288 |
| * Cvent Inc. | 8,848 | 279 |
| * Qualys Inc. | 9,411 | 273 |
| * Loral Space & Communications Inc. | 4,960 | 269 |
| * M/A-COM Technology Solutions Holdings Inc. | 8,878 | 262 |
| * Gigamon Inc. | 10,345 | 236 |
| * Interactive Intelligence Group Inc. | 6,541 | 229 |
| * Dot Hill Systems Corp. | 23,482 | 227 |
| * CalAmp Corp. | 13,647 | 227 |
| * Global Eagle Entertainment Inc. | 17,451 | 205 |
72
| Vanguard® Russell 2000 Growth Index Fund | |||
| Schedule of Investments | |||
| August 31, 2015 | |||
| Market | |||
| Value | |||
| Shares | ($000) | ||
| * | PROS Holdings Inc. | 9,168 | 203 |
| * | GTT Communications Inc. | 9,209 | 202 |
| * | MaxLinear Inc. | 19,839 | 197 |
| * | LivePerson Inc. | 21,447 | 196 |
| * | Q2 Holdings Inc. | 7,466 | 195 |
| *,^ | Advanced Micro Devices Inc. | 107,481 | 195 |
| * | Textura Corp. | 7,448 | 193 |
| * | Plexus Corp. | 4,876 | 186 |
| *,^ | VASCO Data Security International Inc. | 11,043 | 185 |
| * | NeuStar Inc. Class A | 6,267 | 175 |
| * | Internap Corp. | 21,089 | 168 |
| * | Comverse Inc. | 8,711 | 164 |
| * | Unisys Corp. | 12,122 | 160 |
| * | Globant SA | 5,858 | 159 |
| * | DTS Inc. | 5,985 | 159 |
| * | Silver Spring Networks Inc. | 13,145 | 152 |
| * | Perficient Inc. | 9,189 | 152 |
| * | Semtech Corp. | 8,609 | 146 |
| * | PMC-Sierra Inc. | 23,155 | 146 |
| * | Rubicon Project Inc. | 9,868 | 142 |
| * | Wix.com Ltd. | 7,181 | 142 |
| * | Lionbridge Technologies Inc. | 24,680 | 132 |
| * | Rogers Corp. | 2,244 | 125 |
| * | Immersion Corp. | 10,747 | 125 |
| * | PDF Solutions Inc. | 9,579 | 117 |
| * | Yodlee Inc. | 7,002 | 113 |
| * | Tangoe Inc. | 14,961 | 112 |
| * | TrueCar Inc. | 18,772 | 111 |
| * | Benefitfocus Inc. | 3,024 | 111 |
| * | Glu Mobile Inc. | 24,002 | 110 |
| * | Pacific DataVision Inc. | 3,413 | 109 |
| * | Applied Optoelectronics Inc. | 5,243 | 108 |
| Alliance Fiber Optic Products Inc. | 5,585 | 105 | |
| * | ARC Document Solutions Inc. | 15,654 | 104 |
| * | Digimarc Corp. | 2,712 | 103 |
| * | Zix Corp. | 22,063 | 97 |
| * | ChannelAdvisor Corp. | 8,347 | 95 |
| * | OPOWER Inc. | 10,031 | 91 |
| * | Intralinks Holdings Inc. | 8,356 | 86 |
| * | A10 Networks Inc. | 12,598 | 84 |
| * | Model N Inc. | 8,070 | 83 |
| * | Barracuda Networks Inc. | 3,103 | 82 |
| * | Mattson Technology Inc. | 28,863 | 81 |
| * | Jive Software Inc. | 17,902 | 81 |
| Sapiens International Corp. NV | 6,929 | 81 | |
| * | Newport Corp. | 5,084 | 78 |
| * | Carbonite Inc. | 7,047 | 78 |
| * | CEVA Inc. | 3,919 | 75 |
| * | Everyday Health Inc. | 7,608 | 74 |
| * | New Relic Inc. | 2,248 | 73 |
| * | Vocera Communications Inc. | 6,212 | 73 |
| * | Clearfield Inc. | 4,200 | 71 |
| * | FormFactor Inc. | 10,374 | 69 |
| * | Silicon Graphics International Corp. | 13,483 | 67 |
| *,^ | Box Inc. | 4,991 | 67 |
| * | SciQuest Inc. | 6,102 | 67 |
| * | Hortonworks Inc. | 2,808 | 67 |
| * | Varonis Systems Inc. | 3,320 | 66 |
| * | Avid Technology Inc. | 7,860 | 65 |
| * | Brightcove Inc. | 11,859 | 63 |
| * | VirnetX Holding Corp. | 17,364 | 63 |
| * | MobileIron Inc. | 15,047 | 62 |
| * | Violin Memory Inc. | 34,854 | 62 |
| * | Cascade Microtech Inc. | 3,985 | 61 |
73
| Vanguard® Russell 2000 Growth Index Fund | |||
| Schedule of Investments | |||
| August 31, 2015 | |||
| Market | |||
| Value | |||
| Shares | ($000) | ||
| Epiq Systems Inc. | 4,743 | 60 | |
| * | iRobot Corp. | 2,042 | 60 |
| * | Xcerra Corp. | 9,103 | 57 |
| * | KVH Industries Inc. | 4,894 | 54 |
| * | Aerohive Networks Inc. | 8,679 | 54 |
| * | Bazaarvoice Inc. | 10,139 | 53 |
| Reis Inc. | 2,038 | 51 | |
| * | Guidance Software Inc. | 6,984 | 50 |
| * | Sparton Corp. | 2,125 | 49 |
| * | Lattice Semiconductor Corp. | 11,328 | 47 |
| * | Applied Micro Circuits Corp. | 8,006 | 47 |
| * | Coherent Inc. | 797 | 46 |
| NVE Corp. | 863 | 45 | |
| * | Digital Turbine Inc. | 16,347 | 43 |
| *,^ | Park City Group Inc. | 3,600 | 42 |
| * | Workiva Inc. | 2,706 | 39 |
| * | ShoreTel Inc. | 5,105 | 38 |
| * | Novatel Wireless Inc. | 12,282 | 34 |
| * | Five9 Inc. | 8,602 | 34 |
| * | Rofin-Sinar Technologies Inc. | 1,239 | 32 |
| * | Harmonic Inc. | 5,435 | 31 |
| * | Amber Road Inc. | 5,968 | 30 |
| Daktronics Inc. | 3,040 | 26 | |
| * | Rudolph Technologies Inc. | 1,961 | 25 |
| * | Travelzoo Inc. | 2,570 | 25 |
| QAD Inc. Class A | 980 | 25 | |
| * | TechTarget Inc. | 2,050 | 19 |
| * | Connecture Inc. | 2,454 | 18 |
| American Software Inc. Class A | 1,572 | 14 | |
| * | Exar Corp. | 2,424 | 14 |
| * | Apigee Corp. | 1,892 | 12 |
| * | MaxPoint Interactive Inc. | 2,533 | 12 |
| * | ePlus Inc. | 151 | 11 |
| * | Extreme Networks Inc. | 2,994 | 9 |
| * | RetailMeNot Inc. | 810 | 7 |
| *,^ | Code Rebel Corp. | 398 | 6 |
| * | Marin Software Inc. | 1,427 | 5 |
| * | Datalink Corp. | 502 | 3 |
| 62,196 | |||
| Utilities (1.3%) | |||
| j2 Global Inc. | 18,345 | 1,276 | |
| Cogent Communications Holdings Inc. | 17,469 | 485 | |
| * | Gogo Inc. | 21,292 | 338 |
| Shenandoah Telecommunications Co. | 7,871 | 305 | |
| ^ | Windstream Holdings Inc. | 35,820 | 258 |
| Consolidated Communications Holdings Inc. | 12,435 | 243 | |
| * | General Communication Inc. Class A | 13,180 | 222 |
| Ormat Technologies Inc. | 5,815 | 205 | |
| * | inContact Inc. | 21,384 | 161 |
| * | FairPoint Communications Inc. | 7,999 | 131 |
| Inteliquent Inc. | 5,375 | 98 | |
| * | 8x8 Inc. | 11,970 | 93 |
| Lumos Networks Corp. | 7,439 | 87 | |
| *,^ | Straight Path Communications Inc. Class B | 3,587 | 82 |
| West Corp. | 2,716 | 66 | |
| * | Boingo Wireless Inc. | 7,430 | 56 |
| American States Water Co. | 1,226 | 46 | |
| * | Vonage Holdings Corp. | 7,137 | 40 |
| * | Intelsat SA | 3,245 | 31 |
| Spark Energy Inc. Class A | 972 | 15 | |
| IDT Corp. Class B | 923 | 14 | |
| Genie Energy Ltd. Class B | 1,072 | 12 | |
74
| Vanguard® Russell 2000 Growth Index Fund | ||||
| Schedule of Investments | ||||
| August 31, 2015 | ||||
| Market | ||||
| Value | ||||
| Shares | ($000) | |||
| York Water Co. | 413 | 9 | ||
| 4,273 | ||||
| Total Common Stocks (Cost $329,015) | 334,123 | |||
| Coupon | ||||
| Temporary Cash Investments (1.6%)1 | ||||
| Money Market Fund (1.6%) | ||||
| 3,4 Vanguard Market Liquidity Fund | 0.168% | 5,270,000 | 5,270 | |
| Face | ||||
| Maturity | Amount | |||
| Date | ($000) | |||
| U.S. Government and Agency Obligations (0.0%) | ||||
| 5,6 Federal Home Loan Bank Discount Notes | 0.090% | 10/14/15 | 100 | 100 |
| Total Temporary Cash Investments (Cost $5,370) | 5,370 | |||
| Total Investments (101.2%) (Cost $334,385) | 339,493 | |||
| Other Assets and Liabilities—Net (-1.2%) | (3,889) | |||
| Net Assets (100%) | 335,604 | |||
* Non-income-producing security.
^ Includes partial security positions on loan to broker-dealers. The total value of securities on loan is $3,546,000.
1 The fund invests a portion of its cash reserves in equity markets through the use of index futures contracts. After giving effect to futures investments, the fund's effective common stock and temporary cash investment positions represent 99.9% and 1.3%, respectively, of net assets.
2 “Other” represents securities that are not classified by the fund’s benchmark index.
3 Affiliated money market fund available only to Vanguard funds and certain trusts and accounts managed by Vanguard. Rate shown is the 7-day yield.
4 Includes $3,846,000 of collateral received for securities on loan.
5 The issuer operates under a congressional charter; its securities are generally neither guaranteed by the U.S. Treasury nor backed by the full faith and credit of the U.S. government.
6 Securities with a value of $100,000 have been segregated as initial margin for open futures contracts.
REIT—Real Estate Investment Trust.
75
© 2015 The Vanguard Group, Inc.
All rights reserved.
Vanguard Marketing Corporation, Distributor.
SNA18510 102015
Report of Independent Registered Public Accounting Firm
To the Board of Trustees of Vanguard Scottsdale Funds and the Shareholders of Vanguard Russell 2000 Index Fund, Vanguard Russell 2000 Value Index Fund and Vanguard Russell 2000 Growth Index Fund:
In our opinion, the accompanying statements of net assets – investments summary and the related statements of operations and of changes in net assets and the financial highlights (included in Item 1 of this Form N-CSR) and the schedules of investments (included in Item 6 of this Form N-CSR) present fairly, in all material respects, the financial position of Vanguard Russell 2000 Index Fund, Vanguard Russell 2000 Value Index Fund and Vanguard Russell 2000 Growth Index Fund (constituting separate portfolios of Vanguard Scottsdale Funds, hereafter referred to as the “Funds”) at August 31, 2015, the results of each of their operations for the year then ended, the changes in each of their net assets for each of the two years in the period then ended, and the financial highlights for each of the periods indicated, in conformity with accounting principles generally accepted in the United States of America. These financial statements, financial highlights, and schedules of investments (hereafter referred to as "financial statements") are the responsibility of the Funds’ management. Our responsibility is to express an opinion on these financial statements based on our audits. We conducted our audits of these financial statements in accordance with the standards of the Public Company Accounting Oversight Board (United States). Those standards require that we plan and perform the audit to obtain reasonable assurance about whether the financial statements are free of material misstatement. An audit includes examining, on a test basis, evidence supporting the amounts and disclosures in the financial statements, assessing the accounting principles used and significant estimates made by management, and evaluating the overall financial statement presentation. We believe that our audits, which included confirmation of securities at August 31, 2015 by correspondence with the custodian and brokers, by agreement to the underlying ownership records of the transfer agent and the application of alternative auditing procedures where securities purchased had not been received, provide a reasonable basis for our opinion.

October 15, 2015
PricewaterhouseCoopers LLP, Two Commerce Square, 2001 Market Street, Suite 1700, Philadelphia, PA 19103-7042
T: (267) 330-3000, F: (267) 330-3300, www.pwc.com/us
| Vanguard® Russell 3000 Index Fund | ||
| Schedule of Investments | ||
| August 31, 2015 | ||
| Market | ||
| Value | ||
| Shares | ($000) | |
| Common Stocks (99.2%)1 | ||
| Consumer Discretionary (14.7%) | ||
| * Amazon.com Inc. | 16,677 | 8,553 |
| Walt Disney Co. | 74,239 | 7,563 |
| Home Depot Inc. | 56,829 | 6,618 |
| Comcast Corp. Class A | 109,758 | 6,183 |
| Wal-Mart Stores Inc. | 69,109 | 4,473 |
| McDonald's Corp. | 41,936 | 3,985 |
| Starbucks Corp. | 65,648 | 3,592 |
| NIKE Inc. Class B | 29,666 | 3,315 |
| Lowe's Cos. Inc. | 41,639 | 2,880 |
| * Priceline Group Inc. | 2,269 | 2,833 |
| Costco Wholesale Corp. | 19,250 | 2,696 |
| Time Warner Inc. | 36,077 | 2,565 |
| Ford Motor Co. | 170,823 | 2,369 |
| Time Warner Cable Inc. | 12,368 | 2,301 |
| Target Corp. | 27,935 | 2,171 |
| * Netflix Inc. | 18,566 | 2,136 |
| Twenty-First Century Fox Inc. Class A | 76,494 | 2,095 |
| TJX Cos. Inc. | 29,765 | 2,093 |
| General Motors Co. | 70,317 | 2,070 |
| Yum! Brands Inc. | 18,930 | 1,510 |
| * eBay Inc. | 53,236 | 1,443 |
| Johnson Controls Inc. | 28,765 | 1,183 |
| VF Corp. | 14,882 | 1,078 |
| * Tesla Motors Inc. | 4,297 | 1,070 |
| * O'Reilly Automotive Inc. | 4,450 | 1,068 |
| Dollar General Corp. | 13,385 | 997 |
| * AutoZone Inc. | 1,382 | 989 |
| CBS Corp. Class B | 21,657 | 980 |
| * Chipotle Mexican Grill Inc. Class A | 1,371 | 973 |
| Delphi Automotive plc | 12,751 | 963 |
| Carnival Corp. | 18,758 | 923 |
| L Brands Inc. | 10,946 | 918 |
| Ross Stores Inc. | 18,271 | 888 |
| Macy's Inc. | 15,055 | 882 |
| * Dollar Tree Inc. | 10,213 | 779 |
| * Under Armour Inc. Class A | 7,931 | 758 |
| Las Vegas Sands Corp. | 16,181 | 748 |
| Estee Lauder Cos. Inc. Class A | 9,301 | 742 |
| * Nielsen Holdings plc | 16,359 | 740 |
| Omnicom Group Inc. | 10,842 | 726 |
| Royal Caribbean Cruises Ltd. | 7,681 | 677 |
| Marriott International Inc. Class A | 9,330 | 659 |
| Viacom Inc. Class B | 15,341 | 625 |
| * Charter Communications Inc. Class A | 3,351 | 609 |
| Whirlpool Corp. | 3,518 | 591 |
| Hilton Worldwide Holdings Inc. | 23,211 | 576 |
| * DISH Network Corp. Class A | 9,721 | 576 |
| Advance Auto Parts Inc. | 3,282 | 575 |
| * Liberty Interactive Corp. QVC Group Class A | 21,142 | 572 |
| * CarMax Inc. | 9,369 | 571 |
| Genuine Parts Co. | 6,814 | 569 |
| * Mohawk Industries Inc. | 2,775 | 547 |
| Starwood Hotels & Resorts Worldwide Inc. | 7,640 | 546 |
| Hanesbrands Inc. | 17,978 | 541 |
| Harley-Davidson Inc. | 9,346 | 524 |
| Tractor Supply Co. | 6,117 | 522 |
| Newell Rubbermaid Inc. | 12,104 | 510 |
| Expedia Inc. | 4,265 | 490 |
| Best Buy Co. Inc. | 13,122 | 482 |
| * Bed Bath & Beyond Inc. | 7,715 | 479 |
| Signet Jewelers Ltd. | 3,472 | 479 |
1
| Vanguard® Russell 3000 Index Fund | ||
| Schedule of Investments | ||
| August 31, 2015 | ||
| Market | ||
| Value | ||
| Shares | ($000) | |
| * Jarden Corp. | 9,230 | 474 |
| Kohl's Corp. | 9,093 | 464 |
| Nordstrom Inc. | 6,327 | 461 |
| BorgWarner Inc. | 10,179 | 444 |
| * Ulta Salon Cosmetics & Fragrance Inc. | 2,778 | 439 |
| DR Horton Inc. | 14,190 | 431 |
| Foot Locker Inc. | 6,046 | 428 |
| PVH Corp. | 3,574 | 425 |
| H&R Block Inc. | 11,900 | 405 |
| Tiffany & Co. | 4,884 | 402 |
| Wyndham Worldwide Corp. | 5,190 | 397 |
| * LKQ Corp. | 13,152 | 394 |
| Staples Inc. | 27,699 | 394 |
| * MGM Resorts International | 19,254 | 393 |
| Lennar Corp. Class A | 7,519 | 383 |
| * Sirius XM Holdings Inc. | 99,367 | 379 |
| * Michael Kors Holdings Ltd. | 8,591 | 373 |
| Polaris Industries Inc. | 2,874 | 373 |
| Darden Restaurants Inc. | 5,439 | 370 |
| Coach Inc. | 11,946 | 361 |
| Hasbro Inc. | 4,816 | 359 |
| Goodyear Tire & Rubber Co. | 11,670 | 347 |
| Lear Corp. | 3,363 | 346 |
| Mattel Inc. | 14,627 | 343 |
| * TripAdvisor Inc. | 4,849 | 339 |
| Gap Inc. | 10,303 | 338 |
| Interpublic Group of Cos. Inc. | 17,854 | 337 |
| Fortune Brands Home & Security Inc. | 6,892 | 330 |
| * Norwegian Cruise Line Holdings Ltd. | 5,681 | 327 |
| PulteGroup Inc. | 15,765 | 326 |
| * Hertz Global Holdings Inc. | 17,548 | 323 |
| * Liberty Media Corp. | 8,670 | 314 |
| * lululemon athletica Inc. | 4,823 | 309 |
| Williams-Sonoma Inc. | 3,962 | 301 |
| Harman International Industries Inc. | 3,078 | 301 |
| * Discovery Communications Inc. | 11,855 | 301 |
| * News Corp. Class A | 21,876 | 298 |
| Ralph Lauren Corp. Class A | 2,588 | 288 |
| * Toll Brothers Inc. | 7,594 | 281 |
| * NVR Inc. | 179 | 272 |
| * WABCO Holdings Inc. | 2,359 | 272 |
| Leggett & Platt Inc. | 5,959 | 265 |
| Wynn Resorts Ltd. | 3,513 | 264 |
| Aramark | 8,358 | 262 |
| Service Corp. International | 8,738 | 259 |
| Domino's Pizza Inc. | 2,386 | 253 |
| * Skechers U.S.A. Inc. Class A | 1,786 | 251 |
| * Liberty Ventures Class A | 6,138 | 244 |
| * TEGNA Inc. | 9,808 | 233 |
| KAR Auction Services Inc. | 6,152 | 228 |
| Carter's Inc. | 2,277 | 224 |
| Cablevision Systems Corp. Class A | 8,781 | 221 |
| Scripps Networks Interactive Inc. Class A | 3,951 | 210 |
| Dunkin' Brands Group Inc. | 4,179 | 210 |
| * Avis Budget Group Inc. | 4,637 | 205 |
| Dick's Sporting Goods Inc. | 4,019 | 201 |
| Brunswick Corp. | 4,042 | 201 |
| Gentex Corp. | 12,844 | 199 |
| GameStop Corp. Class A | 4,667 | 198 |
| * Panera Bread Co. Class A | 1,110 | 198 |
| * Visteon Corp. | 1,958 | 195 |
| Garmin Ltd. | 5,152 | 194 |
| * AutoNation Inc. | 3,186 | 191 |
| * Tempur Sealy International Inc. | 2,599 | 190 |
2
| Vanguard® Russell 3000 Index Fund | ||
| Schedule of Investments | ||
| August 31, 2015 | ||
| Market | ||
| Value | ||
| Shares | ($000) | |
| * Office Depot Inc. | 23,906 | 190 |
| * AMC Networks Inc. Class A | 2,608 | 189 |
| Lamar Advertising Co. Class A | 3,537 | 189 |
| * Madison Square Garden Co. Class A | 2,677 | 189 |
| * GoPro Inc. Class A | 3,898 | 182 |
| Cinemark Holdings Inc. | 5,061 | 180 |
| * Discovery Communications Inc. Class A | 6,762 | 180 |
| * Sally Beauty Holdings Inc. | 6,875 | 180 |
| * Burlington Stores Inc. | 3,216 | 171 |
| Vail Resorts Inc. | 1,551 | 167 |
| * Liberty Media Corp. Class A | 4,471 | 167 |
| * Pandora Media Inc. | 9,102 | 163 |
| * Buffalo Wild Wings Inc. | 822 | 156 |
| * ServiceMaster Global Holdings Inc. | 4,393 | 155 |
| * Live Nation Entertainment Inc. | 6,217 | 153 |
| * Liberty Broadband Corp. | 2,847 | 152 |
| Lions Gate Entertainment Corp. | 4,070 | 149 |
| American Eagle Outfitters Inc. | 8,378 | 143 |
| Brinker International Inc. | 2,620 | 139 |
| Six Flags Entertainment Corp. | 3,086 | 139 |
| * Starz | 3,687 | 139 |
| Tribune Media Co. Class A | 3,435 | 137 |
| Outfront Media Inc. | 5,884 | 133 |
| * Restoration Hardware Holdings Inc. | 1,436 | 133 |
| * Houghton Mifflin Harcourt Co. | 5,868 | 132 |
| Pool Corp. | 1,882 | 131 |
| * Urban Outfitters Inc. | 4,194 | 129 |
| * Vista Outdoor Inc. | 2,766 | 129 |
| Jack in the Box Inc. | 1,606 | 126 |
| * Tenneco Inc. | 2,640 | 124 |
| Dana Holding Corp. | 7,021 | 123 |
| * JC Penney Co. Inc. | 13,230 | 121 |
| Wolverine World Wide Inc. | 4,463 | 120 |
| * G-III Apparel Group Ltd. | 1,727 | 120 |
| Cracker Barrel Old Country Store Inc. | 830 | 120 |
| AMERCO | 319 | 119 |
| Men's Wearhouse Inc. | 2,090 | 118 |
| * HomeAway Inc. | 4,105 | 118 |
| Nu Skin Enterprises Inc. Class A | 2,558 | 117 |
| CST Brands Inc. | 3,324 | 115 |
| Cheesecake Factory Inc. | 2,120 | 115 |
| Big Lots Inc. | 2,356 | 113 |
| * Fossil Group Inc. | 1,821 | 112 |
| Bloomin' Brands Inc. | 5,360 | 111 |
| Coty Inc. Class A | 3,641 | 110 |
| Tupperware Brands Corp. | 2,145 | 110 |
| Texas Roadhouse Inc. Class A | 3,040 | 109 |
| Thor Industries Inc. | 1,985 | 108 |
| Wendy's Co. | 11,796 | 107 |
| Aaron's Inc. | 2,829 | 107 |
| * Helen of Troy Ltd. | 1,240 | 106 |
| Lithia Motors Inc. Class A | 990 | 106 |
| * Kate Spade & Co. | 5,539 | 105 |
| John Wiley & Sons Inc. Class A | 2,016 | 104 |
| Graham Holdings Co. Class B | 154 | 102 |
| * Murphy USA Inc. | 1,968 | 101 |
| * Steven Madden Ltd. | 2,456 | 100 |
| * Bright Horizons Family Solutions Inc. | 1,638 | 100 |
| * Pinnacle Entertainment Inc. | 2,645 | 100 |
| * Cimpress NV | 1,424 | 100 |
| Time Inc. | 4,759 | 99 |
| * Cabela's Inc. | 2,195 | 99 |
| Cooper Tire & Rubber Co. | 2,551 | 98 |
| * TRI Pointe Group Inc. | 7,050 | 98 |
3
| Vanguard® Russell 3000 Index Fund | ||
| Schedule of Investments | ||
| August 31, 2015 | ||
| Market | ||
| Value | ||
| Shares | ($000) | |
| * Deckers Outdoor Corp. | 1,504 | 97 |
| Dillard's Inc. Class A | 1,038 | 96 |
| * Asbury Automotive Group Inc. | 1,186 | 96 |
| Sotheby's | 2,698 | 95 |
| DSW Inc. Class A | 3,198 | 95 |
| Penske Automotive Group Inc. | 1,867 | 94 |
| Chico's FAS Inc. | 6,275 | 94 |
| * Five Below Inc. | 2,399 | 93 |
| * Ascena Retail Group Inc. | 7,582 | 92 |
| Group 1 Automotive Inc. | 1,026 | 90 |
| Monro Muffler Brake Inc. | 1,406 | 89 |
| Ryland Group Inc. | 2,056 | 89 |
| HSN Inc. | 1,422 | 86 |
| Papa John's International Inc. | 1,270 | 85 |
| * IMAX Corp. | 2,646 | 83 |
| * Liberty TripAdvisor Holdings Inc. Class A | 3,255 | 83 |
| Marriott Vacations Worldwide Corp. | 1,131 | 80 |
| Choice Hotels International Inc. | 1,569 | 80 |
| Churchill Downs Inc. | 601 | 80 |
| Sinclair Broadcast Group Inc. Class A | 2,936 | 79 |
| Columbia Sportswear Co. | 1,279 | 78 |
| * La Quinta Holdings Inc. | 4,105 | 77 |
| Meredith Corp. | 1,628 | 77 |
| * Grand Canyon Education Inc. | 2,073 | 77 |
| Hillenbrand Inc. | 2,797 | 75 |
| Matthews International Corp. Class A | 1,470 | 75 |
| * Hyatt Hotels Corp. Class A | 1,453 | 74 |
| New York Times Co. Class A | 6,111 | 74 |
| * Meritage Homes Corp. | 1,759 | 74 |
| * Michaels Cos. Inc. | 2,805 | 74 |
| DeVry Education Group Inc. | 2,810 | 74 |
| PriceSmart Inc. | 862 | 73 |
| * Gentherm Inc. | 1,599 | 73 |
| DineEquity Inc. | 759 | 72 |
| International Game Technology plc | 4,210 | 71 |
| * Express Inc. | 3,495 | 71 |
| Regal Entertainment Group Class A | 3,699 | 70 |
| * American Axle & Manufacturing Holdings Inc. | 3,421 | 69 |
| * Gannett Co. Inc. | 5,106 | 67 |
| * DreamWorks Animation SKG Inc. Class A | 3,354 | 67 |
| * Penn National Gaming Inc. | 3,600 | 65 |
| * Shutterfly Inc. | 1,671 | 65 |
| Nexstar Broadcasting Group Inc. Class A | 1,394 | 65 |
| * Genesco Inc. | 1,080 | 65 |
| Rent-A-Center Inc. | 2,386 | 64 |
| Sonic Corp. | 2,348 | 63 |
| Travelport Worldwide Ltd. | 4,779 | 63 |
| La-Z-Boy Inc. | 2,212 | 61 |
| Caleres Inc. | 1,817 | 60 |
| * Cable One Inc. | 145 | 60 |
| * Fiesta Restaurant Group Inc. | 1,158 | 60 |
| * Liberty Broadband Corp. Class A | 1,075 | 59 |
| Abercrombie & Fitch Co. | 2,929 | 58 |
| Guess? Inc. | 2,548 | 56 |
| * Dorman Products Inc. | 1,101 | 55 |
| Drew Industries Inc. | 993 | 55 |
| * Select Comfort Corp. | 2,241 | 55 |
| Finish Line Inc. Class A | 2,053 | 54 |
| * Boyd Gaming Corp. | 3,322 | 53 |
| * Popeyes Louisiana Kitchen Inc. | 954 | 53 |
| Oxford Industries Inc. | 628 | 53 |
| * Orbitz Worldwide Inc. | 4,598 | 53 |
| * Meritor Inc. | 4,142 | 52 |
| Outerwall Inc. | 833 | 51 |
4
| Vanguard® Russell 3000 Index Fund | ||
| Schedule of Investments | ||
| August 31, 2015 | ||
| Market | ||
| Value | ||
| Shares | ($000) | |
| KB Home | 3,499 | 51 |
| Children's Place Inc. | 850 | 51 |
| * Standard Pacific Corp. | 6,022 | 51 |
| * Mattress Firm Holding Corp. | 844 | 51 |
| * Media General Inc. | 4,305 | 51 |
| SeaWorld Entertainment Inc. | 2,815 | 50 |
| Buckle Inc. | 1,182 | 50 |
| * zulily Inc. Class A | 2,807 | 50 |
| * Stamps.com Inc. | 591 | 49 |
| Sturm Ruger & Co. Inc. | 770 | 48 |
| * Crocs Inc. | 3,274 | 48 |
| Scholastic Corp. | 1,098 | 47 |
| * Belmond Ltd. Class A | 4,169 | 47 |
| * Vitamin Shoppe Inc. | 1,297 | 46 |
| Extended Stay America Inc. | 2,458 | 46 |
| * Red Robin Gourmet Burgers Inc. | 583 | 46 |
| MDC Holdings Inc. | 1,609 | 46 |
| * Krispy Kreme Doughnuts Inc. | 2,669 | 46 |
| * Tumi Holdings Inc. | 2,309 | 46 |
| * Apollo Education Group Inc. | 3,979 | 44 |
| Bob Evans Farms Inc. | 975 | 44 |
| * Smith & Wesson Holding Corp. | 2,421 | 44 |
| * Diamond Resorts International Inc. | 1,715 | 44 |
| * Hibbett Sports Inc. | 1,102 | 44 |
| EW Scripps Co. Class A | 2,435 | 43 |
| Pier 1 Imports Inc. | 4,049 | 41 |
| * Denny's Corp. | 3,661 | 41 |
| ClubCorp Holdings Inc. | 1,812 | 41 |
| * BJ's Restaurants Inc. | 947 | 41 |
| * Eros International plc | 1,167 | 39 |
| Cato Corp. Class A | 1,094 | 38 |
| * TiVo Inc. | 4,184 | 38 |
| Nutrisystem Inc. | 1,359 | 38 |
| Remy International Inc. | 1,280 | 37 |
| * American Woodmark Corp. | 565 | 37 |
| International Speedway Corp. Class A | 1,149 | 37 |
| * 2U Inc. | 1,054 | 37 |
| * LifeLock Inc. | 4,255 | 36 |
| MDC Partners Inc. Class A | 1,788 | 35 |
| * Steiner Leisure Ltd. | 544 | 35 |
| Ethan Allen Interiors Inc. | 1,143 | 34 |
| * Dave & Buster's Entertainment Inc. | 979 | 34 |
| Libbey Inc. | 955 | 34 |
| * Conn's Inc. | 1,126 | 34 |
| National CineMedia Inc. | 2,531 | 33 |
| Interval Leisure Group Inc. | 1,656 | 33 |
| * Constant Contact Inc. | 1,325 | 33 |
| * Cooper-Standard Holding Inc. | 571 | 33 |
| * Wayfair Inc. | 878 | 33 |
| Barnes & Noble Inc. | 2,090 | 33 |
| Callaway Golf Co. | 3,594 | 32 |
| Standard Motor Products Inc. | 887 | 31 |
| * Universal Electronics Inc. | 687 | 31 |
| * Taylor Morrison Home Corp. Class A | 1,504 | 30 |
| Sonic Automotive Inc. Class A | 1,355 | 29 |
| * Zoe's Kitchen Inc. | 835 | 29 |
| AMC Entertainment Holdings Inc. | 992 | 29 |
| * Biglari Holdings Inc. | 75 | 28 |
| New Media Investment Group Inc. | 1,859 | 28 |
| * Iconix Brand Group Inc. | 1,965 | 27 |
| * Shutterstock Inc. | 809 | 27 |
| * Strayer Education Inc. | 517 | 27 |
| * FTD Cos. Inc. | 884 | 26 |
| * Chegg Inc. | 3,501 | 26 |
5
| Vanguard® Russell 3000 Index Fund | ||
| Schedule of Investments | ||
| August 31, 2015 | ||
| Market | ||
| Value | ||
| Shares | ($000) | |
| * HealthStream Inc. | 1,039 | 26 |
| * Motorcar Parts of America Inc. | 807 | 26 |
| * Pep Boys-Manny Moe & Jack | 2,125 | 26 |
| * Coupons.com Inc. | 2,748 | 26 |
| * Performance Sports Group Ltd. | 1,940 | 25 |
| * Cavco Industries Inc. | 348 | 25 |
| * Carmike Cinemas Inc. | 1,042 | 25 |
| * Scientific Games Corp. Class A | 2,252 | 25 |
| Capella Education Co. | 504 | 25 |
| * Caesars Entertainment Corp. | 2,560 | 24 |
| * Sears Holdings Corp. | 903 | 24 |
| * Rentrak Corp. | 523 | 24 |
| * Tower International Inc. | 967 | 24 |
| * M/I Homes Inc. | 942 | 24 |
| World Wrestling Entertainment Inc. Class A | 1,164 | 23 |
| * Zumiez Inc. | 967 | 23 |
| Ruth's Hospitality Group Inc. | 1,400 | 23 |
| Fred's Inc. Class A | 1,700 | 22 |
| * Beazer Homes USA Inc. | 1,329 | 22 |
| * Central Garden & Pet Co. Class A | 1,747 | 22 |
| Winnebago Industries Inc. | 1,062 | 22 |
| Viad Corp. | 785 | 21 |
| * Chuy's Holdings Inc. | 687 | 21 |
| Lennar Corp. Class B | 479 | 20 |
| Viacom Inc. Class A | 462 | 20 |
| * Party City Holdco Inc. | 1,180 | 20 |
| Entravision Communications Corp. Class A | 2,482 | 20 |
| * Gray Television Inc. | 1,687 | 20 |
| * Nautilus Inc. | 1,269 | 19 |
| * MarineMax Inc. | 1,187 | 19 |
| * Lands' End Inc. | 760 | 19 |
| * Francesca's Holdings Corp. | 1,695 | 19 |
| * Carrols Restaurant Group Inc. | 1,499 | 19 |
| * K12 Inc. | 1,434 | 19 |
| * William Lyon Homes Class A | 824 | 19 |
| * WCI Communities Inc. | 747 | 19 |
| * Blue Nile Inc. | 546 | 19 |
| Superior Industries International Inc. | 971 | 19 |
| * Regis Corp. | 1,710 | 19 |
| Haverty Furniture Cos. Inc. | 800 | 18 |
| Citi Trends Inc. | 690 | 18 |
| Movado Group Inc. | 637 | 18 |
| * Lumber Liquidators Holdings Inc. | 1,178 | 18 |
| Inter Parfums Inc. | 676 | 17 |
| National Presto Industries Inc. | 211 | 17 |
| * Barnes & Noble Education Inc. | 1,321 | 17 |
| * Isle of Capri Casinos Inc. | 923 | 17 |
| * Ruby Tuesday Inc. | 2,582 | 17 |
| * Sequential Brands Group Inc. | 1,037 | 17 |
| Shoe Carnival Inc. | 650 | 17 |
| * Tuesday Morning Corp. | 2,093 | 17 |
| Stage Stores Inc. | 1,542 | 17 |
| Marcus Corp. | 831 | 16 |
| * Stoneridge Inc. | 1,318 | 16 |
| * XO Group Inc. | 1,093 | 16 |
| Carriage Services Inc. Class A | 695 | 16 |
| Bassett Furniture Industries Inc. | 542 | 16 |
| * Caesars Acquisition Co. Class A | 2,201 | 16 |
| Tribune Publishing Co. | 1,329 | 16 |
| * Revlon Inc. Class A | 464 | 15 |
| Avon Products Inc. | 2,942 | 15 |
| * Tile Shop Holdings Inc. | 1,282 | 15 |
| * RealD Inc. | 1,611 | 15 |
| * American Public Education Inc. | 670 | 15 |
6
| Vanguard® Russell 3000 Index Fund | ||
| Schedule of Investments | ||
| August 31, 2015 | ||
| Market | ||
| Value | ||
| Shares | ($000) | |
| * Perry Ellis International Inc. | 593 | 15 |
| Stein Mart Inc. | 1,356 | 15 |
| Arctic Cat Inc. | 547 | 14 |
| Kirkland's Inc. | 642 | 14 |
| * Del Frisco's Restaurant Group Inc. | 957 | 14 |
| * Elizabeth Arden Inc. | 1,283 | 14 |
| * Clear Channel Outdoor Holdings Inc. Class A | 1,728 | 14 |
| * Build-A-Bear Workshop Inc. | 716 | 14 |
| * LGI Homes Inc. | 537 | 14 |
| * Century Communities Inc. | 626 | 14 |
| * Entercom Communications Corp. Class A | 1,194 | 13 |
| * Malibu Boats Inc. Class A | 735 | 13 |
| * America's Car-Mart Inc. | 351 | 13 |
| * Angie's List Inc. | 2,367 | 13 |
| * Federal-Mogul Holdings Corp. | 1,328 | 12 |
| * Eastman Kodak Co. | 863 | 12 |
| * Vera Bradley Inc. | 1,123 | 12 |
| Winmark Corp. | 122 | 12 |
| * Reading International Inc. Class A | 925 | 12 |
| Strattec Security Corp. | 188 | 12 |
| * Habit Restaurants Inc. Class A | 474 | 12 |
| Speedway Motorsports Inc. | 601 | 12 |
| * Overstock.com Inc. | 591 | 12 |
| CSS Industries Inc. | 436 | 12 |
| * Daily Journal Corp. | 59 | 11 |
| * 1-800-Flowers.com Inc. Class A | 1,309 | 11 |
| * Boot Barn Holdings Inc. | 493 | 11 |
| * Potbelly Corp. | 1,005 | 11 |
| * Fox Factory Holding Corp. | 698 | 10 |
| Weyco Group Inc. | 383 | 10 |
| Big 5 Sporting Goods Corp. | 891 | 10 |
| * Etsy Inc. | 712 | 10 |
| * Martha Stewart Living Omnimedia Inc. Class A | 1,651 | 10 |
| * Career Education Corp. | 2,668 | 10 |
| * Franklin Covey Co. | 586 | 10 |
| * Container Store Group Inc. | 579 | 10 |
| * Shake Shack Inc. Class A | 196 | 10 |
| * Sportsman's Warehouse Holdings Inc. | 757 | 10 |
| * Hovnanian Enterprises Inc. Class A | 5,161 | 10 |
| * West Marine Inc. | 1,085 | 10 |
| * Eldorado Resorts Inc. | 1,002 | 9 |
| * Black Diamond Inc. | 1,255 | 9 |
| * Monarch Casino & Resort Inc. | 531 | 9 |
| * Intrawest Resorts Holdings Inc. | 1,034 | 9 |
| Hooker Furniture Corp. | 385 | 9 |
| * Skullcandy Inc. | 1,291 | 9 |
| Flexsteel Industries Inc. | 282 | 9 |
| Liberty Tax Inc. | 366 | 9 |
| * Bridgepoint Education Inc. | 1,060 | 9 |
| * JAKKS Pacific Inc. | 871 | 8 |
| Journal Media Group Inc. | 1,211 | 8 |
| * Cherokee Inc. | 305 | 8 |
| * ZAGG Inc. | 1,049 | 8 |
| * Vince Holding Corp. | 830 | 8 |
| Harte-Hanks Inc. | 1,977 | 8 |
| * Cumulus Media Inc. Class A | 5,177 | 7 |
| Metaldyne Performance Group Inc. | 389 | 7 |
| * El Pollo Loco Holdings Inc. | 564 | 7 |
| * Destination XL Group Inc. | 1,200 | 7 |
| * Bojangles' Inc. | 341 | 7 |
| * Bravo Brio Restaurant Group Inc. | 556 | 7 |
| * Care.com Inc. | 1,160 | 7 |
| * Horizon Global Corp. | 656 | 7 |
| * Papa Murphy's Holdings Inc. | 459 | 7 |
7
| Vanguard® Russell 3000 Index Fund | ||
| Schedule of Investments | ||
| August 31, 2015 | ||
| Market | ||
| Value | ||
| Shares | ($000) | |
| * Jamba Inc. | 471 | 7 |
| * TubeMogul Inc. | 574 | 6 |
| * QuinStreet Inc. | 1,120 | 6 |
| * Kona Grill Inc. | 301 | 6 |
| * Weight Watchers International Inc. | 875 | 5 |
| * Crown Media Holdings Inc. Class A | 981 | 5 |
| Escalade Inc. | 277 | 5 |
| * Central European Media Enterprises Ltd. Class A | 2,235 | 5 |
| * Fenix Parts Inc. | 492 | 5 |
| Saga Communications Inc. Class A | 138 | 5 |
| Marchex Inc. Class B | 1,191 | 5 |
| * Noodles & Co. Class A | 381 | 5 |
| * Sizmek Inc. | 688 | 5 |
| Superior Uniform Group Inc. | 264 | 4 |
| Lifetime Brands Inc. | 290 | 4 |
| * VOXX International Corp. Class A | 527 | 4 |
| * Morgans Hotel Group Co. | 788 | 4 |
| Collectors Universe Inc. | 192 | 4 |
| * New Home Co. Inc. | 236 | 4 |
| Johnson Outdoors Inc. Class A | 139 | 3 |
| * Hemisphere Media Group Inc. Class A | 247 | 3 |
| * Townsquare Media Inc. Class A | 277 | 3 |
| * EVINE Live Inc. | 1,106 | 3 |
| * Systemax Inc. | 306 | 3 |
| Universal Technical Institute Inc. | 605 | 3 |
| bebe stores inc | 1,864 | 3 |
| * Cambium Learning Group Inc. | 462 | 2 |
| Comcast Corp. Special Class A | 40 | 2 |
| * Tilly's Inc. Class A | 282 | 2 |
| Marine Products Corp. | 299 | 2 |
| * Quiksilver Inc. | 4,294 | 2 |
| * Christopher & Banks Corp. | 1,027 | 2 |
| * Empire Resorts Inc. | 421 | 2 |
| * SFX Entertainment Inc. | 1,388 | 1 |
| Twenty-First Century Fox Inc. | 51 | 1 |
| * News Corp. Class B | 13 | — |
| 140,058 | ||
| Consumer Staples (7.5%) | ||
| Procter & Gamble Co. | 118,698 | 8,388 |
| Coca-Cola Co. | 171,562 | 6,746 |
| PepsiCo Inc. | 64,579 | 6,001 |
| Philip Morris International Inc. | 67,777 | 5,409 |
| CVS Health Corp. | 49,245 | 5,043 |
| Altria Group Inc. | 86,039 | 4,610 |
| Walgreens Boots Alliance Inc. | 37,616 | 3,256 |
| Mondelez International Inc. Class A | 71,167 | 3,015 |
| Colgate-Palmolive Co. | 39,576 | 2,486 |
| Kraft Heinz Co. | 25,899 | 1,882 |
| Kimberly-Clark Corp. | 15,931 | 1,697 |
| Reynolds American Inc. | 18,104 | 1,516 |
| General Mills Inc. | 26,123 | 1,483 |
| Kroger Co. | 42,911 | 1,480 |
| Archer-Daniels-Midland Co. | 27,246 | 1,226 |
| Sysco Corp. | 26,232 | 1,046 |
| Constellation Brands Inc. Class A | 7,244 | 927 |
| * Monster Beverage Corp. | 6,603 | 914 |
| ConAgra Foods Inc. | 18,923 | 789 |
| Kellogg Co. | 11,108 | 736 |
| Mead Johnson Nutrition Co. | 8,982 | 704 |
| Dr Pepper Snapple Group Inc. | 8,548 | 656 |
| Clorox Co. | 5,852 | 651 |
| JM Smucker Co. | 5,362 | 631 |
| Hershey Co. | 6,521 | 584 |
| Tyson Foods Inc. Class A | 13,213 | 559 |
8
| Vanguard® Russell 3000 Index Fund | ||
| Schedule of Investments | ||
| August 31, 2015 | ||
| Market | ||
| Value | ||
| Shares | ($000) | |
| Brown-Forman Corp. Class B | 5,647 | 554 |
| Whole Foods Market Inc. | 15,989 | 524 |
| Coca-Cola Enterprises Inc. | 10,078 | 519 |
| Church & Dwight Co. Inc. | 5,895 | 509 |
| Bunge Ltd. | 6,443 | 467 |
| McCormick & Co. Inc. | 5,526 | 438 |
| Molson Coors Brewing Co. Class B | 5,967 | 406 |
| Campbell Soup Co. | 7,529 | 361 |
| Hormel Foods Corp. | 5,786 | 354 |
| * Rite Aid Corp. | 42,751 | 353 |
| * WhiteWave Foods Co. Class A | 7,572 | 349 |
| Keurig Green Mountain Inc. | 5,587 | 316 |
| * Hain Celestial Group Inc. | 4,436 | 270 |
| Ingredion Inc. | 3,085 | 266 |
| * Edgewell Personal Care Co. | 2,688 | 237 |
| Pinnacle Foods Inc. | 5,061 | 227 |
| * Herbalife Ltd. | 3,131 | 180 |
| Casey's General Stores Inc. | 1,662 | 176 |
| * Post Holdings Inc. | 2,694 | 176 |
| GNC Holdings Inc. Class A | 3,701 | 173 |
| Flowers Foods Inc. | 7,447 | 173 |
| * TreeHouse Foods Inc. | 1,839 | 146 |
| * Sprouts Farmers Market Inc. | 6,538 | 133 |
| Brown-Forman Corp. Class A | 1,182 | 128 |
| Energizer Holdings Inc. | 2,710 | 113 |
| Spectrum Brands Holdings Inc. | 1,123 | 110 |
| * United Natural Foods Inc. | 2,166 | 104 |
| * SUPERVALU Inc. | 11,521 | 95 |
| Vector Group Ltd. | 3,605 | 86 |
| * Boston Beer Co. Inc. Class A | 403 | 83 |
| B&G Foods Inc. | 2,591 | 79 |
| Lancaster Colony Corp. | 828 | 78 |
| J&J Snack Foods Corp. | 665 | 76 |
| Cal-Maine Foods Inc. | 1,402 | 74 |
| Snyder's-Lance Inc. | 2,193 | 74 |
| Dean Foods Co. | 4,231 | 70 |
| Sanderson Farms Inc. | 937 | 65 |
| * Diplomat Pharmacy Inc. | 1,611 | 64 |
| Core-Mark Holding Co. Inc. | 978 | 59 |
| Fresh Del Monte Produce Inc. | 1,406 | 56 |
| Pilgrim's Pride Corp. | 2,629 | 55 |
| WD-40 Co. | 599 | 50 |
| Universal Corp. | 999 | 49 |
| SpartanNash Co. | 1,548 | 44 |
| Andersons Inc. | 1,200 | 42 |
| * USANA Health Sciences Inc. | 265 | 39 |
| * Fresh Market Inc. | 1,773 | 38 |
| * Seaboard Corp. | 11 | 36 |
| Calavo Growers Inc. | 615 | 36 |
| * Diamond Foods Inc. | 1,084 | 33 |
| Ingles Markets Inc. Class A | 600 | 30 |
| Coca-Cola Bottling Co. Consolidated | 189 | 29 |
| Tootsie Roll Industries Inc. | 781 | 24 |
| John B Sanfilippo & Son Inc. | 353 | 18 |
| Weis Markets Inc. | 430 | 17 |
| * Boulder Brands Inc. | 2,120 | 17 |
| * Omega Protein Corp. | 1,004 | 17 |
| * Smart & Final Stores Inc. | 999 | 16 |
| * Medifast Inc. | 566 | 16 |
| * National Beverage Corp. | 576 | 15 |
| PetMed Express Inc. | 916 | 15 |
| * Seneca Foods Corp. Class A | 436 | 13 |
| * Natural Grocers by Vitamin Cottage Inc. | 510 | 12 |
| * Nutraceutical International Corp. | 485 | 12 |
9
| Vanguard® Russell 3000 Index Fund | ||
| Schedule of Investments | ||
| August 31, 2015 | ||
| Market | ||
| Value | ||
| Shares | ($000) | |
| * Freshpet Inc. | 856 | 11 |
| * Chefs' Warehouse Inc. | 728 | 11 |
| Limoneira Co. | 563 | 11 |
| Village Super Market Inc. Class A | 365 | 10 |
| * Farmer Bros Co. | 428 | 10 |
| Orchids Paper Products Co. | 377 | 9 |
| Alico Inc. | 213 | 9 |
| * Inventure Foods Inc. | 989 | 9 |
| Natural Health Trends Corp. | 280 | 7 |
| MGP Ingredients Inc. | 380 | 6 |
| Nature's Sunshine Products Inc. | 305 | 4 |
| * Castle Brands Inc. | 2,366 | 3 |
| * Fairway Group Holdings Corp. | 1,195 | 3 |
| * Synutra International Inc. | 490 | 2 |
| * Craft Brew Alliance Inc. | 294 | 2 |
| * Lifeway Foods Inc. | 134 | 2 |
| * Arcadia Biosciences Inc. | 289 | 2 |
| 71,940 | ||
| Energy (6.6%) | ||
| Exxon Mobil Corp. | 182,925 | 13,763 |
| Chevron Corp. | 82,271 | 6,663 |
| Schlumberger Ltd. | 55,549 | 4,298 |
| ConocoPhillips | 53,941 | 2,651 |
| Kinder Morgan Inc. | 78,121 | 2,532 |
| Occidental Petroleum Corp. | 33,606 | 2,454 |
| EOG Resources Inc. | 24,016 | 1,881 |
| Phillips 66 | 23,697 | 1,874 |
| Anadarko Petroleum Corp. | 22,247 | 1,592 |
| Williams Cos. Inc. | 32,768 | 1,579 |
| Halliburton Co. | 37,281 | 1,467 |
| Valero Energy Corp. | 22,306 | 1,324 |
| Marathon Petroleum Corp. | 23,857 | 1,129 |
| Baker Hughes Inc. | 19,140 | 1,072 |
| Spectra Energy Corp. | 29,708 | 864 |
| Pioneer Natural Resources Co. | 6,620 | 815 |
| Devon Energy Corp. | 18,184 | 776 |
| Apache Corp. | 16,753 | 758 |
| National Oilwell Varco Inc. | 17,250 | 730 |
| Hess Corp. | 11,245 | 669 |
| * Cheniere Energy Inc. | 10,541 | 655 |
| Noble Energy Inc. | 19,128 | 639 |
| * Concho Resources Inc. | 5,390 | 583 |
| * Cameron International Corp. | 8,584 | 573 |
| EQT Corp. | 6,852 | 533 |
| Marathon Oil Corp. | 30,148 | 521 |
| Tesoro Corp. | 5,647 | 520 |
| Cimarex Energy Co. | 4,089 | 452 |
| Cabot Oil & Gas Corp. | 18,644 | 441 |
| HollyFrontier Corp. | 8,419 | 395 |
| Columbia Pipeline Group Inc. | 13,723 | 348 |
| * FMC Technologies Inc. | 9,984 | 347 |
| * Weatherford International plc | 33,500 | 340 |
| ONEOK Inc. | 9,026 | 325 |
| Range Resources Corp. | 7,310 | 282 |
| * Southwestern Energy Co. | 16,627 | 270 |
| Helmerich & Payne Inc. | 4,170 | 246 |
| Murphy Oil Corp. | 7,694 | 239 |
| * Newfield Exploration Co. | 7,041 | 235 |
| * Diamondback Energy Inc. | 3,066 | 209 |
| Chesapeake Energy Corp. | 25,362 | 198 |
| Energen Corp. | 3,603 | 187 |
| Ensco plc Class A | 10,233 | 185 |
| Oceaneering International Inc. | 4,201 | 184 |
| * Gulfport Energy Corp. | 4,732 | 170 |
10
| Vanguard® Russell 3000 Index Fund | |||
| Schedule of Investments | |||
| August 31, 2015 | |||
| Market | |||
| Value | |||
| Shares | ($000) | ||
| Nabors Industries Ltd. | 14,512 | 167 | |
| Targa Resources Corp. | 2,442 | 161 | |
| * | First Solar Inc. | 3,246 | 155 |
| CONSOL Energy Inc. | 10,054 | 153 | |
| Golar LNG Ltd. | 3,843 | 150 | |
| Noble Corp. plc | 10,379 | 135 | |
| Western Refining Inc. | 3,058 | 132 | |
| * | Cobalt International Energy Inc. | 15,753 | 126 |
| * | SolarCity Corp. | 2,558 | 123 |
| World Fuel Services Corp. | 3,096 | 120 | |
| * | Continental Resources Inc. | 3,689 | 118 |
| * | Dril-Quip Inc. | 1,695 | 117 |
| PBF Energy Inc. Class A | 3,731 | 112 | |
| SM Energy Co. | 2,935 | 108 | |
| QEP Resources Inc. | 7,655 | 107 | |
| Patterson-UTI Energy Inc. | 6,394 | 104 | |
| SemGroup Corp. Class A | 1,884 | 104 | |
| Superior Energy Services Inc. | 6,509 | 104 | |
| * | PDC Energy Inc. | 1,772 | 100 |
| Rowan Cos. plc Class A | 5,454 | 98 | |
| * | WPX Energy Inc. | 11,834 | 86 |
| * | Carrizo Oil & Gas Inc. | 2,265 | 83 |
| * | NOW Inc. | 4,733 | 81 |
| * | Antero Resources Corp. | 3,061 | 79 |
| Delek US Holdings Inc. | 2,516 | 77 | |
| * | RSP Permian Inc. | 3,130 | 75 |
| * | Matador Resources Co. | 3,060 | 70 |
| * | Oasis Petroleum Inc. | 6,226 | 69 |
| Denbury Resources Inc. | 15,917 | 69 | |
| Diamond Offshore Drilling Inc. | 2,890 | 69 | |
| Exterran Holdings Inc. | 3,054 | 68 | |
| * | Memorial Resource Development Corp. | 3,398 | 66 |
| * | Oil States International Inc. | 2,308 | 65 |
| * | Rice Energy Inc. | 3,294 | 64 |
| * | SunPower Corp. Class A | 2,474 | 60 |
| * | Parsley Energy Inc. Class A | 3,435 | 59 |
| * | Ultra Petroleum Corp. | 6,893 | 59 |
| Atwood Oceanics Inc. | 2,909 | 56 | |
| California Resources Corp. | 14,104 | 55 | |
| *,^ | Laredo Petroleum Inc. | 5,069 | 52 |
| TerraForm Power Inc. Class A | 2,264 | 51 | |
| * | McDermott International Inc. | 9,924 | 50 |
| * | SEACOR Holdings Inc. | 751 | 48 |
| * | Synergy Resources Corp. | 4,283 | 46 |
| * | Kosmos Energy Ltd. | 6,488 | 45 |
| * | Flotek Industries Inc. | 2,245 | 44 |
| * | Forum Energy Technologies Inc. | 2,469 | 39 |
| Peabody Energy Corp. | 12,823 | 35 | |
| Green Plains Inc. | 1,625 | 35 | |
| * | Unit Corp. | 2,075 | 32 |
| SunCoke Energy Inc. | 2,706 | 31 | |
| * | Helix Energy Solutions Group Inc. | 4,360 | 30 |
| RPC Inc. | 2,506 | 29 | |
| CVR Energy Inc. | 716 | 29 | |
| * | TETRA Technologies Inc. | 3,695 | 28 |
| * | Hornbeck Offshore Services Inc. | 1,396 | 28 |
| * | Callon Petroleum Co. | 2,961 | 27 |
| Frank's International NV | 1,650 | 27 | |
| * | Newpark Resources Inc. | 3,633 | 27 |
| * | Matrix Service Co. | 1,283 | 26 |
| * | Whiting Petroleum Corp. | 1,327 | 26 |
| CARBO Ceramics Inc. | 815 | 22 | |
| * | Parker Drilling Co. | 6,280 | 21 |
| * | Clean Energy Fuels Corp. | 3,536 | 19 |
11
| Vanguard® Russell 3000 Index Fund | |||
| Schedule of Investments | |||
| August 31, 2015 | |||
| Market | |||
| Value | |||
| Shares | ($000) | ||
| *,^ | Halcon Resources Corp. | 15,113 | 17 |
| * | REX American Resources Corp. | 313 | 17 |
| Seadrill Ltd. | 2,019 | 16 | |
| * | Fairmount Santrol Holdings Inc. | 3,162 | 16 |
| * | Bonanza Creek Energy Inc. | 2,046 | 16 |
| * | Sanchez Energy Corp. | 2,392 | 15 |
| * | Renewable Energy Group Inc. | 1,808 | 15 |
| * | Northern Oil and Gas Inc. | 2,524 | 15 |
| * | Stone Energy Corp. | 2,595 | 15 |
| Tesco Corp. | 1,719 | 15 | |
| * | Clayton Williams Energy Inc. | 284 | 14 |
| * | Era Group Inc. | 847 | 14 |
| * | RigNet Inc. | 490 | 14 |
| * | Natural Gas Services Group Inc. | 620 | 13 |
| * | Bill Barrett Corp. | 2,392 | 13 |
| * | C&J Energy Services Ltd. | 2,321 | 13 |
| * | EnerNOC Inc. | 1,358 | 13 |
| * | Trecora Resources | 957 | 12 |
| * | Westmoreland Coal Co. | 813 | 12 |
| Alon USA Energy Inc. | 652 | 12 | |
| * | PowerSecure International Inc. | 1,001 | 12 |
| Panhandle Oil and Gas Inc. Class A | 685 | 12 | |
| * | Solazyme Inc. | 4,218 | 11 |
| * | Ring Energy Inc. | 1,085 | 11 |
| * | Par Petroleum Corp. | 569 | 11 |
| * | Basic Energy Services Inc. | 1,988 | 10 |
| * | Vivint Solar Inc. | 827 | 10 |
| * | Cloud Peak Energy Inc. | 2,137 | 10 |
| * | EP Energy Corp. Class A | 1,385 | 10 |
| * | Triangle Petroleum Corp. | 2,425 | 10 |
| * | Civeo Corp. | 4,907 | 10 |
| Evolution Petroleum Corp. | 1,494 | 9 | |
| * | Seventy Seven Energy Inc. | 3,018 | 9 |
| * | SandRidge Energy Inc. | 16,072 | 9 |
| * | Eclipse Resources Corp. | 2,204 | 8 |
| * | Magnum Hunter Resources Corp. | 10,305 | 8 |
| * | Independence Contract Drilling Inc. | 1,107 | 8 |
| * | Geospace Technologies Corp. | 413 | 7 |
| * | Pioneer Energy Services Corp. | 2,161 | 7 |
| * | Jones Energy Inc. Class A | 1,193 | 7 |
| * | Abraxas Petroleum Corp. | 3,482 | 7 |
| * | FuelCell Energy Inc. | 8,095 | 7 |
| * | Green Brick Partners Inc. | 510 | 6 |
| * | Rex Energy Corp. | 1,705 | 6 |
| * | Pacific Ethanol Inc. | 821 | 6 |
| * | Enphase Energy Inc. | 1,240 | 6 |
| * | Gastar Exploration Inc. | 3,274 | 5 |
| Energy XXI Ltd. | 2,836 | 5 | |
| * | Contango Oil & Gas Co. | 562 | 5 |
| * | Penn Virginia Corp. | 3,514 | 4 |
| EXCO Resources Inc. | 4,806 | 4 | |
| Nordic American Offshore Ltd. | 569 | 4 | |
| * | Isramco Inc. | 28 | 4 |
| W&T Offshore Inc. | 979 | 3 | |
| * | Approach Resources Inc. | 1,264 | 3 |
| * | Ameresco Inc. Class A | 553 | 3 |
| * | Key Energy Services Inc. | 4,338 | 3 |
| Adams Resources & Energy Inc. | 60 | 3 | |
| North Atlantic Drilling Ltd. | 2,533 | 2 | |
| * | ION Geophysical Corp. | 4,090 | 2 |
| Hallador Energy Co. | 245 | 2 | |
| * | Erin Energy Corp. | 494 | 2 |
| * | TransAtlantic Petroleum Ltd. | 634 | 2 |
| * | Earthstone Energy Inc. | 47 | 1 |
12
| Vanguard® Russell 3000 Index Fund | ||
| Schedule of Investments | ||
| August 31, 2015 | ||
| Market | ||
| Value | ||
| Shares | ($000) | |
| * Sabine Oil & Gas Corp. | 50 | — |
| 63,190 | ||
| Financial Services (20.0%) | ||
| * Berkshire Hathaway Inc. Class B | 81,368 | 10,907 |
| Wells Fargo & Co. | 203,827 | 10,870 |
| JPMorgan Chase & Co. | 162,365 | 10,408 |
| Bank of America Corp. | 459,480 | 7,508 |
| Citigroup Inc. | 132,747 | 7,099 |
| Visa Inc. Class A | 85,433 | 6,091 |
| MasterCard Inc. Class A | 43,632 | 4,030 |
| Goldman Sachs Group Inc. | 18,902 | 3,565 |
| American International Group Inc. | 58,338 | 3,520 |
| US Bancorp | 73,292 | 3,104 |
| American Express Co. | 37,808 | 2,901 |
| Simon Property Group Inc. | 13,618 | 2,442 |
| Morgan Stanley | 67,069 | 2,311 |
| PNC Financial Services Group Inc. | 22,662 | 2,065 |
| MetLife Inc. | 40,990 | 2,054 |
| Bank of New York Mellon Corp. | 49,067 | 1,953 |
| * PayPal Holdings Inc. | 53,117 | 1,859 |
| Capital One Financial Corp. | 23,909 | 1,859 |
| American Tower Corporation | 18,516 | 1,707 |
| BlackRock Inc. | 5,490 | 1,661 |
| Prudential Financial Inc. | 19,819 | 1,599 |
| Charles Schwab Corp. | 50,129 | 1,523 |
| ACE Ltd. | 14,308 | 1,462 |
| Travelers Cos. Inc. | 13,966 | 1,390 |
| CME Group Inc. | 14,070 | 1,329 |
| State Street Corp. | 18,068 | 1,299 |
| Public Storage | 6,362 | 1,280 |
| Marsh & McLennan Cos. Inc. | 23,559 | 1,266 |
| BB&T Corp. | 34,040 | 1,257 |
| Crown Castle International Corp. | 14,673 | 1,224 |
| Chubb Corp. | 10,097 | 1,220 |
| McGraw Hill Financial Inc. | 12,034 | 1,167 |
| Aon plc | 12,383 | 1,157 |
| Equity Residential | 16,005 | 1,140 |
| Intercontinental Exchange Inc. | 4,901 | 1,119 |
| Aflac Inc. | 19,084 | 1,118 |
| Allstate Corp. | 17,976 | 1,048 |
| Discover Financial Services | 19,491 | 1,047 |
| Health Care REIT Inc. | 15,451 | 979 |
| AvalonBay Communities Inc. | 5,834 | 963 |
| SunTrust Banks Inc. | 22,774 | 919 |
| Ameriprise Financial Inc. | 8,005 | 902 |
| * Fiserv Inc. | 10,474 | 893 |
| Prologis Inc. | 23,158 | 880 |
| Fidelity National Information Services Inc. | 12,577 | 869 |
| Hartford Financial Services Group Inc. | 18,595 | 854 |
| T. Rowe Price Group Inc. | 11,528 | 829 |
| Moody's Corp. | 7,856 | 804 |
| Ventas Inc. | 14,608 | 804 |
| Progressive Corp. | 26,023 | 780 |
| Boston Properties Inc. | 6,793 | 770 |
| HCP Inc. | 20,480 | 759 |
| Vornado Realty Trust | 8,348 | 728 |
| Northern Trust Corp. | 10,353 | 723 |
| Fifth Third Bancorp | 35,976 | 717 |
| * Alliance Data Systems Corp. | 2,757 | 709 |
| Franklin Resources Inc. | 17,200 | 698 |
| M&T Bank Corp. | 5,902 | 698 |
| Equinix Inc. | 2,534 | 684 |
| Principal Financial Group Inc. | 13,097 | 659 |
| Invesco Ltd. | 19,164 | 654 |
13
| Vanguard® Russell 3000 Index Fund | ||
| Schedule of Investments | ||
| August 31, 2015 | ||
| Market | ||
| Value | ||
| Shares | ($000) | |
| General Growth Properties Inc. | 25,702 | 652 |
| Weyerhaeuser Co. | 23,054 | 644 |
| Essex Property Trust Inc. | 2,916 | 626 |
| * FleetCor Technologies Inc. | 4,102 | 612 |
| Host Hotels & Resorts Inc. | 33,772 | 599 |
| Regions Financial Corp. | 59,871 | 574 |
| Thomson Reuters Corp. | 14,789 | 574 |
| Lincoln National Corp. | 11,290 | 573 |
| Macerich Co. | 7,099 | 541 |
| Equifax Inc. | 5,348 | 524 |
| KeyCorp | 38,031 | 523 |
| * Markel Corp. | 627 | 516 |
| XL Group plc Class A | 13,786 | 514 |
| Loews Corp. | 13,989 | 510 |
| Realty Income Corp. | 10,478 | 468 |
| SL Green Realty Corp. | 4,484 | 464 |
| * Affiliated Managers Group Inc. | 2,462 | 459 |
| * Ally Financial Inc. | 20,817 | 455 |
| FNF Group | 12,219 | 445 |
| Voya Financial Inc. | 9,900 | 426 |
| Annaly Capital Management Inc. | 40,972 | 412 |
| Western Union Co. | 22,322 | 412 |
| Kimco Realty Corp. | 17,846 | 411 |
| * CBRE Group Inc. Class A | 12,367 | 396 |
| Extra Space Storage Inc. | 5,372 | 395 |
| TD Ameritrade Holding Corp. | 11,544 | 386 |
| Federal Realty Investment Trust | 2,970 | 383 |
| Huntington Bancshares Inc. | 34,956 | 381 |
| Cincinnati Financial Corp. | 7,107 | 372 |
| Digital Realty Trust Inc. | 5,872 | 372 |
| First Republic Bank | 6,150 | 371 |
| * Arch Capital Group Ltd. | 5,363 | 366 |
| Unum Group | 10,788 | 362 |
| UDR Inc. | 11,198 | 362 |
| New York Community Bancorp Inc. | 19,208 | 339 |
| Comerica Inc. | 7,696 | 339 |
| Everest Re Group Ltd. | 1,921 | 338 |
| Citizens Financial Group Inc. | 13,483 | 335 |
| * E*TRADE Financial Corp. | 12,539 | 330 |
| Total System Services Inc. | 7,145 | 327 |
| CIT Group Inc. | 7,526 | 327 |
| * Alleghany Corp. | 692 | 325 |
| Global Payments Inc. | 2,874 | 320 |
| HCC Insurance Holdings Inc. | 4,138 | 320 |
| Torchmark Corp. | 5,453 | 319 |
| * VEREIT Inc. | 39,134 | 319 |
| Arthur J Gallagher & Co. | 7,261 | 317 |
| Leucadia National Corp. | 14,485 | 311 |
| SEI Investments Co. | 6,023 | 305 |
| MSCI Inc. Class A | 4,861 | 294 |
| Raymond James Financial Inc. | 5,525 | 293 |
| * Signature Bank | 2,192 | 293 |
| Plum Creek Timber Co. Inc. | 7,594 | 292 |
| American Capital Agency Corp. | 15,253 | 292 |
| Jones Lang LaSalle Inc. | 1,940 | 289 |
| PartnerRe Ltd. | 2,064 | 286 |
| FactSet Research Systems Inc. | 1,807 | 285 |
| * SVB Financial Group | 2,217 | 277 |
| Broadridge Financial Solutions Inc. | 5,182 | 274 |
| * Vantiv Inc. Class A | 6,205 | 273 |
| Lazard Ltd. Class A | 5,449 | 271 |
| Camden Property Trust | 3,755 | 270 |
| Duke Realty Corp. | 14,919 | 269 |
| Alexandria Real Estate Equities Inc. | 3,114 | 268 |
14
| Vanguard® Russell 3000 Index Fund | ||
| Schedule of Investments | ||
| August 31, 2015 | ||
| Market | ||
| Value | ||
| Shares | ($000) | |
| Omega Healthcare Investors Inc. | 7,901 | 267 |
| Reinsurance Group of America Inc. Class A | 2,862 | 260 |
| WP Carey Inc. | 4,511 | 259 |
| Iron Mountain Inc. | 9,104 | 258 |
| NASDAQ OMX Group Inc. | 5,006 | 256 |
| Mid-America Apartment Communities Inc. | 3,258 | 256 |
| * Realogy Holdings Corp. | 6,336 | 255 |
| Zions Bancorporation | 8,787 | 255 |
| East West Bancorp Inc. | 6,220 | 251 |
| Kilroy Realty Corp. | 3,808 | 247 |
| Axis Capital Holdings Ltd. | 4,372 | 245 |
| Apartment Investment & Management Co. | 6,758 | 243 |
| Regency Centers Corp. | 4,078 | 242 |
| Jack Henry & Associates Inc. | 3,543 | 241 |
| NorthStar Realty Finance Corp. | 16,440 | 231 |
| CBOE Holdings Inc. | 3,631 | 230 |
| WR Berkley Corp. | 4,217 | 229 |
| Assurant Inc. | 2,964 | 220 |
| Starwood Property Trust Inc. | 10,347 | 220 |
| * Howard Hughes Corp. | 1,721 | 216 |
| Navient Corp. | 16,819 | 215 |
| Hudson City Bancorp Inc. | 22,984 | 214 |
| People's United Financial Inc. | 13,458 | 209 |
| American Financial Group Inc. | 3,017 | 208 |
| StanCorp Financial Group Inc. | 1,817 | 207 |
| Equity LifeStyle Properties Inc. | 3,680 | 205 |
| RenaissanceRe Holdings Ltd. | 2,011 | 205 |
| * Forest City Enterprises Inc. Class A | 9,509 | 205 |
| National Retail Properties Inc. | 5,842 | 203 |
| DDR Corp. | 13,215 | 202 |
| Liberty Property Trust | 6,515 | 200 |
| PacWest Bancorp | 4,447 | 190 |
| Legg Mason Inc. | 4,264 | 189 |
| Taubman Centers Inc. | 2,718 | 188 |
| Spirit Realty Capital Inc. | 19,351 | 186 |
| White Mountains Insurance Group Ltd. | 255 | 183 |
| Home Properties Inc. | 2,467 | 183 |
| * Synchrony Financial | 5,466 | 180 |
| City National Corp. | 2,046 | 180 |
| CubeSmart | 7,090 | 179 |
| First American Financial Corp. | 4,614 | 179 |
| Eaton Vance Corp. | 5,156 | 179 |
| Investors Bancorp Inc. | 14,840 | 175 |
| Old Republic International Corp. | 11,125 | 175 |
| Endurance Specialty Holdings Ltd. | 2,722 | 174 |
| Synovus Financial Corp. | 5,679 | 173 |
| Douglas Emmett Inc. | 6,216 | 172 |
| Hospitality Properties Trust | 6,578 | 169 |
| Brixmor Property Group Inc. | 7,377 | 168 |
| Dun & Bradstreet Corp. | 1,580 | 167 |
| Weingarten Realty Investors | 5,276 | 167 |
| American Campus Communities Inc. | 4,779 | 164 |
| Assured Guaranty Ltd. | 6,450 | 163 |
| Allied World Assurance Co. Holdings AG | 4,064 | 162 |
| BioMed Realty Trust Inc. | 8,678 | 161 |
| Validus Holdings Ltd. | 3,615 | 160 |
| * Strategic Hotels & Resorts Inc. | 11,800 | 159 |
| Brown & Brown Inc. | 4,948 | 159 |
| Commerce Bancshares Inc. | 3,519 | 158 |
| BankUnited Inc. | 4,421 | 158 |
| Umpqua Holdings Corp. | 9,409 | 157 |
| Senior Housing Properties Trust | 10,007 | 157 |
| * WEX Inc. | 1,645 | 155 |
| RLJ Lodging Trust | 5,634 | 155 |
15
| Vanguard® Russell 3000 Index Fund | ||
| Schedule of Investments | ||
| August 31, 2015 | ||
| Market | ||
| Value | ||
| Shares | ($000) | |
| Prosperity Bancshares Inc. | 2,992 | 155 |
| * SLM Corp. | 18,125 | 154 |
| * MGIC Investment Corp. | 14,503 | 153 |
| Highwoods Properties Inc. | 4,017 | 152 |
| LaSalle Hotel Properties | 4,810 | 151 |
| CNO Financial Group Inc. | 8,432 | 151 |
| Hanover Insurance Group Inc. | 1,898 | 150 |
| Cullen/Frost Bankers Inc. | 2,311 | 149 |
| Two Harbors Investment Corp. | 15,675 | 148 |
| Radian Group Inc. | 8,205 | 148 |
| Corrections Corp. of America | 4,994 | 147 |
| * CoreLogic Inc. | 3,859 | 146 |
| First Horizon National Corp. | 9,994 | 145 |
| MarketAxess Holdings Inc. | 1,595 | 144 |
| * Euronet Worldwide Inc. | 2,233 | 144 |
| * Equity Commonwealth | 5,571 | 143 |
| New Residential Investment Corp. | 10,081 | 143 |
| LPL Financial Holdings Inc. | 3,526 | 142 |
| Apple Hospitality REIT Inc. | 7,976 | 141 |
| First Niagara Financial Group Inc. | 15,251 | 141 |
| Waddell & Reed Financial Inc. Class A | 3,603 | 141 |
| Bank of the Ozarks Inc. | 3,343 | 140 |
| NorthStar Asset Management Group Inc. | 8,305 | 140 |
| Retail Properties of America Inc. | 10,170 | 139 |
| Webster Financial Corp. | 3,887 | 138 |
| Sovran Self Storage Inc. | 1,529 | 137 |
| * Stifel Financial Corp. | 2,901 | 135 |
| Sun Communities Inc. | 2,015 | 131 |
| * Popular Inc. | 4,475 | 131 |
| Tanger Factory Outlet Centers Inc. | 4,144 | 131 |
| Post Properties Inc. | 2,360 | 131 |
| Healthcare Trust of America Inc. Class A | 5,389 | 129 |
| PrivateBancorp Inc. | 3,400 | 129 |
| FirstMerit Corp. | 7,117 | 128 |
| Paramount Group Inc. | 7,686 | 126 |
| Federated Investors Inc. Class B | 4,053 | 126 |
| Rayonier Inc. | 5,454 | 125 |
| EPR Properties | 2,461 | 125 |
| Medical Properties Trust Inc. | 10,713 | 125 |
| Chimera Investment Corp. | 8,888 | 125 |
| Sunstone Hotel Investors Inc. | 8,971 | 124 |
| DCT Industrial Trust Inc. | 3,843 | 123 |
| Aspen Insurance Holdings Ltd. | 2,665 | 122 |
| Associated Banc-Corp | 6,595 | 121 |
| Gaming and Leisure Properties Inc. | 3,815 | 118 |
| Pebblebrook Hotel Trust | 3,092 | 118 |
| Bank of Hawaii Corp. | 1,885 | 117 |
| * Care Capital Properties Inc. | 3,651 | 116 |
| Columbia Property Trust Inc. | 5,408 | 116 |
| ProAssurance Corp. | 2,390 | 115 |
| Fair Isaac Corp. | 1,344 | 115 |
| American Homes 4 Rent Class A | 7,187 | 115 |
| MFA Financial Inc. | 16,027 | 114 |
| TCF Financial Corp. | 7,313 | 113 |
| * Western Alliance Bancorp | 3,718 | 113 |
| Piedmont Office Realty Trust Inc. Class A | 6,676 | 113 |
| United Bankshares Inc. | 3,004 | 112 |
| * PRA Group Inc. | 2,090 | 111 |
| * Genworth Financial Inc. Class A | 21,272 | 110 |
| CBL & Associates Properties Inc. | 7,235 | 108 |
| MB Financial Inc. | 3,262 | 107 |
| * Texas Capital Bancshares Inc. | 1,984 | 107 |
| Colony Capital Inc. Class A | 4,857 | 105 |
| Wintrust Financial Corp. | 2,061 | 105 |
16
| Vanguard® Russell 3000 Index Fund | |||
| Schedule of Investments | |||
| August 31, 2015 | |||
| Market | |||
| Value | |||
| Shares | ($000) | ||
| Symetra Financial Corp. | 3,333 | 105 | |
| Communications Sales & Leasing Inc. | 5,216 | 105 | |
| Cathay General Bancorp | 3,470 | 103 | |
| DiamondRock Hospitality Co. | 8,696 | 102 | |
| * | Springleaf Holdings Inc. Class A | 2,265 | 101 |
| IBERIABANK Corp. | 1,660 | 101 | |
| Healthcare Realty Trust Inc. | 4,383 | 100 | |
| Interactive Brokers Group Inc. | 2,504 | 100 | |
| BancorpSouth Inc. | 4,204 | 100 | |
| RLI Corp. | 1,890 | 98 | |
| WP GLIMCHER Inc. | 8,056 | 98 | |
| Kennedy-Wilson Holdings Inc. | 4,056 | 97 | |
| AmTrust Financial Services Inc. | 1,671 | 97 | |
| GEO Group Inc. | 3,235 | 97 | |
| Ryman Hospitality Properties Inc. | 1,892 | 97 | |
| Heartland Payment Systems Inc. | 1,612 | 96 | |
| Valley National Bancorp | 10,149 | 96 | |
| Hancock Holding Co. | 3,404 | 96 | |
| Home BancShares Inc. | 2,506 | 96 | |
| FNB Corp. | 7,601 | 95 | |
| Primerica Inc. | 2,246 | 95 | |
| CyrusOne Inc. | 3,010 | 95 | |
| Janus Capital Group Inc. | 6,395 | 95 | |
| Brandywine Realty Trust | 7,838 | 95 | |
| Washington Federal Inc. | 4,156 | 94 | |
| First Industrial Realty Trust Inc. | 4,856 | 94 | |
| Fulton Financial Corp. | 7,718 | 94 | |
| * | Blackhawk Network Holdings Inc. | 2,374 | 94 |
| *,^ | Zillow Group Inc. | 3,778 | 93 |
| WisdomTree Investments Inc. | 4,950 | 93 | |
| Hudson Pacific Properties Inc. | 3,266 | 93 | |
| National Health Investors Inc. | 1,639 | 90 | |
| Xenia Hotels & Resorts Inc. | 4,863 | 90 | |
| Acadia Realty Trust | 3,023 | 89 | |
| Erie Indemnity Co. Class A | 1,070 | 88 | |
| * | Santander Consumer USA Holdings Inc. | 3,900 | 88 |
| First Financial Bankshares Inc. | 2,811 | 88 | |
| Cousins Properties Inc. | 9,493 | 87 | |
| Corporate Office Properties Trust | 4,139 | 87 | |
| UMB Financial Corp. | 1,726 | 87 | |
| Kite Realty Group Trust | 3,667 | 86 | |
| Glacier Bancorp Inc. | 3,310 | 86 | |
| EverBank Financial Corp. | 4,284 | 85 | |
| American Equity Investment Life Holding Co. | 3,390 | 82 | |
| Urban Edge Properties | 3,916 | 82 | |
| First Citizens BancShares Inc. Class A | 340 | 81 | |
| South State Corp. | 1,071 | 80 | |
| Evercore Partners Inc. Class A | 1,529 | 80 | |
| Empire State Realty Trust Inc. | 4,923 | 80 | |
| * | BofI Holding Inc. | 686 | 79 |
| BOK Financial Corp. | 1,250 | 79 | |
| Columbia Banking System Inc. | 2,558 | 78 | |
| EastGroup Properties Inc. | 1,433 | 77 | |
| Selective Insurance Group Inc. | 2,541 | 77 | |
| * | Credit Acceptance Corp. | 377 | 77 |
| Equity One Inc. | 3,265 | 77 | |
| CVB Financial Corp. | 4,705 | 76 | |
| Chesapeake Lodging Trust | 2,642 | 76 | |
| Capitol Federal Financial Inc. | 6,279 | 76 | |
| National Penn Bancshares Inc. | 6,287 | 76 | |
| Pinnacle Financial Partners Inc. | 1,587 | 75 | |
| DuPont Fabros Technology Inc. | 2,800 | 75 | |
| Sterling Bancorp | 5,333 | 75 | |
| Mack-Cali Realty Corp. | 3,981 | 75 | |
17
| Vanguard® Russell 3000 Index Fund | |||
| Schedule of Investments | |||
| August 31, 2015 | |||
| Market | |||
| Value | |||
| Shares | ($000) | ||
| Washington REIT | 3,031 | 75 | |
| Invesco Mortgage Capital Inc. | 5,468 | 74 | |
| Lexington Realty Trust | 9,141 | 74 | |
| Financial Engines Inc. | 2,269 | 74 | |
| Alexander & Baldwin Inc. | 2,165 | 73 | |
| Old National Bancorp | 5,222 | 72 | |
| BGC Partners Inc. Class A | 8,191 | 72 | |
| Chambers Street Properties | 10,529 | 71 | |
| Hatteras Financial Corp. | 4,337 | 70 | |
| * | Hilltop Holdings Inc. | 3,384 | 70 |
| * | Cardtronics Inc. | 2,016 | 70 |
| Trustmark Corp. | 3,020 | 70 | |
| Monogram Residential Trust Inc. | 7,498 | 69 | |
| Kemper Corp. | 1,940 | 69 | |
| Morningstar Inc. | 859 | 69 | |
| Retail Opportunity Investments Corp. | 4,226 | 67 | |
| * | Essent Group Ltd. | 2,495 | 67 |
| Argo Group International Holdings Ltd. | 1,189 | 67 | |
| Community Bank System Inc. | 1,832 | 65 | |
| LTC Properties Inc. | 1,600 | 65 | |
| Artisan Partners Asset Management Inc. Class A | 1,589 | 65 | |
| American Assets Trust Inc. | 1,675 | 65 | |
| New York REIT Inc. | 6,730 | 64 | |
| Sabra Health Care REIT Inc. | 2,658 | 64 | |
| Education Realty Trust Inc. | 2,174 | 64 | |
| International Bancshares Corp. | 2,448 | 63 | |
| First Midwest Bancorp Inc. | 3,522 | 62 | |
| Mercury General Corp. | 1,220 | 62 | |
| Pennsylvania REIT | 3,108 | 62 | |
| Horace Mann Educators Corp. | 1,853 | 62 | |
| HFF Inc. Class A | 1,694 | 62 | |
| Parkway Properties Inc. | 3,810 | 60 | |
| QTS Realty Trust Inc. Class A | 1,500 | 60 | |
| Astoria Financial Corp. | 3,704 | 60 | |
| PS Business Parks Inc. | 803 | 59 | |
| LegacyTexas Financial Group Inc. | 1,960 | 56 | |
| Potlatch Corp. | 1,675 | 55 | |
| * | Enstar Group Ltd. | 374 | 55 |
| Simmons First National Corp. Class A | 1,229 | 54 | |
| * | FNFV Group | 3,652 | 53 |
| * | Eagle Bancorp Inc. | 1,258 | 53 |
| Northwest Bancshares Inc. | 4,090 | 53 | |
| Gramercy Property Trust Inc. | 2,358 | 52 | |
| FelCor Lodging Trust Inc. | 6,458 | 52 | |
| Renasant Corp. | 1,655 | 52 | |
| CYS Investments Inc. | 6,633 | 52 | |
| New Senior Investment Group Inc. | 4,518 | 51 | |
| Hersha Hospitality Trust Class A | 2,104 | 51 | |
| TFS Financial Corp. | 2,994 | 51 | |
| Provident Financial Services Inc. | 2,701 | 51 | |
| Ramco-Gershenson Properties Trust | 3,279 | 51 | |
| Redwood Trust Inc. | 3,468 | 51 | |
| BBCN Bancorp Inc. | 3,458 | 50 | |
| Independent Bank Corp. | 1,104 | 50 | |
| EVERTEC Inc. | 2,708 | 49 | |
| * | First Cash Financial Services Inc. | 1,187 | 49 |
| WesBanco Inc. | 1,583 | 49 | |
| CoreSite Realty Corp. | 1,001 | 49 | |
| * | Third Point Reinsurance Ltd. | 3,474 | 49 |
| * | St. Joe Co. | 2,767 | 48 |
| *,^ | Zillow Group Inc. Class A | 1,887 | 48 |
| Select Income REIT | 2,578 | 48 | |
| Westamerica Bancorporation | 1,051 | 47 | |
| NBT Bancorp Inc. | 1,813 | 47 | |
18
| Vanguard® Russell 3000 Index Fund | ||
| Schedule of Investments | ||
| August 31, 2015 | ||
| Market | ||
| Value | ||
| Shares | ($000) | |
| First Financial Bancorp | 2,540 | 47 |
| Union Bankshares Corp. | 1,971 | 47 |
| PennyMac Mortgage Investment Trust | 3,070 | 46 |
| * iStar Inc. | 3,691 | 46 |
| Government Properties Income Trust | 2,903 | 46 |
| Park National Corp. | 545 | 46 |
| STAG Industrial Inc. | 2,680 | 46 |
| Chemical Financial Corp. | 1,423 | 45 |
| * MBIA Inc. | 6,426 | 45 |
| Summit Hotel Properties Inc. | 3,697 | 45 |
| Great Western Bancorp Inc. | 1,745 | 44 |
| Kearny Financial Corp. | 3,852 | 44 |
| Capstead Mortgage Corp. | 4,181 | 44 |
| * Encore Capital Group Inc. | 1,071 | 44 |
| * HRG Group Inc. | 3,354 | 43 |
| Greenhill & Co. Inc. | 1,224 | 43 |
| United Community Banks Inc. | 2,190 | 43 |
| S&T Bancorp Inc. | 1,432 | 43 |
| * Beneficial Bancorp Inc. | 3,423 | 43 |
| Physicians Realty Trust | 2,895 | 42 |
| Boston Private Financial Holdings Inc. | 3,418 | 41 |
| First Merchants Corp. | 1,555 | 40 |
| CNA Financial Corp. | 1,107 | 40 |
| Apollo Commercial Real Estate Finance Inc. | 2,404 | 39 |
| * FCB Financial Holdings Inc. Class A | 1,187 | 39 |
| Ameris Bancorp | 1,433 | 39 |
| ARMOUR Residential REIT Inc. | 1,812 | 39 |
| Franklin Street Properties Corp. | 3,703 | 39 |
| Banner Corp. | 864 | 38 |
| Starwood Waypoint Residential Trust | 1,572 | 38 |
| Infinity Property & Casualty Corp. | 489 | 38 |
| AMERISAFE Inc. | 804 | 38 |
| Altisource Residential Corp. | 2,448 | 37 |
| Talmer Bancorp Inc. Class A | 2,298 | 37 |
| Nelnet Inc. Class A | 978 | 37 |
| Stewart Information Services Corp. | 946 | 37 |
| Chatham Lodging Trust | 1,577 | 36 |
| First Commonwealth Financial Corp. | 4,087 | 36 |
| Terreno Realty Corp. | 1,777 | 36 |
| Virtus Investment Partners Inc. | 312 | 36 |
| ServisFirst Bancshares Inc. | 951 | 36 |
| * Navigators Group Inc. | 464 | 35 |
| Universal Insurance Holdings Inc. | 1,427 | 35 |
| * LendingClub Corp. | 2,748 | 34 |
| * Green Dot Corp. Class A | 1,949 | 34 |
| Towne Bank | 1,874 | 34 |
| Hanmi Financial Corp. | 1,413 | 34 |
| Tompkins Financial Corp. | 651 | 34 |
| * Xoom Corp. | 1,373 | 34 |
| Berkshire Hills Bancorp Inc. | 1,216 | 34 |
| Investors Real Estate Trust | 5,046 | 34 |
| Cardinal Financial Corp. | 1,492 | 33 |
| American Capital Mortgage Investment Corp. | 2,170 | 33 |
| * Ocwen Financial Corp. | 4,423 | 33 |
| CareTrust REIT Inc. | 2,924 | 33 |
| Brookline Bancorp Inc. | 3,101 | 33 |
| Alexander's Inc. | 90 | 33 |
| City Holding Co. | 686 | 33 |
| Safety Insurance Group Inc. | 621 | 33 |
| Maiden Holdings Ltd. | 2,257 | 32 |
| Wilshire Bancorp Inc. | 3,022 | 32 |
| Cash America International Inc. | 1,162 | 32 |
| WSFS Financial Corp. | 1,164 | 32 |
| National Bank Holdings Corp. Class A | 1,577 | 32 |
19
| Vanguard® Russell 3000 Index Fund | ||
| Schedule of Investments | ||
| August 31, 2015 | ||
| Market | ||
| Value | ||
| Shares | ($000) | |
| New York Mortgage Trust Inc. | 4,858 | 32 |
| United Fire Group Inc. | 954 | 32 |
| Oritani Financial Corp. | 2,085 | 31 |
| Employers Holdings Inc. | 1,425 | 31 |
| American National Insurance Co. | 316 | 31 |
| * Meridian Bancorp Inc. | 2,407 | 31 |
| Banco Latinoamericano de Comercio Exterior SA | 1,238 | 31 |
| Northfield Bancorp Inc. | 2,037 | 30 |
| Lakeland Financial Corp. | 741 | 30 |
| * Greenlight Capital Re Ltd. Class A | 1,191 | 30 |
| Inland Real Estate Corp. | 3,610 | 30 |
| * Ambac Financial Group Inc. | 1,865 | 30 |
| State Bank Financial Corp. | 1,489 | 30 |
| Rexford Industrial Realty Inc. | 2,318 | 30 |
| Sandy Spring Bancorp Inc. | 1,152 | 30 |
| * Piper Jaffray Cos. | 706 | 30 |
| Southside Bancshares Inc. | 1,125 | 29 |
| United Financial Bancorp Inc. | 2,334 | 29 |
| National General Holdings Corp. | 1,597 | 29 |
| * Nationstar Mortgage Holdings Inc. | 1,740 | 29 |
| Heartland Financial USA Inc. | 797 | 29 |
| Ashford Hospitality Trust Inc. | 3,707 | 29 |
| * Customers Bancorp Inc. | 1,153 | 28 |
| First Potomac Realty Trust | 2,680 | 28 |
| Hannon Armstrong Sustainable Infrastructure Capital Inc. | 1,459 | 28 |
| Ladder Capital Corp. | 1,777 | 28 |
| InfraREIT Inc. | 979 | 28 |
| STORE Capital Corp. | 1,363 | 27 |
| Washington Trust Bancorp Inc. | 711 | 27 |
| * Capital Bank Financial Corp. | 891 | 27 |
| * LendingTree Inc. | 258 | 27 |
| * Cowen Group Inc. Class A | 5,113 | 27 |
| Rouse Properties Inc. | 1,717 | 27 |
| Universal Health Realty Income Trust | 580 | 27 |
| * Walker & Dunlop Inc. | 1,089 | 26 |
| TrustCo Bank Corp. NY | 4,377 | 26 |
| CenterState Banks Inc. | 1,870 | 26 |
| * Walter Investment Management Corp. | 1,553 | 26 |
| Cohen & Steers Inc. | 849 | 25 |
| Anworth Mortgage Asset Corp. | 5,028 | 25 |
| Cass Information Systems Inc. | 521 | 25 |
| First Interstate BancSystem Inc. Class A | 929 | 25 |
| * KCG Holdings Inc. Class A | 2,154 | 25 |
| United Development Funding IV | 1,417 | 25 |
| Western Asset Mortgage Capital Corp. | 1,913 | 24 |
| Cedar Realty Trust Inc. | 3,855 | 24 |
| BNC Bancorp | 1,164 | 24 |
| Monmouth Real Estate Investment Corp. | 2,517 | 24 |
| * Marcus & Millichap Inc. | 561 | 24 |
| ConnectOne Bancorp Inc. | 1,231 | 24 |
| Flushing Financial Corp. | 1,175 | 23 |
| Yadkin Financial Corp. | 1,114 | 23 |
| Investment Technology Group Inc. | 1,408 | 23 |
| TriCo Bancshares | 972 | 23 |
| Urstadt Biddle Properties Inc. Class A | 1,283 | 23 |
| Agree Realty Corp. | 808 | 23 |
| Diamond Hill Investment Group Inc. | 118 | 23 |
| Moelis & Co. Class A | 834 | 23 |
| Saul Centers Inc. | 457 | 23 |
| Silver Bay Realty Trust Corp. | 1,435 | 22 |
| * HomeStreet Inc. | 1,002 | 22 |
| Bryn Mawr Bank Corp. | 749 | 22 |
| Virtu Financial Inc. Class A | 929 | 22 |
| * First BanCorp | 5,419 | 22 |
20
| Vanguard® Russell 3000 Index Fund | ||
| Schedule of Investments | ||
| August 31, 2015 | ||
| Market | ||
| Value | ||
| Shares | ($000) | |
| Dime Community Bancshares Inc. | 1,270 | 22 |
| FBL Financial Group Inc. Class A | 378 | 22 |
| Community Trust Bancorp Inc. | 604 | 21 |
| * First NBC Bank Holding Co. | 600 | 21 |
| RAIT Financial Trust | 4,043 | 21 |
| American Residential Properties Inc. | 1,237 | 21 |
| Heritage Financial Corp. | 1,164 | 21 |
| Stock Yards Bancorp Inc. | 578 | 20 |
| Resource Capital Corp. | 6,226 | 20 |
| 1st Source Corp. | 673 | 20 |
| Enterprise Financial Services Corp. | 828 | 20 |
| * Heritage Insurance Holdings Inc. | 1,120 | 20 |
| Central Pacific Financial Corp. | 948 | 20 |
| CoBiz Financial Inc. | 1,516 | 20 |
| National Western Life Insurance Co. Class A | 85 | 19 |
| First Busey Corp. | 2,942 | 19 |
| Waterstone Financial Inc. | 1,452 | 19 |
| Blue Hills Bancorp Inc. | 1,302 | 18 |
| AG Mortgage Investment Trust Inc. | 1,113 | 18 |
| BancFirst Corp. | 304 | 18 |
| OM Asset Management plc | 1,102 | 18 |
| * NMI Holdings Inc. Class A | 2,187 | 18 |
| * Flagstar Bancorp Inc. | 892 | 18 |
| Banc of California Inc. | 1,460 | 18 |
| MainSource Financial Group Inc. | 873 | 18 |
| RE/MAX Holdings Inc. | 491 | 18 |
| Apollo Residential Mortgage Inc. | 1,289 | 18 |
| Great Southern Bancorp Inc. | 446 | 18 |
| Metro Bancorp Inc. | 624 | 18 |
| * Altisource Portfolio Solutions SA | 663 | 18 |
| Arlington Asset Investment Corp. Class A | 1,056 | 18 |
| * Square 1 Financial Inc. Class A | 695 | 18 |
| Lakeland Bancorp Inc. | 1,578 | 17 |
| Peoples Bancorp Inc. | 790 | 17 |
| Independent Bank Group Inc. | 404 | 17 |
| * HomeTrust Bancshares Inc. | 938 | 17 |
| Mercantile Bank Corp. | 818 | 17 |
| Getty Realty Corp. | 1,052 | 17 |
| First Defiance Financial Corp. | 437 | 16 |
| Westwood Holdings Group Inc. | 296 | 16 |
| Preferred Bank | 536 | 16 |
| HCI Group Inc. | 413 | 16 |
| CatchMark Timber Trust Inc. Class A | 1,629 | 16 |
| * Forestar Group Inc. | 1,266 | 16 |
| Clifton Bancorp Inc. | 1,184 | 16 |
| First Financial Corp. | 495 | 16 |
| German American Bancorp Inc. | 558 | 16 |
| * Safeguard Scientifics Inc. | 906 | 16 |
| * INTL. FCStone Inc. | 599 | 16 |
| Opus Bank | 429 | 16 |
| Financial Institutions Inc. | 635 | 16 |
| Univest Corp. of Pennsylvania | 810 | 16 |
| * Pacific Premier Bancorp Inc. | 835 | 16 |
| First Bancorp | 915 | 16 |
| * Ezcorp Inc. Class A | 2,462 | 16 |
| * Enova International Inc. | 1,186 | 15 |
| Independent Bank Corp. | 1,090 | 15 |
| Bank Mutual Corp. | 2,113 | 15 |
| OneBeacon Insurance Group Ltd. Class A | 1,054 | 15 |
| Park Sterling Corp. | 2,107 | 15 |
| Stonegate Bank | 485 | 15 |
| Camden National Corp. | 374 | 15 |
| * CU Bancorp | 691 | 15 |
| Suffolk Bancorp | 559 | 15 |
21
| Vanguard® Russell 3000 Index Fund | ||
| Schedule of Investments | ||
| August 31, 2015 | ||
| Market | ||
| Value | ||
| Shares | ($000) | |
| Fidelity Southern Corp. | 772 | 15 |
| Dynex Capital Inc. | 2,217 | 15 |
| First Connecticut Bancorp Inc. | 868 | 15 |
| Southwest Bancorp Inc. | 880 | 15 |
| * NewStar Financial Inc. | 1,280 | 15 |
| Arrow Financial Corp. | 529 | 15 |
| * Tejon Ranch Co. | 614 | 15 |
| GAMCO Investors Inc. | 248 | 15 |
| * Anchor BanCorp Wisconsin Inc. | 352 | 14 |
| OFG Bancorp | 1,666 | 14 |
| State Auto Financial Corp. | 657 | 14 |
| First Community Bancshares Inc. | 808 | 14 |
| Bridge Bancorp Inc. | 541 | 14 |
| Fidelity & Guaranty Life | 577 | 14 |
| * eHealth Inc. | 951 | 14 |
| First of Long Island Corp. | 553 | 14 |
| * Seacoast Banking Corp. of Florida | 885 | 14 |
| Ashford Hospitality Prime Inc. | 994 | 14 |
| Bank of Marin Bancorp | 286 | 14 |
| * TriState Capital Holdings Inc. | 1,095 | 14 |
| Meta Financial Group Inc. | 315 | 14 |
| Campus Crest Communities Inc. | 2,597 | 13 |
| * Everi Holdings Inc. | 2,593 | 13 |
| Peapack Gladstone Financial Corp. | 631 | 13 |
| Ares Commercial Real Estate Corp. | 1,063 | 13 |
| One Liberty Properties Inc. | 605 | 13 |
| OceanFirst Financial Corp. | 710 | 13 |
| State National Cos. Inc. | 1,372 | 13 |
| * Citizens Inc. Class A | 2,059 | 13 |
| Citizens & Northern Corp. | 645 | 13 |
| Peoples Financial Services Corp. | 359 | 13 |
| Republic Bancorp Inc. Class A | 510 | 13 |
| Heritage Commerce Corp. | 1,200 | 13 |
| United Community Financial Corp. | 2,539 | 13 |
| NewBridge Bancorp | 1,514 | 13 |
| * PICO Holdings Inc. | 976 | 13 |
| West Bancorporation Inc. | 701 | 13 |
| Guaranty Bancorp | 784 | 13 |
| National Bankshares Inc. | 393 | 12 |
| CNB Financial Corp. | 729 | 12 |
| Pacific Continental Corp. | 957 | 12 |
| * Ladenburg Thalmann Financial Services Inc. | 4,674 | 12 |
| Whitestone REIT | 1,064 | 12 |
| * Global Indemnity plc | 452 | 12 |
| Federated National Holding Co. | 552 | 12 |
| * PennyMac Financial Services Inc. Class A | 698 | 12 |
| Federal Agricultural Mortgage Corp. | 503 | 12 |
| Ames National Corp. | 503 | 12 |
| Baldwin & Lyons Inc. | 516 | 12 |
| * World Acceptance Corp. | 313 | 12 |
| Penns Woods Bancorp Inc. | 273 | 12 |
| * FRP Holdings Inc. | 375 | 12 |
| Horizon Bancorp | 488 | 12 |
| * Bancorp Inc. | 1,566 | 11 |
| American National Bankshares Inc. | 479 | 11 |
| Gladstone Commercial Corp. | 781 | 11 |
| National Interstate Corp. | 406 | 11 |
| United Insurance Holdings Corp. | 837 | 11 |
| Armada Hoffler Properties Inc. | 1,097 | 11 |
| MidWestOne Financial Group Inc. | 373 | 11 |
| First Bancorp Inc. | 581 | 11 |
| First Business Financial Services Inc. | 480 | 11 |
| * Sun Bancorp Inc. | 537 | 11 |
| Heritage Oaks Bancorp | 1,358 | 11 |
22
| Vanguard® Russell 3000 Index Fund | ||
| Schedule of Investments | ||
| August 31, 2015 | ||
| Market | ||
| Value | ||
| Shares | ($000) | |
| National Storage Affiliates Trust | 815 | 11 |
| UMH Properties Inc. | 1,104 | 10 |
| James River Group Holdings Ltd. | 373 | 10 |
| * Triumph Bancorp Inc. | 710 | 10 |
| Oppenheimer Holdings Inc. Class A | 512 | 10 |
| * AV Homes Inc. | 685 | 10 |
| EMC Insurance Group Inc. | 421 | 10 |
| GAIN Capital Holdings Inc. | 1,145 | 9 |
| Easterly Government Properties Inc. | 594 | 9 |
| Crawford & Co. Class B | 1,449 | 9 |
| CorEnergy Infrastructure Trust Inc. | 1,799 | 9 |
| Consolidated-Tomoka Land Co. | 167 | 9 |
| QCR Holdings Inc. | 416 | 9 |
| * Regional Management Corp. | 518 | 9 |
| * MoneyGram International Inc. | 976 | 9 |
| * Real Industry Inc. | 869 | 8 |
| NexPoint Residential Trust Inc. | 674 | 8 |
| Charter Financial Corp. | 644 | 8 |
| Preferred Apartment Communities Inc. Class A | 791 | 8 |
| Resource America Inc. Class A | 1,062 | 8 |
| * C1 Financial Inc. | 412 | 8 |
| Bluerock Residential Growth REIT Inc. Class A | 670 | 8 |
| Tiptree Financial Inc. Class A | 1,233 | 7 |
| Territorial Bancorp Inc. | 284 | 7 |
| BankFinancial Corp. | 598 | 7 |
| * Trupanion Inc. | 1,017 | 7 |
| Bar Harbor Bankshares | 212 | 7 |
| * Farmers Capital Bank Corp. | 266 | 7 |
| * Green Bancorp Inc. | 566 | 7 |
| * Old Second Bancorp Inc. | 1,047 | 7 |
| Independence Realty Trust Inc. | 869 | 6 |
| * BSB Bancorp Inc. | 287 | 6 |
| Fox Chase Bancorp Inc. | 344 | 6 |
| Orchid Island Capital Inc. | 652 | 6 |
| Calamos Asset Management Inc. Class A | 561 | 6 |
| Sierra Bancorp | 344 | 6 |
| Hingham Institution for Savings | 48 | 6 |
| * Impac Mortgage Holdings Inc. | 307 | 5 |
| Capital City Bank Group Inc. | 358 | 5 |
| Access National Corp. | 258 | 5 |
| * Atlas Financial Holdings Inc. | 320 | 5 |
| Kansas City Life Insurance Co. | 111 | 5 |
| * National Commerce Corp. | 215 | 5 |
| * Stonegate Mortgage Corp. | 687 | 5 |
| * Cascade Bancorp | 877 | 5 |
| * Hallmark Financial Services Inc. | 402 | 5 |
| * Franklin Financial Network Inc. | 193 | 5 |
| Merchants Bancshares Inc. | 158 | 5 |
| Enterprise Bancorp Inc. | 204 | 4 |
| * RCS Capital Corp. Class A | 2,028 | 4 |
| * Bear State Financial Inc. | 475 | 4 |
| Century Bancorp Inc. Class A | 98 | 4 |
| * On Deck Capital Inc. | 391 | 4 |
| Trade Street Residential Inc. | 518 | 3 |
| Pzena Investment Management Inc. Class A | 320 | 3 |
| * CommunityOne Bancorp | 294 | 3 |
| Donegal Group Inc. Class A | 210 | 3 |
| Independence Holding Co. | 223 | 3 |
| * JG Wentworth Co. Class A | 422 | 2 |
| * Ashford Inc. | 28 | 2 |
| Palmetto Bancshares Inc. | 103 | 2 |
| Great Ajax Corp. | 146 | 2 |
| * Altisource Asset Management Corp. | 46 | 2 |
| Fifth Street Asset Management Inc. | 185 | 2 |
23
| Vanguard® Russell 3000 Index Fund | ||
| Schedule of Investments | ||
| August 31, 2015 | ||
| Market | ||
| Value | ||
| Shares | ($000) | |
| * Hampton Roads Bankshares Inc. | 763 | 1 |
| Medley Management Inc. Class A | 186 | 1 |
| CIFC Corp. | 196 | 1 |
| * BBX Capital Corp. | 59 | 1 |
| * ZAIS Group Holdings Inc. | 136 | 1 |
| * Tejon Ranch Co. Warrants Exp. 08/31/2016 | 64 | — |
| 191,132 | ||
| Health Care (14.8%) | ||
| Johnson & Johnson | 121,321 | 11,402 |
| Pfizer Inc. | 269,409 | 8,680 |
| Gilead Sciences Inc. | 64,294 | 6,755 |
| Merck & Co. Inc. | 123,606 | 6,656 |
| * Allergan plc | 17,171 | 5,216 |
| Amgen Inc. | 33,265 | 5,049 |
| UnitedHealth Group Inc. | 41,647 | 4,819 |
| AbbVie Inc. | 76,565 | 4,778 |
| Medtronic plc | 62,348 | 4,507 |
| Bristol-Myers Squibb Co. | 72,933 | 4,337 |
| * Celgene Corp. | 34,702 | 4,098 |
| Eli Lilly & Co. | 42,810 | 3,525 |
| * Biogen Inc. | 10,291 | 3,060 |
| Abbott Laboratories | 65,132 | 2,950 |
| * Express Scripts Holding Co. | 31,907 | 2,667 |
| Thermo Fisher Scientific Inc. | 17,416 | 2,183 |
| McKesson Corp. | 10,132 | 2,002 |
| * Regeneron Pharmaceuticals Inc. | 3,433 | 1,763 |
| Aetna Inc. | 15,279 | 1,750 |
| * Alexion Pharmaceuticals Inc. | 9,440 | 1,625 |
| Anthem Inc. | 11,524 | 1,625 |
| Cigna Corp. | 11,266 | 1,586 |
| Stryker Corp. | 14,800 | 1,460 |
| * Vertex Pharmaceuticals Inc. | 10,701 | 1,365 |
| Becton Dickinson and Co. | 9,190 | 1,296 |
| * Illumina Inc. | 6,324 | 1,250 |
| * HCA Holdings Inc. | 14,079 | 1,220 |
| Humana Inc. | 6,585 | 1,204 |
| Cardinal Health Inc. | 14,547 | 1,197 |
| Perrigo Co. plc | 6,429 | 1,176 |
| * Boston Scientific Corp. | 59,132 | 990 |
| Zoetis Inc. | 22,020 | 988 |
| AmerisourceBergen Corp. Class A | 9,686 | 969 |
| Baxter International Inc. | 24,062 | 925 |
| * Mylan NV | 18,525 | 919 |
| * BioMarin Pharmaceutical Inc. | 7,071 | 914 |
| St. Jude Medical Inc. | 12,430 | 880 |
| Baxalta Inc. | 24,185 | 850 |
| * Intuitive Surgical Inc. | 1,631 | 833 |
| * Cerner Corp. | 13,249 | 818 |
| * Incyte Corp. | 6,957 | 808 |
| Zimmer Biomet Holdings Inc. | 7,557 | 783 |
| * Endo International plc | 9,104 | 701 |
| * Hospira Inc. | 7,695 | 692 |
| * Edwards Lifesciences Corp. | 4,782 | 674 |
| CR Bard Inc. | 3,316 | 643 |
| * DaVita HealthCare Partners Inc. | 7,883 | 596 |
| Universal Health Services Inc. Class B | 4,112 | 564 |
| Agilent Technologies Inc. | 14,902 | 541 |
| * Laboratory Corp. of America Holdings | 4,505 | 531 |
| * Henry Schein Inc. | 3,752 | 513 |
| * Jazz Pharmaceuticals plc | 2,751 | 464 |
| * Mallinckrodt plc | 5,221 | 450 |
| Quest Diagnostics Inc. | 6,211 | 421 |
| * Hologic Inc. | 10,631 | 413 |
| * Alkermes plc | 6,426 | 383 |
24
| Vanguard® Russell 3000 Index Fund | ||
| Schedule of Investments | ||
| August 31, 2015 | ||
| Market | ||
| Value | ||
| Shares | ($000) | |
| * Varian Medical Systems Inc. | 4,317 | 351 |
| Cooper Cos. Inc. | 2,088 | 339 |
| * Alnylam Pharmaceuticals Inc. | 3,208 | 330 |
| * Envision Healthcare Holdings Inc. | 8,023 | 329 |
| * MEDNAX Inc. | 4,044 | 326 |
| * DexCom Inc. | 3,429 | 323 |
| * Centene Corp. | 5,139 | 317 |
| DENTSPLY International Inc. | 6,045 | 317 |
| ResMed Inc. | 6,093 | 316 |
| * United Therapeutics Corp. | 1,999 | 301 |
| * Medivation Inc. | 3,403 | 300 |
| * IDEXX Laboratories Inc. | 4,047 | 289 |
| * Community Health Systems Inc. | 5,103 | 274 |
| * QIAGEN NV | 10,033 | 263 |
| * Isis Pharmaceuticals Inc. | 5,175 | 260 |
| * Quintiles Transnational Holdings Inc. | 3,424 | 255 |
| PerkinElmer Inc. | 4,894 | 238 |
| Teleflex Inc. | 1,799 | 235 |
| * Sirona Dental Systems Inc. | 2,407 | 230 |
| * Anacor Pharmaceuticals Inc. | 1,759 | 229 |
| * athenahealth Inc. | 1,693 | 225 |
| * Brookdale Senior Living Inc. | 7,962 | 218 |
| * Health Net Inc. | 3,350 | 215 |
| * Tenet Healthcare Corp. | 4,291 | 211 |
| * Bluebird Bio Inc. | 1,571 | 209 |
| * VCA Inc. | 3,596 | 199 |
| * Align Technology Inc. | 3,514 | 199 |
| * Alere Inc. | 3,733 | 194 |
| * Ultragenyx Pharmaceutical Inc. | 1,707 | 191 |
| * Team Health Holdings Inc. | 3,147 | 185 |
| * ABIOMED Inc. | 1,806 | 173 |
| West Pharmaceutical Services Inc. | 3,062 | 171 |
| * WellCare Health Plans Inc. | 1,881 | 171 |
| * Neurocrine Biosciences Inc. | 3,641 | 169 |
| Patterson Cos. Inc. | 3,666 | 168 |
| * Seattle Genetics Inc. | 4,156 | 167 |
| HealthSouth Corp. | 3,895 | 166 |
| STERIS Corp. | 2,550 | 163 |
| * Amsurg Corp. | 2,079 | 163 |
| * Acadia Healthcare Co. Inc. | 2,203 | 161 |
| * PAREXEL International Corp. | 2,363 | 155 |
| Bio-Techne Corp. | 1,590 | 150 |
| * Cepheid | 3,058 | 149 |
| * Thoratec Corp. | 2,360 | 148 |
| * LifePoint Health Inc. | 1,893 | 148 |
| * OPKO Health Inc. | 13,224 | 143 |
| * Dyax Corp. | 6,215 | 143 |
| * Charles River Laboratories International Inc. | 2,032 | 140 |
| * Akorn Inc. | 3,367 | 134 |
| * Molina Healthcare Inc. | 1,796 | 134 |
| Hill-Rom Holdings Inc. | 2,450 | 129 |
| * Intercept Pharmaceuticals Inc. | 681 | 129 |
| * Impax Laboratories Inc. | 3,078 | 126 |
| * ACADIA Pharmaceuticals Inc. | 3,418 | 125 |
| * Bio-Rad Laboratories Inc. Class A | 894 | 125 |
| * Novavax Inc. | 11,533 | 124 |
| * Medicines Co. | 2,901 | 119 |
| * Catalent Inc. | 3,643 | 116 |
| * Medidata Solutions Inc. | 2,390 | 115 |
| * Myriad Genetics Inc. | 3,031 | 114 |
| * NuVasive Inc. | 2,113 | 111 |
| * Chimerix Inc. | 2,219 | 109 |
| * Allscripts Healthcare Solutions Inc. | 7,885 | 109 |
| * Prestige Brands Holdings Inc. | 2,283 | 106 |
25
| Vanguard® Russell 3000 Index Fund | ||
| Schedule of Investments | ||
| August 31, 2015 | ||
| Market | ||
| Value | ||
| Shares | ($000) | |
| * Exact Sciences Corp. | 4,768 | 105 |
| * Clovis Oncology Inc. | 1,341 | 104 |
| * AMAG Pharmaceuticals Inc. | 1,641 | 103 |
| Chemed Corp. | 747 | 102 |
| * Puma Biotechnology Inc. | 1,085 | 100 |
| * Radius Health Inc. | 1,596 | 97 |
| * Agios Pharmaceuticals Inc. | 1,117 | 96 |
| * Portola Pharmaceuticals Inc. Class A | 2,018 | 95 |
| Owens & Minor Inc. | 2,772 | 94 |
| * Pacira Pharmaceuticals Inc. | 1,593 | 92 |
| * Intrexon Corp. | 2,013 | 90 |
| * Bruker Corp. | 4,853 | 89 |
| * KYTHERA Biopharmaceuticals Inc. | 1,143 | 85 |
| * Neogen Corp. | 1,648 | 85 |
| * Haemonetics Corp. | 2,280 | 82 |
| * Amicus Therapeutics Inc. | 5,680 | 82 |
| * Veeva Systems Inc. Class A | 3,133 | 81 |
| * Halozyme Therapeutics Inc. | 4,611 | 80 |
| * Prothena Corp. plc | 1,392 | 80 |
| * Masimo Corp. | 1,957 | 80 |
| * Cyberonics Inc. | 1,170 | 76 |
| Cantel Medical Corp. | 1,523 | 76 |
| * Insulet Corp. | 2,527 | 75 |
| Kindred Healthcare Inc. | 3,723 | 75 |
| * Globus Medical Inc. | 3,050 | 74 |
| * AMN Healthcare Services Inc. | 2,151 | 72 |
| * Depomed Inc. | 2,660 | 72 |
| * Ligand Pharmaceuticals Inc. | 760 | 70 |
| * Tetraphase Pharmaceuticals Inc. | 1,603 | 70 |
| * WebMD Health Corp. | 1,688 | 69 |
| * Integra LifeSciences Holdings Corp. | 1,149 | 69 |
| * Magellan Health Inc. | 1,212 | 68 |
| * Cambrex Corp. | 1,415 | 68 |
| * Insmed Inc. | 2,767 | 68 |
| * Kite Pharma Inc. | 1,268 | 67 |
| * ExamWorks Group Inc. | 1,866 | 67 |
| * ICU Medical Inc. | 583 | 66 |
| * Air Methods Corp. | 1,759 | 66 |
| CONMED Corp. | 1,237 | 66 |
| * Nektar Therapeutics | 5,889 | 65 |
| * ARIAD Pharmaceuticals Inc. | 6,890 | 65 |
| * Sarepta Therapeutics Inc. | 1,816 | 65 |
| * Halyard Health Inc. | 2,061 | 65 |
| * Celldex Therapeutics Inc. | 4,279 | 63 |
| * Acorda Therapeutics Inc. | 1,938 | 62 |
| * HeartWare International Inc. | 710 | 61 |
| Select Medical Holdings Corp. | 4,704 | 61 |
| * Greatbatch Inc. | 1,050 | 60 |
| * PTC Therapeutics Inc. | 1,496 | 57 |
| * Lannett Co. Inc. | 1,191 | 57 |
| * Ironwood Pharmaceuticals Inc. Class A | 5,184 | 57 |
| * IPC Healthcare Inc. | 716 | 57 |
| * Dynavax Technologies Corp. | 1,982 | 56 |
| * Natus Medical Inc. | 1,358 | 55 |
| * Premier Inc. Class A | 1,549 | 55 |
| * MedAssets Inc. | 2,573 | 54 |
| * TESARO Inc. | 1,052 | 54 |
| * Exelixis Inc. | 9,084 | 54 |
| * ImmunoGen Inc. | 3,864 | 52 |
| * Omnicell Inc. | 1,492 | 51 |
| Ensign Group Inc. | 1,047 | 49 |
| * Momenta Pharmaceuticals Inc. | 2,515 | 49 |
| * Wright Medical Group Inc. | 2,117 | 49 |
| Theravance Inc. | 3,505 | 49 |
26
| Vanguard® Russell 3000 Index Fund | |||
| Schedule of Investments | |||
| August 31, 2015 | |||
| Market | |||
| Value | |||
| Shares | ($000) | ||
| * | FibroGen Inc. | 1,970 | 48 |
| * | Repligen Corp. | 1,353 | 46 |
| * | Merrimack Pharmaceuticals Inc. | 4,528 | 46 |
| * | NxStage Medical Inc. | 2,602 | 45 |
| * | ZIOPHARM Oncology Inc. | 5,182 | 45 |
| * | Cempra Inc. | 1,311 | 45 |
| * | Amedisys Inc. | 1,162 | 45 |
| * | HealthEquity Inc. | 1,493 | 44 |
| Abaxis Inc. | 929 | 44 | |
| * | Heron Therapeutics Inc. | 1,134 | 44 |
| * | MiMedx Group Inc. | 4,472 | 43 |
| * | Ophthotech Corp. | 977 | 43 |
| * | Zeltiq Aesthetics Inc. | 1,327 | 43 |
| * | Emergent BioSolutions Inc. | 1,250 | 42 |
| * | Merit Medical Systems Inc. | 1,824 | 41 |
| Analogic Corp. | 512 | 41 | |
| * | PharMerica Corp. | 1,252 | 41 |
| * | Raptor Pharmaceutical Corp. | 3,314 | 40 |
| PDL BioPharma Inc. | 7,056 | 40 | |
| * | NewLink Genetics Corp. | 882 | 40 |
| * | Retrophin Inc. | 1,439 | 39 |
| * | Endologix Inc. | 3,001 | 39 |
| *,^ | MannKind Corp. | 10,154 | 38 |
| * | ZS Pharma Inc. | 752 | 38 |
| * | HMS Holdings Corp. | 3,645 | 38 |
| * | Achillion Pharmaceuticals Inc. | 5,029 | 37 |
| * | LDR Holding Corp. | 957 | 36 |
| Meridian Bioscience Inc. | 1,819 | 35 | |
| * | BioCryst Pharmaceuticals Inc. | 2,984 | 35 |
| * | Inogen Inc. | 696 | 34 |
| * | Array BioPharma Inc. | 5,806 | 34 |
| * | Tornier NV | 1,517 | 34 |
| * | Surgical Care Affiliates Inc. | 923 | 34 |
| * | Orthofix International NV | 895 | 34 |
| * | Alder Biopharmaceuticals Inc. | 858 | 33 |
| * | TherapeuticsMD Inc. | 5,302 | 32 |
| * | Luminex Corp. | 1,770 | 32 |
| * | AtriCure Inc. | 1,312 | 32 |
| * | VWR Corp. | 1,207 | 32 |
| * | Cardiovascular Systems Inc. | 1,306 | 31 |
| * | Insys Therapeutics Inc. | 970 | 31 |
| * | Synergy Pharmaceuticals Inc. | 4,479 | 31 |
| * | Sage Therapeutics Inc. | 579 | 31 |
| * | Spectranetics Corp. | 1,839 | 31 |
| * | Relypsa Inc. | 1,347 | 31 |
| * | Sucampo Pharmaceuticals Inc. Class A | 1,149 | 31 |
| * | Affymetrix Inc. | 3,292 | 31 |
| * | MacroGenics Inc. | 1,165 | 31 |
| Quality Systems Inc. | 2,255 | 31 | |
| * | Cynosure Inc. Class A | 953 | 30 |
| * | PRA Health Sciences Inc. | 797 | 30 |
| * | Eagle Pharmaceuticals Inc. | 379 | 30 |
| * | Dermira Inc. | 1,149 | 30 |
| * | Nevro Corp. | 652 | 29 |
| * | Coherus Biosciences Inc. | 1,045 | 29 |
| * | Supernus Pharmaceuticals Inc. | 1,527 | 28 |
| * | Zafgen Inc. | 754 | 28 |
| * | Capital Senior Living Corp. | 1,316 | 27 |
| * | Fluidigm Corp. | 2,240 | 27 |
| * | Arena Pharmaceuticals Inc. | 9,962 | 27 |
| * | Quidel Corp. | 1,306 | 27 |
| US Physical Therapy Inc. | 585 | 27 | |
| Invacare Corp. | 1,514 | 27 | |
| * | Keryx Biopharmaceuticals Inc. | 4,264 | 26 |
27
| Vanguard® Russell 3000 Index Fund | ||
| Schedule of Investments | ||
| August 31, 2015 | ||
| Market | ||
| Value | ||
| Shares | ($000) | |
| Phibro Animal Health Corp. Class A | 742 | 26 |
| * Atara Biotherapeutics Inc. | 644 | 26 |
| * Hanger Inc. | 1,452 | 26 |
| * Acceleron Pharma Inc. | 895 | 26 |
| * Esperion Therapeutics Inc. | 540 | 26 |
| * Accuray Inc. | 3,751 | 26 |
| * Enanta Pharmaceuticals Inc. | 659 | 26 |
| * Rockwell Medical Inc. | 2,140 | 26 |
| * Adeptus Health Inc. Class A | 255 | 25 |
| * Providence Service Corp. | 564 | 25 |
| * Aratana Therapeutics Inc. | 1,419 | 25 |
| * Intra-Cellular Therapies Inc. | 906 | 24 |
| * Genomic Health Inc. | 876 | 24 |
| National HealthCare Corp. | 399 | 24 |
| Atrion Corp. | 62 | 24 |
| Computer Programs & Systems Inc. | 520 | 24 |
| * Epizyme Inc. | 1,196 | 24 |
| * Agenus Inc. | 3,327 | 24 |
| * Inovio Pharmaceuticals Inc. | 3,135 | 23 |
| * LHC Group Inc. | 534 | 23 |
| * Vascular Solutions Inc. | 667 | 23 |
| * Geron Corp. | 7,508 | 23 |
| * Anika Therapeutics Inc. | 641 | 23 |
| * Sangamo BioSciences Inc. | 2,945 | 22 |
| * INC Research Holdings Inc. Class A | 535 | 22 |
| * Vanda Pharmaceuticals Inc. | 1,813 | 21 |
| * Merge Healthcare Inc. | 2,979 | 21 |
| * Omeros Corp. | 1,491 | 21 |
| * Progenics Pharmaceuticals Inc. | 2,832 | 21 |
| * Cerus Corp. | 4,179 | 21 |
| * Advaxis Inc. | 1,394 | 21 |
| * Infinity Pharmaceuticals Inc. | 2,322 | 20 |
| * Lexicon Pharmaceuticals Inc. | 1,711 | 20 |
| * Spectrum Pharmaceuticals Inc. | 2,787 | 20 |
| * BioTelemetry Inc. | 1,390 | 20 |
| * Xencor Inc. | 1,171 | 20 |
| * Albany Molecular Research Inc. | 984 | 20 |
| * Sagent Pharmaceuticals Inc. | 982 | 20 |
| * Zogenix Inc. | 1,016 | 20 |
| * Revance Therapeutics Inc. | 644 | 19 |
| * Five Prime Therapeutics Inc. | 1,016 | 19 |
| * Theravance Biopharma Inc. | 1,323 | 19 |
| * Triple-S Management Corp. Class B | 913 | 19 |
| * Amphastar Pharmaceuticals Inc. | 1,473 | 19 |
| * OvaScience Inc. | 967 | 19 |
| * ANI Pharmaceuticals Inc. | 379 | 18 |
| * Healthways Inc. | 1,475 | 18 |
| * TG Therapeutics Inc. | 1,455 | 18 |
| * Juno Therapeutics Inc. | 492 | 18 |
| * Accelerate Diagnostics Inc. | 902 | 18 |
| * Aegerion Pharmaceuticals Inc. | 996 | 18 |
| * Sorrento Therapeutics Inc. | 1,360 | 17 |
| * SciClone Pharmaceuticals Inc. | 2,166 | 17 |
| * Cross Country Healthcare Inc. | 1,219 | 17 |
| * Universal American Corp. | 2,363 | 17 |
| Landauer Inc. | 434 | 17 |
| * Almost Family Inc. | 376 | 17 |
| * Spark Therapeutics Inc. | 371 | 16 |
| * Arrowhead Research Corp. | 2,704 | 16 |
| * RTI Surgical Inc. | 2,509 | 16 |
| * GenMark Diagnostics Inc. | 1,548 | 16 |
| * Lion Biotechnologies Inc. | 2,213 | 16 |
| * Civitas Solutions Inc. | 645 | 16 |
| * AngioDynamics Inc. | 1,058 | 16 |
28
| Vanguard® Russell 3000 Index Fund | ||
| Schedule of Investments | ||
| August 31, 2015 | ||
| Market | ||
| Value | ||
| Shares | ($000) | |
| * K2M Group Holdings Inc. | 725 | 15 |
| * Navidea Biopharmaceuticals Inc. | 8,178 | 15 |
| * BioDelivery Sciences International Inc. | 2,219 | 15 |
| * XenoPort Inc. | 2,198 | 15 |
| * Curis Inc. | 5,610 | 15 |
| * Intersect ENT Inc. | 576 | 15 |
| * La Jolla Pharmaceutical Co. | 412 | 15 |
| * Oncothyreon Inc. | 4,286 | 15 |
| * SurModics Inc. | 638 | 15 |
| * Oxford Immunotec Global plc | 1,008 | 14 |
| * Osiris Therapeutics Inc. | 789 | 14 |
| * Rigel Pharmaceuticals Inc. | 4,701 | 14 |
| * Catalyst Pharmaceuticals Inc. | 3,827 | 14 |
| * Northwest Biotherapeutics Inc. | 1,800 | 14 |
| * Flexion Therapeutics Inc. | 574 | 14 |
| * Otonomy Inc. | 608 | 14 |
| * OncoMed Pharmaceuticals Inc. | 696 | 14 |
| * STAAR Surgical Co. | 1,700 | 14 |
| * IGI Laboratories Inc. | 1,729 | 14 |
| * Aerie Pharmaceuticals Inc. | 845 | 13 |
| * Karyopharm Therapeutics Inc. | 952 | 13 |
| * Cara Therapeutics Inc. | 687 | 13 |
| * InVivo Therapeutics Holdings Corp. | 1,329 | 13 |
| * Corcept Therapeutics Inc. | 2,546 | 13 |
| CryoLife Inc. | 1,296 | 13 |
| * Pfenex Inc. | 580 | 13 |
| * Foundation Medicine Inc. | 519 | 12 |
| * Versartis Inc. | 927 | 12 |
| * Imprivata Inc. | 568 | 12 |
| * Antares Pharma Inc. | 6,583 | 12 |
| * POZEN Inc. | 1,342 | 12 |
| * Tandem Diabetes Care Inc. | 1,014 | 12 |
| * OraSure Technologies Inc. | 2,141 | 12 |
| * NeoGenomics Inc. | 1,901 | 12 |
| * Orexigen Therapeutics Inc. | 4,158 | 12 |
| * RadNet Inc. | 1,863 | 11 |
| * Paratek Pharmaceuticals Inc. | 434 | 11 |
| * Galena Biopharma Inc. | 7,119 | 11 |
| * Threshold Pharmaceuticals Inc. | 2,667 | 11 |
| * Peregrine Pharmaceuticals Inc. | 9,691 | 11 |
| * Pacific Biosciences of California Inc. | 2,218 | 11 |
| * Genesis Healthcare Inc. | 1,509 | 11 |
| * Pernix Therapeutics Holdings Inc. | 2,250 | 11 |
| * Exactech Inc. | 550 | 11 |
| * BioSpecifics Technologies Corp. | 216 | 11 |
| * Mirati Therapeutics Inc. | 414 | 11 |
| * Addus HomeCare Corp. | 369 | 11 |
| * Blueprint Medicines Corp. | 386 | 11 |
| Utah Medical Products Inc. | 193 | 10 |
| * Sequenom Inc. | 4,770 | 10 |
| * NanoString Technologies Inc. | 671 | 10 |
| * Immunomedics Inc. | 4,692 | 10 |
| * ChemoCentryx Inc. | 1,537 | 10 |
| * Ocular Therapeutix Inc. | 561 | 10 |
| * CTI BioPharma Corp. | 6,200 | 10 |
| * Ardelyx Inc. | 515 | 10 |
| * Regulus Therapeutics Inc. | 1,165 | 10 |
| * CorVel Corp. | 319 | 10 |
| * Loxo Oncology Inc. | 458 | 9 |
| * Organovo Holdings Inc. | 3,351 | 9 |
| * Ignyta Inc. | 653 | 9 |
| * Genocea Biosciences Inc. | 765 | 9 |
| * Anthera Pharmaceuticals Inc. | 1,272 | 9 |
| * Idera Pharmaceuticals Inc. | 2,866 | 9 |
29
| Vanguard® Russell 3000 Index Fund | |||
| Schedule of Investments | |||
| August 31, 2015 | |||
| Market | |||
| Value | |||
| Shares | ($000) | ||
| * | Adamas Pharmaceuticals Inc. | 428 | 9 |
| * | Concert Pharmaceuticals Inc. | 546 | 8 |
| * | Avalanche Biotechnologies Inc. | 805 | 8 |
| * | Five Star Quality Care Inc. | 2,459 | 8 |
| * | Durect Corp. | 3,994 | 8 |
| * | Foamix Pharmaceuticals Ltd. | 804 | 8 |
| * | Cellular Biomedicine Group Inc. | 350 | 8 |
| * | Stemline Therapeutics Inc. | 861 | 8 |
| * | AAC Holdings Inc. | 328 | 8 |
| * | Cytokinetics Inc. | 1,119 | 8 |
| * | CytRx Corp. | 3,101 | 8 |
| * | Verastem Inc. | 1,244 | 8 |
| * | Applied Genetic Technologies Corp. | 459 | 8 |
| * | Cutera Inc. | 514 | 8 |
| * | Immune Design Corp. | 469 | 7 |
| * | BioTime Inc. | 2,472 | 7 |
| * | Entellus Medical Inc. | 334 | 7 |
| * | Tokai Pharmaceuticals Inc. | 625 | 7 |
| * | Castlight Health Inc. Class B | 1,388 | 7 |
| * | Veracyte Inc. | 752 | 7 |
| * | Akebia Therapeutics Inc. | 1,003 | 7 |
| * | Assembly Biosciences Inc. | 509 | 7 |
| * | Heska Corp. | 202 | 7 |
| * | Dicerna Pharmaceuticals Inc. | 621 | 7 |
| * | Collegium Pharmaceutical Inc. | 432 | 7 |
| * | T2 Biosystems Inc. | 545 | 6 |
| * | Alimera Sciences Inc. | 1,921 | 6 |
| * | Endocyte Inc. | 1,175 | 6 |
| * | VIVUS Inc. | 5,470 | 6 |
| * | Nobilis Health Corp. | 1,137 | 6 |
| * | BioScrip Inc. | 2,415 | 6 |
| * | aTyr Pharma Inc. | 402 | 6 |
| * | Aduro Biotech Inc. | 295 | 6 |
| LeMaitre Vascular Inc. | 423 | 6 | |
| * | Second Sight Medical Products Inc. | 576 | 5 |
| * | Affimed NV | 543 | 5 |
| * | Ocata Therapeutics Inc. | 1,267 | 5 |
| * | Vitae Pharmaceuticals Inc. | 680 | 5 |
| * | Trevena Inc. | 879 | 5 |
| * | Harvard Bioscience Inc. | 1,188 | 5 |
| * | Trovagene Inc. | 868 | 5 |
| *,^ | Unilife Corp. | 4,195 | 5 |
| * | Fibrocell Science Inc. | 872 | 5 |
| * | Bellicum Pharmaceuticals Inc. | 285 | 5 |
| * | Medgenics Inc. | 598 | 5 |
| * | Synta Pharmaceuticals Corp. | 2,212 | 4 |
| * | Sientra Inc. | 180 | 4 |
| * | SeaSpine Holdings Corp. | 293 | 4 |
| * | Proteon Therapeutics Inc. | 274 | 4 |
| * | Agile Therapeutics Inc. | 370 | 3 |
| National Research Corp. Class A | 254 | 3 | |
| * | Corium International Inc. | 309 | 3 |
| * | XOMA Corp. | 3,716 | 3 |
| * | CorMedix Inc. | 1,104 | 3 |
| * | Corindus Vascular Robotics Inc. | 801 | 3 |
| *,^ | XBiotech Inc. | 145 | 3 |
| * | Vital Therapies Inc. | 691 | 3 |
| * | Cidara Therapeutics Inc. | 171 | 2 |
| * | iRadimed Corp. | 101 | 2 |
| * | Carbylan Therapeutics Inc. | 437 | 2 |
| * | TransEnterix Inc. | 799 | 2 |
| * | Alliance HealthCare Services Inc. | 140 | 2 |
| * | Asterias Biotherapeutics Inc. | 372 | 2 |
| * | Abeona Therapeutics Inc. | 367 | 2 |
30
| Vanguard® Russell 3000 Index Fund | ||
| Schedule of Investments | ||
| August 31, 2015 | ||
| Market | ||
| Value | ||
| Shares | ($000) | |
| * Press Ganey Holdings Inc. | 44 | 1 |
| * Calithera Biosciences Inc. | 200 | 1 |
| * Flex Pharma Inc. | 74 | 1 |
| National Research Corp. Class B | 23 | 1 |
| * Invitae Corp. | 28 | — |
| * Tobira Therapeutics Inc. | 10 | — |
| 141,407 | ||
| Materials & Processing (3.8%) | ||
| Dow Chemical Co. | 50,440 | 2,207 |
| EI du Pont de Nemours & Co. | 39,606 | 2,040 |
| Monsanto Co. | 20,831 | 2,034 |
| LyondellBasell Industries NV Class A | 16,875 | 1,441 |
| Precision Castparts Corp. | 6,083 | 1,401 |
| Praxair Inc. | 12,645 | 1,337 |
| Air Products & Chemicals Inc. | 9,441 | 1,317 |
| Ecolab Inc. | 11,599 | 1,266 |
| PPG Industries Inc. | 11,949 | 1,139 |
| Sherwin-Williams Co. | 3,576 | 915 |
| International Paper Co. | 18,621 | 803 |
| Sigma-Aldrich Corp. | 5,317 | 741 |
| WestRock Co. | 11,642 | 691 |
| Ingersoll-Rand plc | 11,753 | 650 |
| Mosaic Co. | 15,536 | 634 |
| Nucor Corp. | 14,254 | 617 |
| CF Industries Holdings Inc. | 10,514 | 603 |
| Vulcan Materials Co. | 5,963 | 558 |
| Alcoa Inc. | 58,568 | 553 |
| Fastenal Co. | 13,208 | 509 |
| Martin Marietta Materials Inc. | 2,918 | 490 |
| Sealed Air Corp. | 9,087 | 467 |
| Eastman Chemical Co. | 6,427 | 466 |
| Celanese Corp. Class A | 6,626 | 402 |
| Masco Corp. | 15,071 | 395 |
| Newmont Mining Corp. | 23,148 | 395 |
| Ball Corp. | 5,966 | 393 |
| International Flavors & Fragrances Inc. | 3,495 | 383 |
| Acuity Brands Inc. | 1,877 | 366 |
| * WR Grace & Co. | 3,146 | 311 |
| Ashland Inc. | 2,922 | 307 |
| * Crown Holdings Inc. | 6,019 | 298 |
| Packaging Corp. of America | 4,234 | 284 |
| Airgas Inc. | 2,938 | 284 |
| Valspar Corp. | 3,512 | 257 |
| RPM International Inc. | 5,760 | 253 |
| Cytec Industries Inc. | 3,306 | 245 |
| FMC Corp. | 5,774 | 244 |
| Owens Corning | 5,143 | 228 |
| Lennox International Inc. | 1,895 | 224 |
| Albemarle Corp. | 4,850 | 219 |
| Steel Dynamics Inc. | 10,566 | 206 |
| Hexcel Corp. | 4,207 | 203 |
| Graphic Packaging Holding Co. | 14,364 | 202 |
| Reliance Steel & Aluminum Co. | 3,258 | 189 |
| Bemis Co. Inc. | 4,268 | 181 |
| AptarGroup Inc. | 2,671 | 180 |
| Eagle Materials Inc. | 2,145 | 175 |
| Sonoco Products Co. | 4,431 | 174 |
| * Berry Plastics Group Inc. | 5,093 | 151 |
| Huntsman Corp. | 8,716 | 144 |
| * Owens-Illinois Inc. | 6,909 | 144 |
| NewMarket Corp. | 364 | 139 |
| Watsco Inc. | 1,128 | 138 |
| Royal Gold Inc. | 2,766 | 133 |
| Sensient Technologies Corp. | 2,021 | 132 |
31
| Vanguard® Russell 3000 Index Fund | ||
| Schedule of Investments | ||
| August 31, 2015 | ||
| Market | ||
| Value | ||
| Shares | ($000) | |
| Southern Copper Corp. | 4,909 | 131 |
| * Axalta Coating Systems Ltd. | 4,336 | 127 |
| PolyOne Corp. | 3,831 | 124 |
| * USG Corp. | 3,996 | 122 |
| Scotts Miracle-Gro Co. Class A | 1,956 | 122 |
| * Platform Specialty Products Corp. | 6,245 | 119 |
| Compass Minerals International Inc. | 1,457 | 118 |
| Domtar Corp. | 2,766 | 111 |
| Valmont Industries Inc. | 1,022 | 109 |
| Timken Co. | 3,371 | 107 |
| United States Steel Corp. | 6,331 | 104 |
| * Louisiana-Pacific Corp. | 6,240 | 103 |
| Westlake Chemical Corp. | 1,748 | 97 |
| * Armstrong World Industries Inc. | 1,704 | 95 |
| Cabot Corp. | 2,772 | 94 |
| Belden Inc. | 1,845 | 93 |
| Allegheny Technologies Inc. | 4,723 | 91 |
| Silgan Holdings Inc. | 1,707 | 89 |
| * Rexnord Corp. | 4,454 | 89 |
| * Masonite International Corp. | 1,331 | 88 |
| Carpenter Technology Corp. | 2,232 | 87 |
| Minerals Technologies Inc. | 1,523 | 82 |
| KapStone Paper and Packaging Corp. | 3,752 | 82 |
| Balchem Corp. | 1,389 | 81 |
| * Chemtura Corp. | 2,985 | 81 |
| * Beacon Roofing Supply Inc. | 2,238 | 81 |
| Commercial Metals Co. | 5,143 | 81 |
| HB Fuller Co. | 2,222 | 80 |
| Mueller Industries Inc. | 2,519 | 80 |
| Axiall Corp. | 3,080 | 78 |
| Chemours Co. | 7,910 | 76 |
| Interface Inc. Class A | 2,963 | 72 |
| Olin Corp. | 3,436 | 69 |
| * RBC Bearings Inc. | 1,048 | 65 |
| Apogee Enterprises Inc. | 1,210 | 63 |
| Kaiser Aluminum Corp. | 753 | 63 |
| * Headwaters Inc. | 3,035 | 61 |
| Simpson Manufacturing Co. Inc. | 1,735 | 61 |
| * MRC Global Inc. | 4,640 | 60 |
| Tahoe Resources Inc. | 7,159 | 60 |
| Mueller Water Products Inc. Class A | 6,621 | 59 |
| * Trex Co. Inc. | 1,383 | 54 |
| * Boise Cascade Co. | 1,652 | 54 |
| Worthington Industries Inc. | 1,977 | 51 |
| Freeport-McMoRan Inc. | 4,726 | 50 |
| Universal Forest Products Inc. | 829 | 50 |
| Innospec Inc. | 997 | 49 |
| * Stillwater Mining Co. | 4,991 | 48 |
| Schweitzer-Mauduit International Inc. | 1,307 | 46 |
| Comfort Systems USA Inc. | 1,664 | 46 |
| Innophos Holdings Inc. | 955 | 46 |
| US Silica Holdings Inc. | 2,197 | 44 |
| * Cabot Microelectronics Corp. | 1,017 | 44 |
| * Clearwater Paper Corp. | 785 | 44 |
| Quaker Chemical Corp. | 550 | 44 |
| OM Group Inc. | 1,295 | 43 |
| A Schulman Inc. | 1,206 | 41 |
| Advanced Drainage Systems Inc. | 1,403 | 40 |
| Neenah Paper Inc. | 688 | 40 |
| Greif Inc. Class A | 1,327 | 39 |
| NN Inc. | 1,582 | 38 |
| Globe Specialty Metals Inc. | 2,765 | 38 |
| * Ferro Corp. | 3,004 | 37 |
| AAON Inc. | 1,757 | 36 |
32
| Vanguard® Russell 3000 Index Fund | ||
| Schedule of Investments | ||
| August 31, 2015 | ||
| Market | ||
| Value | ||
| Shares | ($000) | |
| Stepan Co. | 794 | 36 |
| Calgon Carbon Corp. | 2,169 | 35 |
| * Builders FirstSource Inc. | 2,222 | 33 |
| * Nortek Inc. | 398 | 33 |
| PH Glatfelter Co. | 1,779 | 32 |
| Hecla Mining Co. | 15,501 | 32 |
| TimkenSteel Corp. | 1,744 | 31 |
| Deltic Timber Corp. | 499 | 31 |
| * US Concrete Inc. | 575 | 30 |
| Aceto Corp. | 1,328 | 30 |
| Materion Corp. | 931 | 29 |
| * Continental Building Products Inc. | 1,392 | 28 |
| * PGT Inc. | 2,068 | 28 |
| * Summit Materials Inc. Class A | 1,139 | 27 |
| * Kraton Performance Polymers Inc. | 1,228 | 26 |
| * Installed Building Products Inc. | 950 | 25 |
| Griffon Corp. | 1,521 | 25 |
| Quanex Building Products Corp. | 1,371 | 25 |
| Cliffs Natural Resources Inc. | 5,756 | 23 |
| Schnitzer Steel Industries Inc. | 1,286 | 22 |
| Tronox Ltd. Class A | 2,673 | 21 |
| * AK Steel Holding Corp. | 6,711 | 21 |
| * Gibraltar Industries Inc. | 1,231 | 20 |
| * LSB Industries Inc. | 839 | 20 |
| * Coeur Mining Inc. | 5,827 | 20 |
| * Intrepid Potash Inc. | 2,469 | 19 |
| Haynes International Inc. | 498 | 19 |
| Global Brass & Copper Holdings Inc. | 960 | 19 |
| * Patrick Industries Inc. | 498 | 19 |
| American Vanguard Corp. | 1,389 | 19 |
| Koppers Holdings Inc. | 845 | 18 |
| * Horsehead Holding Corp. | 2,128 | 17 |
| * Trinseo SA | 592 | 17 |
| * Unifi Inc. | 586 | 17 |
| Hawkins Inc. | 425 | 16 |
| Wausau Paper Corp. | 2,062 | 16 |
| Myers Industries Inc. | 1,119 | 16 |
| * Senomyx Inc. | 2,395 | 16 |
| * Ply Gem Holdings Inc. | 1,148 | 16 |
| * Landec Corp. | 1,146 | 15 |
| * Veritiv Corp. | 396 | 14 |
| Tredegar Corp. | 963 | 14 |
| Insteel Industries Inc. | 803 | 14 |
| * NCI Building Systems Inc. | 1,303 | 14 |
| * OMNOVA Solutions Inc. | 2,104 | 13 |
| Culp Inc. | 426 | 13 |
| * Century Aluminum Co. | 2,336 | 13 |
| Chase Corp. | 330 | 13 |
| Rayonier Advanced Materials Inc. | 1,765 | 12 |
| LSI Industries Inc. | 1,263 | 12 |
| FutureFuel Corp. | 1,094 | 11 |
| * Stock Building Supply Holdings Inc. | 570 | 11 |
| Rentech Inc. | 1,298 | 9 |
| KMG Chemicals Inc. | 431 | 9 |
| Kronos Worldwide Inc. | 1,158 | 9 |
| LB Foster Co. Class A | 409 | 7 |
| * AEP Industries Inc. | 124 | 7 |
| * Core Molding Technologies Inc. | 272 | 6 |
| * Lawson Products Inc. | 205 | 5 |
| * Northwest Pipe Co. | 265 | 4 |
| * Uranium Energy Corp. | 3,269 | 4 |
| * Handy & Harman Ltd. | 155 | 4 |
| Olympic Steel Inc. | 255 | 3 |
| Oil-Dri Corp. of America | 135 | 3 |
33
| Vanguard® Russell 3000 Index Fund | ||
| Schedule of Investments | ||
| August 31, 2015 | ||
| Market | ||
| Value | ||
| Shares | ($000) | |
| Omega Flex Inc. | 90 | 3 |
| United States Lime & Minerals Inc. | 55 | 3 |
| * Ryerson Holding Corp. | 343 | 3 |
| Valhi Inc. | 679 | 2 |
| * NL Industries Inc. | 190 | 1 |
| * Energy Fuels Inc. | 20 | — |
| 36,713 | ||
| Other (0.0%)2 | ||
| * Leap Wireless International Inc CVR | 1,716 | 4 |
| * Milacron Holdings Corp. | 206 | 4 |
| * Sunrun Inc. | 300 | 4 |
| * Chiasma Inc. | 114 | 3 |
| * Catabasis Pharmaceuticals Inc. | 200 | 2 |
| * TransUnion | 83 | 2 |
| * Furiex Pharmaceuticals Inc. CVR | 213 | 2 |
| * Global Blood Therapeutics Inc. | 40 | 2 |
| * vTv Therapeutics Inc. Class A | 200 | 2 |
| * Alarm.com Holdings Inc. | 100 | 2 |
| * Blue Buffalo Pet Products Inc. | 56 | 1 |
| * ConforMIS Inc. | 84 | 1 |
| Restaurant Brands International LP | 32 | 1 |
| * Glaukos Corp. | 40 | 1 |
| * Seres Therapeutics Inc. | 23 | 1 |
| * Planet Fitness Inc. Class A | 50 | 1 |
| * Neos Therapeutics Inc. | 24 | 1 |
| * Appfolio Inc. | 40 | 1 |
| * Amplify Snack Brands Inc. | 45 | 1 |
| * Teladoc Inc. | 20 | 1 |
| * Aimmune Therapeutics Inc. | 24 | 1 |
| * Rapid7 Inc. | 20 | — |
| * Ollie's Bargain Outlet Holdings Inc. | 22 | — |
| * MCBC Holdings Inc. | 23 | — |
| * Chelsea Therapeutics International Ltd. CVR Exp. 12/31/2016 | 2,322 | — |
| * Cubist Pharmaceuticals, Inc. CVR | 1,151 | — |
| * Omthera Pharmaceuticals Inc. CVR | 152 | — |
| * Durata Therapeutics Inc CVR Exp. 12/31/2018 | 12 | — |
| * Magnum Hunter Resources Corp. Warrants Exp. 04/15/2016 | 517 | — |
| * Clinical Data CVR | 32 | — |
| * Gerber Scientific Inc. CVR | 223 | — |
| 38 | ||
| Producer Durables (10.6%) | ||
| General Electric Co. | 440,835 | 10,942 |
| Boeing Co. | 30,254 | 3,954 |
| 3M Co. | 27,753 | 3,945 |
| United Technologies Corp. | 38,946 | 3,568 |
| Honeywell International Inc. | 34,201 | 3,395 |
| Union Pacific Corp. | 38,308 | 3,285 |
| United Parcel Service Inc. Class B | 30,693 | 2,997 |
| Accenture plc Class A | 27,482 | 2,591 |
| Lockheed Martin Corp. | 11,870 | 2,388 |
| Danaher Corp. | 26,089 | 2,270 |
| Caterpillar Inc. | 26,414 | 2,019 |
| FedEx Corp. | 12,415 | 1,870 |
| General Dynamics Corp. | 12,755 | 1,812 |
| Automatic Data Processing Inc. | 20,552 | 1,589 |
| Delta Air Lines Inc. | 35,748 | 1,565 |
| Emerson Electric Co. | 29,291 | 1,398 |
| Northrop Grumman Corp. | 8,503 | 1,392 |
| Raytheon Co. | 13,385 | 1,373 |
| Deere & Co. | 14,655 | 1,198 |
| CSX Corp. | 43,371 | 1,187 |
| American Airlines Group Inc. | 30,451 | 1,187 |
| Eaton Corp. plc | 20,526 | 1,171 |
| Illinois Tool Works Inc. | 13,168 | 1,113 |
34
| Vanguard® Russell 3000 Index Fund | ||
| Schedule of Investments | ||
| August 31, 2015 | ||
| Market | ||
| Value | ||
| Shares | ($000) | |
| Southwest Airlines Co. | 29,464 | 1,081 |
| Norfolk Southern Corp. | 13,422 | 1,046 |
| Waste Management Inc. | 20,202 | 1,011 |
| Cummins Inc. | 8,001 | 974 |
| * United Continental Holdings Inc. | 16,869 | 961 |
| PACCAR Inc. | 15,650 | 923 |
| Roper Technologies Inc. | 4,468 | 724 |
| Stanley Black & Decker Inc. | 6,839 | 694 |
| Tyco International plc | 18,755 | 681 |
| Rockwell Automation Inc. | 5,991 | 670 |
| WW Grainger Inc. | 2,983 | 667 |
| Parker-Hannifin Corp. | 6,179 | 665 |
| Paychex Inc. | 14,461 | 646 |
| AMETEK Inc. | 10,828 | 583 |
| * Verisk Analytics Inc. Class A | 7,585 | 554 |
| * TransDigm Group Inc. | 2,396 | 551 |
| * Stericycle Inc. | 3,829 | 540 |
| Xerox Corp. | 49,613 | 505 |
| Rockwell Collins Inc. | 5,959 | 488 |
| Textron Inc. | 12,499 | 485 |
| Kansas City Southern | 4,779 | 443 |
| * Waters Corp. | 3,575 | 434 |
| Republic Services Inc. Class A | 10,488 | 430 |
| Dover Corp. | 6,934 | 430 |
| Pentair plc | 7,767 | 429 |
| CH Robinson Worldwide Inc. | 6,306 | 425 |
| Alaska Air Group Inc. | 5,604 | 419 |
| Expeditors International of Washington Inc. | 8,270 | 405 |
| Snap-on Inc. | 2,512 | 401 |
| Wabtec Corp. | 4,177 | 400 |
| L-3 Communications Holdings Inc. | 3,561 | 376 |
| * Mettler-Toledo International Inc. | 1,210 | 359 |
| Towers Watson & Co. Class A | 2,998 | 356 |
| Cintas Corp. | 4,125 | 351 |
| * IHS Inc. Class A | 2,975 | 345 |
| * Spirit AeroSystems Holdings Inc. Class A | 6,123 | 313 |
| * JetBlue Airways Corp. | 13,544 | 302 |
| Robert Half International Inc. | 5,841 | 298 |
| ManpowerGroup Inc. | 3,383 | 294 |
| * United Rentals Inc. | 4,193 | 291 |
| JB Hunt Transport Services Inc. | 3,976 | 289 |
| Fluor Corp. | 6,338 | 289 |
| Carlisle Cos. Inc. | 2,814 | 283 |
| * Middleby Corp. | 2,479 | 269 |
| Flowserve Corp. | 5,814 | 262 |
| Waste Connections Inc. | 5,356 | 255 |
| Xylem Inc. | 7,842 | 254 |
| * CoStar Group Inc. | 1,403 | 248 |
| Hubbell Inc. Class B | 2,502 | 247 |
| Allegion plc | 4,137 | 247 |
| * HD Supply Holdings Inc. | 7,369 | 243 |
| ADT Corp. | 7,418 | 243 |
| IDEX Corp. | 3,371 | 242 |
| Huntington Ingalls Industries Inc. | 2,107 | 237 |
| Macquarie Infrastructure Corp. | 2,991 | 235 |
| * Keysight Technologies Inc. | 7,348 | 235 |
| Avery Dennison Corp. | 3,940 | 229 |
| B/E Aerospace Inc. | 4,590 | 224 |
| Allison Transmission Holdings Inc. | 7,806 | 223 |
| * Jacobs Engineering Group Inc. | 5,468 | 221 |
| * Quanta Services Inc. | 8,839 | 214 |
| * Trimble Navigation Ltd. | 11,218 | 212 |
| AO Smith Corp. | 3,235 | 209 |
| * Old Dominion Freight Line Inc. | 3,052 | 203 |
35
| Vanguard® Russell 3000 Index Fund | ||
| Schedule of Investments | ||
| August 31, 2015 | ||
| Market | ||
| Value | ||
| Shares | ($000) | |
| Orbital ATK Inc. | 2,658 | 201 |
| Lincoln Electric Holdings Inc. | 3,312 | 194 |
| * Copart Inc. | 5,542 | 194 |
| Ryder System Inc. | 2,327 | 191 |
| ^ Chicago Bridge & Iron Co. NV | 4,286 | 190 |
| Donaldson Co. Inc. | 5,977 | 187 |
| * Zebra Technologies Corp. | 2,238 | 185 |
| * AECOM | 6,573 | 181 |
| Trinity Industries Inc. | 6,614 | 178 |
| Nordson Corp. | 2,664 | 177 |
| MAXIMUS Inc. | 2,893 | 175 |
| Graco Inc. | 2,504 | 173 |
| FLIR Systems Inc. | 5,964 | 171 |
| Pitney Bowes Inc. | 8,586 | 170 |
| Toro Co. | 2,380 | 170 |
| * Kirby Corp. | 2,374 | 167 |
| * Colfax Corp. | 4,271 | 166 |
| * Spirit Airlines Inc. | 3,200 | 164 |
| AGCO Corp. | 3,234 | 159 |
| * Genpact Ltd. | 6,825 | 157 |
| * Genesee & Wyoming Inc. Class A | 2,267 | 155 |
| * Teledyne Technologies Inc. | 1,510 | 148 |
| ITT Corp. | 3,824 | 143 |
| Oshkosh Corp. | 3,382 | 142 |
| Air Lease Corp. Class A | 4,400 | 142 |
| National Instruments Corp. | 4,838 | 141 |
| RR Donnelley & Sons Co. | 8,934 | 140 |
| MSC Industrial Direct Co. Inc. Class A | 2,046 | 138 |
| Curtiss-Wright Corp. | 2,043 | 134 |
| Regal Beloit Corp. | 1,937 | 129 |
| Woodward Inc. | 2,802 | 128 |
| Landstar System Inc. | 1,920 | 127 |
| Deluxe Corp. | 2,160 | 125 |
| EMCOR Group Inc. | 2,710 | 125 |
| * Clean Harbors Inc. | 2,537 | 125 |
| BWX Technologies Inc. | 4,668 | 124 |
| CLARCOR Inc. | 2,170 | 122 |
| Allegiant Travel Co. Class A | 583 | 118 |
| Booz Allen Hamilton Holding Corp. Class A | 4,411 | 118 |
| Rollins Inc. | 4,118 | 115 |
| * Esterline Technologies Corp. | 1,346 | 110 |
| Crane Co. | 2,085 | 110 |
| KBR Inc. | 6,269 | 109 |
| * XPO Logistics Inc. | 3,092 | 109 |
| * WESCO International Inc. | 1,912 | 107 |
| Terex Corp. | 4,585 | 107 |
| * Moog Inc. Class A | 1,680 | 106 |
| * Dycom Industries Inc. | 1,489 | 106 |
| Triumph Group Inc. | 2,131 | 105 |
| Kennametal Inc. | 3,450 | 105 |
| SPX Corp. | 1,779 | 104 |
| Healthcare Services Group Inc. | 3,116 | 104 |
| CEB Inc. | 1,446 | 104 |
| EnerSys | 1,922 | 103 |
| Joy Global Inc. | 4,211 | 102 |
| Manitowoc Co. Inc. | 5,934 | 101 |
| Covanta Holding Corp. | 4,990 | 99 |
| Convergys Corp. | 4,300 | 97 |
| GATX Corp. | 1,919 | 95 |
| * Generac Holdings Inc. | 3,014 | 93 |
| Barnes Group Inc. | 2,409 | 93 |
| * Darling Ingredients Inc. | 7,240 | 93 |
| HNI Corp. | 1,948 | 91 |
| * Electronics For Imaging Inc. | 2,068 | 90 |
36
| Vanguard® Russell 3000 Index Fund | ||
| Schedule of Investments | ||
| August 31, 2015 | ||
| Market | ||
| Value | ||
| Shares | ($000) | |
| * KLX Inc. | 2,309 | 90 |
| * Advisory Board Co. | 1,850 | 90 |
| Littelfuse Inc. | 995 | 89 |
| Con-way Inc. | 2,535 | 89 |
| * On Assignment Inc. | 2,276 | 82 |
| ABM Industries Inc. | 2,489 | 80 |
| Lexmark International Inc. Class A | 2,655 | 80 |
| HEICO Corp. Class A | 1,765 | 77 |
| Korn/Ferry International | 2,245 | 76 |
| Applied Industrial Technologies Inc. | 1,805 | 76 |
| * Proto Labs Inc. | 1,046 | 76 |
| Knight Transportation Inc. | 2,790 | 76 |
| Teekay Corp. | 2,062 | 76 |
| * Swift Transportation Co. | 3,883 | 76 |
| * Huron Consulting Group Inc. | 1,039 | 75 |
| Scorpio Tankers Inc. | 7,908 | 75 |
| * FTI Consulting Inc. | 1,851 | 74 |
| Copa Holdings SA Class A | 1,431 | 73 |
| Matson Inc. | 1,931 | 73 |
| * WageWorks Inc. | 1,610 | 72 |
| Herman Miller Inc. | 2,660 | 72 |
| UniFirst Corp. | 663 | 72 |
| Mobile Mini Inc. | 2,038 | 69 |
| Steelcase Inc. Class A | 3,749 | 66 |
| Tetra Tech Inc. | 2,525 | 66 |
| Watts Water Technologies Inc. Class A | 1,160 | 64 |
| Forward Air Corp. | 1,391 | 63 |
| * OSI Systems Inc. | 827 | 60 |
| * Aerojet Rocketdyne Holdings Inc. | 2,824 | 58 |
| Bristow Group Inc. | 1,552 | 58 |
| Franklin Electric Co. Inc. | 1,961 | 57 |
| Brink's Co. | 2,002 | 57 |
| Aircastle Ltd. | 2,697 | 56 |
| * Hub Group Inc. Class A | 1,485 | 56 |
| Granite Construction Inc. | 1,619 | 56 |
| G&K Services Inc. Class A | 823 | 56 |
| * TASER International Inc. | 2,374 | 56 |
| AZZ Inc. | 1,091 | 55 |
| Essendant Inc. | 1,599 | 55 |
| Actuant Corp. Class A | 2,565 | 55 |
| Nordic American Tankers Ltd. | 4,034 | 55 |
| MSA Safety Inc. | 1,206 | 55 |
| * TopBuild Corp. | 1,619 | 51 |
| * ExlService Holdings Inc. | 1,368 | 49 |
| * Itron Inc. | 1,618 | 49 |
| Werner Enterprises Inc. | 1,826 | 48 |
| Knoll Inc. | 2,010 | 48 |
| Greenbrier Cos. Inc. | 1,113 | 46 |
| Exponent Inc. | 1,069 | 46 |
| * MasTec Inc. | 2,748 | 45 |
| Tennant Co. | 786 | 45 |
| * Hawaiian Holdings Inc. | 1,985 | 45 |
| EnPro Industries Inc. | 941 | 45 |
| US Ecology Inc. | 892 | 45 |
| * Atlas Air Worldwide Holdings Inc. | 1,064 | 44 |
| Brady Corp. Class A | 1,990 | 44 |
| Ship Finance International Ltd. | 2,594 | 44 |
| Kaman Corp. | 1,121 | 44 |
| * TrueBlue Inc. | 1,781 | 43 |
| * Babcock & Wilcox Enterprises Inc. | 2,297 | 42 |
| Heartland Express Inc. | 2,091 | 42 |
| Standex International Corp. | 527 | 42 |
| * Saia Inc. | 1,110 | 42 |
| * Sykes Enterprises Inc. | 1,644 | 41 |
37
| Vanguard® Russell 3000 Index Fund | ||
| Schedule of Investments | ||
| August 31, 2015 | ||
| Market | ||
| Value | ||
| Shares | ($000) | |
| * Astronics Corp. | 800 | 41 |
| * Advanced Energy Industries Inc. | 1,684 | 41 |
| Lindsay Corp. | 535 | 41 |
| * Navistar International Corp. | 2,261 | 40 |
| HEICO Corp. | 792 | 40 |
| John Bean Technologies Corp. | 1,203 | 40 |
| Briggs & Stratton Corp. | 1,987 | 40 |
| ESCO Technologies Inc. | 1,074 | 39 |
| Harsco Corp. | 3,297 | 38 |
| SkyWest Inc. | 2,377 | 38 |
| Cubic Corp. | 892 | 38 |
| * Rush Enterprises Inc. Class A | 1,457 | 37 |
| Albany International Corp. | 1,165 | 37 |
| Insperity Inc. | 836 | 37 |
| Federal Signal Corp. | 2,600 | 37 |
| MTS Systems Corp. | 617 | 37 |
| * Virgin America Inc. | 1,119 | 36 |
| * Team Inc. | 871 | 36 |
| Multi-Color Corp. | 547 | 36 |
| Badger Meter Inc. | 614 | 36 |
| * ACCO Brands Corp. | 4,709 | 36 |
| * Wesco Aircraft Holdings Inc. | 2,541 | 36 |
| AAR Corp. | 1,460 | 36 |
| * Navigant Consulting Inc. | 2,239 | 35 |
| * Wabash National Corp. | 2,846 | 35 |
| Tidewater Inc. | 1,936 | 35 |
| Astec Industries Inc. | 876 | 35 |
| * TriMas Corp. | 1,883 | 34 |
| * PHH Corp. | 2,104 | 34 |
| * Scorpio Bulkers Inc. | 20,193 | 33 |
| * Chart Industries Inc. | 1,271 | 32 |
| CIRCOR International Inc. | 706 | 32 |
| ArcBest Corp. | 1,078 | 31 |
| * ICF International Inc. | 906 | 31 |
| * RPX Corp. | 2,244 | 31 |
| Sun Hydraulics Corp. | 936 | 30 |
| Primoris Services Corp. | 1,597 | 29 |
| General Cable Corp. | 2,012 | 29 |
| * Thermon Group Holdings Inc. | 1,272 | 29 |
| Altra Industrial Motion Corp. | 1,161 | 29 |
| * Echo Global Logistics Inc. | 1,241 | 29 |
| * TriNet Group Inc. | 1,699 | 29 |
| Raven Industries Inc. | 1,570 | 28 |
| * Roadrunner Transportation Systems Inc. | 1,307 | 28 |
| * FARO Technologies Inc. | 719 | 28 |
| Encore Wire Corp. | 860 | 28 |
| McGrath RentCorp | 1,082 | 28 |
| Kforce Inc. | 1,032 | 28 |
| * UTi Worldwide Inc. | 3,873 | 28 |
| * Monster Worldwide Inc. | 3,790 | 28 |
| * Tutor Perini Corp. | 1,550 | 27 |
| * YRC Worldwide Inc. | 1,634 | 27 |
| * Aegion Corp. Class A | 1,450 | 27 |
| DHT Holdings Inc. | 3,686 | 26 |
| TAL International Group Inc. | 1,434 | 26 |
| H&E Equipment Services Inc. | 1,241 | 26 |
| GasLog Ltd. | 1,772 | 25 |
| * Engility Holdings Inc. | 868 | 24 |
| Hyster-Yale Materials Handling Inc. | 391 | 24 |
| * MYR Group Inc. | 820 | 24 |
| Resources Connection Inc. | 1,470 | 23 |
| * CBIZ Inc. | 2,327 | 23 |
| * Aerovironment Inc. | 939 | 23 |
| Teekay Tankers Ltd. Class A | 3,773 | 22 |
38
| Vanguard® Russell 3000 Index Fund | |||
| Schedule of Investments | |||
| August 31, 2015 | |||
| Market | |||
| Value | |||
| Shares | ($000) | ||
| Argan Inc. | 549 | 21 | |
| Celadon Group Inc. | 1,125 | 21 | |
| TeleTech Holdings Inc. | 787 | 21 | |
| * | Paylocity Holding Corp. | 637 | 21 |
| Alamo Group Inc. | 399 | 21 | |
| Douglas Dynamics Inc. | 893 | 20 | |
| Kadant Inc. | 443 | 20 | |
| Titan International Inc. | 2,139 | 20 | |
| American Railcar Industries Inc. | 471 | 20 | |
| Quad/Graphics Inc. | 1,332 | 19 | |
| * | Air Transport Services Group Inc. | 2,111 | 19 |
| * | Lydall Inc. | 679 | 18 |
| Ennis Inc. | 1,116 | 18 | |
| * | Ascent Capital Group Inc. Class A | 639 | 18 |
| Textainer Group Holdings Ltd. | 1,006 | 18 | |
| Gorman-Rupp Co. | 729 | 18 | |
| * | DXP Enterprises Inc. | 584 | 17 |
| Marten Transport Ltd. | 928 | 17 | |
| Hackett Group Inc. | 1,190 | 17 | |
| * | Dorian LPG Ltd. | 1,247 | 16 |
| * | Modine Manufacturing Co. | 1,830 | 16 |
| Kelly Services Inc. Class A | 1,111 | 16 | |
| * | SP Plus Corp. | 690 | 16 |
| Forrester Research Inc. | 492 | 16 | |
| Mesa Laboratories Inc. | 143 | 15 | |
| * | Great Lakes Dredge & Dock Corp. | 2,703 | 15 |
| Columbus McKinnon Corp. | 783 | 15 | |
| Heidrick & Struggles International Inc. | 751 | 15 | |
| * | GP Strategies Corp. | 593 | 15 |
| * | DHI Group Inc. | 1,829 | 14 |
| * | Vectrus Inc. | 571 | 14 |
| Kimball International Inc. Class B | 1,285 | 14 | |
| * | PHI Inc. | 551 | 14 |
| *,^ | Plug Power Inc. | 8,051 | 14 |
| Miller Industries Inc. | 629 | 14 | |
| Navios Maritime Acquisition Corp. | 3,928 | 14 | |
| FreightCar America Inc. | 628 | 14 | |
| * | Casella Waste Systems Inc. Class A | 2,131 | 13 |
| Powell Industries Inc. | 446 | 13 | |
| * | Ducommun Inc. | 544 | 13 |
| Barrett Business Services Inc. | 353 | 13 | |
| Park-Ohio Holdings Corp. | 348 | 13 | |
| * | Blount International Inc. | 1,758 | 12 |
| * | Furmanite Corp. | 1,816 | 11 |
| Ardmore Shipping Corp. | 1,012 | 11 | |
| * | Orion Marine Group Inc. | 1,561 | 11 |
| * | Mistras Group Inc. | 754 | 11 |
| Hurco Cos. Inc. | 351 | 11 | |
| Graham Corp. | 582 | 11 | |
| * | CAI International Inc. | 808 | 11 |
| * | Titan Machinery Inc. | 910 | 11 |
| * | Control4 Corp. | 1,178 | 11 |
| *,^ | Frontline Ltd. | 3,939 | 10 |
| * | Kratos Defense & Security Solutions Inc. | 2,235 | 10 |
| * | ServiceSource International Inc. | 2,164 | 10 |
| * | Covenant Transportation Group Inc. Class A | 418 | 10 |
| VSE Corp. | 228 | 9 | |
| * | USA Truck Inc. | 474 | 9 |
| * | InnerWorkings Inc. | 1,233 | 9 |
| CECO Environmental Corp. | 900 | 9 | |
| Universal Truckload Services Inc. | 420 | 8 | |
| Gulfmark Offshore Inc. | 909 | 8 | |
| Navios Maritime Holdings Inc. | 2,876 | 8 | |
| * | Heritage-Crystal Clean Inc. | 673 | 8 |
39
| Vanguard® Russell 3000 Index Fund | ||
| Schedule of Investments | ||
| August 31, 2015 | ||
| Market | ||
| Value | ||
| Shares | ($000) | |
| * Commercial Vehicle Group Inc. | 1,556 | 8 |
| * Xerium Technologies Inc. | 637 | 8 |
| * Republic Airways Holdings Inc. | 2,473 | 8 |
| * Hill International Inc. | 1,841 | 7 |
| * Golden Ocean Group Ltd. | 2,355 | 7 |
| NACCO Industries Inc. Class A | 133 | 7 |
| * CRA International Inc. | 288 | 7 |
| * Liquidity Services Inc. | 777 | 6 |
| * Radiant Logistics Inc. | 961 | 6 |
| Electro Rent Corp. | 531 | 6 |
| Eagle Bulk Shipping Inc. | 790 | 6 |
| * PFSweb Inc. | 429 | 6 |
| * TRC Cos. Inc. | 607 | 5 |
| * HC2 Holdings Inc. | 716 | 5 |
| * Vicor Corp. | 499 | 5 |
| * Power Solutions International Inc. | 153 | 5 |
| * Patriot National Inc. | 284 | 5 |
| Allied Motion Technologies Inc. | 222 | 4 |
| CDI Corp. | 395 | 4 |
| * Vishay Precision Group Inc. | 349 | 4 |
| * NV5 Holdings Inc. | 181 | 4 |
| * Accuride Corp. | 1,134 | 4 |
| Safe Bulkers Inc. | 1,088 | 4 |
| * PAM Transportation Services Inc. | 92 | 4 |
| Twin Disc Inc. | 237 | 3 |
| Marlin Business Services Corp. | 232 | 3 |
| * Volt Information Sciences Inc. | 340 | 3 |
| * ExOne Co. | 358 | 3 |
| Preformed Line Products Co. | 74 | 2 |
| * Neff Corp. Class A | 328 | 2 |
| * Blue Bird Corp. | 180 | 2 |
| * 6D Global Technologies Inc. | 703 | 2 |
| * Ultrapetrol Bahamas Ltd. | 494 | — |
| 101,602 | ||
| Technology (16.1%) | ||
| Apple Inc. | 252,048 | 28,421 |
| Microsoft Corp. | 353,924 | 15,403 |
| * Facebook Inc. Class A | 94,675 | 8,467 |
| * Google Inc. Class A | 12,613 | 8,171 |
| * Google Inc. Class C | 12,870 | 7,957 |
| Intel Corp. | 207,552 | 5,924 |
| International Business Machines Corp. | 39,733 | 5,876 |
| Cisco Systems Inc. | 222,510 | 5,759 |
| Oracle Corp. | 138,623 | 5,142 |
| QUALCOMM Inc. | 71,325 | 4,036 |
| Hewlett-Packard Co. | 79,520 | 2,231 |
| Texas Instruments Inc. | 45,519 | 2,178 |
| EMC Corp. | 84,968 | 2,113 |
| * salesforce.com inc | 28,701 | 1,991 |
| * Adobe Systems Inc. | 21,887 | 1,720 |
| * Cognizant Technology Solutions Corp. Class A | 26,726 | 1,682 |
| Avago Technologies Ltd. Class A | 11,255 | 1,418 |
| * Yahoo! Inc. | 41,100 | 1,325 |
| Broadcom Corp. Class A | 24,281 | 1,255 |
| Intuit Inc. | 12,110 | 1,038 |
| Corning Inc. | 55,498 | 955 |
| * Electronic Arts Inc. | 13,883 | 918 |
| Applied Materials Inc. | 54,402 | 875 |
| * LinkedIn Corp. Class A | 4,819 | 870 |
| Western Digital Corp. | 9,976 | 818 |
| * Micron Technology Inc. | 47,862 | 785 |
| Analog Devices Inc. | 13,901 | 776 |
| Skyworks Solutions Inc. | 8,477 | 740 |
| Amphenol Corp. Class A | 13,725 | 719 |
40
| Vanguard® Russell 3000 Index Fund | ||
| Schedule of Investments | ||
| August 31, 2015 | ||
| Market | ||
| Value | ||
| Shares | ($000) | |
| * Twitter Inc. | 25,015 | 695 |
| * SBA Communications Corp. Class A | 5,770 | 682 |
| Altera Corp. | 13,426 | 652 |
| Activision Blizzard Inc. | 22,597 | 647 |
| Symantec Corp. | 30,309 | 621 |
| Motorola Solutions Inc. | 9,462 | 613 |
| * Red Hat Inc. | 8,187 | 591 |
| * Akamai Technologies Inc. | 8,000 | 570 |
| NVIDIA Corp. | 24,138 | 543 |
| * Palo Alto Networks Inc. | 3,245 | 533 |
| Lam Research Corp. | 7,111 | 517 |
| SanDisk Corp. | 9,316 | 508 |
| * Citrix Systems Inc. | 7,222 | 492 |
| * ServiceNow Inc. | 6,911 | 490 |
| * Autodesk Inc. | 10,235 | 478 |
| Xilinx Inc. | 11,184 | 468 |
| Juniper Networks Inc. | 17,797 | 458 |
| NetApp Inc. | 13,479 | 431 |
| Linear Technology Corp. | 10,354 | 417 |
| Maxim Integrated Products Inc. | 12,279 | 413 |
| Harris Corp. | 5,344 | 411 |
| Microchip Technology Inc. | 9,144 | 389 |
| Amdocs Ltd. | 6,686 | 382 |
| * F5 Networks Inc. | 3,110 | 378 |
| CA Inc. | 13,655 | 373 |
| Computer Sciences Corp. | 5,999 | 372 |
| * Qorvo Inc. | 6,461 | 359 |
| KLA-Tencor Corp. | 6,914 | 346 |
| * ANSYS Inc. | 3,883 | 344 |
| CDK Global Inc. | 6,931 | 343 |
| * Splunk Inc. | 5,419 | 336 |
| * Workday Inc. Class A | 4,586 | 322 |
| * Synopsys Inc. | 6,706 | 315 |
| * VeriSign Inc. | 4,473 | 308 |
| * Gartner Inc. | 3,590 | 307 |
| * VMware Inc. Class A | 3,542 | 280 |
| * Fortinet Inc. | 6,175 | 260 |
| * Cadence Design Systems Inc. | 12,659 | 253 |
| Avnet Inc. | 5,888 | 250 |
| SS&C Technologies Holdings Inc. | 3,557 | 241 |
| * Arrow Electronics Inc. | 4,158 | 233 |
| CDW Corp. | 5,780 | 230 |
| * FireEye Inc. | 5,962 | 225 |
| IAC/InterActiveCorp | 3,177 | 222 |
| Marvell Technology Group Ltd. | 19,594 | 221 |
| * Ultimate Software Group Inc. | 1,249 | 220 |
| * Tyler Technologies Inc. | 1,471 | 203 |
| * Tableau Software Inc. Class A | 2,143 | 202 |
| Brocade Communications Systems Inc. | 18,285 | 195 |
| * Manhattan Associates Inc. | 3,233 | 189 |
| * NCR Corp. | 7,385 | 185 |
| Ingram Micro Inc. | 6,679 | 181 |
| * Teradata Corp. | 6,179 | 181 |
| * ON Semiconductor Corp. | 18,748 | 179 |
| * Nuance Communications Inc. | 10,773 | 177 |
| * IMS Health Holdings Inc. | 5,697 | 170 |
| * Freescale Semiconductor Ltd. | 4,734 | 169 |
| * Guidewire Software Inc. | 2,996 | 167 |
| * PTC Inc. | 5,041 | 167 |
| Teradyne Inc. | 9,140 | 165 |
| * Rackspace Hosting Inc. | 5,400 | 164 |
| DST Systems Inc. | 1,603 | 164 |
| * Cavium Inc. | 2,371 | 161 |
| Jabil Circuit Inc. | 8,269 | 160 |
41
| Vanguard® Russell 3000 Index Fund | ||
| Schedule of Investments | ||
| August 31, 2015 | ||
| Market | ||
| Value | ||
| Shares | ($000) | |
| * ARRIS Group Inc. | 5,906 | 156 |
| * NetSuite Inc. | 1,712 | 152 |
| * VeriFone Systems Inc. | 4,863 | 152 |
| * Qlik Technologies Inc. | 3,921 | 148 |
| * EPAM Systems Inc. | 2,093 | 148 |
| * Dealertrack Technologies Inc. | 2,352 | 148 |
| * CommScope Holding Co. Inc. | 4,550 | 147 |
| * NetScout Systems Inc. | 4,019 | 147 |
| Atmel Corp. | 17,809 | 145 |
| Cypress Semiconductor Corp. | 14,172 | 142 |
| Solera Holdings Inc. | 2,914 | 140 |
| * Verint Systems Inc. | 2,626 | 140 |
| * Aspen Technology Inc. | 3,648 | 138 |
| FEI Co. | 1,786 | 135 |
| Sabre Corp. | 4,914 | 134 |
| Cognex Corp. | 3,714 | 132 |
| * Microsemi Corp. | 4,115 | 131 |
| * Ambarella Inc. | 1,356 | 130 |
| * Cree Inc. | 4,724 | 129 |
| * Infinera Corp. | 5,821 | 127 |
| * IPG Photonics Corp. | 1,493 | 126 |
| * SunEdison Inc. | 11,778 | 122 |
| Leidos Holdings Inc. | 2,896 | 122 |
| * Integrated Device Technology Inc. | 6,414 | 122 |
| * Ciena Corp. | 5,422 | 121 |
| Blackbaud Inc. | 2,029 | 116 |
| * SolarWinds Inc. | 2,884 | 115 |
| Mentor Graphics Corp. | 4,345 | 112 |
| * Synaptics Inc. | 1,593 | 112 |
| * ViaSat Inc. | 1,859 | 109 |
| * Arista Networks Inc. | 1,459 | 109 |
| * ACI Worldwide Inc. | 5,056 | 108 |
| * Take-Two Interactive Software Inc. | 3,683 | 107 |
| * Tech Data Corp. | 1,613 | 105 |
| SYNNEX Corp. | 1,265 | 100 |
| Science Applications International Corp. | 2,007 | 98 |
| * Groupon Inc. Class A | 21,544 | 97 |
| * Proofpoint Inc. | 1,712 | 96 |
| * Ellie Mae Inc. | 1,293 | 94 |
| Plantronics Inc. | 1,676 | 89 |
| Diebold Inc. | 2,846 | 89 |
| * GrubHub Inc. | 3,285 | 87 |
| * EchoStar Corp. Class A | 1,939 | 86 |
| * Zynga Inc. Class A | 33,800 | 86 |
| * Cornerstone OnDemand Inc. | 2,384 | 85 |
| * Entegris Inc. | 6,195 | 85 |
| * Cirrus Logic Inc. | 2,794 | 84 |
| Monolithic Power Systems Inc. | 1,750 | 84 |
| * CACI International Inc. Class A | 1,067 | 84 |
| * MicroStrategy Inc. Class A | 416 | 83 |
| * Silicon Laboratories Inc. | 1,874 | 81 |
| * Demandware Inc. | 1,460 | 81 |
| * Anixter International Inc. | 1,264 | 80 |
| MKS Instruments Inc. | 2,363 | 80 |
| * comScore Inc. | 1,520 | 79 |
| InterDigital Inc. | 1,589 | 79 |
| Tessera Technologies Inc. | 2,334 | 76 |
| * Fleetmatics Group plc | 1,701 | 76 |
| * DigitalGlobe Inc. | 3,215 | 74 |
| * CommVault Systems Inc. | 2,011 | 72 |
| Dolby Laboratories Inc. Class A | 2,211 | 72 |
| * Sanmina Corp. | 3,719 | 72 |
| * Finisar Corp. | 4,617 | 71 |
| * Virtusa Corp. | 1,338 | 71 |
42
| Vanguard® Russell 3000 Index Fund | ||
| Schedule of Investments | ||
| August 31, 2015 | ||
| Market | ||
| Value | ||
| Shares | ($000) | |
| * Fairchild Semiconductor International Inc. Class A | 5,192 | 71 |
| * Imperva Inc. | 1,177 | 70 |
| * Rambus Inc. | 5,219 | 70 |
| * Synchronoss Technologies Inc. | 1,727 | 70 |
| * Stratasys Ltd. | 2,273 | 70 |
| * NeuStar Inc. Class A | 2,483 | 69 |
| * Yelp Inc. Class A | 2,844 | 69 |
| * LogMeIn Inc. | 1,106 | 69 |
| * 3D Systems Corp. | 4,969 | 68 |
| * Acxiom Corp. | 3,218 | 67 |
| * Universal Display Corp. | 1,781 | 66 |
| * Polycom Inc. | 6,077 | 65 |
| * Knowles Corp. | 3,921 | 64 |
| Intersil Corp. Class A | 5,947 | 63 |
| * Coherent Inc. | 1,075 | 63 |
| Vishay Intertechnology Inc. | 6,080 | 60 |
| * Progress Software Corp. | 2,149 | 58 |
| * Syntel Inc. | 1,293 | 57 |
| * OmniVision Technologies Inc. | 2,392 | 57 |
| * Nimble Storage Inc. | 2,086 | 56 |
| * Viavi Solutions Inc. | 10,174 | 55 |
| * Plexus Corp. | 1,389 | 53 |
| NIC Inc. | 2,698 | 51 |
| * Paycom Software Inc. | 1,301 | 50 |
| * Envestnet Inc. | 1,596 | 50 |
| * Benchmark Electronics Inc. | 2,322 | 50 |
| * Infoblox Inc. | 2,565 | 49 |
| Power Integrations Inc. | 1,212 | 48 |
| * Advanced Micro Devices Inc. | 26,179 | 47 |
| * Luxoft Holding Inc. Class A | 762 | 47 |
| * Semtech Corp. | 2,733 | 46 |
| * SPS Commerce Inc. | 680 | 46 |
| * Bottomline Technologies de Inc. | 1,724 | 46 |
| * Zendesk Inc. | 2,212 | 46 |
| * PMC-Sierra Inc. | 7,270 | 46 |
| * ScanSource Inc. | 1,178 | 45 |
| Ubiquiti Networks Inc. | 1,261 | 44 |
| King Digital Entertainment plc | 3,310 | 44 |
| * NETGEAR Inc. | 1,426 | 43 |
| * Rogers Corp. | 767 | 43 |
| CSG Systems International Inc. | 1,371 | 42 |
| * Super Micro Computer Inc. | 1,544 | 42 |
| Methode Electronics Inc. | 1,579 | 42 |
| * Insight Enterprises Inc. | 1,606 | 41 |
| * RealPage Inc. | 2,191 | 40 |
| * Rovi Corp. | 3,640 | 40 |
| * Ixia | 2,601 | 40 |
| * Lumentum Holdings Inc. | 2,034 | 40 |
| * Marketo Inc. | 1,432 | 40 |
| * Callidus Software Inc. | 2,479 | 39 |
| * AVG Technologies NV | 1,687 | 39 |
| * RingCentral Inc. Class A | 2,259 | 39 |
| * Veeco Instruments Inc. | 1,679 | 39 |
| * BroadSoft Inc. | 1,219 | 38 |
| * Web.com Group Inc. | 1,784 | 38 |
| * HubSpot Inc. | 793 | 37 |
| * Inphi Corp. | 1,577 | 37 |
| * Cray Inc. | 1,763 | 37 |
| ADTRAN Inc. | 2,330 | 37 |
| * QLogic Corp. | 3,592 | 37 |
| Pegasystems Inc. | 1,515 | 37 |
| * II-VI Inc. | 2,198 | 37 |
| Monotype Imaging Holdings Inc. | 1,752 | 37 |
| * Endurance International Group Holdings Inc. | 2,413 | 37 |
43
| Vanguard® Russell 3000 Index Fund | ||
| Schedule of Investments | ||
| August 31, 2015 | ||
| Market | ||
| Value | ||
| Shares | ($000) | |
| * iRobot Corp. | 1,224 | 36 |
| EarthLink Holdings Corp. | 4,189 | 35 |
| * Ruckus Wireless Inc. | 3,102 | 35 |
| * InvenSense Inc. | 3,189 | 33 |
| Integrated Silicon Solution Inc. | 1,480 | 33 |
| Ebix Inc. | 1,136 | 32 |
| * Rofin-Sinar Technologies Inc. | 1,221 | 31 |
| * Black Knight Financial Services Inc. Class A | 939 | 30 |
| * Cvent Inc. | 964 | 30 |
| * Diodes Inc. | 1,543 | 30 |
| Brooks Automation Inc. | 2,893 | 30 |
| * M/A-COM Technology Solutions Holdings Inc. | 1,011 | 30 |
| * Qualys Inc. | 1,023 | 30 |
| ManTech International Corp. Class A | 1,083 | 30 |
| * Loral Space & Communications Inc. | 541 | 29 |
| AVX Corp. | 2,206 | 29 |
| * Photronics Inc. | 3,137 | 29 |
| * Fabrinet | 1,418 | 28 |
| * Bankrate Inc. | 2,836 | 28 |
| * Perficient Inc. | 1,671 | 28 |
| * Unisys Corp. | 2,055 | 27 |
| * Blucora Inc. | 1,920 | 27 |
| * Newport Corp. | 1,749 | 27 |
| * CalAmp Corp. | 1,607 | 27 |
| * GoDaddy Inc. Class A | 1,064 | 27 |
| * Actua Corp. | 1,865 | 27 |
| * Gigamon Inc. | 1,141 | 26 |
| * Dot Hill Systems Corp. | 2,581 | 25 |
| * Interactive Intelligence Group Inc. | 712 | 25 |
| * Textura Corp. | 957 | 25 |
| CTS Corp. | 1,312 | 25 |
| * MaxLinear Inc. | 2,474 | 25 |
| * LivePerson Inc. | 2,637 | 24 |
| * Inovalon Holdings Inc. Class A | 1,076 | 24 |
| Acacia Research Corp. | 2,466 | 23 |
| * Ultratech Inc. | 1,358 | 23 |
| * Glu Mobile Inc. | 4,952 | 23 |
| * Amkor Technology Inc. | 4,159 | 22 |
| * Global Eagle Entertainment Inc. | 1,908 | 22 |
| * GTT Communications Inc. | 1,006 | 22 |
| * Applied Micro Circuits Corp. | 3,724 | 22 |
| * Lattice Semiconductor Corp. | 5,075 | 21 |
| * Q2 Holdings Inc. | 802 | 21 |
| * VASCO Data Security International Inc. | 1,246 | 21 |
| * Harmonic Inc. | 3,591 | 21 |
| * Mercury Systems Inc. | 1,285 | 20 |
| * Globant SA | 735 | 20 |
| * PROS Holdings Inc. | 901 | 20 |
| * Pacific DataVision Inc. | 623 | 20 |
| * TTM Technologies Inc. | 2,859 | 19 |
| * Rubicon Project Inc. | 1,296 | 19 |
| * ShoreTel Inc. | 2,500 | 19 |
| * CEVA Inc. | 953 | 18 |
| * Rudolph Technologies Inc. | 1,392 | 18 |
| * DTS Inc. | 666 | 18 |
| * Intralinks Holdings Inc. | 1,717 | 18 |
| * Sigma Designs Inc. | 1,782 | 18 |
| * Comverse Inc. | 916 | 17 |
| * GSI Group Inc. | 1,307 | 17 |
| * Internap Corp. | 2,129 | 17 |
| Comtech Telecommunications Corp. | 630 | 17 |
| * Silver Spring Networks Inc. | 1,422 | 16 |
| * Kimball Electronics Inc. | 1,378 | 16 |
| * Axcelis Technologies Inc. | 4,926 | 16 |
44
| Vanguard® Russell 3000 Index Fund | ||
| Schedule of Investments | ||
| August 31, 2015 | ||
| Market | ||
| Value | ||
| Shares | ($000) | |
| * Wix.com Ltd. | 811 | 16 |
| * Applied Optoelectronics Inc. | 771 | 16 |
| Epiq Systems Inc. | 1,240 | 16 |
| * ePlus Inc. | 208 | 16 |
| * Calix Inc. | 1,941 | 16 |
| Park Electrochemical Corp. | 867 | 15 |
| * Extreme Networks Inc. | 5,065 | 15 |
| * Yodlee Inc. | 913 | 15 |
| * Immersion Corp. | 1,265 | 15 |
| American Science & Engineering Inc. | 370 | 15 |
| * FormFactor Inc. | 2,187 | 15 |
| * Vocera Communications Inc. | 1,235 | 14 |
| * Oclaro Inc. | 5,329 | 14 |
| * Lionbridge Technologies Inc. | 2,696 | 14 |
| * RetailMeNot Inc. | 1,582 | 14 |
| * Nanometrics Inc. | 1,005 | 14 |
| Sapiens International Corp. NV | 1,172 | 14 |
| * TrueCar Inc. | 2,303 | 14 |
| * Digi International Inc. | 1,326 | 14 |
| Pericom Semiconductor Corp. | 1,112 | 14 |
| * Tangoe Inc. | 1,801 | 13 |
| * KEYW Holding Corp. | 1,599 | 13 |
| * Avid Technology Inc. | 1,606 | 13 |
| * Ciber Inc. | 3,864 | 13 |
| Daktronics Inc. | 1,502 | 13 |
| * Bazaarvoice Inc. | 2,512 | 13 |
| * ChannelAdvisor Corp. | 1,137 | 13 |
| Checkpoint Systems Inc. | 1,597 | 13 |
| * Zix Corp. | 2,928 | 13 |
| IXYS Corp. | 1,084 | 13 |
| * Digimarc Corp. | 332 | 13 |
| * Xcerra Corp. | 1,994 | 12 |
| * Benefitfocus Inc. | 334 | 12 |
| Reis Inc. | 489 | 12 |
| * Sparton Corp. | 518 | 12 |
| * Sonus Networks Inc. | 1,704 | 12 |
| * PDF Solutions Inc. | 983 | 12 |
| American Software Inc. Class A | 1,306 | 12 |
| * SciQuest Inc. | 1,084 | 12 |
| * Cascade Microtech Inc. | 766 | 12 |
| Alliance Fiber Optic Products Inc. | 625 | 12 |
| Black Box Corp. | 755 | 12 |
| * Ultra Clean Holdings Inc. | 1,682 | 11 |
| * Kopin Corp. | 3,672 | 11 |
| Cohu Inc. | 1,162 | 11 |
| * Jive Software Inc. | 2,490 | 11 |
| * ARC Document Solutions Inc. | 1,684 | 11 |
| NVE Corp. | 212 | 11 |
| * Carbonite Inc. | 990 | 11 |
| PC Connection Inc. | 513 | 11 |
| * Seachange International Inc. | 1,766 | 11 |
| QAD Inc. Class A | 422 | 11 |
| * A10 Networks Inc. | 1,595 | 11 |
| * DSP Group Inc. | 1,207 | 11 |
| * Quantum Corp. | 8,790 | 10 |
| * Silicon Graphics International Corp. | 2,029 | 10 |
| * TeleCommunication Systems Inc. Class A | 2,843 | 10 |
| * KVH Industries Inc. | 888 | 10 |
| * OPOWER Inc. | 1,076 | 10 |
| * Exar Corp. | 1,646 | 10 |
| Bel Fuse Inc. Class B | 546 | 10 |
| * Telenav Inc. | 1,316 | 9 |
| * Violin Memory Inc. | 5,123 | 9 |
| * Alpha & Omega Semiconductor Ltd. | 1,154 | 9 |
45
| Vanguard® Russell 3000 Index Fund | ||
| Schedule of Investments | ||
| August 31, 2015 | ||
| Market | ||
| Value | ||
| Shares | ($000) | |
| * Rocket Fuel Inc. | 1,427 | 9 |
| * Everyday Health Inc. | 890 | 9 |
| * Varonis Systems Inc. | 426 | 8 |
| * Brightcove Inc. | 1,556 | 8 |
| * Model N Inc. | 780 | 8 |
| * Barracuda Networks Inc. | 297 | 8 |
| * TechTarget Inc. | 829 | 8 |
| * Mattson Technology Inc. | 2,660 | 7 |
| * NeoPhotonics Corp. | 993 | 7 |
| * Multi-Fineline Electronix Inc. | 450 | 7 |
| * Limelight Networks Inc. | 2,899 | 7 |
| * MobileIron Inc. | 1,601 | 7 |
| * Aerohive Networks Inc. | 1,054 | 7 |
| * New Relic Inc. | 196 | 6 |
| * Marin Software Inc. | 1,774 | 6 |
| * EMCORE Corp. | 884 | 6 |
| * Hortonworks Inc. | 244 | 6 |
| * Five9 Inc. | 1,470 | 6 |
| * Box Inc. | 426 | 6 |
| * United Online Inc. | 521 | 6 |
| * Clearfield Inc. | 318 | 5 |
| * Millennial Media Inc. | 3,754 | 5 |
| * VirnetX Holding Corp. | 1,344 | 5 |
| * Digital Turbine Inc. | 1,730 | 5 |
| * Agilysys Inc. | 399 | 4 |
| * Imation Corp. | 1,248 | 4 |
| * Novatel Wireless Inc. | 1,339 | 4 |
| * Workiva Inc. | 244 | 3 |
| ModusLink Global Solutions Inc. | 1,050 | 3 |
| * Datalink Corp. | 541 | 3 |
| * Park City Group Inc. | 266 | 3 |
| * RealNetworks Inc. | 632 | 3 |
| * Travelzoo Inc. | 224 | 2 |
| * Amber Road Inc. | 414 | 2 |
| * Guidance Software Inc. | 279 | 2 |
| * Connecture Inc. | 225 | 2 |
| * MaxPoint Interactive Inc. | 243 | 1 |
| * Apigee Corp. | 100 | 1 |
| * Code Rebel Corp. | 38 | 1 |
| 154,143 | ||
| Utilities (5.1%) | ||
| AT&T Inc. | 266,553 | 8,850 |
| Verizon Communications Inc. | 178,435 | 8,210 |
| Duke Energy Corp. | 30,255 | 2,145 |
| NextEra Energy Inc. | 19,431 | 1,912 |
| Dominion Resources Inc. | 25,966 | 1,811 |
| Southern Co. | 39,743 | 1,725 |
| American Electric Power Co. Inc. | 21,538 | 1,169 |
| Exelon Corp. | 37,886 | 1,165 |
| PG&E Corp. | 21,140 | 1,048 |
| Sempra Energy | 10,904 | 1,034 |
| PPL Corp. | 29,530 | 915 |
| Public Service Enterprise Group Inc. | 22,369 | 900 |
| Edison International | 14,427 | 844 |
| Consolidated Edison Inc. | 12,987 | 817 |
| Xcel Energy Inc. | 22,516 | 759 |
| CenturyLink Inc. | 25,086 | 678 |
| WEC Energy Group Inc. | 14,070 | 670 |
| Eversource Energy | 14,152 | 669 |
| DTE Energy Co. | 8,008 | 625 |
| FirstEnergy Corp. | 18,858 | 603 |
| * Level 3 Communications Inc. | 12,890 | 577 |
| Entergy Corp. | 8,047 | 526 |
| * T-Mobile US Inc. | 11,868 | 470 |
46
| Vanguard® Russell 3000 Index Fund | ||
| Schedule of Investments | ||
| August 31, 2015 | ||
| Market | ||
| Value | ||
| Shares | ($000) | |
| Ameren Corp. | 10,488 | 423 |
| American Water Works Co. Inc. | 7,781 | 404 |
| CMS Energy Corp. | 11,968 | 392 |
| AES Corp. | 29,505 | 354 |
| CenterPoint Energy Inc. | 18,601 | 346 |
| SCANA Corp. | 6,179 | 327 |
| AGL Resources Inc. | 5,185 | 316 |
| NRG Energy Inc. | 14,419 | 287 |
| Pinnacle West Capital Corp. | 4,788 | 285 |
| Alliant Energy Corp. | 4,885 | 277 |
| Frontier Communications Corp. | 51,084 | 259 |
| * Calpine Corp. | 16,099 | 257 |
| UGI Corp. | 7,459 | 254 |
| Pepco Holdings Inc. | 10,941 | 251 |
| OGE Energy Corp. | 8,629 | 242 |
| Atmos Energy Corp. | 4,379 | 240 |
| NiSource Inc. | 13,765 | 231 |
| Westar Energy Inc. Class A | 6,313 | 231 |
| ITC Holdings Corp. | 6,747 | 221 |
| TECO Energy Inc. | 10,282 | 217 |
| National Fuel Gas Co. | 3,690 | 199 |
| Aqua America Inc. | 7,757 | 197 |
| * Zayo Group Holdings Inc. | 6,156 | 172 |
| Great Plains Energy Inc. | 6,589 | 164 |
| * Sprint Corp. | 32,112 | 162 |
| MDU Resources Group Inc. | 8,333 | 149 |
| Questar Corp. | 7,513 | 145 |
| j2 Global Inc. | 2,085 | 145 |
| Vectren Corp. | 3,550 | 143 |
| * Dynegy Inc. | 5,485 | 141 |
| Cleco Corp. | 2,602 | 139 |
| Portland General Electric Co. | 3,969 | 137 |
| Piedmont Natural Gas Co. Inc. | 3,407 | 131 |
| Hawaiian Electric Industries Inc. | 4,620 | 131 |
| IDACORP Inc. | 2,178 | 129 |
| WGL Holdings Inc. | 2,156 | 117 |
| Telephone & Data Systems Inc. | 4,075 | 116 |
| Southwest Gas Corp. | 2,035 | 112 |
| UIL Holdings Corp. | 2,458 | 112 |
| NorthWestern Corp. | 2,053 | 106 |
| New Jersey Resources Corp. | 3,727 | 105 |
| ALLETE Inc. | 2,132 | 102 |
| Laclede Group Inc. | 1,892 | 100 |
| ONE Gas Inc. | 2,298 | 99 |
| PNM Resources Inc. | 3,508 | 90 |
| Avista Corp. | 2,749 | 86 |
| Black Hills Corp. | 1,981 | 79 |
| South Jersey Industries Inc. | 3,052 | 74 |
| Pattern Energy Group Inc. Class A | 3,007 | 68 |
| El Paso Electric Co. | 1,827 | 65 |
| American States Water Co. | 1,596 | 60 |
| Cogent Communications Holdings Inc. | 2,076 | 58 |
| West Corp. | 2,344 | 57 |
| MGE Energy Inc. | 1,432 | 55 |
| Ormat Technologies Inc. | 1,531 | 54 |
| * Talen Energy Corp. | 3,778 | 54 |
| Northwest Natural Gas Co. | 1,170 | 51 |
| Abengoa Yield plc | 2,211 | 50 |
| NRG Yield Inc. | 2,748 | 44 |
| * Vonage Holdings Corp. | 7,639 | 42 |
| California Water Service Group | 1,971 | 41 |
| Consolidated Communications Holdings Inc. | 2,080 | 41 |
| Shenandoah Telecommunications Co. | 1,032 | 40 |
| Otter Tail Corp. | 1,543 | 40 |
47
| Vanguard® Russell 3000 Index Fund | |||||
| Schedule of Investments | |||||
| August 31, 2015 | |||||
| Market | |||||
| Value | |||||
| Shares | ($000) | ||||
| Empire District Electric Co. | 1,794 | 39 | |||
| * | Gogo Inc. | 2,312 | 37 | ||
| * | Globalstar Inc. | 20,143 | 35 | ||
| Atlantic Tele-Network Inc. | 454 | 32 | |||
| Windstream Holdings Inc. | 4,426 | 32 | |||
| Chesapeake Utilities Corp. | 645 | 32 | |||
| * | Cincinnati Bell Inc. | 9,121 | 31 | ||
| * | 8x8 Inc. | 3,957 | 31 | ||
| Inteliquent Inc. | 1,573 | 29 | |||
| * | Iridium Communications Inc. | 3,856 | 29 | ||
| * | General Communication Inc. Class A | 1,403 | 24 | ||
| NRG Yield Inc. Class A | 1,420 | 22 | |||
| * | inContact Inc. | 2,866 | 22 | ||
| * | Premiere Global Services Inc. | 1,991 | 21 | ||
| Unitil Corp. | 561 | 20 | |||
| * | United States Cellular Corp. | 525 | 19 | ||
| * | ORBCOMM Inc. | 2,994 | 18 | ||
| SJW Corp. | 612 | 18 | |||
| Connecticut Water Service Inc. | 477 | 17 | |||
| Middlesex Water Co. | 712 | 16 | |||
| Spok Holdings Inc. | 954 | 16 | |||
| * | FairPoint Communications Inc. | 888 | 15 | ||
| * | Boingo Wireless Inc. | 1,903 | 14 | ||
| * | Pendrell Corp. | 9,494 | 14 | ||
| York Water Co. | 646 | 14 | |||
| Atlantic Power Corp. | 5,768 | 14 | |||
| IDT Corp. Class B | 788 | 12 | |||
| * | Hawaiian Telcom Holdco Inc. | 528 | 12 | ||
| Lumos Networks Corp. | 787 | 9 | |||
| * | Intelsat SA | 934 | 9 | ||
| * | Straight Path Communications Inc. Class B | 333 | 8 | ||
| Consolidated Water Co. Ltd. | 523 | 6 | |||
| Genie Energy Ltd. Class B | 446 | 5 | |||
| Artesian Resources Corp. Class A | 214 | 5 | |||
| * | NTELOS Holdings Corp. | 426 | 4 | ||
| Spark Energy Inc. Class A | 96 | 2 | |||
| 49,021 | |||||
| Total Common Stocks (Cost $941,592) | 949,244 | ||||
| Coupon | |||||
| Temporary Cash Investments (0.9%)1 | |||||
| Money Market Fund (0.8%) | |||||
| 3,4 | Vanguard Market Liquidity Fund | 0.168% | 7,482,000 | 7,482 | |
| Face | |||||
| Maturity | Amount | ||||
| Date | ($000) | ||||
| U.S. Government and Agency Obligations (0.1%) | |||||
| 5,6 | Federal Home Loan Bank Discount Notes | 0.100% | 10/23/15 | 1,000 | 1,000 |
| Total Temporary Cash Investments (Cost $8,483) | 8,482 | ||||
| Total Investments (100.1%) (Cost $950,075) | 957,726 | ||||
| Other Assets and Liabilities—Net (-0.1%)4 | (907) | ||||
| Net Assets (100%) | 956,819 | ||||
* Non-income-producing security.
^ Includes partial security positions on loan to broker-dealers. The total value of securities on loan is $226,000.
48
Vanguard® Russell 3000 Index Fund
Schedule of Investments
August 31, 2015
1 The fund invests a portion of its cash reserves in equity markets through the use of index futures contracts. After giving effect to futures investments, the fund's effective common stock and temporary cash investment positions represent 100.0% and 0.1%, respectively, of net assets.
2 “Other” represents securities that are not classified by the fund’s benchmark index.
3 Affiliated money market fund available only to Vanguard funds and certain trusts and accounts managed by Vanguard. Rate shown is the 7-day yield.
4 Includes $244,000 of collateral received for securities on loan.
5 The issuer operates under a congressional charter; its securities are generally neither guaranteed by the U.S. Treasury nor backed by the full faith and credit of the U.S. government.
6 Securities with a value of $400,000 have been segregated as initial margin for open futures contracts.
REIT—Real Estate Investment Trust.
49
© 2015 The Vanguard Group, Inc.
All rights reserved.
Vanguard Marketing Corporation, Distributor.
SNA18540 102015
Report of Independent Registered Public Accounting Firm
To the Board of Trustees of Vanguard Scottsdale Funds and the Shareholders of Vanguard Russell 3000 Index Fund:
In our opinion, the accompanying statement of net assets – investments summary and the related statements of operations and of changes in net assets and the financial highlights (included in Item 1 of this Form N-CSR) and the schedule of investments (included in Item 6 of this Form N-CSR) present fairly, in all material respects, the financial position of Vanguard Russell 3000 Index Fund (constituting a separate portfolio of Vanguard Scottsdale Funds, hereafter referred to as the “Fund”) at August 31, 2015, the results of its operations for the year then ended, the changes in its net assets for each of the two years in the period then ended, and the financial highlights for each of the periods indicated, in conformity with accounting principles generally accepted in the United States of America. These financial statements, financial highlights, and schedule of investments (hereafter referred to as "financial statements") are the responsibility of the Fund's management. Our responsibility is to express an opinion on these financial statements based on our audits. We conducted our audits of these financial statements in accordance with the standards of the Public Company Accounting Oversight Board (United States). Those standards require that we plan and perform the audit to obtain reasonable assurance about whether the financial statements are free of material misstatement. An audit includes examining, on a test basis, evidence supporting the amounts and disclosures in the financial statements, assessing the accounting principles used and significant estimates made by management, and evaluating the overall financial statement presentation. We believe that our audits, which included confirmation of securities at August 31, 2015 by correspondence with the custodian and brokers, by agreement to the underlying ownership records of the transfer agent and the application of alternative auditing procedures where securities purchased had not been received, provide a reasonable basis for our opinion.

October 15, 2015
PricewaterhouseCoopers LLP, Two Commerce Square, 2001 Market Street, Suite 1700, Philadelphia, PA 19103-7042
T: (267) 330-3000, F: (267) 330-3300, www.pwc.com/us
| Vanguard® Short-Term Corporate Bond Index Fund | ||||
| Schedule of Investments | ||||
| August 31, 2015 | ||||
| Face | Market | |||
| Maturity | Amount | Value | ||
| Coupon | Date | ($000) | ($000) | |
| U.S. Government and Agency Obligations (0.0%) | ||||
| U.S. Government Securities (0.0%) | ||||
| United States Treasury Note/Bond | 1.000% | 8/15/18 | 100 | 100 |
| United States Treasury Note/Bond | 1.625% | 7/31/20 | 107 | 107 |
| United States Treasury Note/Bond | 1.375% | 8/31/20 | 2,875 | 2,851 |
| Total U.S. Government and Agency Obligations (Cost $3,058) | 3,058 | |||
| Corporate Bonds (98.8%) | ||||
| Finance (42.6%) | ||||
| Banking (33.9%) | ||||
| Abbey National Treasury Services plc | 1.375% | 3/13/17 | 7,670 | 7,661 |
| Abbey National Treasury Services plc | 3.050% | 8/23/18 | 7,095 | 7,310 |
| Abbey National Treasury Services plc | 2.000% | 8/24/18 | 3,700 | 3,697 |
| Abbey National Treasury Services plc | 2.350% | 9/10/19 | 11,025 | 11,026 |
| Abbey National Treasury Services plc | 2.375% | 3/16/20 | 6,500 | 6,480 |
| American Express Bank FSB | 6.000% | 9/13/17 | 6,880 | 7,442 |
| American Express Centurion Bank | 5.950% | 6/12/17 | 300 | 323 |
| American Express Centurion Bank | 6.000% | 9/13/17 | 4,754 | 5,150 |
| American Express Co. | 5.500% | 9/12/16 | 5,150 | 5,376 |
| American Express Co. | 6.150% | 8/28/17 | 9,933 | 10,777 |
| American Express Co. | 7.000% | 3/19/18 | 17,230 | 19,424 |
| American Express Co. | 1.550% | 5/22/18 | 7,750 | 7,692 |
| American Express Co. | 8.125% | 5/20/19 | 1,600 | 1,923 |
| 1 American Express Co. | 6.800% | 9/1/66 | 6,406 | 6,470 |
| American Express Credit Corp. | 2.800% | 9/19/16 | 14,182 | 14,417 |
| American Express Credit Corp. | 2.375% | 3/24/17 | 15,283 | 15,520 |
| American Express Credit Corp. | 1.125% | 6/5/17 | 17,055 | 16,949 |
| American Express Credit Corp. | 2.125% | 7/27/18 | 7,100 | 7,140 |
| American Express Credit Corp. | 1.800% | 7/31/18 | 3,345 | 3,331 |
| American Express Credit Corp. | 2.125% | 3/18/19 | 6,815 | 6,790 |
| American Express Credit Corp. | 2.250% | 8/15/19 | 10,950 | 10,916 |
| American Express Credit Corp. | 2.375% | 5/26/20 | 14,000 | 13,884 |
| Associates Corp. of North America | 6.950% | 11/1/18 | 7,956 | 9,056 |
| Australia & New Zealand Banking Group Ltd. | 1.250% | 1/10/17 | 10,311 | 10,325 |
| Australia & New Zealand Banking Group Ltd. | 1.250% | 6/13/17 | 4,925 | 4,934 |
| Australia & New Zealand Banking Group Ltd. | 1.875% | 10/6/17 | 6,625 | 6,675 |
| Australia & New Zealand Banking Group Ltd. | 2.250% | 6/13/19 | 8,375 | 8,397 |
| Bank of America Corp. | 7.800% | 9/15/16 | 3,900 | 4,141 |
| Bank of America Corp. | 5.625% | 10/14/16 | 13,540 | 14,153 |
| Bank of America Corp. | 1.350% | 11/21/16 | 3,725 | 3,717 |
| Bank of America Corp. | 5.420% | 3/15/17 | 7,351 | 7,734 |
| Bank of America Corp. | 3.875% | 3/22/17 | 11,450 | 11,839 |
| Bank of America Corp. | 5.700% | 5/2/17 | 6,210 | 6,568 |
| Bank of America Corp. | 1.700% | 8/25/17 | 8,275 | 8,261 |
| Bank of America Corp. | 6.400% | 8/28/17 | 19,210 | 20,861 |
| Bank of America Corp. | 6.000% | 9/1/17 | 11,545 | 12,449 |
| Bank of America Corp. | 5.750% | 12/1/17 | 21,180 | 22,891 |
| Bank of America Corp. | 2.000% | 1/11/18 | 22,610 | 22,597 |
| Bank of America Corp. | 6.875% | 4/25/18 | 45,410 | 50,778 |
| Bank of America Corp. | 5.650% | 5/1/18 | 26,140 | 28,448 |
| Bank of America Corp. | 1.750% | 6/5/18 | 15,000 | 14,930 |
| Bank of America Corp. | 6.500% | 7/15/18 | 3,000 | 3,344 |
| Bank of America Corp. | 6.875% | 11/15/18 | 7,111 | 8,077 |
| Bank of America Corp. | 2.600% | 1/15/19 | 38,257 | 38,525 |
| Bank of America Corp. | 5.490% | 3/15/19 | 3,200 | 3,458 |
| Bank of America Corp. | 2.650% | 4/1/19 | 19,685 | 19,817 |
| Bank of America Corp. | 7.625% | 6/1/19 | 19,100 | 22,546 |
| Bank of America Corp. | 2.250% | 4/21/20 | 17,075 | 16,719 |
| Bank of America Corp. | 5.625% | 7/1/20 | 26,430 | 29,624 |
| Bank of America NA | 1.125% | 11/14/16 | 8,850 | 8,832 |
| Bank of America NA | 1.250% | 2/14/17 | 8,201 | 8,194 |
| Bank of America NA | 5.300% | 3/15/17 | 14,254 | 14,984 |
| Bank of America NA | 6.100% | 6/15/17 | 4,345 | 4,660 |
1
| Vanguard® Short-Term Corporate Bond Index Fund | ||||
| Schedule of Investments | ||||
| August 31, 2015 | ||||
| Face | Market | |||
| Maturity | Amount | Value | ||
| Coupon | Date | ($000) | ($000) | |
| Bank of America NA | 1.650% | 3/26/18 | 9,675 | 9,623 |
| Bank of Montreal | 2.500% | 1/11/17 | 10,249 | 10,420 |
| Bank of Montreal | 1.300% | 7/14/17 | 6,825 | 6,823 |
| Bank of Montreal | 1.400% | 9/11/17 | 7,710 | 7,719 |
| Bank of Montreal | 1.450% | 4/9/18 | 7,344 | 7,282 |
| Bank of Montreal | 1.400% | 4/10/18 | 6,975 | 6,907 |
| Bank of Montreal | 1.800% | 7/31/18 | 5,000 | 4,988 |
| Bank of Montreal | 2.375% | 1/25/19 | 10,650 | 10,771 |
| Bank of New York Mellon Corp. | 2.400% | 1/17/17 | 9,246 | 9,378 |
| Bank of New York Mellon Corp. | 1.969% | 6/20/17 | 1,550 | 1,569 |
| Bank of New York Mellon Corp. | 1.350% | 3/6/18 | 8,050 | 7,982 |
| Bank of New York Mellon Corp. | 2.100% | 8/1/18 | 2,600 | 2,623 |
| Bank of New York Mellon Corp. | 2.100% | 1/15/19 | 4,600 | 4,597 |
| Bank of New York Mellon Corp. | 2.200% | 3/4/19 | 6,950 | 6,987 |
| Bank of New York Mellon Corp. | 2.200% | 5/15/19 | 5,800 | 5,783 |
| Bank of New York Mellon Corp. | 5.450% | 5/15/19 | 4,575 | 5,083 |
| Bank of New York Mellon Corp. | 2.300% | 9/11/19 | 6,750 | 6,757 |
| Bank of New York Mellon Corp. | 4.600% | 1/15/20 | 1,225 | 1,340 |
| Bank of New York Mellon Corp. | 2.150% | 2/24/20 | 11,050 | 10,882 |
| Bank of New York Mellon Corp. | 2.600% | 8/17/20 | 8,500 | 8,519 |
| Bank of Nova Scotia | 1.100% | 12/13/16 | 9,739 | 9,733 |
| Bank of Nova Scotia | 2.550% | 1/12/17 | 9,915 | 10,089 |
| Bank of Nova Scotia | 1.250% | 4/11/17 | 7,420 | 7,404 |
| Bank of Nova Scotia | 1.300% | 7/21/17 | 4,100 | 4,096 |
| Bank of Nova Scotia | 1.375% | 12/18/17 | 5,734 | 5,698 |
| Bank of Nova Scotia | 1.450% | 4/25/18 | 7,250 | 7,199 |
| Bank of Nova Scotia | 1.700% | 6/11/18 | 5,000 | 4,989 |
| Bank of Nova Scotia | 2.050% | 10/30/18 | 11,326 | 11,387 |
| Bank of Nova Scotia | 2.050% | 6/5/19 | 12,000 | 12,005 |
| Barclays Bank plc | 5.000% | 9/22/16 | 12,875 | 13,389 |
| Barclays Bank plc | 2.500% | 2/20/19 | 15,050 | 15,201 |
| Barclays Bank plc | 6.750% | 5/22/19 | 11,504 | 13,333 |
| Barclays Bank plc | 5.125% | 1/8/20 | 11,315 | 12,591 |
| Barclays plc | 2.000% | 3/16/18 | 8,000 | 7,962 |
| Barclays plc | 2.750% | 11/8/19 | 9,775 | 9,753 |
| Barclays plc | 2.875% | 6/8/20 | 5,500 | 5,470 |
| BB&T Corp. | 2.150% | 3/22/17 | 7,300 | 7,397 |
| BB&T Corp. | 4.900% | 6/30/17 | 2,575 | 2,719 |
| BB&T Corp. | 1.600% | 8/15/17 | 8,005 | 8,022 |
| BB&T Corp. | 1.450% | 1/12/18 | 3,870 | 3,846 |
| BB&T Corp. | 2.050% | 6/19/18 | 6,909 | 6,949 |
| BB&T Corp. | 2.250% | 2/1/19 | 2,450 | 2,457 |
| BB&T Corp. | 6.850% | 4/30/19 | 3,150 | 3,659 |
| BB&T Corp. | 5.250% | 11/1/19 | 4,722 | 5,214 |
| BB&T Corp. | 2.450% | 1/15/20 | 11,450 | 11,482 |
| Bear Stearns Cos. LLC | 5.550% | 1/22/17 | 9,100 | 9,564 |
| Bear Stearns Cos. LLC | 6.400% | 10/2/17 | 16,560 | 18,070 |
| Bear Stearns Cos. LLC | 7.250% | 2/1/18 | 25,050 | 28,071 |
| Bear Stearns Cos. LLC | 4.650% | 7/2/18 | 3,000 | 3,200 |
| BNP Paribas SA | 1.250% | 12/12/16 | 8,925 | 8,927 |
| BNP Paribas SA | 2.375% | 9/14/17 | 22,203 | 22,520 |
| BNP Paribas SA | 2.700% | 8/20/18 | 4,546 | 4,630 |
| BNP Paribas SA | 2.400% | 12/12/18 | 15,403 | 15,512 |
| BNP Paribas SA | 2.450% | 3/17/19 | 2,940 | 2,962 |
| BNP Paribas SA | 2.375% | 5/21/20 | 7,850 | 7,807 |
| BPCE SA | 1.625% | 2/10/17 | 7,200 | 7,222 |
| BPCE SA | 1.613% | 7/25/17 | 7,100 | 7,102 |
| BPCE SA | 2.500% | 12/10/18 | 8,900 | 9,011 |
| BPCE SA | 2.500% | 7/15/19 | 8,425 | 8,460 |
| BPCE SA | 2.250% | 1/27/20 | 9,025 | 8,973 |
| Branch Banking & Trust Co. | 1.450% | 10/3/16 | 5,463 | 5,501 |
| Branch Banking & Trust Co. | 1.050% | 12/1/16 | 1,675 | 1,670 |
| Branch Banking & Trust Co. | 1.000% | 4/3/17 | 3,000 | 2,986 |
| Branch Banking & Trust Co. | 1.350% | 10/1/17 | 5,750 | 5,723 |
2
| Vanguard® Short-Term Corporate Bond Index Fund | ||||
| Schedule of Investments | ||||
| August 31, 2015 | ||||
| Face | Market | |||
| Maturity | Amount | Value | ||
| Coupon | Date | ($000) | ($000) | |
| Branch Banking & Trust Co. | 2.300% | 10/15/18 | 9,825 | 9,921 |
| Canadian Imperial Bank of Commerce | 1.550% | 1/23/18 | 9,525 | 9,524 |
| Capital One Bank USA NA | 1.150% | 11/21/16 | 4,500 | 4,478 |
| Capital One Bank USA NA | 1.300% | 6/5/17 | 2,550 | 2,524 |
| Capital One Bank USA NA | 2.150% | 11/21/18 | 3,700 | 3,668 |
| Capital One Bank USA NA | 2.250% | 2/13/19 | 13,650 | 13,515 |
| Capital One Bank USA NA | 2.300% | 6/5/19 | 5,750 | 5,658 |
| Capital One Bank USA NA | 8.800% | 7/15/19 | 1,777 | 2,142 |
| Capital One Financial Corp. | 6.150% | 9/1/16 | 9,000 | 9,414 |
| Capital One Financial Corp. | 6.750% | 9/15/17 | 5,300 | 5,809 |
| Capital One Financial Corp. | 2.450% | 4/24/19 | 7,600 | 7,529 |
| Capital One NA | 1.500% | 9/5/17 | 1,800 | 1,783 |
| Capital One NA | 1.650% | 2/5/18 | 12,375 | 12,214 |
| Capital One NA | 1.500% | 3/22/18 | 3,806 | 3,735 |
| Capital One NA | 2.400% | 9/5/19 | 8,100 | 7,983 |
| Citigroup Inc. | 1.300% | 11/15/16 | 8,061 | 8,056 |
| Citigroup Inc. | 4.450% | 1/10/17 | 21,129 | 21,952 |
| Citigroup Inc. | 5.500% | 2/15/17 | 7,499 | 7,890 |
| Citigroup Inc. | 1.350% | 3/10/17 | 8,239 | 8,211 |
| Citigroup Inc. | 1.550% | 8/14/17 | 6,952 | 6,931 |
| Citigroup Inc. | 6.000% | 8/15/17 | 12,856 | 13,882 |
| Citigroup Inc. | 6.125% | 11/21/17 | 23,047 | 25,104 |
| Citigroup Inc. | 1.850% | 11/24/17 | 12,850 | 12,842 |
| Citigroup Inc. | 1.800% | 2/5/18 | 19,850 | 19,755 |
| Citigroup Inc. | 1.700% | 4/27/18 | 22,875 | 22,673 |
| Citigroup Inc. | 1.750% | 5/1/18 | 8,315 | 8,229 |
| Citigroup Inc. | 6.125% | 5/15/18 | 18,424 | 20,332 |
| Citigroup Inc. | 2.150% | 7/30/18 | 6,000 | 5,994 |
| Citigroup Inc. | 2.500% | 9/26/18 | 10,406 | 10,503 |
| Citigroup Inc. | 2.550% | 4/8/19 | 19,200 | 19,291 |
| Citigroup Inc. | 8.500% | 5/22/19 | 19,083 | 23,017 |
| Citigroup Inc. | 2.500% | 7/29/19 | 17,875 | 17,827 |
| Citigroup Inc. | 2.400% | 2/18/20 | 7,670 | 7,589 |
| Citigroup Inc. | 5.375% | 8/9/20 | 1,000 | 1,111 |
| Citizens Bank NA | 1.600% | 12/4/17 | 3,575 | 3,563 |
| Citizens Bank NA | 2.450% | 12/4/19 | 3,800 | 3,753 |
| Comerica Bank | 5.750% | 11/21/16 | 6,518 | 6,852 |
| Comerica Bank | 5.200% | 8/22/17 | 2,655 | 2,821 |
| Comerica Inc. | 2.125% | 5/23/19 | 2,100 | 2,076 |
| Commonwealth Bank of Australia | 1.125% | 3/13/17 | 3,150 | 3,146 |
| Commonwealth Bank of Australia | 1.400% | 9/8/17 | 7,425 | 7,430 |
| Commonwealth Bank of Australia | 1.900% | 9/18/17 | 12,885 | 13,005 |
| Commonwealth Bank of Australia | 1.625% | 3/12/18 | 13,000 | 13,000 |
| Commonwealth Bank of Australia | 2.500% | 9/20/18 | 13,603 | 13,854 |
| Commonwealth Bank of Australia | 2.250% | 3/13/19 | 14,200 | 14,278 |
| Commonwealth Bank of Australia | 2.300% | 9/6/19 | 7,000 | 7,014 |
| Compass Bank | 1.850% | 9/29/17 | 2,300 | 2,288 |
| Compass Bank | 6.400% | 10/1/17 | 1,730 | 1,862 |
| Compass Bank | 2.750% | 9/29/19 | 2,610 | 2,574 |
| Cooperatieve Centrale Raiffeisen-Boerenleenbank BA | 3.375% | 1/19/17 | 15,747 | 16,195 |
| Cooperatieve Centrale Raiffeisen-Boerenleenbank BA | 1.700% | 3/19/18 | 17,650 | 17,561 |
| Cooperatieve Centrale Raiffeisen-Boerenleenbank BA | 2.250% | 1/14/19 | 12,025 | 12,104 |
| Cooperatieve Centrale Raiffeisen-Boerenleenbank BA | 2.250% | 1/14/20 | 10,000 | 9,927 |
| Corpbanca SA | 3.125% | 1/15/18 | 6,600 | 6,615 |
| 2 Corpbanca SA | 3.875% | 9/22/19 | 2,000 | 2,047 |
| Credit Suisse | 1.375% | 5/26/17 | 22,680 | 22,582 |
| Credit Suisse | 1.750% | 1/29/18 | 13,500 | 13,464 |
| Credit Suisse | 6.000% | 2/15/18 | 10,175 | 11,063 |
| Credit Suisse | 1.700% | 4/27/18 | 14,375 | 14,222 |
| Credit Suisse | 2.300% | 5/28/19 | 19,900 | 19,870 |
| Credit Suisse | 5.300% | 8/13/19 | 7,895 | 8,742 |
| Credit Suisse | 5.400% | 1/14/20 | 7,850 | 8,665 |
| 2 Credit Suisse Group Funding Guernsey Ltd. | 2.750% | 3/26/20 | 15,500 | 15,416 |
| Deutsche Bank AG | 1.400% | 2/13/17 | 9,481 | 9,443 |
3
| Vanguard® Short-Term Corporate Bond Index Fund | ||||
| Schedule of Investments | ||||
| August 31, 2015 | ||||
| Face | Market | |||
| Maturity | Amount | Value | ||
| Coupon | Date | ($000) | ($000) | |
| Deutsche Bank AG | 1.350% | 5/30/17 | 12,600 | 12,513 |
| Deutsche Bank AG | 6.000% | 9/1/17 | 22,165 | 23,910 |
| Deutsche Bank AG | 1.875% | 2/13/18 | 8,675 | 8,638 |
| Deutsche Bank AG | 2.500% | 2/13/19 | 20,000 | 20,087 |
| Deutsche Bank AG | 2.950% | 8/20/20 | 1,000 | 998 |
| Discover Bank | 2.000% | 2/21/18 | 5,833 | 5,771 |
| Discover Bank | 2.600% | 11/13/18 | 7,000 | 7,007 |
| Discover Bank | 7.000% | 4/15/20 | 3,475 | 4,023 |
| Discover Bank | 3.100% | 6/4/20 | 3,000 | 2,990 |
| Discover Financial Services | 6.450% | 6/12/17 | 2,675 | 2,888 |
| Fifth Third Bancorp | 5.450% | 1/15/17 | 2,882 | 3,025 |
| Fifth Third Bancorp | 4.500% | 6/1/18 | 1,875 | 1,979 |
| Fifth Third Bancorp | 2.300% | 3/1/19 | 6,300 | 6,287 |
| Fifth Third Bancorp | 2.875% | 7/27/20 | 5,000 | 4,987 |
| Fifth Third Bank | 1.150% | 11/18/16 | 8,306 | 8,290 |
| Fifth Third Bank | 1.350% | 6/1/17 | 5,000 | 4,982 |
| Fifth Third Bank | 1.450% | 2/28/18 | 2,500 | 2,467 |
| Fifth Third Bank | 2.150% | 8/20/18 | 6,000 | 6,011 |
| Fifth Third Bank | 2.375% | 4/25/19 | 7,350 | 7,371 |
| First Niagara Financial Group Inc. | 6.750% | 3/19/20 | 3,100 | 3,425 |
| First Republic Bank | 2.375% | 6/17/19 | 4,220 | 4,201 |
| Goldman Sachs Group Inc. | 5.750% | 10/1/16 | 12,125 | 12,706 |
| Goldman Sachs Group Inc. | 5.625% | 1/15/17 | 19,006 | 19,986 |
| Goldman Sachs Group Inc. | 6.250% | 9/1/17 | 15,338 | 16,645 |
| Goldman Sachs Group Inc. | 5.950% | 1/18/18 | 26,442 | 28,818 |
| Goldman Sachs Group Inc. | 2.375% | 1/22/18 | 21,182 | 21,389 |
| Goldman Sachs Group Inc. | 6.150% | 4/1/18 | 28,275 | 31,145 |
| Goldman Sachs Group Inc. | 2.900% | 7/19/18 | 21,690 | 22,157 |
| Goldman Sachs Group Inc. | 2.625% | 1/31/19 | 22,222 | 22,432 |
| Goldman Sachs Group Inc. | 7.500% | 2/15/19 | 18,802 | 21,903 |
| Goldman Sachs Group Inc. | 2.550% | 10/23/19 | 18,500 | 18,491 |
| Goldman Sachs Group Inc. | 5.375% | 3/15/20 | 18,879 | 20,933 |
| Goldman Sachs Group Inc. | 2.600% | 4/23/20 | 17,000 | 16,947 |
| Goldman Sachs Group Inc. | 6.000% | 6/15/20 | 12,095 | 13,780 |
| HSBC Bank USA NA | 6.000% | 8/9/17 | 4,050 | 4,373 |
| HSBC Bank USA NA | 4.875% | 8/24/20 | 11,680 | 12,769 |
| HSBC USA Inc. | 1.300% | 6/23/17 | 2,100 | 2,096 |
| HSBC USA Inc. | 1.500% | 11/13/17 | 3,275 | 3,260 |
| HSBC USA Inc. | 1.625% | 1/16/18 | 12,500 | 12,434 |
| HSBC USA Inc. | 1.700% | 3/5/18 | 10,250 | 10,194 |
| HSBC USA Inc. | 2.000% | 8/7/18 | 4,150 | 4,139 |
| HSBC USA Inc. | 2.625% | 9/24/18 | 5,484 | 5,575 |
| HSBC USA Inc. | 2.250% | 6/23/19 | 5,900 | 5,872 |
| HSBC USA Inc. | 2.375% | 11/13/19 | 10,100 | 10,045 |
| HSBC USA Inc. | 2.350% | 3/5/20 | 16,700 | 16,431 |
| HSBC USA Inc. | 2.750% | 8/7/20 | 6,000 | 5,988 |
| Huntington Bancshares Inc. | 2.600% | 8/2/18 | 2,050 | 2,065 |
| Huntington National Bank | 1.300% | 11/20/16 | 3,375 | 3,368 |
| Huntington National Bank | 1.375% | 4/24/17 | 1,000 | 994 |
| Huntington National Bank | 2.000% | 6/30/18 | 5,000 | 4,994 |
| Huntington National Bank | 2.200% | 4/1/19 | 6,050 | 6,027 |
| Huntington National Bank | 2.400% | 4/1/20 | 9,825 | 9,698 |
| Huntington National Bank | 2.875% | 8/20/20 | 3,000 | 2,989 |
| Intesa Sanpaolo SPA | 2.375% | 1/13/17 | 10,175 | 10,194 |
| Intesa Sanpaolo SPA | 3.875% | 1/16/18 | 8,800 | 9,055 |
| Intesa Sanpaolo SPA | 3.875% | 1/15/19 | 13,650 | 14,066 |
| JPMorgan Chase & Co. | 1.350% | 2/15/17 | 22,369 | 22,341 |
| JPMorgan Chase & Co. | 6.125% | 6/27/17 | 3,755 | 4,031 |
| JPMorgan Chase & Co. | 2.000% | 8/15/17 | 15,703 | 15,809 |
| JPMorgan Chase & Co. | 6.000% | 1/15/18 | 40,484 | 44,234 |
| JPMorgan Chase & Co. | 1.800% | 1/25/18 | 7,875 | 7,852 |
| JPMorgan Chase & Co. | 1.700% | 3/1/18 | 16,925 | 16,833 |
| JPMorgan Chase & Co. | 1.625% | 5/15/18 | 16,125 | 15,961 |
| JPMorgan Chase & Co. | 2.350% | 1/28/19 | 13,475 | 13,518 |
4
| Vanguard® Short-Term Corporate Bond Index Fund | ||||
| Schedule of Investments | ||||
| August 31, 2015 | ||||
| Face | Market | |||
| Maturity | Amount | Value | ||
| Coupon | Date | ($000) | ($000) | |
| JPMorgan Chase & Co. | 6.300% | 4/23/19 | 17,675 | 20,042 |
| JPMorgan Chase & Co. | 2.200% | 10/22/19 | 14,103 | 13,975 |
| JPMorgan Chase & Co. | 2.250% | 1/23/20 | 31,000 | 30,588 |
| JPMorgan Chase & Co. | 4.950% | 3/25/20 | 5,597 | 6,126 |
| JPMorgan Chase & Co. | 2.750% | 6/23/20 | 16,000 | 16,020 |
| JPMorgan Chase & Co. | 4.400% | 7/22/20 | 19,325 | 20,698 |
| JPMorgan Chase Bank NA | 6.000% | 7/5/17 | 3,200 | 3,447 |
| JPMorgan Chase Bank NA | 6.000% | 10/1/17 | 18,935 | 20,454 |
| KeyBank NA | 1.100% | 11/25/16 | 2,000 | 1,996 |
| KeyBank NA | 1.650% | 2/1/18 | 7,450 | 7,416 |
| KeyBank NA | 1.700% | 6/1/18 | 4,000 | 3,981 |
| KeyBank NA | 2.500% | 12/15/19 | 2,950 | 2,957 |
| KeyBank NA | 2.250% | 3/16/20 | 5,850 | 5,775 |
| KeyCorp | 2.300% | 12/13/18 | 8,225 | 8,268 |
| Lloyds Bank plc | 4.200% | 3/28/17 | 2,450 | 2,551 |
| Lloyds Bank plc | 1.750% | 3/16/18 | 9,475 | 9,432 |
| Lloyds Bank plc | 1.750% | 5/14/18 | 5,775 | 5,737 |
| Lloyds Bank plc | 2.300% | 11/27/18 | 5,000 | 5,029 |
| Lloyds Bank plc | 2.350% | 9/5/19 | 12,175 | 12,176 |
| Lloyds Bank plc | 2.400% | 3/17/20 | 6,275 | 6,222 |
| Lloyds Bank plc | 2.700% | 8/17/20 | 10,000 | 10,066 |
| Manufacturers & Traders Trust Co. | 1.400% | 7/25/17 | 6,500 | 6,476 |
| Manufacturers & Traders Trust Co. | 6.625% | 12/4/17 | 4,165 | 4,603 |
| Manufacturers & Traders Trust Co. | 1.450% | 3/7/18 | 2,150 | 2,132 |
| Manufacturers & Traders Trust Co. | 2.300% | 1/30/19 | 10,750 | 10,798 |
| Manufacturers & Traders Trust Co. | 2.250% | 7/25/19 | 7,400 | 7,394 |
| Manufacturers & Traders Trust Co. | 2.100% | 2/6/20 | 6,825 | 6,725 |
| Morgan Stanley | 5.750% | 10/18/16 | 11,875 | 12,444 |
| Morgan Stanley | 5.450% | 1/9/17 | 22,475 | 23,645 |
| Morgan Stanley | 4.750% | 3/22/17 | 17,775 | 18,651 |
| Morgan Stanley | 5.550% | 4/27/17 | 10,445 | 11,090 |
| Morgan Stanley | 6.250% | 8/28/17 | 8,775 | 9,532 |
| Morgan Stanley | 5.950% | 12/28/17 | 14,875 | 16,179 |
| Morgan Stanley | 1.875% | 1/5/18 | 13,000 | 12,991 |
| Morgan Stanley | 6.625% | 4/1/18 | 25,100 | 27,952 |
| Morgan Stanley | 2.125% | 4/25/18 | 16,525 | 16,576 |
| Morgan Stanley | 2.200% | 12/7/18 | 2,000 | 2,007 |
| Morgan Stanley | 2.500% | 1/24/19 | 9,250 | 9,330 |
| Morgan Stanley | 7.300% | 5/13/19 | 16,390 | 19,186 |
| Morgan Stanley | 2.375% | 7/23/19 | 16,250 | 16,222 |
| Morgan Stanley | 5.625% | 9/23/19 | 29,237 | 32,558 |
| Morgan Stanley | 5.500% | 1/26/20 | 12,925 | 14,375 |
| Morgan Stanley | 2.650% | 1/27/20 | 23,300 | 23,307 |
| Morgan Stanley | 2.800% | 6/16/20 | 14,500 | 14,518 |
| Morgan Stanley | 5.500% | 7/24/20 | 13,336 | 14,866 |
| MUFG Americas Holdings Corp. | 1.625% | 2/9/18 | 3,375 | 3,361 |
| MUFG Americas Holdings Corp. | 2.250% | 2/10/20 | 8,675 | 8,587 |
| MUFG Union Bank NA | 1.500% | 9/26/16 | 5,250 | 5,268 |
| MUFG Union Bank NA | 2.125% | 6/16/17 | 5,925 | 5,969 |
| MUFG Union Bank NA | 2.625% | 9/26/18 | 13,850 | 14,009 |
| MUFG Union Bank NA | 2.250% | 5/6/19 | 2,700 | 2,707 |
| Murray Street Investment Trust I | 4.647% | 3/9/17 | 12,138 | 12,646 |
| National Australia Bank Ltd. | 2.750% | 3/9/17 | 8,350 | 8,546 |
| National Australia Bank Ltd. | 2.300% | 7/25/18 | 5,675 | 5,744 |
| National Australia Bank Ltd. | 2.625% | 7/23/20 | 13,725 | 13,773 |
| National Bank of Canada | 1.450% | 11/7/17 | 6,650 | 6,615 |
| National City Bank | 5.800% | 6/7/17 | 735 | 783 |
| National City Corp. | 6.875% | 5/15/19 | 9,600 | 11,041 |
| Northern Trust Co. | 6.500% | 8/15/18 | 500 | 567 |
| PNC Bank NA | 1.300% | 10/3/16 | 3,700 | 3,710 |
| PNC Bank NA | 1.150% | 11/1/16 | 10,250 | 10,234 |
| PNC Bank NA | 5.250% | 1/15/17 | 3,000 | 3,158 |
| PNC Bank NA | 1.125% | 1/27/17 | 4,900 | 4,886 |
| PNC Bank NA | 4.875% | 9/21/17 | 2,225 | 2,361 |
5
| Vanguard® Short-Term Corporate Bond Index Fund | ||||
| Schedule of Investments | ||||
| August 31, 2015 | ||||
| Face | Market | |||
| Maturity | Amount | Value | ||
| Coupon | Date | ($000) | ($000) | |
| PNC Bank NA | 1.500% | 10/18/17 | 4,450 | 4,449 |
| PNC Bank NA | 6.000% | 12/7/17 | 3,440 | 3,749 |
| PNC Bank NA | 1.500% | 2/23/18 | 9,700 | 9,627 |
| PNC Bank NA | 6.875% | 4/1/18 | 1,365 | 1,523 |
| PNC Bank NA | 1.600% | 6/1/18 | 5,600 | 5,561 |
| PNC Bank NA | 2.200% | 1/28/19 | 5,692 | 5,731 |
| PNC Bank NA | 2.250% | 7/2/19 | 5,825 | 5,829 |
| PNC Bank NA | 2.400% | 10/18/19 | 17,125 | 17,204 |
| PNC Bank NA | 2.300% | 6/1/20 | 250 | 247 |
| PNC Financial Services Group Inc. | 1.850% | 7/20/18 | 3,000 | 3,000 |
| PNC Financial Services Group Inc. | 2.600% | 7/21/20 | 2,600 | 2,599 |
| PNC Funding Corp. | 2.700% | 9/19/16 | 9,950 | 10,083 |
| PNC Funding Corp. | 5.625% | 2/1/17 | 6,739 | 7,107 |
| PNC Funding Corp. | 6.700% | 6/10/19 | 4,125 | 4,776 |
| PNC Funding Corp. | 5.125% | 2/8/20 | 10,535 | 11,664 |
| PNC Funding Corp. | 4.375% | 8/11/20 | 4,065 | 4,391 |
| Regions Bank | 7.500% | 5/15/18 | 3,092 | 3,512 |
| Regions Financial Corp. | 2.000% | 5/15/18 | 4,775 | 4,750 |
| Regions Financial Corp. | 2.250% | 9/14/18 | 5,000 | 4,997 |
| Royal Bank of Canada | 1.450% | 9/9/16 | 3,800 | 3,824 |
| Royal Bank of Canada | 1.200% | 1/23/17 | 16,042 | 16,065 |
| Royal Bank of Canada | 1.000% | 4/27/17 | 4,555 | 4,538 |
| Royal Bank of Canada | 1.250% | 6/16/17 | 6,650 | 6,642 |
| Royal Bank of Canada | 1.400% | 10/13/17 | 11,650 | 11,618 |
| Royal Bank of Canada | 1.500% | 1/16/18 | 11,925 | 11,877 |
| Royal Bank of Canada | 2.200% | 7/27/18 | 14,713 | 14,852 |
| Royal Bank of Canada | 1.800% | 7/30/18 | 6,000 | 6,006 |
| Royal Bank of Canada | 2.150% | 3/15/19 | 4,008 | 4,026 |
| Royal Bank of Canada | 2.150% | 3/6/20 | 4,500 | 4,498 |
| Royal Bank of Scotland Group plc | 1.875% | 3/31/17 | 6,488 | 6,458 |
| Royal Bank of Scotland Group plc | 6.400% | 10/21/19 | 11,536 | 12,903 |
| Royal Bank of Scotland plc | 5.625% | 8/24/20 | 6,963 | 7,864 |
| Santander Bank NA | 2.000% | 1/12/18 | 5,175 | 5,151 |
| Santander Bank NA | 8.750% | 5/30/18 | 2,539 | 2,921 |
| Santander Holdings USA Inc. | 3.450% | 8/27/18 | 7,800 | 8,027 |
| Santander Holdings USA Inc. | 2.650% | 4/17/20 | 4,100 | 4,039 |
| Societe Generale SA | 2.750% | 10/12/17 | 11,750 | 11,996 |
| Societe Generale SA | 2.625% | 10/1/18 | 2,950 | 3,002 |
| State Street Bank & Trust Co. | 5.250% | 10/15/18 | 225 | 247 |
| State Street Corp. | 5.375% | 4/30/17 | 300 | 320 |
| State Street Corp. | 4.956% | 3/15/18 | 4,800 | 5,115 |
| State Street Corp. | 1.350% | 5/15/18 | 5,950 | 5,902 |
| State Street Corp. | 2.550% | 8/18/20 | 9,000 | 9,024 |
| Sumitomo Mitsui Banking Corp. | 1.300% | 1/10/17 | 4,700 | 4,682 |
| Sumitomo Mitsui Banking Corp. | 1.350% | 7/11/17 | 4,500 | 4,481 |
| Sumitomo Mitsui Banking Corp. | 1.800% | 7/18/17 | 7,275 | 7,293 |
| Sumitomo Mitsui Banking Corp. | 1.500% | 1/18/18 | 4,400 | 4,365 |
| Sumitomo Mitsui Banking Corp. | 2.500% | 7/19/18 | 2,225 | 2,261 |
| Sumitomo Mitsui Banking Corp. | 1.950% | 7/23/18 | 7,625 | 7,635 |
| Sumitomo Mitsui Banking Corp. | 2.450% | 1/10/19 | 9,150 | 9,197 |
| Sumitomo Mitsui Banking Corp. | 2.250% | 7/11/19 | 7,695 | 7,667 |
| Sumitomo Mitsui Banking Corp. | 2.450% | 1/16/20 | 16,250 | 16,291 |
| Sumitomo Mitsui Banking Corp. | 2.650% | 7/23/20 | 5,540 | 5,558 |
| SunTrust Bank | 1.350% | 2/15/17 | 5,775 | 5,769 |
| SunTrust Bank | 7.250% | 3/15/18 | 4,175 | 4,666 |
| SunTrust Banks Inc. | 3.500% | 1/20/17 | 4,150 | 4,253 |
| SunTrust Banks Inc. | 6.000% | 9/11/17 | 1,600 | 1,733 |
| SunTrust Banks Inc. | 2.350% | 11/1/18 | 7,883 | 7,915 |
| SunTrust Banks Inc. | 2.500% | 5/1/19 | 4,400 | 4,424 |
| Svenska Handelsbanken AB | 2.875% | 4/4/17 | 15,575 | 15,972 |
| Svenska Handelsbanken AB | 1.625% | 3/21/18 | 8,050 | 8,040 |
| Svenska Handelsbanken AB | 2.500% | 1/25/19 | 7,875 | 8,027 |
| Svenska Handelsbanken AB | 2.250% | 6/17/19 | 8,050 | 8,106 |
| Synchrony Financial | 1.875% | 8/15/17 | 2,800 | 2,788 |
6
| Vanguard® Short-Term Corporate Bond Index Fund | ||||
| Schedule of Investments | ||||
| August 31, 2015 | ||||
| Face | Market | |||
| Maturity | Amount | Value | ||
| Coupon | Date | ($000) | ($000) | |
| Synchrony Financial | 3.000% | 8/15/19 | 11,775 | 11,791 |
| Synchrony Financial | 2.700% | 2/3/20 | 5,150 | 5,055 |
| Toronto-Dominion Bank | 2.375% | 10/19/16 | 14,630 | 14,861 |
| Toronto-Dominion Bank | 1.125% | 5/2/17 | 11,050 | 11,044 |
| Toronto-Dominion Bank | 1.625% | 3/13/18 | 1,615 | 1,615 |
| Toronto-Dominion Bank | 1.400% | 4/30/18 | 17,045 | 16,867 |
| Toronto-Dominion Bank | 1.750% | 7/23/18 | 4,500 | 4,478 |
| Toronto-Dominion Bank | 2.625% | 9/10/18 | 12,625 | 12,932 |
| Toronto-Dominion Bank | 2.125% | 7/2/19 | 16,450 | 16,430 |
| Toronto-Dominion Bank | 2.250% | 11/5/19 | 11,250 | 11,273 |
| UBS AG | 1.375% | 6/1/17 | 9,300 | 9,257 |
| UBS AG | 7.375% | 6/15/17 | 200 | 218 |
| UBS AG | 1.375% | 8/14/17 | 6,845 | 6,813 |
| UBS AG | 5.875% | 12/20/17 | 16,775 | 18,267 |
| UBS AG | 1.800% | 3/26/18 | 24,700 | 24,624 |
| UBS AG | 5.750% | 4/25/18 | 13,544 | 14,837 |
| UBS AG | 2.375% | 8/14/19 | 15,120 | 15,122 |
| UBS AG | 2.350% | 3/26/20 | 8,600 | 8,544 |
| UBS AG | 4.875% | 8/4/20 | 14,650 | 16,207 |
| US Bancorp | 2.200% | 11/15/16 | 13,710 | 13,893 |
| US Bancorp | 1.650% | 5/15/17 | 9,370 | 9,419 |
| US Bancorp | 1.950% | 11/15/18 | 5,750 | 5,774 |
| US Bancorp | 2.200% | 4/25/19 | 7,800 | 7,879 |
| US Bank NA | 1.100% | 1/30/17 | 4,900 | 4,901 |
| US Bank NA | 1.375% | 9/11/17 | 6,475 | 6,476 |
| US Bank NA | 1.350% | 1/26/18 | 5,500 | 5,484 |
| US Bank NA | 2.125% | 10/28/19 | 14,000 | 14,024 |
| Vesey Street Investment Trust I | 4.404% | 9/1/16 | 5,828 | 5,994 |
| Wachovia Bank NA | 6.000% | 11/15/17 | 9,790 | 10,687 |
| Wachovia Corp. | 5.625% | 10/15/16 | 12,690 | 13,305 |
| Wachovia Corp. | 5.750% | 6/15/17 | 15,800 | 16,986 |
| Wachovia Corp. | 5.750% | 2/1/18 | 22,200 | 24,252 |
| Wells Fargo & Co. | 5.125% | 9/15/16 | 4,212 | 4,383 |
| Wells Fargo & Co. | 2.625% | 12/15/16 | 10,200 | 10,398 |
| Wells Fargo & Co. | 2.100% | 5/8/17 | 16,200 | 16,388 |
| Wells Fargo & Co. | 1.150% | 6/2/17 | 6,936 | 6,911 |
| Wells Fargo & Co. | 1.400% | 9/8/17 | 10,400 | 10,382 |
| Wells Fargo & Co. | 5.625% | 12/11/17 | 17,726 | 19,296 |
| Wells Fargo & Co. | 1.500% | 1/16/18 | 13,875 | 13,829 |
| Wells Fargo & Co. | 2.150% | 1/15/19 | 13,640 | 13,657 |
| Wells Fargo & Co. | 2.125% | 4/22/19 | 12,325 | 12,313 |
| Wells Fargo & Co. | 2.150% | 1/30/20 | 8,975 | 8,862 |
| Wells Fargo & Co. | 2.600% | 7/22/20 | 19,878 | 19,831 |
| Westpac Banking Corp. | 1.050% | 11/25/16 | 9,832 | 9,852 |
| Westpac Banking Corp. | 1.200% | 5/19/17 | 10,200 | 10,177 |
| Westpac Banking Corp. | 2.000% | 8/14/17 | 8,664 | 8,764 |
| Westpac Banking Corp. | 1.500% | 12/1/17 | 7,125 | 7,108 |
| Westpac Banking Corp. | 1.600% | 1/12/18 | 6,810 | 6,817 |
| Westpac Banking Corp. | 2.250% | 7/30/18 | 8,900 | 8,992 |
| Westpac Banking Corp. | 2.250% | 1/17/19 | 9,725 | 9,757 |
| Westpac Banking Corp. | 4.875% | 11/19/19 | 15,263 | 16,755 |
| Westpac Banking Corp. | 2.300% | 5/26/20 | 12,000 | 11,926 |
| Brokerage (1.0%) | ||||
| Ameriprise Financial Inc. | 7.300% | 6/28/19 | 1,175 | 1,386 |
| Ameriprise Financial Inc. | 5.300% | 3/15/20 | 6,325 | 7,096 |
| BGC Partners Inc. | 5.375% | 12/9/19 | 2,000 | 2,090 |
| BlackRock Inc. | 6.250% | 9/15/17 | 4,800 | 5,272 |
| BlackRock Inc. | 5.000% | 12/10/19 | 7,100 | 7,930 |
| Charles Schwab Corp. | 1.500% | 3/10/18 | 6,200 | 6,190 |
| Charles Schwab Corp. | 2.200% | 7/25/18 | 2,175 | 2,201 |
| Charles Schwab Corp. | 4.450% | 7/22/20 | 4,150 | 4,544 |
| Eaton Vance Corp. | 6.500% | 10/2/17 | 409 | 447 |
| Franklin Resources Inc. | 1.375% | 9/15/17 | 2,025 | 2,027 |
7
| Vanguard® Short-Term Corporate Bond Index Fund | ||||
| Schedule of Investments | ||||
| August 31, 2015 | ||||
| Face | Market | |||
| Maturity | Amount | Value | ||
| Coupon | Date | ($000) | ($000) | |
| Franklin Resources Inc. | 4.625% | 5/20/20 | 2,450 | 2,707 |
| Intercontinental Exchange Inc. | 2.500% | 10/15/18 | 4,525 | 4,599 |
| Jefferies Group LLC | 5.125% | 4/13/18 | 5,492 | 5,788 |
| Jefferies Group LLC | 8.500% | 7/15/19 | 4,805 | 5,708 |
| Lazard Group LLC | 6.850% | 6/15/17 | 651 | 705 |
| Legg Mason Inc. | 2.700% | 7/15/19 | 3,495 | 3,488 |
| Leucadia National Corp. | 8.125% | 9/15/15 | 1,969 | 1,973 |
| NASDAQ OMX Group Inc. | 5.250% | 1/16/18 | 500 | 538 |
| NASDAQ OMX Group Inc. | 5.550% | 1/15/20 | 6,600 | 7,227 |
| Nomura Holdings Inc. | 2.000% | 9/13/16 | 9,933 | 9,998 |
| Nomura Holdings Inc. | 2.750% | 3/19/19 | 8,350 | 8,444 |
| Nomura Holdings Inc. | 6.700% | 3/4/20 | 10,650 | 12,387 |
| NYSE Euronext | 2.000% | 10/5/17 | 8,350 | 8,426 |
| Raymond James Financial Inc. | 8.600% | 8/15/19 | 2,050 | 2,479 |
| TD Ameritrade Holding Corp. | 5.600% | 12/1/19 | 3,375 | 3,830 |
| Finance Companies (2.5%) | ||||
| Air Lease Corp. | 5.625% | 4/1/17 | 8,050 | 8,452 |
| Air Lease Corp. | 2.125% | 1/15/18 | 3,550 | 3,510 |
| Air Lease Corp. | 2.625% | 9/4/18 | 4,600 | 4,565 |
| Air Lease Corp. | 3.375% | 1/15/19 | 4,498 | 4,543 |
| Air Lease Corp. | 4.750% | 3/1/20 | 2,975 | 3,157 |
| Ares Capital Corp. | 4.875% | 11/30/18 | 5,325 | 5,553 |
| Ares Capital Corp. | 3.875% | 1/15/20 | 3,975 | 4,042 |
| FS Investment Corp. | 4.000% | 7/15/19 | 3,900 | 3,916 |
| FS Investment Corp. | 4.250% | 1/15/20 | 1,325 | 1,334 |
| GATX Corp. | 1.250% | 3/4/17 | 2,650 | 2,641 |
| GATX Corp. | 2.375% | 7/30/18 | 1,575 | 1,578 |
| GATX Corp. | 2.500% | 7/30/19 | 1,575 | 1,564 |
| GATX Corp. | 2.600% | 3/30/20 | 4,050 | 3,954 |
| 1 GE Capital Trust I | 6.375% | 11/15/67 | 6,765 | 7,222 |
| General Electric Capital Corp. | 3.350% | 10/17/16 | 8,890 | 9,128 |
| General Electric Capital Corp. | 5.375% | 10/20/16 | 3,247 | 3,407 |
| General Electric Capital Corp. | 2.900% | 1/9/17 | 11,404 | 11,685 |
| General Electric Capital Corp. | 5.400% | 2/15/17 | 11,503 | 12,184 |
| General Electric Capital Corp. | 2.450% | 3/15/17 | 3,600 | 3,666 |
| General Electric Capital Corp. | 2.300% | 4/27/17 | 15,860 | 16,111 |
| General Electric Capital Corp. | 1.250% | 5/15/17 | 7,025 | 7,034 |
| General Electric Capital Corp. | 5.625% | 9/15/17 | 23,280 | 25,217 |
| General Electric Capital Corp. | 1.600% | 11/20/17 | 7,750 | 7,767 |
| General Electric Capital Corp. | 1.625% | 4/2/18 | 9,425 | 9,420 |
| General Electric Capital Corp. | 5.625% | 5/1/18 | 33,122 | 36,368 |
| General Electric Capital Corp. | 2.300% | 1/14/19 | 6,975 | 7,054 |
| General Electric Capital Corp. | 6.000% | 8/7/19 | 13,801 | 15,740 |
| General Electric Capital Corp. | 2.100% | 12/11/19 | 4,100 | 4,113 |
| General Electric Capital Corp. | 5.500% | 1/8/20 | 16,500 | 18,598 |
| General Electric Capital Corp. | 2.200% | 1/9/20 | 15,900 | 15,866 |
| General Electric Capital Corp. | 5.550% | 5/4/20 | 10,176 | 11,544 |
| 1 General Electric Capital Corp. | 6.375% | 11/15/67 | 12,350 | 13,184 |
| 2 International Lease Finance Corp. | 6.750% | 9/1/16 | 9,070 | 9,433 |
| 2 International Lease Finance Corp. | 7.125% | 9/1/18 | 9,075 | 10,017 |
| Prospect Capital Corp. | 5.000% | 7/15/19 | 2,150 | 2,225 |
| Insurance (3.3%) | ||||
| ACE INA Holdings Inc. | 5.700% | 2/15/17 | 925 | 983 |
| ACE INA Holdings Inc. | 5.800% | 3/15/18 | 7,500 | 8,292 |
| ACE INA Holdings Inc. | 5.900% | 6/15/19 | 3,425 | 3,882 |
| Aegon NV | 4.625% | 12/1/15 | 275 | 277 |
| Aetna Inc. | 1.750% | 5/15/17 | 600 | 603 |
| Aetna Inc. | 1.500% | 11/15/17 | 3,860 | 3,847 |
| Aetna Inc. | 2.200% | 3/15/19 | 2,865 | 2,861 |
| Aflac Inc. | 2.650% | 2/15/17 | 4,925 | 5,023 |
| Aflac Inc. | 2.400% | 3/16/20 | 5,800 | 5,799 |
| 1 Allstate Corp. | 6.125% | 5/15/67 | 4,369 | 4,451 |
| American Financial Group Inc. | 9.875% | 6/15/19 | 2,090 | 2,603 |
8
| Vanguard® Short-Term Corporate Bond Index Fund | ||||
| Schedule of Investments | ||||
| August 31, 2015 | ||||
| Face | Market | |||
| Maturity | Amount | Value | ||
| Coupon | Date | ($000) | ($000) | |
| American International Group Inc. | 5.600% | 10/18/16 | 3,983 | 4,178 |
| American International Group Inc. | 5.850% | 1/16/18 | 9,874 | 10,799 |
| American International Group Inc. | 2.300% | 7/16/19 | 7,440 | 7,417 |
| Anthem Inc. | 2.375% | 2/15/17 | 3,186 | 3,219 |
| Anthem Inc. | 5.875% | 6/15/17 | 4,900 | 5,255 |
| Anthem Inc. | 1.875% | 1/15/18 | 5,075 | 5,053 |
| Anthem Inc. | 2.300% | 7/15/18 | 4,198 | 4,202 |
| Anthem Inc. | 2.250% | 8/15/19 | 7,565 | 7,438 |
| Anthem Inc. | 4.350% | 8/15/20 | 4,075 | 4,312 |
| Assurant Inc. | 2.500% | 3/15/18 | 2,450 | 2,472 |
| Axis Specialty Finance LLC | 5.875% | 6/1/20 | 4,842 | 5,453 |
| AXIS Specialty Finance plc | 2.650% | 4/1/19 | 1,720 | 1,720 |
| Berkshire Hathaway Finance Corp. | 1.600% | 5/15/17 | 8,744 | 8,787 |
| Berkshire Hathaway Finance Corp. | 1.300% | 5/15/18 | 8,138 | 8,111 |
| Berkshire Hathaway Finance Corp. | 5.400% | 5/15/18 | 11,200 | 12,281 |
| Berkshire Hathaway Finance Corp. | 2.000% | 8/15/18 | 5,425 | 5,484 |
| Berkshire Hathaway Inc. | 1.900% | 1/31/17 | 11,917 | 12,058 |
| Berkshire Hathaway Inc. | 1.550% | 2/9/18 | 5,075 | 5,079 |
| Berkshire Hathaway Inc. | 2.100% | 8/14/19 | 2,200 | 2,206 |
| Chubb Corp. | 5.750% | 5/15/18 | 3,805 | 4,191 |
| 1 Chubb Corp. | 6.375% | 3/29/67 | 7,455 | 7,343 |
| Cigna Corp. | 5.125% | 6/15/20 | 2,680 | 2,957 |
| CNA Financial Corp. | 7.350% | 11/15/19 | 1,875 | 2,202 |
| CNA Financial Corp. | 5.875% | 8/15/20 | 1,800 | 2,027 |
| Coventry Health Care Inc. | 5.950% | 3/15/17 | 2,780 | 2,956 |
| Hartford Financial Services Group Inc. | 5.500% | 10/15/16 | 1,300 | 1,362 |
| Hartford Financial Services Group Inc. | 5.375% | 3/15/17 | 3,425 | 3,625 |
| Hartford Financial Services Group Inc. | 6.300% | 3/15/18 | 3,853 | 4,266 |
| Hartford Financial Services Group Inc. | 6.000% | 1/15/19 | 3,020 | 3,370 |
| Hartford Financial Services Group Inc. | 5.500% | 3/30/20 | 3,850 | 4,305 |
| HCC Insurance Holdings Inc. | 6.300% | 11/15/19 | 2,000 | 2,278 |
| Humana Inc. | 7.200% | 6/15/18 | 3,300 | 3,745 |
| Humana Inc. | 6.300% | 8/1/18 | 2,235 | 2,505 |
| Humana Inc. | 2.625% | 10/1/19 | 2,625 | 2,638 |
| Kemper Corp. | 6.000% | 5/15/17 | 3,440 | 3,644 |
| Lincoln National Corp. | 8.750% | 7/1/19 | 1,000 | 1,216 |
| Lincoln National Corp. | 6.250% | 2/15/20 | 3,425 | 3,939 |
| 1 Lincoln National Corp. | 6.050% | 4/20/67 | 4,000 | 3,340 |
| Markel Corp. | 7.125% | 9/30/19 | 3,367 | 3,945 |
| Marsh & McLennan Cos. Inc. | 2.300% | 4/1/17 | 1,450 | 1,472 |
| Marsh & McLennan Cos. Inc. | 2.550% | 10/15/18 | 1,150 | 1,168 |
| Marsh & McLennan Cos. Inc. | 2.350% | 9/10/19 | 2,340 | 2,355 |
| Marsh & McLennan Cos. Inc. | 2.350% | 3/6/20 | 4,500 | 4,490 |
| MetLife Inc. | 1.756% | 12/15/17 | 5,275 | 5,303 |
| MetLife Inc. | 1.903% | 12/15/17 | 3,650 | 3,675 |
| MetLife Inc. | 6.817% | 8/15/18 | 7,232 | 8,255 |
| MetLife Inc. | 7.717% | 2/15/19 | 6,570 | 7,739 |
| PartnerRe Finance B LLC | 5.500% | 6/1/20 | 3,645 | 4,067 |
| Principal Financial Group Inc. | 1.850% | 11/15/17 | 1,625 | 1,634 |
| Principal Financial Group Inc. | 8.875% | 5/15/19 | 2,075 | 2,535 |
| 1 Principal Financial Group Inc. | 4.700% | 5/15/55 | 3,800 | 3,774 |
| 1 Progressive Corp. | 6.700% | 6/15/67 | 4,467 | 4,534 |
| Protective Life Corp. | 7.375% | 10/15/19 | 1,400 | 1,653 |
| Prudential Financial Inc. | 6.000% | 12/1/17 | 5,496 | 6,018 |
| Prudential Financial Inc. | 2.300% | 8/15/18 | 3,625 | 3,667 |
| Prudential Financial Inc. | 7.375% | 6/15/19 | 4,375 | 5,133 |
| Prudential Financial Inc. | 2.350% | 8/15/19 | 2,550 | 2,545 |
| Prudential Financial Inc. | 5.375% | 6/21/20 | 4,874 | 5,457 |
| 1 Prudential Financial Inc. | 8.875% | 6/15/68 | 4,405 | 5,077 |
| Reinsurance Group of America Inc. | 5.625% | 3/15/17 | 4,015 | 4,247 |
| Reinsurance Group of America Inc. | 6.450% | 11/15/19 | 2,925 | 3,339 |
| 1 StanCorp Financial Group Inc. | 6.900% | 6/1/67 | 1,495 | 1,316 |
| Torchmark Corp. | 9.250% | 6/15/19 | 1,000 | 1,232 |
| Travelers Cos. Inc. | 5.750% | 12/15/17 | 2,200 | 2,413 |
9
| Vanguard® Short-Term Corporate Bond Index Fund | ||||
| Schedule of Investments | ||||
| August 31, 2015 | ||||
| Face | Market | |||
| Maturity | Amount | Value | ||
| Coupon | Date | ($000) | ($000) | |
| Travelers Cos. Inc. | 5.800% | 5/15/18 | 3,650 | 4,042 |
| Travelers Cos. Inc. | 5.900% | 6/2/19 | 4,415 | 5,016 |
| UnitedHealth Group Inc. | 1.875% | 11/15/16 | 1,200 | 1,211 |
| UnitedHealth Group Inc. | 6.000% | 6/15/17 | 1,830 | 1,980 |
| UnitedHealth Group Inc. | 1.450% | 7/17/17 | 6,500 | 6,503 |
| UnitedHealth Group Inc. | 1.400% | 10/15/17 | 5,100 | 5,080 |
| UnitedHealth Group Inc. | 1.400% | 12/15/17 | 5,450 | 5,424 |
| UnitedHealth Group Inc. | 6.000% | 2/15/18 | 8,981 | 9,894 |
| UnitedHealth Group Inc. | 1.900% | 7/16/18 | 8,000 | 8,013 |
| UnitedHealth Group Inc. | 1.625% | 3/15/19 | 3,975 | 3,907 |
| UnitedHealth Group Inc. | 2.300% | 12/15/19 | 6,825 | 6,841 |
| UnitedHealth Group Inc. | 2.700% | 7/15/20 | 10,800 | 10,937 |
| Unum Group | 7.125% | 9/30/16 | 2,805 | 2,969 |
| Voya Financial Inc. | 2.900% | 2/15/18 | 7,325 | 7,461 |
| Willis North America Inc. | 6.200% | 3/28/17 | 245 | 260 |
| WR Berkley Corp. | 7.375% | 9/15/19 | 1,282 | 1,508 |
| XLIT Ltd. | 2.300% | 12/15/18 | 5,850 | 5,880 |
| 1 XLIT Ltd. | 6.500% | 10/29/49 | 7,000 | 5,515 |
| Other Finance (0.0%) | ||||
| ORIX Corp. | 3.750% | 3/9/17 | 3,050 | 3,144 |
| XTRA Finance Corp. | 5.150% | 4/1/17 | 2,500 | 2,649 |
| Real Estate Investment Trusts (1.9%) | ||||
| Alexandria Real Estate Equities Inc. | 2.750% | 1/15/20 | 2,900 | 2,865 |
| AvalonBay Communities Inc. | 5.750% | 9/15/16 | 500 | 523 |
| AvalonBay Communities Inc. | 5.700% | 3/15/17 | 1,335 | 1,422 |
| BioMed Realty LP | 3.850% | 4/15/16 | 460 | 466 |
| BioMed Realty LP | 2.625% | 5/1/19 | 2,810 | 2,809 |
| Boston Properties LP | 3.700% | 11/15/18 | 4,415 | 4,608 |
| Boston Properties LP | 5.875% | 10/15/19 | 6,009 | 6,785 |
| Boston Properties LP | 5.625% | 11/15/20 | 1,000 | 1,129 |
| Brandywine Operating Partnership LP | 5.700% | 5/1/17 | 3,650 | 3,862 |
| Brandywine Operating Partnership LP | 4.950% | 4/15/18 | 2,375 | 2,506 |
| DDR Corp. | 7.500% | 4/1/17 | 5,850 | 6,335 |
| Digital Realty Trust LP | 5.875% | 2/1/20 | 3,200 | 3,575 |
| Digital Realty Trust LP | 5.250% | 3/15/21 | 2,160 | 2,355 |
| Duke Realty LP | 5.950% | 2/15/17 | 6,007 | 6,380 |
| EPR Properties | 7.750% | 7/15/20 | 1,000 | 1,178 |
| Equity CommonWealth | 6.250% | 6/15/17 | 1,000 | 1,049 |
| Equity CommonWealth | 6.650% | 1/15/18 | 1,000 | 1,075 |
| ERP Operating LP | 5.750% | 6/15/17 | 6,425 | 6,888 |
| ERP Operating LP | 2.375% | 7/1/19 | 3,500 | 3,505 |
| ERP Operating LP | 4.750% | 7/15/20 | 3,475 | 3,810 |
| Essex Portfolio LP | 5.500% | 3/15/17 | 1,625 | 1,716 |
| Government Properties Income Trust | 3.750% | 8/15/19 | 2,500 | 2,550 |
| HCP Inc. | 6.000% | 1/30/17 | 3,100 | 3,279 |
| HCP Inc. | 6.700% | 1/30/18 | 8,345 | 9,230 |
| HCP Inc. | 3.750% | 2/1/19 | 2,000 | 2,073 |
| HCP Inc. | 2.625% | 2/1/20 | 8,625 | 8,546 |
| Health Care REIT Inc. | 4.700% | 9/15/17 | 5,200 | 5,488 |
| Health Care REIT Inc. | 2.250% | 3/15/18 | 3,436 | 3,450 |
| Health Care REIT Inc. | 4.125% | 4/1/19 | 2,100 | 2,217 |
| Health Care REIT Inc. | 6.125% | 4/15/20 | 3,275 | 3,733 |
| Highwoods Realty LP | 5.850% | 3/15/17 | 2,110 | 2,232 |
| Hospitality Properties Trust | 5.625% | 3/15/17 | 975 | 1,023 |
| Hospitality Properties Trust | 6.700% | 1/15/18 | 3,925 | 4,225 |
| Kilroy Realty LP | 4.800% | 7/15/18 | 4,450 | 4,737 |
| Kimco Realty Corp. | 5.700% | 5/1/17 | 4,600 | 4,907 |
| Kimco Realty Corp. | 4.300% | 2/1/18 | 3,075 | 3,249 |
| Kimco Realty Corp. | 6.875% | 10/1/19 | 1,425 | 1,661 |
| Liberty Property LP | 5.500% | 12/15/16 | 1,413 | 1,481 |
| Liberty Property LP | 6.625% | 10/1/17 | 725 | 793 |
| Mack-Cali Realty LP | 2.500% | 12/15/17 | 1,000 | 1,003 |
| Mack-Cali Realty LP | 7.750% | 8/15/19 | 2,950 | 3,398 |
10
| Vanguard® Short-Term Corporate Bond Index Fund | ||||
| Schedule of Investments | ||||
| August 31, 2015 | ||||
| Face | Market | |||
| Maturity | Amount | Value | ||
| Coupon | Date | ($000) | ($000) | |
| ProLogis LP | 4.500% | 8/15/17 | 2,225 | 2,331 |
| ProLogis LP | 2.750% | 2/15/19 | 3,050 | 3,083 |
| ProLogis LP | 6.875% | 3/15/20 | 3,150 | 3,650 |
| Realty Income Corp. | 5.950% | 9/15/16 | 1,900 | 1,985 |
| Realty Income Corp. | 2.000% | 1/31/18 | 2,875 | 2,892 |
| Realty Income Corp. | 6.750% | 8/15/19 | 3,110 | 3,585 |
| Regency Centers LP | 5.875% | 6/15/17 | 2,000 | 2,138 |
| Select Income REIT | 2.850% | 2/1/18 | 5,375 | 5,392 |
| Senior Housing Properties Trust | 3.250% | 5/1/19 | 4,475 | 4,484 |
| Simon Property Group LP | 5.250% | 12/1/16 | 3,250 | 3,383 |
| Simon Property Group LP | 2.800% | 1/30/17 | 3,725 | 3,796 |
| Simon Property Group LP | 2.150% | 9/15/17 | 4,975 | 5,041 |
| Simon Property Group LP | 6.125% | 5/30/18 | 8,775 | 9,767 |
| Simon Property Group LP | 2.200% | 2/1/19 | 6,800 | 6,843 |
| Simon Property Group LP | 10.350% | 4/1/19 | 4,236 | 5,321 |
| Simon Property Group LP | 5.650% | 2/1/20 | 3,801 | 4,285 |
| Simon Property Group LP | 2.500% | 9/1/20 | 1,800 | 1,796 |
| SL Green Realty Corp. | 7.750% | 3/15/20 | 2,500 | 2,948 |
| Tanger Properties LP | 6.125% | 6/1/20 | 2,500 | 2,848 |
| UDR Inc. | 4.250% | 6/1/18 | 2,300 | 2,423 |
| Ventas Realty LP | 1.550% | 9/26/16 | 6,713 | 6,726 |
| Ventas Realty LP / Ventas Capital Corp. | 2.000% | 2/15/18 | 5,125 | 5,132 |
| Ventas Realty LP / Ventas Capital Corp. | 4.000% | 4/30/19 | 3,375 | 3,528 |
| Ventas Realty LP / Ventas Capital Corp. | 2.700% | 4/1/20 | 3,125 | 3,091 |
| Vornado Realty LP | 2.500% | 6/30/19 | 3,325 | 3,296 |
| 2 Washington Prime Group LP | 3.850% | 4/1/20 | 1,800 | 1,823 |
| 5,251,453 | ||||
| Industrial (51.2%) | ||||
| Basic Industry (3.3%) | ||||
| Agrium Inc. | 6.750% | 1/15/19 | 4,799 | 5,462 |
| Air Products & Chemicals Inc. | 1.200% | 10/15/17 | 1,925 | 1,922 |
| Air Products & Chemicals Inc. | 4.375% | 8/21/19 | 1,115 | 1,217 |
| Airgas Inc. | 1.650% | 2/15/18 | 1,850 | 1,826 |
| Airgas Inc. | 3.050% | 8/1/20 | 5,500 | 5,518 |
| Albemarle Corp. | 3.000% | 12/1/19 | 1,675 | 1,670 |
| Barrick Gold Corp. | 6.950% | 4/1/19 | 4,134 | 4,620 |
| Barrick North America Finance LLC | 6.800% | 9/15/18 | 5,796 | 6,343 |
| Barrick PD Australia Finance Pty Ltd. | 4.950% | 1/15/20 | 475 | 497 |
| BHP Billiton Finance USA Ltd. | 1.875% | 11/21/16 | 5,625 | 5,675 |
| BHP Billiton Finance USA Ltd. | 1.625% | 2/24/17 | 11,503 | 11,553 |
| BHP Billiton Finance USA Ltd. | 5.400% | 3/29/17 | 514 | 545 |
| BHP Billiton Finance USA Ltd. | 2.050% | 9/30/18 | 10,806 | 10,821 |
| BHP Billiton Finance USA Ltd. | 6.500% | 4/1/19 | 12,475 | 14,228 |
| Cabot Corp. | 2.550% | 1/15/18 | 1,125 | 1,142 |
| Celulosa Arauco y Constitucion SA | 7.250% | 7/29/19 | 2,315 | 2,660 |
| CF Industries Inc. | 6.875% | 5/1/18 | 9,125 | 10,152 |
| CF Industries Inc. | 7.125% | 5/1/20 | 4,890 | 5,764 |
| Domtar Corp. | 10.750% | 6/1/17 | 399 | 456 |
| Dow Chemical Co. | 5.700% | 5/15/18 | 2,755 | 3,014 |
| Dow Chemical Co. | 8.550% | 5/15/19 | 13,500 | 16,300 |
| Eastman Chemical Co. | 2.400% | 6/1/17 | 11,625 | 11,755 |
| Eastman Chemical Co. | 2.700% | 1/15/20 | 8,675 | 8,608 |
| Ecolab Inc. | 3.000% | 12/8/16 | 6,250 | 6,374 |
| Ecolab Inc. | 1.450% | 12/8/17 | 3,693 | 3,649 |
| Ecolab Inc. | 1.550% | 1/12/18 | 3,490 | 3,459 |
| Ecolab Inc. | 2.250% | 1/12/20 | 2,400 | 2,390 |
| EI du Pont de Nemours & Co. | 5.250% | 12/15/16 | 1,514 | 1,595 |
| EI du Pont de Nemours & Co. | 6.000% | 7/15/18 | 13,003 | 14,466 |
| EI du Pont de Nemours & Co. | 4.625% | 1/15/20 | 8,180 | 8,917 |
| Freeport-McMoRan Inc. | 2.150% | 3/1/17 | 5,820 | 5,544 |
| Freeport-McMoRan Inc. | 2.300% | 11/14/17 | 2,265 | 2,106 |
| Freeport-McMoRan Inc. | 2.375% | 3/15/18 | 12,795 | 11,579 |
| Freeport-McMoRan Inc. | 3.100% | 3/15/20 | 5,817 | 5,003 |
11
| Vanguard® Short-Term Corporate Bond Index Fund | ||||
| Schedule of Investments | ||||
| August 31, 2015 | ||||
| Face | Market | |||
| Maturity | Amount | Value | ||
| Coupon | Date | ($000) | ($000) | |
| Glencore Canada Corp. | 5.500% | 6/15/17 | 900 | 943 |
| Goldcorp Inc. | 2.125% | 3/15/18 | 5,145 | 5,090 |
| International Paper Co. | 7.950% | 6/15/18 | 9,400 | 10,900 |
| International Paper Co. | 9.375% | 5/15/19 | 118 | 145 |
| Lubrizol Corp. | 8.875% | 2/1/19 | 3,088 | 3,747 |
| LyondellBasell Industries NV | 5.000% | 4/15/19 | 13,100 | 14,223 |
| MeadWestvaco Corp. | 7.375% | 9/1/19 | 750 | 875 |
| Methanex Corp. | 3.250% | 12/15/19 | 1,975 | 1,985 |
| Monsanto Co. | 1.150% | 6/30/17 | 3,746 | 3,715 |
| Monsanto Co. | 5.125% | 4/15/18 | 2,527 | 2,734 |
| Monsanto Co. | 1.850% | 11/15/18 | 2,035 | 2,045 |
| Monsanto Co. | 2.125% | 7/15/19 | 8,700 | 8,641 |
| Newmont Mining Corp. | 5.125% | 10/1/19 | 5,806 | 6,142 |
| Nucor Corp. | 5.750% | 12/1/17 | 6,900 | 7,505 |
| Nucor Corp. | 5.850% | 6/1/18 | 5,568 | 6,164 |
| Potash Corp. of Saskatchewan Inc. | 3.250% | 12/1/17 | 4,640 | 4,762 |
| Potash Corp. of Saskatchewan Inc. | 6.500% | 5/15/19 | 1,850 | 2,116 |
| Potash Corp. of Saskatchewan Inc. | 4.875% | 3/30/20 | 3,475 | 3,814 |
| PPG Industries Inc. | 2.300% | 11/15/19 | 9,000 | 8,986 |
| Praxair Inc. | 5.200% | 3/15/17 | 2,125 | 2,254 |
| Praxair Inc. | 1.050% | 11/7/17 | 1,675 | 1,659 |
| Praxair Inc. | 1.250% | 11/7/18 | 4,800 | 4,707 |
| Praxair Inc. | 4.500% | 8/15/19 | 4,675 | 5,073 |
| Rio Tinto Finance USA Ltd. | 6.500% | 7/15/18 | 15,918 | 17,721 |
| Rio Tinto Finance USA Ltd. | 9.000% | 5/1/19 | 13,760 | 16,925 |
| Rio Tinto Finance USA plc | 2.000% | 3/22/17 | 4,525 | 4,541 |
| Rio Tinto Finance USA plc | 1.625% | 8/21/17 | 8,500 | 8,451 |
| Rio Tinto Finance USA plc | 2.250% | 12/14/18 | 6,130 | 6,121 |
| Rock-Tenn Co. | 4.450% | 3/1/19 | 5,000 | 5,302 |
| Rock-Tenn Co. | 3.500% | 3/1/20 | 2,500 | 2,563 |
| Rohm & Haas Co. | 6.000% | 9/15/17 | 1,756 | 1,913 |
| RPM International Inc. | 6.500% | 2/15/18 | 1,500 | 1,656 |
| RPM International Inc. | 6.125% | 10/15/19 | 3,000 | 3,355 |
| Sherwin-Williams Co. | 1.350% | 12/15/17 | 6,200 | 6,160 |
| Southern Copper Corp. | 5.375% | 4/16/20 | 2,750 | 2,932 |
| Teck Resources Ltd. | 3.150% | 1/15/17 | 2,600 | 2,487 |
| Teck Resources Ltd. | 2.500% | 2/1/18 | 3,341 | 2,831 |
| Teck Resources Ltd. | 3.000% | 3/1/19 | 2,921 | 2,395 |
| Vale Overseas Ltd. | 6.250% | 1/23/17 | 8,525 | 8,869 |
| Vale Overseas Ltd. | 5.625% | 9/15/19 | 6,475 | 6,741 |
| Valspar Corp. | 7.250% | 6/15/19 | 800 | 928 |
| Weyerhaeuser Co. | 7.375% | 10/1/19 | 4,000 | 4,691 |
| Capital Goods (4.7%) | ||||
| 3M Co. | 1.375% | 9/29/16 | 3,542 | 3,568 |
| 3M Co. | 1.000% | 6/26/17 | 5,445 | 5,451 |
| 3M Co. | 1.375% | 8/7/18 | 3,875 | 3,882 |
| 3M Co. | 1.625% | 6/15/19 | 3,975 | 3,964 |
| 3M Co. | 2.000% | 8/7/20 | 3,875 | 3,872 |
| ABB Finance USA Inc. | 1.625% | 5/8/17 | 600 | 601 |
| Acuity Brands Lighting Inc. | 6.000% | 12/15/19 | 2,125 | 2,337 |
| Bemis Co. Inc. | 6.800% | 8/1/19 | 2,900 | 3,364 |
| Boeing Capital Corp. | 2.900% | 8/15/18 | 850 | 884 |
| Boeing Capital Corp. | 4.700% | 10/27/19 | 3,734 | 4,118 |
| Boeing Co. | 3.750% | 11/20/16 | 1,848 | 1,914 |
| Boeing Co. | 0.950% | 5/15/18 | 6,910 | 6,802 |
| Boeing Co. | 6.000% | 3/15/19 | 1,900 | 2,149 |
| Boeing Co. | 4.875% | 2/15/20 | 10,275 | 11,523 |
| Caterpillar Financial Services Corp. | 1.350% | 9/6/16 | 3,840 | 3,861 |
| Caterpillar Financial Services Corp. | 1.000% | 11/25/16 | 3,000 | 3,003 |
| Caterpillar Financial Services Corp. | 1.000% | 3/3/17 | 8,742 | 8,725 |
| Caterpillar Financial Services Corp. | 1.625% | 6/1/17 | 2,894 | 2,912 |
| Caterpillar Financial Services Corp. | 1.250% | 8/18/17 | 4,900 | 4,892 |
| Caterpillar Financial Services Corp. | 1.250% | 11/6/17 | 7,357 | 7,317 |
12
| Vanguard® Short-Term Corporate Bond Index Fund | ||||
| Schedule of Investments | ||||
| August 31, 2015 | ||||
| Face | Market | |||
| Maturity | Amount | Value | ||
| Coupon | Date | ($000) | ($000) | |
| Caterpillar Financial Services Corp. | 1.300% | 3/1/18 | 2,750 | 2,730 |
| Caterpillar Financial Services Corp. | 5.450% | 4/15/18 | 2,790 | 3,067 |
| Caterpillar Financial Services Corp. | 2.450% | 9/6/18 | 4,300 | 4,389 |
| Caterpillar Financial Services Corp. | 7.050% | 10/1/18 | 4,000 | 4,612 |
| Caterpillar Financial Services Corp. | 7.150% | 2/15/19 | 10,687 | 12,504 |
| Caterpillar Financial Services Corp. | 2.100% | 6/9/19 | 3,650 | 3,643 |
| Caterpillar Financial Services Corp. | 2.250% | 12/1/19 | 750 | 754 |
| Caterpillar Financial Services Corp. | 2.000% | 3/5/20 | 2,800 | 2,760 |
| Caterpillar Inc. | 1.500% | 6/26/17 | 8,241 | 8,276 |
| Caterpillar Inc. | 7.900% | 12/15/18 | 7,495 | 8,900 |
| Cooper US Inc. | 6.100% | 7/1/17 | 2,660 | 2,876 |
| Crane Co. | 2.750% | 12/15/18 | 3,900 | 3,955 |
| CRH America Inc. | 6.000% | 9/30/16 | 5,380 | 5,680 |
| CRH America Inc. | 8.125% | 7/15/18 | 2,350 | 2,728 |
| Danaher Corp. | 5.625% | 1/15/18 | 6,965 | 7,620 |
| Danaher Corp. | 5.400% | 3/1/19 | 6,225 | 6,905 |
| Deere & Co. | 4.375% | 10/16/19 | 2,925 | 3,165 |
| Dover Corp. | 4.875% | 10/15/15 | 175 | 176 |
| Dover Corp. | 5.450% | 3/15/18 | 1,735 | 1,896 |
| Eaton Corp. | 5.300% | 3/15/17 | 2,300 | 2,436 |
| Eaton Corp. | 1.500% | 11/2/17 | 7,225 | 7,183 |
| Eaton Corp. | 5.600% | 5/15/18 | 5,075 | 5,531 |
| Eaton Corp. | 6.950% | 3/20/19 | 75 | 87 |
| Emerson Electric Co. | 5.125% | 12/1/16 | 375 | 395 |
| Emerson Electric Co. | 5.375% | 10/15/17 | 5,010 | 5,429 |
| Emerson Electric Co. | 5.250% | 10/15/18 | 2,950 | 3,252 |
| Emerson Electric Co. | 4.875% | 10/15/19 | 2,310 | 2,559 |
| Exelis Inc. | 4.250% | 10/1/16 | 1,100 | 1,131 |
| Fortune Brands Home & Security Inc. | 3.000% | 6/15/20 | 2,490 | 2,482 |
| General Dynamics Corp. | 1.000% | 11/15/17 | 8,425 | 8,351 |
| General Electric Co. | 5.250% | 12/6/17 | 33,118 | 35,799 |
| Harris Corp. | 1.999% | 4/27/18 | 6,150 | 6,118 |
| Harris Corp. | 2.700% | 4/27/20 | 2,900 | 2,849 |
| Honeywell International Inc. | 5.300% | 3/15/17 | 3,375 | 3,594 |
| Honeywell International Inc. | 5.300% | 3/1/18 | 13,350 | 14,596 |
| Honeywell International Inc. | 5.000% | 2/15/19 | 6,675 | 7,401 |
| Illinois Tool Works Inc. | 1.950% | 3/1/19 | 6,175 | 6,173 |
| Illinois Tool Works Inc. | 6.250% | 4/1/19 | 4,375 | 4,983 |
| Ingersoll-Rand Global Holding Co. Ltd. | 6.875% | 8/15/18 | 6,874 | 7,740 |
| Ingersoll-Rand Global Holding Co. Ltd. | 2.875% | 1/15/19 | 3,025 | 3,060 |
| Ingersoll-Rand Luxembourg Finance SA | 2.625% | 5/1/20 | 2,250 | 2,234 |
| John Deere Capital Corp. | 1.850% | 9/15/16 | 3,300 | 3,336 |
| John Deere Capital Corp. | 1.050% | 10/11/16 | 3,114 | 3,120 |
| John Deere Capital Corp. | 1.050% | 12/15/16 | 1,693 | 1,696 |
| John Deere Capital Corp. | 2.000% | 1/13/17 | 4,925 | 4,993 |
| John Deere Capital Corp. | 1.400% | 3/15/17 | 2,664 | 2,677 |
| John Deere Capital Corp. | 5.500% | 4/13/17 | 1,675 | 1,794 |
| John Deere Capital Corp. | 1.125% | 6/12/17 | 4,000 | 3,991 |
| John Deere Capital Corp. | 2.800% | 9/18/17 | 3,744 | 3,862 |
| John Deere Capital Corp. | 1.200% | 10/10/17 | 3,850 | 3,840 |
| John Deere Capital Corp. | 1.350% | 1/16/18 | 4,000 | 3,989 |
| John Deere Capital Corp. | 1.300% | 3/12/18 | 8,530 | 8,477 |
| John Deere Capital Corp. | 5.350% | 4/3/18 | 2,325 | 2,555 |
| John Deere Capital Corp. | 1.600% | 7/13/18 | 2,000 | 1,995 |
| John Deere Capital Corp. | 5.750% | 9/10/18 | 2,480 | 2,766 |
| John Deere Capital Corp. | 1.950% | 12/13/18 | 6,758 | 6,783 |
| John Deere Capital Corp. | 1.950% | 3/4/19 | 6,300 | 6,317 |
| John Deere Capital Corp. | 2.250% | 4/17/19 | 8,293 | 8,367 |
| John Deere Capital Corp. | 2.300% | 9/16/19 | 2,500 | 2,512 |
| John Deere Capital Corp. | 1.700% | 1/15/20 | 1,425 | 1,392 |
| John Deere Capital Corp. | 2.050% | 3/10/20 | 6,000 | 5,918 |
| John Deere Capital Corp. | 2.375% | 7/14/20 | 2,000 | 1,999 |
| Joy Global Inc. | 6.000% | 11/15/16 | 1,185 | 1,224 |
| Kennametal Inc. | 2.650% | 11/1/19 | 3,374 | 3,352 |
13
| Vanguard® Short-Term Corporate Bond Index Fund | ||||
| Schedule of Investments | ||||
| August 31, 2015 | ||||
| Face | Market | |||
| Maturity | Amount | Value | ||
| Coupon | Date | ($000) | ($000) | |
| L-3 Communications Corp. | 3.950% | 11/15/16 | 4,425 | 4,541 |
| L-3 Communications Corp. | 1.500% | 5/28/17 | 5,305 | 5,250 |
| L-3 Communications Corp. | 5.200% | 10/15/19 | 2,950 | 3,137 |
| L-3 Communications Corp. | 4.750% | 7/15/20 | 7,634 | 7,964 |
| Lockheed Martin Corp. | 2.125% | 9/15/16 | 5,795 | 5,860 |
| Lockheed Martin Corp. | 4.250% | 11/15/19 | 6,600 | 7,157 |
| Martin Marietta Materials Inc. | 6.600% | 4/15/18 | 3,050 | 3,405 |
| Northrop Grumman Corp. | 1.750% | 6/1/18 | 7,175 | 7,121 |
| Northrop Grumman Corp. | 5.050% | 8/1/19 | 1,175 | 1,282 |
| Owens Corning | 6.500% | 12/1/16 | 197 | 208 |
| Owens Corning | 9.000% | 6/15/19 | 62 | 74 |
| Parker Hannifin Corp. | 5.500% | 5/15/18 | 4,103 | 4,533 |
| Pentair Finance SA | 1.875% | 9/15/17 | 2,770 | 2,763 |
| Pentair Finance SA | 2.650% | 12/1/19 | 500 | 494 |
| Precision Castparts Corp. | 1.250% | 1/15/18 | 10,465 | 10,374 |
| Precision Castparts Corp. | 2.250% | 6/15/20 | 3,800 | 3,797 |
| Raytheon Co. | 6.400% | 12/15/18 | 3,266 | 3,748 |
| Raytheon Co. | 4.400% | 2/15/20 | 2,550 | 2,781 |
| Republic Services Inc. | 3.800% | 5/15/18 | 5,721 | 6,010 |
| Republic Services Inc. | 5.500% | 9/15/19 | 5,370 | 6,000 |
| Republic Services Inc. | 5.000% | 3/1/20 | 5,117 | 5,624 |
| Rockwell Automation Inc. | 5.650% | 12/1/17 | 500 | 545 |
| Rockwell Automation Inc. | 2.050% | 3/1/20 | 5,000 | 4,956 |
| Rockwell Collins Inc. | 5.250% | 7/15/19 | 650 | 722 |
| Roper Technologies Inc. | 1.850% | 11/15/17 | 3,825 | 3,823 |
| Roper Technologies Inc. | 2.050% | 10/1/18 | 7,228 | 7,180 |
| Roper Technologies Inc. | 6.250% | 9/1/19 | 1,868 | 2,107 |
| 1 Stanley Black & Decker Inc. | 5.750% | 12/15/53 | 2,800 | 3,017 |
| Textron Inc. | 4.625% | 9/21/16 | 2,000 | 2,065 |
| Textron Inc. | 5.600% | 12/1/17 | 2,275 | 2,450 |
| Textron Inc. | 7.250% | 10/1/19 | 1,250 | 1,459 |
| Tyco International Finance SA | 8.500% | 1/15/19 | 2,000 | 2,386 |
| United Technologies Corp. | 1.800% | 6/1/17 | 16,874 | 17,044 |
| United Technologies Corp. | 5.375% | 12/15/17 | 7,187 | 7,814 |
| United Technologies Corp. | 6.125% | 2/1/19 | 6,650 | 7,546 |
| United Technologies Corp. | 4.500% | 4/15/20 | 9,337 | 10,241 |
| Valmont Industries Inc. | 6.625% | 4/20/20 | 668 | 762 |
| Waste Management Inc. | 2.600% | 9/1/16 | 1,021 | 1,036 |
| Waste Management Inc. | 6.100% | 3/15/18 | 5,147 | 5,681 |
| Waste Management Inc. | 4.750% | 6/30/20 | 4,400 | 4,818 |
| Xylem Inc. | 3.550% | 9/20/16 | 3,780 | 3,860 |
| Communication (6.9%) | ||||
| 21st Century Fox America Inc. | 7.250% | 5/18/18 | 500 | 569 |
| 21st Century Fox America Inc. | 8.250% | 8/10/18 | 3,280 | 3,841 |
| 21st Century Fox America Inc. | 6.900% | 3/1/19 | 4,575 | 5,224 |
| 21st Century Fox America Inc. | 5.650% | 8/15/20 | 4,100 | 4,623 |
| America Movil SAB de CV | 2.375% | 9/8/16 | 13,725 | 13,853 |
| America Movil SAB de CV | 5.625% | 11/15/17 | 3,525 | 3,815 |
| America Movil SAB de CV | 5.000% | 10/16/19 | 7,025 | 7,685 |
| America Movil SAB de CV | 5.000% | 3/30/20 | 13,078 | 14,312 |
| American Tower Corp. | 4.500% | 1/15/18 | 6,590 | 6,914 |
| American Tower Corp. | 3.400% | 2/15/19 | 6,675 | 6,789 |
| American Tower Corp. | 2.800% | 6/1/20 | 9,500 | 9,367 |
| AT&T Inc. | 1.600% | 2/15/17 | 9,100 | 9,101 |
| AT&T Inc. | 1.700% | 6/1/17 | 7,261 | 7,253 |
| AT&T Inc. | 1.400% | 12/1/17 | 13,350 | 13,205 |
| AT&T Inc. | 5.500% | 2/1/18 | 19,829 | 21,399 |
| AT&T Inc. | 5.600% | 5/15/18 | 5,252 | 5,724 |
| AT&T Inc. | 2.375% | 11/27/18 | 14,206 | 14,259 |
| AT&T Inc. | 5.800% | 2/15/19 | 16,549 | 18,287 |
| AT&T Inc. | 2.300% | 3/11/19 | 12,925 | 12,943 |
| AT&T Inc. | 2.450% | 6/30/20 | 16,475 | 16,144 |
| British Telecommunications plc | 1.250% | 2/14/17 | 3,465 | 3,456 |
14
| Vanguard® Short-Term Corporate Bond Index Fund | ||||
| Schedule of Investments | ||||
| August 31, 2015 | ||||
| Face | Market | |||
| Maturity | Amount | Value | ||
| Coupon | Date | ($000) | ($000) | |
| British Telecommunications plc | 5.950% | 1/15/18 | 7,790 | 8,529 |
| British Telecommunications plc | 2.350% | 2/14/19 | 6,925 | 6,903 |
| CBS Corp. | 1.950% | 7/1/17 | 4,325 | 4,341 |
| CBS Corp. | 4.625% | 5/15/18 | 1,025 | 1,091 |
| CBS Corp. | 2.300% | 8/15/19 | 4,500 | 4,445 |
| CBS Corp. | 5.750% | 4/15/20 | 3,410 | 3,805 |
| CC Holdings GS V LLC / Crown Castle GS III Corp. | 2.381% | 12/15/17 | 8,175 | 8,188 |
| 2 CCO Safari II LLC | 3.579% | 7/23/20 | 14,575 | 14,543 |
| Comcast Cable Communications LLC | 8.875% | 5/1/17 | 4,700 | 5,278 |
| Comcast Corp. | 6.500% | 1/15/17 | 10,199 | 10,918 |
| Comcast Corp. | 6.300% | 11/15/17 | 3,725 | 4,104 |
| Comcast Corp. | 5.875% | 2/15/18 | 7,940 | 8,737 |
| Comcast Corp. | 5.700% | 5/15/18 | 9,875 | 10,906 |
| Comcast Corp. | 5.700% | 7/1/19 | 1,615 | 1,823 |
| Comcast Corp. | 5.150% | 3/1/20 | 9,625 | 10,760 |
| Deutsche Telekom International Finance BV | 6.750% | 8/20/18 | 6,400 | 7,266 |
| Deutsche Telekom International Finance BV | 6.000% | 7/8/19 | 3,525 | 3,993 |
| DIRECTV Holdings LLC / DIRECTV Financing Co. Inc. | 2.400% | 3/15/17 | 13,040 | 13,141 |
| DIRECTV Holdings LLC / DIRECTV Financing Co. Inc. | 1.750% | 1/15/18 | 4,850 | 4,791 |
| DIRECTV Holdings LLC / DIRECTV Financing Co. Inc. | 5.875% | 10/1/19 | 5,443 | 6,086 |
| DIRECTV Holdings LLC / DIRECTV Financing Co. Inc. | 5.200% | 3/15/20 | 7,215 | 7,861 |
| Discovery Communications LLC | 5.625% | 8/15/19 | 3,035 | 3,344 |
| Discovery Communications LLC | 5.050% | 6/1/20 | 8,475 | 9,192 |
| Graham Holdings Co. | 7.250% | 2/1/19 | 2,100 | 2,197 |
| Grupo Televisa SAB | 6.000% | 5/15/18 | 2,350 | 2,568 |
| Historic TW Inc. | 6.875% | 6/15/18 | 6,514 | 7,367 |
| Interpublic Group of Cos. Inc. | 2.250% | 11/15/17 | 2,250 | 2,256 |
| McGraw Hill Financial Inc. | 5.900% | 11/15/17 | 2,477 | 2,685 |
| 2 McGraw Hill Financial Inc. | 2.500% | 8/15/18 | 3,500 | 3,518 |
| 2 McGraw Hill Financial Inc. | 3.300% | 8/14/20 | 4,900 | 4,932 |
| Moody's Corp. | 2.750% | 7/15/19 | 4,325 | 4,379 |
| NBCUniversal Media LLC | 5.150% | 4/30/20 | 15,725 | 17,584 |
| Nippon Telegraph & Telephone Corp. | 1.400% | 7/18/17 | 5,225 | 5,223 |
| Omnicom Group Inc. | 6.250% | 7/15/19 | 2,900 | 3,304 |
| Omnicom Group Inc. | 4.450% | 8/15/20 | 10,350 | 11,081 |
| Orange SA | 2.750% | 9/14/16 | 5,650 | 5,741 |
| Orange SA | 2.750% | 2/6/19 | 9,350 | 9,532 |
| Orange SA | 5.375% | 7/8/19 | 7,980 | 8,851 |
| Qwest Corp. | 6.500% | 6/1/17 | 2,862 | 3,050 |
| RELX Capital Inc. | 8.625% | 1/15/19 | 875 | 1,038 |
| Rogers Communications Inc. | 6.800% | 8/15/18 | 12,075 | 13,626 |
| Scripps Networks Interactive Inc. | 2.700% | 12/15/16 | 3,625 | 3,677 |
| Scripps Networks Interactive Inc. | 2.750% | 11/15/19 | 3,000 | 3,000 |
| Scripps Networks Interactive Inc. | 2.800% | 6/15/20 | 6,450 | 6,345 |
| Telefonica Emisiones SAU | 6.221% | 7/3/17 | 8,250 | 8,888 |
| Telefonica Emisiones SAU | 3.192% | 4/27/18 | 11,690 | 11,960 |
| Telefonica Emisiones SAU | 5.877% | 7/15/19 | 1,980 | 2,208 |
| Telefonica Emisiones SAU | 5.134% | 4/27/20 | 12,525 | 13,827 |
| Telefonos de Mexico SAB de CV | 5.500% | 11/15/19 | 1,250 | 1,396 |
| Thomson Reuters Corp. | 1.300% | 2/23/17 | 4,850 | 4,833 |
| Thomson Reuters Corp. | 1.650% | 9/29/17 | 3,025 | 3,020 |
| Thomson Reuters Corp. | 6.500% | 7/15/18 | 8,850 | 9,913 |
| Thomson Reuters Corp. | 4.700% | 10/15/19 | 4,575 | 4,970 |
| Time Warner Cable Inc. | 5.850% | 5/1/17 | 8,750 | 9,282 |
| Time Warner Cable Inc. | 6.750% | 7/1/18 | 15,156 | 16,875 |
| Time Warner Cable Inc. | 8.750% | 2/14/19 | 15,275 | 18,033 |
| Time Warner Cable Inc. | 8.250% | 4/1/19 | 10,550 | 12,330 |
| Time Warner Cable Inc. | 5.000% | 2/1/20 | 11,575 | 12,427 |
| Time Warner Cos. Inc. | 7.250% | 10/15/17 | 983 | 1,095 |
| Time Warner Inc. | 2.100% | 6/1/19 | 3,650 | 3,604 |
| Time Warner Inc. | 4.875% | 3/15/20 | 10,149 | 11,086 |
| Verizon Communications Inc. | 2.500% | 9/15/16 | 8,517 | 8,639 |
| Verizon Communications Inc. | 2.000% | 11/1/16 | 12,472 | 12,566 |
| Verizon Communications Inc. | 1.350% | 6/9/17 | 9,350 | 9,325 |
15
| Vanguard® Short-Term Corporate Bond Index Fund | ||||
| Schedule of Investments | ||||
| August 31, 2015 | ||||
| Face | Market | |||
| Maturity | Amount | Value | ||
| Coupon | Date | ($000) | ($000) | |
| Verizon Communications Inc. | 1.100% | 11/1/17 | 5,000 | 4,948 |
| Verizon Communications Inc. | 5.500% | 2/15/18 | 4,750 | 5,150 |
| Verizon Communications Inc. | 6.100% | 4/15/18 | 7,482 | 8,239 |
| Verizon Communications Inc. | 3.650% | 9/14/18 | 25,318 | 26,545 |
| Verizon Communications Inc. | 6.350% | 4/1/19 | 18,550 | 21,035 |
| Verizon Communications Inc. | 2.550% | 6/17/19 | 4,125 | 4,160 |
| Verizon Communications Inc. | 2.625% | 2/21/20 | 23,348 | 23,355 |
| Viacom Inc. | 2.500% | 12/15/16 | 3,500 | 3,540 |
| Viacom Inc. | 3.500% | 4/1/17 | 2,775 | 2,832 |
| Viacom Inc. | 6.125% | 10/5/17 | 4,800 | 5,181 |
| Viacom Inc. | 2.500% | 9/1/18 | 4,655 | 4,616 |
| Viacom Inc. | 2.200% | 4/1/19 | 4,100 | 3,986 |
| Viacom Inc. | 5.625% | 9/15/19 | 2,500 | 2,725 |
| Viacom Inc. | 2.750% | 12/15/19 | 3,100 | 3,045 |
| Vodafone Group plc | 5.625% | 2/27/17 | 5,290 | 5,589 |
| Vodafone Group plc | 1.625% | 3/20/17 | 4,625 | 4,621 |
| Vodafone Group plc | 1.250% | 9/26/17 | 11,265 | 11,148 |
| Vodafone Group plc | 1.500% | 2/19/18 | 5,550 | 5,473 |
| Vodafone Group plc | 4.625% | 7/15/18 | 5,175 | 5,491 |
| Vodafone Group plc | 5.450% | 6/10/19 | 9,620 | 10,537 |
| Walt Disney Co. | 5.625% | 9/15/16 | 5,014 | 5,267 |
| Walt Disney Co. | 1.125% | 2/15/17 | 3,450 | 3,460 |
| Walt Disney Co. | 0.875% | 5/30/17 | 2,550 | 2,539 |
| Walt Disney Co. | 6.000% | 7/17/17 | 4,209 | 4,593 |
| Walt Disney Co. | 1.100% | 12/1/17 | 10,220 | 10,178 |
| Walt Disney Co. | 5.875% | 12/15/17 | 3,700 | 4,072 |
| Walt Disney Co. | 1.850% | 5/30/19 | 3,400 | 3,393 |
| Consumer Cyclical (6.9%) | ||||
| Advance Auto Parts Inc. | 5.750% | 5/1/20 | 2,175 | 2,408 |
| 2 Alibaba Group Holding Ltd. | 1.625% | 11/28/17 | 7,000 | 6,926 |
| 2 Alibaba Group Holding Ltd. | 2.500% | 11/28/19 | 15,850 | 15,550 |
| Amazon.com Inc. | 1.200% | 11/29/17 | 7,300 | 7,254 |
| Amazon.com Inc. | 2.600% | 12/5/19 | 13,800 | 13,962 |
| American Honda Finance Corp. | 1.125% | 10/7/16 | 5,850 | 5,863 |
| American Honda Finance Corp. | 1.200% | 7/14/17 | 3,800 | 3,789 |
| American Honda Finance Corp. | 1.550% | 12/11/17 | 8,300 | 8,319 |
| American Honda Finance Corp. | 1.500% | 3/13/18 | 3,500 | 3,488 |
| American Honda Finance Corp. | 1.600% | 7/13/18 | 9,000 | 8,969 |
| American Honda Finance Corp. | 2.125% | 10/10/18 | 8,150 | 8,194 |
| American Honda Finance Corp. | 2.250% | 8/15/19 | 10,325 | 10,351 |
| AutoNation Inc. | 6.750% | 4/15/18 | 2,325 | 2,572 |
| AutoZone Inc. | 1.300% | 1/13/17 | 4,200 | 4,197 |
| AutoZone Inc. | 7.125% | 8/1/18 | 1,325 | 1,504 |
| Brinker International Inc. | 2.600% | 5/15/18 | 3,016 | 3,016 |
| Carnival Corp. | 1.875% | 12/15/17 | 4,375 | 4,370 |
| CDK Global Inc. | 3.300% | 10/15/19 | 1,500 | 1,501 |
| Costco Wholesale Corp. | 5.500% | 3/15/17 | 7,150 | 7,646 |
| Costco Wholesale Corp. | 1.125% | 12/15/17 | 8,000 | 7,960 |
| Costco Wholesale Corp. | 1.700% | 12/15/19 | 8,050 | 7,942 |
| Costco Wholesale Corp. | 1.750% | 2/15/20 | 4,085 | 4,030 |
| CVS Health Corp. | 1.200% | 12/5/16 | 5,800 | 5,802 |
| CVS Health Corp. | 5.750% | 6/1/17 | 7,778 | 8,341 |
| CVS Health Corp. | 1.900% | 7/20/18 | 19,400 | 19,457 |
| CVS Health Corp. | 2.250% | 12/5/18 | 11,407 | 11,509 |
| CVS Health Corp. | 2.250% | 8/12/19 | 7,000 | 7,022 |
| CVS Health Corp. | 4.750% | 5/18/20 | 2,517 | 2,729 |
| CVS Health Corp. | 2.800% | 7/20/20 | 23,350 | 23,586 |
| Darden Restaurants Inc. | 6.450% | 10/15/17 | 1,230 | 1,356 |
| Dollar General Corp. | 4.125% | 7/15/17 | 4,000 | 4,137 |
| Dollar General Corp. | 1.875% | 4/15/18 | 2,150 | 2,113 |
| eBay Inc. | 1.350% | 7/15/17 | 4,200 | 4,140 |
| eBay Inc. | 2.200% | 8/1/19 | 7,900 | 7,740 |
| Expedia Inc. | 7.456% | 8/15/18 | 4,775 | 5,432 |
16
| Vanguard® Short-Term Corporate Bond Index Fund | ||||
| Schedule of Investments | ||||
| August 31, 2015 | ||||
| Face | Market | |||
| Maturity | Amount | Value | ||
| Coupon | Date | ($000) | ($000) | |
| Expedia Inc. | 5.950% | 8/15/20 | 1,825 | 2,008 |
| Ford Motor Co. | 6.500% | 8/1/18 | 150 | 168 |
| Ford Motor Credit Co. LLC | 8.000% | 12/15/16 | 12,575 | 13,546 |
| Ford Motor Credit Co. LLC | 4.250% | 2/3/17 | 8,315 | 8,598 |
| Ford Motor Credit Co. LLC | 1.461% | 3/27/17 | 2,600 | 2,584 |
| Ford Motor Credit Co. LLC | 3.000% | 6/12/17 | 16,760 | 17,040 |
| Ford Motor Credit Co. LLC | 6.625% | 8/15/17 | 9,812 | 10,611 |
| Ford Motor Credit Co. LLC | 1.724% | 12/6/17 | 8,500 | 8,414 |
| Ford Motor Credit Co. LLC | 2.145% | 1/9/18 | 8,775 | 8,737 |
| Ford Motor Credit Co. LLC | 2.375% | 1/16/18 | 14,521 | 14,505 |
| Ford Motor Credit Co. LLC | 5.000% | 5/15/18 | 18,605 | 19,804 |
| Ford Motor Credit Co. LLC | 2.240% | 6/15/18 | 50 | 50 |
| Ford Motor Credit Co. LLC | 2.875% | 10/1/18 | 8,880 | 8,956 |
| Ford Motor Credit Co. LLC | 2.375% | 3/12/19 | 15,650 | 15,453 |
| Ford Motor Credit Co. LLC | 2.597% | 11/4/19 | 9,150 | 9,009 |
| Ford Motor Credit Co. LLC | 8.125% | 1/15/20 | 9,450 | 11,293 |
| Ford Motor Credit Co. LLC | 2.459% | 3/27/20 | 2,500 | 2,427 |
| Ford Motor Credit Co. LLC | 3.157% | 8/4/20 | 7,100 | 7,101 |
| General Motors Co. | 3.500% | 10/2/18 | 8,985 | 9,120 |
| General Motors Financial Co. Inc. | 2.625% | 7/10/17 | 2,615 | 2,615 |
| General Motors Financial Co. Inc. | 4.750% | 8/15/17 | 4,750 | 4,934 |
| General Motors Financial Co. Inc. | 3.000% | 9/25/17 | 8,785 | 8,818 |
| General Motors Financial Co. Inc. | 3.250% | 5/15/18 | 3,745 | 3,764 |
| General Motors Financial Co. Inc. | 6.750% | 6/1/18 | 11,600 | 12,731 |
| General Motors Financial Co. Inc. | 3.500% | 7/10/19 | 7,000 | 7,052 |
| General Motors Financial Co. Inc. | 3.150% | 1/15/20 | 7,000 | 6,912 |
| General Motors Financial Co. Inc. | 3.200% | 7/13/20 | 11,750 | 11,618 |
| Home Depot Inc. | 2.250% | 9/10/18 | 9,815 | 10,010 |
| Home Depot Inc. | 2.000% | 6/15/19 | 8,780 | 8,797 |
| Johnson Controls Inc. | 2.600% | 12/1/16 | 5,330 | 5,421 |
| Johnson Controls Inc. | 1.400% | 11/2/17 | 1,400 | 1,388 |
| Johnson Controls Inc. | 5.000% | 3/30/20 | 2,850 | 3,088 |
| Lowe's Cos. Inc. | 5.400% | 10/15/16 | 1,000 | 1,049 |
| Lowe's Cos. Inc. | 1.625% | 4/15/17 | 5,875 | 5,927 |
| Lowe's Cos. Inc. | 4.625% | 4/15/20 | 4,125 | 4,513 |
| Macy's Retail Holdings Inc. | 5.900% | 12/1/16 | 4,708 | 4,963 |
| Macy's Retail Holdings Inc. | 7.450% | 7/15/17 | 2,180 | 2,399 |
| Marriott International Inc. | 6.375% | 6/15/17 | 2,180 | 2,357 |
| Marriott International Inc. | 3.000% | 3/1/19 | 3,935 | 4,003 |
| Marriott International Inc. | 3.375% | 10/15/20 | 800 | 821 |
| MasterCard Inc. | 2.000% | 4/1/19 | 5,625 | 5,654 |
| McDonald's Corp. | 5.300% | 3/15/17 | 1,125 | 1,193 |
| McDonald's Corp. | 5.800% | 10/15/17 | 3,520 | 3,825 |
| McDonald's Corp. | 5.350% | 3/1/18 | 8,615 | 9,361 |
| McDonald's Corp. | 5.000% | 2/1/19 | 4,435 | 4,849 |
| McDonald's Corp. | 1.875% | 5/29/19 | 5,534 | 5,498 |
| McDonald's Corp. | 2.200% | 5/26/20 | 250 | 247 |
| McDonald's Corp. | 3.500% | 7/15/20 | 2,425 | 2,547 |
| Nordstrom Inc. | 6.250% | 1/15/18 | 5,667 | 6,248 |
| Nordstrom Inc. | 4.750% | 5/1/20 | 2,775 | 3,055 |
| PACCAR Financial Corp. | 1.600% | 3/15/17 | 3,107 | 3,134 |
| PACCAR Financial Corp. | 1.100% | 6/6/17 | 1,300 | 1,296 |
| PACCAR Financial Corp. | 1.400% | 11/17/17 | 2,400 | 2,401 |
| PACCAR Financial Corp. | 1.450% | 3/9/18 | 3,000 | 2,990 |
| PACCAR Financial Corp. | 1.400% | 5/18/18 | 3,000 | 2,983 |
| PACCAR Financial Corp. | 1.750% | 8/14/18 | 1,750 | 1,752 |
| PACCAR Financial Corp. | 2.200% | 9/15/19 | 1,850 | 1,853 |
| PACCAR Financial Corp. | 2.500% | 8/14/20 | 2,500 | 2,509 |
| QVC Inc. | 3.125% | 4/1/19 | 2,250 | 2,221 |
| Ralph Lauren Corp. | 2.125% | 9/26/18 | 1,475 | 1,489 |
| Ralph Lauren Corp. | 2.625% | 8/18/20 | 2,000 | 1,998 |
| Staples Inc. | 2.750% | 1/12/18 | 2,925 | 2,947 |
| Starbucks Corp. | 0.875% | 12/5/16 | 5,360 | 5,359 |
| Starbucks Corp. | 2.000% | 12/5/18 | 3,525 | 3,578 |
17
| Vanguard® Short-Term Corporate Bond Index Fund | ||||
| Schedule of Investments | ||||
| August 31, 2015 | ||||
| Face | Market | |||
| Maturity | Amount | Value | ||
| Coupon | Date | ($000) | ($000) | |
| Starwood Hotels & Resorts Worldwide Inc. | 6.750% | 5/15/18 | 1,300 | 1,440 |
| Target Corp. | 5.375% | 5/1/17 | 2,928 | 3,135 |
| Target Corp. | 6.000% | 1/15/18 | 7,250 | 7,987 |
| Target Corp. | 2.300% | 6/26/19 | 9,175 | 9,293 |
| Target Corp. | 3.875% | 7/15/20 | 8,225 | 8,862 |
| TJX Cos. Inc. | 6.950% | 4/15/19 | 4,775 | 5,556 |
| Toyota Motor Credit Corp. | 2.000% | 9/15/16 | 9,259 | 9,373 |
| Toyota Motor Credit Corp. | 2.050% | 1/12/17 | 6,775 | 6,869 |
| Toyota Motor Credit Corp. | 1.125% | 5/16/17 | 6,575 | 6,579 |
| Toyota Motor Credit Corp. | 1.750% | 5/22/17 | 8,925 | 9,004 |
| Toyota Motor Credit Corp. | 1.250% | 10/5/17 | 9,900 | 9,878 |
| Toyota Motor Credit Corp. | 1.375% | 1/10/18 | 5,544 | 5,533 |
| Toyota Motor Credit Corp. | 1.450% | 1/12/18 | 8,850 | 8,833 |
| Toyota Motor Credit Corp. | 1.550% | 7/13/18 | 9,000 | 8,959 |
| Toyota Motor Credit Corp. | 2.000% | 10/24/18 | 7,980 | 8,001 |
| Toyota Motor Credit Corp. | 2.100% | 1/17/19 | 13,154 | 13,221 |
| Toyota Motor Credit Corp. | 2.125% | 7/18/19 | 6,600 | 6,596 |
| Toyota Motor Credit Corp. | 2.150% | 3/12/20 | 14,000 | 13,909 |
| Toyota Motor Credit Corp. | 4.500% | 6/17/20 | 1,750 | 1,913 |
| Wal-Mart Stores Inc. | 5.375% | 4/5/17 | 7,225 | 7,733 |
| Wal-Mart Stores Inc. | 5.800% | 2/15/18 | 11,953 | 13,239 |
| Wal-Mart Stores Inc. | 1.125% | 4/11/18 | 14,030 | 13,955 |
| Wal-Mart Stores Inc. | 1.950% | 12/15/18 | 10,645 | 10,762 |
| Wal-Mart Stores Inc. | 4.125% | 2/1/19 | 250 | 270 |
| Wal-Mart Stores Inc. | 3.625% | 7/8/20 | 9,233 | 9,844 |
| Walgreen Co. | 5.250% | 1/15/19 | 1,352 | 1,492 |
| Walgreens Boots Alliance Inc. | 1.750% | 11/17/17 | 6,800 | 6,809 |
| Walgreens Boots Alliance Inc. | 2.700% | 11/18/19 | 10,261 | 10,262 |
| Western Union Co. | 5.930% | 10/1/16 | 7,254 | 7,584 |
| Western Union Co. | 2.875% | 12/10/17 | 1,965 | 2,004 |
| Western Union Co. | 3.650% | 8/22/18 | 4,115 | 4,272 |
| Western Union Co. | 5.253% | 4/1/20 | 2,175 | 2,372 |
| Wyndham Worldwide Corp. | 6.000% | 12/1/16 | 1,688 | 1,773 |
| Wyndham Worldwide Corp. | 2.950% | 3/1/17 | 2,700 | 2,727 |
| Wyndham Worldwide Corp. | 2.500% | 3/1/18 | 2,576 | 2,565 |
| Yum! Brands Inc. | 6.250% | 3/15/18 | 868 | 955 |
| Yum! Brands Inc. | 5.300% | 9/15/19 | 900 | 991 |
| Consumer Noncyclical (13.2%) | ||||
| Abbott Laboratories | 5.125% | 4/1/19 | 2,440 | 2,684 |
| Abbott Laboratories | 2.000% | 3/15/20 | 10,100 | 10,036 |
| Abbott Laboratories | 4.125% | 5/27/20 | 4,065 | 4,406 |
| AbbVie Inc. | 1.750% | 11/6/17 | 26,630 | 26,604 |
| AbbVie Inc. | 1.800% | 5/14/18 | 25,250 | 25,095 |
| AbbVie Inc. | 2.000% | 11/6/18 | 8,575 | 8,548 |
| AbbVie Inc. | 2.500% | 5/14/20 | 24,929 | 24,669 |
| Actavis Funding SCS | 1.850% | 3/1/17 | 8,000 | 8,008 |
| Actavis Funding SCS | 1.300% | 6/15/17 | 4,800 | 4,758 |
| Actavis Funding SCS | 2.350% | 3/12/18 | 20,200 | 20,198 |
| Actavis Funding SCS | 2.450% | 6/15/19 | 7,187 | 7,144 |
| Actavis Funding SCS | 3.000% | 3/12/20 | 23,050 | 22,811 |
| Actavis Inc. | 1.875% | 10/1/17 | 10,349 | 10,309 |
| Actavis Inc. | 6.125% | 8/15/19 | 750 | 845 |
| Agilent Technologies Inc. | 5.000% | 7/15/20 | 3,125 | 3,417 |
| Allergan Inc. | 1.350% | 3/15/18 | 2,025 | 1,992 |
| Altria Group Inc. | 9.700% | 11/10/18 | 2,015 | 2,481 |
| Altria Group Inc. | 9.250% | 8/6/19 | 6,768 | 8,400 |
| Altria Group Inc. | 2.625% | 1/14/20 | 14,500 | 14,486 |
| AmerisourceBergen Corp. | 1.150% | 5/15/17 | 5,775 | 5,736 |
| AmerisourceBergen Corp. | 4.875% | 11/15/19 | 2,650 | 2,923 |
| Amgen Inc. | 2.500% | 11/15/16 | 6,713 | 6,810 |
| Amgen Inc. | 2.125% | 5/15/17 | 10,119 | 10,227 |
| Amgen Inc. | 1.250% | 5/22/17 | 6,825 | 6,805 |
| Amgen Inc. | 5.850% | 6/1/17 | 6,462 | 6,941 |
18
| Vanguard® Short-Term Corporate Bond Index Fund | ||||
| Schedule of Investments | ||||
| August 31, 2015 | ||||
| Face | Market | |||
| Maturity | Amount | Value | ||
| Coupon | Date | ($000) | ($000) | |
| Amgen Inc. | 6.150% | 6/1/18 | 3,845 | 4,299 |
| Amgen Inc. | 5.700% | 2/1/19 | 3,186 | 3,561 |
| Amgen Inc. | 2.200% | 5/22/19 | 15,945 | 15,822 |
| Amgen Inc. | 4.500% | 3/15/20 | 1,450 | 1,574 |
| Amgen Inc. | 2.125% | 5/1/20 | 7,215 | 7,035 |
| Anheuser-Busch Cos. LLC | 5.600% | 3/1/17 | 1,486 | 1,586 |
| Anheuser-Busch Cos. LLC | 5.500% | 1/15/18 | 6,667 | 7,291 |
| Anheuser-Busch Cos. LLC | 5.000% | 3/1/19 | 1,631 | 1,790 |
| Anheuser-Busch InBev Finance Inc. | 1.125% | 1/27/17 | 1,504 | 1,507 |
| Anheuser-Busch InBev Finance Inc. | 1.250% | 1/17/18 | 11,775 | 11,703 |
| Anheuser-Busch InBev Finance Inc. | 2.150% | 2/1/19 | 10,600 | 10,649 |
| Anheuser-Busch InBev Worldwide Inc. | 1.375% | 7/15/17 | 22,175 | 22,232 |
| Anheuser-Busch InBev Worldwide Inc. | 7.750% | 1/15/19 | 18,235 | 21,476 |
| Anheuser-Busch InBev Worldwide Inc. | 6.875% | 11/15/19 | 8,572 | 10,164 |
| Anheuser-Busch InBev Worldwide Inc. | 5.375% | 1/15/20 | 12,900 | 14,443 |
| Anheuser-Busch InBev Worldwide Inc. | 5.000% | 4/15/20 | 3,000 | 3,343 |
| Archer-Daniels-Midland Co. | 5.450% | 3/15/18 | 4,775 | 5,247 |
| AstraZeneca plc | 5.900% | 9/15/17 | 11,050 | 12,042 |
| AstraZeneca plc | 1.950% | 9/18/19 | 7,692 | 7,642 |
| 2 Baxalta Inc. | 2.000% | 6/22/18 | 2,400 | 2,393 |
| 2 Baxalta Inc. | 2.875% | 6/23/20 | 7,300 | 7,237 |
| Baxter International Inc. | 5.900% | 9/1/16 | 1 | 1 |
| Baxter International Inc. | 1.850% | 1/15/17 | 3,400 | 3,416 |
| Baxter International Inc. | 5.375% | 6/1/18 | 2,725 | 2,975 |
| Baxter International Inc. | 1.850% | 6/15/18 | 8,300 | 8,232 |
| Baxter International Inc. | 4.500% | 8/15/19 | 2,410 | 2,589 |
| Baxter International Inc. | 4.250% | 3/15/20 | 3,775 | 3,990 |
| Beam Suntory Inc. | 1.875% | 5/15/17 | 1,125 | 1,132 |
| Beam Suntory Inc. | 1.750% | 6/15/18 | 2,725 | 2,706 |
| Becton Dickinson & Co. | 1.750% | 11/8/16 | 2,875 | 2,886 |
| Becton Dickinson & Co. | 1.450% | 5/15/17 | 4,900 | 4,876 |
| Becton Dickinson & Co. | 1.800% | 12/15/17 | 11,105 | 11,094 |
| Becton Dickinson & Co. | 5.000% | 5/15/19 | 2,850 | 3,091 |
| Becton Dickinson & Co. | 6.375% | 8/1/19 | 3,250 | 3,711 |
| Becton Dickinson & Co. | 2.675% | 12/15/19 | 9,050 | 9,067 |
| Biogen Inc. | 6.875% | 3/1/18 | 4,720 | 5,294 |
| Boston Scientific Corp. | 5.125% | 1/12/17 | 1,650 | 1,726 |
| Boston Scientific Corp. | 2.650% | 10/1/18 | 8,200 | 8,255 |
| Boston Scientific Corp. | 6.000% | 1/15/20 | 5,450 | 6,093 |
| Boston Scientific Corp. | 2.850% | 5/15/20 | 2,650 | 2,633 |
| Bottling Group LLC | 5.125% | 1/15/19 | 8,535 | 9,411 |
| Bristol-Myers Squibb Co. | 0.875% | 8/1/17 | 5,800 | 5,752 |
| Bristol-Myers Squibb Co. | 1.750% | 3/1/19 | 3,150 | 3,135 |
| Brown-Forman Corp. | 1.000% | 1/15/18 | 2,150 | 2,096 |
| Bunge Ltd. Finance Corp. | 3.200% | 6/15/17 | 5,165 | 5,268 |
| Bunge Ltd. Finance Corp. | 8.500% | 6/15/19 | 5,100 | 6,103 |
| Campbell Soup Co. | 3.050% | 7/15/17 | 2,645 | 2,727 |
| Campbell Soup Co. | 4.500% | 2/15/19 | 1,110 | 1,192 |
| Cardinal Health Inc. | 1.900% | 6/15/17 | 3,900 | 3,920 |
| Cardinal Health Inc. | 1.700% | 3/15/18 | 6,160 | 6,120 |
| Cardinal Health Inc. | 1.950% | 6/15/18 | 1,975 | 1,972 |
| Catholic Health Initiatives Colorado GO | 1.600% | 11/1/17 | 1,200 | 1,197 |
| Celgene Corp. | 1.900% | 8/15/17 | 3,700 | 3,719 |
| Celgene Corp. | 2.125% | 8/15/18 | 5,000 | 5,000 |
| Celgene Corp. | 2.300% | 8/15/18 | 3,175 | 3,185 |
| Celgene Corp. | 2.250% | 5/15/19 | 4,350 | 4,363 |
| Celgene Corp. | 2.875% | 8/15/20 | 4,925 | 4,933 |
| Celgene Corp. | 3.950% | 10/15/20 | 5,000 | 5,246 |
| Church & Dwight Co. Inc. | 2.450% | 12/15/19 | 3,375 | 3,400 |
| Clorox Co. | 5.950% | 10/15/17 | 3,406 | 3,707 |
| Coca-Cola Co. | 1.800% | 9/1/16 | 4,725 | 4,776 |
| Coca-Cola Co. | 0.750% | 11/1/16 | 450 | 450 |
| Coca-Cola Co. | 1.650% | 3/14/18 | 3,541 | 3,570 |
| Coca-Cola Co. | 1.150% | 4/1/18 | 14,413 | 14,332 |
19
| Vanguard® Short-Term Corporate Bond Index Fund | ||||
| Schedule of Investments | ||||
| August 31, 2015 | ||||
| Face | Market | |||
| Maturity | Amount | Value | ||
| Coupon | Date | ($000) | ($000) | |
| Coca-Cola Co. | 1.650% | 11/1/18 | 14,745 | 14,811 |
| Coca-Cola Enterprises Inc. | 3.500% | 9/15/20 | 900 | 937 |
| Coca-Cola Femsa SAB de CV | 2.375% | 11/26/18 | 9,100 | 9,190 |
| Coca-Cola Femsa SAB de CV | 4.625% | 2/15/20 | 2,175 | 2,354 |
| Colgate-Palmolive Co. | 1.300% | 1/15/17 | 3,106 | 3,128 |
| Colgate-Palmolive Co. | 2.625% | 5/1/17 | 625 | 643 |
| Colgate-Palmolive Co. | 0.900% | 5/1/18 | 2,950 | 2,935 |
| Colgate-Palmolive Co. | 1.500% | 11/1/18 | 1,925 | 1,922 |
| Colgate-Palmolive Co. | 1.750% | 3/15/19 | 6,844 | 6,859 |
| ConAgra Foods Inc. | 5.819% | 6/15/17 | 1,526 | 1,634 |
| ConAgra Foods Inc. | 1.900% | 1/25/18 | 15,900 | 15,788 |
| Covidien International Finance SA | 6.000% | 10/15/17 | 12,175 | 13,282 |
| Covidien International Finance SA | 4.200% | 6/15/20 | 325 | 350 |
| CR Bard Inc. | 1.375% | 1/15/18 | 3,675 | 3,633 |
| Diageo Capital plc | 5.500% | 9/30/16 | 3,371 | 3,531 |
| Diageo Capital plc | 1.500% | 5/11/17 | 9,198 | 9,217 |
| Diageo Capital plc | 5.750% | 10/23/17 | 7,390 | 8,019 |
| Diageo Capital plc | 1.125% | 4/29/18 | 4,863 | 4,794 |
| Diageo Capital plc | 4.828% | 7/15/20 | 4,210 | 4,659 |
| Dignity Health California GO | 2.637% | 11/1/19 | 1,700 | 1,730 |
| Dr Pepper Snapple Group Inc. | 6.820% | 5/1/18 | 6,670 | 7,528 |
| Dr Pepper Snapple Group Inc. | 2.600% | 1/15/19 | 1,750 | 1,765 |
| Dr Pepper Snapple Group Inc. | 2.000% | 1/15/20 | 500 | 487 |
| Edwards Lifesciences Corp. | 2.875% | 10/15/18 | 3,950 | 4,009 |
| Eli Lilly & Co. | 5.200% | 3/15/17 | 5,170 | 5,488 |
| Eli Lilly & Co. | 1.250% | 3/1/18 | 4,800 | 4,797 |
| Eli Lilly & Co. | 1.950% | 3/15/19 | 5,025 | 5,048 |
| Express Scripts Holding Co. | 2.650% | 2/15/17 | 12,358 | 12,521 |
| Express Scripts Holding Co. | 2.250% | 6/15/19 | 4,300 | 4,254 |
| Express Scripts Holding Co. | 7.250% | 6/15/19 | 6,140 | 7,177 |
| General Mills Inc. | 5.700% | 2/15/17 | 8,955 | 9,510 |
| General Mills Inc. | 1.400% | 10/20/17 | 1,800 | 1,793 |
| General Mills Inc. | 5.650% | 2/15/19 | 8,215 | 9,120 |
| General Mills Inc. | 2.200% | 10/21/19 | 4,900 | 4,883 |
| Gilead Sciences Inc. | 3.050% | 12/1/16 | 6,490 | 6,646 |
| Gilead Sciences Inc. | 2.050% | 4/1/19 | 5,982 | 5,982 |
| Gilead Sciences Inc. | 2.350% | 2/1/20 | 3,150 | 3,158 |
| GlaxoSmithKline Capital Inc. | 5.650% | 5/15/18 | 17,920 | 19,808 |
| GlaxoSmithKline Capital plc | 1.500% | 5/8/17 | 16,026 | 16,098 |
| Hasbro Inc. | 6.300% | 9/15/17 | 1,975 | 2,149 |
| Hershey Co. | 5.450% | 9/1/16 | 1,400 | 1,465 |
| Hershey Co. | 1.500% | 11/1/16 | 4,350 | 4,378 |
| Hershey Co. | 1.600% | 8/21/18 | 2,000 | 2,003 |
| 2 JM Smucker Co. | 1.750% | 3/15/18 | 2,500 | 2,499 |
| 2 JM Smucker Co. | 2.500% | 3/15/20 | 5,000 | 4,981 |
| Johnson & Johnson | 5.550% | 8/15/17 | 6,400 | 6,948 |
| Johnson & Johnson | 1.125% | 11/21/17 | 3,000 | 3,003 |
| Johnson & Johnson | 5.150% | 7/15/18 | 8,502 | 9,386 |
| Johnson & Johnson | 1.650% | 12/5/18 | 6,150 | 6,202 |
| Johnson & Johnson | 1.875% | 12/5/19 | 7,025 | 7,073 |
| Kellogg Co. | 1.875% | 11/17/16 | 5,100 | 5,138 |
| Kellogg Co. | 1.750% | 5/17/17 | 2,775 | 2,784 |
| Kellogg Co. | 3.250% | 5/21/18 | 450 | 467 |
| Kellogg Co. | 4.150% | 11/15/19 | 3,225 | 3,437 |
| Kimberly-Clark Corp. | 6.125% | 8/1/17 | 9,671 | 10,563 |
| Kimberly-Clark Corp. | 6.250% | 7/15/18 | 1,478 | 1,668 |
| Kimberly-Clark Corp. | 7.500% | 11/1/18 | 3,375 | 3,978 |
| Kimberly-Clark Corp. | 1.900% | 5/22/19 | 1,000 | 1,001 |
| Kimberly-Clark Corp. | 1.850% | 3/1/20 | 525 | 519 |
| Kimberly-Clark Corp. | 3.625% | 8/1/20 | 1,300 | 1,382 |
| Kimberly-Clark Corp. | 2.150% | 8/15/20 | 1,825 | 1,818 |
| Koninklijke Philips NV | 5.750% | 3/11/18 | 8,850 | 9,627 |
| Kraft Foods Group Inc. | 2.250% | 6/5/17 | 8,099 | 8,179 |
| Kraft Foods Group Inc. | 6.125% | 8/23/18 | 7,025 | 7,798 |
20
| Vanguard® Short-Term Corporate Bond Index Fund | ||||
| Schedule of Investments | ||||
| August 31, 2015 | ||||
| Face | Market | |||
| Maturity | Amount | Value | ||
| Coupon | Date | ($000) | ($000) | |
| Kraft Foods Group Inc. | 5.375% | 2/10/20 | 6,454 | 7,140 |
| 2 Kraft Heinz Foods Co. | 1.600% | 6/30/17 | 7,500 | 7,490 |
| 2 Kraft Heinz Foods Co. | 2.000% | 7/2/18 | 9,725 | 9,705 |
| 2 Kraft Heinz Foods Co. | 2.800% | 7/2/20 | 11,555 | 11,540 |
| Kroger Co. | 1.200% | 10/17/16 | 210 | 210 |
| Kroger Co. | 2.200% | 1/15/17 | 4,240 | 4,281 |
| Kroger Co. | 6.400% | 8/15/17 | 6,906 | 7,513 |
| Kroger Co. | 6.800% | 12/15/18 | 425 | 486 |
| Kroger Co. | 2.300% | 1/15/19 | 7,525 | 7,506 |
| Kroger Co. | 6.150% | 1/15/20 | 3,625 | 4,124 |
| Laboratory Corp. of America Holdings | 2.200% | 8/23/17 | 5,300 | 5,324 |
| Laboratory Corp. of America Holdings | 2.625% | 2/1/20 | 4,400 | 4,389 |
| Life Technologies Corp. | 6.000% | 3/1/20 | 4,375 | 4,908 |
| Mattel Inc. | 2.500% | 11/1/16 | 1,655 | 1,674 |
| Mattel Inc. | 2.350% | 5/6/19 | 1,875 | 1,863 |
| McKesson Corp. | 5.700% | 3/1/17 | 2,060 | 2,190 |
| McKesson Corp. | 1.292% | 3/10/17 | 5,000 | 4,977 |
| McKesson Corp. | 1.400% | 3/15/18 | 3,550 | 3,499 |
| McKesson Corp. | 7.500% | 2/15/19 | 3,200 | 3,725 |
| McKesson Corp. | 2.284% | 3/15/19 | 8,750 | 8,764 |
| Mead Johnson Nutrition Co. | 4.900% | 11/1/19 | 4,475 | 4,871 |
| Medco Health Solutions Inc. | 7.125% | 3/15/18 | 10,545 | 11,814 |
| 2 Medtronic Inc. | 1.500% | 3/15/18 | 2,400 | 2,390 |
| Medtronic Inc. | 1.375% | 4/1/18 | 12,400 | 12,319 |
| Medtronic Inc. | 5.600% | 3/15/19 | 3,727 | 4,179 |
| 2 Medtronic Inc. | 2.500% | 3/15/20 | 22,963 | 23,014 |
| Medtronic Inc. | 4.450% | 3/15/20 | 7,757 | 8,451 |
| Merck & Co. Inc. | 1.100% | 1/31/18 | 8,726 | 8,706 |
| Merck & Co. Inc. | 1.300% | 5/18/18 | 8,790 | 8,747 |
| Merck & Co. Inc. | 1.850% | 2/10/20 | 4,925 | 4,894 |
| Merck Sharp & Dohme Corp. | 5.000% | 6/30/19 | 9,725 | 10,776 |
| Molson Coors Brewing Co. | 2.000% | 5/1/17 | 1,100 | 1,108 |
| Mondelez International Inc. | 6.500% | 8/11/17 | 4,557 | 4,984 |
| Mondelez International Inc. | 6.125% | 2/1/18 | 9,075 | 10,046 |
| Mondelez International Inc. | 6.125% | 8/23/18 | 500 | 560 |
| Mondelez International Inc. | 2.250% | 2/1/19 | 5,560 | 5,551 |
| Mondelez International Inc. | 5.375% | 2/10/20 | 3,351 | 3,703 |
| Mylan Inc. | 1.350% | 11/29/16 | 2,480 | 2,458 |
| Mylan Inc. | 2.600% | 6/24/18 | 2,742 | 2,737 |
| Mylan Inc. | 2.550% | 3/28/19 | 8,029 | 7,868 |
| Newell Rubbermaid Inc. | 2.050% | 12/1/17 | 6,950 | 6,957 |
| Newell Rubbermaid Inc. | 2.875% | 12/1/19 | 5,200 | 5,195 |
| Novant Health Inc. | 5.850% | 11/1/19 | 1,300 | 1,482 |
| Novartis Capital Corp. | 4.400% | 4/24/20 | 5,675 | 6,243 |
| Novartis Securities Investment Ltd. | 5.125% | 2/10/19 | 23,070 | 25,589 |
| PepsiAmericas Inc. | 5.000% | 5/15/17 | 750 | 799 |
| PepsiCo Inc. | 0.950% | 2/22/17 | 1,300 | 1,299 |
| PepsiCo Inc. | 1.125% | 7/17/17 | 4,500 | 4,494 |
| PepsiCo Inc. | 1.250% | 8/13/17 | 9,917 | 9,929 |
| PepsiCo Inc. | 1.250% | 4/30/18 | 4,700 | 4,675 |
| PepsiCo Inc. | 5.000% | 6/1/18 | 13,006 | 14,194 |
| PepsiCo Inc. | 7.900% | 11/1/18 | 10,664 | 12,627 |
| PepsiCo Inc. | 2.250% | 1/7/19 | 3,425 | 3,468 |
| PepsiCo Inc. | 4.500% | 1/15/20 | 7,225 | 7,920 |
| PepsiCo Inc. | 1.850% | 4/30/20 | 6,625 | 6,483 |
| Perrigo Co. plc | 2.300% | 11/8/18 | 8,125 | 8,106 |
| Pfizer Inc. | 0.900% | 1/15/17 | 3,850 | 3,851 |
| Pfizer Inc. | 1.100% | 5/15/17 | 6,872 | 6,877 |
| Pfizer Inc. | 1.500% | 6/15/18 | 11,697 | 11,664 |
| Pfizer Inc. | 6.200% | 3/15/19 | 19,182 | 21,855 |
| Pfizer Inc. | 2.100% | 5/15/19 | 14,775 | 14,849 |
| Pharmacia Corp. | 6.500% | 12/1/18 | 1,340 | 1,538 |
| Philip Morris International Inc. | 1.625% | 3/20/17 | 5,500 | 5,539 |
| Philip Morris International Inc. | 1.250% | 8/11/17 | 2,400 | 2,398 |
21
| Vanguard® Short-Term Corporate Bond Index Fund | ||||
| Schedule of Investments | ||||
| August 31, 2015 | ||||
| Face | Market | |||
| Maturity | Amount | Value | ||
| Coupon | Date | ($000) | ($000) | |
| Philip Morris International Inc. | 1.125% | 8/21/17 | 8,664 | 8,635 |
| Philip Morris International Inc. | 1.250% | 11/9/17 | 600 | 597 |
| Philip Morris International Inc. | 5.650% | 5/16/18 | 13,545 | 14,924 |
| Philip Morris International Inc. | 1.875% | 1/15/19 | 11,525 | 11,490 |
| Philip Morris International Inc. | 4.500% | 3/26/20 | 2,700 | 2,939 |
| Procter & Gamble Co. | 1.600% | 11/15/18 | 4,050 | 4,085 |
| Procter & Gamble Co. | 4.700% | 2/15/19 | 11,885 | 13,076 |
| Procter & Gamble Co. | 1.900% | 11/1/19 | 5,700 | 5,725 |
| Quest Diagnostics Inc. | 2.700% | 4/1/19 | 2,200 | 2,226 |
| Quest Diagnostics Inc. | 4.750% | 1/30/20 | 3,375 | 3,687 |
| Quest Diagnostics Inc. | 2.500% | 3/30/20 | 2,600 | 2,578 |
| 2 Reynolds American Inc. | 3.500% | 8/4/16 | 5,579 | 5,679 |
| Reynolds American Inc. | 6.750% | 6/15/17 | 4,850 | 5,248 |
| 2 Reynolds American Inc. | 2.300% | 8/21/17 | 2,515 | 2,533 |
| Reynolds American Inc. | 7.750% | 6/1/18 | 1,350 | 1,545 |
| Reynolds American Inc. | 2.300% | 6/12/18 | 6,675 | 6,712 |
| 2 Reynolds American Inc. | 8.125% | 6/23/19 | 3,842 | 4,529 |
| 2 Reynolds American Inc. | 6.875% | 5/1/20 | 5,300 | 6,118 |
| Reynolds American Inc. | 3.250% | 6/12/20 | 12,265 | 12,423 |
| Sanofi | 1.250% | 4/10/18 | 10,414 | 10,326 |
| Stryker Corp. | 2.000% | 9/30/16 | 2,077 | 2,096 |
| Stryker Corp. | 1.300% | 4/1/18 | 4,350 | 4,316 |
| Stryker Corp. | 4.375% | 1/15/20 | 3,700 | 4,043 |
| Sysco Corp. | 5.250% | 2/12/18 | 4,373 | 4,760 |
| Sysco Corp. | 5.375% | 3/17/19 | 150 | 168 |
| Teva Pharmaceutical Finance Co. BV | 2.400% | 11/10/16 | 5,993 | 6,058 |
| Teva Pharmaceutical Finance IV LLC | 2.250% | 3/18/20 | 6,100 | 5,907 |
| Thermo Fisher Scientific Inc. | 1.300% | 2/1/17 | 5,474 | 5,444 |
| Thermo Fisher Scientific Inc. | 1.850% | 1/15/18 | 4,762 | 4,753 |
| Thermo Fisher Scientific Inc. | 2.400% | 2/1/19 | 6,820 | 6,814 |
| Thermo Fisher Scientific Inc. | 4.700% | 5/1/20 | 275 | 299 |
| Tyson Foods Inc. | 2.650% | 8/15/19 | 11,000 | 10,976 |
| Unilever Capital Corp. | 0.850% | 8/2/17 | 3,575 | 3,558 |
| Unilever Capital Corp. | 4.800% | 2/15/19 | 5,375 | 5,878 |
| Unilever Capital Corp. | 2.200% | 3/6/19 | 5,220 | 5,277 |
| Unilever Capital Corp. | 2.100% | 7/30/20 | 4,525 | 4,493 |
| Whirlpool Corp. | 1.350% | 3/1/17 | 2,150 | 2,151 |
| Whirlpool Corp. | 1.650% | 11/1/17 | 200 | 200 |
| Whirlpool Corp. | 2.400% | 3/1/19 | 7,595 | 7,618 |
| Wyeth LLC | 5.450% | 4/1/17 | 3,945 | 4,219 |
| Zimmer Biomet Holdings Inc. | 1.450% | 4/1/17 | 5,000 | 4,994 |
| Zimmer Biomet Holdings Inc. | 2.000% | 4/1/18 | 7,125 | 7,092 |
| Zimmer Biomet Holdings Inc. | 4.625% | 11/30/19 | 3,925 | 4,244 |
| Zimmer Biomet Holdings Inc. | 2.700% | 4/1/20 | 8,960 | 8,865 |
| Zoetis Inc. | 1.875% | 2/1/18 | 3,025 | 3,008 |
| Energy (8.7%) | ||||
| Anadarko Petroleum Corp. | 5.950% | 9/15/16 | 15,425 | 16,096 |
| Anadarko Petroleum Corp. | 6.375% | 9/15/17 | 14,475 | 15,663 |
| Anadarko Petroleum Corp. | 8.700% | 3/15/19 | 4,495 | 5,323 |
| Anadarko Petroleum Corp. | 6.950% | 6/15/19 | 750 | 850 |
| Apache Corp. | 5.625% | 1/15/17 | 4,100 | 4,367 |
| Apache Corp. | 1.750% | 4/15/17 | 4,763 | 4,799 |
| Apache Corp. | 6.900% | 9/15/18 | 1,775 | 2,002 |
| Baker Hughes Inc. | 7.500% | 11/15/18 | 5,625 | 6,493 |
| Boardwalk Pipelines LP | 5.500% | 2/1/17 | 2,200 | 2,271 |
| Boardwalk Pipelines LP | 5.750% | 9/15/19 | 3,105 | 3,256 |
| BP Capital Markets plc | 2.248% | 11/1/16 | 5,285 | 5,354 |
| BP Capital Markets plc | 1.846% | 5/5/17 | 12,457 | 12,553 |
| BP Capital Markets plc | 1.375% | 11/6/17 | 7,900 | 7,869 |
| BP Capital Markets plc | 1.674% | 2/13/18 | 7,650 | 7,666 |
| BP Capital Markets plc | 1.375% | 5/10/18 | 11,730 | 11,605 |
| BP Capital Markets plc | 2.241% | 9/26/18 | 9,200 | 9,274 |
| BP Capital Markets plc | 4.750% | 3/10/19 | 6,465 | 7,043 |
22
| Vanguard® Short-Term Corporate Bond Index Fund | ||||
| Schedule of Investments | ||||
| August 31, 2015 | ||||
| Face | Market | |||
| Maturity | Amount | Value | ||
| Coupon | Date | ($000) | ($000) | |
| BP Capital Markets plc | 2.237% | 5/10/19 | 10,475 | 10,491 |
| BP Capital Markets plc | 2.521% | 1/15/20 | 6,325 | 6,356 |
| BP Capital Markets plc | 2.315% | 2/13/20 | 6,750 | 6,740 |
| Buckeye Partners LP | 6.050% | 1/15/18 | 2,525 | 2,661 |
| Buckeye Partners LP | 2.650% | 11/15/18 | 3,078 | 2,976 |
| Cameron International Corp. | 1.150% | 12/15/16 | 2,100 | 2,088 |
| Cameron International Corp. | 6.375% | 7/15/18 | 6,800 | 7,504 |
| Canadian Natural Resources Ltd. | 5.700% | 5/15/17 | 8,314 | 8,784 |
| Canadian Natural Resources Ltd. | 1.750% | 1/15/18 | 5,425 | 5,308 |
| Canadian Natural Resources Ltd. | 5.900% | 2/1/18 | 1,775 | 1,912 |
| Cenovus Energy Inc. | 5.700% | 10/15/19 | 8,350 | 9,133 |
| CenterPoint Energy Resources Corp. | 6.125% | 11/1/17 | 900 | 987 |
| CenterPoint Energy Resources Corp. | 6.000% | 5/15/18 | 900 | 1,000 |
| Chevron Corp. | 1.345% | 11/15/17 | 8,750 | 8,735 |
| Chevron Corp. | 1.104% | 12/5/17 | 9,385 | 9,320 |
| Chevron Corp. | 1.365% | 3/2/18 | 13,800 | 13,733 |
| Chevron Corp. | 1.718% | 6/24/18 | 19,675 | 19,736 |
| Chevron Corp. | 4.950% | 3/3/19 | 10,121 | 11,115 |
| Chevron Corp. | 2.193% | 11/15/19 | 4,275 | 4,296 |
| Chevron Corp. | 1.961% | 3/3/20 | 11,025 | 10,890 |
| Chevron Corp. | 2.427% | 6/24/20 | 5,525 | 5,542 |
| 2 Columbia Pipeline Group Inc. | 2.450% | 6/1/18 | 3,200 | 3,200 |
| 2 Columbia Pipeline Group Inc. | 3.300% | 6/1/20 | 4,800 | 4,787 |
| ConocoPhillips | 5.200% | 5/15/18 | 3,340 | 3,638 |
| ConocoPhillips | 6.650% | 7/15/18 | 2,489 | 2,817 |
| ConocoPhillips | 5.750% | 2/1/19 | 11,194 | 12,521 |
| ConocoPhillips | 6.000% | 1/15/20 | 7,206 | 8,266 |
| ConocoPhillips Canada Funding Co. I | 5.625% | 10/15/16 | 9,550 | 10,030 |
| ConocoPhillips Co. | 1.050% | 12/15/17 | 9,500 | 9,397 |
| ConocoPhillips Co. | 1.500% | 5/15/18 | 2,500 | 2,483 |
| ConocoPhillips Co. | 2.200% | 5/15/20 | 6,350 | 6,286 |
| Devon Energy Corp. | 2.250% | 12/15/18 | 5,425 | 5,411 |
| Devon Energy Corp. | 6.300% | 1/15/19 | 4,465 | 4,994 |
| Diamond Offshore Drilling Inc. | 5.875% | 5/1/19 | 3,575 | 3,885 |
| Dominion Gas Holdings LLC | 1.050% | 11/1/16 | 200 | 200 |
| Dominion Gas Holdings LLC | 2.500% | 12/15/19 | 8,500 | 8,561 |
| El Paso Natural Gas Co. LLC | 5.950% | 4/15/17 | 4,050 | 4,297 |
| 2 Enable Midstream Partners LP | 2.400% | 5/15/19 | 3,700 | 3,485 |
| Enbridge Energy Partners LP | 5.875% | 12/15/16 | 3,139 | 3,303 |
| Enbridge Energy Partners LP | 6.500% | 4/15/18 | 2,551 | 2,770 |
| Enbridge Energy Partners LP | 9.875% | 3/1/19 | 1,825 | 2,201 |
| Enbridge Energy Partners LP | 5.200% | 3/15/20 | 6,250 | 6,680 |
| Enbridge Inc. | 5.600% | 4/1/17 | 1,153 | 1,222 |
| Encana Corp. | 6.500% | 5/15/19 | 3,820 | 4,325 |
| Energy Transfer Partners LP | 6.125% | 2/15/17 | 5,850 | 6,153 |
| Energy Transfer Partners LP | 2.500% | 6/15/18 | 4,200 | 4,170 |
| Energy Transfer Partners LP | 6.700% | 7/1/18 | 9,275 | 10,152 |
| Energy Transfer Partners LP | 9.700% | 3/15/19 | 2,000 | 2,392 |
| Energy Transfer Partners LP | 9.000% | 4/15/19 | 1,425 | 1,675 |
| EnLink Midstream Partners LP | 2.700% | 4/1/19 | 2,775 | 2,726 |
| Enterprise Products Operating LLC | 6.300% | 9/15/17 | 4,769 | 5,184 |
| Enterprise Products Operating LLC | 6.650% | 4/15/18 | 1,469 | 1,632 |
| Enterprise Products Operating LLC | 1.650% | 5/7/18 | 3,000 | 2,969 |
| Enterprise Products Operating LLC | 6.500% | 1/31/19 | 6,700 | 7,493 |
| Enterprise Products Operating LLC | 2.550% | 10/15/19 | 7,175 | 7,137 |
| Enterprise Products Operating LLC | 5.250% | 1/31/20 | 5,475 | 5,985 |
| 1 Enterprise Products Operating LLC | 8.375% | 8/1/66 | 965 | 948 |
| 1 Enterprise Products Operating LLC | 7.034% | 1/15/68 | 6,601 | 7,030 |
| EOG Resources Inc. | 5.875% | 9/15/17 | 3,005 | 3,263 |
| EOG Resources Inc. | 6.875% | 10/1/18 | 1,825 | 2,095 |
| EOG Resources Inc. | 5.625% | 6/1/19 | 6,627 | 7,431 |
| EOG Resources Inc. | 4.400% | 6/1/20 | 8,075 | 8,777 |
| EQT Corp. | 6.500% | 4/1/18 | 3,543 | 3,841 |
| EQT Corp. | 8.125% | 6/1/19 | 4,525 | 5,300 |
23
| Vanguard® Short-Term Corporate Bond Index Fund | ||||
| Schedule of Investments | ||||
| August 31, 2015 | ||||
| Face | Market | |||
| Maturity | Amount | Value | ||
| Coupon | Date | ($000) | ($000) | |
| Exxon Mobil Corp. | 1.305% | 3/6/18 | 9,200 | 9,182 |
| Exxon Mobil Corp. | 1.819% | 3/15/19 | 10,673 | 10,695 |
| Exxon Mobil Corp. | 1.912% | 3/6/20 | 15,000 | 14,925 |
| FMC Technologies Inc. | 2.000% | 10/1/17 | 2,240 | 2,224 |
| Halliburton Co. | 2.000% | 8/1/18 | 1,750 | 1,755 |
| Halliburton Co. | 5.900% | 9/15/18 | 4,775 | 5,305 |
| Halliburton Co. | 6.150% | 9/15/19 | 6,375 | 7,260 |
| Hess Corp. | 1.300% | 6/15/17 | 2,200 | 2,174 |
| Hess Corp. | 8.125% | 2/15/19 | 7,388 | 8,600 |
| Husky Energy Inc. | 6.150% | 6/15/19 | 1,010 | 1,125 |
| Husky Energy Inc. | 7.250% | 12/15/19 | 6,870 | 7,869 |
| Kinder Morgan Energy Partners LP | 6.000% | 2/1/17 | 4,027 | 4,231 |
| Kinder Morgan Energy Partners LP | 5.950% | 2/15/18 | 10,100 | 10,837 |
| Kinder Morgan Energy Partners LP | 2.650% | 2/1/19 | 525 | 512 |
| Kinder Morgan Energy Partners LP | 9.000% | 2/1/19 | 3,500 | 4,111 |
| Kinder Morgan Energy Partners LP | 6.850% | 2/15/20 | 5,175 | 5,793 |
| Kinder Morgan Energy Partners LP | 6.500% | 4/1/20 | 3,675 | 4,105 |
| Kinder Morgan Inc. | 7.000% | 6/15/17 | 9,722 | 10,430 |
| Kinder Morgan Inc. | 2.000% | 12/1/17 | 3,250 | 3,201 |
| Kinder Morgan Inc. | 7.250% | 6/1/18 | 1,000 | 1,105 |
| Kinder Morgan Inc. | 3.050% | 12/1/19 | 10,775 | 10,584 |
| Magellan Midstream Partners LP | 5.650% | 10/15/16 | 1,525 | 1,595 |
| Magellan Midstream Partners LP | 6.550% | 7/15/19 | 3,696 | 4,153 |
| Marathon Oil Corp. | 6.000% | 10/1/17 | 2,925 | 3,135 |
| Marathon Oil Corp. | 5.900% | 3/15/18 | 8,702 | 9,390 |
| Marathon Oil Corp. | 2.700% | 6/1/20 | 3,210 | 3,115 |
| Murphy Oil Corp. | 2.500% | 12/1/17 | 4,600 | 4,519 |
| Nabors Industries Inc. | 2.350% | 9/15/16 | 1,500 | 1,492 |
| Nabors Industries Inc. | 6.150% | 2/15/18 | 6,750 | 7,117 |
| Nabors Industries Inc. | 9.250% | 1/15/19 | 1,550 | 1,761 |
| National Fuel Gas Co. | 8.750% | 5/1/19 | 2,300 | 2,640 |
| National Oilwell Varco Inc. | 1.350% | 12/1/17 | 3,060 | 3,026 |
| Noble Energy Inc. | 8.250% | 3/1/19 | 8,000 | 9,289 |
| Noble Holding International Ltd. | 2.500% | 3/15/17 | 4,075 | 3,965 |
| Noble Holding International Ltd. | 4.900% | 8/1/20 | 2,225 | 2,044 |
| Occidental Petroleum Corp. | 1.750% | 2/15/17 | 9,974 | 10,029 |
| Occidental Petroleum Corp. | 1.500% | 2/15/18 | 4,860 | 4,825 |
| ONEOK Partners LP | 6.150% | 10/1/16 | 2,450 | 2,556 |
| ONEOK Partners LP | 2.000% | 10/1/17 | 3,775 | 3,721 |
| ONEOK Partners LP | 3.200% | 9/15/18 | 2,450 | 2,460 |
| ONEOK Partners LP | 8.625% | 3/1/19 | 6,575 | 7,740 |
| Panhandle Eastern Pipe Line Co. LP | 6.200% | 11/1/17 | 1,561 | 1,690 |
| Panhandle Eastern Pipe Line Co. LP | 7.000% | 6/15/18 | 5,347 | 5,966 |
| Petro-Canada | 6.050% | 5/15/18 | 3,586 | 3,955 |
| Phillips 66 | 2.950% | 5/1/17 | 14,865 | 15,194 |
| Phillips 66 Partners LP | 2.646% | 2/15/20 | 2,225 | 2,158 |
| Pioneer Natural Resources Co. | 6.650% | 3/15/17 | 2,445 | 2,590 |
| Pioneer Natural Resources Co. | 6.875% | 5/1/18 | 4,125 | 4,516 |
| Pioneer Natural Resources Co. | 7.500% | 1/15/20 | 2,775 | 3,163 |
| Plains All American Pipeline LP / PAA Finance Corp. | 6.125% | 1/15/17 | 2,370 | 2,487 |
| Plains All American Pipeline LP / PAA Finance Corp. | 6.500% | 5/1/18 | 5,650 | 6,209 |
| Plains All American Pipeline LP / PAA Finance Corp. | 8.750% | 5/1/19 | 5,140 | 6,025 |
| Plains All American Pipeline LP / PAA Finance Corp. | 5.750% | 1/15/20 | 5,640 | 6,131 |
| Pride International Inc. | 8.500% | 6/15/19 | 4,125 | 4,575 |
| Pride International Inc. | 6.875% | 8/15/20 | 8,300 | 8,716 |
| Questar Corp. | 2.750% | 2/1/16 | 275 | 277 |
| Rowan Cos. Inc. | 5.000% | 9/1/17 | 1,700 | 1,717 |
| Rowan Cos. Inc. | 7.875% | 8/1/19 | 5,125 | 5,533 |
| Shell International Finance BV | 0.900% | 11/15/16 | 2,050 | 2,047 |
| Shell International Finance BV | 5.200% | 3/22/17 | 7,200 | 7,628 |
| Shell International Finance BV | 1.125% | 8/21/17 | 7,295 | 7,237 |
| Shell International Finance BV | 1.900% | 8/10/18 | 9,450 | 9,494 |
| Shell International Finance BV | 2.000% | 11/15/18 | 15,525 | 15,583 |
| Shell International Finance BV | 4.300% | 9/22/19 | 13,775 | 14,870 |
24
| Vanguard® Short-Term Corporate Bond Index Fund | ||||
| Schedule of Investments | ||||
| August 31, 2015 | ||||
| Face | Market | |||
| Maturity | Amount | Value | ||
| Coupon | Date | ($000) | ($000) | |
| Shell International Finance BV | 4.375% | 3/25/20 | 6,905 | 7,548 |
| Shell International Finance BV | 2.125% | 5/11/20 | 16,344 | 16,197 |
| 2 Southern Natural Gas Co. LLC | 5.900% | 4/1/17 | 2,858 | 3,016 |
| Southwestern Energy Co. | 3.300% | 1/23/18 | 1,725 | 1,719 |
| Southwestern Energy Co. | 7.500% | 2/1/18 | 5,606 | 6,019 |
| Southwestern Energy Co. | 4.050% | 1/23/20 | 11,575 | 11,451 |
| Spectra Energy Capital LLC | 6.200% | 4/15/18 | 2,907 | 3,175 |
| Spectra Energy Capital LLC | 8.000% | 10/1/19 | 3,825 | 4,472 |
| Spectra Energy Partners LP | 2.950% | 9/25/18 | 9,698 | 9,756 |
| Suncor Energy Inc. | 6.100% | 6/1/18 | 11,327 | 12,528 |
| Sunoco Inc. | 5.750% | 1/15/17 | 1,100 | 1,146 |
| Sunoco Logistics Partners Operations LP | 5.500% | 2/15/20 | 1,200 | 1,294 |
| Talisman Energy Inc. | 7.750% | 6/1/19 | 5,000 | 5,681 |
| Tennessee Gas Pipeline Co. LLC | 7.500% | 4/1/17 | 3,275 | 3,535 |
| Total Capital Canada Ltd. | 1.450% | 1/15/18 | 11,179 | 11,152 |
| Total Capital International SA | 1.500% | 2/17/17 | 9,075 | 9,121 |
| Total Capital International SA | 1.550% | 6/28/17 | 11,601 | 11,648 |
| Total Capital International SA | 2.125% | 1/10/19 | 7,334 | 7,390 |
| Total Capital International SA | 2.100% | 6/19/19 | 5,650 | 5,702 |
| Total Capital SA | 2.125% | 8/10/18 | 11,865 | 11,993 |
| Total Capital SA | 4.450% | 6/24/20 | 9,250 | 10,129 |
| TransCanada PipeLines Ltd. | 1.875% | 1/12/18 | 2,750 | 2,759 |
| TransCanada PipeLines Ltd. | 6.500% | 8/15/18 | 9,317 | 10,471 |
| TransCanada PipeLines Ltd. | 7.125% | 1/15/19 | 2,392 | 2,767 |
| 1 TransCanada PipeLines Ltd. | 6.350% | 5/15/67 | 6,375 | 5,402 |
| Transcontinental Gas Pipe Line Co. LLC | 6.050% | 6/15/18 | 1,375 | 1,515 |
| Valero Energy Corp. | 6.125% | 6/15/17 | 3,300 | 3,533 |
| Valero Energy Corp. | 9.375% | 3/15/19 | 4,948 | 6,028 |
| Valero Energy Corp. | 6.125% | 2/1/20 | 5,530 | 6,210 |
| Weatherford International LLC | 6.350% | 6/15/17 | 2,400 | 2,472 |
| Weatherford International Ltd. | 6.000% | 3/15/18 | 2,804 | 2,830 |
| Weatherford International Ltd. | 9.625% | 3/1/19 | 5,757 | 6,189 |
| Western Gas Partners LP | 2.600% | 8/15/18 | 3,650 | 3,637 |
| Williams Partners LP | 5.250% | 3/15/20 | 12,945 | 13,830 |
| Williams Partners LP/Williams Partners Finance Corp. | 7.250% | 2/1/17 | 3,125 | 3,341 |
| XTO Energy Inc. | 6.250% | 8/1/17 | 3,485 | 3,812 |
| XTO Energy Inc. | 5.500% | 6/15/18 | 8,350 | 9,232 |
| XTO Energy Inc. | 6.500% | 12/15/18 | 3,235 | 3,717 |
| Other Industrial (0.0%) | ||||
| Cintas Corp. No 2 | 6.125% | 12/1/17 | 2,125 | 2,325 |
| Yale University Connecticut GO | 2.086% | 4/15/19 | 1,400 | 1,414 |
| Technology (6.1%) | ||||
| Adobe Systems Inc. | 4.750% | 2/1/20 | 9,475 | 10,320 |
| Altera Corp. | 1.750% | 5/15/17 | 6,575 | 6,596 |
| Altera Corp. | 2.500% | 11/15/18 | 4,500 | 4,560 |
| Amphenol Corp. | 1.550% | 9/15/17 | 2,075 | 2,072 |
| Amphenol Corp. | 2.550% | 1/30/19 | 7,875 | 7,958 |
| Analog Devices Inc. | 3.000% | 4/15/16 | 275 | 279 |
| Apple Inc. | 1.050% | 5/5/17 | 10,850 | 10,865 |
| Apple Inc. | 0.900% | 5/12/17 | 5,350 | 5,341 |
| Apple Inc. | 1.000% | 5/3/18 | 34,493 | 34,112 |
| Apple Inc. | 2.100% | 5/6/19 | 15,345 | 15,504 |
| Apple Inc. | 1.550% | 2/7/20 | 7,575 | 7,394 |
| Apple Inc. | 2.000% | 5/6/20 | 10,750 | 10,703 |
| Arrow Electronics Inc. | 3.000% | 3/1/18 | 3,100 | 3,141 |
| Arrow Electronics Inc. | 6.000% | 4/1/20 | 1,400 | 1,534 |
| Autodesk Inc. | 1.950% | 12/15/17 | 2,525 | 2,534 |
| Autodesk Inc. | 3.125% | 6/15/20 | 3,000 | 3,019 |
| Avnet Inc. | 6.625% | 9/15/16 | 1,600 | 1,677 |
| Avnet Inc. | 5.875% | 6/15/20 | 1,300 | 1,427 |
| Baidu Inc. | 2.250% | 11/28/17 | 5,900 | 5,893 |
| Baidu Inc. | 3.250% | 8/6/18 | 6,900 | 7,020 |
| Baidu Inc. | 2.750% | 6/9/19 | 6,925 | 6,852 |
25
| Vanguard® Short-Term Corporate Bond Index Fund | ||||
| Schedule of Investments | ||||
| August 31, 2015 | ||||
| Face | Market | |||
| Maturity | Amount | Value | ||
| Coupon | Date | ($000) | ($000) | |
| Baidu Inc. | 3.000% | 6/30/20 | 5,500 | 5,456 |
| Broadcom Corp. | 2.700% | 11/1/18 | 3,477 | 3,535 |
| CA Inc. | 2.875% | 8/15/18 | 1,850 | 1,881 |
| CA Inc. | 5.375% | 12/1/19 | 4,925 | 5,398 |
| CA Inc. | 3.600% | 8/1/20 | 3,000 | 3,010 |
| Cisco Systems Inc. | 1.100% | 3/3/17 | 11,220 | 11,237 |
| Cisco Systems Inc. | 3.150% | 3/14/17 | 6,270 | 6,474 |
| Cisco Systems Inc. | 1.650% | 6/15/18 | 5,000 | 5,006 |
| Cisco Systems Inc. | 4.950% | 2/15/19 | 19,331 | 21,211 |
| Cisco Systems Inc. | 2.125% | 3/1/19 | 16,500 | 16,615 |
| Cisco Systems Inc. | 4.450% | 1/15/20 | 20,035 | 21,912 |
| Cisco Systems Inc. | 2.450% | 6/15/20 | 11,000 | 11,075 |
| Computer Sciences Corp. | 6.500% | 3/15/18 | 5,450 | 5,991 |
| Corning Inc. | 1.450% | 11/15/17 | 2,850 | 2,842 |
| Corning Inc. | 1.500% | 5/8/18 | 2,750 | 2,738 |
| Corning Inc. | 6.625% | 5/15/19 | 3,155 | 3,621 |
| Corning Inc. | 4.250% | 8/15/20 | 825 | 891 |
| Dun & Bradstreet Corp. | 3.250% | 12/1/17 | 2,100 | 2,141 |
| EMC Corp. | 1.875% | 6/1/18 | 15,700 | 15,646 |
| EMC Corp. | 2.650% | 6/1/20 | 20,680 | 20,554 |
| Equifax Inc. | 6.300% | 7/1/17 | 1,800 | 1,937 |
| Fidelity National Information Services Inc. | 1.450% | 6/5/17 | 8,326 | 8,231 |
| Fidelity National Information Services Inc. | 2.000% | 4/15/18 | 475 | 467 |
| Fiserv Inc. | 2.700% | 6/1/20 | 5,700 | 5,655 |
| Hewlett-Packard Co. | 3.000% | 9/15/16 | 7,726 | 7,858 |
| Hewlett-Packard Co. | 3.300% | 12/9/16 | 4,355 | 4,447 |
| Hewlett-Packard Co. | 5.400% | 3/1/17 | 4,375 | 4,596 |
| Hewlett-Packard Co. | 2.600% | 9/15/17 | 7,750 | 7,846 |
| Hewlett-Packard Co. | 5.500% | 3/1/18 | 6,826 | 7,413 |
| Hewlett-Packard Co. | 2.750% | 1/14/19 | 11,720 | 11,833 |
| Intel Corp. | 1.950% | 10/1/16 | 11,100 | 11,238 |
| Intel Corp. | 1.350% | 12/15/17 | 23,393 | 23,359 |
| Intel Corp. | 2.450% | 7/29/20 | 12,000 | 12,034 |
| International Business Machines Corp. | 1.250% | 2/6/17 | 6,225 | 6,255 |
| International Business Machines Corp. | 5.700% | 9/14/17 | 19,941 | 21,683 |
| International Business Machines Corp. | 1.125% | 2/6/18 | 13,300 | 13,196 |
| International Business Machines Corp. | 1.250% | 2/8/18 | 10,925 | 10,877 |
| International Business Machines Corp. | 7.625% | 10/15/18 | 10,204 | 11,935 |
| International Business Machines Corp. | 1.950% | 2/12/19 | 2,100 | 2,108 |
| International Business Machines Corp. | 1.875% | 5/15/19 | 3,775 | 3,772 |
| International Business Machines Corp. | 8.375% | 11/1/19 | 2,689 | 3,365 |
| International Business Machines Corp. | 1.625% | 5/15/20 | 11,100 | 10,832 |
| Intuit Inc. | 5.750% | 3/15/17 | 3,350 | 3,548 |
| Jabil Circuit Inc. | 8.250% | 3/15/18 | 1,550 | 1,744 |
| Juniper Networks Inc. | 3.300% | 6/15/20 | 2,200 | 2,209 |
| 2 Keysight Technologies Inc. | 3.300% | 10/30/19 | 3,500 | 3,484 |
| KLA-Tencor Corp. | 3.375% | 11/1/19 | 1,200 | 1,216 |
| Lam Research Corp. | 2.750% | 3/15/20 | 3,650 | 3,594 |
| Lexmark International Inc. | 6.650% | 6/1/18 | 1,100 | 1,215 |
| Lexmark International Inc. | 5.125% | 3/15/20 | 3,400 | 3,544 |
| Maxim Integrated Products Inc. | 2.500% | 11/15/18 | 3,685 | 3,723 |
| Microsoft Corp. | 0.875% | 11/15/17 | 3,100 | 3,091 |
| Microsoft Corp. | 1.000% | 5/1/18 | 2,348 | 2,333 |
| Microsoft Corp. | 1.625% | 12/6/18 | 9,350 | 9,389 |
| Microsoft Corp. | 4.200% | 6/1/19 | 8,095 | 8,796 |
| National Semiconductor Corp. | 6.600% | 6/15/17 | 3,850 | 4,204 |
| NetApp Inc. | 2.000% | 12/15/17 | 4,455 | 4,448 |
| Oracle Corp. | 1.200% | 10/15/17 | 16,102 | 16,043 |
| Oracle Corp. | 5.750% | 4/15/18 | 19,074 | 21,071 |
| Oracle Corp. | 2.375% | 1/15/19 | 14,250 | 14,466 |
| Oracle Corp. | 5.000% | 7/8/19 | 16,675 | 18,389 |
| Oracle Corp. | 2.250% | 10/8/19 | 16,670 | 16,717 |
| Oracle Corp. | 3.875% | 7/15/20 | 3,625 | 3,895 |
| Pitney Bowes Inc. | 5.750% | 9/15/17 | 3,080 | 3,310 |
26
| Vanguard® Short-Term Corporate Bond Index Fund | ||||
| Schedule of Investments | ||||
| August 31, 2015 | ||||
| Face | Market | |||
| Maturity | Amount | Value | ||
| Coupon | Date | ($000) | ($000) | |
| Pitney Bowes Inc. | 5.600% | 3/15/18 | 725 | 784 |
| Pitney Bowes Inc. | 4.750% | 5/15/18 | 2,905 | 3,095 |
| Pitney Bowes Inc. | 6.250% | 3/15/19 | 500 | 559 |
| QUALCOMM Inc. | 2.250% | 5/20/20 | 18,000 | 17,779 |
| Seagate HDD Cayman | 3.750% | 11/15/18 | 10,725 | 11,020 |
| 2 Semiconductor Manufacturing International Corp. | 4.125% | 10/7/19 | 3,500 | 3,497 |
| Symantec Corp. | 2.750% | 6/15/17 | 3,975 | 3,971 |
| Tech Data Corp. | 3.750% | 9/21/17 | 1,700 | 1,749 |
| Texas Instruments Inc. | 1.000% | 5/1/18 | 5,675 | 5,595 |
| Texas Instruments Inc. | 1.650% | 8/3/19 | 4,334 | 4,272 |
| Texas Instruments Inc. | 1.750% | 5/1/20 | 1,696 | 1,653 |
| Total System Services Inc. | 2.375% | 6/1/18 | 4,275 | 4,258 |
| Tyco Electronics Group SA | 6.550% | 10/1/17 | 9,395 | 10,310 |
| Tyco Electronics Group SA | 2.375% | 12/17/18 | 990 | 995 |
| Tyco Electronics Group SA | 2.350% | 8/1/19 | 3,550 | 3,540 |
| Xerox Corp. | 6.750% | 2/1/17 | 4,050 | 4,310 |
| Xerox Corp. | 2.950% | 3/15/17 | 5,150 | 5,229 |
| Xerox Corp. | 6.350% | 5/15/18 | 4,970 | 5,486 |
| Xerox Corp. | 2.750% | 3/15/19 | 4,500 | 4,537 |
| Xerox Corp. | 5.625% | 12/15/19 | 2,092 | 2,291 |
| Xerox Corp. | 2.800% | 5/15/20 | 1,650 | 1,605 |
| Xilinx Inc. | 2.125% | 3/15/19 | 3,275 | 3,257 |
| Transportation (1.4%) | ||||
| Burlington Northern Santa Fe LLC | 5.650% | 5/1/17 | 3,736 | 3,993 |
| Burlington Northern Santa Fe LLC | 5.750% | 3/15/18 | 5,100 | 5,593 |
| Burlington Northern Santa Fe LLC | 4.700% | 10/1/19 | 4,106 | 4,476 |
| Canadian National Railway Co. | 1.450% | 12/15/16 | 3,670 | 3,684 |
| Canadian National Railway Co. | 5.850% | 11/15/17 | 1,300 | 1,411 |
| Canadian National Railway Co. | 5.550% | 5/15/18 | 1,900 | 2,088 |
| Canadian National Railway Co. | 5.550% | 3/1/19 | 3,100 | 3,465 |
| Canadian Pacific Railway Co. | 6.500% | 5/15/18 | 1,639 | 1,837 |
| Canadian Pacific Railway Co. | 7.250% | 5/15/19 | 3,980 | 4,677 |
| Con-way Inc. | 7.250% | 1/15/18 | 3,100 | 3,435 |
| 1 Continental Airlines 2009-1 Pass Through Trust | 9.000% | 1/8/18 | 1,195 | 1,267 |
| 1 Continental Airlines 2009-2 Class A Pass Through Trust | 7.250% | 5/10/21 | 2,831 | 3,213 |
| CSX Corp. | 5.600% | 5/1/17 | 2,695 | 2,886 |
| CSX Corp. | 7.900% | 5/1/17 | 1,500 | 1,659 |
| CSX Corp. | 6.250% | 3/15/18 | 6,325 | 7,033 |
| CSX Corp. | 7.375% | 2/1/19 | 3,425 | 3,980 |
| 1 Delta Air Lines 2009-1 Class A Pass Through Trust | 7.750% | 6/17/21 | 2,549 | 2,906 |
| 1 Delta Air Lines 2010-1 Class A Pass Through Trust | 6.200% | 1/2/20 | 1,175 | 1,269 |
| 1 Delta Air Lines 2010-2 Class A Pass Through Trust | 4.950% | 11/23/20 | 2,144 | 2,268 |
| 1 Delta Air Lines 2012-1 Class A Pass Through Trust | 4.750% | 11/7/21 | 1,996 | 2,111 |
| FedEx Corp. | 8.000% | 1/15/19 | 5,425 | 6,458 |
| FedEx Corp. | 2.300% | 2/1/20 | 1,700 | 1,690 |
| JB Hunt Transport Services Inc. | 2.400% | 3/15/19 | 1,950 | 1,948 |
| Kansas City Southern de Mexico SA de CV | 2.350% | 5/15/20 | 2,150 | 2,094 |
| Norfolk Southern Corp. | 7.700% | 5/15/17 | 4,299 | 4,733 |
| Norfolk Southern Corp. | 5.750% | 4/1/18 | 4,225 | 4,645 |
| Norfolk Southern Corp. | 5.900% | 6/15/19 | 4,225 | 4,770 |
| Norfolk Southern Railway Co. | 9.750% | 6/15/20 | 1,286 | 1,672 |
| 1 Northwest Airlines 2007-1 Class A Pass Through Trust | 7.027% | 5/1/21 | 1,703 | 1,899 |
| Ryder System Inc. | 5.850% | 11/1/16 | 1,225 | 1,287 |
| Ryder System Inc. | 2.500% | 3/1/17 | 2,650 | 2,683 |
| Ryder System Inc. | 3.500% | 6/1/17 | 1,975 | 2,044 |
| Ryder System Inc. | 2.500% | 3/1/18 | 2,470 | 2,512 |
| Ryder System Inc. | 2.450% | 11/15/18 | 2,675 | 2,687 |
| Ryder System Inc. | 2.350% | 2/26/19 | 1,775 | 1,770 |
| Ryder System Inc. | 2.550% | 6/1/19 | 2,125 | 2,135 |
| Ryder System Inc. | 2.450% | 9/3/19 | 2,850 | 2,838 |
| Ryder System Inc. | 2.650% | 3/2/20 | 3,000 | 2,999 |
| Ryder System Inc. | 2.500% | 5/11/20 | 2,800 | 2,760 |
| Ryder System Inc. | 2.875% | 9/1/20 | 2,600 | 2,594 |
27
| Vanguard® Short-Term Corporate Bond Index Fund | ||||
| Schedule of Investments | ||||
| August 31, 2015 | ||||
| Face | Market | |||
| Maturity | Amount | Value | ||
| Coupon | Date | ($000) | ($000) | |
| Southwest Airlines Co. | 5.750% | 12/15/16 | 2,245 | 2,371 |
| Southwest Airlines Co. | 5.125% | 3/1/17 | 1,700 | 1,791 |
| Southwest Airlines Co. | 2.750% | 11/6/19 | 3,000 | 3,042 |
| 1 UAL 2009-2A Pass Through Trust | 9.750% | 7/15/18 | 2,090 | 2,252 |
| Union Pacific Corp. | 5.750% | 11/15/17 | 2,025 | 2,217 |
| Union Pacific Corp. | 5.700% | 8/15/18 | 2,775 | 3,105 |
| Union Pacific Corp. | 2.250% | 2/15/19 | 2,700 | 2,732 |
| Union Pacific Corp. | 1.800% | 2/1/20 | 2,450 | 2,408 |
| Union Pacific Corp. | 2.250% | 6/19/20 | 4,100 | 4,119 |
| United Parcel Service Inc. | 1.125% | 10/1/17 | 7,725 | 7,726 |
| United Parcel Service Inc. | 5.500% | 1/15/18 | 6,670 | 7,314 |
| United Parcel Service Inc. | 5.125% | 4/1/19 | 7,295 | 8,111 |
| United Parcel Service of America Inc. | 8.375% | 4/1/20 | 800 | 1,014 |
| 6,321,202 | ||||
| Utilities (5.0%) | ||||
| Electric (4.7%) | ||||
| Alabama Power Co. | 5.500% | 10/15/17 | 1,925 | 2,078 |
| Ameren Illinois Co. | 6.125% | 11/15/17 | 625 | 687 |
| American Electric Power Co. Inc. | 1.650% | 12/15/17 | 6,815 | 6,799 |
| Appalachian Power Co. | 5.000% | 6/1/17 | 210 | 222 |
| Arizona Public Service Co. | 8.750% | 3/1/19 | 5,500 | 6,709 |
| Arizona Public Service Co. | 2.200% | 1/15/20 | 1,500 | 1,492 |
| Atlantic City Electric Co. | 7.750% | 11/15/18 | 750 | 888 |
| Avista Corp. | 5.950% | 6/1/18 | 1,460 | 1,615 |
| Baltimore Gas & Electric Co. | 5.900% | 10/1/16 | 2,250 | 2,358 |
| Berkshire Hathaway Energy Co. | 1.100% | 5/15/17 | 1,750 | 1,739 |
| Berkshire Hathaway Energy Co. | 5.750% | 4/1/18 | 5,745 | 6,304 |
| Berkshire Hathaway Energy Co. | 2.000% | 11/15/18 | 2,968 | 2,967 |
| Berkshire Hathaway Energy Co. | 2.400% | 2/1/20 | 2,350 | 2,342 |
| CenterPoint Energy Inc. | 6.500% | 5/1/18 | 4,328 | 4,823 |
| Cleco Power LLC | 6.650% | 6/15/18 | 817 | 914 |
| Cleveland Electric Illuminating Co. | 7.880% | 11/1/17 | 2,128 | 2,394 |
| Cleveland Electric Illuminating Co. | 8.875% | 11/15/18 | 500 | 598 |
| CMS Energy Corp. | 6.550% | 7/17/17 | 1,000 | 1,086 |
| CMS Energy Corp. | 5.050% | 2/15/18 | 1,000 | 1,070 |
| CMS Energy Corp. | 8.750% | 6/15/19 | 7,125 | 8,591 |
| CMS Energy Corp. | 6.250% | 2/1/20 | 1,125 | 1,275 |
| Commonwealth Edison Co. | 1.950% | 9/1/16 | 500 | 504 |
| Commonwealth Edison Co. | 6.150% | 9/15/17 | 3,125 | 3,414 |
| Commonwealth Edison Co. | 5.800% | 3/15/18 | 5,400 | 5,955 |
| Commonwealth Edison Co. | 2.150% | 1/15/19 | 7,375 | 7,401 |
| Connecticut Light & Power Co. | 5.650% | 5/1/18 | 5,450 | 6,042 |
| Connecticut Light & Power Co. | 5.500% | 2/1/19 | 1,850 | 2,069 |
| Consolidated Edison Co. of New York Inc. | 5.500% | 9/15/16 | 6,113 | 6,400 |
| Consolidated Edison Co. of New York Inc. | 5.850% | 4/1/18 | 5,225 | 5,769 |
| Consolidated Edison Co. of New York Inc. | 7.125% | 12/1/18 | 5,825 | 6,763 |
| Consolidated Edison Co. of New York Inc. | 6.650% | 4/1/19 | 3,175 | 3,659 |
| Consolidated Edison Co. of New York Inc. | 4.450% | 6/15/20 | 1,500 | 1,652 |
| Consumers Energy Co. | 5.500% | 8/15/16 | 640 | 667 |
| Consumers Energy Co. | 5.150% | 2/15/17 | 1,005 | 1,059 |
| Consumers Energy Co. | 5.650% | 9/15/18 | 2,000 | 2,215 |
| Consumers Energy Co. | 6.125% | 3/15/19 | 5,400 | 6,178 |
| Consumers Energy Co. | 6.700% | 9/15/19 | 75 | 87 |
| Consumers Energy Co. | 5.650% | 4/15/20 | 2,875 | 3,244 |
| Dayton Power & Light Co. | 1.875% | 9/15/16 | 3,225 | 3,237 |
| Dominion Resources Inc. | 1.250% | 3/15/17 | 2,800 | 2,789 |
| Dominion Resources Inc. | 1.400% | 9/15/17 | 5,125 | 5,086 |
| Dominion Resources Inc. | 6.400% | 6/15/18 | 2,190 | 2,444 |
| Dominion Resources Inc. | 5.200% | 8/15/19 | 2,650 | 2,918 |
| Dominion Resources Inc. | 2.500% | 12/1/19 | 10,487 | 10,511 |
| DTE Electric Co. | 5.600% | 6/15/18 | 850 | 936 |
| DTE Energy Co. | 2.400% | 12/1/19 | 5,900 | 5,883 |
| Duke Energy Carolinas LLC | 1.750% | 12/15/16 | 2,725 | 2,749 |
28
| Vanguard® Short-Term Corporate Bond Index Fund | ||||
| Schedule of Investments | ||||
| August 31, 2015 | ||||
| Face | Market | |||
| Maturity | Amount | Value | ||
| Coupon | Date | ($000) | ($000) | |
| Duke Energy Carolinas LLC | 5.100% | 4/15/18 | 5,432 | 5,905 |
| Duke Energy Carolinas LLC | 7.000% | 11/15/18 | 2,527 | 2,926 |
| Duke Energy Carolinas LLC | 4.300% | 6/15/20 | 1,575 | 1,716 |
| Duke Energy Corp. | 2.150% | 11/15/16 | 6,240 | 6,316 |
| Duke Energy Corp. | 1.625% | 8/15/17 | 5,300 | 5,315 |
| Duke Energy Corp. | 2.100% | 6/15/18 | 6,690 | 6,753 |
| Duke Energy Corp. | 6.250% | 6/15/18 | 2,000 | 2,233 |
| Duke Energy Corp. | 5.050% | 9/15/19 | 7,420 | 8,147 |
| Duke Energy Florida LLC | 5.800% | 9/15/17 | 265 | 288 |
| Duke Energy Florida LLC | 5.650% | 6/15/18 | 5,897 | 6,529 |
| Duke Energy Indiana Inc. | 3.750% | 7/15/20 | 2,025 | 2,158 |
| Duke Energy Ohio Inc. | 5.450% | 4/1/19 | 4,063 | 4,538 |
| Duke Energy Progress LLC | 5.300% | 1/15/19 | 5,205 | 5,770 |
| Edison International | 3.750% | 9/15/17 | 2,540 | 2,645 |
| Entergy Corp. | 4.700% | 1/15/17 | 5,875 | 6,035 |
| Entergy Gulf States Louisiana LLC | 6.000% | 5/1/18 | 2,325 | 2,568 |
| Entergy Louisiana LLC | 6.500% | 9/1/18 | 3,075 | 3,478 |
| Entergy Texas Inc. | 7.125% | 2/1/19 | 5,655 | 6,529 |
| Eversource Energy | 1.450% | 5/1/18 | 3,200 | 3,158 |
| Eversource Energy | 4.500% | 11/15/19 | 1,487 | 1,599 |
| Exelon Corp. | 1.550% | 6/9/17 | 2,500 | 2,489 |
| Exelon Corp. | 2.850% | 6/15/20 | 2,500 | 2,496 |
| Exelon Generation Co. LLC | 6.200% | 10/1/17 | 4,615 | 5,002 |
| Exelon Generation Co. LLC | 5.200% | 10/1/19 | 5,050 | 5,550 |
| Exelon Generation Co. LLC | 2.950% | 1/15/20 | 10,200 | 10,203 |
| Florida Power & Light Co. | 5.550% | 11/1/17 | 2,477 | 2,690 |
| Georgia Power Co. | 5.700% | 6/1/17 | 1,300 | 1,396 |
| Georgia Power Co. | 5.400% | 6/1/18 | 2,500 | 2,735 |
| Georgia Power Co. | 4.250% | 12/1/19 | 3,155 | 3,435 |
| Indiana Michigan Power Co. | 7.000% | 3/15/19 | 3,817 | 4,415 |
| Jersey Central Power & Light Co. | 5.650% | 6/1/17 | 1,000 | 1,063 |
| Kansas City Power & Light Co. | 6.375% | 3/1/18 | 3,346 | 3,723 |
| Kansas City Power & Light Co. | 7.150% | 4/1/19 | 4,300 | 5,012 |
| Metropolitan Edison Co. | 7.700% | 1/15/19 | 1,517 | 1,762 |
| MidAmerican Energy Co. | 5.950% | 7/15/17 | 3,539 | 3,822 |
| Mississippi Power Co. | 2.350% | 10/15/16 | 670 | 677 |
| National Rural Utilities Cooperative Finance Corp. | 5.450% | 4/10/17 | 4,629 | 4,947 |
| National Rural Utilities Cooperative Finance Corp. | 0.950% | 4/24/17 | 2,560 | 2,553 |
| National Rural Utilities Cooperative Finance Corp. | 5.450% | 2/1/18 | 3,637 | 3,965 |
| National Rural Utilities Cooperative Finance Corp. | 10.375% | 11/1/18 | 10,664 | 13,388 |
| National Rural Utilities Cooperative Finance Corp. | 2.150% | 2/1/19 | 5,000 | 5,008 |
| National Rural Utilities Cooperative Finance Corp. | 2.300% | 11/15/19 | 1,300 | 1,300 |
| National Rural Utilities Cooperative Finance Corp. | 2.000% | 1/27/20 | 5,000 | 4,898 |
| National Rural Utilities Cooperative Finance Corp. | 2.350% | 6/15/20 | 2,585 | 2,585 |
| Nevada Power Co. | 6.500% | 5/15/18 | 475 | 536 |
| Nevada Power Co. | 6.500% | 8/1/18 | 3,095 | 3,515 |
| Nevada Power Co. | 7.125% | 3/15/19 | 6,735 | 7,859 |
| NextEra Energy Capital Holdings Inc. | 6.000% | 3/1/19 | 8,800 | 9,796 |
| NextEra Energy Capital Holdings Inc. | 2.400% | 9/15/19 | 2,400 | 2,386 |
| NextEra Energy Capital Holdings Inc. | 2.700% | 9/15/19 | 3,239 | 3,242 |
| 1 NextEra Energy Capital Holdings Inc. | 6.350% | 10/1/66 | 2,800 | 2,251 |
| 1 NextEra Energy Capital Holdings Inc. | 6.650% | 6/15/67 | 3,075 | 2,552 |
| 1 NextEra Energy Capital Holdings Inc. | 7.300% | 9/1/67 | 1,005 | 1,000 |
| Northern States Power Co. | 5.250% | 3/1/18 | 5,425 | 5,894 |
| Northern States Power Co. | 2.200% | 8/15/20 | 3,000 | 2,991 |
| NSTAR Electric Co. | 5.625% | 11/15/17 | 1,555 | 1,695 |
| Oglethorpe Power Corp. | 6.100% | 3/15/19 | 725 | 816 |
| Ohio Power Co. | 6.050% | 5/1/18 | 775 | 855 |
| Oklahoma Gas & Electric Co. | 8.250% | 1/15/19 | 1,225 | 1,465 |
| Oncor Electric Delivery Co. LLC | 5.000% | 9/30/17 | 1,000 | 1,070 |
| Oncor Electric Delivery Co. LLC | 6.800% | 9/1/18 | 4,195 | 4,768 |
| Oncor Electric Delivery Co. LLC | 2.150% | 6/1/19 | 2,250 | 2,231 |
| Pacific Gas & Electric Co. | 5.625% | 11/30/17 | 6,056 | 6,567 |
| Pacific Gas & Electric Co. | 8.250% | 10/15/18 | 8,190 | 9,747 |
29
| Vanguard® Short-Term Corporate Bond Index Fund | ||||
| Schedule of Investments | ||||
| August 31, 2015 | ||||
| Face | Market | |||
| Maturity | Amount | Value | ||
| Coupon | Date | ($000) | ($000) | |
| PacifiCorp | 5.650% | 7/15/18 | 5,325 | 5,898 |
| PacifiCorp | 5.500% | 1/15/19 | 3,100 | 3,450 |
| Peco Energy Co. | 1.200% | 10/15/16 | 3,225 | 3,229 |
| Peco Energy Co. | 5.350% | 3/1/18 | 2,700 | 2,951 |
| Pennsylvania Electric Co. | 6.050% | 9/1/17 | 3,775 | 4,092 |
| Pennsylvania Electric Co. | 5.200% | 4/1/20 | 2,350 | 2,554 |
| PG&E Corp. | 2.400% | 3/1/19 | 1,975 | 1,981 |
| Portland General Electric Co. | 6.100% | 4/15/19 | 1,885 | 2,142 |
| PPL Capital Funding Inc. | 1.900% | 6/1/18 | 5,250 | 5,231 |
| 1 PPL Capital Funding Inc. | 6.700% | 3/30/67 | 2,500 | 2,131 |
| Progress Energy Inc. | 4.875% | 12/1/19 | 1,950 | 2,129 |
| PSEG Power LLC | 2.750% | 9/15/16 | 300 | 304 |
| PSEG Power LLC | 5.320% | 9/15/16 | 5,950 | 6,186 |
| PSEG Power LLC | 2.450% | 11/15/18 | 3,000 | 3,009 |
| PSEG Power LLC | 5.125% | 4/15/20 | 1,625 | 1,776 |
| Public Service Co. of Colorado | 5.125% | 6/1/19 | 3,525 | 3,904 |
| Public Service Co. of New Mexico | 7.950% | 5/15/18 | 1,265 | 1,435 |
| Public Service Co. of Oklahoma | 5.150% | 12/1/19 | 872 | 967 |
| Public Service Electric & Gas Co. | 5.300% | 5/1/18 | 3,115 | 3,401 |
| Public Service Electric & Gas Co. | 2.300% | 9/15/18 | 1,600 | 1,624 |
| Public Service Electric & Gas Co. | 1.800% | 6/1/19 | 5,200 | 5,129 |
| Public Service Electric & Gas Co. | 3.500% | 8/15/20 | 625 | 657 |
| San Diego Gas & Electric Co. | 5.300% | 11/15/15 | 300 | 303 |
| SCANA Corp. | 6.250% | 4/1/20 | 4,000 | 4,486 |
| South Carolina Electric & Gas Co. | 5.250% | 11/1/18 | 2,225 | 2,474 |
| South Carolina Electric & Gas Co. | 6.500% | 11/1/18 | 2,325 | 2,667 |
| Southern California Edison Co. | 1.125% | 5/1/17 | 1,115 | 1,109 |
| Southern California Edison Co. | 5.500% | 8/15/18 | 3,700 | 4,107 |
| Southern Co. | 1.950% | 9/1/16 | 2,550 | 2,574 |
| Southern Co. | 1.300% | 8/15/17 | 3,050 | 3,030 |
| Southern Co. | 2.450% | 9/1/18 | 4,500 | 4,533 |
| Southern Co. | 2.150% | 9/1/19 | 5,125 | 5,034 |
| Southern Co. | 2.750% | 6/15/20 | 9,275 | 9,185 |
| Southwestern Electric Power Co. | 5.550% | 1/15/17 | 675 | 712 |
| Southwestern Electric Power Co. | 5.875% | 3/1/18 | 2,875 | 3,157 |
| Southwestern Electric Power Co. | 6.450% | 1/15/19 | 3,770 | 4,286 |
| Southwestern Public Service Co. | 8.750% | 12/1/18 | 155 | 188 |
| Tampa Electric Co. | 6.100% | 5/15/18 | 2,150 | 2,390 |
| TECO Finance Inc. | 6.572% | 11/1/17 | 4,428 | 4,857 |
| TECO Finance Inc. | 5.150% | 3/15/20 | 1,950 | 2,145 |
| TransAlta Corp. | 6.650% | 5/15/18 | 2,600 | 2,840 |
| Union Electric Co. | 6.400% | 6/15/17 | 4,477 | 4,867 |
| Union Electric Co. | 6.700% | 2/1/19 | 4,575 | 5,265 |
| Virginia Electric & Power Co. | 5.950% | 9/15/17 | 1,775 | 1,937 |
| Virginia Electric & Power Co. | 1.200% | 1/15/18 | 1,100 | 1,091 |
| Virginia Electric & Power Co. | 5.400% | 4/30/18 | 5,900 | 6,448 |
| WEC Energy Group Inc. | 1.650% | 6/15/18 | 2,200 | 2,196 |
| WEC Energy Group Inc. | 2.450% | 6/15/20 | 2,400 | 2,397 |
| 1 WEC Energy Group Inc. | 6.110% | 12/1/66 | 2,700 | 2,322 |
| 1 WEC Energy Group Inc. | 6.250% | 5/15/67 | 3,170 | 2,746 |
| Westar Energy Inc. | 8.625% | 12/1/18 | 1,250 | 1,503 |
| Wisconsin Electric Power Co. | 1.700% | 6/15/18 | 2,250 | 2,253 |
| Wisconsin Electric Power Co. | 4.250% | 12/15/19 | 1,175 | 1,281 |
| Wisconsin Power & Light Co. | 5.000% | 7/15/19 | 1,725 | 1,902 |
| Xcel Energy Inc. | 1.200% | 6/1/17 | 1,000 | 999 |
| Xcel Energy Inc. | 4.700% | 5/15/20 | 5,615 | 6,107 |
| Natural Gas (0.3%) | ||||
| AGL Capital Corp. | 5.250% | 8/15/19 | 2,825 | 3,104 |
| Atmos Energy Corp. | 6.350% | 6/15/17 | 2,300 | 2,496 |
| Atmos Energy Corp. | 8.500% | 3/15/19 | 1,787 | 2,144 |
| British Transco Finance Inc. | 6.625% | 6/1/18 | 1,985 | 2,254 |
| NiSource Finance Corp. | 6.400% | 3/15/18 | 3,465 | 3,849 |
| NiSource Finance Corp. | 6.800% | 1/15/19 | 2,675 | 3,062 |
30
| Vanguard® Short-Term Corporate Bond Index Fund | ||||
| Schedule of Investments | ||||
| August 31, 2015 | ||||
| Face | Market | |||
| Maturity | Amount | Value | ||
| Coupon | Date | ($000) | ($000) | |
| ONE Gas Inc. | 2.070% | 2/1/19 | 2,600 | 2,593 |
| Sempra Energy | 2.300% | 4/1/17 | 5,860 | 5,930 |
| Sempra Energy | 6.150% | 6/15/18 | 7,925 | 8,856 |
| Sempra Energy | 9.800% | 2/15/19 | 500 | 621 |
| Sempra Energy | 2.400% | 3/15/20 | 3,750 | 3,719 |
| Other Utility (0.0%) | ||||
| American Water Capital Corp. | 6.085% | 10/15/17 | 3,000 | 3,278 |
| 617,015 | ||||
| Total Corporate Bonds (Cost $12,216,811) | 12,189,670 | |||
| Taxable Municipal Bonds (0.0%) | ||||
| Dartmouth College New Hampshire GO | 4.750% | 6/1/19 | 1,440 | 1,600 |
| Emory University Georgia GO | 5.625% | 9/1/19 | 1,000 | 1,148 |
| Stanford University California GO | 4.750% | 5/1/19 | 1,800 | 1,994 |
| Total Taxable Municipal Bonds (Cost $4,709) | 4,742 | |||
| Shares | ||||
| Temporary Cash Investment (0.7%) | ||||
| Money Market Fund (0.7%) | ||||
| 3 Vanguard Market Liquidity Fund (Cost $80,364) | 0.168% | 80,364,000 | 80,364 | |
| Total Investments (99.5%) (Cost $12,304,942) | 12,277,834 | |||
| Other Assets and Liabilities—Net (0.5%) | 66,241 | |||
| Net Assets (100%) | 12,344,075 | |||
1 The average or expected maturity is shorter than the final maturity shown because of the possibility of interim principal payments and prepayments or the possibility of the issue being called.
2 Security exempt from registration under Rule 144A of the Securities Act of 1933. Such securities may be sold in transactions exempt from registration, normally to qualified institutional buyers. At August 31, 2015, the aggregate value of these securities was $195,782,000, representing 1.6% of net assets.
3 Affiliated money market fund available only to Vanguard funds and certain trusts and accounts managed by Vanguard. Rate shown is the 7-day yield.
GO—General Obligation Bond.
REIT—Real Estate Investment Trust.
31
| Vanguard® Intermediate-Term Corporate Bond Index Fund | ||||
| Schedule of Investments | ||||
| August 31, 2015 | ||||
| Face | Market | |||
| Maturity | Amount | Value | ||
| Coupon | Date | ($000) | ($000) | |
| U.S. Government and Agency Obligations (0.0%) | ||||
| U.S. Government Securities (0.0%) | ||||
| United States Treasury Note/Bond (cost $810) | 2.000% | 8/15/25 | 825 | 809 |
| Corporate Bonds (98.8%) | ||||
| Finance (31.4%) | ||||
| Banking (18.4%) | ||||
| Abbey National Treasury Services plc | 4.000% | 3/13/24 | 2,934 | 3,034 |
| American Express Co. | 2.650% | 12/2/22 | 3,398 | 3,256 |
| American Express Co. | 3.625% | 12/5/24 | 3,031 | 2,966 |
| Bancolombia SA | 5.950% | 6/3/21 | 4,700 | 4,988 |
| Bank of America Corp. | 5.875% | 1/5/21 | 6,825 | 7,764 |
| Bank of America Corp. | 5.000% | 5/13/21 | 9,535 | 10,447 |
| Bank of America Corp. | 5.700% | 1/24/22 | 11,175 | 12,616 |
| Bank of America Corp. | 3.300% | 1/11/23 | 18,925 | 18,627 |
| Bank of America Corp. | 4.100% | 7/24/23 | 9,050 | 9,336 |
| Bank of America Corp. | 4.125% | 1/22/24 | 12,550 | 12,964 |
| Bank of America Corp. | 4.000% | 4/1/24 | 12,625 | 12,925 |
| Bank of America Corp. | 4.200% | 8/26/24 | 14,862 | 14,736 |
| Bank of America Corp. | 4.000% | 1/22/25 | 11,650 | 11,343 |
| Bank of America Corp. | 3.950% | 4/21/25 | 11,500 | 11,102 |
| Bank of America Corp. | 3.875% | 8/1/25 | 11,000 | 11,038 |
| Bank of Montreal | 2.550% | 11/6/22 | 3,661 | 3,555 |
| Bank of New York Mellon Corp. | 4.150% | 2/1/21 | 1,150 | 1,243 |
| Bank of New York Mellon Corp. | 3.550% | 9/23/21 | 5,925 | 6,160 |
| Bank of New York Mellon Corp. | 3.650% | 2/4/24 | 2,300 | 2,348 |
| Bank of New York Mellon Corp. | 3.400% | 5/15/24 | 2,931 | 2,932 |
| Bank of New York Mellon Corp. | 3.250% | 9/11/24 | 3,300 | 3,263 |
| Bank of New York Mellon Corp. | 3.000% | 2/24/25 | 4,700 | 4,547 |
| Bank of Nova Scotia | 4.375% | 1/13/21 | 2,950 | 3,201 |
| Bank of Nova Scotia | 2.800% | 7/21/21 | 4,779 | 4,771 |
| Barclays Bank plc | 5.140% | 10/14/20 | 4,800 | 5,239 |
| Barclays Bank plc | 3.750% | 5/15/24 | 7,675 | 7,695 |
| Barclays plc | 4.375% | 9/11/24 | 3,000 | 2,890 |
| Barclays plc | 3.650% | 3/16/25 | 9,800 | 9,295 |
| BB&T Corp. | 3.950% | 3/22/22 | 2,359 | 2,451 |
| BNP Paribas SA | 5.000% | 1/15/21 | 13,740 | 15,346 |
| BNP Paribas SA | 3.250% | 3/3/23 | 4,750 | 4,758 |
| BNP Paribas SA | 4.250% | 10/15/24 | 4,800 | 4,777 |
| BPCE SA | 4.000% | 4/15/24 | 7,250 | 7,423 |
| Branch Banking & Trust Co. | 2.850% | 4/1/21 | 4,000 | 4,032 |
| Capital One Bank USA NA | 3.375% | 2/15/23 | 6,355 | 6,044 |
| Capital One Financial Corp. | 4.750% | 7/15/21 | 5,754 | 6,154 |
| Capital One Financial Corp. | 3.500% | 6/15/23 | 3,765 | 3,661 |
| Capital One Financial Corp. | 3.750% | 4/24/24 | 1,915 | 1,861 |
| Capital One Financial Corp. | 3.200% | 2/5/25 | 5,050 | 4,688 |
| Capital One NA | 2.950% | 7/23/21 | 6,900 | 6,735 |
| Citigroup Inc. | 5.375% | 8/9/20 | 9,249 | 10,280 |
| Citigroup Inc. | 4.500% | 1/14/22 | 10,075 | 10,785 |
| Citigroup Inc. | 4.050% | 7/30/22 | 4,000 | 4,069 |
| Citigroup Inc. | 3.500% | 5/15/23 | 7,075 | 6,831 |
| Citigroup Inc. | 3.875% | 10/25/23 | 10,650 | 10,889 |
| Citigroup Inc. | 3.750% | 6/16/24 | 8,600 | 8,667 |
| Citigroup Inc. | 4.000% | 8/5/24 | 2,200 | 2,164 |
| Citigroup Inc. | 3.875% | 3/26/25 | 5,350 | 5,163 |
| Citigroup Inc. | 3.300% | 4/27/25 | 6,500 | 6,257 |
| Citigroup Inc. | 4.400% | 6/10/25 | 11,500 | 11,495 |
| City National Corp. | 5.250% | 9/15/20 | 2,050 | 2,319 |
| Comerica Bank | 4.000% | 7/27/25 | 1,375 | 1,377 |
| Compass Bank | 3.875% | 4/10/25 | 2,500 | 2,328 |
| Cooperatieve Centrale Raiffeisen-Boerenleenbank BA | 4.500% | 1/11/21 | 6,840 | 7,454 |
| Cooperatieve Centrale Raiffeisen-Boerenleenbank BA | 3.875% | 2/8/22 | 14,488 | 15,143 |
| Cooperatieve Centrale Raiffeisen-Boerenleenbank BA | 3.950% | 11/9/22 | 6,725 | 6,710 |
32
| Vanguard® Intermediate-Term Corporate Bond Index Fund | ||||
| Schedule of Investments | ||||
| August 31, 2015 | ||||
| Face | Market | |||
| Maturity | Amount | Value | ||
| Coupon | Date | ($000) | ($000) | |
| Cooperatieve Centrale Raiffeisen-Boerenleenbank BA | 4.625% | 12/1/23 | 10,225 | 10,500 |
| Cooperatieve Centrale Raiffeisen-Boerenleenbank BA | 3.375% | 5/21/25 | 5,150 | 5,021 |
| Cooperatieve Centrale Raiffeisen-Boerenleenbank BA | 4.375% | 8/4/25 | 3,000 | 3,010 |
| Credit Suisse | 3.000% | 10/29/21 | 15,700 | 15,637 |
| Credit Suisse | 3.625% | 9/9/24 | 12,950 | 12,852 |
| 1 Credit Suisse Group Funding Guernsey Ltd. | 3.750% | 3/26/25 | 10,050 | 9,724 |
| Deutsche Bank AG | 3.700% | 5/30/24 | 7,208 | 7,136 |
| Deutsche Bank AG | 4.500% | 4/1/25 | 10,125 | 9,807 |
| 2 Deutsche Bank AG | 4.296% | 5/24/28 | 4,350 | 4,114 |
| Discover Bank | 3.200% | 8/9/21 | 3,600 | 3,552 |
| Discover Bank | 4.200% | 8/8/23 | 2,750 | 2,775 |
| Discover Financial Services | 5.200% | 4/27/22 | 225 | 238 |
| Discover Financial Services | 3.850% | 11/21/22 | 3,502 | 3,412 |
| Discover Financial Services | 3.950% | 11/6/24 | 2,600 | 2,500 |
| Discover Financial Services | 3.750% | 3/4/25 | 2,200 | 2,079 |
| Fifth Third Bancorp | 3.500% | 3/15/22 | 2,325 | 2,346 |
| Fifth Third Bancorp | 4.300% | 1/16/24 | 2,965 | 3,029 |
| Fifth Third Bank | 2.875% | 10/1/21 | 3,900 | 3,873 |
| FirstMerit Corp. | 4.350% | 2/4/23 | 1,125 | 1,155 |
| Goldman Sachs Group Inc. | 5.250% | 7/27/21 | 16,870 | 18,723 |
| Goldman Sachs Group Inc. | 5.750% | 1/24/22 | 21,031 | 23,817 |
| Goldman Sachs Group Inc. | 3.625% | 1/22/23 | 11,800 | 11,831 |
| Goldman Sachs Group Inc. | 4.000% | 3/3/24 | 16,250 | 16,550 |
| Goldman Sachs Group Inc. | 3.850% | 7/8/24 | 10,024 | 10,103 |
| Goldman Sachs Group Inc. | 3.500% | 1/23/25 | 15,675 | 15,313 |
| Goldman Sachs Group Inc. | 3.750% | 5/22/25 | 5,125 | 5,102 |
| HSBC Bank plc | 7.650% | 5/1/25 | 250 | 313 |
| HSBC Holdings plc | 5.100% | 4/5/21 | 9,575 | 10,510 |
| HSBC Holdings plc | 4.875% | 1/14/22 | 4,650 | 5,060 |
| HSBC Holdings plc | 4.000% | 3/30/22 | 9,533 | 9,887 |
| HSBC Holdings plc | 4.250% | 3/14/24 | 12,200 | 12,213 |
| HSBC Holdings plc | 4.250% | 8/18/25 | 3,000 | 2,972 |
| HSBC USA Inc. | 5.000% | 9/27/20 | 3,500 | 3,835 |
| HSBC USA Inc. | 3.500% | 6/23/24 | 3,100 | 3,103 |
| Huntington Bancshares Inc. | 7.000% | 12/15/20 | 1,875 | 2,238 |
| Intesa Sanpaolo SPA | 5.250% | 1/12/24 | 4,700 | 5,023 |
| JPMorgan Chase & Co. | 4.250% | 10/15/20 | 10,250 | 10,973 |
| JPMorgan Chase & Co. | 4.625% | 5/10/21 | 11,337 | 12,261 |
| JPMorgan Chase & Co. | 4.350% | 8/15/21 | 13,000 | 13,875 |
| JPMorgan Chase & Co. | 4.500% | 1/24/22 | 14,297 | 15,257 |
| JPMorgan Chase & Co. | 3.250% | 9/23/22 | 15,022 | 14,896 |
| JPMorgan Chase & Co. | 3.200% | 1/25/23 | 13,900 | 13,680 |
| JPMorgan Chase & Co. | 3.375% | 5/1/23 | 7,525 | 7,258 |
| JPMorgan Chase & Co. | 3.875% | 2/1/24 | 7,325 | 7,452 |
| JPMorgan Chase & Co. | 3.625% | 5/13/24 | 10,225 | 10,180 |
| JPMorgan Chase & Co. | 3.875% | 9/10/24 | 15,750 | 15,492 |
| JPMorgan Chase & Co. | 3.125% | 1/23/25 | 10,200 | 9,742 |
| JPMorgan Chase & Co. | 3.900% | 7/15/25 | 11,500 | 11,703 |
| KeyBank NA | 3.300% | 6/1/25 | 2,750 | 2,671 |
| KeyCorp | 5.100% | 3/24/21 | 4,850 | 5,336 |
| Lloyds Bank plc | 6.375% | 1/21/21 | 7,333 | 8,671 |
| Lloyds Bank plc | 3.500% | 5/14/25 | 2,825 | 2,776 |
| Lloyds Banking Group plc | 4.500% | 11/4/24 | 4,900 | 4,953 |
| Manufacturers & Traders Trust Co. | 2.900% | 2/6/25 | 3,800 | 3,585 |
| Morgan Stanley | 5.750% | 1/25/21 | 10,703 | 12,117 |
| Morgan Stanley | 5.500% | 7/28/21 | 10,475 | 11,766 |
| Morgan Stanley | 4.875% | 11/1/22 | 8,500 | 8,967 |
| Morgan Stanley | 3.750% | 2/25/23 | 11,950 | 12,102 |
| Morgan Stanley | 4.100% | 5/22/23 | 11,500 | 11,534 |
| Morgan Stanley | 3.875% | 4/29/24 | 15,000 | 15,221 |
| Morgan Stanley | 3.700% | 10/23/24 | 12,993 | 12,948 |
| Morgan Stanley | 4.000% | 7/23/25 | 13,000 | 13,197 |
| MUFG Americas Holdings Corp. | 3.500% | 6/18/22 | 4,650 | 4,699 |
33
| Vanguard® Intermediate-Term Corporate Bond Index Fund | ||||
| Schedule of Investments | ||||
| August 31, 2015 | ||||
| Face | Market | |||
| Maturity | Amount | Value | ||
| Coupon | Date | ($000) | ($000) | |
| MUFG Americas Holdings Corp. | 3.000% | 2/10/25 | 2,400 | 2,276 |
| National Australia Bank Ltd. | 3.000% | 1/20/23 | 2,575 | 2,569 |
| Northern Trust Corp. | 3.450% | 11/4/20 | 2,125 | 2,220 |
| Northern Trust Corp. | 3.375% | 8/23/21 | 1,750 | 1,815 |
| Northern Trust Corp. | 2.375% | 8/2/22 | 3,475 | 3,348 |
| People's United Bank | 4.000% | 7/15/24 | 1,500 | 1,475 |
| People's United Financial Inc. | 3.650% | 12/6/22 | 2,150 | 2,118 |
| PNC Bank NA | 2.700% | 11/1/22 | 5,425 | 5,194 |
| PNC Bank NA | 2.950% | 1/30/23 | 3,575 | 3,456 |
| PNC Bank NA | 3.800% | 7/25/23 | 2,150 | 2,192 |
| PNC Bank NA | 3.300% | 10/30/24 | 825 | 814 |
| PNC Bank NA | 2.950% | 2/23/25 | 3,250 | 3,111 |
| PNC Bank NA | 3.250% | 6/1/25 | 1,000 | 978 |
| PNC Financial Services Group Inc. | 2.854% | 11/9/22 | 2,165 | 2,128 |
| PNC Financial Services Group Inc. | 3.900% | 4/29/24 | 3,850 | 3,882 |
| PNC Funding Corp. | 3.300% | 3/8/22 | 9,002 | 9,132 |
| Royal Bank of Scotland plc | 6.125% | 1/11/21 | 3,575 | 4,130 |
| Santander Holdings USA Inc. | 4.500% | 7/17/25 | 5,000 | 4,994 |
| State Street Corp. | 4.375% | 3/7/21 | 3,175 | 3,462 |
| State Street Corp. | 3.100% | 5/15/23 | 3,250 | 3,173 |
| State Street Corp. | 3.700% | 11/20/23 | 4,035 | 4,152 |
| State Street Corp. | 3.300% | 12/16/24 | 4,931 | 4,878 |
| State Street Corp. | 3.550% | 8/18/25 | 1,725 | 1,732 |
| Sumitomo Mitsui Banking Corp. | 3.200% | 7/18/22 | 2,640 | 2,630 |
| Sumitomo Mitsui Banking Corp. | 3.000% | 1/18/23 | 775 | 759 |
| Sumitomo Mitsui Banking Corp. | 3.950% | 7/19/23 | 3,100 | 3,262 |
| Sumitomo Mitsui Banking Corp. | 3.950% | 1/10/24 | 3,125 | 3,257 |
| Sumitomo Mitsui Banking Corp. | 3.400% | 7/11/24 | 1,600 | 1,574 |
| Sumitomo Mitsui Banking Corp. | 3.650% | 7/23/25 | 2,500 | 2,522 |
| SunTrust Bank | 2.750% | 5/1/23 | 3,175 | 3,019 |
| SVB Financial Group | 3.500% | 1/29/25 | 3,125 | 3,021 |
| Synchrony Financial | 3.750% | 8/15/21 | 2,600 | 2,572 |
| Synchrony Financial | 4.250% | 8/15/24 | 7,933 | 7,808 |
| Synchrony Financial | 4.500% | 7/23/25 | 5,500 | 5,446 |
| UBS AG | 4.875% | 8/4/20 | 8,452 | 9,350 |
| US Bancorp | 4.125% | 5/24/21 | 3,356 | 3,617 |
| US Bancorp | 3.000% | 3/15/22 | 6,169 | 6,215 |
| US Bancorp | 2.950% | 7/15/22 | 5,948 | 5,834 |
| US Bancorp | 3.700% | 1/30/24 | 2,550 | 2,641 |
| US Bancorp | 3.600% | 9/11/24 | 2,727 | 2,724 |
| US Bank NA | 2.800% | 1/27/25 | 5,800 | 5,574 |
| Wells Fargo & Co. | 3.000% | 1/22/21 | 6,600 | 6,714 |
| Wells Fargo & Co. | 4.600% | 4/1/21 | 10,347 | 11,301 |
| Wells Fargo & Co. | 3.500% | 3/8/22 | 12,135 | 12,445 |
| Wells Fargo & Co. | 3.450% | 2/13/23 | 9,625 | 9,553 |
| Wells Fargo & Co. | 4.125% | 8/15/23 | 6,467 | 6,689 |
| Wells Fargo & Co. | 4.480% | 1/16/24 | 3,450 | 3,593 |
| Wells Fargo & Co. | 3.300% | 9/9/24 | 9,260 | 9,136 |
| Wells Fargo & Co. | 3.000% | 2/19/25 | 11,375 | 10,916 |
| Brokerage (1.3%) | ||||
| Affiliated Managers Group Inc. | 4.250% | 2/15/24 | 4,300 | 4,372 |
| Affiliated Managers Group Inc. | 3.500% | 8/1/25 | 1,125 | 1,075 |
| Ameriprise Financial Inc. | 4.000% | 10/15/23 | 4,450 | 4,605 |
| Ameriprise Financial Inc. | 3.700% | 10/15/24 | 2,675 | 2,709 |
| Apollo Investment Corp. | 5.250% | 3/3/25 | 750 | 741 |
| BlackRock Inc. | 4.250% | 5/24/21 | 3,350 | 3,655 |
| BlackRock Inc. | 3.375% | 6/1/22 | 2,330 | 2,389 |
| BlackRock Inc. | 3.500% | 3/18/24 | 5,108 | 5,182 |
| Brookfield Asset Management Inc. | 4.000% | 1/15/25 | 2,250 | 2,211 |
| Charles Schwab Corp. | 3.225% | 9/1/22 | 1,350 | 1,364 |
| Charles Schwab Corp. | 3.000% | 3/10/25 | 1,000 | 969 |
34
| Vanguard® Intermediate-Term Corporate Bond Index Fund | ||||
| Schedule of Investments | ||||
| August 31, 2015 | ||||
| Face | Market | |||
| Maturity | Amount | Value | ||
| Coupon | Date | ($000) | ($000) | |
| CME Group Inc. | 3.000% | 9/15/22 | 3,575 | 3,543 |
| CME Group Inc. | 3.000% | 3/15/25 | 3,500 | 3,386 |
| Eaton Vance Corp. | 3.625% | 6/15/23 | 1,350 | 1,360 |
| Franklin Resources Inc. | 2.800% | 9/15/22 | 1,400 | 1,382 |
| Franklin Resources Inc. | 2.850% | 3/30/25 | 2,425 | 2,304 |
| Intercontinental Exchange Inc. | 4.000% | 10/15/23 | 3,750 | 3,864 |
| Invesco Finance plc | 3.125% | 11/30/22 | 2,955 | 2,966 |
| Invesco Finance plc | 4.000% | 1/30/24 | 3,000 | 3,114 |
| Janus Capital Group Inc. | 4.875% | 8/1/25 | 1,400 | 1,406 |
| Jefferies Group LLC | 6.875% | 4/15/21 | 3,110 | 3,476 |
| Jefferies Group LLC | 5.125% | 1/20/23 | 2,900 | 2,905 |
| Lazard Group LLC | 4.250% | 11/14/20 | 2,075 | 2,166 |
| Lazard Group LLC | 3.750% | 2/13/25 | 2,100 | 1,985 |
| Legg Mason Inc. | 3.950% | 7/15/24 | 1,175 | 1,184 |
| Leucadia National Corp. | 5.500% | 10/18/23 | 3,500 | 3,524 |
| NASDAQ OMX Group Inc. | 4.250% | 6/1/24 | 2,308 | 2,334 |
| Stifel Financial Corp. | 4.250% | 7/18/24 | 1,525 | 1,511 |
| TD Ameritrade Holding Corp. | 2.950% | 4/1/22 | 3,300 | 3,272 |
| TD Ameritrade Holding Corp. | 3.625% | 4/1/25 | 2,500 | 2,532 |
| Finance Companies (1.7%) | ||||
| Air Lease Corp. | 3.875% | 4/1/21 | 2,325 | 2,348 |
| Air Lease Corp. | 3.750% | 2/1/22 | 2,600 | 2,600 |
| Air Lease Corp. | 4.250% | 9/15/24 | 2,075 | 2,039 |
| Block Financial LLC | 5.500% | 11/1/22 | 2,675 | 2,913 |
| FS Investment Corp. | 4.750% | 5/15/22 | 1,300 | 1,274 |
| GATX Corp. | 4.750% | 6/15/22 | 1,775 | 1,893 |
| GATX Corp. | 3.900% | 3/30/23 | 725 | 728 |
| GATX Corp. | 3.250% | 3/30/25 | 1,800 | 1,709 |
| General Electric Capital Corp. | 4.375% | 9/16/20 | 10,050 | 10,906 |
| General Electric Capital Corp. | 4.625% | 1/7/21 | 11,125 | 12,212 |
| General Electric Capital Corp. | 5.300% | 2/11/21 | 8,766 | 9,887 |
| General Electric Capital Corp. | 4.650% | 10/17/21 | 13,210 | 14,496 |
| General Electric Capital Corp. | 3.150% | 9/7/22 | 9,171 | 9,237 |
| 3 General Electric Capital Corp. | 3.100% | 1/9/23 | 13,544 | 13,531 |
| General Electric Capital Corp. | 3.450% | 5/15/24 | 5,002 | 5,098 |
| HSBC Finance Corp. | 6.676% | 1/15/21 | 13,272 | 15,436 |
| Prospect Capital Corp. | 5.875% | 3/15/23 | 1,150 | 1,154 |
| Insurance (5.1%) | ||||
| ACE INA Holdings Inc. | 2.700% | 3/13/23 | 2,022 | 1,927 |
| ACE INA Holdings Inc. | 3.350% | 5/15/24 | 3,827 | 3,746 |
| ACE INA Holdings Inc. | 3.150% | 3/15/25 | 4,585 | 4,389 |
| AEGON Funding Co. LLC | 5.750% | 12/15/20 | 2,270 | 2,555 |
| Aetna Inc. | 3.950% | 9/1/20 | 3,260 | 3,438 |
| Aetna Inc. | 4.125% | 6/1/21 | 1,650 | 1,730 |
| Aetna Inc. | 2.750% | 11/15/22 | 5,813 | 5,536 |
| Aetna Inc. | 3.500% | 11/15/24 | 3,150 | 3,076 |
| Aflac Inc. | 4.000% | 2/15/22 | 300 | 314 |
| Aflac Inc. | 3.625% | 6/15/23 | 7,100 | 7,143 |
| Aflac Inc. | 3.625% | 11/15/24 | 900 | 897 |
| Aflac Inc. | 3.250% | 3/17/25 | 2,125 | 2,050 |
| Alleghany Corp. | 5.625% | 9/15/20 | 300 | 335 |
| Alleghany Corp. | 4.950% | 6/27/22 | 2,525 | 2,719 |
| Allied World Assurance Co. Ltd. | 5.500% | 11/15/20 | 1,375 | 1,528 |
| Allstate Corp. | 3.150% | 6/15/23 | 2,625 | 2,596 |
| 2 Allstate Corp. | 5.750% | 8/15/53 | 3,775 | 3,902 |
| Alterra Finance LLC | 6.250% | 9/30/20 | 895 | 1,029 |
| American International Group Inc. | 3.375% | 8/15/20 | 5,450 | 5,614 |
| American International Group Inc. | 6.400% | 12/15/20 | 4,774 | 5,591 |
| American International Group Inc. | 4.875% | 6/1/22 | 6,950 | 7,557 |
| American International Group Inc. | 4.125% | 2/15/24 | 6,150 | 6,368 |
| American International Group Inc. | 3.750% | 7/10/25 | 3,000 | 2,994 |
| Anthem Inc. | 3.700% | 8/15/21 | 1,705 | 1,737 |
35
| Vanguard® Intermediate-Term Corporate Bond Index Fund | ||||
| Schedule of Investments | ||||
| August 31, 2015 | ||||
| Face | Market | |||
| Maturity | Amount | Value | ||
| Coupon | Date | ($000) | ($000) | |
| Anthem Inc. | 3.125% | 5/15/22 | 3,850 | 3,716 |
| Anthem Inc. | 3.300% | 1/15/23 | 4,444 | 4,326 |
| Anthem Inc. | 3.500% | 8/15/24 | 4,643 | 4,492 |
| Aon Corp. | 5.000% | 9/30/20 | 1,825 | 2,013 |
| Aon plc | 4.000% | 11/27/23 | 1,875 | 1,906 |
| Aon plc | 3.500% | 6/14/24 | 3,581 | 3,464 |
| Aspen Insurance Holdings Ltd. | 6.000% | 12/15/20 | 100 | 110 |
| Aspen Insurance Holdings Ltd. | 4.650% | 11/15/23 | 2,650 | 2,727 |
| Assurant Inc. | 4.000% | 3/15/23 | 1,800 | 1,808 |
| Assured Guaranty US Holdings Inc. | 5.000% | 7/1/24 | 2,033 | 2,045 |
| Berkshire Hathaway Finance Corp. | 2.900% | 10/15/20 | 2,750 | 2,828 |
| Berkshire Hathaway Finance Corp. | 4.250% | 1/15/21 | 3,449 | 3,752 |
| Berkshire Hathaway Finance Corp. | 3.000% | 5/15/22 | 4,600 | 4,590 |
| Berkshire Hathaway Inc. | 3.750% | 8/15/21 | 4,275 | 4,544 |
| Berkshire Hathaway Inc. | 3.400% | 1/31/22 | 78 | 80 |
| Berkshire Hathaway Inc. | 3.000% | 2/11/23 | 2,925 | 2,903 |
| Brown & Brown Inc. | 4.200% | 9/15/24 | 2,725 | 2,710 |
| Cigna Corp. | 4.375% | 12/15/20 | 430 | 461 |
| Cigna Corp. | 4.500% | 3/15/21 | 2,924 | 3,123 |
| Cigna Corp. | 4.000% | 2/15/22 | 2,665 | 2,736 |
| Cigna Corp. | 3.250% | 4/15/25 | 4,000 | 3,776 |
| CNA Financial Corp. | 5.875% | 8/15/20 | 2,302 | 2,592 |
| CNA Financial Corp. | 5.750% | 8/15/21 | 2,350 | 2,672 |
| CNA Financial Corp. | 3.950% | 5/15/24 | 2,545 | 2,524 |
| Coventry Health Care Inc. | 5.450% | 6/15/21 | 3,700 | 4,120 |
| Fidelity National Financial Inc. | 5.500% | 9/1/22 | 1,475 | 1,566 |
| First American Financial Corp. | 4.300% | 2/1/23 | 725 | 725 |
| First American Financial Corp. | 4.600% | 11/15/24 | 2,200 | 2,214 |
| Hanover Insurance Group Inc. | 6.375% | 6/15/21 | 1,225 | 1,411 |
| Hartford Financial Services Group Inc. | 5.125% | 4/15/22 | 3,313 | 3,656 |
| Humana Inc. | 3.150% | 12/1/22 | 2,169 | 2,113 |
| Humana Inc. | 3.850% | 10/1/24 | 3,350 | 3,356 |
| Infinity Property & Casualty Corp. | 5.000% | 9/19/22 | 575 | 604 |
| Kemper Corp. | 4.350% | 2/15/25 | 1,500 | 1,487 |
| Lincoln National Corp. | 4.850% | 6/24/21 | 800 | 869 |
| Lincoln National Corp. | 4.200% | 3/15/22 | 1,372 | 1,428 |
| Lincoln National Corp. | 4.000% | 9/1/23 | 1,625 | 1,665 |
| Lincoln National Corp. | 3.350% | 3/9/25 | 2,985 | 2,887 |
| Loews Corp. | 2.625% | 5/15/23 | 1,950 | 1,840 |
| Manulife Financial Corp. | 4.900% | 9/17/20 | 2,975 | 3,268 |
| Markel Corp. | 5.350% | 6/1/21 | 405 | 449 |
| Markel Corp. | 4.900% | 7/1/22 | 2,375 | 2,567 |
| Markel Corp. | 3.625% | 3/30/23 | 1,025 | 1,016 |
| Marsh & McLennan Cos. Inc. | 4.800% | 7/15/21 | 2,425 | 2,672 |
| Marsh & McLennan Cos. Inc. | 4.050% | 10/15/23 | 825 | 847 |
| Marsh & McLennan Cos. Inc. | 3.500% | 6/3/24 | 4,075 | 4,010 |
| Marsh & McLennan Cos. Inc. | 3.500% | 3/10/25 | 2,525 | 2,478 |
| MetLife Inc. | 4.750% | 2/8/21 | 3,950 | 4,341 |
| MetLife Inc. | 3.048% | 12/15/22 | 2,275 | 2,237 |
| MetLife Inc. | 4.368% | 9/15/23 | 4,000 | 4,229 |
| MetLife Inc. | 3.600% | 4/10/24 | 5,375 | 5,385 |
| MetLife Inc. | 3.000% | 3/1/25 | 3,200 | 3,051 |
| Montpelier Re Holdings Ltd. | 4.700% | 10/15/22 | 675 | 686 |
| Navigators Group Inc. | 5.750% | 10/15/23 | 1,000 | 1,073 |
| Old Republic International Corp. | 4.875% | 10/1/24 | 1,700 | 1,757 |
| OneBeacon US Holdings Inc. | 4.600% | 11/9/22 | 1,225 | 1,235 |
| Primerica Inc. | 4.750% | 7/15/22 | 750 | 809 |
| Principal Financial Group Inc. | 3.300% | 9/15/22 | 1,325 | 1,310 |
| Principal Financial Group Inc. | 3.125% | 5/15/23 | 1,383 | 1,344 |
| Principal Financial Group Inc. | 3.400% | 5/15/25 | 1,974 | 1,905 |
| ProAssurance Corp. | 5.300% | 11/15/23 | 700 | 747 |
| Progressive Corp. | 3.750% | 8/23/21 | 2,763 | 2,922 |
| Prudential Financial Inc. | 4.500% | 11/15/20 | 2,300 | 2,499 |
| Prudential Financial Inc. | 4.500% | 11/16/21 | 1,830 | 2,001 |
36
| Vanguard® Intermediate-Term Corporate Bond Index Fund | ||||
| Schedule of Investments | ||||
| August 31, 2015 | ||||
| Face | Market | |||
| Maturity | Amount | Value | ||
| Coupon | Date | ($000) | ($000) | |
| Prudential Financial Inc. | 3.500% | 5/15/24 | 3,200 | 3,156 |
| 2 Prudential Financial Inc. | 5.875% | 9/15/42 | 4,650 | 4,917 |
| 2 Prudential Financial Inc. | 5.625% | 6/15/43 | 7,375 | 7,559 |
| 2 Prudential Financial Inc. | 5.200% | 3/15/44 | 2,350 | 2,297 |
| 2 Prudential Financial Inc. | 5.375% | 5/15/45 | 4,100 | 4,049 |
| Reinsurance Group of America Inc. | 5.000% | 6/1/21 | 1,920 | 2,100 |
| Reinsurance Group of America Inc. | 4.700% | 9/15/23 | 1,850 | 1,976 |
| Torchmark Corp. | 3.800% | 9/15/22 | 900 | 904 |
| Travelers Cos. Inc. | 3.900% | 11/1/20 | 1,125 | 1,201 |
| Trinity Acquisition plc | 4.625% | 8/15/23 | 725 | 742 |
| UnitedHealth Group Inc. | 3.875% | 10/15/20 | 1,625 | 1,730 |
| UnitedHealth Group Inc. | 4.700% | 2/15/21 | 2,850 | 3,129 |
| UnitedHealth Group Inc. | 3.375% | 11/15/21 | 2,300 | 2,368 |
| UnitedHealth Group Inc. | 2.875% | 12/15/21 | 3,475 | 3,479 |
| UnitedHealth Group Inc. | 2.875% | 3/15/22 | 4,490 | 4,461 |
| UnitedHealth Group Inc. | 3.350% | 7/15/22 | 4,600 | 4,693 |
| UnitedHealth Group Inc. | 2.750% | 2/15/23 | 2,875 | 2,772 |
| UnitedHealth Group Inc. | 2.875% | 3/15/23 | 3,220 | 3,131 |
| UnitedHealth Group Inc. | 3.750% | 7/15/25 | 9,500 | 9,685 |
| Unum Group | 5.625% | 9/15/20 | 1,325 | 1,476 |
| Unum Group | 4.000% | 3/15/24 | 1,750 | 1,754 |
| Voya Financial Inc. | 5.500% | 7/15/22 | 3,136 | 3,513 |
| Willis Group Holdings plc | 5.750% | 3/15/21 | 2,015 | 2,231 |
| WR Berkley Corp. | 5.375% | 9/15/20 | 1,450 | 1,606 |
| WR Berkley Corp. | 4.625% | 3/15/22 | 1,500 | 1,586 |
| XLIT Ltd. | 5.750% | 10/1/21 | 3,165 | 3,590 |
| XLIT Ltd. | 6.375% | 11/15/24 | 680 | 803 |
| XLIT Ltd. | 4.450% | 3/31/25 | 1,900 | 1,875 |
| Other Finance (0.0%) | ||||
| Jones Lang LaSalle Inc. | 4.400% | 11/15/22 | 925 | 946 |
| Real Estate Investment Trusts (4.9%) | ||||
| Alexandria Real Estate Equities Inc. | 4.600% | 4/1/22 | 2,826 | 2,924 |
| Alexandria Real Estate Equities Inc. | 3.900% | 6/15/23 | 1,400 | 1,393 |
| American Campus Communities Operating Partnership | ||||
| LP | 3.750% | 4/15/23 | 2,000 | 1,942 |
| American Campus Communities Operating Partnership | ||||
| LP | 4.125% | 7/1/24 | 1,900 | 1,887 |
| AvalonBay Communities Inc. | 3.625% | 10/1/20 | 1,900 | 1,975 |
| AvalonBay Communities Inc. | 3.950% | 1/15/21 | 1,000 | 1,056 |
| AvalonBay Communities Inc. | 2.950% | 9/15/22 | 3,114 | 3,053 |
| AvalonBay Communities Inc. | 2.850% | 3/15/23 | 1,200 | 1,142 |
| AvalonBay Communities Inc. | 4.200% | 12/15/23 | 2,300 | 2,414 |
| AvalonBay Communities Inc. | 3.500% | 11/15/24 | 1,400 | 1,390 |
| AvalonBay Communities Inc. | 3.450% | 6/1/25 | 675 | 659 |
| BioMed Realty LP | 4.250% | 7/15/22 | 1,150 | 1,169 |
| Boston Properties LP | 5.625% | 11/15/20 | 3,410 | 3,849 |
| Boston Properties LP | 4.125% | 5/15/21 | 3,075 | 3,239 |
| Boston Properties LP | 3.850% | 2/1/23 | 5,155 | 5,226 |
| Boston Properties LP | 3.125% | 9/1/23 | 1,575 | 1,512 |
| Boston Properties LP | 3.800% | 2/1/24 | 2,211 | 2,224 |
| Brandywine Operating Partnership LP | 3.950% | 2/15/23 | 625 | 614 |
| Brandywine Operating Partnership LP | 4.100% | 10/1/24 | 1,725 | 1,710 |
| Brixmor Operating Partnership LP | 3.875% | 8/15/22 | 2,300 | 2,286 |
| Brixmor Operating Partnership LP | 3.850% | 2/1/25 | 3,275 | 3,122 |
| Camden Property Trust | 4.625% | 6/15/21 | 1,100 | 1,179 |
| Camden Property Trust | 2.950% | 12/15/22 | 1,925 | 1,837 |
| Camden Property Trust | 4.250% | 1/15/24 | 2,000 | 2,065 |
| CBL & Associates LP | 5.250% | 12/1/23 | 3,125 | 3,232 |
| CBL & Associates LP | 4.600% | 10/15/24 | 1,000 | 966 |
| Columbia Property Trust Operating Partnership LP | 4.150% | 4/1/25 | 1,250 | 1,239 |
| Corporate Office Properties LP | 3.700% | 6/15/21 | 1,400 | 1,372 |
| Corporate Office Properties LP | 3.600% | 5/15/23 | 975 | 895 |
37
| Vanguard® Intermediate-Term Corporate Bond Index Fund | ||||
| Schedule of Investments | ||||
| August 31, 2015 | ||||
| Face | Market | |||
| Maturity | Amount | Value | ||
| Coupon | Date | ($000) | ($000) | |
| Corporate Office Properties LP | 5.250% | 2/15/24 | 2,250 | 2,271 |
| CubeSmart LP | 4.800% | 7/15/22 | 575 | 618 |
| CubeSmart LP | 4.375% | 12/15/23 | 1,150 | 1,195 |
| DCT Industrial Operating Partnership LP | 4.500% | 10/15/23 | 1,200 | 1,218 |
| DDR Corp. | 7.875% | 9/1/20 | 2,200 | 2,679 |
| DDR Corp. | 3.500% | 1/15/21 | 2,050 | 2,058 |
| DDR Corp. | 4.625% | 7/15/22 | 2,199 | 2,275 |
| DDR Corp. | 3.375% | 5/15/23 | 1,100 | 1,037 |
| DDR Corp. | 3.625% | 2/1/25 | 2,675 | 2,514 |
| Digital Realty Trust LP | 3.950% | 7/1/22 | 4,400 | 4,394 |
| Digital Realty Trust LP | 3.625% | 10/1/22 | 3,650 | 3,574 |
| Duke Realty LP | 6.750% | 3/15/20 | 675 | 779 |
| Duke Realty LP | 3.875% | 2/15/21 | 1,000 | 1,028 |
| Duke Realty LP | 3.875% | 10/15/22 | 1,650 | 1,656 |
| Duke Realty LP | 3.625% | 4/15/23 | 1,200 | 1,179 |
| Duke Realty LP | 3.750% | 12/1/24 | 1,800 | 1,754 |
| EPR Properties | 5.750% | 8/15/22 | 1,300 | 1,371 |
| EPR Properties | 5.250% | 7/15/23 | 925 | 950 |
| EPR Properties | 4.500% | 4/1/25 | 2,450 | 2,289 |
| Equity Commonwealth | 5.875% | 9/15/20 | 800 | 862 |
| Equity One Inc. | 3.750% | 11/15/22 | 1,100 | 1,094 |
| ERP Operating LP | 4.625% | 12/15/21 | 4,650 | 5,017 |
| ERP Operating LP | 3.000% | 4/15/23 | 2,375 | 2,303 |
| ERP Operating LP | 3.375% | 6/1/25 | 1,300 | 1,266 |
| Essex Portfolio LP | 3.625% | 8/15/22 | 1,300 | 1,311 |
| Essex Portfolio LP | 3.375% | 1/15/23 | 1,996 | 1,972 |
| Essex Portfolio LP | 3.250% | 5/1/23 | 1,075 | 1,037 |
| Essex Portfolio LP | 3.875% | 5/1/24 | 1,600 | 1,599 |
| Essex Portfolio LP | 3.500% | 4/1/25 | 3,800 | 3,652 |
| Excel Trust LP | 4.625% | 5/15/24 | 600 | 575 |
| Federal Realty Investment Trust | 3.000% | 8/1/22 | 575 | 565 |
| Federal Realty Investment Trust | 2.750% | 6/1/23 | 2,925 | 2,786 |
| HCP Inc. | 5.375% | 2/1/21 | 5,633 | 6,170 |
| HCP Inc. | 3.150% | 8/1/22 | 1,525 | 1,464 |
| HCP Inc. | 4.250% | 11/15/23 | 3,800 | 3,791 |
| HCP Inc. | 4.200% | 3/1/24 | 275 | 274 |
| HCP Inc. | 3.400% | 2/1/25 | 5,725 | 5,298 |
| HCP Inc. | 4.000% | 6/1/25 | 3,400 | 3,297 |
| Health Care REIT Inc. | 4.950% | 1/15/21 | 1,760 | 1,915 |
| Health Care REIT Inc. | 5.250% | 1/15/22 | 1,940 | 2,107 |
| Health Care REIT Inc. | 3.750% | 3/15/23 | 3,625 | 3,579 |
| Health Care REIT Inc. | 4.500% | 1/15/24 | 2,125 | 2,187 |
| Health Care REIT Inc. | 4.000% | 6/1/25 | 3,425 | 3,383 |
| Healthcare Realty Trust Inc. | 5.750% | 1/15/21 | 2,025 | 2,240 |
| Healthcare Realty Trust Inc. | 3.750% | 4/15/23 | 1,150 | 1,113 |
| Healthcare Realty Trust Inc. | 3.875% | 5/1/25 | 925 | 895 |
| Healthcare Trust of America Holdings LP | 3.375% | 7/15/21 | 2,525 | 2,511 |
| Healthcare Trust of America Holdings LP | 3.700% | 4/15/23 | 1,875 | 1,825 |
| Highwoods Realty LP | 3.200% | 6/15/21 | 3,334 | 3,284 |
| Highwoods Realty LP | 3.625% | 1/15/23 | 700 | 696 |
| Hospitality Properties Trust | 5.000% | 8/15/22 | 1,736 | 1,812 |
| Hospitality Properties Trust | 4.500% | 6/15/23 | 1,875 | 1,873 |
| Hospitality Properties Trust | 4.650% | 3/15/24 | 2,425 | 2,402 |
| Hospitality Properties Trust | 4.500% | 3/15/25 | 1,175 | 1,150 |
| Host Hotels & Resorts LP | 6.000% | 10/1/21 | 3,100 | 3,529 |
| Host Hotels & Resorts LP | 5.250% | 3/15/22 | 2,297 | 2,467 |
| Host Hotels & Resorts LP | 4.750% | 3/1/23 | 2,691 | 2,799 |
| Host Hotels & Resorts LP | 3.750% | 10/15/23 | 1,940 | 1,879 |
| Host Hotels & Resorts LP | 4.000% | 6/15/25 | 1,100 | 1,068 |
| Kilroy Realty LP | 3.800% | 1/15/23 | 2,375 | 2,340 |
| Kimco Realty Corp. | 3.200% | 5/1/21 | 875 | 875 |
| Kimco Realty Corp. | 3.125% | 6/1/23 | 1,900 | 1,804 |
| Lexington Realty Trust | 4.250% | 6/15/23 | 1,325 | 1,339 |
| Lexington Realty Trust | 4.400% | 6/15/24 | 1,200 | 1,206 |
38
| Vanguard® Intermediate-Term Corporate Bond Index Fund | ||||
| Schedule of Investments | ||||
| August 31, 2015 | ||||
| Face | Market | |||
| Maturity | Amount | Value | ||
| Coupon | Date | ($000) | ($000) | |
| Liberty Property LP | 4.750% | 10/1/20 | 525 | 562 |
| Liberty Property LP | 4.125% | 6/15/22 | 1,765 | 1,804 |
| Liberty Property LP | 3.375% | 6/15/23 | 1,225 | 1,181 |
| Liberty Property LP | 4.400% | 2/15/24 | 2,025 | 2,082 |
| Liberty Property LP | 3.750% | 4/1/25 | 1,975 | 1,906 |
| Mack-Cali Realty LP | 4.500% | 4/18/22 | 2,115 | 2,101 |
| Mack-Cali Realty LP | 3.150% | 5/15/23 | 500 | 439 |
| Mid-America Apartments LP | 4.300% | 10/15/23 | 1,775 | 1,841 |
| Mid-America Apartments LP | 3.750% | 6/15/24 | 1,650 | 1,615 |
| National Retail Properties Inc. | 5.500% | 7/15/21 | 1,600 | 1,793 |
| National Retail Properties Inc. | 3.800% | 10/15/22 | 2,225 | 2,233 |
| National Retail Properties Inc. | 3.900% | 6/15/24 | 2,375 | 2,357 |
| Omega Healthcare Investors Inc. | 6.750% | 10/15/22 | 1,615 | 1,676 |
| Omega Healthcare Investors Inc. | 5.875% | 3/15/24 | 2,000 | 2,120 |
| Omega Healthcare Investors Inc. | 4.950% | 4/1/24 | 1,955 | 2,019 |
| Omega Healthcare Investors Inc. | 4.500% | 1/15/25 | 1,125 | 1,114 |
| Piedmont Operating Partnership LP | 3.400% | 6/1/23 | 700 | 655 |
| Piedmont Operating Partnership LP | 4.450% | 3/15/24 | 2,675 | 2,689 |
| Post Apartment Homes LP | 3.375% | 12/1/22 | 500 | 486 |
| ProLogis LP | 3.350% | 2/1/21 | 1,500 | 1,500 |
| ProLogis LP | 4.250% | 8/15/23 | 3,625 | 3,720 |
| Realty Income Corp. | 5.750% | 1/15/21 | 450 | 504 |
| Realty Income Corp. | 3.250% | 10/15/22 | 2,720 | 2,625 |
| Realty Income Corp. | 4.650% | 8/1/23 | 3,725 | 3,897 |
| Realty Income Corp. | 3.875% | 7/15/24 | 1,900 | 1,886 |
| Regency Centers LP | 4.800% | 4/15/21 | 500 | 543 |
| Regency Centers LP | 3.750% | 6/15/24 | 650 | 648 |
| Retail Opportunity Investments Corp. | 5.000% | 12/15/23 | 1,250 | 1,314 |
| Retail Properties of America Inc. | 4.000% | 3/15/25 | 1,650 | 1,600 |
| Select Income REIT | 4.150% | 2/1/22 | 1,275 | 1,249 |
| Select Income REIT | 4.500% | 2/1/25 | 1,975 | 1,901 |
| Senior Housing Properties Trust | 4.750% | 5/1/24 | 2,575 | 2,556 |
| Simon Property Group LP | 4.375% | 3/1/21 | 4,690 | 5,044 |
| Simon Property Group LP | 4.125% | 12/1/21 | 3,400 | 3,633 |
| Simon Property Group LP | 3.375% | 3/15/22 | 2,679 | 2,752 |
| Simon Property Group LP | 2.750% | 2/1/23 | 1,700 | 1,621 |
| Simon Property Group LP | 3.750% | 2/1/24 | 3,625 | 3,679 |
| Simon Property Group LP | 3.375% | 10/1/24 | 2,775 | 2,728 |
| Simon Property Group LP | 3.500% | 9/1/25 | 1,800 | 1,769 |
| Tanger Properties LP | 3.875% | 12/1/23 | 1,750 | 1,745 |
| Tanger Properties LP | 3.750% | 12/1/24 | 1,000 | 980 |
| UDR Inc. | 3.700% | 10/1/20 | 3,675 | 3,796 |
| UDR Inc. | 4.625% | 1/10/22 | 1,700 | 1,817 |
| UDR Inc. | 3.750% | 7/1/24 | 1,500 | 1,498 |
| Ventas Realty LP | 3.750% | 5/1/24 | 2,800 | 2,720 |
| Ventas Realty LP | 3.500% | 2/1/25 | 5,600 | 5,296 |
| Ventas Realty LP / Ventas Capital Corp. | 4.750% | 6/1/21 | 3,145 | 3,372 |
| Ventas Realty LP / Ventas Capital Corp. | 4.250% | 3/1/22 | 1,295 | 1,333 |
| Ventas Realty LP / Ventas Capital Corp. | 3.250% | 8/15/22 | 1,150 | 1,105 |
| Vornado Realty LP | 5.000% | 1/15/22 | 1,400 | 1,492 |
| Washington REIT | 4.950% | 10/1/20 | 425 | 457 |
| Washington REIT | 3.950% | 10/15/22 | 1,050 | 1,038 |
| Weingarten Realty Investors | 3.375% | 10/15/22 | 600 | 583 |
| Weingarten Realty Investors | 3.500% | 4/15/23 | 2,975 | 2,925 |
| Weingarten Realty Investors | 4.450% | 1/15/24 | 725 | 754 |
| Weingarten Realty Investors | 3.850% | 6/1/25 | 600 | 588 |
| WP Carey Inc. | 4.600% | 4/1/24 | 2,133 | 2,144 |
| WP Carey Inc. | 4.000% | 2/1/25 | 2,050 | 1,980 |
| 1,930,818 | ||||
| Industrial (62.0%) | ||||
| Basic Industry (5.6%) | ||||
| Agrium Inc. | 3.150% | 10/1/22 | 2,893 | 2,824 |
| Agrium Inc. | 3.500% | 6/1/23 | 3,825 | 3,727 |
39
| Vanguard® Intermediate-Term Corporate Bond Index Fund | ||||
| Schedule of Investments | ||||
| August 31, 2015 | ||||
| Face | Market | |||
| Maturity | Amount | Value | ||
| Coupon | Date | ($000) | ($000) | |
| Agrium Inc. | 3.375% | 3/15/25 | 3,100 | 2,918 |
| Air Products & Chemicals Inc. | 3.000% | 11/3/21 | 1,650 | 1,669 |
| Air Products & Chemicals Inc. | 2.750% | 2/3/23 | 1,800 | 1,772 |
| Air Products & Chemicals Inc. | 3.350% | 7/31/24 | 2,075 | 2,072 |
| Airgas Inc. | 2.900% | 11/15/22 | 1,050 | 1,015 |
| Airgas Inc. | 3.650% | 7/15/24 | 1,750 | 1,722 |
| Albemarle Corp. | 4.500% | 12/15/20 | 1,725 | 1,845 |
| Albemarle Corp. | 4.150% | 12/1/24 | 2,925 | 2,880 |
| Barrick Gold Corp. | 3.850% | 4/1/22 | 7,325 | 6,541 |
| Barrick Gold Corp. | 4.100% | 5/1/23 | 8,371 | 7,478 |
| Barrick North America Finance LLC | 4.400% | 5/30/21 | 2,551 | 2,416 |
| BHP Billiton Finance USA Ltd. | 3.250% | 11/21/21 | 5,850 | 5,842 |
| BHP Billiton Finance USA Ltd. | 2.875% | 2/24/22 | 6,305 | 6,077 |
| BHP Billiton Finance USA Ltd. | 3.850% | 9/30/23 | 5,475 | 5,542 |
| Braskem Finance Ltd. | 6.450% | 2/3/24 | 3,200 | 2,896 |
| Cabot Corp. | 3.700% | 7/15/22 | 2,950 | 2,970 |
| Carpenter Technology Corp. | 5.200% | 7/15/21 | 200 | 211 |
| Carpenter Technology Corp. | 4.450% | 3/1/23 | 1,500 | 1,475 |
| Celulosa Arauco y Constitucion SA | 4.750% | 1/11/22 | 3,825 | 3,917 |
| Celulosa Arauco y Constitucion SA | 4.500% | 8/1/24 | 2,100 | 2,118 |
| CF Industries Inc. | 3.450% | 6/1/23 | 3,400 | 3,197 |
| Cytec Industries Inc. | 3.500% | 4/1/23 | 1,081 | 1,071 |
| Domtar Corp. | 4.400% | 4/1/22 | 446 | 454 |
| Dow Chemical Co. | 4.250% | 11/15/20 | 5,350 | 5,657 |
| Dow Chemical Co. | 4.125% | 11/15/21 | 6,448 | 6,715 |
| Dow Chemical Co. | 3.000% | 11/15/22 | 8,226 | 7,959 |
| Dow Chemical Co. | 3.500% | 10/1/24 | 2,825 | 2,717 |
| Eastman Chemical Co. | 4.500% | 1/15/21 | 500 | 544 |
| Eastman Chemical Co. | 3.600% | 8/15/22 | 7,083 | 7,004 |
| Eastman Chemical Co. | 3.800% | 3/15/25 | 3,800 | 3,721 |
| Ecolab Inc. | 4.350% | 12/8/21 | 5,475 | 5,885 |
| EI du Pont de Nemours & Co. | 3.625% | 1/15/21 | 3,325 | 3,490 |
| EI du Pont de Nemours & Co. | 4.250% | 4/1/21 | 2,850 | 3,101 |
| EI du Pont de Nemours & Co. | 2.800% | 2/15/23 | 5,200 | 4,975 |
| Fibria Overseas Finance Ltd. | 5.250% | 5/12/24 | 2,760 | 2,753 |
| FMC Corp. | 3.950% | 2/1/22 | 775 | 780 |
| FMC Corp. | 4.100% | 2/1/24 | 2,400 | 2,432 |
| Freeport-McMoRan Inc. | 4.000% | 11/14/21 | 3,500 | 2,844 |
| Freeport-McMoRan Inc. | 3.550% | 3/1/22 | 11,525 | 8,989 |
| Freeport-McMoRan Inc. | 3.875% | 3/15/23 | 7,980 | 6,145 |
| Freeport-McMoRan Inc. | 4.550% | 11/14/24 | 3,150 | 2,457 |
| Georgia-Pacific LLC | 8.000% | 1/15/24 | 2,113 | 2,718 |
| Goldcorp Inc. | 3.625% | 6/9/21 | 2,900 | 2,769 |
| Goldcorp Inc. | 3.700% | 3/15/23 | 4,700 | 4,316 |
| International Paper Co. | 7.500% | 8/15/21 | 1,740 | 2,107 |
| International Paper Co. | 4.750% | 2/15/22 | 3,102 | 3,314 |
| International Paper Co. | 3.650% | 6/15/24 | 4,750 | 4,657 |
| Kinross Gold Corp. | 5.125% | 9/1/21 | 2,550 | 2,347 |
| Kinross Gold Corp. | 5.950% | 3/15/24 | 2,050 | 1,747 |
| LYB International Finance BV | 4.000% | 7/15/23 | 5,400 | 5,453 |
| LyondellBasell Industries NV | 6.000% | 11/15/21 | 4,575 | 5,187 |
| LyondellBasell Industries NV | 5.750% | 4/15/24 | 2,275 | 2,548 |
| Methanex Corp. | 4.250% | 12/1/24 | 1,250 | 1,226 |
| Monsanto Co. | 2.750% | 7/15/21 | 4,663 | 4,564 |
| Monsanto Co. | 3.375% | 7/15/24 | 5,130 | 4,928 |
| Monsanto Co. | 2.850% | 4/15/25 | 1,650 | 1,510 |
| Monsanto Co. | 5.500% | 8/15/25 | 575 | 640 |
| Mosaic Co. | 3.750% | 11/15/21 | 1,925 | 1,984 |
| Mosaic Co. | 4.250% | 11/15/23 | 6,250 | 6,265 |
| NewMarket Corp. | 4.100% | 12/15/22 | 1,050 | 1,073 |
| Newmont Mining Corp. | 3.500% | 3/15/22 | 6,507 | 5,920 |
| Nucor Corp. | 4.125% | 9/15/22 | 2,841 | 2,904 |
| Nucor Corp. | 4.000% | 8/1/23 | 3,490 | 3,534 |
| Packaging Corp. of America | 3.900% | 6/15/22 | 1,675 | 1,682 |
40
| Vanguard® Intermediate-Term Corporate Bond Index Fund | ||||
| Schedule of Investments | ||||
| August 31, 2015 | ||||
| Face | Market | |||
| Maturity | Amount | Value | ||
| Coupon | Date | ($000) | ($000) | |
| Packaging Corp. of America | 4.500% | 11/1/23 | 5,005 | 5,204 |
| Packaging Corp. of America | 3.650% | 9/15/24 | 1,000 | 978 |
| Plains Exploration & Production Co. | 6.500% | 11/15/20 | 2,138 | 2,010 |
| Plains Exploration & Production Co. | 6.750% | 2/1/22 | 3,064 | 2,834 |
| Plains Exploration & Production Co. | 6.875% | 2/15/23 | 3,009 | 2,738 |
| Plum Creek Timberlands LP | 4.700% | 3/15/21 | 3,000 | 3,217 |
| Potash Corp. of Saskatchewan Inc. | 3.625% | 3/15/24 | 2,590 | 2,596 |
| Potash Corp. of Saskatchewan Inc. | 3.000% | 4/1/25 | 2,750 | 2,572 |
| PPG Industries Inc. | 3.600% | 11/15/20 | 2,602 | 2,731 |
| Praxair Inc. | 4.050% | 3/15/21 | 2,775 | 3,005 |
| Praxair Inc. | 3.000% | 9/1/21 | 3,000 | 3,088 |
| Praxair Inc. | 2.450% | 2/15/22 | 3,900 | 3,772 |
| Praxair Inc. | 2.200% | 8/15/22 | 4,218 | 3,953 |
| Praxair Inc. | 2.650% | 2/5/25 | 500 | 481 |
| Rayonier Inc. | 3.750% | 4/1/22 | 1,750 | 1,714 |
| Reliance Steel & Aluminum Co. | 4.500% | 4/15/23 | 1,675 | 1,615 |
| Rio Tinto Finance USA Ltd. | 3.500% | 11/2/20 | 4,175 | 4,307 |
| Rio Tinto Finance USA Ltd. | 4.125% | 5/20/21 | 4,379 | 4,592 |
| Rio Tinto Finance USA Ltd. | 3.750% | 9/20/21 | 5,250 | 5,322 |
| Rio Tinto Finance USA Ltd. | 3.750% | 6/15/25 | 6,000 | 5,796 |
| Rio Tinto Finance USA plc | 3.500% | 3/22/22 | 4,600 | 4,596 |
| Rio Tinto Finance USA plc | 2.875% | 8/21/22 | 4,081 | 3,892 |
| Rock-Tenn Co. | 4.900% | 3/1/22 | 2,000 | 2,143 |
| Rock-Tenn Co. | 4.000% | 3/1/23 | 2,120 | 2,161 |
| Rockwood Specialties Group Inc. | 4.625% | 10/15/20 | 4,750 | 4,922 |
| RPM International Inc. | 3.450% | 11/15/22 | 1,775 | 1,713 |
| Sherwin-Williams Co. | 3.450% | 8/1/25 | 50 | 50 |
| Sigma-Aldrich Corp. | 3.375% | 11/1/20 | 240 | 252 |
| Southern Copper Corp. | 3.500% | 11/8/22 | 1,200 | 1,141 |
| Southern Copper Corp. | 3.875% | 4/23/25 | 3,300 | 3,136 |
| Syngenta Finance NV | 3.125% | 3/28/22 | 1,700 | 1,692 |
| Teck Resources Ltd. | 4.500% | 1/15/21 | 1,925 | 1,526 |
| Teck Resources Ltd. | 4.750% | 1/15/22 | 1,286 | 1,016 |
| Teck Resources Ltd. | 3.750% | 2/1/23 | 5,100 | 3,819 |
| Vale Overseas Ltd. | 4.625% | 9/15/20 | 4,125 | 4,148 |
| Vale Overseas Ltd. | 4.375% | 1/11/22 | 10,690 | 9,855 |
| Valspar Corp. | 4.200% | 1/15/22 | 2,400 | 2,494 |
| Valspar Corp. | 3.950% | 1/15/26 | 500 | 503 |
| Westlake Chemical Corp. | 3.600% | 7/15/22 | 200 | 198 |
| Weyerhaeuser Co. | 4.625% | 9/15/23 | 2,000 | 2,120 |
| Weyerhaeuser Co. | 8.500% | 1/15/25 | 1,375 | 1,791 |
| Yamana Gold Inc. | 4.950% | 7/15/24 | 2,235 | 2,017 |
| Capital Goods (4.6%) | ||||
| 3M Co. | 2.000% | 6/26/22 | 1,486 | 1,430 |
| 3M Co. | 3.000% | 8/7/25 | 2,300 | 2,291 |
| ABB Finance USA Inc. | 2.875% | 5/8/22 | 5,475 | 5,367 |
| Avery Dennison Corp. | 3.350% | 4/15/23 | 1,150 | 1,111 |
| Bemis Co. Inc. | 4.500% | 10/15/21 | 2,625 | 2,783 |
| Boeing Co. | 8.750% | 8/15/21 | 800 | 1,066 |
| Boeing Co. | 2.350% | 10/30/21 | 3,200 | 3,159 |
| Boeing Co. | 7.950% | 8/15/24 | 1,615 | 2,180 |
| Boeing Co. | 2.850% | 10/30/24 | 3,025 | 2,983 |
| Boeing Co. | 2.500% | 3/1/25 | 500 | 474 |
| Carlisle Cos. Inc. | 3.750% | 11/15/22 | 2,475 | 2,459 |
| Caterpillar Financial Services Corp. | 2.750% | 8/20/21 | 1,000 | 1,004 |
| Caterpillar Financial Services Corp. | 2.850% | 6/1/22 | 2,300 | 2,256 |
| Caterpillar Financial Services Corp. | 2.625% | 3/1/23 | 2,600 | 2,543 |
| Caterpillar Financial Services Corp. | 3.750% | 11/24/23 | 2,600 | 2,668 |
| Caterpillar Financial Services Corp. | 3.300% | 6/9/24 | 2,000 | 1,974 |
| Caterpillar Financial Services Corp. | 3.250% | 12/1/24 | 500 | 497 |
| Caterpillar Inc. | 3.900% | 5/27/21 | 4,003 | 4,268 |
| Caterpillar Inc. | 2.600% | 6/26/22 | 2,300 | 2,233 |
| Caterpillar Inc. | 3.400% | 5/15/24 | 5,100 | 5,110 |
41
| Vanguard® Intermediate-Term Corporate Bond Index Fund | ||||
| Schedule of Investments | ||||
| August 31, 2015 | ||||
| Face | Market | |||
| Maturity | Amount | Value | ||
| Coupon | Date | ($000) | ($000) | |
| Cooper US Inc. | 3.875% | 12/15/20 | 100 | 105 |
| Crane Co. | 4.450% | 12/15/23 | 1,700 | 1,770 |
| CRH America Inc. | 5.750% | 1/15/21 | 1,884 | 2,152 |
| Danaher Corp. | 3.900% | 6/23/21 | 2,650 | 2,838 |
| Deere & Co. | 2.600% | 6/8/22 | 4,600 | 4,487 |
| Dover Corp. | 4.300% | 3/1/21 | 3,250 | 3,588 |
| Eaton Corp. | 2.750% | 11/2/22 | 8,463 | 8,098 |
| Embraer Netherlands BV | 5.050% | 6/15/25 | 3,300 | 3,099 |
| 1 Embraer Overseas Ltd. | 5.696% | 9/16/23 | 5,361 | 5,441 |
| Embraer SA | 5.150% | 6/15/22 | 1,750 | 1,722 |
| Emerson Electric Co. | 4.250% | 11/15/20 | 1,075 | 1,171 |
| Emerson Electric Co. | 2.625% | 12/1/21 | 1,750 | 1,755 |
| Emerson Electric Co. | 2.625% | 2/15/23 | 2,650 | 2,592 |
| Emerson Electric Co. | 3.150% | 6/1/25 | 2,250 | 2,234 |
| Exelis Inc. | 5.550% | 10/1/21 | 2,875 | 3,184 |
| Flowserve Corp. | 3.500% | 9/15/22 | 3,275 | 3,268 |
| Flowserve Corp. | 4.000% | 11/15/23 | 1,075 | 1,090 |
| Fortune Brands Home & Security Inc. | 4.000% | 6/15/25 | 2,200 | 2,199 |
| General Dynamics Corp. | 3.875% | 7/15/21 | 1,800 | 1,927 |
| General Dynamics Corp. | 2.250% | 11/15/22 | 6,465 | 6,123 |
| General Electric Co. | 2.700% | 10/9/22 | 17,100 | 16,716 |
| General Electric Co. | 3.375% | 3/11/24 | 3,533 | 3,580 |
| Harris Corp. | 4.400% | 12/15/20 | 1,200 | 1,277 |
| Harris Corp. | 3.832% | 4/27/25 | 1,750 | 1,688 |
| Honeywell International Inc. | 4.250% | 3/1/21 | 2,167 | 2,395 |
| Honeywell International Inc. | 3.350% | 12/1/23 | 1,900 | 1,956 |
| IDEX Corp. | 4.200% | 12/15/21 | 2,775 | 2,927 |
| Illinois Tool Works Inc. | 3.375% | 9/15/21 | 977 | 1,017 |
| Illinois Tool Works Inc. | 3.500% | 3/1/24 | 3,230 | 3,291 |
| Ingersoll-Rand Global Holding Co. Ltd. | 4.250% | 6/15/23 | 3,900 | 4,000 |
| Ingersoll-Rand Luxembourg Finance SA | 3.550% | 11/1/24 | 2,168 | 2,114 |
| John Deere Capital Corp. | 2.800% | 3/4/21 | 3,600 | 3,633 |
| John Deere Capital Corp. | 3.900% | 7/12/21 | 1,900 | 2,028 |
| John Deere Capital Corp. | 3.150% | 10/15/21 | 3,750 | 3,846 |
| John Deere Capital Corp. | 2.750% | 3/15/22 | 2,150 | 2,118 |
| John Deere Capital Corp. | 2.800% | 1/27/23 | 3,075 | 3,012 |
| John Deere Capital Corp. | 3.350% | 6/12/24 | 800 | 805 |
| Joy Global Inc. | 5.125% | 10/15/21 | 2,550 | 2,509 |
| Kennametal Inc. | 3.875% | 2/15/22 | 1,250 | 1,261 |
| L-3 Communications Corp. | 4.950% | 2/15/21 | 4,500 | 4,748 |
| L-3 Communications Corp. | 3.950% | 5/28/24 | 2,033 | 1,930 |
| Leggett & Platt Inc. | 3.800% | 11/15/24 | 2,300 | 2,329 |
| Legrand France SA | 8.500% | 2/15/25 | 1,835 | 2,460 |
| Lockheed Martin Corp. | 3.350% | 9/15/21 | 5,250 | 5,369 |
| Lockheed Martin Corp. | 2.900% | 3/1/25 | 4,075 | 3,846 |
| Martin Marietta Materials Inc. | 4.250% | 7/2/24 | 1,500 | 1,497 |
| Mohawk Industries Inc. | 3.850% | 2/1/23 | 3,915 | 3,921 |
| Northrop Grumman Corp. | 3.500% | 3/15/21 | 2,225 | 2,278 |
| Northrop Grumman Corp. | 3.250% | 8/1/23 | 2,865 | 2,788 |
| Owens Corning | 4.200% | 12/15/22 | 3,925 | 3,946 |
| Owens Corning | 4.200% | 12/1/24 | 750 | 733 |
| Parker Hannifin Corp. | 3.500% | 9/15/22 | 1,420 | 1,466 |
| Parker-Hannifin Corp. | 3.300% | 11/21/24 | 4,100 | 4,095 |
| Pentair Finance SA | 5.000% | 5/15/21 | 3,220 | 3,529 |
| Pentair Finance SA | 3.150% | 9/15/22 | 1,300 | 1,256 |
| Precision Castparts Corp. | 2.500% | 1/15/23 | 4,750 | 4,529 |
| Precision Castparts Corp. | 3.250% | 6/15/25 | 2,000 | 1,960 |
| Raytheon Co. | 3.125% | 10/15/20 | 4,675 | 4,835 |
| Raytheon Co. | 2.500% | 12/15/22 | 6,500 | 6,283 |
| Republic Services Inc. | 5.250% | 11/15/21 | 4,883 | 5,474 |
| Republic Services Inc. | 3.550% | 6/1/22 | 2,908 | 2,937 |
| Republic Services Inc. | 4.750% | 5/15/23 | 1,670 | 1,830 |
| Republic Services Inc. | 3.200% | 3/15/25 | 3,100 | 2,973 |
| Rockwell Collins Inc. | 3.100% | 11/15/21 | 559 | 568 |
42
| Vanguard® Intermediate-Term Corporate Bond Index Fund | ||||
| Schedule of Investments | ||||
| August 31, 2015 | ||||
| Face | Market | |||
| Maturity | Amount | Value | ||
| Coupon | Date | ($000) | ($000) | |
| Rockwell Collins Inc. | 3.700% | 12/15/23 | 2,290 | 2,362 |
| ROPER TECHNOLOGIES INC. | 3.125% | 11/15/22 | 2,247 | 2,204 |
| Snap-on Inc. | 6.125% | 9/1/21 | 1,410 | 1,650 |
| Sonoco Products Co. | 4.375% | 11/1/21 | 775 | 821 |
| Stanley Black & Decker Inc. | 3.400% | 12/1/21 | 2,175 | 2,237 |
| Stanley Black & Decker Inc. | 2.900% | 11/1/22 | 2,500 | 2,442 |
| Textron Inc. | 3.650% | 3/1/21 | 1,000 | 1,008 |
| Textron Inc. | 4.300% | 3/1/24 | 2,000 | 2,060 |
| Textron Inc. | 3.875% | 3/1/25 | 1,200 | 1,182 |
| Timken CO | 3.875% | 9/1/24 | 1,020 | 1,006 |
| Tyco International Finance SA / Tyco Fire & Security | ||||
| Finance SCA | 6.875% | 1/15/21 | 1,700 | 2,002 |
| United Technologies Corp. | 3.100% | 6/1/22 | 11,054 | 11,064 |
| Waste Management Inc. | 4.600% | 3/1/21 | 1,280 | 1,391 |
| Waste Management Inc. | 2.900% | 9/15/22 | 2,100 | 2,070 |
| Waste Management Inc. | 3.500% | 5/15/24 | 1,450 | 1,458 |
| Waste Management Inc. | 3.125% | 3/1/25 | 3,300 | 3,174 |
| Xylem Inc. | 4.875% | 10/1/21 | 2,350 | 2,554 |
| Communication (8.6%) | ||||
| 21st Century Fox America Inc. | 4.500% | 2/15/21 | 4,350 | 4,611 |
| 21st Century Fox America Inc. | 3.000% | 9/15/22 | 5,910 | 5,736 |
| 21st Century Fox America Inc. | 8.875% | 4/26/23 | 1,000 | 1,317 |
| 21st Century Fox America Inc. | 4.000% | 10/1/23 | 2,250 | 2,290 |
| 21st Century Fox America Inc. | 3.700% | 9/15/24 | 1,150 | 1,130 |
| America Movil SAB de CV | 3.125% | 7/16/22 | 7,662 | 7,481 |
| American Tower Corp. | 5.050% | 9/1/20 | 4,531 | 4,883 |
| American Tower Corp. | 3.450% | 9/15/21 | 2,300 | 2,273 |
| American Tower Corp. | 5.900% | 11/1/21 | 2,374 | 2,649 |
| American Tower Corp. | 4.700% | 3/15/22 | 2,750 | 2,872 |
| American Tower Corp. | 3.500% | 1/31/23 | 6,940 | 6,609 |
| American Tower Corp. | 5.000% | 2/15/24 | 533 | 556 |
| American Tower Corp. | 4.000% | 6/1/25 | 4,875 | 4,727 |
| AT&T Inc. | 4.450% | 5/15/21 | 4,755 | 5,037 |
| AT&T Inc. | 3.875% | 8/15/21 | 7,854 | 8,046 |
| AT&T Inc. | 3.000% | 2/15/22 | 7,049 | 6,786 |
| AT&T Inc. | 3.000% | 6/30/22 | 14,800 | 14,192 |
| AT&T Inc. | 2.625% | 12/1/22 | 8,675 | 8,079 |
| AT&T Inc. | 3.900% | 3/11/24 | 3,500 | 3,501 |
| AT&T Inc. | 3.400% | 5/15/25 | 20,050 | 19,005 |
| CBS Corp. | 4.300% | 2/15/21 | 3,625 | 3,794 |
| CBS Corp. | 3.375% | 3/1/22 | 1,271 | 1,243 |
| CBS Corp. | 3.700% | 8/15/24 | 2,083 | 2,005 |
| CBS Corp. | 3.500% | 1/15/25 | 2,750 | 2,605 |
| CC Holdings GS V LLC / Crown Castle GS III Corp. | 3.849% | 4/15/23 | 6,582 | 6,473 |
| 1 CCO Safari II LLC | 4.464% | 7/23/22 | 13,925 | 13,869 |
| 1 CCO Safari II LLC | 4.908% | 7/23/25 | 20,875 | 20,686 |
| Comcast Cable Communications Holdings Inc. | 9.455% | 11/15/22 | 5,204 | 7,155 |
| Comcast Corp. | 3.125% | 7/15/22 | 4,925 | 4,949 |
| Comcast Corp. | 2.850% | 1/15/23 | 3,450 | 3,377 |
| Comcast Corp. | 3.600% | 3/1/24 | 6,681 | 6,811 |
| Comcast Corp. | 3.375% | 2/15/25 | 3,625 | 3,599 |
| Comcast Corp. | 3.375% | 8/15/25 | 5,425 | 5,375 |
| DIRECTV Holdings LLC / DIRECTV Financing Co. Inc. | 4.600% | 2/15/21 | 4,320 | 4,533 |
| DIRECTV Holdings LLC / DIRECTV Financing Co. Inc. | 5.000% | 3/1/21 | 3,950 | 4,218 |
| DIRECTV Holdings LLC / DIRECTV Financing Co. Inc. | 3.800% | 3/15/22 | 8,535 | 8,455 |
| DIRECTV Holdings LLC / DIRECTV Financing Co. Inc. | 4.450% | 4/1/24 | 6,600 | 6,678 |
| DIRECTV Holdings LLC / DIRECTV Financing Co. Inc. | 3.950% | 1/15/25 | 6,800 | 6,585 |
| Discovery Communications LLC | 4.375% | 6/15/21 | 2,700 | 2,790 |
| Discovery Communications LLC | 3.300% | 5/15/22 | 1,853 | 1,815 |
| Discovery Communications LLC | 3.250% | 4/1/23 | 1,900 | 1,770 |
| Discovery Communications LLC | 3.450% | 3/15/25 | 2,350 | 2,168 |
| Grupo Televisa SAB | 6.625% | 3/18/25 | 2,335 | 2,788 |
43
| Vanguard® Intermediate-Term Corporate Bond Index Fund | ||||
| Schedule of Investments | ||||
| August 31, 2015 | ||||
| Face | Market | |||
| Maturity | Amount | Value | ||
| Coupon | Date | ($000) | ($000) | |
| GTE Corp. | 8.750% | 11/1/21 | 1,175 | 1,513 |
| Historic TW Inc. | 9.150% | 2/1/23 | 1,195 | 1,564 |
| Interpublic Group of Cos. Inc. | 3.750% | 2/15/23 | 1,500 | 1,457 |
| Interpublic Group of Cos. Inc. | 4.200% | 4/15/24 | 4,325 | 4,302 |
| 1 McGraw Hill Financial Inc. | 4.000% | 6/15/25 | 2,875 | 2,772 |
| Moody's Corp. | 5.500% | 9/1/20 | 2,700 | 3,031 |
| Moody's Corp. | 4.500% | 9/1/22 | 1,971 | 2,096 |
| Moody's Corp. | 4.875% | 2/15/24 | 3,425 | 3,567 |
| NBCUniversal Media LLC | 4.375% | 4/1/21 | 7,701 | 8,332 |
| NBCUniversal Media LLC | 2.875% | 1/15/23 | 5,250 | 5,117 |
| Omnicom Group Inc. | 3.625% | 5/1/22 | 8,573 | 8,578 |
| Omnicom Group Inc. | 3.650% | 11/1/24 | 5,483 | 5,331 |
| Orange SA | 4.125% | 9/14/21 | 3,650 | 3,868 |
| Qwest Corp. | 6.750% | 12/1/21 | 5,520 | 5,990 |
| RELX Capital Inc. | 3.125% | 10/15/22 | 4,219 | 4,091 |
| Rogers Communications Inc. | 3.000% | 3/15/23 | 2,750 | 2,612 |
| Rogers Communications Inc. | 4.100% | 10/1/23 | 2,600 | 2,615 |
| Scripps Networks Interactive Inc. | 3.500% | 6/15/22 | 5,200 | 5,085 |
| Scripps Networks Interactive Inc. | 3.900% | 11/15/24 | 1,900 | 1,885 |
| Telefonica Emisiones SAU | 5.462% | 2/16/21 | 7,007 | 7,796 |
| Telefonica Emisiones SAU | 4.570% | 4/27/23 | 1,625 | 1,697 |
| Thomson Reuters Corp. | 3.950% | 9/30/21 | 3,377 | 3,497 |
| Thomson Reuters Corp. | 4.300% | 11/23/23 | 2,000 | 2,058 |
| Thomson Reuters Corp. | 3.850% | 9/29/24 | 2,450 | 2,412 |
| Time Warner Cable Inc. | 4.125% | 2/15/21 | 4,625 | 4,717 |
| Time Warner Cable Inc. | 4.000% | 9/1/21 | 4,516 | 4,514 |
| Time Warner Cos. Inc. | 7.570% | 2/1/24 | 1,720 | 2,086 |
| Time Warner Entertainment Co. LP | 8.375% | 3/15/23 | 3,535 | 4,373 |
| Time Warner Inc. | 4.700% | 1/15/21 | 4,550 | 4,917 |
| Time Warner Inc. | 4.750% | 3/29/21 | 3,150 | 3,391 |
| Time Warner Inc. | 4.000% | 1/15/22 | 2,475 | 2,529 |
| Time Warner Inc. | 3.400% | 6/15/22 | 2,401 | 2,373 |
| Time Warner Inc. | 4.050% | 12/15/23 | 2,675 | 2,700 |
| Time Warner Inc. | 3.550% | 6/1/24 | 4,905 | 4,798 |
| Time Warner Inc. | 3.600% | 7/15/25 | 6,875 | 6,639 |
| Verizon Communications Inc. | 4.500% | 9/15/20 | 19,930 | 21,396 |
| Verizon Communications Inc. | 3.450% | 3/15/21 | 5,475 | 5,595 |
| Verizon Communications Inc. | 4.600% | 4/1/21 | 6,938 | 7,431 |
| Verizon Communications Inc. | 3.000% | 11/1/21 | 7,585 | 7,493 |
| Verizon Communications Inc. | 3.500% | 11/1/21 | 7,968 | 8,070 |
| Verizon Communications Inc. | 2.450% | 11/1/22 | 8,769 | 8,198 |
| Verizon Communications Inc. | 5.150% | 9/15/23 | 38,450 | 42,002 |
| Verizon Communications Inc. | 4.150% | 3/15/24 | 7,508 | 7,641 |
| Verizon Communications Inc. | 3.500% | 11/1/24 | 7,975 | 7,788 |
| Viacom Inc. | 4.500% | 3/1/21 | 1,655 | 1,677 |
| Viacom Inc. | 3.875% | 12/15/21 | 4,325 | 4,200 |
| Viacom Inc. | 3.125% | 6/15/22 | 3,000 | 2,718 |
| Viacom Inc. | 4.250% | 9/1/23 | 3,975 | 3,779 |
| Viacom Inc. | 3.875% | 4/1/24 | 2,325 | 2,156 |
| Vodafone Group plc | 4.375% | 3/16/21 | 3,258 | 3,468 |
| Vodafone Group plc | 2.500% | 9/26/22 | 3,223 | 2,942 |
| Vodafone Group plc | 2.950% | 2/19/23 | 4,988 | 4,698 |
| Walt Disney Co. | 3.750% | 6/1/21 | 1,275 | 1,359 |
| Walt Disney Co. | 2.750% | 8/16/21 | 4,425 | 4,467 |
| Walt Disney Co. | 2.550% | 2/15/22 | 3,000 | 2,962 |
| Walt Disney Co. | 2.350% | 12/1/22 | 3,850 | 3,724 |
| WPP Finance 2010 | 4.750% | 11/21/21 | 1,009 | 1,091 |
| WPP Finance 2010 | 3.625% | 9/7/22 | 3,125 | 3,119 |
| WPP Finance 2010 | 3.750% | 9/19/24 | 3,018 | 2,953 |
| Consumer Cyclical (7.2%) | ||||
| Advance Auto Parts Inc. | 4.500% | 1/15/22 | 1,600 | 1,673 |
| Advance Auto Parts Inc. | 4.500% | 12/1/23 | 1,600 | 1,655 |
44
| Vanguard® Intermediate-Term Corporate Bond Index Fund | ||||
| Schedule of Investments | ||||
| August 31, 2015 | ||||
| Face | Market | |||
| Maturity | Amount | Value | ||
| Coupon | Date | ($000) | ($000) | |
| 1 Alibaba Group Holding Ltd. | 3.125% | 11/28/21 | 6,300 | 6,098 |
| 1 Alibaba Group Holding Ltd. | 3.600% | 11/28/24 | 10,900 | 10,288 |
| Amazon.com Inc. | 3.300% | 12/5/21 | 4,625 | 4,728 |
| Amazon.com Inc. | 2.500% | 11/29/22 | 6,175 | 5,842 |
| Amazon.com Inc. | 3.800% | 12/5/24 | 4,818 | 4,812 |
| AutoZone Inc. | 4.000% | 11/15/20 | 2,484 | 2,619 |
| AutoZone Inc. | 2.500% | 4/15/21 | 525 | 517 |
| AutoZone Inc. | 3.700% | 4/15/22 | 4,855 | 4,945 |
| AutoZone Inc. | 2.875% | 1/15/23 | 1,425 | 1,372 |
| AutoZone Inc. | 3.125% | 7/15/23 | 500 | 488 |
| AutoZone Inc. | 3.250% | 4/15/25 | 1,000 | 965 |
| Bed Bath & Beyond Inc. | 3.749% | 8/1/24 | 1,475 | 1,462 |
| BorgWarner Inc. | 4.625% | 9/15/20 | 75 | 82 |
| BorgWarner Inc. | 3.375% | 3/15/25 | 2,475 | 2,412 |
| Brinker International Inc. | 3.875% | 5/15/23 | 1,450 | 1,399 |
| Carnival Corp. | 3.950% | 10/15/20 | 3,250 | 3,384 |
| CDK Global Incorporated | 4.500% | 10/15/24 | 2,300 | 2,297 |
| Coach Inc. | 4.250% | 4/1/25 | 2,800 | 2,618 |
| Costco Wholesale Corp. | 2.250% | 2/15/22 | 2,000 | 1,936 |
| Cummins Inc. | 3.650% | 10/1/23 | 2,025 | 2,087 |
| CVS Health Corp. | 3.500% | 7/20/22 | 8,900 | 9,084 |
| CVS Health Corp. | 2.750% | 12/1/22 | 6,175 | 5,987 |
| CVS Health Corp. | 4.000% | 12/5/23 | 7,300 | 7,589 |
| CVS Health Corp. | 3.375% | 8/12/24 | 2,515 | 2,469 |
| CVS Health Corp. | 3.875% | 7/20/25 | 13,000 | 13,290 |
| Delphi Corp. | 5.000% | 2/15/23 | 2,600 | 2,704 |
| Delphi Corp. | 4.150% | 3/15/24 | 3,477 | 3,506 |
| Dollar General Corp. | 3.250% | 4/15/23 | 2,800 | 2,659 |
| eBay Inc. | 3.250% | 10/15/20 | 2,300 | 2,306 |
| eBay Inc. | 2.875% | 8/1/21 | 3,600 | 3,453 |
| eBay Inc. | 2.600% | 7/15/22 | 4,075 | 3,688 |
| eBay Inc. | 3.450% | 8/1/24 | 4,115 | 3,794 |
| Expedia Inc. | 5.950% | 8/15/20 | 3,525 | 3,879 |
| Expedia Inc. | 4.500% | 8/15/24 | 2,033 | 2,023 |
| Ford Motor Credit Co. LLC | 5.750% | 2/1/21 | 7,585 | 8,490 |
| Ford Motor Credit Co. LLC | 5.875% | 8/2/21 | 7,677 | 8,621 |
| Ford Motor Credit Co. LLC | 3.219% | 1/9/22 | 5,250 | 5,110 |
| Ford Motor Credit Co. LLC | 4.250% | 9/20/22 | 5,675 | 5,826 |
| Ford Motor Credit Co. LLC | 4.375% | 8/6/23 | 6,325 | 6,465 |
| Ford Motor Credit Co. LLC | 3.664% | 9/8/24 | 500 | 483 |
| Ford Motor Credit Co. LLC | 4.134% | 8/4/25 | 1,950 | 1,930 |
| Gap Inc. | 5.950% | 4/12/21 | 5,672 | 6,289 |
| General Motors Co. | 4.875% | 10/2/23 | 11,435 | 11,707 |
| General Motors Financial Co. Inc. | 4.375% | 9/25/21 | 5,900 | 6,003 |
| General Motors Financial Co. Inc. | 3.450% | 4/10/22 | 2,365 | 2,259 |
| General Motors Financial Co. Inc. | 4.250% | 5/15/23 | 3,400 | 3,345 |
| General Motors Financial Co. Inc. | 4.000% | 1/15/25 | 6,125 | 5,803 |
| General Motors Financial Co. Inc. | 4.300% | 7/13/25 | 3,750 | 3,647 |
| Harley-Davidson Inc. | 3.500% | 7/28/25 | 3,850 | 3,852 |
| Harman International Industries Inc. | 4.150% | 5/15/25 | 1,900 | 1,865 |
| Home Depot Inc. | 3.950% | 9/15/20 | 2,500 | 2,689 |
| Home Depot Inc. | 4.400% | 4/1/21 | 5,063 | 5,523 |
| Home Depot Inc. | 2.625% | 6/1/22 | 3,450 | 3,390 |
| Home Depot Inc. | 2.700% | 4/1/23 | 6,650 | 6,470 |
| Home Depot Inc. | 3.750% | 2/15/24 | 4,075 | 4,241 |
| Hyatt Hotels Corp. | 5.375% | 8/15/21 | 800 | 891 |
| Hyatt Hotels Corp. | 3.375% | 7/15/23 | 1,975 | 1,915 |
| Johnson Controls Inc. | 4.250% | 3/1/21 | 1,864 | 1,940 |
| Johnson Controls Inc. | 3.750% | 12/1/21 | 2,496 | 2,527 |
| Johnson Controls Inc. | 3.625% | 7/2/24 | 1,800 | 1,742 |
| Kohl's Corp. | 4.000% | 11/1/21 | 3,170 | 3,250 |
| Kohl's Corp. | 3.250% | 2/1/23 | 2,825 | 2,670 |
| Kohl's Corp. | 4.250% | 7/17/25 | 2,100 | 2,046 |
| Lowe's Cos. Inc. | 3.750% | 4/15/21 | 1,000 | 1,048 |
45
| Vanguard® Intermediate-Term Corporate Bond Index Fund | ||||
| Schedule of Investments | ||||
| August 31, 2015 | ||||
| Face | Market | |||
| Maturity | Amount | Value | ||
| Coupon | Date | ($000) | ($000) | |
| Lowe's Cos. Inc. | 3.800% | 11/15/21 | 4,649 | 4,880 |
| Lowe's Cos. Inc. | 3.120% | 4/15/22 | 1,800 | 1,811 |
| Lowe's Cos. Inc. | 3.875% | 9/15/23 | 3,216 | 3,354 |
| Lowe's Cos. Inc. | 3.125% | 9/15/24 | 2,325 | 2,286 |
| Macy's Retail Holdings Inc. | 3.875% | 1/15/22 | 3,775 | 3,828 |
| Macy's Retail Holdings Inc. | 2.875% | 2/15/23 | 2,621 | 2,429 |
| Macy's Retail Holdings Inc. | 4.375% | 9/1/23 | 3,050 | 3,114 |
| Macy's Retail Holdings Inc. | 3.625% | 6/1/24 | 2,993 | 2,878 |
| Macy's Retail Holdings Inc. | 6.650% | 7/15/24 | 50 | 59 |
| Magna International Inc. | 3.625% | 6/15/24 | 3,313 | 3,230 |
| Marriott International Inc. | 3.375% | 10/15/20 | 3,975 | 4,077 |
| Marriott International Inc. | 3.125% | 10/15/21 | 650 | 657 |
| Marriott International Inc. | 3.250% | 9/15/22 | 900 | 892 |
| MasterCard Inc. | 3.375% | 4/1/24 | 3,858 | 3,898 |
| McDonald's Corp. | 3.625% | 5/20/21 | 2,071 | 2,184 |
| McDonald's Corp. | 2.625% | 1/15/22 | 2,168 | 2,105 |
| McDonald's Corp. | 3.375% | 5/26/25 | 5,045 | 4,930 |
| NIKE Inc. | 2.250% | 5/1/23 | 1,400 | 1,337 |
| Nordstrom Inc. | 4.000% | 10/15/21 | 2,325 | 2,470 |
| NVR Inc. | 3.950% | 9/15/22 | 2,802 | 2,825 |
| O'Reilly Automotive Inc. | 4.875% | 1/14/21 | 1,735 | 1,884 |
| O'Reilly Automotive Inc. | 4.625% | 9/15/21 | 1,596 | 1,713 |
| O'Reilly Automotive Inc. | 3.800% | 9/1/22 | 1,700 | 1,721 |
| O'Reilly Automotive Inc. | 3.850% | 6/15/23 | 1,375 | 1,398 |
| Priceline Group Inc. | 3.650% | 3/15/25 | 2,300 | 2,220 |
| QVC Inc. | 5.125% | 7/2/22 | 1,925 | 1,926 |
| QVC Inc. | 4.375% | 3/15/23 | 1,800 | 1,718 |
| QVC Inc. | 4.850% | 4/1/24 | 3,683 | 3,530 |
| QVC Inc. | 4.450% | 2/15/25 | 2,250 | 2,126 |
| Ross Stores Inc. | 3.375% | 9/15/24 | 925 | 908 |
| Signet UK Finance plc | 4.700% | 6/15/24 | 1,825 | 1,842 |
| Staples Inc. | 4.375% | 1/12/23 | 2,025 | 2,014 |
| Starbucks Corp. | 2.700% | 6/15/22 | 1,500 | 1,498 |
| Starbucks Corp. | 3.850% | 10/1/23 | 4,400 | 4,633 |
| Starwood Hotels & Resorts Worldwide Inc. | 3.125% | 2/15/23 | 1,625 | 1,523 |
| Starwood Hotels & Resorts Worldwide Inc. | 3.750% | 3/15/25 | 1,500 | 1,465 |
| Target Corp. | 2.900% | 1/15/22 | 2,250 | 2,264 |
| Target Corp. | 3.500% | 7/1/24 | 6,575 | 6,754 |
| TJX Cos. Inc. | 2.750% | 6/15/21 | 3,225 | 3,230 |
| TJX Cos. Inc. | 2.500% | 5/15/23 | 3,125 | 2,982 |
| Toyota Motor Credit Corp. | 4.250% | 1/11/21 | 2,175 | 2,351 |
| Toyota Motor Credit Corp. | 2.750% | 5/17/21 | 2,500 | 2,523 |
| Toyota Motor Credit Corp. | 3.400% | 9/15/21 | 6,600 | 6,818 |
| Toyota Motor Credit Corp. | 3.300% | 1/12/22 | 5,630 | 5,748 |
| Toyota Motor Credit Corp. | 2.800% | 7/13/22 | 1,300 | 1,291 |
| Toyota Motor Credit Corp. | 2.625% | 1/10/23 | 2,854 | 2,765 |
| VF Corp. | 3.500% | 9/1/21 | 2,240 | 2,346 |
| Wal-Mart Stores Inc. | 3.250% | 10/25/20 | 9,158 | 9,601 |
| Wal-Mart Stores Inc. | 4.250% | 4/15/21 | 4,700 | 5,129 |
| Wal-Mart Stores Inc. | 2.550% | 4/11/23 | 8,650 | 8,310 |
| Wal-Mart Stores Inc. | 3.300% | 4/22/24 | 8,944 | 9,021 |
| Walgreen Co. | 3.100% | 9/15/22 | 3,550 | 3,433 |
| Walgreens Boots Alliance Inc. | 3.300% | 11/18/21 | 5,900 | 5,842 |
| Walgreens Boots Alliance Inc. | 3.800% | 11/18/24 | 11,150 | 10,891 |
| Wyndham Worldwide Corp. | 4.250% | 3/1/22 | 3,850 | 3,766 |
| Wyndham Worldwide Corp. | 3.900% | 3/1/23 | 2,450 | 2,321 |
| Yum! Brands Inc. | 3.875% | 11/1/20 | 3,325 | 3,455 |
| Yum! Brands Inc. | 3.750% | 11/1/21 | 900 | 914 |
| Yum! Brands Inc. | 3.875% | 11/1/23 | 400 | 397 |
| Consumer Noncyclical (14.7%) | ||||
| Abbott Laboratories | 2.550% | 3/15/22 | 3,500 | 3,427 |
| Abbott Laboratories | 2.950% | 3/15/25 | 4,500 | 4,335 |
| AbbVie Inc. | 2.900% | 11/6/22 | 14,054 | 13,554 |
46
| Vanguard® Intermediate-Term Corporate Bond Index Fund | ||||
| Schedule of Investments | ||||
| August 31, 2015 | ||||
| Face | Market | |||
| Maturity | Amount | Value | ||
| Coupon | Date | ($000) | ($000) | |
| AbbVie Inc. | 3.200% | 11/6/22 | 4,750 | 4,683 |
| AbbVie Inc. | 3.600% | 5/14/25 | 16,820 | 16,502 |
| Actavis Funding SCS | 3.450% | 3/15/22 | 12,514 | 12,132 |
| Actavis Funding SCS | 3.850% | 6/15/24 | 5,933 | 5,763 |
| Actavis Funding SCS | 3.800% | 3/15/25 | 19,726 | 18,841 |
| Actavis Inc. | 3.250% | 10/1/22 | 8,625 | 8,279 |
| Agilent Technologies Inc. | 3.200% | 10/1/22 | 2,700 | 2,614 |
| Agilent Technologies Inc. | 3.875% | 7/15/23 | 2,900 | 2,902 |
| Allergan Inc. | 3.375% | 9/15/20 | 1,375 | 1,395 |
| Allergan Inc. | 2.800% | 3/15/23 | 3,050 | 2,838 |
| Altria Group Inc. | 4.750% | 5/5/21 | 8,999 | 9,703 |
| Altria Group Inc. | 2.850% | 8/9/22 | 4,012 | 3,852 |
| Altria Group Inc. | 2.950% | 5/2/23 | 3,000 | 2,871 |
| Altria Group Inc. | 4.000% | 1/31/24 | 7,544 | 7,659 |
| AmerisourceBergen Corp. | 3.500% | 11/15/21 | 3,100 | 3,182 |
| AmerisourceBergen Corp. | 3.400% | 5/15/24 | 2,450 | 2,413 |
| AmerisourceBergen Corp. | 3.250% | 3/1/25 | 2,175 | 2,095 |
| Amgen Inc. | 3.450% | 10/1/20 | 3,842 | 3,956 |
| Amgen Inc. | 4.100% | 6/15/21 | 4,425 | 4,653 |
| Amgen Inc. | 3.875% | 11/15/21 | 7,400 | 7,692 |
| Amgen Inc. | 2.700% | 5/1/22 | 1,700 | 1,645 |
| Amgen Inc. | 3.625% | 5/15/22 | 4,725 | 4,742 |
| Amgen Inc. | 3.625% | 5/22/24 | 7,444 | 7,324 |
| Amgen Inc. | 3.125% | 5/1/25 | 3,760 | 3,552 |
| Anheuser-Busch InBev Finance Inc. | 2.625% | 1/17/23 | 10,528 | 10,043 |
| Anheuser-Busch InBev Finance Inc. | 3.700% | 2/1/24 | 6,350 | 6,482 |
| Anheuser-Busch InBev Worldwide Inc. | 4.375% | 2/15/21 | 2,300 | 2,499 |
| Anheuser-Busch InBev Worldwide Inc. | 2.500% | 7/15/22 | 7,563 | 7,273 |
| Archer-Daniels-Midland Co. | 4.479% | 3/1/21 | 3,166 | 3,467 |
| 1 Baxalta Inc. | 3.600% | 6/23/22 | 2,350 | 2,338 |
| 1 Baxalta Inc. | 4.000% | 6/23/25 | 7,950 | 7,896 |
| Beam Suntory Inc. | 3.250% | 5/15/22 | 1,275 | 1,245 |
| Beam Suntory Inc. | 3.250% | 6/15/23 | 1,050 | 1,023 |
| Becton Dickinson & Co. | 3.250% | 11/12/20 | 3,310 | 3,359 |
| Becton Dickinson & Co. | 3.125% | 11/8/21 | 4,550 | 4,489 |
| Becton Dickinson & Co. | 3.734% | 12/15/24 | 7,719 | 7,688 |
| Becton Dickinson and Co. | 3.300% | 3/1/23 | 2,150 | 2,120 |
| Becton Dickinson and Co. | 3.875% | 5/15/24 | 2,100 | 2,119 |
| Bio-Rad Laboratories Inc. | 4.875% | 12/15/20 | 2,650 | 2,849 |
| Boston Scientific Corp. | 3.375% | 5/15/22 | 1,750 | 1,697 |
| Boston Scientific Corp. | 4.125% | 10/1/23 | 2,710 | 2,742 |
| Boston Scientific Corp. | 3.850% | 5/15/25 | 3,500 | 3,359 |
| Bristol-Myers Squibb Co. | 2.000% | 8/1/22 | 3,843 | 3,627 |
| Bristol-Myers Squibb Co. | 7.150% | 6/15/23 | 900 | 1,154 |
| Bristol-Myers Squibb Co. | 3.250% | 11/1/23 | 2,350 | 2,391 |
| Brown-Forman Corp. | 2.250% | 1/15/23 | 1,175 | 1,111 |
| Campbell Soup Co. | 4.250% | 4/15/21 | 2,100 | 2,280 |
| Campbell Soup Co. | 2.500% | 8/2/22 | 2,075 | 1,953 |
| Campbell Soup Co. | 3.300% | 3/19/25 | 1,100 | 1,082 |
| Cardinal Health Inc. | 4.625% | 12/15/20 | 2,625 | 2,838 |
| Cardinal Health Inc. | 3.200% | 6/15/22 | 1,200 | 1,199 |
| Cardinal Health Inc. | 3.200% | 3/15/23 | 4,525 | 4,408 |
| Cardinal Health Inc. | 3.750% | 9/15/25 | 700 | 701 |
| Catholic Health Initiatives Colorado GO | 2.950% | 11/1/22 | 1,800 | 1,757 |
| Celgene Corp. | 3.950% | 10/15/20 | 3,750 | 3,934 |
| Celgene Corp. | 3.250% | 8/15/22 | 2,545 | 2,484 |
| Celgene Corp. | 3.550% | 8/15/22 | 2,000 | 1,999 |
| Celgene Corp. | 4.000% | 8/15/23 | 3,285 | 3,324 |
| Celgene Corp. | 3.625% | 5/15/24 | 7,233 | 7,111 |
| Celgene Corp. | 3.875% | 8/15/25 | 4,000 | 3,974 |
| Church & Dwight Co. Inc. | 2.875% | 10/1/22 | 900 | 879 |
| Clorox Co. | 3.800% | 11/15/21 | 3,288 | 3,453 |
| Clorox Co. | 3.050% | 9/15/22 | 2,100 | 2,062 |
| Clorox Co. | 3.500% | 12/15/24 | 2,233 | 2,204 |
47
| Vanguard® Intermediate-Term Corporate Bond Index Fund | ||||
| Schedule of Investments | ||||
| August 31, 2015 | ||||
| Face | Market | |||
| Maturity | Amount | Value | ||
| Coupon | Date | ($000) | ($000) | |
| Coca-Cola Co. | 2.450% | 11/1/20 | 5,550 | 5,596 |
| Coca-Cola Co. | 3.150% | 11/15/20 | 6,577 | 6,827 |
| Coca-Cola Co. | 3.300% | 9/1/21 | 5,175 | 5,378 |
| Coca-Cola Co. | 2.500% | 4/1/23 | 4,075 | 3,934 |
| Coca-Cola Co. | 3.200% | 11/1/23 | 4,150 | 4,211 |
| Coca-Cola Enterprises Inc. | 3.500% | 9/15/20 | 2,975 | 3,098 |
| Coca-Cola Enterprises Inc. | 3.250% | 8/19/21 | 425 | 441 |
| Coca-Cola Enterprises Inc. | 4.500% | 9/1/21 | 1,500 | 1,657 |
| Coca-Cola Femsa SAB de CV | 3.875% | 11/26/23 | 4,500 | 4,707 |
| Coca-Cola Refreshments USA Inc. | 8.500% | 2/1/22 | 975 | 1,290 |
| Colgate-Palmolive Co. | 2.450% | 11/15/21 | 2,875 | 2,875 |
| Colgate-Palmolive Co. | 2.300% | 5/3/22 | 2,650 | 2,591 |
| Colgate-Palmolive Co. | 1.950% | 2/1/23 | 3,975 | 3,762 |
| Colgate-Palmolive Co. | 2.100% | 5/1/23 | 650 | 619 |
| Colgate-Palmolive Co. | 3.250% | 3/15/24 | 3,253 | 3,342 |
| ConAgra Foods Inc. | 3.250% | 9/15/22 | 1,925 | 1,838 |
| ConAgra Foods Inc. | 3.200% | 1/25/23 | 4,723 | 4,415 |
| Covidien International Finance SA | 3.200% | 6/15/22 | 4,580 | 4,618 |
| Covidien International Finance SA | 2.950% | 6/15/23 | 3,475 | 3,389 |
| CR Bard Inc. | 4.400% | 1/15/21 | 2,245 | 2,410 |
| DENTSPLY International Inc. | 4.125% | 8/15/21 | 1,880 | 1,936 |
| Diageo Capital plc | 2.625% | 4/29/23 | 9,261 | 8,820 |
| Diageo Investment Corp. | 2.875% | 5/11/22 | 4,821 | 4,729 |
| Dignity Health California GO | 3.125% | 11/1/22 | 800 | 795 |
| Dignity Health California GO | 3.812% | 11/1/24 | 2,300 | 2,395 |
| Dr Pepper Snapple Group Inc. | 3.200% | 11/15/21 | 1,475 | 1,500 |
| Dr Pepper Snapple Group Inc. | 2.700% | 11/15/22 | 625 | 601 |
| Eli Lilly & Co. | 2.750% | 6/1/25 | 3,700 | 3,584 |
| Estee Lauder Cos. Inc. | 2.350% | 8/15/22 | 1,000 | 982 |
| Express Scripts Holding Co. | 4.750% | 11/15/21 | 2,650 | 2,832 |
| Express Scripts Holding Co. | 3.900% | 2/15/22 | 4,879 | 4,928 |
| Express Scripts Holding Co. | 3.500% | 6/15/24 | 4,265 | 4,101 |
| Flowers Foods Inc. | 4.375% | 4/1/22 | 2,350 | 2,479 |
| Fomento Economico Mexicano SAB de CV | 2.875% | 5/10/23 | 1,200 | 1,125 |
| General Mills Inc. | 3.150% | 12/15/21 | 3,275 | 3,303 |
| General Mills Inc. | 3.650% | 2/15/24 | 3,911 | 3,978 |
| Gilead Sciences Inc. | 4.500% | 4/1/21 | 4,625 | 4,992 |
| Gilead Sciences Inc. | 4.400% | 12/1/21 | 5,300 | 5,676 |
| Gilead Sciences Inc. | 3.700% | 4/1/24 | 8,794 | 8,927 |
| Gilead Sciences Inc. | 3.500% | 2/1/25 | 9,650 | 9,608 |
| GlaxoSmithKline Capital Inc. | 2.800% | 3/18/23 | 6,075 | 5,924 |
| GlaxoSmithKline Capital plc | 2.850% | 5/8/22 | 8,767 | 8,644 |
| Hasbro Inc. | 3.150% | 5/15/21 | 2,125 | 2,148 |
| Hershey Co. | 4.125% | 12/1/20 | 1,525 | 1,671 |
| Hershey Co. | 2.625% | 5/1/23 | 1,750 | 1,699 |
| Hershey Co. | 3.200% | 8/21/25 | 1,400 | 1,401 |
| Hillshire Brands Co. | 4.100% | 9/15/20 | 1,279 | 1,328 |
| Hormel Foods Corp. | 4.125% | 4/15/21 | 1,100 | 1,209 |
| Ingredion Inc. | 4.625% | 11/1/20 | 2,225 | 2,380 |
| International Flavors & Fragrances Inc. | 3.200% | 5/1/23 | 975 | 960 |
| JM Smucker Co. | 3.500% | 10/15/21 | 4,050 | 4,133 |
| 1 JM Smucker Co. | 3.000% | 3/15/22 | 1,400 | 1,369 |
| 1 JM Smucker Co. | 3.500% | 3/15/25 | 4,500 | 4,342 |
| Johnson & Johnson | 2.950% | 9/1/20 | 2,750 | 2,879 |
| Johnson & Johnson | 3.550% | 5/15/21 | 3,400 | 3,653 |
| Johnson & Johnson | 2.450% | 12/5/21 | 3,000 | 3,032 |
| Johnson & Johnson | 6.730% | 11/15/23 | 50 | 64 |
| Johnson & Johnson | 3.375% | 12/5/23 | 1,900 | 1,988 |
| Kaiser Foundation Hospitals | 3.500% | 4/1/22 | 1,425 | 1,449 |
| Kellogg Co. | 4.000% | 12/15/20 | 4,525 | 4,804 |
| Kellogg Co. | 3.125% | 5/17/22 | 825 | 830 |
| Kimberly-Clark Corp. | 3.875% | 3/1/21 | 1,075 | 1,175 |
| Kimberly-Clark Corp. | 2.400% | 3/1/22 | 2,800 | 2,753 |
48
| Vanguard® Intermediate-Term Corporate Bond Index Fund | ||||
| Schedule of Investments | ||||
| August 31, 2015 | ||||
| Face | Market | |||
| Maturity | Amount | Value | ||
| Coupon | Date | ($000) | ($000) | |
| Kimberly-Clark Corp. | 2.400% | 6/1/23 | 2,275 | 2,184 |
| Kimberly-Clark Corp. | 2.650% | 3/1/25 | 750 | 719 |
| Koninklijke Philips NV | 3.750% | 3/15/22 | 4,312 | 4,264 |
| Kraft Foods Group Inc. | 3.500% | 6/6/22 | 9,856 | 9,948 |
| 1 Kraft Heinz Foods Co. | 3.500% | 7/15/22 | 5,325 | 5,366 |
| 1 Kraft Heinz Foods Co. | 3.950% | 7/15/25 | 7,175 | 7,266 |
| Kroger Co. | 3.300% | 1/15/21 | 3,775 | 3,825 |
| Kroger Co. | 2.950% | 11/1/21 | 2,990 | 2,941 |
| Kroger Co. | 3.400% | 4/15/22 | 1,918 | 1,922 |
| Kroger Co. | 3.850% | 8/1/23 | 3,150 | 3,201 |
| Kroger Co. | 4.000% | 2/1/24 | 1,425 | 1,468 |
| Laboratory Corp. of America Holdings | 4.625% | 11/15/20 | 2,250 | 2,412 |
| Laboratory Corp. of America Holdings | 3.200% | 2/1/22 | 1,730 | 1,691 |
| Laboratory Corp. of America Holdings | 3.750% | 8/23/22 | 950 | 973 |
| Laboratory Corp. of America Holdings | 4.000% | 11/1/23 | 1,425 | 1,456 |
| Laboratory Corp. of America Holdings | 3.600% | 2/1/25 | 4,065 | 3,888 |
| Life Technologies Corp. | 5.000% | 1/15/21 | 1,958 | 2,124 |
| Mattel Inc. | 3.150% | 3/15/23 | 1,350 | 1,328 |
| McCormick & Co. Inc. | 3.900% | 7/15/21 | 275 | 295 |
| McCormick & Co. Inc. | 3.500% | 9/1/23 | 1,200 | 1,249 |
| McKesson Corp. | 4.750% | 3/1/21 | 1,475 | 1,604 |
| McKesson Corp. | 2.700% | 12/15/22 | 2,825 | 2,694 |
| McKesson Corp. | 2.850% | 3/15/23 | 1,250 | 1,191 |
| McKesson Corp. | 3.796% | 3/15/24 | 5,550 | 5,623 |
| Medco Health Solutions Inc. | 4.125% | 9/15/20 | 4,650 | 4,920 |
| Medtronic Inc. | 4.125% | 3/15/21 | 2,500 | 2,714 |
| Medtronic Inc. | 3.125% | 3/15/22 | 2,961 | 2,993 |
| 1 Medtronic Inc. | 3.150% | 3/15/22 | 10,600 | 10,585 |
| Medtronic Inc. | 3.150% | 3/15/22 | 1,000 | 1,001 |
| Medtronic Inc. | 2.750% | 4/1/23 | 6,425 | 6,175 |
| Medtronic Inc. | 3.625% | 3/15/24 | 5,108 | 5,164 |
| 1 Medtronic Inc. | 3.500% | 3/15/25 | 16,245 | 16,122 |
| Merck & Co. Inc. | 3.875% | 1/15/21 | 5,386 | 5,734 |
| Merck & Co. Inc. | 2.350% | 2/10/22 | 6,300 | 6,147 |
| Merck & Co. Inc. | 2.400% | 9/15/22 | 4,800 | 4,617 |
| Merck & Co. Inc. | 2.800% | 5/18/23 | 7,025 | 6,893 |
| Merck & Co. Inc. | 2.750% | 2/10/25 | 12,460 | 11,914 |
| Molson Coors Brewing Co. | 3.500% | 5/1/22 | 1,875 | 1,897 |
| Mondelez International Inc. | 4.000% | 2/1/24 | 7,825 | 8,008 |
| Mylan Inc. | 4.200% | 11/29/23 | 3,050 | 3,059 |
| Newell Rubbermaid Inc. | 4.000% | 6/15/22 | 1,125 | 1,148 |
| Newell Rubbermaid Inc. | 4.000% | 12/1/24 | 4,372 | 4,411 |
| Novartis Capital Corp. | 2.400% | 9/21/22 | 8,935 | 8,661 |
| Novartis Capital Corp. | 3.400% | 5/6/24 | 8,268 | 8,415 |
| Owens & Minor Inc. | 4.375% | 12/15/24 | 2,100 | 2,127 |
| Partners Healthcare System Massachusetts GO | 3.443% | 7/1/21 | 1,225 | 1,282 |
| PepsiCo Inc. | 3.125% | 11/1/20 | 2,945 | 3,043 |
| PepsiCo Inc. | 3.000% | 8/25/21 | 5,450 | 5,549 |
| PepsiCo Inc. | 2.750% | 3/5/22 | 6,590 | 6,499 |
| PepsiCo Inc. | 3.100% | 7/17/22 | 2,450 | 2,475 |
| PepsiCo Inc. | 2.750% | 3/1/23 | 3,425 | 3,353 |
| PepsiCo Inc. | 3.600% | 3/1/24 | 5,350 | 5,462 |
| PepsiCo Inc. | 2.750% | 4/30/25 | 5,925 | 5,594 |
| PepsiCo Inc. | 3.500% | 7/17/25 | 3,500 | 3,510 |
| PerkinElmer Inc. | 5.000% | 11/15/21 | 2,500 | 2,680 |
| Perrigo Co. plc | 4.000% | 11/15/23 | 3,500 | 3,467 |
| Perrigo Finance plc | 3.500% | 12/15/21 | 2,000 | 1,951 |
| Perrigo Finance plc | 3.900% | 12/15/24 | 3,350 | 3,247 |
| Pfizer Inc. | 3.000% | 6/15/23 | 3,650 | 3,604 |
| Pfizer Inc. | 3.400% | 5/15/24 | 3,181 | 3,177 |
| Philip Morris International Inc. | 4.125% | 5/17/21 | 2,870 | 3,084 |
| Philip Morris International Inc. | 2.900% | 11/15/21 | 2,350 | 2,330 |
| Philip Morris International Inc. | 2.500% | 8/22/22 | 3,386 | 3,257 |
| Philip Morris International Inc. | 2.625% | 3/6/23 | 2,750 | 2,634 |
49
| Vanguard® Intermediate-Term Corporate Bond Index Fund | ||||
| Schedule of Investments | ||||
| August 31, 2015 | ||||
| Face | Market | |||
| Maturity | Amount | Value | ||
| Coupon | Date | ($000) | ($000) | |
| Philip Morris International Inc. | 3.600% | 11/15/23 | 3,775 | 3,830 |
| Philip Morris International Inc. | 3.250% | 11/10/24 | 2,900 | 2,849 |
| Philip Morris International Inc. | 3.375% | 8/11/25 | 500 | 497 |
| 2 Procter & Gamble - Esop | 9.360% | 1/1/21 | 1,072 | 1,293 |
| Procter & Gamble Co. | 2.300% | 2/6/22 | 5,635 | 5,551 |
| Procter & Gamble Co. | 3.100% | 8/15/23 | 4,250 | 4,318 |
| Quest Diagnostics Inc. | 4.700% | 4/1/21 | 1,650 | 1,792 |
| Quest Diagnostics Inc. | 4.250% | 4/1/24 | 2,375 | 2,401 |
| Quest Diagnostics Inc. | 3.500% | 3/30/25 | 800 | 755 |
| Reynolds American Inc. | 4.000% | 6/12/22 | 4,890 | 5,006 |
| Reynolds American Inc. | 3.250% | 11/1/22 | 3,665 | 3,556 |
| 1 Reynolds American Inc. | 3.750% | 5/20/23 | 2,225 | 2,160 |
| Reynolds American Inc. | 4.850% | 9/15/23 | 2,650 | 2,782 |
| Reynolds American Inc. | 4.450% | 6/12/25 | 12,160 | 12,456 |
| Sanofi | 4.000% | 3/29/21 | 9,200 | 9,816 |
| St. Jude Medical Inc. | 3.250% | 4/15/23 | 4,550 | 4,399 |
| Stryker Corp. | 3.375% | 5/15/24 | 2,475 | 2,457 |
| Sysco Corp. | 2.600% | 6/12/22 | 1,300 | 1,256 |
| Teva Pharmaceutical Finance Co. BV | 3.650% | 11/10/21 | 4,001 | 3,968 |
| Teva Pharmaceutical Finance Co. BV | 2.950% | 12/18/22 | 4,086 | 3,843 |
| Teva Pharmaceutical Finance IV BV | 3.650% | 11/10/21 | 1,749 | 1,737 |
| Thermo Fisher Scientific Inc. | 4.500% | 3/1/21 | 5,445 | 5,814 |
| Thermo Fisher Scientific Inc. | 3.600% | 8/15/21 | 8,528 | 8,675 |
| Thermo Fisher Scientific Inc. | 3.300% | 2/15/22 | 3,211 | 3,130 |
| Thermo Fisher Scientific Inc. | 3.150% | 1/15/23 | 1,160 | 1,130 |
| Thermo Fisher Scientific Inc. | 4.150% | 2/1/24 | 3,690 | 3,770 |
| Tupperware Brands Corp. | 4.750% | 6/1/21 | 2,200 | 2,277 |
| Tyson Foods Inc. | 4.500% | 6/15/22 | 3,990 | 4,184 |
| Tyson Foods Inc. | 3.950% | 8/15/24 | 7,426 | 7,418 |
| Unilever Capital Corp. | 4.250% | 2/10/21 | 4,813 | 5,271 |
| Unilever Capital Corp. | 3.100% | 7/30/25 | 2,225 | 2,215 |
| Whirlpool Corp. | 4.850% | 6/15/21 | 1,850 | 2,022 |
| Whirlpool Corp. | 4.700% | 6/1/22 | 1,898 | 2,055 |
| Whirlpool Corp. | 3.700% | 3/1/23 | 1,475 | 1,477 |
| Whirlpool Corp. | 3.700% | 5/1/25 | 600 | 592 |
| Wyeth LLC | 6.450% | 2/1/24 | 4,139 | 5,061 |
| Zeneca Wilmington Inc. | 7.000% | 11/15/23 | 1,600 | 2,023 |
| Zimmer Biomet Holdings Inc. | 3.375% | 11/30/21 | 1,650 | 1,664 |
| Zimmer Biomet Holdings Inc. | 3.150% | 4/1/22 | 4,200 | 4,084 |
| Zimmer Biomet Holdings Inc. | 3.550% | 4/1/25 | 9,200 | 8,771 |
| Zoetis Inc. | 3.250% | 2/1/23 | 5,200 | 4,947 |
| Energy (11.2%) | ||||
| Anadarko Petroleum Corp. | 3.450% | 7/15/24 | 2,033 | 1,963 |
| Apache Corp. | 3.625% | 2/1/21 | 3,750 | 3,823 |
| Apache Corp. | 3.250% | 4/15/22 | 5,142 | 4,959 |
| Baker Hughes Inc. | 3.200% | 8/15/21 | 3,050 | 3,037 |
| Boardwalk Pipelines LP | 3.375% | 2/1/23 | 1,700 | 1,481 |
| Boardwalk Pipelines LP | 4.950% | 12/15/24 | 3,050 | 2,854 |
| BP Capital Markets plc | 4.500% | 10/1/20 | 7,990 | 8,703 |
| BP Capital Markets plc | 4.742% | 3/11/21 | 7,795 | 8,558 |
| BP Capital Markets plc | 3.561% | 11/1/21 | 4,586 | 4,716 |
| BP Capital Markets plc | 3.062% | 3/17/22 | 1,700 | 1,687 |
| BP Capital Markets plc | 3.245% | 5/6/22 | 7,604 | 7,550 |
| BP Capital Markets plc | 2.500% | 11/6/22 | 6,675 | 6,310 |
| BP Capital Markets plc | 2.750% | 5/10/23 | 9,325 | 8,824 |
| BP Capital Markets plc | 3.994% | 9/26/23 | 3,775 | 3,872 |
| BP Capital Markets plc | 3.814% | 2/10/24 | 3,469 | 3,479 |
| BP Capital Markets plc | 3.535% | 11/4/24 | 4,225 | 4,134 |
| BP Capital Markets plc | 3.506% | 3/17/25 | 4,272 | 4,191 |
| Buckeye Partners LP | 4.875% | 2/1/21 | 2,783 | 2,815 |
| Buckeye Partners LP | 4.150% | 7/1/23 | 3,071 | 2,835 |
| Cameron International Corp. | 4.500% | 6/1/21 | 350 | 369 |
| Cameron International Corp. | 3.600% | 4/30/22 | 1,150 | 1,152 |
50
| Vanguard® Intermediate-Term Corporate Bond Index Fund | ||||
| Schedule of Investments | ||||
| August 31, 2015 | ||||
| Face | Market | |||
| Maturity | Amount | Value | ||
| Coupon | Date | ($000) | ($000) | |
| Cameron International Corp. | 4.000% | 12/15/23 | 1,400 | 1,423 |
| Cameron International Corp. | 3.700% | 6/15/24 | 1,800 | 1,778 |
| Canadian Natural Resources Ltd. | 3.450% | 11/15/21 | 350 | 340 |
| Canadian Natural Resources Ltd. | 3.800% | 4/15/24 | 5,275 | 4,961 |
| Canadian Natural Resources Ltd. | 3.900% | 2/1/25 | 1,775 | 1,639 |
| Cenovus Energy Inc. | 3.000% | 8/15/22 | 5,050 | 4,585 |
| CenterPoint Energy Resources Corp. | 4.500% | 1/15/21 | 2,800 | 3,002 |
| Chevron Corp. | 2.411% | 3/3/22 | 3,250 | 3,150 |
| Chevron Corp. | 2.355% | 12/5/22 | 6,592 | 6,244 |
| Chevron Corp. | 3.191% | 6/24/23 | 12,725 | 12,739 |
| Cimarex Energy Co. | 5.875% | 5/1/22 | 1,500 | 1,575 |
| Cimarex Energy Co. | 4.375% | 6/1/24 | 4,700 | 4,524 |
| 1 Columbia Pipeline Group Inc. | 4.500% | 6/1/25 | 4,500 | 4,290 |
| ConocoPhillips Co. | 2.875% | 11/15/21 | 3,200 | 3,168 |
| ConocoPhillips Co. | 2.400% | 12/15/22 | 3,950 | 3,667 |
| ConocoPhillips Co. | 3.350% | 11/15/24 | 2,900 | 2,807 |
| ConocoPhillips Co. | 3.350% | 5/15/25 | 1,800 | 1,731 |
| Continental Resources Inc. | 5.000% | 9/15/22 | 11,273 | 10,216 |
| Continental Resources Inc. | 4.500% | 4/15/23 | 8,325 | 7,492 |
| Continental Resources Inc. | 3.800% | 6/1/24 | 2,075 | 1,748 |
| Copano Energy LLC / Copano Energy Finance Corp. | 7.125% | 4/1/21 | 1,673 | 1,748 |
| Devon Energy Corp. | 4.000% | 7/15/21 | 2,845 | 2,900 |
| Devon Energy Corp. | 3.250% | 5/15/22 | 3,762 | 3,624 |
| Diamond Offshore Drilling Inc. | 3.450% | 11/1/23 | 475 | 430 |
| Dominion Gas Holdings LLC | 3.550% | 11/1/23 | 1,725 | 1,716 |
| Dominion Gas Holdings LLC | 3.600% | 12/15/24 | 2,750 | 2,704 |
| El Paso Natural Gas Co. LLC | 8.625% | 1/15/22 | 650 | 790 |
| 1 Enable Midstream Partners LP | 3.900% | 5/15/24 | 2,700 | 2,371 |
| Enbridge Energy Partners LP | 4.200% | 9/15/21 | 3,469 | 3,500 |
| Enbridge Inc. | 4.000% | 10/1/23 | 2,594 | 2,442 |
| Enbridge Inc. | 3.500% | 6/10/24 | 2,406 | 2,167 |
| Encana Corp. | 3.900% | 11/15/21 | 1,640 | 1,536 |
| Energy Transfer Partners LP | 4.150% | 10/1/20 | 5,365 | 5,395 |
| Energy Transfer Partners LP | 4.650% | 6/1/21 | 4,476 | 4,517 |
| Energy Transfer Partners LP | 5.200% | 2/1/22 | 5,425 | 5,450 |
| Energy Transfer Partners LP | 3.600% | 2/1/23 | 3,825 | 3,476 |
| Energy Transfer Partners LP | 7.600% | 2/1/24 | 930 | 1,062 |
| Energy Transfer Partners LP | 4.050% | 3/15/25 | 6,900 | 6,249 |
| EnLink Midstream Partners LP | 4.400% | 4/1/24 | 4,725 | 4,509 |
| EnLink Midstream Partners LP | 4.150% | 6/1/25 | 1,500 | 1,381 |
| Ensco plc | 4.700% | 3/15/21 | 7,200 | 6,594 |
| Ensco plc | 4.500% | 10/1/24 | 4,033 | 3,458 |
| Ensco plc | 5.200% | 3/15/25 | 1,700 | 1,518 |
| Enterprise Products Operating LLC | 5.200% | 9/1/20 | 4,000 | 4,384 |
| Enterprise Products Operating LLC | 4.050% | 2/15/22 | 4,443 | 4,502 |
| Enterprise Products Operating LLC | 3.350% | 3/15/23 | 5,725 | 5,462 |
| Enterprise Products Operating LLC | 3.900% | 2/15/24 | 3,794 | 3,697 |
| Enterprise Products Operating LLC | 3.750% | 2/15/25 | 3,175 | 3,028 |
| EOG Resources Inc. | 4.100% | 2/1/21 | 4,840 | 5,164 |
| EOG Resources Inc. | 2.625% | 3/15/23 | 7,200 | 6,839 |
| EOG Resources Inc. | 3.150% | 4/1/25 | 775 | 752 |
| EQT Corp. | 4.875% | 11/15/21 | 3,425 | 3,546 |
| EQT Midstream Partners LP | 4.000% | 8/1/24 | 1,900 | 1,706 |
| Exxon Mobil Corp. | 2.397% | 3/6/22 | 6,000 | 5,860 |
| Exxon Mobil Corp. | 3.176% | 3/15/24 | 1,581 | 1,597 |
| Exxon Mobil Corp. | 2.709% | 3/6/25 | 8,750 | 8,523 |
| FMC Technologies Inc. | 3.450% | 10/1/22 | 2,575 | 2,396 |
| Gulf South Pipeline Co. LP | 4.000% | 6/15/22 | 750 | 711 |
| Halliburton Co. | 3.250% | 11/15/21 | 2,150 | 2,165 |
| Halliburton Co. | 3.500% | 8/1/23 | 4,975 | 4,902 |
| Hess Corp. | 3.500% | 7/15/24 | 2,000 | 1,853 |
| Husky Energy Inc. | 3.950% | 4/15/22 | 1,779 | 1,733 |
| Husky Energy Inc. | 4.000% | 4/15/24 | 3,668 | 3,484 |
| Kerr-McGee Corp. | 6.950% | 7/1/24 | 4,123 | 4,831 |
51
| Vanguard® Intermediate-Term Corporate Bond Index Fund | ||||
| Schedule of Investments | ||||
| August 31, 2015 | ||||
| Face | Market | |||
| Maturity | Amount | Value | ||
| Coupon | Date | ($000) | ($000) | |
| Kinder Morgan Energy Partners LP | 5.300% | 9/15/20 | 1,500 | 1,599 |
| Kinder Morgan Energy Partners LP | 3.500% | 3/1/21 | 4,400 | 4,192 |
| Kinder Morgan Energy Partners LP | 5.800% | 3/1/21 | 2,650 | 2,796 |
| Kinder Morgan Energy Partners LP | 5.000% | 10/1/21 | 1,950 | 1,994 |
| Kinder Morgan Energy Partners LP | 4.150% | 3/1/22 | 850 | 813 |
| Kinder Morgan Energy Partners LP | 3.950% | 9/1/22 | 4,145 | 3,862 |
| Kinder Morgan Energy Partners LP | 3.450% | 2/15/23 | 2,350 | 2,083 |
| Kinder Morgan Energy Partners LP | 3.500% | 9/1/23 | 2,650 | 2,356 |
| Kinder Morgan Energy Partners LP | 4.150% | 2/1/24 | 6,133 | 5,677 |
| Kinder Morgan Energy Partners LP | 4.300% | 5/1/24 | 2,618 | 2,376 |
| Kinder Morgan Energy Partners LP | 4.250% | 9/1/24 | 3,133 | 2,876 |
| Kinder Morgan Inc. | 6.500% | 9/15/20 | 2,503 | 2,772 |
| Kinder Morgan Inc. | 4.300% | 6/1/25 | 4,800 | 4,419 |
| Magellan Midstream Partners LP | 4.250% | 2/1/21 | 900 | 927 |
| Magellan Midstream Partners LP | 3.200% | 3/15/25 | 2,275 | 2,087 |
| Marathon Oil Corp. | 2.800% | 11/1/22 | 3,606 | 3,258 |
| Marathon Oil Corp. | 3.850% | 6/1/25 | 5,200 | 4,738 |
| Marathon Petroleum Corp. | 5.125% | 3/1/21 | 5,250 | 5,707 |
| Marathon Petroleum Corp. | 3.625% | 9/15/24 | 2,899 | 2,793 |
| MPLX LP | 4.000% | 2/15/25 | 2,000 | 1,849 |
| Murphy Oil Corp. | 4.000% | 6/1/22 | 311 | 271 |
| Murphy Oil Corp. | 3.700% | 12/1/22 | 4,900 | 4,159 |
| Nabors Industries Inc. | 5.000% | 9/15/20 | 2,500 | 2,502 |
| Nabors Industries Inc. | 4.625% | 9/15/21 | 3,075 | 2,901 |
| Nabors Industries Inc. | 5.100% | 9/15/23 | 2,225 | 2,106 |
| National Fuel Gas Co. | 4.900% | 12/1/21 | 1,475 | 1,537 |
| National Fuel Gas Co. | 3.750% | 3/1/23 | 3,075 | 2,869 |
| National Fuel Gas Co. | 5.200% | 7/15/25 | 1,000 | 996 |
| National Oilwell Varco Inc. | 2.600% | 12/1/22 | 8,011 | 7,267 |
| Noble Energy Inc. | 4.150% | 12/15/21 | 8,836 | 8,774 |
| Noble Energy Inc. | 5.875% | 6/1/24 | 4,500 | 4,533 |
| Noble Energy Inc. | 3.900% | 11/15/24 | 27 | 25 |
| Noble Holding International Ltd. | 4.625% | 3/1/21 | 2,275 | 1,970 |
| Noble Holding International Ltd. | 3.950% | 3/15/22 | 2,100 | 1,706 |
| Noble Holding International Ltd. | 5.950% | 4/1/25 | 1,775 | 1,567 |
| Occidental Petroleum Corp. | 4.100% | 2/1/21 | 7,665 | 8,155 |
| Occidental Petroleum Corp. | 3.125% | 2/15/22 | 3,600 | 3,561 |
| Occidental Petroleum Corp. | 2.700% | 2/15/23 | 3,020 | 2,854 |
| Occidental Petroleum Corp. | 3.500% | 6/15/25 | 4,500 | 4,483 |
| Oceaneering International Inc. | 4.650% | 11/15/24 | 2,300 | 2,182 |
| ONEOK Partners LP | 3.375% | 10/1/22 | 3,080 | 2,733 |
| ONEOK Partners LP | 5.000% | 9/15/23 | 1,450 | 1,402 |
| ONEOK Partners LP | 4.900% | 3/15/25 | 2,650 | 2,489 |
| Petro-Canada | 9.250% | 10/15/21 | 2,575 | 3,430 |
| Phillips 66 | 4.300% | 4/1/22 | 10,100 | 10,514 |
| Phillips 66 Partners LP | 3.605% | 2/15/25 | 2,118 | 1,895 |
| Pioneer Natural Resources Co. | 3.950% | 7/15/22 | 1,965 | 1,917 |
| Plains All American Pipeline LP / PAA Finance Corp. | 5.000% | 2/1/21 | 2,789 | 2,947 |
| Plains All American Pipeline LP / PAA Finance Corp. | 3.650% | 6/1/22 | 1,650 | 1,600 |
| Plains All American Pipeline LP / PAA Finance Corp. | 2.850% | 1/31/23 | 1,400 | 1,265 |
| Plains All American Pipeline LP / PAA Finance Corp. | 3.850% | 10/15/23 | 6,348 | 6,064 |
| Plains All American Pipeline LP / PAA Finance Corp. | 3.600% | 11/1/24 | 3,774 | 3,504 |
| Regency Energy Partners LP / Regency Energy Finance | ||||
| Corp. | 5.750% | 9/1/20 | 4,000 | 4,260 |
| Regency Energy Partners LP / Regency Energy Finance | ||||
| Corp. | 6.500% | 7/15/21 | 330 | 341 |
| Regency Energy Partners LP / Regency Energy Finance | ||||
| Corp. | 5.875% | 3/1/22 | 3,350 | 3,451 |
| Regency Energy Partners LP / Regency Energy Finance | ||||
| Corp. | 5.000% | 10/1/22 | 3,250 | 3,189 |
| Regency Energy Partners LP / Regency Energy Finance | ||||
| Corp. | 5.500% | 4/15/23 | 3,650 | 3,550 |
52
| Vanguard® Intermediate-Term Corporate Bond Index Fund | ||||
| Schedule of Investments | ||||
| August 31, 2015 | ||||
| Face | Market | |||
| Maturity | Amount | Value | ||
| Coupon | Date | ($000) | ($000) | |
| Regency Energy Partners LP / Regency Energy Finance | ||||
| Corp. | 4.500% | 11/1/23 | 3,110 | 2,877 |
| Rowan Cos. Inc. | 4.875% | 6/1/22 | 3,661 | 3,218 |
| Rowan Cos. Inc. | 4.750% | 1/15/24 | 1,400 | 1,190 |
| Sasol Financing International plc | 4.500% | 11/14/22 | 3,300 | 3,251 |
| Schlumberger Investment SA | 3.650% | 12/1/23 | 9,063 | 9,228 |
| SESI LLC | 7.125% | 12/15/21 | 3,450 | 3,441 |
| Shell International Finance BV | 2.375% | 8/21/22 | 3,100 | 2,965 |
| Shell International Finance BV | 2.250% | 1/6/23 | 5,356 | 5,051 |
| Shell International Finance BV | 3.400% | 8/12/23 | 4,525 | 4,546 |
| Shell International Finance BV | 3.250% | 5/11/25 | 13,400 | 13,141 |
| Southern Natural Gas Co. LLC / Southern Natural | ||||
| Issuing Corp. | 4.400% | 6/15/21 | 3,300 | 3,376 |
| Southwestern Energy Co. | 4.100% | 3/15/22 | 5,113 | 4,642 |
| Southwestern Energy Co. | 4.950% | 1/23/25 | 5,350 | 4,910 |
| Spectra Energy Capital LLC | 3.300% | 3/15/23 | 3,425 | 3,031 |
| Spectra Energy Partners LP | 4.600% | 6/15/21 | 850 | 885 |
| Spectra Energy Partners LP | 4.750% | 3/15/24 | 5,650 | 5,780 |
| Spectra Energy Partners LP | 3.500% | 3/15/25 | 1,650 | 1,528 |
| Suncor Energy Inc. | 3.600% | 12/1/24 | 2,961 | 2,912 |
| Sunoco Logistics Partners Operations LP | 4.650% | 2/15/22 | 1,650 | 1,626 |
| Sunoco Logistics Partners Operations LP | 3.450% | 1/15/23 | 445 | 399 |
| Sunoco Logistics Partners Operations LP | 4.250% | 4/1/24 | 3,200 | 2,980 |
| Talisman Energy Inc. | 3.750% | 2/1/21 | 3,195 | 3,070 |
| TC Pipelines LP | 4.650% | 6/15/21 | 1,478 | 1,531 |
| Total Capital Canada Ltd. | 2.750% | 7/15/23 | 2,925 | 2,771 |
| Total Capital International SA | 2.750% | 6/19/21 | 6,750 | 6,781 |
| Total Capital International SA | 2.875% | 2/17/22 | 4,746 | 4,666 |
| Total Capital International SA | 2.700% | 1/25/23 | 6,000 | 5,729 |
| Total Capital International SA | 3.700% | 1/15/24 | 4,563 | 4,627 |
| Total Capital International SA | 3.750% | 4/10/24 | 6,883 | 6,997 |
| Total Capital SA | 4.125% | 1/28/21 | 2,475 | 2,658 |
| TransCanada PipeLines Ltd. | 3.800% | 10/1/20 | 5,367 | 5,664 |
| TransCanada PipeLines Ltd. | 2.500% | 8/1/22 | 4,836 | 4,527 |
| TransCanada PipeLines Ltd. | 3.750% | 10/16/23 | 4,950 | 4,863 |
| Valero Energy Corp. | 3.650% | 3/15/25 | 2,500 | 2,400 |
| Weatherford International Ltd. | 5.125% | 9/15/20 | 3,800 | 3,391 |
| Weatherford International Ltd. | 4.500% | 4/15/22 | 2,025 | 1,702 |
| Western Gas Partners LP | 5.375% | 6/1/21 | 2,482 | 2,629 |
| Western Gas Partners LP | 4.000% | 7/1/22 | 2,856 | 2,770 |
| Western Gas Partners LP | 3.950% | 6/1/25 | 2,300 | 2,155 |
| Williams Cos. Inc. | 7.875% | 9/1/21 | 1,063 | 1,205 |
| Williams Cos. Inc. | 3.700% | 1/15/23 | 4,803 | 4,162 |
| Williams Cos. Inc. | 4.550% | 6/24/24 | 5,750 | 5,126 |
| Williams Partners LP | 4.125% | 11/15/20 | 2,907 | 2,955 |
| Williams Partners LP | 4.000% | 11/15/21 | 2,236 | 2,178 |
| Williams Partners LP | 3.600% | 3/15/22 | 6,600 | 6,238 |
| Williams Partners LP | 3.350% | 8/15/22 | 4,125 | 3,822 |
| Williams Partners LP | 4.500% | 11/15/23 | 2,200 | 2,133 |
| Williams Partners LP | 4.300% | 3/4/24 | 4,300 | 4,019 |
| Williams Partners LP | 3.900% | 1/15/25 | 3,815 | 3,390 |
| Williams Partners LP / ACMP Finance Corp. | 4.875% | 5/15/23 | 6,625 | 6,244 |
| Williams Partners LP / ACMP Finance Corp. | 4.875% | 3/15/24 | 4,610 | 4,333 |
| Other Industrial (0.3%) | ||||
| CBRE Services Inc. | 5.000% | 3/15/23 | 1,500 | 1,509 |
| CBRE Services Inc. | 5.250% | 3/15/25 | 3,200 | 3,240 |
| Cintas Corp. No 2 | 4.300% | 6/1/21 | 700 | 755 |
| Cintas Corp. No 2 | 3.250% | 6/1/22 | 1,300 | 1,315 |
| Fluor Corp. | 3.375% | 9/15/21 | 3,180 | 3,297 |
| Fluor Corp. | 3.500% | 12/15/24 | 2,475 | 2,521 |
| Howard Hughes Medical Institute Revenue | 3.500% | 9/1/23 | 5,625 | 5,806 |
| Technology (7.6%) | ||||
| Adobe Systems Inc. | 3.250% | 2/1/25 | 4,445 | 4,255 |
53
| Vanguard® Intermediate-Term Corporate Bond Index Fund | ||||
| Schedule of Investments | ||||
| August 31, 2015 | ||||
| Face | Market | |||
| Maturity | Amount | Value | ||
| Coupon | Date | ($000) | ($000) | |
| Altera Corp. | 4.100% | 11/15/23 | 3,050 | 3,218 |
| Amphenol Corp. | 3.125% | 9/15/21 | 1,500 | 1,485 |
| Amphenol Corp. | 4.000% | 2/1/22 | 2,400 | 2,472 |
| Analog Devices Inc. | 2.875% | 6/1/23 | 2,050 | 1,974 |
| Apple Inc. | 2.850% | 5/6/21 | 10,425 | 10,574 |
| Apple Inc. | 2.150% | 2/9/22 | 6,425 | 6,168 |
| Apple Inc. | 2.700% | 5/13/22 | 6,800 | 6,704 |
| Apple Inc. | 2.400% | 5/3/23 | 27,200 | 25,955 |
| Apple Inc. | 3.450% | 5/6/24 | 12,100 | 12,277 |
| Apple Inc. | 2.500% | 2/9/25 | 9,047 | 8,482 |
| Apple Inc. | 3.200% | 5/13/25 | 6,200 | 6,162 |
| Applied Materials Inc. | 4.300% | 6/15/21 | 4,600 | 4,871 |
| Arrow Electronics Inc. | 5.125% | 3/1/21 | 300 | 325 |
| Arrow Electronics Inc. | 3.500% | 4/1/22 | 1,600 | 1,561 |
| Arrow Electronics Inc. | 4.500% | 3/1/23 | 1,566 | 1,590 |
| Arrow Electronics Inc. | 4.000% | 4/1/25 | 2,400 | 2,341 |
| Autodesk Inc. | 3.600% | 12/15/22 | 1,568 | 1,546 |
| Autodesk Inc. | 4.375% | 6/15/25 | 1,300 | 1,301 |
| Avnet Inc. | 4.875% | 12/1/22 | 1,050 | 1,083 |
| Baidu Inc. | 3.500% | 11/28/22 | 3,102 | 3,056 |
| Baidu Inc. | 4.125% | 6/30/25 | 2,250 | 2,213 |
| Broadcom Corp. | 2.500% | 8/15/22 | 2,650 | 2,586 |
| Broadcom Corp. | 3.500% | 8/1/24 | 1,700 | 1,655 |
| Broadridge Financial Solutions Inc. | 3.950% | 9/1/20 | 1,150 | 1,204 |
| CA Inc. | 3.600% | 8/1/20 | 2,200 | 2,207 |
| CA Inc. | 4.500% | 8/15/23 | 900 | 914 |
| Cadence Design Systems Inc. | 4.375% | 10/15/24 | 1,575 | 1,601 |
| Cisco Systems Inc. | 2.900% | 3/4/21 | 2,600 | 2,644 |
| Cisco Systems Inc. | 3.625% | 3/4/24 | 4,858 | 5,031 |
| Cisco Systems Inc. | 3.500% | 6/15/25 | 2,275 | 2,302 |
| Computer Sciences Corp. | 4.450% | 9/15/22 | 1,500 | 1,534 |
| Corning Inc. | 4.250% | 8/15/20 | 1,175 | 1,270 |
| Corning Inc. | 2.900% | 5/15/22 | 4,000 | 3,972 |
| Corning Inc. | 3.700% | 11/15/23 | 1,300 | 1,334 |
| Dun & Bradstreet Corp. | 4.375% | 12/1/22 | 1,650 | 1,625 |
| EMC Corp. | 3.375% | 6/1/23 | 3,187 | 3,110 |
| Equifax Inc. | 3.300% | 12/15/22 | 1,750 | 1,751 |
| Fidelity National Information Services Inc. | 5.000% | 3/15/22 | 4,069 | 4,232 |
| Fidelity National Information Services Inc. | 3.500% | 4/15/23 | 6,175 | 5,730 |
| Fidelity National Information Services Inc. | 3.875% | 6/5/24 | 2,833 | 2,641 |
| Fiserv Inc. | 4.625% | 10/1/20 | 2,175 | 2,370 |
| Fiserv Inc. | 3.500% | 10/1/22 | 5,592 | 5,566 |
| Fiserv Inc. | 3.850% | 6/1/25 | 3,400 | 3,358 |
| 1 Flextronics International Ltd. | 4.750% | 6/15/25 | 4,750 | 4,621 |
| Google Inc. | 3.625% | 5/19/21 | 4,295 | 4,535 |
| Google Inc. | 3.375% | 2/25/24 | 3,625 | 3,687 |
| Hewlett-Packard Co. | 3.750% | 12/1/20 | 5,350 | 5,512 |
| Hewlett-Packard Co. | 4.300% | 6/1/21 | 5,970 | 6,214 |
| Hewlett-Packard Co. | 4.375% | 9/15/21 | 3,825 | 3,974 |
| Hewlett-Packard Co. | 4.650% | 12/9/21 | 5,699 | 6,016 |
| Hewlett-Packard Co. | 4.050% | 9/15/22 | 2,900 | 2,926 |
| Ingram Micro Inc. | 4.950% | 12/15/24 | 3,808 | 3,918 |
| Intel Corp. | 3.300% | 10/1/21 | 10,862 | 11,152 |
| Intel Corp. | 3.100% | 7/29/22 | 4,500 | 4,524 |
| Intel Corp. | 2.700% | 12/15/22 | 5,175 | 5,010 |
| Intel Corp. | 3.700% | 7/29/25 | 10,000 | 10,095 |
| International Business Machines Corp. | 2.900% | 11/1/21 | 3,850 | 3,894 |
| International Business Machines Corp. | 1.875% | 8/1/22 | 3,450 | 3,244 |
| International Business Machines Corp. | 3.375% | 8/1/23 | 5,150 | 5,139 |
| International Business Machines Corp. | 3.625% | 2/12/24 | 8,925 | 9,035 |
| Jabil Circuit Inc. | 5.625% | 12/15/20 | 1,775 | 1,899 |
| Jabil Circuit Inc. | 4.700% | 9/15/22 | 1,125 | 1,122 |
| Juniper Networks Inc. | 4.600% | 3/15/21 | 1,780 | 1,868 |
| Juniper Networks Inc. | 4.500% | 3/15/24 | 2,075 | 2,085 |
54
| Vanguard® Intermediate-Term Corporate Bond Index Fund | ||||
| Schedule of Investments | ||||
| August 31, 2015 | ||||
| Face | Market | |||
| Maturity | Amount | Value | ||
| Coupon | Date | ($000) | ($000) | |
| Juniper Networks Inc. | 4.350% | 6/15/25 | 450 | 442 |
| 1 Keysight Technologies Inc. | 4.550% | 10/30/24 | 2,100 | 2,024 |
| KLA-Tencor Corp. | 4.125% | 11/1/21 | 500 | 504 |
| KLA-Tencor Corp. | 4.650% | 11/1/24 | 8,406 | 8,255 |
| Lam Research Corp. | 3.800% | 3/15/25 | 2,250 | 2,125 |
| Lender Processing Services Inc / Black Knight Lending | ||||
| Solutions Inc | 5.750% | 4/15/23 | 1,540 | 1,629 |
| Maxim Integrated Products Inc. | 3.375% | 3/15/23 | 1,950 | 1,922 |
| Microsoft Corp. | 3.000% | 10/1/20 | 6,645 | 6,913 |
| Microsoft Corp. | 4.000% | 2/8/21 | 4,775 | 5,170 |
| Microsoft Corp. | 2.375% | 2/12/22 | 10,000 | 9,841 |
| Microsoft Corp. | 2.125% | 11/15/22 | 2,375 | 2,276 |
| Microsoft Corp. | 2.375% | 5/1/23 | 1,794 | 1,711 |
| Microsoft Corp. | 3.625% | 12/15/23 | 6,675 | 6,937 |
| Microsoft Corp. | 2.700% | 2/12/25 | 6,525 | 6,269 |
| Motorola Solutions Inc. | 3.750% | 5/15/22 | 3,653 | 3,363 |
| Motorola Solutions Inc. | 3.500% | 3/1/23 | 2,920 | 2,576 |
| Motorola Solutions Inc. | 4.000% | 9/1/24 | 4,607 | 4,231 |
| Motorola Solutions Inc. | 7.500% | 5/15/25 | 1,371 | 1,562 |
| NetApp Inc. | 3.375% | 6/15/21 | 2,900 | 2,856 |
| Oracle Corp. | 2.800% | 7/8/21 | 6,940 | 6,978 |
| Oracle Corp. | 2.500% | 5/15/22 | 10,500 | 10,199 |
| Oracle Corp. | 2.500% | 10/15/22 | 14,493 | 13,928 |
| Oracle Corp. | 3.625% | 7/15/23 | 5,025 | 5,139 |
| Oracle Corp. | 3.400% | 7/8/24 | 10,969 | 11,074 |
| Oracle Corp. | 2.950% | 5/15/25 | 10,300 | 9,891 |
| Pitney Bowes Inc. | 4.625% | 3/15/24 | 2,625 | 2,623 |
| QUALCOMM Inc. | 3.000% | 5/20/22 | 7,000 | 6,794 |
| QUALCOMM Inc. | 3.450% | 5/20/25 | 9,400 | 8,760 |
| Seagate HDD Cayman | 4.750% | 6/1/23 | 3,900 | 3,793 |
| Seagate HDD Cayman | 4.750% | 1/1/25 | 6,625 | 6,352 |
| Symantec Corp. | 4.200% | 9/15/20 | 4,475 | 4,598 |
| Symantec Corp. | 3.950% | 6/15/22 | 400 | 400 |
| Telefonaktiebolaget LM Ericsson | 4.125% | 5/15/22 | 4,125 | 4,272 |
| Texas Instruments Inc. | 2.250% | 5/1/23 | 2,685 | 2,537 |
| Total System Services Inc. | 3.750% | 6/1/23 | 2,200 | 2,142 |
| Trimble Navigation Ltd. | 4.750% | 12/1/24 | 1,925 | 1,917 |
| Tyco Electronics Group SA | 4.875% | 1/15/21 | 1,500 | 1,647 |
| Tyco Electronics Group SA | 3.500% | 2/3/22 | 3,361 | 3,434 |
| Tyco Electronics Group SA | 3.450% | 8/1/24 | 1,200 | 1,203 |
| Verisk Analytics Inc. | 5.800% | 5/1/21 | 3,075 | 3,436 |
| Verisk Analytics Inc. | 4.125% | 9/12/22 | 2,200 | 2,221 |
| Verisk Analytics Inc. | 4.000% | 6/15/25 | 1,750 | 1,708 |
| Xerox Corp. | 2.750% | 9/1/20 | 2,900 | 2,787 |
| Xerox Corp. | 4.500% | 5/15/21 | 3,100 | 3,174 |
| Xerox Corp. | 3.800% | 5/15/24 | 2,150 | 2,040 |
| Xilinx Inc. | 3.000% | 3/15/21 | 3,541 | 3,574 |
| Transportation (2.2%) | ||||
| 2 American Airlines 2011-1 Class A Pass Through Trust | 5.250% | 7/31/22 | 1,462 | 1,560 |
| 2 American Airlines 2013-1 Class A Pass Through Trust | 4.000% | 1/15/27 | 2,116 | 2,140 |
| 2 American Airlines 2013-2 Class A Pass Through Trust | 4.950% | 7/15/24 | 5,532 | 5,899 |
| 2 American Airlines 2015-1 Class B Pass Through Trust | 3.700% | 11/1/24 | 1,850 | 1,822 |
| Burlington Northern Santa Fe LLC | 3.600% | 9/1/20 | 950 | 991 |
| Burlington Northern Santa Fe LLC | 4.100% | 6/1/21 | 840 | 898 |
| Burlington Northern Santa Fe LLC | 3.450% | 9/15/21 | 2,550 | 2,605 |
| Burlington Northern Santa Fe LLC | 3.050% | 3/15/22 | 2,850 | 2,814 |
| Burlington Northern Santa Fe LLC | 3.050% | 9/1/22 | 2,950 | 2,902 |
| Burlington Northern Santa Fe LLC | 3.000% | 3/15/23 | 2,958 | 2,866 |
| Burlington Northern Santa Fe LLC | 3.850% | 9/1/23 | 3,500 | 3,581 |
| Burlington Northern Santa Fe LLC | 3.750% | 4/1/24 | 2,325 | 2,363 |
| Burlington Northern Santa Fe LLC | 3.400% | 9/1/24 | 3,100 | 3,078 |
| Burlington Northern Santa Fe LLC | 3.000% | 4/1/25 | 875 | 832 |
| Burlington Northern Santa Fe LLC | 3.650% | 9/1/25 | 1,500 | 1,504 |
55
| Vanguard® Intermediate-Term Corporate Bond Index Fund | ||||
| Schedule of Investments | ||||
| August 31, 2015 | ||||
| Face | Market | |||
| Maturity | Amount | Value | ||
| Coupon | Date | ($000) | ($000) | |
| Canadian National Railway Co. | 2.850% | 12/15/21 | 2,200 | 2,215 |
| Canadian National Railway Co. | 2.250% | 11/15/22 | 1,025 | 996 |
| Canadian National Railway Co. | 2.950% | 11/21/24 | 1,325 | 1,308 |
| Canadian Pacific Railway Co. | 9.450% | 8/1/21 | 1,900 | 2,550 |
| Canadian Pacific Railway Co. | 4.450% | 3/15/23 | 2,211 | 2,345 |
| Canadian Pacific Railway Co. | 2.900% | 2/1/25 | 2,000 | 1,881 |
| Canadian Pacific Railway Ltd. | 4.500% | 1/15/22 | 1,350 | 1,436 |
| 2 Continental Airlines 2007-1 Class A Pass Through Trust | 5.983% | 10/19/23 | 2,628 | 2,900 |
| 2 Continental Airlines 2010-1 Class A Pass Through Trust | 4.750% | 7/12/22 | 1,767 | 1,864 |
| 2 Continental Airlines 2012-1 Class A Pass Through Trust | 4.150% | 10/11/25 | 3,146 | 3,209 |
| 2 Continental Airlines 2012-2 Class A Pass Through Trust | 4.000% | 4/29/26 | 2,927 | 2,960 |
| CSX Corp. | 3.700% | 10/30/20 | 1,199 | 1,259 |
| CSX Corp. | 4.250% | 6/1/21 | 3,450 | 3,686 |
| CSX Corp. | 3.700% | 11/1/23 | 2,975 | 3,037 |
| CSX Corp. | 3.400% | 8/1/24 | 1,858 | 1,845 |
| 2 Delta Air Lines 2007-1 Class A Pass Through Trust | 6.821% | 2/10/24 | 2,388 | 2,741 |
| FedEx Corp. | 2.625% | 8/1/22 | 2,575 | 2,499 |
| FedEx Corp. | 2.700% | 4/15/23 | 300 | 287 |
| FedEx Corp. | 4.000% | 1/15/24 | 3,325 | 3,422 |
| FedEx Corp. | 3.200% | 2/1/25 | 3,300 | 3,151 |
| JB Hunt Transport Services Inc. | 3.300% | 8/15/22 | 1,600 | 1,588 |
| JB Hunt Transport Services Inc. | 3.850% | 3/15/24 | 1,325 | 1,369 |
| Kansas City Southern de Mexico SA de CV | 3.000% | 5/15/23 | 1,875 | 1,793 |
| Norfolk Southern Corp. | 3.250% | 12/1/21 | 2,426 | 2,440 |
| Norfolk Southern Corp. | 3.000% | 4/1/22 | 2,592 | 2,573 |
| Norfolk Southern Corp. | 2.903% | 2/15/23 | 3,064 | 2,958 |
| Norfolk Southern Corp. | 3.850% | 1/15/24 | 1,725 | 1,754 |
| Norfolk Southern Corp. | 5.590% | 5/17/25 | 1,081 | 1,240 |
| Ryder System Inc. | 2.875% | 9/1/20 | 1,400 | 1,397 |
| 2 Southwest Airlines Co. 2007-1 Pass Through Trust | 6.150% | 2/1/24 | 1,276 | 1,438 |
| Trinity Industries Inc. | 4.550% | 10/1/24 | 1,840 | 1,723 |
| Union Pacific Corp. | 4.000% | 2/1/21 | 2,825 | 3,022 |
| Union Pacific Corp. | 4.163% | 7/15/22 | 4,527 | 4,807 |
| Union Pacific Corp. | 2.950% | 1/15/23 | 1,275 | 1,258 |
| Union Pacific Corp. | 2.750% | 4/15/23 | 1,550 | 1,504 |
| Union Pacific Corp. | 3.646% | 2/15/24 | 1,925 | 1,967 |
| Union Pacific Corp. | 3.750% | 3/15/24 | 500 | 516 |
| Union Pacific Corp. | 3.250% | 1/15/25 | 1,950 | 1,929 |
| Union Pacific Corp. | 3.250% | 8/15/25 | 1,300 | 1,284 |
| 2 United Airlines 2013-1 Class A Pass Through Trust | 4.300% | 2/15/27 | 3,142 | 3,240 |
| United Parcel Service Inc. | 3.125% | 1/15/21 | 6,300 | 6,481 |
| United Parcel Service Inc. | 2.450% | 10/1/22 | 6,445 | 6,303 |
| 2 US Airways 2012-1 Class A Pass Through Trust | 5.900% | 4/1/26 | 1,013 | 1,119 |
| 2 US Airways Inc. 2012-2 Class A Pass Through Trust | 4.625% | 12/3/26 | 1,190 | 1,235 |
| 3,816,341 | ||||
| Utilities (5.4%) | ||||
| Electric (5.0%) | ||||
| Alabama Power Co. | 3.550% | 12/1/23 | 2,000 | 2,051 |
| Alabama Power Co. | 2.800% | 4/1/25 | 2,000 | 1,900 |
| Ameren Illinois Co. | 2.700% | 9/1/22 | 2,170 | 2,131 |
| Ameren Illinois Co. | 3.250% | 3/1/25 | 1,500 | 1,495 |
| American Electric Power Co. Inc. | 2.950% | 12/15/22 | 1,600 | 1,552 |
| Appalachian Power Co. | 4.600% | 3/30/21 | 4,092 | 4,421 |
| Appalachian Power Co. | 3.400% | 6/1/25 | 300 | 296 |
| Arizona Public Service Co. | 3.350% | 6/15/24 | 900 | 903 |
| Arizona Public Service Co. | 3.150% | 5/15/25 | 2,000 | 1,981 |
| Baltimore Gas & Electric Co. | 3.500% | 11/15/21 | 3,922 | 4,059 |
| Baltimore Gas & Electric Co. | 3.350% | 7/1/23 | 1,125 | 1,120 |
| Berkshire Hathaway Energy Co. | 3.750% | 11/15/23 | 3,025 | 3,086 |
| Berkshire Hathaway Energy Co. | 3.500% | 2/1/25 | 2,775 | 2,750 |
| Black Hills Corp. | 4.250% | 11/30/23 | 1,000 | 1,043 |
| CenterPoint Energy Houston Electric LLC | 2.250% | 8/1/22 | 825 | 786 |
| Cleveland Electric Illuminating Co. | 5.500% | 8/15/24 | 1,000 | 1,138 |
56
| Vanguard® Intermediate-Term Corporate Bond Index Fund | ||||
| Schedule of Investments | ||||
| August 31, 2015 | ||||
| Face | Market | |||
| Maturity | Amount | Value | ||
| Coupon | Date | ($000) | ($000) | |
| CMS Energy Corp. | 5.050% | 3/15/22 | 1,375 | 1,500 |
| CMS Energy Corp. | 3.875% | 3/1/24 | 1,100 | 1,106 |
| Commonwealth Edison Co. | 4.000% | 8/1/20 | 2,625 | 2,817 |
| Commonwealth Edison Co. | 3.400% | 9/1/21 | 1,600 | 1,663 |
| Commonwealth Edison Co. | 3.100% | 11/1/24 | 1,450 | 1,438 |
| Connecticut Light & Power Co. | 2.500% | 1/15/23 | 3,975 | 3,838 |
| Consolidated Edison Co. of New York Inc. | 3.300% | 12/1/24 | 825 | 822 |
| Constellation Energy Group Inc. | 5.150% | 12/1/20 | 3,050 | 3,338 |
| Consumers Energy Co. | 2.850% | 5/15/22 | 1,684 | 1,677 |
| Consumers Energy Co. | 3.375% | 8/15/23 | 1,650 | 1,666 |
| Consumers Energy Co. | 3.125% | 8/31/24 | 1,000 | 1,004 |
| Delmarva Power & Light Co. | 3.500% | 11/15/23 | 2,575 | 2,631 |
| Dominion Resources Inc. | 4.450% | 3/15/21 | 3,158 | 3,361 |
| Dominion Resources Inc. | 2.750% | 9/15/22 | 1,500 | 1,447 |
| Dominion Resources Inc. | 3.625% | 12/1/24 | 2,150 | 2,123 |
| 2 Dominion Resources Inc. | 5.750% | 10/1/54 | 3,125 | 3,215 |
| DTE Electric Co. | 3.450% | 10/1/20 | 1,500 | 1,573 |
| DTE Electric Co. | 3.900% | 6/1/21 | 2,275 | 2,425 |
| DTE Electric Co. | 2.650% | 6/15/22 | 1,800 | 1,759 |
| DTE Electric Co. | 3.650% | 3/15/24 | 2,300 | 2,364 |
| DTE Electric Co. | 3.375% | 3/1/25 | 250 | 252 |
| DTE Energy Co. | 3.500% | 6/1/24 | 2,700 | 2,679 |
| Duke Energy Carolinas LLC | 3.900% | 6/15/21 | 2,975 | 3,168 |
| Duke Energy Corp. | 3.550% | 9/15/21 | 2,250 | 2,324 |
| Duke Energy Corp. | 3.050% | 8/15/22 | 2,325 | 2,290 |
| Duke Energy Corp. | 3.950% | 10/15/23 | 3,700 | 3,800 |
| Duke Energy Corp. | 3.750% | 4/15/24 | 2,150 | 2,167 |
| Duke Energy Florida LLC | 3.100% | 8/15/21 | 1,725 | 1,772 |
| Duke Energy Ohio Inc. | 3.800% | 9/1/23 | 1,521 | 1,591 |
| Duke Energy Progress LLC | 3.000% | 9/15/21 | 2,336 | 2,382 |
| Duke Energy Progress LLC | 2.800% | 5/15/22 | 1,900 | 1,893 |
| Duke Energy Progress LLC | 3.250% | 8/15/25 | 2,450 | 2,461 |
| Empresa Nacional de Electricidad SA | 4.250% | 4/15/24 | 450 | 456 |
| Entergy Arkansas Inc. | 3.750% | 2/15/21 | 2,055 | 2,165 |
| Entergy Arkansas Inc. | 3.050% | 6/1/23 | 200 | 197 |
| Entergy Corp. | 5.125% | 9/15/20 | 3,950 | 4,240 |
| Entergy Gulf States Louisiana LLC | 3.950% | 10/1/20 | 1,785 | 1,901 |
| Entergy Gulf States Louisiana LLC | 5.590% | 10/1/24 | 2,960 | 3,462 |
| Entergy Louisiana LLC | 4.050% | 9/1/23 | 3,550 | 3,753 |
| Entergy Louisiana LLC | 5.400% | 11/1/24 | 2,190 | 2,537 |
| Entergy Mississippi Inc. | 3.100% | 7/1/23 | 1,425 | 1,404 |
| Eversource Energy | 2.800% | 5/1/23 | 1,300 | 1,247 |
| Eversource Energy | 3.150% | 1/15/25 | 2,000 | 1,942 |
| Exelon Corp. | 3.950% | 6/15/25 | 5,800 | 5,807 |
| Exelon Generation Co. LLC | 4.250% | 6/15/22 | 1,511 | 1,538 |
| FirstEnergy Solutions Corp. | 6.050% | 8/15/21 | 2,225 | 2,421 |
| Florida Power & Light Co. | 2.750% | 6/1/23 | 2,150 | 2,104 |
| Florida Power & Light Co. | 3.250% | 6/1/24 | 1,675 | 1,699 |
| Georgia Power Co. | 2.850% | 5/15/22 | 1,900 | 1,829 |
| Great Plains Energy Inc. | 4.850% | 6/1/21 | 3,350 | 3,678 |
| Indiana Michigan Power Co. | 3.200% | 3/15/23 | 1,625 | 1,611 |
| Interstate Power & Light Co. | 3.250% | 12/1/24 | 1,025 | 1,025 |
| Interstate Power & Light Co. | 3.400% | 8/15/25 | 1,125 | 1,122 |
| ITC Holdings Corp. | 4.050% | 7/1/23 | 1,925 | 1,971 |
| ITC Holdings Corp. | 3.650% | 6/15/24 | 1,275 | 1,262 |
| Kansas City Power & Light Co. | 3.150% | 3/15/23 | 1,775 | 1,750 |
| Kansas City Power & Light Co. | 3.650% | 8/15/25 | 975 | 977 |
| Kentucky Utilities Co. | 3.250% | 11/1/20 | 1,625 | 1,687 |
| LG&E & KU Energy LLC | 3.750% | 11/15/20 | 2,145 | 2,247 |
| LG&E & KU Energy LLC | 4.375% | 10/1/21 | 1,375 | 1,486 |
| MidAmerican Energy Co. | 3.500% | 10/15/24 | 2,498 | 2,536 |
| National Rural Utilities Cooperative Finance Corp. | 3.050% | 2/15/22 | 2,998 | 2,992 |
| National Rural Utilities Cooperative Finance Corp. | 3.400% | 11/15/23 | 875 | 892 |
57
| Vanguard® Intermediate-Term Corporate Bond Index Fund | ||||
| Schedule of Investments | ||||
| August 31, 2015 | ||||
| Face | Market | |||
| Maturity | Amount | Value | ||
| Coupon | Date | ($000) | ($000) | |
| National Rural Utilities Cooperative Finance Corp. | 2.850% | 1/27/25 | 1,850 | 1,783 |
| 2 National Rural Utilities Cooperative Finance Corp. | 4.750% | 4/30/43 | 1,850 | 1,826 |
| NextEra Energy Capital Holdings Inc. | 4.500% | 6/1/21 | 2,575 | 2,766 |
| NextEra Energy Capital Holdings Inc. | 3.625% | 6/15/23 | 925 | 930 |
| Northern States Power Co. | 2.150% | 8/15/22 | 475 | 453 |
| Northern States Power Co. | 2.600% | 5/15/23 | 2,385 | 2,314 |
| NSTAR Electric Co. | 2.375% | 10/15/22 | 1,700 | 1,631 |
| Ohio Power Co. | 5.375% | 10/1/21 | 1,425 | 1,620 |
| Oncor Electric Delivery Co. LLC | 4.100% | 6/1/22 | 1,750 | 1,825 |
| Oncor Electric Delivery Co. LLC | 7.000% | 9/1/22 | 4,194 | 5,137 |
| 1 Oncor Electric Delivery Co. LLC | 2.950% | 4/1/25 | 1,000 | 951 |
| Pacific Gas & Electric Co. | 3.500% | 10/1/20 | 2,786 | 2,895 |
| Pacific Gas & Electric Co. | 4.250% | 5/15/21 | 1,716 | 1,833 |
| Pacific Gas & Electric Co. | 3.250% | 9/15/21 | 500 | 509 |
| Pacific Gas & Electric Co. | 2.450% | 8/15/22 | 3,600 | 3,419 |
| Pacific Gas & Electric Co. | 3.250% | 6/15/23 | 1,700 | 1,690 |
| Pacific Gas & Electric Co. | 3.850% | 11/15/23 | 3,900 | 4,040 |
| Pacific Gas & Electric Co. | 3.750% | 2/15/24 | 1,536 | 1,571 |
| Pacific Gas & Electric Co. | 3.400% | 8/15/24 | 1,500 | 1,490 |
| PacifiCorp | 3.850% | 6/15/21 | 4,400 | 4,683 |
| PacifiCorp | 2.950% | 2/1/22 | 3,520 | 3,481 |
| PacifiCorp | 3.600% | 4/1/24 | 1,650 | 1,690 |
| Peco Energy Co. | 2.375% | 9/15/22 | 1,629 | 1,570 |
| Potomac Electric Power Co. | 3.600% | 3/15/24 | 1,700 | 1,733 |
| PPL Capital Funding Inc. | 4.200% | 6/15/22 | 1,750 | 1,827 |
| PPL Capital Funding Inc. | 3.500% | 12/1/22 | 1,980 | 1,963 |
| PPL Capital Funding Inc. | 3.400% | 6/1/23 | 3,119 | 3,078 |
| PPL Capital Funding Inc. | 3.950% | 3/15/24 | 1,525 | 1,550 |
| PPL Electric Utilities Corp. | 3.000% | 9/15/21 | 4,150 | 4,225 |
| Progress Energy Inc. | 4.400% | 1/15/21 | 1,597 | 1,702 |
| Progress Energy Inc. | 3.150% | 4/1/22 | 975 | 975 |
| PSEG Power LLC | 4.150% | 9/15/21 | 1,011 | 1,042 |
| PSEG Power LLC | 4.300% | 11/15/23 | 1,325 | 1,362 |
| Public Service Co. of Colorado | 3.200% | 11/15/20 | 1,675 | 1,725 |
| Public Service Co. of Colorado | 2.250% | 9/15/22 | 1,585 | 1,515 |
| Public Service Co. of Colorado | 2.500% | 3/15/23 | 400 | 385 |
| Public Service Co. of Colorado | 2.900% | 5/15/25 | 1,200 | 1,164 |
| Public Service Co. of New Hampshire | 3.500% | 11/1/23 | 2,050 | 2,116 |
| Public Service Co. of New Mexico | 3.850% | 8/1/25 | 1,100 | 1,092 |
| Public Service Co. of Oklahoma | 4.400% | 2/1/21 | 500 | 535 |
| Public Service Electric & Gas Co. | 3.500% | 8/15/20 | 375 | 394 |
| Public Service Electric & Gas Co. | 2.375% | 5/15/23 | 2,452 | 2,334 |
| Public Service Electric & Gas Co. | 3.150% | 8/15/24 | 1,250 | 1,243 |
| Public Service Electric & Gas Co. | 3.050% | 11/15/24 | 1,400 | 1,380 |
| Public Service Electric & Gas Co. | 3.000% | 5/15/25 | 1,500 | 1,464 |
| Puget Energy Inc. | 6.500% | 12/15/20 | 2,100 | 2,465 |
| Puget Energy Inc. | 6.000% | 9/1/21 | 2,326 | 2,674 |
| Puget Energy Inc. | 5.625% | 7/15/22 | 3,100 | 3,474 |
| 1 Puget Energy Inc. | 3.650% | 5/15/25 | 1,850 | 1,801 |
| San Diego Gas & Electric Co. | 3.000% | 8/15/21 | 2,577 | 2,640 |
| San Diego Gas & Electric Co. | 3.600% | 9/1/23 | 2,050 | 2,130 |
| SCANA Corp. | 4.750% | 5/15/21 | 2,700 | 2,837 |
| SCANA Corp. | 4.125% | 2/1/22 | 725 | 729 |
| Scottish Power Ltd. | 5.810% | 3/15/25 | 1,760 | 1,983 |
| Sierra Pacific Power Co. | 3.375% | 8/15/23 | 750 | 761 |
| Southern California Edison Co. | 3.875% | 6/1/21 | 4,925 | 5,238 |
| 2 Southern California Edison Co. | 1.845% | 2/1/22 | 2,577 | 2,550 |
| Southern California Edison Co. | 2.400% | 2/1/22 | 750 | 732 |
| Southern California Edison Co. | 3.500% | 10/1/23 | 1,605 | 1,643 |
| Southwestern Electric Power Co. | 3.550% | 2/15/22 | 1,075 | 1,105 |
| Tampa Electric Co. | 5.400% | 5/15/21 | 1,000 | 1,137 |
| Tampa Electric Co. | 2.600% | 9/15/22 | 475 | 461 |
| TransAlta Corp. | 4.500% | 11/15/22 | 2,169 | 2,102 |
| 1 Tri-State Generation & Transmission Association Inc. | 3.700% | 11/1/24 | 1,100 | 1,102 |
58
| Vanguard® Intermediate-Term Corporate Bond Index Fund | ||||
| Schedule of Investments | ||||
| August 31, 2015 | ||||
| Face | Market | |||
| Maturity | Amount | Value | ||
| Coupon | Date | ($000) | ($000) | |
| Tucson Electric Power Co. | 5.150% | 11/15/21 | 600 | 667 |
| Tucson Electric Power Co. | 3.050% | 3/15/25 | 1,650 | 1,578 |
| UIL Holdings Corp. | 4.625% | 10/1/20 | 1,750 | 1,867 |
| Union Electric Co. | 3.500% | 4/15/24 | 1,700 | 1,726 |
| Virginia Electric & Power Co. | 2.950% | 1/15/22 | 2,000 | 2,004 |
| Virginia Electric & Power Co. | 3.450% | 9/1/22 | 1,715 | 1,757 |
| Virginia Electric & Power Co. | 2.750% | 3/15/23 | 2,600 | 2,554 |
| Virginia Electric & Power Co. | 3.450% | 2/15/24 | 765 | 776 |
| Virginia Electric & Power Co. | 3.100% | 5/15/25 | 1,850 | 1,820 |
| WEC Energy Group Inc. | 3.550% | 6/15/25 | 2,800 | 2,804 |
| Wisconsin Electric Power Co. | 2.950% | 9/15/21 | 1,425 | 1,445 |
| Wisconsin Electric Power Co. | 3.100% | 6/1/25 | 700 | 698 |
| Wisconsin Power & Light Co. | 2.250% | 11/15/22 | 875 | 830 |
| Xcel Energy Inc. | 3.300% | 6/1/25 | 1,000 | 978 |
| Natural Gas (0.3%) | ||||
| AGL Capital Corp. | 3.500% | 9/15/21 | 2,100 | 2,150 |
| NiSource Finance Corp. | 5.450% | 9/15/20 | 4,625 | 5,215 |
| NiSource Finance Corp. | 6.125% | 3/1/22 | 3,327 | 3,861 |
| ONE Gas Inc. | 3.610% | 2/1/24 | 1,200 | 1,246 |
| Sempra Energy | 2.875% | 10/1/22 | 5,100 | 4,888 |
| Sempra Energy | 4.050% | 12/1/23 | 3,100 | 3,195 |
| Sempra Energy | 3.550% | 6/15/24 | 2,219 | 2,184 |
| Other Utility (0.1%) | ||||
| American Water Capital Corp. | 3.400% | 3/1/25 | 3,800 | 3,796 |
| 333,710 | ||||
| Total Corporate Bonds (Cost $6,168,463) | 6,080,869 | |||
| Taxable Municipal Bonds (0.1%) | ||||
| Cornell University New York GO | 5.450% | 2/1/19 | 750 | 845 |
| George Washington University District of Columbia GO | 3.485% | 9/15/22 | 1,450 | 1,492 |
| Total Taxable Municipal Bonds (Cost $2,332) | 2,337 | |||
| Shares | ||||
| Temporary Cash Investment (0.1%) | ||||
| Money Market Fund (0.1%) | ||||
| 4 Vanguard Market Liquidity Fund (Cost $7,785) | 0.168% | 7,785,428 | 7,785 | |
| Total Investments (99.0%) (Cost $6,179,390) | 6,091,800 | |||
| Total Other Assets and Liabilities—Net (1.0%) | 62,458 | |||
| Net Assets (100%) | 6,154,258 | |||
1 Security exempt from registration under Rule 144A of the Securities Act of 1933. Such securities may be sold in transactions exempt from registration, normally to qualified institutional buyers. At August 31, 2015, the aggregate value of these securities was $143,482,000, representing 2.3% of net assets.
2 The average or expected maturity is shorter than the final maturity shown because of the possibility of interim principal payments and prepayments or the possibility of the issue being called.
3 Securities with a value of $300,000 have been segregated as initial margin for open futures contracts.
4 Affiliated money market fund available only to Vanguard funds and certain trusts and accounts managed by Vanguard. Rate shown is the 7-day yield.
GO—General Obligation Bond.
REIT—Real Estate Investment Trust.
59
| Vanguard® Long-Term Corporate Bond Index Fund | ||||
| Schedule of Investments | ||||
| August 31, 2015 | ||||
| Face | Market | |||
| Maturity | Amount | Value | ||
| Coupon | Date | ($000) | ($000) | |
| U.S. Government and Agency Obligations (0.2%) | ||||
| U.S. Government Securities (0.2%) | ||||
| United States Treasury Note/Bond | 2.500% | 2/15/45 | 720 | 652 |
| United States Treasury Note/Bond | 3.000% | 5/15/45 | 1,415 | 1,425 |
| Total U.S. Government and Agency Obligations (Cost $2,090) | 2,077 | |||
| Corporate Bonds (97.9%) | ||||
| Finance (19.2%) | ||||
| Banking (10.3%) | ||||
| American Express Co. | 4.050% | 12/3/42 | 372 | 348 |
| Bank of America Corp. | 6.220% | 9/15/26 | 400 | 458 |
| Bank of America Corp. | 4.250% | 10/22/26 | 2,215 | 2,174 |
| Bank of America Corp. | 6.750% | 6/1/28 | 390 | 473 |
| Bank of America Corp. | 6.110% | 1/29/37 | 2,795 | 3,162 |
| Bank of America Corp. | 7.750% | 5/14/38 | 2,053 | 2,758 |
| Bank of America Corp. | 5.875% | 2/7/42 | 1,150 | 1,347 |
| Bank of America Corp. | 5.000% | 1/21/44 | 2,470 | 2,608 |
| Bank of America Corp. | 4.875% | 4/1/44 | 1,800 | 1,874 |
| Bank of America Corp. | 4.750% | 4/21/45 | 600 | 571 |
| Bank of America NA | 6.000% | 10/15/36 | 1,075 | 1,279 |
| Bank of New York Mellon Corp. | 3.950% | 11/18/25 | 550 | 572 |
| Bank One Capital III | 8.750% | 9/1/30 | 220 | 315 |
| Bank One Corp. | 7.625% | 10/15/26 | 545 | 692 |
| Bank One Corp. | 8.000% | 4/29/27 | 500 | 657 |
| Barclays plc | 5.250% | 8/17/45 | 400 | 400 |
| Branch Banking & Trust Co. | 3.800% | 10/30/26 | 750 | 758 |
| Citigroup Inc. | 5.500% | 9/13/25 | 1,225 | 1,328 |
| Citigroup Inc. | 4.300% | 11/20/26 | 1,625 | 1,607 |
| Citigroup Inc. | 6.625% | 1/15/28 | 200 | 246 |
| Citigroup Inc. | 6.625% | 6/15/32 | 820 | 984 |
| Citigroup Inc. | 6.000% | 10/31/33 | 1,195 | 1,348 |
| Citigroup Inc. | 6.125% | 8/25/36 | 2,048 | 2,359 |
| Citigroup Inc. | 8.125% | 7/15/39 | 2,375 | 3,418 |
| Citigroup Inc. | 5.875% | 1/30/42 | 1,080 | 1,252 |
| Citigroup Inc. | 6.675% | 9/13/43 | 900 | 1,111 |
| Citigroup Inc. | 4.950% | 11/7/43 | 850 | 878 |
| Citigroup Inc. | 5.300% | 5/6/44 | 1,200 | 1,250 |
| Citigroup Inc. | 4.650% | 7/30/45 | 1,450 | 1,442 |
| Comerica Inc. | 3.800% | 7/22/26 | 250 | 242 |
| Cooperatieve Centrale Raiffeisen-Boerenleenbank BA | 5.250% | 5/24/41 | 1,710 | 1,858 |
| Cooperatieve Centrale Raiffeisen-Boerenleenbank BA | 5.750% | 12/1/43 | 1,450 | 1,566 |
| Cooperatieve Centrale Raiffeisen-Boerenleenbank BA | 5.250% | 8/4/45 | 650 | 659 |
| 1 Credit Suisse Group Funding Guernsey Ltd. | 4.875% | 5/15/45 | 1,750 | 1,722 |
| Credit Suisse USA Inc. | 7.125% | 7/15/32 | 625 | 806 |
| Discover Bank | 4.250% | 3/13/26 | 485 | 479 |
| Fifth Third Bancorp | 8.250% | 3/1/38 | 882 | 1,249 |
| FirstMerit Bank NA | 4.270% | 11/25/26 | 275 | 274 |
| Goldman Sachs Capital I | 6.345% | 2/15/34 | 1,930 | 2,211 |
| Goldman Sachs Group Inc. | 5.950% | 1/15/27 | 315 | 352 |
| Goldman Sachs Group Inc. | 6.125% | 2/15/33 | 2,415 | 2,871 |
| Goldman Sachs Group Inc. | 6.450% | 5/1/36 | 1,195 | 1,361 |
| Goldman Sachs Group Inc. | 6.750% | 10/1/37 | 5,397 | 6,389 |
| Goldman Sachs Group Inc. | 6.250% | 2/1/41 | 2,830 | 3,366 |
| Goldman Sachs Group Inc. | 4.800% | 7/8/44 | 2,600 | 2,623 |
| Goldman Sachs Group Inc. | 5.150% | 5/22/45 | 2,500 | 2,442 |
| HSBC Bank USA NA | 5.875% | 11/1/34 | 1,475 | 1,699 |
| HSBC Bank USA NA | 5.625% | 8/15/35 | 900 | 1,011 |
| HSBC Bank USA NA | 7.000% | 1/15/39 | 925 | 1,213 |
| HSBC Holdings plc | 7.625% | 5/17/32 | 595 | 750 |
| HSBC Holdings plc | 6.500% | 5/2/36 | 2,250 | 2,622 |
| HSBC Holdings plc | 6.500% | 9/15/37 | 1,810 | 2,131 |
| HSBC Holdings plc | 6.800% | 6/1/38 | 1,155 | 1,416 |
| HSBC Holdings plc | 6.100% | 1/14/42 | 990 | 1,207 |
60
| Vanguard® Long-Term Corporate Bond Index Fund | ||||
| Schedule of Investments | ||||
| August 31, 2015 | ||||
| Face | Market | |||
| Maturity | Amount | Value | ||
| Coupon | Date | ($000) | ($000) | |
| HSBC Holdings plc | 5.250% | 3/14/44 | 1,950 | 1,989 |
| JPMorgan Chase & Co. | 4.125% | 12/15/26 | 2,172 | 2,141 |
| JPMorgan Chase & Co. | 6.400% | 5/15/38 | 2,620 | 3,278 |
| JPMorgan Chase & Co. | 5.500% | 10/15/40 | 1,485 | 1,677 |
| JPMorgan Chase & Co. | 5.600% | 7/15/41 | 1,265 | 1,450 |
| JPMorgan Chase & Co. | 5.400% | 1/6/42 | 1,455 | 1,626 |
| JPMorgan Chase & Co. | 5.625% | 8/16/43 | 1,400 | 1,512 |
| JPMorgan Chase & Co. | 4.850% | 2/1/44 | 1,600 | 1,675 |
| JPMorgan Chase & Co. | 4.950% | 6/1/45 | 1,475 | 1,467 |
| KeyBank NA | 6.950% | 2/1/28 | 566 | 718 |
| Morgan Stanley | 5.000% | 11/24/25 | 2,261 | 2,375 |
| Morgan Stanley | 6.250% | 8/9/26 | 950 | 1,131 |
| Morgan Stanley | 4.350% | 9/8/26 | 1,690 | 1,678 |
| Morgan Stanley | 3.950% | 4/23/27 | 1,970 | 1,879 |
| Morgan Stanley | 7.250% | 4/1/32 | 530 | 691 |
| Morgan Stanley | 6.375% | 7/24/42 | 2,311 | 2,856 |
| Morgan Stanley | 4.300% | 1/27/45 | 2,900 | 2,719 |
| Northern Trust Corp. | 3.950% | 10/30/25 | 800 | 827 |
| PNC Bank NA | 4.200% | 11/1/25 | 600 | 624 |
| Regions Bank | 6.450% | 6/26/37 | 550 | 653 |
| Regions Financial Corp. | 7.375% | 12/10/37 | 530 | 662 |
| UBS AG | 7.750% | 9/1/26 | 525 | 676 |
| Wachovia Bank NA | 5.850% | 2/1/37 | 750 | 890 |
| Wachovia Corp. | 6.605% | 10/1/25 | 565 | 677 |
| Wachovia Corp. | 7.574% | 8/1/26 | 450 | 577 |
| Wachovia Corp. | 7.500% | 4/15/35 | 945 | 1,278 |
| Wachovia Corp. | 5.500% | 8/1/35 | 589 | 660 |
| Wachovia Corp. | 6.550% | 10/15/35 | 25 | 30 |
| Wells Fargo & Co. | 4.100% | 6/3/26 | 2,805 | 2,809 |
| Wells Fargo & Co. | 4.300% | 7/22/27 | 2,500 | 2,531 |
| Wells Fargo & Co. | 5.375% | 2/7/35 | 360 | 401 |
| Wells Fargo & Co. | 5.375% | 11/2/43 | 2,139 | 2,292 |
| Wells Fargo & Co. | 5.606% | 1/15/44 | 2,440 | 2,713 |
| Wells Fargo & Co. | 4.650% | 11/4/44 | 2,000 | 1,946 |
| Wells Fargo & Co. | 3.900% | 5/1/45 | 2,100 | 1,916 |
| Wells Fargo Bank NA | 5.950% | 8/26/36 | 1,075 | 1,288 |
| Wells Fargo Bank NA | 6.600% | 1/15/38 | 1,375 | 1,797 |
| 2 Wells Fargo Capital X | 5.950% | 12/1/86 | 920 | 919 |
| Brokerage (0.3%) | ||||
| Brookfield Asset Management Inc. | 7.375% | 3/1/33 | 310 | 371 |
| CME Group Inc. | 5.300% | 9/15/43 | 855 | 951 |
| Invesco Finance plc | 5.375% | 11/30/43 | 465 | 515 |
| Jefferies Group LLC | 6.450% | 6/8/27 | 400 | 428 |
| Jefferies Group LLC | 6.250% | 1/15/36 | 385 | 361 |
| Jefferies Group LLC | 6.500% | 1/20/43 | 425 | 401 |
| Legg Mason Inc. | 5.625% | 1/15/44 | 495 | 510 |
| Leucadia National Corp. | 6.625% | 10/23/43 | 285 | 270 |
| Finance Companies (1.8%) | ||||
| GATX Corp. | 5.200% | 3/15/44 | 375 | 390 |
| GATX Corp. | 4.500% | 3/30/45 | 225 | 207 |
| General Electric Capital Corp. | 5.550% | 1/5/26 | 275 | 324 |
| General Electric Capital Corp. | 6.750% | 3/15/32 | 5,037 | 6,589 |
| General Electric Capital Corp. | 7.500% | 8/21/35 | 400 | 563 |
| General Electric Capital Corp. | 6.150% | 8/7/37 | 2,130 | 2,622 |
| General Electric Capital Corp. | 5.875% | 1/14/38 | 6,503 | 7,844 |
| General Electric Capital Corp. | 6.875% | 1/10/39 | 4,325 | 5,766 |
| Insurance (6.1%) | ||||
| ACE Capital Trust II | 9.700% | 4/1/30 | 240 | 355 |
| ACE INA Holdings Inc. | 4.150% | 3/13/43 | 947 | 886 |
| Aetna Inc. | 6.625% | 6/15/36 | 805 | 983 |
| Aetna Inc. | 6.750% | 12/15/37 | 640 | 796 |
| Aetna Inc. | 4.500% | 5/15/42 | 705 | 682 |
| Aetna Inc. | 4.125% | 11/15/42 | 300 | 271 |
61
| Vanguard® Long-Term Corporate Bond Index Fund | ||||
| Schedule of Investments | ||||
| August 31, 2015 | ||||
| Face | Market | |||
| Maturity | Amount | Value | ||
| Coupon | Date | ($000) | ($000) | |
| Aetna Inc. | 4.750% | 3/15/44 | 425 | 424 |
| Aflac Inc. | 6.900% | 12/17/39 | 495 | 627 |
| Aflac Inc. | 6.450% | 8/15/40 | 350 | 427 |
| Alleghany Corp. | 4.900% | 9/15/44 | 450 | 436 |
| Allstate Corp. | 5.350% | 6/1/33 | 690 | 769 |
| Allstate Corp. | 5.550% | 5/9/35 | 340 | 388 |
| Allstate Corp. | 5.950% | 4/1/36 | 395 | 473 |
| Allstate Corp. | 4.500% | 6/15/43 | 205 | 205 |
| 2 Allstate Corp. | 6.500% | 5/15/67 | 525 | 584 |
| American International Group Inc. | 3.875% | 1/15/35 | 1,415 | 1,277 |
| American International Group Inc. | 4.700% | 7/10/35 | 575 | 574 |
| American International Group Inc. | 6.250% | 5/1/36 | 1,085 | 1,275 |
| American International Group Inc. | 4.500% | 7/16/44 | 2,164 | 2,058 |
| American International Group Inc. | 4.800% | 7/10/45 | 750 | 740 |
| American International Group Inc. | 4.375% | 1/15/55 | 825 | 739 |
| 2 American International Group Inc. | 8.175% | 5/15/68 | 650 | 852 |
| 2 American International Group Inc. | 6.250% | 3/15/87 | 379 | 406 |
| Anthem Inc. | 5.950% | 12/15/34 | 466 | 504 |
| Anthem Inc. | 5.850% | 1/15/36 | 695 | 745 |
| Anthem Inc. | 6.375% | 6/15/37 | 660 | 769 |
| Anthem Inc. | 4.625% | 5/15/42 | 885 | 828 |
| Anthem Inc. | 4.650% | 1/15/43 | 1,050 | 986 |
| Anthem Inc. | 5.100% | 1/15/44 | 600 | 603 |
| Anthem Inc. | 4.650% | 8/15/44 | 800 | 750 |
| Anthem Inc. | 4.850% | 8/15/54 | 250 | 235 |
| Aon Corp. | 8.205% | 1/1/27 | 575 | 736 |
| Aon Corp. | 6.250% | 9/30/40 | 335 | 402 |
| Aon plc | 4.450% | 5/24/43 | 375 | 352 |
| Aon plc | 4.600% | 6/14/44 | 750 | 723 |
| Aon plc | 4.750% | 5/15/45 | 700 | 674 |
| Arch Capital Group Ltd. | 7.350% | 5/1/34 | 275 | 361 |
| Arch Capital Group US Inc. | 5.144% | 11/1/43 | 400 | 408 |
| Assurant Inc. | 6.750% | 2/15/34 | 500 | 585 |
| AXA SA | 8.600% | 12/15/30 | 1,385 | 1,822 |
| AXIS Specialty Finance plc | 5.150% | 4/1/45 | 425 | 431 |
| Berkshire Hathaway Finance Corp. | 5.750% | 1/15/40 | 805 | 946 |
| Berkshire Hathaway Finance Corp. | 4.400% | 5/15/42 | 395 | 382 |
| Berkshire Hathaway Finance Corp. | 4.300% | 5/15/43 | 795 | 756 |
| Berkshire Hathaway Inc. | 4.500% | 2/11/43 | 1,030 | 1,012 |
| Chubb Corp. | 6.000% | 5/11/37 | 750 | 909 |
| Chubb Corp. | 6.500% | 5/15/38 | 575 | 736 |
| Cigna Corp. | 7.875% | 5/15/27 | 565 | 754 |
| Cigna Corp. | 6.150% | 11/15/36 | 505 | 569 |
| Cigna Corp. | 5.875% | 3/15/41 | 375 | 418 |
| Cigna Corp. | 5.375% | 2/15/42 | 575 | 609 |
| Cincinnati Financial Corp. | 6.920% | 5/15/28 | 300 | 378 |
| Cincinnati Financial Corp. | 6.125% | 11/1/34 | 394 | 458 |
| Endurance Specialty Holdings Ltd. | 7.000% | 7/15/34 | 420 | 501 |
| Everest Reinsurance Holdings Inc. | 4.868% | 6/1/44 | 415 | 403 |
| Hartford Financial Services Group Inc. | 5.950% | 10/15/36 | 438 | 513 |
| Hartford Financial Services Group Inc. | 6.625% | 3/30/40 | 391 | 496 |
| Hartford Financial Services Group Inc. | 6.100% | 10/1/41 | 505 | 601 |
| Humana Inc. | 8.150% | 6/15/38 | 260 | 368 |
| Humana Inc. | 4.625% | 12/1/42 | 405 | 388 |
| Humana Inc. | 4.950% | 10/1/44 | 755 | 752 |
| Lincoln National Corp. | 6.150% | 4/7/36 | 525 | 608 |
| Lincoln National Corp. | 7.000% | 6/15/40 | 860 | 1,094 |
| Loews Corp. | 6.000% | 2/1/35 | 315 | 366 |
| Loews Corp. | 4.125% | 5/15/43 | 865 | 774 |
| Markel Corp. | 5.000% | 3/30/43 | 325 | 327 |
| Marsh & McLennan Cos. Inc. | 5.875% | 8/1/33 | 315 | 366 |
| MetLife Inc. | 6.500% | 12/15/32 | 650 | 804 |
| MetLife Inc. | 6.375% | 6/15/34 | 765 | 938 |
| MetLife Inc. | 5.700% | 6/15/35 | 995 | 1,141 |
62
| Vanguard® Long-Term Corporate Bond Index Fund | ||||
| Schedule of Investments | ||||
| August 31, 2015 | ||||
| Face | Market | |||
| Maturity | Amount | Value | ||
| Coupon | Date | ($000) | ($000) | |
| MetLife Inc. | 5.875% | 2/6/41 | 970 | 1,144 |
| MetLife Inc. | 4.125% | 8/13/42 | 765 | 708 |
| MetLife Inc. | 4.875% | 11/13/43 | 1,045 | 1,096 |
| MetLife Inc. | 4.721% | 12/15/44 | 680 | 697 |
| MetLife Inc. | 4.050% | 3/1/45 | 695 | 645 |
| 2 MetLife Inc. | 6.400% | 12/15/66 | 1,310 | 1,438 |
| 2 MetLife Inc. | 10.750% | 8/1/69 | 460 | 728 |
| Munich Re America Corp. | 7.450% | 12/15/26 | 350 | 452 |
| 2 Nationwide Financial Services Inc. | 6.750% | 5/15/87 | 365 | 375 |
| Principal Financial Group Inc. | 6.050% | 10/15/36 | 640 | 739 |
| Principal Financial Group Inc. | 4.625% | 9/15/42 | 325 | 313 |
| Principal Financial Group Inc. | 4.350% | 5/15/43 | 320 | 297 |
| Progressive Corp. | 6.625% | 3/1/29 | 338 | 434 |
| Progressive Corp. | 6.250% | 12/1/32 | 315 | 395 |
| Progressive Corp. | 4.350% | 4/25/44 | 700 | 682 |
| Protective Life Corp. | 8.450% | 10/15/39 | 310 | 424 |
| Prudential Financial Inc. | 5.750% | 7/15/33 | 500 | 562 |
| Prudential Financial Inc. | 5.400% | 6/13/35 | 445 | 481 |
| Prudential Financial Inc. | 5.900% | 3/17/36 | 695 | 793 |
| Prudential Financial Inc. | 5.700% | 12/14/36 | 1,050 | 1,165 |
| Prudential Financial Inc. | 6.625% | 12/1/37 | 960 | 1,179 |
| Prudential Financial Inc. | 6.625% | 6/21/40 | 550 | 687 |
| Prudential Financial Inc. | 5.100% | 8/15/43 | 380 | 397 |
| Prudential Financial Inc. | 4.600% | 5/15/44 | 800 | 773 |
| Swiss Re Solutions Holding Corp. | 7.000% | 2/15/26 | 445 | 568 |
| Transatlantic Holdings Inc. | 8.000% | 11/30/39 | 280 | 372 |
| Travelers Cos. Inc. | 6.750% | 6/20/36 | 555 | 721 |
| Travelers Cos. Inc. | 6.250% | 6/15/37 | 435 | 539 |
| Travelers Cos. Inc. | 5.350% | 11/1/40 | 416 | 468 |
| Travelers Cos. Inc. | 4.600% | 8/1/43 | 655 | 669 |
| Travelers Cos. Inc. | 4.300% | 8/25/45 | 500 | 491 |
| Travelers Property Casualty Corp. | 6.375% | 3/15/33 | 500 | 633 |
| Trinity Acquisition plc | 6.125% | 8/15/43 | 375 | 407 |
| UnitedHealth Group Inc. | 4.625% | 7/15/35 | 775 | 807 |
| UnitedHealth Group Inc. | 5.800% | 3/15/36 | 685 | 797 |
| UnitedHealth Group Inc. | 6.500% | 6/15/37 | 515 | 648 |
| UnitedHealth Group Inc. | 6.625% | 11/15/37 | 755 | 955 |
| UnitedHealth Group Inc. | 6.875% | 2/15/38 | 1,260 | 1,651 |
| UnitedHealth Group Inc. | 5.700% | 10/15/40 | 10 | 12 |
| UnitedHealth Group Inc. | 5.950% | 2/15/41 | 585 | 701 |
| UnitedHealth Group Inc. | 4.625% | 11/15/41 | 813 | 814 |
| UnitedHealth Group Inc. | 4.375% | 3/15/42 | 505 | 494 |
| UnitedHealth Group Inc. | 3.950% | 10/15/42 | 625 | 567 |
| UnitedHealth Group Inc. | 4.250% | 3/15/43 | 850 | 815 |
| UnitedHealth Group Inc. | 4.750% | 7/15/45 | 2,115 | 2,211 |
| Unum Group | 5.750% | 8/15/42 | 575 | 628 |
| Validus Holdings Ltd. | 8.875% | 1/26/40 | 285 | 355 |
| Voya Financial Inc. | 5.700% | 7/15/43 | 425 | 475 |
| WR Berkley Corp. | 4.750% | 8/1/44 | 625 | 611 |
| XLIT Ltd. | 6.250% | 5/15/27 | 205 | 241 |
| XLIT Ltd. | 5.250% | 12/15/43 | 425 | 444 |
| XLIT Ltd. | 5.500% | 3/31/45 | 600 | 558 |
| Real Estate Investment Trusts (0.7%) | ||||
| Alexandria Real Estate Equities Inc. | 4.500% | 7/30/29 | 365 | 364 |
| Brandywine Operating Partnership LP | 4.550% | 10/1/29 | 730 | 705 |
| ERP Operating LP | 4.500% | 7/1/44 | 350 | 348 |
| ERP Operating LP | 4.500% | 6/1/45 | 425 | 414 |
| Federal Realty Investment Trust | 4.500% | 12/1/44 | 475 | 465 |
| HCP Inc. | 6.750% | 2/1/41 | 440 | 540 |
| Health Care REIT Inc. | 6.500% | 3/15/41 | 450 | 538 |
| Health Care REIT Inc. | 5.125% | 3/15/43 | 325 | 328 |
| Kilroy Realty LP | 4.250% | 8/15/29 | 485 | 462 |
| Kimco Realty Corp. | 4.250% | 4/1/45 | 450 | 408 |
63
| Vanguard® Long-Term Corporate Bond Index Fund | ||||
| Schedule of Investments | ||||
| August 31, 2015 | ||||
| Face | Market | |||
| Maturity | Amount | Value | ||
| Coupon | Date | ($000) | ($000) | |
| 1 Omega Healthcare Investors Inc. | 4.500% | 4/1/27 | 755 | 725 |
| Realty Income Corp. | 5.875% | 3/15/35 | 385 | 439 |
| Simon Property Group LP | 3.500% | 9/1/25 | 500 | 492 |
| Simon Property Group LP | 6.750% | 2/1/40 | 795 | 1,032 |
| Simon Property Group LP | 4.750% | 3/15/42 | 465 | 482 |
| Simon Property Group LP | 4.250% | 10/1/44 | 400 | 381 |
| Ventas Realty LP | 5.700% | 9/30/43 | 250 | 272 |
| Ventas Realty LP | 4.375% | 2/1/45 | 375 | 338 |
| 255,825 | ||||
| Industrial (66.0%) | ||||
| Basic Industry (5.3%) | ||||
| Agrium Inc. | 4.125% | 3/15/35 | 500 | 434 |
| Agrium Inc. | 7.125% | 5/23/36 | 330 | 410 |
| Agrium Inc. | 6.125% | 1/15/41 | 500 | 557 |
| Agrium Inc. | 4.900% | 6/1/43 | 500 | 478 |
| Agrium Inc. | 5.250% | 1/15/45 | 400 | 393 |
| Albemarle Corp. | 5.450% | 12/1/44 | 525 | 522 |
| Barrick Gold Corp. | 5.250% | 4/1/42 | 1,115 | 885 |
| Barrick North America Finance LLC | 7.500% | 9/15/38 | 265 | 263 |
| Barrick North America Finance LLC | 5.700% | 5/30/41 | 530 | 434 |
| Barrick North America Finance LLC | 5.750% | 5/1/43 | 1,200 | 1,023 |
| Barrick PD Australia Finance Pty Ltd. | 5.950% | 10/15/39 | 795 | 666 |
| BHP Billiton Finance USA Ltd. | 6.420% | 3/1/26 | 300 | 352 |
| BHP Billiton Finance USA Ltd. | 4.125% | 2/24/42 | 1,180 | 1,038 |
| BHP Billiton Finance USA Ltd. | 5.000% | 9/30/43 | 2,100 | 2,156 |
| CF Industries Inc. | 5.150% | 3/15/34 | 850 | 815 |
| CF Industries Inc. | 4.950% | 6/1/43 | 825 | 752 |
| CF Industries Inc. | 5.375% | 3/15/44 | 725 | 694 |
| Domtar Corp. | 6.250% | 9/1/42 | 425 | 425 |
| Domtar Corp. | 6.750% | 2/15/44 | 175 | 188 |
| Dow Chemical Co. | 7.375% | 11/1/29 | 1,435 | 1,817 |
| Dow Chemical Co. | 4.250% | 10/1/34 | 221 | 203 |
| Dow Chemical Co. | 9.400% | 5/15/39 | 870 | 1,276 |
| Dow Chemical Co. | 5.250% | 11/15/41 | 755 | 758 |
| Dow Chemical Co. | 4.375% | 11/15/42 | 1,150 | 1,009 |
| Eastman Chemical Co. | 4.800% | 9/1/42 | 1,180 | 1,124 |
| Eastman Chemical Co. | 4.650% | 10/15/44 | 615 | 573 |
| Ecolab Inc. | 5.500% | 12/8/41 | 608 | 674 |
| EI du Pont de Nemours & Co. | 6.500% | 1/15/28 | 450 | 561 |
| EI du Pont de Nemours & Co. | 4.900% | 1/15/41 | 810 | 852 |
| EI du Pont de Nemours & Co. | 4.150% | 2/15/43 | 725 | 680 |
| Freeport-McMoRan Inc. | 5.400% | 11/14/34 | 775 | 560 |
| Freeport-McMoRan Inc. | 5.450% | 3/15/43 | 1,860 | 1,339 |
| Georgia-Pacific LLC | 7.375% | 12/1/25 | 402 | 508 |
| Georgia-Pacific LLC | 7.250% | 6/1/28 | 305 | 391 |
| Georgia-Pacific LLC | 7.750% | 11/15/29 | 540 | 725 |
| Georgia-Pacific LLC | 8.875% | 5/15/31 | 365 | 526 |
| Glencore Canada Corp. | 6.200% | 6/15/35 | 175 | 158 |
| Goldcorp Inc. | 5.450% | 6/9/44 | 425 | 376 |
| International Paper Co. | 3.800% | 1/15/26 | 550 | 533 |
| International Paper Co. | 5.000% | 9/15/35 | 700 | 674 |
| International Paper Co. | 8.700% | 6/15/38 | 25 | 33 |
| International Paper Co. | 7.300% | 11/15/39 | 785 | 928 |
| International Paper Co. | 6.000% | 11/15/41 | 725 | 768 |
| International Paper Co. | 4.800% | 6/15/44 | 965 | 876 |
| International Paper Co. | 5.150% | 5/15/46 | 1,000 | 966 |
| Kinross Gold Corp. | 6.875% | 9/1/41 | 260 | 198 |
| Lubrizol Corp. | 6.500% | 10/1/34 | 240 | 302 |
| LYB International Finance BV | 5.250% | 7/15/43 | 875 | 869 |
| LYB International Finance BV | 4.875% | 3/15/44 | 700 | 672 |
| LyondellBasell Industries NV | 4.625% | 2/26/55 | 950 | 826 |
| MeadWestvaco Corp. | 8.200% | 1/15/30 | 500 | 668 |
| MeadWestvaco Corp. | 7.950% | 2/15/31 | 300 | 387 |
64
| Vanguard® Long-Term Corporate Bond Index Fund | ||||
| Schedule of Investments | ||||
| August 31, 2015 | ||||
| Face | Market | |||
| Maturity | Amount | Value | ||
| Coupon | Date | ($000) | ($000) | |
| Methanex Corp. | 5.650% | 12/1/44 | 250 | 239 |
| Monsanto Co. | 4.200% | 7/15/34 | 1,180 | 1,081 |
| Monsanto Co. | 5.875% | 4/15/38 | 230 | 254 |
| Monsanto Co. | 3.600% | 7/15/42 | 665 | 519 |
| Monsanto Co. | 4.400% | 7/15/44 | 820 | 737 |
| Monsanto Co. | 3.950% | 4/15/45 | 750 | 625 |
| Monsanto Co. | 4.700% | 7/15/64 | 1,120 | 968 |
| Mosaic Co. | 5.450% | 11/15/33 | 600 | 627 |
| Mosaic Co. | 4.875% | 11/15/41 | 145 | 139 |
| Mosaic Co. | 5.625% | 11/15/43 | 825 | 862 |
| Newmont Mining Corp. | 5.875% | 4/1/35 | 505 | 444 |
| Newmont Mining Corp. | 6.250% | 10/1/39 | 1,090 | 971 |
| Newmont Mining Corp. | 4.875% | 3/15/42 | 1,307 | 1,000 |
| Nucor Corp. | 6.400% | 12/1/37 | 480 | 554 |
| Nucor Corp. | 5.200% | 8/1/43 | 925 | 945 |
| Placer Dome Inc. | 6.450% | 10/15/35 | 50 | 46 |
| Potash Corp. of Saskatchewan Inc. | 5.875% | 12/1/36 | 560 | 623 |
| Potash Corp. of Saskatchewan Inc. | 5.625% | 12/1/40 | 635 | 686 |
| PPG Industries Inc. | 5.500% | 11/15/40 | 285 | 327 |
| Praxair Inc. | 3.550% | 11/7/42 | 425 | 376 |
| Reliance Steel & Aluminum Co. | 6.850% | 11/15/36 | 285 | 298 |
| Rio Tinto Alcan Inc. | 7.250% | 3/15/31 | 480 | 583 |
| Rio Tinto Alcan Inc. | 6.125% | 12/15/33 | 794 | 874 |
| Rio Tinto Alcan Inc. | 5.750% | 6/1/35 | 535 | 557 |
| Rio Tinto Finance USA Ltd. | 7.125% | 7/15/28 | 665 | 833 |
| Rio Tinto Finance USA Ltd. | 5.200% | 11/2/40 | 1,145 | 1,144 |
| Rio Tinto Finance USA plc | 4.750% | 3/22/42 | 600 | 562 |
| Rio Tinto Finance USA plc | 4.125% | 8/21/42 | 475 | 407 |
| Rohm & Haas Co. | 7.850% | 7/15/29 | 760 | 1,001 |
| RPM International Inc. | 5.250% | 6/1/45 | 200 | 193 |
| Sherwin-Williams Co. | 3.450% | 8/1/25 | 150 | 150 |
| Sherwin-Williams Co. | 4.000% | 12/15/42 | 216 | 200 |
| Sherwin-Williams Co. | 4.550% | 8/1/45 | 300 | 304 |
| Southern Copper Corp. | 7.500% | 7/27/35 | 1,495 | 1,539 |
| Southern Copper Corp. | 6.750% | 4/16/40 | 990 | 946 |
| Southern Copper Corp. | 5.250% | 11/8/42 | 1,150 | 911 |
| Southern Copper Corp. | 5.875% | 4/23/45 | 1,125 | 961 |
| Syngenta Finance NV | 4.375% | 3/28/42 | 225 | 209 |
| Teck Resources Ltd. | 6.125% | 10/1/35 | 555 | 384 |
| Teck Resources Ltd. | 6.000% | 8/15/40 | 570 | 382 |
| Teck Resources Ltd. | 6.250% | 7/15/41 | 1,135 | 776 |
| Teck Resources Ltd. | 5.200% | 3/1/42 | 788 | 495 |
| Teck Resources Ltd. | 5.400% | 2/1/43 | 300 | 194 |
| The Dow Chemical Company | 4.625% | 10/1/44 | 425 | 394 |
| Vale Canada Ltd. | 7.200% | 9/15/32 | 660 | 617 |
| Vale Overseas Ltd. | 8.250% | 1/17/34 | 295 | 291 |
| Vale Overseas Ltd. | 6.875% | 11/21/36 | 3,035 | 2,589 |
| Vale Overseas Ltd. | 6.875% | 11/10/39 | 2,020 | 1,709 |
| Vale SA | 5.625% | 9/11/42 | 1,760 | 1,321 |
| Valspar Corp. | 3.950% | 1/15/26 | 500 | 503 |
| Weyerhaeuser Co. | 6.950% | 10/1/27 | 341 | 404 |
| Weyerhaeuser Co. | 7.375% | 3/15/32 | 805 | 1,005 |
| Weyerhaeuser Co. | 6.875% | 12/15/33 | 625 | 759 |
| Worthington Industries Inc. | 4.550% | 4/15/26 | 200 | 197 |
| Capital Goods (4.3%) | ||||
| 3M Co. | 6.375% | 2/15/28 | 550 | 709 |
| 3M Co. | 5.700% | 3/15/37 | 555 | 677 |
| 3M Co. | 3.875% | 6/15/44 | 30 | 29 |
| ABB Finance USA Inc. | 4.375% | 5/8/42 | 550 | 534 |
| Boeing Co. | 6.125% | 2/15/33 | 380 | 479 |
| Boeing Co. | 3.300% | 3/1/35 | 275 | 251 |
| Boeing Co. | 6.875% | 3/15/39 | 395 | 545 |
| Boeing Co. | 5.875% | 2/15/40 | 650 | 809 |
65
| Vanguard® Long-Term Corporate Bond Index Fund | ||||
| Schedule of Investments | ||||
| August 31, 2015 | ||||
| Face | Market | |||
| Maturity | Amount | Value | ||
| Coupon | Date | ($000) | ($000) | |
| Boeing Co. | 3.500% | 3/1/45 | 250 | 223 |
| Caterpillar Inc. | 5.300% | 9/15/35 | 350 | 386 |
| Caterpillar Inc. | 6.050% | 8/15/36 | 940 | 1,114 |
| Caterpillar Inc. | 3.803% | 8/15/42 | 2,060 | 1,863 |
| Caterpillar Inc. | 4.300% | 5/15/44 | 500 | 491 |
| Caterpillar Inc. | 4.750% | 5/15/64 | 550 | 548 |
| Deere & Co. | 5.375% | 10/16/29 | 695 | 824 |
| Deere & Co. | 8.100% | 5/15/30 | 504 | 724 |
| Deere & Co. | 7.125% | 3/3/31 | 300 | 399 |
| Deere & Co. | 3.900% | 6/9/42 | 735 | 687 |
| Dover Corp. | 6.600% | 3/15/38 | 200 | 260 |
| Dover Corp. | 5.375% | 3/1/41 | 580 | 669 |
| Eaton Corp. | 4.000% | 11/2/32 | 765 | 731 |
| Eaton Corp. | 4.150% | 11/2/42 | 500 | 457 |
| Emerson Electric Co. | 6.000% | 8/15/32 | 160 | 193 |
| Emerson Electric Co. | 6.125% | 4/15/39 | 270 | 339 |
| Emerson Electric Co. | 5.250% | 11/15/39 | 345 | 394 |
| General Dynamics Corp. | 3.600% | 11/15/42 | 400 | 363 |
| General Electric Co. | 4.125% | 10/9/42 | 2,375 | 2,267 |
| General Electric Co. | 4.500% | 3/11/44 | 2,455 | 2,481 |
| Harris Corp. | 4.854% | 4/27/35 | 500 | 476 |
| Harris Corp. | 6.150% | 12/15/40 | 400 | 429 |
| Harris Corp. | 5.054% | 4/27/45 | 425 | 401 |
| Honeywell International Inc. | 5.700% | 3/15/36 | 700 | 838 |
| Honeywell International Inc. | 5.700% | 3/15/37 | 840 | 1,009 |
| Honeywell International Inc. | 5.375% | 3/1/41 | 630 | 736 |
| Illinois Tool Works Inc. | 4.875% | 9/15/41 | 639 | 681 |
| Illinois Tool Works Inc. | 3.900% | 9/1/42 | 1,156 | 1,084 |
| Ingersoll-Rand Global Holding Co. Ltd. | 5.750% | 6/15/43 | 600 | 655 |
| Ingersoll-Rand Luxembourg Finance SA | 4.650% | 11/1/44 | 450 | 422 |
| Lockheed Martin Corp. | 3.600% | 3/1/35 | 1,300 | 1,174 |
| Lockheed Martin Corp. | 6.150% | 9/1/36 | 965 | 1,150 |
| Lockheed Martin Corp. | 5.500% | 11/15/39 | 475 | 523 |
| Lockheed Martin Corp. | 5.720% | 6/1/40 | 779 | 884 |
| Lockheed Martin Corp. | 4.850% | 9/15/41 | 1,205 | 1,235 |
| Lockheed Martin Corp. | 4.070% | 12/15/42 | 290 | 266 |
| Lockheed Martin Corp. | 3.800% | 3/1/45 | 930 | 814 |
| Northrop Grumman Corp. | 5.050% | 11/15/40 | 790 | 815 |
| Northrop Grumman Corp. | 4.750% | 6/1/43 | 725 | 729 |
| Northrop Grumman Corp. | 3.850% | 4/15/45 | 600 | 522 |
| Northrop Grumman Systems Corp. | 7.750% | 2/15/31 | 660 | 874 |
| Owens Corning | 7.000% | 12/1/36 | 615 | 717 |
| Parker Hannifin Corp. | 6.250% | 5/15/38 | 640 | 815 |
| Parker-Hannifin Corp. | 4.200% | 11/21/34 | 405 | 410 |
| Parker-Hannifin Corp. | 4.450% | 11/21/44 | 260 | 266 |
| Precision Castparts Corp. | 4.200% | 6/15/35 | 250 | 251 |
| Precision Castparts Corp. | 3.900% | 1/15/43 | 425 | 394 |
| Precision Castparts Corp. | 4.375% | 6/15/45 | 400 | 390 |
| Raytheon Co. | 7.200% | 8/15/27 | 455 | 609 |
| Raytheon Co. | 4.875% | 10/15/40 | 400 | 430 |
| Raytheon Co. | 4.700% | 12/15/41 | 710 | 742 |
| Republic Services Inc. | 6.200% | 3/1/40 | 1,060 | 1,280 |
| Republic Services Inc. | 5.700% | 5/15/41 | 730 | 820 |
| Rockwell Automation Inc. | 6.700% | 1/15/28 | 285 | 370 |
| Rockwell Automation Inc. | 6.250% | 12/1/37 | 330 | 410 |
| Rockwell Collins Inc. | 4.800% | 12/15/43 | 350 | 376 |
| Sonoco Products Co. | 5.750% | 11/1/40 | 645 | 711 |
| Stanley Black & Decker Inc. | 5.200% | 9/1/40 | 315 | 341 |
| United Technologies Corp. | 6.700% | 8/1/28 | 400 | 515 |
| United Technologies Corp. | 7.500% | 9/15/29 | 705 | 973 |
| United Technologies Corp. | 5.400% | 5/1/35 | 400 | 446 |
| United Technologies Corp. | 6.050% | 6/1/36 | 600 | 725 |
| United Technologies Corp. | 6.125% | 7/15/38 | 940 | 1,133 |
| United Technologies Corp. | 5.700% | 4/15/40 | 1,205 | 1,408 |
66
| Vanguard® Long-Term Corporate Bond Index Fund | ||||
| Schedule of Investments | ||||
| August 31, 2015 | ||||
| Face | Market | |||
| Maturity | Amount | Value | ||
| Coupon | Date | ($000) | ($000) | |
| United Technologies Corp. | 4.500% | 6/1/42 | 3,430 | 3,465 |
| United Technologies Corp. | 4.150% | 5/15/45 | 1,100 | 1,054 |
| Valmont Industries Inc. | 5.000% | 10/1/44 | 180 | 166 |
| Valmont Industries Inc. | 5.250% | 10/1/54 | 350 | 310 |
| Waste Management Inc. | 3.900% | 3/1/35 | 625 | 574 |
| Waste Management Inc. | 6.125% | 11/30/39 | 700 | 841 |
| Waste Management Inc. | 4.100% | 3/1/45 | 675 | 615 |
| WW Grainger Inc. | 4.600% | 6/15/45 | 1,025 | 1,051 |
| Communication (15.5%) | ||||
| 21st Century Fox America Inc. | 7.700% | 10/30/25 | 285 | 363 |
| 21st Century Fox America Inc. | 6.550% | 3/15/33 | 785 | 933 |
| 21st Century Fox America Inc. | 6.200% | 12/15/34 | 715 | 802 |
| 21st Century Fox America Inc. | 6.400% | 12/15/35 | 940 | 1,062 |
| 21st Century Fox America Inc. | 8.150% | 10/17/36 | 350 | 475 |
| 21st Century Fox America Inc. | 6.150% | 3/1/37 | 1,025 | 1,141 |
| 21st Century Fox America Inc. | 6.650% | 11/15/37 | 1,445 | 1,693 |
| 21st Century Fox America Inc. | 7.850% | 3/1/39 | 250 | 332 |
| 21st Century Fox America Inc. | 6.900% | 8/15/39 | 810 | 970 |
| 21st Century Fox America Inc. | 6.150% | 2/15/41 | 1,150 | 1,287 |
| 21st Century Fox America Inc. | 5.400% | 10/1/43 | 760 | 764 |
| 21st Century Fox America Inc. | 4.750% | 9/15/44 | 575 | 549 |
| 21st Century Fox America Inc. | 7.750% | 12/1/45 | 780 | 1,042 |
| Alltel Corp. | 7.875% | 7/1/32 | 500 | 666 |
| America Movil SAB de CV | 6.375% | 3/1/35 | 740 | 850 |
| America Movil SAB de CV | 6.125% | 11/15/37 | 650 | 727 |
| America Movil SAB de CV | 6.125% | 3/30/40 | 2,425 | 2,728 |
| America Movil SAB de CV | 4.375% | 7/16/42 | 800 | 724 |
| Ameritech Capital Funding Corp. | 6.550% | 1/15/28 | 385 | 437 |
| AT&T Corp. | 8.250% | 11/15/31 | 880 | 1,158 |
| AT&T Inc. | 6.150% | 9/15/34 | 1,067 | 1,148 |
| AT&T Inc. | 4.500% | 5/15/35 | 2,150 | 1,970 |
| AT&T Inc. | 6.500% | 9/1/37 | 1,137 | 1,271 |
| AT&T Inc. | 6.300% | 1/15/38 | 1,585 | 1,735 |
| AT&T Inc. | 6.400% | 5/15/38 | 660 | 741 |
| AT&T Inc. | 6.550% | 2/15/39 | 1,605 | 1,809 |
| AT&T Inc. | 5.350% | 9/1/40 | 3,630 | 3,555 |
| AT&T Inc. | 5.550% | 8/15/41 | 2,206 | 2,217 |
| AT&T Inc. | 4.300% | 12/15/42 | 1,463 | 1,239 |
| AT&T Inc. | 4.800% | 6/15/44 | 1,915 | 1,757 |
| AT&T Inc. | 4.350% | 6/15/45 | 3,789 | 3,230 |
| AT&T Inc. | 4.750% | 5/15/46 | 3,100 | 2,802 |
| AT&T Mobility LLC | 7.125% | 12/15/31 | 422 | 519 |
| Bellsouth Capital Funding Corp. | 7.875% | 2/15/30 | 598 | 715 |
| Bellsouth Capital Funding Corp. | 7.120% | 7/15/97 | 200 | 227 |
| BellSouth Corp. | 6.875% | 10/15/31 | 498 | 565 |
| BellSouth Corp. | 6.550% | 6/15/34 | 370 | 407 |
| BellSouth Corp. | 6.000% | 11/15/34 | 375 | 391 |
| BellSouth Telecommunications LLC | 6.375% | 6/1/28 | 372 | 410 |
| British Telecommunications plc | 9.625% | 12/15/30 | 2,727 | 3,971 |
| CBS Corp. | 4.000% | 1/15/26 | 600 | 587 |
| CBS Corp. | 7.875% | 7/30/30 | 861 | 1,105 |
| CBS Corp. | 5.500% | 5/15/33 | 695 | 691 |
| CBS Corp. | 5.900% | 10/15/40 | 250 | 259 |
| CBS Corp. | 4.850% | 7/1/42 | 495 | 452 |
| CBS Corp. | 4.900% | 8/15/44 | 500 | 449 |
| CBS Corp. | 4.600% | 1/15/45 | 625 | 538 |
| 1 CCO Safari II LLC | 6.384% | 10/23/35 | 1,000 | 1,015 |
| 1 CCO Safari II LLC | 6.484% | 10/23/45 | 4,550 | 4,611 |
| 1 CCO Safari II LLC | 6.834% | 10/23/55 | 500 | 499 |
| Comcast Corp. | 4.250% | 1/15/33 | 1,455 | 1,435 |
| Comcast Corp. | 7.050% | 3/15/33 | 985 | 1,271 |
| Comcast Corp. | 4.200% | 8/15/34 | 1,350 | 1,313 |
| Comcast Corp. | 5.650% | 6/15/35 | 1,085 | 1,237 |
67
| Vanguard® Long-Term Corporate Bond Index Fund | ||||
| Schedule of Investments | ||||
| August 31, 2015 | ||||
| Face | Market | |||
| Maturity | Amount | Value | ||
| Coupon | Date | ($000) | ($000) | |
| Comcast Corp. | 4.400% | 8/15/35 | 715 | 715 |
| Comcast Corp. | 6.500% | 11/15/35 | 1,260 | 1,566 |
| Comcast Corp. | 6.450% | 3/15/37 | 1,585 | 1,962 |
| Comcast Corp. | 6.950% | 8/15/37 | 1,750 | 2,273 |
| Comcast Corp. | 6.400% | 5/15/38 | 955 | 1,178 |
| Comcast Corp. | 6.550% | 7/1/39 | 1,086 | 1,377 |
| Comcast Corp. | 6.400% | 3/1/40 | 950 | 1,184 |
| Comcast Corp. | 4.650% | 7/15/42 | 1,015 | 1,033 |
| Comcast Corp. | 4.500% | 1/15/43 | 600 | 594 |
| Comcast Corp. | 4.750% | 3/1/44 | 700 | 723 |
| Comcast Corp. | 4.600% | 8/15/45 | 2,250 | 2,270 |
| Deutsche Telekom International Finance BV | 8.750% | 6/15/30 | 3,639 | 5,126 |
| Deutsche Telekom International Finance BV | 9.250% | 6/1/32 | 523 | 769 |
| DIRECTV Holdings LLC / DIRECTV Financing Co. Inc. | 6.350% | 3/15/40 | 650 | 686 |
| DIRECTV Holdings LLC / DIRECTV Financing Co. Inc. | 6.000% | 8/15/40 | 970 | 996 |
| DIRECTV Holdings LLC / DIRECTV Financing Co. Inc. | 6.375% | 3/1/41 | 1,225 | 1,307 |
| DIRECTV Holdings LLC / DIRECTV Financing Co. Inc. | 5.150% | 3/15/42 | 1,685 | 1,578 |
| Discovery Communications LLC | 6.350% | 6/1/40 | 610 | 635 |
| Discovery Communications LLC | 4.950% | 5/15/42 | 750 | 647 |
| Discovery Communications LLC | 4.875% | 4/1/43 | 925 | 787 |
| Embarq Corp. | 7.995% | 6/1/36 | 1,630 | 1,717 |
| Grupo Televisa SAB | 8.500% | 3/11/32 | 190 | 245 |
| Grupo Televisa SAB | 6.625% | 1/15/40 | 375 | 416 |
| Grupo Televisa SAB | 5.000% | 5/13/45 | 1,275 | 1,169 |
| GTE Corp. | 6.940% | 4/15/28 | 810 | 950 |
| Historic TW Inc. | 6.625% | 5/15/29 | 590 | 701 |
| Koninklijke KPN NV | 8.375% | 10/1/30 | 1,025 | 1,333 |
| 1 McGraw Hill Financial Inc. | 4.400% | 2/15/26 | 770 | 765 |
| McGraw Hill Financial Inc. | 6.550% | 11/15/37 | 600 | 683 |
| Moody's Corp. | 5.250% | 7/15/44 | 450 | 468 |
| NBCUniversal Media LLC | 6.400% | 4/30/40 | 990 | 1,223 |
| NBCUniversal Media LLC | 5.950% | 4/1/41 | 1,195 | 1,423 |
| NBCUniversal Media LLC | 4.450% | 1/15/43 | 1,100 | 1,075 |
| New Cingular Wireless Services Inc. | 8.750% | 3/1/31 | 970 | 1,338 |
| Orange SA | 9.000% | 3/1/31 | 2,550 | 3,543 |
| Orange SA | 5.375% | 1/13/42 | 885 | 911 |
| Orange SA | 5.500% | 2/6/44 | 910 | 973 |
| Pacific Bell Telephone Co. | 7.125% | 3/15/26 | 655 | 797 |
| Qwest Corp. | 7.200% | 11/10/26 | 30 | 30 |
| Qwest Corp. | 6.875% | 9/15/33 | 1,370 | 1,351 |
| Qwest Corp. | 7.125% | 11/15/43 | 585 | 573 |
| Rogers Communications Inc. | 7.500% | 8/15/38 | 755 | 959 |
| Rogers Communications Inc. | 4.500% | 3/15/43 | 675 | 609 |
| Rogers Communications Inc. | 5.450% | 10/1/43 | 475 | 493 |
| Rogers Communications Inc. | 5.000% | 3/15/44 | 375 | 366 |
| TCI Communications Inc. | 7.875% | 2/15/26 | 477 | 640 |
| TCI Communications Inc. | 7.125% | 2/15/28 | 395 | 505 |
| Telefonica Emisiones SAU | 7.045% | 6/20/36 | 2,075 | 2,508 |
| Telefonica Europe BV | 8.250% | 9/15/30 | 1,262 | 1,688 |
| Thomson Reuters Corp. | 5.500% | 8/15/35 | 300 | 322 |
| Thomson Reuters Corp. | 5.850% | 4/15/40 | 465 | 500 |
| Thomson Reuters Corp. | 5.650% | 11/23/43 | 925 | 986 |
| Time Warner Cable Inc. | 6.550% | 5/1/37 | 1,550 | 1,551 |
| Time Warner Cable Inc. | 7.300% | 7/1/38 | 1,650 | 1,724 |
| Time Warner Cable Inc. | 6.750% | 6/15/39 | 1,270 | 1,280 |
| Time Warner Cable Inc. | 5.875% | 11/15/40 | 1,210 | 1,140 |
| Time Warner Cable Inc. | 5.500% | 9/1/41 | 1,281 | 1,153 |
| Time Warner Cable Inc. | 4.500% | 9/15/42 | 1,350 | 1,077 |
| Time Warner Cos. Inc. | 6.950% | 1/15/28 | 938 | 1,147 |
| Time Warner Entertainment Co. LP | 8.375% | 7/15/33 | 1,200 | 1,428 |
| Time Warner Inc. | 7.625% | 4/15/31 | 2,160 | 2,717 |
| Time Warner Inc. | 7.700% | 5/1/32 | 1,905 | 2,438 |
| Time Warner Inc. | 6.500% | 11/15/36 | 1,015 | 1,166 |
| Time Warner Inc. | 6.200% | 3/15/40 | 475 | 530 |
68
| Vanguard® Long-Term Corporate Bond Index Fund | ||||
| Schedule of Investments | ||||
| August 31, 2015 | ||||
| Face | Market | |||
| Maturity | Amount | Value | ||
| Coupon | Date | ($000) | ($000) | |
| Time Warner Inc. | 6.100% | 7/15/40 | 985 | 1,081 |
| Time Warner Inc. | 6.250% | 3/29/41 | 1,160 | 1,286 |
| Time Warner Inc. | 5.375% | 10/15/41 | 220 | 224 |
| Time Warner Inc. | 4.900% | 6/15/42 | 755 | 729 |
| Time Warner Inc. | 5.350% | 12/15/43 | 500 | 503 |
| Time Warner Inc. | 4.650% | 6/1/44 | 285 | 260 |
| Time Warner Inc. | 4.850% | 7/15/45 | 1,050 | 1,014 |
| Verizon Communications Inc. | 7.750% | 12/1/30 | 1,300 | 1,661 |
| Verizon Communications Inc. | 6.400% | 9/15/33 | 1,647 | 1,884 |
| Verizon Communications Inc. | 5.050% | 3/15/34 | 625 | 620 |
| Verizon Communications Inc. | 4.400% | 11/1/34 | 3,045 | 2,799 |
| Verizon Communications Inc. | 5.850% | 9/15/35 | 1,175 | 1,261 |
| Verizon Communications Inc. | 4.272% | 1/15/36 | 3,240 | 2,901 |
| Verizon Communications Inc. | 6.250% | 4/1/37 | 945 | 1,062 |
| Verizon Communications Inc. | 6.400% | 2/15/38 | 900 | 1,014 |
| Verizon Communications Inc. | 6.900% | 4/15/38 | 590 | 711 |
| Verizon Communications Inc. | 7.350% | 4/1/39 | 600 | 731 |
| Verizon Communications Inc. | 6.000% | 4/1/41 | 1,110 | 1,216 |
| Verizon Communications Inc. | 4.750% | 11/1/41 | 805 | 744 |
| Verizon Communications Inc. | 3.850% | 11/1/42 | 1,295 | 1,058 |
| Verizon Communications Inc. | 6.550% | 9/15/43 | 6,190 | 7,309 |
| Verizon Communications Inc. | 4.862% | 8/21/46 | 4,803 | 4,502 |
| Verizon Communications Inc. | 4.522% | 9/15/48 | 5,328 | 4,697 |
| Verizon Communications Inc. | 5.012% | 8/21/54 | 6,209 | 5,675 |
| Verizon Communications Inc. | 4.672% | 3/15/55 | 5,800 | 5,017 |
| Verizon Florida LLC | 6.860% | 2/1/28 | 975 | 944 |
| Verizon Maryland LLC | 5.125% | 6/15/33 | 695 | 684 |
| Verizon New England Inc. | 7.875% | 11/15/29 | 800 | 1,002 |
| Verizon New York Inc. | 7.375% | 4/1/32 | 437 | 504 |
| Viacom Inc. | 4.850% | 12/15/34 | 650 | 548 |
| Viacom Inc. | 6.875% | 4/30/36 | 1,125 | 1,178 |
| Viacom Inc. | 4.375% | 3/15/43 | 1,450 | 1,073 |
| Viacom Inc. | 4.875% | 6/15/43 | 450 | 361 |
| Viacom Inc. | 5.850% | 9/1/43 | 1,300 | 1,197 |
| Viacom Inc. | 5.250% | 4/1/44 | 600 | 509 |
| Vodafone Group plc | 7.875% | 2/15/30 | 835 | 1,011 |
| Vodafone Group plc | 6.250% | 11/30/32 | 465 | 492 |
| Vodafone Group plc | 6.150% | 2/27/37 | 1,185 | 1,264 |
| Vodafone Group plc | 4.375% | 2/19/43 | 1,650 | 1,417 |
| Walt Disney Co. | 7.000% | 3/1/32 | 595 | 822 |
| Walt Disney Co. | 4.375% | 8/16/41 | 625 | 633 |
| Walt Disney Co. | 4.125% | 12/1/41 | 685 | 670 |
| Walt Disney Co. | 3.700% | 12/1/42 | 500 | 456 |
| Walt Disney Co. | 4.125% | 6/1/44 | 225 | 216 |
| WPP Finance 2010 | 5.125% | 9/7/42 | 975 | 949 |
| Consumer Cyclical (6.6%) | ||||
| 1 Alibaba Group Holding Ltd. | 4.500% | 11/28/34 | 825 | 769 |
| Amazon.com Inc. | 4.800% | 12/5/34 | 1,175 | 1,177 |
| Amazon.com Inc. | 4.950% | 12/5/44 | 1,601 | 1,602 |
| Bed Bath & Beyond Inc. | 4.915% | 8/1/34 | 425 | 403 |
| Bed Bath & Beyond Inc. | 5.165% | 8/1/44 | 825 | 790 |
| BorgWarner Inc. | 4.375% | 3/15/45 | 500 | 460 |
| Cummins Inc. | 7.125% | 3/1/28 | 275 | 360 |
| Cummins Inc. | 4.875% | 10/1/43 | 525 | 542 |
| CVS Health Corp. | 4.875% | 7/20/35 | 3,225 | 3,334 |
| CVS Health Corp. | 5.750% | 5/15/41 | 1,014 | 1,142 |
| CVS Health Corp. | 5.300% | 12/5/43 | 1,100 | 1,171 |
| CVS Health Corp. | 5.125% | 7/20/45 | 3,050 | 3,240 |
| Daimler Finance North America LLC | 8.500% | 1/18/31 | 1,645 | 2,392 |
| Darden Restaurants Inc. | 7.050% | 10/15/37 | 100 | 120 |
| eBay Inc. | 4.000% | 7/15/42 | 550 | 421 |
| Ford Holdings LLC | 9.300% | 3/1/30 | 400 | 565 |
| Ford Motor Co. | 6.625% | 10/1/28 | 675 | 780 |
69
| Vanguard® Long-Term Corporate Bond Index Fund | ||||
| Schedule of Investments | ||||
| August 31, 2015 | ||||
| Face | Market | |||
| Maturity | Amount | Value | ||
| Coupon | Date | ($000) | ($000) | |
| Ford Motor Co. | 6.375% | 2/1/29 | 325 | 371 |
| Ford Motor Co. | 7.450% | 7/16/31 | 1,610 | 2,019 |
| Ford Motor Co. | 4.750% | 1/15/43 | 1,825 | 1,720 |
| Ford Motor Co. | 7.400% | 11/1/46 | 400 | 504 |
| General Motors Co. | 5.000% | 4/1/35 | 1,150 | 1,091 |
| General Motors Co. | 6.250% | 10/2/43 | 1,655 | 1,785 |
| General Motors Co. | 5.200% | 4/1/45 | 1,100 | 1,048 |
| Harley-Davidson Inc. | 4.625% | 7/28/45 | 325 | 321 |
| Home Depot Inc. | 5.875% | 12/16/36 | 2,260 | 2,730 |
| Home Depot Inc. | 5.400% | 9/15/40 | 955 | 1,089 |
| Home Depot Inc. | 5.950% | 4/1/41 | 915 | 1,129 |
| Home Depot Inc. | 4.200% | 4/1/43 | 1,175 | 1,144 |
| Home Depot Inc. | 4.875% | 2/15/44 | 1,325 | 1,406 |
| Home Depot Inc. | 4.400% | 3/15/45 | 1,755 | 1,765 |
| Home Depot Inc. | 4.250% | 4/1/46 | 410 | 403 |
| Johnson Controls Inc. | 6.000% | 1/15/36 | 190 | 207 |
| Johnson Controls Inc. | 5.700% | 3/1/41 | 520 | 537 |
| Johnson Controls Inc. | 5.250% | 12/1/41 | 605 | 587 |
| Johnson Controls Inc. | 4.625% | 7/2/44 | 400 | 357 |
| Johnson Controls Inc. | 4.950% | 7/2/64 | 300 | 264 |
| Kohl's Corp. | 5.550% | 7/17/45 | 400 | 377 |
| Lowe's Cos. Inc. | 6.875% | 2/15/28 | 410 | 522 |
| Lowe's Cos. Inc. | 6.500% | 3/15/29 | 40 | 50 |
| Lowe's Cos. Inc. | 5.500% | 10/15/35 | 870 | 989 |
| Lowe's Cos. Inc. | 5.800% | 10/15/36 | 450 | 528 |
| Lowe's Cos. Inc. | 6.650% | 9/15/37 | 130 | 166 |
| Lowe's Cos. Inc. | 5.800% | 4/15/40 | 455 | 537 |
| Lowe's Cos. Inc. | 5.125% | 11/15/41 | 455 | 500 |
| Lowe's Cos. Inc. | 4.650% | 4/15/42 | 760 | 787 |
| Lowe's Cos. Inc. | 5.000% | 9/15/43 | 585 | 633 |
| Lowe's Cos. Inc. | 4.250% | 9/15/44 | 900 | 880 |
| Macy's Retail Holdings Inc. | 7.000% | 2/15/28 | 200 | 242 |
| Macy's Retail Holdings Inc. | 6.900% | 4/1/29 | 460 | 555 |
| Macy's Retail Holdings Inc. | 6.900% | 1/15/32 | 225 | 270 |
| Macy's Retail Holdings Inc. | 6.700% | 7/15/34 | 40 | 46 |
| Macy's Retail Holdings Inc. | 4.500% | 12/15/34 | 500 | 451 |
| Macy's Retail Holdings Inc. | 6.375% | 3/15/37 | 510 | 557 |
| Macy's Retail Holdings Inc. | 5.125% | 1/15/42 | 340 | 319 |
| Macy's Retail Holdings Inc. | 4.300% | 2/15/43 | 225 | 190 |
| McDonald's Corp. | 6.300% | 10/15/37 | 910 | 1,089 |
| McDonald's Corp. | 6.300% | 3/1/38 | 773 | 921 |
| McDonald's Corp. | 5.700% | 2/1/39 | 800 | 906 |
| McDonald's Corp. | 3.700% | 2/15/42 | 1,070 | 917 |
| McDonald's Corp. | 3.625% | 5/1/43 | 400 | 332 |
| McDonald's Corp. | 4.600% | 5/26/45 | 220 | 219 |
| Metropolitan Museum of Art | 3.400% | 7/1/45 | 300 | 268 |
| NIKE Inc. | 3.625% | 5/1/43 | 525 | 481 |
| Nordstrom Inc. | 6.950% | 3/15/28 | 405 | 509 |
| Nordstrom Inc. | 5.000% | 1/15/44 | 329 | 345 |
| QVC Inc. | 5.450% | 8/15/34 | 350 | 310 |
| QVC Inc. | 5.950% | 3/15/43 | 350 | 321 |
| Starbucks Corp. | 4.300% | 6/15/45 | 530 | 533 |
| Starwood Hotels & Resorts Worldwide Inc. | 4.500% | 10/1/34 | 350 | 305 |
| Target Corp. | 6.350% | 11/1/32 | 455 | 571 |
| Target Corp. | 6.500% | 10/15/37 | 1,187 | 1,522 |
| Target Corp. | 7.000% | 1/15/38 | 1,255 | 1,691 |
| Target Corp. | 4.000% | 7/1/42 | 1,282 | 1,224 |
| Tiffany & Co. | 4.900% | 10/1/44 | 400 | 381 |
| VF Corp. | 6.450% | 11/1/37 | 835 | 1,071 |
| Wal-Mart Stores Inc. | 5.875% | 4/5/27 | 755 | 934 |
| Wal-Mart Stores Inc. | 7.550% | 2/15/30 | 695 | 978 |
| Wal-Mart Stores Inc. | 5.250% | 9/1/35 | 2,840 | 3,243 |
| Wal-Mart Stores Inc. | 6.500% | 8/15/37 | 3,125 | 4,056 |
| Wal-Mart Stores Inc. | 6.200% | 4/15/38 | 1,735 | 2,190 |
70
| Vanguard® Long-Term Corporate Bond Index Fund | ||||
| Schedule of Investments | ||||
| August 31, 2015 | ||||
| Face | Market | |||
| Maturity | Amount | Value | ||
| Coupon | Date | ($000) | ($000) | |
| Wal-Mart Stores Inc. | 5.625% | 4/1/40 | 1,347 | 1,599 |
| Wal-Mart Stores Inc. | 4.875% | 7/8/40 | 1,000 | 1,068 |
| Wal-Mart Stores Inc. | 5.000% | 10/25/40 | 1,530 | 1,685 |
| Wal-Mart Stores Inc. | 5.625% | 4/15/41 | 2,175 | 2,603 |
| Wal-Mart Stores Inc. | 4.000% | 4/11/43 | 1,125 | 1,082 |
| Wal-Mart Stores Inc. | 4.750% | 10/2/43 | 900 | 948 |
| Wal-Mart Stores Inc. | 4.300% | 4/22/44 | 950 | 957 |
| Walgreen Co. | 4.400% | 9/15/42 | 850 | 743 |
| Walgreens Boots Alliance Inc. | 4.500% | 11/18/34 | 750 | 690 |
| Walgreens Boots Alliance Inc. | 4.800% | 11/18/44 | 1,325 | 1,217 |
| Western Union Co. | 6.200% | 11/17/36 | 500 | 489 |
| Western Union Co. | 6.200% | 6/21/40 | 270 | 258 |
| Yum! Brands Inc. | 6.875% | 11/15/37 | 335 | 389 |
| Yum! Brands Inc. | 5.350% | 11/1/43 | 300 | 284 |
| Consumer Noncyclical (14.2%) | ||||
| Abbott Laboratories | 6.150% | 11/30/37 | 600 | 744 |
| Abbott Laboratories | 6.000% | 4/1/39 | 445 | 547 |
| Abbott Laboratories | 5.300% | 5/27/40 | 805 | 899 |
| AbbVie Inc. | 4.500% | 5/14/35 | 2,200 | 2,099 |
| AbbVie Inc. | 4.400% | 11/6/42 | 2,808 | 2,569 |
| AbbVie Inc. | 4.700% | 5/14/45 | 2,777 | 2,680 |
| Actavis Funding SCS | 4.550% | 3/15/35 | 2,662 | 2,408 |
| Actavis Funding SCS | 4.850% | 6/15/44 | 2,325 | 2,118 |
| Actavis Funding SCS | 4.750% | 3/15/45 | 1,775 | 1,614 |
| Actavis Inc. | 4.625% | 10/1/42 | 1,115 | 1,028 |
| Ahold Finance USA LLC | 6.875% | 5/1/29 | 515 | 635 |
| Altria Group Inc. | 9.950% | 11/10/38 | 1,218 | 1,936 |
| Altria Group Inc. | 10.200% | 2/6/39 | 741 | 1,182 |
| Altria Group Inc. | 4.250% | 8/9/42 | 1,100 | 974 |
| Altria Group Inc. | 4.500% | 5/2/43 | 475 | 441 |
| Altria Group Inc. | 5.375% | 1/31/44 | 1,125 | 1,172 |
| AmerisourceBergen Corp. | 4.250% | 3/1/45 | 550 | 510 |
| Amgen Inc. | 6.375% | 6/1/37 | 495 | 581 |
| Amgen Inc. | 6.900% | 6/1/38 | 935 | 1,167 |
| Amgen Inc. | 6.400% | 2/1/39 | 1,585 | 1,868 |
| Amgen Inc. | 5.750% | 3/15/40 | 714 | 779 |
| Amgen Inc. | 4.950% | 10/1/41 | 1,135 | 1,116 |
| Amgen Inc. | 5.150% | 11/15/41 | 1,652 | 1,677 |
| Amgen Inc. | 5.650% | 6/15/42 | 1,388 | 1,509 |
| Amgen Inc. | 5.375% | 5/15/43 | 875 | 915 |
| Amgen Inc. | 4.400% | 5/1/45 | 840 | 782 |
| Anheuser-Busch Cos. LLC | 6.800% | 8/20/32 | 265 | 336 |
| Anheuser-Busch Cos. LLC | 5.950% | 1/15/33 | 20 | 24 |
| Anheuser-Busch Cos. LLC | 5.750% | 4/1/36 | 225 | 263 |
| Anheuser-Busch Cos. LLC | 6.450% | 9/1/37 | 830 | 1,039 |
| Anheuser-Busch Cos. LLC | 6.500% | 5/1/42 | 275 | 355 |
| Anheuser-Busch InBev Finance Inc. | 4.000% | 1/17/43 | 810 | 740 |
| Anheuser-Busch InBev Finance Inc. | 4.625% | 2/1/44 | 805 | 819 |
| Anheuser-Busch InBev Worldwide Inc. | 8.200% | 1/15/39 | 1,140 | 1,693 |
| Anheuser-Busch InBev Worldwide Inc. | 8.000% | 11/15/39 | 715 | 1,049 |
| Anheuser-Busch InBev Worldwide Inc. | 6.375% | 1/15/40 | 860 | 1,085 |
| Anheuser-Busch InBev Worldwide Inc. | 3.750% | 7/15/42 | 1,285 | 1,126 |
| Archer-Daniels-Midland Co. | 5.935% | 10/1/32 | 405 | 490 |
| Archer-Daniels-Midland Co. | 5.375% | 9/15/35 | 810 | 920 |
| Archer-Daniels-Midland Co. | 4.535% | 3/26/42 | 958 | 991 |
| Archer-Daniels-Midland Co. | 4.016% | 4/16/43 | 125 | 120 |
| 2 Ascension Health | 4.847% | 11/15/53 | 475 | 509 |
| AstraZeneca plc | 6.450% | 9/15/37 | 2,826 | 3,611 |
| AstraZeneca plc | 4.000% | 9/18/42 | 1,025 | 993 |
| 1 Baxalta Inc. | 5.250% | 6/23/45 | 1,000 | 999 |
| Becton Dickinson & Co. | 6.000% | 5/15/39 | 330 | 375 |
| Becton Dickinson & Co. | 5.000% | 11/12/40 | 590 | 594 |
| Becton Dickinson & Co. | 4.875% | 5/15/44 | 1,050 | 1,052 |
71
| Vanguard® Long-Term Corporate Bond Index Fund | ||||
| Schedule of Investments | ||||
| August 31, 2015 | ||||
| Face | Market | |||
| Maturity | Amount | Value | ||
| Coupon | Date | ($000) | ($000) | |
| Becton Dickinson & Co. | 4.685% | 12/15/44 | 433 | 425 |
| Boston Scientific Corp. | 7.000% | 11/15/35 | 550 | 645 |
| Boston Scientific Corp. | 7.375% | 1/15/40 | 580 | 734 |
| Bristol-Myers Squibb Co. | 5.875% | 11/15/36 | 825 | 1,003 |
| Bristol-Myers Squibb Co. | 6.125% | 5/1/38 | 270 | 340 |
| Bristol-Myers Squibb Co. | 3.250% | 8/1/42 | 635 | 540 |
| Bristol-Myers Squibb Co. | 4.500% | 3/1/44 | 560 | 588 |
| Brown-Forman Corp. | 3.750% | 1/15/43 | 375 | 342 |
| Brown-Forman Corp. | 4.500% | 7/15/45 | 450 | 456 |
| Campbell Soup Co. | 3.800% | 8/2/42 | 200 | 173 |
| Cardinal Health Inc. | 3.750% | 9/15/25 | 275 | 275 |
| Cardinal Health Inc. | 4.600% | 3/15/43 | 825 | 791 |
| Cardinal Health Inc. | 4.900% | 9/15/45 | 550 | 546 |
| 2 Catholic Health Initiatives Colorado GO | 4.350% | 11/1/42 | 425 | 388 |
| Celgene Corp. | 5.700% | 10/15/40 | 260 | 278 |
| Celgene Corp. | 5.250% | 8/15/43 | 1,650 | 1,676 |
| Celgene Corp. | 4.625% | 5/15/44 | 1,000 | 940 |
| Children's Hospital Medical Center Ohio GO | 4.268% | 5/15/44 | 325 | 309 |
| Cleveland Clinic Foundation Ohio Revenue | 4.858% | 1/1/14 | 450 | 431 |
| Coca-Cola Femsa SAB de CV | 5.250% | 11/26/43 | 700 | 752 |
| Colgate-Palmolive Co. | 4.000% | 8/15/45 | 625 | 614 |
| ConAgra Foods Inc. | 7.125% | 10/1/26 | 410 | 482 |
| ConAgra Foods Inc. | 7.000% | 10/1/28 | 375 | 448 |
| ConAgra Foods Inc. | 8.250% | 9/15/30 | 545 | 742 |
| ConAgra Foods Inc. | 6.625% | 8/15/39 | 635 | 663 |
| ConAgra Foods Inc. | 4.650% | 1/25/43 | 548 | 475 |
| Covidien International Finance SA | 6.550% | 10/15/37 | 760 | 946 |
| Delhaize America LLC | 9.000% | 4/15/31 | 220 | 291 |
| Delhaize Group SA | 5.700% | 10/1/40 | 867 | 913 |
| Diageo Capital plc | 5.875% | 9/30/36 | 545 | 639 |
| Diageo Capital plc | 3.875% | 4/29/43 | 325 | 294 |
| Diageo Investment Corp. | 7.450% | 4/15/35 | 335 | 456 |
| Diageo Investment Corp. | 4.250% | 5/11/42 | 534 | 520 |
| Dignity Health California GO | 4.500% | 11/1/42 | 375 | 354 |
| Dignity Health California GO | 5.267% | 11/1/64 | 400 | 415 |
| Dr Pepper Snapple Group Inc. | 7.450% | 5/1/38 | 310 | 424 |
| Eli Lilly & Co. | 5.550% | 3/15/37 | 355 | 413 |
| Eli Lilly & Co. | 3.700% | 3/1/45 | 1,625 | 1,487 |
| Estee Lauder Cos. Inc. | 6.000% | 5/15/37 | 315 | 384 |
| Estee Lauder Cos. Inc. | 3.700% | 8/15/42 | 450 | 403 |
| Estee Lauder Cos. Inc. | 4.375% | 6/15/45 | 275 | 273 |
| Express Scripts Holding Co. | 6.125% | 11/15/41 | 770 | 875 |
| Fomento Economico Mexicano SAB de CV | 4.375% | 5/10/43 | 835 | 792 |
| Genentech Inc. | 5.250% | 7/15/35 | 350 | 410 |
| General Mills Inc. | 5.400% | 6/15/40 | 853 | 929 |
| General Mills Inc. | 4.150% | 2/15/43 | 425 | 397 |
| Gilead Sciences Inc. | 5.650% | 12/1/41 | 1,325 | 1,495 |
| Gilead Sciences Inc. | 4.800% | 4/1/44 | 1,825 | 1,867 |
| Gilead Sciences Inc. | 4.500% | 2/1/45 | 2,245 | 2,193 |
| GlaxoSmithKline Capital Inc. | 5.375% | 4/15/34 | 805 | 906 |
| GlaxoSmithKline Capital Inc. | 6.375% | 5/15/38 | 2,820 | 3,518 |
| Hasbro Inc. | 6.350% | 3/15/40 | 535 | 599 |
| Hasbro Inc. | 5.100% | 5/15/44 | 755 | 736 |
| Hershey Co. | 7.200% | 8/15/27 | 42 | 57 |
| Ingredion Inc. | 6.625% | 4/15/37 | 275 | 327 |
| 1 JM Smucker Co. | 4.250% | 3/15/35 | 300 | 279 |
| 1 JM Smucker Co. | 4.375% | 3/15/45 | 1,250 | 1,151 |
| Johnson & Johnson | 6.950% | 9/1/29 | 210 | 299 |
| Johnson & Johnson | 4.950% | 5/15/33 | 800 | 907 |
| Johnson & Johnson | 4.375% | 12/5/33 | 880 | 938 |
| Johnson & Johnson | 5.950% | 8/15/37 | 1,265 | 1,603 |
| Johnson & Johnson | 5.850% | 7/15/38 | 640 | 808 |
| Johnson & Johnson | 4.500% | 9/1/40 | 784 | 831 |
| Johnson & Johnson | 4.850% | 5/15/41 | 295 | 332 |
72
| Vanguard® Long-Term Corporate Bond Index Fund | ||||
| Schedule of Investments | ||||
| August 31, 2015 | ||||
| Face | Market | |||
| Maturity | Amount | Value | ||
| Coupon | Date | ($000) | ($000) | |
| Kaiser Foundation Hospitals | 4.875% | 4/1/42 | 870 | 931 |
| Kellogg Co. | 7.450% | 4/1/31 | 1,215 | 1,554 |
| Kimberly-Clark Corp. | 6.625% | 8/1/37 | 851 | 1,111 |
| Kimberly-Clark Corp. | 5.300% | 3/1/41 | 235 | 270 |
| Kimberly-Clark Corp. | 3.700% | 6/1/43 | 425 | 393 |
| Koninklijke Philips NV | 6.875% | 3/11/38 | 240 | 280 |
| Koninklijke Philips NV | 5.000% | 3/15/42 | 659 | 635 |
| Kraft Foods Group Inc. | 6.875% | 1/26/39 | 950 | 1,159 |
| Kraft Foods Group Inc. | 6.500% | 2/9/40 | 925 | 1,097 |
| Kraft Foods Group Inc. | 5.000% | 6/4/42 | 2,180 | 2,221 |
| 1 Kraft Heinz Foods Co. | 5.000% | 7/15/35 | 1,010 | 1,040 |
| 1 Kraft Heinz Foods Co. | 5.200% | 7/15/45 | 1,470 | 1,528 |
| Kroger Co. | 7.700% | 6/1/29 | 480 | 646 |
| Kroger Co. | 8.000% | 9/15/29 | 200 | 274 |
| Kroger Co. | 7.500% | 4/1/31 | 230 | 295 |
| Kroger Co. | 6.900% | 4/15/38 | 480 | 598 |
| Kroger Co. | 5.400% | 7/15/40 | 505 | 540 |
| Kroger Co. | 5.000% | 4/15/42 | 400 | 405 |
| Kroger Co. | 5.150% | 8/1/43 | 310 | 324 |
| Laboratory Corp. of America Holdings | 4.700% | 2/1/45 | 950 | 865 |
| Mattel Inc. | 5.450% | 11/1/41 | 720 | 729 |
| 2 Mayo Clinic | 3.774% | 11/15/43 | 600 | 548 |
| 2 Mayo Clinic | 4.000% | 11/15/47 | 225 | 212 |
| McKesson Corp. | 6.000% | 3/1/41 | 530 | 613 |
| McKesson Corp. | 4.883% | 3/15/44 | 700 | 699 |
| Mead Johnson Nutrition Co. | 5.900% | 11/1/39 | 300 | 333 |
| Mead Johnson Nutrition Co. | 4.600% | 6/1/44 | 500 | 461 |
| 1 Medtronic Inc. | 4.375% | 3/15/35 | 2,950 | 2,916 |
| Medtronic Inc. | 6.500% | 3/15/39 | 155 | 196 |
| Medtronic Inc. | 5.550% | 3/15/40 | 480 | 554 |
| Medtronic Inc. | 4.500% | 3/15/42 | 685 | 669 |
| Medtronic Inc. | 4.000% | 4/1/43 | 1,300 | 1,182 |
| Medtronic Inc. | 4.625% | 3/15/44 | 786 | 784 |
| 1 Medtronic Inc. | 4.625% | 3/15/45 | 4,280 | 4,364 |
| Memorial Sloan-Kettering Cancer Center | 4.200% | 7/1/55 | 325 | 303 |
| Memorial Sloan-Kettering Cancer Center New York GO | 5.000% | 7/1/42 | 400 | 435 |
| Memorial Sloan-Kettering Cancer Center New York GO | 4.125% | 7/1/52 | 600 | 548 |
| Merck & Co. Inc. | 6.500% | 12/1/33 | 1,365 | 1,807 |
| Merck & Co. Inc. | 6.550% | 9/15/37 | 725 | 960 |
| Merck & Co. Inc. | 3.600% | 9/15/42 | 1,385 | 1,238 |
| Merck & Co. Inc. | 4.150% | 5/18/43 | 1,920 | 1,878 |
| Merck & Co. Inc. | 3.700% | 2/10/45 | 780 | 707 |
| Merck Sharp & Dohme Corp. | 5.950% | 12/1/28 | 560 | 689 |
| Molson Coors Brewing Co. | 5.000% | 5/1/42 | 1,125 | 1,070 |
| Mondelez International Inc. | 6.500% | 11/1/31 | 705 | 858 |
| Mondelez International Inc. | 6.500% | 2/9/40 | 629 | 760 |
| Mylan Inc. | 5.400% | 11/29/43 | 735 | 729 |
| New York & Presbyterian Hospital | 4.024% | 8/1/45 | 900 | 839 |
| Novant Health Inc. | 4.371% | 11/1/43 | 300 | 287 |
| Novartis Capital Corp. | 3.700% | 9/21/42 | 525 | 498 |
| Novartis Capital Corp. | 4.400% | 5/6/44 | 1,925 | 2,027 |
| NYU Hospitals Center | 4.784% | 7/1/44 | 425 | 428 |
| Partners Healthcare System Inc. | 4.117% | 7/1/55 | 275 | 248 |
| PepsiCo Inc. | 5.500% | 1/15/40 | 1,044 | 1,207 |
| PepsiCo Inc. | 4.875% | 11/1/40 | 1,070 | 1,138 |
| PepsiCo Inc. | 4.000% | 3/5/42 | 850 | 787 |
| PepsiCo Inc. | 4.250% | 10/22/44 | 968 | 940 |
| PepsiCo Inc. | 4.600% | 7/17/45 | 385 | 395 |
| Perrigo Co. plc | 5.300% | 11/15/43 | 375 | 379 |
| Perrigo Finance plc | 4.900% | 12/15/44 | 450 | 428 |
| Pfizer Inc. | 7.200% | 3/15/39 | 2,280 | 3,101 |
| Pfizer Inc. | 4.300% | 6/15/43 | 750 | 735 |
| Pfizer Inc. | 4.400% | 5/15/44 | 320 | 316 |
| Pharmacia Corp. | 6.600% | 12/1/28 | 555 | 711 |
73
| Vanguard® Long-Term Corporate Bond Index Fund | ||||
| Schedule of Investments | ||||
| August 31, 2015 | ||||
| Face | Market | |||
| Maturity | Amount | Value | ||
| Coupon | Date | ($000) | ($000) | |
| Philip Morris International Inc. | 6.375% | 5/16/38 | 1,515 | 1,873 |
| Philip Morris International Inc. | 4.375% | 11/15/41 | 845 | 808 |
| Philip Morris International Inc. | 4.500% | 3/20/42 | 960 | 945 |
| Philip Morris International Inc. | 3.875% | 8/21/42 | 985 | 885 |
| Philip Morris International Inc. | 4.125% | 3/4/43 | 915 | 851 |
| Philip Morris International Inc. | 4.875% | 11/15/43 | 925 | 963 |
| Procter & Gamble Co. | 6.450% | 1/15/26 | 350 | 442 |
| Procter & Gamble Co. | 5.800% | 8/15/34 | 700 | 874 |
| Procter & Gamble Co. | 5.550% | 3/5/37 | 1,883 | 2,266 |
| Quest Diagnostics Inc. | 5.750% | 1/30/40 | 460 | 487 |
| Quest Diagnostics Inc. | 4.700% | 3/30/45 | 225 | 204 |
| Reynolds American Inc. | 5.700% | 8/15/35 | 700 | 737 |
| Reynolds American Inc. | 7.250% | 6/15/37 | 625 | 746 |
| 1 Reynolds American Inc. | 8.125% | 5/1/40 | 340 | 418 |
| Reynolds American Inc. | 4.750% | 11/1/42 | 575 | 531 |
| Reynolds American Inc. | 6.150% | 9/15/43 | 375 | 406 |
| Reynolds American Inc. | 5.850% | 8/15/45 | 2,394 | 2,570 |
| Southern Baptist Hospital of Florida Inc. | 4.857% | 7/15/45 | 175 | 176 |
| St. Jude Medical Inc. | 4.750% | 4/15/43 | 650 | 625 |
| Stryker Corp. | 4.100% | 4/1/43 | 410 | 378 |
| Stryker Corp. | 4.375% | 5/15/44 | 400 | 391 |
| Sysco Corp. | 5.375% | 9/21/35 | 780 | 899 |
| Teva Pharmaceutical Finance Co. LLC | 6.150% | 2/1/36 | 889 | 993 |
| 2 Texas Health Resources | 4.330% | 11/15/55 | 300 | 290 |
| The Pepsi Bottling Group Inc. | 7.000% | 3/1/29 | 1,135 | 1,556 |
| Thermo Fisher Scientific Inc. | 5.300% | 2/1/44 | 425 | 442 |
| Trinity Health Corp. | 4.125% | 12/1/45 | 400 | 374 |
| Tyson Foods Inc. | 4.875% | 8/15/34 | 685 | 678 |
| Tyson Foods Inc. | 5.150% | 8/15/44 | 775 | 785 |
| Unilever Capital Corp. | 5.900% | 11/15/32 | 1,595 | 2,051 |
| Whirlpool Corp. | 5.150% | 3/1/43 | 319 | 323 |
| Wyeth LLC | 6.500% | 2/1/34 | 1,180 | 1,488 |
| Wyeth LLC | 6.000% | 2/15/36 | 430 | 517 |
| Wyeth LLC | 5.950% | 4/1/37 | 1,994 | 2,355 |
| Zimmer Biomet Holdings Inc. | 4.250% | 8/15/35 | 500 | 459 |
| Zimmer Biomet Holdings Inc. | 5.750% | 11/30/39 | 475 | 519 |
| Zimmer Biomet Holdings Inc. | 4.450% | 8/15/45 | 875 | 789 |
| Zoetis Inc. | 4.700% | 2/1/43 | 1,375 | 1,193 |
| Energy (11.9%) | ||||
| Alberta Energy Co. Ltd. | 7.375% | 11/1/31 | 880 | 942 |
| Anadarko Finance Co. | 7.500% | 5/1/31 | 1,042 | 1,282 |
| Anadarko Petroleum Corp. | 6.450% | 9/15/36 | 2,310 | 2,593 |
| Anadarko Petroleum Corp. | 7.950% | 6/15/39 | 155 | 200 |
| Anadarko Petroleum Corp. | 6.200% | 3/15/40 | 715 | 775 |
| Anadarko Petroleum Corp. | 4.500% | 7/15/44 | 575 | 520 |
| Apache Corp. | 6.000% | 1/15/37 | 1,086 | 1,145 |
| Apache Corp. | 5.100% | 9/1/40 | 1,635 | 1,544 |
| Apache Corp. | 5.250% | 2/1/42 | 605 | 579 |
| Apache Corp. | 4.750% | 4/15/43 | 1,795 | 1,642 |
| Apache Finance Canada Corp. | 7.750% | 12/15/29 | 375 | 497 |
| Baker Hughes Inc. | 6.875% | 1/15/29 | 350 | 424 |
| Baker Hughes Inc. | 5.125% | 9/15/40 | 1,570 | 1,590 |
| Buckeye Partners LP | 5.850% | 11/15/43 | 475 | 432 |
| Buckeye Partners LP | 5.600% | 10/15/44 | 400 | 350 |
| Burlington Resources Finance Co. | 7.200% | 8/15/31 | 644 | 832 |
| Burlington Resources Finance Co. | 7.400% | 12/1/31 | 482 | 645 |
| Cameron International Corp. | 7.000% | 7/15/38 | 275 | 332 |
| Cameron International Corp. | 5.950% | 6/1/41 | 380 | 416 |
| Cameron International Corp. | 5.125% | 12/15/43 | 175 | 175 |
| Canadian Natural Resources Ltd. | 7.200% | 1/15/32 | 428 | 488 |
| Canadian Natural Resources Ltd. | 6.450% | 6/30/33 | 350 | 373 |
| Canadian Natural Resources Ltd. | 5.850% | 2/1/35 | 600 | 602 |
| Canadian Natural Resources Ltd. | 6.500% | 2/15/37 | 830 | 897 |
74
| Vanguard® Long-Term Corporate Bond Index Fund | ||||
| Schedule of Investments | ||||
| August 31, 2015 | ||||
| Face | Market | |||
| Maturity | Amount | Value | ||
| Coupon | Date | ($000) | ($000) | |
| Canadian Natural Resources Ltd. | 6.250% | 3/15/38 | 855 | 865 |
| Canadian Natural Resources Ltd. | 6.750% | 2/1/39 | 225 | 244 |
| Cenovus Energy Inc. | 6.750% | 11/15/39 | 1,272 | 1,333 |
| Cenovus Energy Inc. | 4.450% | 9/15/42 | 875 | 690 |
| Cenovus Energy Inc. | 5.200% | 9/15/43 | 387 | 329 |
| CenterPoint Energy Resources Corp. | 6.625% | 11/1/37 | 430 | 530 |
| CenterPoint Energy Resources Corp. | 5.850% | 1/15/41 | 254 | 292 |
| 1 Columbia Pipeline Group Inc. | 5.800% | 6/1/45 | 550 | 523 |
| Conoco Funding Co. | 7.250% | 10/15/31 | 515 | 655 |
| ConocoPhillips | 5.900% | 10/15/32 | 665 | 759 |
| ConocoPhillips | 5.900% | 5/15/38 | 1,085 | 1,222 |
| ConocoPhillips | 6.500% | 2/1/39 | 2,055 | 2,463 |
| ConocoPhillips Canada Funding Co. I | 5.950% | 10/15/36 | 775 | 874 |
| ConocoPhillips Co. | 4.150% | 11/15/34 | 575 | 538 |
| ConocoPhillips Co. | 4.300% | 11/15/44 | 853 | 791 |
| ConocoPhillips Holding Co. | 6.950% | 4/15/29 | 885 | 1,102 |
| Continental Resources Inc. | 4.900% | 6/1/44 | 725 | 530 |
| Devon Energy Corp. | 7.950% | 4/15/32 | 945 | 1,179 |
| Devon Energy Corp. | 5.600% | 7/15/41 | 1,540 | 1,537 |
| Devon Energy Corp. | 4.750% | 5/15/42 | 1,215 | 1,115 |
| Devon Financing Corp. LLC | 7.875% | 9/30/31 | 1,695 | 2,108 |
| Diamond Offshore Drilling Inc. | 5.700% | 10/15/39 | 500 | 402 |
| Diamond Offshore Drilling Inc. | 4.875% | 11/1/43 | 825 | 590 |
| Dominion Gas Holdings LLC | 4.800% | 11/1/43 | 500 | 491 |
| Dominion Gas Holdings LLC | 4.600% | 12/15/44 | 500 | 469 |
| El Paso Natural Gas Co. LLC | 8.375% | 6/15/32 | 372 | 429 |
| 1 Enable Midstream Partners LP | 5.000% | 5/15/44 | 525 | 407 |
| Enbridge Energy Partners LP | 7.500% | 4/15/38 | 635 | 715 |
| Enbridge Energy Partners LP | 5.500% | 9/15/40 | 350 | 318 |
| Enbridge Inc. | 4.500% | 6/10/44 | 600 | 460 |
| Encana Corp. | 7.200% | 11/1/31 | 550 | 580 |
| Encana Corp. | 6.500% | 8/15/34 | 781 | 765 |
| Encana Corp. | 6.625% | 8/15/37 | 293 | 279 |
| Encana Corp. | 6.500% | 2/1/38 | 365 | 344 |
| Encana Corp. | 5.150% | 11/15/41 | 715 | 586 |
| Energy Transfer Partners LP | 4.750% | 1/15/26 | 1,000 | 945 |
| Energy Transfer Partners LP | 8.250% | 11/15/29 | 214 | 263 |
| Energy Transfer Partners LP | 4.900% | 3/15/35 | 600 | 500 |
| Energy Transfer Partners LP | 6.625% | 10/15/36 | 635 | 622 |
| Energy Transfer Partners LP | 7.500% | 7/1/38 | 712 | 759 |
| Energy Transfer Partners LP | 6.050% | 6/1/41 | 431 | 399 |
| Energy Transfer Partners LP | 6.500% | 2/1/42 | 780 | 767 |
| Energy Transfer Partners LP | 5.150% | 2/1/43 | 625 | 517 |
| Energy Transfer Partners LP | 5.950% | 10/1/43 | 674 | 627 |
| Energy Transfer Partners LP | 5.150% | 3/15/45 | 800 | 671 |
| Energy Transfer Partners LP | 6.125% | 12/15/45 | 1,150 | 1,100 |
| Eni USA Inc. | 7.300% | 11/15/27 | 395 | 508 |
| EnLink Midstream Partners LP | 5.600% | 4/1/44 | 400 | 362 |
| EnLink Midstream Partners LP | 5.050% | 4/1/45 | 450 | 379 |
| Ensco plc | 5.750% | 10/1/44 | 875 | 673 |
| Enterprise Products Operating LLC | 3.700% | 2/15/26 | 425 | 400 |
| Enterprise Products Operating LLC | 6.875% | 3/1/33 | 465 | 527 |
| Enterprise Products Operating LLC | 6.650% | 10/15/34 | 360 | 401 |
| Enterprise Products Operating LLC | 5.750% | 3/1/35 | 700 | 703 |
| Enterprise Products Operating LLC | 7.550% | 4/15/38 | 390 | 468 |
| Enterprise Products Operating LLC | 6.125% | 10/15/39 | 560 | 580 |
| Enterprise Products Operating LLC | 6.450% | 9/1/40 | 510 | 550 |
| Enterprise Products Operating LLC | 5.950% | 2/1/41 | 875 | 894 |
| Enterprise Products Operating LLC | 5.700% | 2/15/42 | 670 | 669 |
| Enterprise Products Operating LLC | 4.850% | 8/15/42 | 590 | 530 |
| Enterprise Products Operating LLC | 4.450% | 2/15/43 | 1,500 | 1,262 |
| Enterprise Products Operating LLC | 4.850% | 3/15/44 | 1,225 | 1,093 |
| Enterprise Products Operating LLC | 5.100% | 2/15/45 | 850 | 782 |
| Enterprise Products Operating LLC | 4.900% | 5/15/46 | 500 | 450 |
75
| Vanguard® Long-Term Corporate Bond Index Fund | ||||
| Schedule of Investments | ||||
| August 31, 2015 | ||||
| Face | Market | |||
| Maturity | Amount | Value | ||
| Coupon | Date | ($000) | ($000) | |
| Enterprise Products Operating LLC | 4.950% | 10/15/54 | 1,100 | 939 |
| EOG Resources Inc. | 3.900% | 4/1/35 | 510 | 475 |
| Exxon Mobil Corp. | 3.567% | 3/6/45 | 1,200 | 1,102 |
| Halliburton Co. | 6.700% | 9/15/38 | 916 | 1,111 |
| Halliburton Co. | 7.450% | 9/15/39 | 770 | 1,011 |
| Halliburton Co. | 4.500% | 11/15/41 | 650 | 615 |
| Halliburton Co. | 4.750% | 8/1/43 | 820 | 800 |
| Hess Corp. | 7.875% | 10/1/29 | 745 | 899 |
| Hess Corp. | 7.300% | 8/15/31 | 410 | 463 |
| Hess Corp. | 7.125% | 3/15/33 | 650 | 732 |
| Hess Corp. | 6.000% | 1/15/40 | 1,075 | 1,066 |
| Hess Corp. | 5.600% | 2/15/41 | 1,350 | 1,289 |
| Husky Energy Inc. | 6.800% | 9/15/37 | 400 | 443 |
| Kerr-McGee Corp. | 7.875% | 9/15/31 | 390 | 482 |
| Kinder Morgan Energy Partners LP | 7.400% | 3/15/31 | 238 | 252 |
| Kinder Morgan Energy Partners LP | 7.750% | 3/15/32 | 442 | 483 |
| Kinder Morgan Energy Partners LP | 7.300% | 8/15/33 | 575 | 601 |
| Kinder Morgan Energy Partners LP | 5.800% | 3/15/35 | 1,075 | 987 |
| Kinder Morgan Energy Partners LP | 6.500% | 2/1/37 | 585 | 561 |
| Kinder Morgan Energy Partners LP | 6.950% | 1/15/38 | 495 | 501 |
| Kinder Morgan Energy Partners LP | 6.500% | 9/1/39 | 655 | 632 |
| Kinder Morgan Energy Partners LP | 6.550% | 9/15/40 | 425 | 409 |
| Kinder Morgan Energy Partners LP | 7.500% | 11/15/40 | 400 | 431 |
| Kinder Morgan Energy Partners LP | 6.375% | 3/1/41 | 525 | 499 |
| Kinder Morgan Energy Partners LP | 5.625% | 9/1/41 | 540 | 470 |
| Kinder Morgan Energy Partners LP | 5.000% | 8/15/42 | 1,212 | 951 |
| Kinder Morgan Energy Partners LP | 4.700% | 11/1/42 | 479 | 357 |
| Kinder Morgan Energy Partners LP | 5.000% | 3/1/43 | 600 | 472 |
| Kinder Morgan Energy Partners LP | 5.500% | 3/1/44 | 400 | 336 |
| Kinder Morgan Energy Partners LP | 5.400% | 9/1/44 | 450 | 372 |
| Kinder Morgan Inc. | 7.750% | 1/15/32 | 1,350 | 1,425 |
| Kinder Morgan Inc. | 5.300% | 12/1/34 | 990 | 856 |
| Kinder Morgan Inc. | 5.550% | 6/1/45 | 1,900 | 1,630 |
| Magellan Midstream Partners LP | 6.400% | 5/1/37 | 265 | 291 |
| Magellan Midstream Partners LP | 4.200% | 12/1/42 | 250 | 207 |
| Magellan Midstream Partners LP | 5.150% | 10/15/43 | 525 | 501 |
| Magellan Midstream Partners LP | 4.200% | 3/15/45 | 300 | 247 |
| Marathon Oil Corp. | 6.800% | 3/15/32 | 661 | 711 |
| Marathon Oil Corp. | 6.600% | 10/1/37 | 805 | 837 |
| Marathon Oil Corp. | 5.200% | 6/1/45 | 850 | 749 |
| Marathon Petroleum Corp. | 6.500% | 3/1/41 | 1,620 | 1,737 |
| Marathon Petroleum Corp. | 4.750% | 9/15/44 | 680 | 597 |
| Marathon Petroleum Corp. | 5.000% | 9/15/54 | 250 | 214 |
| Murphy Oil Corp. | 7.050% | 5/1/29 | 430 | 439 |
| Murphy Oil Corp. | 5.125% | 12/1/42 | 300 | 223 |
| National Oilwell Varco Inc. | 3.950% | 12/1/42 | 1,210 | 1,001 |
| Noble Energy Inc. | 8.000% | 4/1/27 | 245 | 304 |
| Noble Energy Inc. | 6.000% | 3/1/41 | 740 | 726 |
| Noble Energy Inc. | 5.250% | 11/15/43 | 1,000 | 893 |
| Noble Energy Inc. | 5.050% | 11/15/44 | 1,100 | 970 |
| Noble Holding International Ltd. | 6.200% | 8/1/40 | 460 | 344 |
| Noble Holding International Ltd. | 6.050% | 3/1/41 | 750 | 542 |
| Noble Holding International Ltd. | 5.250% | 3/15/42 | 100 | 67 |
| Noble Holding International Ltd. | 6.950% | 4/1/45 | 200 | 162 |
| Occidental Petroleum Corp. | 4.625% | 6/15/45 | 900 | 880 |
| ONEOK Partners LP | 6.650% | 10/1/36 | 725 | 717 |
| ONEOK Partners LP | 6.850% | 10/15/37 | 385 | 377 |
| ONEOK Partners LP | 6.125% | 2/1/41 | 320 | 284 |
| ONEOK Partners LP | 6.200% | 9/15/43 | 738 | 652 |
| Petro-Canada | 7.875% | 6/15/26 | 270 | 356 |
| Petro-Canada | 7.000% | 11/15/28 | 145 | 184 |
| Petro-Canada | 5.350% | 7/15/33 | 345 | 366 |
| Petro-Canada | 5.950% | 5/15/35 | 720 | 802 |
| Petro-Canada | 6.800% | 5/15/38 | 860 | 1,054 |
76
| Vanguard® Long-Term Corporate Bond Index Fund | ||||
| Schedule of Investments | ||||
| August 31, 2015 | ||||
| Face | Market | |||
| Maturity | Amount | Value | ||
| Coupon | Date | ($000) | ($000) | |
| Phillips 66 | 4.650% | 11/15/34 | 1,350 | 1,295 |
| Phillips 66 | 5.875% | 5/1/42 | 1,351 | 1,450 |
| Phillips 66 | 4.875% | 11/15/44 | 1,455 | 1,383 |
| Phillips 66 Partners LP | 4.680% | 2/15/45 | 275 | 224 |
| Pioneer Natural Resources Co. | 7.200% | 1/15/28 | 275 | 319 |
| Plains All American Pipeline LP / PAA Finance Corp. | 6.700% | 5/15/36 | 515 | 553 |
| Plains All American Pipeline LP / PAA Finance Corp. | 6.650% | 1/15/37 | 785 | 840 |
| Plains All American Pipeline LP / PAA Finance Corp. | 5.150% | 6/1/42 | 745 | 678 |
| Plains All American Pipeline LP / PAA Finance Corp. | 4.300% | 1/31/43 | 425 | 346 |
| Plains All American Pipeline LP / PAA Finance Corp. | 4.700% | 6/15/44 | 605 | 530 |
| Plains All American Pipeline LP / PAA Finance Corp. | 4.900% | 2/15/45 | 425 | 382 |
| Pride International Inc. | 7.875% | 8/15/40 | 585 | 535 |
| Rowan Cos. Inc. | 5.400% | 12/1/42 | 1,050 | 726 |
| Rowan Cos. Inc. | 5.850% | 1/15/44 | 150 | 109 |
| Shell International Finance BV | 4.125% | 5/11/35 | 1,500 | 1,437 |
| Shell International Finance BV | 6.375% | 12/15/38 | 2,770 | 3,493 |
| Shell International Finance BV | 5.500% | 3/25/40 | 1,095 | 1,272 |
| Shell International Finance BV | 3.625% | 8/21/42 | 235 | 201 |
| Shell International Finance BV | 4.550% | 8/12/43 | 1,725 | 1,742 |
| Shell International Finance BV | 4.375% | 5/11/45 | 3,050 | 3,026 |
| Southern Natural Gas Co. LLC | 8.000% | 3/1/32 | 320 | 376 |
| Spectra Energy Capital LLC | 7.500% | 9/15/38 | 315 | 340 |
| Spectra Energy Partners LP | 5.950% | 9/25/43 | 550 | 560 |
| Spectra Energy Partners LP | 4.500% | 3/15/45 | 275 | 228 |
| Suncor Energy Inc. | 7.150% | 2/1/32 | 715 | 900 |
| Suncor Energy Inc. | 5.950% | 12/1/34 | 625 | 680 |
| Suncor Energy Inc. | 6.500% | 6/15/38 | 1,015 | 1,195 |
| Suncor Energy Inc. | 6.850% | 6/1/39 | 700 | 858 |
| Sunoco Logistics Partners Operations LP | 4.950% | 1/15/43 | 850 | 677 |
| Sunoco Logistics Partners Operations LP | 5.300% | 4/1/44 | 350 | 291 |
| Sunoco Logistics Partners Operations LP | 5.350% | 5/15/45 | 1,250 | 1,064 |
| Talisman Energy Inc. | 7.250% | 10/15/27 | 535 | 594 |
| Talisman Energy Inc. | 5.850% | 2/1/37 | 370 | 325 |
| Talisman Energy Inc. | 6.250% | 2/1/38 | 265 | 251 |
| Talisman Energy Inc. | 5.500% | 5/15/42 | 585 | 501 |
| Tennessee Gas Pipeline Co. LLC | 7.000% | 3/15/27 | 560 | 644 |
| Tennessee Gas Pipeline Co. LLC | 7.000% | 10/15/28 | 565 | 652 |
| Tennessee Gas Pipeline Co. LLC | 7.625% | 4/1/37 | 485 | 533 |
| Texas Eastern Transmission LP | 7.000% | 7/15/32 | 605 | 724 |
| Tosco Corp. | 7.800% | 1/1/27 | 700 | 909 |
| Tosco Corp. | 8.125% | 2/15/30 | 720 | 980 |
| TransCanada PipeLines Ltd. | 4.625% | 3/1/34 | 1,200 | 1,156 |
| TransCanada PipeLines Ltd. | 5.600% | 3/31/34 | 760 | 807 |
| TransCanada PipeLines Ltd. | 5.850% | 3/15/36 | 560 | 605 |
| TransCanada PipeLines Ltd. | 6.200% | 10/15/37 | 940 | 1,068 |
| TransCanada PipeLines Ltd. | 7.250% | 8/15/38 | 505 | 624 |
| TransCanada PipeLines Ltd. | 7.625% | 1/15/39 | 1,367 | 1,771 |
| TransCanada PipeLines Ltd. | 6.100% | 6/1/40 | 795 | 891 |
| TransCanada PipeLines Ltd. | 5.000% | 10/16/43 | 475 | 443 |
| Transcontinental Gas Pipe Line Co. LLC | 5.400% | 8/15/41 | 300 | 271 |
| Transcontinental Gas Pipe Line Co. LLC | 4.450% | 8/1/42 | 985 | 777 |
| Valero Energy Corp. | 7.500% | 4/15/32 | 559 | 665 |
| Valero Energy Corp. | 6.625% | 6/15/37 | 1,440 | 1,583 |
| Valero Energy Corp. | 10.500% | 3/15/39 | 515 | 748 |
| Valero Energy Corp. | 4.900% | 3/15/45 | 550 | 494 |
| Weatherford International LLC | 6.800% | 6/15/37 | 210 | 174 |
| Weatherford International Ltd. | 6.500% | 8/1/36 | 605 | 494 |
| Weatherford International Ltd. | 7.000% | 3/15/38 | 173 | 145 |
| Weatherford International Ltd. | 9.875% | 3/1/39 | 430 | 462 |
| Weatherford International Ltd. | 6.750% | 9/15/40 | 535 | 445 |
| Weatherford International Ltd. | 5.950% | 4/15/42 | 530 | 405 |
| Western Gas Partners LP | 5.450% | 4/1/44 | 525 | 492 |
| Williams Cos. Inc. | 7.500% | 1/15/31 | 287 | 296 |
| Williams Cos. Inc. | 8.750% | 3/15/32 | 476 | 547 |
77
| Vanguard® Long-Term Corporate Bond Index Fund | ||||
| Schedule of Investments | ||||
| August 31, 2015 | ||||
| Face | Market | |||
| Maturity | Amount | Value | ||
| Coupon | Date | ($000) | ($000) | |
| Williams Cos. Inc. | 5.750% | 6/24/44 | 1,000 | 818 |
| Williams Partners LP | 4.000% | 9/15/25 | 825 | 736 |
| Williams Partners LP | 6.300% | 4/15/40 | 1,010 | 967 |
| Williams Partners LP | 5.800% | 11/15/43 | 425 | 380 |
| Williams Partners LP | 5.400% | 3/4/44 | 450 | 380 |
| Williams Partners LP | 4.900% | 1/15/45 | 525 | 420 |
| Williams Partners LP | 5.100% | 9/15/45 | 1,040 | 848 |
| XTO Energy Inc. | 6.750% | 8/1/37 | 105 | 147 |
| Other Industrial (0.5%) | ||||
| California Institute of Technology GO | 4.700% | 11/1/11 | 510 | 488 |
| CBRE Services Inc. | 4.875% | 3/1/26 | 525 | 520 |
| Cintas Corp. No 2 | 6.150% | 8/15/36 | 25 | 30 |
| 2 Johns Hopkins University Maryland GO | 4.083% | 7/1/53 | 425 | 415 |
| 2 Massachusetts Institute of Technology GO | 3.959% | 7/1/38 | 650 | 663 |
| Massachusetts Institute of Technology GO | 5.600% | 7/1/11 | 1,055 | 1,308 |
| Massachusetts Institute of Technology GO | 4.678% | 7/1/14 | 650 | 673 |
| 2 Northwestern University Illinois GO | 3.688% | 12/1/38 | 600 | 575 |
| 2 Northwestern University Illinois GO | 4.643% | 12/1/44 | 600 | 657 |
| President & Fellows of Harvard College Massachusetts | ||||
| GO | 3.619% | 10/1/37 | 700 | 678 |
| 2 University of Notre Dame DU LAC Indiana GO | 3.438% | 2/15/45 | 575 | 527 |
| University of Pennsylvania GO | 4.674% | 9/1/12 | 375 | 363 |
| Technology (4.2%) | ||||
| Apple Inc. | 3.850% | 5/4/43 | 3,250 | 2,954 |
| Apple Inc. | 4.450% | 5/6/44 | 1,200 | 1,180 |
| Apple Inc. | 3.450% | 2/9/45 | 2,350 | 1,982 |
| Apple Inc. | 4.375% | 5/13/45 | 2,000 | 1,987 |
| Applied Materials Inc. | 5.850% | 6/15/41 | 715 | 784 |
| Broadcom Corp. | 4.500% | 8/1/34 | 290 | 287 |
| Cisco Systems Inc. | 5.900% | 2/15/39 | 1,690 | 2,027 |
| Cisco Systems Inc. | 5.500% | 1/15/40 | 1,795 | 2,081 |
| Corning Inc. | 7.250% | 8/15/36 | 35 | 43 |
| Corning Inc. | 4.700% | 3/15/37 | 250 | 256 |
| Corning Inc. | 5.750% | 8/15/40 | 470 | 550 |
| Corning Inc. | 4.750% | 3/15/42 | 525 | 544 |
| Equifax Inc. | 7.000% | 7/1/37 | 200 | 231 |
| Hewlett-Packard Co. | 6.000% | 9/15/41 | 685 | 685 |
| HP Enterprise Services LLC | 7.450% | 10/15/29 | 260 | 336 |
| Intel Corp. | 4.000% | 12/15/32 | 398 | 378 |
| Intel Corp. | 4.800% | 10/1/41 | 1,455 | 1,474 |
| Intel Corp. | 4.250% | 12/15/42 | 925 | 859 |
| Intel Corp. | 4.900% | 7/29/45 | 1,850 | 1,893 |
| International Business Machines Corp. | 7.000% | 10/30/25 | 325 | 413 |
| International Business Machines Corp. | 6.220% | 8/1/27 | 580 | 708 |
| International Business Machines Corp. | 6.500% | 1/15/28 | 200 | 248 |
| International Business Machines Corp. | 5.875% | 11/29/32 | 730 | 868 |
| International Business Machines Corp. | 5.600% | 11/30/39 | 840 | 948 |
| International Business Machines Corp. | 4.000% | 6/20/42 | 1,184 | 1,081 |
| Juniper Networks Inc. | 5.950% | 3/15/41 | 420 | 415 |
| KLA-Tencor Corp. | 5.650% | 11/1/34 | 630 | 612 |
| Microsoft Corp. | 3.500% | 2/12/35 | 1,125 | 1,036 |
| Microsoft Corp. | 5.200% | 6/1/39 | 1,055 | 1,171 |
| Microsoft Corp. | 4.500% | 10/1/40 | 1,050 | 1,076 |
| Microsoft Corp. | 5.300% | 2/8/41 | 1,200 | 1,369 |
| Microsoft Corp. | 3.500% | 11/15/42 | 1,005 | 862 |
| Microsoft Corp. | 3.750% | 5/1/43 | 825 | 760 |
| Microsoft Corp. | 4.875% | 12/15/43 | 850 | 903 |
| Microsoft Corp. | 3.750% | 2/12/45 | 1,725 | 1,569 |
| Microsoft Corp. | 4.000% | 2/12/55 | 1,570 | 1,411 |
| Motorola Solutions Inc. | 5.500% | 9/1/44 | 350 | 291 |
| Oracle Corp. | 3.250% | 5/15/30 | 740 | 682 |
| Oracle Corp. | 4.300% | 7/8/34 | 2,000 | 1,979 |
| Oracle Corp. | 3.900% | 5/15/35 | 1,400 | 1,311 |
78
| Vanguard® Long-Term Corporate Bond Index Fund | ||||
| Schedule of Investments | ||||
| August 31, 2015 | ||||
| Face | Market | |||
| Maturity | Amount | Value | ||
| Coupon | Date | ($000) | ($000) | |
| Oracle Corp. | 6.500% | 4/15/38 | 1,295 | 1,631 |
| Oracle Corp. | 6.125% | 7/8/39 | 1,340 | 1,605 |
| Oracle Corp. | 5.375% | 7/15/40 | 2,091 | 2,331 |
| Oracle Corp. | 4.500% | 7/8/44 | 1,145 | 1,141 |
| Oracle Corp. | 4.125% | 5/15/45 | 1,983 | 1,857 |
| Oracle Corp. | 4.375% | 5/15/55 | 1,600 | 1,489 |
| QUALCOMM Inc. | 4.650% | 5/20/35 | 1,100 | 1,000 |
| QUALCOMM Inc. | 4.800% | 5/20/45 | 1,625 | 1,391 |
| 1 Seagate HDD Cayman | 4.875% | 6/1/27 | 1,125 | 1,041 |
| 1 Seagate HDD Cayman | 5.750% | 12/1/34 | 825 | 809 |
| Tyco Electronics Group SA | 7.125% | 10/1/37 | 870 | 1,132 |
| Verisk Analytics Inc. | 5.500% | 6/15/45 | 650 | 644 |
| Xerox Corp. | 6.750% | 12/15/39 | 310 | 341 |
| Transportation (3.5%) | ||||
| 2 American Airlines 2014-1 Class A Pass Through Trust | 3.700% | 4/1/28 | 777 | 769 |
| 2 American Airlines 2015-1 Class A Pass Through Trust | 3.375% | 11/1/28 | 1,035 | 1,004 |
| 2 BNSF Funding Trust I | 6.613% | 12/15/55 | 440 | 492 |
| Burlington Northern Santa Fe LLC | 3.650% | 9/1/25 | 350 | 351 |
| Burlington Northern Santa Fe LLC | 7.000% | 12/15/25 | 365 | 463 |
| Burlington Northern Santa Fe LLC | 7.950% | 8/15/30 | 295 | 411 |
| Burlington Northern Santa Fe LLC | 6.200% | 8/15/36 | 435 | 521 |
| Burlington Northern Santa Fe LLC | 6.150% | 5/1/37 | 675 | 812 |
| Burlington Northern Santa Fe LLC | 5.750% | 5/1/40 | 780 | 882 |
| Burlington Northern Santa Fe LLC | 5.050% | 3/1/41 | 505 | 522 |
| Burlington Northern Santa Fe LLC | 5.400% | 6/1/41 | 450 | 487 |
| Burlington Northern Santa Fe LLC | 4.950% | 9/15/41 | 250 | 256 |
| Burlington Northern Santa Fe LLC | 4.400% | 3/15/42 | 650 | 615 |
| Burlington Northern Santa Fe LLC | 4.375% | 9/1/42 | 670 | 625 |
| Burlington Northern Santa Fe LLC | 4.450% | 3/15/43 | 965 | 916 |
| Burlington Northern Santa Fe LLC | 5.150% | 9/1/43 | 450 | 471 |
| Burlington Northern Santa Fe LLC | 4.900% | 4/1/44 | 940 | 960 |
| Burlington Northern Santa Fe LLC | 4.550% | 9/1/44 | 840 | 812 |
| Burlington Northern Santa Fe LLC | 4.150% | 4/1/45 | 1,055 | 954 |
| Burlington Northern Santa Fe LLC | 4.700% | 9/1/45 | 900 | 895 |
| Canadian National Railway Co. | 6.900% | 7/15/28 | 435 | 577 |
| Canadian National Railway Co. | 6.250% | 8/1/34 | 675 | 849 |
| Canadian National Railway Co. | 6.200% | 6/1/36 | 660 | 841 |
| Canadian National Railway Co. | 6.375% | 11/15/37 | 240 | 313 |
| Canadian National Railway Co. | 3.500% | 11/15/42 | 560 | 505 |
| Canadian Pacific Railway Co. | 3.700% | 2/1/26 | 275 | 273 |
| Canadian Pacific Railway Co. | 7.125% | 10/15/31 | 385 | 491 |
| Canadian Pacific Railway Co. | 5.750% | 3/15/33 | 170 | 191 |
| Canadian Pacific Railway Co. | 5.950% | 5/15/37 | 470 | 547 |
| Canadian Pacific Railway Co. | 4.800% | 8/1/45 | 580 | 585 |
| Canadian Pacific Railway Ltd. | 5.750% | 1/15/42 | 350 | 399 |
| Con-way Inc. | 6.700% | 5/1/34 | 335 | 369 |
| CSX Corp. | 6.000% | 10/1/36 | 266 | 311 |
| CSX Corp. | 6.150% | 5/1/37 | 660 | 772 |
| CSX Corp. | 6.220% | 4/30/40 | 815 | 966 |
| CSX Corp. | 5.500% | 4/15/41 | 596 | 654 |
| CSX Corp. | 4.750% | 5/30/42 | 565 | 563 |
| CSX Corp. | 4.400% | 3/1/43 | 350 | 331 |
| CSX Corp. | 4.100% | 3/15/44 | 825 | 744 |
| CSX Corp. | 3.950% | 5/1/50 | 600 | 516 |
| CSX Corp. | 4.500% | 8/1/54 | 485 | 452 |
| 2 Delta Air Lines 2015-1 Class AA Pass Through Trust | 3.625% | 7/30/27 | 325 | 329 |
| FedEx Corp. | 4.900% | 1/15/34 | 530 | 549 |
| FedEx Corp. | 3.900% | 2/1/35 | 620 | 570 |
| FedEx Corp. | 3.875% | 8/1/42 | 581 | 503 |
| FedEx Corp. | 4.100% | 4/15/43 | 535 | 477 |
| FedEx Corp. | 5.100% | 1/15/44 | 760 | 781 |
| FedEx Corp. | 4.100% | 2/1/45 | 530 | 469 |
| FedEx Corp. | 4.500% | 2/1/65 | 265 | 231 |
79
| Vanguard® Long-Term Corporate Bond Index Fund | |||||
| Schedule of Investments | |||||
| August 31, 2015 | |||||
| Face | Market | ||||
| Maturity | Amount | Value | |||
| Coupon | Date | ($000) | ($000) | ||
| 2 | Hawaiian Airlines 2013-1 Class A Pass Through | ||||
| Certificates | 3.900% | 1/15/26 | 388 | 380 | |
| Kansas City Southern Railway Co. | 4.300% | 5/15/43 | 475 | 448 | |
| Kansas City Southern Railway Co. | 4.950% | 8/15/45 | 545 | 551 | |
| 1,2 | Latam Airlines 2015-1 Pass Through Trust A | 4.200% | 11/15/27 | 875 | 838 |
| Norfolk Southern Corp. | 7.800% | 5/15/27 | 550 | 743 | |
| Norfolk Southern Corp. | 7.250% | 2/15/31 | 280 | 357 | |
| Norfolk Southern Corp. | 7.050% | 5/1/37 | 255 | 334 | |
| Norfolk Southern Corp. | 4.837% | 10/1/41 | 628 | 633 | |
| Norfolk Southern Corp. | 3.950% | 10/1/42 | 585 | 517 | |
| Norfolk Southern Corp. | 4.800% | 8/15/43 | 475 | 472 | |
| Norfolk Southern Corp. | 4.450% | 6/15/45 | 729 | 696 | |
| Norfolk Southern Corp. | 7.900% | 5/15/97 | 200 | 288 | |
| Norfolk Southern Corp. | 6.000% | 3/15/05 | 597 | 667 | |
| Norfolk Southern Corp. | 6.000% | 5/23/11 | 520 | 578 | |
| 2 | Spirit Airlines 2015-1 Pass Through Trust A | 4.100% | 10/1/29 | 485 | 489 |
| Union Pacific Corp. | 3.250% | 8/15/25 | 480 | 474 | |
| Union Pacific Corp. | 6.625% | 2/1/29 | 540 | 708 | |
| Union Pacific Corp. | 3.375% | 2/1/35 | 345 | 309 | |
| Union Pacific Corp. | 4.750% | 9/15/41 | 530 | 556 | |
| Union Pacific Corp. | 4.300% | 6/15/42 | 175 | 171 | |
| Union Pacific Corp. | 4.250% | 4/15/43 | 350 | 340 | |
| Union Pacific Corp. | 4.750% | 12/15/43 | 605 | 636 | |
| Union Pacific Corp. | 4.821% | 2/1/44 | 317 | 337 | |
| Union Pacific Corp. | 4.850% | 6/15/44 | 260 | 278 | |
| Union Pacific Corp. | 4.150% | 1/15/45 | 375 | 360 | |
| Union Pacific Corp. | 3.875% | 2/1/55 | 540 | 468 | |
| 2 | United Airlines 2014-1 Class A Pass Through Trust | 4.000% | 10/11/27 | 825 | 837 |
| 2 | United Airlines 2014-2 Class A Pass Through Trust | 3.750% | 3/3/28 | 865 | 865 |
| United Parcel Service Inc. | 6.200% | 1/15/38 | 1,400 | 1,779 | |
| United Parcel Service Inc. | 4.875% | 11/15/40 | 675 | 739 | |
| United Parcel Service Inc. | 3.625% | 10/1/42 | 565 | 524 | |
| United Parcel Service of America Inc. | 8.375% | 4/1/30 | 225 | 318 | |
| 2 | US Airways 2013-1 Class A Pass Through Trust | 3.950% | 5/15/27 | 558 | 562 |
| 881,352 | |||||
| Utilities (12.7%) | |||||
| Electric (11.7%) | |||||
| AEP Texas Central Co. | 6.650% | 2/15/33 | 550 | 688 | |
| Alabama Power Co. | 6.125% | 5/15/38 | 490 | 605 | |
| Alabama Power Co. | 6.000% | 3/1/39 | 405 | 496 | |
| Alabama Power Co. | 5.500% | 3/15/41 | 320 | 374 | |
| Alabama Power Co. | 5.200% | 6/1/41 | 365 | 410 | |
| Alabama Power Co. | 4.100% | 1/15/42 | 260 | 252 | |
| Alabama Power Co. | 3.850% | 12/1/42 | 375 | 350 | |
| Alabama Power Co. | 4.150% | 8/15/44 | 400 | 390 | |
| Alabama Power Co. | 3.750% | 3/1/45 | 630 | 546 | |
| Ameren Illinois Co. | 4.800% | 12/15/43 | 390 | 429 | |
| Ameren Illinois Co. | 4.300% | 7/1/44 | 170 | 172 | |
| Appalachian Power Co | 4.400% | 5/15/44 | 285 | 274 | |
| Appalachian Power Co. | 5.800% | 10/1/35 | 320 | 363 | |
| Appalachian Power Co. | 6.375% | 4/1/36 | 355 | 429 | |
| Appalachian Power Co. | 6.700% | 8/15/37 | 260 | 326 | |
| Appalachian Power Co. | 7.000% | 4/1/38 | 640 | 820 | |
| Appalachian Power Co. | 4.450% | 6/1/45 | 375 | 359 | |
| Arizona Public Service Co. | 5.500% | 9/1/35 | 215 | 245 | |
| Arizona Public Service Co. | 5.050% | 9/1/41 | 330 | 362 | |
| Arizona Public Service Co. | 4.500% | 4/1/42 | 498 | 509 | |
| Arizona Public Service Co. | 4.700% | 1/15/44 | 345 | 366 | |
| Baltimore Gas & Electric Co. | 6.350% | 10/1/36 | 448 | 559 | |
| Berkshire Hathaway Energy Co. | 8.480% | 9/15/28 | 328 | 481 | |
| Berkshire Hathaway Energy Co. | 6.125% | 4/1/36 | 1,695 | 2,003 | |
| Berkshire Hathaway Energy Co. | 5.950% | 5/15/37 | 541 | 627 | |
| Berkshire Hathaway Energy Co. | 6.500% | 9/15/37 | 1,035 | 1,274 | |
80
| Vanguard® Long-Term Corporate Bond Index Fund | ||||
| Schedule of Investments | ||||
| August 31, 2015 | ||||
| Face | Market | |||
| Maturity | Amount | Value | ||
| Coupon | Date | ($000) | ($000) | |
| Berkshire Hathaway Energy Co. | 5.150% | 11/15/43 | 800 | 854 |
| Berkshire Hathaway Energy Co. | 4.500% | 2/1/45 | 775 | 756 |
| CenterPoint Energy Houston Electric LLC | 6.950% | 3/15/33 | 450 | 596 |
| CenterPoint Energy Houston Electric LLC | 3.550% | 8/1/42 | 500 | 444 |
| CenterPoint Energy Houston Electric LLC | 4.500% | 4/1/44 | 400 | 414 |
| Cleco Power LLC | 6.500% | 12/1/35 | 255 | 296 |
| Cleco Power LLC | 6.000% | 12/1/40 | 320 | 356 |
| Cleveland Electric Illuminating Co. | 5.950% | 12/15/36 | 280 | 307 |
| CMS Energy Corp. | 4.700% | 3/31/43 | 290 | 293 |
| CMS Energy Corp. | 4.875% | 3/1/44 | 295 | 305 |
| Commonwealth Edison Co. | 5.875% | 2/1/33 | 185 | 218 |
| Commonwealth Edison Co. | 5.900% | 3/15/36 | 875 | 1,045 |
| Commonwealth Edison Co. | 6.450% | 1/15/38 | 496 | 639 |
| Commonwealth Edison Co. | 3.800% | 10/1/42 | 370 | 343 |
| Commonwealth Edison Co. | 4.600% | 8/15/43 | 310 | 325 |
| Commonwealth Edison Co. | 4.700% | 1/15/44 | 525 | 551 |
| Commonwealth Edison Co. | 3.700% | 3/1/45 | 615 | 553 |
| Connecticut Light & Power Co. | 6.350% | 6/1/36 | 351 | 447 |
| Connecticut Light & Power Co. | 4.300% | 4/15/44 | 410 | 415 |
| Consolidated Edison Co. of New York Inc. | 5.300% | 3/1/35 | 595 | 673 |
| Consolidated Edison Co. of New York Inc. | 5.850% | 3/15/36 | 550 | 658 |
| Consolidated Edison Co. of New York Inc. | 6.200% | 6/15/36 | 276 | 343 |
| Consolidated Edison Co. of New York Inc. | 5.700% | 12/1/36 | 395 | 463 |
| Consolidated Edison Co. of New York Inc. | 6.300% | 8/15/37 | 430 | 533 |
| Consolidated Edison Co. of New York Inc. | 6.750% | 4/1/38 | 325 | 427 |
| Consolidated Edison Co. of New York Inc. | 5.500% | 12/1/39 | 515 | 590 |
| Consolidated Edison Co. of New York Inc. | 5.700% | 6/15/40 | 515 | 608 |
| Consolidated Edison Co. of New York Inc. | 4.200% | 3/15/42 | 325 | 314 |
| Consolidated Edison Co. of New York Inc. | 3.950% | 3/1/43 | 750 | 697 |
| Consolidated Edison Co. of New York Inc. | 4.450% | 3/15/44 | 875 | 867 |
| Consolidated Edison Co. of New York Inc. | 4.625% | 12/1/54 | 815 | 795 |
| Consumers Energy Co. | 3.950% | 5/15/43 | 420 | 405 |
| Consumers Energy Co. | 4.350% | 8/31/64 | 180 | 172 |
| Delmarva Power & Light Co. | 4.000% | 6/1/42 | 400 | 384 |
| Dominion Resources Inc. | 6.300% | 3/15/33 | 570 | 674 |
| Dominion Resources Inc. | 5.250% | 8/1/33 | 318 | 340 |
| Dominion Resources Inc. | 5.950% | 6/15/35 | 620 | 706 |
| Dominion Resources Inc. | 7.000% | 6/15/38 | 130 | 161 |
| Dominion Resources Inc. | 4.900% | 8/1/41 | 475 | 477 |
| Dominion Resources Inc. | 4.050% | 9/15/42 | 155 | 139 |
| Dominion Resources Inc. | 4.700% | 12/1/44 | 580 | 570 |
| DTE Electric Co. | 6.625% | 6/1/36 | 470 | 612 |
| DTE Electric Co. | 5.700% | 10/1/37 | 200 | 237 |
| DTE Electric Co. | 3.950% | 6/15/42 | 280 | 268 |
| DTE Electric Co. | 4.000% | 4/1/43 | 375 | 360 |
| DTE Electric Co. | 4.300% | 7/1/44 | 355 | 356 |
| DTE Electric Co. | 3.700% | 3/15/45 | 585 | 531 |
| DTE Energy Co. | 6.375% | 4/15/33 | 240 | 298 |
| Duke Energy Carolinas LLC | 6.000% | 12/1/28 | 695 | 834 |
| Duke Energy Carolinas LLC | 6.450% | 10/15/32 | 375 | 476 |
| Duke Energy Carolinas LLC | 6.100% | 6/1/37 | 595 | 727 |
| Duke Energy Carolinas LLC | 6.000% | 1/15/38 | 610 | 756 |
| Duke Energy Carolinas LLC | 6.050% | 4/15/38 | 670 | 830 |
| Duke Energy Carolinas LLC | 5.300% | 2/15/40 | 770 | 878 |
| Duke Energy Carolinas LLC | 4.250% | 12/15/41 | 670 | 661 |
| Duke Energy Carolinas LLC | 4.000% | 9/30/42 | 635 | 612 |
| Duke Energy Carolinas LLC | 3.750% | 6/1/45 | 305 | 280 |
| Duke Energy Florida LLC | 6.350% | 9/15/37 | 500 | 644 |
| Duke Energy Florida LLC | 6.400% | 6/15/38 | 915 | 1,179 |
| Duke Energy Florida LLC | 5.650% | 4/1/40 | 375 | 454 |
| Duke Energy Florida LLC | 3.850% | 11/15/42 | 415 | 387 |
| Duke Energy Indiana Inc. | 6.120% | 10/15/35 | 363 | 442 |
| Duke Energy Indiana Inc. | 6.350% | 8/15/38 | 590 | 750 |
| Duke Energy Indiana Inc. | 6.450% | 4/1/39 | 150 | 193 |
81
| Vanguard® Long-Term Corporate Bond Index Fund | ||||
| Schedule of Investments | ||||
| August 31, 2015 | ||||
| Face | Market | |||
| Maturity | Amount | Value | ||
| Coupon | Date | ($000) | ($000) | |
| Duke Energy Indiana Inc. | 4.200% | 3/15/42 | 280 | 275 |
| Duke Energy Indiana Inc. | 4.900% | 7/15/43 | 475 | 514 |
| Duke Energy Progress LLC | 6.300% | 4/1/38 | 340 | 440 |
| Duke Energy Progress LLC | 4.100% | 5/15/42 | 545 | 535 |
| Duke Energy Progress LLC | 4.100% | 3/15/43 | 460 | 447 |
| Duke Energy Progress LLC | 4.375% | 3/30/44 | 470 | 481 |
| Duke Energy Progress LLC | 4.150% | 12/1/44 | 705 | 690 |
| Duke Energy Progress LLC | 4.200% | 8/15/45 | 750 | 747 |
| El Paso Electric Co. | 6.000% | 5/15/35 | 355 | 424 |
| Entergy Louisiana LLC | 4.440% | 1/15/26 | 60 | 63 |
| Entergy Louisiana LLC | 4.950% | 1/15/45 | 575 | 576 |
| Entergy Texas Inc. | 5.150% | 6/1/45 | 80 | 79 |
| Exelon Corp. | 4.950% | 6/15/35 | 740 | 743 |
| Exelon Corp. | 5.625% | 6/15/35 | 650 | 704 |
| Exelon Corp. | 5.100% | 6/15/45 | 985 | 978 |
| Exelon Generation Co. LLC | 6.250% | 10/1/39 | 765 | 817 |
| Exelon Generation Co. LLC | 5.750% | 10/1/41 | 410 | 413 |
| Exelon Generation Co. LLC | 5.600% | 6/15/42 | 803 | 793 |
| FirstEnergy Solutions Corp. | 6.800% | 8/15/39 | 400 | 415 |
| Florida Power & Light Co. | 5.950% | 10/1/33 | 275 | 338 |
| Florida Power & Light Co. | 5.625% | 4/1/34 | 525 | 624 |
| Florida Power & Light Co. | 4.950% | 6/1/35 | 285 | 314 |
| Florida Power & Light Co. | 5.400% | 9/1/35 | 310 | 361 |
| Florida Power & Light Co. | 6.200% | 6/1/36 | 375 | 476 |
| Florida Power & Light Co. | 5.650% | 2/1/37 | 425 | 510 |
| Florida Power & Light Co. | 5.850% | 5/1/37 | 260 | 319 |
| Florida Power & Light Co. | 5.950% | 2/1/38 | 460 | 573 |
| Florida Power & Light Co. | 5.960% | 4/1/39 | 600 | 752 |
| Florida Power & Light Co. | 5.690% | 3/1/40 | 415 | 507 |
| Florida Power & Light Co. | 5.250% | 2/1/41 | 510 | 584 |
| Florida Power & Light Co. | 5.125% | 6/1/41 | 275 | 310 |
| Florida Power & Light Co. | 4.125% | 2/1/42 | 630 | 621 |
| Florida Power & Light Co. | 4.050% | 6/1/42 | 605 | 585 |
| Florida Power & Light Co. | 3.800% | 12/15/42 | 435 | 409 |
| Florida Power & Light Co. | 4.050% | 10/1/44 | 530 | 516 |
| Georgia Power Co. | 5.650% | 3/1/37 | 585 | 643 |
| Georgia Power Co. | 5.950% | 2/1/39 | 460 | 525 |
| Georgia Power Co. | 5.400% | 6/1/40 | 650 | 696 |
| Georgia Power Co. | 4.750% | 9/1/40 | 530 | 521 |
| Georgia Power Co. | 4.300% | 3/15/42 | 870 | 782 |
| Georgia Power Co. | 4.300% | 3/15/43 | 330 | 297 |
| Iberdrola International BV | 6.750% | 7/15/36 | 530 | 647 |
| Indiana Michigan Power Co. | 6.050% | 3/15/37 | 365 | 430 |
| Interstate Power & Light Co. | 6.250% | 7/15/39 | 465 | 604 |
| ITC Holdings Corp. | 5.300% | 7/1/43 | 310 | 326 |
| Jersey Central Power & Light Co. | 6.150% | 6/1/37 | 295 | 339 |
| 2 John Sevier Combined Cycle Generation LLC | 4.626% | 1/15/42 | 895 | 976 |
| Kansas City Power & Light Co. | 6.050% | 11/15/35 | 250 | 302 |
| Kansas City Power & Light Co. | 5.300% | 10/1/41 | 470 | 509 |
| Kentucky Utilities Co. | 5.125% | 11/1/40 | 545 | 616 |
| Kentucky Utilities Co. | 4.650% | 11/15/43 | 410 | 438 |
| Louisville Gas & Electric Co. | 5.125% | 11/15/40 | 320 | 360 |
| Louisville Gas & Electric Co. | 4.650% | 11/15/43 | 225 | 239 |
| MidAmerican Energy Co. | 6.750% | 12/30/31 | 490 | 643 |
| MidAmerican Energy Co. | 5.750% | 11/1/35 | 380 | 465 |
| MidAmerican Energy Co. | 5.800% | 10/15/36 | 410 | 495 |
| MidAmerican Energy Co. | 4.800% | 9/15/43 | 385 | 413 |
| MidAmerican Energy Co. | 4.400% | 10/15/44 | 350 | 354 |
| MidAmerican Funding LLC | 6.927% | 3/1/29 | 200 | 262 |
| Mississippi Power Co. | 4.250% | 3/15/42 | 565 | 491 |
| National Rural Utilities Cooperative Finance Corp. | 4.023% | 11/1/32 | 1,421 | 1,409 |
| Nevada Power Co. | 6.650% | 4/1/36 | 350 | 454 |
| Nevada Power Co. | 6.750% | 7/1/37 | 370 | 486 |
| Nevada Power Co. | 5.375% | 9/15/40 | 235 | 266 |
82
| Vanguard® Long-Term Corporate Bond Index Fund | ||||
| Schedule of Investments | ||||
| August 31, 2015 | ||||
| Face | Market | |||
| Maturity | Amount | Value | ||
| Coupon | Date | ($000) | ($000) | |
| Nevada Power Co. | 5.450% | 5/15/41 | 241 | 276 |
| Northern States Power Co. | 5.250% | 7/15/35 | 260 | 298 |
| Northern States Power Co. | 6.250% | 6/1/36 | 340 | 436 |
| Northern States Power Co. | 6.200% | 7/1/37 | 486 | 627 |
| Northern States Power Co. | 5.350% | 11/1/39 | 275 | 322 |
| Northern States Power Co. | 4.850% | 8/15/40 | 360 | 392 |
| Northern States Power Co. | 3.400% | 8/15/42 | 405 | 356 |
| Northern States Power Co. | 4.125% | 5/15/44 | 400 | 397 |
| Northern States Power Co. | 4.000% | 8/15/45 | 300 | 291 |
| NorthWestern Corp. | 4.176% | 11/15/44 | 470 | 464 |
| NSTAR Electric Co. | 5.500% | 3/15/40 | 460 | 548 |
| NSTAR Electric Co. | 4.400% | 3/1/44 | 265 | 269 |
| Oglethorpe Power Corp. | 5.950% | 11/1/39 | 365 | 436 |
| Oglethorpe Power Corp. | 5.375% | 11/1/40 | 520 | 574 |
| Oglethorpe Power Corp. | 4.200% | 12/1/42 | 215 | 201 |
| Oglethorpe Power Corp. | 4.550% | 6/1/44 | 430 | 421 |
| Oglethorpe Power Corp. | 5.250% | 9/1/50 | 235 | 256 |
| Ohio Edison Co. | 6.875% | 7/15/36 | 445 | 556 |
| Ohio Edison Co. | 8.250% | 10/15/38 | 225 | 317 |
| Ohio Power Co. | 6.600% | 2/15/33 | 250 | 315 |
| Ohio Power Co. | 5.850% | 10/1/35 | 321 | 381 |
| Oklahoma Gas & Electric Co. | 5.850% | 6/1/40 | 210 | 253 |
| Oklahoma Gas & Electric Co. | 5.250% | 5/15/41 | 225 | 251 |
| Oklahoma Gas & Electric Co. | 3.900% | 5/1/43 | 350 | 326 |
| Oklahoma Gas & Electric Co. | 4.550% | 3/15/44 | 245 | 252 |
| Oklahoma Gas & Electric Co. | 4.000% | 12/15/44 | 400 | 379 |
| Oncor Electric Delivery Co. LLC | 7.000% | 5/1/32 | 480 | 616 |
| Oncor Electric Delivery Co. LLC | 7.250% | 1/15/33 | 380 | 505 |
| Oncor Electric Delivery Co. LLC | 7.500% | 9/1/38 | 335 | 463 |
| Oncor Electric Delivery Co. LLC | 5.250% | 9/30/40 | 455 | 496 |
| Oncor Electric Delivery Co. LLC | 4.550% | 12/1/41 | 405 | 404 |
| Oncor Electric Delivery Co. LLC | 5.300% | 6/1/42 | 520 | 573 |
| 1 Oncor Electric Delivery Co. LLC | 3.750% | 4/1/45 | 455 | 401 |
| Pacific Gas & Electric Co. | 6.050% | 3/1/34 | 3,145 | 3,755 |
| Pacific Gas & Electric Co. | 5.800% | 3/1/37 | 1,000 | 1,158 |
| Pacific Gas & Electric Co. | 6.350% | 2/15/38 | 555 | 688 |
| Pacific Gas & Electric Co. | 6.250% | 3/1/39 | 620 | 761 |
| Pacific Gas & Electric Co. | 5.400% | 1/15/40 | 760 | 853 |
| Pacific Gas & Electric Co. | 4.500% | 12/15/41 | 185 | 186 |
| Pacific Gas & Electric Co. | 4.450% | 4/15/42 | 775 | 766 |
| Pacific Gas & Electric Co. | 4.600% | 6/15/43 | 505 | 511 |
| Pacific Gas & Electric Co. | 5.125% | 11/15/43 | 595 | 650 |
| Pacific Gas & Electric Co. | 4.750% | 2/15/44 | 465 | 478 |
| Pacific Gas & Electric Co. | 4.300% | 3/15/45 | 610 | 590 |
| PacifiCorp | 7.700% | 11/15/31 | 350 | 484 |
| PacifiCorp | 5.250% | 6/15/35 | 310 | 352 |
| PacifiCorp | 6.100% | 8/1/36 | 365 | 457 |
| PacifiCorp | 5.750% | 4/1/37 | 680 | 804 |
| PacifiCorp | 6.250% | 10/15/37 | 715 | 897 |
| PacifiCorp | 6.350% | 7/15/38 | 360 | 458 |
| PacifiCorp | 6.000% | 1/15/39 | 665 | 810 |
| PacifiCorp | 4.100% | 2/1/42 | 300 | 290 |
| Peco Energy Co. | 5.950% | 10/1/36 | 170 | 206 |
| Peco Energy Co. | 4.150% | 10/1/44 | 440 | 428 |
| Pennsylvania Electric Co. | 6.150% | 10/1/38 | 310 | 350 |
| Potomac Electric Power Co. | 6.500% | 11/15/37 | 475 | 609 |
| Potomac Electric Power Co. | 7.900% | 12/15/38 | 145 | 217 |
| Potomac Electric Power Co. | 4.150% | 3/15/43 | 515 | 498 |
| PPL Capital Funding Inc. | 4.700% | 6/1/43 | 470 | 471 |
| PPL Capital Funding Inc. | 5.000% | 3/15/44 | 415 | 427 |
| PPL Electric Utilities Corp. | 6.250% | 5/15/39 | 355 | 452 |
| PPL Electric Utilities Corp. | 5.200% | 7/15/41 | 265 | 302 |
| PPL Electric Utilities Corp. | 4.750% | 7/15/43 | 200 | 213 |
| PPL Electric Utilities Corp. | 4.125% | 6/15/44 | 330 | 329 |
83
| Vanguard® Long-Term Corporate Bond Index Fund | ||||
| Schedule of Investments | ||||
| August 31, 2015 | ||||
| Face | Market | |||
| Maturity | Amount | Value | ||
| Coupon | Date | ($000) | ($000) | |
| Progress Energy Inc. | 7.750% | 3/1/31 | 380 | 504 |
| Progress Energy Inc. | 7.000% | 10/30/31 | 420 | 526 |
| Progress Energy Inc. | 6.000% | 12/1/39 | 745 | 885 |
| PSEG Power LLC | 8.625% | 4/15/31 | 615 | 839 |
| Public Service Co. of Colorado | 6.250% | 9/1/37 | 230 | 295 |
| Public Service Co. of Colorado | 6.500% | 8/1/38 | 230 | 307 |
| Public Service Co. of Colorado | 4.750% | 8/15/41 | 345 | 371 |
| Public Service Co. of Colorado | 3.600% | 9/15/42 | 560 | 506 |
| Public Service Co. of Colorado | 3.950% | 3/15/43 | 170 | 164 |
| Public Service Co. of Colorado | 4.300% | 3/15/44 | 475 | 480 |
| Public Service Co. of Oklahoma | 6.625% | 11/15/37 | 225 | 290 |
| Public Service Electric & Gas Co. | 5.700% | 12/1/36 | 125 | 149 |
| Public Service Electric & Gas Co. | 5.800% | 5/1/37 | 440 | 529 |
| Public Service Electric & Gas Co. | 5.375% | 11/1/39 | 695 | 804 |
| Public Service Electric & Gas Co. | 3.950% | 5/1/42 | 605 | 581 |
| Public Service Electric & Gas Co. | 3.650% | 9/1/42 | 630 | 570 |
| Public Service Electric & Gas Co. | 4.000% | 6/1/44 | 275 | 264 |
| Public Service Electric & Gas Co. | 4.050% | 5/1/45 | 255 | 248 |
| Puget Sound Energy Inc. | 7.020% | 12/1/27 | 375 | 495 |
| Puget Sound Energy Inc. | 5.483% | 6/1/35 | 470 | 537 |
| Puget Sound Energy Inc. | 6.724% | 6/15/36 | 128 | 170 |
| Puget Sound Energy Inc. | 6.274% | 3/15/37 | 340 | 427 |
| Puget Sound Energy Inc. | 5.757% | 10/1/39 | 420 | 506 |
| Puget Sound Energy Inc. | 5.795% | 3/15/40 | 295 | 362 |
| Puget Sound Energy Inc. | 5.764% | 7/15/40 | 295 | 356 |
| Puget Sound Energy Inc. | 5.638% | 4/15/41 | 225 | 269 |
| Puget Sound Energy Inc. | 4.434% | 11/15/41 | 345 | 356 |
| Puget Sound Energy Inc. | 4.300% | 5/20/45 | 365 | 361 |
| San Diego Gas & Electric Co. | 6.000% | 6/1/26 | 245 | 302 |
| San Diego Gas & Electric Co. | 5.350% | 5/15/35 | 265 | 311 |
| San Diego Gas & Electric Co. | 6.125% | 9/15/37 | 310 | 394 |
| San Diego Gas & Electric Co. | 6.000% | 6/1/39 | 245 | 306 |
| San Diego Gas & Electric Co. | 5.350% | 5/15/40 | 310 | 362 |
| San Diego Gas & Electric Co. | 4.500% | 8/15/40 | 425 | 445 |
| San Diego Gas & Electric Co. | 3.950% | 11/15/41 | 300 | 291 |
| San Diego Gas & Electric Co. | 4.300% | 4/1/42 | 310 | 314 |
| Sierra Pacific Power Co. | 6.750% | 7/1/37 | 285 | 374 |
| South Carolina Electric & Gas Co. | 6.625% | 2/1/32 | 300 | 375 |
| South Carolina Electric & Gas Co. | 5.300% | 5/15/33 | 405 | 443 |
| South Carolina Electric & Gas Co. | 6.050% | 1/15/38 | 490 | 580 |
| South Carolina Electric & Gas Co. | 5.450% | 2/1/41 | 345 | 386 |
| South Carolina Electric & Gas Co. | 4.350% | 2/1/42 | 565 | 546 |
| South Carolina Electric & Gas Co. | 4.600% | 6/15/43 | 405 | 407 |
| South Carolina Electric & Gas Co. | 4.500% | 6/1/64 | 400 | 369 |
| South Carolina Electric & Gas Co. | 5.100% | 6/1/65 | 240 | 245 |
| Southern California Edison Co. | 6.650% | 4/1/29 | 450 | 568 |
| Southern California Edison Co. | 6.000% | 1/15/34 | 480 | 586 |
| Southern California Edison Co. | 5.750% | 4/1/35 | 401 | 477 |
| Southern California Edison Co. | 5.350% | 7/15/35 | 480 | 546 |
| Southern California Edison Co. | 5.550% | 1/15/36 | 220 | 255 |
| Southern California Edison Co. | 5.625% | 2/1/36 | 390 | 456 |
| Southern California Edison Co. | 5.550% | 1/15/37 | 330 | 385 |
| Southern California Edison Co. | 5.950% | 2/1/38 | 665 | 820 |
| Southern California Edison Co. | 6.050% | 3/15/39 | 350 | 437 |
| Southern California Edison Co. | 5.500% | 3/15/40 | 320 | 373 |
| Southern California Edison Co. | 4.500% | 9/1/40 | 665 | 680 |
| Southern California Edison Co. | 3.900% | 12/1/41 | 235 | 221 |
| Southern California Edison Co. | 4.050% | 3/15/42 | 620 | 602 |
| Southern California Edison Co. | 3.900% | 3/15/43 | 275 | 258 |
| Southern California Edison Co. | 4.650% | 10/1/43 | 831 | 873 |
| Southern California Edison Co. | 3.600% | 2/1/45 | 285 | 254 |
| Southern Power Co. | 5.150% | 9/15/41 | 520 | 520 |
| Southern Power Co. | 5.250% | 7/15/43 | 395 | 404 |
| Southwestern Electric Power Co. | 6.200% | 3/15/40 | 375 | 453 |
84
| Vanguard® Long-Term Corporate Bond Index Fund | ||||
| Schedule of Investments | ||||
| August 31, 2015 | ||||
| Face | Market | |||
| Maturity | Amount | Value | ||
| Coupon | Date | ($000) | ($000) | |
| Southwestern Electric Power Co. | 3.900% | 4/1/45 | 370 | 324 |
| Southwestern Public Service Co. | 4.500% | 8/15/41 | 520 | 538 |
| Tampa Electric Co. | 6.550% | 5/15/36 | 350 | 452 |
| Tampa Electric Co. | 6.150% | 5/15/37 | 265 | 331 |
| Tampa Electric Co. | 4.100% | 6/15/42 | 455 | 445 |
| Tampa Electric Co. | 4.350% | 5/15/44 | 190 | 193 |
| Tampa Electric Co. | 4.200% | 5/15/45 | 220 | 217 |
| Toledo Edison Co. | 6.150% | 5/15/37 | 310 | 362 |
| TransAlta Corp. | 6.500% | 3/15/40 | 335 | 304 |
| 1 Tri-State Generation & Transmission Association Inc. | 4.700% | 11/1/44 | 270 | 273 |
| Union Electric Co. | 5.300% | 8/1/37 | 435 | 499 |
| Union Electric Co. | 8.450% | 3/15/39 | 260 | 415 |
| Union Electric Co. | 3.900% | 9/15/42 | 530 | 502 |
| Union Electric Co. | 3.650% | 4/15/45 | 215 | 194 |
| Virginia Electric & Power Co. | 6.000% | 1/15/36 | 835 | 1,037 |
| Virginia Electric & Power Co. | 6.000% | 5/15/37 | 580 | 718 |
| Virginia Electric & Power Co. | 6.350% | 11/30/37 | 527 | 677 |
| Virginia Electric & Power Co. | 8.875% | 11/15/38 | 580 | 900 |
| Virginia Electric & Power Co. | 4.000% | 1/15/43 | 685 | 653 |
| Virginia Electric & Power Co. | 4.650% | 8/15/43 | 565 | 595 |
| Virginia Electric & Power Co. | 4.450% | 2/15/44 | 630 | 645 |
| Virginia Electric & Power Co. | 4.200% | 5/15/45 | 440 | 429 |
| Westar Energy Inc. | 4.125% | 3/1/42 | 520 | 514 |
| Westar Energy Inc. | 4.100% | 4/1/43 | 475 | 468 |
| Westar Energy Inc. | 4.625% | 9/1/43 | 435 | 463 |
| Wisconsin Electric Power Co. | 5.625% | 5/15/33 | 285 | 339 |
| Wisconsin Electric Power Co. | 5.700% | 12/1/36 | 290 | 353 |
| Wisconsin Electric Power Co. | 3.650% | 12/15/42 | 200 | 181 |
| Wisconsin Electric Power Co. | 4.250% | 6/1/44 | 270 | 272 |
| Wisconsin Power & Light Co. | 6.375% | 8/15/37 | 484 | 627 |
| Wisconsin Power & Light Co. | 4.100% | 10/15/44 | 605 | 584 |
| Wisconsin Public Service Corp. | 3.671% | 12/1/42 | 295 | 271 |
| Wisconsin Public Service Corp. | 4.752% | 11/1/44 | 470 | 511 |
| Xcel Energy Inc. | 6.500% | 7/1/36 | 580 | 709 |
| Xcel Energy Inc. | 4.800% | 9/15/41 | 240 | 245 |
| Natural Gas (0.8%) | ||||
| AGL Capital Corp. | 6.000% | 10/1/34 | 215 | 252 |
| AGL Capital Corp. | 5.875% | 3/15/41 | 384 | 448 |
| AGL Capital Corp. | 4.400% | 6/1/43 | 685 | 665 |
| Atmos Energy Corp. | 5.500% | 6/15/41 | 550 | 635 |
| Atmos Energy Corp. | 4.150% | 1/15/43 | 305 | 289 |
| Atmos Energy Corp. | 4.125% | 10/15/44 | 375 | 352 |
| KeySpan Corp. | 8.000% | 11/15/30 | 480 | 654 |
| KeySpan Corp. | 5.803% | 4/1/35 | 265 | 301 |
| Laclede Group Inc. | 4.700% | 8/15/44 | 275 | 280 |
| NiSource Finance Corp. | 6.250% | 12/15/40 | 480 | 584 |
| NiSource Finance Corp. | 5.950% | 6/15/41 | 490 | 563 |
| NiSource Finance Corp. | 5.800% | 2/1/42 | 300 | 344 |
| Nisource Finance Corp. | 5.250% | 2/15/43 | 820 | 874 |
| NiSource Finance Corp. | 4.800% | 2/15/44 | 1,000 | 1,001 |
| ONE Gas Inc. | 4.658% | 2/1/44 | 650 | 680 |
| Piedmont Natural Gas Co. Inc. | 4.100% | 9/18/34 | 450 | 452 |
| Piedmont Natural Gas Co. Inc. | 4.650% | 8/1/43 | 325 | 355 |
| Southern California Gas Co. | 5.750% | 11/15/35 | 400 | 480 |
| Southern California Gas Co. | 5.125% | 11/15/40 | 625 | 702 |
| Southern California Gas Co. | 3.750% | 9/15/42 | 525 | 487 |
| Southern California Gas Co. | 4.450% | 3/15/44 | 305 | 316 |
| Southwest Gas Corp. | 4.875% | 10/1/43 | 300 | 311 |
| Other Utility (0.2%) | ||||
| American Water Capital Corp. | 6.593% | 10/15/37 | 755 | 973 |
| American Water Capital Corp. | 4.300% | 12/1/42 | 475 | 469 |
| American Water Capital Corp. | 4.300% | 9/1/45 | 200 | 196 |
| United Utilities plc | 6.875% | 8/15/28 | 445 | 528 |
85
| Vanguard® Long-Term Corporate Bond Index Fund | ||||
| Schedule of Investments | ||||
| August 31, 2015 | ||||
| Face | Market | |||
| Maturity | Amount | Value | ||
| Coupon | Date | ($000) | ($000) | |
| Veolia Environnement SA | 6.750% | 6/1/38 | 500 | 607 |
| 169,857 | ||||
| Total Corporate Bonds (Cost $1,380,628) | 1,307,034 | |||
| Taxable Municipal Bonds (0.2%) | ||||
| George Washington University District of Columbia GO | 4.300% | 9/15/44 | 425 | 404 |
| New York University Hospitals Center GO | 4.428% | 7/1/42 | 350 | 339 |
| New York University Hospitals Center Revenue | 5.750% | 7/1/43 | 350 | 406 |
| President & Fellows of Harvard College Massachusetts | ||||
| GO | 6.300% | 10/1/37 | 65 | 67 |
| President & Fellows of Harvard College Massachusetts | ||||
| GO | 4.875% | 10/15/40 | 275 | 319 |
| Princeton University New Jersey GO | 5.700% | 3/1/39 | 610 | 775 |
| Tufts University Massachusetts GO | 5.017% | 4/15/12 | 325 | 335 |
| University of Southern California GO | 5.250% | 10/1/11 | 415 | 498 |
| Total Taxable Municipal Bonds (Cost $3,183) | 3,143 | |||
| Shares | ||||
| Temporary Cash Investment (0.3%) | ||||
| Money Market Fund (0.3%) | ||||
| 3 Vanguard Market Liquidity Fund (Cost $3,805) | 0.168% | 3,804,996 | 3,805 | |
| Total Investments (98.6%) (Cost $1,389,706) | 1,316,059 | |||
| Other Assets and Liabilities—Net (1.4%) | 18,495 | |||
| Net Assets (100%) | 1,334,554 | |||
1 Security exempt from registration under Rule 144A of the Securities Act of 1933. Such securities may be sold in transactions exempt from registration, normally to qualified institutional buyers. At August 31, 2015, the aggregate value of these securities was $27,093,000, representing 2.0% of net assets.
2 The average or expected maturity is shorter than the final maturity shown because of the possibility of interim principal payments and prepayments or the possibility of the issue being called.
3 Affiliated money market fund available only to Vanguard funds and certain trusts and accounts managed by Vanguard. Rate shown is the 7-day yield.
GO—General Obligation Bond.
REIT—Real Estate Investment Trust.
86
This page intentionally left blank.
87
© 2015 The Vanguard Group, Inc.
All rights reserved.
Vanguard Marketing Corporation, Distributor.
SNA16420 102015
Report of Independent Registered Public Accounting Firm
To the Board of Trustees of Vanguard Scottsdale Funds and the Shareholders of Vanguard Intermediate-Term Corporate Bond Index Fund, Vanguard Long-Term Corporate Bond Index Fund and Vanguard Short-Term Corporate Bond Index Fund:
In our opinion, the accompanying statements of net assets – investments summary and the related statements of operations and of changes in net assets and the financial highlights (included in Item 1 of this Form N-CSR) and the schedules of investments (included in Item 6 of this Form N-CSR) present fairly, in all material respects, the financial position of Vanguard Intermediate-Term Corporate Bond Index Fund, Vanguard Long-Term Corporate Bond Index Fund and Vanguard Short-Term Corporate Bond Index Fund (constituting separate portfolios of Vanguard Scottsdale Funds, hereafter referred to as the “Funds”) at August 31, 2015, the results of each of their operations for the year then ended, the changes in each of their net assets for each of the two years in the period then ended, and the financial highlights for each of the periods indicated, in conformity with accounting principles generally accepted in the United States of America. These financial statements, financial highlights, and schedules of investments (hereafter referred to as "financial statements") are the responsibility of the Funds’ management. Our responsibility is to express an opinion on these financial statements based on our audits. We conducted our audits of these financial statements in accordance with the standards of the Public Company Accounting Oversight Board (United States). Those standards require that we plan and perform the audit to obtain reasonable assurance about whether the financial statements are free of material misstatement. An audit includes examining, on a test basis, evidence supporting the amounts and disclosures in the financial statements, assessing the accounting principles used and significant estimates made by management, and evaluating the overall financial statement presentation. We believe that our audits, which included confirmation of securities at August 31, 2015 by correspondence with the custodian and brokers, by agreement to the underlying ownership records of the transfer agent and the application of alternative auditing procedures where securities purchased had not been received, provide a reasonable basis for our opinion.

October 12, 2015
PricewaterhouseCoopers LLP, Two Commerce Square, 2001 Market Street, Suite 1700, Philadelphia, PA 19103-7042
T: (267) 330-3000, F: (267) 330-3300, www.pwc.com/us
Item 7: Disclosure of Proxy Voting Policies and Procedures for Closed-End Management Investment Companies.
Not Applicable.
Item 8: Portfolio Managers of Closed-End Management Investment Companies.
Not Applicable.
Item 9: Purchase of Equity Securities by Closed-End Management Investment Company and Affiliated Purchasers.
Not Applicable.
Item 10: Submission of Matters to a Vote of Security Holders.
Not Applicable.
Item 11: Controls and Procedures.
(a) Disclosure Controls and Procedures. The Principal Executive and Financial Officers concluded that the Registrant’s Disclosure Controls and Procedures are effective based on their evaluation of the Disclosure Controls and Procedures as of a date within 90 days of the filing date of this report.
(b) Internal Control Over Financial Reporting. There were no significant changes in Registrant’s Internal Control Over Financial Reporting or in other factors that could significantly affect this control subsequent to the date of the evaluation, including any corrective actions with regard to significant deficiencies and material weaknesses.
Item 12: Exhibits.
(a) Code of Ethics. (b) Certifications.
Pursuant to the requirements of the Securities Exchange Act of 1934 and the Investment Company Act of 1940, the registrant has duly caused this report to be signed on its behalf by the undersigned, thereunto duly authorized.
| VANGUARD SCOTTSDALE FUNDS | |
| By: | /s/ F. WILLIAM MCNABB III* |
| F. WILLIAM MCNABB III | |
| CHIEF EXECUTIVE OFFICER | |
| Date: October 16, 2015 | |
Pursuant to the requirements of the Securities Exchange Act of 1934 and the Investment Company Act of 1940, this report has been signed below by the following persons on behalf of the registrant and in the capacities and on the dates indicated.
| VANGUARD SCOTTSDALE FUNDS | |
| By: | /s/ F. WILLIAM MCNABB III* |
| F. WILLIAM MCNABB III | |
| CHIEF EXECUTIVE OFFICER | |
| Date: October 16, 2015 | |
| VANGUARD SCOTTSDALE FUNDS | |
| By: | /s/ THOMAS J. HIGGINS* |
| THOMAS J. HIGGINS | |
| CHIEF FINANCIAL OFFICER | |
| Date: October 16, 2015 | |
* By: /s/ Heidi Stam
Heidi Stam, pursuant to a Power of Attorney filed on April 22, 2014 see file Number 2-17620, Incorporated by Reference.