UNITED STATES
SECURITIES AND EXCHANGE COMMISSION
Washington, D.C. 20549
Form 6K
REPORT OF FOREIGN PRIVATE ISSUER
PURSUANT TO RULE 13a16 OR 15d16 UNDER THE
SECURITIES EXCHANGE ACT OF 1934
For November 17, 2022
Harmony Gold Mining Company Limited
Randfontein Office Park
Corner Main Reef Road and Ward Avenue Randfontein, 1759
South Africa
(Address of principal executive offices)
*-
(Indicate by check mark whether the registrant files or will file annual reports under cover of
Form 20 F or Form 40F.)
Form 20F ☒ Form 40F ☐
(Indicate by check mark whether the registrant by furnishing the information contained in this form is also thereby furnishing the information to the Commission pursuant to Rule 12g32(b) under the Securities Exchange Act of 1934.)
Yes ☐ No ☒
Harmony Gold Mining Company Limited
Incorporated in the Republic of South Africa
Registration number: 1950/038232/06
JSE share code: HAR NYSE share code: HMY
ISIN: ZAE000015228
("Harmony" or "the Company")
OPERATIONAL UPDATE
for the three months ended 30 September 2022 ("Q1FY23")
Salient features (Q1FY23 vs Q4FY22)
‐ South Africa total LTIFR at 5.68, trending below 6.00 for four consecutive quarters
‐ Operating free cash flow up 17% to R857m (US$50m) driven by South African underground performance
‐ Tshepong Operations disaggregation delivers outstanding results, generating operating free cash flow of R314m (US$18m), 37% of group
‐ Underground recovered grades up 1% to 5.35g/t from 5.30g/t
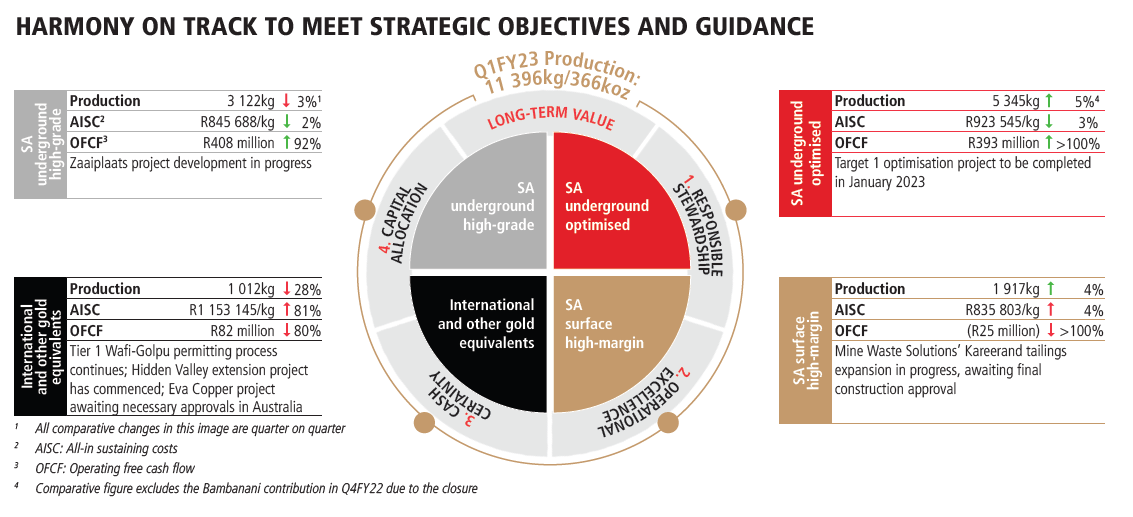
‐ Total gold production down 4% to 11 396kg (366 390oz) from 11 879kg (381 919oz) mainly due to the closure of Bambanani at the end of FY22
‐ Average gold price received up 1% to R954 916/kg (US$1 743/oz) from R944 671/kg (US$1 885/oz) last quarter
‐ Group all‐in sustaining costs ("AISC") increased 5% to R907 864/kg (US$1 657oz) from R865 523/kg (US$1 727/oz) impacted by Eskom winter electricity tariffs
‐ Group all‐in costs ("AIC") increased 4% to R946 204/kg (US$1 727/oz) from R906 706/kg (US$1 810/oz)
‐ Net debt to EBITDA increased to 0.26x from 0.1x due to working capital movements and currency translation
STRONG PERFORMANCE FROM SOUTH AFRICAN SURFACE AND UNDERGROUND MINES. TSHEPONG NORTH AND SOUTH SHINE
Johannesburg, South Africa. Thursday, 17 November 2022.
Harmony Gold Mining Company Limited ("Harmony" or "the Company") is pleased to report our operational performance for the three months ended 30 September 2022 ("Q1FY23").
OVERVIEW
The operational results for the first quarter of the financial year 2023 were driven primarily by a good performance from the South African ("SA") underground and SA surface operations. As a rand‐cost producer, the gold price received continued to move in Harmony's favour, increasing 1% to R954 916/kg (US$1 743/oz) from R944 671/kg (US$1 885/oz) in the previous quarter ("Q4FY22"). This resulted in a 1% increase in gold revenue for Q1FY23 to R11 226 million (US$659 million) from R11 073 million (US$711 million) in the previous quarter. Improved performances at our SA high‐grade and SA optimised underground operations resulted in total group operating free cash flow increasing 17% to R857 million (US$50 million) from R731 million (US$47 million). Group operating cash flow margins improved to 8% from 7% in the previous quarter.
Total group production declined 4% to 11 396kg (366 390oz) from 11 879kg (381 919oz) in Q4FY22. This was mainly due to the closure of Bambanani. SA underground production decreased by 2% to 8 467kg (272 219oz) from 8 643kg (277 880oz) in the previous quarter. Adjusting for the closure of Bambanani, which delivered 317kg (10 192oz) in the previous quarter, the remaining SA underground production increased by 2% to 8 467kg (272 219oz). Production was further supported by a 1% increase in underground recovered grades to 5.35g/t from 5.30g/t.
Production at the SA surface operations increased 4% to 1 917kg (61 634oz) from 1 835kg (58 996oz) on the back of an improved performance from Mine Waste Solutions. The ongoing energy crisis in South Africa had a negative impact on group production, with approximately 100kg (3 215oz) in production lost as a result of load curtailment this quarter. Production from our international segment declined 28% to 1 012kg (32 537oz) from 1 401kg (45 043oz). Lower production at Hidden Valley in Papua New Guinea ("PNG") was expected due to planned waste stripping to expose higher grades.
Following the restructure and disaggregation of Tshepong Operations at the end of the previous financial year, Tshepong North and Tshepong South both delivered strong operational performances due to better recovered grades. Tshepong North's operating free cash flow margins improved to 11% this quarter from ‐13% in Q4FY22 while Tshepong South's operating free cash flow margins improved to 22% from 9%. These two mines contributed R314 million (US$18 million), or 37% of group operating free cash flow, driving much of the improvement in the SA underground optimised portfolio. Operating free cash flow margins for the SA underground operations improved to 9% from 2% in the previous quarter. Margins at the high‐grade operations, Mponeng and Moab Khotsong, each improved to 13% from 5% and 9% respectively. The free cash flow contribution of R407 million (US$24 million) from our high‐grade operations represents 48% of total group operating free cash flow. Hidden Valley generated R82 million (US$5 million) in operating free cash flow this quarter.
Group AISC increased by 5% to R907 864/kg (US$1 657/oz) from R865 523/kg (US$1 727/oz) in Q4FY22 mainly due to lower production at Hidden Valley, Kusasalethu and Target 1.
Net debt to EBITDA increased to 0.26 times in this quarter from 0.1 times in the previous quarter on the back of currency translation and working capital movements. Net debt increased to R2 070 million (US$114 million) from R731 million (US$45 million).
OUTLOOK
Harmony is a 1.4 to 1.5 million ounce gold producer with near‐term copper prospects. On the back of the strong quarterly performance from the South African assets and the favourable US$/Rand exchange rate, Harmony remains on track to meet the FY23 cost, grade and production guidance provided in August 2022. Our four strategic pillars are: responsible stewardship, operational excellence, cash certainty and effective capital allocation. Continued focus is placed on delivering safe production and value creation through execution excellence and productivity initiatives. To boost our existing copper footprint, Harmony announced the acquisition of Eva Copper in Australia on 6 October 2022. Alongside the Tier 1 Wafi‐Golpu project in PNG, this investment introduces lower‐risk, near‐term copper into the Harmony portfolio. This acquisition complements our investments in our higher‐grade and higher‐margin assets and will ensure we continue to deliver on our strategy of safe profitable ounces.
Our embedded approach to sustainable mining practices and meaningful investment in organic and inorganic growth will deliver long‐term value creation for all our stakeholders.
THREE MONTHS OF THE FINANCIAL YEAR 2023 KEY OPERATIONAL METRICS
Unit | Q1FY23 | Q4FY22 | Q-on-Q (%) | Q1FY22 | Y-on-Y (%) | |||||||||||||||
Average gold price received | R/kg | 954 916 | 944 671 | 1 | 832 756 | 15 | ||||||||||||||
| $/oz | 1 743 | 1 885 | (8) | 1 771 | (2) | |||||||||||||||
| Underground yield | g/t | 5.35 | 5.30 | 1 | 5.27 | 2 | ||||||||||||||
Gold produced total | kg | 11 396 | 11 879 | (4) | 12 868 | (11) | ||||||||||||||
| oz | 366 390 | 381 919 | (4) | 413 714 | (11) | |||||||||||||||
SA optimised underground1 | kg | 5 345 | 5 102* | 5 | 5 470* | (2) | ||||||||||||||
| oz | 171 845 | 164 034* | 5 | 175 864* | (2) | |||||||||||||||
SA high grade underground2 | kg | 3 122 | 3 224 | (3) | 3 504 | (11) | ||||||||||||||
| oz | 100 374 | 103 654 | (3) | 112 656 | (11) | |||||||||||||||
SA surface3 | kg | 1 917 | 1 835 | 4 | 2 273 | (16) | ||||||||||||||
| oz | 61 634 | 58 996 | 4 | 73 078 | (16) | |||||||||||||||
International (Hidden Valley) | kg | 1 012 | 1 401 | (28) | 1 138 | (11) | ||||||||||||||
| oz | 32 537 | 45 043 | (28) | 36 587 | (11) | |||||||||||||||
Total cash costs | R/kg | 757 726 | 712 240 | (6) | 663 458 | (14) | ||||||||||||||
| $/oz | 1 383 | 1 422 | 3 | 1 411 | 2 | |||||||||||||||
Group AISC | R/kg | 907 864 | 865 523 | (5) | 795 086 | (14) | ||||||||||||||
| US$/oz | 1 657 | 1 727 | 4 | 1 691 | 2 | |||||||||||||||
Group AIC | R/kg | 946 204 | 906 706 | (4) | 814 603 | (16) | ||||||||||||||
| US$/oz | 1 727 | 1 810 | 5 | 1 732 | — | |||||||||||||||
| Average exchange rate | R/US$ | 17.04 | 15.58 | 9 | 14.63 | 16 | ||||||||||||||
(1)Tshepong South, Tshepong North, Target 1, Joel, Masimong, Doornkop and Kusasalethu
(2) Mponeng and Moab Khotsong
(3) Mine Waste Solutions, Phoenix, Central Plant, Savuka Tailings, Dumps and Kalgold
* Excludes Bambanani due to closure at the end of FY22
RESPONSIBLE STEWARDSHIP
Environmental, social and governance (ESG) practices are embedded in our strategy and determine how we operate across the globe. We believe this will create lasting legacies and a sustainable future for all our stakeholders. Responsible stewardship is the first of our four strategic pillars and an integrated and risk‐based approach to sustainable development guides how we operate. Harmony remains committed to good governance, transparent reporting and comprehensive disclosures. Our latest ESG and Taskforce for Climate‐related Financial Disclosure ("TCFD") reports are available at www.harmony.co.za
SAFETY
The safety of our people remains our top priority. Safety will always take precedence over production. Through our Thibakotsi (prevent harm) culture transformation programme and Harmony Risk Management framework, we continue to embed a proactive safety culture at all our operations. Our goal remains zero‐loss of life.
Q1FY23 marked the fourth consecutive quarter where the Lost Time Injury Frequency Rate ("LTIFR") was below six (5.68 per million hours worked) at our SA operations. Reportable injuries relating to fall of ground, rail bound equipment and winch injury frequency rate also improved for the quarter. As part of our drive to emphasize the importance of safety, a comprehensive visible felt leadership initiative was conducted at all Harmony's operations on 8 September 2022. On 6 October 2022, Harmony again hosted a safety meeting made up of all the general managers and plant managers to continue driving the safety message.
We have made considerable progress to improve the overall safety at Harmony. We are therefore deeply saddened by the loss of the following colleagues:
‐ Mr Juliao Macamo from our Moab Khotsong operation who lost his life in a fall of ground incident on 13 August 2022
‐ Mr Ernesto Euseblo Macuacua from our Tshepong North operation who lost his life in a fall of ground incident on 7 November 2022
We extend our deepest condolences to the families and loved ones of our colleagues who lost their lives.
It is imperative that we continue to adhere to the various controls and continuously improve our systems, ensuring work places are safe at all times. We are working continuously to ensure a culture of safety throughout Harmony and we believe that zero‐loss of life is indeed possible.
Please see the Company's FY22 integrated annual report and website for more information on our safety initiatives: www.harmony.co.za.
HEALTH
Harmony remains dedicated to delivering best‐in‐class employee health and wellness. The company also extends its health drive to include mental health, ensuring that every employee can live a fulfilled and healthy life.
Occupational lung diseases, particularly silicosis, noise induced hearing loss ("NIHL") and heat related illnesses at our South African operations are addressed through a pro‐active, risk‐based approach. In PNG, NIHL is a significant focus area although there have been no recorded cases.
Non‐occupational diseases like HIV/AIDS, tuberculosis and other chronic illnesses continue to receive full attention through all ongoing initiatives at our healthcare hubs.
Over 90% of our employees volunteered to be vaccinated for Covid‐19 and we continue to monitor the situation closely. More information on employee health and wellness can be found at www.harmony.co.za and in our ESG report.
ENVIRONMENT
As a company, we believe the responsible management of natural resources and ecosystems is vital to ensure a sustainable future not only for Harmony, but also our host communities and future generations.
In alignment with the Science Based Targets initiative, we finalised new environmental targets to be implemented from FY23 to FY27.
Our baseline group environmental performance targets focus on our strategic imperatives and material risks, including energy, water, land and biodiversity. These targets have been set to ensure we achieve net zero emissions by 2045.
To further help us achieve our decarbonisation goals, the first of a three‐phased renewable (solar) energy project is progressing well and is expected to contribute 30MW into the energy supply by the end of Q4FY23.
More information on our environmental, energy and decarbonisation initiatives can be found at www.harmony.co.za and in our ESG and TCFD reports.
HIGH‐GRADE SA UNDERGROUND OPERATIONS
Moab Khotsong and Mponeng delivered 3 122kg (100 374oz) of gold this quarter, a 3% decline from the 3 224kg (103 654oz) produced in the previous quarter. Production from these two operations represented 27% of group production.
Mponeng recovered grades improved 4% to 7.29g/t from 7.04g/t while tonnes milled remained flat for the quarter. This resulted in a 3% increase in gold production to 1 634kg (52 534oz) from 1 584kg (50 927oz) while AISC also improved 4% to R883 709/kg from R921 520/kg.
At Moab Khotsong, safety‐related stoppages resulted in lower volumes and underground recovered grades. Yields decreased 2% to 6.23g/t from 6.36g/t, while gold production declined 9% to 1 488kg (47 840oz) from
1 640kg (52 727oz).
OPTIMISED SA UNDERGROUND OPERATIONS
The optimised SA operations comprise Tshepong North, Tshepong South, Doornkop, Joel, Target 1, Kusasalethu and Masimong. These mines ‐ contributed 5 345kg (171 845oz) this quarter compared to 5 419kg (174 225oz) in the previous quarter which included 317kg (10 192 oz) from Bambanani. Production from these optimised assets represented 47% of group production. AISC at the optimised assets improved 3%.
Underground recovered grade from Tshepong North improved by 12% to 4.25g/t from 3.80g/t. After the unbundling, higher grades were targeted and a more focussed approach was taken to mining. While the volumes were slightly lower, the mine is more profitable with AISC improving 15% to R897 520/kg from R1 052 814/kg.
At Tshepong South, tonnes milled increased 6% while underground recovered grade improved 11% to 6.57g/t from 5.94g/t. This resulted in a 17% increase in production to 973kg (31 283oz) from 832kg (26 749oz). AISC improved 13% to R779 756/kg from R895 193/kg in the previous quarter.
Doornkop underground recovered grades improved 42% to 5.07g/t from 3.58g/t and tonnes milled increased 5% to 228 000 tonnes. The increase in grade was due to a mill clean‐up at the plant this quarter. The release of inventory drove the 49% increase in gold production to 1 155kg (37 134oz) from 776kg (24 949oz) in the previous quarter. AISC at Doornkop improved 24% to R764 087/kg from R998 311/kg.
Joel had its second consecutive profitable quarter and is performing well. Tonnes milled increased 7% to 127 000 tonnes. Underground recovered grades were marginally lower at 4.13g/t from 4.19g/t due to waste dilution but gold production increased 5% to 525kg (16 879oz) from 499kg (16 043oz).
Target 1 production was down 13% to 326kg (10 481oz) from 376kg (12 089oz). Underground recovered grades declined 13% to 2.99g/t from 3.42g/t due to a pillar failure which restricted access to high‐grade ore and delayed the mining of high‐grade massives.
At Kusasalethu, tonnes milled increased 13% but underground recovered grades dropped by 29% from 7.73g/t to 5.49g/t as a result of increased off‐reef mining as we negotiated poor ground conditions. This resulted in low recovered grades from a very high‐grade area.
SA SURFACE OPERATIONS
Total gold production from the South African surface operations increased 5% to 1 917kg (61 634oz) from 1 835kg (58 996oz) in Q4FY22.
At Mine Waste Solutions, recovered grades improved 5% to 0.114g/t from 0.109g/t and volumes increased 15% to 6.3 million tonnes from 5.5 million tonnes. This resulted in a 19% increase in production to 711kg (22 859oz) from 600kg (19 290oz).
INTERNATIONAL ‐ HIDDEN VALLEY
Total production from the Hidden Valley operations declined 28% to 1 012kg (32 537oz) from 1 401kg (45 043oz). The decline in quarterly production was in line with plan and a result of lower grade material being processed while waste stripping takes place to open up the stage 7 orebody. Gold recovery grades therefore decreased 32% to 1.01g/t from 1.48g/t. The grade profile is expected to improve in the second half of the financial year.
Silver production decreased 6% to 19 955kg (641 579oz) from 21 307kg (685 022oz). Silver recovery grades decreased 12% to 19.87g/t from 22.58g/t.
Crushed material transported via the overland conveyor belt and tonnes milled continue to improve as a result of a dedicated improvement programme and coaching and development of key skills in our mining and fixed plant maintenance teams.
AISC
Group AISC for the reporting period increased by 5% to R907 864/kg (US$1 657/oz) from R865 523/kg (US$1 727/oz). The primary driver behind the increase this quarter was the higher Eskom winter electricity tariffs and increases in AISC at Hidden Valley, Kusasalethu and Target 1.
SA underground AISC improved by 3% to R895 447/kg (US$1 634/oz) from R918 639/kg (US$1 833/oz) in Q4FY22.
AISC at SA surface operations increased by 4% to R835 803/kg (US$1 526/oz) from R803 391/kg (US$1 603/oz) primarily as a result of higher costs at the waste rock dumps. This was driven by lower recovery grades and higher transportation costs as the higher grade dumps are being depleted. Waste rock dumps' AISC increased 21% to R1 047 900/kg from R864 730/kg.
International (Hidden Valley) AISC increased in line with plan by 81% to R1 153 145/kg (US$2 100/oz) from R636 155/kg (US$1 274/oz). This was a result of the waste stripping taking place and processing of lower grade stockpiles whilst the stage 7 orebody is opened up. In addition, the ongoing drought in PNG has necessitated on‐site diesel power generation, which has contributed an additional US$91/oz to our AISC for the quarter.
PROJECTS
Our pipeline of projects is aimed at delivering value realisation by lowering Harmony's overall risk profile and improving our margins. This includes the improvement in safety and responding to climate change through various energy saving initiatives. We are investing in those projects that will generate positive financial, social and environmental returns for many years to come.
In South Africa, the Zaaiplaats project at Moab Khotsong is progressing well and in execution. At Mine Waste Solutions, the environmental authorisation and the water use licence for the Kareerand tailings expansion have been received but we are still waiting for the approval of the licence to begin construction. The Target 1 optimisation project is expected to be completed in January 2023. The first phase of the 30MW solar renewable project is underway and is expected to be complete in FY23. The feasibility study for phase two (137MW) of our renewable projects is underway and is expected to be completed in early 2023.
In Papua New Guinea, Harmony and our joint venture partner Newcrest Mining Limited, continue to work with the PNG Government to progress permitting of the Wafi‐Golpu Project and obtain a Special Mining Lease. The Hidden Valley Mine extension project has commenced with the Tailings Storage Facility 2 ("TSF 2") regulatory approval obtained during the quarter. Detail design work on TSF 2 is underway.
Since the announcement of the acquisition of Eva Copper in Queensland, Australia on 6 October 2022, Harmony has begun engaging with project stakeholders in the Cloncurry, Mount Isa and broader North West communities as we take the project forward. We have begun a detailed review of the existing project feasibility study prepared by Copper Mountain. We expect to conclude the transaction in early 2023, subject to conditions precedent being fulfilled.
ANNUAL PRODUCTION, COST AND GRADE GUIDANCE
Production guidance for FY23 remains unchanged and is estimated to be between 1.4Moz and 1.5Moz at an AISC of under R900 000/kg.
Underground recovered grade is planned to be between 5.45g/t and 5.60g/t.
SAFETY
The safety of our people remains our top priority. Safety will always take precedence over production. Through our Thibakotsi (prevent harm) culture transformation programme and Harmony Risk Management framework, we continue to embed a proactive safety culture at all our operations. Our goal remains zero‐loss of life.
Q1FY23 marked the fourth consecutive quarter where the Lost Time Injury Frequency Rate ("LTIFR") was below six (5.68 per million hours worked) at our SA operations. Reportable injuries relating to fall of ground, rail bound equipment and winch injury frequency rate also improved for the quarter.
As part of our drive to emphasize the importance of safety, a comprehensive visible felt leadership initiative was conducted at all Harmony's operations on 8 September 2022. On 6 October 2022, Harmony again hosted a safety meeting made up of all the general managers and plant managers to continue driving the safety message.
We have made considerable progress to improve the overall safety at Harmony. We are therefore deeply saddened by the loss of the following colleagues:
‐ Mr Juliao Macamo from our Moab Khotsong operation who lost his life in a fall of ground incident on 13 August 2022
‐ Mr Ernesto Euseblo Macuacua from our Tshepong North operation who lost his life in a fall of ground incident on 7 November 2022
We extend our deepest condolences to the families and loved ones of our colleagues who lost their lives.
It is imperative that we continue to adhere to the various controls and continuously improve our systems, ensuring work places are safe at all times. We are working continuously to ensure a culture of safety throughout Harmony and we believe that zero‐loss of life is indeed possible.
Please see the Company's FY22 integrated annual report and website for more information on our safety initiatives: www.harmony.co.za.
HEALTH
Harmony remains dedicated to delivering best‐in‐class employee health and wellness. The company also extends its health drive to include mental health, ensuring that every employee can live a fulfilled and healthy life.
Occupational lung diseases, particularly silicosis, noise induced hearing loss ("NIHL") and heat related illnesses at our South African operations are addressed through a pro‐active, risk‐based approach. In PNG, NIHL is a significant focus area although there have been no recorded cases.
Non‐occupational diseases like HIV/AIDS, tuberculosis and other chronic illnesses continue to receive full attention through all ongoing initiatives at our healthcare hubs.
Over 90% of our employees volunteered to be vaccinated for Covid‐19 and we continue to monitor the situation closely. More information on employee health and wellness can be found at www.harmony.co.za and in our ESG report.
ENVIRONMENT
As a company, we believe the responsible management of natural resources and ecosystems is vital to ensure a sustainable future not only for Harmony, but also our host communities and future generations.
In alignment with the Science Based Targets initiative, we finalised new environmental targets to be implemented from FY23 to FY27.
Our baseline group environmental performance targets focus on our strategic imperatives and material risks, including energy, water, land and biodiversity. These targets have been set to ensure we achieve net zero emissions by 2045.
To further help us achieve our decarbonisation goals, the first of a three‐phased renewable (solar) energy project is progressing well and is expected to contribute 30MW into the energy supply by the end of Q4FY23.
More information on our environmental, energy and decarbonisation initiatives can be found at www.harmony.co.za and in our ESG and TCFD reports.
HIGH‐GRADE SA UNDERGROUND OPERATIONS
Moab Khotsong and Mponeng delivered 3 122kg (100 374oz) of gold this quarter, a 3% decline from the 3 224kg (103 654oz) produced in the previous quarter. Production from these two operations represented 27% of group production.
Mponeng recovered grades improved 4% to 7.29g/t from 7.04g/t while tonnes milled remained flat for the quarter. This resulted in a 3% increase
in gold production to 1 634kg (52 534oz) from 1 584kg (50 927oz) while AISC also improved 4% to R883 709/kg from R921 520/kg.
At Moab Khotsong, safety‐related stoppages resulted in lower volumes and underground recovered grades. Yields decreased 2% to 6.23g/t from 6.36g/t, while gold production declined 9% to 1 488kg (47 840oz) from 1 640kg (52 727oz).
OPTIMISED SA UNDERGROUND OPERATIONS
The optimised SA operations comprise Tshepong North, Tshepong South, Doornkop, Joel, Target 1, Kusasalethu and Masimong. These mines ‐ contributed 5 345kg (171 845oz) this quarter compared to 5 419kg (174 225oz) in the previous quarter which included 317kg (10 192 oz) from Bambanani. Production from these optimised assets represented 47% of group production. AISC at the optimised assets improved 3%.
Underground recovered grade from Tshepong North improved by 12% to 4.25g/t from 3.80g/t. After the unbundling, higher grades were targeted and a more focussed approach was taken to mining. While the volumes were slightly lower, the mine is more profitable with AISC improving 15% to R897 520/kg from R1 052 814/kg.
At Tshepong South, tonnes milled increased 6% while underground recovered grade improved 11% to 6.57g/t from 5.94g/t. This resulted in a 17% increase in production to 973kg (31 283oz) from 832kg (26 749oz). AISC improved 13% to R779 756/kg from R895 193/kg in the previous quarter.
Doornkop underground recovered grades improved 42% to 5.07g/t from 3.58g/t and tonnes milled increased 5% to 228 000 tonnes. The increase in grade was due to a mill clean‐up at the plant this quarter. The release of inventory drove the 49% increase in gold production to 1 155kg (37 134oz) from 776kg (24 949oz) in the previous quarter. AISC at Doornkop improved 24% to R764 087/kg from R998 311/kg.
Joel had its second consecutive profitable quarter and is performing well. Tonnes milled increased 7% to 127 000 tonnes. Underground recovered grades were marginally lower at 4.13g/t from 4.19g/t due to waste dilution but gold production increased 5% to 525kg (16 879oz) from 499kg (16 043oz).
Target 1 production was down 13% to 326kg (10 481oz) from 376kg (12 089oz). Underground recovered grades declined 13% to 2.99g/t from 3.42g/t due to a pillar failure which restricted access to high‐grade ore and delayed the mining of high‐grade massives.
At Kusasalethu, tonnes milled increased 13% but underground recovered grades dropped by 29% from 7.73g/t to 5.49g/t as a result of increased off‐reef mining as we negotiated poor ground conditions. This resulted in low recovered grades from a very high‐grade area.
SA SURFACE OPERATIONS
Total gold production from the South African surface operations increased 5% to 1 917kg (61 634oz) from 1 835kg (58 996oz) in Q4FY22.
At Mine Waste Solutions, recovered grades improved 5% to 0.114g/t from 0.109g/t and volumes increased 15% to 6.3 million tonnes from 5.5 million tonnes. This resulted in a 19% increase in production to 711kg (22 859oz) from 600kg (19 290oz).
INTERNATIONAL ‐ HIDDEN VALLEY
Total production from the Hidden Valley operations declined 28% to 1 012kg (32 537oz) from 1 401kg (45 043oz). The decline in quarterly production was in line with plan and a result of lower grade material being processed while waste stripping takes place to open up the stage 7 orebody. Gold recovery grades therefore decreased 32% to 1.01g/t from 1.48g/t. The grade profile is expected to improve in the second half of the financial year.
Silver production decreased 6% to 19 955kg (641 579oz) from 21 307kg (685 022oz). Silver recovery grades decreased 12% to 19.87g/t from 22.58g/t.
Crushed material transported via the overland conveyor belt and tonnes milled continue to improve as a result of a dedicated improvement programme and coaching and development of key skills in our mining and fixed plant maintenance teams.
AISC
Group AISC for the reporting period increased by 5% to R907 864/kg (US$1 657/oz) from R865 523/kg (US$1 727/oz). The primary driver behind the increase this quarter was the higher Eskom winter electricity tariffs and increases in AISC at Hidden Valley, Kusasalethu and Target 1.
SA underground AISC improved by 3% to R895 447/kg (US$1 634/oz) from R918 639/kg (US$1 833/oz) in Q4FY22.
AISC at SA surface operations increased by 4% to R835 803/kg (US$1 526/oz) from R803 391/kg (US$1 603/oz) primarily as a result of higher costs at the waste rock dumps. This was driven by lower recovery grades and higher transportation costs as the higher grade dumps are being depleted. Waste rock dumps' AISC increased 21% to R1 047 900/kg from R864 730/kg.
International (Hidden Valley) AISC increased in line with plan by 81% to R1 153 145/kg (US$2 100/oz) from R636 155/kg (US$1 274/oz). This was a result of the waste stripping taking place and processing of lower grade stockpiles whilst the stage 7 orebody is opened up. In addition, the ongoing drought in PNG has necessitated on‐site diesel power generation, which has contributed an additional US$91/oz to our AISC for the quarter.
PROJECTS
Our pipeline of projects is aimed at delivering value realisation by lowering Harmony's overall risk profile and improving our margins. This includes
the improvement in safety and responding to climate change through various energy saving initiatives. We are investing in those projects that will generate positive financial, social and environmental returns for many years to come.
In South Africa, the Zaaiplaats project at Moab Khotsong is progressing well and in execution. At Mine Waste Solutions, the environmental authorisation and the water use licence for the Kareerand tailings expansion have been received but we are still waiting for the approval of the licence to begin construction. The Target 1 optimisation project is expected to be completed in January 2023. The first phase of the 30MW solar renewable project is underway and is expected to be complete in FY23. The feasibility study for phase two (137MW) of our renewable projects is underway and is expected to be completed in early 2023.
In Papua New Guinea, Harmony and our joint venture partner Newcrest Mining Limited, continue to work with the PNG Government to progress permitting of the Wafi‐Golpu Project and obtain a Special Mining Lease. The Hidden Valley Mine extension project has commenced with the Tailings Storage Facility 2 ("TSF 2") regulatory approval obtained during the quarter. Detail design work on TSF 2 is underway.
Since the announcement of the acquisition of Eva Copper in Queensland, Australia on 6 October 2022, Harmony has begun engaging with project stakeholders in the Cloncurry, Mount Isa and broader North West communities as we take the project forward. We have begun a detailed review of the existing project feasibility study prepared by Copper Mountain. We expect to conclude the transaction in early 2023, subject to conditions precedent being fulfilled.
ANNUAL PRODUCTION, COST AND GRADE GUIDANCE
Production guidance for FY23 remains unchanged and is estimated to be between 1.4Moz and 1.5Moz at an AISC of under R900 000/kg. Underground recovered grade is planned to be between 5.45g/t and 5.60g/t.
HEDGING
Realised overall derivative gains for the quarter amounted to R236 million (US$13 million). The average forward Rand gold price on the hedge book has now increased to R1 036 000/kg as at 30 September 2022 from R1 016 000kg as at 30 June 2022.
HEDGE POSITION AS AT 30 SEPTEMBER 2022
| FY2023 | FY2024 | FY2025 | Total | |||||||||||||||||||||||||||||
| Q2 | Q3 | Q4 | Q1 | Q2 | Q3 | Q4 | Q1 | |||||||||||||||||||||||||
| Rand gold | ||||||||||||||||||||||||||||||||
| Forward contracts | koz | 72 | 72 | 70 | 44 | 32 | 16 | — | — | 306 | ||||||||||||||||||||||
| R’000/kg | 999 | 1 019 | 1 039 | 1 061 | 1 082 | 1 107 | — | — | 1 036 | |||||||||||||||||||||||
| Dollar gold | ||||||||||||||||||||||||||||||||
| Forward contracts | koz | 9 | 9 | 9 | 9 | 8 | 4 | — | — | 48 | ||||||||||||||||||||||
| $/oz | 1 867 | 1 826 | 1 836 | 1 860 | 1 926 | 2 009 | — | — | 1 874 | |||||||||||||||||||||||
| Total gold | koz | 81 | 81 | 79 | 53 | 40 | 20 | — | — | 354 | ||||||||||||||||||||||
| Currency hedges | ||||||||||||||||||||||||||||||||
| Rand dollar | ||||||||||||||||||||||||||||||||
| Zero cost collars | $m | 36 | 42 | 42 | 42 | 42 | 42 | 42 | 36 | 324 | ||||||||||||||||||||||
| Floor R/$ | 16.59 | 16.99 | 17.02 | 17.21 | 17.36 | 17.52 | 17.70 | 17.92 | 17.29 | |||||||||||||||||||||||
| Cap R/$ | 18.55 | 18.96 | 19.00 | 19.21 | 19.36 | 19.52 | 19.70 | 19.92 | 19.28 | |||||||||||||||||||||||
| Forward contracts | $m | 12 | 12 | 18 | 18 | 18 | 18 | 18 | — | 114 | ||||||||||||||||||||||
| R/$ | 17.95 | 17.95 | 17.99 | 18.17 | 18.31 | 18.49 | 18.68 | — | 18.25 | |||||||||||||||||||||||
| Total dollar | $m | 48 | 54 | 60 | 60 | 60 | 60 | 60 | 36 | 438 | ||||||||||||||||||||||
| Dollar silver | ||||||||||||||||||||||||||||||||
| Zero cost collars | koz | 270 | 210 | 105 | 30 | 30 | 20 | — | — | 665 | ||||||||||||||||||||||
| Floor $/oz | 25.97 | 25.62 | 25.49 | 25.14 | 25.41 | 25.68 | — | — | 25.71 | |||||||||||||||||||||||
| Cap $/oz | 29.00 | 28.81 | 28.58 | 28.14 | 28.41 | 28.68 | — | — | 28.80 | |||||||||||||||||||||||
OPERATING RESULTS – QUARTER ON QUARTER (RAND/METRIC)
Three months ended | SOUTH AFRICA | ||||||||||||||||||||||||||||||||||||||||
| UNDERGROUND PRODUCTION | |||||||||||||||||||||||||||||||||||||||||
Moab Khotsong | Mponeng | Tshepong North | Tshepong South | Doornkop | Joel | Target 1 | Kusasalethu | Masimong | Bambanani³ | TOTAL UNDER- GROUND | |||||||||||||||||||||||||||||||
Ore milled | t'000 | Sep-22 | 239 | 224 | 222 | 148 | 228 | 127 | 109 | 168 | 119 | — | 1 584 | ||||||||||||||||||||||||||||
| Jun-22 | 258 | 225 | 254 | 140 | 217 | 119 | 110 | 149 | 121 | 37 | 1 630 | ||||||||||||||||||||||||||||||
Yield | g/tonne | Sep-22 | 6.23 | 7.29 | 4.25 | 6.57 | 5.07 | 4.13 | 2.99 | 5.49 | 4.20 | — | 5.35 | ||||||||||||||||||||||||||||
| Jun-22 | 6.36 | 7.04 | 3.80 | 5.94 | 3.58 | 4.19 | 3.42 | 7.73 | 4.16 | 8.57 | 5.30 | ||||||||||||||||||||||||||||||
Gold produced | kg | Sep-22 | 1 488 | 1 634 | 944 | 973 | 1 155 | 525 | 326 | 922 | 500 | — | 8 467 | ||||||||||||||||||||||||||||
| Jun-22 | 1 640 | 1 584 | 964 | 832 | 776 | 499 | 376 | 1 152 | 503 | 317 | 8 643 | ||||||||||||||||||||||||||||||
Gold sold | kg | Sep-22 | 1 595 | 1 695 | 968 | 988 | 1 200 | 536 | 300 | 957 | 512 | 19 | 8 770 | ||||||||||||||||||||||||||||
| Jun-22 | 1 527 | 1 526 | 949 | 818 | 734 | 491 | 400 | 1 110 | 495 | 312 | 8 362 | ||||||||||||||||||||||||||||||
Gold price received | R/kg | Sep-22 | 966 735 | 958 899 | 969 247 | 968 917 | 968 493 | 969 448 | 974 730 | 968 215 | 969 115 | 962 579 | 966 715 | ||||||||||||||||||||||||||||
| Jun-22 | 961 149 | 966 650 | 957 584 | 957 918 | 961 143 | 956 782 | 956 400 | 955 908 | 956 913 | 957 974 | 959 883 | ||||||||||||||||||||||||||||||
Gold revenue¹ | R'000 | Sep-22 | 1 541 942 | 1 625 333 | 938 231 | 957 290 | 1 162 192 | 519 624 | 292 419 | 926 582 | 496 187 | 18 289 | 8 478 089 | ||||||||||||||||||||||||||||
| Jun-22 | 1 467 675 | 1 475 108 | 908 747 | 783 577 | 705 479 | 469 780 | 382 560 | 1 061 058 | 473 672 | 298 888 | 8 026 544 | ||||||||||||||||||||||||||||||
| Cash operating cost (net of by-product credits) | R'000 | Sep-22 | 1 091 482 | 1 244 224 | 698 963 | 637 590 | 732 877 | 398 353 | 509 551 | 864 642 | 426 594 | — | 6 604 276 | ||||||||||||||||||||||||||||
| Jun-22 | 1 034 625 | 1 218 351 | 741 500 | 574 713 | 684 993 | 359 065 | 457 613 | 798 216 | 389 384 | 265 787 | 6 524 247 | ||||||||||||||||||||||||||||||
Inventory movement | R'000 | Sep-22 | 29 459 | 33 765 | 14 188 | 6 585 | 47 320 | 6 024 | (27 886) | 35 694 | 7 125 | 15 728 | 168 002 | ||||||||||||||||||||||||||||
| Jun-22 | (26 264) | (48 225) | (13 983) | (12 057) | (90 305) | (11 240) | 22 858 | (26 596) | (5 200) | (4 264) | (215 276) | ||||||||||||||||||||||||||||||
Operating costs | R'000 | Sep-22 | 1 120 941 | 1 277 989 | 713 151 | 644 175 | 780 197 | 404 377 | 481 665 | 900 336 | 433 719 | 15 728 | 6 772 278 | ||||||||||||||||||||||||||||
| Jun-22 | 1 008 361 | 1 170 126 | 727 517 | 562 656 | 594 688 | 347 825 | 480 471 | 771 620 | 384 184 | 261 523 | 6 308 971 | ||||||||||||||||||||||||||||||
Production profit | R'000 | Sep-22 | 421 001 | 347 344 | 225 080 | 313 115 | 381 995 | 115 247 | (189 246) | 26 246 | 62 468 | 2 561 | 1 705 811 | ||||||||||||||||||||||||||||
| Jun-22 | 459 314 | 304 982 | 181 230 | 220 921 | 110 791 | 121 955 | (97 911) | 289 438 | 89 488 | 37 365 | 1 717 573 | ||||||||||||||||||||||||||||||
Capital expenditure | R'000 | Sep-22 | 256 352 | 167 670 | 132 981 | 111 886 | 180 343 | 64 198 | 106 194 | 50 302 | 3 557 | — | 1 073 483 | ||||||||||||||||||||||||||||
| Jun-22 | 300 546 | 176 509 | 287 469 | 136 037 | 162 511 | 78 749 | 108 393 | 61 857 | 11 912 | — | 1 323 983 | ||||||||||||||||||||||||||||||
Cash operating costs | R/kg | Sep-22 | 733 523 | 761 459 | 740 427 | 655 283 | 634 526 | 758 768 | 1 563 040 | 937 790 | 853 188 | — | 780 002 | ||||||||||||||||||||||||||||
| Jun-22 | 630 869 | 769 161 | 769 191 | 690 761 | 882 723 | 719 569 | 1 217 056 | 692 896 | 774 123 | 838 445 | 754 859 | ||||||||||||||||||||||||||||||
Cash operating costs | R/tonne | Sep-22 | 4 567 | 5 555 | 3 148 | 4 308 | 3 214 | 3 137 | 4 675 | 5 147 | 3 585 | — | 4 169 | ||||||||||||||||||||||||||||
| Jun-22 | 4 010 | 5 415 | 2 919 | 4 105 | 3 157 | 3 017 | 4 160 | 5 357 | 3 218 | 7 183 | 4 003 | ||||||||||||||||||||||||||||||
| Cash operating cost and Capital | R/kg | Sep-22 | 905 802 | 864 072 | 881 297 | 770 273 | 790 667 | 881 050 | 1 888 788 | 992 347 | 860 302 | — | 906 786 | ||||||||||||||||||||||||||||
| Jun-22 | 814 129 | 880 593 | 1 067 395 | 854 267 | 1 092 144 | 877 383 | 1 505 335 | 746 591 | 797 805 | 838 445 | 908 045 | ||||||||||||||||||||||||||||||
All-in sustaining cost | R/kg | Sep-22 | 805 284 | 883 709 | 897 520 | 779 756 | 764 087 | 871 350 | 1 948 919 | 1 022 713 | 914 971 | 827 789 | 895 447 | ||||||||||||||||||||||||||||
| Jun-22 | 808 618 | 921 520 | 1 052 814 | 895 193 | 998 311 | 843 454 | 1 516 214 | 782 136 | 831 207 | 885 487 | 918 639 | ||||||||||||||||||||||||||||||
| Operating free cash flow margin² | % | Sep-22 | 13% | 13% | 11% | 22% | 21% | 11% | (111)% | 1% | 13% | 100% | 9% | ||||||||||||||||||||||||||||
| Jun-22 | 9% | 5% | (13)% | 9% | (20)% | 7% | (48)% | 19% | 15% | 11% | 2% | ||||||||||||||||||||||||||||||
OPERATING RESULTS – QUARTER ON QUARTER (RAND/METRIC) continued
Three months ended | SOUTH AFRICA | Hidden Valley | TOTAL HARMONY | |||||||||||||||||||||||||||||||||||
| SURFACE PRODUCTION | TOTAL SOUTH AFRICA | |||||||||||||||||||||||||||||||||||||
| Mine Waste Solutions | Phoenix | Central Plant Reclamation | Savuka Tailings | Dumps | Kalgold | TOTAL SURFACE | ||||||||||||||||||||||||||||||||
Ore milled | t'000 | Sep-22 | 6 263 | 1 607 | 1 006 | 987 | 1 133 | 332 | 11 328 | 12 912 | 1 004 | 13 916 | ||||||||||||||||||||||||||
| Jun-22 | 5 519 | 1 567 | 1 013 | 969 | 1 298 | 348 | 10 714 | 12 344 | 944 | 13 288 | ||||||||||||||||||||||||||||
Yield | g/tonne | Sep-22 | 0.114 | 0.123 | 0.143 | 0.146 | 0.380 | 0.87 | 0.17 | 0.80 | 1.01 | 0.82 | ||||||||||||||||||||||||||
| Jun-22 | 0.109 | 0.128 | 0.157 | 0.152 | 0.353 | 0.78 | 0.17 | 0.85 | 1.48 | 0.89 | ||||||||||||||||||||||||||||
Gold produced | kg | Sep-22 | 711 | 198 | 144 | 144 | 431 | 289 | 1 917 | 10 384 | 1 012 | 11 396 | ||||||||||||||||||||||||||
| Jun-22 | 600 | 200 | 159 | 147 | 458 | 271 | 1 835 | 10 478 | 1 401 | 11 879 | ||||||||||||||||||||||||||||
Gold sold | kg | Sep-22 | 694 | 201 | 137 | 135 | 410 | 285 | 1 862 | 10 632 | 1 031 | 11 663 | ||||||||||||||||||||||||||
| Jun-22 | 602 | 205 | 173 | 139 | 462 | 269 | 1 850 | 10 212 | 1 404 | 11 616 | ||||||||||||||||||||||||||||
Gold price received | R/kg | Sep-22 | 781 914 | 945 244 | 968 467 | 957 578 | 963 634 | 971 063 | 894 972 | 954 150 | 962 808 | 954 916 | ||||||||||||||||||||||||||
| Jun-22 | 774 437 | 940 727 | 960 150 | 969 511 | 957 013 | 959 959 | 897 458 | 948 574 | 916 284 | 944 671 | ||||||||||||||||||||||||||||
Gold revenue¹ | R'000 | Sep-22 | 631 946 | 189 994 | 132 680 | 129 273 | 395 090 | 276 753 | 1 755 736 | 10 233 825 | 992 655 | 11 226 480 | ||||||||||||||||||||||||||
| Jun-22 | 566 282 | 192 849 | 166 106 | 134 762 | 442 140 | 258 229 | 1 760 368 | 9 786 912 | 1 286 463 | 11 073 375 | ||||||||||||||||||||||||||||
| Cash operating cost (net of by-product credits) | R'000 | Sep-22 | 483 203 | 129 704 | 85 888 | 83 698 | 449 510 | 219 208 | 1 451 211 | 8 055 487 | 579 563 | 8 635 050 | ||||||||||||||||||||||||||
| Jun-22 | 399 720 | 112 492 | 74 515 | 71 309 | 397 088 | 207 466 | 1 262 590 | 7 786 837 | 673 857 | 8 460 694 | ||||||||||||||||||||||||||||
Inventory movement | R'000 | Sep-22 | (17 338) | (149) | (5 590) | (6 287) | (20 457) | (6 324) | (56 145) | 111 857 | 37 245 | 149 102 | ||||||||||||||||||||||||||
| Jun-22 | 12 622 | 3 465 | 6 198 | (3 890) | 2 275 | 2 275 | 22 945 | (192 331) | (22 831) | (215 162) | ||||||||||||||||||||||||||||
Operating costs | R'000 | Sep-22 | 465 865 | 129 555 | 80 298 | 77 411 | 429 053 | 212 884 | 1 395 066 | 8 167 344 | 616 808 | 8 784 152 | ||||||||||||||||||||||||||
| Jun-22 | 412 342 | 115 957 | 80 713 | 67 419 | 399 363 | 209 741 | 1 285 535 | 7 594 506 | 651 026 | 8 245 532 | ||||||||||||||||||||||||||||
Production profit | R'000 | Sep-22 | 166 081 | 60 439 | 52 382 | 51 862 | (33 963) | 63 869 | 360 670 | 2 066 481 | 375 847 | 2 442 328 | ||||||||||||||||||||||||||
| Jun-22 | 153 940 | 76 892 | 85 393 | 67 343 | 42 777 | 48 488 | 474 833 | 2 192 406 | 635 437 | 2 827 843 | ||||||||||||||||||||||||||||
Capital expenditure | R'000 | Sep-22 | 147 053 | 12 400 | 151 | 5 156 | 586 | 79 339 | 244 685 | 1 318 168 | 438 464 | 1 756 632 | ||||||||||||||||||||||||||
| Jun-22 | 139 479 | 15 282 | 5 661 | 7 495 | 3 997 | 83 937 | 255 851 | 1 579 834 | 144 979 | 1 724 813 | ||||||||||||||||||||||||||||
Cash operating costs | R/kg | Sep-22 | 679 610 | 655 071 | 596 444 | 581 236 | 1 042 947 | 758 505 | 757 022 | 775 760 | 572 691 | 757 726 | ||||||||||||||||||||||||||
| Jun-22 | 666 200 | 562 460 | 468 648 | 485 095 | 867 004 | 765 557 | 688 060 | 743 161 | 480 983 | 712 240 | ||||||||||||||||||||||||||||
Cash operating costs | R/tonne | Sep-22 | 77 | 81 | 85 | 85 | 397 | 660 | 128 | 624 | 577 | 621 | ||||||||||||||||||||||||||
| Jun-22 | 72 | 72 | 74 | 74 | 306 | 596 | 118 | 631 | 714 | 637 | ||||||||||||||||||||||||||||
| Cash operating cost and Capital | R/kg | Sep-22 | 886 436 | 717 697 | 597 493 | 617 042 | 1 044 306 | 1 033 035 | 884 661 | 902 702 | 1 005 956 | 911 871 | ||||||||||||||||||||||||||
| Jun-22 | 898 665 | 638 870 | 504 252 | 536 082 | 875 731 | 1 075 288 | 827 488 | 893 937 | 584 465 | 857 438 | ||||||||||||||||||||||||||||
All-in sustaining cost | R/kg | Sep-22 | 747 860 | 706 585 | 592 141 | 611 607 | 1 047 900 | 1 059 292 | 835 803 | 884 087 | 1 153 145 | 907 864 | ||||||||||||||||||||||||||
| Jun-22 | 802 182 | 641 194 | 503 641 | 484 457 | 864 730 | 1 139 450 | 803 391 | 897 054 | 636 155 | 865 523 | ||||||||||||||||||||||||||||
| Operating free cash flow margin² | % | Sep-22 | (16)% | 25% | 35% | 31% | (14)% | (6)% | (1)% | 8% | 8% | 8% | ||||||||||||||||||||||||||
| Jun-22 | (16)% | 34% | 52% | 42% | 9% | (13)% | 8% | 3% | 32% | 7% | ||||||||||||||||||||||||||||
¹Includes a non-cash consideration to Franco-Nevada (Sep-22: R89.298m, Jun-22: R100.071m) under Mine Waste Solutions, excluded from the gold price calculation.
²Excludes run of mine costs for Kalgold (Sep-22: R4.632m, Jun-22: -R0.774m) and Hidden Valley (Sep-22: R107.114m, Jun-22: -R56.240m).
³Bambanani operation closed in June 2022.
OPERATING RESULTS – QUARTER ON QUARTER (US$/IMPERIAL)
Three months ended | SOUTH AFRICA | ||||||||||||||||||||||||||||||||||||||||
| UNDERGROUND PRODUCTION | |||||||||||||||||||||||||||||||||||||||||
Moab Khotsong | Mponeng | Tshepong North | Tshepong South | Doornkop | Joel | Target 1 | Kusasalethu | Masimong | Bambanani³ | TOTAL UNDER- GROUND | |||||||||||||||||||||||||||||||
Ore milled | t'000 | Sep-22 | 264 | 247 | 245 | 163 | 251 | 140 | 120 | 185 | 131 | — | 1 746 | ||||||||||||||||||||||||||||
| Jun-22 | 285 | 248 | 280 | 154 | 239 | 131 | 121 | 164 | 133 | 41 | 1 796 | ||||||||||||||||||||||||||||||
Yield | oz/ton | Sep-22 | 0.181 | 0.213 | 0.124 | 0.192 | 0.148 | 0.121 | 0.087 | 0.160 | 0.123 | — | 0.156 | ||||||||||||||||||||||||||||
| Jun-22 | 0.185 | 0.205 | 0.111 | 0.174 | 0.104 | 0.122 | 0.100 | 0.226 | 0.122 | 0.249 | 0.155 | ||||||||||||||||||||||||||||||
Gold produced | oz | Sep-22 | 47 840 | 52 534 | 30 350 | 31 283 | 37 134 | 16 879 | 10 481 | 29 643 | 16 075 | — | 272 219 | ||||||||||||||||||||||||||||
| Jun-22 | 52 727 | 50 927 | 30 994 | 26 749 | 24 949 | 16 043 | 12 089 | 37 038 | 16 172 | 10 192 | 277 880 | ||||||||||||||||||||||||||||||
Gold sold | oz | Sep-22 | 51 280 | 54 495 | 31 122 | 31 765 | 38 581 | 17 233 | 9 645 | 30 768 | 16 461 | 611 | 281 961 | ||||||||||||||||||||||||||||
| Jun-22 | 49 094 | 49 062 | 30 511 | 26 299 | 23 599 | 15 786 | 12 860 | 35 687 | 15 915 | 10 031 | 268 844 | ||||||||||||||||||||||||||||||
Gold price received | $/oz | Sep-22 | 1 765 | 1 750 | 1 769 | 1 769 | 1 768 | 1 769 | 1 779 | 1 767 | 1 769 | 1 756 | 1 764 | ||||||||||||||||||||||||||||
| Jun-22 | 1 918 | 1 929 | 1 911 | 1 912 | 1 918 | 1 910 | 1 909 | 1 908 | 1 910 | 1 912 | 1 916 | ||||||||||||||||||||||||||||||
Gold revenue¹ | $'000 | Sep-22 | 90 486 | 95 379 | 55 058 | 56 177 | 68 201 | 30 493 | 17 160 | 54 375 | 29 118 | 1 073 | 497 520 | ||||||||||||||||||||||||||||
| Jun-22 | 94 179 | 94 656 | 58 313 | 50 281 | 45 270 | 30 145 | 24 548 | 68 087 | 30 395 | 19 179 | 515 053 | ||||||||||||||||||||||||||||||
| Cash operating cost (net of by-product credits) | $'000 | Sep-22 | 64 051 | 73 015 | 41 018 | 37 416 | 43 007 | 23 377 | 29 902 | 50 740 | 25 034 | — | 387 560 | ||||||||||||||||||||||||||||
| Jun-22 | 66 390 | 78 181 | 47 581 | 36 879 | 43 955 | 23 041 | 29 365 | 51 220 | 24 986 | 17 055 | 418 653 | ||||||||||||||||||||||||||||||
Inventory movement | $'000 | Sep-22 | 1 729 | 1 981 | 833 | 386 | 2 777 | 354 | (1 636) | 2 095 | 418 | 923 | 9 860 | ||||||||||||||||||||||||||||
| Jun-22 | (1 685) | (3 095) | (897) | (774) | (5 795) | (721) | 1 467 | (1 707) | (334) | (274) | (13 815) | ||||||||||||||||||||||||||||||
Operating costs | $'000 | Sep-22 | 65 780 | 74 996 | 41 851 | 37 802 | 45 784 | 23 731 | 28 266 | 52 835 | 25 452 | 923 | 397 420 | ||||||||||||||||||||||||||||
| Jun-22 | 64 705 | 75 086 | 46 684 | 36 105 | 38 160 | 22 320 | 30 832 | 49 513 | 24 652 | 16 781 | 404 838 | ||||||||||||||||||||||||||||||
Production profit | $'000 | Sep-22 | 24 706 | 20 383 | 13 207 | 18 375 | 22 417 | 6 762 | (11 106) | 1 540 | 3 666 | 150 | 100 100 | ||||||||||||||||||||||||||||
| Jun-22 | 29 474 | 19 570 | 11 629 | 14 176 | 7 110 | 7 825 | (6 284) | 18 574 | 5 743 | 2 398 | 110 215 | ||||||||||||||||||||||||||||||
Capital expenditure | $'000 | Sep-22 | 15 044 | 9 840 | 7 804 | 6 566 | 10 583 | 3 768 | 6 231 | 2 952 | 209 | — | 62 997 | ||||||||||||||||||||||||||||
| Jun-22 | 19 287 | 11 326 | 18 449 | 8 728 | 10 429 | 5 055 | 6 956 | 3 969 | 765 | — | 84 964 | ||||||||||||||||||||||||||||||
Cash operating costs | $/oz | Sep-22 | 1 339 | 1 390 | 1 351 | 1 196 | 1 158 | 1 385 | 2 853 | 1 712 | 1 557 | — | 1 424 | ||||||||||||||||||||||||||||
| Jun-22 | 1 259 | 1 535 | 1 535 | 1 379 | 1 762 | 1 436 | 2 429 | 1 383 | 1 545 | 1 673 | 1 507 | ||||||||||||||||||||||||||||||
Cash operating costs | $/t | Sep-22 | 243 | 296 | 167 | 230 | 171 | 167 | 249 | 274 | 191 | — | 222 | ||||||||||||||||||||||||||||
| Jun-22 | 233 | 315 | 170 | 239 | 184 | 176 | 243 | 312 | 188 | 416 | 233 | ||||||||||||||||||||||||||||||
| Cash operating cost and Capital | $/oz | Sep-22 | 1 653 | 1 577 | 1 609 | 1 406 | 1 443 | 1 608 | 3 447 | 1 811 | 1 570 | — | 1 655 | ||||||||||||||||||||||||||||
| Jun-22 | 1 625 | 1 758 | 2 130 | 1 705 | 2 180 | 1 751 | 3 004 | 1 490 | 1 592 | 1 673 | 1 812 | ||||||||||||||||||||||||||||||
All-in sustaining cost | $/oz | Sep-22 | 1 470 | 1 613 | 1 638 | 1 423 | 1 395 | 1 590 | 3 557 | 1 867 | 1 670 | 1 511 | 1 634 | ||||||||||||||||||||||||||||
| Jun-22 | 1 614 | 1 839 | 2 101 | 1 787 | 1 992 | 1 683 | 3 026 | 1 561 | 1 659 | 1 767 | 1 833 | ||||||||||||||||||||||||||||||
| Operating free cash flow margin² | % | Sep-22 | 13% | 13% | 11% | 22% | 21% | 11% | (111)% | 1% | 13% | 100% | 9% | ||||||||||||||||||||||||||||
| Jun-22 | 9% | 5% | (13)% | 9% | (20)% | 7% | (48)% | 19% | 15% | 11% | 2% | ||||||||||||||||||||||||||||||
OPERATING RESULTS – QUARTER ON QUARTER (US$/IMPERIAL) continued
Three months ended | SOUTH AFRICA | Hidden Valley | TOTAL HARMONY | |||||||||||||||||||||||||||||||||||
| SURFACE PRODUCTION | TOTAL SOUTH AFRICA | |||||||||||||||||||||||||||||||||||||
| Mine Waste Solutions | Phoenix | Central Plant Reclamation | Savuka Tailings | Dumps | Kalgold | TOTAL SURFACE | ||||||||||||||||||||||||||||||||
Ore milled | t'000 | Sep-22 | 6 906 | 1 772 | 1 109 | 1 088 | 1 249 | 366 | 12 490 | 14 236 | 1 107 | 15 343 | ||||||||||||||||||||||||||
| Jun-22 | 6 086 | 1 728 | 1 117 | 1 069 | 1 431 | 384 | 11 815 | 13 611 | 1 041 | 14 652 | ||||||||||||||||||||||||||||
Yield | oz/ton | Sep-22 | 0.003 | 0.004 | 0.004 | 0.004 | 0.011 | 0.025 | 0.005 | 0.023 | 0.029 | 0.024 | ||||||||||||||||||||||||||
| Jun-22 | 0.003 | 0.004 | 0.005 | 0.004 | 0.010 | 0.023 | 0.005 | 0.025 | 0.043 | 0.026 | ||||||||||||||||||||||||||||
Gold produced | oz | Sep-22 | 22 859 | 6 366 | 4 630 | 4 630 | 13 857 | 9 292 | 61 634 | 333 853 | 32 537 | 366 390 | ||||||||||||||||||||||||||
| Jun-22 | 19 290 | 6 430 | 5 112 | 4 726 | 14 725 | 8 713 | 58 996 | 336 876 | 45 043 | 381 919 | ||||||||||||||||||||||||||||
Gold sold | oz | Sep-22 | 22 313 | 6 462 | 4 405 | 4 340 | 13 182 | 9 163 | 59 865 | 341 826 | 33 147 | 374 973 | ||||||||||||||||||||||||||
| Jun-22 | 19 355 | 6 591 | 5 562 | 4 469 | 14 854 | 8 649 | 59 480 | 328 324 | 45 140 | 373 464 | ||||||||||||||||||||||||||||
Gold price received | $/oz | Sep-22 | 1 427 | 1 725 | 1 768 | 1 748 | 1 759 | 1 772 | 1 634 | 1 742 | 1 757 | 1 743 | ||||||||||||||||||||||||||
| Jun-22 | 1 546 | 1 878 | 1 916 | 1 935 | 1 910 | 1 916 | 1 791 | 1 893 | 1 829 | 1 885 | ||||||||||||||||||||||||||||
Gold revenue¹ | $'000 | Sep-22 | 37 084 | 11 149 | 7 786 | 7 586 | 23 185 | 16 241 | 103 031 | 600 551 | 58 252 | 658 803 | ||||||||||||||||||||||||||
| Jun-22 | 36 337 | 12 375 | 10 659 | 8 648 | 28 371 | 16 570 | 112 960 | 628 013 | 82 551 | 710 564 | ||||||||||||||||||||||||||||
| Cash operating cost (net of by-product credits) | $'000 | Sep-22 | 28 356 | 7 611 | 5 040 | 4 912 | 26 379 | 12 864 | 85 162 | 472 722 | 34 011 | 506 733 | ||||||||||||||||||||||||||
| Jun-22 | 25 650 | 7 218 | 4 782 | 4 575 | 25 481 | 13 313 | 81 019 | 499 672 | 43 241 | 542 913 | ||||||||||||||||||||||||||||
Inventory movement | $'000 | Sep-22 | (1 017) | (9) | (328) | (369) | (1 200) | (371) | (3 294) | 6 566 | 2 186 | 8 752 | ||||||||||||||||||||||||||
| Jun-22 | 810 | 222 | 398 | (250) | 146 | 146 | 1 472 | (12 343) | (1 465) | (13 808) | ||||||||||||||||||||||||||||
Operating costs | $'000 | Sep-22 | 27 339 | 7 602 | 4 712 | 4 543 | 25 179 | 12 493 | 81 868 | 479 288 | 36 197 | 515 485 | ||||||||||||||||||||||||||
| Jun-22 | 26 460 | 7 440 | 5 180 | 4 325 | 25 627 | 13 459 | 82 491 | 487 329 | 41 776 | 529 105 | ||||||||||||||||||||||||||||
Production profit | $'000 | Sep-22 | 9 745 | 3 547 | 3 074 | 3 043 | (1 994) | 3 748 | 21 163 | 121 263 | 22 055 | 143 318 | ||||||||||||||||||||||||||
| Jun-22 | 9 877 | 4 935 | 5 479 | 4 323 | 2 744 | 3 111 | 30 469 | 140 684 | 40 775 | 181 459 | ||||||||||||||||||||||||||||
Capital expenditure | $'000 | Sep-22 | 8 630 | 727 | 9 | 303 | 34 | 4 656 | 14 359 | 77 356 | 25 731 | 103 087 | ||||||||||||||||||||||||||
| Jun-22 | 8 950 | 981 | 364 | 481 | 257 | 5 386 | 16 419 | 101 383 | 9 303 | 110 686 | ||||||||||||||||||||||||||||
Cash operating costs | $/oz | Sep-22 | 1 240 | 1 196 | 1 089 | 1 061 | 1 904 | 1 384 | 1 382 | 1 416 | 1 045 | 1 383 | ||||||||||||||||||||||||||
| Jun-22 | 1 330 | 1 123 | 935 | 968 | 1 730 | 1 528 | 1 373 | 1 483 | 960 | 1 422 | ||||||||||||||||||||||||||||
Cash operating costs | $/t | Sep-22 | 4 | 4 | 5 | 5 | 21 | 35 | 7 | 33 | 31 | 33 | ||||||||||||||||||||||||||
| Jun-22 | 4 | 4 | 4 | 4 | 18 | 35 | 7 | 37 | 42 | 37 | ||||||||||||||||||||||||||||
| Cash operating cost and Capital | $/oz | Sep-22 | 1 618 | 1 310 | 1 090 | 1 126 | 1 906 | 1 885 | 1 615 | 1 648 | 1 836 | 1 664 | ||||||||||||||||||||||||||
| Jun-22 | 1 794 | 1 275 | 1 007 | 1 070 | 1 748 | 2 146 | 1 652 | 1 784 | 1 167 | 1 711 | ||||||||||||||||||||||||||||
All-in sustaining cost | $/oz | Sep-22 | 1 365 | 1 290 | 1 081 | 1 116 | 1 913 | 1 933 | 1 526 | 1 614 | 2 100 | 1 657 | ||||||||||||||||||||||||||
| Jun-22 | 1 601 | 1 280 | 1 005 | 967 | 1 726 | 2 274 | 1 603 | 1 790 | 1 274 | 1 727 | ||||||||||||||||||||||||||||
| Operating free cash flow margin² | % | Sep-22 | (16)% | 25% | 35% | 31% | (14)% | (6)% | (1)% | 8% | 8% | 8% | ||||||||||||||||||||||||||
| Jun-22 | (16)% | 34% | 52% | 42% | 9% | (13)% | 8% | 3% | 32% | 7% | ||||||||||||||||||||||||||||
¹Includes a non-cash consideration to Franco-Nevada (Sep-22: R5.240m, Jun-22: R6.421m) under Mine Waste Solutions, excluded from the gold price calculation. ²Excludes run of mine costs for Kalgold (Sep-22: US$0.272m, Jun-22: US$0.050m) and Hidden Valley (Sep-22: US$6.286m, Jun-22: -US$3.609m).
³Bambanani operation closed in June 2022.
DIRECTORATE AND ADMINISTRATION HARMONY GOLD MINING COMPANY LIMITED
Harmony Gold Mining Company Limited was incorporated and registered as a public company in South Africa on 25 August 1950
Registration number: 1950/038232/06
CORPORATE OFFICE
Randfontein Office Park
PO Box 2, Randfontein, 1760, South Africa Corner Main Reef Road and Ward Avenue Randfontein, 1759, South Africa Telephone: +27 11 411 2000
Website: www.harmony.co.za
DIRECTORS
Dr PT Motsepe* (chairman), KT Nondumo*^ (deputy chairman), M Msimang*^ (lead independent director), PW Steenkamp (chief executive officer), BP Lekubo (financial director), HE Mashego (executive director) JA Chissano*^#, B Nqwababa*^, VP Pillay*^, MJL Prinsloo*^, GR Sibiya*^, PL Turner*^,
JL Wetton*^, AJ Wilkens*
* Non‐executive
^ Independent
# Mozambican
COMPANY SECRETARY
SS Mohatla
E‐mail queries: companysecretariat@harmony.co.za Telephone: +27 11 411 2359
INVESTOR RELATIONS
E‐mail: HarmonyIR@harmony.co.za
Telephone: +27 11 411 6073 or +27 82 746 4120
TRANSFER SECRETARIES
JSE Investor Services (Proprietary) Limited
(Registration number 2000/007239/07)
19 Ameshoff Street, 13th Floor, Hollard House, Braamfontein
PO Box 4844, Johannesburg, 2000, South Africa
Telephone: +27 86 154 6572
E‐mail: info@jseinvestorservices.co.za
Fax: +27 86 674 4381
AMERICAN DEPOSITARY RECEIPTS DEPOSITARY
Deutsche Bank Trust Company Americas c/o American Stock Transfer and Trust Company
Operations Centre, 6201 15th Avenue, Brooklyn, NY 11219, United States
E‐mail queries: db@astfinancial.com
Toll free (within the US): +1 886 249 2593
Int: +1 718 921 8137
Fax: +1 718 921 8334
SPONSOR
JP Morgan Equities South Africa Proprietary Limited
1 Fricker Road, corner Hurlingham Road, Illovo, Johannesburg, 2196
Private Bag X9936, Sandton, 2146 Telephone: +27 11 507 0300
Fax: +27 11 507 0503
TRADING SYMBOLS
ISIN: ZAE 000015228
HARMONY'S ANNUAL REPORTS
Harmony's Integrated Annual Report, and its annual report filed on a Form 20F with the United States' Securities and Exchange Commission for the financial year ended 30 June 2022, are available on our website (www.harmony.co.za/invest).
FORWARD‐LOOKING STATEMENTS
This booklet contains forward‐looking statements within the meaning of the safe harbour provided by Section 21E of the Exchange Act and Section 27A of the Securities Act of 1933, as amended (the “Securities Act”), with respect to our financial condition, results of operations, business strategies, operating efficiencies, competitive positions, growth opportunities for existing services, plans and objectives of management, markets for stock and other matters.
These forward‐looking statements, including, among others, those relating to our future business prospects, revenues, and the potential benefit of acquisitions (including statements regarding growth and cost savings) wherever they may occur in this booklet, and including any climate change‐related statements, targets and metrics, are necessarily estimates reflecting the best judgement of our senior management and involve a number of risks and uncertainties that could cause actual
results to differ materially from those suggested by the forward‐looking statements. As a consequence, these forward‐ looking statements should be considered in light of various important factors, including those set forth in our integrated annual report.
Important factors that could cause actual results to differ materially from estimates or projections contained in the forward‐looking statements include, without limitation: overall economic and business conditions in South Africa, Papua New Guinea, Australia and elsewhere; the impact from, and measures taken to address, Covid‐19 and other contagious diseases, such as HIV and tuberculosis; rising inflation, supply chain issues, volatile commodity costs and other inflationary pressures exacerbated by the Russian invasion of Ukraine and subsequent sanctions; estimates of future earnings, and the sensitivity of earnings to gold and other metals prices; estimates of future gold and other metals production and sales; estimates of future cash costs; estimates of future cash flows, and the sensitivity of cash flows to gold and other metals prices;
estimates of provision for silicosis settlement; increasing regulation of environmental and sustainability matters such as greenhouse gas emission and climate change, and the impact of climate change on our operations; estimates of future tax liabilities under the Carbon Tax Act; statements regarding future debt repayments; estimates of future capital expenditures; the success of our business strategy, exploration and development activities and other initiatives; future financial position, plans, strategies, objectives, capital expenditures, projected costs and anticipated cost savings and financing plans; estimates of reserves statements regarding future exploration results and the replacement of reserves; the ability to achieve anticipated efficiencies and other cost savings in connection with past and future acquisitions, as well as at existing operations; fluctuations in the market price of gold; the occurrence of hazards associated with underground and surface gold mining; the occurrence of labour disruptions related to industrial action or health and safety incidents; power cost increases as well as power stoppages, fluctuations and usage constraints; supply chain shortages and increases in the prices of production imports and the availability, terms and deployment of capital; our ability to hire and retain senior management, sufficiently technically‐skilled employees, as well as our ability to achieve sufficient representation of historically disadvantaged persons in management positions or sufficient gender diversity in management positions or at Board level; our ability to comply with requirements that we operate in a sustainable manner and provide benefits to affected communities; potential liabilities related to occupational health diseases; changes in government regulation and the political environment, particularly tax and royalties, mining rights, health, safety, environmental regulation and business ownership including any interpretation thereof; court decisions affecting the mining industry, including, without limitation, regarding the interpretation of mining rights; our ability to protect our information technology and communication systems and the personal data we retain; risks related to the failure of internal controls; the outcome of pending or future litigation or regulatory proceedings; fluctuations in exchange rates and currency devaluations and other macroeconomic monetary policies; the adequacy of the Group's insurance coverage; any further downgrade of South Africa's credit rating; and socio‐economic or political instability in South Africa, Papua New Guinea and other countries in which we operate.
These forward‐looking statements speak only as of the date they are made. The foregoing factors and others described under “Risk Factors” in our Integrated Annual Report (www.har.co.za) and our Form 20F should not be construed as exhaustive. We undertake no obligation to update publicly or release any revisions to these forward‐looking statements to reflect events or circumstances after the date of this annual report or to reflect the occurrence of unanticipated events, except as required by law. All subsequent written or oral forward‐looking statements attributable to Harmony or any person acting on its behalf are qualified by the cautionary statements herein.
These forward‐looking statements are the responsibility of the directors and have not been reviewed and reported on by the Company's external auditors.
SIGNATURES
Pursuant to the requirements of the Securities Exchange Act of 1934, the registrant has duly caused this report to be signed on its behalf by the undersigned, thereunto duly authorized.
| Harmony Gold Mining Company Limited | |||||||||||||||||
| Date: November 17, 2022 | By: /s/ Boipelo Lekubo | ||||||||||||||||
| Name: Boipelo Lekubo | |||||||||||||||||
| Title: Financial Director | |||||||||||||||||