HARMONY GOLD MINING COMPANY LIMITED
Technical Report Summary of the
Mineral Resources and Mineral Reserves
for
Mponeng Mine
Carletonville, South Africa
Effective Date: June 30, 2024
Final Report Date: August 31, 2024
Technical Report Summary for
Mponeng Mine, Gauteng, South Africa
| | |
IMPORTANT NOTICE
This Technical Report Summary has been prepared for Harmony Gold Mining Company Limited in support of disclosure and filing requirements with the United States Securities and Exchange Commission’s (SEC) under Subpart 1300 of Regulation S-K and Section 229.601(b)(96) of Regulation S-K. The quality of information, estimates, and conclusions contained in this Technical Report Summary apply as of the effective date of this report. Subsequent events that may have occurred since that date may have resulted in material changes to such information, estimates and conclusions in this summary. |
Effective Date: June 30, 2024
ii
Technical Report Summary for
Mponeng Mine, Gauteng, South Africa
QP Consent and Sign-off
I have read and understood the requirements of:
•the South African Code for Reporting of Exploration Results, Mineral Resources and Mineral Reserves (the “SAMREC Code, 2016 edition”)
•the Harmony Guidelines on the Reporting of Exploration Results, Mineral Resources and Mineral Reserves
•Subpart 1300 (17 CFR 229.1300) of Regulation S-K, Disclosure by Registrants Engaged in Mining Operations (“Regulation S-K 1300”)
I am a Competent Person as defined by the SAMREC Code, 2016 edition and the Qualified Person (“QP”) under Regulation S-K 1300, having more than five years` experience that is relevant to the style of mineralization and type of deposit described in the Report, and to all activities for which I am accepting responsibility and have been appointed as QP for Mponeng Mine Mineral Resources and Mineral Reserves.
I am a Member of SAGC and my registration is as follow:
Willie Olivier
SAGC (South African Geomatics Council)
No. MS 0136
Years’ Experience: 34
I have reviewed the tables and graphs included for the Mponeng Mine Mineral Resource and Mineral Reserve which will be used in the 2024 Harmony Gold Mineral Resource and Mineral Reserve Report to which this Consent Statement applies.
I acknowledge responsibility for all the Sections of the TRS report and as the QP and author I relied on information provided by various subject experts.
At the effective date of the Report, to the best of my knowledge, information and belief, the Report contains all scientific and technical information that is required to be disclosed to make the Report not misleading
/s/ Willie Olivier
___________________________________
Mr Willie Olivier
GDE (Mining Engineering)
Certificate of Competency Mine Survey
SAGC (No. MS 0136)
Ore Reserve Manager, Mponeng Mine
Harmony Gold Mining Company Limited
Effective Date: June 30, 2024
iii
Technical Report Summary for
Mponeng Mine, Gauteng, South Africa
List of Contents
Effective Date: June 30, 2024
iv
Technical Report Summary for
Mponeng Mine, Gauteng, South Africa
Effective Date: June 30, 2024
v
Technical Report Summary for
Mponeng Mine, Gauteng, South Africa
Effective Date: June 30, 2024
vi
Technical Report Summary for
Mponeng Mine, Gauteng, South Africa
Effective Date: June 30, 2024
vii
Technical Report Summary for
Mponeng Mine, Gauteng, South Africa
List of Figures
Effective Date: June 30, 2024
viii
Technical Report Summary for
Mponeng Mine, Gauteng, South Africa
List of Tables
Effective Date: June 30, 2024
ix
Technical Report Summary for
Mponeng Mine, Gauteng, South Africa
Units of Measure and Abbreviations
| | | | | |
| Unit / Abbreviation | Description or Definition |
| °C | degrees Celsius |
| µm | Micrometers |
| 2D | Two-dimensional |
| 3D | Three-dimensional |
| AE | Abnormal expenditure |
| Ag | Silver |
| AMIS | African Mineral Standards |
| AngloGold | AngloGold Ashanti Limited |
| Au | Gold |
| AuBIS | Harmony electronic database |
| Ave. | Average |
| BLR | Black Reef |
| BMD | Below mine datum |
| Bn | Billion |
| c. | Approximately |
| CIP | Carbon-In-Pulp |
| CLR | Carbon Leader Reef |
| cm | Centimeter |
| cmg/t | Centimetre-grams per tonne |
| CODM | Chief Operating Decision-Maker |
| Company | Harmony Gold Mining Company Limited |
| COP | Code of Practice |
| COV | Coefficient of Variation |
| CRG | Central Rand Group |
| CRM | Certified Reference Material |
| DMRE | Department of Mineral Resources and Energy |
| DWS | Department of Water and Sanitation |
| EIA | Environmental Impact Assessment |
| EMPR | Environmental Management Program |
| EMS | Environmental Management System |
| EMTS | Electric Monorail Transport System |
| ESG | Environmental Social and Governance |
| Eskom | Eskom Holdings State Owned Company (SOC) Limited |
| ETF's | Exchange Traded Funds |
| EW-SX | Electro-wining solvent extraction |
| FX | Foreign Exchange rate |
| g | Gram |
| g/t | Grams per tonne |
| g/t | Grams per metric tonne |
| GDARD | Gauteng Department of Agriculture and Rural Development |
| GHG | Greenhouse gas |
| GISTM | Global Industry Standard on Tailings Management |
| Harmony | Harmony Gold Mining Company Limited |
| HPE | Hydro-powered |
| Kalgold | Kalahari Goldridge Mining Company Limited |
| kg | Kilogram |
| km | Kilometer |
km2 | Square kilometer |
| Kusasalethu | Kusasalethu Gold Mine |
Effective Date: June 30, 2024
x
Technical Report Summary for
Mponeng Mine, Gauteng, South Africa
| | | | | |
| Unit / Abbreviation | Description or Definition |
| kWh | Kilowatt-hour |
| LDL | Lower detection limit |
| LIB | Long Inclined Borehole |
| LMBA | London Bullion Market Association |
| LOM | Life of Mine |
| Ltd | Limited |
| m | Meter |
| M | Million |
m3/hr | Cubic meters per hour |
| masl | Meters above sea level |
| MCC | Mining Charter Compliance |
| MCF | Mine Call Factor |
| Mintek | South Africa's national mineral research organization |
| Moz | Million troy ounces |
| Mponeng | Mponeng Gold Mine |
| MPRDA | Mineral and Petroleum Resources Development Act, 28 of 2002 |
| Mt | Million tonnes |
| Mtpa | Million tonnes per annum |
| Mtpm | Million tonnes per month |
| MW | Megawatts |
| NEMA | National Environmental Management Act, 107 of 1998 |
| No. | Number |
| NPV | Net present value |
| OTC | Over the counter |
| oz | Troy ounce |
| PFZ | Pretorius Fault Zone |
| PSD | Particle Size Distribution |
| Pty | Proprietary |
| QA/QC | Quality Assurance/Quality Control |
| QP | Qualified Person |
| ROM | Run-of-Mine |
| SACNASP | South African Council for Natural Scientific Professions |
| SAMREC | The South African Code for the Reporting of Exploration Results, Mineral Resources and Mineral Reserves |
| SANAS | South African National Accreditation System |
| Savuka | Savuka Gold Mine |
| SD | Standard Deviation |
| SEC | Securities and Exchange Commission |
| SGM | Sequential Grid Mining |
| SLP | Social Labour Plan |
| t | Metric tonne |
t/m3 | Tonne per cubic meter |
| TauTona | TauTona Gold Mine |
| TRS | Technical Report Summary |
| TSF | Tailings Storage Facility |
| USD | United States Dollars |
| USD/oz | United States Dollar per troy ounce |
| VCR | Ventersdorp Contact Reef |
| West Wits | Harmony's West Rand operations |
| WRG | West Rand Group |
| WUL(s) | Water Use License(s) |
Effective Date: June 30, 2024
xi
Technical Report Summary for
Mponeng Mine, Gauteng, South Africa
| | | | | |
| Unit / Abbreviation | Description or Definition |
| ZAR | South African Rand |
| ZAR/kg | South African Rand per kilogram |
Effective Date: June 30, 2024
xii
Technical Report Summary for
Mponeng Mine, Gauteng, South Africa
Glossary of Terms
| | | | | |
| Term | Definition |
| Co-kriging | A method that is used to predict the value of the point at unobserved locations by sample points that are known to be spatially interconnected by adding other variables that have a correlation with the main variable or can also be used to predict 2 or more variables simultaneously. |
| Cut-off grade | Cut-off grade is the grade (i.e., the concentration of metal or mineral in rock) that determines the destination of the material during mining. For purposes of establishing “prospects of economic extraction,” the cut-off grade is the grade that distinguishes material deemed to have no economic value (it will not be mined in underground mining or if mined in surface mining, its destination will be the waste dump) from material deemed to have economic value (its ultimate destination during mining will be a processing facility). Other terms used in similar fashion as cut-off grade include net smelter return, pay limit, and break-even stripping ratio. |
| Dilution | Unmineralized rock that is by necessity, removed along with ore during the mining process that effectively lowers the overall grade of the ore. |
| Head grade | The average grade of ore fed into the mill. |
| Economically viable | Economically viable, when used in the context of Mineral Reserve determination, means that the qualified person has determined, using a discounted cash flow analysis, or has otherwise analytically determined, that extraction of the Mineral Reserve is economically viable under reasonable investment and market assumptions. |
| Indicated Mineral Resource | Indicated Mineral Resource is that part of a Mineral Resource for which quantity and grade or quality are estimated on the basis of adequate geological evidence and sampling. The level of geological certainty associated with an Indicated Mineral Resource is sufficient to allow a qualified person to apply modifying factors in sufficient detail to support mine planning and evaluation of the economic viability of the deposit. Because an Indicated Mineral Resource has a lower level of confidence than the level of confidence of a Measured Mineral Resource, an Indicated Mineral Resource may only be converted to a probable Mineral Reserve. |
| Inferred Mineral Resource | Inferred Mineral Resource is that part of a Mineral Resource for which quantity and grade or quality are estimated on the basis of limited geological evidence and sampling. The level of geological uncertainty associated with an Inferred Mineral Resource is too high to apply relevant technical and economic factors likely to influence the prospects of economic extraction in a manner useful for evaluation of economic viability. Because an Inferred Mineral Resource has the lowest level of geological confidence of all Mineral Resources, which prevents the application of the modifying factors in a manner useful for evaluation of economic viability, an Inferred Mineral Resource may not be considered when assessing the economic viability of a mining project, and may not be converted to a Mineral Reserve. |
| Kriging | A method of interpolation based on Gaussian process governed by prior covariances. It uses a limited set of sampled data points to estimate the value of a variable over a continuous spatial field |
| Mine Call Factor | The ratio, expressed as a percentage, of the total quantity of recovered and unrecovered mineral product after processing with the amount estimated in the ore based on sampling. |
| Measured Mineral Resource | Measured Mineral Resource is that part of a Mineral Resource for which quantity and grade or quality are estimated on the basis of conclusive geological evidence and sampling. The level of geological certainty associated with a Measured Mineral Resource is sufficient to allow a qualified person to apply modifying factors, as defined in this section, in sufficient detail to support detailed mine planning and final evaluation of the economic viability of the deposit. Because a Measured Mineral Resource has a higher level of confidence than the level of confidence of either an Indicated Mineral Resource or an Inferred Mineral Resource, a Measured Mineral Resource may be converted to a Proven Mineral Reserve or to a Probable Mineral Reserve. |
| Mineral Reserve | Mineral Reserve is an estimate of tonnage and grade or quality of Indicated and Measured Mineral Resources that, in the opinion of the qualified person, can be the basis of an economically viable project. More specifically, it is the economically mineable part of a Measured or Indicated Mineral Resource, which includes diluting materials and allowances for losses that may occur when the material is mined or extracted. |
| Mineral Resource | Mineral Resource is a concentration or occurrence of material of economic interest in or on the Earth’s crust in such form, grade or quality, and quantity that there are reasonable prospects for economic extraction. A Mineral Resource is a reasonable estimate of mineralization, taking into account relevant factors such as cut-off grade, likely mining dimensions, location or continuity, that, with the assumed and justifiable technical and economic conditions, is likely to, in whole or in part, become economically extractable. It is not merely an inventory of all mineralization drilled or sampled. |
Effective Date: June 30, 2024
xiii
Technical Report Summary for
Mponeng Mine, Gauteng, South Africa
| | | | | |
| Term | Definition |
| Modifying Factors | Modifying Factors are the factors that a qualified person must apply to Indicated and Measured Mineral Resources and then evaluate in order to establish the economic viability of Mineral Reserves. A qualified person must apply and evaluate modifying factors to convert Measured and Indicated Mineral Resources to Proven and Probable Mineral Reserves. These factors include but are not restricted to; mining; processing; metallurgical; infrastructure; economic; marketing; legal; environmental compliance; plans, negotiations, or agreements with local individuals or groups; and governmental factors. The number, type and specific characteristics of the modifying factors applied will necessarily be a function of and depend upon the mineral, mine, property, or project. |
| Pre-Feasibility Study | A pre-feasibility study (or preliminary feasibility study) is a comprehensive study of a range of options for the technical and economic viability of a mineral project that has advanced to a stage where a qualified person has determined (in the case of underground mining) a preferred mining method, or (in the case of surface mining) a pit configuration, and in all cases has determined an effective method of mineral processing and an effective plan to sell the product. (1) A pre-feasibility study includes a financial analysis based on reasonable assumptions, based on appropriate testing, about the modifying factors and the evaluation of any other relevant factors that are sufficient for a qualified person to determine if all or part of the Indicated and Measured Mineral Resources may be converted to Mineral Reserves at the time of reporting. The financial analysis must have the level of detail necessary to demonstrate, at the time of reporting, that extraction is economically viable. (2) A pre-feasibility study is less comprehensive and results in a lower confidence level than a feasibility study. A pre-feasibility study is more comprehensive and results in a higher confidence level than an initial assessment. |
| Probable Mineral Reserve | Probable Mineral Reserve is the economically mineable part of an Indicated and, in some cases, a Measured Mineral Resource. |
| Proven Mineral Reserve | Proven Mineral Reserve is the economically mineable part of a Measured Mineral Resource and can only result from conversion of a Measured Mineral Resource. |
| Qualified Person | A qualified person is: (1) A mineral industry professional with at least five years of relevant experience in the type of mineralization and type of deposit under consideration and in the specific type of activity that person is undertaking on behalf of the registrant; and (2) An eligible member or licensee in good standing of a recognized professional organization at the time the technical report is prepared. For an organization to be a recognized professional organization, it must: (i) Be either: (A) An organization recognized within the mining industry as a reputable professional association; or (B) A board authorized by U.S. federal, state or foreign statute to regulate professionals in the mining, geoscience or related field; (ii) Admit eligible members primarily on the basis of their academic qualifications and experience; (iii) Establish and require compliance with professional standards of competence and ethics; (iv) Require or encourage continuing professional development; (v) Have and apply disciplinary powers, including the power to suspend or expel a member regardless of where the member practices or resides; and (vi) Provide a public list of members in good standing. |
| Tailings | Finely ground rock of low residual value from which valuable minerals have been extracted is discarded and stored in a designed dam facility. |
| Tailings Freeboard | The vertical height between the beached tailings against the embankment crest and the crest itself. |
Effective Date: June 30, 2024
xiv
Technical Report Summary for
Mponeng Mine, Gauteng, South Africa
1Executive Summary
Section 229.601(b)(96)) (iii)(B) (1)
The QP of Harmony Gold Mining Company Limited (“Harmony” or the “Company”) has prepared this Technical Report Summary (“TRS”) to disclose the Mineral Resource and Mineral Reserve estimates for the Company’s Mponeng Mine (“Mponeng”). The TRS has been prepared in accordance with the U.S. Securities and Exchange Commission’s (“SEC”) Regulation S-K 1300, with an effective date as at June 30, 2024. No material changes have occurred between the effective date and the date of signature of this TRS.
This TRS updates the TRS filed by Harmony on Mponeng on October 31, 2022, named Exhibit 96.6 Technical Report Summary of the Mineral Resources and Mineral Reserves for Mponeng Mine, Carletonville, South Africa, which was effective on June 30, 2022. Changes year on year was notable on the extension of the Reserve Plan and increase on the Mineral Reserves reported. This TRS is being filed to satisfy the requirement of Item 1302(e)(6) of regulation S-K. An economic assessment was included, using a detailed discounted cashflow analysis for the Mineral Reserves, excluding all scheduled Inferred Mineral Resource which is not reported under Mineral Reserve. No material changes have occurred between the effective date and the date of signature of this TRS.
Property Description
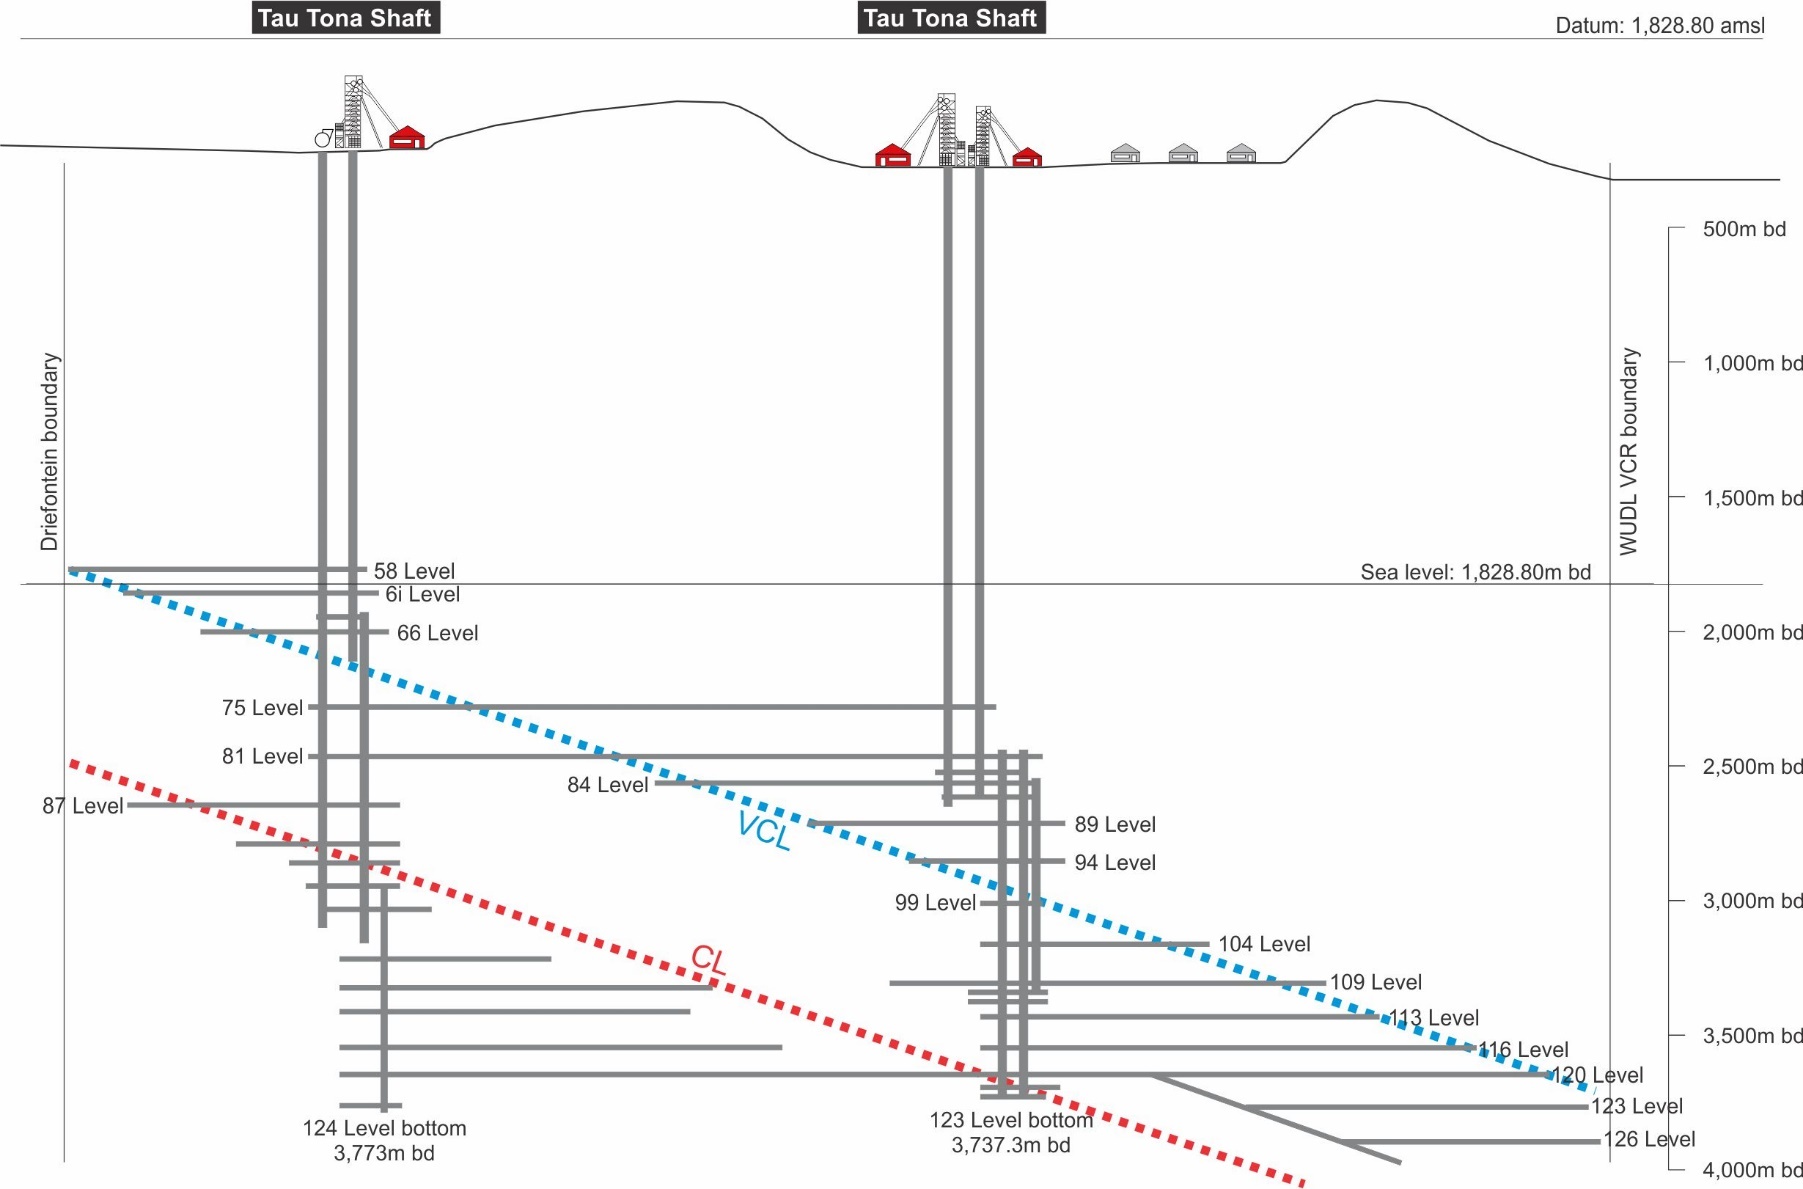
Mponeng is a deep-level underground gold producing mine situated near the town of Carletonville, South Africa. The mine is included as part of Harmony’s West Wits operations and is the deepest mine in the world with development currently at 3,841m below mine datum (“BMD”). The primary reef mined is the Ventersdorp Contact Reef (“VCR”), with future expansion planned on both the VCR and the Carbon Leader Reef (“CLR”) horizon.
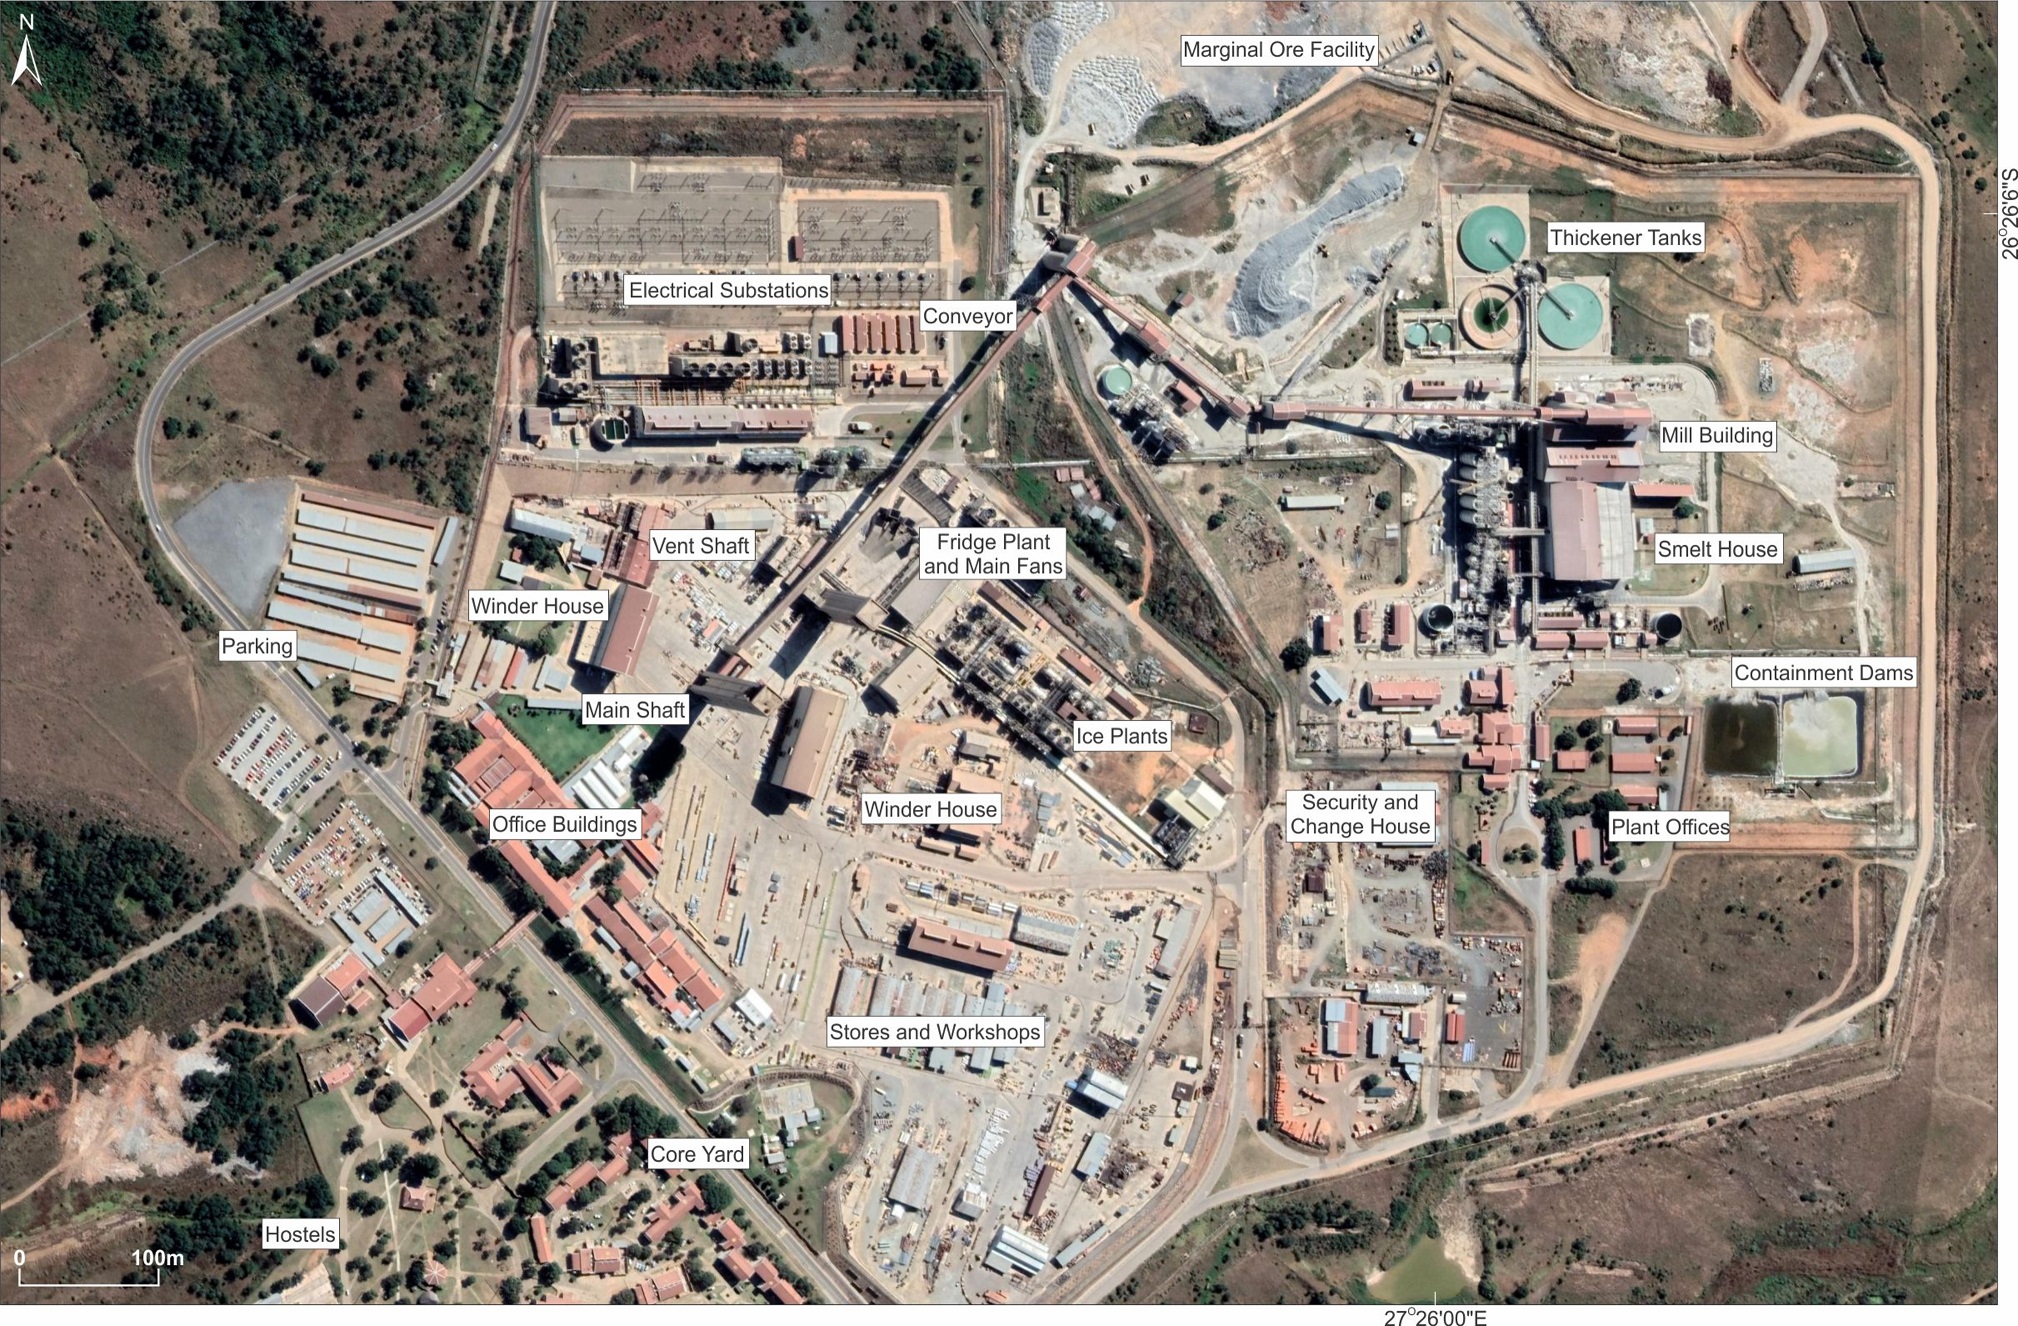
The original vertical twin shaft sinking from the surface commenced in 1981 and was commissioned along with the gold plant complex in 1986. Today, Mponeng comprises a twin-shaft system housing two surface shafts and two sub-shafts. Mponeng has its own processing plant situated adjacent to the mine. Ore and waste material are hoisted separately with ore being delivered to the plant by means of a conveyor belt and the waste rock going to the low-grade stockpile. Operations are powered by electricity from Eskom Holdings SOC Limited (a state-owned electricity supplier).
The following mining rights make up the full mining lease area of approximately 6,673ha:
•GP30/5/1/2/2(01) MR valid from 14 February 2006 to 13 February 2036; and
•GP30/5/1/2/2(248) MR (for Sand) valid from 16 October 2012 to 15 October 2022.
The mining rights 01MR and 248MR were ceded from AngloGold Ashanti Limited ("AngloGold") to Golden Core Trade and Investment (Pty) Ltd ("Golden Core"), a wholly owned subsidiary of Harmony on 30 September 2020 and were successfully registered in the Mining Titles Office on the 14 June 2021 as part of AngloGold Ashanti’s sale of their last remaining South African assets to Harmony, including its West Wits Operations ("Transaction").
A section 102 Application in terms of the Mineral and Petroleum Resources Development Act, 28 of 2002 (‘MPRDA”) was submitted previously by AngloGold in March 2017 to consolidate its West Wits mining rights into a single mining right (GP30/5/1/2/2(01) MR) ("AngloGold Application"). The AngloGold Application was approved by the Department of Minerals and Energy ("DMRE") in August 2020, but was, however, not implemented due to a change in circumstances as a result of the Transaction and was withdrawn by AngloGold Ashanti. On 15 February 2022, Golden Core submitted an application in terms of section 102 of the MPRDA, substantively similar to the AngloGold Application, to consolidate the mining rights and mining right areas into a single mining right (GP30/5/1/2/2(01) MR) ("Golden Core Consolidation Application"). The Golden Core Application is currently pending at the DMRE. A renewal application for GP30/5/1/2/2(248) MR was timeously submitted, while awaiting the processing of the Golden Core Consolidation Application by the DMRE” as the DMRE advised that they could not process the consolidation application while there was a renewal application submitted (even though both applications clearly stated that the consolidation application should be progressed as the priority application). The estimated timeline for approval is by end 2024 and no risk is foreseen while the approval is pending.
There is no material litigation (including violations or fines) against Golden Core, which threatens its mineral rights, tenure, or operations.
Effective Date: June 30, 2024
1
Technical Report Summary for
Mponeng Mine, Gauteng, South Africa
Ownership
Mponeng is wholly owned by Harmony, including the associated mineral rights. Harmony acquired the mine as part of the transaction concluded on 1 October 2020 to take full ownership and control of South African business.
Geology and Mineralization
Mponeng is situated on the northwestern margin of the Witwatersrand Basin of South Africa, one of the prominent gold provinces in the world. There are seven gold-bearing conglomerates within the lease area, of which only the Ventersdorp Contact Reef (“VCR”) and Carbon Leader Reef (“CLR”) are economically viable.
The VCR is a gold bearing, quartz pebble conglomerate of intermediate to high grade. It forms the base of the Ventersdorp Supergroup, which caps the Witwatersrand Supergroup through an angular unconformity. A characteristic of this horizon is the pronounced palaeomorphology, where a thick reef is preserved in the form of terraces separated stratigraphically by a thin inter-terrace slope reef.
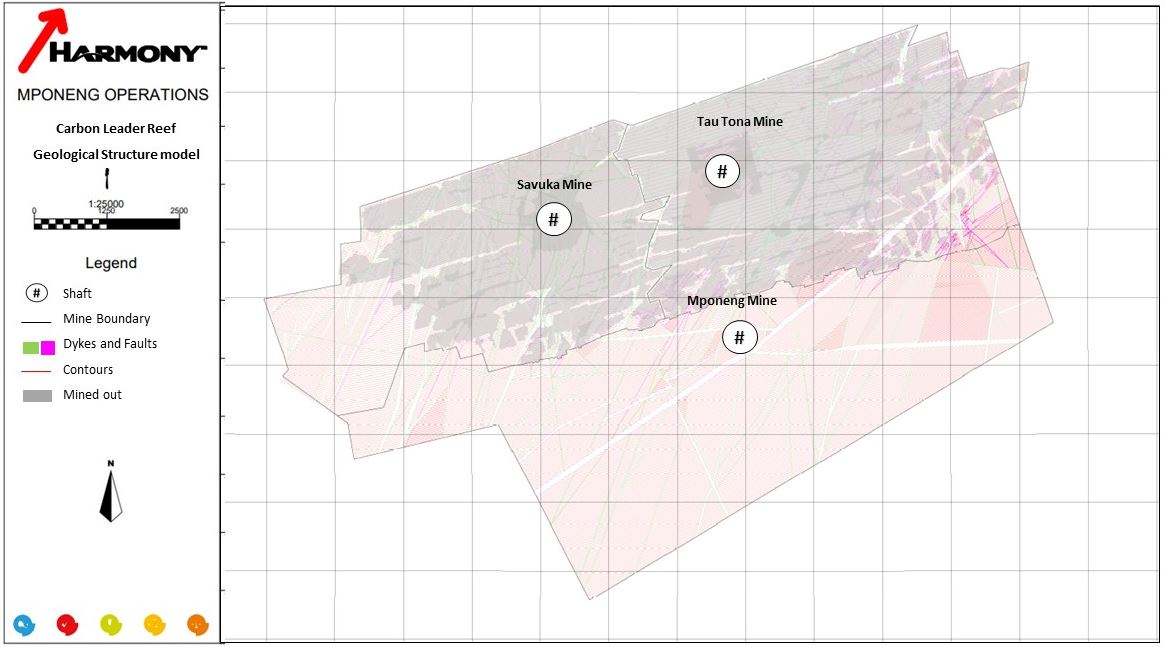
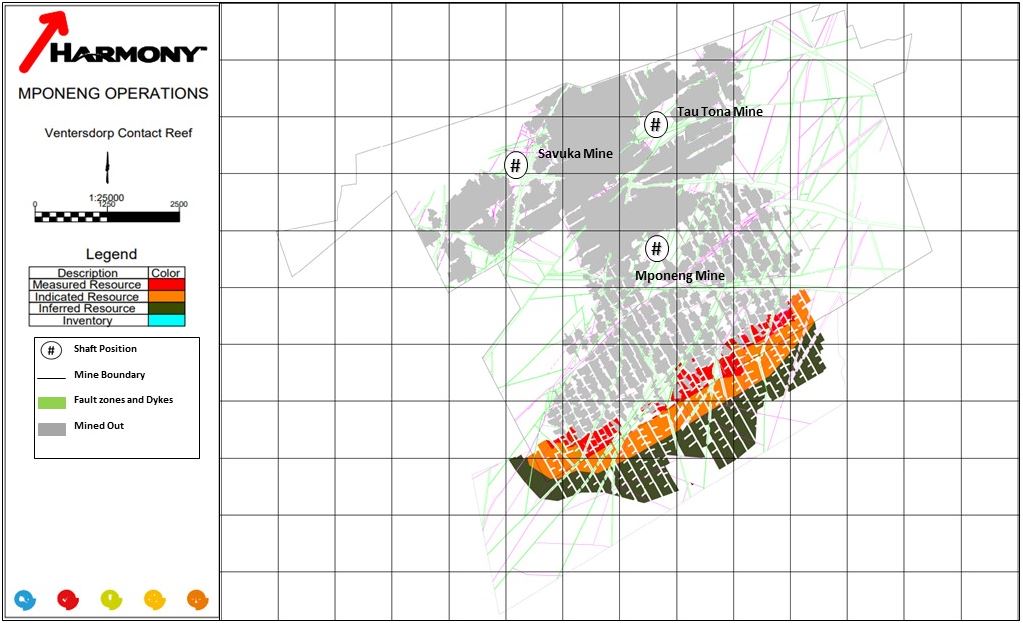
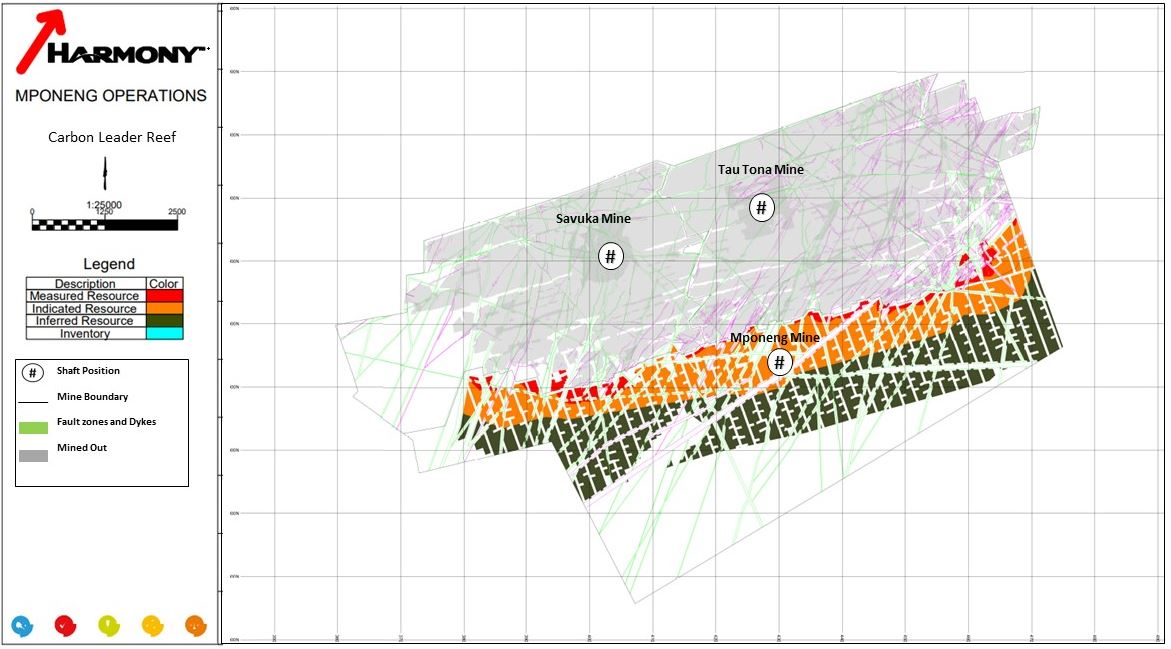
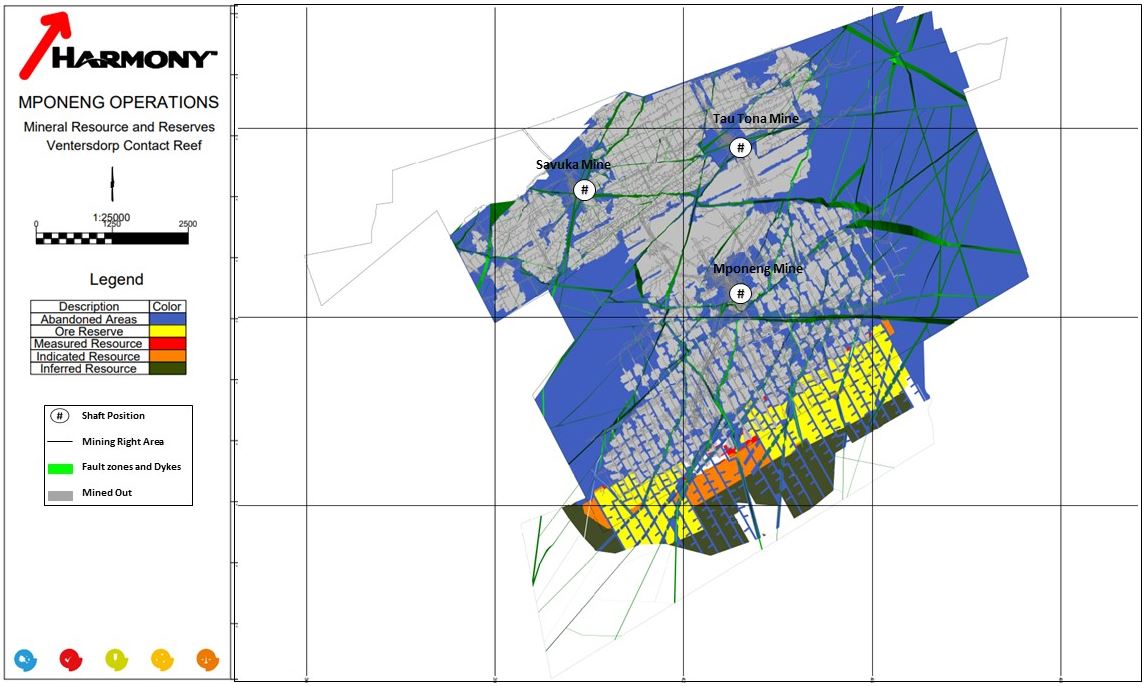
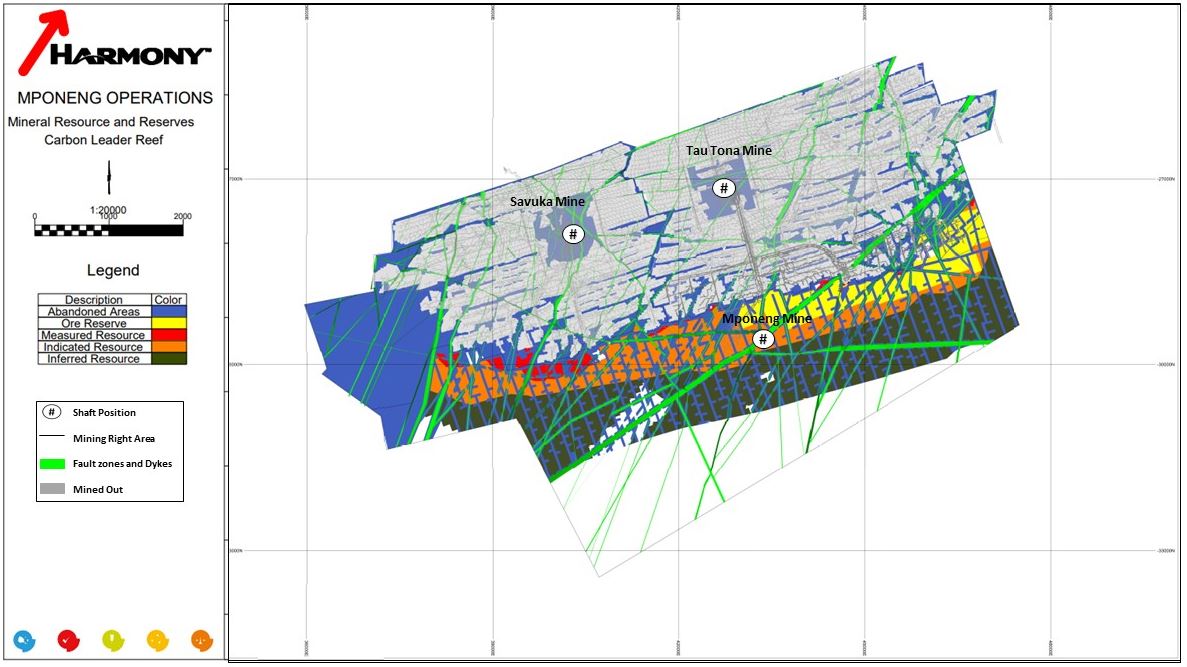
The CLR, historically mined at the adjacent Harmony wholly owned TauTona and Savuka Mines, is reported as part of the Mponeng Mineral Resource. It is a c.20cm thick tabular, auriferous quartz pebble conglomerate. It lies 800-900m stratigraphically deeper than the VCR, near the base of the Johannesburg Subgroup of the Central Rand Group (“CRG”) of the Witwatersrand Supergroup.
Both the VCR and the CLR have been subjected to faulting and are intruded by a series of igneous dykes and sills of various ages that cut across the reefs. The gold mineralization at Mponeng succeeded a period of deep burial, fracturing, and alteration. The gold and other elements are believed to have precipitated through the reaction of hydrothermal fluids at high temperatures along the reef horizons.
Status of Exploration, Development and Operation
Mponeng has mainly been mining the VCR for the past 38 years and has now included the CLR remaining at the adjacent TauTona Mine in the extraction model. The Mponeng Mine site is therefore well established and operates uninterrupted at a steady state capacity throughout the years.
The VCR at Mponeng has extensively been explored. Currently, Harmony continues to conduct underground production and exploration drilling and channel (chip) sampling. Sampling of underground drill hole intersections, as well as sampling of established stopes on the reef horizon, enable the Mponeng geological model to be updated monthly as new data is generated. Harmony has budgeted annually for exploration to compliment the already substantive sampling database. These infill drilling programs are aimed at increasing the confidence in the current below 120 level mining fronts, as well as gather more information regarding the below 126 level (3 840mbd). Since Mponeng is highly dependent on 123-126 VCR mining levels for bulk of the production, execution of replacement levels will commence by 2024. Expansion for additional levels, has been approved during February 2024 which entails expanding 2-3 levels on the VCR and 2 levels on the CLR east. Limited mining is also planned from the Tau Tona VCR shaft pillar.
Mineral Resource Estimate
The current Mineral Resources for both the VCR and CLR were estimated by the Harmony Qualified Person (“QP”) using 2D projected surfaces created in DESWIK CAD software and DatamineTM . The QP created block models based on a verified electronic database containing surface drill hole data, as well as underground drilling, mapping, and sampling data obtained until December 2023. Gold values were estimated using ordinary and simple macro kriging interpolation methods.
The Mineral Resources were originally prepared, classified and reported according to the South African Code for the Reporting of Exploration Results, Mineral Resources and Mineral Reserves, 2016 edition (“SAMREC, 2016”). For the purposes of this TRS, the Mineral Resources have been classified in accordance with § 229.1302(d)(1)(iii)(A) (Item 1302(d)(1)(iii)(A) of Regulation S-K). The S-K classification is similar to SAMREC 2016. The Mineral Resource estimate, as at June 30, 2024, exclusive of the reported Mineral Reserves is summarized in Table 1-1. These Mineral Resources account for mining depletion recorded from July 2023 to June 2024.
Effective Date: June 30, 2024
2
Technical Report Summary for
Mponeng Mine, Gauteng, South Africa
The QP compiling the Mineral Resource estimate is Mr WH Olivier, Ore Reserve Manager at Mponeng, and employee of Harmony.
The rock engineering support and bracket pillars, clamping geological structures are excluded from the Mineral Resources.
Table 1-1: Summary of the Mponeng Mineral Resources (Exclusive of Mineral Reserves) as at June 30, 20241-8
| | | | | | | | | | | |
| METRIC |
| Mineral Resource Category | Tonnes (Mt) | Gold Grade (g/t) | Gold Content (kg) |
| Measured | 2.688 | 15.55 | 41,800 |
| Indicated | 13.719 | 13.48 | 184,915 |
| Total / Ave. Measured + Indicated | 16.407 | | 13.82 | | 226,716 | |
| Inferred | 32.105 | 11.34 | 364,070 |
| | | |
| IMPERIAL |
| Mineral Resource Category | Tons (Mt) | Gold Grade (oz/t) | Gold Content (Moz) |
| Measured | 2.963 | 0.454 | 1.344 |
| Indicated | 15.123 | 0.393 | 5.945 |
| Total / Ave. Measured + Indicated | 18.085 | | 0.403 | | 7.289 | |
| Inferred | 35.389 | 0.331 | 11.705 |
Notes:
1. Mineral Resources are reported with an effective date of June 30, 2024 were originally prepared, classified and reported according to SAMREC, 2016. For the purposes of this TRS, the Mineral Resources have been classified in accordance with § 229.1302(d)(1)(iii)(A) (Item 1302(d)(1)(iii)(A) of Regulation S-K). The Qualified Person responsible for the estimate is Mr WH Olivier, who is Ore Reserve Manager at Mponeng, and a Harmony employee.
2. The Mineral Resource tonnes are reported as in-situ with reasonable prospects for economic extraction.
3. No modifying factors or dilution sources have been included to in-situ Reserve which was subtracted from the SAMREC Resource in order to obtain the S-K 1300 Resource. For cut-off determination an operating cost of ZAR/t 6,292 was used.
4. The Mineral Resources are reported using a cut-off value of 761cmg/t and a gold price of USD1,878/oz.
5. Tonnes are reported as rounded to three decimal places. Gold values are rounded to zero decimal places.
6. Mineral Resources are exclusive of Mineral Reserves. Mineral Resources are not Mineral Reserves and do not necessarily demonstrate economic viability.
7. Rounding as required by reporting guidelines may result in apparent summation differences.
8. The Mineral Resource estimate is for Harmony’s 100% interest.
Mineral Reserve Estimate
The Mineral Reserves were originally prepared, classified and reported according to SAMREC, 2016. For the purposes of this TRS, the Mineral Reserves have been classified in accordance with § 229.1302(d)(1)(iii)(A) (Item 1302(d)(1)(iii)(A) of Regulation S-K). Same criteria was used.
Mineral Reserves are derived from the Mineral Resources, a detailed business plan and the operational mine planning processes. Mine planning utilises and takes into consideration historical technical parameters achieved. In addition, Mineral Resource conversion to Mineral Reserves considers Modifying Factors, dilution, ore losses, minimum mining widths, planned mine call factors as well as costs, prices and results of economic testing. The Mineral Reserves are 4.503Moz as at June 30, 2024 (Table 1-2).
The QP compiling the Mineral Reserve estimate is Mr WH Olivier, Ore Reserve Manager at Mponeng, and employee of Harmony.
Effective Date: June 30, 2024
3
Technical Report Summary for
Mponeng Mine, Gauteng, South Africa
Table 1-2: Summary of the Mponeng Mineral Reserves as at June 30, 2024 1-6
| | | | | | | | | | | |
| METRIC |
| Mineral Reserve Category | Tonnes (Mt) | Gold Grade (g/t) | Gold Content (kg) |
| Proved | 4.466 | 9.67 | 43,190 |
| Probable | 10.940 | 8.86 | 96,875 |
| Total (Proved + Probable) | 15.406 | | 9.09 | | 140,065 | |
| | | |
| IMPERIAL |
| Mineral Reserve Category | Tons (Mt) | Gold Grade (oz/t) | Gold Content (Moz) |
| Proved | 4.923 | 0.28 | 1.389 |
| Probable | 12.059 | 0.26 | 3.115 |
| Total (Proved + Probable) | 16.982 | | 0.27 | | 4.503 | |
Notes:
1. The Mineral Reserves were originally prepared, classified and reported according to SAMREC, 2016. For the purposes of this TRS, the Mineral Reserves have been classified in accordance with § 229.1302(d)(1)(iii)(A) (Item 1302(d)(1)(iii)(A) of Regulation S-K). The Qualified Person responsible for the estimate is Mr WH Olivier, who is the Mponeng Ore Reserve Manager, and a Harmony employee.
2. Tonnes, grade, and gold content are declared as net delivered to the mills.
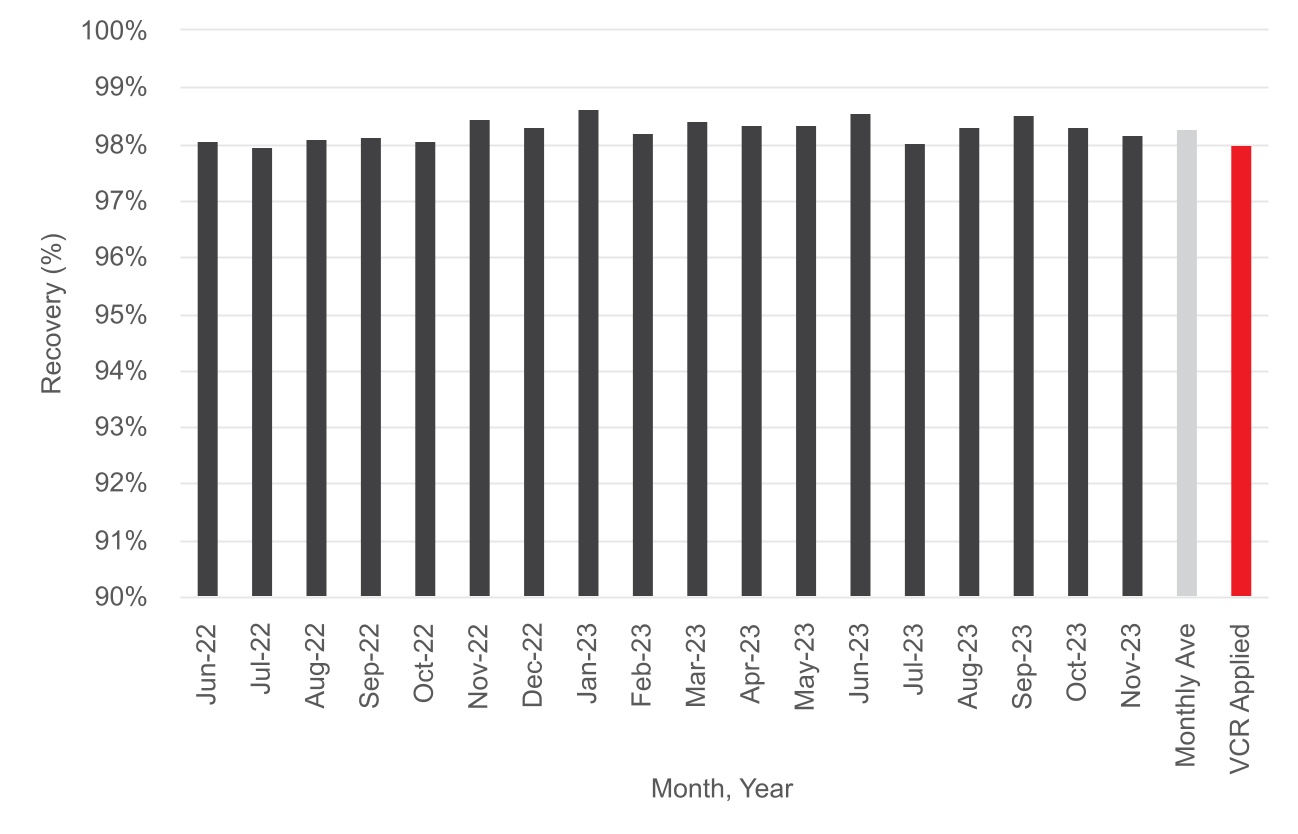
3. Figures are fully inclusive of all mining dilutions, gold losses and are reported as mill delivered tonnes and head grades. Metallurgical recovery factors have not been applied to the reserve figures. For cut-off determination an operating cost of R6,292/t was used. Gold content in table excludes Plant recovery factor at 98%.
4. Gold content is after taking into consideration the modifying factors.
5. Mineral Reserves are reported using a cut-off grade of 971cmg/t determined using a gold price of USD1,772/oz gold.
6. Rounding as required by reporting guidelines may result in apparent summation differences.
The Mineral Reserves comprise 31% Proved Reserves and 69% Probable Reserves. In the opinion of the QP, given that Mponeng is an established operation, the modifying factors informing the Mineral Reserve estimates would at minimum, satisfy the confidence levels of a Pre-Feasibility Study.
Mineral Reserves comprise the VCR from Mponeng Mine and the CLR from the TauTona Mine. The declared Mineral Reserve is depleted to generate the Mponeng cashflows. The economic analysis of the Reserve plan cashflows display positive results and are deemed both technically and economically achievable. It is important to note that the Mineral Reserves are declared as delivered to the mills. This recovered gold content is calculated after factoring in the plant recovery as a modifying factor.
Capital and Operating Cost Estimates
The capital cost estimates for Mponeng are determined at corporate level, using the business plan as a basis. The capital cost elements are equipment, infrastructure, and operating capital. The capital and operating costs are reported in ZAR terms and on a real basis. The capital cost estimates are shown in Table 1-3 for the Mineral Reserves.
The operating cost estimates for Mponeng are categorised into direct and total costs. A summary of the Mponeng operating cost estimate is shown in the Table 1-4 for the Mineral Reserves.
Both, the capital and operating estimates are accounted for in the economic analysis of Mponeng Mine. The results of the economic analysis demonstrate positive returns. Accuracy levels for the capex and opex is consistent with PFS level. The post tax NPV at 9% discount rate is R6.15billion.
Table 1-3: Summary of Reserve plan Capital Cost Estimate for Mponeng
| | | | | |
| Capital Cost Element (ZAR'000) | Total Reserve plan FY2025-FY2042 |
| AE | 1,583,725 |
| Shaft Projects | 3,084,314 |
| Major Projects | 8,469,901 |
| OCD | 7,085,568 |
| Total (excluding MCC) | 20,223,508 |
| MCC (LED/housing etc.) | 271,894 |
| Total (Including MCC) | 20,495,402 |
| Unit Operating cost (R/t) | 8,519 |
Note: No capital costs for 2043 onwards.
Effective Date: June 30, 2024
4
Technical Report Summary for
Mponeng Mine, Gauteng, South Africa
Table 1-4: Summary of Operating Cost Estimates for Mponeng
| | | | | |
| Operating Cost Element (ZAR'000) | Total Reserve plan
(FY2025 - FY2042) |
| Mining | 42,348,239 | |
| Services | 7,979,105 | |
| Medical Hub / Station | 1,473,337 | |
| Engineering | 50,612,640 | |
| Workshops | 663,498 | |
| Total Direct Costs | 103,076,819 | |
| Mine Overheads | 5,853,899 | |
| |
| Total Cost | 108,930,718 | |
Permitting Requirements
Mponeng’s valid environmental permits are summarized in Table 1-5.
An application to renew and amend the existing Waste Management License, Environmental Management Program (“EMPR”) and Water Use License (“WUL”) was submitted during March 2023 to the respective regulator. The approval for these environmental permits is pending at the effective date of this TRS. Most of the required environmental authorizations are in place and only require amendments to be made. No risk to the operation is anticipated.
Based on current industry norms, a realistic timeframe to obtain relevant authorizations is estimated between 12 and 18 months. There is no material litigation (including violations or fines) against the Company as at the date of this report, which threatens its mineral rights, tenure, or operations.
Table 1-5: Status of Environmental Permits and Licenses
| | | | | | | | | | | | | | |
| Permit / License | Reference No. | Issued By | Date Granted | Validity |
| Environmental Management Programme (Amendment) | (GP) 30/5/1/2/3/2/1 (01) | DMRE | 12-Apr-2012 | Life of Reserve |
| Waste Management Licence | GAUT 002/09-10/W0011 | GDARD | 22-Jun-2015 | Expired July 2019. Request for review submitted to GDARD in 2019, resubmitted in March 2023. Awaiting amended licence. |
| Hazardous Waste Generator Certificate | GPG-01-513 | GDARD | 14-Jul-2015 | In perpetuity |
| Water Use Licence | 08/C23E/AEFGCEI/12157 | DWS | Licenced issued under Harmony Gold issued Sep 2022 | 9 years |
| | | | |
| Certificate of Registration Inflammable Liquids and Substances | RP438/ptn5 | West Rand District Municipality | 01-Feb-2024 | Annually |
| | | | |
| | | | |
| | | | |
| | | | |
| | | | |
| | | | |
| | | | |
Conclusions
In the QP’s opinion, Mponeng Mine, a 100% owned Harmony asset, is located in a well-established mining district and has been operating successfully for the past 38 years. The mine is accessible within national and provincial roads, with well-established infrastructure. Management has a good handle on aspects pertaining to legal and environmental matters with respect to operating within the South African mining law, as regulated by the MPRDA, and supporting legislation.
Effective Date: June 30, 2024
5
Technical Report Summary for
Mponeng Mine, Gauteng, South Africa
Mponeng hosts a prominent gold bearing Mineral Resource. The interpretation of the regional geological setting, mineralization and ore body deposit is well understood and provides valuable insight to the gold mining operations. The mining methods of the Mineral Reserves is of sound design and has evolved over the history of the operations.
The current preferred, Sequential Grid Mining method, has progressively improved, with a significant focus on increased safety and reduced seismicity related events. The gold recovery is well monitored through continuous bench marking initiatives against the mineral processing plants’ historical data.
Harmony is in possession of robust contracts, with the gold price showing upside potential. The economics for Mponeng Mine display positive cashflows, based on detailed operating and capital costs. The valuation of the asset is proven to be most sensitive to the gold price. The assumptions and conclusions in this TRS contain the views of the QP and does not contain any known material risks at the time of compilation.
Mponeng did not incur any fines or penalties for non-compliance during the year ended June 30, 2024 and no significant encumbrances exist.
Recommendations
Mponeng Mine has a current Mineral Reserve plan of an estimated eighteen years which has been extended through the approval of the LOM extension. The previous Mineral Reserve plan indicated 7 years. As there are still areas of opportunity, continuous exploration drilling will allow for further updates in these areas for potential upgrading into the Mineral Reserve plan.
Effective Date: June 30, 2024
6
Technical Report Summary for
Mponeng Mine, Gauteng, South Africa
2Introduction
Section 229.601(b)(96)(iii)(B)(2) (i-v)
This TRS on the Mponeng Mine has been prepared for the registrant, Harmony. The TRS has been prepared in accordance with Regulation S-K 1300. It has been prepared to meet the requirements of Section 229.601(b)96 - Technical Report Summary. The purpose of this TRS is to provide open and transparent disclosure of all material, exploration activities, Mineral Resource and Mineral Reserve information to enable the investor to understand Mponeng which forms part of Harmony’s activities. A material change since the previous report includes the extension of the Reserve plan by 11 years and an increase in the Reserves.
This TRS has been prepared from the following sources of information:
•data available in the Competent Persons Report dated June 30, 2024;
•the 2024 and 2025 Corporate Business Plan;
•published Ore Reserve as at June 30, 2024
•base geological data;
•mine planning data; and
•various internal technical reports.
The TRS was prepared by a QP employed on a full-time basis by the registrant. The QP’s qualifications, areas of responsibility and personal inspection of the property are summarized in Table 2-1.
Table 2-1: QP Qualification, Section Responsibilities and Personal Inspections
| | | | | | | | | | | | | | |
| Qualified Person | Professional Organization | Qualification | TRS Section Responsibility | Personal Insp. |
| Mr. W. Oliver | SAGC (No. MS 0136) | GDE (Mining Engineering) Government Certificate of Competency in Mine Survey | All information in the TRS | Full time |
| | | | |
| | | | |
| | | | |
| | | | |
| | | | |
| | | | |
| | | | |
| | | | |
| | | | |
| | | | |
This TRS updates the TRS filed by Harmony on Mponeng on October 31, 2022, named Exhibit 96.6 Technical Report Summary of the Mineral Resources and Mineral Reserves for Mponeng Mine, Carletonville, South Africa, which was effective on June 30, 2022. This updated TRS has an effective date of June 30, 2024 and no material changes have occurred between the effective date and the date of signature.
Effective Date: June 30, 2024
7
Technical Report Summary for
Mponeng Mine, Gauteng, South Africa
3Property Description and Location
Section 229.601(b)(96)(iii)(B)(3) (i-vii)
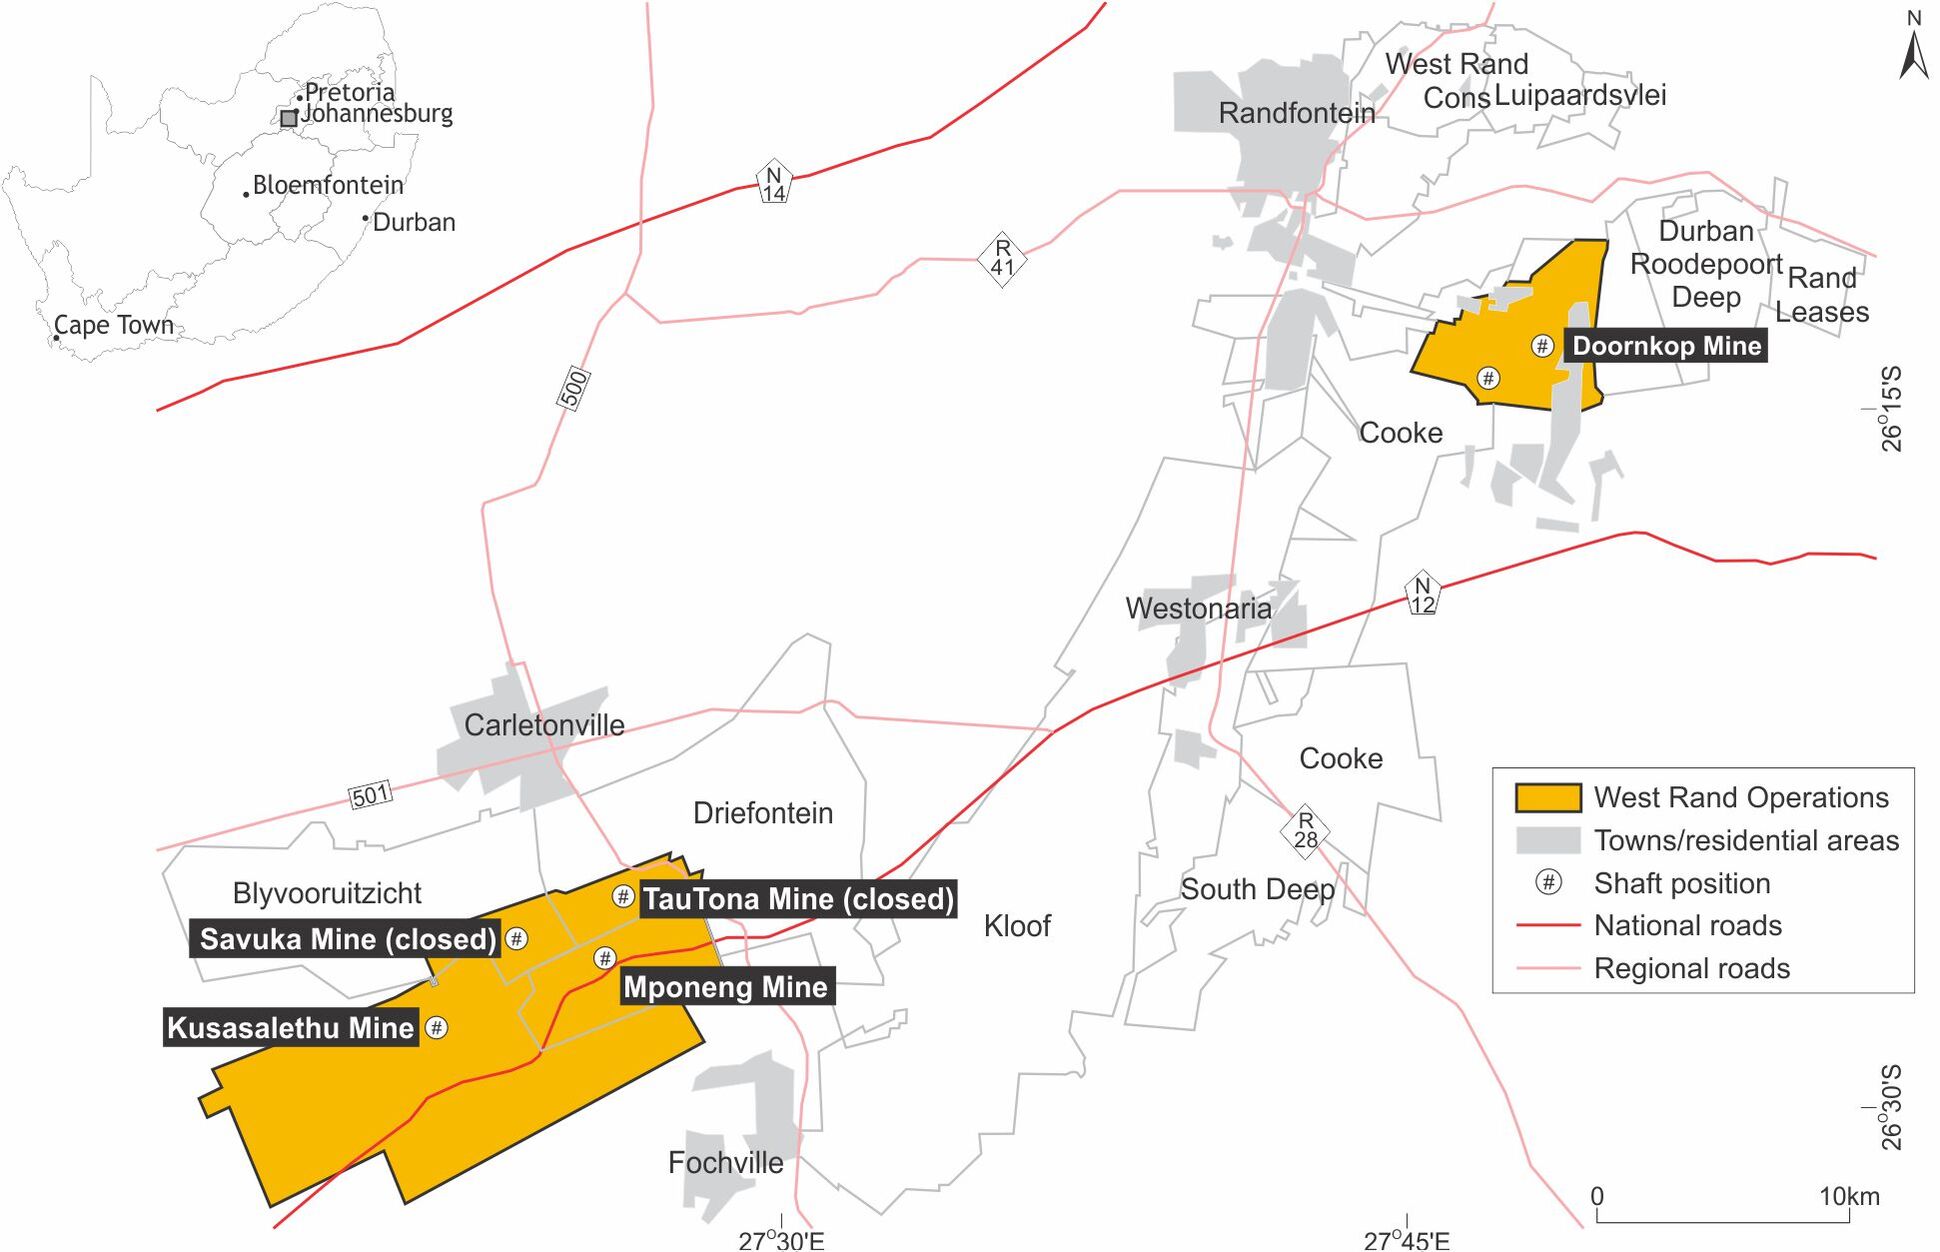
Mponeng is an underground gold producing mine located in the West Wits mining district south-west of Johannesburg, on the border between Gauteng and the North West Province. At longitude 27°25'53.62"E and latitude 26°26'12.27"S, the mine is approximately 65km from Johannesburg and 15km from Carletonville and forms part of Harmony's West Rand (“West Wits”) operations. The location of Mponeng and its relative proximity to the other West Wits operations is shown in Figure 3-1.
3.1Mineral Tenure
South African Mining Law is regulated by the MPRDA which is the predominant piece of legislation dealing with acquisitions or rights to conduct reconnaissance, prospecting and mining. There are several other pieces of legislation which deal with such ancillary issues such as royalties (the Mineral and Petroleum Resources Royalty Act, 2008), title registration (the Mining Titles Registration Act, 1967), and health and safety (the Mine Health and Safety Act, 1996).
As part of the acquisition of AngloGold Ashanti’s South African business, all mining rights related to Mponeng were transferred and are now held by Golden Core. There are two mining rights that form Mponeng area which were successfully converted, executed and registered at the Mineral and Petroleum Resources Titles Office. The principal mining right (GP30/5/1/2/2(01) MR) covers an area of 6,477ha for the mining of gold, silver, nickel and uranium. This mining right, granted on the 14 February 2006, unless cancelled or suspended will continue in force for 36 years ending 13 February 2036. The other mining right, GP30/5/1/2/2(248) MR, is planned to be incorporated into the principal mining right (GP30/5/1/2/2(01) MR. On 15 February 2022, Golden Core applied in terms of section 102 of the MPRDA, substantively similar to the AngloGold Ashanti’s Application, to consolidate the mining rights and mining right areas into a single mining right (GP30/5/1/2/2(01) MR) as part of the Golden Core Consolidation Application referred to above, which is currently pending at the DMRE. No risk to the operation is envisaged while this is pending.
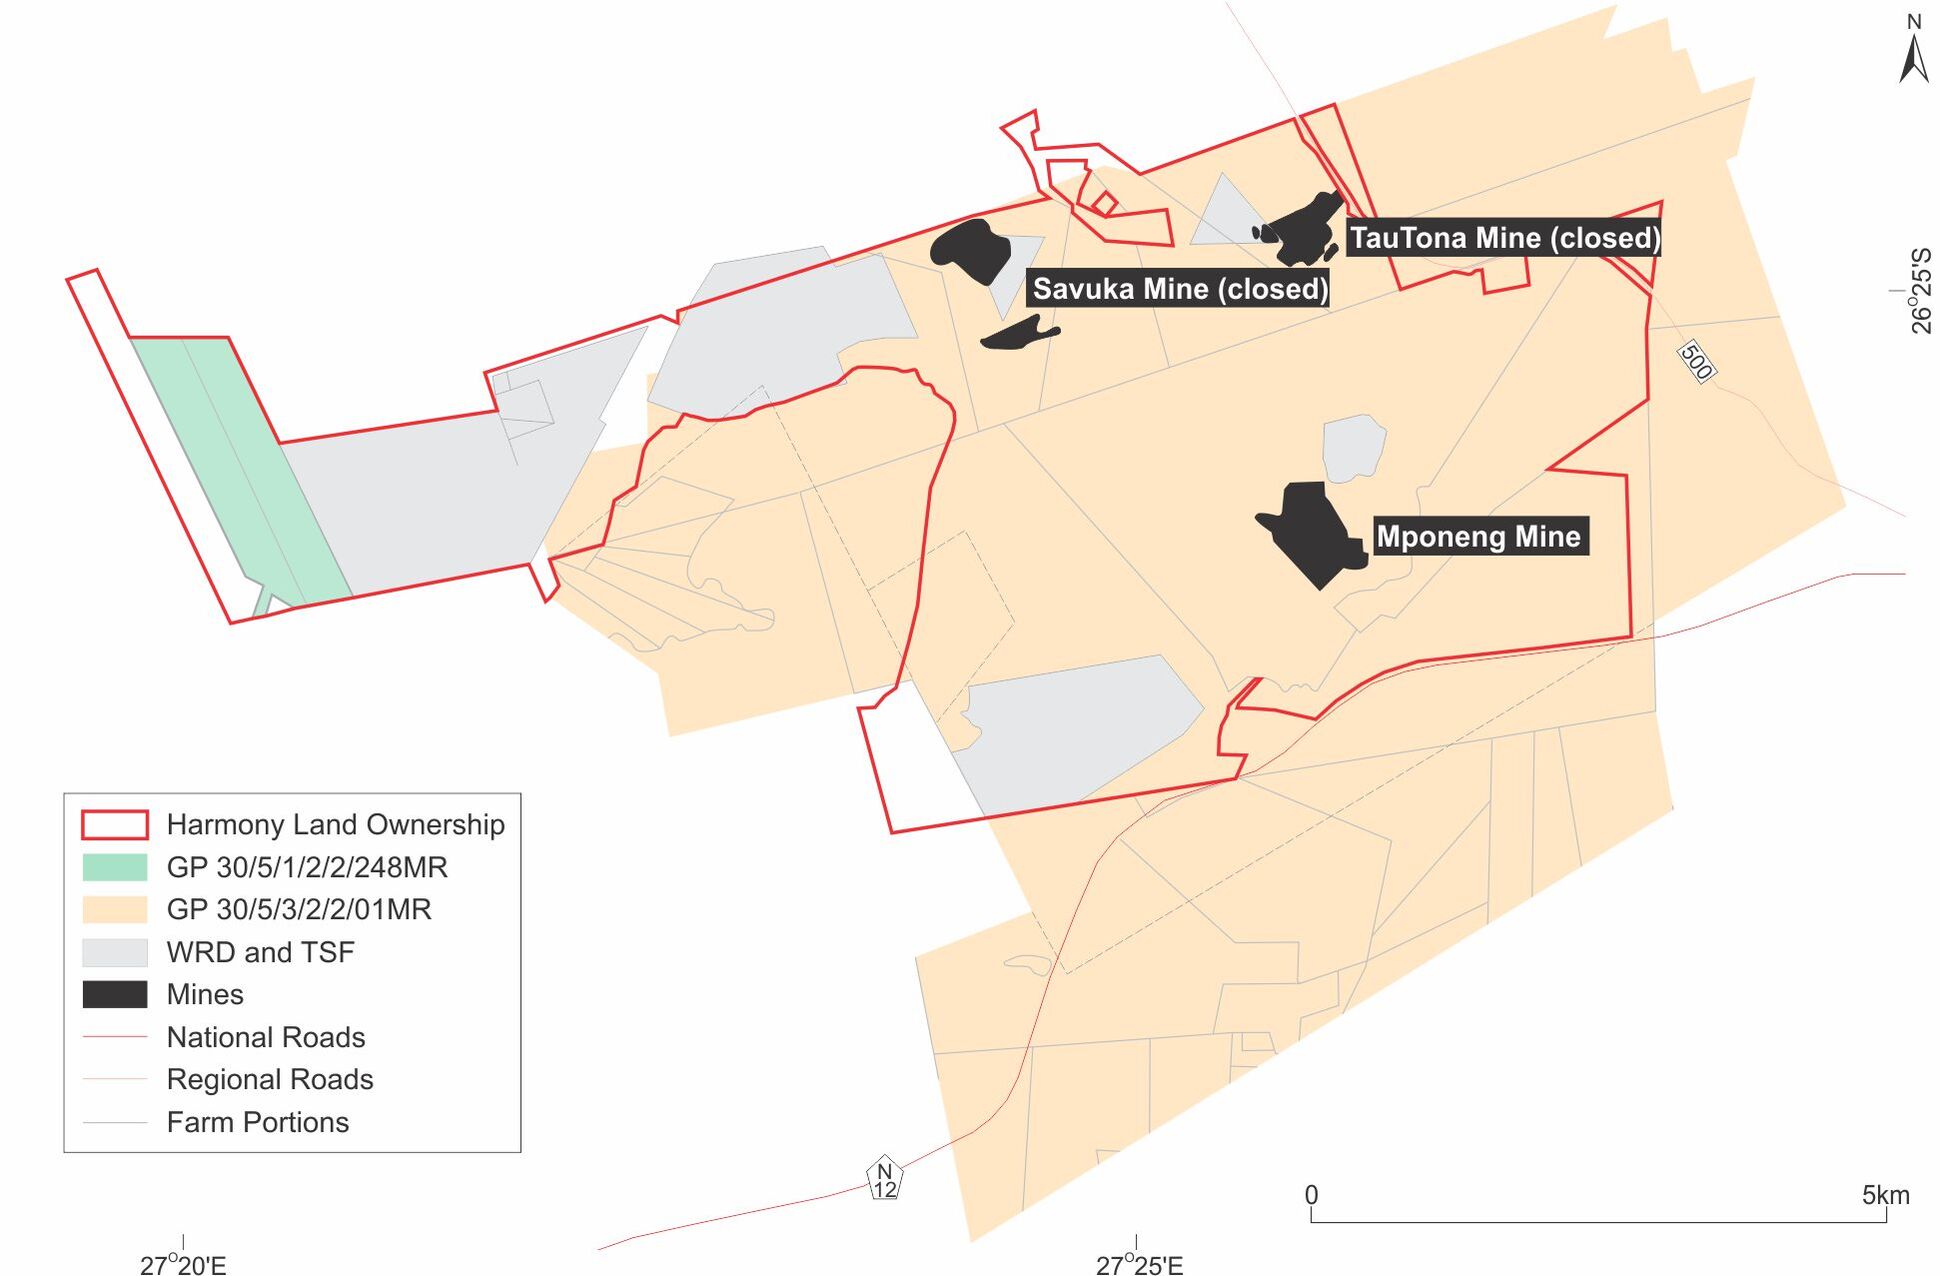
The Mponeng mining area and associated mining rights held by Harmony are shown in Figure 3-2 and detailed in Table 3-1, respectively.
Table 3-1: Summary of Mining Rights for Mponeng
| | | | | | | | | | | | | | | | | |
| Operation | License Type | Reference No. | Effective Date | Expiry Date | Area (ha) |
| Mponeng Mine | Mining Right | GP30/5/1/2/2(01) MR | 14-Feb-2006 | 13-Feb-2036 | 6,477.35 | |
| Magnum Farm | Mining Right | GP30/5/1/2/2(248) MR | 16-Oct-2012 | 15-Oct-2022 | 195.83 | |
| | | | | |
| | | | | |
| | | | | |
| | | | | |
| | | | | |
| | | | | |
| Total | 6,673.18 |
In the opinion of the QP, under the MPRDA, Harmony is entitled to apply to review the mining right on its expiry. There are no known legal proceedings that may influence the right to mine. The mining right associated with Savuka Mine has expired, however this is not considered a material risk given that no Mineral Resource and Mineral Reserve has been declared under this mining right.
3.2Property Permitting Requirements
Mponeng is located on a site that has been operational for over 60 years, formerly known as Western Deep Levels. Western Deep Levels comprised No. 2 Shaft, No. 3 Shaft and No. 1 Shaft. 1 Shaft was commissioned in 1986 and renamed to Mponeng in 1999. The surface rights in the Mponeng area were previously held by AngloGold Ashanti. Harmony has access to all the properties it requires to conduct its current mining activities. The surface lease and surface right areas are sufficient in size and nature to accommodate the required surface infrastructure to facilitate current and planned mining and processing operations.
Harmony monitors complaints and litigation against the Company as part of its risk management systems, policies and procedures. There is no material litigation (including violations or fines) against the Company as at the date of this report which threatens its mineral rights, tenure or operations.
Effective Date: June 30, 2024
8
Technical Report Summary for
Mponeng Mine, Gauteng, South Africa
Figure 3-1: Location of Mponeng Mine
Figure 3-2: Legal Tenure of Mponeng Mine
Effective Date: June 30, 2024
9
Technical Report Summary for
Mponeng Mine, Gauteng, South Africa
4Accessibility, Climate, Local Resources, Infrastructure and Physiography
Section 229.601(b)(96)(iii)(B)(4) (i-iv)
4.1Accessibility
Mponeng is located adjacent to the N12, a National Road and can be reached via tarred roads to all main access points. Access to the mine is restricted by security fencing, security guards, booms and lockable gates at the main entrance. In addition, a communication system and access control system monitors personnel entering and leaving the mine property.
4.2Physiology and Climate
Mponeng is situated approximately 1,550 meters above sea level (“masl”) within the Highveld region of South Africa. The surrounding area is characterized by undulating plains interspersed by rocky peaks. A prominent rock ridge known as the Gatsrand extends from the eastern extent to the western extremity forming a watershed.
The mine falls within the Highveld climatic zone, which is characterized by warm temperatures, dry winters, and summer rainfall (with all conditions being erratic and extremely variable). The average annual rainfall recorded at the operation, based on recorded data between 2015 and 2018 was 698mm. Heavy thunderstorms between November and February, during which much of the rainfall occurs, results in erosion and runoff. Temperature patterns are characterized by seasonal and daily variations, where summers are hot, and winters are mild to cold. The seasonal fluctuations in mean temperatures between the warmest and the coldest months vary between 12°C and 15°C. The month of June is generally the coldest month with lowest recorded temperatures of an estimated -2°C while the maximum recorded temperature of 37°C generally occurs in February. Windy months occur between August and November. The Mponeng operation is not restricted by climatic or seasonal occurrences.
4.3Local Resources and Infrastructure
Infrastructure in the region is well established supporting the numerous operational gold mines in the area. The regional infrastructure includes national and provincial paved road networks, power transmission and distribution networks, water supply networks and communication infrastructure. Supplies and consumables required for operational purposes are readily available from well established suppliers. The labour compliment is also sourced within the company and locally in the area of operation.
Mponeng comprises a twin-shaft system with two surface vertical shafts and two sub-vertical shafts. Ore and waste material are hoisted separately with ore being delivered to the plant by means of a conveyor belt and the waste rock going to the low-grade stockpile. Mponeng has its own processing plant situated adjacent to the mine. Operations are powered by electricity from Eskom Holdings State Owned Company (SOC) Limited.
Effective Date: June 30, 2024
10
Technical Report Summary for
Mponeng Mine, Gauteng, South Africa
5History
Section 229.601(b)(96)(iii)(B)(5) (i-ii)
5.1Historical Ownership and Development
Mponeng was formerly known as Western Deep Levels South Shaft, or No.1 Shaft when Anglo American Corporation first owned the operation. The No. 1 South Shaft system (i.e., the vertical twin shaft) together with the gold plant were commissioned in 1986. The shaft system allowed access to the deeper VCR in the southern part of the lease area. The name changed in 1999 to Mponeng and was 100% owned and operated up until recently by AngloGold Ashanti. As at 1 October 2020, Harmony took full control and ownership of Mponeng as part of the acquisition of AngloGold Ashanti’s South African business. During February 2024, the LOM extension was approved allowing the extension on the VCR and CLR reefs.
Mponeng is part of the West Wits mining district that includes the Savuka Mine (previously known as Western Deep Levels No.2 Shaft) and the TauTona Mine (previously known as Western Deep Levels No. 3 Shaft) (both now also 100% owned by Harmony). These two mines predominantly exploited the CLR within the lease area, which is now mostly mined out resulting in them being placed on care and maintenance in 2017. The Mineral Resources and Mineral Reserves for TauTona were transferred to Mponeng during the same year. The historical ownership and associated activities related to Mponeng are summarized in Table 5-1.
Table 5-1: Summary of Historical Ownership Changes and Activities of Mponeng Mine
| | | | | |
| Year | Asset History Highlights |
| 1981 | Anglo American Corporation commenced construction of the original twin shaft system and the gold plant complex in the southern part of the lease area. |
| 1986 | The vertical twin shaft system and the gold plant was commissioned. |
| 1993 | A sub-vertical shaft was commissioned that enabled development and production of the VCR. |
| 1995 | Anglo American Corporation approves a project to deepen the mine’s South Shaft system from 3 036m to 3 805m BMD |
| 1998 | AngloGold Ashanti was formed through the merger of the gold interests of Anglo American and its associated companies. |
| 1999 | In November, Gold Fields Limited and AngloGold agreed to a mineral rights exchange between Western Deep Levels and Driefontein. |
| 1999 | The Western Deep South Shaft or No 1 Shaft changed name to Mponeng Mine. |
| 2001 | AngloGold Ashanti approves the deepening project to establish the mining area from 109 level to 120 level. |
| 2004-2009 | The SSV shaft and the SS2 shaft were sunk and equipped. |
| 2007 | AngloGold Ashanti approves the USD1.1bilion B120 Phase 1 project, formerly known as the VCR B120 project. |
| 2017 | Savuka and TauTona mines placed under care and maintenance and the Mineral Resources and Mineral Reserves for TauTona were transferred to Mponeng. |
| 2017 | AngloGold Ashanti submitted a section 102 application to consolidate the three mining rights. |
| 2020 | Harmony takes ownership and control of Mponeng as of 1 October from AngloGold Ashanti. |
| 2024 | Approval of Mponeng mine extension |
| |
| |
| |
| |
| |
5.2Historical Exploration
Exploration work on the Mponeng (then Western Deep Levels) lease area commenced in the early 1980s. The work was initially limited to surface platforms, where an extensive surface exploration program was conducted across the Western Deep Levels leases by Anglo American. As the underground areas were accessed, more platforms were generated underground. During the 1980s and 1990s, the exploration work complimented and supported the longwall mining activities, exploring east and west of the mining fronts on the shallower levels, as well as ahead of the deepening project to 3,000m below surface.
From 1990s to 2000, longer exploration drill holes from the underground platforms began to probe the deeper parts of the VCR horizon to 3,500m below the ground surface. From 2000, exploration started to ramp up as more underground platforms were developed allowing rigs to be positioned across the east and west of the mine, targeting the deeper parts of the VCR to 3,700m below the ground surface.
Effective Date: June 30, 2024
11
Technical Report Summary for
Mponeng Mine, Gauteng, South Africa
From 2008, the deeper parts of the CLR horizon were explored from the Mponeng underground platforms for the CLR deepening project. The program was completed in 2010/2011.
The last of the surface exploration programs at Mponeng was started in 2009 and stopped in 2019, when it was decided that probing deeper than 4,000m was no longer aligned with the strategy for mining the VCR. The last four surface drill holes were drilled during this period, with the last two of these being abandoned. These intersections complimented the already extensive surface drill hole program completed decades before.
Underground exploration from 2020 to current continued to probe the areas east and west ahead of the current mining front from 126 level and deeper. The information generated there has improved confidence in the geological structure model and added data points for the estimation on the VCR so that value estimates can be extrapolated deeper with more confidence.
5.3Previous Mineral Resource and Mineral Reserve Estimates
The previous in-situ Mineral Resource estimate for both the VCR and CLR horizons at Mponeng was declared as at June 30, 2023 under Regulation S-K 1300. The Mineral Resource was estimated using mixed support co-kriging, a technique that allows both drill hole and underground sampling data to be used together.
The previous Mineral Resource estimate is summarized in Table 5-2, is exclusive of Mineral Reserves and has been superseded by the current estimate prepared by Harmony in Section 12 of this TRS.
Table 5-2: Summary of the Previous Mponeng Mineral Resources as at June 30, 2023 (exclusive of Mineral Reserves)
| | | | | | | | | | | |
| METRIC |
| Mineral Resource Category | Tonnes (Mt) | Gold Grade (g/t) | Gold Content (kg) |
| Measured | 2.843 | 17.99 | 51,126 |
| Indicated | 18.632 | 13.92 | 259,408 |
| Total / Ave. Measured + Indicated | 21.474 | 14.46 | 310,534 |
| Inferred | 31.520 | 11.70 | 368,729 |
| | | |
| IMPERIAL |
| Mineral Resource Category | Tons (Mt) | Gold Grade (oz/t) | Gold Content (Moz) |
| Measured | 3.133 | 0.525 | 1.644 |
| Indicated | 20.538 | 0.406 | 8.340 |
| Total / Ave. Measured + Indicated | 23.671 | 0.422 | 9.984 |
| Inferred | 34.745 | 0.341 | 11.855 |
The previous Mineral Reserve estimate for the VCR horizon (at Mponeng) and CLR horizon (at TauTona) was declared by Harmony as at June 30, 2023 in accordance with the SAMREC Code. Modifying Factors were applied to the in situ Mineral Resource to arrive at the Mineral Reserve estimate. These factors included a dilution to accommodate the difference between milling width and stoping width, as well as the Mine Call Factor (“MCF”). The previous Mineral Reserve estimate is summarized in Table 5-3 and has been superseded by the current estimate prepared by Harmony as detailed in Section 12.3 of this TRS.
Effective Date: June 30, 2024
12
Technical Report Summary for
Mponeng Mine, Gauteng, South Africa
Table 5-3: Summary of the Previous Mponeng Mineral Reserves as at June 30, 2023
| | | | | | | | | | | |
| METRIC |
| Mineral Reserve Category | Tonnes (Mt) | Gold Grade (g/t) | Gold Content (kg) |
| Proven | 2.678 | 9.68 | 25,929 |
| Probable | 3.316 | 8.87 | 29,410 |
| Total / Ave. Proven + Probable | 5.994 | 9.23 | 55,340 |
| | | |
| IMPERIAL |
| Mineral Reserve Category | Tons (Mt) | Gold Grade (oz/t) | Gold Content (Moz) |
| Proven | 2.952 | 0.282 | 0.834 |
| Probable | 3.655 | 0.259 | 0.946 |
| Total / Ave. Proven + Probable | 6.607 | 0.269 | 1.779 |
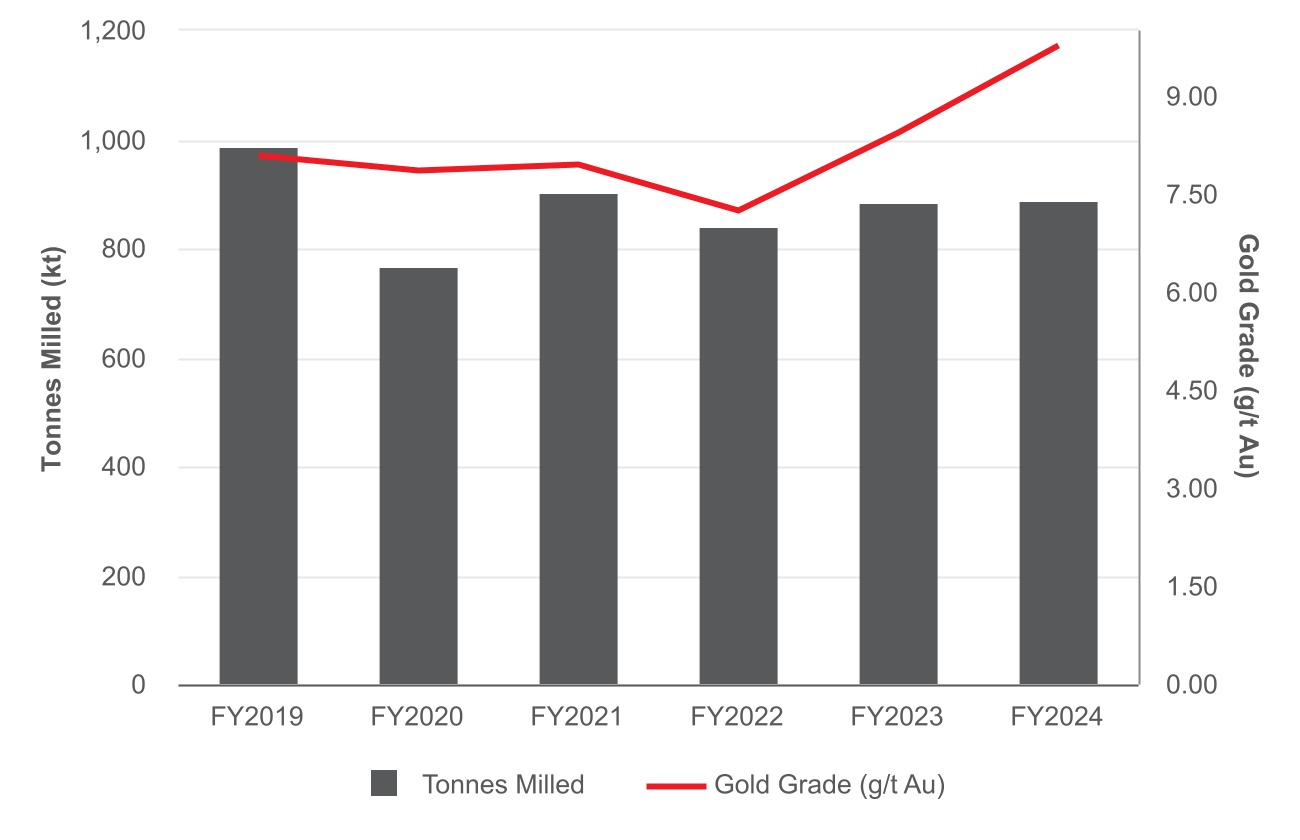
5.4Past Production
Since the commencement of mining in 1986 and reaching a steady state in 1991, the average annual production rate during this period was 327koz. The highest product rates at Mponeng were achieved in the period between 2002 and 2008, during which the average annual production was 528koz.
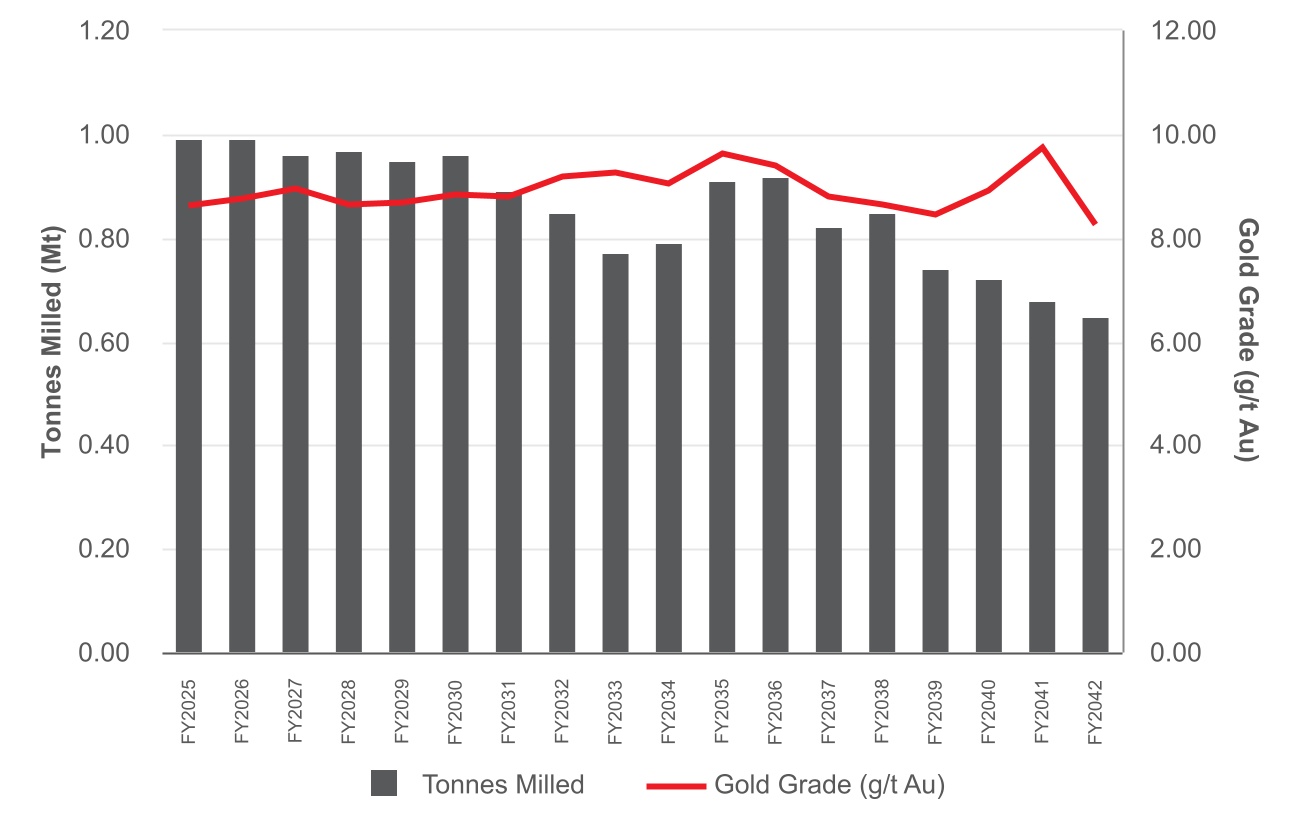
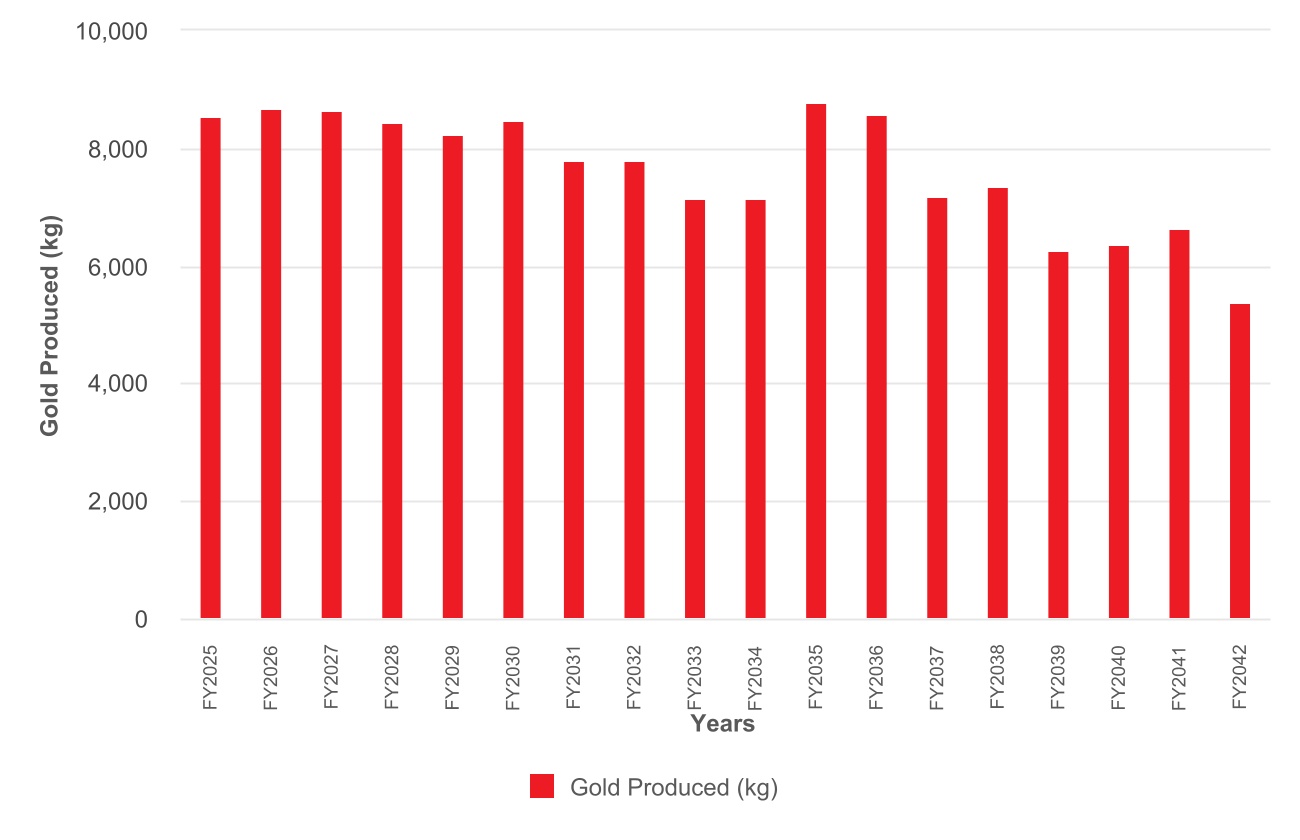
In 2022, the production rate was slightly lower than the average annual production rate of 7,122kg achieved between 2018 and 2021 (Figure 5-1 and Figure 5-2). The average annual production is generally proportional to the number of active production levels as shown in Table 5-4. The production rate achieved in 2020 was not representative of normal operations at Mponeng, given that operations at Mponeng were not run by Harmony for the full year. For 2022, 6,086kg was produced, which was a decrease of 12% year on year against 2021. For 2023, 7,449kg was produced, which was an increase of 18% from 2022. Gold production for 2024 is at 8,751 kg, which is an increase of 22% from 2023.
Table 5-4: Number of Active Production Levels at Mponeng
| | | | | |
| Period (Years) | Number of Active Levels |
| |
| |
| |
| |
| |
| |
| 2019-2024 | 3 - 4 |
| 2015-2018 | 4 - 5 |
| 2009-2014 | 4 - 5 |
| 2002-2008 | 7 |
| 1992-2001 | 4 - 5 |
| 1986-1991 | 3 |
Effective Date: June 30, 2024
13
Technical Report Summary for
Mponeng Mine, Gauteng, South Africa
Figure 5-1: Graph of Past Production – Tonnes and Grade
Figure 5-2: Graph of Past Metal Production 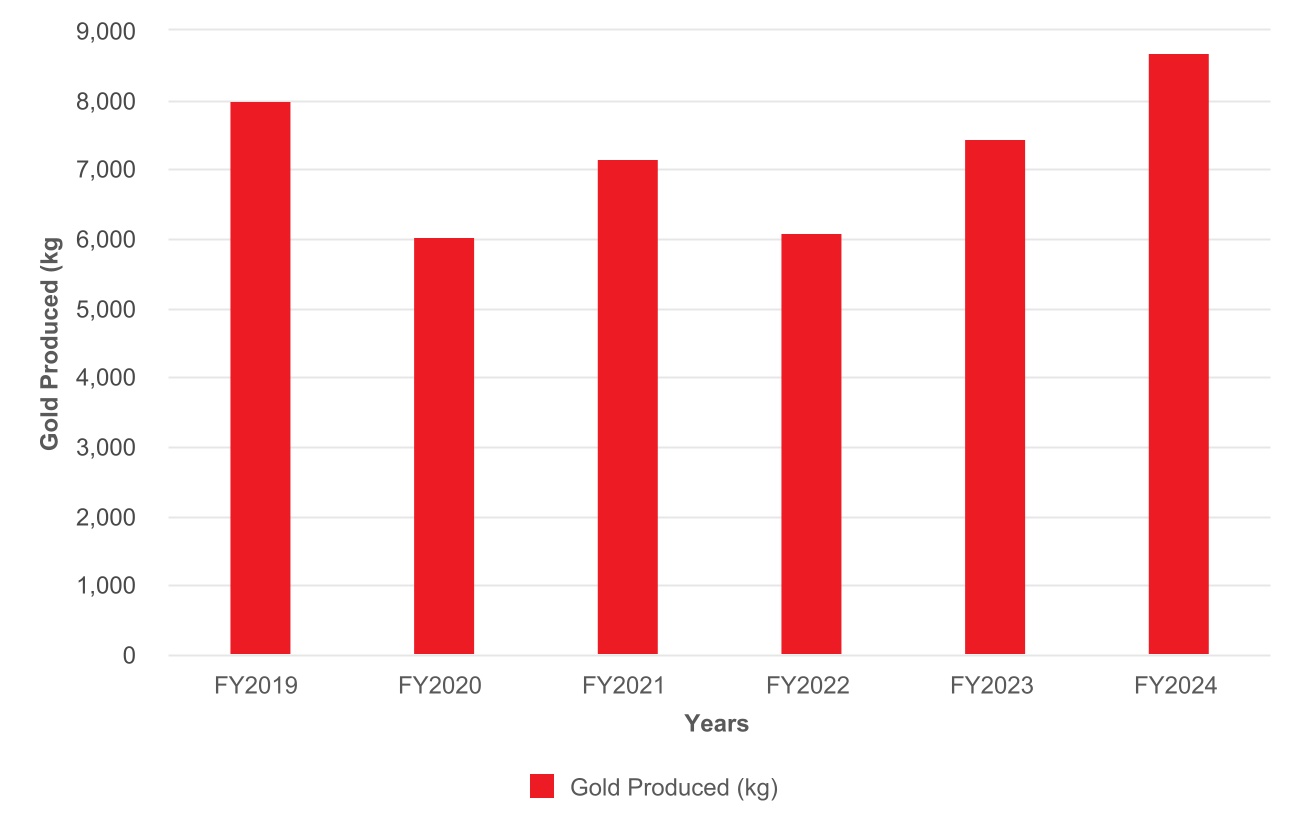
Effective Date: June 30, 2024
14
Technical Report Summary for
Mponeng Mine, Gauteng, South Africa
6Geological Setting, Mineralization and Deposit
Section 229.601(b)(96)(iii)(B)(6) (i-iii)
6.1Regional Geology
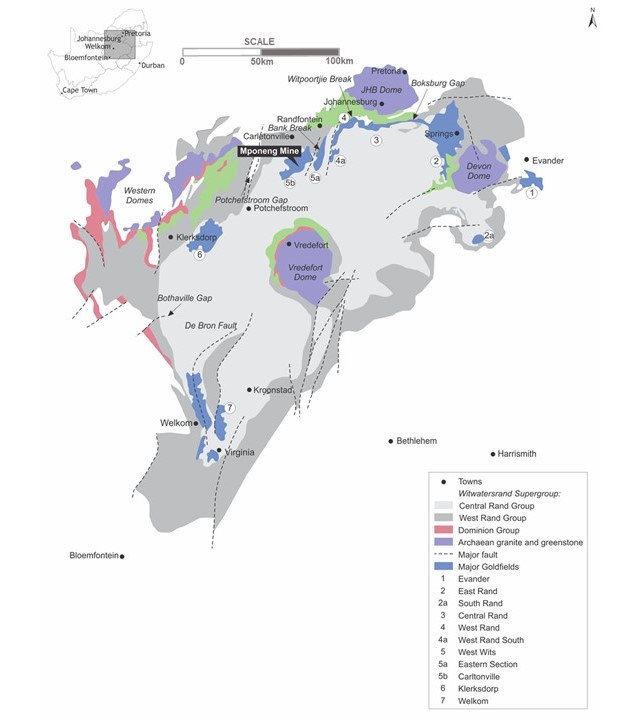
Mponeng is located on the north-western margin of the Archean Witwatersrand Basin, one of the prominent gold provinces in the world. The Witwatersrand Basin is an approximately 7,000m thick terrigenous sequence comprising mainly arenaceous and argillaceous, together with minor rudaceous, lithologies deposited in a fluvio-deltaic environment in the center of the Archaean Kaapvaal Craton of South Africa (Robb and Meyer, 1995). The regional geology of the Witwatersrand Basin is shown in Figure 6-1.
The Witwatersrand Basin hosts the Witwatersrand Supergroup, which either conformably or unconformably overlies the metamorphosed volcanic and minor clastic sediments of the Dominion Group (Tucker et al., 2016). The Dominion Group overlies the older granite-greenstone basement.
Majority of the Witwatersrand Supergroup is capped by the volcano-sedimentary sequence of the Ventersdorp Supergroup through an angular unconformity. The Ventersdorp Supergroup is in turn overlain by the dolomitic and quarzitic sequence of the Transvaal Supergroup, and sediments of the Karoo Supergroup (Tucker et al., 2016). Several suites of dykes and sills cut across the Archaean basement and the Witwatersrand, Ventersdorp, Transvaal and Karoo supergroups, and forms important geological time-markers.
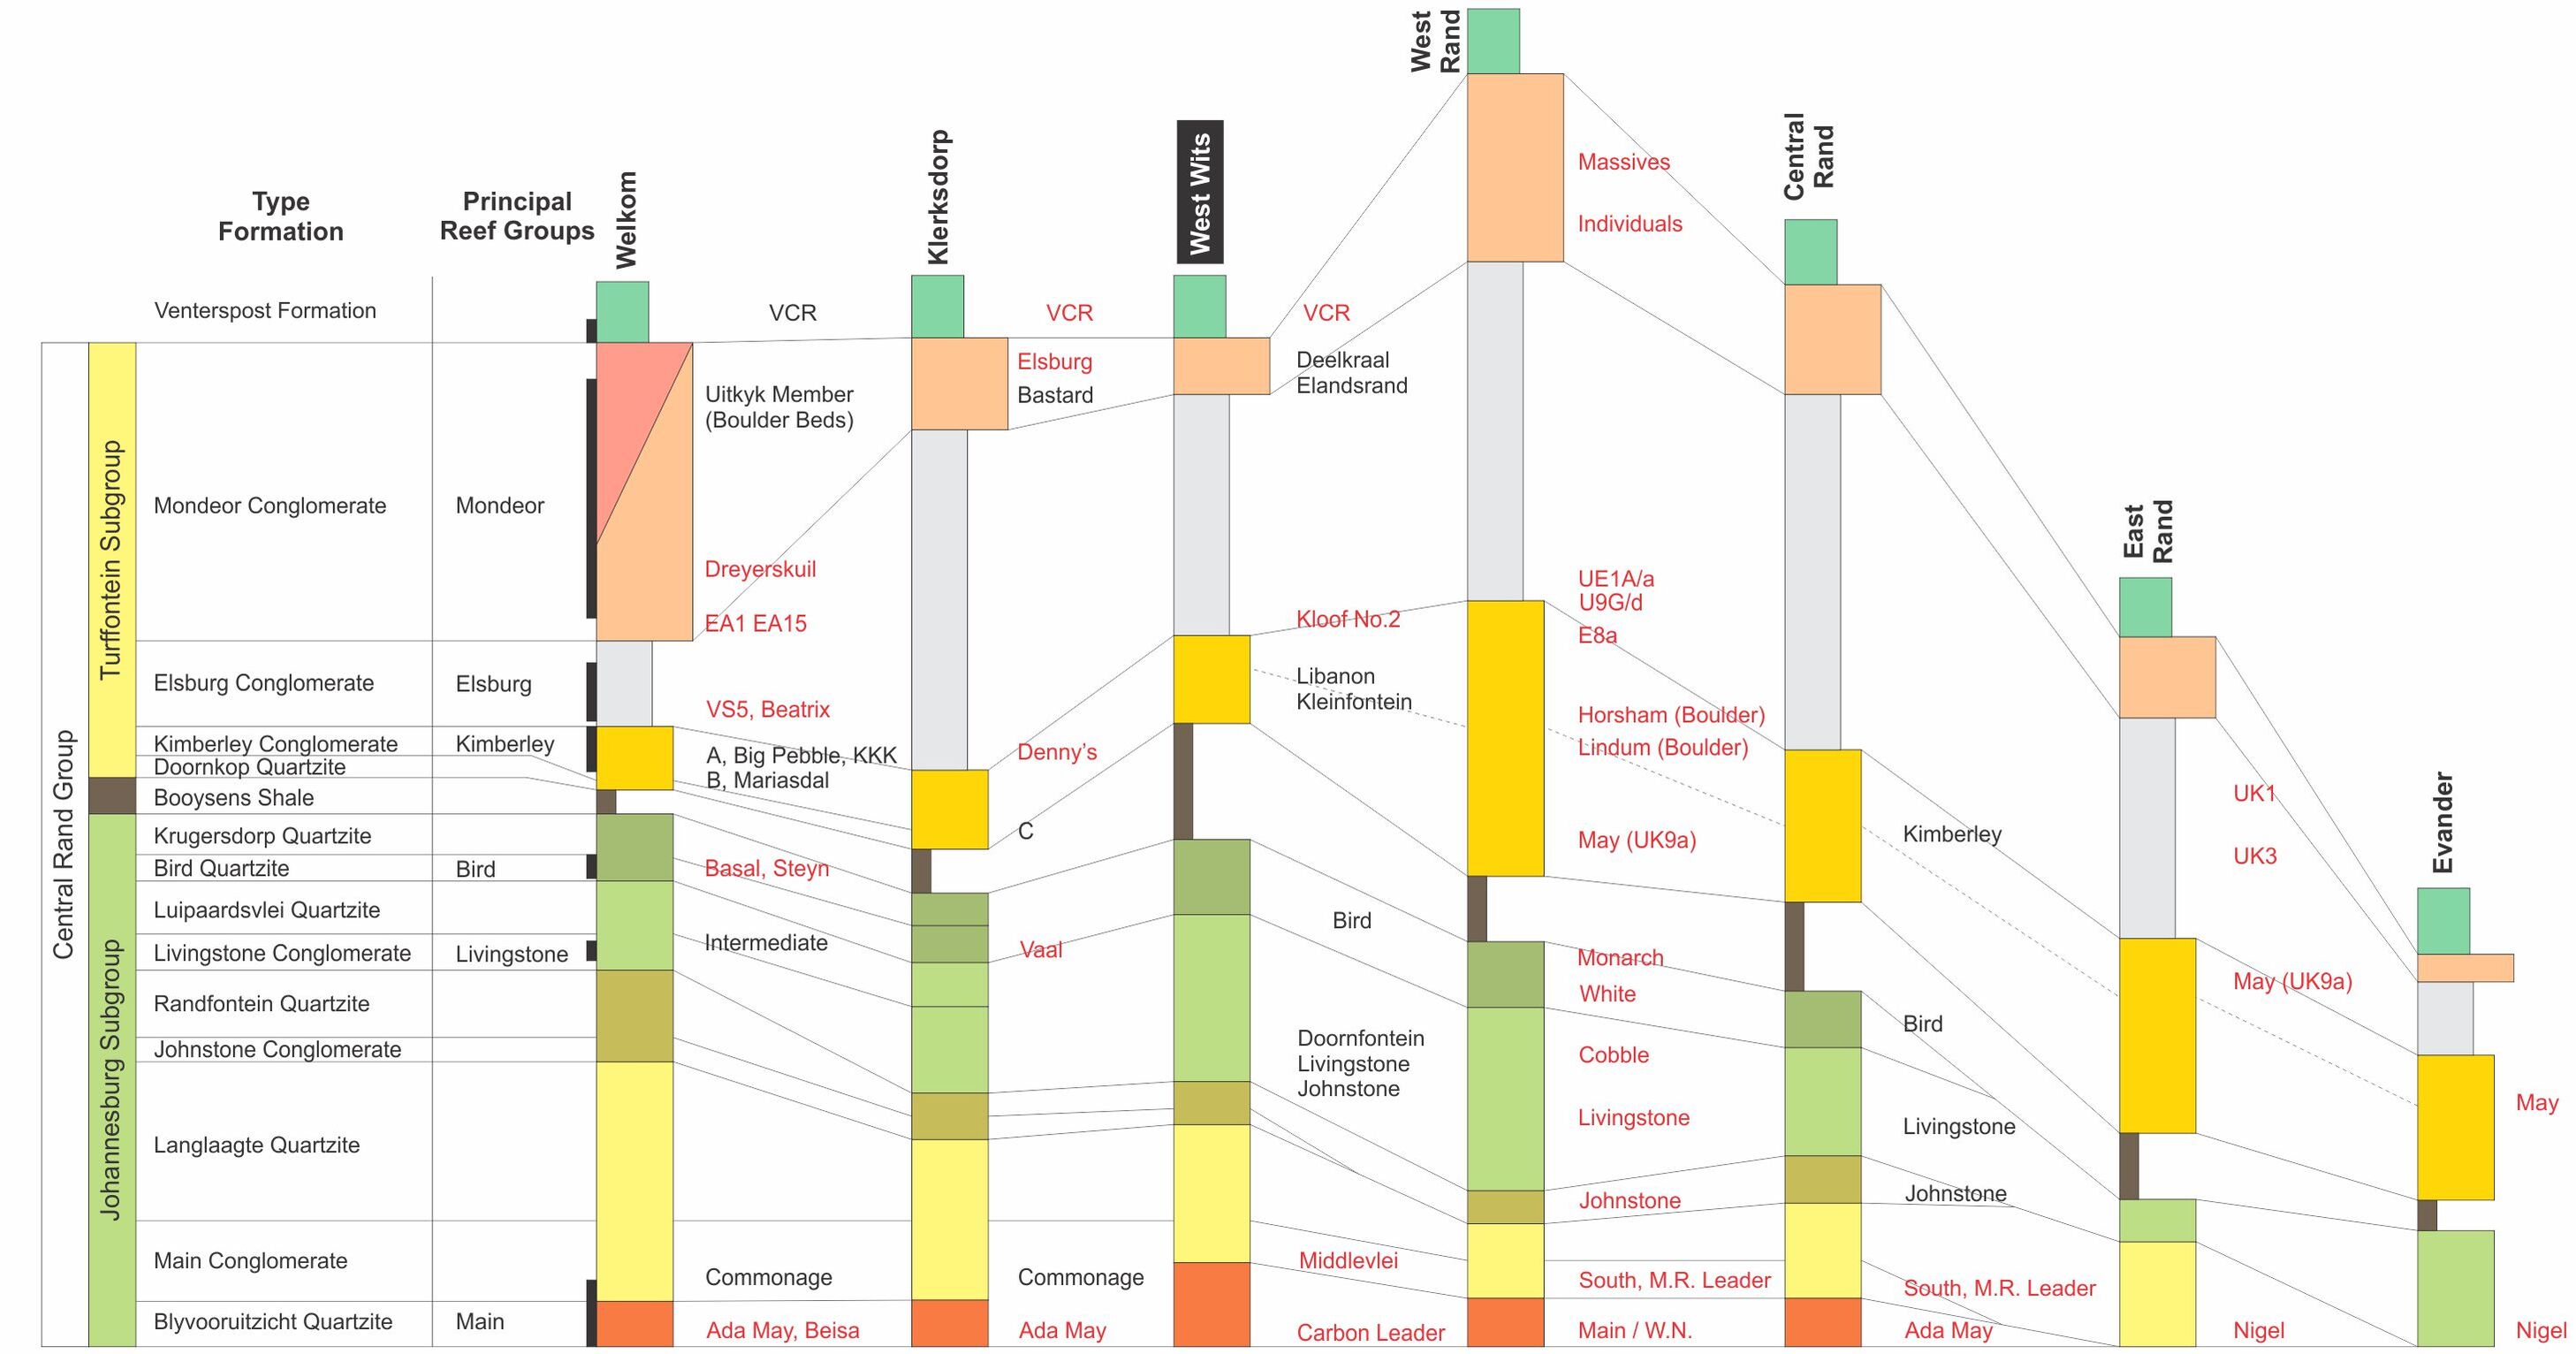
The Witwatersrand Supergroup is subdivided into the basal West Rand Group (“WRG”) and overlying CRG (Robb and Robb, 1998). The WRG extends over an area of 43,000km2 and is up to 5,150m thick. It is sub-divided in three subgroups, namely, from bottom upwards, the Hospital Hill Subgroup; Government Subgroup and Jeppestown Subgroup. The stratigraphic succession of the WRG mainly consists of shale sediments, with occasional units of banded iron formation and conglomerate. The CRG is up to 2,880m thick and covers an area of up to 9,750km2, with a basal extent of c.290km x 150km. It is sub-divided into the lower Johannesburg Subgroup and upper Turffontein Subgroup as shown in Figure 6-2. These subgroups are separated by the Booysens Shale Formation. The stratigraphic succession of the CRG comprises coarse-grained fluvio-deltaic sedimentary rocks.
The major gold bearing conglomerates are mostly confined to the CRG, and these conglomerate horizons are known as reefs. The most important reefs within the CRG are at six stratigraphic positions, three within the Johannesburg Sub-group and three within the Turffontein Sub-group. The reefs are mined in seven major goldfields, and a few smaller occurrences, which extend for over 400km in what has been called “The Golden Arc”. This arc is centered on the prominent Vredefort Dome, as shown in Figure 6-1, which is thought to be a major meteorite impact site in the center of the Witwatersrand Basin (Therriault et al., 1997). The goldfields, as shown in Figure 6-1, include: East Rand, South Rand, Central Rand, West Rand, West Wits, Klerksdorp, Free State (Welkom), and Evander.
6.2Local Geology
Mponeng is located within the West Wits Goldfield as shown in Figure 6-1. The general orientation of the Witwatersrand Supergroup succession in this goldfield is interpreted as west-southwest-trending and south-southeast dipping (Dankert and Hein, 2010).
The north-northeast-trending Bank Fault and the bedding sub-parallel Master Bedding Fault are the main faults identified in the goldfield (Dankert and Hein, 2010). The Bank Fault is described as a west dipping reverse fault that was reactivated as a normal fault. The Master Bedding Fault, which hosts brecciated and mylonite rock fragments, is described by various scholars as a 1m to 50m wide fault zone that is sub-parallel to bedding.
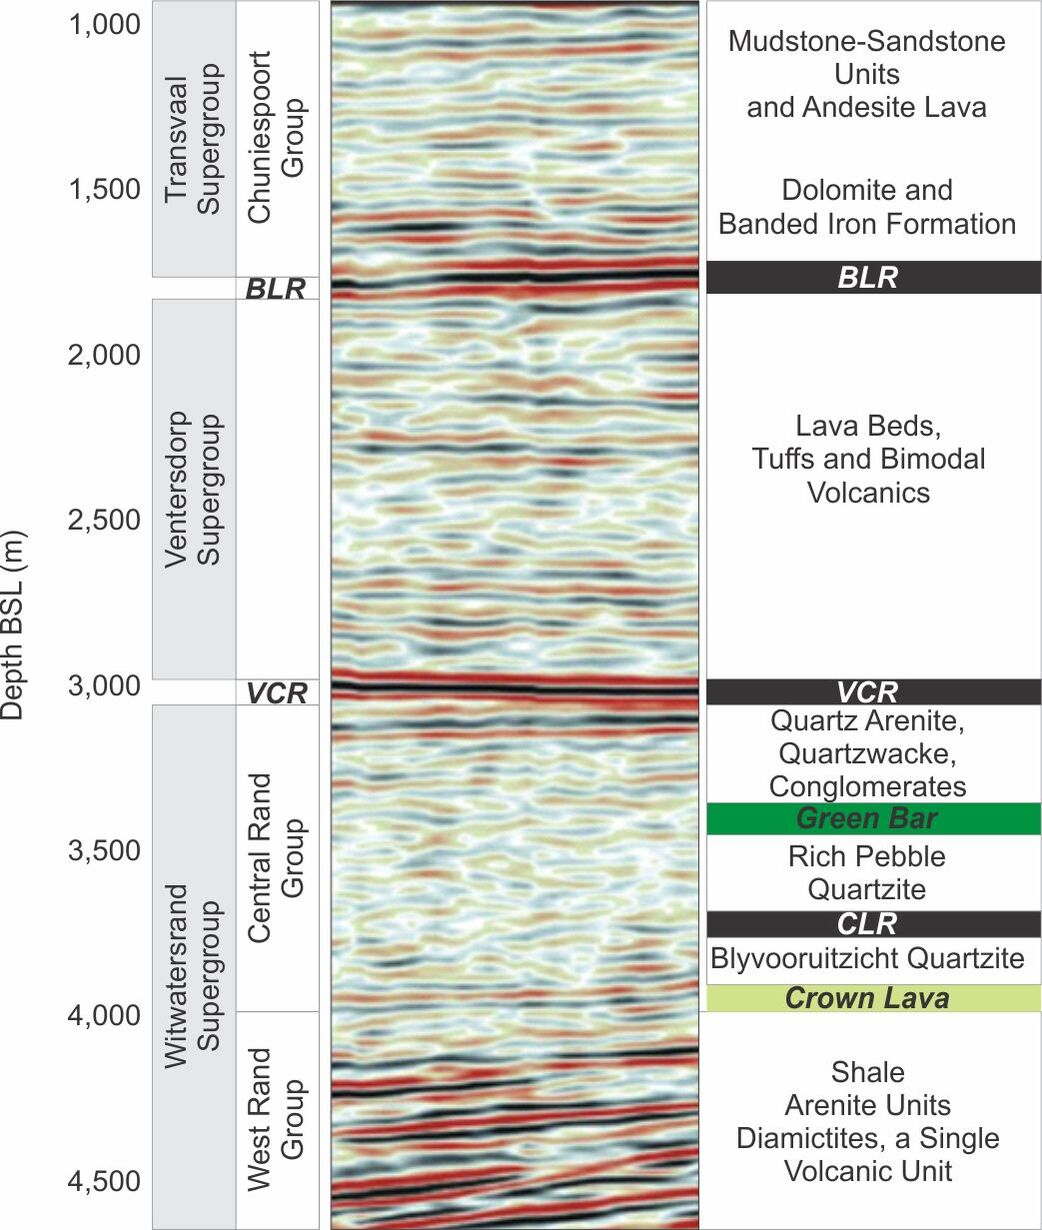
Mponeng mainly exploits the VCR, a tabular inclined gold-hosting horizon which is located at the top of the CRG (Figure 6-2), capping the Witwatersrand Supergroup (Figure 6-3). Extrusion of the overlying lavas of the Ventersdorp Supergroup halted the deposition of the VCR, preserving it in its current state.
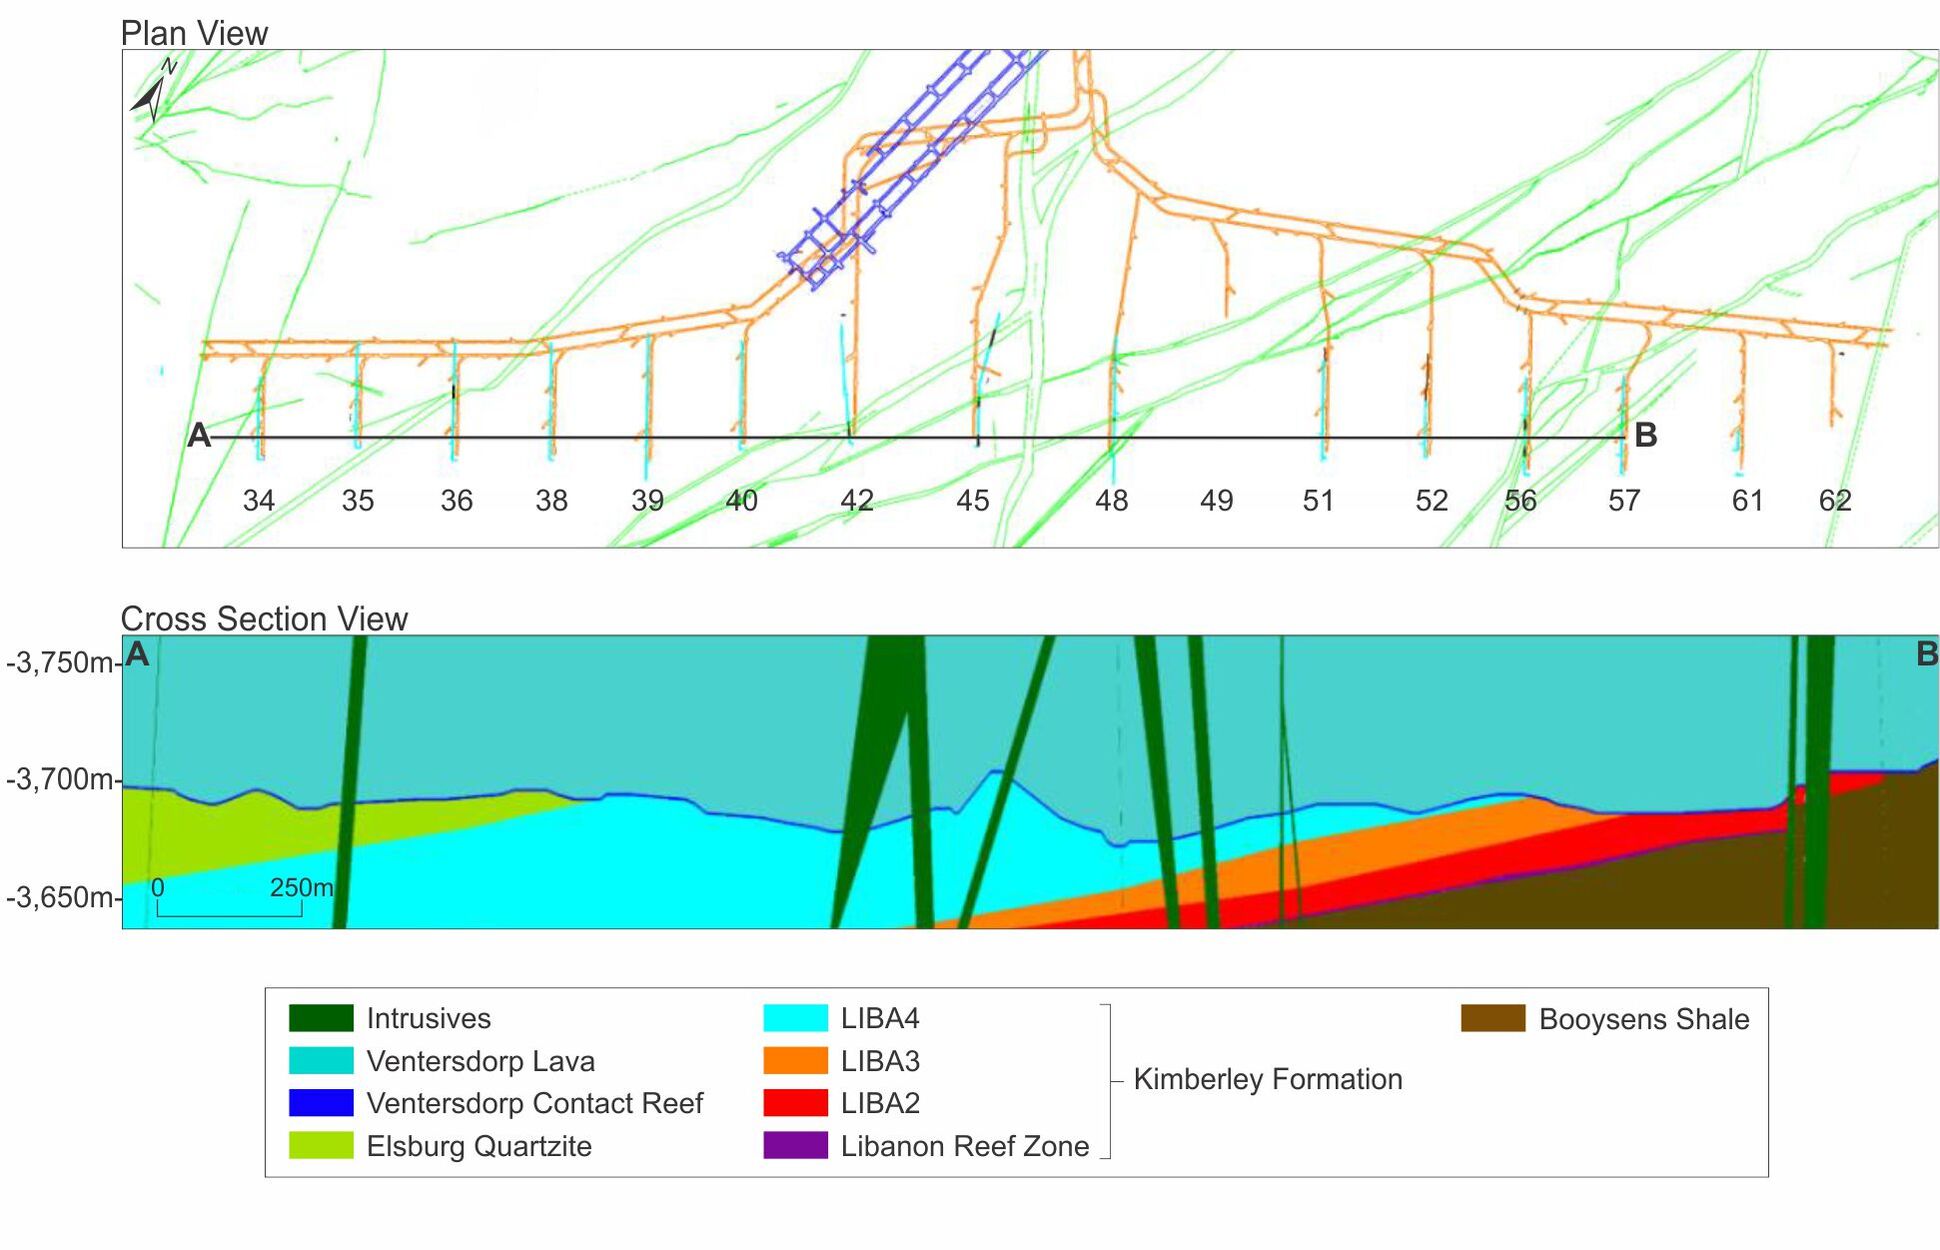
The VCR was deposited on the uneven footwall strata due to uplift and is now represented by a shallow angular unconformity. An east–west cross section showing variable footwall sub-outcrops across 123 level VCR intersection at Mponeng is presented in Figure 6-4. The footwall lithologies to the VCR therefore vary across Mponeng as the unconformity cuts deeper in an easterly direction into older strata of the Witwatersrand Supergroup.
Effective Date: June 30, 2024
15
Technical Report Summary for
Mponeng Mine, Gauteng, South Africa
Figure 6-1: Regional Geology of the Witwatersrand Basin
Effective Date: June 30, 2024
16
Technical Report Summary for
Mponeng Mine, Gauteng, South Africa
Figure 6-2: Stratigraphy of the CRG in the Witwatersrand Supergroup
Source: Modified after Tucker et al. (2016)
Effective Date: June 30, 2024
17
Technical Report Summary for
Mponeng Mine, Gauteng, South Africa
Figure 6-3: Simplified stratigraphy of the West Wits Goldfield
Source: Adapted from Mazi et al. (2015)
Figure 6-4: Mponeng west - east section across 123 level VCR intersection
6.3Property Geology
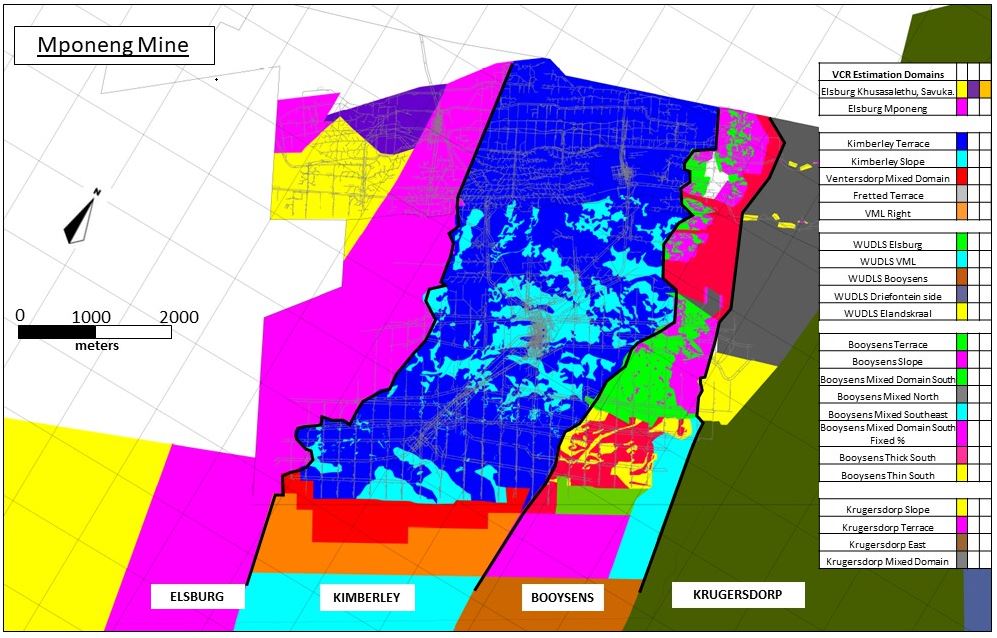
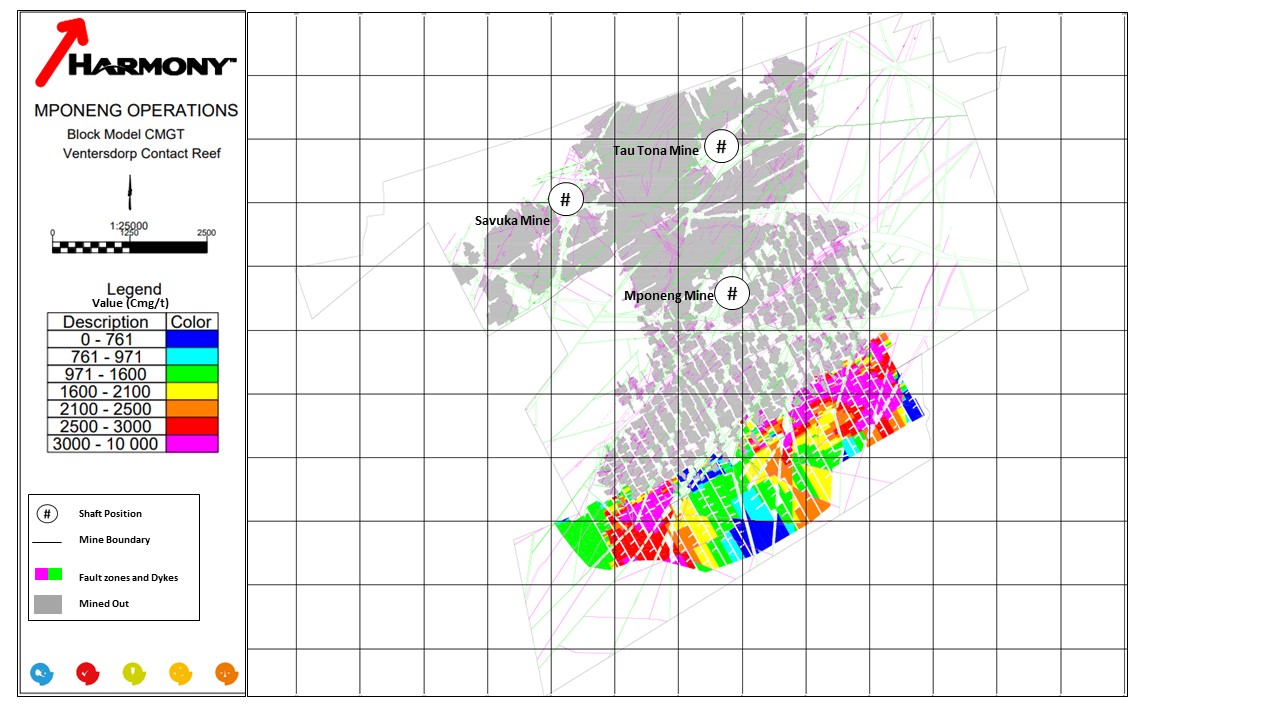
The VCR is continuously developed across the entire Mponeng mining area and dips at c.22 degrees in a south-southeast direction. The CLR, historically mined at the adjacent TauTona and Savuka mines, is the other gold-bearing reef reported as part of the Mponeng Mineral Resource. It lies 800-900m stratigraphically deeper than the VCR, near the base of the Johannesburg Subgroup of the CRG (Figure 6-2).
Effective Date: June 30, 2024
18
Technical Report Summary for
Mponeng Mine, Gauteng, South Africa
6.3.1VCR Lithology
The VCR consists of a quartz pebble conglomerate, which can be up to 3m thick in places. The footwall stratigraphy, following periods of uplift and erosion, controlled the development and preservation of the VCR. It is characterized by three major sedimentary facies referred to as the upper, middle and lower terrace reefs.
The upper terraces represent the original pulse of conglomerate deposition, and the lower terraces represent the final reworked product. The terraces are separated by narrow, laterally impersistent areas of slope reef. These slope reef areas constitute approximately 10-15% of the total surface area of the VCR.
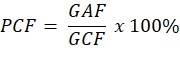
Intermediate (middle) terrace elevations between the upper and lower terraces are observed throughout the relatively argillaceous protoquartzites of the Kimberley Formation (Figure 6-2) in the central portion of Mponeng are covered by the best-preserved VCR conglomerates. The Elsburg Formation (Figure 6-2) in the west is relatively more durable while the eastern side of the mine is dominated by shales and siltstones of the Booysens Formation. No VCR is preserved on the Krugersdorp Formation (Figure 6-2) on the far eastern side of Mponeng.
6.3.2CLR Lithology
The CLR consists of, on average, a 20cm thick, tabular, auriferous quartz pebble conglomerate and three distinct sedimentary facies (namely Unit 1, 2 and 3 facies). Economically, the most important facies is Unit 1, which is characterised by a hydrocarbon seam typically 1m to 20mm thick at the base of the <0.1m thick conglomerate (Fletcher, 2009; Muller, 1991). Unit 1 is a complex channel deposit that is only present along the eastern side of the lease area. Unit 2 can be up to 2m thick and consists of an interbedded conglomerate-quartzite sequence (Muller, 1991). Unit 3 is exposed in the southern edges of the lease area and is the oldest of the conglomerates. The unit has smaller amounts of hydrocarbons than Unit 1.
6.3.3Structure
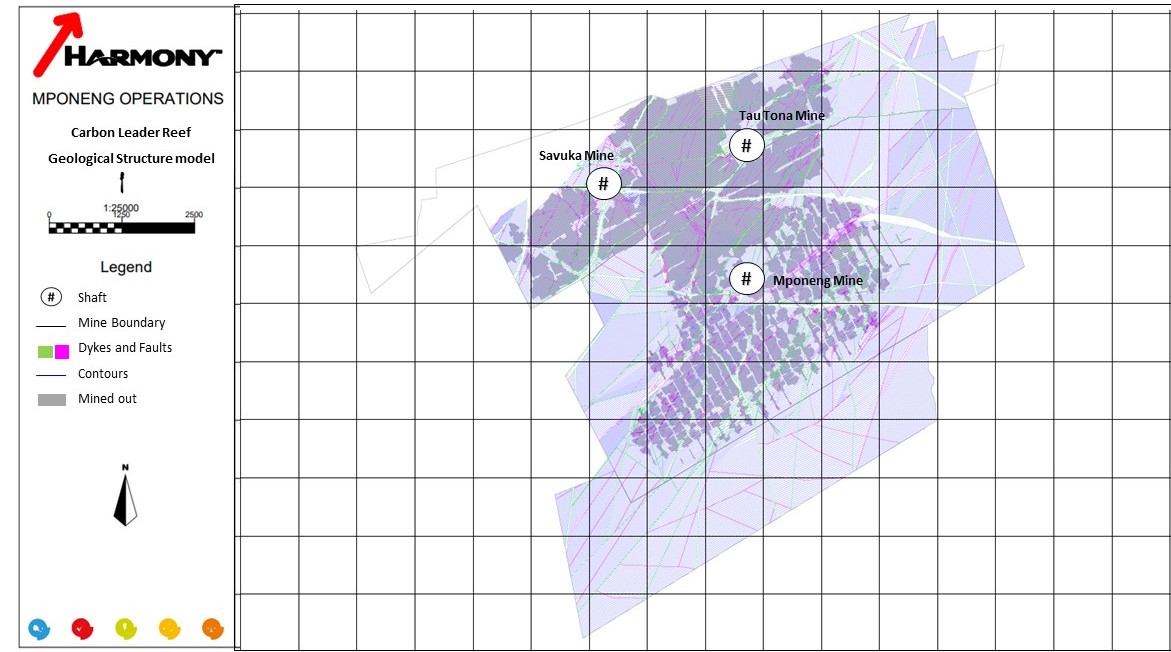
The structural geology plan for the VCR is presented in Figure 6-5 and the plan for the CLR is presented in Figure 6-6. Major faults at Mponeng were interpreted from historical seismic data using information from surface drill holes. These major faults define the margins of some of the reef blocks, as well as the preliminary contoured surface of the reefs.
One of the most important structures identified at Mponeng is the north-northeast-trending Pretorius Fault Zone (“PFZ”), with a maximum throw of 500m (Mazi et al., 2015). The delineation of the PFZ is paramount for both mine safety and planning. It has been interpreted as a growth fault with several phases of movement (Dankert and Hein, 2010). It is surrounded by a series of smaller normal faults that are likely to cause poor ground conditions when mining. This type of faulting cannot be detected by surface drilling and presents a major challenge to mine planning (Mazi et al., 2015).
The Mponeng lease area is also invaded by dolerite sills and syenite dykes of different ages (Mazi et al., 2015). Many of these dykes strike north to north–northeast with thicknesses that vary from 1m to 90m. Dykes located east of the mine are referred to as Gemsbokfontein and Venterspost; and dykes located on the west are referred to as Bank and Oberholzer.
Intrusive sills, although rare, have been identified in drill hole data and may be laterally continuous over several hundreds of metres. These sills often intrude along or close to the lava/quartzite contact (VCR horizon), thus removing or interrupting substantial portions of the reef.
Effective Date: June 30, 2024
19
Technical Report Summary for
Mponeng Mine, Gauteng, South Africa
Figure 6-5: Mponeng VCR Geological Structure Plan
Figure 6-6: Mponeng CLR Geological Structure Plan
6.4Mineralization
Gold mineralization is believed to have followed an episode of deep burial, fracturing and alteration. A variant of Archean gold bearing hydrothermal fluid was introduced into the conglomerates and circulated throughout in hydrothermal cells. The fluids precipitated gold and other elements through reactions that took place at elevated temperatures along the reef horizons, which was the more favorable fluid conduit. In the case of the VCR, the resulting gold grades are mostly uniformly distributed throughout the reef package.
6.4.1VCR Mineralization
The VCR is dominated by silicate phases such as quartz (c.60%), chlorite (c.10 %), muscovite (c.5%) and zircon (c.1 %), as well as sulphide phases such as pyrite, pyrrhotite and chalcopyrite (c.10 %). The pyrrhotite/pyrite
Effective Date: June 30, 2024
20
Technical Report Summary for
Mponeng Mine, Gauteng, South Africa
relationship is thermally related to prograde metamorphism often associated with the extrusion of the lavas of the Ventersdorp Supergroup.
6.4.2CLR Mineralization
CLR mineralization associated with the conglomerate occurs in the form of fine layers and stringers of pyrite rather than finely disseminated pyrite around the pebbles. “Flyspeck” carbon can be frequently found at the base of the conglomerate. The hydrocarbon precipitated also in thin, flat veins, usually at the base of the CLR conglomerate, and this is where the majority of the gold is concentrated.
6.4.3Alteration
The VCR displays strong alteration features, which can be explained by the hydrothermal fluids that infiltrated the reef and have overprinted on the original mineral assemblage. Portions of the reef contain authigenic sulphides such as pyrite, pyrrhotite, chalcopyrite, sphalerite and galena, incorporated in the conglomerate matrix. Gold associations with these mineral assemblages indicate a strong correlation of gold mobilisation and redistribution at the time of the hydrothermal fluid influx.
There is also a strong association of gold with a chloritization event focused along the reef horizon. The chlorite alteration gives a dark coloration to the reef. Gold was precipitated by cooling and reactions between the fluids and wallrock, in this case pyritic conglomerates. Gold mineralization was enhanced in certain areas of high fluid throughput, which were often the sites of high carbon precipitation and early alteration in the case of the CLR.
6.5Deposit Type
The Mponeng deposit is classed a meta-sedimentary gold deposit. Folding and basin edge faulting have been important controls for sediment deposition and gold distribution patterns within the Witwatersrand Basin and fold trends have been employed in the economic evaluation of various reef horizons.
The individual reefs range in thickness from a few tens of centimeters to several meters and are confined to the interval between a basal degradation surface, which is normally an angular unconformity, and an upper planar bedding surface marking the contact with overlying quartzwackes or siltstones. Both the upper and lower margins of the reefs are marked by a sharp change in gold content from several grams per tonne to <20 part per billion.
The reefs occur as a lens-like fluvial bar and channel beds with unimodal palaeo-current directions. Thicker reefs occur as multi-channel sequences of conglomerate and quartz-arenite representing flood and waning stage flows. The depositional environment of the reef-hosts a range from proximal alluvial fans, to terraced fluvial, braid plain and braid delta, merging into shoreline environments.
On a regional scale the reefs are distributed along the margin of the CRG basin, at the main entry points of complex river systems into the original basin. On a mine scale, the highest grades are usually, but not exclusively in the channel facies, with higher grades where the channels are thickest. Individual reefs may be of the order of 3km or wider and 5km to 10km long.
6.6Commentary on Geological Setting, Mineralization and Deposit
In the QP’s opinion, there is an inherent risk in mining through the faults and intrusives that cross-cut both the VCR and CLR, and a key objective of Mponeng geologists is to identify these geological features ahead of the working face to assist with deciding on the best way to approach and mine through these structures. Identified major structures define the margins of the reef blocks upon which the mine is designed.
Effective Date: June 30, 2024
21
Technical Report Summary for
Mponeng Mine, Gauteng, South Africa
7Exploration
Section 229.601(b)(96)(iii)(B)(7) (i-vi)
Exploration at Mponeng has mainly focused on improving confidence in the geological model, as well as adding and upgrading additional Mineral Resources to the mine. Geological data has been obtained through structured underground channel (chip) sampling, mapping and drilling. This underground detailed, closer spaced data gathering exercise has been preceded by surface exploration of the lease area using a historical geophysical seismic survey, as well as surface diamond core drilling.
Exploration from underground platforms is currently continuing for the VCR in the east and west of the current mining levels, between 3,500m and 3,700m below surface, to improve geological confidence.
7.1Geophysical Seismic Survey
A 3D seismic reflection survey was conducted by AngloGold Ashanti in 1993 for Mponeng Mine planning. The 3D survey was conducted by Compagnie Générale de Géophysique, covering an area of c.300km2 (Mazi et al., 2015). The objective of the survey was to delineate the sub-surface formations above and below the VCR and CLR horizons, at depths ranging from 2.7km to 4.2km.
The data obtained from the survey was processed by Velseis Processing Pty, successfully delineating the entire stratigraphy from surface through the Ventersdorp Supergroup to the base of the Witwatersrand Basin (c.11km in depth) including the VCR (see Figure 6-3). This enabled AngloGold Ashanti to better understand the structural characteristics of the VCR at depths between 2.5km and 3.5km below the surface. The CLR was not detected due to its relatively thin nature and association with quartzitic units which have unfavorable characteristic for seismic contrast.
In 1994, AngloGold Ashanti interpreted the results of the survey using Geophysical AIS-3D software which was further enhanced using exploration drill core and VCR mappings from sub-shaft intersections. The interpretation together with the new data allowed for the bulk shift of all interpreted data of about 42m. Additional analysis and interpretation of the dataset was undertaken in 1997 using the GeoQuest software. The results improved confidence in the geological planning at the then Western Deep Levels, particularly the positioning of the VCR at the sub-outcrop of the Kimberley Quartzite.
In 2010 and 2011, AngloGold Ashanti completed further analysis and interpretation on the 3D dataset particularly focusing on the CLR horizon. This confirmed the reef elevations in relation to already completed CLR underground exploration drill holes. This also confirmed major structures that could interrupt the continuity of the deeper extensions of the mineralized horizon from where it had been mined at TauTona. No further surveys and interpretations have been undertaken on Mponeng.
7.2Underground Mapping
Face and reef development mapping is undertaken by a team comprising two or more personnel. Face tapes are setup along gullies and the stope face and secured with the latest survey pegs installed in the workplaces. Reef position and other lithological and stratigraphic information is collected and measured relative to the reference tapes. The information is captured in a notebook.
Once at surface, the personnel transfer the information from the notebook into the system where a mapping report is produced for each mapped workplace. The mapping reports depict the geological information graphically relative to the survey measurement points. Data from the mapping is also incorporated into the geological models.
Approximately 80-90% of all workplaces are inspected by member of the Geosciences team on a monthly basis to ensure that suitable mapping information coverage is achieved.
7.3Channel Sampling Methods and Sample Quality
Channel (chip) sampling of underground panels blasted on monthly basis is conducted perpendicular to the channel contact across the exposed channels.
The section lines demarcating the width of the sample are drawn parallel to the reef waste contact while those demarcating the length of the sample are drawn at right angles to the reef waste contact and are marked 10cm apart. The samples are chipped out between these section lines. The sampler ensures that the
Effective Date: June 30, 2024
22
Technical Report Summary for
Mponeng Mine, Gauteng, South Africa
face is clean and free of any contamination during chipping and also avoiding spillage during bagging of the underground chip samples to ensure integrity.
Sampling of the VCR and CLR channels are undertaken at the advancing face on a grid spacing of 5m x 5m. The sampling process is audited monthly and annually by the Geoscience Manager.
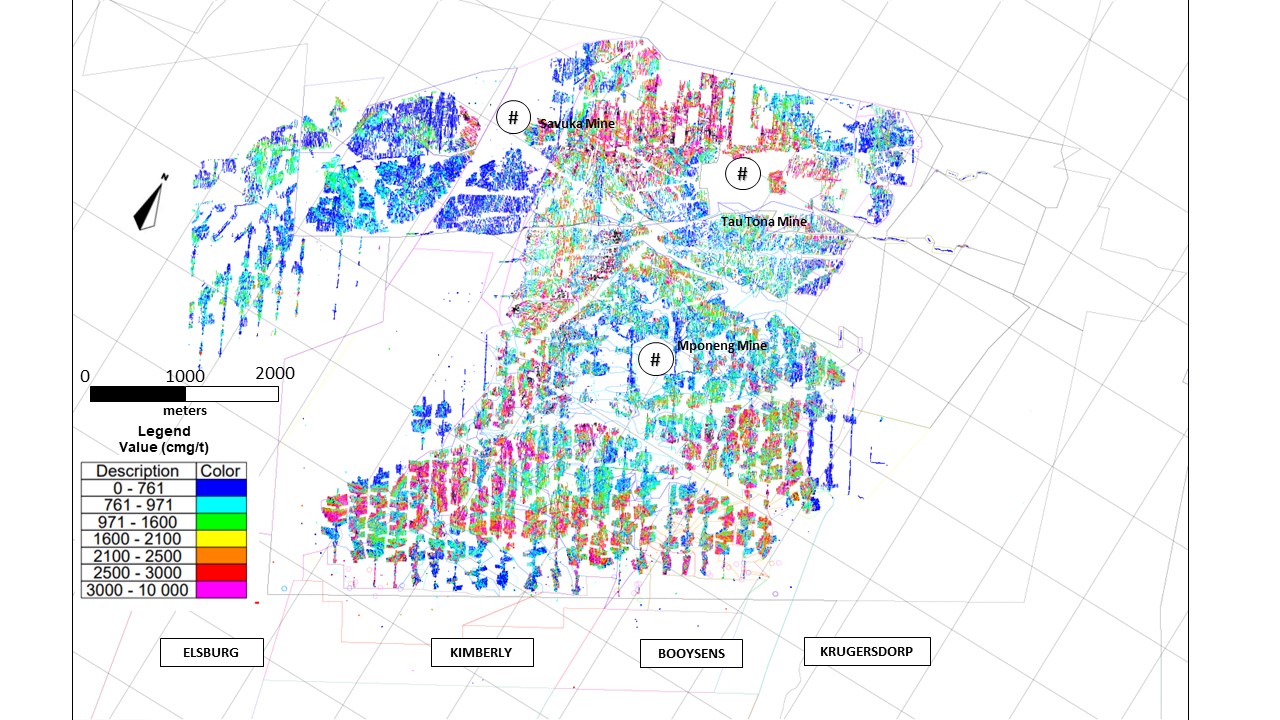
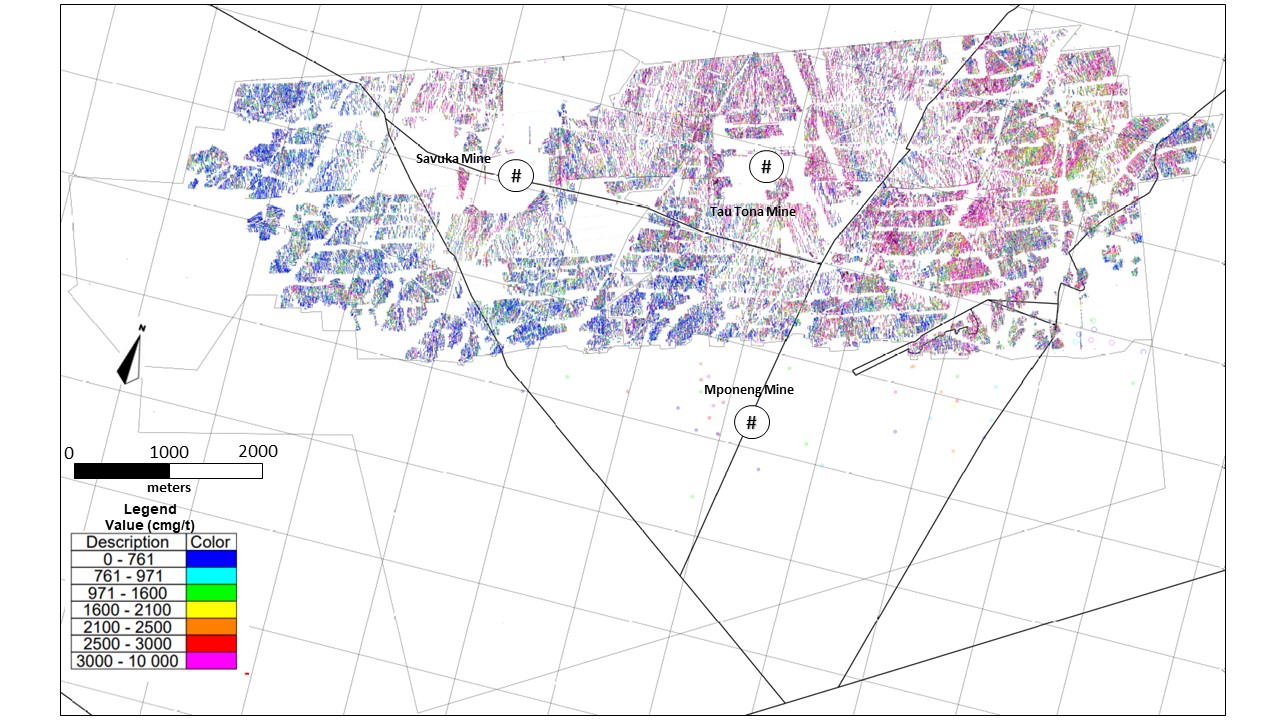
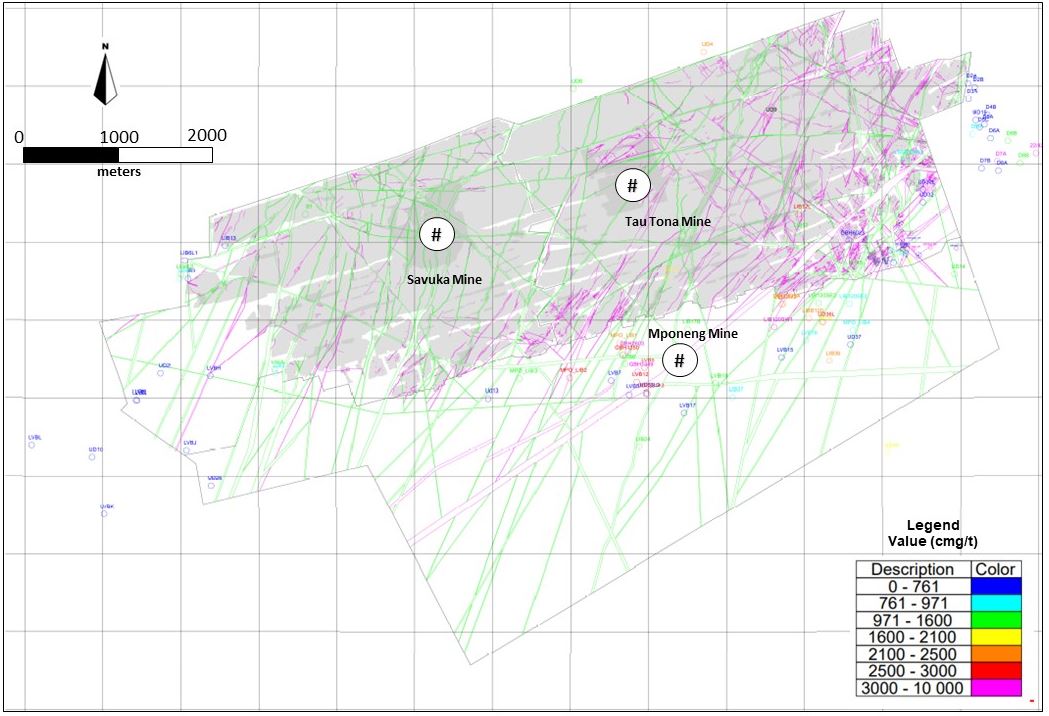
The location of samples collected from the VCR to date is shown in Figure 7-1 and the location of the samples collected from the CLR is shown in Figure 7-2. The reader is referred to Section 6.3 for a brief description of the geological domains presented in the diagrams (for the VCR: the Elsburg, Kimberley, Booysens and Krugersdorp domains; and for the CLR: the BLY, SAV, TAU and DRIE domains).
7.4Drilling Campaigns, Procedures, Sampling, Recoveries and Results
7.4.1Surface Drilling
Most of the surface drill holes used in the estimation of the current Mineral Resources, as well as those drilled on adjacent properties, such as Kusasalethu Gold Mine (“Kusasalethu”) Savuka and TauTona mines, were drilled by Anglo American and AngloGold Ashanti before Harmony acquired the mine. The drill holes were completed using the diamond core drilling method.
The surface diamond core drilling has been undertaken using a thin-walled core barrel (TNW size core barrel) that delivers NQ (47.6 mm) core for better sample recovery. The drill grid spacing of the surface drill hole intersections is up to 1,000m, and is often required to be complimented by underground drill hole intersections. The accuracy of the surface drilling intersection positions from drill holes that are from 2,500m to 4,000m in depth is the major limiting factor of achieving any sort of planned grid. Long surface drill holes often deflect and the controlling direction over that depth has always been challenging in the South African gold mining context. The drilling contractor supplies monthly stick-up depth markings from counting of rods, while the Senior Geologist assesses the core for percentage recovery, sequence accuracy, and quality. The qualified service provider also surveys boreholes to verify the drilled length and trajectory.
The location of the surface drill holes intersecting the VCR on Mponeng is shown on Figure 7-3 and the location of the surface drill holes intersecting the CLR is shown on Figure 7-4. The VCR surface drilling results are summarized in Table 7-1 and results for the CLR are summarized in Table 7-2.
7.4.2Underground Drilling
Underground exploration drilling has been on-going throughout the operational life of Mponeng as the mine deepens. Most of the underground drill holes used in the estimation of the current Mineral Resources were drilled by Anglo American and AngloGold Ashanti before Harmony acquired the mine.
Two types of underground drilling methods are used at Mponeng Mine. The first method involves drilling of Long Inclined Boreholes (“LIB”) or Long Vertical Boreholes (“LVB”), which are drilled up to 1,500m in length at any angle between zero degrees to -90 degrees. These drill holes are generally drilled using a more powerful hydraulic machine to improve depth penetration and core recovery. The core sizes used for reef intersections are BX (42mm) or BQ (36.5mm).
The second underground method is infill diamond core drilling, which is undertaken using small hydraulic and pneumatic drill rigs. The core size used for reef intersections is AXT (35.51mm).
The underground exploration strategy adopted to address the geological structure and reef locations at Mponeng includes the following:
•definition drilling aiming for a 100m to 200m drilling grid for optimal placement of primary haulage and cross-cut development; and
•infill drilling from haulages and crosscuts at a 100m to 50m drilling spacing is used for placement of secondary development and understanding reef existence and quality.
More drilling may be required in more complex areas and areas beyond the 200m drill spacing where geological definition is limited.
The location of the underground drill holes intersecting the VCR on Mponeng is shown on Figure 7-3 and the location of the underground drill holes intersecting the CLR is shown on Figure 7-4. The underground drilling results are summarized in Table 7-1 and results for the CLR are summarized in Table 7-2. The underground
Effective Date: June 30, 2024
23
Technical Report Summary for
Mponeng Mine, Gauteng, South Africa
exploration drill holes vary in length depending on the target position and ground conditions, but can have a length of up to 1,500m.
Figure 7-1: Location of Samples Collected from the VCR to Date
Figure 7-2: Location of Samples Collected from the CLR to Date
Effective Date: June 30, 2024
24
Technical Report Summary for
Mponeng Mine, Gauteng, South Africa
Figure 7-3: Location of Surface and Underground Drill holes Intersecting the VCR
Figure 7-4: Location of Surface and Underground Drill holes Intersecting the CLR
Effective Date: June 30, 2024
25
Technical Report Summary for
Mponeng Mine, Gauteng, South Africa
Table 7-1: Summary of Surface and Underground Drill holes Intersecting the VCR as of October 2023
| | | | | | | | |
| Drill Hole ID | Ave. Au Value (cmg/t) | Ave. Channel Width (cm) |
| UD35 | 68 | - |
| UD21-2 | 108 | 20 |
| UD13 | 344 | - |
| LIB1 | 566 | - |
| LIB60 | 566 | - |
| UD21-1 | 2,018 | - |
| S2E | 0 | 13 |
| UD58A | 2,464 | 194 |
| LIB16B | 22,905 | 279 |
| LIB25 | 1,621 | 38 |
| LIB50 | 7,527 | 204 |
| LIB53 | 1,752 | 39 |
| LIB68 | 1,435 | 46 |
| LIB72 | 573 | 89 |
| LIB75 | 2,164 | 108 |
| LIB76 | 5,948 | 148 |
| LIB79 | 951 | 43 |
| UD42.1 | 7,387 | 174 |
| UD42.2 | 13,199 | 227 |
| UD60 | 3,785 | 118 |
| LIB86 | 2,035 | 89 |
| LIB83 | 1,127 | 91 |
| LIB85 | 416 | 72 |
| LIB88 | 561 | 95 |
| LIB21 | 959 | 44 |
| LIB26 | 481 | 25 |
| LIB29A | 376 | 13 |
| LIB30B | 728 | 29 |
| LIB40 | 50 | 18 |
| LIB51 | 895 | 27 |
| | | | | | | | |
| Drill Hole ID | Ave. Au Value (cmg/t) | Ave. Channel Width (cm) |
| S8E | 139 | 10 |
| S9E | 1,389 | 74 |
| UD3 | 1,184 | 31 |
| UD30 | 511 | 27 |
| UD51.1 | 93 | 21 |
| UD51.2 | 38 | 19 |
| UD6 | 422 | 23 |
| LIB80 | 104 | 16 |
| LIB87 | 1,150 | 60 |
| LIB78 | 2,740 | 69 |
| LIB84 | 2,370 | 115 |
| UD59 | 3,308 | 189 |
| LIB90 | 3,196 | 244 |
| LIB69 | 557 | 20 |
| LIB65 | 385 | 21 |
| LIB82 | 2,425 | 24 |
| LIB89 | 1,015 | 34 |
| LIB96_MP | 9,575 | 153 |
| LIB96_MP_D1 | 6,979 | 149 |
| LIB96_MP_D2 | 5,555 | 163 |
| LIB96_MP_D3 | 8,362 | 232 |
| LIB97_MP | 459 | 13 |
| LIB97D1_MP | 459 | 12 |
| LIB97D2_MP | 1,847 | 38 |
| LIB97D3_MP | 1,005 | 10 |
| LIB91_MP | 2,544 | 16 |
| LIB92_MP | 39 | 17 |
| LIB98_MP | 1,973 | 82 |
| LIB98_MP_D1 | 1,534 | 54 |
| LIB98_MP_D2 | 739 | 49 |
| | | | | | | | |
| Drill Hole ID | Ave. Au Value (cmg/t) | Ave. Channel Width (cm) |
| LIB98_MP_D3 | 930 | 51 |
| LIB99_MP | 101 | 54 |
| LIB99_MP_D1 | 237 | 47 |
| LIB99_MP_D2 | 929 | 75 |
| LIB99_MP_D3 | 517 | 47 |
| LIB99_MP_D4 | 232 | 21 |
| LIB100_D1_MP | 3,262 | 75 |
| LIB100_D2_MP | 831 | 106 |
| LIB100_D3_MP | 1,533 | 142 |
| LIB100_D3_MP | 1,625 | 146 |
| LIB102_D1_MP | 274 | 17 |
| LIB102_D2_MP | 695 | 23 |
| LIB102_D3_MP | 793 | 17 |
| LIB102_MP | 932 | 30 |
| LIB104_MP | 621 | 11 |
| LIB104_MP_D1 | 13 | 8 |
| LIB104_MP_D2 | 2,349 | 19 |
| | |
| | |
| | |
| | |
| | |
| | |
| | |
| | |
| | |
| | |
| | |
| | |
| | |
| | |
| | |
| | |
| | |
| | |
| | |
| | |
| | |
| | |
| | |
| | |
| | |
| | |
| | |
| | |
| | |
| | |
| | |
| | |
| | |
| | |
| | |
| | |
| | |
| | |
| | |
| | |
| | |
| | |
| | |
| | |
| | |
| | |
| | |
| | |
| | |
| | |
Effective Date: June 30, 2024
26
Technical Report Summary for
Mponeng Mine, Gauteng, South Africa
Table 7-2: Summary of Surface and Underground Drill holes Intersecting the CLR as from October 2023
| | | | | | | | |
| Drill Hole ID | Ave. Au Value (cmg/t) | Ave. Channel Width (cm) |
| 22/4253 | 3,522 | 65 |
| B1 | 994 | 55 |
| B3 | 341 | 20 |
| CM1 | 1,293 | 56 |
| D2A | 498 | 41 |
| D2B | 691 | 48 |
| D3A | 468 | 53 |
| D4B | 380 | 24 |
| D5A | 586 | 17 |
| D5B | 810 | 28 |
| D5C | 164 | 70 |
| D6A | 104 | 47 |
| D6B | 1,308 | 94 |
| D7A | 3,048 | 79 |
| D7B | 291 | 69 |
| D8A | 243 | 65 |
| D8B | 1,586 | 8 |
| DK4 | 673 | 35 |
| DPH3879A | 2,129 | 31 |
| E1C | 8,433 | 34 |
| E1E | 1,781 | 66 |
| E1G | 2,521 | 184 |
| E1H | 1,635 | 61 |
| E1L | 1,484 | 38 |
| E1S | 1,549 | 34 |
| E2C | 1,854 | 16 |
| E2D | 1,445 | 17 |
| E3B | 1,201 | 53 |
| E4 | 546 | 117 |
| E4A | 1,027 | 74 |
| | | | | | | | |
| Drill Hole ID | Ave. Au Value (cmg/t) | Ave. Channel Width (cm) |
| E5 | 1,085 | 18 |
| E8G | 28 | 196 |
| GBH1349 | 3,368 | 190 |
| GBH1350 | 2,848 | 137 |
| GBH2603 | 8,364 | 72 |
| GBH6023 | 307 | 26 |
| LIB12 | 1,107 | 51 |
| LIB120Q | 2,269 | 22 |
| LIB120SE2 | 1,041 | 32 |
| LIB120SE2 | 950 | 42 |
| LIB120SW1 | 5,929 | 41 |
| LIB12L | 2,905 | 75 |
| LIB13 | 258 | 101 |
| LIB17B | 1,382 | 102 |
| LIB24 | 1,048 | 26 |
| LIB3 | 856 | 40 |
| LIB36 | 2,336 | 86 |
| LIB37 | 861 | 25 |
| LIB3L | 1,139 | 54 |
| LIB6 | 783 | 166 |
| LIB6L1 | 320 | 52 |
| LIB6L2 | 989 | 191 |
| LIBB120 | 2,195 | 144 |
| LIBTT2002 | 960 | 302 |
| LIC118 | 1,213 | 402 |
| LVB12 | 2,680 | 239 |
| LVB14 | 1,970 | 22 |
| LVB15 | 446 | 80 |
| LVB16 | 895 | 43 |
| LVB17 | 628 | 73 |
| | | | | | | | |
| Drill Hole ID | Ave. Au Value (cmg/t) | Ave. Channel Width (cm) |
| LVB18 | 1,156 | 61 |
| LVB5 | 14 | 27 |
| LVB6 | 1,344 | 28 |
| LVB7 | 69 | 20 |
| LVB9 | 2,792 | 49 |
| LVBH | 354 | 52 |
| LVBI | 756 | 37 |
| LVBIL | 562 | 13 |
| LVBJ | 576 | 13 |
| LVBK | 517 | 24 |
| LVBL | 127 | 11 |
| MPO_LIB1 | 2,276 | 14 |
| MPO_LIB2 | 2,552 | 68 |
| MPO_LIB3 | 1,035 | 35 |
| MPO_LIB4 | 929 | 49 |
| UD12 | 1,624 | 28 |
| Ud13 | 353 | 90 |
| UD14 | 1,442 | 76 |
| UD15 | 340 | 55 |
| UD16 | 137 | 57 |
| UD2 | 315 | 21 |
| UD25 | 523 | 31 |
| UD32 | 699 | 36 |
| UD32L | 424 | 31 |
| UD33L1+3 | 2,668 | 23 |
| UD33L2 | 631 | 28 |
| UD34 | 501 | 43 |
| UD36 | 1,980 | 38 |
| UD36L | 2,616 | 34 |
| UD37 | 548 | 93 |
| | | | | | | | |
| Drill Hole ID | Ave. Au Value (cmg/t) | Ave. Channel Width (cm) |
| UD4 | 2,168 | 23 |
| UD49 | 1,846 | 24 |
| UD6 | 1,515 | 38 |
| UD9 | 18,889 | 28 |
| LIB106TT | 1,123 | 100 |
| LIB106TT D1 | 532 | 83 |
| | |
| | |
| | |
| | |
| | |
| | |
| | |
| | |
| | |
| | |
| | |
| | |
| | |
| | |
| | |
| | |
| | |
| | |
| | |
| | |
| | |
| | |
| | |
| | |
| | |
Effective Date: June 30, 2024
27
Technical Report Summary for
Mponeng Mine, Gauteng, South Africa
7.4.3Collar and Downhole Surveys
The drill holes used for reef delineation at Mponeng are surveyed to confirm both position and trajectory. Drill hole collar and downhole surveys are conducted on surface and LIBs/LVBs, as well as on the majority of the GBH and DBH drill holes drilled on the mine.
Surface drill hole collars are surveyed by internal Land Survey Department. Underground drill hole collars are checked against layouts issued to diamond drilling contractors and confirmed by offsets taken underground in the workplaces.
Downhole surveying is conducted using Electronic Multishot System and non-magnetic north seeking Gyro tools as supplied by a certified and specialized downhole survey company. Additional surveys are conducted on all LIB/LVB drill holes for verification purposes, and the results are submitted together with the primary survey data used to determine the drill hole trajectories. The survey data is collected with an in-run and out-run per borehole. The dip and azimuth difference must be within 0.5° and 1.5° on the in-run and out-run respectively.
All records received from the survey company are checked for quality and then captured and stored in the electronic databases.
7.4.4Sample Length and True Thickness
In areas where drill holes intersect the reefs at obtuse angles, the sampled width is corrected for true thickness using the angle of intersection and the drilled width. The true thickness is used to determine the value the gold content of the reef.
7.4.5Logging Procedures
All drill cores are photographed prior to logging and sampling. Drill core logging is qualitative, and all pertinent features are logged, including stratigraphy, lithology, structure, alteration and mineralization characteristics. Observations are captured on the diamond drilling database by geologists. The logs are checked by the Senior Geologist prior to sampling.
7.4.6Core Recovery
Where possible, precautions are taken by the drilling contractors to utilize core barrels to ensure maximum recovery. Reef intersection “acceptability” is categorised as per the criteria summarized in Table 7-3.
Table 7-3: Drill hole Acceptance Criteria
| | | | | |
| Category | Comment |
| Acceptable | 100% core recovery in the reef zone, or very minor loss due to reef chipping. No evidence of faulting within the reef horizon or at either contact with hanging wall or footwall lithologies. |
| Minimum value | Light to moderate disking of core in the core barrel due to drilling and/or ground conditions. Visual observations indicate that the conglomerate portion of the reef is usually more prone to disking, resulting in possible gold loss. |
| Faulted minimum value | If the fault loss is considered to be minor, this term may be used if the geologist is certain that only low-value internal quartzite is missing from the intersection. |
| Not acceptable | Heavy disking of core which may indicate core loss, partial known core loss due to grinding. Also faulting of any description within the reef zone. |
| |
Geological acceptability of drill hole intersections is determined by geologists based on, amongst others, drill core condition and faulting. The acceptability is verified for each reef intersection before the assay results are used for Mineral Resource estimation. In the added set of 48 boreholes, 81% of reef intersections had 95% and above core recovery.
7.5Hydrogeology
Dykes within the lease area form impervious water barriers in the dolomite strata. The dykes separate the water-bearing dolomites into compartments. These compartments have been dewatered since the inception of mining to prevent the inflow of water into mining excavations. This has led to the development of numerous surface sinkholes in the area.
Effective Date: June 30, 2024
28
Technical Report Summary for
Mponeng Mine, Gauteng, South Africa
Subsurface water migrates along Ventersdorp and post-Ventersdorp age faults and dykes to the working areas of the mine. These features are usually closed. Therefore, significant water intersections are fewer than on some neighboring mines. Water ingress also occurs at the sub-outcrop of the VCR with the Black Reef (not an economic reef horizon).
Many of the fault systems on the mine carry significant quantities of water and flammable gases. On the western side of the mine, the brittle Denny’s Quartzite creates the ideal host for the formation of open fissures, through which water and gas can be transmitted. The brittle Ventersdorp Lava also exhibits many of the deformation characteristics of the Denny’s Quartzite and may contain locally high water and gas yields.
Throughout the mine, water and gas, usually in small quantities, may also occur at the contact zones of dykes and sills. Intersections of water and gas in geological cover drilling account for most of the delays in the mine development.
7.6Geotechnical Data
Geotechnical issues related to underground workings are discussed in more detail in the Mining and Mine Design sections (Section 13).
7.7Commentary on Exploration
Exploration of the VCR target areas deeper than 126-level mining front is planned for 2024-2025. These will form part of the approved exploration campaign. These targets will generate the needed information in two areas, on the Booysens/Kimberley areas and the area west of the Kimberley estimation domains further down dip of the ore body.
Both areas are currently showing high levels of variability in reef thickness and grade that will benefit from the additional information that will be generated for the completion of these exploration drill holes. VCR variability limits the forward confidence in the Mineral Resource estimation. More data collected can assist the QP define the zones of high variability.
Mponeng Mine has budgeted ZAR17.1M for infill exploration drilling of the VCR and CLR 2024-2025. All drilling will be conducted from underground platforms on VCR and CLR.
Effective Date: June 30, 2024
29
Technical Report Summary for
Mponeng Mine, Gauteng, South Africa
8Sample Preparation, Analyses and Security
Section 229.601(b)(96)(iii)(B)(8) (i-v)
This section summarizes information relating to the sample preparation on site through to the laboratory preparation and analysis.
8.1Sampling Method and Approach
Sample types used to support both production and geological exploration include diamond drill core samples and channel (chip) samples.
8.1.1Channel Samples
Channel sampling is undertaken according to industry best practice, as well as the internal Underground Sampling Procedure. Samples are chipped from the advancing face from within clearly measured and marked channel sections, including the 2cm hanging wall and footwall width. Samples are weighed and submitted to the designated laboratory for assay.
An adequate mass of each sample is collected to allow sufficient sized aliquots to be analyzed at the designated laboratory.
8.1.2Core Samples
Diamond drilled core is transported to the storage facility under the supervision of a Senior Geologist. Upon arrival, the core is logged and sampled according to the internal Drill hole Sampling Procedure.
Where possible the entire channel width intersected in each drill hole is split using a diamond drill core cutter and one half of the sample is bagged, tagged and sent to the designated laboratory for assay. The remaining half is retained for future reference. If the core condition is such that a successful cut cannot be achieved, then the whole core is submitted for assay. Pertinent data captured during sampling includes sample width (cm), mass, core lithological intersection angles and a detailed visual description of the reef. The data is recorded in the drill hole database together with the unique sample number, collection date and spatial location.
All samples are assessed for quality in terms of preserved lithological contacts, core sequence accuracy, percentage loss, and faulting within reef. All sampled core is signed-off by the Senior Geologist for completeness and auditability, prior to laboratory dispatch.
8.2Density Determination
The Relative Density of samples was determined through the work conducted originally in 2003 and again in 2015 and 2016. A further total of 72 samples were taken from underground workings in 2022 including hanging wall, reef and footwall samples. The dry mass and the submerged mass of the samples in water were measured and the density was calculated. Tests have occasionally been conducted thereafter on samples collected from the working places. A relative density (RD) of 2.71t/m³ is in use. A 20% of the samples used for RD determination at the mine in 2016 were sent to SGS laboratory in Randfontein for external verification of RDs. The correlation coefficient was 0.91 for reef samples and 0.82 for all types of samples.
8.3Sample Security
Samples are stored in secured facility and can only be transported by a permit holder for transporting gold bearing material. Waybills and registers are checked and signed off by security. The samples are received from the mine in locked containers with seals. The sample labels are scanned at the designated laboratory and the batches compared to the submitted sample sheets. The scanned bar codes are kept at the laboratory and compared to the work sheets that are automatically created on the system. Sample lists submitted by the mine are used to compare what is received at the laboratory.
8.4Laboratory Sample Preparation
All samples are sent to the external SGS South Africa (Pty) Ltd laboratory (previously Performance Laboratories (Pty) Ltd) in Randfontein for preparation and assay. The laboratory is ISO/IEC 17025:2017 certified for chemical analysis by the South African National Accreditation System (“SANAS”) (accreditation number T0265).
Effective Date: June 30, 2024
30
Technical Report Summary for
Mponeng Mine, Gauteng, South Africa
Upon receipt, the samples are dried, crushed, and milled to the appropriate size. Routine screen tests on pulps by the assay laboratory are used to check comminution of samples to contract specification. The contract specification is that the comminution should be 90% to 95% passing 75µm.
The grind should not be less than 90% passing 75µm nor should it be more than 95% passing 75µm. If the grind is less than 90% passing 75µm (under milled), not all the gold will be liberated. If more than 95% passing 75µm (over milled), the risk is run of smearing and rolling the gold particles (adversely affecting the Au assay/value obtained). This standard is applicable to all gold assay methods.
For 2023 - 2024 period the average of 94.07% was reported passing 75µm.
The total percentage mass loss on each sample should not exceed 2%.
8.5Assaying Methods and Analytical Procedures
For the period September 2022 to Oct 2023, Mponeng submitted in addition to the existing total, 34,669 new samples for analysis of gold using the following analytical techniques:
•gold: 30g fire assay with a gravimetric finish. The lower detection limit is 0.2g/t.; and
•uranium: XRD analysis. (No sample were analyzed for uranium).
All pulps of exploration drill hole intersections are held and stored on site. Underground chip sample pulps are kept for a few months and then discarded.
8.6Sampling and Assay Quality Control (“QC”) Procedures and Quality Assurance (“QA”)
This section summarizes information relating to the field and laboratory QAQC measures in place to ensure the integrity of the assay results.
8.6.1Field QAQC
Out of the primary 34,669 primary samples submitted for analysis, 4,462 were QAQC samples. The QAQC was comprised of the following:
•1045 coarse blanks;
•1048 crushed blanks;
•1059 milled blanks;
•1310 Certified Reference Material (“CRMs”) or standards sourced from both African Mineral Standards (AMIS) and Rocklabs; and
•3097 pairs of duplicates (381 below the lower detection limit).
Blank samples are submitted to monitor the possible contamination in the fusion process stage of the analysis at the laboratory. High- and low-grade CRMs are inserted to monitor the accuracy of the analytical methods. This ensures that the full range of gold categories is covered. Duplicate samples are submitted to monitor precision of the analytical methods. Pulverized primary samples are also selected at random and re-assayed.
Monthly Process Compliance Reports are compiled as part of the quality control on the sampling process. Standard formats are used and recorded for audit purposes. Process Compliance Reports on the Chippers are also compiled in order to check the quality of the chipping. These observations are made weekly and are also kept on record for audit purposes.
The assay results on the chip samples are reviewed daily and re-assays are requested if necessary. Chip sample data is also swapped where applicable on an annual basis or as required from the neighboring operations. This data is used in the evaluation process for the macro estimates.
Effective Date: June 30, 2024
31
Technical Report Summary for
Mponeng Mine, Gauteng, South Africa
8.6.2Laboratory QAQC
The laboratory's QAQC procedures include the following:
•repeat assays on some samples from the mine; and
•regular audits of the laboratory processes and facility are conducted by mine personnel and regional experts to monitor compliance. All audit reports compiled are assessed for remedial action by the responsible persons before next review. Monthly laboratory meetings are held with the Mponeng representatives to discuss concerns over the specific periods.
8.6.3QAQC results
The DatamineTM Fusion software setup for QAQC is used to assess results of the QC samples. This is undertaken to validate the accuracy of the laboratory assay data and ensure a high level of confidence in the Mineral Resource estimate.
If results of any of the CRM samples fall outside three standard deviations of the expected value for that particular CRM, they are deemed to have failed (they plot outside the acceptable tolerance limit). Portions of the batches that fail this criterion are queried with the laboratory and those samples are re-assayed.
The degree of bias is also monitored by comparing the calculated mean value to the expected value. Consistent failure of a standard and the bias to the low or high side of a standard, are cause for concern and acted on as soon as a trend is observed. All concerns are addressed with the laboratory directly. Results of the Mponeng quality control samples and the performance of the CRM or standard samples is summarized in Table 8-1 and Table 8-2, respectively.
Results of the CRMs are used to identify any issues with specific sample batches, and biases associated with the laboratory to which primary samples are sent. Control charts are produced to demonstrate performance of the laboratory’s sample preparation and analytical procedures.
Table 8-1: Summary of Analytical Quality Control Data
| | | | | | | | | | | |
| Quality Control Material Type | No. of Samples Submitted | No. of Failed Samples | Action Taken |
| CRMs / standards | 1,310 | 30 | Queries were raised at the laboratory. Photos were taken to confirm CRM, replacements were submitted, and re-assay was conducted. |
| Coarse blanks | 1,045 | 25 | Queries were raised at the laboratory. Photos were taken to confirm blank and re-assay was conducted. |
| Crushed blanks | 1,048 | 40 | Queries were raised at the laboratory. Photos were taken to confirm blank and re-assay was conducted. |
| Milled blanks | 1,059 | 24 | Queries were raised at the laboratory. Photos were taken to confirm blank and re-assay was conducted. |
| Pulp duplicates (13-months rolling) | 3,097 | 381 pairs removed less than 2x lower detection limit ("LDL") | HARD analysis shows that 71.32% of the pairs has a precision of 10%. Ninety percent of the pairs have a precision of 49.5%. Sample values less than 2 X LDL (0.20g/t) were removed from the interpretation. 14.03% were removed. |
| Particle size analyses (pulverization) | 1,417 | n/a | Average of 94.07% passing 75 microns. The passing rate was 93.1% to 96.8% passing 75µm. |
| | | |
Effective Date: June 30, 2024
32
Technical Report Summary for
Mponeng Mine, Gauteng, South Africa
Table 8-2: Summary of Mponeng CRM Performance
| | | | | | | | | | | | | | | | | | | | | | | | | | |
| Standard | CRM Alias | Certified Value
(g/t Au) | Mponeng (±2 STD) | SGS Randfontein |
| Upper Limit (g/t Au) | Lower Limit (g/t Au) | Analysis | Ave. (g/t) | Outliers & Failures | Bias (%) |
| AMIS0685 | CRMOI003 | 81.2 | 90.650 | 71.750 | 243 | 81.97 | 2 | 0.95 |
| AMIS0705 | CRMOC007 | 12.91 | 15.31 | 10.51 | 311 | 13.64 | 5 | 5.64 |
| AMIS0553 | CRMOF001 | 26.75 | 31.28 | 22.22 | 66 | 27.11 | 1 | 1.36 |
| AMIS0428 | CRMOG008 | 43.42 | 45.98 | 40.95 | 573 | 44.88 | 19 | 3.38 |
| AMIS0694 | | 72.42 | 85.17 | 59.67 | 117 | 72.64 | 3 | 0.30 |
| | | | | | | | |
| | | | | | | | |
| | | | | | | | |
| | | | | | | | |
| | | | | | | | |
High-grade reference material (CRMOI003: AMIS0685) – 81.2g/t. 243 aliquots were submitted to the laboratory. There were 2 failures on this CRM.
The Lower-grade reference material (CRMOC007: AMIS0705) – 12.91g/t. 311 aliquots were submitted to the laboratory. There were 5 failures on this CRM. The overall performance of the CRM showed a positive bias of 5.64%
High-grade reference material (CRMOF001: AMIS0553 ) – 26.75g/t. We submitted 66 aliquots to the laboratory this month. There was 1 failure on this CRM. A positive bias of 1.36% was calculated.
High-grade reference material (CRMOG008: AMIS0428 ) – 43.42g/t. A total of 573 were submitted with 19 failures. A positive bias of 3.38% was calculated.
High-grade reference material (AMIS0694) – 72.42g/t. A total of 117 were submitted with 3 failures. A positive bias of 0.3% was calculated.
8.7Comment on Sample Preparation, Analyses and Security
In the opinion of the QP that:
•the drill core sampling method adopted at Mponeng is appropriate for the Witwatersrand and VCR-type mineralization;
•all underground chip sampling is representative of the channel sampled;
•the sample preparation, security and analytical procedures followed for gold grade determination are adequate; and
•the results of the QAQC assessment have been appropriately addressed to ensure that the assay results of the primary samples are adequate for Mineral Resource estimation.
Effective Date: June 30, 2024
33
Technical Report Summary for
Mponeng Mine, Gauteng, South Africa
9Data verification
Section 229.601(b)(96)(iii)(B)(9) (i-iii)
All Mponeng drill hole and underground channel sampling data was previously captured and stored in AuBIS electronic database. Upon acquisition of the mine, Harmony migrated the database to DatamineTM Fusion (“Datamine”). This database is protected through administration rights allocated to an authorized administrator.
9.1Data Verification Procedures
Data verification procedures included the following:
•the drill hole database was checked against the original logs;
•the database was integrated with DESWIK CAD (“DESWIK”) software in order to check for missing collar coordinates, collar position and elevation errors, downhole survey errors, interval errors and duplicate sample records;
•when assay results were returned from the laboratory, they were captured into the electronic database by the Senior Evaluator and Geologist. The QC sample results were assessed for performance before the primary sample results could be used for Mineral Resource estimation;
•the primary assay results captured in the database were validated by spot checking a selection of drill holes used in the current Mineral Resource estimate; and
•the assays captured in the electronic database were checked against the original laboratory certificates.
The QP did not identify any critical errors in the database.
9.2Data Verification
Replacement of the Mponeng databases and process for reporting of Mineral Resources and Reserves with the current Harmony designed databases and process maps, have been implemented since 2021. The system has been signed off and is fully integrated as per the Harmony system specifications for Mponeng.
9.3Comment on Data Verification
The QP is of the opinion that the Mponeng drill hole and sample database is reliable and adequate for the purposes Mineral Resource and Mineral Reserve estimation.
Effective Date: June 30, 2024
34
Technical Report Summary for
Mponeng Mine, Gauteng, South Africa
10Mineral Processing and Metallurgical Testing
Section 229.601(b)(96)(iii)(B)(10) (i-v)
10.1Introduction
Over the decades, Harmony Gold has continuously refined and optimized these processes, ensuring consistent gold recovery and efficient mineral extraction from diverse ore bodies. The company's well-established metallurgical practices are crucial in understanding production dynamics, enabling precise forecasting, and supporting informed management and operational decisions.
The standards and methodologies outlined in this document are meticulously designed to:
•Ensure Consistency and Accuracy: Harmony Gold maintains rigorous gold allocation and metallurgical accounting practices across all operations, ensuring that every ounce of gold is precisely accounted for;
•Facilitate Data Integrity and Accessibility: All relevant data are systematically recorded and easily accessible, allowing for transparent and informed decision-making based on reliable information; and
•Support Continuous Optimisation: By reflecting ongoing optimisation efforts and established processes, Harmony Gold ensures that recovery estimates and test results are grounded in robust and credible data.
Adhering to strict principles, Harmony Gold's metallurgical accounting system guarantees the highest accuracy in all tonnage and gold splits. This system provides a technically precise reflection of production per source and ensures that data outputs undergo rigorous verification for accuracy and credibility.
Through this overview, Harmony Gold is committed to maintaining the highest efficiency and technical excellence standards in mineral processing and metallurgical testing practices.
10.2Sampling and Testing Methodologies
Harmony Gold Mining Company Limited employs a comprehensive range of mineral processing and metallurgical testing procedures to ensure optimal recovery rates and efficient mineral extraction. These methodologies are integral to maintaining high operational standards and achieving consistent gold recovery.
10.2.1Systematic and Continuous Sampling
Harmony Gold utilises a systematic and continuous sampling approach, where ore samples are collected at various stages of the mining and processing operations. This process is automated using mechanical samplers strategically placed at critical points along the process flow, such as conveyor belts, feed points, and tailings streams. These samplers operate without human intervention, thereby minimizing potential biases and ensuring the samples accurately represent the processed material.
The sampling process is tightly integrated with the operations’ SCADA system, which controls the timing and frequency of sampling. This integration ensures that samples are taken consistently, reflecting temporal and spatial variations in the ore.
10.2.2Composite Sampling
Composite samples are created by aggregating individual samples taken over a specific period. This approach is used to obtain a more representative sample that reflects the processed ore's average grade and mineralogical characteristics. Composite sampling reduces the variability in smaller, discrete samples, providing a more accurate reflection of the ore body as a whole.
10.2.3Calibration and Verification of Equipment
The accuracy and reliability of the sampling process are maintained through regular calibration and verification of the equipment used. The mass flow systems, essential for calculating the dry mass of the ore, are calibrated monthly by the Original Equipment Manufacturer (OEM). Additionally, slurry density measurements, crucial for ensuring accurate mass calculations, are verified weekly by operational teams. This regular calibration and verification are critical to ensuring the sampling system produces accurate and representative results.
Effective Date: June 30, 2024
35
Technical Report Summary for
Mponeng Mine, Gauteng, South Africa
10.2.4Specific Testing Procedures
Harmony Gold conducts a variety of specific tests to address different aspects of the mineral processing workflow, ensuring the representativeness of the samples:
•Comminution Testing: Involves crushing and grinding ore to liberate valuable minerals. Tests such as the Bond Work Index and SMC are conducted to determine the hardness and grindability of the ore.
•Leaching Tests: Bottle roll and column leach tests are conducted to determine the ore's amenability to cyanidation and other leaching methods. A typical bottle roll test involves transferring a weighed sample into a leaching bottle, adding water to prepare slurries at 50% solids, and adjusting the pH with hydrated lime to about 10.5. Sodium cyanide is added (concentration based on plant conditions), and the bottles are rolled for 40 hours, with periodic pH checks and adjustments. After the leaching period, the slurries are filtered, and the residues are analyzed for gold content.
•Diagnostic Leaching is a laboratory technique used to identify the mineral phases associated with gold and understand the causes of gold losses in the leaching process. This method involves sequentially solubilizing the least stable minerals and extracting the associated gold, providing insights into the disposition of gold within the ore.
10.2.5Analytical Laboratories
SGS South Africa conducts most of the Harmony Gold's metallurgical testing. These laboratories are equipped with advanced analytical instruments and follow rigorous testing methodologies. Essential procedures include fire assay for gold analysis, with samples pulverized and analyzed in triplicate using atomic absorption spectroscopy (AAS) finish. SGS Laboratories ensure high accuracy and reliability in their testing processes, adhering to strict quality control standards.
10.3Data Validation and Quality Control
Harmony Gold employs a rigorous data validation and quality control process to ensure that the metallurgical test samples are representative and that their data are accurate and reliable.
10.3.1Statistical Analysis
Harmony Gold employs statistical analysis based on standard deviations to ensure the representativeness of samples. Samples are monitored to determine if their values fall within a predefined range. Specifically, if a sample’s value falls outside two standard deviations from the mean, it is identified as a "special cause." These special cause samples are investigated further to understand the underlying reasons for the deviation, ensuring any anomalies are identified and addressed promptly. This statistical approach helps maintain the reliability and accuracy of the sampling process.
10.3.2Continuous Improvement
Harmony Gold is committed to continuously improving its sampling and testing methodologies. The company regularly reviews and updates its protocols to incorporate the latest advancements in sampling technology and analytical techniques. This commitment ensures that the samples remain representative of the ore bodies despite changes in mining practices, ore characteristics, or processing technologies.
10.4Recovery Estimates and Processing Factors
Recovery estimates form the backbone of metallurgical accounting at Harmony Gold, providing a clear metric of the efficiency with which gold is extracted from the ore. These estimates are derived from a combination of historical data, ongoing testing, and sophisticated modelling to accurately reflect the processing plants' performance and the characteristics of the treated ores.
10.4.1Detailed Calculation of Recovery Estimates
The calculation of gold recovery involves multiple stages, each tailored to the specific ore types and the complex processing techniques employed. The basic theoretical formula for recovery estimation is:
10.4.2Head Grade and Residue Grade
The Head Grade refers to the gold content in the ore as it enters the processing plant. It is typically measured using automated belt samplers that provide a continuous stream of data on the gold content of the material.
Effective Date: June 30, 2024
36
Technical Report Summary for
Mponeng Mine, Gauteng, South Africa
The Residue Grade represents the gold content in the tailings after the ore has undergone the complete processing cycle. By comparing these two metrics, the recovery percentage is calculated, indicating how much of the gold has been successfully extracted.
10.4.3Adjustments for Solution and Carbon Adsorption
In addition to the gold recovered from the solid ore, a significant portion remains in solution or adsorbed onto activated carbon during the cyanidation process. Harmony Gold’s metallurgical accounting system ensures that these forms of gold are accounted for by integrating measurements of gold in solution (measured in mg/L) and on carbon (measured in g/t). This approach ensures that the total gold recovered is comprehensively calculated, considering all forms of gold within the processing circuit.
Taking the Harmony accounting standard into account, the actual total plant recovery is calculated by:
10.4.4Integration of Bottle Roll Tests for Baseline Recovery Rates
Bottle Roll Tests are a cornerstone of Harmony Gold’s approach to establishing baseline recovery rates. Conducted monthly, these tests simulate the leaching process on a small scale, using representative samples of ore from various sources. The procedure involves placing a weighed sample in a sealed bottle with a cyanide solution and then rolling the bottle to ensure thorough mixing. Over a defined period, typically 24 to 48 hours, the solution is periodically sampled to measure the amount of gold that has leached into the solution.
The data obtained from these tests are critical for calibrating the recovery models used in the processing plants. They provide a baseline recovery rate for each ore type, which is then applied to the blended ore feed processed at the plants. This method ensures that the recovery estimates reflect the actual performance of the plant and the variability in ore characteristics.
10.4.5Processing Factors Affecting Recovery
Several factors directly influence the recovery of gold during processing. Understanding and managing these factors is essential to maintaining high recovery rates and ensuring the processing plants operate efficiently.
Ore Characteristics
The mineralogical composition of the ore profoundly impacts the recovery process. For example, refractory ores contain gold particles locked within sulphide minerals, making them more challenging to process. Harmony Gold employs specific pre-treatment methods, such as ultra-fine grinding or roasting, to liberate the gold from these complex ores, thus enhancing recovery rates.
Leaching Conditions
The effectiveness of the cyanidation process, which is the primary method for gold recovery at Harmony Gold, depends heavily on the leaching conditions. Key parameters include the concentration of cyanide in the leach solution, the pH levels, and the presence of oxygen. These conditions are meticulously controlled and monitored through the SCADA system, which provides real-time feedback and allows for immediate adjustments to optimize recovery.
Particle Size Distribution
The comminution process, which involves crushing and grinding the ore to liberate the gold, is critical for maximizing recovery. The particle size distribution directly affects the surface area available for leaching. Too coarse a grind may leave gold particles locked within the ore, while too fine a grind can lead to excessive reagent consumption or poor settling in thickeners. Harmony Gold employs the Bond Work Index and SMC tests to determine the optimal grind size for different ore types.
Preg-Robbing
Some ores contain naturally occurring carbonaceous material that can adsorb dissolved gold from the leach solution, a phenomenon known as preg-robbing. This effect can significantly reduce the amount of gold recovered. Harmony Gold mitigates this issue by pre-treating the ore to deactivate the preg-robbing materials or using additives in the leach solution that preferentially adsorb to the carbonaceous material, leaving more gold in the recovery solution.
Effective Date: June 30, 2024
37
Technical Report Summary for
Mponeng Mine, Gauteng, South Africa
Blending Strategies
Given the variability in ore characteristics, Harmony Gold employs sophisticated blending strategies to ensure that the feed to the processing plant is consistent regarding grade and mineralogy. This approach helps stabilize recovery rates and ensure that the plant operates efficiently. The baseline recovery rates obtained from bottle roll tests for individual sources are used to predict the overall recovery from the blended feed, allowing for accurate forecasting and operational planning.
Process Control and Monitoring
Continuous monitoring of the processing conditions is essential for maintaining high recovery rates. Harmony Gold uses a SCADA system to track critical variables such as slurry density, reagent addition rates, and leach tank conditions. Real-time data analytics allow for immediate adjustments, ensuring that the plant operates within the optimal parameters for gold recovery.
10.4.6Gold Inventory Management and Accountability
Gold inventory management is a critical component of Harmony Gold’s metallurgical accounting, ensuring that all gold within the process is accurately tracked and accounted for. Several vital metrics and calculations are used to manage and verify the accuracy of gold inventories:
Gold Accounted For (GAF)
This metric represents the total gold recovered, including the gold produced and remaining in the residue. It serves as a critical reference point for the overall gold balance.
Gold Called For (GCF)
GCF represents the expected amount of gold based on the ore feed and its calculated head grade, adjusted for any inventory changes.
Plant Call Factor (PCF)
This is the ratio of GAF to GCF, expressed as a percentage, indicating the efficiency in accounting for the amount of gold.
Pulp Call
A daily estimate of gold production, based on pulp gold, adjusted for inventory changes and residue losses.
These formulas ensure that gold recovery and inventory are accurately managed and accounted for. They provide a structured approach to monitoring and optimizing the metallurgical processes, ensuring that Harmony Gold maintains high operational efficiency and accountability standards.
10.5Conclusion
Extensive and detailed practices underpin Harmony Gold Mining Company Limited's mineral processing and metallurgical operations. The methodologies described herein reflect the company’s commitment to operational precision, consistency in gold recovery, and rigorous adherence to industry standards.
Advanced testing procedures, robust data validation, and comprehensive recovery calculations are integrated to ensure that the company’s operations are efficient, transparent, and accountable. Continuous process improvement and meticulous gold inventory management position Harmony Gold as a responsible and effective resource extraction leader.
Effective Date: June 30, 2024
38
Technical Report Summary for
Mponeng Mine, Gauteng, South Africa
11Mineral Resource Estimate
Section 229.601(b)(96)(iii)(B)(11) (i-vii)
The current Mineral Resources for Mponeng have been estimated using DatamineTM Studio 3 (“Datamine”) modelling software. A Scripting/macro system has been generated, which is linked to a customized scripting menu. This scripting menu allows for professional and easy managing of the data and building of geostatistical models.
Gold values have been estimated into geological domains using geostatistical parameters that reflect the variability of the data and the data spacing. The key assumption is that our data is divided into thick and thin channels (slope and terrace model) within each of the footwall geozones on the VCR estimation model. On the CLR there is six geozones based on reef sedimentology, values trends, and structural influence. A type of de-clustering is undertaken into different block sizes in order to account for the change in support parameters.
11.1Geological Database
The Mponeng Mineral Resource estimate is based on the surface and underground exploration data obtained up to October 2023. The database was exported from the electronic database to Datamine modelling software.
The VCR validated database contains a total of 362,911 total samples made up of underground drill holes (surface and underground), and underground channel (chip) samples. The CLR validated database contains a total of 584,345 made up of surface and underground drill holes, and the rest comprising of underground (chip) samples.
11.2Global Statistics
Histograms of the clean data and statistics are calculated for each geological domain for comparison purposes. The Coefficient of Variation ("COV"), calculated by dividing the standard deviation with the mean, gives a measure of the variability of the data. A high COV (>1) represents highly variable or highly skewed data, which may require some form of capping of extreme values to lower the COV to a more reasonable value (c.1).
The global statistics by geozone are presented in Table 11-1.
Table 11-1: Summary of the VCR Gold Assay Descriptive Statistics
| | | | | | | | | | | | | | | | | | | | | | | |
| Geozone | No. Samples | Minimum (cmg/t Au) | Maximum (cmg/t Au) | Mean (cmg/t Au) | Variance | SD (cmg/t Au) | COV |
| 1 ELS | 67,881 | 1.00 | 69,765 | 1,410 | 6,207,408 | 2,491 | 1.77 |
| 2 VTK | 197,796 | 0.80 | 122,659 | 2,482 | 9,828,328 | 3,135 | 1.26 |
| 2 VTN | 36,678 | 0.80 | 57,572 | 758 | 1,562,550 | 1,250 | 1.65 |
| 3 BTK | 26,697 | 1.00 | 259,298 | 2,287 | 15,665,045 | 3,958 | 1.73 |
| 3 BTN | 14,548 | 1.00 | 27,694 | 575 | 1,480,474 | 1,217 | 2.12 |
| 4 BTKS | 12,022 | 1.00 | 165,341 | 3,049 | 25,100,550 | 5,010 | 1.64 |
| 4 BTNS | 5,380 | 0.80 | 77,236 | 1,464 | 6,758,134 | 2,600 | 1.78 |
| 5 KRG | 1,909 | 1.00 | 78,330 | 543 | 8,402,079 | 2,899 | 5.34 |
| | | | | | | |
| | | | | | | |
| | | | | | | |
| | | | | | | |
| | | | | | | |
| | | | | | | |
| | | | | | | |
| Total | 362,911 | | | | | | |
Effective Date: June 30, 2024
39
Technical Report Summary for
Mponeng Mine, Gauteng, South Africa
Table 11-2: Summary of the CLR Gold Assay Descriptive Statistics
| | | | | | | | | | | | | | | | | | | | | | | |
| Geozone | No. Samples | Minimum (cmg/t Au) | Maximum (cmg/t Au) | Mean (cmg/t Au) | Variance | SD (cmg/t Au) | COV |
| 1 BLY | 160,034 | 1.00 | 365,235 | 3,633 | 29,682,586 | 5,448 | 1.50 |
| 2 TAU | 175,243 | 1.00 | 317,327 | 3,195 | 17,384,224 | 4,169 | 1.30 |
| 3 PLZ | 1,445 | 5.00 | 37,128 | 3,571 | 14,008,535 | 3,743 | 1.05 |
| 4 DRIE | 17,060 | 0.70 | 91,869 | 2,208 | 9,088,769 | 3,015 | 1.36 |
| 5 PEG | 59,862 | 1.00 | 150,653 | 2,003 | 9,722,083 | 3,118 | 1.56 |
| 6 SAV | 170,701 | 1.00 | 87,173 | 1,512 | 6,026,580 | 2,455 | 1.69 |
| | | | | | | |
| | | | | | | |
| | | | | | | |
| | | | | | | |
| | | | | | | |
| | | | | | | |
| | | | | | | |
| | | | | | | |
| | | | | | | |
| Total | 584,345 | | | | | | |
11.3Geological Interpretation
The imported data is attributed to both the VCR and CLR geological domains for generating geostatistical models.
11.3.1VCR Facies Model
The VCR facies model consists of three geological parameters, namely: terrace elevation, footwall lithology, and channel development or reef architecture. The geological model aims to divide the data into areas of slope and terrace, clearly defining the areas where VCR is preserved.
Due to the varying hardness of the footwall zones across the mine, it has been observed that there exists a relationship between conglomerate development and preservation, and the footwall lithology. The geological model is divided up according to the footwall lithology sub-outcrop against the VCR. These parameters are observed in all underground mappings and drill hole intersections and are used to inform the final estimation model.
Variography and other statistical parameters were used to determine the similarities or differences between terraces. Statistically, the results showed that the geological terrace facies were homogeneous across all terrace elevations. It was therefore decided to continue with the terrace/slope model in conjunction with the footwall zones. The output of the model provides the geological basis for the evaluation model. Polygons defining areas of thick and thin VCR are outlined using new geological information. The VCR horizon is subdivided according to the footwall lithology, as illustrated in Figure 11-1.
Effective Date: June 30, 2024
40
Technical Report Summary for
Mponeng Mine, Gauteng, South Africa
Figure 11-1: Mponeng VCR Footwall Estimation Domains
Figure 11-2: Mponeng CLR Footwall Estimation Domains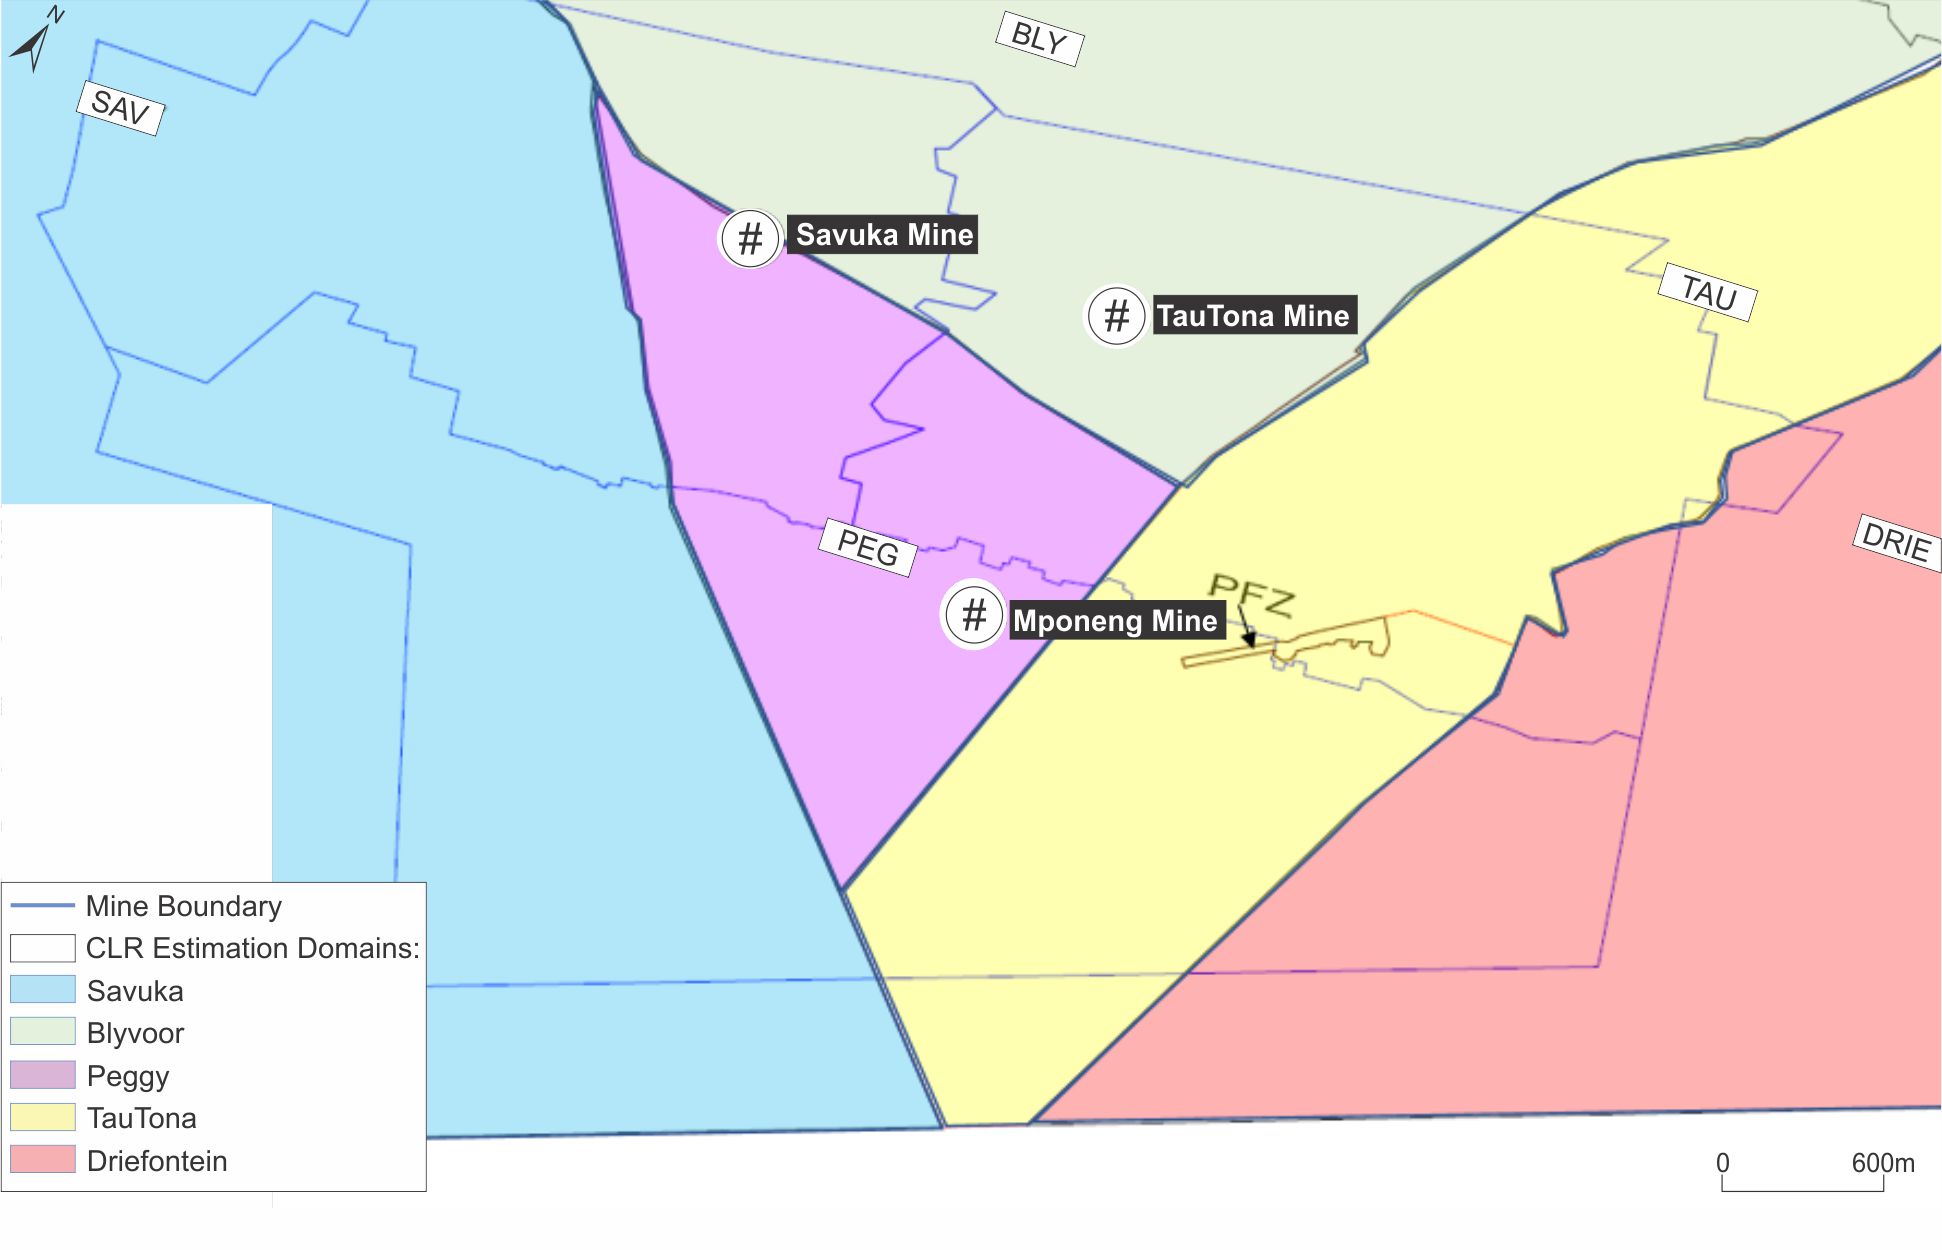
11.3.2CLR Facies Model
The CLR facies model is based on sedimentological changes across the West Wits Goldfield and is not able to provide much information on the mineralization within the CLR. As a result, there was development of an estimation domain model that encompasses CLR mineralogical characteristics, alteration mineralogy,
Effective Date: June 30, 2024
41
Technical Report Summary for
Mponeng Mine, Gauteng, South Africa
sedimentology facies, structural influences as well as trend analyses with the variations of gold values and channel width (Burnett et al., 2015). The estimation model is shown in Figure 11-2 and comprises five estimation domains related to surrounding mines, namely: Savuka (“SAV”), Blyvooruitzicht (“BLY”), Peggy (“PEG”), TauTona (“TAU”), and Driefontein (“Drie”). These domains are differentiated by conglomerate characteristics, which include matrix support, gold values and thickness.
11.4Mineral Resource Estimation Methods
2D surfaces of the VCR and CLR are created on DESWIK CAD Software.
11.4.1Statistics
Histograms and statistics of the raw data are calculated for each geological domain for comparison purposes. The Coefficient of Variation ("CV"), calculated by dividing the standard deviation with the mean, gives a measure of the variability of the data. A high CV (>1) represents highly variable or highly skewed data, which may require some form of capping of extreme values to lower the CV to a more reasonable value (c.1).
Outlying values (both for cmg/t and channel width) are calculated per domain at an optimal percentile using the “QUANTILE” process. The “capping” allows for meaningful Semi-Variogram modelling and avoids potential over-estimation due to extreme sample values.
The experimental Semi-Variogram is a descriptive statistic diagnostic tool for spatially characterizing regionalized variables and is central to the process of kriging with the set data that can be used. The Semi-Variogram is a mathematical function that describes how the spatial continuity of the sampled attribute changes as a function of distance and orientation.
The Semi-Variogram estimation process allows for the display of experimental Semi-Variograms and the fitting of a model using interactive graphics. Either an isotropic or an anisotropic model can be defined, comprising a nugget variance and up to nine individual structures, although it is rarely necessary to include more than three structures. If the Nugget effect is more than two-thirds of the sill then geostatistical analysis cannot be undertaken. Each structure may be either spherical, power, exponential, Gaussian or De Wijsian, although spherical models are deemed adequate for Mponeng. Normally the Lag distance should coincide with the sample spacing and the Lag tolerance is typically half the separation distance of the Variograms longest direction.
The Semi Variogram’s Sill is the distances and variability factor to the estimation process. The sill is generated from the Nugget = Cο. Spherical Component = C₁. Sill = Cο+C₁.
11.4.2Evaluation Parameters
The defined search ellipse adheres to the direction of the associated Semi-Variogram, as well as the range distances. The current minimum and maximum for VCR Measured Mineral Resource estimation, as well as the Indicated/Inferred Mineral Resource estimation, is variable per geological domain.
The current minimum and maximum is 5 and 40 for VCR, 9 and 40 for the CLR Measured Mineral Resource estimation, 6 and 20 for Indicated Mineral Resource estimation and 3 and 10 for the Inferred Mineral Resource estimation. For the search parameter files, the ellipsoid search is equivalent to the associate variogram angles.
11.4.3Gold Value Estimation
The gold value (cmg/t) estimation method used for local Measured Mineral Resource estimates is Ordinary Kriging and for local Indicated and Inferred Mineral Resource estimates is Simple Macro Kriging. The orientations and ranges of each geological domain's Semi-Variogram are used to determine the kriging search parameters, and the estimation parameters are also optimized. Estimates are generally kriged into 30m x 30m blocks for the Measured Mineral Resource from the point support data. The Indicated Mineral Resource is kriged into 60m x 60m block sizes. The Inferred Mineral Resource is estimated using the associated regularized variograms and kriging into 120m x 120m blocks. Any un-kriged areas in the inferred regions are then covered by global mean estimates.
The Measured Mineral Resource model is then tested on a Slope of Regression Estimation Confidence (“SR”) and merged with the Indicated Mineral Resource and Mineral Resource models to produce a combined
Effective Date: June 30, 2024
42
Technical Report Summary for
Mponeng Mine, Gauteng, South Africa
kriged block model. The Measured Mineral Resource estimation confidence is calculated for the Measured Mineral Resource halo to have both geostatistical and geological historical confidence with the very erratic gold deposit. SR is not used for Indicated or Inferred Mineral Resource estimation since simple macro kriging is implemented.
Gold value (cmg/t), which factors in both the thickness of the reef (cm) and the grade (g/t), is the only variable estimated in large block sizes. The distribution of the VCR gold values is show in Figure 11-3 and the distribution of the gold values in the CLR is shown Figure 11-4. The channel width is estimated for all block sizes.
11.4.4Declustering
The declustering process has been carried out by using both the “THK” and “THN” in their known areas and then with a mixed data set into the unknown areas.
The point database is declustered into 60m x 60m (VCR Indicated Mineral Resource) and 120m x 120m (VCR Inferred Mineral Resource) block sizes and 60m x 60m (CLR Indicated Mineral Resource) and 120m x 120m (CLR Inferred Mineral Resource). The number of points contained inside each declustered block is of importance, as a regularized block containing only one sample point, for instance, cannot be considered a declustered value but rather a point support value. Therefore, so as not to over-estimate the declustered Semi-Variogram sill, a minimum required number of sample points contained in a regularized block needs to be declustered.
To determine how many sample points are required to decluster in a 60m x 60m and 120m x 120m block regularization, the regularization process is carried out sequentially starting with a minimum of one sample section up to a minimum of 40 sample sections.
The overall zonal block variance is calculated for each regularization run and plotted on an x-axis showing the number of samples. The block variance will decrease as more samples are used to obtain the block average and then begin to stabilize as additional samples make little difference to the regularized estimate. A minimum sample number is selected just before the stabilization of the variance is reached, as a compromise is reached between over estimation of block variance and losing too many regularized blocks for semi-variogram estimation. Note that this is only done for the cmg/t variable, as gold accumulation is the driving factor for estimation. Additionally, the curves generated by this procedure (called Leonard curves) are used for calculating the “MKNUG” field for simple macro kriging of the cmg/t.
Experimental declustered 60m x 60m and 120m x 120m Semi-Variograms are generated for each domain. However, some domains do not contain enough sampling information to obtain any meaningful declustered Semi-Variogram. In such case, declustered macro kriging cannot take place within the domain, and the zonal/global mean is then used to classify the Inferred Mineral Resource portion of the domain.
The minimum number of sample points needed within a declustered block is determined by the “Leonard Curve”.
Effective Date: June 30, 2024
43
Technical Report Summary for
Mponeng Mine, Gauteng, South Africa
Figure 11-3: Distribution of the VCR Gold Value at Mponeng
Figure 11-4: Distribution of the CLR Gold Value at Mponeng and TauTona
11.4.5Inferred Declustered Global Mean
The cmg/t global mean for each domain is calculated by declustering the zonal sampling data into 10m x 10m blocks, 30m x 30m blocks, 50m x 50m blocks, and so forth, up until 190m x 190m. The cmg/t arithmetic mean of each declustered block size is then calculated, and the overall minimum is then identified as the global mean. The channel width global mean is calculated by simply considering the channel width arithmetic mean of the zonal de-clustered data.
11.4.6Relative Density and Tonnage Calculation
The Relative Density currently used for tonnage calculation at Mponeng is an average of 2.71t/m3. Reef volume is determined by block area multiplied by the thickness estimate. The tonnage of each reef horizon is determined by multiplying the volume by the Relative Density.
Effective Date: June 30, 2024
44
Technical Report Summary for
Mponeng Mine, Gauteng, South Africa
11.4.7Model Validation
The QP validated the Mponeng Mineral Resource model using the following:
•visual comparisons with the raw drill hole data;
•comparisons of the raw drill hole data statistics with the model statistics;
•model volume; and
•visual assessment of the block model with drill hole intersections to ensure that the grades are locally honored by the model.
The QP did not identify any critical errors in the block model.
11.5Mineral Resource Evaluation
The Mineral Resource estimate is reported in-situ within the Mponeng lease area (which now includes TauTona and Savuka), as determined through the analysis of the reasonable prospect for economic extraction by underground mining method. The cut-off value for the Mineral Resources is determined at 761cmg/t gold based on the economic assumptions presented in Table 11-3 at the effective date June 30, 2024. This cut-off value represents typical costs for the mining method and preliminary mining and metallurgical recovery assumptions.
Table 11-3: Harmony Economic Assumptions (June 30, 2024)1
| | | | | | | | |
| Description | Unit | Value |
| Gold price | USD/oz | 1,878 |
| FX rate | ZAR:USD | 18.26 |
| Gold price | ZAR/kg | 1,100,000 |
| Plant recovery factor | % | 98.00 |
| Unit cost | ZAR/t | 6,292 |
Notes:
1. Unit cost includes cash operating cost, royalty and ongoing development capital
The gold price of USD1,878/oz was derived by the Harmony Executive Committee at Head Office. The QP considers the price to be appropriate for Mineral Resource estimation and is slightly higher than that used for estimating Mineral Reserves (USD1,772/oz). The operating costs (both mining and processing) are based on historical performance and budget.
11.6Mineral Resource Classification and Uncertainties
The Mponeng Mineral Resources have been classified into Measured, Indicated, and Inferred categories, according to the S-K 1300 definitions. The classification is based on drill hole spacing and geological confidence.
The following drill hole spacings have been used:
•1,000m x 1,000m to upgrade to Inferred Mineral Resource;
•100m x 100m for Indicated Mineral Resource; and
•5m x 5m for Measured Mineral Resource (underground channel sampling).
The geological confidence criteria include confidence in the sedimentary facies and mineralization model and confidence in the structural model. A structural model discount has been applied to both the VCR and CLR models to account for any unknown geological structures that cannot be adequately defined by the available geological information ahead of the mining faces. For the VCR a 3% has been applied for all categories. For the CLR, a 3% was applied on Measured, 8% applied to Indicated and 10% applied to Inferred categories.
The limit of the optimized 30m x 30m local Kriging determines the extent of the Measured Mineral Resource component of the Mineral Resource. The Indicated and Inferred Mineral Resource categories are determined by the Lower Limit percentage confidence.
Effective Date: June 30, 2024
45
Technical Report Summary for
Mponeng Mine, Gauteng, South Africa
For every macro block that is estimated, a 95% confidence lower and upper value is calculated for the estimate. The ratio of the 95% lower limit value to the estimated value (in real space) expressed as a percentage is the Lower Limit percentage confidence. The 95% lower limit value is used as this represents the risk in the estimated value (the 95% upper limit value represents the opportunity). The lower this ratio is the less confidence there is in the estimated value because the difference between the estimated mean and the lower limit becomes greater.
11.7Mineral Resource Estimate
The Mineral Resources were originally prepared, classified and reported according to SAMREC, 2016. For the purposes of this TRS, the Mineral Resources have been classified in accordance with § 229.1302(d)(1)(iii)(A) (Item 1302(d)(1)(iii)(A) of Regulation S-K).
The location of the VCR and CLR Mineral Resources in relation to the license boundaries is presented in Figure 11-5 and Figure 11-6, respectively.
The Mineral Resource estimate for both the VCR at Mponeng and CLR remaining at TauTona is presented in Table 11-4 as at June 30, 2024, exclusive of Mineral Reserves. These estimates account for mining depletion recorded from 1 July 2023 to June 30, 2024.
The QP compiling the Mineral Resource estimates is Mr WH Olivier, who is Ore Reserve Manager at Mponeng, and Harmony employee.
Factors that may affect the Mineral Resource estimates include the following:
•gold price assumptions;
•exchange rate assumptions;
•operating and capital cost assumptions;
•gold recovery assumptions;
•geology-related risks; and
•operational risks.
It is important to note that the combined Measured and Indicated Mineral Resources, inclusive of Mineral Reserves, are carried forward to the Mineral Reserves conversion and subsequent LOM planning.
Effective Date: June 30, 2024
46
Technical Report Summary for
Mponeng Mine, Gauteng, South Africa
Figure 11-5: Location of Mponeng VCR Mineral Resources
Figure 11-6: Location of Mponeng CLR Mineral Resources
Effective Date: June 30, 2024
47
Technical Report Summary for
Mponeng Mine, Gauteng, South Africa
Table 11-4: Summary of the Mponeng Mineral Resources as at June 30, 2024 (Exclusive of Mineral Reserves) 1-8
| | | | | | | | | | | |
| METRIC |
| Mineral Resource Category | Tonnes (Mt) | Gold Grade (g/t) | Gold Content (kg) |
| Measured | 2.688 | 15.55 | 41,800 |
| Indicated | 13.719 | 13.48 | 184,915 |
| Total / Ave. Measured + Indicated | 16.407 | 13.82 | 226,716 |
| Inferred | 32.105 | 11.34 | 364,070 |
| | | |
| IMPERIAL |
| Mineral Resource Category | Tons (Mt) | Gold Grade (oz/t) | Gold Content (Moz) |
| Measured | 2.963 | 0.454 | 1.344 |
| Indicated | 15.123 | 0.393 | 5.945 |
| Total / Ave. Measured + Indicated | 18.085 | 0.403 | 7.289 |
| Inferred | 35.389 | 0.331 | 11.705 |
Notes:
1. Mineral Resources are reported with an effective date of June 30, 2024 were originally prepared, classified and reported according to SAMREC, 2016. For the purposes of this TRS, the Mineral Resources have been classified in accordance with § 229.1302(d)(1)(iii)(A) (Item 1302(d)(1)(iii)(A) of Regulation S-K). The Qualified Person responsible for the estimate is Mr WH Olivier, who is Ore Reserve Manager at Mponeng, and a Harmony employee.
2. The Mineral Resource tonnes are reported as in-situ with reasonable prospects for economic extraction.
3. No modifying factors or dilution sources have been included to in-situ Reserve which was subtracted from the SAMREC Resource in order to obtain the S-K 1300 Resource.
4. The Mineral Resources are reported using a cut-off value of 761cmg/t and a gold price of USD1,878/oz.
5. Tonnes are reported as rounded to three decimal places. Gold values are rounded to zero decimal places.
6. Mineral Resources are exclusive of Mineral Reserves. Mineral Resources are not Mineral Reserves and do not necessarily demonstrate economic viability.
7. Rounding as required by reporting guidelines may result in apparent summation differences.
8. The Mineral Resource estimate is for Harmony’s 100% interest.
11.8Mineral Resource Reconciliation
The combined Measured, Indicated and Inferred Mineral Resource gold content estimate for 2024, exclusive of Mineral Reserves, decreased by approximately 12.6%, from 21.744Moz gold as of June 2023 to 18.994Moz gold up to June 2024. The major difference is the upgrading from Resource to Reserve due to the approval of the LOM extention. An estimated 3.0Moz gold were transferred to the Mineral Reserve.
11.9Comment on Mineral Resource Estimates
In the opinion of the QP:
•methodologies applied in estimating the Mineral Resource are based on historical parameters;
•there is no known geological data that was not used that could materially influence the estimated quantity and quality of the Mineral Resource;
•there is no obvious geological, mining, metallurgical, environmental, social, infrastructural, legal and economic factors that could have an effect on the prospects of any possible exploration target or deposit; and
•the model for the Mineral Resource estimate is sound and it was not deemed necessary to consider alternative interpretations for the current Mineral Resource Statement.
Effective Date: June 30, 2024
48
Technical Report Summary for
Mponeng Mine, Gauteng, South Africa
12Mineral Reserve Estimate
Section 229.601(b)(96)(iii)(B)(12) (i-vi)
The reported Mineral Resources and Mineral Reserves are derived through a business planning process and consideration by the Chief Operating Decision-Maker (“CODM”), identified as the CEO's office. The business planning process comprises multi-functional reviews inclusive of all mining, support and service departments that are involved in the verification of the inputs and the Modifying Factors. The CODM consists of various executive roles and responsibilities. These executives assess the profitability, the revenue and production costs. The CODM also considers capital expenditure, gold production and tonnes milled when assessing the overall economic sustainability.
12.1Key Assumptions, Parameters, and Methods used to Estimate the Mineral Reserve
The results and assumptions derived from the business planning process extends over an 18-month period. The planning process carefully considers strategic plan directives; analysis of historical performance; realistic productivity, and cost parameters; Modifying Factors; and technical and economic studies that have demonstrated justified extraction, as applicable to specific portions of the Mineral Resources and Mineral Reserves.
All reported Mineral Resources and Mineral Reserves originate in situ from the underground tabular ore bodies at Mponeng. The Mineral Reserves are considered based on several factors, including:
•the latest geological structure and associated Mineral Resource estimation models that constrain the layout for the mine design and LOM planning;
•regional rock engineering stability pillars which are used for mining and geological support. In addition, the Mineral Reserves do not include pillar mining, mining of remnant areas, reclamation of broken ore out of old areas, tailings, or any other source;
•identified mining areas referred to as Above 120 Level, Phase 1 Below 120 Level, the remainder of the TauTona Eastern Block and the additions through the LOM extension. These additions includes areas from the VCR as well as the CLR;
•the mining methodologies. At Mponeng the Sequential Grid Mining (“SGM”) method is preferred, taking into consideration the mining and rock engineering design guidelines. More details on the mine design and layout can be found in Section 13;
•the Mineral Reserves cater for allowances in dilution sources and relevant Modifying Factors. Dilution of the ore body is predominantly attributed to the differences in stoping width and channel width being mined, and 2.9% of development waste declared to reef. More details on the Modifying Factors can be found in Table 12-1; and
•Measured and Indicated Mineral Resource estimates are reported exclusive of the portion converted to Mineral Reserves. Only Measured and Indicated Mineral Resources are used to derive the Mineral Reserves.
Both the Mineral Resources and Mineral Reserves are modelled in the DatamineTM Studio UG mining software. A macros system is generated, linked to a customized scripting menu that allows for professional and easy management of the data and the building of geostatistical models. The Mineral Resources form the basis of identifying the mineable areas.
These mineable areas are then planned, as per Mponeng Mine design parameters and layout (Section 13), using DeswikTM (Version 3). The Modifying Factors are then computed in Microsoft Excel in order attain the Mineral Reserve Statement. Rounding of figures may result in minor computational discrepancies in the Mineral Resource and Mineral Reserve tabulations. No other sources of information are published as part of the Mineral Reserves for Mponeng.
The location of the VCR and CLR Mineral Reserves in relation to the license boundaries is presented in Figure 12-1 and Figure 12-2, respectively.
Effective Date: June 30, 2024
49
Technical Report Summary for
Mponeng Mine, Gauteng, South Africa
Figure 12-1: Location of Mponeng VCR Mineral Reserves
Figure 12-2: Location of Mponeng CLR Mineral Reserves
Effective Date: June 30, 2024
50
Technical Report Summary for
Mponeng Mine, Gauteng, South Africa
12.2Modifying Factors
Table 12-1 presents a summary of the Modifying Factors used to convert the Mineral Resource to the Mineral Reserve for Mponeng. The Modifying Factors are consistent with the modelling, planning and computing estimates used in determining the Mineral Reserves, which are also consistent with historical performance. Plant recovery as shown in Table 12-1, is also consistent with the processing and recovery methods as defined in Section 14.
Table 12-1: Mponeng Modifying Factors Used for Mineral Reserve Determination
| | | | | | | | |
| Modifying Factor | Unit | Value |
| Relative Density | t/m³ | 2.71 |
| Stoping width | cm | 146.4 |
| Gully | % | 6.67 |
| Off Reef | % | 7.08 |
| Waste to Reef | % | 6.92 |
| Flushing tons | % | 6.78 |
| Discrepancy | % | 21.28 |
| Mine Call Factor | % | 80.15 |
| Plant Recover Factor | % | 98.01 |
| Mine Recover Factor | % | 78.56 |
| Plant Call Factor | % | 100.00 |
| Mineral Reserve cut-off | cmg/t | 971 |
12.3Mineral Reserve Estimate
The Mineral Reserves were originally prepared, classified and reported according to SAMREC, 2016. For the purposes of this TRS, the Mineral Reserves have been classified in accordance with § 229.1302(d)(1)(iii)(A) (Item 1302(d)(1)(iii)(A) of Regulation S-K). No significant differences were observed.
Mineral Reserves are derived from the Mineral Resources, a detailed business plan and the operational mine planning processes. Mine planning utilises and takes into consideration historical technical parameters achieved. In addition, Mineral Resource conversion to Mineral Reserves considers Modifying Factors, dilution, ore losses, minimum mining widths, planned mine call factors.
The QP compiling the Mineral Reserve estimates is Mr WH Olivier, who is Ore Reserve Manager at Mponeng, and a Harmony employee. The reported Mineral Reserve as at June 30, 2024 is 15.406Mt of milled ore containing 4.503Moz and comprise of 31% Proved Reserves and 69% are Probable Reserves. Mponeng Mineral Reserves are presented in Table 12-2, as at June 30, 2024.
Effective Date: June 30, 2024
51
Technical Report Summary for
Mponeng Mine, Gauteng, South Africa
Table 12-2: Summary of the Mponeng Mineral Reserves as at June 30, 2024 1-5 | | | | | | | | | | | |
| METRIC |
| Mineral Reserves Category | Tonnes (Mt) | Gold Grade (g/t) | Gold Content (kg) |
| Proved | 4.466 | 9.67 | 43,190 |
| Probable | 10.940 | 8.86 | 96,875 |
| Total / (Proved + Probable) | 15.406 | 9.09 | 140,065 |
| | | |
| IMPERIAL |
| Mineral Reserves Category | Tons (Mt) | Gold Grade (oz/t) | Gold Content (Moz) |
| Proved | 4.923 | 0.282 | 1.389 |
| Probable | 12.059 | 0.258 | 3.115 |
| Total / (Proved + Probable) | 16.982 | 0.265 | 4.503 |
Notes:
1. The Mineral Reserves were originally prepared, classified and reported according to SAMREC, 2016. For the purposes of this TRS, the Mineral Reserves have been classified in accordance with § 229.1302(d)(1)(iii)(A) (Item 1302(d)(1)(iii)(A) of Regulation S-K). The Qualified Person responsible for the estimate is Mr WH Olivier, who is the Mponeng Ore Reserve Manager, and a Harmony employee.
2. Tonnes, grade, and gold content are declared as net delivered to the mills.
3. Figures are fully inclusive of all mining dilutions, gold losses and are reported as mill delivered tonnes and head grades. Metallurgical recovery factors have not been applied to the reserve figures. For cut-off determination an operating cost of R6,292/t was used. Gold content in table excludes Plant recovery factor.
4. Gold content is after taking into consideration the modifying factors.
5. Mineral Reserves are reported using a cut-off grade of 971cmg/t determined using a gold price of USD1,772/oz gold.
6. Rounding as required by reporting guidelines may result in apparent summation differences.
12.4Mineral Reserve Reconciliation
The declared Mineral Reserve increased from 1.779Moz as at June 30, 2023 to 4.503Moz as at June 30, 2024. The key variances are noted as follows:
•depletions: 0.281Moz;
•increase in Mineral Reserves due to changes in the mining model attributable to grade: 0.049Moz;
•decrease in Mineral Reserves due to changes in the mining model attributable to design: 0.615Moz;
•addition of reserves due to Modifying Factors: 0.025Moz; and
•increase in reserves due to LOM extension: 2.339Moz.
12.5Commentary on Mineral Reserve Estimate
The reef within the Mponeng lease area has been mined since 1986. The declared Mineral Reserves takes into consideration all Modifying Factors. The Mineral Reserve is 15.406Mt of milled ore containing 4.503Moz as at June 30, 2024. The mine is currently mining profitably, and the Mineral Reserve estimates show positive cash flows. Silver or any other by-products that are recovered as part of the refining process, however, make up an immaterial component of the total metal inventory, and is thus not reported as part of the Mineral Reserve estimates.
There are no obvious material risks that could have significant effect on the Mineral Reserves.
Effective Date: June 30, 2024
52
Technical Report Summary for
Mponeng Mine, Gauteng, South Africa
13Mining Method
Section 229.601(b)(96)(iii)(B)(13) (i-v)
Mponeng is a deep level underground gold mine currently operating at depths ranging between 3,350m and 3,830m BMD, and currently the deepest mine in the world with development at 3,890m BMD. Potential future mining operations at Mponeng are expected to deepen the shaft bottom to 4,227m BMD. The reef portion currently being mined at Mponeng is accessible between 3,405 – 3,830m BMD.
There are two mining methods in practice at Mponeng. Historically, longwall mining was practiced at Mponeng until the breast mining method was used, aimed at reducing the occurrence of large seismic events. However, this has evolved to the sequential-grid mining (SGM) method with backfill support. The SGM method makes use of dip and stabilizing pillars and reduced mining spans with access tunnels developed in advance, aimed at further control of stresses experienced in rock movement. Mponeng’s business plan is based on the SGM method. The mining sequence involves stoping towards the smaller solid first (i.e., towards the mined-out area) before turning to the opposite side of the raise to complete the block of ground towards the larger solid, thus better managing field stress. An underhand face configuration is typically adopted when mining towards the west and an overhand face configuration when mining towards the east, thus maximizing the intersection angle to a major joint set. An example of the mining sequence used at Mponeng is shown in Figure 13-1.
Both breast mining and SGM mining methods are suitable for underground, narrow reef mining. The common feature of breast mining and SGM is the layout of the primary and secondary development (see schematic layout in Figure 13-2 and Figure 13-3). Primary development is done off-reef (in waste rock), while secondary development is done on-reef (in the mineralized zone). In primary development, horizontal haulages are developed from the vertical shaft, extending to the extremities of the mining level. Inter-level spacing is the vertical distance between two consecutive level stations underground. Further development is done at set intervals along the haulages towards the mineralized zones in the form of horizontal crosscuts. For secondary development, an inclined excavation that connects two levels is established, referred to a raise or winze, depending on the upwards or downwards direction of the development, respectively.
A key feature of breast mining is that the mine design includes pillars in the stoping areas that are designed to cave in a planned and controlled manner. These pillars are referred to as crush pillars and the dimensions of the pillars are determined by the geotechnical properties of the host rock. The use of crush pillars minimizes the risk of unpredicted collapse of stoping areas. These collapses can compromise the safety of mining operations and may lead to permanent closure of stoping panels or sterilization of ore.
The use of crush pillars is appropriate at shallower depths, but for the current ultra-deep workings, crush pillars become a source of seismicity and hence the complete migration to the SGM method. A key feature of the SGM mine design is that crush pillars are replaced by self-confining backfill, consisting of classified tailing material, and non-crushing stabilizing and regional pillars as shown in Figure 13-1 (not to scale). During the Mponeng Mine design process, the pillar dimensions for a particular layout and depth are determined using the assumptions and model created by the geotechnical team. More details of the geotechnical and geohydrological considerations are found in Section 13.5.
13.1SGM
To manage the seismic risk associated with ultra-deep level mining, the SGM is used in the current mining operations for both the VCR and CLR horizons, and for planning the LOM extension projects. The SGM offers various advantages, the critical one being increased safety. As part of the strategy to maximize flexibility and mitigate the risks associated with the production plan, development is undertaken ~24 months ahead of mining. A noticeable characteristic of the SGM method is that mining from the raises is advanced in only one direction at a time, which is directed towards the stabilizing or regional pillars. At Mponeng, SGM works in conjunction with backfill support which allows this mining method to be more effective. This SGM mining sequence also eliminates the creation of remnant pillars (a feature in breast mining) reducing the risk of seismicity. Therefore, the advantages offered by the SGM method make it the preferred mining method, especially when considering the current operating depths at Mponeng.
Effective Date: June 30, 2024
53
Technical Report Summary for
Mponeng Mine, Gauteng, South Africa
Figure 13-1: Plan Showing the SGM Sequence at Mponeng
13.2Mine design
The mine design strategy aims at maximizing the safe extraction of ore, while minimizing the risk of geotechnical failures, which can result in operational disruptions and dangerous working conditions. Both the VCR and CLR horizons are considered for the Mponeng Mine design and planning. A common parameter that varies in mining is the geology of the area, which is the most critical parameter. Both, the CLR and VCR reef horizons have been subject to faulting and intrusions by igneous dykes and sills that cut across the reefs. The most significant form of control at Mponeng for rockfalls and rockbursts is the backfill support. Backfill is considered as a regional support system. Ledged raises are supported by a combination of packs and backfill ribs, which keeps the central raise line much more stable during the stoping operations.
Effective Date: June 30, 2024
54
Technical Report Summary for
Mponeng Mine, Gauteng, South Africa
The occurrence of geological faults is also a source of groundwater intersections during mining operations which may lead to production delays, geotechnical risks, and the potential of flooding. Depending on the geology of the dyke or sill, a change in the mining direction may be required, or as in the case of low-risk scenarios the Rock Engineering department may suggest a safety and support strategy to mitigate the associated geotechnical risk. A change in mining direction may result in Mineral Resource losses, or an increase in dilution.
A mine design that is sufficiently informed, with geological data, is progressed to the mine planning phase. Mine planning is done on a macro scale as well as on a micro scale. On a macro scale, a regional cut-off grade is applied and the material below cut-off is excluded from the mining model. On a micro scale, the mining model is then subject to constraints that are applied because of the geotechnical design and other limitations. The geotechnical modelling is driven by the most recent information from mining operations, which ensures that the model is a clear representation of the current operational conditions.
Reefs are accessed through a vertical twin shaft system with supporting sub-vertical shafts, and a decline shaft system. Section 15 provides more details of the surface and underground infrastructural layout supporting Mponeng mining operations. Mining production is accessed through underground excavations, developed as haulages and cross cuts. The majority of Mponeng’s production is currently from the VCR between 120 level and 126 level. The inter-level spacing between 120 level and 126 level is ~90m. In addition, the CLR, which is in the TauTona lease area, contributes to mining production, and is accessed through Mponeng’s underground haulage development.
Development, with respect to the VCR horizon, is predominantly through the hanging wall, for levels above the 109 level, with the exception of the 99 level development which is in the footwall. The access haulages below 109 level (i.e., 113 Level and below) have all been developed in the footwall. The haulage development for the CLR is also positioned in the footwall. The presence of large geological structures within the raise line can influence these developments. The mine design parameters for the VCR and CLR horizons are noted in Table 13-1. As part of primary development, a crosscut is developed in the direction of the mine mineralized zone. A plan view of a typical footwall crosscut is shown in Figure 13-2.
The section view of the inclined secondary development, which is used to access the reef contact, and advanced from the position of respective crosscuts is depicted in Figure 13-3. Ore is extracted from stoping panels established from the inclined development. The typical stoping panel dimensions are a panel length of 28m-35m and a stoping width of 1.6m for the VCR horizon and 1.2m for the CLR horizon.
Figure 13-2: Plan view of a Typical Footwall Crosscut at Mponeng
Effective Date: June 30, 2024
55
Technical Report Summary for
Mponeng Mine, Gauteng, South Africa
Figure 13-3: Section of a Typical Footwall Crosscut at Mponeng
Effective Date: June 30, 2024
56
Technical Report Summary for
Mponeng Mine, Gauteng, South Africa
Effective Date: June 30, 2024
57
Technical Report Summary for
Mponeng Mine, Gauteng, South Africa
13.2.1Mine Design Parameters
Mine design is done internally, with the mine designs for the VCR and CLR horizons done separately, using DeswikTM software (Version 3). The geological models, and the geotechnical parameters formulated by the Rock Engineers, are used as a basis of the mine planning process. The mine design parameters used for the VCR and CLR horizons are shown in Table 13-1. The stopes are mined from the center raise line westwards and eastwards, one direction at a time, towards the stabilizing pillars (Figure 13-1). Additional support is provided using bracket pillars, to ensure safety around major geological features.
Table 13-1: Key Mine Design Parameters
| | | | | | | | | | | |
| Parameter | Unit | VCR | CLR |
| Regional Stability |
| Dip stabilizing pillar dimensions |
| Dip pillar strike span (spacing) | m | 180 | 180 |
| Stabilizing pillar width | m | 30 | 30/40 |
| Strike stability pillar spacing (max 1st & 2nd phase) | m | 210 & 140 | 210 & 140 |
| Access haulages middling to reef | m | 85 - 150 | 70 |
| Primary Development |
| Advance | m/month | 35 | 35 |
| Secondary Development |
| Advance | m/month | 25 | 25 |
| Stoping Parameters |
| Middling to reef (VCR) | m | 85 - 150 | |
| Middling - footwall placement (CLR) | m | | 70 |
| Economic Parameters |
| Cut-off grade (planning) | cmg/t | 971 | 971 |
Notes:
1. Pillar spacing is measured skin to skin.
13.2.2Geohydrological and Seismic Monitoring
Approximately 85% of the Mponeng Mine lease area lies in the Oberholzer Compartment. These compartments have been dewatered continuously since the inception of mining, to prevent the inflow of groundwater into the mining areas. In addition, subsurface water migrates along the faults and dykes in the mining areas, and water ingress occurs at the sub-outcrop of the VCR. Further, water and gas can infiltrate the mining operations through open fissures, boreholes as well as through brittle rock occurrences underground. Water and gas usually occur in small quantities throughout the mine.
To fully understand the nature and modes of structural control of gas, water and seismicity at Mponeng’s depth, an integration of different datasets such as borehole, gas and seismic compositional data is required. The mine monitors water levels through vertical boreholes strategically located. Cover drilling is also done ahead of development to identify water and gas intersections in advance. Apart from drilling, water is also identified during primary and secondary development. In the event of major water intersections, a water sealing plan is initiated. Most of the the old mining areas have been sealed off, and in some cases hoses and pipes are installed which diverts water to sumps, to be eventually pumped out to surface.
Methane gas pathways are identified during geological mapping, investigation of seismic data and cover drilling. Attributes based on structural interpretation, give rise to the identification and understanding of methane gas migration pathways. The identification of this structural architecture is critical for the mine as it provides a better understanding of these pathways. Any risks identified from the presence of gas is controlled though the use of Mponeng’s ventilation and refrigeration systems. The Geology department maintains detailed electronic records of all water and gas intersections at the operations.
Seismic monitoring at Mponeng is done using uniaxial and triaxial sensors, which measure seismic activity from surface and underground. The sensors are placed strategically based on set criteria, including event sensitivity and accuracy. In addition to the monitoring done through the systems that are in place, visual monitoring of the mining excavations is done by the Rock Engineering department, mainly focusing on ground conditions. While surface monitoring seeks to identify and interpret any ground motion on the Earth’s surface.
Effective Date: June 30, 2024
58
Technical Report Summary for
Mponeng Mine, Gauteng, South Africa
13.3Mine Plan Development and Reserve Schedule
The preferred SGM mining method is dependent on development staying ahead of the mining front, so that accurate geological information is gathered and included in final designs before mining commences. This also enables, planning and scheduling activities to be accurately sequenced, which leads to better planning, safer working conditions, and improved profitability.
At Mponeng, the Reserve plan and scheduling originates with the use of the Mineral Reserves model, which is modelled at a 971cmg/t cut-off grade. The 15.406Mt of Mineral Reserves are partly accessible through Mponeng’s existing infrastructure. There are Mineral Resources located beyond the current infrastructure that are included in the Mineral Reserve estimates, and as a result are also included in the Reserve plan. Development towards these areas will commence during July 2024. The mining rates used in determining the Reserve plan are based on the current and expected operational performance, notwithstanding any unforeseen underground mining constraints. The remaining Reserve plan for the operations is planned for eighteen years, with a planned mining rate averaging at approximately 847ktpa (milled tons) over the LOM period. The extent of the Mponeng LOM plan is shown in Figure 13 4.
13.4Geotechnical and Geohydrological Considerations
Apart from the geotechnical risks that can be caused by the existence of geological structures and the presence of water and gas, there is also a seismicity risk at Mponeng due to the depth of the current mining operations. Mponeng maintains a working geotechnical model, to manage and control seismicity risk, consisting of primary data sourced from seismometers, reinforced with data inputs from geohydrological and other seismic monitoring processes. The geotechnical model for Mponeng takes the latest geological structural model and the selected mining method into account to design a suitable pillar layout.
The purpose of the pillar designs, regardless of the pillar type, is to customize them to the prevailing mining conditions, with the objective of making the mine design safe, practical, easy to implement, and profitable. These pillars include dip stabilizing-, bracket- and strike pillars. The details of the pillar design can be found in Table 13 1. The dimensions depicted for the pillars are standard and are adjusted depending on planned bracketing of geological structures, backfilling or in some circumstances, if patches of low value reef have been encountered. The Rock Engineers model the expected release of seismic energy, known as the energy release rate to establish backfilling support requirements and pillar design limits. Studies at Mponeng Mine have shown a positive correlation with the SGM method in areas mined, with backfill support.
This model is also used to manage and monitor the occurrence of ground water and gas intersections at the mine. There is a material risk associated with flooding and gas explosions at the mine, in the event of an unforeseen influx of uncontrolled water or gas, from within the mining operations or from neighboring mining operations. The rock fall mitigation strategy is detailed and managed through the Mining and Rock engineering Code of Practice (COP) and is communicated, adhered to, and monitored by both the mine’s technical services and operational teams.
13.5Mining Operations
Mponeng Mine has been operating economically since inception and is operating within well-defined infrastructure. The most recent development at Mponeng, is the mine’s deepening project which is the decline shaft system extending down to the 127 level. This is part of the current infrastructure that contains mining on the VCR 123 and 126 levels. Further extension towards 135 level will enable a LoM of 18 years. The main source of ore from the mining production at Mponeng is from the VCR, supported by limited mining from the CLR, in the TauTona portion of the mine. The mined ore is processed at the Mponeng mineral processing plant, where the design capacity of the plant exceeds the maximum planned production volume. This spare capacity is used to process marginal ore, that is either sourced from Kusasalethu or Mponeng, from the low-grade stockpile located on surface. The processed marginal ore material is used as a secondary support function, in the form of backfill, for the underground excavations.
13.5.1Mining Rates
The forecast on mining production rates for Mponeng are the tonnages of the Reserve plan which considers the planned and available working areas, inclusive of the mines current infrastructure capacity. The annual
Effective Date: June 30, 2024
59
Technical Report Summary for
Mponeng Mine, Gauteng, South Africa
forecast on tonnages and gold produced for the Reserve plan is shown in Figure 13-5 and Figure 13-6, respectively.
Figure 13-5: Graph of Mponeng Reserve Plan - Tonnes and Grade
Figure 13-6: Graph of Mponeng Reserve Plan – Gold Produced (kg)
Effective Date: June 30, 2024
60
Technical Report Summary for
Mponeng Mine, Gauteng, South Africa
13.5.2Mining Equipment and Machinery
There are various machinery and equipment used at Mponeng Mine, depending on the type of mining or development activity. The following equipment can be found at the frontline of mining production:
•haulages and associated development: Hydro-powered (“HPE”) drill rigs are used at Mponeng for underground excavations and tunnelling. These rigs are preferred as they are versatile and capable of angular, horizontal, and vertical drilling;
•production drilling in stopes: There are 2 types of drilled holes adopted in a stoping panel at Mponeng, namely production drilling and pre-conditioned drilling. Pre-conditioning is a methodology aimed at transferring the stresses away from the stope face, therefore reducing the potential for face burst damage. Pre-conditioned holes are drilled longer than production holes and are blasted with the production round. Equipment used for this type of drilling is compressed air hand-held drills;
•raise boring: Is a drilling technique used for ventilation development purposes and ore passes. Raise boring and control mechanisms are currently operated via control modules connected through the mine’s underground and shaft communication networks, conducted on surface by a contractor. The benefits of this allow personnel to be removed from dangerous underground workings and have the upside of productivity achieved through automation;
•rock movement: Ore from the stoping ore passes is loaded directly into hoppers from the box-front chutes and then trammed to the shaft to the inter-level tips, then transferred to the main loading bins for hoisting to the surface. Waste rock from development operations is loaded into similar hoppers and trammed and hoisted in the same manner as the ore movement but is done using in a dedicated waste system to prevent diluting the ore grade;
•material movement: Mponeng have recently investigated the movement of material through an Electric Monorail Transport System (“EMTS”). The EMTS was partially adopted at Mponeng narrow vein decline operations due to their consistent maintenance of speed in steep and changing gradients, while allowing for varying weight bearing capacities, works as efficiently in undulating floor conditions, and is almost impossible to de-rail due to the L-shaped sliding beam design; and
•ancillary equipment: Small articulated dump trucks, graders, and crawler mounted bulldozers for dump, waste and marginal ore movement also support the Mponeng Mine operations.
13.5.3Grade and Dilution Control
The selected SGM mining method is planned and designed to better support recovered grade because of the improved selectivity, flexibility, and reduced off-reef mining. Ore grade and dilution control is done using a Quality Index monitoring tool. This Quality Index was developed at Mponeng and considers key parameters including Mine Call Factor, stoping width, proportion of ore lock-up, and an on-reef index. During the mine design and planning process, external dilution control is implemented by applying an adapted mine recovery factor. The Mine Planning department performs critical raise line monitoring and ensures the ratio of the combined ore mined is within grade tolerance limits.
Operationally, grade and dilution control is mostly achieved through improved drilling and blasting practices. Drilling accuracy is achieved by holes that are drilled parallel, aimed at being correctly burdened and that are within the stoping limits. This ensures consistent and economic rock breaking, without dilution. Mponeng also adopts electronic blasting technology consisting of an integrated electronic system, which allows for precision timing and improved control of rock breaking. This technique controls stoping width and protects the integrity of the footwall and hanging wall, aimed at minimizing dilution.
13.5.4Ore transport
The blasted ore from the stoping panels is moved with winch-operated scrapers along gullies to ore passes where it gravitates down to the loading boxes in the footwall cross-cuts below the stopes. The ore is discharged into rail hoppers and transported, via front-driven locomotives, to dedicated inter-level transfer systems that gravity feed to the main silos on 121 level. The ore is hoisted up the sub-vertical shaft and transferred to the main shaft rock system and silos. Once hoisted up the main vertical shaft to surface, the ore is transported to the processing plant via conveyor belt.
Effective Date: June 30, 2024
61
Technical Report Summary for
Mponeng Mine, Gauteng, South Africa
13.5.5Mining Personnel
Mponeng Mine is labour intensive. Holistically, the mine is supported by approximately 5,000 mine-employed personnel and approximately 2,600 labour personnel are in direct production. The underground mining operations uses an 11-hour shift system, operating a 2-shift cycle per day. Mining is scheduled over a five day working week, with an effective 20 shifts during a month. During December and January, shorter productive shifts are planned. The mining personnel, operating on this shift cycle, comprise of workers performing development, stoping, and other additional tasks. These personnel are sub-divided and organized into support, breaking (also referred to as drill and blast), and cleaning crews (Figure 13-7).
The supporting and breaking crew complete tasks during the day shift, while cleaning is done during the night shift. A development crew is responsible for one development end at a time and operate in the mining cycle as shown in Table 13 2.
Table 13-2: Mining Personnel Functions
| | | | | | | | |
| Mining cycle day and shift | Crew No. | Function of Mining Crew |
| Day 1 - Dayshift | E2 | Support |
| Day 1 - Dayshift | E1 | Break |
| Day 1 - Nightshift | E1 | Clean |
| Day 2 - Dayshift | E1 | Support |
| Day 2 - Dayshift | E2 | Break |
| Day 2 - Nightshift | E2 | Clean |
| Day 3 - Dayshift | E2 | Support |
| Day 3 - Dayshift | E1 | Break |
| Day 3 - Nightshift | E1 | Clean |
| Day 4 - Dayshift | E1 | Support |
| Day 4 - Dayshift | E2 | Break |
| Day 4 - Nightshift | E2 | Clean |
| | |
| | |
| | |
| | |
| | |
| | |
| | |
| | |
| | |
| | |
| | |
| | |
Notes:
1. See crew no. (E1 and E2), and function of mining crew (support, break, clean) depicted in Figure 13-7.
The 11-hour cycle mining shifts implemented aim at supporting crews in their efforts to complete the mining cycles found in Figure 13-7, and as explained in Table 13-2, as well other additional work, such as:
•pre-conditioning;
•support functions for mining gullies;
•backfill support;
•maintaining efficient spacing on strike; and
•in-stope support and blasting functions.
Mponeng is committed to continuous improvement projects aimed at efficient extraction from workplaces, through optimizing personnel time and function. Over the past five years Mponeng has maintained 300m² average/crew/month. Currently on an approximate average, typical mining crews can attain an advance of 14,000m2/month, with almost 50 mining crews required for this advance.
13.6Commentary on Mining Method
The SGM mining method is the prevalent mining method at Mponeng Mine. This mining method works well with the implementation of backfill support. The use of backfill displays results with lower levels of energy release in relation to other mining methods. Low energy release is known to control the reduction in seismic events, and rockbursts or rockfalls. The mine design, planning and scheduling for the mine is developed using the DatamineTM and DeswikTM (Version 3) software, respectively, considering the geotechnical model and related parameters. The main geotechnical and geohydrological risks at Mponeng include the presence of gas, ground water and seismicity, which are managed through the integrated monitoring systems, and incorporated into working mining models that inform daily mine planning decision-making. The mining rates, machinery and equipment, ore transport, grade and dilution control, and labour resourcing and optimisation are driven by the mine schedule and continuous improvement initiatives on-site.
Effective Date: June 30, 2024
62
Technical Report Summary for
Mponeng Mine, Gauteng, South Africa
Figure 13-7: Mponeng Cycle Mining and Supporting Crew Functions
Effective Date: June 30, 2024
63
Technical Report Summary for
Mponeng Mine, Gauteng, South Africa
14Processing and Recovery Methods
Section 229.601(b)(96)(iii)(B)(14) (i-iv)
Mponeng's gold processing facility has been in operation since 1986. The technology used to process the gold-bearing ore is well established and is suitable for the style of mineralization (VCR and CLR ore). During the timeframe, the plant has been operating without significant challenges and target metallurgical recoveries have been achieved.
14.1Mineral Processing Description
All mined ore is treated and smelted at Mponeng's gold plant as depicted in Figure 14-1. The ore is initially reduced in size by crushing (90% passing 75micron) followed by semi-autogenous milling after which a conventional gold leach process (cyanidation), incorporating oxygen injection by means of compressed air. The cyanidation process is one of the most utilized methods for the recovery of gold from auriferous ores. The use of cyanide leaching for gold recovery is based on gold’s properties, mainly its solubility (ability to dissolve) in cyanide solutions. Once the gold is dissolved into the cyanide solution it has a higher ability to adsorb (attach) onto activated carbon through the application of carbon in pulp (“CIP”) technology.
The loaded carbon then enters the elution columns, which are high pressure vessels that circulate the loaded carbon extracting the gold. The gold will “deabsorb” from the activated carbon and attach onto stainless-steel wool by means of electrowinning. The CIP circuit makes use of gravity flow of slime between the consecutive counter-flow stages in order to recover recirculate the activated carbon back into the system. Following this process, the cathode steel wool is smelted after drying in the calcining ovens. The bullion (gold) will then be dispatched to Rand Refinery for final refining, with silver as a by-product.
14.2Plant Throughput, Design, Equipment Characteristics and Specifications
The milled ore from Mponeng follows a standard cyanide leach, CIP, Elution and electrowinning process in order to extract the gold bullion. The current capacity of the plant is designed to process 95tph ore (Table 14-1). The plant is operating below its designed throughput capacity and has shown its ability to produce the forecasted ounces of gold at said capacity (Table 14-2).
Table 14-1: Key Equipment Specifications at Mponeng Gold Plant
| | | | | | | | |
| Equipment | Unit | Capacity |
| Mill Silo (per silo – 3 silos) | Volume / silo (m3) | 3,478 |
| Tonnes | 3,500 |
| ROM Mill (per mill – 3 mills) | Volume / tank (m3) | 127 |
| Leach (10 leach tanks) | Dry Tonnes / tank | 1,011 |
| CIP (8 tanks) | Volume / tank (m3) | 231 |
| Dry Tonnes / tank (t) | 159 |
| Acid Wash (2 tanks) | Volume / tank (m3) | 10 |
| Carbon (t) | 5 |
| Cycle time (hr) | 3 |
| Elution (3 tanks) | Volume / tank (m3) | 11 |
| Carbon (t) | 5 |
| Cycle time (hr) | 12 |
| Thickener (3 thickeners) | Volume / thickener (m3) | 1,590 |
| Dry Tonnes (t) | 5,620 |
Table 14-2: Design Throughput Versus Actual Throughput at Mponeng Gold Plant
| | | | | | | | |
| | Throughput |
| Equipment | Design (t/hr) | Actual (t/hr) |
| Mill | 95 | 75 |
| Leach | 300 | 223 |
| CIP | 300 | 223 |
| Thickener | 160 | 110 |
Effective Date: June 30, 2024
64
Technical Report Summary for
Mponeng Mine, Gauteng, South Africa
Figure 14-1: Schematic Flow Diagram of the Metallurgical Process
Effective Date: June 30, 2024
65
Technical Report Summary for
Mponeng Mine, Gauteng, South Africa
14.3Energy, Water, Process Material and Personnel Requirements
Since the introduction of the McArthur/Forrest process in 1890, the leaching of Witwatersrand gold ores has been carried out in alkaline cyanide solutions. The process requires significant amounts of reagents which can be summarized in Table 14-3.
Table 14-3: Consumables
| | | | | | | | |
| Equipment | Unit | Value |
| Steel Balls | Steel balls / annum | 550 |
| Lime | tpm | 67,500 |
| Flocculant | tpm | 3,000 |
| Cyanide | tpm | 51,750 |
| Carbon | tpm | 6,000 |
The cyanide leach is an intricate balance of time, pH and oxygen sparging. These parameters have been determined with metallurgical test work and historical performance to optimize the recovery. The parameters used in this process are set out in Table 14-4.
Table 14-4: Leaching Process Material and Properties
| | | | | |
| Process Requirements | Properties |
| pH | 10.5 - 11.5 (controlled by lime addition) |
| Cyanide | 180 - 300ppm as 100% NaCN |
| Leaching Time | 24 – 40 hours |
| Oxygen | Air or oxygen sparged, 5 - 25ppm O2 |
| Cyanide Relative Density | 1.38 - 1.45, 40-50% solids at SG 2.7 |
14.4Commentary on the Processing and Recovery Methods
In the QP’s opinion, the metallurgical process is a well-tested technology which has been in operation at the mine since 1986 processing VCR and CLR ore. Recoveries used in the business plan were based on historic performance. The methodology applied considered the historical metallurgical recovery (18-month period) for the relevant ore source. The actual monthly head grades were reviewed and the relationship between the head grade and recovery were used as base for the Business Plan (BP) 2024/25 metallurgical recoveries, taking into consideration the relevant forecast head grades (Figure 14-2 and Figure 14-3).
Effective Date: June 30, 2024
66
Technical Report Summary for
Mponeng Mine, Gauteng, South Africa
Figure 14-2: Graph of VCR Historical Recovery Factor (18 months actual)
Effective Date: June 30, 2024
67
Technical Report Summary for
Mponeng Mine, Gauteng, South Africa
15Infrastructure
Section 229.601(b)(96)(iii)(B)(15)
Mponeng is an established operation and as a result, all the current surface and underground infrastructure is sufficient for the declared Reserve plan requirements, as detailed in the Mineral Reserves statement (Section 12.3) and supported by the mine plan (Section 13.5.1). Mponeng is accessible via the national and provincial roads (Figure 3-1). The general layout of Mponeng Mine infrastructure in relation to the neighboring Harmony mines, TauTona and Savuka is displayed in Figure 15-1.
15.1Surface Infrastructure
The infrastructural layout includes hauling and hoisting facilities; logistical support for core handling, sampling, and transporting; a mineral processing plant; marginal ore and waste facilities; tailings and leaching infrastructure; roads; water and power supply; ventilation and refrigeration systems; stores and workshop support; electrical supply; offices; housing and security.
15.1.1Ore and Waste Rock Storage Facilities
Ore mined at Mponeng is classified as gold bearing ore and marginal ore. The gold bearing ore is directly processed at the mineral processing plant, situated adjacent to the security, and change house (Figure 15-2). More details of the infrastructure supporting the mineral processing operation can be found in Section 14.1. Marginal ore and waste are transported and deposited on the marginal ore facility, adjacent to the plant (Figure 15-2). The design capacity of the Mponeng plant exceeds the current maximum planned production volume. Therefore, the plants spare capacity is used to process the marginal ore which ensures sufficient backfill material supply to the operation. Waste mining at Mponeng is insignificant, as reflected in the planned Reserve. The existing physical extent on site for this waste dumping is sufficient.
15.1.2Tailings Storage Facilities
The tailings storage facility (“TSF”) is located to the southwestern section of the Mponeng Mine lease area as shown in Figure 15-1. The TSF is currently active and is owned and operated by Mponeng. All waste material from the mineral processing activities at Mponeng is accumulated at this TSF. The initial TSF operations began in 1990. Incidental ore recovered since the inception of development and mining in 1986, until the commissioning of the tailings facility, was transported and processed via the Savuka infrastructure system.
The TSF site has full engineering records including design, construction, operation, and maintenance plans. The design height is 41m and is engineered in an upstream raising method, divided into three compartments; namely Compartment 1, Compartment 2 and Lower Compartment. The designed volume is 50.2Mm3. A feasibility study was done by independent tailings engineer company (Jones & Wagener Engineering and Environmental Consultants) in 2018 as part of the LOM extension project. The study indicated that the Mponeng TSF has sufficient capacity at the current Reserve plan and production rate.
An analysis of the downstream impact on communities, ecosystems, and critical infrastructure in the event of catastrophic failure is complete. A closure plan, typically extending over a 2-year period, to assess the TSF against the impact of extreme weather events because of climate change is also in place. The facility has never failed stability certifications and has no notable stability concerns. There is also a long-term monitoring and closure plan in progress. The TSF adheres to the SANS 10286 governed classification system and is monitored by internal engineers, supported by external engineering specialists.
15.1.3Power and Electrical
Mponeng Mine power supply is designed to satisfy the planned Reserve plan production and service requirements. Main power supply is managed and distributed via electrical sub-stations located on site, as represented in Figure 15-2.
The operation has capacity to supply 220MW, however currently only 110MW is utilized. No risks are identified related to continued power supply. For any mitigation on unplanned power outage, a back up alternator is on site to ensure that mine can be life sustaining, people withdrawn and infrastructure protected.
Effective Date: June 30, 2024
68
Technical Report Summary for
Mponeng Mine, Gauteng, South Africa
Figure 15-1: Mponeng Surface Mine Layout and Infrastructure
Effective Date: June 30, 2024
69
Technical Report Summary for
Mponeng Mine, Gauteng, South Africa
Figure 15-2: Mponeng Mine Detailed Surface Infrastructure
Source: Google Earth Image Date: March 2021
Effective Date: June 30, 2024
70
Technical Report Summary for
Mponeng Mine, Gauteng, South Africa
15.1.4Water Usage
Mponeng Mine sends underground approximately 32 ML of cold water (3°C) per day for bulk air cooling, spot air cooling and Mining purposes. In addition to this, the mine produces approximately 3,500ton (3.5ML) of Ice per day, which is send to the same dam for the same purposes.
Each day the mine dewaters approximately 50ML of water with the balance of water coming from adjacent Savuka Mine and TauTona mines. Mponeng uses approximately 500,000kWh per day to pump water from underground at an average cost of ZAR850,000 per day. The amount of energy used to cool the water largely depends on the season with warm months utilizing approximately 460,808kWh per day at a cost of ZAR783,373 per day.
15.2Underground Infrastructure and Shafts
Mponeng Mine existing shaft headgear and underground infrastructure used to access the portion of the reef, which is located between 3,000m and 3,600m BMD is schematically depicted in Figure 15-3. The underground workings are accessed and mined via three shaft systems, namely two vertical shaft systems and a decline shaft system. The main vertical shaft system comprises two shafts, which extends from surface to 85 level. In addition, there are two sub-vertical shafts which emanate on 81 level and extend to 121 level. A decline shaft system connects the 121 level to the 127 level.
Majority of the mining production is currently on the VCR. This mining area, known as the Phase 1 below 120 level, is located between the 120 level and the 126 level, and is primarily serviced by the decline shaft system. The remainder of the CLR reef belonging to the TauTona Eastern Block, is accessible via the 120 level.
All movement is systematically facilitated by respective man and material tramming sections. Underground broken rock handling is track-bound via locomotive material cars. These movements are supported by traffic management systems, including control room monitoring, decline logistics control, etc. Rock is transferred via gravity feed to the main silo infrastructure, located on 121 level. Rock from the 121 level silos is transferred to surface by means of the sub-shaft and vertical shaft systems.
15.3Commentary on Infrastructure
The operational infrastructure including road, rail, offices, security services, water and power supply is adequate, and is shared with the Harmony operations in the relevant areas. Operations are powered by electricity from Eskom. Overall, Mponeng is well-established with sufficient logistical and infrastructure support for the existing and planned mining operations.
The “Property, Plant, and Equipment” as of June 30, 2024, including buildings and mine infrastructure, mining assets, rehabilitation and assets under construction, had a carrying value of R4,438 million.
Effective Date: June 30, 2024
71
Technical Report Summary for
Mponeng Mine, Gauteng, South Africa
Figure 15-3: Mponeng Mine Shaft and Underground Infrastructure
Effective Date: June 30, 2024
72
Technical Report Summary for
Mponeng Mine, Gauteng, South Africa
16Market Studies
Section 229.601(b)(96)(iii)(B)(16) (i-ii)
Gold is traded in a variety of markets/exchanges both in physical form through over the counter (“OTC”) markets, bullion banks and metal exchanges etc., and through passive investments such as exchange traded funds (“ETFs”), which are based on gold prices and units representing physical gold which may be in paper or dematerialized form. Demand is driven by the jewelry market, bar and coin, use in technology, ETF’s and other financial products, and by central banks. An overview of the gold market is given in the following sections based mainly on data from the World Gold Council and GoldHub websites.
16.1Market Overview
Unlike almost all mineral commodities, the gold market does not respond the same way to typical supply and demand dynamics which are founded on availability and consumption, but rather on global economic affairs, particular those of the major nations, industrial powerhouses and economic regions, such as the Eurozone. The gold market is affected by government and central bank policies, changes in interest rates, inflationary or deflationary environments and events such as stocking and de-stocking of central reserves. It is also largely affected by global events such as financial crises, geopolitical trade tensions and other geopolitical risks.
Annual global gold demand (excl. over-the-counter demand (OTC) and other) experienced a decline of 5.0% on an annual basis, totaling 4 448.4 tonnes in 2023 when compared to the 4 699.0 tonnes recorded in 2022. The fourth quarter of 2023 recorded an average gold demand (excl. OTC and other) of 1 149.8 tonnes, 8.0% above the average recorded over the last five years. However, when compared to the fourth quarter of 2022, gold demand declined by a substantial 12.0%.
The main contributing factors of the higher gold demand during the fourth quarter of 2023 include:
•Jewelry consumption was 1.0% lower when compared to the same quarter in 2022, whilst jewelry inventory recorded a significant decrease of 29.0% in 2023 when compared to 2022. Furthermore, jewelry fabrication in the fourth quarter of 2023 was 3.0% lower compared to the same period in 2022.
•Bar and coin demand in the final quarter of 2023 was 7.0% lower on an annual basis at 313.8 tonnes, reflecting weak sentiment among some investor segments. Furthermore, official coins decreased by a notable 30.0% in the fourth quarter of 2023 when compared to the same quarter a year ago.
•Central Banks and other institutions invested 229.4 tonnes of gold in the fourth quarter of 2023, recording a drastic decline of 40.0% when compared to the 382.1 tonnes investment recorded in the fourth quarter of 2022.
Although bullion prices recently surged to record highs, the first quarter of 2024 also witnessed significant gold demand, driven by sizable OTC demand.
16.2Global Production and Supply
Total Gold supply was 3.0% higher in 2023 when compared to 2022, similar to the annual supply growth of 3.0% witnessed in the first quarter of 2024 when compared to the first quarter of 2023. Gold production and supply are sourced from existing mining operations, new mines and recycling.
16.2.1New Mine Production
Gold supply from mine production exhibited an annual increase of 1.0% in 2023, amounting to 3 644.4 tonnes, but remained just below the highest output recorded in 2018. In the fourth quarter of 2023, mine production of gold decreased by 2.0% when compared to the corresponding quarter of 2022. However, moving into the first quarter of 2024 mine production increased by 4.0% year-on-year, reaching 893.0 tonnes, though, still lower when compared to the 939.9 tonnes produced in the previous quarter. The upward trend in mine production over the past two years can primarily be attributed to an uninterrupted mining industry.
According to the WGC, preliminary data indicated notable increases in gold mine production in the first quarter of 2024 for Canada (16.0% y-o-y); Ghana (15.0% y-o-y); Indonesia (14.0% y-o-y) and China (5.0%
y-o-y).
Effective Date: June 30, 2024
73
Technical Report Summary for
Mponeng Mine, Gauteng, South Africa
In 2023, China remained the largest gold producer in the world (378.2t), followed by the Russian Federation (321.8t), Australia (293.8t), Canada (191.9t), United States (166.7t), Ghana (135.1t), Indonesia (132.5t), Peru (128.8t), Mexico (126.6t), Uzbekistan (119.6t) and Mali (105.0t). South Africa produced 104.3t in 2023; higher when compared to the 92.6t produced in 2022.
Figure 16-1 World Gold Council: Mine Production - Major producing Gold Countries ranked by 2023
Source: ETSA & World Gold Council, 2024
16.2.2Recycling
The global annual supply of recycled gold increased by 9.0% in 2023 to reach 1 237.3 tonnes when compared to 2022, but still remained below the 1 293.0 tonnes recorded in 2020 and below the all-time high recorded in 2009. The rise in supply was encouraged by higher prices, resulting in a 12.0% surge in recycled gold during the first quarter of 2024 when compared to the same period in 2023. This marked the strongest quarterly performance since the third quarter of 2020 and the strongest first-quarter supply volume since 2014. Notably, East Asia recorded the most significant increase among all regions, primarily driven by volume increases in China.
16.3Global Consumption and Demand
During first quarter of 2024, gold demand (excl. OTC and other) reached 1 101.8 tonnes, reflecting a decrease of 5.0% compared to the same quarter the previous year. However, when including OTC and other, total demand increased by 3.0% on an annual basis in the first quarter of 2024 to reach 1 238.3 tonnes; resulting in the strongest first quarter since 2016. Furthermore, demand from central banks buying gold was also high during the first quarter of 2024.
16.3.1Jewelry
Global jewelry consumption experienced a significant quarter-on-quarter decline of 23.2% during the first quarter of 2024, dropping from 623.5 tonnes in the fourth quarter of 2023 to 479.0 tonnes in the first quarter of 2024. In China, demand for gold jewelry decreased by 6.0% in the first quarter of 2024 when compared to the same period in the previous year, while demand from India increased by 4.0%, supported by a robust macroeconomic environment that supported gold consumption. However, despite the first quarter initially commencing with increased demand, investor appetite for bullion tapered off towards the end of the quarter due to a price rally in March 2024 and continued to remain under pressure entering the second quarter of 2024.
Effective Date: June 30, 2024
74
Technical Report Summary for
Mponeng Mine, Gauteng, South Africa
16.3.2Investment
A total annual gold investment demand of 940.7 tonnes was recorded by the World Gold Council (WGC) for 2023, reflecting a 15.0% decrease from the 1 112.8 tonnes recorded in 2022. In the first quarter of 2024, investment in gold (excluding OTC) was significantly lower and recorded a 28.0% year-on-year decline, reaching 198.6 tonnes, down from 275.3 tonnes recorded in the first quarter of 2023 and also lower when compared to the 257.1 tonnes recorded in the fourth quarter of 2023. Despite the decline, long positions of fund managers reached a two-year peak in March 2024 which was supported by the gold price rally, however, gold exchange-traded funds (ETF) holdings decreased by 113.7 tonnes (USD6.0 billion) on a quarterly basis during the first quarter of 2024. Furthermore, global physically-backed gold ETFs were 10.0% lower on an annual basis amounting to 3 112.4 tonnes globally during the first quarter of 2024. Market divergence was evident as Asia had positive demand growth for physically backed ETFs while the Western investors focused on profit-taking.
According to the WGC, global bar and coin investment increased by 3.0% when compared to the first quarter of 2023, reaching an average of 312.3 tonnes in the first three months of 2024.
The average London Bullion Market Association (LBMA) price of gold traded 10.0% higher in the first quarter of 2024 when compared to the same period a year ago, at USD2 069.80 an ounce, which also represented a 5.0% quarter-on-quarter increase that can be ascribed to risk and momentum factors.
Figure 16-2: World Gold Council: Total Gold Supply & Demand
16.3.3Currency
The inverse relationship between the value of U.S. Dollar (USD) and that of gold is one of the most discussed relationships in currency markets. The USD is the internationally accepted currency and most of the international transactions take place in USD equivalent. The major reason behind the relationship of gold and the USD, is that gold is used as a hedge against the adverse exchange value of the USD. As the US Dollar’s exchange value decreases, it takes more USD to buy gold, which increases the value of gold. Two other factors linked to the USD, or the strength of the USD is inflation and interest rates.
Interest rates have remained high whilst inflation started retreating in 2024. The USD is forecast to lose some strength as U.S. interest rate cuts are nearing inevitably and the currency depreciated in May 2024, for the first time in five months. Furthermore, global economic growth and lower risk also place pressure on the US Dollar. Central banks are planning to start with interest rate cuts, which in turn could cause non-yielding bullion to become more attractive and result in further increases in the gold price.
Effective Date: June 30, 2024
75
Technical Report Summary for
Mponeng Mine, Gauteng, South Africa
16.4Gold Price
16.4.1Historical Gold Price
The LBMA gold price reached a record annual average price of USD1 940.54 an ounce in 2023, 8.0% higher when compared to average of USD1 800.09 an ounce recorded in 2022. The upward trajectory continued into the first quarter of 2024 where gold prices averaged 5.0% higher at USD2 069.80 an ounce on a quarter-on-quarter basis.
Moving into the second quarter of 2024, gold prices continued to gain a lot of momentum which can mainly be attributed to the ongoing geopolitical tensions in the Middle East, along with central bank hedge purchasing and uncertainty surrounding global inflation. The safe-haven appeal of gold drove a bullish market with bullion prices reaching new record highs after increasing by roughly 18.0% between the March 1, 2024 and the April 12, 2024.
The bullish price trend for bullion could increase recycling supply of gold and decrease jewelry demand, whilst mine supply is also expected to reach a new peak. The latest market expectations point to U.S. interest rates staying higher for longer as the U.S. Federal Reserve Bank awaits assurance that inflation is returning to the central bank’s target of 2.0%. Bullion acts as a hedge against lower interest rates and the price is anticipated to increase later in 2024 when interest rates are lowered.
Figure 16-3: Graph of Annual Gold Price History – ZAR/kg
Effective Date: June 30, 2024
76
Technical Report Summary for
Mponeng Mine, Gauteng, South Africa
Figure 16-4: World Gold Council: Daily Gold Price (ZAR/oz & USD/oz)
16.4.2Forecast Gold Price
Consensus gold price range for the year 2024 to year 2026 is presented in Table 16.1. The long-term gold prices are considered from year 2025 onwards by the QP. Forecasts as advised from various financial institutions show that gold is expected to trade in a range of USD1,600/oz – USD2,238/oz, for the period 2024 to 2026 with a long-term outlook of USD1,772/oz.
Table 16-1 Consensus View of Forecast Gold Price
| | | | | | | | | | | |
| Institutions | 2024 | 2025 | 2026 |
| World Bank: Development | 2,100 | | 2,050 | | — | |
| BMO Capital Markets | 2,150 | | 2,100 | | — | |
| Scotiabank | 2,018 | | 1,950 | | — | |
| Nedbank | 2,211 | | 2,238 | | 2,210 | |
| Fitch Solutions | 1,900 | | 1,800 | | 1,600 | |
| S&P Global | 2,120 | | 2,134 | | 2,076 | |
| Australian Government | 2,023 | | 2,030 | | 1,924 | |
| Average | 2,075 | | 2,043 | | 1,953 | |
16.4.3Harmony Group Gold Hedging Policy
Harmony has a hedging policy which is managed and executed at Group treasury level on-behalf of its operating entities. The key features of the hedging program are as follows:
•the policy provides for hedging (or forward selling) up to a maximum of 20% of expected gold production for a rolling 24-month period;
◦Year 1, 30%
◦Year 2, 20%
◦Year 3, 10%
•the policy has no minimum quantity that should be hedged, and if an attractive margin above cost cannot be achieved (i.e., in a low gold price environment) then no hedges are entered into;
•Harmony enters into ZAR-denominated gold hedges for its South African operations (for the non-South African assets it enters into USD-denominated hedges);
•Individual mines do not enter into hedges in their own name but delivers bullion to Rand Refinery for refining on behalf of Harmony. Rand Refinery is one of the world’s largest single-site precious metals refining and smelting complex in the world. Rand Refinery refine all of Harmony’s gold to at least
Effective Date: June 30, 2024
77
Technical Report Summary for
Mponeng Mine, Gauteng, South Africa
99.5% purity, and acting as agent, sells the gold on the daily spot London fixing price and make payment to the Harmony two days later;
•gains and losses realized from the hedging program are accounted for at Group level and the financial benefit (or downside) is distributed amongst the operations proportional to their levels of gold sales; and
•Harmony does its mine planning and financial forecasts based on the estimated future gold price provided by an external source (ETSA), but its year-end actual financial results reflect the received gold price inclusive of the impact of the hedging program. Therefore, in theory, individual mines receive a hedged gold price for a maximum of 20% of its gold sales with the balance attracting the spot price.
16.5Commentary on Market Studies
The factors which affect the global gold market are well-documented as are the elements which influence the daily gold price.. The LBMA gold price reached a record annual average price of US$1 940.54 an ounce in 2023, 8.0% higher when compared to average of US$1 800.09 an ounce recorded in 2022. The upward trajectory continued into the first quarter of 2024 where gold prices averaged 5.0% higher at US$2 069.80 an ounce on a quarter-on-quarter basis. The gold price remains well above the 5-year historical average.
The positive outlook for gold will likely be sustained. Key headwinds for gold are interest rate hikes, currently at near historically low levels, but continued geopolitical risk and underperformance of stocks and bonds will support gold (Gold Mid-Year Outlook 2022, Gold.org, Accessed 2022).
Harmony has a relatively conservative gold hedging policy in place, and this is used to take advantage of the movements in the gold price to maximize the average gold price received, with the benefit of this hedging program flowing through to Mponeng mine.
16.6Material Contracts
As with all major businesses, Harmony and Mponeng enters into a multitude of vendor agreements for the provisions of supplies and services. These agreements are entered into on a competitive basis and typically are of a medium-term duration all with clauses providing for periodic updating of pricing, annual (or other) renewal or termination.
Harmony has contractual vendor agreements with various service providers and suppliers. The most significant of these contracts currently in place to support the Mponeng operation are listed in Table 16-2.
All of the listed contracts are currently valid and in good standing. Terms, rates and charges of contracts are considered consistent with industry norms. Contract management processes are in place and resourced so that contracts re-tendered and/or renewed as they approach expiry.
Table 16-2: Material Contracts
| | | | | |
| Vendor Name | Nature of Service /Supply |
| Phakamisa Hard Rock Mining (Pty) Ltd. | Mining – load and haul |
| Cyclone Engineering Projects | Re-mining of Savuka TSF |
| Rand Refinery (Pty) Ltd. | Refining Cost |
| Eskom | Power |
| |
| |
| |
| |
| |
| |
| |
| |
| |
| |
| |
Effective Date: June 30, 2024
78
Technical Report Summary for
Mponeng Mine, Gauteng, South Africa
17Environmental Studies, Permitting and Plans, Negotiations, or Agreements with Local Individuals or Groups
Section 229.601(b)(96)(iii)(B)(17) (i-vii)
The South African Government has an extensive legal framework within which mining, environmental and social aspects of the industry are managed. Harmony and its Mponeng operation is primarily regulated and managed by certain principal Acts (as listed in Section 17.3) as well as corporate policies, management systems and certain industry-wide guidelines, including:
•Energy Efficiency and Climate Change Policy;
•Environmental Policy;
•Harmony Water Management Strategy;
•Biodiversity and Rehabilitation Position Statement;
•Socio-Economic Transformation Policy; and
•Corporate Social Responsibility Policy.
The latest sustainability policies and public environmental social and governance (“ESG”) performance and disclosure report(s) are available on the corporate website. Harmony has identified the environmental risks for the business and has strategies in place to manage the risks.
17.1Results of Environmental Studies
Mponeng has prepared multiple Environmental Impact Assessments (“EIA”) for regulatory approval, which under the current legal framework, require stakeholder engagement. The most recent EIA was undertaken in 2012 as part of the application for environmental authorization for the construction of a 62,000m³ pollution control dam and associated infrastructure. The EIA required the involvement of certain specialist studies (namely: heritage, biodiversity and ecology, geotechnical and agricultural assessment) to assess the potential impacts of the project on the receiving environment.
The results of the studies indicated that the pollution control dam would have an impact on air, soil, and water. The measures proposed in the EIA and EMPR were considered appropriate to adequately mitigate the impacts to acceptable levels. The Environmental Authorization (Gaut:002/11-12/E0263) was granted on this basis by the Gauteng Department of Agriculture and Rural Development (“GDARD”) In November 2013.
Harmony is committed to maintaining good relationships with regulatory authorities, industries, communities, business partners and surrounding stakeholders.
17.2Waste and Tailings Disposal, Monitoring & Water Management
The primary materials consumed in conducting mining activities and processes include the rock (ore and waste) together with liquefied petroleum gas, grease, cyanide and other chemical, fuels and lubricating and hydraulic oils. Harmony recognizes that responsible and effective waste management can positively reduce its environmental impacts and mitigate associated environmental liabilities. Waste management is thus a priority focus area. Internally, guidelines on mineral, non-mineral and hazardous waste materials are included in the environmental management systems (“EMS”) implemented at Mponeng.
Tailings comprises of crushed rock and process water emitted from the gold elution process in the form of slurry once gold has been extracted. As tailings contain impurities and pollutants, they are placed in TSF engineered to contain them, in line with Harmony's tailings management program and the Global Industry Standard on Tailings Management (“GISTM”). Harmony's overall tailings management strategy is to ensure robust, meticulous engineering and dam design, along with a continual focus on management of risks through layered assurance and oversight. The focus areas include, but are not limited to:
•freeboard control;
•water management;
•maintaining stability and the safety factor as advised by the engineer of record;
•erosion controls; and
Effective Date: June 30, 2024
79
Technical Report Summary for
Mponeng Mine, Gauteng, South Africa
•monitoring and control measures implemented to ensure continued compliance (including regular inspections, audits, and meetings on varying intervals with subsequent actions, minutes and reports).
As part of its mining, environmental and water approvals and licenses, Harmony is required to implement monitoring programs and plans to establish the operations impact on the environment. The compliance limits for the monitoring variable are included in the applicable EMPR(s), WUL(s) and environmental authorizations. The environmental monitoring implemented at Mponeng includes:
•ground and surface water monitoring;
•biodiversity monitoring;
•waste classification and quantification;
•integrated waste and water management plan updates;
•water balance reviews;
•license and authorization compliance reviews; and
•air quality (i.e., noise and dust) and greenhouse gas emissions ("GHG") monitoring.
17.3Permitting and Licenses
In respect of environment, the following national Acts and the regulations promulgated thereunder provide the regulatory framework for mine permitting and licensing in South Africa:
•Mineral and Petroleum Resources Development Act, 2002 (“MPRDA”);
•National Environmental Management Act, 1998 (“NEMA”);
•National Environmental Management: Waste Act, 2008 (“NEM:WA”);
•National Environmental Management: Air Quality Act, 2004 (“NEM:AQA”); and
•National Water Act, 1998 (“NWA”).
A summary of the status of environmental permits and licenses issued at the effective date related to Mponeng’s operation is presented in Table 17-1. Harmony is in the process of transferring all licenses and permits previously held by AngloGold Ashanti into the company’s name.
Table 17-1: Status of Environmental Permits and Licenses
| | | | | | | | | | | | | | |
| Permit / License | Reference No. | Issued By | Date Granted | Validity |
| Environmental Management Programme (Amendment) | (GP) 30/5/1/2/3/2/1 (01) | DMRE | April 12, 2012 | February 13, 2036 |
| Waste Management Licence | GAUT 002/09-10/W0011 | GDARD | June 22, 2015 | Expired July 2019. A renewal application is currently underway with GDARD |
| Hazardous Waste Generator Certificate | GPG-01-513 | GDARD | July 14, 2015 | In perpetuity |
| Water Use Licence | 08/C23E/AEFGCEI/12157 | DWS | Licenced issued under Harmony Gold issued September 2022 | December 01, 2031 |
| | | | |
| Certificate of Registration Inflammable Liquids and Substances | RP438/ptn5 | West Rand District Municipality | 01-Feb-2024 | Annually |
| | | | |
| | | | |
| | | | |
| | | | |
| | | | |
| | | | |
| | | | |
Harmony submitted a renewal application for the Waste Management License as well as an updated EMPR to the DMRE in March 2023 and are awaiting the decision.
Effective Date: June 30, 2024
80
Technical Report Summary for
Mponeng Mine, Gauteng, South Africa
17.4Local Stakeholder Plans and Agreements
Harmony strives to create sustainable shared value within the communities it operates. Local stakeholder plans and agreements are based on the results from socio-economic information, government development strategies and EIAs undertaken. The socio-economic development program commits to:
•contribute to areas that will have the most meaningful socioeconomic impact on communities, namely infrastructure, education and skills development, job creation and entrepreneurial development;
•enhance broad-based local and community economic empowerment and enterprise development initiatives;
•facilitate socio-economic development in local communities by means of social and labour plan(s) (“SLP”) and corporate social responsibility programs;
•support arts, culture, and sports and recreation; and
•build relationships based on trust within host communities.
In South Africa, mining companies are required to have a SLP which forms an important component of Harmony's community investment plan. It sets out the Company’s obligation to develop and implement comprehensive human resource development programs, community development plans, housing and living condition plans and employment equity plans. The ultimate aim of the SLP is to ensure the uplift of the social and economic circumstances of local communities surrounding the mine and are a prerequisite to securing and maintaining a mining right, with progress required to be reported each year. Harmony has budgeted to spend approximately ZAR271.9M over the next eighteen years to meet its SLP commitments (refer to Table 18-1).
17.5Mine Closure Plans
Harmony makes provision for closure and rehabilitation both for accounting purposes and as required under the MPRDA. The statutory obligation for all environmental rehabilitation at Mponeng is administered by the DMRE and requires the preparation of a closure plan, the development of a cost estimate, and financial assurance. The Company makes an annual submission to the DMRE setting out the cost of closure in accordance with the MPRDA and the regulations issued thereunder. Harmony appointed Digby Wells Environment, independent environmental consultants, to review and update the closure cost. The mine closure assessment was done in terms of regulation 53 and 54 of the MPRDA and in accordance with the requirements of NEMA. The closure cost as at June 30, 2024, was calculated to be ZAR1 059m including a 10% contingency allowance .
17.6Status of Issues Related to Environmental Compliance, Permitting, and Local Individuals Or Groups
Most of the required environmental authorizations are in place and only require amendments to be made to reflect the current infrastructure at Mponeng. Based on current industry norms, a realistic timeframe to obtain relevant authorizations is estimated between 12 and 18 months.
17.7Local Procurement and Hiring
Harmony is committed to investing in the future of local communities beyond the Reserve plan and not to only empower them, but also to mitigate the impacts its activities to ensure a positive legacy. The 2014 Mining Charter serves to guide the south African mining industry in socio-economic transformation. Local procurement (goods and services) and human resource management are key measures set under the Mining Charter and are reported on annually. Having only recently acquired Mponeng, an assessment of Harmony’s compliance in respect of these matters will be known in next reporting period.
Portable skills are developed through expanded learning programs, learnerships and other programs opened only to operating communities and areas where labour is sourced. Local procurement is being supported where there is a skills shortage.
Effective Date: June 30, 2024
81
Technical Report Summary for
Mponeng Mine, Gauteng, South Africa
Since the acquisition of Mponeng, Harmony have not reported on its compliance and performance against the Mining Charter at the effective date of this TSR.
17.8Commentary on Environmental Studies, Permitting and Plans, Negotiations, or Agreements with Local Individuals or Groups
Periodic inspections are conducted by the DMRE to verify compliance with applicable environmental laws, regulations, permits and standards. In addition, Mponeng has implemented an EMS in line with the ISO 14001 standard. The EMS is audited on an annual basis by a third party and includes the needs and expectations of interested parties.
As part of Harmony, Mponeng conducts its operation based on policies and systems that are aligned to its corporate sustainable development framework. Although Harmony is not a signatory to the International Council on Mining and Metals or the UN Global Compact, these form the guiding principles of the framework. Harmony discloses its sustainable development voluntarily in accordance with the guidelines issued by the Global Reporting Initiative (GRI). Further to this, Harmony discloses environmental information on the Carbon Disclosure Project (CDP) for both climate change and water. The CDP runs the global environmental disclosure system that supports companies to measure and manage their risks and opportunities on climate change, water security and deforestation.
Harmony has a good understanding of the environmental and social aspects of the operations through baseline and specialist studies previously conducted. Risk management and mitigation measures were adequately addressed in the environmental management plans and will be effective to mitigate risks and impacts to acceptable levels should the measures be implemented according to the specialists’ recommendations.
The QP is of the opinion that most of the required environmental authorizations are in place and only require amendments to be made to reflect the current infrastructure at Mponeng. Based on current industry norms, a realistic timeframe to obtain relevant authorizations is estimated between 12 and 18 months.
Effective Date: June 30, 2024
82
Technical Report Summary for
Mponeng Mine, Gauteng, South Africa
18Capital and Operating Costs
Section 229.601(b)(96)(iii)(B)(18) (i-ii)
Economic parameters for the Harmony Group are determined, and signed off by the CODM, before distribution to the business units, including Mponeng. The capital and operating costs are reported in ZAR terms and on a real basis. Rounding of figures may result in minor computational discrepancies.
18.1Capital Costs
The estimated capital costs for Mponeng are reported according to costs associated with major equipment outside the main operating sections which is termed abnormal expenditure (“AE”), infrastructure development, as well as operating capital, as presented in Table 18-1. Contingencies are only applied to major capital projects, in the case of Mponeng the Carbon Leader Project which includes a ZAR3.7m contingency. The estimated capital costs presented in Table 18-1 are carried forward and modelled in the Mponeng cash flow.
Costs in relation to the Mining Charter Compliance (“MCC”) are determined because of Mponeng’s SLP requirements and modelled as such. These costs are extracted from the SLP model.
Table 18-1: Summary of Capital Cost Estimates for Mponeng
| | | | | |
| Capital Cost Element (ZAR'000s) | Total Reserve plan (FY2025 - FY2042) |
| OCD | 7,085,568 |
| Abnormal Expenditure | 1,583,725 |
| Shaft Projects | 3,084,314 |
| Major Projects | 8,469,900 |
| Mining Charter Compliance | 271,895 |
| Total Cost | 20,495,402 |
Note:
No capital costs for 2041 onwards.
18.2Operating Costs
A summary of the direct and indirect operating costs for Mponeng are presented in Table 18-2. Operating costs are based on historic performance while applying any changes expected within the new financial year (such as electricity requirements, increased/decreased labour) and are used as an input into the Mponeng cash flow model. Accuracy of this is at PFS level.
Table 18-2: Summary of Operating Cost Estimates for Mponeng
| | | | | |
| Operating Cost Element (ZAR'000) | Total Reserve plan (FY2025 - FY2042) |
| Mining | 42,348,239 |
| Services | 7,979,105 |
| Medical Hub / Station | 1,473,337 |
| Engineering | 50,612,640 |
| Workshops | 663,498 |
| Total Direct Costs | 103,076,819 |
| Mine Overheads | 5,853,899 |
| |
| Total Cost | 108,930,718 |
18.3Comment on Capital and Operating Costs
The capital and operating cost estimates for Mponeng are based on actual historical data, as well as budget forecasts. Therefore, in the opinion of the QP the forecasted costs are reliable, and at minimum meet the confidence levels of a PFS. This approach of estimating capital and operating costs is consistent with industry practice. A record of the forecast and budget costs is maintained by the operation, allowing for an assessment of the alignment of the forecast and actual costs.
Effective Date: June 30, 2024
83
Technical Report Summary for
Mponeng Mine, Gauteng, South Africa
19Economic Analysis
Section 229.601(b)(96)(iii)(B)(19) (i-iv)
19.1Key Economic Assumptions and Parameters
The QP and CODM forms, reviews, signs-off and distributes economic assumptions to its various business units. On an annual basis, during the period October to November, long-term commodity prices and exchange rates forecasts’, are received from various financial institutions. In addition, a specialist in Economics from a reputable economics company based in South Africa, provides expert views on the global markets, forward looking commodity prices, exchange rates, consumer price index, production price index, electricity cost and consumable increases. All factors are analyzed, cognizance is taken of the requirements of the NYSE and JSE markets, and a proposal is presented to the CODM for recommendation and approval. These assumptions are then applied at Mponeng, along with specific operational considerations.
19.1.1Gold Price
The forecast gold price (USD1,772/oz) is the price that is used by Harmony for the Mponeng annual planning cycle and forms the basis for the spot gold price assumptions used in the Mponeng cashflow. The reader is referred to Figure 16-2 for the consensus forecast gold price. The conversions used in the calculation of the various gold prices is presented in Table 19-1.
Table 19-1: Conversions Used in Gold Price Calculations
| | | | | | | | | | | | | | |
| Economic Factors | Gold Price (USD/oz) | Conversion Factor (oz/kg) | Exchange Rate (ZAR:USD) | Gold Price (ZAR/kg) |
| 2024 Mineral Resource | 1,878 | 32.15 | 18.26 | 1,100,000 |
| 2024 Mineral Reserve | 1,772 | 32.15 | 18.26 | 1,040,000 |
19.1.2Exchange Rate
The South African Rand (ZAR) depreciated to average at R18.89/US$ during the first quarter of 2024, 0.7% weaker compared to an average of R18.76/US$ recorded during the last quarter of 2023. Moving onto May 2024, the ZAR appreciated by 2.4% on a month-on-month basis, and 3.4% compared to May 2023 to average at R18.42/US$, following a 3.8% annual depreciation recorded in April 2024.
The South African Rand has been volatile in recent weeks as uncertainty loomed around the elections, however, the local currency has been supported by the outcome of a Government of National Unity after the ruling African National Congress (ANC) lost the majority vote for the first time since the start of democracy. The ZAR appreciated to trade at R18.11/US$ on the 18th of June 2024 and is expected to strengthen further over the medium term.
Furthermore, the U.S. Federal Reserve held interest rates unchanged on the 12th of June 2024 and Jerome Powell, Chairman of the Fed, stated that interest rates will not be reduced before a greater decline in inflation or an increase in unemployment is visible. Data later indicated that retail sales barely rose in May 2024 and speculation of rate cuts amongst investors increased, pressuring the US Dollar and lending strength to the ZAR exchange rate.
Effective Date: June 30, 2024
84
Technical Report Summary for
Mponeng Mine, Gauteng, South Africa
Figure 19-1: Annual Exchange Rates and ETSA Forecast
Table 19-2: Consensus View of Forecast Exchange Rate (ZAR:USD)
| | | | | | | | | | | |
| Institutions | 2024 | 2025 | 2026 |
| Nedbank | 18.74 | | 18.44 | | 18.57 | |
| Investec | 18.54 | | 18.23 | | 18.48 | |
| FNB | 18.70 | | 17.70 | | 18.30 | |
| PWC | 18.80 | | 19.30 | | — | |
| IDC | 18.76 | | 18.31 | | 18.10 | |
| AVERAGE | 18.71 | | 18.40 | | 18.36 | |
The exchange rate of 18.26 ZAR:USD is the exchange rate that is used by Harmony for the annual planning cycle and forms the basis for the ZAR:USD exchange rate in the company LOM and Mineral Reserve cashflow.
Table 19-3: ZAR:USD Exchange Rate Performance (June 2021 – June 2024)
| | | | | |
| Period | Average Exchange Rate (ZAR:USD) |
| July 2021 to June 2022 | 15.21 |
| July 2022 to June 2023 | 17.77 |
| July 2023 to June 2024 | 18.70 |
| 3-Year Ave. (not weighted) | 17.23 |
19.1.3SA/SARS gold royalty calculation
Royalty is an expense paid to the government of South Africa and is accounted for in the Mponeng cash flow models. In terms of the mining ring-fencing application, each ring-fenced mine is treated separately, and deductions can normally only be utilized against mining income generated from the relevant ring-fenced mine.
19.1.4Capital Expenditure
At Harmony, capital is allocated to the mines with a longer life. Mponeng currently has extended its Reserve plan with another 11 years up to 2042. Detailed capital costs can be found in Table 18-1. The total capital costs shown in Table 18-1 represents the capital costs (excluding Ongoing Capital Development) in the Mponeng cash flow (Table 19-5).
Effective Date: June 30, 2024
85
Technical Report Summary for
Mponeng Mine, Gauteng, South Africa
19.1.5Operating Expenditure
The operating costs are determined as a function of the cash working costs of the mining and mineral processing plant activities, and ongoing capital development for mining. Whereas, total costs are a function of the operating costs, capital costs, and royalties. Detailed operating costs can be found in Table 18-2.
19.1.6Working Capital
Working capital is calculated at a Harmony Group level and not at an operational level.
19.1.7Taxes
Mining tax on gold mining taxable income in South Africa is determined according to a formula, based on the taxable income from mining operations. Of that, 5% of total revenue is exempt from taxation while the remainder is taxable at a higher rate (33%) than non-mining income (27%). Accounting depreciation is eliminated when calculating the South African mining tax income. Excess capital expenditure is carried forward as unredeemed capital to be claimed against future mining taxable income.
19.1.8Closure Cost and Salvage Value
The closure cost estimates are those provided in Section 17.5. No account has been taken of any potential salvage values.
19.1.9Summary
The key assumptions used in the cash flow are summarized for Mponeng in Table 19-4.
Table 19-4: Key Economic Assumptions and Parameters for Mponeng Cash Flow
| | | | | | | | |
| Parameter | Unit | Value |
| Production Rate | tpm | 78.00 |
| Gold Recovery | % | 98.00 |
| Royalty | % | Formula |
| Tax Rate | % | Formula |
| Gold Price | ZAR/kg | 1,040,000 |
| Exchange Rate | USD:ZAR | 18.26 |
| Discount Rate | % | 9.00 |
19.2Economic Analysis
Harmony's respective business units and its associated operating sites consider the economic assumptions discussed in Section 19.1 during their respective planning and analysis processes. The past year’s average gold price is used for testing purposes. A Harmony Gold price of ZAR1 040,000/kg is used for forecasting the revenue of the Mponeng cash flow (Table 19-5).
The discounted cash flow model is used to calculate the NPV of the investments (real model). The NPV for the Harmony Gold price, is approximately ZAR5,201 million, at a discount rate of 9%. The NPV is calculated on a cash flow that accounts for factors such as:
•mining and ore processing working costs;
•royalty payments;
•capital costs, including costs allocated to ongoing development;
•any significant project work considered as major projects; and
•costs deemed as abnormal expenditure.
Effective Date: June 30, 2024
86
Technical Report Summary for
Mponeng Mine, Gauteng, South Africa
Table 19-5: Mponeng Cash Flow (Mineral Reserves)
| | | | | | | | | | | | | | | | | | | | | | | | | | | | | | | | | | | |
| Item | Units | Total Reserve plan | FY2025 | FY2026 | FY2027 | FY2028 | FY2029 | FY2030 | FY2031 | FY2032 | FY2033 |
| Milled Tonnes | t'000 | 15,406 | 990 | 990 | 965 | 975 | 949 | 959 | 885 | 850 | 770 |
| Yield | g/t | 8.91 | 8.62 | 8.75 | 8.95 | 8.64 | 8.67 | 8.82 | 8.79 | 9.18 | 9.25 |
| Gold Recovered | kg | 137,279 | 8,527 | 8,659 | 8,636 | 8,422 | 8,228 | 8,462 | 7,781 | 7,800 | 7,127 |
| Gold Price | R/kg | 1,040,000 | | 1,040,000 | | 1,040,000 | | 1,040,000 | | 1,040,000 | | 1,040,000 | | 1,040,000 | | 1,040,000 | | 1,040,000 | | 1,040,000 | |
| Revenue | ZAR'000 | 142,770,022 | | 8,867,983 | | 9,005,353 | | 8,981,351 | | 8,758,729 | | 8,557,057 | | 8,800,169 | | 8,091,727 | | 8,111,712 | | 7,412,287 | |
| Total Operating cost | ZAR'000 | 108,930,718 | | 6,114,315 | | 6,118,634 | | 6,141,783 | | 6,123,988 | | 6,171,971 | | 6,181,314 | | 6,101,332 | | 6,066,863 | | 5,911,488 | |
| Total Capital including MCC | ZAR'000 | 20,495,402 | | 2,016,039 | | 1,888,108 | | 1,744,289 | | 2,014,885 | | 1,431,958 | | 1,330,431 | | 1,177,821 | | 1,274,290 | | 1,240,563 | |
| Royalty | ZAR'000 | 1,818,724 | | 103,381 | | 134,163 | | 140,036 | | 93,382 | | 119,036 | | 147,075 | | 105,465 | | 102,203 | | 57,880 | |
| Total Cost | ZAR'000 | 131,244,842 | | 8,233,735 | | 8,140,905 | | 8,026,108 | | 8,232,256 | | 7,722,964 | | 7,658,820 | | 7,384,618 | | 7,443,357 | | 7,209,931 | |
| Cash flow before tax | ZAR'000 | 11,525,181 | | 634,248 | | 864,447 | | 955,243 | | 526,473 | | 834,092 | | 1,141,350 | | 707,110 | | 668,356 | | 202,356 | |
| Taxation Payable | ZAR'000 | (1,796,360) | | (62,980) | | (136,679) | | (167,038) | | (29,217) | | (134,059) | | (231,442) | | (99,832) | | (86,714) | | — | |
| Net cash flow after tax | ZAR'000 | 9,728,820 | | 571,268 | | 727,768 | | 788,205 | | 497,256 | | 700,033 | | 909,907 | | 607,277 | | 581,642 | | 202,356 | |
| | | | | | | | | | | |
| Discounted NPV (ZAR’000) | Rate | NPV after tax | | | | | | | | | |
| NPV - (Harmony Preferred) | @9% | 5,200,810 | | | | | | | | | |
| NPV - (medium discount rate) | @12% | 4,399,403 | | | | | | | | | |
| NPV - (high discount rate) | @15% | 3,783,280 | | | | | | | | | |
| | | | | | | | | | | | | | | | | | | | | | | | | | | | | | | | | | | |
| Item | Units | Total Reserve plan | FY2034 | FY2035 | FY2036 | FY2037 | FY2038 | FY2039 | FY2040 | FY2041 | FY2042 |
| Milled Tonnes | t'000 | 15,406 | 791 | 913 | 915 | 816 | 852 | 740 | 715 | 681 | 650 |
| Yield | g/t | 8.91 | 9.03 | 9.62 | 9.38 | 8.79 | 8.63 | 8.45 | 8.91 | 9.73 | 8.24 |
| Gold Recovered | kg | 137,279 | 7,128 | 8,781 | 8,587 | 7,173 | 7,355 | 6,254 | 6,372 | 6,630 | 5,359 |
| Gold Price | R/kg | 1,040,000 | | 1,040,000 | | 1,040,000 | | 1,040,000 | | 1,040,000 | | 1,040,000 | | 1,040,000 | | 1,040,000 | | 1,040,000 | | 1,040,000 | |
| Revenue | ZAR'000 | 142,770,022 | | 7,411,888 | | 9,132,467 | | 8,930,409 | | 7,459,788 | | 7,649,266 | | 6,504,345 | | 6,626,475 | | 6,895,209 | | 5,573,808 | |
| Total Operating cost | ZAR'000 | 108,930,718 | | 5,988,321 | | 6,293,508 | | 6,294,982 | | 6,154,524 | | 6,247,362 | | 6,062,579 | | 6,014,018 | | 5,610,836 | | 5,332,899 | |
| Total Capital including MCC | ZAR'000 | 20,495,402 | | 1,126,124 | | 1,070,837 | | 993,216 | | 813,341 | | 801,188 | | 698,954 | | 488,472 | | 370,641 | | 14,246 | |
| Royalty | ZAR'000 | 1,818,724 | | 60,855 | | 187,112 | | 176,029 | | 76,653 | | 86,304 | | 32,522 | | 43,051 | | 107,575 | | 46,002 | |
| Total Cost | ZAR'000 | 131,244,842 | | 7,175,300 | | 7,551,457 | | 7,464,226 | | 7,044,517 | | 7,134,854 | | 6,794,054 | | 6,545,541 | | 6,089,052 | | 5,393,147 | |
| Cash flow before tax | ZAR'000 | 11,525,181 | | 236,588 | | 1,581,010 | | 1,466,182 | | 415,271 | | 514,412 | | (289,709) | | 80,933 | | 806,157 | | 180,661 | |
| Taxation Payable | ZAR'000 | (1,796,360) | | — | | (371,048) | | (336,488) | | (13,959) | | (43,543) | | — | | — | | (83,364) | | — | |
| Net cash flow after tax | ZAR'000 | 9,728,820 | | 236,588 | | 1,209,963 | | 1,129,694 | | 401,318 | | 470,869 | | (289,710) | | 80,933 | | 722,792 | | 180,661 | |
| | | | | | | | | | | |
| Discounted NPV (ZAR’000) | Rate | NPV after tax | | | | | | | | | |
| NPV - (Harmony Preferred) | @9% | 5,200,810 | | | | | | | | | |
| NPV - (medium discount rate) | @12% | 4,399,403 | | | | | | | | | |
| NPV - (high discount rate) | @15% | 3,783,280 | | | | | | | | | |
Effective Date: June 30, 2024
87
Technical Report Summary for
Mponeng Mine, Gauteng, South Africa
19.3Sensitivity Analysis
The economic assumptions, cash flow breakdown and economic analysis contribute to the basis for the sensitivity analysis. The sensitivities are calculated and analyzed, as shown in the accompanying Table 19-6 to Table 19-8. Harmony has reviewed its exposure in terms of South Africa’s political instability, the COVID-19 pandemic, the currency exchange rate, and the gold price, on its financial assets and financial liabilities, and has determined the sensitivities for a ±10% variance. Management considers this range to be a reasonable change given the volatility in the market.
The sensitivity analysis is completed for variations in commodity price (ZAR/kg), total operating costs, which include capital costs and royalties paid; and a combined analysis considering variations in commodity price, total operating costs, and changes in production. Capital investments in Mponeng are relatively low and not expected to have any significant impact on the NPV and therefore not included in a sensitivity analysis. The base case in the analysis below is the economic results emanating from the Reserve plan (Table 19-5).
Table 19-6: Gold Price Sensitivity Analysis
| | | | | | | | | | | | | | | | | | | | |
| Sensitivity (%) | Production (kg) | Gold Price (ZAR/kg) | Revenue (ZAR’000) | Total cost including tax (ZAR'000) | Net cash flow after tax (ZAR'000) | After tax NPV (ZAR’000) |
| 10% | 137,279 | 1,144,000 | 157,047,024 | 137,168,287 | 19,878,737 | 10,280,817 |
| 5% | 137,279 | 1,092,000 | 149,908,523 | 135,031,338 | 14,877,186 | 7,768,946 |
| Reserve plan | 137,279 | 1,040,000 | 142,770,023 | 133,041,202 | 9,728,821 | 5,200,810 |
| -5% | 137,279 | 988,000 | 135,631,521 | 131,689,252 | 3,942,269 | 2,332,720 |
| -10% | 137,279 | 936,000 | 128,493,020 | 131,244,843 | (2,751,823) | (1,090,304) |
Table 19-7: Total Operating Cost Sensitivity Analysis1
| | | | | | | | | | | | | | | | | | | | |
| Sensitivity (%) | Production (kg) | Gold Price (ZAR/kg) | Revenue (ZAR’000) | Total cost including tax (ZAR'000) | Net cash flow after tax (ZAR'000) | After tax NPV (ZAR’000) |
| 10% | 137,279 | 1,040,000 | 142,770,022 | 144,369,328 | (1,599,305) | (475,619) |
| 5% | 137,279 | 1,040,000 | 142,770,022 | 138,323,022 | 4,447,000 | 2,604,444 |
| Reserve plan | 137,279 | 1,040,000 | 142,770,023 | 133,041,202 | 9,728,821 | 5,200,810 |
| -5% | 137,279 | 1,040,000 | 142,770,022 | 128,386,569 | 14,383,453 | 7,506,106 |
| -10% | 137,279 | 1,040,000 | 142,770,022 | 123,899,043 | 18,870,980 | 9,749,566 |
Note:
1. Total operating cost, including capital and royalty (ZAR).
Table 19-8: Production Sensitivity Analysis
| | | | | | | | | | | | | | | | | | | | |
| Sensitivity (%) | Production (kg) | Gold Price (ZAR/kg) | Revenue (ZAR’000) | Total cost including tax (ZAR'000) | Net cash flow after tax (ZAR'000) | After tax NPV (ZAR’000) |
| 10% | 151,007 | 1,040,000 | 157,047,024 | 137,168,287 | 19,878,737 | 10,280,817 |
| 5% | 144,143 | 1,040,000 | 149,908,523 | 135,031,338 | 14,877,186 | 7,768,946 |
| Reserve plan | 137,279 | 1,040,000 | 142,770,023 | 133,041,202 | 9,728,821 | 5,200,810 |
| -5% | 130,415 | 1,040,000 | 135,631,521 | 131,689,252 | 3,942,269 | 2,332,720 |
| -10% | 123,551 | 1,040,000 | 128,493,020 | 131,244,843 | (2,751,823) | (1,090,304) |
The sensitivity in Table 19-6, Table 19-7 and Table 19-8 are based upon the change in a single assumption while holding all other assumptions constant. In practice, this is unlikely to occur, as risks and/or opportunities will have an impact on the cash flows, and changes in some of these assumptions may be correlated. The insights that can be provided by this sensitivity analysis is that Mponeng Mine is most sensitive to changes in the gold price (ZAR/kg), closely followed by changes in total operating costs (Table 19-7).
Effective Date: June 30, 2024
88
Technical Report Summary for
Mponeng Mine, Gauteng, South Africa
20Adjacent properties
Section 229.601(b)(96)(iii)(B)(20) (i-iv)
Mponeng lies to the south of TauTona and Savuka Mines and east of Kusasalethu Mine. All mines are 100% owned by Harmony and collectively form the West Wits operation. TauTona and Savuka have completely mined out the VCR horizon and some infrastructure is still available on the CLR horizon. The remaining portions of CLR Mineral Resource from these two mines was transferred to Mponeng in 2017 as at the time they were placed under and care and maintenance with intention to move towards eventual closure. Blyvooruitzicht Gold (Pty) Limited and Sibanye-Stillwater Limited own and operate other gold mines located to the north east and north west of Mponeng.
Effective Date: June 30, 2024
89
Technical Report Summary for
Mponeng Mine, Gauteng, South Africa
21Other Relevant Data and Information
Section 229.601(b)(96)(iii)(B)(21)
Public disclosure reports on Mponeng’s operational, financial and environmental performance are available on the Company’s corporate website. The following reports are relevant to this TRS:
•Integrated report 2024;
•ESG report 2024;
•Financial report 2024;
•Operational report 2024; and
•Climate action and impact report 2024.
Effective Date: June 30, 2024
90
Technical Report Summary for
Mponeng Mine, Gauteng, South Africa
22Interpretation and Conclusions
Section 229.601(b)(96)(iii)(B)(22)
In the opinion of the QP, Mponeng is a well-established mine and has been in operation since commissioning in 1986. The name Mponeng was adopted in 1999 (previously known as Western Deep Level South Shaft), and the asset was acquired by Harmony in October 2020. Harmony has no known risks to conduct mining activities over the permitted mining rights’ areas, incorporated as Mponeng. In addition, no known risks are posed over surface access and activities, regarding mining related activities.
The gold-bearing conglomerates at Mponeng are found in the north-western margin of the Archean Witwatersrand Basin, a prominent gold deposit in the world. These gold bearing conglomerates are mostly confined to their horizons known as reefs. The VCR, hosted in the Kimberley and Booysens domain, is continuously developed across the entire Mponeng mining area and is currently the most exploited reef at Mponeng. The CLR, hosted in the Krugersdorp domain, was historically mined at the adjacent TauTona and Savuka Mines, and is the other gold-bearing reef that contributes to the Mponeng Mineral Resource.
Mponeng’s regional geological setting, mineralization and deposit is well understood. The geology is supported by seismic survey and, surface and underground drilling findings. The geological anomalies, synonymous with both the VCR and CLR reefs are identified, defined, and managed by the Mponeng Geology Department. Planned targeted exploration for the 2024/2025 period is aimed at extending the Mineral Resources for the Booysens/Kimberley transition towards the east of the Phase 1 Reserve extension area, and the area west of the Kimberley domain.
The sampling approach, density assumptions, laboratory procedures, and assaying and analysis are in keeping with industry standards and practices and is appropriate for the Witwatersrand and VCR-type mineralization. The holistic understanding of the regional geology, lithological and structural controls of the mineralization at Mponeng is sufficient to support the estimation of Mineral Resources.
Gold bearing ore mined at Mponeng is processed at the Mponeng processing facility which has been in operation since 1986, as such the processing method is considered well established for mineralization at Mponeng. The plant therefore makes use of historical trends and data as a basis for their recoveries of VCR and CLR. However, metallurgical testwork is adopted for optimisation projects. In the recent past, a blend of ore was evaluated to optimize the mine’s processing conditions. The evaluation recommended that the optimal blend recovery is a composite of ore in a 40:60 ratio, with respect to Mponeng is to Kusasalethu. Current performance is aligned with this ratio.
The data pertaining to the mineralization, regional and geological setting, exploration findings, sample collection, preparation, and testing, inclusive of data verification and metallurgical test work gives rise to the Mineral Resource estimate. The combined Measured and Indicated Mineral Resource, exclusive of Mineral Reserves, as at June 30, 2024 is 16.41Mt at 13.82g/t gold, containing 7.29Moz of gold, and the Inferred Mineral Resource contains 32.11Mt at 11.34g/t gold, containing 11.71Moz of gold.
Mineral Reserves are derived from the Mineral Resources, a detailed business plan and operational mine planning processes. Mine planning utilises and takes into consideration actual historical technical parameters. In addition, conversion of the Mineral Resources to Mineral Reserves considers Modifying Factors, dilution, ore losses, minimum mining widths, planned mine call and plant recovery factors. The Mineral Reserve is 15.41Mt of milled ore containing 4.503Moz as at June 30, 2024.
The mine is currently mining profitably, and the Mineral Reserve estimates show positive cash flows. Silver or any other by-products that are recovered as part of the refining process, make up an immaterial component of the total metal inventory, and is thus not reported as part of the Mineral Reserve estimates. There are no obvious material risks that could have significant effect on the Mineral Reserves.
The Mineral Reserves are extracted via the SGM method with backfill support, taking into consideration the mining and rock engineering design guidelines. This mining method increases flexibility and minimizes seismicity. In addition, the breast mining method that is adopted in some parts of the mine provide a safe and economic mining method, for these specific areas. Extracted minerals from the Mponeng Mine are recovered at an onsite processing plant. The metallurgical process is a well-tested technology, processing ore from the VCR and CLR reefs.
Effective Date: June 30, 2024
91
Technical Report Summary for
Mponeng Mine, Gauteng, South Africa
The mine’s regional and local infrastructure is capable of fully supporting the mining and surface related mining activities. Mponeng is accessed via national and provincial road networks, has key power transmission and distribution networks provided by the National electricity regulator, water supply networks and communication infrastructure. Overall, Mponeng is well-established with sufficient logistics and infrastructure support for the existing and planned mining operations.
Harmony and Mponeng are exposed to market risks such as exchange rate and gold price fluctuations which are partially offset by the Harmony Group hedging policy. The hedging program takes into account factors effecting the global gold market and these, along with macro-economic conditions, are used to determine planning and forecasting inputs at group level for all of Harmony’s operating business units. Other non-gold related risks are addressed to some extent by Mponeng entering into vendor agreements for the provision of supplies and services which are done on a competitive basis with customary price adjustment, renewal and termination clauses.
To successfully operate a mining operation in South Africa the state requires compliance with applicable environmental laws, regulations, permits and standards. Mponeng adheres to said compliance and regulatory standards and have, in addition, implemented an Environmental Management System in line with the ISO 14001.
As part of Harmony, Mponeng conducts its operations based on policies and systems that are aligned its corporate sustainable development framework. This is guided by the principles of the framework from the International Council on Mining and Metals or the UN Global Compact. Harmony discloses its sustainable development voluntarily in accordance with the guidelines issued by the Global Reporting Initiative (GRI). Further to this, Harmony discloses environmental information on the Carbon Disclosure Project (CDP) for both climate change and water.
Harmony has a good understanding of the environmental and social aspects through baseline and specialist studies previously conducted. Risk management and mitigation measures were adequately addressed in the environmental management plans. Most of the required environmental authorizations are in place and only require amendments to be made to reflect the current infrastructure at Mponeng. Based on current industry norms, a realistic timeframe to obtain relevant authorizations is estimated between 12 and 18 months.
One of the ways Harmony aims to grow and develop the people and assets and provide sustainable value to all stakeholders is through economic regeneration. The economics of Mponeng is based on the discounted cash flow model, with a Harmony Gold price of above ZAR1 040 000/kg. The NPV for the Harmony Gold price, is ZAR5,201 million, at a discount rate of 9%. The NPV is calculated on cash flow that takes factors such as: capital and operating costs; and royalties. The capital and operating cost estimates for Mponeng are based on historical data, as well as budget forecasts. This estimation technique allows for the forecast and actual costs to be aligned.
Royalties and taxes are paid to the South African government and accounted for in the Mponeng cash flow and NPV analysis. There are also specific tax relief benefits that apply to gold mining companies, where 5% of total revenue is exempt from taxation, amongst other benefits. The economics of Mponeng are tested for its sensitivity to commodity price (ZAR/kg), operating costs (ZAR) and gold production (kg). The insights provided by the sensitivity analysis is that Mponeng Mine is most sensitive to changes in the gold price (ZAR/kg), closely followed by changes in total operating costs (ZAR).
To the south of Mponeng is the TauTona and limited Savuka Mines and to the east of Mponeng is the Kusasalethu Mine. All these mines are 100% owned by Harmony and collectively form the West Wits operation. TauTona and Savuka have completely mined out the VCR horizon. Portions of CLR Mineral Resource from TauTona and Savuka have been transferred to Mponeng. The TRS provides sufficient information as required and there is no other relevant data and information.
The TRS was prepared by a team of experienced professionals. The TRS provides a summary of the material scientific and technical information concerning the mineral exploration, Mineral Resources, Mineral Reserves, and associated production activities of the mineral asset, including references to the valuation for Mponeng. The QP was responsible for specific sections of this TRS which he has personally supervised and reviewed. This TRS contains the expression of the QP opinions, based on the information available at the time of preparation.
Effective Date: June 30, 2024
92
Technical Report Summary for
Mponeng Mine, Gauteng, South Africa
23Recommendations
Section 229.601(b)(96)(iii)(B)(23)
With the approval of the LOM extension, an additional 11 years have been added on the Reserve plan. Current Reserve plan indicates 18 years. Further potential however exists, with continuous exploration drilling. Target areas for the near term includes the edges on the VCR 123 level and the lower grade zone below 126 level.
Effective Date: June 30, 2024
93
Technical Report Summary for
Mponeng Mine, Gauteng, South Africa
24References
Section 229.601(b)(96)(iii)(B)(24)
Burnett, R.J., Orton, R., Chola, D., Lavery, R.K. and Linton, P., 2015. Carbon Leader Reef Estimation Domain Model (unpubl.), in: AngloGold Ashanti Limited: Carbon Leader Reef Geoscience Project 2015, 1-54.
Dankert, B.T., and Hein, K.A.A., 2010. Evaluating the structural character and tectonic history of the Witwatersrand Basin. Precambrian Research 177, 1–22.
Fletcher, P., 2009. The Carbon Leader Reef (unpublished), in: AngloGold Ashanti Limited: TauTona Company Report 2009, 1–30.
https://www.gold.org/goldhub/data/gold-prices. Accessed 22 July 2022.
Manzi, M., Cooper, M., Malehmir, A., Durrheim, R., and Nkosi, Z. 2015. Integrated interpretation of 3D seismic data to enhance the detection of the gold-bearing reef: Mponeng Gold mine, Witwatersrand Basin (South Africa). Geophysical Prospecting 63: 881–902.
Muller, C., 1991. The Occurrence of Carbon in the Carbon Leader Reef and some important considerations, in: Gold Fields Oberholzer Geological Centre (Sedimentology Unit) Reference: 990/29/73/SED, 61–64.
Robb, L.J., and Meyer, F., 1995. The Witwatersrand Basin, South Africa: Geological framework and mineralisation processes. Ore Geology Reviews, 10(2), 67-94.
Robb, L.J., Robb, V.M., 1998. Gold in the Witwatersrand Basin. In: Wilson, M.G.C., Anhaeusser, C.R. (Eds.), The Mineral Resources of South Africa. Handbook. Council for Geoscience, 294–349.
South African Revenue Services. (2021, July 29). South African Revenue Services. Retrieved from Tax Relief Measures: https://www.sars.gov.za/media/tax-relief-measures/
Therriault, A.M., Grieve, R.A.F., Reimold, W.U., 1997. Original size of the Vredefort Structure: Implications for the geological evolution of the Witwatersrand Basin. Meteoritics and Planetary Science 32, 71–77.
Tucker, R.F., Viljoen, R.P., and Viljoen, M.J., 2016. A Review of the Witwatersrand Basin The World’s Greatest Goldfield, accessed from https:// www.researchgate.net /publication /305924249 _A_Review_of_the_Witwatersrand_Basin_-_The_World's_Greatest_Goldfield.
World Gold Council. (2024, July 12). World Gold Council, Gold Hub, Gold mine production: Gold Production by Country | Gold Production | Goldhub
Effective Date: June 30, 2024
94
Technical Report Summary for
Mponeng Mine, Gauteng, South Africa
25Reliance on Information Provided by the Registrant
Section 229.601(b)(96)(iii)(B)(25)
Further to Section 24, in the preparation of this TRS, the QP and authors relied upon information provided by the Registrant and other internal specialists with regards to mining rights, surface rights, contractual agreements, historical operating expenditures, community relations and other matters. The work conducted by these specialists was completed under the supervision and direction of the QP. The specialists who assisted the principal authors and QPs are listed in Table 25-1.
Table 25-1: Other Specialists
| | | | | | | | | | | |
| Name | Specialist | Area of Responsibility | Association / Company |
| C Gunter | Finance/Costing | Mponeng Finance Manager | Mponeng |
| N Strydom | Mining Rights | Harmony Senior Legal Council | Central |
| N Maluleke | Processing | Process plant | Plant |
| E Kleynhans | Rock Engineering | Rock Engineering | Mponeng |
| J Powell | Geostatistician | Estimation | Central |
| G Flitton | Geosciences | Geology and Sampling | Mponeng |
| W Beukes | Survey and Planning | Survey and Planning | Mponeng |
| | | |
| | | |
| | | |
| | | |
Effective Date: June 30, 2024
95