HARMONY GOLD MINING COMPANY LIMITED
Technical Report Summary of the
Mineral Resources and Mineral Reserves
for
Kalgold Mine
North West Province, South Africa
Effective Date: June 30, 2024
Final Report Date: October 31, 2024
Technical Report Summary for
Kalgold Mine, North West Province, South Africa
| | |
IMPORTANT NOTICE
This Technical Report Summary has been prepared for Harmony Gold Mining Company Limited in support of disclosure and filing requirements with the United States Securities and Exchange Commission’s (SEC) under Subpart 1300 of Regulation S-K 1300 and Section 229.601(b)(96) of Regulation S-K. The quality of information, estimates, and conclusions contained in this Technical Report Summary apply as of the effective date of this report. Subsequent events that may have occurred since that date may have resulted in material changes to such information, estimates and conclusions in this summary. |
Effective Date: June 30, 2024
Final Report Date: October 31, 2024
ii
Technical Report Summary for
Kalgold Mine, North West Province, South Africa
QP Consent and Sign-off
I have read and understood the requirements of:
•the South African Code for Reporting of Exploration Results, Mineral Resources and Mineral Reserves (the “SAMREC Code, 2016 edition”)
•the Harmony Guidelines on the Reporting of Exploration Results, Mineral Resources and Mineral Reserves
•Subpart 1300 (17 CFR 229.1300) of Regulation S-K, Disclosure by Registrants Engaged in Mining Operations (“Regulation S-K 1300”)
I am a Competent Person as defined by the SAMREC Code, 2016 edition and the Qualified Person (“QP”) under Regulation S-K 1300, having more than five years` experience that is relevant to the style of mineralization and type of deposit described in the Report, and to the all activities for which I am accepting responsibility and have been appointed as QP for Kalgold Mineral Resources and Mineral Reserves.
I am a Member of SACNASP and my registration is as follow:
Mineral Resource
Rebaone Francis Gaelejwe
SACNASP (South African Council for Natural Scientific Professions)
Nr 400207/14
Years’ Experience: 23
I have reviewed the tables and graphs included for the Kalgold Mineral Resource and Mineral Reserve which will be used in the 2024 Harmony Gold Mineral Resource and Mineral Reserve Report to which this Consent Statement applies.
I acknowledge responsibility for all the Sections of the TRS report and as the QP and author I relied on information provided by various subject experts.
At the effective date of the Report, to the best of my knowledge, information and belief, the Report contains all scientific and technical information that is required to be disclosed to make the Report not misleading.
/s/ Rebaone Francis Gaelejwe
____________________________________
Mr Rebaone Francis Gaelejwe
BSc. Hons (Geol), PgDip, EMBA
SACNASP (No. 400207/14)
Ore Reserve Manager
Harmony Gold Mining Company Limited
Effective Date: June 30, 2024
Final Report Date: October 31, 2024
iii
Technical Report Summary for
Kalgold Mine, North West Province, South Africa
List of Contents
Effective Date: June 30, 2024
Final Report Date: October 31, 2024
iv
Technical Report Summary for
Kalgold Mine, North West Province, South Africa
Effective Date: June 30, 2024
Final Report Date: October 31, 2024
v
Technical Report Summary for
Kalgold Mine, North West Province, South Africa
Effective Date: June 30, 2024
Final Report Date: October 31, 2024
vi
Technical Report Summary for
Kalgold Mine, North West Province, South Africa
Effective Date: June 30, 2024
Final Report Date: October 31, 2024
vii
Technical Report Summary for
Kalgold Mine, North West Province, South Africa
List of Figures
Effective Date: June 30, 2024
Final Report Date: October 31, 2024
viii
Technical Report Summary for
Kalgold Mine, North West Province, South Africa
List of Tables
Effective Date: June 30, 2024
Final Report Date: October 31, 2024
ix
Technical Report Summary for
Kalgold Mine, North West Province, South Africa
Units of Measure and Abbreviations
| | | | | |
| Unit / Abbreviation | Description or Definition |
| °C | degrees Celsius |
| µm | Micrometres |
| 3D | Three-dimensional |
| ADT | Articulated dump truck |
| AE | Abnormal expenditure |
| Andru Mining | Andru Mining (Pty) Limited |
| amsl | Above mean sea level |
| Avg. | Average |
| BIF | Banded iron formation |
| c. | Approximately |
| CIL | Carbon-in-Leach |
| cm | Centimetre |
| cmg/t | Centimetre-grams per tonne |
| CODM | Chief Operating Decision-Maker |
| Company | Harmony Gold Mining Company Limited |
| COP | Code of Practice |
| CRM | Certified Reference Material |
| COV | Coefficient of Variation |
| DD | Diamond Drilling |
| DMRE | Department of Mineral Resources and Energy |
| DWS | Department of Water and Sanitation |
| EIA | Environmental Impact Assessment |
| EMPR | Environmental Management Programme |
| EMS | Environmental Management System |
| EMTS | Electric Monorail Transport System |
| ESG | Environmental Social and Governance |
| ETF | Exchange traded fund |
| g | Gram |
| FEL | Front end loader |
| GHG | Greenhouse gas |
| g/t | Grams per metric tonne |
| GISTM | Global Industry Standard on Tailings Management |
| HG | High grade |
| kg | Kilogram |
| Kalgold | Kalahari Goldridge Mining Company Limited |
| KGB | Kalahari Greenstone Belt |
| km | Kilometre |
| Kpa | Kilo Pascals |
| ktpm | Kilo tonnes per month |
| Leapfrog | Leapfrog Geo 4.5 software |
| LBMA | London Bullion Market Association |
| LG | Low grade |
| Ltd | Limited |
| m | Metre |
| M | Million |
| Ma | Million years |
| masl | Metres above sea level |
| MCC | Mining Charter Compliance |
| MCF | Mine Call Factor |
Effective Date: June 30, 2024
Final Report Date: October 31, 2024
x
Technical Report Summary for
Kalgold Mine, North West Province, South Africa
| | | | | |
| Unit / Abbreviation | Description or Definition |
| NEMA | National Environmental Management Act, 107 of 1998 |
| MPRDA | Mineral and Petroleum Resources Development Act, 28 of 2002 |
| MRMR | Modified Rock Mass Ratings |
| Moz | Million troy ounces |
| Mpa | Mega Pascals |
| Mt | Million tonnes |
| Mtpa | Million tonnes per annum |
| Mtpm | Million tonnes per month |
| No. | Number |
| NPV | Net present value |
| OTC | Over the counter |
| oz | Troy ounce |
| PERC | Percussion drilling |
| Pty | Proprietary |
| QAQC | Quality Assurance and Quality Control |
| QP | Qualified Person |
| RC | Reverse Circulation drilling |
| RCDD | Reverse Circulation Diamond Drilling |
| RMR | Rock Mass Ratings |
| SACNASP | South African Council for Natural Scientific Professions |
| SAMREC | South African Code for the Reporting of Exploration Results, Mineral Resources and Mineral Reserves |
| SANAS | South African National Accreditation System |
| SD | Standard Deviation |
| SEC | Securities and Exchange Commission |
| SGS | SGS South Africa (Pty) Limited |
| Shamrock | Shamrock Mining and Prospecting Company |
| Shell | Shell Limited |
| SLP | Social Labour Plan |
| SP | Stockpile |
| t | Metric tonne |
| t/m3 | tonne per cubic metre |
| TRS | Technical Report Summary |
| TSF | Tailings Storage Facility |
| UCS | Uniaxial compressive strength (MPa) |
| USD | United States Dollars |
| USD/oz | United States Dollar per troy ounce |
| WRCM | West Rand Consolidated Mines |
| WUL(s) | Water Use Licence(s) |
| y-o-y | Year on year |
| Yr | Year |
| ZAR | South African Rand |
| ZAR/kg | South African Rand per kilogram |
Effective Date: June 30, 2024
Final Report Date: October 31, 2024
xi
Technical Report Summary for
Kalgold Mine, North West Province, South Africa
Glossary of Terms
| | | | | |
| Term | Definition |
| Co-kriging | A method that is used to predict the value of the point at unobserved locations by sample points that are known to be spatially interconnected by adding other variables that have a correlation with the main variable or can also be used to predict 2 or more variables simultaneously. |
| Cut-off grade | Cut-off grade is the grade (i.e., the concentration of metal or mineral in rock) that determines the destination of the material during mining. For purposes of establishing “prospects of economic extraction,” the cut-off grade is the grade that distinguishes material deemed to have no economic value (it will not be mined in underground mining or if mined in surface mining, its destination will be the waste dump) from material deemed to have economic value (its ultimate destination during mining will be a processing facility). Other terms used in similar fashion as cut-off grade include net smelter return, pay limit, and break-even stripping ratio. |
| Dilution | Unmineralized rock that is by necessity, removed along with ore during the mining process that effectively lowers the overall grade of the ore. |
| Head grade | The average grade of ore fed into the mill. |
| Economically viable | Economically viable, when used in the context of Mineral Reserve determination, means that the qualified person has determined, using a discounted cash flow analysis, or has otherwise analytically determined, that extraction of the Mineral Reserve is economically viable under reasonable investment and market assumptions. |
| Harmony | Harmony Gold Mining Company Limited |
| Indicated Mineral Resource | Indicated Mineral Resource is that part of a Mineral Resource for which quantity and grade or quality are estimated on the basis of adequate geological evidence and sampling. The level of geological certainty associated with an Indicated Mineral Resource is sufficient to allow a qualified person to apply Modifying Factors in sufficient detail to support mine planning and evaluation of the economic viability of the deposit. Because an Indicated Mineral Resource has a lower level of confidence than the level of confidence of a Measured Mineral Resource, an Indicated Mineral Resource may only be converted to a probable Mineral Reserve. |
| Inferred Mineral Resource | Inferred Mineral Resource is that part of a Mineral Resource for which quantity and grade or quality are estimated on the basis of limited geological evidence and sampling. The level of geological uncertainty associated with an Inferred Mineral Resource is too high to apply relevant technical and economic factors likely to influence the prospects of economic extraction in a manner useful for evaluation of economic viability. Because an Inferred Mineral Resource has the lowest level of geological confidence of all Mineral Resources, which prevents the application of the Modifying Factors in a manner useful for evaluation of economic viability, an Inferred Mineral Resource may not be considered when assessing the economic viability of a mining project and may not be converted to a Mineral Reserve. |
| Kriging | A method of interpolation based on Gaussian process governed by prior covariances. It uses a limited set of sampled data points to estimate the value of a variable over a continuous spatial field. |
| LOM | The Life of Mine (LOM) is a technically achievable and economically viable period, which is formed from the basis of the determined Mineral Reserves, during which the Proven and Probable Mineral Reserves of the operation are planned to be extracted |
| Mine Call Factor | The ratio, expressed as a percentage, of the total quantity of recovered and unrecovered mineral product after processing with the amount estimated in the ore based on sampling. |
| Measured Mineral Resource | Measured Mineral Resource is that part of a Mineral Resource for which quantity and grade or quality are estimated on the basis of conclusive geological evidence and sampling. The level of geological certainty associated with a Measured Mineral Resource is sufficient to allow a qualified person to apply Modifying Factors, as defined in this section, in sufficient detail to support detailed mine planning and final evaluation of the economic viability of the deposit. Because a Measured Mineral Resource has a higher level of confidence than the level of confidence of either an Indicated Mineral Resource or an Inferred Mineral Resource, a Measured Mineral Resource may be converted to a Proven Mineral Reserve or to a Probable Mineral Reserve. |
| Mineral Reserve | Mineral Reserve is an estimate of tonnage and grade or quality of Indicated and Measured Mineral Resources that, in the opinion of the qualified person, can be the basis of an economically viable project. More specifically, it is the economically mineable part of a Measured or Indicated Mineral Resource, which includes diluting materials and allowances for losses that may occur when the material is mined or extracted. |
| Mineral Resource | Mineral Resource is a concentration or occurrence of material of economic interest in or on the Earth’s crust in such form, grade or quality, and quantity that there are reasonable prospects for economic extraction. A Mineral Resource is a reasonable estimate of mineralisation, taking into account relevant factors such as cut-off grade, likely mining dimensions, location, or continuity, that, with the assumed and justifiable technical and economic conditions, is likely to, in whole or in part, become economically extractable. It is not merely an inventory of all mineralisation drilled or sampled. |
Effective Date: June 30, 2024
Final Report Date: October 31, 2024
xii
Technical Report Summary for
Kalgold Mine, North West Province, South Africa
| | | | | |
| Term | Definition |
| Modifying Factors | Modifying Factors are the factors that a qualified person must apply to Indicated and Measured Mineral Resources and then evaluate in order to establish the economic viability of Mineral Reserves. A qualified person must apply and evaluate Modifying Factors to convert Measured and Indicated Mineral Resources to Proven and Probable Mineral Reserves. These factors include but are not restricted to mining; processing; metallurgical; infrastructure; economic; marketing; legal; environmental compliance; plans, negotiations, or agreements with local individuals or groups; and governmental factors. The number, type and specific characteristics of the Modifying Factors applied will necessarily be a function of and depend upon the mineral, mine, property, or project. |
| Pre-Feasibility Study | A pre-feasibility study (or preliminary feasibility study) is a comprehensive study of a range of options for the technical and economic viability of a mineral project that has advanced to a stage where a qualified person has determined (in the case of underground mining) a preferred mining method, or (in the case of surface mining) a pit configuration, and in all cases has determined an effective method of mineral processing and an effective plan to sell the product. (1) A pre-feasibility study includes a financial analysis based on reasonable assumptions, based on appropriate testing, about the modifying factors and the evaluation of any other relevant factors that are sufficient for a qualified person to determine if all or part of the Indicated and Measured Mineral Resources may be converted to Mineral Reserves at the time of reporting. The financial analysis must have the level of detail necessary to demonstrate, at the time of reporting, that extraction is economically viable. (2) A pre-feasibility study is less comprehensive and results in a lower confidence level than a feasibility study. A pre-feasibility study is more comprehensive and results in a higher confidence level than an initial assessment. |
|
|
| Probable Mineral Reserve | Probable Mineral Reserve is the economically mineable part of an Indicated and, in some cases, a Measured Mineral Resource. |
| Proven Mineral Reserve | Proven Mineral Reserve is the economically mineable part of a Measured Mineral Resource and can only result from conversion of a Measured Mineral Resource. |
| Qualified Person | A qualified person is: (1) A mineral industry professional with at least five years of relevant experience in the type of mineralization and type of deposit under consideration and in the specific type of activity that person is undertaking on behalf of the registrant; and (2) An eligible member or licensee in good standing of a recognized professional organization at the time the technical report is prepared. For an organization to be a recognized professional organization, it must: (i) Be either: A) An organization recognized within the mining industry as a reputable professional association; or (B) A board authorized by U.S. federal, state or foreign statute to regulate professionals in the mining, geoscience or related field; (ii) Admit eligible members primarily on the basis of their academic qualifications and experience; (iii) Establish and require compliance with professional standards of competence and ethics; (iv) Require or encourage continuing professional development; (v) Have and apply disciplinary powers, including the power to suspend or expel a member regardless of where the member practices or resides; and (vi) Provide a public list of members in good standing. |
|
|
|
|
|
|
|
|
|
|
| Tailings | Finely ground rock of low residual value from which valuable minerals have been extracted is discarded and stored in a designed dam facility. |
| Tailings Freeboard | The vertical height between the beached tailings against the embankment crest and the crest itself. |
Effective Date: June 30, 2024
Final Report Date: October 31, 2024
xiii
Technical Report Summary for
Kalgold Mine, North West Province, South Africa
1Executive Summary
Section 229.601(b)(96)(iii)(B)(1)
The QP of Harmony Gold Mining Company Limited (“Harmony” or the “Company”) has prepared this Technical Report Summary (“TRS”) to disclose the Mineral Resource and Mineral Reserve estimates for the Company’s Kalahari Goldridge Mining Company Limited (“Kalgold” or “Kalgold Mine”). The TRS has been prepared in accordance with the U.S. Securities and Exchange Commission’s (“SEC”) Regulation S-K 1300, with an effective date as at June 30, 2024. No material changes have occurred between the effective date and the date of signature of this TRS.
This TRS updates the TRS filed by Harmony on Kalgold on October 31, 2023, named Exhibit 96.6 Technical Report Summary of the Mineral Resources and Mineral Reserves for Kalgold Mine, North West Province, South Africa, which was effective on 30 June 2023. This TRS is prepared to satisfy the requirement of Item 1302(e)(6) of regulation S-K. An economic assessment was included, using a detailed discounted cashflow analysis for the Mineral Reserves, excluding all scheduled Inferred Mineral Resource which is not reported under Mineral Reserve.
Property Description
Kalgold is a modular open gold pit mine, extracting ore from a series of satellite orebodies. The mine is in the North West Province of South Africa, 55km southwest of the town of Mahikeng. The Kalgold Mine is serviced by well-maintained sealed roads with good access to all nearby towns and cities. The mine is surrounded by farmland and the closest community is at Kraaipan, approximately 15km to the south of the mine. The Kalgold Mine has been in operation since 1995 and is the only significant mining operation in the region.
The mining rights related to Kalgold was successfully acquired as the Kalahari Goldridge Mining Company Limited in July 1999. Through a successful legislative Section 11 process undertaken in terms of the Mineral and Petroleum Resources Development Act, 2008 (“MPRDA”), Harmony is now the holder of the following mining rights:
•NW30/5/1/2/2/77MR valid from 28 August 2008 to 27 August 2038; and
•NW30/5/1/1/2/863 and 1469PR lapsed. New PR application NW30/5/1/1/2/14264 PR has be lodged on the 31st January 2024. The area is currently reserved, and the Department of Mineral Resources and Energy (“DMRE”) may not accept any other applications for the area.
There is no material litigation (including violations or fines) against the Company which threatens its mineral rights, tenure, or operations.
Ownership
Kalgold is 100% owned by Harmony, including the associated mineral rights. Harmony acquired the mine as part of a transaction concluded by the company in July 1999.
Geology and Mineralisation
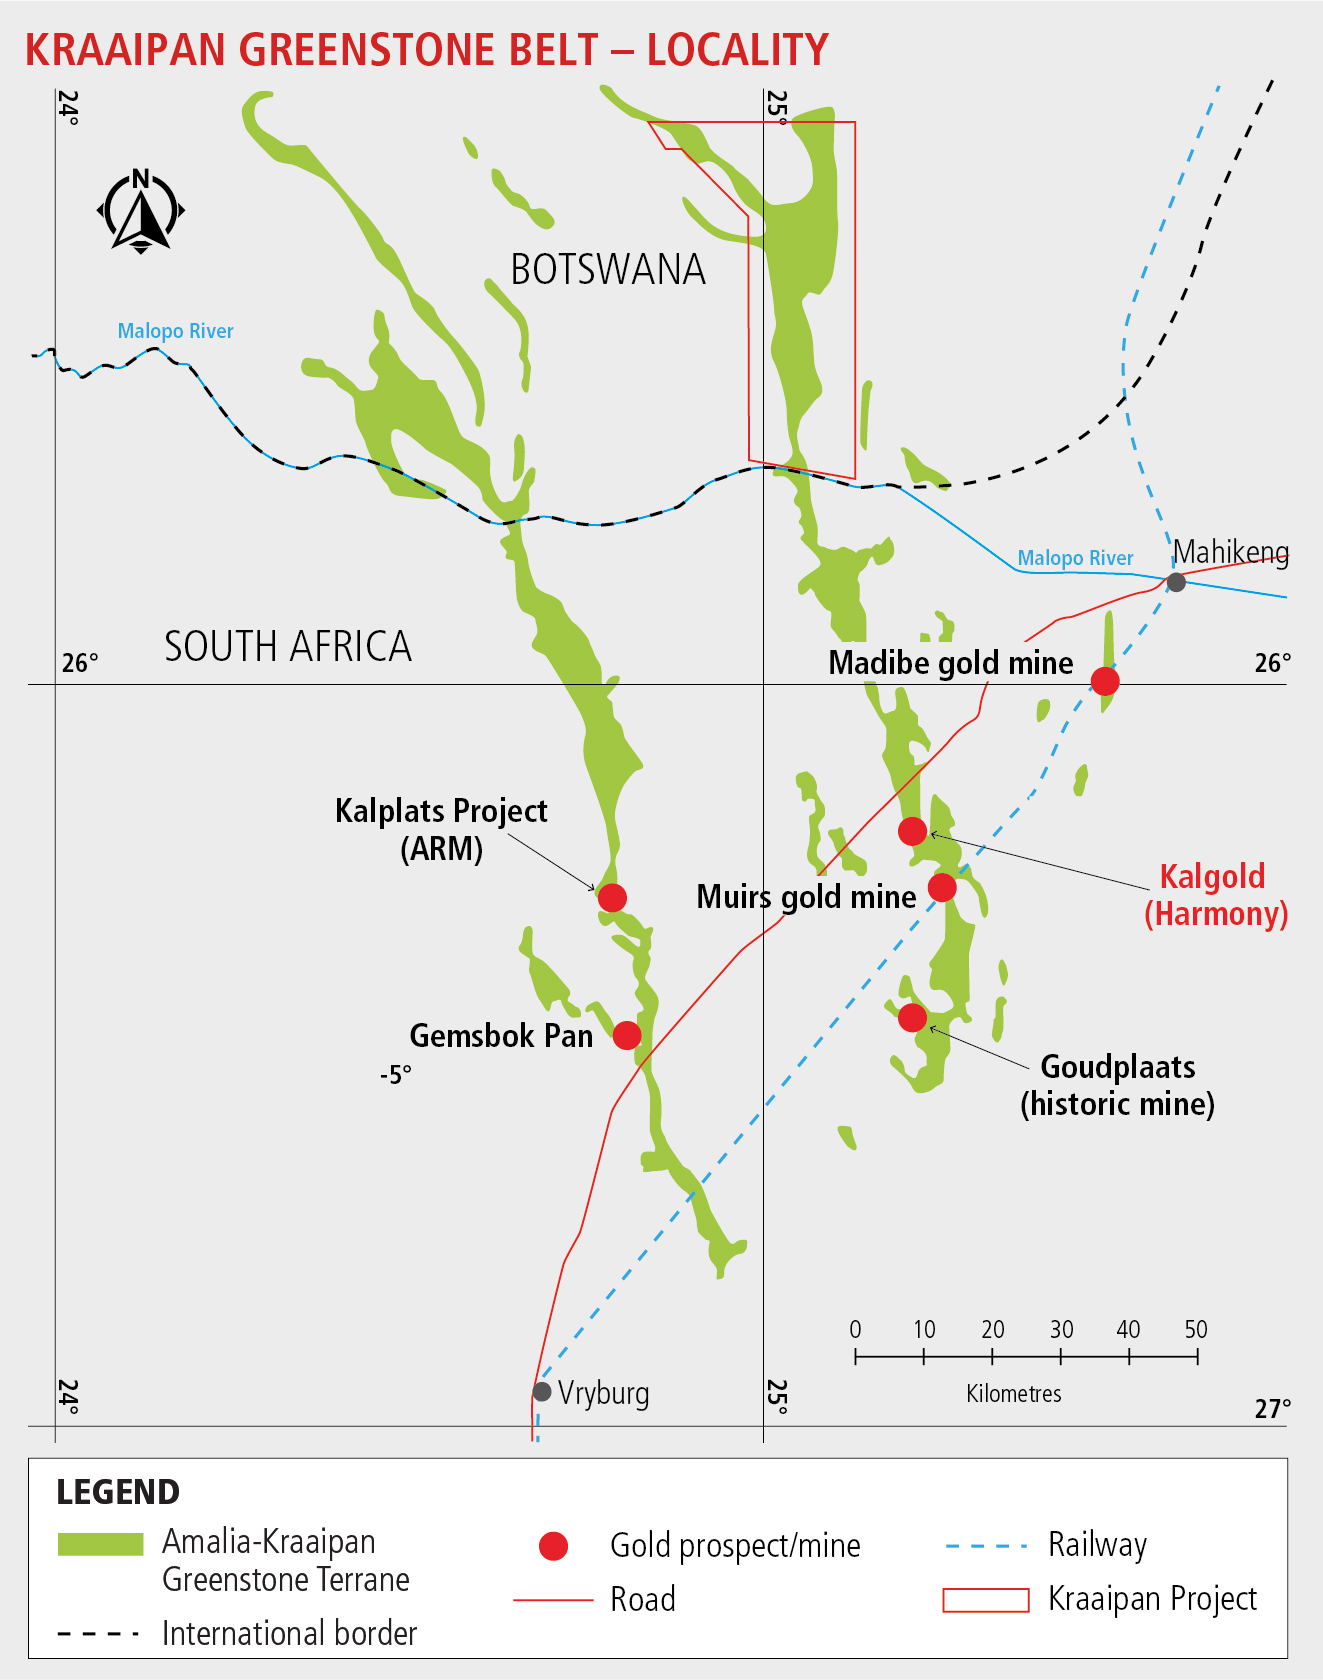
The Kalgold lode deposit is located within the geological terrane known as the Archaean Kraaipan Greenstone Belt ("KGB"). The KGB forms part of the Kaapvaal Craton of South Africa and comprises a linear belt of weakly metamorphosed mafic volcanic rocks with interbedded metasedimentary rocks and Banded Iron Formation (“BIF”). The belt extends in a roughly north/south direction over 250km from South Africa into southern Botswana.
The belt is intruded by several granitoid suites which range from tonalitic and trondhjemitic gneisses through to granodiorite-monzonite suites. There is a general paucity of outcrop owing to the variably developed weathering profile and to the Tertiary-to-Recent cover, including transported Kalahari sands. Due to the younger cover rocks and lack of surface exposure, the mineralisation potential of the belt was poorly understood for many years.
The Kalgold lode deposit is accessed through five discrete mining areas, namely the D Zone, A Zone and A Zone south extension (Henrys), Bridge Zone, Watertank, and Windmill pits. The geology of the D Zone Pit is used as a benchmark for the other pits. The geology consists of mafic schist, which forms the immediate footwall, a BIF horizon as the main mineralised zone and a succession of clastic sediments consisting of shale,
Effective Date: June 30, 2024
1
Technical Report Summary for
Kalgold Mine, North West Province, South Africa
greywacke, and volcanic conglomerates as the hanging wall. Mining is currently taking place at the A Zone, Watertank, Henrys and Windmill pits.
Mineralisation at Kalgold is essentially strata bound to the BIF packages, resulting from intense silica, carbonate, sulphide, potassium alteration and metasomatic replacement of the BIF lenses. The mineralisation is manifested primarily as quartz veined and sulphidised BIF, with sulphides dominated by pyrrhotite and pyrite. Gold predominantly occurs as small grains of native gold, in association with pyrrhotite and trace chalcopyrite and sphalerite.
Status of Exploration, Development and Operation
Kalgold is an established, existing mining operation that has been in production for over 25 years. It currently mines at rates of c.3Mtpa of ore. An average of c.1,300kg of gold is produced annually, with ore sources originating from mining and stockpile handling operations.
In the period 2017 - 2019, definition and exploration drilling were undertaken over the Kalgold line of lode deposit. This exploration was aimed at validating and expanding the Mineral Resource estimate at that time. The drilling yielded significant extensions to the Mineral Resource area, expanding on the understanding of the deposit. The drilling results were analysed and incorporated into the geological model to upgrade the Mineral Resource estimates, and in-fill the areas between the A Zone and Watertank mining pits, known as the Bridge Zone.
Further exploration drilling took place during 2021 -2023. The results from this exploration drilling extended and in-filled the mineralised area beyond the current resource limits. The exploration drilling and the subsequent definition of the Mineral Resources are ongoing, and the intention is that the Mineral Resource estimate will be continuously updated as the data becomes available and incorporated into the model.
Exploratory work planned to the south of the D zone will commence as soon as the pending prospecting right application approval is received. This drilling is aimed at expanding Mineral Resource and Reserve beyond the current limits.
Overall, the current Kalgold Mine site is well established and operates uninterrupted at a steady state capacity throughout the year.
Mineral Resource Estimate
The declared Mineral Resource estimate for Kalgold is based on the January 2024 Mineral Resource model. The model was completed by the QP using Leapfrog Geo 4.5 modelling software. The QP created wireframes and block models using the Datamine RMTM modelling software. The data used for the modelling in Datamine RM was based on a validated DatamineTM (“Datamine”) Fusion database containing exploration drill hole data, obtained until December 2023. The gold grade was estimated using the Ordinary Kriging interpolation method.
For the purposes of this TRS, the Mineral Resources are classified in accordance with § 229.1302(d)(1)(iii)(A) (Item 1302(d)(1)(iii)(A) of Regulation S-K), which is similar to the South African Code for the Reporting of Exploration Results, Mineral Resources and Mineral Reserves.
The QP compiling the Mineral Resource estimates is Mr RF Gaelejwe, who is Ore Reserve Manager at Kalgold, and an employee of Harmony.
The Mineral Resource estimate, as at June 30, 2024, exclusive of the reported Mineral Reserves is summarised in Table 1-1. These Mineral Resources account for mining depletions recorded until June 30, 2024 (19 January 2024 actuals plus five months forecast). They incorporate the A Zone, Watertank, Henry's and the Windmill Zone.
Effective Date: June 30, 2024
2
Technical Report Summary for
Kalgold Mine, North West Province, South Africa
Table 1-1: Summary of the Kalgold Mineral Resources as at June 30, 2024 (Exclusive of Mineral Reserves) 1-8
| | | | | | | | | | | |
| METRIC |
| Mineral Resource Category | Tonnes (Mt) | Gold Grade (g/t) | Gold Content (kg) |
| Measured | 8.928 | 1.15 | 10 223 |
| Indicated | 14.715 | 1.33 | 19 538 |
| Total / Ave. Measured + Indicated | 23.643 | 1.26 | 29 762 |
| Inferred | 31.688 | 0.60 | 18 855 |
| IMPERIAL |
| Mineral Resource Category | Tons (Mt) | Gold Grade (oz/t) | Gold Content (Moz) |
| Measured | 9.841 | 0.033 | 0.329 |
| Indicated | 16.221 | 0.039 | 0.628 |
| Total / Ave. Measured + Indicated | 26.062 | 0.037 | 0.957 |
| Inferred | 34.930 | 0.017 | 0.606 |
Notes:
1. Mineral Resources reported with an effective date of June 30, 2024 were originally classified and reported according to SAMREC, 2016. For the purposes of this TRS, the Mineral Resources have been classified in accordance with § 229.1302(d)(1)(iii)(A) (Item 1302(d)(1)(iii)(A) of Regulation S-K). The Qualified Person responsible for the estimate is Mr RF Gaelejwe, who is Ore Reserve Manager at Kalgold, and a Harmony employee.
2. The Mineral Resource tonnes are reported as in-situ with reasonable prospects for economic extraction.
3. No modifying factors or dilution sources have been included to in-situ Reserve which was subtracted from the SAMREC Resource in order to obtain the S-K 1300 Resource.
4. The Mineral Resources are reported using a cut-off value of 0.55g/t and a gold price of USD1,878/oz
5. Tonnes are reported as rounded to three decimal places. Gold values are rounded to zero decimal places.
6. Mineral Resources are exclusive of Mineral Reserves. Mineral Resources are not Mineral Reserves and do not necessarily demonstrate economic viability.
7. Rounding as required by reporting guidelines may result in apparent summation differences.
8. The inferred portion of the Mineral Resource includes the historical Surface tailings of 6 263Kg (0,201Moz)
9. The Mineral Resource estimate is for Harmony’s 100% interest.
Mineral Reserve Estimate
The Mineral Reserves were originally prepared, classified and reported according to SAMREC, 2016. For the purposes of this TRS, the Mineral Reserves have been classified in accordance with § 229.1302(d)(1)(iii)(A) (Item 1302(d)(1)(iii)(A) of Regulation S-K).
Mineral Reserves are derived from the Mineral Resources, a detailed business plan and the operational mine planning processes. Mine planning utilises and takes into consideration historical technical parameters achieved. In addition, Mineral Resource conversion to Mineral Reserves considers Modifying Factors, dilution, ore losses, minimum mining widths and planned mine call factor. The Mineral Reserves are 0.645Moz as at June 30, 2024 (Table 1-2).
The Mineral Reserves comprise 51% Proved Reserves and 49% are Probable Reserves. In the opinion of the QP, given that Kalgold is an established operation, the Modifying Factors informing the Mineral Reserve estimates would at minimum, satisfy the confidence levels of a Pre-Feasibility Study.
The declared Mineral Reserve is depleted to generate the Kalgold cash flows. The economic analysis of the cash flows displays positive 9% discounted NPV result of ZAR1 150 million. Declared Mineral Reserves are deemed both technically and economically achievable. It is important to note that the Mineral Reserves are declared as delivered to the mills.
Effective Date: June 30, 2024
3
Technical Report Summary for
Kalgold Mine, North West Province, South Africa
Table 1-2: Summary of the Kalgold Mineral Reserves as at June 30, 2024 1-5
| | | | | | | | | | | |
| METRIC |
| Mineral Reserve Category | Milled Tonnes (Mt) | Gold Grade (g/t) | Gold Content (kg) |
| Proved | 10.342 | 0.99 | 10 207 |
| Probable | 8.369 | 1.18 | 9 854 |
| Total (Proved + Probable) | 18.711 | 1.07 | 20 061 |
| | | | | | | | | | | |
| IMPERIAL |
| Mineral Reserve Category | Milled Tons (Mt) | Gold Grade (oz/t) | Gold Content (Moz) |
| Proved | 11.400 | 0.029 | 0.328 |
| Probable | 9.225 | 0.034 | 0.317 |
| Total (Proved + Probable) | 20.625 | 0.031 | 0.645 |
Notes:
1. The Mineral Reserves were originally prepared, classified and reported according to SAMREC, 2016. For the purposes of this TRS, the Mineral Reserves have been classified in accordance with § 229.1302(d)(1)(iii)(A) (Item 1302(d)(1)(iii)(A) of Regulation S-K). The Qualified Person responsible for the estimate is Mr RF Gaelejwe, who is the Kalgold Ore Reserve Manager, and a Harmony employee.
2. Tonnes, grade, and gold content are declared as net delivered to the mills.
3. Figures are fully inclusive of all mining dilutions, gold losses and are reported as mill delivered tonnes and head grades. Metallurgical recovery factors have not been applied to the reserve figures.
4. Gold content is delivered gold content after taking into consideration the modifying factors.
5. Mineral Reserves are reported using a cut-off grade of 0.58g/t determined using a gold price of USD1,772/oz gold.
6. Rounding as required by reporting guidelines may result in apparent summation differences.
Capital and Operating Cost Estimates
The capital and operating cost estimates for Kalgold are based on actual historical data, as well as budget forecasts. Therefore, the forecast costs are reliable, and at minimum meet the confidence levels of a Feasibility Study.
The capital cost estimates for Kalgold are determined using the business plan as a basis. The capital cost elements can be mostly attributed to vehicle replacements, pumping and water control mechanisms, and slope stability monitoring. The capital and operating costs are reported in ZAR terms and on a real basis.
The capital cost estimates are shown in Table 1-3.
The operating cost estimates for Kalgold are categorised into direct and total costs. A summary of the Kalgold operating cost estimate is shown in the Table 1-4. All inclusive unit operating costs starts at R890/t year one and gradually decreases in the last years of life of mine to R393/t in financial year 2036, inline with mining completion and low grade stockpile feeding at the end of life.
The above operating unit costs are as per approved business plan submitted to the board for financial year 2024.
Permitting Requirements
Kalgold has the following valid permits and does not require any additional permits to continue with their mining operations. Environmental Management Programme (Amendment) authorisation was granted by DMRE on March 8, 2022, allowing the expansion of the current mining footprint within the approved Mining Right area.
Kalgold’s valid environmental permits are summarised in Table 1-5.
At the effective date, Harmony was still awaiting the approval of the new Prospecting right application lodged on January 31, 2024. to secure the area where the section 102 application was refused by DMRE in 2021. The Prospecting Rights will be an extension to the current Mining Right which will be converted to a mining right as soon as the resource has been confirmed.
Effective Date: June 30, 2024
4
Technical Report Summary for
Kalgold Mine, North West Province, South Africa
Conclusions
Kalgold Mine, a 100% owned Harmony asset, is well-established and has been operating successfully for over 25 years. The mine is accessible within national and provincial roads, with secure infrastructure. Management has a good handle on aspects pertaining to legal and environmental matters with respect to operating within the South African mining law, as regulated by the MPRDA, and supporting legislation.
Kalgold hosts a distinct gold bearing Mineral Resource. The interpretation of the regional geological setting, mineralisation and orebody deposit is well understood and provides valuable insight to the gold mining operations. The mining methods of the Mineral Reserves is of sound design and has evolved over the history of the operations. The current preferred, modular open pit mining method based on the satellite orebodies, has progressively improved, with a significant focus on increased safety, grade control and pit slope stability monitoring. The gold recovery is well monitored through continuous benchmarking initiatives against the mineral processing plants’ historical data.
Harmony is in possession of robust contracts, with the gold price showing upside potential. The economics for Kalgold Mine display positive discounted NPV result of ZAR1 150 million, based on detailed operating and capital costs. The valuation of the asset is proven to be most sensitive to the gold price. The assumptions and conclusions in this TRS contain the views of the QP and does not contain any known material risks at the time of compilation.
Kalgold did not incur any fines or penalties for non-compliance during the year ended June 30, 2024 and no significant encumbrances exist.
Recommendations
The current geological model is well understood. The Mineral Resource model in use, as updated in January 2024, is drilled to a standard suitable for robust estimation. However, a significant amount of additional definition drilling would be required to increase more Mineral Resources to a Measured category, as the small high grade ore lenses that fit inside the current drill spacing, would be better defined. To this end, further exploration drilling is required to expand on the current Mineral Resource and Mineral Reserve base.
Table 1-3: Summary of the Mineral Reserve Capital Cost Estimate for Kalgold
| | | | | |
| Capital Cost Element (ZAR'000s) | Total Mineral Reserve (FY2025- FY2036) |
| Shaft | 73 488 |
| MCC | 37 336 |
| Total | 110 824 |
Table 1-4: Summary of Operating Cost Estimates for Kalgold
| | | | | |
| Operating Cost Element (ZAR'000) | Total Mineral Reserve
(FY2025- FY2036) |
| Wages - payroll 1 | 529 708 |
| Wages - payroll 2 | 44 653 |
| Stores and materials | 1 785 063 |
| Electric power and water | 24 604 |
| Outside contractors | 5 643 911 |
| Other | 447 854 |
| Direct Costs | 8 475 793 |
| Refining charge | 105 031 |
| Assay cost | 57 302 |
| Plant treatment cost | 6 120 199 |
| Re-allocated costs | 6 282 532 |
| Mine overheads re-allocated | (260 591) |
| Total | 14 738 367 |
Effective Date: June 30, 2024
5
Technical Report Summary for
Kalgold Mine, North West Province, South Africa
Table 1-5: Status of Environmental Permits and Licences
| | | | | | | | | | | | | | |
| Permit / Licence | Reference No. | Issued By | Date Granted | Validity |
| Environmental Management Programme (Amendment) | NW30/5/1/2/2/77MR | DMR | March 8, 2022 | LOM |
| Environmental Authorisation | (NW) 30/5/1/2/3/2/1/77 EM | DMR | October 4, 2022 | LOM |
| Water Use Licence | 07/D41B/ABCGIJ/4754 | DWS | February 22, 2021 | 15 Years |
| Certificate of Registration Inflammable Liquids and Substances | FS/FLM 01/06/02/2023 | Ngaka Modiri Molema District Municipality | June 6, 2024 | 12 Months |
| Protected Trees Permit | 01-12-2020/24NW | DFFE | December 2, 2020 | December 2, 2025 |
| Atmospheric Emission Licence | NWPG/KALGOLDAEL 4.1,4.13 & 4.17/OCT2023 | DEDECT | October 4, 2023 | September 1, 2024 |
| | | | |
| | | | |
| | | | |
| | | | |
| | | | |
Notes: DMRE - Department of Mineral Resources and Energy, DEDECT - Development of Economic Development, Environment, Conservation and Tourism, DWS -Department of Water and Sanitation
Effective Date: June 30, 2024
6
Technical Report Summary for
Kalgold Mine, North West Province, South Africa
2Introduction
Section 229.601(b)(96)(iii)(B)(2) (i-v)
This TRS on Kalgold has been prepared for the registrant, Harmony. The TRS has been prepared in accordance with Regulation S-K 1300. It has been prepared to meet the requirements of Section 229.601(b)96 - Technical Report Summary. The purpose of this TRS is to provide open and transparent disclosure of all material, exploration activities, geological model, mine planning inputs, Mineral Resource and Mineral Reserve information to enable the investor to understand the Kalgold Mine, which forms part of Harmony’s activities.
The TRS was prepared with inputs from Technical Specialists employed by Kalgold or Harmony at Corporate Office. Those based at corporate office, visit the operation on ad hoc basis and they participate in the business planning process reviews.
The TRS was prepared by a QP employed on a full-time basis by the registrant. The QP’s qualifications, areas of responsibility / contribution and personal inspections of the property are summarised in Table 2 1.
Table 2-1: List of Responsible and Contributing Authors
| | | | | | | | | | | | | | |
| Qualified Person | Prof. Assoc. | Qualifications | TRS Section Responsibility | Personal Insp. |
| Mr RF Gaelejwe | SACNASP (400207/14) | BSc. Hons (Geol), PgDip, EMBA | All | Full time |
| | | | |
The QP states that this TRS updates the TRS filed by Harmony on Kalgold on October 31, 2023, named Exhibit 96.6 Technical Report Summary of the Mineral Resources and Mineral Reserves for Kalgold Mine, North West Province, South Africa, which was effective on June 30, 2023. This updated TRS has an effective date of June 30, 2024, and no material changes occurred between the effective date and the final date of this report.
3Property Description
Section 229.601(b)(96)(iii)(B)(3) (i-vii)
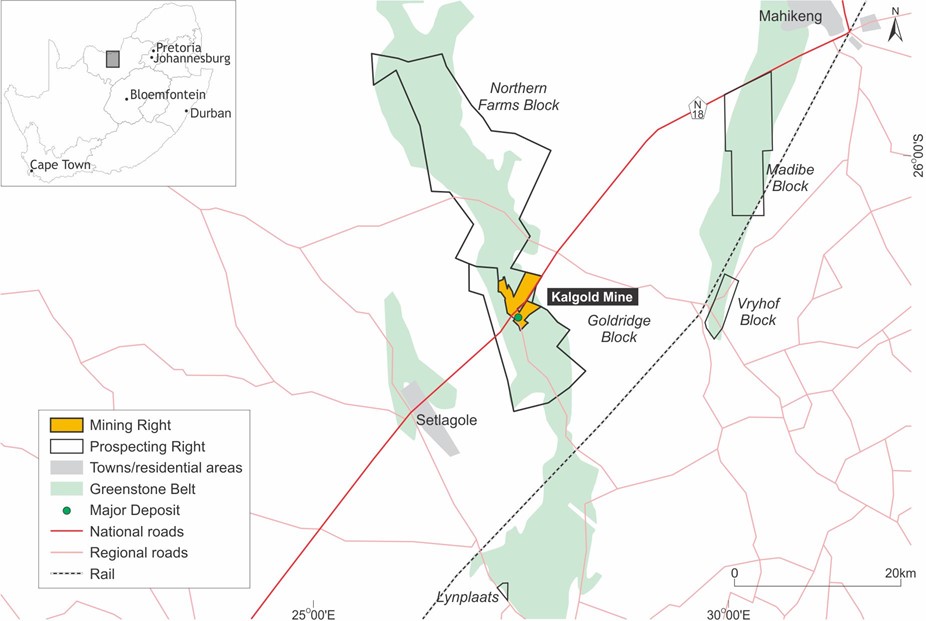
Kalgold is located at latitude 26°10.0’S and longitude 25°14.5’E, 55km southwest of Mahikeng, between Mahikeng and Stella, along the Mahikeng-Vryburg road (N18) in North West Province, South Africa (Figure 3-1). The Kalgold Mine is serviced by well-maintained sealed roads with good access to all nearby towns and cities. The mine is surrounded by farmland and the closest community is at Kraaipan, approximately 15km to the south of the mine. The Kalgold Mine has been in operation since 1997 and is the only significant mining operation in the region.
3.1Mineral Tenure
South African Mining Law is regulated by the MPRDA which is the predominant piece of legislation dealing with acquisitions or rights to conduct reconnaissance, prospecting, and mining. There are several other pieces of legislation which deal with such ancillary issues such as royalties (MPRDA), title registration (Mining Titles Registration Act, 1967), and health and safety (Mine Health and Safety Act, 1996).
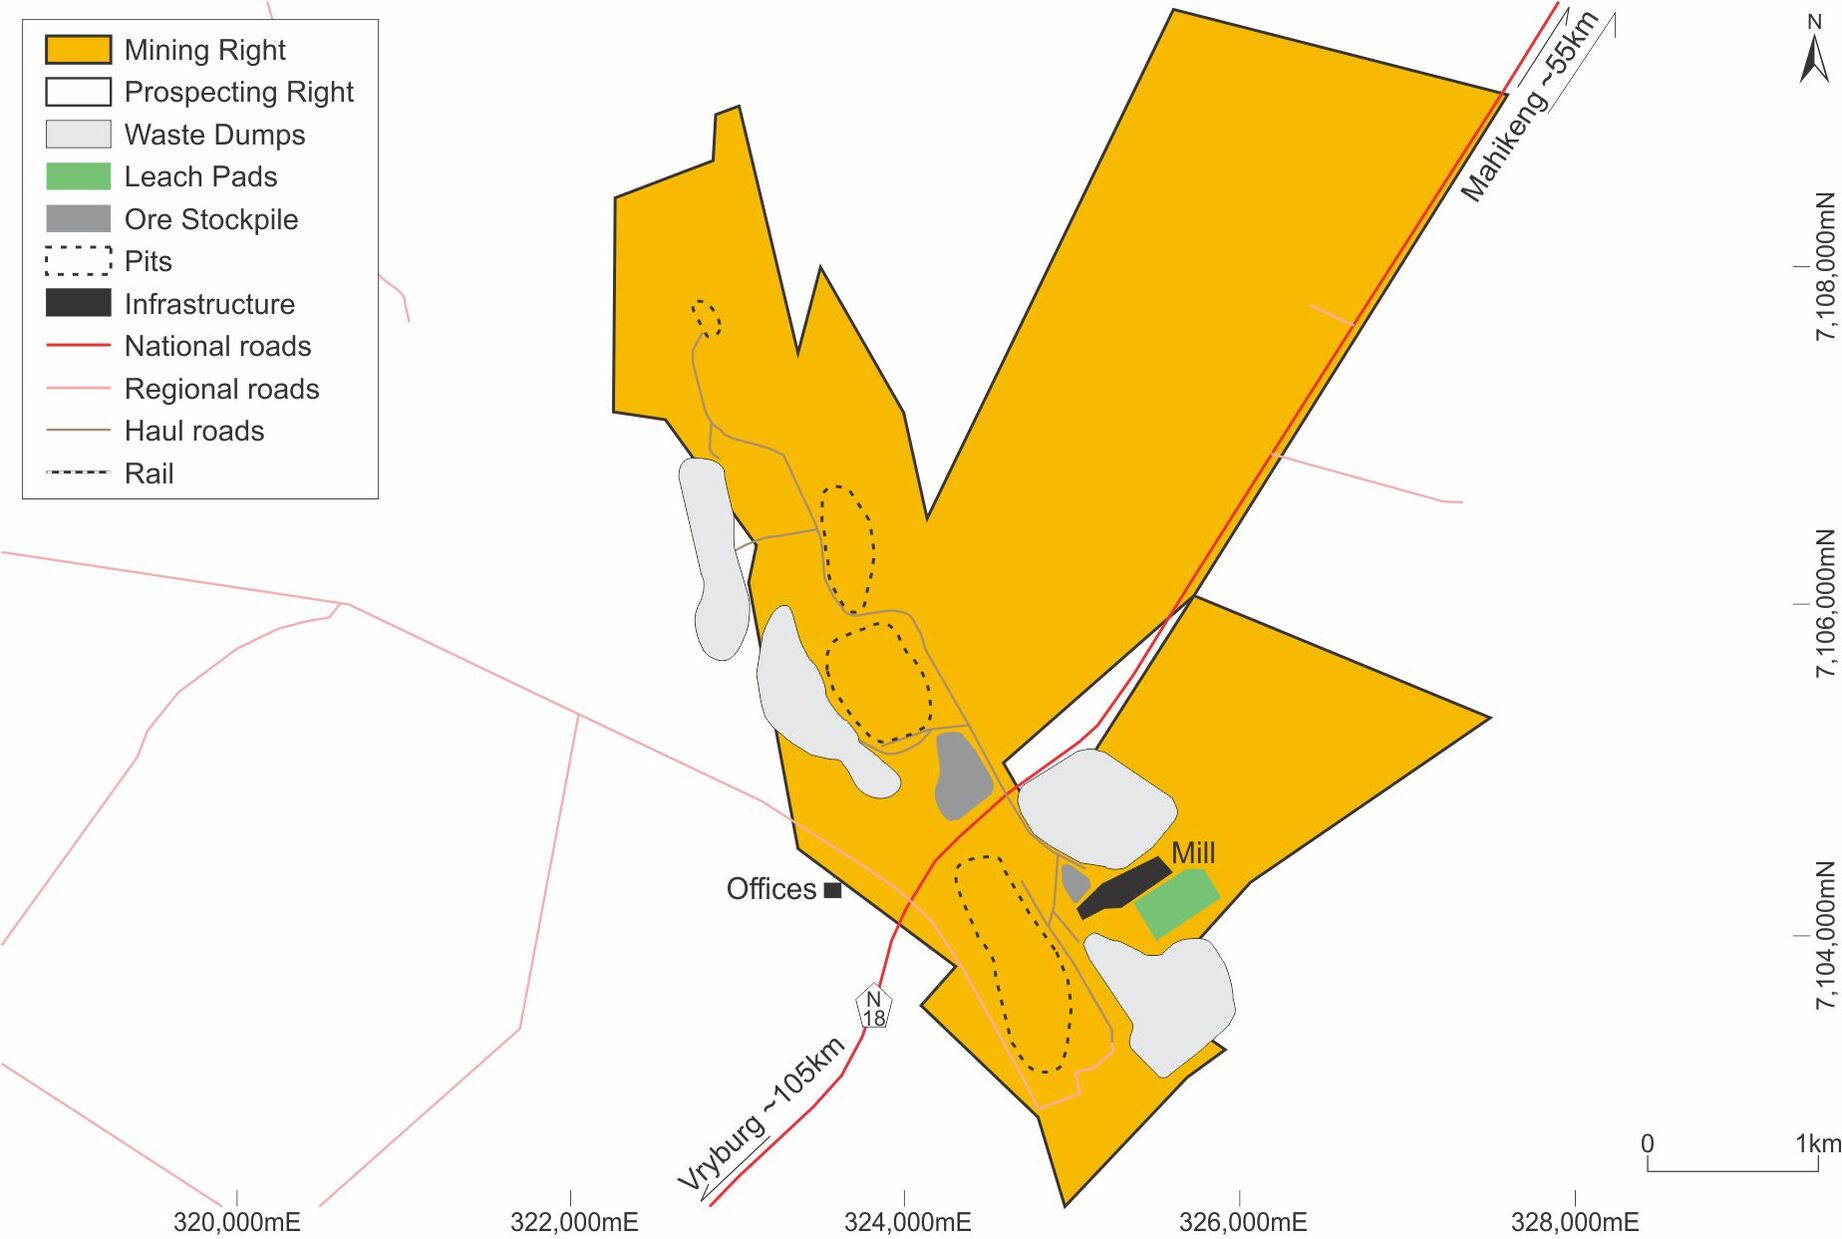
The Kalgold Mining Right, which encompassed 615ha, was successfully converted, executed, and registered as a New Order Mining Right on 24 February 2015 as MR12/2015 under Mining Right Protocol 574/2008. A Section 102, in terms of the MPRDA, to include portions of the farms Goldridge 632 IO and Ferndale 544 IO was executed on 9 November 2010 under Mining Right Protocol 774/2010.
The Mining Right now encompasses 988.23ha (Figure 3-2, Table 3-1). The mining right was issued for a period of 30 years, expiring on 27 August 2038, and Kalgold has the exclusive right to renew the right for a further 30 years. The Kalgold mineral rights are held by Harmony (Table 3-1, Figure 3-2). Under the MPRDA, Harmony is entitled to apply to renew the mining right on its expiry. At the effective date, Harmony was still awaiting the approval of the new Prospecting right application lodged on January 31, 2024 to secure the area where the section 102 application was refused by DMRE in 2021. The Prospecting Rights will be an extension to the current Mining Right which will be converted to a mining right as soon as the resource has been confirmed.
Figure 3-1 depicts the prospecting right boundaries of the renewed application refused by DMRE in 2021.
Table 3-1: Summary of Mineral Rights for Kalgold
Effective Date: June 30, 2024
7
Technical Report Summary for
Kalgold Mine, North West Province, South Africa
| | | | | | | | | | | | | | | | | |
| Licence Holder | Licence Type | Reference No. | Effective Date | Expiry Date | Area (ha) |
| Kalahari Goldridge Mining Company Ltd | MR | NW30/5/1/2/2/77 MR | 26-Aug-08 | 27-Aug-38 | 988.23 |
| PR | NW30/5/1/1/2/14264 PR | PR application lodged 31 January 2024 | 16 254.10 |
| | | | | |
| | | | | |
| | | | | |
| | | | | |
| | | | | |
Notes: MR - Mining Right, PR - Prospecting Right
There is no material litigation (including violations or fines) against the Company which threatens its mineral rights, tenure, or operations.
3.2Property Permitting Requirements
Kalgold is located on a site that has been operational for over 40 years. The surface rights in the Kalgold area were previously held by Shamrock Mining and Prospecting Company (“Shamrock”), a wholly owned exploration and development subsidiary of Shell Limited (“Shell”). Harmony has access to all the properties it requires to conduct its current mining activities. The surface lease and surface right areas are sufficient in size and nature to accommodate the required surface infrastructure to facilitate current and planned mining and processing operations. There are no land claims or other legal proceedings that may have an influence on the rights to mine the minerals.
Harmony monitors complaints and litigation against the Company as part of its risk management systems, policies, and procedures. There is no material litigation (including violations or fines) against the Company as at the date of this report which threatens its property permitting. The QP is also not aware of any land claims pending on the property.
Figure 3-1: Location of Kalgold
Effective Date: June 30, 2024
8
Technical Report Summary for
Kalgold Mine, North West Province, South Africa
Figure 3-2: Mineral Tenure of Kalgold
Effective Date: June 30, 2024
9
Technical Report Summary for
Kalgold Mine, North West Province, South Africa
4Accessibility, Climate, Local Resources, Infrastructure and Physiography
Section 229.601(b)(96)(iii)(B)(4) (i-iv)
4.1Accessibility
Kalgold is located adjacent to the N18 National Road and can be reached via the local R49 road between Mahikeng and Vryburg (Figure 3-1). The mine is surrounded by farmland. The closest community is at Kraaipan, approximately 15km to the south of the mine. Access to the mine is restricted by security fencing, security guards, booms, and lockable gates at the main entrance. In addition, a communication system and access control system monitors personnel entering and leaving the mine property.
4.2Physiology and Climate
Kalgold is situated approximately 1,250 metres above sea level (“masl”) on the south eastern edge of the Kalahari Desert. The topography around the area is generally flat to low undulating country with outcrops rare and commonly confined to low ridges and hillocks. Much of the mine area is covered in bright orange-red Kalahari sands which progressively get deeper to the north and south of the operation. A significant paleo-channel cuts the mine site to the south and another to the north of the operation.
The area comprising farmlands are devoted to cereal production and cattle farming. However, there are belts of natural vegetation present which are considered part of the Savannah Biome and forms part of the Semi-arid Bushveld. The vegetation comprises Kalahari Thornveld and shrub Bushveld which is dominated by grasses and open forest comprising trees from the genus Acacia.
The climate is in a region that is considered as sub-tropical steppe climate, synonymous to a sub-tropical desert which is hot and dry. The winters are characterised as cool to mild, experiencing a daily mean temperature of approximately 16°C and the summers are characterised as hot and humid, experiencing a daily mean temperature of approximately 31°C. The average annual rainfall for the area is approximately 100mm - 550mm, the majority of which falls during the months of November to February. The months of May through to September rarely sees rain. The average annual precipitation for the area is approximately 37mm. The wettest month experienced is February (~80mm). Rain occurs during only 17.2% of the year, while no rainfall is received for 82.8% of the year. However, the Kraaipan area can experience rare occurrences of heavy rainfall which can result in a brief stoppage of the open pit mining activities. There are no other specific climatic risks which affect the property.
4.3Local Resources and Infrastructure
Infrastructure in the region is well established. Kalgold Mine is serviced locally by well-maintained sealed roads with good access to all nearby towns and cities. Regional infrastructure also includes power transmission and distribution and communication networks. Schools, clinics and hospitals are readily available in the surrounding areas. The mine personnel are typically sourced from local communities e.g., Ratlou local municipality, in which they reside.
Operations are powered by electricity from Eskom Holdings State Owned Company (“SOC”) Limited.
Ore and waste material are transported separately, with ore being trucked from the pit to the plant ROM pad, and waste rock going to the mines waste dumps. Marginal and low-grade ore is transported by truck and stockpiled for future processing. Kalgold has its own processing plant situated adjacent to the mine.
Mining consumables, such as processing reagents, diesel, etc, are sourced from neighbouring provinces through the procurement system managed from Corporate Office located in Randfontein, Gauteng province.
Effective Date: June 30, 2024
10
Technical Report Summary for
Kalgold Mine, North West Province, South Africa
5History
Section 229.601(b)(96)(iii)(B)(5) (i-ii)
5.1Historical Ownership and Development
Kalgold was previously known as Shamrock, formed in 1982 as a wholly owned exploration and development subsidiary of Shell.
Exploration of the Kraaipan Greenstone belt by Shell, began in the 1980s. In 1994, West Rand Consolidated Mines (“WRCM”) acquired Shamrock. The company changed its name to Kalgold in May 1996 and was listed on the Johannesburg Stock Exchange on 14 October 1996, via an issue of 18.4% of the shares of the company, as a dividend in specie, to shareholders of WRCM.
Harmony acquired 100% of Kalgold in July 1999. The historical ownership and associated activities related to Kalgold are summarised in Table 5-1.
Table 5-1: Summary of Historical Ownership Changes and Activities of Kalgold
| | | | | |
| Year | Asset History Highlights |
| 1982 | Formed by Shamrock, a wholly owned exploration and development subsidiary of Shell. |
| 1987 - 1994 | Shell conducted extensive exploration work in the Kraaipan region. In 1991, the D Zone one area was discovered on the Goldridge farm. |
| 1994 | Shamrock was acquired by West Rand Consolidated Exploration Limited, a subsidiary of WRCM. |
| 1994 - 1996 | WRCM intensified exploration work. Mining commences in the D-Zone, in December 1995. |
| Jan-96 | Construction of the crushing plant and phase 1 of the metallurgical extraction plant, consisting of the heap leach and gold recovery section, began. |
| May-96 | WRCM changed its name to Kalahari Goldridge Mining Company Limited (“Kalgold”). |
| Jul-96 | Planned mine infrastructure activities are completed and the first gold is produced. |
| Oct-96 | Kalgold listed on the Johannesburg Stock Exchange (JSE), via an issue of 18.4% of the shares of the company as a dividend in specie to shareholders of WRCM. |
| Dec-96 | The D-Zone open pit was exposed to a maximum depth of 25m below surface. The plant ore processing capabilities averaged at approximately 70ktpm. 174kg of gold was produced from approximately 345kt of low-grade and near-surface heap leach ore. |
| Mar-97 | Mills are installed and the plant ore processing capabilities was increased to an average of approximately 90ktpm. |
| May-97 | Construction commenced on the second phase of the processing facility which included an 80ktpm carbon-in-leach (“CIL”) plant and associated Tailings Storage Facility (“TSF”). |
| Jan-98 | The second phase of the construction was fully commissioned. The throughput in the heap leach facility was reduced. |
| Jul-99 | Harmony acquires Kalgold. |
| 2003 | A third mill was added to increase treatment capacity. |
| 2012 | A Mineral Resource model was constructed by ExplorMine Consultants. |
| 2017 - 2019 | Exploration drilling supported improvements in significantly expanding the understanding of the deposit, upgraded the Windmill and A Zone south extension (Henry) pit Mineral Resources, and provided insightful data to the areas between the A-Zone and Watertank Zone (current mining), known as the Bridge Zone. |
| 2018 | A new Mineral Resource model was generated by the Harmony South East Asia team. The model included the updated drilling database based on the exploration drilling, and an updated geological and oxide model based on new drilling information. |
| 2019 | The Mineral Resource model was updated by the Harmony South East Asia team. The model included the updated drilling database based on additional exploration drilling and updated implicitly geological and oxide models. |
| 2022 - 2024 | Harmony team updated the Mineral Resource model yearly using Datamine. The model included the updated drilling database based on additional exploration drilling and geological limb models. |
Effective Date: June 30, 2024
11
Technical Report Summary for
Kalgold Mine, North West Province, South Africa
5.2Historical Exploration
Historical technical investigations which led to the discovery of the Kalgold deposit include detailed geological mapping, soils sampling, geotechnical sampling and geophysical surveys, followed by drilling and metallurgical testwork. A total of 212,395m of exploration and evaluation drilling was completed within the area and on surrounding properties in the periods 1987 to 2023. Historical drilling completed by previous owners is summarised in Table 5-2 and includes air core (“AC”), percussion, reverse circulation (“RC”) and diamond core (“DD”) drilling. Much of the deeper historic drilling has been focused on the D Zone Pit which has been mined out.
Table 5-2: Summary of Historical Drilling at Kalgold
| | | | | | | | | | | | | | | | | | | | | | | |
| Year | Company | No. Drill Holes | Drill Hole ID | Diamond Drill Hole (m) | Percussion Drill Hole (m) | AC or RC (m) | Assay Lab |
| N/A | Various | 2 805 | ARC Series, CRC series, GDP Series, DD series, ADD Series, SDD Series, SPD Series, WDD | 18 167 | 71 820 | 21 240 | N/A |
| 1990 | Shell | 11 | GDP1-GDP11 | — | 300 | 352 | N/A |
| 1991 | Shell | 43 | GDP12-GDP76 DD1-DD5 | 933 | 1 514 | 845 | N/A |
| 1992 | Shell | 6 | GDP253-GDP259 | — | 150 | — | N/A |
| 1993 | Shell | 3 | GDP331-GDP333 | — | — | 183 | - |
| 1995 | WRCM | 18 | GDP377-GDP404 DD18-DD21 | 487 | 101 | 175 | N/A |
| 1996 | Kalgold | 1 | GDP415 | — | — | 77 | N/A |
| 1997 | Kalgold | 63 | GDP440-GD600 | — | 1 783 | 5 870 | N/A |
| 1998 | Kalgold | 1 | GDP589 | — | — | 528 | N/A |
| 1999 | Harmony | 46 | GDP602-GD647 | 588 | 879 | 5 132 | N/A |
| 2000 | Harmony | 1 | WB98 | — | — | 150 | N/A |
| 2001 | Harmony | 17 | GDP648-GDP664 | — | — | 1 853 | N/A |
| 2002 | Harmony | 37 | GDP668-GDP707 | 8 200 | — | 234 | N/A |
| 2003 | Harmony | 6 | GDP710-GDP716 | 1 150 | — | 295 | N/A |
| 2017 | Harmony | 34 | KG001-KG037 | 4 935 | 3 934 | — | SGS |
| 2018 | Harmony | 97 | KG029 - KG126 | 25 194 | 4 952 | — | SGS |
| 2019 | Harmony | 81 | KG127 KG204 | 3 173 | 7 370 | — | SGS |
| 2022 | Harmony | 142 | KG205-KG344 | 101 | 16 135 | — | SGS |
| 2023 | Harmony | 35 | KG345-KG380 | — | 3 595 | — | SGS |
| Total | 3 447 | | 62 928 | 112 533 | 36 934 | |
Notes: Lab - Laboratory
5.3Previous Mineral Resource and Mineral Reserve Estimates
The previous Mineral Resource estimate for Kalgold was reported by Harmony on June 30, 2023 in accordance with Regulation S-K 1300; 229.601(b)(96). The Mineral Resource estimates are updated annually by Harmony, incorporating the latest exploration drilling information. The previous Mineral Resource estimate exclusive of Mineral Reserves is presented in Table 5-3. The inferred portion of the Mineral Resource includes the historical Surface tailings of 6 263Kg (0,201Moz).
Effective Date: June 30, 2024
12
Technical Report Summary for
Kalgold Mine, North West Province, South Africa
Table 5-3: Summary of the Previous Kalgold Mineral Resources as at June 30, 2023 (exclusive of Mineral Reserves)
| | | | | | | | | | | |
| METRIC |
| Mineral Resource Category | Tonnes (Mt) | Gold Grade (g/t) | Gold Content (kg) |
| Measured | 3.474 | 1.05 | 3 634 |
| Indicated | 31.832 | 1.20 | 38 187 |
| Total / Ave. Measured + Indicated | 35.306 | 1.18 | 41 821 |
| Inferred | 25.448 | 0.34 | 8 648 |
| IMPERIAL |
| Mineral Resource Category | Tons (Mt) | Gold Grade (oz/t) | Gold Content (Moz) |
| Measured | 3.830 | 0.031 | 0.117 |
| Indicated | 35.089 | 0.035 | 1.228 |
| Total / Ave. Measured + Indicated | 38.918 | 0.035 | 1.345 |
| Inferred | 28.052 | 0.010 | 0.278 |
The previous Mineral Reserve estimate for Kalgold was declared by Harmony on June 30, 2023 in accordance with the SAMREC Code. Modifying Factors were considered and applied to the Mineral Resource to arrive at the Mineral Reserve estimate. These factors included the cut-off grade, the mine call factor (“MCF”), dilution, and the plant recovery factor. The previous Mineral Reserve estimate is summarised in Table 5-4 and has been superseded by the current estimate prepared by Harmony as detailed in Section 11 of this TRS.
Table 5-4: Summary of the Previous Kalgold Mineral Reserves as at June 30, 2023
| | | | | | | | | | | |
| METRIC |
| Mineral Reserve Category | Tonnes (Mt) | Gold Grade (g/t) | Gold Content (kg) |
| Proved | 5.384 | 0.93 | 4 991 |
| Probable | 8.529 | 0.85 | 7 217 |
| Total / Ave. Proven + Probable | 13.913 | 0.88 | 12 208 |
| IMPERIAL |
| Mineral Reserve Category | Tons (Mt) | Gold Grade (oz/t) | Gold Content (Moz) |
| Proved | 5.935 | 0.027 | 0.160 |
| Probable | 9.401 | 0.025 | 0.232 |
| Total / Ave. Proven + Probable | 15.336 | 0.026 | 0.392 |
5.4Past Production
The opening up of the D Zone pit commenced in December 1995. By December 1996, ~2.1Mt of overburden waste material had been moved, to gain access to the D-Zone orebody and approximately 345kt of low-grade and near-surface heap leach ore was treated. Plant construction activities started at the Kalgold site in January 1996, with the crushing plant and Phase 1 of the metallurgical extraction plant. By 30 July 1996, when the first gold was poured, the mine infrastructure was complete.
Ore was treated by heap leaching until the installation of the first two mills in 1997. The mill rate built up to more than 90ktpm by the end of the first quarter of 1997. In May 1997 construction work commenced on the second phase of the processing facility which included an 80ktpm CIL plant and associated tailings disposal facility. In 1998, when the mill and CIL plant were fully commissioned, throughput in the heap leach facility was reduced to 50ktpm. In 2003, a third mill was added to increase treatment capacity. The D Zone pit was mined out in 2009.
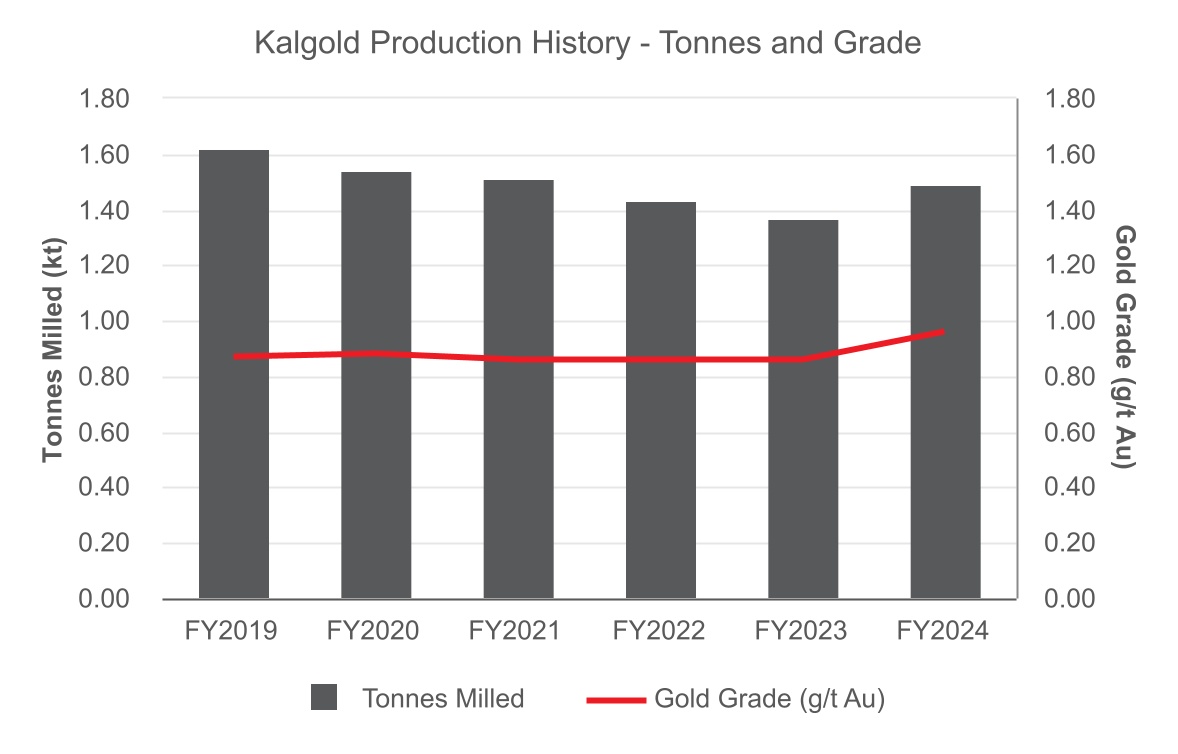
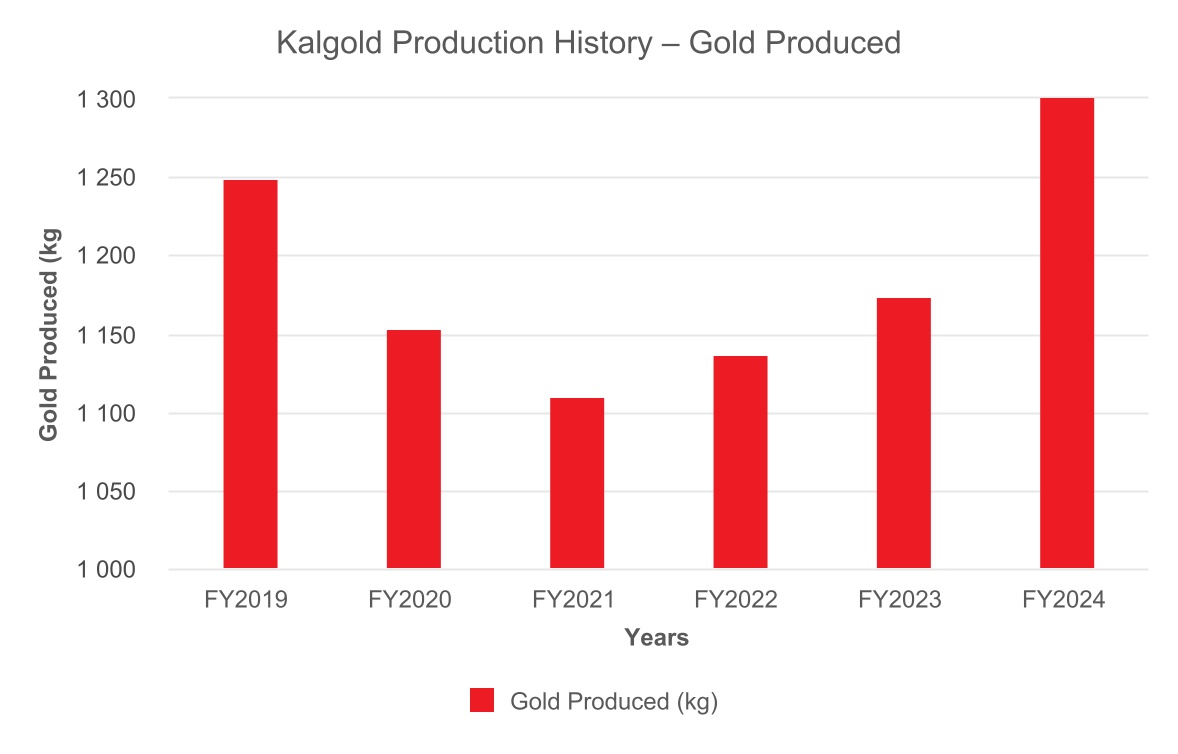
Past production for Kalgold is presented in Figure 5-1 and Figure 5-2. The production numbers are reported on a 12 month Harmony Financial year calendar starting July ending June.
Effective Date: June 30, 2024
13
Technical Report Summary for
Kalgold Mine, North West Province, South Africa
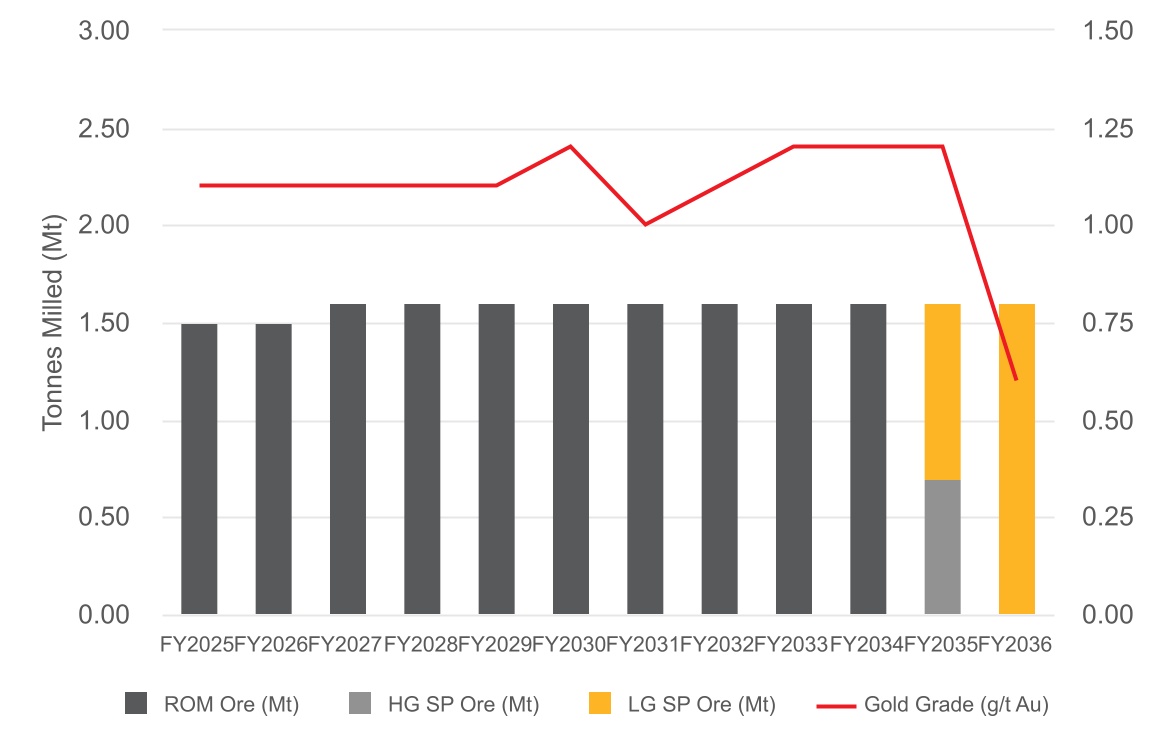
Figure 5-1: Graph of Kalgold Production History – Tonnes and Grade
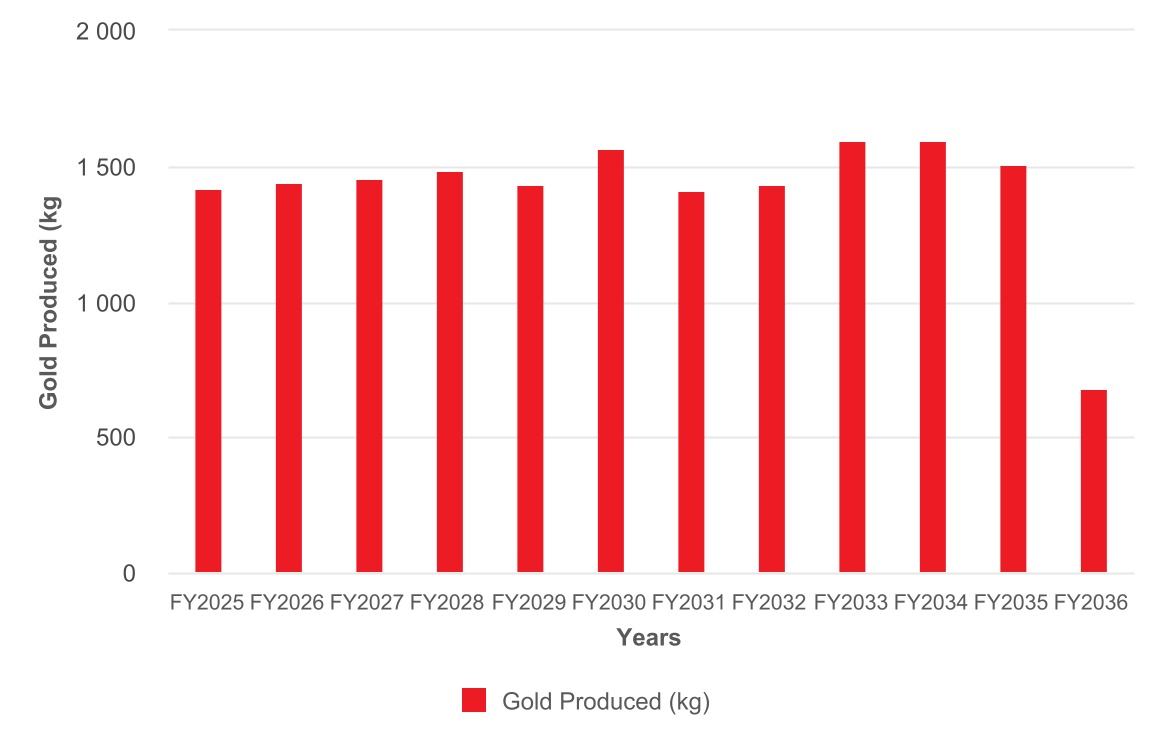
Figure 5-2: Graph of Kalgold Production History – Gold Produced
Effective Date: June 30, 2024
14
Technical Report Summary for
Kalgold Mine, North West Province, South Africa
6Geological Setting, Mineralisation and Deposit
Section 229.601(b)(96)(iii)(B)(6) (i-iii)
6.1Regional Geology
The Kaapvaal Craton of southern Africa hosts many of the region's economic mineral deposits. The craton has been subdivided into four sectors, namely the Eastern, Central, Northern and Western Terranes. The Western Terrane hosts the KGB, Amalia, and Madibe greenstone belts, and their southerly extensions. It is also host to the Gaborone Granite Complex to the north, which intrudes the Archaean granite-greenstone basement in south-eastern Botswana (Poujol et. al, 2002).
The Kalgold deposit is located within the KGB. The KGB has received significantly less geological attention when compared to the Murchison and Barberton greenstone belts, situated in the Northern and Eastern Terranes, respectively (Hammond and Moore, 2006). Investigations conducted in the region indicated that the KGB extends approximately 250km, in a north-south direction, from southern Botswana into South Africa (Hammond and Moore, 2006) (Figure 6-1). In the north, the KGB is subdivided into three narrow, sub-parallel north-to northwest-trending belts, spaced at 30km - 40km intervals, namely the western (Stella), central (Kraaipan) and eastern (Madibeng) belts.
The KGB, consisting of metamorphosed mafic volcanic rocks and interlayered metasediments (mainly gold-hosting BIFs, jaspilite’s and ferruginous chert), are exposed as discontinuous outcrops of steeply dipping units beneath cover sequences comprising mainly late Archean volcanic rocks of the Ventersdorp Supergroup and a blanket of Tertiary-to-Recent Kalahari sands. A variety of granitoid rocks (ranging from tonalitic and trondhjemitic gneisses through to granodiorite – monzonite) intruded the KGB. This age relationship was based upon whole-rock lead dating of the BIFs which yielded an age of 3,410Ma (±61Ma – 64Ma).
The lack of exposure has made mapping of the KGB difficult. However, subdivisions of the Kraaipan Group have been proposed for the region on the basis BIFs and chert exposures (SAC, 1980). The Kraaipan Group consists of three formations, namely the Khunwana, Ferndale and Gold Ridge formations. The Gold Ridge Formation is the oldest of the three and contains gold hosting BIFs (Anon, 2017).
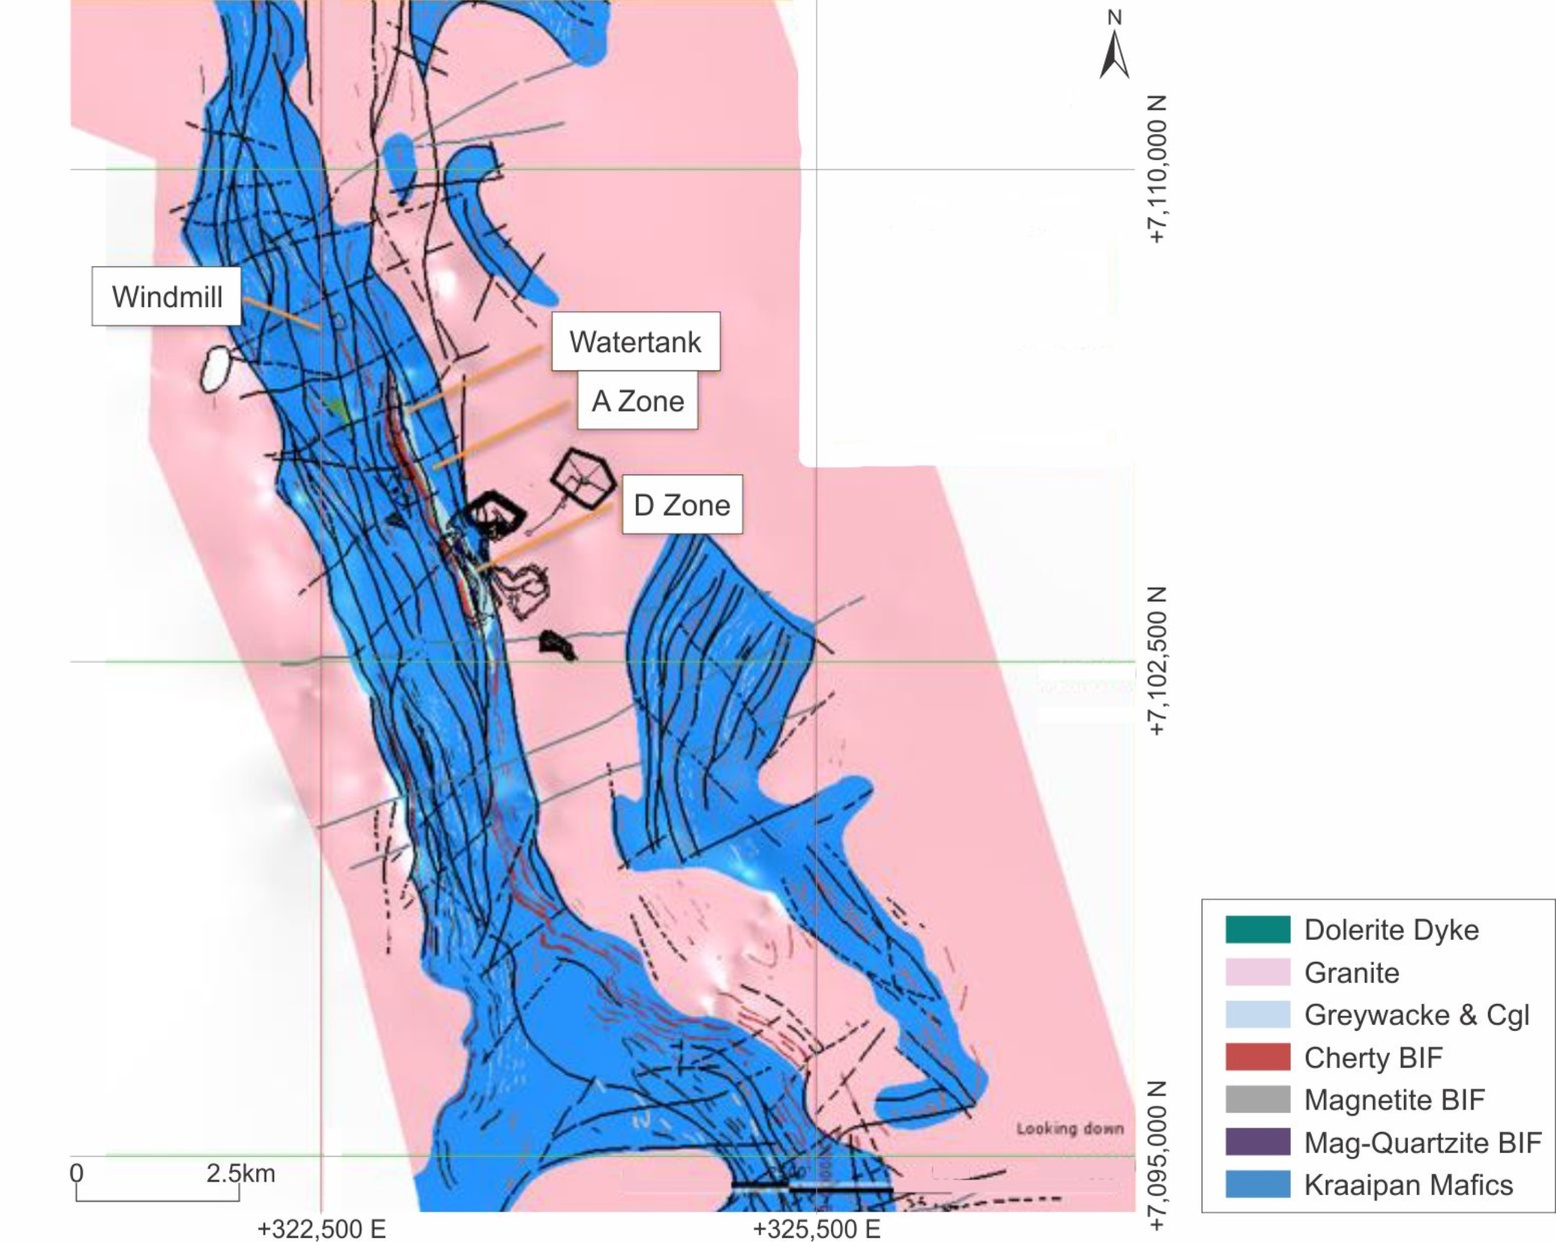
6.2Local Geology
The Kalgold deposit occurs within the central (Kraaipan) belt (Figure 6-1), which comprises steeply dipping gold-hosting BIFs interbedded with magnetite quartzite, chert, greywacke, shale, and schist (Figure 6-2). BIFs are rhythmically banded chemical sediments comprising alternating light and dark laminae, which vary from 10mm - 50mm in thickness (Hilliard, 1996). The assemblage is surrounded by intrusive granites and gneisses. These rocks have a complex history of deformation, which includes folding, thrusting, faulting, and shearing. Several large dykes with a predominant east-west trend have intruded the rocks.
6.3Property Geology
The geology of the Mining Right area and its immediate vicinity is characterized by ferruginous chemical and clastic sediments interbedded with meta-lavas and non-ferruginous metasedimentary rocks. Outcrops in the area are sparse and generally restricted to the ferruginous rock types which are more resistant to erosion. The Kalahari Sand cover ranges from 2m - 12m thick. Magnetite quartzite and clastic sediments form a low ridge to the west of the lease area. Eastwards of this unit the iron-rich rocks generally comprise chemical sediments represented by magnetite-rich BIF, cherty BIF, and banded chert. These units are interbedded with mafic schist, greywacke, and sparse black shale (Mathe and Hilliard, 1998).
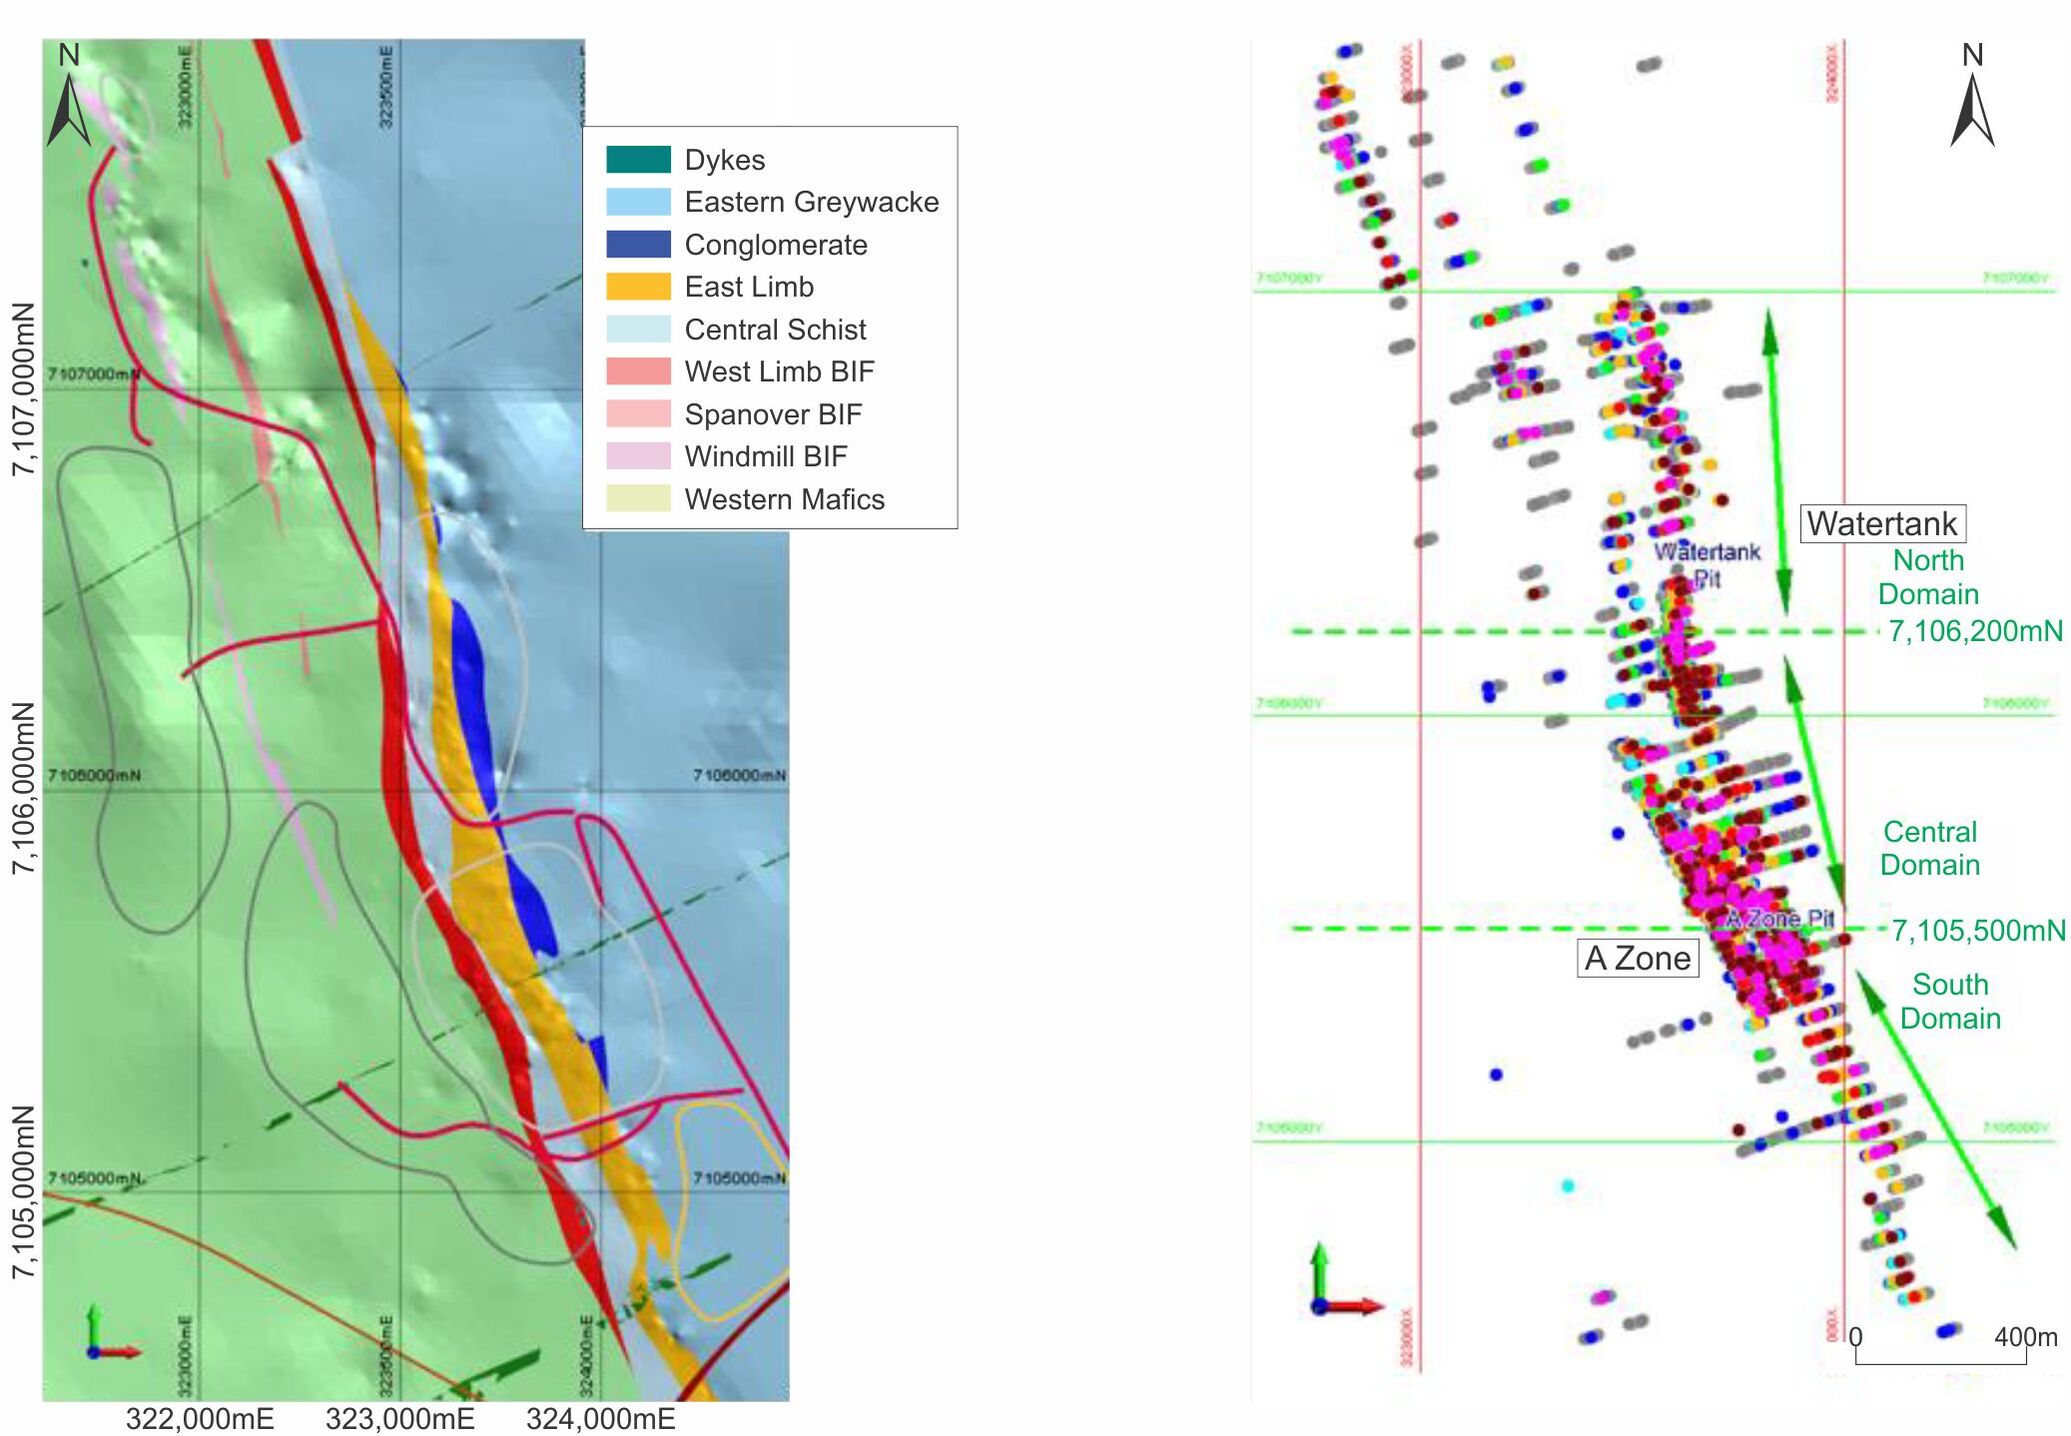
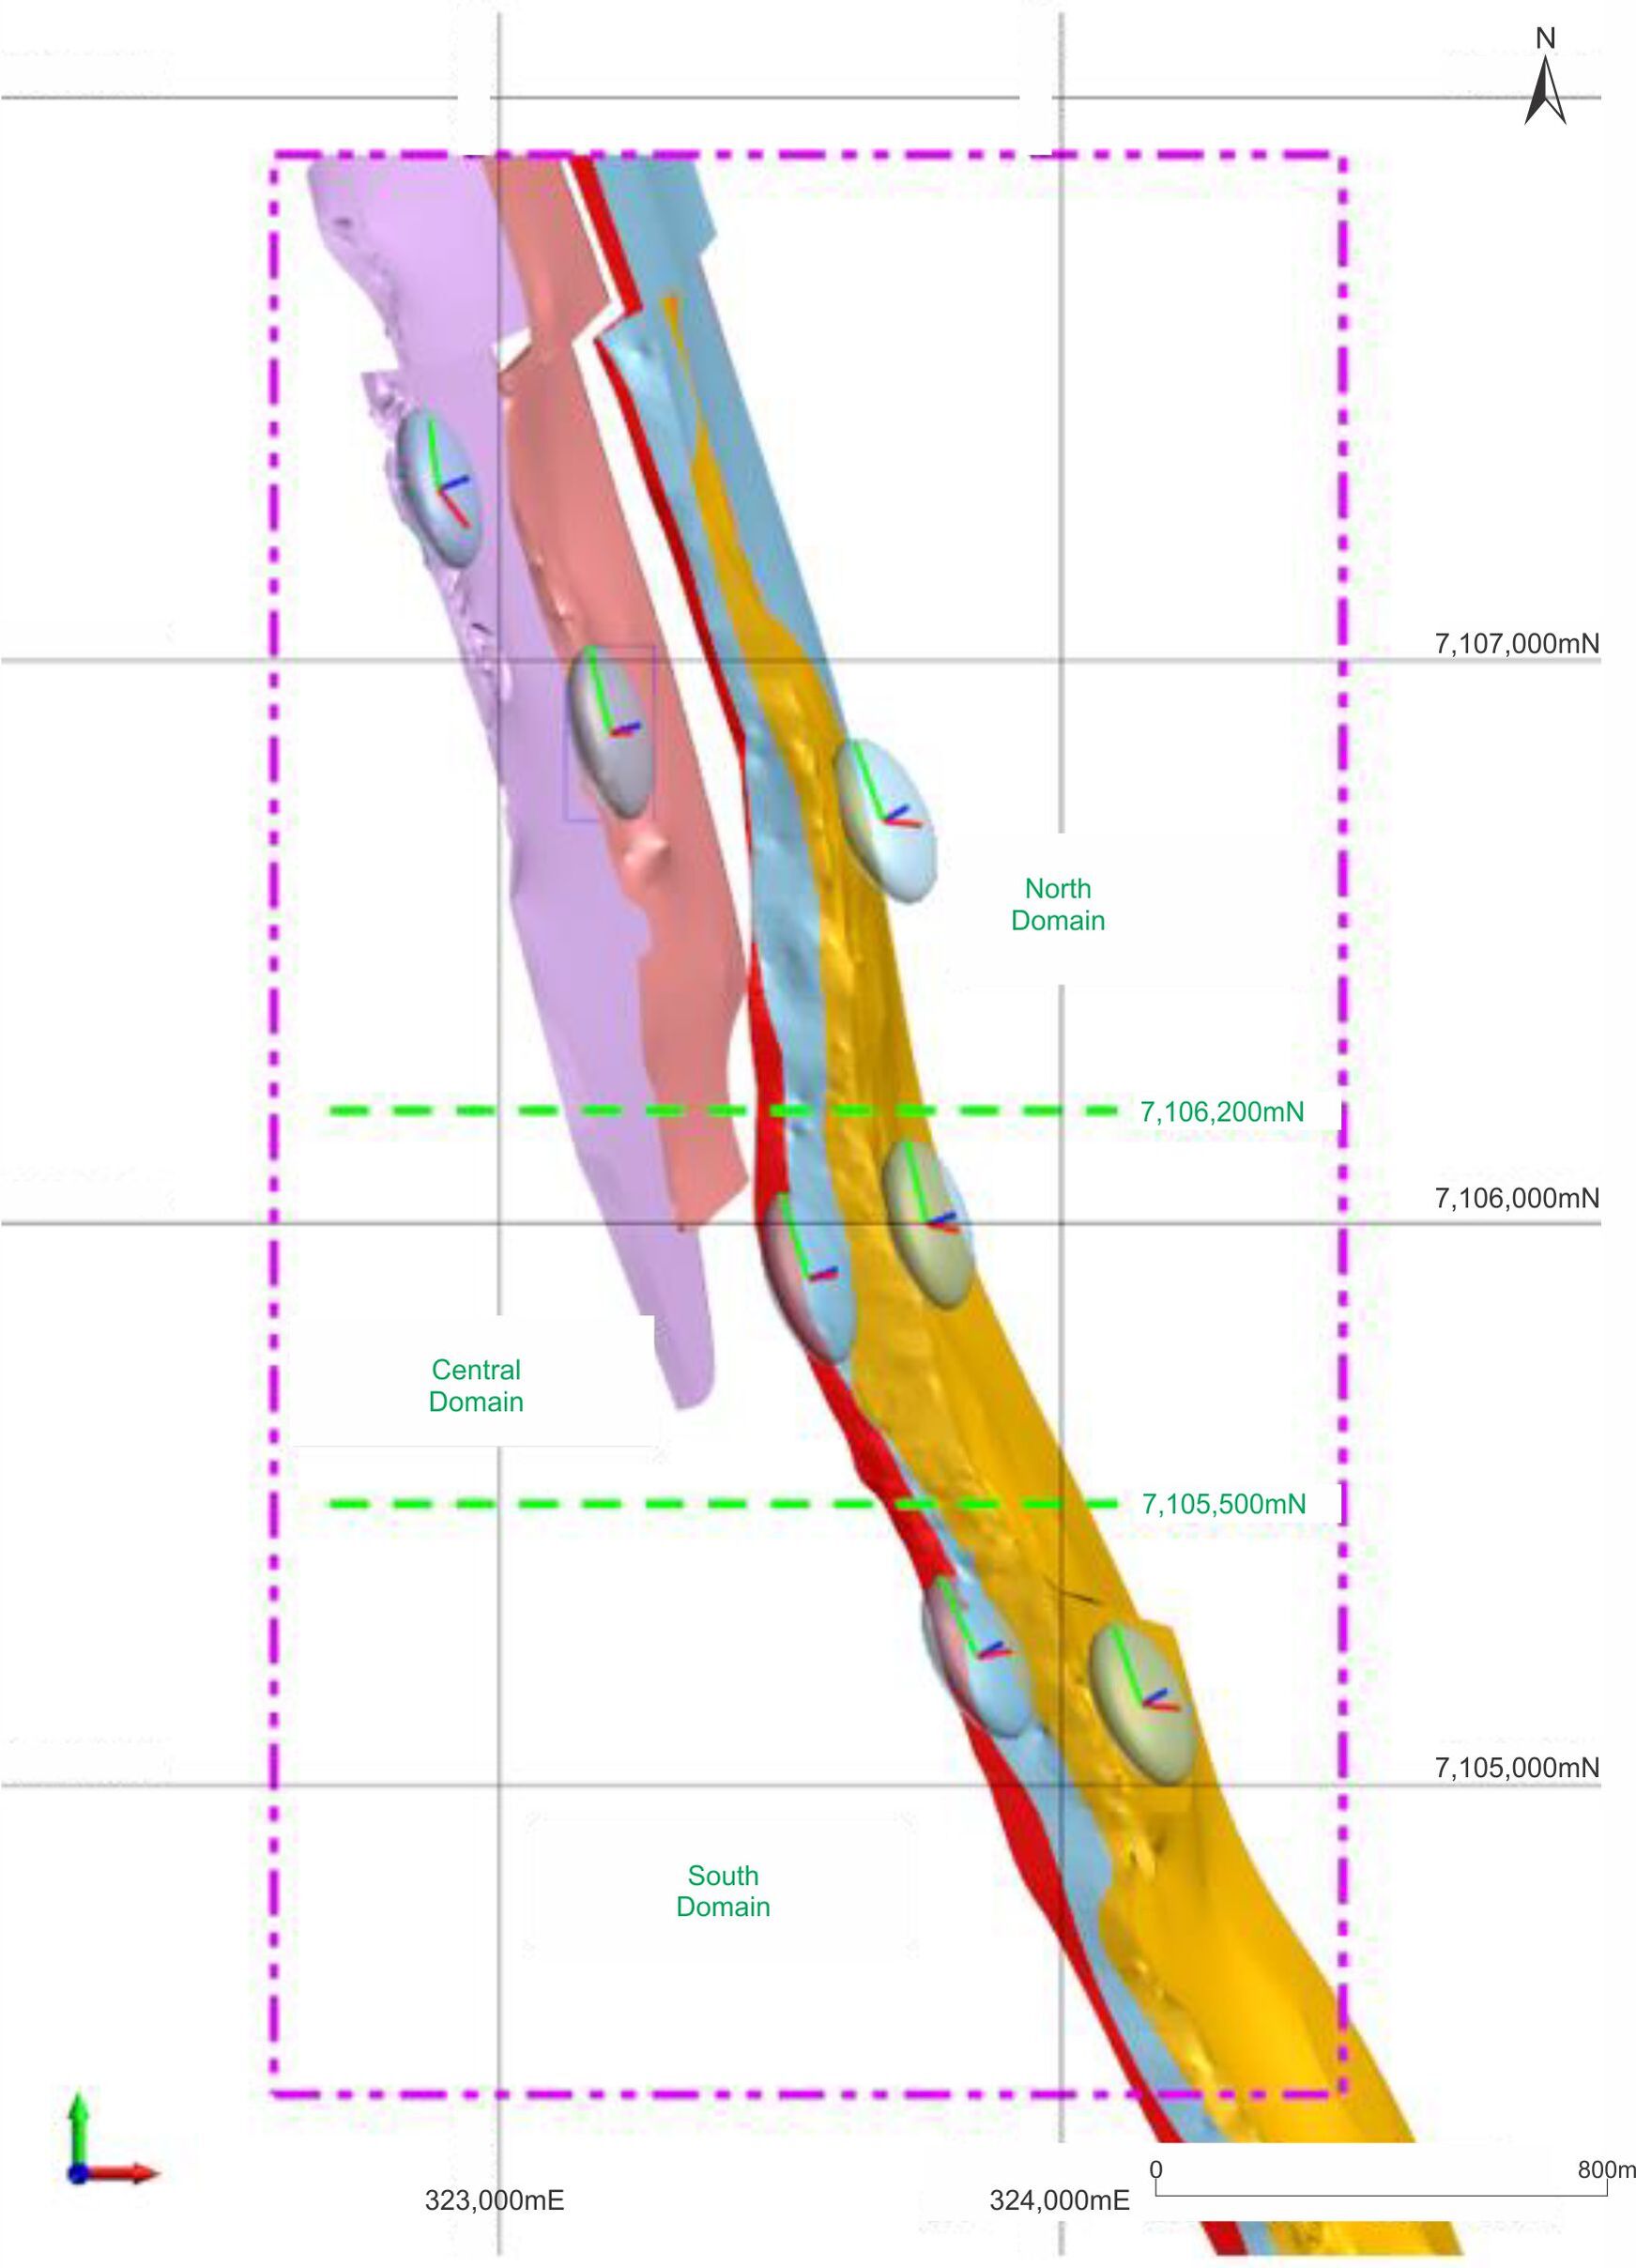
Kalgold comprises five discrete mineralised zones, namely D Zone, A Zone, Watertank, Windmill and A Zone south extension (Henry) (Figure 6-3), which are all hosted in BIF. Watertank pit can be split into Watertank Main and North. Watertank North refers to the Northern extension of the pit. The Spanover Zone occurs closer to the Windmill zones. The geology of the D Zone is used as a benchmark at Kalgold. The previous mining activities have provided extensive geological information of the deposit. Pits are now well established in the A Zone and Watertank areas. However, the geology does not vary significantly from that found at D Zone. Deposit thickness ranges up to 45m, and the main line of lode containing the D Zone, A Zone and Watertank Zone extends over 4.5km of strike.
Effective Date: June 30, 2024
15
Technical Report Summary for
Kalgold Mine, North West Province, South Africa
Figure 6-1: Regional Geology of the Kraaipan Greenstone Belt
Effective Date: June 30, 2024
16
Technical Report Summary for
Kalgold Mine, North West Province, South Africa
Figure 6-2: Local Geology of Kalgold
Figure 6-3: Property Geology of Kalgold
Effective Date: June 30, 2024
17
Technical Report Summary for
Kalgold Mine, North West Province, South Africa
The D Zone is hosted by a sheared, cherty-BIF with associated silicification and carbonate alteration. The gold mineralisation occurs within blebs, veins, and disseminations of pyrite and pyrrhotite, which are oxidized, to goethite near the surface. This zone dips 70° east, and has a strike length of 1,500m, varying in width between 15m-45m. The footwall rocks predominantly comprise chloritic schist with subordinate BIF and carbonaceous shale. Carbonaceous shale and greywacke are exposed in the hanging wall.
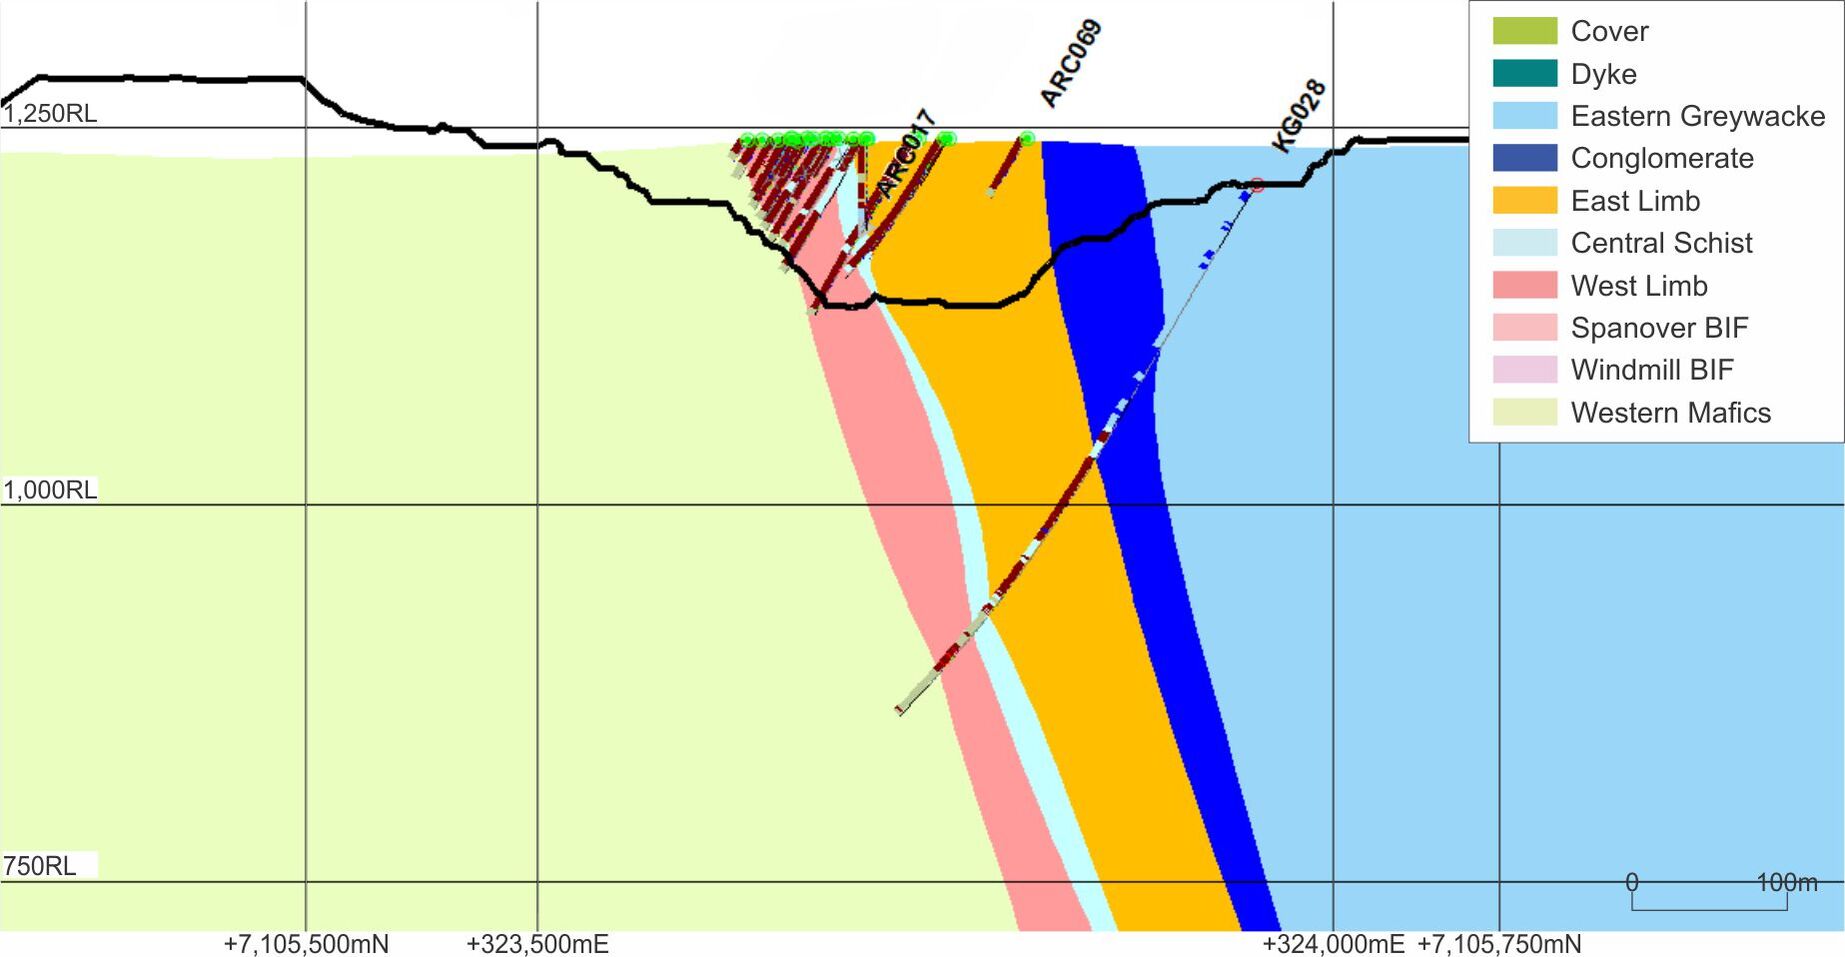
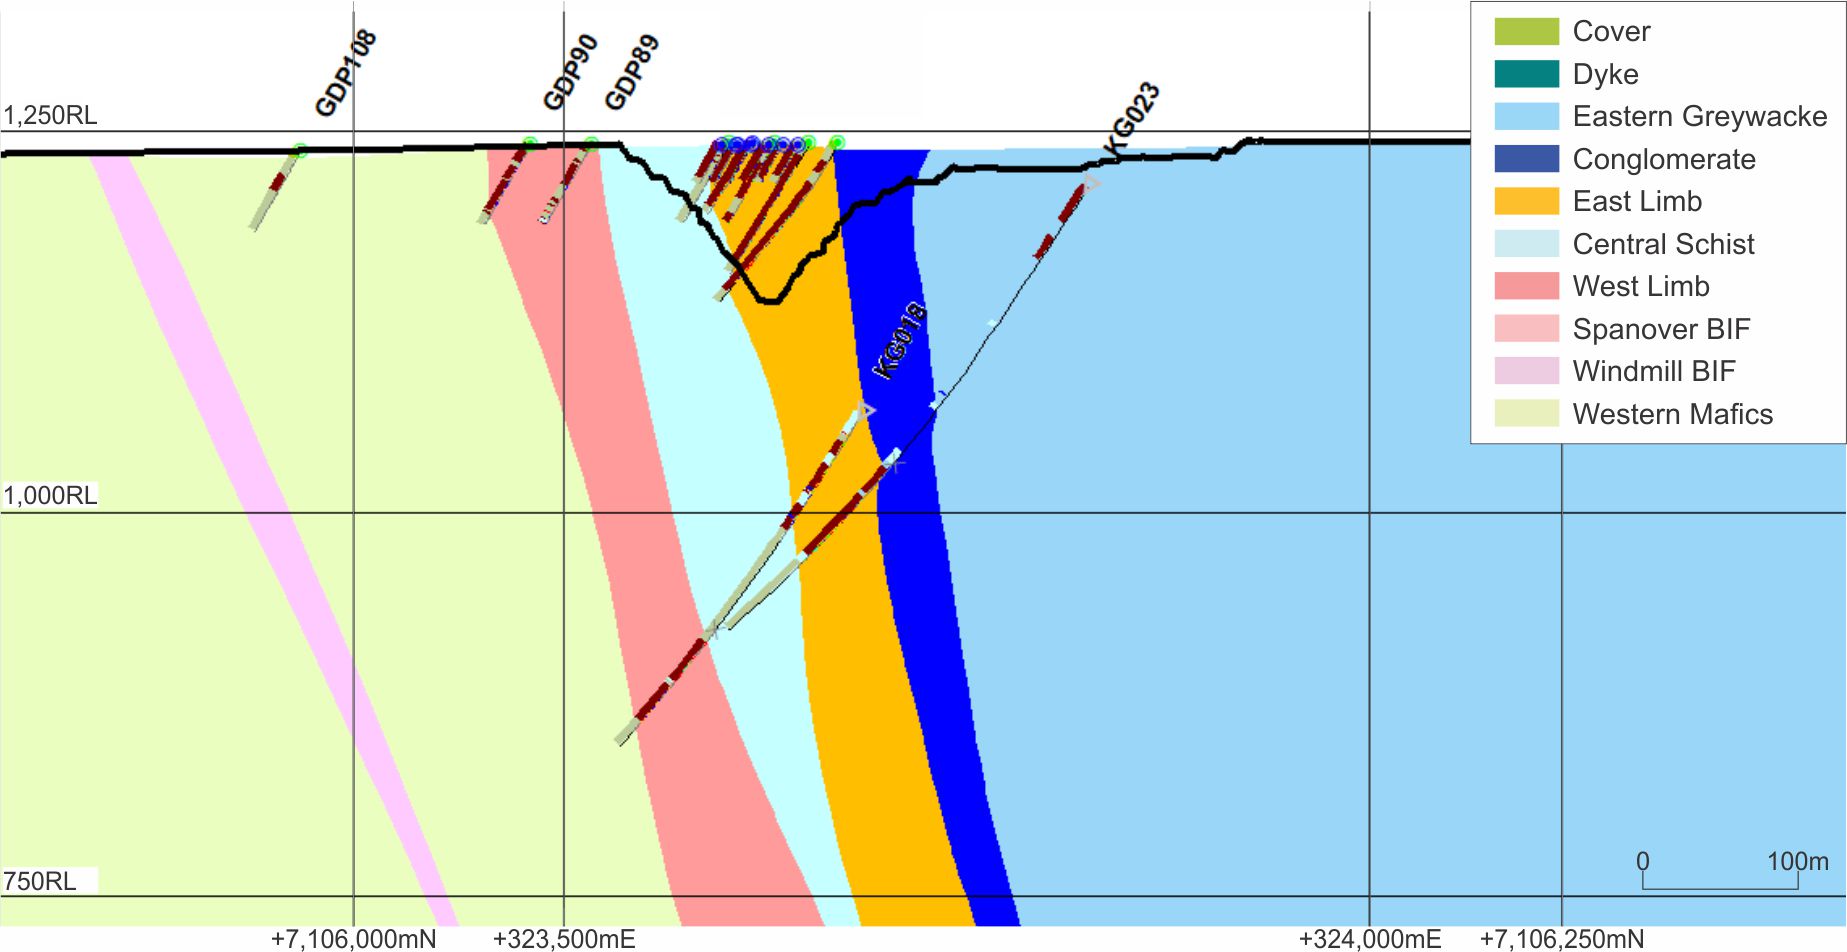
The A Zone occurs to the north of the D Zone at a similar stratigraphic position. It is a composite, consisting of several mineralised cherty BIF units that are interbedded with schist and shale and is referred to as the east limb in Figure 6-4. Due to shearing in the pillow basalts between the two BIF lenses, the central schist unit thins out and both west and east limbs are very close to each other in the A Zone pit. The A Zone has an overall strike length of 850m and comprises individual zones of mineralisation which are steeply dipping and have strike length that ranges from 200m - 500m. The width of these mineralised zones or mineralised limbs range between 15m - 70m.
A section through the A Zone from the June 2019 geological model (Figure 6-4) shows the east and west limbs. The east limb and west limb are separated by a zone of sericite-chlorite schist with intercalated shale and phyllite that pinches out to the north. The A Zone west limb is situated in the footwall of the A Zone, and is separated by a chloritic schist unit that pinches out to the north. The A Zone west limb has an overall strike length of 750m and width of 20m thinning to the north.
The geology associated to the Watertank pit is a long narrow more northerly striking, hoisted by cherty BIF and is in the northern extension to the A Zone east limb mineralised BIF. The host rock BIF is steeply dipping and has a strike length of 1,200m and an average width of 45m. The mineralised zones within this unit ranges from 2m - 12m in width. Recent drilling has shown an extension of this BIF to the north, where it has intersected significant intervals of mineralised BIF. This area has been termed the Watertank North. A section through the Watertank Zone from the 2019 geological model is presented in Figure 6-5.
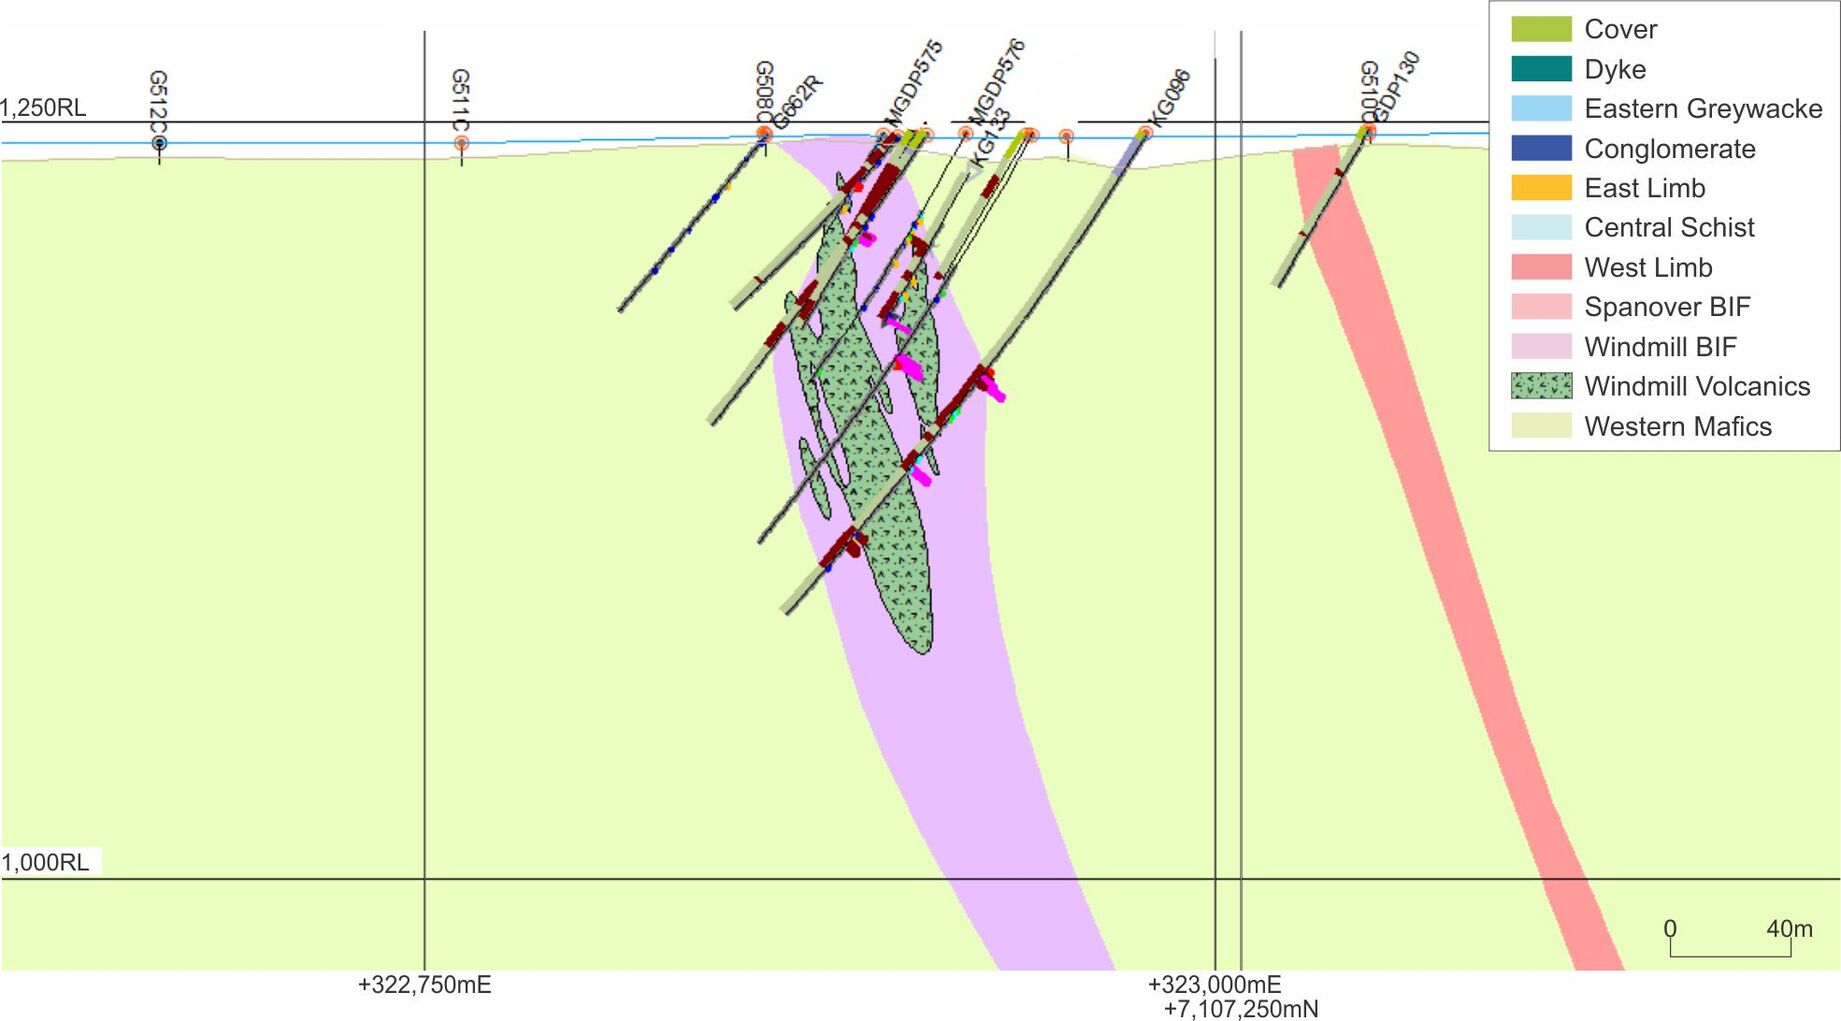
The Windmill Zone represented in Figure 6-6, is the smallest of the Kalgold zones but contains generally higher gold grades. It sits stratigraphically below the other three mineral zones and is hoisted by a magnetite-rich BIF unit with interbedded schist units. The host rock BIF has a strike length of 950m and thins to the north and south with a maximum width of 25m in the centre. Mineralisation within this zone occurs over a length of 800m with widths ranging from 2m - 17m and is structurally complex with displacements by faulting and dips varying from 75° - 90° east.
6.3.1Lithology
The lithological sequence at the Kalgold Mine area is grouped as follows:
•footwall mafic, including metabasaltic rocks and chlorite schist;
•package of interbedded shale and BIF; and
•hanging wall metasediments comprising a succession of metamorphosed chert, conglomerate, and greywacke.
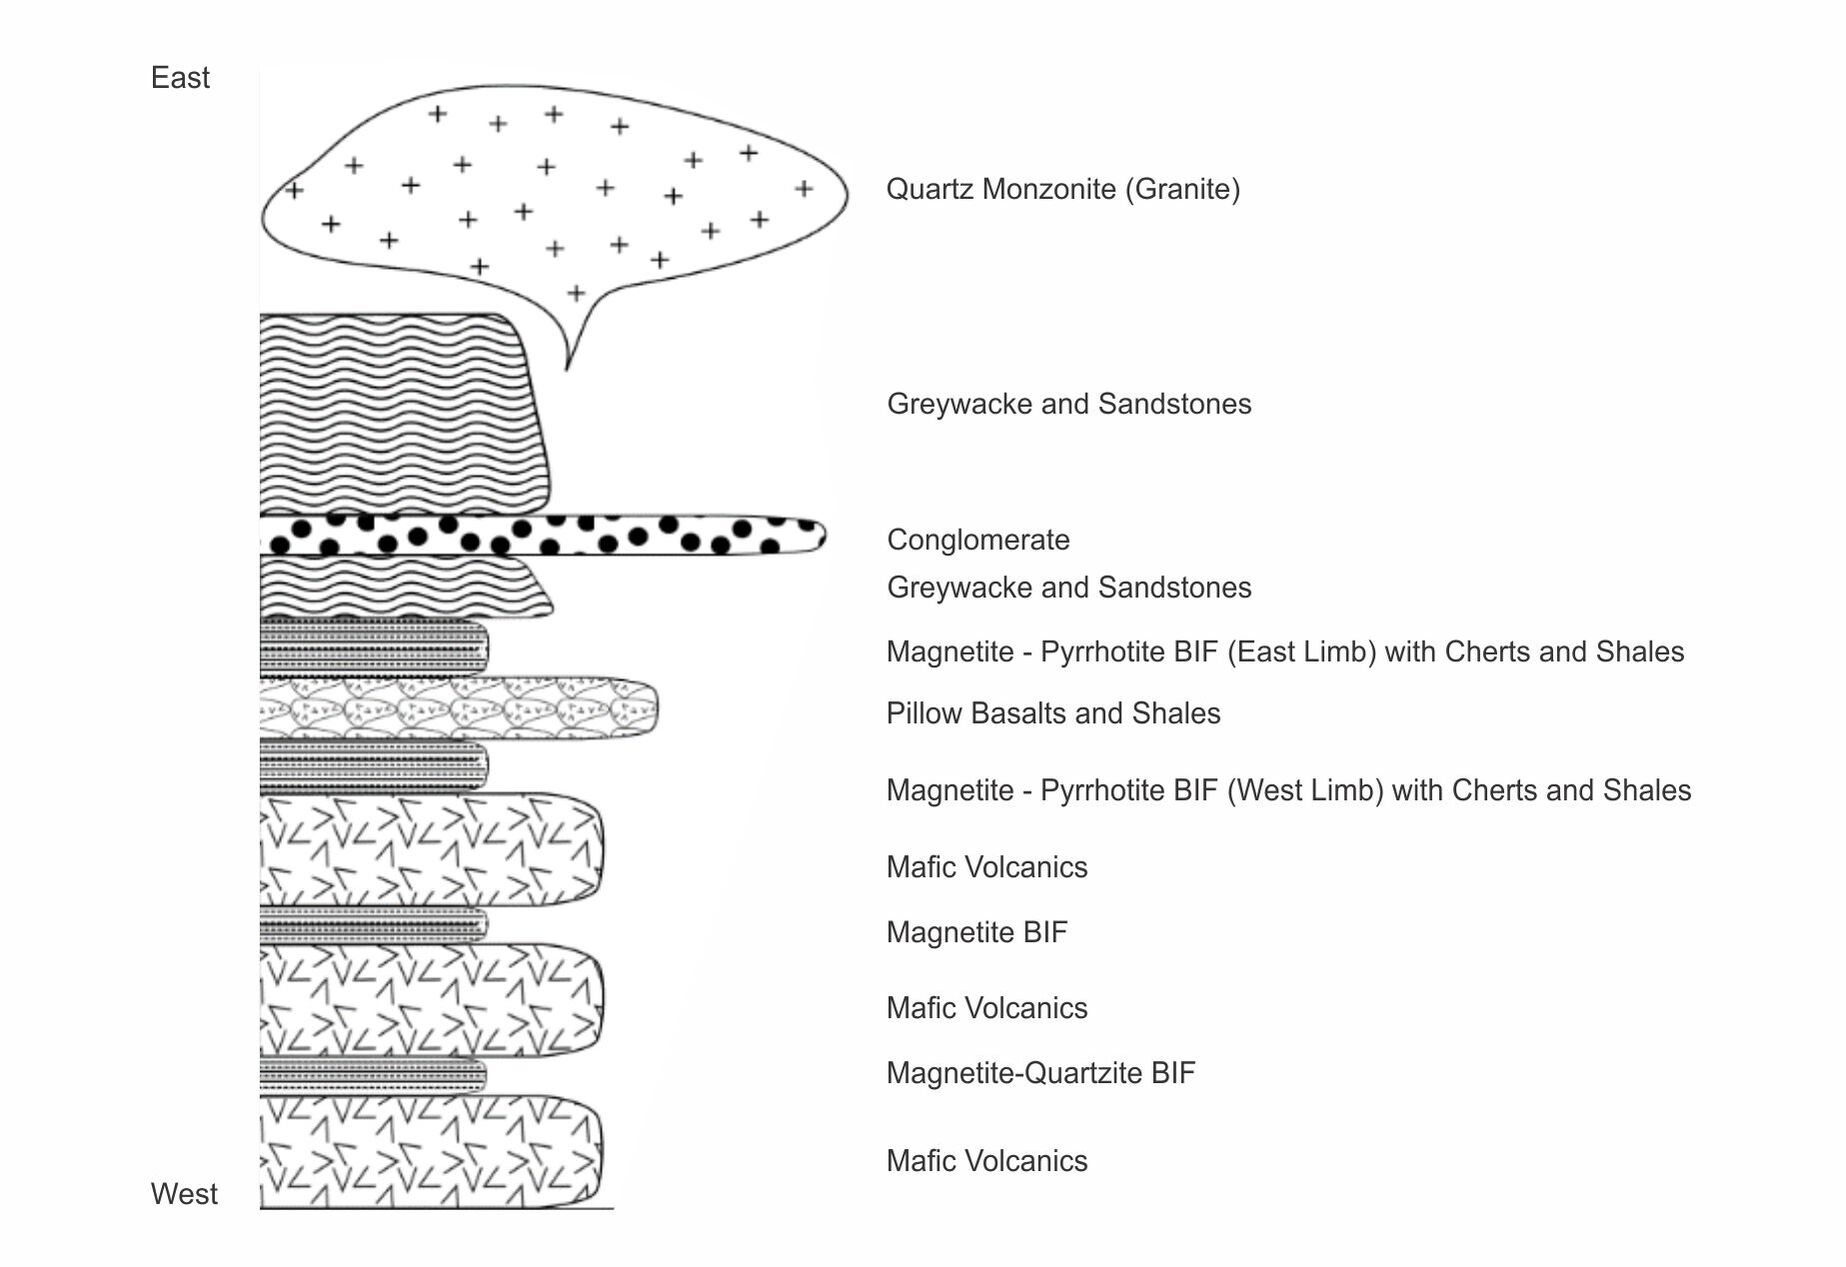
A schematic stratigraphic column of the immediate Kalgold Mine is presented in Figure 6-7 showing the thin BIF units spaced between a significant package of mafic volcanics, capped by the deep water greywacke units. The mafic volcanics show significant evidence of pillow basalts indicating these are possibly deep water volcanics, the BIFs being chemical sediments, all capped by nearer shore sedimentary package.
6.3.2Structure
The KGB within the Kalgold Mine region is strongly deformed with consistent uniform regional fabric striking ~340° and dipping 65° - 70° east (Hilliard, 1996; Wilson, 1996; Moore, 1999; Hammond and Moore, 2016). The earliest tectonic fabric developed in the area, is a bedding parallel foliation defined, aligned with phyllosilicate and carbonate grains (Hilliard, 1996; Hammond and Moore, 2006). This foliation is best developed in the footwall schists and phyllites but is also evident in the BIF units as a strong slaty cleavage.
Mineral lineations are defined by elongate quartz and sulphide grains, strained clasts in the conglomerates and rods in the BIF. They have an average plunge of 67° towards 108° (Hilliard, 1996; Hammond and Moore, 2006).
Effective Date: June 30, 2024
18
Technical Report Summary for
Kalgold Mine, North West Province, South Africa
Figure 6-4: Cross Section Through A Zone Pit
Figure 6-5: Cross Section Through Watertank Pit
Effective Date: June 30, 2024
19
Technical Report Summary for
Kalgold Mine, North West Province, South Africa
Figure 6-6: Cross Section Through the Windmill Pit
Figure 6-7: Schematic Kalgold Stratigraphy
Effective Date: June 30, 2024
20
Technical Report Summary for
Kalgold Mine, North West Province, South Africa
Small scale isoclinal folds are common in the schist and BIF, and have axial planes dipping 61° - 64°, subparallel to the foliation. The axes of the isoclinal folds are subparallel to the mineral lineations (Hammond and Moore, 2006). Large open folds extend along the entire length in the north-south direction, with subvertical axial planes and fold axes plunging steeply to the east (Hilliard, 1996; Hammond and Moore, 2006). These open folds appear to have a significant impact on the contacts of the BIFs.
Late northeast to east-northeast trending faults are present cutting across the stratigraphy with visible fault offsets of 10s - 100s of metres (Wilson, 1996). Many of the late northeast to east-northeast striking dolerite dykes follow these structures (Wilson, 1996). In many areas, the dykes show evidence of minor shearing and foliation development that indicate and pre-date the last ductile deformation event. The BIF displays centimetre-scale boudins in some mineralised sections that are defined by orthogonal fracturing of Fe-rich and siliceous bands commonly filled with quartz and carbonates (Hammond and Moore, 2006).
6.4Mineralisation
Gold mineralisation at Kalgold is BIF-hosted. The BIFs are oxidized to a depth of approximately 40m below surface. Near the surface the material is red and porous, composed of quartz, hematite, and goethite with minor magnetite. At depth the unaltered BIF consists of quartz, siderite, pyrite, pyrrhotite and magnetite with minor chlorite, calcite and stilpnomelane. In general, gold mineralisation has an erratic and localized distribution. Individual gold grains are on average less than 10µm in diameter and occur in clusters. Gold is generally associated with goethite in the weathered rocks and with pyrite and pyrrhotite in the fresh material.
Hammond (2002) established that the gold mineralisation is associated with two generations of sub horizontal quartz-carbon veins oriented approximately 20° - 40° west. The first generation consists of ladder vein sets preferentially developed in iron-rich mesobands, whilst the second generation consists of large quartz-carbon veins, which cut across the entire deposit, extending into the footwall, and hanging wall in places. Hammond (2002) indicated that major structures that control the mineralisation are related to meso-scale isoclinal folds with fold axes sub-parallel to mineral elongation lineation. Gold is closely associated with sulphides, mainly pyrite and pyrrhotite and to a lesser extent, bismuth telluride and carbonate gangue. The ore fluid responsible for gold deposition is a carbon-oxygen-hydrogen system with increased methane content attributed to localized hydrolysis reactions between interbedded carbonaceous sediments and ore fluid (Hammond, 2002; Hammond and Moore, 2006).
The mineralisation at Windmill South is strongly associated with sulphide replacement within the magnetite-rich BIF unit. These zones of sulphide replacement appear to be more structurally controlled compared to the mineralisation in the eastern and western limbs at Watertank and A zone pits, respectively. Mineralised veins and thin open fractures formed through crystallisation of hydrothermal fluids in a brittle structural environment. Alteration and mineralisation of the Kalgold deposit has been described by several previous workers and the paragenesis and associated mineral assemblages are described in detail by Hammond 2002, amongst other scholars.
6.5Deposit Type
The Kalgold deposit is a BIF hosted lode gold deposit of a type typical throughout Archean greenstone belts across the world. Gold is precipitated through the sulphidation of iron rich BIF host rock due to late movement of retrograde fluids during the later stages of deformation.
6.6Commentary on Geological Setting, Mineralisation and Deposit
The Kalgold geological model is not complicated, being based on the stratigraphy as determined through the mining and drilling.
The geological model has been well tested through years of mining and exploration drilling.
New drilling does not result in significant changes to the geological model, which has remained relatively unchanged for many years. Drilling undertaken on the Kalgold deposit to the current effective date of June 30, 2024, has confirmed this model. Continuous mining activities have also resulted in a relatively high level of confidence in the nature of the Kalgold mineralisation and its association with the cherty BIF horizons.
Effective Date: June 30, 2024
21
Technical Report Summary for
Kalgold Mine, North West Province, South Africa
7Exploration
Section 229.601(b)(96)(iii)(B)(7) (i-vi)
Extensive Surface exploration drilling commenced in 2017 to present, in order to both infill the current Mineral Resource areas, and to identify additional potential mining targets. Recent Infill drilling targeted the Windmill North, and the Spanover ore limb next to Windmill South . The Spanover is on the footwall of the Watertank Zone. The results of this drilling have been incorporated in the latest resource model used for FY25 business planning process.
Most of the deeper pre 2017 historical drilling was centred on the D-Zone deposit which has been mined-out. Historical drilling in the current mining areas is predominantly shallow drilling and mining already beyond this drilling
7.1Aeromagnetic Survey
The Mining Right area is covered by a high resolution aeromagnetic and radiometric survey completed by Xcalibur Airborne Geophysics in September 2012. The survey comprised 7,680 line-km over a 47km x 8km area of the KGB at a line spacing of 50m and nominal flying height above ground of 30m. The aeromagnetic data provided detail of the magnetite bearing horizons, structural offsets to stratigraphy and intrusive bodies at a local scale. However, it was not able to differentiate mineralised from non-mineralised BIF units.
7.2Geological and Topographical Mapping
Several geological maps of the Kalgold Mine exist but they are relatively simple and sparse as much of the area is covered in Kalahari sands with very little outcrop. Therefore, reliance was largely placed on geophysical interpretation rather than ground mapping. The topography has been generated from surveyed pickups and traditional air photo mapping methods. New DTMs have recently been generated from shuttle radar topography mission data. Some detailed mapping results for the Windmill Zone has also been incorporated into the geological mapping.
Drone and GPS surveys are used for day to day data management and volume movements calculation.
7.3Surface Drilling Campaigns, Procedures, Sampling, Recoveries and Results
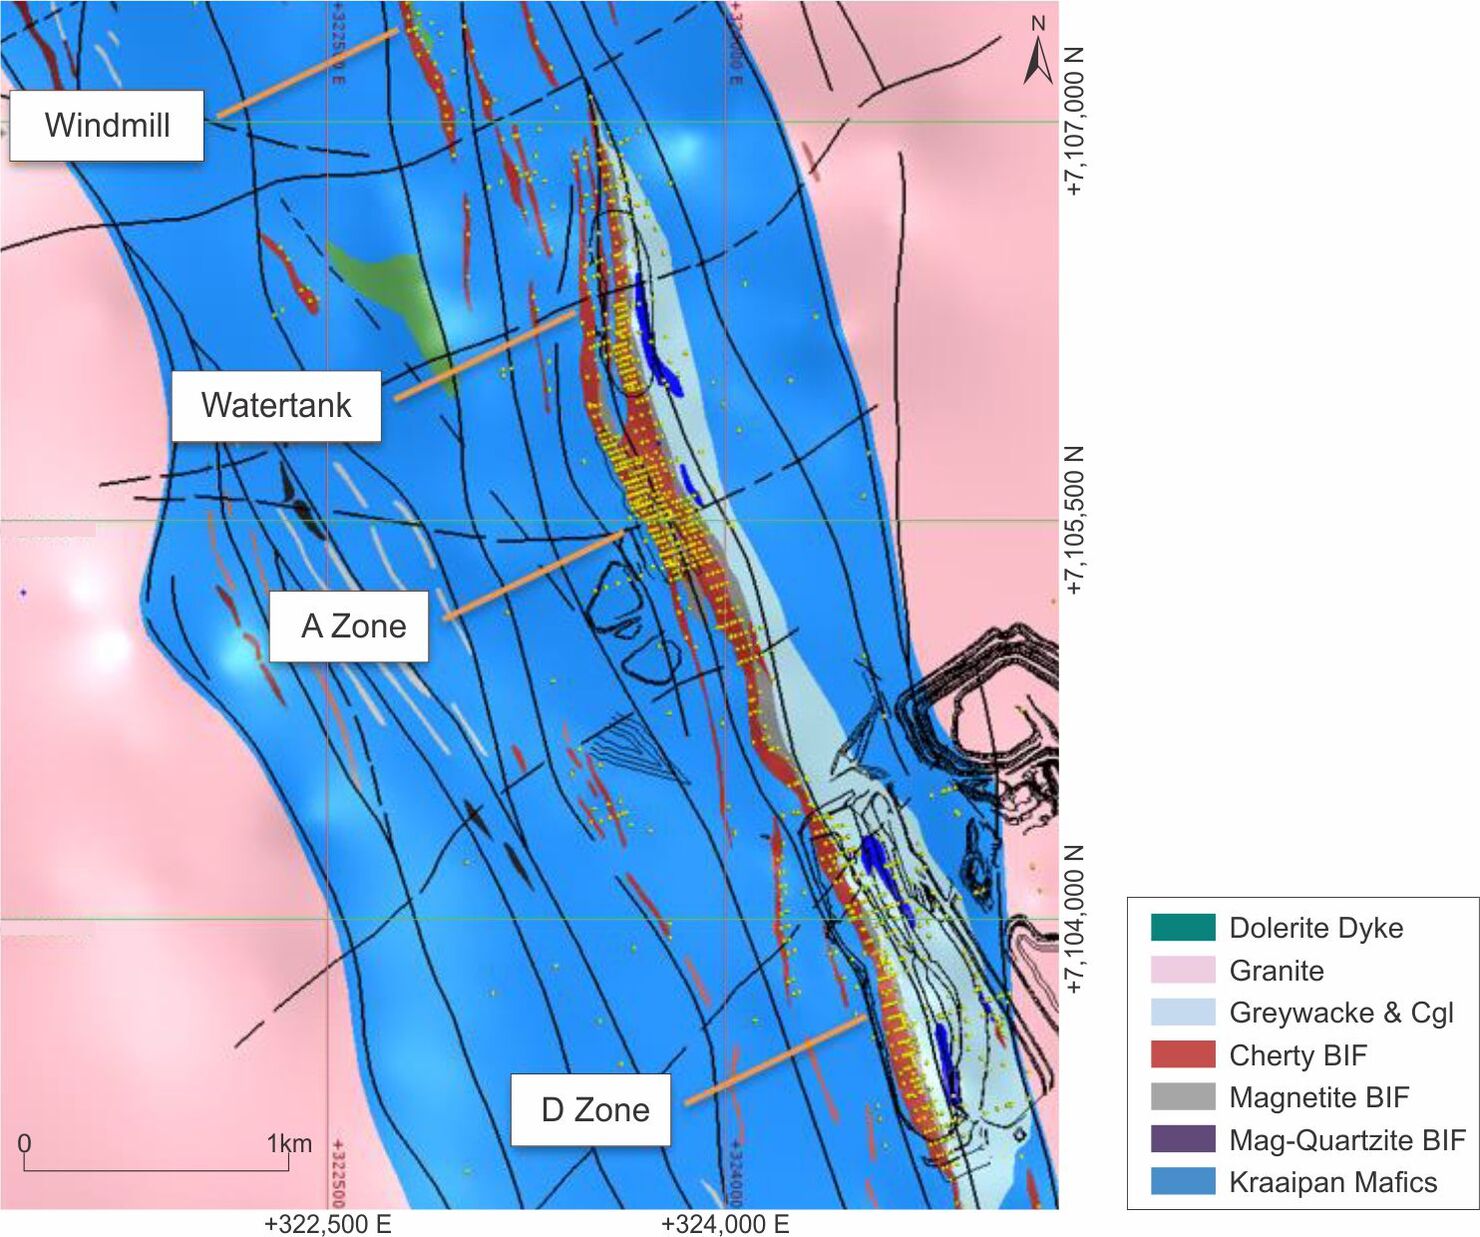
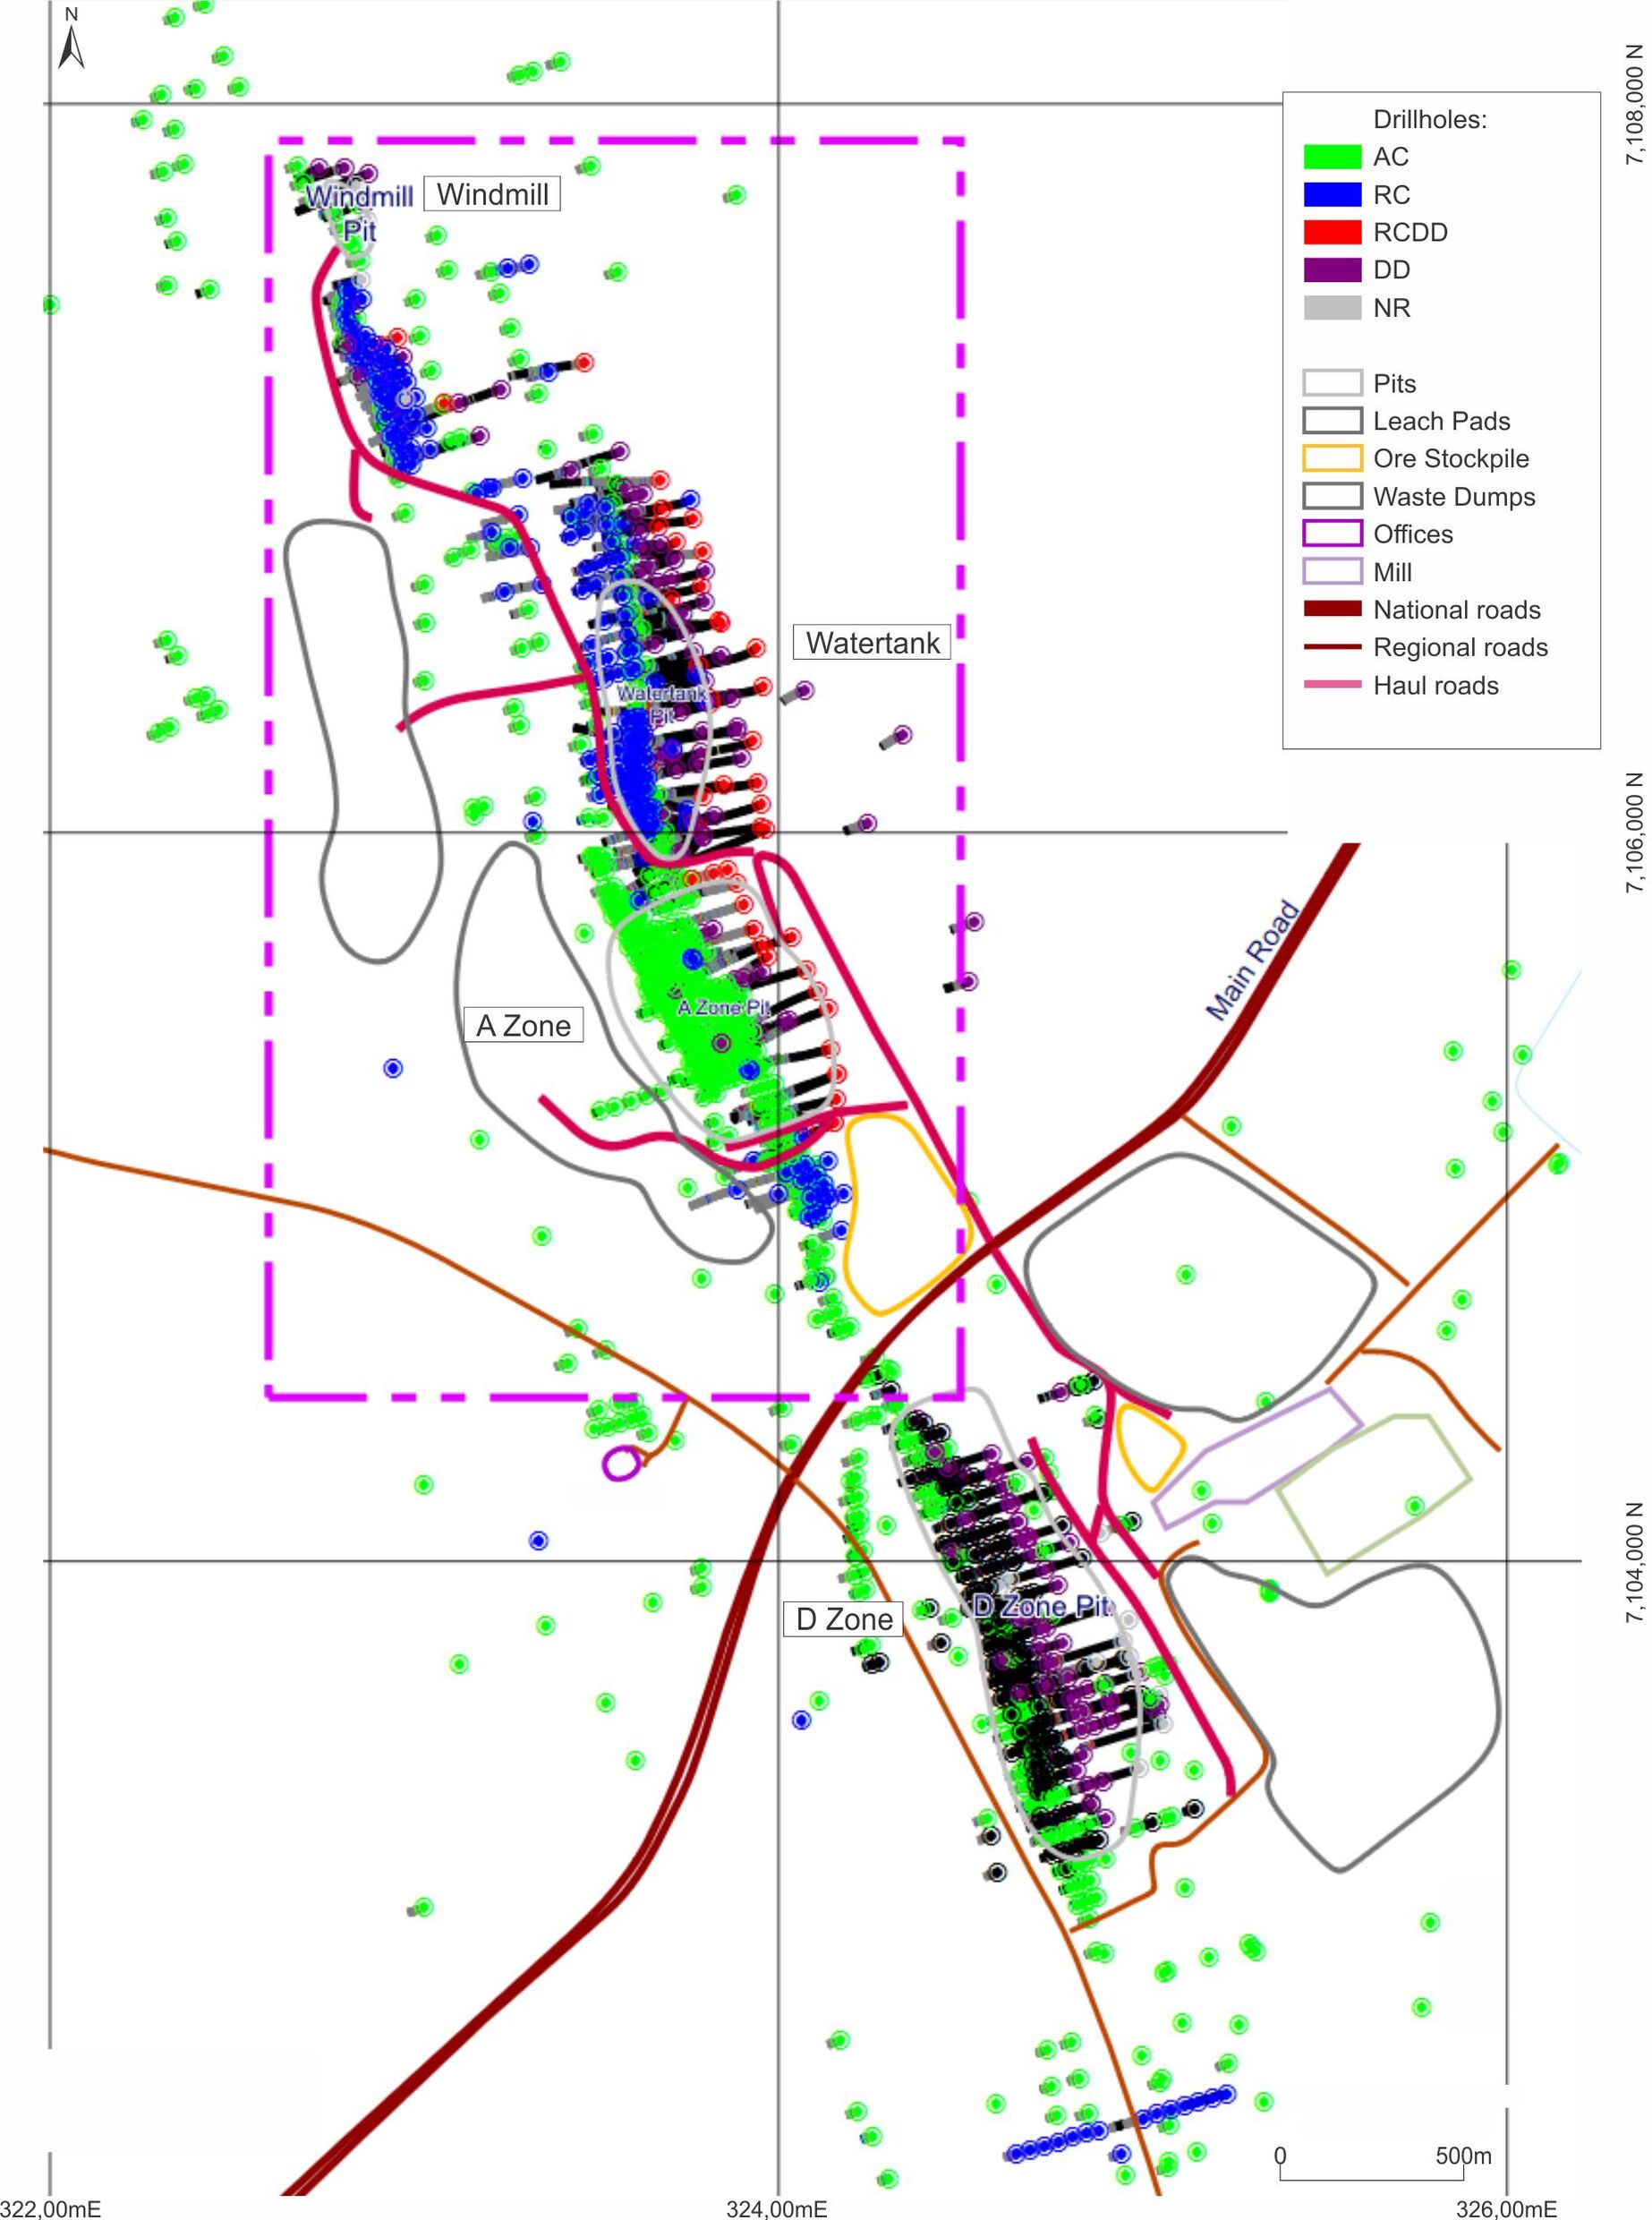
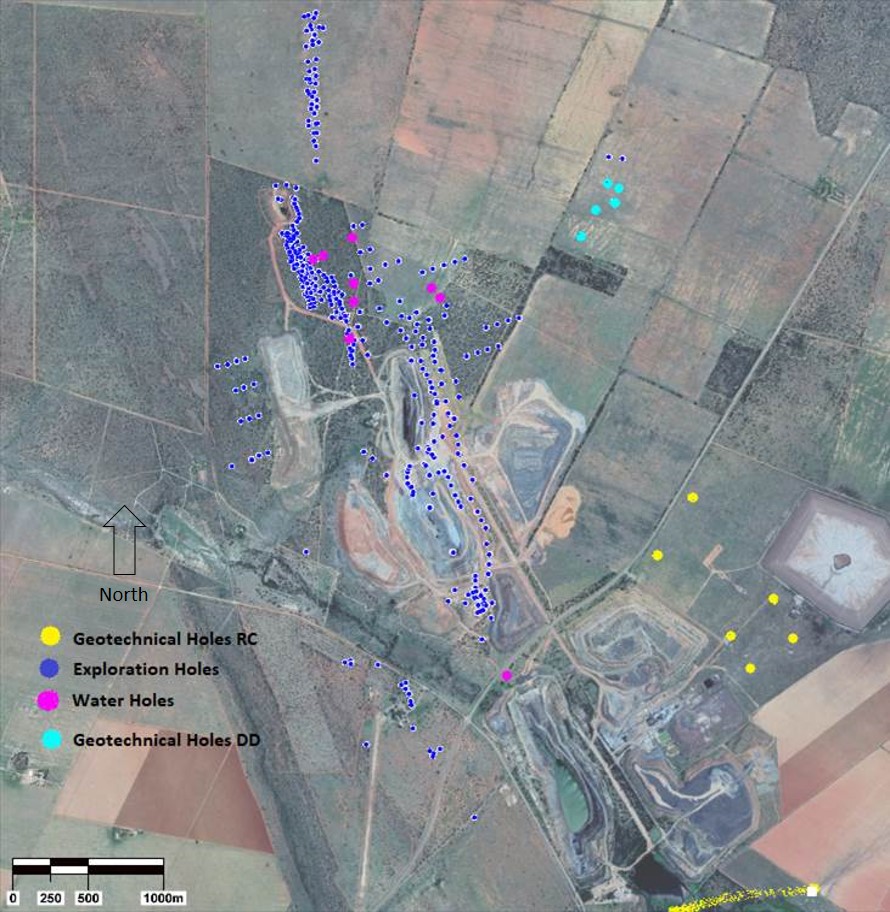
The location of the drilling from 2017 to 2019 is indicated in Figure 7-1. Location of drilling from 2020 to 2023 is depicted in Figure 7-2.
Drill holes flagged as Not Recorded (“NR”) are generally assumed to be either AC, as in the case of shallow drill holes, or RC for the deeper drill holes. Surface drilling at Kalgold has:
•indicated significant extensions to the Mineral Resource area;
•expanded significantly on an understanding of the Kalgold deposit;
•upgraded the Windmill and A Zone south extension (Henry) pit Mineral Resources; and
•infilled the areas between the A Zone and Watertank Zone (current mining), known as the Bridge Zone.
A combination of RC only and RC pre-collars with DD tails (“RCDD”) was completed during the exploration drilling programme. The depth of the RC drill holes and pre-collars varied depending on the target depth, the depth and amount of groundwater, and the penetration rate. If penetration rates of the RC drilling decreased materially, or if groundwater inflows prevented the collection of a dry sample, then the drill hole would be continued with a DD tail. In some cases, in the hanging wall units where mineralisation was not intersected, the RC pre-collars were continued through zones of groundwater and associated wet samples to achieve the planned pre-collar depth prior to commencing the DD tail.
7.3.1AC and Percussion Drilling
Part of the historic drilling at Kalgold comprised very shallow, regional AC or percussion drill holes.
AC drilling uses blades and compressed air to obtain a sample of the top unconsolidated or semi-consolidated cover and regolith. AC drilling technique was previously used to identify presence of BIF under cover and guide exploration activities.
Percussion drilling uses hammer and compressed air to deliver samples to surface. Since the sample travels between the rods and the walls of the hole it becomes contaminated with the rocks overlying the sampled horizon. This drilling technique has not been used at Kalgold with the exception of pre-collars being drilled
Effective Date: June 30, 2024
22
Technical Report Summary for
Kalgold Mine, North West Province, South Africa
through the overburden for the diamond boreholes. No AC or percussion data has been used in the evaluation of the deposits.
Figure 7-1: Location of Kalgold Targeted Exploratory Drilling in Relation to the Mining Pits (2017 - 2019)
7.3.2RC Drilling
Effective Date: June 30, 2024
23
Technical Report Summary for
Kalgold Mine, North West Province, South Africa
The 2017 RC drilling was completed by Van Zyl Boorwerke drilling contractors using a HDM400 rig with an Atlas Copco compressor and booster. The RC drill holes were drilled with a 5.5-inch face‐sampling bit. The 2018 – 2019 RC drilling was completed by Major Drilling using a Hanjin DB36 multipurpose rig. RC drill holes were drilled using either a 4.5 inch or 5.5 inch face sampling bit. The inclined RC drill holes, generally varying between 60° - 70° inclinations, were drilled ~50m apart and 100m on spaced lines along strike, with infill drilling stepping this down to 50m line spacing. The down dip separation of mineralised intersections was planned at c.20m - 25m.
The infill RC drilling at selected targets re-commenced in October 2020 following a hiatus due to COVID19. This drilling was carried out by Torque Exploration using Thor 5000 and Thor 8000 rigs, along with a Kirloskar 1200cfm compressor and a Hurricane 1400cfm booster. Holes were drilled with a RC 5,5-inch face sampling bit, and sampling was performed with a rotary cone splitter.
A total of 75 boreholes covering 9,817m were drilled for the period to June 30, 2023 (Figure 7-2). Drilling focused on potential Mineral Resource extensions as well as testing the areas earmarked for infrastructure development. Drilling was finalised in the 3rd quarter of 2023.
The infill RC drilling at Windmill North & Spanover re-commenced in March 2023. Torque Exploration conducted this drilling using a Thor 5000 rig, along with a Kirloskar 1200cfm compressor and a Hurricane 1400cfm booster. Holes were drilled with a RC 5.5-inch face sampling bit, and sampling was performed with a rotary cone splitter.
35 boreholes covering 3,595m were drilled for the period to June 30, 2023. Drilling focused on potential Mineral Resource extensions as well as finalizing a geological model at Windmill North and Spanover area.
Figure 7-2 depicts the location of drill boreholes for period
No further Resource extension drilling was carried out at the Kalgold satellite prospects in FY24. A Resource model update was compiled for the Spanover and Windmill North prospects, using all the assay results obtained and verified from the drilling programme completed in FY23.
7.3.3Diamond Core Drilling
The 2017 DD was completed by Van Zyl Boorwerke using two HR6 and one Everdighm diamond rigs. All drill cores were orientated using a ACT III digital core orientation tool. Drilling contractors were changed during December 2017 and Major Drilling commenced operation using Hanjin DB36 multipurpose drill rigs to continue the programme. Van Zyl Boorwerke completed RC drilling for drill holes KG001 - KG037 and DD up to KG029. Major Drilling completed all RC drilling from KG038 onwards and all diamond drilling from KG033 onwards. Major Drilling utilised HQ (63.5mm), NQ2 (50.6mm) and NQ3 (45.0mm) core sizes in the drilling completed up to the latest drilling up to June 30, 2023.
At completion of each drilling shift, all Diamond Drill cores trays are transported to the Kalgold core shed where they are kept safely and logged. All logging is undertaken by suitably experienced or qualified Kalgold geologists. Cores are logged, with the geological attributes captured including lithology, alteration, veining, mineralogy, weathering, structural zones, orientated structure, specific gravity, colour, and magnetic susceptibility. All core is logged regardless of its mineralisation status.
7.3.4Drilling Results
Results for the 2017 to 2023 drilling programme are presented in Table 7-1. Only the weighted average gold grade for the drill holes completed during this period are summarised. Historical results are too voluminous to report. However, they have been included in the estimation of the current Mineral Resources. Much of the deeper pre 2017 historical drilling was centred on the D-Zone deposit which has been mined-out. Historical drilling in the current mining areas is predominantly shallow drilling and mining already beyond this drilling.
Table 7-1: Summary of Drilling Results
Effective Date: June 30, 2024
24
Technical Report Summary for
Kalgold Mine, North West Province, South Africa
| | | | | | | | | | | | | | | | | | | | | | | | | | |
| Year | Company | Drill Hole ID | No. Drill Holes | Gold Grade (g/t Au) | Thickness (m) | | | |
| 2017 | Harmony | KG001 - KG037 | 34 | 1.36 | 16 | | | |
| 2018 | Harmony | KG029 - KG126 | 97 | 1.45 | 15 | | | |
| 2019 | Harmony | KG127 - KG204 | 81 | 2.44 | 14 | | | |
| 2022 | Harmony | KG205 - KG344 | 142 | 1.54 | 10 | | | |
| 2023 | Harmony | KG345-KG380 | 35 | 0.95 | 11 | | | |
| Total | 389 | | | | | |
7.3.5Collar and Downhole Surveys
Collar surveys are completed by the Kalgold Mine survey department. Planned collar coordinates are surveyed using a hand-held Global Positioning System ("GPS"), Trimble R8 RTK GPS. The coordinate system used is the Cape Datum and the Clarke 1880 Ellipsoid. The original coordinates are stored in a database along with the transformed coordinates to WGS84 Zone 35S. The accuracy of collar surveys is ±0.1m.
Downhole surveys are completed by the drilling contractor. Due to the magnetic nature of the BIF units, downhole surveys are taken using a reflex gyro survey tool. Downhole surveys are typically completed at the end of the RC pre-collar and/or at the end of the DD. A survey reading is taken every 10m from the end-of-hole depth to the collar position. Interim downhole surveys are completed at times during drilling in cases where the drill hole deviation is required to be monitored against the planned drill hole path. In cases where sections of the drill hole are surveyed separately, a 20m - 30m overlap between the surveys is completed to ensure robust survey checks.
Effective Date: June 30, 2024
25
Technical Report Summary for
Kalgold Mine, North West Province, South Africa
Figure 7-2: Location of Kalgold Drill Holes (2020-2023)
Source: Google Earth Image Date June 2019
7.3.6Sample Length and True Thickness
In areas where drill holes intersect the deposit at obtuse angles, the sampled width is corrected for true thickness using the angle of intersection and the drilled width. The true thickness is used for modelling and reporting purposes if required.
7.3.7Logging Procedure
At completion of drilling, all DD cores and RC chip trays are transported to the Kalgold core shed where they are logged. All logging is undertaken by suitably experienced or qualified Kalgold geologists. All RC chip samples are geologically logged at 1m intervals and the results captured into the LogChief logging system / Datamine Fusion. Geological attributes logged include lithology, weathering, veining, mineralogy colour and magnetic susceptibility.
DD cores are logged, with the geological attributes captured including lithology, alteration, veining, mineralogy, weathering, structural zones, orientated structure, specific gravity, colour, and magnetic susceptibility. All core is logged regardless of its mineralisation status. The DD core results are also captured into the LogChief logging system / Datamine Fusion. Basic geotechnical logging of the DD core comprises logging of two key attributes, namely core recovery and Rock Quality Description (“RQD”).
Effective Date: June 30, 2024
26
Technical Report Summary for
Kalgold Mine, North West Province, South Africa
Drill core photography is conducted at the core shed, with all core trays photographed and documented before logging and sampling occurs. The details of the logging were sufficient for use in the Mineral Resource estimation and in technical studies.
7.3.8Core Recovery
During RC drilling, weights are recorded for the bulk and split samples over the 1m interval along with the condition of the sample, whether it is dry, moist, or wet. Bulk sample weights are monitored to indicate potential intervals of poor recovery, although variation in sample weights is also associated with changes in weathering and lithology/mineralisation. Comparison of sample recovery and gold grade does not indicate any sample bias nor any preferential loss or gain in the RC samples.
For DD holes, recovery of the drill core is assessed for each ‘run’ with the length of core recovered physically measured by the geologist or field assistant using a tape measure and compared to the drilled length as recorded by the driller for the corresponding run. The driller records the run information on the shift run sheet and the details on each core block which is placed in the core tray at the end of each run.
The measured recovery data is captured by the geologist or field assistant in LogChief and synchronised to the main database. Core recovery was calculated as a percentage recovery. Typically, recoveries >95% have been achieved at Kalgold, with minimal core loss recorded in some strongly fractured zones associated with faulting.
Experienced drillers are employed by the drilling contractor to oversee and manage the drill rig to ensure maximum recovery is achieved. Core recovery and grade have been reviewed and there is no correlation between them which would lead to a bias in the sample results. Additionally, RQD versus gold shows that the gold mineralised zones generally have good quality core.
7.4Hydrogeology
Harmony has conducted several specialist studies and the risk of surface decant due to rising groundwater levels has been obviated for Kalgold. However, in capturing and analysing geological data, a secondary function is to subsequently understand and assess the mineralisation and groundwater potential in the area. Nevertheless, in hard rock environments such as Kalgold, it is worth noting that deep saturated fractures in bedrock are also potential sources of groundwater and dykes are also known preferential pathways for groundwater. These deeper lying geological features, with the combined low risk potential of a rainy season, can pose a risk to the mining operations. Risks associated to the accumulation of groundwater is managed through a planned pumping strategy, driven by the mining section. Groundwater is pumped out from the pits and used for dust allaying on the haul roads, muck piles and run-of-mine pads. Kalgold also applies annual rainy season discount to the business pan to cater for production impact during this period
7.5Geotechnical Data
The slope design used in the Kalgold pit optimisation process was informed by the geotechnical analysis completed by the Rock Engineering specialist. The latter include pit optimisation inputs per pit, geotechnical pit shell depth assessment to inform stacks in weathered and fresh rock and compliance verification expanded to pit shell hazard identification and risk assessment. A total of nine core holes were drilled for the purpose of collecting geotechnical data. Four holes were drilled in the A-Zone, Henry and Watertank Zone.
Two holes were drilled in Watertank North, and three holes were drilled in Windmill. Geotechnical zones were classified based on the fresh rock types, with the weathered zone was classified as a separate geotechnical zone based on the depth of weathering. The Rock Mass Ratings (“RMR”) and Modified Rock Mass Ratings (“MRMR”) was classified as Fair to Good across the different rock types in all nine holes, and only the weathered zone was classified as Poor.
A total of 45 samples was sent to Rocklab in Pretoria for the uniaxial compressive strength (“UCS”) and tensile strength testing, which included 15 samples from the hanging wall, 15 samples from the orebody and 15 samples from the footwall, for the A Zone, Henry and Watertank pits. A total of 20 samples was sent to Rocklab in Pretoria for the UCS and tensile strength testing, which included 7 samples from the hanging wall, 7 samples from the orebody and 6 samples from the footwall, for the Watertank North pit.
Effective Date: June 30, 2024
27
Technical Report Summary for
Kalgold Mine, North West Province, South Africa
A total of ten samples was sent to Rocklab in Pretoria for the UCS and tensile strength testing, which included seven samples from the hanging wall and three samples from the orebody, for the Windmill pit. Rock samples analysed at Rocklab presented findings as shown in Table 7-2.
In addition, six samples of discontinuities were taken from the drill core of the hanging wall, BIF and footwall and were sent for shear strength testing, for the A Zone, Henry, Watertank and Watertank North pits; while two samples of discontinuities were analysed for Windmill pit. The results for these peak strengths are shown in Table 7-3. The use of the geotechnical data related to Kalgold mining is discussed in more detail in Section 13.
Table 7-2: Summary of Geotechnical Drilling Results
| | | | | | | | | | | | | | | | | | | | | | | | | | | | | |
| Area | No. Samples | Min. Tensile Strength (Mpa) | Avg. Tensile Strength (Mpa) | Max. Tensile Strength (Mpa) | No. Samples | Min. UCS (Mpa) | Avg. UCS (Mpa) | Max. UCS (Mpa) |
| A Zone, Henry and Watertank | Hanging wall | 14 | 8.0 | 15.0 | 20.8 | 15 | 74.1 | 119.0 | 180.7 |
| Orebody | 12 | 8.0 | 15.0 | 21.8 | 15 | 50.6 | 142.0 | 283.3 |
| Footwall | 18 | 6.7 | 13.0 | 17.8 | 15 | 68.3 | 96.0 | 156.7 |
| Watertank North | Hanging wall | 7 | 6.3 | 12.2 | 19.5 | 7 | 24.2 | 53.0 | 82.8 |
| Orebody | 7 | 9.3 | 12.6 | 18.7 | 7 | 120.4 | 191.5 | 249.4 |
| Footwall | 6 | 9.4 | 13.1 | 19.3 | 6 | 32.0 | 69.0 | 95.7 |
| Windmill | Hanging wall | 7 | 3.8 | 12.2 | 20.5 | 7 | 12.6 | 116.0 | 197.7 |
| Orebody | 3 | 5.9 | 13.7 | 29.1 | 3 | 56.5 | 118.0 | 204.3 |
| Total | 74 | | | | 75 | | | |
Table 7-3: Geotechnical Drilling Results - Shear Strength Tests
| | | | | | | | | | | |
| Area | Cohesion (kpa) | Joint Friction Angle (°) |
| A Zone, Henry and Watertank | Hanging wall | 155 | 29 |
| Orebody | 260 | 29 |
| Footwall | 75 | 34 |
| Watertank and North Extension | Hanging wall | 30 | 29 |
| Orebody | 130 | 29 |
| Footwall | 450 | 20 |
| Windmill | Footwall | 230 | 41 |
7.6Commentary on Exploration
The QP is of the opinion that the drilling and survey processes, the geological, geohydrological and geotechnical logging and the sampling and assaying data is appropriate for the Kalgold modelled deposit and mineralisation style.
Effective Date: June 30, 2024
28
Technical Report Summary for
Kalgold Mine, North West Province, South Africa
8Sample Preparation, Analyses and Security
Section 229.601(b)(96)(iii)(B)(8) (i-v)
This section summarises information relating to the sample preparation on site through to the laboratory preparation and analysis of the drilling from 2017 to current. Pre 2017 drilling is mainly in the depleted areas as discussed under Section 7.
8.1Sampling Method and Approach
Sampling is carried out in accordance with the Harmony internal sampling procedure guidelines. Drill hole sampling data used for ore resource estimations are obtained from reverse circulation (RC) drilling, diamond drilling. Samples from RC drilling represent the most of the data used in the ore resource estimation. Inclined drill holes (generally 60 to 70 degrees) are drilled approximately 50 m apart 100 m spaced lines along strike, with infill drilling steps this down to 50 m line spacing. Most of the areas covered by RC have been mined, hence the intensified infill drilling from 2017 to improve model resource and reserve definition Historically relatively few of diamond holes had been drilled and these mainly target the deeper parts of the orebody. Where detailed geological or geo-technical information was required diamond drilling was used. Much of the current program utilises diamond drilling where target zones are below the maximum usable depth of the RC rigs. Sampling is carried out on BIF intervals at 1 m lengths, cut to geological boundaries. Cores are sawn into two halves, one half is submitted for assay and the other half is kept for reference. Core photography is conducted at the core shed with all core trays photographed and documented before logging and sampling occurs.
8.1.1RC Samples
Samples are collected as drilling chips from the RC rig using a cyclone collection unit and directed through a splitter assembly to create a 1.5kg ‐ 3.0kg sample for assay which is approximately 4% - 7% of the metre interval sampled, this is considered appropriate by the QP for the style of mineralisation and size of the RC sample over each 1m interval.
8.1.2Core Samples
After logging is completed, the DD core is transported to the Kalgold core shed, where it is subsequently marked with metre intervals. Sample numbers and their associated drill hole intervals are recorded by the responsible geologist and given to the core yard technician for cutting and sampling. The core is cut along the orientation line at the bottom of the drill hole to reduce the possibility of sample bias. The core is split using a core saw, with half core samples taken in the HQ and NQ sections.
Sampling typically commences 10m above the hanging wall contact of the mineralised BIF and continues through to 10m below the footwall contact of the BIF. Drill core within the interval designated for sampling is continuously sampled along metre intervals and not split on lithological or alteration-based boundaries. For intervals of very broken core, samples are collected by taking approximately half of the drill core over the relevant sample interval. The remaining half core is stored on site.
The core samples sent for assay are bagged in labelled calico sample bags which are then placed within larger poly weave bags for transport to the designated laboratory.
8.2Density Determination
Density measurements used in the density estimates were undertaken using both Archimedes water displacement method and laboratory-based pycnometer method. For the Archimedes method, collection of drill core samples for bulk density testing has been completed at either 30m and 10m intervals downhole. Samples were air dried, then a piece of core approximately 10cm in length selected and weighed in air followed by weighing submerged in water.
Model densities are estimated via Inverse Distance method over assigned domains in order to fill the density field with estimated values where measurements have been taken, thereafter densities are assigned as determined on lithology types with sub domains based on oxidation profiles where there were not enough samples for the estimate to run. BIF densities varies from 2.88t/m3 to 3.12t/m3 from oxides to fresh rock at depth. Surrounding Footwall and Hangingwall densities varies from 2.72t/m3 to 2.81t/m3 with depth.
Effective Date: June 30, 2024
29
Technical Report Summary for
Kalgold Mine, North West Province, South Africa
8.3Sample Security
Samples are collected by SGS from the Kalgold core shed and transported to the SGS laboratory in Randfontein. A hard copy sample submission form is sent with the samples and a digital copy along with a list of samples included in the submission is emailed to the laboratory. Upon receipt at the laboratory, the submission is sorted and checked against the sample submission form and the senior geologist is notified of any missing and/or additional samples.
All remaining RC chip trays, and DD half core samples are kept at Harmony’s core storage facility. The 1m bulk samples from the RC drilling are stored on site or at mine laydown facilities for a minimum of three months and then discarded. Coarse rejects from the assay laboratory samples are kept for three months and then discarded unless otherwise requested. This allows time for resamples or Quality Assurance and Quality Control (“QAQC”) checks. All pulp samples are returned and stored on site at the core storage facility.
8.4Laboratory Sample Preparation
Historical exploration samples were sent to independent laboratories where they were crushed and pulverized. Aliquots (portions of larger samples) weighing 30g or 50g were taken for fire assay. The primary and a second, independent laboratory were used to assay pulp duplicate samples. Several laboratories were used during various exploration phases, including Performance Laboratories, Bergstrom, and Baker (now Set Point), and the onsite Kalgold analytical laboratory. All these laboratories are currently South African National Accreditation System (“SANAS”) accredited laboratories (except for the Kalgold laboratory). However, this may not have been the case when certain phases of historical exploration were undertaken.
Sample preparation and assaying of both RC and DD samples for the 2017 to 2023 drilling programme was completed at the external SGS laboratory in Randfontein. This laboratory is SANAS accredited (No. T0265) and conforms to the requirements of ISO/IEC 17025 for specific tests.
The sample preparation and analysis flow sheet for both the RC and DD samples from the 2017 to 2023 drilling programme is outlined in Figure 8-1. Screen sizing tests after the crushing and pulverising stage are completed at every 20th sample to ensure particle size tolerances are achieved prior to further splitting of the sample. Charts of screen sizing tests from samples submitted to the current effective date of June 30, 2024, illustrate the sizing tolerances are being met by the laboratory with only minor exceptions (Screen sizing tests after the crushing (90% passing 2mm) and pulverising (95% passing 75um) stages.
8.5Assaying Methods and Analytical Procedures
The method used for gold assay of both RC and DD samples is FAA303 (Au by lead fusion followed by Atomic Absorption Spectroscopy (‘AAS’) finish). This is an accredited method and conforms to ISO/IEC 17025. The multi-element assays are completed by Inductively Coupled Plasma – Optical Emission Spectrometry (ICP-OES) and ICP- Mass Spectrometry (ICP-MS) methods, which are not SANAS accredited.
Historical assays were done by various laboratories including Performance Laboratories and Setpoint Laboratories using fire assay method with AA finish or ICP finish respectively. There are no details on the methodology of the assays done during early years of exploration.
8.6Sampling and Assay Quality Control (“QC”) Procedures and Quality Assurance (“QA”)
Routine quality control measures must be undertaken to check the precision and accuracy of analytical methods used by the laboratories. The checks involve regularly inserting blanks, duplicates, gold, and base metal standards into all batches of samples dispatched to the laboratory for analyses. The current primary analytical laboratories used for sample analysis also have several internal QAQC protocols in place.
At each interval of 20 samples a pulp Certified Reference Material ("CRM") or Gravel Blank is included as a sample. For RC drilling a duplicate field sample is taken from the splitter assembly every 50th sample and a gold assay pill is included into the sequence with the CRM standards and blanks. A photographic record of the relevant standard, blank and assay pill is captured as a record of quality control sample and corresponding sample number it was submitted as. This minimises the risk of a sample mix-up occurring in the sampling stage prior to dispatch and provides a reference point for investigations into QAQC issues at the laboratory.
The internal laboratory QAQC includes CRMs, blanks, splits at the crushing stage and repeats after the pulverising stage along with screen sizing tests and reporting of the lead button weights. The total samples
Effective Date: June 30, 2024
30
Technical Report Summary for
Kalgold Mine, North West Province, South Africa
submitted for the drilling program to December 2023 and QAQC ratios of both Harmony and internal laboratory samples are outlined in Table 8-1.
Table 8-1: Summary of Sample Batches for 2017 - 2023 Drilling
| | | | | |
| Sample Description | Total number (No.) |
| Batches submitted to laboratories | 1 386 |
| Drill hole samples | 41 258 |
| Quality control samples | 16 265 |
| CRMs | 3 900 |
Each batch is reviewed upon receipt and any QAQC issues raised with the laboratory. Depending on the type and number of QAQC samples that are outside expected ranges, either a portion or the entire batch is re-assayed. Once the re-assay results are received and the QAQC issue rectified, these values are set as the preferred values for the relevant samples.
Effective Date: June 30, 2024
31
Technical Report Summary for
Kalgold Mine, North West Province, South Africa
Figure 8-1: Laboratory Sample Preparation Process
Effective Date: June 30, 2024
32
Technical Report Summary for
Kalgold Mine, North West Province, South Africa
The impact of historical anomalous data on the Mineral Resource estimate, has been attempted to be controlled through the exclusion of some of the data from these drill holes. Holes that were misplaced or had grade profiles that did not appear to be in the correct locations, were excluded from estimating the Mineral Resource. Sampling of only mineralised material has resulted in many poorly sampled holes and gaps in the database.
However, this has been handled in the compositing process by inserting a background grade of 0.005g/t Au. It is also possible that this low grade “non-sampled” zones will have a negative impact on the Mineral Resources estimate, resulting in a lower estimate of the overall head grade.
Instead, maintaining the null value was preferred for the estimate fill blocks in low grade and waste areas, with high grade areas extrapolated over for the minute modelled intersections. Given that most of the drilling is historical, it was not possible to exclude historical drilling from the dataset. The historically adopted assay methods have evolved since the mid-nineties, and the QA data indicates the sampling methods are robust enough for inclusion into this model.
As discussed under the drilling results section, much of the deeper pre 2017 historical drilling was centred on the D-Zone deposit which has been mined-out, and in the current mining areas is predominantly shallow drilling and mining already beyond this drilling. Thus the historical drilling has minimal influence in the current resource estimate at depth and new areas which are covered by the post 2017 drilling.
8.6.1Standards
A range of CRMs derived from similar mineralisation styles were sourced from the African Minerals Standards (“AMIS”) and inserted into the sample sequence by the logging geologist. The CRM standard assigned to a particular sample depended on the expected grade of the surrounding samples and, where possible, the grade of the standard was matched to the expected grade. Results of the CRM standards submitted to December 2023 are summarised in Table 8-2.
Table 8-2: Summary of AMIS Standard Results
| | | | | | | | | | | | | | | | | | | | | | | |
| | Au Standard | No. Samples | Calculated Values |
| Standard | Certified Value (g/t Au) | Expected STD | Mean (g/t Au) | SD | COV | Bias (%) |
| AMIS0440 | 1.74 | 0.04 | 460.00 | 1.73 | 0.13 | 0.08 | (1)% |
| AMIS0441 | 2.44 | 0.12 | 526.00 | 2.39 | 0.23 | 0.10 | (2)% |
| AMIS0473 | 0.41 | 0.02 | 375.00 | 0.42 | 0.11 | 0.26 | 3% |
| AMIS0571 | 0.59 | 0.02 | 292.00 | 0.60 | 0.05 | 0.08 | 1% |
| AMIS0748 | 1.38 | 0.10 | 105.00 | 1.37 | 0.06 | 0.04 | (1)% |
| AMIS0747 | 62.00 | 0.04 | 81.00 | 0.60 | 0.10 | 0.17 | (4)% |
| AMIS0724 | 2.38 | 0.12 | 108.00 | 2.28 | 0.20 | 0.09 | (4)% |
| AMIS0719 | 0.90 | 0.04 | 138.00 | 0.89 | 0.11 | 0.12 | (1)% |
| AMIS0439 | — | — | 261.00 | 8.00 | 0.54 | 6.51 | —% |
| AMIS0681 | — | — | 281.00 | 0.01 | 0.06 | 5.69 | —% |
| Blank_Gravel | — | — | 967.00 | 0.03 | 0.07 | 2.57 | —% |
| AMIS0570 | 0.86 | 0.04 | 79.00 | 0.88 | 0.22 | 0.26 | 2% |
| AMIS0519 | 1.61 | 0.05 | 192.00 | 1.59 | 0.18 | 0.11 | (1)% |
Review of the QAQC performance of the CRMs illustrates some outliers falling outside three Standard Deviations (“3SD”) from the expected result. However, most results fall within 2SDs of the certified values.
8.6.2Blanks
Blank material initially comprising barren quartz gravel. Subsequently RC chips from barren intervals were inserted into the sample sequence for both RC and DD samples at a ratio of approximately every 30th sample. The control chart for performance blanks between 2017 – 2023 was assessed and illustrated a small number of anomalous results. Investigation of these outliers found they were the result of mix-ups during the sample preparation or assay process which resulted in partial or complete re-assay of the corresponding batch.
Effective Date: June 30, 2024
33
Technical Report Summary for
Kalgold Mine, North West Province, South Africa
8.6.3Duplicates and Repeats
Scatter plots illustrating all duplicate and repeat results were reviewed, along with field duplicate results from RC samples. No bias is apparent in laboratory duplicates, pulp splits or laboratory repeats. Outliers were predominantly associated with repeats of samples in batches that experienced sample swaps/mix-ups. However, some outliers were due to the presence of coarse gold in the original samples.
8.6.4Gold Assay Pills
A range of gold assay pills were sourced from Geostats (Pty) Limited in Perth, Australia. These comprise a 1g pill of known gold grade added to a blank sample. The expected grade is calculated from the weight of blank material and grade of pill. The advantages of the gold assay pills over pulp type CRM standards are that they are difficult to distinguish from the normal RC chip samples in the batch and test the sample size reduction and splitting processes along with the potential sample mix-ups and analytical errors. As the expected value of each inserted pill sample is different the relative difference plotted against expected grade is used to plot and review results. The target for the pill QAQC samples is required to be within ± 10% range of the expected result.
Problems were experienced with determination of the correct weight and control of the moisture content of the blank material with assay pills, which negatively affected the results. The use of assay pills was therefore discontinued. The milling of the entire sample was implemented to optimise the sample preparation process.
8.7Comment on Sample Preparation, Analyses and Security
In the QP’s opinion:
•the sampling methods are appropriate for the mineralisation styles encountered at Kalgold. No compositing of sample occurs prior to assay;
•the methods used for both the gold and multi-element assay are appropriate for the style of mineralisation; and
•anomalies created with the historical drill hole datasets has been adequately addressed, while maintaining the integrity of the drill hole database for the inclusion in the Mineral Resource estimate. Estimation techniques adopted a null value for low grade and waste areas, while keeping the extrapolation of high grade intersections to a minimum.
Effective Date: June 30, 2024
34
Technical Report Summary for
Kalgold Mine, North West Province, South Africa
9Data verification
Section 229.601(b)(96)(iii)(B)(9) (i-iii)
The Kalgold drill hole data is stored in DatamineTM (“Datamine”) Fusion database, which can only be accessed by the geologists granted access by the QP and Technical Specialist (Exploration Manager). The backup process is managed by the Harmony IT Department and comprises a full backup of servers HGMTSP303 and ZAGPDCPGEO01 daily incremental and full back-up monthly managed by GABSTON for recovery. The latest round of drilling, which commenced in 2017, has been subject to extensive modern QAQC procedures and monitoring, which has included laboratory visits and audits by the geologists in charge.
9.1Data Verification Procedures
Data verification procedures included the following:
•the drill hole database was checked against the original logs;
•the drill hole database was checked for missing collar coordinates, collar position and elevation errors, downhole survey errors, interval errors and duplicate sample records;
•the database was exported into the modelling software to check that the drill hole collars rest on the topography;
•when assay results were returned from the laboratory, the QC sample results were assessed for performance before the primary sample results could be used for Mineral Resource estimation;
•the primary assay results captured in the database were validated by spot checking a selection of drill holes used in the current Mineral Resource estimate; and
•the assays captured in the electronic database were checked against the original laboratory certificates.
Errors identified were recorded in a spreadsheet, which was subsequently sent back to the site geologist so that they could be corrected before the data could be used for Mineral Resource estimation.
The potential impact of anomalous and historical incomplete data has been managed through the exclusion of some holes in a systematic data verification approach. Holes that were obviously misplaced or had grade profiles that did not appear to be in the correct locations were excluded from the resource. The habit of sampling only obviously mineralised material has resulted in a large number of poorly sampled holes and gaps in the database. Whilst this has been handled in the compositing process by inserting a background grade of 0.005g/t Au it is possible that these low grade “non-sampled” zones will have a negative impact on the estimate, dragging the overall head grade down. It was felt this was preferable to maintaining the Null value and having the estimate fill blocks in low grade and waste areas with high grades spilled over from the small modelled intersections. Given the majority of the drilling into the deposit is historical drilling it was not possible to exclude all historical drilling from the dataset. The assay methods used have changed little since the mid-nineties and the historical QA data reviewed indicates the sampling methods are robust enough for inclusion into this model.
9.2Limitations to the Data Verification
There has been no re-logging of the historical core and as such, lithology logs have been used as they are for creating the geological and domain models. Historical assay data is largely lacking QAQC information, however, the data that has been available has been subject to some assessment of duplicates and QAQC in the past. None of this information was supplied with the database, as such, all assay data supplied has been taken as is.
9.3Comment on Data Verification
The sampling methods, sample preparation procedures, and analytical techniques are all considered appropriate for the estimation of Mineral Resources. The Kalgold deposit is drilled to a standard suitable for robust estimation of Mineral Resources. However, a significant amount of additional Mineral Resource definition drilling would be required to increase the level of geological confidence. Historical data is adequately handled and the drilling from 2017 has greater influence on the estimate, as most of the areas relying on the historical data has been mined-out.
Effective Date: June 30, 2024
35
Technical Report Summary for
Kalgold Mine, North West Province, South Africa
10Mineral Processing and Metallurgical Testing
Section 229.601(b)(96)(iii)(B)(10) (i-v)
Over the decades, Harmony Gold has continuously refined and optimised these processes, ensuring consistent gold recovery and efficient mineral extraction from diverse ore bodies. The company's well-established metallurgical practices are crucial in understanding production dynamics, enabling precise forecasting, and supporting informed management and operational decisions.
Kalgold and its processing facility have been in operation since 1996, as such the processing method is considered well established for the style of mineralization. The plant makes use of historical trends and data as a basis for their recoveries of ore mined, however when projects are planned for optimization, appropriate test work will be performed. The latest detailed metallurgical test work program was conducted in July 2019 by Maelgwyn Mineral Services Africa for the Kalgold expansion project pre-feasibility study.
Two main composite samples (oxide and sulphide samples) as well as nine variability samples were evaluated with the objective to compare overall gold recoveries with different flowsheets including gravity, flotation, and leaching. The details and results of the tests are documented in the report entitled “Kalgold Expansion Project: Evaluation of Oxide (2019)”.
Composite samples are created by aggregating individual samples taken over a specific period. This approach is used to obtain a more representative sample that reflects the processed ore's average grade and mineralogical characteristics. Composite sampling reduces the variability in smaller, discrete samples, providing a more accurate reflection of the ore body as a whole.
10.1Extent of Processing, Testing, and Analytical Procedures
The Kalgold ore can be described as semi-refractory and contains 3% - 5% sulphides. These sulphides negatively affect recoveries and will hence increase reagent consumption. The optimal conditions, as seen in Table 10-1, for the standard leach flowsheet, has been determined to be a grind at 80 um -75um, a 28hr leach time and a 2-pass pre-oxidation with shear reactors.
Table 10-1: Leach Flowsheet Determination
| | | | | | | | | | | | | | | | | | | | |
| Leach Condition (28hr) | Head grade (g/t Au) | Residue Grade (g/t Au) | Cyanide Consump. (kg/t) | Dissolution (%) | Soluble Loss (%) | Overall Recovery (%) |
| Base case | 1.43 | 0.15 | 0.31 | 88.59 | 1.50 | 87.09 |
| 2 pass pre-ox | 1.43 | 0.12 | 0.26 | 90.65 | 1.50 | 89.15 |
| 2 pass pre-ox + AAL | 1.43 | 0.14 | 0.60 | 89.51 | 1.50 | 88.01 |
Note: Consump. - Consumption
Harmony Gold conducts a variety of specific tests to address different aspects of the mineral processing workflow, ensuring the representativeness of the samples:
•Comminution Testing: Involves crushing and grinding ore to liberate valuable minerals. Tests such as the Bond Work Index and SMC are conducted to determine the hardness and grindability of the ore.
•Leaching Tests: Bottle roll and column leach tests are conducted to determine the ore's amenability to cyanidation and other leaching methods. A typical bottle roll test involves transferring a weighed sample into a leaching bottle, adding water to prepare slurries at 50% solids, and adjusting the pH with hydrated lime to about 10.5. Sodium cyanide is added (concentration based on plant conditions), and the bottles are rolled for 40 hours, with periodic pH checks and adjustments. After the leaching period, the slurries are filtered, and the residues are analyzed for gold content.
•Diagnostic Leaching is a laboratory technique used to identify the mineral phases associated with gold and understand the causes of gold losses in the leaching process. This method involves sequentially solubilizing the least stable minerals and extracting the associated gold, providing insights into the disposition of gold within the ore.
10.2Degree of Representation of the Mineral Deposit
The location of the drill holes used in the latest metallurgical test work are presented in Figure 10-1. Multiple holes were used from across the length of the deposit and are therefore deemed representative of Kalgold
Effective Date: June 30, 2024
36
Technical Report Summary for
Kalgold Mine, North West Province, South Africa
ore types. Nine metallurgical domains were identified based on the results of the current drilling campaign. Samples for each metallurgical domain have been obtained from the available cores and from the ROM feed to the plant.
10.3Analytical Laboratory Details
Maelgwyn Metallurgical Laboratory, established in 2009, conducts commercial mineral processing and metallurgical test work for the process design and development purposes. All leach work conducted can be validated by full metal balances including solid, liquid and carbon metal content.
The Maelgwyn Metallurgical and SGS laboratories holds an ISO quality accreditation required for commercial laboratories.
10.4Test Results and Recovery Estimates
The overall gold recovery calculated for the two options tested namely; ROM- Leach and Flotation – Leach are outlined in Table 10-2.
Table 10-2: Metallurgical Test Work Results
| | | | | | | | | | | |
| Two Options | Recovery (%) | NaCN Consumption (kg/t) | Lime Consumption (kg/t) |
| ROM - Leach | 89.1 | 0.65 | 0.75 |
| Floatation - Leach | 87.1 | 4.20 | 1.41 |
Effective Date: June 30, 2024
37
Technical Report Summary for
Kalgold Mine, North West Province, South Africa
Figure 10-1: Position of Drill Holes Used for Metallurgical Test Work
Source: Google Earth Image June 2019
10.5Commentary on Mineral Processing and Metallurgical Testing
Kalgold and its processing facility have been in operation since 1996, and as such the processing method is well established for the style of mineralization processed. The plant therefore makes use of historical trends and data as a basis for their recoveries.
QP is satisfied that the metallurgical process is well-tested as part of the ongoing operations and has been subjected to reviews as part of the on going expansion project work. Kalgold ore body is quite complex and necessary adjustments on the process are carried out whenever there is a need to ensure that the stipulated metallurgical efficiency targets are attained all the time.
Effective Date: June 30, 2024
38
Technical Report Summary for
Kalgold Mine, North West Province, South Africa
11Mineral Resource Estimate
Section 229.601(b)(96)(iii)(B)(11) (i-vii)
The current Kalgold Mineral Resource estimate is based on the January 2024 geological model which was created by the QP using the following:
•Leapfrog Geo 4.5 ("Leapfrog") software for geological modelling;
•Datamine modelling software for Mineral Resource estimation and drill hole validation.
11.1Geological Database
The Kalgold Mineral Resource estimate is based on the exploration drill hole data obtained up to December 2023. The validated database contains a total of 2,756 drill holes (207,323m of drilling). Approximately 1,367 of those drill holes (63,416m) are valid and fall within the Mineral Resource model extents and were used in the estimation. The remaining of these holes have been excluded from the estimation. Around 89% of the exploration drilling assays comprise 1m long samples with the rest largely comprising samples <2m long. There is no apparent correlation between sample length and grade.
11.2Geological Interpretation
The Kalgold geological model has been constructed using drilling information, mapping information, geophysical survey and interpretation information and air photography and satellite studies. The estimation domains are controlled by the underlying geology model. Rock codes have been assigned to the different geology types as classified from drilling and mapping. The assigned codes are listed in Table 11-1.
Table 11-1: Geological Modelling Rock Codes
| | | | | |
| Lithology | Model Code |
| Cover | 99 |
| Eastern limb BIF | 10 |
| Central schist | 20 |
| Western limb BIF | 30 |
| Spanover BIF | 70 |
| Windmill BIF | 80 |
| Eastern Greywacke | 90 |
| Western Mafic | 91 |
| Conglomerate unit | 95 |
| Windmill Volcanics | 96 |
| Dolerite Intrusives | 100 |
There is a good general understanding of the stratigraphy and the deposit type owing to the long history of mining. As such there has been no attempt to model different interpretations of the geology. New drilling has started to indicate more complexity at the northern end, where there was historically poor drill coverage. There is some scope for changes to the interpretation, but this is all north of the current mining area. Additional drilling work in these areas are planned to firm up the interpretation in this area.
11.2.1Oxidation
The oxidation model was built from the oxidation as logged in drilling. However, the quality of the oxidation logging was not reliable, with many drill holes logged either fresh from surface or oxidised the entire length. Most oxidation codes within the database were not specific regarding the amount of oxidation present, and this made separating the oxidation into complete/partial/fresh difficult. To this end only two oxidation domains were completed based on all available information, as shown in Table 11-2.
Effective Date: June 30, 2024
39
Technical Report Summary for
Kalgold Mine, North West Province, South Africa
Table 11-2: Oxidation Domains
| | | | | |
| Description | Model Code |
| Oxidised | 2 |
| Not Oxidised (Fresh) | 1 |
The Kalgold area contains an overburden of Kalahari sands. Modelling of the overburden surface followed the below process:
•extracting the base of the logged overburden from the drill hole database;
•adding points to replicate the BIF outcrop along strike of the Windmill Zone; and
•modelling the surface and clipped it to the topography.
11.2.2Estimation Domains
The Kalgold estimation domains listed in Table 11-3 are based on the geology and structural domains. All wireframes generated using implicit modelling were assessed and modified using points and polylines inside Leapfrog to generate a reliable model. Wireframes were then exported to DatamineTM for data extraction and model generation..
Table 11-3: Lode Estimation Domains
| | | | | |
| Description | Estimation Domain (Lode No.) |
| Eastern limb BIF | 10 |
| Central schist | 20 |
| Western limb BIF | 30 |
| Spanover BIF | 70/71/72/73 |
| Windmill BIF | 80 |
| Waste host | 75/76/90/91/95/96/121/122/140 |
| Kalahari sands cover | 99 |
| Dolerite intrusives | 103 |
The estimation domains (Figure 11-1) have been split into east limb BIF, central schist, west limb BIF, Spanover BIF, Windmill BIF and Waste (comprising both the western mafic unit, conglomerate unit, and the eastern greywacke). Whilst no separate waste estimate has been conducted based on the boundary analysis, the waste rock composites have been used in the estimation of certain of the BIF units. The overprinting dykes are not mineralised and stope out the mineralisation. However, they have been included here as a domain in the model to ensure these blocks are excluded from the estimate.
The strike of the BIF units varies across the deposit. As such, the estimation domains have been split into three structural domains, namely North, Central and South. This split is based on the general strike and orientation of the stratigraphy and was used to inform the search direction. The structural domains are shown in 11-2.
11.3Mineral Resource Estimation Methods
11.3.1Exploratory Data Analysis
Analysis of exploration data has been conducted on all estimation domains. However, Domain 20 (Central schist) was not estimated due to a lack of consistent sampling resulting from a policy which did not require sampling of this schist unit. An updated Mineral Resource estimate has been prepared for the Spanover (Domain 70/71/72/73) and Windmill North (Domain 120) mineralized zones. This update incorporates new drill hole data. The exploration history, both historical and recent, suggests substantial potential for expanding the existing resource areas.
11.3.2Global Analysis
A global analysis of the data shows that the natural cut-off for the data sits around 0.2g/t, which is a good basis to develop a grade shell. However, the lack of consistent sampling downhole (selective geology-based sampling has been completed) has made it difficult to build a coherent grade shell with which to constrain the estimate. This resulted in minor smearing of grade into potentially undrilled low-grade areas. As drilling data increases into the future, the potential for smearing grade is expected to reduce.
Effective Date: June 30, 2024
40
Technical Report Summary for
Kalgold Mine, North West Province, South Africa
Figure 11-1: Kalgold Geological Domains Used in Mineral Resource Estimation
Effective Date: June 30, 2024
41
Technical Report Summary for
Kalgold Mine, North West Province, South Africa
Figure 11-2: Distribution of the Kalgold Structural Domains
Effective Date: June 30, 2024
42
Technical Report Summary for
Kalgold Mine, North West Province, South Africa
11.3.3Decluster Analysis
Sample cluster analysis was conducted to assess the clustering in the exploration drilling using both Isatis and GSLib. The analysis was conducted by selecting an approximate cell size based on the average drill spacing and then adjusting using a fixed variable, 160m(X) and 160m(Y) and 80m(Z).
11.3.4Data Compositing
Various composite lengths for the exploration drill hole data were assessed to select a representative composite length, which comprised 1.0m, 2.0m, 2.5m and 5.0m lengths. Statistics by domain show that there generally is a significant fall in variability between raw, 1.0m and 2.0m lengths. However, after the 2.0m length, the variability was stable. A comparison of the data before and after compositing to 2.0m is presented in Table 11-4. Compositing to 2.0m adequately reduces the sample variance whilst maintaining an adequate amount of sample for Ordinary Kriging estimation. The data in all domains was negatively skewed and showed significant variance.
Table 11-4: Comparison of Data Before and After Data Compositing to 2m Lengths
| | | | | | | | | | | | | | | | | | | | | | | | | | |
| Domain | Description | No. Samples | Minimum (g/t Au) | Maximum (g/t Au) | Mean (g/t Au) | SD (g//t Au) | Variance | COV |
| Eastern Limb BIF | Raw data | 49 222 | 0.001 | 269 | 0.94 | 2.48 | 6.13 | 2.63 |
| Composited data | 19 598 | 0.001 | 134 | 0.93 | 1.97 | 3.86 | 2.11 |
| Western Limb BIF | Raw data | 15 064 | 0.001 | 136 | 0.62 | 1.68 | 2.83 | 2.72 |
| Composited data | 5 830 | 0.001 | 68 | 0.63 | 1.36 | 1.85 | 2.16 |
| Windmill South BIF | Raw data | 6 563 | 0.001 | 37 | 0.97 | 2.67 | 7.11 | 2.74 |
| Composited data | 2 559 | 0.001 | 24 | 0.89 | 2.04 | 4.15 | 2.29 |
| Windmill North BIF | Raw data | 3 462 | 0.001 | 28 | 0.42 | 1.08 | 1.18 | 2.55 |
| Composited data | 1 486 | 0.001 | 18 | 0.42 | 0.85 | 0.73 | 2.02 |
| Spanover BIF | Raw data | 2 035 | 0.001 | 18 | 0.44 | 1.14 | 1.29 | 2.59 |
| Composited data | 963 | 0.001 | 9 | 0.46 | 0.91 | 0.83 | 1.99 |
| | | | | | | | |
| | | | | | | |
| Total | 30 436 | | | | | | |
11.3.5Diffusivity and Proportional Effect
Diffusivity tests how well the grade is connected across the domain. A diffuse deposit is one where different bins of grade are connected to others, creating a smooth gradation from high-grade to low-grade. Diffuse deposits can be estimated with simple linear estimation methods like Ordinary Kriging and inverse distance. Non-Diffuse deposits (sometimes referred to as mosaic-type deposits) are not smooth. High-grades and low- grades are found adjacent to each other without a gradational pattern between them. A mosaic-type deposit does not estimate well when linear estimation types are used. In these cases, a non-linear method such as Indicator Kriging or Conditional Simulation must be used. Diffusivity is tested by generating a series of cross variograms between different grade bins.
The proportion effect is a test of variability against grade. A positive result indicates that variability increases with grade. As a precious metal deposit, this is expected.
The Kalgold deposit is both diffuse and shows a strong proportional effect. This means that whilst Ordinary Kriging is an appropriate method for this deposit care needs to be taken when constructing the variograms to ensure representativity. Standard semi-variograms are problematic in projects where a strong proportional effect is present. Harmony has resolved this problem by using correlograms and back transforms normal scores for variography.
11.3.6Contact Analysis
A domain boundary contact analysis was completed using MicromineTM (normal distance to wireframe) to understand the nature of the boundaries between the different units.
The hanging wall to the East limb BIF and the footwall to the West limb BIF were both found to be soft over 10m - 20m. However, the internal Central schist appears to have hard boundaries between it and the BIFs on either side, with significant grade drops moving from the BIF unit into the schist.
11.3.7Basis Statistics
Effective Date: June 30, 2024
43
Technical Report Summary for
Kalgold Mine, North West Province, South Africa
The basic domain statistical analysis shows that the domains are strongly skewed but generally contain only low to medium grades.
11.3.8Top Cut Determination
Top cuts were determined using statistical analysis, specifically analysing where the histogram breaks down and assessing that point against the data distribution in three-dimensional (“3D”), the metal content of the cut samples and the 99th percentile. Top cuts were determined from exploration data only and, where possible, less than ~10% of contained metal was removed from a domain.
Five estimated domains were assessed, and the final top cuts are 8.00g/t for domains 10 (east limb BIF), 8.00g/t (west limb BIF) and 7.54g/t for 70 (Spanover BIF), 15.15g/t for Zone 80 (Windmill BIF) and 7.59g/t for Zone 120 Windmill North.
The post top cut domain statistical analysis shows the domains are less strongly skewed and, while they do only contain low to medium grades, the Coefficient of Variation (“COV”) variable indicates the domains are amenable to Ordinary Kriging.
11.3.9Stationarity
To test for domain stationarity a series of grade swath plots of mean grade and SD were used as shown in Figure 11-3. These charts show that there is very little drift in the Kalgold deposit with steps in the graphs correlated to changes in deposit strike which will be handled through search parameters, staged estimation and structural domaining.
11.3.10Variography
The variography generally exhibits a high nugget effect and variograms are noisy because of the strong proportional effect seen in the Kalgold deposit. To enable a relatively robust estimate, a series of correlograms were modelled for each domain. Back transformed Gaussian variograms were also assessed to compare the parameters used. The Gaussian variograms and correlograms were generally in agreement.
Variograms tend to indicate a nugget of between 15% - 30%. The second structure tends to comprise a further 40% -60% of the variance, with the long range third structure comprising the remainder. The first structure commonly covers 70% - 80% of the total variance and 20% - 30% of the total range with distances of between 20m - 50m. This indicates that to obtain a high-quality estimate drilling needs to be spaced at the 20m - 40m spacing.
The variograms were modelled in Isatis as correlograms and in Supervisor as Normal score back transform variograms. Rotations were determined using the Isatis Geological Plane to ensure easy transfer, from Isatis to Leapfrog and DatamineTM. Geological Plane rotation is ZYZ rotation or Z (azimuth), Y (dip right hand down looking along the strike) and Z (pitch in plane rotated down from Azimuth direction).
Effective Date: June 30, 2024
44
Technical Report Summary for
Kalgold Mine, North West Province, South Africa
Figure 11-3: Variogram Ellipses Used for Each Structural Domain
Effective Date: June 30, 2024
45
Technical Report Summary for
Kalgold Mine, North West Province, South Africa
11.3.11Block Model
The Mineral Resource model was constructed in the LO25 grid. The parameters used in constructing the block model are shown in Table 11-5.
The resulting model was then re-blocked to 10m x 10m x 5m to create the Mineral Reserve model. The Windmill Mineral Resource, which has been included in the Kalgold model, utilises the same parameters and block size as the Broader model. A trial was run utilising a smaller block size on Windmill alone as a test. However, whilst there was a slight drop in tonnes and a higher gold grade, the overall result was not significant enough to justify a separate model.
Table 11-5: Summary of Block Model Extents
| | | | | | | | | | | |
| Variable | X | Y | Z |
| Minimum (Origin Centroid) | 22 595 | (95 220) | 775 |
| Maximum | 24 455 | (91 760) | 1 355 |
| Extents | 1 860 | 3 460 | 580 |
| Parent block size | 10 | 20 | 20 |
| Sub block size | 5 | 5 | 2.5 |
| No. of blocks | 186 | 173 | 29 |
| Rotation (Bearing/Plunge/Dip) | — | — | — |
11.3.12Grade Estimation
The Ordinary Kriging grade interpolation method has been selected for Kalgold based on data density and grade distribution. The variograms helped inform the data searches in combination with the level of sample support. The first pass was roughly based on half the main variogram range at the recommendation of an independent reviewer. The second pass was double the first and the third was three times the first. The purpose of the third pass was to simply inform those parts of the model not filled by the earlier passes.
The Central schist unit was not estimated due to a lack of sampling that consequently causes grade smearing during estimation. The Spanover BIF (Domain 70), Windmill(Domain 80) and Windmill North BIF (Domain 120) was estimated and classified using the same methodology as described in detail in “Harmony Kalgold Operations Kalgold Mineral Resource Report, (R.Reid December 2019). Extensive additional drilling has occurred in these three domains, resulting in an upgraded Mineral Resource Model for Domain 70, 80 and 120. However, Domain 10 and 30 remains relatively unchanged compared to last year.
Grade continuity is considered moderately good. Variography and 3D analysis indicates that the grade is relatively continuous and tightly constrained to the extents of the BIF units. Mapping the BIFs essentially maps the grade distribution. Within this broad envelope of the BIF there is a strong structural component to the grade distribution which results in shallow northerly plunging high grade lozenges that are contained in an overall broad tablet-type low-grade halo constrained within the BIF. These grade lozenges are in the order of 40m to 80m in length and would require a high density of drilling to accurately map them within the model, this is well inside the current drill density and this lack of drill density negatively impacts the ability of the model to accurately replicate these small high-grade lenses.
11.3.13Relative Density and Tonnage Calculation
Densities used in past were taken from the Kalgold 2017 DatamineTM Ordinary Kriging estimation macro. This is because there were not enough samples across the deposit to update the assigned density numbers. Over the past couple of years, a significant number of density measurements were obtained from the new drilling at a rate of approximately 1 every 10m. As such, the density data now covers a significant portion of the deposit. This data has been combined with grab sample data taken from the pit during the sampling process. For the current estimation, the densities used were assigned to the block model using a Datamine RMTM macro. The densities have largely been estimated into the main domains using the Inverse Distance Squared interpolation method.
The densities that were used to calculate the Mineral Resource tonnage are presented in Table 11-6. Areas not covered were extrapolated by nearest neighbour estimates.
Effective Date: June 30, 2024
46
Technical Report Summary for
Kalgold Mine, North West Province, South Africa
Table 11-6: Densities Assigned by Depth
| | | | | | | | |
| Lithology | Depth (mRL) | Density (t/m3) |
| BIF | >=900 | 2.99 |
| BIF | >=1,160 | 2.93 |
| BIF (approximate base of oxide) | >=1,200 | 2.88 |
| Not BIF | >=900 | 2.81 |
| Not BIF | >=1,120 | 2.80 |
| Not BIF | >=1,150 | 2.80 |
| Not BIF (approximate base of oxide) | >=1,200 | 2.72 |
11.3.14Model Validation
The block model was validated and reviewed by the QP using statistical tests, visual assessments, swath plots and estimation quality parameters. Swath plots were generated to compare the block model grades to the composite and declustered composite grades for easting, northing, and elevation slices through the deposit. Block model grades generally follow the composites and display an adequate amount of smoothing.
Estimation risk was assessed using cross validation plots and a supporting Inverse Distance Squared estimate. The grade-tonnage curves from both estimates replicate each other indicating no significant estimation issues with the Ordinary Kriging estimate showing some additional smoothing related to the variograms and high nugget.
11.4Mineral Resource Evaluation
The Mineral Resources at Kalgold are considered by the QP to have reasonable prospects of economic extraction by open pit mining methods. Kalgold is an on-going operation with a well-defined set of operating parameters and costs. These parameters are used to generate a series of open pit Mineral Resource shells based on various gold prices, to constrain the Mineral Resource block model for reporting purposes. The parameters used to determine the economic cut-off grade at the current effective date of June 30, 2024 are presented in Table 11-7.
Table 11-7: Economic Parameters for Mineral Resource Shell
| | | | | | | | |
| Description | Unit | Value |
| Gold price | ZAR/kg | 1 100 000 |
| Planned recovery factor | % | 86.00% |
| Mining costs | ZAR/t | Modelled based on Andru mining rates |
| Processing costs | ZAR/t | 310.00 |
| Plant throughput | ktpm | 130 |
| Planned dilution (Weighted planned per pit) | % | 6.94 |
The gold price, as used for the Mineral Resource shell modelling and the Mineral Resource economic analysis, corresponds to the USD1,772/oz (ZAR1,100,000/kg) gold price (Table 11-7). This is for the reporting period June 30, 2024, it will updated for next reporting period. The plant recovery factor is based on metallurgical test work and historical plant performance, as discussed in Section 10 of this TRS. Based on the parameters presented in Table 11-7, the cut-off grade reporting to the Kalgold Mineral Resources at the effective date is 0.55g/t gold. The cut-off grade has been updated using the Gold price of USD1,878/oz (ZAR1,100,000/kg).
The Kalgold Mineral Resource estimate is reported in situ at economic viability of 0.55g/t gold economic cut-off. The latter is determined taking into account the Gold Price, mining costs and the plant processing costs.
Effective Date: June 30, 2024
47
Technical Report Summary for
Kalgold Mine, North West Province, South Africa
11.5Mineral Resource Classification and Uncertainties
The Kalgold Mineral Resource model was classified into Measured, Indicated and Inferred Mineral Resource categories. The classification criteria are based on the assessment of the quality of the Kriged estimate (using population breaks in the slope of regression and Kriging efficiency parameters) and sample support (average sample distance and data spacing). Each of these parameters were considered individually and ranked in order of priority with Estimation Pass, Average Sample Distance and the Slope of Regression having the most significant impact. Histograms of this data were assessed, and break points identified in the data that equate with the parameters presented in Table 11-8.
A combination of these parameters was used to classify the Mineral Resource estimate using a set of "if-else" statements that were collated into a single automatic classification. This data was then used to generate a series of wireframes for the Measured, Indicated, and Inferred categories. The wireframes were adjusted to account for the continuity seen in the geological model that included geology, structural understanding, grade continuity, historical reconciliation, and deposit type. No further geological losses or discounts were applied additional to those modelled in the ore limb model. The measured wireframe was further adjusted 20m below the blasthole data to cater for year on year confidence upgrade.
Table 11-8: Parameters Considered for Constructing the Mineral Resource Classification Wireframes
| | | | | | | | | | | |
| | Mineral Resource Category |
| Parameter | Measured | Indicated | Inferred |
| Kriging Variance | 0.2 | 0.3 | 0.4 |
| Kriging Efficiency | 0.6 | 0.3 | 0.1 |
| Slope of Regression | 0.8 | 0.5 | 0.3 |
| Average Sample Distance (m) | 20 | 40 | 100 |
| Estimation Pass | 1 | 2 | 3 |
The Kalgold geological model is considered robust by the QP, as it is based upon the well understood stratigraphic model with defined geological units that are readily mapped between drill holes and along strike.
A 3D image of the final classified Mineral Resource model prior to the application of the economic cut-off grade is shown in Figure 11-4. There is a significant amount of mineralised material outside this area that remains unclassified either due to lack of supporting data, poor chances at economic extraction, or poor estimate quality.
11.6Mineral Resource Estimate
The Mineral Resource estimate is reported as in-situ with reasonable prospects for economic extraction, classified in accordance with § 229.1302(d)(1)(iii)(A) (Item 1302(d)(1)(iii)(A) of Regulation S-K).
The location of the Mineral Resources is indicated in Figure 11-4.
The Mineral Resource estimate for A Zone, Watertank and Windmill Zone is presented in Table 11-9 as at June 30, 2024, exclusive of Mineral Reserves. The estimate accounts for mining depletions up to June 2024. The Mineral Resource figures reported herein only consider the tonnages contained within the Mineral Resource model, with the inferred portion of the Mineral Resource including the historical Surface tailings of 6 263Kg (0,201Moz).
The QP compiling the Mineral Resource estimates is Mr RF Gaelejwe, who is the fulltime Ore Reserve Manager at Kalgold, and an employee of Harmony.
Effective Date: June 30, 2024
48
Technical Report Summary for
Kalgold Mine, North West Province, South Africa
Figure 11-4: Location and Classification of Kalgold’s Mineral Resources and Mineral Reserves
Effective Date: June 30, 2024
49
Technical Report Summary for
Kalgold Mine, North West Province, South Africa
Table 11-9: Summary of the Kalgold Mineral Resources as at June 30, 2024 (Exclusive of Mineral Reserves) 1-8
| | | | | | | | | | | |
| METRIC |
| Mineral Resource Category | Tonnes (Mt) | Gold Grade (g/t) | Gold Content (kg) |
| Measured | 8.928 | 1.15 | 10 223 |
| Indicated | 14.715 | 1.33 | 19 538 |
| Total / Ave. Measured + Indicated | 23.643 | 1.26 | 29 762 |
| Inferred | 31.688 | 0.60 | 18 855 |
| IMPERIAL |
| Mineral Resource Category | Tons (Mt) | Gold Grade (oz/t) | Gold Content (Moz) |
| Measured | 9.841 | 0.033 | 0.329 |
| Indicated | 16.221 | 0.039 | 0.628 |
| Total / Ave. Measured + Indicated | 26.062 | 0.037 | 0.957 |
| Inferred | 34.930 | 0.017 | 0.606 |
Notes:
1. Mineral Resources are reported with an effective date of June 30, 2024 were originally prepared, classified and reported according to SAMREC, 2016. For the purposes of this TRS, the Mineral Resources have been classified in accordance with § 229.1302(d)(1)(iii)(A) (Item 1302(d)(1)(iii)(A) of Regulation S-K). The Qualified Person responsible for the estimate is Mr RF Gaelejwe, who is Ore Reserve Manager at Kalgold, and a Harmony employee.
2. The Mineral Resource tonnes are reported as in-situ with reasonable prospects for economic extraction.
3. No modifying factors or dilution sources have been included to in-situ Reserve which was subtracted from the SAMREC Resource in order to obtain the S-K 1300 Resource.
4.The Mineral Resources are reported using a cut-off value of 0.55g/t and a gold price of USD1,878/oz
5. Tonnes are reported as rounded to three decimal places. Gold values are rounded to zero decimal places.
6. Mineral Resources are exclusive of Mineral Reserves. Mineral Resources are not Mineral Reserves and do not necessarily demonstrate economic viability.
7. Rounding as required by reporting guidelines may result in apparent summation differences.
8. The inferred portion of the Mineral Resource includes the historical Surface tailings of 6 263Kg (0,201Moz)
9. The Mineral Resource estimate is for Harmony’s 100% interest.
Factors that may affect the Mineral Resource estimates include the following:
•Historical Data validations assumptions
•gold price assumptions;
•exchange rate assumptions;
•operating and capital cost assumptions;
•gold recovery assumptions; and
•operational risks.
11.7Mineral Resource Reconciliation
The Measured and Indicated Mineral Resources, exclusive of Mineral Reserves, decreased by 28.8% year on year from 1.345Moz to 0.957Moz. The Inferred Mineral Resources, exclusive of Mineral Reserves, increased from 0.278Moz in June 2023 to 0.606Moz in June 2024. The change is due to updated A Zone - Watertank pits pit optimisation and Windmill North resource upgrade.
11.8Comment on Mineral Resource Estimates
In the opinion of the QP:
•there are no obvious geological, mining, metallurgical, environmental, social, infrastructural, legal and economic factors that could have a significant effect on the declared Mineral Resource;
•there is no known geological data that could materially influence the estimated quantity and quality of the Mineral Resource; and
•current models/interpretations are continuously subjected to ongoing review for improvements where applicable.
Effective Date: June 30, 2024
50
Technical Report Summary for
Kalgold Mine, North West Province, South Africa
12Mineral Reserve Estimate
Section 229.601(b)(96)(iii)(B)(12) (i-vi)
The reported Mineral Reserves are derived through a business planning process by the QP. The business planning process comprises multi-functional reviews inclusive of all mining, support and service departments that are involved in the verification of the inputs and the Modifying Factors. The CODM comprises various executive roles and responsibilities. These executives assess the profitability, the revenue and production costs. The CODM also considers capital expenditure, gold production and tonnes milled when assessing the overall economic sustainability.
12.1Key Assumptions, Parameters, and Methods used to Estimate the Mineral Reserve
The results and assumptions derived from the business planning process come from a review of the last 18-month period production. The planning process carefully considers strategic plan directives; analysis of historical performance; realistic productivity, and cost parameters; Modifying Factors; and technical and economic studies that have demonstrated justified extraction, as applicable to specific portions of the Mineral Reserves.
All reported Mineral Resources and Mineral Reserves originate in situ from the orebody hosted within the Kraaipan Greenstone belts at Kalgold. The Mineral Reserves are considered based on several factors, including:
•the latest geological structure and associated Mineral Resource estimation models that constrain the layout for the mine design and LOM planning;
•pit slope stability design parameters as guided by geotechnical design and modelling;
•identified mining areas can be found in four discrete orebodies - D Zone, A Zone, Watertank, and Windmill;
•the open pit mining methodology is informed by the geological model;
•the Mineral Reserves cater for allowances in dilution sources and relevant Modifying Factors. Dilution of the orebody is predominantly expected to be incurred during mining operations; and
•only Measured and Indicated Mineral Resources are used to derive the Mineral Reserves.
No other sources of information are published as part of the Mineral Reserves for Kalgold.
12.2Modifying Factors
A summary of the Modifying Factors used to convert the Mineral Resource to the Mineral Reserve for Kalgold is presented in Table 12-1. The Modifying Factors are consistent with the modelling of the orebody, planning and computing estimates used in determining the Mineral Reserves, which are also consistent with historical performance. Plant recovery as shown in Table 12-1, closely aligns to the overall metallurgical test work and gold recovery calculated for the both the ROM-leach and flotation-leach methods, as defined in Section 10 and Section 14, respectively.
The Mineral Reserves are declared as delivered to the mills. Modifying Factors used for Mineral Reserves determination are shown in Table 12-1.
Table 12-1: Kalgold Modifying Factors Used for Mineral Reserve Determination
| | | | | | | | |
| Modifying Factor | Unit | Value |
| Mineral Reserve cut-off - Pit Mineral Reserves | g/t | 0.58 |
| MCF - Pit Mineral Reserves | % | 100 |
| Dilution - Pit Mineral Reserves (Weighted planned per pit) | % | 6.94 |
| Plant Recovery Factor - Pit Mineral Reserves | % | 86.00 |
| Plant Recovery Factor - Stockpile Mineral Reserves | % | 70.00 |
Dilution of 6.94% over the Mineral Reserve LOM (Table 12-1) is a weighted average from different pits. In the first 3 Years A Zone, Watertank and Windmill South dilution is at 7.5%, 5% and 10% respectively. Post 3 years
Effective Date: June 30, 2024
51
Technical Report Summary for
Kalgold Mine, North West Province, South Africa
A Zone, Watertank and Windmill North dilution is planned at 10%, 5% and 10% respectively for the rest of the Mineral Reserve LOM. Dilution planning is informed by historical mining and orebody knowledge.
12.3Mineral Reserve Estimate
The Mineral Reserves were originally prepared, classified and reported according to SAMREC, 2016. For the purposes of this TRS, the Mineral Reserves have been classified in accordance with § 229.1302(d)(1)(iii)(A) (Item 1302(d)(1)(iii)(A) of Regulation S-K).
Mineral Reserves are derived from the Mineral Resources, a detailed business plan and the operational mine planning processes. Mine planning utilises and takes into consideration historical technical parameters achieved. In addition, Mineral Resource conversion to Mineral Reserves considers Modifying Factors, dilution, ore losses, minimum mining widths and planned mine call factors.
The QP compiling the Mineral Resource estimates is Mr RF Gaelejwe, who is Ore Reserve Manager at Kalgold, and an employee of Harmony.
The Mineral Reserves are 18.711Mt of milled ore containing 645koz of gold and comprises 51% Proved Reserves and 49% are Probable Reserves. The Kalgold Mineral Reserves are presented in Table 12-2, whilst their locality is presented in Figure 11-4.
Table 12-2: Summary of the Kalgold Mineral Reserves as at June 30, 2024 1-5
| | | | | | | | | | | |
| METRIC |
| Mineral Reserve Category | Milled Tonnes (Mt) | Gold Grade (g/t) | Gold Content (kg) |
| Proved (Open pits and stockpiles) | 10.342 | 0.99 | 10 207 |
| Probable (Open pits and stockpiles | 8.369 | 1.18 | 9 854 |
| Total (Proved + Probable) | 18.711 | 1.07 | 20 061 |
| |
| IMPERIAL |
| Mineral Reserve Category | Milled Tons (Mt) | Gold Grade (oz/t) | Gold Content (Moz) |
| Proved (Open pits and stockpiles) | 11.400 | 0.029 | 0.328 |
| Probable (Open pits and stockpiles | 9.225 | 0.034 | 0.317 |
| Total (Proved + Probable) | 20.625 | 0.031 | 0.645 |
Notes:
1. The Mineral Reserves were originally prepared, classified and reported according to SAMREC, 2016. For the purposes of this TRS, the Mineral Reserves have been classified in accordance with § 229.1302(d)(1)(iii)(A) (Item 1302(d)(1)(iii)(A) of Regulation S-K). The Qualified Person responsible for the estimate is Mr RF Gaelejwe, who is the Kalgold Ore Reserve Manager, and a Harmony employee.
2. Tonnes, grade, and gold content are declared as net delivered to the mills.
3. Figures are fully inclusive of all mining dilutions, gold losses and are reported as mill delivered tonnes and head grades. Metallurgical recovery factors have not been applied to the reserve figures.
4. Gold content is delivered gold content after taking into consideration the modifying factors.
5. Mineral Reserves are reported using a cut-off grade of 0.58g/t determined using a gold price of USD1,772/oz.
6. Rounding as required by reporting guidelines may result in apparent summation differences.
12.4Mineral Reserve Reconciliation
The declared Mineral Reserve estimate increased by 65% from 0.392Moz as at June 30, 2023 to 0.645Moz as at June 30, 2024. The increase is attributed to the Inclusion of Watertank Main mining at improved strip ratio.
12.5Commentary on Mineral Reserve Estimate
The declared Mineral Reserves takes into consideration all Modifying Factors. The Mineral Reserves are depleted to generate the cash flows presented in Section 19 and are deemed by the QP to be appropriate and, both technically and economically achievable. Any by-products that are recovered as part of the refining process, make up an immaterial component of the total metal inventory, and is thus not reported as part of the Mineral Reserve estimate.
In the opinion of the QP, the methodologies applied in estimating the Mineral Reserve is sound.
Effective Date: June 30, 2024
52
Technical Report Summary for
Kalgold Mine, North West Province, South Africa
13Mining Method
Section 229.601(b)(96)(iii)(B)(13) (i-v)
Kalgold is an open-pit mining operation located in the geological terrane of the Archaean KGB. Gold mineralisation is hosted by steeply dipping BIF interbedded with schist, shale, and greywacke. The nature of the orebody requires the selective mining of the ore blocks, defined by the east and west mineralised limbs, to separate the ROM destined ore, above the Mineral Reserve cut-off of 0,58g/t Au. Based on the gold grade, properties of the host rock, and shallow depth of mineralisation, open pit mining is appropriate for Kalgold. The gold deposit is mined most cost effectively, using a modular approach with multiple small to medium open pits defined by mineralised zones, as presented in Figure 13-1.
The various mineralised zones at Kalgold include the D Zone, A Zone, Watertank, Bridge Zone, Henrys, and Windmill. Some of these zones are delineated by structural geological domains, are currently being mined, or scheduled to be mined, from the following pits:
•the D Zone, located to the south of the Kalgold lease area in south domain, was mined out via the D Zone pit;
•the A Zone, located largely in the south domain with some portion in central domain, is currently being mined;
•the Watertank Zone is defined in the north domain and is currently being mined as the Watertank pit;
•the Bridge Zone extends north, from the A Zone, and is mostly located in the central domain, and is the infill area that combines the respective A Zone and Watertank pits;
•Henry’s pit located to the south of the A Zone pit, known as the A Zone south extension, is in the south domain,is mined-out in 2024; and
•the Windmill Zone, located north of the A Zone and Watertank pits, in the north domain, is planned to be mined via the Windmill South and North pits. This Zone also commenced mining in Q1 of 2022, along with Henry’s pit.
13.1Mine design
The mine design strategy aims at maximising the safe extraction of ore, while minimising the risk of geotechnical failures, which can result in operational disruptions and dangerous working conditions. The geological modelling, mining method, and geotechnical considerations are considered as part of the mine design process. Pit slope design work and recommendations play a critical role in the ultimate pit design and access ways.
While there are other satellite orebodies at Kalgold, the current A Zone and Watertank mining pits are discussed in detail. The A Zone and Watertank pits have an overall approximate strike of 2km and comprise two zones of mineralisation, which dip steeply towards the east. The mineralised zones range between 15m and 120m thick. A 10m bench height is used to mine the orebody. A plan view of the current designed mining pits shown in Figure 13-1.
13.1.1Mine Design Parameters
The mine design process at Kalgold incorporates the pit slope design for current and future operations. The pit slope design criteria are incorporated into the pit design and optimisation process. Mine planning and optimisation is conducted using the DatamineTM and DeswikTM software. Key mine design parameters for the current A Zone and Watertank pits are shown in Table 13-1 and Figure 13-2.
Effective Date: June 30, 2024
53
Technical Report Summary for
Kalgold Mine, North West Province, South Africa
Figure 13-1: Plan Showing Kalgold Mining Zones
Effective Date: June 30, 2024
54
Technical Report Summary for
Kalgold Mine, North West Province, South Africa
Table 13-1: Key Mine Design Parameters
| | | | | | | | |
| Parameter | Unit | Value |
| Technical |
| Dilution (Weighted planned per pit) | % | 9.3 |
| Mineral Reserve cut-off grade | g/t | 0.58 |
| MCF | % | 100.0 |
| Plant Recovery Factor | % | 86.0 |
| Geotechnical Slope Design Angles |
| Weathered East and West: |
| Design | ° | |
| Overall (Windmill) | ° | 46.4 |
| Overall (Watertank) | ° | 46.4 |
| Overall (A Zone) | ° | 46.4 |
| Fresh Eastern |
| Design | | |
| Overall (Windmill) | ° | 49.2 |
| Overall (Watertank) | ° | 54.2 |
| Overall (A Zone) | ° | 54.2 |
| Fresh Western |
| Design | | |
| Overall (Windmill) | ° | 53.5 |
| Overall (Watertank) | ° | 46.8 |
| Overall (A Zone) | ° | 63.8 |
| | |
| | |
| Ramps | | |
| Design | | |
| Ramp Width | m | 23.7 |
| Reduced Ramp width at pit bottom | m | 11.85 |
| | |
| | |
| | |
13.2Mine Plan Development and Life of Mine Schedule
The modular open pit mining method is dependent on the detailed geological understanding of the various satellite orebodies. Exploratory infill drilling provides accurate geological information and is included in the final mine designs. The optimised mine design gives rise to the short-term planning and scheduling activities. These activities lead to the better grade control, safer working conditions, and improved profitability. The short-term planning is based on a monthly mining tonnage profile which considers rainy season.
At Kalgold, the LOM plan and scheduling originates with the use of the Mineral Reserves model, which is modelled at a 0.58g/t cut-off grade. The 18,711Mt (milled ore) of Mineral Reserves are included in the LOM plan and are fully accessible via the mine’s existing infrastructure. The mining rates used in determining the LOM plan are based on the current and expected operational performance, notwithstanding any unforeseen constraints. The remaining LOM for the operations is planned for 12 years. More details of the mined waste and ore tons profile, the milled ore tons, and recovered gold are presented in Section 13.4.1.
13.3Geotechnical and Geohydrological Considerations
13.3.1Geotechnical
The main geotechnical risk in open pit mining is slope failure.
The geotechnical model used in the Kalgold Mine design shown in Table 13-1, takes the geology and geological structures, observations from other historical slope failure incidents, results of the slope stability monitoring systems, groundwater flows, and mining conditions that may potentially induce slope failure. The geotechnical model also incorporates the geohydrology of the mining areas.
Slope failure is considered as a material risk which may impact Kalgold’s Mineral Resource and Mineral Reserve estimates. Current remedial action includes pre-split blasting to protect the integrity of the high walls. The pit slope mitigation strategy is detailed and managed through the Mining and Rock engineering
Effective Date: June 30, 2024
55
Technical Report Summary for
Kalgold Mine, North West Province, South Africa
Code of Practice (“COP”) and is communicated, adhered to, and monitored by both the mine’s technical services and operational teams. An example of the geotechnical recommendations for the A Zone and Watertank pits highwall design, in consideration of the ramp design, is represented in Figure 13-2.
13.3.2Geohydrological and Seismic Monitoring
The semi-arid nature and rainfall patterns associated to the Kraaipan climate, currently do not pose any significant risks to the Kalgold Mine.
Nevertheless, in hard rock environments such as Kalgold, it is worth noting that deep saturated fractures in bedrock are also potential sources of groundwater and dykes are also known preferential pathways for groundwater. These deeper lying geological features, with the combined low risk potential of a rainy season, can pose a risk to the mining operations. Risks associated to the accumulation of groundwater is managed through a planned pumping strategy water drainage controls in and around the pits.
The Leica GeoMos Monitoring Solution is installed and is used for data capturing. Data is being collected on limited scale due to current pushback in A Zone-Watertank complex. The data is being used to understand Kalgold conditions and for system fine-tuning. The monitoring system is planned to be expanded as the push backs are completed and the pit progresses deeper. Seismic monitoring includes the monitoring of pit slope stability by tracking and electronically recording prisms data points. These data points are captured via high resolution imaging from a remote monitoring location aimed at detecting movement in the pit high walls. The data collected thus far reflect stable high walls. It will be used to fine tune the monitoring parameters for when the system migrates to live reporting when the A Zone and Watertank pits pushback have progressed deeper.
13.4Mining Operations
Kalgold is an open-pit mining operation. There is currently one active pit, following the merger of the A Zone and Watertank pits, which is the main source of ore for the Mineral Reserve plan. The Mineral Reserve plan extends over the inclusive financial year period of 2025 - 2036. ROM ore is supplied for the period 2025 - 2034 from the pit. The remaining Mineral Reserve plan is supported with ore from the onsite managed stockpile.
13.4.1Mining Rates
The forecast mining production rates for Kalgold considers the planned mining areas, inclusive of the mines current infrastructure capacity. Kalgold Mineral Reserve plan comprises the planned ROM ore of c.1.5Mtpa to 1.6Mtpa for the period 2025 – 2034. The remaining of the Mineral Reserve plan to 2036 consists of material supplied from the stockpiles only. The Mineral Reserve LOM plan is presented in Figure 13-3.
The planned average stripping ratio for the period 2024 - 2031 is 4.78. The waste material movement is balanced with ore mining.
Ore destined for the plant consists of ore from the pit and ore from the high grade (“HG”) and low grade (“LG”) stockpiles (“SP”). The annual forecast milled tonnages and the associated yield used for the gold recovery is shown in Figure 13-4. Recovered gold content is based on the ore milled and processed originating from the various ore sources. The annual forecast gold produced for the LOM is shown in Figure 13-5.
13.4.2Mining Equipment and Machinery
Mining is conducted by mining contractors, Andru Mining (Pty) Limited (“Andru Mining”), under the management of Harmony. A contractor mining approach is envisaged for the proposed LOM plan.
Effective Date: June 30, 2024
56
Technical Report Summary for
Kalgold Mine, North West Province, South Africa
Figure 13-2: Section View of A Zone and Watertank Pit Slope and Ramp Design
Figure 13-3: Kalgold LOM Plan
Effective Date: June 30, 2024
57
Technical Report Summary for
Kalgold Mine, North West Province, South Africa
Figure 13-4: Graph of Kalgold Mineral Reserve Plan - Tonnes and Grade
Figure 13-5: Graph of Kalgold Mineral Reserve Plan – Gold Produced (kg)
Conventional truck and shovel methods are adopted by the mining contractor using the following mining fleet for both waste and ore movement:
•7 excavators (5 x 120t and 2 x 80t); and
•35 trucks (777: 9 @ 100t, 773: 11 @80t, ADT: 16 @ 40t )
Ancillary equipment includes, but not limited to, the use of water and diesel bowsers, mechanical and electrical maintenance fleet, graders, and dozers.
Effective Date: June 30, 2024
58
Technical Report Summary for
Kalgold Mine, North West Province, South Africa
Stockpile handling is also carried out by the mining contractor using the following fleet:
•4 front end loaders (“FEL”); and
•5 articulated dump trucks (“ADTs”).
The mining contract is aimed at delivering a specific volume of ore and waste mined. The contractor is bound by providing the necessary fleet, taking into consideration all equipment availability and utilisation, to deliver the required volumes.
13.4.3Dilution and Grade Control
The selective open pit mining method is used to maintain grade control through improved selectivity and flexibility using modular pits. Ore grade and dilution control is monitored through key parameters including geological grade control and mining within cut-off grade. The Geology department performs critical grade control monitoring, to ensure the ratio of the combined ore mined is within grade tolerance limits.
Operationally, grade and dilution control is mostly achieved through improved drilling and blasting practices. Drilling accuracy is achieved by holes that are drilled with minimum deviations, aimed at being correctly burdened and that are within the planned mining block limits. The ROM ore above the cut-off is earmarked for immediate processing from the ROM pad, while the low-grade ore is transported to a dedicated low-grade stockpile (Table 13-2).
Table 13-2: Stockpile Categories
| | | | | |
| Type of Stockpile | Grade Category (g/t) |
| ROM pad | >0.58 |
| Low-grade | 0.35 - 0.57 |
| Mineralised zone (Waste Dump) | <0.35 |
The annual forecast feed grades from the respective ore sources, the average feed grade for these respective sources, and the recovered grade for the Mineral Reserve is shown in Figure 13-4.
13.4.4Ore transport
Ore and waste material are transported separately, with ore being trucked from the pit to the plant ROM pad, and waste rock going to the mines waste dumps. There is sufficient provision in the current regulator approved Waste Rock Dump capacity to support the LOM. Low-grade ore is also delivered via trucks to the low-grade ore stockpile. Material re-handling, from the stockpile, is managed by a separate small loading and hauling fleet. There are established haul roads, maintained by the mining contractor, within the pit, plant, and stockpile that are designated for ore transport.
13.4.5Mining Personnel
The mine is supported by approximately 726 employees, comprising 248 permanent employees and 471 contractors. 284 of the 471 contractor employees are direct mining production employees. The open pit mining operations uses a 10-hour shift system, operating a 2-shift cycle per day. All other employees work on a day shift rotation system only. The Kalgold operations are supported by the key mining personnel functions, where some individuals carry overall accountability, as per the Mine Health and Safety Act 29 of 1996 (MHSA).
13.5Commentary on Mining Method
The open pit modular mining method is the prevalent mining method at the Kalgold Mine. This mining method works well with a robust understanding of the orebody’s geology and the ideal implementation of the pit slope design.
The mine design, planning and scheduling for the mine is developed using the DatamineTM software, considering the geotechnical model and related parameters. Grade control is an important activity at Kalgold and is closely monitored through onsite stockpiling practices.
The geohydrological risks at Kalgold are low, based on the hot and dry climate conditions and the low expectancy of rain days. Potential slope failure is the main geotechnical risk, which is managed through
Effective Date: June 30, 2024
59
Technical Report Summary for
Kalgold Mine, North West Province, South Africa
integrated monitoring systems and operational practises. The monitoring data is incorporated into working mining models that inform daily mine planning decision-making.
The mining rates, machinery and equipment, ore transport, grade and dilution control, and labour resourcing and optimisation are driven by the mine schedule and continuous monitoring initiatives on-site.
QP is satisfied with the mining method, design and allocated labour and equipment resources to execute the plan. Geotechnical risks are addressed in the designs strategy and monitoring plan is in place through the Strata Control officer and Rock Engineer.
Effective Date: June 30, 2024
60
Technical Report Summary for
Kalgold Mine, North West Province, South Africa
14Processing and Recovery Methods
Section 229.601(b)(96)(iii)(B)(14) (i-iv)
Kalgold's gold processing facility has been in operation since 1996. The technology used to process the gold-bearing ore is well established and has proven to be suitable for the style of mineralisation.
Kalgold plant employs the cyanidation process for the gold extraction. The pre oxidation process is integrated into the process to enhance the benefit of the process. The plant has been operating with minimal challenges depending area being mined. Greater part of the mining area yields the desirable dissolution. The ore body is quite complex and necessary adjustments on the process are carried out whenever there is a need to ensure that the stipulated metallurgical efficiency targets are attained all the time.
14.1Mineral Processing Description
Kalgold processes the ore using a well-established cyanide and CIL process for their recovery of gold. The processing flowsheet is presented in Figure 14-1.
The mine ore is transported from the pit by truck and tipped into the plant ROM pad from where it is fed into the pre-primary crusher for first stage of comminution, to decrease its particle size distribution. Pre-primary product reports to the primary crusher, followed by secondary and tertiary crushing, after which the product is temporarily stored in the dome prior to milling.
Ore within the dome is fed to the A, B and C ball mills with the product ranging from 75% - 80% passing at 75μm. A and B mills are identical in capacity with C being larger (Table 14-1). The A and B mill cluster cyclone overflow gravitates onto a vibrating screen for over-size material removal, while the C mill uses a conventional linear screen for the removal of over-size material. Once the excess over-size material is removed all overflow is pumped out to the thickeners for dewatering prior to leaching.
Table 14-1: Processing Parameters at Kalgold Plant
| | | | | | | | |
| Equipment | Unit | Value |
| Average ROM | ktpm | 130 |
| Moisture Content | % | 1 |
| Rate of feed to Mill A and B | t/hr | 55 |
| Rate of feed to Mill C | t/hr | 105 - 110 |
| Recovery of gold at CIL | % | 85 |
| Thickener underflow | % | 50 - 55 |
The thickener allows for separation of solids and liquid over time, by allowing the solids to settle at the bottom. The underflow, which is rich in gold reports to the pre-aeration tank for pre-conditioning prior to the addition of cyanide.
Cyanide is automatically added to either Leach 2 or Leach 3, depending on the degree of pre-aeration stage as Kalgold ore requires large amounts of cyanide to complete the leaching process. Generally, 75% dissolution takes place in the two leaching tanks. The remaining slurry gravitates to the CIL tanks for further leaching and adsorption.
Once the gold is dissolved into the cyanide solution it has a higher ability to adsorb (attach) onto activated carbon through the application CIL technology. There are seven stages in the CIL process with an average of 85% of gold adsorbed onto activated carbon. Once the carbon loading in the head tank reaches the required gold loading, the stream is pumped to the load make-up screen for the elution process.
The Kalgold plant employs the Zadra elution process for gold recovery where the loaded carbon is treated with a hot caustic and cyanide solution. The pregnant solution is pumped into the electro-winning circuit, where the gold will “de-absorb” from the activated carbon and attach onto stainless-steel wool.
Activated carbon can be regenerated for use again and as such once the gold has been removed from the activated carbon the eluted carbon passes through the acid column to be treated with hydrochloric acid for the removal of inorganic material. Acid-treated carbon is rinsed with high-pH water to neutralise the acid and
Effective Date: June 30, 2024
61
Technical Report Summary for
Kalgold Mine, North West Province, South Africa
transferred to the kiln for carbon regeneration. The regeneration process takes place at temperatures above 700°C in the absence of air to drive off the organic material.
The electro-winning cathodes are washed through the gold table and filtered through the press to retain the gold sludge, which is dried, weighed, and dispatched to Rand Refinery for refining.
Effective Date: June 30, 2024
62
Technical Report Summary for
Kalgold Mine, North West Province, South Africa
Figure 14-1: Schematic Flow Diagram of the Metallurgical Process
Effective Date: June 30, 2024
63
Technical Report Summary for
Kalgold Mine, North West Province, South Africa
14.2Plant Throughput, Design, Equipment Characteristics and Specifications
The basic processing parameters for comminution, thickening, pre-oxidation followed by leach and CIL at Kalgold are shown in Table 14-1
14.3Energy, Water, Process Material and Personnel Requirements
The CIL and Zadra process requires significant amounts of reagents to achieve the 86% recovery, which are summarised in Table 14-2.
Table 14-2: Reagent Consumption
| | | | | | | | |
| Reagent | Unit | Value |
| Lime use | g/t | 700 - 1,000 |
| Flocculant | g/t | 44 477 |
| Cyanide addition | kg/t | 0.6 -1.8 |
Kalgold Plant has a total labour force of 195 employees.
The plant main sections for the processing gold are crushing (pre-primary, secondary and tertiary), milling and carbon–in-Leach (“CIL”) processes. The Crusher section is receiving ore from Azone and Water tank open pit, the crusher section consists of pre-primary and primary jaw crushers, secondary and tertiary Symons cone crushers.
The milling plant consists of 3 tumbling ball mills to grind the ore to the required size for liberation of gold. Mill sizes are 3.66m x 4.88m for the A & B Mills at throughput of 50t/h each and 4.26m x 7.31m for the C Mill at throughput of 100t/h.
The overflow from the Mills cyclone is routed to two thickeners which are utilized to upgrade the relative density of the slurry to the required density for dissolution and adsorption which consists of one Pre-aeration tank and two leach tanks to dissolve the liberated gold and eight CIL vessels for adsorption of gold onto activated carbon. The Plant use about 224,000m3 water for processing of the Sulphide and Oxide ores. The water is reused/recirculated between the plant and the tailings dam. The is sufficient water to meet plan use demand. The power notified maximum demand for the operation is 12MVA and is available and managed from Eskom power utility grid.
The first year of the Reserve plan’s average planned milling tonnages per month is 126.071ktpm at the planned feed grade of 1,09g/t.
14.4Commentary on the Processing and Recovery Methods
The average historical plant recovery is 84.84%, which has shown significant variations throughout the operating years (Figure 14-2). The variability in the recovery can be attributed to the following:
•differences in ore characteristics;
•varying feed grades; and
•plant condition and operating efficiency.
QP is satisfied that the metallurgical process is well-tested as part of the ongoing operations and has been subjected to reviews as part of the on going expansion project work. Kalgold ore body is quite complex and necessary adjustments on the process are carried out whenever there is a need to ensure that the stipulated metallurgical efficiency targets are attained all the time.
Effective Date: June 30, 2024
64
Technical Report Summary for
Kalgold Mine, North West Province, South Africa
Figure 14-2: Historical Plant Recovery
Effective Date: June 30, 2024
65
Technical Report Summary for
Kalgold Mine, North West Province, South Africa
15Infrastructure
Section 229.601(b)(96)(iii)(B)(15)
Kalgold is an established operation and as a result, the current infrastructure is satisfactory for the declared Mineral Reserve requirements, as detailed in the Mineral Reserves statement (Section 12.2) and supported by the mine plan (Section 13.2). Kalgold is accessible via the national and provincial roads (Figure 3-1). The general layout of Kalgold Mine infrastructure, neighbouring main access roads, surrounding farmlands, stockpiles, and the pits is displayed in Figure 15-1.
A Google Earth image of the plant is presented in Figure 15-2.
15.1Surface Infrastructure
The detailed surface infrastructural layout comprises of ore process plant, on-site equipment and consumables store, Diesel storage and dispensing facilities, mining and engineering workshops, explosives storage facility, training centre, on site medical hub and administration offices. Infrastructure also includes established haul roads for the transport of ore and waste, the waste dumps, stockpiles for the associated pits and water satellite dams use for the allaying of dust.
15.1.1Ore and Waste Rock Storage Facilities
Kalgold relies on ore blending and thus the high and low-grade ore stockpiles play a crucial role in the optimum recovery of gold. The low-grade ore is transported to the north of the N18 road, adjacent to the waste rock storage facility, while the high-grade ore (above 0,60g/t) is transported to the processing plant, south of the N18 road, adjacent to the D Zone pit (Figure 15-1).
Any waste identified in the pit is mined and transported to an associated waste rock dump. The D Zone waste is currently placed on the South Waste Dump. Waste from the current A Zone and Watertank mining areas are transported to dedicated locations north of the N18 road mining (Figure 15-1). Spanover waste rock dump, located to the east of the Watertank and A Zone pits, is used for deposition of waste from current mining operations. Deposition on the Watertank rock dump resumed in Q1 of 2021, with the mining of the pushback area for the Watertank pit and subsequently Windmill pit. There is enough remining Waste Rock (WRD) capacity including approved extensions of the current WRD to handle dumping requirements over the LOM.
15.1.2Leach Stockpiles
Heap leach stockpiles accumulated from historical mining activities are situated adjacent to the mineral processing plant. Leach stockpile activities are closely monitored, and Kalgold satisfies the relevant environmental legislation and associated regulations. In addition, metallurgical efficiency has been improved by increasing oxidation levels to reduce the presence of weak acid dissociable cyanide.
15.1.3Tailings Storage Facilities
The D Zone, where mining began in 1995, has been mined out and is currently being used for tailings deposition. The operation comprises a single TSF which was commissioned in 1998, after the replacement of the heap leach operation with a CIL plant. The TSF is currently inactive.
The current Mineral Reserve plan for Kalgold requires a total placement of approximately 18,7Mt. D Zone has remaining capacity of ~22.0Mt and is adequate remaining capacity to meet the overall requirements of the Mineral Reserve plan with no need to use the TSF. However the tailings water level needs managed closed to maintain the capacity. The tailings dam complex is currently operated, managed and controlled in a responsible and diligent manner by the Kalgold personnel, and no impairment to the integrity of the dam is anticipated, provided current practices and levels of management control are maintained with all necessary measures undertaken in a timely manner.
15.1.4Power and Electrical
Operations are powered by electricity from Eskom Holdings State Owned Company (“SOC”) Limited. Kalgold power supply is designed to satisfy the planned Mineral Reserve production and service requirements. Main power supply is managed and distributed via electrical sub-stations located on site. The Kalgold processing plant has a dedicated 20MVA transformer, with a maximum nominated demand of 12MVA, therefore a spare capacity of 8MVA is available when needed. The ball mills are the largest consumers of electricity of the processing plant and forms part of the baseline consumption of 5.2MVA under steady state running. The
Effective Date: June 30, 2024
66
Technical Report Summary for
Kalgold Mine, North West Province, South Africa
maximum nominated demand caters for the additional startup current consumed by large motors, as well as extra consumption required at other process startups like heating requirements.
Figure 15-1: Kalgold Mine Layout and Infrastructure
Effective Date: June 30, 2024
67
Technical Report Summary for
Kalgold Mine, North West Province, South Africa
Figure 15-2: Detailed Surface Infrastructure of Kalgold Plant
Source: Google Earth Image Date March 2021
The Kalgold central offices and training centre are dependent on a rural electrical supply, supported by a 100kVA transformer. An extension of the pit, offices and workshops will be on the Eskom rural line installation with no foreseeable constraint on the line capacity.
Effective Date: June 30, 2024
68
Technical Report Summary for
Kalgold Mine, North West Province, South Africa
15.1.5Water Usage
Kalgold uses borehole water for domestic use. Boreholes have restrictions of between 20 000m³ and 30 000m³ per annum based on the Water Use licence. Return water from the plant residue material is re-used in the plant for further processing activities. Groundwater is pumped out from the pits and used for dust allaying on the haul roads, muck piles and run-of-mine pads.
15.1.6Logistics and Supplies
The procurement of supplies and equipment are handled centrally, via Harmony, and then delivered to Kalgold. Kalgold is accessed via three dedicated main entrances namely, the plant main gate accessed from the N18, the central offices and mining contractor access, located along the Kraaipan Road. All Kalgold supplies and equipment deliveries are handled at the security entrance and then transferred to the central mine stores located on-site.
15.2Commentary on Infrastructure
Kalgold is an existing mining operation equipped with the necessary infrastructure and infrastructural support to mine as per the current mine plan of 130ktpm of ROM ore. In addition, the QP is satisfied that the surrounding operational infrastructure including road, rail, offices, security services, water and power supply is adequate. The operations are powered by electricity supply from Eskom and there is service level agreement in place and the are regular engagements with Eskom on power supply management and requirements.
Overall, the QP is satisfied that Kalgold is well-established with sufficient logistical and infrastructure support for the existing and planned mining operations.
The “Property, Plant, and Equipment” as of June 30, 2024, including buildings and mine infrastructure, mining assets, rehabilitation and assets under construction, had a carrying value of R1,025 million.
Effective Date: June 30, 2024
69
Technical Report Summary for
Kalgold Mine, North West Province, South Africa
16Market Studies
Section 229.601(b)(96)(iii)(B)(16) (i-ii)
Gold is traded in a variety of markets/exchanges both in physical form through over the counter (“OTC”) markets, bullion banks and metal exchanges etc., and through passive investments such as exchange traded funds (“ETFs”), which are based on gold prices and units representing physical gold which may be in paper or dematerializsed form. Demand is driven by the jewellery market, bar and coin, use in technology, ETF’s and other financial products, and by central banks. An overview of the gold market is given in the following sections based mainly on data from the World Gold Council and GoldHub websites.
16.1Market Overview
Unlike almost all mineral commodities, the gold market does not respond the same way to typical supply and demand dynamics which are founded on availability and consumption, but rather on global economic affairs, particular those of the major nations, industrial powerhouses and economic regions, such as the Eurozone. The gold market is affected by government and central bank policies, changes in interest rates, inflationary or deflationary environments and events such as stocking and de-stocking of central reserves. It is also largely affected by global events such as financial crises, geopolitical trade tensions and other geopolitical risks.
Annual global gold demand (excl. over-the-counter demand (OTC) and other) experienced a decline of 5.0% on an annual basis, totalling 4 448.4 tonnes in 2023 when compared to the 4 699.0 tonnes recorded in 2022. The fourth quarter of 2023 recorded an average gold demand (excl. OTC and other) of 1 149.8 tonnes, 8.0% above the average recorded over the last five years. However, when compared to the fourth quarter of 2022, gold demand declined by a substantial 12.0%.
The main contributing factors of the higher gold demand during the fourth quarter of 2023 include:
•Jewellery consumption was 1.0% lower when compared to the same quarter in 2022, whilst jewellery inventory recorded a significant decrease of 29.0% in 2023 when compared to 2022. Furthermore, jewellery fabrication in the fourth quarter of 2023 was 3.0% lower compared to the same period in 2022.
•Bar and coin demand in the final quarter of 2023 was 7.0% lower on an annual basis at 313.8 tonnes, reflecting weak sentiment among some investor segments. Furthermore, official coins decreased by a notable 30.0% in the fourth quarter of 2023 when compared to the same quarter a year ago.
•Central Banks and other institutions invested 229.4 tonnes of gold in the fourth quarter of 2023, recording a drastic decline of 40.0% when compared to the 382.1 tonnes investment recorded in the fourth quarter of 2022.
Although bullion prices recently surged to record highs, the first quarter of 2024 also witnessed significant gold demand, driven by sizable OTC demand.
16.2Global Production and Supply
Total Gold supply was 3.0% higher in 2023 when compared to 2022, similar to the annual supply growth of 3.0% witnessed in the first quarter of 2024 when compared to the first quarter of 2023. Gold production and supply are sourced from existing mining operations, new mines and recycling.
16.2.1New Mine Production
Gold supply from mine production exhibited an annual increase of 1.0% in 2023, amounting to 3 644.4 tonnes, but remained just below the highest output recorded in 2018. In the fourth quarter of 2023, mine production of gold decreased by 2.0% when compared to the corresponding quarter of 2022. However, moving into the first quarter of 2024 mine production increased by 4.0% year-on-year, reaching 893.0 tonnes, though, still lower when compared to the 939.9 tonnes produced in the previous quarter. The upward trend in mine production over the past two years can primarily be attributed to an uninterrupted mining industry.
According to the WGC, preliminary data indicated notable increases in gold mine production in the first quarter of 2024 for Canada (16.0% y-o-y); Ghana (15.0% y-o-y); Indonesia (14.0% y-o-y) and China (5.0%
y-o-y)
Effective Date: June 30, 2024
70
Technical Report Summary for
Kalgold Mine, North West Province, South Africa
In 2023, China remained the largest gold producer in the world (378.2t), followed by the Russian Federation (321.8t), Australia (293.8t), Canada (191.9t), United States (166.7t), Ghana (135.1t), Indonesia (132.5t), Peru (128.8t), Mexico (126.6t), Uzbekistan (119.6t) and Mali (105.0t). South Africa produced 104.3t in 2023; higher when compared to the 92.6t produced in 2022.
Figure 16-1 World Gold Council: Mine Production - Major producing Gold Countries ranked by 2023
Source: ETSA & World Gold Council, 2024
16.2.2Recycling
The global annual supply of recycled gold increased by 9.0% in 2023 to reach 1 237.3 tonnes when compared to 2022, but still remained below the 1 293.0 tonnes recorded in 2020 and below the all-time high recorded in 2009. The rise in supply was encouraged by higher prices, resulting in a 12.0% surge in recycled gold during the first quarter of 2024 when compared to the same period in 2023. This marked the strongest quarterly performance since the third quarter of 2020 and the strongest first-quarter supply volume since 2014. Notably, East Asia recorded the most significant increase among all regions, primarily driven by volume increases in China.
16.3Global Consumption and Demand
During first quarter of 2024, gold demand (excl. OTC and other) reached 1 101.8 tonnes, reflecting a decrease of 5.0% compared to the same quarter the previous year. However, when including OTC and other, total demand increased by 3.0% on an annual basis in the first quarter of 2024 to reach 1 238.3 tonnes; resulting in the strongest first quarter since 2016. Furthermore, demand from central banks buying gold was also high during the first quarter of 2024.
16.3.1Jewellery
Global jewellery consumption experienced a significant quarter-on-quarter decline of 23.2% during the first quarter of 2024, dropping from 623.5 tonnes in the fourth quarter of 2023 to 479.0 tonnes in the first quarter of 2024. In China, demand for gold jewellery decreased by 6.0% in the first quarter of 2024 when compared to the same period in the previous year, while demand from India increased by 4.0%, supported by a robust macroeconomic environment that supported gold consumption. However, despite the first quarter initially commencing with increased demand, investor appetite for bullion tapered off towards the end of the quarter due to a price rally in March 2024 and continued to remain under pressure entering the second quarter of 2024.
Effective Date: June 30, 2024
71
Technical Report Summary for
Kalgold Mine, North West Province, South Africa
16.3.2Investment
A total annual gold investment demand of 940.7 tonnes was recorded by the World Gold Council (WGC) for 2023, reflecting a 15.0% decrease from the 1 112.8 tonnes recorded in 2022. In the first quarter of 2024, investment in gold (excluding OTC) was significantly lower and recorded a 28.0% year-on-year decline, reaching 198.6 tonnes, down from 275.3 tonnes recorded in the first quarter of 2023 and also lower when compared to the 257.1 tonnes recorded in the fourth quarter of 2023. Despite the decline, long positions of fund managers reached a two-year peak in March 2024 which was supported by the gold price rally, however, gold exchange-traded funds (ETF) holdings decreased by 113.7 tonnes (USD6.0 billion) on a quarterly basis during the first quarter of 2024. Furthermore, global physically-backed gold ETFs were 10.0% lower on an annual basis amounting to 3 112.4 tonnes globally during the first quarter of 2024. Market divergence was evident as Asia had positive demand growth for physically backed ETFs while the Western investors focused on profit-taking.
According to the WGC, global bar and coin investment increased by 3.0% when compared to the first quarter of 2023, reaching an average of 312.3 tonnes in the first three months of 2024.
The average London Bullion Market Association (LBMA) price of gold traded 10.0% higher in the first quarter of 2024 when compared to the same period a year ago, at USD2 069.80 an ounce, which also represented a 5.0% quarter-on-quarter increase that can be ascribed to risk and momentum factors.
Figure 16-2 World Gold Council: Total Gold Supply & Demand
16.3.3Currency
The inverse relationship between the value of U.S. Dollar (USD) and that of gold is one of the most discussed relationships in currency markets. The USD is the internationally accepted currency and most of the international transactions take place in USD equivalent. The major reason behind the relationship of gold and the USD, is that gold is used as a hedge against the adverse exchange value of the USD. As the US Dollar’s exchange value decreases, it takes more USD to buy gold, which increases the value of gold. Two other factors linked to the USD, or the strength of the USD is inflation and interest rates.
Interest rates have remained high whilst inflation started retreating in 2024. The USD is forecast to lose some strength as U.S. interest rate cuts are nearing inevitably and the currency depreciated in May 2024, for the first time in five months. Furthermore, global economic growth and lower risk also place pressure on the US Dollar. Central banks are planning to start with interest rate cuts, which in turn could cause non-yielding bullion to become more attractive and result in further increases in the gold price.
Effective Date: June 30, 2024
72
Technical Report Summary for
Kalgold Mine, North West Province, South Africa
16.4Gold Price
16.4.1Historical Gold Price
The LBMA gold price reached a record annual average price of USD1 940.54 an ounce in 2023, 8.0% higher when compared to average of USD1 800.09 an ounce recorded in 2022. The upward trajectory continued into the first quarter of 2024 where gold prices averaged 5.0% higher at USD2 069.80 an ounce on a quarter-on-quarter basis.
Moving into the second quarter of 2024, gold prices continued to gain a lot of momentum which can mainly be attributed to the ongoing geopolitical tensions in the Middle East, along with central bank hedge purchasing and uncertainty surrounding global inflation. The safe-haven appeal of gold drove a bullish market with bullion prices reaching new record highs after increasing by roughly 18.0% between March 1, 2024 and April 12, 2024.
The bullish price trend for bullion could increase recycling supply of gold and decrease jewellery demand, whilst mine supply is also expected to reach a new peak. The latest market expectations point to U.S. interest rates staying higher for longer as the U.S. Federal Reserve Bank awaits assurance that inflation is returning to the central bank’s target of 2.0%. Bullion acts as a hedge against lower interest rates and the price is anticipated to increase later in 2024 when interest rates are lowered.
16.4.2Forecast Gold Price
Consensus gold price range for the year 2024 to year 2026 is presented in Table 16.1. The long-term gold prices are considered from year 2025 onwards by the QP. Forecasts as advised from various financial institutions show that gold is expected to trade in a range of USD1,600/oz – USD2,238/oz, for the period 2024 to 2026 with a long-term outlook of USD1,772/oz.
Figure 16-3: World Gold Council: Daily Gold Price (ZAR/oz & USD/oz)
Table 16-1 Consensus View of Forecast Gold Price
| | | | | | | | | | | |
| Institutions | 2024 | 2025 | 2026 |
| World Bank: Development | 2 100 | | 2 050 | | — | |
| BMO Capital Markets | 2 150 | | 2 100 | | — | |
| Scotiabank | 2 018 | | 1 950 | | — | |
| Nedbank | 2 211 | | 2 238 | | 2 210 | |
| Fitch Solutions | 1 900 | | 1 800 | | 1 600 | |
| S&P Global | 2 120 | | 2 134 | | 2 076 | |
| Australian Government | 2 023 | | 2 030 | | 1 924 | |
| Average | 2 075 | | 2 043 | | 1 953 | |
Effective Date: June 30, 2024
73
Technical Report Summary for
Kalgold Mine, North West Province, South Africa
16.4.3Harmony Group Gold Hedging Policy
Harmony has a hedging policy which is managed and executed at Group treasury level on-behalf of its operating entities. The key features of the hedging program are as follows:
•the policy provides for hedging (or forward selling) up to a maximum of 20% of expected gold production for a rolling 24-month period;
◦Year 1, 30%
◦Year 2, 20%
◦Year 3, 10%
•the policy has no minimum quantity that should be hedged, and if an attractive margin above cost cannot be achieved (i.e., in a low gold price environment) then no hedges are entered into;
•Harmony enters into ZAR-denominated gold hedges for its South African operations (for the non-South African assets it enters into USD-denominated hedges);
•Individual mines do not enter into hedges in their own name but delivers bullion to Rand Refinery for refining on behalf of Harmony. Rand Refinery is one of the world’s largest single-site precious metals refining and smelting complex in the world. Rand Refinery refine all of Harmony’s gold to at least 99.5% purity, and acting as agent, sells the gold on the daily spot London fixing price and make payment to the Harmony two days later;
•gains and losses realized from the hedging program are accounted for at Group level and the financial benefit (or downside) is distributed amongst the operations proportional to their levels of gold sales; and
•Harmony does its mine planning and financial forecasts based on the estimated future gold price provided by an external source (ETSA), but its year-end actual financial results reflect the received gold price inclusive of the impact of the hedging program. Therefore, in theory, individual mines receive a hedged gold price for a maximum of 20% of its gold sales with the balance attracting the spot price.
16.5Commentary on Market Studies
The factors which affect the global gold market are well-documented as are the elements which influence the daily gold price. The LBMA gold price reached a record annual average price of US$1 940.54 an ounce in 2023, 8.0% higher when compared to average of US$1 800.09 an ounce recorded in 2022. The upward trajectory continued into the first quarter of 2024 where gold prices averaged 5.0% higher at US$2 069.80 an ounce on a quarter-on-quarter basis. The gold price remains well above the 5-year historical average
The positive outlook for gold will likely be sustained. Key headwinds for gold are interest rate hikes, currently at near historically low levels, but continued geopolitical risk and underperformance of stocks and bonds will support gold (Gold Mid-Year Outlook 2022, Gold.org, Accessed 2022).
Harmony has a relatively conservative gold hedging policy in place, and this is used to take advantage of the movements in the gold price to maximize the average gold price received, with the benefit of this hedging program flowing through to Kalgold.
16.6Material Contracts
As with all major businesses, Harmony and Kalgold enters into a multitude of vendor agreements for the provisions of supplies and services. These agreements are entered into on a competitive basis and typically are of a medium-term duration all with clauses providing for periodic updating of pricing, annual (or other) renewal or termination.
Harmony has contractual vendor agreements with various service providers and suppliers. The most significant of these contracts currently in place to support the Kalgold are listed in Table 16-2.
All of the listed contracts are currently valid and in good standing. Terms, rates and charges of contracts are considered consistent with industry norms. Contract management processes are in place and resourced so that contracts re-tendered and/or renewed as they approach expiry.
Effective Date: June 30, 2024
74
Technical Report Summary for
Kalgold Mine, North West Province, South Africa
Table 16-2: Material Contracts
| | | | | |
| Vendor Name | Nature of Service /Supply |
| Andru Mining (Pty) Ltd. | Contract mining |
| B&E International (Pty) Ltd. | Crushing and screening |
| Grinding Media South Africa (Pty) Ltd. | Supply of grinding media products |
| Sasol Chemicals South Africa | Supply of cyanide |
| Air Liquide (Pty) Ltd. | Supply of industrial gases and services |
| |
| |
| |
| |
| |
| |
| |
All the listed contracts are currently valid and in good standing. Terms, rates, and charges of contracts are considered consistent with industry norms. Contract management processes are in place and resourced so that contracts re-tendered and/or renewed as they approach expiry.
Effective Date: June 30, 2024
75
Technical Report Summary for
Kalgold Mine, North West Province, South Africa
17Environmental Studies, Permitting and Plans, Negotiations, or Agreements with Local Individuals or Groups
Section 229.601(b)(96)(iii)(B)(17) (i-vii)
The South African Government has an extensive legal framework within which mining, environmental and social aspects are managed. Harmony and its Kalgold operation is primarily regulated and managed by certain principal Acts (Section 17.3) as well as corporate policies, management systems and certain industry wide guidelines, including:
•Energy Efficiency and Climate Change Policy;
•Environmental Policy;
•Harmony Water Management Strategy;
•Biodiversity and Rehabilitation Position Statement;
•Socio-Economic Transformation Policy; and
•Corporate Social Responsibility Policy.
The latest sustainability policies and public Environmental Social and Governance (“ESG”) performance and disclosure reports are available on the corporate website. Harmony has identified the environmental risks for the business and has strategies in place to manage the risks.
17.1Results of Environmental Studies
Kalgold has completed multiple environmental impact assessments (“EIA”) for regulatory approval under the South African legal framework. The EIA identifies and predicts the likely environmental, social, and other related impacts of a mining related project. Furthermore, it establishes the measures that are necessary to avoid, minimise or offset predicted adverse impacts and, where appropriate, to incorporate these into an EMPR. The competent authority either approves or rejects the proposed projects and establishes the terms and conditions for its implementation.
Kalgold has been granted several environmental permits and licences since the commencement of operation. The most recent approvals were obtained in September 2016, February 2021 and December 2021 required for the closure of the D-Zone open pit, the amendment of existing WUL and expansion of the mining footprint, respectively.
The management measures and others are contained in the amended 2022 EMPR. All other environmental aspects and impacts emanating from mining activities (such as stockpiling of topsoil, and the location and planning of all dumps, stockpiles, and infrastructure) are captured in an environmental aspect register in line with ISO 14001:2015 standard. Kalgold has maintained its ISO 14001 certification since 2010 and the operation remains committed to eliminating or minimizing the effects of mining activities on the environment and adjacent communities.
17.2Waste and Tailings Disposal, Monitoring & Water Management
The primary materials from mining activities and processes include the rock (ore and waste) together with liquefied petroleum gas, grease, cyanide and other chemical, fuels and lubricating and hydraulic oils. Harmony recognises that responsible and effective waste management can positively reduce its environmental impacts and mitigate associated environmental liabilities. Waste management is thus a priority focus area. Internally, guidelines on mineral, non-mineral and hazardous waste materials are included in the environmental management systems (“EMS”) implemented at Kalgold.
Tailings comprises of crushed rock and process water emitted from the gold elution process in the form of slurry, once gold has been extracted. As tailings contain impurities and pollutants, they are placed in TSF engineered to contain them, in line with Harmony's tailings management programme and the Global Industry Standard on Tailings Management (“GISTM”). Harmony's overall tailings management strategy is to ensure robust, meticulous engineering and dam design, along with a continual focus on management of risks through layered assurance and oversight.
Effective Date: June 30, 2024
76
Technical Report Summary for
Kalgold Mine, North West Province, South Africa
The focus areas include, but are not limited to:
•freeboard control;
•water management;
•maintaining stability and the safety factor as advised by the engineer of record;
•erosion controls; and
•monitoring and control measures implemented to ensure continued compliance (including regular inspections, audits, and meetings on varying intervals with subsequent actions, minutes and reports).
As part of its mining, environmental and water approvals and licences, Harmony is required to implement monitoring programmes and plans to establish the operations impact on the environment. The compliance limits for the monitoring variable are included in the applicable EMPRs, WULs and environmental authorisations. The environmental monitoring implemented at Kalgold includes:
•annual EMPR performance assessments;
•monthly and quarterly ground and surface water monitoring;
•annual biomonitoring surveys;
•waste classification and quantification;
•annual Integrated waste and water management plan updates;
•annual water balance reviews;
•monthly and quarterly air quality (i.e., noise and dust) monitoring;
•periodic Greenhouse Gas emissions ("GHG") monitoring; and
•periodic licence and authorisation compliance assessments.
In addition, environmental legal compliance audits are conducted every two years by a third party to help the operation maintain its compliance with all relevant environmental legislation. Audit results show that Kalgold is environmentally compliant.
We are in the process of addressing the Waste Rock Dump angles compliance and the storm water management controls raised in the last compliance audits.
17.3Permitting and Licences
In respect of environment, the following national Acts and the regulations promulgated thereunder provide the regulatory framework for mine permitting and licencing in South Africa:
•Mineral and Petroleum Resources Development Act, 2002 (“MPRDA”);
•National Environmental Management Act, 1998 (“NEMA”);
•National Environmental Management: Waste Act, 2008 (“NEM:WA”);
•National Environmental Management: Air Quality Act, 2004 (“NEM:AQA”); and
•National Water Act, 1998 (“NWA”).
A summary of the status of environmental permits and licences issued at the effective date related to Kalgold’s operation is presented in Table 17-1.
All relevant mining, environmental and water-use permits are in place that cover the environmental, archaeological, and hydrological components of Kalgold. All permits are audited regularly for compliance and no material risks to the operations have been identified.
Effective Date: June 30, 2024
77
Technical Report Summary for
Kalgold Mine, North West Province, South Africa
Table 17-1: Status of Environmental Permits and Licences
| | | | | | | | | | | | | | |
| Permit / Licence | Reference No. | Issued By | Date Granted | Validity |
| Environmental Management Programme (Amendment) | NW30/5/1/2/2/77MR | DMRE | March 8, 2022 | LOM |
| Environmental Authorisation | (NW) 30/5/1/2/3/2/1/77 EM | DMRE | October 4, 2022 | LOM |
| Water Use Licence | 07/D41B/ABCGIJ/4754 | DWS | February 22, 2021 | 15 Years |
| Certificate of Registration Inflammable Liquids and Substances | FS/FLM 01/06/02/2023 | Ngaka Modiri Molema District Municipality | June 6, 2024 | 12 Months |
| Protected Trees Permit | 01-12-2020/24NW | DFFE | December 2, 2020 | December 2, 2025 |
| Atmospheric Emission Licence | NWPG/KALGOLDAEL 4.1,4.13 & 4.17/OCT2023 | DEDECT | October 4, 2023 | September 1, 2024 |
Notes: DMRE - Department of Mineral Resources and Energy, DEDECT - Development of Economic Development, Environment, Conservation and Tourism, DWS -Department of Water and Sanitation
17.4Local Stakeholder Plans and Agreements
Harmony strives to create sustainable shared value within the communities it operates. Local stakeholder plans and agreements are based on the results from socio-economic information, government development strategies and EIAs undertaken. The socio-economic development programme commits to:
•contribute to areas that will have the most meaningful socioeconomic impact on communities, namely infrastructure, education and skills development, job creation and entrepreneurial development;
•enhance broad-based local and community economic empowerment and enterprise development initiatives;
•facilitate socio-economic development in local communities by means of SLPs and corporate social responsibility programmes;
•support arts, culture, and sports and recreation; and
•build relationships based on trust within host communities.
In South Africa, mining companies are required to have a SLP which forms an important component of Harmony's community investment plan. It sets out the Company’s obligation to develop and implement comprehensive human resource development programs, community development plans, housing and living condition plans and employment equity plans. The aim of the SLP is to ensure the uplift of the social and economic circumstances of local communities surrounding the mine and are a prerequisite to securing and maintaining a mining right, with progress required to be reported each year. The SLP is renewed every five years. New generation SLP has been submitted and is currently under review with the DMRE
Due to the high-level of unemployment and skill shortage in the surrounding communities, there is potential risk that there will be an influx of people into the area resulting in the establishment of informal settlements. This social risk and others were considered as part of the EIA process and appropriate mitigation measures are captured in the EMPR, the SLP as well as other governance structures implemented by the mine.
17.5Mine Closure Plans
Harmony makes provision for closure and rehabilitation both for accounting purposes and as required under the MPRDA. The statutory obligation for all environmental rehabilitation at Kalgold is administered by the DMRE and requires the preparation of a closure plan, the development of a cost estimate, and financial assurance. This amount was ZAR155.248m as of June 30, 2024, which includes an allowance for management
Effective Date: June 30, 2024
78
Technical Report Summary for
Kalgold Mine, North West Province, South Africa
and contingency costs. The Company makes an annual submission to the DMRE setting out the cost of closure in accordance with the MPRDA and the regulations issued thereunder. Kalgold is covered under Harmony Gold Env. Trust Fund.
Kalgold Liability is fully covered with no shortfall. The required cover is calculated at R155.248m and the balance in the trust (R87.7m)+ guarantees (R75m) is R162.7m.
Table 17-2: Mine Closure Liability
| | | | | |
| Area | Total Closure Cost (ZAR) |
| Kalgold | 155 248 480 | |
17.6Status of Issues Related to Environmental Compliance, Permitting, and Local Individuals or Groups
Kalgold has valid permits and does not require any additional permits to continue with their current mining operations. Management will commence with the EMP amendment on the expansion of the current mining footprint within the approved Mining Right area to include the Windmill North satellite pit. Windmill North is planned to start mining from year four of the FY25 business plan.
17.7Local Procurement and Hiring
Harmony is committed to investing in the future of local communities beyond the life of mine and not to only empower them, but also to mitigate the impacts its activities to ensure a positive legacy. The Mining Charter serves to guide the South African mining industry in socio-economic transformation. Local procurement (goods and services) and human resource management are key measures set under the Mining Charter and are reported on annually. Portable skills are developed through expanded learning programmes, learnerships and other programmes opened only to operating communities and areas where labour is sourced. Recruitment needs analysis takes place at a local community level and priority is given to hiring people form the immediate surrounding community.
17.8Commentary on Environmental Studies, Permitting and Plans, Negotiations, or Agreements with Local Individuals or Groups
Periodic inspections are conducted by the DMRE to verify compliance with applicable environmental laws, regulations, permits and standards. In addition, Kalgold has implemented an EMS in line with the ISO 14001 standard. The EMS is audited on an annual basis by a third party and includes the needs and expectations of interested parties.
As part of Harmony, Kalgold conducts its operation based on policies and systems that are aligned to its corporate sustainable development framework. Although Harmony is not a signatory to the International Council on Mining and Metals or the UN Global Compact, these form the guiding principles of the framework. Harmony discloses its sustainable development voluntarily in accordance with the guidelines issued by the Global Reporting Initiative (“GRI”). Further to this, Harmony discloses environmental information on the Carbon Disclosure Project (“CDP”) for both climate change and water. CDP is a global environmental disclosure system that supports companies to measure and manage their risks and opportunities on climate change, water security and deforestation.
Harmony has a good understanding of the environmental and social aspects of the operations through baseline and specialist studies previously conducted. Risk management and mitigation measures were adequately addressed in the environmental management plans and will be effective to mitigate risks and impacts to acceptable levels should the measures be implemented according to the specialists’ recommendations. Most of the required environmental authorisations are in place and only require amendments to be made to reflect the current infrastructure at Kalgold. Based on current industry norms, a realistic timeframe to obtain relevant authorisations is estimated between 12 and 18 months.
Effective Date: June 30, 2024
79
Technical Report Summary for
Kalgold Mine, North West Province, South Africa
18Capital and Operating Costs
Section 229.601(b)(96)(iii)(B)(18) (i-ii)
Economic parameters for the Harmony Group, including capital and operating costs, are determined and signed off by the CODM, before distribution to the business units, including Kalgold. The capital and operating costs are reported in ZAR terms and on a real basis. Reporting periods are done for the financial years, inclusive of the months from July - June.
18.1Capital Costs
The stay-in-business capital for Kalgold is presented in Table 18-1. The capital costs are considered for mining activities only. An average contingency of 10% is applied where the capital cost estimates have a level of uncertainty. There is no contingency applied, where capital cost estimates have a reasonable basis. The estimated capital costs presented in Table 18-1 are carried forward and modelled in the Kalgold cash flow.
Costs associated with the Mining Charter Compliance (“MCC”) are determined because of Kalgold’s SLP requirements and modelled as such. These costs are extracted from the SLP model. Shaft capital costs are costs that can be attributed to Kalgold’s open pit mining activities such as, and not limited to, site clearance, dust suppression requirements, vehicle replacements, pumping and water control mechanisms, blasting measures, and slope stability monitoring.
18.2Operating Costs
A summary of the direct and re-allocated operating costs for Kalgold are presented in Table 18-2. The cash operating costs are used as an input into the cash flow model. There is no contingency applied. Cost estimates for Kalgold are based on actual historical data, as well as budget forecasts. Therefore, the forecast costs are reliable, and at minimum meet the confidence levels of a Feasibility Study.
The operating cost estimates for Kalgold are categorised into direct and total costs. A summary of the Kalgold operating cost estimate is shown in the Table 18-2. All inclusive unit operating costs starts at R890/t year one and decreases in the last 3 years of life of mine to R393/t in financial year 2036, inline with pit production profile and low grade stockpile feeding at the end of life.
The above operating unit costs are as per approved business plan submitted to the board for financial year 2024.
18.3Comment on Capital and Operating Costs
The capital and operating cost estimates for Kalgold are based on actual historical data, as well as budget forecasts. Therefore, the forecast costs are reliable, and at minimum meet the confidence levels of a Feasibility Study. This approach of estimating capital and operating costs is consistent with industry practice. A record of the forecast and budget costs is maintained by the operation, allowing for an assessment of the alignment of the forecast and actual costs.
Table 18-1: Summary of Capital Cost Estimates for Kalgold
| | | | | |
| Capital Cost Element (ZAR'000s) | Total LOM (FY2025 - FY2036) |
| Shaft | 73 488 |
| MCC | 37 335 |
| Total | 110 823 |
Effective Date: June 30, 2024
80
Technical Report Summary for
Kalgold Mine, North West Province, South Africa
Table 18-2: Summary of Operating Cost Estimates for Kalgold
| | | | | |
| Operating Cost Element (ZAR'000) | Total LOM (FY2025 - FY2036) |
| Wages - payroll 1 | 529 708 |
| Wages - payroll 2 | 44 653 |
| Stores and materials | 1 785 063 |
| Electric power and water | 24 604 |
| Outside contractors | 5 643 911 |
| Other | 447 854 |
| Direct Costs | 8 475 793 |
| Refining charge | 105 031 |
| Assay cost | 57 302 |
| Plant treatment cost | 6 120 199 |
| Re-allocated costs | 6 282 532 |
| Mine overheads re-allocated | (260 689) |
| Total | 14 497 636 |
Effective Date: June 30, 2024
81
Technical Report Summary for
Kalgold Mine, North West Province, South Africa
19Economic Analysis
Section 229.601(b)(96)(iii)(B)(19) (i-iv)
19.1Key Economic Assumptions and Parameters
The QP and CODM forms, reviews, signs-off and distributes economic assumptions to its various business units. On an annual basis, during the period October to November, long-term commodity prices and exchange rates forecasts’, are received from various financial institutions. In addition, a specialist in Economics from a reputable economics company based in South Africa, provides expert views on the global markets, forward looking commodity prices, exchange rates, consumer price index, production price index, electricity cost and consumable increases. All factors are analysed, cognisance is taken of the requirements of the NYSE and JSE markets, and a proposal is presented to the CODM for recommendation and approval. These assumptions are then applied at Kalgold, along with specific operational considerations.
19.1.1Metallurgical Recoveries
The metallurgical recoveries used in the cash flow are provided in Table 12-1.
19.1.2Gold Price
The forecast gold price (USD1,772/oz) is the price that is used by Harmony for the Kalgold annual planning cycle and forms the basis for the Kalgold cashflow. The reader is referred to Table 16-1 for the consensus forecast gold price. The conversions used in the calculation of the various gold prices is presented in Table 19-1.
Table 19-1: Conversions Used in Gold Price Calculations
| | | | | | | | | | | | | | |
| Economic Factors | Gold Price (USD/oz) | Conversion Factor (oz/kg) | Exchange Rate (ZAR:USD) | Gold Price (ZAR/kg) |
| 2024 Mineral Resource | 1 878 | 32.15 | 18.26 | 1 100 000 |
| 2024 Mineral Reserve | 1 772 | 32.15 | 18.26 | 1 040 000 |
19.1.3Exchange Rate
The South African Rand (ZAR) depreciated to average at R18.89/US$ during the first quarter of 2024, 0.7% weaker compared to an average of R18.76/US$ recorded during the last quarter of 2023. Moving onto May 2024, the ZAR appreciated by 2.4% on a month-on-month basis, and 3.4% compared to May 2023 to average at R18.42/US$, following a 3.8% annual depreciation recorded in April 2024.
The South African Rand has been volatile in recent weeks as uncertainty loomed around the elections, however, the local currency has been supported by the outcome of a Government of National Unity after the ruling African National Congress (ANC) lost the majority vote for the first time since the start of democracy. The ZAR appreciated to trade at R18.11/US$ on June 18, 2024 and is expected to strengthen further over the medium term.
Furthermore, the U.S. Federal Reserve held interest rates unchanged on June 12, 2024 and Jerome Powell, Chairman of the Fed, stated that interest rates will not be reduced before a greater decline in inflation or an increase in unemployment is visible. Data later indicated that retail sales barely rose in May 2024 and speculation of rate cuts amongst investors increased, pressuring the US Dollar and lending strength to the ZAR exchange rate.
Effective Date: June 30, 2024
82
Technical Report Summary for
Kalgold Mine, North West Province, South Africa
Figure 19-1: Annual Exchange Rates and ETSA Forecast
Table 19-2: Consensus View of Forecast Exchange Rate (ZAR:USD)
| | | | | | | | | | | |
| Institutions | 2024 | 2025 | 2026 |
| Nedbank | 18.74 | | 18.44 | | 18.57 | |
| Investec | 18.54 | | 18.23 | | 18.48 | |
| FNB | 18.70 | | 17.70 | | 18.30 | |
| PWC | 18.80 | | 19.30 | | — | |
| IDC | 18.76 | | 18.31 | | 18.10 | |
| AVERAGE | 18.71 | | 18.40 | | 18.36 | |
The exchange rate of 18.26 ZAR:USD is the exchange rate that is used by Harmony for the annual planning cycle and forms the basis for the ZAR:USD exchange rate in the company LOM and Mineral Reserve cashflow.
Table 19-3: ZAR:USD Exchange Rate Performance (June 2020 – June 2024)
| | | | | |
| Period | Average Exchange Rate (ZAR:USD) |
| July 2021 to June 2022 | 15.21 |
| July 2022 to June 2023 | 17.77 |
| July 2023 to June 2024 | 18.70 |
| 3-Year Ave. (not weighted) | 17.23 |
19.1.4Royalties
Royalty is an expense paid to the government of South Africa and is accounted for in the Kalgold cash flow models. In terms of the mining ring-fencing application, each ring-fenced mine is treated separately, and deductions can normally only be utilised against mining income generated from the relevant ring-fenced mine.
19.1.5Capital Expenditure
At Harmony, capital is allocated to the mines with a longer life. Kalgold currently has a relatively short LOM model, and therefore has relatively small amounts dedicated to capital expenditure. Detailed capital costs can be found in Table 18-1. The total capital costs shown Table 18-1 represents the capital costs in the Kalgold cash flow (Table 19-4).
Effective Date: June 30, 2024
83
Technical Report Summary for
Kalgold Mine, North West Province, South Africa
19.1.6Operating Expenditure
The operating costs are determined as a function of the cash working costs of the mining and mineral processing plant activities, and ongoing capital development for mining. Whereas, total costs are a function of the operating costs, capital costs, and royalties. Detailed operating costs can be found in Table 18-2.
19.1.7Working Capital
Working capital is calculated at a Harmony Group level and not at an operational level.
19.1.8Taxes
Mining tax on gold mining taxable income in South Africa is determined according to a formula, based on the taxable income from mining operations. Of that, 5% of total revenue is exempt from taxation while the remainder is taxable at a higher rate (33%) than non-mining income (27%). Accounting depreciation is eliminated when calculating the South African mining tax income. Excess capital expenditure is carried forward as unredeemed capital to be claimed against future mining taxable income.
19.1.9Closure Cost and Salvage Value
The closure cost estimates are those provided in Section 17.5. No account has been taken of any potential salvage values.
19.1.10Summary
The key assumptions used in the cash flow are summarised for Kalgold in Table 19-4.
Table 19-4: Key Economic Assumptions and Parameters for Kalgold Cash Flow
| | | | | | | | |
| Parameter | Unit | Value |
| Production Rate (milled) | tpm | 130 000 |
| Gold Recovery | % | 86.00 |
| Royalty | % | 0.05 |
| Tax Rate | % | Formula |
| Gold Price | ZAR/kg | 1 040 000 |
| Exchange Rate | USD:ZAR | 18.26 |
| Discount Rate | % | 9.00 |
19.2Economic Analysis
Harmony's respective business units and its associated operating sites consider the economic assumptions discussed in Section 19.1 during their respective planning and analysis processes. The past year’s average gold price is used for testing purposes. A gold price of ZAR1 040 000/kg is used for forecasting the revenue of the Kalgold Mineral Reserve cash flow (Table 19-5).
The discounted cash flow model is used to calculate the Net Present Value (“NPV”) of the Mineral Reserve. The NPV at a gold price of ZARR1 040 000/Kg, is approximately ZAR1 150 million cash positive, at a discount rate of 9% (Table 19-4).
The NPV is calculated on a cash flow that accounts for factors such as:
• mining and ore processing working costs;
• royalty payments;
• capital costs, including costs allocated to ongoing development;
• any significant project work considered as major projects; and
• costs deemed as abnormal expenditure.
Effective Date: June 30, 2024
84
Technical Report Summary for
Kalgold Mine, North West Province, South Africa
Table 19-5: Kalgold Cash Flow
| | | | | | | | | | | | | | | | | | | | | | | | | | | | | |
| Item | Units | Total Reserve Plan | FY2025 | FY2026 | FY2027 | FY2028 | FY2029 | FY2030 | FY2031 |
| Waste tonnes mined | t'000 | 64 941 | 5 535 | 4 580 | 5 704 | 6 892 | 7 196 | 7 428 | 6 852 |
| Ore tonnes mined | t'000 | 29 190 | 3 991 | 4 979 | 3 835 | 2 780 | 2 304 | 2 096 | 2 760 |
| Total tonnes mined | t'000 | 94 131 | 9 526 | 9 559 | 9 539 | 9 672 | 9 500 | 9 523 | 9 612 |
| Milled Tonnes | t'000 | 18 711 | 1 513 | 1 542 | 1 566 | 1 566 | 1 566 | 1 566 | 1 566 |
| Yield | g/t | 0.91 | 0.94 | 0.93 | 0.93 | 0.95 | 0.92 | 1 | 0.9 |
| Gold Recovered | kg | 17 009 | 1415 | 1441 | 1455 | 1482 | 1434 | 1560 | 1408 |
| Gold Price | R/kg | 1 040 000 | | 1 040 000 | | 1 040 000 | | 1 040 000 | | 1 040 000 | | 1 040 000 | | 1 040 000 | | 1 040 000 | |
| Revenue | ZAR'000 | 17 689 708 | | 1 471 799 | | 1 499 121 | | 1 513 299 | | 1 541 621 | | 1 491 214 | | 1 622 833 | | 1 464 610 | |
| Total Operating cost | ZAR'000 | 14 497 636 | | 1 312 783 | | 1 316 797 | | 1 328 970 | | 1 331 497 | | 1 333 944 | | 1 336 162 | | 1 338 137 | |
| Total Capital including MCC | ZAR'000 | 110 823 | | 26 573 | | 21 969 | | 16 769 | | 11 219 | | 5 719 | | 4 619 | | 7 319 | |
| Royalty | ZAR'000 | 88 449 | | 17 401 | | 19 766 | | 20 410 | | 23 059 | | 19 019 | | 30 117 | | 16 294 | |
| Total Cost | ZAR'000 | 14 937 637 | | 1 356 757 | | 1 358 532 | | 1 366 149 | | 1 365 775 | | 1 358 682 | | 1 370 898 | | 1 361 750 | |
| Cash flow before tax | ZAR'000 | 2 752 068 | | 115 042 | | 140 589 | | 147 150 | | 175 844 | | 132 532 | | 251 934 | | 102 860 | |
| Taxation Payable | ZAR'000 | (616 302) | | (13 679) | | (21 659) | | (23 590) | | (32 592) | | (19 130) | | (56 362) | | (9 778) | |
| Net cash flow after tax | ZAR'000 | 2 135 766 | | 101 363 | | 118 930 | | 123 560 | | 143 253 | | 113 401 | | 195 573 | | 93 082 | |
| | | | | | | | | |
| Discounted NPV (ZAR’000) | Rate | NPV after tax | | | | | | | |
| NPV - (low discount rate - 9%) | ZAR'000 | 1 150 358 | | | | | | | |
| NPV - (medium discount rate - 12%) | ZAR'000 | 964 488 | | | | | | | |
| NPV - (high discount rate - 15%) | ZAR'000 | 819 607 | | | | | | | |
Notes: 1. R/t, where t refers to tonnes milled. 2. Adjustments in tonnes due to stockpile management.
Effective Date: June 30, 2024
85
Technical Report Summary for
Kalgold Mine, North West Province, South Africa
| | | | | | | | | | | | | | | | | | | | | | | | | | | | | |
| Item | Units | Total Reserve Plan | FY2032 | FY2033 | FY2034 | FY2035 | FY2036 | | |
| Waste tonnes mined | t'000 | 64 941 | 7 393 | 7 275 | 6 087 | — | — | | |
| Ore tonnes mined | t'000 | 29 190 | 2 167 | 2 312 | 1 967 | — | — | | |
| Total tonnes mined | t'000 | 94 131 | 9 559 | 9 587 | 8 054 | — | — | | |
| Milled Tonnes | t'000 | 18 711 | 1 566 | 1 566 | 1 566 | 1 566 | 1 566 | | |
| Yield | g/t | 0.91 | 0.91 | 1.02 | 1.02 | 0.96 | 0.43 | | |
| Gold Recovered | kg | 17 009 | 1 431 | 1 597 | 1 597 | 1 509 | 679 | | |
| Gold Price | R/kg | 1 040 000 | | 1 040 000 | | 1 040 000 | | 1 040 000 | | 1 040 000 | | 1 040 000 | | | |
| Revenue | ZAR'000 | 17 689 708 | | 1 488 414 | | 1 660 638 | | 1 660 638 | | 1 568 906 | | 706 613 | | | |
| Total Operating cost | ZAR'000 | 14 497 636 | | 1 340 131 | | 1 342 126 | | 1 226 807 | | 680 968 | | 609 314 | | | |
| Total Capital including MCC | ZAR'000 | 110 823 | | 3 919 | | 4 419 | | 3 319 | | 3 319 | | 1 660 | | | |
| Royalty | ZAR'000 | 88 449 | | 18 430 | | 32 870 | | 42 183 | | 78 445 | | 11 184 | | | |
| Total Cost | ZAR'000 | 14 937 637 | | 1 362 480 | | 1 379 415 | | 1 272 309 | | 762 732 | | 622 158 | | | |
| Cash flow before tax | ZAR'000 | 2 752 068 | | 125 933 | | 281 224 | | 388 330 | | 806 174 | | 84 455 | | | |
| Taxation Payable | ZAR'000 | (616 302) | | (16 999) | | (65 403) | | (100 748) | | (240 150) | | (16 211) | | | |
| Net cash flow after tax | ZAR'000 | 2 135 766 | | 108 934 | | 215 820 | | 287 581 | | 566 023 | | 68 244 | | | |
| | | | | | | | | |
| Discounted NPV (ZAR’000) | Rate | NPV after tax | | | | | | | |
| NPV - (low discount rate - 9%) | ZAR'000 | 1 150 358 | | | | | | | |
| NPV - (medium discount rate - 12%) | ZAR'000 | 964 488 | | | | | | | |
| NPV - (high discount rate - 15%) | ZAR'000 | 819 607 | | | | | | | |
Effective Date: June 30, 2024
86
Technical Report Summary for
Kalgold Mine, North West Province, South Africa
19.3Sensitivity Analysis
The economic assumptions, cash flow breakdown and economic analysis contribute to the basis for the sensitivity analysis. The sensitivities are calculated and analysed, as shown in the accompanying Table 19-5 and Table 19-6.
Harmony has reviewed its exposure in terms of South Africa’s political instability, the currency exchange rate and the gold price, on its financial assets and financial liabilities, and has determined the sensitivities for a ±10% variance. Management considers this range to be a reasonable change given the volatility in the market.
The sensitivity analysis (Table 19-6, Table 19-7 and Table 19-8) is based on a change in a single assumption while holding all other assumptions constant. In practice, this is unlikely to occur, as risks and/or opportunities will have an impact on the cash flows, and changes in some of these assumptions may be correlated. The insights that can be provided by this sensitivity analysis is that Kalgold is almost equally sensitive to changes in the gold price (ZAR/kg), as to changes in total operating costs (ZAR).
The impact of one or a combination of risks and opportunities occurring at the same time cannot be specifically quantified so an analysis considering multi-parameters is not considered.
Table 19-6: Gold Price Sensitivity Analysis (Mineral Reserves)
| | | | | | | | | | | | | | | | | | | | |
| Sensitivity (%) | Production (kg) | Gold Price (ZAR/kg) | Revenue (ZAR’000) | Total cost including tax (ZAR'000) | Net cash flow after tax (ZAR'000) | After tax NPV (ZAR’000) |
| 10% | 17 009 | 1 144 000 | 19 458 677 | 16 108 513 | 3 350 164 | 1 883 749 |
| 5% | 17 009 | 1 092 000 | 18 574 191 | 15 831 227 | 2 742 964 | 1 517 054 |
| Reserve plan | 17 009 | 1 040 000 | 17 689 708 | 15 553 942 | 2 135 766 | 1 150 358 |
| -5% | 17 009 | 988 000 | 16 805 221 | 15 311 773 | 1 493 448 | 760 252 |
| -10% | 17 009 | 936 000 | 15 920 735 | 15 172 916 | 747 819 | 292 837 |
Table 19-7: Total Operating Costs Sensitivity Analysis (Mineral Reserves)
| | | | | | | | | | | | | | | | | | | | |
| Sensitivity (%) | Production (kg) | Gold Price (ZAR/kg) | Revenue (ZAR’000) | Total cost including tax (ZAR'000) | Net cash flow after tax (ZAR'000) | After tax NPV (ZAR’000) |
| 10% | 17 009 | 1 040 000 | 17 689 706 | 16 714 936 | 974 770 | 416 975 |
| 5% | 17 009 | 1 040 000 | 17 689 706 | 16 085 277 | 1 604 429 | 820 725 |
| Reserve plan | 17 009 | 1 040 000 | 17 689 708 | 15 553 942 | 2 135 766 | 1 150 358 |
| -5% | 17 009 | 1 040 000 | 17 689 706 | 15 053 530 | 2 636 176 | 1 459 536 |
| -10% | 17 009 | 1 040 000 | 17 689 706 | 14 553 119 | 3 136 587 | 1 768 713 |
Table 19-8: Production Sensitivity Analysis (Mineral Reserves)
| | | | | | | | | | | | | | | | | | | | |
| Sensitivity (%) | Production (kg) | Gold Price (ZAR/kg) | Revenue (ZAR’000) | Total cost including tax (ZAR'000) | Net cash flow after tax (ZAR'000) | After tax NPV (ZAR’000) |
| 10% | 18 710 | 1 040 000 | 19 458 677 | 16 108 513 | 3 350 164 | 1 883 749 |
| 5% | 17 860 | 1 040 000 | 18 574 191 | 15 831 227 | 2 742 964 | 1 517 054 |
| Reserve plan | 17 009 | 1 040 000 | 17 689 708 | 15 553 942 | 2 135 766 | 1 150 358 |
| -5% | 16 159 | 1 040 000 | 16 805 221 | 15 311 773 | 1 493 448 | 760 252 |
| -10% | 15 308 | 1 040 000 | 15 920 735 | 15 172 916 | 747 819 | 292 837 |
20Adjacent properties
Section 229.601(b)(96)(iii)(B)(20) (i-iv)
Kalgold is surrounded by several tenements, namely the Goldridge Block and farms to the North of Goldridge Farm known as the Northern Farms Block (Figure 3-1). There are no other operations nearby. There are no adjacent properties that have bearing on this TRS.
Effective Date: June 30, 2024
87
Technical Report Summary for
Kalgold Mine, North West Province, South Africa
21Other Relevant Data and Information
Section 229.601(b)(96)(iii)(B)(21)
Other relevant data and information pertaining to Kalgold include a Feasibility Study with respect to an increase in the plant capacity, and details of exploration drilling. Feasibility Study was completed in Q2 of 2021. It included a robust feasibility level mining plan to mine and process 300ktpm of ore in a new plant. The indicative initial capital outlay required for the plant was extensive. Thus, the focus is now on sustaining the current 130Ktpm plan with organic growth and the current Prospecting Right application will be key.
The results from the exploration drilling at Kalgold outline an expanded, robust mineralised system that extends beyond the current Mineral Resource limits. The exploration drilling and the subsequent definition of the Mineral Resources are ongoing, and the intention is that the Mineral Resource estimate will be continuously updated as the data becomes available and incorporated into the model.
At the effective date, Harmony was still awaiting the approval of a new Prospecting right application to secure part of the area where the section 102 application was refused by DMRE in 2021.
The priority drilling targets lie south of the D Zone pit, within the above mentioned Prospecting Right application. This drilling program has the potential to expand the Kalgold Mineral Resource estimates. An exploration budget for this program has been approved and the drilling will start as soon as the formal approval from the DMRE is obtained.
Other relevant information includes the public disclosure reports on Kalgold’s operational, financial, and environmental performance are available on the Company’s corporate website. The following reports are relevant to this TRS:
•Integrated report 2024;
•ESG report 2024;
•Financial report 2024;
•Operational report 2024; and
•Climate action and impact report 2024.
Effective Date: June 30, 2024
88
Technical Report Summary for
Kalgold Mine, North West Province, South Africa
22Interpretation and Conclusions
Section 229.601(b)(96)(iii)(B)(22)
Kalgold is a well-established mine and has been in operation since December 1995. Harmony has no known risks to conduct mining activities over the permitted mining rights’ areas, incorporated as Kalgold. In addition, no known risks are posed over surface access and activities, regarding mining related activities.
Kalgold’s regional geological setting, mineralisation and deposit is well understood. The geology is supported by high resolution aeromagnetic and radiometric survey and, surface and infill drilling findings. The geological anomalies are identified, defined, and managed by the Kalgold Geology Department. Targeted exploration for the FY25 period aimed at extending the Mineral Resources south of the D Zone pit, will commence once the approval of the pending Prospecting Right application lodged on 31 January 2024 is received.
The sampling approach and management, density assumptions, laboratory procedures, and assaying and analysis are in keeping with industry standards and practices and is appropriate for the strata bound, BIF packages type of mineralisation. The holistic understanding of the regional geology, lithological and structural controls of the mineralisation at Kalgold is sufficient to support the estimation of Mineral Resources.
Ore mined at Kalgold is processed at the Kalgold processing facility which has been in operation since January 1996, as such the processing method is considered well established for mineralisation at Kalgold. Kalgold makes use of historical trends and data as a basis for the ore recovery. However, metallurgical test work is adopted for optimisation and Mineral estimation projects.
The data pertaining to the mineralisation, regional and geological setting, exploration findings, sample collection, preparation, and testing, inclusive of data verification and metallurgical test work gives rise to the Mineral Resource estimate. The combined Measured and Indicated Mineral Resource, exclusive of Mineral Reserves, as at June 30, 2024 is 23.643Mt at 1.26g/t gold, containing 0.957Moz of gold, and the Inferred Mineral Resource contains 31.688Mt at 0.60g/t gold, containing 0.606Moz of gold.
Mineral Reserves are derived from the Mineral Resources, a detailed business plan and operational mine planning processes. Mine planning utilises and takes into consideration actual historical technical parameters. In addition, conversion of the Mineral Resources to Mineral Reserves considers Modifying Factors, such as cut-off grade, dilution, and the plant recovery factor. The Mineral Reserve is 18.711Mt of milled ore at 1.07g/t gold containing 0.645Moz of gold as at June 30, 2024.
Kalgold is currently operating profitably, and the Mineral Reserve estimates show positive discounted NPV. Any other by-products that are recovered as part of the refining process, make up an immaterial component of the total metal inventory, and is thus not reported as part of the Mineral Reserve estimates. There are no obvious material risks that could have significant effect on the Mineral Reserves.
The Mineral Reserves are extracted via an open pit mining method using a modular pit approach, based on numerous satellite orebodies, which takes into consideration the mining and rock engineering design guidelines. This mining method increases flexibility and supports overall optimisation of the gold grade. Extracted minerals from Kalgold are recovered at an on-site processing plant. The plant initially treated ore via the heap leach processing methodologies, until January 1998 where the CIL treatment facility and TSF was fully complete.
The mine’s regional and local infrastructure is capable of fully supporting the mining and other surface related mining activities. Kalgold is accessed via national and provincial road networks, has key power transmission and distribution networks provided by the National electricity regulator, water supply networks and communication infrastructure. Overall, Kalgold is well-established with sufficient logistics and infrastructure support for the existing and planned mining operations.
Harmony and Kalgold are exposed to market risks such as exchange rate and gold price fluctuations which are partially offset by the Harmony Group hedging policy. The hedging programme considers factors effecting the global gold market and these, along with macro-economic conditions, are used to determine planning and forecasting inputs at group level for all of Harmony’s operating business units. Other non-gold related risks are addressed to some extent by Kalgold when entering into vendor agreements for the provisions of supplies and services, which are done on a competitive basis with customary price adjustment, renewal, and termination clauses.
Effective Date: June 30, 2024
89
Technical Report Summary for
Kalgold Mine, North West Province, South Africa
To successfully operate a mining operation in South Africa the state requires compliance with applicable environmental laws, regulations, permits and standards. Kalgold adheres to said compliance and regulatory standards. As part of Harmony, Kalgold conducts its operations based on policies and systems that are aligned to its corporate sustainable development framework. This is guided by the principles of the framework from the International Council on Mining and Metals or the United Nations Global Compact. Harmony discloses its sustainable development voluntarily in accordance with the guidelines issued by the GRI. Further to this, Harmony discloses environmental information on the CDP for both climate change and water.
Harmony has a good understanding of the environmental and social aspects through baseline and specialist studies previously conducted. Risk management and mitigation measures were adequately addressed in the environmental management plans. All the required environmental authorisations are in place, except for the pending waiting approval Prospecting Rights application lodged on the 31st of January 2024. This application incorporates exploration drilling area outside of the existing mining lease, which is currently halted.
The economics of Kalgold is based on the discounted cash flow model, with a gold price of ZAR1040,000/kg. The NPV for the metal price, is ZAR1 150 million cash positive, at a discount rate of 9%. The NPV is calculated on cash flows that consider factors such as: capital and operating costs; and royalties. The capital and operating cost estimates for Kalgold are based on historical data, as well as budget forecasts. This estimation technique allows for the forecast and actual costs to be aligned.
Royalties and taxes are paid to the South African government and accounted for in the Kalgold cash flow and NPV analysis. There are also specific tax relief benefits that apply to gold mining companies, where 5% of total revenue is exempt from taxation, amongst other benefits.
The economics of Kalgold are tested for its sensitivity to commodity price (ZAR/kg), operating costs (ZAR) gold production (kg). The insights provided by the sensitivity analysis is that Kalgold Mine is most sensitive to changes in the gold price (ZAR/kg).
The TRS was prepared with the contribution of experienced professionals. The TRS provides a summary of the material scientific and technical information concerning the mineral exploration, Mineral Resources, Mineral Reserves, and associated production activities of the mineral asset, including references to the valuation for Kalgold. This TRS contains the expression of the QP opinion, based on the information available at the time of preparation.
Effective Date: June 30, 2024
90
Technical Report Summary for
Kalgold Mine, North West Province, South Africa
23Recommendations
Section 229.601(b)(96)(iii)(B)(23)
23.1Additional Exploratory Drilling
The current geological model is well understood. The Mineral Resource model in use, as updated in January 2024, is drilled to a standard suitable for robust estimation. However, a significant amount of additional definition drilling would be required to increase more Mineral Resources to a Measured category, as the small high grade ore lenses that fit inside the current drill spacing, would be better defined. To this end, further exploration drilling is required to continue to expand on the current Mineral Resource and Mineral Reserve base. This will also allow the operation to expand on the modular pit approach, which will improve the mining flexibility and LOM.
24References
Section 229.601(b)(96)(iii)(B)(24)
Anon. 2017. Harmony Gold Mining Company Limited Mineral Resources and Mineral Reserves 2017. https://www.harmony.co.za/component/jdownloads/send/130-2017/2550-kalgold
Anhausseur, C.R. and Walraven, F. 1997. Poly Crustal Evolution of the Archean Kraaipan Granite-Greenstone Terrane, Kaapvaal Craton, South Africa. Economic Geology Research Unit, Department of Geology, University of the Witwatersrand. Information Circular No.313.
Geological Survey of South Africa, Handbook Vol 8, p 690. Lithostratigraphy of the Republic of South Africa, South West Africa/Namibia, and the Republics of Bophuthatswana, Transkei and Venda.
https://www.gold.org/goldhub/data/gold-prices. Accessed July 22, 2022.
https://www.sars.gov.za/media/tax-relief-measures/ Retrieved from Tax Relief Measures.
https://www.wits.ac.za/media/migration/files/cs-38933-fix/migrated-pdf/pdfs-8/EGRI%20313.pdf
Hammond N Q and Moore J M 2006 - Archaean lode gold mineralisation in banded iron formation at the Kalahari Goldridge deposit, Kraaipan Greenstone Belt, South Africa: in Mineralium Deposita v41 pp 483-503
Hammond N Q, Moore J M and Sheets R W, 2007 - Physico-chemical conditions of ore-forming fluids associated with genesis of the Kalahari Goldridge deposit, Kraaipan Greenstone Belt, South Africa: in Ore Geology Reviews v30 pp 106-134
Hammond, N.Q., Moore, J.M. Archaean lode gold mineralisation in banded iron formation at the Kalahari Goldridge deposit, Kraaipan Greenstone Belt, South Africa. Miner Deposita 41, 483–503 (2006). https://doi.org/10.1007/s00126-006-0074-6
Poujol. M., Robb. L.J., Anhausseur, C.R., and Gericke, B. 2002. Chronological Constraints on the Evolution of the Kaapvaal Craton, South Africa. Economic Geology Research Institute – Hugh Allsopp Laboratory, School of Geosciences, University of the Witwatersrand. Information Circular No. 360.
https://www.wits.ac.za/media/migration/files/cs-38933-fix/migrated-pdf/pdfs-7/360.pdf.
SACS (South African Committee for Stratigraphy) (1980) Stratigraphy of South Africa. Part I. (Compiler, L. E Kent).
South African Revenue Services. (July 29, 2021). South African Revenue Services.
SRK, February 2021. Review of the Kalgold Mine 2020 Mineral Resource Estimate, Report No. 557066.
Effective Date: June 30, 2024
91
Technical Report Summary for
Kalgold Mine, North West Province, South Africa
25Reliance on Information Provided by the Registrant
Section 229.601(b)(96)(iii)(B)(25)
Further to Section 24, in the preparation of this TRS, the QP and author relied entirely on information provided by various parties relating specifically to mining rights, surface rights, contractual agreements, historical operating expenditures, community relations and other matters. The work conducted by technical experts was completed under the supervision and direction of the QP. The technical experts who assisted the principal and author are listed in Table 25-1..
| | | | | | | | | | | |
| Table 25-1: Other Specialists |
| Name | Specialist | Area of Responsibility | Association / Company |
| Mrs B van der Linden | Financial modelling | Finance/Costing | Kalgold |
| Mr T Moloto | Mining Rights | Specialist: Mining and Prospecting Rights | Central |
| Mr R Montshonyane | Processing | Process plant | Kalgold Plant |
| Mr K Le Bron | Rock Engineering | Geotechnical Modelling and Designs | MLB |
| Mr D Fourie | Geostatistician | Estimation | Central |
| Mr T Hewitt | Exploration | Exploration | Central |
| Ms N Mogale | Enviromental | Environmental | Kalgold |
| Mr R Reid | Geology | Geological Model | SE Asia Harmony |
| Mr D Vyas | Mine Design & Schedulling | Mine Design & Scheduling | A & B Global Mining |
| Mr N Wessels | Engineering | Infrastructure | Kalgold |
Effective Date: June 30, 2024
92