HARMONY GOLD MINING COMPANY LIMITED
Technical Report Summary of the
Mineral Resources and Mineral Reserves
for
Mine Waste Solutions (MWS) and West Wits Operations
North West and Gauteng Provinces,
South Africa
Effective Date: June 30, 2024
Final Report Date: August 31, 2024
Technical Report Summary for
Mine Waste Solutions, North West, South Africa
| | |
IMPORTANT NOTICE
This Technical Report Summary has been prepared for Harmony Gold Mining Company Limited in support of disclosure and filing requirements with the United States Securities and Exchange Commission’s (SEC) under Subpart 1300 of Regulation S-K 1300 and Section 229.601(b)(96) of Regulation S-K. The quality of information, estimates, and conclusions contained in this Technical Report Summary apply as of the effective date of this report. Subsequent events that may have occurred since that date may have resulted in material changes to such information, estimates and conclusions in this summary. |
Effective Date: June 30, 2024
ii
Technical Report Summary for
Mine Waste Solutions, North West, South Africa
QP Consent and Sign-off
I have read and understood the requirements of:
•the South African Code for Reporting of Exploration Results, Mineral Resources and Mineral Reserves (the "SAMREC Code, 2016 edition")
•the Harmony Guidelines on the Reporting of Exploration Results, Mineral Resources and Mineral Reserves
•Subpart 1300 (17 CFR 229.1300) of Regulation S-K, Disclosure by Registrants Engaged in Mining Operations (“Regulation S-K 1300”)
I am a Competent Person as defined by the SAMREC Code, 2016 edition and the Qualified Person (“QP”) under Regulation S-K 1300, having more than five years` experience that is relevant to the style of mineralization and type of deposit described in the Report, and to all activities for which I am accepting responsibility and have been appointed as QP for Mine Waste Solutions Mineral Resources and Mineral Reserves.
I am a Member of SAGC and my registration is as follow:
Mineral Resource
Bareng Joseph Selebogo
SAGC (South African Geomatics Council)
Nr MS 0151
Years’ Experience: 13
I have reviewed the tables and graphs included for the Mine Waste Solutions Mineral Resource and Mineral Reserve which will be used in the 2024 Harmony Gold Mineral Resource and Mineral Reserve Report to which this Consent Statement applies.
I acknowledge responsibility for all the sections of the TRS report and as the QP and author I relied on information provided by various subject experts.
At the effective date of the Report, to the best of my knowledge, information and belief, the Report contains all scientific and technical information that is required to be disclosed to make the Report not misleading.
/s/ Bareng Joseph Selebogo
___________________________________
Mr Bareng Joseph Selebogo
NHD Mineral Resource Management
SAGC (No. MS 0151), MSCC (No. 1900)
Ore Reserve Manager
Harmony Gold Mining Company Limited
Effective Date: June 30, 2024
iii
Technical Report Summary for
Mine Waste Solutions, North West, South Africa
List of Contents
Effective Date: June 30, 2024
iv
Technical Report Summary for
Mine Waste Solutions, North West, South Africa
Effective Date: June 30, 2024
v
Technical Report Summary for
Mine Waste Solutions, North West, South Africa
Effective Date: June 30, 2024
vi
Technical Report Summary for
Mine Waste Solutions, North West, South Africa
Effective Date: June 30, 2024
vii
Technical Report Summary for
Mine Waste Solutions, North West, South Africa
Effective Date: June 30, 2024
viii
Technical Report Summary for
Mine Waste Solutions, North West, South Africa
List of Figures
Effective Date: June 30, 2024
ix
Technical Report Summary for
Mine Waste Solutions, North West, South Africa
List of Tables
Effective Date: June 30, 2024
x
Technical Report Summary for
Mine Waste Solutions, North West, South Africa
Effective Date: June 30, 2024
xi
Technical Report Summary for
Mine Waste Solutions, North West, South Africa
Units of Measure and Abbreviations
| | | | | |
| Unit / Abbreviation | Description or Definition |
| °C | degrees Celsius |
| µm | Micrometers |
| 2D | Two-dimensional |
| 3D | Three-dimensional |
| AE | Abnormal expenditure |
| Ag | Silver |
| AGA | AngloGold Ashanti Limited |
| Au | Gold |
| AuBIS | Harmony electronic database |
| Ave. | Average |
| Bn | Billion |
| c. | Approximately |
| CCLAS | Comlabs Computerised Laboratory Automation System |
| CIL | Carbon in leach |
| CIP | Carbon-In-Pulp |
| CLR | Carbon Leader Reef |
| cm | Centimeter |
| cmg/t | Centimetre-grams per tonne |
| CODM | Chief Operating Decision-Maker |
| Company | Harmony Gold Mining Company Limited |
| COP | Code of Practice |
| COV | Coefficient of Variation |
| CRG | Central Rand Group |
| CRM | Certified Reference Material |
| Datamine™ | Datamine™ Studio RM modelling software |
| DMRE | Department of Mineral Resources and Energy |
| DTM | Digital Terrain Model |
| DWS | Department of Water and Sanitation |
| EIA | Environmental Impact Assessment |
| EMPR | Environmental Management Program |
| EMS | Environmental Management System |
| ESG | Environmental Social and Governance |
| ETF | Exchange traded funds |
| EW-SX | Electro-wining solvent extraction |
| FAAS | Flame Atomic Absorption Spectroscopy |
| FX | Foreign Exchange rate |
| g | Gram |
| g/t | Grams per tonne |
| g/t | Grams per metric tonne |
| GISTM | Global Industry Standard on Tailings Management |
| GPS | Global positioning system |
| Ha | Hectares |
| Harmony | Harmony Gold Mining Company Limited |
| HPE | Hydro-powered |
| Kg | Kilogram |
| km | Kilometer |
km2 | Square kilometer |
| Kusasalethu | Kusasalethu Gold Mine |
| kWh | Kilowatt-hour |
| LOM | Life of Mine |
Effective Date: June 30, 2024
xii
Technical Report Summary for
Mine Waste Solutions, North West, South Africa
| | | | | |
| Unit / Abbreviation | Description or Definition |
| Ltd | Limited |
| m | Meter |
| M | Million |
m3/hr | Cubic meters per hour |
| masl | Meters above sea level |
| MCC | Mining Charter Compliance |
| MCF | Mine Call Factor |
| Mine Waste Solutions | Mine Waste Solutions operation |
| Mintek | South Africa's national mineral research organization |
| Mlb | Million pounds |
| Moz | Million troy ounces |
| Mponeng | Mponeng Gold Mine |
| MPRDA | Mineral and Petroleum Resources Development Act, 28 of 2002 |
| Mt | Million tonnes |
| Mtpa | Million tonnes per annum |
| Mtpm | Million tonnes per month |
| MWS Operations | Mine Waste Solutions Operation on Free State / North West Province boundary |
| NEMA | National Environmental Management Act, 107 of 1998 |
| No. | Number |
| NPV | Net present value |
| OTC | Over the counter |
| oz | Troy ounce |
| PSD | Particle Size Distribution |
| Pty | Proprietary |
| QA/QC | Quality Assurance/Quality Control |
| QP | Qualified Person |
| ROM | Run-of-Mine |
| SACNASP | South African Council for Natural Scientific Professions |
| SAMREC | The South African Code for the Reporting of Exploration Results, Mineral Resources and Mineral Reserves |
| Savuka | Savuka Gold Mine |
| SD | Standard Deviation |
| SEC | Securities and Exchange Commission |
| SGS | SGS South Africa (Pty) Limited |
| SLP | Social Labour Plan |
| t | Metric tonne |
t/m3 | Tonne per cubic meter |
| TauTona | TauTona Gold Mine |
| TRS | Technical Report Summary |
| TSF | Tailings Storage Facility |
| USD | United States Dollars |
| USD/oz | United States Dollar per troy ounce |
| VCR | Ventersdorp Contact Reef |
| VR | Vaal Reef |
| West Wits | Harmony's West Rand operations |
| WRD | Waste Rock Dump |
| WRG | West Rand Group |
| WUL(s) | Water Use License(s) |
| XRF | is X-ray fluorescence spectrometry |
| ZAR | South African Rand |
| ZAR/kg | South African Rand per kilogram |
Effective Date: June 30, 2024
xiii
Technical Report Summary for
Mine Waste Solutions, North West, South Africa
Glossary of Terms
| | | | | |
| Term | Definition |
| Cut-off grade | Cut-off grade is the grade (i.e. the concentration of metal or mineral in rock) that determines the destination of the material during mining. For purposes of establishing “prospects of economic extraction,” the cut-off grade is the grade that distinguishes material deemed to have no economic value (it will not be mined in underground mining or if mined in surface mining, its destination will be the waste dump) from material deemed to have economic value (its ultimate destination during mining will be a processing facility). Other terms used in similar fashion as cut-off grade include net smelter return, pay limit, and break-even stripping ratio. |
| Dilution | Unmineralized rock that is by necessity, removed along with ore during the mining process that effectively lowers the overall grade of the ore. |
| Head grade | The average grade of ore fed into the mill. |
| Economically viable | Economically viable, when used in the context of Mineral Reserve determination, means that the qualified person has determined, using a discounted cash flow analysis, or has otherwise analytically determined, that extraction of the Mineral Reserve is economically viable under reasonable investment and market assumptions. |
| Indicated Mineral Resource | Indicated Mineral Resource is that part of a Mineral Resource for which quantity and grade or quality are estimated on the basis of adequate geological evidence and sampling. The level of geological certainty associated with an Indicated Mineral Resource is sufficient to allow a qualified person to apply modifying factors in sufficient detail to support mine planning and evaluation of the economic viability of the deposit. Because an Indicated Mineral Resource has a lower level of confidence than the level of confidence of a Measured Mineral Resource, an Indicated Mineral Resource may only be converted to a probable Mineral Reserve. |
| Inferred Mineral Resource | Inferred Mineral Resource is that part of a Mineral Resource for which quantity and grade or quality are estimated on the basis of limited geological evidence and sampling. The level of geological uncertainty associated with an Inferred Mineral Resource is too high to apply relevant technical and economic factors likely to influence the prospects of economic extraction in a manner useful for evaluation of economic viability. Because an Inferred Mineral Resource has the lowest level of geological confidence of all Mineral Resources, which prevents the application of the modifying factors in a manner useful for evaluation of economic viability, an Inferred Mineral Resource may not be considered when assessing the economic viability of a mining project, and may not be converted to a Mineral Reserve. |
| Kriging | A method of interpolation based on Gaussian process governed by prior covariances. It uses a limited set of sampled data points to estimate the value of a variable over a continuous spatial field |
| Mine Call Factor | The ratio, expressed as a percentage, of the total quantity of recovered and unrecovered mineral product after processing with the amount estimated in the ore based on sampling. |
| Measured Mineral Resource | Measured Mineral Resource is that part of a Mineral Resource for which quantity and grade or quality are estimated on the basis of conclusive geological evidence and sampling. The level of geological certainty associated with a Measured Mineral Resource is sufficient to allow a qualified person to apply modifying factors, as defined in this section, in sufficient detail to support detailed mine planning and final evaluation of the economic viability of the deposit. Because a Measured Mineral Resource has a higher level of confidence than the level of confidence of either an Indicated Mineral Resource or an Inferred Mineral Resource, a Measured Mineral Resource may be converted to a Proven Mineral Reserve or to a Probable Mineral Reserve. |
| Mineral Reserve | Mineral Reserve is an estimate of tonnage and grade or quality of Indicated and Measured Mineral Resources that, in the opinion of the qualified person, can be the basis of an economically viable project. More specifically, it is the economically mineable part of a Measured or Indicated Mineral Resource, which includes diluting materials and allowances for losses that may occur when the material is mined or extracted. |
| Mineral Resource | Mineral Resource is a concentration or occurrence of material of economic interest in or on the Earth’s crust in such form, grade or quality, and quantity that there are reasonable prospects for economic extraction. A Mineral Resource is a reasonable estimate of mineralization, taking into account relevant factors such as cut-off grade, likely mining dimensions, location or continuity, that, with the assumed and justifiable technical and economic conditions, is likely to, in whole or in part, become economically extractable. It is not merely an inventory of all mineralization drilled or sampled. |
| Modifying Factors | Modifying factors are the factors that a qualified person must apply to Indicated and Measured Mineral Resources and then evaluate in order to establish the economic viability of Mineral Reserves. A qualified person must apply and evaluate modifying factors to convert Measured and Indicated Mineral Resources to Proven and Probable Mineral Reserves. These factors include but are not restricted to; mining; processing; metallurgical; infrastructure; economic; marketing; legal; environmental compliance; plans, negotiations, or agreements with local individuals or groups; and governmental factors. The number, type and specific characteristics of the modifying factors applied will necessarily be a function of and depend upon the mineral, mine, property, or project. |
Effective Date: June 30, 2024
xiv
Technical Report Summary for
Mine Waste Solutions, North West, South Africa
| | | | | |
| Term | Definition |
| Pre-Feasibility Study | A pre-feasibility study (or preliminary feasibility study) is a comprehensive study of a range of options for the technical and economic viability of a mineral project that has advanced to a stage where a qualified person has determined (in the case of underground mining) a preferred mining method, or (in the case of surface mining) a pit configuration, and in all cases has determined an effective method of mineral processing and an effective plan to sell the product. (1) A pre-feasibility study includes a financial analysis based on reasonable assumptions, based on appropriate testing, about the modifying factors and the evaluation of any other relevant factors that are sufficient for a qualified person to determine if all or part of the Indicated and Measured Mineral Resources may be converted to Mineral Reserves at the time of reporting. The financial analysis must have the level of detail necessary to demonstrate, at the time of reporting, that extraction is economically viable. (2) A pre-feasibility study is less comprehensive and results in a lower confidence level than a feasibility study. A pre-feasibility study is more comprehensive and results in a higher confidence level than an initial assessment. |
|
|
| Probable Mineral Reserve | Probable Mineral Reserve is the economically mineable part of an Indicated and, in some cases, a Measured Mineral Resource. |
| Proven Mineral Reserve | Proven Mineral Reserve is the economically mineable part of a Measured Mineral Resource and can only result from conversion of a Measured Mineral Resource. |
| Qualified Person | A qualified person is: (1) A mineral industry professional with at least five years of relevant experience in the type of mineralization and type of deposit under consideration and in the specific type of activity that person is undertaking on behalf of the registrant; and (2) An eligible member or licensee in good standing of a recognized professional organization at the time the technical report is prepared. For an organization to be a recognized professional organization, it must: (i) Be either: (A) An organization recognized within the mining industry as a reputable professional association; or (B) A board authorized by U.S. federal, state or foreign statute to regulate professionals in the mining, geoscience or related field; (ii) Admit eligible members primarily on the basis of their academic qualifications and experience; (iii) Establish and require compliance with professional standards of competence and ethics; (iv) Require or encourage continuing professional development; (v) Have and apply disciplinary powers, including the power to suspend or expel a member regardless of where the member practices or resides; and (vi) Provide a public list of members in good standing. |
|
|
|
|
|
|
|
|
|
|
| Tailings | Finely ground rock of low residual value from which valuable minerals have been extracted is discarded and stored in a designed dam facility. |
| Tailings Freeboard | The vertical height between the beached tailings against the embankment crest and the crest itself. |
Effective Date: June 30, 2024
xv
Technical Report Summary for
Mine Waste Solutions, North West, South Africa
1Executive Summary
Section 229.601(b)(96)(iii)(B) (1)
The QP of Harmony Gold Mining Company Limited (“Harmony” or the “Company”) has prepared this Technical Report Summary (“TRS”) to disclose the Mineral Resource and Mineral Reserve estimates for the Company’s Mine Waste Solutions (“Mine Waste Solutions”) operations. The TRS has been prepared in accordance with the U.S. Securities and Exchange Commission's (“SEC”), Regulation S-K 1300, with an effective date as at June 30, 2024. No material changes have occurred between the effective date and the date of signature of this TRS.
This TRS updates the TRS filed by Harmony on Mine Waste Solutions on October 31, 2022, named Exhibit 96.8 Technical Report Summary of the Mineral Resources and Mineral Reserves for Mine Waste Solutions (MWS) and West Wits Operations, North West and Gauteng Provinces, South Africa, which was effective on June 30, 2022. This TRS is prepared to satisfy the requirement of Item 1302(e)(6) of Regulation S-K. An economic assessment was included, using a detailed discounted cashflow analysis for the Mineral Reserves, excluding all scheduled Inferred Mineral Resource which is not reported under Mineral Reserve. This TRS is necessitated by the change of scheduled Mineral Resources (LOM plan), capital and operating costs as well as the change in Mineral Reserve price.
Property Description
Mine Waste Solutions is a surface operation in production stage which produces an estimated 95,000 ounces (“oz”) of gold per annum from the reclamation of gold from tailings storage facilities (“TSFs”) and waste rock dumps (“WRDs”). Mine Waste Solutions is divided into two distinct, geographically separated operations namely, the MWS operation (or “MWS”) and the West Wits operation.
The MWS operation is located near the Vaal River, on the Free State - North West Provincial border and processes reclaimed tailings from TSFs, which are fed via three ore streams operating as separate plants within the MWS gold plant. The MWS operation also has access to WRDs which are included in its Mineral Resource estimates. These WRD are not processed at the MWS processing plant because the plant is only equipped to process tailings material. Kopanang plant used to process these WRDs but has since been placed on care and maintenance. Only the Moab MOD is being processed at Noligwa plant and the rest of the WRD are not being processed currently.
The West Wits operation (“West Wits”) is situated in the West Rand region of the Gauteng Province. The West Wits operation is in production stage and processes reclaimed tailings from the Old North TSF and waste rock from the Savuka WRD. The Savuka plant processes the reclaimed Old North tailings only, while the Kusasalethu plant processes both the Old North tailings and the Savuka WRD. Mponeng plant processes the Mponeng WRD as a gap-filler for the reef.
Both the MWS operation and West Wits operation are broadly governed by Harmony’s underground mining operations and their respective mining rights and environmental permits. There is no requirement under the existing legislative framework to hold a mining right to process mine residue stockpiles which are linked to existing operations by road, rail and/or pipeline. All the TSFs and WRDs are within Harmony's surface rights.
Ownership
Mine Waste Solutions and its associated mineral rights are wholly owned by Harmony through its interest in Chemwes Proprietary Limited. Harmony acquired the assets as part of the transaction to take full ownership and control of AngloGold Ashanti's remaining South African business, as of October 1, 2020.
Geology and Mineralization
Material contained in the TSFs and WRDs predominantly originates from deep level gold mines, operated by Harmony and others, mostly located in Klerksdorp and Carletonville. The West Wits processed TSF material is generated from the original processing of the Ventersdorp Contact Reef ("VCR") and Carbon Leader Reef ("CLR") while the TSF's re-mined and processed in the MWS area are derived from the historical processing of the Vaal Reef ("VR"). The WRD were also generated from the waste development to mine the afore mentioned reefs respectively.
Effective Date: June 30, 2024
1
Technical Report Summary for
Mine Waste Solutions, North West, South Africa
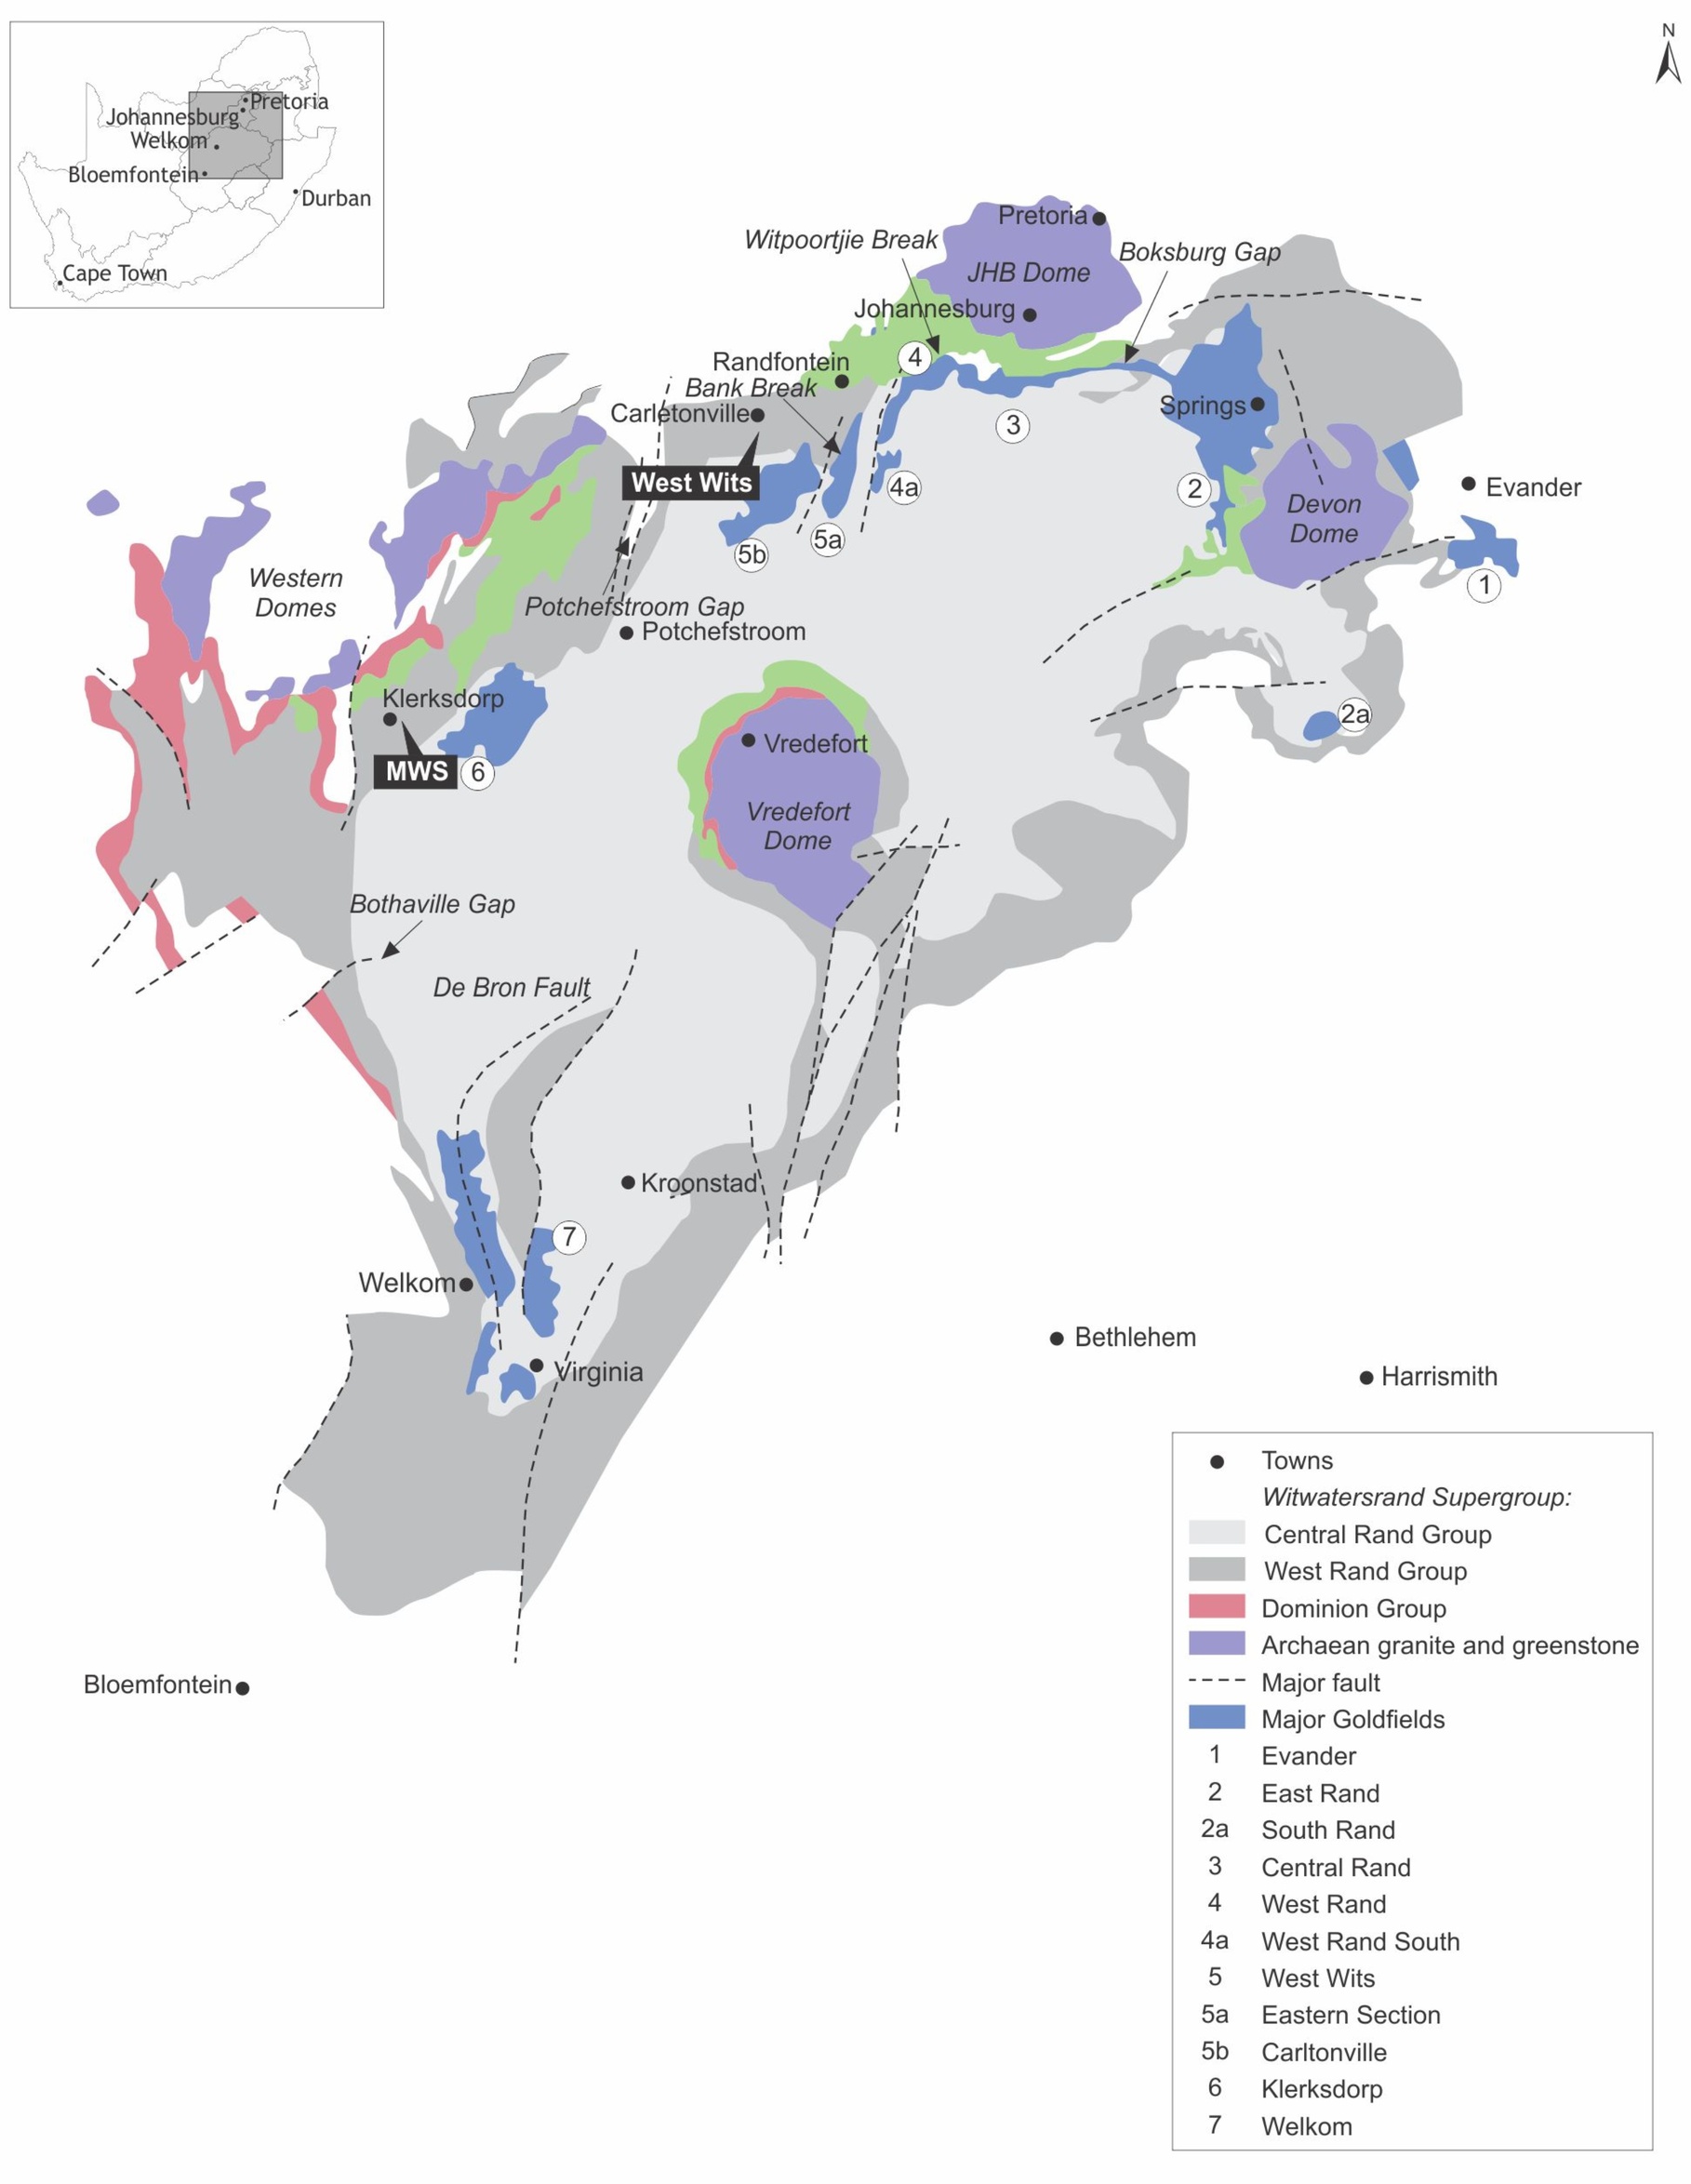
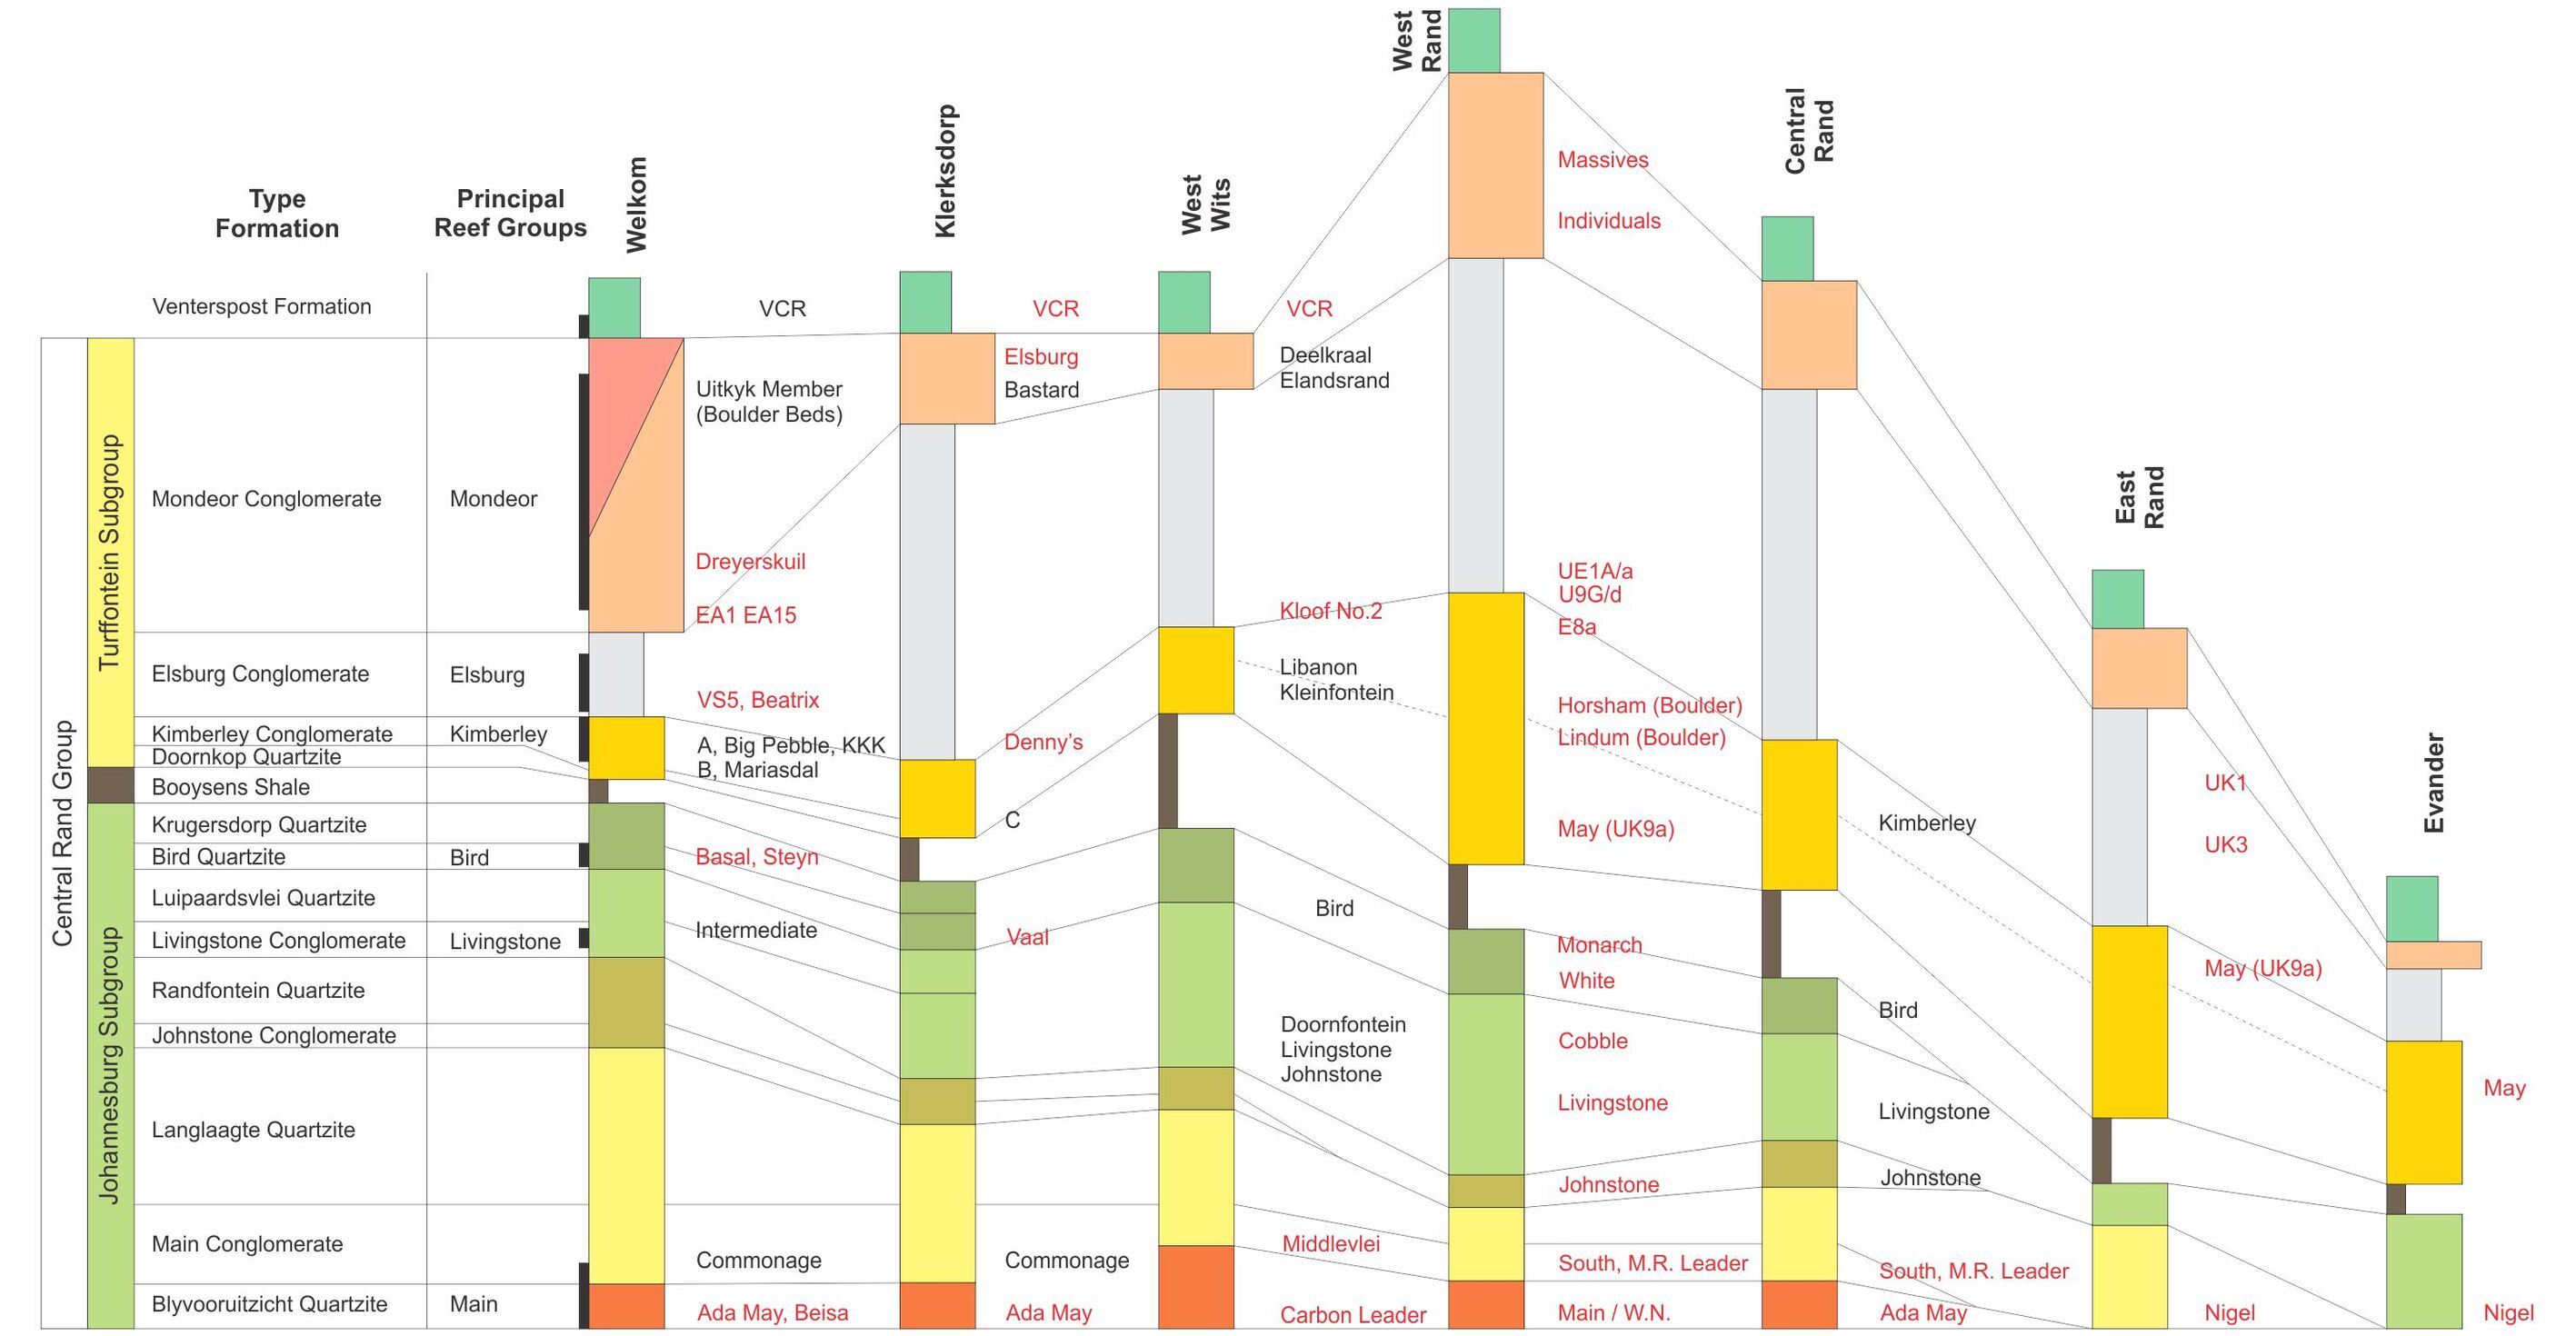
The Witwatersrand reefs occur within the Archaean Witwatersrand Basin which hosts the Witwatersrand Supergroup succession. The VCR horizon is located at the top of the Turffontein Subgroup of the Central Rand Group (“CRG”), capping the Witwatersrand Supergroup. The VR horizon is situated within the Krugersdorp Formation, in the Johannesburg Subgroup of the CRG. The CLR is situated near the base of the Johannesburg Subgroup.
The TSF material comprises previously treated residues of gold-bearing conglomeratic reefs processed by carbon-in-leach (“CIL”). They are man-made “deposits” and are not the result of natural sedimentary processes. The grade of the TSFs is determined by the grade of the ore source at the time that they were processed, and the processing efficiency.
The WRDs are unconsolidated and are comprised of untreated, low grade, gold-bearing material from underground workings. The WRDs are also man-made deposits, with no geological structure or continuity, and one in which the grade does not behave as a natural mineral deposit.
The most significant mineral in the TSFs and WRDs is quartz, which makes up more than 60% of the bulk mineral composition. The gold predominantly occurs in pyrite. Other minerals identified include uranium, iron oxide, titanium oxide and calcite from the VR, VCR and CLR conglomerates.
Current Status of Exploration, Development and Operation
Prior to 2011, grade estimations for the TSFs were based on residue grades obtained from the process plants, as well as various sampling projects in selected areas. Most of these TSFs have since been re-sampled by means of an extensive auger drilling exercise which commenced in 2011. The remaining active TSFs will be re-sampled once they go out of service and become dormant.
Mine Waste Solutions made a recent decision not to treat WRD material, and hence the Savuka plant was converted to a TSF-only processing facility by late 2021.
Mineral Resource Estimate
The current Mineral Resources for the TSFs were estimated using Datamine™ Studio RM modelling software (“Datamine™”), based on a validated Datamine™ Fusion database. The database contained auger drillhole sampling data obtained until June 2023. The QP created three dimensional (“3D”) digital terrain models (“DTM”) based on the TSF topographical survey results and gold values were estimated using the ordinary kriging interpolation method.
The Mineral Resources for the WRDs were also estimated using 3D DTMs to constrain the volumes. The gold grade was estimated by using the weighted average of the sample assays, as well as the gold grades obtained from reclaimed tonnes and from rock deposited on the stockpiles.
The Mineral Resources were originally prepared, classified and reported according to the South African Code for the Reporting of Exploration Results, Mineral Resources and Mineral Reserves, 2016 edition (“SAMREC, 2016”). For the purposes of this TRS, the Mineral Resources have been classified in accordance with § 229.1302(d)(1)(iii)(A) (Item 1302(d)(1)(iii)(A) of Regulation S-K), similar to the SAMREC 2016 classification scheme.
The Mineral Resource estimates, as at June 30, 2024, exclusive of the reported Mineral Reserves, are summarized in Table 1-1 and Table 1-2 for the MWS and West Wits operations, respectively.
The QP compiling the Mineral Resource estimates is Mr BJ Selebogo, who is the Ore Reserve Manager and an employee of Harmony.
Effective Date: June 30, 2024
2
Technical Report Summary for
Mine Waste Solutions, North West, South Africa
Table 1-1: Summary of the MWS Operation Mineral Resources as at June 30, 2024 (exclusive of Mineral Reserves)
| | | | | | | | | | | | | | | | | | | | |
| METRIC | Grade | Metal Content |
| Mineral Resource Category | Source | Tonnes (Mt) | Gold (g/t) | U3O8 (kg/t) | Gold (kg) | U3O8 (t) |
| Measured | TSF | 52.334 | 0.20 | 0.067 | 10,513 | 3,507 |
| | | | | |
| | | | | |
| Indicated | TSF | 52.459 | 0.24 | 0.088 | 12,613 | 4,616 |
| WRD | 1.872 | 0.30 | — | 563 | — |
| | | | | |
| Total / Ave. Measured + Indicated | 106.665 | 0.22 | 0.078 | 23,689 | 8,123 |
| Inferred | TSF | 79.585 | 0.13 | 0.039 | 10,505 | 3,067 |
| WRD | 2.502 | 0.24 | — | 611 | — |
| Total / Ave Inferred | 82.087 | 0.14 | 0.037 | 11,116 | 3,067 |
| |
| IMPERIAL | Grade | Metal Content |
| Mineral Resource Category | Source | Tons (Mt) | Gold (oz/t) | U3O8 (lb/t) | Gold (Moz) | U3O8 (Mlbs) |
| Measured | TSF | 57.688 | 0.006 | 0.134 | 0.338 | 7.730 |
| | | | | |
| | | | | |
| Indicated | TSF | 57.826 | 0.007 | 0.176 | 0.406 | 10.177 |
| WRD | 2.064 | 0.009 | — | 0.018 | — |
| | | | | |
| Total / Ave. Measured + Indicated | 117.578 | 0.006 | 0.152 | 0.762 | 17.907 |
| Inferred | TSF | 87.727 | 0.004 | 0.077 | 0.338 | 6.762 |
| WRD | 2.758 | 0.007 | — | 0.020 | — |
| Total / Ave Inferred | 90.486 | 0.004 | 0.075 | 0.357 | 6.762 |
Notes:
1. The Mineral Resources were originally prepared, classified and reported according to SAMREC, 2016. For the purposes of this TRS, the Mineral Reserves have been classified in accordance with § 229.1302(d)(1)(iii)(A) (Item 1302(d)(1)(iii)(A) of Regulation S-K). The QP responsible for the estimate is Mr BJ Selebogo, who is Ore Reserve Manager, and a Harmony employee.
2. The Mineral Resource tonnes are reported as in-situ tailings quantities deposited on TSF's with reasonable prospects for economic extraction.
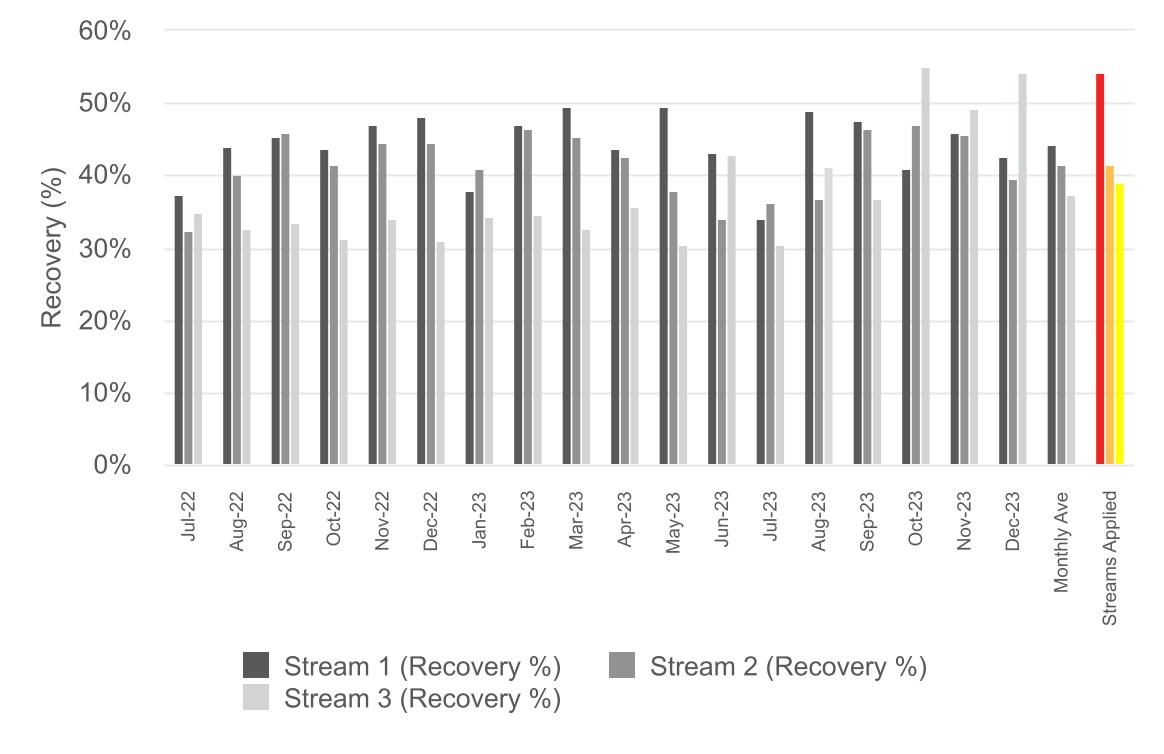
3. A cut-off grade of 0.0g/t has been applied for the estimation of Mineral Resources. Mineral Resource tonnes are reported based on a recovery of 45.32%, an operating cost of R102/t and a gold price of USD1,878/oz.
4. Tonnes are reported as million tonnes rounded to three decimal places. Gold values are rounded to zero decimal places.
5. Uranium content is reported as part of the MWS Mineral Resource estimate as a bi product of Gold with no contribution to project economics.
6. Metal content does not include allowances for processing losses.
7. Mineral Resources are exclusive of Mineral Reserves. Mineral Resources are not Mineral Reserves and do not necessarily demonstrate economic viability, but have been assessed for prospects for economic extraction.
Table 1-2: Summary of the West Wits operation Mineral Resources as at June 30, 2024 (exclusive of Mineral Reserves)
| | | | | | | | | | | | | | | | | | | | |
| METRIC | Grade | Metal Content |
| Mineral Resource Category | Source | Tonnes (Mt) | Gold (g/t) | U3O8 (kg/t) | Gold (kg) | U3O8 (t) |
| | | | | | |
| | | | | |
| | | | | |
| Indicated | TSF | 25.736 | 0.32 | — | 8,321 | — |
| WRD | 0.152 | 0.37 | — | 56 | — |
| | | | | |
| Total / Ave. Measured + Indicated | 25.888 | 0.32 | — | 8,376 | — |
| | | | | | |
| | | | | |
| | | | | |
| |
| IMPERIAL | Grade | Metal Content |
| Mineral Resource Category | Source | Tons (Mt) | Gold (oz/t) | U3O8 (lb/t) | Gold (Moz) | U3O8 (Mlbs) |
| | | | | | |
| | | | | |
| | | | | |
| Indicated | TSF | 28.369 | 0.009 | — | 0.268 | — |
| WRD | 0.167 | 0.011 | — | 0.002 | — |
| | | | | |
| Total / Ave. Measured + Indicated | 28.537 | 0.009 | — | 0.269 | — |
| | | | | | |
| | | | | |
| | | | | |
Notes:
1. The Mineral Resources were originally prepared, classified and reported according to SAMREC, 2016. For the purposes of this TRS, the Mineral Reserves have been classified in accordance with § 229.1302(d)(1)(iii)(A) (Item 1302(d)(1)(iii)(A) of Regulation S-K). The QP responsible for the estimate is Mr BJ Selebogo, who is Ore Reserve Manager, and a Harmony employee.
2. The Mineral Resource tonnes are reported as in-situ tailings quantities deposited on TSF's with reasonable prospects for economic extraction.
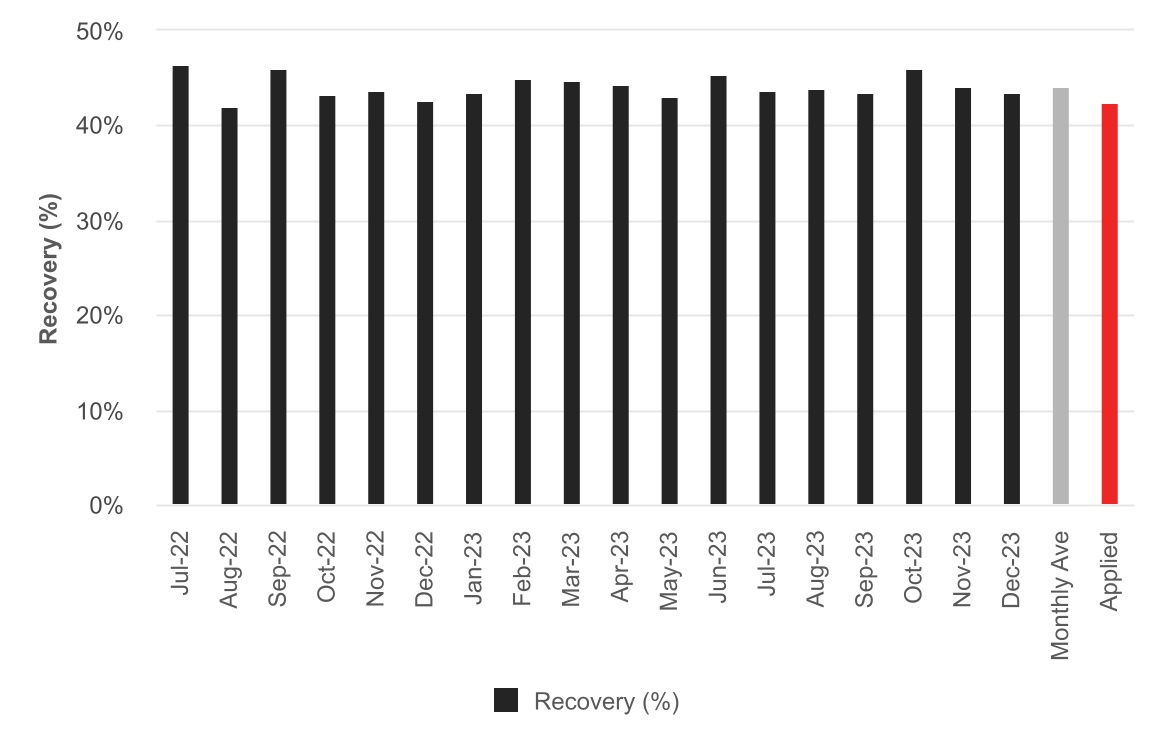
3. A cut-off grade of 0.0g/t has been applied for the estimation of Mineral Resources. Mineral Resource tonnes are reported based on a recovery of 42.5%, an operating cost of R98/t and a gold price of USD1,878/oz.
4. Tonnes are reported as million metric tonnes (“Mt”) rounded to three decimal places. Gold values are rounded to zero decimal places.
5. Metal content does not include allowances for processing losses.
6. Mineral Resources are exclusive of Mineral Reserves. Mineral Resources are not Mineral Reserves and do not necessarily demonstrate economic viability, but have been assessed for prospects for economic extraction.
7. The Mineral Resource estimate is for Harmony’s 100% interest.
Effective Date: June 30, 2024
3
Technical Report Summary for
Mine Waste Solutions, North West, South Africa
Mineral Reserve Estimate
The Mineral Reserves were originally prepared, classified and reported according to SAMREC, 2016. For the purposes of this TRS, the Mineral Reserves have been classified in accordance with § 229.1302(d)(1)(iii)(A) (Item 1302(d)(1)(iii)(A) of Regulation S-K).
Mineral Reserves are derived from the Mineral Resources, a detailed business plan and the operational planning processes. The planning team utilises and takes into consideration historical technical parameters achieved. In addition, Mineral Resource conversion to Mineral Reserves considers modifying factors, costs, gold price and recovery to calculate the cut-off grade.
The Mineral Reserves are reported at June 30, 2024, as delivered to the plant. The Mineral Reserves are declared as delivered to the plant for all TSFs, except for the recovered gold content. This gold content is calculated after factoring in the plant recovery as a modifying factor. The Mineral Reserve estimates for MWS and West Wits operations are provided in Table 1-3 and Table 1-4, respectively
The QP compiling the Mineral Resource estimates is Mr BJ Selebogo, who is the Ore Reserve Manager and an employee of Harmony.
Table 1-3: Summary of the MWS operation Mineral Reserves as at June 30, 2024
| | | | | | | | | | | | | | |
| METRIC |
| Mineral Reserve Category | Source | Tonnes (Mt) | Gold Grade (g/t Au) | Gold Content (kg) |
| Proved | TSF | 7.499 | 0.28 | 2,099 |
| | | |
| | | |
| Probable | TSF | 367.071 | 0.28 | 101,389 |
| | | |
| | | |
| Total / Ave (Proved + Probable) | 374.570 | 0.28 | 103,488 |
| IMPERIAL |
| Mineral Reserve Category | Source | Tons (Mt) | Gold Grade (oz/t) | Gold Content (Moz) |
| Proved | TSF | 8.266 | 0.008 | 0.067 |
| | | |
| | | |
| Probable | TSF | 404.626 | 0.008 | 3.260 |
| | | |
| | | |
| Total / Ave (Proved + Probable) | 412.892 | 0.008 | 3.327 |
Notes:
1. The Mineral Reserves were originally prepared, classified and reported according to SAMREC, 2016. For the purposes of this TRS, the Mineral Reserves have been classified in accordance with § 229.1302(d)(1)(iii)(A) (Item 1302(d)(1)(iii)(A) of Regulation S-K). The QP responsible for the estimate is Mr BJ Selebogo, who is the Ore Reserve Manager, and a Harmony employee.
2. Tonnes, grade, and content are declared as tailings delivered to the mills.
3. Gold content is gold before applying PRF. Metallurgical recovery factors have not been applied to the reserve figures.
4. Mineral Reserves are reported using a cut-off grade of 0.22g/t at recovery of 45.32%, a gold price of USD1,772/oz and R102/t operating cost.
5. Recovered gold (kg) is based on a conversion factor of 32.1507oz/kg.
6. Rounding as required by reporting guidelines may result in apparent summation differences.
Table 1-4: Summary of the West Wits operation Mineral Reserves as at June 30, 2024
| | | | | | | | | | | | | | |
| METRIC |
| Mineral Reserve Category | Source | Tonnes (Mt) | Grade (g/t Au) | Content Au (kg) |
| | | | |
| | | |
| | | |
| Probable | TSF | 12.281 | 0.32 | 3,931 |
| | | |
| | | |
| Total / Ave (Proved + Probable) | 12.281 | 0.32 | 3,931 |
| IMPERIAL |
| Mineral Reserve Category | Source | Tons (Mt) | Gold Grade (oz/t) | Content (Moz Au) |
| | | | |
| | | |
| | | |
| Probable | TSF | 13.537 | 0.009 | 0.126 |
| | | |
| | | |
| Total / Ave (Proved + Probable) | 13.537 | 0.009 | 0.126 |
Notes:
1. The Mineral Reserves were originally prepared, classified and reported according to SAMREC, 2016. For the purposes of this TRS, the Mineral Reserves have been classified in accordance with § 229.1302(d)(1)(iii)(A) (Item 1302(d)(1)(iii)(A) of Regulation S-K). The QP responsible for the estimate is Mr BJ Selebogo, who is the Ore Reserve Manager, and a Harmony employee.
2. Tonnes, grade, and gold content are declared as tailings delivered to the mills.
3. Gold content is gold before applying PRF. Metallurgical recovery factors have not been applied to the reserve figures.
4. Mineral Reserves are reported using a cut-off grade of 0.22g/t at recovery of 42.5%, a gold price of USD1,772/oz and R98/t.
5. Recovered gold (kg) is based on a conversion factor of 32.1507oz/kg.
6. Rounding as required by reporting guidelines may result in apparent summation differences.
In my opinion as the QP, given that Mine Waste Solutions is an established operation, the modifying factors informing the Mineral Reserve estimates would at minimum, satisfy the confidence levels of a Pre-Feasibility Study.
Effective Date: June 30, 2024
4
Technical Report Summary for
Mine Waste Solutions, North West, South Africa
The economic analysis of the cash flows displays positive results and are deemed both technically and economically achievable. The discounted cashflow NPV for Mine Waste Solutions for the current business plan amounts to ZAR3,818 million. The first year two years is cash negative due to the Kareerand extension project capital, and from FY 2027 until end of life in FY 2039 the cashflow is cash positive.
Capital and Operating Cost Estimates
The capital cost estimates for the MWS and West Wits operations are determined at corporate level, using the business plan as a basis. The capital cost elements include equipment, infrastructure and operating capital. The capital costs are reported in ZAR terms and on a real basis. Project Capital to ensure ongoing TSF reclamation includes Kareerand Extension project for future TSF residue deposition, construction of Stream 4 planned to be in production from mid November 2024, this will increase processing capacity and bring gold forward, as well as Pumpstation construction for MWS 4 & 5 which will be operational from September 2024. Mispah TSF's planned production will start in July 2026.
Also shown in Table 1-5 is the stay in business plant capital to ensure plans run at optimal performance. The capital cost estimates for MWS are presented in Table 1-5. West Wits does not have any capital requirements outside the plant, but has planned a capital of R85.9m to keep the plant running to make sure that the Mineral Reserve plan is realized.
The operating cost estimates for the MWS and West Wits operations are categorised into nine allocated cost categories. The capital costs are reported in ZAR terms and on a real basis. A summary of the MWS and West Wits operating cost estimate, per stream, are presented in Table 1-6 and Table 1-7, respectively. The Capex and Opex budgets are consistent with feasibility level.
Table 1-5: Summary of Mineral Reserve capital cost estimate for MWS operation major projects
| | | | | |
| Capital Cost Element (ZAR'000) | Total Reserve Plan (FY2025- FY2039) |
| Kareerand | 1,015,278 |
| Stream 4 Gold Plant Implementation | 58,311 |
| MWS 4 & 5 Pump Station | 36,153 |
| Mispah Pump Station | 507,321 |
| |
| West Pump Station | 2,500 |
| Other | 1,823,788 |
| Total | 3,443,351 |
Effective Date: June 30, 2024
5
Technical Report Summary for
Mine Waste Solutions, North West, South Africa
Table 1-6: Summary of operating cost estimates for MWS operation (MWS gold plant)
| | | | | |
| Operating Cost Element (ZAR'000) | Total Reserve Plan |
| Wages - Payroll 1 | 812,126 |
| Wages - Payroll 2 | 419,974 |
| Stores and materials | 1,286,560 |
| Electric Power and Water | 2,493,878 |
| Outside Contractors | 2,235,188 |
| Other | 1,227,661 |
| Total Direct Costs | 8,475,387 |
| Pumping Allocation | — |
| Refining Charges | 64,046 |
| Uranium Allocation | — |
| Hostel Cost | — |
| Backfill Cost | — |
| Plant Treatment Cost | 24,884,331 |
| Working Cost Transfer to Capital | — |
| Care and Maintenance | — |
| Mine Overheads Re-allocated | 1,822,038 |
| Total | 35,245,802 | |
Table 1-7: Summary of operating cost estimates for West Wits operation
| | | | | | |
| Operating Cost Element (ZAR'000) | Total Reserve Plan | |
| Wages - Payroll 1 | — | |
| Wages - Payroll 2 | — | |
| Stores and materials | 15,381 | |
| Electric Power and Water | 42,821 | |
| Outside Contractors | 53,061 | |
| Other | 6,585 | |
| Total Direct Costs | 117,848 | |
| Pumping Allocation | — | |
| Refining Charges | 2,831 | |
| Uranium Allocation | — | |
| Hostel Cost | — | |
| Backfill Cost | — | |
| Plant Treatment Cost | 923,082 | |
| Working Cost Transfer to Capital | — | |
| Care and Maintenance | — | |
| Mine Overheads Re-allocated | 70,934 | |
| Total | 1,114,695 | | |
Permitting Requirements
To successfully operate a mining or reclamation operation in South Africa, the State requires compliance with applicable environmental laws, regulations, permits and standards. Mine Waste Solutions and West Wits operations adhere to said compliance and regulatory standards and have, in addition, implemented an Environmental Management System in line with the ISO 14001. Mine Waste Solutions has all permits required to operate. The status of the permits held by the company are presented in Table 1-8. The permits expiring in 2024 are the ones that are renewed yearly and will be by the beginning of the year.
Effective Date: June 30, 2024
6
Technical Report Summary for
Mine Waste Solutions, North West, South Africa
Table 1-8: Status of environmental permits and licenses
| | | | | | | | | | | | | | | | | |
| Operation | Permit / License | Reference No. | Issued By | Date Granted | Validity |
| MWS | MWS: AEL License CHEMWES: Atmospheric Emission License | NWPG/CHEMWES/AEL. 4.1,4.2 & 4.17/October 2020 | DEDECT | 30-Sep-20 | 30-Sep-26 |
| MWS Plant: Certificate of Registration Inflammable Liquids and Substances (required by the by-laws) | 4357 | City Council of Matlosana Fire and Rescue | 29/11/2023 | 31/12/2024 |
| Harties 1 & 2: Certificate of Registration Inflammable Liquids and Substances (required by the by-laws) | 4354 | City Council of Matlosana Fire and Rescue | 29/11/2023 | 31/12/2024 |
| Kareerand: Certificate of Registration Inflammable Liquids and Substances (required by the by-laws) | 4356 | City Council of Matlosana Fire and Rescue | 29/11/2023 | 31/12/2024 |
| Sulphur Pay Dam: Certificate of Registration Inflammable Liquids and Substances (required by the by-laws) | 4355 | City Council of Matlosana Fire and Rescue | 29/11/2023 | 31/12/2024 |
| East Complex: Certificate of Registration Inflammable Liquids and Substances (required by the by-laws) | 4353 | City Council of Matlosana Fire and Rescue | 29/11/2023 | 31/12/2024 |
| West Complex: Certificate of Registration Inflammable Liquids and Substances (required by the by-laws) | 4358 | City Council of Matlosana Fire and Rescue | 29/11/2023 | 31/12/2024 |
| Water Use License: Bio-monitoring - 6 monthly reporting. Water balance quarterly | 27/2/2/C224/101/1 - 27087241 - 08/C24B/AACIG/8368 | DWS | 31/11/2018 | 10 years |
| Water Use License: Environmental Water report - Quarterly. Water incidents - as they occur | 08/C24B/AIACGI/11868 | DWS | 18/09/2023 | 20 years |
| Water Use Licence (Mispah): 6 Monthly monitoring reports must be submitted to the Provincial Head/CEO for the duration of the construction phase and yearly thereafter or until otherwise agreed in writing with the Provincial Head/CEO. | 08/C24B/CI/13793 | DWS | 20/10/2023 | 20-Oct-29 |
| Environmental authorisation for expansion of Kareerand tailings storage facilities, re-processing of the waste dumps and disposal of tailings in respect of various portions | NWP/EIA/176/2008 | DMRE | 21/11/2022 | N/A |
| NEMA Amendment Authorisation for the construction of pipelines | NW 30/5/1/2/3/2/1/378 EM | DMRE | 21/11/2021 | N/A |
Effective Date: June 30, 2024
7
Technical Report Summary for
Mine Waste Solutions, North West, South Africa
| | | | | | | | | | | | | | | | | |
| Operation | Permit / License | Reference No. | Issued By | Date Granted | Validity |
| MWS | License to Construct a Dam with Safety Risk | 12/2/C241/37 | DWS | 18/06/2010 | N/A |
| Application to discharge Sewerage into Municipal system | 17/3/1/1 | City Council of Matlosana Fire and Rescue | 29/02/2002 | N/A |
| MWS: Certificate of Registration | COR-30 (Variation 30) | NNR | 14/04/2023 | N/A |
| License to Construct Harmony Solar PV Facility | NWP/EIA/75/2023: May be reviewed at intervals of not more than 5 years | DEDECT | 07/05/2024 | N/A |
| Environmental authorisation for the construction of a return water pipeline from Kareerand Tailings storage facility to Midway | NWP/EIA/32/2023: EA is valid for 5 Years- Activities must be concluded within 5 years from the date of issue. Awaiting WUL | DEDECT | 06/11/2023 | N/A |
| MWS: Environmental Authorisation for Mispah TSF Reclamation and associated pipelines in the Free State and North West Provinces | 14/12/16/3/3/1/2714 | DFFE | 07/09/2023 | N/A |
| WW | Environmental Authorisation | WR/16-17/AEL9/3 | Dr. Kenneth Kaunda District Municipality | 14-Dec-2023 | 31-Dec-2028 |
| Water Use Licence | 08/C23E/AFGJCEI/12157 | DWS | 27/09/2022 | 27/09/2031 |
| Environmental Authorisation | (GP) 30/5/1/2/3/2/1(01) EM | DMRE | 29-Mar-23 | N/A |
| (GP) 30/5/1/2/2(01) MR |
| In progress of updating |
| Waste Management Licence | Gaut 002/09-10/W0011 | GDARD | 27-Jul-15 | Expired |
| Golden Core Trade and Invest (Pty) LTD submitted renewal application. Awaiting approval. | DMRE |
Note: DEDET - Department of Economic Development, Environment, Conservation and Tourism, DWS - Department of Water and Sanitation, Department of Mineral Resources and Energy, GDARD - Gauteng Department of Agriculture and Rural Development, AGA - Anglogold Ashanti Limited.
Effective Date: June 30, 2024
8
Technical Report Summary for
Mine Waste Solutions, North West, South Africa
Conclusions
In the opinion of the QP, Mine Waste Solutions is a wholly owned asset of Harmony, which is comprised of the MWS and West Wits operations. The majority of the assets were previously owned by AngloGold Ashanti and have been operating for many years. The operations are accessible and have good regional infrastructure. Management has a good handle on aspects pertaining to legal and environmental matters with respect to operating within the South African law, as regulated by the MPRDA, and supporting legislation.
MWS and West Wits have a significant Mineral Resource base, comprising gold-bearing TSFs and WRDs. These man-made deposits have their own depositional and mineralization characteristics, and the exploration, modelling and estimation practices informing Mineral Resource estimates for these types of deposits is well established. The exploitation of these deposits either through reclamation by hydraulic monitoring guns or through loading operations is also well established, and Mine Waste Solutions has all the necessary infrastructure required to implement the mineral reserve plan.
Under the assumptions in this TRS, the MWS and West Wits operations show a positive cash flow over the Mineral Reserve plan which supports the Mineral Resource and Mineral Reserve estimates, and the Mineral Reserve plan is achievable under the set of assumptions and parameters used.
Mine Waste Solutions did not incur any fines or penalties for non-compliance during the year ended June 30, 2024 and no significant encumbrances exist.
Recommendations
The QP recommend that an aerial survey be carried out monthly, instead of a manual GPS survey, to provide a high degree of accuracy with respect to digital terrain model and monthly survey results.
In the case where deposition occurred after drilling, it is recommended that the model totals be updated with the deposited volumes, tonnage and gold grade.
Effective Date: June 30, 2024
9
Technical Report Summary for
Mine Waste Solutions, North West, South Africa
2Introduction
Section 229.601(b)(96)(iii)(B) (2) (i-v)
This TRS on Mine Waste Solutions has been prepared for the registrant, Harmony. The TRS has been prepared in accordance with Regulation S-K 1300. It has been prepared to meet the requirements of Section 229.601(b)96 - Technical Report Summary. The purpose of this TRS is to provide open and transparent disclosure of all material, exploration activities, Mineral Resource and Mineral Reserve information to enable the investor to understand MWS and West Wits Surface Sources which form part of Harmony’s activities.
This TRS is prepared to satisfy the requirement of Item 1302(e)(6) of Regulation S-K. An economic assessment was included, using a detailed discounted cashflow analysis for the Mineral Reserves, excluding all scheduled Inferred Mineral Resources which are not reported under Mineral Reserve. This TRS is necessitated by the change of scheduled Mineral Resources (LOM plan), capital and operating costs as well as the change in Mineral Reserve price.
This TRS has been prepared from the following sources of information:
•Competent Persons Report dated June 30, 2024 prepared by Mr BJ Selebogo;
•BP2025 Harmony Corporate Mineral Reserves plan;
•Published Mineral Resource and Mineral Reserve statement as at June 30, 2024; and
•Various internal technical reports from various stakeholders.
This TRS was prepared by a QP employed on a full-time basis by the registrant. The QPs qualifications, areas of responsibility (Sections in the TRS report) and Professional Organization are presented in Table 2-1.
Table 2-1: QP qualification, section responsibilities and personal inspections
| | | | | | | | | | | | | | |
| Qualified Person | Professional Organization | Qualification | TRS Section Responsibility | Personal Insp. |
| Mr. BJ. Selebogo | SAGC | MSCC, HND (MRM) | All Sections | Full time |
| | | | |
| | | | |
| | | | |
| | | | |
| | | | |
| | | | |
| | | | |
| | | | |
| | | | |
| | | | |
| | | | |
| | | | |
| | | | |
| | | | |
| | | | |
| | | | |
The QP states that this TRS updates the TRS filed by Harmony on Mine Waste Solutions on October 31, 2022, named Exhibit 96.8 Technical Report Summary of the Mineral Resources and Mineral Reserves for Mine Waste Solutions (MWS) and West Wits operations, North West and Gauteng Provinces, South Africa, which was effective on June 30, 2022. This updated TRS has an effective date as at June 30, 2024. No material changes have occurred between the effective date and the date of signature. This TRS is necessitated by the change of scheduled Mineral Resources (LOM plan), capital and operating costs as well as the change in Mineral Reserve price. An economic assessment was included, using a detailed discounted cashflow analysis for the Mineral Reserves, excluding all scheduled Inferred Mineral Resources which are not reported under Mineral Reserve.
Effective Date: June 30, 2024
10
Technical Report Summary for
Mine Waste Solutions, North West, South Africa
3Property Description and Location
Section 229.601(b)(96)(iii)(B) (3) (i-vii)
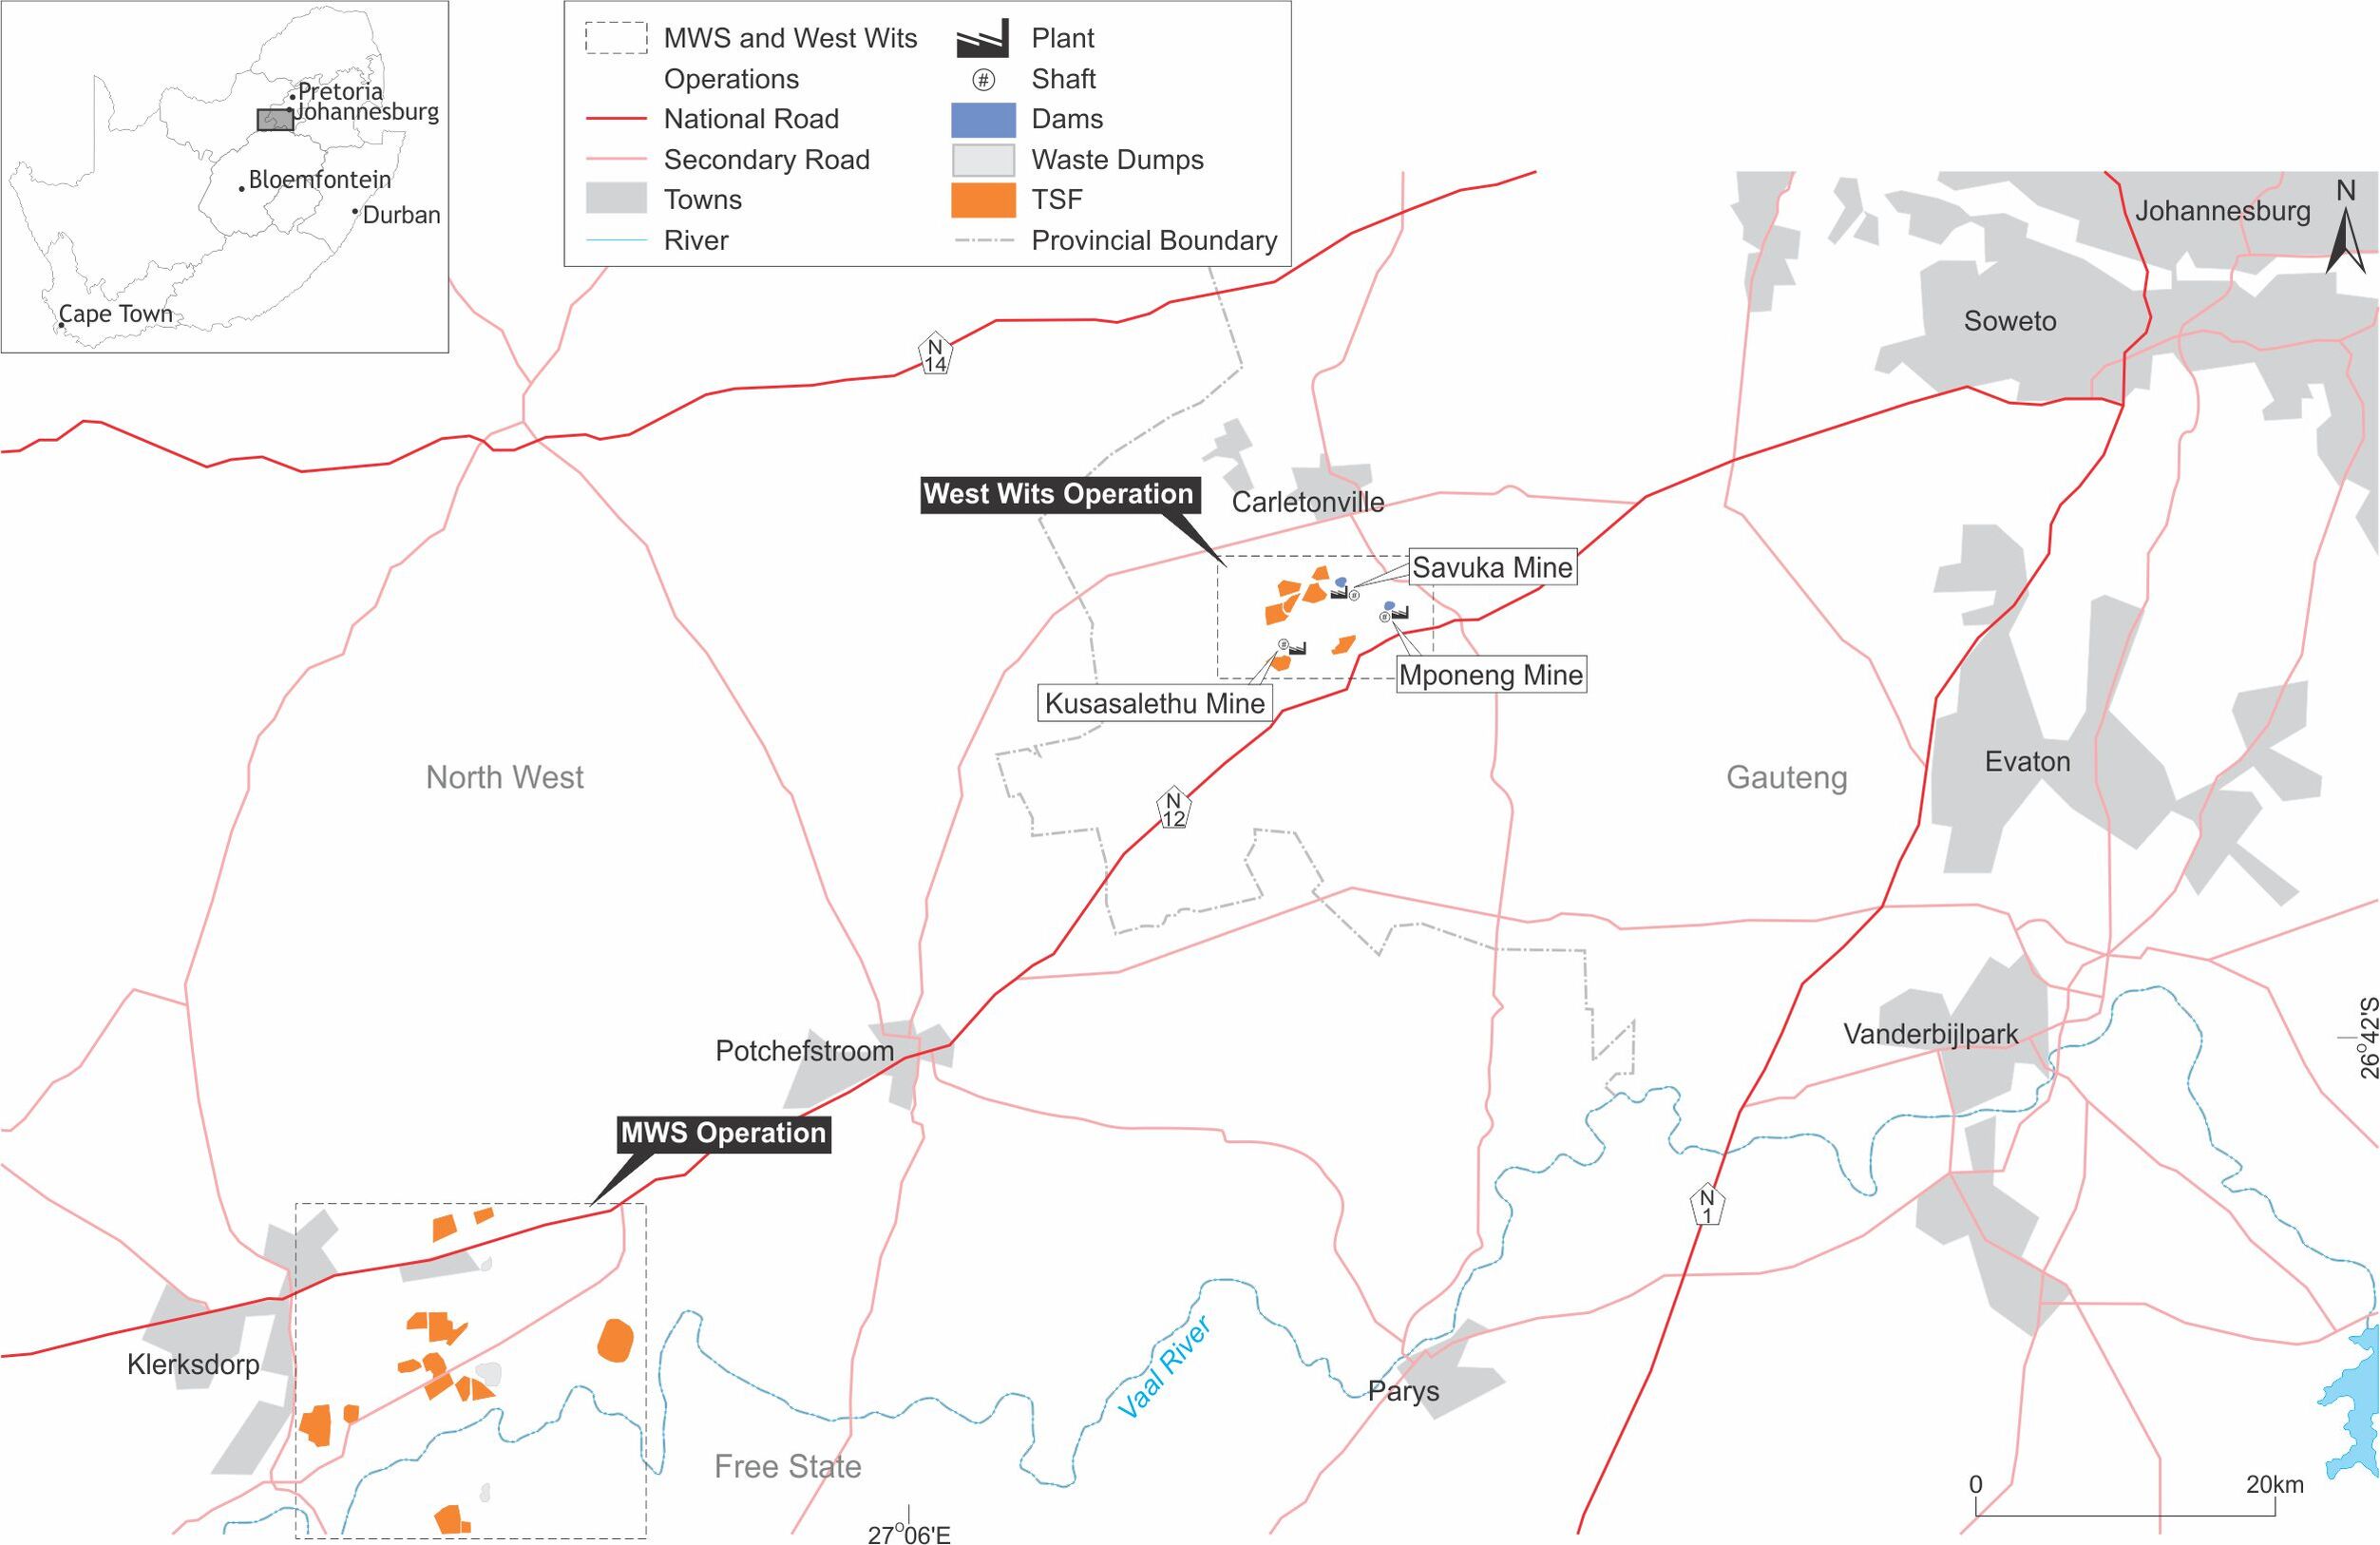
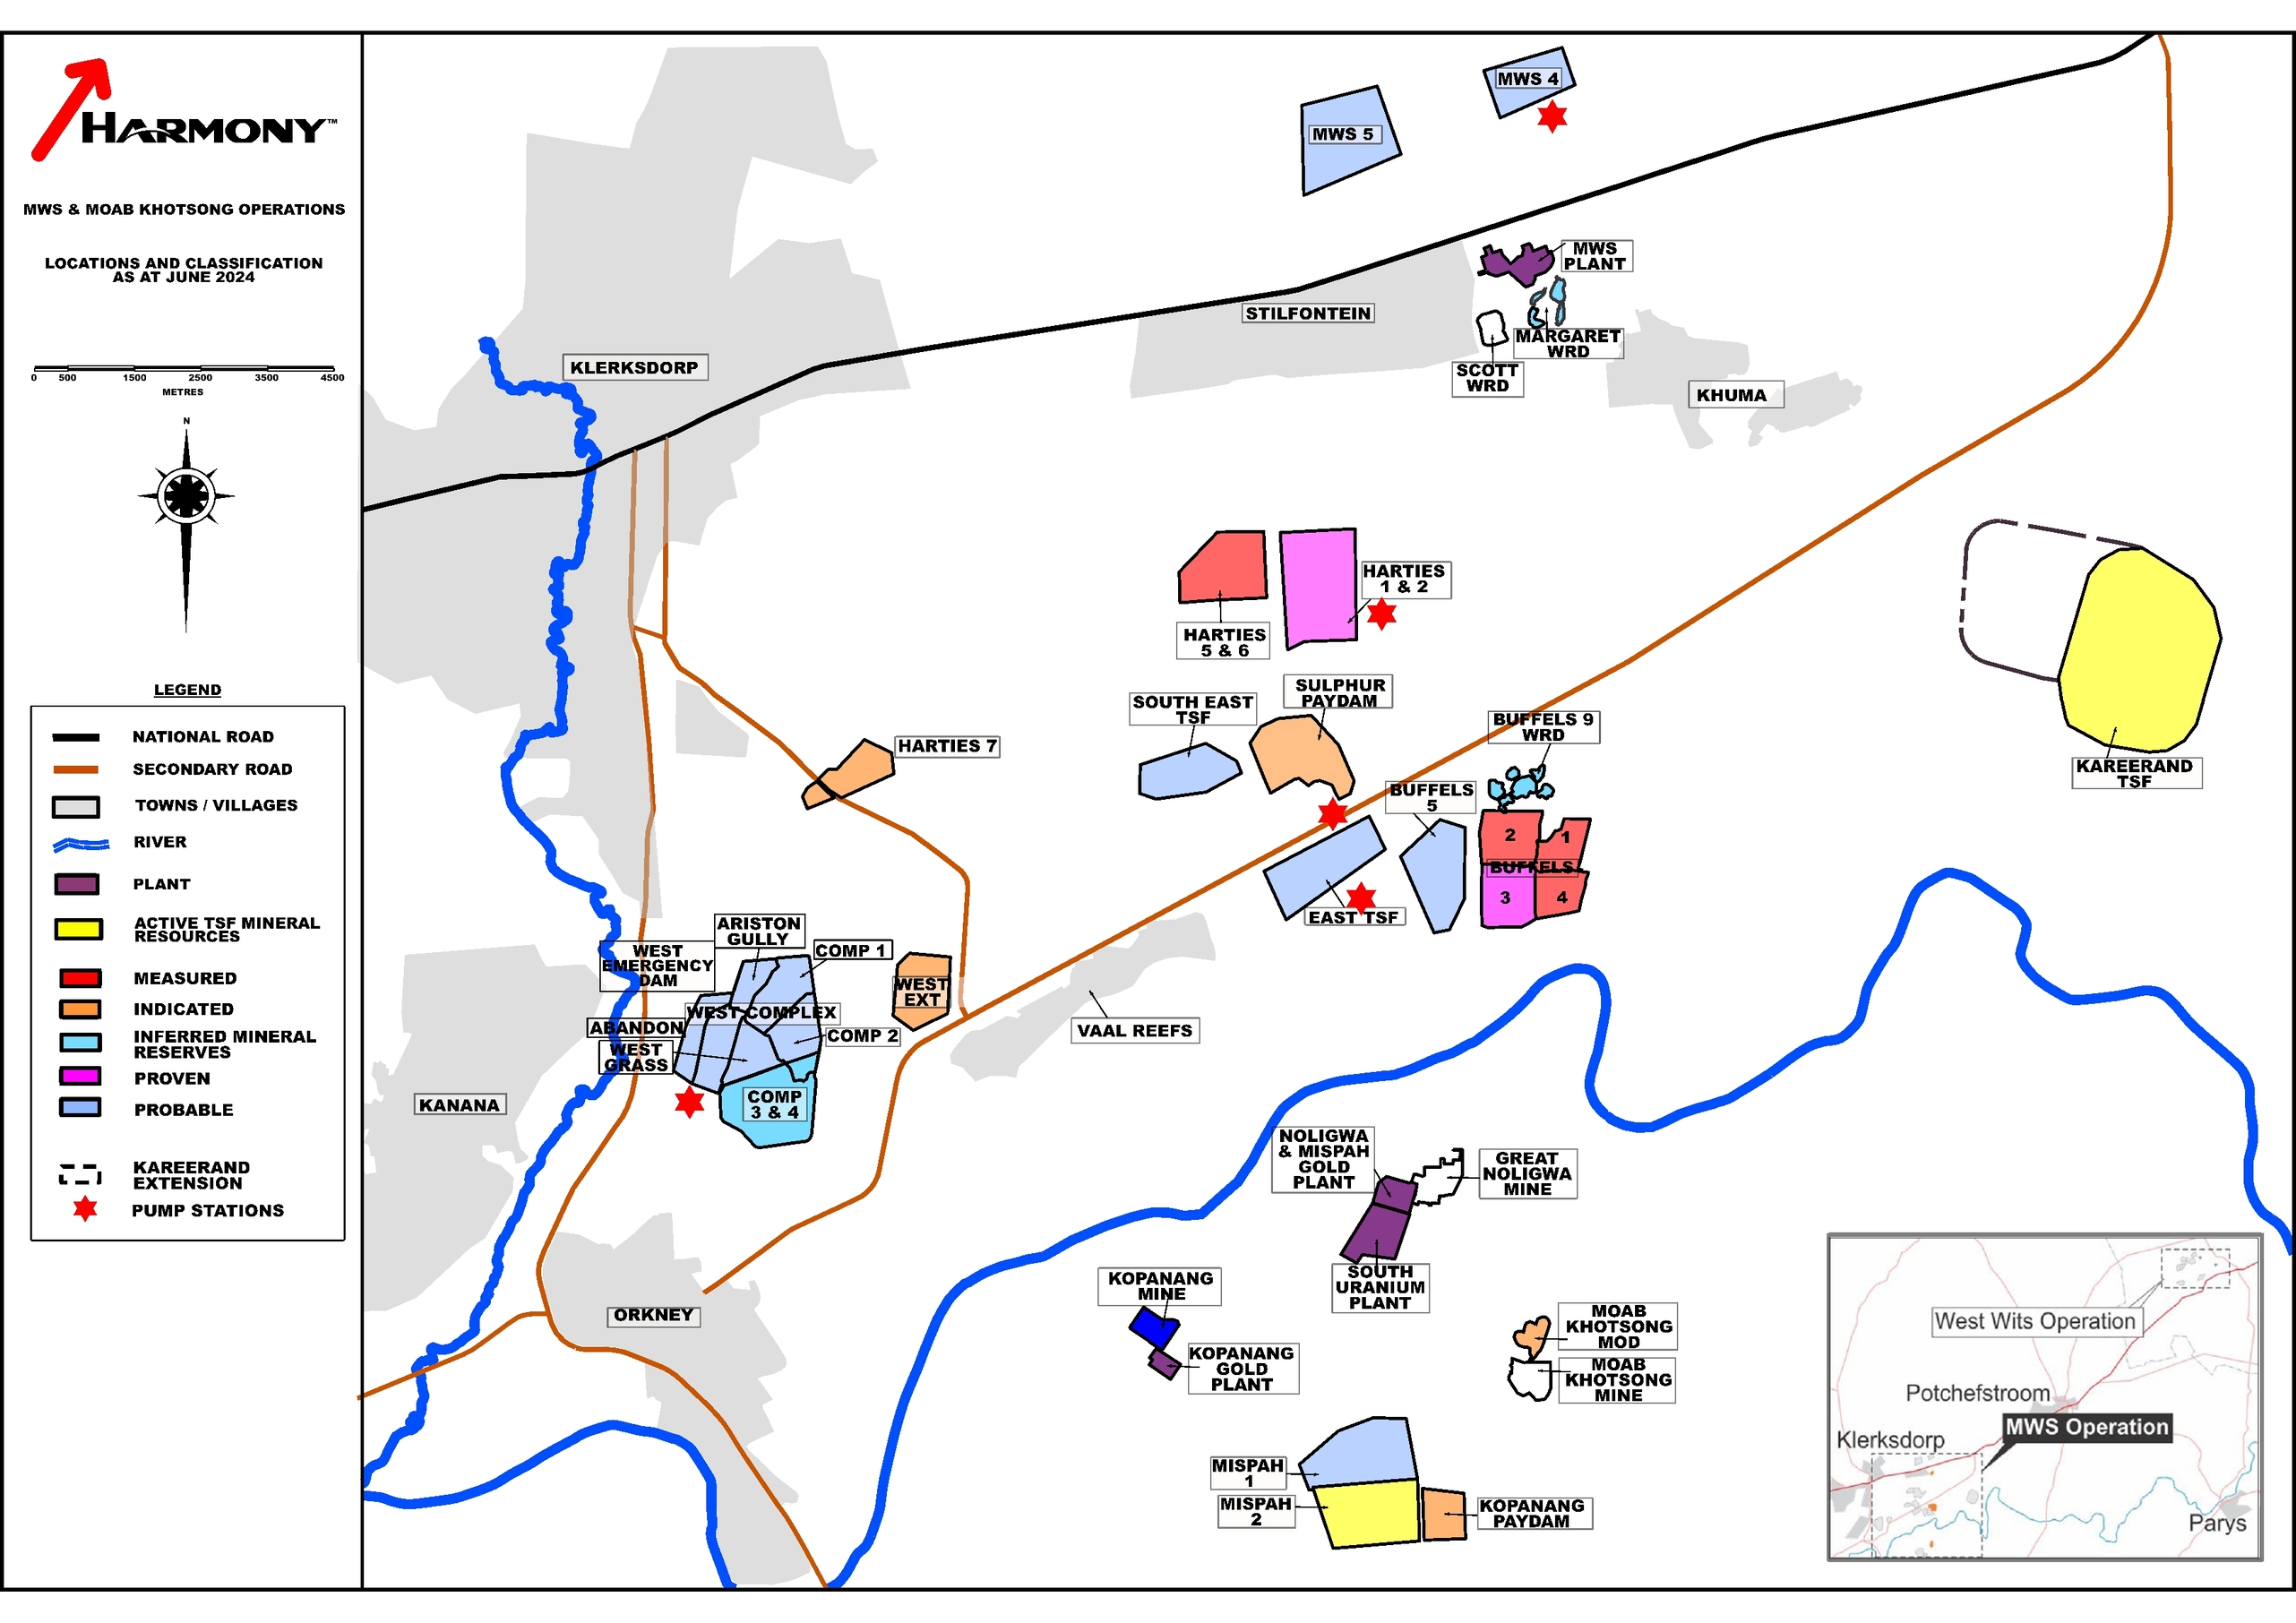
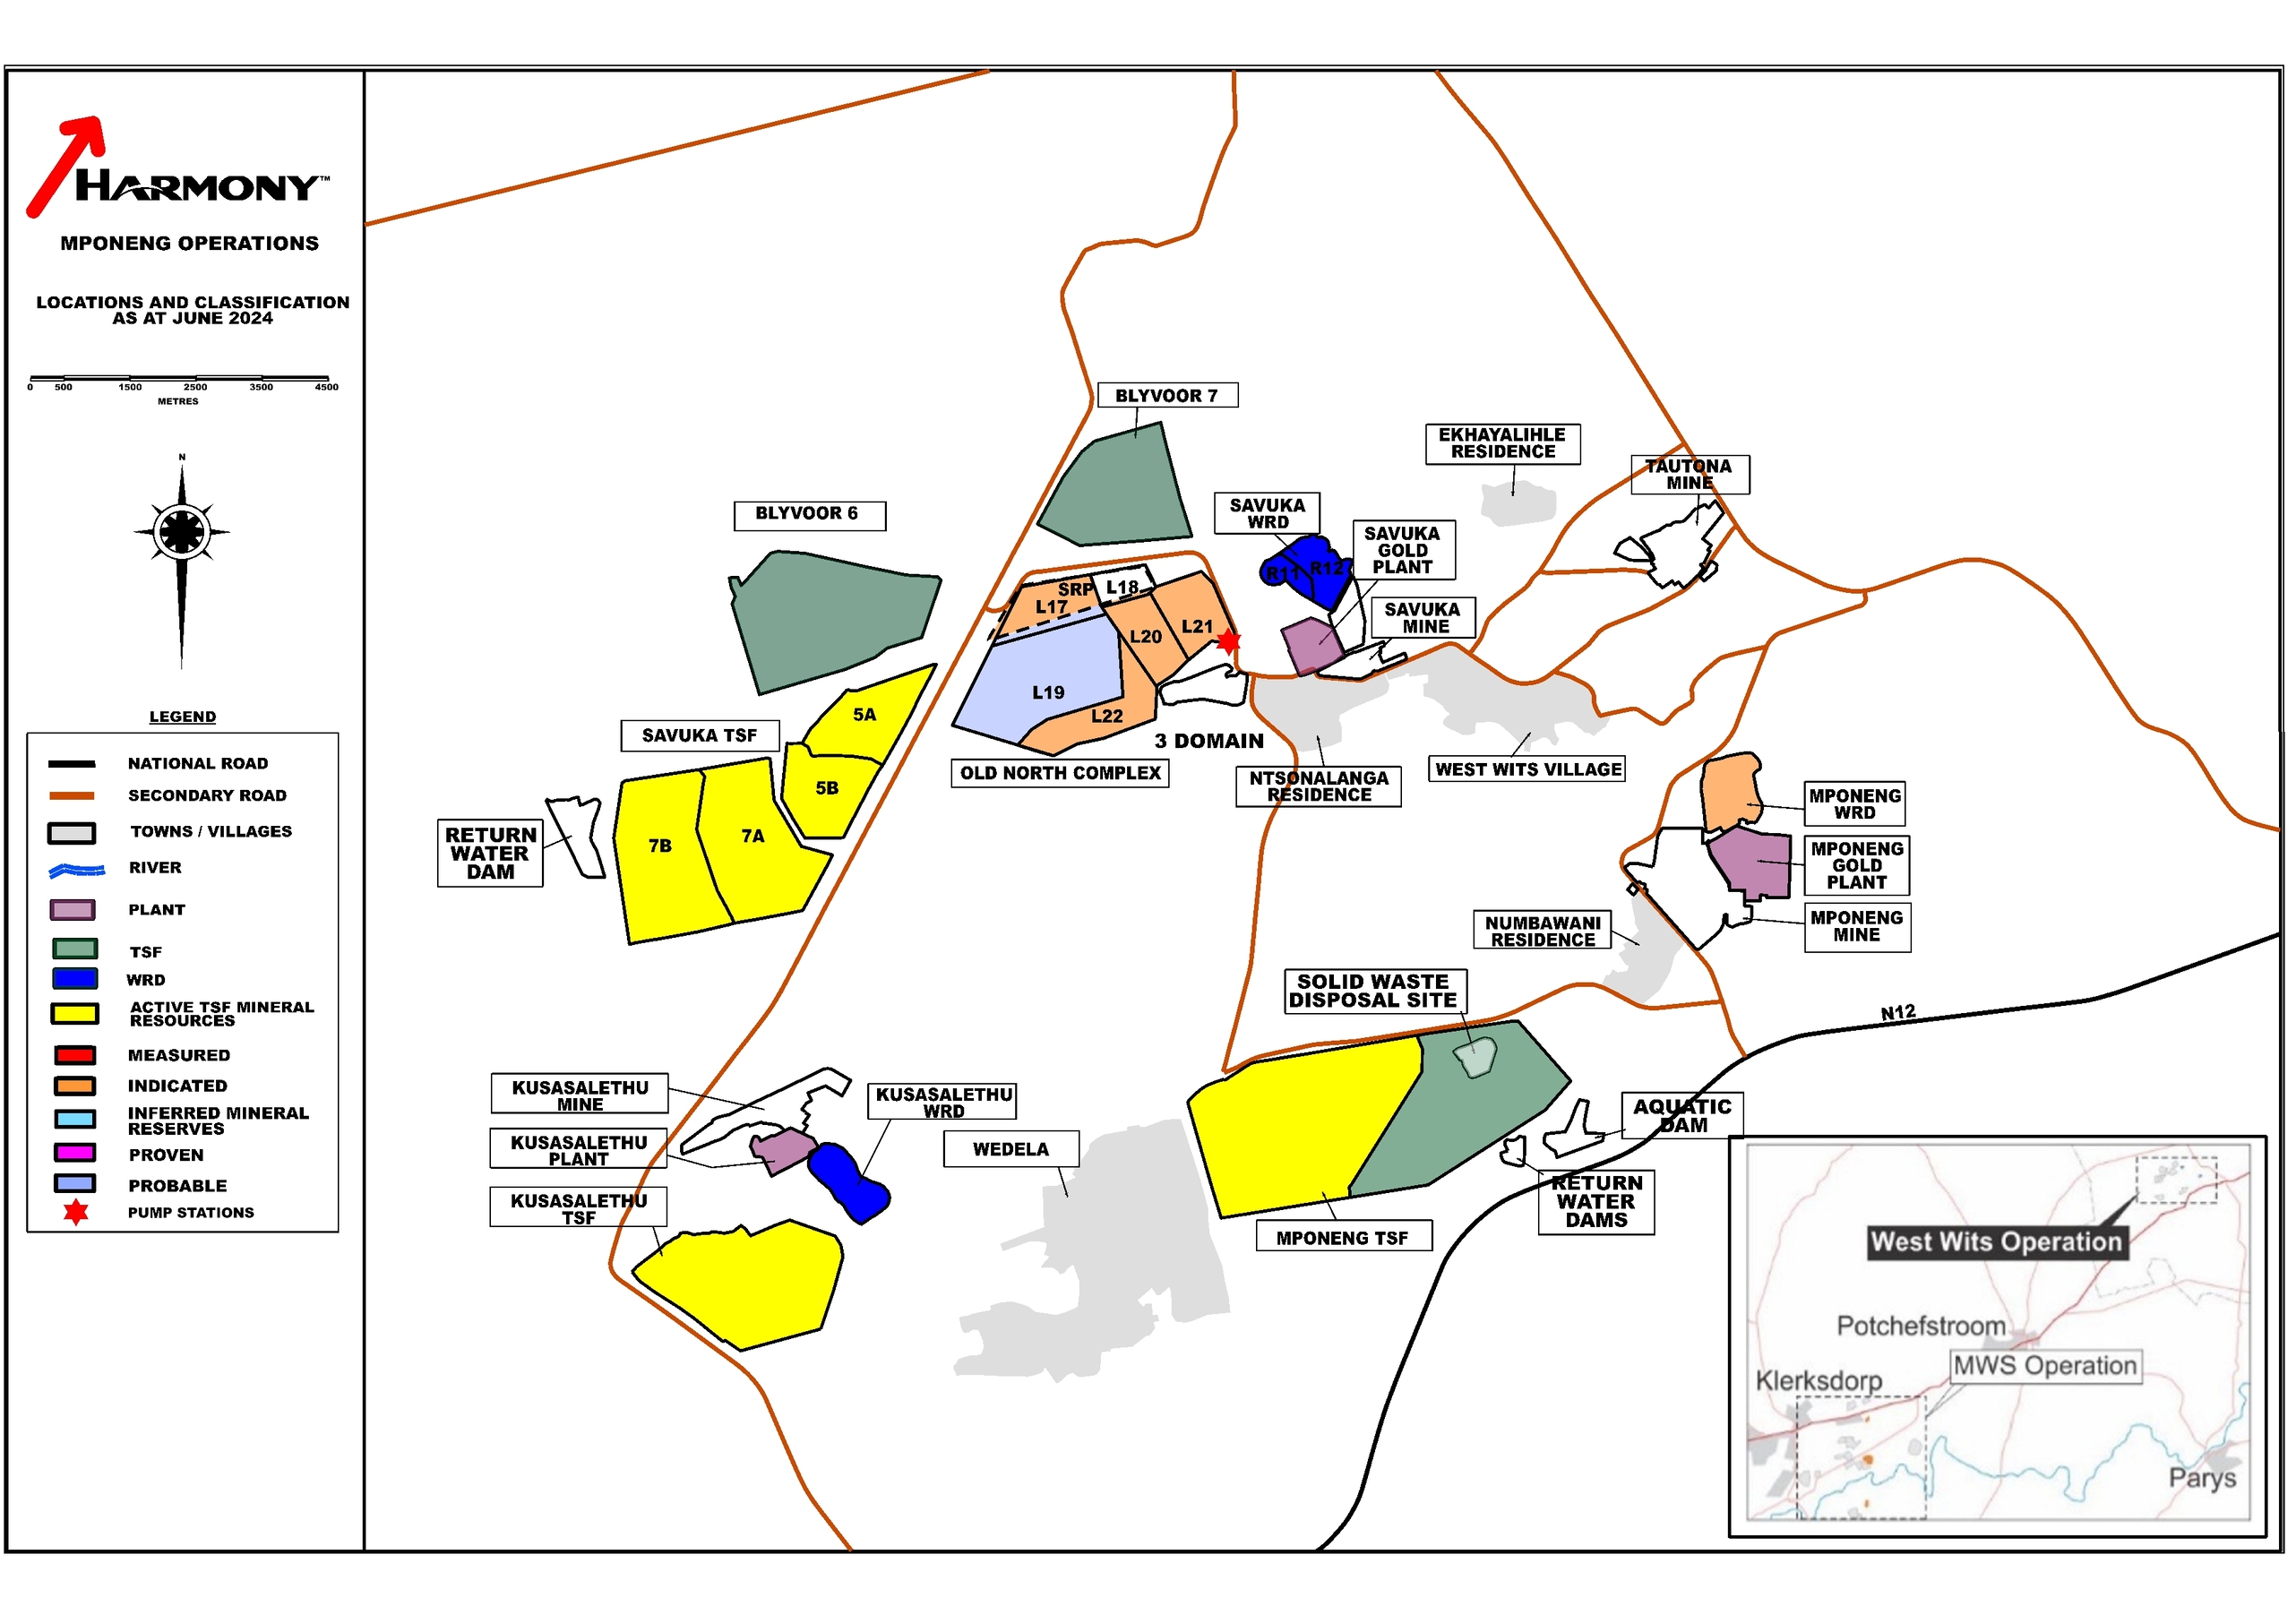
Mine Waste Solutions is comprised of two distinct, geographically separated, operations namely the MWS operation located on the Free State - North West provincial boundary, and the West Wits operation situated in the West Rand region of the Gauteng Province (Figure 3-1). Each operation will be discussed separately due to their geographical locations.
3.1MWS Operation
3.1.1Description and Location
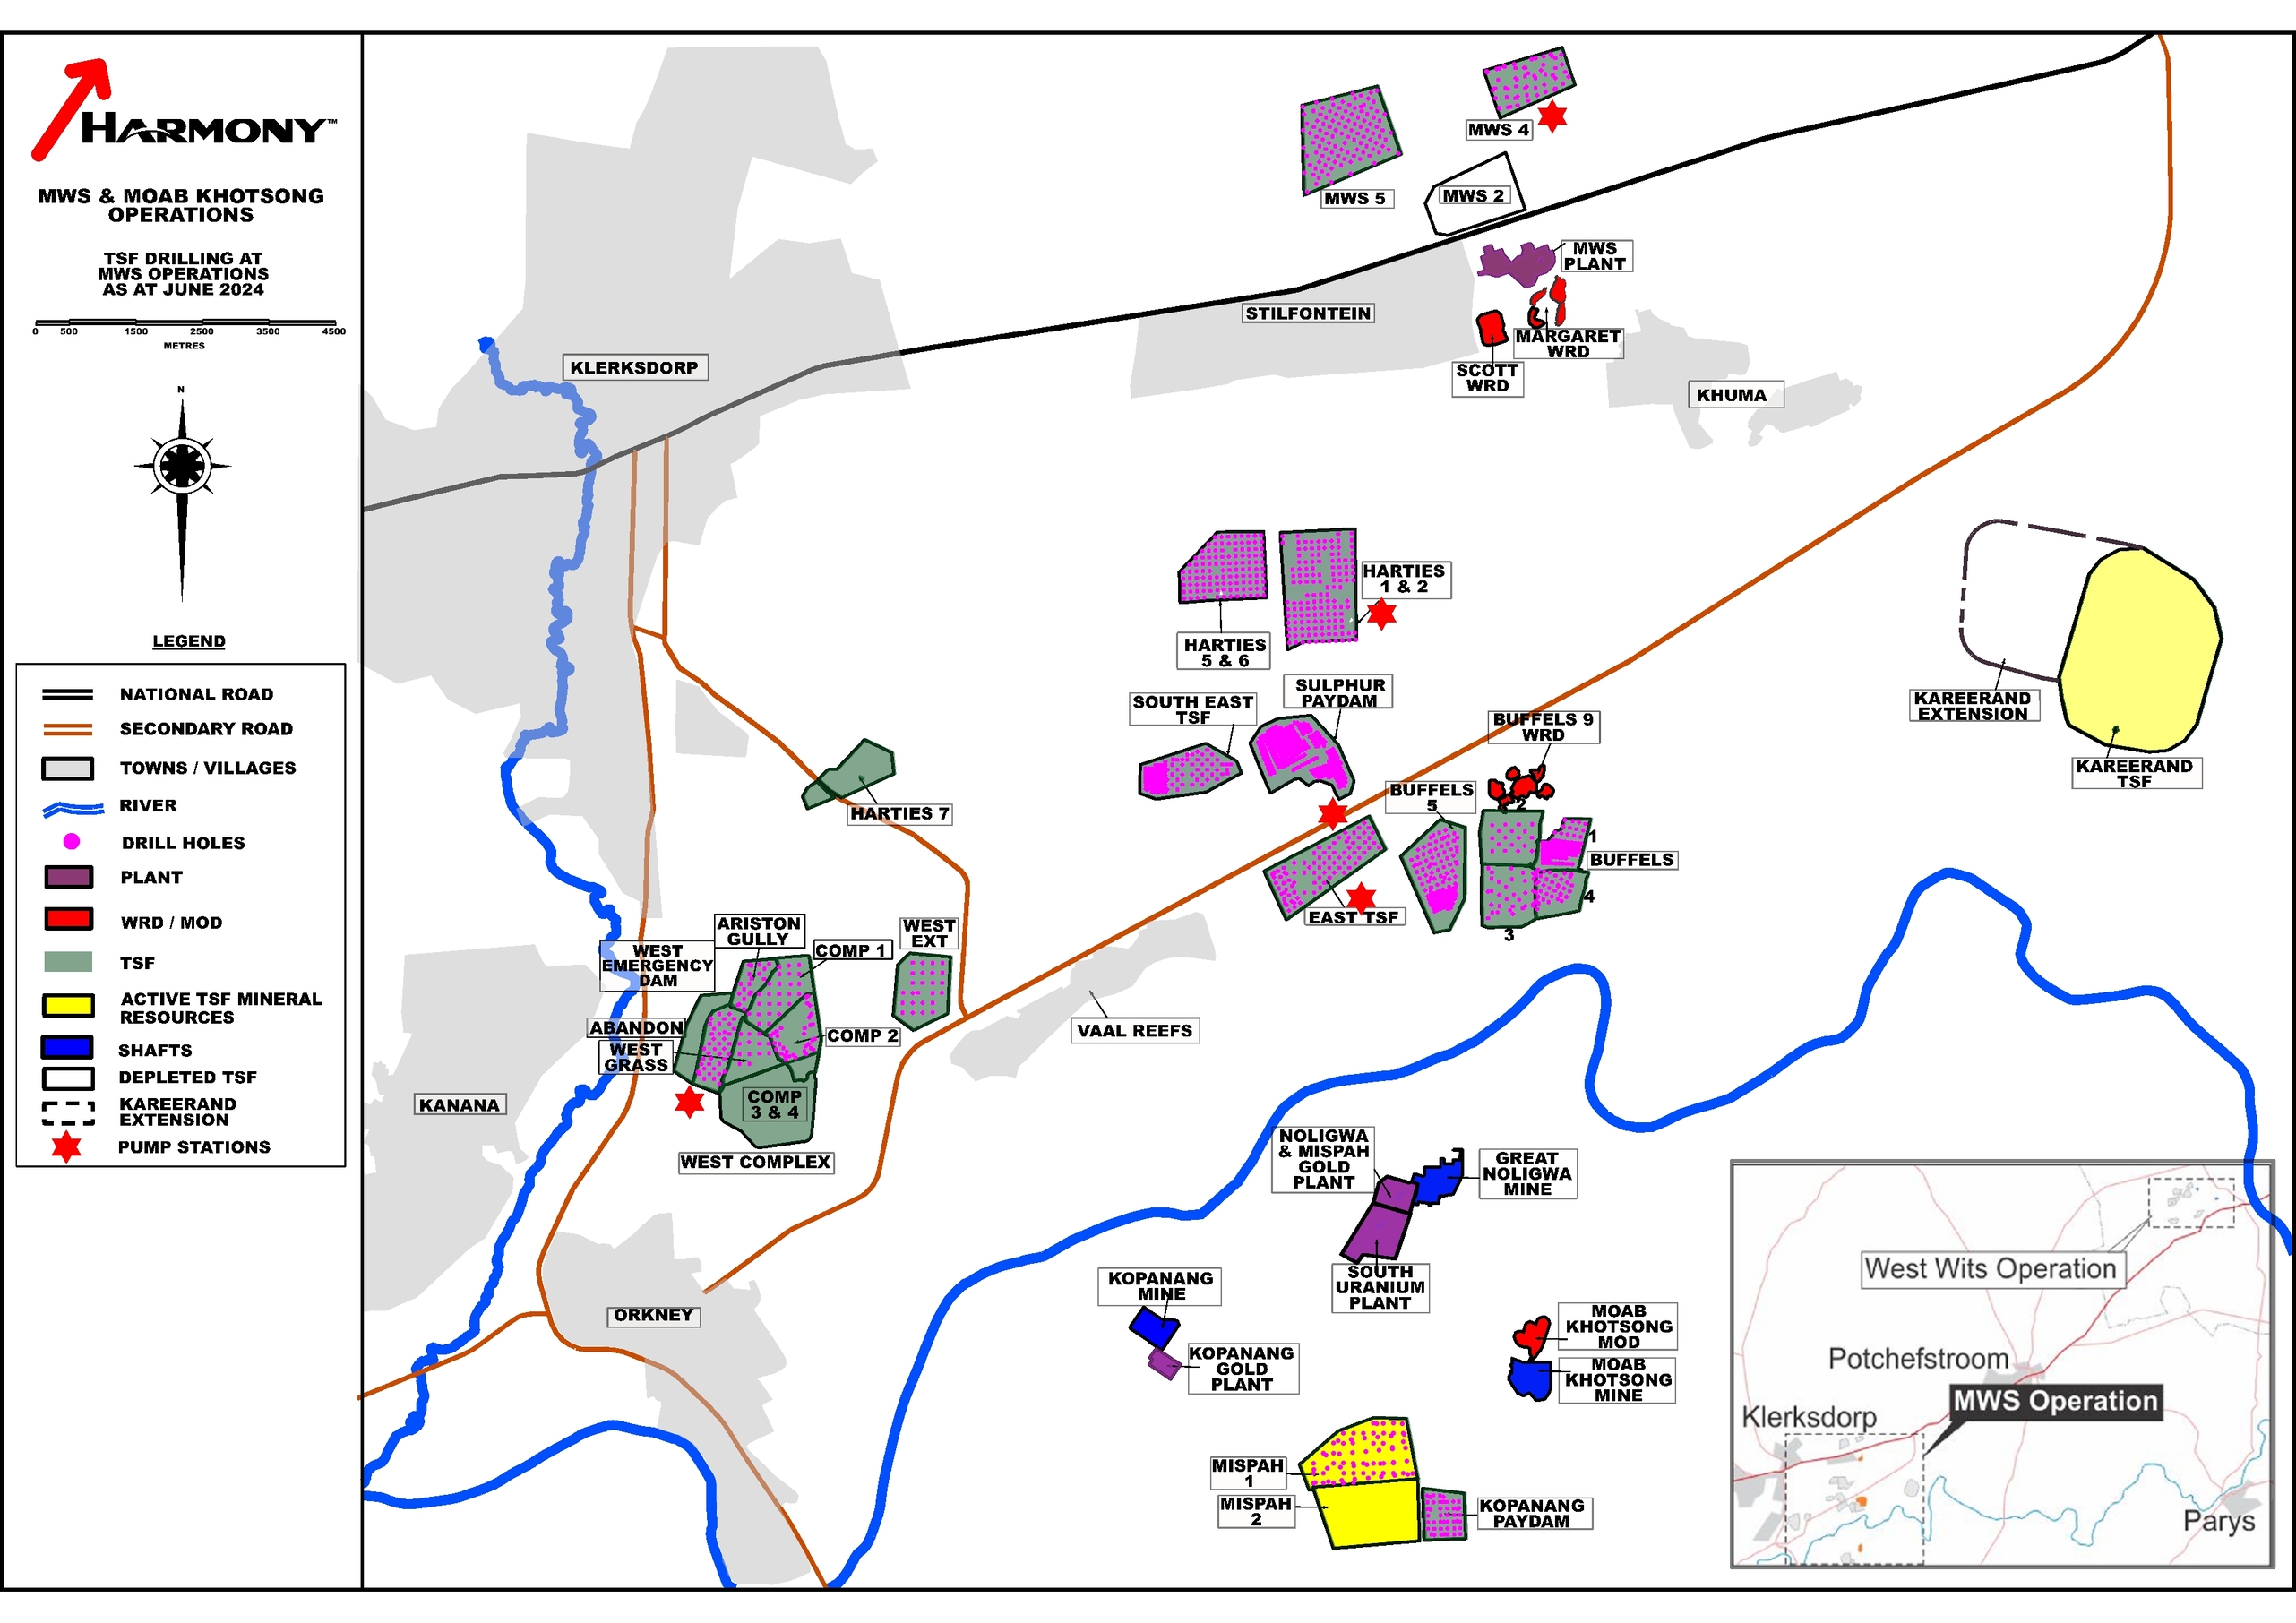
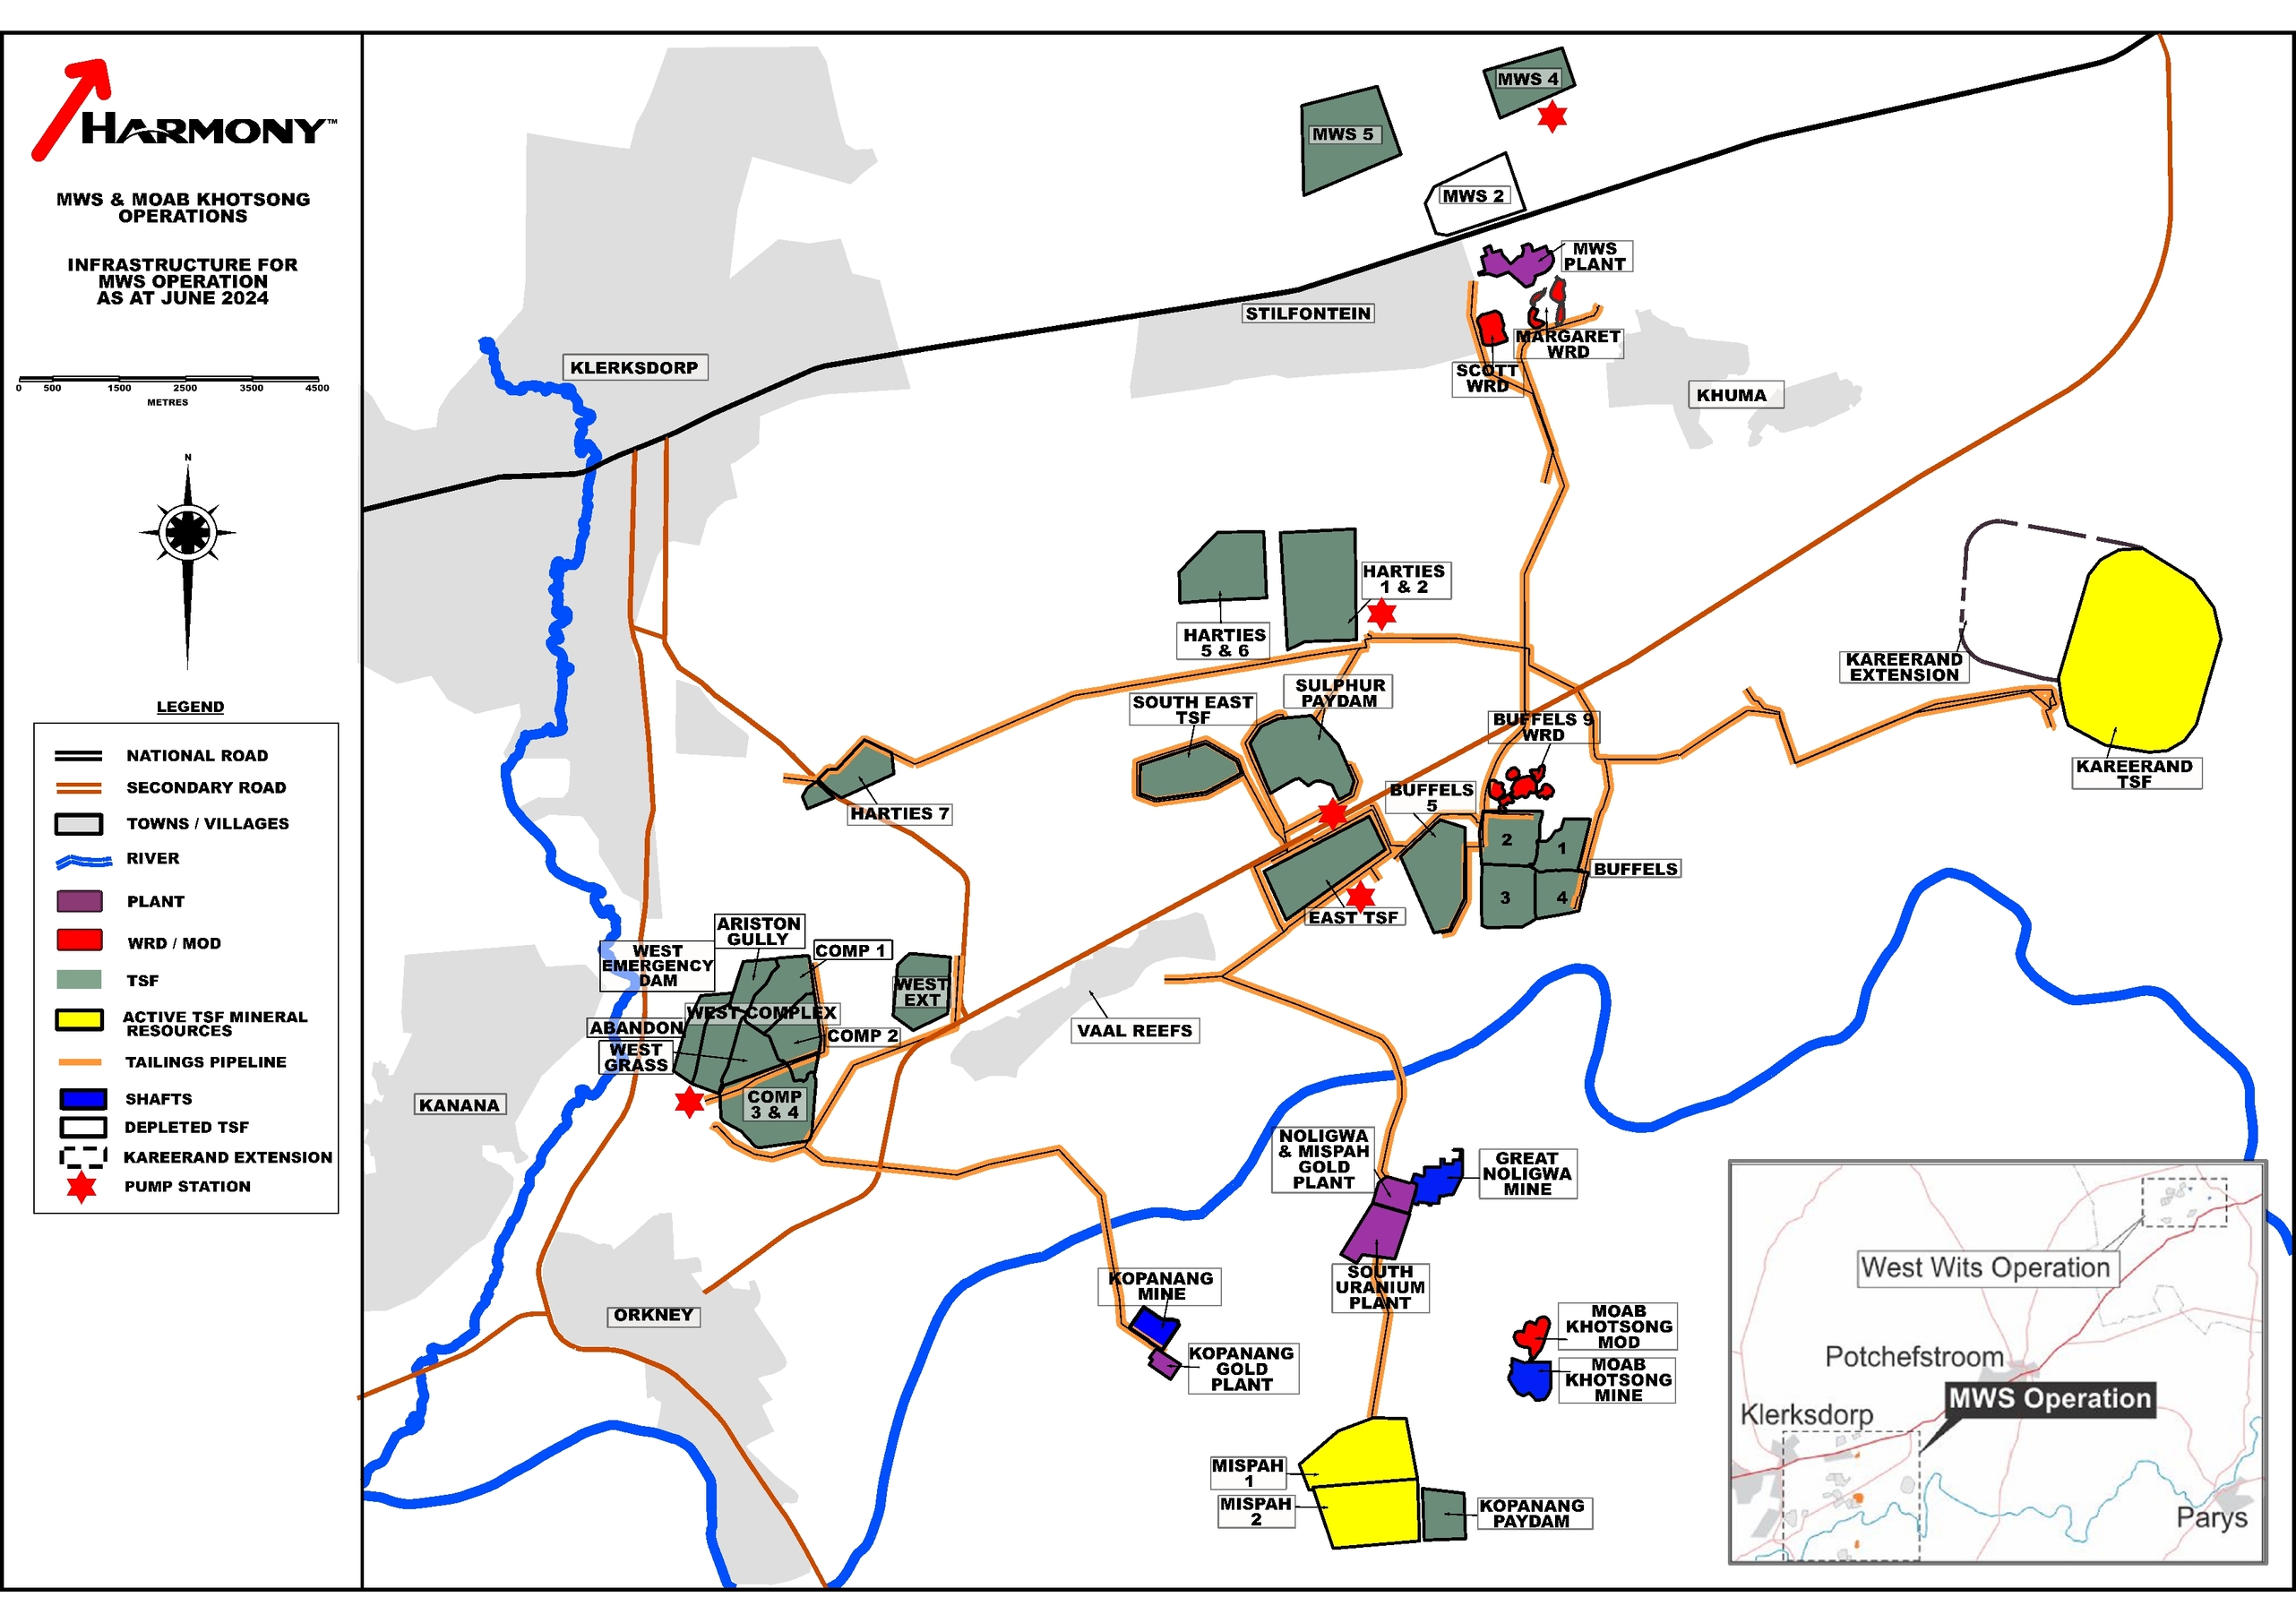
MWS is located in the Vaal River area, and straddles the Free State, North West provincial border of South Africa, close to the town of Klerksdorp. The MWS gold plant (26° 50’8.66”S; 26° 47’41.83”E) is situated close to the town of Stilfontein, while the TSFs and WRD for this operation are scattered over an area that stretches approximately 13.5km north to south and 14.0km east to west (Figure 3-1).
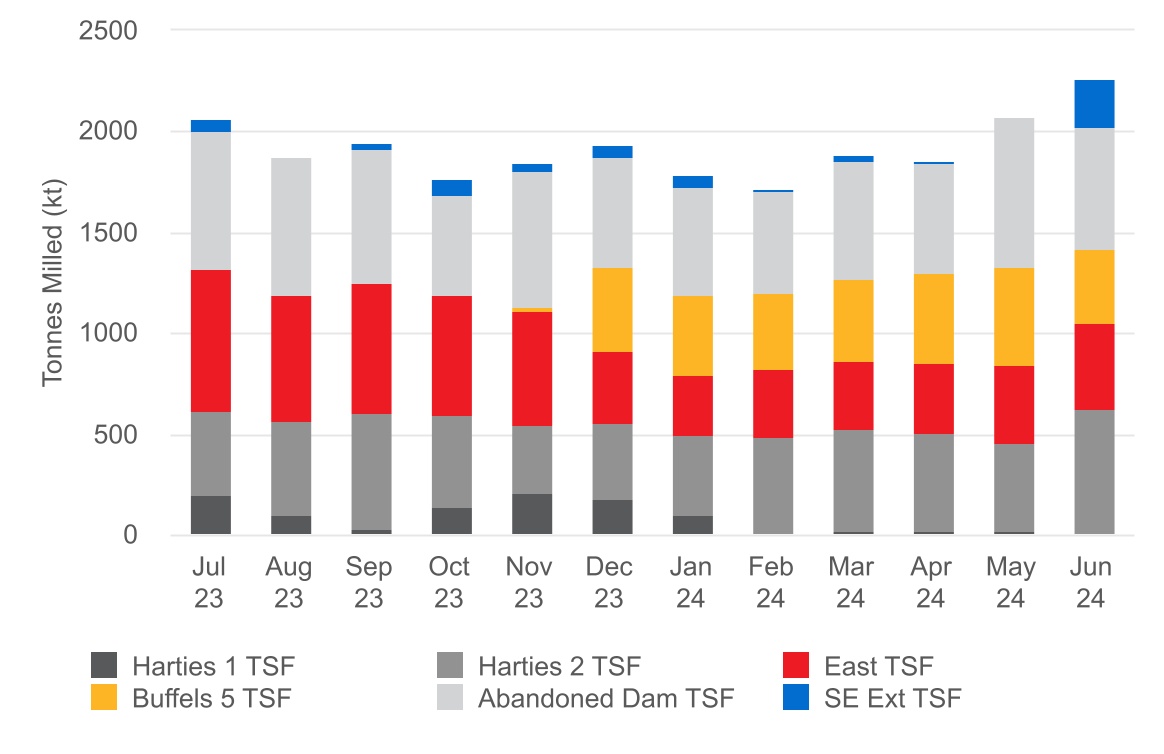
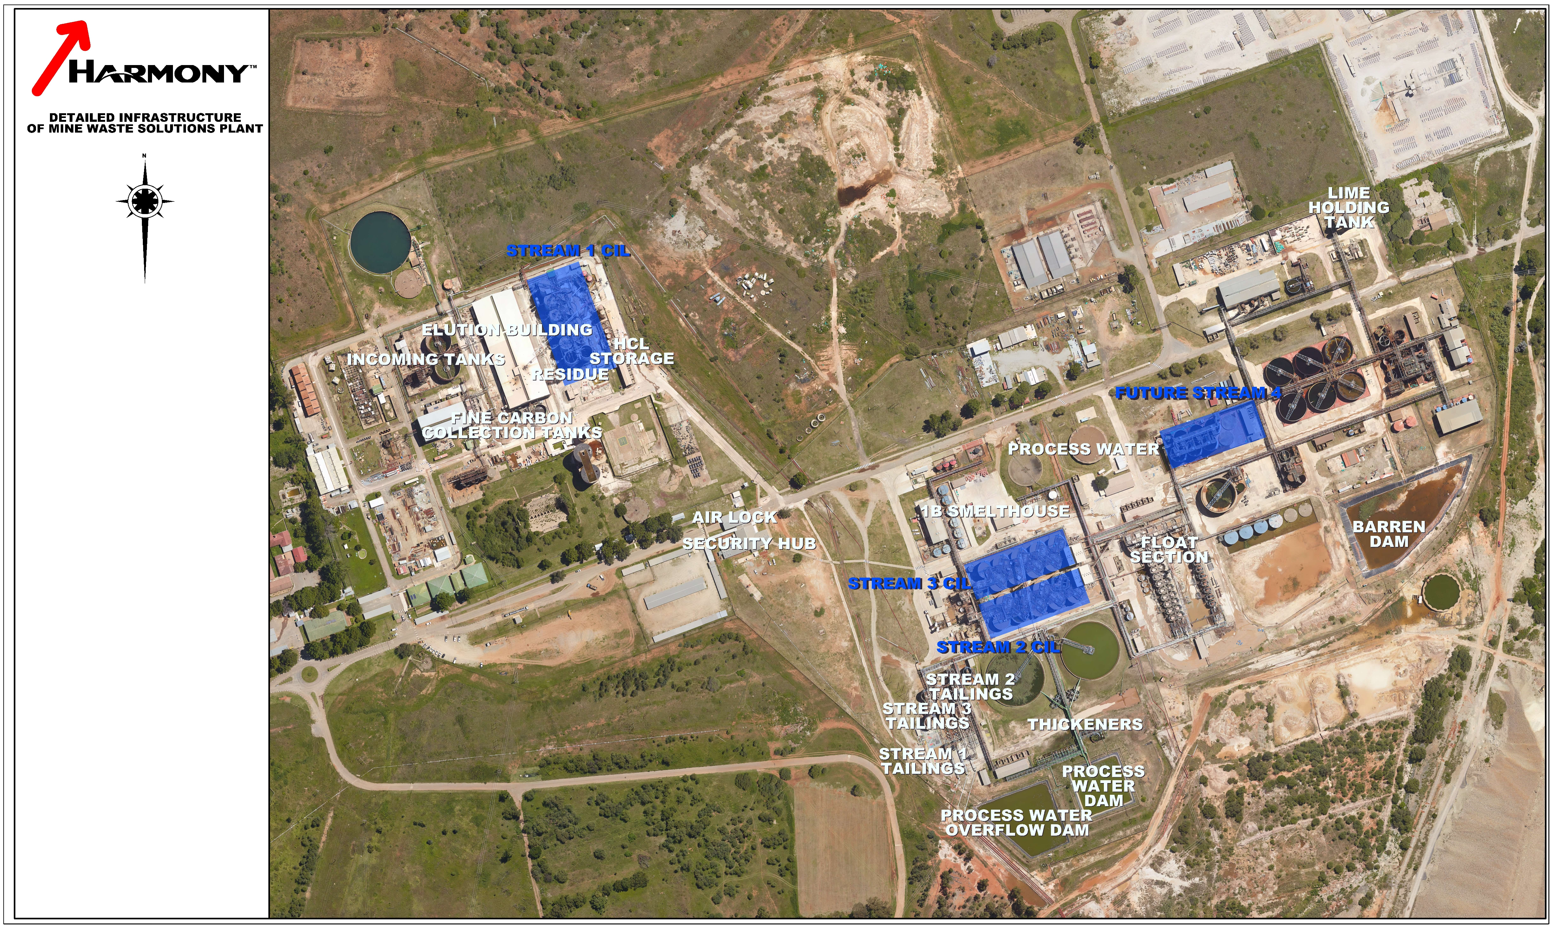
The MWS operation reprocesses tailings from 14 TSFs which are currently being fed to three separate streams and the fourth stream will be added later within the MWS gold plant (Table 3-1). The location of the surface deposits is indicated on Figure 3-2.
Table 3-1: MWS Surface Deposits and Processing Route
| | | | | | | | | | | | | | |
| Operation | Type | Surface Deposit ID | Processing Plant | Processing Stream |
| MWS | TSF | Abandon | MWS Gold Plant | Stream 1 & Stream 4 from West Sources |
| TSF | Ariston Gully |
| TSF | West Grass Dam |
| TSF | South East Extension |
| TSF | Sulphur Paydam |
| TSF | West Compartment 1 |
| TSF | West Compartment 2 |
| TSF | East Tailings | Stream 2 |
| TSF | Buffels 5 |
| TSF | Buffels 3 |
| TSF | Mispah 1 |
| TSF | Harties 1 | Stream 3 |
| TSF | Harties 2 |
| TSF | MWS 4 |
| TSF | MWS 5 |
| TSF | West Compartment 3 | In Mineral Resource - Not planned for in Life of Mine |
| TSF | West Compartment 4 |
| TSF | West Extension |
| TSF | Harties 5 |
| TSF | Harties 6 |
| TSF | Buffels 1 |
| TSF | Kopanang Paydam |
| WRD | Moab |
| WRD | Buffels 9 |
| WRD | Margaret |
3.1.2Mineral Tenure
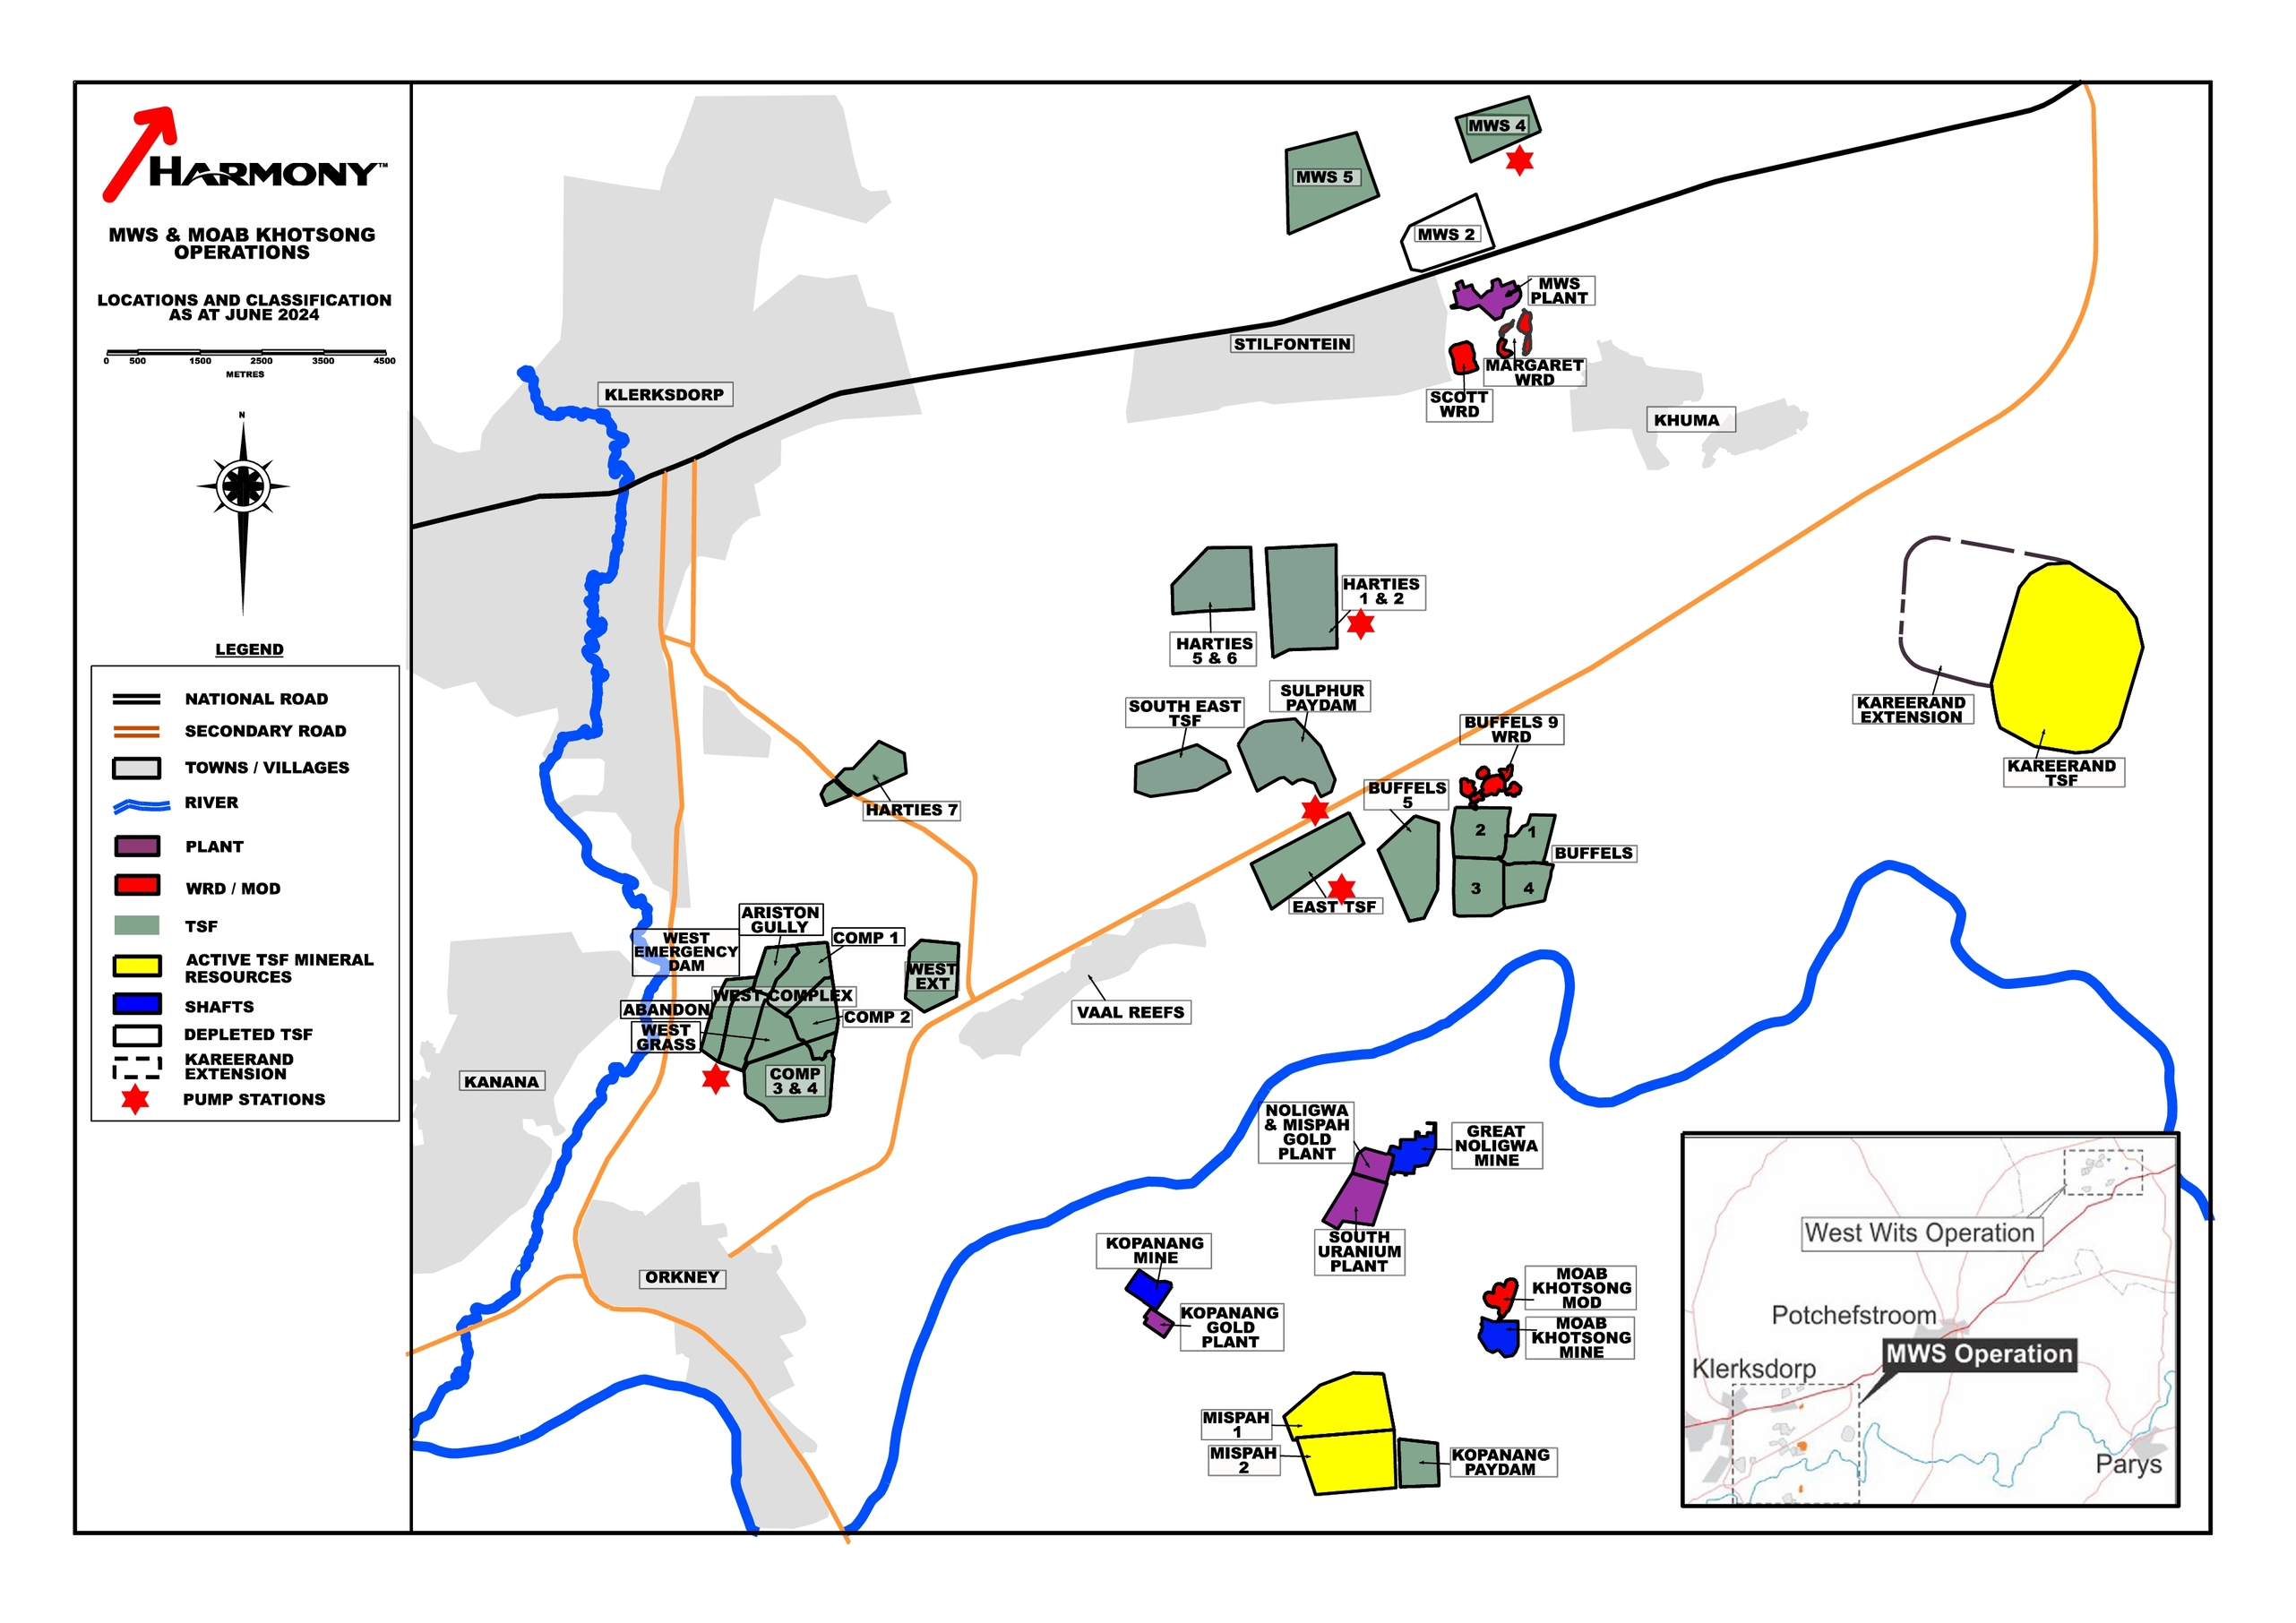
The MWS operation’s license to operate is covered by the Environmental Authorization under the National Environmental Management Act No. 107 of 1998. In terms of the current legislation, the MPRDA, a mining right is not required to reclaim TSFs. No mineral title license is required to claim ownership of the TSFs and WRDs and surface rights automatically provides a legal claim to ownership. No mineral title license is required to claim ownership of the TSFs and WRDs and surface rights automatically provides a legal claim to ownership. The location of the various residue deposits is indicated in Figure 3-2.
Following the acquisition of MWS operation, all relevant permits and licenses were acquired by Harmony, including the approved EMP, the financial provision for rehabilitation liabilities for the MWS operation mining rights, as well as the historic surface rights permits for MWS operation. All of these permits are still valid.
Effective Date: June 30, 2024
11
Technical Report Summary for
Mine Waste Solutions, North West, South Africa
Figure 3-1: Location of MWS and West Wits
Effective Date: June 30, 2024
12
Technical Report Summary for
Mine Waste Solutions, North West, South Africa
Figure 3-2: Mineral tenure and location of MWS operation
Effective Date: June 30, 2024
13
Technical Report Summary for
Mine Waste Solutions, North West, South Africa
3.1.3Property Permitting Requirements
MWS has all the permits required to operate and to realize the current Mineral Reserve plan reflected in the Mineral Reserve estimate and has access to all the properties it requires to conduct its current mining activities (Table 3-2).
Table 3-2: MWS property and land ownership
| | | | | | | | | | | | | | |
| Surface Deposit ID | Farm Name & No. | Portion No. | Owner | Title Deed No. |
| MWS 4 | Stilfontein 408 IP | 15 | Chemwes Pty Ltd | T18439/2005 |
| Stilfontein 408 IP | 49 | Chemwes Pty Ltd | T18439/2005 |
| MWS 5 | Stilfontein 408 IP | 15 | Chemwes Pty Ltd | T18439/2005 |
| Stilfontein 408 IP | 48 | Chemwes Pty Ltd | T18439/2005 |
| Margaret WRD | Stilfontein 534 IP | 0 | Omv Pty Ltd | T35140/2021 |
| Harties 1&2 | Zandpan 423 IP | 0 | Driade cc | T2888/1992 |
| Zandpan 423 IP | 4 | Republic of South Africa | T75460/2012 |
| Mapaiskraal 441 IP | 1 | African Rainbow Minerals Ltd | T121387/2000 |
| Harties 5&6 | Zandpan 423 IP | 3 | Temotuo rehabilitation co | T25046/2001 |
| Zandpan 423 IP | 4 | Republic of South Africa | T75460/2012 |
| South East TSF | Modderfontein 440 IP | 4 | Harmony Moab Khotsong Operations Pty Ltd | T85432/2022 |
| Vaalkop 439 IP | 3 | Harmony Moab Khotsong Operations Pty Ltd | T100817/2022 |
| Sulphur Paydam | Modderfontein 440 IP | 4 | Harmony Moab Khotsong Operations Pty Ltd | T85432/2022 |
| East TSF | Modderfontein 440 IP | 4 | Harmony Moab Khotsong Operations Pty Ltd | T85432/2022 |
| Buffels 1 - 4 | Buffelsfontein 443 IP | 9 | Chemwes Pty Ltd | T76488/2013 |
| Buffels 5 | Mapaiskraal 441 IP | 0 | Harmony Moab Khotsong Operations Pty Ltd | T85432/2022 |
| Mapaiskraal 441 IP | 2 | Rocha Maria Ines Da | T37394/1990 |
| Buffels 9 WRD | Hartebeestfontein 422 IP | 8 | Buffelsfontein Gold Mines Ltd | T95911/1996 |
| Hartebeestfontein 422 IP | 41 | Buffelsfontein Gold Mines Ltd | T95911/1996 |
| Buffelsfontein 443 IP | 9 | Chemwes Pty Ltd | T76488/2013 |
| Kareerand | Megadam 574 IP | 0 | Chemwes Pty Ltd | T80960/2010 |
| Kareerand Extension | Wildebeestpan 442 IP | Re | Wildebeestpan (Portion 9 & 10) Communal Property Association | T76828/2005 |
| West Extension | Nooitgedacht 434 IP | 200 | Harmony Moab Khotsong Operations Pty Ltd | T85432/2022 |
| Witkop 438 IP | 2 | Harmony Moab Khotsong Operations Pty Ltd | T100817/2022 |
| West complex | Nooitgedacht 434 IP | 200 | Harmony Moab Khotsong Operations Pty Ltd | T85432/2022 |
| Witkop 438 IP | 1 | Harmony Moab Khotsong Operations Pty Ltd | T100817/2022 |
| 2 | Harmony Moab Khotsong Operations Pty Ltd | T100817/2022 |
| 4 | Harmony Moab Khotsong Operations Pty Ltd | T34454/2023 |
| Harties 7 TSF | Klerksdorp 424 IP | 1 | City of Matlosana | G201/1906 |
| Ellaton TSF | Strathmore 436 IP | 5 | City of Matlosana | T58081/1981 |
| Moab WRD | Anglo 593 | 0 | Harmony Moab Khotsong Operations Pty Ltd | T8152/2018 |
| Hoekplaats 598 | 0 | Harmony Moab Khotsong Operations Pty Ltd | T8152/2018 |
| Mispah 274 | 0 | Harmony Moab Khotsong Operations Pty Ltd | T8152/2018 |
| Mispah TSF | Mispah 274 | 0 | Harmony Moab Khotsong Operations Pty Ltd | T8152/2018 |
3.2West Wits Operation
3.2.1Description and Location
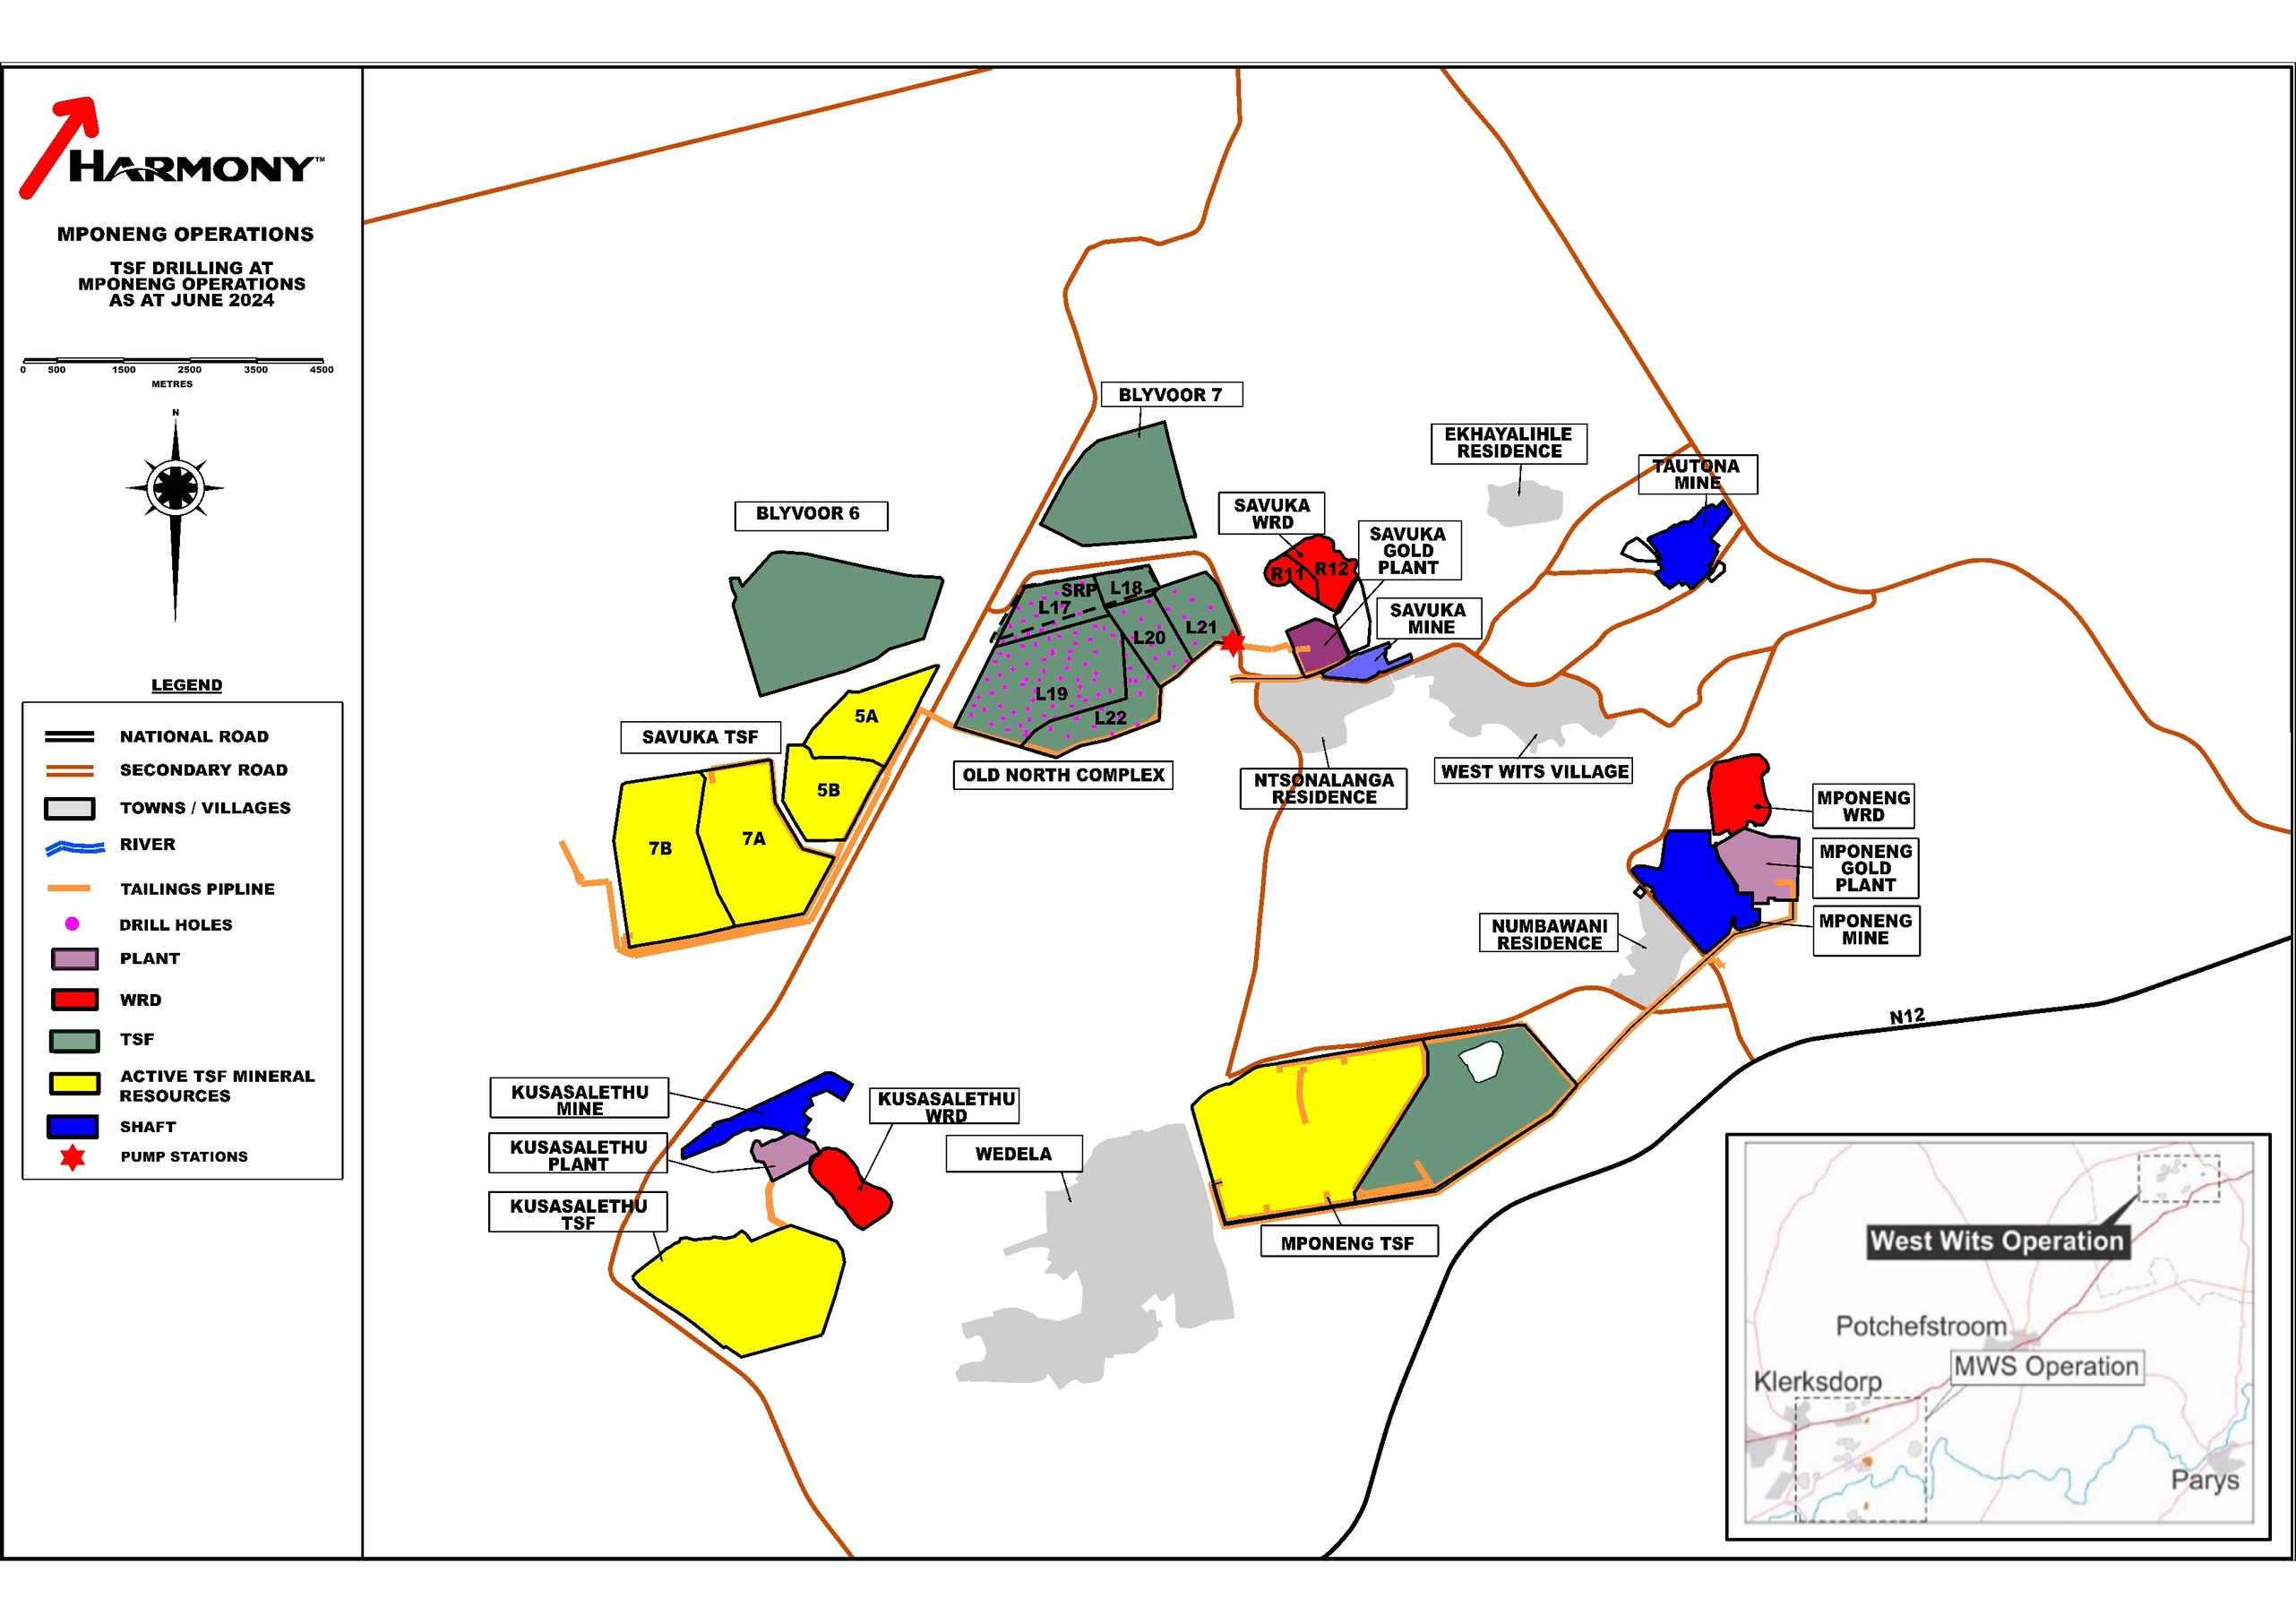
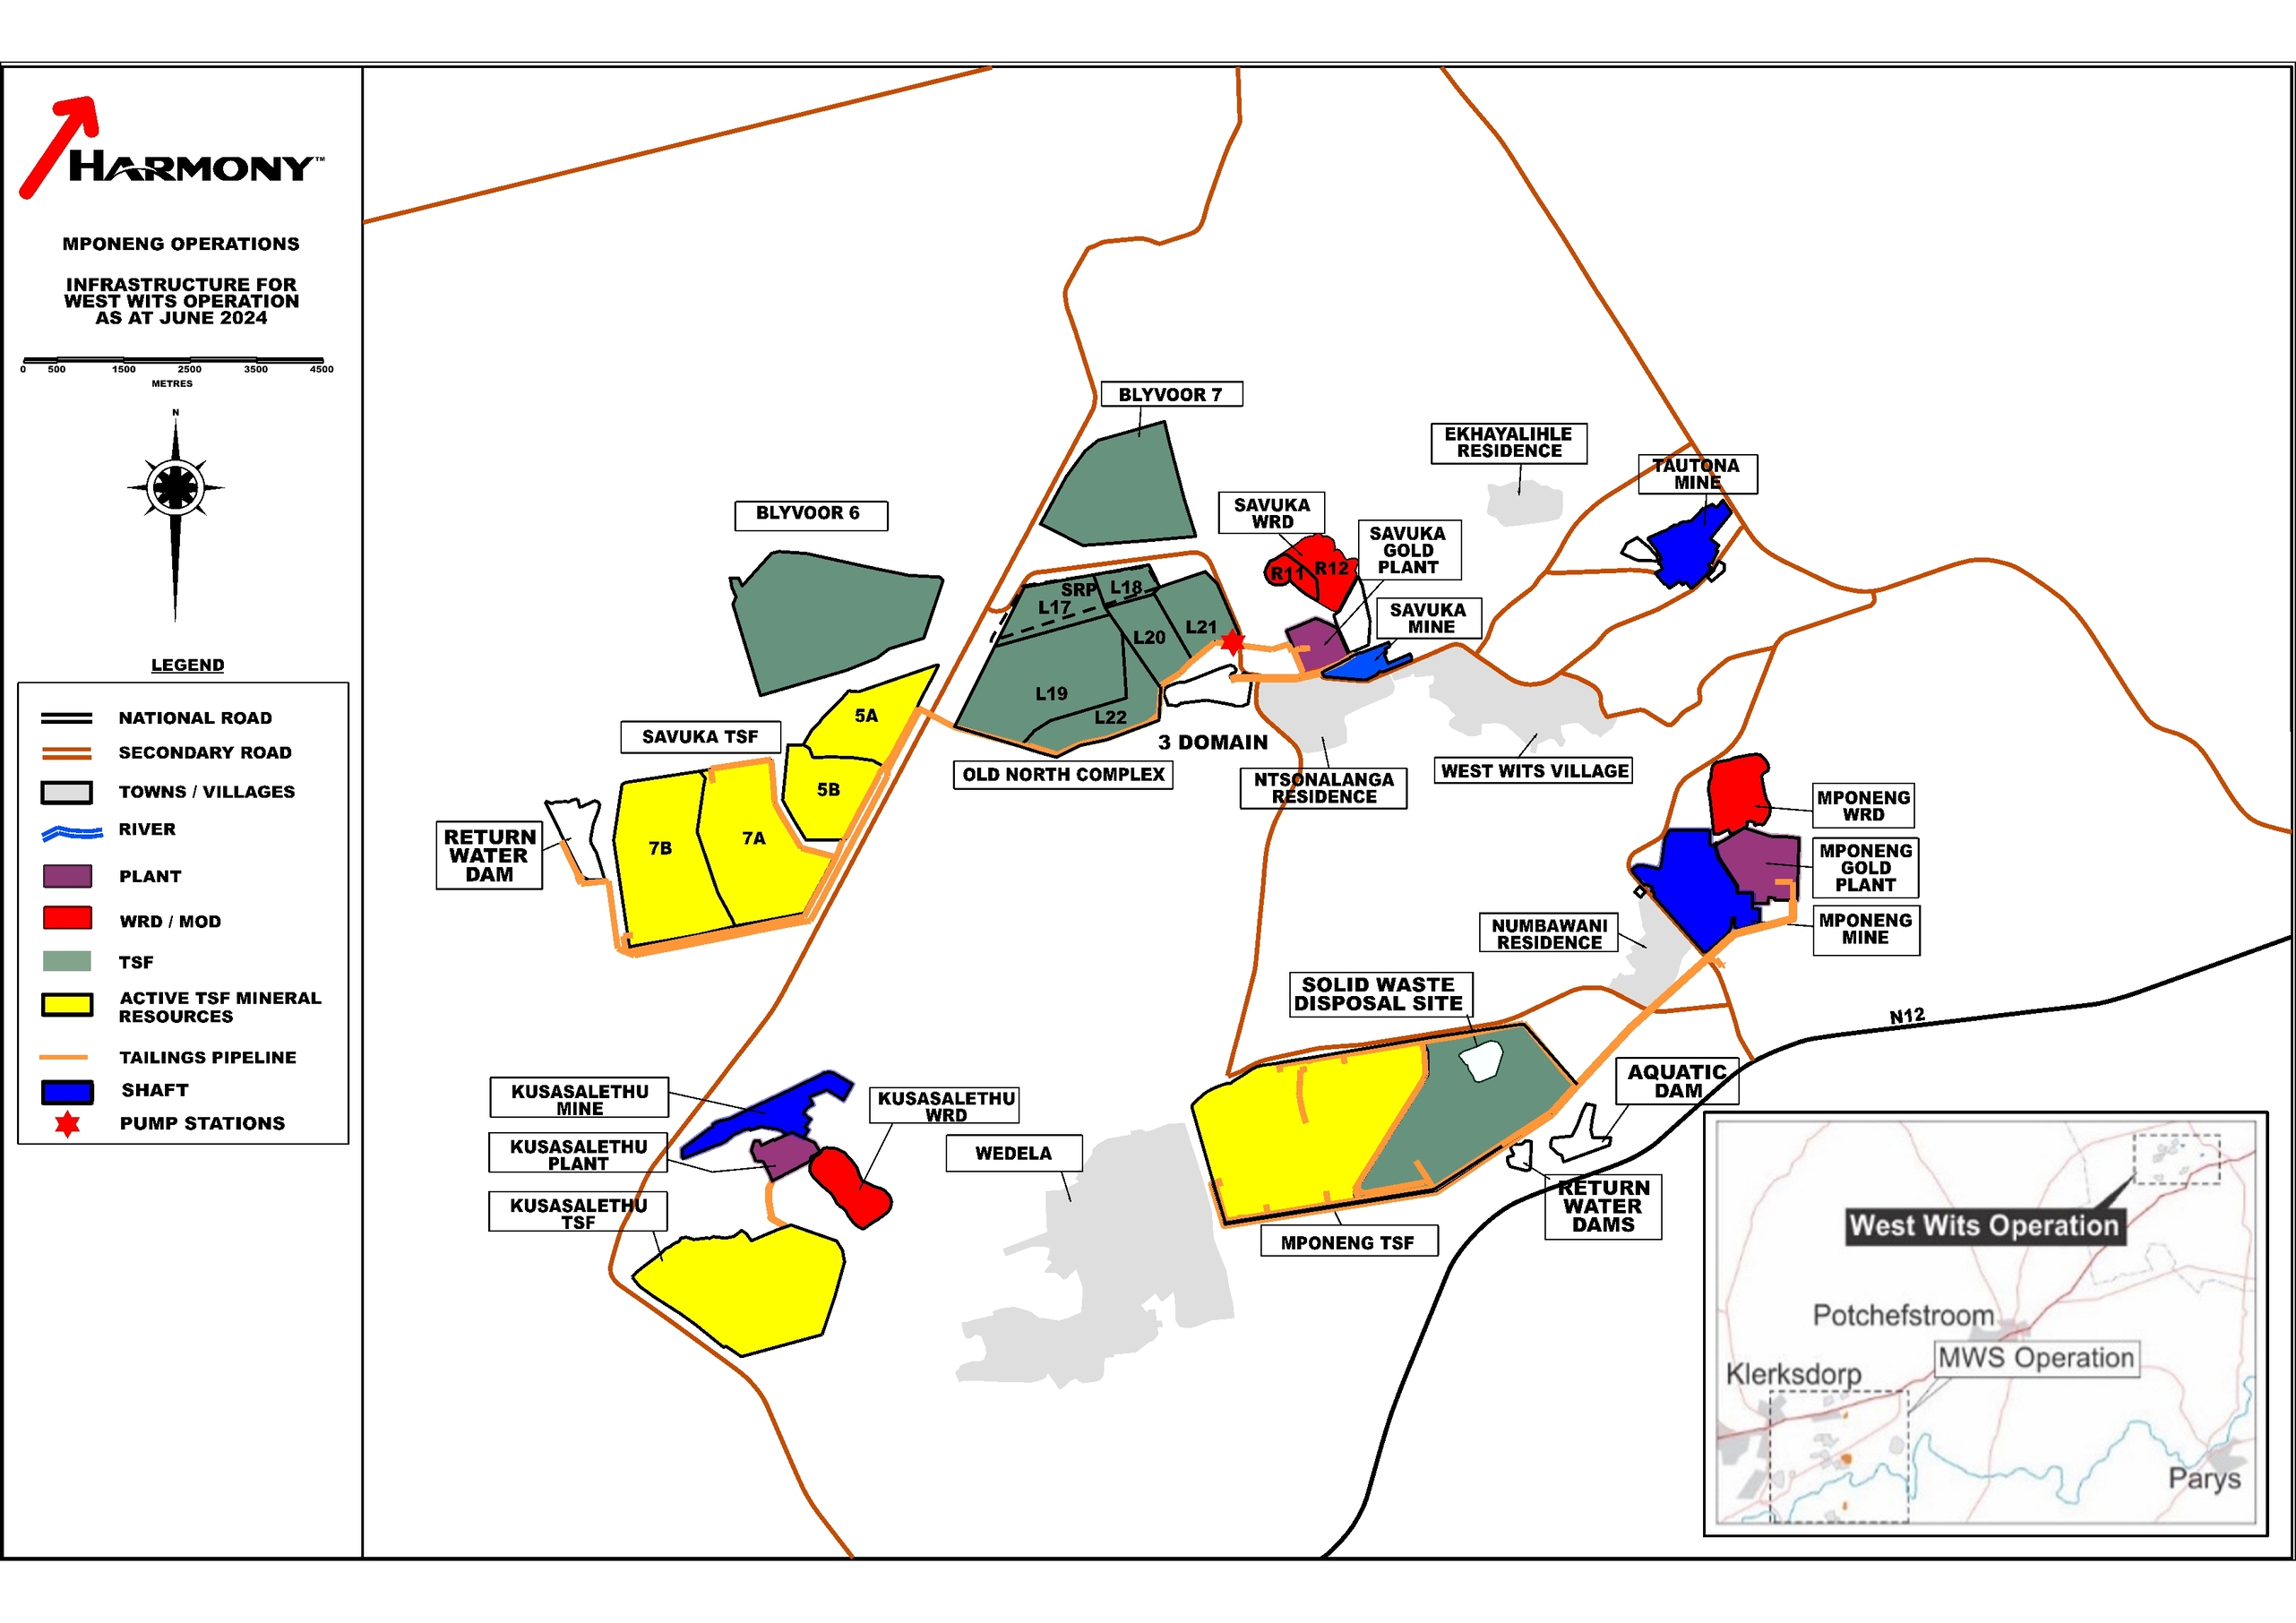
The West Wits operation is situated in the West Rand region of the Gauteng Province (Figure 3-1). The West Wits operation is situated approximately 75km west of Johannesburg. The site is approximately 7km south of Carletonville. West Wits operation occupies an area 4,176ha in extent and is close to the boundary between Gauteng and North West Province (Figure 3-1).
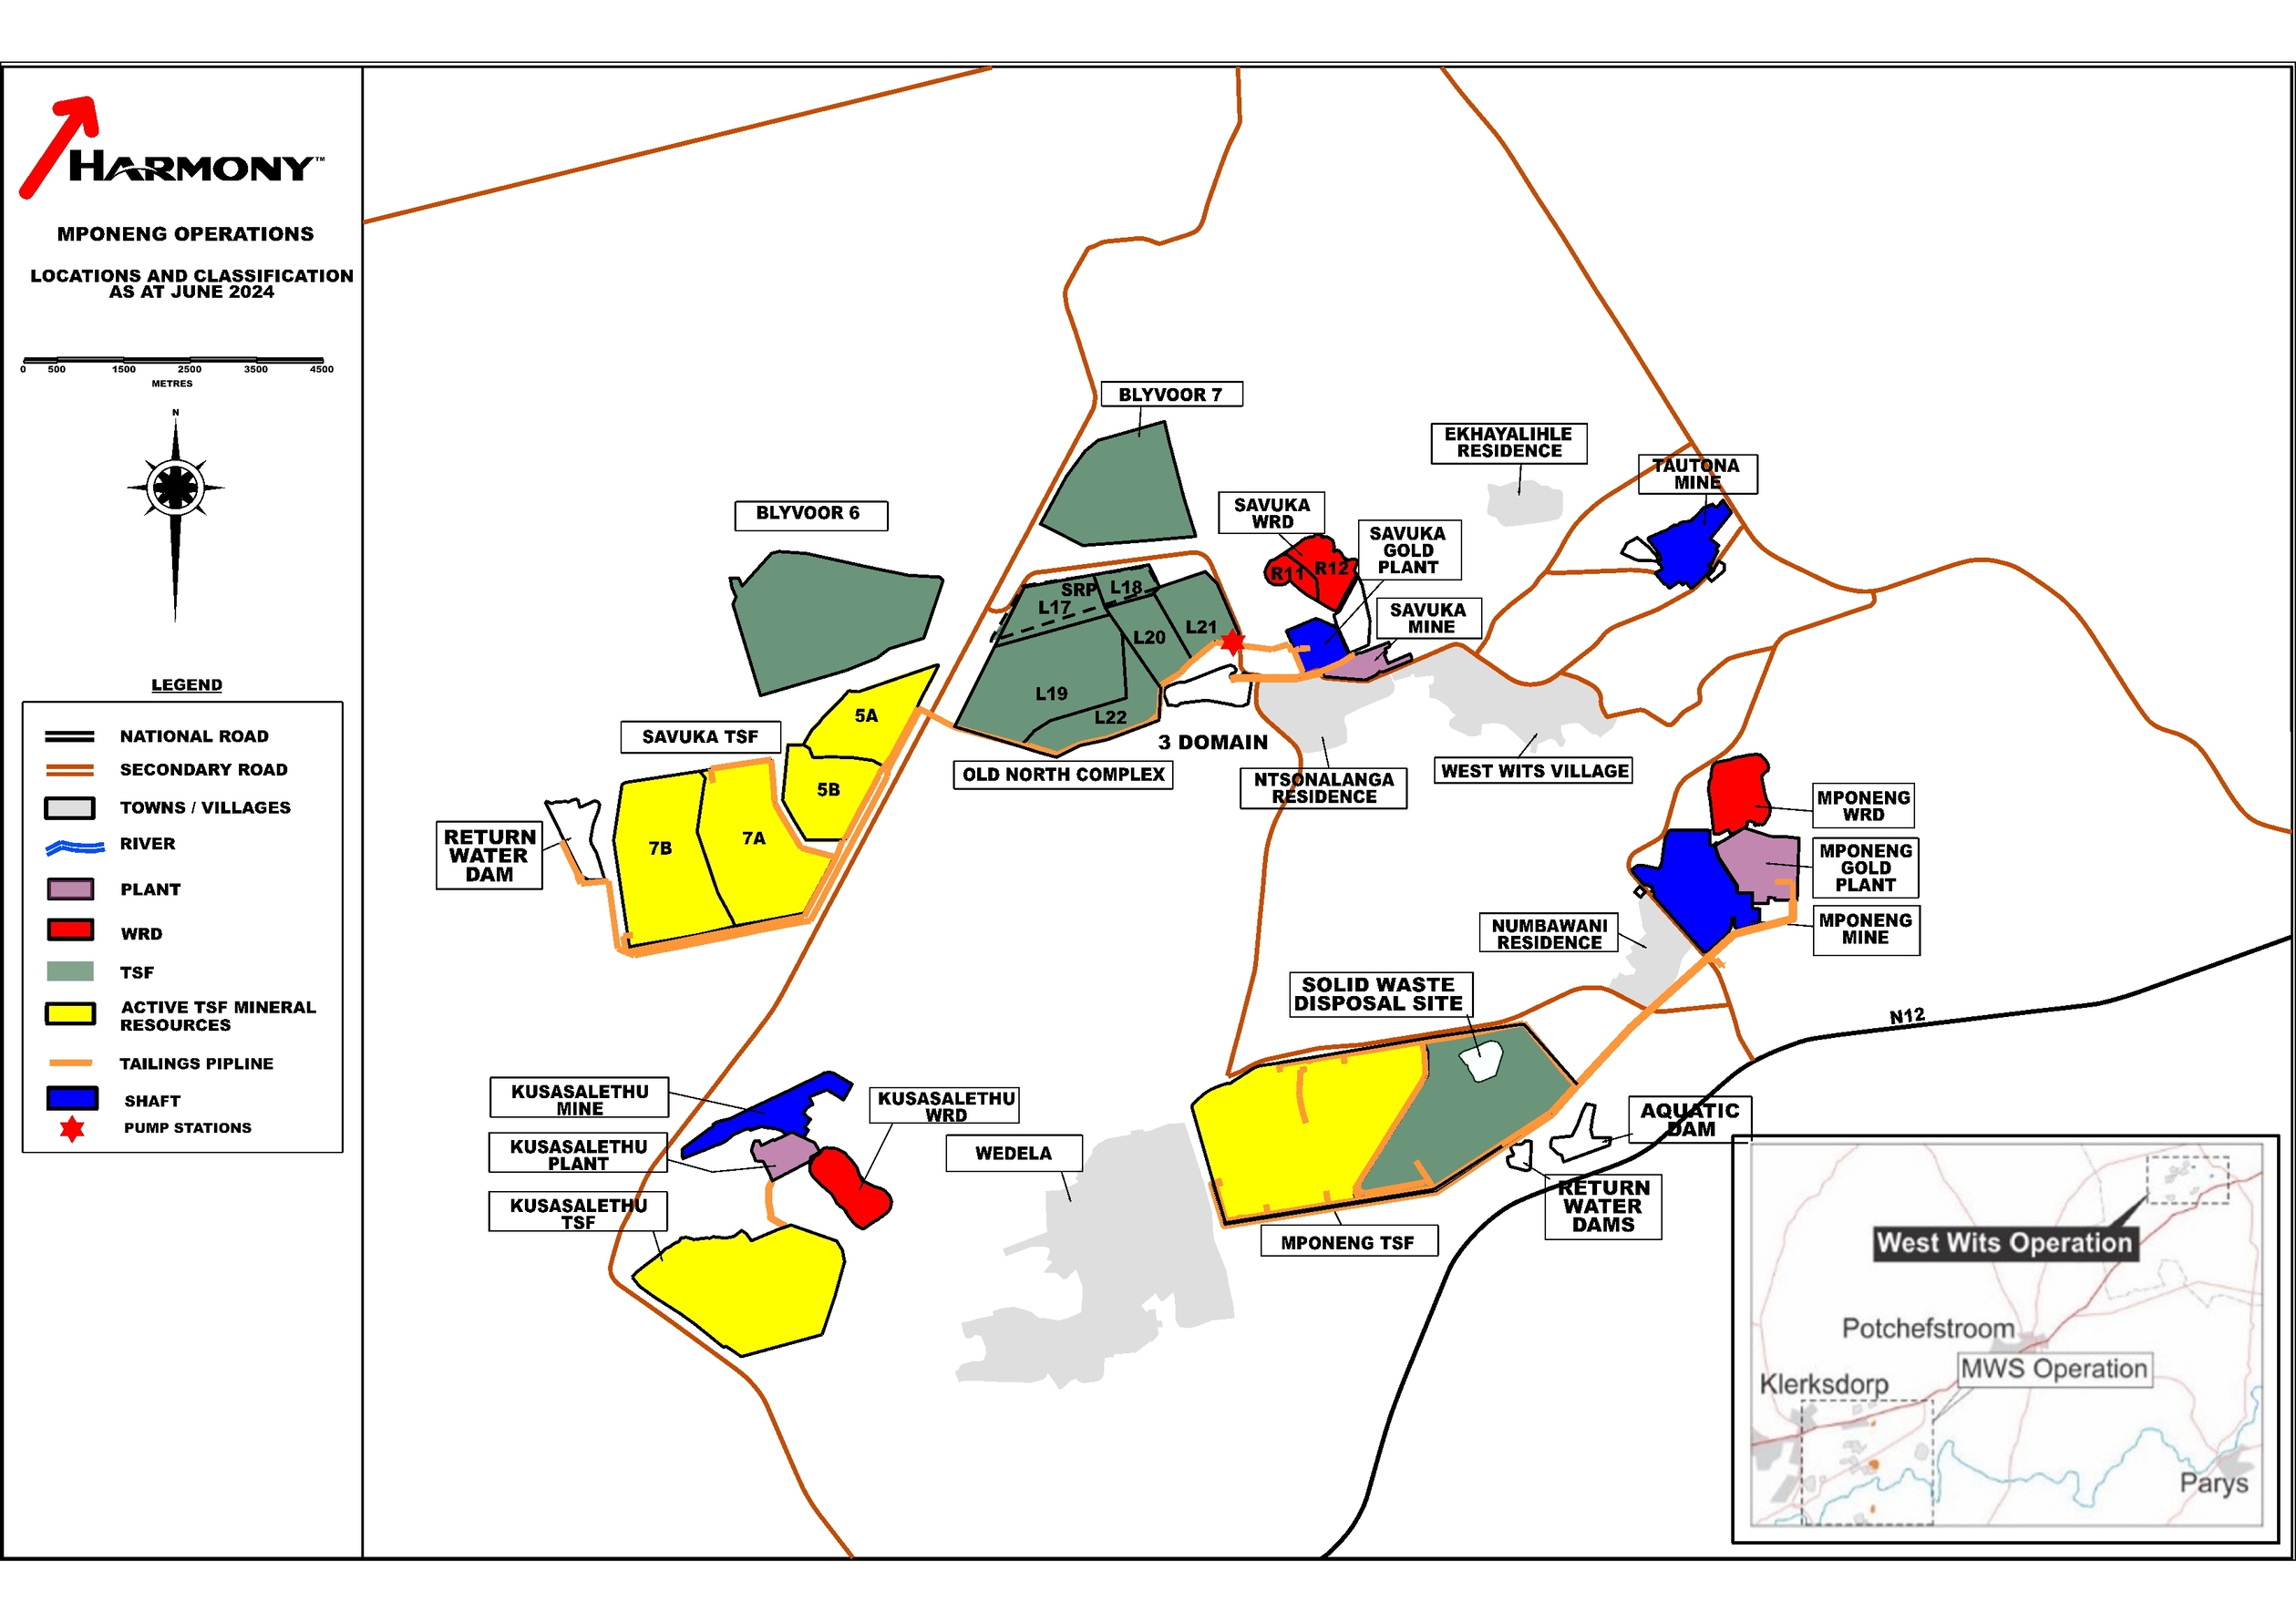
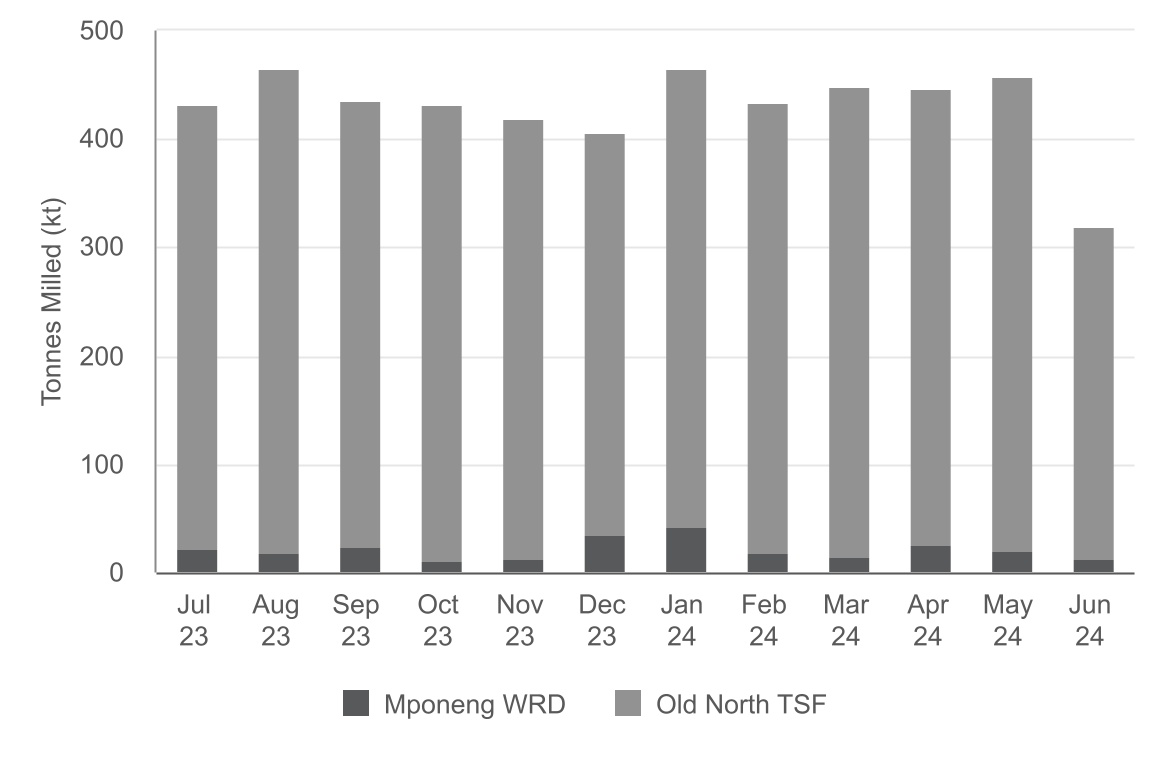
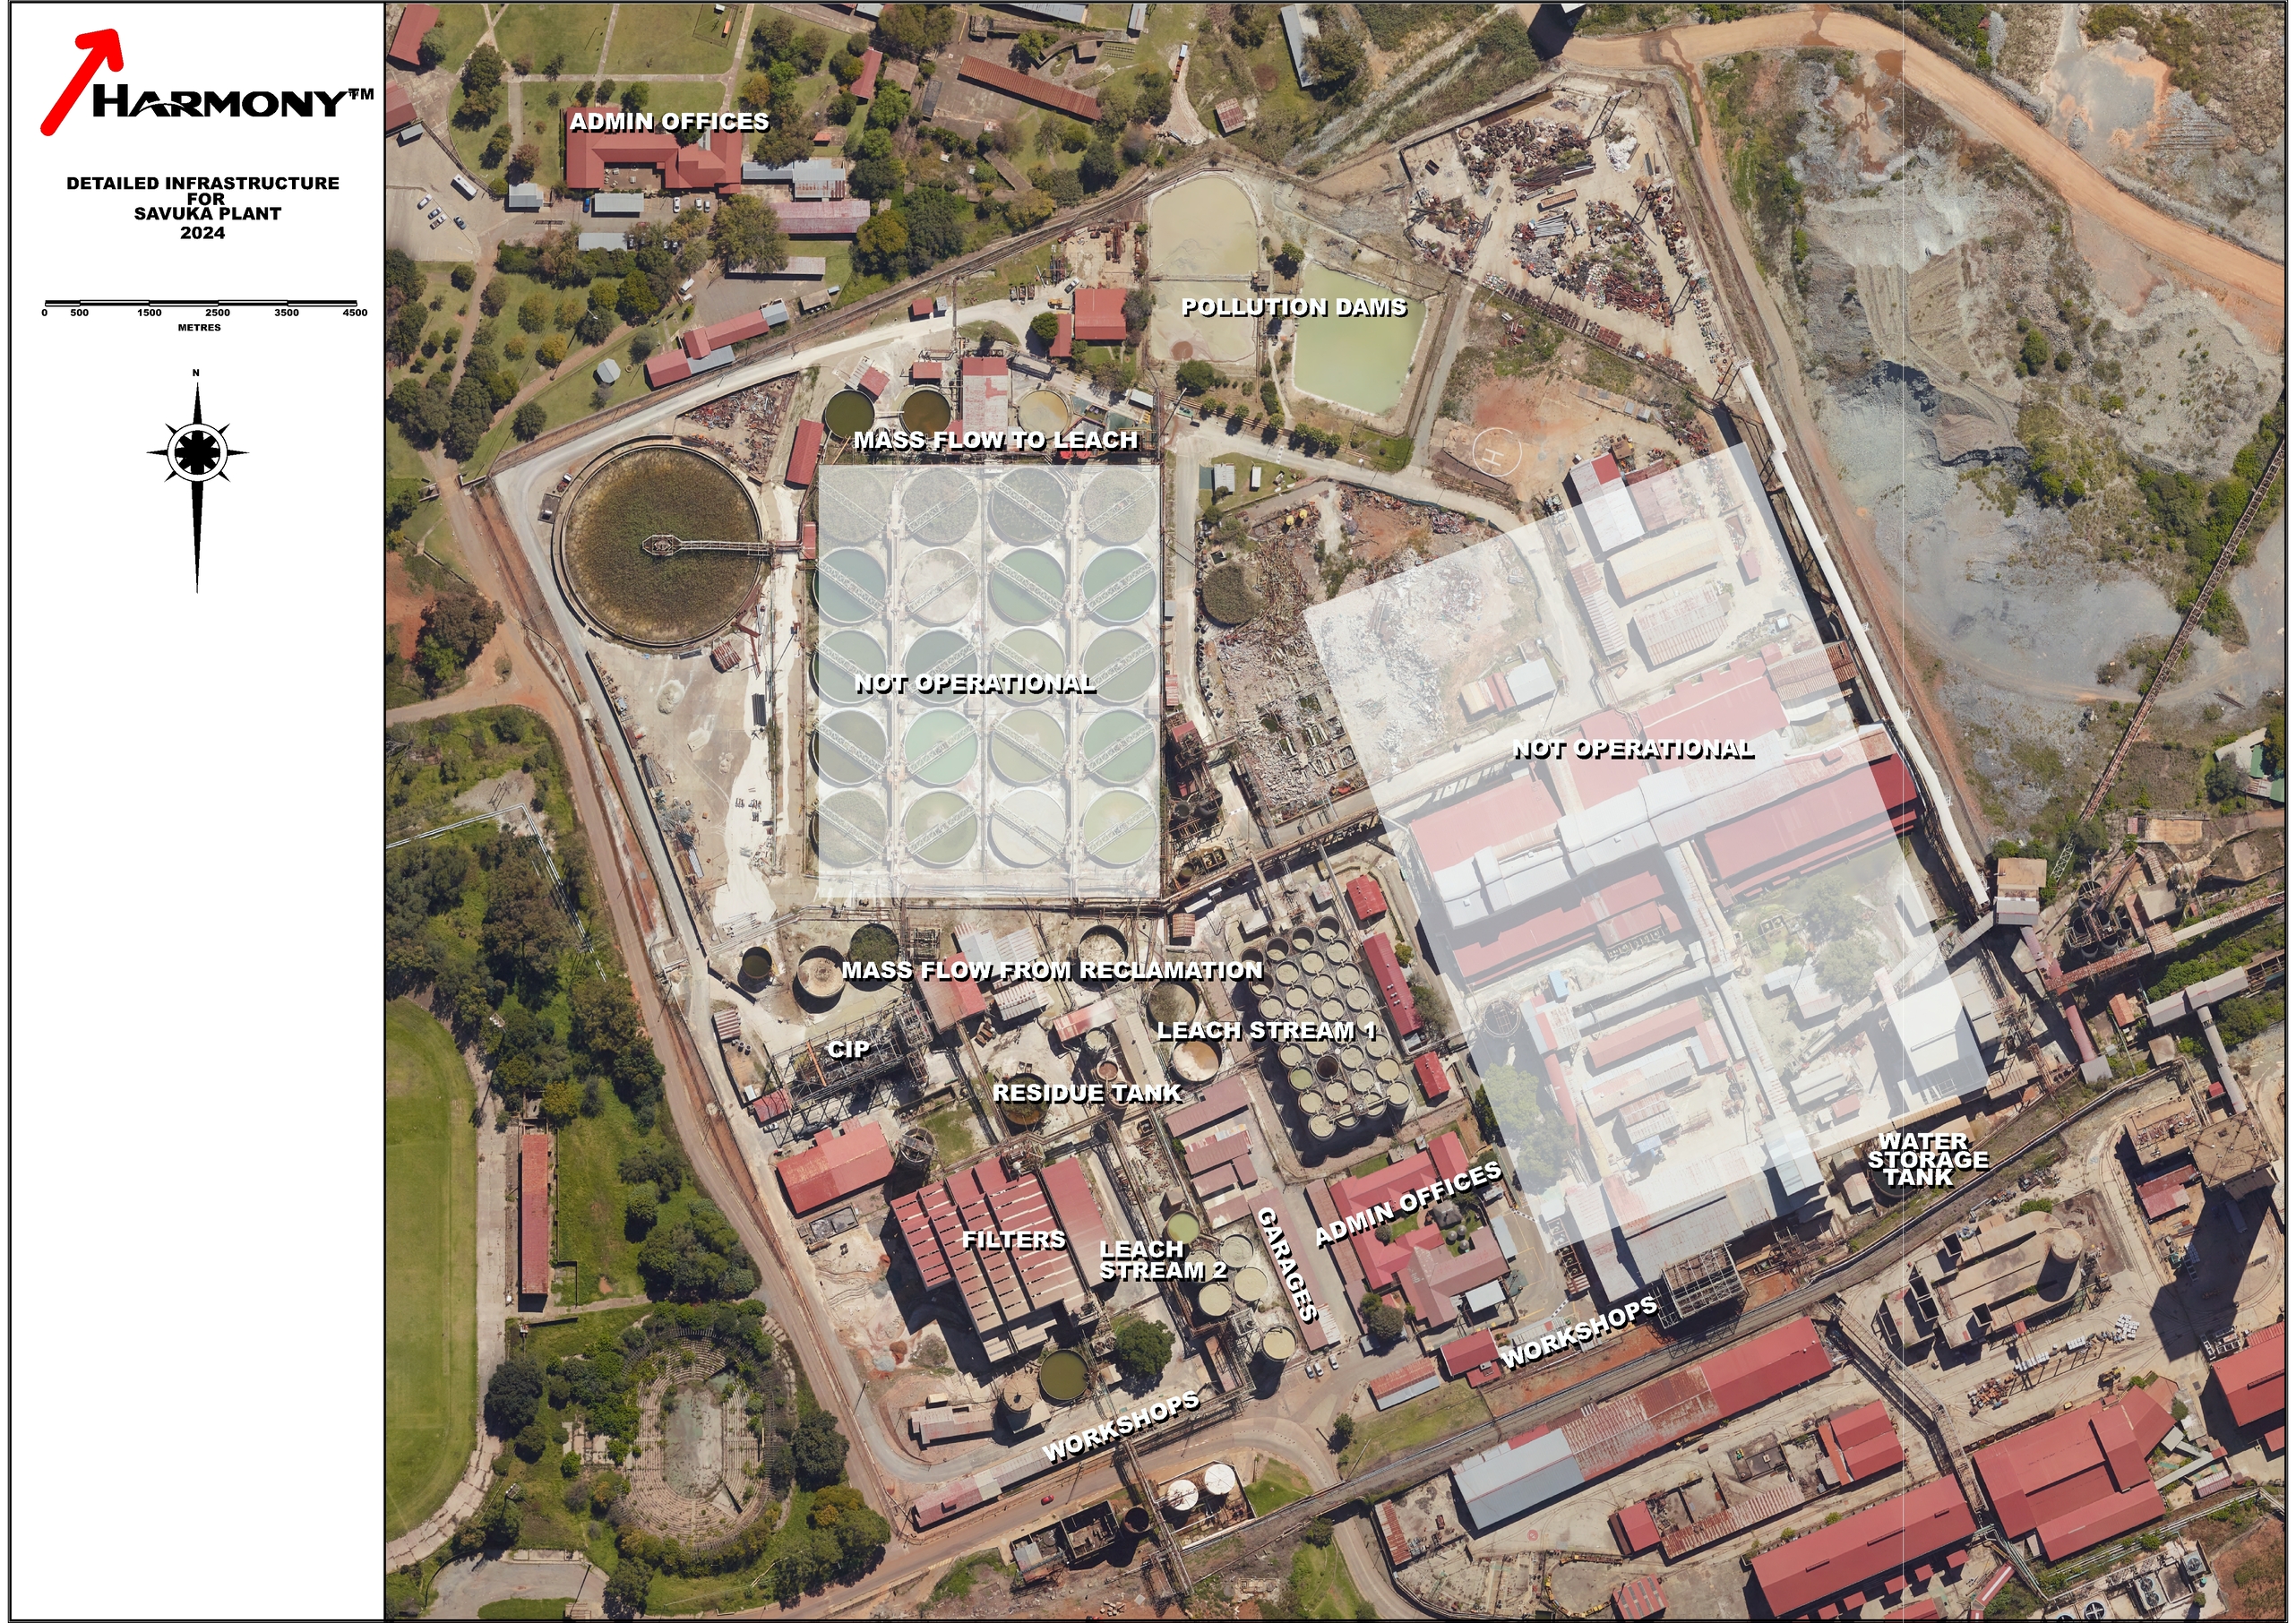
The West Wits operation processes reclaimed tailings from the Old North TSF and waste rock from the Savuka WRD and Mponeng WRD. The Savuka plant (26° 25’20.31”S and 27° 24’11.30”E) (Figure 3-3), processes the reclaimed Old North tailings only, while the Kusasalethu plant processes both the Old North tailings and the Savuka WRD. Mponeng plant processes the Mponeng WRD as a gap-filler for the reef.
Effective Date: June 30, 2024
14
Technical Report Summary for
Mine Waste Solutions, North West, South Africa
Figure 3-3: Mineral tenure and location of West Wits operation
The feed sources for West Wits are presented in Table 3-3.
Effective Date: June 30, 2024
15
Technical Report Summary for
Mine Waste Solutions, North West, South Africa
Table 3-3: West Wits surface deposits and processing route
| | | | | | | | | | | |
| Operation | Type | Surface Deposit ID | Processing Plant |
| West Wits | TSF | Old North TSF L 19 | Savuka Plant and Kusasalethu Plant |
| WRD | Mponeng Low Grade | In Mineral Resource - Planned in the 1st year of Mponeng Gold Plant |
| TSF | Old North TSF L17, L20, L21, L22 | In Mineral Resource - not currently being treated. |
3.2.2Mineral Tenure
South African Mining Law is regulated by the MPRDA which is the predominant piece of legislation dealing with acquisitions or rights to conduct reconnaissance, prospecting and mining. There are several other pieces of legislation which deal with such ancillary issues such as royalties (the Mineral and Petroleum Resources Royalty Act, 2008), title registration (the Mining Titles Registration Act, 1967), and health and safety (the Mine Health and Safety Act, 1996).
The following mining rights make up the full Mponeng mining right area of approximately 6,673ha:
•GP30/5/1/2/2(01) MR valid from February 14, 2006 to February 13, 2036; and
•GP30/5/1/2/2(248) MR (for sand) valid from October 16, 2012 to October 15, 2022.- in the process of being consolidated into a single mining right (GP30/5/1/2/2/01) and is currently pending at the DMRE.
The mining rights 01MR and 248MR were ceded from AngloGold Ashanti Limited ("AngloGold Ashanti" or “AGA”) to Golden Core Trade and Investment (Pty) Ltd ("Golden Core"), a wholly-owned subsidiary of Harmony on September 30, 2020 and were successfully registered in the Mining Titles Office on June 14, 2021 as part of AngloGold Ashanti’s sale of their last remaining South African assets to Harmony, including its West Wits operations ("Transaction").
A section 102 Application in terms of the MPRDA was submitted previously by AngloGold Ashanti in March 2017 to consolidate its West Wits mining rights into a single mining right (GP30/5/1/2/2(01) MR). The AngloGold Ashanti Application was approved by the Department of Minerals and Energy ("DMRE") in August 2020, but was, however, not implemented due to a change in circumstances as a result of the transaction, and has subsequently been withdrawn by AngloGold Ashanti. A renewal application for GP30/5/1/2/2(248) MR (for sand) was submitted timeously. However, the DMRE requested Golden core to withdraw the renewal so they could process the S102 Consolidation application. A conditional withdrawal was subsequently submitted for the renewal application. On February 15, 2022, Golden Core submitted an application in terms of section 102 of the MPRDA, substantively similar to the AngloGold Ashanti Application, to consolidate the mining rights and mining right areas into a single mining right (GP30/5/1/2/2(01) MR) ("Golden Core Application"). The Golden Core Application is currently pending at the DMRE. By operation of law, submission of these applications to the DMRE automatically extended the validity of MR248 in the interim until DMRE approves or rejects the application.
The mineral rights are summarized in Table 3-4. The location of the residue deposits is presented in Figure 3-3.
Table 3-4: Summary of mining rights for West Wits
| | | | | | | | | | | | | | | | | |
| Operation | License Type | Reference No. | Effective Date | Expiry Date | Area (ha) |
| Mponeng Mine | Mining Right | GP30/5/1/2/2(01) MR | 14-Feb-2006 | 13-Feb-2036 | 6,477 |
| Magnum Farm | Mining Right | GP30/5/1/2/2(248) MR (for sand) | 16-Oct-2012 | 15-Oct-2022 (application still pending at the DMRE) | 196 |
| Total | 6,673 |
There is no material litigation (including violations or fines) against Golden Core which threatens its mineral rights, tenure, or operations.
Effective Date: June 30, 2024
16
Technical Report Summary for
Mine Waste Solutions, North West, South Africa
3.2.3Property Permitting Requirements
West Wits, operating as Golden Core, has all the permits required to operate and to realize the current LOM plan reflected in the Mineral Reserve estimate and has access to all the properties it requires to conduct its current mining activities (Table 3-5).
Following the acquisition of West Wits surface operations, all relevant permits and licenses were transferred to Golden Core including the approved EMP, the financial provision for rehabilitation liabilities for the West Wits operation mining rights, as well as the historic surface rights permits for West Wits operation. All of these permits are still valid.
Table 3-5: West Wits property and land ownership
| | | | | | | | | | | | | | |
| Surface Deposit ID | Farm Name & No. | Portion No. | Owner | Title Deed No. |
| Mponeng TSF | Elandsfontein 115 IQ | 23 | Golden Core Trade and Investment | T66629/2022 |
| New North TSF 7B | Doornfontein 118 IQ | 25 | Golden Core Trade and Investment | T66629/2022 |
| New North TSF 7A | Doornfontein 118 IQ | 25 | Golden Core Trade and Investment | T66629/2022 |
| Blyvooruitzicht 116 IQ | 93 | Golden Core Trade and Investment | T66629/2022 |
| New North TSF 5B | Blyvooruitzicht 116 IQ | 16 | Golden Core Trade and Investment | T66629/2022 |
| Blyvooruitzicht 116 IQ | 17 | Golden Core Trade and Investment | T66629/2022 |
| Blyvooruitzicht 116 IQ | 93 | Golden Core Trade and Investment | T66629/2022 |
| Doornfontein 118 IQ | 25 | Golden Core Trade and Investment | T66629/2022 |
| New North TSF 5A | Blyvooruitzicht 116 IQ | 16 | Golden Core Trade and Investment | T66629/2022 |
| Blyvooruitzicht 116 IQ | 93 | Golden Core Trade and Investment | T66629/2022 |
| Old North TSF | Blyvooruitzicht 116 IQ | 1 | Blyvooruitzicht Gold Mining Co Ltd | T14831/1986 |
| Blyvooruitzicht 116 IQ | 70 | Blyvooruitzicht Gold Mining Co Ltd | T11479/1966 |
| Blyvooruitzicht 116 IQ | 93 | Golden Core Trade and Investment | T66629/2022 |
| Savuka WRD | Blyvooruitzicht 116 IQ | 3 | Golden Core Trade and Investment | T66629/2022 |
| Mponeng WRD | Elandsfontein 115 IQ | 5 | Golden Core Trade and Investment | T66629/2022 |
Effective Date: June 30, 2024
17
Technical Report Summary for
Mine Waste Solutions, North West, South Africa
4Accessibility, Climate, Local Resources, Infrastructure and Physiography
Section 229.601(b)(96)(iii)(B) (4) (i-iv)
4.1MWS Operation
4.1.1Accessibility
The MWS operation is accessible from Johannesburg via the N12 national road and R502 regional road in Klerksdorp, North West. A large network of either tarred roads or well-maintained gravel roads exist between the tailing dams, waste rock dumps and the MWS plant that are scattered in the area (Figure 3-1).
4.1.2Physiology and Climate
The area where the MWS operation is situated is at an elevation ranging between 1,270m above mean sea level (“amsl”) and 1,340 amsl. A natural rocky ridge (Black Reef rocks) constitutes the northern boundary of the operational area, with man-made structures such as headgears and TSFs altering the topography of the landscape.
The region’s climate is characterized as sub-tropical dry savanna, with a mean annual evaporation at ~1,300mm which far exceeds mean annual rainfall of ~600mm.
Temperature patterns are characterized by seasonal and daily variations, where summers are hot and winters are mild to cold. The seasonal fluctuations in mean temperatures vary between 2°C and 22°C in the winter months (May – August) and vary between 13°C and 29°C in the summer months (September – April). The month of June is generally the coldest month with lowest recorded temperatures of an estimated 2°C while the maximum recorded temperature of 29°C generally occurs in February.
4.1.3Local Resources and Infrastructure
Infrastructure in the region is well established supporting the numerous operational gold mines in the area. The regional infrastructure includes national and provincial paved road networks, power transmission and distribution networks, water supply networks and communication infrastructure. Harmony has enough reliable suppliers of consumables on its database and the company also has a healthy workforce to sustain the operation.
4.2West Wits Operation
4.2.1Accessibility
The West Wits Surface operations near Carletonville are accessible via the N12 national road and R500 regional road from Johannesburg.
4.2.2Physiology and Climate
The area where the West Wits operation is situated is approximately at an elevation of 1,700m above sea level. A prominent rocky ridge known as the Gatsrand extends across the West Wits operation from east to west forming a watershed. Other man-made structures such as headgears, TSFs and WRDs altering the topography of the landscape.
The West Wits operation falls within the Highveld climatic zone, which is characterized by warm temperatures, dry winters and summer rainfall (with all conditions being erratic and extremely variable). The mean annual evaporation is recorded at ~596mm with the highest precipitation occurring in January (194.7mm) and the lowest occurring in July (2.3mm).
The summer months are warm and mostly clear, and winters are cold and dry. The month of July is generally the coldest month with lowest recorded temperatures of an estimated 2°C while the maximum recorded temperature of 27°C generally occurs in February. The seasonal fluctuations in mean temperatures between the warmest and the coldest months vary between 12°C and 15°C.
4.2.3Local Resources and Infrastructure
Infrastructure in the region is well established supporting the numerous operational gold mines in the area. The regional infrastructure includes national and provincial paved road networks, power transmission and distribution networks, water supply networks and communication infrastructure. Harmony has enough reliable suppliers of consumables on its database and the company also has a healthy workforce to sustain the operation.
Effective Date: June 30, 2024
18
Technical Report Summary for
Mine Waste Solutions, North West, South Africa
5History
Section 229.601(b)(96)(iii)(B) (5) (i-ii)
5.1Historical Ownership and Development
5.1.1MWS Operation
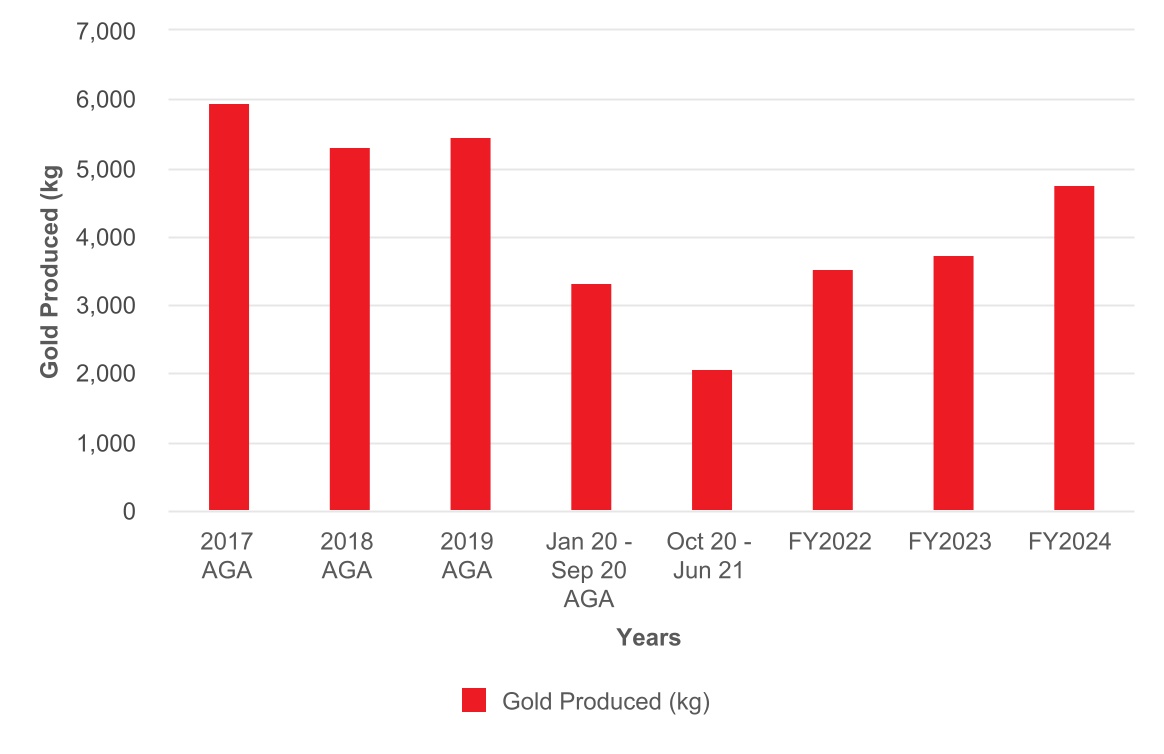
The MWS gold plant commenced production in 1952 and was the original gold processing plant for the Stilfontein gold mine. Following the rise in the uranium price in the 1970s, the operation investigated uranium recovery from the Stilfontein Gold Mine’s gold tailings dams and commissioned the uranium plant in mid-1979. The plant operated until 1989, processing 29.4Mt of tailings and recovering 4.56t of U3O8. In 2003, the plant was converted into a gold tailings treatment operation and no further uranium was produced at that stage.
In 2007, First Uranium (Pty) Ltd (South Africa) ("First Uranium") acquired the MWS operations with the purpose of treating the tailings dams for both gold and uranium. The second and third processing plants were commissioned between 2007 and 2012. The Stream 4 will start in November 2024.
On July 20, 2012, the MWS operations were acquired by AngloGold Ashanti from First Uranium. The MWS uranium plant and flotation plants were commissioned in 2014 and were further reconfigured into a more efficient operation during 2016, as part of an optimisation drive. In 2017, the uranium and flotation plants were discontinued resulting in MWS plants producing only gold.
On October 1, 2020 Harmony acquired all of AngloGold Ashanti’s surface operations, including the MWS operations.
5.1.2West Wits Operation
The Savuka plant was commissioned in 1961 and originally designed to treat ore from Savuka mine and TauTona mine. In 2015, upon the change in strategy to treat the ore from Savuka and TauTona at Mponeng plant, the plant was converted into a tailings and WRD treatment facility. The Savuka plant treats tailings material from Old North TSF and Mponeng plant waste rock from the Mponeng WRD. On October 1, 2020, Harmony acquired all of AngloGold Ashanti’s South African business, including the surface assets which constitute the West Wits operation.
Kusasalethu plant was commissioned in 1980 as conventional filter plant. In 1998 Carousel pump cell CIP plant was introduced with off-site elutions. In 2012 the milling circuit was re-configured from open circuit primary milling to closed circuit primary milling and re-grind mill was de-commissioned. In 2014 an elution facility was constructed on site. Its treatment capacity is 120,000 tpm at 65 tph and 85% mill availability with
Recovery Efficiency of 95%. In July 2021 the plant was converted to a waste rock treatment facility. The plant has been converted into a small scale TSF re-treatment operation.
5.2Historical Exploration
Prior to 2011, grade estimations for the Vaal River TSFs were based on residue grades obtained from the process plants, as well as various sampling projects in selected areas. Post AGA ownership, the Vaal River TSFs including MWS TSFs, and West Wits TSFs were drilled on a regular grid spacing and sampled every 1.5m from the top of the TSF till red soil intersection using auger drilling. The same method of drilling continued post Harmony ownership in 2021. The exploration drilling carried out since 2011 has been used in the estimation of the Mineral Resources and, as such, is discussed in Section 11.
The reader should note that drilling cannot be carried out on WRDs due to their composition of unconsolidated rock. Therefore, historical exploration is not available. These deposits are sampled by Harmony for the purposes of Mineral Resource estimation, as discussed in Section 11.
5.3Previous Mineral Resource and Mineral Reserve Estimates
The previous Mineral Resource estimate for Mine Waste Solutions and West Wits were declared as at June 2023 according to SAMREC Code, 2016. The previous Mineral Resource estimates, summarized in Table 5-1 and Table 5-2 for MWS and West Wits respectively, are exclusive of Mineral Reserves and have been superseded by the current estimate prepared by the QP in Section 11 of this TRS.
Effective Date: June 30, 2024
19
Technical Report Summary for
Mine Waste Solutions, North West, South Africa
Table 5-1: Summary of the previous MWS Mineral Resources as at June 30, 2023 (exclusive of Mineral Reserves)
| | | | | | | | | | | | | | | | | | | | |
| METRIC | Grade | Metal Content |
| Mineral Resource Category | Source | Tonnes (Mt) | Gold (g/t) | U3O8 (kg/t) | Gold (kg) | U3O8 (t) |
| Measured | TSF | 54.061 | 0.20 | 0.061 | 10,902 | 3,272 |
| WRD | — | — | — | — | — |
| Sub Total / Ave Measured | 54.061 | 0.20 | 0.061 | 10,902 | 3,272 |
| Indicated | TSF | 52.912 | 0.24 | 0.096 | 12,840 | 5,076 |
| WRD | 2.060 | 0.30 | — | 619 | — |
| Sub Total / Ave Indicated | 54.972 | 0.24 | — | 13,459 | 5,076 |
| Total / Ave. Measured + Indicated | 109.033 | 0.22 | 0.078 | 24,360 | 8,348 |
| Inferred | TSF | 77.701 | 0.13 | 0.039 | 9,984 | 3,031 |
| WRD | 2.502 | 0.24 | — | 611 | — |
| Total / Ave Inferred | 80.203 | 0.13 | 0.038 | 10,594 | 3,031 |
| |
| IMPERIAL | Grade | Metal Content |
| Mineral Resource Category | Source | Tons (Mt) | Gold (oz/t) | U3O8 (lb/t) | Gold (Moz) | U3O8 (Mlbs) |
| Measured | TSF | 59.592 | 0.006 | 0.133 | 0.351 | 7.946 |
| WRD | — | — | — | — | — |
| Sub Total / Ave Measured | 59.592 | 0.006 | 0.133 | 0.351 | 7.946 |
| Indicated | TSF | 58.326 | 0.007 | 0.190 | 0.414 | 11.102 |
| WRD | 2.270 | 0.009 | — | 0.020 | — |
| Sub Total / Ave Indicated | 60.596 | 0.007 | 0.190 | 0.434 | 11.102 |
| Total / Ave. Measured + Indicated | 120.188 | 0.007 | 0.323 | 0.785 | 19.048 |
| Inferred | TSF | 85.651 | 0.004 | 0.078 | 0.321 | 6.683 |
| WRD | 2.758 | 0.007 | — | 0.020 | — |
| Total / Ave Inferred | 88.409 | 0.004 | 0.076 | 0.341 | 6.683 |
Effective Date: June 30, 2024
20
Technical Report Summary for
Mine Waste Solutions, North West, South Africa
Table 5-2: Summary of the previous West Wits Mineral Resources as at June 30, 2023 (exclusive of Mineral Reserves)
| | | | | | | | | | | | | | | | | | | | |
| METRIC | Grade | Metal Content |
| Mineral Resource Category | Source | Tonnes (Mt) | Gold (g/t) | U3O8 (kg/t) | Gold (kg) | U3O8 (t) |
| Measured | TSF | — | — | — | — | — |
| WRD | — | — | — | — | — |
| Sub Total / Ave Measured | — | — | — | — | — |
| Indicated | TSF | 25.427 | 0.32 | — | 8,259 | — |
| WRD | 0.272 | 0.37 | — | 100 | — |
| Sub Total Indicated | 25.699 | 0.33 | — | 8,359 | — |
| Total / Ave. Measured + Indicated | 25.699 | 0.33 | — | 8,359 | — |
| Inferred | TSF | — | — | — | — | — |
| WRD | — | — | — | — | — |
| Total / Ave Inferred | — | — | — | — | — |
| |
| IMPERIAL | Grade | Metal Content |
| Mineral Resource Category | Source | Tons (Mt) | Gold (oz/t) | U3O8 (lb/t) | Gold (Moz) | U3O8 (Mlbs) |
| Measured | TSF | — | — | — | — | — |
| WRD | — | — | — | — | — |
| Sub Total / Ave Measured | — | — | — | — | — |
| Indicated | TSF | 28.028 | 0.009 | — | 0.266 | — |
| WRD | 0.300 | 0.011 | — | 0.003 | — |
| Sub Total Indicated | 28.328 | 0.009 | — | 0.269 | — |
| Total / Ave. Measured + Indicated | 28.328 | 0.009 | — | 0.269 | — |
| Inferred | TSF | — | — | — | — | — |
| WRD | — | — | — | — | — |
| Total / Ave Inferred | — | — | — | — | — |
The previous Mineral Reserve estimate for Mine Waste Solutions and West Wits as at June 30, 2023, were estimated in accordance with the SAMREC Code, 2016. Modifying factors were applied to the Mineral Resource estimates to arrive at the Mineral Reserve estimates. The previous Mineral Reserve estimates are summarized in Table 5-3 and Table 5-4 for MWS and West Wits, respectively, and has been superseded by the current estimate prepared by Harmony as detailed in Section 12 of this TRS.
Effective Date: June 30, 2024
21
Technical Report Summary for
Mine Waste Solutions, North West, South Africa
Table 5-3: Summary of the previous MWS Mineral Reserves as at June 30, 2023
| | | | | | | | | | | | | | |
| METRIC |
| Mineral Reserve Category | Source | Tonnes (Mt) | Gold Grade (g/t Au) | Gold Content (kg) |
| Proved | TSF | 14.215 | 0.27 | 3,823 |
| WRD | — | — | — |
| Sub Total / Ave Proven | 14.215 | 0.27 | 3,823 |
| Probable | TSF | 381.126 | 0.28 | 105,832 |
| WRD | — | — | — |
| Sub Total / Ave Probable | 381.126 | 0.28 | 105,832 |
| Total / Ave (Proved + Probable) | 395.341 | 0.28 | 109,655 |
| IMPERIAL |
| Mineral Reserve Category | Source | Tons (Mt) | Gold Grade (oz/t) | Gold Content (Moz) |
| Proved | TSF | 15.670 | 0.008 | 0.123 |
| WRD | — | — | — |
| Sub Total / Ave Proven | 15.670 | 0.008 | 0.123 |
| Probable | TSF | 420.119 | 0.008 | 3.403 |
| WRD | — | — | — |
| Sub Total / Ave Probable | 420.119 | 0.008 | 3.403 |
| Total / Ave (Proved + Probable) | 435.789 | 0.008 | 3.525 |
Table 5-4: Summary of the previous West Wits Mineral Reserves as at June 30, 2023
| | | | | | | | | | | | | | |
| METRIC |
| Mineral Reserve Category | Source | Tonnes (Mt) | Grade (g/t Au) | Content Au (kg) |
| Proved | TSF | — | — | — |
| WRD | — | — | — |
| Sub Total / Ave Proven | — | — | — |
| Probable | TSF | 17.357 | 0.32 | 5,485 |
| WRD | — | — | — |
| Sub Total / Ave Probable | 17.357 | 0.32 | 5,485 |
| Total / Ave (Proved + Probable) | 17.357 | 0.32 | 5,485 |
| IMPERIAL |
| Mineral Reserve Category | Source | Tons (Mt) | Gold Grade (oz/t) | Content (Moz Au) |
| Proved | TSF | — | — | — |
| WRD | — | — | — |
| Sub Total / Ave Proven | — | — | — |
| Probable | TSF | 19.133 | 0.009 | 0.176 |
| WRD | — | — | — |
| Sub Total / Ave Probable | 19.133 | 0.009 | 0.176 |
| Total / Ave (Proved + Probable) | 19.133 | 0.009 | 0.176 |
5.4Past Production
Mine Waste Solutions’ surface operations, including the MWS operation and the West Wits operation, were previously owned by AngloGold Ashanti (“AGA”) and have reprocessed TSF and WRD material for over 10 years ending in 2019. The last four years’ historical production from AngloGold Ashanti and the previous three years’ production since Harmony took control are presented in Figure 5-1 and Figure 5-2. AGA reporting period is from January till December vs the Harmony reporting period which is from July till June. Previous production included the Kopanang plant which was closed down in September 2021.
Effective Date: June 30, 2024
22
Technical Report Summary for
Mine Waste Solutions, North West, South Africa
Figure 5-1: Graph of past production – Tonnes and grade
Figure 5-2: Graph of Past Metal Production
Effective Date: June 30, 2024
23
Technical Report Summary for
Mine Waste Solutions, North West, South Africa
6Geological Setting, Mineralization and Deposit
Section 229.601(b)(96)(iii)(B) (6) (i-iii)
The TSFs and WRD which are processed by Mine Waste Solutions are man-made deposits, which arise from the processing of reefs or the deposition of waste material. They therefore have a very different geological setting, mineralization and deposit-type to other orebodies.
6.1Regional Geology
Gold mined from Harmony’s deep level operations occurs within the Archean Witwatersrand Basin (Figure 6-1). The Witwatersrand Basin is an approximately 7,000m thick terrigenous sequence comprising mainly arenaceous and argillaceous, together with minor rudaceous, lithologies deposited in a fluvio-deltaic environment in the centre of the Archaean Kaapvaal Craton (Robb and Meyer, 1995).
The Witwatersrand Basin hosts the Witwatersrand Supergroup, which is subdivided into the basal West Rand Group (“WRG”) and overlying CRG (Robb and Robb, 1998). The WRG extends over an area of 43,000km2 and is up to 5,150m thick. It is sub-divided in into Hospital Hill Subgroup; Government Subgroup and Jeppestown Subgroup.
The CRG is up to 2,880m thick and covers an area of up to 9,750km2, with a basal extent of c.290km x 150km. It is sub-divided into the lower Johannesburg Subgroup and upper Turffontein Subgroup as shown in (Figure 6-2). These subgroups are separated by the Booysens Shale Formation. The CRG comprises coarse-grained fluvio-deltaic sedimentary rocks.
The major gold-bearing conglomerate reefs, including the three which are the main source of the material deposited on the TSFs and WRDs, are mostly confined to the CRG. The reefs are mined in seven major goldfields, including the East Rand, South Rand, Central Rand, West Rand, West Wits, Klerksdorp, Free State (Welkom), and Evander goldfields (Figure 6-1).
6.2Local Geology
The material contained in the TSFs and WRDs originates from deep level gold mines mined by Harmony and its predecessors and are located near the towns of Klerksdorp and Stilfontein (including the Moab Khotsong Mine, Stilfontein gold mine and Hartbeesfontein Gold Mine) and Carletonville (including Savuka mine, Kusasalethu mine and Mponeng mine).
The mines near Carletonville have predominantly extracted tabular gold-bearing conglomeratic reefs, namely the CLR and VCR. The Klerksdorp operations have mainly exploited the VR and C-Reef. The MWS TSF's resulted from VR deposited material. The West Wits operations predominantly deposited CLR on Old North TSFs.
The VCR horizon is located at the top of the Turffontein Subgroup of the CRG, capping the Witwatersrand Supergroup. The VR horizon is situated within the Krugersdorp Formation, in the Johannesburg Subgroup. The CLR is situated near the base of the Johannesburg Subgroup (Figure 6-2).
6.3Property Geology
6.3.1TSF
The TSF material is previously treated residue of gold-bearing conglomeratic reefs described above processing by CIL. They are man-made “deposits” and are not the result of natural sedimentary processes. The TSFs are typically deposited by a number of spigots, which are placed at intervals around the TSF, and these spigots are periodically raised as deposition takes place over time. The result is that the TSFs are comprised of horizontal or near-horizontal layers.
The typical particle size within the TSF will depend on the fineness of the comminution process in the plant that generated the tailings, but they are generally comprised of unconsolidated, fine to very fine-grained material.
Effective Date: June 30, 2024
24
Technical Report Summary for
Mine Waste Solutions, North West, South Africa
Figure 6-1: Geological setting of the Witwatersrand Basin- Not to scale
Effective Date: June 30, 2024
25
Technical Report Summary for
Mine Waste Solutions, North West, South Africa
Figure 6-2: Stratigraphy of the CRG in the Witwatersrand Supergroup
Source: Modified after Tucker et al. (2016)
Effective Date: June 30, 2024
26
Technical Report Summary for
Mine Waste Solutions, North West, South Africa
The grade of the TSFs is determined by the grade of the ore source at the time that they were processed, and the processing efficiency. These parameters would both have varied over time, and hence the grade of the deposits can vary within a TSF, and between TSFs. The mining method applied for the deposits does not typically allow for partial or selective mining, and hence the grade estimation methodology tends to be focused on achieving a robust estimate of the mean grade.
The reader should note that a stratigraphic column through the TSF (or WRD) would be meaningless as it is a man made, uniform structure. The stratigraphic column provided in Figure 6‑2 is related to the ore mined to produce the TSF (or WRD).
6.3.2WRDs
The WRD material is derived from the following underground workings:
•minor reef intersected while accessing the primary reef;
•gold-bearing reef within small fault blocks that were exposed by off-reef development; and
•cross-tramming of gold-bearing reef material to the waste tips.
The WRDs are man-made deposits, with very little structure or continuity, and one in which the grade does not behave as a natural mineral deposit. The WRDs are unconsolidated rock piles, in which the angle of the slope is determined by the angle of repose. The particle size is variable but can range from gravels to large boulders.
The WRDs are typically deposited by a conveyor belt system, which would have migrated over time, or they are deposited by trucks. The style of deposition can result in internal layering, but the grades are seldom sufficiently variable to model – and as with TSFs, the grade estimation methodology is focused on achieving a robust estimate of the mean.
6.4Mineralization
The most significant mineral in the TSFs and WRDs is quartz, which is above 60% of the bulk mineral composition. The gold predominantly occurs in pyrite. Other minerals identified are iron oxide, titanium oxide and calcite from the VR, VCR and CLR conglomerates.
The gold present in the TSFs is fine grained, less than 20µm on average, with the majority of the gold being locked up with poor surface exposure.
The main uranium mineral in the Witwatersrand Supergroup is uraninite. Uraninite grains are associated with gold and other heavy minerals such as pyrite, chromite, zircon, rutile. The grain size of the uraniferous minerals identified within the TSF are between 20 - 40µm.
6.5Deposit Type
The TSFs are tabular, man-made deposits of previously processed waste material from conglomeratic reefs.
The WRDs are tabular, man-made deposit of previously uncrushed and untreated, low-grade material.
6.6Commentary on Geological Setting, Mineralization and Deposit
The QP is of the opinion that the source and characteristics of the material deposited on the TSFs and WRDs are well understood.
Effective Date: June 30, 2024
27
Technical Report Summary for
Mine Waste Solutions, North West, South Africa
7Exploration
Section 229.601(b)(96)(iii)(B) (7) (i-vi)
Prior to 2011, grade estimations for the TSFs were based on residue grades obtained from the process plants, as well as various sampling projects in selected areas. Most of these TSFs have since been re-sampled by means of an extensive auger drilling exercise which commenced in 2011 until current. The active TSFs will be re-sampled once they go out of service and become dormant.
WRDs cannot be explored using drilling techniques for grade block model determination because they comprised of unconsolidated rocks that are moved during benching and loading into to trucks during reclamation. The movement of the WRD in relation to a static model makes it difficult to reconcile feed to grade block model. No drilling is undertaken on the MWS and West Wits WRDs. The reader is referred to Section 8.2.1 for a summary of the sampling methods and approach.
7.1Mapping Surveys
No mapping is undertaken of TSFs nor WRDs because they are man-made residue deposits.
7.2Topographic Surveys
All of the TSFs and WRDs are surveyed on a monthly and annual basis to determine the volume of the contained material. The surveys are conducted using a Total Station and RTK GPS Rovers, to collect GPS data. These surveys are used both to inform the volume of the deposits for Mineral Resource estimation, and they are used to reconcile the monthly addition and depletion records, once mining takes place.
LiDAR surveys are not typically used to inform the Mineral Resource estimates and may be undertaken on an ad hoc basis to determine volume if required.
7.3TSF Surface Drilling Campaigns, Procedures and Results
The location of the surface drilling undertaken on the TSFs at both MWS’s and West Wits’ operations are presented in Figure 7-1 and Figure 7-2, respectively. A total of 1577 drill holes (for WW and MWS) have been drilled in these TSFs between 2011 and present.
7.3.1Drilling Methods
Drilling of the TSFs is undertaken using a portable hydraulic auger drilling machine, which uses a rotating spiral enclosed in a 50mm nominal core barrel. Drilling is conducted vertically from the top of the TSF to intersect between 1.0m and 1.5m into the underlying strata.
All drilling of the TSFs since 2011 has been undertaken by an independent contractor, SGS South Africa (Pty) Limited, who sub-contracted Dump and Dune (Pty) Limited to perform the physical drilling.
The drill hole spacing is determined based on the purpose of the drilling. The drilling undertaken on newly acquired TSFs or TSFs with no historical data is classified as exploration drilling.
Grade control drilling occurs prior mining to increase the level of confidence in the Mineral Resource estimate. The grade control drilling uses the same drilling methods as described above. The drill hole spacing for the various types of drilling is shown in Table 7-1.
In addition, metallurgical test work is conducted to determine gold recovery parameters.
Table 7-1: TSF drilling grid spacing
| | | | | | | | |
| Drilling Purpose | Horizontal Direction (Xm, Ym) | Vertical Direction (Zm) |
| Exploration (Mineral Resource) | 150 x 150 | 1.50 |
| Grade Control | 100 x 100 to 50 x 50 | 1.50 |
| Geo-metallurgical Test work | 300 x 300 to 100 x 100 | 6.0 (Composites) |
Effective Date: June 30, 2024
28
Technical Report Summary for
Mine Waste Solutions, North West, South Africa
Figure 7-1: Location of TSF drilling at MWS operation
Effective Date: June 30, 2024
29
Technical Report Summary for
Mine Waste Solutions, North West, South Africa
Figure 7-2: Location of TSF drilling at West Wits operation
Effective Date: June 30, 2024
30
Technical Report Summary for
Mine Waste Solutions, North West, South Africa
Drill “cores” or samples are extracted at 1.5m intervals. Three different lengths of the rotating spiral core barrel and extension rods of 1.5m, 3.0m and 4.5m are connected as the drill hole depth increases vertically downwards to maintain the 1.5m sample extraction.
The TSF auger drilling process is undertaken according to the internal best practice, as outlined in Harmony procedure document (STD2015-2378). This standard describes the full process including drilling, logging and sampling. The drilling methodology and orientation is dictated by the fine-grained nature of the deposit, and the near-horizontal layering.
7.3.2Collar and Downhole Surveys
Drill hole collars completed on the TSFs are planned by the geologist and then pegged on the TSFs by the internal surveyor using a Global Positioning System (“GPS”) with an accuracy of 0.03m. The LO27 Cape Datum system is used to record the coordinates.
No downhole surveys are carried out on any of the drill holes.
7.3.3Logging Procedure
The samples are collected in a plastic chute as the spiral is removed from the core barrel, and immediately transferred into sample bags. The sample bags are sealed and labelled with unique sample numbers prior to dispatch at the designated laboratory for analysis.
The samples are logged at the drilling site, by the responsible geologist. The information captured on the sample log sheet includes the unique sample number, sample mass, date collected, spatial location (survey collar) and a description of the sample, such as color, mineral content and grain size.
7.3.4Drilling Results
With over 30,691 samples for gold and 15 796 for uranium taken since 2011, the results are too voluminous to be reported in this report. The results have, however, been included into the geological modelling and Mineral Resource estimation process. Refer to Table 11-1 for details per TSF.
7.3.5Sample Recovery
While the TSF auger drilling process, with the spiral in the core barrel, is designed to maximize the sample recovery, obtaining good sample recoveries requires careful drilling and sample handling. Sample recovery recorded is recorded by measuring the total samples extracted, and a re-drill is required if the recovery is zero due to foreign material in the TSF, a hole adjacent to the original hole is drilled and taken in for analysis (the hole must be less than 2m away from original hole).
7.3.6Sample Length and True Thickness
Samples are taken every 1.5m down the auger hole. The auger holes are drilled vertically into the TSF and therefore the drill length equals the true thickness.
7.4Hydrogeology
Hydrogeology is only applicable to TSFs and WRDs from an environmental perspective, as they are man-made deposits located above ground. The reader is therefore referred to Section 17. The TSFs were hydraulically deposited and allowed to consolidate, and the water was decanted. The control of the deposition process has resulted in stable structures which still contain varying amounts of water. For MWS, two of the TSFs are currently in active deposition phase and the phreatic level within these TSFs is well monitored. Within the Savuka and Mponeng plant, two TSF's are active.
Seepage is one of MWS biggest environmental aspects in terms of impacts on the groundwater resource at Kareerand. The existing Kareerand TSF is not lined as it was not a requirement when the water use license was issued in 2010. Seepage from the TSF could cause groundwater pollution towards the Vaal River as the natural drainage is towards the Vaal River.
The current water use license (WUL) requires that the groundwater around Kareerand be sampled and analysed for a range of constituents. These results are used by external geohydrologists to develop and update a numerical transport model. The model takes into account the rate of seepage, water levels in the boreholes, transmissivity of the geology around the TSF and other sources of contamination like dam overflows.
Effective Date: June 30, 2024
31
Technical Report Summary for
Mine Waste Solutions, North West, South Africa
The model can predict what the future migration distance of the plume will be over time. Harmony needs to protect the integrity of the Vaal River at all costs by preventing the groundwater plume from reaching the Vaal River. The following measures have been put in place to mitigate the plume’s progress towards the Vaal River:
•22 interception boreholes have been drilled and equipped to pump the shallow groundwater back to the process for reuse, thus slowing down the plume. The WUL authorized the abstraction of 3,3Mm3 of groundwater/annum. Seven newly drilled boreholes are being equipped to pump more groundwater from the eastern and southeastern sides of Kareerand. An additional six interception boreholes will be drilled before year end 2024 to have the total boreholes at 35 as authorized in the WUL;
•35 Ha of Eucalyptus macarthurii trees were planted to assist with the interception of shallow seepage south of Kareerand. An additional 15 Ha will be planted before the end of 2025 to have a total block of 50Ha planted;
•The return water dams, pollution control dams and the Kareerand expansion are lined with HDPE liners to minimize any seepage from these dams; and
•The dam levels of the return water and pollution control dams are kept at a freeboard of 800mm to prevent any overflows of these process water dams.
7.5Geotechnical Data
For a new TSF deposition site, a comprehensive geotechnical investigation report was done on the existing and new TSF facility to determine the stability of the facilities. For the new facility it forms part of the design report. Annual stability analyses are done for the operational TSF, and piezocone testing is done every 2-3 years to augment the analyses. Seismic risks are included in the stability analyses.
For a tailings to be reclaimed, the CPTU tests reports are considered before the TSF is reclaimed and the geotechnical consultants are used to develop a mining plan to start the new TSF. CPTU testing which includes Lab testing is done every 3-5 years and data is collected is shown in the table below. With this data the stability analysis which include the Factor of Safety is calculated. The sequence of testing gets determined by the following:
•Tonnages deposited – Lower tonnages mean the testing will be moved further out;
•Rate of Rise (RoR) – low RoR will move testing out;
•Piezometer measurements – If any major changes are detected in the readings, the piezometer levels testing are done sooner than the 2-3 years period;
•Material changes – If material properties changes, testing could also be done sooner than anticipated; and
•Drain measurement – Any significant changes in the drain reading also influence the testing frequency.
Effective Date: June 30, 2024
32
Technical Report Summary for
Mine Waste Solutions, North West, South Africa
Table 7-2: Geotech test work
| | | | | | | | | | | |
| Tests | Type of Tests | Values Obtained (measured) | Purpose |
| Test pitting | Soil layering and bulk sampling | Lab testing | |
| In-situ testing (SCPTu) | Seismic Test | Low strain in-situ compression and shear wave velocities | Soil microstructure, liquefaction potential, soil stiffness |
| Dissipation Test | Time taken for excess pore water pressures to dissipate | U0 , Pore pressure regime, Phreatic surface position, t50, etc., |
| Cone Penetration Test with pore pressure measurement (CPTu) | Cone Resistance (qc), Sleeve Friction (fs), U2 (Dynamic Pore Pressures) | Undrained shear strengths (Peak and Residual), Stratigraphy, Liquefaction Potential, Brittleness etc. |
| Laboratory Testing | Foundation Indicator Tests (Sieve analysis, | Percentage of sample passing sieve size | Particle Size Distribution, Soil Classification |
| Atterberg Limits, | Critical water contents in fine-grained soils. | |
| Hydrometer Analysis) and specific gravity | Calculates the size of soil particles from the speed at which they settle out of suspension from a liquid | |
| Triaxial | Consolidated Undrained Test | Mechanical properties of the soil (Undrained shear strength, Drained Shear Strength, Brittleness, Liquefaction Potential) |
| Permeability | Flexible Wall Permeability | Material permeability for future height analysis (k values) |
| Shear Vane Testing | Shear vane test | In-situ testing method used to determine the undrained shear strength of a cohesive soil | Undrained shear strength, undrained shear strength ratios, Nkt values. |
7.6Commentary on Exploration
The QP is of the opinion that:
•the drilling and sampling methodology in use for Harmony’s TSFs has been developed specifically for the challenges posed by these deposits and is aligned with industry best practice. This protocol has been in place since 2011, and the drilling components are applied by contractors who are experienced in this specific methodology;
•the drill hole samples are deemed to be representative as they provide both vertical and horizontal coverage of each TSF;
•drill holes are positioned at regular intervals across the TSF;
•the drill hole statistics are based on statistics from the 2008 MWS Technical Report of 2008. Post 2012, after AngloGold Ashanti acquired the operations, a drilling campaign was implemented on the Chemwes TSF for updated block models except on MWS 4 (drilled and model update in FY25) and Buffels 2,3,4 (floor cleaning);
•the data spacing, density and distribution is sufficient to support the estimation of Mineral Resources for the various TSFs;
•Bulk density testing is a work in progress for tailing Mineral Resources and Reserves estimates; and
•WRDs are not explored using exploration methods due to their unconsolidated nature.
Effective Date: June 30, 2024
33
Technical Report Summary for
Mine Waste Solutions, North West, South Africa
8Sample Preparation, Analyses and Security
Section 229.601(b)(96)(iii)(B) (8) (i-v)
This section summarizes information relating to the sample preparation on site all the way through to the laboratory preparation and analysis.
8.1TSFs
Sampling is carried out in accordance with the Harmony’s internal sampling procedure guidelines, which were first put in place by AngloGold Ashanti in 2011.
8.1.1Sampling Method and Approach
Samples are collected at 1.5m increments, with each weighing approximately 3.0kg-4.5kg. As noted in Section 11, the samples are collected in a plastic chute as the spiral is removed from the core barrel, and immediately transferred into sample bags. No sub sampling occurs in the field.
The sample bags are sealed and labelled with unique sample numbers prior to dispatch at the designated laboratory for analysis. A sample list with the unique sample number is also generated for laboratory dispatch.
8.1.2Density Determination
The work done on the density determination involved:
•comparing survey measured volume mined per TSF with tonnes treated in the plant; and
•and dry mass of the extracted sample using auger with volume of the auger casing.
The studies so far indicate variability in density per TSF. The next investigation is to confirm the volume of the casing in the laboratory environment. The work will then be presented to the head of ORM for review and finalization. However, for this cycle of reporting a density of 1.45t/m3is used (as in the previous cycles) and it will be changed accordingly once the determination of density is finalized and approved.
8.1.3Sample Security
At the end of each drilling shift, the samples are transported from the field to the storage facility by the responsible geologist. At the end of each drilling shift, the samples are delivered to the SGS lab for analysis. In times where the samples cannot be delivered to the lab, the samples are temporarily stored at the plant and delivered the following day at the lab.
The collection and transportation of the samples requires a gold-bearing material permit which is issued by the security department. The permit accompanies the samples in transit at all times. A signed waybill is also required for transporting samples. The samples are counted upon arrival at the designated laboratory to ensure that they correspond to the total number on the security waybill and log sheet.
8.1.4Sample Storage
60 days after analysis is complete. The samples are then delivered to the respective plant for permanent storage and future usage on other projects.
8.1.5Laboratories Used
During the period 2014 to 2019, samples were sent to the external SGS South Africa (Pty) Limited (“SGS”) laboratory in Allanridge for preparation and gold assay. Following the closure of the Allanridge laboratory, the SGS Vaal River, Orkney and Randfontein laboratories have been used for gold analysis and metallurgical test work. SGS is ISO/IEC 17025:2017 accredited for chemical analysis, with current certification expiring on February 27, 2025.
8.1.6Laboratory Sample Preparation
Upon receipt at the laboratory, the samples are first weighed to obtain the “as received” mass and then dried at 100 °C ±10 °C. The samples are weighed again after drying to obtain the dry mass and are subsequently agglomerated to a 1000µm sieve.
The dry and sieved samples are then sub-sampled by means of an 8-way rotary splitter. The eight sub-samples (obtained from splitting) are transferred to individual sample bags together with barcoded laboratory sample tickets. One sub-sample is marked for gold assay and the second for uranium and sulphur analysis. The remaining sub-samples are used for metallurgical test work and Quality Assurance and Quality Control (“QAQC”).
Effective Date: June 30, 2024
34
Technical Report Summary for
Mine Waste Solutions, North West, South Africa
8.1.7Assaying Methods and Analytical Procedures
The method of sample analysis is Fire Assay with Flame Atomic Absorption Spectroscopy Finish (“FAAS”). The assaying and analysis procedures are summarized as follows:
•fluxing for fire assay:
•the required amount of flux (±330g) is measured and transferred into new crucibles which are lined with plastic bags. For low grade samples, SGS’s standard is 300g to 400g for 100g aliquot;
•each sample bag is emptied onto a brown paper sheet and flattened. Multiple scoops are collected with a thin bladed spatula until the required aliquot mass (100g) is obtained;
•the aliquot mass extracted is weighed in a weighing boat on a calibrated balance. The weights are captured in the Comlabs Computerized Laboratory Automation System (“CCLAS”);
•the required amount of silver nitrate is dispensed into the content of each charged crucible by means of a calibrated bottle dispenser; and
•the crucibles are then submitted to the furnace section.
•fusion and de-slagging:
•prepared samples are loaded into a pre-heated (1,100°C ±50°C) furnace for 55 minutes;
•the slag becomes thoroughly fluid and allows the lead to fall as a rain of fine droplets through the slag, collecting all the noble metals;
•the slag is allowed sufficient time to cool in the cast iron moulds;
•the anvil is cleaned with a continuous flow of air (preventing slag from being hammered into the lead buttons) during the de-slagging process; and
•the lead buttons are weighed at a dedicated mass balance. The mass of each lead button is checked against the rejection criteria, i.e., minimum mass of 60.36g and maximum mass of 93.80g;
•cupellation and digestion of prills:
•the cupels are cleaned and pre-heated before the lead buttons are transferred;
•prills are individually placed on the anvil and hammered; and
•the hammered prills are transferred into their respective (10ml) volumetric flasks and digested by a nitric acid (HNO3 70% m/m) and hydrochloric acid (HCl 33% m/m) solution (ratio of 1:3). Aqua regia dissolves the gold.
The method of sample analysis for uranium or other trace element is X-ray fluorescence spectrometry (“XRF”). The assaying and analysis procedures are summarized as follows:
•ensure all instruments used for sample analysis is verified daily before been used;
•pressed pellet preparation is required to achieve a homogenous pressed powder pellet by milling 20g ± 0.05g sample pulp with 3g ± 0.05g binder (Sasol Wax);
•the above mixture is milled in a milling pot with 5ml volume of Vertex XF or methanol added before the top of the pot lid is placed. Pre-set time of milling to 5 minutes. All equipment is cleaned in between sample preparation;
•an aluminum cup is used for pressing the milled sample. The cup is placed onto a hydraulic lift and pressed down button to lower the cup into the die enclosure. The die cap is gently placed on top. Mylar film is placed in between the sample and the die to avoid contamination from the die surface. This film is then removed immediately after pressing. Close the arm to lock the die and start pressing; and
•the pressed pallet is then taken in the XRF for reading of uranium or other trace elements.
8.1.8Sampling and Assay Quality Control (“QC”) Procedures and Quality Assurance (“QA”)
TSF samples are submitted to the laboratory with QC material to verify accuracy and precision of the primary sample results. The QC material includes milled blanks, pulp duplicates and standards or certified reference materials (“CRM”). The CRMs are sourced from African Minerals Standards (“AMIS”) and cover the low-grade spectrum. This section is the consolidated QAQC covering all the TSF drilled.
Effective Date: June 30, 2024
35
Technical Report Summary for
Mine Waste Solutions, North West, South Africa
Every ninth sample of the borehole is a QC material (standard, blank and pulp). The QAQC submitted constitute greater than 12.5% of the samples. Previously, two standard deviations were used for standard performance. In 2022, Harmony Gold operations implemented using three standard deviation for standard performances. A three times the lowest detection limit is implemented for milled blanks.
Assay results received from the laboratory for primary samples are considered acceptable if all the QC sample results have passed. If a blank or CRM fails, the samples above and below the failed QC samples are re-assayed. If the QC still fails, then the entire sample batch is re-assayed.
A summary of the quality control samples for the year is provided in Table 8-1.
Table 8-1: Summary of analytical quality control data
| | | | | | | | | | | |
| Quality Control Material Type | No. of Samples Submitted | No. of Failed Samples | Action Taken |
| CRMs / standards | 111 | 3 | Data for the current financial year. Failed CRM queried with the laboratory for reanalysis were possible and swops due to loading corrected in fusion. |
| Milled blanks | 46 | 1 | Data for the current financial year. The failed results were due to incorrect loading in fusion. Action done was to reload. |
| Pulp duplicates | 23 | — | Data for the current financial year. Correlation of 82% (including 2 outliers). and Correlation of 94% excluding the outliers. |
8.1.9Standards
Harmony Gold employs statistical analysis based on standard deviations to ensure the representativeness of samples. Samples are monitored to determine if their values fall within a predefined range. Specifically, if a sample’s value falls outside two standard deviations from the mean, it is identified as a "special cause." These special cause samples are investigated further to understand the underlying reasons for the deviation, ensuring any anomalies are identified and addressed promptly. This statistical approach helps maintain the reliability and accuracy of the sampling process.
The CRM results are used to identify any issues with specific sample batches, and biases associated with the laboratory to which primary samples are sent. Control charts are typically plotted of the CRM results. A total of 56 AMIS0647 observations were made from which one outlier was identified. Analytical bias including outliers is +5.51% (including outliers) and 3.21% (excluding outliers). A total of 55 AMIS0828 observations were made from which two outliers were identified. Analytical bias including outliers is +2.03% (including outliers and 3.32% (excluding outliers).
8.1.9.1Milled Blanks
The control line used to assess the QC sample results are two times the lowest detection limit for milled blanks.
The results of the milled blanks are used to identify any contamination of primary samples during the laboratory preparation process. Control charts are produced using the QC sample results in order to demonstrate performance of the laboratory’s sample preparation and analytical procedures. The lowest detection limit at the laboratory is 0.01ppm. One outlier sample was identified for the July 2023 to June 2024 analyses.
8.1.9.2Duplicates
Duplicate samples are submitted to monitor precision of the analytical methods. Ideally, the required precision is that 90% of the pulp duplicates should have a maximum precision of 10%. Scatter plots are routinely plotted by the responsible geologist and show good reproducibility of original assays, although some outliers can be observed. The correlation coefficient (specific measure that quantifies the strength of the linear relationship between two variables in a correlation analysis) was found to be 0.963, which is considered strong. The relative bias between duplicate versus the original is 6.38%. The current half absolute relative difference for tailings with less than 5% outliers removed, indicate 90% of the pairs has a precision of 14%, which needs to be monitored.
Effective Date: June 30, 2024
36
Technical Report Summary for
Mine Waste Solutions, North West, South Africa
8.2WRDs
8.2.1Sampling Method and Approach
Samples from the WRDs are collected from the face of the dumps and from the conveyor belts on their way to the processing plant. Belts sampling is primarily used for Mineral Resource estimates and monthly grade control for feed treated in the plant.
Face sampling is undertaken according to the internal best practice, using Harmony’s Standard for Broken Ore plant Sampling, and an internal best practice guideline for rock dump sampling. These procedures have been in place since 2011 and were first put in place by AngloGold Ashanti.
Face sampling involves digging a pit on a predetermined grid on the dumps:
•sample bag mass ranges between 7 - 11 kg;
•2x bags (50 x 60cm) per sampling point;
•20m intervals between sampling points;
•the excavator loosens material and then shovels are used to put material into bags; and
•each bag gets a sample tag with plant name (e.g. MPO for Mponeng) and number.
After bagging, samples are dispatched to the laboratory for analysis.
For Mponeng, Noligwa and Kusasalethu metallurgical plants, go-belt sampling of the WRD material is undertaken by means of mechanical stop belt samplers on the feed belts.
•A one-ton bin is used in the belt sample collection over a 24-hour period. However, Mponeng plant is still using battery size boxes due to the height of the belt;
•The frequency of the sampling interval is dependent on the tons hoisted;
•For example, hoisting 6000 tons for 24-hour shifts requires maximum cuts at 200 ton intervals equating to 30 cuts. Average cuts to fill a sampling bin are approximately 10 to 15, therefore 2 to 3 bins will be required; and
•The sample bis are taken to the laboratory for analysis.
8.2.2Density Determination
The WRDs are not homogeneous and consist of various size fractions which makes the determination of Relative Density (RD) through only the Archimedes method difficult. Historically a relative density of 1.67t/m3 is used to calculate WRD tonnes from volumes. This RD was determined through broken ore samples taken from various WRD, broken ore from belt samples and a combination of tonnes hoisted and volumes measured.
8.2.3Sample Security
The samples are transported from the field to the storage facility by the responsible geologist. The samples are transported to the plant’s air lock where they are stored overnight before being transported to the lab.
Collection and transportation of the samples requires a gold-bearing material permit which is issued by the security department. The permit accompanies the samples in transit at all times. A signed waybill is also required for transporting samples. The samples are counted upon arrival at the designated laboratory to ensure that they correspond to the total number on the security waybill and log sheet.
8.2.4Sample Storage
After analysis, samples are stored for a period of 60 days by the laboratory.
8.2.5Laboratories Used
WRD samples are sent to the external SGS laboratory in Orkney for preparation and gold assay. SGS is ISO/IEC 17025:2017 accredited for chemical analysis, with current certification expiring in February 2025.
Effective Date: June 30, 2024
37
Technical Report Summary for
Mine Waste Solutions, North West, South Africa
8.2.6Laboratory Sample Preparation Procedures
Upon receipt, each sample is weighed and dried at 105 °C ±5°C if wet. The sample is then crushed using a waste crusher and two opposite drums amounting to 20% of the received sample, depending on the sample weight, are taken. The sample is then crushed again to pass 75% using a 2.36mm sieve. The sieved sub-sample is then split using a riffle splitter to obtain a 500g sub-sample, which is milled to pass 85% at 75μm. After milling, the sub-sample is transferred into a sample paper bag which is labelled to indicate the sample and job numbers. The paper bag is then packed in labelled box and accompanied by a sample log sheet.
8.2.7Assaying and Analytical Procedures
The method of sample analysis is lead fusion FAAS (internally referred to as GC-FAA100V10 and GO-FAA50V10 schemes). The assaying and analytical procedure can be summarized as follows:
•fluxing and fusion:
•samples are well pulverized and homogenized;
•for GC-FAA100V10 analysis, a 100g sample is weighed and 300g to 400g of basic lead flux is required. For GO-FAA50V10, a 50g sample is weighed and 190g ±10g of basic lead flux is required. Prior to weighing;
•approximately 1ml for 100g sample, and 0.5ml for 50g sample, of 20mg/ml silver solution or 31.5mg/ml of silver nitrate solution is added for fluxing; and
•crucibles are loaded into the Fusion Furnace set at 1,100°C ±50°C and the samples are fused for a minimum of 1 hour or until the fusion is complete.
•de-slagging and cupellation:
•when the samples are ready for pouring, the crucibles are removed from the furnace and poured carefully into clean moulds and subsequently cooled;
•after cooling, the lead buttons are separated from the slag using a hammer. The lead buttons are then weighed, and each is required to be 20g to 45g; and
•after weighing, each lead button is cupelled for 1 hour at cupellation furnace temperature of 950°C ±20°C.
•prill digestion and FAAS Finish:
•prills/beads are transferred into 10ml volumetric flasks or test tubes;
•approximately 1ml of 50% nitric acid is then added and allowed to digest in a water bath at 70°C ±5°C for approximately 15 minutes;
•once each prill/bead has completely parted, 1ml of hydrochloric acid is dispensed on each test tube and placed back in the water bath for 30 minutes;
•the water bath is then removed and allowed to cool to room temperature; and
•approximately 8ml of distilled water is then added to the test tube and mixed well by inverting at least 20 time. Each sample is then allowed to settle prior to transfer for analysis.
8.2.8Sampling and Assay QC Procedures and QA
WRD samples are not submitted to SGS laboratory with Harmony internal QC material. The QP relies on the laboratory’s internal QAQC procedures to verify accuracy and precision of the primary sample results. The laboratory’s procedures include the insertion of CRMs or standards, blanks and duplicates or repeat analysis into the primary sequence.
8.2.8.1Standards
The laboratory sources a range of CRMs from AMIS. If results of any of the CRMs fall outside three standard deviations of the expected value for that particular CRM, they are deemed to have failed. Portions of the batches that fail, the laboratory re-assay before reporting results.
The degree of bias is also monitored by comparing the calculated mean value to the target or expected value of the CRM. Consistent failure with respect to a standard and the bias to the low or high side of a standard, are cause for concern and acted on as soon as a trend is observed. All concerns are addressed with the laboratory directly. Results of the performance of laboratory CRMs analyzed from July 2023 to June 2024 is summarized in Table 8-2. All CRMs were analyzed using the GO-FAA100V10 scheme.
Effective Date: June 30, 2024
38
Technical Report Summary for
Mine Waste Solutions, North West, South Africa
Table 8-2: Summary of laboratory standard results for WRDs
| | | | | | | | | | | | | | | | | | | | | | | | | | |
| CRM Code | Target Value (mg/kg) | Mean (mg/kg) | Bias (%) | Expected SD | Laboratory SD | % Relative SD | Average Z-Score | Bias Level |
| AMIS0646 | 0.166 | 0.167 | 0.526 | 0.013 | 0.014 | 8.400 | 0.065 | Excellent |
| AMIS0644 | 0.151 | 0.158 | 4.446 | 0.013 | 0.007 | 4.486 | (0.949) | Acceptable |
| AMIS0804 | 0.342 | 0.352 | 3.007 | 0.019 | 0.012 | 3.500 | 0.537 | Acceptable |
| AMIS0772 | 0.370 | 0.380 | 2.826 | 0.020 | 0.017 | 4.430 | (0.620) | Acceptable |
| AMIS0428 | 0.395 | 0.405 | 2.550 | 0.021 | 0.027 | 6.700 | 0.483 | Acceptable |
| AMIS0848 | 0.230 | 0.227 | (1.276) | 0.016 | 0.018 | 7.713 | 0.167 | Acceptable |
| AMIS0728 | 0.667 | 0.652 | (2.259) | 0.030 | 0.045 | 6.900 | (0.508) | Acceptable |
| AMIS0519 | 1.614 | 1.614 | 0.269 | 0.060 | 0.076 | 4.700 | 0.072 | Excellent |
Control charts are regularly plotted for each QC sample.
Results demonstrating the performance of standards predominately below 5% bias with AMIS0644 (at 0.151g/t) indicated a highest bias of 4.446%. The average Z-score (numerical measurement that describes a value's relationship to the mean of a group of values) were negative 0.949. The bias level was considered acceptable due to the number observation. The other standards produced an acceptable bias level.
8.2.8.2Blanks
The control chart demonstrating performance of the blank samples from July 2023 to June 2024 was reviewed. The lowest detection limit at the laboratory is 0.01mg/kg. No outliers (results outside two and three SDs) were observed out of a total of 139 observations. This was deemed to be an acceptable result.
8.2.8.3Duplicates
For the samples analyzed from July 2023 to June 2024, a total of 126 repeat or duplicate sample observations were made from which a total of 59 (47%) positive differences were identified. For the regression of SD on concentration, the correlation coefficient (specific measure that quantifies the strength of the linear relationship between two variables in a correlation analysis) was found to be 0.9999, which is considered strong.
8.3Commentary on Sample Preparation, Analyses and Security
In the QPs opinion:
•samples are collected at regular intervals across both the vertical and horizontal extent of each TSF. Samples are therefore representative of the deposit and adequate for use in the estimation of Mineral Resources and Mineral Reserves;
•samples are only collected from the surface of WRDs, at regular intervals, due to their unconsolidated nature. Although samples are only representative of the surface, additional belt samples are taken during the mining process to reconfirm the original estimates and are used in Mineral Resource estimation;
•the sample preparation, security and analytical procedures followed for gold grade determination are adequate;
•the use of 1.45t/m3 density for the TSFs is less than ideal, however test work is underway regarding bulk density;
•the assay methods are suitable for both TSF and WRD material types and grade ranges; and
•the results of the QAQC assessment have been appropriately addressed to ensure that the assay results of the primary samples are adequate for Mineral Resource and Mineral Reserve estimation.
Effective Date: June 30, 2024
39
Technical Report Summary for
Mine Waste Solutions, North West, South Africa
9Data verification
Section 229.601(b)(96)(iii)(B) (9) (i-iii)
9.1Databases
All primary data for the TSFs was transferred from log sheets onto an access-controlled electronic database Datamine™ Fusion. Any data that has not yet been incorporated into Datamine™ Fusion is stored on the Company server, in an access-restricted Mineral Resource Management folder.
All primary data for WRDs is captured in Microsoft Excel files which are stored in an access restricted folder on the Company server.
9.2Data Verification Procedures
All inputs to the drilling and sample database are first verified by the Section Geostatistician. Laboratory assay results are verified using internal QC material that are sent to the designated laboratory for analysis together with the primary samples analyzed. Accepted assay data is captured on Datamine™ Fusion.
The database verification procedures conducted by the QP prior to Mineral Resource estimation included checking for the following:
•overlapping drill hole and sample intersections;
•missing drill hole and sample intervals;
•existence of any outlier assay values; and
•the drilling, sampling, survey and assay files are loaded onto Datamine and the spatial location of the drill holes are verified.
9.3Limitations to the Data Verification
Limitations encountered by the QP include the following:
•drill hole data for the Chemwes TSF block models is limited; and
•the drill hole statistics are based on statistics from the 2008 MWS Technical Report of 2008. Post 2012, after AngloGold Ashanti acquired the operations, a drilling campaign was implemented to cover TSFs with limited data as part of future drilling plan.
9.4Comment on Data Verification
The QP is of the opinion that the database is suitable for TSF Mineral Resource and Mineral Reserve estimation purposes. The database is auditable, and access is limited to authorized personnel. Any changes made can be tracked by the administrator.
WRDs are not drilled, but rather sampled by grab samples. These are used to give an indication of the expected delivered grade for blending purposes. The weighted averages are calculated in excel and are not used for metal accounting. The grades used for metal accounting are sampled on the belt inside the processing plant and these metal accounting files are accessed controlled.
Effective Date: June 30, 2024
40
Technical Report Summary for
Mine Waste Solutions, North West, South Africa
10Mineral Processing and Metallurgical Testing
Section 229.601(b)(96)(iii)(B) (10) (i-v)
Diagnostic Leach test work (DLT):
SGS South Africa (Pty) Limited (“SGS”) had been, from June 2021, conducting metallurgical tests on Mine Waste Solutions’ gold-bearing ore samples specifically for MWS gold plant Stream 1, Stream 2 and Stream 3 residue material. The objective of the study was to establish the gold/mineral association within the residue material of the MWS gold plant’s three gold processing streams.
The metallurgical test work that was planned to be conducted for WRD and processed at Savuka plant would follow a similar procedure. However, since the processing of WRD material was concluded by late 2021 there was no longer a requirement to continue with the planned metallurgical test work.
Base Leach test work (BLT):
In addition to the test work described above, the reclaimed ore from current ore samples is sampled daily for the duration of the production month to yield a composite sample for the base leach test work. Simulating the plant conditions at an ISO/IEC17025 accredited laboratory, i.e. SGS, the leachability of the material is established, and the data is used to formulate the performance targets.
10.1Extent of Processing, Testing, and Analytical Procedures
All TSF's comprise of material of similar mineralogy from similar gold bearing reefs. All the currently reclaimed and some future TSF's have metallurgical test work results available. In areas where the TSF's have no test work, a drilling program is under way to perform metallurgical test work during planned grade control drilling.
The current TSF's were tested from samples extracted during auger drilling every 1.5m from the top to the bottom of the TSF's. The four 1.5m samples extracted were composited into 6m composites representing half the mining bench height. The composite samples were sent through for leaching, particle size distribution and Aachen reactor benefit.
For test work inside the plant, a total of four samples were taken from MWS Gold Plant Stream 1, 2 and 3. The aim of the test work was to determine the gold-mineral association within the individual ore sources reporting to the processing streams at MWS gold plant by quantifying the amount of free gold, leachable gold, gold in carbonaceous material and gold reporting to gangue.
For diagnostic leach test work, a total of three composite samples are taken from MWS gold plant Streams 1, 2 and 3 residue material. The aim of the test work is to determine the gold-mineral association within the individual gold processing streams at MWS gold plant by quantifying the amount of free gold, leachable gold, gold in carbonaceous material and gold reporting to gangue in the residue material.
The first step in the preparation involved the blending and splitting of the samples into representative sub-samples for the test work. The test procedure was carried out on the “as received” samples.
The leach procedure involved the sequential solubilizing of the least-stable minerals via various pre-treatments, and extraction of the associated gold by cyanidation and CIL. The sequential solubilizing steps were as follows:
•to quantify the gold that could be extracted via direct cyanidation (i.e., free and exposed gold) a sample was cyanided;
•to quantify the gold that was preg-robbed, but recoverable via CIL processing, a second sample was cyanided in the presence of activated carbon. Preg-robbed is a scientific phenomenon whereby the gold cyanide complex is removed from solution by the constituents of the ore, the primary constituent being carbonaceous matter;
•to quantify the gold that could be extracted via a mild oxidative pre-leach, (i.e. gold associated with calcite, dolomite, pyrrhotite, haematite etc.) and the gold that was associated with other sulphide minerals (i.e. pyrite, arsenopyrite etc.), the CIL residue was first subjected to a severe oxidative pre-treatment using hot HNO3 (nitric acid) followed by CIL dissolution of the acid-treated residue;
•to quantify the gold associated with carbonaceous material such as kerogen, the subsequent residue sample was subjected to complete oxidation via roasting, followed by CIL dissolution of the calcined product; and
•the undissolved gold remaining in the final residue was assumed to be associated with gangue.
Effective Date: June 30, 2024
41
Technical Report Summary for
Mine Waste Solutions, North West, South Africa
For base leach test work, composite representative samples from TSFs being reclaimed and processed by the MWS gold plant is subjected to leaching test work. The aim of the test work is to determine the gold content as well as the gold dissolution achieved for each sample (TSF).
The first step in the preparation involved the blending and splitting of the samples into representative sub-samples for the test work. The test procedure was carried out on the “as received” samples.
The leach procedure entails a single bottle roll cyanidation test on each of the samples. The leach test work takes place at a slurry pH of 10.5. Predetermined amounts of solid sodium cyanide (NaCN) are added to the samples and rolled for 11hours. The tests are terminated after 11 hours of leaching and the final pH and cyanide levels are determined. At the end of the leaching period, each residue solid- and solution sub-sample are subjected to gold analysis. The filtrates are sampled for Au analysis and titrated to establish the residual cyanide and lime concentrations to calculate the reagent consumption.
10.2Degree of Representation of the Mineral Deposit
The degree of representation of the mineral deposit was excellent as surface exploration auger holes were used to provide the metallurgical samples. As discussed in Section 7.3, and indicated in Table 7-1, these augers are drilled on a regular grid pattern across the surface of the TSF and are drilled vertically to intersect the soil beneath the dump. Auger holes are sampled at regular 1.5m intervals.
10.3Analytical Laboratory Details
Samples were submitted to independent laboratory, SGS (Randfontein, South Africa), for base leach tests to estimate gold recoveries. The laboratory received approximately 4kg of the monthly composites samples and only uses 1.5kg after blending the composite sample.
SGS is ISO/IEC 17025:2017 accredited for chemical analysis, with current certification expiring in February 2025.
10.4Test Results and Recovery Estimates for period June 2023 to May 2024
The diagnostic test results for Stream 1’s residue sample are presented in Table 10-1 according to each indicator tested. The sample’s initial assayed gold grade was 0.155g/t. The results show that approximately 23.63% of the contained gold is expected to be recoverable via further CIL processing.
Table 10-1: Gold Association for the Stream 1 sample
| | | | | | | | |
| Gold Association | Gold |
| g/t | % |
| Available to direct cyanidation | 0.03 | | 16.53 | |
| Preg-robbed -CIL | 0.01 | | 7.10 | |
HNO3 digestible minerals | 0.08 | | 50.56 | |
| Carbonaceous matter | 0.02 | | 9.46 | |
| Quartz (balance) | 0.03 | | 16.35 | |
| Total | 0.16 | | 100.00 | |
| Available via CIL Recovery | | 23.63 | |
The results of Stream 2, with an initial gold grade of 0.165g/t, is presented in (Table 10-2). The results show that 33.69% of contained gold is expected to be recoverable via CIL processing
Effective Date: June 30, 2024
42
Technical Report Summary for
Mine Waste Solutions, North West, South Africa
Table 10-2: Gold Association for the Stream 2 sample
| | | | | | | | |
| Gold Association | Gold |
| g/t | % |
| Available to direct cyanidation | 0.04 | 24.43 |
| Preg-robbed -CIL | 0.01 | 9.26 |
HNO3 digestible minerals | 0.07 | 46.28 |
| Carbonaceous matter | 0.01 | 5.06 |
| Quartz (balance) | 0.03 | 14.97 |
| Total | 0.17 | 100.00 |
| Available via CIL Recovery | | 33.69 |
The results of Stream 3, with an initial gold grade of 0.234g/t, is presented in Table 10-3. The result indicates that 37.56% of contained gold is expected to be recoverable via CIL processing.
Table 10-3: Gold Association for the Stream 3 sample
| | | | | | | | |
| Gold Association | Gold |
| g/t | % |
| Available to direct cyanidation | 0.07 | 29.54 |
| Preg-robbed -CIL | 0.02 | 8.01 |
HNO3 digestible minerals | 0.09 | 38.68 |
| Carbonaceous matter | 0.02 | 6.76 |
| Quartz (balance) | 0.04 | 17.01 |
| Total | 0.23 | 100.00 |
| Available via CIL Recovery | | 37.56 |
The TSFs mostly reclaimed from in the period June 2023 to May 2024 were Harties 1&2, Abandon dam, East Complex, Buffels 5 and South East Extension. From the base leach test work the following TSF in Table 10-4 was determined:
Table 10-4: Metallurgical base leach test work for the different MWS TSFs samples
| | | | | | | | |
| Tailings Storage Facility (TSF) | Avg Head grade (g/t) | Dissolution achieved (%) |
| Harties 1 | 0.23 | | 32.83 |
| Harties 2 | 0.26 | | 34.24 |
| East Complex & Buffels 5 | 0.28 | | 50.78 |
| Abandon dam | 0.39 | | 54.71 |
| South East Extension | 0.28 | | 41.85 |
The results of Savuka, with an initial gold grade of 0.19g/t, is presented in Table 10-5. The result indicates that 22.87% of contained gold is expected to be recoverable via CIL processing.
Table 10-5: Metallurgical base leach test work for the different Savuka TSFs samples | | | | | | | | |
| Gold Association | Gold |
| g/t | % |
| Available to direct cyanidation | 0.03 | 17.94 |
| Preg-robbed -CIL | 0.01 | 4.93 |
HNO3 digestible minerals | 0.10 | 51.61 |
| Carbonaceous matter | 0.01 | 7.48 |
| Quartz (balance) | 0.03 | 18.04 |
| Total | 0.19 | 100.00 |
| Available via CIL Recovery | 0.04 | 22.87 |
Effective Date: June 30, 2024
43
Technical Report Summary for
Mine Waste Solutions, North West, South Africa
10.5Commentary on Mineral Processing and Metallurgical Testing
The objective of the diagnostic leach test work is to establish the gold-mineral association within the individual ore sources that are currently being reclaimed from TSFs and processed at MWS gold plant as well as to estimate the percentage of gold expected to be recoverable using CIL. The recovery predictions, as determined from this metallurgical test work are used to inform the financial model and plant mass balance.
In addition to the test work described above, the reclaimed ore from current ore samples is sampled daily for the duration of the production month to make a composite sample for the base leach test work. Simulating the plant conditions at an ISO/IEC17025 accredited laboratory, the leachability of the material is established, and the data is used to formulate the performance targets
On prospective deposits, samples are collected through drilling at regular intervals both vertically and horizontally. The samples collected are sent to an ISO/IEC17025 accredited laboratory for grade, mineralogical association determination and gold recovery test works. The acquired data is used to determine the financial viability of the deposit in-line with the existing plant infrastructure.
Effective Date: June 30, 2024
44
Technical Report Summary for
Mine Waste Solutions, North West, South Africa
11Mineral Resource Estimate
Section 229.601(b)(96)(iii)(B) (11) (i-vii)
Mineral Resources have been estimated for the TSFs and WRDs using the methods outlined in the section to follow. The QP assumed that the TSFs consist of tailings material only and no other material was dumped together with the tailings.
11.1TSFs - Mineral Resource Estimation Methods
Mineral Resource estimation is carried out for 24 TSFs located at MWS operation and one located at West Wits. The one compartment (Comp 3&4) located at MWS operation was a residue deposition site for Kopanang plant. This resource is currently in Inferred Resource category since the plant data was used to estimate this compartment. The estimation on this dam will take place after drilling is complete.
There was no geological modelling of the TSFs, as they are man-made deposits situated above ground. Only three dimensional (“3D”) wireframing and block modelling was carried out using Datamine.
11.1.1Geological (Sampling) Database
The Mineral Resource estimate is based on the auger sampling results obtained up to June 2022. The following validated datasets were imported into Datamine:
•auger drill hole collar coordinates;
•sample logs; and
•gold and/or uranium assays.
The database contained a total of 30,691 samples' gold results.
11.1.2Global Statistics
Descriptive statistics were used to analyze the gold grade distribution in all TSFs, as well as to identify outliers. Histograms and statistics of the raw data were calculated for each TSF. The Coefficient of Variation ("COV"), calculated by dividing the standard deviation with the mean, gives a measure of the variability of the data. A high COV (>1) represents highly variable or highly skewed data, which may require some form of capping of extreme values to lower the COV to a more reasonable value (c.1). A summary of the gold and uranium statistics is presented in Table 11-1 and Table 11-2, respectively.
Table 11-1: Summary of the Gold Assay Descriptive Statistics for the TSFs
| | | | | | | | | | | | | | | | | | | | | | | | | | |
| Surface Deposit ID | Ave. BH Spacing (m) | No. Samples | Minimum (g/t Au) | Maximum (g/t Au) | Mean (g/t Au) | Variance | SD (g/t Au) | COV |
| Abandon | 75 | 771 | 0.03 | 0.90 | 0.41 | 0.01 | 0.10 | 0.24 |
| Ariston gully | 150 | 385 | 0.14 | 0.95 | 0.31 | 0.01 | 0.11 | 0.35 |
| West Comp 1 | 150 | 774 | 0.02 | 2.91 | 0.28 | 0.02 | 0.12 | 0.43 |
| West Comp 2 | 150 | 988 | 0.08 | 2.93 | 0.31 | 0.02 | 0.12 | 0.39 |
| West Grass | 150 | 399 | 0.08 | 0.56 | 0.28 | 0.01 | 0.09 | 0.31 |
| West Ext | 150 | 426 | 0.02 | 0.51 | 0.23 | 0.01 | 0.07 | 0.30 |
| Buffels 1 | 100 | 1,547 | 0.02 | 0.72 | 0.18 | — | 0.06 | 0.35 |
| Buffels 5 | 100 | 2,187 | 0.01 | 1.05 | 0.22 | 0.01 | 0.11 | 0.49 |
| Buffels 2 | 270 | 490 | 0.12 | 0.86 | 0.35 | 0.01 | 0.11 | 0.30 |
| Buffels 3 | 370 | 885 | — | 0.80 | 0.30 | 0.01 | 0.11 | 0.36 |
| Buffels 4 | 350 | 842 | 0.02 | 1.60 | 0.32 | 0.01 | 0.12 | 0.37 |
| Old North | 75 | 1,974 | — | 0.99 | 0.31 | 0.02 | 0.12 | 0.39 |
| East | 75 | 2,496 | 0.02 | 0.71 | 0.26 | 0.01 | 0.08 | 0.32 |
| Harties 2 | 100 | 1,909 | 0.02 | 0.79 | 0.22 | 0.01 | 0.09 | 0.39 |
| Harties 1 | 100 | 1,299 | 0.09 | 0.93 | 0.29 | 0.01 | 0.10 | 0.34 |
| Harties 5 | 663 | 187 | 0.08 | 2.38 | 0.23 | 0.04 | 0.21 | 0.88 |
| Harties 6 | 211 | 209 | 0.08 | 0.84 | 0.20 | 0.01 | 0.11 | 0.53 |
Effective Date: June 30, 2024
45
Technical Report Summary for
Mine Waste Solutions, North West, South Africa
| | | | | | | | | | | | | | | | | | | | | | | | | | |
| Surface Deposit ID | Ave. BH Spacing (m) | No. Samples | Minimum (g/t Au) | Maximum (g/t Au) | Mean (g/t Au) | Variance | SD (g/t Au) | COV |
| MWS 4 domain 1 | 125 | 266 | 0.08 | 0.46 | 0.14 | 0.01 | 0.07 | 0.49 |
| MWS 4 domain 2 | 125 | 426 | 0.08 | 0.60 | 0.28 | 0.01 | 0.09 | 0.32 |
| MWS 5 | 142 | 1,556 | 0.06 | 1.46 | 0.27 | 0.01 | 0.10 | 0.37 |
| SPD | 50 | 4,053 | 0.01 | 3.03 | 0.35 | 0.03 | 0.16 | 0.45 |
| South East | 75 | 2,411 | 0.07 | 0.98 | 0.28 | 0.01 | 0.09 | 0.34 |
| KOP Paydam | 200 | 754 | 0.01 | 1.08 | 0.21 | 0.01 | 0.11 | 0.53 |
| Mispah 1 | 200 | 1,480 | 0.03 | 3.23 | 0.31 | 0.01 | 0.12 | 0.38 |
| Harties 7 | 150 | 25 | 0.08 | 0.84 | 0.26 | 0.01 | 0.08 | 0.31 |
| Old North L19 | 150 | 1,661 | 0.01 | 0.81 | 0.32 | 0.01 | 0.11 | 0.34 |
| Old north L17 | 100 | 169 | 0.02 | 0.56 | 0.25 | 0.01 | 0.09 | 0.36 |
| Old North L20 | 150 | 44 | 0.10 | 0.88 | 0.42 | 0.04 | 0.21 | 0.50 |
| Old North L21 | 150 | 18 | 0.12 | 0.99 | 0.37 | 0.04 | 0.21 | 0.57 |
| Old North L22 | 150 | 60 | 0.01 | 0.55 | 0.25 | 0.01 | 0.10 | 0.40 |
| Total | | 30,691 | | | | | | |
Table 11-2: Summary of the Uranium Assay Descriptive Statistics for the TSFs
| | | | | | | | | | | | | | | | | | | | | | | |
| Surface Deposit ID | No. Samples | Minimum (kg/t U3O8) | Maximum (kg/t U3O8) | Mean (kg/t U3O8) | Variance | SD (kg/t U3O8) | COV |
| Abandoned | 494 | — | 0.30 | 0.06 | — | 0.05 | 0.80 |
| Ariston gully | 200 | 0.01 | 0.19 | 0.07 | — | 0.04 | 0.49 |
| Comp 2 | 988 | 0.01 | 0.59 | 0.07 | — | 0.04 | 0.64 |
| W Grass | 399 | 0.01 | 0.29 | 0.08 | — | 0.04 | 0.44 |
| Comp 1 | 774 | — | 0.68 | 0.08 | — | 0.05 | 0.67 |
| Buffels 1 | 1,459 | — | 0.18 | 0.03 | — | 0.03 | 0.80 |
| Buffels 5 | 1,829 | — | 0.62 | 0.06 | — | 0.04 | 0.67 |
| Buffels 2 | 490 | 0.02 | 0.27 | 0.09 | — | 0.04 | 0.44 |
| Buffels 3 | 885 | — | 0.98 | 0.07 | — | 0.06 | 0.94 |
| Buffels 4 | 842 | 0.01 | 0.27 | 0.10 | — | 0.05 | 0.45 |
| East | 1,837 | — | 0.98 | 0.11 | — | 0.05 | 0.47 |
| Harties 1 | 391 | 0.02 | 0.18 | 0.06 | — | 0.01 | 0.25 |
| Harties 5 | 186 | 0.01 | 0.13 | 0.06 | — | 0.03 | — |
| Harties 6 | 209 | 0.01 | 0.15 | 0.06 | — | 0.03 | — |
| MWS 5 | 1,554 | 0.01 | 210.00 | 30.73 | 2,626.14 | 51.25 | 1.67 |
| MWS 4 domain 1 | 271 | 5.00 | 147.00 | 48.62 | 815.87 | 28.56 | — |
| MWS 4 domain 2 | 434 | 9.00 | 234.00 | 128.46 | 1,364.03 | 36.93 | — |
| South East | 1,040 | — | 0.99 | 0.12 | — | 0.06 | 0.51 |
| KOP Paydam | 712 | 4.00 | 290.00 | 118.45 | 2,461.48 | 49.61 | 0.42 |
| Mispah 1 | 777 | 9.00 | 1,230.00 | 132.90 | 4,334.00 | 65.83 | 0.50 |
| Harties 7 | 25 | 0.07 | 0.27 | 0.17 | — | 0.06 | 0.35 |
| Total | 15,796 | | | | | | |
11.1.3Compositing
The drill holes were not composited. The 1.5m sampling interval was used for the estimation process.
Effective Date: June 30, 2024
46
Technical Report Summary for
Mine Waste Solutions, North West, South Africa
11.1.4Capping
Extreme gold grade values were capped based on the extreme value theory. This was undertaken to reduce the influence of the extreme values or outliers on the mean of the data, which has the potential risk of overestimating the gold grades. Capping of extreme values does not change the shape of the distribution. Refer to figure below of capping exercise on South East TSF.
Figure 11-1: South East TSF uncapped versus capped data
11.1.5Variography
The experimental semi-variogram is a descriptive statistic diagnostic tool for spatially characterizing regionalized variables and is central to the process of kriging with the set data that can be used. The semi-variogram is a mathematical function that describes how the spatial continuity of the sampled attribute changes as a function of distance and orientation. Anisotropic semi-variograms were modelled on the horizontal and downhole direction. The range of stationarity is dependent on the drill hole grid.
11.1.63D Model
A 3D DTM was constructed for each TSF from the survey data (Section 14). This topographical surface was used to constrain the volume. The QP also modelled the base of each TSF in order to create and close the 3D wireframe based on the drill hole intersections. The QP used the top of the soil intersection in each drill hole to define the base of the TSF wireframe.
The block size used for estimation is typically half that of the sampling grid.
11.1.7Grade Estimation
Gold grade was estimated into the block model using the ordinary kriging grade interpolation method, after the kriging estimation parameters had been optimized.
The distance at which the kriging can search through the data is dependent of the search volume used. In addition, the number of samples used constrains the kriging process. The other parameter optimized is the discretization. These parameters are optimized by investigating the behaviour of the kriging variance, slope of regression and the number of negative weights (which should be low or zero). The optimum kriging parameters are chosen where the kriging variance is low and has stabilized and the slope of regression close to one and stable.
A search volume optimisation is conducted for each surface deposit by keeping the minimum, maximum and discretization constant and changing the search distances. The first search distance used is related directly to the variogram modelled second range.
The results for the discretization optimisation are reviewed. The optimisation is conducted by keeping the search range, as well as the minimum and maximum samples constant, while changing the discretization.
Effective Date: June 30, 2024
47
Technical Report Summary for
Mine Waste Solutions, North West, South Africa
The results for number of samples optimisation are reviewed. The maximum number of samples optimisation is conducted by keeping the search volume and discretization constant and changing the maximum samples. This was done on all TSFs kriged prior 2021 with AngloGold Ashanti.
The other method of optimizing kriging parameters is the use the second range of the variogram as the search volume and changing maximum number of samples. The different kriged models are then compared to the borehole data using swath plots, section through model and descriptive statistics.
Examples of the gold distribution into the block models is presented in for the South East, MWS 5, East 5 and Old North TSFs is shown in Figure 11-1.
11.1.8Density Assignment
For this cycle of reporting, a bulk density of 1.45t/m3 is used to determine the tonnage from the volume estimates and there is still work underway to determine the specific bulk density per source.
The work done on the density determination involved:
•comparing survey measured volume mined per TSF with tonnes treated in the plant; and
•and dry mass of the extracted sample using auger with volume of the auger casing.
The studies so far indicate variability in density per TSF. The next investigation is to confirm the volume of the casing in the laboratory environment. The work will then be presented to the head of ORM for review and finalization. However, for this cycle of reporting a density of 1.45t/m3is used (as in the previous cycles) and it will be changed accordingly once the determination of density is finalized and approved.
11.1.9Block Model Validation
The processes of checking and validating the estimate is undertaken using histograms, swath plots and visual checking of the raw data in relation to the estimate. This is undertaken for each model produced.
Histograms of the previous model, the updated model and the previous drill hole data were analyzed. These showed a good alignment between data and model, with the expected smoothing introduced by the ordinary kriging process.
Swath plots were produced in the west/east direction, south/north direction and for elevations for each block model. The results also show good alignment between data and model, with the expected smoothing introduced by the ordinary kriging process.
Visual validation is also undertaken on each block model. The validation results typically show that the models are representative of the sampling data and no significant bias was identified.
A database tracking additions and depletions for each TSF is also updated monthly. The daily, monthly and annual results for reclamation and deposition are compiled and analyzed to assess the grade of the Mineral Resource, together with block model tonnage and remaining gold content. The annual Mineral Resource grade is compared to the monthly depletions and additions for verification purposes.
Effective Date: June 30, 2024
48
Technical Report Summary for
Mine Waste Solutions, North West, South Africa
Figure 11-2: Distribution of gold grades into the Block Models for South East, MWS 5, East 5 and Old North TSFs
Effective Date: June 30, 2024
49
Technical Report Summary for
Mine Waste Solutions, North West, South Africa
11.2WRDs - Mineral Resource Estimation Methods
There is no geological modelling of the WRDs as they are man-made deposits. Mineral Resource estimation is carried out on four WRDs, located at MWS operations and West Wits operations, as shown in Figure 11-3 and Figure 11-4.
11.2.1Geological (Sampling) Database
The QP will consider all historic sampling data available for a WRD when estimating the content of a WRD. The sources of sampling consist of a combination of data from:
•initial sampling data during deposition;
•bulk ore sampling of the WRD;
•sampling data from historic reclamation; and
•diluted or zero grades associated with sinking material deposition.
11.2.2Global Statistics
Histograms and descriptive statistics were used to determine the expected feed grade at the plant, as well as for planning purposes. However, the overall deposition trend is considered to determine the grade used in planning. The descriptive statistical analysis results for the Mine Waste Solutions and West Wits operations WRDs are summarized in Table 11-3. The latter are the only declared resources that were treated between July 2023 and June 2024.
Table 11-3: Summary of the Gold Assay Descriptive Statistics for the Moab Khotsong, Savuka and Mponeng WRDs
| | | | | | | | |
| Statistics | Moab Khotsong | Mponeng |
| Total samples | 366 | 27 |
| Minimum (g/t Au) | 0.041 | 0.027 |
| Maximum (g/t Au) | 1.074 | 10.000 |
| Range (g/t Au) | 1.033 | 9.973 |
| Mean (g/t Au) | 0.412 | 1.919 |
| Variance | 0.012 | 6.555 |
| Standard deviation (g/t Au) | 0.111 | 2.560 |
| Skewness | 0.719 | 2.396 |
| Kurtosis | 6.525 | 5.476 |
| Geometric mean | 0.394 | 0.990 |
11.2.3Compositing
No compositing is undertaken for WRDs as drilling is not available.
11.2.4Variography
There is no variography undertaken for WRDs due to the paucity of sampling data.
11.2.53D Model
There is no block modelling undertaken for WRDs due to the paucity of sampling data.
11.2.6Grade Estimation
Grade estimation is based upon grades obtained from the following:
•reclaimed tonnages from the different stockpiles;
•grades obtained from rocks deposited on the WRD facilities; and
•grades from various other sampling projects carried out on some of the WRDs.
Effective Date: June 30, 2024
50
Technical Report Summary for
Mine Waste Solutions, North West, South Africa
11.2.7Density Assignment
A 3D DTM of each WRD topographical surface is constructed from the topographic survey information, which is used to constrain the volume. The base of the WRD is assumed to be mainly even and is measured as the elevations from the elevations of the base of the WRD. A bulk density of 1.67t/m3 is used for all WRDs to determine the tonnage. The WRDs are not homogeneous and consist of various size fractions which makes the determination of RD through only the Archimedes method difficult. Historically a relative density of 1.67t/m3 is used to calculate WRD tonnes from volumes. This RD was determined through broken ore samples taken from various WRD, broken ore from belt samples and a combination of tonnes hoisted and volumes measured.
11.2.8Block Model Validation
There are no block models for the WRDs. However, a database for tracking addition and depletion of WRD material is also updated monthly. The annual Mineral Resource grade is compared to the monthly depletions and additions for verification purposes.
11.3Mineral Resource Evaluation
Evaluation of reasonable prospects for economic extraction of the TSFs and WRDs is based primarily on assumptions regarding the cost of reclamation, cost of processing and the gold recovery assumptions. This is demonstrated by the results of the cash flow for the operations.
A gold price of ZAR1,100,000/kg was applied. The QP considers the price to be appropriate for Mineral Resource estimation and is slightly higher than that used for estimating Mineral Reserves (ZAR1,040,000/kg). The Uranium Resource price is $55/lbs. The operating costs (both reclamation and processing) are based on historical performance and budget.
The mining method prevents the use of selective mining and hence no cut-off grades are applied to the TSFs and WRDs; however, each TSF and WRD is assessed on a standalone basis, and all of the Mineral Resources are considered to have reasonable prospects for economic extraction.
11.4Mineral Resource Classification and Uncertainties
Mineral Resource classification is a function of the confidence of the entire process from drilling, sampling, geological understanding and geostatistical relationships. The Chemwes TSF parameters used for Mineral Resource classification are summarized in Table 11-4.
Table 11-4: Summary of geostatistical parameters used for Mineral Resource estimation
| | | | | | | | | | | |
| | Mineral Resource Category |
| Parameter | Measured | Indicated | Inferred |
| Sampling (QAQC) | High confidence, no problem areas. | High confidence, some problem areas with low risk. | Some aspects might be of medium to high risk. |
| Number of samples used to estimate a specific block | At least 4x drill holes within variogram range and minimum of 20x 1.5m composited samples. | At least 3x drill holes within variogram range and minimum of 12x 1.5m composited samples. | At least 3x drill holes within variogram range. |
| Kriged Variance | This is a relative parameter and is only an indication and used in conjunction with the other parameters. |
| Distance to sample (variogram range) | Within at least 67%. | Within range. | Further than range. |
| Lower confidence limit (blocks) | Less than 20% from mean (80% confidence). | 20%-40% from mean, (80%-60% confidence). | More than 40% (less than 60% confidence) |
| Kriging efficiency | More than 40%. | 20%-40% | Less than 20%. |
| Deviation from 90% confidence limit (distribution within Mineral Resource area considered for classification) | Less than 10% deviation from mean. | 10%-20% | More than 20% |
11.4.1TSFs
Effective Date: June 30, 2024
51
Technical Report Summary for
Mine Waste Solutions, North West, South Africa
The Mineral Resource estimate for the TSFs is classified based on the regression slope estimate and in addition the drill hole sampling is considered. Measured resource category for regression slope greater than 80%. Indicated Resource category for regression slope less than 80%. In addition, the drill hole spacing is used as a guide in resource classification. Indicated Mineral Resources (100m x 100m or 300m x 300m drill hole spacing) or Measured Mineral Resources (50m x 50m drill hole spacing) based on drill hole spacing. TSF's are classified as Inferred when only plant residue deposited tonnage and grade are available.
11.4.2WRDs
The Mineral Resource grade estimates for the WRDs are based on face sampling and / or conveyor belt sampling. Neither of these methods are adequate to confirm grade continuity which is required for the classification into a Measured Mineral Resource.
The WRDs are classified as indicated Mineral Resource where skin sampling took place. Where WRD are only sampled using conveyor belt sampling, the resource is classified as Inferred Mineral Resources.
The West Wits operation WRDs were sampled using face sampling and are therefore classified as Indicated Mineral Resources.
11.5Mineral Resource Estimate
The Mineral Resources for both MWS and West Wits were originally prepared, classified and reported according to SAMREC, 2016. For the purposes of this TRS, the Mineral Resources have been classified in accordance with § 229.1302(d)(1)(iii)(A) (Item 1302(d)(1)(iii)(A) of Regulation S-K).
The location of the Mineral Resources for MWS and West Wits are presented in Figure 11-2 and Figure 11-3, respectively.
The classification of the various TFS and WRDs into Mineral Resources or Mineral Reserves is summarized in Table 11-5 and Table 11-6, for the two operations, respectively.
The Mineral Resource estimate, as at June 30, 2024, exclusive of the reported Mineral Reserves, for MWS and West Wits are presented in Table 11-7 and Table 11-8, respectively. These estimates account for depletion recorded from July 2023 to June 2024 as well as block model and evaluation updates.
The QP compiling the Mineral Resource estimates for both operations is Mr BJ Selebogo, Ore Reserve Manager and employee of Harmony.
Factors that may affect the Mineral Resource estimates include the following:
•gold price assumptions;
•exchange rate assumptions;
•operating and capital cost assumptions;
•gold recovery assumptions; and
•reclamation risks.
Effective Date: June 30, 2024
52
Technical Report Summary for
Mine Waste Solutions, North West, South Africa
Figure 11-3: Location and classification of MWS operation Mineral Resources
Effective Date: June 30, 2024
53
Technical Report Summary for
Mine Waste Solutions, North West, South Africa
Figure 11-4: Location and classification of West Wits operation Mineral Resources
Effective Date: June 30, 2024
54
Technical Report Summary for
Mine Waste Solutions, North West, South Africa
Table 11-5: Classification of MWS Mineral Resources and Mineral Reserves by surface deposit ID
| | | | | | | | | | | | | | | | | | | | | | | | | | | | | | | | | | | |
| | | | Mineral Resource Category | | Mineral Reserve Category | | | |
| Source | Surface Deposit ID | Measured | Indicated | Inferred | | Proved | Probable | | Processing Plant | Processing Stream |
| TSF | Abandon | | | | | | | | MWS Gold Plant | Stream 1 & Stream 4 from West Sources |
| Ariston Gully | | | | | | | |
| West Grass Dam | | | | | | | |
| South East Extension | | | | | | | |
| | | | | | | |
| West Compartment 1 | | | | | | | |
| West Compartment 2 | | | | | | | |
| East Tailings | | | | | | | | Stream 2 |
| Buffels 5 | | | | | | | |
| Buffels 3 | | | | | | | |
| Mispah 1 | | | | | | | |
| Harties 1 | | | | | | | | Stream 3 |
| Harties 2 | | | | | | | |
| MWS 4 | | | | | | | |
| MWS 5 | | | | | | | |
| West Compartment 3 | | | | | | | | |
| West Compartment 4 | | | | | | | |
| West Extension | | | | | | | |
| Harties 5 | | | | | | | |
| Harties 6 | | | | | | | |
| Buffels 1 | | | | | | | |
| Kopanang Paydam | | | | | | | |
| WRD | Moab | | | | | | | |
| Buffels 9 | | | | | | | |
| Margaret | | | | | | | |
Table 11-6: Classification of West Wits Mineral Resources and Mineral Reserves by surface deposit ID
| | | | | | | | | | | | | | | | | | | | | | | |
| | | Mineral Resource Category | | Mineral Reserve Category |
| Source | Surface Deposit ID | Measured | Indicated | Inferred | | Proved | Probable |
| TSF | Old North TSF L 19 | | | | | | |
| WRD | Mponeng Low Grade | | | | | | |
| TSF | Old North TSF L17, L20, L21, L22 | | | | | | |
Effective Date: June 30, 2024
55
Technical Report Summary for
Mine Waste Solutions, North West, South Africa
Table 11-7: Summary of the MWS operation Mineral Resources as at June 30, 2024 (exclusive of Mineral Reserves)
| | | | | | | | | | | | | | | | | | | | |
| METRIC | Grade | Metal Content |
| Mineral Resource Category | Source | Tonnes (Mt) | Gold (g/t) | U3O8 (kg/t) | Gold (kg) | U3O8 (t) |
| Measured | TSF | 52.334 | 0.20 | 0.067 | 10,513 | 3,507 |
| WRD | — | — | — | — | — |
| Sub Total / Ave Measured | 52.334 | 0.20 | 0.067 | 10,513 | 3,507 |
| Indicated | TSF | 52.459 | 0.24 | 0.088 | 12,613 | 4,616 |
| WRD | 1.872 | 0.30 | — | 563 | — |
| Sub Total / Ave Indicated | 54.331 | 0.24 | 0.088 | 13,176 | 4,616 |
| Total / Ave. Measured + Indicated | 106.665 | 0.22 | 0.078 | 23,689 | 8,123 |
| Inferred | TSF | 79.585 | 0.13 | 0.039 | 10,505 | 3,067 |
| WRD | 2.502 | 0.28 | — | 611 | — |
| Total / Ave Inferred | 82.087 | 0.14 | 0.037 | 11,115 | 3,067 |
| |
| IMPERIAL | Grade | Metal Content |
| Mineral Resource Category | Source | Tons (Mt) | Gold (oz/t) | U3O8 (lb/t) | Gold (Moz) | U3O8 (Mlbs) |
| Measured | TSF | 57.688 | 0.006 | 0.134 | 0.338 | 7.730 |
| WRD | — | — | — | — | — |
| Sub Total / Ave Measured | 57.688 | 0.006 | 0.134 | 0.338 | 7.730 |
| Indicated | TSF | 57.826 | 0.007 | 0.176 | 0.406 | 10.177 |
| WRD | 2.064 | 0.009 | — | 0.018 | — |
| Sub Total / Ave Indicated | 59.890 | 0.007 | 0.176 | 0.424 | 10.177 |
| Total / Ave. Measured + Indicated | 117.578 | 0.006 | 0.152 | 0.762 | 17.907 |
| Inferred | TSF | 87.727 | 0.004 | 0.077 | 0.338 | 6.762 |
| WRD | 2.758 | 0.007 | — | 0.020 | — |
| Total / Ave Inferred | 90.486 | 0.004 | 0.075 | 0.357 | 6.762 |
Notes:
1. The Mineral Resources were originally prepared, classified and reported according to SAMREC, 2016. For the purposes of this TRS, the Mineral Reserves have been classified in accordance with § 229.1302(d)(1)(iii)(A) (Item 1302(d)(1)(iii)(A) of Regulation S-K). The QP responsible for the estimate is Mr BJ Selebogo, who is Ore Reserve Manager, and a Harmony employee.
2. The Mineral Resource tonnes are reported as in-situ tailings quantities deposited on TSF's with reasonable prospects for economic extraction.
3. A cut-off grade of 0.0g/t has been applied for the estimation of Mineral Resources. Mineral Resource tonnes are reported based on a recovery of 45.32%, an operating cost of R102/t and gold price of USD1,878/oz.
4. Tonnes are reported as million tonnes rounded to three decimal places. Gold values are rounded to zero decimal places.
5. Uranium content is reported as part of the MWS Mineral Resource estimate only as a bi product of Gold with no contribution to project economics.
6. Metal content does not include allowances for processing losses.
7. Mineral Resources are exclusive of Mineral Reserves. Mineral Resources are not Mineral Reserves and do not necessarily demonstrate economic viability, but have been assessed for prospects for economic extraction.
8. Rounding as required by reporting guidelines may result in apparent summation differences.
9. The Mineral Resource estimate is for Harmony’s 100% interest.
Effective Date: June 30, 2024
56
Technical Report Summary for
Mine Waste Solutions, North West, South Africa
Table 11-8: Summary of the West Wits operation Mineral Resources as at June 30, 2024 (exclusive of Mineral Reserves)
| | | | | | | | | | | | | | | | | | | | |
| METRIC | Grade | Metal Content |
| Mineral Resource Category | Source | Tonnes (Mt) | Gold (g/t) | U3O8 (kg/t) | Gold (kg) | U3O8 (t) |
| Measured | TSF | — | — | — | — | — |
| WRD | — | — | — | — | — |
| Sub Total / Ave Measured | — | — | — | — | — |
| Indicated | TSF | 25.736 | 0.32 | — | 8,321 | — |
| WRD | 0.152 | 0.37 | — | 56 | — |
| Sub Total Indicated | 25.888 | 0.32 | — | 8,376 | — |
| Total / Ave. Measured + Indicated | 25.888 | 0.32 | — | 8,376 | — |
| Inferred | TSF | — | — | — | — | — |
| WRD | — | — | — | — | — |
| Total / Ave Inferred | — | — | — | — | — |
| |
| IMPERIAL | Grade | Metal Content |
| Mineral Resource Category | Source | Tons (Mt) | Gold (oz/t) | U3O8 (lb/t) | Gold (Moz) | U3O8 (Mlbs) |
| Measured | TSF | — | — | — | — | — |
| WRD | — | — | — | — | — |
| Sub Total / Ave Measured | — | — | — | — | — |
| Indicated | TSF | 28.369 | 0.009 | — | 0.268 | — |
| WRD | 0.167 | 0.011 | — | 0.002 | — |
| Sub Total Indicated | 28.537 | 0.009 | — | 0.269 | — |
| Total / Ave. Measured + Indicated | 28.537 | 0.009 | — | 0.269 | — |
| Inferred | TSF | — | — | — | — | — |
| WRD | — | — | — | — | — |
| Total / Ave Inferred | — | — | — | — | — |
Notes:
1. The Mineral Resources were originally prepared, classified and reported according to SAMREC, 2016. For the purposes of this TRS, the Mineral Reserves have been classified in accordance with § 229.1302(d)(1)(iii)(A) (Item 1302(d)(1)(iii)(A) of Regulation S-K). The QP responsible for the estimate is Mr BJ Selebogo, who is Ore Reserve Manager, and a Harmony employee.
2. The Mineral Resource tonnes are reported as in-situ tailings quantities deposited on TSF's with reasonable prospects for economic extraction.
3. A cut-off grade of 0.0g/t has been applied for the estimation of Mineral Resources. Mineral Resource tonnes are reported based on a recovery of 45.32%, an operating cost of R102/t and gold price of USD1,878/oz.
4. Tonnes are reported as million tonnes rounded to three decimal places. Gold values are rounded to zero decimal places.
5. Uranium content is reported as part of the MWS Mineral Resource estimate only as a bi product of Gold with no contribution to project economics.
6. Metal content does not include allowances for processing losses.
7. Mineral Resources are exclusive of Mineral Reserves. Mineral Resources are not Mineral Reserves and do not necessarily demonstrate economic viability, but have been assessed for prospects for economic extraction.
8. Rounding as required by reporting guidelines may result in apparent summation differences.
9. The Mineral Resource estimate is for Harmony’s 100% interest.
11.6Mineral Resource Reconciliation
The MWS Measured and Indicated Mineral Resources, exclusive of Mineral Reserves, decreased from 109Mt at a grade of 0.22g/t (0.785Moz gold) in June 2023 to 107Mt at a grade of 0.22g/t (0.762Moz gold) in June 2024.
The MWS Inferred Mineral Resources increased from 80Mt at a grade of 0.132g/t (0.341Moz gold) in June 2023 to 82Mt at a grade of 0.135g/t (0.357Moz gold) on June 2024. The grade increase was due to higher grade deposition on Mispah 1.
The West Wits Measured and Indicated Mineral Resources, exclusive of Mineral Reserves, increased from 25.730Mt at a grade of 0.325g/t (0.269Moz gold) in June 2023 to 25.888Mt at a grade of 0.324g/t (0.269Moz
gold) in June 2024 due to decrease in Mineral Reserves on the back of deposition constrains.
11.7Commentary on Mineral Resource Estimate
In my opinion as QP:
•there are no obvious reclamation, metallurgical, environmental, social, infrastructural, legal and economic factors that could have a significant effect on the TSFs and WRDs;
Effective Date: June 30, 2024
57
Technical Report Summary for
Mine Waste Solutions, North West, South Africa
•the regression slope, data spacing and distribution is sufficient to establish the grade continuity appropriate for the TSF Mineral Resource estimation procedure and classifications applied; and
•the grade estimation exercises are inadequate to determine grade continuity on WRDs. However, the low confidence in grade continuity has been considered in Mineral Resource classification of WRDs only.
Effective Date: June 30, 2024
58
Technical Report Summary for
Mine Waste Solutions, North West, South Africa
12Mineral Reserve Estimate
Section 229.601(b)(96)(iii)(B) (12) (i-vii)
The Mineral Reserves are derived through a business planning process and consideration by the QP as well as the Chief CODM. WRDs are not declared as Mineral Reserves. The business planning process comprises multi-functional reviews inclusive of all mining, engineering and service departments that are involved in the verification of the inputs and the Modifying factors.
The CODM consists of various executive roles and responsibilities who assess the profitability, the revenue and production costs. The CODM also considers capital expenditure, gold production and tonnes milled when assessing the overall economic sustainability. Due to their geographic separation, MWS and West Wits are discussed separately in the sections to follow.
12.1MWS Operation Mineral Reserve Estimate
12.1.1Key Assumptions, Parameters, and Methods used to Estimate the Mineral Reserve
The results of the previous 18-months inform the business planning process, however, there are other factors that are considered, e.g. future reclamation areas with regard to the grades. The planning process carefully considers strategic plan directives; analysis of historical performance; realistic productivity, and cost parameters; Modifying factors; and technical and economic studies that have demonstrated justified extraction, as applicable to specific portions of the Mineral Reserves.
The material contained in the TSFs originates from ore-bearing reefs previously mined and treated by now Harmony at the MWS operation, Buffelsfontein, Hartebeestfontein and Stilfontein gold mines. All reported Mineral Reserves are located on surface and are connected to the source mines by either shafts, road, rail or pipelines. The Mineral Reserves are estimated considering the follow:
•grade estimates, based on historical data and exploratory drilling;
•slope stability design parameters, guided by geotechnical design and modelling;
•mining methodology, informed by the geological estimates;
•spatial reconciliation of historical material deposition on the TSF, as well as the grade control drilling;
•gold price estimates;
•gold recovery estimates for economic analysis only; and
•cut-off grade assumptions.
Only Measured and Indicated Mineral Resources are used to inform the Mineral Reserves.
Mineral Reserves are planned for the TSFs using Deswik CAD software and scheduling is completed in the Deswik SCHED Scheduler software.
12.1.2Modifying Factors
The Modifying factors used to convert the Mineral Resource to a Mineral Reserve for the MWS operation are presented in Table 12-1. The Modifying factors used are based on Harmony’s knowledge of the TSF, planning and computing estimates used in determining the Mineral Reserves, and historical data. Each TSF has its own recovery factor, the table below is the weighted average of all TSF's and these recoveries are used for economical analysis only.
Table 12-1: MWS operation Mineral Reserves modifying factors (June 30, 2024)
| | | | | | | | |
| Modifying Factor | Unit | Value |
| Gold Accounted For (“GAF”) - Grade Cut-off | g/t | 0.22 |
| Recovery Factor | % | 45.35 |
| Plant Call Factor | % | 100.00 |
| Dilution | % | N/A |
| Conversion factor | oz/kg | 32.15 |
Effective Date: June 30, 2024
59
Technical Report Summary for
Mine Waste Solutions, North West, South Africa
The Mineral Reserves are declared as delivered gold to the mineral processing plant, and the the recovered gold is only considered for the economic analysis. This gold content is calculated after factoring in the plant recovery factor, as shown in the modifying factors (Table 12-1). This is the gold content which informs the MWS operation cashflow.
12.1.3Mineral Reserve Estimate
The Mineral Reserves were originally prepared, classified and reported according to SAMREC, 2016. For the purposes of this TRS, the Mineral Reserves have been classified in accordance with § 229.1302(d)(1)(iii)(A) (Item 1302(d)(1)(iii)(A) of Regulation S-K).
Mineral Reserves are derived from the Mineral Resources, a detailed Mineral Reserve business plan and the operation’s planning processes. The Mineral Resource conversion to Mineral Reserves considers modifying factors, dilution, ore losses, minimum mining widths, planned mine call and plant recovery factors.
The Mineral Reserves are declared as delivered to the plant for all TSFs. The Mineral Reserve estimates for MWS are summarized in Table 12-2.
The location and classification of the MWS Mineral Reserves is presented in Figure 11-2 and Table 11-5, respectively.
The QP compiling the Mineral Reserve estimates is Mr BJ Selebogo, Ore Reserve Manager and employee of Harmony.
Table 12-2: Summary of the MWS Mineral Reserves as at June 30, 2024
| | | | | | | | | | | | | | |
| METRIC |
| Mineral Reserve Category | Source | Tonnes (Mt) | Gold Grade (g/t Au) | Gold Content (kg) |
| Proved | TSF | 7.499 | 0.28 | 2,099 |
| WRD | — | — | — |
| Sub Total / Ave Proven | 7.499 | 0.28 | 2,099 |
| Probable | TSF | 367.071 | 0.28 | 101,389 |
| WRD | — | — | — |
| Sub Total / Ave Probable | 367.071 | 0.28 | 101,389 |
| Total / Ave (Proved + Probable) | 374.570 | 0.28 | 103,488 |
| IMPERIAL |
| Mineral Reserve Category | Source | Tons (Mt) | Gold Grade (oz/t) | Gold Content (Moz) |
| Proved | TSF | 8.266 | 0.008 | 0.067 |
| WRD | — | — | — |
| Sub Total / Ave Proven | 8.266 | 0.008 | 0.067 |
| Probable | TSF | 404.626 | 0.008 | 3.260 |
| WRD | — | — | — |
| Sub Total / Ave Probable | 404.626 | 0.008 | 3.260 |
| Total / Ave (Proved + Probable) | 412.892 | 0.008 | 3.327 |
Notes:
1. The Mineral Reserves were originally prepared, classified and reported according to SAMREC, 2016. For the purposes of this TRS, the Mineral Reserves have been classified in accordance with § 229.1302(d)(1)(iii)(A) (Item 1302(d)(1)(iii)(A) of Regulation S-K). The QP responsible for the estimate is Mr BJ Selebogo, who is the Ore Reserve Manager, and a Harmony employee.
2. Tonnes, grade, and content are declared as net delivered to the mills.
3. Gold content is gold before applying PRF. Metallurgical recovery factors have not been applied to the reserve figures.
4. Mineral Reserves are reported using a cut-off grade of 0.22g/t, a recovery of 45.32%, an operating cost of R103/t and a gold price of USD1,772/oz.
5. Recovered gold (kg) is based on a conversion factor of 32.1507oz/kg.
6. Rounding as required by reporting guidelines may result in apparent summation differences.
12.2West Wits Operation Mineral Reserve Estimate
12.2.1Key Assumptions, Parameters, and Methods used to Estimate the Mineral Reserve
The results and assumptions derived from the business planning process extends over an 18-month period. The planning process carefully considers strategic plan directives; analysis of historical performance; realistic productivity, and cost parameters; modifying factors; and technical and economic studies that have demonstrated justified extraction, as applicable to specific portions of the Mineral Reserves.
Effective Date: June 30, 2024
60
Technical Report Summary for
Mine Waste Solutions, North West, South Africa
The material contained in the TSFs originates from the mining and processing of multiple ore-bearing reefs of the West Wits operation. The tailings and WRD are residue or low grade WRDs of the VCR and CLR reefs.
Mineral Reserves are planned for the TSFs using Deswik CAD software and scheduling is completed in the Deswik SCHED Scheduler software.
12.2.2Modifying Factors
The modifying factors used to convert the Mineral Resource to the Mineral Reserve for the West Wits operation is shown in Table 12-3 for TSFs only. The modifying factors are consistent with the modelling based on knowledge of the TSF, planning and computing estimates used in determining the Mineral Reserves, and historical data. Old North L19 is the only source for West Wits that is in Reserve. This source is processed at both Savuka and Kusasalethu gold plants.
Table 12-3: West Wits operation Mineral Reserves modifying factors (June 30, 2024)
| | | | | | | | |
| Modifying Factor | Unit | Value |
| GAF - Grade Cut-off | g/t | 0.22 |
| Recovery Factor | % | 42.50 |
| Mine Call Factor | % | 100.00 |
| Dilution | % | N/A |
12.2.3Mineral Reserve Estimate
The Mineral Reserves were originally prepared, classified and reported according to SAMREC, 2016. For the purposes of this TRS, the Mineral Reserves have been classified in accordance with § 229.1302(d)(1)(iii)(A) (Item 1302(d)(1)(iii)(A) of Regulation S-K).
Mineral Reserves are derived from the Mineral Resources, a detailed business plan and the operation’s planning processes are used for this.
The QP compiling the Mineral Reserve estimates is Mr BJ Selebogo, Ore Reserve Manager and employee of Harmony.
Effective Date: June 30, 2024
61
Technical Report Summary for
Mine Waste Solutions, North West, South Africa
Table 12-4: Summary of the West Wits Mineral Reserves as at June 30, 2024
| | | | | | | | | | | | | | |
| METRIC |
| Mineral Reserve Category | Source | Tonnes Treated (Mt) | Grade (g/t Au) | Content Au (kg) |
| Proved | TSF | — | — | — |
| WRD | — | — | — |
| Sub Total / Ave Proven | — | — | — |
| Probable | TSF | 12.281 | 0.32 | 3,931 |
| WRD | — | — | — |
| Sub Total / Ave Probable | 12.281 | 0.32 | 3,931 |
| Total / Ave (Proved + Probable) | 12.281 | 0.32 | 3,931 |
| IMPERIAL |
| Mineral Reserve Category | Source | Tonnes Treated (Mt) | Gold Grade (oz/t) | Content (Moz Au) |
| Proved | TSF | — | — | — |
| WRD | — | — | — |
| Sub Total / Ave Proven | — | — | — |
| Probable | TSF | 13.537 | 0.009 | 0.126 |
| WRD | — | — | — |
| Sub Total / Ave Probable | 13.537 | 0.009 | 0.126 |
| Total / Ave (Proved + Probable) | 13.537 | 0.009 | 0.126 |
Notes:
1. The Mineral Reserves were originally prepared, classified and reported according to SAMREC, 2016. For the purposes of this TRS, the Mineral Reserves have been classified in accordance with § 229.1302(d)(1)(iii)(A) (Item 1302(d)(1)(iii)(A) of Regulation S-K). The QP responsible for the estimate is Mr BJ Selebogo, who is the Ore Reserve Manager, and a Harmony employee.
2. Tonnes, grade, and gold content are declared as net delivered to the mills.
3. Gold content is gold before applying PRF.
4. Mineral Reserves are reported using a cut-off grade of 0.22g/t, a recovery of 42.5%, an operating cost of R98/t and a gold price of USD1,772/oz.
5. Recovered gold (kg) is based on a conversion factor of 32.1507oz/kg.
6. Rounding as required by reporting guidelines may result in apparent summation differences.
12.3Mineral Reserve Reconciliation
The Mineral Reserve estimate for MWS decreased from 395Mt at a grade of 0.28g/t (3.5Moz gold) in June 30, 2023 to 375Mt at a grade of 0.28g/t (3.3Moz gold) as at June 30, 2024. The key difference can be attributed to sources that were processed during the year and they included, Abandoned Dam, South East Extension, East TSF, Buffels 5 as well as Harties 1 and 2 (-0.198Moz).
The Mineral Reserve estimate for West Wits decreased from 17.4Mt at a grade of 0.32g/t (0.176Moz gold) on June 30, 2023 to 12.3Mt at a grade of 0.32g/t (0.126Moz gold) as at June 30, 2024. The key difference can be attributed to the reclamation of Old North L19.
12.4Commentary on Mineral Reserve Estimate
The QP is of the opinion that the declared Mineral Reserves take into consideration all modifying factors. The Mineral Reserves are depleted to generate the cash flows presented in Section 19 and are deemed by the QP to be appropriate and, both technically and economically achievable.
With the mixture of sources through life of mine in the various streams, the grade received remains above the cut-off grade of 0.22g/t, as show in Figure 12.1. The total Mineral Reserves declared 3.327Moz at 0.28g/t for sources processed at MWS and 0.126Moz at 0.32g/t for Old North. The risk in modifying factors is on the recovery factor for future sources not drilled yet for metallurgical test work. Current reclaimed sources are based on historical recoveries and the drilled sources were based on test work results obtained.
Any by-products that are recovered as part of the refining process, make up an immaterial component of the total metal inventory, and is thus not reported as part of the Mineral Reserve estimate. Material risk to Mineral Reserve is mainly recovery factor. The operations are currently profitable, and the Mineral Reserve estimates are supported by an economic analysis which indicates an NPV of ZAR3,818 million at a discount rate of 9%.
Effective Date: June 30, 2024
62
Technical Report Summary for
Mine Waste Solutions, North West, South Africa
13Mining Method
Section 229.601(b)(96)(iii)(B) (13) (i-v)
The mining methodologies adopted at Mine Waste Solutions entail the hydro-mining of the TSFs and reclamation of WRDs using front-end loaders (“FELs”).
Mining Methods:
•Top-down method;
•Bottom-up method;
•Bench height and Width; and
•Safety Controls.
The top down method is the most commonly used method with the gun positioned at the top of the face, which it will cut and shoot at a safe angle downwards. The distance between the cutting face and track gun path is 1 meter. This will allow for a safe angle of repose that will be sufficient for stability purposes. This method is suitable for tailings which are relatively soft and easy to re-pulp (Harties 1 and East Residue dam). The bottom up method is used as an alternative to the Top down method and is used in clay areas or where hard layers of tailings are encountered.
Although hydraulic tailings remining is the best practice, mechanical remining via shovel or by special purpose reclaimers are utilized in instances where trucks or loaders move the material to an area where it can be hydraulically mined. This occurs where the height of the TSF is close to floor-level or where there is no pumpstation at the specific TSF.
13.1Mine Design
The mine designs used for TSFs and WRDs are significantly different and, as such, are discussed separately in the sections to follow. The principals of mine design for the two types of surface deposit are used irrespective of their location, i.e., MWS or West Wits.
13.1.1TSFs
The mine design strategy aims at maximizing the safe extraction of the TSFs, while minimizing the risk of geotechnical failures, which can result in operational disruptions and dangerous working conditions. The hydro-mining method of extraction has proven to be safer and cheaper than loading and hauling methods, using truck and shovel operations.
The TSFs 3D geological model, with the interpolated grade, is used as the basis for determining a mining model. Bench heights are constrained by safety measures and the pressure induced at the mining face by the monitoring guns. Key design and modelling parameters for the hydro-mining methods adopted for the TSFs reclamation are shown in Table 13-1.
Table 13-1: Key Hydro-Mining Design Parameters for TSFs
| | | | | | | | |
| Parameter | Unit | Value |
| Water Pressure - Design Capacity | Bar | <40 |
| Face Length | m | 25.00 |
| Relative Density – Slurry | kg/l | 1.45 - 1.50 |
| TSF Bulk Density | t/m3 | 1.45 |
| Water - Slime Ratio | : | 1:1 |
The proposed TSF reclamation plan further reviews safety measures by incorporating data from the Tailings Production Manager to ensure that the designs are procedurally correct, based on the Standard Operating Procedure. Planning also takes equipment maintenance and replacement into consideration. Once the designs and scheduling are complete, the results are evaluated using the latest official Mineral Resource and Mineral Reserve models available for the planned TSFs, in consultation with the Senior Evaluator who is responsible for these models.
13.2Mining Operations
Effective Date: June 30, 2024
63
Technical Report Summary for
Mine Waste Solutions, North West, South Africa
13.2.1TSFs
The TSF material is reclaimed using several hydraulic monitoring guns which deliver high-pressure water to the face (Figure 13-1). High pressure water is transferred to the monitoring guns observing the maximum design capacity of the equipment is limited to 40 bars (“b”). Typically, a 25m mining face length is achieved with a water pressure in the range of 27b - 30b.
The tailings material can be mined based on the positioning of the monitoring guns to achieve a required mining mix. The TSF face is broken by the water pressure, resulting in the slurry gravitating towards the collection sumps that deliver the slurry to the pumping stations, which is then pumped via overland pipelines to the respective plant streams. The TSFs are fed into one of the three respective plant streams, which comprise the MWS gold plant. The tailings material size is appropriate for high-pressure water to re-pulp the consolidated slimes to a slurry at a minimum relative density of around 1.45. No milling is required, as the material as previously been milled through the CIL plant treatment process.
13.3Geotechnical and Hydrological Considerations
13.3.1TSFs
The TSFs are reclaimed as per the procedure that states that a bench must not be more that 20m high and the angle be at 45o. The TSF’s were hydraulically deposited, the pulp was originally pumped from the Metallurgical plant and the TSF was constructed by the conventional ‘paddock and pool’ system. The TSF, when reclaimed will be deemed as a dormant stable structure. The moisture content of the TSF will vary, but generally the TSF will be considered to be ‘dry’. The geotechnical and hydrological considerations informing the mining of TSFs are described in Section 13.1.1, and are not discussed further here.
13.4Dilution and Grade Control
13.4.1TSFs
The reclamation method uses grade control to blend to the required mining mix, however the entire TSF will ultimately be reclaimed . Dilution is not applied to the Mineral Reserve estimates.
13.5Mineral Reserve Schedule
The Mineral Reserve schedule feed rates cater for provisions including availability and utilization factors, as well as weather conditions which may affect the rate of reclamation. The gold content produced informs the economic analysis shown in the cashflow.
13.6Ore Transport
13.6.1MWS operation
After the slurry has been washed into the collection sumps and delivered to the pump station at the TSF, there are a series of overland pipelines through which the slurry is pumped, to the respective stream at the MWS plant. The processing stream, and the TSFs which feed it, are shown in Table 3-1.
13.6.2West Wits operation
For the mining of the remaining WRD material (which ceased in 2021 at Savuka plant but continues at Mponeng and Kusasalethu plants), front end loaders are used to load the dozed material into trucks, which is transported to milling and mineral processing.
The Old North TSF is processed through Savuka plant and Kusasalethu, as shown in Table 3-3, by an overland pipeline, which feeds the Savuka plant in the same way as the MWS plant is fed. The Old North TSF feeding into Kusasalethu plant is reclaimed mechanically and trucked to the Kusasalethu plant.
Effective Date: June 30, 2024
64
Technical Report Summary for
Mine Waste Solutions, North West, South Africa
13.7Mining Equipment and Machinery
13.7.1MWS operation
The following equipment and machinery are employed in the reclamation of the TSFs in the MWS operation:
•hydraulic monitoring guns (3 to 5 per TSF) are used to deliver high-pressure water streams to the TSF mining faces; and
•pumps are required to pump the slurry from the pump station at the TSF, through the overland pipeline, and to the MWS Gold Plant.
13.7.2West Wits operation
The following equipment and machinery are required in the mining of the West Wits operations:
•tracked bulldozers are used on the top of the WRDs to maintain WRD slope stability; bulldozers are also used at the bottom of the WRDs to create a safe loading distance between the base of the WRD and the loading face; and
•hydraulic monitoring guns (3 to 5 per TSF) are used to deliver high-pressure water streams to the TSF mining faces.
Figure 13-1: Graph of FY2024 Production by Source for MWS
Effective Date: June 30, 2024
65
Technical Report Summary for
Mine Waste Solutions, North West, South Africa
Figure 13-2: Graph of FY2024 Production by Source for West Wits
Figure 13-3: Graph of Mineral Reserve for MWS – Tonnes and Grade
Effective Date: June 30, 2024
66
Technical Report Summary for
Mine Waste Solutions, North West, South Africa
Figure 13-4: Graph of Mineral Reserve for MWS – Gold Produced (kg)
Figure 13-5: Graph of Mineral Reserve for West Wits – Tonnes and Grade
Effective Date: June 30, 2024
67
Technical Report Summary for
Mine Waste Solutions, North West, South Africa
Figure 13-6: Graph of Mineral Reserve for MWS – Gold Produced (kg)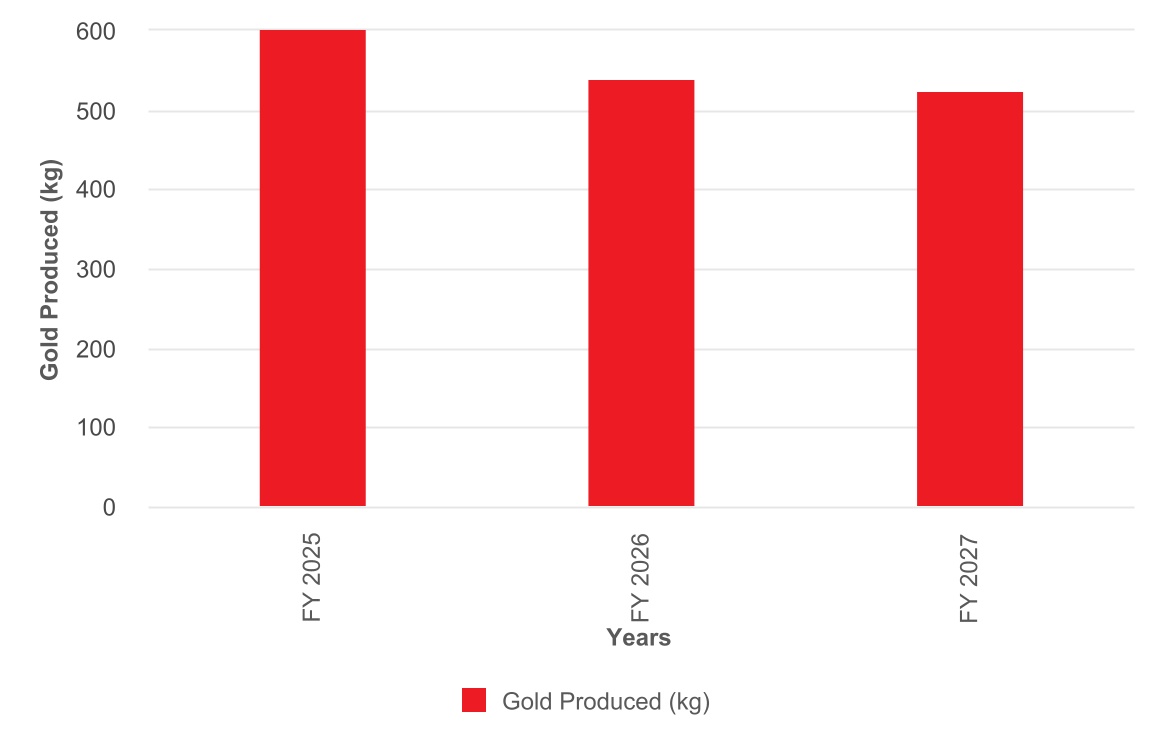
13.8Mining Personnel
13.8.1MWS operation
The number of personnel employed at MWS operation is inclusive of both mining and processing (Table 13-2).
Table 13-2: MWS operation Mining and Processing Employee Count
| | | | | |
| Employees | Unit |
| Permanent | 557 |
| Contractor | 2,284 |
| Total | 2,841 |
| Employees available | Unit |
| Engineering | 116 |
| Metallurgy | 60 |
| Projects | 9 |
| Services | 98 |
| Mngmt Eng | 2 |
| Mngmt Met | 2 |
| Mngmt Snr Met | 2 |
| Mngmt Met Eng | 2 |
| Total Payroll 1 | 291 |
| Engineering P2 | 68 |
| Services P2 | 190 |
| Metallurgy P2 | 14 |
| Total Payroll 2 | 272 |
| Grand Total | 563 |
13.8.2West Wits surface sources operation
The number of personnel employed at West Wits operation is inclusive of both mining and processing (Table 13-3).
Effective Date: June 30, 2024
68
Technical Report Summary for
Mine Waste Solutions, North West, South Africa
Table 13-3: West Wits operation Mining and Processing Employee Count
| | | | | |
| Employees | Unit |
| Permanent | 105 |
| Contractor | 150 |
| Total | 255 |
| Employees available | Unit |
| Engineer | 1 |
| Plant Manager | 1 |
| Senior Metallurgist | 1 |
| Management Total | 3 |
| Engineering P1 | 19 |
| Metallurgy P1 | 22 |
| Services P1 | 27 |
| Total Payroll 1 | 68 |
| Engineering P2 | 14 |
| Services P2 | 3 |
| Metallurgy P2 | 26 |
| Total Payroll 2 | 43 |
| Grand Total | 114 |
13.9Commentary on Mining Method
The QP is of the opinion that the extraction of the TSF material via the hydro-mining method of extraction has proven to be safer and cheaper than loading and hauling methods, using truck and shovel operations. The method has been historically tested and is well understood for extraction of the MWS operation TSFs. The TSF operations are established and supported by existing equipment, pipeline, infrastructure, and plants. Defined maintenance and capital equipment schedules are completed on an annual basis, once the CODM completes the business planning process. These schedules are incorporated in the mine planning process.
Dozers are positioned on top of the WRD. The dozers are used to create safe loading faces and blend the rock. The material is then loaded from the face onto trucks using FELs and transported to the relevant gold plants for processing. When loading is done at the bottom of the WRD, precaution must be taken to ensure that the face is not undercut. This precaution measure is put in place to prevent rock falls from the dump. A slope with a maximum inclination angle of 15° is created towards the loading point, where the WRD material is pushed down. The slope angle is monitored and maintained on a continuous basis.
As a safety measure, two red indicating poles are located at the top of the dump in the area where the dozer is working. The dozer must not go beyond the indicating poles, and dozing does not take place vertically above a loading point where an FEL loading. A 30m advance is required between the dozer and the point vertically above an active loading point. As an additional safety consideration, operations at the WRDs take place during hours of daylight.
Effective Date: June 30, 2024
69
Technical Report Summary for
Mine Waste Solutions, North West, South Africa
14Processing and Recovery Methods
Section 229.601(b)(96)(iii)(B) (14) (i-iv)
There are four plants, namely the MWS gold plant ,Savuka plant Mponeng gold plant and Kusasalethu plant, which are processing tailings and/or WRD material. Reclaimed tailings are pumped as slurry via pipelines and WRD material is transported on trucks, to the respective plants for processing.
14.1MWS Operation (MWS Gold Plant)
MWS gold plant is a gold tailings retreatment plant located in the town of Stilfontein in the North West Province, roughly 130km southwest of Johannesburg.
Reclaimed tailings from Abandoned Dam, South East Extension, East TSF, Buffels 5, Harties 1 TSF and Harties 2 TSF are processed through the MWS gold plant (Table 3-1). Other TSFs form part of the MWS operation Mineral Reserve plan. Although MWS gold plant historically processed gold and uranium in 2017, the uranium and flotation plants were discontinued resulting in the MWS gold plant producing only gold. The old uranium plant infrastructure will be used to construct Stream 4 which will be a gold processing stream which will be in operations November 2024.
14.1.1Mineral Processing Description
MWS gold plant treats over 2Mtpm through three CIL streams that are fed from three separate reclamation sites approximately 15km from of the plant. The flow diagram is presented in Figure 14-1.
The gold bearing slurry is pumped from the reclamation sites to the respective Streams where the gold is dissolved and adsorbed onto activated carbon then later eluted into a concentrated solution. The concentrated solution is then circulated through a series of electrowinning cells to produce a concentrated gold sludge. The sludge is smelted on site to produce gold doré bars with a purity of 85-95% and dispatched to Rand Refinery for further refining. The low gold residue slurry is then pumped to a central mega TSF approximately 20km from the plant.
14.1.2Plant Throughput, Design, Equipment Characteristics and Specifications
MWS gold plant is currently capable of processing 78,000tpd (Table 14-1). This excludes Stream 4 which is planned for commissioning in November 2024 at an expected capacity of 8,000tpd. Each source has its own recovery factor based on test work and historical performance. Grades for all the streams vary between 0.200g/t and 0.500g/t
Table 14-1: MWS gold plant Capacities and Treatment Rates
| | | | | |
| Activity | Plant Capacity (t/day) |
| Stream 1 | 22,000 |
| Stream 2 | 28,000 |
| Stream 3 | 28,000 |
| Stream 4 (from November 2024) | 8,000 |
| Total MWS Gold Plant | 86,000 |
The cyanide leach is an intricate balance of time, pH and oxygen sparging. These parameters have been determined with metallurgical test work and historical performance in order to optimize the recovery. The parameters used in this process are set out in Table 14-2.
Table 14-2: MWS gold plant Leaching Process Parameters
| | | | | | | | |
| Processing parameters | Unit | Value |
| Slurry relative density | kg/l | 1.45 – 1.50 |
| Leach time | hr | 10 – 13 |
| pH | | 10.5 |
| Cyanide dosage | ppm | 250 – 300 |
The following table outlines the current number and capacities of the major plant equipment found at MWS gold plant.
Effective Date: June 30, 2024
70
Technical Report Summary for
Mine Waste Solutions, North West, South Africa
Figure 14-1: Schematic Flow Diagram of the Metallurgical Process Diagram at MWS gold plant
Effective Date: June 30, 2024
71
Technical Report Summary for
Mine Waste Solutions, North West, South Africa
Table 14-3: MWS gold plant Equipment Specifications
| | | | | | | | |
| Plant Equipment | No. of Tanks | Volume (m3) |
| Receiving Tanks | 1 per stream | 2,500 |
| Leach Tanks | 8 per stream | 2,500 |
| Acid Wash Column | 1 per stream | 20 |
| Elution Columns | 1 per stream | 20 |
| Concentrate Tanks | 2 per stream | 260 |
| Spent Tanks | 1 per stream | 260 |
14.1.3Energy, Water, Process Material and Personnel Requirements
The operational water supply is sourced from circulating return water at Kareerand, the existing TSF, for the MWS gold plant. Power to the MWS gold plant is received from Eskom. MWS does not partake in load shedding. There is an agreement with Eskom that they will not shed Stilfontein as there are no redundant lines in place. MWS partake in load curtailment if it is called for; i.e.although MWS is a 24/7 operation, there are instances where certain equipment is switched off for the period stages 1 to 4 is implemented. When the stage is higher than 5, a decision will be taken to stop one complete stream. This was requested only once in the last 4 years. Harmony is on a company target which includes all business units to reach the target. The company plans to install a solar farm of 15 MW to cater for the load curtailment.
The monthly averages of energy and water consumption and requirements are shown below (Table 14-4). The personnel requirements for the plant are included in Table 13-2.
Table 14-4: MWS gold plant Energy and Water Requirements
| | | | | | | | | | | |
| Parameter | Unit | Value | Available |
| Electricity consumption | kWh/month | 17,968,401 | 19,078,154 |
| Water consumption | kL | 325,000 | 372,677 |
14.2West Wits operation (Savuka plant)
Historically, TSF and WRD material processed at Savuka plant was fed from Old North TSF dumps and the Savuka WRD. However, the plant was converted exclusively to a TSF processing facility by late 2021.
14.2.1Mineral Processing Description
The feed slurry comes from a reclamation site and is pumped into the plant sampler tank, where lime is added and thereafter cyanide. The Savuka plant flow diagram is presented in Figure 14-2.
The slurry is pumped into 32 leach Pachucas which constitutes of four rows of eight Pachucas each and thereafter it gets pumped onto eight CIP vessels. The reagent used to dissolve the gold is sodium cyanide with the addition of lime via tightly controlled predetermined levels to control the pH.
Once the slurry is adequately leached and the gold has attached to the activated carbon this slurry is transported to Mponeng plant for the final gold recovery processing which involves elution, electrowinning and smelting (Figure 14-2). The spent carbon is reactivated in a kiln and then returned to the Savuka plant for reuse.
14.2.2Plant Throughput, Design, Equipment Characteristics and Specifications
The Savuka plant is a single process flow with a current processing capacity of 11,500tpd. The cyanide leach is an intricate balance of time, pH and oxygen sparging. These parameters have been determined with metallurgical test work and historical performance in order to optimize the recovery. However, the dosing valves are linked to an online analyzer so that accurate concentrations which optimize the leach can be controlled, if required. The parameters used in this process are set out in Table 14-5.
Effective Date: June 30, 2024
72
Technical Report Summary for
Mine Waste Solutions, North West, South Africa
Figure 14-2: Schematic Flow Diagram of the Metallurgical Process Diagram at Savuka Plant
Effective Date: June 30, 2024
73
Technical Report Summary for
Mine Waste Solutions, North West, South Africa
Table 14-5: Savuka plant Leaching Process Parameters
| | | | | | | | |
| Processing parameters | Unit | Value |
| Leach time | hr | 24 - 40 |
| pH | | 10.5 – 11.5 (With lime addition) |
| Cyanide dosage | ppm | 180 – 300 as 100% NaCN |
| Oxygen | ppm | Sparged at 5 – 25 |
| RD | | 1.38 – 1.45 |
| | 40 – 50% solids |
| | SG of 2.7 |
The major equipment used at the Savuka plant are presented in Table 14-6.
Table 14-6: Savuka plant Equipment Specification
| | | | | | | | |
| Plant Equipment | No. of Tanks | Volume (m3) |
| Leach |
| Stream 1 | 32 | 10,723 |
| Stream 2 | 5 | 3,173 |
| Pachuca | 1 | 1,165 |
| CIP | 8 | 1,111 |
| Sampler | 1 | 80 |
14.2.3Energy, Water, Process Material and Personnel Requirements
The operational water supply is source. Power to the Savuka plant is received from Eskom. Savuka gold plant does not partake in load shedding. If load curtailment is called for, the Mponeng plant switches off kiln no 3 which does regeneration on the carbon to contribute to the bottom line. The monthly averages of consumption are shown in Table 14-7. The personnel requirements for the plant are included in Table 13-3.
Table 14-7: Savuka plant Energy and Water Requirements
| | | | | | | | | | | |
| Parameter | Unit | Value | Available |
| Electricity consumption | kWh per month | 3,462,602 | 3,568,147 |
| Water consumption | kL per month | 6,811 | 6,812 |
14.3Commentary on the Processing and Recovery Methods
The QP is of the opinion that the MWS gold plant has been in operation since 2003, when the plant was dedicated solely to tailings re-treatment, and, as such, the processing method is considered well established for the material being treated. The plant makes use of historical data (Figure 14-3), trends and metallurgical test work (Section 10) as the basis for their projected recoveries.
The Savuka plant has been in operation since 1961, and in 2015 the plant was dedicated solely to tailings re-treatment and WRD processing, and as such the processing method is considered well established for the material being treated. The plant makes use of historical data (Figure 14-4), trends as a basis for their projected recoveries.
The metallurgical process is a well-tested technology which has been in operation at the mine since 1986 processing VCR and CLR ore. Recoveries used in the business plan were based on historic performance. The methodology applied considered the historical metallurgical recovery (18-month period) for the relevant ore source. The actual monthly head grades were reviewed and the relationship between the head grade and recovery were used as base for the Business Plan (BP) 2023/24 metallurgical recoveries, taking into consideration the relevant forecast head grades.
Effective Date: June 30, 2024
74
Technical Report Summary for
Mine Waste Solutions, North West, South Africa
Figure 14-3: Graph of Historical Gold Recovery at MWS gold plant
Figure 14-4: Graph of Historical Gold Recovery at Savuka plant
Effective Date: June 30, 2024
75
Technical Report Summary for
Mine Waste Solutions, North West, South Africa
15Infrastructure
Section 229.601(b)(96)(iii)(B) (15)
Both MWS operation and West Wits operation have adequate access to the infrastructure required to meet the planned Mineral Reserve production schedules.
15.1MWS Operation Surface Infrastructure
The surface infrastructure associated with MWS is presented in Figure 15-1, whilst an orthophoto image of the MWS plant is presented in Figure 15-2.
15.1.1Ore and Waste Rock Storage Facilities
There is no requirement for waste rock deposition.
15.1.2Tailings Storage Facilities
The existing Kareerand tailings storage facility was commissioned in 2011 with a design life to 2025 at a tailings deposition rate of 1.9Mtpm. The plant has been designed to treat a total of 352Mt to incorporate all tailings for the prepared Mineral Reserve LOM tailings disposal from the MWS operation. Since commissioning, the production plan for MWS gold plant has been increased and has targeted a total tailings deposition rate of 2.5Mtpm until 2039. The increased tonnage throughput requires additional deposition space hence an extension project was initiated to split the tonnages between two facilities.
The extension project consists of a new TSF basin adjacent to the existing facility covering an area of 340ha and will abut the existing TSF on the western slope to form one expanded TSF. The license to construct was received from the Department of Water and Sanitation and the construction in the basin started on November 25, 2022. Deposition in the extended basin is planned from September 2024.
15.1.3Pipelines and Conveyors
The slime is recovered using monitor guns that spray a high velocity stream of water at the slimes dam so that as it mined it is mixed with water. Monitor water is pumped via four trains comprising four pumps in series each supplying monitor guns at the face with a working pressure of approximately 30Bar at the nozzles.
The mobilized slurry flows to the pump station from where it is pumped to receiving tanks and then to the treatment plant using 14/12 High Pressure Warman Pumps for further processing. Two trains of transfer pumps, each consisting of 3-5 pumps in series is provided for this duty. One train remains on standby whilst the other is in operation.
The slurry is pumped long distances via overland lined pipelines to the plant with estimated distances listed below:
Table 15-1: Mine Waste Solutions pipe stations
| | | | | | | | | | | |
| Start | End | km | Pipe Diameter (mm) |
| West Pump Station | Sulphur Pay Dam | 15 | 600 and 500 |
| Sulphur Pay Dam Pump Staton | Plant | 6 | 600 and 500 |
| East Pump Station | Plant | 9 | 500 |
| Harties 1& 2 Pump Station | Plant | 9 | 500 |
| MWS 4 & 5 Pumpstation | Plant | 3.5 | 600 |
15.1.4Power and Electrical
The power supply for the operations is from Eskom substations. MWS does not partake in load shedding as there is an agreement with Eskom that they will not shed Stilfontein because there are not redundant lines in place. Mine waste partake in load curtailment if it is called for.
15.1.5Water Usage
The operational water supply is sourced from circulating return water at Kareerand, the existing TSF for the MWS gold plant tailings (Figure 15-1) and pumped water from old underground workings.
15.1.6Logistics and Supply
The MWS operations have adequate access through maintained provincial tarred roads.
Effective Date: June 30, 2024
76
Technical Report Summary for
Mine Waste Solutions, North West, South Africa
Figure 15-1: Infrastructure Plan for MWS operation
Effective Date: June 30, 2024
77
Technical Report Summary for
Mine Waste Solutions, North West, South Africa
Figure 15-2: Detailed Infrastructure for the MWS plant
Orthophoto Image Date February 2023
Effective Date: June 30, 2024
78
Technical Report Summary for
Mine Waste Solutions, North West, South Africa
15.2West Wits operation surface Infrastructure
The surface infrastructure associated with West Wits is presented in Figure 15-3, whilst a Orthophoto image of the Savuka plant is presented in Figure 15-4.
15.2.1Ore and Waste Rock Storage Facilities
There is no requirement for waste rock deposition.
15.2.2Tailings Storage Facilities
The Savuka gold plant deposits tailings onto active Dams 5A, 5B, 7A and 7B (Figure 3-2) at 290,000tpm throughout the Mineral Reserve LOM. The Savuka complex will no longer have capacity in 2028 hence the LOM ending in FY2028. This is as a result of the 60m height restriction on the dams, as well as the limitation on rate-of-rise on Dams 5A and 5B.
15.2.3Pipelines and Conveyors
The surface infrastructure associated with West Wits operation is presented in Figure 15-3. Reclaimed tailings are pumped as slurry via CD Pumps to 350mm pipes. The distance to the plant is about 2,5km. (Figure 15-3) and WRD material is transported on trucks, to the Savuka plant for processing. These pipelines have been dedicated to the transport of material since 2015 and have been maintained effectively for this purpose.
15.2.4Power and Electrical
The power supply for the operations is from Eskom substations. Savuka gold plant do not partake in load shedding as per Eskom agreement. If there are load curtailment we ask Mponeng plant to switch off the kiln no 3 that is used for regeneration on the carbon to contribute to the bottom line. (See Table 14.7)
15.2.5Water Usage
Water supply for West Wits operation (both reclamation and processing), is sourced from circulating depositional water from No.7 and Nursery Dam as back-up. (See Table 14.7)
15.2.6Logistics and Supply
The West Wits operations have adequate access through maintained provincial tarred roads.
15.3Commentary on Infrastructure
The operational infrastructure for both the MWS operation and West Wits operation including road, rail, offices, security services, water and power supply is adequate, and is shared with the Harmony operations in the relevant areas. Mine Waste Solutions is well-established with sufficient logistical and infrastructure to support for current operation. With the inclusion of the Kareerand extension at the MWS operation there will be sufficient capacity for the planned mining operations.
The “Property, Plant, and Equipment” as of June 30, 2024, including buildings and mine infrastructure, mining assets, rehabilitation and assets under construction, had a carrying value of R3,546 million.
Effective Date: June 30, 2024
79
Technical Report Summary for
Mine Waste Solutions, North West, South Africa
Figure 15-3: Infrastructure Plan for West Wits operation
Effective Date: June 30, 2024
80
Technical Report Summary for
Mine Waste Solutions, North West, South Africa
Figure 15-4: Detailed Infrastructure for the Savuka plant
Orthophoto Image Date April 14, 2023
Effective Date: June 30, 2024
81
Technical Report Summary for
Mine Waste Solutions, North West, South Africa
16Market Studies
Section 229.601(b)(96)(iii)(B) (16) (i-ii)
Gold is traded in a variety of markets/exchanges both in physical form through over the counter (“OTC”) markets, bullion banks and metal exchanges etc., and through passive investments such as exchange traded funds (“ETFs”), which are based on gold prices and units representing physical gold which may be in paper or dematerialized form. Demand is driven by the jewelry market, bar and coin, use in technology, ETF’s and other financial products, and by central banks. An overview of the gold market is given in the following sections based mainly on data from the World Gold Council and GoldHub websites.
16.1Market Overview
Unlike almost all mineral commodities, the gold market does not respond the same way to typical supply and demand dynamics which are founded on availability and consumption, but rather on global economic affairs, particular those of the major nations, industrial powerhouses and economic regions, such as the Eurozone. The gold market is affected by government and central bank policies, changes in interest rates, inflationary or deflationary environments and events such as stocking and de-stocking of central reserves. It is also largely affected by global events such as financial crises, geopolitical trade tensions and other geopolitical risks.
Annual global gold demand (excl. over-the-counter demand (OTC) and other) experienced a decline of 5.0% on an annual basis, totaling 4 448.4 tonnes in 2023 when compared to the 4 699.0 tonnes recorded in 2022. The fourth quarter of 2023 recorded an average gold demand (excl. OTC and other) of 1 149.8 tonnes, 8.0% above the average recorded over the last five years. However, when compared to the fourth quarter of 2022, gold demand declined by a substantial 12.0%.
The main contributing factors of the higher gold demand during the fourth quarter of 2023 include:
•Jewelry consumption was 1.0% lower when compared to the same quarter in 2022, whilst jewelry inventory recorded a significant decrease of 29.0% in 2023 when compared to 2022. Furthermore, jewelry fabrication in the fourth quarter of 2023 was 3.0% lower compared to the same period in 2022;
•Bar and coin demand in the final quarter of 2023 was 7.0% lower on an annual basis at 313.8 tonnes, reflecting weak sentiment among some investor segments. Furthermore, official coins decreased by a notable 30.0% in the fourth quarter of 2023 when compared to the same quarter a year ago; and
•Central Banks and other institutions invested 229.4 tonnes of gold in the fourth quarter of 2023, recording a drastic decline of 40.0% when compared to the 382.1 tonnes investment recorded in the fourth quarter of 2022.
Although bullion prices recently surged to record highs, the first quarter of 2024 also witnessed significant gold demand, driven by sizable OTC demand.
16.2Global Production and Supply
Total Gold supply was 3.0% higher in 2023 when compared to 2022, similar to the annual supply growth of 3.0% witnessed in the first quarter of 2024 when compared to the first quarter of 2023. Gold production and supply are sourced from existing mining operations, new mines and recycling.
16.2.1New Mine Production
Gold supply from mine production exhibited an annual increase of 1.0% in 2023, amounting to 3 644.4 tonnes, but remained just below the highest output recorded in 2018. In the fourth quarter of 2023, mine production of gold decreased by 2.0% when compared to the corresponding quarter of 2022. However, moving into the first quarter of 2024 mine production increased by 4.0% year-on-year, reaching 893.0 tonnes, though, still lower when compared to the 939.9 tonnes produced in the previous quarter. The upward trend in mine production over the past two years can primarily be attributed to an uninterrupted mining industry.
According to the WGC, preliminary data indicated notable increases in gold mine production in the first quarter of 2024 for Canada (16.0% y-o-y); Ghana (15.0% y-o-y); Indonesia (14.0% y-o-y) and China (5.0%
y-o-y).
Effective Date: June 30, 2024
82
Technical Report Summary for
Mine Waste Solutions, North West, South Africa
In 2023, China remained the largest gold producer in the world (378.2t), followed by the Russian Federation (321.8t), Australia (293.8t), Canada (191.9t), United States (166.7t), Ghana (135.1t), Indonesia (132.5t), Peru (128.8t), Mexico (126.6t), Uzbekistan (119.6t) and Mali (105.0t). South Africa produced 104.3t in 2023; higher when compared to the 92.6t produced in 2022.
Figure 16-1 World Gold Council: Mine production - Major producing gold countries ranked by 2023
Source: ETSA & World Gold Council, 2024
16.2.2Recycling
The global annual supply of recycled gold increased by 9.0% in 2023 to reach 1 237.3 tonnes when compared to 2022, but still remained below the 1 293.0 tonnes recorded in 2020 and below the all-time high recorded in 2009. The rise in supply was encouraged by higher prices, resulting in a 12.0% surge in recycled gold during the first quarter of 2024 when compared to the same period in 2023. This marked the strongest quarterly performance since the third quarter of 2020 and the strongest first-quarter supply volume since 2014. Notably, East Asia recorded the most significant increase among all regions, primarily driven by volume increases in China.
16.3Global Consumption and Demand
During first quarter of 2024, gold demand (excl. OTC and other) reached 1 101.8 tonnes, reflecting a decrease of 5.0% compared to the same quarter the previous year. However, when including OTC and other, total demand increased by 3.0% on an annual basis in the first quarter of 2024 to reach 1 238.3 tonnes; resulting in the strongest first quarter since 2016. Furthermore, demand from central banks buying gold was also high during the first quarter of 2024.
16.3.1Jewelry
Global jewelry consumption experienced a significant quarter-on-quarter decline of 23.2% during the first quarter of 2024, dropping from 623.5 tonnes in the fourth quarter of 2023 to 479.0 tonnes in the first quarter of 2024. In China, demand for gold jewelry decreased by 6.0% in the first quarter of 2024 when compared to the same period in the previous year, while demand from India increased by 4.0%, supported by a robust macroeconomic environment that supported gold consumption. However, despite the first quarter initially commencing with increased demand, investor appetite for bullion tapered off towards the end of the quarter due to a price rally in March 2024 and continued to remain under pressure entering the second quarter of 2024.
Effective Date: June 30, 2024
83
Technical Report Summary for
Mine Waste Solutions, North West, South Africa
16.3.2Investment
A total annual gold investment demand of 940.7 tonnes was recorded by the World Gold Council (WGC) for 2023, reflecting a 15.0% decrease from the 1 112.8 tonnes recorded in 2022. In the first quarter of 2024, investment in gold (excluding OTC) was significantly lower and recorded a 28.0% year-on-year decline, reaching 198.6 tonnes, down from 275.3 tonnes recorded in the first quarter of 2023 and also lower when compared to the 257.1 tonnes recorded in the fourth quarter of 2023. Despite the decline, long positions of fund managers reached a two-year peak in March 2024 which was supported by the gold price rally, however, gold exchange-traded funds (ETF) holdings decreased by 113.7 tonnes (USD6.0 billion) on a quarterly basis during the first quarter of 2024. Furthermore, global physically-backed gold ETFs were 10.0% lower on an annual basis amounting to 3 112.4 tonnes globally during the first quarter of 2024. Market divergence was evident as Asia had positive demand growth for physically backed ETFs while the Western investors focused on profit-taking.
According to the WGC, global bar and coin investment increased by 3.0% when compared to the first quarter of 2023, reaching an average of 312.3 tonnes in the first three months of 2024.
The average London Bullion Market Association (LBMA) price of gold traded 10.0% higher in the first quarter of 2024 when compared to the same period a year ago, at USD2 069.80 an ounce, which also represented a 5.0% quarter-on-quarter increase that can be ascribed to risk and momentum factors.
Figure 16-2 World Gold Council: Total Gold Supply & Demand
16.3.3Currency
The inverse relationship between the value of U.S. Dollar (USD) and that of gold is one of the most discussed relationships in currency markets. The USD is the internationally accepted currency and most of the international transactions take place in USD equivalent. The major reason behind the relationship of gold and the USD, is that gold is used as a hedge against the adverse exchange value of the USD. As the US Dollar’s exchange value decreases, it takes more USD to buy gold, which increases the value of gold. Two other factors linked to the USD, or the strength of the USD is inflation and interest rates.
Interest rates have remained high whilst inflation started retreating in 2024. The USD is forecast to lose some strength as U.S. interest rate cuts are nearing inevitably and the currency depreciated in May 2024, for the first time in five months. Furthermore, global economic growth and lower risk also place pressure on the US Dollar. Central banks are planning to start with interest rate cuts, which in turn could cause non-yielding bullion to become more attractive and result in further increases in the gold price.
Effective Date: June 30, 2024
84
Technical Report Summary for
Mine Waste Solutions, North West, South Africa
16.4Gold Price
16.4.1Historical Gold Price
The LBMA gold price reached a record annual average price of USD1 940.54 an ounce in 2023, 8.0% higher when compared to average of USD1 800.09 an ounce recorded in 2022. The upward trajectory continued into the first quarter of 2024 where gold prices averaged 5.0% higher at USD2 069.80 an ounce on a quarter-on-quarter basis.
Moving into the second quarter of 2024, gold prices continued to gain a lot of momentum which can mainly be attributed to the ongoing geopolitical tensions in the Middle East, along with central bank hedge purchasing and uncertainty surrounding global inflation. The safe-haven appeal of gold drove a bullish market with bullion prices reaching new record highs after increasing by roughly 18.0% between March 1, 2024 and April 12, 2024.
The bullish price trend for bullion could increase recycling supply of gold and decrease jewelry demand, whilst mine supply is also expected to reach a new peak. The latest market expectations point to U.S. interest rates staying higher for longer as the U.S. Federal Reserve Bank awaits assurance that inflation is returning to the central bank’s target of 2.0%. Bullion acts as a hedge against lower interest rates and the price is anticipated to increase later in 2024 when interest rates are lowered.
Figure 16-3: Graph of Annual Gold Price History – ZAR/kg
Effective Date: June 30, 2024
85
Technical Report Summary for
Mine Waste Solutions, North West, South Africa
Figure 16-4: World Gold Council: Daily Gold Price (ZAR/oz & USD/oz)
16.4.2Forecast Gold Price
Consensus gold price range for the year 2024 to year 2026 is presented in Table 16.1. The long-term gold prices are considered from year 2025 onwards by the QP. Forecasts as advised from various financial institutions show that gold is expected to trade in a range of USD1,600/oz – USD2,238/oz, for the period 2024 to 2026 with a long-term outlook of USD1,772/oz.
Table 16-1 Consensus View of Forecast Gold Price
| | | | | | | | | | | |
| Institutions | 2024 | 2025 | 2026 |
| World Bank: Development | 2,100 | | 2,050 | | — | |
| BMO Capital Markets | 2,150 | | 2,100 | | — | |
| Scotiabank | 2,018 | | 1,950 | | — | |
| Nedbank | 2,211 | | 2,238 | | 2,210 | |
| Fitch Solutions | 1,900 | | 1,800 | | 1,600 | |
| S&P Global | 2,120 | | 2,134 | | 2,076 | |
| Australian Government | 2,023 | | 2,030 | | 1,924 | |
| Average | 2,075 | | 2,043 | | 1,953 | |
16.4.3Harmony Group Gold Hedging Policy
Harmony has a hedging policy which is managed and executed at Group treasury level on-behalf of its operating entities. The key features of the hedging program are as follows:
•the policy provides for hedging (or forward selling) up to a maximum of 20% of expected gold production for a rolling 24-month period;
◦Year 1, 30%
◦Year 2, 20%
◦Year 3, 10%
•the policy has no minimum quantity that should be hedged, and if an attractive margin above cost cannot be achieved (i.e., in a low gold price environment) then no hedges are entered into;
•Harmony enters into ZAR-denominated gold hedges for its South African operations (for the non-South African assets it enters into USD-denominated hedges);
•Individual mines do not enter into hedges in their own name but delivers bullion to Rand Refinery for refining on behalf of Harmony. Rand Refinery is one of the world’s largest single-site precious metals refining and smelting complex in the world. Rand Refinery refine all of Harmony’s gold to at least
Effective Date: June 30, 2024
86
Technical Report Summary for
Mine Waste Solutions, North West, South Africa
99.5% purity, and acting as agent, sells the gold on the daily spot London fixing price and make payment to the Harmony two days later;
•gains and losses realized from the hedging program are accounted for at Group level and the financial benefit (or downside) is distributed amongst the operations proportional to their levels of gold sales; and
•Harmony does its mine planning and financial forecasts based on the estimated future gold price provided by an external source (ETSA), but its year-end actual financial results reflect the received gold price inclusive of the impact of the hedging program. Therefore, in theory, individual mines receive a hedged gold price for a maximum of 20% of its gold sales with the balance attracting the spot price.
16.4.4Gold-Streaming Arrangement: Franco-Nevada Corporation
Other than the Harmony Group hedging program, Chemwes (Pty) Limited (“Chemwes”), internally referred to as Mine Waste Solutions, entered into a gold-streaming contract with Franco-Nevada Corporation (“Franco Nevada”), a Canada-based, gold-focused royalty and streaming company. The key terms of the contract are as follows:
•the contract is at operational level and was entered into in the name of Chemwes (inherited through the acquisition of Anglogold Ashanti’s South African assets);
•Franco-Nevada is entitled to 25% of all gold produced by Chemwes until 312,500oz of gold are received. This is anticipated to be reached by 2024;
•as at the June 30, 2024 Chemwes (latest forecast) had delivered 303 336oz of gold; and
•Franco-Nevada makes ongoing payments to Chemwes equal to the lesser of USD400/oz of payable gold (subject to a 1% annual inflation that commenced December 2012) and the spot price for gold; the current ongoing price is equal to USD450.72/oz of gold as of June 2024.
16.5Commentary on Market Studies
The factors which affect the global gold market are well-documented as are the elements which influence the daily gold price. The LBMA gold price reached a record annual average price of US$1 940.54 an ounce in 2023, 8.0% higher when compared to average of US$1 800.09 an ounce recorded in 2022. The upward trajectory continued into the first quarter of 2024 where gold prices averaged 5.0% higher at US$2 069.80 an ounce on a quarter-on-quarter basis. The gold price remains well above the 5-year historical average.
The positive outlook for gold will likely be sustained. Key headwinds for gold are interest rate hikes, currently at near historically low levels, but continued geopolitical risk and underperformance of stocks and bonds will support gold (Gold Mid-Year Outlook 2022, Gold.org, Accessed 2022).
Harmony has a relatively conservative gold hedging policy in place, and this is used to take advantage of the movements in the gold price to maximize the average gold price received, with the benefit of this hedging program flowing through to MWS and West Wits.
16.6Material Contracts
As with all major businesses, Harmony enters into a multitude of vendor agreements for the provisions of supplies and services. These agreements are entered into on a competitive basis and typically are of a medium-term duration all with clauses providing for periodic updating of pricing, annual (or other) renewal or termination.
Harmony has contractual vendor agreements with various service providers and suppliers. The most significant of these contracts currently in place to support the West Wits and MWS operation are listed in Table 16-2.
All of the listed contracts are currently valid and in good standing. Terms, rates and charges of contracts are considered consistent with industry norms. Contract management processes are in place and resourced so that contracts re-tendered and/or renewed as they approach expiry.
Table 16-2: Material Contracts
| | | | | |
| Vendor Name | Nature of Service /Supply |
| Eskom | Electricity supply for MWS and West Wits |
Effective Date: June 30, 2024
87
Technical Report Summary for
Mine Waste Solutions, North West, South Africa
| | | | | |
| Shomene 1 cc | Earth moving equipment hire for MWS and West Wits |
| Intasol Tailings (Pty) Ltd | Re-mining of MWS TSF |
| Intasol Tailings (Pty) Ltd | Deposition of West Wits Savuka GP Tailings |
| Cyclone Projects | Deposition of MWS tailings |
| Cyclone Projects | Re-mining of MWS TSF |
| Cyclone Projects | Re-mining of West Wits Savuka TSF |
Effective Date: June 30, 2024
88
Technical Report Summary for
Mine Waste Solutions, North West, South Africa
17Environmental Studies, Permitting and Plans, Negotiations, or Agreements with Local Individuals or Groups
Section 229.601(b)(96)(iii)(B) (17) (i-vii)
The South African Government has an extensive legal framework within which mining, environmental and social aspects of the industry are managed. Harmony and Surface operations are primarily regulated and managed by certain principal Acts (Section 17.3) as well as corporate policies, management systems and certain industry-wide guidelines, including:
•Energy Efficiency and Climate Change Policy;
•Environmental Policy;
•Harmony Water Management Strategy;
•Biodiversity and Rehabilitation Position Statement;
•Socio-Economic Transformation Policy; and
•Corporate Social Responsibility Policy.
The latest sustainability policies and public environmental social and governance (“ESG”) performance and disclosure report(s) are available on the corporate website. Harmony has identified the environmental risks for the business and has strategies and management systems in place to manage the risks.
17.1Results of Environmental Studies
In South Africa, the regulatory scoping and EIA process and associated report(s) form the basis on which the national Department of Forestry, Fisheries and Environment ("DFFE") administers the legislation and issues environmental authorizations. The EIA report generally identifies and predicts the likely environmental, social and other related impacts and establishes the measures that are necessary to avoid, minimize or offset predicted adverse impacts. The mitigation measures are captured in an EMP and operationalized in an EMS.
Mine Waste Solutions has implemented an EMS aligned with ISO 14001:2015 standard to help identify, manage and monitor its environmental impacts. The EMS provides a holistic approach to encourage better environmental performance and helps demonstrate its compliance with its statutory and regulatory requirements. Mine Waste Solutions has successfully maintained its ISO 14001 certification since its accreditation in 2019. Every effort is made by both the surface operation and underground operations to eliminate or minimize the negative effects of Mine Waste Solutions’ activities on the environment and adjacent communities.
17.2Waste and Tailings Disposal, Monitoring & Water Management
As part of its environmental and water approvals, and licenses, Mine Waste Solutions is required to implement monitoring programs and plans to establish the operations impact on the environment. The compliance limits for the monitoring variable are included in the applicable Environmental Authorizations (EA’s), Water Use License (WUL) and Atmospheric Emissions Licenses (AEL). Besides these, Mine Waste Solutions also complies with local authority requirements e.g. registration of it chemical and flammable storage areas, i.e. with Matlosana Local Authority.
The environmental monitoring implemented at Mine Waste Solutions includes:
• monthly chemical of surface water quality;
• quarterly chemical analysis of groundwater quality;
• biomonitoring surveys;
• radiation management program;
• integrated waste and water management plan updates;
• ground water plume delineation and prediction;
• water conservation and demand management plans;
• monthly water balance assessments;
Effective Date: June 30, 2024
89
Technical Report Summary for
Mine Waste Solutions, North West, South Africa
• monthly and bi-annual air quality (i.e. fall-out dust) monitoring;
• periodic license and authorization compliance assessments;
• annual ISO 14001:2015 external and internal audits;
• license to Construct the Kareerand TSF expansion, including dam safety/ geotechnical assessments;
• Annual invader assessments and eradication;
• Annual firebreak preparation and firefighting arrangements; and
• Heritage sites assessment and protection
Inspections are done and the following reports are compiled quarterly, bi-annually and annually:
•Air Emissions License we use the services of air quality specialists who compile the stack compliance reports, quarterly compliance air quality reports and an annual air quality compliance report;
•Air quality- Annual dust-fall out report compiled by air quality specialist;
•Annual and quarterly dust interpretation reports compiled by air quality specialist;
•Annual interpretation water report for groundwater and surface water- compiled by water management specialist; and
•Bi-annual compliance audit report compiled by MWS Snr Environmental Officer.
17.3Permitting and Licenses
In respect of environment, the following national Acts and the regulations promulgated thereunder provide the regulatory framework:
•Mineral and Petroleum Resources Development Act, 2002 (“MPRDA”);
•National Environmental Management Act, 1998 (“NEMA”);
•National Environmental Management: Waste Act, 2008 (“NEM:WA”);
•National Environmental Management: Air Quality Act, 2004 (“NEM:AQA”);
•National Water Act, 1998 (“NWA”); and
•National Environmental Management Biodiversity Act.
MWS is not required in terms of existing legislative framework to hold a mining right to process mine residue stockpiles, which are linked to existing operations by road, rail and/or pipeline. Environmental permits and licenses are however required that trigger any specific activity listed under the above-mentioned acts and regulations. A summary of the status of all environmental permits and licenses issued at the effective date related to both the MWS is presented in Table 17 1. The inflammable liquids and substances certificates are valid for 12 months. A renewal application will be done before the current certification expires.
MWS no longer operates under any mining right. All relevant environmental and water-use permits are in place that cover the environmental, archaeological, and hydrological components of Mine Waste Solutions. All permits are audited regularly for compliance. The latest of environmental authorization (EA) is applicable to the Kareerand TSF expansion activities, issued to MWS in 2022. MWS is currently busy with an environmental authorization process to increase it piping capacity from Kareerand TSF to enable more return water to be pumped back to the MWS Plant and reclamation activities.
17.4Local Stakeholder Plans and Agreements
Harmony strives to create sustainable shared value within the communities it operates. Local stakeholder plans and agreements are based on the results from socio-economic information, government development strategies and EIAs undertaken. The socio-economic development program commits to:
•contribute to areas that will have the most meaningful socioeconomic impact on communities, namely infrastructure, education and skills development, job creation and entrepreneurial development;
Effective Date: June 30, 2024
90
Technical Report Summary for
Mine Waste Solutions, North West, South Africa
•enhance broad-based local and community economic empowerment and enterprise development initiatives;
•facilitate socio-economic development in local communities by means of corporate social responsibility programs;
•support arts, culture, and sports and recreation; and
•build relationships based on trust within host communities.
Despite no formal or regulatory agreements in place for Mine Waste Solutions, they have committed to source labour from the surrounding communities as far as possible, where applicable. MWS have also recently commenced with and dedicated Environmental Forum where stakeholders will be informed about Harmony’s processes of managing environmental risks as well as providing feedback to communities on any environmental related concerns, if any.
Effective Date: June 30, 2024
91
Technical Report Summary for
Mine Waste Solutions, North West, South Africa
Table 17-1: Status of Environmental Permits and Licenses | | | | | | | | | | | | | | | | | | | | |
| Operation | Permit / License | Reference No. | Issued By | Date Granted | Validity | |
| MWS | MWS: AEL License CHEMWES: Atmospheric Emission License | NWPG/CHEMWES/AEL. 4.1,4.2 & 4.17/October 2020 | DEDECT | 30-Sep-20 | 30-Sep-26 | |
| MWS Plant: Certificate of Registration Inflammable Liquids and Substances (required by the by-laws) | 4357 | City Council of Matlosana Fire and Rescue | 29/11/2023 | 31/12/2024 | |
| Harties 1 & 2: Certificate of Registration Inflammable Liquids and Substances (required by the by-laws) | 4354 | City Council of Matlosana Fire and Rescue | 29/11/2023 | 31/12/2024 | |
| Kareerand: Certificate of Registration Inflammable Liquids and Substances (required by the by-laws) | 4356 | City Council of Matlosana Fire and Rescue | 29/11/2023 | 31/12/2024 | |
| Sulphur Pay Dam: Certificate of Registration Inflammable Liquids and Substances (required by the by-laws) | 4355 | City Council of Matlosana Fire and Rescue | 29/11/2023 | 31/12/2024 | |
| East Complex: Certificate of Registration Inflammable Liquids and Substances (required by the by-laws) | 4353 | City Council of Matlosana Fire and Rescue | 29/11/2023 | 31/12/2024 | |
| West Complex: Certificate of Registration Inflammable Liquids and Substances (required by the by-laws) | 4358 | City Council of Matlosana Fire and Rescue | 29/11/2023 | 31/12/2024 | |
| Water Use License: Bio-monitoring - 6 monthly reporting. Water balance quarterly | 27/2/2/C224/101/1 - 27087241 - 08/C24B/AACIG/8368 | DWS | 31/11/2018 | 10 years | |
| Water Use License: Environmental Water report - Quarterly. Water incidents - as they occur | 08/C24B/AIACGI/11868 | DWS | 18/09/2023 | 20 years | |
| Water Use Licence (Mispah): 6 Monthly monitoring reports must be submitted to the Provincial Head/CEO for the duration of the construction phase and yearly thereafter or until otherwise agreed in writing with the Provincial Head/CEO. | 08/C24B/CI/13793 | DWS | 20/10/2023 | 20-Oct-29 | |
| Environmental authorisation for expansion of Kareerand tailings storage facilities, re-processing of the waste dumps and disposal of tailings in respect of various portions | NWP/EIA/176/2008 | DMRE | 21/11/2022 | N/A | |
Effective Date: June 30, 2024
92
Technical Report Summary for
Mine Waste Solutions, North West, South Africa
| | | | | | | | | | | | | | | | | | | | |
| MWS | NEMA Amendment Authorisation for the construction of pipelines | NW 30/5/1/2/3/2/1/378 EM | DMRE | 21/11/2021 | N/A | |
| License to Construct a Dam with Safety Risk | 12/2/C241/37 | DWS | 18/06/2010 | N/A | |
| Application to discharge Sewerage into Municipal system | 17/3/1/1 | City Council of Matlosana Fire and Rescue | 29/02/2002 | N/A | |
| MWS: Certificate of Registration | COR-30 (Variation 30) | NNR | 14/04/2023 | N/A | |
| License to Construct Harmony Solar PV Facility | NWP/EIA/75/2023: May be reviewed at intervals of not more than 5 years | DEDECT | 07/05/2024 | N/A | |
| Environmental authorisation for the construction of a return water pipeline from Kareerand Tailings storage facility to Midway | NWP/EIA/32/2023: EA is valid for 5 Years- Activities must be concluded within 5 years from the date of issue. Awaiting WUL | DEDECT | 06/11/2023 | N/A | |
| MWS: Environmental Authorisation for Mispah TSF Reclamation and associated pipelines in the Free State and North West Provinces | 14/12/16/3/3/1/2714 | DFFE | 07/09/2023 | N/A | |
| Environmental Authorisation | WR/16-17/AEL9/3 | Dr. Kenneth Kaunda District Municipality | 14-Dec-2023 | 31-Dec-2028 | |
| WW | Water Use Licence | 08/C23E/AFGJCEI/12157 | DWS | 27/09/2022 | 27/09/2031 | |
| Environmental Authorisation | (GP) 30/5/1/2/3/2/1(01) EM | DMRE | 29-Mar-23 | N/A | |
| (GP) 30/5/1/2/2(01) MR | |
| In progress of updating | |
| Waste Management Licence | Gaut 002/09-10/W0011 | GDARD | 27-Jul-15 | Expired | |
| Golden Core Trade and Invest (Pty) LTD submitted renewal application. Awaiting approval. | DMRE | |
Note: DEDET - Department of Economic Development, Environment, Conservation and Tourism, DWS - Department of Water and Sanitation, Department of Mineral Resources and Energy, GDARD - Gauteng Department of Agriculture and Rural Development, AGA - Anglogold Ashanti Limited
Effective Date: June 30, 2024
93
Technical Report Summary for
Mine Waste Solutions, North West, South Africa
17.5Mine Closure Plans
Since Mine Waste Solutions does not operate under a mining right, there is no legal requirement under the current South African legislative framework for Harmony to compile a closure plan and provide financial assurance to the regulator. Despite this, Harmony appointed Digby Wells Environmental (“Digby Wells”), an independent environmental consultant, to review and update the closure cost for MWS which was evaluated in June 2024. The exercise was conducted under the general “duty of care” principle as per Section 28 of NEMA, using regulation 53 and 54 of the MPRDA as a guideline.
The approach followed by Digby Wells involved:
•identifying all areas and infrastructure that form part of Mine Waste Solutions responsibility (including both the MWS Operation and West Wits Operation);
•measuring the volumes and areas of the active waste rock dumps and TSFs using survey data;
•developing a site-specific closure cost model aligned with the methodologies applied to other Harmony operations; and
•compiling a report that outlines the methodology, assumptions, technical solutions, and any potential risks identified related to the closure cost.
The closure cost as at June 30, 2024, was calculated to be ZAR1 254m for West Wits and MWS, including a 10% contingency allowance.
Harmony does not have a legal obligation to have a post-performance or reclamation bond in place with the regulator to fund the cost of closure.
17.6Status of Issues Related to Environmental Compliance, Permitting, and Local Individuals or Groups
The required environmental authorizations are in place and only require amendments to be made to reflect the current infrastructure at Mine Waste Solutions. The Air Emissions License of MWS needs to be amended. Based on current industry norms, a realistic timeframe to obtain relevant authorizations is estimated between 6 and 18 months.
Table 17-2: Environmental Cost
| | | | | | |
| Area | | Cost (ZAR'000) |
| Infrastructure | |
| Margaret Village | | 2643 | |
| Harties 1&2 Pump Station | | 3,541 | |
| Midway Dam | | 1,684 | |
| Kareenrand Pump Station | | 48,407 | |
| Old Gold Plant | | 41,408 | |
| New Gold and Uranium Plant | | 81,699 | |
| Tailings Storage Facilities and Waste Rock Dumps | | 584,426 | |
| Dams, Spillages and Footprints | | 260,045 | |
| Pipelines | | 13,051 | |
| East Pumps Station | | 8,223 | |
| MWS 4 & 5 Pump Station | | 5,165 | |
| Sub-total Infrastructure | | 1,050,292 | |
| Monitoring and Maintenance | |
| Water Monitoring | | 3,836 | |
| Vegetation Monitoring | | 820 | |
| Vegetation Maintenance | | 30,947 | |
| Sub-total Monitoring and Maintenance | | 35,603 | |
| Preliminary and General (6%) | | 63,018 | |
| Contingency (10%) | | 105,029 | |
| Grand Total | | 1,253,942 | |
Effective Date: June 30, 2024
94
Technical Report Summary for
Mine Waste Solutions, North West, South Africa
17.7Local Procurement and Hiring
Harmony is committed to investing in the future of local communities beyond the life of the operations and not to only empower them, but also to mitigate the impacts of its operations to ensure a positive legacy. Although Mine Waste Solutions is not governed by the MPRDA and therefore there is no legal obligation to comply with the 2014 Mining Charter, the Company applies this framework in its socio-economic development initiatives such as the procurement of local goods and services. Portable skills are developed through expanded learning programs, learnerships and other programs opened to operating communities and areas where labour is sourced.
17.8Commentary on Environmental Studies, Permitting and Plans, Negotiations, or Agreements with Local Individuals or Groups
The QP is of the opinion that periodic inspections are conducted by the regulator to verify compliance with applicable environmental laws, regulations, permits and standards. In addition, Mine Waste Solutions has implemented an EMS in line with the ISO 14001: 2015 standard. The EMS is audited on an annual basis by a third party and includes the needs and expectations of interested parties.
As part of the Harmony group, Mine Waste Solutions conducts its operation based on policies and systems that are aligned to its corporate sustainable development framework. Although Harmony is not a signatory to the International Council on Mining and Metals or the UN Global Compact, these form the guiding principles of the framework. Harmony discloses its sustainable development voluntarily in accordance with the guidelines issued by the Global Reporting Initiative (GRI). Further to this, Harmony discloses environmental information on the Carbon Disclosure Project (CDP) for both climate change and water.
Mine Waste Solutions has good understanding of the environmental and social aspects of the operations through baseline and specialist studies previously conducted. Risk management and mitigation measures were adequately addressed in the environmental management plans and will be effective to mitigate risks and impacts to acceptable levels should the measures be implemented according to the specialists’ recommendations.
All the required environmental authorizations are in place or are being applied for.
Effective Date: June 30, 2024
95
Technical Report Summary for
Mine Waste Solutions, North West, South Africa
18Capital and Operating Costs
Section 229.601(b)(96)(iii)(B) (18) (i-ii)
Economic parameters for the Harmony Group, including capital and operating costs, are determined, and signed off by the CODM, before distribution to the business units, including Mine Waste Solutions. The capital and operating costs are reported in ZAR terms and on a real basis. The capex and opex budgets are consistent with feasibility level.
18.1MWS Operation
18.1.1Capital Costs
A detailed breakdown of the capital costs for major projects covering the Mineral Reserve is shown in Table 18-1. The Kareerand TSF expansion project contributes the majority to the capital allocation as the extension footprint will consist of a new TSF basin adjacent to the existing facility covering an area of 340ha. Other capital contributions will be assigned to the relocation of the current pump stations as the reclamation footprint is exhausted and the addition of Stream 4 to the MWS gold plant as production is planned to increase.
18.1.2Operating Costs
A summary of the direct and indirect unit operating costs for the MWS operation is presented in Table 18-2. The costs shown in the below show the budgeted operating expenditure going forward. The cash flow model is for the MWS gold plant (all streams inclusive).
18.2West Wits operation
18.2.1Capital Costs
No capital costs have been allocated to the West Wits operation for the remaining duration of the Mineral Reserve LOM as the infrastructure to process the available sources is in place.
18.2.2Operating Costs
A summary of the direct and indirect unit operating costs for the West Wits operation are presented in Table 18-3. The costs shown in the tables below show the 2023 actual operating expenditure and the budgeted operating expenditure going forward.
Effective Date: June 30, 2024
96
Technical Report Summary for
Mine Waste Solutions, North West, South Africa
Table 18-1: MWS Mineral Reserve Capital Cost Estimate for MWS operation Major Projects
| | | | | |
Capital Cost Element (ZAR'000) | Mineral Reserves (FY2025 -FY2039) |
| Kareerand | 1,015,278 |
| Stream 4 Gold Plant Implementation | 58,311 |
| MWS 4 & 5 Pump Station | 36,153 |
| Mispah Pump Station | 507,321 |
| West Pump Station | 2,500 |
| Other | 1,823,788 |
| Total | 3,443,351 |
Table 18-2: Summary of Operating Cost Estimates for MWS operation (MWS Gold Plant)
| | | | | |
| Operating Cost Element (ZAR'000) | Total Reserve Plan |
| Wages - Payroll 1 | 812,126 | |
| Wages - Payroll 2 | 419,974 | |
| Stores and materials | 1,286,560 | |
| Electric Power and Water | 2,493,878 | |
| Outside Contractors | 2,235,188 | |
| Other | 1,227,661 | |
| Total Direct Costs | 8,475,388 | |
| Pumping Allocation | — | |
| Refining Charges | 64,046 | |
| Uranium Allocation | — | |
| Hostel Cost | — | |
| Backfill Cost | — | |
| Plant Treatment Cost | 24,884,330 | |
| Working Cost Transfer to Capital | — | |
| Care and Maintenance | — | |
| Mine Overheads Re-allocated | 1,822,038 | |
| Total | 35,245,802 | |
Effective Date: June 30, 2024
97
Technical Report Summary for
Mine Waste Solutions, North West, South Africa
Table 18-3: Summary of Operating Cost Estimates for West Wits Operation
| | | | | |
| Operating Costs (ZAR'000) | Total Reserve Plan |
| Wages - Payroll 1 | — |
| Wages - Payroll 2 | — |
| Stores and materials | 15,381 |
| Electric Power and Water | 42,821 |
| Outside Contractors | 53,061 |
| Other | 6,585 |
| Total Direct Costs | 117,847 |
| Pumping Allocation | — |
| Refining Charges | 2,831 |
| Uranium Allocation | — |
| Hostel Cost | — |
| Backfill Cost | — |
| Plant Treatment Cost | 923,082 |
| Working Cost Transfer to Capital | — |
| Care and Maintenance | — |
| Mine Overheads Re-allocated | 70,934 |
| Total | 1,114,695 |
Effective Date: June 30, 2024
98
Technical Report Summary for
Mine Waste Solutions, North West, South Africa
19Economic Analysis
Section 229.601(b)(96)(iii)(B) (19) (i-iv)
19.1Key Economic Assumptions and Parameters
The QP and CODM forms, reviews, signs-off and distributes economic assumptions to its various business units. On an annual basis, during the period October to November, long-term commodity prices and exchange rates forecasts are received from various financial institutions. In addition, a specialist in Economics from a reputable economics company based in South Africa, provides expert views on the global markets, forward looking commodity prices, exchange rates, consumer price index, production price index, electricity cost and consumable increases. All factors are analyzed, cognizance is taken of the requirements of the NYSE and JSE markets, and a proposal is presented to the CODM for recommendation and approval. These assumptions are then applied at MWS and West Wits, along with specific operational considerations.
19.1.1Metallurgical Recoveries
The metallurgical recoveries used in the economic analysis are those provided in Table 12-1 and Table 12-3. These are based on metallurgical test work, and historical results.
19.1.2Gold Price
The forecast gold price (USD1,772/oz) is the price that is used by Harmony for the MWS and West Wits annual planning cycle and forms the basis for the MWS and West Wits cashflow. The reader is referred to Table 16-1 for the consensus forecast gold price. The conversions used in the calculation of the various gold prices is presented in Table 19-1.
Table 19-1: Conversions Used in Gold Price Calculations
| | | | | | | | | | | | | | |
| Economic Factors | Gold Price (USD/oz) | Conversion Factor (oz/kg) | Exchange Rate (ZAR:USD) | Gold Price (ZAR/kg) |
| 2024 Mineral Resource | 1,878 | 32.15 | 18.26 | 1,100,000 |
| 2024 Mineral Reserve | 1,772 | 32.15 | 18.26 | 1,040,000 |
19.1.3Exchange Rate
The South African Rand (ZAR) depreciated to average at R18.89/US$ during the first quarter of 2024, 0.7% weaker compared to an average of R18.76/US$ recorded during the last quarter of 2023. Moving onto May 2024, the ZAR appreciated by 2.4% on a month-on-month basis, and 3.4% compared to May 2023 to average at R18.42/US$, following a 3.8% annual depreciation recorded in April 2024.
The South African Rand has been volatile in recent weeks as uncertainty loomed around the elections, however, the local currency has been supported by the outcome of a Government of National Unity after the ruling African National Congress (ANC) lost the majority vote for the first time since the start of democracy. The ZAR appreciated to trade at R18.11/US$ on June 18, 2024 and is expected to strengthen further over the medium term.
Furthermore, the U.S. Federal Reserve held interest rates unchanged on June 12, 2024 and Jerome Powell, Chairman of the Fed, stated that interest rates will not be reduced before a greater decline in inflation or an increase in unemployment is visible. Data later indicated that retail sales barely rose in May 2024 and speculation of rate cuts amongst investors increased, pressuring the US Dollar and lending strength to the ZAR exchange rate.
Effective Date: June 30, 2024
99
Technical Report Summary for
Mine Waste Solutions, North West, South Africa
Figure 19-1: Annual Exchange Rates and ETSA Forecast
Table 19-2: Consensus View of Forecast Exchange Rate (ZAR:USD)
| | | | | | | | | | | |
| Institutions | 2024 | 2025 | 2026 |
| Nedbank | 18.74 | | 18.44 | | 18.57 | |
| Investec | 18.54 | | 18.23 | | 18.48 | |
| FNB | 18.70 | | 17.70 | | 18.30 | |
| PWC | 18.80 | | 19.30 | | — | |
| IDC | 18.76 | | 18.31 | | 18.10 | |
| AVERAGE | 18.71 | | 18.40 | | 18.36 | |
The exchange rate of 18.26 ZAR:USD is the exchange rate that is used by Harmony for the annual planning cycle and forms the basis for the ZAR:USD exchange rate in the company LOM and Mineral Reserve cashflow.
Table 19-3: ZAR:USD Exchange Rate Performance (June 2020 – June 2023)
| | | | | |
| Period | Average Exchange Rate (ZAR:USD) |
| July 2021 to June 2022 | 15.21 |
| July 2022 to June 2023 | 17.77 |
| July 2023 to June 2024 | 18.70 |
| 3-Year Ave. (not weighted) | 17.23 |
19.1.4Royalties
Royalty is an expense paid to the government of South Africa and is accounted for in the MWS and West Wits cash flow models. In terms of the mining ring-fencing application, each ring-fenced mine is treated separately, and deductions can normally only be utilized against mining income generated from the relevant ring-fenced mine.
19.1.5Capital Expenditure
Detailed capital costs can be found for MWS operation in (Table 18-1), West Wits operation has a plant capital of R84.187m declared within their cash flow model.
19.1.6Operating Expenditure
The operating costs are determined as a function of the cash working costs of the mining and mineral processing plant activities, and ongoing capital development for mining. Whereas, total costs are a function
Effective Date: June 30, 2024
100
Technical Report Summary for
Mine Waste Solutions, North West, South Africa
of the operating costs, capital costs, and royalties. Detailed operating costs can be found for MWS operation in Table 18-2, those for West Wits operation can be found in Table 18-3.
19.1.7Working Capital
Movements in working capital are accounted for in the economic analysis; they are not however provided as a separate line item within Table 19-6 and Table 19-7.
19.1.8Taxes
Mining tax on gold mining taxable income in South Africa is determined according to a formula, based on the taxable income from mining operations. Of that, 5% of total revenue is exempt from taxation while the remainder is taxable at a higher rate (33%) than non-mining income (27%). Accounting depreciation is eliminated when calculating the South African mining tax income. Excess capital expenditure is carried forward as unredeemed capital to be claimed against future mining taxable income.
19.1.9Closure Cost and Salvage Value
The closure cost estimates are those provided in Section 17.5. No account has been taken of any potential salvage values.
19.1.10Summary
The key assumptions used in the cash flow are summarized for MWS and West Wits in Table 19-4 and Table 19-5 respectively.
Table 19-4: Key Economic Assumptions and Parameters for MWS Cash Flow
| | | | | | | | |
| Parameter | Unit | Value |
| Production Rate | tpm | 2,358,013 |
| Gold Recovery | % | 45.30 |
| Royalty | % of Revenue | 0.02 |
| Tax Rate | % | Formula |
| Gold Price | ZAR/kg | 1,040,000 |
| Exchange Rate | USD:ZAR | 18.26 |
| Discount Rate | % | 9.00 |
Note: 1. This is based on the Franco Nevada arrangement that concludes in 2025
Table 19-5: Key Economic Assumptions and Parameters for West Wits Cash Flow
| | | | | | | | |
| Parameter | Unit | Value |
| Production Rate | tpm | 319,072 |
| Gold Recovery | % | 42.50 |
| Royalty | % of Revenue | 0.50 |
| Tax Rate | % | Formula |
| Gold Price | ZAR/kg | 1,040,000 |
| Exchange Rate | USD:ZAR | 18.26 |
| Discount Rate | % | 9.00 |
19.2Economic Analysis
Harmony's respective business units and its associated operating sites consider the economic assumptions discussed in Section 19.1 during their respective planning and analysis processes. The past year’s average gold price is used for testing purposes. A gold price of ZAR1 040 000/kg is used for forecasting the revenue of the MWS and West Wits Mineral Reserve cash flow (Table 19-6 and Table 19-7).
The discounted cash flow model is used to calculate the Net Present Value (“NPV”) of the Mineral Reserve. The NPV for MWS is ZAR3,818 million which includes Franco Nevada price until the commitment is satisfied, thereafter the spot price is used. The NPV for West Wits operation spot price is ZAR241 million at a discount rate of 9%. The NPV is calculated on a cash flow that accounts for factors such as:
•mining and ore processing working costs;
•royalty payments;
Effective Date: June 30, 2024
101
Technical Report Summary for
Mine Waste Solutions, North West, South Africa
•capital costs, including costs allocated to ongoing development;
•any significant project work considered as major projects; and
•costs deemed as abnormal expenditure.
The cash flow for MWS is presented in Table 19-6, whilst that for West Wits is provided in Table 19-7.
Effective Date: June 30, 2024
102
Technical Report Summary for
Mine Waste Solutions, North West, South Africa
Table 19-6: MWS Cash Flow
| | | | | | | | | | | | | | | | | | | | | | | | | | | | | |
| Item | Units | Total | 2025 | 2026 | 2027 | 2028 | 2029 | 2030 | 2031 |
| Treated Tonnes | t'000 | 374,570 | | 27,061 | | 28,356 | | 28,344 | | 28,492 | | 28,334 | | 28,412 | | 28,412 | |
| Yield | g/t | 0.13 | | 0.14 | | 0.12 | | 0.12 | | 0.12 | | 0.13 | | 0.12 | | 0.11 | |
| Gold Recovered | kg | 46,897 | | 3,786 | | 3,335 | | 3,376 | | 3,366 | | 3,564 | | 3,395 | | 3,246 | |
| Gold Price | R/kg | 1,040,000 | | 948,245 | | 1,040,000 | | 1,040,000 | | 1,040,000 | | 1,040,000 | | 1,040,000 | | 1,040,000 | |
| Revenue | ZAR'000 | 48,425,424 | | 3,589,657 | | 3,468,794 | | 3,511,126 | | 3,500,228 | | 3,706,480 | | 3,530,450 | | 3,375,620 | |
| Total Operating cost | ZAR'000 | 35,245,802 | | 2,410,280 | | 2,518,486 | | 2,592,317 | | 2,635,413 | | 2,598,033 | | 2,608,261 | | 2,603,798 | |
| Total Capital including MCC | ZAR'000 | 3,443,351 | | 1,373,933 | | 608,758 | | 184,947 | | 184,946 | | 113,886 | | 121,962 | | 106,537 | |
| Royalty | ZAR'000 | 27,513 | | 254 | | 283 | | 73 | | 1,553 | | 3,144 | | 3,407 | | 2,117 | |
| Total Cost | ZAR'000 | 38,716,666 | | 3,784,467 | | 3,127,527 | | 2,777,337 | | 2,821,912 | | 2,715,063 | | 2,733,630 | | 2,712,452 | |
| Cash flow before tax | ZAR'000 | 9,708,758 | | (194,810) | | 341,267 | | 733,789 | | 678,316 | | 991,417 | | 796,820 | | 663,168 | |
| Taxation Payable | ZAR'000 | (2,310,899) | | — | | — | | (22,111) | | (166,091) | | (266,011) | | (204,698) | | (163,148) | |
| Net cash flow after tax | ZAR'000 | 7,397,859 | | (194,810) | | 341,267 | | 711,678 | | 512,225 | | 725,406 | | 592,122 | | 500,020 | |
| | | | | | | | | |
| Discounted NPV (ZAR’000) | Rate | NPV after tax | | | | | | | |
| NPV - (Harmony Preferred) | @9% | 3,817,898 | | | | | | | | |
| NPV - (medium discount rate) | @12% | 3,150,059 | | | | | | | | |
| NPV - (high discount rate) | @15% | 2,630,755 | | | | | | | | |
Effective Date: June 30, 2024
103
Technical Report Summary for
Mine Waste Solutions, North West, South Africa
| | | | | | | | | | | | | | | | | | | | | | | | | | | | | |
| Item | Units | Total | 2032 | 2033 | 2034 | 2035 | 2036 | 2037 | 2038 |
| Treated Tonnes | t'000 | 374,570 | | 28,492 | | 28,334 | | 28,412 | | 28,412 | | 28,492 | | 23,983 | | 11,033 | |
| Yield | g/t | 0.13 | | 0.12 | | 0.13 | 0.13 | 0.13 | 0.14 | 0.15 | 0.15 |
| Gold Recovered | kg | 46,897 | | 3,386 | | 3,399 | | 3,715 | | 3,630 | | 3,674 | | 3,407 | | 1,619 | |
| Gold Price | R/kg | 1,032,593 | | 1,040,000 | | 1,040,000 | | 1,040,000 | | 1,040,000 | | 1,040,000 | | 1,040,000 | | 1,040,000 | |
| Revenue | ZAR'000 | 48,425,424 | | 3,521,106 | | 3,534,552 | | 3,863,174 | | 3,775,471 | | 3,821,439 | | 3,543,727 | | 1,683,600 | |
| Total Operating cost | ZAR'000 | 35,245,802 | | 2,621,932 | | 2,626,330 | | 2,650,690 | | 2,662,061 | | 2,655,004 | | 2,622,521 | | 1,440,676 | |
| Total Capital including MCC | ZAR'000 | 3,443,351 | | 104,101 | | 113,380 | | 93,796 | | 107,569 | | 105,051 | | 87,689 | | 136,796 | |
| Royalty | ZAR'000 | 27,513 | | 2,505 | | 2,547 | | 3,099 | | 3,287 | | 2,673 | | 1,932 | | 639 | |
| Total Cost | ZAR'000 | 38,716,666 | | 2,728,538 | | 2,742,257 | | 2,747,585 | | 2,772,917 | | 2,762,728 | | 2,712,142 | | 1,578,111 | |
| Cash flow before tax | ZAR'000 | 9,708,758 | | 792,568 | | 792,295 | | 1,115,589 | | 1,002,554 | | 1,058,711 | | 831,585 | | 105,489 | |
| Taxation Payable | ZAR'000 | (2,310,899) | | (203,449) | | (203,137) | | (304,402) | | (268,548) | | (286,321) | | (215,951) | | (7,032) | |
| Net cash flow after tax | ZAR'000 | 7,397,859 | | 589,119 | | 589,158 | | 811,187 | | 734,006 | | 772,390 | | 615,634 | | 98,457 | |
| | | | | | | | | |
| Discounted NPV (ZAR’000) | Rate | NPV after tax | | | | | | | |
| NPV - (Harmony Preferred) | @9% | 3,817,898 | | | | | | | | |
| NPV - (medium discount rate) | @12% | 3,150,059 | | | | | | | | |
| NPV - (high discount rate) | @15% | 2,630,755 | | | | | | | | |
Effective Date: June 30, 2024
104
Technical Report Summary for
Mine Waste Solutions, North West, South Africa
Table 19-7: West Wits Operation Cash Flow
| | | | | | | | | | | | | | | | | |
| Item | Units | Total Reserve Plan | FY2025 | FY2026 | FY2027 |
| Treated Tonnes | t ('000) | 12,281 | 4,515 | 3,883 | 3,883 |
| Yield | g/t | 0.14 | 0.14 | 0.14 | 0.14 |
| Gold Recovered | kg | 1,689 | 624 | 540 | 525 |
| Gold Price | R/kg | 1,040,000 | 1,040,000 | 1,040,000 | 1,040,000 |
| Revenue | ZAR'000 | 1,757,019 | 649,210 | 561,894 | 545,915 |
| Total Operating cost | ZAR'000 | 1,354,788 | 598,622 | 376,482 | 379,684 |
| Total Capital including MCC | ZAR'000 | — | — | — | — |
| Royalty | ZAR'000 | 9,419 | 2,903 | 3,114 | 3,402 |
| Total Cost | ZAR'000 | 1,364,206 | 601,524 | 379,596 | 383,086 |
| Cash flow before tax | ZAR'000 | 392,812 | 47,685 | 182,298 | 162,829 |
| Taxation Payable | ZAR'000 | (100,637) | (5,024) | (50,887) | (44,726) |
| Net cash flow after tax | ZAR'000 | 292,175 | 42,661 | 131,411 | 118,103 |
| | | | | |
| Discounted NPV (ZAR’000) | Rate | NPV after tax | | | |
| NPV - (Harmony Preferred) | @9% | 240,942 | | | |
| NPV - (medium discount rate) | @12% | 226,914 | | | |
| NPV - (high discount rate) | @15% | 214,117 | | | |
Effective Date: June 30, 2024
105
Technical Report Summary for
Mine Waste Solutions, North West, South Africa
19.3Sensitivity Analysis
The economic assumptions, cash flow breakdown and economic analysis contribute to the basis for the sensitivity analysis. The sensitivities are calculated and analyzed, as shown in the accompanying Table 19-8, Table 19-9 and Table 19-10.
Harmony has reviewed its exposure in terms of South Africa’s political instability, the currency exchange rate, and the gold price, on its financial assets and financial liabilities, and has determined the sensitivities for a ±10% variance. Management considers this range to be a reasonable change given the volatility in the market.
The sensitivity analysis (Table 19-8 and Table 19-9) is based on a change in a single assumption while holding all other assumptions constant. In practice, this is unlikely to occur, as risks and/or opportunities will have an impact on the cash flows, and changes in some of these assumptions may be correlated. The insights that can be provided by this sensitivity analysis is that MWS and West Wits is most sensitive to gold price and production equally.
The impact of one or a combination of risks and opportunities occurring at the same time cannot be specifically quantified so an analysis considering multi-parameters is not considered.
19.3.1MWS Operation Sensitivity Analysis
The sensitivities for MWS are presented in Table 19-8, Table 19-9 and Table 19-10. The sensitivity analysis for MWS indicates that the cash flow is most sensitive to changes in the gold price (ZAR/kg), closely followed by changes in total operating costs (ZARm). Due to the Franco Nevada gold streaming arrangement, the sensitivities on the gold price used for the MWS operation is based on the Franco Nevada streaming arrangement (Table 19-2).
Table 19-8: MWS Gold Price Sensitivity Analysis
| | | | | | | | | | | | | | | | | | | | |
| Sensitivity (%) | Production (kg) | Gold Price (ZAR/kg) | Revenue (ZAR’000) | Total cost including tax (ZAR'000) | Net cash flow after tax (ZAR'000) | After tax NPV (ZAR’000) |
| 10% | 46,563 | 1,144,000 | 53,267,966 | 42,494,389 | 10,773,577 | 5,753,116 |
| 5% | 46,563 | 1,092,000 | 50,846,695 | 41,792,455 | 9,054,239 | 4,761,472 |
| Reserve plan | 46,563 | 1,040,000 | 48,425,424 | 41,027,563 | 7,397,860 | 3,817,898 |
| -5% | 46,563 | 988,000 | 46,004,152 | 40,337,067 | 5,667,085 | 2,820,016 |
| -10% | 46,563 | 936,000 | 43,582,881 | 39,658,250 | 3,924,631 | 1,806,565 |
Table 19-9: MWS operating Cost Sensitivity Analysis
| | | | | | | | | | | | | | | | | | | | |
| Sensitivity (%) | Production (kg) | Gold Price (ZAR/kg) | Revenue (ZAR’000) | Total cost including tax (ZAR'000) | Net cash flow after tax (ZAR'000) | After tax NPV (ZAR’000) |
| 10% | 46,563 | 1,040,000 | 48,425,424 | 43,782,313 | 4,643,110 | 2,175,502 |
| 5% | 46,563 | 1,040,000 | 48,425,424 | 42,401,512 | 6,023,911 | 3,001,580 |
| Reserve plan | 46,563 | 1,040,000 | 48,425,424 | 41,027,563 | 7,397,860 | 3,817,898 |
| -5% | 46,563 | 1,040,000 | 48,425,424 | 39,730,556 | 8,694,868 | 4,578,702 |
| -10% | 46,563 | 1,040,000 | 48,425,424 | 38,376,312 | 10,049,111 | 5,383,094 |
Table 19-10: MWS Total Production Sensitivity Analysis
| | | | | | | | | | | | | | | | | | | | |
| Sensitivity (%) | Production (kg) | Gold Price (ZAR/kg) | Revenue (ZAR’000) | Total cost including tax (ZAR'000) | Net cash flow after tax (ZAR'000) | After tax NPV (ZAR’000) |
| 10% | 51,219 | 1,040,000 | 53,267,966 | 42,494,389 | 10,773,577 | 5,753,116 |
| 5% | 48,891 | 1,040,000 | 50,846,695 | 41,792,456 | 9,054,239 | 4,761,472 |
| Reserve plan | 46,563 | 1,040,000 | 48,425,424 | 41,027,563 | 7,397,860 | 3,817,898 |
| -5% | 44,235 | 1,040,000 | 46,004,152 | 40,337,067 | 5,667,085 | 2,820,016 |
| -10% | 41,907 | 1,040,000 | 43,582,881 | 39,658,250 | 3,924,631 | 1,806,565 |
Effective Date: June 30, 2024
106
Technical Report Summary for
Mine Waste Solutions, North West, South Africa
19.3.2West Wits Operation Sensitivity Analysis
The sensitivities are calculated and analyzed, as shown in the accompanying tables (Table 19-11, Table 19-12 and Table 19-13). The sensitivity analysis indicates that West Wits is most sensitive to changes in the gold price (ZAR/kg).
Table 19-11: West Wits Total Gold Price Sensitivity Analysis
| | | | | | | | | | | | | | | | | | | | |
| Sensitivity (%) | Production (kg) | Gold Price (ZAR/kg) | Revenue (ZAR’000) | Total cost including tax (ZAR'000) | Net cash flow after tax (ZAR'000) | After tax NPV (ZAR’000) |
| 10% | 1,689 | 1,144,000 | 1,932,720 | 1,519,926 | 412,794 | 343,236 |
| 5% | 1,689 | 1,092,000 | 1,844,870 | 1,492,385 | 352,485 | 292,089 |
| Reserve plan | 1,689 | 1,040,000 | 1,757,019 | 1,464,844 | 292,175 | 240,942 |
| -5% | 1,689 | 988,000 | 1,669,168 | 1,442,454 | 226,713 | 185,068 |
| -10% | 1,689 | 936,000 | 1,581,317 | 1,413,714 | 167,603 | 134,159 |
Table 19-12: West Wits Total Operating Cost Sensitivity Analysis
| | | | | | | | | | | | | | | | | | | | |
| Sensitivity (%) | Production (kg) | Gold Price (ZAR/kg) | Revenue (ZAR’000) | Total cost including tax (ZAR'000) | Net cash flow after tax (ZAR'000) | After tax NPV (ZAR’000) |
| 10% | 1,689 | 1,040,000 | 1,757,019 | 1,562,843 | 194,175 | 156,065 |
| 5% | 1,689 | 1,040,000 | 1,757,019 | 1,515,445 | 241,573 | 197,345 |
| Reserve plan | 1,689 | 1,040,000 | 1,757,019 | 1,464,844 | 292,175 | 240,942 |
| -5% | 1,689 | 1,040,000 | 1,757,019 | 1,419,143 | 337,876 | 280,042 |
| -10% | 1,689 | 1,040,000 | 1,757,019 | 1,373,442 | 383,577 | 319,142 |
Table 19-13: West Wits Total Production Sensitivity Analysis
| | | | | | | | | | | | | | | | | | | | |
| Sensitivity (%) | Production (kg) | Gold Price (ZAR/kg) | Revenue (ZAR’000) | Total cost including tax (ZAR'000) | Net cash flow after tax (ZAR'000) | After tax NPV (ZAR’000) |
| 10% | 1,858 | 1,040,000 | 1,932,720 | 1,519,926 | 412,794 | 343,236 |
| 5% | 1,774 | 1,040,000 | 1,844,870 | 1,492,385 | 352,485 | 292,089 |
| Reserve plan | 1,689 | 1,040,000 | 1,757,019 | 1,464,844 | 292,175 | 240,942 |
| -5% | 1,605 | 1,040,000 | 1,669,168 | 1,442,454 | 226,713 | 185,068 |
| -10% | 1,520 | 1,040,000 | 1,581,317 | 1,413,714 | 167,603 | 134,159 |
Effective Date: June 30, 2024
107
Technical Report Summary for
Mine Waste Solutions, North West, South Africa
20Adjacent properties
Section 229.601(b)(96)(iii)(B) (20) (i-iv)
The footprints of the MWS operation TSFs cover an area of approximately 1,100ha. The material contained in the TSFs (which forms part of the LOM plan and thus the Mineral Reserves) and WRDs originates from the Vaal River, Buffelsfontein, Hartebeestfontein, and Stilfontein gold mines.
The West Wits operation is located to the northwest of the Mponeng mine with its major TSF being the Old North TSF that was used as the TSF for the original Savuka mine. TauTona and Savuka have been completely mined out with respect to the VCR horizon, however some infrastructure remains on the CLR horizon.
Effective Date: June 30, 2024
108
Technical Report Summary for
Mine Waste Solutions, North West, South Africa
21Other Relevant Data and Information
Section 229.601(b)(96)(iii)(B) (21)
Public disclosure reports on Mine Waste Solutions operational, financial, and environmental performance are available on the Company’s corporate website. The following reports are relevant to this TRS:
•Integrated report 2024;
•ESG report 2024;
•Financial report 2024;
•Operational report 2024; and
•Climate action and impact report 2024.
Effective Date: June 30, 2024
109
Technical Report Summary for
Mine Waste Solutions, North West, South Africa
22Interpretation and Conclusions
Section 229.601(b)(96)(iii)(B) (22)
In the opinion of the QP, Mine Waste Solutions and West Wits operations are 100% owned Harmony assets and are located in well-established mining districts. Both operations are accessible within the national and provincial road network, with well-established infrastructure. Management has an in depth understanding of the aspects pertaining to legal and environmental matters with respect to operating within the South African mining law, as regulated by the MPRDA, and supporting legislation.
AngloGold Ashanti acquired MWS operations from First Uranium in 2012. On October 1, 2020 Harmony acquired all of AngloGold Ashanti’s surface operations, including the MWS and West Wits operations.
The drilling and sampling methodology in use for Harmony’s TSFs has been developed specifically for the challenges posed by these deposits and is aligned with industry best practice. This protocol has been in place since 2011, and the drilling components are applied by contractors who are experienced in this specific methodology.
Mine Waste Solutions’ Mineral Resources and Mineral Reserves are derived from TSFs and WRDs originating from deep level gold mines, mostly located in Klerksdorp and Carletonville. The MWS operations are mainly derived from the mining of VR. The Carletonville mining operations predominantly mined reefs such as the CLR and the VCR.
Post 2012, after AngloGold Ashanti acquired the operations, a drilling campaign was implemented on all planned TSFs for updated block models except Buffels 2,3,4 (floor cleaning). Belt sampling is used in the Mineral Resource estimate and grade control as WRDs are not drilled.
The TSF samples are submitted with internal Harmony QAQC material. The received laboratory results are verified based on the performance internal QAQC. WRD samples are not submitted to the laboratory with Harmony internal QC material. The QP relies on the laboratory’s internal QAQC procedures to verify accuracy and precision of the primary sample results. TSF drilling data is stored in an accessed controlled database that is auditable.
On the current sources, the reclaimed source gets sampled daily for the duration of the production month to make a composite sample for the base leach test work. Simulating the plant conditions at an ISO/IEC17025 accredited laboratory, the leachability of the material is established, and the data is used to formulate the performance targets.
On prospective deposits, samples are collected through drilling on an even grid system covering the entire surface area of the dam and the height of the deposit. The collected samples get sent to an ISO/IEC17025 accredited laboratory for grade, mineralogical association determination and gold recovery test works. The acquired data is used to determine the financial viability of the deposit as an ore resource in-line with the existing plant infrastructure.
To successfully operate a mining or reclamation operation in South Africa, the State requires compliance with applicable environmental laws, regulations, permits and standards. Mine Waste Solutions and West Wits operations adhere to said compliance and regulatory standards and have, in addition, implemented an Environmental Management System in line with the ISO 14001. Mine Waste Solutions has all permits required to operate. The status of the permits held by the company are presented in Table 1-8. The permits expiring in 2024 are the ones that are renewed yearly and will be by the beginning of the year.
As part of Harmony, MWS and West Wits conduct their operations based on policies and systems that are aligned with corporate sustainable development framework. This is guided by the principles of the framework from the International Council on Mining and Metals or the United Nations Global Compact. Harmony discloses its sustainable development voluntarily in accordance with the guidelines issued by the Global Reporting Initiative (“GRI”). Further to this, Harmony discloses environmental information on the Carbon Disclosure Project (“CDP”) for both climate change and water.
The MWS Measured and Indicated Mineral Resources, exclusive of Mineral Reserves, decreased from 0.783Moz gold in June 2023 to 0.762Moz gold in June 2024. The key difference can be attributed to the processing of Tailings Material through Mine Waste solutions plant.
Effective Date: June 30, 2024
110
Technical Report Summary for
Mine Waste Solutions, North West, South Africa
The MWS Inferred Mineral Resources increased from 0.341Moz gold in June 2023 to 0.357Moz gold in June 2024 due to the residue deposits onto Mispah 1.
The West Wits Measured and Indicated Mineral Resources, exclusive of Mineral Reserves, increased from 0.2692Moz gold in June 2023 to 0.2693Moz gold in June 2024 due to Old North L19 reduction in Mineral Reserves on the back of deposition constrains. The above is offset by Mponeng Waste Rock dump processing through Mponeng gold plant.
The Mineral Reserve estimate for MWS decreased from 3.525Moz gold in June 2023 to 3.327Moz gold in June 2024. The key difference can be attributed to TSF processing. Sources that were processed during the year included, Abandoned Dam, South East Extension, East TSF, Buffels 5 as well as Harties 1 and 2.
The Mineral Reserve estimate for West Wits decreased from 17.4Mt at a grade of 0.32g/t (0.176Moz gold) in June 2023 to 12.3Mt at a grade of 0.32g/t (0.126Moz gold) in June 2024. The key difference can be attributed to the Old North L19 processing period reduction to accommodate the deposition constraints.
Reclaimed tailings are pumped as slurry via pipelines and WRD material is transported on trucks, to the respective plants for processing at one of two plants, using an established processing method. The operational infrastructure for both MWS operation and West Wits operation including road, rail, offices, security services, water and power supply is adequate, and is shared with the Harmony operations in the relevant areas. The infrastructure is sufficient for the realization of the current Mineral Reserve plan.
The economics for both MWS and West Wits operations display positive discounted cashflow. The streaming contract with Franco Nevada concluded in the second quarter of the 2025 financial year. This contract resulted in Mine Waste Solutions' average gold price received for FY24 being approximately 18% below the average gold price received at our other operations. Once this contract ends, we expect a further boost to gold revenue and cash flows. The NPV after tax for MWS and West Wits are ZAR3,818 million and ZAR241 million respectively, at a discount rate of 9%. The NPV is calculated on cash flow that takes input parameters including capital and operating costs and royalties. The capital and operating cost estimates for MWS are based on budget forecasts. The assumptions and conclusions in this TRS contain the views of QPs and does not contain any known material risks at the time of compilation.
Each specialist was responsible for specific sections of this TRS which they have personally supervised and reviewed. This TRS contains the expression of the QP's opinions, based on the information available at the time of preparation.
The gold price used for both Mineral Resources and Reserves are signed off by Harmony Corporate Office (Randfontein) and the QP is of the opinion that this price is reasonable.
All the required permits are in place and amendments are being actioned. The Kareerand expansion capital has been approved. The West Complex pump station is in the process of being constructed. The MWS pump station is in feasibility phase and will commence in September 2024 and Stream 4 will commence in November 2024.
In the West Wits, Old north TSF is not depleted in the plan due to deposition constraint
Effective Date: June 30, 2024
111
Technical Report Summary for
Mine Waste Solutions, North West, South Africa
23Recommendations
Section 229.601(b)(96)(iii)(B) (23)
It is recommended that an aerial survey be carried out monthly, instead of a manual GPS survey, to provide a high degree of accuracy with respect to digital terrain model and monthly survey results. This is also safer than the manual GPS survey.
Stringent measures must be put in place to ensure the reclamation is done at an acceptable relative density to avoid bypass to Kareerand to ensure all declared tonnages are processed for gold.
Effective Date: June 30, 2024
112
Technical Report Summary for
Mine Waste Solutions, North West, South Africa
24 References
Section 229.601(b)(96)(iii)(B) (24)
CAE (2015) Technical report of the AGA Sulphur Pay Dam Mineral Resource Estimation. REP2015-2720.
Govindsammy, V. (2005). Vaal River Surface Mineral Resource Statement as at December 31, 2005.
Govindsammy, V. (2006) Vaal River Surface Resource Project.
Harmony Gold Mining Company (2020) Corporate Business Plan, 2020.
Harmony Gold Mining Company (2021) Corporate Business Plan, 2021.
https://www.gold.org/goldhub/data/gold-prices. Accessed July 22, 2022.
King, HL. (2012) An Independent Qualified Persons Report on the Mine Waste Solutions Tailings Recovery Project, North West Province, South Africa.
Lenahan, WC and Murray-Smith, RdL. (1989) Assay and analytical practice in the South African Mining Industry. The South African Institute of Mining and Metallurgy. Johannesburg.
Minxcon (2016) Technical Report on the AGA Old North Tailings Storage Facility Mineral resource estimation, Savuka Mine, Gauteng, South Africa
Minxcon (2018) Technical Report on the AGA Old North Tailings Storage Facility Mineral resource estimation, Savuka Mine, Gauteng, South Africa
Rademeyer B. (2000) Vaal River Surface Mineral Resources as at December 31, 2000.
Selebogo BJ (2019) WW and VR Waste Rock Dump Sampling procedure, 2019.
Selebogo BJ (2021) Competent Persons Report, Mine Waste Solutions, 2022.
Maipushi, MS. (2015) Tailings storage facilities sampling procedure. SA Surface Operations, Mine Waste Solutions. STD2015-2378_Auger drilling and sampling procedure
Maipushi MS (2021) Summary on scout drilling program and usage. Mine Waste Solution, North West, South Africa.
Maipushi MS (2000) East TSF metallurgical test work report. Mine Waste Solution, North West, South Africa
Robb, L.J., and Meyer, F., 1995. The Witwatersrand Basin, South Africa: Geological framework and mineralisation processes. Ore Geology Reviews, 10(2), 67-94.
Robb, L.J., Robb, V.M., 1998. Gold in the Witwatersrand Basin. In: Wilson, M.G.C., Anhaeusser, C.R. (Eds.), The Mineral Resources of South Africa. Handbook. Council for Geoscience, 294–349.
World Gold Council. (July 13, 2022). World Gold Council, Gold Hub, Gold mine production: Gold Production by Country | Gold Production | Goldhub
Effective Date: June 30, 2024
113
Technical Report Summary for
Mine Waste Solutions, North West, South Africa
25Reliance on Information Provided by the Registrant
Section 229.601(b)(96)(iii)(B) (25)
Further to Section 24, in the preparation of this TRS, the QP relied upon information provided by the Registrant and other internal specialists with regards to mining rights, surface rights, contractual agreements, historical operating expenditures, community relations and other matters. The work conducted by these specialists was completed under the supervision and direction of the QP. The specialists who assisted the QP are listed in Table 25-1.
Table 25-1: Other Specialists
| | | | | | | | | | | | | | |
| Name | Specialist | Area of Responsibility | TRS Section Responsibility | Association / Company |
| G Lodder | Finance/Costing | Finance Manager | 18.1 | MWS |
| N Sekwele | Finance/Costing | Company Accountant | 18.2 | West Wits |
| C Geel | Environmental | Environmental Manager | 17 | Central |
| MS Maipushi | Mineral Resources | Mineral Resources | Geology | MWS & West Wits |
| S Venter | Senior Mine Planner | LOM Plan | Mineral Reserves | MWS & West Wits |
| | | | |
| | | | |
| | | | |
| | | | |
| | | | |
Effective Date: June 30, 2024
114