HARMONY GOLD MINING COMPANY LIMITED
Technical Report Summary of the
Mineral Resources and Mineral Reserves
for
Tshepong South
Free State Province, South Africa
Effective Date: June 30, 2024
Final Report Date: October 31, 2024
Technical Report Summary for
Tshepong South, Free State Province, South Africa
| | |
IMPORTANT NOTICE
This Technical Report Summary has been prepared for Harmony Gold Mining Company Limited in support of disclosure and filing requirements with the United States Securities and Exchange Commission’s (SEC) under Subpart 1300 of Regulation S-K 1300 and Section 229.601(b)(96) of Regulation S-K. The quality of information, estimates, and conclusions contained in this Technical Report Summary apply as of the effective date of this report. Subsequent events that may have occurred since that date may have resulted in material changes to such information, estimates and conclusions in this summary. |
Effective Date: June 30, 2024
Technical Report Summary for
Tshepong South, Free State Province, South Africa
QP Consent and Sign-off
I have read and understood the requirements of:
•the South African Code for Reporting of Exploration Results, Mineral Resources and Mineral Reserves (the “SAMREC Code, 2016 edition”)
•the Harmony Guidelines on the Reporting of Exploration Results, Mineral Resources and Mineral Reserves
•Subpart 1300 (17 CFR 229.1300) of Regulation S-K, Disclosure by Registrants Engaged in Mining Operations (“Regulation S-K 1300”)
I am a Competent Person as defined by the SAMREC Code, 2016 edition and the Qualified Person (“QP”) under Regulation S-K 1300, having more than five years` experience that is relevant to the style of mineralization and type of deposit described in the Report, and to the all activities for which I am accepting responsibility and have been appointed as QP for Tshepong South Mineral Resources and Mineral Reserves.
I am a Member of SACNASP and my registration is as follow:
Mineral Resource
Mr C. Pienaar
SACNASP (South African Council for Natural Scientific Professions)
Nr 135676
Years’ Experience: 15
I have reviewed the tables and graphs included for the Tshepong South Mineral Resource and Mineral Reserve which will be used in the 2024 Harmony Gold Mineral Resource and Mineral Reserve Report to which this Consent Statement applies.
I acknowledge responsibility for all the sections of the TRS report and as the QP and author I relied on information provided by various subject experts.
At the effective date of the Report, to the best of my knowledge, information and belief, the Report contains all scientific and technical information that is required to be disclosed to make the Report not misleading.
/s/ Conrad Pienaar
___________________________________
Mr C. Pienaar
B.Sc Hons (Geology)
SACNASP (135676)
HOD Geology
Tshepong South
Harmony Gold Mining Company Limited
Effective Date: June 30, 2024
Technical Report Summary for
Tshepong South, Free State Province, South Africa
List of Contents
Effective Date: June 30, 2024
Technical Report Summary for
Tshepong South, Free State Province, South Africa
Effective Date: June 30, 2024
Technical Report Summary for
Tshepong South, Free State Province, South Africa
Effective Date: June 30, 2024
Technical Report Summary for
Tshepong South, Free State Province, South Africa
Effective Date: June 30, 2024
Technical Report Summary for
Tshepong South, Free State Province, South Africa
List of Figures
Effective Date: June 30, 2024
Technical Report Summary for
Tshepong South, Free State Province, South Africa
List of Tables
Effective Date: June 30, 2024
Technical Report Summary for
Tshepong South, Free State Province, South Africa
Units of Measure and Abbreviations
| | | | | |
| Unit / Abbreviation | Description or Definition |
| °C | degrees Celsius |
| µm | Micrometers |
| 2D | Two-dimensional |
| 3D | Three-dimensional |
| AE | Abnormal expenditure |
| Ag | Silver |
| AngloGold Ashanti | AngloGold Ashanti Limited |
| ARM | African Rainbow Minerals Limited |
| ARMGold | ARM Gold Division |
| Au | Gold |
| AuBIS | Harmony electronic database |
| Ave. | Average |
| BLR | Black Reef |
| BMD | Below mine datum |
| Bn | Billion |
| c. | Approximately |
| CIP | Carbon-In-Pulp |
| CLR | Carbon Leader Reef |
| cm | Centimeter |
| cmg/t | Centimeter-grams per tonne |
| CODM | Chief Operating Decision-Maker |
| Company | Harmony Gold Mining Company Limited |
| COP | Code of Practice |
| CRG | Central Rand Group |
| CRM | Certified Reference Material |
| CV | Coefficient of Variation |
| DBH | Dewatering borehole |
| DMRE | Department of Mineral Resources and Energy |
| DWAFEC | Department of Water Affairs, Forestry and Environmental Conservation |
| DWS | Department of Water and Sanitation |
| EIA | Environmental Impact Assessment |
| EMPR | Environmental Management Program |
| EMS | Environmental Management System |
| EMTS | Electric Monorail Transport System |
| ESG | Environmental Social and Governance |
| ETF | Exchange traded fund |
| FAG | Fully autogenous |
| FX | Foreign Exchange rate |
| g | Gram |
| g/t | Grams per metric tonne |
| GBH | Groundwater boreholes |
| GDARD | Gauteng Department of Agriculture and Rural Development |
| GHG | Greenhouse gas |
| GISTM | Global Industry Standard on Tailings Management |
| ha | Hectare |
| Harmony | Harmony Gold Mining Company Limited |
| HLS | Heavy liquid separation |
| HPE | Hydro-powered |
| kg | Kilogram |
Effective Date: June 30, 2024
Technical Report Summary for
Tshepong South, Free State Province, South Africa
| | | | | |
| Unit / Abbreviation | Description or Definition |
| km | Kilometer |
km2 | Square kilometer |
| kWh | Kilowatt-hour |
| LBMA | London Bullion Market Association |
| LIB | Long Inclined Borehole |
| LOM | Life of Mine |
| LOI | Loss on ignition |
| Ltd | Limited |
| m | Meter |
| M | Million |
m3/hr | Cubic meters per hour |
| MCC | Mining Charter Compliance |
| MCF | Mine Call Factor |
| Moz | Million troy ounces |
| MPRDA | Mineral and Petroleum Resources Development Act, 28 of 2002 |
| Mt | Million tonnes |
| Mtpa | Million tonnes per annum |
| Mtpm | Million tonnes per month |
| NEMA | National Environmental Management Act, 107 of 1998 |
| No. | Number |
| NPV | Net present value |
| OK | Ordinary Kriging |
| oz | Troy ounce |
| OTC | Over the counter |
| Tshepong South | Tshepong South Mine |
| Pty | Proprietary |
| QA/QC | Quality Assurance/Quality Control |
| QEMSCAN | Scanning electron microscope |
| QP | Qualified Person |
| RAW’s | Return Airways |
| ROM | Run-of-Mine |
| SACNASP | South African Council for Natural Scientific Professions |
| SAMREC | The South African Code for the Reporting of Exploration Results, Mineral Resources and Mineral Reserves |
| SD | Standard Deviation |
| SEC | Securities and Exchange Commission |
| SGM | Sequential Grid Mining |
| SLP | Social Labour Plan |
| SMK | Simple Macro Kriging |
| t | Metric tonne |
t/m3 | Tonne per cubic meter |
| Target | Target Mine |
| TCFD | Task Force on Climate-Related Financial Disclosure |
| TMS | Trace mineral search |
| TRS | Technical Report Summary |
| TSF | Tailings Storage Facility |
| Tshepong | Tshepong Mine |
| USD | United States Dollars |
| USD/oz | United States Dollar per troy ounce |
| WRG | West Rand Group |
| WUL(s) | Water Use License(s) |
Effective Date: June 30, 2024
Technical Report Summary for
Tshepong South, Free State Province, South Africa
| | | | | |
| Unit / Abbreviation | Description or Definition |
| X/C’s | Cross-cuts |
| XRD | X-ray diffraction |
| ZAR | South African Rand |
| ZAR/kg | South African Rand per kilogram |
Effective Date: June 30, 2024
Technical Report Summary for
Tshepong South, Free State Province, South Africa
Glossary of Terms
| | | | | |
| Term | Definition |
| Co-kriging | A method that is used to predict the value of the point at unobserved locations by sample points that are known to be spatially interconnected by adding other variables that have a correlation with the main variable or can also be used to predict 2 or more variables simultaneously. |
| Cut-off grade | Cut-off grade is the grade (i.e., the concentration of metal or mineral in rock) that determines the destination of the material during mining. For purposes of establishing “prospects of economic extraction,” the cut-off grade is the grade that distinguishes material deemed to have no economic value (it will not be mined in underground mining or if mined in surface mining, its destination will be the waste dump) from material deemed to have economic value (its ultimate destination during mining will be a processing facility). Other terms used in similar fashion as cut-off grade include net smelter return, pay limit, and break-even stripping ratio. |
| Dilution | Unmineralized rock that is by necessity, removed along with ore during the mining process that effectively lowers the overall grade of the ore. |
| Head grade | The average grade of ore fed into the mill. |
| Economically viable | Economically viable, when used in the context of Mineral Reserve determination, means that the qualified person has determined, using a discounted cash flow analysis, or has otherwise analytically determined, that extraction of the Mineral Reserve is economically viable under reasonable investment and market assumptions. |
| Indicated Mineral Resource | Indicated Mineral Resource is that part of a Mineral Resource for which quantity and grade or quality are estimated on the basis of adequate geological evidence and sampling. The level of geological certainty associated with an Indicated Mineral Resource is sufficient to allow a qualified person to apply modifying factors in sufficient detail to support mine planning and evaluation of the economic viability of the deposit. Because an Indicated Mineral Resource has a lower level of confidence than the level of confidence of a Measured Mineral Resource, an Indicated Mineral Resource may only be converted to a probable Mineral Reserve. |
| Inferred Mineral Resource | Inferred Mineral Resource is that part of a Mineral Resource for which quantity and grade or quality are estimated on the basis of limited geological evidence and sampling. The level of geological uncertainty associated with an Inferred Mineral Resource is too high to apply relevant technical and economic factors likely to influence the prospects of economic extraction in a manner useful for evaluation of economic viability. Because an Inferred Mineral Resource has the lowest level of geological confidence of all Mineral Resources, which prevents the application of the modifying factors in a manner useful for evaluation of economic viability, an Inferred Mineral Resource may not be considered when assessing the economic viability of a mining project and may not be converted to a Mineral Reserve. |
| Kriging | A method of interpolation based on Gaussian process governed by prior covariances. It uses a limited set of sampled data points to estimate the value of a variable over a continuous spatial field |
| Mine Call Factor | The ratio, expressed as a percentage, of the total quantity of recovered and unrecovered mineral product after processing with the amount estimated in the ore based on sampling. |
| Measured Mineral Resource | Measured Mineral Resource is that part of a Mineral Resource for which quantity and grade or quality are estimated on the basis of conclusive geological evidence and sampling. The level of geological certainty associated with a Measured Mineral Resource is sufficient to allow a qualified person to apply modifying factors, as defined in this section, in sufficient detail to support detailed mine planning and final evaluation of the economic viability of the deposit. Because a Measured Mineral Resource has a higher level of confidence than the level of confidence of either an Indicated Mineral Resource or an Inferred Mineral Resource, a Measured Mineral Resource may be converted to a Proven Mineral Reserve or to a Probable Mineral Reserve. |
| Mineral Reserve | Mineral Reserve is an estimate of tonnage and grade or quality of Indicated and Measured Mineral Resources that, in the opinion of the qualified person, can be the basis of an economically viable project. More specifically, it is the economically mineable part of a Measured or Indicated Mineral Resource, which includes diluting materials and allowances for losses that may occur when the material is mined or extracted. |
| Mineral Resource | Mineral Resource is a concentration or occurrence of material of economic interest in or on the Earth’s crust in such form, grade or quality, and quantity that there are reasonable prospects for economic extraction. A Mineral Resource is a reasonable estimate of mineralization, taking into account relevant factors such as cut-off grade, likely mining dimensions, location or continuity, that, with the assumed and justifiable technical and economic conditions, is likely to, in whole or in part, become economically extractable. It is not merely an inventory of all mineralisation drilled or sampled. |
Effective Date: June 30, 2024
Technical Report Summary for
Tshepong South, Free State Province, South Africa
| | | | | |
| Term | Definition |
| Modifying Factors | Modifying factors are the factors that a qualified person must apply to Indicated and Measured Mineral Resources and then evaluate in order to establish the economic viability of Mineral Reserves. A qualified person must apply and evaluate modifying factors to convert Measured and Indicated Mineral Resources to Proven and Probable Mineral Reserves. These factors include but are not restricted to; mining; processing; metallurgical; infrastructure; economic; marketing; legal; environmental compliance; plans, negotiations, or agreements with local individuals or groups; and governmental factors. The number, type and specific characteristics of the modifying factors applied will necessarily be a function of and depend upon the mineral, mine, property, or project. |
| Pre-Feasibility Study | A pre-feasibility study (or preliminary feasibility study) is a comprehensive study of a range of options for the technical and economic viability of a mineral project that has advanced to a stage where a qualified person has determined (in the case of underground mining) a preferred mining method, or (in the case of surface mining) a pit configuration, and in all cases has determined an effective method of mineral processing and an effective plan to sell the product. (1) A pre-feasibility study includes a financial analysis based on reasonable assumptions, based on appropriate testing, about the modifying factors and the evaluation of any other relevant factors that are sufficient for a qualified person to determine if all or part of the Indicated and Measured Mineral Resources may be converted to Mineral Reserves at the time of reporting. The financial analysis must have the level of detail necessary to demonstrate, at the time of reporting, that extraction is economically viable. (2) A pre-feasibility study is less comprehensive and results in a lower confidence level than a feasibility study. A pre-feasibility study is more comprehensive and results in a higher confidence level than an initial assessment. |
|
|
| Probable Mineral Reserve | Probable Mineral Reserve is the economically mineable part of an Indicated and, in some cases, a Measured Mineral Resource. |
| Proven Mineral Reserve | Proven Mineral Reserve is the economically mineable part of a Measured Mineral Resource and can only result from conversion of a Measured Mineral Resource. |
| Qualified Person | A qualified person is: (1) A mineral industry professional with at least five years of relevant experience in the type of mineralization and type of deposit under consideration and in the specific type of activity that person is undertaking on behalf of the registrant; and (2) An eligible member or licensee in good standing of a recognized professional organization at the time the technical report is prepared. For an organization to be a recognized professional organization, it must: (i) Be either: (A) An organization recognized within the mining industry as a reputable professional association; or (B) A board authorized by U.S. federal, state or foreign statute to regulate professionals in the mining, geoscience or related field; (ii) Admit eligible members primarily on the basis of their academic qualifications and experience; (iii) Establish and require compliance with professional standards of competence and ethics; (iv) Require or encourage continuing professional development; (v) Have and apply disciplinary powers, including the power to suspend or expel a member regardless of where the member practices or resides; and (vi) Provide a public list of members in good standing. |
|
|
|
|
|
|
|
|
|
|
| Tailings | Finely ground rock of low residual value from which valuable minerals have been extracted is discarded and stored in a designed dam facility. |
Effective Date: June 30, 2024
Technical Report Summary for
Tshepong South, Free State Province, South Africa
1Executive Summary
Section 229.601(b)(96)(iii)(B)(1)
The QP of Harmony Gold Mining Company Limited (“Harmony” or the “Company”) has prepared this Technical Report Summary (“TRS”) to disclose the Mineral Resource and Mineral Reserve estimates for the Company’s Tshepong South Mine (“Tshepong South”). The TRS has been prepared in accordance with the U.S. Securities and Exchange Commission’s (“SEC”) Regulation S-K 1300, with an effective date as at June 30, 2024. No material changes have occurred between the effective date and the date of signature of this TRS.
This TRS updates the TRS filed by Harmony on Tshepong South on October 31, 2023, named Exhibit 96.13 Technical Report Summary of the Mineral Resources and Mineral Reserves for Tshepong South, Free State Province, South Africa, which was effective on June 30, 2023. This TRS is being filed to satisfy the requirement of Item 1302(e)(6) of regulation S-K. An economic assessment was included, using a detailed discounted cashflow analysis for the Mineral Reserves, excluding all scheduled Inferred Mineral Resources which is not reported under Mineral Reserves.
Property Description
Tshepong South comprise the underground and surface assets associated with one mine, namely Tshepong South (“Tshepong South”,“Tshepong South Mine” or “Phakisa”), situated between the towns of Welkom and Odendaalsrus in the Free State Province of South Africa. The mine is a moderate to deep-level gold mine, operating at depths of between 1.6km and 2.4km below mine datum (“BMD”). The primary reef mined is the Basal Reef, with additional gold mineralization being found in the B-Reef and A-Reef.
Mining at Tshepong South is carried out under the following mining right, covering both Tshepong North and Tshepong South:
•FS30/5/1/284MR, which is valid from December 11, 2007 to December 10, 2029 and covers an area of 10,798.74 hectares (“ha”).
The mining right was originally held in a joint venture between African Rainbow Minerals Limited (“ARM”) Gold Division (“ARMGold”) and Harmony until ARMGold was incorporated into Harmony.
All relevant underground mining and surface right permits, and any other permit related to the work conducted on the property have been obtained and are valid. There are no known legal proceedings (including violations or fines) against Harmony, which threaten its mineral rights, tenure, or operations.
Ownership
Tshepong South is wholly owned by Harmony, including the associated mineral rights. Harmony commenced acquiring the assets through the acquisition of AngloGold Ashanti Limited (“AngloGold Ashanti”) Free State operations in 2001, together with ARMGold. ARMGold was subsequently incorporated into Harmony in 2003, giving Harmony 100% ownership and control of the Tshepong South.
Geology and Mineralization
Tshepong South is situated in the Free State Goldfield, on the southwestern margin of the Witwatersrand Basin of South Africa, one of the most prominent gold provinces in the world. The major gold bearing conglomerate reefs are mostly confined to the Central Rand Group (“CRG”) of the Witwatersrand Supergroup.
The general orientation of the Witwatersrand Supergroup succession in this goldfield is interpreted as north-trending, within a syncline that is plunging to the north. The syncline has been divided by faults into the Odendaalsrus, Central Horst and Virginia sections. The Tshepong South mining right area is also affected by the Ophir and Dagbreek faults.
Tshepong South exploited primarily the Basal Reef, which occurs within the Harmony Formation of the Johannesburg Subgroup of the CRG.
Effective Date: June 30, 2024
1
Technical Report Summary for
Tshepong South, Free State Province, South Africa
Mineralization also occurs within the stratigraphically higher A- and B-Reefs of the Kimberley (formerly Aandenk) Formation, within the Turffontein subgroup of the CRG. However, only the B-Reef can be economically extracted.
Mineralization is associated with the presence of medium to coarse, clast-supported oligomictic pebble horizons. The presence of allogenic pyrite and detrital carbon is also common.
Status of Exploration, Development and Operation
The Basal Reef at Tshepong South has been extensively explored from historic borehole data collected during initial Shaft Sinking stage beginning of 1994 and vigorous data collection (Borehole and Chip sample) in the early 2007 when development from the Station commenced. Recent exploration has mainly focused on improving confidence in the geological model, as well as adding and upgrading Mineral Resources to replace the mining depletion. Geological data has been obtained through underground channel sampling, mapping and exploration drilling. Initial exploration included a historical geophysical seismic survey and surface diamond core drilling comprising of nine mother holes. This was followed up with closer spaced underground data gathering exercises.
Mineral Resource Estimate
The Mineral Resources for the Basal Reef and B-Reef were estimated by the Harmony QP in Datamine™ Studio software. The QP created block models based on a verified electronic database containing surface drill hole data, as well as underground drilling, mapping, and sampling data obtained up until December 2023. Gold values were estimated using ordinary and simple macro kriging interpolation methods.
The Mineral Resources for Tshepong South were correspondingly originally prepared, classified and reported in accordance with the South African Code for the Reporting of Exploration Results, Mineral Resources and Mineral Reserves (“SAMREC, 2016”). For the purposes of this TRS, the Mineral Resources have been classified in accordance with § 229.1302(d)(1)(iii)(A) (Item 1302(d)(1)(iii)(A) of Regulation S-K).
The QP compiling the Mineral Resource estimate for Tshepong South is Mr Conrad Pienaar, Geology HOD at Tshepong South and an employee of Harmony.
The Mineral Resource estimate for Tshepong South, as at June 30, 2024, exclusive of the reported Mineral Reserves is summarized in Table 1-1.
Table 1-1: Summary of Tshepong South Mineral Resources as at June 30, 2024 (Exclusive of Mineral Reserves) 1-8
| | | | | | | | | | | |
| METRIC |
| Mineral Resource Category | Tonnes (Mt) | Gold Grade (g/t) | Gold Content (kg) |
| Measured | 6.155 | 12.80 | 78 768 |
| Indicated | 8.687 | 11.10 | 96 434 |
| Total / Ave. Measured + Indicated | 14.843 | 11.80 | 175 202 |
| Inferred | 22.799 | 11.03 | 251 447 |
| IMPERIAL |
| Mineral Resource Category | Tons (Mt) | Gold Grade (oz/t) | Gold Content (Moz) |
| Measured | 6.785 | 0.373 | 2.532 |
| Indicated | 9.576 | 0.324 | 3.100 |
| Total / Ave. Measured + Indicated | 16.361 | 0.344 | 5.633 |
| Inferred | 25.131 | 0.322 | 8.084 |
Notes:
1. Mineral Resources are reported with an effective date of June 30, 2024 were originally prepared, classified and reported according to SAMREC, 2016. For the purposes of this TRS, the Mineral Resources have been classified in accordance with § 229.1302(d)(1)(iii)(A) (Item 1302(d)(1)(iii)(A) of Regulation S-K). The Qualified Person responsible for the estimate is Mr Conrad Pienaar, who is Geology HOD at Tshepong South, and a Harmony employee.
2. The Mineral Resource tonnes are reported as in-situ with reasonable prospects for economic extraction.
3. No modifying factors or dilution sources have been included to in-situ Reserve which was subtracted from the SAMREC Resource in order to obtain the S-K 1300 Resource.
4. The Mineral Resources are reported using a cut-off value of 780cmg/t determined at a gold price of USD1,878/oz.
5. Tonnes are reported as rounded to three decimal places. Gold values are rounded to zero decimal places.
6. Mineral Resources are exclusive of Mineral Reserves. Mineral Resources are not Mineral Reserves and do not necessarily demonstrate economic viability.
7. Rounding as required by reporting guidelines may result in apparent summation differences.
8. The Mineral Resource estimate is for Harmony’s 100% interest.
Effective Date: June 30, 2024
2
Technical Report Summary for
Tshepong South, Free State Province, South Africa
Mineral Reserve Estimate
Mineral Reserves are derived from the Mineral Resources, a detailed business plan and the operational mine planning processes. Mine planning utilises and takes into consideration historical technical parameters achieved. In addition, Mineral Resource conversion to Mineral Reserves considers Modifying Factors, dilution, ore losses and minimum mining widths.
The Mineral Reserves for Tshepong South were originally prepared, classified and reported according to SAMREC, 2016. For the purposes of this TRS, the Mineral Reserves have been classified in accordance with § 229.1302(d)(1)(iii)(A) (Item 1302(d)(1)(iii)(A) of Regulation S-K). The Mineral Reserve estimate for Tshepong South, as at June 30, 2024, is summarized in Table 1-2.
The QP compiling the Mineral Resource estimate for Tshepong South is Mr Conrad Pienaar, Geology HOD at Tshepong South and employee of Harmony.
Table 1-2: Summary of Tshepong South Mineral Reserves as at June 30, 2024 1-5
| | | | | | | | | | | |
| METRIC |
| Mineral Reserve Category | Tonnes (Mt) | Gold Grade (g/t) | Gold Content (kg) |
| Proved | 2.355 | 8.02 | 18 900 |
| Probable | 0.229 | 7.08 | 1 621 |
| Total (Proved + Probable) | 2.584 | 7.94 | 20 521 |
| | | | | | | | | | | |
| IMPERIAL |
| Mineral Reserve Category | Tons (Mt) | Gold Grade (oz/t) | Gold Content (Moz) |
| Proved | 2.596 | 0.234 | 0.608 |
| Probable | 0.252 | 0.207 | 0.052 |
| Total (Proved + Probable) | 2.849 | 0.232 | 0.660 |
Notes:
1. The Mineral Reserves were originally prepared, classified and reported according to SAMREC, 2016. For the purposes of this TRS, the Mineral Reserves have been classified in accordance with § 229.1302(d)(1)(iii)(A) (Item 1302(d)(1)(iii)(A) of Regulation S-K). The Qualified Person responsible for the estimate is Mr Conrad, who is Geology HOD at Tshepong South, and a Harmony employee.
2. Tonnes, grade, and gold content are declared as net delivered to the mills.
3. Figures are fully inclusive of all mining dilutions, gold losses and are reported as mill delivered tonnes and head grades. Metallurgical recovery factors have not been applied to the reserve figures.
4. Gold content has not taken metallurgical recovery factors into account.
5. Mineral Reserves are reported using a cut-off grade of 790cmg/t determined using a gold price of USD1,772/oz gold.
6. Rounding as required by reporting guidelines may result in apparent summation differences.
Capital and Operating Cost Estimates
The capital cost estimates for Tshepong South are determined at a corporate level, using the business plan as the basis. The capital costs are associated with major equipment outside the main operating sections which is termed abnormal expenditure (“AE”), infrastructure development, as well as ongoing capital development (“OCD”). Costs associated with the Mining Charter Compliance (“MCC”), as per South Africa’s Social Labour Plan (“SLP”) requirements are also included in the capital estimates.
The capital costs are presented in Table 1-5. The accuracy level of the capital cost is to the accuracy level of Feasibility level.
The operating cost estimates for Tshepong South are categorised into direct and total costs. The operating cost estimates are shown in Table 1-6.
The capital and operating costs are reported in ZAR terms and on a real basis. The economic analysis, including the capital and operating costs are reported for the period comprising the financial year (“FY25”) July – June. Both the capital and operating estimates are accounted for in the economic analysis of Tshepong South. The results of the economic analysis demonstrate a positive NPV at a discounted cash flow of 9% for the Mineral Reserve.
Effective Date: June 30, 2024
3
Technical Report Summary for
Tshepong South, Free State Province, South Africa
Table 1-3: Summary of capital cost estimate for Tshepong South
| | | | | |
| Capital Cost Element (ZAR'000s) | Total Reserve plan
(FY2025-FY2028) |
| OCD | 1 154 928 | |
| AE | 195 940 | |
| Shaft Projects | 150 720 | |
| Major Projects | 67 101 | |
| MCC | 89 523 | |
| Total | 1 658 212 | |
Table 1-4: Summary of operating cost estimate for Tshepong South
| | | | | |
| Operating Cost Element (ZAR'000) | Total Reserve Plan
(FY2025-FY2028) |
| Mining | 6 393 267 | |
| Services | 1 667 146 | |
| Medical Hub / Station | 400 487 | |
| Engineering | 7 111 649 | |
| Workshops | — | |
| Plant | — | |
| Total Direct Costs | 15 572 549 | |
| Mine Overheads | 937 052 | |
| Total Cost | 16 509 601 | |
Permitting Requirements
The permits held by Tshepong South are presented in Table 1-5.
Tshepong South has the necessary valid permits, administered and managed by various departments, and do not require any additional permits to continue with their mining operations, except for the application which has been submitted to amend the Water Use Applications.
An application to renew and amend the Water Use License Applications (WULA) was submitted to the respective regulator in November 2023. The approval for this permit is still pending at the effective date of this TRS. Based on current industry norms, a realistic timeframe to obtain relevant authorizations is estimated between 12 and 18 months.
There is no material litigation (including violations or fines) against the Company as at the date of this report which threatens its mineral rights, tenure, or operations.
Conclusions
In the QP’s opinion, Tshepong South, a 100% owned Harmony asset, is located in a well-established mining district and has been operating successfully for the past 30 years. The mine is accessible within national and provincial roads, with well-established infrastructure. Management has a good handle on aspects pertaining to legal and environmental matters with respect to operating within the South African mining law, as regulated by the MPRDA, and supporting legislation.
Tshepong South hosts a prominent gold bearing Mineral Resource. The interpretation of the regional geological setting, mineralization and ore body deposit is well understood and provides valuable insight to the gold mining operations. The mining methods of the Mineral Reserves is of sound design and has evolved over the history of the operations.
The economics for Tshepong South display positive discounted cashflows, based on detailed operating and capital costs. The valuation of the asset is proven to be most sensitive to the gold price. The assumptions and conclusions in this TRS contain the views of QPs and does not contain any known material risks at the time of compilation.
Tshepong South did not incur any fines or penalties for non-compliance during the year ended June 30, 2024 and no significant encumbrances exist.
Effective Date: June 30, 2024
4
Technical Report Summary for
Tshepong South, Free State Province, South Africa
Recommendations
In the QP’s opinion, the gold output from Tshepong South can be optimized through improvement of quality of mining and this will result in achieving the planned shaft call factor. This impact will be realized through our currently implemented Business Improvement Initiative program that will look at driving the quality of mining through measures such as in-stope water controls and better fragmentation during blasting to contain the gold.
Table 1-5: Status of environmental permits and licenses
| | | | | | | | | | | | | | |
| Permit / License | Reference No. | Issued By | Date Granted | Validity |
| Environmental Management Programme | FS 30/5/1/2/3/2/1(84)EM | DMRE | April 6, 1910 | LOM |
| Environmental Management Updated | FS 30/5/1/2/2/84MR | DWAFEC | Pending Approval Submitted in 2020 | LOM |
| Water Permit 936B. Harmony. Free State Geduld Mines. Discharge of untreated effluents | B33/2/340/31 | DWAFEC | April 2, 1981 | LOM |
| Water Permit 870B. Harmony. Discharge of untreated effluents. | B33/2/340/25 | DWAFEC | May 27, 1991 | LOM |
| Water Permit 1214N. Free State Consolidated Gold Mine. Tshepong, Freddie’s and Phakisa shafts. | B33/2/340/12 | DWAFEC | Not indicated. | LOM |
Notes: DWAFEC - Department of Water Affairs, Forestry and Environmental Conservation, DWA - Department of Water Affairs.
Effective Date: June 30, 2024
5
Technical Report Summary for
Tshepong South, Free State Province, South Africa
2Introduction
Section 229.601(b)(96)(iii)(B)(2) (i-v)
This TRS on Tshepong South has been prepared for the registrant, Harmony. The TRS has been prepared in accordance with Regulation S-K 1300. It has been prepared to meet the requirements of Section 229.601(b)96 - Technical Report Summary. The purpose of this TRS is to provide open and transparent disclosure of all material, exploration activities, Mineral Resource and Mineral Reserve information to enable the investor to understand Tshepong South, which forms part of Harmony’s activities. No material change has occurred since the previous TRS report.
This TRS has been prepared from the following sources of information:
•File 18 (Competent Persons Report) Tshepong South Mineral Resource and Reserve Statement FY25;
•Tshepong South Gold Mine 2024 SAMREC Table 1
•The 2024 and 2025 Corporate Business Plan
•Base Geological and Mine Planning data; and
•Integrated Internal Technical Report FY25.
The TRS was prepared by a QP employed on a full-time basis by the registrant. The QP’s qualifications, areas of responsibility and personal inspection of the property are summarized in Table 2-1.
Table 2-1: QP qualification, section responsibilities and personal inspections
| | | | | | | | | | | | | | |
| Qualified Person | Professional Organization | Qualification | TRS Section Responsibility | Personal Insp. |
| | | | |
| Mr C. Pienaar | SACNASP Reg nr 135676 | B.Sc Hons (Geology) | All Sections (Phakisa) | Full Time |
This TRS updates the TRS filed by Harmony on Tshepong South on October 31, 2023, named Exhibit 96.13 Technical Report Summary of the Mineral Resources and Mineral Reserves for Tshepong South, Free State Province, South Africa, which was effective on June 30, 2023. This updated TRS has an effective date as at June 30, 2024. No material changes have occurred between the effective date and the date of signature.
Effective Date: June 30, 2024
6
Technical Report Summary for
Tshepong South, Free State Province, South Africa
3Property Description and Location
Section 229.601(b)(96)(iii)(B)(3) (i-vii)
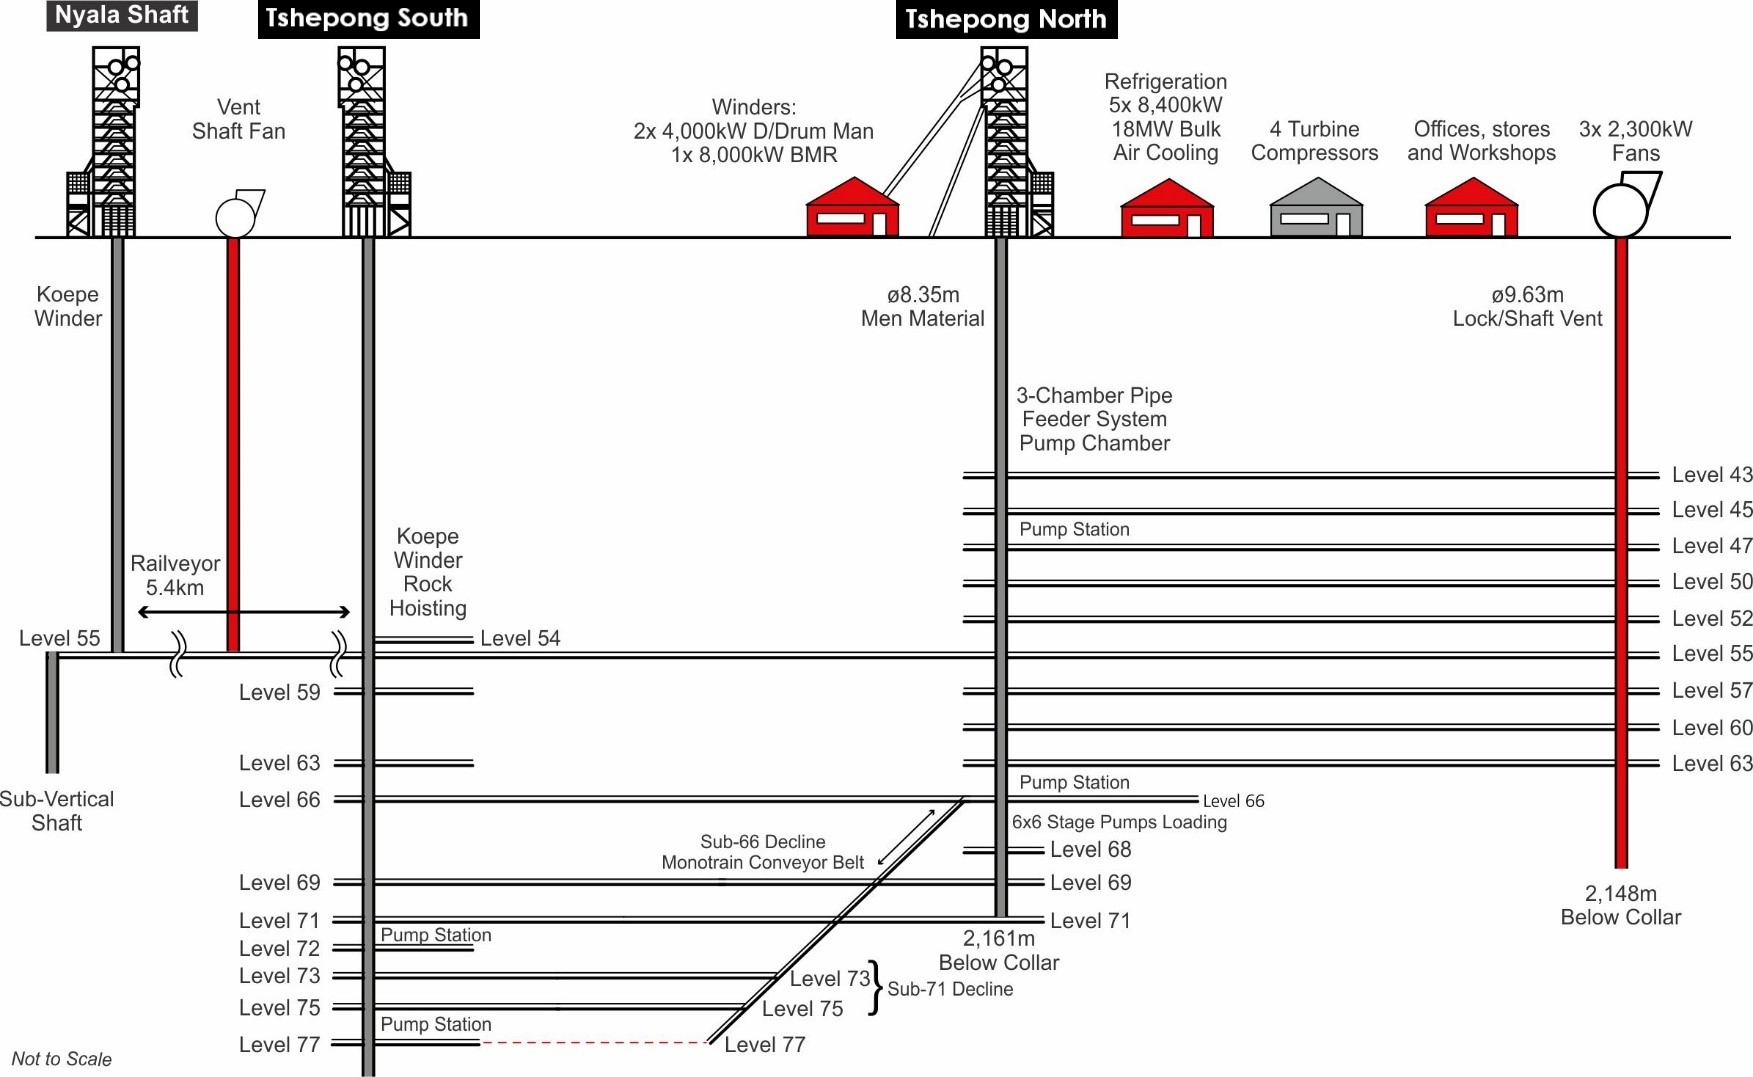
Tshepong South comprises one operating underground gold mine namely “Tshepong South”. Tshepong South is a mature, moderate to deep-level underground operation using conventional underground mining methods to depths of 2,427m BMD. The mine utilises the Tshepong North and Nyala shafts. Tshepong South’s success is greatly dependent on the services rendered via Nyala. Four main compressors and Tshepong South’s ore is transported 5.2km’s via the railveyor system that runs underground on 55 level to Nyala where it is then hoisted and transported via Rail system to the plant.
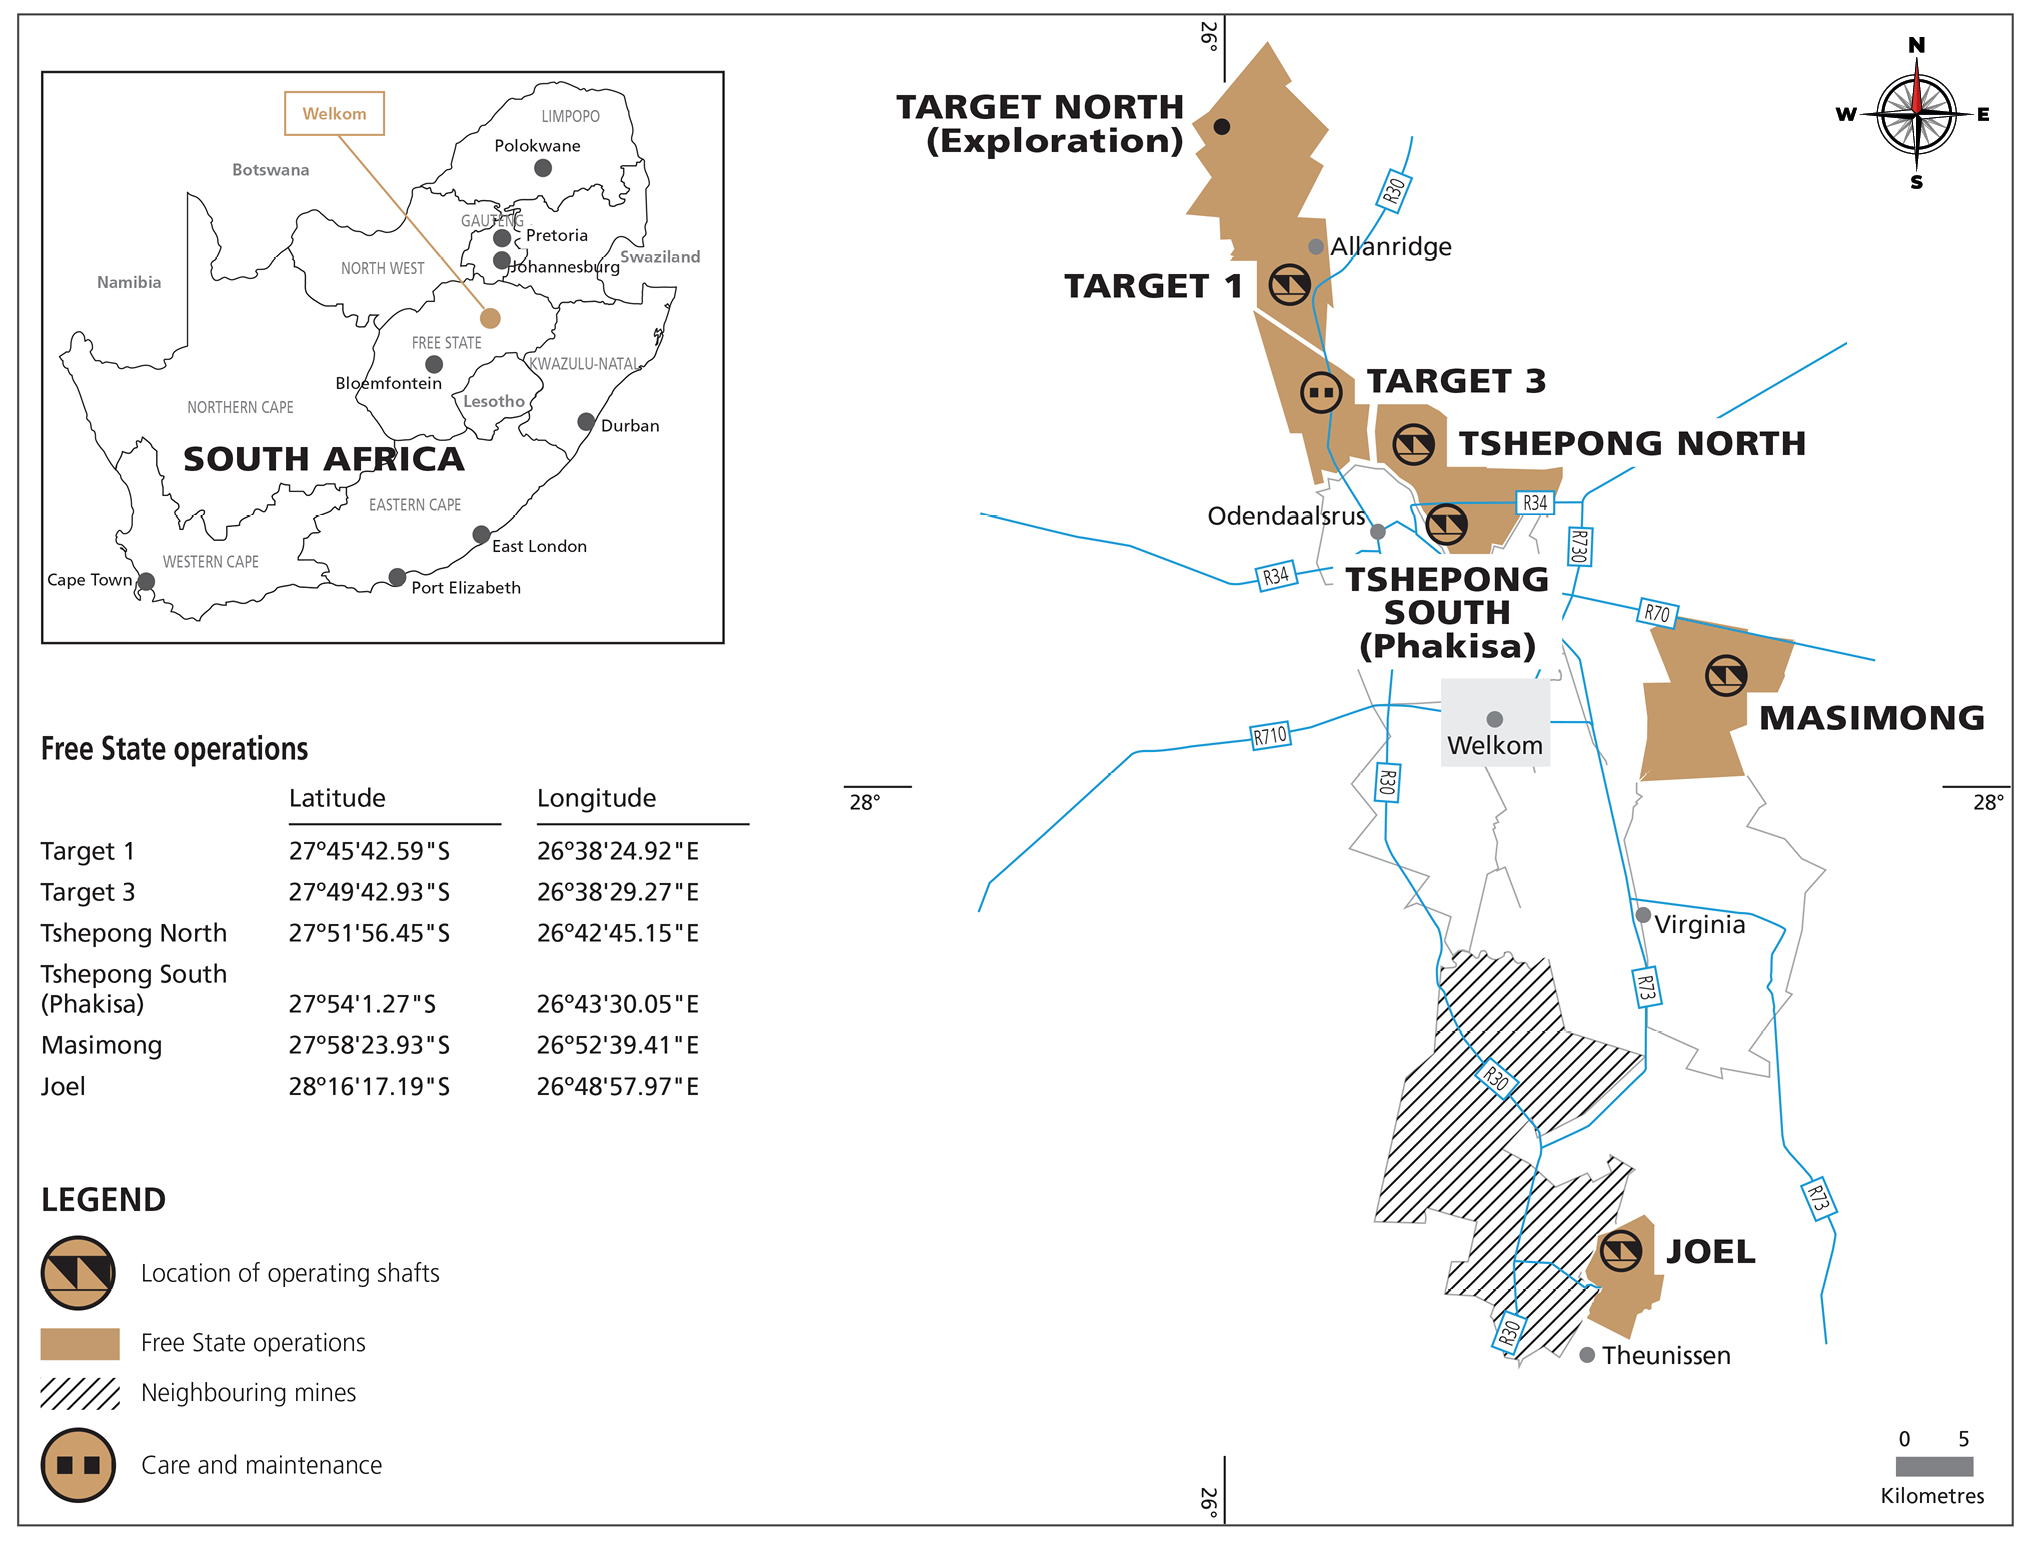
The mines are located in the Free State Province of South Africa, approximately 250km southwest of Johannesburg and 15km to the north of the town of Welkom (Figure 3-1).Tshepong South is situated adjacent to the south of Tshepong North, and is located at a latitude of 27°54’1.27”S and longitude of 26°43’30.05”E.
3.1Mineral Tenure
South African Mining Law is regulated by the MPRDA which is the predominant piece of legislation dealing with acquisitions or rights to conduct reconnaissance, prospecting and mining. There are several other pieces of legislation which deal with such ancillary issues such as royalties (the Mineral and Petroleum Resources Royalty Act, 2008), title registration (the Mining Titles Registration Act, 1967), and health and safety (the Mine Health and Safety Act, 1996).
Tshepong South Mine is in the legal entity called Freegold (Harmony)(Pty) Ltd. Mineral royalties are payable to SARS by the legal entity and are calculated using a specific formula to determine the Royalty percentage. The Gross sales and EBIT (which are defined terms in the Royalty Act) are inputs into this formula. The minimum royalty rate is 0.5% of gross sales and the maximum rate is 5%. The royalty formula to determine the Royalty rate to be applied is: Formula: Y = 0.5 + [EBIT/(GS x 12.5)] x 100. Mineral royalty payments to SARS are up to date.
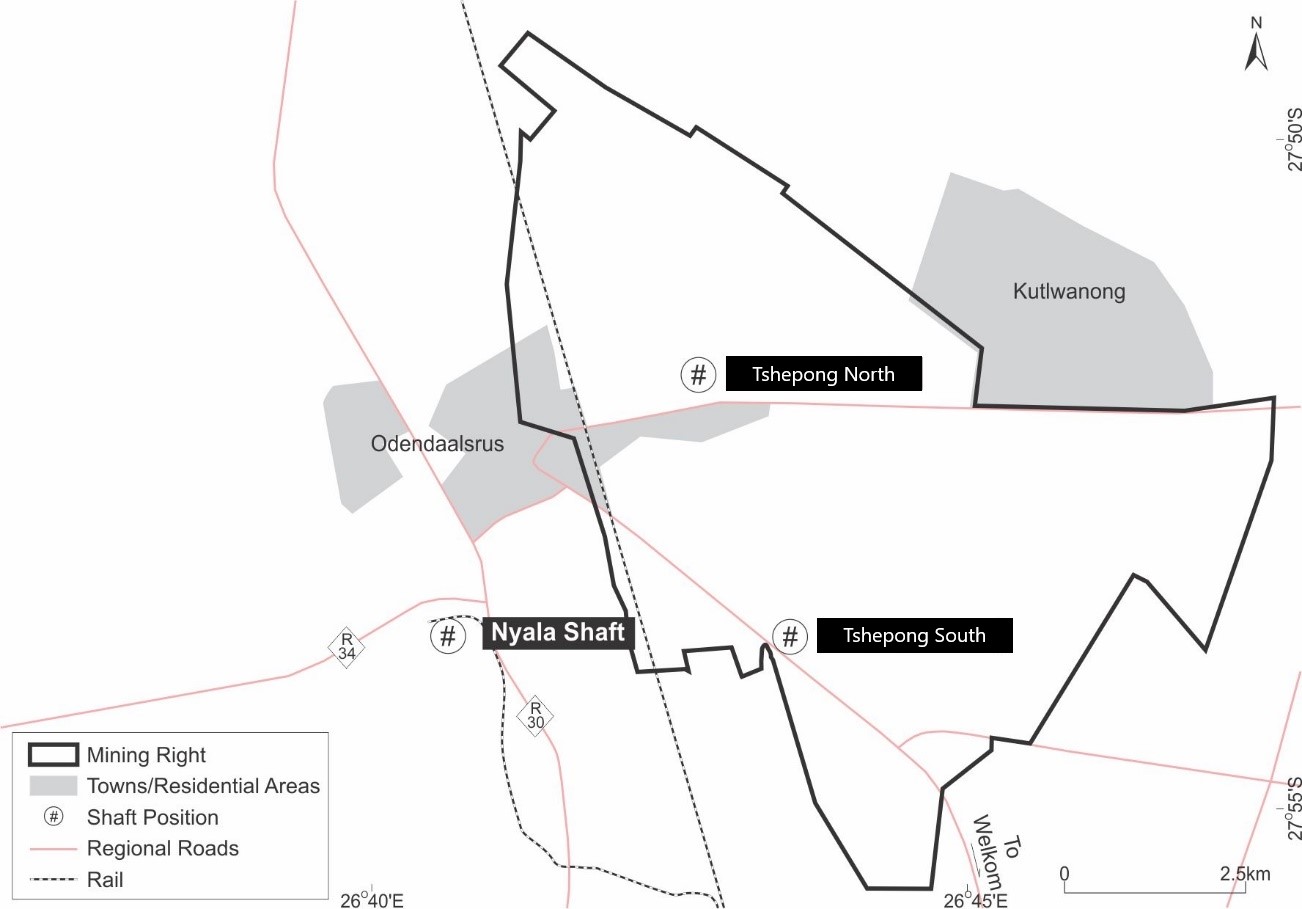
The current mining right for Tshepong (Tshepong South and Tshepong North) encompasses an area of 10,798.74ha (Figure 3-2). Harmony holds several mining rights in the Free State goldfields which have been successfully converted and executed as new order mining rights, some of which are still to be registered at the Mineral and Petroleum Resources Titles Office (“MPRTO”). The mining right for Tshepong South is presented in Table 3-1.
Tshepong South is wholly owned by Harmony, including the associated mineral rights. Harmony commenced acquiring the assets through the acquisition of AngloGold Ashanti Limited (“AngloGold Ashanti”) Free State operations in 2001, together with ARMGold. ARMGold was subsequently incorporated into Harmony in 2003, giving Harmony 100% ownership and control of Tshepong South.
Table 3-1: Summary of mining rights for Tshepong South
| | | | | | | | | | | | | | | | | |
| License Holder | License Type | Reference No. | Effective Date | Expiry Date | Area (ha) |
| Freegold (Harmony) (PTY) LTD | Mining Right | FS30/5/1/284MR | 11-Dec-2007 | 10-Dec-2029 | 10798.74 |
| | | | | |
| | | | | |
| | | | | |
| | | | | |
| | | | | |
| | | | | |
| | | | | |
| | | | | |
There are no known legal proceedings (including violations or fines) against the Company which threatens its mineral rights, tenure, or operations.
3.2Property Permitting Requirements
All relevant underground mining and surface permits, and any other permit related to the work conducted on the property have been obtained and are valid. An application to renew and amend the water use license applications (WULA) was submitted to the respective regulator as per Table 1-5.
Harmony has access to all the properties it requires to conduct its current mining activities. The surface lease and surface right areas are sufficient in size and nature to accommodate the required surface infrastructure to facilitate current and planned mining operations.
Effective Date: June 30, 2024
7
Technical Report Summary for
Tshepong South, Free State Province, South Africa
Harmony monitors complaints and litigation against the Company as part of its risk management systems, policies and procedures. There is no material litigation (including violations or fines) against the Company as at the date of this report which threatens its mineral rights, tenure or operations.
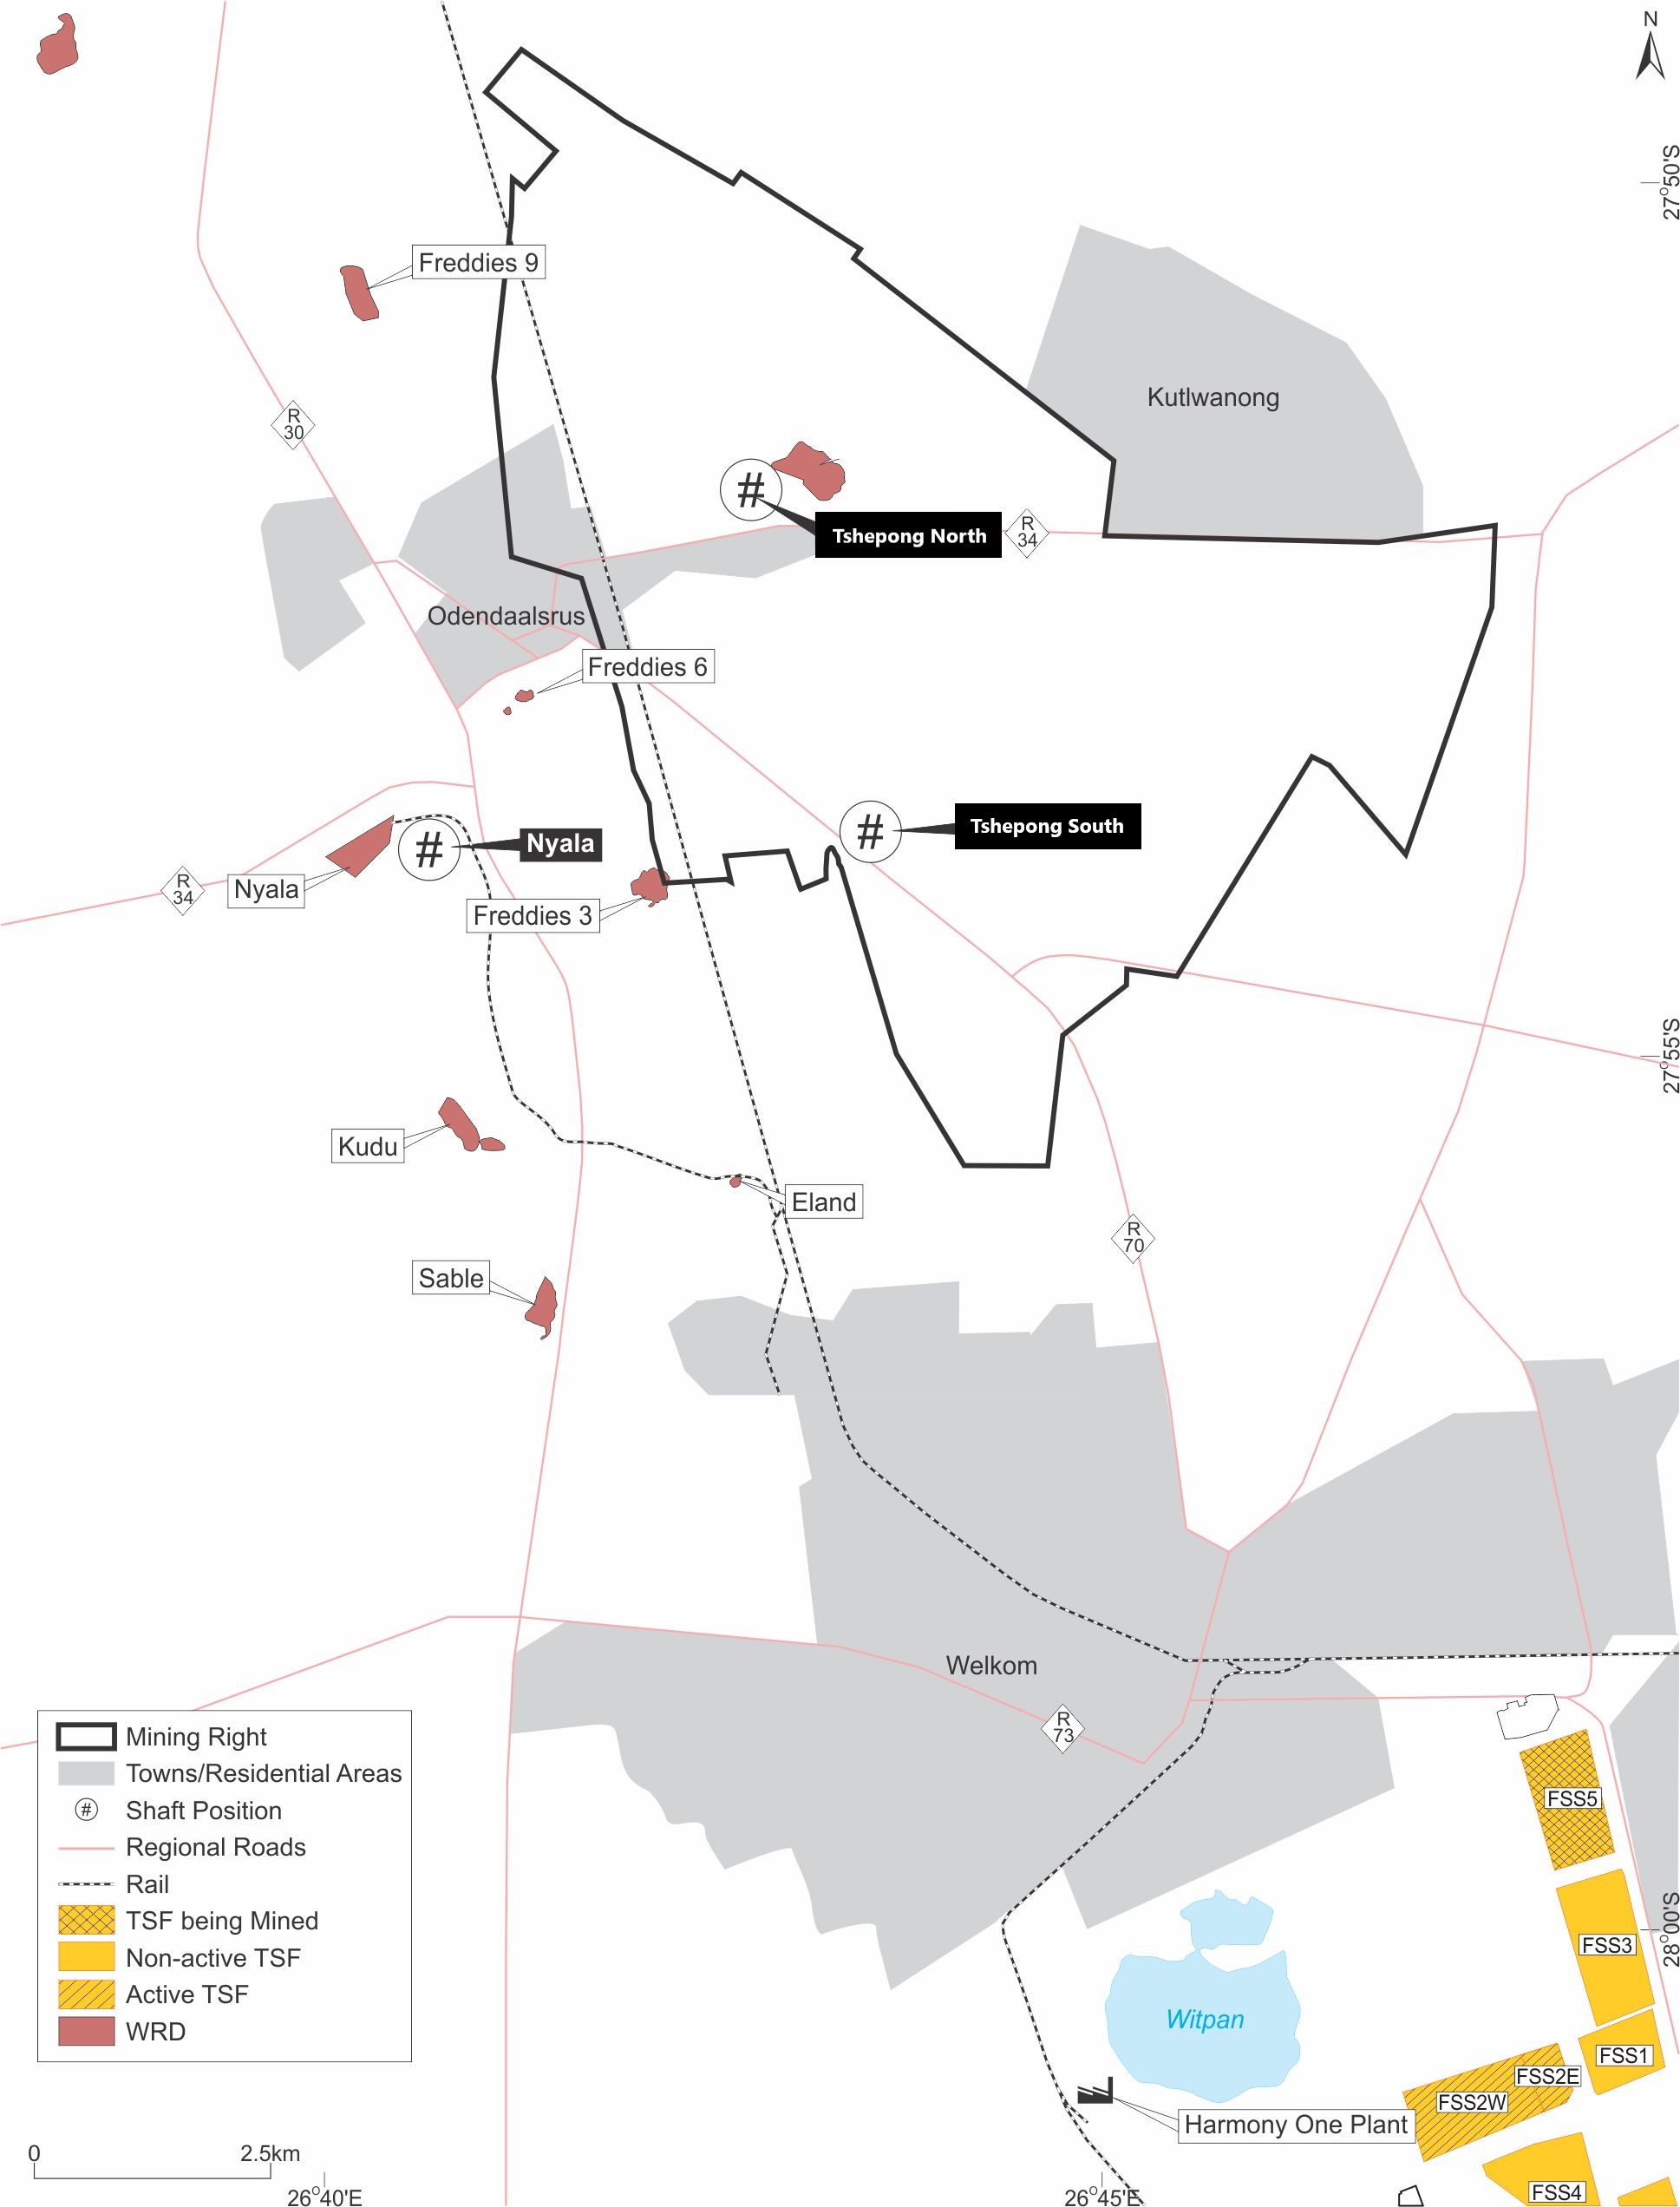
Figure 3-1: Location of Tshepong South in the Free State Goldfield
Figure 3-2: Mineral Tenure for Tshepong South
Effective Date: June 30, 2024
8
Technical Report Summary for
Tshepong South, Free State Province, South Africa
4Accessibility, Climate, Local Resources, Infrastructure and Physiography
Section 229.601(b)(96)(iii)(B)(4) (i-iv)
4.1Accessibility
Access to Tshepong South is accessible via the local R70 road between Welkom and Odendaalsrus (Figure 3-1). The area has well-established rail links and an airfield within close proximity.
Entry into the mining area is restricted by security fencing, security guards, booms and lockable gates at the main entrance. In addition, a communication system and access control system monitors personnel entering and leaving the mine property.
4.2Physiography and Climate
The mine lease area (Tshepong South) is flat with an average height of around 1,344m above mean sea level (“amsl”). There are no prominent topographical landmarks in the area. The topography has been affected by the presence of slimes dams, waste rock dumps and solid waste disposal sites.
Tshepong South is situated in the Free State Goldfield, a semi-arid region with an annual rainfall of between 400mm and 600mm. Local thunderstorms and showers are responsible for most of the precipitation during summer, from October to March, peaking in January. Hail is sometimes associated with thunderstorms.
The seasonal fluctuations in mean temperatures between the warmest and the coldest months vary between an average minimum of 7.7°C in winter to a maximum of 37°C in summer. The month of July is generally the coldest month with the hottest month typically being February.
Tshepong South is not restricted by climatic or seasonal variability.
4.3Local Resources and Infrastructure
The surrounding areas of Welkom and Odendaalsrus are well developed in terms of access and mining-related infrastructure, which supports the numerous operational gold mines in the area. The regional infrastructure includes national and provincial paved road networks, power transmission and distribution networks, water supply networks and communication infrastructure.
As part of the Social Labour Plan members from the surrounding community are trained and skilled on a rotational basis and placed back in the community to create a talent pool of available people that are available as needed. Higher skilled and senior positions are managed and maintained through talent pools and succession planning.
Availability of consumables is handled through the IMS (Internal Material Supply) system as part of the on-site Finance department. Lead times are taken into account and material and supplies ordered and delivery scheduled to ensure a constant supply to the shaft.
Tshepong South operates a single vertical shaft for man and materials. Rock is transported from the underground working via a RailVeyorTM system to the Nyala Shaft for hoisting.
Tshepong South ore is transported, by rail, from Nyala shaft to the Harmony One Plant in Welkom for processing (Figure 3-2).
Tshepong South is powered by electricity from Eskom Holdings State Owned Company (“SOC”) Limited.
Effective Date: June 30, 2024
9
Technical Report Summary for
Tshepong South, Free State Province, South Africa
5History
Section 229.601(b)(96)(iii)(B)(5) (i-ii)
5.1Historical Ownership and Development
Tshepong South “Phakisa” was formerly known as FSG 4, Freddies 4 and Tshepong South. Tshepong South development commenced in October 1993 and shaft sinking was started in February 1994. In 1995, shaft sinking was halted on 59 Level due to the prevailing low gold price. Operations at Tshepong South recommenced in September 1996 and sinking was completed to 75 Level, before being halted again in 1999.
Harmony acquired Tshepong South as part of the acquisition from AngloGold Ashanti’s Free State operations (previously known as Freegold), which completed in September 2003. Sinking and equipping was completed to a depth of 2,427m in 2006.
Tshepong South and Tshepong North were merged into Tshepong operations by Harmony in 2017 and split into separate operations in 2023.
The historical ownership and associated activities related to Tshepong are summarized in Table 5-1.
Table 5-1: Summary of historical ownership changes and activities of Tshepong South
| | | | | |
| Year | Asset History Highlights |
| Tshepong South |
| 1994 | Shaft sinking began. |
| 2002 | Harmony (as part of a 50:50 joint venture with ARMGold) acquired Phakisa from AngloGold Ashanti. |
| 2003 | The Phakisa Shaft Project began development. ARMGold and Harmony merged. |
| 2005 | Phakisa shaft completed and shaft equipping underway. |
| 2008 | Phakisa started production with full-scale production planned by June 2011. |
| 2009 | Five ice plants commissioned, improving ventilation and cooling. |
| 2011 | Phakisa reached full production. |
| 2017 | Tshepong and Phakisa merged into Tshepong operations |
| 2023 | Tshepong and Phakisa operations split into separate operations. |
| |
| |
| |
| |
| |
| |
| |
| |
| |
5.2Historical Exploration
A total of nine surface holes were drilled into Tshepong South. Two surface holes UT3 and EV10 had B-Reef intersection values of 845 cmg/t and 1429cmg/t respectively. Strong linear B-Reef value trends running from Tshepong North Mine into Tshepong South Mine were also identified where an expected value of the area averaged 1291cmg/t. A high level capital exploration drilling project for B-Reef was approved in August 2016 for Tshepong South Mine. Eight drill holes were planned, totaling 5,180m at a total cost of ZAR5.5m. The exploration drilling program was successfully concluded in October 2020, with the planned eight holes drilled in the target area which confirmed the extension of the Tshepong North B-Reef payshoot.
5.3Previous Mineral Resource and Mineral Reserve Estimates
The previous in-situ Mineral Resource estimates for Tshepong South were declared as at June 30, 2023 by Harmony, according to the SK 1300 TRS documentation. The previous Mineral Resource estimates, exclusive of Mineral Reserves, are summarized in Table 5-2. These have been superseded by the current estimate prepared by Harmony in Section 11 of this TRS.
Effective Date: June 30, 2024
10
Technical Report Summary for
Tshepong South, Free State Province, South Africa
Table 5-2: Summary of the previous Tshepong South Mineral Resources as at June 30, 2023 (Exclusive of Mineral Reserves)
| | | | | | | | | | | |
| METRIC |
| Mineral Resource Category | Tonnes (Mt) | Gold Grade (g/t) | Gold Content (kg) |
| Measured | 5.661 | 13.02 | 73 695 |
| Indicated | 6.680 | 11.67 | 77 950 |
| Total / Ave. Measured + Indicated | 12.341 | 12.29 | 151 645 |
| Inferred | 25.090 | 10.67 | 267 678 |
| IMPERIAL |
| Mineral Resource Category | Tons (Mt) | Gold Grade (oz/t) | Gold Content (Moz) |
| Measured | 6.241 | 0.380 | 2.369 |
| Indicated | 7.363 | 0.340 | 2.506 |
| Total / Ave. Measured + Indicated | 13.604 | 0.350 | 4.875 |
| Inferred | 27.657 | 0.311 | 8.606 |
Table 5-3: Summary of the previous Tshepong South Mineral Reserves as at June 30, 2023
| | | | | | | | | | | |
| METRIC |
| Mineral Reserve Category | Tonnes (Mt) | Gold Grade (g/t) | Gold Content (kg) |
| Proven | 2.882 | 7.79 | 22 466 |
| Probable | 0.563 | 7.06 | 3 972 |
| Total / Ave. Proven + Probable | 3.445 | 7.67 | 26 438 |
| IMPERIAL |
| Mineral Reserve Category | Tons (Mt) | Gold Grade (oz/t) | Gold Content (Moz) |
| Proven | 3.177 | 0.227 | 0.722 |
| Probable | 0.620 | 0.206 | 0.128 |
| Total / Ave. Proven + Probable | 3.797 | 0.224 | 0.850 |
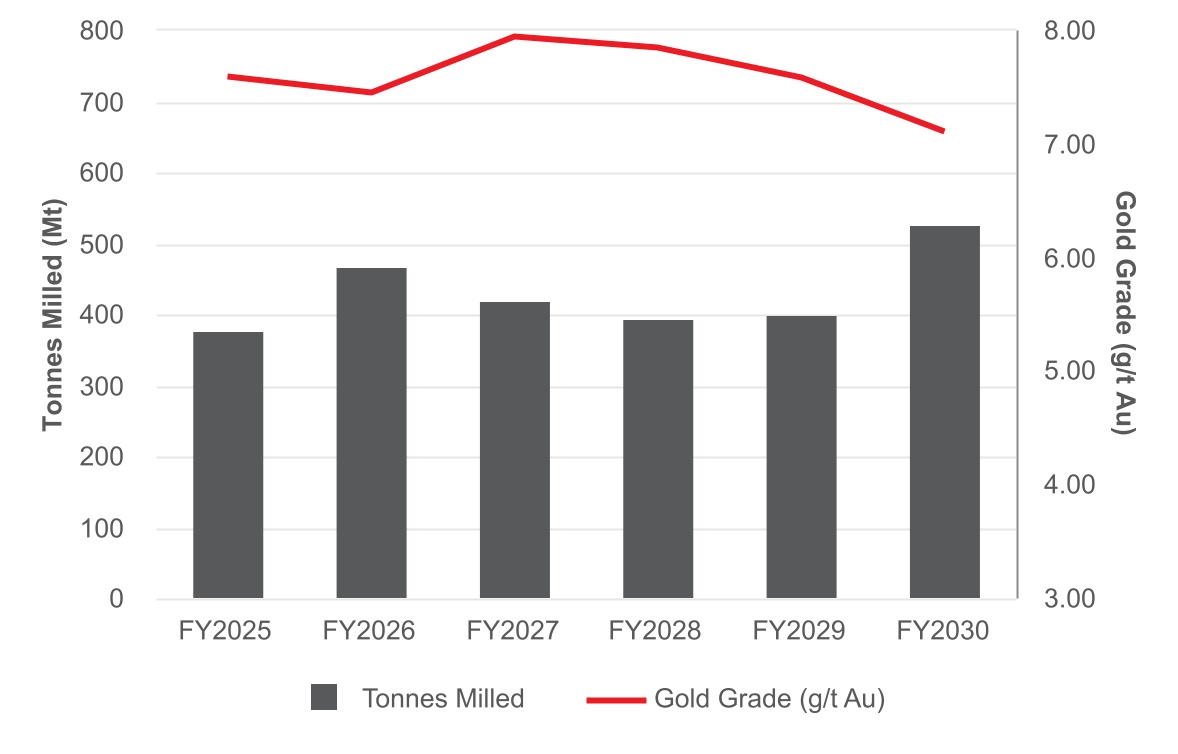
5.4Past Production
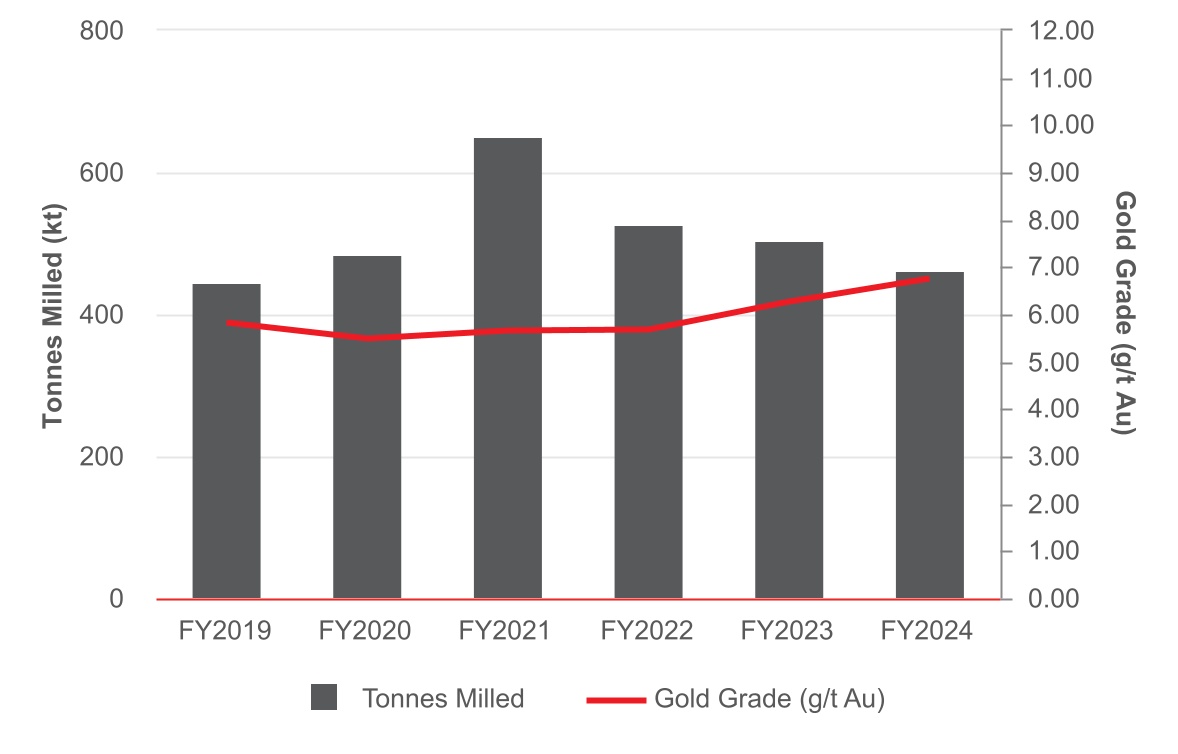
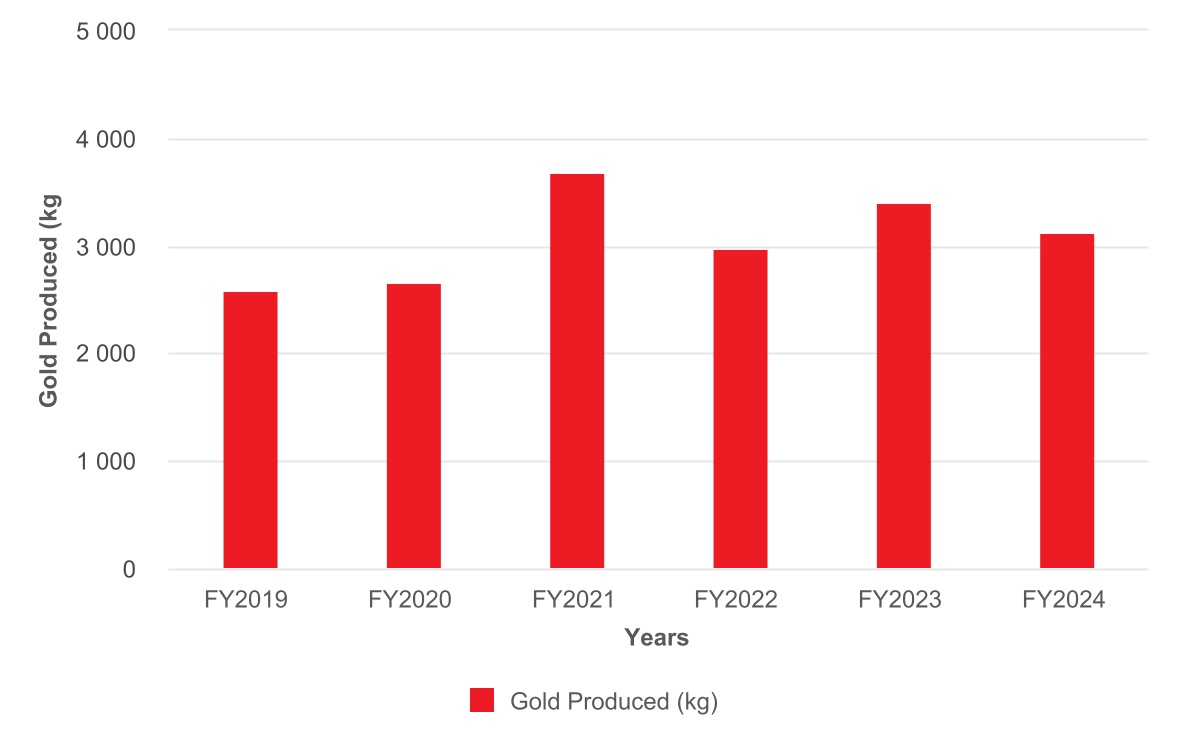
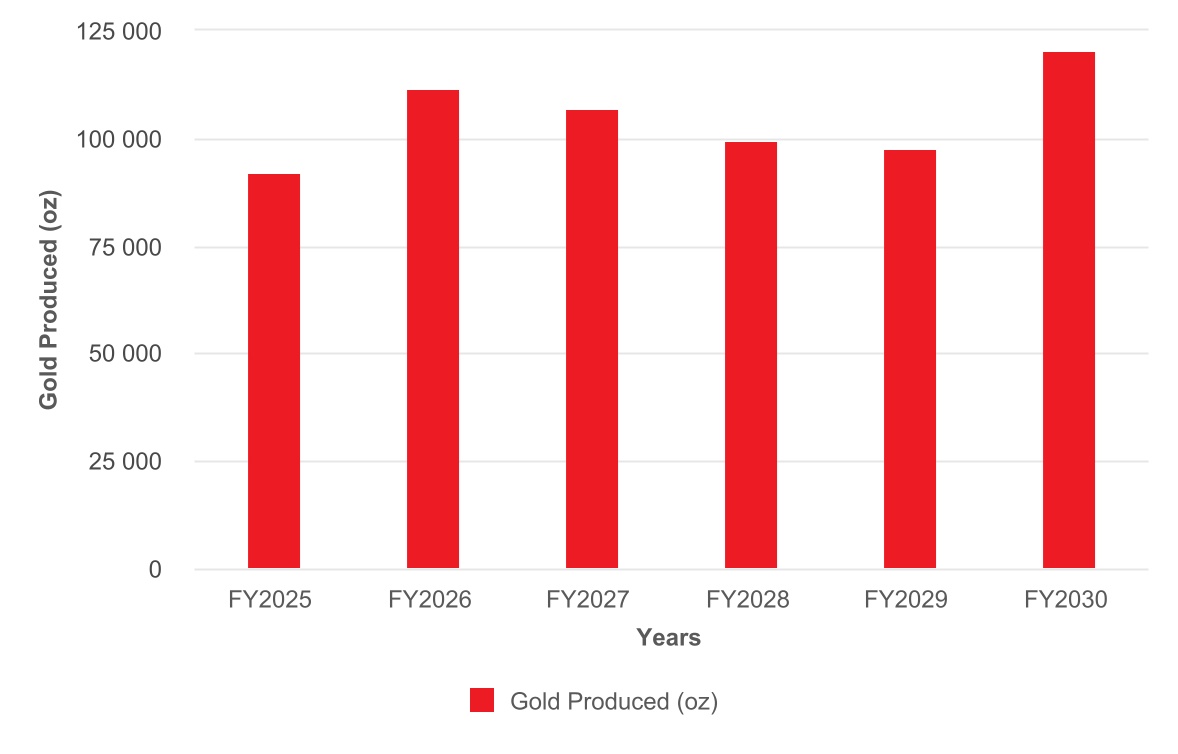
The annual Financial Year’s tonnage, grade and gold production for Tshepong South is presented in Figure 5-1 and Figure 5-2. The reader should note that the figures are reported separately from Tshepong North and the Financial year period runs from July to June the following year (12 months).
Effective Date: June 30, 2024
11
Technical Report Summary for
Tshepong South, Free State Province, South Africa
Figure 5-1: Graph of past production – Tonnes and grade
Figure 5-2: Graph of past metal production
Effective Date: June 30, 2024
12
Technical Report Summary for
Tshepong South, Free State Province, South Africa
6Geological Setting, Mineralization and Deposit
Section 229.601(b)(96)(iii)(B)(6) (i-iii)
6.1Regional Geology
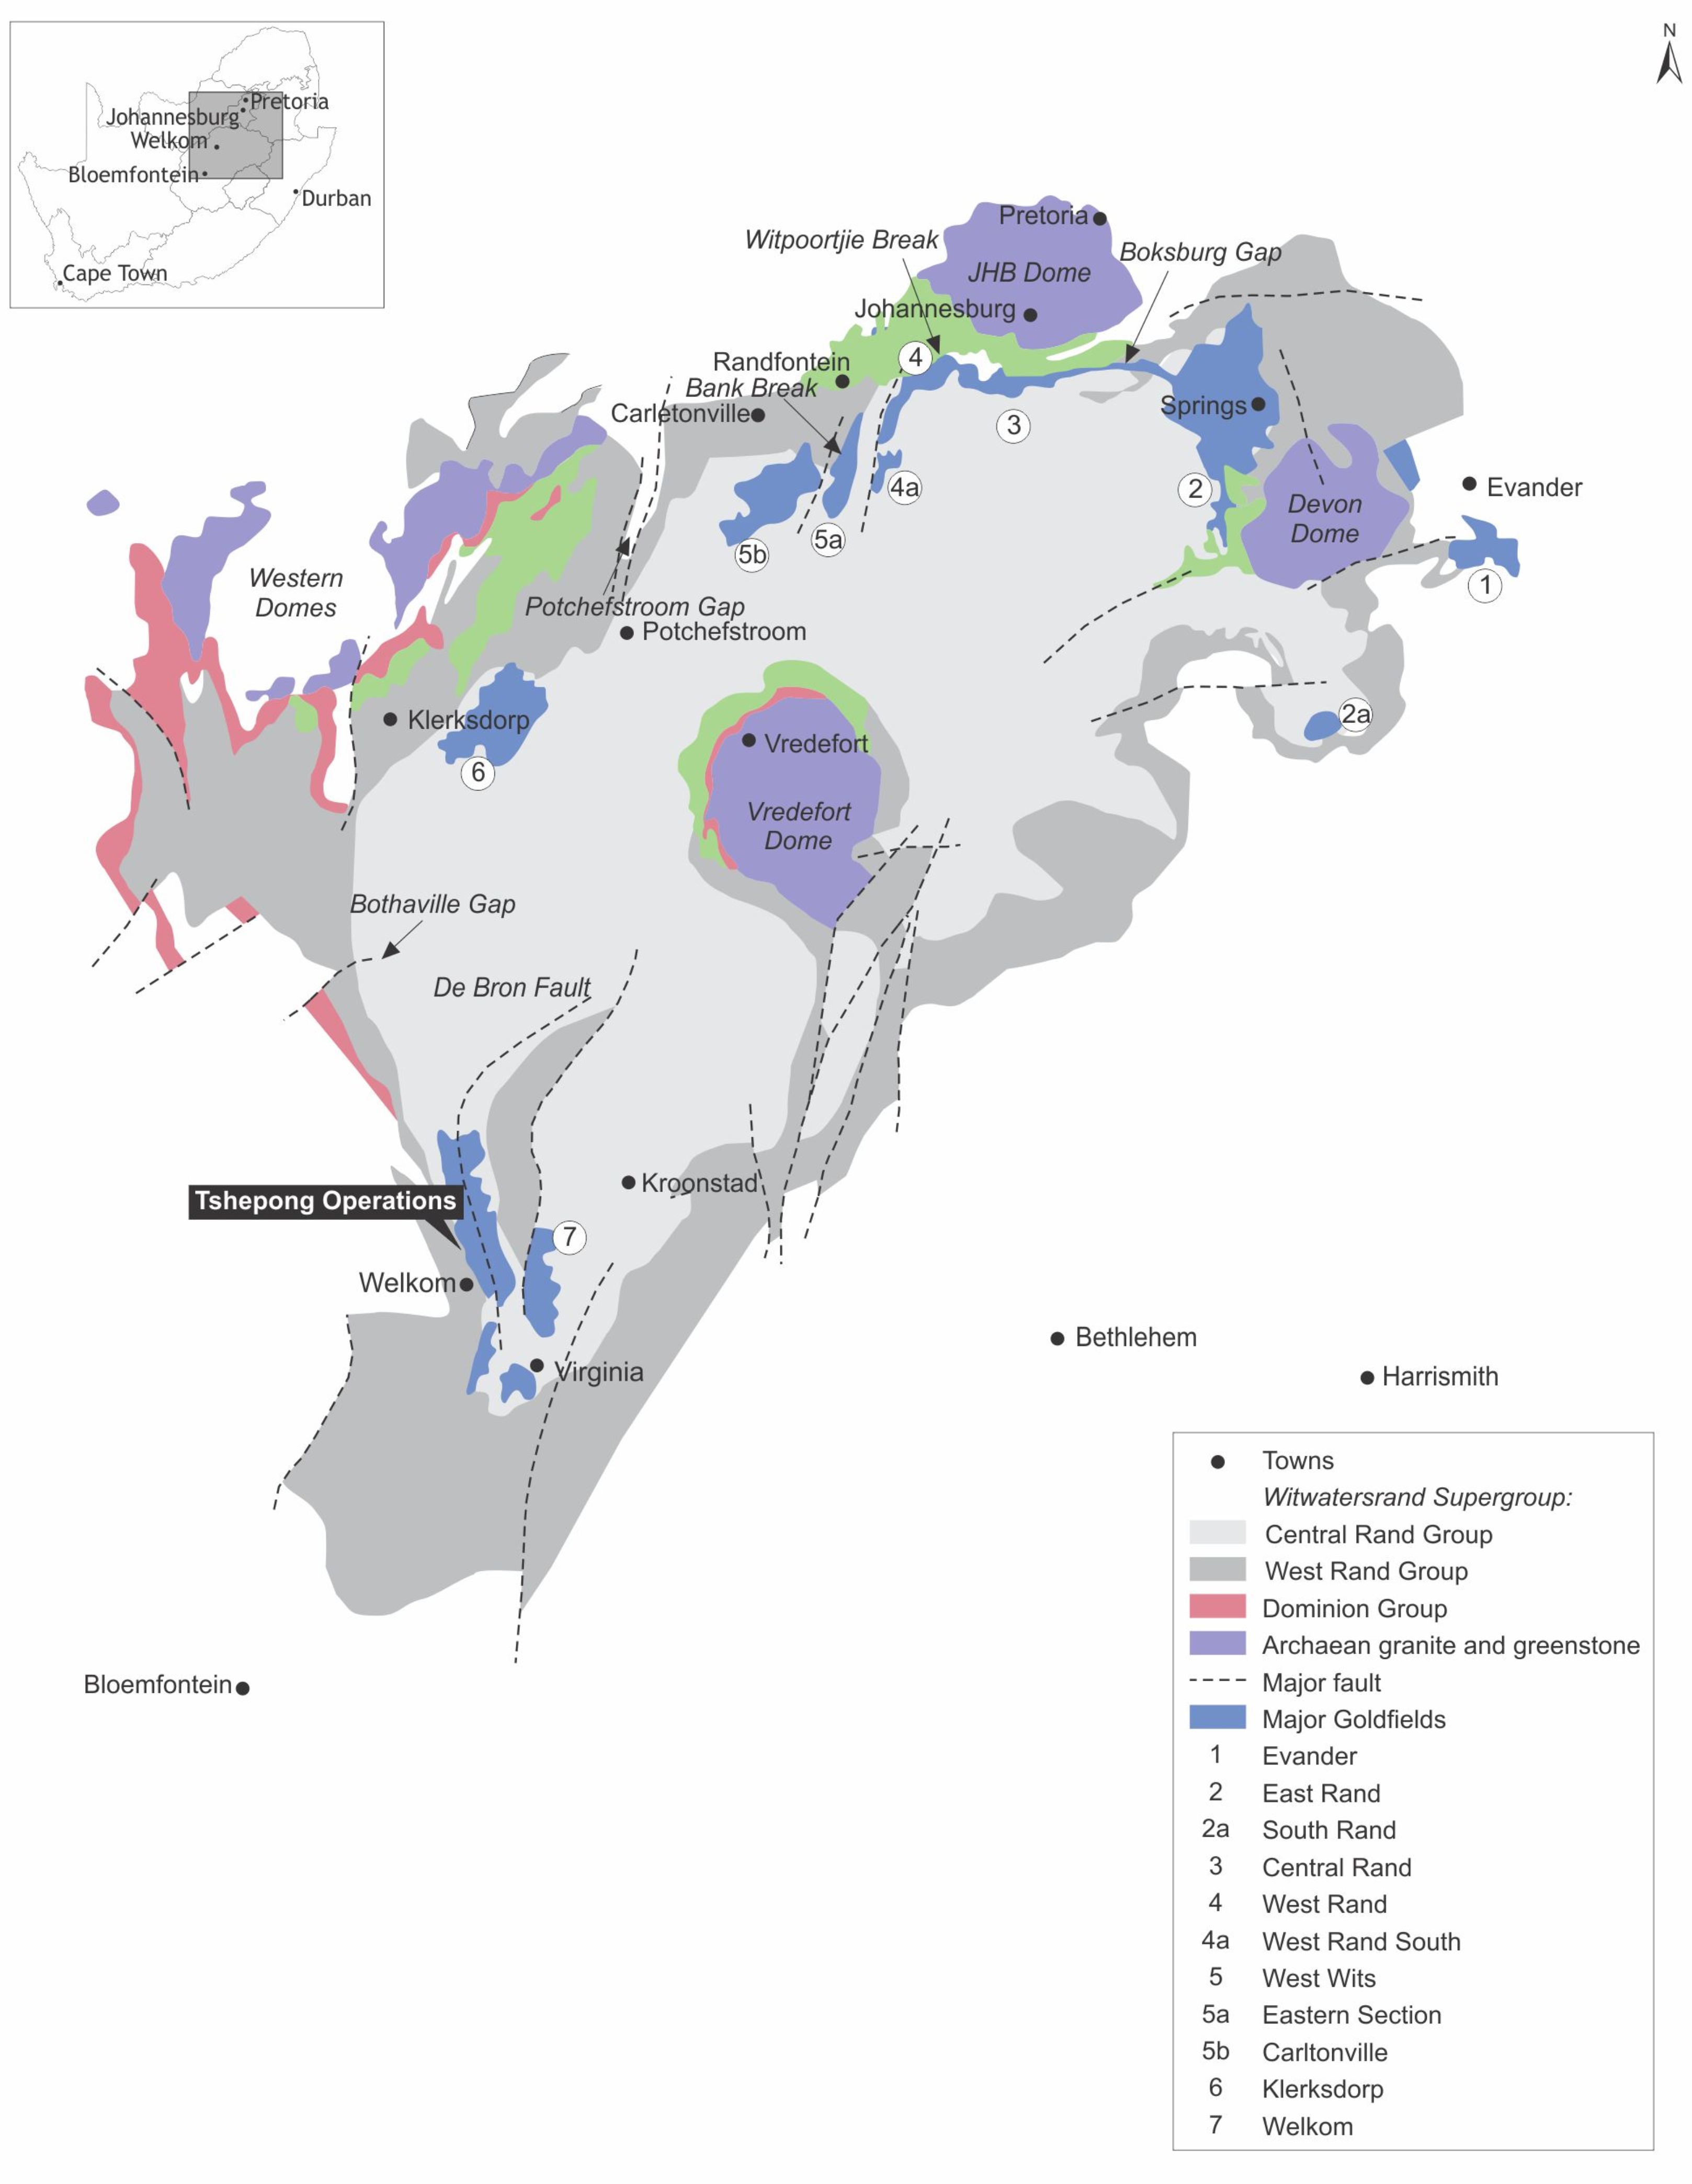
Tshepong South is located on the southwestern margin of the Archean Witwatersrand Basin, one of the prominent gold provinces in the world. The Witwatersrand Basin is an approximately 7,000m thick terrigenous sequence comprising mainly arenaceous and argillaceous, together with minor rudaceous, lithologies deposited in a fluvio-deltaic environment in the center of the Archaean Kaapvaal Craton of South Africa (Robb and Meyer, 1995). The regional geology of the Witwatersrand Basin is shown in Figure 6-1.
The Witwatersrand Basin hosts the Witwatersrand Supergroup, which either conformably or unconformably overlies the metamorphosed volcanic and minor clastic sediments of the Dominion Group (Tucker et al., 2016). The Dominion Group overlies the older granite-greenstone basement.
The majority of the Witwatersrand Supergroup is capped by the volcano-sedimentary sequence of the Ventersdorp Supergroup through an angular unconformity. The Ventersdorp Supergroup is in turn overlain by the dolomitic and quartizitic sequence of the Transvaal Supergroup, and sediments of the Karoo Supergroup (Tucker et al., 2016). Several suites of dykes and sills cut across the Archaean basement and the Witwatersrand, Ventersdorp, Transvaal and Karoo supergroups, and form important geological time-markers.
The Witwatersrand Supergroup is sub-divided into the basal West Rand Group (“WRG”) and overlying CRG (Robb and Robb, 1998). The WRG extends over an area of 43,000km2 and is up to 5,150m thick. It is sub-divided in three subgroups, namely, from bottom upwards, the Hospital Hill Subgroup; Government Subgroup and Jeppestown Subgroup. The stratigraphic succession of the WRG mainly consists of shale sediments, with occasional units of banded iron formation and conglomerate.
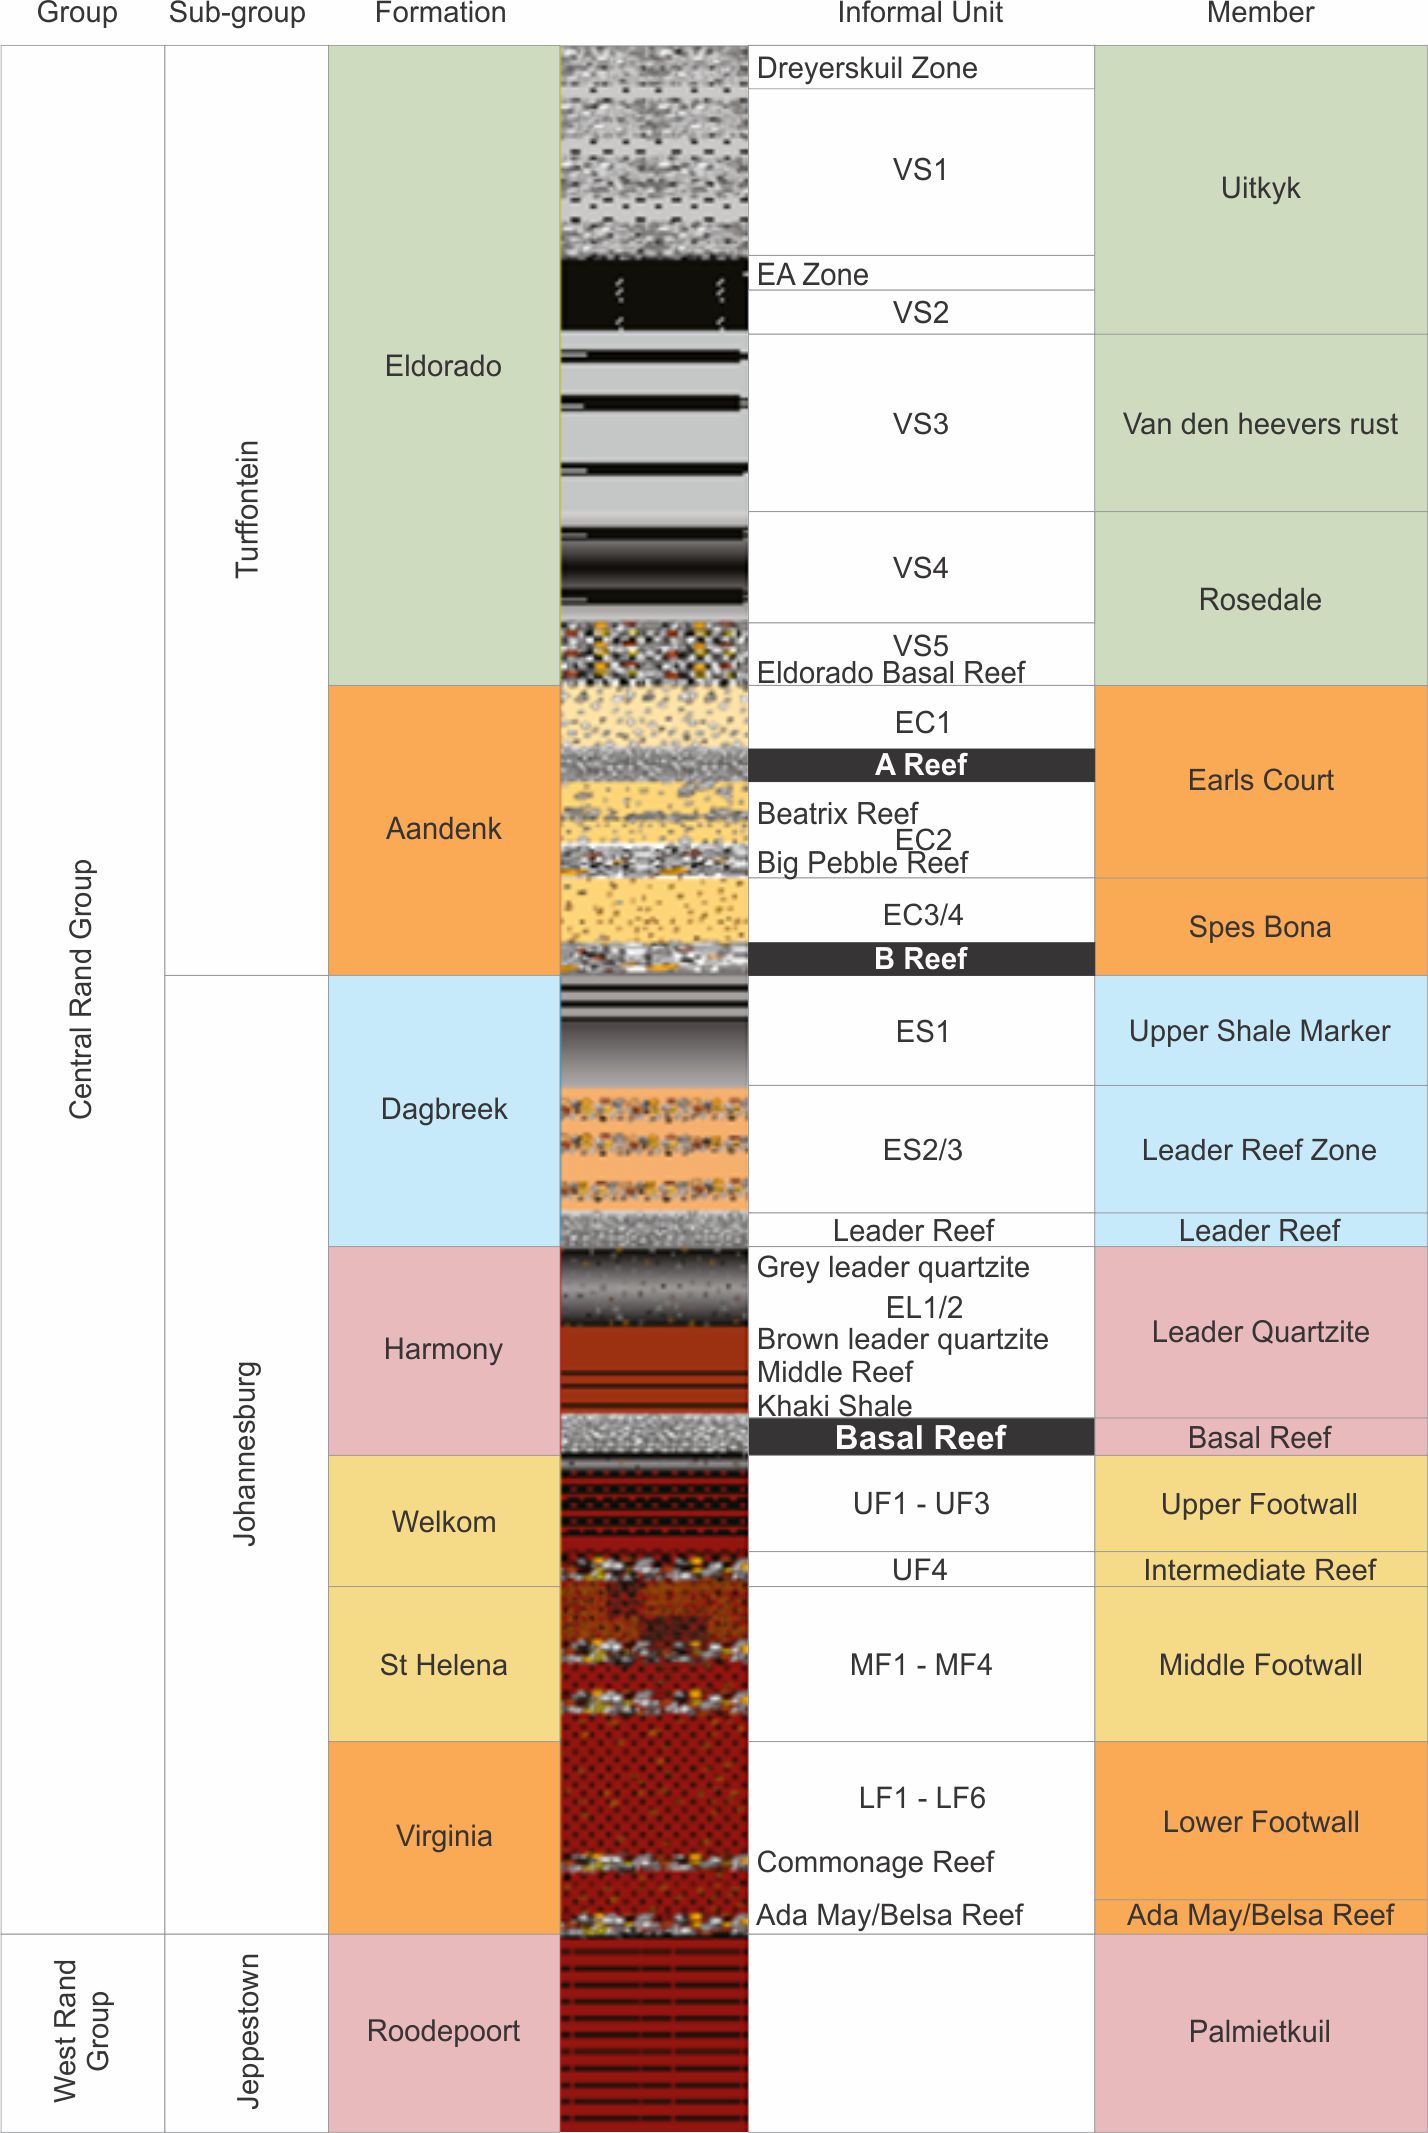
The CRG is up to 2,880m thick and covers an area of up to 9,750km2, with a basal extent of c.290km x 150km. It is sub-divided into the lower Johannesburg Subgroup and upper Turffontein Subgroup as shown in Figure 6-2. These subgroups are separated by the Booysens Shale Formation. The stratigraphic succession of the CRG comprises coarse-grained fluvio-deltaic sedimentary rocks.
The major gold bearing conglomerates are mostly confined to the CRG, and these conglomerate horizons are known as reefs. The most important reefs within the CRG are at six stratigraphic positions, three within the Johannesburg Sub-group and three within the Turffontein Sub-group. The reefs are mined in seven major goldfields, and a few smaller occurrences, which extend for over 400km in what has been called “The Golden Arc”. This arc is centered on the prominent Vredefort Dome, as shown in Figure 6-1, which is thought to be a major meteorite impact site in the center of the Witwatersrand Basin (Therriault et al., 1997). The goldfields, as shown in Figure 6-1, include: East Rand, South Rand, Central Rand, West Rand, West Wits, Klerksdorp, Free State (Welkom), and Evander.
6.2Local Geology
Tshepong South is located within the Free State Goldfield (Figure 6-1). The stratigraphic column of the Free State Goldfield is presented in Figure 6-2. The Johannesburg Subgroup comprises the Virginia, St Helena, Welkom, Harmony and Dagbreek formations.
The Free State Goldfield forms a triangle between the towns of Allanridge, Welkom and Virginia. The area is host to several gold mines, all of which produce gold from auriferous bearing reefs situated within sediments of the Central Rand Group of the Witwatersrand Sequence (Figure 6-2). Most of the presently exploitable reefs are situated within five stratigraphically separate placers including the Basal/Steyn, Saaiplaas Leader, B, Kimberley and Eldorado, with the majority of tonnage derived from the Basal/ Steyn and Saaiplaas Leader.
The Witwatersrand and overlying Ventersdorp lavas were deposited in a basin with significant and continual down warping to accommodate the sediments and lavas. During Platburg times, the basin underwent a significant rifting and tilting event, resulting in the region being split by significant faults. These faults are generally westerly dipping, with downthrows to the west, and strata dipping generally to the east.
Effective Date: June 30, 2024
13
Technical Report Summary for
Tshepong South, Free State Province, South Africa
Figure 6-1: Regional geology of the Witwatersrand Basin
Effective Date: June 30, 2024
14
Technical Report Summary for
Tshepong South, Free State Province, South Africa
Figure 6-2: Simplified stratigraphy of the Free State Goldfield
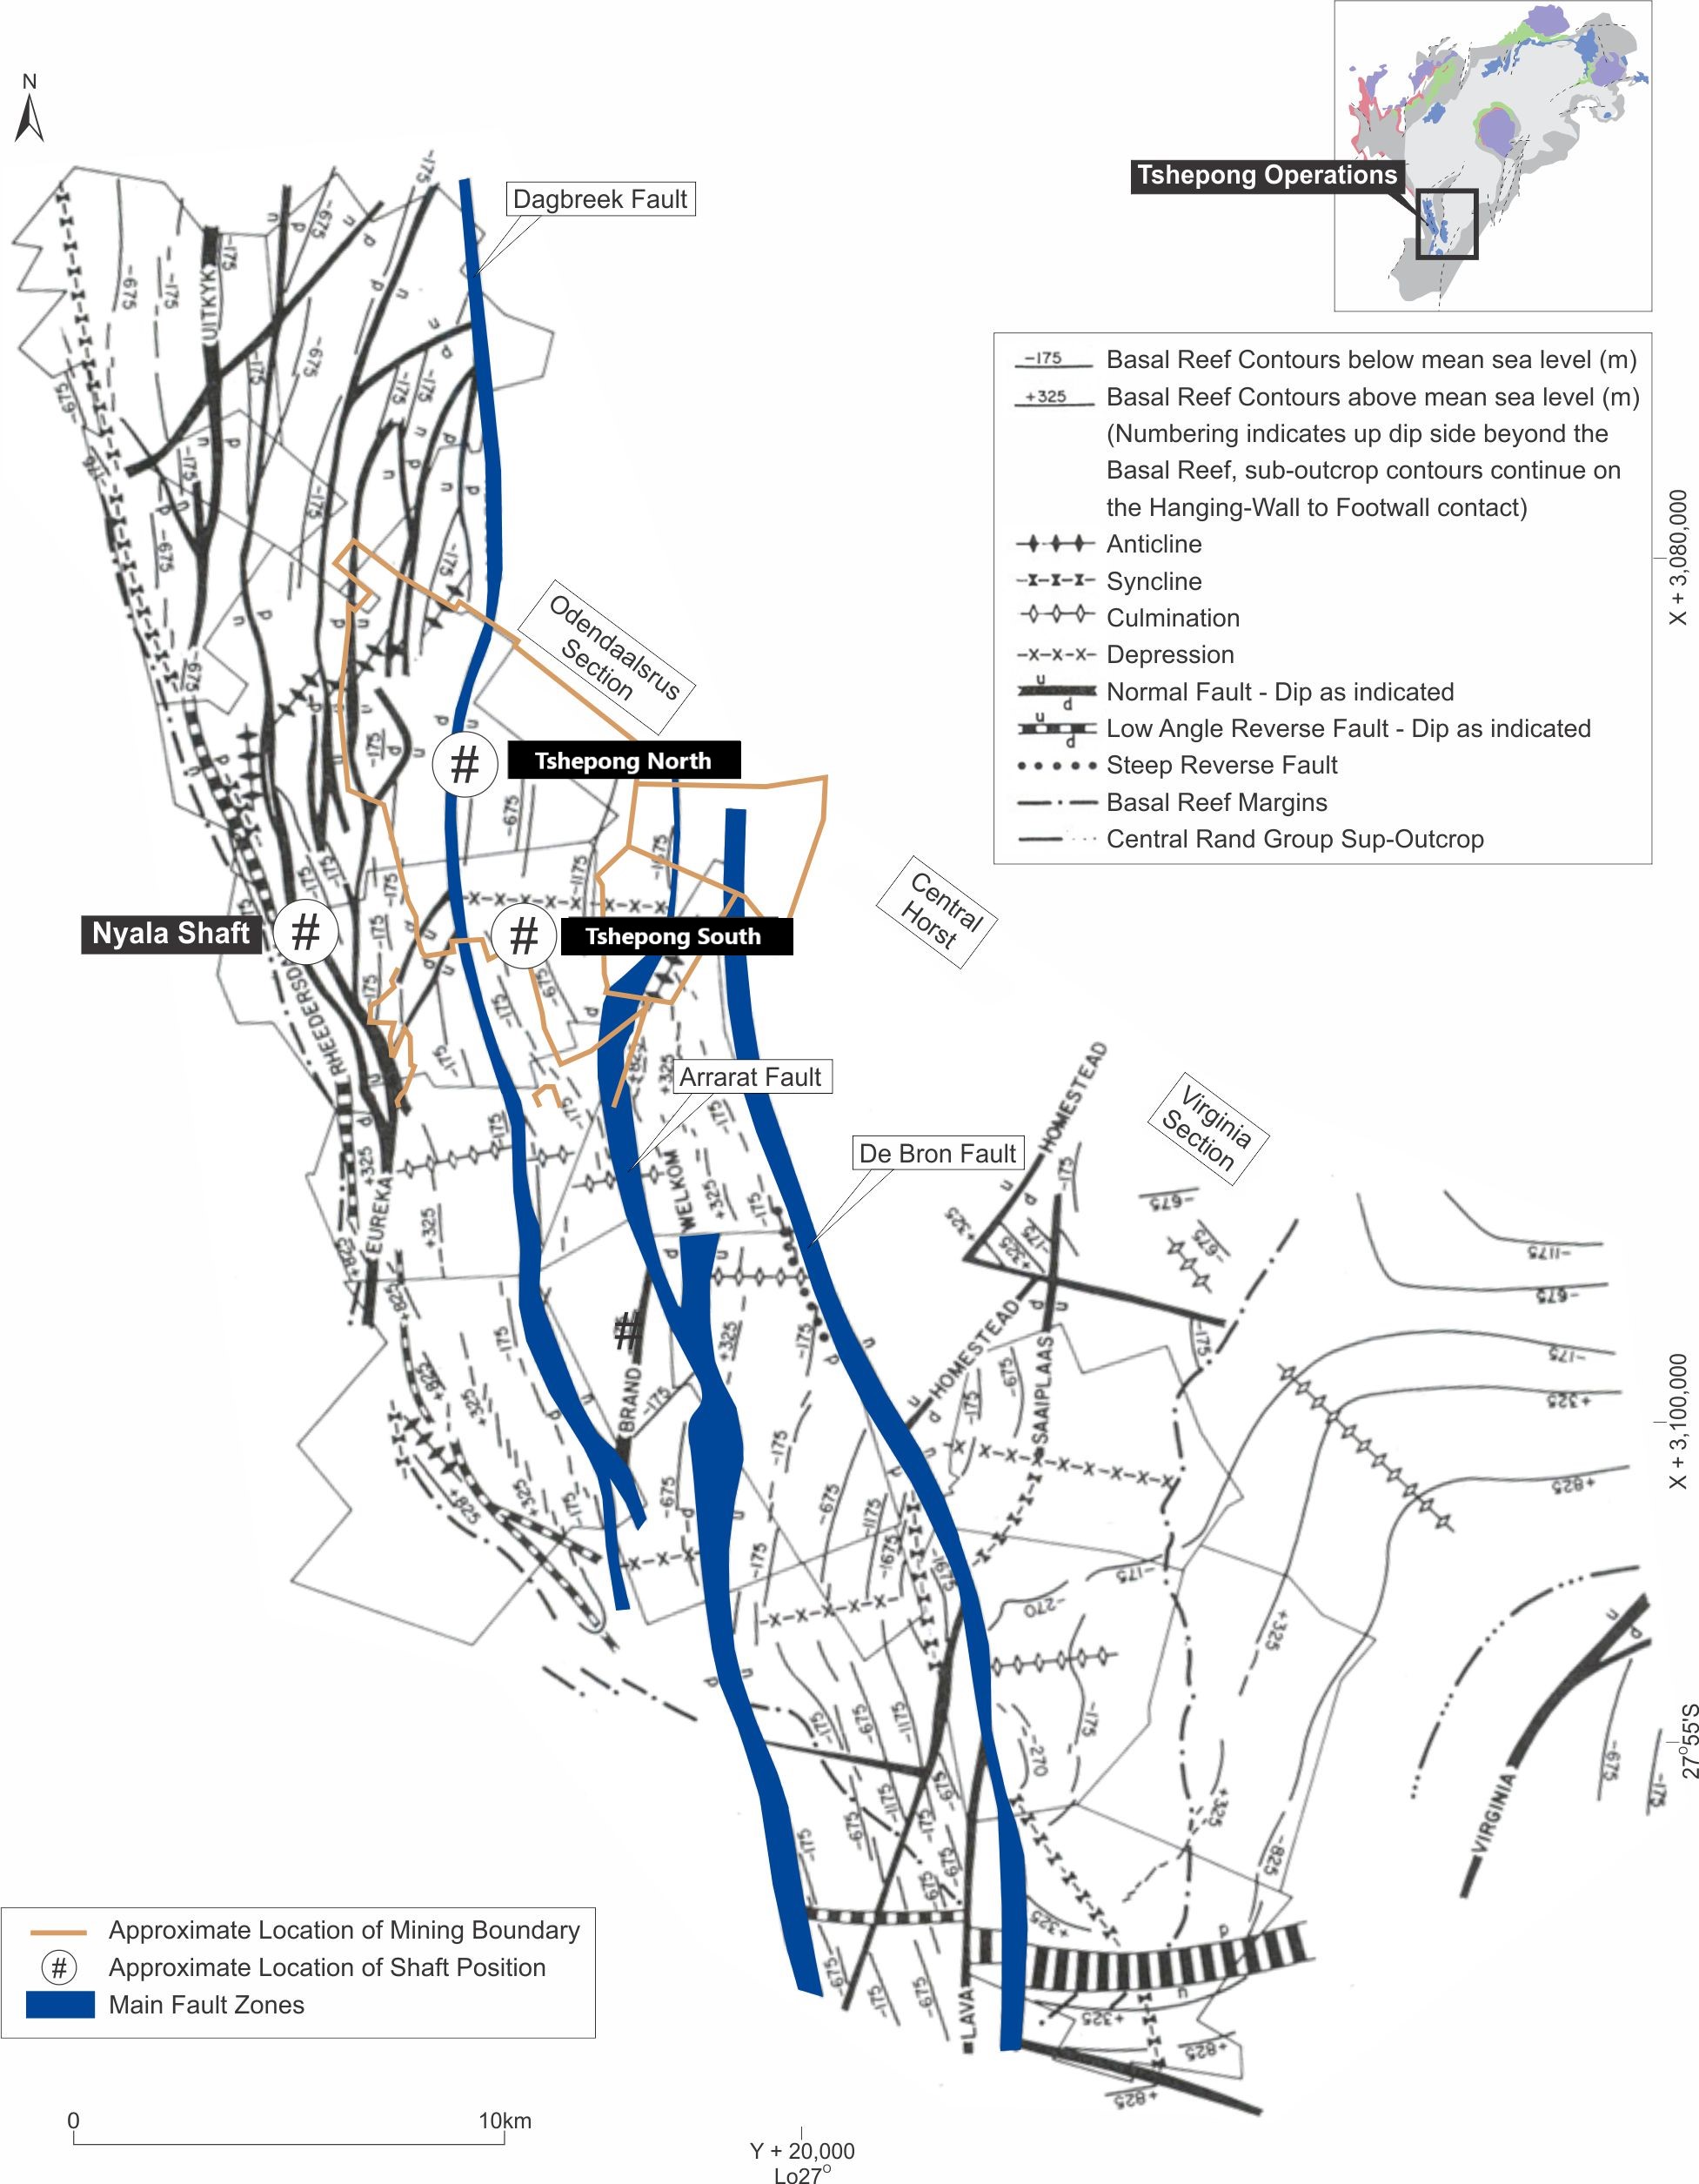
The general orientation of the Witwatersrand Supergroup succession in the Free State Goldfield is interpreted as north-trending within a syncline that is plunging to the north (Figure 6-3). The syncline is cut by two major faults resulting in the formation of three major fault bounded blocks:
•Odendaalsrus Section to the west of the De Bron fault;
•the Central Horst between the De Bron and Homestead faults; and
•the Virginia Section to the east of the Homestead Fault.
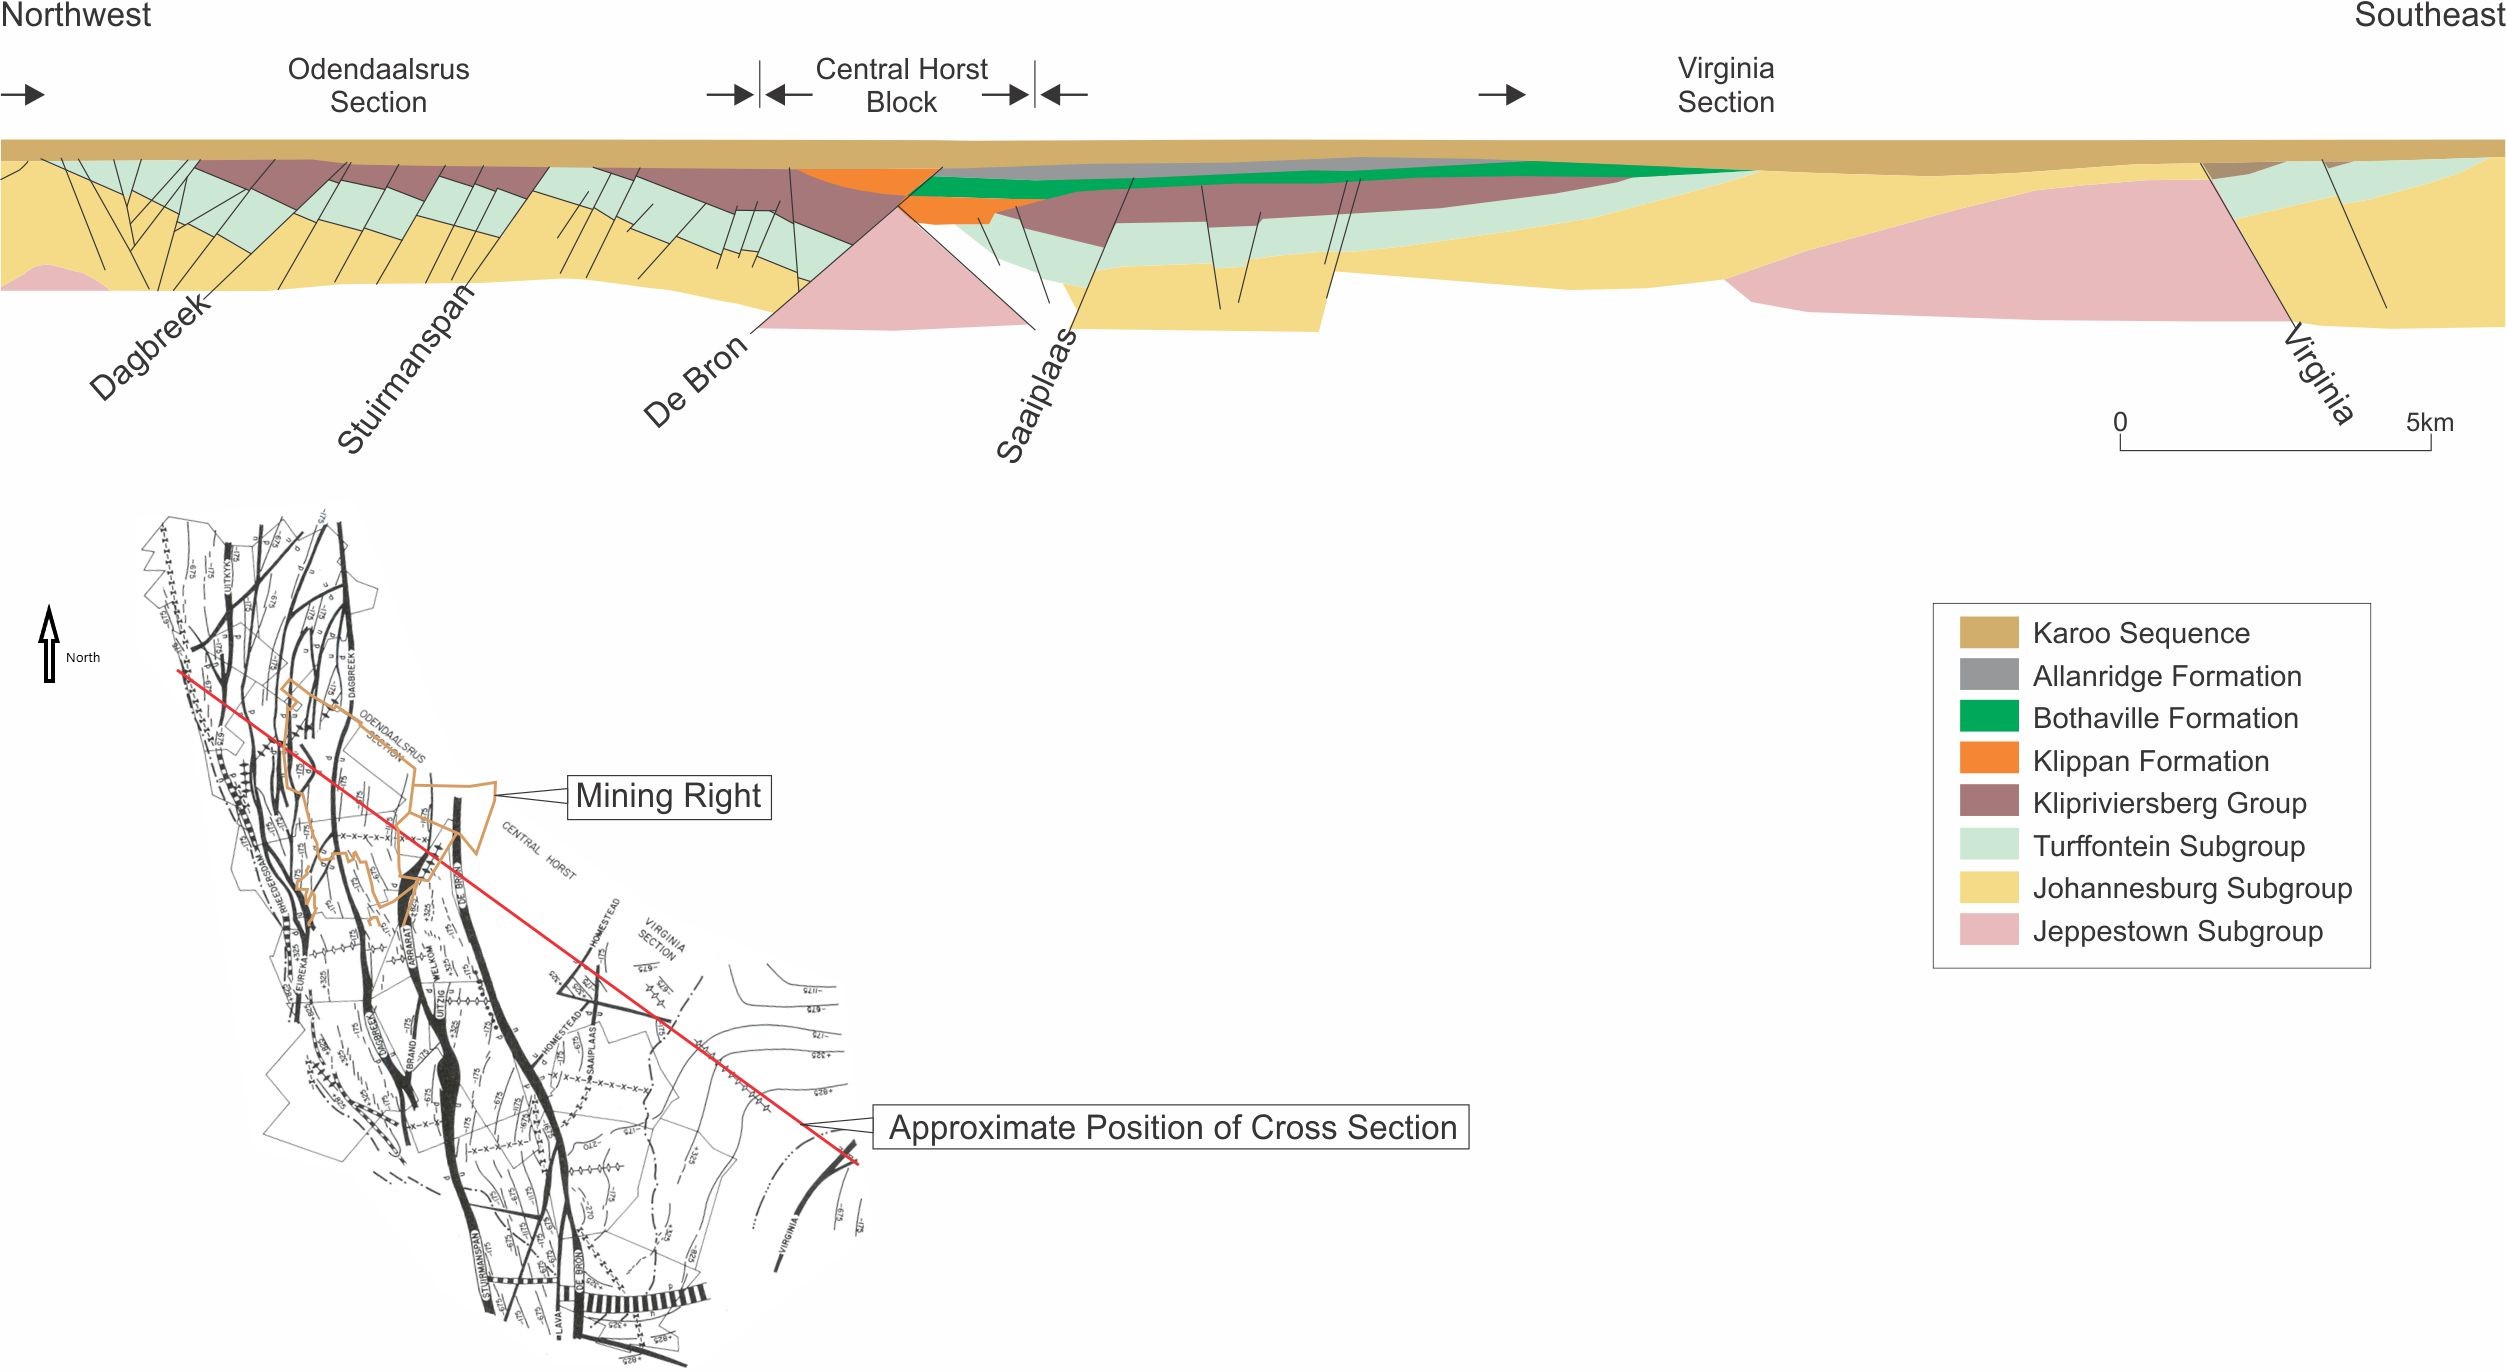
The Central Horst was uplifted, and the Central Rand Group rocks eroded away prior to deposition of the Ventersdorp Supergroup and therefore comprises West Rand quartzites. The western margin of Tshepong South mining right area is also affected by the Tribute fault (~270m) and Arrarat Fault (~180m) to the far south-east of the shaft.
A cross section through the fault bounded blocks is presented in Figure 6-4.
Effective Date: June 30, 2024
15
Technical Report Summary for
Tshepong South, Free State Province, South Africa
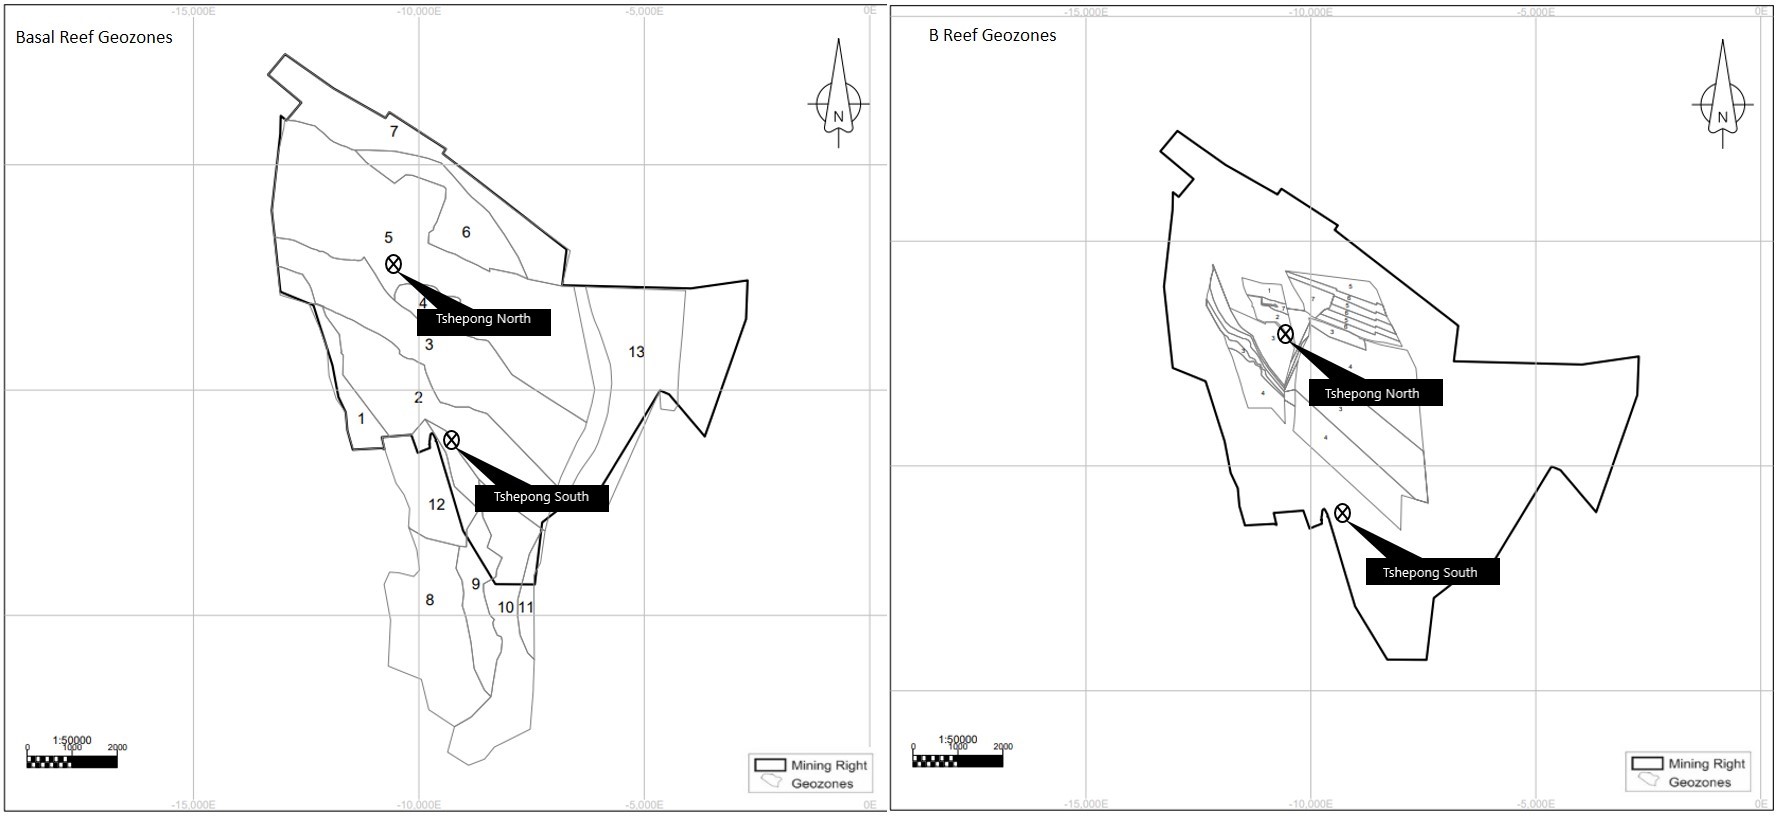
6.3Property Geology
The principal gold-bearing orebody is the stratiform and strata-bound Basal Reef (or Basal Reef Zone (“BRZ”)) (Figure 6-2). A secondary reef, the B-Reef, lying between 140m and 160m stratigraphically above the Basal Reef, contributes less than 20% to the mining production at Tshepong South Mine.
6.3.1Basal Reef Lithology
The Basal Reef comprises a thin conglomerate, overlain by clean ‘placer’ quartzites. The Basal Reef is underlain by a thick series of siliceous and argillaceous quartzites comprising the Welkom Formation and overlain by shales and quartzites of the Harmony Formation, both of the Johannesburg Sub-group of the CRG. The Basal Reef sits unconformably on the Welkom Formation (Figure 6-2).
The Upper Cycle Black Chert facies Basal Reef prevails in the South of Tshepong South’s area and consists of a slightly polymictic (yellow shale specks present), matrix-supported medium-pebble conglomerate with a more gradational contact absent of carbon, where mineralization is associated with fine disseminated and buck-shot pyrite. The conglomerate is slightly thicker compared to the Lower Cycle, but is also overlain by barren reef quartzite, the entire package being characteristically from 40cm to 60cm thick. The lower Khaki Shale is up to 1m thick.
There are two facies of Basal Reef on Tshepong South, namely; the Lower Cycle Black Chert facies in the north and the Upper Cycle Black Chert facies in the south. The reef package ranges from 100cm to 160cm thick.
The Lower Cycle Black Chert facies predominates in the north with a northwest / southeast value trend. The reef consists of an oligomictic small pebble matrix-supported conglomerate lag with fly-speck carbon contact. The rest of the reef package constitutes barren siliceous fine-grained reef quartzite. The entire reef package reaches up to 160cm thick and is overlain by 1cm to 30cm of lower khaki shale. This in turn is overlain by the approximately 3-4m thick waxy brown leader quartzite, above which lies the 3-4m thick upper khaki shale.
6.3.2B-Reef Lithology
The B-Reef at Tshepong South is located about 140m stratigraphically above the Basal Reef and varies in thickness from 10cm to 170cm. The conglomerate varies in character depending on the facies, with B1 being a small to medium pebble conglomerate and usually no more than 30cm thick with abundant carbon. The B2 facies is a small pebble lag in an argillaceous quartzite, with little to no mineralization. B3 facies is a 20cm to 150cm thick conglomerate, mature, well packed, with pebble sizes varying from small to cobble size, very polymictic, normally with abundant pyrite and some carbon. This is the most common facies.
The lowest unit is a basal lag (Zone A), overlying Doornkop Quartzite Formation. Where this unit is developed (or preserved), it may be a highly mineralized oligomictic or polymictic conglomerate, with visible gold, buckshot pyrite and carbon mineralization. This unit may carry gold values of many thousands of cmg/t and represents a potentially rewarding exploration target.
The unit overlying the Zone A may be either Zone B, which comprises a mildly erosive pebbly quartzite formation, and/or the stratigraphically younger Zone C, which is a polymictic conglomerate with low values and is erosional into the underlying A and B zones.
Effective Date: June 30, 2024
16
Technical Report Summary for
Tshepong South, Free State Province, South Africa
Figure 6-3: Structural geology of the Free State Goldfields
Effective Date: June 30, 2024
17
Technical Report Summary for
Tshepong South, Free State Province, South Africa
Figure 6-4: Tshepong South Cross Section
Source: Modified after Tucker et al. (2016)
Effective Date: June 30, 2024
18
Technical Report Summary for
Tshepong South, Free State Province, South Africa
6.3.3Structure
At Tshepong South, there are several major faults and dykes present interpreted from surface drill holes and intersected in the development and stoping. Among these are the Enrico, Zero, Zindaba, Eland, Savannah and Enkeldoorn Dykes, as well as the Tribute and Tshepong South Faults. The easterly limit of the ore body is not clearly defined but appears to cut off at approximately 3,000m below surface on a major component of the north-south striking Arrarat Fault.
Two principal age-based divisions in Tshepong South’s intrusive structures have been identified, namely; Ventersdorp and post-Ventersdorp eras. Various subdivisions within each of these two categories have also been observed.
Yellow porphyry, acicular and quartz diorite dykes are found in the Ventersdorp suite of intrusives, while Karoo dolerites and lamprophyres occur in the post-Ventersdorp suite of intrusives. These intrusives tend to utilise any plane of weakness in their passage. It is therefore not unusual to find an intrusive infill along the various fault planes and other faults within the mine area. Accompanying gouge material, showing slicken-siding along the contacts of the intrusions, indicates that movement has taken place after these rocks were intruded.
6.4Mineralization
The gold mineralization in the Witwatersrand deposits is believed to have followed an episode of deep burial, fracturing and alteration. The mineralization model is that Archean gold bearing hydrothermal fluid was introduced into the conglomerates and circulated throughout in hydrothermal cells. The fluids precipitated gold and other elements through reactions that took place at elevated temperatures along the reef horizons, which was the more favorable fluid conduit.
The generic mineralization model for Tshepong South Basal Reef is based on structurally controlled fluid flow within a conglomerate hosted lithology. Fluid flow is dependent on the permeability of the host rock mass during mineralization. Fluid flow, permeability and subsequent gold mineralization are believed to be controlled by four key factors, including:
•stratigraphy;
•the presence or absence of mineralization age thrust faulting;
•sedimentology; and
•precipitation agent
It is the QP's view, the sedimentological parameters are more influential and predictive for gold distribution on a regional scale.
The gold mineralization is related to the facies-type, and the mineralization characteristics within the facies are similar between Tshepong North and Tshepong South and are hence simply described by facies in the section to follow.
6.4.1Basal Reef
Within the Lower Cycle Black Chert facies, mineralization is characterized by a fine disseminated interstitial pyrite, together with a carbon contact. Mineralization is associated with the carbon contact and conglomerate, although some concentration is also found just below the upper reef contact. At the top of the reef is a granular textured often gritty quartzite with fine pyrite stringers about 10cm thick.
In the Upper Cycle Black Chert Facies, mineralization is associated with the carbon contact and conglomerate, although some concentration is also found just below the upper reef contact. It does not have such a well-developed carbon contact as the Lower Cycle facies and is often of lower grade.
6.4.2B-Reef
The B1 facies has abundant carbon and gold as associated with the carbon. The B2 facies has little to no gold mineralization, while the B3 facies normally has abundant pyrite and some carbon. Free gold can be found in association with the flyspeck carbon in the B3 facies and the carbon seams in the B1 facies.
Effective Date: June 30, 2024
19
Technical Report Summary for
Tshepong South, Free State Province, South Africa
6.4.3Alteration
Alteration is evident in the Basal Reef and B-Reef at Tshepong South and is a result of the hydrothermal fluids that infiltrated the reef and have overprinted on the original mineral assemblage. The reefs contain authigenic sulphides such as pyrite, and other minerals associated with alteration such as chlorite. Gold associations with these mineral assemblages indicate a strong correlation of gold mobilization and redistribution at the time of the hydrothermal fluid influx.
While alteration is an important part of the mineralization, alteration is not used for the identification, modelling or mining of the reefs.
6.5Deposit Type
Tshepong South’s deposits are classed a meta-sedimentary gold deposit. Folding and basin edge faulting have been important controls for sediment deposition and gold distribution patterns within the Witwatersrand Basin and fold trends have been employed in the economic evaluation of various reef horizons.
6.6Commentary on Geological Setting, Mineralization and Deposit
The regional geological setting, local and property geology, mineralization and deposit-type for Tshepong South is well established, through many decades of exploration and mining. Reliable geological models, maps and cross sections are available that support the interpretations and inform the Mineral Resource estimates.
Effective Date: June 30, 2024
20
Technical Report Summary for
Tshepong South, Free State Province, South Africa
7Exploration
Section 229.601(b)(96)(iii)(B)(7) (i-vi)
Geological data has been obtained through initial surface drilling, followed by underground drilling, mapping and channel (chip) sampling.
Tshepong South is undergoing B-Reef exploration drilling to identify any potential continuation of the current pay shoots connecting Tshepong South and Tshepong North mines. Footwall development began at Tshepong South during FY20 and will be used as a drilling platform to confirm and delineate the anticipated B-Reef channel.
7.1Geophysical Surveys
Initial exploration included a historical geophysical seismic survey to obtain information of subsurface rock formations and geological structures using shock wave reflections and surface diamond core drilling. The current Mineral Resource model is no longer informed by the geophysical seismic survey and the model relies only on borehole information and underground mapping information.
7.2Topographic Surveys
As an underground operation, topographic surveys are not material to the Mineral Resource estimates.
7.3Underground Mapping
Face and reef development mapping is undertaken by a team comprising a Sampler or Geologist and an assistant. Face tapes are setup along gullies and the stope face and secured with reference to the latest survey pegs installed in the workplaces. Reef position and other lithological and stratigraphic information is collected and measured relative to the reference tapes. The information is captured in a notebook.
Once at surface, the person responsible transfers the information from the notebook to the applicable survey plan, a mapping report is then produced for each mapped workplace. The mapping reports depict the geological information graphically relative to the survey measurement points. Data from the mapping is also incorporated into the geological models.
Approximately 80-90% of all workplaces are inspected by members of the Geosciences team monthly to ensure that suitable mapping information coverage is achieved.
7.4Channel Sampling Methods and Sample Quality
Channel sampling of underground panels is carried out on a monthly basis. Sampling is conducted perpendicular to the channel contact across the exposed channels. The section lines demarcating the width of the sample are drawn parallel to the reef waste contact while those demarcating the length of the sample are drawn at right angles to the reef waste contact and are marked 10cm apart. The samples are chipped out between these section lines.
Sampling of the Basal Reef stoping channels are undertaken at the advancing face on a grid spacing of 5m x 6m at Tshepong South, while the grid spacing for the B-Reef is at 3m x 3m, to counteract the highly channelized nature of the B-Reef. The sampling process is audited monthly and annually by the Geoscience Manager. Development sampling is on a smaller grid at 4m x 4m for Basal and 2m x 2m for B-Reef. Development sampling is done in addition to the face sampling. The results are captured into the information system and plotted on a development sampling sheet.
Measured taken to ensure sample integrity during collection are as follows:
After samplers arriving from underground to surface samples been put in a steel pipe that goes into a locked bin before crushing out to lamps room so no one can take samples out of shaft area. Sampler crew supervisor will then unlock the bin and count all the samples in the afternoons. The sample crew supervisor will then check that all the samples that he counted must correspond with the samples captured by all samplers on the Assay analyses form check by Valuator.
The sample crew supervisor then makes out a waybill for all the samples and await the driver to transport samples and himself to Lab.He also locks all samples in a locked sample box while traveling to the lab.
Effective Date: June 30, 2024
21
Technical Report Summary for
Tshepong South, Free State Province, South Africa
On arrival at assay lab samples been unlocked from sample box and placed into each sample dish and been counted again and confirmed by lab supervisor by signing on assay analysis form.
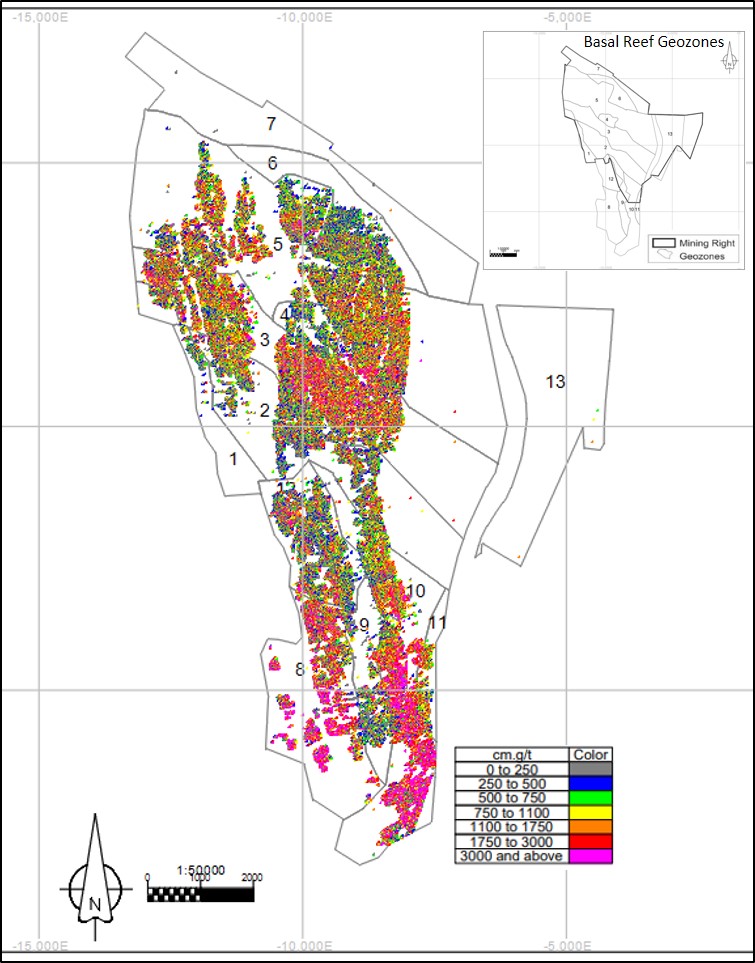
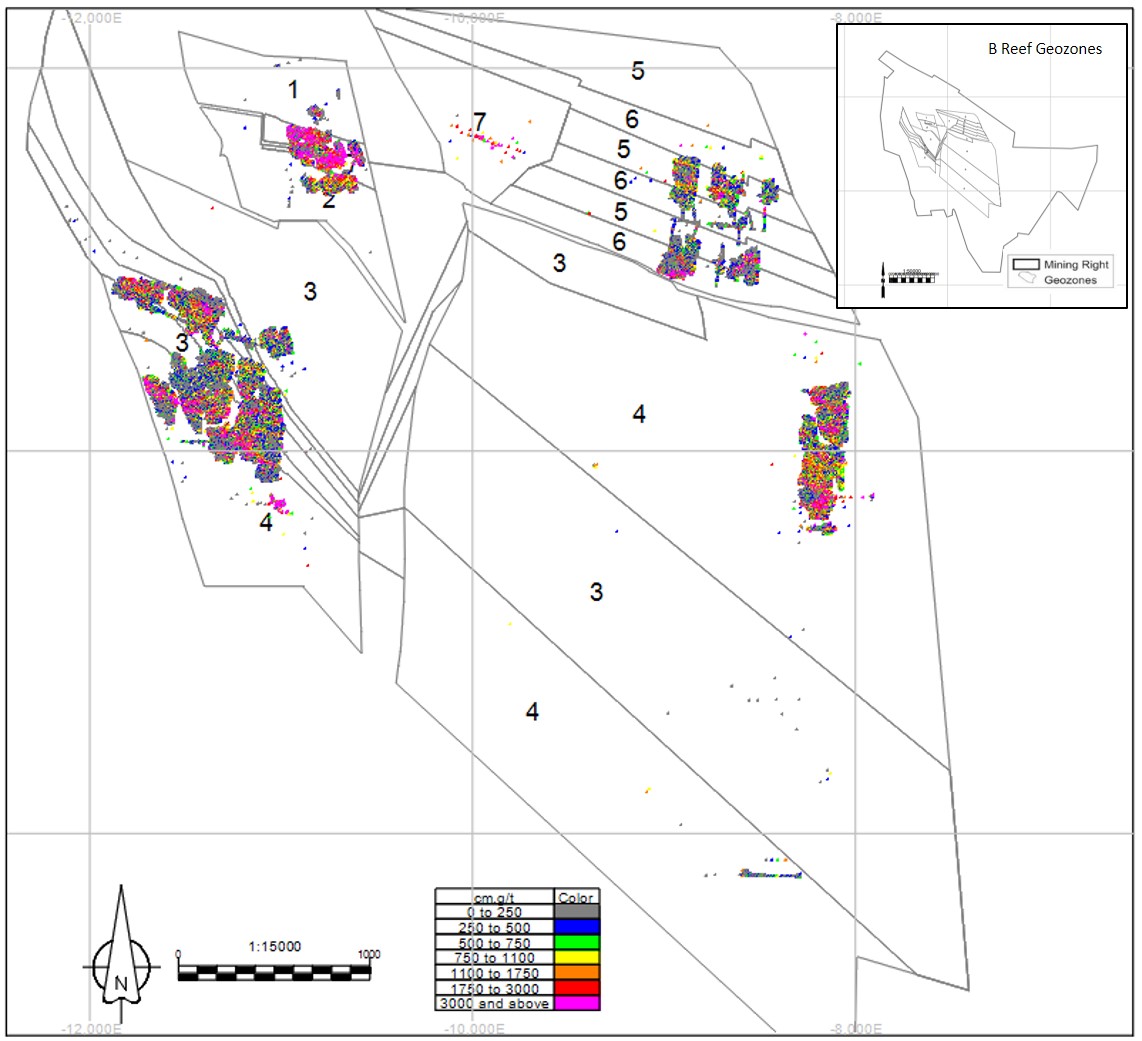
The location of samples collected from the Basal and B-Reef, to date, are shown in Figure 7-1 and Figure 7-2.
A total of 1479 gold samples on average are taken monthly, 1357 Basal Reef and 123 B-Reef.
The channel sample data for B/Reef indicates reef width ranging from 18.0cm to 297.0cm, and grades ranging from 14cmgt to 5216cmgt.
The channel sample data for Basal Reef indicates reef width ranging from 8.0cm to 198.0cm, and grades ranging from 2cmgt to 19103cmgt.
7.5Surface Drilling Campaigns, Procedures, Sampling, Recoveries and Results
Most surface drill holes used in the estimation of the current Mineral Resources were drilled by AngloGold Ashanti, or its forebears, before Harmony acquired Tshepong South.
Effective Date: June 30, 2024
22
Technical Report Summary for
Tshepong South, Free State Province, South Africa
Figure 7-1: Location of channel samples collected from the Basal Reef
Effective Date: June 30, 2024
23
Technical Report Summary for
Tshepong South, Free State Province, South Africa
Figure 7-2: Location of channel samples collected from the B-Reef
7.5.1Drilling Methods
The surface diamond core drilling has been undertaken using a thin-walled core barrel (AXT size core barrel) that delivers 35.51mm core. A single mother hole is drilled, typically with multiple deflection holes drilled from it.
The grid spacing of the surface drilling is determined on a per project basis, with deflections from wedges spaced at up to 100m intervals and is often required to be complemented by underground drill hole intersections. The accuracy of the surface drilling intersection positions from drill holes that are from 2,000m to 3,000m in depth is the major limiting factor of achieving the planned grid. Long surface drill holes often deflect and controlling direction over that depth has always been challenging in the South African gold mining context.
7.5.2Collar and Downhole Surveys
The drill holes are surveyed to confirm both collar position and trajectory. Drill hole collar and downhole surveys are conducted on all surface drill holes.
Surface drill hole collars are surveyed by the internal Land Survey Department. Underground drill hole collars are checked against layouts issued to diamond drilling.
Effective Date: June 30, 2024
24
Technical Report Summary for
Tshepong South, Free State Province, South Africa
Downhole surveying is conducted by DownHole Survey, based in Fochville. A magnetic tool is used to record X, Y, Z and inclination points every 3 meters, with the hole collar being the base. The survey is provided as a spreadsheet containing the relevant information at the specific intervals. The point data can be imported directly to Deswik™ and printed to scale, which makes tracing onto a plan quick and accurate.
7.5.3Logging Procedures
Upon arrival at the core yard located on-site, drill core is marked at every meter interval. The core is then orientated so that the low point of bedding is coincident with the edge of the angle iron. The cut line is defined by the low point of the bedding at the base of the reef zone, when viewed as per convention, from left to right in the direction of increasing depth, is drawn parallel to the core. The core is then rotated through 90° and a yellow line is then drawn parallel to the core, to define the retention half core.
All drill cores are photographed prior to logging and sampling. The geologist conducts the core logging.
Drill core logging is quantitative and qualitative. The following information is recorded:
•lithology;
•packing density;
•roundness;
•sorting;
•contact type, grain/pebble size;
•sediment maturity; and
•mineralization; and alteration.
The geologist responsible for logging the core stores the original paper record. Core logging is also stored electronically using both DeswikTM and Datamine FusionTM software. Internal peer reviewing is undertaken on the interpretation of the stratigraphy and spatial correlation of drill holes.
Observations are captured on the diamond drilling database by geologists. The logs are checked by the Senior Geologist prior to sampling. Logging procedures are conducted as per the Harmony company standards, which are used on all underground mines and are best practice and have been in place since 2001.
7.5.4Drilling Results
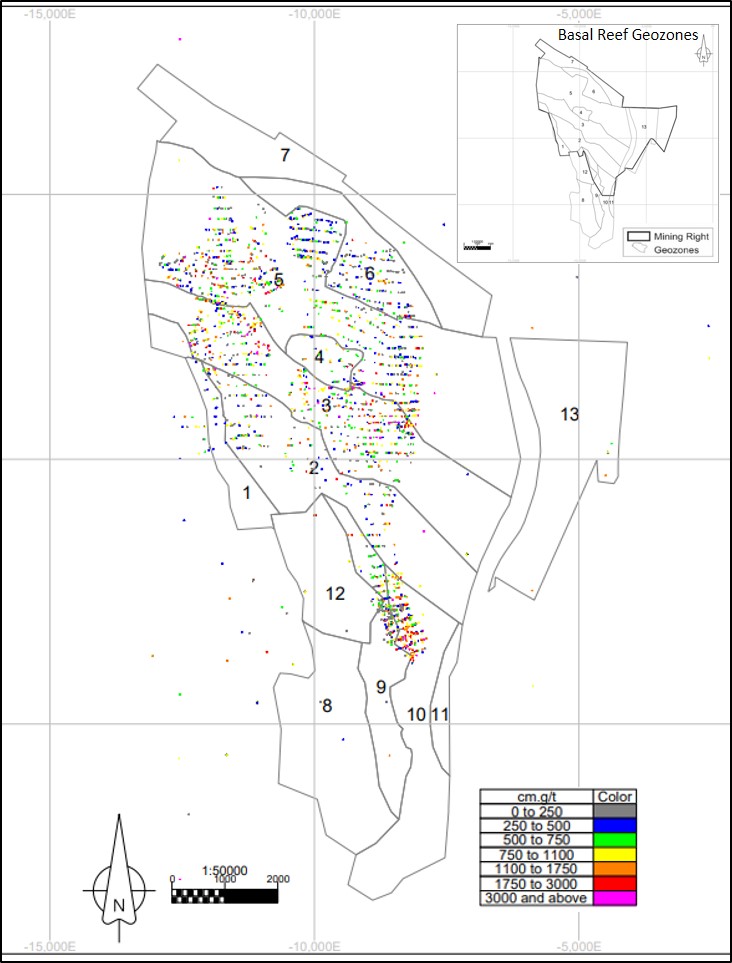
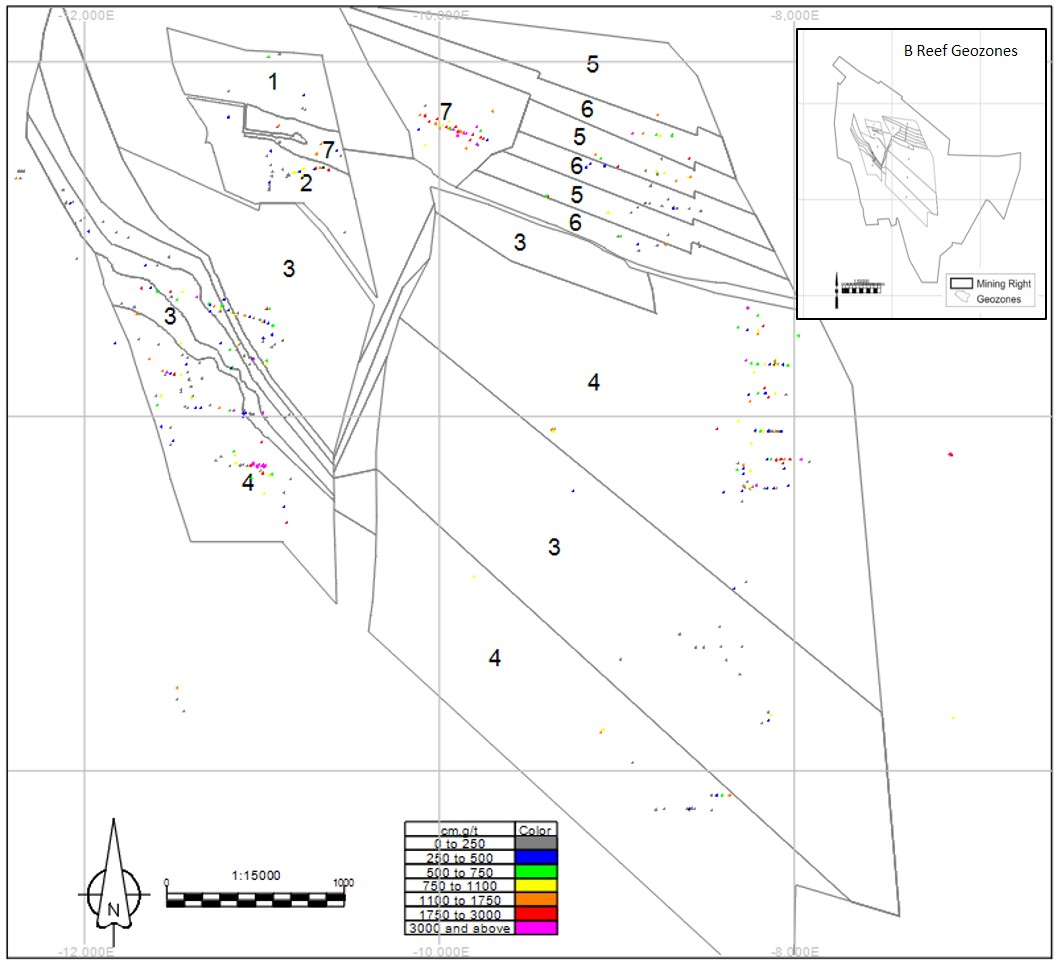
The location of the surface and underground drill holes intersecting the Basal and B-Reefs are presented in Figure 7-3 and Figure 7-4. There are no recent surface drilling results (Table 7-1 and Table 7-2), all drilling dates back to previous project owners and is pre-2017. The results have been included into the geological modelling and Mineral Resource estimation process. These drill holes were drilled to a depth of 2,373m below the surface.
The Basal borehole data indicates reef widths ranging from 2cm to 336cm with an average width of 64cm, and gold grade ranging from 0.2 g/t to 438.53 g/t.
The B Reef borehole data indicates reef width ranging from 8cm to 352cm with an average width of 118cm and gold grade ranging from 0.04 g/t to 78.12 g/t.
Effective Date: June 30, 2024
25
Technical Report Summary for
Tshepong South, Free State Province, South Africa
Figure 7-3: Location of surface and underground drill holes on the Basal Reef
Effective Date: June 30, 2024
26
Technical Report Summary for
Tshepong South, Free State Province, South Africa
Figure 7-4: Location of surface and underground drill holes on the B-Reef
Table 7-1: Summary of surface and underground drilling for Tshepong South
| | | | | | | | | | | | | | |
| Year | Company | No. Drill Holes | Surface (m) | Underground (m) |
| 2018 | Harmony | 129 | — | 11 081 |
| 2019 | Harmony | 105 | — | 7 305 |
| 2020 | Harmony | 58 | — | 4 265 |
| 2021 | Harmony | 113 | — | 7 190 |
| 2022 | Harmony | 32 | — | 2 132 |
| 2023 | Harmony | 108 | — | 8 145 |
| 2024 | Harmony | 93 | — | 7 809 |
| Total | 638 | — | 47 927 |
7.5.5Core Recovery
Upon delivery to the core yard, and prior to logging and sampling, the drill core is checked to ensure 100% core recovery. Core recovery is determined by dividing the measured length of the recovered core by the total length of the core run.
An intersection is complete and representative if core recovery is greater than 99%. Drill holes with poor recovery are not sampled. Extra caution is taken during the drilling process to ensure maximum core recovery on reef intersections, to prevent sample bias.
Reef intersection “acceptability” is categorised as per the criteria summarized in Table 7-2 and is determined by geologists based on, amongst others, drill core condition and faulting. The acceptability is verified for each reef intersection before the assay results are used for Mineral Resource estimation.
Effective Date: June 30, 2024
27
Technical Report Summary for
Tshepong South, Free State Province, South Africa
Records of recoveries over 42 060m of drilled core were available and indicated an average core recovery of 90%.
Table 7-2: Drill hole acceptance criteria
| | | | | |
| Category | Comment |
| Acceptable | 100% core recovery in the reef zone, or very minor loss due to reef chipping. No evidence of faulting within the reef horizon or at either contact with hanging wall or footwall lithologies. |
| Minimum value | Light to moderate disking of core in the core barrel due to drilling and/or ground conditions. Visual observations indicate that the conglomerate portion of the reef is usually more prone to disking, resulting in possible gold loss. |
| Faulted minimum value | If the fault loss is considered to be minor, this term may be used if the geologist is certain that only low-value internal quartzite is missing from the intersection. |
| Not acceptable | Heavy disking of core which may indicate core loss, partial known core loss due to grinding. Also faulting of any description within the reef zone. |
| |
| |
| |
| |
| |
7.5.6Sample Length and True Thickness
Mineralization of the reefs is perpendicular to or at an angle to the drill holes. As such, all drill hole reef intersection widths are corrected to true thickness for gold value calculation.
7.6Underground Drilling Campaigns, Procedures and Sampling
Underground exploration drilling has been ongoing throughout the operational life of Tshepong South as the mine deepens. Most of the surface boreholes used in the estimation of the current Mineral Resources were drilled by AngloGold Ashanti before Harmony acquired the mine.
7.6.1Drilling Methods
Underground diamond core drilling is conducted using hydraulic driven and pneumatic drill rigs, which typically delivers an AXT size core (35.51mm). These are short drill holes rarely exceeding 200m in length.
Fans of drill holes are drilled from diamond drilling bays, which are developed at 50m intervals along footwall developments ends (X/C’s) and 100m intervals along haulages and RAW’s. The drilling fans consist of up to ten individual drill holes at inclinations ranging from +5° to +90° of vertical, or as dictated by local geological structures.
7.6.2Collar and Downhole Surveys
At Tshepong South, exploration holes are normally not surveyed as the maximum length of the holes are 150m and stabilizers are used to minimize the risk of deflection. In exceptional cases where drilling provides unexpected or anomalous data, or where high accuracy is absolutely required, exploration holes with stabilizers have been surveyed and the results have generally shown the stabilizers to be effective. LIBs drilled for Tshepong South Sub 75 Capital Project and the B-Reef initial drilling project before footwall development was established were all surveyed, including the planned deflections.
Boreholes related to Capital projects are generally surveyed to ensure accurate interpretation, as these tend to be longer holes (up to 300m) drilled with special rigs designed for the purpose. The company used for the surveys is DownHole Survey, based in Fochville. A magnetic tool is used to record X, Y, Z and inclination points every 3 meters, with the hole collar being the base. The survey is provided as a spreadsheet containing the relevant information at the specific intervals. The point data can be imported directly to Deswik™ and printed to scale, which makes tracing onto a plan quick and accurate.
With normal exploration and cover holes the collar position is measured from a known survey peg, as well as the distance above or below the grade line. This is done by the drill contractor and provided to the relevant geologist. The geologist will also do spot checks when passing by a drill rig. Exact XYZ coordinates can then be read from the plan after the collar is plotted.
Effective Date: June 30, 2024
28
Technical Report Summary for
Tshepong South, Free State Province, South Africa
7.6.3Logging Procedures
Upon arrival at the core yard located on-site, drill core is marked at every meter interval. The core is then orientated so that the low point of bedding is coincident with the edge of the angle iron. The cut line is defined by the low point of the bedding at the base of the reef zone, when viewed as per convention, from left to right in the direction of increasing depth, is drawn parallel to the core. The core is then rotated through 90° and a yellow line is then drawn parallel to the core, to define the retention half core.
All drill cores are photographed prior to logging and sampling. The geologist conducts the core logging.
Drill core logging is quantitative and qualitative. The following information is recorded:
•lithology;
•packing density;
•roundness;
•sorting;
•contact type, grain/pebble size;
•sediment maturity; and
•mineralization; and alteration.
The geologist responsible for logging the core stores the original paper record. Core logging is also stored electronically using Datamine FusionTM software. Internal peer reviewing is undertaken on the interpretation of the stratigraphy and spatial correlation of drill holes.
Observations are captured on the diamond drilling database by geologists. The logs are checked by the Senior Geologist prior to sampling. Logging procedures are conducted as per the Harmony company standards, which are used on all underground mines and are best practice and have been in place since 2001.
7.6.4Drilling Results
The location of the underground drill holes intersecting the Basal and B-Reefs are presented in Figure 7-3 and Figure 7-4.
With over 2601 Basal Reef and B-Reef surface and underground drill holes in the database, the results are too voluminous to be reported in this report. The results have, however, been included into the geological modelling and Mineral Resource estimation process.
The Basal borehole data indicates reef width ranging from 2cm to 336cm with an average width of 64cm and gold grade ranging from 0.2 g/t to 438.53 g/t.
The B Reef borehole data indicates reef width ranging from 8cm to 352cm with an average width of 118cm and gold grade ranging from 0.04 g/t to 78.12 g/t.
The recent Basal Reef and B-Reef underground drilling results for Tshepong South are summarized in Table 7-4 and Table 7-5. A total of 93 underground drill holes were drilled for 2024 which included 78 Basal Reef intersections and 15 B-Reef intersections.
7.6.5Core Recovery
Upon delivery to the core yard, prior to logging and sampling, the drill core is checked to ensure 100% core recovery. Core recovery is determined by dividing the measured length of the recovered core by the total length of the core run.
An intersection is complete and representative if core recovery is greater than 99%. Drillholes with poor recovery are not sampled. Extra caution is taken during the drilling process to ensure maximum core recovery on reef intersections, to prevent sample bias.
Effective Date: June 30, 2024
29
Technical Report Summary for
Tshepong South, Free State Province, South Africa
Reef intersection “acceptability” is categorised as per the criteria summarized in Table 7-2 and is determined by geologists based on, amongst others, drill core condition and faulting. The acceptability is verified for each reef intersection before the assay results are used for Mineral Resource estimation.
Records of recoveries over 42 060m of drilled core were available and indicated an average core recovery of 90%.
7.6.6Sample Length and True Thickness
Mineralization of the reefs is perpendicular to or at an angle to the drill holes. As such, all drill hole reef intersection widths are corrected to true thickness for gold value calculation.
7.7Hydrogeology
Tshepong South has a good understanding of the local geology and geohydrology through numerous geohydrological and mass transport models done over the years.
Tshepong South mine is characterized by two aquifers:
•A Shallow Weathered and Fractured Karoo Aquifer (Karoo Formations): A shallow, weathered aquifer exists in the weathered shale and sandstone at an average depth of 10m – 20m below ground level. The most consistent water strike is located at the fresh bedrock / weathering interface.
•The primary porosity of the Vryheid Formation is very low. Any water bearing capacity is therefore associated with secondary joints, bedding planes and faults. The contact zones of dolerite intrusions are considered the primary source of groundwater flow within the deeper formations.
•The two aquifers may or may not be hydraulically connected, dependent on the local geology.
•A Deep Witwatersrand / Ventersdorp Aquifer: The deep brine Witwatersrand aquifer is situated approximately 300m below surface. This aquifer is thought to be connate (i.e. original formation water) or extremely old (fossil) water and is usually concentrated on geological structures such as fault zones or igneous intrusions (e.g. dykes).
The major fractures that that formed during the Ventersdorp tectonic events were filled with water to a depth of several kilometers. The impermeable nature of the overlying Karoo sediments, particularly the Dwyka Formation at the base of the Karoo, effectively sealed of the aquifer (Van Biljon, 1995). Post-Karoo movement and intrusions provided conduits for leakage from the Karoo aquifers to the deep Witwatersrand aquifer. However, the deep aquifer recharge from surface is regarded as negligible and at best localised (Van Biljon, 1995).
This is concluded based on the dewatering of this aquifer over the past 40 years during which the water levels in the Witwatersrand aquifer dropped significantly. Underground dewatering boreholes have dried up in some instances (Van Biljon, 1995).
Previous studies concluded the following:
•There is no or very limited hydraulic connectivity between the Karoo aquifers and the deeper Witwatersrand aquifer.
•Recharge to the Witwatersrand aquifer is negligible.
•Once the Witwatersrand aquifer is dewatered (or the water level lowered) it will not recover. The estimated post-mining water level in the Witwatersrand aquifer will therefore be deeper than the pre-mining water level of ~200m below surface.
7.8Geotechnical Data
Geological exploration drilling is not typically used to gather geotechnical data – these data are gathered independently by the Geotechnical Engineer. Geotechnical issues related to underground workings are discussed in more detail in the Mining and Mine Design sections (Section 13).
Effective Date: June 30, 2024
30
Technical Report Summary for
Tshepong South, Free State Province, South Africa
Numerical modelling is done using rock mass characteristics from geological core samples, to determine the rock wall condition factor and average pillar stress. A point load test machine is used to conduct point load tests of random rock samples, correlating it with core testing results. Applying the geotechnical properties obtained improves back analysis of seismic events and building a more comprehensive geotechnical model of the mine. Quality assurance is enhanced by using expert external service providers where applicable.
A seismic network is utilized at Tshepong South to monitor seismicity which consist out of 48 component geophones which are installed across the mine and 2 regional seismic sites is also installed. The digital seismic data is transmitted from the seismic underground stations to the surface seismic server (RTS) via the mines Hirschman switches and through ADSL, the Ethernet (LAN) based infrastructure available on the mine. Automatic as well as Manual processing of the recorded seismic data is done by the Institute of Mine Seismology. On Harmony Gold the objective of seismic monitoring is to prevent seismicity. The seismic network is planned to a horizontal accuracy within 25 to 50m with a network sensitivity of (Mmin) – 0.0 to 0.5. The seismic monitoring system is designed to provide information to the rock engineering practitioner and production officials on a daily and monthly basis. Daily, seismic plots are produced to indicate the existence of “high seismic deformation” areas.
Effective Date: June 30, 2024
31
Technical Report Summary for
Tshepong South, Free State Province, South Africa
Table 7-3: Summary of recent Tshepong South underground drill holes intersecting the Basal Reef
| | | | | | | | | | | | | | | | | | | | | | | | | | | | | | | | | | | | | | | | | |
Year | Drill Hole ID | Gold Value (cmg/t) | Ave. Channel Width (cm) | | Year | Drill Hole ID | Gold Value (cmg/t) | Ave. Channel Width (cm) | | Year | Drill Hole ID | Gold Value (cmg/t) | Ave. Channel Width (cm) |
| 2023 | GDD 2423 | 483 | 34 | | 2023 | GDD 2548 | 364 | 32 | | 2024 | GDD 2578 | 2 701 | 173 |
| 2023 | GDD 2423 | 1 245 | 46 | | 2023 | GDD 2573 | 524 | 13 | | 2024 | GDD 2538 | 1 042 | 50 |
| 2023 | GDD 2473 | 218 | 162 | | 2023 | GDD 2568 | 1 509 | 52 | | 2024 | GDD 2530 | 2 191 | 197 |
| 2023 | GDD 2441 | 2 990 | 50 | | 2023 | GDD 2578 | 2 701 | 173 | | 2024 | GDD 2586 | 67 | 76 |
| 2023 | GDD 2476 | 513 | 37 | | 2023 | GDD 2538 | 1 042 | 50 | | 2024 | GDD 2552 | 457 | 52 |
| 2023 | GDD 2468 | 2 160 | 54 | | 2023 | GDD 2530 | 2 191 | 197 | | 2024 | GDD 2574 | 1 363 | 69 |
| 2023 | GDD 2467 | 909 | 63 | | 2023 | GDD 2586 | 67 | 76 | | 2024 | GDD 2554 | 27 | 44 |
| 2023 | GDD 2485 | 499 | 23 | | 2023 | GDD 2552 | 457 | 52 | | 2024 | GDD 2569 | 611 | 39 |
| 2023 | GDD 2469 | 1 316 | 55 | | 2023 | GDD 2574 | 1 363 | 69 | | 2024 | GDD 2531 | 665 | 112 |
| 2023 | GDD 2424 | 33 | 35 | | 2023 | GDD 2554 | 27 | 44 | | 2024 | GDD 2572 | 1 004 | 51 |
| 2023 | GDD 2438 | 38 | 43 | | 2023 | GDD 2569 | 611 | 39 | | 2024 | GDD 2587 | 1 650 | 49 |
| 2023 | CDD 2462 | 141 | 27 | | 2023 | GDD 2531 | 665 | 112 | | 2024 | GDD 2575 | 1 206 | 61 |
| 2023 | CDD 2454 | 257 | 141 | | 2023 | GDD 2572 | 1 004 | 51 | | 2024 | GDD 2590 | 454 | 39 |
| 2023 | GDD 2451 | 1 750 | 43 | | 2023 | GDD 2587 | 1 650 | 49 | | 2024 | GDD 2581 | 1 023 | 63 |
| 2023 | GDD 2463 | 5 378 | 42 | | 2023 | GDD 2575 | 1 206 | 61 | | 2024 | GDD 2591 | 2 783 | 68 |
| 2023 | GDD 2501 | 9 | 41 | | 2023 | GDD 2517 | 107 | 1 | | 2024 | GDD 2595 | 92 | 84 |
| 2023 | GDD 2487 | 464 | 158 | | 2023 | GDD 2456 | 88 | 4 | | 2024 | CDD 2588 | 1 015 | 84 |
| 2023 | GDD 2461 | 177 | 16 | | 2023 | GDD 2507 | 12 | 25 | | 2024 | GDD 2555 | 193 | 52 |
| 2023 | GDD 2493 | 7 894 | 38 | | 2024 | GDD 2505 | 445 | 34 | | 2024 | CDD 2608 | 3 535 | 57 |
| 2023 | GDD 2494 | 339 | 80 | | 2024 | GDD 2489 | 1 528 | 35 | | 2024 | GDD 2584 | 363 | 53 |
| 2023 | GDD 2507 | 86 | 7 | | 2024 | GDD 2425 | 1 435 | 38 | | 2024 | CDD 2541 | 1 745 | 16 |
| 2023 | GDD 2505 | 445 | 34 | | 2024 | GDD 2509 | 3 820 | 14 | | 2024 | GDD 2607 | 1 209 | 37 |
| 2023 | GDD 2489 | 1 528 | 35 | | 2024 | GDD 2492 | 333 | 36 | | 2024 | GDD 2582 | 28 | 10 |
| 2023 | GDD 2425 | 1 435 | 38 | | 2024 | GDD 2504 | 951 | 35 | | 2024 | GDD 2621 | 2 430 | 58 |
| 2023 | GDD 2509 | 3 820 | 14 | | 2024 | GDD 2495 | 1 991 | 40 | | 2024 | GDD 2556 | 1 890 | 45 |
| 2023 | GDD 2492 | 333 | 36 | | 2024 | GDD 2496 | 3 292 | 118 | | 2024 | GDD 2542 | 3 | 15 |
| 2023 | GDD 2504 | 951 | 35 | | 2024 | GDD 2519 | 705 | 75 | | 2024 | GDD 2636 | 1 126 | 37 |
| 2023 | GDD 2495 | 1 991 | 40 | | 2024 | GDD 2535 | 61 | 44 | | 2024 | GDD 2622 | 12 126 | 52 |
| 2023 | GDD 2496 | 3 292 | 118 | | 2024 | GDD 2474 | 591 | 119 | | 2024 | GDD 2543 | 696 | 43 |
| 2023 | GDD 2519 | 705 | 75 | | 2024 | GDD 2497 | 1 101 | 38 | | 2024 | GDD 2583 | 870 | 40 |
| 2023 | GDD 2535 | 61 | 44 | | 2024 | GDD 2516 | 1 461 | 48 | | 2024 | GDD 2614 | 193 | 113 |
| 2023 | GDD 2474 | 591 | 119 | | 2024 | GDD 2520 | 1 116 | 33 | | 2024 | GDD 2635 | 1 821 | 33 |
| 2023 | GDD 2497 | 1 101 | 38 | | 2024 | GDD 2522 | 4 166 | 53 | | 2024 | GDD 2557 | 2 308 | 31 |
| 2023 | GDD 2516 | 1 461 | 48 | | 2024 | CDD 2544 | 429 | 29 | | 2024 | GDD 2637 | 687 | 45 |
| 2023 | GDD 2520 | 1 116 | 33 | | 2024 | GDD 2536 | 364 | 47 | | 2024 | GDD 2615 | 204 | 56 |
Effective Date: June 30, 2024
32
Technical Report Summary for
Tshepong South, Free State Province, South Africa
| | | | | | | | | | | | | | | | | | | | | | | | | | | | | | | | | | | | | | | | | |
| 2023 | GDD 2522 | 4 166 | 53 | | 2024 | GDD 2545 | 9 | 2 | | 2024 | GDD 2648 | 722 | 137 |
| 2023 | CDD 2544 | 429 | 29 | | 2024 | GDD 2533 | 231 | 85 | | 2024 | GDD 2633 | 2 781 | 38 |
| 2023 | GDD 2536 | 364 | 47 | | 2024 | GDD 2437 | 251 | 21 | | 2024 | GDD 2632 | 79 | 42 |
| 2023 | GDD 2545 | 9 | 2 | | 2024 | GDD 2549 | 332 | 18 | | 2024 | GDD 2656 | 145 | 34 |
| 2023 | GDD 2533 | 231 | 85 | | 2024 | GDD 2537 | 839 | 49 | | 2024 | CDD 2647 | 575 | 75 |
| 2023 | GDD 2437 | 251 | 21 | | 2024 | GDD 2560 | 2 242 | 39 | | 2024 | GDD 2670 | 263 | 78 |
| 2023 | GDD 2549 | 332 | 18 | | 2024 | GDD 2561 | 577 | 137 | | 2024 | GDD 2645 | 659 | 60 |
| 2023 | GDD 2537 | 839 | 49 | | 2024 | GDD 2562 | 2 588 | 14 | | 2024 | GDD 2646 | 3 612 | 40 |
| 2023 | GDD 2560 | 2 242 | 39 | | 2024 | GDD 2563 | 366 | 126 | | 2024 | GDD 2668 | 25 | 39 |
| 2023 | GDD 2561 | 577 | 137 | | 2024 | GDD 2567 | 956 | 75 | | 2024 | GDD 2682 | 733 | 71 |
| 2023 | GDD 2562 | 2 588 | 14 | | 2024 | GDD 2548 | 364 | 32 | | 2024 | GDD 2677 | 1 014 | 107 |
| 2023 | GDD 2563 | 366 | 126 | | 2024 | GDD 2573 | 524 | 13 | | 2024 | GDD 2652 | 1 113 | 31 |
| 2023 | GDD 2567 | 956 | 75 | | 2024 | GDD 2568 | 1 509 | 52 | | 2024 | GDD 2674 | 511 | 63 |
Table 7-4: Summary of recent Tshepong South underground drill holes intersecting the B-Reef
| | | | | | | | | | | |
| Year | Drill Hole ID | Gold Value (cmg/t) | Ave. Channel Width (cm) |
| 2023 | GDD 2512 | 102 | 47 |
| 2023 | GDD 2564 | 170 | 185 |
| 2024 | GDD 2488 | 228 | 175 |
| 2024 | GDD 2499 | 131 | 30 |
| 2024 | GDD 2512 | 102 | 47 |
| 2024 | GDD 2564 | 170 | 185 |
| 2024 | GDD 2601 | 592 | 225 |
| 2024 | GDD 2602 | 412 | 70 |
| 2024 | GDD 2603 | 82 | 203 |
| 2024 | GDD 2566 | 150 | 19 |
| 2024 | GDD 2565 | 64 | 9 |
| 2024 | GDD 2609 | 203 | 52 |
| 2024 | GDD 2610 | 1415 | 160 |
| 2024 | GDD 2617 | 270 | 50 |
| 2024 | GDD 2618 | 1170 | 161 |
| 2024 | GDD 2655 | 661 | 8 |
| 2024 | GDD 2660 | 134 | 61 |
Effective Date: June 30, 2024
33
Technical Report Summary for
Tshepong South, Free State Province, South Africa
Table 7-5: Summary of surface boreholes for Tshepong South and North
| | | | | | | | | | | | | | |
| Summary of Surface Boreholes for Tshepong South and North |
| Drill Hole ID | Reef | Gold Value (cmg/t) | Reef | Gold Value (cmg/t) |
| UT1 | Basal | 1720 | B Reef | Tr |
| UT2 | Basal | 224 | B Reef | 514 |
| UT3 | Basal | 1696 | B Reef | 845 |
| UT4 | Basal | 605 | B Reef | 216 |
| AR5A | Basal | 630 | B Reef | |
| AL5 | Basal | 479 | B Reef | 159 |
| ELD3 | Basal | 1228 | B Reef | 731 |
| LB5 | Basal | 763 | B Reef | 2427 |
| NK2 | Basal | 652 | B Reef | Tr |
| EV10 | Basal | | B Reef | 1429 |
7.9Commentary on Exploration
Surface drilling was used as the initial exploration drilling and this was later infilled to provide sufficient detail for geological modelling and Mineral Resource estimation. The underground infill drilling system is in place to improve data density in specific areas and boreholes are drilled from the underground development access drives.
Logging procedures are conducted as per the Harmony company standards, which are used on all surface and underground mines and are best practice and have been in place consistently since 2001.
Previous to this system surface exploration holes (historical drilling) were drilled by Anglo and detailed logs exist in a safe room at the Harmony Steyn offices.
The QP is of the opinion that the quality and quantity of the exploration methods and information gathered is sufficient to support the estimation of Mineral Resources and Mineral Reserves.
Effective Date: June 30, 2024
34
Technical Report Summary for
Tshepong South, Free State Province, South Africa
8Sample Preparation, Analyses and Security
Section 229.601(b)(96)(iii)(B)(8) (i-v)
This section summarizes information relating to the sample preparation on site through to the laboratory preparation and analysis.
8.1Sampling Method and Approach
Sample types used to support both production and geological exploration include diamond drill core samples and channel (chip) samples.
8.1.1Channel Samples
Channel sampling is (and was by Anglo previously) undertaken according to industry best practice, and presently now according to Harmony’s Underground Sampling Procedure which incorporates QAQC principles.
Tshepong South’s standard is to achieve 100% stope sampling coverage.The sampling grid in the Basal Reef stoping is a 5m interval along dip and a 6m interval on strike creating a 5m x 6m grid.
For 100% development coverage on Tshepong South, the full extent of the on-reef development must be sampled on one sidewall every 4m. Due to the high nugget effect and variability associated with B-Reef, these intervals may be increased where appropriate (currently 2m interval).
Samples are chipped from the advancing face from within clearly measured and marked channel sections, including the 2cm hanging wall and footwall width. Sample widths are measured at right angles to the dip of the reef. Individual sample widths are measured from bottom to top along the two parallel lines. Two clino-rules are used for measuring the sample widths. One ruler is held horizontally with the spirit level on strike, and another held at right angles to the dip. The two rulers must cross each other at right angles. The face measured must agree with the totals of all individual widths. All measurements are made to the nearest centimeter.
The channel and sample lines are chipped out using a standard chisel and mallet, bagged, labelled with a unique sampling number, and sealed. An adequate mass of each sample is collected to allow sufficient sized aliquots to be analyzed at the designated laboratory. The minimum sample weight sent for assay is approximately 300g.
Samples are weighed and submitted to the designated laboratory for analyses. All inter-person transfers are recorded. This process continues until the samples have been submitted to the laboratory.
8.1.2Core Samples
Diamond drill core is transported to the on-site storage facility under the supervision of a Senior Geologist. Upon arrival, the core is logged and sampled according to the internal Harmony Drill hole Sampling Procedure.
Where possible the entire channel width intersected in each drill hole is split using a diamond drill core cutter and one half of the sample is bagged, tagged and sent to the designated laboratory for assay. The remaining half is retained for future reference. If the core condition is such that a successful cut cannot be achieved, then the whole core is submitted for assay.
Pertinent data captured during sampling includes sample width (cm), mass, core lithological intersection angles and a detailed visual description of the reef. The data is recorded in the drill hole database together with the unique sample number, collection date and spatial location.
All samples are assessed for quality and signed-off by the Senior Geologist for completeness and auditability, prior to laboratory dispatch.
Effective Date: June 30, 2024
35
Technical Report Summary for
Tshepong South, Free State Province, South Africa
8.2Density Determination
The relative density of samples was determined through the work conducted by the Harmony Free State central office regarding relative densities on the various shafts since August 2009.
More recently in 2020, a total of 50 samples were taken from underground workings including hanging wall, reef and footwall samples. The dry mass and the submerged mass of the samples in water were measured and the density was calculated.
Tests have occasionally been conducted thereafter on samples collected from the working places.
A relative density (RD) of 2.72t/m³ is in use and seen as representative of the orebody by the QP.
8.3Sample Security
Chip samples are bagged, sealed and delivered by the samplers to the onsite coreyard on the same day as they are collected. The core yard is a secure facility with access control measures in place. Samples are delivered to the laboratory by the mine.
Cores are delivered to the core yard at the end of each day’s drilling for secure storage. Sampling only takes place at the core yard. The samples are bagged and sealed and stored until they are delivered to the laboratory.
Samples are stored in secured a facility and can only be transported by a permit holder for transporting gold bearing material. Waybills and registers are checked and signed off by security. The samples are received from the mine in locked containers with seals.
The sample labels are scanned at the designated laboratory and the batches compared to the submitted sample sheets. The scanned bar codes are kept at the laboratory and compared to the work sheets that are automatically created on the system. Sample lists submitted by the mine are used to compare what is received at the laboratory.
8.4Sample Storage
All pulp samples of exploration drill hole intersections and underground chip samples are kept for a few months at the laboratory and later discarded. The remaining half of the sampled core of exploration holes is kept at the core yard for future references.
8.5Laboratories Used
Both the underground and surface exploration samples were historically sent to the SGS South Africa (Pty) Limited (“SGS”) independent laboratory, with Anglo American Laboratories used as a secondary independent laboratory.
All samples are currently sent to the Harmony Assay Laboratory located in Welkom for preparation and assay. The laboratory is ISO/IEC 17025:2017 certified for chemical analysis by the South African National Accreditation System (Accreditation No. T0520). Harmony Assay Laboratory is however not an independent laboratory.
8.6Laboratory Sample Preparation
Upon receipt, the samples are dried, crushed, and milled to the appropriate size. Routine screen tests on pulps by the assay laboratory are used to check comminution of samples to contract specification. The contract specification is that the comminution should be 80% passing 75µm for Tshepong North and 80% passing 75µm for Tshepong South.
The total percentage mass loss on each sample should not exceed 2%.
Effective Date: June 30, 2024
36
Technical Report Summary for
Tshepong South, Free State Province, South Africa
8.7Assaying Methods and Analytical Procedures
For the period July 1, 2023 to June 30, 2024 , Tshepong South submitted a total of 17,748 samples for analysis of gold. Gold is analyzed by fire assay with a gravimetric finish, while uranium is analyzed by XRD. For a period ranging from 2010 up to March 2020, the development and drill hole reef samples were also assayed for uranium. As uranium is not reported as a Mineral Resource or Mineral Reserve assaying for Uranium was discontinued.
After the preparation stage the samples are packed into trays and transported to the fluxing-room. A catch weight aliquot of ±25g and a flux aliquot of ±100g is placed into a fire assay crucible and thoroughly mixed. The samples are then transferred to the ovens for the fusion process. The cupellation process is where the precious metals are collected in a lead button and then separated from the lead by means of oxidation fusion. The gold prill is then added to a nitric acid solution to dissolve the silver and thereafter the remaining gold prill is weighed to determine its mass relative to the original sample mass.
To ensure that a high standard of analysis is maintained, each step of the analytical process and procedure,
including the adherence to safety standards, is checked by a supervisor.
8.8Sampling and Assay Quality Control (“QC”) Procedures and Quality Assurance (“QA”)
The assessment of assaying accuracy and precision is carried out using certified Standard Reference Materials (“SRM”), blanks and duplicates. SRMs, blank samples and duplicate samples are added with the underground chip sample and drill hole core sample streams prior to being sent to the assay laboratory.
In addition, regular audits of the laboratory processes and facilities are conducted by mine evaluators and regional experts to monitor compliance and quality controls.
8.8.1Standards
A range of SRMs were sourced from African Minerals Standards (“AMIS”) and inserted into the sample sequence by the logging geologist.
For analysis of surface and underground drill holes, a minimum of one gold SRM is required for every 20 drill hole samples assayed. This means that a minimum of 5% of the samples should be composed of reference material, however in batches composed of less than 20 samples the percentage SRM to sample will be higher. This is to ensure that the correct QA/QC controls are available for every batch of samples assayed.
Laboratory statistical control is deemed acceptable should SRMs be within three standard deviations of the recommended value. Investigative action is taken when reference materials returned exceed the standard deviation limit.
If the SRM or blank sample has been deemed to have failed, the entire batch of samples are re-assayed with the failed QAQC sample having to be identified. A request must then be sent to the laboratory requesting the laboratory to repeat the assay procedure on all samples within the batch.
A second SRM or blank sample is provided to the laboratory to include with the batch of samples. Should the batch of samples fail the QAQC standards again, these samples are excluded from the sampling database (not captured in the sampling system), and the panel/drill hole will have to be resampled if necessary.
A total of 520 SRMs were submitted to Harmony Assay Laboratory for Tshepong South between September 2022 and August 2023. The results are summarized in Table 8-1. One out of 520 samples (0.2%) failed, and the respective sample trays were deleted from the system and do not form part of the model.
Table 8-1: Summary of Harmony Assay Laboratory SRM performance for Tshepong South
| | | | | | | | | | | |
| Quality Control Material Type | No. of Samples Submitted | No. of Failed Samples | Action Taken |
| AMIS0866 | 147 | 5 | Values accepted on 2nd tray repeat |
| AMIS0694 | 373 | 3 | Lab queried, two samples passed and one failed on re-assay. |
| Total | 520 | 8 | |
Effective Date: June 30, 2024
37
Technical Report Summary for
Tshepong South, Free State Province, South Africa
8.8.2Blanks
A total of 597 coarse blank samples were submitted to Harmony Assay Laboratory during September 2022 to August 2023 for Tshepong South . The lowest detection limit at the laboratory is 0.063g/t. Working on the three deviation standard gives a LDL of 0.2g/t.
Failed samples were queried from the lab and re-assays were requested. For the applicable period 5 samples failed the original assay, with two samples failing the re-assay. Where the re-assays failed the sample sheet was deleted from the system.
8.8.3Duplicates
For the samples analyzed at Harmony Assay Laboratory during July 2022 to June 2023, results of duplicate analysis indicated correlation at lower grades. A total of 447 duplicate samples were analyzed for Tshepong South and, out of the analysis, a total of 217 samples (49%) were outside the average required mean value.
Failures were queried during the central QA/QC meetings held every six months.
8.9Comment on Sample Preparation, Analyses and Security
In the opinion of the QP that:
•The drill core sampling method is appropriate for the mineralization styles encountered at Tshepong South;
•All underground chip sampling is representative of the channel sampled;
•The sample preparation, security and analytical procedures followed for gold grade determination are adequate; and
•The results of the QAQC assessment have been appropriately addressed to ensure that the assay results of the primary samples are adequate for Mineral Resource estimation.
Effective Date: June 30, 2024
38
Technical Report Summary for
Tshepong South, Free State Province, South Africa
9Data verification
Section 229.601(b)(96)(iii)(B)(9) (i-iii)
9.1Databases
Tshepong South drill hole and underground channel sampling data was previously captured and stored in AuBIS electronic database. Upon acquisition of the mine, Harmony has migrated to data capture in the GMSITM system.
Geological core logging is stored using the Datamine FusionTM (“Datamine”). This database is protected through administration rights allocated to an authorized administrator.
9.2Data Verification Procedures
Data verification procedures included the following:
•the drill hole database was checked against the original logs;
•the database was integrated with DeswikTM and DatamineTM software to check for missing collar coordinates, collar position and elevation errors, downhole survey errors, interval errors and duplicate sample records;
•when assay results were returned from the laboratory, they were captured into the electronic database by the Senior Evaluator and Geologist. The QC sample results were assessed for performance before the primary sample results could be used for Mineral Resource estimation;
•the primary assay results captured in the database were validated by spot checking a selection of drill holes used in the current Mineral Resource estimate; and
•the assays captured in the electronic database were checked against the original laboratory certificates.
The QP did not identify any critical errors in the database.
9.3Limitations to the Data Verification
Previous data has been verified through various methodologies i.e. a “post plot” of all sample points relative to the mine workings are made in order to locate any co-ordination errors. When “manual” capturing (re-digitising old assay tracings) of data occurs, there is a risk that entire sample sheets may be plotted incorrectly due to the use of incorrect projections and or scales/constants. All co-ordination errors are identified and corrected.
9.4Comment on Data Verification
The QP is of the opinion that Tshepong South and Tshepong North drill hole and sample databases are reliable and adequate for the purpose of Mineral Resource estimation.
Effective Date: June 30, 2024
39
Technical Report Summary for
Tshepong South, Free State Province, South Africa
10Mineral Processing and Metallurgical Testing
Section 229.601(b)(96)(iii)(B)(10) (i-v)
10.1Introduction
Over the decades, Harmony Gold has continuously refined and optimized these processes, ensuring consistent gold recovery and efficient mineral extraction from diverse ore bodies. The company's well-established metallurgical practices are crucial in understanding production dynamics, enabling precise forecasting, and supporting informed management and operational decisions.
The standards and methodologies outlined in this document are meticulously designed to:
•Ensure Consistency and Accuracy: Harmony Gold maintains rigorous gold allocation and metallurgical accounting practices across all operations, ensuring that every ounce of gold is precisely accounted for;
•Facilitate Data Integrity and Accessibility: All relevant data is systematically recorded and easily accessible, allowing for transparent and informed decision-making based on reliable information; and
•Support Continuous Optimisation: By reflecting ongoing optimisation efforts and established processes, Harmony Gold ensures that recovery estimates and test results are grounded in robust and credible data.
Adhering to strict principles, Harmony Gold's metallurgical accounting system guarantees the highest accuracy in all tonnage and gold splits. This system provides a technically precise reflection of production per source and ensures that data outputs undergo rigorous verification for accuracy and credibility.
Through this overview, Harmony Gold is committed to maintaining the highest efficiency and technical excellence standards in mineral processing and metallurgical testing practices.
10.2Sampling and Testing Methodologies
Harmony Gold Mining Company Limited employs a comprehensive range of mineral processing and metallurgical testing procedures to ensure optimal recovery rates and efficient mineral extraction. These methodologies are integral to maintaining high operational standards and achieving consistent gold recovery.
10.2.1Systematic and Continuous Sampling
Harmony Gold utilises a systematic and continuous sampling approach where ore samples are collected at various stages of the mining and processing operations. This process is automated using mechanical samplers strategically placed at critical points along the process flow, such as conveyor belts, feed points and tailings streams. These samplers operate without human intervention, thereby minimizing potential biases and ensuring the samples accurately represent the processed material.
The sampling process is tightly integrated with the operations’ SCADA system, which controls the timing and frequency of sampling. This integration ensures that samples are taken consistently, reflecting temporal and spatial variations in the ore.
10.2.2Composite Sampling
Composite samples are created by aggregating individual samples taken over a specific period. This approach is used to obtain a more representative sample that reflects the processed ore's average grade and mineralogical characteristics. Composite sampling reduces the variability in smaller, discrete samples, providing a more accurate reflection of the ore body as a whole.
10.2.3Calibration and Verification of Equipment
The accuracy and reliability of the sampling process is maintained through regular calibration and verification of the equipment used. The mass flow systems, essential for calculating the dry mass of the ore, are calibrated monthly by the Original Equipment Manufacturer (OEM). Additionally, slurry density measurements, crucial for ensuring accurate mass calculations, are verified weekly by operational teams. This regular calibration and verification are critical to ensuring the sampling system produces accurate and representative results.
Effective Date: June 30, 2024
40
Technical Report Summary for
Tshepong South, Free State Province, South Africa
10.2.4Specific Testing Procedures
Harmony Gold conducts a variety of specific tests to address different aspects of the mineral processing workflow, ensuring the representativeness of the samples:
•Comminution Testing: Involves crushing and grinding ore to liberate valuable minerals. Tests such as the Bond Work Index and SMC are conducted to determine the hardness and grindability of the ore.
•Leaching Tests: Bottle roll and column leach tests are conducted to determine the ore's amenability to cyanidation and other leaching methods. A typical bottle roll test involves transferring a weighed sample into a leaching bottle, adding water to prepare slurries at 50% solids, and adjusting the pH with hydrated lime to about 10.5. Sodium cyanide is added (concentration based on plant conditions) and the bottles are rolled for 40 hours, with periodic pH checks and adjustments. After the leaching period, the slurries are filtered and the residues are analyzed for gold content.
•Diagnostic Leaching is a laboratory technique used to identify the mineral phases associated with gold and understand the causes of gold losses in the leaching process. This method involves sequentially solubilizing the least stable minerals and extracting the associated gold, providing insights into the disposition of gold within the ore.
10.2.5Analytical Laboratories
SGS South Africa conducts most of the Harmony Gold's metallurgical testing. These laboratories are equipped with advanced analytical instruments and follow rigorous testing methodologies. Essential procedures include fire assay for gold analysis, with samples pulverized and analyzed in triplicate using atomic absorption spectroscopy (AAS) finish. SGS Laboratories ensure high accuracy and reliability in their testing processes, adhering to strict quality control standards.
10.3Data Validation and Quality Control
Harmony Gold employs a rigorous data validation and quality control process to ensure that the metallurgical test samples are representative and that their data is accurate and reliable.
10.3.1Statistical Analysis
Harmony Gold employs statistical analysis based on standard deviations to ensure the representativeness of samples. Samples are monitored to determine if their values fall within a predefined range. Specifically, if a sample’s value falls outside two standard deviations from the mean, it is identified as a "special cause." These special cause samples are investigated further to understand the underlying reasons for the deviation, ensuring any anomalies are identified and addressed promptly. This statistical approach helps maintain the reliability and accuracy of the sampling process.
10.3.2Continuous Improvement
Harmony Gold is committed to continuously improving its sampling and testing methodologies. The company regularly reviews and updates its protocols to incorporate the latest advancements in sampling technology and analytical techniques. This commitment ensures that the samples remain representative of the ore bodies despite changes in mining practices, ore characteristics or processing technologies.
10.4Recovery Estimates and Processing Factors
Recovery estimates form the backbone of metallurgical accounting at Harmony Gold, providing a clear metric of the efficiency with which gold is extracted from the ore. These estimates are derived from a combination of historical data, ongoing testing, and sophisticated modelling to accurately reflect the processing plants' performance and the characteristics of the treated ores.
10.4.1Detailed Calculation of Recovery Estimates
The calculation of gold recovery involves multiple stages, each tailored to the specific ore types and the complex processing techniques employed. The basic theoretical formula for recovery estimation is:
Effective Date: June 30, 2024
41
Technical Report Summary for
Tshepong South, Free State Province, South Africa
10.4.2Head Grade and Residue Grade
The Head Grade refers to the gold content in the ore as it enters the processing plant. It is typically measured using automated belt samplers that provide a continuous stream of data on the gold content of the material. The Residue Grade represents the gold content in the tailings after the ore has undergone the complete processing cycle. The recovery percentage is calculated by comparing these two metrics, indicating how much of the gold has been successfully extracted.
10.4.3Adjustments for Solution and Carbon Adsorption
In addition to the gold recovered from the solid ore, a significant portion remains in solution or adsorbed onto activated carbon during the cyanidation process. Harmony Gold’s metallurgical accounting system ensures that these forms of gold are accounted for by integrating measurements of gold in solution (measured in mg/L) and on carbon (measured in g/t). This approach ensures that the total gold recovered is comprehensively calculated, considering all forms of gold within the processing circuit.
Taking the Harmony accounting standard into account, the actual total plant recovery is calculated by:
10.4.4Integration of Bottle Roll Tests for Baseline Recovery Rates
Bottle Roll Tests are a cornerstone of Harmony Gold’s approach to establishing baseline recovery rates. Conducted monthly, these tests simulate the leaching process on a small scale, using representative samples of ore from various sources. The procedure involves placing a weighed sample in a sealed bottle with a cyanide solution and then rolling the bottle to ensure thorough mixing. Over a defined period, typically 24 to 48 hours, the solution is periodically sampled to measure the amount of gold that has leached into the solution.
The data obtained from these tests is critical for calibrating the recovery models used in the processing plants. They provide a baseline recovery rate for each ore type, which is then applied to the blended ore feed processed at the plants. This method ensures that the recovery estimates reflect the actual performance of the plant and the variability in ore characteristics.
10.4.5Processing Factors Affecting Recovery
Several factors directly influence the recovery of gold during processing. Understanding and managing these factors is essential to maintaining high recovery rates and ensuring the processing plants operate efficiently.
Ore Characteristics
The mineralogical composition of the ore profoundly impacts the recovery process. For example, refractory ores contain gold particles locked within sulphide minerals, making them more challenging to process. Harmony Gold employs specific pre-treatment methods, such as ultra-fine grinding or roasting, to liberate the gold from these complex ores, thus enhancing recovery rates.
Leaching Conditions
The effectiveness of the cyanidation process, which is the primary method for gold recovery at Harmony Gold, depends heavily on the leaching conditions. Key parameters include the concentration of cyanide in the leach solution, the pH levels, and the presence of oxygen. These conditions are meticulously controlled and monitored through the SCADA system, which provides real-time feedback and allows for immediate adjustments to optimize recovery.
Particle Size Distribution
The comminution process, which involves crushing and grinding the ore to liberate the gold, is critical to maximize recovery. The particle size distribution directly affects the surface area available for leaching. Too coarse a grind may leave gold particles locked within the ore, while too fine a grind can lead to excessive reagent consumption or poor settling in thickeners. Harmony Gold employs the Bond Work Index and SMC tests to determine the optimal grind size for different ore types.
Preg-Robbing
Some ores contain naturally occurring carbonaceous material that can adsorb dissolved gold from the leach solution, a phenomenon known as preg-robbing. This effect can significantly reduce the amount of gold recovered.
Effective Date: June 30, 2024
42
Technical Report Summary for
Tshepong South, Free State Province, South Africa
Harmony Gold mitigates this issue by pre-treating the ore to deactivate the preg-robbing materials or using additives in the leach solution that preferentially adsorb to the carbonaceous material, leaving more gold in the recovery solution.
Blending Strategies
Given the variability in ore characteristics, Harmony Gold employs sophisticated blending strategies to ensure that the feed to the processing plant is consistent regarding grade and mineralogy. This approach helps stabilize recovery rates and ensure that the plant operates efficiently. The baseline recovery rates obtained from bottle roll tests for individual sources are used to predict the overall recovery from the blended feed, allowing for accurate forecasting and operational planning.
Process Control and Monitoring
Continuous monitoring of the processing conditions is essential for maintaining high recovery rates. Harmony Gold uses a SCADA system to track critical variables such as slurry density, reagent addition rates, and leach tank conditions. Real-time data analytics allow for immediate adjustments, ensuring that the plant operates within the optimal parameters for gold recovery.
10.4.6Gold Inventory Management and Accountability
Gold inventory management is a critical component of Harmony Gold’s metallurgical accounting, ensuring that all gold within the process is accurately tracked and accounted for. Several vital metrics and calculations are used to manage and verify the accuracy of gold inventories:
Gold Accounted For (GAF)
This metric represents the total gold recovered, including the gold produced and remaining in the residue. It serves as a critical reference point for the overall gold balance.
Gold Called For (GCF)
GCF represents the expected amount of gold based on the ore feed and its calculated head grade, adjusted for any inventory changes.
Plant Call Factor (PCF)
This is the ratio of GAF to GCF, expressed as a percentage, indicating the efficiency in accounting for the amount of gold.
Pulp Call
A daily estimate of gold production, based on pulp gold, adjusted for inventory changes and residue losses.
These formulas ensure that gold recovery and inventory are accurately managed and accounted for. They provide a structured approach to monitoring and optimizing the metallurgical processes, ensuring that Harmony Gold maintains high operational efficiency and accountability standards.
10.5Conclusion
Extensive and detailed practices underpin Harmony Gold Mining Company Limited's mineral processing and metallurgical operations. The methodologies described herein reflect the company’s commitment to operational precision, consistency in gold recovery, and rigorous adherence to industry standards.
Advanced testing procedures, robust data validation, and comprehensive recovery calculations are integrated to ensure that the company’s operations are efficient, transparent, and accountable. Continuous process improvement and meticulous gold inventory management position Harmony Gold as a responsible and effective resource extraction leader.
Effective Date: June 30, 2024
43
Technical Report Summary for
Tshepong South, Free State Province, South Africa
11Mineral Resource Estimate
Section 229.601(b)(96)(iii)(B)(11) (i-vii)
The current Mineral Resources for Tshepong South have been estimated using DatamineTM Studio 3 (“Datamine”) modelling software, which is linked to a customized scripting menu. This scripting menu allows for professional and easy managing of the data and building of geostatistical models.
The narrow-tabular nature of the reefs lends themselves to the estimation of grade and thickness in two-dimensional (“2D”) block models, without the requirements for geological wireframes. An independent process of building a set of three-dimensional (“3D”) wireframes of the structural interpretation to inform mine planning and the Mineral Reserve estimates is also undertaken.
The estimation method used for Measured Mineral Resource estimates at Tshepong South is ordinary kriging (“OK”), while simple macro kriging (“SMK”) is used for Indicated and Inferred Mineral Resource estimates.
11.1Geological Database
Tshepong South Mineral Resource estimate is based on the surface and underground exploration data obtained up to December 30, 2023. The database was exported from the electronic database to DatamineTM modelling software.
The Basal Reef validated database contains a total of 4567 surface and underground drill holes and 527185 underground channel (chip) samples. The B Reef validated database contains a total of 438 surface and underground drill holes, and 60137 underground channel (chip) samples.
11.2Global Statistics
Histograms and statistics of the raw data are calculated for each geological domain for comparison purposes. The Coefficient of Variation ("COV"), calculated by dividing the standard deviation with the mean, gives a measure of the variability of the data. A high COV (>1) represents highly variable or highly skewed data, which may require some form of capping of extreme values to lower the COV to a more reasonable value (c.1).
The global statistics for the Basal and B-Reefs, reported according to geozones, are provided in Table 11-1.
Effective Date: June 30, 2024
44
Technical Report Summary for
Tshepong South, Free State Province, South Africa
Table 11-1: Global statistics for Basal and B-Reef
| | | | | | | | | | | | | | | | | | | | | | | |
| Reef / Geozone | No. Samples | Minimum (cmg/t Au) | Maximum (cmg/t Au) | Mean (cmg/t Au) | Variance | SD (cmg/t Au) | COV |
| Basal Reef |
| 1 | 3 167 | 0.70 | 7 377 | 643 | 360 753 | 601 | 0.934 |
| 2 | 59 700 | 1.00 | 32 511 | 982 | 1 166 183 | 1 080 | 1.100 |
| 3 | 127 496 | 0.14 | 62 313 | 1 599 | 2 672 381 | 1 635 | 1.022 |
| 4 | 13 850 | 1.00 | 13 066 | 694 | 490 556 | 700 | 1.010 |
| 5 | 131 330 | 0.43 | 33 878 | 1 225 | 1 333 853 | 1 155 | 0.943 |
| 6 | 44 836 | 0.28 | 32 215 | 867 | 803 916 | 897 | 1.035 |
| 7 | 29 | 18.00 | 1 528 | 252 | 88 330 | 297 | 1.178 |
| 8 | 34 757 | 1.00 | 5 140 | 1 940 | 2 400 199 | 1 549 | 0.799 |
| 9 | 21 297 | 1.00 | 33 943 | 925 | 899 427 | 948 | 1.026 |
| 10 | 44 869 | 1.00 | 31 513 | 2 280 | 3 801 280 | 1 950 | 0.852 |
| 11 | 3 862 | 4.00 | 3 956 | 1 303 | 853 670 | 924 | 0.709 |
| 12 | 46 555 | 0.50 | 11 386 | 1 028 | 1 075 555 | 1 037 | 1.009 |
| 13 | 4 | 525.00 | 1 218 | 967 | 70 256 | 265 | 0.274 |
| B Reef |
| 1 | 761 | 1 000.00 | 26 112 | 901 | 3 830 142 | 1 957 | 2.173 |
| 2 | 1 594 | 1 000.00 | 10 438 | 1 092 | 1 364 556 | 1 168 | 1.070 |
| 3 | 6 916 | 400.00 | 61 987 | 839 | 4 504 717 | 2 122 | 2.531 |
| 4 | 36 716 | 440.00 | 188 462 | 1 782 | 17 822 516 | 4 222 | 2.369 |
| 5 | 5 923 | 800.00 | 132 958 | 1 486 | 22 357 694 | 4 728 | 3.182 |
| 6 | 4 835 | 320.00 | 367 721 | 2 125 | 213 859 981 | 14 624 | 6.881 |
| 7 | 3 830 | 910.00 | 127 457 | 4 872 | 59 131 298 | 7 690 | 1.578 |
| Total | 592 327 | | | | | | |
11.3Geological Interpretation
The imported data is attributed to geological domains or geozones. Geozones are selected based upon continuity in facies type, as well as gold grade and channel width distribution. Geozones may be constrained by geological structures. Geozones are identified for both the Basal and B-Reefs.
The Basal Reef is continuous over both Tshepong South and Tshepong North, and a single model is created across both mines. The area is divided into 13 geozones. The B-Reef geozones from Tshepong (Tshepong South, Tshepong North) have been divided into a series of seven geozones and projected through to Tshepong South shaft. The geozones for both reefs are presented in Figure 11-1.
Geozones are continuously updated based on geological information, new sampling and drilling results. Any proposed changes to the geozones are presented to the geostatistical team for approval and signed off.
11.4Structural Wireframe Model
The geological structure is interpreted by means of series of 1:1,000 structural plan overlays. These plans are vertical projections of the reef plane showing base-of-reef strike lines at 10m intervals based on elevations below datum. Interruptions in the continuity of the reef are marked by fault-reef cut-offs illustrating the loss or gain of ground and with displacement measured as vertical stratigraphic throws. Known or suspected lateral shifts are also illustrated.
A set of 3D structural wireframes is generated, representing the geological interpretation for each reef. This is informed by the geological drilling, chip sampling and underground geological mapping and is created in Deswik™ to allow subsequent mine design and planning to take cognizance of the latest geological information. These wireframes are not required for the Mineral Resource estimates.
11.5Compositing
The drill hole and chip samples are composited over the full length of the reef intersection.
Effective Date: June 30, 2024
45
Technical Report Summary for
Tshepong South, Free State Province, South Africa
11.6Capping
Outlying values (both for cmg/t and channel width) are calculated per domain at an optimal percentile using the “QUANTILE” process. The capping allows for meaningful Semi-Variogram modelling and avoids potential over-estimation due to extreme sample values. The capping values applied are shown in Table 11-2.
11.7Variography
The experimental semi-variogram is a descriptive statistical diagnostic tool for spatially characterizing regionalized variables. The semi-variogram is a mathematical function that describes how the spatial continuity of the sampled attribute changes as a function of distance and orientation.
Either an isotropic or an anisotropic model can be defined, comprising a nugget variance and up to nine individual structures, although it is rarely necessary to include more than three structures. Each structure may be either spherical, power, exponential, Gaussian or De Wijsian, although spherical models are deemed adequate for Tshepong North and Tshepong South. Point-support semi-variograms are modelled for the Measured Mineral Resources; 60m x 60m declustered-support semi-variograms are modelled for the Indicated Mineral Resources and 120m x 120m declustered-support semi-variograms are modelled for the Inferred Mineral Resources.
Effective Date: June 30, 2024
46
Technical Report Summary for
Tshepong South, Free State Province, South Africa
Figure 11-1: Tshepong operations Basal and B-Reef Geozones
Effective Date: June 30, 2024
47
Technical Report Summary for
Tshepong South, Free State Province, South Africa
Table 11-2: Capping values by reef and geozone
| | | | | | | | | | | | | | | | | | | | |
| Geozone | Gold Cut (cmg/t) (Max) | CW Cut (cm) (Max) | | Geozone | Gold Cut (cmg/t) (Max) | CW Cut (cm) (Max) |
| Basal Reef | | B Reef |
| 1 | 2 272 | 20 | | 1 | 8 002 | 170 |
| 2 | 4 023 | 123 | | 2 | 4 474 | 218 |
| 3 | 6 191 | 137 | | 3 | 5 330 | 218 |
| 4 | 2 511 | 20 | | 4 | 11 366 | 211 |
| 5 | 4 442 | 36 | | 5 | 10 510 | 199 |
| 6 | 3 279 | 27 | | 6 | 15 433 | 172 |
| 7 | 1 528 | 33 | | 7 | 26 112 | 227 |
| 8 | 5 073 | 77 | | | | |
| 9 | 3 408 | 98 | | | | |
| 10 | 7 762 | 60 | | | | |
| 11 | 3 956 | 58 | | | | |
| 12 | 4 893 | 40 | | | | |
| 13 | 1 218 | 46 | | | | |
11.8Mineral Resource Estimation Methods and Parameters
Grade and thickness estimates are undertaken within each geozone and informed by statistical and geostatistical analysis. Two variables are estimated namely; gold accumulation (cmg/t) (which factors in both the thickness of the reef thickness and grade) and channel width. No change of support corrections is considered necessary as it is accepted that the differing support sizes for chip samples and drill hole samples are negligible.
The orientations and ranges of each geozone’s semi-variogram are used to determine the optimized set of kriging estimation parameters. The search ellipse is aligned with respect to its range and direction, to the direction of the associated semi-variogram, as well as the range distances.
The Basal reef Measured Mineral Resource estimates are undertaken using OK. Estimates are generally kriged into 30m x 30m blocks for the Measured Mineral Resource from the point support data. Indicated and Inferred Mineral Resource estimates are undertaken using SMK. The Indicated Mineral Resource is kriged into 60m x 60m block sizes. The Inferred Mineral Resource is estimated using the associated regularized variograms and kriging into 120m x 120m blocks. Any un-kriged areas in the Inferred Mineral Resource areas are then covered by global mean estimates.
The B-Reef Measured Mineral Resource estimates are undertaken using OK. Estimates are generally kriged into 15m x 15m blocks for the Measured Mineral Resource from the point support data. Indicated and Inferred Mineral Resource estimates are undertaken using SMK. The Indicated Mineral Resource is kriged into 30m x 30m block sizes. The Inferred Mineral Resource is estimated using the associated regularized variograms and kriging into 60m x 60m blocks. Any un-kriged areas in the Inferred Mineral Resource areas are then covered by global mean estimates. B-Reef is estimated into smaller blocks due to high variability which is common to the grade distribution
The results of the Basal and B-Reef estimation are shown in Figure 11-2, for Tshepong North.
The current minimum and maximum sample points for the Basal Reef is:
•12 and 25 for the Basal Reef Measured Mineral Resource estimation;
•8 and 20 for Indicated Mineral Resource estimation; and
•3 and 10 for the Inferred Mineral Resource estimation.
The current minimum and maximum sample points for the B-Reef is:
•11 and 30 for Measured Mineral Resource estimation;
•8 and 20 for Indicated Mineral Resource estimation; and
•3 and 15 for the Inferred Mineral Resource estimation.
Any un-kriged areas in the Inferred Mineral Resource category regions are then estimated using a global mean.
Effective Date: June 30, 2024
48
Technical Report Summary for
Tshepong South, Free State Province, South Africa
Figure 11-2: Tshepong operations Basal Reef and B Reef estimation results
Effective Date: June 30, 2024
49
Technical Report Summary for
Tshepong South, Free State Province, South Africa
11.9Density Assignment
The relative density currently used for tonnage calculations at the Tshepong (Tshepong South and Tshepong North) is 2.72t/m3. Reef volume is determined by block area multiplied by the thickness estimate. The tonnage of each reef horizon is determined by multiplying the volume by the relative density.
11.10Model Validation
The QP validated the Tshepong Mineral Resource model using the following:
•visual comparisons with the raw drill hole data; (Figures 7-3 and 7-4)
•comparisons of the raw drill hole data statistics with the model statistics;
•model volume; and
•visual assessment of the block model with drill hole intersections to ensure that the grades are locally honored by the model.
The QP did not identify any critical errors in the block model.
11.11Mineral Resource Evaluation
The Mineral Resource estimate for Tshepong (Tshepong South, Tshepong North) is considered by the QP to have reasonable prospects for economic extraction. The cut-off value for the Mineral Resources is determined at 780cmg/t for Tshepong South for the gold based on the economic assumptions presented in Table 11-3 at the effective date June 30, 2024. This cut-off value represents typical costs for the mining method and preliminary mining and metallurgical recovery assumptions.
Table 11-3: Harmony economic assumptions (June 30, 2024)
| | | | | | | | | | | |
| | Tshepong South | | |
| | Description | Unit | Value |
| | Gold price | USD/oz | 1 878 |
| | FX rate | ZAR:USD | 18.26 |
| | Gold price | ZAR/kg | 1 100 000 |
| | Plant recovery factor | % | 95.28 | |
| | Unit cost | ZAR/t | 5 016 |
Notes: Unit cost includes cash operating cost, royalty and ongoing development capital
The expected gold price was derived by the Harmony Executive Committee at Head Office. Based on current market trends the QP agrees with the set price and considers the price to be appropriate for Mineral Resource estimation and is slightly higher than that used for estimating Mineral Reserves (USD1,772/oz). The operating costs (both mining and processing) are based on historical performance and budget.
11.12Mineral Resource Classification and Uncertainties
The Tshepong (Tshepong South and Tshepong North) Mineral Resources have been classified into Measured, Indicated and Inferred categories, according to the S-K 1300 definitions. The classification is based on drill hole spacing, geological and geostatistical confidence.
For the geostatistical confidence, the Measured Mineral Resource model is constrained by the Slope of Regression Estimation Confidence, and the Indicated and Inferred Mineral Resource models are constrained by their kriging estimation parameters.
The QP then considers if the geostatistical confidence boundaries require modification based on the geological confidence in an area. The geological confidence could include confidence in the sedimentary facies and mineralization model, or confidence in the structural model.
Effective Date: June 30, 2024
50
Technical Report Summary for
Tshepong South, Free State Province, South Africa
The application of the classification criteria results in the following set of approximate sample spacings for each Mineral Resource category:
•5m x 5m for Measured Mineral Resources (underground channel sampling);
•100m x 100m for Indicated Mineral Resources; and
•1,000m x 1,000m for Inferred Mineral Resources.
Mineral Resources are discounted by a geological loss to account for unknown but anticipated fault loss. The discounts used for the Basal Reef are between:
•1% and 3% for Measured Mineral Resources;
•3% and 11% for Indicated Mineral Resources; and
•7% and 60% for Inferred Mineral Resources.
The ranges are used due to variations in the structural complexity of the different shaft areas. Some areas are geologically much more complex than others and the resulting geological loss will be greater than in an area of relatively simple geology. Defining expected loss percentages for the different areas allows for a more accurate estimation than when a blanket approach is used. The same information applies to the B-Reef.
Factors that may affect the Mineral Resource estimates include the following:
•gold price assumptions;
•exchange rate assumptions;
•operating and capital cost assumptions;
•gold recovery assumptions;
•geology-related risks; and
•operational risks.
11.13Mineral Resource Estimate
The Mineral Resources for Tshepong South and Tshepong North were originally prepared, classified and reported according to SAMREC, 2016. For the purposes of this TRS, the Mineral Resources have been classified in accordance with § 229.1302(d)(1)(iii)(A) (Item 1302(d)(1)(iii)(A) of Regulation S-K).
The location of the Basal Reef Mineral Resources across both Tshepong South and Tshepong North are presented in Figure 11-3. The location of the B-Reef Mineral Resources is shown in Figure 11-4.
The QP compiling the Mineral Resource estimate for Tshepong South is Mr Conrad Pienaar, Geology HOD at Tshepong South and employee of Harmony. The Mineral Resource estimate for Tshepong South, as at June 30, 2024, exclusive of Mineral Reserves, is summarized in Table 11-4.
Effective Date: June 30, 2024
51
Technical Report Summary for
Tshepong South, Free State Province, South Africa
Figure 11-3: Location and classification of Tshepong South Mineral Resources and Mineral Reserves for the Basal Reef
Effective Date: June 30, 2024
52
Technical Report Summary for
Tshepong South, Free State Province, South Africa
Figure 11-4: Location and classification of Tshepong operations Mineral Resources and Mineral Reserves for the B-Reef
Effective Date: June 30, 2024
53
Technical Report Summary for
Tshepong South, Free State Province, South Africa
Table 11-4: Summary of Tshepong South Mineral Resources as at June 30, 2024 (Exclusive of Mineral Reserves) 1-8
| | | | | | | | | | | |
| METRIC |
| Mineral Resource Category | Tonnes (Mt) | Gold Grade (g/t) | Gold Content (kg) |
| Measured | 6.155 | 12.80 | 78 768 |
| Indicated | 8.687 | 11.10 | 96 434 |
| Total / Ave. Measured + Indicated | 14.843 | 11.80 | 175 202 |
| Inferred | 22.799 | 11.03 | 251 447 |
| IMPERIAL |
| Mineral Resource Category | Tons (Mt) | Gold Grade (oz/t) | Gold Content (Moz) |
| Measured | 6.785 | 0.373 | 2.532 |
| Indicated | 9.576 | 0.324 | 3.100 |
| Total / Ave. Measured + Indicated | 16.361 | 0.344 | 5.633 |
| Inferred | 25.131 | 0.322 | 8.084 |
Notes:
1. Mineral Resources are reported with an effective date of June 30, 2024 were originally prepared, classified and reported according to SAMREC, 2016. For the purposes of this TRS, the Mineral Resources have been classified in accordance with § 229.1302(d)(1)(iii)(A) (Item 1302(d)(1)(iii)(A) of Regulation S-K). The Qualified Person responsible for the estimate is Mr Conrad Pienaar, who is Geology HOD at Tshepong South, and a Harmony employee.
2. The Mineral Resource tonnes are reported as in-situ with reasonable prospects for economic extraction.
3. No modifying factors or dilution sources have been included to in-situ Reserve which was subtracted from the SAMREC Resource in order to obtain the S-K 1300 Resource.
4. The Mineral Resources are reported using a cut-off value of 780cmg/t determined using a gold price of USD1,878/oz and a unit cost of R5,016/Tonne.
5. Tonnes are reported as rounded to three decimal places. Gold values are rounded to zero decimal places.
6. Mineral Resources are exclusive of Mineral Reserves. Mineral Resources are not Mineral Reserves and do not necessarily demonstrate economic viability.
7. Rounding as required by reporting guidelines may result in apparent summation differences.
8. The Mineral Resource estimate is for Harmony’s 100% interest.
11.14Mineral Resource Reconciliation
Tshepong South’s Measured and Indicated Mineral Resource gold content estimate, exclusive of Mineral Reserves, increased by approximately 15.5%, from 4.875Moz gold as at June 2023 to 5.633Moz gold as at June 2024. The increase is mainly due to the conversion from Inferred to Indicated category.
Total Mineral Resource, exclusive of Mineral Reserves, increased from 13.482Moz gold as at June 2023 to 13.717 Moz as at June 2024.
11.15Comment on Mineral Resource Estimates
The QP is of the opinion that Mineral Resources were estimated using industry accepted practices and conform to SAMREC, 2016. The Mineral Resources have also been reported in accordance with the S-K 1300 guidelines.
There are no other environmental, legal, title, taxation, socioeconomic, marketing, political or other relevant factors known to the QP that would materially affect the estimation of Mineral Resources that are not discussed in this TRS.
Effective Date: June 30, 2024
54
Technical Report Summary for
Tshepong South, Free State Province, South Africa
12Mineral Reserve Estimate
Section 229.601(b)(96)(iii)(B)(12) (i-vi)
The reported Mineral Reserves are derived through a business planning process and consideration by the Chief Operating Decision-Maker (“CODM”). The business planning process comprises multi-functional reviews inclusive of all mining, support and service departments that are involved in the verification of the inputs and the Modifying Factors. The CODM consists of various executive roles and responsibilities. These executives assess the profitability, the revenue and production costs. The CODM also considers capital expenditure, gold production and tonnes milled when assessing the overall economic sustainability.
The QP is in agreement and accountable for the final integrated report.
12.1Tshepong South
12.1.1Key Assumptions, Parameters, and Methods Used to Estimate the Mineral Reserve
The results and assumptions derived from the business planning process extends over an 18-month period. The planning process carefully considers strategic plan directives; analysis of historical performance; realistic productivity, and cost parameters; Modifying Factors; and technical and economic studies that have demonstrated justified extraction, as applicable to specific portions of the Mineral Reserves.
All reported Mineral Reserves originate in situ from the Basal Reef. The Mineral Reserves are considered based on several factors, including:
•the latest geological structure and associated Mineral Resource estimation models that constrain the layout for the mine design and Mineral Reserve planning;
•the need for regional rock engineering stability pillars;
•the extent of pillar mining, mining of remnant areas, reclamation of broken ore out of old areas, tailings, or any other source;
•the Scattered Grid Mining method in use at the mine,
•the sources of dilution and other Modifying Factors; and
•only Measured and Indicated Mineral Resources are used to derive Mineral Reserves.
A combination of modelling exercises forms an integrated model informing the Mineral Reserve plan and the Tshepong South Mine Mineral Reserves estimates, and includes the:
•geological block model;
•structural model depicting prominent geological features;
•isopach model highlighting the mine’s sedimentology and shale formations; and
•geotechnical model including interpreted data, modelled in the form of support pillars.
Effective Date: June 30, 2024
55
Technical Report Summary for
Tshepong South, Free State Province, South Africa
12.1.2Modifying Factors
The Modifying Factors used to convert the Mineral Resource to a Mineral Reserve for Tshepong South are presented in Table 12-1.
Table 12-1: Tshepong South modifying factors used for Mineral Reserve determination
| | | | | | | | |
| Modifying Factor | Unit | Value |
| Relative Density | t/m3 | 2.72 |
| Stoping Width | cm | 133 |
| Gully | % | 6.27 |
| Off Reef | % | 4.72 |
| Waste to Reef | % | 0.23 |
| Flushing tons | % | — |
| Discrepancy | % | 7.02 |
| Mine Call Factor | % | 83.00 |
| Plant Recover Factor | % | 95.28 |
| Mine Recover Factor | % | 79.09 |
| Plant Call Factor | % | 100.00 |
| Mineral Reserve cut-off | cmg/t | 790 |
Notes: Development waste to reef, including the decline development.
The Modifying Factors are consistent with the modelling, planning and computing estimates used in determining the Mineral Reserves, which are also consistent with historical performance. The plant recovery as shown in Table 12-1, is also consistent with the processing and recovery methods.
12.1.3Mineral Reserve Estimate
The Mineral Reserves for Tshepong South were originally prepared, classified and reported according to SAMREC, 2016. For the purposes of this TRS, the Mineral Reserves have been classified in accordance with § 229.1302(d)(1)(iii)(A) (Item 1302(d)(1)(iii)(A) of Regulation S-K) and is still in alignment with SAMREC, 2016. The Mineral Reserve estimate for Tshepong South, as at June 30, 2024, is summarized in Table 12-2.
The location of Tshepong South’s Basal and B-Reef Mineral Reserves are presented in Figure 11-3 and Figure 11-4, respectively.
The QP compiling the Mineral Reserve estimate for Tshepong South is Mr Conrad Pienaar, Geology HOD at Tshepong South and employee of Harmony.
Table 12-2: Summary of Tshepong South Mineral Reserves as at June 30, 2024 1-5
| | | | | | | | | | | |
| METRIC |
| Mineral Reserve Category | Tonnes (Mt) | Gold Grade (g/t) | Gold Content (kg) |
| Proved | 2.355 | 8.02 | 18 900 |
| Probable | 0.229 | 7.08 | 1 621 |
| Total (Proved + Probable) | 2.584 | 7.94 | 20 521 |
| | | | |
| IMPERIAL |
| Mineral Reserve Category | Tons (Mt) | Gold Grade (oz/t) | Gold Content (Moz) |
| Proved | 2.596 | 0.234 | 0.608 |
| Probable | 0.252 | 0.207 | 0.052 |
| Total (Proved + Probable) | 2.849 | 0.232 | 0.660 |
Notes:
1. The Mineral Reserves were originally prepared, classified and reported according to SAMREC, 2016. For the purposes of this TRS, the Mineral Reserves have been classified in accordance with § 229.1302(d)(1)(iii)(A) (Item 1302(d)(1)(iii)(A) of Regulation S-K). The Qualified Person responsible for the estimate is Mr Conrad Pienaar, who is Geology HOD at Tshepong South, and a Harmony employee.
2. Tonnes, grade, and gold content are declared as net delivered to the mills.
3. Figures are fully inclusive of all mining dilutions, gold losses and are reported as mill delivered tonnes and head grades. Metallurgical recovery factors have not been applied to the reserve figures.
4. Gold content has not taken metallurgical recovery factors into account.
5. Mineral Reserves are reported using a cut-off grade of 790cmg/t determined using a gold price of USD1,772/oz gold.A unit cost of R5,016/Tonne.
6. Rounding as required by reporting guidelines may result in apparent summation differences.
Effective Date: June 30, 2024
56
Technical Report Summary for
Tshepong South, Free State Province, South Africa
12.1.4Mineral Reserve Reconciliation
The declared Mineral Reserve decreased from 0.850Moz as at June 30, 2023 to 0.660Moz as at June 30, 2024. The key variances can be attributed to:
•Mining depletion loss;
•Geological structures fault loss discounts increased to the South due to Tribute fault loss;
•Abandoned Blocks loss;
•Additional B-Reef on 71 level gain
12.2Commentary on Mineral Reserve Estimate
The declared Mineral Reserves takes into consideration all Modifying Factors, respective to the mining area. The declared Mineral Reserves are depleted to generate Tshepong South’s cash flows. The economic analysis of the cash flows displays positive results and are deemed both technically and economically achievable.
Any by-products that are recovered as part of the refining process, make up an immaterial component of the total metal inventory, and is thus not reported as part of the Mineral Reserve estimate.
With respect to risk – Tshepong South maintains working and robust Isopach models, to manage the geotechnical risk and the stress model to manage the seismicity risk. The geotechnical and Isopach models for Tshepong South take the latest geological structural model into account and the data update is dynamic as mining progresses. Geotechnical models are also used as a basis to manage and monitor the occurrence of ground water and gas intersections.
There are no obvious material risks that could have significant effect on the Mineral Reserves based on above risk management systems in place.
In the opinion of the QP, given that Tshepong South is an established operation, the modifying factors informing the Mineral Reserve estimates would at a minimum, satisfy the confidence levels of a Feasibility Study.
Effective Date: June 30, 2024
57
Technical Report Summary for
Tshepong South, Free State Province, South Africa
13Mining Methods
Section 229.601(b)(96)(iii)(B)(13) (i-v)
Tshepong South may be classified as moderate to deep level underground gold mine currently operating at depths of up to 2,427m below surface.
13.1Mining Operations
Tshepong resulted from the integration and consolidation of the Tshepong South and Tshepong North mines. This was to enable Harmony to optimize existing synergies, reduce costs and make better use of the Tshepong section’s underused infrastructure, though a decision was taken to report results separately as of FY24.
Tshepong South utilize three main shafts (Figure 3-2). Tshepong South, The Nyala Shaft (Ore handling) to a lesser extent and Tshepong North shaft for Cross tramming of ore. The three shafts operate semi-independently with respect to ventilation requirements, ore and waste hoisting and men and material movement. An underground lightweight electric rail system, referred to as the RailVeyorTM is used to transport ore and waste from the working sections to the Nyala Shaft from Tshepong North where it is hoisted to surface. More information on the details of the shaft operations, any interdependencies and the railway systems are described in Section 15.
13.1.1Tshepong South
The Tshepong South Mine was established approximately 8 years after the Tshepong North Mine. Production from the Tshepong South Mine is attributable to the Basal Reef with development currently underway to access the B-Reef. The B-Reef is expected to start mining towards the end of FY24. The Tshepong South Mine is accessed via a single underground vertical shaft. The mine is also assisted by two other shafts for the supply of air for ventilation and cooling.
All working levels are accessed via the single vertical shaft system. The strata-bound Basal Reef has a shale roof and, in some instances, a WBLQ hanging wall. The Basal Reef contributes approximately 95% to the total production volume and the B-Reef contributing approximately 5%. Development and stoping operations are based on conventional mining methods.
13.1.2Scattered Mining Method
The orebody at Tshepong South Mine is broken up into blocks by geological structures with large displacements. Scattered mining method is practiced at the Tshepong South Mine due to the orebody being broken up into these small blocks of ground. The mine design criteria is based on the grid mining method where the crosscuts are spaced at fixed distance of 160 m apart, however additional development is required in some instances and/or crosscut spacing reduced/increased depending on the prevailing geological structures. Primary Waste Development is done ahead of the stoping front in the virgin stress environment.
Primary development is done off-reef (in waste rock), while secondary development is done on-reef (in the mineralized zone). In primary development, horizontal haulages are developed from the vertical shaft, extending to the extremities of the mining level. Further development is done at set intervals between 150 m to 180 m along the haulages towards the mineralized zones in the form of crosscuts. For secondary development, an inclined excavation that connects two levels is established, referred to a raise or winze, depending on the upwards or downwards direction of the development.
13.1.3Open Stoping and Undercut Stoping
The presence of shale in the hanging wall of the Basal reef necessitates that either the undercut and open stoping mining methods are used at Tshepong South Mine. The open stoping mining method is mainly used in the Southern part of the mine where the shale is inter-layered with the Waxy Brown Leader Quartzite. The thin layer of shale is mined out with the reef. The undercut stoping method is used in the Northern part of the mine (only approximately 20cm of the bottom-loaded Basal Reef channel is removed, leaving a residual beam thickness of ± 80 cm to 100 cm thick between the stope and the overlaying shale). The shale layer above the reef is very thick (up to 5m) and is very weak by nature. The Shale unravels when exposed, thereby resulting in the loss of reserves.
Effective Date: June 30, 2024
58
Technical Report Summary for
Tshepong South, Free State Province, South Africa
13.1.4Integrated Approach
The differences of the reef formations and mining conditions at the respective parts of the mine (North and South) have led to the application of an integrated mining method approach. The objective of the adopted mining methods is aimed at the safe and profitable extraction of the Mineral Reserves, while reducing the occurrence of large seismic events.
13.2Mine Design
The mine design strategy aims at maximizing the safe extraction of ore, while minimizing the risk of geotechnical failures, which can result in operational disruptions and dangerous working conditions. The Basal Reef is modelled and designed across the Tshepong South Mine. In addition, the Tshepong South Mine considers the B-Reef for design and planning.
Both the Basal and B-Reef horizons have been subject to faulting and intrusions by igneous dykes and sills that cut across the reefs. The most significant form of control at the Tshepong South Mine for rockfalls and rockbursts is the systematic modelling and design processes.
Figure 13-1: Schematic representation of the scattered mining sequence
Effective Date: June 30, 2024
59
Technical Report Summary for
Tshepong South, Free State Province, South Africa
Figure 13-1A: Schematic representation of the sequential mining method.
Effective Date: June 30, 2024
60
Technical Report Summary for
Tshepong South, Free State Province, South Africa
The occurrence of geological faults is also a source of groundwater intersections during mining operations which may lead to production delays, geotechnical risks, and the potential of flooding. Depending on the geology of the dyke or sill, a change in the mining direction may be required, or as in the case of low-risk scenarios the Rock Engineering department may suggest a safety and support strategy to mitigate the associated geotechnical risk. A change in mining direction may result in Mineral Resource losses, or an increase in dilution.
Based on the latest geological structure model,the geotechnical team designed a suitable pillar layout based on modelling results. A detailed mine design and schedule is done based on the pillar design taking cognizance of uneconomical areas which are excluded on macro scale. This design and schedule are the basis of the mine plan and the declared Mineral Reserves.
A mine design that is sufficiently informed, with geological data, is progressed to the mine planning phase. Mine planning is done on a macro scale as well as on a micro scale. On a macro scale, the material below cut-off is excluded from the mining model. On a micro scale, the mining model is then subject to constraints that are applied because of the geotechnical design and other limitations.
The geotechnical modelling is driven by the most recent information from mining operations, which ensures that the model is an accurate representation of the current operational conditions.
Development is done by either mechanized, mechanical or conventional method depending on the most suitable method for the specific requirements. Tshepong South is essentially a conventional mine design with trackless mining in the twin decline.
Mining production is accessed through underground excavations, developed as haulages and cross cuts. Crosscuts are primary development, in the direction of the mine workings. Inclined secondary development is used to access the reef contact, and advanced from the position of respective crosscuts. Ore is extracted from stoping panels established from the inclined development.
13.2.1Mine Design Parameters
Mine design is done internally, with the mine designs for the Basal Reef and B-Reef horizons done separately, using the DeswikTM software suite. The geological models and the geotechnical parameters formulated by the Rock Engineers, are used as a basis of the mine planning process. The mine design parameters used for Tshepong South and Tshepong Mine are shown in Table 13-1 and Table 13-2, respectively.
Table 13-1: Tshepong South mine design parameters
| | | | | | | | |
| Parameter | Unit | Value |
| Regional Stability |
| Dip stabilizing pillar dimensions |
| Strike span | m | 160 |
| Dip span | m | N/A |
| Strike stability pillar spacing¹ | m | N/A |
| Access haulages middling to reef | m | 90 |
| Primary Development |
| Advance | m/month | 28 |
| Crosscut spacing | m | 160 |
| Secondary Development |
| Advance | m/month | 14 |
| Stoping Parameters |
| CW < 80cm | m | 133 |
| CW > 80cm | m | 133 |
| Economic Parameters |
| Cut-off grade (planning) | cmg/t | 790 |
| RD | | 2.72 |
Notes: 1. Pillar spacing is measured skin to skin.
Effective Date: June 30, 2024
61
Technical Report Summary for
Tshepong South, Free State Province, South Africa
13.3Geotechnical Considerations and Seismic Monitoring
With respect to Risk – Tshepong South maintains working and robust Isopach models, to manage the geotechnical risk and the stress model to manage the seismicity risk. The geotechnical and Isopach models for Tshepong South take the latest geological structural model into account and the data update is dynamic as mining progresses.
The purpose of the pillar designs, regardless of the pillar type, is to customize them to the prevailing mining conditions, with the objective of making the mine design safe, practical, easy to implement, and profitable. These pillars include bracket and strike pillars. The details of the pillar design can be found in Table 13-1. The dimensions depicted for the pillars are standard and are adjusted depending on planned bracketing of geological structures or if patches of low value reef are encountered.
The Rock Engineers follow the following geotechnical modelling and approach:
•evaluate the principal stress directions using seismic source mechanisms and update the input parameters for numerical modelling;
•using seismic source mechanisms, delineate planar features to confirm and/or detect the position and orientation of geological structures;
•confirm the expected ground motion produced by large, potentially damaging seismic events, and calibrate the Ground Motion Prediction Equation; and
•monitor mine-wide seismic activity and test each geotechnical region for deviation from the expected co-seismic rock mass response, which tests the release of seismic energy.
The geotechnical stress model is also used to manage and monitor the occurrence of seismic hazards. Seismic hazards are categorically measured as per mine planning cycles of short, medium and long term. Events for the last 100 - 200 days definitively estimated, to accurately determine the intermediate probabilities of occurrence. The behaviour of identified medium term events are then monitored daily. Alarms are raised, and people are evacuated in the event of a predicted or anomalous seismic pattern is identified and people are removed from the specific danger areas.
Tshepong South Mine uses an Integrated Seismic System supplied by Institute of Mine Seismology to record seismic events on the property.
The seismic systems for Tshepong South consist of 25 three-component geophones. The digital seismic data is transmitted from the underground seismic stations through to the surface monitoring stations via manual and automated recording systems, based on available infrastructure at the mine. The data is recorded continuously and reported on a daily basis.
13.4Geotechnical Geohydrological Considerations
Apart from the geotechnical risks that can be caused by the existence of geological structures, the presence of water and gas also pose risks to Tshepong South. The geotechnical models are used as a basis to manage and monitor the occurrence of ground water and gas intersections. Cover holes are drilled in all flat development ends to identify water or gas. Water or gas intersections are plotted in a 1:200 survey sheet plans. These intersections are plotted against a stope plan indicating the geology, structural features, reef contours, pillar layout, faults with associated losses or gains, reef elevation, grade and channel width. These geospatially referenced plots articulacy help the mining team execute the mine plan, in relation to the operation’s geotechnical requirements and assist in the early detection of the presence of water or gas.
Daily management of influx water is handled through a series of diversion strategies aimed at re-directing and controlling the flow, temperature regulation, and re-circulation of water. The water strategies at Tshepong South are supported by the Integrated Waste and Water Management Plan (“IWWMP”). Tshepong South maintain graphical and numerical databases of the operations geohydrological conditions.
Water reticulation around the mine has been designed to maximize water re-use and minimize the amount of water pumped to surface. The 77-level pump station is used to transfer water from various levels back to 55/59 level ice dam where it is cooled by addition of ice from the surfaces ice plants and returned via PRV’s to the different working levels. From the workings, water is pumped via vertical spindle pumps and drain system to the shaft, cascading back to 77 level pump station via NX holes and two settlers.
Effective Date: June 30, 2024
62
Technical Report Summary for
Tshepong South, Free State Province, South Africa
Excess water gets pumped via Railveyor haulage to Nyala Shaft’s 57 level dams, to 35 level dams and then to the surface dam. The water is cleaned via RO plant and supplied to Tshepong North residence and the Nyala Shaft as potable water. Excess water can also be diverted to Tshepong North via 66 level in case of emergency at rate of approximately 35l/s.
13.5Mine Plan Development and Reserve Schedule
The Tshepong South Mine has Mineral Reserves available during the life of mine, however extraction of ore from Isolated Blocks of Ground (IBG’s) will become more important as the life of mine progresses. Volumetrically these Mineral Reserves are not significant.
The preferred mining method is dependent on development staying ahead of the mining front, so that accurate geological information is gathered and included in final designs before mining commences. This also enables planning and scheduling activities to be accurately sequenced, which leads to better planning, safer working conditions, and improved profitability.
At Tshepong South Mine, the Mineral Reserves plan and scheduling originates with the use of the Mineral Reserves model, which is modelled at a 790cmg/t cut-off grade. The 2.584Mt of Mineral Reserves are fully accessible through the existing infrastructure at the Tshepong South Mine. The mining rates used in determining the Mineral Reserves plan are based on the current and expected operational performance, notwithstanding any unforeseen underground mining constraints. The remaining Mineral Reserves for the operation is planned for six years, with a planned mining rate averaging at approximately 431ktpa (milled tons) over the Mineral Reserves period. The extent of the Tshepong South Mine Mineral Reserves plan is shown in Figure 13-2. The milled ore and gold recovered for Tshepong South Mine are presented in Figure 13-3.
Figure 13-2 Tshepong South mine Mineral Reserves plan
Effective Date: June 30, 2024
63
Technical Report Summary for
Tshepong South, Free State Province, South Africa
Figure 13-3: Graph of Tshepong South mine Mineral Reserves plan – Tonnes and grade
Figure 13-4: Graph of Tshepong South mine Mineral Reserves plan – Gold produced (oz)
Effective Date: June 30, 2024
64
Technical Report Summary for
Tshepong South, Free State Province, South Africa
13.6Mining Rates
Mining rates are based on current and expected performance depending on underground conditions and constraints. Dilution is included in the production plan mainly from external waste sources from the stoping operations, but allowances are also made for dilution occurred in the ore flow process. The Mineral Reserves plan considers the planned and available working areas, inclusive of the mine’s current infrastructure capacity.
Tshepong South will be mined at an average rate of 35,894tpm.
13.7Grade and Dilution Control
The selected Scattered mining method is planned and designed to better support recovered grade because of the improved selectivity, flexibility, and reduced off-reef mining. Mine grades are currently increasing as mining moves towards further South into the Eland mine payshoot.
Ore grade and dilution control is done using a Quality Index monitoring tool. This Quality Index considers key parameters including Mine Call Factor, stoping width, proportion of ore lock-up, and an On-Reef index (percentage of On-Reef vs Off-Reef mining due to faulting, dykes, etc.). During the mine design and planning process, external dilution control is implemented by applying an adapted mine recovery factor.
Operationally, grade and dilution control are mostly achieved through improved drilling (marking sticks used on undercut mining) and blasting practices and compliance to blasting barricades on stopes <35 degrees. Drilling accuracy is achieved by holes that are drilled parallel, aimed at being correctly burdened and that are within the stoping limits. This ensures consistent and economic rock breaking, without dilution.
The Tshepong South Mine also adopts electronic blasting technology consisting of an integrated electronic system, which allows for precision timing and improved control of rock breaking. This technique controls stoping width and protects the integrity of the footwall and hanging wall, aimed at minimizing dilution.
13.8Mining Equipment and Machinery
There are various machinery and equipment used at Tshepong South, depending on the type of mining or development activity. The following equipment can be found at the frontline of mining production:
| | | | | | | | |
| Equipment description | Application | Number in use |
| Compressed air hand held drills | Development | 160 |
| Compressed air hand held drills | Stoping | 301 |
| Drop raise S36 compressed air machine | Development - Orepasses | 4 |
| Battery charged Locomotives | Tramming of Hopper with ore | 47 |
| Salzgitter Loaders | Loading of Broken ore | 38 |
Haulages and associated development: Conventional hand held drills are used
Production drilling in stopes: Equipment used for this type of drilling is compressed air hand-held drills.
Drop raising: Is a drilling technique used ore passes.The benefits of this allow personnel to be removed from dangerous underground workings and have the upside of productivity achieved through automation.
Rock movement: Ore from the stoping ore passes is loaded from the box-front chutes directly into spans of hoppers pulled by battery powered locomotives and then trammed to the shaft inter-level tips. Ore is then transferred to the main loading bins for hoisting to the surface. Waste rock from development operations is loaded into similar hoppers and trammed and hoisted in the same manner as the ore movement but is done using in a dedicated waste system to prevent diluting the ore grade.
Tshepong South utilises battery charged locomotives for transportation of ore from the workings to the shaft.
Ancillary equipment: Area where draw points are not available in the workings i.e box front chutes, Salzgitter loaders are used.
Effective Date: June 30, 2024
65
Technical Report Summary for
Tshepong South, Free State Province, South Africa
13.9Ore transport
The blasted ore from the stoping panels is moved with winch-operated scrapers along gullies to ore passes where it gravitates down to the loading boxes in the footwall crosscuts below the stopes. The ore is discharged into rail hoppers and transported, via battery locomotives, to dedicated inter-level transfer systems that gravity feed to the main silos. Once hoisted up the main vertical shaft at Nyala to surface, the ore is transported to the Harmony One Plant via Rail system.
The existing Tshepong South Shaft is connected to the Tshepong Shaft. At the Tshepong South Shaft, broken rock handling on all levels is rail-bound. Several inter-level sub-vertical transfer systems feed the main silos on 55 level. Phakisa shaft’s underground reef and waste orepasses capacity is 4500t each. From 77 level, the rock is hoisted to 55 level where a RailVeyorTM system transports the rock from Tshepong South to the Nyala Shaft. The Railveyor reef silo capacity is 400t, and waste silo is 300t. Nyala shaft’s underground reef and waste orepasses have a capacity of 1000t each.The rock is hoisted to surface by means of the rock winder, and then transported to Harmony One Plant by train (Figure 3-1). Nyala shaft’s surface reef silo has a capacity of 2000t, and the waste silo 700t.
13.10Mining Personnel
Tshepong South is labour intensive, with the mine being supported by over 3,370 employees, with 87% being permanent staff and the remainder contractors.
The underground mining operation uses an 11 day fortnight shift system, operating a 3-shift cycle per day. The underground work force is essentially split into two categories that are either involved in production activities or they provide supporting services required underground. Production activities are directly related to the mining of ore and non-production personnel provide supporting services such as safety, engineering functions, maintenance and underground store controls. The mining personnel for Tshepong South is presented in Table 13-2.
Table 13-2: Tshepong South mine mining personnel
| | | | | |
| Labour Requirement | No. of Employees |
| Services | 351 |
| Engineering | 712 |
| Mining | 1 878 |
| Contractors | 435 |
| Total Employees | 3 376 |
Effective Date: June 30, 2024
66
Technical Report Summary for
Tshepong South, Free State Province, South Africa
Figure 13-5: Tshepong South shaft and underground infrastructure
Effective Date: June 30, 2024
67
Technical Report Summary for
Tshepong South, Free State Province, South Africa
13.11Commentary on Mining Methods
The Scattered mining method is the main mining method utilized at Tshepong South and is appropriate for the reef characteristics and the mine depth. The mine design, planning and scheduling for the mine is developed using the DatamineTM and DeswikTM geological software, respectively, considering the geotechnical model and related parameters.
The main geotechnical and geohydrological risks at Tshepong South include the presence of gas, ground water and seismicity, which are managed through the integrated monitoring systems, and incorporated into working mining models that inform daily mine planning decision-making.
The mining rates, machinery and equipment, ore transport, grade and dilution control, and labour resourcing and optimisation are driven by the mine schedule and improvement initiatives at the respective mine sites.
Effective Date: June 30, 2024
68
Technical Report Summary for
Tshepong South, Free State Province, South Africa
14Processing and Recovery Methods
Section 229.601(b)(96)(iii)(B)(14) (i-iv)
All ore mined at Tshepong South is processed at Harmony One Plant located west of Welkom (Figure 3-1). Harmony One Plant is Harmony’s largest gold processing plant and processes underground ore from multiple shafts, as well as surface ore from nearby mine waste facilities. The plant was commissioned in 1986 and comprises three independent modules, each consisting of four feed silos, two ROM mills, two conventional thickeners, cyanide leach, carbon in pulp (“CIP”) adsorption, elution, zinc precipitation and smelting. The plant CIP process reflects the technology which was current at the time of construction and has been operating with no significant challenges and target metallurgical recoveries have been achieved.
14.1Mineral Processing Description
The processing flow sheet is presented in Figure 14-1.
Ore delivered to the plant is fed from the concrete silos via two mill feed conveyors through vibrating feeders directly into the ROM mills. Fully autogenous (“FAG”) milling is a milling process in which the entire ROM ore stream is fed directly into the mills and where the grinding media is generated within the mill from suitably sized pieces of ROM ore itself. The average feed rate to the mills is 65tph. The milling circuit consists of two single stage ROM mills that are controlled on maximum power for optimum milling. Each ROM mill is 4.27m in diameter and 10m in length and grinds the ore to 75% - 90% passing minus 75 microns.
Milling is followed by a conventional gold leach process (cyanidation).The cyanidation process is one of the most utilized methods for the recovery of gold from auriferous ores. The use of cyanide leaching for gold recovery is based on gold’s properties, mainly its solubility (ability to dissolve) in cyanide solutions. Once the gold is dissolved into the cyanide solution it has a higher ability to adsorb (attach) onto activated carbon through the application of carbon in pulp (“CIP”) technology.
The loaded carbon then enters the elution columns, which are high pressure vessels that circulate the loaded carbon extracting the gold. The gold will “de-absorb” from the activated carbon and attach onto stainless-steel wool by means of electrowinning. The CIP circuit makes use of gravity flow of slime between the consecutive counter-flow stages to recover recirculate the activated carbon back into the system.
Following this process, the cathode steel wool is smelted (induction furnaces) after drying in the calcining ovens. The doré bars are then dispatched to Rand Refinery Limited, located near Johannesburg in Gauteng Province.
The tailings residue is pumped from the plant to one of two TSFs, the FSS8 West/East complex, which is the biggest facility with a total deposition capacity of 320,000tpm. The second TSF is the FSS2 facility with a capacity of 160,000tpm. The combined capacity of the two TSFs are 480,000tpm which is well above the plants designed capacity thus, creating some flexibility in the deposition strategy.
Both TSFs are conventional day wall paddock facilities with a fixed penstock tower arrangement that would be the primary means of draining excess water from the facility which is pumped back to the plant to be used in the process again.
Effective Date: June 30, 2024
69
Technical Report Summary for
Tshepong South, Free State Province, South Africa
Figure 14-1: Schematic flow diagram of the metallurgical process
Effective Date: June 30, 2024
70
Technical Report Summary for
Tshepong South, Free State Province, South Africa
14.2Plant Throughput, Design, Equipment Characteristics and Specifications
The Harmony One Plant has a steady state design capacity of 390ktpm with its conventional CIP flowsheet. The design parameters and equipment specifications are presented in Table 14 1. The Harmony One plant is in good working condition and the equipment is also in good order with audits done on regular bases to check the operating performance of the plant.
Table 14-1: Key design parameters and equipment specifications
| | | | | | | | | | | |
| Process | Parameter | Unit | Value |
| Overall Plant | Recovery | % | 95 |
| Availability | % | 100 |
| Milling | Throughput ROM | t/hr | 90 -100 |
| Densification | Desired pH | pH | >10.5 |
| Desired Density | g/cm3 | 1.50 - 1.55 |
| Leaching | Residence Time | hr | 27 |
| Acid wash and elution | Elution Temperature | °C | 130 (Ambient) |
14.3Energy, Water, Process Material and Personnel Requirements
14.3.1Energy
Phakisa shaft requires 15GwH of Eskom units per month, and Nyala shaft requires 10GwH of Eskom units per month. These quantities are readily available from Eskom.
14.3.2Water
Phakisa shaft requires 100 Mega liters of water per month. These quantities are readily available from Sedibeng.
14.3.3Process Material
The reagents and their consumption rates are presented in Table 14-2. All reagents above are currently being utilized in the plant and are sourced in South Africa. Carbon is supplied from international suppliers to local authorized vendors who manage in country stock levels according to commercial agreements.
Table 14-2: Harmony One Plant consumables
| | | | | | | | |
| Equipment | Unit | Value |
| Lime | tpm | 341.00 |
| Flocculant | tpm | 0.71 |
| Cyanide | tpm | 9.06 |
| Carbon | tpm | 190.00 |
14.3.4Personnel
The personnel is provided in Table 14-3.
Table 14-3: Harmony One Plant personnel
| | | | | |
| Personnel | No. |
| Services | 57 |
| Engineering | 77 |
| Metallurgy | 138 |
| Contractors | 245 |
| Total | 517 |
Effective Date: June 30, 2024
71
Technical Report Summary for
Tshepong South, Free State Province, South Africa
14.4Commentary on the Processing and Recovery Methods
The metallurgical process is a well-tested CIP technology which has been in operation at the Harmony One plant since 1986. Recoveries used in the business plan were based on historic performance. The methodology applied considered the historical metallurgical recovery (18-month period) (Figure 14-2) for the relevant ore sources at the plant.
It should be noted that since the Harmony One plant processes ore from multiple sources a metal accounting operating procedure is required to manage the input feed delivered to the plant and gold output produced. A basic overview of the procedure is as follows:
•each operation delivers ore to the plant and is booked against each source;
•a delivery sheet reflects each shaft/operations figures; and
•from total ore processed, each shaft/operations equivalent proportion of gold is determined out of the monthly full gold produced.
Figure 14-2: Graph of historical recovery factor (18 month actual)
Effective Date: June 30, 2024
72
Technical Report Summary for
Tshepong South, Free State Province, South Africa
15Infrastructure
Section 229.601(b)(96)(iii)(B)(15)
The proximity of Tshepong South to Tshepong North allows for the integration of infrastructural requirements by using the excess hoisting capacity and underused infrastructure available at Tshepong North. This has also enabled the debottlenecking of Tshepong South’s infrastructure. Tshepong South therefore has adequate access to the infrastructure required to meet the planned Mineral Reserves production schedules.
15.1Surface Infrastructure
The surface infrastructure associated with Tshepong South is presented in Figure 15-1, whilst Google Earth images of the shaft and Harmony One Plant are presented in Figure 15-2, Figure 15-3, Figure 15-4 and Figure 15-5.
Tshepong South’s mining area is well developed in terms of access and mining-related infrastructure. Access to the shafts is via well-maintained roads. Adequately maintained gravel roads is used to access other areas of the mine such as the explosives magazines, sewage works, slimes dam and the evaporation ponds.
The infrastructural layout includes hoisting facilities; logistical support for core handling, sampling, and transporting; ore and waste facilities; tailings and leaching infrastructure; roads; water and power supply; ventilation and refrigeration systems; stores and workshop support; electrical supply; offices; housing and security.
15.1.1Ore and Waste Rock Storage Facilities
Ore mined at Tshepong South is hoisted at Nyala Shaft where it is stored in silos on surface before being transported by rail to the Harmony One Plant for processing (Figure 15-1 and Figure 15-5). The capacity of Phakisa shaft’s underground reef and waste orepasses are 4500t each. The capacity of Nyala’s underground reef and waste orepasses are 1000t each. The capacity of Nyala’s reef silo is 2000t, and the waste silo is 700t. Ore is stored in silos located at the plant prior to processing.
The ore and waste hoisting for the Tshepong South Mine is done using two rock winders via the Nyala Shaft and is delivered via the RailVeyorTM. The capacity of the Railveyor reef silo is 400t, and waste silo is 300t. Waste rock is deposited in waste silos and transported to the plant. The Nyala (“WRDs”) is not currently used, but is available adjacent to the respective shafts (Figure 15-1).
15.1.2Tailings Storage Facilities
Harmony One Plant pumps tailings as a slurry to two TSFs namely FS2 and St Helena No.4, located to the south of the plant. All TSFs are currently owned and operated by Harmony.
The current Mineral Reserves plans for Tshepong (Tshepong South and Tshepong North) require a total collective placement of approximately 0.77Mt of tailings.
The capacity remaining in the two TSFs is sufficient until 2024, and work is in progress to extend the life of St. Helena 4 TSF, for approximately another 6 years, by converting it to a cyclone deposition site scheduled to be completed in February 2025. Once converted, St. Helena 4 TSF will manage to have a deposition rate of 300,000 tons per month. FSS2 TSF is currently operating at a monitored deposition rate of 140,000 tons per month. The site was scheduled to be stopped for deposition by 2024. The Engineer of Record is currently conducting a Continuity Report to establish if there can be any continued deposition on the site beyond 2024. Preliminary data is showing an extension of over 2 years of life on the site until 2026. The full study will be completed at the end of September 2024 then a full report will follow.
The TSF sites have full engineering records including design, construction, operation, and maintenance plans.
15.1.3Rail
A railway line which traverses the Tshepong South Mining Right area is used to transport hoisted ore to the Harmony One Plant (Figure 15-1).
Effective Date: June 30, 2024
73
Technical Report Summary for
Tshepong South, Free State Province, South Africa
Figure 15-1: Tshepong South surface layout and infrastructure
Effective Date: June 30, 2024
74
Technical Report Summary for
Tshepong South, Free State Province, South Africa
Figure 15-2: Tshepong South detailed surface infrastructure
Source: Google Earth Image Date May 2021
Effective Date: June 30, 2024
75
Technical Report Summary for
Tshepong South, Free State Province, South Africa
Figure 15-3: Nyala detailed surface infrastructure
Source: Google Earth Image Date May 2021
Effective Date: June 30, 2024
76
Technical Report Summary for
Tshepong South, Free State Province, South Africa
Figure 15-4: Harmony One Plant detailed surface infrastructure
Source: Google Earth Image Date: September 2021
Effective Date: June 30, 2024
77
Technical Report Summary for
Tshepong South, Free State Province, South Africa
15.2Underground Infrastructure and Shafts
The Tshepong South shaft and underground infrastructure is schematically depicted in Figure 13-7. The underground workings are accessed and mined via four vertical shafts and a sub-vertical shaft.
At Tshepong South, the main vertical shaft system extends from surface to 54 level. A sub-vertical extends from 55 level to 66 level. A RailVeyorTM connects the 54 level and 55 level. A Koepe winder is used at the Nyala shaft for rock hoisting. There are two pump stations located at the Tshepong South shaft 71 level and 76 level. Tshepong South and Tshepong North shafts are connected laterally at 54 level and 66 level.
Mine ventilation systems are well established. The Nyala Shaft supports the Tshepong North operations with the supply of compressed air, water handling and rock hoisting. Four compressors installed on surface feed air down the Nyala shaft for the Tshepong South workings. Refrigeration systems for Tshepong South shaft are installed on 55 level to cool the working places. The main return airway for the Tshepong South Shaft is predominantly via the Tshepong Shaft on 66 Level, 69 Level and 73 Level. The current additional holing, booster fan installations and pressure upgrades will significantly assist with the return air capacity and the refrigeration on the shaft.
15.2.1RailVeyorTM
A 5.4km RailVeyorTM system connects the Tshepong South Shaft through 55 level to the Nyala Shaft. The RailVeyorTM is used to transport the rock from Tshepong South to the Nyala Shaft.
The RailVeyorTM was initially installed by the RailVeyorTM company. It is a remote controlled, electrically powered friction light-rail haulage solution. The system comprises four trains and is maintained with a dedicated maintenance bay and digital monitoring systems. The RailVeyorTM system is maintained by Tshepong South, where support can be provided by the company as required.
15.3Power and Electrical
Power is supplied by Eskom. Tshepong South’s power supply is designed to satisfy the planned Mineral Reserves production and service requirements. Main power supply is managed and distributed via electrical sub-stations located adjacent to the Mine shafts (Figure 15-2, Figure 15-3). Phakisa shaft requires 15GwH Eskom units, and Nyala shaft requires 10GwH Eskom units, per month.
Power lines traverse the mine property to connect the shafts, reduction works and hostel complexes.
In addition, Tshepong South has an onsite emergency power generator system, sufficient to support the critical mining and mineral processing activities in case of emergencies. The Tshepong South operation has an installed capacity to supply of 40MVA, however currently only 27MVA is utilized. At Nyala where hoisting and compressors are installed the installed capacity is 40MVA and currently only 22MVA is utilized.
15.4Water Usage
The primary source of bulk water supply is from Sedibeng municipality. Phakisa shaft requires 100 mega liters of water per month. The processing plant, refrigeration plant and underground mining activities are the three largest water consumers.
The Tshepong South underground water supply is supported by two operational settlers. The main pump stations at the Nyala shaft are situated on 35 level and 57 level. The water that reports at the Nyala shaft is mainly excess water from Tshepong South, melted ice and drinking water, and an estimated 1Ml of fissure water from surrounding shafts.
Tshepong South has two underground water dams on 77 level and one on 55 level. Water for the use of dust suppression, footwall and sidewall treatment is re-purposed at the Tshepong South Mine. To ensure continuous availability of water supply during municipality challenges/breakdowns of the system, there is a total of three potable water storage dams installed with a buffer capacity of 7.5ML between water outages. Water usage at Tshepong South shaft is approximately 4ML daily average use for ice production as well as for water drinking and sanitizing.
The storage facilities have sufficient water to supply water to the operation for up to 60 hours if the bulk water supply was interrupted.
Effective Date: June 30, 2024
78
Technical Report Summary for
Tshepong South, Free State Province, South Africa
15.5Logistics and Supply
The procurement of supplies and equipment are handled centrally, via Harmony, and then delivered to Tshepong South.
Harmony operates its own rail system which connects the shafts, reduction works, shaft stores, explosives magazine and the mine workshops. This system is used to transport ore between shafts and to transport consumables between the surface stores to the respective locations, as required. It is also connected to the regional Transnet railway system, which transports ore to the Harmony One Plant.
15.6Commentary on Infrastructure
The operational infrastructure including road, rail, offices, security services, refrigeration, Compressors, pump stations, chairlift, ice plant and RailVeyorTM, water and power supply is adequate to satisfy the Tshepong South Mineral Reserves plan. The Operations is powered by electricity from Eskom. Overall, Tshepong South is well-established with sufficient logistical and infrastructure support for the existing and planned mining operations.
The “Property, Plant, and Equipment” as of June 30, 2024, including buildings and mine infrastructure, mining assets, rehabilitation and assets under construction, had a carrying value of R2,326 million.
Effective Date: June 30, 2024
79
Technical Report Summary for
Tshepong South, Free State Province, South Africa
16Market Studies
Section 229.601(b)(96)(iii)(B)(16) (i-ii)
Gold is traded in a variety of markets/exchanges both in physical form through over the counter (“OTC”) markets, bullion banks and metal exchanges etc., and through passive investments such as exchange traded funds (“ETFs”), which are based on gold prices and units representing physical gold which may be in paper or dematerialized form. Demand is driven by the jewelry market, bar and coin, use in technology, ETF’s and other financial products, and by central banks. An overview of the gold market is given in the following sections based mainly on data from the World Gold Council and GoldHub websites.
16.1Market Overview
Unlike almost all mineral commodities, the gold market does not respond the same way to typical supply and demand dynamics which are founded on availability and consumption, but rather on global economic affairs, particular those of the major nations, industrial powerhouses and economic regions, such as the Eurozone. The gold market is affected by government and central bank policies, changes in interest rates, inflationary or deflationary environments and events such as stocking and de-stocking of central reserves. It is also largely affected by global events such as financial crises, geopolitical trade tensions and other geopolitical risks.
Annual global gold demand (excl. over-the-counter demand (OTC) and other) experienced a decline of 5.0% on an annual basis, totaling 4 448.4 tonnes in 2023 when compared to the 4 699.0 tonnes recorded in 2022. The fourth quarter of 2023 recorded an average gold demand (excl. OTC and other) of 1 149.8 tonnes, 8.0% above the average recorded over the last five years. However, when compared to the fourth quarter of 2022, gold demand declined by a substantial 12.0%.
The main contributing factors of the higher gold demand during the fourth quarter of 2023 include:
•Jewelry consumption was 1.0% lower when compared to the same quarter in 2022, whilst jewelry inventory recorded a significant decrease of 29.0% in 2023 when compared to 2022. Furthermore, jewelry fabrication in the fourth quarter of 2023 was 3.0% lower compared to the same period in 2022.
•Bar and coin demand in the final quarter of 2023 was 7.0% lower on an annual basis at 313.8 tonnes, reflecting weak sentiment among some investor segments. Furthermore, official coins decreased by a notable 30.0% in the fourth quarter of 2023 when compared to the same quarter a year ago.
•Central Banks and other institutions invested 229.4 tonnes of gold in the fourth quarter of 2023, recording a drastic decline of 40.0% when compared to the 382.1 tonnes investment recorded in the fourth quarter of 2022.
Although bullion prices recently surged to record highs, the first quarter of 2024 also witnessed significant gold demand, driven by sizable OTC demand.
16.2Global Production and Supply
Total Gold supply was 3.0% higher in 2023 when compared to 2022, similar to the annual supply growth of 3.0% witnessed in the first quarter of 2024 when compared to the first quarter of 2023. Gold production and supply are sourced from existing mining operations, new mines and recycling.
Effective Date: June 30, 2024
80
Technical Report Summary for
Tshepong South, Free State Province, South Africa
16.2.1New Mine Production
Gold supply from mine production exhibited an annual increase of 1.0% in 2023, amounting to 3 644.4 tonnes, but remained just below the highest output recorded in 2018. In the fourth quarter of 2023, mine production of gold decreased by 2.0% when compared to the corresponding quarter of 2022. However, moving into the first quarter of 2024 mine production increased by 4.0% year-on-year, reaching 893.0 tonnes, though, still lower when compared to the 939.9 tonnes produced in the previous quarter. The upward trend in mine production over the past two years can primarily be attributed to an uninterrupted mining industry.
According to the WGC, preliminary data indicated notable increases in gold mine production in the first quarter of 2024 for Canada (16.0% y-o-y); Ghana (15.0% y-o-y); Indonesia (14.0% y-o-y) and China (5.0%
y-o-y)
In 2023, China remained the largest gold producer in the world (378.2t), followed by the Russian Federation (321.8t), Australia (293.8t), Canada (191.9t), United States (166.7t), Ghana (135.1t), Indonesia (132.5t), Peru (128.8t), Mexico (126.6t), Uzbekistan (119.6t) and Mali (105.0t). South Africa produced 104.3t in 2023; higher when compared to the 92.6t produced in 2022.
Figure 16-1 World Gold Council: Mine production - Major producing gold countries ranked by 2023
Source: ETSA & World Gold Council, 2024
16.2.2Recycling
The global annual supply of recycled gold increased by 9.0% in 2023 to reach 1 237.3 tonnes when compared to 2022, but still remained below the 1 293.0 tonnes recorded in 2020 and below the all-time high recorded in 2009. The rise in supply was encouraged by higher prices, resulting in a 12.0% surge in recycled gold during the first quarter of 2024 when compared to the same period in 2023. This marked the strongest quarterly performance since the third quarter of 2020 and the strongest first-quarter supply volume since 2014. Notably, East Asia recorded the most significant increase among all regions, primarily driven by volume increases in China.
16.3Global Consumption and Demand
During first quarter of 2024, gold demand (excl. OTC and other) reached 1 101.8 tonnes, reflecting a decrease of 5.0% compared to the same quarter the previous year. However, when including OTC and other, total demand increased by 3.0% on an annual basis in the first quarter of 2024 to reach 1 238.3 tonnes; resulting in the strongest first quarter since 2016. Furthermore, demand from central banks buying gold was also high during the first quarter of 2024.
Effective Date: June 30, 2024
81
Technical Report Summary for
Tshepong South, Free State Province, South Africa
16.3.1Jewelry
Global jewelry consumption experienced a significant quarter-on-quarter decline of 23.2% during the first quarter of 2024, dropping from 623.5 tonnes in the fourth quarter of 2023 to 479.0 tonnes in the first quarter of 2024. In China, demand for gold jewelry decreased by 6.0% in the first quarter of 2024 when compared to the same period in the previous year, while demand from India increased by 4.0%, supported by a robust macroeconomic environment that supported gold consumption. However, despite the first quarter initially commencing with increased demand, investor appetite for bullion tapered off towards the end of the quarter due to a price rally in March 2024 and continued to remain under pressure entering the second quarter of 2024.
16.3.2Investment
A total annual gold investment demand of 940.7 tonnes was recorded by the World Gold Council (WGC) for 2023, reflecting a 15.0% decrease from the 1 112.8 tonnes recorded in 2022. In the first quarter of 2024, investment in gold (excluding OTC) was significantly lower and recorded a 28.0% year-on-year decline, reaching 198.6 tonnes, down from 275.3 tonnes recorded in the first quarter of 2023 and also lower when compared to the 257.1 tonnes recorded in the fourth quarter of 2023. Despite the decline, long positions of fund managers reached a two-year peak in March 2024 which was supported by the gold price rally, however, gold exchange-traded funds (ETF) holdings decreased by 113.7 tonnes (USD6.0 billion) on a quarterly basis during the first quarter of 2024. Furthermore, global physically-backed gold ETFs were 10.0% lower on an annual basis amounting to 3 112.4 tonnes globally during the first quarter of 2024. Market divergence was evident as Asia had positive demand growth for physically backed ETFs while the Western investors focused on profit-taking.
According to the WGC, global bar and coin investment increased by 3.0% when compared to the first quarter of 2023, reaching an average of 312.3 tonnes in the first three months of 2024.
The average London Bullion Market Association (LBMA) price of gold traded 10.0% higher in the first quarter of 2024 when compared to the same period a year ago, at USD2 069.80 an ounce, which also represented a 5.0% quarter-on-quarter increase that can be ascribed to risk and momentum factors.
Figure 16-2 World Gold Council: Total gold supply & demand
16.3.3Currency
The inverse relationship between the value of U.S. Dollar (USD) and that of gold is one of the most discussed relationships in currency markets. The USD is the internationally accepted currency and most of the international transactions take place in USD equivalent. The major reason behind the relationship of gold and the USD, is that gold is used as a hedge against the adverse exchange value of the USD.
Effective Date: June 30, 2024
82
Technical Report Summary for
Tshepong South, Free State Province, South Africa
As the US Dollar’s exchange value decreases, it takes more USD to buy gold, which increases the value of gold. Two other factors linked to the USD, or the strength of the USD is inflation and interest rates.
Interest rates have remained high whilst inflation started retreating in 2024. The USD is forecast to lose some strength as U.S. interest rate cuts are nearing inevitably and the currency depreciated in May 2024, for the first time in five months. Furthermore, global economic growth and lower risk also place pressure on the US Dollar. Central banks are planning to start with interest rate cuts, which in turn could cause non-yielding bullion to become more attractive and result in further increases in the gold price.
16.4Gold Price
16.4.1Historical Gold Price
The LBMA gold price reached a record annual average price of USD1 940.54 an ounce in 2023, 8.0% higher when compared to average of USD1 800.09 an ounce recorded in 2022. The upward trajectory continued into the first quarter of 2024 where gold prices averaged 5.0% higher at USD2 069.80 an ounce on a quarter-on-quarter basis.
Moving into the second quarter of 2024, gold prices continued to gain a lot of momentum which can mainly be attributed to the ongoing geopolitical tensions in the Middle East, along with central bank hedge purchasing and uncertainty surrounding global inflation. The safe-haven appeal of gold drove a bullish market with bullion prices reaching new record highs after increasing by roughly 18.0% between March 1, 2024 and April 12, 2024.
The bullish price trend for bullion could increase recycling supply of gold and decrease jewelry demand, whilst mine supply is also expected to reach a new peak. The latest market expectations point to U.S. interest rates staying higher for longer as the U.S. Federal Reserve Bank awaits assurance that inflation is returning to the central bank’s target of 2.0%. Bullion acts as a hedge against lower interest rates and the price is anticipated to increase later in 2024 when interest rates are lowered.
16.4.2Forecast Gold Price
Consensus gold price range for the year 2024 to year 2026 is presented in Table 16.1. The long-term gold prices are considered from year 2025 onwards by the QP. Forecasts as advised from various financial institutions show that gold is expected to trade in a range of USD1,600/oz – USD2,238/oz, for the period 2024 to 2026 with a long-term outlook of USD1,772/oz.
Figure 16-3: World Gold Council: Daily gold price (ZAR/oz & USD/oz)
Effective Date: June 30, 2024
83
Technical Report Summary for
Tshepong South, Free State Province, South Africa
Table 16-1 Consensus view of forecast gold price
| | | | | | | | | | | |
| Institutions | 2024 | 2025 | 2026 |
| World Bank: Development | 2 100 | | 2 050 | | — | |
| BMO Capital Markets | 2 150 | | 2 100 | | — | |
| Scotiabank | 2 018 | | 1 950 | | — | |
| Nedbank | 2 211 | | 2 238 | | 2 210 | |
| Fitch Solutions | 1 900 | | 1 800 | | 1 600 | |
| S&P Global | 2 120 | | 2 134 | | 2 076 | |
| Australian Government | 2 023 | | 2 030 | | 1 924 | |
| Average | 2 075 | | 2 043 | | 1 953 | |
16.4.3Harmony Group Gold Hedging Policy
Harmony has a hedging policy which is managed and executed at Group treasury level on-behalf of its operating entities. The key features of the hedging program are as follows:
•the policy provides for hedging (or forward selling) up to a maximum of 20% of expected gold production for a rolling 24-month period;
◦Year 1, 30%
◦Year 2, 20%
◦Year 3, 10%
•the policy has no minimum quantity that should be hedged, and if an attractive margin above cost cannot be achieved (i.e., in a low gold price environment) then no hedges are entered into;
•Harmony enters into ZAR-denominated gold hedges for its South African operations (for the non-South African assets it enters into USD-denominated hedges);
•Individual mines do not enter into hedges in their own name but delivers bullion to Rand Refinery for refining on behalf of Harmony. Rand Refinery is one of the world’s largest single-site precious metals refining and smelting complex in the world. Rand Refinery refine all of Harmony’s gold to at least 99.5% purity, and acting as agent, sells the gold on the daily spot London fixing price and make payment to the Harmony two days later;
•gains and losses realized from the hedging program are accounted for at Group level and the financial benefit (or downside) is distributed amongst the operations proportional to their levels of gold sales; and
•Harmony does its mine planning and financial forecasts based on the estimated future gold price provided by an external source (ETSA), but its year-end actual financial results reflect the received gold price inclusive of the impact of the hedging program. Therefore, in theory, individual mines receive a hedged gold price for a maximum of 20% of its gold sales with the balance attracting the spot price.
16.5Commentary on Market Studies
The factors which affect the global gold market are well-documented as are the elements which influence the daily gold price.. The LBMA gold price reached a record annual average price of US$1 940.54 an ounce in 2023, 8.0% higher when compared to average of US$1 800.09 an ounce recorded in 2022. The upward trajectory continued into the first quarter of 2024 where gold prices averaged 5.0% higher at US$2 069.80 an ounce on a quarter-on-quarter basis. The gold price remains well above the 5-year historical average
The positive outlook for gold will likely be sustained. Key headwinds for gold are interest rate hikes, currently at near historically low levels, but continued geopolitical risk and underperformance of stocks and bonds will support gold (Gold Mid-Year Outlook 2022, Gold.org, Accessed 2022).
Harmony has a relatively conservative gold hedging policy in place, and this is used to take advantage of the movements in the gold price to maximize the average gold price received, with the benefit of this hedging program flowing through to Tshepong South.
Effective Date: June 30, 2024
84
Technical Report Summary for
Tshepong South, Free State Province, South Africa
16.6Material Contracts
As with all major businesses, Harmony and Tshepong South enters into a multitude of vendor agreements for the provisions of supplies and services. These agreements are entered into on a competitive basis and typically are of a medium-term duration all with clauses providing for periodic updating of pricing, annual (or other) renewal or termination.
Harmony has contractual vendor agreements with various service providers and suppliers. The most significant of these contracts currently in place to support Tshepong South are listed in Table 16-2.
All of the listed contracts are currently valid and in good standing. Terms, rates and charges of contracts are considered consistent with industry norms. Contract management processes are in place and resourced so that contracts re-tendered and/or renewed as they approach expiry.
Table 16-2: Material contracts
| | | | | |
| Vendor Name | Nature of Service / Supply |
| Axis Mining & Construction cc | Underground Support services |
| Genflo Mine Vacuum Systems SA (Pty) Ltd | Shaft Bottom Cleaning at Nyala Shaft |
| Transnet Limited (t/a Spoornet) | Rail transportation of ore and waste |
| Lesedi Drilling & Mining Company (Pty) Limited | Underground diamond drilling at Tshepong South operations |
| Bidvest Protea Coin (Pty) Ltd | Security services |
| |
| |
| |
| |
| |
| |
| |
| |
| |
| |
Effective Date: June 30, 2024
85
Technical Report Summary for
Tshepong South, Free State Province, South Africa
17Environmental Studies, Permitting and Plans, Negotiations, or Agreements with Local Individuals or Groups
Section 229.601(b)(96)(iii)(B)(17) (i-vii)
The South African Government has an extensive legal framework within which mining, environmental and social aspects of the industry are managed. Harmony and its Tshepong South Operation is primarily regulated and managed by certain principal Acts (as listed in Section 17.3) as well as corporate policies, management systems and certain industry-wide guidelines, including:
•Energy Efficiency and Climate Change Policy;
•Environmental Policy;
•Harmony Water Management Strategy;
•Biodiversity and Rehabilitation Position Statement;
•Socio-Economic Transformation Policy; and
•Corporate Social Responsibility Policy.
The latest sustainability policies and public environmental social and governance (“ESG”) performance and disclosure report(s) are available on the corporate website. Harmony has identified the environmental risks for the business and has strategies in place to manage the risks.
17.1Results of Environmental Studies
Tshepong South has prepared multiple environmental impact assessments (“EIA”) for regulatory approval, which under the current legal framework, require stakeholder engagement. The most recent EIA was undertaken in 2022. The results of the studies have been incorporated into the Harmony business planning process. The results of all the studies are too voluminous to include in this TRS and therefore the reader is directed to EMP PAR (Environmental Management Program Performance Assessment) Harmony Tshepong, Matjhabeng and ARM (Reference Number FS 30/5/1/2/2/84MR).
Harmony is committed to maintaining good relationships with regulatory authorities, industries, communities, business partners and surrounding stakeholders.
17.2Waste and Tailings Disposal, Monitoring & Water Management
The process of mining and beneficiation produce significant waste, typically consisting of 1) solid waste in the form of waste rock and overburden, 2) liquid wastes in the form of wastewater and tailings slurry and 3) gaseous emissions such as liquefied petroleum gas.
Measures have been put in place for the handling and disposal of all hazardous chemicals (e.g., cyanide), hydrocarbons (i.e., hydraulic oils and diesel) and other chemicals to ensure the protection of human health and its potential impact on the environment.
Harmony recognizes that responsible and effective waste management can positively reduce its environmental impacts and mitigate associated environmental liabilities. Waste management is thus a priority focus area. Internally, guidelines on mineral, non-mineral and hazardous waste materials are included in the environmental management systems (“EMS”) implemented at Tshepong South.
Tailings comprises of crushed rock and process water emitted from the gold elution process in the form of slurry once gold has been extracted. As tailings contain impurities and pollutants, they are placed in TSF engineered to contain them, in line with Harmony's tailings management program and the Global Industry Standard on Tailings Management (“GISTM”).
Harmony's overall tailings management strategy is to ensure robust, meticulous engineering and dam design, along with a continual focus on management of risks through layered assurance and oversight.
Effective Date: June 30, 2024
86
Technical Report Summary for
Tshepong South, Free State Province, South Africa
The focus areas include, but are not limited to:
•freeboard control;
•water management;
•maintaining stability and the safety factor as advised by the engineer of record;
•erosion controls; and
•monitoring and control measures implemented to ensure continued compliance (including regular inspections, audits, and meetings on varying intervals with subsequent actions, minutes and reports).
As part of its mining, environmental and water approvals and licenses, Harmony is required to implement monitoring programs and plans to establish the operations impact on the environment. The compliance limits for the monitoring variable are included in the applicable EMPR(s), WULA(s) and environmental authorizations. The environmental monitoring implemented at Tshepong South includes:
•ground and surface water monitoring
•biodiversity monitoring;
•waste classification and quantification;
•integrated waste and water management plan (“IWWMP”) updates;
•water balance reviews;
•license and authorization compliance reviews; and
•air quality (i.e., noise and dust) and greenhouse gas emissions ("GHG") monitoring.
A focus area during the next financial year will be on creating effective awareness and implementation of its waste and waste management procedures such as the IWWMP. This plan provides water conservation management measures to help reduce the demand for water from external and natural sources.
17.3Permitting and Licenses
In respect of environment, the following national Acts and the regulations promulgated thereunder provide the regulatory framework for mine permitting and licensing in South Africa:
•Mineral and Petroleum Resources Development Act, 2002 (“MPRDA”);
•National Environmental Management Act, 1998 (“NEMA”);
•National Environmental Management: Waste Act, 2008 (“NEM:WA”);
•National Environmental Management: Air Quality Act, 2004 (“NEM:AQA”); and
•National Water Act, 1998 (“NWA”).
A summary of the status of environmental permits and licenses issued at the effective date related to Tshepong South is presented in Table 17-1.
All relevant mining, environmental and water-use permits are in place that cover the environmental, archaeological, and hydrological components of Tshepong South. All permits are audited regularly for compliance and no material risks to the operations have been identified.
There are applications submitted or being considered by the relevant authorities to ensure compliance and alignment with operations LOM requirements. To this end, Water Use License Applications were submitted / lodged in November 2023 with DWS. Environmental Management Program Amendments were submitted / lodged in 2020 with DMRE. Tshepong operations (South and North) are still awaiting approval from the regulator at the effective date of this TRS. These pending environmental permits and licenses do not pose a material risk to the continuation of the operation.
Effective Date: June 30, 2024
87
Technical Report Summary for
Tshepong South, Free State Province, South Africa
Table 17-1: Status of environmental permits and licenses
| | | | | | | | | | | | | | |
| Permit / License | Reference No. | Issued By | Date Granted | Validity |
| Environmental Management Programme | FS 30/5/1/2/3/2/1(84)EM | DMRE | April 16, 2010 | LOM |
| Environmental Management Updated | FS 30/5/1/2/2/84MR | DWAFEC | Pending Approval Submitted in 2020 | LOM |
| Water Permit 936B. Harmony. Free State Geduld Mines. Discharge of untreated effluents | B33/2/340/31 | DWAFEC | April 2, 1981 | LOM |
| Water Permit 870B. Harmony. Discharge of untreated effluents. | B33/2/340/25 | DWAFEC | May 27, 1991 | LOM |
| Water Permit 1214N. Free State Consolidated Gold Mine. Tshepong, Freddie’s and Phakisa shafts. | B33/2/340/12 | DWAFEC | Not indicated. | LOM |
| | | | |
| | | | |
| | | | |
| | | | |
| | | | |
| | | | |
Notes: DWAFEC - Department of Water Affairs, Forestry and Environmental Conservation, DWA - Department of Water Affairs.
17.4Local Stakeholder Plans and Agreements
Harmony strives to create sustainable shared value within the communities it operates. Local stakeholder plans and agreements are based on the results from socio-economic information, government development strategies and EIAs undertaken. The socio-economic development program commits to:
•contribute to areas that will have the most meaningful socioeconomic impact on communities, namely infrastructure, education and skills development, job creation and entrepreneurial development;
•enhance broad-based local and community economic empowerment and enterprise development initiatives;
•facilitate socio-economic development in local communities by means of social and labour plan(s) (“SLP”) and corporate social responsibility programs;
•support arts, culture, and sports and recreation; and
•build relationships based on trust within host communities.
In South Africa, mining companies are required to have a SLP, which forms an important component of Harmony's community investment plan. It sets out the Company’s obligation to develop and implement comprehensive human resource development programs, community development plans, housing and living condition plans and employment equity plans. The aim of the SLP is to ensure the uplift of the social and economic circumstances of local communities surrounding the mine. The SLP is a prerequisite to securing and maintaining a mining right, with progress required to be reported annually.
Harmony has budgeted to spend approximately ZAR15.385m in FY25 to meet its SLP commitments for Tshepong South.
17.5Mine Closure Plans
Harmony makes provision for closure and rehabilitation both for accounting purposes and as required under the MPRDA. The statutory obligation for all environmental rehabilitation at Tshepong South is administered by the DMRE and requires the preparation of a closure plan, the development of a cost estimate, and financial assurance. The Company makes an annual submission to the DMRE setting out the cost of closure in accordance with the MPRDA and the regulations issued thereunder.
Harmony appointed Digby Wells and Associates (South Africa) (Pty) Ltd, independent environmental consultants, to review and update the Closure Cost Assessment for unscheduled closure associated with Tshepong (South and North) and Matjhabeng Mining Operations. The Matjhabeng Mining Operations is a Harmony operation, located north of the town of Welkom in the Free State Province. The mine closure assessment was done in terms of regulation 53 and 54 of the MPRDA and in accordance with the requirements of NEMA. The closure cost as at June 30, 2024, was calculated to be approximately ZAR508.9m.
Harmony is required to make funding available in an amount equal to the cost of closure as determined under the MPRDA in the form of a trust fund and/or bank guarantees.
Effective Date: June 30, 2024
88
Technical Report Summary for
Tshepong South, Free State Province, South Africa
Table 17-2: Mine closure liability
| | | | | |
| Area | Total Closure Cost (ZAR) |
| Western Holdings 5 Shaft | R9,689,029 |
| Eland Shaft and Freddies 6 | R18,567,239 |
| Nyala Shaft | R80,273,185 |
| Tailings Dams - North | R311,950,999 |
| Tshepong South (Phakisa) | R19,926,035 |
| North Shaft/Tshepong | R42,098,186 |
| Sable Shaft | R5,711,048 |
| Kudu Shaft | R8,277,414 |
| Sewage Treatment Plant | R5,340,558 |
| Floatation Plant | R7,123,613 |
| Grand Total | R508,957,306 |
Table 17-3: Rehabilitation assurance
| | | | | | | | | | | |
| Area | Trust Fund (ZAR) | Bank Guarantee (ZAR) | Total (ZAR) |
| Tshepong and Matjhabeng Operation | 2 913 320 908 | 0 | 2 913 320 908 |
| Tshepong South (Phakisa) | Included in above | | |
| Total | 2 913 320 908 | 0 | 2 913 320 908 |
17.6Status of Issues Related to Environmental Compliance, Permitting, and Local Individuals or Groups
The required environmental authorizations are in place and only require renewal and amendments to be made to reflect the current infrastructure at Tshepong South (WULA permit application submitted, awaiting resolution). Based on current industry norms, a realistic timeframe to obtain relevant authorizations is estimated between 12 and 18 months. With the delays emanating from the Department side, and whilst still in anticipation of the approval, continuous monitoring systems are in place and results submitted on six months bases to the Department.These pending environmental permits and licenses do not pose a material risk to the continuation of the operation.. Harmony has been working very closely with the department these last few months to finalize the WULA submitted in 2020.
17.7Local Procurement and Hiring
Harmony is committed to investing in the future of local communities beyond the mine closure and not to only empower them, but also to mitigate the impacts its activities to ensure a positive legacy. The 2014 Mining Charter serves to guide the south African mining industry in socio-economic transformation. Local procurement (goods and services) and human resource management are key measures set under the Mining Charter and are reported on annually. Refer to the Company’s corporate website on updated information pertaining to its compliance to the Mining Charter.
Portable skills are developed internally as well as through expanded learning programs, learnerships and other programs opened only to operating communities. Local procurement is being supported where there is a skills shortage. Some of the portable skills training offered to its employees include but not limited to basic plumbing, electrical appliance repair, welding, catering and baking, sewing and clothing manufacturing.
Effective Date: June 30, 2024
89
Technical Report Summary for
Tshepong South, Free State Province, South Africa
17.8Commentary on Environmental Studies, Permitting and Plans, Negotiations, or Agreements with Local Individuals or Groups
Periodic inspections are conducted by the DMRE to verify compliance with applicable environmental laws, regulations, permits and standards. In addition, Tshepong South has implemented an EMS in line with the ISO 14001 standard. The EMS is audited on an annual basis by a third party and includes the needs and expectations of interested parties.
As part of Harmony, Tshepong South conducts its operation based on policies and systems that are aligned to its corporate sustainable development framework. Although Harmony is not a signatory to the International Council on Mining and Metals or the UN Global Compact, these form the guiding principles of the framework. Harmony discloses its sustainable development voluntarily in accordance with the guidelines issued by the Global Reporting Initiative (“GRI”). Further to this, Harmony discloses environmental information on the Carbon Disclosure Project (“CDP”) for both climate change and water. The CDP runs the global environmental disclosure system that supports companies to measure and manage their risks and opportunities on climate change, water security and deforestation.
Harmony has a good understanding of the environmental and social aspects of the operations through baseline and specialist studies previously conducted. Risk management and mitigation measures were adequately addressed in the environmental management plans and will be effective to mitigate risks and impacts to acceptable levels should the measures be implemented according to the specialists’ recommendations.
The required environmental authorizations are in place and only require amendments to be made to reflect the current infrastructure at Tshepong South (WUL permit application submitted in November 2023, awaiting resolution). Based on current industry norms, a realistic timeframe to obtain relevant authorizations is estimated between 12 and 18 months.
Effective Date: June 30, 2024
90
Technical Report Summary for
Tshepong South, Free State Province, South Africa
18Capital and Operating Costs
Section 229.601(b)(96)(iii)(B)(18) (i-ii)
Economic parameters for the Harmony Group, including capital and operating costs, is determined, and signed off by the CODM, before distribution to the business units, including Tshepong South. The capital and operating costs are reported in ZAR terms and on a real basis. Rounding of figures may result in minor computational discrepancies.
18.1Capital Costs
The estimated capital costs for Tshepong South are reported according to costs associated with major equipment outside the main operating sections which is termed AE, infrastructure development, as well as operating capital, as presented in Table 18-1.
An average contingency of 10% is applied where the capital cost estimates have a level of uncertainty, for example, where a capital project is an isolated occurrence. Where the capital cost estimates have a reasonable basis, there is no contingency applied. The estimated capital costs are carried forward and modelled in the Tshepong South cash flow. The level of accuracy is that of a feasibility study.
18.2Operating Costs
A summary of the direct and indirect operating costs for Tshepong South is presented in Table 18-2. Operating costs are based on historic performance while applying any changes expected within the new financial year (such as electricity requirements, increased/decreased labour) and are used as an input into the Tshepong South cash flow model.
18.3Comment on Capital and Operating Costs
The capital and operating cost estimates for Tshepong South is based on actual historical data, as well as budget forecasts. Therefore, the forecasted costs are reliable, and at minimum meet the confidence levels of a Feasibility Study. This approach of estimating capital and operating costs is consistent with industry practice. A record of the forecast and budget costs is maintained by the operation, allowing for an assessment of the alignment of the forecast and actual costs.
Table 18-1: Summary of capital cost estimate for Tshepong South
| | | | | |
| Capital Cost Element (ZAR'000s) | Total Reserve plan
(FY2025-FY2028) |
| OCD | 1 154 928 | |
| AE | 195 940 | |
| Shaft Projects | 150 720 | |
| Major Projects | 67 101 | |
| MCC | 89 523 | |
| Total | 1 658 212 | |
Table 18-2: Summary of operating cost estimate for Tshepong South
| | | | | |
| Operating Cost Element (ZAR'000) | Total Reserve Plan
(FY2025-FY2028) |
| Mining | 6 393 267 | |
| Services | 1 667 146 | |
| Medical Hub / Station | 400 487 | |
| Engineering | 7 111 649 | |
| Workshops | — | |
| Plant | — | |
| Total Direct Costs | 15 572 549 | |
| Mine Overheads | 937 052 | |
| Total Cost | 16 509 601 | |
Effective Date: June 30, 2024
91
Technical Report Summary for
Tshepong South, Free State Province, South Africa
19Economic Analysis
Section 229.601(b)(96)(iii)(B)(19) (i-iv)
19.1Key Economic Assumptions and Parameters
The QP and CODM forms, reviews, signs-off and distributes economic assumptions to its various business units. On an annual basis, during the period October to November, long-term commodity prices and exchange rates forecasts’, are received from various financial institutions. In addition, a specialist in Economics from a reputable economics company based in South Africa, provides expert views on the global markets, forward looking commodity prices, exchange rates, consumer price index, production price index, electricity cost and consumable increases. All factors are analyzed, cognizance is taken of the requirements of the NYSE and JSE markets, and a proposal is presented to the CODM for recommendation and approval. These assumptions are then applied at Tshepong South, along with specific operational considerations.
19.1.1Gold Price
The forecast gold price (USD1,772/oz) is the price that is used by Harmony for the Tshepong South annual planning cycle and forms the basis for the Tshepong South cashflow. The reader is referred to Table 16-1 for the consensus forecast gold price. The conversions used in the calculation of the various gold prices is presented in Table 19-1.
Table 19-1: Conversions used in gold price calculations
| | | | | | | | | | | | | | |
| Economic Factors | Gold Price (USD/oz) | Conversion Factor (oz/kg) | Exchange Rate (ZAR:USD) | Gold Price (ZAR/kg) |
| 2024 Mineral Resource | 1 878 | 32.15 | 18.26 | 1 100 000 |
| 2024 Mineral Reserve | 1 772 | 32.15 | 18.26 | 1 040 000 |
19.1.2Exchange Rate
The South African Rand (ZAR) depreciated to average at R18.89/US$ during the first quarter of 2024, 0.7% weaker compared to an average of R18.76/US$ recorded during the last quarter of 2023. Moving onto May 2024, the ZAR appreciated by 2.4% on a month-on-month basis, and 3.4% compared to May 2023 to average at R18.42/US$, following a 3.8% annual depreciation recorded in April 2024.
The South African Rand has been volatile in recent weeks as uncertainty loomed around the elections, however, the local currency has been supported by the outcome of a Government of National Unity after the ruling African National Congress (ANC) lost the majority vote for the first time since the start of democracy. The ZAR appreciated to trade at R18.11/US$ on June 18, 2024 and is expected to strengthen further over the medium term.
Furthermore, the U.S. Federal Reserve held interest rates unchanged on June 12, 2024 and Jerome Powell, Chairman of the Fed, stated that interest rates will not be reduced before a greater decline in inflation or an increase in unemployment is visible. Data later indicated that retail sales barely rose in May 2024 and speculation of rate cuts amongst investors increased, pressuring the US Dollar and lending strength to the ZAR exchange rate.
Effective Date: June 30, 2024
92
Technical Report Summary for
Tshepong South, Free State Province, South Africa
Figure 19-1: Annual exchange rates and ETSA forecast
Table 19-2: Consensus view of forecast exchange rate (ZAR:USD)
| | | | | | | | | | | |
| Institutions | 2024 | 2025 | 2026 |
| Nedbank | 18.74 | | 18.44 | | 18.57 | |
| Investec | 18.54 | | 18.23 | | 18.48 | |
| FNB | 18.70 | | 17.70 | | 18.30 | |
| PWC | 18.80 | | 19.30 | | — | |
| IDC | 18.76 | | 18.31 | | 18.10 | |
| AVERAGE | 18.71 | | 18.40 | | 18.36 | |
The exchange rate of 18.26 ZAR:USD is the exchange rate that is used by Harmony for the annual planning cycle and forms the basis for the ZAR:USD exchange rate in the company LOM and Mineral Reserve cashflow.
Table 19-2A: ZAR:USD exchange rate performance (June 2021 – June 2024)
| | | | | |
| Period | Average Exchange Rate (ZAR:USD) |
| July 2021 to June 2022 | 15.21 |
| July 2022 to June 2023 | 17.77 |
| July 2023 to June 2024 | 18.70 |
| 3-Year Ave. (not weighted) | 17.23 |
19.1.3Royalties
Royalty is an expense paid to the government of South Africa and is accounted for in the Tshepong South cash flow models. In terms of the mining ring-fencing application, each ring-fenced mine is treated separately, and deductions can normally only be utilized against mining income generated from the relevant ring-fenced mine.
19.1.4Taxes
Mining tax on gold mining taxable income in South Africa is determined according to a formula, based on the taxable income from mining operations. Of that, 5% of total revenue is exempt from taxation while the remainder is taxable at a higher rate (33%) than non-mining income (27%). Accounting depreciation is eliminated when calculating the South African mining tax income. Excess capital expenditure is carried forward as unredeemed capital to be claimed against future mining taxable income.
Effective Date: June 30, 2024
93
Technical Report Summary for
Tshepong South, Free State Province, South Africa
19.1.5Closure Cost and Salvage Value
The closure cost estimates are those provided in Section 17.5. No account has been taken of any potential salvage values.
19.1.6Summary
The key assumptions used in the cash flow are summarized for Tshepong South in Table 19-4.
Table 19-4: Key economic assumptions and parameters for Tshepong South cash flow
| | | | | | | | |
| Parameter | Unit | Value |
| Production Rate (milled) | ktpm | 35 894 |
| Gold Recovery | % | 0.9528 |
| Royalty | % | 0.0005 |
| Tax Rate | % | Formula |
| Gold Price | ZAR/kg | 1 040 000 |
| Exchange Rate | USD:ZAR | 18.26 |
| Discount Rate | % | 0.09 |
19.2Economic Analysis
Harmony's respective business units and its associated operating sites consider the economic assumptions discussed in Section 19.1 during their respective planning and analysis processes. The past year’s average gold price is used for testing purposes. A gold price of ZAR1 040 000/kg is used to forecast the revenue of the Tshepong South Mineral Reserve cash flow (Table 19-4A).
The discounted cash flow model is used to calculate the Net Present Value (“NPV”) of the Mineral Reserve. The NPV for Tshepong South Mineral Reserves is approximately ZAR1 070 million cash positive, at a discount rate of 9% (Table 19-4).
The NPV is calculated on a cash flow that accounts for factors such as:
• mining and ore processing working costs;
• royalty payments;
• capital costs, including costs allocated to ongoing development;
• any significant project work considered as major projects; and
• costs deemed as abnormal expenditure.
Effective Date: June 30, 2024
94
Technical Report Summary for
Tshepong South, Free State Province, South Africa
Table 19-4: Tshepong South cash flow (Mineral Reserves)
| | | | | | | | | | | | | | | | | | | | | | | | | | | | |
| Item | Units | Total Reserve Plan | 2025 | 2026 | 2027 | 2028 | 2029 | 20230 | | |
| Milled Tonnes | t'000 | 2 584 348 | 376 291 | 466 494 | 419 218 | 394 564 | 400 172 | 527 610 | | |
| Yield | g/t | 7.56 | 7.59 | 7.45 | 7.94 | 7.85 | 7.58 | 7.11 | | |
| Gold Recovered | kg | 19 536 | 2 855 | 3 474 | 3 327 | 3 097 | 3 034 | 3 750 | | |
| Gold Price | R/kg | 1 040 000 | 1 040 000 | 1 040 000 | 1 040 000 | 1 040 000 | 1 040 000 | 1 040 000 | | |
| Revenue | ZAR'000 | 20 317 357 | 2 969 592 | 3 612 947 | 3 459 621 | 3 220 870 | 3 154 844 | 3 899 483 | | |
| Total Operating cost | ZAR'000 | 16 509 601 | 2 623 741 | 2 827 899 | 2 718 472 | 2 684 741 | 2 641 799 | 3 012 948 | | |
| Total Capital including MCC | ZAR'000 | 1 658 212 | 431 654 | 440 112 | 337 804 | 283 581 | 150 233 | 14 828 | | |
| Royalty | ZAR'000 | 228 533 | 14 848 | 35 335 | 35 187 | 31 472 | 39 176 | 72 515 | | |
| Total Cost | ZAR'000 | 18 396 346 | 3 070 243 | 3 303 347 | 3 091 463 | 2 999 794 | 2 831 209 | 3 100 290 | | |
| Cash flow before tax | ZAR'000 | 1 921 012 | (100 651) | 309 600 | 368 158 | 221 076 | 323 634 | 799 193 | | |
| Taxation Payable | ZAR'000 | (347 696) | — | (9 340) | (64 408) | (19 811) | (54 745) | (199 392) | | |
| Net cash flow after tax | ZAR'000 | 1 573 316 | (100 651) | 300 261 | 303 750 | 201 265 | 268 890 | 599 801 | | |
| | | | | | | | | | |
| Discounted NPV (ZAR’000) | Rate | NPV after tax | | | | | | | | |
| NPV - (Harmony Preferred) | @9% | 1 069 917 | | | | | | | | |
| NPV - (medium discount rate) | @12% | 950 063 | | | | | | | | |
| NPV - (high discount rate) | @15% | 847 309 | | | | | | | | |
Effective Date: June 30, 2024
95
Technical Report Summary for
Tshepong South, Free State Province, South Africa
19.3Sensitivity Analysis
The economic assumptions, cash flow breakdown and economic analysis contribute to the basis for the sensitivity analysis. The sensitivities are calculated and analyzed, as shown in the accompanying Table 19-5, Table 19-6 and Table 19.7.
Harmony has reviewed its exposure in terms of South Africa’s political instability, the COVID-19 pandemic, the currency exchange rate, and the gold price, on its financial assets and financial liabilities, and has determined the sensitivities for a ±10% variance. Management considers this range to be a reasonable change given the volatility in the market.
The sensitivity analysis (Table 19-5, Table 19-6 and Table 19.7) is based on a change in a single assumption while holding all other assumptions constant. In practice, this is unlikely to occur, as risks and/or opportunities will have an impact on the cash flows, and changes in some of these assumptions may be correlated. The insights that can be provided by this sensitivity analysis is that Tshepong South is almost equally sensitive to changes in the gold price (ZAR/kg), as to changes in total operating costs (ZAR).
The impact of one or a combination of risks and opportunities occurring at the same time cannot be specifically quantified so an analysis considering multi-parameters is not considered.
Table 19-5: Gold price sensitivity analysis
| | | | | | | | | | | | | | | | | | | | |
| Sensitivity (%) | Production (kg) | Gold Price (ZAR/kg) | Revenue (ZAR’000) | Total cost including tax (ZAR'000) | Net cash flow after tax (ZAR'000) | After tax NPV (ZAR’000) |
| 10% | 19 536 | 1 144 000 | 22 349 093 | 19 331 992 | 3 017 101 | 2 153 597 |
| 5% | 19 536 | 1 092 000 | 21 333 225 | 19 049 183 | 2 284 043 | 1 602 771 |
| Reserve plan | 19 536 | 1 040 000 | 20 317 357 | 18 744 042 | 1 573 316 | 1 069 917 |
| -5% | 19 536 | 988 000 | 19 301 490 | 18 539 906 | 761 584 | 455 429 |
| -10% | 19 536 | 936 000 | 18 285 622 | 18 396 346 | (110 724) | (213 393) |
Table 19-6: Total operating cost sensitivity analysis
| | | | | | | | | | | | | | | | | | | | |
| Sensitivity (%) | Production (kg) | Gold Price (ZAR/kg) | Revenue (ZAR’000) | Total cost including tax (ZAR'000) | Net cash flow after tax (ZAR'000) | After tax NPV (ZAR’000) |
| 10% | 19 536 | 1 040 000 | 20 317 357 | 20 235 980 | 81 377 | (83 791) |
| 5% | 19 536 | 1 040 000 | 20 317 357 | 19 472 430 | 844 927 | 512 506 |
| Reserve plan | 19 536 | 1 040 000 | 20 317 357 | 18 744 042 | 1 573 316 | 1 069 917 |
| -5% | 19 536 | 1 040 000 | 20 317 357 | 18 110 320 | 2 207 038 | 1 550 673 |
| -10% | 19 536 | 1 040 000 | 20 317 357 | 17 462 488 | 2 854 869 | 2 041 858 |
Table 19-7: Total production sensitivity analysis
| | | | | | | | | | | | | | | | | | | | |
| Sensitivity (%) | Production (kg) | Gold Price (ZAR/kg) | Revenue (ZAR’000) | Total cost including tax (ZAR'000) | Net cash flow after tax (ZAR'000) | After tax NPV (ZAR’000) |
| 10% | 21 490 | 1 040 000 | 22 349 093 | 19 331 992 | 3 017 101 | 2 153 597 |
| 5% | 20 513 | 1 040 000 | 21 333 225 | 19 049 183 | 2 284 043 | 1 602 771 |
| Reserve plan | 19 536 | 1 040 000 | 20 317 357 | 18 744 042 | 1 573 316 | 1 069 917 |
| -5% | 18 559 | 1 040 000 | 19 301 490 | 18 539 906 | 761 584 | 455 429 |
| -10% | 17 582 | 1 040 000 | 18 285 622 | 18 396 346 | (110 724) | (213 393) |
Effective Date: June 30, 2024
96
Technical Report Summary for
Tshepong South, Free State Province, South Africa
20Adjacent properties
Section 229.601(b)(96)(iii)(B)(20) (i-iv)
Tshepong South is 100% owned by Harmony. The Tshepong South Mine lies to the south-east of the Tshepong North Mine. The Eland Mine is located south-east of Tshepong South, while the Welkom 4 Shaft is further south from the Tshepong South Mine.
Effective Date: June 30, 2024
97
Technical Report Summary for
Tshepong South, Free State Province, South Africa
21Other Relevant Data and Information
Section 229.601(b)(96)(iii)(B)(21)
Other relevant data and information pertaining to Tshepong South is its separate reporting structure as of Financial Year 2024. Tshepong South previously reported under the Tshepong operations.
Other relevant information includes the public disclosure reports on Tshepong South operational, financial and environmental performance are available on the Company’s corporate website. The following reports are relevant to this TRS:
•Integrated report 2024;
•ESG report 2024;
•Financial report 2024;
•Operational report 2024; and
•Climate action and impact report 2024.
Effective Date: June 30, 2024
98
Technical Report Summary for
Tshepong South, Free State Province, South Africa
22Interpretation and Conclusions
Section 229.601(b)(96)(iii)(B)(22)
Tshepong South and Tshepong North mine were merged into a single operation in 2017 and were collectively called the Tshepong operations. Tshepong operations are well-established with Tshepong North having been in operation since 1986, and Tshepong South since 1994. Harmony acquired the operations in 2001.In Financial Year 2024 “FY24” the two mines were split and reporting separately as Tshepong South and Tshepong North.
Harmony has no known risks to conduct mining activities over the permitted mining rights’ areas, incorporated as Tshepong operations. In addition, no known risks are posed over surface access and activities, regarding mining related activities.
Tshepong South’s regional geological setting, mineralization and deposit is well understood. The geology is supported by historical geophysical surveys, surface diamond core drilling and underground channel (chip) sampling and mapping. Economic mineralization occurs in the Basal Reef and B-Reefs . The former is mined at 100 % currently , while the latter is still under development which will complete in FY24.
The sampling approach and management, density assumptions, laboratory procedures, and assaying and analysis are in keeping with industry standards and practices and is appropriate for the mineralization at the Central Rand Group. The holistic understanding of the regional geology, lithological and structural controls of the mineralization at Tshepong South is sufficient to support the estimation of Mineral Resources.
Gold bearing ore mined at Tshepong South is processed at the Harmony One Plant facility which has been in operation since 1986. As such, the processing method is considered well established for the mineralization at Tshepong South. The plant makes use of historical trends and data as a basis for their recoveries of Basal and B-Reefs.
The data pertaining to the mineralization, regional and geological setting, exploration findings, sample collection, preparation, and testing, inclusive of data verification and metallurgical test work gives rise to the Mineral Resource estimate.
The combined Measured and Indicated Mineral Resource, exclusive of Mineral Reserves, for the Tshepong South Mine, as at June 30, 2024 is 14.843Mt at a grade of 11.80g/t, containing 5.633Moz of gold, and the Inferred Mineral Resource contains 22.799Mt at a gold grade of 11.03g/t, containing 8.084Moz of gold.
Mineral Reserves are derived from the Mineral Resources, a detailed business plan and operational mine planning processes. Mine planning utilises and takes into consideration actual historical technical parameters. In addition, conversion of the Mineral Resources to Mineral Reserves considers Modifying Factors, dilution, ore losses, minimum mining widths, planned mine call and plant recovery factors.
The Mineral Reserves for the Tshepong South Mine, as at June 30, 2024 is 2.584Mt of milled ore at a grade of 7.94g/t, containing 0.660Moz and comprise of 85% Proved Reserves and 15% Probable Reserves.
Tshepong South is currently mining profitably, and the NPV shows a positive result. Any by-products that are recovered as part of the refining process, make up an immaterial component of the total metal inventory, and is thus not reported as part of the Mineral Reserve estimates. There are no obvious material risks that could have significant effect on the Mineral Reserves.
The Mineral Reserves are extracted via the Scattered method, with minor undercut and open stoping methods. Mining methods take into consideration the mining and rock engineering design guidelines. The integrated selection of the mining method increases flexibility, safety and minimizes seismic events.
Extracted minerals from Tshepong South are recovered at the Harmony One Plant. The metallurgical process is well-tested technology, based on sound historic operating parameters.
The mine’s regional and local infrastructure is capable of fully supporting the mining and surface related activities. Tshepong South is accessed via national and provincial road networks, has key power transmission and distribution networks provided by the National electricity regulator, water supply networks and communication infrastructure. Overall, Tshepong South is well-established with sufficient logistics and infrastructure support for the existing and planned mining operations.
Effective Date: June 30, 2024
99
Technical Report Summary for
Tshepong South, Free State Province, South Africa
Harmony and Tshepong South is exposed to market risks such as exchange rate and gold price fluctuations which are partially offset by the Harmony Group hedging policy. The hedging program considers factors effecting the global gold market and these, along with macro-economic conditions, are used to determine planning and forecasting inputs at group level for all of Harmony’s operating business units. Other non-gold related risks are addressed to some extent by Tshepong South entering into vendor agreements for the provisions of supplies and services which are done on a competitive basis with customary price adjustment, renewal and termination clauses.
To successfully operate a mining operation in South Africa the state requires compliance with applicable environmental laws, regulations, permits and standards. Tshepong South adheres to said compliance and regulatory standards and have, in addition, implemented an Environmental Management System in line with the ISO 14001.
As part of Harmony, Tshepong South conducts its operations based on policies and systems that are aligned to its corporate sustainable development framework. This is guided by the principles of the framework from the International Council on Mining and Metals or the UN Global Compact. Harmony discloses its sustainable development voluntarily in accordance with the guidelines issued by the Global Reporting Initiative. Further to this, Harmony discloses environmental information on the Carbon Disclosure Project for both climate change and water.
Harmony has a good understanding of the environmental and social aspects through baseline and specialist studies previously conducted. Risk management and mitigation measures were adequately addressed in the environmental management plans. Most of the required environmental authorizations are in place and only require amendments to be made to reflect the current infrastructure at Tshepong South (WULA permit application submitted, awaiting resolution). Based on current industry norms, a realistic timeframe to obtain relevant authorizations is estimated between 12 and 18 months.
One of the ways Harmony aims to grow and develop the people and assets and provide sustainable value to all stakeholders is through economic regeneration.
The economics of Tshepong South is based on the discounted cash flow model, with a metal price of ZAR1,040,000/kg. The NPV for the metal price, is ZAR1 070 million, at a discount rate of 9%. The NPV is calculated on cash flow that takes factors such as: capital and operating costs; and royalties. The capital and operating cost estimates for Tshepong South is based on historical data, as well as budget forecasts. This estimation technique allows for the forecast and actual costs to be aligned.
Royalties and taxes are paid to the South African government and accounted for in the Tshepong South cash flow and NPV analysis. There are also specific tax relief benefits that apply to gold mining companies, where 5% of total revenue is exempt from taxation, amongst other benefits. In addition, in response to challenges faced by companies during the COVID-19 pandemic, the government have implemented various stimulus packages to provide some tax relief to companies.
The economics of Tshepong South is tested for its sensitivity to commodity price (ZAR/kg), operating costs(ZAR) and gold production (kg). The insights provided by the sensitivity analysis is that Tshepong South is most sensitive to changes in the gold price (ZAR/kg), closely followed by changes in total operating costs (ZAR).
This TRS was prepared by a team of experienced professionals. The TRS provides a summary of the material scientific and technical information concerning the mineral exploration, Mineral Resources, Mineral Reserves, and associated production activities of the mineral asset, including references to the valuation for Tshepong South. The QP was responsible for specific sections of this TRS which he had personally supervised and reviewed. This TRS contains the expression of the QP’s opinions, based on the information available at the time of preparation.
Effective Date: June 30, 2024
100
Technical Report Summary for
Tshepong South, Free State Province, South Africa
23Recommendations
Section 229.601(b)(96)(iii)(B)(23)
The gold output can be optimized through improvement of quality of mining and this will result in achieving planned shaft call factor. This impact will be realized through our currently implemented Business Initiative program that will look at driving quality of mining through measures such as in-stope water controls and better fragmentation during blasting to contain the gold.
Effective Date: June 30, 2024
101
Technical Report Summary for
Tshepong South, Free State Province, South Africa
24References
Section 229.601(b)(96)(iii)(B)(24)
Dankert, B.T., and Hein, K.A.A., 2010. Evaluating the structural character and tectonic history of the Witwatersrand Basin. Precambrian Research 177, 1–22.
https://www.gold.org/goldhub/data/gold-prices. Accessed July 22, 2022.
Robb, L.J., and Meyer, F., 1995. The Witwatersrand Basin, South Africa: Geological framework and mineralisation processes. Ore Geology Reviews, 10(2), 67-94.
Robb, L.J., Robb, V.M., 1998. Gold in the Witwatersrand Basin. In: Wilson, M.G.C., Anhaeusser, C.R. (Eds.), The Mineral Resources of South Africa. Handbook. Council for Geoscience, 294–349.
South African Revenue Services. (July 29, 2021). South African Revenue Services. Retrieved from Tax Relief Measures: https://www.sars.gov.za/media/tax-relief-measures/
Therriault, A.M., Grieve, R.A.F., Reimold, W.U., 1997. Original size of the Vredefort Structure: Implications for the geological evolution of the Witwatersrand Basin. Meteoritics and Planetary Science 32, 71–77.
Tucker, R.F., Viljoen, R.P., and Viljoen, M.J., 2016. A Review of the Witwatersrand Basin The World’s Greatest Goldfield, accessed from https:// www.researchgate.net /publication /305924249 _A_Review_of_the_Witwatersrand_Basin_-_The_World's_Greatest_Goldfield.
World Gold Council. (July 12, 2023). World Gold Council, Gold Hub, Gold mine production: Gold Production by Country | Gold Production | Goldhub
Effective Date: June 30, 2024
102
Technical Report Summary for
Tshepong South, Free State Province, South Africa
25Reliance on Information Provided by the Registrant
Section 229.601(b)(96)(iii)(B)(25)
Further to Section 24, in the preparation of this TRS, the QP and authors relied upon information provided by the Registrant and other internal specialists with regards to mining rights, surface rights, contractual agreements, historical operating expenditures, community relations and other matters. The work conducted by these specialists was completed under the supervision and direction of the QP. The specialists who assisted the principal authors and QP’s are listed in Table 25-1.
Table 25-1: Other specialists
| | | | | | | | | | | |
| Name | Specialist | Area of Responsibility | Association / Company |
| B Reinders | Senior Valuator | Valuation and Estimation | Tshepong South |
| R du Toit | Section Valuator | Valuation and Estimation | Tshepong Nth / Sth |
| R du Bruyn | Section Planner | Mine planning and design | Tshepong South |
| B Erasmus | Financial Manager | Finance and costing | Tshepong South |
| J Powell | Geostatistician | Geostatistics Central | Central |
| J Basson | Senior Engineer | Engineering | Tshepong South |
| J van der Merwe | Rock Engineering Manager | Rock engineering | Tshepong Nth / Sth |
| A Oosthuizen | Senior Hygienist | Occupational, Environmental, Ventilation | Tshepong Nth / Sth |
Effective Date: June 30, 2024
103