Exhibit 99.2
First State Bancorporation
The Holding Company for First State Bank N.M.
Acquisition of: Access Anytime Bancorp, Inc. and
New Mexico Financial Corporation (holding company for Ranchers Banks)
Investor Presentation September 6, 2005
Michael R. Stanford
President and Chief Executive Officer
H. Patrick Dee
Chief Operating Officer
Forward Looking Information
This presentation contains forward looking statements with respect to the financial condition, results of operations and business of First State Bancorporation (“First State,” “FSNM” or “the Company”) and Access Anytime Bancorp, Inc. (“Access Anytime” or “AABC”) and New Mexico Financial Corporation, the holding company for Ranchers Banks (“Ranchers”) and assuming the consummation of either transaction, a combined FSNM and AABC, or combined FSNM and Ranchers including statements relating to: (i) revenue enhancements and accretion to reported GAAP and cash earnings that will be realized from the merger; and (ii) the restructuring charges expected to be incurred in connection with the merger. These forward looking statements involve certain risks and uncertainties. Factors that may cause actual results to differ materially from those contemplated by such forward looking statements include, among other things, the following possibilities: (i) revenues following the merger are lower than expected; (ii) competitive pressure among depository institutions increase significantly; (iii) the integration of the business of FSNM with either or both AABC and Ranchers costs more, takes longer or is less successful than expected; (iv) the cost of additional capital is more than expected; (v) changes in the interest rate environment reduces interest margins; (vi) general economic conditions, either nationally or in the states in which the combined company will be doing business, are less favorable than expected; (vii) legislation or regulatory requirements or changes adversely affect the business in which the combined company will be engaged; and (viii) changes may occur in the securities market. Neither FSNM nor AABC nor Ranchers assume any obligation to update forward looking statements.
2

Discussion Outline
1. Strategic Rationale
2. Overview of Access Anytime
3. Overview of Ranchers Banks
4. Transaction Overviews
5. Pro Forma Financial Impact
3
Strategic Rationale
Strategic Rationale
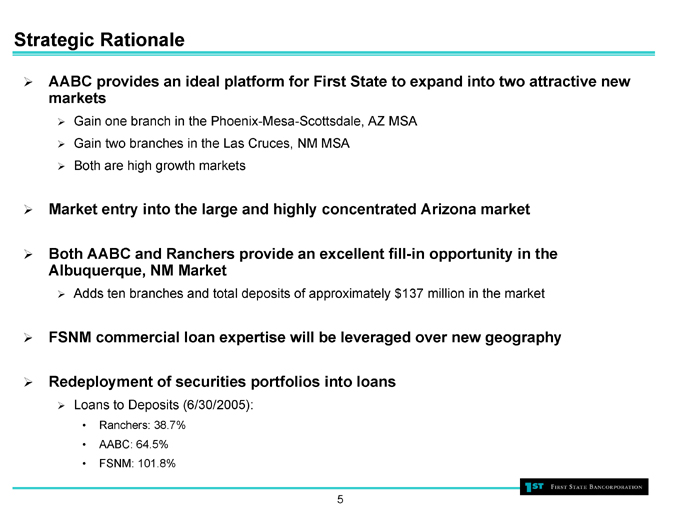
AABC provides an ideal platform for First State to expand into two attractive new markets
Gain one branch in the Phoenix-Mesa-Scottsdale, AZ MSA Gain two branches in the Las Cruces, NM MSA
Both are high growth markets
Market entry into the large and highly concentrated Arizona market
Both AABC and Ranchers provide an excellent fill-in opportunity in the Albuquerque, NM Market
Adds ten branches and total deposits of approximately $137 million in the market
FSNM commercial loan expertise will be leveraged over new geography
Redeployment of securities portfolios into loans
Loans to Deposits (6/30/2005):
Ranchers: 38.7% AABC: 64.5% FSNM: 101.8%
5
Strategic Rationale
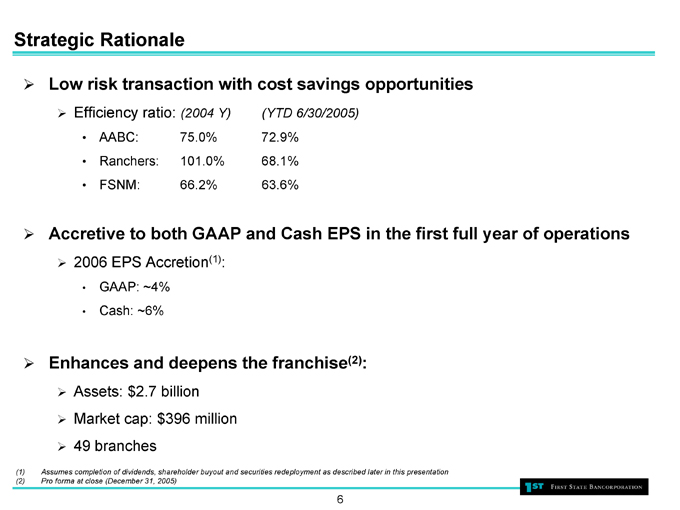
Low risk transaction with cost savings opportunities
Efficiency ratio: (2004 Y) (YTD 6/30/2005)
AABC: 75.0% 72.9%
Ranchers: 101.0% 68.1%
FSNM: 66.2% 63.6%
Accretive to both GAAP and Cash EPS in the first full year of operations
2006 EPS Accretion(1):
GAAP: ~4%
Cash: ~6%
Enhances and deepens the franchise(2):
Assets: $2.7 billion
Market cap: $396 million
49 branches
(1) Assumes completion of dividends, shareholder buyout and securities redeployment as described later in this presentation (2) Pro forma at close (December 31, 2005)
6
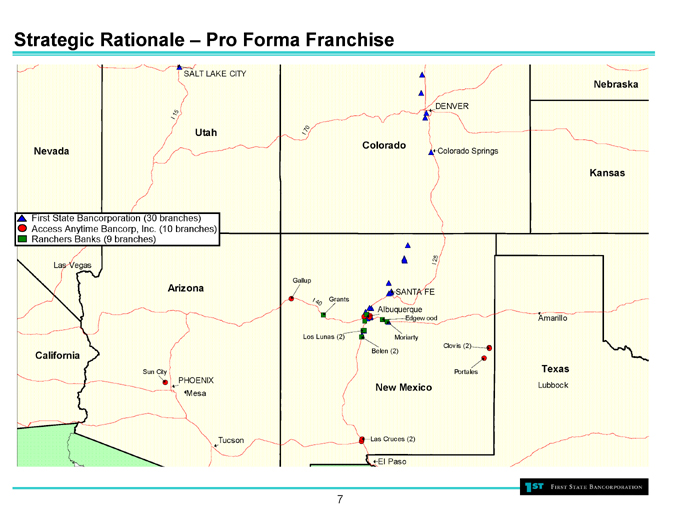
Strategic Rationale – Pro Forma Franchise
First State Bancorporation (30 branches) Access Anytime Bancorp, Inc. (10 branches) Ranchers Banks (9 branches)
Nevada SALT LAKE CITY Utah DENVER Nebraska Colorado Colorado Springs Kansas Las Vegas Arizona California Sun City PHOENIX Mesa Tucson Gallup Grants I40 Los Lunas (2) SANTA FE I15, I70, I25
Albuquerque Edgew ood Moriarty Belen (2) Clovis (2) Portales Amarillo Texas Lubbock New Mexico Las Cruces (2) EI Paso
7
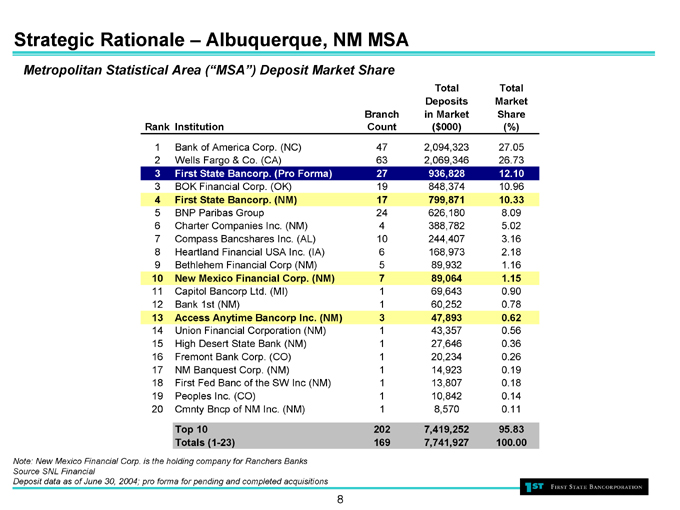
Strategic Rationale – Albuquerque, NM MSA
Metropolitan Statistical Area (“MSA”) Deposit Market Share
Rank Institution Branch Count Total Deposits in Market ($000) Total Market Share (%)
1 Bank of America Corp. (NC) 47 2,094,323 27.05
2 Wells Fargo & Co. (CA) 63 2,069,346 26.73
3 First State Bancorp. (Pro Forma) 27 936,828 12.10
3 BOK Financial Corp. (OK) 19 848,374 10.96
4 First State Bancorp. (NM) 17 799,871 10.33
5 BNP Paribas Group 24 626,180 8.09
6 Charter Companies Inc. (NM) 4 388,782 5.02
7 Compass Bancshares Inc. (AL) 10 244,407 3.16
8 Heartland Financial USA Inc. (IA) 6 168,973 2.18
9 Bethlehem Financial Corp (NM) 5 89,932 1.16
10 New Mexico Financial Corp. (NM) 7 89,064 1.15
11 Capitol Bancorp Ltd. (MI) 1 69,643 0.90
12 Bank 1st (NM) 1 60,252 0.78
13 Access Anytime Bancorp Inc. (NM) 3 47,893 0.62
14 Union Financial Corporation (NM) 1 43,357 0.56
15 High Desert State Bank (NM) 1 27,646 0.36
16 Fremont Bank Corp. (CO) 1 20,234 0.26
17 NM Banquest Corp. (NM) 1 14,923 0.19
18 First Fed Banc of the SW Inc (NM) 1 13,807 0.18
19 Peoples Inc. (CO) 1 10,842 0.14
20 Cmnty Bncp of NM Inc. (NM) 1 8,570 0.11
Top 10 202 7,419,252 95.83
Totals (1-23) 169 7,741,927 100.00
Note: New Mexico Financial Corp. is the holding company for Ranchers Banks Source SNL Financial Deposit data as of June 30, 2004; pro forma for pending and completed acquisitions
8
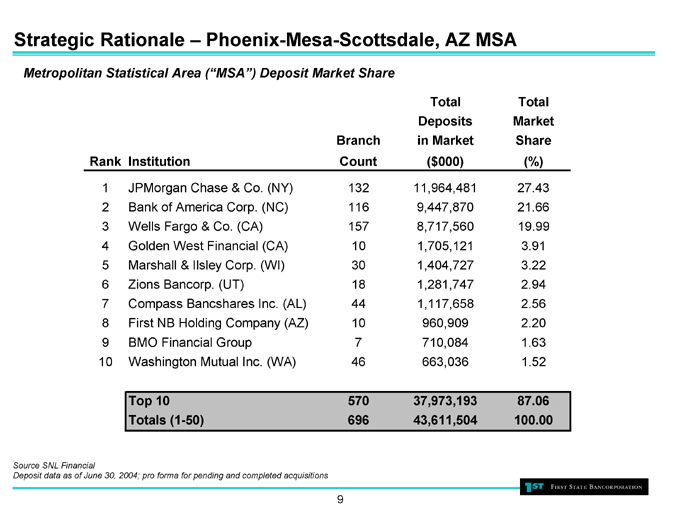
Strategic Rationale – Phoenix-Mesa-Scottsdale, AZ MSA
Metropolitan Statistical Area (“MSA”) Deposit Market Share
Rank Institution Branch Count Total Deposits in Market ($000) Total Market Share (%)
1 JPMorgan Chase & Co. (NY) 132 11,964,481 27.43
2 Bank of America Corp. (NC) 116 9,447,870 21.66
3 Wells Fargo & Co. (CA) 157 8,717,560 19.99
4 Golden West Financial (CA) 10 1,705,121 3.91
5 Marshall & Ilsley Corp. (WI) 30 1,404,727 3.22
6 Zions Bancorp. (UT) 18 1,281,747 2.94
7 Compass Bancshares Inc. (AL) 44 1,117,658 2.56
8 First NB Holding Company (AZ) 10 960,909 2.20
9 BMO Financial Group 7 710,084 1.63
10 Washington Mutual Inc. (WA) 46 663,036 1.52
Top 10 570 37,973,193 87.06
Totals (1-50) 696 43,611,504 100.00
Source SNL Financial
Deposit data as of June 30, 2004; pro forma for pending and completed acquisitions
9

Overview of Access Anytime
Overview of Access Anytime
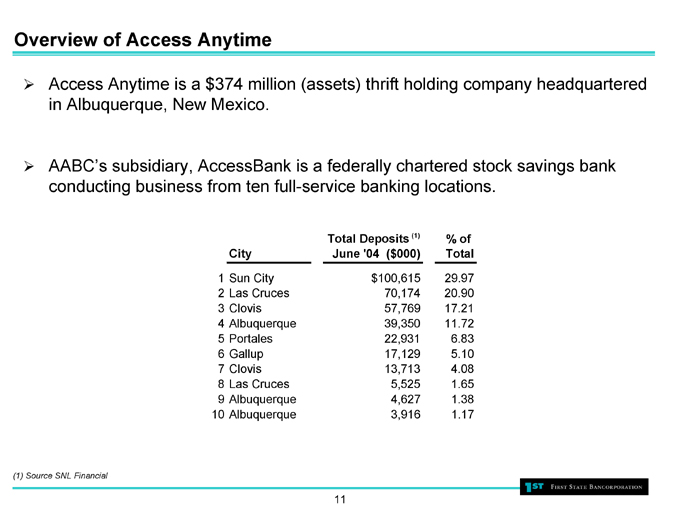
Access Anytime is a $374 million (assets) thrift holding company headquartered in Albuquerque, New Mexico.
AABC’s subsidiary, AccessBank is a federally chartered stock savings bank conducting business from ten full-service banking locations.
City Total Deposits (1) June ‘04 ($000) % of Total
1 Sun City $100,615 29.97
2 Las Cruces 70,174 20.90
3 Clovis 57,769 17.21
4 Albuquerque 39,350 11.72
5 Portales 22,931 6.83
6 Gallup 17,129 5.10
7 Clovis 13,713 4.08
8 Las Cruces 5,525 1.65
9 Albuquerque 4,627 1.38
10 Albuquerque 3,916 1.17
(1) Source SNL Financial
11
Overview of Access Anytime
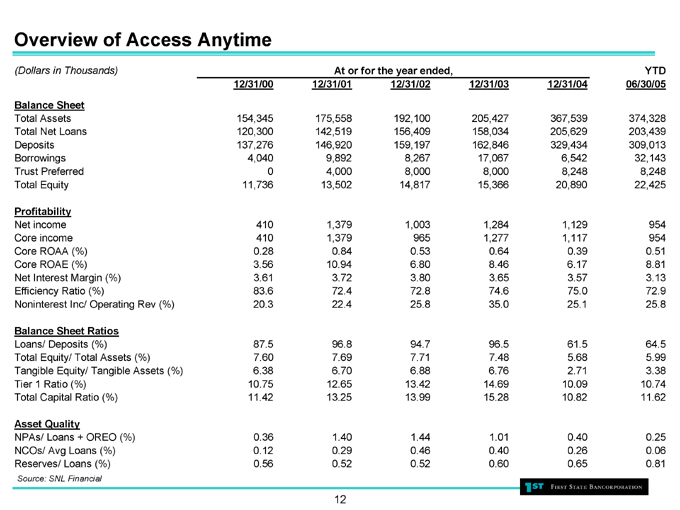
(Dollars in Thousands)
At or for the year ended,
12/31/00 12/31/01 12/31/02 12/31/03 12/31/04 YTD 06/30/05
Balance Sheet
Total Assets 154,345 175,558 192,100 205,427 367,539 374,328
Total Net Loans 120,300 142,519 156,409 158,034 205,629 203,439
Deposits 137,276 146,920 159,197 162,846 329,434 309,013
Borrowings 4,040 9,892 8,267 17,067 6,542 32,143
Trust Preferred 0 4,000 8,000 8,000 8,248 8,248
Total Equity 11,736 13,502 14,817 15,366 20,890 22,425
Profitability
Net income 410 1,379 1,003 1,284 1,129 954
Core income 410 1,379 965 1,277 1,117 954
Core ROAA (%) 0.28 0.84 0.53 0.64 0.39 0.51
Core ROAE (%) 3.56 10.94 6.80 8.46 6.17 8.81
Net Interest Margin (%) 3.61 3.72 3.80 3.65 3.57 3.13
Efficiency Ratio (%) 83.6 72.4 72.8 74.6 75.0 72.9
Noninterest Inc/ Operating Rev (%) 20.3 22.4 25.8 35.0 25.1 25.8
Balance Sheet Ratios
Loans/ Deposits (%) 87.5 96.8 94.7 96.5 61.5 64.5
Total Equity/ Total Assets (%) 7.60 7.69 7.71 7.48 5.68 5.99
Tangible Equity/ Tangible Assets (%) 6.38 6.70 6.88 6.76 2.71 3.38
Tier 1 Ratio (%) 10.75 12.65 13.42 14.69 10.09 10.74
Total Capital Ratio (%) 11.42 13.25 13.99 15.28 10.82 11.62
Asset Quality
NPAs/ Loans + OREO (%) 0.36 1.40 1.44 1.01 0.40 0.25
NCOs/ Avg Loans (%) 0.12 0.29 0.46 0.40 0.26 0.06
Reserves/ Loans (%) 0.56 0.52 0.52 0.60 0.65 0.81
Source: SNL Financial
12
Overview of Loan and Deposit Portfolio
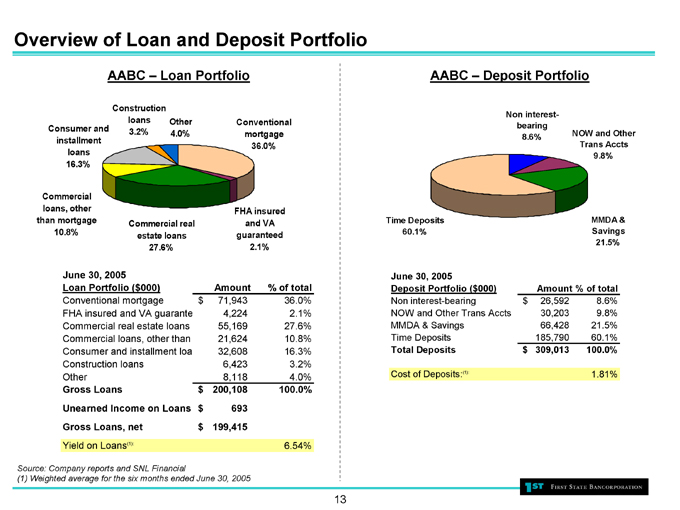
AABC – Loan Portfolio
Consumer and installment loans 16.3%
Construction loans 3.2%
Other 4.0%
Conventional mortgage 36.0%
Commercial loans, other than mortgage 10.8%
Commercial real estate loans 27.6%
FHA insured and VA guaranteed 2.1%
June 30, 2005 Loan Portfolio ($000) Amount % of total
Conventional mortgage $71,943 36.0%
FHA insured and VA guarante 4,224 2.1%
Commercial real estate loans 55,169 27.6%
Commercial loans, other than 21,624 10.8%
Consumer and installment loa 32,608 16.3%
Construction loans 6,423 3.2%
Other 8,118 4.0%
Gross Loans $200,108 100.0%
Unearned Income on Loans $693
Gross Loans, net $199,415
Yield on Loans(1): 6.54%
Source: Company reports and SNL Financial
(1) Weighted average for the six months ended June 30, 2005
AABC – Deposit Portfolio
Non interest-bearing 8.6%
NOW and Other Trans Accts 9.8%
Time Deposits 60.1%
MMDA & Savings 21.5%
June 30, 2005 Deposit Portfolio ($000) Amount % of total
Non interest-bearing $26,592 8.6%
NOW and Other Trans Accts 30,203 9.8%
MMDA & Savings 66,428 21.5%
Time Deposits 185,790 60.1%
Total Deposits $309,013 100.0%
Cost of Deposits:(1): 1.81%
13
Overview of Ranchers Banks
Overview of Ranchers Banks
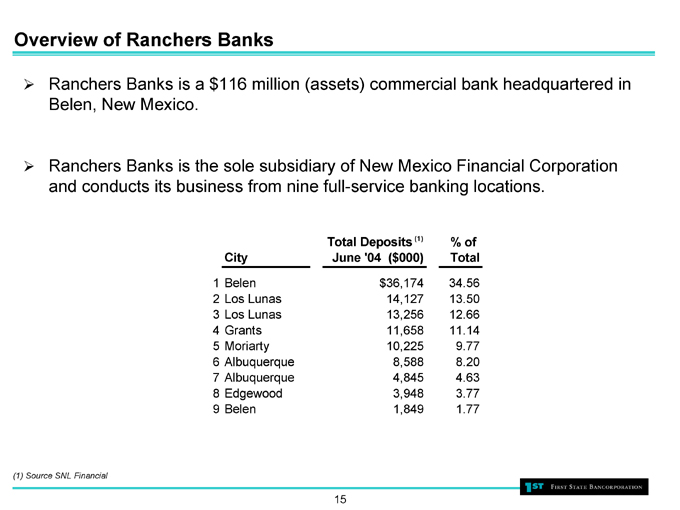
Ranchers Banks is a $116 million (assets) commercial bank headquartered in Belen, New Mexico.
Ranchers Banks is the sole subsidiary of New Mexico Financial Corporation and conducts its business from nine full-service banking locations.
City Total Deposits (1) June ‘04 ($000) % of Total
1 Belen $36,174 34.56
2 Los Lunas 14,127 13.50
3 Los Lunas 13,256 12.66
4 Grants 11,658 11.14
5 Moriarty 10,225 9.77
6 Albuquerque 8,588 8.20
7 Albuquerque 4,845 4.63
8 Edgewood 3,948 3.77
9 Belen 1,849 1.77
(1) Source SNL Financial
15
Overview of Ranchers Banks
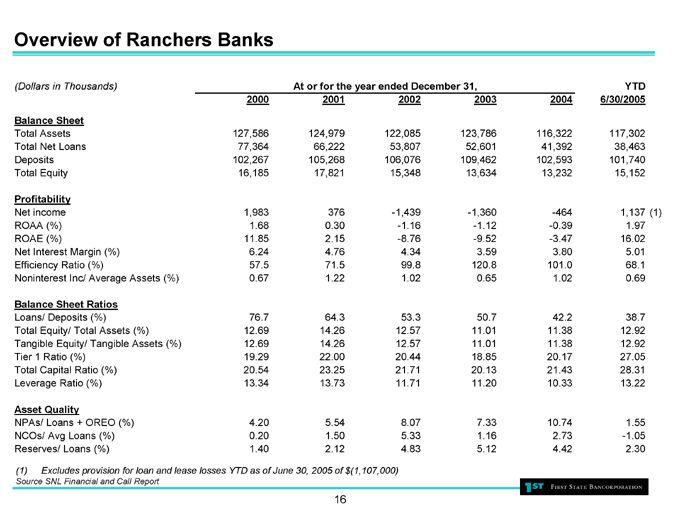
(Dollars in Thousands)
At or for the year ended December 31,
2000 2001 2002 2003 2004 YTD 6/30/2005
Balance Sheet
Total Assets 127,586 124,979 122,085 123,786 116,322 117,302
Total Net Loans 77,364 66,222 53,807 52,601 41,392 38,463
Deposits 102,267 105,268 106,076 109,462 102,593 101,740
Total Equity 16,185 17,821 15,348 13,634 13,232 15,152
Profitability
Net income 1,983 376 -1,439 -1,360 -464 1,137 (1)
ROAA (%) 1.68 0.30 -1.16 -1.12 -0.39 1.97
ROAE (%) 11.85 2.15 -8.76 -9.52 -3.47 16.02
Net Interest Margin (%) 6.24 4.76 4.34 3.59 3.80 5.01
Efficiency Ratio (%) 57.5 71.5 99.8 120.8 101.0 68.1
Noninterest Inc/ Average Assets (%) 0.67 1.22 1.02 0.65 1.02 0.69
Balance Sheet Ratios
Loans/ Deposits (%) 76.7 64.3 53.3 50.7 42.2 38.7
Total Equity/ Total Assets (%) 12.69 14.26 12.57 11.01 11.38 12.92
Tangible Equity/ Tangible Assets (%) 12.69 14.26 12.57 11.01 11.38 12.92
Tier 1 Ratio (%) 19.29 22.00 20.44 18.85 20.17 27.05
Total Capital Ratio (%) 20.54 23.25 21.71 20.13 21.43 28.31
Leverage Ratio (%) 13.34 13.73 11.71 11.20 10.33 13.22
Asset Quality
NPAs/ Loans + OREO (%) 4.20 5.54 8.07 7.33 10.74 1.55
NCOs/ Avg Loans (%) 0.20 1.50 5.33 1.16 2.73 -1.05
Reserves/ Loans (%) 1.40 2.12 4.83 5.12 4.42 2.30
(1) Excludes provision for loan and lease losses YTD as of June 30, 2005 of $(1,107,000)
Source SNL Financial and Call Report
16
Overview of Ranchers’ Loan and Deposit Portfolio
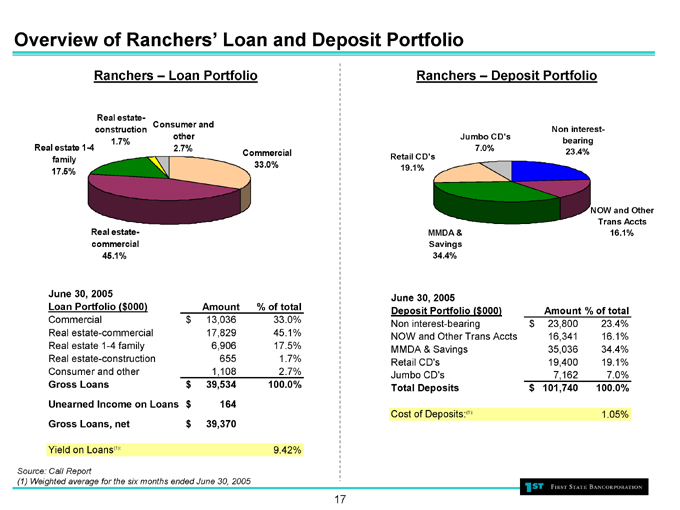
Ranchers – Loan Portfolio
Real estate 1-4 family 17.5%
Real estate-construction 1.7%
Consumer and other 2.7%
Commercial 33.0%
Real estate-commercial 45.1%
June 30, 2005 Loan Portfolio ($000) Amount % of total
Commercial $13,036 33.0%
Real estate-commercial 17,829 45.1%
Real estate 1-4 family 6,906 17.5%
Real estate-construction 655 1.7%
Consumer and other 1,108 2.7%
Gross Loans $39,534 100.0%
Unearned Income on Loans $164
Gross Loans, net $39,370
Yield on Loans(1): 9.42%
Source: Call Report
(1) Weighted average for the six months ended June 30, 2005
Ranchers – Deposit Portfolio
Retail CD’s 19.1%
Jumbo CD’s 7.0%
Non interest-bearing 23.4%
MMDA & Savings 34.4%
NOW and Other Trans Accts 16.1%
June 30, 2005 Deposit Portfolio ($000) Amount % of total
Non interest-bearing $23,800 23.4%
NOW and Other Trans Accts 16,341 16.1%
MMDA & Savings 35,036 34.4%
Retail CD’s 19,400 19.1%
Jumbo CD’s 7,162 7.0%
Total Deposits $101,740 100.0%
Cost of Deposits:(1): 1.05%
17
Transaction Overviews
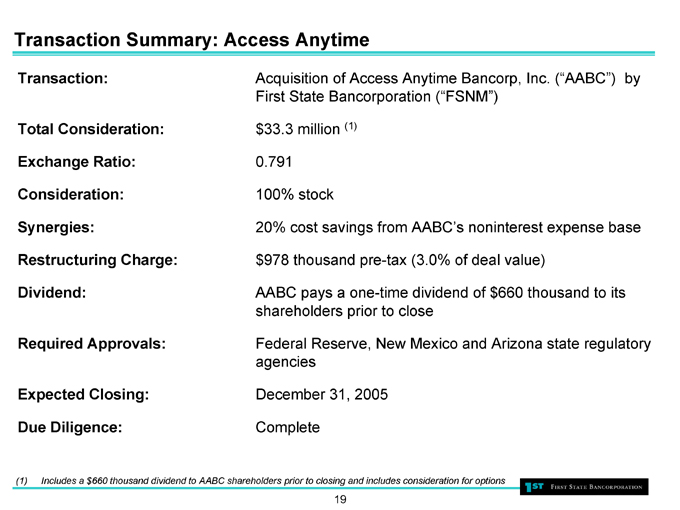
Transaction Summary: Access Anytime
Transaction: Acquisition of Access Anytime Bancorp, Inc. (“AABC”) by First State Bancorporation (“FSNM”)
Total Consideration: $33.3 million (1) Exchange Ratio: 0.791 Consideration: 100% stock
Synergies: 20% cost savings from AABC’s noninterest expense base
Restructuring Charge: $978 thousand pre-tax (3.0% of deal value)
Dividend: AABC pays a one-time dividend of $660 thousand to its shareholders prior to close
Required Approvals: Federal Reserve, New Mexico and Arizona state regulatory agencies
Expected Closing: December 31, 2005
Due Diligence: Complete
(1) Includes a $660 thousand dividend to AABC shareholders prior to closing and includes consideration for options
19
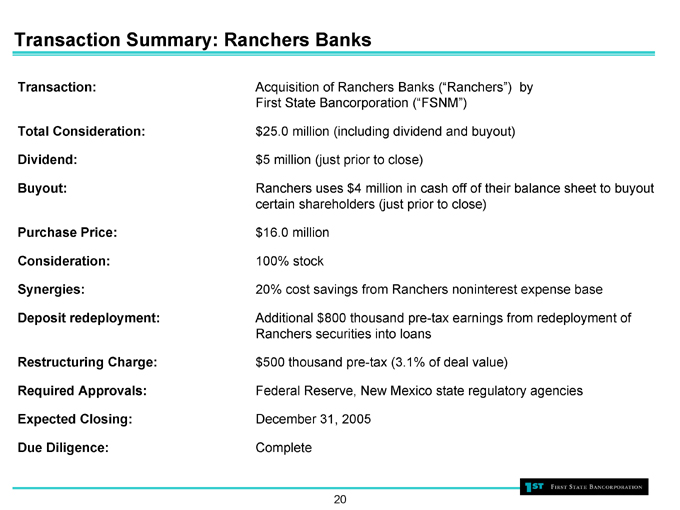
Transaction Summary: Ranchers Banks
Transaction: Acquisition of Ranchers Banks (“Ranchers”) by First State Bancorporation (“FSNM”)
Total Consideration: $25.0 million (including dividend and buyout)
Dividend: $5 million (just prior to close)
Buyout: Ranchers uses $4 million in cash off of their balance sheet to buyout certain shareholders (just prior to close)
Purchase Price: $16.0 million
Consideration: 100% stock
Synergies: 20% cost savings from Ranchers noninterest expense base
Deposit redeployment: Additional $800 thousand pre-tax earnings from redeployment of Ranchers securities into loans
Restructuring Charge: $500 thousand pre-tax (3.1% of deal value)
Required Approvals: Federal Reserve, New Mexico state regulatory agencies
Expected Closing: December 31, 2005
Due Diligence: Complete
20
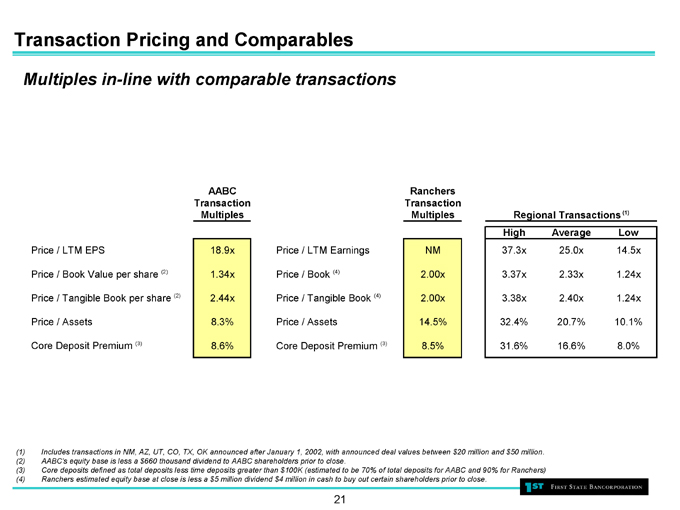
Transaction Pricing and Comparables
Multiples in-line with comparable transactions
AABC Transaction Multiples
Ranchers Transaction Multiples
Regional Transactions (1)
High Average Low
Price / LTM EPS 18.9x Price / LTM Earnings NM 37.3x 25.0x 14.5x
Price / Book Value per share (2) 1.34x Price / Book (4) 2.00x 3.37x 2.33x 1.24x
Price / Tangible Book per share (2) 2.44x Price / Tangible Book (4) 2.00x 3.38x 2.40x 1.24x
Price / Assets 8.3% Price / Assets 14.5% 32.4% 20.7% 10.1%
Core Deposit Premium (3) 8.6% Core Deposit Premium (3) 8.5% 31.6% 16.6% 8.0%
(1) Includes transactions in NM, AZ, UT, CO, TX, OK announced after January 1, 2002, with announced deal values between $20 million and $50 million. (2) AABC’s equity base is less a $660 thousand dividend to AABC shareholders prior to close.
(3) Core deposits defined as total deposits less time deposits greater than $100K (estimated to be 70% of total deposits for AABC and 90% for Ranchers) (4) Ranchers estimated equity base at close is less a $5 million dividend $4 million in cash to buy out certain shareholders prior to close.
21
Pro Forma Financial Impact
Pro Forma Financial Impact
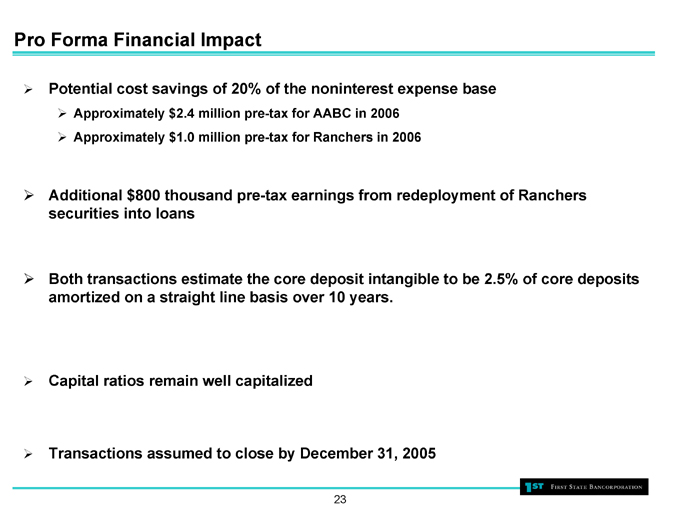
Potential cost savings of 20% of the noninterest expense base
Approximately $2.4 million pre-tax for AABC in 2006
Approximately $1.0 million pre-tax for Ranchers in 2006
Additional $800 thousand pre-tax earnings from redeployment of Ranchers securities into loans
Both transactions estimate the core deposit intangible to be 2.5% of core deposits amortized on a straight line basis over 10 years.
Capital ratios remain well capitalized
Transactions assumed to close by December 31, 2005
23
Pro Forma Financial Impact: Earnings Impact
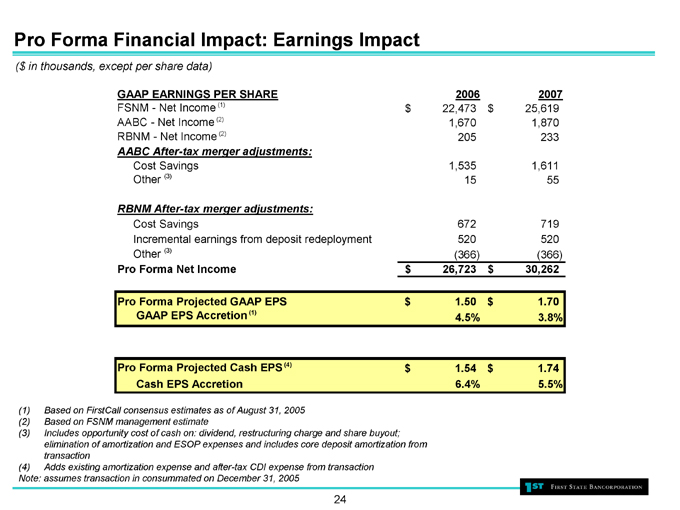
($ in thousands, except per share data)
GAAP EARNINGS PER SHARE 2006 2007
FSNM - Net Income (1) $22,473 $25,619
AABC - Net Income (2) 1,670 1,870
RBNM - Net Income (2) 205 233
AABC After-tax merger adjustments:
Cost Savings 1,535 1,611
Other (3) 15 55
RBNM After-tax merger adjustments:
Cost Savings 672 719
Incremental earnings from deposit redeployment 520 520
Other (3) (366) (366)
Pro Forma Net Income $26,723 $30,262
Pro Forma Projected GAAP EPS $1.50 $1.70
GAAP EPS Accretion(1) 4.5% 3.8%
Pro Forma Projected Cash EPS (4) $1.54 $1.74
Cash EPS Accretion 6.4% 5.5%
(1) Based on FirstCall consensus estimates as of August 31, 2005 (2) Based on FSNM management estimate
(3) Includes opportunity cost of cash on: dividend, restructuring charge and share buyout; elimination of amortization and ESOP expenses and includes core deposit amortization from transaction (4) Adds existing amortization expense and after-tax CDI expense from transaction Note: assumes transaction in consummated on December 31, 2005
24
Pro Forma Financial Impact: Balance Sheet
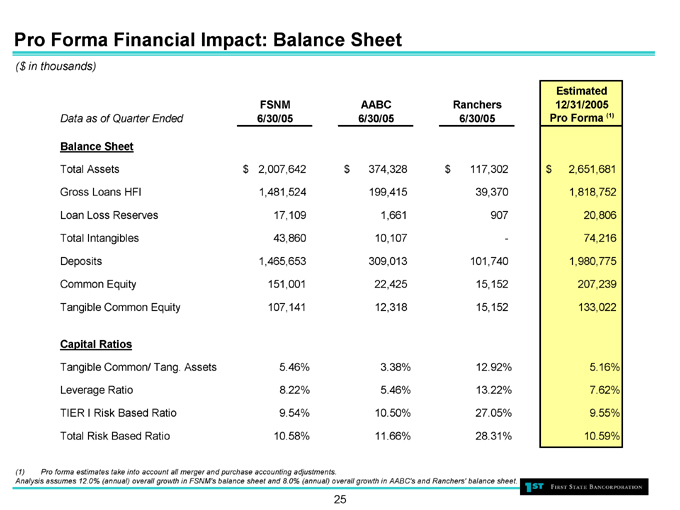
($ in thousands)
Data as of Quarter Ended FSNM 6/30/05 AABC 6/30/05 Ranchers 6/30/05 Estimated 12/31/2005 Pro Forma (1)
Balance Sheet
Total Assets $2,007,642 $374,328 $117,302 $2,651,681
Gross Loans HFI 1,481,524 199,415 39,370 1,818,752
Loan Loss Reserves 17,109 1,661 907 20,806
Total Intangibles 43,860 10,107 - 74,216
Deposits 1,465,653 309,013 101,740 1,980,775
Common Equity 151,001 22,425 15,152 207,239
Tangible Common Equity 107,141 12,318 15,152 133,022
Capital Ratios
Tangible Common/ Tang. Assets 5.46% 3.38% 12.92% 5.16%
Leverage Ratio 8.22% 5.46% 13.22% 7.62%
TIER I Risk Based Ratio 9.54% 10.50% 27.05% 9.55%
Total Risk Based Ratio 10.58% 11.66% 28.31% 10.59%
(1) Pro forma estimates take into account all merger and purchase accounting adjustments.
Analysis assumes 12.0% (annual) overall growth in FSNM’s balance sheet and 8.0% (annual) overall growth in AABC’s and Ranchers’ balance sheet.
25
Pro Forma Financial Impact: Asset Quality
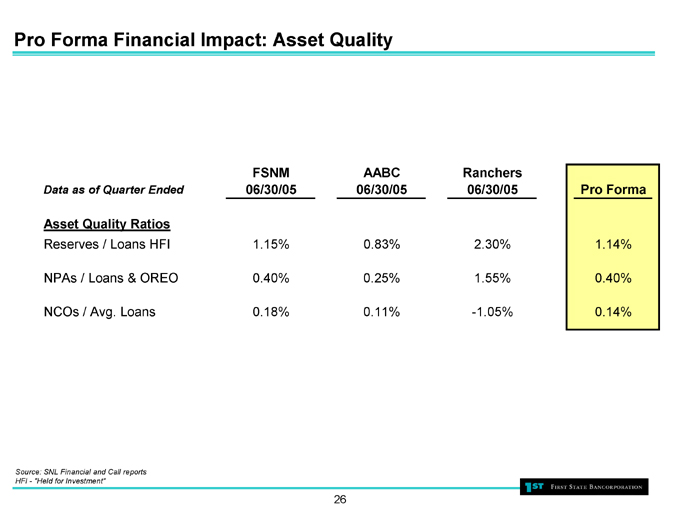
Data as of Quarter Ended FSNM 06/30/05 AABC 06/30/05 Ranchers 06/30/05 Pro Forma
Asset Quality Ratios
Reserves / Loans HFI 1.15% 0.83% 2.30% 1.14%
NPAs / Loans & OREO 0.40% 0.25% 1.55% 0.40%
NCOs / Avg. Loans 0.18% 0.11% -1.05% 0.14%
Source: SNL Financial and Call reports HFI - “Held for Investment”
26
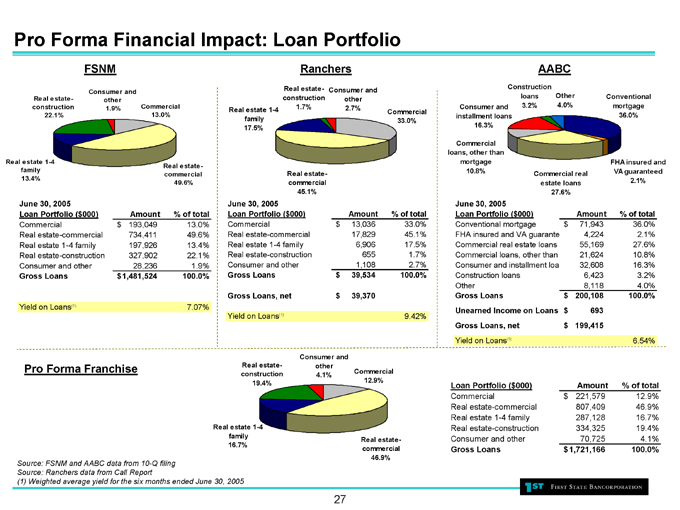
Pro Forma Financial Impact: Loan Portfolio
FSNM
Real estate 1-4 family 13.4%
Real estate-construction 22.1%
Consumer and other 1.9%
Commercial 13.0%
Real estate-commercial 49.6%
June 30, 2005 Loan Portfolio ($000) Amount % of total
Commercial $193,049 13.0%
Real estate-commercial 734,411 49.6%
Real estate 1-4 family 197,926 13.4%
Real estate-construction 327,902 22.1%
Consumer and other 28,236 1.9%
Gross Loans $1,481,524 100.0%
Yield on Loans(1): 7.07%
Ranchers
Real estate 1-4 family 17.5%
Real estate-construction 1.7%
Consumer and other 2.7%
Commercial 33.0%
Real estate-commercial 45.1%
June 30, 2005 Loan Portfolio ($000) Amount % of total
Commercial $13,036 33.0%
Real estate-commercial 17,829 45.1%
Real estate 1-4 family 6,906 17.5%
Real estate-construction 655 1.7%
Consumer and other 1,108 2.7%
Gross Loans $39,534 100.0%
Gross Loans, net $39,370
Yield on Loans(1): 9.42%
AABC
Consumer and installment loans 16.3%
Commercial loans, other than mortgage 10.8%
Construction loans 3.2%
Other 4.0%
Conventional mortgage 36.0%
Commercial real estate loans 27.6%
FHA insured and VA guaranteed 2.1%
June 30, 2005 Loan Portfolio ($000) Amount % of total
Conventional mortgage $71,943 36.0%
FHA insured and VA guarante 4,224 2.1%
Commercial real estate loans 55,169 27.6%
Commercial loans, other than 21,624 10.8%
Consumer and installment loa 32,608 16.3%
Construction loans 6,423 3.2%
Other 8,118 4.0%
Gross Loans $200,108 100.0%
Unearned Income on Loans $693
Gross Loans, net $199,415
Yield on Loans(1): 6.54%
Pro Forma Franchise
Real estate 1-4 family 16.7%
Real estate-construction 19.4%
Consumer and other 4.1%
Commercial 12.9%
Real estate-commercial 46.9%
Loan Portfolio ($000) Amount % of total
Commercial $221,579 12.9%
Real estate-commercial 807,409 46.9%
Real estate 1-4 family 287,128 16.7%
Real estate-construction 334,325 19.4%
Consumer and other 70,725 4.1%
Gross Loans $1,721,166 100.0%
Source: FSNM and AABC data from 10-Q filing Source: Ranchers data from Call Report
(1) Weighted average yield for the six months ended June 30, 2005
27
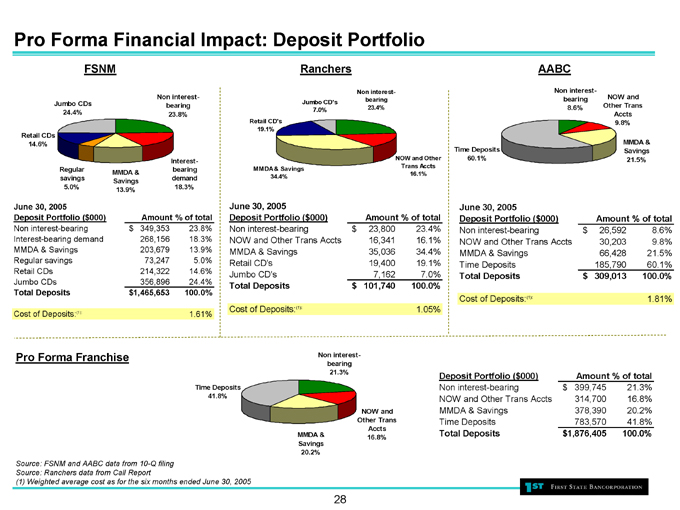
Pro Forma Financial Impact: Deposit Portfolio
FSNM
Retail CDs 14.6%
Jumbo CDs 24.4%
Non interest-bearing 23.8%
Regular savings 5.0%
MMDA & Savings 13.9%
Interest-bearing demand 18.3%
June 30, 2005 Deposit Portfolio ($000) Amount % of total
Non interest-bearing $349,353 23.8%
Interest-bearing demand 268,156 18.3%
MMDA & Savings 203,679 13.9%
Regular savings 73,247 5.0%
Retail CDs 214,322 14.6%
Jumbo CDs 356,896 24.4%
Total Deposits $1,465,653 100.0%
Cost of Deposits:(1): 1.61%
Ranchers
MMDA & Savings 34.4%
Retail CD’s 19.1%
Jumbo CD’s 7.0%
Non interest-bearing 23.4%
NOW and Other Trans Accts 16.1%
June 30, 2005 Deposit Portfolio ($000) Amount % of total
Non interest-bearing $23,800 23.4%
NOW and Other Trans Accts 16,341 16.1%
MMDA & Savings 35,036 34.4%
Retail CD’s 19,400 19.1%
Jumbo CD’s 7,162 7.0%
Total Deposits $101,740 100.0%
Cost of Deposits:(1): 1.05%
AABC
Time Deposits 60.1%
Non interest-bearing 8.6%
NOW and Other Trans Accts 9.8%
MMDA & Savings 21.5%
June 30, 2005 Deposit Portfolio ($000) Amount % of total
Non interest-bearing $26,592 8.6%
NOW and Other Trans Accts 30,203 9.8%
MMDA & Savings 66,428 21.5%
Time Deposits 185,790 60.1%
Total Deposits $309,013 100.0%
Cost of Deposits:(1): 1.81%
Pro Forma Franchise
Time Deposits 41.8%
Non interest-bearing 21.3%
MMDA & Savings 20.2%
NOW and Other Trans Accts 16.8%
Deposit Portfolio ($000) Amount % of total
Non interest-bearing $399,745 21.3%
NOW and Other Trans Accts 314,700 16.8%
MMDA & Savings 378,390 20.2%
Time Deposits 783,570 41.8%
Total Deposits $1,876,405 100.0%
Source: FSNM and AABC data from 10-Q filing Source: Ranchers data from Call Report
(1) Weighted average cost as for the six months ended June 30, 2005
28
Conclusion: Ideal Business Partners
AABC provides an ideal platform for First State to expand into attractive new markets
Both transactions provide an excellent fill-in opportunity in the Albuquerque, NM Market
Opportunity to lend-up low loan to deposit ratios
FSNM’s commercial loan expertise will be leveraged over new geography
Low risk transactions with cost savings opportunities
Accretive to earnings in the first full year of operations
Market entry into the large and highly concentrated Arizona market
Enhances and deepens the franchise
29