File No. 333-
AS FILED WITH THE SECURITIES AND EXCHANGE COMMISSION ON DECEMBER 21, 2010
SECURITIES AND EXCHANGE COMMISSION
WASHINGTON, D.C. 20549
FORM N-14
REGISTRATION STATEMENT
UNDER
| THE SECURITIES ACT OF 1933 | x | |
| Pre-Effective Amendment No. | ¨ | |
| Post-Effective Amendment No. | ¨ |
EQ Advisors Trust
(Exact Name of Registrant as Specified in Charter)
1290 Avenue of the Americas
New York, New York 10104
(Address of Principal Executive Offices)
(212) 554-1234
(Registrant’s Area Code and Telephone Number)
STEVEN M. JOENK
AXA Funds Management Group
AXA Equitable Life Insurance Company
1290 Avenue of the Americas
New York, New York 10104
(Name and Address of Agent for Service)
With copies to:
PATRICIA LOUIE, ESQ. AXA Equitable Life Insurance Company | CLIFFORD J. ALEXANDER, ESQ. MARK C. AMOROSI, ESQ. | |
1290 Avenue of the Americas New York, New York 10104 | K&L Gates LLP 1601 K Street, N.W. Washington, DC 20006 |
Approximate Date of Proposed Public Offering:
As soon as practicable after this Registration Statement becomes effective.
It is proposed that this Registration Statement will become effective on the 30th day after filing pursuant to Rule 488 under the Securities Act of 1933, as amended.
Title of securities being registered: Class IA and Class IB shares of beneficial interest in the series of the registrant designated as the EQ/Large Cap Growth PLUS Portfolio and EQ/Large Cap Value Index Portfolio.
No filing fee is required because the registrant is relying on Section 24(f) of the Investment Company Act of 1940, as amended, pursuant to which it has previously registered an indefinite number of shares (File Nos. 333-17217 and 811-07953).
EQ ADVISORS TRUST
CONTENTS OF REGISTRATION STATEMENT
This Registration Statement contains the following papers and documents:
Cover Sheet
Contents of Registration Statement
Letter to Shareholders
Notice of Special Meeting
Information Statement
Part A - Proxy Statement/Prospectus
Part B - Statement of Additional Information
Part C - Other Information
Signature Page
Exhibits
AXA EQUITABLE LIFE INSURANCE COMPANY
MONY LIFE INSURANCE COMPANY
MONY LIFE INSURANCE COMPANY OF AMERICA
1290 Avenue of the Americas
New York, New York 10104
, 2011
Dear Contractholder:
Enclosed is a notice of a Special Meeting of Shareholders of each of the following Portfolios:
| • | EQ/Capital Guardian Growth Portfolio (the “Capital Guardian Growth Portfolio”), and |
| • | EQ/Lord Abbett Growth and Income Portfolio (the “Lord Abbett Growth and Income Portfolio” and together, the “Acquired Portfolios”). |
Each Acquired Portfolio is a portfolio of EQ Advisors Trust (the “Trust”). The Special Meeting of Shareholders of the Acquired Portfolios is scheduled to be held at the Trust’s offices, 1290 Avenue of the Americas, New York, New York 10104, on April 20, 2011 at , Eastern time (the “Meeting”). At the Meeting, the shareholders of the Acquired Portfolios will be asked to approve the proposals described below.
The Trust’s Board of Trustees (the “Board of Trustees”) has called the Meeting to request shareholder approval of the reorganization of each Acquired Portfolio into a corresponding series of the Trust (the “Acquiring Portfolios”) (the “Reorganizations”) as set forth below:
| • | the Capital Guardian Growth Portfolio into the EQ/Large Cap Growth PLUS Portfolio, and |
| • | the Lord Abbett Growth and Income Portfolio into the EQ/Large Cap Value Index Portfolio. |
The Board of Trustees has approved these proposals.
Each Portfolio is managed by AXA Equitable Life Insurance Company (“AXA Equitable”) and sub-advised by one or more investment sub-advisers. In each case, if a Reorganization is approved and implemented, each Contractholder that invests indirectly in an Acquired Portfolio will automatically become a Contractholder that invests indirectly in the corresponding Acquiring Portfolio.
As an owner of an annuity contract or certificate and/or life insurance policy that participates in the Acquired Portfolios through the investment divisions of separate accounts established by AXA Equitable, MONY Life Insurance Company or MONY Life Insurance Company of America (each, an “Insurance Company”), you are entitled to instruct the applicable Insurance Company how to vote the Acquired Portfolio shares related to your interest in those accounts as of the close of business on January 31, 2011. The attached Notice of Special Meeting of Shareholders and Combined Proxy Statement and Prospectus concerning the Meeting describe the matters to be considered at the Meeting.
You are cordially invited to attend the Meeting. Since it is important that your vote be represented whether or not you are able to attend, you are urged to consider these matters and to exercise your voting instructions by completing, dating, signing, and returning the enclosed voting instruction card in the accompanying return envelope at your earliest convenience or by relaying your voting instructions via telephone or the Internet by following the enclosed instructions. Of course, we hope that you will be able to attend the Meeting, and if you wish, you may vote your shares in person, even though you may have already returned a voting instruction card or submitted your voting instructions via telephone or the Internet. Please respond promptly in order to save additional costs of proxy solicitation and in order to make sure you are represented.
| Very truly yours, |
| Steven M. Joenk |
| President |
| AXA Funds Management Group |
| AXA Equitable Life Insurance Company |
EQ ADVISORS TRUST
EQ/Capital Guardian Growth Portfolio
EQ/Lord Abbett Growth and Income Portfolio
1290 Avenue of the Americas
New York, New York 10104
NOTICE OF SPECIAL MEETING OF SHAREHOLDERS
TO BE HELD ON April 20, 2011
To the Shareholders:
NOTICE IS HEREBY GIVEN that a Special Meeting of Shareholders of each of the following Portfolios, each of which is a portfolio of EQ Advisors Trust (the “Trust”), will be held on Wednesday, April 20, 2011, at , Eastern time, at the offices of the Trust, located at 1290 Avenue of the Americas, New York, New York 10104 (the “Meeting”):
| • | EQ/Capital Guardian Growth Portfolio (the “Capital Guardian Growth Portfolio”), and |
| • | EQ/Lord Abbett Growth and Income Portfolio (the “Lord Abbett Growth and Income Portfolio” and together, the “Acquired Portfolios”). |
The Meeting will be held to act on the following proposals:
| 1. | To approve the Plan of Reorganization and Termination adopted by the Trust (the “Reorganization Plan”), which provides for the reorganization of the Capital Guardian Growth Portfolio into the EQ/Large Cap Growth PLUS Portfolio, also a series of the Trust. |
| 2. | To approve the Reorganization Plan, which provides for the reorganization of the Lord Abbett Growth and Income Portfolio into the EQ/Large Cap Value Index Portfolio, also a series of the Trust. |
| 3. | To transact other business that may properly come before the Meeting or any adjournments thereof. |
Please note that owners of variable life insurance policies or variable annuity contracts or certificates (the “Contractholders”) issued by AXA Equitable Life Insurance Company, MONY Life Insurance Company or MONY Life Insurance Company of America (each, an “Insurance Company”) who have invested in shares of the Acquired Portfolios through the investment divisions of a separate account or accounts of an Insurance Company will be given the opportunity, to the extent required by law, to provide the applicable Insurance Company with voting instructions on the above proposals.
You should read the Combined Proxy Statement and Prospectus attached to this notice prior to completing your proxy or voting instruction card. The record date for determining the number of shares outstanding, the shareholders entitled to vote and the Contractholders entitled to provide voting instructions at the Meeting and any adjournments thereof has been fixed as the close of business on January 31, 2011. If you attend the Meeting, you may vote or give your voting instructions in person.
YOUR VOTE IS IMPORTANT
PLEASE RETURN YOUR PROXY CARD OR VOTING INSTRUCTION CARD PROMPTLY
Regardless of whether you plan to attend the Meeting, you should vote or give voting instructions by promptly completing, dating, signing, and returning the enclosed proxy or voting instruction card for the Portfolio in which you directly or indirectly own shares in the enclosed postage-paid envelope. You also can vote or provide voting instructions through the Internet or by telephone using the 12-digit control number that appears on the enclosed
proxy or voting instruction card and following the simple instructions. If you are present at the Meeting, you may change your vote or voting instructions, if desired, at that time. The Trust’s Board of Trustees recommends that you vote or provide voting instructions to vote FOR the proposals.
| By order of the Board of Trustees, |
| Patricia Louie |
| Vice President and Secretary |
, 2011
New York, New York
ii
AXA EQUITABLE LIFE INSURANCE COMPANY
MONY LIFE INSURANCE COMPANY
MONY LIFE INSURANCE COMPANY OF AMERICA
INFORMATION STATEMENT
REGARDING A SPECIAL MEETING OF SHAREHOLDERS OF
EQ/CAPITAL GUARDIAN GROWTH PORTFOLIO
EQ/LORD ABBETT GROWTH AND INCOME PORTFOLIO
EACH A SERIES OF EQ ADVISORS TRUST
TO BE HELD ON APRIL 20, 2011
DATED: , 2011
GENERAL
This Information Statement is being furnished by AXA Equitable Life Insurance Company (“AXA Equitable”), MONY Life Insurance Company or MONY Life Insurance Company of America (each, an “Insurance Company” and together, the “Insurance Companies”), each of which is a stock life insurance company, to owners of their variable life insurance policies or variable annuity contracts or certificates (the “Contracts”) (the “Contractholders”) who, as of January 31, 2011 (the “Record Date”), had net premiums or contributions allocated to the investment divisions of their separate accounts (the “Separate Accounts”) that are invested in shares of one or more of the following Portfolios:
| • | EQ/Capital Guardian Growth Portfolio, and |
| • | EQ/Lord Abbett Growth and Income Portfolio (together, the “Acquired Portfolios”). |
Each Acquired Portfolio is a portfolio of EQ Advisors Trust (the “Trust”), a Delaware statutory trust that is registered with the Securities and Exchange Commission as an open-end management investment company.
Each Insurance Company is required to offer Contractholders the opportunity to instruct it, as the record owner of all of the shares of beneficial interest in the Acquired Portfolios (the “Shares”) held by its Separate Accounts, as to how it should vote on the reorganization proposals (the “Proposals”) to be considered at the Special Meeting of Shareholders of the Acquired Portfolios referred to in the preceding Notice and at any adjournments (the “Meeting”). The enclosed Combined Proxy Statement and Prospectus, which you should retain for future reference, sets forth concisely information about the proposed reorganizations involving the Acquired Portfolios and corresponding series of the Trust that a Contractholder should know before completing the enclosed voting instruction card.
AXA Financial, Inc. is the parent company of each Insurance Company and is a wholly owned subsidiary of AXA, a French insurance holding company. The principal executive offices of AXA Financial, Inc. and each Insurance Company are located at 1290 Avenue of the Americas, New York, New York 10104.
This Information Statement and the accompanying voting instruction card are being mailed to Contractholders on or about February , 2011.
HOW TO INSTRUCT AN INSURANCE COMPANY
To instruct an Insurance Company as to how to vote the Shares held in the investment divisions of its Separate Accounts, Contractholders are asked to promptly complete their voting instructions on the enclosed voting instruction card(s); and sign, date and mail the voting instruction card(s) in the accompanying postage-paid envelope. Contractholders also may provide voting instructions by phone at 1-800- or by Internet at our website at .
If a voting instruction card is not marked to indicate voting instructions but is signed, dated and returned, it will be treated as an instruction to vote the Shares in favor of the Proposal(s).
The number of Shares held in the investment division of a Separate Account corresponding to an Acquired Portfolio for which a Contractholder may provide voting instructions was determined as of the Record Date by dividing (i) a Contract’s account value (minus any Contract indebtedness) allocable to that investment division by (ii) the net asset value of one Share of the corresponding Acquired Portfolio. At any time prior to an Insurance Company’s voting at the Meeting, a Contractholder may revoke his or her voting instructions with respect to that investment division by providing the Insurance Company with a properly executed written revocation of such voting instructions, properly executing later-dated voting instructions by a voting instruction card, telephone or the Internet, or appearing and voting in person at the Meeting.
HOW AN INSURANCE COMPANY WILL VOTE
An Insurance Company will vote the Shares for which it receives timely voting instructions from Contractholders in accordance with those instructions. An Insurance Company will vote Shares attributable to Contracts for which it is the Contractholder “FOR” each applicable Proposal. Shares in each investment division of a Separate Account for which an Insurance Company receives a voting instruction card that is signed, dated and timely returned but is not marked to indicate voting instructions will be treated as an instruction to vote the Shares in favor of the applicable Proposal. Shares in each investment division of a Separate Account for which an Insurance Company receives no timely voting instructions from Contractholders, or that are attributable to amounts retained by AXA Equitable as surplus or seed money, will be voted by the applicable Insurance Company either for or against approval of the Proposals, or as an abstention, in the same proportion as the Shares for which Contractholders (other than the Insurance Company) have provided voting instructions to the Insurance Company.
OTHER MATTERS
The Insurance Companies are not aware of any matters, other than the specified Proposals, to be acted on at the Meeting. If any other matters come before the Meeting, an Insurance Company will vote the Shares upon such matters in its discretion. Voting instruction cards may be solicited by employees of AXA Equitable or its affiliates as well as officers and agents of the Trust. The principal solicitation will be by mail but voting instructions may also be solicited by telephone, telegraph, fax, personal interview, the Internet or other permissible means.
If the necessary quorum to transact business is not established or the vote required to approve or reject a Proposal is not obtained at the Meeting, the persons named as proxies may propose one or more adjournments of the Meeting in accordance with applicable law to permit further solicitation of voting instructions. The persons named as proxies will vote in favor of such adjournment with respect to those Shares for which they received voting instructions in favor of a Proposal and will vote against any such adjournment those Shares for which they received voting instructions against a Proposal.
It is important that your Contract be represented. Please promptly mark your voting instructions on the enclosed voting instruction card; then sign, date and mail the voting instruction card in the accompanying postage-paid envelope. You may also provide your voting instructions by telephone at 1-800- or by Internet at our website at .
ii
COMBINED PROXY STATEMENT AND PROSPECTUS
, 2011
EQ ADVISORS TRUST
EQ/Capital Guardian Growth Portfolio
EQ/Lord Abbett Growth and Income Portfolio
EQ/Large Cap Growth PLUS Portfolio
EQ/Large Cap Value Index Portfolio
1290 Avenue of the Americas
New York, New York 10104
1-877-222-2144
This Combined Proxy Statement and Prospectus (the “Proxy Statement/Prospectus”) is being furnished to owners of variable life insurance policies or variable annuity contracts or certificates (the “Contracts”) (the “Contractholders”) issued by AXA Equitable Life Insurance Company (“AXA Equitable”), MONY Life Insurance Company or MONY Life Insurance Company of America (each, an “Insurance Company” and together, the “Insurance Companies”) who, as of January 31, 2011, had net premiums or contributions allocated to the investment divisions of an Insurance Company’s separate accounts (the “Separate Accounts”) that are invested in shares of beneficial interest in one or more of the following Portfolios:
| • | EQ/Capital Guardian Growth Portfolio (the “Capital Guardian Growth Portfolio”), and |
| • | EQ/Lord Abbett Growth and Income Portfolio (the “Lord Abbett Growth and Income Portfolio” and each an “Acquired Portfolio” and together the “Acquired Portfolios”). |
Each Acquired Portfolio is a portfolio of EQ Advisors Trust (the “Trust”), an open-end management investment company. This Proxy Statement/Prospectus also is being furnished to the Insurance Companies as the record owners of shares and to other shareholders that were invested in one or more of the Acquired Portfolios as of January 31, 2011. Contractholders are being provided the opportunity to instruct the applicable Insurance Company to approve or disapprove the proposals contained in this Proxy Statement/Prospectus in connection with the solicitation by the Board of Trustees of the Trust (the “Board”) of proxies to be used at the Special Meeting of Shareholders of the Acquired Portfolios to be held at 1290 Avenue of the Americas, New York, New York 10104, on Wednesday, April 20, 2011, at , Eastern time, or any adjournment or adjournments thereof (the “Meeting”).
THE SEC HAS NOT APPROVED OR DISAPPROVED THE SECURITIES DESCRIBED IN THIS PROXY STATEMENT/PROSPECTUS OR DETERMINED IF THIS PROXY STATEMENT/PROSPECTUS IS ACCURATE OR COMPLETE. ANY REPRESENTATION TO THE CONTRARY IS A CRIMINAL OFFENSE.
The proposals described in this Proxy Statement/Prospectus are as follows:
Proposal | Shareholders Entitled to Vote on the Proposal | |
1. To approve the Plan of Reorganization and Termination adopted by the Trust (the “Reorganization Plan”), which provides for the reorganization of the Capital Guardian Growth Portfolio into the EQ/Large Cap Growth PLUS Portfolio (the “Growth PLUS Portfolio”), also a series of the Trust. | Shareholders of the Capital Guardian Growth Portfolio | |
2. To approve the Reorganization Plan, which provides for the reorganization of the Lord Abbett Growth and Income Portfolio into the EQ/Large Cap Value Index Portfolio (the “Large Cap Value Index Portfolio”), also a series of the Trust. | Shareholders of the Lord Abbett Growth and Income Portfolio. | |
Each reorganization referred to in Proposals 1 and 2 above is referred to herein as a “Reorganization” and together as the “Reorganizations.” Each of the Growth PLUS and Large Cap Value Index Portfolios is referred to herein as an “Acquiring Portfolio” and together as the “Acquiring Portfolios.” In addition, the Growth PLUS Portfolio may be referred to herein as a “PLUS Portfolio.”
This Proxy Statement/Prospectus, which you should retain for future reference, contains important information regarding the proposals that you should know before voting or providing voting instructions. Additional information about the Trust has been filed with the Securities and Exchange Commission (the “SEC”) and is available upon oral or written request without charge. This Proxy Statement/Prospectus is being provided to the Insurance Companies and mailed to Contractholders and other shareholders on or about February , 2011. It is expected that one or more representatives of each Insurance Company will attend the Meeting in person or by proxy and will vote shares held by the Insurance Company in accordance with voting instructions received from its Contractholders and in accordance with voting procedures established by the Trust.
The following documents have been filed with the SEC and are incorporated by reference into this Proxy Statement/Prospectus:
| 1. | The Prospectus and Statement of Additional Information of the Trust, each dated May 1, 2010, as supplemented, with respect to all of the Acquired Portfolios (File Nos. 333-17217 and 811-07953); |
| 2. | The Annual Report to Shareholders of the Trust with respect to all of the Acquired Portfolios for the fiscal year ended December 31, 2009 (File Nos. 333-17217 and 811-07953); |
| 3. | The Semi-Annual Report to Shareholders of the Trust with respect to all of the Acquired Portfolios for the semi-annual period ended June 30, 2010 (File Nos. 333-17217 and 811-07953); and |
| 4. | The Statement of Additional Information dated , 2011, relating to the Reorganizations (File No. 333- ). |
For a free copy of any of the above documents, please call or write the Trust at the phone number below or the above address.
Shareholders and Contractholders can find out more about the Acquired Portfolios in the Trust’s Annual Report listed above, which has been furnished to shareholders and Contractholders. Shareholders and Contractholders may request another copy thereof, without charge, by writing to the Trust at the above address or by calling 1-877-222-2144.
The Trust is subject to the informational requirements of the Securities Exchange Act of 1934, as amended. Accordingly, it must file certain reports and other information with the SEC. You can copy and review information about the Trust at the SEC’s Public Reference Room in Washington, DC, and at certain of the following SEC Regional Offices: New York Regional Office, 3 World Financial Center, Suite 400, New York, New York 10281;
ii
Miami Regional Office, 801 Brickell Avenue, Suite 1800, Miami, Florida 33131; Chicago Regional Office, 175 W. Jackson Boulevard, Suite 900, Chicago, Illinois 60604; Denver Regional Office, 1801 California Street, Suite 1500, Denver, Colorado 80202; Los Angeles Regional Office, 5670 Wilshire Boulevard, 11th Floor, Los Angeles, California 90036; Boston Regional Office, 33 Arch Street, 23rd Floor, Boston, MA 02110; Philadelphia Regional Office, The Mellon Independence Center, 701 Market Street, Philadelphia, PA 19106; Atlanta Regional Office, 3475 Lenox Road, N.E., Suite 1000, Atlanta, GA 30326; Fort Worth Regional Office, Burnett Plaza, Suite 1900, 801 Cherry Street, Unit 18, Fort Worth, TX 76102; Salt Lake Regional Office, 15 W. South Temple Street, Suite 1800, Salt Lake City, UT 84101; San Francisco Regional Office, 44 Montgomery Street, Suite 2600, San Francisco, CA 94104. You may obtain information on the operation of the Public Reference Room by calling the SEC at (202)
551-8090. Reports and other information about the Trust are available on the IDEA Database on the SEC’s Internet site at http://www.sec.gov. You may obtain copies of this information from the SEC’s Public Reference Branch, Office of Consumer Affairs and Information Services, Washington, DC 20549, at prescribed rates.
iii
| 1 | ||||
| 1 | ||||
| 2 | ||||
| 4 | ||||
| 5 | ||||
| 5 | ||||
Comparison of Investment Objectives, Policies and Strategies | 5 | |||
| 7 | ||||
| 8 | ||||
| 10 | ||||
| 10 | ||||
| 12 | ||||
| 13 | ||||
| 13 | ||||
Comparison of Investment Objectives, Policies and Strategies | 14 | |||
| 15 | ||||
| 15 | ||||
| 17 | ||||
| 17 | ||||
| 17 | ||||
| 18 | ||||
| 18 | ||||
| 20 | ||||
| 22 | ||||
| 23 | ||||
| 23 | ||||
| 23 | ||||
| 23 | ||||
| 24 | ||||
| 25 | ||||
| 26 | ||||
| 28 | ||||
| 28 | ||||
| 28 | ||||
| 30 | ||||
| 31 | ||||
| 31 | ||||
| 32 | ||||
| 33 | ||||
| 33 | ||||
| 33 | ||||
| 34 | ||||
| 34 | ||||
| 34 | ||||
| 35 | ||||
| A-1 | ||||
| B-1 | ||||
| C-1 |
iv
You should read this entire Proxy Statement/Prospectus carefully. For additional information, you should consult the Reorganization Plan, a copy of which is attached hereto as Appendix A (the “Reorganization Plan”).
This Proxy Statement/Prospectus is soliciting shareholders with amounts invested in one or more of the Acquired Portfolios as of January 31, 2011 to approve the Reorganization Plan, whereby each Acquired Portfolio will be reorganized into the corresponding Acquiring Portfolio. (Each Acquired Portfolio and Acquiring Portfolio is sometimes referred to herein as a “Portfolio.”)
Each Acquired Portfolio’s shares are divided into two classes, designated Class IA and Class IB shares (“Acquired Portfolio Shares”). Each Acquiring Portfolio’s shares also are divided into two classes, designated Class IA and Class IB shares (“Acquiring Portfolio Shares”). The rights and preferences of each class of Acquiring Portfolio Shares are identical to the corresponding class of Acquired Portfolio Shares.
The Reorganization Plan provides, with respect to each Reorganization, for:
| • | the transfer of all of the assets of the Acquired Portfolio to the corresponding Acquiring Portfolio in exchange for Acquiring Portfolio Shares having an aggregate net asset value equal to the Acquired Portfolio’s net assets; |
| • | the Acquiring Portfolio’s assumption of all the liabilities of the Acquired Portfolio; |
| • | the distribution to the shareholders (for the benefit of the Separate Accounts, as applicable, and thus the Contractholders) of those Acquiring Portfolio Shares; and |
| • | the complete termination of the Acquired Portfolio. |
A comparison of the investment objective(s), investment policies, strategies and principal risks of each Acquired Portfolio and its corresponding Acquiring Portfolio is included in “Comparison of Investment Objectives, Policies and Strategies” and “Comparison of Principal Risk Factors” below. The Portfolios have identical distribution procedures, purchase procedures, exchange rights and redemption procedures, which are discussed in “Additional Information about the Acquiring Portfolios” below. Each Portfolio offers its shares to Separate Accounts and certain other eligible investors. Shares of each Portfolio are offered and redeemed at their net asset value without any sales load. You will not incur any sales loads or similar transaction charges as a result of a Reorganization.
Subject to shareholder approval, each Reorganization is expected to be effective at the close of business on May 6, 2011, or on a later date the Trust decides upon (the “Closing Date”). As a result of each Reorganization, each shareholder invested in shares of one or more of the Acquired Portfolios would become an owner of shares of the corresponding Acquiring Portfolio. Each such shareholder would hold, immediately after the Closing Date, Class IA or Class IB shares of the applicable Acquiring Portfolio having an aggregate value equal to the aggregate value of the Class IA or Class IB Acquired Portfolio Shares, as applicable, that were held by the shareholder as of the Closing Date. Similarly, each Contractholder whose Contract values are invested in shares of one or more of the Acquired Portfolios would become an indirect owner of shares of the corresponding Acquiring Portfolio. Each such Contractholder would indirectly hold, immediately after the Closing Date, Class IA or Class IB shares of the applicable Acquiring Portfolio having an aggregate value equal to the aggregate value of the Class IA or Class IB Acquired Portfolio Shares, as applicable, that were indirectly held by the Contractholder as of the Closing Date. The consummation of any one Reorganization is not contingent on the consummation of any other Reorganization. The Trust believes that there will be no adverse tax consequences to shareholders or Contractholders as a result of the Reorganizations. Please see “Additional Information about the Reorganizations – Federal Income Tax Consequences of the Reorganizations” below for further information.
1
The Board has unanimously approved the Reorganization Plan with respect the Portfolios involved therein. Accordingly, the Board is submitting the Reorganization Plan for approval by each Acquired Portfolio’s shareholders. In considering whether to approve a proposal (a “Proposal”), you should review the Proposal for the Acquired Portfolio(s) in which you were a direct or indirect holder on the Record Date (as defined under “Voting Information”). In addition, you should review the information in this Proxy Statement/Prospectus that relates to all of the Proposals and the Reorganization Plan generally. The Board recommends that you vote “FOR” the Proposals to approve the Reorganization Plan.
| PROPOSAL 1: | APPROVAL OF THE REORGANIZATION PLAN WITH RESPECT TO THE REORGANIZATION OF THE CAPITAL GUARDIAN GROWTH PORTFOLIO INTO THE GROWTH PLUS PORTFOLIO. |
This Proposal 1 requests your approval of the Reorganization Plan, pursuant to which the Capital Guardian Growth Portfolio will be reorganized into the Growth PLUS Portfolio.
In considering whether you should approve this Proposal, you should note that:
��
| • | The Portfolios have identical investment objectives. Each Portfolio seeks long-term growth of capital. |
| • | The Portfolios have substantially similar investment policies. Each Portfolio invests primarily in large-cap equity securities. In addition, each Portfolio seeks to invest primarily in securities of companies that have “growth” characteristics (e.g., higher forecasted growth values and/or higher price-to-book ratios). Each Portfolio also may invest in foreign securities, derivatives (e.g., futures contracts) and exchange-traded funds (“ETFs”). There are, however, differences in the Portfolios’ primary investment policies and strategies of which you should be aware. |
One primary difference between the two Portfolios is that the Growth PLUS Portfolio normally allocates its assets among three investment advisers, each of which manages its portion of the Portfolio using a different but complementary investment strategy. One portion of the Growth PLUS Portfolio is actively managed by an investment sub-adviser (“Adviser”) (the “Active Allocated Portion”); one portion of the Portfolio seeks to track the performance of a particular index (the “Index Allocated Portion”); and one portion of the Portfolio invests in ETFs (the “ETF Allocated Portion”). The Capital Guardian Growth Portfolio is actively managed by one Adviser and does not have an Index Allocated Portion or ETF Allocated Portion; however, each Portfolio uses the Russell 1000 Growth Index as its benchmark index. The Capital Guardian Portfolio also may invest, to a limited extent, in ETFs.
In addition, while each Portfolio may invest in derivatives, the Growth PLUS Portfolio may invest in derivatives to a greater extent than the Capital Guardian Growth Portfolio and normally uses derivatives to a greater extent than the Capital Guardian Growth Portfolio to manage the Portfolio’s equity exposure (the “tactical strategy”).
Also, while each Portfolio may invest in foreign securities, the Active Allocated Portion of the Growth PLUS Portfolio may invest up to 25% of its total assets in securities of foreign issuers, while the Capital Guardian Growth Portfolio does not have a stated limit with respect to investments in foreign securities. For a detailed comparison of the each Portfolio’s investment policies and strategies, see “Comparison of Investment Objectives, Policies and Strategies” below.
| • | The Portfolios also have comparable risk profiles, although there are differences of which you should be aware. Each Portfolio’s principal risks include equity risk, foreign securities risk (including currency risk), investment style risk and large-cap company risk. The Capital Guardian Growth Portfolio, however, also is subject to depositary receipts risk and mid-cap and small-cap company risk, while the Growth PLUS Portfolio generally is not. In addition, the principal risks of investing in the Growth PLUS Portfolio also include derivatives risk, emerging markets risk, ETF risk, focused portfolio risk, index strategy risk and portfolio turnover risk, which are not principal risks of investing in the Capital Guardian Growth Portfolio. For a detailed comparison of the each Portfolio’s risks, see “Comparison of Principal Risk Factors” below. |
2
| • | AXA Equitable (the “Manager”) serves as the investment manager and administrator for each Portfolio and would continue to manage and administer the Growth PLUS Portfolio after the Reorganization. AXA Equitable has received an exemptive order from the SEC that generally permits AXA Equitable and the Board to appoint, dismiss and replace each Portfolio’s Adviser(s) and to amend the advisory agreements between AXA Equitable and the Advisers without obtaining shareholder approval (except with respect to Affiliated Advisers (as defined herein)). AXA Equitable has appointed one Adviser to manage the assets of the Capital Guardian Growth Portfolio. In particular, Capital Guardian Trust Company currently serves as the Adviser for the Capital Guardian Growth Portfolio. AXA Equitable has appointed two Advisers to manage distinct portions of the Growth PLUS Portfolio’s assets. In particular, Marsico Capital Management, LLC, which is responsible for the management of the Active Allocated Portion of the Growth PLUS Portfolio, and BlackRock Investment Management, LLC, which is responsible for the Index Allocated Portion of the Growth PLUS Portfolio, currently serve as Advisers to the Growth PLUS Portfolio and it is anticipated that they will continue to advise their respective portion of the Growth PLUS Portfolio after the Reorganization. In addition, AXA Equitable is responsible for the management of the ETF Allocated Portion of the Growth PLUS Portfolio and the implementation of the tactical strategy, and it is anticipated that it would continue to manage the ETF Allocated Portion and implement the tactical strategy for the Growth PLUS Portfolio after the Reorganization. For a detailed description of the Manager and the Growth PLUS Portfolio’s Advisers, please see “Additional Information about the Acquiring Portfolios - The Manager” and “- The Advisers” below. |
| • | The Capital Guardian Growth Portfolio and Growth PLUS Portfolio had net assets of approximately $351.1 million and $1.74 billion, respectively, as of October 31, 2010. Thus, if the Reorganization had been in effect on that date, the combined Portfolio would have had net assets of approximately $2.09 billion. |
| • | Class IA shareholders of the Capital Guardian Portfolio will receive Class IA shares of the Growth PLUS Portfolio, and Class IB shareholders of the Capital Guardian Portfolio will receive Class IB shares of the Growth PLUS Portfolio, pursuant to the Reorganization. Shareholders will not pay any sales charges in connection with the Reorganization. Please see “Comparative Fee and Expense Tables,” “Additional Information about the Reorganizations” and “Additional Information about the Acquiring Portfolios” below for more information. |
| • | It is estimated that the annual operating expense ratios for the Growth PLUS Portfolio’s Class IA and Class IB shares, for the fiscal year following the Reorganization, will be the same as those of the Capital Guardian Growth Portfolio’s Class IA and Class IB shares, respectively, for the fiscal year ended December 31, 2009. For a more detailed comparison of the fees and expenses of the Portfolios, please see “Comparative Fee and Expense Tables” and “Additional Information about the Acquiring Portfolios” below. |
| • | The maximum management fee for the Capital Guardian Growth Portfolio is equal to an annual rate of 0.65% of its average daily net assets, while the maximum management fee for the Growth PLUS Portfolio is equal to an annual rate of 0.50% of its average daily net assets. The administration fee schedule for the Capital Guardian Portfolio is $30,000 per year, plus its proportionate share of an asset-based administration fee for the Trust, which is equal to an annual rate of 0.12% of the first $3 billion of total Trust average daily net assets (exclusive of certain Portfolios, including the Growth PLUS Portfolio), 0.11% of the next $3 billion, 0.105% of the next $4 billion, 0.10% of the next $20 billion and 0.0975% thereafter. The Growth PLUS Portfolio pays AXA Equitable an annual fee of $32,500 plus its proportionate share of an asset-based administration fee, which is equal to an annual rate of 0.15% of the first $20 billion of the Growth PLUS Portfolio’s and certain other of the Trust’s multi-adviser portfolios’ aggregate average daily net assets, 0.125% of the next $5 billion of these portfolios’ aggregate average daily net assets, and 0.10% on these portfolios’ aggregate average daily net assets thereafter, and an additional $32,500 for each portion of the Growth PLUS Portfolio for which separate administrative services are provided (e.g., portions of the Growth PLUS Portfolio allocated to separate Advisers and/or managed in a discrete style). For a more detailed description of the fees and expenses of the Portfolios, please see “Comparative Fee and Expense Tables” and “Additional Information about the Acquiring Portfolios” below. |
3
| • | Following the Reorganization, the combined Portfolio will be managed in accordance with the investment objective, policies and strategies of the Growth PLUS Portfolio. It is not expected that the Growth PLUS Portfolio will revise any of its investment policies following the Reorganization to reflect those of the Capital Guardian Growth Portfolio. AXA Equitable has reviewed Capital Guardian Growth Portfolio’s current portfolio holdings and determined that all or a substantial portion of the Capital Guardian Growth Portfolio’s holdings is consistent with the Growth PLUS Portfolio’s investment objectives and policies and thus, if the Reorganization is approved, could be transferred to and held by the Growth PLUS Portfolio. However, it is expected that some of those holdings may not remain at the time of the Reorganization due to normal portfolio turnover. If the Reorganization is approved, the Manager will liquidate the Capital Guardian Growth Portfolio’s holdings that, based on market conditions and an assessment by the Manager and the Growth PLUS Portfolio’s Advisers, are not compatible with the Growth PLUS Portfolio’s current portfolio composition, investment objective and policies, or investment strategies. The proceeds of such liquidation will be held in temporary investments or reinvested in assets that are consistent with the Growth PLUS Portfolio’s investment objective, policies and strategies. Although any sale of portfolio investments in connection with the Reorganization would be conducted in an orderly manner, the need for a Portfolio to sell such investments may result in its selling securities at a disadvantageous time and price and could result in the Portfolio realizing gains (or losses) that otherwise would not have been realized and incurring transaction costs that otherwise would not have been incurred. |
| • | The Capital Guardian Growth Portfolio will bear its proportionate share of the expenses of the Reorganizations described in this Proxy Statement/Prospectus, subject to an aggregate maximum of $100,000 for the Acquired Portfolios. AXA Equitable generally will bear expenses of the Reorganizations in excess of this amount, subject to certain limitations. Please see “Additional Information about the Reorganizations” below for more information. |
Comparative Fee and Expense Tables
The following tables show the fees and expenses of each class of shares of each Portfolio and the estimated pro forma fees and expenses of each class of shares of the Acquiring Portfolio after giving effect to the proposed Reorganization. Fees and expenses for each Portfolio are based on those incurred by each class of its shares for the fiscal year ended December 31, 2009. The pro forma fees and expenses of the Acquiring Portfolio Shares assume that the Reorganization has been in effect for the last year ended June 30, 2010. The tables below do not reflect any Contract-related fees and expenses, which would increase overall fees and expenses. See a Contract prospectus for a description of those fees and expenses.
Shareholder Fees
(fees paid directly from your investment)
| Capital Guardian Growth Portfolio | Growth PLUS Portfolio | Pro Forma Growth PLUS Portfolio (assuming the Reorganization is approved) | ||||
| Not applicable. | ||||||
Annual Operating Expenses
(expenses that you may pay each year as a percentage of the value of your investment)
| Capital Guardian Growth Portfolio | Growth PLUS Portfolio | Pro Forma Growth PLUS Portfolio (assuming the Reorganization is approved) | ||||||||||||||||||||||
| Class IA | Class IB | Class IA | Class IB | Class IA | Class IB | |||||||||||||||||||
Management Fee | 0.65 | % | 0.65 | % | 0.50 | % | 0.50 | % | 0.50 | % | 0.50 | % | ||||||||||||
Distribution and/or Service Fees (12b-1 fees) | None | 0.25 | % | None | 0.25 | % | None | 0.25 | % | |||||||||||||||
Other Expenses | 0.16 | % | 0.16 | % | 0.20 | % | 0.20 | % | 0.18 | % | 0.18 | % | ||||||||||||
Acquired Fund Fees and Expenses | N/A | N/A | 0.02 | % | 0.02 | % | 0.02 | % | 0.02 | % | ||||||||||||||
4
Total Annual Portfolio Operating Expenses | 0.81 | % | 1.06 | % | 0.72 | % | 0.97 | % | 0.70 | % | 0.95 | % | ||||||||||||
Fee Waiver and Expense Reimbursement† | -0.11 | % | -0.11 | % | N/A | N/A | N/A | N/A | ||||||||||||||||
Net Annual Portfolio Operating Expenses After Fee Waiver and/or Expense Reimbursement | 0.70 | % | 0.95 | % | 0.72 | % | 0.97 | % | 0.70 | % | 0.95 | % |
| † | The expense reimbursement or fee waiver is expected to continue until April 30, 2012, unless the Board of Trustees consents to an earlier revision or termination. The expense reimbursement or fee waiver may be terminated by AXA Equitable at any time after that date. |
This example is intended to help you compare the costs of investing in the Portfolios with the cost of investing in other investment options. The example assumes that:
| • | You invest $10,000 in a Portfolio for the time periods indicated; |
| • | Your investment has a 5% return each year; |
| • | The Portfolio’s operating expenses remain the same; and |
| • | The expense limitation currently in effect is not renewed. |
This example does not reflect any Contract-related fees and expenses, including redemption fees (if any) at the Contract level. If such fees and expenses were reflected, the total expenses would be higher. Although your actual costs may be higher or lower, based on these assumptions your costs would be:
| 1 Year | 3 Years | 5 Years | 10 Years | |||||||||||||
Capital Guardian Growth Portfolio | ||||||||||||||||
Class IA | $ | 72 | $ | 248 | $ | 439 | $ | 991 | ||||||||
Class IB | $ | 97 | $ | 326 | $ | 574 | $ | 1,284 | ||||||||
Growth PLUS Portfolio | ||||||||||||||||
Class IA | $ | 74 | $ | 230 | $ | 401 | $ | 894 | ||||||||
Class IB | $ | 99 | $ | 309 | $ | 536 | $ | 1,190 | ||||||||
Pro Forma Growth PLUS Portfolio (assuming the Reorganization is approved) | ||||||||||||||||
Class IA | $ | 72 | $ | 224 | $ | 390 | $ | 871 | ||||||||
Class IB | $ | 97 | $ | 303 | $ | 525 | $ | 1,166 | ||||||||
Each Portfolio pays transaction costs, such as commissions, when it buys and sells securities (or “turns over” its portfolio). A higher portfolio turnover rate may indicate higher transaction costs. These costs, which are not reflected in annual fund operating expenses or in the example, affect a Portfolio’s performance. During the fiscal year ended December 31, 2009, the portfolio turnover rate for the Capital Guardian Growth Portfolio and Growth PLUS Portfolio was 50% and 43%, respectively, of the average value of the Portfolio.
Comparison of Investment Objectives, Policies and Strategies
The following table compares the investment objectives and principal investment policies and strategies of the Capital Guardian Growth Portfolio with those of the Growth PLUS Portfolio. The Board may change the investment objective of a Portfolio without a vote of the Portfolio’s shareholders. For more detailed information about each Portfolio’s investment strategies and risk, see Appendix B.
5
Acquiring Portfolio | Acquired Portfolio | |
| Growth PLUS Portfolio | Capital Guardian Growth Portfolio | |
| Investment Objective | ||
Seeks to provide long-term growth of capital. | Same. | |
| Principal Investment Strategies | ||
Under normal circumstances, the Portfolio intends to invest at least 80% of its net assets, plus borrowings for investment purposes, in securities of large-cap companies (or other financial instruments that derive their value from the securities of such companies).
For this Portfolio, large-cap companies mean those companies with market capitalizations within the range of the following indices at the time of purchase: S&P 500 Index (market capitalization range of approximately $1.1 billion - $322.7 billion as of December 31, 2009), Russell 1000 Index (market capitalization range of approximately $262.5 million - $322.7 billion as of December 31, 2009), S&P 100 Index (market capitalization range of approximately $6.3 billion - $322.7 billion as of December 31, 2009) Morningstar Large Core Index (market capitalization range of approximately $9.7 billion - $203.7 billion), NYSE 100 Index (market capitalization $14.4 billion - $322.7 billion as of December 31, 2009). | The Adviser seeks to achieve the Portfolio’s investment objective by investing primarily in equity securities of U.S. issuers and securities whose principal markets are in the U.S., including American Depository Receipts (“ADRs”) and other U.S.-registered foreign securities.
The Portfolio normally is invested primarily in common stocks or other equity securities of companies with market capitalization greater than $1.5 billion at the time of purchase. | |
| The Portfolio’s assets normally are allocated among three investment managers, each of which manages its portion of the Portfolio using a different but complementary investment strategy. One portion of the Portfolio is an Active Allocated Portion; one portion of the Portfolio is an Index Allocated Portion; and one portion of the Portfolio is an ETF Allocated Portion. Under normal circumstances, the Active Allocated Portion consists of approximately 30% of the Portfolio’s net assets, the Index Allocated Portion consists of approximately 60% of the Portfolio’s net assets and the ETF Allocated Portion consists of approximately 10% of the Portfolio’s net assets. Actual allocations among the distinct portions of the Portfolio may deviate from the amounts shown above by up to 15% of the Portfolio’s net assets. | No corresponding strategy. | |
| The Active Allocated Portion primarily invests in common stocks, but it also may invest in other equity securities that the Adviser believes provide opportunities for capital appreciation. | The Portfolio normally is invested primarily in common stocks or other equity securities. | |
| The Active Allocated Portion may also invest up to 25% of its total assets in securities of foreign issuers (which may include up to 15% of its total assets in emerging market countries at the time of purchase), which may be publicly traded in the United States or on a foreign exchange, and may be denominated in a foreign currency. | The Portfolio also may invest in foreign securities. | |
| The Active Allocated Portion also may engage in active and frequent trading to achieve the Portfolio’s investment objective. | No corresponding strategy. | |
6
| In choosing investments, the Adviser utilizes a “focus” style, which concentrates the Active Allocated Portion’s investments in a core position of 20-30 companies selected for their growth potential. | The Adviser seeks to invest primarily in securities that at the time of purchase exhibit one or more “growth” characteristics. | |
| The Index Allocated Portion of the Portfolio seeks to track the performance (before fees and expenses) of the Russell 1000 Growth with minimal tracking error. Generally, the Index Allocated Portion uses a full replication technique, although in certain instances a sampling approach may be utilized for a portion of the Index Allocated Portion. The Index Allocated Portion also may invest in other instruments, such as futures and options contracts, that provide comparable exposure as the index without buying the underlying securities comprising the index. | No corresponding strategy. | |
| AXA Equitable also may utilize futures and options to manage equity exposure. When market volatility is increasing above specific thresholds set for the Portfolio, the Manager may limit equity exposure either by reducing investments in securities, selling long futures and options positions on an index, increasing cash levels, and/or shorting an index. The Portfolio may invest up to 25% of its assets in derivatives, such as exchange-traded futures, and options contracts on indices or other similar investments. | No corresponding strategy; however, the Portfolio may invest, to a limited extent, in derivatives. | |
| The ETF Allocated Portion invests in ETFs that meet the investment criteria of the Portfolio as a whole. | The Portfolio may invest, to a limited extent, in ETFs. | |
Comparison of Principal Risk Factors
An investment in a Portfolio is not a deposit of a bank and is not insured or guaranteed by the Federal Deposit Insurance Corporation or any other government agency. You may lose money by investing in a Portfolio. The following table compares the principal risks of an investment in each Portfolio. For an explanation of each such risk, see “Additional Information about the Reorganizations – Description of Risk Factors” below.
7
Risks | Growth PLUS Portfolio | Capital Guardian Growth Portfolio | ||
Currency Risk | X | X | ||
Depositary Receipts | X | |||
Derivatives Risk | X | |||
Emerging Markets Risk | X | |||
Equity Risk | X | X | ||
ETF Risk | X | |||
Focused Portfolio Risk | X | |||
Foreign Securities Risk | X | X | ||
Index Strategy Risk | X | |||
Investment Style Risk | X | X | ||
Large-Cap Company Risk | X | X | ||
Mid-Cap and Small-Cap Company Risk | X | |||
Portfolio Turnover Risk | X | |||
Comparative Performance Information
The bar charts and table below provide some indication of the risks of investing in each Portfolio by showing changes in the Portfolio’s performance from year to year and by showing how the Portfolios’ average annual total returns for the past one, five and ten years through December 31, 2009 compare to the returns of a broad-based market index. Past performance is not an indication of future performance.
The performance results do not reflect any Contract-related fees and expenses, which would reduce the performance results.
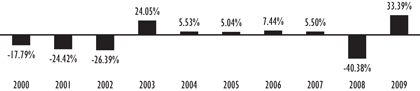
| Capital Guardian Growth Portfolio – Calendar Year Total Returns (Class IB) | ||||||||||||||||||
| ||||||||||||||||||
| Best Quarter (% and time period) | Worst Quarter (% and time period) | |||||||||||||||||
| 17.15% (2009 2nd Quarter) | -26.21% (2008 4th Quarter) | |||||||||||||||||
8
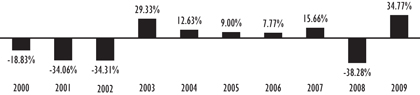
| Growth PLUS Portfolio – Calendar Year Total Returns (Class IB) | ||||||||||||||||||
| ||||||||||||||||||
Best Quarter (% and time period) | Best Quarter (% and time period) -28.50% (2001 3rdQuarter) | |||||||||||||||||
Capital Guardian Growth Portfolio - Average Annual Total Returns (For the periods ended December 31, 2009)
| ||||||
| One Year | Five Years | Ten Years | ||||
Capital Guardian Growth Portfolio – Class IA* | 33.73% | -0.84% | -5.35% | |||
Capital Guardian Growth Portfolio – Class IB | 33.39% | -1.09% | -5.52% | |||
Russell 1000 Growth Index† | 37.21% | 1.63% | -3.99% | |||
Growth PLUS Portfolio - Average Annual Total Returns (For the periods ended December 31, 2009)
| ||||||
| One Year | Five Years | Ten Years | ||||
Growth PLUS Portfolio – Class IA | 33.93% | 2.83% | -5.04% | |||
Growth PLUS Portfolio – Class IB | 34.77% | 2.50% | -5.31% | |||
Russell 1000 Growth Index† | 37.21% | 1.63% | 3.99% | |||
| * | For periods prior to the date Class IA shares commenced operations (October 2, 2002), Class IA share performance information shown is the performance of Class IB shares which reflects the effect of 12b-1 fees paid by Class IB shares. Class IA shares do not pay 12b-1 fees. |
| † | The Russell 1000 Growth Index is an unmanaged index of common stocks that measures the performance of those Russell 1000 Index companies with lower price to book ratios and lower forecasted growth values. The Russell 1000 Index is an unmanaged index of common stocks that measures the performance of approximately 100 of the largest companies in the Russell 3000 Index, and represents approximately 90% of the total market capitalization of the Russell 3000 Index. |
9
The following table shows the capitalization of each Portfolio as of June 30, 2010 and of the Growth PLUS Portfolio on a pro forma combined basis as of June 30, 2010 after giving effect to the proposed Reorganization.
| Net Assets (in millions) | Net Asset Value Per Share | Shares Outstanding | ||||||||||
Capital Guardian Growth Portfolio – Class IA | $ | 1.0 | $ | 10.52 | 97,067 | |||||||
Growth PLUS Portfolio – Class IA | $ | 851.7 | $ | 13.60 | 62,619,171 | |||||||
Adjustments* | — | — | (21,959 | ) | ||||||||
Pro forma Growth PLUS Portfolio – Class IA (assuming the Reorganization is approved) | $ | 852.7 | $ | 13.60 | 62,694,279 | |||||||
Capital Guardian Growth Portfolio – Class IB | $ | 309.2 | $ | 10.51 | 29,435,313 | |||||||
Growth PLUS Portfolio – Class IB | $ | 591.5 | $ | 13.22 | 44,734,875 | |||||||
Adjustments* | — | — | (6,047,359 | ) | ||||||||
Pro forma Growth PLUS Portfolio – Class IB (assuming the Reorganization is approved) | $ | 900.7 | $ | 13.22 | 68,122,829 | |||||||
| * | The Capital Guardian Growth Portfolio will bear its proportionate share of the expenses of the Reorganizations described in this Proxy Statement/Prospectus, subject to an aggregate maximum of $100,000 for the Acquired Portfolios. AXA Equitable generally will bear expenses of the Reorganizations in excess of this amount, subject to certain limitations. For additional information, please refer to “Additional Information About the Reorganizations - Terms of the Reorganization Plan” below. |
After careful consideration, the Board unanimously approved the Reorganization Plan with respect to the Capital Guardian Growth Portfolio. Accordingly, the Board has submitted the Reorganization Plan for approval by this Portfolio’s shareholders. The Board recommends that you vote “FOR” Proposal 1.
* * * * *
| PROPOSAL 2: | APPROVAL OF THE REORGANIZATION PLAN WITH RESPECT TO THE REORGANIZATION OF THE LORD ABBETT GROWTH AND INCOME PORTFOLIO INTO THE LARGE CAP VALUE INDEX PORTFOLIO. |
This Proposal 2 requests your approval of the Reorganization Plan, pursuant to which the Lord Abbett Growth and Income Portfolio will be reorganized into the Large Cap Value Index Portfolio.
In considering whether you should approve this Proposal, you should note that:
| • | The Portfolios have similar investment objectives. Each Portfolio seeks a combination of capital appreciation and income. The Large Cap Value Index Portfolio, however, seeks to achieve a total return before expenses that approximates the total return performance of the Russell 1000 Value Index, including reinvestment of dividends, at a risk level consistent with that of the Russell 1000 Value Index. The Lord Abbett Growth and Income Portfolio seeks capital appreciation and growth of income without excessive fluctuation in market value. |
| • | The Portfolios also have similar investment policies. Each Portfolio invests primarily in equity securities of large capitalization companies that are considered to be undervalued. However, there are differences in their primary investment policies and strategies of which you should be aware. |
The Large Cap Value Index Portfolio is an index portfolio, while the Lord Abbett Growth and Income Portfolio is an actively managed portfolio. The Lord Abbett Growth and Income Portfolio is managed in a value style under which the Portfolio invests primarily in equity securities of large companies that the Adviser believes are underpriced. In contrast, the Large Cap Value Index Portfolio is constructed and maintained
10
generally by utilizing a replication construction technique, which means that the Portfolio seeks to hold all of the securities in the Russell 1000 Value Index in the approximate weight each represents in the index. Accordingly, the Large Cap Value Index Portfolio will remain substantially fully invested in common stocks even when the common stock prices are falling and the adverse performance of a stock ordinarily will not result in its elimination from the Portfolio. The Lord Abbett Growth and Income Portfolio is not similarly constrained.
In addition, the Lord Abbett Growth and Income Portfolio may invest, without limit, in American Depositary Receipts and similar depositary receipts and may invest up to 10% of its net assets in other foreign securities that are primarily traded outside of the United States; the Large Cap Value Index Portfolio generally does not invest in depositary receipts or foreign securities. For a detailed comparison of each Portfolio’s investment policies and strategies, see “Comparison of Investment Objectives, Policies and Strategies” below.
| • | The Portfolios also have comparable risk profiles, although there are differences in the principal risks. Each Portfolio’s principal risks include equity risk, large-cap company risk and investment style risk. The Large Cap Value Index Portfolio, however, also is subject to index strategy risk as a principal risk, which is not a principal risk of the Lord Abbett Growth and Income Portfolio. In addition, the Lord Abbett Growth and Income Portfolio is also subject to currency risk, depositary receipts risk, emerging markets risk and foreign securities risk as principal risks, which are not principal risks of the Large Cap Value Index Portfolio. For a detailed comparison of the each Portfolio’s risks, see “Comparison of Principal Risk Factors” below. |
| • | AXA Equitable (the “Manager”) serves as the investment manager and administrator for each Portfolio and would continue to manage and administer the Large Cap Value Index Portfolio after the Reorganization. AXA Equitable has received an exemptive order from the SEC that generally permits AXA Equitable and the Board to appoint, dismiss and replace each Portfolio’s Adviser(s) and to amend the advisory agreements between AXA Equitable and the Advisers without obtaining shareholder approval (except with respect to Affiliated Advisers (as defined herein)). AXA Equitable has appointed one Adviser, Lord, Abbett & Co. LLC, to manage the assets of the Lord Abbett Growth and Income Portfolio. AXA Equitable has appointed one Adviser, SSgA Funds Management, Inc., to manage the Large Cap Value Index Portfolio, and it is anticipated that this Adviser will continue to advise the Large Cap Value Index Portfolio after the Reorganization. For a detailed description of the Manager and the Large Cap Value Index Portfolio’s Adviser, please see “Additional Information about the Acquiring Portfolios - The Manager” and “- The Advisers” below. |
| • | The Lord Abbett Growth and Income Portfolio and Large Cap Value Index Portfolio had net assets of approximately $194.3 million and $135.3 million, respectively, as of October 31, 2010. Thus, if the Reorganization had been in effect on that date, the combined Portfolio would have had net assets of approximately $329.6 million. |
| • | Class IA shareholders of the Lord Abbett Growth and Income Portfolio will receive Class IA shares of the Large Cap Value Index Portfolio, and Class IB shareholders of the Lord Abbett Growth and Income Portfolio will receive Class IB shares of the Large Cap Value Index Portfolio, pursuant to the Reorganization. Shareholders will not pay any sales charges in connection with the Reorganization. Please see “Comparative Fee and Expense Tables,” “Additional Information about the Reorganizations” and “Additional Information about the Acquiring Portfolios” below for more information. |
| • | It is estimated that the annual operating expense ratios for the Large Cap Value Index Portfolio’s Class IA and Class IB shares, immediately following the Reorganization, will be lower than those of the Lord Abbett Growth and Income Portfolio’s Class IA and Class IB shares, respectively, for the fiscal year ended December 31, 2009. For a more detailed comparison of the fees and expenses of the Portfolios, please see “Comparative Fee and Expense Tables” and “Additional Information about the Acquiring Portfolios” below. |
11
| • | The maximum management fee for the Lord Abbett Growth and Income Portfolio is equal to an annual rate of 0.65% of its average daily net assets, while the maximum management fee for the Large Cap Value Index Portfolio is equal to an annual rate of 0.35% of its average daily net assets. The Portfolios are subject to the same administration fee, which is equal to $30,000 per year plus the Portfolio’s proportionate share of the Trust’s administration fee for portfolios with a single Adviser, which is equal to an annual rate of 0.12% of the first $3 billion of the Trust’s average daily net assets (exclusive of certain portfolios), 0.11% of the next $3 billion, 0.105% of the next $4 billion, 0.10% of the next $20 billion and 0.0975% thereafter. For a more detailed description of the fees and expenses of the Portfolios, please see “Comparative Fee and Expense Tables” and “Additional Information about the Acquiring Portfolios” below. |
| • | Following the Reorganization, the combined Portfolio will be managed in accordance with the investment objective, policies and strategies of the Large Cap Value Index Portfolio. It is not expected that the Large Cap Value Index Portfolio will revise any of its investment policies following the Reorganization to reflect those of the Lord Abbett Growth and Income Portfolio. AXA Equitable has reviewed Lord Abbett Growth and Income Portfolio’s current portfolio holdings and determined that, because both Portfolios invest in equity securities of large capitalization companies that are considered undervalued, a portion of the Lord Abbett Growth and Income Portfolio’s holdings are consistent with the Large Cap Value Index Portfolio’s current portfolio composition, investment objectives and policies and, thus, could be transferred to and held by the Large Cap Value Index Portfolio if the Reorganization is approved. However, it is expected that some of those holdings may not remain at the time of the Reorganization due to normal portfolio turnover. If the Reorganization is approved, the Manager will liquidate that portion of the Lord Abbett Growth and Income Portfolio’s holdings that, based on market conditions and an assessment by the Manager and the Large Cap Value Index Portfolio’s Adviser, is not compatible with the Large Cap Value Index Portfolio’s current portfolio composition, investment objective and policies, or investment strategies. The proceeds of such liquidation will be held in temporary investments or reinvested in assets that are consistent with the Large Cap Value Index Portfolio’s investment objective, policies and strategies. Although any sale of portfolio investments in connection with the Reorganization would be conducted in an orderly manner, the need for a Portfolio to sell such investments may result in its selling securities at a disadvantageous time and price and could result in the Portfolio realizing gains (or losses) that otherwise would not have been realized and incurring transaction costs that otherwise would not have been incurred. |
| • | The Lord Abbett Growth and Income Portfolio will bear its proportionate share of the expenses of the Reorganizations described in this Proxy Statement/Prospectus, subject to an aggregate maximum of $100,000 for the Acquired Portfolios. AXA Equitable generally will bear expenses of the Reorganizations in excess of this amount, subject to certain limitations. Please see “Additional Information about the Reorganizations” below for more information. |
Comparative Fee and Expense Tables
The following tables show the fees and expenses of each class of shares of each Portfolio and the estimated pro forma fees and expenses of each class of shares of the Acquiring Portfolio after giving effect to the proposed Reorganization. Fees and expenses for each Portfolio are based on those incurred by each class of its shares for the fiscal year ended December 31, 2009. The pro forma fees and expenses of the Acquiring Portfolio Shares assume that the Reorganization has been in effect for the last year ended on June 30, 2010. The tables below do not reflect any Contract-related fees and expenses, which would increase overall fees and expenses. See a Contract prospectus for a description of those fees and expenses.
12
Shareholder Fees
(fees paid directly from your investment)
| Lord Abbett Growth and Income Portfolio | Large Cap Value Index Portfolio | Pro Forma Large Cap Value Index Portfolio (assuming the Reorganization is approved) | ||||
Not applicable. | ||||||
Annual Operating Expenses
(expenses that you may pay each year as a percentage of the value of your investment)
| Lord Abbett Growth and Income Portfolio | Large Cap Value Index Portfolio | Pro Forma Large Cap Value Index Portfolio (assuming the Reorganization is approved) | ||||||||||||||||||||||
| Class IA | Class IB | Class IA | Class IB | Class IA | Class IB | |||||||||||||||||||
Management Fee | 0.65 | % | 0.65 | % | 0.35 | % | 0.35 | %% | 0.35 | % | 0.35 | % | ||||||||||||
Distribution and/or Service Fees (12b-1 fees) | None | 0.25 | % | None | 0.25 | % | None | 0.25 | % | |||||||||||||||
Other Expenses | 0.18 | % | 0.18 | % | 0.15 | % | 0.15 | % | 0.16 | % | 0.16 | % | ||||||||||||
Total Annual Portfolio Operating Expenses | 0.83 | % | 1.08 | % | 0.50 | % | 0.75 | % | 0.51 | % | 0.76 | % | ||||||||||||
Fee Waiver and Expense Reimbursement† | -0.08 | % | -0.08 | % | N/A | N/A | N/A | N/A | ||||||||||||||||
Net Annual Portfolio Operating Expenses After Fee Waiver and/or Expense Reimbursement | 0.75 | % | 1.00 | % | 0.50 | % | 0.75 | % | 0.51 | % | 0.76 | % | ||||||||||||
| † | The expense reimbursement or fee waiver is expected to continue until April 30, 2012, unless the Board of Trustees consents to an earlier revision or termination. The expense reimbursement or fee waiver may be terminated by AXA Equitable at any time after that date. |
This example is intended to help you compare the costs of investing in the Portfolios with the cost of investing in other investment options. The example assumes that:
| • | You invest $10,000 in a Portfolio for the time periods indicated; |
| • | Your investment has a 5% return each year; |
| • | The Portfolio’s operating expenses remain the same; and |
| • | The expense limitation currently in effect is not renewed. |
This example does not reflect any Contract-related fees and expenses, including redemption fees (if any) at the Contract level. If such fees and expenses were reflected, the total expenses would be higher. Although your actual costs may be higher or lower, based on these assumptions your costs would be:
| 1 Year | 3 Years | 5 Years | 10 Years | |||||||||||||
Lord Abbett Growth and Income Portfolio | ||||||||||||||||
Class IA | $ | 77 | $ | 257 | $ | 453 | $ | 1,018 | ||||||||
Class IB | $ | 102 | $ | 336 | $ | 588 | $ | 1,310 | ||||||||
Large Cap Value Index Portfolio | ||||||||||||||||
Class IA | $ | 51 | $ | 160 | $ | 280 | $ | 628 | ||||||||
Class IB | $ | 77 | $ | 240 | $ | 417 | $ | 930 | ||||||||
Pro Forma Large Cap Value Index Portfolio (assuming the Reorganization is approved) | ||||||||||||||||
Class IA | $ | 52 | $ | 164 | $ | 285 | $ | 640 | ||||||||
Class IB | $ | 78 | $ | 243 | $ | 422 | $ | 942 | ||||||||
13
The Portfolio pays transaction costs, such as commissions, when it buys and sells securities (or “turns over” its portfolio). A higher portfolio turnover rate may indicate higher transaction costs. These costs, which are not reflected in annual fund operating expenses or in the example, affect the Portfolio’s performance. During the fiscal year ended December 31, 2009, the portfolio turnover rate for the Lord Abbett Growth and Income Portfolio and Large Cap Value Index Portfolio was 75% and 100%, respectively, of the average value of the Portfolio.
Comparison of Investment Objectives, Policies and Strategies
The following table compares the investment objectives and principal investment policies and strategies of the Lord Abbett Growth and Income Portfolio with those of the Large Cap Value Index Portfolio. The Board may change the investment objective of a Portfolio without a vote of the Portfolio’s shareholders. For more detailed information about each Portfolio’s investment strategies and risk, see Appendix B.
Acquiring Portfolio | Acquired Portfolio | |
| Large Cap Value Index Portfolio | Lord Abbett Growth and Income Portfolio | |
| Investment Objective | ||
| Seeks to achieve a total return before expenses that approximates the total return performance of the Russell 1000 Value Index, including reinvestment of dividends, at a risk level consistent with that of the Russell 1000 Value Index. | Seeks to achieve capital appreciation and growth of income without excessive fluctuation in market value. | |
| Principal Investment Strategies | ||
| The Portfolio normally invests at least 80% of its net assets, plus borrowings for investment purposes, in equity securities in the Russell 1000 Value Index. The Portfolio’s investments in equity securities in the Russell 1000 Value Index may include financial instruments that derive their value from such securities. The Russell 1000 Value Index measures the performance of the large-cap value segment of the U.S. equity universe. As of December 31, 2009, the market capitalization of companies in the Russell 1000 Value Index ranged from $262.5 million to $322.7 billion. | The Portfolio primarily invests in the equity securities of large, seasoned, U.S. and multinational companies that the Adviser believes are undervalued. Under normal circumstances, the Portfolio invests at least 80% of its net assets in equity securities of large companies. For this Portfolio, a large company is defined as a company having a market capitalization at the time of purchase that falls within the market capitalization range of companies in the Russell 1000 Index. As of December 31, 2009, the market capitalization range of the Russell 1000 Index was $262.5 million to $322.7 billion. This range varies daily. Equity securities in which the Portfolio may invest include common stocks, preferred stocks, convertible securities, warrants, and similar instruments. | |
| The Adviser does not anticipate utilizing customary economic, financial or market analyses or other traditional investment techniques to manage the Portfolio. The Portfolio is constructed and maintained by utilizing a replication construction technique. That is, the Portfolio seeks to hold all securities in the Russell 1000 Value Index in the approximate weight each represents in the Index, although in certain instances a sampling approach may be utilized. | In selecting investments, the Adviser attempts to invest in securities selling at reasonable prices in relation to its assessment of their potential value. The Adviser seeks to limit the Portfolio’s downside risk by investing in value stocks, which are stocks of companies that the Adviser believes are underpriced, and in large, seasoned companies, which tend to be less volatile than the stocks of smaller companies. | |
| The Portfolio will remain substantially fully invested in common stocks even when common stock prices are generally falling. Similarly, adverse performance of a stock will ordinarily not result in its elimination from the Portfolio. | The Adviser generally will sell a stock when it thinks it seems less likely to benefit from the current market and economic environment, shows deteriorating fundamentals or has reached the Adviser’s valuation target. | |
| No corresponding strategy. | The Portfolio may invest, without limit, in American Depositary Receipts and similar depositary receipts. The Portfolio limits its other investments in foreign securities that are primarily traded outside of the U.S. to 10% of its net assets. | |
14
Comparison of Principal Risk Factors
An investment in a Portfolio is not a deposit of a bank and is not insured or guaranteed by the Federal Deposit Insurance Corporation or any other government agency. You may lose money by investing in a Portfolio. The following table compares the principal risks of an investment in each Portfolio. For an explanation of each such risk, see “Additional Information about the Reorganizations – Description of Risk Factors” below.
Risks | Large Cap Value Index Portfolio | Lord Abbett Growth and Income Portfolio | ||
Currency Risk | X | |||
Depositary Receipts | X | |||
Emerging Markets Risk | X | |||
Equity Risk | X | X | ||
Foreign Securities Risk | X | |||
Index Strategy Risk | X | |||
Investment Style Risk | X | X | ||
Large-Cap Company Risk | X | X | ||
Comparative Performance Information
The bar charts and table below provide some indication of the risks of investing in each Portfolio by showing changes in the Portfolio’s performance from year to year and by showing how the Portfolios’ average annual total returns for the past one-year and since-inception periods through December 31, 2009 compare to the returns of a broad-based market index. Past performance is not an indication of future performance.
The performance results do not reflect any Contract-related fees and expenses, which would reduce the performance results.
15
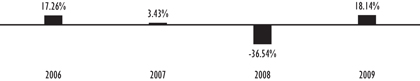
| Lord Abbett Growth and Income Portfolio – Calendar Year Total Returns (Class IB) | ||||||||||
|
| |||||||||
| Best Quarter (% and time period) 18.23% (2009 2nd Quarter) | Worst Quarter (% and time period) -19.93% (2008 4th Quarter) | |||||||||
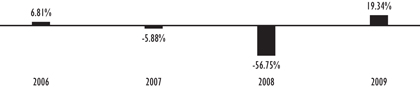
Large Cap Value Index Portfolio – Calendar Year Total Returns (Class IB) |
| |||||||||
|
| |||||||||
| Best Quarter (% and time period) 18.00% (2009 3rd Quarter) | Best Quarter (% and time period) -32.33% (2008 4th Quarter) | |||||||||
Lord Abbett Growth and Income Portfolio - Average Annual Total Returns (For the periods ended December 31, 2009)
|
| |||||||
| One Year | Since Inception (April 29, 2005) | |||||||
Lord Abbett Growth and Income Portfolio – Class IA | 18.33 | % | -0.29 | % | ||||
Lord Abbett Growth and Income Portfolio – Class IB | 18.14 | % | 0.51 | % | ||||
Russell 1000 Value Index† | 19.69 | % | 0.10 | % | ||||
Large Cap Value Index Portfolio - Average Annual Total Returns (For the periods ended December 31, 2009)
|
| |||||||
| One Year | Since Inception (October 3, 2005) | |||||||
Large Cap Value Index Portfolio – Class IA | 19.37 | % | -13.18 | % | ||||
Large Cap Value Index Portfolio – Class IB | 19.34 | % | -13.38 | % | ||||
Russell 1000 Value Index† | 19.69 | % | -1.57 | % | ||||
| † | Russell 1000® Value Index is an unmanaged index of common stocks that measures the performance of those Russell 1000 companies with lower price to book ratios and lower forecasted growth values. The Russell 1000 Index is an unmanaged index of common stocks that measures the performance of approximately 100 of the largest companies in the Russell 3000 Index, and represents approximately 90% of the total market capitalization of the Russell 3000 Index. |
16
The following table shows the capitalization of each Portfolio as of June 30, 2010 and of the Large Cap Value Index Portfolio on a pro forma combined basis as of June 30, 2010 after giving effect to the proposed Reorganization.
| Net Assets (in millions) | Net Asset Value Per Share | Shares Outstanding | ||||||||||
Lord Abbett Growth and Income Portfolio – Class IA | $ | 27.4 | $ | 8.41 | 3,262,539 | |||||||
Large Cap Value Index Portfolio – Class IA | $ | 2.8 | $ | 4.41 | 643,649 | |||||||
Adjustments* | — | — | 2,959,891 | |||||||||
Pro forma Large Cap Value Index Portfolio – Class IA (assuming the Reorganization is approved) | $ | 30.2 | $ | 4.41 | 6,866,079 | |||||||
Lord Abbett Growth and Income Portfolio – Class IB | $ | 144.1 | $ | 8.41 | 17,133,227 | |||||||
Large Cap Value Index Portfolio – Class IB | $ | 117.7 | $ | 4.39 | 26,827,888 | |||||||
Adjustments* | — | — | 15,681,261 | |||||||||
Pro forma Large Cap Value Index Portfolio – Class IB (assuming the Reorganization is approved) | $ | 261.8 | $ | 4.39 | 59,642,376 | |||||||
| * | The Lord Abbett Growth and Income Portfolio will bear its proportionate share of the expenses of the Reorganizations described in this Proxy Statement/Prospectus, subject to an aggregate maximum of $100,000 for the Acquired Portfolios. AXA Equitable generally will bear expenses of the Reorganizations in excess of this amount, subject to certain limitations. For additional information, please refer to “Additional Information About the Reorganizations - Terms of the Reorganization Plan” below. |
After careful consideration, the Board unanimously approved the Reorganization Plan with respect to the Lord Abbett Growth and Income Portfolio. Accordingly, the Board has submitted the Reorganization Plan for approval by this Portfolio’s shareholders. The Board recommends that you vote “FOR” Proposal 2.
* * * * *
ADDITIONAL INFORMATION ABOUT THE REORGANIZATIONS
Terms of the Reorganization Plan
The terms and conditions under which the Reorganizations would be completed are contained in the Reorganization Plan. The following summary thereof is qualified in its entirety by reference to the Reorganization Plan, a copy of which is attached to this Proxy Statement/Prospectus as Appendix A.
Each Reorganization involves an Acquiring Portfolio acquiring all the assets of the corresponding Acquired Portfolio in exchange solely for Acquiring Portfolio Shares equal in net asset value (as determined in accordance with the Trust’s normal valuation procedures), by class, to the outstanding Acquired Portfolio Shares and the Acquiring Portfolio’s assumption of the Acquired Portfolio’s liabilities. The Reorganization Plan further provides that, on or as promptly as reasonably practicable after the Closing Date, each Acquired Portfolio will distribute the Acquiring Portfolio Shares it receives in the Reorganization to its shareholders, for the benefit of the Separate Accounts, as applicable, and thus the Contractholders, by class. The number of full and fractional Acquiring Portfolio Shares each shareholder will receive (for the benefit of each Separate Account, as applicable) will be equal in net asset value, as of immediately after the close of business (generally 4:00 p.m., Eastern time) on the Closing Date, to the corresponding Acquired Portfolio Shares the shareholder holds at that time (for the benefit thereof, as applicable). After such distribution, the Trust will take all necessary steps under its Amended and Restated Declaration of Trust, as amended (the “Declaration”), and Delaware and any other applicable law to effect a complete termination of each Acquired Portfolio.
The Board may terminate the Reorganization Plan with respect to, and abandon, either Reorganization or both Reorganizations at any time prior to the Closing Date, before or after approval by the relevant Acquired Portfolio’s shareholders, if circumstances develop that, in the Board’s opinion, make proceeding with a Reorganization inadvisable for a Portfolio. The completion of each Reorganization also is subject to various conditions, including
17
approval of the Reorganization Plan with respect to the applicable Reorganization by the Acquired Portfolio’s shareholders, completion of all filings with, and receipt of all necessary approvals from, the SEC, delivery of a legal opinion regarding the federal income tax consequences of the Reorganization (see below) and other customary corporate and securities matters. Subject to the satisfaction of those conditions, each Reorganization will take place immediately after the close of business on the Closing Date.
The Board, including the Trustees who are not “interested persons” (as defined in the Investment Company Act of 1940, as amended (the “1940 Act”)) of the Trust (the “Independent Trustees”), has determined, with respect to each Portfolio, that the interests of the Portfolio’s existing shareholders will not be diluted as a result of the Reorganization and that participation in the Reorganization is in the best interests of the Portfolio.
The following expenses of the Reorganizations (referred to in the Reorganization Plan as “Identified Expenses”), up to an aggregate maximum of $100,000, will be borne by the Acquired Portfolios in proportion to their respective net asset values (each, an “NAV”) immediately after the close of regular trading on the New York Stock Exchange (“NYSE”), and the declaration of any dividends and/or other distributions, on the Closing Date, with any Identified Expenses in excess of such amount borne solely by AXA Equitable: (1) costs associated with preparing, printing and distributing proxy materials, (2) legal and accounting fees in connection with the Reorganizations, and (3) expenses of holding the Meeting (including any adjournment or postponement thereof). Notwithstanding the foregoing, (a) AXA Equitable will not bear any brokerage or similar expenses incurred by or for the benefit of any Portfolio in connection with the Reorganizations, and (b) all expenses other than Identified Expenses will be borne by the Portfolio that directly incurs them.
Approval of the Reorganization Plan with respect to each Acquired Portfolio covered thereby will require a majority vote of its shareholders. Such majority is defined in the 1940 Act as the lesser of (i) 67% or more of the voting securities of the Portfolio present at a meeting, if the holders of more than 50% of its outstanding voting securities are present or represented by proxy, or (ii) more than 50% of its outstanding voting securities. If the Reorganization Plan is not approved with respect to an Acquired Portfolio by its shareholders or its Reorganization is not consummated for any other reason, the Board will consider other possible courses of action. The consummation of one Reorganization is not contingent on the consummation of the other Reorganization. Please see “Voting Information” below for more information.
Description of the Securities to Be Issued
The shareholders of each Acquired Portfolio will receive Class IA or Class IB shares of the corresponding Acquiring Portfolio in accordance with the procedures provided for in the Reorganization Plan. Each such share will be fully paid and non-assessable by the Trust when issued and will have no preemptive or conversion rights.
The Trust may issue an unlimited number of authorized shares of beneficial interest, par value $0.001 per share. The Declaration authorizes the Board to issue shares in different series and classes. In addition, the Declaration authorizes the Board to create new series and to name the rights and preferences of the shareholders of each series. The Board does not need additional shareholder action to divide the shares into separate series or classes or to name the shareholders’ rights and preferences. Each Acquired and Acquiring Portfolio is a series of the Trust.
The Trust currently offers two classes of shares – Class IA and Class IB shares. The Trust has adopted, in the manner prescribed under Rule 12b-1 under the 1940 Act, a plan of distribution pertaining to the Class IB shares of the Acquiring Portfolios. The maximum distribution and/or service (12b-1) fee for each Acquiring Portfolio’s Class IB shares is equal to an annual rate of 0.25% of the average daily net assets attributable to those shares. Because these distribution/service fees are paid out of an Acquiring Portfolio’s assets on an ongoing basis, over time these fees will increase your cost of investing and may cost more than paying other types of charges.
At a meeting of the Board held on December 7-8, 2010, AXA Equitable’s representatives (“management”) recommended that each Acquired Portfolio be reorganized into the corresponding Acquiring Portfolio. Management noted that it believed that the Reorganizations would be beneficial to the shareholders invested in the Acquired Portfolios because each Reorganization would provide a means by which Contractholders with amounts allocated to an Acquired Portfolio could pursue similar or identical investment objectives in the context of a larger fund with the
18
potential for less volatility and better growth prospects, greater opportunities for portfolio diversification and the potential for lower expenses through greater economies of scale. In addition, Management noted that the portfolio manager for one of the Acquired Portfolios, the Lord Abbett Growth and Income Portfolio, had left the Adviser and that AXA Equitable did not believe that the Adviser had a suitable replacement. Management also noted that AXA Equitable may cease offering the Acquired Portfolios as investment options under its Contracts because the Acquired Portfolios have either underperformed expectations and/or failed to attract sufficient Contract owner interest. Management further noted that if it ceased offering the Acquired Portfolios, the Acquired Portfolios’ future growth prospects and their corresponding ability to achieve economies of scale and greater portfolio diversification could be limited.
In determining whether to approve the Reorganization Plan with respect to the Acquired Portfolios and recommend its approval to shareholders, the Board, including the Independent Trustees, with the advice and assistance of independent legal counsel, inquired into a number of matters and considered the following factors, among others: (1) the potential benefits of the Reorganizations to shareholders, including the greater potential to increase the assets of the Acquired Portfolios and to realize economies of scale in the Acquired Portfolios’ expenses and portfolio management as a result of asset growth; (2) comparisons of the Portfolios’ investment objectives, policies, strategies and risks; (3) the effect of a Reorganization on an Acquired Portfolio’s annual operating expenses and shareholder costs; (4) the relative historical performance records of the Portfolios; (5) the direct or indirect federal income tax consequences of the Reorganizations to shareholders and Contractholders; (6) the terms and conditions of the Reorganization Plan and whether the Reorganizations would result in dilution of shareholder interests; (7) the potential benefits of the Reorganizations to other persons, including AXA Equitable and its affiliates as discussed below in the section entitled “Potential Benefits of the Reorganizations to AXA Equitable;” and (8) possible alternatives to the Reorganizations, including the potential benefits and detriments of maintaining the current structure.
In connection with the Board’s consideration of the proposed Reorganizations, the Independent Trustees requested, and management provided the Board, information regarding the factors set forth above as well as other information relating to the Reorganizations.
In reaching the decision to recommend approval of the Reorganizations, the Board, including the Independent Trustees, concluded that each Portfolio’s participation in the relevant Reorganization is in its best interests and that the interests of existing shareholders of that Portfolio would not be diluted as a result of the Reorganization. The Board’s conclusion was based on a number of factors, including the following:
| • | The Reorganizations will permit shareholders invested in each Acquired Portfolio to continue to allocate amounts to a Portfolio that pursues a similar or identical investment objective and similar investment policies, and that is part of a larger combined portfolio with the potential for less volatility and better growth prospects, greater opportunities for portfolio diversification and the potential for lower expenses through greater economies of scale. |
| • | The annual operating expense ratios for the Class IA and Class IB shares of each Acquiring Portfolio are expected to be the same as, or lower than, those of the corresponding classes of shares of the corresponding Acquired Portfolio for the fiscal year ended December 31, 2009. |
| • | AXA Equitable will continue to serve as the investment manager and administrator of the Acquiring Portfolios following the Reorganizations, and the current Advisers to the Acquiring Portfolios will continue to serve as the Advisers to those Portfolios. |
| • | As a result of the Reorganizations, each shareholder of Class IA or Class IB shares of an Acquired Portfolio would hold, immediately after the Closing Date, Class IA or Class IB shares of the corresponding Acquiring Portfolio, as applicable, having an aggregate value equal to the aggregate value of the relevant Acquired Portfolio Shares such shareholder holds as of the Closing Date. |
19
| • | The Reorganizations will be effected on the basis of each participating Portfolio’s net asset value, which will be determined in connection with each Reorganization in accordance with the Trust’s normal valuation procedures, which are identical for all of the Trust’s Portfolios. |
| • | Shareholders will not pay sales charges in connection with the Reorganizations. |
| • | The Reorganizations are not expected to have any adverse tax results to Contractholders. |
On the basis of the information provided to it and its evaluation of that information, the Board, including the Independent Trustees, voted unanimously to approve the Reorganization Plan and to recommend that the shareholders of each Acquired Portfolio also approve the relevant Reorganization Plan.
Potential Benefits of the Reorganizations to AXA Equitable
AXA Equitable may realize benefits in connection with the Reorganizations. For example, the profitability from the fees payable to AXA Equitable and its affiliates in connection with the Acquiring Portfolios may be higher than the profits derived from the fees paid by the corresponding Acquired Portfolios. In addition, the Reorganizations will reduce or eliminate AXA Equitable’s obligations under expense limitation arrangements currently in effect by reorganizing Acquired Portfolios that are subject to expense limitation arrangements into Acquiring Portfolios that are subject to either higher expense limits or no expense limits. The elimination or reduction of certain expense limits may result in increased profits to AXA Equitable from the fees it receives with respect to the Portfolios. A Reorganization also may enable AXA Equitable to recoup certain fees and expenses previously waived or reimbursed, subject to the terms of the expense limitation arrangements in effect for the applicable Portfolio.
In addition, the Portfolios are offered and sold through Contracts issued by AXA Equitable and its affiliates that may provide certain death benefit, income benefit or other guarantees to Contract owners. In providing these guarantees, AXA Equitable assumes the risk that Contract owner account values will not be sufficient to pay the guaranteed amounts when due, and therefore that AXA Equitable will have to use its own resources to cover any shortfall. AXA Equitable may enter into hedging transactions from time to time that are intended to help manage its risks under these guarantees. The Reorganizations described in this Proxy Statement/Prospectus may enhance AXA Equitable’s ability to manage this risk, for example, by eliminating a Portfolio that has underperformed expectations and reducing or eliminating exposure to certain potentially volatile asset classes that may be difficult to hedge. This could have a positive impact on AXA Equitable’s profitability and/or financial position.
A Portfolio’s Performance may be affected by one or more of the following risks, which are described in detail in Appendix B “More Information on Risk Factors.”
Derivatives Risk. A Portfolio’s investments in derivatives may rise or fall more rapidly than other investments. Changes in the value of the derivative may not correlate perfectly with the underlying asset, rate or index, and a Portfolio could lose more than the principal amount invested. Derivatives also may be subject to a number of risks such as leverage risk, liquidity risk, interest rate risk, market risk, credit risk and also involve the risk of mispricing or improper valuation.
Equity Risk. In general, stocks and other equity security values fluctuate, and sometimes widely fluctuate, in response to changes in a company’s financial condition as well as general market, economic and political conditions.
Exchange Traded Funds (“ETFs”) Risk. When a Portfolio invests in ETFs, it will indirectly bear fees and expenses charged by the ETF, in addition to the advisory and other fees paid directly by the Portfolio. A Portfolio’s investment in an ETF involves other considerations. For example, shares of ETFs are listed and traded on securities exchanges and in over-the-counter markets, and the purchase and sale of these shares involve transaction fees and commissions. Also, even though the market price of an ETF is derived from the securities it owns, such price at any given time may be at, below or above the ETF’s net asset value. In addition, many ETFs invest in securities
20
included in, or representative of, underlying indexes regardless of investment merit or market trends and, therefore, these ETFs do not change their investment strategies to respond to changes in the economy, which means that an ETF may be particularly susceptible to a general decline in the market segment relating to the relevant index. There is also the risk that an ETF’s performance may not match that of the relevant index. In addition, it is also possible that an active trading market for an ETF may not develop or be maintained, in which case the liquidity and value of a Portfolio’s investment in the ETF could be substantially and adversely affected.
Focused Portfolio Risk. A Portfolio that employs a strategy of investing in the securities of a limited number of companies may incur more risk because changes in the value of a single security may have a more significant effect, either positive or negative, on the Portfolio’s net asset value.
Foreign Securities Risk. Investments in foreign securities, including depositary receipts, involve risks not associated with investing in U.S. securities. Foreign markets, particularly emerging markets, may be less liquid, more volatile and subject to less government supervision than domestic markets. Security values also may be negatively affected by changes in the exchange rates between the U.S. dollar and foreign currencies. Differences between U.S. and foreign legal, political and economic systems, regulatory regimes and market practices also may impact security values and it may take more time to clear and settle trades involving foreign securities.
Currency Risk. Investments in foreign currencies and in securities that trade in, or receive revenues in, foreign currencies are subject to the risk that those currencies will decline in value relative to the U.S. dollar. Any such decline may erode or reverse any potential gains from an investment in securities denominated in foreign currency or may widen existing loss. Currency rates may fluctuate significantly over short periods of time for a number of reasons, including changes in interest rates, intervention by governments, central banks or supranational entities, or by the imposition of currency controls or other political developments in the U.S. or abroad.
Depositary Receipts Risk. Investments in depositary receipts (including American Depositary Receipts, European Depositary Receipts and Global Depositary Receipts) are generally subject to the same risks of investing in the foreign securities that they evidence or into which they may be converted. In addition, issuers underlying unsponsored depositary receipts may not provide as much information as U.S. issuers and issuers underlying sponsored depositary receipts. Unsponsored depositary receipts also may not carry the same voting privileges as sponsored depositary receipts.
Emerging Markets Risk. There are greater risks involved in investing in emerging market countries and/or their securities markets. Investments in these countries and/or markets may present market, credit, currency, liquidity, legal, political, technical and other risks different from, or greater than, the risks of investing in developed countries. In addition, the risks associated with investing in a narrowly defined geographic area are generally more pronounced with respect to investments in emerging market countries.
Index Strategy Risk. A Portfolio that employs an index strategy generally invests in the securities included in the relevant index or a representative sample of such securities regardless of market trends. Such a portfolio generally will not modify its index strategy to respond to changes in the economy, which means that it may be particularly susceptible to a general decline in the market segment relating to the relevant index. In addition, although the index strategy attempts to closely track its benchmark index, the Portfolio may not invest in all of the securities in the index. Also, the Portfolio’s fees and expenses will reduce the Portfolio’s returns, unlike those of the benchmark index. Cash flow into and out of the Portfolio, portfolio transaction costs, changes in the securities that comprise the index, and the Portfolio’s valuation procedures also may affect the Portfolio’s performance. Therefore, there can be no assurance that the performance of the index strategy will match that of the benchmark index.
Investment Style Risk. The Adviser may use a particular style or set of styles – such as “growth” and “value” styles – to select investments. Those styles may be out of favor or may not produce the best results over short or longer time periods.
Growth Style. Growth stocks may be more sensitive to changes in current or expected earnings than the prices of other stocks. Growth investing also is subject to the risk that the stock price of one or more companies will fall or will fail to appreciate as anticipated, regardless of movements in the securities
21
market. Growth stocks also tend to be more volatile than value stocks, so in a declining market, their prices may decrease more than value stocks in general. They also may increase the volatility of the Portfolio’s share price.
Value Style. Value stocks are subject to the risks that notwithstanding that a stock is selling at a discount to a its perceived true worth, the market will never fully recognize their intrinsic value. In addition, there is the risk that a stock judged to be undervalued may actually be appropriately priced. They may also increase the volatility of the Portfolio’s share price.
Large-Cap Company Risk. Larger more established companies may be unable to respond quickly to new competitive challenges such as changes in technology and consumer tastes. Many larger companies also may not be able to attain the high growth rate of successful smaller companies, especially during extended periods of economic expansion.
Leveraging Risk. When a Portfolio leverages its holdings, the value of an investment in that Portfolio will be more volatile and all other risks will tend to be compounded. For example, a Portfolio may take on leveraging risk when it engages in derivatives transactions, invests in collateral from securities loans or borrows money.
Mid-Cap and Small-Cap Company Risk. A Portfolio’s investments in mid- and small-cap companies may involve greater risks than investments in larger, more established issuers because they generally are more vulnerable than larger companies to adverse business or economic developments. Such companies generally have narrower product lines, more limited financial resources and more limited markets for their stock as compared with larger companies. As a result, the value of such securities may be more volatile than the securities of larger companies, and the Portfolio may experience difficulty in purchasing or selling such securities at the desired time and price. In general, these risks are greater for small-capitalization companies than for mid-capitalization companies.
Portfolio Turnover Risk. High portfolio turnover (generally, turnover, in excess of 100% in any given fiscal year) may result in increased transaction costs to a Portfolio, which may result in higher fund expenses and lower total return.
Federal Income Tax Consequences of the Reorganizations
Each Reorganization is intended to qualify for federal income tax purposes as a tax-free reorganization under Section 368(a) of the Internal Revenue Code of 1986, as amended (the “Code”).
As a condition to consummation of each Reorganization, the Trust will receive an opinion from K&L Gates LLP (“Counsel”), with respect to the Reorganization and the Portfolios participating therein and their shareholders, substantially to the effect that, based on the facts and assumptions stated therein as well as certain representations of the Trust and conditioned on the Reorganization’s being completed in accordance with the Reorganization Plan (without the waiver or modification of any terms or conditions thereof and without taking into account any amendment thereof that Counsel has not approved), for federal income tax purposes: (1) the Reorganization will qualify as a “reorganization” (as defined in Section 368(a)(1) of the Code), and each Portfolio will be a “party to a reorganization” (within the meaning of Section 368(b) of the Code); (2) neither Portfolio will recognize any gain or loss on the Reorganization; (3) an Acquired Portfolio shareholder will not recognize any gain or loss on the exchange of its Acquired Portfolio Shares for Acquiring Portfolio Shares; (4) the holding period for and tax basis in the Acquiring Portfolio Shares that an Acquired Portfolio shareholder receives pursuant to the Reorganization will include the holding period for, and will be the same as the aggregate tax basis in, the Acquired Portfolio Shares that the shareholder holds immediately before the Reorganization (provided, with respect to inclusion of the holding period, the shareholder holds the shares as capital assets on the Closing Date); and (5) the Acquiring Portfolio’s tax basis in each asset the Acquired Portfolio transfers to it will be the same as the Acquired Portfolio’s tax basis therein immediately before the Reorganization, and the Acquiring Portfolio’s holding period for each such asset will include the Acquired Portfolio’s holding period therefor (except where the Acquiring Portfolio’s investment activities have the effect of reducing or eliminating an asset’s holding period). Notwithstanding clauses (2) and (5), such opinion may state that no opinion is expressed as to the effect of a Reorganization on the Portfolios or the Acquired Portfolio shareholders with respect to any transferred asset as to which any unrealized gain or loss is required to be recognized for federal income tax purposes at the end of a taxable year (or on the termination or transfer thereof) under a mark-to-market system of accounting.
22
Contractholders who had premiums or contributions allocated to the investment divisions of the Separate Accounts that are invested in Acquired Portfolio Shares generally will not recognize any gain or loss as a result of the Reorganizations. If an Acquired Portfolio sells securities before its Reorganization, it may recognize net gains or losses. Any net gains recognized on those sales would increase the amount of any distribution that such an Acquired Portfolio must make to its shareholders before consummating its Reorganization.
As a result of the Reorganizations, each Acquiring Portfolio will succeed to certain tax attributes of the corresponding Acquired Portfolio, except that the amount of an Acquired Portfolio’s accumulated capital loss carryovers (plus any net capital loss that Acquired Portfolio sustains during its taxable year ending on the Closing Date and any net unrealized built-in loss it has on that date) that the corresponding Acquiring Portfolio may use to offset capital gains it recognizes after its Reorganization, generally in no more than the eight succeeding taxable years, will be subject to an annual limitation under Sections 382 and 383 of the Code. In general, the limitation applicable to an Acquiring Portfolio for each taxable year will equal the sum of (1) the product of the NAV of the corresponding Acquired Portfolio as of the Closing Date (the “Acquired Portfolio’s NAV”) multiplied by the “long-term tax-exempt rate” (which is a market-based rate published by the Internal Revenue Service (the “Service”) each month, currently 3.67%) for the month in which the Closing Date occurs plus (2) the amount of any net unrealized built-in gain of that Acquired Portfolio as of the Closing Date that that Acquiring Portfolio recognizes in any taxable year all or part of which is in the period through the fifth anniversary of the Closing Date (as long as the amount of that net unrealized built-in gain is greater than the lesser of (i) 15% of that Acquired Portfolio’s NAV or (ii) $10,000,000). The annual limitation will be proportionately reduced for the portion of an Acquiring Portfolio’s current taxable year after the Closing Date and for any subsequent short taxable year.
If a Reorganization fails to meet the requirements of Code Section 368(a)(1), a Separate Account that is invested in shares of the Acquired Portfolio involved therein could realize a gain or loss on the transaction equal to the difference between its tax basis in those shares and the fair market value of the Acquiring Portfolio Shares it receives.
The Trust has not sought a tax ruling from the Service but instead is acting in reliance on the opinion of Counsel discussed above. That opinion is not binding on the Service or the courts and does not preclude the Service from adopting a contrary position. Contractholders are urged to consult their tax advisers as to the specific consequences to them of the Reorganizations, including the applicability and effect of state, local, foreign and other taxes.
ADDITIONAL INFORMATION ABOUT THE ACQUIRING PORTFOLIOS
This section gives you information about the Trust, the Manager and the Advisers for the Acquiring Portfolios.
The Trust is organized as a Delaware statutory trust and is registered with the SEC as an open-end management investment company. The Trust’s Board of Trustees is responsible for the overall management of the Trust and each of its series (the “portfolios”), including the Acquiring Portfolios. The Trust issues shares of beneficial interest that are currently divided among sixty-eight (68) portfolios, each of which has authorized Class IA and Class IB shares. The Proxy Statement/Prospectus describes the Class IA and Class IB shares of the Acquiring Portfolios.
New York, New York 10104, is the Manager to each Portfolio. AXA Equitable is a wholly owned subsidiary of AXA Financial, Inc., a subsidiary of AXA, a French insurance holding company.
The Manager has a variety of responsibilities for the general management and administration of the Trust and the portfolios. With respect to the PLUS Portfolios, the Manager is responsible for, among other things, determining the asset allocation range for the portfolios, selecting and monitoring the Advisers for the portfolios, advising the ETF
23
Allocated Portions of the portfolios (including selecting ETFs in which the portfolios invest) and ensuring that asset allocations are consistent with the guidelines that have been approved by the Board. With respect to the Trust’s other portfolios, the Manager’s management responsibilities include the selection and monitoring of Advisers for the portfolios.
The Manager plays an active role in monitoring each portfolio (or portion thereof) and Adviser and uses portfolio analytics systems to strengthen its evaluation of performance, style, risk levels, diversification and other criteria. The Manager also monitors each Adviser’s portfolio management team to determine whether its investment activities remain consistent with the portfolios’ or portion thereof’s investment style and objectives.
Beyond performance analysis, the Manager monitors significant changes that may impact the Adviser’s overall business. The Manager monitors continuity in the Adviser’s operations and changes in investment personnel and senior management. The Manager performs due diligence reviews with each Adviser no less frequently than annually.
The Manager obtains detailed, comprehensive information concerning portfolio (or portion thereof) and Adviser performance and portfolio (or portion thereof) operations that is used to supervise and monitor the Advisers and the portfolio (or portion thereof) operations. A team is responsible for conducting ongoing investment reviews with each Adviser and for developing the criteria by which portfolio (or portion thereof) performance is measured.
The Manager selects Advisers from a pool of candidates, including its affiliates, to manage the portfolios (or portions thereof). The Manager may appoint, dismiss and replace Advisers and amend advisory agreements subject to the approval of the Trust’s Board of Trustees. The Manager also may allocate a portfolio’s assets to additional Advisers subject to the approval of the Trust’s Board of Trustees and has discretion to allocate each portfolio’s assets among a portfolio’s current Advisers. The Manager recommends Advisers for each portfolio to the Trust’s Board of Trustees based upon its continuing quantitative and qualitative evaluation of each Adviser’s skills in managing assets pursuant to specific investment styles and strategies. Short-term investment performance, by itself, is not a significant factor in selecting or terminating an Adviser, and the Manager does not expect to recommend frequent changes of Advisers.
If the Manager appoints, dismisses or replaces an Adviser to a portfolio or adjusts the asset allocation among Advisers in a portfolio the affected portfolio may experience a period of transition during which the securities held in the portfolio may be repositioned in connection with the change in Adviser(s). A portfolio may not pursue its principal investment strategies during such a transition period and may incur increased brokerage commissions and other transaction costs in connection with the change(s). Generally, transitions may be implemented before or after the effective date of the new Adviser’s appointment as an adviser to the portfolio, and may be completed in several days to several weeks, depending on the particular circumstances of the transition. In addition, the past performance of a portfolio is not necessarily an indication of future performance. This may be particularly true for any portfolios that have undergone sub-adviser changes and/or changes to the investment objectives or policies of the portfolio.
The Manager has received an exemptive order from the SEC to permit it and the Trust’s Board of Trustees to appoint, dismiss and replace Advisers and to amend the advisory agreements between the Manager and the Advisers without obtaining shareholder approval. Accordingly, the Manager is able, subject to the approval of the Trust’s Board of Trustees, to appoint, dismiss and replace Advisers and to amend advisory agreements without obtaining shareholder approval. If a new Adviser is retained for a portfolio, shareholders will receive notice of such action. However, the Manager may not enter into an advisory agreement with an “affiliated person” of the Manager (as that term is defined in the 1940 Act) (the “Affiliated Adviser”), such as AllianceBernstein L.P., unless the advisory agreement with the Affiliated Adviser, including compensation, is also approved by the affected portfolio’s shareholders.
Each Acquiring Portfolio pays a fee to AXA Equitable for management services. The table below shows the annual rate of the management fees (as a percentage of each Acquiring Portfolio’s average daily net assets) that the Manager received in 2009 for managing each of the Acquiring Portfolios included in the table and the rate of the management fees waived by the Manager in 2009 in accordance with the provisions of the Expense Limitation Agreement, as defined below, between the Manager and the Trust with respect to certain of the Trust’s Portfolios, including the Growth PLUS Portfolio.
24
Acquiring Portfolio | Annual Rate Received | Rate of Fees Waived and Expenses Reimbursed | ||||||
Growth PLUS Portfolio | 0.50 | % | 0.00 | % | ||||
Large Cap Value Index Portfolio | 0.35 | % | N/A | |||||
The Advisers to the Acquiring Portfolios are paid by AXA Equitable. Changes to the advisory fees may be negotiated, which could result in an increase or decrease in the amount of the management fee retained by AXA Equitable, without shareholder approval. A discussion of the basis for the decision by the Board to approve the investment management agreements with AXA Equitable and the investment advisory agreement with an Adviser with respect to each Acquiring Portfolio is available in the Trust’s Annual or Semi-Annual Report to Shareholders for the fiscal year ended December 31 or semi-annual period ended June 30.
AXA Equitable also currently serves as the Administrator of the Trust. The administrative services provided to the Trust by AXA Equitable include, among others, coordination of the Trust’s audit, financial statements and tax returns; expense management and budgeting; legal administrative services and compliance monitoring; portfolio accounting services, including daily net asset value accounting; operational risk management; and oversight of the Trust’s proxy voting policies and procedures and anti-money laundering program. For administrative services, in addition to the management fee, the Large Cap Value Index Portfolio pays AXA Equitable an annual fee of $30,000 plus its proportionate share of an asset-based administration fee for the Trust. The Trust’s asset-based administration fee is equal to an annual rate of 0.12% of the first $3 billion of total Trust average daily net assets (exclusive of certain Portfolios noted below), 0.11% of the next $3 billion, 0.105% of the next $4 billion, 0.10% of the next $20 billion and 0.0975% thereafter. The excluded Portfolios are: EQ/ Franklin Core Balanced Portfolio, the EQ/AXA Franklin Small Cap Value Core Portfolio, the EQ/Mutual Large Cap Equity Portfolio, the EQ/Templeton Global Equity Portfolio, the EQ/Global Multi-Sector Equity Portfolio (together, the “PACTIVE Portfolios”), All Asset Allocation Portfolio, EQ/Franklin Templeton Allocation Portfolio, the Strategic Allocation Series Portfolios, the AXA Tactical Manager Portfolios, and the PLUS Portfolios. The PACTIVE Portfolios and the PLUS Portfolios, including the Growth PLUS Portfolio, each pay AXA Equitable an annual fee of $32,500 plus its proportionate share of an asset-based administration fee for these Portfolios, which is equal to an annual rate of 0.15% of the first $20 billion of the Portfolios’ aggregate average daily net assets, 0.125% of the next $5 billion of the Portfolios’ aggregate average daily net assets, and 0.10% of the Portfolios’ aggregate average daily net assets thereafter, and an additional $32,500 for each portion of the Portfolio for which separate administrative services are provided (e.g., portions of a Portfolio allocated to separate Advisers and/or managed in a discrete style). Pursuant to a sub-administration arrangement, the Manager has contracted with JPMorgan Investors Services Co. (“JPMorgan Services”) to provide the Trust with certain administrative services, including monitoring of portfolio compliance and portfolio accounting services.
In the interest of limiting through April 30, 2012 (unless the Board of Trustees consents to an earlier revision or termination of this arrangement) the expenses of the Growth PLUS Portfolio, the Manager has entered into an expense limitation agreement with the Trust with respect to the Portfolio (the “Expense Limitation Agreement”). Pursuant to that Expense Limitation Agreement, the Manager has agreed to make payments or waive its management, administrative and other fees to limit the expenses of the Growth PLUS Portfolio so that the annual operating expenses of the Portfolio (other than interest, taxes, brokerage commissions, fees and expenses of other investment companies in which the Portfolio invests, other expenditures which are capitalized in accordance with generally accepted accounting principles, and other extraordinary expenses not incurred in the ordinary course of each Portfolio’s business) do not exceed 0.75% for the Class IA shares and 1.00% for the Class IB shares.
25
AXA Equitable may be reimbursed the amount of any such payments or waivers in the future, provided that the payments or waivers are reimbursed within three years of the payment or waiver being made and the combination of the Growth PLUS Portfolio’s expense ratio and such reimbursements do not exceed its expense cap. If the actual expense ratio is less than the expense cap and AXA Equitable has recouped any eligible previous payments made, the Growth PLUS Portfolio will be charged such lower expenses.
Each Acquiring Portfolio’s investments are selected by one or more Advisers. The following table describes each Acquiring Portfolio’s Adviser(s), portfolio managers and each portfolio manager’s business experience. Information about the portfolio managers’ compensation, other accounts they manage and their ownership of securities of the Acquiring Portfolios is available in the Trust’s Statement of Additional Information dated May 1, 2010.
Acquiring Portfolio | Adviser and Portfolio Managers | Business Experience | ||
Growth PLUS Portfolio | AXA Equitable 1290 Avenue of the Americas New York, New York 10104
Portfolio Managers Steven M. Joenk Alwi Chan Kenneth T. Kozlowski | Steven M. Joenk and Alwi Chan are jointly and primarily responsible for determining the allocation of assets between the actively and passively managed portions of the Portfolio, overseeing the models used to manage the Portfolio, selecting and monitoring the Advisers for the Portfolios, and ensuring that asset allocations are consistent with the guidelines that have been approved by the Trust’s Board of Trustees.
Steven M. Joenk is President of AXA FMG and has held this position since 2004. Mr. Joenk also has served as Trustee and Chairman of the Trust’s Board of Trustees since 2004 and as the Trust’s Chief Executive Officer and President since 2002. Mr. Joenk has been managing the Portfolio since May 2009.
Alwi Chan is a Vice President of AXA FMG and has held this position since 2007. Prior to that, he served as an Assistant Vice President (2005-2007) and Senior Investment Analyst (2002-2005) of AXA Equitable. He also has served as a Vice President of the Trust since 2007. Mr. Chan has been managing the Portfolio since May 2009.
A committee of AXA FMG investment personnel manages the ETF Allocated Portion of the Portfolio. Kenneth Kozlowski serves as the lead portfolio manager of the committee with primary responsibility for day-to-day management of the ETF Allocated Portion. Xavier Poutas assists the lead portfolio manager with day-to-day management of the ETF Allocated Portion, but does not have joint and primary responsibility for management of the ETF Allocated Portion.
Kenneth T. Kozlowski, CFP®, CHFC, CLU has served as Vice President of AXA Equitable from February 2001 to present. He has had primary responsibility for the ETF Allocated Portions since May 25, 2007. Prior to June 1, 2007, Mr. Kozlowski served as Chief Financial Officer and Treasurer of the Trust since December 2002. Mr. Kozlowski has been managing the Portfolio since May 2009. |
26
Xavier Poutas, CFA® joined AXA FMG in October 2004 as a Fund Administrator and was involved in the implementation of the asset allocation strategy for AXA Equitable’s funds of funds. Mr. Poutas assists in portfolio analysis and portfolio performance evaluation with respect to the Portfolios.
| ||||
BlackRock Investment Management, LLC P.O. Box 9011 Princeton, NJ 08543-9011
Portfolio Managers Debra L. Jelilian Edward Corallo | The Index Allocated Portion of the Portfolio has been managed by Debra L. Jelilian and Edward Corallo since May 2010.
Ms. Jelilian has been a Managing Director of BlackRock Inc. since 2009. She was a Director of BlackRock from 2006 to 2009 and a Director of MLIM from 1999 to 2006. Ms. Jelilian has more than 5 years of portfolio management responsibility.
Mr. Corallo is a Managing Director of BlackRock, Inc. since 2009. He was a principal of Barclay’s Global Investors from 1998 to 2009. Mr. Corallo has more than five years of portfolio management responsibility.
| |||
Marsico Capital Management, LLC (“Marsico”) 1200 17th Street Suite 1600 Denver, CO 80202
Portfolio Managers Thomas F. Marsico A. Douglas Rao | Thomas F. Marsico is co-manager of the Active Allocated Portion of the Portfolio. Mr. Marsico has been Chief Executive Officer and Chief Investment Officer of Marsico since its inception in 1997. Mr. Marsico has over 20 years of experience as a securities analyst and portfolio manager. Mr. Marsico has been managing the Portfolio since May 2007.
A. Douglas Rao is a co-manager of the Active Allocated Portion of the Portfolio. Mr. Rao is a portfolio manager and senior analyst with Marsico. He joined Marsico in 2005, as an analyst. Mr. Rao has been a portfolio manager since July 2007. Mr. Rao has been managing the Portfolio since May 2010.
| |||
| Large Cap Value Index Portfolio | SSgA Funds Management, Inc. (“SSgA FM”) State Street Financial Center One Lincoln Street Boston, MA 02111
Portfolio Managers Lynn Blake John Tucker | The Portfolio is managed by SSgA’s Global Structured Products Group. Portfolio managers Lynn Blake and John Tucker have been jointly and primarily responsible for the day-to-day management of the Portfolio since December 2008.
Lynn Blake is a Principal of SSgA FM, Senior Managing Director of State Street Global Advisors and the Head of Non-US Markets in the Global Structured Products Group. Ms. Blake joined SSgA in 1987, and is currently responsible for overseeing the management of all non-US equity index strategies as well as serving as portfolio manager for several non-US equity index portfolios.
John Tucker is a Principal of SSgA FM, Senior Managing Director of State Street Global Advisors and Head of US Equity Markets in the Global Structured Products Group. He is also responsible for all Derivative Strategies and Exchange Traded Funds. Mr. Tucker manages numerous index strategies and works closely with the other Unit Heads in the group. Previously, Mr. Tucker was head of the Structured Products group in SSgA’s London office, where he was responsible for the management of all index strategies in their second largest investment center. Mr. Tucker joined State Street in 1988. |
27
Fund Distribution Arrangements
The Trust offers two classes of shares on behalf of each Acquiring Portfolio: Class IA shares and Class IB shares. AXA Advisors, LLC (“AXA Advisors”) and AXA Distributors, LLC (“AXA Distributors”) serve as the co-distributors for the Class IA and Class IB shares of the Trust. Both classes of shares are offered and redeemed at their net asset value without any sales load. AXA Advisors and AXA Distributors are affiliates of AXA Equitable. Both AXA Advisors and AXA Distributors are registered as broker-dealers under the Securities Exchange Act of 1934, as amended, and are members of the Financial Industry Regulatory Authority (“FINRA”).
The Trust has adopted a Distribution Plan pursuant to Rule 12b-1 under the 1940 Act for the Trust’s Class IB shares. Under the Class IB Distribution Plan, the Class IB shares of the Trust are charged an annual fee to compensate each of the co-distributors for promoting, selling and servicing shares of the Acquiring Portfolios. The maximum annual distribution and/or service (12b-1) fee for each Acquiring Portfolio’s Class IB shares is 0.25% of the average daily net assets attributable to Class IB shares. Because these fees are paid out of an Acquiring Portfolio’s assets on an on going basis, over time, the fees will increase your cost of investing and may cost you more than other types of charges.
The co-distributors may receive payments from certain Advisers of the Acquiring Portfolios or their affiliates to help defray expenses for sales meetings or seminar sponsorships that may relate to the Contracts and/or the Advisers’ respective Acquiring Portfolios. These sales meetings or seminar sponsorships may provide the Advisers with increased access to persons involved in the distribution of the Contracts. The co-distributors also may receive marketing support from the Advisers in connection with the distribution of the Contracts.
Payments to Broker-Dealers and Other Financial Intermediaries
The Portfolios are not sold directly to the general public but instead is offered as an underlying investment option for Contracts, retirement plans and other eligible investments. Each Portfolio and its related companies may make payments to a sponsoring insurance company (or its affiliates) or other financial intermediary for distribution and/or other services. These payments may create a conflict of interest by influencing the insurance company or other financial intermediary and your financial adviser to recommend the Portfolio over another investment or by influencing an insurance company to include the Portfolio as an underlying investment option in the Contract. The prospectus (or other offering document) for your Contract may contain additional information about these payments.
Each Portfolio’s shares are currently sold only to insurance company separate accounts in connection with Contracts issued by AXA Equitable, AXA Life and Annuity Company, other affiliated or unaffiliated insurance companies and to The AXA Equitable 401(k) Plan. Shares also may be sold to other tax-qualified retirement plans, to other portfolios managed by AXA Equitable that currently sell their shares to such accounts and plans and to other eligible investors. The Portfolio does not have minimum initial or subsequent investment requirements. Shares of the Portfolio are redeemable on any business day upon receipt of a request. All redemption requests will be processed and payment with respect thereto will normally be made within seven days after tender. Please refer to your Contract prospectus for more information on purchasing and redeeming Portfolio shares.
28
All shares are purchased and sold at their net asset value without any sales load. All redemption requests will be processed and payment with respect thereto will normally be made within seven days after tender. The Acquiring Portfolios reserve the right to suspend or change the terms of purchasing or selling shares.
The Trust may suspend the right of redemption for any period or postpone payment for more than seven days when the NYSE is closed (other than a weekend or holiday) or when trading is restricted by the SEC or the SEC declares that an emergency exists. Redemptions may also be suspended and payments may be postponed for more than seven days during other periods permitted by the SEC. An Acquiring Portfolio may pay the redemption price in whole or part by a distribution in kind of readily marketable securities in lieu of cash or may take up to seven days to pay a redemption request in order to raise capital, when it is detrimental for an Acquiring Portfolio to make cash payments as determined in the sole discretion of AXA Equitable.
Frequent transfers or purchases and redemptions of Acquiring Portfolio Shares, including market timing and other program trading or short-term trading strategies, may be disruptive to the Acquiring Portfolios. Excessive purchases and redemptions of shares of an Acquiring Portfolio may adversely affect the Acquiring Portfolio’s performance and the interests of long-term investors by requiring the Acquiring Portfolio to maintain larger amounts of cash or to liquidate portfolio holdings at a disadvantageous time or price. For example, when market timing occurs, an Acquiring Portfolio may have to sell its holdings to have the cash necessary to redeem the market timer’s shares. This can happen when it is not advantageous to sell any securities, so the Acquiring Portfolio’s performance may be hurt. When large dollar amounts are involved, market timing can also make it difficult to use long-term investment strategies because an Acquiring Portfolio cannot predict how much cash it will have to invest. In addition, disruptive transfers or purchases and redemptions of Acquiring Portfolio shares may impede efficient portfolio management and impose increased transaction costs, such as brokerage costs, by requiring the portfolio manager to affect more frequent purchases and sales of portfolio securities. Similarly, an Acquiring Portfolio may bear increased administrative costs as a result of the asset level and investment volatility that accompanies patterns of excessive or short-term trading. Acquiring Portfolios (or underlying ETFs in which an Acquiring Portfolio invests) that invest a significant portion of their assets in foreign securities, in securities of small- and mid-capitalization companies, or in high-yield securities tend to be subject to the risks associated with market timing and short-term trading strategies to a greater extent than funds that do not. Securities trading in overseas markets present time zone arbitrage opportunities when events affecting portfolio securities values occur after the close of the overseas market but prior to the close of the U.S. market. Securities of small- and mid-capitalization companies and high-yield securities also present arbitrage opportunities because the market for such securities may be less liquid than the market for the securities of larger companies and higher quality bonds which could result in pricing inefficiencies.
The Trust’s Board of Trustees has adopted policies and procedures regarding disruptive transfer activity. The Trust and the Acquiring Portfolios discourage frequent purchases and redemptions of portfolio shares by Contractholders and will not make special arrangements to accommodate such transactions in Acquiring Portfolio Shares. As a general matter, each Acquiring Portfolio and the Trust reserve the right to reject a transfer that they believe, in their sole discretion is disruptive (or potentially disruptive) to the management of the Acquiring Portfolio.
The Trust’s policies and procedures seek to discourage what it considers to be disruptive trading activity. The Trust seeks to apply its policies and procedures to all Contractholders uniformly, including omnibus accounts. It should be recognized, however, that such policies and procedures are subject to limitations:
| • | They do not eliminate the possibility that disruptive transfer activity, including market timing, will occur or that portfolio performance will be affected by such activity. |
| • | The design of such policies and procedures involves inherently subjective judgments, which AXA Equitable, on behalf of the Trust, seeks to make in a fair and reasonable manner consistent with the interests of all Contractholders. |
| • | The limits on AXA Equitable’s ability to monitor certain potentially disruptive transfer activity means that some Contractholders may be treated differently than others, resulting in the risk that some Contractholders may be able to engage in frequent transfer activity while others will bear the effect of that frequent transfer activity. |
If AXA Equitable, on behalf of the Trust, determines that a Contractholder’s transfer patterns among the Trust’s portfolios are disruptive to the Trust’s portfolios, it may, among other things, restrict the availability of personal
29
telephone requests, facsimile transmissions, automated telephone services, internet services or any electronic transfer services. AXA Equitable may also refuse to act on transfer instructions of an agent acting under a power of attorney who is acting on behalf of more than one owner. In making these determinations, AXA Equitable may consider the combined transfer activity of Contracts that it believes are under common ownership, control or direction.
The Trust currently considers transfers into and out of (or vice versa) the same portfolio within a five-business day period as potentially disruptive transfer activity. In order to reduce disruptive activity, it monitors the frequency of transfers, including the size of transfers in relation to portfolio assets, in each portfolio. The Trust aggregates inflows and outflows for each portfolio on a daily basis. When a potentially disruptive transfer into or out of a portfolio occurs on a day when the portfolio’s net inflows and outflows exceed an established monitoring threshold, AXA Equitable sends a letter to the Contractholder explaining that there is a policy against disruptive transfer activity and that if such activity continues, AXA Equitable may take action to restrict the availability of voice, fax and automated transaction services. If such Contractholder is identified a second time as engaging in potentially disruptive transfer activity, AXA Equitable currently restricts the availability of voice, fax and automated transaction services. AXA Equitable currently applies such action for the remaining life of each affected Contract. Because AXA Equitable exercises discretion in determining whether or not to take the actions discussed above, some Contractholders may be treated differently than others, resulting in the risk that some Contractholders may be able to engage in frequent transfer activity while others will bear the effect of the frequent transfer activity. Although AXA Equitable currently provides a letter to Contractholders who have engaged in disruptive transfer activity of its intention to restrict access to communication services, AXA Equitable may not continue to provide such letters. Consistent with seeking to discourage potentially disruptive transfer activity, AXA Equitable or the Trust may also, in its sole discretion and without further notice, change what it considers potentially disruptive transfer activity and its monitoring procedures and thresholds, as well as change its procedures to restrict this activity You should consult the Contract prospectus that accompanies this Prospectus for information on other specific limitations on the transfer privilege.
The above policies and procedures with respect to frequent transfers or purchases and redemptions of portfolio shares also apply to retirement plan participants, but do not apply to AXA Equitable’s funds of funds.
Notwithstanding our efforts, we may be unable to detect or deter market timing activity by certain persons, which can lead to disruption of management of, and excess costs to, a particular Acquiring Portfolio.
How Portfolio Shares Are Priced
“Net asset value” is the price of one share of a portfolio of the Trust, including an Acquiring Portfolio, without a sales charge, and is calculated each business day using the following formula:
Net Asset Value = | Total market value of securities + Cash and other assets - Liabilities | |
Number of outstanding shares |
The net asset value of portfolio shares is determined according to this schedule:
| • | A share’s net asset value is determined as of the close of regular trading on the NYSE on the days it is open for trading. This is normally 4:00 p.m. Eastern time. |
| • | The price for purchasing or redeeming a share will be based upon the net asset value next calculated after an order is received and accepted by a portfolio or its designated agent. |
| • | A portfolio heavily invested in foreign securities may have net asset value changes on days when shares cannot be purchase or sold because foreign securities sometimes trade on days when a portfolio’s shares are not priced. |
30
Generally, portfolio securities are valued as follows:
| • | Equity securities (including securities issued by ETFs) – most recent sales price or official closing price or if there is no sale or official closing price, latest available bid price. |
| • | Debt securities – based upon pricing service valuations. |
| • | Securities traded on foreign exchanges – most recent sales or bid price on the foreign exchange or market, unless a significant event or circumstance occurs after the close of that market or exchange that will materially affect its value. In that case, fair value as determined by or under the direction of the Trust’s Board of Trustees at the close of regular trading on the NYSE. Foreign currency is converted into U.S. dollar equivalent daily at current exchange rates. |
| • | Options – last sales price or, if not available, previous day’s sales price. If the bid price is higher or the asked price is lower than the last sale price, the higher bid or lower asked price may be used. Options not traded on an exchange or actively traded are valued according to fair value methods. |
| • | Futures – last sales price or, if there is no sale, latest available bid price. |
| • | Investment Company Securities – shares of open-end mutual funds (other than ETFs) held by a portfolio will be valued at the net asset value of the shares of such funds as described in these funds’ prospectuses. |
| • | Other Securities – other securities and assets for which market quotations are not readily available or for which valuation cannot be provided are valued at their fair value as determined in good faith by or under the direction of the Board of Trustees of the Trust. For example, a security whose trading has been halted during the trading day may be fair valued based on the available information at the time of the close of the trading market. Similarly, securities for which there is no ready market (e.g., securities of certain small capitalization issuers, high yield securities and certain issuers located in emerging markets) also may be fair valued. Some methods for valuing these securities may include: fundamental analysis (earnings multiple, etc.), matrix pricing, discounts from market prices of similar securities, or discounts applied due to the nature and duration of restrictions on the disposition of the securities. |
Events or circumstances affecting the values of portfolio securities that occur between the closing of their principal markets and the time the net asset value is determined, such as foreign securities trading on foreign exchanges that close before the time the net asset value of portfolio shares is determined, may be reflected in the Trust’s calculations of net asset values for each applicable portfolio when the Trust deems that the particular event or circumstance would materially affect such portfolio’s net asset value. Such events or circumstances may be company specific, such as an earning report, country or region specific, such as a natural disaster, or global in nature. Such events or circumstances also may include price movements in the U.S. securities markets.
The effect of fair value pricing as described above is that securities may not be priced on the basis of quotations from the primary market in which they are traded, but rather may be priced by another method that the Trust’s Board of Trustees believes reflects fair value. As such, fair value pricing is based on subjective judgments and it is possible that fair value may differ materially from the value realized on a sale. This policy is intended to assure that the portfolio’s net asset value fairly reflects security values as of the time of pricing. Also, fair valuation of a portfolio’s securities can serve to reduce arbitrage opportunities available to short-term traders, but there is no assurance that fair value pricing policies will prevent dilution of the portfolio’s NAV by those traders.
Dividends and Other Distributions
The Acquiring Portfolios generally distribute most or all of their net investment income and their net realized gains, if any, annually. Dividends and other distributions by an Acquiring Portfolio are automatically reinvested at net asset value in shares of that Acquiring Portfolio.
Federal Income Tax Considerations
Each of the Trust’s Portfolios currently only sells its shares to insurance company separate accounts, tax-qualified retirement plans and other eligible investors. Accordingly, distributions an Acquiring Portfolio makes of its net investment income and net realized gains
31
— most or all of which it intends to distribute annually — and redemptions or exchanges of that Portfolio’s shares generally will not be taxable to its shareholders (or to the holders of underlying Contracts or plan participants or beneficiaries). See the prospectus for your Contract for further tax information.
Each Acquiring Portfolio is treated as a separate corporation, and intends to continue to qualify to be treated as a regulated investment company, for federal tax purposes. An Acquiring Portfolio will be so treated if it meets specified federal income tax rules, including requirements regarding types of investments, limits on investments, types of income, and distributions. A regulated investment company that satisfies those requirements is not taxed at the entity (Portfolio) level to the extent it passes through its net income and gains to its shareholders by making distributions. Although the Trust intends that each Acquiring Portfolio will be operated to have no federal tax liability, if an Acquiring Portfolio does have any federal tax liability, that would hurt its investment performance. Also, an Acquiring Portfolio that invests in foreign securities or holds foreign currencies could be subject to foreign taxes that would reduce its investment performance.
It is important for each Acquiring Portfolio to maintain its regulated investment company status (and to satisfy certain other requirements) because the shareholders of an Acquiring Portfolio that are insurance company separate accounts will then be able to use a “look-through” rule in determining whether the Contracts indirectly funded by the Portfolio meet the investment diversification rules for separate accounts. If an Acquiring Portfolio failed to meet those diversification rules, owners of non-pension plan Contracts funded through that Portfolio would be taxed immediately on the accumulated investment earnings under their Contracts and would lose any benefit of tax deferral. AXA Equitable, in its capacity as Manager and administrator of the Trust, therefore carefully monitors compliance with all of the regulated investment company rules and separate account investment diversification rules.
Contractholders seeking to more fully understand the tax consequences of their investment should consult with their tax advisers or the insurance company that issued their Contract or refer to their Contract prospectus.
The following financial highlights tables are intended to help you understand the financial performance of each Acquiring Portfolio’s Class IA and Class IB shares. The financial information in the tables is for the past five years (or, if shorter, the period of the Portfolio’s operations). The financial information below for the Class IA and Class IB shares of each Acquiring Portfolio has been derived from the financial statements of each Acquiring Portfolio, which have been audited by PricewaterhouseCoopers LLP (“PwC”), an independent registered public accounting firm. PwC’s report on each Acquiring Portfolio’s financial statements as of December 31, 2009 and the financial statements themselves appear in the Trust’s Annual Report.
Certain information reflects financial results for a single share. The total returns in the tables represent the rate that a shareholder would have earned (or lost) on an investment in each Acquiring Portfolio (assuming reinvestment of all dividends and other distributions). The total return figures shown below do not reflect any Separate Account or Contract fees and charges. The total return figures would be lower if they did reflect such fees and charges. The information should be read in conjunction with the financial statements contained in the Trust’s Annual Report, which are incorporated by reference into the Trust’s Statement of Additional Information relating to this Proxy Statement/Prospectus and available upon request.
32
EQ ADVISORS TRUST
EQ/LARGE CAP GROWTH PLUS PORTFOLIO
FINANCIAL HIGHLIGHTS
| Six Months Ended June 30, 2010 (Unaudited) | Year Ended December 31, | |||||||||||||||||||||||
| Class IA | 2009 | 2008 | 2007 | 2006 | 2005 | |||||||||||||||||||
Net asset value, beginning of period | $ | 14.95 | $ | 11.32 | $ | 18.12 | $ | 15.74 | $ | 14.57 | $ | 13.32 | ||||||||||||
Income (loss) from investment operations: | ||||||||||||||||||||||||
Net investment income (loss) | 0.05 | (e) | 0.13 | (e) | 0.14 | (e) | 0.10 | — | #(e) | (0.01 | )(e) | |||||||||||||
Net realized and unrealized gain (loss) on investments, futures and foreign currency transactions | (1.40 | ) | 3.71 | (6.89 | ) | 2.39 | 1.17 | 1.26 | ||||||||||||||||
Total from investment operations | (1.35 | ) | 3.84 | (6.75 | ) | 2.49 | 1.17 | 1.25 | ||||||||||||||||
Less distributions: | ||||||||||||||||||||||||
Dividends from net investment income | — | (0.21 | ) | (0.05 | ) | (0.11 | ) | — | — | |||||||||||||||
Net asset value, end of period | $ | 13.60 | $ | 14.95 | $ | 11.32 | $ | 18.12 | $ | 15.74 | $ | 14.57 | ||||||||||||
Total return (b) | (9.03 | )% | 33.93 | % | (37.28 | )% | 15.81 | % | 8.03 | % | 9.38 | % | ||||||||||||
Ratios/Supplemental Data: | ||||||||||||||||||||||||
Net assets, end of period (000’s) | $ | 851,739 | $ | 939,856 | $ | 2,408,216 | $ | 7,371 | $ | 4,679 | $ | 3,304 | ||||||||||||
Ratio of expenses to average net assets: | ||||||||||||||||||||||||
After waivers and reimbursements (a) | 0.71 | % | 0.70 | % | 0.73 | % | 0.73 | % | 0.77 | % | 0.71 | % | ||||||||||||
After waivers, reimbursements and fees paid indirectly (a) | 0.71 | % | 0.69 | % | 0.73 | % | 0.58 | % | 0.75 | % | 0.68 | % | ||||||||||||
Before waivers, reimbursements and fees paid indirectly (a) | 0.71 | % | 0.70 | % | 0.74 | % | 0.74 | % | 0.77 | % | 0.71 | % | ||||||||||||
Ratio of net investment income (loss) to average net assets: | ||||||||||||||||||||||||
After waivers and reimbursements (a) | 0.66 | % | 1.10 | % | 0.18 | % | 0.49 | % | (0.04 | )% | (0.11 | )% | ||||||||||||
After waivers, reimbursements and fees paid indirectly (a) | 0.66 | % | 1.10 | % | 0.18 | % | 0.64 | % | (0.02 | )% | (0.08 | )% | ||||||||||||
Before waivers, reimbursements and fees paid indirectly (a) | 0.66 | % | 1.10 | % | 0.17 | % | 0.49 | % | (0.04 | )% | (0.11 | )% | ||||||||||||
Portfolio turnover rate | 27 | % | 43 | % | 33 | % | 136 | % | 130 | % | 97 | % | ||||||||||||
33
EQ ADVISORS TRUST
EQ/LARGE CAP GROWTH PLUS PORTFOLIO
FINANCIAL HIGHLIGHTS (Continued)
| Six Months Ended June 30, 2010 (Unaudited) | Year Ended December 31, | |||||||||||||||||||||||
| Class IB | 2009 | 2008 | 2007 | 2006 | 2005 | |||||||||||||||||||
Net asset value, beginning of period | $ | 14.59 | $ | 10.95 | $ | 17.75 | $ | 15.40 | $ | 14.29 | $ | 13.11 | ||||||||||||
Income (loss) from investment operations: | ||||||||||||||||||||||||
Net investment income (loss) | 0.03 | (e) | 0.12 | (e) | 0.07 | (e) | 0.06 | (0.04 | )(e) | (0.04 | )(e) | |||||||||||||
Net realized and unrealized gain (loss) on investments, futures and foreign currency transactions | (1.40 | ) | 3.68 | (6.85 | ) | 2.35 | 1.15 | 1.22 | ||||||||||||||||
Total from investment operations | (1.37 | ) | 3.80 | (6.78 | ) | 2.41 | 1.11 | 1.18 | ||||||||||||||||
Less distributions: | ||||||||||||||||||||||||
Dividends from net investment income | — | (0.16 | ) | (0.02 | ) | (0.06 | ) | — | — | |||||||||||||||
Net asset value, end of period | $ | 13.22 | $ | 14.59 | $ | 10.95 | $ | 17.75 | $ | 15.40 | $ | 14.29 | ||||||||||||
Total return (b) | (9.39 | )% | 34.77 | % | (38.28 | )% | 15.66 | % | 7.77 | % | 9.00 | % | ||||||||||||
Ratios/Supplemental Data: | ||||||||||||||||||||||||
Net assets, end of period (000’s) | $ | 591,511 | $ | 679,158 | $ | 537,379 | $ | 978,032 | $ | 860,495 | $ | 916,611 | ||||||||||||
Ratio of expenses to average net assets: | ||||||||||||||||||||||||
After waivers and reimbursements (a) | 0.96 | % | 0.95 | %(c) | 0.98 | %(c) | 0.98 | %(c) | 1.02 | %(c) | 0.96 | % | ||||||||||||
After waivers, reimbursements and fees paid indirectly (a) | 0.96 | % | 0.94 | % | 0.98 | %(c) | 0.83 | % | 1.00 | %(c) | 0.93 | % | ||||||||||||
Before waivers, reimbursements and fees paid indirectly (a) | 0.96 | % | 0.95 | %(c) | 0.99 | %(c) | 0.99 | % | 1.02 | %(c) | 0.96 | % | ||||||||||||
Ratio of net investment income (loss) to average net assets: | ||||||||||||||||||||||||
After waivers and reimbursements (a) | 0.44 | % | 0.94 | % | 0.48 | % | 0.24 | % | (0.30 | )% | (0.36 | )% | ||||||||||||
After waivers, reimbursements and fees paid indirectly (a) | 0.44 | % | 0.95 | % | 0.49 | % | 0.39 | % | (0.28 | )% | (0.33 | )% | ||||||||||||
Before waivers, reimbursements and fees paid indirectly (a) | 0.44 | % | 0.94 | % | 0.47 | % | 0.23 | % | (0.30 | )% | (0.36 | )% | ||||||||||||
Portfolio turnover rate | 27 | % | 43 | % | 33 | % | 136 | % | 130 | % | 97 | % | ||||||||||||
| # | Per share amount is less than $0.01. |
| (a) | Ratios for periods less than one year are annualized. |
| (b) | Total returns for periods less than one year are not annualized. |
| (c) | Reflects overall fund ratios for non-class specific expense. |
| (e) | Net investment income per share is based on average shares outstanding. |
34
EQ ADVISORS TRUST
EQ/LARGE CAP VALUE INDEX PORTFOLIO
FINANCIAL HIGHLIGHTS
| Six Months Ended June 30, 2010 (Unaudited) | Year Ended December 31, | October 3, 2005* to December 31, 2005 | ||||||||||||||||||||||
| Class IA | 2009 | 2008 | 2007 | 2006 | ||||||||||||||||||||
Net asset value, beginning of period | $ | 4.66 | $ | 4.25 | $ | 10.32 | $ | 11.19 | $ | 10.45 | $ | 10.00 | ||||||||||||
Income (loss) from investment operations: | ||||||||||||||||||||||||
Net investment income (loss) | 0.04 | (e) | 0.09 | (e) | 0.12 | (e) | 0.03 | (e) | 0.03 | (e) | 0.01 | (e) | ||||||||||||
Net realized and unrealized gain (loss) on investments and futures | (0.29 | ) | 0.73 | (5.88 | ) | (0.67 | ) | 0.71 | 0.47 | |||||||||||||||
Total from investment operations | (0.25 | ) | 0.82 | (5.76 | ) | (0.64 | ) | 0.74 | 0.48 | |||||||||||||||
Less distributions: | ||||||||||||||||||||||||
Dividends from net investment income | — | (0.41 | ) | (0.11 | ) | — | — | # | (0.03 | ) | ||||||||||||||
Distributions from net realized gains | — | — | (0.20 | ) | (0.23 | ) | — | # | — | |||||||||||||||
Total dividends and distributions | — | (0.41 | ) | (0.31 | ) | (0.23 | ) | — | # | (0.03 | ) | |||||||||||||
Net asset value, end of period | $ | 4.41 | $ | 4.66 | $ | 4.25 | $ | 10.32 | $ | 11.19 | $ | 10.45 | ||||||||||||
Total return (b) | (5.36 | )% | 19.37 | % | (56.56 | )% | (5.70 | )% | 7.12 | % | 4.80 | % | ||||||||||||
Ratios/Supplemental Data: | ||||||||||||||||||||||||
Net assets, end of period (000’s) | $ | 2,838 | $ | 1,746 | $ | 1,187 | $ | 1,246 | $ | 112 | $ | 105 | ||||||||||||
Ratio of expenses to average net assets: | ||||||||||||||||||||||||
After waivers (a) | 0.60 | % | 0.50 | % | 0.75 | % | 0.75 | % | 0.75 | % | 0.75 | % | ||||||||||||
After waivers and fees paid indirectly (a) | 0.58 | % | 0.49 | % | 0.45 | % | 0.72 | % | 0.72 | % | 0.74 | % | ||||||||||||
Before waivers and fees paid indirectly (a) | 0.60 | % | 0.50 | % | 0.83 | % | 0.82 | % | 0.84 | % | 3.64 | % | ||||||||||||
Ratio of net investment income to average net assets: | ||||||||||||||||||||||||
After waivers (a) | 1.79 | % | 2.03 | % | 1.50 | % | 0.28 | % | 0.21 | % | 0.35 | % | ||||||||||||
After waivers and fees paid indirectly (a) | 1.80 | % | 2.04 | % | 1.80 | % | 0.30 | % | 0.24 | % | 0.36 | % | ||||||||||||
Before waivers and fees paid indirectly (a) | 1.79 | % | 2.03 | % | 1.42 | % | 0.21 | % | 0.12 | % | (2.54 | )% | ||||||||||||
Portfolio turnover rate | 26 | % | 100 | % | 82 | % | 29 | % | 9 | % | 0 | %‡ | ||||||||||||
35
EQ ADVISORS TRUST
EQ/LARGE CAP VALUE INDEX PORTFOLIO
FINANCIAL HIGHLIGHTS (Continued)
| Six Months Ended June 30, 2010 (Unaudited) | Year Ended December 31, | October 3, 2005* to December 31, 2005 | ||||||||||||||||||||||
| Class IB | 2009 | 2008 | 2007 | 2006 | ||||||||||||||||||||
Net asset value, beginning of period | $ | 4.65 | $ | 4.23 | $ | 10.29 | $ | 11.18 | $ | 10.47 | $ | 10.00 | ||||||||||||
Income (loss) from investment operations: | ||||||||||||||||||||||||
Net investment income (loss) | 0.03 | (e) | 0.08 | (e) | 0.10 | (e) | (0.01 | )(e) | — | #(e) | — | #(e) | ||||||||||||
Net realized and unrealized gain (loss) on investments and futures | (0.29 | ) | 0.73 | (5.86 | ) | (0.65 | ) | 0.71 | 0.47 | |||||||||||||||
Total from investment operations | (0.26 | ) | 0.81 | (5.76 | ) | (0.66 | ) | 0.71 | 0.47 | |||||||||||||||
Less distributions: | ||||||||||||||||||||||||
Dividends from net investment income | — | (0.39 | ) | (0.10 | ) | — | — | # | — | # | ||||||||||||||
Distributions from net realized gains | — | — | (0.20 | ) | (0.23 | ) | — | # | — | |||||||||||||||
Total dividends and distributions | — | (0.39 | ) | (0.30 | ) | (0.23 | ) | — | # | — | # | |||||||||||||
Net asset value, end of period | $ | 4.39 | $ | 4.65 | $ | 4.23 | $ | 10.29 | $ | 11.18 | $ | 10.47 | ||||||||||||
Total return (b) | (5.59 | )% | 19.34 | % | (56.75 | )% | (5.88 | )% | 6.81 | % | 4.74 | % | ||||||||||||
Ratios/Supplemental Data: | ||||||||||||||||||||||||
Net assets, end of period (000’s) | $ | 117,775 | $ | 122,699 | $ | 87,602 | $ | 213,065 | $ | 203,514 | $ | 32,087 | ||||||||||||
Ratio of expenses to average net assets: | ||||||||||||||||||||||||
After waivers (a) | 0.85 | % | 0.75 | %(c) | 1.00 | % | 1.00 | % | 1.00 | % | 1.00 | % | ||||||||||||
After waivers and fees paid indirectly (a) | 0.83 | % | 0.74 | %(c) | 0.70 | %(c) | 0.97 | %(c) | 0.97 | %(c) | 0.99 | % | ||||||||||||
Before waivers and fees paid indirectly (a) | 0.85 | % | 0.75 | %(c) | 1.08 | % | 1.07 | % | 1.09 | % | 3.89 | % | ||||||||||||
Ratio of net investment income to average net assets: | ||||||||||||||||||||||||
After waivers (a) | 1.44 | % | 1.97 | % | 1.16 | % | (0.07 | )% | (0.05 | )% | 0.10 | % | ||||||||||||
After waivers and fees paid indirectly (a) | 1.46 | % | 1.97 | % | 1.37 | % | (0.05 | )% | (0.01 | )% | 0.11 | % | ||||||||||||
Before waivers and fees paid indirectly (a) | 1.44 | % | 1.97 | % | 1.07 | % | (0.15 | )% | (0.14 | )% | (2.79 | )% | ||||||||||||
Portfolio turnover rate | 26 | % | 100 | % | 82 | % | 29 | % | 9 | % | 0 | %‡ | ||||||||||||
| * | Commencement of Operations. |
| # | Per share amount is less than $0.01. |
| ‡ | Amount is less than 1%. |
| (a) | Ratios for periods less than one year are annualized. |
| (b) | Total returns for periods less than one year are not annualized. |
| (c) | Reflects overall fund ratios for non-class specific expense. |
| (e) | Net investment income per share is based on average shares outstanding. |
36
The following information applies to the Reorganization of each Acquired Portfolio and Acquiring Portfolio for which you are entitled to vote.
Shareholders with amounts allocated to the Acquired Portfolios at the close of business on January 31, 2011 (the “Record Date”) will be entitled to be present and vote or give voting instructions for the applicable Acquired Portfolio at the Meeting with respect to their shares or shares attributable to their Contracts as of the Record Date.
Each whole share of the Acquired Portfolios is entitled to one vote as to each matter with respect to which it is entitled to vote, as described above, and each fractional share is entitled to a proportionate fractional vote. Votes cast by proxy or in person by a shareholder at the Meeting will be counted by persons appointed as inspectors of election for the Meeting. The table below shows the number of outstanding shares of the Acquired Portfolios as of the Record Date that are entitled to vote at the Meeting. Together, the Insurance Companies owned of record more than 95% of those shares.
Portfolio | Total Number | Number of Class IA | Number of Class IB | |||
Capital Guardian Growth Portfolio | ||||||
Lord Abbett Growth and Income Portfolio |
Approval of a Plan with respect to a Reorganization involving an Acquired Portfolio will require the affirmative vote of (i) 67% or more of the voting securities of the Portfolio present at the Meeting, if the holders of more than 50% of its outstanding voting securities are present or represented by proxy, or (ii) more than 50% of its outstanding voting securities, whichever is less. The presence, in person or by proxy, of at least one-third of the shares of an Acquired Portfolio entitled to vote at the Meeting will constitute a quorum for the transaction of business at the Meeting with respect to an Acquired Portfolio. If a proxy card is not marked to indicate voting instructions but is signed, dated and returned, it will be treated as an instruction to vote the shares in favor of the proposal. If a shareholder abstains from voting as to any matter, the shares represented by the abstention will be deemed present at the Meeting for purposes of determining a quorum but will not be voted and, therefore, will have the effect of a vote against the Reorganization(s).
To the knowledge of the Trust, as of the Record Date, the officers and Trustees owned, as a group, less than 1% of the shares of each Portfolio.
Each Insurance Company may be deemed to be a control person of each Portfolio by virtue of its direct or indirect ownership of more than 25% of the shares of each Portfolio. In addition, AXA Equitable may be deemed to be a control person of the Trust by virtue of its direct or indirect ownership of more than 95% of the Trust’s shares. Shareholders owning 25% or more of the outstanding shares of a Portfolio may be able to determine the outcome of most issues that are submitted to shareholders for a vote. As of the Record Date, except as set forth in Appendix C, to the Trust’s knowledge, (1) no person, other than the Insurance Companies, owned beneficially or of record 5% or more of the outstanding Class IA or Class IB shares of a Portfolio and (2) no Contractholder owned Contracts entitling such Contractholder to give voting instructions regarding more than 5% of the outstanding Class IA or Class IB shares of a Portfolio.
37
Solicitation of Proxies and Voting Instructions
Solicitation of proxies and voting instructions is being made primarily by the mailing of this Notice and Proxy Statement/Prospectus with its enclosures on or about February , 2011. In addition to the solicitation of proxies and voting instructions by mail, officers, agents and employees of AXA Equitable and the Trust and their affiliates, without additional compensation, may solicit proxies and voting instructions in person or by telephone, telegraph, fax, the internet or oral communication.
Contractholders with amounts allocated to an Acquired Portfolio on the Record Date will be entitled to be present and give voting instructions for the Acquired Portfolio at the Meeting with respect to shares held indirectly as of the Record Date, to the extent required by applicable law. An Insurance Company will vote the shares for which it receives timely voting instructions from Contractholders in accordance with those instructions. An Insurance Company will vote shares attributable to Contracts for which it is the Contractholder “FOR” each proposal. Shares in each investment division of a Separate Account for which an Insurance Company receives a voting instruction card that is signed, dated and timely returned but is not marked to indicate voting instructions will be treated as an instruction to vote the shares in favor of the applicable proposal. Shares in each investment division of a Separate Account for which an Insurance Company receives no timely voting instructions from Contractholders, or which are attributable to amounts retained by AXA Equitable as surplus or seed money, will be voted by the applicable Insurance Company “FOR” or “AGAINST” approval of the proposal, or as an abstention, in the same proportion as the shares for which Contractholders (other the Insurance Company) have provided voting instructions to the Insurance Company.
Voting instructions executed by a Contractholder may be revoked at any time prior to an Insurance Company voting the shares represented thereby by the Contractholder providing the Insurance Company with a properly executed written revocation of such voting instructions, or by the Contractholder providing the Insurance Company with proper later-dated voting instructions by voting instruction card, telephone or the Internet. In addition, any Contractholder who attends the Meeting in person may provide voting instructions by a voting instruction card at the Meeting, thereby canceling any voting instruction previously given. Proxies executed by an Insurance Company may be revoked at any time before they are exercised by a written revocation duly received, by properly executing a later-dated proxy or by attending the Meeting and voting in person.
An Insurance Company will vote as directed by the voting instruction card, but in the absence of voting instructions in any voting instruction card that is signed and returned, an Insurance Company intends to vote “FOR” the applicable proposal and may vote in its discretion with respect to other matters not now known to the Board that may be presented at the Meeting.
The cost of the Meeting, including the cost of solicitation of proxies and voting instructions, will be borne by the Acquired Portfolios up to an aggregate maximum of $100,000, with AXA Equitable bearing any such expenses in excess of this amount. The principal solicitation will be by mail, but voting instructions also may be solicited by telephone, telegraph, fax, personal interview by officers or agents of the Trust or the Internet. Contractholders can provide voting instructions: (1) by Internet at our website at ; (2) by telephone at 1-800- ; or (3) by mail, with the enclosed voting instruction card.
If sufficient votes in favor of a proposal are not received by the time scheduled for the Meeting, the persons named as proxies may propose one or more adjournments of the Meeting to permit further solicitation of proxies. Any adjournment will require the affirmative vote of a majority of the shares represented in person or by proxy at the session of the Meeting to be adjourned. An Insurance Company will vote in favor of such adjournment those proxies that it is entitled to vote in favor of the proposal. An Insurance Company will vote against the adjournment those proxies required to be voted against the proposal. An Insurance Company will pay the costs of any additional solicitation and any adjourned session.
38
The Trust does not know of any matters to be presented at the Meeting other than those described in this Proxy Statement/Prospectus. If other business properly comes before the Meeting, the proxyholders will vote thereon in accordance with their best judgment.
The Trust is not required to hold regular shareholder meetings and, in order to minimize its costs, does not intend to hold meetings of shareholders unless so required by applicable law, regulation or regulatory policy or if otherwise deemed advisable by the Trust’s management. Therefore, it is not practicable to specify a date by which proposals must be received in order to be incorporated in an upcoming proxy statement for a meeting of shareholders.
Prompt execution and return of the enclosed voting instruction card is requested. A self-addressed, postage-paid envelope is enclosed for your convenience. If executed but unmarked voting instructions are received, an Insurance Company will vote those unmarked voting instructions in favor of the Reorganization Plan.
* * * * *
39
PLAN OF REORGANIZATION AND TERMINATION
THIS PLAN OF REORGANIZATION AND TERMINATION (“Plan”) is adopted by EQ ADVISORS TRUST, a Delaware statutory trust (“Trust”), on behalf of each of its segregated portfolios of assets (“series”) listed on Schedule A to this Plan (“Schedule A”). (Each series listed under the heading “Targets” on Schedule A is referred to herein as a “Target”; each series listed under the heading “Acquiring Portfolios” on Schedule A is referred to herein as an “Acquiring Portfolio”; and each Target and Acquiring Portfolio is sometimes referred to herein as a “Portfolio.”) All agreements, covenants, actions, and obligations of each Portfolio contained herein shall be deemed to be agreements, covenants, actions, and obligations of, and all rights and benefits created hereunder in favor of each Portfolio shall inure to and be enforceable by, the Trust acting on its behalf.
The Trust (1) is a statutory trust that is duly organized, validly existing, and in good standing under the laws of the State of Delaware, (2) is duly registered under the Investment Company Act of 1940, as amended (“1940 Act”), as an open-end management investment company, and (3) has the power to own all its properties and assets and to carry on its business as described in its current registration statement on Form N-1A. Each Portfolio is a duly established and designated series thereof.
The Trust may sell voting shares of beneficial interest in the Portfolios, $0.001 par value per share (“shares”), to (1) separate accounts of AXA Equitable Life Insurance Company (“AXA Equitable”), (2) separate accounts of AXA Life and Annuity Company and other affiliated or unaffiliated insurance companies, (3) AXA Equitable’s Investment Plan for Employees (a 401(k) plan it sponsors) and other tax-qualified retirement plans, and (4) other series of the Trust and series of AXA Premier VIP Trust, a separate registered investment company managed by AXA Equitable that currently sells its shares to such accounts and plans. At the date of adoption hereof, some shares in certain Portfolios are held by one or more shareholders described in clauses (2) – (4) (collectively, “Other Shareholders”) and the balance of the shares in those Portfolios and all the shares in each other Portfolio are held by AXA Equitable for separate accounts thereof. The Portfolios are underlying investment options for those separate accounts, which fund certain variable annuity certificates and contracts and variable life insurance policies issued by AXA Equitable (collectively, “Contracts”). Under applicable law, the assets of all those separate accounts (i.e., the shares of the Portfolios) are the property of AXA Equitable, which is the owner of record of those shares, and are held for the benefit of the Contract holders.
The Trust wishes to effect two separate reorganizations, each described in section 368(a)(1)(D) of the Internal Revenue Code of 1986, as amended (“Code”) (all “section” references are to the Code, unless otherwise noted), and intends this Plan to be, and adopts it as, a “plan of reorganization” (within the meaning of the regulations under section 368(a) (“Regulations”)). Each reorganization will consist of (1) the transfer of all of a Target’s assets to the Acquiring Portfolio listed on Schedule A opposite its name (“corresponding Acquiring Portfolio”) in exchange solely for shares in that Acquiring Portfolio and that Acquiring Portfolio’s assumption of all of that Target’s liabilities, (2) the distribution of those shares pro rata to that Target’s shareholders in exchange for their shares in that Target and in liquidation thereof, and (3) that Target’s termination (all the foregoing transactions involving each Target
A-1
and its corresponding Acquiring Portfolio being referred to herein collectively as a “Reorganization”), all on the terms and conditions set forth herein. The consummation of one Reorganization shall not be contingent on the consummation of any other Reorganization. (For convenience, the balance of this Plan, except paragraph 5, refers only to a single Reorganization, one Target, and one Acquiring Portfolio, but the terms and conditions hereof shall apply separately to each Reorganization and the Portfolios participating therein.)
The Trust’s Amended and Restated Declaration of Trust, as amended (“Declaration”), permits it to vary its shareholders’ investment. The Trust does not have a fixed pool of assets — each series thereof (including each Portfolio) is a managed portfolio of securities, and AXA Equitable and each investment sub-adviser thereof have the authority to buy and sell securities for it.
The Trust’s Board of Trustees (“Board”), including a majority of its members who are not “interested persons” (as that term is defined in the 1940 Act) thereof, (1) has duly adopted and approved this Plan and the transactions contemplated hereby and has duly authorized performance thereof on each Portfolio’s behalf by all necessary Board action and (2) has determined that participation in the Reorganization is in the best interests of each Portfolio and that the interests of the existing shareholders thereof will not be diluted as a result of the Reorganization.
Target offers two classes of shares, designated Class IA and Class IB shares (“Class IA Target Shares” and “Class IB Target Shares,” respectively, and collectively, “Target Shares”). Acquiring Portfolio also offers two classes of shares, also designated Class IA and Class IB shares (“Class IA Acquiring Portfolio Shares” and “Class IB Acquiring Portfolio Shares,” respectively, and collectively, “Acquiring Portfolio Shares”). The Portfolios’ identically designated classes of shares have identical characteristics.
1. PLAN OF REORGANIZATION AND TERMINATION
1.1 Subject to the requisite approval of Target’s shareholders and the terms and conditions set forth herein, Target shall assign, sell, convey, transfer, and deliver all of its assets described in paragraph 1.2 (“Assets”) to Acquiring Portfolio. In exchange therefor, Acquiring Portfolio shall —
(a) issue and deliver to Target the number of full and fractional (all references herein to “fractional” shares meaning fractions rounded to the eighth decimal place) (i) Class IA Acquiring Portfolio Shares determined by dividing Target’s net value (computed as set forth in paragraph 2.1) (“Target Value”) attributable to the Class IA Target Shares by the net asset value (computed as set forth in paragraph 2.2) (“NAV”) of a Class IA Acquiring Portfolio Share and (ii) Class IB Acquiring Portfolio Shares determined by dividing the Target Value attributable to the Class IB Target Shares by the NAV of a Class IB Acquiring Portfolio Share, and
(b) assume all of Target’s liabilities described in paragraph 1.3 (“Liabilities”).
Such transactions shall take place at the Closing (as defined in paragraph 3.1).
A-2
1.2 The Assets shall consist of all assets and property — including all cash, cash equivalents, securities, commodities, futures interests, receivables (including interest and dividends receivable), claims and rights of action, rights to register shares under applicable securities laws, books and records, and deferred and prepaid expenses (other than unamortized organizational expenses) shown as assets on Target’s books — Target owns at the Valuation Time (as defined in paragraph 2.1).
1.3 The Liabilities shall consist of all of Target’s liabilities, debts, obligations, and duties of whatever kind or nature existing at the Valuation Time, whether absolute, accrued, contingent, or otherwise, whether known or unknown, whether or not arising in the ordinary course of business, whether or not determinable at the Effective Time (as defined in paragraph 3.1), and whether or not specifically referred to in this Plan, except Reorganization Expenses (as defined in paragraph 4.3(j)) borne by Acquiring Portfolio and AXA Equitable pursuant to paragraph 5. Notwithstanding the foregoing, Target will endeavor to discharge all its known liabilities, debts, obligations, and duties before the Effective Time.
1.4 At or immediately before the Effective Time, Target shall declare and pay to its shareholders one or more dividends and/or other distributions in an amount large enough so that it will have distributed substantially all (and in any event not less than 98%) of its (a) “investment company taxable income” (within the meaning of section 852(b)(2)), computed without regard to any deduction for dividends paid, and (b) “net capital gain” (as defined in section 1222(11)), after reduction by any capital loss carryforward, for prior taxable years and the current taxable year through the Effective Time.
1.5 At the Effective Time (or as soon thereafter as is reasonably practicable), Target shall distribute the Acquiring Portfolio Shares it receives pursuant to paragraph 1.1(a) to the separate accounts for which AXA Equitable holds Target Shares, and Other Shareholders, of record at the Effective Time (each, a “Shareholder”), in proportion to the Target Shares then so held and in constructive exchange therefor, and shall completely liquidate. That distribution shall be accomplished by the Trust’s transfer agent (“Transfer Agent”) opening accounts on Acquiring Portfolio’s shareholder records in the names of the Shareholders (except Shareholders in whose names accounts thereon already exist) and transferring those Acquiring Portfolio Shares to those newly opened and existing accounts. Each Shareholder’s newly opened or existing account shall be credited with the respective pro rata number of full and fractional Acquiring Portfolio Shares due that Shareholder, by class (i.e., the account for each Shareholder that holds Class IA Target Shares shall be credited with the respective pro rata number of full and fractional Class IA Acquiring Portfolio Shares due that Shareholder, and the account for each Shareholder that holds Class IB Target Shares shall be credited with the respective pro rata number of full and fractional Class IB Acquiring Portfolio Shares due that Shareholder). The aggregate NAV of Acquiring Portfolio Shares to be so credited to each Shareholder’s account shall equal the aggregate NAV of the Target Shares such Shareholder owned at the Effective Time. All issued and outstanding Target Shares, including any represented by certificates, shall simultaneously be canceled on Target’s shareholder records. Acquiring Portfolio shall not issue certificates representing the Acquiring Portfolio Shares issued in connection with the Reorganization.
A-3
1.6 As soon as reasonably practicable after distribution of the Acquiring Portfolio Shares pursuant to paragraph 1.5, but in all events within six months after the Effective Time, Target shall be terminated as a series of the Trust and any further actions shall be taken in connection therewith as required by applicable law.
1.7 Any reporting responsibility of Target to a public authority, including the responsibility for filing regulatory reports, tax returns, and other documents with the Securities and Exchange Commission (“Commission”), any state securities commission, any federal, state, and local tax authorities, and any other relevant regulatory authority, is and shall remain its responsibility up to and including the date on which it is terminated.
2. VALUATION
2.1 For purposes of paragraph 1.1(a), Target’s net value shall be (a) the value of the Assets computed immediately after the close of regular trading on the New York Stock Exchange, and the declaration of any dividends and/or other distributions, on the date of the Closing (“Valuation Time”), using the valuation procedures set forth in the Trust’s then-current prospectus and statement of additional information and valuation procedures established by the Board, less (b) the amount of the Liabilities at the Valuation Time.
2.2 For purposes of paragraph 1.1(a), the NAV per share for each class of Acquiring Portfolio Shares shall be computed at the Valuation Time, using the valuation procedures referred to in paragraph 2.1.
2.3 All computations pursuant to paragraphs 2.1 and 2.2 shall be made by AXA Equitable, in its capacity as the Trust’s administrator.
3. CLOSING AND EFFECTIVE TIME
3.1 Unless the Trust determines otherwise, all acts necessary to consummate the Reorganization (“Closing”) shall be deemed to take place simultaneously as of immediately after the close of business (4:00 p.m., Eastern Time) on a date in April 2011 determined by the Trust (“Effective Time”). If at the Valuation Time (a) the New York Stock Exchange or another primary trading market for portfolio securities of either Portfolio (each, an “Exchange”) is closed to trading or trading thereon is restricted or (b) trading or the reporting of trading on an Exchange or elsewhere is disrupted so that, in the Board’s judgment, accurate appraisal of the value of either Portfolio’s net assets and/or the NAV per share of either class of Acquiring Portfolio Shares is impracticable, the Effective Time shall be postponed until the first business day after the day when such trading has been fully resumed and such reporting has been restored. The Closing shall be held at the Trust’s offices or at such other place as the Trust determines.
3.2 The Trust shall direct the custodian of the Portfolios’ assets to deliver at the Closing a certificate of an authorized officer stating that (a) the Assets it holds will be transferred to Acquiring Portfolio at the Effective Time, (b) all necessary taxes in connection with the delivery of the Assets, including all applicable federal and state stock transfer stamps, if any, have been paid or provision for payment has been made, and (c) the information (including adjusted basis and holding period, by lot) concerning the Assets, including all portfolio securities, transferred by Target to Acquiring Portfolio, as reflected on Acquiring Portfolio’s books immediately after the Closing, does or will conform to such information on Target’s books immediately before the Closing.
A-4
3.3 The Trust shall direct the Transfer Agent to deliver at the Closing a certificate of an authorized officer (a) stating that its records contain the number of full and fractional outstanding Target Shares each Shareholder owns at the Effective Time and (b) as to the opening of accounts on Acquiring Portfolio’s shareholder records in the names of the Shareholders (except Shareholders in whose names accounts thereon already exist) and a confirmation, or other evidence satisfactory to the Trust, that the Acquiring Portfolio Shares to be credited to Target at the Effective Time have been credited to Target’s account on those records.
4. CONDITIONS PRECEDENT
4.1 The Trust’s obligation to implement this Plan on Acquiring Portfolio’s behalf shall be subject to satisfaction of the following conditions at or before (and continuing through) the Effective Time:
(a) At the Effective Time, the Trust, on Target’s behalf, will have good and marketable title to the Assets and full right, power, and authority to sell, assign, transfer, and deliver the Assets hereunder free of any liens or other encumbrances (except securities that are subject to “securities loans,” as referred to in section 851(b)(2), or that are restricted to resale by their terms); and on delivery and payment for the Assets, the Trust, on Acquiring Portfolio’s behalf, will acquire good and marketable title thereto, subject to no restrictions on the full transfer thereof, including restrictions that might arise under the Securities Act of 1933, as amended (“1933 Act”);
(b) Target is not currently engaged in, and the Trust’s adoption and performance of this Plan and consummation of the Reorganization will not result in, (1) a conflict with or material violation of any provision of Delaware law, the Declaration or the Trust’s By-Laws (collectively, “Governing Documents”), or any agreement, indenture, instrument, contract, lease, or other undertaking (each, an “Undertaking”) to which the Trust, on Target’s behalf, is a party or by which it is bound or (2) the acceleration of any obligation, or the imposition of any penalty, under any Undertaking, judgment, or decree to which the Trust, on Target’s behalf, is a party or by which it is bound;
(c) All material contracts and other commitments of or applicable to Target (other than this Plan and certain investment contracts, including options, futures, forward contracts, and swap agreements) will terminate, or provision for discharge of any liabilities of Target thereunder will be made, at or before the Effective Time, without either Portfolio’s incurring any liability or penalty with respect thereto and without diminishing or releasing any rights the Trust, on Target’s behalf, may have had with respect to actions taken or omitted or to be taken by any other party thereto before the Closing;
(d) No litigation, administrative proceeding, action, or investigation of or before any court, governmental body, or arbitrator is presently pending or, to the Trust’s
A-5
knowledge, threatened against the Trust, with respect to Target or any of its properties or assets attributable or allocable to Target, that, if adversely determined, would materially and adversely affect Target’s financial condition or the conduct of its business; and the Trust, on Target’s behalf, knows of no facts that might form the basis for the institution of any such litigation, proceeding, action, or investigation and is not a party to or subject to the provisions of any order, decree, judgment, or award of any court, governmental body, or arbitrator that materially and adversely affects Target’s business or the Trust’s ability to consummate the transactions contemplated hereby;
(e) Target’s Statement of Assets and Liabilities (including Schedule of Investments), Statement of Operations, and Statement of Changes in Net Assets (collectively, “Statements”) at and for the fiscal year (in the case of the last Statement, for the two fiscal years) ended December 31, 2009, have been audited by PricewaterhouseCoopers LLP (“PwC”) and are in accordance with generally accepted accounting principles consistently applied in the United States (“GAAP”); and such Statements and Target’s unaudited Statements at and for the six months ended June 30, 2009, present fairly, in all material respects, Target’s financial condition at their respective dates in accordance with GAAP, and there are no known contingent liabilities of Target required to be reflected on a balance sheet (including the notes thereto) in accordance with GAAP at either such date that are not disclosed therein;
(f) Since December 31, 2009, there has not been any material adverse change in Target’s financial condition, assets, liabilities, or business, other than changes occurring in the ordinary course of business, or any incurrence by Target of indebtedness maturing more than one year from the date such indebtedness was incurred; for purposes of this subparagraph, a decline in NAV per Target Share due to declines in market values of securities Target holds, the discharge of Target liabilities, or the redemption of Target Shares by its shareholders shall not constitute a material adverse change;
(g) At the Effective Time, all federal and other tax returns, dividend reporting forms, and other tax-related reports (collectively, “Returns”) of Target required by law to have been filed by such time (including any extensions) shall have been filed and are or will be correct in all material respects, and all federal and other taxes shown as due or required to be shown as due on such Returns shall have been paid or provision shall have been made for the payment thereof, and to the best of the Trust’s knowledge, no such Return is currently under audit and no assessment has been asserted with respect to such Returns;
(h) Target is a “fund” (as defined in section 851(g)(2)); for each taxable year of its operation (including the taxable year that will end at the Effective Time), Target has met (or for such year will meet) the requirements of Part I of Subchapter M of Chapter 1 of Subtitle A of the Code (“Subchapter M”) for qualification and treatment as a regulated investment company (“RIC”) and has been (or for such year will be) eligible to and has computed (or for such year will compute) its federal income tax under section 852; Target has declared and paid to its shareholders the dividend(s) and/or other distribution(s) described in paragraph 1.4; and Target has no earnings and profits accumulated in any taxable year in which the provisions of Subchapter M did not apply to it;
A-6
(i) Target is in the same line of business as Acquiring Portfolio is in, for purposes of section 1.368-1(d)(2) of the Regulations, and did not enter into such line of business as part of the plan of reorganization; from the time the Board approved the transactions contemplated hereby (“Approval Time”) through the Effective Time, Target has invested and will invest its assets in a manner that ensures its compliance with the foregoing and paragraph 4.1(h); from the time it commenced operations through the Effective Time, Target has conducted and will conduct its “historic business” (within the meaning of such section) in a substantially unchanged manner; from the Approval Time through the Effective Time, Target (1) has not disposed of and/or acquired, and will not dispose of and/or acquire, any assets (i) for the purpose of satisfying Acquiring Portfolio’s investment objective or policies or (ii) for any other reason except in the ordinary course of its business as a RIC and (2) has not otherwise changed, and will not otherwise change, its historic investment policies; and the Trust believes, based on its review of each Portfolio’s investment portfolio, that most of Target’s assets are consistent with Acquiring Portfolio’s investment objective and policies and thus can be transferred to and held by Acquiring Portfolio;
(j) At the Effective Time, (1) at least 33 1/3% of Target’s portfolio assets will meet Acquiring Portfolio’s investment objective, strategies, policies, risks, and restrictions, (2) Target will not have altered its portfolio in connection with the Reorganization to meet such 33 1/3% threshold, and (3) Target will not have modified its investment objective or any of its investment strategies, policies, risks, or restrictions as part of the plan of reorganization for purposes of section 1.368-1(d)(2) of the Regulations;
(k) To the best of the Trust’s management’s knowledge, at the record date for Target’s shareholders entitled to vote on approval of this Plan, there was no plan or intention by its shareholders to redeem, sell, exchange, or otherwise dispose of a number of Target Shares (or Acquiring Portfolio Shares to be received in the Reorganization), in connection with the Reorganization, that would reduce their ownership of the Target Shares (or the equivalent Acquiring Portfolio Shares) to a number of shares that was less than 50% of the number of the Target Shares at such date;
(l) All issued and outstanding Target Shares are, and at the Effective Time will be, duly and validly issued and outstanding, fully paid, and non-assessable by the Trust and have been offered and sold in every state and the District of Columbia in compliance in all material respects with applicable registration requirements of the 1933 Act and state securities laws; all issued and outstanding Target Shares will, at the Effective Time, be held by the persons and in the amounts set forth on Target’s shareholder records, as provided in paragraph 3.3; and Target does not have outstanding any options, warrants, or other rights to subscribe for or purchase any Target Shares, nor are there outstanding any securities convertible into any Target Shares;
(m) Target incurred the Liabilities, which are associated with the Assets, in the ordinary course of its business;
A-7
(n) At the Effective Time, Target will not be under the jurisdiction of a court in a “title 11 or similar case” (as defined in section 368(a)(3)(A));
(o) During the five-year period ending at the Effective Time, neither Target nor any person “related” (within the meaning of section 1.368-1(e)(4) of the Regulations (“Related”), without regard to section 1.368-1(e)(4)(i)(A) thereof) to it will have (1) acquired Target Shares with consideration other than Acquiring Portfolio Shares or Target Shares, except for shares redeemed in the ordinary course of Target’s business as a series of an open-end investment company pursuant to section 22(e) of the 1940 Act, or (2) made distributions with respect to Target Shares except for normal, regular dividend distributions made pursuant to Target’s historic dividend-paying practice and dividends and other distributions declared and paid to ensure Target’s continuing qualification as a RIC and to avoid the imposition of fund-level tax; and
(p) Not more than 25% of the value of Target’s total assets (excluding cash, cash items, and U.S. government securities) is invested in the stock and securities of any one issuer, and not more than 50% of the value of such assets is invested in the stock and securities of five or fewer issuers.
4.2 The Trust’s obligation to implement this Plan on Target’s behalf shall be subject to satisfaction of the following conditions at or before (and continuing through) the Effective Time:
(a) No consideration other than Acquiring Portfolio Shares (and Acquiring Portfolio’s assumption of the Liabilities) will be issued in exchange for the Assets in the Reorganization;
(b) Acquiring Portfolio is not currently engaged in, and the Trust’s adoption and performance of this Plan and consummation of the Reorganization will not result in, (1) a conflict with or material violation of any provision of Delaware law, the Governing Documents, or any Undertaking to which the Trust, on Acquiring Portfolio’s behalf, is a party or by which it is bound or (2) the acceleration of any obligation, or the imposition of any penalty, under any Undertaking, judgment, or decree to which the Trust, on Acquiring Portfolio’s behalf, is a party or by which it is bound;
(c) No litigation, administrative proceeding, action, or investigation of or before any court, governmental body, or arbitrator is presently pending or, to the Trust’s knowledge, threatened against the Trust, with respect to Acquiring Portfolio or any of its properties or assets attributable or allocable to Acquiring Portfolio, that, if adversely determined, would materially and adversely affect Acquiring Portfolio’s financial condition or the conduct of its business; and the Trust, on Acquiring Portfolio’s behalf, knows of no facts that might form the basis for the institution of any such litigation, proceeding, action, or investigation and is not a party to or subject to the provisions of any order, decree, judgment, or award of any court, governmental body, or arbitrator that materially and adversely affects Acquiring Portfolio’s business or the Trust’s ability to consummate the transactions contemplated hereby;
A-8
(d) Acquiring Portfolio’s Statements at and for the fiscal year (in the case of its Statement of Changes in Net Assets, for the two fiscal years) ended December 31, 2009, have been audited by PwC and are in accordance with GAAP; and such Statements and Acquiring Portfolio’s unaudited Statements at and for the six months ended June 30, 2009, present fairly, in all material respects, Acquiring Portfolio’s financial condition at their respective dates in accordance with GAAP, and there are no known contingent liabilities of Acquiring Portfolio required to be reflected on a balance sheet (including the notes thereto) in accordance with GAAP at either such date that are not disclosed therein;
(e) Since December 31, 2009, there has not been any material adverse change in Acquiring Portfolio’s financial condition, assets, liabilities, or business, other than changes occurring in the ordinary course of business, or any incurrence by Acquiring Portfolio of indebtedness maturing more than one year from the date such indebtedness was incurred; for purposes of this subparagraph, a decline in NAV per Acquiring Portfolio Share due to declines in market values of securities Acquiring Portfolio holds, the discharge of Acquiring Portfolio liabilities, or the redemption of Acquiring Portfolio Shares by its shareholders shall not constitute a material adverse change;
(f) At the Effective Time, all Returns of Acquiring Portfolio required by law to have been filed by such time (including any extensions) shall have been filed and are or will be correct in all material respects, and all federal and other taxes shown as due or required to be shown as due on such Returns shall have been paid or provision shall have been made for the payment thereof, and to the best of the Trust’s knowledge, no such Return is currently under audit and no assessment has been asserted with respect to such Returns;
(g) Acquiring Portfolio is a “fund” (as defined in section 851(g)(2)); for each taxable year of its operation (including the taxable year that includes the Effective Time), Acquiring Portfolio has met (or for such year will meet) the requirements of Subchapter M for qualification and treatment as a RIC and has been (or for such year will be) eligible to and has computed (or for such year will compute) its federal income tax under section 852; Acquiring Portfolio intends to continue after the Reorganization to meet all such requirements and to be eligible to and to so compute its federal income tax; and Acquiring Portfolio has no earnings and profits accumulated in any taxable year in which the provisions of Subchapter M did not apply to it;
(h) Acquiring Portfolio is in the same line of business as Target was in preceding the Reorganization, for purposes of section 1.368-1(d)(2) of the Regulations, and did not enter into such line of business as part of the plan of reorganization; following the Reorganization, Acquiring Portfolio will continue, and has no intention to change, such line of business; and at the Effective Time, (1) at least 33 1/3% of Target’s portfolio assets will meet Acquiring Portfolio’s investment objective, strategies, policies, risks, and restrictions and (2) Acquiring Portfolio will have no plan or intention to change its investment objective or any of its investment strategies, policies, risks, or restrictions after the Reorganization;
A-9
(i) Following the Reorganization, Acquiring Portfolio (1) will continue Target’s “historic business” (within the meaning of section 1.368-1(d)(2) of the Regulations) and (2) will use a significant portion of Target’s “historic business assets” (within the meaning of section 1.368-1(d)(3) of the Regulations) in a business; moreover, Acquiring Portfolio (3) has no plan or intention to sell or otherwise dispose of any of the Assets, except for dispositions made in the ordinary course of that business and dispositions necessary to maintain its status as a RIC, and (4) expects to retain substantially all the Assets in the same form as it receives them in the Reorganization, unless and until subsequent investment circumstances suggest the desirability of change or it becomes necessary to make dispositions thereof to maintain such status;
(j) At the Effective Time and at all times thereafter, neither Acquiring Portfolio nor any person Related to it will have any plan or intention to acquire or redeem — either directly or through any transaction, agreement, or arrangement with any other person — any Acquiring Portfolio Shares issued pursuant to the Reorganization, other than redemptions that Acquiring Portfolio will make in the ordinary course of its business as a series of an open-end investment company pursuant to section 22(e) of the 1940 Act;
(k) All issued and outstanding Acquiring Portfolio Shares are, and at the Effective Time will be, duly and validly issued and outstanding, fully paid, and non-assessable by the Trust and have been offered and sold in every state and the District of Columbia in compliance in all material respects with applicable registration requirements of the 1933 Act and state securities laws; and Acquiring Portfolio does not have outstanding any options, warrants, or other rights to subscribe for or purchase any Acquiring Portfolio Shares, nor are there outstanding any securities convertible into any Acquiring Portfolio Shares;
(l) There is no plan or intention for Acquiring Portfolio to be dissolved or merged into another statutory or business trust or a corporation or any “fund” thereof (as defined in section 851(g)(2)) following the Reorganization;
(m) Acquiring Portfolio will not own, nor will it have owned during the five years preceding the Effective Time, directly or indirectly, any Target Shares;
(n) Before or pursuant to the Reorganization, neither Acquiring Portfolio nor any person Related to it will have acquired Target Shares, directly or through any transaction, agreement, or arrangement with any other person, with consideration other than Acquiring Portfolio Shares;
(o) Assuming satisfaction of the condition in paragraph 4.1(p), immediately after the Reorganization (1) not more than 25% of the value of Acquiring Portfolio’s total assets (excluding cash, cash items, and U.S. government securities) will be invested in the stock and securities of any one issuer and (2) not more than 50% of the value of such assets will be invested in the stock and securities of five or fewer issuers; and
(p) The Acquiring Portfolio Shares to be issued and delivered to Target, for the Shareholders’ benefit, pursuant to the terms of this Plan, (1) will have been duly
A-10
authorized by the Trust and duly registered under the federal securities laws (and appropriate notices respecting them will have been duly filed under applicable state securities laws) at the Effective Time and (2) when so issued and delivered, will be duly and validly issued and outstanding Acquiring Portfolio Shares and will be fully paid and non-assessable by the Trust.
4.3 The Trust’s obligation to implement this Plan on each Portfolio’s behalf shall be subject to satisfaction of the following conditions at or before (and continuing through) the Effective Time:
(a) No governmental consents, approvals, authorizations, or filings are required under the 1933 Act, the Securities Exchange Act of 1934, as amended, the 1940 Act, or state securities laws, and no consents, approvals, authorizations, or orders of any court are required, for the Trust’s adoption and performance, on either Portfolio’s behalf, of this Plan, except for (1) the Trust’s filing with the Commission of a registration statement on Form N-14 relating to the Acquiring Portfolio Shares issuable hereunder, and any supplement or amendment thereto, including therein a prospectus and proxy statement (“Registration Statement”), and (2) consents, approvals, authorizations, and filings that have been made or received or may be required after the Effective Time;
(b) The fair market value of the Acquiring Portfolio Shares each Shareholder receives will be approximately equal to the fair market value of its Target Shares it actually or constructively surrenders in exchange therefor;
(c) The Trust’s management (1) is unaware of any plan or intention of the Shareholders to redeem, sell, or otherwise dispose of (i) any portion of their Target Shares before the Reorganization to any person Related to either Portfolio or (ii) any portion of the Acquiring Portfolio Shares they receive in the Reorganization to any person Related to Acquiring Portfolio, (2) does not anticipate dispositions of those Acquiring Portfolio Shares at the time of or soon after the Reorganization to exceed the usual rate and frequency of dispositions of shares of Target as a series of an open-end investment company, (3) expects that the percentage of shareholder interests, if any, that will be disposed of as a result, or at the time, of the Reorganization will be de minimis, and (4) does not anticipate that there will be extraordinary redemptions of Acquiring Portfolio Shares immediately following the Reorganization;
(d) The Shareholders will pay their own expenses (such as fees of personal investment or tax advisers for advice concerning the Reorganization), if any, incurred in connection with the Reorganization;
(e) The fair market value of the Assets will equal or exceed the Liabilities to be assumed by Acquiring Portfolio and those to which the Assets are subject;
(f) At the Effective Time, there will be no intercompany indebtedness between the Portfolios that was issued or acquired, or will be settled, at a discount;
(g) Pursuant to the Reorganization, Target will transfer to Acquiring Portfolio, and Acquiring Portfolio will acquire, at least 90% of the fair market value of the net
A-11
assets, and at least 70% of the fair market value of the gross assets, Target held immediately before the Reorganization; for the purposes of the foregoing, any amounts Target uses to pay its Reorganization expenses and to make redemptions and distributions immediately before the Reorganization (except (1) redemptions in the ordinary course of its business required by section 22(e) of the 1940 Act and (2) dividends and other distributions declared and paid to ensure Target’s continuing qualification as a RIC and to avoid the imposition of fund-level tax) will be included as assets it held immediately before the Reorganization;
(h) Immediately after the Reorganization, AXA Equitable (through its separate accounts) will own shares constituting “control” (within the meaning of section 368(a)(2)(H)(i), i.e., as defined in section 304(c)) of Acquiring Portfolio;
(i) None of the compensation AXA Equitable receives as a service provider to Target will be separate consideration for, or allocable to, any of the Target Shares that AXA Equitable (on any Shareholder’s behalf) holds; none of the Acquiring Portfolio Shares AXA Equitable (on any Shareholder’s behalf) receives will be separate consideration for, or allocable to, any employment agreement, investment advisory agreement, or other service agreement; and the compensation paid to AXA Equitable will be for services actually rendered and will be commensurate with amounts paid to third parties bargaining at arm’s-length for similar services;
(j) No expenses incurred by Target or on its behalf in connection with the Reorganization will be paid or assumed by Acquiring Portfolio, AXA Equitable, or any other third party unless those expenses are solely and directly related to the Reorganization (determined in accordance with the guidelines set forth in Rev. Rul. 73-54, 1973-1 C.B. 187) (“Reorganization Expenses”), and no cash or property other than Acquiring Portfolio Shares will be transferred to Target or any of its shareholders with the intention that such cash or property be used to pay any expenses (even Reorganization Expenses) thereof;
(k) All necessary filings shall have been made with the Commission and state securities authorities, and no order or directive shall have been received that any other or further action is required to permit the Trust to carry out the transactions contemplated hereby; the Registration Statement shall have become effective under the 1933 Act, no stop orders suspending the effectiveness thereof shall have been issued, and, to the Trust’s best knowledge, no investigation or proceeding for that purpose shall have been instituted or be pending, threatened, or contemplated under the 1933 Act or the 1940 Act; the Commission shall not have issued an unfavorable report with respect to the Reorganization under section 25(b) of the 1940 Act nor instituted any proceedings seeking to enjoin consummation of the transactions contemplated hereby under section 25(c) of the 1940 Act; and all consents, orders, and permits of federal, state, and local regulatory authorities (including the Commission and state securities authorities) the Trust deems necessary to permit consummation, in all material respects, of the transactions contemplated hereby shall have been obtained, except where failure to obtain same would not involve a risk of a material adverse effect on either Portfolio’s assets or properties;
A-12
(l) At the Effective Time, no action, suit, or other proceeding shall be pending (or, to the Trust’s best knowledge, threatened to be commenced) before any court, governmental agency, or arbitrator in which it is sought to enjoin the performance of, restrain, prohibit, affect the enforceability of, or obtain damages or other relief in connection with, the transactions contemplated hereby;
(m) The Trust shall have called a meeting of Target’s shareholders to consider and act on this Plan and to take all other action necessary to obtain approval of the transactions contemplated hereby (“Shareholders Meeting”);
(n) The Trust shall have received an opinion of K&L Gates LLP (“Counsel”) as to the federal income tax consequences mentioned below (“Tax Opinion”). In rendering the Tax Opinion, Counsel may assume satisfaction of all the conditions set forth in this paragraph 4, may treat them as representations and warranties the Trust made to Counsel, and may rely as to factual matters, exclusively and without independent verification, on such representations and warranties and, if Counsel requests, on representations and warranties made in a separate letter addressed to Counsel (collectively, “Representations”). The Tax Opinion shall be substantially to the effect that, based on the facts and assumptions stated therein and conditioned on the Representations’ being true and complete at the Effective Time and consummation of the Reorganization in accordance with this Plan (without the waiver or modification of any terms or conditions hereof and without taking into account any amendment hereof that Counsel has not approved), for federal income tax purposes:
(1) Target’s transfer of the Assets to Acquiring Portfolio in exchange solely for Acquiring Portfolio Shares and Acquiring Portfolio’s assumption of the Liabilities, followed by Target’s distribution of those shares pro rata to the Shareholders actually or constructively in exchange for their Target Shares, in complete liquidation of Target, will qualify as a “reorganization” (as defined in section 368(a)(1)(D)), and each Portfolio will be “a party to a reorganization” (within the meaning of section 368(b));
(2) Target will recognize no gain or loss on the transfer of the Assets to Acquiring Portfolio in exchange solely for Acquiring Portfolio Shares and Acquiring Portfolio’s assumption of the Liabilities or on the subsequent distribution of those shares to the Shareholders in exchange for their Target Shares;
(3) Acquiring Portfolio will recognize no gain or loss on its receipt of the Assets in exchange solely for Acquiring Portfolio Shares and its assumption of the Liabilities;
(4) Acquiring Portfolio’s basis in each Asset will be the same as Target’s basis therein immediately before the Reorganization, and Acquiring Portfolio’s holding period for each Asset will include Target’s holding period therefor (except where Acquiring Portfolio’s investment activities have the effect of reducing or eliminating an Asset’s holding period);
A-13
(5) A Shareholder will recognize no gain or loss on the exchange of all its Target Shares solely for Acquiring Portfolio Shares pursuant to the Reorganization; and
(6) A Shareholder’s aggregate basis in the Acquiring Portfolio Shares it receives in the Reorganization will be the same as the aggregate basis in its Target Shares it actually or constructively surrenders in exchange for those Acquiring Portfolio Shares, and its holding period for those Acquiring Portfolio Shares will include, in each instance, its holding period for those Target Shares, provided the Shareholder holds them as capital assets at the Effective Time.
Notwithstanding subparagraphs (2) and (4), the Tax Opinion may state that no opinion is expressed as to the effect of the Reorganization on the Portfolios or any Shareholder with respect to any Asset as to which any unrealized gain or loss is required to be recognized for federal income tax purposes at the end of a taxable year (or on the termination or transfer thereof) under a mark-to-market system of accounting.
5. EXPENSES
Subject to satisfaction of the condition contained in paragraph 4.3(j), the sum of the following Reorganization Expenses for the Reorganizations (collectively, “Identified Expenses”), up to an aggregate maximum of $100,000, shall be borne by the Acquired Portfolios in proportion to their respective NAVs at the Valuation Time, with any Identified Expenses in excess of such amount borne solely by AXA Equitable: (1) costs associated with obtaining any necessary order of exemption from the 1940 Act, preparing the Registration Statement, and printing and distributing Acquiring Portfolio’s prospectus and Target’s proxy materials, (2) legal and accounting fees in connection with the Reorganization, and (3) expenses of holding the Shareholders Meeting (including any adjournment or postponement thereof). Notwithstanding the foregoing, (a) AXA Equitable shall not bear any brokerage or similar expenses incurred by or for the benefit of any Portfolio in connection with the Reorganizations, (b) all expenses other than Identified Expenses shall be borne by the Portfolio that directly incurs them, and (c) expenses shall be paid by the Portfolio directly incurring them if and to the extent that the payment thereof by another person would result in such Portfolio’s disqualification as a RIC or would prevent the Reorganization from qualifying as a tax-free reorganization.
6. TERMINATION
The Board may terminate this Plan and abandon the transactions contemplated hereby, at any time before the Effective Time, if circumstances develop that, in its opinion, make proceeding with the Reorganization inadvisable for either Portfolio.
7. AMENDMENTS
The Board may amend, modify, or supplement this Plan at any time in any manner, notwithstanding Target’s shareholders’ approval thereof; provided that, following such approval, no such amendment, modification, or supplement shall have a material adverse effect on the Shareholders’ interests.
A-14
8. MISCELLANEOUS
8.1 This Plan shall be governed by and construed in accordance with the internal laws of the State of Delaware, without giving effect to principles of conflicts of laws; provided that, in the case of any conflict between those laws and the federal securities laws, the latter shall govern.
8.2 Nothing expressed or implied herein is intended or shall be construed to confer on or give any person, firm, trust, or corporation other than the Trust (on the Portfolios’ behalf) and its successors and assigns any rights or remedies under or by reason of this Plan.
8.3 Notice is hereby given that this instrument is adopted on behalf of the Trust’s trustees solely in their capacities as trustees, and not individually, and that the Trust’s obligations under this instrument are not binding on or enforceable against any of its trustees, officers, shareholders, or series other than the Portfolios but are only binding on and enforceable against the respective Portfolio’s property. The Trust, in asserting any rights or claims under this Plan on either Portfolio’s behalf, shall look only to the other Portfolio’s property in settlement of such rights or claims and not to the property of any other series of the Trust or to such trustees, officers, or shareholders.
8.4 Any term or provision of this Plan that is invalid or unenforceable in any jurisdiction shall, as to such jurisdiction, be ineffective to the extent of such invalidity or unenforceability without rendering invalid or unenforceable the remaining terms and provisions hereof or affecting the validity or enforceability of any of the terms and provisions hereof in any other jurisdiction.
A-15
SCHEDULE A
TARGETS | ACQUIRING PORTFOLIOS | |
EQ/Lord Abbett Growth and Income Portfolio | EQ/Large Cap Value Index Portfolio | |
EQ/Capital Guardian Growth Portfolio | EQ/Large Cap Growth PLUS Portfolio | |
More Information on Strategies and Risk Factors
Strategies
Changes in Investment Objectives and Principal Investment Strategies
Each Portfolio has its own investment objective(s), policies and strategies. There is no assurance that a Portfolio will achieve its investment objective. The investment objective and, except as otherwise noted, the investment policies of a Portfolio are not fundamental policies and may be changed without a shareholder vote.
80% Policies
Each of the Acquiring Portfolios has a policy that it will invest at least 80% of its net assets, plus borrowings for investment purposes, in a particular type of investment connoted by its name. Each such policy is subject to change only upon at least sixty (60) days’ prior notice to shareholders of the affected Portfolio.
PLUS Portfolios
Each allocation percentage for Growth PLUS Portfolio is an asset allocation target established by AXA Equitable to achieve the Portfolio’s investment objective and may be changed without shareholder approval. Actual allocations among the distinct portions of the Portfolio may deviate from the amounts shown above by up to 15% of the Portfolio’s net assets. The asset allocation range for the Portfolio is as follows: 15% to 45% in the Active Allocated Portion; 45% to 75% in the Index Allocated Portion; and 0% to 25% in the ETF Allocated Portion. Each portion of the Portfolio may deviate temporarily from its asset allocation target for defensive purposes or as a result of appreciation or depreciation of its holdings. AXA Equitable rebalances each portion of the Portfolio as it deems appropriate. To the extent that the Portfolio is being rebalanced or takes a temporary defensive position, it may not be pursuing its investment goal or executing its principal investment strategy.
Active Management Strategies
Each Adviser has complete discretion to select portfolio securities for its portion of a portfolio’s assets, subject to the Portfolio’s investment objectives, restrictions and policies and other parameters that may be developed from time to time by the Manager. In selecting investments, the Advisers use their proprietary investment strategies. The following is an additional general description of certain common types of active management strategies that may be used by the Advisers to the Portfolios.
Growth investing generally focuses on companies that, due to their strong earnings and revenue potential, offer above-average prospects for capital growth, with less emphasis on dividend income. Earnings predictability and confidence in earnings forecasts are an important part of the selection process. An Adviser using this approach generally seeks out companies experiencing some or all of the following: high sales growth, high unit growth, high or improving returns on assets and equity, and a strong balance sheet. Such an Adviser also prefers companies with a competitive advantage such as unique management, marketing or research and development.
Value investing attempts to identify strong companies selling at a discount from their perceived true worth. An Adviser using this approach generally selects stocks at prices that, in its view, are temporarily low relative to the company’s earnings, assets, cash flow and dividends. Value investing generally emphasizes companies that, considering their assets and earnings history, are attractively priced and may provide dividend income.
B-1
Additional Strategies
The following provides additional information regarding the principal investment strategies discussed in “Comparison of Investment Objectives, Policies and Strategies” and additional investment strategies that the Portfolios may employ in pursuing their investment objectives. Each strategy may apply to all of the Portfolios. For further information about investment strategies, please see the Portfolios’ Statement of Additional Information (the “SAI”).
Derivatives. Each Portfolio may use “derivative” instruments to hedge its portfolio against market, economic, currency, issuer and other risks, to gain or manage exposure to the markets, sectors and securities in which the Portfolio may invest and to other economic factors that affect the Portfolio’s performance (such as interest rate movements), to increase total return or income, to reduce transaction costs, to manage cash, and for other portfolio management purposes. In general terms, a derivative instrument is an investment contract the value of which is linked to (or is derived from), in whole or in part, the value of an underlying asset, reference rate or index (e.g., stocks, bonds, commodities, currencies, interest rates and market indexes). Certain derivative securities may have the effect of creating financial leverage by multiplying a change in the value of the asset underlying the derivative to produce a greater change in the value of the derivative security. This creates an opportunity for increased return but, at the same time, creates the possibility for greater loss (including the likelihood of greater volatility in the net asset value of the shares of a Portfolio). Futures and options contracts (including futures and options on individual securities and equity and bond market indexes and options on futures contracts), swaps and forward contracts, including forward currency contracts, are examples of derivatives in which a Portfolio may invest.
Equity Securities. Certain Portfolios, including certain Portfolios that invest primarily in debt securities, may invest in equity securities. Equity securities may be bought on stock exchanges or in the over-the-counter market. Equity securities generally include common stock, preferred stock, warrants, securities convertible into common stock, securities of other investment companies and securities of real estate investment trusts.
Foreign Securities. Certain Portfolios may invest in foreign securities, including securities of companies in emerging markets. Generally, foreign securities are issued by companies organized outside the U.S. or by foreign governments or international organizations, are traded primarily in markets outside the U.S., and are denominated in a foreign currency. Foreign securities may include securities of issuers in developing countries or emerging markets, which generally involve greater risk because the economic structures of these countries and markets are less developed and their political systems are less stable. In addition, foreign securities may include depositary receipts of foreign companies. American Depositary Receipts are receipts typically issued by an American bank or trust company that evidence underlying securities issued by a foreign corporation. European Depositary Receipts (issued in Europe) and Global Depositary Receipts (issued throughout the world) each evidence a similar ownership arrangement. Depositary receipts also may be convertible into securities of foreign issuers. These securities may not necessarily be denominated in the same currency as the securities into which they may be converted.
Mid-Cap and Small-Cap Companies. Each Portfolio may invest in the securities of mid- and small-cap companies. These companies are more likely than larger companies to have limited product lines, markets or financial resources or to depend on a small, inexperienced management groups. Generally, they are more vulnerable than larger companies to adverse business or economic developments and their securities may be less well-known, trade less frequently and in more limited volume than the securities of larger more established companies.
Portfolio Turnover. The Portfolios do not restrict the frequency of trading to limit expenses. The Portfolios may engage in active and frequent trading of portfolio securities to achieve their investment objectives. Frequent trading can result in a portfolio turnover in excess of 100% (high portfolio turnover).
Securities Lending. For purposes of realizing additional income, each Portfolio may lend its portfolio securities with a value of up to 33 1/3% of the Portfolio’s total assets (including collateral received for securities lent) to broker-dealers approved by the Trust’s board of trustees. Generally, any such loan of portfolio securities will be continuously secured by collateral at least equal to the value of the security loaned. Such collateral will be in the form of cash, marketable securities issued or guaranteed by the U.S. Government or its agencies, or a standby letter of credit issued by qualified banks. Loans will only be made to firms deemed by the Manager to be of good standing and will not be made unless the consideration to be earned from such loans justifies the risk.
B-2
Securities of Other Investment Companies. Each Portfolio may invest in the securities of other investment companies, including exchange-traded funds (“ETFs”), to the extent permitted by applicable law. Generally, a Portfolio’s investments in other investment companies are subject to statutory limitations in the Investment Company Act of 1940, as amended (the “1940 Act”), including in certain circumstances a prohibition against acquiring shares of another investment company if, immediately after such acquisition, the Portfolio and its affiliated persons (i) would hold more than 3% of such other investment company’s total outstanding shares, (ii) would have invested more than 5% of its total assets in such other investment company, or (iii) would have invested more than 10% of its total assets in investment companies. However, there are statutory and regulatory exemptions from these restrictions under the 1940 Act on which the Portfolios may rely to invest in other investment companies in excess of these limits, subject to certain conditions. In addition, many ETFs have obtained exemptive relief from the Securities and Exchange Commission (the “SEC”) to permit unaffiliated funds (such as the Portfolios) to invest in their shares beyond the statutory limits, subject to certain conditions and pursuant to contractual arrangements between the ETFs and the investing funds. A Portfolio may rely on these exemptive orders in investing in ETFs. A Portfolio that invests in other investment companies indirectly bears the fees and expenses of that investment company.
Temporary Defensive Investments. For temporary defensive purposes, each Portfolio (except the Portfolios that seek to track the performance (before fees and expenses) of a particular securities market index) may invest without limit, in cash, money market instruments or high quality short-term debt securities, including repurchase agreements. To the extent a Portfolio is invested in these instruments, the Portfolio will not be pursuing its investment goal. In addition, each PLUS Portfolio may deviate from its asset allocation targets and target investment percentages for defensive purposes.
Risks.
Risk is the chance that you will lose money on your investment or that it will not earn as much as you expect. In general, the greater the risk, the more money your investment can earn for you and the more you can lose. Like other investment companies, the value of each Portfolio’s shares may be affected by its investment objective, principal investment strategies and particular risk factors. Consequently, each Portfolio may be subject to different principal risks. Some of the principal risks of investing in the Portfolios are noted below. However, other factors may also affect each Portfolio’s net asset value. There is no guarantee that a Portfolio will achieve its investment objective or that it will not lose principal value.
General Investment Risks: Each Portfolio is subject to the following risks:
Adviser Selection Risk: The risk that the Manager’s process for selecting or replacing an Adviser and its decision to select or replace an Adviser does not produce the intended results.
Asset Class Risk: There is the risk that the returns from the types of securities in which a Portfolio invests will underperform the general securities markets or different asset classes. Different types of securities and asset classes tend to go through cycles of outperformance and underperformance in comparison to the general securities markets.
Issuer-Specific Risk: The value of an individual security or particular type of security can be more volatile than the market as a whole and can perform differently from the market as a whole.
Market Risk: The risk that the securities markets will move down, sometimes rapidly and unpredictably based on overall economic conditions and other factors.
Multiple Adviser Risk: A Portfolio may have multiple Advisers, each of which is responsible for investing a specific allocated portion of the Portfolio’s assets. Because each Adviser manages its allocated portion of the Portfolio independently from another Adviser, the same security may be held in different portions of the Portfolio, or may be acquired for one portion of the Portfolio at a time when an Adviser to
B-3
another portion deems it appropriate to dispose of the security from that other portion. Similarly, under some market conditions, one Adviser may believe that temporary, defensive investments in short-term instruments or cash are appropriate when another Adviser believes continued exposure to the equity or debt markets is appropriate for its allocated portion of the Portfolio. Because each Adviser directs the trading for its own portion of the Portfolio, and does not aggregate its transactions with those of the other Adviser, the Portfolio may incur higher brokerage costs than would be the case if a single Adviser were managing the entire Portfolio. In addition, while the Manager seeks to allocate a Portfolio’s assets among the Portfolio’s Advisers in a manner that it believes is consistent with achieving the Portfolio’s investment objective, the Manager may be subject to potential conflicts of interest in allocating the Portfolio’s assets among Advisers because the Manager pays different fees to the Advisers and due to other factors that could impact the Manager’s revenues and profits.
Portfolio Management Risk: The risk that strategies used by the Manager or the Advisers and their securities selections fail to produce the intended results. In addition, the Manager may be subject to potential conflicts of interest in connection with providing advice to a Portfolio with respect to the allocation of assets between passively and actively managed portions of a Portfolio and the development and implementation of the models used tomanage a Portfolio to the extent that such advice may impact its obligations with respect to any death benefit, income benefit or other guarantees that it and its affiliates may provide through Contracts that offer the Portfolio as an investment option. Consistent with its fiduciary duties, the Manager seeks to implement each Portfolio’s investment program in a manner that is in the best interests of the Portfolio and that is consistent with the Portfolio’s investment objective, policies and strategies described in detail in this Prospectus.
Securities Lending Risk: A Portfolio that lends securities is subject to the risk that the loaned securities will not be available to the portfolio on a timely basis and, therefore, that the Portfolio may lose the opportunity to sell the securities at a desirable time and price. There is also the risk that the Portfolio will not receive (or will experience delays in receiving) additional collateral or the loaned securities when due, which could result in a loss to the portfolio. If the borrower fails financially, it is also possible that the portfolio could lose its right to the collateral it holds. In addition, the Portfolio bears the risk of a decline in the value of the collateral held by a Portfolio in connection with a securities loan.
Securities Selection Risk: The securities selected for a Portfolio may not perform as well as other securities that were not selected for a Portfolio. As a result, a Portfolio may underperform other funds with the same objective or in the same asset class.
As indicated in each Proposal’s “Comparison of Principal Risk Factors,” a particular Portfolio may be subject to the following as principal risks. In addition, to the extent a Portfolio invests in a particular type of investment, it will be subject to the risks of such investment as described below:
Derivatives Risk. Derivatives are financial instruments whose value depends upon, or is derived from, the value of something else, such as one or more underlying investments, indexes or currencies. Derivatives include options, swaps, futures, options on futures, forward contracts and structured securities. Investing in derivatives involves investment techniques and risks different from those associated with ordinary mutual fund securities transactions. A Portfolio’s investment in derivatives may rise or fall more rapidly than other investments. Changes in the value of the derivative may not correlate perfectly with the underlying asset, rate or index, and a Portfolio could lose more than the principal amount invested. Derivatives also may be subject to a number of risks such as leverage risk, liquidity risk, interest rate risk, market risk, credit risk and also involve the risk of mispricing or improper valuation. The use of derivatives may increase the volatility of a Portfolio’s net asset value. Derivatives may be leveraged such that a small investment in derivative securities can have a significant impact on a Portfolio’s exposure to stock market values, interest rates, currency exchange rates or other investments. As a result, a relatively small price movement in a derivatives contract may cause an immediate and substantial loss or gain. Derivatives may be illiquid in that a Portfolio may not be able to sell or otherwise close a derivative position when desired. The possible lack of a liquid secondary market for derivatives and the resulting inability of a Portfolio to sell or otherwise close a derivatives position could expose the Portfolio to losses and could make derivatives more difficult for the Portfolio to value accurately. Over-the-counter derivatives often do not have liquidity beyond the counterparty to the
B-4
transaction, and because they are not traded on exchanges, they do not offer the protections provided by exchanges in the event that the counterparty is unable to fulfill its contractual obligation. Over-the-counter derivatives therefore involve greater counterparty and credit risk and may be more difficult to value than exchange-traded derivatives.
Equity Risk. In general, stocks and other equity security values fluctuate and sometimes widely fluctuate, in response to changes in a
Exchange Traded Funds (“ETF”) Risk. When a Portfolio invests in ETFs, it will indirectly bear fees and expenses charged by the ETFs, in addition to the Portfolio’s direct fees and expenses. Therefore, the cost of investing in the Portfolio may be higher than the cost of investing in mutual funds that invest directly in individual stocks and bonds. In addition, when a Portfolio invests in an ETF, it is subject to the risks associated with the underlying securities in which that ETF invests. ETFs also may change their investment objectives or policies without the approval of the Portfolio. If that were to occur, the Portfolio might be forced to withdraw its investment from the ETF at a time and price that is unfavorable to the Portfolio. Most ETFs are not actively managed. An ETF invests in the securities included in, or representative of, its underlying index regardless of their investment merit or market trends. It is possible for an ETF to miss out on an investment opportunity because the assets necessary to take advantage of it are tied up in less profitable investments. In addition, ETFs do not change their investment strategies to respond to changes in the economy. This means that an ETF may be particularly susceptible to a general decline in the market segment relating to the underlying index. Imperfect correlation between an ETF’s securities and those in the index it seeks to track, rounding of prices, changes to the indices and regulatory policies may cause an ETF’s performance to not match the performance of its index. No ETF fully replicates its index and may hold securities not included in the index. Therefore, there is a risk that the investment strategy of the ETF manager may not produce the intended results. Moreover, there is the risk that an ETF may value certain securities at a higher price than it can sell them for. Secondary market trading in shares of ETFs may be halted by a national securities exchange because of market conditions or for other reasons. In addition, trading in these shares is subject to trading halts caused by extraordinary market volatility pursuant to “circuit breaker” rules. There can be no assurance that the requirements necessary to maintain the listing of the shares will continue to be met or will remain unchanged. In addition, although ETFs are listed for trading on national securities exchanges and certain foreign exchanges, there can be no assurance that an active trading market for such shares will develop or be maintained. The market price of an ETF may be different from the net asset value of such ETF (i.e., an ETF may trade at a discount or premium to its net asset value). The performance of a Portfolio that invests in such an ETF could be adversely impacted.
Focused Portfolio Risk. A Portfolio that employs a strategy of investing in the securities of a limited number of companies may incur more risk because changes in the value of a single security may have a more significant effect, either positive or negative, on the Portfolio’s net asset value.
Foreign Securities Risk. Investments in foreign securities, including depositary receipts, involve risks not associated with investing in U.S. securities. Foreign markets, particularly emerging markets, may be less liquid, more volatile and subject to less government supervision than domestic markets. Security values also may be negatively affected by changes in the exchange rates between the U.S. dollar and foreign currencies. Differences between U.S. and foreign legal, political and economic systems, regulatory regimes and market practices also may impact security values and it may take more time to clear and settle trades involving foreign securities.
Currency Risk: Investments in foreign currencies and in securities that trade in, or receive revenues in, foreign currencies are subject to the risk that those currencies will decline in value relative to the U.S. dollar. Any such decline may erode or reverse any potential gains from an investment in securities denominated in foreign currency or may widen existing loss. Currency rates may fluctuate significantly over short periods of time for a number of reasons, including changes in interest rates, intervention by governments, central banks or supranational entities, or by the imposition of currency controls or other political developments in the U.S. or abroad.
Depositary Receipts Risk: Investments in depositary receipts (including American Depositary Receipts, European Depositary Receipts and Global Depositary Receipts) are generally subject to the same risks of investing in the foreign securities that they evidence or into which they may be converted. In addition,
B-5
issuers underlying unsponsored depositary receipts may not provide as much information as U.S. issuers and issuers underlying sponsored depositary receipts. Unsponsored depositary receipts also may not carry the same voting privileges as sponsored depositary receipts.
Emerging Markets Risk: Emerging market countries generally are located in Asia, the Middle East, Eastern Europe, Central and South America and Africa. There are greater risks involved in investing in emerging market countries and/or their securities markets. Investments in these countries and/or markets may present market, credit, currency, liquidity, legal, political, technical and other risks different from, or greater than, the risks of investing in developed countries. For instance, these countries may be more likely than developed countries to experience rapid and significant developments in their political or economic structures. Some emerging market countries restrict foreign investments, impose withholding or other taxes on foreign investments, or may nationalize or expropriate the assets of private countries. Therefore, a Portfolio may be limited in its ability to make direct or additional investments in an emerging markets country. Such restrictions also may have negative impacts on transaction costs, market price, investment returns and the legal rights and remedies of a Portfolio. In addition, the securities markets of emerging markets countries generally are smaller, less liquid and more volatile than those of developed countries. Emerging market countries often have less uniformity in accounting and reporting requirements and less reliable settlement, registration and custodial procedures. Emerging market countries also may be subject to high inflation and rapid currency devaluations and may be heavily dependent on international trade, which can materially affect their securities markets. The risks associated with investing in a narrowly defined geographic area also generally are more pronounced with respect to investments in emerging market countries.
Geographic Risk: The economies and financial markets of certain regions, such as Latin America and Asia, can be highly interdependent and may decline all at the same time. In addition, certain markets are prone to natural disasters such as earthquakes, volcanoes, droughts or tsunamis and are economically sensitive to environmental events.
Political/Economic Risk: Changes in economic and tax policies, government instability, war or other political or economic actions or factors may have an adverse effect on a Portfolio’s foreign investments.
Regulatory Risk: Less information may be available about foreign companies. In general, foreign companies are not subject to uniform accounting, auditing and financial reporting standards or to other regulatory practices and requirements as are U.S. companies.
Settlement Risk: Settlement and clearance procedures in certain foreign markets differ significantly from those in the United States. Foreign settlement and clearance procedures and trade regulations also may involve certain risks (such as delays in payment for or delivery of securities) not typically associated with the settlement of U.S. investments. At times, settlements in certain foreign countries have not kept pace with the number of securities transactions. These problems may make it difficult for a Portfolio to carry out transactions. If a Portfolio cannot settle or is delayed in settling a purchase of securities, it may miss attractive investment opportunities and certain of its assets may be uninvested with no return earned thereon for some period. If a Portfolio cannot settle or is delayed in settling a sale of securities, it may lose money if the value of the security then declines or, if it has contracted to sell the security to another party, the Portfolio could be liable for any losses incurred.
Transaction Costs Risk: The costs of buying and selling foreign securities, including tax, brokerage and custody costs, generally are higher than those involving domestic transactions.
Index Strategy Risk: A Portfolio that employs an index strategy generally invests in the securities included in the relevant index or a representative sample of such securities regardless of market trends to track the performance of an unmanaged index of securities, whereas actively managed portfolios typically seek to outperform a benchmark index. Such a portfolio generally will not modify its index strategy to respond to changes in the economy, which means that it may be particularly susceptible to a general decline in the market segment relating to the relevant index. In addition, although the index strategy attempts to closely track its benchmark index, the Portfolio may not invest in all of the securities in the index. Also, the Portfolio’s fees and expenses will reduce the Portfolio’s returns,
B-6
unlike those of the benchmark index. Cash flow into and out of the Portfolio, portfolio transaction costs, changes in the securities that comprise the index, and the Portfolio’s valuation procedures also may affect the Portfolio’s performance. Therefore, there can be no assurance that the performance of the index strategy will match that of the benchmark index.
Investment Style Risk. An Adviser may use a particular style or set of styles, for example, growth, value, momentum or quantitative investing styles, to select investments. Those styles may be out of favor or may not produce the best results over short or longer time periods. They may also increase the volatility of the Portfolio’s share price.
Growth investing generally focuses on companies that, due to their strong earnings and revenue potential, offer above-average prospects for capital growth, with less emphasis on dividend income. Earnings predictability and confidence in earnings forecasts are an important part of the selection process. As a result, the price of growth stocks may be more sensitive to changes in current or expected earnings than the prices of other stocks. An Adviser using this approach generally seeks out companies experiencing some or all of the following: high sales growth, high unit growth, high or improving returns on assets and equity, and a strong balance sheet. Such an Adviser also prefers companies with a competitive advantage such as unique management, marketing or research and development. Growth investing is also subject to the risk that the stock price of one or more companies will fall or will fail to appreciate as anticipated by the Adviser, regardless of movements in the securities market. Growth stocks tend to be more volatile than value stocks, so in a declining market, their prices may decrease more than value stocks in general.
Value investing attempts to identify strong companies selling at a discount from their perceived true worth. An Adviser using this approach generally selects stocks at prices that, in its view, are temporarily low relative to the company’s earnings, assets, cash flow and dividends. Value investing is subject to the risk that a stock’s intrinsic value may never be fully recognized or realized by the market, or its price may go down. In addition, there is the risk that a stock judged to be undervalued may actually be appropriately priced. Value investing generally emphasizes companies that, considering their assets and earnings history, are attractively priced and may provide dividend income.
Large-Cap Company Risk. Larger more established companies may be unable to respond quickly to new competitive challenges such as changes in technology and consumer tastes. Many larger companies also may not be able to attain the high growth rate of successful smaller companies, especially during extended periods of economic expansion.
Leveraging Risk. When a Portfolio leverages its holdings, the value of an investment in that Portfolio will be more volatile and all other risks will tend to be compounded. For example, a Portfolio may take on leveraging risk when it engages in derivatives transactions, invests in collateral from securities loans or borrows money.
Mid-Cap and Small-Cap Company Risk. A Portfolio’s investments in mid- and small-cap companies may involve greater risks than investments in larger, more established issuers because they generally are more vulnerable than larger companies to adverse business or economic developments. Such companies generally have narrower product lines, more limited financial resources and more limited markets for their stock as compared with larger companies. As a result, the value of such securities may be more volatile than the securities of larger companies, and the portfolio may experience difficulty in purchasing or selling such securities at the desired time and price. In general, these risks are greater for small-capitalization companies than for mid-capitalization companies.
Portfolio Turnover Risk. High portfolio turnover (generally, turnover in excess of 100% in any given fiscal year) may result in increased transaction costs to a Portfolio, which may result in higher fund expenses and lower total return.
B-7
SECURITY OWNERSHIP OF CERTAIN BENEFICIAL OWNERS
As of the Record Date, to the Trust’s knowledge, the following persons owned beneficially or of record 5% or more of the Class IA or Class IB shares of a Portfolio.
Shareholder’s or Contractholder’s Name/Address | Percent Beneficial Ownership of Shares of the Portfolio | Percent Beneficial Ownership of Shares of the Combined Portfolio (assuming the Reorganizations occur) | ||
C-1
STATEMENT OF ADDITIONAL INFORMATION
, 2011
EQ ADVISORS TRUST
EQ/Capital Guardian Growth Portfolio
EQ/Lord Abbett Growth and Income Portfolio
(each, an “Acquired Portfolio” and together, the “Acquired Portfolios”)
AND
EQ/Large Cap Growth PLUS Index
EQ/Large Cap Value Index Portfolio
(each, an “Acquiring Portfolio” and together, the “Acquiring Portfolios”)
1290 Avenue of the Americas
New York, New York 10104
(877) 222-2144
Acquisition of the assets and assumption of the liabilities of: | By and in exchange for shares of: | |
| EQ/Capital Guardian Growth Portfolio | EQ/Large Cap Growth PLUS Portfolio | |
| EQ/Lord Abbett Growth and Income Portfolio | EQ/Large Cap Value Index Portfolio | |
The Acquired and Acquiring Portfolios are series of EQ Advisors Trust (the “Trust”).
This Statement of Additional Information (the “SAI”) relates specifically to the proposed reorganization of each Acquired Portfolio into the corresponding Acquiring Portfolio under which the Acquiring Portfolio would acquire all of the assets of the Acquired Portfolio in exchange solely for shares of the Acquiring Portfolio and that Acquiring Portfolio’s assumption of all of the corresponding Acquired Portfolio’s liabilities (the “Reorganizations”). This SAI is available to owners of and participants in variable life insurance contracts and variable annuity contracts and certificates (the “Contracts”) with amounts allocated to an Acquired Portfolio and to other shareholders of the Acquired Portfolios as of January 31, 2011.
This SAI consists of the cover page, the information set forth below and the following described documents, each of which is incorporated by reference herein and accompanies this SAI:
(1) The combined Statement of Additional Information of the Trust dated May 1, 2010, as supplemented, with respect to the Acquiring Portfolios (File Nos. 333-17217 and 811-07953); and
(2) The Annual Report to Shareholders of the Trust with respect to the Acquiring and Acquired Portfolios for the fiscal year ended December 31, 2009 (File Nos. 333-17217 and 811-07953); and
(3) The Semi-Annual Report to Shareholders of the Trust with respect to the Acquiring and Acquired Portfolios for the semi-annual period ended June 30, 2010 (File Nos. 333-17217 and 811-07953).
The Trust’s SAI that is incorporated by reference above includes information about the Trust’s other portfolios that is not relevant to the Reorganizations. Please disregard that information.
This SAI is not a prospectus. A Combined Proxy Statement and Prospectus dated , 20 relating to the Reorganizations (the “Proxy Statement/Prospectus”) may be obtained, without charge, by writing to the Trust at 1290 Avenue of the Americas, New York, New York 10104 or calling (877) 222-2144. This SAI should be read in conjunction with the Proxy Statement/Prospectus.
PRO FORMA FINANCIAL STATEMENTS
The following tables set forth the pro forma Portfolio of Investments as of June 30, 2010, the pro forma condensed Statement of Assets and Liabilities as of June 30, 2010, and the pro forma condensed Statement of Operations for the twelve-month period ended June 30, 2010 for the Acquired Portfolios and the Acquiring Portfolios, as adjusted giving effect to the Reorganizations.
The pro forma Portfolio of Investments contains information about the securities holdings of the combined Portfolios as of June 30, 2010, which has, and will continue to, change over time due to normal portfolio turnover in response to changes in market conditions. Thus, it is expected that some of an Acquired Portfolio’s holdings may not remain at the time of the Reorganizations. It is also expected that, if a Reorganization is approved, AXA Equitable Life Insurance Company (the “Manager”) will liquidate an Acquired Portfolio’s holdings that, based on market conditions and an assessment by the Manager and the investment advisers to the corresponding Acquiring Portfolio, are not compatible with the Acquiring Portfolio’s current portfolio composition, investment objective and policies, or investment strategies. The proceeds of such liquidation will be held in temporary investments or reinvested in assets that are consistent with the Acquiring Portfolio’s investment objective, policies and strategies. Although any sale of portfolio investments in connection with a Reorganization will be conducted in an orderly manner, the need for a Portfolio to sell investments may result in its selling securities at a disadvantageous time and price and could result in the Portfolio realizing gains (or losses) that otherwise would not have been realized and incurring transaction costs that otherwise would not have been incurred.
EQ ADVISORS TRUST
PORTFOLIO OF INVESTMENTS
June 30, 2010 (Unaudited)
| Number of Shares | Value (Note 1) | |||||||||||||||||||||||||||
| EQ/Capital Guardian Growth | EQ/Large Cap Growth PLUS | Pro Forma | EQ/Capital Guardian Growth | EQ/Large Cap Growth PLUS | Pro Forma | % of Net Assets | ||||||||||||||||||||||
COMMON STOCKS: | ||||||||||||||||||||||||||||
Consumer Discretionary | ||||||||||||||||||||||||||||
Auto Components | ||||||||||||||||||||||||||||
Autoliv, Inc.* | — | 3,745 | 3,745 | $ | — | $ | 179,198 | $ | 179,198 | |||||||||||||||||||
BorgWarner, Inc.* | — | 14,001 | 14,001 | — | 522,797 | 522,797 | ||||||||||||||||||||||
Federal-Mogul Corp.* | — | 627 | 627 | — | 8,164 | 8,164 | ||||||||||||||||||||||
Gentex Corp. | — | 17,987 | 17,987 | — | 323,406 | 323,406 | ||||||||||||||||||||||
Goodyear Tire & Rubber Co.* | — | 31,334 | 31,334 | — | 311,460 | 311,460 | ||||||||||||||||||||||
Johnson Controls, Inc. | — | 81,827 | 81,827 | — | 2,198,692 | 2,198,692 | ||||||||||||||||||||||
Lear Corp.* | — | 1,800 | 1,800 | — | 119,160 | 119,160 | ||||||||||||||||||||||
TRW Automotive Holdings Corp.* | — | 6,855 | 6,855 | — | 188,992 | 188,992 | ||||||||||||||||||||||
| — | 3,851,869 | 3,851,869 | 0.22 | % | ||||||||||||||||||||||||
Automobiles | ||||||||||||||||||||||||||||
Ford Motor Co.* | — | 430,192 | 430,192 | — | 4,336,335 | 4,336,335 | ||||||||||||||||||||||
Harley-Davidson, Inc. | — | 30,371 | 30,371 | — | 675,147 | 675,147 | ||||||||||||||||||||||
Thor Industries, Inc. | — | 4,321 | 4,321 | — | 102,624 | 102,624 | ||||||||||||||||||||||
| — | 5,114,106 | 5,114,106 | 0.29 | % | ||||||||||||||||||||||||
Distributors | ||||||||||||||||||||||||||||
LKQ Corp.* | — | 18,422 | 18,422 | — | 355,176 | 355,176 | 0.02 | % | ||||||||||||||||||||
Diversified Consumer Services | ||||||||||||||||||||||||||||
Apollo Group, Inc., Class A* | — | 16,699 | 16,699 | — | 709,207 | 709,207 | ||||||||||||||||||||||
Career Education Corp.* | — | 8,422 | 8,422 | — | 193,874 | 193,874 | ||||||||||||||||||||||
DeVry, Inc. | — | 8,215 | 8,215 | — | 431,205 | 431,205 | ||||||||||||||||||||||
Education Management Corp.* | — | 3,300 | 3,300 | — | 50,325 | 50,325 | ||||||||||||||||||||||
H&R Block, Inc. | — | 17,535 | 17,535 | — | 275,124 | 275,124 | ||||||||||||||||||||||
Hillenbrand, Inc. | — | 8,032 | 8,032 | — | 171,804 | 171,804 | ||||||||||||||||||||||
ITT Educational Services, Inc.* | — | 4,502 | 4,502 | — | 373,756 | 373,756 | ||||||||||||||||||||||
Strayer Education, Inc. | 18,900 | 1,795 | 20,695 | 3,929,121 | 373,163 | 4,302,284 | ||||||||||||||||||||||
Weight Watchers International, Inc. | — | 4,285 | 4,285 | — | 110,082 | 110,082 | ||||||||||||||||||||||
| 3,929,121 | 2,688,540 | 6,617,661 | 0.38 | % | ||||||||||||||||||||||||
Hotels, Restaurants & Leisure | ||||||||||||||||||||||||||||
Bally Technologies, Inc.* | — | 7,123 | 7,123 | — | 230,714 | 230,714 | ||||||||||||||||||||||
Brinker International, Inc. | — | 11,521 | 11,521 | — | 166,594 | 166,594 | ||||||||||||||||||||||
Burger King Holdings, Inc. | — | 11,828 | 11,828 | — | 199,184 | 199,184 | ||||||||||||||||||||||
Carnival Corp. | — | 21,092 | 21,092 | — | 637,822 | 637,822 | ||||||||||||||||||||||
Chipotle Mexican Grill, Inc.* | — | 4,064 | 4,064 | — | 555,996 | 555,996 | ||||||||||||||||||||||
Choice Hotels International, Inc. | — | 253 | 253 | — | 7,643 | 7,643 | ||||||||||||||||||||||
Darden Restaurants, Inc. | — | 18,098 | 18,098 | — | 703,107 | 703,107 | ||||||||||||||||||||||
See notes to pro-forma financial statements.
EQ ADVISORS TRUST
PORTFOLIO OF INVESTMENTS
June 30, 2010 (Unaudited)
| Number of Shares | Value (Note 1) | |||||||||||||||||||||||||||
| EQ/Capital Guardian Growth | EQ/Large Cap Growth PLUS | Pro Forma | EQ/Capital Guardian Growth | EQ/Large Cap Growth PLUS | Pro Forma | % of Net Assets | ||||||||||||||||||||||
International Game Technology | — | 38,452 | 38,452 | — | 603,696 | 603,696 | ||||||||||||||||||||||
International Speedway Corp., Class A | — | 1,345 | 1,345 | — | 34,647 | 34,647 | ||||||||||||||||||||||
Las Vegas Sands Corp.* | — | 40,800 | 40,800 | — | 903,312 | 903,312 | ||||||||||||||||||||||
Marriott International, Inc., Class A | — | 35,003 | 35,003 | — | 1,047,990 | 1,047,990 | ||||||||||||||||||||||
McDonald’s Corp. | — | 339,883 | 339,883 | — | 22,388,093 | 22,388,093 | ||||||||||||||||||||||
MGM MIRAGE* | — | 5,676 | 5,676 | — | 54,717 | 54,717 | ||||||||||||||||||||||
Panera Bread Co., Class A* | — | 3,947 | 3,947 | — | 297,170 | 297,170 | ||||||||||||||||||||||
Royal Caribbean Cruises Ltd.* | — | 6,611 | 6,611 | — | 150,532 | 150,532 | ||||||||||||||||||||||
Starbucks Corp. | — | 96,109 | 96,109 | — | 2,335,449 | 2,335,449 | ||||||||||||||||||||||
Starwood Hotels & Resorts Worldwide, Inc. | — | 24,443 | 24,443 | — | 1,012,673 | 1,012,673 | ||||||||||||||||||||||
Wendy’s/Arby’s Group, Inc., Class A | — | 16,283 | 16,283 | — | 65,132 | 65,132 | ||||||||||||||||||||||
WMS Industries, Inc.* | — | 7,476 | 7,476 | — | 293,433 | 293,433 | ||||||||||||||||||||||
Wynn Resorts Ltd. | — | 71,590 | 71,590 | — | 5,460,169 | 5,460,169 | ||||||||||||||||||||||
Yum! Brands, Inc. | — | 60,272 | 60,272 | — | 2,353,019 | 2,353,019 | ||||||||||||||||||||||
| — | 39,501,092 | 39,501,092 | 2.25 | % | ||||||||||||||||||||||||
Household Durables | ||||||||||||||||||||||||||||
Fortune Brands, Inc. | — | 2,377 | 2,377 | — | 93,131 | 93,131 | ||||||||||||||||||||||
Garmin Ltd. | — | 882 | 882 | — | 25,737 | 25,737 | ||||||||||||||||||||||
Harman International Industries, Inc.* | — | 4,267 | 4,267 | — | 127,541 | 127,541 | ||||||||||||||||||||||
Leggett & Platt, Inc. | — | 11,364 | 11,364 | — | 227,962 | 227,962 | ||||||||||||||||||||||
Mohawk Industries, Inc.* | — | 867 | 867 | — | 39,674 | 39,674 | ||||||||||||||||||||||
NVR, Inc.* | — | 795 | 795 | — | 520,749 | 520,749 | ||||||||||||||||||||||
Tempur-Pedic International, Inc.* | — | 9,338 | 9,338 | — | 287,143 | 287,143 | ||||||||||||||||||||||
Tupperware Brands Corp. | — | 8,149 | 8,149 | — | 324,738 | 324,738 | ||||||||||||||||||||||
Whirlpool Corp. | — | 4,147 | 4,147 | — | 364,189 | 364,189 | ||||||||||||||||||||||
| — | 2,010,864 | 2,010,864 | 0.11 | % | ||||||||||||||||||||||||
Internet & Catalog Retail | ||||||||||||||||||||||||||||
Amazon.com, Inc.* | — | 138,801 | 138,801 | — | 15,165,397 | 15,165,397 | ||||||||||||||||||||||
Expedia, Inc. | — | 10,895 | 10,895 | — | 204,608 | 204,608 | ||||||||||||||||||||||
Netflix, Inc.* | — | 5,142 | 5,142 | — | 558,678 | 558,678 | ||||||||||||||||||||||
priceline.com, Inc.* | — | 47,960 | 47,960 | — | 8,466,859 | 8,466,859 | ||||||||||||||||||||||
| — | 24,395,542 | 24,395,542 | 1.39 | % | ||||||||||||||||||||||||
Leisure Equipment & Products | ||||||||||||||||||||||||||||
Hasbro, Inc. | — | 16,829 | 16,829 | — | 691,672 | 691,672 | ||||||||||||||||||||||
Mattel, Inc. | — | 27,285 | 27,285 | — | 577,351 | 577,351 | ||||||||||||||||||||||
| — | 1,269,023 | 1,269,023 | 0.07 | % | ||||||||||||||||||||||||
See notes to pro-forma financial statements.
EQ ADVISORS TRUST
PORTFOLIO OF INVESTMENTS
June 30, 2010 (Unaudited)
| Number of Shares | Value (Note 1) | |||||||||||||||||||||||||||
| EQ/Capital Guardian Growth | EQ/Large Cap Growth PLUS | Pro Forma | EQ/Capital Guardian Growth | EQ/Large Cap Growth PLUS | Pro Forma | % of Net Assets | ||||||||||||||||||||||
Media | ||||||||||||||||||||||||||||
CBS Corp.(Non-Voting), Class B | — | 10,437 | 10,437 | — | 134,950 | 134,950 | ||||||||||||||||||||||
DIRECTV, Class A* | — | 114,414 | 114,414 | — | 3,880,923 | 3,880,923 | ||||||||||||||||||||||
Discovery Communications, Inc., Class A* | — | 26,808 | 26,808 | — | 957,314 | 957,314 | ||||||||||||||||||||||
DreamWorks Animation SKG, Inc., Class A* | 169,300 | 9,563 | 178,863 | 4,833,515 | 273,024 | 5,106,539 | ||||||||||||||||||||||
Interactive Data Corp. | — | 4,431 | 4,431 | — | 147,907 | 147,907 | ||||||||||||||||||||||
Interpublic Group of Cos., Inc.* | — | 63,117 | 63,117 | — | 450,024 | 450,024 | ||||||||||||||||||||||
John Wiley & Sons, Inc., Class A | — | 5,364 | 5,364 | — | 207,426 | 207,426 | ||||||||||||||||||||||
Lamar Advertising Co., Class A* | — | 1,558 | 1,558 | — | 38,202 | 38,202 | ||||||||||||||||||||||
Madison Square Garden, Inc., Class A* | — | 2,505 | 2,505 | — | 49,273 | 49,273 | ||||||||||||||||||||||
McGraw-Hill Cos., Inc. | — | 28,567 | 28,567 | — | 803,875 | 803,875 | ||||||||||||||||||||||
Meredith Corp. | — | 1,974 | 1,974 | — | 61,451 | 61,451 | ||||||||||||||||||||||
Morningstar, Inc.* | — | 2,845 | 2,845 | — | 120,969 | 120,969 | ||||||||||||||||||||||
News Corp., Class A | — | 61,608 | 61,608 | — | 736,832 | 736,832 | ||||||||||||||||||||||
Omnicom Group, Inc. | 47,600 | 31,911 | 79,511 | 1,632,680 | 1,094,547 | 2,727,227 | ||||||||||||||||||||||
Regal Entertainment Group, Class A | — | 2,395 | 2,395 | — | 31,231 | 31,231 | ||||||||||||||||||||||
Scripps Networks Interactive, Inc., Class A | 43,700 | 11,553 | 55,253 | 1,762,858 | 466,048 | 2,228,906 | ||||||||||||||||||||||
Sirius XM Radio, Inc.* | — | 501,208 | 501,208 | — | 475,897 | 475,897 | ||||||||||||||||||||||
Thomson Reuters Corp. | — | 15,631 | 15,631 | — | 560,059 | 560,059 | ||||||||||||||||||||||
Time Warner Cable, Inc. | 49,167 | — | 49,167 | 2,560,617 | — | 2,560,617 | ||||||||||||||||||||||
Time Warner, Inc. | 46,033 | 30,285 | 76,318 | 1,330,814 | 875,539 | 2,206,353 | ||||||||||||||||||||||
Viacom, Inc., Class B | 184,600 | 15,434 | 200,034 | 5,790,902 | 484,165 | 6,275,067 | ||||||||||||||||||||||
Walt Disney Co. | — | 348,145 | 348,145 | — | 10,966,567 | 10,966,567 | ||||||||||||||||||||||
| 17,911,386 | 22,816,223 | 40,727,609 | 2.32 | % | ||||||||||||||||||||||||
Multiline Retail | ||||||||||||||||||||||||||||
Big Lots, Inc.* | — | 10,459 | 10,459 | — | 335,629 | 335,629 | ||||||||||||||||||||||
Dollar General Corp.* | — | 9,012 | 9,012 | — | 248,281 | 248,281 | ||||||||||||||||||||||
Dollar Tree, Inc.* | — | 16,851 | 16,851 | — | 701,507 | 701,507 | ||||||||||||||||||||||
Family Dollar Stores, Inc. | — | 17,422 | 17,422 | — | 656,635 | 656,635 | ||||||||||||||||||||||
J.C. Penney Co., Inc. | — | 9,906 | 9,906 | — | 212,781 | 212,781 | ||||||||||||||||||||||
Kohl’s Corp.* | — | 29,301 | 29,301 | — | 1,391,798 | 1,391,798 | ||||||||||||||||||||||
Macy’s, Inc. | — | 5,390 | 5,390 | — | 96,481 | 96,481 | ||||||||||||||||||||||
Nordstrom, Inc. | — | 168,998 | 168,998 | — | 5,440,046 | 5,440,046 | ||||||||||||||||||||||
Target Corp. | 206,950 | 94,997 | 301,947 | 10,175,732 | 4,671,002 | 14,846,734 | ||||||||||||||||||||||
| 10,175,732 | 13,754,160 | 23,929,892 | 1.36 | % | ||||||||||||||||||||||||
Specialty Retail | ||||||||||||||||||||||||||||
Aaron’s, Inc. | — | 5,232 | 5,232 | — | 89,310 | 89,310 | ||||||||||||||||||||||
Abercrombie & Fitch Co., Class A | — | 8,692 | 8,692 | — | 266,757 | 266,757 | ||||||||||||||||||||||
Advance Auto Parts, Inc. | — | 11,332 | 11,332 | — | 568,640 | 568,640 | ||||||||||||||||||||||
Aeropostale, Inc.* | — | 12,054 | 12,054 | — | 345,227 | 345,227 | ||||||||||||||||||||||
See notes to pro-forma financial statements.
EQ ADVISORS TRUST
PORTFOLIO OF INVESTMENTS
June 30, 2010 (Unaudited)
| Number of Shares | Value (Note 1) | |||||||||||||||||||||||||||
| EQ/Capital Guardian Growth | EQ/Large Cap Growth PLUS | Pro Forma | EQ/Capital Guardian Growth | EQ/Large Cap Growth PLUS | Pro Forma | % of Net Assets | ||||||||||||||||||||||
American Eagle Outfitters, Inc. | — | 6,665 | 6,665 | — | 78,314 | 78,314 | ||||||||||||||||||||||
AutoNation, Inc.* | — | 3,185 | 3,185 | — | 62,108 | 62,108 | ||||||||||||||||||||||
AutoZone, Inc.* | — | 3,589 | 3,589 | — | 693,467 | 693,467 | ||||||||||||||||||||||
Bed Bath & Beyond, Inc.* | — | 33,893 | 33,893 | — | 1,256,752 | 1,256,752 | ||||||||||||||||||||||
Best Buy Co., Inc. | — | 44,511 | 44,511 | — | 1,507,142 | 1,507,142 | ||||||||||||||||||||||
CarMax, Inc.* | — | 28,848 | 28,848 | — | 574,075 | 574,075 | ||||||||||||||||||||||
Chico’s FAS, Inc. | — | 23,052 | 23,052 | — | 227,754 | 227,754 | ||||||||||||||||||||||
Dick’s Sporting Goods, Inc.* | — | 11,540 | 11,540 | — | 287,231 | 287,231 | ||||||||||||||||||||||
Gap, Inc. | — | 52,712 | 52,712 | — | 1,025,776 | 1,025,776 | ||||||||||||||||||||||
Guess?, Inc. | — | 8,181 | 8,181 | — | 255,574 | 255,574 | ||||||||||||||||||||||
Home Depot, Inc. | — | 480,762 | 480,762 | — | 13,494,989 | 13,494,989 | ||||||||||||||||||||||
J. Crew Group, Inc.* | — | 7,114 | 7,114 | — | 261,866 | 261,866 | ||||||||||||||||||||||
Limited Brands, Inc. | — | 34,459 | 34,459 | — | 760,510 | 760,510 | ||||||||||||||||||||||
Lowe’s Cos., Inc. | 88,500 | 141,835 | 230,335 | 1,807,170 | 2,896,271 | 4,703,441 | ||||||||||||||||||||||
Office Depot, Inc.* | — | 4,429 | 4,429 | — | 17,893 | 17,893 | ||||||||||||||||||||||
O’Reilly Automotive, Inc.* | — | 17,816 | 17,816 | — | 847,329 | 847,329 | ||||||||||||||||||||||
PetSmart, Inc. | — | 15,262 | 15,262 | — | 460,455 | 460,455 | ||||||||||||||||||||||
Ross Stores, Inc. | — | 15,784 | 15,784 | — | 841,129 | 841,129 | ||||||||||||||||||||||
Staples, Inc. | — | 94,153 | 94,153 | — | 1,793,615 | 1,793,615 | ||||||||||||||||||||||
Tiffany & Co. | — | 16,302 | 16,302 | — | 618,009 | 618,009 | ||||||||||||||||||||||
TJX Cos., Inc. | — | 52,624 | 52,624 | — | 2,207,577 | 2,207,577 | ||||||||||||||||||||||
Tractor Supply Co. | — | 4,688 | 4,688 | — | 285,827 | 285,827 | ||||||||||||||||||||||
Urban Outfitters, Inc.* | 141,000 | 15,729 | 156,729 | 4,848,990 | 540,920 | 5,389,910 | ||||||||||||||||||||||
Williams-Sonoma, Inc. | — | 12,418 | 12,418 | — | 308,215 | 308,215 | ||||||||||||||||||||||
| 6,656,160 | 32,572,732 | 39,228,892 | 2.24 | % | ||||||||||||||||||||||||
Textiles, Apparel & Luxury Goods |
| |||||||||||||||||||||||||||
Coach, Inc. | 151,100 | 39,354 | 190,454 | 5,522,705 | 1,438,389 | 6,961,094 | ||||||||||||||||||||||
Fossil, Inc.* | — | 6,788 | 6,788 | — | 235,544 | 235,544 | ||||||||||||||||||||||
Hanesbrands, Inc.* | — | 12,328 | 12,328 | — | 296,612 | 296,612 | ||||||||||||||||||||||
NIKE, Inc., Class B | — | 134,373 | 134,373 | — | 9,076,896 | 9,076,896 | ||||||||||||||||||||||
Phillips-Van Heusen Corp. | — | 7,287 | 7,287 | — | 337,169 | 337,169 | ||||||||||||||||||||||
Polo Ralph Lauren Corp. | — | 7,194 | 7,194 | — | 524,874 | 524,874 | ||||||||||||||||||||||
| 5,522,705 | 11,909,484 | 17,432,189 | 0.99 | % | ||||||||||||||||||||||||
Total Consumer Discretionary | 44,195,104 | 160,238,811 | 204,433,915 | 11.66 | % | |||||||||||||||||||||||
Consumer Staples | ||||||||||||||||||||||||||||
Beverages | ||||||||||||||||||||||||||||
Brown-Forman Corp., Class B | — | 10,286 | 10,286 | — | 588,668 | 588,668 | ||||||||||||||||||||||
Coca-Cola Co. | — | 202,687 | 202,687 | — | 10,158,673 | 10,158,673 | ||||||||||||||||||||||
See notes to pro-forma financial statements.
EQ ADVISORS TRUST
PORTFOLIO OF INVESTMENTS
June 30, 2010 (Unaudited)
| Number of Shares | Value (Note 1) | |||||||||||||||||||||||||||
| EQ/Capital Guardian Growth | EQ/Large Cap Growth PLUS | Pro Forma | EQ/Capital Guardian Growth | EQ/Large Cap Growth PLUS | Pro Forma | % of Net Assets | ||||||||||||||||||||||
Coca-Cola Enterprises, Inc. | — | 25,204 | 25,204 | — | 651,775 | 651,775 | ||||||||||||||||||||||
Dr. Pepper Snapple Group, Inc. | — | 9,698 | 9,698 | — | 362,608 | 362,608 | ||||||||||||||||||||||
Hansen Natural Corp.* | — | 7,215 | 7,215 | — | 282,179 | 282,179 | ||||||||||||||||||||||
PepsiCo, Inc. | 185,800 | 119,615 | 305,415 | 11,324,510 | 7,290,534 | 18,615,044 | ||||||||||||||||||||||
| 11,324,510 | 19,334,437 | 30,658,947 | 1.75 | % | ||||||||||||||||||||||||
Food & Staples Retailing | ||||||||||||||||||||||||||||
BJ’s Wholesale Club, Inc.* | — | 671 | 671 | — | 24,834 | 24,834 | ||||||||||||||||||||||
Costco Wholesale Corp. | — | 56,776 | 56,776 | — | 3,113,028 | 3,113,028 | ||||||||||||||||||||||
CVS Caremark Corp. | — | 19,483 | 19,483 | — | 571,242 | 571,242 | ||||||||||||||||||||||
Kroger Co. | — | 4,738 | 4,738 | — | 93,291 | 93,291 | ||||||||||||||||||||||
Sysco Corp. | — | 76,308 | 76,308 | — | 2,180,119 | 2,180,119 | ||||||||||||||||||||||
Walgreen Co. | — | 114,974 | 114,974 | — | 3,069,806 | 3,069,806 | ||||||||||||||||||||||
Wal-Mart Stores, Inc. | 35,100 | 158,986 | 194,086 | 1,687,257 | 7,642,457 | 9,329,714 | ||||||||||||||||||||||
Whole Foods Market, Inc.* | — | 18,046 | 18,046 | — | 650,017 | 650,017 | ||||||||||||||||||||||
| 1,687,257 | 17,344,794 | 19,032,051 | 1.09 | % | ||||||||||||||||||||||||
Food Products | ||||||||||||||||||||||||||||
Campbell Soup Co. | — | 14,219 | 14,219 | — | 509,467 | 509,467 | ||||||||||||||||||||||
ConAgra Foods, Inc. | — | 5,804 | 5,804 | — | 135,349 | 135,349 | ||||||||||||||||||||||
Flowers Foods, Inc. | — | 3,666 | 3,666 | — | 89,560 | 89,560 | ||||||||||||||||||||||
General Mills, Inc. | 43,100 | 50,928 | 94,028 | 1,530,912 | 1,808,963 | 3,339,875 | ||||||||||||||||||||||
Green Mountain Coffee Roasters, Inc.* | — | 14,256 | 14,256 | — | 366,379 | 366,379 | ||||||||||||||||||||||
H.J. Heinz Co. | — | 16,723 | 16,723 | — | 722,768 | 722,768 | ||||||||||||||||||||||
Hershey Co. | — | 11,588 | 11,588 | — | 555,413 | 555,413 | ||||||||||||||||||||||
Kellogg Co. | — | 29,717 | 29,717 | — | 1,494,765 | 1,494,765 | ||||||||||||||||||||||
McCormick & Co., Inc.(Non-Voting) | — | 8,526 | 8,526 | — | 323,647 | 323,647 | ||||||||||||||||||||||
Mead Johnson Nutrition Co. | — | 188,639 | 188,639 | — | 9,454,587 | 9,454,587 | ||||||||||||||||||||||
Sara Lee Corp. | — | 60,817 | 60,817 | — | 857,520 | 857,520 | ||||||||||||||||||||||
| 1,530,912 | 16,318,418 | 17,849,330 | 1.02 | % | ||||||||||||||||||||||||
Household Products | — | |||||||||||||||||||||||||||
Church & Dwight Co., Inc. | — | 9,142 | 9,142 | — | 573,295 | 573,295 | ||||||||||||||||||||||
Clorox Co. | — | 17,114 | 17,114 | — | 1,063,806 | 1,063,806 | ||||||||||||||||||||||
Colgate-Palmolive Co. | 43,800 | 52,952 | 96,752 | 3,449,688 | 4,170,500 | 7,620,188 | ||||||||||||||||||||||
Kimberly-Clark Corp. | — | 42,291 | 42,291 | — | 2,564,103 | 2,564,103 | ||||||||||||||||||||||
Procter & Gamble Co. | 57,200 | 22,288 | 79,488 | 3,430,856 | 1,336,834 | 4,767,690 | ||||||||||||||||||||||
| 6,880,544 | 9,708,538 | 16,589,082 | 0.95 | % | ||||||||||||||||||||||||
Personal Products | ||||||||||||||||||||||||||||
Alberto-Culver Co. | 64,700 | 2,460 | 67,160 | 1,752,723 | 66,641 | 1,819,364 | ||||||||||||||||||||||
See notes to pro-forma financial statements.
EQ ADVISORS TRUST
PORTFOLIO OF INVESTMENTS
June 30, 2010 (Unaudited)
| Number of Shares | Value (Note 1) | |||||||||||||||||||||||||||
| EQ/Capital Guardian Growth | EQ/Large Cap Growth PLUS | Pro Forma | EQ/Capital Guardian Growth | EQ/Large Cap Growth PLUS | Pro Forma | % of Net Assets | ||||||||||||||||||||||
Avon Products, Inc. | 85,900 | 55,258 | 141,158 | 2,276,350 | 1,464,337 | 3,740,687 | ||||||||||||||||||||||
Estee Lauder Cos., Inc., Class A | — | 14,222 | 14,222 | — | 792,592 | 792,592 | ||||||||||||||||||||||
Herbalife Ltd. | — | 7,760 | 7,760 | — | 357,348 | 357,348 | ||||||||||||||||||||||
| 4,029,073 | 2,680,918 | 6,709,991 | 0.38 | % | ||||||||||||||||||||||||
| Tobacco | ||||||||||||||||||||||||||||
Altria Group, Inc. | — | 156,610 | 156,610 | — | 3,138,464 | 3,138,464 | ||||||||||||||||||||||
Philip Morris International, Inc. | 119,600 | 201,133 | 320,733 | 5,482,464 | 9,219,937 | 14,702,401 | ||||||||||||||||||||||
| 5,482,464 | 12,358,401 | 17,840,865 | ||||||||||||||||||||||||||
Total Consumer Staples | 30,934,760 | 77,745,506 | 108,680,266 | 6.20 | % | |||||||||||||||||||||||
Energy | ||||||||||||||||||||||||||||
Energy Equipment & Services | ||||||||||||||||||||||||||||
Atwood Oceanics, Inc.* | — | 1,461 | 1,461 | — | 37,285 | 37,285 | ||||||||||||||||||||||
Baker Hughes, Inc. | 22,900 | 15,164 | 38,064 | 951,953 | 630,368 | 1,582,321 | ||||||||||||||||||||||
Cameron International Corp.* | — | 17,985 | 17,985 | — | 584,872 | 584,872 | ||||||||||||||||||||||
Core Laboratories N.V. | — | 2,880 | 2,880 | — | 425,117 | 425,117 | ||||||||||||||||||||||
Diamond Offshore Drilling, Inc. | 18,300 | 2,881 | 21,181 | 1,138,077 | 179,169 | 1,317,246 | ||||||||||||||||||||||
Dresser-Rand Group, Inc.* | — | 9,611 | 9,611 | — | 303,227 | 303,227 | ||||||||||||||||||||||
Exterran Holdings, Inc.* | — | 836 | 836 | — | 21,577 | 21,577 | ||||||||||||||||||||||
FMC Technologies, Inc.* | — | 15,683 | 15,683 | — | 825,867 | 825,867 | ||||||||||||||||||||||
Halliburton Co. | 114,600 | 116,773 | 231,373 | 2,813,430 | 2,866,777 | 5,680,207 | ||||||||||||||||||||||
Nabors Industries Ltd.* | — | 14,679 | 14,679 | — | 258,644 | 258,644 | ||||||||||||||||||||||
Oil States International, Inc.* | — | 407 | 407 | — | 16,109 | 16,109 | ||||||||||||||||||||||
Pride International, Inc.* | — | 8,968 | 8,968 | — | 200,345 | 200,345 | ||||||||||||||||||||||
Rowan Cos., Inc.* | — | 1,670 | 1,670 | — | 36,640 | 36,640 | ||||||||||||||||||||||
Schlumberger Ltd. | 145,291 | 153,862 | 299,153 | 8,040,404 | 8,514,723 | 16,555,127 | ||||||||||||||||||||||
Superior Energy Services, Inc.* | — | 729 | 729 | — | 13,610 | 13,610 | ||||||||||||||||||||||
Transocean Ltd.* | 55,600 | — | 55,600 | 2,575,948 | — | 2,575,948 | ||||||||||||||||||||||
Weatherford International Ltd.* | 317,900 | 38,482 | 356,382 | 4,177,206 | 505,654 | 4,682,860 | ||||||||||||||||||||||
| 19,697,018 | 15,419,984 | 35,117,002 | 2.00 | % | ||||||||||||||||||||||||
Oil, Gas & Consumable Fuels | ||||||||||||||||||||||||||||
Alpha Natural Resources, Inc.* | — | 2,075 | 2,075 | — | 70,280 | 70,280 | ||||||||||||||||||||||
Anadarko Petroleum Corp. | 51,700 | — | 51,700 | 1,865,853 | — | 1,865,853 | ||||||||||||||||||||||
Arch Coal, Inc. | — | 14,817 | 14,817 | — | 293,525 | 293,525 | ||||||||||||||||||||||
Atlas Energy, Inc.* | — | 7,385 | 7,385 | — | 199,912 | 199,912 | ||||||||||||||||||||||
Chevron Corp. | — | 13,732 | 13,732 | — | 931,853 | 931,853 | ||||||||||||||||||||||
Cimarex Energy Co. | — | 10,820 | 10,820 | — | 774,496 | 774,496 | ||||||||||||||||||||||
Concho Resources, Inc.* | — | 11,809 | 11,809 | — | 653,392 | 653,392 | ||||||||||||||||||||||
ConocoPhillips | — | 73,528 | 73,528 | — | 3,609,490 | 3,609,490 | ||||||||||||||||||||||
See notes to pro-forma financial statements.
EQ ADVISORS TRUST
PORTFOLIO OF INVESTMENTS
June 30, 2010 (Unaudited)
| Number of Shares | Value (Note 1) | |||||||||||||||||||||||||||
| EQ/Capital Guardian Growth | EQ/Large Cap Growth PLUS | Pro Forma | EQ/Capital Guardian Growth | EQ/Large Cap Growth PLUS | Pro Forma | % of Net Assets | ||||||||||||||||||||||
Consol Energy, Inc. | — | 13,362 | 13,362 | — | 451,101 | 451,101 | ||||||||||||||||||||||
Continental Resources, Inc.* | — | 3,599 | 3,599 | — | 160,587 | 160,587 | ||||||||||||||||||||||
El Paso Corp. | — | 16,697 | 16,697 | — | 185,504 | 185,504 | ||||||||||||||||||||||
EOG Resources, Inc. | — | 120,023 | 120,023 | — | 11,806,662 | 11,806,662 | ||||||||||||||||||||||
EXCO Resources, Inc. | — | 18,935 | 18,935 | — | 276,640 | 276,640 | ||||||||||||||||||||||
Exxon Mobil Corp. | — | 604,166 | 604,166 | — | 34,479,754 | 34,479,754 | ||||||||||||||||||||||
Forest Oil Corp.* | — | 9,326 | 9,326 | — | 255,159 | 255,159 | ||||||||||||||||||||||
Frontline Ltd. | — | 5,472 | 5,472 | — | 156,171 | 156,171 | ||||||||||||||||||||||
Holly Corp. | — | 3,886 | 3,886 | — | 103,290 | 103,290 | ||||||||||||||||||||||
Marathon Oil Corp. | — | 24,436 | 24,436 | — | 759,715 | 759,715 | ||||||||||||||||||||||
Mariner Energy, Inc.* | — | 956 | 956 | — | 20,535 | 20,535 | ||||||||||||||||||||||
Murphy Oil Corp. | — | 2,914 | 2,914 | — | 144,389 | 144,389 | ||||||||||||||||||||||
Occidental Petroleum Corp. | — | 21,267 | 21,267 | — | 1,640,749 | 1,640,749 | ||||||||||||||||||||||
Petrohawk Energy Corp.* | — | 27,669 | 27,669 | — | 469,543 | 469,543 | ||||||||||||||||||||||
Quicksilver Resources, Inc.* | — | 938 | 938 | — | 10,318 | 10,318 | ||||||||||||||||||||||
Range Resources Corp. | — | 20,564 | 20,564 | — | 825,645 | 825,645 | ||||||||||||||||||||||
SandRidge Energy, Inc.* | — | 2,874 | 2,874 | — | 16,755 | 16,755 | ||||||||||||||||||||||
SM Energy Co. | — | 5,508 | 5,508 | — | 221,201 | 221,201 | ||||||||||||||||||||||
Southwestern Energy Co.* | — | 44,654 | 44,654 | — | 1,725,431 | 1,725,431 | ||||||||||||||||||||||
Ultra Petroleum Corp.* | — | 19,632 | 19,632 | — | 868,716 | 868,716 | ||||||||||||||||||||||
Whiting Petroleum Corp.* | — | 467 | 467 | — | 36,622 | 36,622 | ||||||||||||||||||||||
Williams Cos., Inc. | — | 31,051 | 31,051 | — | 567,612 | 567,612 | ||||||||||||||||||||||
| 1,865,853 | 61,715,047 | 63,580,900 | 3.63 | % | ||||||||||||||||||||||||
Total Energy | 21,562,871 | 77,135,031 | 98,697,902 | 5.63 | % | |||||||||||||||||||||||
Financials | ||||||||||||||||||||||||||||
Capital Markets | ||||||||||||||||||||||||||||
Affiliated Managers Group, Inc.* | — | 5,746 | 5,746 | — | 349,184 | 349,184 | ||||||||||||||||||||||
Ameriprise Financial, Inc. | — | 6,676 | 6,676 | — | 241,204 | 241,204 | ||||||||||||||||||||||
Bank of New York Mellon Corp. | 56,000 | — | 56,000 | 1,382,640 | — | 1,382,640 | ||||||||||||||||||||||
BlackRock, Inc. | — | 1,522 | 1,522 | — | 218,255 | 218,255 | ||||||||||||||||||||||
Charles Schwab Corp. | 280,700 | 127,626 | 408,326 | 3,980,326 | 1,809,737 | 5,790,063 | ||||||||||||||||||||||
Eaton Vance Corp. | — | 15,217 | 15,217 | — | 420,141 | 420,141 | ||||||||||||||||||||||
Federated Investors, Inc., Class B | — | 7,814 | 7,814 | — | 161,828 | 161,828 | ||||||||||||||||||||||
Franklin Resources, Inc. | — | 19,178 | 19,178 | — | 1,652,952 | 1,652,952 | ||||||||||||||||||||||
GLG Partners, Inc.* | — | 15,272 | 15,272 | — | 66,891 | 66,891 | ||||||||||||||||||||||
Goldman Sachs Group, Inc. | 38,600 | 40,013 | 78,613 | 5,067,022 | 5,252,507 | 10,319,529 | ||||||||||||||||||||||
Greenhill & Co., Inc. | — | 3,799 | 3,799 | — | 232,233 | 232,233 | ||||||||||||||||||||||
Invesco Ltd. | — | 17,051 | 17,051 | — | 286,968 | 286,968 | ||||||||||||||||||||||
Janus Capital Group, Inc. | — | 2,150 | 2,150 | — | 19,092 | 19,092 | ||||||||||||||||||||||
See notes to pro-forma financial statements.
EQ ADVISORS TRUST
PORTFOLIO OF INVESTMENTS
June 30, 2010 (Unaudited)
| Number of Shares | Value (Note 1) | |||||||||||||||||||||||||||
| EQ/Capital Guardian Growth | EQ/Large Cap Growth PLUS | Pro Forma | EQ/Capital Guardian Growth | EQ/Large Cap Growth PLUS | Pro Forma | % of Net Assets | ||||||||||||||||||||||
Lazard Ltd., Class A | — | 11,864 | 11,864 | — | 316,887 | 316,887 | ||||||||||||||||||||||
Morgan Stanley | — | 57,337 | 57,337 | — | 1,330,792 | 1,330,792 | ||||||||||||||||||||||
Northern Trust Corp. | — | 12,446 | 12,446 | — | 581,228 | 581,228 | ||||||||||||||||||||||
SEI Investments Co. | — | 19,299 | 19,299 | — | 392,928 | 392,928 | ||||||||||||||||||||||
T. Rowe Price Group, Inc. | — | 33,480 | 33,480 | — | 1,486,177 | 1,486,177 | ||||||||||||||||||||||
TD Ameritrade Holding Corp.* | — | 30,078 | 30,078 | — | 460,193 | 460,193 | ||||||||||||||||||||||
Waddell & Reed Financial, Inc., Class A | — | 11,144 | 11,144 | — | 243,831 | 243,831 | ||||||||||||||||||||||
| 10,429,988 | 15,523,028 | 25,953,016 | 1.48 | % | ||||||||||||||||||||||||
| Commercial Banks | ||||||||||||||||||||||||||||
Bank of Hawaii Corp. | — | 1,989 | 1,989 | — | 96,168 | 96,168 | ||||||||||||||||||||||
ICICI Bank Ltd. (ADR) | — | 109,211 | 109,211 | — | 3,946,886 | 3,946,886 | ||||||||||||||||||||||
PNC Financial Services Group, Inc. | — | 114,664 | 114,664 | — | 6,478,516 | 6,478,516 | ||||||||||||||||||||||
U.S. Bancorp | — | 541,580 | 541,580 | — | 12,104,313 | 12,104,313 | ||||||||||||||||||||||
Wells Fargo & Co. | — | 661,928 | 661,928 | — | 16,945,357 | 16,945,357 | ||||||||||||||||||||||
| — | 39,571,240 | 39,571,240 | 2.26 | % | ||||||||||||||||||||||||
Consumer Finance | ||||||||||||||||||||||||||||
American Express Co. | — | 298,848 | 298,848 | — | 11,864,266 | 11,864,266 | 0.68 | % | ||||||||||||||||||||
| Diversified Financial Services | ||||||||||||||||||||||||||||
Interactive Brokers Group, Inc., Class A* | — | 1,358 | 1,358 | — | 22,543 | 22,543 | ||||||||||||||||||||||
IntercontinentalExchange, Inc.* | — | 9,538 | 9,538 | — | 1,078,080 | 1,078,080 | ||||||||||||||||||||||
JPMorgan Chase & Co. | 74,300 | 261,523 | 335,823 | 2,720,123 | 9,574,357 | 12,294,480 | ||||||||||||||||||||||
Moody’s Corp. | — | 26,474 | 26,474 | — | 527,362 | 527,362 | ||||||||||||||||||||||
MSCI, Inc., Class A* | — | 14,227 | 14,227 | — | 389,820 | 389,820 | ||||||||||||||||||||||
NASDAQ OMX Group, Inc.* | — | 1,707 | 1,707 | — | 30,351 | 30,351 | ||||||||||||||||||||||
NYSE Euronext | — | 7,270 | 7,270 | — | 200,870 | 200,870 | ||||||||||||||||||||||
| 2,720,123 | 11,823,383 | 14,543,506 | 0.83 | % | ||||||||||||||||||||||||
| Insurance | ||||||||||||||||||||||||||||
ACE Ltd. | — | 6,640 | 6,640 | — | 341,827 | 341,827 | ||||||||||||||||||||||
Aflac, Inc. | — | 57,237 | 57,237 | — | 2,442,303 | 2,442,303 | ||||||||||||||||||||||
Arch Capital Group Ltd.* | — | 391 | 391 | — | 29,129 | 29,129 | ||||||||||||||||||||||
Arthur J. Gallagher & Co. | — | 3,357 | 3,357 | — | 81,844 | 81,844 | ||||||||||||||||||||||
Axis Capital Holdings Ltd. | — | 4,643 | 4,643 | — | 137,990 | 137,990 | ||||||||||||||||||||||
Brown & Brown, Inc. | — | 7,776 | 7,776 | — | 148,833 | 148,833 | ||||||||||||||||||||||
Endurance Specialty Holdings Ltd. | — | 637 | 637 | — | 23,907 | 23,907 | ||||||||||||||||||||||
Erie Indemnity Co., Class A | — | 2,661 | 2,661 | — | 121,075 | 121,075 | ||||||||||||||||||||||
Genworth Financial, Inc., Class A* | — | 11,666 | 11,666 | — | 152,475 | 152,475 | ||||||||||||||||||||||
Hartford Financial Services Group, Inc. | — | 4,812 | 4,812 | — | 106,489 | 106,489 | ||||||||||||||||||||||
See notes to pro-forma financial statements.
EQ ADVISORS TRUST
PORTFOLIO OF INVESTMENTS
June 30, 2010 (Unaudited)
| Number of Shares | Value (Note 1) | |||||||||||||||||||||||||||
| EQ/Capital Guardian Growth | EQ/Large Cap Growth PLUS | Pro Forma | EQ/Capital Guardian Growth | EQ/Large Cap Growth PLUS | Pro Forma | % of Net Assets | ||||||||||||||||||||||
Marsh & McLennan Cos., Inc. | — | 64,369 | 64,369 | — | 1,451,521 | 1,451,521 | ||||||||||||||||||||||
MetLife, Inc. | — | 23,775 | 23,775 | — | 897,744 | 897,744 | ||||||||||||||||||||||
Progressive Corp. | 189,000 | — | 189,000 | 3,538,080 | — | 3,538,080 | ||||||||||||||||||||||
Renaissance Reinsurance Holdings Ltd. | 13,700 | — | 13,700 | 770,899 | — | 770,899 | ||||||||||||||||||||||
Travelers Cos., Inc. | — | 7,412 | 7,412 | — | 365,041 | 365,041 | ||||||||||||||||||||||
Validus Holdings Ltd. | — | 1,172 | 1,172 | — | 28,620 | 28,620 | ||||||||||||||||||||||
| 4,308,979 | 6,328,798 | 10,637,777 | 0.61 | % | ||||||||||||||||||||||||
| Real Estate Investment Trusts (REIT’s) | ||||||||||||||||||||||||||||
AMB Property Corp. (REIT) | — | 2,017 | 2,017 | — | 47,823 | 47,823 | ||||||||||||||||||||||
Apartment Investment & Management Co. (REIT), Class A | — | 7,430 | 7,430 | — | 143,919 | 143,919 | ||||||||||||||||||||||
Digital Realty Trust, Inc. (REIT) | — | 9,486 | 9,486 | — | 547,153 | 547,153 | ||||||||||||||||||||||
Equity Residential (REIT) | — | 2,336 | 2,336 | — | 97,271 | 97,271 | ||||||||||||||||||||||
Essex Property Trust, Inc. (REIT) | — | 1,510 | 1,510 | — | 147,285 | 147,285 | ||||||||||||||||||||||
Federal Realty Investment Trust (REIT) | — | 4,733 | 4,733 | — | 332,588 | 332,588 | ||||||||||||||||||||||
General Growth Properties, Inc. (REIT) | — | 26,082 | 26,082 | — | 345,847 | 345,847 | ||||||||||||||||||||||
Plum Creek Timber Co., Inc. (REIT) | — | 8,934 | 8,934 | — | 308,491 | 308,491 | ||||||||||||||||||||||
ProLogis (REIT) | — | 3,811 | 3,811 | — | 38,606 | 38,606 | ||||||||||||||||||||||
Public Storage (REIT) | — | 16,412 | 16,412 | — | 1,442,779 | 1,442,779 | ||||||||||||||||||||||
Rayonier, Inc. (REIT) | — | 3,070 | 3,070 | — | 135,141 | 135,141 | ||||||||||||||||||||||
Simon Property Group, Inc. (REIT) | — | 26,129 | 26,129 | — | 2,109,917 | 2,109,917 | ||||||||||||||||||||||
UDR, Inc. (REIT) | — | 1,380 | 1,380 | — | 26,399 | 26,399 | ||||||||||||||||||||||
Ventas, Inc. (REIT) | — | 5,503 | 5,503 | — | 258,366 | 258,366 | ||||||||||||||||||||||
Vornado Realty Trust (REIT) | — | 1,875 | 1,875 | — | 136,781 | 136,781 | ||||||||||||||||||||||
| — | 6,118,366 | 6,118,366 | 0.35 | % | ||||||||||||||||||||||||
| Real Estate Management & Development | ||||||||||||||||||||||||||||
CB Richard Ellis Group, Inc., Class A* | — | 36,934 | 36,934 | — | 502,672 | 502,672 | ||||||||||||||||||||||
Jones Lang LaSalle, Inc. | — | 5,422 | 5,422 | — | 355,900 | 355,900 | ||||||||||||||||||||||
St. Joe Co.* | — | 10,733 | 10,733 | — | 248,576 | 248,576 | ||||||||||||||||||||||
| — | 1,107,148 | 1,107,148 | 0.06 | % | ||||||||||||||||||||||||
| Thrifts & Mortgage Finance | ||||||||||||||||||||||||||||
Capitol Federal Financial | — | 176 | 176 | — | 5,836 | 5,836 | ||||||||||||||||||||||
Hudson City Bancorp, Inc. | — | 5,113 | 5,113 | — | 62,583 | 62,583 | ||||||||||||||||||||||
| — | 68,419 | 68,419 | 0.00 | % | ||||||||||||||||||||||||
Total Financials | 17,459,090 | 92,404,648 | 109,863,738 | 6.27 | % | |||||||||||||||||||||||
Health Care | ||||||||||||||||||||||||||||
| Biotechnology | ||||||||||||||||||||||||||||
Abraxis Bioscience, Inc.* | — | 353 | 353 | — | 26,193 | 26,193 | ||||||||||||||||||||||
See notes to pro-forma financial statements.
EQ ADVISORS TRUST
PORTFOLIO OF INVESTMENTS
June 30, 2010 (Unaudited)
| Number of Shares | Value (Note 1) | |||||||||||||||||||||||||||
| EQ/Capital Guardian Growth | EQ/Large Cap Growth PLUS | Pro Forma | EQ/Capital Guardian Growth | EQ/Large Cap Growth PLUS | Pro Forma | % of Net Assets | ||||||||||||||||||||||
Alexion Pharmaceuticals, Inc.* | — | 11,555 | 11,555 | — | 591,500 | 591,500 | ||||||||||||||||||||||
Amylin Pharmaceuticals, Inc.* | — | 18,523 | 18,523 | — | 348,232 | 348,232 | ||||||||||||||||||||||
BioMarin Pharmaceutical, Inc.* | — | 13,106 | 13,106 | — | 248,490 | 248,490 | ||||||||||||||||||||||
Celgene Corp.* | 129,500 | 59,446 | 188,946 | 6,581,190 | 3,021,046 | 9,602,236 | ||||||||||||||||||||||
Dendreon Corp.* | — | 17,407 | 17,407 | — | 562,768 | 562,768 | ||||||||||||||||||||||
Genzyme Corp.* | — | 26,195 | 26,195 | — | 1,329,920 | 1,329,920 | ||||||||||||||||||||||
Gilead Sciences, Inc.* | — | 114,790 | 114,790 | — | 3,935,001 | 3,935,001 | ||||||||||||||||||||||
Human Genome Sciences, Inc.* | — | 24,166 | 24,166 | — | 547,602 | 547,602 | ||||||||||||||||||||||
Myriad Genetics, Inc.* | — | 12,609 | 12,609 | — | 188,504 | 188,504 | ||||||||||||||||||||||
Regeneron Pharmaceuticals, Inc. | — | 8,368 | 8,368 | — | 186,774 | 186,774 | ||||||||||||||||||||||
Talecris Biotherapeutics Holdings Corp. | — | 6,606 | 6,606 | — | 139,387 | 139,387 | ||||||||||||||||||||||
United Therapeutics Corp.* | — | 6,390 | 6,390 | — | 311,896 | 311,896 | ||||||||||||||||||||||
Vertex Pharmaceuticals, Inc.* | — | 26,081 | 26,081 | — | 858,065 | 858,065 | ||||||||||||||||||||||
| 6,581,190 | 12,295,378 | 18,876,568 | 1.08 | % | ||||||||||||||||||||||||
| Health Care Equipment & Supplies | ||||||||||||||||||||||||||||
Alcon, Inc. | — | 8,946 | 8,946 | — | 1,325,708 | 1,325,708 | ||||||||||||||||||||||
Baxter International, Inc. | 29,100 | 64,087 | 93,187 | 1,182,624 | 2,604,496 | 3,787,120 | ||||||||||||||||||||||
Becton, Dickinson and Co. | — | 30,097 | 30,097 | — | 2,035,159 | 2,035,159 | ||||||||||||||||||||||
Boston Scientific Corp.* | 242,300 | — | 242,300 | 1,405,340 | — | 1,405,340 | ||||||||||||||||||||||
C.R. Bard, Inc. | — | 12,266 | 12,266 | — | 950,983 | 950,983 | ||||||||||||||||||||||
CareFusion Corp.* | — | 5,082 | 5,082 | — | 115,361 | 115,361 | ||||||||||||||||||||||
Cooper Cos., Inc. | — | 1,119 | 1,119 | — | 44,525 | 44,525 | ||||||||||||||||||||||
Covidien plc | — | 64,659 | 64,659 | — | 2,597,999 | 2,597,999 | ||||||||||||||||||||||
DENTSPLY International, Inc. | — | 18,783 | 18,783 | — | 561,800 | 561,800 | ||||||||||||||||||||||
Edwards Lifesciences Corp.* | — | 14,615 | 14,615 | — | 818,732 | 818,732 | ||||||||||||||||||||||
Gen-Probe, Inc.* | — | 6,398 | 6,398 | — | 290,597 | 290,597 | ||||||||||||||||||||||
Hill-Rom Holdings, Inc. | — | 6,863 | 6,863 | — | 208,841 | 208,841 | ||||||||||||||||||||||
Hospira, Inc.* | — | 21,397 | 21,397 | — | 1,229,258 | 1,229,258 | ||||||||||||||||||||||
IDEXX Laboratories, Inc.* | — | 7,436 | 7,436 | — | 452,852 | 452,852 | ||||||||||||||||||||||
Intuitive Surgical, Inc.* | — | 44,626 | 44,626 | — | 14,084,858 | 14,084,858 | ||||||||||||||||||||||
Inverness Medical Innovations, Inc.* | — | 3,164 | 3,164 | — | 84,352 | 84,352 | ||||||||||||||||||||||
Kinetic Concepts, Inc.* | — | 708 | 708 | — | 25,849 | 25,849 | ||||||||||||||||||||||
Medtronic, Inc. | 173,400 | 109,264 | 282,664 | 6,289,218 | 3,963,005 | 10,252,223 | ||||||||||||||||||||||
ResMed, Inc.* | — | 9,780 | 9,780 | — | 594,722 | 594,722 | ||||||||||||||||||||||
St. Jude Medical, Inc.* | — | 42,150 | 42,150 | — | 1,521,193 | 1,521,193 | ||||||||||||||||||||||
Stryker Corp. | — | 40,628 | 40,628 | — | 2,033,838 | 2,033,838 | ||||||||||||||||||||||
Teleflex, Inc. | — | 802 | 802 | — | 43,533 | 43,533 | ||||||||||||||||||||||
Thoratec Corp.* | — | 7,395 | 7,395 | — | 315,988 | 315,988 | ||||||||||||||||||||||
Varian Medical Systems, Inc.* | — | 15,934 | 15,934 | — | 833,030 | 833,030 | ||||||||||||||||||||||
| 8,877,182 | 36,736,679 | 45,613,861 | 2.60 | % | ||||||||||||||||||||||||
See notes to pro-forma financial statements.
EQ ADVISORS TRUST
PORTFOLIO OF INVESTMENTS
June 30, 2010 (Unaudited)
| Number of Shares | Value (Note 1) | |||||||||||||||||||||||||||
| EQ/Capital Guardian Growth | EQ/Large Cap Growth PLUS | Pro Forma | EQ/Capital Guardian Growth | EQ/Large Cap Growth PLUS | Pro Forma | % of Net Assets | ||||||||||||||||||||||
Health Care Providers & Services | ||||||||||||||||||||||||||||
AmerisourceBergen Corp. | — | 36,443 | 36,443 | — | 1,157,065 | 1,157,065 | ||||||||||||||||||||||
Brookdale Senior Living, Inc.* | — | 1,512 | 1,512 | — | 22,680 | 22,680 | ||||||||||||||||||||||
Cardinal Health, Inc. | — | 16,066 | 16,066 | — | 539,978 | 539,978 | ||||||||||||||||||||||
Community Health Systems, Inc.* | — | 8,481 | 8,481 | — | 286,743 | 286,743 | ||||||||||||||||||||||
DaVita, Inc.* | 11,128 | 13,401 | 24,529 | 694,832 | 836,759 | 1,531,591 | ||||||||||||||||||||||
Emdeon, Inc., Class A* | — | 3,115 | 3,115 | — | 39,031 | 39,031 | ||||||||||||||||||||||
Emergency Medical Services Corp., Class A | — | 3,829 | 3,829 | — | 187,736 | 187,736 | ||||||||||||||||||||||
Express Scripts, Inc.* | — | 70,699 | 70,699 | — | 3,324,267 | 3,324,267 | ||||||||||||||||||||||
Health Management Associates, Inc., Class A | — | 32,290 | 32,290 | — | 250,893 | 250,893 | ||||||||||||||||||||||
Henry Schein, Inc.* | — | 11,786 | 11,786 | — | 647,052 | 647,052 | ||||||||||||||||||||||
Laboratory Corp. of America Holdings* | — | 13,461 | 13,461 | — | 1,014,286 | 1,014,286 | ||||||||||||||||||||||
Lincare Holdings, Inc.* | — | 12,820 | 12,820 | — | 416,762 | 416,762 | ||||||||||||||||||||||
McKesson Corp. | — | 15,122 | 15,122 | — | 1,015,594 | 1,015,594 | ||||||||||||||||||||||
Medco Health Solutions, Inc.* | — | 58,929 | 58,929 | — | 3,245,809 | 3,245,809 | ||||||||||||||||||||||
MEDNAX, Inc.* | — | 5,730 | 5,730 | — | 318,645 | 318,645 | ||||||||||||||||||||||
Omnicare, Inc. | — | 1,517 | 1,517 | — | 35,953 | 35,953 | ||||||||||||||||||||||
Patterson Cos., Inc. | — | 13,172 | 13,172 | — | 375,797 | 375,797 | ||||||||||||||||||||||
Quest Diagnostics, Inc. | — | 16,642 | 16,642 | — | 828,272 | 828,272 | ||||||||||||||||||||||
Tenet Healthcare Corp.* | — | 45,080 | 45,080 | — | 195,647 | 195,647 | ||||||||||||||||||||||
Universal Health Services, Inc., Class B | 46,100 | 775 | 46,875 | 1,758,715 | 29,566 | 1,788,281 | ||||||||||||||||||||||
VCA Antech, Inc.* | — | 11,086 | 11,086 | — | 274,490 | 274,490 | ||||||||||||||||||||||
| 2,453,547 | 15,043,025 | 17,496,572 | 1.00 | % | ||||||||||||||||||||||||
Health Care Technology | ||||||||||||||||||||||||||||
Allscripts-Misys Healthcare Solutions, Inc.* | — | 8,386 | 8,386 | — | 135,014 | 135,014 | ||||||||||||||||||||||
Cerner Corp.* | 143,800 | 8,876 | 152,676 | 10,912,982 | 673,600 | 11,586,582 | ||||||||||||||||||||||
SXC Health Solutions Corp.* | — | 3,949 | 3,949 | — | 289,264 | 289,264 | ||||||||||||||||||||||
| 10,912,982 | 1,097,878 | 12,010,860 | 0.68 | % | ||||||||||||||||||||||||
Life Sciences Tools & Services | ||||||||||||||||||||||||||||
Charles River Laboratories International, Inc.* | — | 2,030 | 2,030 | — | 69,446 | 69,446 | ||||||||||||||||||||||
Covance, Inc.* | — | 8,341 | 8,341 | — | 428,060 | 428,060 | ||||||||||||||||||||||
Illumina, Inc.* | — | 15,775 | 15,775 | — | 686,686 | 686,686 | ||||||||||||||||||||||
Life Technologies Corp.* | — | 16,676 | 16,676 | — | 787,941 | 787,941 | ||||||||||||||||||||||
Mettler-Toledo International, Inc. | — | 4,339 | 4,339 | — | 484,363 | 484,363 | ||||||||||||||||||||||
Millipore Corp.* | — | 7,253 | 7,253 | — | 773,532 | 773,532 | ||||||||||||||||||||||
PerkinElmer, Inc. | — | 6,914 | 6,914 | — | 142,912 | 142,912 | ||||||||||||||||||||||
Pharmaceutical Product Development, Inc. | — | 13,606 | 13,606 | — | 345,728 | 345,728 | ||||||||||||||||||||||
Techne Corp. | — | 4,808 | 4,808 | — | 276,220 | 276,220 | ||||||||||||||||||||||
Waters Corp.* | — | 11,988 | 11,988 | — | 775,624 | 775,624 | ||||||||||||||||||||||
| — | 4,770,512 | 4,770,512 | 0.27 | % | ||||||||||||||||||||||||
See notes to pro-forma financial statements.
EQ ADVISORS TRUST
PORTFOLIO OF INVESTMENTS
June 30, 2010 (Unaudited)
| Number of Shares | Value (Note 1) | |||||||||||||||||||||||||||
| EQ/Capital Guardian Growth | EQ/Large Cap Growth PLUS | Pro Forma | EQ/Capital Guardian Growth | EQ/Large Cap Growth PLUS | Pro Forma | % of Net Assets | ||||||||||||||||||||||
Pharmaceuticals | ||||||||||||||||||||||||||||
Abbott Laboratories, Inc. | — | 179,593 | 179,593 | — | 8,401,361 | 8,401,361 | ||||||||||||||||||||||
Allergan, Inc. | 85,600 | 39,223 | 124,823 | 4,987,056 | 2,285,132 | 7,272,188 | ||||||||||||||||||||||
Eli Lilly and Co. | — | 30,173 | 30,173 | — | 1,010,795 | 1,010,795 | ||||||||||||||||||||||
Johnson & Johnson | — | 53,364 | 53,364 | — | 3,151,678 | 3,151,678 | ||||||||||||||||||||||
Merck & Co., Inc. | 39,800 | 408,995 | 448,795 | 1,391,806 | 14,302,555 | 15,694,361 | ||||||||||||||||||||||
Mylan, Inc.* | — | 33,544 | 33,544 | — | 571,590 | 571,590 | ||||||||||||||||||||||
Perrigo Co. | — | 10,419 | 10,419 | — | 615,450 | 615,450 | ||||||||||||||||||||||
Shire plc (ADR) | 107,000 | — | 107,000 | 6,567,660 | — | 6,567,660 | ||||||||||||||||||||||
Teva Pharmaceutical Industries Ltd. (ADR) | 44,584 | — | 44,584 | 2,317,922 | — | 2,317,922 | ||||||||||||||||||||||
Valeant Pharmaceuticals International* | — | 7,341 | 7,341 | — | 383,861 | 383,861 | ||||||||||||||||||||||
Warner Chilcott plc, Class A* | — | 11,612 | 11,612 | — | 265,334 | 265,334 | ||||||||||||||||||||||
| 15,264,444 | 30,987,756 | 46,252,200 | 2.64 | % | ||||||||||||||||||||||||
Total Health Care | 44,089,345 | 100,931,228 | 145,020,573 | 8.27 | % | |||||||||||||||||||||||
Industrials | ||||||||||||||||||||||||||||
Aerospace & Defense | ||||||||||||||||||||||||||||
Alliant Techsystems, Inc.* | — | 3,885 | 3,885 | — | 241,103 | 241,103 | ||||||||||||||||||||||
Boeing Co. | — | 79,307 | 79,307 | — | 4,976,514 | 4,976,514 | ||||||||||||||||||||||
General Dynamics Corp. | — | 181,729 | 181,729 | — | 10,642,050 | 10,642,050 | ||||||||||||||||||||||
Goodrich Corp. | — | 167,385 | 167,385 | — | 11,089,256 | 11,089,256 | ||||||||||||||||||||||
Honeywell International, Inc. | — | 98,831 | 98,831 | — | 3,857,374 | 3,857,374 | ||||||||||||||||||||||
Lockheed Martin Corp. | — | 31,299 | 31,299 | — | 2,331,776 | 2,331,776 | ||||||||||||||||||||||
Precision Castparts Corp. | — | 18,315 | 18,315 | — | 1,884,980 | 1,884,980 | ||||||||||||||||||||||
Rockwell Collins, Inc. | — | 10,678 | 10,678 | — | 567,322 | 567,322 | ||||||||||||||||||||||
Spirit AeroSystems Holdings, Inc., Class A* | — | 2,064 | 2,064 | — | 39,340 | 39,340 | ||||||||||||||||||||||
TransDigm Group, Inc. | — | 6,352 | 6,352 | — | 324,143 | 324,143 | ||||||||||||||||||||||
United Technologies Corp. | — | 110,009 | 110,009 | — | 7,140,684 | 7,140,684 | ||||||||||||||||||||||
| — | 43,094,542 | 43,094,542 | 2.46 | % | ||||||||||||||||||||||||
Air Freight & Logistics | ||||||||||||||||||||||||||||
C.H. Robinson Worldwide, Inc. | — | 21,397 | 21,397 | — | 1,190,957 | 1,190,957 | ||||||||||||||||||||||
Expeditors International of Washington, Inc. | — | 27,459 | 27,459 | — | 947,610 | 947,610 | ||||||||||||||||||||||
FedEx Corp. | 50,000 | 124,858 | 174,858 | 3,505,500 | 8,753,795 | 12,259,295 | ||||||||||||||||||||||
United Parcel Service, Inc., Class B | — | 92,117 | 92,117 | — | 5,240,536 | 5,240,536 | ||||||||||||||||||||||
UTi Worldwide, Inc. | — | 10,974 | 10,974 | — | 135,858 | 135,858 | ||||||||||||||||||||||
| 3,505,500 | 16,268,756 | 19,774,256 | 1.13 | % | ||||||||||||||||||||||||
See notes to pro-forma financial statements.
EQ ADVISORS TRUST
PORTFOLIO OF INVESTMENTS
June 30, 2010 (Unaudited)
| Number of Shares | Value (Note 1) | |||||||||||||||||||||||||||
| EQ/Capital Guardian Growth | EQ/Large Cap Growth PLUS | Pro Forma | EQ/Capital Guardian Growth | EQ/Large Cap Growth PLUS | Pro Forma | % of Net Assets | ||||||||||||||||||||||
Airlines | ||||||||||||||||||||||||||||
AMR Corp.* | — | 13,853 | 13,853 | — | 93,923 | 93,923 | ||||||||||||||||||||||
Continental Airlines, Inc., Class B* | — | 18,012 | 18,012 | — | 396,264 | 396,264 | ||||||||||||||||||||||
Copa Holdings S.A., Class A | — | 2,521 | 2,521 | — | 111,479 | 111,479 | ||||||||||||||||||||||
Delta Air Lines, Inc.* | — | 102,236 | 102,236 | — | 1,201,273 | 1,201,273 | ||||||||||||||||||||||
Southwest Airlines Co. | — | 12,766 | 12,766 | — | 141,830 | 141,830 | ||||||||||||||||||||||
UAL Corp.* | — | 16,258 | 16,258 | — | 334,265 | 334,265 | ||||||||||||||||||||||
| — | 2,279,034 | 2,279,034 | 0.13 | % | ||||||||||||||||||||||||
Building Products | ||||||||||||||||||||||||||||
Armstrong World Industries, Inc.* | — | 213 | 213 | — | 6,428 | 6,428 | ||||||||||||||||||||||
Lennox International, Inc. | — | 6,059 | 6,059 | — | 251,872 | 251,872 | ||||||||||||||||||||||
Masco Corp. | — | 13,875 | 13,875 | — | 149,295 | 149,295 | ||||||||||||||||||||||
Owens Corning, Inc.* | — | 8,191 | 8,191 | — | 244,993 | 244,993 | ||||||||||||||||||||||
USG Corp.* | — | 3,559 | 3,559 | — | 42,993 | 42,993 | ||||||||||||||||||||||
| — | 695,581 | 695,581 | 0.04 | % | ||||||||||||||||||||||||
Commercial Services & Supplies | ||||||||||||||||||||||||||||
Avery Dennison Corp. | — | 810 | 810 | — | 26,025 | 26,025 | ||||||||||||||||||||||
Copart, Inc.* | — | 9,316 | 9,316 | — | 333,606 | 333,606 | ||||||||||||||||||||||
Corrections Corp. of America* | — | 2,447 | 2,447 | — | 46,689 | 46,689 | ||||||||||||||||||||||
Covanta Holding Corp.* | — | 968 | 968 | — | 16,059 | 16,059 | ||||||||||||||||||||||
Iron Mountain, Inc. | 116,900 | 23,572 | 140,472 | 2,625,574 | 529,427 | 3,155,001 | ||||||||||||||||||||||
KAR Auction Services, Inc.* | — | 326 | 326 | — | 4,033 | 4,033 | ||||||||||||||||||||||
Pitney Bowes, Inc. | — | 19,140 | 19,140 | — | 420,314 | 420,314 | ||||||||||||||||||||||
R.R. Donnelley & Sons Co. | — | 1,406 | 1,406 | — | 23,016 | 23,016 | ||||||||||||||||||||||
Republic Services, Inc. | — | 12,515 | 12,515 | — | 372,071 | 372,071 | ||||||||||||||||||||||
Stericycle, Inc.* | — | 10,915 | 10,915 | — | 715,806 | 715,806 | ||||||||||||||||||||||
Waste Connections, Inc.* | — | 7,919 | 7,919 | — | 276,294 | 276,294 | ||||||||||||||||||||||
| 2,625,574 | 2,763,340 | 5,388,914 | 0.31 | % | ||||||||||||||||||||||||
Construction & Engineering | ||||||||||||||||||||||||||||
Aecom Technology Corp.* | — | 4,030 | 4,030 | — | 92,932 | 92,932 | ||||||||||||||||||||||
Chicago Bridge & Iron Co. N.V. (N.Y. Shares)* | — | 5,278 | 5,278 | — | 99,279 | 99,279 | ||||||||||||||||||||||
Fluor Corp. | — | 1,382 | 1,382 | — | 58,735 | 58,735 | ||||||||||||||||||||||
Jacobs Engineering Group, Inc.* | 22,000 | 9,739 | 31,739 | 801,680 | 354,889 | 1,156,569 | ||||||||||||||||||||||
KBR, Inc. | — | 1,201 | 1,201 | — | 24,428 | 24,428 | ||||||||||||||||||||||
Shaw Group, Inc.* | — | 6,264 | 6,264 | — | 214,354 | 214,354 | ||||||||||||||||||||||
| 801,680 | 844,617 | 1,646,297 | 0.09 | % | ||||||||||||||||||||||||
See notes to pro-forma financial statements.
EQ ADVISORS TRUST
PORTFOLIO OF INVESTMENTS
June 30, 2010 (Unaudited)
| Number of Shares | Value (Note 1) | |||||||||||||||||||||||||||
| EQ/Capital Guardian Growth | EQ/Large Cap Growth PLUS | Pro Forma | EQ/Capital Guardian Growth | EQ/Large Cap Growth PLUS | Pro Forma | % of Net Assets | ||||||||||||||||||||||
Electrical Equipment | ||||||||||||||||||||||||||||
AMETEK, Inc. | — | 13,717 | 13,717 | — | 550,738 | 550,738 | ||||||||||||||||||||||
Cooper Industries plc | — | 21,609 | 21,609 | — | 950,796 | 950,796 | ||||||||||||||||||||||
Emerson Electric Co. | 42,600 | 97,151 | 139,751 | 1,861,194 | 4,244,527 | 6,105,721 | ||||||||||||||||||||||
General Cable Corp.* | — | 2,405 | 2,405 | — | 64,093 | 64,093 | ||||||||||||||||||||||
Hubbell, Inc., Class B | — | 3,112 | 3,112 | — | 123,515 | 123,515 | ||||||||||||||||||||||
Regal-Beloit Corp. | — | 4,162 | 4,162 | — | 232,156 | 232,156 | ||||||||||||||||||||||
Rockwell Automation, Inc. | — | 18,393 | 18,393 | — | 902,913 | 902,913 | ||||||||||||||||||||||
Roper Industries, Inc. | — | 12,121 | 12,121 | — | 678,291 | 678,291 | ||||||||||||||||||||||
Thomas & Betts Corp.* | — | 1,183 | 1,183 | — | 41,050 | 41,050 | ||||||||||||||||||||||
| 1,861,194 | 7,788,079 | 9,649,273 | 0.55 | % | ||||||||||||||||||||||||
Industrial Conglomerates | ||||||||||||||||||||||||||||
3M Co. | — | 91,922 | 91,922 | — | 7,260,919 | 7,260,919 | ||||||||||||||||||||||
Carlisle Cos., Inc. | — | 556 | 556 | — | 20,088 | 20,088 | ||||||||||||||||||||||
General Electric Co. | — | 319,506 | 319,506 | — | 4,607,277 | 4,607,277 | ||||||||||||||||||||||
McDermott International, Inc.* | — | 23,550 | 23,550 | — | 510,093 | 510,093 | ||||||||||||||||||||||
Textron, Inc. | — | 18,156 | 18,156 | — | 308,107 | 308,107 | ||||||||||||||||||||||
Tyco International Ltd. | — | 9,550 | 9,550 | — | 336,446 | 336,446 | ||||||||||||||||||||||
| — | 13,042,930 | 13,042,930 | 0.74 | % | ||||||||||||||||||||||||
Machinery | ||||||||||||||||||||||||||||
Bucyrus International, Inc. | — | 9,696 | 9,696 | — | 460,075 | 460,075 | ||||||||||||||||||||||
Caterpillar, Inc. | — | 81,031 | 81,031 | — | 4,867,532 | 4,867,532 | ||||||||||||||||||||||
CNH Global N.V.* | — | 566 | 566 | — | 12,820 | 12,820 | ||||||||||||||||||||||
Cummins, Inc. | — | 25,873 | 25,873 | — | 1,685,109 | 1,685,109 | ||||||||||||||||||||||
Danaher Corp. | 115,800 | 63,518 | 179,318 | 4,298,496 | 2,357,788 | 6,656,284 | ||||||||||||||||||||||
Deere & Co. | — | 51,732 | 51,732 | — | 2,880,438 | 2,880,438 | ||||||||||||||||||||||
Donaldson Co., Inc. | — | 9,944 | 9,944 | — | 424,112 | 424,112 | ||||||||||||||||||||||
Dover Corp. | — | 15,224 | 15,224 | — | 636,211 | 636,211 | ||||||||||||||||||||||
Eaton Corp. | — | 191,303 | 191,303 | — | 12,518,868 | 12,518,868 | ||||||||||||||||||||||
Flowserve Corp. | — | 6,146 | 6,146 | — | 521,181 | 521,181 | ||||||||||||||||||||||
Gardner Denver, Inc. | — | 6,389 | 6,389 | — | 284,886 | 284,886 | ||||||||||||||||||||||
Graco, Inc. | — | 7,817 | 7,817 | — | 220,361 | 220,361 | ||||||||||||||||||||||
Harsco Corp. | — | 776 | 776 | — | 18,236 | 18,236 | ||||||||||||||||||||||
IDEX Corp. | — | 8,654 | 8,654 | — | 247,245 | 247,245 | ||||||||||||||||||||||
Illinois Tool Works, Inc. | 82,700 | 56,844 | 139,544 | 3,413,856 | 2,346,520 | 5,760,376 | ||||||||||||||||||||||
Joy Global, Inc. | — | 13,278 | 13,278 | — | 665,095 | 665,095 | ||||||||||||||||||||||
Kennametal, Inc. | — | 7,886 | 7,886 | — | 200,541 | 200,541 | ||||||||||||||||||||||
Lincoln Electric Holdings, Inc. | — | 5,493 | 5,493 | — | 280,088 | 280,088 | ||||||||||||||||||||||
Manitowoc Co., Inc. | — | 16,935 | 16,935 | — | 154,786 | 154,786 | ||||||||||||||||||||||
Navistar International Corp.* | — | 9,175 | 9,175 | — | 451,410 | 451,410 | ||||||||||||||||||||||
See notes to pro-forma financial statements.
EQ ADVISORS TRUST
PORTFOLIO OF INVESTMENTS
June 30, 2010 (Unaudited)
| Number of Shares | Value (Note 1) | |||||||||||||||||||||||||||
| EQ/Capital Guardian Growth | EQ/Large Cap Growth PLUS | Pro Forma | EQ/Capital Guardian Growth | EQ/Large Cap Growth PLUS | Pro Forma | % of Net Assets | ||||||||||||||||||||||
Oshkosh Corp.* | — | 11,579 | 11,579 | — | 360,802 | 360,802 | ||||||||||||||||||||||
PACCAR, Inc. | — | 47,069 | 47,069 | — | 1,876,641 | 1,876,641 | ||||||||||||||||||||||
Pall Corp. | — | 15,079 | 15,079 | — | 518,265 | 518,265 | ||||||||||||||||||||||
Parker Hannifin Corp. | — | 5,878 | 5,878 | — | 325,994 | 325,994 | ||||||||||||||||||||||
Pentair, Inc. | — | 6,617 | 6,617 | — | 213,067 | 213,067 | ||||||||||||||||||||||
SPX Corp. | — | 1,248 | 1,248 | — | 65,907 | 65,907 | ||||||||||||||||||||||
Timken Co. | — | 8,219 | 8,219 | — | 213,612 | 213,612 | ||||||||||||||||||||||
Toro Co. | — | 4,337 | 4,337 | — | 213,033 | 213,033 | ||||||||||||||||||||||
Valmont Industries, Inc. | — | 2,858 | 2,858 | — | 207,662 | 207,662 | ||||||||||||||||||||||
WABCO Holdings, Inc.* | — | 8,421 | 8,421 | — | 265,093 | 265,093 | ||||||||||||||||||||||
Wabtec Corp. | — | 964 | 964 | — | 38,454 | 38,454 | ||||||||||||||||||||||
| 7,712,352 | 35,531,832 | 43,244,184 | 2.47 | % | ||||||||||||||||||||||||
Marine | ||||||||||||||||||||||||||||
Kirby Corp.* | — | 451 | 451 | — | 17,251 | 17,251 | 0.00 | % | ||||||||||||||||||||
Professional Services | ||||||||||||||||||||||||||||
Dun & Bradstreet Corp. | — | 6,499 | 6,499 | — | 436,213 | 436,213 | ||||||||||||||||||||||
FTI Consulting, Inc.* | — | 4,888 | 4,888 | — | 213,068 | 213,068 | ||||||||||||||||||||||
IHS, Inc., Class A* | — | 6,247 | 6,247 | — | 364,950 | 364,950 | ||||||||||||||||||||||
Robert Half International, Inc. | — | 19,350 | 19,350 | — | 455,693 | 455,693 | ||||||||||||||||||||||
Towers Watson & Co., Class A | — | 838 | 838 | — | 32,556 | 32,556 | ||||||||||||||||||||||
Verisk Analytics, Inc., Class A* | — | 13,326 | 13,326 | — | 398,447 | 398,447 | ||||||||||||||||||||||
| — | 1,900,927 | 1,900,927 | 0.11 | % | ||||||||||||||||||||||||
Road & Rail | ||||||||||||||||||||||||||||
Con-way, Inc. | — | 553 | 553 | — | 16,601 | 16,601 | ||||||||||||||||||||||
Hertz Global Holdings, Inc.* | — | 21,316 | 21,316 | — | 201,650 | 201,650 | ||||||||||||||||||||||
J.B. Hunt Transport Services, Inc. | — | 11,758 | 11,758 | — | 384,134 | 384,134 | ||||||||||||||||||||||
Kansas City Southern* | — | 7,786 | 7,786 | — | 283,021 | 283,021 | ||||||||||||||||||||||
Landstar System, Inc. | — | 6,468 | 6,468 | — | 252,187 | 252,187 | ||||||||||||||||||||||
Ryder System, Inc. | — | 3,616 | 3,616 | — | 145,472 | 145,472 | ||||||||||||||||||||||
Union Pacific Corp. | — | 254,777 | 254,777 | — | 17,709,549 | 17,709,549 | ||||||||||||||||||||||
| — | 18,992,614 | 18,992,614 | 1.08 | % | ||||||||||||||||||||||||
Trading Companies & Distributors |
| |||||||||||||||||||||||||||
Fastenal Co. | — | 17,076 | 17,076 | — | 857,045 | 857,045 | ||||||||||||||||||||||
GATX Corp. | — | 1,602 | 1,602 | — | 42,741 | 42,741 | ||||||||||||||||||||||
MSC Industrial Direct Co., Class A | — | 5,632 | 5,632 | — | 285,317 | 285,317 | ||||||||||||||||||||||
W.W. Grainger, Inc. | 20,800 | 7,983 | 28,783 | 2,068,560 | 793,909 | 2,862,469 | ||||||||||||||||||||||
WESCO International, Inc.* | — | 1,772 | 1,772 | — | 59,663 | 59,663 | ||||||||||||||||||||||
| 2,068,560 | 2,038,675 | 4,107,235 | 0.23 | % | ||||||||||||||||||||||||
Total Industrials | 18,574,860 | 145,258,178 | 163,833,038 | 9.34 | % | |||||||||||||||||||||||
See notes to pro-forma financial statements.
EQ ADVISORS TRUST
PORTFOLIO OF INVESTMENTS
June 30, 2010 (Unaudited)
| Number of Shares | Value (Note 1) | |||||||||||||||||||||||||||
| EQ/Capital Guardian Growth | EQ/Large Cap Growth PLUS | Pro Forma | EQ/Capital Guardian Growth | EQ/Large Cap Growth PLUS | Pro Forma | % of Net Assets | ||||||||||||||||||||||
Information Technology | ||||||||||||||||||||||||||||
Communications Equipment | ||||||||||||||||||||||||||||
Ciena Corp.* | — | 11,940 | 11,940 | — | 151,399 | 151,399 | ||||||||||||||||||||||
Cisco Systems, Inc.* | 372,880 | 1,206,370 | 1,579,250 | 7,946,073 | 25,707,745 | 33,653,818 | ||||||||||||||||||||||
F5 Networks, Inc.* | — | 10,338 | 10,338 | 708,877 | 708,877 | |||||||||||||||||||||||
Harris Corp. | — | 16,747 | 16,747 | — | 697,513 | 697,513 | ||||||||||||||||||||||
JDS Uniphase Corp.* | — | 27,836 | 27,836 | — | 273,906 | 273,906 | ||||||||||||||||||||||
Juniper Networks, Inc.* | 273,300 | 67,865 | 341,165 | 6,236,706 | 1,548,679 | 7,785,385 | ||||||||||||||||||||||
Polycom, Inc.* | — | 10,991 | 10,991 | — | 327,422 | 327,422 | ||||||||||||||||||||||
QUALCOMM, Inc. | 216,700 | 211,593 | 428,293 | 7,116,428 | 6,948,714 | 14,065,142 | ||||||||||||||||||||||
Research in Motion Ltd.* | 54,200 | — | 54,200 | 2,669,892 | — | 2,669,892 | ||||||||||||||||||||||
| 23,969,099 | 36,364,255 | 60,333,354 | 3.44 | % | ||||||||||||||||||||||||
Computers & Peripherals | ||||||||||||||||||||||||||||
Apple, Inc.* | 39,790 | 243,739 | 283,529 | 10,008,379 | 61,307,671 | 71,316,050 | ||||||||||||||||||||||
Dell, Inc.* | — | 219,487 | 219,487 | — | 2,647,013 | 2,647,013 | ||||||||||||||||||||||
Diebold, Inc. | — | 1,826 | 1,826 | — | 49,758 | 49,758 | ||||||||||||||||||||||
EMC Corp.* | — | 265,156 | 265,156 | — | 4,852,355 | 4,852,355 | ||||||||||||||||||||||
Hewlett-Packard Co. | — | 302,498 | 302,498 | — | 13,092,113 | 13,092,113 | ||||||||||||||||||||||
NCR Corp.* | — | 20,677 | 20,677 | — | 250,605 | 250,605 | ||||||||||||||||||||||
NetApp, Inc.* | 86,400 | 44,570 | 130,970 | 3,223,584 | 1,662,907 | 4,886,491 | ||||||||||||||||||||||
QLogic Corp.* | — | 14,411 | 14,411 | — | 239,511 | 239,511 | ||||||||||||||||||||||
SanDisk Corp.* | — | 29,665 | 29,665 | — | 1,248,007 | 1,248,007 | ||||||||||||||||||||||
Seagate Technology* | — | 45,391 | 45,391 | — | 591,899 | 591,899 | ||||||||||||||||||||||
Teradata Corp.* | — | 21,528 | 21,528 | — | 656,173 | 656,173 | ||||||||||||||||||||||
Western Digital Corp.* | — | 6,768 | 6,768 | — | 204,123 | 204,123 | ||||||||||||||||||||||
| 13,231,963 | 86,802,135 | 100,034,098 | 5.70 | % | ||||||||||||||||||||||||
Electronic Equipment, Instruments & Components |
| |||||||||||||||||||||||||||
Agilent Technologies, Inc.* | — | 45,061 | 45,061 | — | 1,281,084 | 1,281,084 | ||||||||||||||||||||||
Amphenol Corp., Class A | — | 22,385 | 22,385 | — | 879,283 | 879,283 | ||||||||||||||||||||||
Arrow Electronics, Inc.* | — | 1,720 | 1,720 | — | 38,442 | 38,442 | ||||||||||||||||||||||
AVX Corp. | — | 467 | 467 | — | 5,987 | 5,987 | ||||||||||||||||||||||
Corning, Inc. | — | 25,162 | 25,162 | — | 406,366 | 406,366 | ||||||||||||||||||||||
Dolby Laboratories, Inc., Class A* | — | 6,906 | 6,906 | — | 432,937 | 432,937 | ||||||||||||||||||||||
FLIR Systems, Inc.* | — | 19,777 | 19,777 | — | 575,313 | 575,313 | ||||||||||||||||||||||
Ingram Micro, Inc., Class A* | — | 1,237 | 1,237 | — | 18,790 | 18,790 | ||||||||||||||||||||||
Itron, Inc.* | — | 4,823 | 4,823 | — | 298,158 | 298,158 | ||||||||||||||||||||||
See notes to pro-forma financial statements.
EQ ADVISORS TRUST
PORTFOLIO OF INVESTMENTS
June 30, 2010 (Unaudited)
| Number of Shares | Value (Note 1) | |||||||||||||||||||||||||||
| EQ/Capital Guardian Growth | EQ/Large Cap Growth PLUS | Pro Forma | EQ/Capital Guardian Growth | EQ/Large Cap Growth PLUS | Pro Forma | % of Net Assets | ||||||||||||||||||||||
Jabil Circuit, Inc. | 69,100 | 16,418 | 85,518 | 919,030 | 218,360 | 1,137,390 | ||||||||||||||||||||||
National Instruments Corp. | — | 7,458 | 7,458 | — | 237,015 | 237,015 | ||||||||||||||||||||||
Trimble Navigation Ltd.* | — | 15,645 | 15,645 | — | 438,060 | 438,060 | ||||||||||||||||||||||
| 919,030 | 4,829,795 | 5,748,825 | 0.33 | % | ||||||||||||||||||||||||
Internet Software & Services | ||||||||||||||||||||||||||||
Akamai Technologies, Inc.* | 55,200 | 22,200 | 77,400 | 2,239,464 | 900,654 | 3,140,118 | ||||||||||||||||||||||
Baidu, Inc. (ADR)* | — | 180,905 | 180,905 | — | 12,316,012 | 12,316,012 | ||||||||||||||||||||||
eBay, Inc.* | 76,600 | 56,375 | 132,975 | 1,502,126 | 1,105,514 | 2,607,640 | ||||||||||||||||||||||
Equinix, Inc.* | — | 5,871 | 5,871 | — | 476,843 | 476,843 | ||||||||||||||||||||||
Google, Inc., Class A* | 23,380 | 54,964 | 78,344 | 10,402,931 | 24,456,232 | 34,859,163 | ||||||||||||||||||||||
IAC/InterActiveCorp* | — | 4,586 | 4,586 | — | 100,754 | 100,754 | ||||||||||||||||||||||
Monster Worldwide, Inc.* | — | 8,385 | 8,385 | — | 97,685 | 97,685 | ||||||||||||||||||||||
VeriSign, Inc.* | — | 23,538 | 23,538 | — | 624,934 | 624,934 | ||||||||||||||||||||||
VistaPrint N.V.* | — | 5,642 | 5,642 | — | 267,939 | 267,939 | ||||||||||||||||||||||
WebMD Health Corp.* | — | 6,905 | 6,905 | — | 320,599 | 320,599 | ||||||||||||||||||||||
Yahoo!, Inc.* | — | 75,391 | 75,391 | — | 1,042,657 | 1,042,657 | ||||||||||||||||||||||
| 14,144,521 | 41,709,823 | 55,854,344 | 3.19 | % | ||||||||||||||||||||||||
IT Services | ||||||||||||||||||||||||||||
Accenture plc, Class A | — | 78,852 | 78,852 | — | 3,047,630 | 3,047,630 | ||||||||||||||||||||||
Alliance Data Systems Corp.* | — | 6,920 | 6,920 | — | 411,878 | 411,878 | ||||||||||||||||||||||
Amdocs Ltd.* | — | 7,455 | 7,455 | — | 200,167 | 200,167 | ||||||||||||||||||||||
Automatic Data Processing, Inc. | — | 64,880 | 64,880 | — | 2,612,069 | 2,612,069 | ||||||||||||||||||||||
Broadridge Financial Solutions, Inc. | — | 16,003 | 16,003 | — | 304,857 | 304,857 | ||||||||||||||||||||||
Cognizant Technology Solutions Corp., Class A* | — | 38,622 | 38,622 | — | 1,933,417 | 1,933,417 | ||||||||||||||||||||||
DST Systems, Inc. | — | 4,572 | 4,572 | — | 165,232 | 165,232 | ||||||||||||||||||||||
Fiserv, Inc.* | — | 13,129 | 13,129 | — | 599,470 | 599,470 | ||||||||||||||||||||||
Gartner, Inc.* | — | 9,429 | 9,429 | — | 219,224 | 219,224 | ||||||||||||||||||||||
Genpact Ltd.* | — | 8,492 | 8,492 | — | 131,881 | 131,881 | ||||||||||||||||||||||
Global Payments, Inc. | — | 10,526 | 10,526 | — | 384,620 | 384,620 | ||||||||||||||||||||||
Hewitt Associates, Inc., Class A* | — | 12,076 | 12,076 | — | 416,139 | 416,139 | ||||||||||||||||||||||
International Business Machines Corp. | 15,400 | 165,412 | 180,812 | 1,901,592 | 20,425,074 | 22,326,666 | ||||||||||||||||||||||
Lender Processing Services, Inc. | — | 12,229 | 12,229 | — | 382,890 | 382,890 | ||||||||||||||||||||||
Mastercard, Inc., Class A | — | 12,554 | 12,554 | — | 2,504,900 | 2,504,900 | ||||||||||||||||||||||
NeuStar, Inc., Class A* | — | 9,668 | 9,668 | — | 199,354 | 199,354 | ||||||||||||||||||||||
Paychex, Inc. | 61,600 | 41,629 | 103,229 | 1,599,752 | 1,081,105 | 2,680,857 | ||||||||||||||||||||||
SAIC, Inc.* | — | 39,902 | 39,902 | — | 667,960 | 667,960 | ||||||||||||||||||||||
Visa, Inc., Class A | 78,800 | 60,227 | 139,027 | 5,575,100 | 4,261,060 | 9,836,160 | ||||||||||||||||||||||
Western Union Co. | — | 86,697 | 86,697 | — | 1,292,652 | 1,292,652 | ||||||||||||||||||||||
| 9,076,444 | 41,241,579 | 50,318,023 | 2.87 | % | ||||||||||||||||||||||||
See notes to pro-forma financial statements.
EQ ADVISORS TRUST
PORTFOLIO OF INVESTMENTS
June 30, 2010 (Unaudited)
| Number of Shares | Value (Note 1) | |||||||||||||||||||||||||||
| EQ/Capital Guardian Growth | EQ/Large Cap Growth PLUS | Pro Forma | EQ/Capital Guardian Growth | EQ/Large Cap Growth PLUS | Pro Forma | % of Net Assets | ||||||||||||||||||||||
Office Electronics | ||||||||||||||||||||||||||||
Zebra Technologies Corp., Class A* | — | 4,257 | 4,257 | — | 108,000 | 108,000 | 0.01 | % | ||||||||||||||||||||
Semiconductors & Semiconductor Equipment |
| |||||||||||||||||||||||||||
Advanced Micro Devices, Inc.* | — | 29,666 | 29,666 | — | 217,155 | 217,155 | ||||||||||||||||||||||
Altera Corp. | — | 38,911 | 38,911 | — | 965,382 | 965,382 | ||||||||||||||||||||||
Analog Devices, Inc. | — | 38,435 | 38,435 | — | 1,070,799 | 1,070,799 | ||||||||||||||||||||||
Applied Materials, Inc. | — | 173,270 | 173,270 | — | 2,082,705 | 2,082,705 | ||||||||||||||||||||||
Atheros Communications, Inc.* | — | 9,019 | 9,019 | — | 248,383 | 248,383 | ||||||||||||||||||||||
Atmel Corp.* | — | 53,185 | 53,185 | — | 255,288 | 255,288 | ||||||||||||||||||||||
Avago Technologies Ltd.* | — | 13,692 | 13,692 | — | 288,354 | 288,354 | ||||||||||||||||||||||
Broadcom Corp., Class A | 146,400 | 64,014 | 210,414 | 4,826,808 | 2,110,542 | 6,937,350 | ||||||||||||||||||||||
Cree, Inc.* | — | 13,865 | 13,865 | — | 832,316 | 832,316 | ||||||||||||||||||||||
Cypress Semiconductor Corp.* | — | 21,147 | 21,147 | — | 212,316 | 212,316 | ||||||||||||||||||||||
First Solar, Inc.* | 45,700 | 7,151 | 52,851 | 5,202,031 | 813,998 | 6,016,029 | ||||||||||||||||||||||
Intel Corp. | — | 490,914 | 490,914 | — | 9,548,277 | 9,548,277 | ||||||||||||||||||||||
Intersil Corp., Class A | — | 5,694 | 5,694 | — | 68,954 | 68,954 | ||||||||||||||||||||||
KLA-Tencor Corp. | — | 1,206 | 1,206 | — | 33,623 | 33,623 | ||||||||||||||||||||||
Lam Research Corp.* | — | 16,320 | 16,320 | — | 621,139 | 621,139 | ||||||||||||||||||||||
Linear Technology Corp. | — | 28,912 | 28,912 | — | 804,043 | 804,043 | ||||||||||||||||||||||
Marvell Technology Group Ltd.* | — | 69,832 | 69,832 | — | 1,100,552 | 1,100,552 | ||||||||||||||||||||||
Maxim Integrated Products, Inc. | 78,000 | 39,000 | 117,000 | 1,304,940 | 652,470 | 1,957,410 | ||||||||||||||||||||||
MEMC Electronic Materials, Inc.* | — | 12,227 | 12,227 | — | 120,803 | 120,803 | ||||||||||||||||||||||
Microchip Technology, Inc. | — | 23,765 | 23,765 | — | 659,241 | 659,241 | ||||||||||||||||||||||
National Semiconductor Corp. | — | 28,139 | 28,139 | — | 378,751 | 378,751 | ||||||||||||||||||||||
Novellus Systems, Inc.* | — | 10,989 | 10,989 | — | 278,681 | 278,681 | ||||||||||||||||||||||
NVIDIA Corp.* | — | 73,808 | 73,808 | — | 753,580 | 753,580 | ||||||||||||||||||||||
ON Semiconductor Corp.* | — | 55,418 | 55,418 | — | 353,567 | 353,567 | ||||||||||||||||||||||
PMC-Sierra, Inc.* | — | 1,567 | 1,567 | — | 11,784 | 11,784 | ||||||||||||||||||||||
Rambus, Inc.* | — | 13,534 | 13,534 | — | 237,116 | 237,116 | ||||||||||||||||||||||
Silicon Laboratories, Inc.* | — | 5,934 | 5,934 | — | 240,683 | 240,683 | ||||||||||||||||||||||
Skyworks Solutions, Inc.* | — | 22,804 | 22,804 | — | 382,879 | 382,879 | ||||||||||||||||||||||
SunPower Corp., Class A* | — | 4,910 | 4,910 | — | 59,411 | 59,411 | ||||||||||||||||||||||
Teradyne, Inc.* | — | 23,249 | 23,249 | — | 226,678 | 226,678 | ||||||||||||||||||||||
Texas Instruments, Inc. | — | 71,416 | 71,416 | — | 1,662,565 | 1,662,565 | ||||||||||||||||||||||
Varian Semiconductor Equipment Associates, Inc.* | — | 9,620 | 9,620 | — | 275,709 | 275,709 | ||||||||||||||||||||||
Xilinx, Inc. | — | 35,685 | 35,685 | — | 901,403 | 901,403 | ||||||||||||||||||||||
| 11,333,779 | 28,469,147 | 39,802,926 | 2.27 | % | ||||||||||||||||||||||||
See notes to pro-forma financial statements.
EQ ADVISORS TRUST
PORTFOLIO OF INVESTMENTS
June 30, 2010 (Unaudited)
| Number of Shares | Value (Note 1) | |||||||||||||||||||||||||||
| EQ/Capital Guardian Growth | EQ/Large Cap Growth PLUS | Pro Forma | EQ/Capital Guardian Growth | EQ/Large Cap Growth PLUS | Pro Forma | % of Net Assets | ||||||||||||||||||||||
Software | ||||||||||||||||||||||||||||
Activision Blizzard, Inc. | — | 18,126 | 18,126 | — | 190,142 | 190,142 | ||||||||||||||||||||||
Adobe Systems, Inc.* | 182,200 | 67,902 | 250,102 | 4,815,546 | 1,794,650 | 6,610,196 | ||||||||||||||||||||||
ANSYS, Inc.* | — | 11,673 | 11,673 | — | 473,574 | 473,574 | ||||||||||||||||||||||
Autodesk, Inc.* | — | 29,573 | 29,573 | — | 720,398 | 720,398 | ||||||||||||||||||||||
BMC Software, Inc.* | — | 23,413 | 23,413 | — | 810,792 | 810,792 | ||||||||||||||||||||||
CA, Inc. | — | 40,848 | 40,848 | — | 751,603 | 751,603 | ||||||||||||||||||||||
Cadence Design Systems, Inc.* | — | 34,854 | 34,854 | — | 201,805 | 201,805 | ||||||||||||||||||||||
Citrix Systems, Inc.* | — | 23,960 | 23,960 | — | 1,011,831 | 1,011,831 | ||||||||||||||||||||||
Compuware Corp.* | — | 16,399 | 16,399 | — | 130,864 | 130,864 | ||||||||||||||||||||||
Electronic Arts, Inc.* | — | 39,970 | 39,970 | — | 575,568 | 575,568 | ||||||||||||||||||||||
FactSet Research Systems, Inc. | — | 6,082 | 6,082 | — | 407,433 | 407,433 | ||||||||||||||||||||||
Informatica Corp.* | — | 11,846 | 11,846 | — | 282,882 | 282,882 | ||||||||||||||||||||||
Intuit, Inc.* | — | 36,181 | 36,181 | — | 1,258,013 | 1,258,013 | ||||||||||||||||||||||
McAfee, Inc.* | — | 20,125 | 20,125 | — | 618,240 | 618,240 | ||||||||||||||||||||||
MICROS Systems, Inc.* | — | 10,356 | 10,356 | — | 330,046 | 330,046 | ||||||||||||||||||||||
Microsoft Corp. | — | 660,986 | 660,986 | — | 15,209,288 | 15,209,288 | ||||||||||||||||||||||
Nintendo Co., Ltd. (ADR) | 133,100 | — | 133,100 | 4,960,903 | — | 4,960,903 | ||||||||||||||||||||||
Nuance Communications, Inc.* | — | 29,338 | 29,338 | — | 438,603 | 438,603 | ||||||||||||||||||||||
Oracle Corp. | 220,200 | 491,390 | 711,590 | 4,725,492 | 10,545,229 | 15,270,721 | ||||||||||||||||||||||
Red Hat, Inc.* | — | 24,331 | 24,331 | — | 704,139 | 704,139 | ||||||||||||||||||||||
Rovi Corp.* | — | 13,164 | 13,164 | — | 499,047 | 499,047 | ||||||||||||||||||||||
Salesforce.com, Inc.* | — | 14,775 | 14,775 | — | 1,267,990 | 1,267,990 | ||||||||||||||||||||||
Solera Holdings, Inc. | — | 9,028 | 9,028 | — | 326,814 | 326,814 | ||||||||||||||||||||||
Sybase, Inc.* | — | 11,204 | 11,204 | — | 724,451 | 724,451 | ||||||||||||||||||||||
Symantec Corp.* | — | 9,682 | 9,682 | — | 134,386 | 134,386 | ||||||||||||||||||||||
Synopsys, Inc.* | — | 1,195 | 1,195 | — | 24,940 | 24,940 | ||||||||||||||||||||||
VMware, Inc., Class A* | — | 9,479 | 9,479 | — | 593,291 | 593,291 | ||||||||||||||||||||||
| 14,501,941 | 40,026,019 | 54,527,960 | 3.11 | % | ||||||||||||||||||||||||
Total Information Technology | 87,176,777 | 279,550,753 | 366,727,530 | 20.91 | % | |||||||||||||||||||||||
Materials | ||||||||||||||||||||||||||||
Chemicals | ||||||||||||||||||||||||||||
Air Products & Chemicals, Inc. | — | 27,392 | 27,392 | — | 1,775,276 | 1,775,276 | ||||||||||||||||||||||
Airgas, Inc. | — | 10,767 | 10,767 | — | 669,707 | 669,707 | ||||||||||||||||||||||
Albemarle Corp. | — | 11,789 | 11,789 | — | 468,141 | 468,141 | ||||||||||||||||||||||
Ashland, Inc. | — | 901 | 901 | — | 41,824 | 41,824 | ||||||||||||||||||||||
Celanese Corp., Class A | — | 20,207 | 20,207 | — | 503,356 | 503,356 | ||||||||||||||||||||||
CF Industries Holdings, Inc. | — | 6,607 | 6,607 | — | 419,214 | 419,214 | ||||||||||||||||||||||
Dow Chemical Co. | — | 711,695 | 711,695 | — | 16,881,405 | 16,881,405 | ||||||||||||||||||||||
E.I. du Pont de Nemours & Co. | — | 40,321 | 40,321 | — | 1,394,703 | 1,394,703 | ||||||||||||||||||||||
See notes to pro-forma financial statements.
EQ ADVISORS TRUST
PORTFOLIO OF INVESTMENTS
June 30, 2010 (Unaudited)
| Number of Shares | Value (Note 1) | |||||||||||||||||||||||||||
| EQ/Capital Guardian Growth | EQ/Large Cap Growth PLUS | Pro Forma | EQ/Capital Guardian Growth | EQ/Large Cap Growth PLUS | Pro Forma | % of Net Assets | ||||||||||||||||||||||
Eastman Chemical Co. | — | 1,932 | 1,932 | — | 103,092 | 103,092 | ||||||||||||||||||||||
Ecolab, Inc. | 47,400 | 30,102 | 77,502 | 2,128,734 | 1,351,881 | 3,480,615 | ||||||||||||||||||||||
FMC Corp. | — | 6,413 | 6,413 | — | 368,299 | 368,299 | ||||||||||||||||||||||
International Flavors & Fragrances, Inc. | — | 10,257 | 10,257 | — | 435,102 | 435,102 | ||||||||||||||||||||||
Lubrizol Corp. | — | 8,799 | 8,799 | — | 706,648 | 706,648 | ||||||||||||||||||||||
Monsanto Co. | 88,700 | 163,396 | 252,096 | 4,099,714 | 7,552,163 | 11,651,877 | ||||||||||||||||||||||
Mosaic Co. | — | 20,394 | 20,394 | — | 794,958 | 794,958 | ||||||||||||||||||||||
Nalco Holding Co. | — | 16,710 | 16,710 | — | 341,887 | 341,887 | ||||||||||||||||||||||
Potash Corp. of Saskatchewan, Inc. | — | 49,594 | 49,594 | — | 4,276,987 | 4,276,987 | ||||||||||||||||||||||
PPG Industries, Inc. | — | 3,518 | 3,518 | — | 212,522 | 212,522 | ||||||||||||||||||||||
Praxair, Inc. | — | 172,874 | 172,874 | — | 13,136,695 | 13,136,695 | ||||||||||||||||||||||
RPM International, Inc. | — | 8,358 | 8,358 | — | 149,107 | 149,107 | ||||||||||||||||||||||
Scotts Miracle-Gro Co., Class A | — | 5,924 | 5,924 | — | 263,085 | 263,085 | ||||||||||||||||||||||
Sherwin-Williams Co. | — | 7,335 | 7,335 | — | 507,509 | 507,509 | ||||||||||||||||||||||
Sigma-Aldrich Corp. | — | 14,451 | 14,451 | — | 720,093 | 720,093 | ||||||||||||||||||||||
Valspar Corp. | — | 1,293 | 1,293 | — | 38,945 | 38,945 | ||||||||||||||||||||||
| 6,228,448 | 53,112,599 | 59,341,047 | 3.38 | % | ||||||||||||||||||||||||
Construction Materials | ||||||||||||||||||||||||||||
Eagle Materials, Inc. | — | 5,654 | 5,654 | — | 146,608 | 146,608 | ||||||||||||||||||||||
Martin Marietta Materials, Inc. | — | 5,861 | 5,861 | — | 497,072 | 497,072 | ||||||||||||||||||||||
Vulcan Materials Co. | 101,100 | — | 101,100 | 4,431,213 | — | 4,431,213 | ||||||||||||||||||||||
| 4,431,213 | 643,680 | 5,074,893 | 0.29 | % | ||||||||||||||||||||||||
Containers & Packaging | ||||||||||||||||||||||||||||
Ball Corp. | — | 2,500 | 2,500 | — | 132,075 | 132,075 | ||||||||||||||||||||||
Crown Holdings, Inc.* | — | 20,894 | 20,894 | — | 523,185 | 523,185 | ||||||||||||||||||||||
Owens-Illinois, Inc.* | — | 6,573 | 6,573 | — | 173,856 | 173,856 | ||||||||||||||||||||||
Pactiv Corp.* | — | 15,393 | 15,393 | — | 428,695 | 428,695 | ||||||||||||||||||||||
Temple-Inland, Inc. | — | 2,567 | 2,567 | — | 53,060 | 53,060 | ||||||||||||||||||||||
| — | 1,310,871 | 1,310,871 | 0.07 | % | ||||||||||||||||||||||||
Metals & Mining | ||||||||||||||||||||||||||||
AK Steel Holding Corp. | — | 2,112 | 2,112 | — | 25,175 | 25,175 | ||||||||||||||||||||||
Alcoa, Inc. | — | 19,091 | 19,091 | — | 192,055 | 192,055 | ||||||||||||||||||||||
Allegheny Technologies, Inc. | 138,100 | 12,711 | 150,811 | 6,102,639 | 561,699 | 6,664,338 | ||||||||||||||||||||||
BHP Billiton plc (ADR) | — | 242,238 | 242,238 | — | 12,460,723 | 12,460,723 | ||||||||||||||||||||||
Carpenter Technology Corp. | — | 5,673 | 5,673 | — | 186,245 | 186,245 | ||||||||||||||||||||||
Cliffs Natural Resources, Inc. | 46,700 | 17,469 | 64,169 | 2,202,372 | 823,838 | 3,026,210 | ||||||||||||||||||||||
Compass Minerals International, Inc. | — | 4,221 | 4,221 | — | 296,652 | 296,652 | ||||||||||||||||||||||
Freeport-McMoRan Copper & Gold, Inc. | — | 55,808 | 55,808 | — | 3,299,927 | 3,299,927 | ||||||||||||||||||||||
See notes to pro-forma financial statements.
EQ ADVISORS TRUST
PORTFOLIO OF INVESTMENTS
June 30, 2010 (Unaudited)
| Number of Shares | Value (Note 1) | |||||||||||||||||||||||||||
| EQ/Capital Guardian Growth | EQ/Large Cap Growth PLUS | Pro Forma | EQ/Capital Guardian Growth | EQ/Large Cap Growth PLUS | Pro Forma | % of Net Assets | ||||||||||||||||||||||
Gerdau Ameristeel Corp.* | — | 2,173 | 2,173 | — | 23,686 | 23,686 | ||||||||||||||||||||||
Newmont Mining Corp. | — | 61,363 | 61,363 | — | 3,788,552 | 3,788,552 | ||||||||||||||||||||||
Nucor Corp. | — | 17,438 | 17,438 | — | 667,527 | 667,527 | ||||||||||||||||||||||
Reliance Steel & Aluminum Co. | — | 1,081 | 1,081 | — | 39,078 | 39,078 | ||||||||||||||||||||||
Royal Gold, Inc. | — | 869 | 869 | — | 41,712 | 41,712 | ||||||||||||||||||||||
Schnitzer Steel Industries, Inc., Class A | — | 572 | 572 | — | 22,422 | 22,422 | ||||||||||||||||||||||
Southern Copper Corp. | — | 21,819 | 21,819 | — | 579,076 | 579,076 | ||||||||||||||||||||||
Titanium Metals Corp.* | — | 11,024 | 11,024 | — | 193,912 | 193,912 | ||||||||||||||||||||||
United States Steel Corp. | — | 3,477 | 3,477 | — | 134,038 | 134,038 | ||||||||||||||||||||||
Walter Energy, Inc. | — | 5,440 | 5,440 | — | 331,024 | 331,024 | ||||||||||||||||||||||
| 8,305,011 | 23,667,341 | 31,972,352 | 1.82 | % | ||||||||||||||||||||||||
Paper & Forest Products | ||||||||||||||||||||||||||||
International Paper Co. | — | 43,814 | 43,814 | — | 991,511 | 991,511 | 0.06 | % | ||||||||||||||||||||
Total Materials | 18,964,672 | 79,726,002 | 98,690,674 | 5.63 | % | |||||||||||||||||||||||
Telecommunication Services | ||||||||||||||||||||||||||||
Diversified Telecommunication Services |
| |||||||||||||||||||||||||||
Frontier Communications Corp. | — | 15,679 | 15,679 | — | 111,478 | 111,478 | ||||||||||||||||||||||
Level 3 Communications, Inc.* | — | 82,467 | 82,467 | — | 89,889 | 89,889 | ||||||||||||||||||||||
tw telecom, Inc.* | — | 19,568 | 19,568 | — | 326,394 | 326,394 | ||||||||||||||||||||||
Windstream Corp. | — | 25,865 | 25,865 | — | 273,135 | 273,135 | ||||||||||||||||||||||
| — | 800,896 | 800,896 | 0.05 | % | ||||||||||||||||||||||||
Wireless Telecommunication Services | ||||||||||||||||||||||||||||
American Tower Corp., Class A* | 151,858 | 52,095 | 203,953 | 6,757,681 | 2,318,227 | 9,075,908 | ||||||||||||||||||||||
Clearwire Corp., Class A* | — | 14,950 | 14,950 | — | 108,836 | 108,836 | ||||||||||||||||||||||
Crown Castle International Corp. | — | 37,464 | 37,464 | — | 1,395,909 | 1,395,909 | ||||||||||||||||||||||
MetroPCS Communications, Inc.* | — | 15,498 | 15,498 | — | 126,929 | 126,929 | ||||||||||||||||||||||
NII Holdings, Inc.* | — | 17,047 | 17,047 | — | 554,368 | 554,368 | ||||||||||||||||||||||
SBA Communications Corp., Class A* | — | 15,093 | 15,093 | — | 513,313 | 513,313 | ||||||||||||||||||||||
| 6,757,681 | 5,017,582 | 11,775,263 | 0.67 | % | ||||||||||||||||||||||||
Total Telecommunication Services | 6,757,681 | 5,818,478 | 12,576,159 | 0.72 | % | |||||||||||||||||||||||
Utilities | ||||||||||||||||||||||||||||
Electric Utilities | ||||||||||||||||||||||||||||
ITC Holdings Corp. | — | 5,684 | 5,684 | — | 300,740 | 300,740 | 0.02 | % | ||||||||||||||||||||
See notes to pro-forma financial statements.
EQ ADVISORS TRUST
PORTFOLIO OF INVESTMENTS
June 30, 2010 (Unaudited)
| Number of Shares | Value (Note 1) | |||||||||||||||||||||||||||
| EQ/Capital Guardian Growth | EQ/Large Cap Growth PLUS | Pro Forma | EQ/Capital Guardian Growth | EQ/Large Cap Growth PLUS | Pro Forma | % of Net Assets | ||||||||||||||||||||||
Gas Utilities | ||||||||||||||||||||||||||||
EQT Corp. | — | 17,876 | 17,876 | — | 646,039 | 646,039 | 0.04 | % | ||||||||||||||||||||
Independent Power Producers & Energy Traders | ||||||||||||||||||||||||||||
Calpine Corp.* | — | 20,938 | 20,938 | — | 266,331 | 266,331 | ||||||||||||||||||||||
Ormat Technologies, Inc. | — | 1,291 | 1,291 | — | 36,523 | 36,523 | ||||||||||||||||||||||
| — | 302,854 | 302,854 | 0.02 | % | ||||||||||||||||||||||||
Total Utilities | — | 1,249,633 | 1,249,633 | 0.07 | % | |||||||||||||||||||||||
Total Common Stocks | 289,715,160 | 1,020,058,268 | 1,309,773,428 | 74.69 | % | |||||||||||||||||||||||
(Cost $1,195,337,724) | 283,260,098 | 912,077,626 | 1,195,337,724 | |||||||||||||||||||||||||
INVESTMENT COMPANIES: |
| |||||||||||||||||||||||||||
Exchange Traded Funds (ETFs) |
| |||||||||||||||||||||||||||
iShares Morningstar Large Core Index Fund | — | 16,923 | 16,923 | — | 1,004,719 | 1,004,719 | ||||||||||||||||||||||
iShares Morningstar Large Growth Index Fund | — | 804,865 | 804,865 | — | 41,861,029 | 41,861,029 | ||||||||||||||||||||||
iShares Morningstar Large Value Index Fund | — | 162,568 | 162,568 | — | 7,993,469 | 7,993,469 | ||||||||||||||||||||||
iShares NYSE 100 Index Fund | — | 11,194 | 11,194 | — | 558,916 | 558,916 | ||||||||||||||||||||||
iShares Russell 1000 Growth Index Fund | — | 637,618 | 637,618 | — | 29,228,409 | 29,228,409 | ||||||||||||||||||||||
iShares Russell 1000 Index Fund | — | 42,225 | 42,225 | — | 2,412,736 | 2,412,736 | ||||||||||||||||||||||
iShares Russell 1000 Value Index Fund | — | 54,590 | 54,590 | — | 2,959,324 | 2,959,324 | ||||||||||||||||||||||
iShares S&P 100 Index Fund | — | 47,087 | 47,087 | — | 2,206,968 | 2,206,968 | ||||||||||||||||||||||
iShares S&P 500 Growth Index Fund | — | 682,750 | 682,750 | — | 36,144,785 | 36,144,785 | ||||||||||||||||||||||
iShares S&P 500 Index Fund | — | 27,879 | 27,879 | — | 2,884,361 | 2,884,361 | ||||||||||||||||||||||
iShares S&P 500 Value Index Fund | — | 77,104 | 77,104 | — | 3,828,985 | 3,828,985 | ||||||||||||||||||||||
Total Investment Companies | — | 131,083,701 | 131,083,701 | 7.48 | % | |||||||||||||||||||||||
(Cost $121,456,555) | — | 121,456,555 | 121,456,555 | |||||||||||||||||||||||||
| Principal Amount | ||||||||||||||||||||||||||||
SHORT-TERM INVESTMENTS: |
| |||||||||||||||||||||||||||
Short-Term Investment |
| |||||||||||||||||||||||||||
BlackRock Liquidity Funds TempFund | ||||||||||||||||||||||||||||
0.16%# | $ | — | $ | 254,031,186 | $ | 254,031,186 | — | 254,031,186 | 254,031,186 | 14.49 | % | |||||||||||||||||
Time Deposit | ||||||||||||||||||||||||||||
JP Morgan Chase Nassau | ||||||||||||||||||||||||||||
0.000%, 7/1/10 | 20,730,876 | 11,431,662 | 32,162,538 | 20,730,876 | 11,431,662 | 32,162,538 | 1.83 | % | ||||||||||||||||||||
Total Short-Term Investments |
| 20,730,876 | 265,462,848 | 286,193,724 | 16.32 | % | ||||||||||||||||||||||
(Cost/Amortized Cost $286,193,724) | 20,730,876 | 265,462,848 | 286,193,724 | |||||||||||||||||||||||||
See notes to pro-forma financial statements.
EQ ADVISORS TRUST
PORTFOLIO OF INVESTMENTS
June 30, 2010 (Unaudited)
| Number of Shares | Value (Note 1) | |||||||||||||||||||||||||||
| EQ/Capital Guardian Growth | EQ/Large Cap Growth PLUS | Pro Forma | EQ/Capital Guardian Growth | EQ/Large Cap Growth PLUS | Pro Forma | % of Net Assets | ||||||||||||||||||||||
Total Investments | 310,446,036 | 1,416,604,817 | 1,727,050,853 | 98.49 | % | |||||||||||||||||||||||
(Cost/Amortized Cost $1,602,988,003) | 303,990,974 | 1,298,997,029 | 1,602,988,003 | |||||||||||||||||||||||||
Other Assets Less Liabilities | (174,773 | ) | 26,645,546 | 26,470,773 | 1.51 | % | ||||||||||||||||||||||
Net Assets (100%) | $ | 310,271,263 | $ | 1,443,250,363 | $ | 1,753,521,626 | 100.00 | % | ||||||||||||||||||||
See notes to pro-forma financial statements.
NOTES TO SCHEDULE OF PORTFOLIO INVESTMENTS:
| * | Non-income producing. |
| # | Affiliated company as defined under the Investment Company Act of 1940. |
Glossary:
ADR — American Depositary Receipt
As of June 30, 2010, the gross unrealized appreciation (depreciation) of investments based on the aggregate cost of investments for Federal income tax purposes was as follows:
| EQ/Capital Guardian Growth | EQ/Large Cap Growth PLUS | Combined Pro Forma | ||||||||||
Aggregate gross unrealized appreciation | $ | 32,878,448 | $ | 80,307,151 | $ | 113,185,599 | ||||||
Aggregate gross unrealized depreciation | (27,029,558 | ) | (38,184,700 | ) | $ | (65,214,258 | ) | |||||
Net unrealized depreciation | $ | 5,848,890 | $ | 42,122,451 | $ | 47,971,341 | ||||||
Federal income tax cost of investments | $ | 304,597,146 | $ | 1,374,482,366 | $ | 1,679,079,512 | ||||||
Investments in companies which were affiliates for the six months ended June 30, 2010 were as follows:
| EQ/Capital Guardian Growth | EQ/Large Cap Growth PLUS | Combined Pro Forma | ||||||||||
BlackRock Liquidity Funds TempFund | ||||||||||||
Market Value December 31, 2009 | $ | — | $ | — | $ | — | ||||||
Purchase at Cost | $ | — | $ | 342,311,179 | $ | 342,311,179 | ||||||
Sales at Cost | $ | — | $ | 88,279,993 | $ | 88,279,993 | ||||||
Market Value June 30, 2010 | $ | — | $ | 254,031,186 | $ | 254,031,186 | ||||||
Dividend Income | $ | — | $ | 47,499 | $ | 47,499 | ||||||
Realized Gain (Loss) | $ | — | $ | — | $ | — | ||||||
At June 30, 2010, the Portfolio had the following futures contracts open:
Purchase | ||||||||||||
NASDAQ 100 E-Mini Index | ||||||||||||
Number of Contracts | — | 1,605 | 1,605 | |||||||||
Expiration Date | September-10 | September-10 | ||||||||||
Original Value | $ | — | $ | 58,747,034 | $ | 58,747,034 | ||||||
Value at 6/30/2010 | $ | — | $ | 55,789,800 | $ | 55,789,800 | ||||||
Unrealized Appreciation (Depreciation) | $ | — | $ | (2,957,234 | ) | $ | (2,957,234 | ) | ||||
S&P 500 E-Mini Index | ||||||||||||
Number of Contracts | — | 4,390 | 4,390 | |||||||||
Expiration Date | September-10 | September-10 | ||||||||||
Original Value | $ | — | $ | 237,839,472 | $ | 237,839,472 | ||||||
Value at 6/30/2010 | $ | — | $ | 225,338,700 | $ | 225,338,700 | ||||||
Unrealized Appreciation (Depreciation) | $ | — | $ | (12,500,772 | ) | $ | (12,500,772 | ) | ||||
| $ | (15,458,006 | ) | ||||||||||
The following is a summary of the inputs used to value the Portfolio’s net assets as of June 30, 2010:
The inputs or methodology used for valuing securities are not necessarily an indication of the risk associated with investing in those securities. For example, money market securities are valued using amortized cost, in accordance with rules under the Investment Company Act of 1940. Generally, amortized cost approximates the current fair value of a security, but since the value is not obtained from a quoted price in an active market, such securities are reflected as Level 2.
| EQ/Capital Guardian Growth | EQ/Large Cap Growth PLUS | Combined Pro Forma | ||||||||||
Level 1 | ||||||||||||
Assets | ||||||||||||
Investments in Securities | $ | 289,715,160 | $ | 1,151,141,969 | $ | 1,440,857,129 | ||||||
Other Investments* | — | — | — | |||||||||
Liabilities | ||||||||||||
Investments in Securities | — | — | — | |||||||||
Other Investments* | — | (15,458,006 | ) | (15,458,006 | ) | |||||||
Level 1 Total | $ | 289,715,160 | $ | 1,135,683,963 | $ | 1,425,399,123 | ||||||
Level 2 | ||||||||||||
Assets | ||||||||||||
Investments in Securities | $ | 20,730,876 | $ | 265,462,848 | $ | 286,193,724 | ||||||
Other Investments* | — | — | — | |||||||||
Liabilities | ||||||||||||
Investments in Securities | — | — | — | |||||||||
Other Investments* | — | — | — | |||||||||
Level 2 Total | $ | 20,730,876 | $ | 265,462,848 | $ | 286,193,724 | ||||||
Level 3 | ||||||||||||
Assets | ||||||||||||
Investments in Securities | — | — | — | |||||||||
Other Investments* | — | — | — | |||||||||
Liabilities | ||||||||||||
Investments in Securities | — | — | — | |||||||||
Other Investments* | — | — | — | |||||||||
Level 3 Total | — | — | — | |||||||||
Total | $ | 310,446,036 | $ | 1,401,146,811 | $ | 1,711,592,847 | ||||||
| * | Other investments are derivative instruments, such as futures, forwards and written options, which are valued at the unrealized appreciation/deprecation on the investment. |
| EQ/Capital Guardian Growth | EQ/Large Cap Growth PLUS | Combined Pro Forma | ||||||||||||
Derivatives Not Accounted for as | ||||||||||||||
Hedging Instruments^ | Asset Derivatives | Fair Value | ||||||||||||
Interest rate contracts | Receivables, Net Assets -Unrealized appreciation | $ | — | * | $ | — | * | $ | — | * | ||||
Foreign exchange contracts | Receivables | — | — | — | ||||||||||
Credit contracts | Receivables | — | — | — | ||||||||||
Equity contracts | Receivables, Net Assets -Unrealized appreciation | — | * | — | * | — | * | |||||||
Commodity contracts | Receivables | — | — | — | ||||||||||
Other contracts | Receivables | — | — | — | ||||||||||
Total | $ | — | $ | — | $ | — | ||||||||
| Liability Derivatives | ||||||||||||||
Interest rate contracts | Payables, Net Assets -Unrealized depreciation | $ | — | * | $ | — | * | $ | — | * | ||||
Foreign exchange contracts | Payables | — | — | — | ||||||||||
Credit contracts | Payables | — | — | — | ||||||||||
Equity contracts | Payables, Net Assets -Unrealized depreciation | — | * | (15,458,006 | )* | (15,458,006 | )* | |||||||
Commodity contracts | Payables | — | — | — | ||||||||||
Other contracts | Payables | — | — | — | ||||||||||
Total | $ | — | $ | (15,458,006 | ) | $ | (15,458,006 | ) | ||||||
| * | Includes cumulative appreciation/depreciation of futures contracts as reported in Portfolio of Investments. Only current day’s variation margin is reported within the Statement of Assets & Liabilities. |
The Effect of Derivative Instruments on the Statement of Operations for the six months ended June 30, 2010:
Amount of Realized Gain or (Loss) on Derivatives Recognized in Income
| EQ/Capital Guardian Growth | EQ/Large Cap Growth PLUS | Combined Pro Forma | ||||||||||||||||||||||||||||||||||||||||||||||||||||||||||
Derivatives | Options | Futures | Forward Currency Contracts | Swaps | Total | Options | Futures | Forward Currency Contracts | Swaps | Total | Options | Futures | Forward Currency Contracts | Swaps | Total | |||||||||||||||||||||||||||||||||||||||||||||
Interest rate contracts | $ | — | $ | — | $ | — | $ | — | $ | — | $ | — | $ | — | $ | — | $ | — | $ | — | $ | — | $ | — | $ | — | $ | — | $ | — | ||||||||||||||||||||||||||||||
Foreign exchange contracts | — | — | — | — | — | — | — | — | — | — | — | — | — | — | — | |||||||||||||||||||||||||||||||||||||||||||||
Credit contracts | — | — | — | — | — | — | — | — | — | — | — | — | — | — | — | |||||||||||||||||||||||||||||||||||||||||||||
Equity contracts | — | — | — | — | — | — | (20,322,338 | ) | — | — | (20,322,338 | ) | — | (20,322,338 | ) | — | — | (20,322,338 | ) | |||||||||||||||||||||||||||||||||||||||||
Commodity contracts | — | — | — | — | — | — | — | — | — | — | — | — | — | — | — | |||||||||||||||||||||||||||||||||||||||||||||
Other contracts | — | — | — | — | — | — | — | — | — | — | — | — | — | — | — | |||||||||||||||||||||||||||||||||||||||||||||
Total | $ | — | $ | — | $ | — | $ | — | $ | — | $ | — | $ | (20,322,338 | ) | $ | — | $ | — | $ | (20,322,338 | ) | $ | — | $ | (20,322,338 | ) | $ | — | $ | — | $ | (20,322,338 | ) | ||||||||||||||||||||||||||
Amount of Unrealized Appreciation or (Depreciation) on Derivatives Recognized in Income
| EQ/Capital Guardian Growth | EQ/Large Cap Growth PLUS | Combined Pro Forma | ||||||||||||||||||||||||||||||||||||||||||||||||||||||||||
Derivatives | Options | Futures | Forward Currency Contracts | Swaps | Total | Options | Futures | Forward Currency Contracts | Swaps | Total | Options | Futures | Forward Currency Contracts | Swaps | Total | |||||||||||||||||||||||||||||||||||||||||||||
Interest rate contracts | $ | — | $ | — | $ | — | $ | — | $ | — | $ | — | $ | — | $ | — | $ | — | $ | — | $ | — | $ | — | $ | — | $ | — | $ | — | ||||||||||||||||||||||||||||||
Foreign exchange contracts | — | — | — | — | — | — | — | — | — | — | — | — | — | — | — | |||||||||||||||||||||||||||||||||||||||||||||
Credit contracts | — | — | — | — | — | — | — | �� | — | — | — | — | — | — | — | — | ||||||||||||||||||||||||||||||||||||||||||||
Equity contracts | — | — | — | — | — | — | (15,221,547 | ) | — | — | (15,221,547 | ) | — | (15,221,547 | ) | — | — | (15,221,547 | ) | |||||||||||||||||||||||||||||||||||||||||
Commodity contracts | — | — | — | — | — | — | — | — | — | — | — | — | — | — | — | |||||||||||||||||||||||||||||||||||||||||||||
Other contracts | — | — | — | — | — | — | — | — | — | — | — | — | — | — | — | |||||||||||||||||||||||||||||||||||||||||||||
Total | $ | — | $ | — | $ | — | $ | — | $ | — | $ | — | $ | (15,221,547 | ) | $ | — | $ | — | $ | (15,221,547 | ) | $ | — | $ | (15,221,547 | ) | $ | — | $ | — | $ | (15,221,547 | ) | ||||||||||||||||||||||||||
The Portfolio held futures contracts with an average notional balance of approximately $76,823,000 during the six months ended June 30, 2010.
| ^ | This Portfolio held futures contracts to gain or reduce exposure to the financial markets. |
| EQ/Capital Guardian Growth | EQ/Large Cap Growth PLUS | Combined Pro Forma | ||||||||||
Cost of Purchases: | ||||||||||||
Stocks and long-term corporate debt securities | $ | 43,947,327 | $ | 394,798,080 | $ | 438,745,407 | ||||||
Net Proceeds of Sales and Redemptions: | ||||||||||||
Stocks and long-term corporate debt securities | $ | 73,006,628 | $ | 723,346,162 | $ | 796,352,790 | ||||||
ProForma
The Portfolio has a net capital loss carryforward of $1,273,490,896 of which $466,299,140 expires in the year 2010, $68,612,394 expires in the year 2011, $87,529,724 expires in the year 2016, and $651,049,638 expires in the year 2017.
| EQ/Capital Guardian Growth | EQ/Large Cap Growth PLUS | Adjustment | TOTAL | |||||||||||||
STATEMENT OF ASSETS AND LIABILITIES | ||||||||||||||||
June 30, 2010 (Unaudited) | ||||||||||||||||
(Investments at Cost - Affiliated Issuers) | $ | — | $ | 254,031,186 | $ | 254,031,186 | ||||||||||
(Investments at Cost - Unaffiliated Issuers) | $ | 303,990,974 | $ | 1,044,965,843 | $ | 1,348,956,817 | ||||||||||
ASSETS | ||||||||||||||||
Investments at value - Affiliated Issuers | $ | — | $ | 254,031,186 | $ | 254,031,186 | ||||||||||
Investments at value - Unaffiliated Issuers | 310,446,036 | 1,162,573,631 | 1,473,019,667 | |||||||||||||
Cash held as collateral at broker | — | 29,328,000 | 29,328,000 | |||||||||||||
Receivable for securities sold | — | 2,387,624 | 2,387,624 | |||||||||||||
Dividends, interest, and other receivables | 231,923 | 1,505,916 | 1,737,839 | |||||||||||||
Receivable from Separate Accounts for Trust shares sold | 22,249 | 186,723 | 208,972 | |||||||||||||
Receivable from investment sub-adviser | — | 20,440 | 20,440 | |||||||||||||
Other assets | 4,274 | 6,938 | 11,212 | |||||||||||||
Total assets | 310,704,482 | 1,450,040,458 | — | 1,760,744,940 | ||||||||||||
LIABILITIES | ||||||||||||||||
Overdraft payable | — | 248,998 | 248,998 | |||||||||||||
Variation margin payable on futures contracts | — | 2,727,886 | 2,727,886 | |||||||||||||
Payable for securities purchased | — | 1,546,442 | 1,546,442 | |||||||||||||
Investment management fees payable | 151,593 | 790,094 | 941,687 | |||||||||||||
Payable to Separate Accounts for Trust shares redeemed | 94,175 | 745,250 | 839,425 | |||||||||||||
Administrative fees payable | 30,054 | 200,509 | 230,563 | |||||||||||||
Distribution fees payable- Class IB | 64,542 | 129,304 | 193,846 | |||||||||||||
Trustees’ fees payable | 1,226 | — | 1,226 | |||||||||||||
Accrued expenses | 91,629 | 401,612 | 493,241 | |||||||||||||
Total liabilities | 433,219 | 6,790,095 | — | 7,223,314 | ||||||||||||
NET ASSETS | $ | 310,271,263 | $ | 1,443,250,363 | $ | — | $ | 1,753,521,626 | ||||||||
Net assets were comprised of: | ||||||||||||||||
Paid in capital | $ | 470,347,066 | $ | 2,408,078,783 | $ | 2,878,425,849 | ||||||||||
Accumulated undistributed net investment income (loss) | 1,029,852 | 4,931,760 | 5,961,612 | |||||||||||||
Accumulated undistributed net realized gain (loss) on investments and futures | (167,560,717 | ) | (1,071,909,338 | ) | (1,239,470,055 | ) | ||||||||||
Net Unrealized appreciation (depreciation) on investments, futures and foreign currency translations | 6,455,062 | 102,149,158 | 108,604,220 | |||||||||||||
Net Assets | $ | 310,271,263 | $ | 1,443,250,363 | $ | — | $ | 1,753,521,626 | ||||||||
Class IA Shares: | ||||||||||||||||
Net Assets | 1,021,617 | 851,738,883 | 852,760,500 | |||||||||||||
Shares outstanding | 97,067 | 62,619,171 | (21,959 | )* | 62,694,279 | |||||||||||
Net asset value, offering and redemption price per share | $ | 10.52 | $ | 13.60 | $ | 13.60 | ||||||||||
Class IB Shares: | ||||||||||||||||
Net Assets | 309,249,646 | 591,511,480 | 900,761,126 | |||||||||||||
Shares outstanding | 29,435,313 | 44,734,875 | (6,047,359 | )* | 68,122,829 | |||||||||||
Net asset value, offering and redemption price per share | $ | 10.51 | $ | 13.22 | $ | 13.22 | ||||||||||
| * | Reflects retired shares of the Acquired Portfolio |
| STATEMENT OF OPERATIONS | ||||||||||||||||||
| For the Twelve Months Ended June 30, 2010 (Unaudited) | EQ/ Capital Guardian Growth | EQ/ Large Cap Growth PLUS | Adjustment | TOTAL | ||||||||||||||
(Foreign withholding tax) | $ | 3,346 | $ | 8,975 | $ | 12,321 | ||||||||||||
(Dividend income received from affiliates) | $ | — | $ | 47,499 | $ | 47,499 | ||||||||||||
INVESTMENT INCOME | ||||||||||||||||||
Dividends | 3,588,583 | 27,224,226 | 30,812,809 | |||||||||||||||
Interest | — | 5,697 | 5,697 | |||||||||||||||
Total income | 3,588,583 | 27,229,923 | — | 30,818,506 | ||||||||||||||
EXPENSES | ||||||||||||||||||
Investment management fees | 2,237,165 | 8,287,030 | (72,695 | ) (b) | 10,451,500 | |||||||||||||
Administrative fees | 382,530 | 2,626,124 | 256,796 | (b) | 3,265,450 | |||||||||||||
Distribution fees - Class IB | 858,929 | 1,631,893 | 2,490,822 | |||||||||||||||
Recoupment fees | — | — | — | |||||||||||||||
Printing and mailing expenses | 64,006 | 255,900 | (90,906 | ) (e)(f) | 229,000 | |||||||||||||
Custodian fees | 17,563 | 135,734 | (43,297 | ) (a) | 110,000 | |||||||||||||
Professional fees | 14,857 | 50,359 | (20,216 | ) (a) | 45,000 | |||||||||||||
Trustees’ fees | 8,233 | 48,529 | 56,762 | |||||||||||||||
Miscellaneous | 10,742 | 70,572 | (15,308 | ) (a) | 66,006 | |||||||||||||
Gross expenses | 3,594,025 | 13,106,141 | 14,374 | 16,714,540 | ||||||||||||||
Less: | Waiver from investment advisor | (324,619 | ) | — | 324,619 | (d) | — | |||||||||||
Reimbursement from sub-adviser | — | (20,440 | ) | (20,440 | ) | |||||||||||||
Fees paid indirectly | (27,323 | ) | (19,233 | ) | 27,323 | (c) | (19,233 | ) | ||||||||||
Net expenses | 3,242,083 | 13,066,468 | 366,316 | 16,674,867 | ||||||||||||||
NET INVESTMENT INCOME (LOSS) | 346,500 | 14,163,455 | (366,316 | ) | 14,143,639 | |||||||||||||
REALIZED AND UNREALIZED GAIN (LOSS) | ||||||||||||||||||
Realized gain (loss) on: | ||||||||||||||||||
Securities | (4,304,762 | ) | 237,796,300 | 233,491,538 | ||||||||||||||
Foreign currency translations | — | 567 | 567 | |||||||||||||||
Futures | — | (20,322,338 | ) | (20,322,338 | ) | |||||||||||||
Net realized gain (loss) | (4,304,762 | ) | 217,474,529 | — | 213,169,767 | |||||||||||||
Change in unrealized appreciation (depreciation) on: | ||||||||||||||||||
Securities | 32,488,531 | (2,597,754 | ) | 29,890,777 | ||||||||||||||
Foreign currency translations | — | (1,215 | ) | (1,215 | ) | |||||||||||||
Futures | — | (15,221,547 | ) | (15,221,547 | ) | |||||||||||||
Net change in unrealized appreciation (depreciation) | 32,488,531 | (17,820,516 | ) | — | 14,668,015 | |||||||||||||
NET REALIZED AND UNREALIZED GAIN (LOSS) | 28,183,769 | 199,654,013 | — | 227,837,782 | ||||||||||||||
NET INCREASE (DECREASE) IN NET ASSETS RESULTING FROM OPERATIONS | $ | 28,530,269 | $ | 213,817,468 | $ | (366,316 | ) | $ | 241,981,421 | |||||||||
(a) Reflects adjustment in expenses due to elimination of duplicative expenses.
(b) Reflects adjustment in expenses due to effects of new contract rate.
(c) Reflects adjustment to eliminate EQ/Capital Guardian Growth’s fees paid indirectly.
(d) Reflects decrease in waiver due to expense adjustment.
(e) Reflects adjustment due to reduced shareholder fees in 2010 due to mailing of CDs.
(f) Reflects adjustment due to proxy costs associated with the reorganization.
NOTES TO PRO FORMA FINANCIAL STATEMENTS
(UNAUDITED - As of June 30, 2010)
NOTE 1 – BASIS OF COMBINATION:
On December 7-8, 2010 the Board of Trustees of EQ Advisors Trust (the “Trust”) approved a proposed Plan of Reorganization and Termination (“Reorganization Plan”) that provides for the transfer of all of the assets of the EQ/Capital Guardian Growth Portfolio (“Cap Guardian Portfolio”) to the EQ/Large Cap Growth PLUS Portfolio (“LC Growth PLUS Portfolio”), each a series of the Trust, and the assumption by the LC Growth PLUS Portfolio of all of the liabilities of the Cap Guardian Portfolio in exchange for shares of the LC Growth PLUS Portfolio having an aggregate value equal to the net assets of the Cap Guardian Portfolio, the distribution of the LC Growth PLUS Portfolio shares to the Cap Guardian Portfolio shareholders of record determined immediately after the close of business on the closing date, and the subsequent liquidation of the Cap Guardian Portfolio.
The Cap Guardian Portfolio’s annual contractual management fee equals 0.650% of average daily net assets for the first $1 billion, 0.600% of average daily net assets for the next $1 billion, 0.575% for the next $3 billion, 0.550% for the next $5 billion, and 0.525% of average daily net assets thereafter. The LC Growth PLUS Portfolio’s annual contractual management fee rate equals 0.500% of average daily net assets for the first $2 billion, 0.450% of average daily net assets for the next $1 billion, 0.425% of average daily net assets for the next $3 billion, 0.400% of average daily net assets for the next $5 billion, and 0.375% of average daily net assets thereafter. The Reorganization Plan is subject to the approval of the Cap Guardian Portfolio’s shareholders. A special meeting of shareholders of the Cap Guardian Portfolio will be held on or about April 20, 2011.
The Reorganization will be accounted for as a tax-free reorganization of investment companies. The unaudited pro forma combined financial statements are presented for the information of the reader and may not necessarily be representative of what the actual combined financial statements would have been had the Reorganization occurred at June 30, 2010. The unaudited pro forma portfolio of investments and statement of assets and liabilities reflect the financial position of the Cap Guardian Portfolio and the LC Growth PLUS Portfolio at June 30, 2010. The unaudited pro forma statement of operations reflects the results of operations of the LC Growth PLUS Portfolio as if it had acquired the Cap Guardian Portfolio at the beginning of the 12 month period ended June 30, 2010. These statements have been derived from the Portfolios’ respective books and records utilized in calculating daily net asset value at the dates indicated above for each Portfolio under accounting principles generally accepted in the United States of America. The historical cost of investment securities will be carried forward to the surviving entity and results of operations of the LC Growth PLUS Portfolio for pre-combination periods will not be restated.
The unaudited pro forma portfolio of investments and statements of assets and liabilities and operations should be read in conjunction with the historical financial
NOTES TO PRO FORMA FINANCIAL STATEMENTS—(Continued)
(UNAUDITED - As of June 30, 2010)
statements of the Portfolios included in the Trust’s Statement of Additional Information. The preparation of financial statements in accordance with accounting principles generally accepted in the United States of America requires management to make estimates and assumptions that affect the reported amounts and disclosures. Actual results could differ from those estimated.
Following the Reorganization, the LC Growth PLUS Portfolio is the “accounting survivor.” The general criteria that are applied to determine the proper accounting survivor are outlined in the “AICPA Accounting and Audit Guide for Investment Companies.” The legal survivor normally is considered the accounting survivor of a reorganization. In this case, the LC Growth PLUS Portfolio is the legal survivor. Other criteria include:
| a.) | Portfolio Management – The merged entity will be managed by the Manager, Adviser and portfolio managers to the LC Growth PLUS Portfolio in a manner consistent with the current management style. |
| b.) | Portfolio Composition – The merged entity’s portfolio holdings are expected to be consistent with the LC Growth PLUS Portfolio’s current investment strategies and will more closely resemble the current portfolio holdings of the LC Growth PLUS Portfolio than those of the Cap Guardian Portfolio. |
| c.) | Investment Objective, Policies and Restrictions – The merged entity’s investment objective, policies and fundamental and non-fundamental investment restrictions will be the same as the LC Growth PLUS Portfolio’s current investment objective, policies and fundamental and non-fundamental investment restrictions. |
| d.) | Expense Structure and Expense Ratios – The merged entity’s expense structure will be the same as that of LC Growth PLUS Portfolio. The expense ratio of the merged entity will be the same as that of the LC Growth PLUS Portfolio and the Cap Guardian Portfolio. |
| e.) | Asset Size – The LC Growth PLUS Portfolio is significantly larger than the Cap Guardian Portfolio. |
NOTE 2 - SIGNIFICANT ACCOUNTING POLICIES:
Each of the Portfolios has substantially the same significant accounting policies, which are detailed in the historical financial statements referenced above in Note 1.
The preparation of financial statements in accordance with accounting principles generally accepted in the United States of America requires management to make estimates and assumptions that affect the reported amounts and disclosures. Actual results could differ from those estimates.
NOTES TO PRO FORMA FINANCIAL STATEMENTS—(Continued)
(UNAUDITED - As of June 30, 2010)
NOTE 3 – SHARES:
The unaudited pro forma net asset value per share assumes additional common shares of beneficial interest issued in connection with the proposed acquisition of the Cap Guardian Portfolio by the LC Growth PLUS Portfolio as of June 30, 2010. The number of additional shares issued was calculated based on the net assets of the Cap Guardian Portfolio and net asset value of the LC Growth PLUS Portfolio at June 30, 2010.
NOTE 4 – UNAUDITED PRO FORMA ADJUSTMENTS:
The accompanying unaudited pro forma financial statements reflect changes in the LC Growth PLUS Portfolio’s shares as if the merger had taken place on June 30, 2010. The Cap Guardian Portfolio will bear the expenses of the Reorganization (i.e., the costs associated with preparing, printing and distributing the prospectus and proxy materials, legal and accounting fees in connection with the Reorganization, and expenses of holding the shareholders meeting) up to $64,000 and AXA Equitable will bear the remaining expenses, which are estimated at approximately $222,000.
EQ ADVISORS TRUST
PORTFOLIO OF INVESTMENTS
June 30, 2010 (Unaudited)
| Number of Shares | Value (Note 1) | |||||||||||||||||||||||||||
| EQ/Lord Abbett Growth and Income | EQ/Large Cap Value Index | Pro Forma | EQ/Lord Abbett Growth and Income | EQ/Large Cap Value Index | Pro Forma | % of Net Assets | ||||||||||||||||||||||
COMMON STOCKS: | ||||||||||||||||||||||||||||
Consumer Discretionary | ||||||||||||||||||||||||||||
Auto Components | ||||||||||||||||||||||||||||
Autoliv, Inc.* | — | 1,254 | 1,254 | $ | — | $ | 60,004 | $ | 60,004 | |||||||||||||||||||
BorgWarner, Inc.* | — | 194 | 194 | — | 7,244 | 7,244 | ||||||||||||||||||||||
Federal-Mogul Corp.* | — | 278 | 278 | — | 3,619 | 3,619 | ||||||||||||||||||||||
Johnson Controls, Inc. | — | 826 | 826 | — | 22,195 | 22,195 | ||||||||||||||||||||||
Lear Corp.* | — | 700 | 700 | — | 46,340 | 46,340 | ||||||||||||||||||||||
TRW Automotive Holdings Corp.* | — | 600 | 600 | — | 16,542 | 16,542 | ||||||||||||||||||||||
| — | 155,944 | 155,944 | 0.05 | % | ||||||||||||||||||||||||
Automobiles | ||||||||||||||||||||||||||||
Ford Motor Co.* | 244,140 | — | 244,140 | 2,460,931 | — | 2,460,931 | 0.84 | % | ||||||||||||||||||||
Distributors | ||||||||||||||||||||||||||||
Genuine Parts Co. | — | 3,601 | 3,601 | — | 142,059 | 142,059 | 0.05 | % | ||||||||||||||||||||
Diversified Consumer Services | ||||||||||||||||||||||||||||
Education Management Corp.* | — | 300 | 300 | — | 4,575 | 4,575 | ||||||||||||||||||||||
H&R Block, Inc. | — | 4,300 | 4,300 | — | 67,467 | 67,467 | ||||||||||||||||||||||
Service Corp. International | — | 6,175 | 6,175 | — | 45,695 | 45,695 | ||||||||||||||||||||||
| — | 117,737 | 117,737 | 0.04 | % | ||||||||||||||||||||||||
Hotels, Restaurants & Leisure | ||||||||||||||||||||||||||||
Brinker International, Inc. | — | 300 | 300 | — | 4,338 | 4,338 | ||||||||||||||||||||||
Carnival Corp. | 48,500 | 6,014 | 54,514 | 1,466,640 | 181,863 | 1,648,503 | ||||||||||||||||||||||
Choice Hotels International, Inc. | — | 494 | 494 | — | 14,924 | 14,924 | ||||||||||||||||||||||
Hyatt Hotels Corp., Class A* | 49,720 | 1,000 | 50,720 | 1,844,115 | 37,090 | 1,881,205 | ||||||||||||||||||||||
International Speedway Corp., Class A | — | 599 | 599 | — | 15,430 | 15,430 | ||||||||||||||||||||||
Marriott International, Inc., Class A | 60,953 | — | 60,953 | 1,824,933 | — | 1,824,933 | ||||||||||||||||||||||
MGM MIRAGE* | — | 5,052 | 5,052 | — | 48,701 | 48,701 | ||||||||||||||||||||||
Penn National Gaming, Inc.* | — | 1,480 | 1,480 | — | 34,188 | 34,188 | ||||||||||||||||||||||
Royal Caribbean Cruises Ltd.* | — | 1,740 | 1,740 | — | 39,620 | 39,620 | ||||||||||||||||||||||
Wendy’s/Arby’s Group, Inc., Class A | — | 4,731 | 4,731 | — | 18,924 | 18,924 | ||||||||||||||||||||||
Wyndham Worldwide Corp. | — | 3,983 | 3,983 | — | 80,218 | 80,218 | ||||||||||||||||||||||
| 5,135,688 | 475,296 | 5,610,984 | 1.92 | % | ||||||||||||||||||||||||
Household Durables | ||||||||||||||||||||||||||||
D.R. Horton, Inc. | — | 6,450 | 6,450 | — | 63,403 | 63,403 | ||||||||||||||||||||||
Fortune Brands, Inc. | — | 2,949 | 2,949 | — | 115,542 | 115,542 | ||||||||||||||||||||||
See notes to pro-forma financial statements.
EQ ADVISORS TRUST
PORTFOLIO OF INVESTMENTS
June 30, 2010 (Unaudited)
| Number of Shares | Value (Note 1) | |||||||||||||||||||||||||||
| EQ/Lord Abbett Growth and Income | EQ/Large Cap Value Index | Pro Forma | EQ/Lord Abbett Growth and Income | EQ/Large Cap Value Index | Pro Forma | % of Net Assets | ||||||||||||||||||||||
Garmin Ltd. | — | 2,370 | 2,370 | — | 69,157 | 69,157 | ||||||||||||||||||||||
Harman International Industries, Inc.* | — | 762 | 762 | — | 22,776 | 22,776 | ||||||||||||||||||||||
Jarden Corp. | — | 2,065 | 2,065 | — | 55,487 | 55,487 | ||||||||||||||||||||||
KB Home | — | 1,557 | 1,557 | — | 17,127 | 17,127 | ||||||||||||||||||||||
Leggett & Platt, Inc. | — | 1,252 | 1,252 | — | 25,115 | 25,115 | ||||||||||||||||||||||
Lennar Corp., Class A | — | 3,722 | 3,722 | — | 51,773 | 51,773 | ||||||||||||||||||||||
M.D.C. Holdings, Inc. | — | 802 | 802 | — | 21,614 | 21,614 | ||||||||||||||||||||||
Mohawk Industries, Inc.* | — | 1,080 | 1,080 | — | 49,421 | 49,421 | ||||||||||||||||||||||
Newell Rubbermaid, Inc. | — | 6,168 | 6,168 | — | 90,300 | 90,300 | ||||||||||||||||||||||
Pulte Group, Inc.* | 102,990 | 7,039 | 110,029 | 852,757 | 58,283 | 911,040 | ||||||||||||||||||||||
Stanley Black & Decker, Inc. | — | 3,551 | 3,551 | — | 179,396 | 179,396 | ||||||||||||||||||||||
Toll Brothers, Inc.* | — | 3,237 | 3,237 | — | 52,957 | 52,957 | ||||||||||||||||||||||
Whirlpool Corp. | — | 957 | 957 | — | 84,044 | 84,044 | ||||||||||||||||||||||
| 852,757 | 956,395 | 1,809,152 | 0.62 | % | ||||||||||||||||||||||||
Internet & Catalog Retail | ||||||||||||||||||||||||||||
Expedia, Inc. | — | 2,693 | 2,693 | — | 50,575 | 50,575 | ||||||||||||||||||||||
HSN, Inc.* | 110,036 | — | 110,036 | 2,640,864 | — | 2,640,864 | ||||||||||||||||||||||
Liberty Media Corp.- Interactive, Class A* | — | 13,181 | 13,181 | — | 138,400 | 138,400 | ||||||||||||||||||||||
| 2,640,864 | 188,975 | 2,829,839 | 0.97 | % | ||||||||||||||||||||||||
Leisure Equipment & Products | ||||||||||||||||||||||||||||
Mattel, Inc. | — | 3,375 | 3,375 | — | 71,415 | 71,415 | 0.02 | % | ||||||||||||||||||||
Media | ||||||||||||||||||||||||||||
Cablevision Systems Corp. - New York Group, Class A | — | 5,380 | 5,380 | — | 129,174 | 129,174 | ||||||||||||||||||||||
CBS Corp., Class B | — | 13,153 | 13,153 | — | 170,068 | 170,068 | ||||||||||||||||||||||
Central European Media Enterprises Ltd., Class A* | — | 747 | 747 | — | 14,865 | 14,865 | ||||||||||||||||||||||
Clear Channel Outdoor Holdings, Inc., Class A* | — | 838 | 838 | — | 7,274 | 7,274 | ||||||||||||||||||||||
Comcast Corp., Class A | 135,780 | 62,008 | 197,788 | 2,358,499 | 1,077,079 | 3,435,578 | ||||||||||||||||||||||
Discovery Communications, Inc., Class A* | — | 1,700 | 1,700 | — | 60,707 | 60,707 | ||||||||||||||||||||||
DISH Network Corp., Class A | — | 4,484 | 4,484 | — | 81,385 | 81,385 | ||||||||||||||||||||||
Gannett Co., Inc. | — | 5,414 | 5,414 | — | 72,872 | 72,872 | ||||||||||||||||||||||
Interactive Data Corp. | — | 25 | 25 | — | 835 | 835 | ||||||||||||||||||||||
John Wiley & Sons, Inc., Class A | — | 100 | 100 | — | 3,867 | 3,867 | ||||||||||||||||||||||
Lamar Advertising Co., Class A* | — | 952 | 952 | — | 23,343 | 23,343 | ||||||||||||||||||||||
Liberty Global, Inc., Class A* | — | 5,556 | 5,556 | — | 144,400 | 144,400 | ||||||||||||||||||||||
Liberty Media Corp. - Capital, Class A* | — | 1,770 | 1,770 | — | 74,181 | 74,181 | ||||||||||||||||||||||
Liberty Media Corp. - Starz* | — | 1,162 | 1,162 | — | 60,238 | 60,238 | ||||||||||||||||||||||
Madison Square Garden, Inc., Class A* | — | 945 | 945 | — | 18,588 | 18,588 | ||||||||||||||||||||||
See notes to pro-forma financial statements.
EQ ADVISORS TRUST
PORTFOLIO OF INVESTMENTS
June 30, 2010 (Unaudited)
| Number of Shares | Value (Note 1) | |||||||||||||||||||||||||||
| EQ/Lord Abbett Growth and Income | EQ/Large Cap Value Index | Pro Forma | EQ/Lord Abbett Growth and Income | EQ/Large Cap Value Index | Pro Forma | % of Net Assets | ||||||||||||||||||||||
McGraw-Hill Cos., Inc. | — | 2,100 | 2,100 | — | 59,094 | 59,094 | ||||||||||||||||||||||
Meredith Corp. | — | 424 | 424 | — | 13,199 | 13,199 | ||||||||||||||||||||||
New York Times Co., Class A* | — | 2,956 | 2,956 | — | 25,569 | 25,569 | ||||||||||||||||||||||
News Corp., Class A* | — | 39,824 | 39,824 | — | 476,295 | 476,295 | ||||||||||||||||||||||
Omnicom Group, Inc. | 14,130 | 1,300 | 15,430 | 484,659 | 44,590 | 529,249 | ||||||||||||||||||||||
Regal Entertainment Group, Class A | — | 865 | 865 | — | 11,280 | 11,280 | ||||||||||||||||||||||
Thomson Reuters Corp. | — | 5,600 | 5,600 | — | 200,648 | 200,648 | ||||||||||||||||||||||
Time Warner Cable, Inc. | 18,341 | 7,846 | 26,187 | 955,199 | 408,620 | 1,363,819 | ||||||||||||||||||||||
Time Warner, Inc. | 19,006 | 19,884 | 38,890 | 549,463 | 574,846 | 1,124,309 | ||||||||||||||||||||||
Viacom, Inc., Class B | — | 10,759 | 10,759 | — | 337,510 | 337,510 | ||||||||||||||||||||||
Virgin Media, Inc. | — | 7,299 | 7,299 | — | 121,820 | 121,820 | ||||||||||||||||||||||
Walt Disney Co. | — | 43,265 | 43,265 | — | 1,362,848 | 1,362,848 | ||||||||||||||||||||||
Washington Post Co., Class B | — | 144 | 144 | — | 59,109 | 59,109 | ||||||||||||||||||||||
| 4,347,820 | 5,634,304 | 9,982,124 | 3.42 | % | ||||||||||||||||||||||||
Multiline Retail | ||||||||||||||||||||||||||||
J.C. Penney Co., Inc. | 23,640 | 3,508 | 27,148 | 507,787 | 75,352 | 583,139 | ||||||||||||||||||||||
Kohl’s Corp.* | 22,500 | 1,719 | 24,219 | 1,068,750 | 81,652 | 1,150,402 | ||||||||||||||||||||||
Macy’s, Inc. | — | 8,334 | 8,334 | — | 149,179 | 149,179 | ||||||||||||||||||||||
Sears Holdings Corp.* | — | 991 | 991 | — | 64,068 | 64,068 | ||||||||||||||||||||||
Target Corp. | 63,120 | — | 63,120 | 3,103,611 | — | 3,103,611 | ||||||||||||||||||||||
| 4,680,148 | 370,251 | 5,050,399 | 1.73 | % | ||||||||||||||||||||||||
Specialty Retail | ||||||||||||||||||||||||||||
Aaron’s Inc. | — | 700 | 700 | — | 11,949 | 11,949 | ||||||||||||||||||||||
Abercrombie & Fitch Co., Class A | — | 420 | 420 | — | 12,890 | 12,890 | ||||||||||||||||||||||
American Eagle Outfitters, Inc. | — | 3,500 | 3,500 | — | 41,125 | 41,125 | ||||||||||||||||||||||
AutoNation, Inc.* | — | 1,072 | 1,072 | — | 20,904 | 20,904 | ||||||||||||||||||||||
Foot Locker, Inc. | — | 3,481 | 3,481 | — | 43,930 | 43,930 | ||||||||||||||||||||||
GameStop Corp., Class A* | — | 3,348 | 3,348 | — | 62,909 | 62,909 | ||||||||||||||||||||||
Gap, Inc. | — | 1,187 | 1,187 | — | 23,099 | 23,099 | ||||||||||||||||||||||
Home Depot, Inc. | 13,480 | — | 13,480 | 378,384 | — | 378,384 | ||||||||||||||||||||||
J. Crew Group, Inc.* | 19,340 | — | 19,340 | 711,905 | — | 711,905 | ||||||||||||||||||||||
Lowe’s Cos., Inc. | — | 7,604 | 7,604 | — | 155,274 | 155,274 | ||||||||||||||||||||||
Office Depot, Inc.* | — | 4,801 | 4,801 | — | 19,396 | 19,396 | ||||||||||||||||||||||
RadioShack Corp. | — | 2,622 | 2,622 | — | 51,155 | 51,155 | ||||||||||||||||||||||
Signet Jewelers Ltd.* | — | 2,008 | 2,008 | — | 55,220 | 55,220 | ||||||||||||||||||||||
| 1,090,289 | 497,851 | 1,588,140 | 0.54 | % | ||||||||||||||||||||||||
See notes to pro-forma financial statements.
EQ ADVISORS TRUST
PORTFOLIO OF INVESTMENTS
June 30, 2010 (Unaudited)
| Number of Shares | Value (Note 1) | |||||||||||||||||||||||||||
| EQ/Lord Abbett Growth and Income | EQ/Large Cap Value Index | Pro Forma | EQ/Lord Abbett Growth and Income | EQ/Large Cap Value Index | Pro Forma | % of Net Assets | ||||||||||||||||||||||
Textiles, Apparel & Luxury Goods | ||||||||||||||||||||||||||||
VF Corp. | — | 1,972 | 1,972 | — | 140,367 | 140,367 | 0.05 | % | ||||||||||||||||||||
Total Consumer Discretionary | 21,208,497 | 8,750,594 | 29,959,091 | 10.26 | % | |||||||||||||||||||||||
Consumer Staples | ||||||||||||||||||||||||||||
Beverages | ||||||||||||||||||||||||||||
Brown-Forman Corp., Class B | — | 542 | 542 | — | 31,019 | 31,019 | ||||||||||||||||||||||
Central European Distribution Corp.* | — | 1,378 | 1,378 | — | 29,462 | 29,462 | ||||||||||||||||||||||
Coca-Cola Co. | — | 11,817 | 11,817 | — | 592,268 | 592,268 | ||||||||||||||||||||||
Coca-Cola Enterprises, Inc. | — | 2,730 | 2,730 | — | 70,598 | 70,598 | ||||||||||||||||||||||
Constellation Brands, Inc., Class A* | — | 4,240 | 4,240 | — | 66,229 | 66,229 | ||||||||||||||||||||||
Dr. Pepper Snapple Group, Inc. | — | 3,723 | 3,723 | — | 139,203 | 139,203 | ||||||||||||||||||||||
Hansen Natural Corp.* | — | 200 | 200 | — | 7,822 | 7,822 | ||||||||||||||||||||||
Molson Coors Brewing Co., Class B | — | 2,710 | 2,710 | — | 114,795 | 114,795 | ||||||||||||||||||||||
PepsiCo, Inc. | 17,350 | 15,100 | 32,450 | 1,057,483 | 920,345 | 1,977,828 | ||||||||||||||||||||||
| 1,057,483 | 1,971,741 | 3,029,224 | 1.04 | % | ||||||||||||||||||||||||
Food & Staples Retailing | ||||||||||||||||||||||||||||
BJ’s Wholesale Club, Inc.* | — | 961 | 961 | — | 35,567 | 35,567 | ||||||||||||||||||||||
CVS Caremark Corp. | — | 26,619 | 26,619 | — | 780,469 | 780,469 | ||||||||||||||||||||||
Kroger Co. | 183,696 | 13,367 | 197,063 | 3,616,974 | 263,196 | 3,880,170 | ||||||||||||||||||||||
Safeway, Inc. | — | 8,594 | 8,594 | — | 168,958 | 168,958 | ||||||||||||||||||||||
SUPERVALU, Inc. | — | 4,713 | 4,713 | — | 51,089 | 51,089 | ||||||||||||||||||||||
Walgreen Co. | — | 1,900 | 1,900 | — | 50,730 | 50,730 | ||||||||||||||||||||||
Wal-Mart Stores, Inc. | — | 17,800 | 17,800 | — | 855,646 | 855,646 | ||||||||||||||||||||||
| 3,616,974 | 2,205,655 | 5,822,629 | 1.99 | % | ||||||||||||||||||||||||
Food Products | ||||||||||||||||||||||||||||
Archer-Daniels-Midland Co. | 90,070 | 14,144 | 104,214 | 2,325,607 | 365,198 | 2,690,805 | ||||||||||||||||||||||
Bunge Ltd. | — | 3,072 | 3,072 | — | 151,112 | 151,112 | ||||||||||||||||||||||
Campbell Soup Co. | — | 1,437 | 1,437 | — | 51,488 | 51,488 | ||||||||||||||||||||||
ConAgra Foods, Inc. | — | 8,831 | 8,831 | — | 205,939 | 205,939 | ||||||||||||||||||||||
Corn Products International, Inc. | — | 1,635 | 1,635 | — | 49,540 | 49,540 | ||||||||||||||||||||||
Dean Foods Co.* | — | 4,000 | 4,000 | — | 40,280 | 40,280 | ||||||||||||||||||||||
Del Monte Foods Co. | — | 4,371 | 4,371 | — | 62,899 | 62,899 | ||||||||||||||||||||||
Flowers Foods, Inc. | — | 1,032 | 1,032 | — | 25,212 | 25,212 | ||||||||||||||||||||||
General Mills, Inc. | — | 5,968 | 5,968 | — | 211,983 | 211,983 | ||||||||||||||||||||||
H.J. Heinz Co. | — | 4,154 | 4,154 | — | 179,536 | 179,536 | ||||||||||||||||||||||
Hershey Co. | — | 1,479 | 1,479 | — | 70,888 | 70,888 | ||||||||||||||||||||||
Hormel Foods Corp. | — | 1,394 | 1,394 | — | 56,429 | 56,429 | ||||||||||||||||||||||
See notes to pro-forma financial statements.
EQ ADVISORS TRUST
PORTFOLIO OF INVESTMENTS
June 30, 2010 (Unaudited)
| Number of Shares | Value (Note 1) | |||||||||||||||||||||||||||
| EQ/Lord Abbett Growth and Income | EQ/Large Cap Value Index | Pro Forma | EQ/Lord Abbett Growth and Income | EQ/Large Cap Value Index | Pro Forma | % of Net Assets | ||||||||||||||||||||||
J.M. Smucker Co. | — | 2,621 | 2,621 | — | 157,837 | 157,837 | ||||||||||||||||||||||
Kellogg Co. | — | 600 | 600 | — | 30,180 | 30,180 | ||||||||||||||||||||||
Kraft Foods, Inc., Class A | 18,089 | 35,285 | 53,374 | 506,492 | 987,980 | 1,494,472 | ||||||||||||||||||||||
McCormick & Co., Inc. (Non-Voting) | — | 1,500 | 1,500 | — | 56,940 | 56,940 | ||||||||||||||||||||||
Mead Johnson Nutrition Co. | — | 3,874 | 3,874 | — | 194,165 | 194,165 | ||||||||||||||||||||||
Ralcorp Holdings, Inc.* | — | 1,284 | 1,284 | — | 70,363 | 70,363 | ||||||||||||||||||||||
Sara Lee Corp. | — | 4,202 | 4,202 | — | 59,248 | 59,248 | ||||||||||||||||||||||
Smithfield Foods, Inc.* | — | 2,803 | 2,803 | — | 41,765 | 41,765 | ||||||||||||||||||||||
Tyson Foods, Inc., Class A | — | 6,822 | 6,822 | — | 111,812 | 111,812 | ||||||||||||||||||||||
| 2,832,099 | 3,180,794 | 6,012,893 | 2.06 | % | ||||||||||||||||||||||||
Household Products | ||||||||||||||||||||||||||||
Clorox Co. | — | 160 | 160 | — | 9,945 | 9,945 | ||||||||||||||||||||||
Colgate-Palmolive Co. | 20,910 | 1,800 | 22,710 | 1,646,872 | 141,768 | 1,788,640 | ||||||||||||||||||||||
Energizer Holdings, Inc.* | — | 1,542 | 1,542 | — | 77,532 | 77,532 | ||||||||||||||||||||||
Kimberly-Clark Corp. | — | 1,863 | 1,863 | — | 112,954 | 112,954 | ||||||||||||||||||||||
Procter & Gamble Co. | — | 59,602 | 59,602 | — | 3,574,927 | 3,574,927 | ||||||||||||||||||||||
| 1,646,872 | 3,917,126 | 5,563,998 | 1.90 | % | ||||||||||||||||||||||||
Personal Products | ||||||||||||||||||||||||||||
Alberto-Culver Co. | — | 1,504 | 1,504 | — | 40,743 | 40,743 | ||||||||||||||||||||||
NBTY, Inc.* | — | 1,288 | 1,288 | — | 43,805 | 43,805 | ||||||||||||||||||||||
| — | 84,548 | 84,548 | 0.03 | % | ||||||||||||||||||||||||
Tobacco | ||||||||||||||||||||||||||||
Altria Group, Inc. | — | 19,100 | 19,100 | — | 382,764 | 382,764 | ||||||||||||||||||||||
Lorillard, Inc. | — | 3,341 | 3,341 | — | 240,485 | 240,485 | ||||||||||||||||||||||
Philip Morris International, Inc. | — | 6,400 | 6,400 | — | 293,376 | 293,376 | ||||||||||||||||||||||
Reynolds American, Inc. | — | 3,692 | 3,692 | — | 192,427 | 192,427 | ||||||||||||||||||||||
| — | 1,109,052 | 1,109,052 | 0.38 | % | ||||||||||||||||||||||||
Total Consumer Staples | 9,153,428 | 12,468,916 | 21,622,344 | 7.40 | % | |||||||||||||||||||||||
Energy | ||||||||||||||||||||||||||||
Energy Equipment & Services | ||||||||||||||||||||||||||||
Atwood Oceanics, Inc.* | — | 981 | 981 | — | 25,035 | 25,035 | ||||||||||||||||||||||
Baker Hughes, Inc. | — | 6,830 | 6,830 | — | 283,923 | 283,923 | ||||||||||||||||||||||
Cameron International Corp.* | — | 2,300 | 2,300 | — | 74,796 | 74,796 | ||||||||||||||||||||||
Diamond Offshore Drilling, Inc. | — | 1,000 | 1,000 | — | 62,190 | 62,190 | ||||||||||||||||||||||
Dresser-Rand Group, Inc.* | — | 200 | 200 | — | 6,310 | 6,310 | ||||||||||||||||||||||
See notes to pro-forma financial statements.
EQ ADVISORS TRUST
PORTFOLIO OF INVESTMENTS
June 30, 2010 (Unaudited)
| Number of Shares | Value (Note 1) | |||||||||||||||||||||||||||
| EQ/Lord Abbett Growth and Income | EQ/Large Cap Value Index | Pro Forma | EQ/Lord Abbett Growth and Income | EQ/Large Cap Value Index | Pro Forma | % of Net Assets | ||||||||||||||||||||||
Exterran Holdings, Inc.* | — | 1,218 | 1,218 | — | 31,436 | 31,436 | ||||||||||||||||||||||
Halliburton Co. | 91,430 | — | 91,430 | 2,244,607 | — | 2,244,607 | ||||||||||||||||||||||
Helmerich & Payne, Inc. | — | 2,121 | 2,121 | — | 77,459 | 77,459 | ||||||||||||||||||||||
Nabors Industries Ltd.* | — | 3,743 | 3,743 | — | 65,952 | 65,952 | ||||||||||||||||||||||
National Oilwell Varco, Inc. | — | 9,266 | 9,266 | — | 306,427 | 306,427 | ||||||||||||||||||||||
Oceaneering International, Inc.* | — | 1,200 | 1,200 | — | 53,880 | 53,880 | ||||||||||||||||||||||
Oil States International, Inc.* | — | 1,089 | 1,089 | — | 43,103 | 43,103 | ||||||||||||||||||||||
Patterson-UTI Energy, Inc. | — | 2,809 | 2,809 | — | 36,152 | 36,152 | ||||||||||||||||||||||
Pride International, Inc.* | — | 2,016 | 2,016 | — | 45,037 | 45,037 | ||||||||||||||||||||||
Rowan Cos., Inc.* | — | 2,166 | 2,166 | — | 47,522 | 47,522 | ||||||||||||||||||||||
Schlumberger Ltd. | 70,469 | — | 70,469 | 3,899,754 | — | 3,899,754 | ||||||||||||||||||||||
SEACOR Holdings, Inc.* | — | 538 | 538 | — | 38,015 | 38,015 | ||||||||||||||||||||||
Smith International, Inc. | — | 5,475 | 5,475 | — | 206,134 | 206,134 | ||||||||||||||||||||||
Superior Energy Services, Inc.* | — | 1,566 | 1,566 | — | 29,237 | 29,237 | ||||||||||||||||||||||
Tidewater, Inc. | — | 1,164 | 1,164 | — | 45,070 | 45,070 | ||||||||||||||||||||||
Unit Corp.* | — | 862 | 862 | — | 34,989 | 34,989 | ||||||||||||||||||||||
Weatherford International Ltd.* | — | 9,700 | 9,700 | — | 127,458 | 127,458 | ||||||||||||||||||||||
| 6,144,361 | 1,640,125 | 7,784,486 | 2.67 | % | ||||||||||||||||||||||||
Oil, Gas & Consumable Fuels | ||||||||||||||||||||||||||||
Alpha Natural Resources, Inc.* | — | 2,300 | 2,300 | — | 77,901 | 77,901 | ||||||||||||||||||||||
Anadarko Petroleum Corp. | 28,160 | 10,904 | 39,064 | 1,016,294 | 393,525 | 1,409,819 | ||||||||||||||||||||||
Apache Corp. | 6,940 | 7,438 | 14,378 | 584,279 | 626,205 | 1,210,484 | ||||||||||||||||||||||
Arch Coal, Inc. | — | 1,094 | 1,094 | — | 21,672 | 21,672 | ||||||||||||||||||||||
Atlas Energy, Inc.* | — | 500 | 500 | — | 13,535 | 13,535 | ||||||||||||||||||||||
Cabot Oil & Gas Corp. | — | 2,334 | 2,334 | — | 73,101 | 73,101 | ||||||||||||||||||||||
Chesapeake Energy Corp. | — | 14,353 | 14,353 | — | 300,695 | 300,695 | ||||||||||||||||||||||
Chevron Corp. | 78,010 | 41,857 | 119,867 | 5,293,759 | 2,840,416 | 8,134,175 | ||||||||||||||||||||||
Cobalt International Energy, Inc.* | — | 1,000 | 1,000 | — | 7,450 | 7,450 | ||||||||||||||||||||||
Comstock Resources, Inc.* | — | 952 | 952 | — | 26,389 | 26,389 | ||||||||||||||||||||||
ConocoPhillips | — | 20,242 | 20,242 | — | 993,680 | 993,680 | ||||||||||||||||||||||
Consol Energy, Inc. | — | 2,700 | 2,700 | — | 91,152 | 91,152 | ||||||||||||||||||||||
Continental Resources, Inc.* | — | 67 | 67 | — | 2,990 | 2,990 | ||||||||||||||||||||||
Denbury Resources, Inc.* | — | 9,084 | 9,084 | — | 132,990 | 132,990 | ||||||||||||||||||||||
Devon Energy Corp. | — | 9,794 | 9,794 | — | 596,651 | 596,651 | ||||||||||||||||||||||
El Paso Corp. | 151,360 | 12,672 | 164,032 | 1,681,609 | 140,786 | 1,822,395 | ||||||||||||||||||||||
EOG Resources, Inc. | 10,490 | — | 10,490 | 1,031,901 | — | 1,031,901 | ||||||||||||||||||||||
Exxon Mobil Corp. | 136,871 | 9,167 | 146,038 | 7,811,252 | 523,165 | 8,334,417 | ||||||||||||||||||||||
Forest Oil Corp.* | — | 896 | 896 | — | 24,515 | 24,515 | ||||||||||||||||||||||
Frontier Oil Corp. | — | 2,283 | 2,283 | — | 30,706 | 30,706 | ||||||||||||||||||||||
See notes to pro-forma financial statements.
EQ ADVISORS TRUST
PORTFOLIO OF INVESTMENTS
June 30, 2010 (Unaudited)
| Number of Shares | Value (Note 1) | |||||||||||||||||||||||||||
| EQ/Lord Abbett Growth and Income | EQ/Large Cap Value Index | Pro Forma | EQ/Lord Abbett Growth and Income | EQ/Large Cap Value Index | Pro Forma | % of Net Assets | ||||||||||||||||||||||
Frontline Ltd. | — | 181 | 181 | — | 5,166 | 5,166 | ||||||||||||||||||||||
Hess Corp. | 17,100 | 6,401 | 23,501 | 860,814 | 322,226 | 1,183,040 | ||||||||||||||||||||||
Holly Corp. | — | 300 | 300 | — | 7,974 | 7,974 | ||||||||||||||||||||||
Marathon Oil Corp. | 56,930 | 11,483 | 68,413 | 1,769,954 | 357,006 | 2,126,960 | ||||||||||||||||||||||
Mariner Energy, Inc.* | — | 2,072 | 2,072 | — | 44,507 | 44,507 | ||||||||||||||||||||||
Massey Energy Co. | — | 2,312 | 2,312 | — | 63,233 | 63,233 | ||||||||||||||||||||||
Murphy Oil Corp. | — | 3,698 | 3,698 | — | 183,236 | 183,236 | ||||||||||||||||||||||
Newfield Exploration Co.* | — | 2,958 | 2,958 | — | 144,528 | 144,528 | ||||||||||||||||||||||
Noble Energy, Inc. | — | 3,872 | 3,872 | — | 233,598 | 233,598 | ||||||||||||||||||||||
Occidental Petroleum Corp. | — | 14,279 | 14,279 | — | 1,101,625 | 1,101,625 | ||||||||||||||||||||||
Peabody Energy Corp. | — | 5,900 | 5,900 | — | 230,867 | 230,867 | ||||||||||||||||||||||
Petrohawk Energy Corp.* | — | 1,900 | 1,900 | — | 32,243 | 32,243 | ||||||||||||||||||||||
Petroleo Brasileiro S.A. (ADR) | 22,810 | — | 22,810 | 782,839 | — | 782,839 | ||||||||||||||||||||||
Pioneer Natural Resources Co. | — | 2,601 | 2,601 | — | 154,629 | 154,629 | ||||||||||||||||||||||
Plains Exploration & Production Co.* | — | 3,061 | 3,061 | — | 63,087 | 63,087 | ||||||||||||||||||||||
Quicksilver Resources, Inc.* | — | 2,400 | 2,400 | — | 26,400 | 26,400 | ||||||||||||||||||||||
SandRidge Energy, Inc.* | — | 3,476 | 3,476 | — | 20,265 | 20,265 | ||||||||||||||||||||||
SM Energy Co. | — | 474 | 474 | — | 19,036 | 19,036 | ||||||||||||||||||||||
Southern Union Co. | — | 2,477 | 2,477 | — | 54,147 | 54,147 | ||||||||||||||||||||||
Spectra Energy Corp. | — | 14,259 | 14,259 | — | 286,178 | 286,178 | ||||||||||||||||||||||
Suncor Energy, Inc. | 32,850 | — | 32,850 | 967,104 | — | 967,104 | ||||||||||||||||||||||
Sunoco, Inc. | — | 2,741 | 2,741 | — | 95,305 | 95,305 | ||||||||||||||||||||||
Teekay Corp. | — | 924 | 924 | — | 24,181 | 24,181 | ||||||||||||||||||||||
Tesoro Corp. | — | 3,109 | 3,109 | — | 36,282 | 36,282 | ||||||||||||||||||||||
Valero Energy Corp. | 63,850 | 12,488 | 76,338 | 1,148,023 | 224,534 | 1,372,557 | ||||||||||||||||||||||
Whiting Petroleum Corp.* | — | 1,026 | 1,026 | — | 80,459 | 80,459 | ||||||||||||||||||||||
Williams Cos., Inc. | — | 7,604 | 7,604 | — | 139,001 | 139,001 | ||||||||||||||||||||||
| 22,947,828 | 10,867,237 | 33,815,065 | 11.58 | % | ||||||||||||||||||||||||
Total Energy | 29,092,189 | 12,507,362 | 41,599,551 | 14.24 | % | |||||||||||||||||||||||
Financials | ||||||||||||||||||||||||||||
Capital Markets | ||||||||||||||||||||||||||||
Ameriprise Financial, Inc. | — | 4,499 | 4,499 | — | 162,549 | 162,549 | ||||||||||||||||||||||
Ares Capital Corp. | — | 4,200 | 4,200 | — | 52,626 | 52,626 | ||||||||||||||||||||||
Bank of New York Mellon Corp. | 154,037 | 26,668 | 180,705 | 3,803,174 | 658,433 | 4,461,607 | ||||||||||||||||||||||
BlackRock, Inc. | — | 532 | 532 | — | 76,289 | 76,289 | ||||||||||||||||||||||
Charles Schwab Corp. | 137,500 | — | 137,500 | 1,949,750 | — | 1,949,750 | ||||||||||||||||||||||
E*TRADE Financial Corp.* | — | 4,800 | 4,800 | — | 56,736 | 56,736 | ||||||||||||||||||||||
Federated Investors, Inc., Class B | — | 597 | 597 | — | 12,364 | 12,364 | ||||||||||||||||||||||
See notes to pro-forma financial statements.
EQ ADVISORS TRUST
PORTFOLIO OF INVESTMENTS
June 30, 2010 (Unaudited)
| Number of Shares | Value (Note 1) | |||||||||||||||||||||||||||
| EQ/Lord Abbett Growth and Income | EQ/Large Cap Value Index | Pro Forma | EQ/Lord Abbett Growth and Income | EQ/Large Cap Value Index | Pro Forma | % of Net Assets | ||||||||||||||||||||||
Franklin Resources, Inc. | 11,670 | — | 11,670 | 1,005,837 | — | 1,005,837 | ||||||||||||||||||||||
GLG Partners, Inc.* | — | 300 | 300 | — | 1,314 | 1,314 | ||||||||||||||||||||||
Goldman Sachs Group, Inc. | 18,740 | 11,356 | 30,096 | 2,460,000 | 1,490,702 | 3,950,702 | ||||||||||||||||||||||
Invesco Ltd. | — | 6,679 | 6,679 | — | 112,408 | 112,408 | ||||||||||||||||||||||
Janus Capital Group, Inc. | — | 3,715 | 3,715 | — | 32,989 | 32,989 | ||||||||||||||||||||||
Jefferies Group, Inc. | — | 2,565 | 2,565 | — | 54,070 | 54,070 | ||||||||||||||||||||||
Legg Mason, Inc. | — | 3,676 | 3,676 | — | 103,038 | 103,038 | ||||||||||||||||||||||
Morgan Stanley | 87,950 | 20,977 | 108,927 | 2,041,319 | 486,876 | 2,528,195 | ||||||||||||||||||||||
Northern Trust Corp. | — | 3,200 | 3,200 | — | 149,440 | 149,440 | ||||||||||||||||||||||
Raymond James Financial, Inc. | — | 2,335 | 2,335 | — | 57,651 | 57,651 | ||||||||||||||||||||||
State Street Corp. | 43,660 | 11,100 | 54,760 | 1,476,581 | 375,402 | 1,851,983 | ||||||||||||||||||||||
| 12,736,661 | 3,882,887 | 16,619,548 | 5.69 | % | ||||||||||||||||||||||||
Commercial Banks | ||||||||||||||||||||||||||||
Associated Banc-Corp | — | 3,921 | 3,921 | — | 48,071 | 48,071 | ||||||||||||||||||||||
BancorpSouth, Inc. | — | 1,837 | 1,837 | — | 32,846 | 32,846 | ||||||||||||||||||||||
Bank of Hawaii Corp. | — | 762 | 762 | — | 36,843 | 36,843 | ||||||||||||||||||||||
BB&T Corp. | 35,300 | 15,278 | 50,578 | 928,743 | 401,964 | 1,330,707 | ||||||||||||||||||||||
BOK Financial Corp. | — | 553 | 553 | — | 26,251 | 26,251 | ||||||||||||||||||||||
CapitalSource, Inc. | — | 7,107 | 7,107 | — | 33,829 | 33,829 | ||||||||||||||||||||||
CIT Group, Inc.* | — | 4,400 | 4,400 | — | 148,984 | 148,984 | ||||||||||||||||||||||
City National Corp./California | — | 985 | 985 | — | 50,462 | 50,462 | ||||||||||||||||||||||
Comerica, Inc. | — | 3,845 | 3,845 | — | 141,611 | 141,611 | ||||||||||||||||||||||
Commerce Bancshares, Inc./Missouri | — | 1,557 | 1,557 | — | 56,036 | 56,036 | ||||||||||||||||||||||
Cullen/Frost Bankers, Inc. | — | 1,167 | 1,167 | — | 59,984 | 59,984 | ||||||||||||||||||||||
East West Bancorp, Inc. | — | 3,300 | 3,300 | — | 50,325 | 50,325 | ||||||||||||||||||||||
Fifth Third Bancorp | — | 17,485 | 17,485 | — | 214,891 | 214,891 | ||||||||||||||||||||||
First Citizens BancShares, Inc./North Carolina, Class A | — | 144 | 144 | — | 27,696 | 27,696 | ||||||||||||||||||||||
First Horizon National Corp.* | — | 4,698 | 4,698 | — | 53,790 | 53,790 | ||||||||||||||||||||||
Fulton Financial Corp. | — | 4,512 | 4,512 | — | 43,541 | 43,541 | ||||||||||||||||||||||
Huntington Bancshares, Inc./Ohio | — | 15,793 | 15,793 | — | 87,493 | 87,493 | ||||||||||||||||||||||
KeyCorp | 198,700 | 19,407 | 218,107 | 1,528,003 | 149,240 | 1,677,243 | ||||||||||||||||||||||
M&T Bank Corp. | 16,840 | 1,655 | 18,495 | 1,430,558 | 140,592 | 1,571,150 | ||||||||||||||||||||||
Marshall & Ilsley Corp. | — | 12,246 | 12,246 | — | 87,926 | 87,926 | ||||||||||||||||||||||
PNC Financial Services Group, Inc. | 47,320 | 11,618 | 58,938 | 2,673,580 | 656,417 | 3,329,997 | ||||||||||||||||||||||
Popular, Inc.* | — | 13,779 | 13,779 | — | 36,928 | 36,928 | ||||||||||||||||||||||
Regions Financial Corp. | 135,020 | 26,885 | 161,905 | 888,432 | 176,903 | 1,065,335 | ||||||||||||||||||||||
SunTrust Banks, Inc. | 150,060 | 11,012 | 161,072 | 3,496,398 | 256,580 | 3,752,978 | ||||||||||||||||||||||
Synovus Financial Corp. | — | 17,239 | 17,239 | — | 43,787 | �� | 43,787 | |||||||||||||||||||||
TCF Financial Corp. | — | 3,108 | 3,108 | — | 51,624 | 51,624 | ||||||||||||||||||||||
See notes to pro-forma financial statements.
EQ ADVISORS TRUST
PORTFOLIO OF INVESTMENTS
June 30, 2010 (Unaudited)
| Number of Shares | Value (Note 1) | |||||||||||||||||||||||||||
| EQ/Lord Abbett Growth and Income | EQ/Large Cap Value Index | Pro Forma | EQ/Lord Abbett Growth and Income | EQ/Large Cap Value Index | Pro Forma | % of Net Assets | ||||||||||||||||||||||
U.S. Bancorp | — | 42,170 | 42,170 | — | 942,500 | 942,500 | ||||||||||||||||||||||
Valley National Bancorp | — | 3,802 | 3,802 | — | 51,783 | 51,783 | ||||||||||||||||||||||
Wells Fargo & Co. | 277,120 | 107,224 | 384,344 | 7,094,272 | 2,744,934 | 9,839,206 | ||||||||||||||||||||||
Wilmington Trust Corp. | — | 2,048 | 2,048 | — | 22,712 | 22,712 | ||||||||||||||||||||||
Zions Bancorp | 99,160 | 3,645 | 102,805 | 2,138,881 | 78,623 | 2,217,504 | ||||||||||||||||||||||
| 20,178,867 | 6,955,166 | 27,134,033 | 9.29 | % | ||||||||||||||||||||||||
Consumer Finance | ||||||||||||||||||||||||||||
AmeriCredit Corp.* | — | 1,313 | 1,313 | — | 23,923 | 23,923 | ||||||||||||||||||||||
Capital One Financial Corp. | — | 10,011 | 10,011 | — | 403,443 | 403,443 | ||||||||||||||||||||||
Discover Financial Services | — | 12,205 | 12,205 | — | 170,626 | 170,626 | ||||||||||||||||||||||
SLM Corp.* | — | 10,695 | 10,695 | — | 111,121 | 111,121 | ||||||||||||||||||||||
| — | 709,113 | 709,113 | 0.24 | % | ||||||||||||||||||||||||
Diversified Financial Services | ||||||||||||||||||||||||||||
Bank of America Corp. | 255,626 | 220,922 | 476,548 | 3,673,346 | 3,174,649 | 6,847,995 | ||||||||||||||||||||||
CBOE Holdings, Inc.* | 4,820 | — | 4,820 | 156,891 | — | 156,891 | ||||||||||||||||||||||
Citigroup, Inc.* | 737,970 | 465,911 | 1,203,881 | 2,774,767 | 1,751,825 | 4,526,592 | ||||||||||||||||||||||
CME Group, Inc. | — | 1,478 | 1,478 | — | 416,131 | 416,131 | ||||||||||||||||||||||
Interactive Brokers Group, Inc., Class A* | — | 862 | 862 | — | 14,309 | 14,309 | ||||||||||||||||||||||
JPMorgan Chase & Co. | 162,049 | 87,590 | 249,639 | 5,932,614 | 3,206,670 | 9,139,284 | ||||||||||||||||||||||
Leucadia National Corp.* | — | 4,342 | 4,342 | — | 84,713 | 84,713 | ||||||||||||||||||||||
NASDAQ OMX Group, Inc.* | — | 2,726 | 2,726 | — | 48,468 | 48,468 | ||||||||||||||||||||||
NYSE Euronext | — | 4,413 | 4,413 | — | 121,931 | 121,931 | ||||||||||||||||||||||
| 12,537,618 | 8,818,696 | 21,356,314 | 7.31 | % | ||||||||||||||||||||||||
Insurance | ||||||||||||||||||||||||||||
ACE Ltd. | — | 6,300 | 6,300 | — | 324,324 | 324,324 | ||||||||||||||||||||||
Aflac, Inc. | — | 600 | 600 | — | 25,602 | 25,602 | ||||||||||||||||||||||
Alleghany Corp.* | — | 154 | 154 | — | 45,168 | 45,168 | ||||||||||||||||||||||
Allied World Assurance Co. Holdings Ltd./Bermuda | — | 1,119 | 1,119 | — | 50,780 | 50,780 | ||||||||||||||||||||||
Allstate Corp. | — | 11,876 | 11,876 | — | 341,198 | 341,198 | ||||||||||||||||||||||
American Financial Group, Inc./Ohio | — | 1,897 | 1,897 | — | 51,826 | 51,826 | ||||||||||||||||||||||
American International Group, Inc.* | — | 2,614 | 2,614 | — | 90,026 | 90,026 | ||||||||||||||||||||||
American National Insurance Co. | — | 112 | 112 | — | 9,069 | 9,069 | ||||||||||||||||||||||
Aon Corp. | — | 5,982 | 5,982 | — | 222,052 | 222,052 | ||||||||||||||||||||||
Arch Capital Group Ltd.* | — | 1,077 | 1,077 | — | 80,237 | 80,237 | ||||||||||||||||||||||
Arthur J. Gallagher & Co. | — | 1,755 | 1,755 | — | 42,787 | 42,787 | ||||||||||||||||||||||
Aspen Insurance Holdings Ltd. | — | 1,824 | 1,824 | — | 45,126 | 45,126 | ||||||||||||||||||||||
Assurant, Inc. | — | 2,602 | 2,602 | — | 90,289 | 90,289 | ||||||||||||||||||||||
See notes to pro-forma financial statements.
EQ ADVISORS TRUST
PORTFOLIO OF INVESTMENTS
June 30, 2010 (Unaudited)
| Number of Shares | Value (Note 1) | |||||||||||||||||||||||||||
| EQ/Lord Abbett Growth and Income | EQ/Large Cap Value Index | Pro Forma | EQ/Lord Abbett Growth and Income | EQ/Large Cap Value Index | Pro Forma | % of Net Assets | ||||||||||||||||||||||
Assured Guaranty Ltd. | — | 4,100 | 4,100 | — | 54,407 | 54,407 | ||||||||||||||||||||||
Axis Capital Holdings Ltd. | — | 2,103 | 2,103 | — | 62,501 | 62,501 | ||||||||||||||||||||||
Berkshire Hathaway, Inc., Class B* | — | 38,100 | 38,100 | — | 3,036,189 | 3,036,189 | ||||||||||||||||||||||
Brown & Brown, Inc. | — | 1,182 | 1,182 | — | 22,623 | 22,623 | ||||||||||||||||||||||
Chubb Corp. | — | 7,215 | 7,215 | — | 360,822 | 360,822 | ||||||||||||||||||||||
Cincinnati Financial Corp. | — | 3,190 | 3,190 | — | 82,525 | 82,525 | ||||||||||||||||||||||
CNA Financial Corp.* | — | 297 | 297 | — | 7,591 | 7,591 | ||||||||||||||||||||||
Endurance Specialty Holdings Ltd. | — | 875 | 875 | — | 32,839 | 32,839 | ||||||||||||||||||||||
Erie Indemnity Co., Class A | — | 226 | 226 | — | 10,283 | 10,283 | ||||||||||||||||||||||
Everest Reinsurance Group Ltd. | — | 1,272 | 1,272 | — | 89,956 | 89,956 | ||||||||||||||||||||||
Fidelity National Financial, Inc., Class A | — | 4,485 | 4,485 | — | 58,260 | 58,260 | ||||||||||||||||||||||
Genworth Financial, Inc., Class A* | — | 8,764 | 8,764 | — | 114,546 | 114,546 | ||||||||||||||||||||||
Hanover Insurance Group, Inc. | — | 1,074 | 1,074 | — | 46,719 | 46,719 | ||||||||||||||||||||||
Hartford Financial Services Group, Inc. | — | 8,988 | 8,988 | — | 198,904 | 198,904 | ||||||||||||||||||||||
HCC Insurance Holdings, Inc. | — | 2,478 | 2,478 | — | 61,355 | 61,355 | ||||||||||||||||||||||
Lincoln National Corp. | — | 6,616 | 6,616 | — | 160,703 | 160,703 | ||||||||||||||||||||||
Loews Corp. | — | 6,965 | 6,965 | — | 232,004 | 232,004 | ||||||||||||||||||||||
Markel Corp.* | — | 224 | 224 | — | 76,160 | 76,160 | ||||||||||||||||||||||
Marsh & McLennan Cos., Inc. | — | 928 | 928 | — | 20,926 | 20,926 | ||||||||||||||||||||||
MBIA, Inc.* | — | 2,842 | 2,842 | — | 15,944 | 15,944 | ||||||||||||||||||||||
Mercury General Corp. | — | 584 | 584 | — | 24,201 | 24,201 | ||||||||||||||||||||||
MetLife, Inc. | 24,528 | 8,884 | 33,412 | 926,177 | 335,460 | 1,261,637 | ||||||||||||||||||||||
Old Republic International Corp. | — | 5,437 | 5,437 | — | 65,951 | 65,951 | ||||||||||||||||||||||
OneBeacon Insurance Group Ltd., Class A | — | 519 | 519 | — | 7,432 | 7,432 | ||||||||||||||||||||||
PartnerReinsurance Ltd. | — | 1,702 | 1,702 | — | 119,378 | 119,378 | ||||||||||||||||||||||
Principal Financial Group, Inc. | — | 7,000 | 7,000 | — | 164,080 | 164,080 | ||||||||||||||||||||||
Progressive Corp. | — | 14,807 | 14,807 | — | 277,187 | 277,187 | ||||||||||||||||||||||
Protective Life Corp. | — | 1,878 | 1,878 | — | 40,170 | 40,170 | ||||||||||||||||||||||
Prudential Financial, Inc. | — | 10,241 | 10,241 | — | 549,532 | 549,532 | ||||||||||||||||||||||
Reinsurance Group of America, Inc. | — | 1,485 | 1,485 | — | 67,879 | 67,879 | ||||||||||||||||||||||
RenaissanceReinsurance Holdings Ltd. | — | 1,350 | 1,350 | — | 75,965 | 75,965 | ||||||||||||||||||||||
StanCorp Financial Group, Inc. | — | 1,096 | 1,096 | — | 44,432 | 44,432 | ||||||||||||||||||||||
Symetra Financial Corp. | — | 500 | 500 | — | 6,000 | 6,000 | ||||||||||||||||||||||
Torchmark Corp. | — | 1,839 | 1,839 | — | 91,049 | 91,049 | ||||||||||||||||||||||
Transatlantic Holdings, Inc. | — | 1,407 | 1,407 | — | 67,480 | 67,480 | ||||||||||||||||||||||
Travelers Cos., Inc. | — | 9,624 | 9,624 | — | 473,982 | 473,982 | ||||||||||||||||||||||
Unitrin, Inc. | — | 919 | 919 | — | 23,526 | 23,526 | ||||||||||||||||||||||
Unum Group | — | 7,325 | 7,325 | — | 158,953 | 158,953 | ||||||||||||||||||||||
Validus Holdings Ltd. | — | 1,763 | 1,763 | — | 43,052 | 43,052 | ||||||||||||||||||||||
W.R. Berkley Corp. | — | 2,797 | 2,797 | — | 74,009 | 74,009 | ||||||||||||||||||||||
See notes to pro-forma financial statements.
EQ ADVISORS TRUST
PORTFOLIO OF INVESTMENTS
June 30, 2010 (Unaudited)
| Number of Shares | Value (Note 1) | |||||||||||||||||||||||||||
| EQ/Lord Abbett Growth and Income | EQ/Large Cap Value Index | Pro Forma | EQ/Lord Abbett Growth and Income | EQ/Large Cap Value Index | Pro Forma | % of Net Assets | ||||||||||||||||||||||
Wesco Financial Corp. | — | 68 | 68 | — | 21,978 | 21,978 | ||||||||||||||||||||||
White Mountains Insurance Group Ltd. | — | 161 | 161 | — | 52,196 | 52,196 | ||||||||||||||||||||||
XL Capital Ltd., Class A | — | 7,564 | 7,564 | — | 121,100 | 121,100 | ||||||||||||||||||||||
| 926,177 | 9,068,733 | 9,994,910 | 3.42 | % | ||||||||||||||||||||||||
Real Estate Investment Trusts (REIT’s) |
| |||||||||||||||||||||||||||
Alexandria Real Estate Equities, Inc. (REIT) | — | 986 | 986 | — | 62,483 | 62,483 | ||||||||||||||||||||||
AMB Property Corp. (REIT) | — | 3,311 | 3,311 | — | 78,504 | 78,504 | ||||||||||||||||||||||
Annaly Capital Management, Inc. (REIT) | 24,500 | 12,545 | 37,045 | 420,175 | 215,147 | 635,322 | ||||||||||||||||||||||
Apartment Investment & Management Co. (REIT), Class A | — | 1,332 | 1,332 | — | 25,801 | 25,801 | ||||||||||||||||||||||
AvalonBay Communities, Inc. (REIT) | — | 1,844 | 1,844 | — | 172,174 | 172,174 | ||||||||||||||||||||||
Boston Properties, Inc. (REIT) | — | 3,021 | 3,021 | — | 215,518 | 215,518 | ||||||||||||||||||||||
Brandywine Realty Trust (REIT) | — | 2,793 | 2,793 | — | 30,025 | 30,025 | ||||||||||||||||||||||
BRE Properties, Inc. (REIT) | — | 1,454 | 1,454 | — | 53,696 | 53,696 | ||||||||||||||||||||||
Camden Property Trust (REIT) | — | 1,500 | 1,500 | — | 61,275 | 61,275 | ||||||||||||||||||||||
Chimera Investment Corp. (REIT) | — | 17,348 | 17,348 | — | 62,626 | 62,626 | ||||||||||||||||||||||
Corporate Office Properties Trust/Maryland (REIT) | — | 1,252 | 1,252 | — | 47,275 | 47,275 | ||||||||||||||||||||||
Developers Diversified Realty Corp. (REIT) | — | 4,400 | 4,400 | — | 43,560 | 43,560 | ||||||||||||||||||||||
Digital Realty Trust, Inc. (REIT) | — | 100 | 100 | — | 5,768 | 5,768 | ||||||||||||||||||||||
Douglas Emmett, Inc. (REIT) | — | 2,633 | 2,633 | — | 37,441 | 37,441 | ||||||||||||||||||||||
Duke Realty Corp. (REIT) | — | 5,263 | 5,263 | — | 59,735 | 59,735 | ||||||||||||||||||||||
Equity Residential (REIT) | — | 5,845 | 5,845 | — | 243,386 | 243,386 | ||||||||||||||||||||||
Essex Property Trust, Inc. (REIT) | — | 429 | 429 | — | 41,845 | 41,845 | ||||||||||||||||||||||
Federal Realty Investment Trust (REIT) | — | 510 | 510 | — | 35,838 | 35,838 | ||||||||||||||||||||||
General Growth Properties, Inc. (REIT) | — | 1,000 | 1,000 | — | 13,260 | 13,260 | ||||||||||||||||||||||
HCP, Inc. (REIT) | — | 6,445 | 6,445 | — | 207,851 | 207,851 | ||||||||||||||||||||||
Health Care REIT, Inc. (REIT) | — | 2,748 | 2,748 | — | 115,746 | 115,746 | ||||||||||||||||||||||
Hospitality Properties Trust (REIT) | — | 2,910 | 2,910 | — | 61,401 | 61,401 | ||||||||||||||||||||||
Host Hotels & Resorts, Inc. (REIT) | — | 14,469 | 14,469 | — | 195,042 | 195,042 | ||||||||||||||||||||||
HRPT Properties Trust (REIT)* | — | 5,891 | 5,891 | — | 36,583 | 36,583 | ||||||||||||||||||||||
Kimco Realty Corp. (REIT) | — | 8,922 | 8,922 | — | 119,912 | 119,912 | ||||||||||||||||||||||
Liberty Property Trust (REIT) | — | 2,643 | 2,643 | — | 76,251 | 76,251 | ||||||||||||||||||||||
Macerich Co. (REIT) | — | 2,939 | 2,939 | — | 109,683 | 109,683 | ||||||||||||||||||||||
Mack-Cali Realty Corp. (REIT) | — | 1,895 | 1,895 | — | 56,338 | 56,338 | ||||||||||||||||||||||
Nationwide Health Properties, Inc. (REIT) | — | 2,634 | 2,634 | — | 94,218 | 94,218 | ||||||||||||||||||||||
Piedmont Office Realty Trust, Inc. (REIT), Class A | — | 900 | 900 | — | 16,857 | 16,857 | ||||||||||||||||||||||
Plum Creek Timber Co., Inc. (REIT) | — | 2,075 | 2,075 | — | 71,650 | 71,650 | ||||||||||||||||||||||
ProLogis (REIT) | — | 9,807 | 9,807 | — | 99,345 | 99,345 | ||||||||||||||||||||||
Public Storage (REIT) | — | 300 | 300 | — | 26,373 | 26,373 | ||||||||||||||||||||||
Rayonier, Inc. (REIT) | — | 1,270 | 1,270 | — | 55,905 | 55,905 | ||||||||||||||||||||||
See notes to pro-forma financial statements.
EQ ADVISORS TRUST
PORTFOLIO OF INVESTMENTS
June 30, 2010 (Unaudited)
| Number of Shares | Value (Note 1) | |||||||||||||||||||||||||||
| EQ/Lord Abbett Growth and Income | EQ/Large Cap Value Index | Pro Forma | EQ/Lord Abbett Growth and Income | EQ/Large Cap Value Index | Pro Forma | % of Net Assets | ||||||||||||||||||||||
Realty Income Corp. (REIT) | — | 2,403 | 2,403 | — | 72,883 | 72,883 | ||||||||||||||||||||||
Regency Centers Corp. (REIT) | — | 1,892 | 1,892 | — | 65,085 | 65,085 | ||||||||||||||||||||||
Senior Housing Properties Trust (REIT) | — | 2,999 | 2,999 | — | 60,310 | 60,310 | ||||||||||||||||||||||
Simon Property Group, Inc. (REIT) | — | 2,034 | 2,034 | — | 164,245 | 164,245 | ||||||||||||||||||||||
SL Green Realty Corp. (REIT) | — | 1,791 | 1,791 | — | 98,577 | 98,577 | ||||||||||||||||||||||
Taubman Centers, Inc. (REIT) | — | 1,149 | 1,149 | — | 43,237 | 43,237 | ||||||||||||||||||||||
UDR, Inc. (REIT) | — | 3,327 | 3,327 | — | 63,645 | 63,645 | ||||||||||||||||||||||
Ventas, Inc. (REIT) | — | 2,520 | 2,520 | — | 118,314 | 118,314 | ||||||||||||||||||||||
Vornado Realty Trust (REIT) | — | 3,269 | 3,269 | — | 238,474 | 238,474 | ||||||||||||||||||||||
Weingarten Realty Investors (REIT) | — | 2,535 | 2,535 | — | 48,292 | 48,292 | ||||||||||||||||||||||
| 420,175 | 3,821,574 | 4,241,749 | 1.45 | % | ||||||||||||||||||||||||
Real Estate Management & Development |
| |||||||||||||||||||||||||||
Forest City Enterprises, Inc., Class A* | — | 2,377 | 2,377 | — | 26,908 | 26,908 | ||||||||||||||||||||||
St. Joe Co.* | — | 200 | 200 | — | 4,632 | 4,632 | ||||||||||||||||||||||
| — | 31,540 | 31,540 | 0.01 | % | ||||||||||||||||||||||||
Thrifts & Mortgage Finance |
| |||||||||||||||||||||||||||
Capitol Federal Financial | — | 400 | 400 | — | 13,264 | 13,264 | ||||||||||||||||||||||
First Niagara Financial Group, Inc. | — | 4,994 | 4,994 | — | 62,575 | 62,575 | ||||||||||||||||||||||
Hudson City Bancorp, Inc. | — | 9,481 | 9,481 | — | 116,047 | 116,047 | ||||||||||||||||||||||
New York Community Bancorp, Inc. | — | 9,880 | 9,880 | — | 150,868 | 150,868 | ||||||||||||||||||||||
People’s United Financial, Inc. | — | 8,344 | 8,344 | — | 112,644 | 112,644 | ||||||||||||||||||||||
TFS Financial Corp. | — | 1,601 | 1,601 | — | 19,868 | 19,868 | ||||||||||||||||||||||
Washington Federal, Inc. | — | 2,439 | 2,439 | — | 39,463 | 39,463 | ||||||||||||||||||||||
| — | 514,729 | 514,729 | 0.18 | % | ||||||||||||||||||||||||
Total Financials | 46,799,498 | 33,802,438 | 80,601,936 | 27.59 | % | |||||||||||||||||||||||
Health Care | ||||||||||||||||||||||||||||
Biotechnology | ||||||||||||||||||||||||||||
Abraxis Bioscience, Inc.* | — | 100 | 100 | — | 7,420 | 7,420 | ||||||||||||||||||||||
Amgen, Inc.* | 45,720 | 21,100 | 66,820 | 2,404,872 | 1,109,860 | 3,514,732 | ||||||||||||||||||||||
Biogen Idec, Inc.* | — | 5,900 | 5,900 | — | 279,955 | 279,955 | ||||||||||||||||||||||
Cephalon, Inc.* | — | 1,700 | 1,700 | — | 96,475 | 96,475 | ||||||||||||||||||||||
Genzyme Corp.* | — | 1,400 | 1,400 | — | 71,078 | 71,078 | ||||||||||||||||||||||
Gilead Sciences, Inc.* | 18,420 | — | 18,420 | 631,438 | — | 631,438 | ||||||||||||||||||||||
| 3,036,310 | 1,564,788 | 4,601,098 | 1.58 | % | ||||||||||||||||||||||||
See notes to pro-forma financial statements.
EQ ADVISORS TRUST
PORTFOLIO OF INVESTMENTS
June 30, 2010 (Unaudited)
| Number of Shares | Value (Note 1) | |||||||||||||||||||||||||||
| EQ/Lord Abbett Growth and Income | EQ/Large Cap Value Index | Pro Forma | EQ/Lord Abbett Growth and Income | EQ/Large Cap Value Index | Pro Forma | % of Net Assets | ||||||||||||||||||||||
Health Care Equipment & Supplies | ||||||||||||||||||||||||||||
Baxter International, Inc. | — | 2,200 | 2,200 | — | 89,408 | 89,408 | ||||||||||||||||||||||
Beckman Coulter, Inc. | — | 1,500 | 1,500 | — | 90,435 | 90,435 | ||||||||||||||||||||||
Boston Scientific Corp.* | — | 33,388 | 33,388 | — | 193,650 | 193,650 | ||||||||||||||||||||||
CareFusion Corp.* | — | 3,109 | 3,109 | — | 70,574 | 70,574 | ||||||||||||||||||||||
Cooper Cos., Inc. | — | 842 | 842 | — | 33,503 | 33,503 | ||||||||||||||||||||||
Covidien plc | 42,780 | — | 42,780 | 1,718,900 | — | 1,718,900 | ||||||||||||||||||||||
Hill-Rom Holdings, Inc. | — | 200 | 200 | — | 6,086 | 6,086 | ||||||||||||||||||||||
Hologic, Inc.* | — | 5,392 | 5,392 | — | 75,111 | 75,111 | ||||||||||||||||||||||
Inverness Medical Innovations, Inc.* | — | 1,337 | 1,337 | — | 35,644 | 35,644 | ||||||||||||||||||||||
Kinetic Concepts, Inc.* | — | 1,217 | 1,217 | — | 44,433 | 44,433 | ||||||||||||||||||||||
Medtronic, Inc. | — | 5,600 | 5,600 | — | 203,112 | 203,112 | ||||||||||||||||||||||
Teleflex, Inc. | — | 702 | 702 | — | 38,105 | 38,105 | ||||||||||||||||||||||
Zimmer Holdings, Inc.* | — | 4,500 | 4,500 | — | 243,225 | 243,225 | ||||||||||||||||||||||
| 1,718,900 | 1,123,286 | 2,842,186 | 0.97 | % | ||||||||||||||||||||||||
Health Care Providers & Services | ||||||||||||||||||||||||||||
Aetna, Inc. | — | 9,322 | 9,322 | — | 245,914 | 245,914 | ||||||||||||||||||||||
Brookdale Senior Living, Inc.* | — | 1,611 | 1,611 | — | 24,165 | 24,165 | ||||||||||||||||||||||
Cardinal Health, Inc. | — | 5,218 | 5,218 | — | 175,377 | 175,377 | ||||||||||||||||||||||
CIGNA Corp. | 5,200 | 5,886 | 11,086 | 161,512 | 182,819 | 344,331 | ||||||||||||||||||||||
Community Health Systems, Inc.* | — | 626 | 626 | — | 21,165 | 21,165 | ||||||||||||||||||||||
Coventry Health Care, Inc.* | — | 3,287 | 3,287 | — | 58,114 | 58,114 | ||||||||||||||||||||||
Emdeon, Inc., Class A* | — | 200 | 200 | — | 2,506 | 2,506 | ||||||||||||||||||||||
Health Net, Inc.* | — | 2,296 | 2,296 | — | 55,954 | 55,954 | ||||||||||||||||||||||
Humana, Inc.* | — | 3,714 | 3,714 | — | 169,618 | 169,618 | ||||||||||||||||||||||
LifePoint Hospitals, Inc.* | — | 1,322 | 1,322 | — | 41,511 | 41,511 | ||||||||||||||||||||||
Lincare Holdings, Inc.* | — | 1 | 1 | — | 16 | 16 | ||||||||||||||||||||||
McKesson Corp. | — | 3,356 | 3,356 | — | 225,389 | 225,389 | ||||||||||||||||||||||
MEDNAX, Inc.* | — | 89 | 89 | — | 4,949 | 4,949 | ||||||||||||||||||||||
Omnicare, Inc. | — | 2,385 | 2,385 | — | 56,525 | 56,525 | ||||||||||||||||||||||
Quest Diagnostics, Inc. | — | 400 | 400 | — | 19,908 | 19,908 | ||||||||||||||||||||||
Tenet Healthcare Corp.* | — | 3,324 | 3,324 | — | 14,426 | 14,426 | ||||||||||||||||||||||
UnitedHealth Group, Inc. | 92,520 | 25,077 | 117,597 | 2,627,568 | 712,187 | 3,339,755 | ||||||||||||||||||||||
Universal Health Services, Inc., Class B | — | 1,798 | 1,798 | — | 68,594 | 68,594 | ||||||||||||||||||||||
WellPoint, Inc.* | — | 9,286 | 9,286 | — | 454,364 | 454,364 | ||||||||||||||||||||||
| 2,789,080 | 2,533,501 | 5,322,581 | 1.82 | % | ||||||||||||||||||||||||
Life Sciences Tools & Services | ||||||||||||||||||||||||||||
Bio-Rad Laboratories, Inc., | — | 400 | 400 | — | 34,596 | 34,596 | ||||||||||||||||||||||
Charles River Laboratories International, Inc.* | — | 1,157 | 1,157 | — | 39,581 | 39,581 | ||||||||||||||||||||||
See notes to pro-forma financial statements.
EQ ADVISORS TRUST
PORTFOLIO OF INVESTMENTS
June 30, 2010 (Unaudited)
| Number of Shares | Value (Note 1) | |||||||||||||||||||||||||||
| EQ/Lord Abbett Growth and Income | EQ/Large Cap Value Index | Pro Forma | EQ/Lord Abbett Growth and Income | EQ/Large Cap Value Index | Pro Forma | % of Net Assets | ||||||||||||||||||||||
Life Technologies Corp.* | — | 1,165 | 1,165 | — | 55,046 | 55,046 | ||||||||||||||||||||||
PerkinElmer, Inc. | — | 1,392 | 1,392 | — | 28,773 | 28,773 | ||||||||||||||||||||||
Thermo Fisher Scientific, Inc.* | — | 9,032 | 9,032 | — | 443,019 | 443,019 | ||||||||||||||||||||||
| — | 601,015 | 601,015 | 0.21 | % | ||||||||||||||||||||||||
Pharmaceuticals | ||||||||||||||||||||||||||||
Abbott Laboratories, Inc. | 44,817 | 3,300 | 48,117 | 2,096,539 | 154,374 | 2,250,913 | ||||||||||||||||||||||
Bristol-Myers Squibb Co. | — | 37,924 | 37,924 | — | 945,825 | 945,825 | ||||||||||||||||||||||
Eli Lilly and Co. | — | 17,244 | 17,244 | — | 577,674 | 577,674 | ||||||||||||||||||||||
Endo Pharmaceuticals Holdings, Inc.* | — | 2,673 | 2,673 | — | 58,325 | 58,325 | ||||||||||||||||||||||
Forest Laboratories, Inc.* | — | 6,798 | 6,798 | — | 186,469 | 186,469 | ||||||||||||||||||||||
Johnson & Johnson | 33,080 | 51,616 | 84,696 | 1,953,705 | 3,048,441 | 5,002,146 | ||||||||||||||||||||||
King Pharmaceuticals, Inc.* | — | 5,825 | 5,825 | — | 44,212 | 44,212 | ||||||||||||||||||||||
Merck & Co., Inc. | 32,980 | 68,707 | 101,687 | 1,153,311 | 2,402,684 | 3,555,995 | ||||||||||||||||||||||
Mylan, Inc.* | — | 1,075 | 1,075 | — | 18,318 | 18,318 | ||||||||||||||||||||||
Pfizer, Inc. | 46,880 | 177,613 | 224,493 | 668,509 | 2,532,761 | 3,201,270 | ||||||||||||||||||||||
Teva Pharmaceutical Industries Ltd. (ADR) | 33,090 | — | 33,090 | 1,720,349 | — | 1,720,349 | ||||||||||||||||||||||
Watson Pharmaceuticals, Inc.* | — | 2,525 | 2,525 | — | 102,439 | 102,439 | ||||||||||||||||||||||
| 7,592,413 | 10,071,522 | 17,663,935 | 6.05 | % | ||||||||||||||||||||||||
Total Health Care | 15,136,703 | 15,894,112 | 31,030,815 | 10.62 | % | |||||||||||||||||||||||
Industrials | ||||||||||||||||||||||||||||
Aerospace & Defense | ||||||||||||||||||||||||||||
Alliant Techsystems, Inc.* | — | 100 | 100 | — | 6,206 | 6,206 | ||||||||||||||||||||||
BE Aerospace, Inc.* | — | 2,123 | 2,123 | — | 53,988 | 53,988 | ||||||||||||||||||||||
Boeing Co. | — | 3,224 | 3,224 | — | 202,306 | 202,306 | ||||||||||||||||||||||
General Dynamics Corp. | — | 7,564 | 7,564 | — | 442,948 | 442,948 | ||||||||||||||||||||||
Goodrich Corp. | — | 2,000 | 2,000 | — | 132,500 | 132,500 | ||||||||||||||||||||||
Honeywell International, Inc. | 18,000 | — | 18,000 | 702,540 | — | 702,540 | ||||||||||||||||||||||
ITT Corp. | — | 4,044 | 4,044 | — | 181,657 | 181,657 | ||||||||||||||||||||||
L-3 Communications Holdings, Inc. | — | 2,568 | 2,568 | — | 181,917 | 181,917 | ||||||||||||||||||||||
Lockheed Martin Corp. | 13,030 | 1,500 | 14,530 | 970,735 | 111,750 | 1,082,485 | ||||||||||||||||||||||
Northrop Grumman Corp. | — | 6,643 | 6,643 | — | 361,645 | 361,645 | ||||||||||||||||||||||
Raytheon Co. | 8,920 | 8,434 | 17,354 | 431,639 | 408,121 | 839,760 | ||||||||||||||||||||||
Rockwell Collins, Inc. | — | 1,600 | 1,600 | — | 85,008 | 85,008 | ||||||||||||||||||||||
Spirit AeroSystems Holdings, Inc., Class A* | — | 2,019 | 2,019 | — | 38,482 | 38,482 | ||||||||||||||||||||||
United Technologies Corp. | — | 1,784 | 1,784 | — | 115,799 | 115,799 | ||||||||||||||||||||||
| 2,104,914 | 2,322,327 | 4,427,241 | 1.52 | % | ||||||||||||||||||||||||
See notes to pro-forma financial statements.
EQ ADVISORS TRUST
PORTFOLIO OF INVESTMENTS
June 30, 2010 (Unaudited)
| Number of Shares | Value (Note 1) | |||||||||||||||||||||||||||
| EQ/Lord Abbett Growth and Income | EQ/Large Cap Value Index | Pro Forma | EQ/Lord Abbett Growth and Income | EQ/Large Cap Value Index | Pro Forma | % of Net Assets | ||||||||||||||||||||||
Air Freight & Logistics | ||||||||||||||||||||||||||||
FedEx Corp. | — | 2,469 | 2,469 | — | 173,102 | 173,102 | ||||||||||||||||||||||
UTi Worldwide, Inc. | — | 46 | 46 | — | 569 | 569 | ||||||||||||||||||||||
| — | 173,671 | 173,671 | 0.06 | % | ||||||||||||||||||||||||
Airlines | ||||||||||||||||||||||||||||
AMR Corp.* | 105,790 | 5,000 | 110,790 | 717,256 | 33,900 | 751,156 | ||||||||||||||||||||||
Copa Holdings S.A., Class A | — | 200 | 200 | — | 8,844 | 8,844 | ||||||||||||||||||||||
Delta Air Lines, Inc.* | 300,900 | — | 300,900 | 3,535,575 | — | 3,535,575 | ||||||||||||||||||||||
Southwest Airlines Co. | — | 14,234 | 14,234 | — | 158,140 | 158,140 | ||||||||||||||||||||||
UAL Corp.* | — | 900 | 900 | — | 18,504 | 18,504 | ||||||||||||||||||||||
| 4,252,831 | 219,388 | 4,472,219 | 1.53 | % | ||||||||||||||||||||||||
Building Products | ||||||||||||||||||||||||||||
Armstrong World Industries, Inc.* | — | 285 | 285 | — | 8,601 | 8,601 | ||||||||||||||||||||||
Masco Corp. | — | 5,568 | 5,568 | — | 59,912 | 59,912 | ||||||||||||||||||||||
Owens Corning, Inc.* | — | 1,017 | 1,017 | — | 30,419 | 30,419 | ||||||||||||||||||||||
USG Corp.* | — | 867 | 867 | — | 10,473 | 10,473 | ||||||||||||||||||||||
| — | 109,405 | 109,405 | 0.04 | % | ||||||||||||||||||||||||
Commercial Services & Supplies | ||||||||||||||||||||||||||||
Avery Dennison Corp. | — | 2,189 | 2,189 | — | 70,333 | 70,333 | ||||||||||||||||||||||
Cintas Corp. | — | 2,642 | 2,642 | — | 63,329 | 63,329 | ||||||||||||||||||||||
Corrections Corp. of America* | — | 2,216 | 2,216 | — | 42,281 | 42,281 | ||||||||||||||||||||||
Covanta Holding Corp.* | — | 2,734 | 2,734 | — | 45,357 | 45,357 | ||||||||||||||||||||||
KAR Auction Services, Inc.* | — | 500 | 500 | — | 6,185 | 6,185 | ||||||||||||||||||||||
Pitney Bowes, Inc. | — | 1,340 | 1,340 | — | 29,426 | 29,426 | ||||||||||||||||||||||
R.R. Donnelley & Sons Co. | — | 4,337 | 4,337 | — | 70,997 | 70,997 | ||||||||||||||||||||||
Republic Services, Inc. | — | 5,002 | 5,002 | — | 148,709 | 148,709 | ||||||||||||||||||||||
Waste Connections, Inc.* | — | 415 | 415 | — | 14,479 | 14,479 | ||||||||||||||||||||||
Waste Management, Inc. | — | 10,633 | 10,633 | — | 332,707 | 332,707 | ||||||||||||||||||||||
| — | 823,803 | 823,803 | 0.28 | % | ||||||||||||||||||||||||
Construction & Engineering | ||||||||||||||||||||||||||||
Aecom Technology Corp.* | — | 1,500 | 1,500 | — | 34,590 | 34,590 | ||||||||||||||||||||||
Chicago Bridge & Iron Co. N.V. (N.Y. Shares)* | — | 1,300 | 1,300 | — | 24,453 | 24,453 | ||||||||||||||||||||||
Fluor Corp. | 7,400 | 3,700 | 11,100 | 314,500 | 157,250 | 471,750 | ||||||||||||||||||||||
Jacobs Engineering Group, Inc.* | — | 1,100 | 1,100 | — | 40,084 | 40,084 | ||||||||||||||||||||||
KBR, Inc. | — | 3,342 | 3,342 | — | 67,976 | 67,976 | ||||||||||||||||||||||
Quanta Services, Inc.* | — | 4,858 | 4,858 | — | 100,318 | 100,318 | ||||||||||||||||||||||
See notes to pro-forma financial statements.
EQ ADVISORS TRUST
PORTFOLIO OF INVESTMENTS
June 30, 2010 (Unaudited)
| Number of Shares | Value (Note 1) | |||||||||||||||||||||||||||
| EQ/Lord Abbett Growth and Income | EQ/Large Cap Value Index | Pro Forma | EQ/Lord Abbett Growth and Income | EQ/Large Cap Value Index | Pro Forma | % of Net Assets | ||||||||||||||||||||||
Shaw Group, Inc.* | — | 745 | 745 | — | 25,494 | 25,494 | ||||||||||||||||||||||
URS Corp.* | — | 1,668 | 1,668 | — | 65,636 | 65,636 | ||||||||||||||||||||||
| 314,500 | 515,801 | 830,301 | 0.28 | % | ||||||||||||||||||||||||
Electrical Equipment | ||||||||||||||||||||||||||||
Emerson Electric Co. | 22,890 | — | 22,890 | 1,000,064 | — | 1,000,064 | ||||||||||||||||||||||
General Cable Corp.* | — | 703 | 703 | — | 18,735 | 18,735 | ||||||||||||||||||||||
Hubbell, Inc., Class B | — | 788 | 788 | — | 31,276 | 31,276 | ||||||||||||||||||||||
Regal-Beloit Corp. | — | 100 | 100 | — | 5,578 | 5,578 | ||||||||||||||||||||||
Thomas & Betts Corp.* | — | 832 | 832 | — | 28,870 | 28,870 | ||||||||||||||||||||||
| 1,000,064 | 84,459 | 1,084,523 | 0.37 | % | ||||||||||||||||||||||||
Industrial Conglomerates | ||||||||||||||||||||||||||||
Carlisle Cos., Inc. | — | 1,139 | 1,139 | — | 41,152 | 41,152 | ||||||||||||||||||||||
General Electric Co. | — | 180,624 | 180,624 | — | 2,604,598 | 2,604,598 | ||||||||||||||||||||||
McDermott International, Inc.* | — | 1,100 | 1,100 | — | 23,826 | 23,826 | ||||||||||||||||||||||
Textron, Inc. | — | 2,906 | 2,906 | — | 49,315 | 49,315 | ||||||||||||||||||||||
Tyco International Ltd. | — | 9,600 | 9,600 | — | 338,208 | 338,208 | ||||||||||||||||||||||
| — | 3,057,099 | 3,057,099 | 1.05 | % | ||||||||||||||||||||||||
Machinery | ||||||||||||||||||||||||||||
AGCO Corp.* | — | 2,028 | 2,028 | — | 54,695 | 54,695 | ||||||||||||||||||||||
CNH Global N.V.* | — | 500 | 500 | — | 11,325 | 11,325 | ||||||||||||||||||||||
Caterpillar, Inc. | 31,150 | — | 31,150 | 1,871,181 | — | 1,871,181 | ||||||||||||||||||||||
Crane Co. | — | 1,046 | 1,046 | — | 31,600 | 31,600 | ||||||||||||||||||||||
Danaher Corp. | — | 916 | 916 | — | 34,002 | 34,002 | ||||||||||||||||||||||
Deere & Co. | — | 573 | 573 | — | 31,905 | 31,905 | ||||||||||||||||||||||
Dover Corp. | — | 1,514 | 1,514 | — | 63,270 | 63,270 | ||||||||||||||||||||||
Eaton Corp. | 51,396 | 2,741 | 54,137 | 3,363,354 | 179,371 | 3,542,725 | ||||||||||||||||||||||
Flowserve Corp. | — | 200 | 200 | — | 16,960 | 16,960 | ||||||||||||||||||||||
Gardner Denver, Inc. | — | 64 | 64 | — | 2,854 | 2,854 | ||||||||||||||||||||||
Harsco Corp. | — | 1,638 | 1,638 | — | 38,493 | 38,493 | ||||||||||||||||||||||
IDEX Corp. | — | 301 | 301 | — | 8,599 | 8,599 | ||||||||||||||||||||||
Ingersoll-Rand plc | — | 7,100 | 7,100 | — | 244,879 | 244,879 | ||||||||||||||||||||||
Kennametal, Inc. | — | 439 | 439 | — | 11,164 | 11,164 | ||||||||||||||||||||||
Parker Hannifin Corp. | — | 2,500 | 2,500 | — | 138,650 | 138,650 | ||||||||||||||||||||||
Pentair, Inc. | — | 1,020 | 1,020 | — | 32,844 | 32,844 | ||||||||||||||||||||||
Snap-On, Inc. | — | 1,303 | 1,303 | — | 53,306 | 53,306 | ||||||||||||||||||||||
SPX Corp. | — | 855 | 855 | — | 45,152 | 45,152 | ||||||||||||||||||||||
Terex Corp.* | — | 2,582 | 2,582 | — | 48,387 | 48,387 | ||||||||||||||||||||||
See notes to pro-forma financial statements.
EQ ADVISORS TRUST
PORTFOLIO OF INVESTMENTS
June 30, 2010 (Unaudited)
| Number of Shares | Value (Note 1) | |||||||||||||||||||||||||||
| EQ/Lord Abbett Growth and Income | EQ/Large Cap Value Index | Pro Forma | EQ/Lord Abbett Growth and Income | EQ/Large Cap Value Index | Pro Forma | % of Net Assets | ||||||||||||||||||||||
Timken Co. | — | 462 | 462 | — | 12,007 | 12,007 | ||||||||||||||||||||||
Trinity Industries, Inc. | — | 1,704 | 1,704 | — | 30,195 | 30,195 | ||||||||||||||||||||||
Wabtec Corp. | — | 900 | 900 | — | 35,901 | 35,901 | ||||||||||||||||||||||
| 5,234,535 | 1,125,559 | 6,360,094 | 2.18 | % | ||||||||||||||||||||||||
Marine | ||||||||||||||||||||||||||||
Alexander & Baldwin, Inc. | — | 871 | 871 | — | 25,938 | 25,938 | ||||||||||||||||||||||
Kirby Corp.* | — | 952 | 952 | — | 36,414 | 36,414 | ||||||||||||||||||||||
| — | 62,352 | 62,352 | 0.02 | % | ||||||||||||||||||||||||
Professional Services | ||||||||||||||||||||||||||||
Equifax, Inc. | — | 2,826 | 2,826 | — | 79,297 | 79,297 | ||||||||||||||||||||||
FTI Consulting, Inc.* | — | 200 | 200 | — | 8,718 | 8,718 | ||||||||||||||||||||||
Manpower, Inc. | — | 1,848 | 1,848 | — | 79,797 | 79,797 | ||||||||||||||||||||||
Towers Watson & Co., Class A | — | 800 | 800 | — | 31,080 | 31,080 | ||||||||||||||||||||||
| — | 198,892 | 198,892 | 0.07 | % | ||||||||||||||||||||||||
Road & Rail | ||||||||||||||||||||||||||||
Con-way, Inc. | — | 886 | 886 | — | 26,598 | 26,598 | ||||||||||||||||||||||
CSX Corp. | — | 8,568 | 8,568 | — | 425,230 | 425,230 | ||||||||||||||||||||||
Hertz Global Holdings, Inc.* | 275,410 | 600 | 276,010 | 2,605,378 | 5,676 | 2,611,054 | ||||||||||||||||||||||
Kansas City Southern* | — | 891 | 891 | — | 32,388 | 32,388 | ||||||||||||||||||||||
Norfolk Southern Corp. | — | 8,178 | 8,178 | — | 433,843 | 433,843 | ||||||||||||||||||||||
Ryder System, Inc. | — | 558 | 558 | — | 22,448 | 22,448 | ||||||||||||||||||||||
Union Pacific Corp. | — | 9,740 | 9,740 | — | 677,027 | 677,027 | ||||||||||||||||||||||
| 2,605,378 | 1,623,210 | 4,228,588 | 1.45 | % | ||||||||||||||||||||||||
Trading Companies & Distributors |
| |||||||||||||||||||||||||||
GATX Corp. | — | 583 | 583 | — | 15,554 | 15,554 | ||||||||||||||||||||||
WESCO International, Inc.* | — | 470 | 470 | — | 15,825 | 15,825 | ||||||||||||||||||||||
| — | 31,379 | 31,379 | 0.01 | % | ||||||||||||||||||||||||
Total Industrials | 15,512,222 | 10,347,345 | 25,859,567 | 8.85 | % | |||||||||||||||||||||||
Information Technology | ||||||||||||||||||||||||||||
Communications Equipment | ||||||||||||||||||||||||||||
Brocade Communications Systems, Inc.* | — | 9,823 | 9,823 | — | 50,687 | 50,687 | ||||||||||||||||||||||
CommScope, Inc.* | — | 2,047 | 2,047 | — | 48,657 | 48,657 | ||||||||||||||||||||||
EchoStar Corp., Class A* | — | 776 | 776 | — | 14,806 | 14,806 | ||||||||||||||||||||||
Motorola, Inc.* | — | 51,141 | 51,141 | — | 333,439 | 333,439 | ||||||||||||||||||||||
See notes to pro-forma financial statements.
EQ ADVISORS TRUST
PORTFOLIO OF INVESTMENTS
June 30, 2010 (Unaudited)
| Number of Shares | Value (Note 1) | |||||||||||||||||||||||||||
| EQ/Lord Abbett Growth and Income | EQ/Large Cap Value Index | Pro Forma | EQ/Lord Abbett Growth and Income | EQ/Large Cap Value Index | Pro Forma | % of Net Assets | ||||||||||||||||||||||
Tellabs, Inc. | — | 8,510 | 8,510 | — | 54,379 | 54,379 | ||||||||||||||||||||||
| — | 501,968 | 501,968 | 0.17 | % | ||||||||||||||||||||||||
Computers & Peripherals | ||||||||||||||||||||||||||||
Diebold, Inc. | — | 1,171 | 1,171 | — | 31,910 | 31,910 | ||||||||||||||||||||||
EMC Corp.* | 60,750 | — | 60,750 | 1,111,725 | — | 1,111,725 | ||||||||||||||||||||||
Hewlett-Packard Co. | 30,480 | — | 30,480 | 1,319,175 | — | 1,319,175 | ||||||||||||||||||||||
Lexmark International, Inc., Class A* | — | 1,773 | 1,773 | — | 58,562 | 58,562 | ||||||||||||||||||||||
Seagate Technology* | — | 2,949 | 2,949 | — | 38,455 | 38,455 | ||||||||||||||||||||||
Western Digital Corp.* | — | 3,860 | 3,860 | — | 116,418 | 116,418 | ||||||||||||||||||||||
| 2,430,900 | 245,345 | 2,676,245 | 0.92 | % | ||||||||||||||||||||||||
Electronic Equipment, Instruments & Components |
| |||||||||||||||||||||||||||
Arrow Electronics, Inc.* | — | 2,374 | 2,374 | — | 53,059 | 53,059 | ||||||||||||||||||||||
Avnet, Inc.* | — | 3,349 | 3,349 | — | 80,744 | 80,744 | ||||||||||||||||||||||
AVX Corp. | — | 791 | 791 | — | 10,141 | 10,141 | ||||||||||||||||||||||
Corning, Inc. | — | 30,102 | 30,102 | — | 486,147 | 486,147 | ||||||||||||||||||||||
Ingram Micro, Inc., Class A* | — | 3,599 | 3,599 | — | 54,669 | 54,669 | ||||||||||||||||||||||
Itron, Inc.* | — | 26 | 26 | — | 1,607 | 1,607 | ||||||||||||||||||||||
Jabil Circuit, Inc. | — | 1,116 | 1,116 | — | 14,843 | 14,843 | ||||||||||||||||||||||
Molex, Inc. | — | 2,898 | 2,898 | — | 52,859 | 52,859 | ||||||||||||||||||||||
Tech Data Corp.* | — | 1,110 | 1,110 | — | 39,538 | 39,538 | ||||||||||||||||||||||
Vishay Intertechnology, Inc.* | — | 3,167 | 3,167 | — | 24,513 | 24,513 | ||||||||||||||||||||||
| — | 818,120 | 818,120 | 0.28 | % | ||||||||||||||||||||||||
Internet Software & Services | ||||||||||||||||||||||||||||
AOL, Inc.* | — | 2,434 | 2,434 | — | 50,603 | 50,603 | ||||||||||||||||||||||
eBay, Inc.* | — | 15,676 | 15,676 | — | 307,406 | 307,406 | ||||||||||||||||||||||
IAC/InterActiveCorp* | — | 1,163 | 1,163 | — | 25,551 | 25,551 | ||||||||||||||||||||||
Monster Worldwide, Inc.* | — | 1,126 | 1,126 | — | 13,118 | 13,118 | ||||||||||||||||||||||
Yahoo!, Inc.* | — | 17,621 | 17,621 | — | 243,699 | 243,699 | ||||||||||||||||||||||
| — | 640,377 | 640,377 | 0.22 | % | ||||||||||||||||||||||||
IT Services | ||||||||||||||||||||||||||||
Amdocs Ltd.* | — | 3,275 | 3,275 | — | 87,934 | 87,934 | ||||||||||||||||||||||
Broadridge Financial Solutions, Inc. | — | 249 | 249 | — | 4,743 | 4,743 | ||||||||||||||||||||||
Computer Sciences Corp. | — | 3,482 | 3,482 | — | 157,561 | 157,561 | ||||||||||||||||||||||
Convergys Corp.* | — | 1,795 | 1,795 | — | 17,609 | 17,609 | ||||||||||||||||||||||
CoreLogic, Inc. | — | 2,267 | 2,267 | — | 40,035 | 40,035 | ||||||||||||||||||||||
Fidelity National Information Services, Inc. | — | 7,281 | 7,281 | — | 195,276 | 195,276 | ||||||||||||||||||||||
See notes to pro-forma financial statements.
EQ ADVISORS TRUST
PORTFOLIO OF INVESTMENTS
June 30, 2010 (Unaudited)
| Number of Shares | Value (Note 1) | |||||||||||||||||||||||||||
| EQ/Lord Abbett Growth and Income | EQ/Large Cap Value Index | Pro Forma | EQ/Lord Abbett Growth and Income | EQ/Large Cap Value Index | Pro Forma | % of Net Assets | ||||||||||||||||||||||
Fiserv, Inc.* | — | 1,100 | 1,100 | — | 50,226 | 50,226 | ||||||||||||||||||||||
Total System Services, Inc. | — | 3,665 | 3,665 | — | 49,844 | 49,844 | ||||||||||||||||||||||
| — | 603,228 | 603,228 | 0.21 | % | ||||||||||||||||||||||||
Office Electronics | ||||||||||||||||||||||||||||
Xerox Corp. | 20,230 | 30,411 | 50,641 | 162,649 | 244,504 | 407,153 | ||||||||||||||||||||||
Zebra Technologies Corp., Class A* | — | 223 | 223 | — | 5,658 | 5,658 | ||||||||||||||||||||||
| 162,649 | 250,162 | 412,811 | 0.14 | % | ||||||||||||||||||||||||
Semiconductors & Semiconductor Equipment |
| |||||||||||||||||||||||||||
Advanced Micro Devices, Inc.* | — | 8,118 | 8,118 | — | 59,424 | 59,424 | ||||||||||||||||||||||
Applied Materials, Inc. | 69,140 | — | 69,140 | 831,063 | — | 831,063 | ||||||||||||||||||||||
Atmel Corp.* | — | 1,080 | 1,080 | — | 5,184 | 5,184 | ||||||||||||||||||||||
Fairchild Semiconductor International, Inc.* | — | 2,644 | 2,644 | — | 22,236 | 22,236 | ||||||||||||||||||||||
Intel Corp. | 48,070 | 38,691 | 86,761 | 934,961 | 752,540 | 1,687,501 | ||||||||||||||||||||||
International Rectifier Corp.* | — | 1,533 | 1,533 | — | 28,529 | 28,529 | ||||||||||||||||||||||
Intersil Corp., Class A | — | 1,348 | 1,348 | — | 16,324 | 16,324 | ||||||||||||||||||||||
KLA-Tencor Corp. | — | 3,586 | 3,586 | — | 99,978 | 99,978 | ||||||||||||||||||||||
LSI Corp.* | — | 14,994 | 14,994 | — | 68,972 | 68,972 | ||||||||||||||||||||||
MEMC Electronic Materials, Inc.* | — | 2,900 | 2,900 | — | 28,652 | 28,652 | ||||||||||||||||||||||
Micron Technology, Inc.* | — | 18,859 | 18,859 | — | 160,113 | 160,113 | ||||||||||||||||||||||
National Semiconductor Corp. | — | 500 | 500 | — | 6,730 | 6,730 | ||||||||||||||||||||||
Novellus Systems, Inc.* | — | 267 | 267 | — | 6,771 | 6,771 | ||||||||||||||||||||||
PMC-Sierra, Inc.* | — | 4,811 | 4,811 | — | 36,179 | 36,179 | ||||||||||||||||||||||
SunPower Corp., Class A* | — | 1,300 | 1,300 | — | 15,730 | 15,730 | ||||||||||||||||||||||
Texas Instruments, Inc. | — | 14,700 | 14,700 | — | 342,216 | 342,216 | ||||||||||||||||||||||
| 1,766,024 | 1,649,578 | 3,415,602 | 1.17 | % | ||||||||||||||||||||||||
Software | ||||||||||||||||||||||||||||
Activision Blizzard, Inc. | — | 8,368 | 8,368 | — | 87,780 | 87,780 | ||||||||||||||||||||||
CA, Inc. | — | 1,607 | 1,607 | — | 29,569 | 29,569 | ||||||||||||||||||||||
Compuware Corp.* | — | 2,151 | 2,151 | — | 17,165 | 17,165 | ||||||||||||||||||||||
Electronic Arts, Inc.* | — | 400 | 400 | — | 5,760 | 5,760 | ||||||||||||||||||||||
Microsoft Corp. | — | 55,800 | 55,800 | — | 1,283,958 | 1,283,958 | ||||||||||||||||||||||
Novell, Inc.* | — | 7,714 | 7,714 | — | 43,816 | 43,816 | ||||||||||||||||||||||
Symantec Corp.* | — | 15,900 | 15,900 | — | 220,692 | 220,692 | ||||||||||||||||||||||
Synopsys, Inc.* | — | 3,083 | 3,083 | — | 64,342 | 64,342 | ||||||||||||||||||||||
| — | 1,753,082 | 1,753,082 | 0.60 | % | ||||||||||||||||||||||||
Total Information Technology | 4,359,573 | 6,461,860 | 10,821,433 | 3.70 | % | |||||||||||||||||||||||
See notes to pro-forma financial statements.
EQ ADVISORS TRUST
PORTFOLIO OF INVESTMENTS
June 30, 2010 (Unaudited)
| Number of Shares | Value (Note 1) | |||||||||||||||||||||||||||
| EQ/Lord Abbett Growth and Income | EQ/Large Cap Value Index | Pro Forma | EQ/Lord Abbett Growth and Income | EQ/Large Cap Value Index | Pro Forma | % of Net Assets | ||||||||||||||||||||||
Materials | ||||||||||||||||||||||||||||
Chemicals | ||||||||||||||||||||||||||||
Ashland, Inc. | — | 1,651 | 1,651 | — | 76,639 | 76,639 | ||||||||||||||||||||||
Cabot Corp. | — | 1,400 | 1,400 | — | 33,754 | 33,754 | ||||||||||||||||||||||
CF Industries Holdings, Inc. | — | 367 | 367 | — | 23,286 | 23,286 | ||||||||||||||||||||||
Cytec Industries, Inc. | — | 1,026 | 1,026 | — | 41,030 | 41,030 | ||||||||||||||||||||||
Dow Chemical Co. | 68,370 | 25,524 | 93,894 | 1,621,736 | 605,429 | 2,227,165 | ||||||||||||||||||||||
E.I. du Pont de Nemours & Co. | — | 13,042 | 13,042 | — | 451,123 | 451,123 | ||||||||||||||||||||||
Eastman Chemical Co. | — | 1,312 | 1,312 | — | 70,008 | 70,008 | ||||||||||||||||||||||
FMC Corp. | — | 516 | 516 | — | 29,634 | 29,634 | ||||||||||||||||||||||
Huntsman Corp. | — | 3,456 | 3,456 | — | 29,964 | 29,964 | ||||||||||||||||||||||
Intrepid Potash, Inc.* | — | 934 | 934 | — | 18,278 | 18,278 | ||||||||||||||||||||||
Mosaic Co. | 35,390 | — | 35,390 | 1,379,502 | — | 1,379,502 | ||||||||||||||||||||||
Potash Corp. of Saskatchewan, inc. | 3,840 | — | 3,840 | 331,162 | — | 331,162 | ||||||||||||||||||||||
PPG Industries, Inc. | — | 3,013 | 3,013 | — | 182,015 | 182,015 | ||||||||||||||||||||||
RPM International, Inc. | — | 1,322 | 1,322 | — | 23,585 | 23,585 | ||||||||||||||||||||||
Sherwin-Williams Co. | — | 800 | 800 | — | 55,352 | 55,352 | ||||||||||||||||||||||
Sigma-Aldrich Corp. | — | 200 | 200 | — | 9,966 | 9,966 | ||||||||||||||||||||||
Valspar Corp. | — | 2,015 | 2,015 | — | 60,692 | 60,692 | ||||||||||||||||||||||
| 3,332,400 | 1,710,755 | 5,043,155 | 1.73 | % | ||||||||||||||||||||||||
Construction Materials | ||||||||||||||||||||||||||||
Vulcan Materials Co. | — | 2,844 | 2,844 | — | 124,652 | 124,652 | 0.04 | % | ||||||||||||||||||||
Containers & Packaging | ||||||||||||||||||||||||||||
AptarGroup, Inc. | — | 1,544 | 1,544 | — | 58,394 | 58,394 | ||||||||||||||||||||||
Ball Corp. | — | 1,573 | 1,573 | — | 83,102 | 83,102 | ||||||||||||||||||||||
Bemis Co., Inc. | — | 2,525 | 2,525 | — | 68,175 | 68,175 | ||||||||||||||||||||||
Greif, Inc., Class A | — | 801 | 801 | — | 44,487 | 44,487 | ||||||||||||||||||||||
Owens-Illinois, Inc.* | — | 2,502 | 2,502 | — | 66,178 | 66,178 | ||||||||||||||||||||||
Packaging Corp. of America | — | 1,998 | 1,998 | — | 43,996 | 43,996 | ||||||||||||||||||||||
Pactiv Corp.* | — | 341 | 341 | — | 9,497 | 9,497 | ||||||||||||||||||||||
Sealed Air Corp. | — | 3,564 | 3,564 | — | 70,282 | 70,282 | ||||||||||||||||||||||
Sonoco Products Co. | — | 2,331 | 2,331 | — | 71,049 | 71,049 | ||||||||||||||||||||||
Temple-Inland, Inc. | — | 1,894 | 1,894 | — | 39,149 | 39,149 | ||||||||||||||||||||||
| — | 554,309 | 554,309 | 0.19 | % | ||||||||||||||||||||||||
Metals & Mining | ||||||||||||||||||||||||||||
AK Steel Holding Corp. | — | 2,035 | 2,035 | — | 24,257 | 24,257 | ||||||||||||||||||||||
See notes to pro-forma financial statements.
EQ ADVISORS TRUST
PORTFOLIO OF INVESTMENTS
June 30, 2010 (Unaudited)
| Number of Shares | Value (Note 1) | |||||||||||||||||||||||||||
| EQ/Lord Abbett Growth and Income | EQ/Large Cap Value Index | Pro Forma | EQ/Lord Abbett Growth and Income | EQ/Large Cap Value Index | Pro Forma | % of Net Assets | ||||||||||||||||||||||
Alcoa, Inc. | — | 19,217 | 19,217 | — | 193,323 | 193,323 | ||||||||||||||||||||||
Barrick Gold Corp. | 62,320 | — | 62,320 | 2,829,951 | — | 2,829,951 | ||||||||||||||||||||||
Cliffs Natural Resources, Inc. | 26,960 | — | 26,960 | 1,271,434 | — | 1,271,434 | ||||||||||||||||||||||
Commercial Metals Co. | — | 2,370 | 2,370 | — | 31,331 | 31,331 | ||||||||||||||||||||||
Gerdau Ameristeel Corp.* | — | 2,700 | 2,700 | — | 29,430 | 29,430 | ||||||||||||||||||||||
Newmont Mining Corp. | 42,080 | — | 42,080 | 2,598,019 | — | 2,598,019 | ||||||||||||||||||||||
Nucor Corp. | — | 3,928 | 3,928 | — | 150,364 | 150,364 | ||||||||||||||||||||||
Reliance Steel & Aluminum Co. | — | 1,429 | 1,429 | — | 51,658 | 51,658 | ||||||||||||||||||||||
Royal Gold, Inc. | — | 741 | 741 | — | 35,568 | 35,568 | ||||||||||||||||||||||
Schnitzer Steel Industries, Inc., Class A | — | 424 | 424 | — | 16,621 | 16,621 | ||||||||||||||||||||||
Steel Dynamics, Inc. | — | 4,950 | 4,950 | — | 65,291 | 65,291 | ||||||||||||||||||||||
United States Steel Corp. | 26,520 | 2,523 | 29,043 | 1,022,346 | 97,262 | 1,119,608 | ||||||||||||||||||||||
Walter Energy, Inc. | — | 300 | 300 | — | 18,255 | 18,255 | ||||||||||||||||||||||
| 7,721,750 | 713,360 | 8,435,110 | 2.89 | % | ||||||||||||||||||||||||
Paper & Forest Products | ||||||||||||||||||||||||||||
Domtar Corp. | — | 900 | 900 | — | 44,235 | 44,235 | ||||||||||||||||||||||
International Paper Co. | — | 2,089 | 2,089 | — | 47,274 | 47,274 | ||||||||||||||||||||||
MeadWestvaco Corp. | — | 3,917 | 3,917 | — | 86,957 | 86,957 | ||||||||||||||||||||||
Weyerhaeuser Co. | — | 4,687 | 4,687 | — | 164,983 | 164,983 | ||||||||||||||||||||||
| — | 343,449 | 343,449 | 0.12 | % | ||||||||||||||||||||||||
Total Materials | 11,054,150 | 3,446,525 | 14,500,675 | 4.96 | % | |||||||||||||||||||||||
Telecommunication Services | ||||||||||||||||||||||||||||
Diversified Telecommunication Services |
| |||||||||||||||||||||||||||
AT&T, Inc. | 129,387 | 130,100 | 259,487 | 3,129,872 | 3,147,119 | 6,276,991 | ||||||||||||||||||||||
CenturyLink, Inc. | — | 6,596 | 6,596 | — | 219,713 | 219,713 | ||||||||||||||||||||||
Frontier Communications Corp. | — | 3,780 | 3,780 | — | 26,876 | 26,876 | ||||||||||||||||||||||
Level 3 Communications, Inc.* | — | 22,433 | 22,433 | — | 24,452 | 24,452 | ||||||||||||||||||||||
Qwest Communications International, Inc. | — | 38,280 | 38,280 | — | 200,970 | 200,970 | ||||||||||||||||||||||
Verizon Communications, Inc. | 49,700 | 62,307 | 112,007 | 1,392,594 | 1,745,842 | 3,138,436 | ||||||||||||||||||||||
Windstream Corp. | — | 6,458 | 6,458 | — | 68,196 | 68,196 | ||||||||||||||||||||||
| 4,522,466 | 5,433,168 | 9,955,634 | 3.41 | % | ||||||||||||||||||||||||
Wireless Telecommunication Services |
| |||||||||||||||||||||||||||
Clearwire Corp., Class A* | — | 1,390 | 1,390 | — | 10,119 | 10,119 | ||||||||||||||||||||||
Leap Wireless International, Inc.* | — | 1,350 | 1,350 | — | 17,523 | 17,523 | ||||||||||||||||||||||
MetroPCS Communications, Inc.* | — | 2,900 | 2,900 | — | 23,751 | 23,751 | ||||||||||||||||||||||
NII Holdings, Inc.* | — | 787 | 787 | — | 25,593 | 25,593 | ||||||||||||||||||||||
See notes to pro-forma financial statements.
EQ ADVISORS TRUST
PORTFOLIO OF INVESTMENTS
June 30, 2010 (Unaudited)
| Number of Shares | Value (Note 1) | |||||||||||||||||||||||||||
| EQ/Lord Abbett Growth and Income | EQ/Large Cap Value Index | Pro Forma | EQ/Lord Abbett Growth and Income | EQ/Large Cap Value Index | Pro Forma | % of Net Assets | ||||||||||||||||||||||
Sprint Nextel Corp.* | — | 64,963 | 64,963 | — | 275,443 | 275,443 | ||||||||||||||||||||||
Telephone & Data Systems, Inc. | — | 1,948 | 1,948 | — | 59,200 | 59,200 | ||||||||||||||||||||||
U.S. Cellular Corp.* | — | 345 | 345 | — | 14,197 | 14,197 | ||||||||||||||||||||||
| — | 425,826 | 425,826 | 0.15 | % | ||||||||||||||||||||||||
Total Telecommunication Services |
| 4,522,466 | 5,858,994 | 10,381,460 | 3.55 | % | ||||||||||||||||||||||
Utilities | ||||||||||||||||||||||||||||
Electric Utilities | ||||||||||||||||||||||||||||
Allegheny Energy, Inc. | — | 3,780 | 3,780 | — | 78,170 | 78,170 | ||||||||||||||||||||||
American Electric Power Co., Inc. | — | 10,556 | 10,556 | — | 340,959 | 340,959 | ||||||||||||||||||||||
DPL, Inc. | — | 2,493 | 2,493 | — | 59,583 | 59,583 | ||||||||||||||||||||||
Duke Energy Corp. | — | 28,971 | �� | 28,971 | — | 463,536 | 463,536 | |||||||||||||||||||||
Edison International | — | 7,178 | 7,178 | — | 227,686 | 227,686 | ||||||||||||||||||||||
Entergy Corp. | — | 4,187 | 4,187 | — | 299,873 | 299,873 | ||||||||||||||||||||||
Exelon Corp. | — | 14,591 | 14,591 | — | 554,020 | 554,020 | ||||||||||||||||||||||
FirstEnergy Corp. | — | 6,711 | 6,711 | — | 236,429 | 236,429 | ||||||||||||||||||||||
Great Plains Energy, Inc. | — | 2,944 | 2,944 | — | 50,107 | 50,107 | ||||||||||||||||||||||
Hawaiian Electric Industries, Inc. | — | 2,021 | 2,021 | — | 46,038 | 46,038 | ||||||||||||||||||||||
ITC Holdings Corp. | — | 100 | 100 | — | 5,291 | 5,291 | ||||||||||||||||||||||
NextEra Energy, Inc. | 13,250 | 9,161 | 22,411 | 646,070 | 446,690 | 1,092,760 | ||||||||||||||||||||||
Northeast Utilities | — | 3,942 | 3,942 | — | 100,442 | 100,442 | ||||||||||||||||||||||
NV Energy, Inc. | — | 5,161 | 5,161 | — | 60,952 | 60,952 | ||||||||||||||||||||||
Pepco Holdings, Inc. | — | 4,887 | 4,887 | — | 76,628 | 76,628 | ||||||||||||||||||||||
Pinnacle West Capital Corp. | — | 2,396 | 2,396 | — | 87,119 | 87,119 | ||||||||||||||||||||||
PPL Corp. | 37,180 | 8,300 | 45,480 | 927,641 | 207,085 | 1,134,726 | ||||||||||||||||||||||
Progress Energy, Inc. | 30,010 | 6,373 | 36,383 | 1,176,992 | 249,949 | 1,426,941 | ||||||||||||||||||||||
Southern Co. | 56,770 | 18,154 | 74,924 | 1,889,306 | 604,165 | 2,493,471 | ||||||||||||||||||||||
Westar Energy, Inc. | — | 2,364 | 2,364 | — | 51,086 | 51,086 | ||||||||||||||||||||||
| 4,640,009 | 4,245,808 | 8,885,817 | 3.04 | % | ||||||||||||||||||||||||
Gas Utilities | ||||||||||||||||||||||||||||
AGL Resources, Inc. | — | 1,706 | 1,706 | — | 61,109 | 61,109 | ||||||||||||||||||||||
Atmos Energy Corp. | — | 2,149 | 2,149 | — | 58,109 | 58,109 | ||||||||||||||||||||||
Energen Corp. | — | 1,600 | 1,600 | — | 70,928 | 70,928 | ||||||||||||||||||||||
EQT Corp. | — | 200 | 200 | — | 7,228 | 7,228 | ||||||||||||||||||||||
National Fuel Gas Co. | — | 1,641 | 1,641 | — | 75,289 | 75,289 | ||||||||||||||||||||||
ONEOK, Inc. | — | 2,321 | 2,321 | — | 100,383 | 100,383 | ||||||||||||||||||||||
Questar Corp. | — | 3,902 | 3,902 | — | 177,502 | 177,502 | ||||||||||||||||||||||
UGI Corp. | — | 2,399 | 2,399 | — | 61,031 | 61,031 | ||||||||||||||||||||||
| — | 611,579 | 611,579 | 0.21 | % | ||||||||||||||||||||||||
See notes to pro-forma financial statements.
EQ ADVISORS TRUST
PORTFOLIO OF INVESTMENTS
June 30, 2010 (Unaudited)
| Number of Shares | Value (Note 1) | |||||||||||||||||||||||||||
| EQ/Lord Abbett Growth and Income | EQ/Large Cap Value Index | Pro Forma | EQ/Lord Abbett Growth and Income | EQ/Large Cap Value Index | Pro Forma | % of Net Assets | ||||||||||||||||||||||
Independent Power Producers & Energy Traders |
| |||||||||||||||||||||||||||
AES Corp.* | — | 14,724 | 14,724 | — | 136,050 | 136,050 | ||||||||||||||||||||||
Calpine Corp.* | — | 4,097 | 4,097 | — | 52,114 | 52,114 | ||||||||||||||||||||||
Constellation Energy Group, Inc. | — | 4,076 | 4,076 | — | 131,451 | 131,451 | ||||||||||||||||||||||
Mirant Corp.* | — | 3,089 | 3,089 | — | 32,620 | 32,620 | ||||||||||||||||||||||
NRG Energy, Inc.* | — | 5,660 | 5,660 | — | 120,048 | 120,048 | ||||||||||||||||||||||
Ormat Technologies, Inc. | — | 200 | 200 | — | 5,658 | 5,658 | ||||||||||||||||||||||
RRI Energy, Inc.* | — | 7,546 | 7,546 | — | 28,599 | 28,599 | ||||||||||||||||||||||
| �� | ||||||||||||||||||||||||||||
| — | 506,540 | 506,540 | 0.17 | % | ||||||||||||||||||||||||
Multi-Utilities | ||||||||||||||||||||||||||||
Alliant Energy Corp. | — | 2,572 | 2,572 | — | 81,635 | 81,635 | ||||||||||||||||||||||
Ameren Corp. | — | 5,397 | 5,397 | — | 128,287 | 128,287 | ||||||||||||||||||||||
CenterPoint Energy, Inc. | — | 8,698 | 8,698 | — | 114,466 | 114,466 | ||||||||||||||||||||||
CMS Energy Corp. | — | 5,313 | 5,313 | — | 77,835 | 77,835 | ||||||||||||||||||||||
Consolidated Edison, Inc. | — | 6,247 | 6,247 | — | 269,246 | 269,246 | ||||||||||||||||||||||
Dominion Resources, Inc. | — | 13,156 | 13,156 | — | 509,663 | 509,663 | ||||||||||||||||||||||
DTE Energy Co. | — | 3,762 | 3,762 | — | 171,585 | 171,585 | ||||||||||||||||||||||
Integrys Energy Group, Inc. | — | 1,691 | 1,691 | — | 73,964 | 73,964 | ||||||||||||||||||||||
MDU Resources Group, Inc. | — | 4,255 | 4,255 | — | 76,718 | 76,718 | ||||||||||||||||||||||
NiSource, Inc. | — | 6,166 | 6,166 | — | 89,407 | 89,407 | ||||||||||||||||||||||
NSTAR | — | 2,354 | 2,354 | — | 82,390 | 82,390 | ||||||||||||||||||||||
OGE Energy Corp. | — | 2,135 | 2,135 | — | 78,056 | 78,056 | ||||||||||||||||||||||
PG&E Corp. | 38,910 | 8,196 | 47,106 | 1,599,201 | 336,856 | 1,936,057 | ||||||||||||||||||||||
Public Service Enterprise Group, Inc. | 21,550 | 11,170 | 32,720 | 675,161 | 349,956 | 1,025,117 | ||||||||||||||||||||||
SCANA Corp. | — | 2,532 | 2,532 | — | 90,544 | 90,544 | ||||||||||||||||||||||
Sempra Energy | — | 5,450 | 5,450 | — | 255,005 | 255,005 | ||||||||||||||||||||||
TECO Energy, Inc. | — | 4,938 | 4,938 | — | 74,416 | 74,416 | ||||||||||||||||||||||
Vectren Corp. | — | 1,748 | 1,748 | — | 41,358 | 41,358 | ||||||||||||||||||||||
Wisconsin Energy Corp. | — | 2,675 | 2,675 | — | 135,729 | 135,729 | ||||||||||||||||||||||
Xcel Energy, Inc. | — | 10,117 | 10,117 | — | 208,511 | 208,511 | ||||||||||||||||||||||
| 2,274,362 | 3,245,627 | 5,519,989 | 1.89 | % | ||||||||||||||||||||||||
Water Utilities | ||||||||||||||||||||||||||||
American Water Works Co., Inc. | — | 3,834 | 3,834 | — | 78,981 | 78,981 | ||||||||||||||||||||||
Aqua America, Inc. | — | 3,024 | 3,024 | — | 53,464 | 53,464 | ||||||||||||||||||||||
| — | 132,445 | 132,445 | 0.05 | % | ||||||||||||||||||||||||
See notes to pro-forma financial statements.
EQ ADVISORS TRUST
PORTFOLIO OF INVESTMENTS
June 30, 2010 (Unaudited)
| Number of Shares | Value (Note 1) | |||||||||||||||||||||||||||
| EQ/Lord Abbett Growth and Income | EQ/Large Cap Value Index | Pro Forma | EQ/Lord Abbett Growth and Income | EQ/Large Cap Value Index | Pro Forma | % of Net Assets | ||||||||||||||||||||||
Total Utilities | 6,914,371 | 8,741,999 | 15,656,370 | 5.36 | % | |||||||||||||||||||||||
Total Common Stocks | 163,753,097 | 118,280,145 | 282,033,242 | 96.55 | % | |||||||||||||||||||||||
(Cost $279,256,089) | 162,264,655 | 116,991,434 | 279,256,089 | |||||||||||||||||||||||||
| Principal Amount | ||||||||||||||||||||||||||||
SHORT-TERM INVESTMENTS: |
| |||||||||||||||||||||||||||
Government Securities | ||||||||||||||||||||||||||||
U.S. Treasury Bills | $ | — | $ | 444,000 | $ | 444,000 | — | 443,804 | 443,804 | 0.15 | % | |||||||||||||||||
Time Deposit | ||||||||||||||||||||||||||||
JP Morgan Chase Nassau | 7,405,449 | 1,370,307 | 8,775,756 | 7,405,449 | 1,370,307 | 8,775,756 | 3.00 | % | ||||||||||||||||||||
Total Short-Term Investments |
| 7,405,449 | 1,814,111 | 9,219,560 | 3.16 | % | ||||||||||||||||||||||
(Cost/Amortized Cost $9,219,652) | 7,405,449 | 1,814,203 | 9,219,652 | |||||||||||||||||||||||||
Total Investments | 171,158,546 | 120,094,256 | 291,252,802 | 99.71 | % | |||||||||||||||||||||||
(Cost/Amortized Cost $288,475,741) | 169,670,104 | 118,805,637 | 288,475,741 | |||||||||||||||||||||||||
Other Assets Less Liabilities |
| 328,847 | 517,862 | 846,709 | 0.29 | % | ||||||||||||||||||||||
Net Assets (100%) | $ | 171,487,393 | $ | 120,612,118 | $ | 292,099,511 | 100.00 | % | ||||||||||||||||||||
See notes to pro-forma financial statements.
NOTES TO SCHEDULE OF PORTFOLIO INVESTMENTS:
| * | Non-income producing. |
| # | All, or a portion of security held by broker as collateral for financial futures contracts, with a total collateral value of $443,803. |
| (p) | Yield to maturity. |
Glossary:
ADR — American Depositary Receipt
As of June 30, 2010, the Portfolio had the following futures contracts open: Note (1)
Purchases | Number of Contracts | Expiration Date | Original Value | Value at 6/30/2010 | Unrealized Appreciation/ (Depreciation) | |||||||||||||||
S&P 500 E-Mini Index | 32 | September-10 | $ | 1,732,609 | $ | 1,642,560 | $ | (90,049 | ) | |||||||||||
S&P MidCap 400 E-Mini Index | 6 | September-10 | 435,703 | 426,000 | (9,703 | ) | ||||||||||||||
| $ | (99,752 | ) | ||||||||||||||||||
As of June 30, 2010, the gross unrealized appreciation (depreciation) of investments based on the aggregate cost of investments for Federal income tax purposes was as follows:
| EQ/Lord Abbett Growth and Income | EQ/Large Cap Value Index | Combined Pro Forma | ||||||||||
Aggregate gross unrealized appreciation | $ | 10,511,421 | $ | 2,215,360 | $ | 12,726,781 | ||||||
Aggregate gross unrealized depreciation | (13,483,617 | ) | (5,382,507 | ) | $ | (18,866,124 | ) | |||||
Net unrealized depreciation | $ | (2,972,196 | ) | $ | (3,167,147 | ) | $ | (6,139,343 | ) | |||
Federal income tax cost of investments | $ | 174,130,742 | $ | 123,261,403 | $ | 297,392,145 | ||||||
The following is a summary of the inputs used to value the Portfolio’s net assets as of June 30, 2010:
The inputs or methodology used for valuing securities are not necessarily an indication of the risk associated with investing in those securities. For example, money market securities are valued using amortized cost, in accordance with rules under the Investment Company Act of 1940. Generally, amortized cost approximates the current fair value of a security , but since the value is not obtained from a quoted price in an active market, such securities are reflected as Level 2.
Various inputs are used in determining the value of the Portfolio’s investments. These inputs are summarized in the three broad levels listed below:
| EQ/Lord Abbett Growth and Income | EQ/Large Cap Value Index | Combined Pro Forma | ||||||||||
Level 1 | ||||||||||||
Assets | ||||||||||||
Investments in Securities | $ | 163,753,097 | $ | 118,280,145 | $ | 282,033,242 | ||||||
Other Investments* | — | — | — | |||||||||
Liabilities | ||||||||||||
Investments in Securities | — | — | — | |||||||||
Other Investments* | — | (99,752 | ) | (99,752 | ) | |||||||
Level 1 Total | $ | 163,753,097 | $ | 118,180,393 | $ | 281,933,490 | ||||||
Level 2 | ||||||||||||
Assets | ||||||||||||
Investments in Securities | $ | 7,405,449 | $ | 1,814,111 | $ | 9,219,560 | ||||||
Other Investments* | — | — | — | |||||||||
Liabilities | ||||||||||||
Investments in Securities | — | — | — | |||||||||
Other Investments* | — | — | — | |||||||||
Level 2 Total | $ | 7,405,449 | $ | 1,814,111 | $ | 9,219,560 | ||||||
Level 3 | ||||||||||||
Assets | ||||||||||||
Investments in Securities | — | — | — | |||||||||
Other Investments* | — | — | — | |||||||||
Liabilities | ||||||||||||
Investments in Securities | — | — | — | |||||||||
Other Investments* | — | — | — | |||||||||
Level 3 Total | — | — | — | |||||||||
Total | $ | 171,158,546 | $ | 119,994,504 | $ | 291,153,050 | ||||||
| * | Other investments are derivative instruments, such as futures, forwards and written options, which are valued at the unrealized appreciation/deprecation on the investment. |
| EQ/Lord Abbett Growth and Income | EQ/Large Cap Value Index | Combined Pro Forma | ||||||||||
Cost of Purchases: | ||||||||||||
Stocks and long-term corporate debt securities | $ | 43,575,161 | $ | 37,806,693 | $ | 81,381,854 | ||||||
Net Proceeds of Sales and Redemptions: | ||||||||||||
Stocks and long-term corporate debt securities | $ | 31,967,665 | $ | 33,079,161 | $ | 65,046,826 | ||||||
Fair Values of Derivative Instruments as of June 30, 2010:
Statement of Assets and Liabilities | ||||||||||||||
Derivatives Not Accounted for as | Asset Derivatives | Fair Value | ||||||||||||
| EQ/Lord Abbett Growth and Income | EQ/Large Cap Value Index | Combined Pro Forma | ||||||||||||
Interest rate contracts | Receivables, Net Assets - Unrealized appreciation | $ | — | $ | — | $ | — | * | ||||||
Foreign exchange contracts | Receivables | — | — | — | ||||||||||
Credit contracts | Receivables | — | — | — | ||||||||||
Equity contracts | Receivables, Net Assets - Unrealized appreciation | — | — | — | * | |||||||||
Commodity contracts | Receivables | — | — | — | ||||||||||
Other contracts | Receivables | — | — | — | ||||||||||
Total | $ | — | $ | — | $ | — | ||||||||
Statement of Assets and Liabilities | ||||||||||||||
Derivatives Not Accounted for as | Liability Derivatives | Fair Value | ||||||||||||
| EQ/Lord Abbett Growth and Income | EQ/Large Cap Value Index | Combined Pro Forma | ||||||||||||
Interest rate contracts | Receivables, Net Assets - Unrealized depreciation | $ | — | $ | — | $ | — | * | ||||||
Foreign exchange contracts | Receivables | — | — | — | ||||||||||
Credit contracts | Receivables | — | — | — | ||||||||||
Equity contracts | Receivables, Net Assets - Unrealized depreciation | — | (99,752 | ) | (99,752 | )* | ||||||||
Commodity contracts | Receivables | — | — | — | ||||||||||
Other contracts | Receivables | — | — | — | ||||||||||
Total | $ | — | $ | (99,752 | ) | $ | (99,752 | ) | ||||||
| * | Includes cumulative appreciation/depreciation of futures contracts as reported in Portfolio of Investments. Only current day’s variation margin is reported within the Statement of Assets & Liabilities. |
The Effect of Derivative Instruments on the Statement of Operations for the twelve months ended June 30, 2010:
Amount of Realized Gain or (Loss) on Derivatives Recognized in Income | ||||||||||||||||||||||||||||||||||||||||||||||||||||||||||||
Derivatives Not Accounted | Options | Futures | Forward Currency Contracts | Swaps | Total | |||||||||||||||||||||||||||||||||||||||||||||||||||||||
| EQ/ Lord Abbett Growth and Income | EQ/ Large Cap Value Index | Combined Pro Forma | EQ/ Lord Abbett Growth and Income | EQ/Large Cap Value Index | Combined Pro Forma | EQ/ Lord Abbett Growth and Income | EQ/ Large Cap Value Index | Combined Pro Forma | EQ/ Lord Abbett Growth and Income | EQ/ Large Cap Value Index | Combined Pro Forma | EQ/ Lord Abbett Growth and Income | EQ/Large Cap Value Index | Combined Pro Forma | ||||||||||||||||||||||||||||||||||||||||||||||
Interest rate contracts | $ | — | $ | — | $ | — | $ | — | $ | — | $ | — | $ | — | $ | — | $ | — | $ | — | $ | — | $ | — | $ | — | $ | — | $ | — | ||||||||||||||||||||||||||||||
Foreign exchange contracts | — | — | — | — | — | — | — | — | — | — | — | — | — | — | — | |||||||||||||||||||||||||||||||||||||||||||||
Credit contracts | — | — | — | — | — | — | — | — | — | — | — | — | — | — | — | |||||||||||||||||||||||||||||||||||||||||||||
Equity contracts | — | — | — | — | 2,359,449 | 2,359,449 | — | — | — | — | — | — | — | 2,359,449 | 2,359,449 | |||||||||||||||||||||||||||||||||||||||||||||
Commodity contracts | — | — | — | — | — | — | — | — | — | — | — | — | — | — | — | |||||||||||||||||||||||||||||||||||||||||||||
Other contracts | — | — | — | — | — | — | — | — | — | — | — | — | — | — | — | |||||||||||||||||||||||||||||||||||||||||||||
Total | $ | — | $ | — | $ | — | $ | — | $ | 2,359,449 | $ | 2,359,449 | $ | — | $ | — | $ | — | $ | — | $ | — | $ | — | $ | — | $ | 2,359,449 | $ | 2,359,449 | ||||||||||||||||||||||||||||||
Amount of Unrealized Appreciation or (Depreciation) on Derivatives Recognized in Income | ||||||||||||||||||||||||||||||||||||
Derivatives Not Accounted for as Hedging Instruments^ | Options | Futures | Forward Currency Contracts | |||||||||||||||||||||||||||||||||
| EQ/ Lord Abbett Growth and Income | EQ/ Large Cap Value Index | Combined Pro Forma | EQ/ Lord Abbett Growth and Income | EQ/ Large Cap Value Index | Combined Pro Forma | EQ/ Lord Abbett Growth and Income | EQ/ Large Cap Value Index | Combined Pro Forma | ||||||||||||||||||||||||||||
Interest rate contracts | $ | — | $ | — | $ | — | $ | — | $ | — | $ | — | $ | — | $ | — | $ | — | ||||||||||||||||||
Foreign exchange contracts | — | — | — | — | — | — | — | — | — | |||||||||||||||||||||||||||
Credit contracts | — | — | — | — | — | — | — | — | — | |||||||||||||||||||||||||||
Equity contracts | — | — | — | — | (27,363 | ) | (27,363 | ) | — | — | — | |||||||||||||||||||||||||
Commodity contracts | — | — | — | — | — | — | — | — | — | |||||||||||||||||||||||||||
Other contracts | — | — | — | — | — | — | — | — | — | |||||||||||||||||||||||||||
Total | $ | — | $ | — | $ | — | $ | — | $ | (27,363 | ) | $ | (27,363 | ) | $ | — | $ | — | $ | — | ||||||||||||||||
| ^ | This Portfolio held futures contracts to gain or reduce exposure to the financial markets. |
| EQ/Lord Abbett Growth and Income | EQ/Large Cap Value Index | Adjustment | TOTAL | |||||||||||||
STATEMENT OF ASSETS AND LIABILITIES | ||||||||||||||||
June 30, 2010 (Unaudited) | ||||||||||||||||
(Investments at Cost) | $ | 169,670,104 | $ | 118,805,637 | $ | 288,475,741 | ||||||||||
ASSETS | ||||||||||||||||
Investments at value | $ | 171,158,546 | $ | 120,094,256 | $ | 291,252,802 | ||||||||||
Cash | — | 20,910 | 20,910 | |||||||||||||
Receivable from Separate Accounts for Trust shares sold | 657,994 | 583,384 | 1,241,378 | |||||||||||||
Receivable for securities sold | 499,997 | — | 499,997 | |||||||||||||
Dividends, interest, and other receivables | 91,208 | 173,929 | 265,137 | |||||||||||||
Other assets | 2,702 | 1,297 | 3,999 | |||||||||||||
Total assets | 172,410,447 | 120,873,776 | — | 293,284,223 | ||||||||||||
LIABILITIES | ||||||||||||||||
Payable for securities purchased | 488,817 | 81,870 | 570,687 | |||||||||||||
Payable to Separate Accounts for Trust shares redeemed | 235,721 | 14,756 | 250,477 | |||||||||||||
Investment management fees payable | 87,277 | 36,265 | 123,542 | |||||||||||||
Distribution fees payable- Class IB | 30,718 | 25,355 | 56,073 | |||||||||||||
Administrative fees payable | 17,464 | 13,071 | 30,535 | |||||||||||||
Variation margin payable on futures contracts | — | 16,080 | 16,080 | |||||||||||||
Trustees’ fees payable | 656 | 604 | 1,260 | |||||||||||||
Accrued expenses | 62,401 | 73,657 | 136,058 | |||||||||||||
Total liabilities | 923,054 | 261,658 | — | 1,184,712 | ||||||||||||
NET ASSETS | $ | 171,487,393 | $ | 120,612,118 | $ | — | $ | 292,099,511 | ||||||||
Net assets were comprised of: | ||||||||||||||||
Paid in capital | $ | 229,213,597 | $ | 177,289,041 | $ | 406,502,638 | ||||||||||
Accumulated undistributed net investment income (loss) | 479,794 | 939,555 | 1,419,349 | |||||||||||||
Accumulated undistributed net realized gain (loss) on investments and futures | (59,694,440 | ) | (58,805,345 | ) | (118,499,785 | ) | ||||||||||
Net Unrealized appreciation (depreciation) on investments and futures and foreign currency translations | 1,488,442 | 1,188,867 | 2,677,309 | |||||||||||||
Net Assets | $ | 171,487,393 | $ | 120,612,118 | $ | — | $ | 292,099,511 | ||||||||
Class IA Shares: | ||||||||||||||||
Net Assets | 27,431,594 | 2,837,528 | 30,269,122 | |||||||||||||
Shares outstanding | 3,262,539 | 643,649 | 2,959,891 | * | 6,866,079 | |||||||||||
Net asset value, offering and redemption price per share | $ | 8.41 | $ | 4.41 | $ | 4.41 | ||||||||||
Class IB Shares: | ||||||||||||||||
Net Assets | 144,055,799 | 117,774,590 | 261,830,389 | |||||||||||||
Shares outstanding | 17,133,227 | 26,827,888 | 15,681,261 | * | 59,642,376 | |||||||||||
Net asset value, offering and redemption price per share | $ | 8.41 | $ | 4.39 | $ | 4.39 | ||||||||||
| * | Reflects new shares issued of the Acquiring Portfolio |
STATEMENT OF OPERATIONS
For the Twelve Months Ended June 30, 2010 (Unaudited) | EQ/Lord Abbett Growth and Income | EQ/Large Cap Value Index | Adjustment | TOTAL | ||||||||||||
(Foreign withholding tax) | $ | 6,044 | $ | — | $ | 6,044 | ||||||||||
INVESTMENT INCOME | ||||||||||||||||
Dividends | 2,438,175 | 7,770,796 | 10,208,971 | |||||||||||||
Interest | (17 | ) | 747 | 730 | ||||||||||||
Total income | 2,438,158 | 7,771,543 | — | 10,209,701 | ||||||||||||
EXPENSES | ||||||||||||||||
Investment management fees | 1,104,193 | 1,153,960 | (1,104,553 | )(b) | 1,153,600 | |||||||||||
Distribution fees - Class IB | 347,718 | 303,713 | 651,431 | |||||||||||||
Administrative fees | 203,996 | 368,113 | (205,917 | )(b) | 366,192 | |||||||||||
Custodian fees | 2,218 | 112,205 | (39,423 | )(a) | 75,000 | |||||||||||
Professional fees | 14,575 | 23,816 | (8,391 | )(a) | 30,000 | |||||||||||
Printing and mailing expenses | 31,778 | 104,797 | (85,575 | )(e)(f) | 51,000 | |||||||||||
Trustees’ fees | 3,986 | 11,647 | 15,633 | |||||||||||||
Miscellaneous | 9,258 | 18,474 | (10,732 | )(a) | 17,000 | |||||||||||
Gross expenses | 1,717,722 | 2,096,725 | (1,454,591 | ) | 2,359,856 | |||||||||||
Less: Waiver from investment advisor | (95,501 | ) | — | 95,501 | (d) | — | ||||||||||
Fees paid indirectly | (23,028 | ) | (46,520 | ) | 23,028 | (c) | (46,520 | ) | ||||||||
Net expenses | 1,599,193 | 2,050,205 | (1,336,062 | ) | 2,313,336 | |||||||||||
NET INVESTMENT INCOME (LOSS) | 838,965 | 5,721,338 | 1,336,062 | 7,896,365 | ||||||||||||
REALIZED AND UNREALIZED GAIN (LOSS) | ||||||||||||||||
Realized gain (loss) on: | ||||||||||||||||
Securities | 2,808,058 | 210,121,716 | 212,929,774 | |||||||||||||
Futures | — | 2,359,449 | 2,359,449 | |||||||||||||
Net realized gain (loss) | 2,808,058 | 212,481,165 | — | 215,289,223 | ||||||||||||
Change in unrealized appreciation (depreciation) on: | ||||||||||||||||
Securities | 13,625,864 | (57,710,045 | ) | (44,084,181 | ) | |||||||||||
Futures | — | (27,363 | ) | (27,363 | ) | |||||||||||
Net change in unrealized appreciation (depreciation) | 13,625,864 | (57,737,408 | ) | — | (44,111,544 | ) | ||||||||||
NET REALIZED AND UNREALIZED GAIN (LOSS) | 16,433,922 | 154,743,757 | — | 171,177,679 | ||||||||||||
NET INCREASE (DECREASE) IN NET ASSETS RESULTING FROM OPERATIONS | $ | 17,272,887 | $ | 160,465,095 | $ | 1,336,062 | $ | 179,074,044 | ||||||||
(a) Reflects adjustment in expenses due to elimination of duplicative expenses.
(b) Reflects adjustment in expenses due to effects of new contract rate.
(c) Reflects adjustment to eliminate EQ/Lord Abbett Growth and Income’s fees paid indirectly.
(d) Reflects decrease in waiver due to expense adjustment.
(e) Reflects adjustment due to reduced shareholder fees in 2010 due to mailing of CDs.
(f) Reflects adjustment due to proxy costs associated with the reorganization.
NOTES TO PRO FORMA FINANCIAL STATEMENTS
(UNAUDITED - As of June 30, 2010)
NOTE 1 – BASIS OF COMBINATION:
On December 7-8, 2010 the Board of Trustees of EQ Advisors Trust (the “Trust”) approved a proposed Plan of Reorganization and Termination (“Reorganization Plan”) that provides for the transfer of all of the assets of the EQ/Lord Abbett Growth and Income Portfolio (“Growth and Income Portfolio”) to the EQ/Large Cap Value Index Portfolio (“LC Value Index Portfolio”), each a series of the Trust, and the assumption by the LC Value Index Portfolio of all of the liabilities of the Growth and Income Portfolio in exchange for shares of the LC Value Index Portfolio having an aggregate value equal to the net assets of the Growth and Income Portfolio, the distribution of the LC Value Index Portfolio shares to the Growth and Income Portfolio shareholders of record determined immediately after the close of business on the closing date, and the subsequent liquidation of the Growth and Income Portfolio.
The Growth and Income Portfolio’s annual contractual management fee equals 0.650% of average daily net assets for the first $1 billion, 0.600% of average daily net assets for the next $1 billion, 0.575% for the next $3 billion, 0.550% for the next $5 billion, and 0.525% of average daily net assets thereafter. The LC Value Index Portfolio’s annual contractual management fee rate equals 0.35% of average daily net assets. The Reorganization Plan is subject to the approval of the Growth and Income Portfolio’s shareholders. A special meeting of shareholders of the Growth and Income Portfolio will be held on or about April 20, 2011.
The Reorganization will be accounted for as a tax-free reorganization of investment companies. The unaudited pro forma combined financial statements are presented for the information of the reader and may not necessarily be representative of what the actual combined financial statements would have been had the Reorganization occurred at June 30, 2010. The unaudited pro forma portfolio of investments and statement of assets and liabilities reflect the financial position of the Growth and Income Portfolio and the LC Value Index Portfolio at June 30, 2010. The unaudited pro forma statement of operations reflects the results of operations of the LC Value Index Portfolio as if it had acquired the Growth and Income Portfolio at the beginning of the 12 month period ended June 30, 2010. These statements have been derived from the Portfolios’ respective books and records utilized in calculating daily net asset value at the dates indicated above for each Portfolio under accounting principles generally accepted in the United States of America. The historical cost of investment securities will be carried forward to the surviving entity and results of operations of the LC Value Index Portfolio for pre-combination periods will not be restated.
The unaudited pro forma portfolio of investments and statements of assets and liabilities and operations should be read in conjunction with the historical financial statements of the Portfolios included in the Trust’s Statement of Additional Information. The preparation of financial statements in accordance with accounting principles
NOTES TO PRO FORMA FINANCIAL STATEMENTS—(Continued)
(UNAUDITED - As of June 30, 2010)
generally accepted in the United States of America requires management to make estimates and assumptions that affect the reported amounts and disclosures. Actual results could differ from those estimated.
Following the Reorganization, the LC Value Index Portfolio will be the “accounting survivor.” The general criteria that are applied to determine the proper accounting survivor are outlined in the “AICPA Accounting and Audit Guide for Investment Companies.” The legal survivor normally is considered the accounting survivor of a reorganization. In this case, the LC Value Index Portfolio is the legal survivor. Other criteria include:
| a.) | Portfolio Management – The merged entity will be managed by the Manager, Adviser and portfolio managers to the LC Value Index Portfolio in a manner consistent with the current management style. |
| b.) | Portfolio Composition – The merged entity’s investments are anticipated to be wholly composed of securities currently held by the LC Value Index Portfolio. |
| c.) | Investment Objective, Policies and Restrictions – The merged entity’s investment objective, policies and fundamental and non-fundamental investment restrictions will be the same as the LC Value Index Portfolio’s current investment objective, policies and fundamental and non-fundamental investment restrictions. |
| d.) | Expense Structure and Expense Ratios – The merged entity’s expense structure will be the same as that of the LC Value Index Portfolio. The expense ratio of the merged entity will closely resemble that of LC Value Index Portfolio and will be lower than that of the Growth and Income Portfolio. |
| e.) | Asset Size – The asset sizes of the LC Value Index Portfolio and the Growth and Income Portfolio are comparable. Although the Growth and Income Portfolio is somewhat larger than the LC Value Index Portfolio, it will not be a dominant portion of the merged entity. |
NOTE 2 – SIGNIFICANT ACCOUNTING POLICIES:
Each of the Portfolios has substantially the same significant accounting policies, which are detailed in the historical financial statements referenced above in Note 1.
The preparation of financial statements in accordance with accounting principles generally accepted in the United States of America requires management to make estimates and assumptions that affect the reported amounts and disclosures. Actual results could differ from those estimates.
NOTES TO PRO FORMA FINANCIAL STATEMENTS—(Continued)
(UNAUDITED - As of June 30, 2010)
NOTE 3 – SHARES:
The unaudited pro forma net asset value per share assumes additional common shares of beneficial interest issued in connection with the proposed acquisition of the Growth and Income Portfolio by the LC Value Index Portfolio as of June 30, 2010. The number of additional shares issued was calculated based on the net assets of the Growth and Income Portfolio and net asset value of the LC Value Index Portfolio at June 30, 2010.
NOTE 4 – UNAUDITED PRO FORMA ADJUSTMENTS:
The accompanying unaudited pro forma financial statements reflect changes in the LC Value Index Portfolio’s shares as if the merger had taken place on June 30, 2010. The Growth and Income Portfolio will bear the expenses of the Reorganization (i.e., the costs associated with preparing, printing and distributing the prospectus and proxy materials, legal and accounting fees in connection with the Reorganization, and expenses of holding the shareholders meeting) up to $36,000 and AXA Equitable will bear the remaining expenses, which are estimated at approximately $95,000.
PART C
OTHER INFORMATION
| Item 15. | Indemnification |
Registrant’s Amended and Restated Agreement and Declaration of Trust (“Declaration of Trust”) and By-Laws.
Article VII, Section 2 of the Declaration of Trust of EQ Advisors Trust (“Trust”) states, in relevant part, that a “Trustee, when acting in such capacity, shall not be personally liable to any Person, other than the Trust or a Shareholder to the extent provided in this Article VII, for any act, omission or obligation of the Trust, of such Trustee or of any other Trustee. The Trustees shall not be responsible or liable in any event for any neglect or wrongdoing of any officer, agent, employee, Manager, or Principal Underwriter of the Trust. The Trust shall indemnify each Person who is serving or has served at the Trust’s request as a director, officer, trustee, employee, or agent of another organization in which the Trust has any interest as a shareholder, creditor, or otherwise to the extent and in the manner provided in the By-Laws.” Article VII, Section 4 of the Trust’s Declaration of Trust further states, in relevant part, that the “Trustees shall be entitled and empowered to the fullest extent permitted by law to purchase with Trust assets insurance for liability and for all expenses reasonably incurred or paid or expected to be paid by a Trustee, officer, employee, or agent of the Trust in connection with any claim, action, suit, or proceeding in which he or she may become involved by virtue of his or her capacity or former capacity as a Trustee of the Trust.”
Article VI, Section 2 of the Trust’s By-Laws states, in relevant part, that “[s]ubject to the exceptions and limitations contained in Section 3 of this Article VI, every [Trustee, officer, employee or other agent of the Trust] shall be indemnified by the Trust to the fullest extent permitted by law against all liabilities and against all expenses reasonably incurred or paid by him or her in connection with any proceeding in which he or she becomes involved as a party or otherwise by virtue of his or her being or having been an agent.” Article VI, Section 3 of the Trust’s By-Laws further states, in relevant part, that “[n]o indemnification shall be provided hereunder to [a Trustee, officer, employee or other agent of the Trust]: (a) who shall have been adjudicated, by the court or other body before which the proceeding was brought, to be liable to the Trust or its Shareholders by reason of willful misfeasance, bad faith, gross negligence or reckless disregard of the duties involved in the conduct of his or her office (collectively, “disabling conduct”); or (b) with respect to any proceeding disposed of (whether by settlement, pursuant to a consent decree or otherwise) without an adjudication by the court or other body before which the proceeding was brought that such [Trustee, officer, employee or other agent of the Trust] was liable to the Trust or its Shareholders by reason of disabling conduct, unless there has been a determination that such [Trustee, officer, employee or other agent of the Trust] did not engage in disabling conduct: (i) by the court or other body before which the proceeding was brought; (ii) by at least a majority of those Trustees who are neither Interested Persons of the Trust nor are parties to the proceeding based upon a review of readily available facts (as opposed to a full trial-type inquiry); or (iii) by written opinion of independent legal counsel based upon a review of readily available facts (as opposed to a full trial-type inquiry); provided, however, that indemnification shall be provided hereunder to [a Trustee, officer, employee or other agent of the Trust] with respect to any proceeding in the event of (1) a final decision on the merits by the court or other body before which the proceeding was brought that the [Trustee, officer, employee or other agent of the Trust] was not liable by reason of disabling conduct, or (2) the dismissal of the proceeding by the court or other body before which it was brought for insufficiency of evidence of any disabling conduct with which such [Trustee, officer, employee or other agent of the Trust] has been charged.” Article VI, Section 4 of the Trust’s By-Laws also states that the “rights of indemnification herein provided (i) may be insured against by policies maintained by the Trust on behalf of any [Trustee, officer, employee or other agent of the Trust], (ii) shall be severable, (iii) shall not be exclusive of or affect any other rights to which any [Trustee, officer, employee or other agent of the Trust] may now or hereafter be entitled and (iv) shall inure to the benefit of [such party’s] heirs, executors and administrators.”
Registrant’s Investment Management Agreements state:
Limitations on Liability. Manager will exercise its best judgment in rendering its services to the Trust, and the Trust agrees, as an inducement to Manager’s undertaking to do so, that the Manager will not be liable for any error of judgment or mistake of law or for any loss suffered by the Trust in connection with the matters to which this Agreement relates, but will be liable only for willful misconduct, bad faith, gross negligence, reckless disregard of
C-1
its duties or its failure to exercise due care in rendering its services to the Trust as specified in this Agreement. Any person, even though an officer, director, employee or agent of Manager, who may be or become an officer, Trustee, employee or agent of the Trust, shall be deemed, when rendering services to the Trust or when acting on any business of the Trust, to be rendering such services to or to be acting solely for the Trust and not as an officer, director, employee or agent, or one under the control or direction of Manager, even though paid by it.
Sections 5(a) and 5(b) of certain of the Registrant’s Investment Advisory Agreements state:
5. LIABILITY AND INDEMNIFICATION
(a) Except as may otherwise be provided by the Investment Company Act or any other federal securities law, neither the Adviser nor any of its officers, members or employees (its “Affliates”) shall be liable for any losses, claims, damages, liabilities or litigation (including legal and other expenses) incurred or suffered by the Manager or the Trust as a result of any error of judgment or mistake of law by the Adviser or its Affiliates with respect to the services provided to the Portfolio, except that nothing in this Agreement shall operate or purport to operate in any way to exculpate, waive or limit the liability of the Adviser or its Affiliates for, and the Adviser shall indemnify and hold harmless the Trust, the Manager, all affiliated persons thereof (within the meaning of Section 2(a)(3) of the Investment Company Act) and all controlling persons (as described in Section 15 of the Securities Act of 1933, as amended (“1933 Act”)) (collectively, “Manager Indemnitees”) against any and all losses, claims, damages, liabilities or litigation (including reasonable legal and other expenses) to which any of the Manager Indemnitees may become subject under the 1933 Act, the Investment Company Act, the Advisers Act, or under any other statute, at common law or otherwise arising out of or based on (i) any willful misconduct, bad faith, reckless disregard or gross negligence of the Adviser in the performance of any of its duties or obligations hereunder or (ii) any untrue statement of a material fact contained in the Prospectus and SAI, proxy materials, reports, advertisements, sales literature, or other materials pertaining to the Portfolio or the omission to state therein a material fact known to the Adviser which was required to be stated therein or necessary to make the statements therein not misleading, if such statement or omission was made in reliance upon information furnished to the Manager or the Trust by the Adviser Indemnitees (as defined below) for use therein.
(b) Except as may otherwise be provided by the Investment Company Act or any other federal securities law, the Manager and the Trust shall not be liable for any losses, claims, damages, liabilities or litigation (including reasonable legal and other expenses) incurred or suffered by the Adviser as a result of any error of judgment or mistake of law by the Manager with respect to the Portfolio, except that nothing in this Agreement shall operate or purport to operate in any way to exculpate, waive or limit the liability of the Manager for, and the Manager shall indemnify and hold harmless the Adviser, all affiliated persons thereof (within the meaning of Section 2(a)(3) of the Investment Company Act) and all controlling persons (as described in Section 15 of the 1933 Act) (collectively, “Adviser Indemnitees”) against any and all losses, claims, damages, liabilities or litigation (including reasonable legal and other expenses) to which any of the Adviser Indemnities may become subject under the 1933 Act, the Investment Company Act, the Advisers Act, or under any other statute, at common law or otherwise arising out of or based on (i) any willful misconduct, bad faith, reckless disregard or gross negligence of the Manager in the performance of any of its duties or obligations hereunder or (ii) any untrue statement of a material fact contained in the Prospectus and SAI, proxy materials, reports, advertisements, sales literature, or other materials pertaining to the Portfolio or the omission to state therein a material fact known to the Manager which was required to be stated therein or necessary to make the statements therein not misleading, unless such statement or omission was made in reliance upon information furnished to the Manager or the Trust by the Adviser Indemnitees for use therein.
Section 14 of each of the Registrant’s Distribution Agreements states:
The Trust shall indemnify and hold harmless [the Distributor] from any and all losses, claims, damages or liabilities (or actions in respect thereof) to which [the Distributor] may be subject, insofar as such losses, claims, damages or liabilities (or actions in respect thereof) arise out of or result from negligent, improper, fraudulent or unauthorized acts or omissions by the Trust or its officers, trustees, agents or representatives, other than acts or omissions caused directly or indirectly by [the Distributor].
[The Distributor] will indemnify and hold harmless the Trust, its officers, trustees, agents and representatives against any losses, claims, damages or liabilities, to which the Trust, its officers, trustees, agents and representatives may
C-2
become subject, insofar as such losses, claims, damages or liabilities (or actions in respect thereof) arise out of or are based upon: (i) any untrue statement or alleged untrue statement of any material fact contained in the Trust Prospectus and/or SAI or any supplements thereto; (ii) the omission or alleged omission to state any material fact required to be stated in the Trust Prospectus and/or SAI or any supplements thereto or necessary to make the statements therein not misleading; or (iii) other misconduct or negligence of [the Distributor] in its capacity as a principal underwriter of the Trust’s Class [IA and/or IB] shares and will reimburse the Trust, its officers, Trustees, agents and representatives for any legal or other expenses reasonably incurred by any of them in connection with investigating or defending against such loss, claim, damage, liability or action; provided, however, that [the Distributor] shall not be liable in any such instance to the extent that any such loss, claim, damage or liability arises out of or is based upon an untrue statement or alleged untrue statement or omission or alleged omission made in the Trust Prospectus and/or SAI or any supplement in good faith reliance upon and in conformity with written information furnished by the Preparing Parties specifically for use in the preparation of the Trust Prospectus and/or SAI.
Section 6 of the Registrant’s Mutual Funds Service Agreement states:
(a) [AXA Equitable Life Insurance Co. (“Equitable”)] shall not be liable for any error of judgment or mistake of law or for any loss or expense suffered by the Trust, in connection with the matters to which this Agreement relates, except for a loss or expense caused by or resulting from or attributable to willful misfeasance, bad faith or negligence on Equitable’s part (or on the part of any third party to whom Equitable has delegated any of its duties and obligations pursuant to Section 4(c) hereunder) in the performance of its (or such third party’s) duties or from reckless disregard by Equitable (or by such third party) of its obligations and duties under this Agreement (in the case of Equitable) or under an agreement with Equitable (in the case of such third party) or, subject to Section 10 below, Equitable’s (or such third party’s) refusal or failure to comply with the terms of this Agreement (in the case of Equitable) or an agreement with Equitable (in the case of such third party) or its breach of any representation or warranty under this Agreement (in the case of Equitable) or under an agreement with Equitable (in the case of such third party). In no event shall Equitable (or such third party) be liable for any indirect, incidental special or consequential losses or damages of any kind whatsoever (including but not limited to lost profits), even if Equitable (or such third party) has been advised of the likelihood of such loss or damage and regardless of the form of action.
(b) Except to the extent that Equitable may be held liable pursuant to Section 6(a) above, Equitable shall not be responsible for, and the Trust shall indemnify and hold Equitable harmless from and against any and all losses, damages, costs, reasonable attorneys’ fees and expenses, payments, expenses and liabilities, including but not limited to those arising out of or attributable to:
| (i) | any and all actions of Equitable or its officers or agents required to be taken pursuant to this Agreement; |
| (ii) | the reliance on or use by Equitable or its officers or agents of information, records, or documents which are received by Equitable or its officers or agents and furnished to it or them by or on behalf of the Trust, and which have been prepared or maintained by the Trust or any third party on behalf of the Trust; |
| (iii) | the Trust’s refusal or failure to comply with the terms of this Agreement or the Trust’s lack of good faith, or its actions, or lack thereof, involving negligence or willful misfeasance; |
| (iv) | the breach of any representation or warranty of the Trust hereunder; |
| (v) | the reliance on or the carrying out by Equitable or its officers or agents of any proper instructions reasonably believed to be duly authorized, or requests of the Trust; |
| (vi) | any delays, inaccuracies, errors in or omissions from information or data provided to Equitable by data services, including data services providing information in connection with any third party computer system licensed to Equitable, and by any corporate action services, pricing services or securities brokers and dealers; |
C-3
| (vii) | the offer or sale of shares by the Trust in violation of any requirement under the Federal securities laws or regulations or the securities laws or regulations of any state, or in violation of any stop order or other determination or ruling by any Federal agency or any state agency with respect to the offer or sale of such shares in such state (1) resulting from activities, actions, or omissions by the Trust or its other service providers and agents, or (2) existing or arising out of activities, actions or omissions by or on behalf of the Trust prior to the effective date of this Agreement; |
| (viii) | any failure of the Trust’s registration statement to comply with the 1933 Act and the 1940 Act (including the rules and regulations thereunder) and any other applicable laws, or any untrue statement of a material fact or omission of a material fact necessary to make any statement therein not misleading in a Trust’s prospectus; |
| (ix) | except as provided for in Schedule B.III, the actions taken by the Trust, its Manager, its investment advisers, and its distributor in compliance with applicable securities, tax, commodities and other laws, rules and regulations, or the failure to so comply, and |
| (x) | all actions, inactions, omissions, or errors caused by third parties to whom Equitable or the Trust has assigned any rights and/or delegated any duties under this Agreement at the specific request of or as required by the Trust, its Funds, investment advisers, or Trust distributors. |
The Trust shall not be liable for any indirect, incidental, special or consequential losses or damages of any kind whatsoever (including but not limited to lost profits) even if the Trust has been advised of the likelihood of such loss or damage and regardless of the form of action, except when the Trust is required to indemnify Equitable pursuant to this Agreement.
Section 12(a)(iv) of the Registrant’s Global Custody Agreement states:
(A) Customer shall indemnify and hold Bank and its directors, officers, agents and employees (collectively the “Indemnitees”) harmless from and against any and all claims, liabilities, losses, damages, fines, penalties, and expenses, including out-of-pocket and incidental expenses and legal fees (“Losses”) that may be incurred by, or asserted against, the Indemnitees or any of them for following any instructions or other directions upon which Bank is authorized to rely pursuant to the terms of this Agreement. (B) In addition to and not in limitation of the preceding subparagraph, Customer shall also indemnify and hold the Indemnitees and each of them harmless from and against any and all Losses that may be incurred by, or asserted against, the Indemnitees or any of them in connection with or arising out of Bank’s performance under this Agreement, provided the Indemnitees have not acted with negligence or engaged in willful misconduct. (C) In performing its obligations hereunder, Bank may rely on the genuineness of any document which it reasonably believes in good faith to have been validly executed.
Article VIII of the Registrant’s Amended and Restated Participation Agreement states:
8.1(a). [AXA Equitable Life Insurance Company (for the purposes of this Article, “Equitable”] agrees to indemnify and hold harmless the Trust, each member of the Board, the Distributors, and the directors and officers and each person, if any, who controls any such person within the meaning of Section 15 of the 1933 Act (collectively, the “Indemnified Parties” for purposes of this Section 8.1) against any and all losses, claims, damages, liabilities (including amounts paid in settlement with the written consent of Equitable), investigation of claims or litigation (including legal and other expenses), to which the Indemnified Parties may become subject under any statute, regulation, at common law or otherwise, insofar as such losses, claims, damages, liabilities or expenses (or actions in respect thereof) or settlements are related to the sale or acquisition of the Trust’s shares or the Equitable Contracts or interests in the Accounts and:
(i) arise out of or are based upon any untrue statements or alleged untrue statements of any material fact contained in the registration statement, prospectus, or Statement of Additional Information for the Equitable Contracts or contained in the Equitable Contracts or sales literature for the Equitable Contracts (or any amendment or supplement to any of the foregoing), or arise out of or are based upon the omission or the alleged omission to state therein a material fact required to be stated therein or necessary to make the statements therein not misleading, provided that this agreement to indemnify shall not apply as to any Indemnified Party if such statement or omission
C-4
or such alleged statement or omission was made in reliance upon and in conformity with information furnished to Equitable by or on behalf of the Trust for use in the registration statement, prospectus, or Statement of Additional Information for the Equitable Contracts or in the Equitable Contracts or sales literature (or any amendment or supplement) or otherwise for use in connection with the sale of the Equitable Contracts or Trust shares; or
(ii) arise out of or as a result of statements or representations (other than statements or representations contained in the Registration Statement, prospectus or Statement of Additional Information, or sales literature of the Trust not supplied by Equitable or persons under its control) or wrongful conduct of Equitable or persons under its control, with respect to the sale or distribution of the Equitable Contracts or Trust shares; or
(iii) arise out of any untrue statement or alleged untrue statement of a material fact contained in a Registration Statement, prospectus, or Statement of Additional Information, or sales literature of the Trust or any amendment thereof or supplement thereto or the omission or alleged omission to state therein a material fact required to be stated therein or necessary to make the statements therein not misleading if such a statement or omission was made in reliance upon information furnished to the Trust by or on behalf of Equitable; or
(iv) arise as a result of any failure by Equitable to provide the services and furnish the materials required to be provided or furnished by it under the terms of this Agreement; or
(v) arise out of or result from any material breach of any representation and/or warranty made by Equitable in this Agreement or arise out of or result from any other material breach of this Agreement by Equitable; as limited by and in accordance with the provisions of Sections 8.1(b) and 8.1(c) hereof…
8.2(a). Each of the Distributors agrees to indemnify and hold harmless Equitable, and the Trust and each of their directors and officers and each person, if any, who controls Equitable within the meaning of Section 15 of the 1933 Act (collectively, the “Indemnified Parties” for purposes of this Section 8.2) against any and all losses, claims, damages, liabilities (including amounts paid in settlement with the written consent of the Distributors), investigation of claims or litigation (including legal and other expenses) to which the Indemnified Parties may become subject under any statute, regulation, at common law or otherwise, insofar as such losses, claims, damages, liabilities or expenses (or actions in respect thereof) or settlements are related to the sale or acquisition of the Trust’s shares or the Equitable Contracts or interests in the Accounts and:
(i) arise out of or are based upon any untrue statement or alleged untrue statement of any material fact contained in the Registration Statement, prospectus or Statement of Additional Information, or sales literature of the Trust (or any amendment or supplement to any of the foregoing), or arise out of or are based upon the omission or the alleged omission to state therein a material fact required to be stated therein or necessary to make the statements therein not misleading, provided that this agreement to indemnify shall not apply as to any Indemnified Party if such statement or omission or such alleged statement or omission was made in reliance upon and in conformity with information furnished to the Distributors or Trust by or on behalf of Equitable for use in the Registration Statement, prospectus, or Statement of Additional Information for the Trust, or in sales literature (or any amendment or supplement) or otherwise for use in connection with the sale of the Equitable Contracts or Trust shares; or
(ii) arise out of or as a result of statements or representations (other than statements or representations contained in the registration statement, prospectus or Statement of Additional Information, or sales literature for the Equitable Contracts not supplied by the Distributors or persons under their control) or wrongful conduct of the Distributors or persons under their control, with respect to the sale or distribution of the Equitable Contracts or Trust shares; or
(iii) arise out of any untrue statement or alleged untrue statement of a material fact contained in a registration statement, prospectus, or Statement of Additional Information or sales literature covering the Equitable Contracts, or any amendment thereof or supplement thereto, or the omission or alleged omission to state therein a material fact required to be stated therein or necessary to make the statement or statements therein not misleading, if such statement or omission was made in reliance upon information furnished to Equitable by or on behalf of the Distributors or the Trust; or
C-5
(iv) arise as a result of any failure by the Distributors or the Trust to provide the services and furnish the materials required to be provided or furnished by the Distributors or the Trust under the terms of this Agreement (including a failure, whether unintentional or in good faith or otherwise, to comply with the diversification or other qualification requirements specified in Article VI of this Agreement); or
(v) arise out of or result from any material breach of any representation and/or warranty made by the Distributors in this Agreement or arise out of or result from any other material breach of this Agreement by the Distributors;
as limited by and in accordance with the provisions of Sections 8.2(b) and 8.2(c) hereof…
8.3(a) The Trust agrees to indemnify and hold harmless Equitable and each of its directors and officers and each person, if any, who controls Equitable within the meaning of Section 15 of the 1933 Act (collectively, the “Indemnified Parties” for purposes of this Section 8.3) against any and all losses, claims, damages, liabilities (including amounts paid in settlement with the written consent of the Trust), investigation of claims or litigation (including legal and other expenses) to which the Indemnified Parties may become subject under any statute, regulation, at common law or otherwise, insofar as such losses, claims, damages, liabilities or expenses (or actions in respect thereof) or settlements result from the gross negligence, bad faith or willful misconduct of the Board or any member thereof, are related to the operations of the Trust and:
(i) arise as a result of any failure by the Trust to provide the services and furnish the materials required to be provided or furnished by it under the terms of this Agreement (including a failure to comply with the diversification and other qualification requirements specified in … this Agreement); or
(ii) arise out of or result from any material breach of any representation and/or warranty made by the Trust in this Agreement or arise out of or result from any other material breach of this Agreement by the Trust;
as limited by and in accordance with the provisions of Sections 8.3(b) and 8.3(c) hereof…
Article VII of the Registrant’s Amended and Restated Retirement Plan Participation Agreement states:
7.1. Indemnification By the Plan. Except as provided to the contrary in Section 7.4 or 7.5 hereof, [AXA Equitable Life Insurance Company (for the purposes of this Article, “Equitable”)] and the Plan shall jointly and severally indemnify and hold harmless the Trust, each member of the Board, the Distributor, the trustees, directors and officers thereof and each person, if any, who controls any such person within the meaning of Section 15 of the 1933 Act (collectively, the “Indemnified Parties” for purposes of this Section 7.1) against any and all losses, claims, damages, liabilities (including amounts paid in settlement with the written consent of Equitable and the Plan), investigation of claims or litigation (including legal and other expenses), to which the Indemnified Parties may become subject under any statute, regulation, at common law or otherwise, insofar as such losses, claims, damages, liabilities or expenses (or actions in respect thereof) or settlements are related to, arise out of or are based upon:
(i) the failure (intentional or otherwise) of the Plan at any time to be or to continue to be a Qualified Plan…;
(ii) the sale or acquisition of the Class IA shares of the Designated Portfolios and (1) arise out of or are based upon any untrue statements or alleged untrue statements of any material fact made by Equitable or the Plan or any person under its control or the omission or the alleged omission to state a material fact required to be stated or necessary to make such statements not misleading, unless such statement or omission or alleged statement or omission was made in reliance upon and in conformity with information furnished by the Trust or the Distributor to Equitable or the Plan for use in connection with the sale or distribution of Class IA shares of the Designated Portfolios; or (2) arise out of or as a result of warranties or representations (other than warranties or representations contained in a Registration Statement, any SEC Disclosure Materials or sales literature of the Trust not supplied by the Plan or persons under its control) or wrongful conduct of Equitable or the Plan or any of such, with respect to the sale or distribution of Class IA shares of the Designated Portfolios; or (3) arise out of any untrue statement or alleged untrue statement of a material fact contained in a Registration Statement, any SEC Disclosure Materials or sales literature of the Trust or the omission or alleged omission to state therein a material fact required to be stated
C-6
therein or necessary to make the statements therein not misleading , but only if such a statement or omission was made in reliance upon information furnished to the Trust or the Distributor by Equitable or the Plan or persons under their control; or
(iii) arise as a result of any failure by the Plan to provide the services or furnish the materials required to be provided or furnished by it under the terms of this Agreement; or
(iv) arise out of or result from any material breach of any representation and/or warranty made by Equitable or the Plan in this Agreement or arise out of or result from any other material breach of this Agreement by Equitable or the Plan.
7.2. Indemnification by the Distributor. Except as provided to the contrary in Section 7.4 or 7.5 hereof, the Distributor shall indemnify and hold harmless the Plan, its trustees, the Trust, the Board and their officers and each person, if any, who controls the Plan within the meaning of Section 15 of the 1933 Act (collectively, the “Indemnifed Parties” for purposes of this Section 7.2) against any and all losses, claims, damages, liabilities (including amounts paid in settlement with the written consent of the Distributor), investigation of claims or litigation (including legal and other expenses) to which the Indemnified Parties may become subject under any statute, regulation, at common law or otherwise, insofar as such losses, claims, damages, liabilities or expenses (or actions in respect thereof) or settlements are related to, arise out of or are based upon
(i) the sale or acquisition of Class IA shares of the Designated Portfolios by the Plan and (1) arise out of or are based upon any untrue statement or alleged untrue statement of any material fact contained in a Registration Statement, any SEC Disclosure Materials or sales literature of the Trust or arise out of or are based upon the omission or the alleged omission to state therein a material fact required to be stated therein or necessary to make the statements therein not misleading, but only if such statement or omission or such alleged statement or omission was made in reliance upon and in conformity with information furnished by the Distributor to the Trust for use in a Registration Statement, any SEC Disclosure Materials or sales literature of the Trust or otherwise for use in connection with the sale or acquisition of Class IA shares of the Delegated Portfolios by the Plan; or (2) arise out of any untrue statement or alleged untrue statement of a material fact contained in a Registration Statement, any SEC Disclosure Materials or sales literature of the Trust or the omission or alleged omission to state therein a material fact required to be stated therein or necessary to make the statement or statements therein not misleading, but only if such statement or omission was made in reliance upon information furnished to the Plan or the Trust by the Distributor; or
(ii) any failure by the Distributor to provide the services and furnish the materials required to be provided or furnished by the Distributor under the terms of this Agreement; or
(iii) arise out of or result from any material breach of any representation and/or warranty made by the Distributor in this Agreement or arise out of or result from any other material breach of this Agreement by the Distributor.
7.3. Indemnification By the Trust. Except as provided to the contrary in Section 7.4 or 7.5 hereof, the Trust shall indemnify and hold harmless the Plan and each of its trustees and officers, the Distributor, the directors and officers thereof and each person, if any, who controls any such person within the meaning of Section 15 of the 1933 Act (collectively, the “Indemnified Parties” for purposes of this Section 7.3) against any and all losses, claims, damages, liabilities (including amounts paid in settlement with the written consent of the Trust), investigation of claims or litigation (including legal and other expenses) to which the Indemnified Parties may become subject under any statute, regulation, at common law or otherwise, insofar as such losses, claims, damages, liabilities or expenses (or actions in respect thereof) or settlements result from the gross negligence, bad faith or willful misconduct of the Board or any member thereof, are related to, arise out of or are based upon:
(i) any failure by the Trust to provide the services and furnish the materials required to be provided or furnished by it under the terms of this Agreement (including a failure to comply with the diversification and other qualification requirements specified in … this Agreement); or
C-7
(ii) arise out of or result from any material breach of any representation and/or warranty made by the Trust in this Agreement or arise out of or result from any other material breach of this Agreement by the Trust….
| Item 16. | Exhibits |
| (1)(a) | Agreement and Declaration of Trust.1 | |
| (1)(b)(i) | Amended and Restated Agreement and Declaration of Trust.2 | |
| (1)(b)(ii) | Amendment No. 1 to the Amended and Restated Agreement and Declaration of Trust.10 | |
| (1)(b)(iii) | Amendment No. 2 to the Amended and Restated Agreement and Declaration of Trust.13 | |
| (1)(c) | Certificate of Trust.1 | |
| (1)(d) | Certificate of Amendment to the Certificate of Trust.2 | |
| (2) | By-Laws.1 | |
| (3) | None. | |
| (4) | Plan of Reorganization and Termination; filed as Appendix A to the Combined Proxy Statement and Prospectus set forth as Part A to this Registration Statement on Form N-14. | |
| (5) | Provisions of instruments defining the rights of holders of the securities being registered are contained in the Registrant’s Amended and Restated Agreement and Declaration of Trust and By-laws (Exhibits (1)(b)(i) and (2)). | |
| (6) | Investment Advisory Contracts | |
| (6)(a) | Investment Management Agreement between EQ Advisors Trust (“Trust”) and EQ Financial Consultants, Inc. (“EQFC”) dated April 14, 1997.4 | |
| (6)(a)(i) | Amendment No. 1, dated December 9, 1997, to Investment Management Agreement between the Trust and EQFC dated April 14, 1997.5 | |
| (6)(a)(ii) | Amendment No. 2, dated as of December 31, 1998, to Investment Management Agreement between the Trust and EQFC dated April 14, 1997.6 | |
| (6)(a)(iii) | Form of Amendment No. 3, dated as of April 30, 1999, to Investment Management Agreement between the Trust and EQFC.6 | |
| (6)(a)(iv) | Form of Amendment No. 4, dated as of August 30, 1999, to Investment Management Agreement between the Trust and EQFC.7 | |
| (6)(a)(v) | Amended and Restated Investment Management Agreement, dated as of May 1, 2000, between the Trust and AXA Equitable Life Insurance Co. (formerly known as The Equitable Life Assurance Society of the United States) (“AXA Equitable”).9 | |
| (6)(a)(vi) | Revised Amendment No. 1, dated as of September 1, 2000, to the Amended and Restated Investment Management Agreement between the Trust and AXA Equitable dated May 1, 2000.10 | |
| (6)(a)(vii) | Amendment No. 2, dated as of September 1, 2001, to the Amended and Restated Investment Management Agreement between the Trust and AXA Equitable dated May 1, 2000.11 | |
C-8
| (6)(a)(viii) | Amendment No. 3, dated as of November 22, 2002 to the Amended and Restated Investment Management Agreement between the Trust and AXA Equitable dated May 1, 2000.13 | |
| (6)(a)(ix) | Amendment No. 4, dated as of May 2, 2003 to the Amended and Restated Investment Management Agreement between the Trust and AXA Equitable dated May 1, 2000.14 | |
| (6)(a)(x) | Amendment No. 5 dated July 8, 2004 to the Amended and Restated Investment Management Agreement between the Trust and AXA Equitable dated May 1, 2000.17 | |
| (6)(a)(xi) | Amendment No. 6 dated October 25, 2004 to the Amended and Restated Investment Management Agreement between the Trust and AXA Equitable dated May 1, 2000.17 | |
| (6)(a)(xii) | Amendment No. 7 dated May 1, 2005 to the Amended and Restated Investment Management Agreement between the Trust and AXA Equitable dated May 1, 2000.18 | |
| (6)(a)(xiii) | Amendment No. 8 dated September 30, 2005 to the Amended and Restated Investment Management Agreement between the Trust and AXA Equitable dated May 1, 2000.20 | |
| (6)(a)(xiv) | Amendment No. 9 dated August 1, 2006 to the Amended and Restated Investment Management Agreement between the Trust and AXA Equitable dated May 1, 2000.23 | |
| (6)(a)(xv) | Amendment No. 10 dated May 1, 2007 to the Amended and Restated Investment Management Agreement between the Trust and AXA Equitable dated May 1, 2000.25 | |
| (6)(a)(xvi) | Amendment No. 11 dated July 11, 2007 to the Amended and Restated Investment Management Agreement between the Trust and AXA Equitable dated May 1, 2000.26 | |
| (6)(a)(xvii) | Amendment No. 12 dated May 1, 2008 to the Amended and Restated Investment Management Agreement between the Trust and AXA Equitable dated May 1, 2000.29 | |
| (6)(a)(xviii) | Amendment No. 13 dated December 1, 2008 to the Investment Management Agreement between the Trust and AXA Equitable dated May 1, 2000.29 | |
| (6)(a)(xix) | Amendment No. 14 dated January 1, 2009 to the Investment Management Agreement between the Trust and AXA Equitable dated as of May 1, 2000.29 | |
| (6)(a)(xx) | Amendment No. 15 dated as of May 1, 2009 to the Investment Management Agreement between the Trust and AXA Equitable dated May 1, 2000.33 | |
| (6)(a)(xxi) | Amendment No. 16 effective as of June 5, 2009 to the Amended and Restated Investment Management Agreement between the Trust and AXA Equitable, dated May 1, 2000.35 | |
| (6)(a)(xxii) | Amendment No. 17 dated as of September 29, 2009 to the Amended and Restated Investment Management Agreement between the Trust and AXA Equitable, dated May 1, 2000.35 | |
| (6)(a)(xxiii) | Form of Amendment No. 18 dated as of June __, 2010 to the Amended and Restated Investment Management Agreement between the Trust and AXA Equitable, dated May 1, 2000.36 | |
| (6)(a)(xxiv) | Amendment No. 19 dated as of August 16, 2010 to the Amended and Restated Investment Management Agreement between the Trust and AXA Equitable, dated May 1, 2000. (to be filed by amendment) | |
| (6)(a)(xxv) | Form of Amendment No. 20 dated as of __________, 2010 to the Amended and Restated Investment Management Agreement between the Trust and AXA Equitable, dated May 1, 2000.38 | |
C-9
| (6)(b) | Investment Advisory Agreement between AXA Equitable and Marsico on behalf of MarketPLUS Large Cap Growth Portfolio dated December 14, 2007.28 | |
| (6)(b)(1) | Amendment No. 1 dated May 1, 2008 to the Investment Advisory Agreement between AXA Equitable and Marsico on behalf of EQ/Large Cap Growth PLUS Portfolio (formerly MarketPLUS Large Cap Growth Portfolio) dated December 14, 2007.29 | |
| (6)(c) | Investment Advisory Agreement between AXA Equitable and SSgA Funds Management (“SSgA FM”) dated December 1, 2008.29 | |
| (6)(c)(i) | Amendment No. 1, effective as of January 1, 2009 to the Investment Advisory Agreement between AXA Equitable and SSgA FM dated December 1, 2008.29 | |
| (6)(c)(ii) | Amendment No. 2, dated as of May 1, 2009 to the Investment Advisory Agreement between AXA Equitable and SSgA FM dated as of December 1, 2008.33 | |
| (6)(c)(iii) | Revised Amendment No. 2, effective as of May 1, 2009 to the Investment Advisory Agreement between AXA Equitable and SSgA FM dated as of December 1, 2008.35 | |
| (6)(c)(iv) | Amendment No. 3, effective as of September 29, 2009 to the Investment Advisory Agreement between AXA Equitable and SSgA FM dated as of December 1, 2008.35 | |
| (6)(c)(v) | Amendment No. 4 effective as of February 1, 2010 to the Investment Advisory Agreement between AXA Equitable and SSgA FM dated as of December 1, 2008.37 | |
| (6)(d) | Investment Advisory Agreement between AXA Equitable and BlackRock Investment Management LLC (“BlackRock Investment”), dated as of October 1, 2006.24 | |
| (6)(d)(i) | Amendment No. 1, dated as of July 11, 2007, to the Investment Advisory Agreement between AXA Equitable and BlackRock Investment dated as of October 1, 2006.28 | |
| (6)(d)(ii) | Amendment No. 2 dated as of July 1, 2008, to the Investment Advisory Agreement between AXA Equitable and BlackRock Investment dated as of October 1, 2006.29 | |
| (6)(d)(iii) | Amendment No. 3 dated as of April 1, 2009, to the Investment Advisory Agreement between AXA Equitable and BlackRock Investment dated as of October 1, 2006.33 | |
| (6)(d)(iv) | Revised Amendment No. 3 effective as of April 1, 2009, to the Investment Advisory Agreement between AXA Equitable and BlackRock Investment dated as of October 1, 2006.35 | |
| (6)(d)(v) | Amendment No. 4 effective September 29, 2009, to the Investment Advisory Agreement between AXA Equitable and BlackRock Investment dated as of October 1, 2006.35 | |
| (6)(d)(vi) | Amendment No. 5 dated effective February 12, 2010, to the Investment Advisory Agreement between AXA Equitable and BlackRock Investment dated as of October 1, 2006.37 | |
| (6)(d)(vii) | Revised Amendment No. 5 dated effective February 12, 2010, to the Investment Advisory Agreement between AXA Equitable and BlackRock Investment dated as of October 1, 2006.37 | |
| (7) | Underwriting or Distribution Contracts | |
| (7)(a) | Amended and Restated Distribution Agreement between the Trust and AXA Distributors dated as July 15, 2002 with respect to Class IA shares.13 | |
C-10
| (7)(a)(i) | Amendment No. 1, dated May 2, 2003, to the Amended and Restated Distribution Agreement between the Trust and AXA Distributors, dated as of July 15, 2002 with respect to Class IA shares.14 | |
| (7)(a)(ii) | Amendment No. 2, dated July 8, 2004, to the Amended and Restated Distribution Agreement between the Trust and AXA Distributors, dated as of July 15, 2002 with respect to Class IA shares.17 | |
| (7)(a)(iii) | Amendment No. 3, dated October 1, 2004 to the Amended and Restated Distribution Agreement between the Trust and AXA Distributors, dated as of July 15, 2002 with respect to Class IA shares.17 | |
| (7)(a)(iv) | Amendment No. 4, dated May 1, 2005 to the Amended and Restated Distribution Agreement between the Trust and AXA Distributors dated as of July 15, 2002 with respect to Class IA shares.18 | |
| (7)(a)(v) | Amendment No. 5 dated September 30, 2005 to the Amended and Restated Distribution Agreement between the Trust and AXA Distributors dated as of July 15, 2002 with respect to Class IA shares.20 | |
| (7)(a)(vi) | Amendment No. 6 dated August 1, 2006 to the Amended and Restated Distribution Agreement between the Trust and AXA Distributors dated as of July 15, 2002 with respect to Class IA shares.23 | |
| (7)(a)(vii) | Amendment No. 7 dated May 1, 2007 to the Amended and Restated Distribution Agreement between the Trust and AXA Distributors dated as of July 15, 2002 with respect to Class IA shares.25 | |
| (7)(a)(viii) | Amendment No. 8 dated July 11, 2007 to the Amended and Restated Distribution Agreement between the Trust and AXA Distributors dated as of July 15, 2002 with respect to Class IA shares.26 | |
| (7)(a)(ix) | Amendment No. 9 dated January 1, 2008 to the Amended and Restated Distribution Agreement between the Trust and AXA Distributors dated as of July 15, 2002 with respect to Class IA shares.27 | |
| (7)(a)(x) | Amendment No. 10 dated May 1, 2008 to the Amended and Restated Distribution Agreement between the Trust and AXA Distributors dated as of July 15, 2002 with respect to Class IA shares.29 | |
| (7)(a)(xi) | Amendment No. 11 dated January 1, 2009 to the Amended and Restated Distribution Agreement between the Trust and AXA Distributors dated as of July 15, 2002 with respect to Class IA shares.31 | |
| (7)(a)(xii) | Amendment No. 12 dated May 1, 2009 to the Amended and Restated Distribution Agreement between the Trust and AXA Distributors dated as of July 15, 2002 with respect to Class IA shares.32 | |
| (7)(a)(xiii) | Amendment No. 13 dated September 29, 2009 to the Amended and Restated Distribution Agreement between the Trust and AXA Distributors dated as of July 15, 2002 with respect to Class IA shares.35 | |
| (7)(a)(xiv) | Form of Amendment No. 14 dated June , 2010 to the Amended and Restated Distribution Agreement between the Trust and AXA Distributors dated as of July 15, 2002 with respect to Class IA shares.36 | |
| (7)(a)(xv) | Form of Amendment No. 15 dated , 2010 to the Amended and Restated Distribution Agreement between the Trust and AXA Distributors dated as of July 15, 2002 with respect to Class IA shares.38 | |
| (7)(b) | Amended and Restated Distribution Agreement between the Trust and AXA Distributors dated as of July 15, 2002 with respect to Class IB shares.13 | |
C-11
| (7)(b)(i) | Amendment No. 1, dated May 2, 2003, to the Amended and Restated Distribution Agreement between the Trust and AXA Distributors, dated as of July 15, 2002 with respect to Class IB shares.14 | |
| (7)(b)(ii) | Amendment No. 2, dated July 8, 2004, to the Amended and Restated Distribution Agreement between the Trust and AXA Distributors, dated as of July 15, 2002 with respect to Class IB shares.17 | |
| (7)(b)(iii) | Amendment No. 3, dated October 1, 2004 to the Amended and Restated Distribution Agreement between the Trust and AXA Distributors, dated as of July 15, 2002 with respect to Class IB shares.17 | |
| (7)(b)(iv) | Amendment No. 4, dated May 1, 2005to the Amended and Restated Distribution Agreement between the Trust and AXA Distributors dated as of July 15, 2002 with respect to Class IB shares.18 | |
| (7)(b)(v) | Amendment No. 5, dated September 30, 2005 to the Amended and Restated Distribution Agreement between the Trust and AXA Distributors dated as of July 15, 2002 with respect to Class IB shares.20 | |
| (7)(b)(vi) | Amendment No. 6 dated August 1, 2006 to the Amended and Restated Distribution Agreement between the Trust and AXA Distributors dated as of July 15, 2002 with respect to Class IB shares.23 | |
| (7)(b)(vii) | Amendment No. 7 dated May 1, 2007 to the Amended and Restated Distribution Agreement between the Trust and AXA Distributors dated as of July 15, 2002 with respect to Class IB shares.25 | |
| (7)(b)(viii) | Amendment No. 8 dated July 11, 2007 to the Amended and Restated Distribution Agreement between the Trust and AXA Distributors dated as of July 15, 2002 with respect to Class IB shares.26 | |
| (7)(b)(ix) | Amendment No. 9 dated January 1, 2008 to the Amended and Restated Distribution Agreement between the Trust and AXA Distributors dated as of July 15, 2002 with respect to Class IB shares.27 | |
| (7)(b)(x) | Amendment No. 10 dated May 1, 2008 to the Amended and Restated Distribution Agreement between the Trust and AXA Distributors dated as of July 15, 2002 with respect to Class IB shares.29 | |
| (7)(b)(xi) | Amendment No. 11 dated January 1, 2009 to the Amended and Restated Distribution Agreement between the Trust and AXA Distributors dated as of July 15, 2002 with respect to Class IB shares.31 | |
| (7)(b)(xii) | Amendment No. 12 dated May 1, 2009 to the Amended and Restated Distribution Agreement between the Trust and AXA Distributors dated as of July 15, 2002 with respect to Class IB shares.32 | |
| (7)(b)(xiii) | Amendment No. 13 dated September 29,2009 to the Amended and Restated Distribution Agreement between the Trust and AXA Distributors dated as of July 15, 2002 with respect to Class IB shares.35 | |
| (7)(b)(xiv) | Form of Amendment No. 14 dated June , 2010 to the Amended and Restated Distribution Agreement between the Trust and AXA Distributors dated as of July 15, 2002 with respect to Class IB shares.36 | |
| (7)(b)(xv) | Form of Amendment No. 15 dated , 2010 to the Amended and Restated Distribution Agreement between the Trust and AXA Distributors dated as of July 15, 2002 with respect to Class IB shares.38 | |
C-12
| (7)(c) | Amended and Restated Distribution Agreement between the Trust and AXA Advisors, dated as of July 15, 2002, with respect to Class IA shares.13 | |
| (7)(c)(i) | Amendment No. 2, dated July 8, 2004 to the Amended and Restated Distribution Agreement between the Trust and AXA Advisors, dated July 15, 2002 with respect to Class IA shares.17 | |
| (7)(c)(ii) | Amendment No. 3, dated October 1, 2004, to the Amended and Restated Distribution Agreement between the Trust and AXA Advisors, dated July 15, 2002 with respect to Class IA shares.17 | |
| (7)(c)(iii) | Amendment No. 4 dated May 1, 2005 to the Amended and Restated Distribution Agreement between the Trust and AXA Advisors dated July 15, 2002 with respect to Class IA shares.18 | |
| (7)(c)(iv) | Amendment No. 5 dated September 30, 2005 to the Amended and Restated Distribution Agreement between the Trust and AXA Advisors dated July 15, 2002 with respect to Class IA shares.20 | |
| (7)(c)(v) | Amendment No. 6 dated August 1, 2006 to the Amended and Restated Distribution Agreement between the Trust and AXA Advisors dated July 15, 2002 with respect to Class IA shares.23 | |
| (7)(c)(vi) | Amendment No. 7 dated May 1, 2007 to the Amended and Restated Distribution Agreement between the Trust and AXA Advisors dated July 15, 2002 with respect to Class IA shares.25 | |
| (7)(c)(vii) | Amendment No. 8 dated July 11, 2007 to the Amended and Restated Distribution Agreement between the Trust and AXA Advisors dated as of July 15, 2002 with respect to Class IA shares.26 | |
| (7)(c)(viii) | Amendment No. 9 dated January 1, 2008 to the Amended and Restated Distribution Agreement between the Trust and AXA Advisors dated as of July 15, 2002 with respect to Class IA shares.27 | |
| (7)(c)(ix) | Amendment No. 10 dated May 1, 2008 to the Amended and Restated Distribution Agreement between the Trust and AXA Advisors dated as of July 15, 2002 with respect to Class IA shares.29 | |
| (7)(c)(x) | Amendment No. 11 dated January 1, 2009 to the Amended and Restated Distribution Agreement between the Trust and AXA Advisors dated as of July 15, 2002 with respect to Class IA shares.31 | |
| (7)(c)(xi) | Amendment No. 12 dated May 1, 2009 to the Amended and Restated Distribution Agreement between the Trust and AXA Advisors dated as of July 15, 2002 with respect to Class IA shares.32 | |
| (7)(c)(xii) | Amendment No. 13 dated September 29, 2009 to the Amended and Restated Distribution Agreement between the Trust and AXA Advisors dated as of July 15, 2002 with respect to Class IA shares.35 | |
| (7)(c)(xiii) | Form of Amendment No. 14 dated June , 2010 to the Amended and Restated Distribution Agreement between the Trust and AXA Advisors dated as of July 15, 2002 with respect to Class IA shares.36 | |
| (7)(c)(xiv) | Form of Amendment No. 15 dated , 2010 to the Amended and Restated Distribution Agreement between the Trust and AXA Advisors dated as of July 15, 2002 with respect to Class IA shares.38 | |
| (7)(d) | Amended and Restated Distribution Agreement between the Trust and AXA Advisors dated as of July 15, 2002, with respect to Class IB shares.13 | |
| (7)(d)(i) | Amendment No. 1, dated May 2, 2003, to the Amended and Restated Distribution Agreement between the Trust and AXA Advisors, dated as of July 15, 2002 with respect to Class IB shares.14 | |
C-13
| (7)(d)(ii) | Amendment No. 2, dated July 8, 2004 to the Amended and Restated Distribution Agreement between the Trust and AXA Advisors, dated July 15, 2002 with respect to Class IB shares.17 | |
| (7)(d)(iii) | Amendment No. 3, dated October 1, 2004, to the Amended and Restated Distribution Agreement between the Trust and AXA Advisors, dated July 15, 2002 with respect to Class IB shares.17 | |
| (7)(d)(iv) | Amendment No. 4 dated May 1, 2005 to the Amended and Restated Distribution Agreement between the Trust and AXA Advisors dated July 15, 2002 with respect to Class IB shares.18 | |
| (7)(d)(v) | Amendment No. 5 dated September 30, 2005 to the Amended and Restated Distribution Agreement between the Trust and AXA Advisors dated July 15, 2002 with respect to Class IB shares.20 | |
| (7)(d)(vi) | Amendment No. 6 dated August 1, 2006 to the Amended and Restated Distribution Agreement between the Trust and AXA Advisors dated July 15, 2002 with respect to Class IB shares.23 | |
| (7)(d)(vii) | Amendment No. 7 dated May 1, 2007 to the Amended and Restated Distribution Agreement between the Trust and AXA Advisors dated July 15, 2002 with respect to Class IB shares.25 | |
| (7)(d)(viii) | Amendment No. 8 dated July 11, 2007 to the Amended and Restated Distribution Agreement between the Trust and AXA Advisors dated as of July 15, 2002 with respect to Class IB shares.26 | |
| (7)(d)(ix) | Amendment No. 9 dated January 1, 2008 to the Amended and Restated Distribution Agreement between the Trust and AXA Advisors dated as of July 15, 2002 with respect to Class IB shares.27 | |
| (7)(d)(x) | Amendment No. 10 dated May 1, 2008 to the Amended and Restated Distribution Agreement between the Trust and AXA Advisors dated as of July 15, 2002 with respect to Class IB shares.29 | |
| (7)(d)(xi) | Amendment No. 11 dated January 1, 2009 to the Amended and Restated Distribution Agreement between the Trust and AXA Advisors dated as of July 15, 2002 with respect to Class IB shares. 53 | |
| (7)(d)(xii) | Amendment No. 12 dated May 1, 2009 to the Amended and Restated Distribution Agreement between the Trust and AXA Advisors dated as of July 15, 2002 with respect to Class IB shares.32 | |
| (7)(d)(xiii) | Amendment No. 13 dated September 29, 2009 to the Amended and Restated Distribution Agreement between the Trust and AXA Advisors dated as of July 15, 2002 with respect to Class IB shares.35 | |
| (7)(d)(xiv) | Form of Amendment No. 14 dated June , 2010 to the Amended and Restated Distribution Agreement between the Trust and AXA Advisors dated as of July 15, 2002 with respect to Class IB shares.36 | |
| (7)(d)(xv) | Form of Amendment No. 15 dated , 2010 to the Amended and Restated Distribution Agreement between the Trust and AXA Advisors dated as of July 15, 2002 with respect to Class IB shares.38 | |
| (8) | Form of Deferred Compensation Plan.3 | |
| (9) | Custodian Agreements | |
| (9)(a) | Amended and Restated Global Custody Agreement between the Trust and JPMorgan Chase Bank dated February 1, 2002.12 | |
| (9)(a)(i) | Amendment No. 1, dated May 2, 2003, to the Amended and Restated Global Custody Agreement between the Trust and JP Morgan Chase Bank dated February 1, 2002. 26 | |
C-14
| (9)(a)(ii) | Amendment No. 2, dated July 8, 2004, to the Amended and Restated Global Custody Agreement between the Trust and JP Morgan Chase Bank dated February 1, 2002.17 | |
| (9)(a)(iii) | Amendment No. 3, dated September 13, 2004, to the Amended and Restated Global Custody Agreement between the Trust and JP Morgan Chase Bank dated February 1, 2002.17 | |
| (9)(a)(iv) | Amendment No. 4 dated May 1, 2005 to the Amended and Restated Global Custody Agreement between the Trust and JP Morgan Chase Bank dated February 1, 2002.18 | |
| (9)(a)(v) | Amendment No. 5 dated September 30, 2005 to the Amended and Restated Global Custody Agreement between the Trust and JP Morgan Chase Bank dated February 1, 2002.20 | |
| (9)(a)(vi) | Amendment No. 6 dated August 1, 2006 to the Amended and Restated Global Custody Agreement between the Trust and JP Morgan Chase Bank dated February 1, 2002.24 | |
| (9)(a)(vii) | Amendment No. 7 dated May 1, 2007 to the Amended and Restated Global Custody Agreement between the Trust and JP Morgan Chase Bank dated February 1, 2002.25 | |
| (9)(a)(viii) | Amendment No. 8 dated April 1, 2007 to the Amended and Restated Global Custody Agreement between the Trust and JP Morgan Chase Bank dated February 1, 2002.26 | |
| (9)(a)(ix) | Amendment No. 9 dated January 1, 2008 to the Amended and Restated Global Custody Agreement between the Trust and JPMorgan Chase Bank dated February 1, 2002.27 | |
| (9)(a)(x) | Amendment No. 10 dated May 1, 2008 to the Amended and Restated Global Custody Agreement between the Trust and JPMorgan Chase Bank dated February 1, 2002.29 | |
| (9)(a)(xi) | Amendment No. 11 dated July 1, 2008 to the Amended and Restated Global Custody Agreement between the Trust and JPMorgan Chase Bank dated February 1, 2002.29 | |
| (9)(a)(xii) | Amendment No. 12 dated January 1, 2009 to the Amended and Restated Global Custody Agreement between the Trust and JPMorgan Chase Bank dated February 1, 2002.31 | |
| (9)(a)(xiii) | Amendment No. 13 dated May 1, 2009 to the Amended and Restated Global Custody Agreement between the Trust and JPMorgan Chase Bank dated February 1, 2002.32 | |
| (9)(a)(xiv) | Amendment No. 14 dated as of September 29, 2009, to the Amended and Restated Global Custody Agreement between the Trust and JPMorgan Chase Bank dated February 1, 2002.35 | |
| (9)(a)(xv) | Amendment No. 15 dated as of October 1, 2009, to the Amended and Restated Global Custody Agreement between the Trust and JPMorgan Chase Bank dated February 1, 2002.35 | |
| (10) | Distribution and Multiple Class Plans | |
| (10)(a) | Distribution Plan Pursuant to Rule 12b-1 under the Investment Company Act of 1940, as amended (the “1940 Act”) for the Trust’s Class IB shares adopted March 31, 1997.4 | |
| (10)(a)(i) | Amended and Restated Distribution Plan pursuant to Rule 12b-1 under the 1940 Act for the Trust’s Class IB shares adopted as of July 14, 2010.38 | |
| (10)(b) | Plan Pursuant to Rule 18f-3 under the 1940 Act.4 | |
| (11) | Legal Opinion of K&L Gates LLP regarding the legality of the securities being registered. (filed herewith) | |
C-15
| (12) | Opinion of K&L Gates LLP as to tax matters. (to be filed by amendment) | |
| (13) | Other Material Contracts | |
| (13)(a) | Form of Mutual Fund Services Agreement between the Trust and AXA Equitable dated May 1, 2000.8 | |
| (13)(a)(i) | Amendment No. 1 dated May 1, 2005 to the Mutual Fund Services Agreement between the Trust and AXA Equitable dated May 1, 2000.19 | |
| (13)(a)(ii) | Amendment No. 2 dated as of May 1, 2006, to the Mutual Fund Services Agreement between the Trust and AXA Equitable dated May 1, 2000.21 | |
| (13)(a)(iii) | Amendment No. 3 dated as of August 1, 2006, to the Mutual Fund Services Agreement between the Trust and AXA Equitable dated May 1, 2000.24 | |
| (13)(a)(iv) | Amendment No. 4 dated as of May 1, 2007, to the Mutual Fund Services Agreement between the Trust and AXA Equitable dated May 1, 2000.25 | |
| (13)(a)(v) | Amendment No. 5 dated as of July 11, 2007 to the Mutual Fund Services Agreement between the Trust and AXA Equitable dated May 1, 2000.26 | |
| (13)(a)(vi) | Amendment No. 6 dated as of January 1, 2008 to the Mutual Fund Services Agreement between the Trust and AXA Equitable dated May 1, 2000.27 | |
| (13)(a)(vii) | Amendment No. 7 dated as of May 1, 2008 to the Mutual Fund Services Agreement between the Trust and AXA Equitable dated May 1, 2000.29 | |
| (13)(a)(viii) | Amendment No. 8 dated December 1, 2008 to the Mutual Fund Services Agreement between the Trust and AXA Equitable dated May 1, 2000.29 | |
| (13)(a)(ix) | Amendment No. 9 dated January 1, 2009 to the Mutual Fund Services Agreement between the Trust and AXA Equitable dated May 1, 2000.31 | |
| (13)(a)(x) | Revised Amendment No. 10 dated May 1, 2009 to the Mutual Fund Services Agreement between the Trust and AXA Equitable dated May 1, 2000.34 | |
| (13)(a)(xi) | Amendment No. 11 dated September 29, 2009 to the Mutual Fund Services Agreement between the Trust and AXA Equitable dated May 1, 2000.35 | |
| (13)(a)(xii) | Form of Amendment No. 12 dated June , 2010 to the Mutual Fund Services Agreement between the Trust and AXA Equitable dated May 1, 2000.36 | |
| (13)(a)(xiii) | Amendment No. 13 dated August 16, 2010 to the Mutual Fund Services Agreement between the Trust and AXA Equitable dated May 1, 2000. (to be filed by amendment) | |
| (13)(a)(xiv) | Form of Amendment No. 14 dated , 2010 to the Mutual Fund Services Agreement between the Trust and AXA Equitable dated May 1, 2000.38 | |
| (13)(b) | Fourth Amended and Restated Expense Limitation Agreement between AXA Equitable and the Trust, dated as of May 1, 2002.13 | |
| (13)(b)(i) | Amendment No. 1, dated as of May 1, 2003 to the Fourth Amended and Restated Expense Limitation Agreement between AXA Equitable and the Trust dated as of May 1, 2002.14 | |
C-16
| (13)(b)(ii) | Amendment No. 2 dated as of May 1, 2004 to the Fourth Amended and Restated Expense Limitation Agreement between AXA Equitable and the Trust dated as of May 1, 2002.15 | |
| (13)(b)(iii) | Amendment No. 3 to the Fourth Amended and Restated Expense Limitation Agreement between AXA Equitable and the Trust dated as of May 1, 2002.17 | |
| (13)(b)(iv) | Amendment No. 4 to the Fourth Amended and Restated Expense Limitation Agreement between AXA Equitable and the Trust dated May 1, 2002.18 | |
| (13)(b)(v) | Amendment No. 5 dated September 30, 2005 to the Fourth Amended and Restated Expense Limitation Agreement between AXA Equitable and the Trust dated May 1, 2002.20 | |
| (13)(b)(vi) | Amendment No. 6 dated October 1, 2005 to the Fourth Amended and Restated Expense Limitation Agreement between AXA Equitable and the Trust dated as of May 1, 2002.21 | |
| (13)(b)(vii) | Amendment No. 7 dated May 1, 2006 to the Fourth Amended and Restated Expense Limitation Agreement between AXA Equitable and the Trust dated as of May 1, 2002.22 | |
| (13)(b)(viii) | Amendment No. 8 dated August 1, 2006 to the Fourth Amended and Restated Expense Limitation Agreement between AXA Equitable and the Trust dated as of May 1, 2002.23 | |
| (13)(b)(ix) | Amendment No. 9 dated May 1, 2007 to the Fourth Amended and Restated Expense Limitation Agreement between AXA Equitable and the Trust dated as of May 1, 2002.25 | |
| (13)(b)(x) | Amendment No. 10 dated May 25, 2007 to the Fourth Amended and Restated Expense Limitation Agreement between AXA Equitable and the Trust dated as of May 1, 2002.26 | |
| (13)(b)(xi) | Amendment No. 11 dated January 1, 2008 to the Fourth Amended and Restated Expense Limitation Agreement between AXA Equitable and the Trust dated as of May 1, 2002.27 | |
| (13)(b)(xii) | Amendment No. 12 dated May 1, 2008 to the Fourth Amended and Restated Expense Limitation Agreement between AXA Equitable and the Trust dated as of May 1, 2002.29 | |
| (13)(b)(xiii) | Amendment No. 13 dated September 1, 2008, to the Expense Limitation Agreement between the Trust and AXA Equitable dated as of May 1, 2002.29 | |
| (13)(b)(xiv) | Amendment No. 14 dated as of January 1, 2009, to the Expense Limitation Agreement between the Trust and AXA Equitable dated May 1, 2002.30 | |
| (13)(b)(xv) | Amendment No. 15 dated as of May 1, 2009 to the Fourth Amended and Restated Expense Limitation Agreement between the Trust and AXA Equitable dated May 1, 2002.32 | |
| (13)(b)(xvi) | Amendment No. 16 dated as of September 29, 2009 to the Fourth Amended and Restated Expense Limitation Agreement between the Trust and AXA Equitable dated May 1, 2002.35 | |
| (13)(b)(xvii) | Amendment No. 17 dated as of May 1, 2010 to the Fourth Amended and Restated Expense Limitation Agreement between the Trust and AXA Equitable dated May 1, 2002.37 | |
| (13)(b)(xviii) | Form of Amendment No. 18 dated as of June , 2010 to the Fourth Amended and Restated Expense Limitation Agreement between the Trust and AXA Equitable dated May 1, 2002.36 | |
| (13)(b)(xix) | Amendment No. 19, dated as of August 16, 2010 to the Fourth Amended and Restated Expense Limitation Agreement between the Trust and AXA Equitable dated May 1, 2002. (to be filed by amendment) | |
C-17
| (13)(b)(xx) | Form of Amendment No. 20, dated as of , 2010 to the Fourth Amended and Restated Expense Limitation Agreement between the Trust and AXA Equitable dated May 1, 2002.38 | |
| (13)(c) | Amended and Restated Participation Agreement among the Trust, AXA Equitable, AXA Distributors and AXA Advisors dated as of July 15, 2002.13 | |
| (13)(c)(i) | Amendment No. 1, dated May 2, 2003, to the Amended and Restated Participation Agreement among the Trust, AXA Equitable, AXA Distributors and AXA Advisors dated July 15, 2002.14 | |
| (13)(c)(ii) | Amendment No. 2, dated July 9, 2004, to the Amended and Restated Participation Agreement among the Trust, AXA Equitable, AXA Distributors and AXA Advisors dated July 15, 2002.17 | |
| (13)(c)(iii) | Amendment No. 3, dated October 1, 2004, to the Amended and Restated Participation Agreement among the Trust, AXA Equitable, AXA Distributors and AXA Advisors dated July 15, 2002.17 | |
| (13)(c)(iv) | Amendment No. 4 dated May 1, 2005 to the Amended and Restated Participation Agreement among the Trust, AXA Equitable, AXA Distributors and AXA Advisors dated July 15, 2002.18 | |
| (13)(c)(v) | Amendment No. 5 dated September 30, 2005 to the Amended and Restated Participation Agreement among the Trust, AXA Equitable, AXA Distributors and AXA Advisors dated July 15, 2002.22 | |
| (13)(c)(vi) | Amendment No. 6 dated August 1, 2006 to the Amended and Restated Participation Agreement among the Trust, AXA Equitable, AXA Distributors and AXA Advisors dated July 15, 2002.24 | |
| (13)(c)(vii) | Amendment No. 7 dated May 1, 2007 to the Amended and Restated Participation Agreement among the Trust, AXA Equitable, AXA Distributors and AXA Advisors dated July 15, 2002.25 | |
| (13)(c)(viii) | Amendment No. 8 dated January 1, 2008 to the Amended and Restated Participation Agreement among the Trust, AXA Equitable, AXA Distributors and AXA Advisors dated July 15, 2002.27 | |
| (13)(c)(ix) | Amendment No. 9 dated May 1, 2008 to the Amended and Restated Participation Agreement among the Trust, AXA Equitable, AXA Distributors and AXA Advisors dated July 15, 2002.29 | |
| (13)(c)(x) | Amendment No. 10 dated January 1, 2009 to the Amended and Restated Participation Agreement among the Trust, AXA Equitable, AXA Distributors and AXA Advisors dated July 15, 2002.31 | |
| (13)(c)(xi) | Amendment No. 11 dated May 1, 2009 to the Amended and Restated Participation Agreement among the Trust, AXA Equitable, AXA Distributors and AXA Advisors dated July 15, 2002.32 | |
| (13)(c)(xii) | Amendment No. 12 dated September 29, 2009 to the Amended and Restated Participation Agreement among the Trust, AXA Equitable, AXA Distributors and AXA Advisors dated July 15, 2002.35 | |
| (13)(d) | Sub-Administration Agreement between AXA Equitable and JPMorgan Investor Services Co. (formerly, “Chase Global Funds Services Company”) dated May 1, 2000 as amended November 1, 2004.22 | |
| (13)(e) | Amended and Restated Retirement Plan Participation Agreement among the Trust, AXA Advisors, the Investment Plan for Employees, Managers and Agents, and AXA Equitable dated as of July 10, 2002.13 | |
C-18
| (14) | Consent of Independent Registered Public Accounting Firm. (filed herewith) | |
| (15) | None. | |
| (16) | Powers of Attorney. (filed herewith) | |
| (17) | Additional Exhibits | |
| (17)(a) | Voting Instruction and Proxy Cards. (filed herewith) | |
| (17)(b) | Revised Code of Ethics of the Trust, AXA Equitable, AXA Advisors and AXA Distributors dated March 31, 1997, as amended July 2008.16 | |
| (17)(c) | Revised Code of Ethics of Marsico effective September 1, 2008.29 | |
| (17)(d) | Revised Code of Ethics of SSgA FM, effective November 1, 2009.39 | |
| (17)(e) | Revised Code of Ethics of BlackRock Financial, BlackRock Investment and BlackRock International effective April 2007.28 | |
| 1. | Incorporated by reference to and/or previously filed Registrant’s Registration Statement on Form N-1A filed on December 3, 1996 (File No. 333-17217). |
| 2. | Incorporated by reference to and/or previously filed with Pre-Effective Amendment No. 1 to Registrant’s Registration Statement on Form N-1A filed on January 23, 1997 (File No. 333-17217). |
| 3. | Incorporated by reference to and/or previously filed with Pre-Effective Amendment No. 2 to Registrant’s Registration Statement on Form N-1A filed on April 7, 1997 (File No. 333-17217). |
| 4. | Incorporated by reference to and/or previously filed with Post-Effective Amendment No. 1 to Registrant’s Registration Statement on Form N-1A filed on August 28, 1997 (File No. 333-17217). |
| 5. | Incorporated by reference to and/or previously filed with Post-Effective Amendment No. 4 to Registrant’s Registration Statement on Form N-1A filed on December 29, 1997 (File No. 333-17217). |
| 6. | Incorporated by reference to and/or previously filed with Post-Effective Amendment No. 10 to Registrant’s Registration Statement on Form N-1A filed on April 30, 1999 (File No. 333-17217). |
| 7. | Incorporated by reference to and/or previously filed with Post-Effective Amendment No. 13 to Registrant’s Registration Statement on Form N-1A filed on August 30, 1999 (File No. 333-17217). |
| 8. | Incorporated by reference to and/or previously filed with Post-Effective Amendment No. 15 to Registrant’s Registration Statement on Form N-1A filed on February 16, 2000 (File No. 333-17217). |
| 9. | Incorporated by reference to and/or previously filed with Post-Effective Amendment No. 16 to Registrant’s Registration Statement on Form N-1A filed on April 21, 2000 (File No. 333-17217). |
| 10. | Incorporated by reference to and/or previously filed with Post-Effective Amendment No. 18 to Registrant’s Registration Statement on Form N-1A filed on January 23, 2001 (File No. 333-17217). |
| 11. | Incorporated by reference to and/or previously filed with Post-Effective Amendment No. 22 to Registrant’s Registration Statement on Form N-1A filed on August 13, 2001 (File No. 333-17217). |
| 12. | Incorporated by reference to and/or previously filed with Post-Effective Amendment No. 24 to Registrant’s Registration Statement on Form N-1A filed on April 3, 2002 (File No. 333-17217). |
| 13. | Incorporated by reference to and/or previously filed with Post-Effective Amendment No. 25 to Registrant’s Registration Statement on Form N-1A filed on February 7, 2003 (File No. 333-17217). |
| 14. | Incorporated by reference to and/or previously filed with Post-Effective Amendment No. 28 to Registrant’s Registration Statement on Form N-1A filed on February 10, 2004 (File No. 333-17217). |
C-19
| 15. | Incorporated by reference to and/or previously filed with Post-Effective Amendment No. 30 to Registrant’s Registration Statement on Form N-1A filed on April 7, 2004 (File No. 333-17217). |
| 16. | Incorporated by reference to and/or previously filed with Post-Effective Amendment No. 32 to Registrant’s Registration Statement on Form N-1A filed on July 12, 2004 (File No. 333-17217). |
| 17. | Incorporated by reference to and/or previously filed with Post-Effective Amendment No. 35 to Registrant’s Registration Statement on Form N-1A filed on October 15, 2004 (File No. 333-17217). |
| 18. | Incorporated by reference to and/or previously filed with Post-Effective Amendment No. 37 to Registrant’s Registration Statement on Form N-1A filed on April 7, 2005 (File No. 333-17217). |
| 19. | Incorporated by reference to and/or previously filed with Post-Effective Amendment No. 41 to Registrant’s Registration Statement on Form N-1A filed on August 23, 2005 (File No. 333-17217). |
| 20. | Incorporated by reference to and/or previously filed with Post-Effective Amendment No. 42 to Registrant’s Registration Statement on Form N-1A filed on August 24, 2005. (File No. 333-17217). |
| 21. | Incorporated by reference to and/or previously filed with Post-Effective Amendment No. 43 to Registrant’s Registration Statement on Form N-1A filed on February 8, 2006. (File No. 333-17217) |
| 22. | Incorporated by reference to and/or previously filed with Post-Effective Amendment No. 44 to Registrant’s Registration Statement on Form N-1A filed on April 5, 2006. (File No. 333-17217) |
| 23. | Incorporated by reference to and/or previously filed with Post-Effective Amendment No. 46 to Registrant’s Registration Statement on Form N-1A filed on August 23, 2006. (File No. 333-17217) |
| 24. | Incorporated by reference to Post-Effective Amendment No. 51 to Registrant’s Registration Statement on Form N-1A filed on February 2, 2007. (File No. 333-17217) |
| 25. | Incorporated by reference to and/or previously filed with Post-Effective Amendment No. 53 to Registrant’s Registration Statement on Form N-1A filed on April 27, 2007. (File No. 333-17217) |
| 26. | Incorporated by reference to Post-Effective Amendment No. 54 to Registrant’s Registration Statement on Form N-1A filed on October 4, 2007. (File No. 333-17217) |
| 27. | Incorporated by reference to and/or previously filed with Post-Effective Amendment No. 56 to Registrant’s Registration Statement on Form N-1A filed on December 27, 2007. (File No. 333-17217) |
| 28. | Incorporated by reference to Post-Effective Amendment No. 57 to Registrant’s Registration Statement on Form N-1A filed on February 1, 2008. (File No. 333-17217) |
| 29. | Incorporated by reference to Post-Effective Amendment No. 61 to the Registrant’s Registration Statement on Form N-1A filed on February 13, 2009. (File No. 333-17217) |
| 30. | Incorporated by reference to and/or previously filed with Post-Effective Amendment No. 63 to the Registrant’s Registration Statement on Form N-1A filed on March 13, 2009. (File No. 333-17217) |
| 31. | Incorporated by reference to Post-Effective Amendment No. 64 to the Registrant’s Registration Statement on Form N-1A filed on March 16, 2009. (File No. 333-17217) |
| 32. | Incorporated by reference to and/or previously filed with Post-Effective Amendment No. 67 to the Registrant’s Registration Statement on Form N-1A filed on April 15, 2009. (File No. 333-17217) |
| 33. | Incorporated by reference to and/or previously filed with Post-Effective Amendment No. 68 to the Registrant’s Registration Statement on Form N-1A filed on April 29, 2009. (File No. 333-17217) |
| 34. | Incorporated by reference to and/or previously filed with Post-Effective Amendment No. 69 to the Registrant’s Registration Statement on Form N-1A filed on May 27, 2009. (File No. 333-17217) |
| 35. | Incorporated by reference to and/or previously filed with Post-Effective Amendment No. 70 to the Registrant’s Registration Statement on Form N-1A filed on January 21, 2010. (File No. 333-17217) |
| 36. | Incorporated by reference to and/or previously filed with Post-Effective Amendment No. 72 to the Registrant’s Registration Statement on Form N-1A filed on April 16, 2010. (File No. 333-17217) |
| 37. | Incorporated by reference to and/or previously filed with Post-Effective Amendment No. 73 to the Registrant’s Registration Statement on Form N-1A filed on April 28, 2010. (File No. 333-17217) |
| 38. | Incorporated by reference to and/or previously filed with Post-Effective Amendment No. 75 to the Registrant’s Registration Statement on Form N-1A filed on October 5, 2010. (File No. 333-17217) |
C-20
| Item 17. | Undertakings |
| (1) | The undersigned Registrant agrees that prior to any public reoffering of the securities registered through the use of a prospectus which is a part of this Registration Statement by any person or party who is deemed to be an underwriter within the meaning of Rule 145(c) under the Securities Act of 1933, as amended (the “1933 Act”), the reoffering prospectus will contain the information called for by the applicable registration form for reofferings by persons who may be deemed underwriters, in addition to the information called for by the other items of the applicable form. |
| (2) | The undersigned Registrant agrees that every prospectus that is filed under paragraph (1) above will be filed as a part of an amendment to the Registration Statement and will not be used until the amendment is effective, and that, in determining any liability under the 1933 Act, each post-effective amendment shall be deemed to be a new registration statement for the securities offered therein, and the offering of the securities at that time shall be deemed to be the initial bona fide offering of them. |
| (3) | The Registrant agrees to file an executed copy of the opinion of counsel supporting the tax consequences of the proposed reorganization as an amendment to this Registration Statement within a reasonable time after receipt of such opinion. |
C-21
SIGNATURES
As required by the Securities Act of 1933, as amended (the “1933 Act”), this Registration Statement has been signed on behalf of the Registrant, in the City of New York and the State of New York on the 21st day of December 2010.
EQ ADVISORS TRUST | ||
| By: | /S/ STEVEN M. JOENK | |
| Steven M. Joenk | ||
Trustee, Chairman, President and Chief Executive Officer | ||
As required by the 1933 Act, this Registration Statement has been signed by the following persons in the capacities and on the dates indicated.
Signature | Title | Date | ||
/S/ STEVEN M. JOENK Steven M. Joenk | Trustee, Chairman, President and Chief Executive Officer | December 21, 2010 | ||
/S/ JETTIE M. EDWARDS* Jettie M. Edwards | Trustee | December 21, 2010 | ||
/S/ WILLIAM M. KEARNS, JR.* William M. Kearns, Jr. | Trustee | December 21, 2010 | ||
/S/ CHRISTOPHER P.A. KOMISARJEVSKY* Christopher P.A. Komisarjevsky | Trustee | December 21, 2010 | ||
/S/ THEODOSSIOS ATHANASSIADES* Theodossios (Ted) Athanassiades | Trustee | December 21, 2010 | ||
/S/ DAVID W. FOX* David W. Fox | Trustee | December 21, 2010 | ||
/S/ GARY S. SCHPERO* Gary S. Schpero | Trustee | December 21, 2010 | ||
/S/ HARVEY ROSENTHAL* Harvey Rosenthal | Trustee | December 21, 2010 | ||
/S/ BRIAN WALSH* Brian Walsh | Treasurer and Chief Financial Officer | December 21, 2010 | ||
| *By: | /S/ STEVEN M. JOENK | |
| Steven M. Joenk | ||
| (Attorney-in-fact) |
EXHIBIT INDEX
Exhibit | Description of Exhibit | |
(11) | Legal Opinion of K&L Gates LLP regarding the legality of the securities being registered. | |
(14) | Consent of Independent Registered Public Accounting Firm. | |
(16) | Powers of Attorney. | |
(17)(a) | Voting Instruction and Proxy Cards. | |